UNITED STATES
SECURITIES AND EXCHANGE COMMISSION
WASHINGTON, D.C. 20549
FORM N-CSR
CERTIFIED SHAREHOLDER REPORT OF REGISTERED
MANAGEMENT INVESTMENT COMPANIES
Investment Company Act file number 811-4108
Oppenheimer Variable Account Funds
(Exact name of registrant as specified in charter)
6803 South Tucson Way, Centennial, Colorado 80112-3924
(Address of principal executive offices) (Zip code)
Arthur S. Gabinet
OFI Global Asset Management, Inc.
225 Liberty Street, New York, New York 10281-1008
(Name and address of agent for service)
Registrant’s telephone number, including area code: (303) 768-3200
Date of fiscal year end: December 31
Date of reporting period: 12/31/2014
| Item 1. | Reports to Stockholders. |
December 31, 2014
| | | | |
| | | |
| | | Oppenheimer Discovery Mid Cap Growth Fund/VA A Series of Oppenheimer Variable Account Funds | | Annual Report |
ANNUAL REPORT
Listing of Top Holdings
Fund Performance Discussion
Financial Statements
PORTFOLIO MANAGERS: Ronald J. Zibelli, Jr., CFA and Justin Livengood, CFA
AVERAGE ANNUAL TOTAL RETURNS FOR THE PERIODS ENDED 12/31/14
| | | | | | | | | | | | | | | | |
| | | Inception Date | | 1-Year | | | 5-Year | | | 10-Year | | | |
Non-Service Shares | | 8/15/86 | | | 5.78 | % | | | 16.64 | % | | | 6.01 | % | | |
Service Shares | | 10/16/00 | | | 5.53 | | | | 16.34 | | | | 5.73 | | | |
Russell Midcap Growth Index | | | | | 11.90 | | | | 16.94 | | | | 9.43 | | | |
Performance data quoted represents past performance, which does not guarantee future results. The investment return and principal value of an investment in the Fund will fluctuate so that an investor’s shares, when redeemed, may be worth more or less than their original cost. Current performance may be lower or higher than the performance quoted. For performance data current to the most recent month end, call us at 1.800.988.8287. The Fund’s total returns should not be expected to be the same as the returns of other funds, whether or not both funds have the same portfolio managers and/or similar names. The Fund’s total returns include changes in share price and reinvested distributions but do not include the charges associated with the separate account products that offer this Fund. Such performance would have been lower if such charges were taken into account.
TOP TEN COMMON STOCK HOLDINGS
| | |
SBA Communications Corp., Cl. A | | 2.3% |
O’Reilly Automotive, Inc. | | 2.2 |
Marriott International, Inc., Cl. A | | 2.0 |
Chipotle Mexican Grill, Inc., Cl. A | | 1.9 |
Sherwin-Williams Co. (The) | | 1.9 |
Palo Alto Networks, Inc. | | 1.8 |
ServiceNow, Inc. | | 1.8 |
Hanesbrands, Inc. | | 1.8 |
Wabtec Corp. | | 1.7 |
Polaris Industries, Inc. | | 1.6 |
Portfolio holdings and allocations are subject to change. Percentages are as of December 31, 2014, and are based on net assets. For more current Fund holdings, please visit oppenheimerfunds.com.
SECTOR ALLOCATION
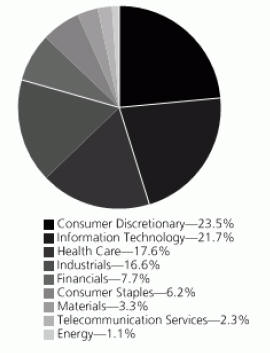
Portfolio holdings and allocations are subject to change. Percentages are as of December 31, 2014, and are based on the total market value of common stocks.
|
| 2 OPPENHEIMER DISCOVERY MID CAP GROWTH FUND/VA |
Fund Performance Discussion
The Fund’s Non-Service shares produced a return of 5.78% during the reporting period, underperforming the Russell Midcap Growth Index’s (the “Index”) return of 11.90% and the Lipper VA Midcap Growth peer group’s return of 8.70% over the same period. The Fund’s underperformance versus the Index stemmed from weaker relative stock selection in the information technology, health care and financials sectors. The Fund outperformed the Index in the consumer discretionary and materials sectors due to stronger relative stock selection.
The investment environment changed significantly during the reporting period. In late 2013 and early 2014, high-quality growth companies continued to outperform the broader market as they had over the previous few years. But in March 2014, the tone of the market changed abruptly where companies with larger market capitalizations and lower valuations began to materially outperform small cap and mid cap companies with higher valuations. Our investment style, which favors high-quality, high-growth companies that often have above average valuations, underperformed meaningfully from mid-March to mid-May despite little or no change to the underlying fundamentals of the companies we own.
For the 3-year, 5-year and 10-year periods ended December 31, 2014, the Fund’s Non-Service shares produced average annual returns of 18.76%, 16.64% and 6.01%, respectively. Over those same periods, the Index generated returns of 20.71%, 16.94% and 9.43%, while the Lipper VA Mid-Cap Growth peer group produced returns of 17.52%, 12.98% and 6.84%, respectively.
MARKET OVERVIEW
Domestic equities were among the top performing asset classes in 2014, outperforming foreign equities, including those domiciled in Europe, Japan and emerging markets. In the U.S., the Federal Reserve (the “Fed”) began tapering its most recent quantitative easing (“QE”) program in January 2014 and completed the process at the end of October, thereby ending the program’s purchases. The Fed reduced its monthly bond purchases in steady $10 billion increments, which helped reduce market volatility and enabled investors to prepare for a post-QE market environment. Although data in the U.S. softened for the first quarter, partially attributed to cold weather effects across much of the country, it was positive in the second and third quarters of 2014, with Gross Domestic Product (“GDP”) growing at 4.6% and an estimated 5.0%, respectively.
Outside of the U.S., the positive data points that had emerged in Europe in 2013 and early 2014 largely reversed themselves later in the reporting period and the European Central Bank (the “ECB”) came under even greater pressure to provide a credible plan to boost growth and avoid deflation. In response, the ECB adopted a number of policies designed to stimulate growth. In Japan, which has been mired in economic weakness for years, the Abe administration has adopted even more aggressive economic policies with the Bank of Japan (the “BoJ”) executing a massive QE program. However, the results have not been particularly impressive, with that economy slipping back into recession in the third quarter of 2014 following the consumption tax increase. Emerging markets’ economic growth was mixed, as certain regions such as Eastern Europe and the Middle East remained burdened by geopolitical turmoil. Many commodity producing emerging market economies also struggled as prices for most commodities fell. Countries such as India and Indonesia have benefited from business-friendly new administrations.
TOP INDIVIDUAL CONTRIBUTORS
Top performing stocks for the Fund this reporting period included Illumina, Inc., GoPro, Inc. and Palo Alto Networks, Inc. Illumina, a leading developer of genetic analysis tools, reported strong financial results during the reporting period, raised full year guidance and announced a series of innovative new products. GoPro is a developer of mountable and wearable cameras and accessories. The company had a successful initial public offering and reported strong financial results. We exited our position during the reporting period. Palo Alto Networks provides next generation enterprise network security platforms. The company reported strong revenue and earnings growth during the year, as the many well-publicized data security breaches from major corporations led to strong demand for Palo Alto’s more advanced security solutions.
TOP INDIVIDUAL DETRACTORS
Detractors from performance this reporting period included Nu Skin Enterprises, Inc., Stratasys Ltd. and Tractor Supply Co. Nu Skin Enterprises, a major direct seller of personal care products and nutritional supplements, sold off sharply following a critical article published in China Daily, a state-owned periodical. This caused investors to worry about the company’s operations in China, an important piece of Nu Skin’s strategic growth plan. Stratasys Ltd., one of the leading makers of 3D printers, issued earnings per share guidance that was moderately below consensus estimates due partly to higher than expected operating
|
| 3 OPPENHEIMER DISCOVERY MID CAP GROWTH FUND/VA |
expenses and share count. We exited our positions in Nu Skin and Stratasys during the reporting period. Tractor Supply, an operator of retail farm and ranch stores, experienced declines early in the reporting period after reporting fourth-quarter 2013 comps below analysts’ expectations, due partly to deflationary pressure in feed-related products.
STRATEGY & OUTLOOK
The outlook for the equity markets in 2015 is mixed. Recent U.S. economic data is solid and positioned to benefit from the recent drop in oil and gasoline prices. However European economies continue to struggle, growth in China continues to slow, and many emerging markets will face headwinds given their positions as exporters of commodities such as oil. Interest rate and currency volatility may be elevated in 2015 as the Fed prepares to raise short-term interest rates in the U.S. while central banks in Japan, China and the European Union move the opposite direction with easier monetary policies.
We believe our long-term investment process is well-suited for this uncertain environment. We continue to seek dynamic mid-cap companies with what we view as above average growth opportunities, structurally attractive industry segments and strong management teams. The Fund has produced positive investment performance for more than a decade with experience across multiple economic cycles.
Investors should consider the Fund’s investment objective, risks, charges and expenses carefully before investing. The Fund’s prospectus and summary prospectus contain this and other information about the Fund, and may be obtained by asking your financial advisor or calling us at 1.800.988.8287. Read prospectuses and summary prospectuses carefully before investing.
Total returns include changes in share price and reinvestment of dividends and capital gains distributions in a hypothetical investment for the periods shown.
The Fund’s investment strategy and focus can change over time. The mention of specific fund holdings does not constitute a recommendation by OppenheimerFunds, Inc. or its affiliates.
Shares of Oppenheimer funds are not deposits or obligations of any bank, are not guaranteed by any bank, are not insured by the FDIC or any other agency, and involve investment risks, including the possible loss of the principal amount invested.
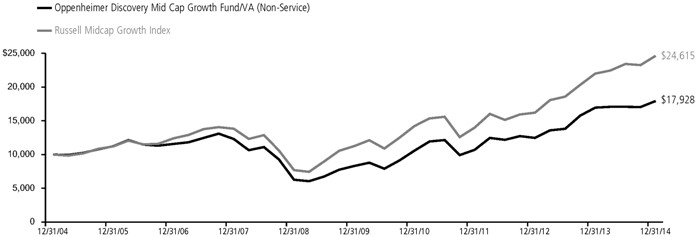
Comparing the Fund’s Performance to the Market. The graphs that follow show the performance of a hypothetical $10,000 investment in each share class of the Fund held until December 31, 2014. Performance is measured over a ten-fiscal-year period for both Classes. Performance information does not reflect charges that apply to separate accounts investing in the Fund. If these charges were taken into account, performance would be lower. The graphs assume that all dividends and capital gains distributions were reinvested in additional shares.
The Fund’s performance is compared to the performance of the Russell Midcap® Growth Index, which measures the performance of the mid-cap growth segment of the U.S. equity universe. It includes those Russell Midcap Index companies with higher price-to-book ratios and higher forecasted growth values. The Index is unmanaged and cannot be purchased directly by investors. While index comparisons may be useful to provide a benchmark for the Fund’s performance, it must be noted that the Fund’s investments are not limited to the investments comprising the Index. Index performance includes reinvestment of income, but does not reflect transaction costs, fees, expenses or taxes. Index performance is shown for illustrative purposes only as a benchmark for the Fund’s performance, and does not predict or depict performance of the Fund. The Fund’s performance reflects the effects of the Fund’s business and operating expenses.
|
| 4 OPPENHEIMER DISCOVERY MID CAP GROWTH FUND/VA |
COMPARISON OF CHANGE IN VALUE OF $10,000 HYPOTHETICAL INVESTMENTS IN:
COMPARISON OF CHANGE IN VALUE OF $10,000 HYPOTHETICAL INVESTMENTS IN:
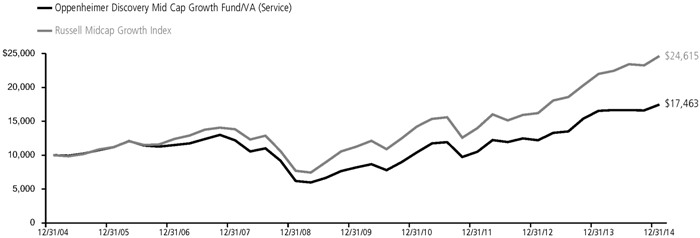
Performance data quoted represents past performance, which does not guarantee future results. The investment return and principal value of an investment in the Fund will fluctuate so that an investor’s shares, when redeemed, may be worth more or less than their original cost. Current performance may be lower or higher than the performance quoted. For performance data current to the most recent month end, call us at 1.800.988.8287. The Fund’s total returns should not be expected to be the same as the returns of other funds, whether or not both funds have the same portfolio managers and/or similar names. The Fund’s total returns include changes in share price and reinvested distributions but do not include the charges associated with the separate account products that offer this Fund. Such performance would have been lower if such charges were taken into account.
|
| 5 OPPENHEIMER DISCOVERY MID CAP GROWTH FUND/VA |
Fund Expenses
Fund Expenses. As a shareholder of the Fund, you incur two types of costs: (1) transaction costs and (2) ongoing costs, including management fees; distribution and service fees; and other Fund expenses. These examples are intended to help you understand your ongoing costs (in dollars) of investing in the Fund and to compare these costs with the ongoing costs of investing in other mutual funds.
The examples are based on an investment of $1,000.00 invested at the beginning of the period and held for the entire 6-month period ended December 31, 2014.
Actual Expenses. The first section of the table provides information about actual account values and actual expenses. You may use the information in this section for the class of shares you hold, together with the amount you invested, to estimate the expense that you paid over the period. Simply divide your account value by $1,000.00 (for example, an $8,600.00 account value divided by $1,000.00 = 8.60), then multiply the result by the number in the first section under the heading entitled “Expenses Paid During Period” to estimate the expenses you paid on your account during this period.
Hypothetical Example for Comparison Purposes.
The second section of the table provides information about hypothetical account values and hypothetical expenses based on the Fund’s actual expense ratio for each class of shares, and an assumed rate of return of 5% per year for each class before expenses, which is not the actual return. The hypothetical account values and expenses may not be used to estimate the actual ending account balance or expenses you paid for the period. You may use this information to compare the ongoing costs of investing in the Fund and other funds. To do so, compare this 5% hypothetical example for the class of shares you hold with the 5% hypothetical examples that appear in the shareholder reports of the other funds.
Please note that the expenses shown in the table are meant to highlight your ongoing costs only and do not reflect any charges associated with the separate accounts that offer this Fund. Therefore, the “hypothetical” lines of the table are useful in comparing ongoing costs only, and will not help you determine the relative total costs of owning different funds. In addition, if these separate account charges were included your costs would have been higher.
| | | | | | | | | | | | | | |
| Actual | | Beginning
Account Value
July 1, 2014 | | | | Ending Account Value
December 31, 2014 | | | | Expenses Paid During 6 Months Ended
December 31, 2014 | | | | |
Non-Service shares | | $ 1,000.00 | | | | $ 1,050.40 | | | | $ 4.14 | | | | |
Service shares | | 1,000.00 | | | | 1,049.20 | | | | 5.44 | | | | |
| | | | | | | |
Hypothetical (5% return before expenses) | | | | | | | | | | | | | | |
Non-Service shares | | 1,000.00 | | | | 1,021.17 | | | | 4.08 | | | | |
Service shares | | 1,000.00 | | | | 1,019.91 | | | | 5.36 | | | | |
Expenses are equal to the Fund’s annualized expense ratio for that class, multiplied by the average account value over the period, multiplied by 184/365 (to reflect the one-half year period). Those annualized expense ratios, excluding indirect expenses from affiliated funds, based on the 6-month period ended December 31, 2014 are as follows:
| | | | |
| Class | | Expense Ratios | | |
Non-Service shares | | 0.80% | |
Service shares | | 1.05 | |
The expense ratios reflect voluntary and/or contractual waivers and/or reimbursements of expenses by the Fund’s Manager. Some of these undertakings may be modified or terminated at any time, as indicated in the Fund’s prospectus. The “Financial Highlights” tables in the Fund’s financial statements, included in this report, also show the gross expense ratios, without such waivers or reimbursements and reduction to custodian expenses, if applicable.
|
| 6 OPPENHEIMER DISCOVERY MID CAP GROWTH FUND/VA |
STATEMENT OF INVESTMENTS December 31, 2014
| | | | | | | | |
| | | Shares | | | Value | |
Common Stocks—98.4% | | | | | | | | |
Consumer Discretionary—23.1% | | | | | | | | |
Auto Components—1.0% | | | | | | | | |
Delphi Automotive plc | | | 99,350 | | | $ | 7,224,732 | |
Hotels, Restaurants & Leisure—5.3% | |
Chipotle Mexican Grill, Inc., Cl. A1 | | | 20,150 | | | | 13,792,877 | |
Domino’s Pizza, Inc. | | | 106,930 | | | | 10,069,598 | |
Marriott International, Inc., Cl. A | | | 180,640 | | | | 14,095,339 | |
| | | | | | | | 37,957,814 | |
Household Durables—1.0% | | | | | | | | |
Harman International Industries, Inc. | | | 68,230 | | | | 7,280,823 | |
Leisure Products—1.6% | | | | | | | | |
Polaris Industries, Inc. | | | 76,300 | | | | 11,539,612 | |
Multiline Retail—1.5% | | | | | | | | |
Dollar Tree, Inc.1 | | | 150,350 | | | | 10,581,633 | |
Specialty Retail—9.3% | | | | | | | | |
Foot Locker, Inc. | | | 131,790 | | | | 7,403,962 | |
L Brands, Inc. | | | 105,520 | | | | 9,132,756 | |
O’Reilly Automotive, Inc.1 | | | 80,910 | | | | 15,584,884 | |
Ross Stores, Inc. | | | 113,840 | | | | 10,730,559 | |
Tiffany & Co. | | | 66,860 | | | | 7,144,660 | |
Tractor Supply Co. | | | 114,850 | | | | 9,052,477 | |
Ulta Salon, Cosmetics & Fragrance, Inc.1 | | | 56,110 | | | | 7,173,102 | |
| | | | | | | | 66,222,400 | |
Textiles, Apparel & Luxury Goods—3.4% | |
Hanesbrands, Inc. | | | 112,806 | | | | 12,591,406 | |
Under Armour, Inc., Cl. A1 | | | 168,130 | | | | 11,416,027 | |
| | | | | | | | 24,007,433 | |
Consumer Staples—6.1% | | | | | | | | |
Beverages—0.9% | | | | | | | | |
Constellation Brands, Inc., Cl. A1 | | | 66,980 | | | | 6,575,427 | |
Food Products—5.2% | | | | | | | | |
Hain Celestial Group, Inc. (The)1 | | | 119,320 | | | | 6,955,163 | |
Hormel Foods Corp. | | | 135,280 | | | | 7,048,088 | |
Keurig Green Mountain, Inc. | | | 54,610 | | | | 7,230,091 | |
Mead Johnson Nutrition Co., Cl. A | | | 88,140 | | | | 8,861,595 | |
WhiteWave Foods Co. (The), Cl. A1 | | | 203,790 | | | | 7,130,612 | |
| | | | | | | | 37,225,549 | |
Energy—1.1% | | | | | | | | |
Oil, Gas & Consumable Fuels—1.1% | |
Concho Resources, Inc.1 | | | 37,590 | | | | 3,749,602 | |
Memorial Resource Development Corp.1 | | | 142,059 | | | | 2,561,324 | |
Range Resources Corp. | | | 28,010 | | | | 1,497,135 | |
| | | | | | | | 7,808,061 | |
Financials—7.6% | | | | | | | | |
Capital Markets—2.9% | | | | | | | | |
Affiliated Managers Group, Inc.1 | | | 26,860 | | | | 5,700,767 | |
Lazard Ltd., Cl. A | | | 95,210 | | | | 4,763,356 | |
Raymond James Financial, Inc. | | | 111,260 | | | | 6,374,085 | |
TD Ameritrade Holding Corp. | | | 101,190 | | | | 3,620,578 | |
| | | | | | | | 20,458,786 | |
Commercial Banks—2.0% | | | | | | | | |
Signature Bank1 | | | 65,650 | | | | 8,269,274 | |
SVB Financial Group1 | | | 53,430 | | | | 6,201,620 | |
| | | | | | | | 14,470,894 | |
Diversified Financial Services—1.0% | |
Moody’s Corp. | | | 72,649 | | | | 6,960,501 | |
Real Estate Investment Trusts (REITs)—0.7% | |
Host Hotels & Resorts, Inc., Cl. REIT | | | 222,780 | | | | 5,295,481 | |
| | | | | | | | |
| | | Shares | | | Value | |
Real Estate Management & Development—1.0% | |
CBRE Group, Inc., Cl. A1 | | | 205,159 | | | $ | 7,026,696 | |
Health Care—17.4% | | | | | | | | |
Biotechnology—3.1% | | | | | | | | |
Alnylam Pharmaceuticals, Inc.1 | | | 35,450 | | | | 3,438,650 | |
Incyte Corp.1 | | | 48,100 | | | | 3,516,591 | |
Medivation, Inc.1 | | | 58,990 | | | | 5,875,994 | |
Vertex Pharmaceuticals, Inc.1 | | | 77,890 | | | | 9,253,332 | |
| | | | | | | | 22,084,567 | |
Health Care Equipment & Supplies—4.0% | |
Cooper Cos., Inc. (The) | | | 44,390 | | | | 7,195,175 | |
DexCom, Inc.1 | | | 96,030 | | | | 5,286,451 | |
Edwards Lifesciences Corp.1 | | | 86,110 | | | | 10,968,692 | |
STERIS Corp. | | | 74,210 | | | | 4,812,519 | |
| | | | | | | | 28,262,837 | |
Health Care Providers & Services—6.7% | |
AmerisourceBergen Corp., Cl. A | | | 116,530 | | | | 10,506,345 | |
Brookdale Senior Living, Inc.1 | | | 150,550 | | | | 5,520,668 | |
Centene Corp.1 | | | 89,720 | | | | 9,317,422 | |
Team Health Holdings, Inc.1 | | | 119,580 | | | | 6,879,437 | |
Universal Health Services, Inc., Cl. B | | | 92,270 | | | | 10,265,960 | |
VCA, Inc.1 | | | 110,750 | | | | 5,401,278 | |
| | | | | | | | 47,891,110 | |
Health Care Technology—1.1% | | | | | | | | |
Cerner Corp.1 | | | 123,010 | | | | 7,953,827 | |
Life Sciences Tools & Services—1.2% | |
Illumina, Inc.1 | | | 46,368 | | | | 8,558,605 | |
Pharmaceuticals—1.3% | | | | | | | | |
Akorn, Inc.1 | | | 99,960 | | | | 3,618,552 | |
Jazz Pharmaceuticals plc1 | | | 33,620 | | | | 5,504,603 | |
| | | | | | | | 9,123,155 | |
Industrials—16.3% | | | | | | | | |
Airlines—2.2% | | | | | | | | |
Southwest Airlines Co. | | | 227,220 | | | | 9,615,950 | |
Spirit Airlines, Inc.1 | | | 82,050 | | | | 6,201,339 | |
| | | | | | | | 15,817,289 | |
Building Products—2.1% | | | | | | | | |
A.O. Smith Corp. | | | 134,700 | | | | 7,598,427 | |
Lennox International, Inc. | | | 75,900 | | | | 7,215,813 | |
| | | | | | | | 14,814,240 | |
Electrical Equipment—1.2% | | | | | | | | |
Acuity Brands, Inc. | | | 62,770 | | | | 8,792,194 | |
Industrial Conglomerates—1.0% | | | | | | | | |
Carlisle Cos., Inc. | | | 79,180 | | | | 7,145,203 | |
Machinery—4.8% | | | | | | | | |
Middleby Corp. (The)1 | | | 108,770 | | | | 10,779,107 | |
Snap-on, Inc. | | | 83,859 | | | | 11,466,880 | |
Wabtec Corp. | | | 138,970 | | | | 12,075,103 | |
| | | | | | | | 34,321,090 | |
Professional Services—1.5% | | | | | | | | |
Robert Half International, Inc. | | | 184,500 | | | | 10,771,110 | |
Road & Rail—1.5% | | | | | | | | |
Old Dominion Freight Line, Inc.1 | | | 134,500 | | | | 10,442,580 | |
Trading Companies & Distributors—2.0% | |
HD Supply Holdings, Inc.1 | | | 296,820 | | | | 8,753,222 | |
United Rentals, Inc.1 | | | 52,590 | | | | 5,364,706 | |
| | | | | | | 14,117,928 | |
|
| 7 OPPENHEIMER DISCOVERY MID CAP GROWTH FUND/VA |
STATEMENT OF INVESTMENTS Continued
| | | | | | | | |
| | | Shares | | | Value | |
Information Technology—21.3% | |
Communications Equipment—2.9% | |
F5 Networks, Inc.1 | | | 63,510 | | | $ | 8,285,832 | |
Palo Alto Networks, Inc.1 | | | 103,700 | | | | 12,710,509 | |
| | | | | | | | 20,996,341 | |
Electronic Equipment, Instruments, & Components—1.0% | |
Amphenol Corp., Cl. A | | | 134,900 | | | | 7,258,969 | |
Internet Software & Services—2.9% | |
CoStar Group, Inc.1 | | | 49,790 | | | | 9,142,938 | |
LendingClub Corp.1 | | | 156,610 | | | | 3,962,233 | |
LinkedIn Corp., Cl. A1 | | | 33,850 | | | | 7,775,683 | |
| | | | | | | | 20,880,854 | |
IT Services—1.8% | |
Fiserv, Inc.1 | | | 98,110 | | | | 6,962,867 | |
Gartner, Inc.1 | | | 66,250 | | | | 5,578,912 | |
| | | | | | | | 12,541,779 | |
Semiconductors & Semiconductor Equipment—5.4% | |
Applied Materials, Inc. | | | 221,740 | | | | 5,525,761 | |
Avago Technologies Ltd., Cl. A | | | 86,900 | | | | 8,741,271 | |
Lam Research Corp. | | | 131,270 | | | | 10,414,962 | |
NXP Semiconductors NV1 | | | 112,450 | | | | 8,591,180 | |
Skyworks Solutions, Inc. | | | 73,400 | | | | 5,336,914 | |
| | | | | | | | 38,610,088 | |
Software—7.3% | |
Electronic Arts, Inc.1 | | | 115,290 | | | | 5,420,359 | |
Mobileye NV1 | | | 54,410 | | | | 2,206,870 | |
NetSuite, Inc.1 | | | 84,707 | | | | 9,247,463 | |
| | | | | | | | |
| | | Shares | | | Value | |
Software (Continued) | |
ServiceNow, Inc.1 | | | 185,680 | | | $ | 12,598,388 | |
Tableau Software, Inc., Cl. A1 | | | 132,040 | | | | 11,191,711 | |
Ultimate Software Group, Inc. (The)1 | | | 51,350 | | | | 7,538,950 | |
Workday, Inc., Cl. A1 | | | 46,840 | | | | 3,822,612 | |
| | | | | | | | 52,026,353 | |
Materials—3.2% | |
Chemicals—1.8% | |
Sherwin-Williams Co. (The) | | | 50,960 | | | | 13,404,518 | |
Construction Materials—0.9% | |
Vulcan Materials Co. | | | 96,660 | | | | 6,353,462 | |
Containers & Packaging—0.5% | |
Crown Holdings, Inc.1 | | | 71,740 | | | | 3,651,566 | |
Telecommunication Services—2.3% | |
Wireless Telecommunication Services—2.3% | |
SBA Communications Corp., Cl. A1 | | | 145,670 | | | | 16,134,409 | |
Total Common Stocks (Cost $535,555,700) | | | | 702,589,916 | |
Investment Company—1.6% | |
Oppenheimer Institutional Money Market Fund, Cl. E, 0.10%2,3 (Cost $11,090,218) | | | 11,090,218 | | | | 11,090,218 | |
Total Investments, at Value (Cost $546,645,918) | | | 100.0 | % | | | 713,680,134 | |
Net Other Assets (Liabilities) | | | (0.0 | ) | | | (201,300 | ) |
Net Assets | | | 100.0 | % | | $ | 713,478,834 | |
| | | | |
| | | | |
Footnotes to Statement of Investments
1. Non-income producing security.
2. Is or was an affiliate, as defined in the Investment Company Act of 1940, as amended, at or during the period ended December 31, 2014, by virtue of the Fund owning at least 5% of the voting securities of the issuer or as a result of the Fund and the issuer having the same investment adviser. Transactions during the period in which the issuer was an affiliate are as follows:
| | | | | | | | | | | | | | | | |
| | | Shares December 31, 2013 | | | Gross Additions | | | Gross Reductions | | | Shares December 31, 2014 | |
Oppenheimer Institutional Money Market Fund, Cl. E | | | 5,136,594 | | | | 330,549,038 | | | | 324,595,414 | | | | 11,090,218 | |
| | | | |
| | | | | | | | | Value | | | Income | |
Oppenheimer Institutional Money Market Fund, Cl. E | | | | | | | | | | $ | 11,090,218 | | | $ | 15,147 | |
3. Rate shown is the 7-day yield as of December 31, 2014.
See accompanying Notes to Financial Statements.
|
| 8 OPPENHEIMER DISCOVERY MID CAP GROWTH FUND/VA |
STATEMENT OF ASSETS AND LIABILITIES December 31, 2014
| | | | |
Assets | | | | |
Investments, at value—see accompanying statement of investments: | | | | |
Unaffiliated companies (cost $535,555,700) | | $ | 702,589,916 | |
Affiliated companies (cost $11,090,218) | | | 11,090,218 | |
| | | | |
| | | | 713,680,134 | |
Cash | | | 499,999 | |
Receivables and other assets: | | | | |
Investments sold | | | 3,518,321 | |
Dividends | | | 212,384 | |
Shares of beneficial interest sold | | | 81,681 | |
Other | | | 42,771 | |
| | | | |
Total assets | | | 718,035,290 | |
Liabilities | | | | |
Payables and other liabilities: | | | | |
Shares of beneficial interest redeemed | | | 3,108,859 | |
Investments purchased | | | 1,344,607 | |
Trustees’ compensation | | | 41,557 | |
Shareholder communications | | | 32,456 | |
Distribution and service plan fees | | | 6,645 | |
Other | | | 22,332 | |
| | | | |
Total liabilities | | | 4,556,456 | |
Net Assets | | $ | 713,478,834 | |
| | | | |
| | |
Composition of Net Assets | | | | |
Par value of shares of beneficial interest | | $ | 9,066 | |
Additional paid-in capital | | | 483,280,573 | |
Accumulated net investment income | | | 6,401 | |
Accumulated net realized gain on investments | | | 63,148,578 | |
Net unrealized appreciation on investments | | | 167,034,216 | |
| | | | |
Net Assets | | $ | 713,478,834 | |
| | | | |
|
| | |
Net Asset Value Per Share | | | | |
Non-Service Shares: | | | | |
Net asset value, redemption price per share and offering price per share (based on net assets of $682,514,620 and 8,659,562 shares of beneficial interest outstanding) | | | $78.82 | |
Service Shares: | | | | |
| Net asset value, redemption price per share and offering price per share (based on net assets of $30,964,214 and 406,306 shares of beneficial interest outstanding) | | | $76.21 | |
See accompanying Notes to Financial Statements.
|
| 9 OPPENHEIMER DISCOVERY MID CAP GROWTH FUND/VA |
STATEMENT OF OPERATIONS For the Year Ended December 31, 2014
| | | | |
Investment Income | | | | |
Dividends: | | | | |
Unaffiliated companies (net of foreign withholding taxes of $ 7,351) | | | $ 2,910,770 | |
Affiliated companies | | | 15,147 | |
| | | | |
Total investment income | | | 2,925,917 | |
|
| | |
Expenses | | | | |
Management fees | | | 5,106,401 | |
Distribution and service plan fees: | | | | |
Service shares | | | 82,084 | |
Transfer and shareholder servicing agent fees: | | | | |
Non-Service shares | | | 686,474 | |
Service shares | | | 32,838 | |
Shareholder communications: | | | | |
Non-Service shares | | | 51,428 | |
Service shares | | | 2,447 | |
Trustees’ compensation | | | 30,718 | |
Custodian fees and expenses | | | 5,482 | |
Other | | | 55,787 | |
| | | | |
Total expenses | | | 6,053,659 | |
Less reduction to custodian expenses | | | (14 | ) |
Less waivers and reimbursements of expenses | | | (216,514 | ) |
| | | | |
Net expenses | | | 5,837,131 | |
Net Investment Loss | | | (2,911,214 | ) |
|
| | |
Realized and Unrealized Gain (Loss) | | | | |
Net realized gain on investments from unaffiliated companies | | | 120,740,276 | |
Net change in unrealized appreciation/depreciation on investments | | | (78,732,569 | ) |
Net Increase in Net Assets Resulting from Operations | | | $ 39,096,493 | |
| | | | |
See accompanying Notes to Financial Statements.
|
| 10 OPPENHEIMER DISCOVERY MID CAP GROWTH FUND/VA |
STATEMENTS OF CHANGES IN NET ASSETS
| | | | | | | | |
| | | Year Ended December 31, 2014 | | | Year Ended December 31, 2013 | |
Operations | | | | | | | | |
Net investment loss | | $ | (2,911,214 | ) | | $ | (1,689,339 | ) |
Net realized gain | | | 120,740,276 | | | | 122,245,177 | |
Net change in unrealized appreciation/depreciation | | | (78,732,569 | ) | | | 79,850,119 | |
Net increase in net assets resulting from operations | | | 39,096,493 | | | | 200,405,957 | |
Dividends and/or Distributions to Shareholders | | | | | | | | |
Dividends from net investment income: | | | | | | | | |
Non-Service shares | | | — | | | | (73,101 | ) |
Service shares | | | — | | | | — | |
| | | — | | | | (73,101 | ) |
Beneficial Interest Transactions | | | | | | | | |
Net decrease in net assets resulting from beneficial interest transactions: | | | | | | | | |
Non-Service shares | | | (80,362,833 | ) | | | (22,913,255 | ) |
Service shares | | | (7,209,426 | ) | | | (10,340,669 | ) |
| | | (87,572,259 | ) | | | (33,253,924 | ) |
Net Assets | | | | | | | | |
Total increase (decrease) | | | (48,475,766 | ) | | | 167,078,932 | |
Beginning of period | | | 761,954,600 | | | | 594,875,668 | |
End of period (including accumulated net investment income (loss) of $6,401 and $(53,163), respectively) | | $ | 713,478,834 | | | $ | 761,954,600 | |
See accompanying Notes to Financial Statements.
|
| 11 OPPENHEIMER DISCOVERY MID CAP GROWTH FUND/VA |
FINANCIAL HIGHLIGHTS
| | | | | | | | | | | | | | | | | | | | |
| Non-Service Shares | | Year Ended
December 31,
2014 | | | Year Ended
December 31,
2013 | | | Year Ended
December 31,
2012 | | | Year Ended December 30,
20111 | | | Year Ended
December 31,
2010 | |
Per Share Operating Data | | | | | | | | | | | | | | | | | | | | |
Net asset value, beginning of period | | $ | 74.51 | | | $ | 54.80 | | | $ | 47.06 | | | $ | 46.55 | | | $ | 36.52 | |
Income (loss) from investment operations: | | | | | | | | | | | | | | | | | | | | |
Net investment income (loss)2 | | | (0.29) | | | | (0.16) | | | | 0.01 | | | | (0.26) | | | | (0.11) | |
Net realized and unrealized gain | | | 4.60 | | | | 19.88 | | | | 7.73 | | | | 0.77 | | | | 10.14 | |
| | | | |
Total from investment operations | | | 4.31 | | | | 19.72 | | | | 7.74 | | | | 0.51 | | | | 10.03 | |
Dividends and/or distributions to shareholders: | | | | | | | | | | | | | | | | | | | | |
Dividends from net investment income | | | 0.00 | | | | (0.01) | | | | 0.00 | | | | 0.00 | | | | 0.00 | |
Net asset value, end of period | | $ | 78.82 | | | $ | 74.51 | | | $ | 54.80 | | | $ | 47.06 | | | $ | 46.55 | |
| | | | |
| | | | | |
Total Return, at Net Asset Value3 | | | 5.78% | | | | 35.98% | | | | 16.45% | | | | 1.09% | | | | 27.46% | |
| |
| | | | | |
Ratios/Supplemental Data | | | | | | | | | | | | | | | | | | | | |
Net assets, end of period (in thousands) | | $ | 682,515 | | | $ | 725,406 | | | $ | 558,934 | | | $ | 543,020 | | | $ | 611,872 | |
Average net assets (in thousands) | | $ | 688,259 | | | $ | 618,970 | | | $ | 575,072 | | | $ | 605,083 | | | $ | 548,739 | |
Ratios to average net assets:4 | | | | | | | | | | | | | | | | | | | | |
Net investment income (loss) | | | (0.39)% | | | | (0.24)% | | | | 0.03% | | | | (0.53)% | | | | (0.29)% | |
Total expenses5 | | | 0.83% | | | | 0.84% | | | | 0.85% | | | | 0.84% | | | | 0.85% | |
| Expenses after payments, waivers and/or reimbursements and reduction to custodian expenses | | | 0.80% | | | | 0.80% | | | | 0.80% | | | | 0.80% | | | | 0.76% | |
Portfolio turnover rate | | | 113% | | | | 84% | | | | 66% | | | | 91% | | | | 95% | |
1. December 30, 2011 represents the last business day of the Fund’s reporting period.
2. Per share amounts calculated based on the average shares outstanding during the period.
3. Assumes an initial investment on the business day before the first day of the fiscal period, with all dividends and distributions reinvested in additional shares on the reinvestment date, and redemption at the net asset value calculated on the last business day of the fiscal period. Total returns are not annualized for periods less than one full year. Total return information does not reflect expenses that apply at the separate account level or to related insurance products. Inclusion of these charges would reduce the total return figures for all periods shown. Returns do not reflect the deduction of taxes that a shareholder would pay on fund distributions or the redemption of fund shares.
4. Annualized for periods less than one full year.
5. Total expenses including indirect expenses from affiliated fund fees and expenses were as follows:
| | | | | | | | |
Year Ended December 31, 2014 | | | 0.83 | % | | | | |
Year Ended December 31, 2013 | | | 0.84 | % | | | |
Year Ended December 31, 2012 | | | 0.85 | % | | | |
Year Ended December 30, 2011 | | | 0.84 | % | | | |
Year Ended December 31, 2010 | | | 0.85 | % | | | |
See accompanying Notes to Financial Statements.
|
| 12 OPPENHEIMER DISCOVERY MID CAP GROWTH FUND/VA |
| | | | | | | | | | | | | | | | | | | | |
| Service Shares | | Year Ended
December 31,
2014 | | | Year Ended
December 31,
2013 | | | Year Ended
December 31,
2012 | | | Year Ended
December 30,
20111 | | | Year Ended
December 31,
2010 | |
Per Share Operating Data | | | | | | | | | | | | | | | | | | | | |
Net asset value, beginning of period | | $ | 72.22 | | | $ | 53.25 | | | $ | 45.84 | | | $ | 45.46 | | | $ | 35.75 | |
Income (loss) from investment operations: | | | | | | | | | | | | | | | | | | | | |
Net investment loss2 | | | (0.46) | | | | (0.30) | | | | (0.12) | | | | (0.37) | | | | (0.20) | |
Net realized and unrealized gain | | | 4.45 | | | | 19.27 | | | | 7.53 | | | | 0.75 | | | | 9.91 | |
| | | | |
Total from investment operations | | | 3.99 | | | | 18.97 | | | | 7.41 | | | | 0.38 | | | | 9.71 | |
Dividends and/or distributions to shareholders: | | | | | | | | | | | | | | | | | | | | |
Dividends from net investment income | | | 0.00 | | | | 0.00 | | | | 0.00 | | | | 0.00 | | | | 0.00 | |
Net asset value, end of period | | $ | 76.21 | | | $ | 72.22 | | | $ | 53.25 | | | $ | 45.84 | | | $ | 45.46 | |
| | | | |
| | | | | |
Total Return, at Net Asset Value3 | | | 5.53% | | | | 35.62% | | | | 16.17% | | | | 0.83% | | | | 27.16% | |
| |
| | | | | |
Ratios/Supplemental Data | | | | | | | | | | | | | | | | | | | | |
Net assets, end of period (in thousands) | | $ | 30,964 | | | $ | 36,549 | | | $ | 35,942 | | | $ | 35,773 | | | $ | 32,669 | |
Average net assets (in thousands) | | $ | 32,927 | | | $ | 35,905 | | | $ | 37,842 | | | $ | 37,775 | | | $ | 27,552 | |
Ratios to average net assets:4 | | | | | | | | | | | | | | | | | | | | |
Net investment loss | | | (0.64)% | | | | (0.49)% | | | | (0.22)% | | | | (0.78)% | | | | (0.53)% | |
Total expenses5 | | | 1.08% | | | | 1.09% | | | | 1.10% | | | | 1.09% | | | | 1.10% | |
| Expenses after payments, waivers and/or reimbursements and reduction to custodian expenses | | | 1.05% | | | | 1.05% | | | | 1.05% | | | | 1.05% | | | | 1.01% | |
Portfolio turnover rate | | | 113% | | | | 84% | | | | 66% | | | | 91% | | | | 95% | |
1. December 30, 2011 represents the last business day of the Fund’s reporting period.
2. Per share amounts calculated based on the average shares outstanding during the period.
3. Assumes an initial investment on the business day before the first day of the fiscal period, with all dividends and distributions reinvested in additional shares on the reinvestment date, and redemption at the net asset value calculated on the last business day of the fiscal period. Total returns are not annualized for periods less than one full year. Total return information does not reflect expenses that apply at the separate account level or to related insurance products. Inclusion of these charges would reduce the total return figures for all periods shown. Returns do not reflect the deduction of taxes that a shareholder would pay on fund distributions or the redemption of fund shares.
4. Annualized for periods less than one full year.
5. Total expenses including indirect expenses from affiliated fund fees and expenses were as follows:
| | | | | | | | |
Year Ended December 31, 2014 | | | 1.08 | % | | | | |
Year Ended December 31, 2013 | | | 1.09 | % | | | |
Year Ended December 31, 2012 | | | 1.10 | % | | | |
Year Ended December 30, 2011 | | | 1.09 | % | | | |
Year Ended December 31, 2010 | | | 1.10 | % | | | |
See accompanying Notes to Financial Statements.
|
| 13 OPPENHEIMER DISCOVERY MID CAP GROWTH FUND/VA |
NOTES TO FINANCIAL STATEMENTS December 31, 2014
1. Organization
Oppenheimer Discovery Mid-Cap Growth Fund/VA (the “Fund”), a separate series of Oppenheimer Variable Account Funds, is a diversified open-end management investment company registered under the Investment Company Act of 1940 (“1940 Act”), as amended. The Fund’s investment objective is to seek capital appreciation. The Fund’s investment adviser is OFI Global Asset Management, Inc. (“OFI Global” or the “Manager”), a wholly-owned subsidiary of OppenheimerFunds Inc. (“OFI” or the “Sub-Adviser”). The Manager has entered into a sub-advisory agreement with OFI. Shares of the Fund are sold only to separate accounts of life insurance companies.
The Fund offers two classes of shares. Both classes are sold at their offering price, which is the net asset value per share, to separate investment accounts of participating insurance companies as an underlying investment for variable life insurance policies, variable annuity contracts or other investment products. The class of shares designated as Service shares is subject to a distribution and service plan. Both classes of shares have identical rights and voting privileges with respect to the Fund in general and exclusive voting rights on matters that affect that class alone. Earnings, net assets and net asset value per share may differ due to each class having its own expenses, such as transfer and shareholder servicing agent fees and shareholder communications, directly attributable to that class.
The following is a summary of significant accounting policies consistently followed by the Fund.
2. Significant Accounting Policies
Security Valuation. All investments in securities are recorded at their estimated fair value, as described in Note 3.
Allocation of Income, Expenses, Gains and Losses. Income, expenses (other than those attributable to a specific class), gains and losses are allocated on a daily basis to each class of shares based upon the relative proportion of net assets represented by such class. Operating expenses directly attributable to a specific class are charged against the operations of that class.
Dividends and Distributions to Shareholders. Dividends and distributions to shareholders, which are determined in accordance with income tax regulations and may differ from U.S. generally accepted accounting principles, are recorded on the ex-dividend date. Income and capital gain distributions, if any, are declared and paid annually or at other times as deemed necessary by the Manager.
Investment Income. Dividend income is recorded on the ex-dividend date or upon ex-dividend notification in the case of certain foreign dividends where the ex-dividend date may have passed. Non-cash dividends included in dividend income, if any, are recorded at the fair market value of the securities received. Interest income is recognized on an accrual basis. Discount and premium, which are included in interest income on the Statement of Operations, are amortized or accreted daily.
Custodian Fees. “Custodian fees and expenses” in the Statement of Operations may include interest expense incurred by the Fund on any cash overdrafts of its custodian account during the period. Such cash overdrafts may result from the effects of failed trades in portfolio securities and from cash outflows resulting from unanticipated shareholder redemption activity. The Fund pays interest to its custodian on such cash overdrafts, to the extent they are not offset by positive cash balances maintained by the Fund, at a rate equal to the Federal Funds Rate plus 0.50%. The “Reduction to custodian expenses” line item, if applicable, represents earnings on cash balances maintained by the Fund during the period. Such interest expense and other custodian fees may be paid with these earnings.
Security Transactions. Security transactions are recorded on the trade date. Realized gains and losses on securities sold are determined on the basis of identified cost.
Indemnifications. The Fund’s organizational documents provide current and former Trustees and officers with a limited indemnification against liabilities arising in connection with the performance of their duties to the Fund. In the normal course of business, the Fund may also enter into contracts that provide general indemnifications. The Fund’s maximum exposure under these arrangements is unknown as this would be dependent on future claims that may be made against the Fund. The risk of material loss from such claims is considered remote.
Federal Taxes. The Fund intends to comply with provisions of the Internal Revenue Code applicable to regulated investment companies and to distribute substantially all of its investment company taxable income, including any net realized gain on investments not offset by capital loss carryforwards, if any, to shareholders. Therefore, no federal income or excise tax provision is required. The Fund files income tax returns in U.S. federal and applicable state jurisdictions. The statute of limitations on the Fund’s tax return filings generally remain open for the three preceding fiscal reporting period ends.
The tax components of capital shown in the following table represent distribution requirements the Fund must satisfy under the income tax regulations, losses the Fund may be able to offset against income and gains realized in future years and unrealized appreciation or depreciation of securities and other investments for federal income tax purposes.
|
| 14 OPPENHEIMER DISCOVERY MID CAP GROWTH FUND/VA |
2. Significant Accounting Policies (Continued)
| | | | | | | | | | | | |
Undistributed
Net Investment
Income | | Undistributed
Long-Term
Gain | | | Accumulated
Loss
Carryforward1,2 | | | Net Unrealized
Appreciation
Based on cost of
Securities and
Other Investments
for Federal Income
Tax Purposes | |
$— | | | $64,118,337 | | | | $— | | | | $166,112,406 | |
1. During the fiscal year ended December 31, 2014, the Fund utilized $50,885,832 of capital loss carryforward to offset capital gains realized in that fiscal year.
2. During the fiscal year ended December 31, 2013, the Fund utilized $121,849,981 of capital loss carryforward to offset capital gains realized in that fiscal year.
Net investment income (loss) and net realized gain (loss) may differ for financial statement and tax purposes. The character of dividends and distributions made during the fiscal year from net investment income or net realized gains may differ from their ultimate characterization for federal income tax purposes. Also, due to timing of dividends and distributions, the fiscal year in which amounts are distributed may differ from the fiscal year in which the income or net realized gain was recorded by the Fund.
Accordingly, the following amounts have been reclassified for December 31, 2014. Net assets of the Fund were unaffected by the reclassifications.
| | | | | | | | |
Increase
to Paid-in Capital | | Reduction
to Accumulated
Net Investment
Loss | | | Reduction
to Accumulated Net
Realized Gain
on Investments3 | |
$2,366,836 | | | $2,970,778 | | | | $5,337,614 | |
3. $5,337,614, all of which was long-term capital gain, was distributed in connection with Fund share redemptions.
The tax character of distributions paid during the years ended December 31, 2014 and December 31, 2013 was as follows:
| | | | | | | | |
| | | Year Ended
December 31, 2014 | | | Year Ended
December 31, 2013 | |
Distributions paid from: | | | | | | | | |
Ordinary income | | $ | — | | | $ | 73,101 | |
The aggregate cost of securities and other investments and the composition of unrealized appreciation and depreciation of securities and other investments for federal income tax purposes as of December 31, 2014 are noted in the following table. The primary difference between book and tax appreciation or depreciation of securities and other investments, if applicable, is attributable to the tax deferral of losses or tax realization of financial statement unrealized gain or loss.
| | | | |
Federal tax cost of securities | | $ | 547,567,728 | |
| | | | |
Gross unrealized appreciation | | $ | 167,190,337 | |
Gross unrealized depreciation | | | (1,077,931 | ) |
| | | | |
Net unrealized appreciation | | $ | 166,112,406 | |
| | | | |
Use of Estimates. The preparation of financial statements in conformity with accounting principles generally accepted in the United States of America requires management to make estimates and assumptions that affect the reported amounts of assets and liabilities and disclosure of contingent assets and liabilities at the date of the financial statements and the reported amounts of increases and decreases in net assets from operations during the reporting period. Actual results could differ from those estimates.
3. Securities Valuation
The Fund calculates the net asset value of its shares as of the close of the New York Stock Exchange (the “Exchange”), normally 4:00 P.M. Eastern time, on each day the Exchange is open for trading.
The Fund’s Board has adopted procedures for the valuation of the Fund’s securities and has delegated the day-to-day responsibility for valuation determinations under those procedures to the Manager. The Manager has established a Valuation Committee which is responsible for determining a “fair valuation” for any security for which market quotations are not “readily available.” The Valuation Committee’s fair valuation determinations are subject to review, approval and ratification by the Fund’s Board at its next regularly scheduled meeting covering the calendar quarter in which the fair valuation was determined.
Valuation Methods and Inputs
Securities are valued using unadjusted quoted market prices, when available, as supplied primarily by third party pricing services or dealers.
The following methodologies are used to determine the market value or the fair value of the types of securities described below:
Securities traded on a registered U.S. securities exchange (including exchange-traded derivatives other than futures and futures options) are valued based on the last sale price of the security reported on the principal exchange on which it is traded, prior to the time when the Fund’s assets are valued. In the absence of a sale, the security is valued at the last sale price on the prior trading day, if it is within the spread of the current day’s closing “bid”
|
| 15 OPPENHEIMER DISCOVERY MID CAP GROWTH FUND/VA |
NOTES TO FINANCIAL STATEMENTS Continued
3. Securities Valuation (Continued)
and “asked” prices, and if not, at the current day’s closing bid price. A security of a foreign issuer traded on a foreign exchange, but not listed on a registered U.S. securities exchange, is valued based on the last sale price on the principal exchange on which the security is traded, as identified by the third party pricing service used by the Manager, prior to the time when the Fund’s assets are valued. If the last sale price is unavailable, the security is valued at the most recent official closing price on the principal exchange on which it is traded. If the last sales price or official closing price for a foreign security is not available, the security is valued at the mean between the bid and asked price per the exchange or, if not available from the exchange, obtained from two dealers. If bid and asked prices are not available from either the exchange or two dealers, the security is valued by using one of the following methodologies (listed in order of priority): (1) using a bid from the exchange, (2) the mean between the bid and asked price as provided by a single dealer, or (3) a bid from a single dealer.
Shares of a registered investment company that are not traded on an exchange are valued at that investment company’s net asset value per share.
Corporate and government debt securities (of U.S. or foreign issuers) and municipal debt securities, event-linked bonds, loans, mortgage-backed securities, collateralized mortgage obligations, and asset-backed securities are valued at the mean between the “bid” and “asked” prices utilizing evaluated prices obtained from third party pricing services or broker-dealers who may use matrix pricing methods to determine the evaluated prices.
Short-term money market type debt securities with a remaining maturity of sixty days or less are valued at cost adjusted by the amortization of discount or premium to maturity (amortized cost), which approximates market value. Short-term debt securities with a remaining maturity in excess of sixty days are valued at the mean between the “bid” and “asked” prices utilizing evaluated prices obtained from third party pricing services or broker-dealers.
A description of the standard inputs that may generally be considered by the third party pricing vendors in determining their evaluated prices is provided below.
| | |
Security Type | | Standard inputs generally considered by third-party pricing vendors |
| Corporate debt, government debt, municipal, mortgage-backed and asset-backed securities | | Reported trade data, broker-dealer price quotations, benchmark yields, issuer spreads on comparable securities, the credit quality, yield, maturity, and other appropriate factors. |
Loans | | Information obtained from market participants regarding reported trade data and broker-dealer price quotations. |
Event-linked bonds | | Information obtained from market participants regarding reported trade data and broker-dealer price quotations. |
If a market value or price cannot be determined for a security using the methodologies described above, or if, in the “good faith” opinion of the Manager, the market value or price obtained does not constitute a “readily available market quotation,” or a significant event has occurred that would materially affect the value of the security the security is fair valued either (i) by a standardized fair valuation methodology applicable to the security type or the significant event as previously approved by the Valuation Committee and the Fund’s Board or (ii) as determined in good faith by the Manager’s Valuation Committee. The Valuation Committee considers all relevant facts that are reasonably available, through either public information or information available to the Manager, when determining the fair value of a security. Fair value determinations by the Manager are subject to review, approval and ratification by the Fund’s Board at its next regularly scheduled meeting covering the calendar quarter in which the fair valuation was determined. Those fair valuation standardized methodologies include, but are not limited to, valuing securities at the last sale price or initially at cost and subsequently adjusting the value based on: changes in company specific fundamentals, changes in an appropriate securities index, or changes in the value of similar securities which may be further adjusted for any discounts related to security-specific resale restrictions. When possible, such methodologies use observable market inputs such as unadjusted quoted prices of similar securities, observable interest rates, currency rates and yield curves. The methodologies used for valuing securities are not necessarily an indication of the risks associated with investing in those securities nor can it be assured that the Fund can obtain the fair value assigned to a security if it were to sell the security.
To assess the continuing appropriateness of security valuations, the Manager, or its third party service provider who is subject to oversight by the Manager, regularly compares prior day prices, prices on comparable securities, and sale prices to the current day prices and challenges those prices exceeding certain tolerance levels with the third party pricing service or broker source. For those securities valued by fair valuations, whether through a standardized fair valuation methodology or a fair valuation determination, the Valuation Committee reviews and affirms the reasonableness of the valuations based on such methodologies and fair valuation determinations on a regular basis after considering all relevant information that is reasonably available.
Classifications
Each investment asset or liability of the Fund is assigned a level at measurement date based on the significance and source of the inputs to its valuation. Various data inputs are used in determining the value of each of the Fund’s investments as of the reporting period end. These data inputs are categorized in the following hierarchy under applicable financial accounting standards:
1) Level 1-unadjusted quoted prices in active markets for identical assets or liabilities (including securities actively traded on a securities exchange)
2) Level 2-inputs other than unadjusted quoted prices that are observable for the asset or liability (such as unadjusted quoted prices for similar assets and market corroborated inputs such as interest rates, prepayment speeds, credit risks, etc.)
3) Level 3-significant unobservable inputs (including the Manager’s own judgments about assumptions that market participants would use in pricing the asset or liability).
The inputs used for valuing securities are not necessarily an indication of the risks associated with investing in those securities.
|
| 16 OPPENHEIMER DISCOVERY MID CAP GROWTH FUND/VA |
3. Securities Valuation (Continued)
The table below categorizes amounts that are included in the Fund’s Statement of Assets and Liabilities as of December 31, 2014 based on valuation input level:
| | | | | | | | | | | | | | | | |
| | | Level 1—
Unadjusted
Quoted Prices | | | Level 2—
Other Significant
Observable Inputs | | | Level 3—
Significant
Unobservable
Inputs | | | Value | |
Assets Table | | | | | | | | | | | | | | | | |
Investments, at Value: | | | | | | | | | | | | | | | | |
Common Stocks | | | | | | | | | | | | | | | | |
Consumer Discretionary | | $ | 164,814,447 | | | $ | — | | | $ | — | | | $ | 164,814,447 | |
Consumer Staples | | | 43,800,976 | | | | — | | | | — | | | | 43,800,976 | |
Energy | | | 7,808,061 | | | | — | | | | — | | | | 7,808,061 | |
Financials | | | 54,212,358 | | | | — | | | | — | | | | 54,212,358 | |
Health Care | | | 123,874,101 | | | | — | | | | — | | | | 123,874,101 | |
Industrials | | | 116,221,634 | | | | — | | | | — | | | | 116,221,634 | |
Information Technology | | | 152,314,384 | | | | — | | | | — | | | | 152,314,384 | |
Materials | | | 23,409,546 | | | | — | | | | — | | | | 23,409,546 | |
Telecommunication Services | | | 16,134,409 | | | | — | | | | — | | | | 16,134,409 | |
Investment Company | | | 11,090,218 | | | | — | | | | — | | | | 11,090,218 | |
| | | | |
Total Assets | | $ | 713,680,134 | | | $ | — | | | $ | — | | | $ | 713,680,134 | |
| | | | |
Forward currency exchange contracts and futures contracts, if any, are reported at their unrealized appreciation/depreciation at measurement date, which represents the change in the contract’s value from trade date. All additional assets and liabilities included in the above table are reported at their market value at measurement date.
4. Investments and Risks
Investment in Oppenheimer Institutional Money Market Fund. The Fund is permitted to invest daily available cash balances in an affiliated money market fund. The Fund may invest the available cash in Class E shares of Oppenheimer Institutional Money Market Fund (“IMMF”) to seek current income while preserving liquidity or for defensive purposes. IMMF is a registered open-end management investment company, regulated as a money market fund under the 1940 Act. The Manager is the investment adviser of IMMF, and the Sub-Adviser provides investment and related advisory services to IMMF. When applicable, the Fund’s investment in IMMF is included in the Statement of Investments. Shares of IMMF are valued at their net asset value per share. As a shareholder, the Fund is subject to its proportional share of IMMF’s Class E expenses, including its management fee. The Manager will waive fees and/or reimburse Fund expenses in an amount equal to the indirect management fees incurred through the Fund’s investment in IMMF.
Equity Security Risk. Stocks and other equity securities fluctuate in price. The value of the Fund’s portfolio may be affected by changes in the equity markets generally. Equity markets may experience significant short-term volatility and may fall sharply at times. Different markets may behave differently from each other and U.S. equity markets may move in the opposite direction from one or more foreign stock markets.
The prices of individual equity securities generally do not all move in the same direction at the same time and a variety of factors can affect the price of a particular company’s securities. These factors may include, but are not limited to, poor earnings reports, a loss of customers, litigation against the company, general unfavorable performance of the company’s sector or industry, or changes in government regulations affecting the company or its industry.
5. Shares of Beneficial Interest
The Fund has authorized an unlimited number of $0.001 par value shares of beneficial interest of each class. Transactions in shares of beneficial interest were as follows:
| | | | | | | | | | | | | | | | |
| | | Year Ended December 31, 2014 | | | Year Ended December 31, 2013 | |
| | | Shares | | | Amount | | | Shares | | | Amount | |
Non-Service Shares | | | | | | | | | | | | | | | | |
Sold | | | 416,592 | | | $ | 31,353,214 | | | | 1,267,875 | | | $ | 87,221,834 | |
Dividends and/or distributions reinvested | | | — | | | | — | | | | 1,176 | | | | 73,101 | |
Redeemed | | | (1,493,014 | ) | | | (111,716,047 | ) | | | (1,732,026 | ) | | | (110,208,190 | ) |
| | | | |
Net decrease | | | (1,076,422 | ) | | $ | (80,362,833 | ) | | | (462,975 | ) | | $ | (22,913,255 | ) |
| | | | |
| | | | | | | | | | | | | | | | |
Service Shares | | | | | | | | | | | | | | | | |
Sold | | | 42,402 | | | $ | 3,058,524 | | | | 78,939 | | | $ | 4,862,175 | |
Dividends and/or distributions reinvested | | | — | | | | — | | | | — | | | | — | |
Redeemed | | | (142,155 | ) | | | (10,267,950 | ) | | | (247,872 | ) | | | (15,202,844 | ) |
| | | | |
Net decrease | | | (99,753 | ) | | $ | (7,209,426 | ) | | | (168,933 | ) | | $ | (10,340,669 | ) |
| | | | |
|
| 17 OPPENHEIMER DISCOVERY MID CAP GROWTH FUND/VA |
NOTES TO FINANCIAL STATEMENTS Continued
6. Purchases and Sales of Securities
The aggregate cost of purchases and proceeds from sales of securities, other than short-term obligations and investments in IMMF, for the year ended December 31, 2014 were as follows:
| | | | | | | | |
| | | Purchases | | | Sales | |
Investment securities | | $ | 801,427,778 | | | $ | 896,249,700 | |
7. Fees and Other Transactions with Affiliates
Management Fees. Under the investment advisory agreement, the Fund pays the Manager a management fee based on the daily net assets of the Fund at an annual rate as shown in the following table:
| | | | |
| Fee Schedule | | | |
Up to $200 million | | | 0.75 | % |
Next $200 million | | | 0.72 | |
Next $200 million | | | 0.69 | |
Next $200 million | | | 0.66 | |
Next $700 million | | | 0.60 | |
Over $1.5 billion | | | 0.58 | |
The Fund’s management fee for the fiscal year ended December 31, 2014 was 0.71% of average annual net assets before any applicable waivers.
Sub-Adviser Fees. The Manager has retained the Sub-Adviser to provide the day-to-day portfolio management of the Fund. Under the Sub-Advisory Agreement, the Manager pays the Sub-Adviser an annual fee in monthly installments, equal to a percentage of the investment management fee collected by the Manager from the Fund, which shall be calculated after any investment management fee waivers. The fee paid to the Sub-Adviser is paid by the Manager, not by the Fund.
Transfer Agent Fees. OFI Global (the “Transfer Agent”) serves as the transfer and shareholder servicing agent for the Fund. The Fund pays the Transfer Agent a fee based on annual net assets. Fees incurred and average net assets for each class with respect to these services are detailed in the Statement of Operations and Financial Highlights, respectively.
Sub-Transfer Agent Fees. The Transfer Agent has retained Shareholder Services, Inc., a wholly-owned subsidiary of OFI (the “Sub-Transfer Agent”), to provide the day-to-day transfer agent and shareholder servicing of the Fund. Under the Sub-Transfer Agency Agreement, the Transfer Agent pays the Sub-Transfer Agent an annual fee in monthly installments, equal to a percentage of the transfer agent fee collected by the Transfer Agent from the Fund, which shall be calculated after any applicable fee waivers. The fee paid to the Sub-Transfer Agent is paid by the Transfer Agent, not by the Fund.
Trustees’ Compensation. The Fund’s Board of Trustees (“Board”) has adopted a compensation deferral plan for Independent Trustees that enables Trustees to elect to defer receipt of all or a portion of the annual compensation they are entitled to receive from the Fund. For purposes of determining the amount owed to the Trustee under the plan, deferred amounts are treated as though equal dollar amounts had been invested in shares of the Fund or in other Oppenheimer funds selected by the Trustee. The Fund purchases shares of the funds selected for deferral by the Trustee in amounts equal to his or her deemed investment, resulting in a Fund asset equal to the deferred compensation liability. Such assets are included as a component of “Other” within the asset section of the Statement of Assets and Liabilities. Deferral of Trustees’ fees under the plan will not affect the net assets of the Fund and will not materially affect the Fund’s assets, liabilities or net investment income per share. Amounts will be deferred until distributed in accordance with the compensation deferral plan.
Distribution and Service Plan for Service Shares. The Fund has adopted a Distribution and Service Plan (the “Plan”) pursuant to Rule 12b-1 under the 1940 Act for Service shares to pay OppenheimerFunds Distributor, Inc. (the “Distributor”), for distribution related services, personal service and account maintenance for the Fund’s Service shares. Under the Plan, payments are made periodically at an annual rate of 0.25% of the daily net assets of Service shares of the Fund. The Distributor currently uses all of those fees to compensate sponsors of the insurance product that offers Fund shares, for providing personal service and maintenance of accounts of their variable contract owners that hold Service shares. These fees are paid out of the Fund’s assets on an on-going basis and increase operating expenses of the Service shares, which results in lower performance compared to the Fund’s shares that are not subject to a service fee. Fees incurred by the Fund under the Plan are detailed in the Statement of Operations.
Waivers and Reimbursements of Expenses. The Manager has contractually agreed to limit the Fund’s expenses after payments, waivers and/or reimbursements and reduction to custodian expenses, excluding expenses incurred directly or indirectly by the Fund as a result of investments in other investment companies, wholly-owned subsidiaries and pooled investment vehicles; so that those expenses, as percentages of daily net assets, will not exceed the annual rate of 0.80% for Non-Service shares and 1.05% for Service shares. During the year ended December 31, 2014, the Manager waived fees and/or reimbursed the Fund $189,852 and $8,922 for Non-Service and Service shares, respectively.
The Manager will waive fees and/or reimburse Fund expenses in an amount equal to the indirect management fees incurred through the Fund’s investment in IMMF. During the year ended December 31, 2014, the Manager waived fees and/or reimbursed the Fund $17,740 for IMMF management fees.
These undertakings may be modified or terminated as set forth according to the terms in the prospectus.
|
| 18 OPPENHEIMER DISCOVERY MID CAP GROWTH FUND/VA |
8. Pending Litigation
In 2009, seven class action lawsuits were filed in the U.S. District Court for the District of Colorado against OppenheimerFunds, Inc. (“OFI”), OppenheimerFunds Distributor, Inc., the Fund’s principal underwriter and distributor (the “Distributor”), and certain funds (but not including the Fund) advised by OFI Global Asset Management, Inc. and distributed by the Distributor (the “Defendant Funds”). The lawsuits also named as defendants certain officers and current and former trustees of the respective Defendant Funds. The lawsuits raised claims under federal securities laws and alleged, among other things, that the disclosure documents of the respective Defendant Funds contained misrepresentations and omissions and that the respective Defendant Funds’ investment policies were not followed. The plaintiffs in these actions sought unspecified damages, equitable relief and awards of attorneys’ fees and litigation expenses. The Defendant Funds’ Boards of Trustees also engaged counsel to represent the Funds and the present and former Independent Trustees named in those suits. In March 2014, the parties in six of these lawsuits executed stipulations and agreements of settlement resolving those actions. In July 2014, the court entered an order and final judgment approving the settlements as fair, reasonable and adequate. The settlements do not resolve a seventh outstanding lawsuit relating to Oppenheimer Rochester California Municipal Fund (the “California Fund Suit”). OFI believes the California Fund Suit is without legal merit and is defending the suit vigorously. While it is premature to render any opinion as to the outcome in the California Fund Suit, or whether any costs that OFI may bear in defending the California Fund Suit might not be reimbursed by insurance, OFI believes the California Fund Suit should not impair the ability of OFI or the Distributor to perform their respective duties to the Fund, and that the outcome of the California Fund Suit should not have any material effect on the operations of any of the Oppenheimer funds.
|
| 19 OPPENHEIMER DISCOVERY MID CAP GROWTH FUND/VA |
REPORT OF INDEPENDENT REGISTERED PUBLIC ACCOUNTING FIRM
The Board of Trustees and Shareholders of Oppenheimer Variable Account Funds:
We have audited the accompanying statement of assets and liabilities of Oppenheimer Discovery Mid Cap Growth Fund/VA (a separate series of Oppenheimer Variable Account Funds), including the statement of investments, as of December 31, 2014, and the related statement of operations for the year then ended, the statements of changes in net assets for each of the years in the two-year period then ended, and the financial highlights for each of the years in the five-year period then ended. These financial statements and financial highlights are the responsibility of the Fund’s management. Our responsibility is to express an opinion on these financial statements and financial highlights based on our audits.
We conducted our audits in accordance with the standards of the Public Company Accounting Oversight Board (United States). Those standards require that we plan and perform the audit to obtain reasonable assurance about whether the financial statements and financial highlights are free of material misstatement. An audit includes examining, on a test basis, evidence supporting the amounts and disclosures in the financial statements. Our procedures included confirmation of securities owned as of December 31, 2014, by correspondence with the custodian, transfer agent and brokers, or by other appropriate auditing procedures where replies from brokers were not received. An audit also includes assessing the accounting principles used and significant estimates made by management, as well as evaluating the overall financial statement presentation. We believe that our audits provide a reasonable basis for our opinion.
In our opinion, the financial statements and financial highlights referred to above present fairly, in all material respects, the financial position of Oppenheimer Discovery Mid Cap Growth Fund/VA as of December 31, 2014, the results of its operations for the year then ended, the changes in its net assets for each of the years in the two-year period then ended, and the financial highlights for each of the years in the five-year period then ended, in conformity with U.S. generally accepted accounting principles.
KPMG LLP
Denver, Colorado
February 13, 2015
|
| 20 OPPENHEIMER DISCOVERY MID CAP GROWTH FUND/VA |
FEDERAL INCOME TAX INFORMATION Unaudited
In early 2015, if applicable, shareholders of record received information regarding all dividends and distributions paid to them by the Fund during calendar year 2014.
The foregoing information is presented to assist shareholders in reporting distributions received from the Fund to the Internal Revenue Service. Because of the complexity of the federal regulations which may affect your individual tax return and the many variations in state and local tax regulations, we recommend that you consult your tax advisor for specific guidance.
|
| 21 OPPENHEIMER DISCOVERY MID CAP GROWTH FUND/VA |
BOARD APPROVAL OF THE FUND’S INVESTMENT ADVISORY AND SUB-ADVISORY AGREEMENTS Unaudited
The Fund has entered into an investment advisory agreement with OFI Global Asset Management, Inc. (“OFI Global” or the “Adviser”), a wholly-owned subsidiary of OppenheimerFunds, Inc. (“OFI” or the “Sub-Adviser”) (“OFI Global” and “OFI” together the “Managers”) and OFI Global has entered into a sub-advisory agreement with OFI whereby OFI provides investment sub-advisory services to the Fund (collectively, the “Agreements”). Each year, the Board of Trustees (the “Board”), including a majority of the independent Trustees, is required to determine whether to renew the Agreements. The Investment Company Act of 1940, as amended, requires that the Board request and evaluate, and that the Managers provide, such information as may be reasonably necessary to evaluate the terms of the Agreements. The Board employs an independent consultant to prepare a report that provides information, including comparative information that the Board requests for that purpose. In addition to in-person meetings focused on this evaluation, the Board receives information throughout the year regarding Fund services, fees, expenses and performance.
The Adviser, Sub-Adviser and the independent consultant provided information to the Board on the following factors: (i) the nature, quality and extent of the Managers’ services, (ii) the investment performance of the Fund and the Managers, (iii) the fees and expenses of the Fund, including comparative expense information, (iv) the profitability of the Managers and their affiliates, including an analysis of the cost of providing services, (v) whether economies of scale are realized as the Fund grows and whether fee levels reflect these economies of scale for Fund investors and (vi) other benefits to the Managers from their relationship with the Fund. The Board was aware that there are alternatives to retaining the Managers.
Outlined below is a summary of the principal information considered by the Board as well as the Board’s conclusions.
Nature, Quality and Extent of Services. The Board considered information about the nature, quality and extent of the services provided to the Fund and information regarding the Managers’ key personnel who provide such services. The Sub-Adviser’s duties include providing the Fund with the services of the portfolio managers and the Sub-Adviser’s investment team, who provide research, analysis and other advisory services in regard to the Fund’s investments; securities trading services; oversight of third-party service providers; monitoring compliance with applicable Fund policies and procedures and adherence to the Fund’s investment restrictions; and risk management. The Managers are responsible for providing certain administrative services to the Fund as well. Those services include providing and supervising all administrative and clerical personnel who are necessary in order to provide effective corporate administration for the Fund; compiling and maintaining records with respect to the Fund’s operations; preparing and filing reports required by the Securities and Exchange Commission; preparing periodic reports regarding the operations of the Fund for its shareholders; preparing proxy materials for shareholder meetings; and preparing the registration statements required by Federal and state securities laws for the sale of the Fund’s shares. The Managers also provide the Fund with office space, facilities and equipment.
The Board also considered the quality of the services provided and the quality of the Managers’ resources that are available to the Fund. The Board took account of the fact that the Sub-Adviser has had over fifty years of experience as an investment adviser and that its assets under management rank it among the top mutual fund managers in the United States. The Board evaluated the Sub-Adviser’s advisory, administrative, accounting, legal, compliance services and risk management, and information the Board has received regarding the experience and professional qualifications of the Managers’ key personnel and the size and functions of its staff. In its evaluation of the quality of the portfolio management services provided, the Board considered the experience of Ronald Zibelli and Justin Livengood, the portfolio managers for the Fund, and the Sub-Adviser’s investment team and analysts. The Board members also considered the totality of their experiences with the Managers as directors or trustees of the Fund and other funds advised by the Managers. The Board considered information regarding the quality of services provided by affiliates of the Managers, which its members have become knowledgeable about in connection with the renewal of the Fund’s service agreements. The Board concluded, in light of the Managers’ experience, reputation, personnel, operations and resources that the Fund benefits from the services provided under the Agreements.
Investment Performance of the Manager, the Sub-Adviser and the Fund. Throughout the year, the Manager and the Sub-Adviser provided information on the investment performance of the Fund, including comparative performance information. The Board also reviewed information, prepared by the Manager, the Sub-Adviser and by the independent consultant, comparing the Fund’s historical performance to relevant market indices and to the performance of other mid-cap growth funds underlying variable insurance products. The Board considered that the Fund underperformed its performance category median for the one-, five- and ten-year periods but outperformed for the three-year period. The Board also considered that the Manager is satisfied with the overall performance of the Fund, noting the Manager’s assertion that the Fund’s one-year performance ranks in the 41st percentile when compared to the overall mid-cap growth category.
Costs of Services by the Manager. The Board reviewed the fees paid to the Manager and the Sub-Adviser and the other expenses borne by the Fund. The independent consultant provided comparative data in regard to the fees and expenses of the Fund and other mid-cap growth funds underlying variable insurance products. In reviewing the fees and expenses charged to the VA funds, the Board considered the Manager’s assertion that, because there is much greater disparity in the fees and services that may be provided by a manager to a VA fund as opposed to a retail fund, when comparing the expenses of the various VA funds to those of retail funds, it is most appropriate to focus on total expenses (rather than on the management fees). Accordingly, while the Board reviewed and considered all expenses, it focused on total expenses. The Board considered that the Fund’s contractual management fees and total expenses, after waivers, were lower than its respective peer group median and category median. Within the total asset range of $500 million to $1 billion, the Fund’s effective management fee rate was lower than its peer group median and category median. The Board noted that the Manager has contractually agreed to limit the Fund’s total annual operating expenses so that those expenses, as percentages of daily net assets, will not exceed the annual rate of 0.80% for Non-Service Shares and 1.05% for Service Shares. This contractual expense limitation may not be amended or withdrawn for one year from the date of the Fund’s prospectus, unless approved by the Board.
Economies of Scale and Profits Realized by the Manager and Sub-Adviser. The Board considered information regarding the Managers’ costs in serving as the Fund’s investment adviser and sub-adviser, including the costs associated with the personnel and systems necessary to manage the Fund, and information regarding the Managers’ profitability from their relationship with the Fund. The Board reviewed whether the Managers may realize economies of scale in managing and supporting the Fund. The Board noted that the Fund currently has management fee breakpoints, which are intended to share with Fund shareholders economies of scale that may exist as the Fund’s assets grow.
Other Benefits to the Managers. In addition to considering the profits realized by the Managers, the Board considered information that was provided regarding the direct and indirect benefits the Managers receive as a result of their relationship with the Fund, including compensation paid to
|
| 22 OPPENHEIMER DISCOVERY MID CAP GROWTH FUND/VA |
the Managers’ affiliates and research provided to the Adviser in connection with permissible brokerage arrangements (soft dollar arrangements).The Board also considered that the Managers must be able to pay and retain experienced professional personnel at competitive rates to provide quality services to the Fund.
Conclusions. These factors were also considered by the independent Trustees meeting separately from the full Board, assisted by experienced counsel to the Fund and to the independent Trustees. Fund counsel and the independent Trustees’ counsel are independent of the Managers within the meaning and intent of the Securities and Exchange Commission Rules.
Based on its review of the information it received and its evaluations described above, the Board, including a majority of the independent Trustees, decided to continue the Agreements through August 31, 2015. In arriving at its decision, the Board did not identify any factor or factors as being more important than others, but considered all of the above information, and considered the terms and conditions of the Agreements, including the management fees, in light of all the surrounding circumstances.
|
| 23 OPPENHEIMER DISCOVERY MID CAP GROWTH FUND/VA |
PORTFOLIO PROXY VOTING POLICIES AND PROCEDURES; UPDATES TO STATEMENTS OF INVESTMENTS Unaudited
The Fund has adopted Portfolio Proxy Voting Policies and Procedures under which the Fund votes proxies relating to securities (“portfolio proxies”) held by the Fund. A description of the Fund’s Portfolio Proxy Voting Policies and Procedures is available (i) without charge, upon request, by calling the Fund toll-free at 1.800.525.7048, (ii) on the Fund’s website at www.oppenheimerfunds.com, and (iii) on the SEC’s website at www.sec.gov. In addition, the Fund is required to file Form N-PX, with its complete proxy voting record for the 12 months ended June 30th, no later than August 31st of each year. The Fund’s voting record is available (i) without charge, upon request, by calling the Fund toll-free at 1.800.525.7048, and (ii) in the Form N-PX filing on the SEC’s website at www.sec.gov.
The Fund files its complete schedule of portfolio holdings with the SEC for the first quarter and the third quarter of each fiscal year on Form N-Q. The Fund’s Form N-Q filings are available on the SEC’s website at www.sec.gov. Those forms may be reviewed and copied at the SEC’s Public Reference Room in Washington, D.C. Information on the operation of the Public Reference Room may be obtained by calling 1-800-SEC-0330.
|
| 24 OPPENHEIMER DISCOVERY MID CAP GROWTH FUND/VA |
TRUSTEES AND OFFICERS Unaudited
| | |
Name, Position(s) Held with the Fund, Length of Service, Year of Birth | | Principal Occupation(s) During the Past 5 Years; Other Trusteeships/Directorships Held; Number of Portfolios in the Fund Complex Currently Overseen |
| |
| INDEPENDENT TRUSTEES | | The address of each Trustee in the chart below is 6803 S. Tucson Way, Centennial, Colorado 80112-3924. Each Trustee serves for an indefinite term, or until his or her resignation, retirement, death or removal. |
| |
Sam Freedman, Chairman of the Board of Trustees (since 2012) and Trustee (since 1996) Year of Birth: 1940 | | Director of Colorado UpLIFT (charitable organization) (since September 1984). Mr. Freedman held several positions with the Sub-Adviser and with subsidiary or affiliated companies of the Sub-Adviser (until October 1994). Oversees 38 portfolios in the OppenheimerFunds complex. Mr. Freedman has served on the Boards of certain Oppenheimer funds since 1996, during which time he has become familiar with the Fund’s (and other Oppenheimer funds’) financial, accounting, regulatory and investment matters and has contributed to the Boards’ deliberations. |
| |
Jon S. Fossel, Trustee (since 1990) Year of Birth: 1942 | | Chairman of the Board of Jack Creek Preserve Foundation (non-profit organization) (since 2005); Chairman of the Board (2006-December 2011) and Director (June 2002-December 2011) of UNUMProvident (insurance company); Director of Northwestern Energy Corp. (public utility corporation) (November 2004-December 2009); Director of P.R. Pharmaceuticals (October 1999-October 2003); Director of Rocky Mountain Elk Foundation (non-profit organization) (February 1998-February 2003 and February 2005-February 2007); Chairman and Director (until October 1996) and President and Chief Executive Officer (until October 1995) of the Sub-Adviser; President, Chief Executive Officer and Director of the following: Oppenheimer Acquisition Corp. (“OAC”) (parent holding company of the Sub-Adviser), Shareholder Services, Inc. and Shareholder Financial Services, Inc. (until October 1995). Oversees 38 portfolios in the OppenheimerFunds complex. Mr. Fossel has served on the Boards of certain Oppenheimer funds since 1990, during which time he has become familiar with the Fund’s (and other Oppenheimer funds’) financial, accounting, regulatory and investment matters and has contributed to the Boards’ deliberations. |
| |
Richard F. Grabish, Trustee (since 2012) Year of Birth: 1948 | | Formerly Senior Vice President and Assistant Director of Sales and Marketing (March 1997-December 2007), Director (March 1987-December 2007) and Manager of Private Client Services (June 1985-June 2005) of A.G. Edwards & Sons, Inc. (broker/dealer and investment firm); Chairman and Chief Executive Officer of A.G. Edwards Trust Company, FSB (March 2001-December 2007); President and Vice Chairman of A.G. Edwards Trust Company, FSB (investment adviser) (April 1987-March 2001); President of A.G. Edwards Trust Company, FSB (investment adviser) (June 2005-December 2007). Oversees 38 portfolios in the OppenheimerFunds complex. Mr. Grabish has served on the Boards of certain Oppenheimer funds since 2001, during which time he has become familiar with the Fund’s (and other Oppenheimer funds’) financial, accounting, regulatory and investment matters and has contributed to the Boards’ deliberations. |
| |
Beverly L. Hamilton, Trustee (since 2002) Year of Birth: 1946 | | Trustee of Monterey Institute for International Studies (educational organization) (since February 2000); Board Member of Middlebury College (educational organization) (December 2005-June 2011); Chairman (since 2010) of American Funds’ Emerging Markets Growth Fund, Inc. (mutual fund); Director of The California Endowment (philanthropic organization) (April 2002-April 2008); Director (February 2002-2005) and Chairman of Trustees (2006-2007) of the Community Hospital of Monterey Peninsula; Director (October 1991-2005); Vice Chairman (2006-2009) of American Funds’ Emerging Markets Growth Fund, Inc. (mutual fund); President of ARCO Investment Management Company (February 1991-April 2000); Member of the investment committees of The Rockefeller Foundation (2001-2006) and The University of Michigan (since 2000); Advisor at Credit Suisse First Boston’s Sprout venture capital unit (venture capital fund) (1994-January 2005); Trustee of MassMutual Institutional Funds (investment company) (1996-June 2004); Trustee of MML Series Investment Fund (investment company) (April 1989-June 2004); Member of the investment committee of Hartford Hospital (2000-2003); and Advisor to Unilever (Holland) pension fund (2000-2003). Oversees 38 portfolios in the OppenheimerFunds complex. Ms. Hamilton has served on the Boards of certain Oppenheimer funds since 2002, during which time she has become familiar with the Fund’s (and other Oppenheimer funds’) financial, accounting, regulatory and investment matters and has contributed to the Boards’ deliberations. |
| |
Victoria J. Herget, Trustee (since 2012) Year of Birth:1951 | | Board Chair (2008-Present) and Director (2004-Present), United Educators (insurance company); Trustee (since 2000) and Chair (since 2010), Newberry Library (independent research library); Trustee, Mather LifeWays (senior living organization) (since 2001); Independent Director of the First American Funds (mutual fund family) (2003-2011); former Managing Director (1993-2001), Principal (1985-1993), Vice President (1978-1985) and Assistant Vice President (1973-1978) of Zurich Scudder Investments (investment adviser) (and its predecessor firms); Trustee (1992-2007), Chair of the Board of Trustees (1999-2007), Investment Committee Chair (1994-1999) and Investment Committee member (2007-2010) of Wellesley College; Trustee, BoardSource (non-profit organization) (2006-2009) and Chicago City Day School (K-8 School) (1994-2005). Oversees 38 portfolios in the OppenheimerFunds complex. Ms. Herget has served on the Boards of certain Oppenheimer funds since 2012, during which time she has become familiar with the Fund’s (and other Oppenheimer funds’) financial, accounting, regulatory and investment matters and has contributed to the Boards’ deliberations. |
| |
Robert J. Malone, Trustee (since 2002) Year of Birth: 1944 | | Chairman of the Board (since 2012) and Director (since August 2005) of Jones International University (educational organization); Chairman, Chief Executive Officer and Director of Steele Street Bank Trust (commercial banking) (since August 2003); Trustee of the Gallagher Family Foundation (non-profit organization) (since 2000); Board of Directors of Opera Colorado Foundation (non-profit organization) (2008-2012); Director of Colorado UpLIFT (charitable organization) (1986-2010); Director of Jones Knowledge, Inc. (2006-2010); Former Chairman of U.S. Bank-Colorado (subsidiary of U.S. Bancorp and formerly Colorado National Bank) (July 1996-April 1999); Director of Commercial Assets, Inc. (real estate investment trust) (1993-2000); Director of U.S. Exploration, Inc. (oil and gas exploration) (1997-February 2004); Chairman of the Board (1991-1994) and Trustee (1985-1994) of Regis University; and Chairman of the Board (1990-1991 and Trustee (1984-1999) of Young Presidents Organization. Oversees 38 portfolios in the OppenheimerFunds |
|
| 25 OPPENHEIMER DISCOVERY MID CAP GROWTH FUND/VA |
TRUSTEES AND OFFICERS Unaudited / Continued
| | |
Robert J. Malone, Continued | | complex. Mr. Malone has served on the Boards of certain Oppenheimer funds since 2002, during which time he has become familiar with the Fund’s (and other Oppenheimer funds’) financial, accounting, regulatory and investment matters and has contributed to the Boards’ deliberations. |
| |
F. William Marshall, Jr., Trustee (since 2001) Year of Birth: 1942 | | Trustee Emeritus of Worcester Polytech Institute (WPI) (private university) (since 2009); Trustee of MassMutual Select Funds (formerly MassMutual Institutional Funds) (investment company) (since 1996), MML Series Investment Fund (investment company) (since 1996) and Mass Mutual Premier Funds (investment company) (since January 2012); President and Treasurer of the SIS Fund (private charitable fund) (January 1999 – March 2011); Former Trustee of WPI (1985-2008); Former Chairman of the Board (2004-2006) and Former Chairman of the Investment Committee of WPI (1994-2008); Chairman of SIS & Family Bank, F.S.B. (formerly SIS Bank) (commercial bank) (January 1999-July 1999); Executive Vice President of Peoples Heritage Financial Group, Inc. (commercial bank) (January 1999-July 1999); and Former President and Chief Executive Officer of SIS Bancorp. (1993-1999). Oversees 42 portfolios in the OppenheimerFunds complex. Mr. Marshall has served on the Boards of certain Oppenheimer funds since 2000, during which time he has become familiar with the Fund’s (and other Oppenheimer funds’) financial, accounting, regulatory and investment matters and has contributed to the Boards’ deliberations. |
| |
Karen L. Stuckey, Trustee (since 2012) Year of Birth: 1953 | | Partner (1990-2012) of PricewaterhouseCoopers LLP (professional services firm) (held various positions 1975- 1990); Trustee (1992-2006) and member of Executive, Nominating and Audit Committees and Chair of Finance Committee of Lehigh University; and member, Women’s Investment Management Forum (professional organization) since inception. Oversees 38 portfolios in the OppenheimerFunds complex. Ms. Stuckey has served on the Boards of certain Oppenheimer funds since 2012, during which time she has become familiar with the Fund’s (and other Oppenheimer funds’) financial, accounting, regulatory and investment matters and has contributed to the Boards’ deliberations. |
| |
James D. Vaughn, Trustee (since 2012) Year of Birth: 1945 | | Retired; former managing partner (1994-2001) of Denver office of Deloitte & Touche LLP, (held various positions 1969-1993); Trustee and Chairman of the Audit Committee of Schroder Funds (2003-2012); Board member and Chairman of Audit Committee of AMG National Trust Bank (since 2005); Trustee and Investment Committee member, University of South Dakota Foundation (since 1996); Board member, Audit Committee Member and past Board Chair, Junior Achievement (since 1993); former Board member, Mile High United Way, Boys and Girls Clubs, Boy Scouts, Colorado Business Committee for the Arts, Economic Club of Colorado and Metro Denver Network. Oversees 38 portfolios in the OppenheimerFunds complex. Mr. Vaughn has served on the Boards of certain Oppenheimer funds since 2012, during which time he has become familiar with the Fund’s (and other Oppenheimer funds’) financial, accounting, regulatory and investment matters and has contributed to the Boards’ deliberations. |
INTERESTED TRUSTEE | | Mr. Glavin is an “Interested Trustee” because he is affiliated with the Manager and the Sub-Adviser by virtue of his positions as director of the Sub-Adviser, and as a shareholder of the Sub-Adviser’s parent company. As a Trustee, he serves for an indefinite term, or until his resignation, retirement, death or removal. Mr. Glavin’s address is 225 Liberty Street, 11th Floor, New York, New York 10281-1008. |
| |
William F. Glavin, Jr., Trustee (since 2009) Year of Birth: 1958 | | Chairman of the Sub-Adviser (July 2014-December 2014 and December 2009-December 2012) and Director of the Sub-Adviser (since January 2009); Chairman, Director and Chief Executive Officer (January 2013-June 2014) of the Manager; President of the Manager (January 2013-May 2013); Chief Executive Officer (January 2009-December 2012); President of the Sub-Adviser (May 2009-December 2012); Management Director (June 2009-June 2014), President (December 2009-June 2014) and Chief Executive Officer (January 2011-June 2014) of Oppenheimer Acquisition Corp. (“OAC”) (the Sub-Adviser’s parent holding company); Director of Oppenheimer Real Asset Management, Inc. (March 2010-June 2014); Executive Vice President (March 2006-February 2009) and Chief Operating Officer (July 2007-February 2009) of Massachusetts Mutual Life Insurance Company (OAC’s parent company); Director (May 2004-March 2006) and Chief Operating Officer and Chief Compliance Officer (May 2004-January 2005), President (January 2005-March 2006) and Chief Executive Officer (June 2005-March 2006) of Babson Capital Management LLC; Director (March 2005-March 2006), President (May 2003-March 2006) and Chief Compliance Officer (July 2005-March 2006) of Babson Capital Securities, Inc. (a broker-dealer); President (May 2003-March 2006) of Babson Investment Company, Inc.; Director (May 2004-August 2006) of Babson Capital Europe Limited; Director (May 2004-October 2006) of Babson Capital Guernsey Limited; Director (May 2004-March 2006) of Babson Capital Management LLC; Non-Executive Director (March 2005-March 2007) of Baring Asset Management Limited; Director (February 2005-June 2006) Baring Pension Trustees Limited; Director and Treasurer (December 2003-November 2006) of Charter Oak Capital Management, Inc.; Director (May 2006-September 2006) of C.M. Benefit Insurance Company; Director (May 2008-June 2009) and Executive Vice President (June 2007-July 2009) of C.M. Life Insurance Company; President (March 2006-May 2007) of MassMutual Assignment Company; Director (January 2005-December 2006), Deputy Chairman (March 2005-December 2006) and President (February 2005-March 2005) of MassMutual Holdings (Bermuda) Limited; Director (May 2008-June 2009) and Executive Vice President (June 2007-July 2009) of MML Bay State Life Insurance Company; Chief Executive Officer and President (April 2007-January 2009) of MML Distributors, LLC; and Chairman (March 2006-December 2008) and Chief Executive Officer (May 2007-December 2008) of MML Investors Services, Inc. An officer of 91 portfolios in the OppenheimerFunds complex. Mr. Glavin has served on the Boards of certain Oppenheimer funds since December 2009, during which time he has become familiar with the Fund’s (and other Oppenheimer funds’) financial, accounting, regulatory and investment matters and has contributed to the Boards’ deliberations. |
OTHER OFFICERS OF THE FUND | | The addresses of the Officers in the chart below are as follows: for Messrs. Zibelli, Jr., Livengood, Steinmetz, Gabinet, Mss. Sexton and Picciotto, 225 Liberty Street, New York, New York 10281-1008, for Mr. Wixted, 6803 S. Tucson Way, Centennial, Colorado 80112-3924. Each Officer serves for an indefinite term or until his or her resignation, retirement, death or removal. |
|
| 26 OPPENHEIMER DISCOVERY MID CAP GROWTH FUND/VA |
| | |
Ronald J. Zibelli, Jr., Vice President (since 2008) Year of Birth: 1959 | | Senior Vice President of the Sub-Adviser (since January 2014); Senior Portfolio Manager of the Sub-Adviser (since May 2006) and Vice President of the Sub-Adviser (May 2006-January 2014). Prior to joining the Sub-Adviser, he spent six years at Merrill Lynch Investment Managers, during which time he was a Managing Director and Small Cap Growth Team Leader, responsible for managing 11 portfolios. Prior to joining Merrill Lynch Investment Managers, Mr. Zibelli spent 12 years with Chase Manhattan Bank, including two years as Senior Portfolio Manager (U.S. Small Cap Equity) at Chase Asset Management. A portfolio manager and an officer of other portfolios in the OppenheimerFunds complex. |
| |
Justin Livengood, Vice President (since 2014) Year of Birth: 1974 | | Vice President (since May 2006) and Senior Portfolio (since January 2014) of the Sub-Adviser. Senior Research Analyst of the Sub-Adviser (May 2006-January 2014), responsible for the health care, energy and financial services sectors for mid- and small-cap growth accounts. Before joining the Sub-Adviser in May 2006, Mr. Livengood was a vice president and fund analyst with Merrill Lynch Investment Managers, where he specialized in financial services, health care, energy and basic materials for the Merrill Lynch Small Cap Growth Fund. During his tenure at Merrill Lynch he also worked as an investment banking analyst in the Global Media Group and as an associate with Merrill Lynch Ventures. A portfolio manager and an officer of other portfolios in the OppenheimerFunds complex. |
| |
Arthur P. Steinmetz, President and Principal Executive Officer (since 2014) Year of Birth: 1958 | | Chairman of the Sub-Adviser (since January 2015); CEO and Chairman of the Manager (since July 2014), President of the Manager (since May 2013), a Director of the Manager (since January 2013), Director of the Sub-Adviser (since July 2014), President, Management Director and CEO of Oppenheimer Acquisition Corp. (the Sub-Adviser’s parent holding company) (since July 2014), and President and Director of OFI SteelPath, Inc. (since January 2013). Chief Investment Officer of the OppenheimerFunds advisory entities from (January 2013-December 2013); Executive Vice President of the Manager (January 2013-May 2013); Chief Investment Officer of the Sub-Adviser (October 2010-December 2012); Chief Investment Officer, Fixed-Income, of the Sub-Adviser (April 2009-October 2010); Executive Vice President of the Sub-Adviser (October 2009-December 2012); Director of Fixed Income of the Sub-Adviser (January 2009-April 2009); and a Senior Vice President of the Sub-Adviser (March 1993-September 2009). An officer of 91 portfolios in the OppenheimerFunds complex. |
| |
Arthur S. Gabinet, Secretary and Chief Legal Officer (since 2011) Year of Birth: 1958 | | Executive Vice President, Secretary and General Counsel of the Manager (since January 2013); General Counsel OFI SteelPath, Inc. (since January 2013); Executive Vice President (May 2010-December 2012) and General Counsel (since January 2011) of the Sub-Adviser; General Counsel of the Distributor (since January 2011); General Counsel of Centennial Asset Management Corporation (January 2011-December 2012); Executive Vice President (January 2011-December 2012) and General Counsel of HarbourView Asset Management Corporation (since January 2011); Assistant Secretary (since January 2011) and Director (since January 2011) of OppenheimerFunds International Ltd. and OppenheimerFunds plc; Director of Oppenheimer Real Asset Management, Inc. (January 2011-December 2012) and General Counsel (since January 2011); Executive Vice President (January 2011-December 2011) and General Counsel of Shareholder Financial Services, Inc. and Shareholder Services, Inc. (since January 2011); Executive Vice President (January 2011-December 2012) and General Counsel of OFI Private Investments Inc. (since January 2011); Vice President of OppenheimerFunds Legacy Program (January 2011-December 2011); Executive Vice President (January 2011-December 2012) and General Counsel of OFI Institutional Asset Management, Inc. (since January 2011); General Counsel, Asset Management of the Sub-Adviser (May 2010-December 2010); Principal, The Vanguard Group (November 2005-April 2010); District Administrator, U.S. Securities and Exchange Commission (January 2003-October 2005). An officer of 91 portfolios in the OppenheimerFunds complex. |
| |
Jennifer Sexton, Vice President and Chief Business Officer (since 2014) Year of Birth: 1969 | | Senior Vice President of OppenheimerFunds Distributor, Inc. (since June 2014); Vice President of OppenheimerFunds Distributor, Inc. (April 2006-June 2014); Vice President of the Sub-Adviser (January 1998-March 2006); Assistant Vice President of the Sub-Adviser (October 1991-December 1998). An officer of 91 portfolios in the OppenheimerFunds complex. |
| |
Mary Ann Picciotto, Chief Compliance Officer and Chief Anti-Money Laundering Officer (since 2014) Year of Birth: 1973 | | Senior Vice President and Chief Compliance Officer of the Manager (since March 2014); Chief Compliance Officer of the Sub-Adviser, OFI SteelPath, Inc., OFI Global Trust Company, OFI Global Institutional, Inc., Oppenheimer Real Asset Management, Inc., OFI Private Investments, Inc., Harborview Asset Management Corporation, Trinity Investment Management Corporation, and Shareholder Services, Inc. (since March 2014); Managing Director of Morgan Stanley Investment Management Inc. and certain of its various affiliated entities; Chief Compliance Officer of various Morgan Stanley Funds (May 2010-January 2014); Chief Compliance Officer of Morgan Stanley Investment Management Inc. (April 2007-January 2014). An officer of 91 portfolios in the OppenheimerFunds complex. |
| |
Brian W. Wixted, Treasurer and Principal Financial & Accounting Officer (since 1999) Year of Birth: 1959 | | Senior Vice President of the Manager (since January 2013); Treasurer of the Sub-Adviser, HarbourView Asset Management Corporation, Shareholder Financial Services, Inc., Shareholder Services, Inc., and Oppenheimer Real Asset Management, Inc. (March 1999-June 2008), OFI Private Investments, Inc. (March 2000-June 2008), OppenheimerFunds International Ltd. and OppenheimerFunds plc (since May 2000), OFI Institutional Asset Management, Inc. (November 2000-June 2008), and OppenheimerFunds Legacy Program (charitable trust program established by the Sub-Adviser) (June 2003-December 2011); Treasurer and Chief Financial Officer of OFI Trust Company (since May 2000); Assistant Treasurer of Oppenheimer Acquisition Corporation (March 1999-June 2008). An officer of 91 portfolios in the OppenheimerFunds complex. |
The Fund’s Statement of Additional Information contains additional information about the Fund’s Trustees and Officers and is available without charge, upon request, by calling 1.800.988.8287.
|
| 27 OPPENHEIMER DISCOVERY MID CAP GROWTH FUND/VA |
OPPENHEIMER DISCOVERY MID CAP GROWTH FUND/VA
A Series of Oppenheimer Variable Account Funds
| | |
| Manager | | OFI Global Asset Management, Inc. |
| |
| Sub-Adviser | | OppenheimerFunds, Inc. |
| |
| Distributor | | OppenheimerFunds Distributor, Inc. |
| |
| Transfer and | | OFI Global Asset Management, Inc. |
| Shareholder | | |
| Servicing Agent | | |
| |
| Sub-Transfer Agent | | Shareholder Services, Inc. |
| | DBA OppenheimerFunds Services |
| |
| Independent | | KPMG LLP |
| Registered | | |
| Public | | |
| Accounting | | |
| Firm | | |
| |
| Counsel | | K&L Gates LLP |
| |
| | Before investing in any of the Oppenheimer funds, investors should carefully consider a fund’s investment objectives, risks, charges and expenses. Fund prospectuses and summary prospectuses contain this and other information about the funds, and may be obtained by asking your financial advisor, or calling us at 1.800.988.8287. Read prospectuses and summary prospectuses carefully before investing. |
| |
| | © 2015 OppenheimerFunds, Inc. All rights reserved. Oppenheimer funds are distributed by OppenheimerFunds Distributor, Inc. |

ANNUAL REPORT
Listing of Top Holdings
Fund Performance Discussion
Financial Statements
PORTFOLIO MANAGERS: Magnus Krantz and Krishna Memani
AVERAGE ANNUAL TOTAL RETURNS FOR THE PERIODS ENDED 12/31/14
| | | | | | | | | | | | | | |
| | | Inception
Date | | | 1-Year | | | | 5-Year | | | | 10-Year | |
Non-Service Shares | | 2/9/87 | | | 8.20 | % | | | 9.36 | % | | | 2.59 | % |
Service Shares | | 5/1/02 | | | 8.02 | | | | 9.10 | | | | 2.34 | |
Russell 3000 Index | | | | | 12.56 | | | | 15.63 | | | | 7.94 | |
Barclays U.S. Aggregate Bond Index | | | | | 5.97 | | | | 4.45 | | | | 4.71 | |
Reference Index | | | | | 8.43 | | | | 8.64 | | | | 6.43 | |
Performance data quoted represents past performance, which does not guarantee future results. The investment return and principal value of an investment in the Fund will fluctuate so that an investor’s shares, when redeemed, may be worth more or less than their original cost. Current performance may be lower or higher than the performance quoted. For performance data current to the most recent month end, call us at 1.800.988.8287. The Fund’s total returns should not be expected to be the same as the returns of other funds, whether or not both funds have the same portfolio managers and/or similar names. The Fund’s total returns include changes in share price and reinvested distributions but do not include the charges associated with the separate account products that offer this Fund. Such performance would have been lower if such charges were taken into account.
TOP TEN COMMON STOCK HOLDINGS
| | |
Apple, Inc. | | 1.3% |
Actavis plc | | 1.0 |
Citigroup, Inc. | | 0.9 |
National Oilwell Varco, Inc. | | 0.8 |
JPMorgan Chase & Co. | | 0.8 |
Mondelez International, Inc., Cl. A | | 0.8 |
Comcast Corp., Cl. A | | 0.7 |
General Electric Co. | | 0.7 |
AutoZone, Inc. | | 0.6 |
Henkel AG & Co. KGaA | | 0.6 |
Portfolio holdings and allocations are subject to change. Percentages are as of December 31, 2014, and are based on net assets. For more current Fund holdings, please visit oppenheimerfunds.com. |
PORTFOLIO ALLOCATION
| | | | |
Mortgage-Backed Obligations | | | | |
Government Agency | | | 24.0 | % |
Non-Agency | | | 8.5 | |
Common Stocks | | | 28.6 | |
Non-Convertible Corporate Bonds and Notes | | | 27.9 | |
Asset-Backed Securities | | | 9.0 | |
Investment Company | | | | |
Oppenheimer Institutional Money Market Fund | | | 1.7 | |
U.S. Government Obligations | | | 0.3 | |
Portfolio holdings and allocations are subject to change. Percentages are as of December 31, 2014, and are based on the total market value of investments. | |
2 OPPENHEIMER CAPITAL INCOME FUND/VA
Fund Performance Discussion
The Fund’s Non-Service shares produced a return of 8.20% during the reporting period. On a relative basis, the Fund underperformed its Reference Index, which returned 8.43%. The Fund’s Reference Index is a customized weighted index currently comprised of the following underlying broad-based security indices: 65% of the Barclays U.S. Aggregate Bond Index and 35% of the Russell 3000 Index. Measured separately, the Barclays U.S. Aggregate Bond Index returned 5.97% and the Russell 3000 Index returned 12.56%.
MARKET OVERVIEW
During the past year domestic equity — as an asset class — once again distinguished itself as stocks appreciated in value across all capitalizations, outperforming international equities and fixed-income securities. In 2014, the U.S. economy provided a favorable backdrop for the outperformance of equities with steady, albeit modest growth, continued little wage inflation, and interest rates that remained low — in fact, well below initial expectations. Under these economic conditions most companies were able to demonstrate ongoing improvement with the majority beating expectations — on both the top and bottom lines.
The ride throughout the year, however, was anything but smooth. Macro influences —particularly the strengthening dollar, flattening yield curve, and tumbling oil price — played a significant role in determining which equities out- or underperformed. Accommodation by the Federal Reserve (the “Fed”), which officially ended its bond-buying stimulus program in October, helped to fuel demand for high-dividend paying stocks such as utilities and real estate investment trusts (“REITs”), while a step-up in merger and acquisition activity — spurred on by the desire to relocate to advantageous low tax jurisdictions — boosted stocks primarily in the health care sector. But not all was rosy. The Fed’s accommodative behavior proved a headwind for many financials as long yields declined, hurting the profitability of banks. The strengthening U.S. dollar also proved a headwind, especially for multi-national companies where translation from local currencies to the greenback negatively impacted the bottom line. Consequently, stocks with international businesses broadly underperformed stocks with mostly domestic exposure.
Geopolitical risks, including those concentrated in Ukraine and Russia and the ever-present turmoil in the Middle East, caused investors to fret and resulted in, at times, quite the roller coaster ride. Add to this the fact that growth outside of the U.S. was anemic, at best, leading investors to worry intermittently about the global outlook and its impact on domestic stocks. And, a new concern raised its very ugly head as the Ebola epidemic in Western Africa spooked investors further. Though volatility remained below historical averages, these issues caused it to it to spike on a number of occasions throughout the year.
In fixed-income markets, higher-yielding securities such as corporate bonds and mortgage-backed securities (“MBS”) generally outperformed U.S. Treasuries. The Treasury curve flattened in 2014 as strong demand pushed up prices on the 30-year bond as well as the 10-year note, although to a lesser degree. This can largely be attributed to anticipation by the financial markets that the Fed may move short-term rates higher at some point during 2015. Although, it is certainly worth noting that the Fed maintained its current forward guidance for interest rates by maintaining that it can be “patient in beginning to normalize the stance of monetary policy”. The last consumer price index (CPI) news release of the reporting period showed the annual inflation rate at 1.3% for the year ended November 30, 2014, which would indicate that inflation pressures are not heating up to any great extent in the U.S. economy.
EQUITY STRATEGY REVIEW
The equity strategy produced positive absolute performance during the reporting period, but underperformed the Russell 3000 Index. The equity strategy’s underperformance stemmed largely from less favorable stock selection in the financials and consumer staples sectors. The equity strategy outperformed the Index primarily in the information technology, consumer discretionary and health care sectors due to stronger relative stock selection.
The equity strategy’s top contributors to performance included information technology holdings Apple, Inc. and Skyworks Solutions, Inc. and health care stock Actavis plc. Apple rallied after iPhone sales came in higher than analysts anticipated and the company announced a 7-for-1 stock split and increased both its dividend and share repurchases. In addition, the introduction of two new iPhones, and the upcoming introduction of a new Apple Watch product, resulted in strong performance. Skyworks Solutions is a supplier of analog semiconductors to the wireless industry. The company’s stock benefited from the successful launch of Apple’s iPhone 6, on which Skyworks provides chips. Skyworks’ content share has increased on iPhone 6 platforms, with its dollar content higher than it was for the iPhone 5. Actavis shares reacted favorably after management pre-announced a positive earnings surprise due mostly to revenue synergies and cost savings from a recent merger with Warner Chilcott. Free cash generation was above expectations as well, and was used to pay down debt. This reduced balance sheet leverage, thus providing financial flexibility for additional acquisitions to further the company’s growth initiatives. The company also announced the acquisition of Forest Labs and Allergan during the reporting period.
3 OPPENHEIMER CAPITAL INCOME FUND/VA
Top detractors from the equity strategy’s performance included Noble Energy, Inc., Genworth Financial, Inc. and Web.com Group, Inc. Noble has a high sensitivity to oil price changes as it has significant exploration and production operations globally. Growth projections are expected to decline as the company adjusts both its cash flow expectations and balance sheet to reflect a diminished outlook for global energy prices. We have maintained our position and continue to have confidence in management’s ability to execute well at period end. Genworth, which provides insurance for the life, mortgage, and long-term care markets, disappointed investors when it reported third quarter results. Management announced a larger than projected charge to reflect a step-up in claims from holders of its long-term care policies. Additionally, the company disclosed that it would conduct a comprehensive review of all policies, adding to investor concerns. We exited our position. Web.com Group, Inc. is a provider of Internet services and online marketing solutions, primarily to small businesses. Over the fourth quarter of 2014, the company disappointed investors for a second consecutive quarter when it reported results. Decelerating growth in its core “Do-It-For-Me” business — a key contributor to the company’s revenue over the past several years — was the prime culprit leading to the shortfall in earnings. This disappointment was a violation of our investment thesis that was predicated on customers continuing to migrate up the value chain, leading to both accelerating revenue growth and improved profitability. As a consequence, we have eliminated our holdings in this stock.
FIXED-INCOME STRATEGY REVIEW
The fixed-income strategy continued to favor corporate bonds, mortgages and other securitized products over government bonds this reporting period, which benefited performance as corporate bonds outperformed U.S. Treasuries during the reporting period. The strongest performing areas for the fixed-income strategy were investment-grade corporate bonds and mortgages.
Corporate bond sectors that contributed positively to performance included financials, utilities and telecommunications. Detracting from performance included the fixed-income strategy’s exposure to basic materials, such as metals and mining and chemicals. Shortly after the July reversal in credit spreads, the market saw pressure on most corporate bond sectors, but in particular on the most directly commodity-sensitive sectors. Energy was hit particularly hard due to dramatically falling oil prices, but basic materials such as metals and mining and chemicals were also negatively impacted. Because the Fund had seen positive results from its holdings in the energy sector for the first half of the year, and we were quick to pare back risk when the sector came under pressure, the Fund was able to end the year with a positive contribution from the energy sector overall. However, basic materials had not seen the same amount of relative strength prior to the credit spread reversal and the Fund’s holdings in that area detracted from performance for the calendar year.
Among mortgages, the Fund had its largest exposure to government agency MBS, with a smaller allocation to non-agency MBS. The Fund also had positions in commercial MBS and asset-backed securities (“ABS”). Each of these positions produced positive results this reporting period as they offered relatively attractive yields, sparking greater demand as investors resumed their search for more competitive levels of current income.
During the reporting period, we decreased our allocation to agency debt and moved a portion of those assets into U.S. Treasuries to maintain liquidity in the Fund. Our U.S. Treasury position minimally detracted from performance this reporting period.
Investors should consider the Fund’s investment objective, risks, charges and expenses carefully before investing. The Fund’s prospectus and summary prospectus contain this and other information about the Fund, and may be obtained by asking your financial advisor or calling us at 1.800.988.8287. Read prospectuses and summary prospectuses carefully before investing.
Total returns include changes in share price and reinvestment of dividends and capital gains distributions in a hypothetical investment for the periods shown.
The Fund’s investment strategy and focus can change over time. The mention of specific fund holdings does not constitute a recommendation by OppenheimerFunds, Inc. or its affiliates.
Shares of Oppenheimer funds are not deposits or obligations of any bank, are not guaranteed by any bank, are not insured by the FDIC or any other agency, and involve investment risks, including the possible loss of the principal amount invested.
Comparing the Fund’s Performance to the Market. The graphs that follow show the performance of a hypothetical $10,000 investment in each share class of the Fund held until December 31, 2014. Performance is measured over a ten-fiscal-year period for both Classes. Performance information does not reflect charges that apply to separate accounts investing in the Fund. If these charges were taken into account, performance would be lower. The graphs assume that all dividends and capital gains distributions were reinvested in additional shares.
4 OPPENHEIMER CAPITAL INCOME FUND/VA
The Fund’s performance is compared to the performance of the Russell 3000 Index, the Barclays U.S. Aggregate Bond Index, and the Fund’s Reference Index. The Russell 3000 Index measures the performance of the largest 3,000 U.S. companies, representing approximately 98% of the investable U.S. equity market. The Barclays U.S. Aggregate Bond Index is an index of U.S dollar-denominated, investment-grade U.S. corporate government and mortgage-backed securities. The Fund’s Reference Index is a customized weighted index currently comprised of 65% of the Barclays U.S. Aggregate Bond Index and 35% of the Russell 3000 Index. The indices are unmanaged and cannot be purchased directly by investors. While index comparisons may be useful to provide a benchmark for the Fund’s performance, it must be noted that the Fund’s investments are not limited to the investments comprising the indices. Index performance includes reinvestment of income, but does not reflect transaction costs, fees, expenses or taxes. Index performance is shown for illustrative purposes only as a benchmark for the Fund’s performance, and does not predict or depict performance of the Fund. The Fund’s performance reflects the effects of the Fund’s business and operating expenses.
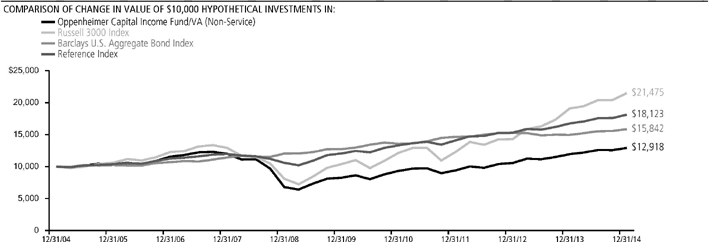

Performance data quoted represents past performance, which does not guarantee future results. The investment return and principal value of an investment in the Fund will fluctuate so that an investor’s shares, when redeemed, may be worth more or less than their original cost. Current performance may be lower or higher than the performance quoted. For performance data current to the most recent month end, call us at 1.800.988.8287. The Fund’s total returns should not be expected to be the same as the returns of other funds, whether or not both funds have the same portfolio managers and/or similar names. The Fund’s total returns include changes in share price and reinvested distributions but do not include the charges associated with the separate account products that offer this Fund. Such performance would have been lower if such charges were taken into account.
5 OPPENHEIMER CAPITAL INCOME FUND/VA
Fund Expenses
Fund Expenses. As a shareholder of the Fund, you incur two types of costs: (1) transaction costs and (2) ongoing costs, including management fees; distribution and service fees; and other Fund expenses. These examples are intended to help you understand your ongoing costs (in dollars) of investing in the Fund and to compare these costs with the ongoing costs of investing in other mutual funds.
The examples are based on an investment of $1,000.00 invested at the beginning of the period and held for the entire 6-month period ended December 31, 2014.
Actual Expenses. The first section of the table provides information about actual account values and actual expenses. You may use the information in this section for the class of shares you hold, together with the amount you invested, to estimate the expense that you paid over the period. Simply divide your account value by $1,000.00 (for example, an $8,600.00 account value divided by $1,000.00 = 8.60), then multiply the result by the number in the first section under the heading entitled “Expenses Paid During Period” to estimate the expenses you paid on your account during this period.
Hypothetical Example for Comparison Purposes.
The second section of the table provides information about hypothetical account values and hypothetical expenses based on the Fund’s actual expense ratio for each class of shares, and an assumed rate of return of 5% per year for each class before expenses, which is not the actual return. The hypothetical account values and expenses may not be used to estimate the actual ending account balance or expenses you paid for the period. You may use this information to compare the ongoing costs of investing in the Fund and other funds. To do so, compare this 5% hypothetical example for the class of shares you hold with the 5% hypothetical examples that appear in the shareholder reports of the other funds.
Please note that the expenses shown in the table are meant to highlight your ongoing costs only and do not reflect any charges associated with the separate accounts that offer this Fund. Therefore, the “hypothetical” lines of the table are useful in comparing ongoing costs only, and will not help you determine the relative total costs of owning different funds. In addition, if these separate account charges were included your costs would have been higher.
| | | | | | | | | | | | |
| Actual | | Beginning
Account
Value
July 1, 2014 | | | Ending
Account
Value
December 31, 2014 | | | Expenses
Paid During
6 Months Ended
December 31, 2014 | |
Non-Service shares | | $ | 1,000.00 | | | $ | 1,025.90 | | | $ | 3.43 | |
Service shares | | | 1,000.00 | | | | 1,024.80 | | | | 4.71 | |
| | | |
Hypothetical (5% return before expenses) | | | | | | | | | |
Non-Service shares | | | 1,000.00 | | | | 1,021.83 | | | | 3.42 | |
Service shares | | | 1,000.00 | | | | 1,020.57 | | | | 4.70 | |
Expenses are equal to the Fund’s annualized expense ratio for that class, multiplied by the average account value over the period, multiplied by 184/365 (to reflect the one-half year period). Those annualized expense ratios, excluding indirect expenses from affiliated funds, based on the 6-month period ended December 31, 2014 are as follows:
| | | | | | |
| Class | | Expense Ratios | | | |
Non-Service shares | | | 0.67% | | | |
Service shares | | | 0.92 | | | |
The expense ratios reflect voluntary and/or contractual waivers and/or reimbursements of expenses by the Fund’s Manager. Some of these undertakings may be modified or terminated at any time, as indicated in the Fund’s prospectus. The “Financial Highlights” tables in the Fund’s financial statements, included in this report, also show the gross expense ratios, without such waivers or reimbursements and reduction to custodian expenses, if applicable.
6 OPPENHEIMER CAPITAL INCOME FUND/VA
STATEMENT OF INVESTMENTS December 31, 2014
| | | | | | | | | | |
| | | Shares | | | Value | | | |
| | | |
| Common Stocks—33.9% | | | | | | | |
| | | |
| Consumer Discretionary—4.2% | | | | | | | | | | |
| | | |
| Auto Components—0.3% | | | | | | | | | | |
| | | |
| Delphi Automotive plc | | | 12,820 | | | | $ 932,270 | | | |
| |
| | | |
| Automobiles—0.4% | | | | | | | |
| | | |
| General Motors Co. | | | 27,900 | | | | 973,989 | | | |
| |
| | | |
| Diversified Consumer Services—0.3% | | | | | | | |
| | | |
| LifeLock, Inc.1 | | | 37,340 | | | | 691,164 | | | |
| |
| | | |
| Hotels, Restaurants & Leisure—0.1% | | | | | | | |
| | | |
| International Speedway Corp., Cl. A | | | 7,500 | | | | 237,375 | | | |
| |
| | | |
| Household Durables—0.3% | | | | | | | |
| | | |
| Toll Brothers, Inc.1 | | | 22,620 | | | | 775,187 | | | |
| |
| | | |
| Media—1.1% | | | | | | | |
| | | |
| Comcast Corp., Cl. A | | | 31,470 | | | | 1,825,575 | | | |
| | | |
| Twenty-First Century Fox, Inc., Cl. A | | | 30,380 | | | | 1,166,744 | | | |
| | | | | | | | | | |
| | | | | | | 2,992,319 | | | |
| |
| | | |
| Specialty Retail—1.2% | | | | | | | |
| | | |
| AutoZone, Inc.1 | | | 2,730 | | | | 1,690,170 | | | |
| | | |
| Ross Stores, Inc. | | | 9,910 | | | | 934,117 | | | |
| | | |
| Signet Jewelers Ltd. | | | 4,590 | | | | 603,906 | | | |
| | | | | | | | | | |
| | | | | | | 3,228,193 | | | |
| |
| | | |
| Textiles, Apparel & Luxury Goods—0.5% | | | | | | | |
| | | |
| PVH Corp. | | | 10,340 | | | | 1,325,278 | | | |
| |
| | | |
| Consumer Staples—2.8% | | | | | | | |
| | | |
| Beverages—0.5% | | | | | | | |
| | | |
| Diageo plc | | | 48,700 | | | | 1,396,771 | | | |
| |
| | | |
| Food Products—1.1% | | | | | | | |
| | | |
| Flowers Foods, Inc. | | | 46,655 | | | | 895,309 | | | |
| | | |
| Mondelez International, Inc., Cl. A | | | 58,150 | | | | 2,112,299 | | | |
| | | | | | | | | | |
| | | | | | | 3,007,608 | | | |
| |
| | | |
| Household Products—0.6% | | | | | | | |
| | | |
| Henkel AG & Co. KGaA | | | 16,738 | | | | 1,629,870 | | | |
| |
| | | |
| Tobacco—0.6% | | | | | | | |
| | | |
| Philip Morris International, Inc. | | | 17,850 | | | | 1,453,883 | | | |
| |
| | | |
| Energy—2.9% | | | | | | | |
| | | |
| Energy Equipment & Services—0.8% | | | | | | | |
| | | |
| National Oilwell Varco, Inc. | | | 33,430 | | | | 2,190,668 | | | |
| |
| | | |
| Oil, Gas & Consumable Fuels—2.1% | | | | | | | |
| | | |
| Antero Midstream Partners LP1 | | | 24,480 | | | | 673,200 | | | |
| | | |
| Chevron Corp. | | | 11,180 | | | | 1,254,173 | | | |
| | | |
| HollyFrontier Corp. | | | 10,750 | | | | 402,910 | | | |
| | | |
| Noble Energy, Inc. | | | 31,040 | | | | 1,472,227 | | | |
| | | |
| Shell Midstream Partners LP1 | | | 14,359 | | | | 588,432 | | | |
| | | |
| Western Refining, Inc. | | | 31,190 | | | | 1,178,358 | | | |
| | | | | | | | | | |
| | | | | | | 5,569,300 | | | |
| |
| | | |
| Financials—5.8% | | | | | | | |
| | | |
| Commercial Banks—3.4% | | | | | | | |
| | | |
| BancorpSouth, Inc. | | | 33,520 | | | | 754,535 | | | |
| | | |
| CIT Group, Inc. | | | 29,970 | | | | 1,433,465 | | | |
| | | |
| Citigroup, Inc. | | | 44,040 | | | | 2,383,005 | | | |
| | | |
| FirstMerit Corp. | | | 39,200 | | | | 740,488 | | | |
| | | |
| Huntington Bancshares, Inc. | | | 92,120 | | | | 969,102 | | | |
| | | |
| JPMorgan Chase & Co. | | | 33,940 | | | | 2,123,965 | | | |
| | | |
| Webster Financial Corp. | | | 18,620 | | | | 605,709 | | | |
| | | | | | | | | | |
| | | | | | | 9,010,269 | | | |
| |
| | | |
| Consumer Finance—0.5% | | | | | | | |
| | | |
| Discover Financial Services | | | 21,221 | | | | 1,389,763 | | | |
| | | | | | | | |
| | | Shares | | | Value | |
| |
| Insurance—1.0% | | | | | |
| |
| American International Group, Inc. | | | 24,960 | | | | $ 1,398,010 | |
| |
| FNF Group | | | 38,610 | | | | 1,330,114 | |
| | | | | | | | |
| | | | 2,728,124 | |
|
| |
| Real Estate Investment Trusts (REITs)—0.9% | |
| |
| Apollo Commercial Real Estate Finance, Inc. | | | 44,110 | | | | 721,640 | |
| |
| Digital Realty Trust, Inc. | | | 18,080 | | | | 1,198,704 | |
| |
| STAG Industrial, Inc. | | | 19,950 | | | | 488,775 | |
| | | | | | | | |
| | | | 2,409,119 | |
|
| |
| Health Care—5.1% | | | | | |
| |
| Biotechnology—0.7% | | | | | |
| |
| BioMarin Pharmaceutical, Inc.1 | | | 6,030 | | | | 545,112 | |
| |
| Celldex Therapeutics, Inc.1 | | | 11,250 | | | | 205,312 | |
| |
| Gilead Sciences, Inc.1 | | | 11,310 | | | | 1,066,081 | |
| | | | | | | | |
| | | | 1,816,505 | |
|
| |
| Health Care Equipment & Supplies—0.5% | | | | | |
| |
| Covidien plc | | | 7,290 | | | | 745,621 | |
| |
| DexCom, Inc.1 | | | 10,640 | | | | 585,732 | |
| | | | | | | | |
| | | | 1,331,353 | |
|
| |
| Health Care Providers & Services—0.9% | | | | | |
| |
| Omnicare, Inc. | | | 7,070 | | | | 515,615 | |
| |
| Team Health Holdings, Inc.1 | | | 8,420 | | | | 484,403 | |
| |
| Universal Health Services, Inc., Cl. B | | | 8,870 | | | | 986,876 | |
| |
| WellCare Health Plans, Inc.1 | | | 6,230 | | | | 511,234 | |
| | | | | | | | |
| | | | 2,498,128 | |
|
| |
| Pharmaceuticals—3.0% | | | | | |
| |
| AbbVie, Inc. | | | 18,800 | | | | 1,230,272 | |
| |
| Actavis plc1 | | | 10,630 | | | | 2,736,268 | |
| |
| Bristol-Myers Squibb Co. | | | 23,480 | | | | 1,386,024 | |
| |
| Pfizer, Inc. | | | 27,405 | | | | 853,666 | |
| |
| Prestige Brands Holdings, Inc.1 | | | 28,440 | | | | 987,437 | |
| |
| Salix Pharmaceuticals Ltd.1 | | | 6,830 | | | | 785,040 | |
| | | | | | | | |
| | | | 7,978,707 | |
|
| |
| Industrials—4.0% | | | | | |
| |
| Aerospace & Defense—0.3% | | | | | |
| |
| L-3 Communications Holdings, Inc. | | | 6,080 | | | | 767,357 | |
|
| |
| Airlines—0.2% | | | | | |
| |
| Spirit Airlines, Inc.1 | | | 8,360 | | | | 631,849 | |
|
| |
| Commercial Services & Supplies—1.0% | | | | | |
| |
| KAR Auction Services, Inc. | | | 16,260 | | | | 563,409 | |
| |
| Republic Services, Inc., Cl. A | | | 19,700 | | | | 792,925 | |
| |
| Tyco International plc | | | 29,820 | | | | 1,307,905 | |
| | | | | | | | |
| | | | 2,664,239 | |
|
| |
| Construction & Engineering—0.3% | | | | | |
| |
| AECOM Technology Corp.1 | | | 15,730 | | | | 477,720 | |
| |
| MasTec, Inc.1 | | | 17,670 | | | | 399,519 | |
| | | | | | | | |
| | | | 877,239 | |
| |
| Industrial Conglomerates—0.7% | | | | | |
| |
| General Electric Co. | | | 68,370 | | | | 1,727,710 | |
|
| |
| Machinery—0.2% | | | | | |
| |
| Joy Global, Inc. | | | 11,550 | | | | 537,306 | |
|
| |
| Professional Services—0.4% | | | | | |
| |
| Robert Half International, Inc. | | | 20,170 | | | | 1,177,524 | |
|
| |
| Road & Rail—0.5% | | | | | |
| |
| Canadian National Railway Co. | | | 20,440 | | | | 1,408,520 | |
|
| |
| Trading Companies & Distributors—0.4% | | | | | |
| |
| NOW, Inc.1 | | | 39,579 | | | | 1,018,368 | |
7 OPPENHEIMER CAPITAL INCOME FUND/VA
STATEMENT OF INVESTMENTS Continued
| | | | | | | | | | |
| | | Shares | | | Value | | | |
| | | |
| Information Technology—6.9% | | | | | | | |
| | | |
| Internet Software & Services—1.3% | | | | | | | |
| | | |
| eBay, Inc.1 | | | 29,020 | | | | $ 1,628,603 | | | |
| | | |
| Facebook, Inc., Cl. A1 | | | 19,750 | | | | 1,540,895 | | | |
| | | |
| Pandora Media, Inc.1 | | | 19,380 | | | | 345,545 | | | |
| | | | | | | | | | |
| | | | | | | 3,515,043 | | | |
| |
| | | |
| IT Services—1.5% | | | | | | | |
| | | |
| Amdocs Ltd. | | | 22,910 | | | | 1,068,866 | | | |
| | | |
| MasterCard, Inc., Cl. A | | | 16,990 | | | | 1,463,858 | | | |
| | | |
| Xerox Corp. | | | 105,510 | | | | 1,462,369 | | | |
| | | | | | | | | | |
| | | | | | | 3,995,093 | | | |
| |
| | | |
| Semiconductors & Semiconductor Equipment—1.2% | | | |
| | | |
| Applied Materials, Inc. | | | 62,160 | | | | 1,549,027 | | | |
| | | |
| Cavium, Inc.1 | | | 9,570 | | | | 591,617 | | | |
| | | |
| Skyworks Solutions, Inc. | | | 13,700 | | | | 996,127 | | | |
| | | | | | | | | | |
| | | | | | | 3,136,771 | | | |
| |
| | | |
| Software—1.2% | | | | | | | |
| | | |
| Fortinet, Inc.1 | | | 20,500 | | | | 628,530 | | | |
| | | |
| Guidewire Software, Inc.1 | | | 14,460 | | | | 732,110 | | | |
| | | |
| Imperva, Inc.1 | | | 10,970 | | | | 542,247 | | | |
| | | |
| ServiceNow, Inc.1 | | | 8,210 | | | | 557,048 | | | |
| | | |
| Splunk, Inc.1 | | | 10,090 | | | | 594,806 | | | |
| | | | | | | | | | |
| | | | | | | 3,054,741 | | | |
| |
| | | |
| Technology Hardware, Storage & Peripherals—1.7% | | | |
| | | |
| Apple, Inc. | | | 32,410 | | | | 3,577,416 | | | |
| | | |
| Western Digital Corp. | | | 9,740 | | | | 1,078,218 | | | |
| | | | | | | | | | |
| | | | | | | 4,655,634 | | | |
| |
| | | |
| Materials—1.2% | | | | | | | |
| | | |
| Construction Materials—0.3% | | | | | | | |
| | | |
| Vulcan Materials Co. | | | 14,130 | | | | 928,765 | | | |
| |
| | | |
| Containers & Packaging—0.3% | | | | | | | |
| | | |
| Packaging Corp. of America | | | 9,850 | | | | 768,792 | | | |
| |
| | | |
| Metals & Mining—0.3% | | | | | | | |
| | | |
| Alcoa, Inc. | | | 58,840 | | | | 929,084 | | | |
| |
| | | |
| Paper & Forest Products—0.3% | | | | | | | |
| | | |
| PH Glatfelter Co. | | | 27,990 | | | | 715,704 | | | |
| |
| | | |
| Telecommunication Services—0.6% | | | | | | | |
| | | |
| Diversified Telecommunication Services—0.6% | | | |
| | | |
| ORBCOMM, Inc.1 | | | 375 | | | | 2,453 | | | |
| | | |
| Verizon Communications, Inc. | | | 31,450 | | | | 1,471,231 | | | |
| | | | | | | | | | |
| | | | | | | 1,473,684 | | | |
| |
| | | |
| Utilities—0.4% | | | | | | | |
| | | |
| Electric Utilities—0.4% | | | | | | | |
| | | |
| Exelon Corp. | | | 28,842 | | | | 1,069,461 | | | |
| | | | | | | | | | |
| Total Common Stocks (Cost $74,142,162) | | | | | | | 90,618,727 | | | |
| | | |
| | | Principal
Amount | | | | | | |
| | | |
| Asset-Backed Securities—10.7% | | | | | | | |
| | | |
| Auto Loan—9.7% | | | | | | | |
| | | |
| American Credit Acceptance Receivables Trust: | | | |
| Series 2012-2,Cl. D, 5.91%, 7/15/192 | | | $ 310,000 | | | | 311,946 | | | |
| Series 2012-3,Cl. C, 2.78%, 9/17/182 | | | 955,000 | | | | 957,205 | | | |
| Series 2013-2,Cl. B, 2.84%, 5/15/192 | | | 443,000 | | | | 446,995 | | | |
| Series 2014-1,Cl. B, 2.39%, 11/12/192 | | | 625,000 | | | | 626,986 | | | |
| Series 2014-2,Cl. A, 0.99%, 10/10/172 | | | 296,670 | | | | 296,478 | | | |
| Series 2014-2,Cl. B, 2.26%, 3/10/202 | | | 160,000 | | | | 159,899 | | | |
| Series 2014-3,Cl. B, 2.43%, 6/10/202 | | | 355,000 | | | | 357,520 | | | |
| Series 2014-4,Cl. B, 2.60%, 10/12/202 | | | 175,000 | | | | 175,105 | | | |
| | | |
| AmeriCredit Automobile Receivables Trust: | | | |
| Series 2012-2,Cl. E, 4.85%, 8/8/192 | | | 210,000 | | | | 217,049 | | | |
| Series 2012-4,Cl. D, 2.68%, 10/9/18 | | | 70,000 | | | | 70,587 | | | |
| Series 2012-5,Cl. C, 1.69%, 11/8/18 | | | 165,000 | | | | 165,495 | | | |
| | | | | | | | |
| | | Principal
Amount | | | Value | |
| |
| Auto Loan (Continued) | |
| |
| AmeriCredit Automobile Receivables Trust: (Continued) | |
| Series 2012-5,Cl. D, 2.35%, 12/10/18 | | | $ 925,000 | | | | $ 931,900 | |
| Series 2013-1,Cl. C, 1.57%, 1/8/19 | | | 725,000 | | | | 723,580 | |
| Series 2013-2,Cl. E, 3.41%, 10/8/202 | | | 415,000 | | | | 418,468 | |
| Series 2013-4,Cl. D, 3.31%, 10/8/19 | | | 677,000 | | | | 688,639 | |
| Series 2014-2,Cl. D, 2.57%, 7/8/20 | | | 225,000 | | | | 222,236 | |
| Series 2014-3,Cl. D, 3.13%, 10/8/20 | | | 195,000 | | | | 196,339 | |
| Series 2014-4,Cl. D, 3.07%, 11/9/20 | | | 190,000 | | | | 190,196 | |
| |
| California Republic Auto Receivables Trust: | |
| Series 2014-2,Cl. C, 3.29%, 3/15/21 | | | 95,000 | | | | 94,592 | |
| Series 2014-4,Cl. C, 3.56%, 9/15/21 | | | 125,000 | | | | 124,978 | |
| |
| Capital Auto Receivables Asset Trust: | |
| Series 2014-1,Cl. D, 3.39%, 7/22/19 | | | 140,000 | | | | 142,536 | |
| Series 2014-3,Cl. D, 3.14%, 2/20/20 | | | 195,000 | | | | 195,938 | |
| |
| Capital Auto Receivables Asset Trust/Ally Financial, Inc., Series 2013-1, Cl. D, 2.19%, 9/20/21 | | | 125,000 | | | | 125,254 | |
| |
| CarFinance Capital Auto Trust: | |
| Series 2013-1A,Cl. A, 1.65%, 7/17/172 | | | 34,790 | | | | 34,830 | |
| Series 2013-2A,Cl. B, 3.15%, 8/15/192 | | | 635,000 | | | | 644,037 | |
| Series 2014-1A,Cl. A, 1.46%, 12/17/182 | | | 118,771 | | | | 118,962 | |
| |
| Centre Point Funding LLC, Series 2010-1A, Cl. 1, 5.43%, 7/20/162 | | | 25,177 | | | | 25,510 | |
| |
| CPS Auto Receivables Trust: | |
| Series 2012-B,Cl. A, 2.52%, 9/16/192 | | | 125,190 | | | | 125,945 | |
| Series 2014-A,Cl. A, 1.21%, 8/15/182 | | | 437,507 | | | | 436,458 | |
| Series 2014-B,Cl. A, 1.11%, 11/15/182 | | | 329,484 | | | | 328,016 | |
| Series 2014-C,Cl. A, 1.31%, 2/15/192 | | | 336,663 | | | | 335,692 | |
| |
| CPS Auto Trust, Series 2012-C, Cl. A, 1.82%, 12/16/192 | | | 44,745 | | | | 45,006 | |
| |
| Credit Acceptance Auto Loan Trust: | |
| Series 2013-1A,Cl. B, 1.83%, 4/15/212 | | | 165,000 | | | | 164,806 | |
| Series 2013-2A,Cl. B, 2.26%, 10/15/212 | | | 310,000 | | | | 311,814 | |
| Series 2014-1A,Cl. B, 2.29%, 4/15/222 | | | 240,000 | | | | 240,459 | |
| Series 2014-2A,Cl. B, 2.67%, 9/15/222 | | | 195,000 | | | | 194,829 | |
| |
| DT Auto Owner Trust: | |
| Series 2012-1A,Cl. D, 4.94%, 7/16/182 | | | 99,298 | | | | 100,751 | |
| Series 2013-1A,Cl. D, 3.74%, 5/15/202 | | | 200,000 | | | | 202,482 | |
| Series 2013-2A,Cl. D, 4.18%, 6/15/202 | | | 545,000 | | | | 550,759 | |
| Series 2014-1A,Cl. D, 3.98%, 1/15/212 | | | 435,000 | | | | 434,433 | |
| Series 2014-2A,Cl. D, 3.68%, 4/15/212 | | | 615,000 | | | | 605,504 | |
| Series 2014-3A,Cl. D, 4.47%, 11/15/212 | | | 245,000 | | | | 245,039 | |
| |
| Exeter Automobile Receivables Trust: | |
| Series 2012-2A,Cl. B, 2.22%, 12/15/172 | | | 130,000 | | | | 130,711 | |
| Series 2012-2A,Cl. C, 3.06%, 7/16/182 | | | 516,000 | | | | 519,952 | |
| Series 2013-2A,Cl. B, 3.09%, 7/16/182 | | | 940,000 | | | | 951,126 | |
| Series 2013-2A,Cl. C, 4.35%, 1/15/192 | | | 375,000 | | | | 380,129 | |
| Series 2014-1A,Cl. B, 2.42%, 1/15/192 | | | 280,000 | | | | 279,965 | |
| Series 2014-1A,Cl. C, 3.57%, 7/15/192 | | | 280,000 | | | | 278,156 | |
| Series 2014-2A,Cl. A, 1.06%, 8/15/182 | | | 96,466 | | | | 96,332 | |
| Series 2014-2A,Cl. C, 3.26%, 12/16/192 | | | 135,000 | | | | 132,228 | |
| |
| First Investors Auto Owner Trust: | |
| Series 2012-1A,Cl. D, 5.65%, 4/15/182 | | | 140,000 | | | | 144,733 | |
| Series 2013-3A,Cl. B, 2.32%, 10/15/192 | | | 465,000 | | | | 468,013 | |
| Series 2013-3A,Cl. C, 2.91%, 1/15/202 | | | 200,000 | | | | 201,318 | |
| Series 2013-3A,Cl. D, 3.67%, 5/15/202 | | | 165,000 | | | | 165,647 | |
| Series 2014-1A,Cl. D, 3.28%, 4/15/212 | | | 270,000 | | | | 266,758 | |
| Series 2014-3A,Cl. D, 3.85%, 2/15/222 | | | 175,000 | | | | 174,888 | |
| |
| Flagship Credit Auto Trust: | |
| Series 2014-1,Cl. A, 1.21%, 4/15/192 | | | 195,166 | | | | 194,723 | |
| Series 2014-2,Cl. A, 1.43%, 12/16/192 | | | 355,619 | | | | 355,279 | |
| |
| Ford Credit Floorplan Master Owner Trust A, Series 2012-2, Cl. C, 2.86%, 1/15/19 | | | 215,000 | | | | 221,344 | |
| |
| GM Financial Automobile Leasing Trust, Series 2014-1A, Cl. D, 2.51%, 3/20/192 | | | 470,000 | | | | 471,056 | |
| |
| Navistar Financial Dealer Note Master Owner Trust II, Series 2014-1, Cl. D, 2.47%, 10/25/192,3 | | | 145,000 | | | | 145,600 | |
| |
| Santander Drive Auto Receivables Trust: | |
| Series 2012-6,Cl. D, 2.52%, 9/17/18 | | | 235,000 | | | | 236,185 | |
| Series 2012-AA,Cl. D, 2.46%, 12/17/182 | | | 945,000 | | | | 945,043 | |
| Series 2013-1,Cl. C, 1.76%, 1/15/19 | | | 295,000 | | | | 295,809 | |
8 OPPENHEIMER CAPITAL INCOME FUND/VA
| | | | | | | | |
| | | Principal
Amount | | | Value | |
| |
Auto Loan (Continued) | | | | | |
| |
| Santander Drive Auto Receivables Trust: (Continued) | |
| Series 2013-1,Cl. D, 2.27%, 1/15/19 | | | $ 155,000 | | | | $ 154,109 | |
| Series 2013-2,Cl. D, 2.57%, 3/15/19 | | | 715,000 | | | | 724,400 | |
| Series 2013-3,Cl. C, 1.81%, 4/15/19 | | | 950,000 | | | | 949,906 | |
| Series 2013-4,Cl. D, 3.92%, 1/15/20 | | | 130,000 | | | | 135,669 | |
| Series 2013-5,Cl. C, 2.25%, 6/17/19 | | | 715,000 | | | | 722,144 | |
| Series 2013-A,Cl. C, 3.12%, 10/15/192 | | | 840,000 | | | | 860,798 | |
| Series 2013-A,Cl. E, 4.71%, 1/15/212 | | | 325,000 | | | | 336,865 | |
| Series 2014-1,Cl. D, 2.91%, 4/15/20 | | | 265,000 | | | | 265,926 | |
| Series 2014-4,Cl. D, 3.10%, 11/16/20 | | | 225,000 | | | | 225,514 | |
| |
| SNAAC Auto Receivables Trust: | |
| Series 2012-1A,Cl. C, 4.38%, 6/15/172 | | | 291,714 | | | | 292,808 | |
| Series 2013-1A,Cl. C, 3.07%, 8/15/182 | | | 100,000 | | | | 101,594 | |
| Series 2014-1A,Cl. A, 1.03%, 9/17/182 | | | 145,392 | | | | 145,371 | |
| Series 2014-1A,Cl. D, 2.88%, 1/15/202 | | | 165,000 | | | | 166,079 | |
| |
| TCF Auto Receivables Owner Trust, Series 2014-1A, Cl. C, 3.12%, 4/15/212 | | | 115,000 | | | | 114,299 | |
| |
| United Auto Credit Securitization Trust: | |
| Series 2013-1,Cl. C, 2.22%, 12/15/172 | | | 170,000 | | | | 170,405 | |
| Series 2014-1,Cl. D, 2.38%, 10/15/182 | | | 190,000 | | | | 187,219 | |
| |
| Westlake Automobile Receivables Trust: | |
| Series 2014-1A,Cl. D, 2.20%, 2/15/212 | | | 180,000 | | | | 178,314 | |
| Series 2014-2A,Cl. D, 2.86%, 7/15/212 | | | 195,000 | | | | 194,965 | |
| | | | | | | | |
| | | | | | | 25,966,633 | |
|
| |
| Equipment—0.7% | | | | | | | | |
| |
| CLI Funding V LLC: | |
| Series 2014-1A,Cl. A, 3.29%, 6/18/292 | | | 578,574 | | | | 576,645 | |
| Series 2014-2A,Cl. A, 3.38%, 10/18/292 | | | 408,083 | | | | 405,977 | |
| |
| Cronos Containers Program I Ltd., Series 2014-2A, Cl. A, 3.27%, 11/18/292 | | | 530,046 | | | | 530,250 | |
| |
| FRS I LLC, Series 2013-1A, Cl. A1, 1.80%, 4/15/432 | | | 56,836 | | | | 56,205 | |
| |
| Trip Rail Master Funding LLC, Series 2014-1A, Cl. A1, 2.863%, 4/15/442 | | | 151,263 | | | | 150,447 | |
| | | | | | | | |
| | | | | | | 1,719,524 | |
|
| |
| Home Equity Loan—0.3% | |
| |
| Element Rail Leasing I LLC, Series 2014-1A, Cl. A1, 2.299%, 4/19/442 | | | 338,349 | | | | 336,251 | |
| |
| TAL Advantage V LLC: | | | | | | | | |
| Series 2014-1A,Cl. A, 3.51%, 2/22/392 | | | 426,250 | | | | 428,648 | |
| Series 2014-2A,Cl. A1, 1.70%, 5/20/392 | | | 131,922 | | | | 131,075 | |
| | | | | | | | |
| | | | | | | 895,974 | |
|
| |
Total Asset-Backed Securities
(Cost $28,547,351) | | | | 28,582,131 | |
|
| |
| Mortgage-Backed Obligations—38.4% | | | | | |
| |
| Government Agency—28.3% | |
| |
| FHLMC/FNMA/FHLB/Sponsored—28.2% | |
| |
| Federal Home Loan Mortgage Corp. Gold Pool: | |
| 4.50%, 10/1/18 | | | 46,913 | | | | 49,291 | |
| 5.00%, 12/1/34 | | | 4,105 | | | | 4,549 | |
| 5.50%, 9/1/39 | | | 631,608 | | | | 706,515 | |
| 6.50%, 4/1/18-4/1/34 | | | 45,215 | | | | 51,007 | |
| 7.00%, 10/1/31-10/1/37 | | | 219,104 | | | | 245,839 | |
| 8.00%, 4/1/16 | | | 3,790 | | | | 3,852 | |
| 9.00%, 8/1/22-5/1/25 | | | 5,245 | | | | 5,795 | |
| |
| Federal Home Loan Mortgage Corp., Interest-Only Stripped Mtg.-Backed Security: | |
| Series 183,Cl. IO, 11.288%, 4/1/274 | | | 103,415 | | | | 20,681 | |
| Series 192,Cl. IO, 4.397%, 2/1/284 | | | 28,453 | | | | 5,234 | |
| Series 243,Cl. 6, 0.00%, 12/15/324,5 | | | 83,363 | | | | 15,195 | |
| |
| Federal Home Loan Mortgage Corp., Mtg.-Linked Amortizing Global Debt Securities, Series 2012-1, Cl. A10, 2.06%, 1/15/22 | | | 359,259 | | | | 366,260 | |
| |
| Federal Home Loan Mortgage Corp., Principal-Only Stripped Mtg.-Backed Security, Series 176, Cl. PO, 4.261%, 6/1/266 | | | 31,895 | | | | 29,862 | |
| | | | | | | | |
| | | Principal
Amount | | | Value | |
| |
| FHLMC/FNMA/FHLB/Sponsored (Continued) | |
| |
| Federal Home Loan Mortgage Corp., Real Estate Mtg. Investment Conduit Multiclass Pass-Through Certificates: | |
| Series 2426,Cl. BG, 6.00%, 3/15/17 | | | $ 66,119 | | | | $ 69,174 | |
| Series 2427,Cl. ZM, 6.50%, 3/15/32 | | | 159,713 | | | | 179,311 | |
| Series 2461,Cl. PZ, 6.50%, 6/15/32 | | | 74,612 | | | | 83,498 | |
| Series 2500,Cl. FD, 0.661%, 3/15/323 | | | 12,014 | | | | 12,179 | |
| Series 2526,Cl. FE, 0.561%, 6/15/293 | | | 14,806 | | | | 14,956 | |
| Series 2551,Cl. FD, 0.561%, 1/15/333 | | | 9,074 | | | | 9,158 | |
| Series 2564,Cl. MP, 5.00%, 2/15/18 | | | 186,744 | | | | 196,125 | |
| Series 2585,Cl. HJ, 4.50%, 3/15/18 | | | 104,611 | | | | 109,082 | |
| Series 2626,Cl. TB, 5.00%, 6/15/33 | | | 181,118 | | | | 195,544 | |
| Series 2635,Cl. AG, 3.50%, 5/15/32 | | | 61,549 | | | | 64,187 | |
| Series 2707,Cl. QE, 4.50%, 11/15/18 | | | 448,020 | | | | 471,366 | |
| Series 2770,Cl. TW, 4.50%, 3/15/19 | | | 19,415 | | | | 20,489 | |
| Series 3010,Cl. WB, 4.50%, 7/15/20 | | | 55,122 | | | | 58,279 | |
| Series 3025,Cl. SJ, 24.16%, 8/15/353 | | | 27,530 | | | | 39,063 | |
| Series 3030,Cl. FL, 0.561%, 9/15/353 | | | 137,840 | | | | 138,946 | |
| Series 3741,Cl. PA, 2.15%, 2/15/35 | | | 425,908 | | | | 433,908 | |
| Series 3815,Cl. BD, 3.00%, 10/15/20 | | | 17,651 | | | | 18,106 | |
| Series 3822,Cl. JA, 5.00%, 6/15/40 | | | 132,166 | | | | 139,004 | |
| Series 3840,Cl. CA, 2.00%, 9/15/18 | | | 13,152 | | | | 13,332 | |
| Series 3848,Cl. WL, 4.00%, 4/15/40 | | | 218,990 | | | | 224,645 | |
| Series 3857,Cl. GL, 3.00%, 5/15/40 | | | 12,434 | | | | 12,726 | |
| Series 4221,Cl. HJ, 1.50%, 7/15/23 | | | 1,118,286 | | | | 1,122,471 | |
| |
| Federal Home Loan Mortgage Corp., Real Estate Mtg. Investment Conduit Multiclass Pass-Through Certificates, Interest-Only Stripped Mtg.-Backed Security: | |
| Series 2130,Cl. SC, 49.438%, 3/15/294 | | | 99,209 | | | | 19,904 | |
| Series 2796,Cl. SD, 50.717%, 7/15/264 | | | 133,262 | | | | 29,216 | |
| Series 2920,Cl. S, 51.816%, 1/15/354 | | | 670,047 | | | | 107,624 | |
| Series 2922,Cl. SE, 4.851%, 2/15/354 | | | 40,049 | | | | 6,413 | |
| Series 3201,Cl. SG, 1.383%, 8/15/364 | | | 110,758 | | | | 18,092 | |
| Series 3397,Cl. GS, 14.828%, 12/15/374 | | | 46,502 | | | | 8,025 | |
| Series 3424,Cl. EI, 8.466%, 4/15/384 | | | 30,547 | | | | 3,486 | |
| Series 3450,Cl. BI, 8.161%, 5/15/384 | | | 127,239 | | | | 16,535 | |
| Series 3606,Cl. SN, 0.412%, 12/15/394 | | | 68,457 | | | | 12,229 | |
| |
| Federal National Mortgage Assn.: | |
| 3.50%, 1/15/45 | | | 6,625,000 | | | | 6,903,268 | |
| 4.00%, 1/25/45 | | | 20,335,000 | | | | 21,697,181 | |
| 4.50%, 1/1/30-1/15/45 | | | 25,389,000 | | | | 27,539,939 | |
| 5.00%, 1/1/45 | | | 4,680,000 | | | | 5,170,752 | |
| 6.00%, 1/1/45 | | | 425,000 | | | | 482,013 | |
| |
| Federal National Mortgage Assn. Pool: | |
| 3.50%, 12/1/20-2/1/22 | | | 511,580 | | | | 541,260 | |
| 5.00%, 3/1/21 | | | 23,084 | | | | 24,377 | |
| 5.50%, 9/1/20 | | | 4,357 | | | | 4,737 | |
| 6.00%, 11/1/17-3/1/37 | | | 298,468 | | | | 336,388 | |
| 6.50%, 5/1/17-10/1/19 | | | 58,787 | | | | 61,450 | |
| 7.00%, 11/1/17-10/1/35 | | | 22,622 | | | | 25,104 | |
| 7.50%, 1/1/33 | | | 94,596 | | | | 111,031 | |
| 8.50%, 7/1/32 | | | 6,027 | | | | 6,955 | |
| |
| Federal National Mortgage Assn., Interest-Only Stripped Mtg.-Backed Security: | |
| Series 222,Cl. 2, 16.438%, 6/25/234 | | | 218,488 | | | | 46,694 | |
| Series 233,Cl. 2, 39.328%, 8/25/234 | | | 161,463 | | | | 37,185 | |
| Series 252,Cl. 2, 37.795%, 11/25/234 | | | 209,687 | | | | 34,743 | |
| Series 319,Cl. 2, 0.00%, 2/25/324,5 | | | 46,067 | | | | 7,918 | |
| Series 320,Cl. 2, 5.21%, 4/25/324 | | | 14,583 | | | | 2,735 | |
| Series 321,Cl. 2, 0.00%, 4/25/324,5 | | | 158,875 | | | | 27,637 | |
| Series 331,Cl. 9, 11.108%, 2/25/334 | | | 178,022 | | | | 38,561 | |
| Series 334,Cl. 17, 18.41%, 2/25/334 | | | 104,559 | | | | 21,643 | |
| Series 339,Cl. 12, 0.00%, 6/25/334,5 | | | 146,061 | | | | 28,370 | |
| Series 339,Cl. 7, 0.00%, 11/25/334,5 | | | 426,630 | | | | 77,893 | |
| Series 343,Cl. 13, 0.00%, 9/25/334,5 | | | 145,087 | | | | 24,440 | |
| Series 345,Cl. 9, 0.00%, 1/25/344,5 | | | 133,719 | | | | 26,446 | |
| Series 351,Cl. 10, 0.00%, 4/25/344,5 | | | 19,661 | | | | 3,226 | |
| Series 351,Cl. 8, 0.00%, 4/25/344,5 | | | 65,193 | | | | 10,611 | |
| Series 356,Cl. 10, 0.00%, 6/25/354,5 | | | 47,482 | | | | 8,850 | |
| Series 356,Cl. 12, 0.00%, 2/25/354,5 | | | 25,285 | | | | 4,040 | |
| Series 362,Cl. 13, 0.00%, 8/25/354,5 | | | 172,012 | | | | 29,891 | |
| Series 364,Cl. 16, 0.00%, 9/25/354,5 | | | 122,180 | | | | 20,180 | |
9 OPPENHEIMER CAPITAL INCOME FUND/VA
STATEMENT OF INVESTMENTS Continued
| | | | | | | | |
| | | Principal
Amount | | | Value | |
| |
| FHLMC/FNMA/FHLB/Sponsored (Continued) | |
| |
| Federal National Mortgage Assn., Real Estate Mtg. Investment Conduit Multiclass Pass-Through Certificates: | |
| Series 1998-61,Cl. PL, 6.00%, 11/25/28 | | | $ 74,599 | | | | $ 81,794 | |
| Series 2003-100,Cl. PA, 5.00%, 10/25/18 | | | 364,205 | | | | 384,698 | |
| Series 2003-130,Cl. CS, 13.761%, 12/25/333 | | | 17,561 | | | | 20,299 | |
| Series 2003-84,Cl. GE, 4.50%, 9/25/18 | | | 28,108 | | | | 29,367 | |
| Series 2004-101,Cl. BG, 5.00%, 1/25/20 | | | 203,795 | | | | 210,610 | |
| Series 2004-25,Cl. PC, 5.50%, 1/25/34 | | | 235,512 | | | | 249,333 | |
| Series 2005-104,Cl. MC, 5.50%, 12/25/25 | | | 348,904 | | | | 381,615 | |
| Series 2005-31,Cl. PB, 5.50%, 4/25/35 | | | 250,000 | | | | 297,180 | |
| Series 2005-73,Cl. DF, 0.42%, 8/25/353 | | | 345,002 | | | | 346,505 | |
| Series 2006-11,Cl. PS, 23.945%, 3/25/363 | | | 102,116 | | | | 146,125 | |
| Series 2006-46,Cl. SW, 23.578%, 6/25/363 | | | 75,859 | | | | 107,388 | |
| Series 2006-50,Cl. KS, 23.579%, 6/25/363 | | | 16,754 | | | | 23,968 | |
| Series 2008-14,Cl. BA, 4.25%, 3/25/23 | | | 126,420 | | | | 132,203 | |
| Series 2008-75,Cl. DB, 4.50%, 9/25/23 | | | 107,402 | | | | 112,375 | |
| Series 2009-113,Cl. DB, 3.00%, 12/25/20 | | | 379,536 | | | | 390,127 | |
| Series 2009-36,Cl. FA, 1.11%, 6/25/373 | | | 118,458 | | | | 121,587 | |
| Series 2009-37,Cl. HA, 4.00%, 4/25/19 | | | 112,998 | | | | 117,135 | |
| Series 2009-70,Cl. NT, 4.00%, 8/25/19 | | | 12,370 | | | | 12,816 | |
| Series 2009-70,Cl. TL, 4.00%, 8/25/19 | | | 1,207,052 | | | | 1,250,603 | |
| Series 2010-43,Cl. KG, 3.00%, 1/25/21 | | | 176,090 | | | | 181,305 | |
| Series 2011-15,Cl. DA, 4.00%, 3/25/41 | | | 62,620 | | | | 65,380 | |
| Series 2011-3,Cl. EL, 3.00%, 5/25/20 | | | 627,695 | | | | 645,417 | |
| Series 2011-3,Cl. KA, 5.00%, 4/25/40 | | | 246,605 | | | | 270,125 | |
| Series 2011-38,Cl. AH, 2.75%, 5/25/20 | | | 14,308 | | | | 14,651 | |
| Series 2011-82,Cl. AD, 4.00%, 8/25/26 | | | 382,331 | | | | 398,225 | |
| |
| Federal National Mortgage Assn., Real Estate Mtg. Investment Conduit Multiclass Pass-Through Certificates, Interest-Only Stripped Mtg.-Backed Security: | |
| Series 2001-65,Cl. S, 26.857%, 11/25/314 | | | 170,613 | | | | 32,207 | |
| Series 2001-81,Cl. S, 23.744%, 1/25/324 | | | 44,544 | | | | 9,681 | |
| Series 2002-47,Cl. NS, 29.521%, 4/25/324 | | | 120,684 | | | | 24,411 | |
| Series 2002-51,Cl. S, 29.714%, 8/25/324 | | | 110,817 | | | | 21,912 | |
| Series 2002-52,Cl. SD, 32.522%, 9/25/324 | | | 156,630 | | | | 32,398 | |
| Series 2002-77,Cl. SH, 34.10%, 12/18/324 | | | 67,858 | | | | 13,339 | |
| Series 2002-84,Cl. SA, 33.134%, 12/25/324 | | | 166,992 | | | | 31,336 | |
| Series 2002-9,Cl. MS, 24.628%, 3/25/324 | | | 48,255 | | | | 9,824 | |
| Series 2003-33,Cl. SP, 27.659%, 5/25/334 | | | 184,051 | | | | 39,958 | |
| Series 2003-4,Cl. S, 29.251%, 2/25/334 | | | 103,518 | | | | 21,490 | |
| Series 2003-46,Cl. IH, 0.00%, 6/25/234,5 | | | 378,096 | | | | 51,176 | |
| Series 2004-54,Cl. DS, 36.53%, 11/25/304 | | | 129,963 | | | | 21,441 | |
| Series 2004-56,Cl. SE, 10.393%, 10/25/334 | | | 36,021 | | | | 6,111 | |
| Series 2005-12,Cl. SC, 7.003%, 3/25/354 | | | 20,026 | | | | 3,332 | |
| Series 2005-14,Cl. SE, 36.29%, 3/25/354 | | | 62,959 | | | | 9,747 | |
| Series 2005-40,Cl. SA, 46.065%, 5/25/354 | | | 348,465 | | | | 68,534 | |
| Series 2005-52,Cl. JH, 0.953%, 5/25/354 | | | 818,091 | | | | 143,459 | |
| Series 2005-93,Cl. SI, 17.337%, 10/25/354 | | | 84,276 | | | | 13,766 | |
| Series 2007-88,Cl. XI, 32.578%, 6/25/374 | | | 202,051 | | | | 27,790 | |
| Series 2008-55,Cl. SA, 14.455%, 7/25/384 | | | 102,367 | | | | 14,108 | |
| Series 2009-8,Cl. BS, 0.00%, 2/25/244,5 | | | 42,284 | | | | 2,868 | |
| Series 2012-40,Cl. PI, 0.496%, 4/25/414 | | | 382,401 | | | | 62,014 | |
| |
| Federal National Mortgage Assn., Real Estate Mtg. Investment Conduit Multiclass Pass-Through Certificates, Principal-Only Stripped Mtg.-Backed Security, Series 1993-184, Cl. M, 5.155%, 9/25/236 | | | 80,517 | | | | 76,868 | |
| | | | | | | | |
| |
| | | | 75,435,272 | |
|
| |
| GNMA/Guaranteed—0.1% | | | | | | | | |
| |
| Government National Mortgage Assn. I Pool: | |
| 7.00%, 1/15/24 | | | 39,005 | | | | 42,238 | |
| 7.50%, 1/15/23-6/15/24 | | | 38,392 | | | | 41,503 | |
| 8.00%, 5/15/17-4/15/23 | | | 27,411 | | | | 30,050 | |
| 8.50%, 8/15/17-12/15/17 | | | 5,795 | | | | 6,134 | |
| |
| Government National Mortgage Assn., Interest-Only Stripped Mtg.-Backed Security: | |
| Series 2002-15,Cl. SM, 59.538%, 2/16/324 | | | 214,385 | | | | 35,430 | |
| Series 2002-76,Cl. SY, 61.71%, 12/16/264 | | | 452,599 | | | | 94,945 | |
| Series 2007-17,Cl. AI, 13.251%, 4/16/374 | | | 474,318 | | | | 97,799 | |
| Series 2011-52,Cl. HS, 9.038%, 4/16/414 | | | 232,946 | | | | 49,141 | |
| | | | | | | | |
| | | | 397,240 | |
| | | | | | | | |
| | | Principal
Amount | | | Value | |
| |
| Non-Agency—10.1% | |
| |
| Commercial—8.9% | |
| |
| Banc of America Commercial Mortgage Trust: | |
| Series 2006-5,Cl. AM, 5.448%, 9/10/47 | | | $ 85,000 | | | | $ 89,148 | |
| Series 2006-6,Cl. AM, 5.39%, 10/10/45 | | | 830,000 | | | | 882,644 | |
| |
| Banc of America Funding Trust, Series 2006-G, Cl. 2A4, 0.455%, 7/20/363 | | | 950,000 | | | | 884,015 | |
| |
| BCAP LLC Trust, Series 2011-R11, Cl. 18A5, 2.24%, 9/26/352,3 | | | 298,684 | | | | 304,716 | |
| |
| Bear Stearns ARM Trust: | |
| Series 2005-2,Cl. A1, 2.58%, 3/25/353 | | | 370,898 | | | | 375,602 | |
| Series 2005-9,Cl. A1, 2.43%, 10/25/353 | | | 1,004,584 | | | | 993,444 | |
| |
| Bear Stearns Commercial Mortgage Securities Trust, Series 2006-T24, Cl. AM, 5.568%, 10/12/413 | | | 365,000 | | | | 388,205 | |
| |
| CD Commercial Mortgage Trust, Series 2006-CD2, Cl. AM, 5.346%, 1/15/463 | | | 515,000 | | | | 536,030 | |
| |
| Chase Mortgage Finance Trust, Series 2005-A2, Cl. 1A3, 2.483%, 1/25/363 | | | 229,110 | | | | 217,411 | |
| |
| Citigroup Commercial Mortgage Trust: | |
| Series 2008-C7,Cl. AM, 6.142%, 12/10/493 | | | 105,000 | | | | 115,088 | |
| Series 2013-GC11,Cl. D, 4.458%, 4/10/462,3 | | | 185,000 | | | | 178,374 | |
| |
| Citigroup Mortgage Loan Trust, Inc., Series 2006-AR1, Cl. 1A1, 2.50%, 10/25/353 | | | 692,406 | | | | 688,320 | |
| |
| COMM Mortgage Trust: | |
| Series 2006-C7,Cl. AM, 5.781%, 6/10/463 | | | 855,000 | | | | 903,730 | |
| Series 2012-CR4,Cl. D, 4.575%, 10/15/452,3 | | | 185,000 | | | | 185,659 | |
| Series 2012-CR5,Cl. E, 4.335%, 12/10/452,3 | | | 225,000 | | | | 222,752 | |
| Series 2013-CR7,Cl. D, 4.354%, 3/10/462,3 | | | 200,000 | | | | 189,512 | |
| Series 2014-CR21,Cl. AM, 3.987%, 12/10/47 | | | 860,000 | | | | 900,081 | |
| |
| COMM Mortgage Trust, Interest-Only Stripped Mtg.-Backed Security, Series 2012-CR5, Cl. XA, 0%, 12/10/453,5 | | | 435,227 | | | | 41,183 | |
| |
| Commercial Mortgage Trust: | |
| Series 2006-GG7,Cl. AM, 5.819%, 7/10/383 | | | 230,000 | | | | 242,591 | |
| Series 2007-GG11,Cl. AM, 5.867%, 12/10/493 | | | 500,000 | | | | 542,803 | |
| Series 2007-GG9,Cl. AM, 5.475%, 3/10/39 | | | 815,000 | | | | 855,473 | |
| |
| Credit Suisse Commercial Mortgage Trust: | |
| Series 2006-C1,Cl. AJ, 5.467%, 2/15/393 | | | 208,000 | | | | 216,400 | |
| Series 2006-C4,Cl. AM, 5.509%, 9/15/39 | | | 35,000 | | | | 37,044 | |
| |
| Credit Suisse First Boston Mortgage Securities Corp., Series 2005-C6, Cl. AJ, 5.23%, 12/15/403 | | | 275,000 | | | | 282,088 | |
| |
| CSMC: | |
| Series 2006-6,Cl. 1A4, 6.00%, 7/25/36 | | | 225,604 | | | | 175,788 | |
| Series 2009-13R,Cl. 4A1, 2.618%, 9/26/362,3 | | | 145,285 | | | | 146,583 | |
| |
| DBUBS Mortgage Trust, Series 2011-LC1A, Cl. E, 5.557%, 11/10/462,3 | | | 50,000 | | | | 54,392 | |
| |
| First Horizon Alternative Mortgage Securities Trust: | |
| Series 2004-FA2,Cl. 3A1, 6.00%, 1/25/35 | | | 157,579 | | | | 151,872 | |
| Series 2005-FA8,Cl. 1A6, 0.82%, 11/25/353 | | | 162,771 | | | | 122,165 | |
| |
| FREMF Mortgage Trust: | |
| Series 2012-K501,Cl. C, 3.458%, 11/25/462,3 | | | 50,000 | | | | 50,808 | |
| Series 2013-K25,Cl. C, 3.743%, 11/25/452,3 | | | 60,000 | | | | 58,266 | |
| Series 2013-K26,Cl. C, 3.60%, 12/25/452,3 | | | 40,000 | | | | 38,755 | |
| Series 2013-K27,Cl. C, 3.497%, 1/25/462,3 | | | 110,000 | | | | 103,760 | |
| Series 2013-K28,Cl. C, 3.494%, 6/25/462,3 | | | 450,000 | | | | 423,160 | |
| Series 2013-K502,Cl. C, 3.195%, 3/25/452,3 | | | 220,000 | | | | 218,790 | |
| Series 2013-K712,Cl. C, 3.368%, 5/25/452,3 | | | 70,000 | | | | 69,181 | |
| Series 2013-K713,Cl. C, 3.165%, 4/25/462,3 | | | 145,000 | | | | 141,561 | |
| Series 2014-K715,Cl. C, 4.124%, 2/25/462,3 | | | 35,000 | | | | 34,842 | |
| |
| GE Capital Commercial Mortgage Corp., Series 2005-C4, Cl. AJ, 5.312%, 11/10/453 | | | 55,000 | | | | 55,418 | |
| |
| GS Mortgage Securities Trust, Series 2006-GG6, Cl. AM, 5.553%, 4/10/383 | | | 200,000 | | | | 207,821 | |
| |
| GSMSC Pass-Through Trust, Series 2009-3R, Cl. 1A2, 6%, 4/25/372,3 | | | 481,903 | | | | 442,816 | |
| |
| GSR Mortgage Loan Trust, Series 2005-AR4, Cl. 6A1, 5.226%, 7/25/353 | | | 56,419 | | | | 55,947 | |
| |
| JP Morgan Chase Commercial Mortgage Securities Trust: | |
| Series 2005-CB13,Cl. AM, 5.284%, 1/12/433 | | | 365,000 | | | | 375,423 | |
| Series 2006-CB16,Cl. AJ, 5.623%, 5/12/45 | | | 470,000 | | | | 482,373 | |
10 OPPENHEIMER CAPITAL INCOME FUND/VA
| | | | | | | | |
| | | Principal Amount | | | Value | |
| |
Commercial (Continued) | |
| |
| JP Morgan Chase Commercial Mortgage Securities Trust: (Continued) | |
| Series 2006-LDP8,Cl. AJ, 5.48%, 5/15/453 | | $ | 690,000 | | | $ | 723,755 | |
| |
| JP Morgan Mortgage Trust: | |
| Series 2007-A1,Cl. 5A1, 2.576%, 7/25/353 | | | 165,632 | | | | 165,241 | |
| Series 2007-S3,Cl. 1A90, 7.00%, 8/25/37 | | | 206,648 | | | | 192,501 | |
| |
| JP Morgan Resecuritization Trust: | |
| Series 2009-11,Cl. 5A1, 2.618%, 9/26/362,3 | | | 539,684 | | | | 541,185 | |
| Series 2009-5,Cl. 1A2, 2.607%, 7/26/362,3 | | | 254,069 | | | | 219,968 | |
| |
| JPMBB Commercial Mortgage Securities Trust: | |
| Series 2014-C25,Cl. AS, 4.065%, 11/15/47 | | | 360,000 | | | | 377,955 | |
| Series 2014-C26,Cl. AS, 3.80%, 1/15/48 | | | 180,000 | | | | 185,385 | |
| |
| LB-UBS Commercial Mortgage Trust, Series 2006-C4, Cl. AM, 5.853%, 6/15/383 | | | 225,000 | | | | 238,979 | |
| |
| MASTR Adjustable Rate Mortgages Trust, Series 2004-13, Cl. 2A2, 2.643%, 4/21/343 | | | 88,702 | | | | 90,802 | |
| |
| Merrill Lynch Mortgage Trust, Series 2006-C2, Cl. AM, 5.782%, 8/12/433 | | | 500,000 | | | | 530,520 | |
| |
| Morgan Stanley Bank of America Merrill Lynch Trust: | |
| Series 2012-C6,Cl. E, 4.662%, 11/15/452,3 | | | 95,000 | | | | 95,290 | |
| Series 2013-C7,Cl. D, 4.302%, 2/15/462,3 | | | 115,000 | | | | 111,157 | |
| Series 2013-C8,Cl. D, 4.171%, 12/15/482,3 | | | 80,000 | | | | 76,665 | |
| Series 2014-C19,Cl. AS, 3.832%, 12/15/47 | | | 720,000 | | | | 744,329 | |
| |
| Morgan Stanley Capital I Trust: | |
| Series 2007-IQ13,Cl. AM, 5.406%, 3/15/44 | | | 470,000 | | | | 500,980 | |
| Series 2007-IQ15,Cl. AM, 5.908%, 6/11/493 | | | 345,000 | | | | 371,254 | |
| |
| Morgan Stanley Reremic Trust, Series 2012-R3, Cl. 1B, 1.957%, 11/26/362,3 | | | 254,220 | | | | 180,197 | |
| |
| Morgan Stanley Resecuritization Trust, Series 2013-R9, Cl. 3A, 2.362%, 6/26/462,3 | | | 689,878 | | | | 700,198 | |
| |
| Structured Adjustable Rate Mortgage Loan Trust: | |
| Series 2004-10,Cl. 2A, 2.391%, 8/25/343 | | | 398,507 | | | | 393,655 | |
| Series 2007-6,Cl. 3A1, 4.544%, 7/25/373 | | | 196,257 | | | | 152,091 | |
| |
| UBS-Barclays Commercial Mortgage Trust, Series 2012-C2, Cl. E, 4.889%, 5/10/632,3 | | | 45,000 | | | | 44,887 | |
| |
| Wachovia Bank Commercial Mortgage Trust, Series 2005-C17, Cl. AJ, 5.224%, 3/15/423 | | | 205,000 | | | | 205,117 | |
| |
| WaMu Mortgage Pass-Through Certificates Trust: | |
| Series 2005-AR14,Cl. 1A4, 2.342%, 12/25/353 | | | 173,676 | | | | 168,696 | |
| Series 2005-AR16,Cl. 1A1, 2.339%, 12/25/353 | | | 161,904 | | | | 154,806 | |
| |
| Wells Fargo Mortgage-Backed Securities Trust: | |
| Series 2005-AR1,Cl. 1A1, 2.611%, 2/25/353 | | | 39,066 | | | | 39,351 | |
| Series 2005-AR10,Cl. 1A1, 2.614%, 6/25/353 | | | 748,798 | | | | 762,573 | |
| Series 2005-AR15,Cl. 1A6, 2.613%, 9/25/353 | | | 532,828 | | | | 508,188 | |
| Series 2006-AR7,Cl. 2A4, 2.613%, 5/25/363 | | | 257,335 | | | | 244,312 | |
| Series 2006-AR8,Cl. 2A4, 2.60%, 4/25/363 | | | 191,910 | | | | 187,530 | |
| Series 2007-16,Cl. 1A1, 6.00%, 12/28/37 | | | 126,077 | | | | 130,662 | |
| Series 2007-AR8,Cl. A1, 2.608%, 11/25/373 | | | 522,339 | | | | 461,708 | |
| |
| WF-RBS Commercial Mortgage Trust: | |
| Series 2012-C10,Cl. D, 4.458%, 12/15/452,3 | | | 50,000 | | | | 48,808 | |
| Series 2012-C7,Cl. E, 4.845%, 6/15/452,3 | | | 80,000 | | | | 80,580 | |
| Series 2013-C11,Cl. D, 4.182%, 3/15/452,3 | | | 49,000 | | | | 47,031 | |
| Series 2013-C15,Cl. D, 4.483%, 8/15/462,3 | | | 225,000 | | | | 216,795 | |
| |
| WF-RBS Commercial Mortgage Trust, Interest-Only Commercial Mtg. Pass-Through Certificates, Series 2011-C3, Cl. XA, 0%, 3/15/442,3,5 | | | 3,860,799 | | | | 210,632 | |
| | | | | | | | |
| | | | | | | 23,785,817 | |
|
| |
Multi-Family—0.2% | |
| |
| Citigroup Mortgage Loan Trust, Inc., Series 2006-AR3, Cl. 1A2A, 5.334%, 6/25/363 | | | 106,869 | | | | 98,497 | |
| |
| Wells Fargo Mortgage-Backed Securities Trust: | |
| Series 2005-AR15,Cl. 1A2, 2.613%, 9/25/353 | | | 270,712 | | | | 265,512 | |
| Series 2006-AR2,Cl. 2A3, 2.612%, 3/25/363 | | | 50,132 | | | | 49,733 | |
| | | | | | | | |
| | | | | | | 413,742 | |
|
| |
Residential—1.0% | |
| |
| Alternative Loan Trust, Series 2005-29CB, Cl. A4, 5%, 7/25/35 | | | 479,095 | | | | 421,980 | |
| |
| Banc of America Funding Trust: | |
| Series 2007-1,Cl. 1A3, 6.00%, 1/25/37 | | | 119,168 | | | | 108,518 | |
| | | | | | | | |
| | | Principal Amount | | | Value | |
| |
Residential (Continued) | |
| |
| Banc of America Funding Trust: (Continued) | |
| Series 2007-C,Cl. 1A4, 5.293%, 5/20/363 | | $ | 45,549 | | | $ | 44,184 | |
| |
| Banc of America Mortgage Trust, Series 2004-E, Cl. 2A6, 2.708%, 6/25/343 | | | 128,255 | | | | 128,161 | |
| |
| Bear Stearns ARM Trust, Series 2006-1, Cl. A1, 2.36%, 2/25/363 | | | 345,142 | | | | 344,980 | |
| |
| Carrington Mortgage Loan Trust, Series 2006-FRE1, Cl. A2, 0.28%, 7/25/363 | | | 83,447 | | | | 82,067 | |
| |
| CD Commercial Mortgage Trust, Series 2007-CD4, Cl. AMFX, 5.366%, 12/11/493 | | | 970,000 | | | | 1,007,841 | |
| |
| CHL Mortgage Pass-Through Trust: | |
| Series 2005-26,Cl. 1A8, 5.50%, 11/25/35 | | | 142,521 | | | | 136,262 | |
| Series 2006-6,Cl. A3, 6.00%, 4/25/36 | | | 70,459 | | | | 68,683 | |
| |
| GSR Mortgage Loan Trust, Series 2006-5F, Cl. 2A1, 6%, 6/25/36 | | | 58,092 | | | | 55,299 | |
| |
| RALI Trust: | |
| Series 2003-QS1,Cl. A2, 5.75%, 1/25/33 | | | 31,387 | | | | 31,708 | |
| Series 2006-QS13,Cl. 1A8, 6.00%, 9/25/36 | | | 15,728 | | | | 12,671 | |
| |
| WaMu Mortgage Pass-Through Certificates Trust, Series 2003-AR10, Cl. A7, 2.419%, 10/25/333 | | | 179,556 | | | | 183,865 | |
| |
| Wells Fargo Mortgage-Backed Securities Trust, Series 2006-AR14, Cl. 1A2, 5.724%, 10/25/363 | | | 104,145 | | | | 101,406 | |
| | | | | | | | |
| | | | | | | 2,727,625 | �� |
| | | | | | | | |
Total Mortgage-Backed Obligations
(Cost $102,238,031) | | | | 102,759,696 | |
|
| |
| |
U.S. Government Obligations—0.3% | |
| |
| Federal Home Loan Mortgage Corp. Nts., 5.50%, 7/18/16 | | | 65,000 | | | | 69,988 | |
| |
| Federal National Mortgage Assn. Nts., 1%, 9/27/17 | | | 193,000 | | | | 192,403 | |
| |
| United States Treasury Nts., 1.625%, 4/30/19 | | | 552,000 | | | | 553,898 | |
| | | | | | | | |
Total U.S. Government Obligations
(Cost $811,851) | | | | 816,289 | |
|
| |
| |
Non-Convertible Corporate Bonds and Notes—32.9% | |
| |
Consumer Discretionary—5.3% | |
| |
Auto Components—0.4% | |
| |
| Dana Holding Corp., 6.75% Sr. Unsec. Nts., 2/15/21 | | | 423,000 | | | | 449,438 | |
| |
| Johnson Controls, Inc., 4.625% Sr. Unsec. Nts., 7/2/44 | | | 238,000 | | | | 245,907 | |
| |
| TRW Automotive, Inc., 7.25% Sr. Unsec. Nts., 3/15/177 | | | 389,000 | | | | 431,790 | |
| | | | | | | | |
| | | | | | | 1,127,135 | |
|
| |
Automobiles—1.2% | |
| |
| Daimler Finance North America LLC: | |
| 1.30% Sr. Unsec. Nts., 7/31/152 | | | 463,000 | | | | 464,997 | |
| 8.50% Sr. Unsec. Unsub. Nts., 1/18/31 | | | 271,000 | | | | 415,552 | |
| |
| Ford Motor Credit Co. LLC, 3.664% Sr. Unsec. Nts., 9/8/24 | | | 970,000 | | | | 973,905 | |
| |
| General Motors Co., 6.25% Sr. Unsec. Nts., 10/2/43 | | | 437,000 | | | | 524,225 | |
| |
| Hyundai Capital America, 1.45% Sr. Unsec. Nts., 2/6/172 | | | 468,000 | | | | 466,631 | |
| |
| Kia Motors Corp., 3.625% Sr. Unsec. Nts., 6/14/162 | | | 341,000 | | | | 351,787 | |
| | | | | | | | |
| | | | | | | 3,197,097 | |
|
| |
Diversified Consumer Services—0.2% | |
| |
| Service Corp. International, 4.50% Sr. Unsec. Unsub. Nts., 11/15/20 | | | 440,000 | | | | 434,500 | |
11 OPPENHEIMER CAPITAL INCOME FUND/VA
STATEMENT OF INVESTMENTS Continued
| | | | | | | | |
| | | Principal Amount | | | Value | |
| |
Hotels, Restaurants & Leisure—0.7% | |
| |
| Brinker International, Inc., 2.60% Sr. Unsec. Nts., 5/15/18 | | $ | 151,000 | | | $ | 150,845 | |
| |
| Carnival Corp., 1.20% Sr. Unsec. Nts., 2/5/16 | | | 465,000 | | | | 464,933 | |
| |
| Hyatt Hotels Corp., 3.875% Sr. Unsec. Unsub. Nts., 8/15/16 | | | 77,000 | | | | 79,932 | |
| |
| Starwood Hotels & Resorts Worldwide, Inc., 7.15% Sr. Unsec. Unsub. Nts., 12/1/19 | | | 164,000 | | | | 193,489 | |
| |
| Wyndham Worldwide Corp., 6% Sr. Unsec. Nts., 12/1/16 | | | 403,000 | | | | 433,667 | |
| |
| Yum! Brands, Inc., 4.25% Sr. Unsec. Nts., 9/15/15 | | | 421,000 | | | | 430,940 | |
| | | | | | | | |
| | | | | | | 1,753,806 | |
|
| |
Household Durables—0.6% | |
| |
| Jarden Corp., 6.125% Sr. Unsec. Nts., 11/15/22 | | | 416,000 | | | | 435,760 | |
| |
| Lennar Corp., 4.75% Sr. Unsec. Nts., 11/15/22 | | | 430,000 | | | | 423,550 | |
| |
| Toll Brothers Finance Corp., 4% Sr. Unsec. Nts., 12/31/18 | | | 430,000 | | | | 432,150 | |
| |
| Whirlpool Corp.: | |
| 1.35% Sr. Unsec. Nts., 3/1/17 | | | 123,000 | | | | 122,734 | |
| 1.65% Sr. Unsec. Nts., 11/1/17 | | | 105,000 | | | | 104,731 | |
| | | | | | | | |
| | | | 1,518,925 | |
|
| |
| Media—1.4% | |
| |
| 21st Century Fox America, Inc., 6.15% Sr. Unsec. Nts., 2/15/41 | | | 183,000 | | | | 233,737 | |
| |
| CCO Holdings LLC/CCO Holdings Capital Corp., 6.50% Sr. Unsec. Nts., 4/30/21 | | | 262,000 | | | | 276,082 | |
| |
| Comcast Cable Communications Holdings, Inc., 9.455% Sr. Unsec. Nts., 11/15/22 | | | 211,000 | | | | 303,800 | |
| |
| Comcast Corp., 4.65% Sr. Unsec. Unsub. Nts., 7/15/42 | | | 156,000 | | | | 171,429 | |
| |
| DIRECTV Holdings LLC/DIRECTV Financing Co., Inc., 5.15% Sr. Unsec. Nts., 3/15/42 | | | 275,000 | | | | 285,225 | |
| |
| Historic TW, Inc.: | |
| 8.05% Sr. Unsec. Nts., 1/15/16 | | | 77,000 | | | | 82,344 | |
| 9.15% Debs., 2/1/23 | | | 118,000 | | | | 160,738 | |
| |
| Interpublic Group of Cos., Inc. (The), 4.20% Sr. Unsec. Nts., 4/15/24 | | | 226,000 | | | | 231,598 | |
| |
| Lamar Media Corp., 5% Sr. Unsec. Sub. Nts., 5/1/23 | | | 441,000 | | | | 438,795 | |
| |
| Numericable-SFR, 4.875% Sr. Sec. Nts., 5/15/192 | | | 448,000 | | | | 445,760 | |
| |
| Pearson Funding Two plc, 4% Sr. Unsec. Nts., 5/17/162 | | | 101,000 | | | | 105,041 | |
| |
| Sky plc, 3.75% Sr. Unsec. Nts., 9/16/242 | | | 197,000 | | | | 198,607 | |
| |
| Time Warner Cable, Inc., 4.50% Sr. Unsec. Unsub. Nts., 9/15/42 | | | 450,000 | | | | 464,421 | |
| |
| Viacom, Inc.: | |
| 2.50% Sr. Unsec. Nts., 12/15/16 | | | 183,000 | | | | 187,120 | |
| 4.85% Sr. Unsec. Nts., 12/15/34 | | | 145,000 | | | | 148,856 | |
| | | | | | | | |
| | | | 3,733,553 | |
|
| |
| Multiline Retail—0.0% | |
| |
| Macy’s Retail Holdings, Inc., 4.50% Sr. Unsec. Nts., 12/15/34 | | | 104,000 | | | | 105,061 | |
|
| |
| Specialty Retail—0.5% | |
| |
| Bed Bath & Beyond, Inc., 5.165% Sr. Unsec. Nts., 8/1/44 | | | 122,000 | | | | 127,549 | |
| |
| Best Buy Co., Inc., 5.50% Sr. Unsec. Nts., 3/15/21 | | | 415,000 | | | | 433,675 | |
| |
| Home Depot, Inc. (The), 4.875% Sr. Unsec. Nts., 2/15/44 | | | 167,000 | | | | 194,898 | |
| |
| L Brands, Inc., 7% Sr. Unsec. Nts., 5/1/20 | | | 51,000 | | | | 58,140 | |
| |
| Ross Stores, Inc., 3.375% Sr. Unsec. Nts., 9/15/24 | | | 425,000 | | | | 426,250 | |
| |
| Sally Holdings LLC/Sally Capital, Inc., 5.75% Sr. Unsec. Nts., 6/1/22 | | | 5,000 | | | | 5,263 | |
| |
| Signet UK Finance plc, 4.70% Sr. Unsec. Nts., 6/15/24 | | | 228,000 | | | | 220,416 | |
| | | | | | | | |
| | | | | | | 1,466,191 | |
| | | | | | | | |
| | | Principal Amount | | | Value | |
| |
| Textiles, Apparel & Luxury Goods—0.3% | |
| |
| Levi Strauss & Co., 6.875% Sr. Unsec. Nts., 5/1/22 | | $ | 400,000 | | | $ | 432,000 | |
| |
| PVH Corp., 4.50% Sr. Unsec. Unsub. Nts., 12/15/22 | | | 431,000 | | | | 427,767 | |
| | | | | | | | |
| | | | 859,767 | |
|
| |
| Consumer Staples—2.2% | |
| |
| Beverages—0.8% | |
| |
| Anheuser-Busch InBev Worldwide, Inc., 8.20% Sr. Unsec. Unsub. Nts., 1/15/39 | | | 386,000 | | | | 597,852 | |
| |
| Constellation Brands, Inc., 3.75% Sr. Unsec. Nts., 5/1/21 | | | 472,000 | | | | 468,460 | |
| |
| Pernod Ricard SA: | |
| 2.95% Sr. Unsec. Nts., 1/15/172 | | | 423,000 | | | | 433,026 | |
| 4.25% Sr. Unsec. Nts., 7/15/222 | | | 260,000 | | | | 275,292 | |
| |
| SABMiller Holdings, Inc., 4.95% Sr. Unsec. Unsub. Nts., 1/15/422 | | | 235,000 | | | | 265,761 | |
| | | | | | | | |
| | | | 2,040,391 | |
|
| |
| Food & Staples Retailing—0.3% | |
| |
| CVS Health Corp., 5.30% Sr. Unsec. Nts., 12/5/43 | | | 101,000 | | | | 121,216 | |
| |
| Delhaize Group SA, 5.70% Sr. Unsec. Nts., 10/1/40 | | | 251,000 | | | | 264,243 | |
| |
| Kroger Co., 6.90% Sr. Unsec. Nts., 4/15/38 | | | 109,000 | | | | 145,519 | |
| |
| Kroger Co. (The), 6.40% Sr. Unsec. Nts., 8/15/17 | | | 382,000 | | | | 427,264 | |
| | | | | | | | |
| | | | 958,242 | |
|
| |
| Food Products—0.8% | |
| |
| Bunge Ltd. Finance Corp.: | |
| 5.10% Sr. Unsec. Unsub. Nts., 7/15/15 | | | 381,000 | | | | 389,357 | |
| 8.50% Sr. Unsec. Nts., 6/15/19 | | | 320,000 | | | | 392,920 | |
| |
| ConAgra Foods, Inc., 1.35% Sr. Unsec. Nts., 9/10/15 | | | 267,000 | | | | 268,151 | |
| |
| Kraft Foods Group, Inc., 5% Sr. Unsec. Nts., 6/4/42 | | | 108,000 | | | | 119,347 | |
| |
| TreeHouse Foods, Inc., 4.875% Sr. Unsec. Nts., 3/15/22 | | | 420,000 | | | | 426,300 | |
| |
| Tyson Foods, Inc.: | |
| 4.875% Sr. Unsec. Nts., 8/15/34 | | | 140,000 | | | | 154,064 | |
| 6.60% Sr. Unsec. Nts., 4/1/16 | | | 402,000 | | | | 428,744 | |
| | | | | | | | |
| | | | 2,178,883 | |
|
| |
| Tobacco—0.3% | |
| |
| Altria Group, Inc., 10.20% Sr. Unsec. Nts., 2/6/39 | | | 241,000 | | | | 420,899 | |
| |
| Reynolds American, Inc., 6.75% Sr. Unsec. Nts., 6/15/17 | | | 388,000 | | | | 432,479 | |
| | | | | | | | |
| | | | 853,378 | |
|
| |
| Energy—2.6% | |
| |
| Energy Equipment & Services—0.3% | |
| |
| Nabors Industries, Inc.: | |
| 2.35% Sr. Unsec. Nts., 9/15/16 | | | 348,000 | | | | 344,451 | |
| 4.625% Sr. Unsec. Nts., 9/15/21 | | | 182,000 | | | | 171,238 | |
| |
| Rowan Cos., Inc., 4.875% Sr. Unsec. Unsub. Nts., 6/1/22 | | | 179,000 | | | | 174,448 | |
| |
| Weatherford International Ltd., 5.95% Sr. Unsec. Nts., 4/15/42 | | | 118,000 | | | | 100,221 | |
| | | | | | | | |
| | | | 790,358 | |
|
| |
| Oil, Gas & Consumable Fuels—2.3% | |
| |
| Anadarko Petroleum Corp., 6.20% Sr. Unsec. Nts., 3/15/40 | | | 189,000 | | | | 222,161 | |
| |
| CNOOC Nexen Finance 2014 ULC, 1.625% Sr. Unsec. Nts., 4/30/17 | | | 444,000 | | | | 442,109 | |
| |
| DCP Midstream LLC, 5.375% Sr. Unsec. Nts., 10/15/152 | | | 342,000 | | | | 352,706 | |
| |
| Devon Energy Corp., 4.75% Sr. Unsec. Nts., 5/15/42 | | | 197,000 | | | | 199,069 | |
| |
| El Paso Pipeline Partners Operating Co. LLC, 4.10% Sr. Unsec. Nts., 11/15/15 | | | 181,000 | | | | 185,233 | |
| |
| EnLink Midstream Partners LP: | |
| 2.70% Sr. Unsec. Nts., 4/1/19 | | | 356,000 | | | | 350,916 | |
| 4.40% Sr. Unsec. Nts., 4/1/24 | | | 112,000 | | | | 113,670 | |
12 OPPENHEIMER CAPITAL INCOME FUND/VA
| | | | | | | | |
| | | Principal Amount | | | Value | |
| |
| Oil, Gas & Consumable Fuels (Continued) | |
| |
| Enterprise Products Operating LLC, 3.75% Sr. Unsec. Nts., 2/15/25 | | $ | 195,000 | | | $ | 196,143 | |
| |
| Kinder Morgan Energy Partners LP, 4.15% Sr. Unsec. Nts., 2/1/24 | | | 198,000 | | | | 197,864 | |
| |
| Kinder Morgan, Inc.: | |
| 3.05% Sr. Unsec. Nts., 12/1/19 | | | 351,000 | | | | 348,603 | |
| 5.00% Sr. Unsec. Nts., 2/15/212 | | | 521,000 | | | | 542,727 | |
| |
| Noble Energy, Inc., 5.05% Sr. Unsec. Nts., 11/15/44 | | | 120,000 | | | | 119,065 | |
| |
| Origin Energy Finance Ltd.: | |
| 3.50% Sr. Unsec. Nts., 10/9/182 | | | 468,000 | | | | 477,932 | |
| 5.45% Sr. Unsec. Nts., 10/14/212 | | | 295,000 | | | | 322,906 | |
| |
| Phillips 66, 4.30% Sr. Unsec. Unsub. Nts., 4/1/22 | | | 185,000 | | | | 195,607 | |
| |
| Pioneer Natural Resources Co.: | |
| 3.95% Sr. Unsec. Nts., 7/15/22 | | | 190,000 | | | | 188,365 | |
| 6.65% Sr. Unsec. Nts., 3/15/17 | | | 355,000 | | | | 389,141 | |
| |
| Spectra Energy Partners LP: | |
| 4.60% Sr. Unsec. Nts., 6/15/21 | | | 277,000 | | | | 300,251 | |
| 4.75% Sr. Unsec. Nts., 3/15/24 | | | 229,000 | | | | 245,919 | |
| |
| Western Gas Partners LP, 4% Sr. Unsec. Nts., 7/1/22 | | | 222,000 | | | | 225,371 | |
| |
| Williams Partners LP, 4.50% Sr. Unsec. Nts., 11/15/23 | | | 228,000 | | | | 230,500 | |
| |
| Woodside Finance Ltd., 4.60% Sr. Unsec. Unsub. Nts., 5/10/212 | | | 372,000 | | | | 396,856 | |
| | | | | | | | |
| | | | 6,243,114 | |
|
| |
| Financials—9.5% | |
| |
| Capital Markets—1.8% | |
| |
| Apollo Management Holdings LP, 4% Sr. Unsec. Nts., 5/30/242 | | | 368,000 | | | | 375,255 | |
| |
| Blackstone Holdings Finance Co. LLC, 5% Sr. Unsec. Nts., 6/15/442 | | | 458,000 | | | | 493,927 | |
| |
| Carlyle Holdings II Finance LLC, 5.625% Sr. Sec. Nts., 3/30/432 | | | 243,000 | | | | 283,177 | |
| |
| Credit Suisse, New York, 3.625% Sr. Unsec. Nts., 9/9/24 | | | 604,000 | | | | 615,162 | |
| |
| Goldman Sachs Group, Inc. (The), 5.70% Jr. Sub. Perpetual Bonds, Series L3,8 | | | 448,000 | | | | 454,832 | |
| |
| Lazard Group LLC, 4.25% Sr. Unsec. Nts., 11/14/20 | | | 401,000 | | | | 423,182 | |
| |
| Morgan Stanley: | |
| 5.00% Sub. Nts., 11/24/25 | | | 395,000 | | | | 422,044 | |
| 5.45% Jr. Sub. Perpetual Bonds, Series H3,8 | | | 428,000 | | | | 429,306 | |
| |
| Nomura Holdings, Inc., 2% Sr. Unsec. Nts., 9/13/16 | | | 452,000 | | | | 455,954 | |
| |
| Raymond James Financial, Inc., 5.625% Sr. Unsec. Unsub. Nts., 4/1/24 | | | 265,000 | | | | 302,384 | |
| |
| UBS Preferred Funding Trust V, 6.243% Jr. Sub. Perpetual Bonds, Series 13,8 | | | 638,000 | | | | 660,336 | |
| | | | | | | | |
| | | | 4,915,559 | |
|
| |
| Commercial Banks—4.0% | |
| |
| Bank of America Corp.: | |
| 7.75% Jr. Sub. Nts., 5/14/38 | | | 424,000 | | | | 600,720 | |
| 8.00% Jr. Sub. Perpetual Bonds, Series K3,8 | | | 393,000 | | | | 423,949 | |
| |
| BNP Paribas SA, 3.25% Sr. Unsec. Nts., 3/3/23 | | | 515,000 | | | | 525,973 | |
| |
| Citigroup, Inc.: | |
| 6.675% Sub. Nts., 9/13/43 | | | 405,000 | | | | 525,594 | |
| 5.95% Jr. Sub. Perpetual Bonds, Series D3,8 | | | 465,000 | | | | 458,606 | |
| |
| Commerzbank AG, 8.125% Sub. Nts., 9/19/232 | | | 378,000 | | | | 436,061 | |
| |
| Credit Agricole SA, 8.375% Jr. Sub. Perpetual Bonds3,7,8 | | | 370,000 | | | | 428,275 | |
| |
| FirstMerit Bank NA, 4.27% Sub. Nts., 11/25/26 | | | 432,000 | | | | 439,701 | |
| |
| HSBC Finance Capital Trust IX, 5.911% Unsec. Sub. Nts., 11/30/353 | | | 1,120,000 | | | | 1,136,800 | |
| |
| Intesa Sanpaolo SpA, 5.017% Sub. Nts., 6/26/242 | | | 445,000 | | | | 432,681 | |
| |
| JPMorgan Chase & Co.: | |
| 3.625% Sr. Unsec. Nts., 5/13/24 | | | 860,000 | | | | 881,343 | |
| | | | | | | | |
| | | Principal Amount | | | Value | |
| |
| Commercial Banks (Continued) | |
| |
| JPMorgan Chase & Co.: (Continued) | |
| 6.75% Jr. Sub. Perpetual Bonds, Series S3,8 | | $ | 399,000 | | | $ | 423,439 | |
| |
| Lloyds Banking Group plc, 6.657% Jr. Sub. Perpetual Bonds2,3,8 | | | 400,000 | | | | 428,000 | |
| |
| Rabobank Capital Funding Trust III, 5.254% Jr. Sub. Perpetual Bonds3,7,8 | | | 751,000 | | | | 783,293 | |
| |
| Regions Bank, Birmingham AL, 6.45% Sub. Nts., 6/26/37 | | | 334,000 | | | | 420,223 | |
| |
| Royal Bank of Scotland Group plc, 7.64% Jr. Sub. Perpetual Bonds, Series U3,8 | | | 500,000 | | | | 527,500 | |
| |
| Societe Generale SA, 5.922% Jr. Sub. Perpetual Bonds2,3,8 | | | 440,000 | | | | 458,427 | |
| |
| SunTrust Banks, Inc.: | |
| 3.60% Sr. Unsec. Nts., 4/15/16 | | | 460,000 | | | | 474,685 | |
| 5.625% Jr. Sub. Perpetual Bonds3,8 | | | 438,000 | | | | 440,464 | |
| |
| Wells Fargo & Co., 5.90% Jr. Sub. Perpetual Bonds, Series S3,8 | | | 449,000 | | | | 453,490 | |
| | | | | | | | |
| | | | 10,699,224 | |
|
| |
| Consumer Finance—0.6% | |
| |
| Ally Financial, Inc., 8% Sr. Unsec. Nts., 11/1/31 | | | 339,000 | | | | 433,073 | |
| |
| American Express Co., 5.20% Jr. Sub. Perpetual Bonds3,8 | | | 437,000 | | | | 446,140 | |
| |
| Discover Financial Services, 3.95% Sr. Unsec. Nts., 11/6/24 | | | 331,000 | | | | 333,395 | |
| |
| Synchrony Financial: | |
| 3.00% Sr. Unsec. Nts., 8/15/19 | | | 202,000 | | | | 204,340 | |
| 3.75% Sr. Unsec. Nts., 8/15/21 | | | 155,000 | | | | 158,466 | |
| | | | | | | | |
| | | | 1,575,414 | |
|
| |
| Diversified Financial Services—0.6% | |
| |
| Berkshire Hathaway Energy Co., 4.50% Sr. Unsec. Nts., 2/1/452 | | | 224,000 | | | | 235,364 | |
| |
| Burlington Northern Santa Fe LLC, 3% Sr. Unsec. Nts., 3/15/23 | | | 365,000 | | | | 364,495 | |
| |
| Leucadia National Corp., 5.50% Sr. Unsec. Nts., 10/18/23 | | | 457,000 | | | | 469,649 | |
| |
| Voya Financial, Inc., 5.65% Jr. Sub. Nts., 5/15/533 | | | 495,000 | | | | 492,525 | |
| | | | | | | | |
| | | | 1,562,033 | |
|
| |
| Insurance—1.8% | |
| |
| AIA Group Ltd., 4.875% Sr. Unsec. Nts., 3/11/442 | | | 347,000 | | | | 396,019 | |
| |
| AXIS Specialty Finance plc, 5.15% Sr. Unsec. Nts., 4/1/45 | | | 368,000 | | | | 400,179 | |
| |
| Five Corners Funding Trust, 4.419% Unsec. Nts., 11/15/232 | | | 374,000 | | | | 396,202 | |
| |
| Liberty Mutual Group, Inc.: | |
| 4.25% Sr. Unsec. Nts., 6/15/232 | | | 543,000 | | | | 560,540 | |
| 4.85% Sr. Unsec. Nts., 8/1/442 | | | 269,000 | | | | 274,510 | |
| |
| Lincoln National Corp., 6.05% Jr. Unsec. Sub. Nts., 4/20/673 | | | 811,000 | | | | 815,055 | |
| |
| Prudential Financial, Inc., 5.20% Jr. Sub. Nts., 3/15/443 | | | 331,000 | | | | 328,931 | |
| |
| Swiss Re Capital I LP, 6.854% Jr. Sub. Perpetual Bonds3,7,8 | | | 780,000 | | | | 819,000 | |
| |
| TIAA Asset Management Finance Co. LLC, 4.125% Sr. Unsec. Nts., 11/1/242 | | | 437,000 | | | | 448,571 | |
| |
| ZFS Finance USA Trust V, 6.50% Jr. Sub. Nts., 5/9/373,7 | | | 437,000 | | | | 467,590 | |
| | | | | | | | |
| | | | 4,906,597 | |
|
| |
| Real Estate—0.1% | |
| |
| Ventas Realty LP, 1.25% Sr. Unsec. Nts., 4/17/17 | | | 178,000 | | | | 176,503 | |
|
| |
| Real Estate Investment Trusts (REITs)—0.6% | |
| |
| American Tower Corp.: | |
| 5.05% Sr. Unsec. Unsub. Nts., 9/1/20 | | | 285,000 | | | | 309,591 | |
| 5.90% Sr. Unsec. Nts., 11/1/21 | | | 233,000 | | | | 262,651 | |
| |
| Corrections Corp. of America, 4.125% Sr. Unsec. Nts., 4/1/20 | | | 457,000 | | | | 446,717 | |
13 OPPENHEIMER CAPITAL INCOME FUND/VA
STATEMENTOFINVESTMENTS Continued
| | | | | | | | |
| | | Principal Amount | | | Value | |
| |
| Real Estate Investment Trusts (REITs) (Continued) | |
| |
| Hospitality Properties Trust, 4.65% Sr. Unsec. Nts., 3/15/24 | | $ | 225,000 | | | $ | 230,883 | |
| |
| Liberty Property LP, 5.50% Sr. Unsec. Nts., 12/15/16 | | | 268,000 | | | | 287,966 | |
| | | | | | | | |
| | | | 1,537,808 | |
|
| |
| Health Care—2.1% | |
| |
| Biotechnology—0.1% | |
| |
| Gilead Sciences, Inc., 5.65% Sr. Unsec. Unsub. Nts., 12/1/41 | | | 263,000 | | | | 326,862 | |
|
| |
| Health Care Equipment & Supplies—0.5% | |
| |
| Becton Dickinson & Co., 4.685% Sr. Unsec. Nts., 12/15/44 | | | 246,000 | | | | 266,022 | |
| |
| CareFusion Corp.: | |
| 1.45% Sr. Unsec. Nts., 5/15/17 | | | 453,000 | | | | 450,218 | |
| 3.875% Sr. Unsec. Nts., 5/15/24 | | | 221,000 | | | | 228,507 | |
| |
| DENTSPLY International, Inc., 2.75% Sr. Unsec. Nts., 8/15/16 | | | 425,000 | | | | 434,563 | |
| | | | | | | | |
| | | | 1,379,310 | |
|
| |
| Health Care Providers & Services—0.7% | |
| |
| Cardinal Health, Inc., 3.50% Sr. Unsec. Nts., 11/15/24 | | | 214,000 | | | | 213,838 | |
| |
| CHS/Community Health Systems, Inc., 5.125% Sr. Sec. Nts., 8/1/21 | | | 420,000 | | | | 437,850 | |
| |
| Express Scripts Holding Co., 3.50% Sr. Unsec. Nts., 6/15/24 | | | 224,000 | | | | 223,660 | |
| |
| Fresenius Medical Care US Finance II, Inc., 5.875% Sr. Unsec. Nts., 1/31/222 | | | 422,000 | | | | 459,980 | |
| |
| LifePoint Hospitals, Inc., 5.50% Sr. Unsec. Nts., 12/1/21 | | | 425,000 | | | | 436,687 | |
| |
| McKesson Corp., 4.883% Sr. Unsec. Nts., 3/15/44 | | | 108,000 | | | | 119,447 | |
| | | | | | | | |
| | | | 1,891,462 | |
|
| |
| Life Sciences Tools & Services—0.2% | |
| |
| Life Technologies Corp., 3.50% Sr. Unsec. Nts., 1/15/16 | | | 28,000 | | | | 28,351 | |
| |
| Thermo Fisher Scientific, Inc.: | |
| 4.15% Sr. Unsec. Nts., 2/1/24 | | | 144,000 | | | | 152,148 | |
| 5.00% Sr. Unsec. Nts., 6/1/15 | | | 198,000 | | | | 201,497 | |
| 5.30% Sr. Unsec. Nts., 2/1/44 | | | 165,000 | | | | 190,248 | |
| | | | | | | | |
| | | | 572,244 | |
|
| |
| Pharmaceuticals—0.6% | |
| |
| Actavis Funding SCS, 1.30% Sr. Unsec. Nts., 6/15/17 | | | 287,000 | | | | 282,047 | |
| |
| Hospira, Inc., 5.20% Sr. Unsec. Nts., 8/12/20 | | | 441,000 | | | | 473,692 | |
| |
| Mallinckrodt International Finance SA, 3.50% Sr. Unsec. Nts., 4/15/18 | | | 468,000 | | | | 454,545 | |
| |
| Perrigo Finance plc, 3.90% Sr. Unsec. Nts., 12/15/24 | | | 217,000 | | | | 221,236 | |
| | | | | | | | |
| | | | 1,431,520 | |
|
| |
| Industrials—3.4% | |
| |
| Aerospace & Defense—0.6% | |
| |
| BAE Systems Holdings, Inc., 3.80% Sr. Unsec. Nts., 10/7/242,9 | | | 196,000 | | | | 201,324 | |
| |
| Huntington Ingalls Industries, Inc., 7.125% Sr. Unsec. Unsub. Nts., 3/15/21 | | | 402,000 | | | | 436,170 | |
| |
| L-3 Communications Corp.: | |
| 1.50% Sr. Unsec. Nts., 5/28/17 | | | 118,000 | | | | 116,951 | |
| 3.95% Sr. Unsec. Nts., 5/28/24 | | | 272,000 | | | | 274,785 | |
| |
| Northrop Grumman Corp., 4.75% Sr. Unsec. Nts., 6/1/43 | | | 105,000 | | | | 117,705 | |
| |
| Textron, Inc.: | |
| 3.875% Sr. Unsec. Nts., 3/1/25 | | | 129,000 | | | | 129,491 | |
| 4.30% Sr. Unsec. Nts., 3/1/24 | | | 230,000 | | | | 240,761 | |
| | | | | | | | |
| | | Principal Amount | | | Value | |
| |
| Aerospace & Defense (Continued) | |
| |
| Textron, Inc.: (Continued) | |
| 6.20% Sr. Unsec. Nts., 3/15/15 | | $ | 34,000 | | | $ | 34,343 | |
| | | | | | | | |
| | | | 1,551,530 | |
|
| |
| Building Products—0.2% | |
| |
| Owens Corning, 4.20% Sr. Unsec. Nts., 12/15/22 | | | 505,000 | | | | 513,352 | |
|
| |
| Commercial Services & Supplies—0.6% | |
| |
| Clean Harbors, Inc., 5.25% Sr. Unsec. Unsub. Nts., 8/1/20 | | | 468,000 | | | | 472,680 | |
| |
| Pitney Bowes, Inc., 4.625% Sr. Unsec. Nts., 3/15/24 | | | 575,000 | | | | 589,651 | |
| |
| Republic Services, Inc., 5.70% Sr. Unsec. Nts., 5/15/41 | | | 102,000 | | | | 126,233 | |
| |
| RR Donnelley & Sons Co., 7.625% Sr. Unsec. Nts., 6/15/20 | | | 385,000 | | | | 424,462 | |
| | | | | | | | |
| | | | 1,613,026 | |
|
| |
| Electrical Equipment—0.1% | |
| |
| Sensata Technologies BV, 4.875% Sr. Unsec. Nts., 10/15/232 | | | 349,000 | | | | 349,000 | |
|
| |
| Industrial Conglomerates—0.3% | |
| |
| General Electric Capital Corp., 6.25% Jr. Sub. Perpetual Bonds, Series B3,8 | | | 682,000 | | | | 745,938 | |
|
| |
| Machinery—0.5% | |
| |
| Crane Co., 4.45% Sr. Unsec. Nts., 12/15/23 | | | 234,000 | | | | 247,146 | |
| |
| Ingersoll-Rand Global Holding Co. Ltd., 4.25% Sr. Unsec. Nts., 6/15/23 | | | 410,000 | | | | 432,949 | |
| |
| Starwood Hotels & Resorts Worldwide, Inc., 7.375% Sr. Unsec. Nts., 11/15/15 | | | 384,000 | | | | 403,019 | |
| |
| Trinity Industries, Inc., 4.55% Sr. Unsec. Nts., 10/1/24 | | | 184,000 | | | | 179,063 | |
| | | | | | | | |
| | | | 1,262,177 | |
|
| |
| Professional Services—0.3% | |
| |
| Experian Finance plc, 2.375% Sr. Unsec. Nts., 6/15/172 | | | 427,000 | | | | 431,068 | |
| |
| Nielsen Finance LLC/Nielsen Finance Co., 4.50% Sr. Unsec. Nts., 10/1/20 | | | 470,000 | | | | 474,700 | |
| | | | | | | | |
| | | | 905,768 | |
|
| |
| Road & Rail—0.5% | |
| |
| ERAC USA Finance LLC, 3.85% Sr. Unsec. Nts., 11/15/242 | | | 216,000 | | | | 219,494 | |
| |
| Kansas City Southern de Mexico SA de CV, 3% Sr. Unsec. Nts., 5/15/23 | | | 372,000 | | | | 362,332 | |
| |
| Penske Truck Leasing Co. LP/PTL Finance Corp.: | |
| 2.50% Sr. Unsec. Nts., 3/15/162 | | | 446,000 | | | | 452,355 | |
| 4.25% Sr. Unsec. Nts., 1/17/232 | | | 250,000 | | | | 259,936 | |
| | | | | | | | |
| | | | 1,294,117 | |
|
| |
| Trading Companies & Distributors—0.3% | |
| |
| Air Lease Corp., 3.875% Sr. Unsec. Nts., 4/1/21 | | | 456,000 | | | | 460,560 | |
| |
| International Lease Finance Corp., 5.875% Sr. Unsec. Unsub. Nts., 4/1/19 | | | 437,000 | | | | 471,960 | |
| | | | | | | | |
| | | | 932,520 | |
|
| |
| Information Technology—1.5% | |
| |
| Communications Equipment—0.1% | |
| |
| Motorola Solutions, Inc., 3.50% Sr. Unsec. Nts., 3/1/23 | | | 248,000 | | | | 244,548 | |
|
| |
| Electronic Equipment, Instruments, & Components—0.4% | |
| |
| Arrow Electronics, Inc., 5.125% Sr. Unsec. Unsub. Nts., 3/1/21 | | | 525,000 | | | | 568,543 | |
| |
| Avnet, Inc., 4.875% Sr. Unsec. Unsub. Nts., 12/1/22 | | | 550,000 | | | | 584,655 | |
| | | | | | | | |
| | | | 1,153,198 | |
14 OPPENHEIMER CAPITAL INCOME FUND/VA
| | | | | | | | |
| | | Principal Amount | | | Value | |
| |
| IT Services—0.4% | |
| |
| Fidelity National Information Services, Inc.: | |
| 1.45% Sr. Unsec. Nts., 6/5/17 | | $ | 351,000 | | | $ | 349,371 | |
| 3.50% Sr. Unsec. Nts., 4/15/23 | | | 244,000 | | | | 242,969 | |
| |
| Xerox Corp., 4.25% Sr. Unsec. Nts., 2/15/15 | | | 449,000 | | | | 450,794 | |
| | | | | | | | |
| | | | | | | 1,043,134 | |
|
| |
| Software—0.1% | |
| |
| Oracle Corp., 3.40% Sr. Unsec. Nts., 7/8/24 | | | 322,000 | | | | 329,498 | |
|
| |
| Technology Hardware, Storage & Peripherals—0.5% | |
| |
| Apple, Inc., 4.45% Sr. Unsec. Nts., 5/6/44 | | | 248,000 | | | | 273,984 | |
| |
| Hewlett-Packard Co., 2.65% Sr. Unsec. Unsub. Nts., 6/1/16 | | | 443,000 | | | | 451,654 | |
| |
| Seagate HDD Cayman: | |
| 3.75% Sr. Unsec. Nts., 11/15/182 | | | 410,000 | | | | 421,788 | |
| 4.75% Sr. Unsec. Nts., 1/1/252 | | | 61,000 | | | | 63,065 | |
| | | | | | | | |
| | | | | | | 1,210,491 | |
|
| |
| Materials—2.3% | |
| |
| Chemicals—0.6% | |
| |
| Agrium, Inc., 3.50% Sr. Unsec. Nts., 6/1/23 | | | 262,000 | | | | 258,820 | |
| |
| Eastman Chemical Co.: | |
| 3.00% Sr. Unsec. Nts., 12/15/15 | | | 218,000 | | | | 222,216 | |
| 4.65% Sr. Unsec. Nts., 10/15/44 | | | 112,000 | | | | 115,071 | |
| |
| LYB International Finance BV, 5.25% Sr. Unsec. Nts., 7/15/43 | | | 144,000 | | | | 157,076 | |
| |
| Methanex Corp., 4.25% Sr. Unsec. Nts., 12/1/24 | | | 220,000 | | | | 219,479 | |
| |
| Rockwood Specialties Group, Inc., 4.625% Sr. Unsec. Nts., 10/15/20 | | | 450,000 | | | | 466,312 | |
| |
| RPM International, Inc., 3.45% Sr. Unsec. Unsub. Nts., 11/15/22 | | | 349,000 | | | | 344,285 | |
| | | | | | | | |
| | | | | | | 1,783,259 | |
|
| |
| Construction Materials—0.2% | |
| |
| CRH America, Inc., 4.125% Sr. Unsec. Nts., 1/15/16 | | | 440,000 | | | | 452,977 | |
|
| |
| Containers & Packaging—0.7% | |
| |
| Crown Americas LLC/Crown Americas Capital Corp. III, 6.25% Sr. Unsec. Nts., 2/1/21 | | | 199,000 | | | | 210,442 | |
| |
| Packaging Corp. of America: | |
| 3.65% Sr. Unsec. Nts., 9/15/24 | | | 113,000 | | | | 111,461 | |
| 4.50% Sr. Unsec. Nts., 11/1/23 | | | 358,000 | | | | 375,676 | |
| |
| Rock-Tenn Co., 3.50% Sr. Unsec. Unsub. Nts., 3/1/20 | | | 729,000 | | | | 740,646 | |
| |
| Silgan Holdings, Inc., 5% Sr. Unsec. Nts., 4/1/20 | | | 355,000 | | | | 362,100 | |
| | | | | | | | |
| | | | | | | 1,800,325 | |
|
| |
| Metals & Mining—0.7% | |
| |
| Alcoa, Inc., 5.125% Sr. Unsec. Nts., 10/1/24 | | | 434,000 | | | | 460,807 | |
| |
| Carpenter Technology Corp., 4.45% Sr. Unsec. Unsub. Nts., 3/1/23 | | | 159,000 | | | | 162,198 | |
| |
| Freeport-McMoRan, Inc., 3.875% Sr. Unsec. Nts., 3/15/23 | | | 250,000 | | | | 235,953 | |
| |
| Glencore Canada Corp., 6% Sr. Unsec. Unsub. Nts., 10/15/15 | | | 391,000 | | | | 404,273 | |
| |
| Glencore Funding LLC, 4.625% Sr. Unsec. Nts., 4/29/242 | | | 339,000 | | | | 342,017 | |
| |
| Rio Tinto Finance USA plc, 4.125% Sr. Unsec. Nts., 8/21/42 | | | 125,000 | | | | 121,863 | |
| |
| Yamana Gold, Inc., 4.95% Sr. Unsec. Nts., 7/15/24 | | | 230,000 | | | | 224,895 | |
| | | | | | | | |
| | | | | | | 1,952,006 | |
|
| |
| Paper & Forest Products—0.1% | |
| |
| International Paper Co., 4.80% Sr. Unsec. Nts., 6/15/44 | | | 183,000 | | | | 187,616 | |
|
| |
| Telecommunication Services—2.1% | |
| |
| Diversified Telecommunication Services—1.9% | |
| |
| AT&T, Inc., 4.35% Sr. Unsec. Nts., 6/15/45 | | | 297,000 | | | | 281,147 | |
| | | | | | | | |
| | | Principal Amount | | | Value | |
| |
| Diversified Telecommunication Services (Continued) | |
| |
| British Telecommunications plc, 9.625% Sr. Unsec. Nts., 12/15/30 | | $ | 288,000 | | | $ | 453,278 | |
| |
| CenturyLink, Inc., 6.45% Sr. Unsec. Nts., 6/15/21 | | | 390,000 | | | | 420,225 | |
| |
| Cox Communications, Inc., 3.85% Sr. Unsec. Nts., 2/1/252 | | | 245,000 | | | | 247,810 | |
| |
| Deutsche Telekom International Finance BV, 5.75% Sr. Unsec. Nts., 3/23/16 | | | 385,000 | | | | 406,756 | |
| |
| Frontier Communications Corp., 8.50% Sr. Unsec. Nts., 4/15/20 | | | 405,000 | | | | 453,600 | |
| |
| Telecom Italia Capital SA, 7.721% Sr. Unsec. Unsub. Nts., 6/4/38 | | | 277,000 | | | | 310,240 | |
| |
| Telefonica Emisiones SAU, 7.045% Sr. Unsec. Unsub. Nts., 6/20/36 | | | 169,000 | | | | 223,005 | |
| |
| T-Mobile USA, Inc., 6.25% Sr. Unsec. Nts., 4/1/21 | | | 455,000 | | | | 467,399 | |
| |
| Verizon Communications, Inc.: | |
| 3.50% Sr. Unsec. Nts., 11/1/24 | | | 189,000 | | | | 186,075 | |
| 4.50% Sr. Unsec. Nts., 9/15/20 | | | 1,050,000 | | | | 1,140,907 | |
| 5.012% Sr. Unsec. Nts., 8/21/542 | | | 105,000 | | | | 109,104 | |
| 6.40% Sr. Unsec. Nts., 2/15/38 | | | 223,000 | | | | 276,056 | |
| | | | | | | | |
| | | | | | | 4,975,602 | |
|
| |
| Wireless Telecommunication Services—0.2% | |
| |
| America Movil SAB de CV, 4.375% Sr. Unsec. Unsub. Nts., 7/16/42 | | | 164,000 | | | | 157,932 | |
| |
| Rogers Communications, Inc., 6.75% Sr. Unsec. Nts., 3/15/15 | | | 123,000 | | | | 124,438 | |
| |
| Vodafone Group plc: | |
| 4.375% Sr. Unsec. Unsub. Nts., 2/19/43 | | | 142,000 | | | | 138,944 | |
| 6.25% Sr. Unsec. Nts., 11/30/32 | | | 150,000 | | | | 183,688 | |
| | | | | | | | |
| | | | | | | 605,002 | |
|
| |
| Utilities—1.9% | |
| |
| Electric Utilities—1.0% | |
| |
| American Transmission Systems, Inc., 5% Sr. Unsec. Nts., 9/1/442 | | | 118,000 | | | | 126,734 | |
| |
| EDP Finance BV, 6% Sr. Unsec. Nts., 2/2/182 | | | 405,000 | | | | 439,328 | |
| |
| ITC Holdings Corp.: | |
| 3.65% Sr. Unsec. Nts., 6/15/24 | | | 390,000 | | | | 396,270 | |
| 5.30% Sr. Unsec. Nts., 7/1/43 | | | 93,000 | | | | 108,861 | |
| |
| Jersey Central Power & Light Co., 4.70% Sr. Unsec. Nts., 4/1/242 | | | 237,000 | | | | 253,493 | |
| |
| Pennsylvania Electric Co., 5.20% Sr. Unsec. Nts., 4/1/20 | | | 88,000 | | | | 97,132 | |
| |
| PPL Capital Funding, Inc.: | |
| 3.50% Sr. Unsec. Unsub. Nts., 12/1/22 | | | 158,000 | | | | 160,302 | |
| 4.20% Sr. Sec. Nts., 6/15/22 | | | 58,000 | | | | 61,541 | |
| |
| PPL WEM Holdings Ltd., 5.375% Sr. Unsec. Unsub. Nts., 5/1/212 | | | 590,000 | | | | 663,986 | |
| |
| Trans-Allegheny Interstate Line Co., 3.85% Sr. Unsec. Nts., 6/1/252 | | | 277,000 | | | | 282,266 | |
| | | | | | | | |
| | | | | | | 2,589,913 | |
|
| |
| Independent Power and Renewable Electricity Producers—0.1% | |
| |
| Dayton Power & Light Co. (The), 1.875% Sec. Nts., 9/15/16 | | | 329,000 | | | | 332,861 | |
| |
| NRG Yield Operating LLC, 5.375% Sr. Unsec. Nts., 8/15/242 | | | 66,000 | | | | 67,320 | |
| | | | | | | | |
| | | | | | | 400,181 | |
|
| |
| Multi-Utilities—0.8% | |
| |
| CenterPoint Energy, Inc., 5.95% Sr. Unsec. Nts., 2/1/17 | | | 386,000 | | | | 421,109 | |
| |
| CMS Energy Corp.: | |
| 3.875% Sr. Unsec. Nts., 3/1/24 | | | 240,000 | | | | 249,684 | |
| 5.05% Sr. Unsec. Unsub. Nts., 3/15/22 | | | 349,000 | | | | 391,865 | |
| |
| Consolidated Edison Co. of New York, Inc., 4.625% Sr. Unsec. Nts., 12/1/54 | | | 100,000 | | | | 110,042 | |
| |
| Dominion Gas Holdings LLC, 4.60% Sr. Unsec. Nts., 12/15/44 | | | 170,000 | | | | 178,814 | |
15 OPPENHEIMER CAPITAL INCOME FUND/VA
STATEMENT OF INVESTMENTS Continued
| | | | | | | | |
| | | Principal
Amount | | | Value | |
| |
Multi-Utilities (Continued) | | | | | |
| |
| Dominion Resources, Inc., 2.50% Sr. Unsec. Nts., 12/1/19 | | | $ 308,000 | | | | $ 309,254 | |
| |
| NiSource Finance Corp., 4.80% Sr. Unsec. Nts., 2/15/44 | | | 107,000 | | | | 114,457 | |
| |
| TECO Finance, Inc., 6.75% Sr. Unsec. Nts., 5/1/15 | | | 259,000 | | | | 263,897 | |
| | | | | | | | |
| | | | | | | 2,039,122 | |
| | | | | | | | |
| Total Non-Convertible Corporate Bonds and Notes (Cost $85,692,699) | | | | | | | 88,169,237 | |
| | | | | | | | |
| | | Shares | | | | |
| |
Investment Company—2.0% | |
| |
| Oppenheimer Institutional Money Market Fund, Cl. E, 0.10%10,11 (Cost $5,367,607) | | | 5,367,607 | | | | $ 5,367,607 | |
|
| |
| Total Investments, at Value (Cost $296,799,701) | | | 118.2 | % | | | 316,313,687 | |
| |
| Net Other Assets (Liabilities) | | | (18.2 | ) | | | (48,749,942) | |
| | | | |
Net Assets | | | 100.0 | % | | | $ 267,563,745 | |
| | | | |
Footnotes to Statement of Investments
1. Non-income producing security.
2. Represents securities sold under Rule 144A, which are exempt from registration under the Securities Act of 1933, as amended. These securities have been determined to be liquid under guidelines established by the Board of Trustees. These securities amount to $41,925,006 or 15.67% of the Fund’s net assets as of December 31, 2014.
3. Represents the current interest rate for a variable or increasing rate security.
4. Interest-Only Strips represent the right to receive the monthly interest payments on an underlying pool of mortgage loans. These securities typically decline in price as interest rates decline. Most other fixed income securities increase in price when interest rates decline. The principal amount of the underlying pool represents the notional amount on which current interest is calculated. The price of these securities is typically more sensitive to changes in prepayment rates than traditional mortgage-backed securities (for example, GNMA pass-throughs). Interest rates disclosed represent current yields based upon the current cost basis and estimated timing and amount of future cash flows. These securities amount to $1,651,914 or 0.62% of the Fund’s net assets as of December 31, 2014.
5. Interest rate is less than 0.0005%.
6. Principal-Only Strips represent the right to receive the monthly principal payments on an underlying pool of mortgage loans. The value of these securities generally increases as interest rates decline and prepayment rates rise. The price of these securities is typically more volatile than that of coupon-bearing bonds of the same maturity. Interest rates disclosed represent current yields based upon the current cost basis and estimated timing of future cash flows. These securities amount to $106,730 or 0.04% of the Fund’s net assets as of December 31, 2014.
7. Restricted security. The aggregate value of restricted securities as of December 31, 2014 was $2,929,948, which represents 1.10% of the Fund’s net assets. See Note 4 of the accompanying Notes. Information concerning restricted securities is as follows:
| | | | | | | | | | | | | | | | |
| Security | | Acquisition Dates | | | Cost | | | Value | | | Unrealized
Appreciation/
(Depreciation) | |
| |
| Credit Agricole SA, 8.375% Jr. Sub. Perpetual Bonds | | | 10/27/14 - 11/13/14 | | | $ | 427,411 | | | $ | 428,275 | | | $ | 864 | |
| Rabobank Capital Funding Trust III, 5.254% Jr. Sub. Perpetual Bonds | | | 5/1/13 - 5/8/13 | | | | 761,484 | | | | 783,293 | | | | 21,809 | |
| Swiss Re Capital I LP, 6.854% Jr. Sub. Perpetual Bonds | | | 3/10/10 - 7/22/13 | | | | 747,673 | | | | 819,000 | | | | 71,327 | |
| TRW Automotive, Inc., 7.25% Sr. Unsec. Nts., 3/15/17 | | | 3/31/14 - 4/8/14 | | | | 433,060 | | | | 431,790 | | | | (1,270) | |
| ZFS Finance USA Trust V, 6.50% Jr. Sub. Nts., 5/9/37 | | | 11/20/13 | | | | 456,396 | | | | 467,590 | | | | 11,194 | |
| | | | | | | | |
| | | | | | $ | 2,826,024 | | | $ | 2,929,948 | | | $ | 103,924 | |
| | | | | | | | |
8. This bond has no contractual maturity date, is not redeemable and contractually pays an indefinite stream of interest. Rate reported represents the current interest rate for this variable rate security.
9. All or a portion of the security position is when-issued or delayed delivery to be delivered and settled after December 31, 2014. See Note 4 of the accompanying Notes.
10. Rate shown is the 7-day yield as of December 31, 2014.
11. Is or was an affiliate, as defined in the Investment Company Act of 1940, as amended, at or during the period ended December 31, 2014, by virtue of the Fund owning at least 5% of the voting securities of the issuer or as a result of the Fund and the issuer having the same investment adviser. Transactions during the period in which the issuer was an affiliate are as follows:
| | | | | | | | | | | | | | | | |
| | | Shares
December 31, 2013 | | | Gross
Additions | | | Gross
Reductions | | | Shares
December 31, 2014 | |
| |
| Oppenheimer Institutional Money Market Fund, Cl. E | | | 19,917,607 | | | | — | | | | 14,550,000 | | | | 5,367,607 | |
| | | | |
| | | | | | | | | Value | | | Income | |
| |
| Oppenheimer Institutional Money Market Fund, Cl. E | | | | | | | | | | $ | 5,367,607 | | | $ | 10,768 | |
| | | | | | | | | | | | | | | | | | | | | | | | |
| Futures Contracts as of December 31, 2014 | |
| | | | | | |
| Description | | Exchange | | | Buy/Sell | | | Expiration Date | | | Number of Contracts | | | Value | | | Unrealized Appreciation
(Depreciation) | |
| |
United States Treasury Long Bonds | | | CBT | | | | Sell | | | | 3/20/15 | | | | 11 | | | | 1,590,188 | | | $ | (7,773) | |
United States Treasury Nts., 10 yr. | | | CBT | | | | Sell | | | | 3/20/15 | | | | 77 | | | | 9,763,359 | | | | 967 | |
United States Treasury Nts., 2 yr. | | | CBT | | | | Sell | | | | 3/31/15 | | | | 78 | | | | 17,050,313 | | | | 32,390 | |
United States Treasury Nts., 5 yr. | | | CBT | | | | Buy | | | | 3/31/15 | | | | 4 | | | | 475,719 | | | | (514) | |
United States Treasury Ultra Bonds | | | CBT | | | | Buy | | | | 3/20/15 | | | | 50 | | | | 8,259,375 | | | | 278,471 | |
| | | | | | | | | | | | | | | | | | | | | | | | |
| | | | | | | | | | | | | | | | | | | | | | $ | 303,541 | |
| | | | | | | | | | | | | | | | | | | | | | | | |
16 OPPENHEIMER CAPITAL INCOME FUND/VA
| | |
| Glossary: | | |
| Currency abbreviations indicate amounts reporting in currencies |
| CHF | | Swiss Franc |
| EUR | | Euro |
| |
| Exchange Abbreviations | | |
| CBT | | Chicago Board of Trade |
See accompanying Notes to Financial Statements.
17 OPPENHEIMER CAPITAL INCOME FUND/VA
STATEMENT OF ASSETS AND LIABILITIES December 31, 2014
| | | | |
| |
Assets | | | | |
Investments, at value—see accompanying statement of investments: | | | | |
Unaffiliated companies (cost $291,432,094) | | $ | 310,946,080 | |
Affiliated companies (cost $5,367,607) | | | 5,367,607 | |
| | | | |
| | | 316,313,687 | |
| |
Cash | | | 9,746,568 | |
| |
Cash used for collateral on futures | | | 260,000 | |
| |
Receivables and other assets: | | | | |
Investments sold (including $5,185,100 sold on a when-issued or delayed delivery basis) | | | 6,659,777 | |
Interest, dividends and principal paydowns | | | 1,260,047 | |
Variation margin receivable | | | 17,813 | |
Shares of beneficial interest sold | | | 16,495 | |
Other | | | 38,505 | |
| | | | |
Total assets | | | 334,312,892 | |
|
| |
Liabilities | | | | |
Payables and other liabilities: | | | | |
Investments purchased (including $66,523,603 purchased on a when-issued or delayed delivery basis) | | | 66,523,603 | |
Shares of beneficial interest redeemed | | | 91,206 | |
Trustees’ compensation | | | 36,004 | |
Variation margin payable | | | 23,691 | |
Distribution and service plan fees | | | 13,656 | |
Shareholder communications | | | 11,705 | |
Other | | | 49,282 | |
| | | | |
Total liabilities | | | 66,749,147 | |
|
| |
Net Assets | | $ | 267,563,745 | |
| | | | |
| | | | |
| |
Composition of Net Assets | | | | |
Par value of shares of beneficial interest | | $ | 18,290 | |
| |
Additional paid-in capital | | | 262,462,549 | |
| |
Accumulated net investment income | | | 5,500,006 | |
| |
Accumulated net realized loss on investments and foreign currency transactions | | | (20,232,167) | |
| |
Net unrealized appreciation on investments and translation of assets and liabilities denominated in foreign currencies | | | 19,815,067 | |
| | | | |
Net Assets | | $ | 267,563,745 | |
| | | | |
|
| |
Net Asset Value Per Share | | | | |
Non-Service Shares: | | | | |
| Net asset value, redemption price per share and offering price per share (based on net assets of $203,684,173 and 13,880,942 shares of beneficial interest outstanding) | | | $14.67 | |
| |
| Service Shares: | | | | |
| Net asset value, redemption price per share and offering price per share (based on net assets of $63,879,572 and 4,409,304 shares of beneficial interest outstanding) | | | $14.49 | |
See accompanying Notes to Financial Statements.
18 OPPENHEIMER CAPITAL INCOME FUND/VA
STATEMENT OF OPERATIONS For the Year Ended December 31, 2014
| | | | |
| |
Investment Income | | | | |
Interest | | $ | 5,780,395 | |
| |
Dividends: | | | | |
Unaffiliated companies (net of foreign withholding taxes of $8,620) | | | 1,598,280 | |
Affiliated companies | | | 10,768 | |
| | | | |
Total investment income | | | 7,389,443 | |
|
| |
Expenses | | | | |
Management fees | | | 2,027,361 | |
| |
Distribution and service plan fees - Service shares | | | 163,156 | |
| |
Transfer and shareholder servicing agent fees: | | | | |
Non-Service shares | | | 207,999 | |
Service shares | | | 65,269 | |
| |
Shareholder communications: | | | | |
Non-Service shares | | | 33,422 | |
Service shares | | | 10,490 | |
| |
Custodian fees and expenses | | | 39,269 | |
| |
Trustees’ compensation | | | 14,478 | |
| |
Other | | | 61,281 | |
| | | | |
Total expenses | | | 2,622,725 | |
Less reduction to custodian expenses | | | (834) | |
Less waivers and reimbursements of expenses | | | (627,704) | |
| | | | |
Net expenses | | | 1,994,187 | |
|
| |
Net Investment Income | | | 5,395,256 | |
|
| |
Realized and Unrealized Gain (Loss) | | | | |
Net realized gain (loss) on: | | | | |
Investments from unaffiliated companies | | | 11,110,497 | |
Closing and expiration of futures contracts | | | 1,463,966 | |
Foreign currency transactions | | | (924) | |
| | | | |
Net realized gain | | | 12,573,539 | |
| |
Net change in unrealized appreciation/depreciation on: | | | | |
Investments | | | 3,571,120 | |
Translation of assets and liabilities denominated in foreign currencies | | | (300,326) | |
Futures contracts | | | 358,972 | |
| | | | |
Net change in unrealized appreciation/depreciation | | | 3,629,766 | |
|
| |
Net Increase in Net Assets Resulting from Operations | | $ | 21,598,561 | |
| | | | |
See accompanying Notes to Financial Statements.
19 OPPENHEIMER CAPITAL INCOME FUND/VA
STATEMENTS OF CHANGES IN NET ASSETS
| | | | | | | | |
| | | Year Ended December 31, 2014 | | | Year Ended December 31, 2013 | |
| |
Operations | | | | | | | | |
Net investment income | | $ | 5,395,256 | | | $ | 5,247,717 | |
| |
Net realized gain | | | 12,573,539 | | | | 37,714,451 | |
| |
Net change in unrealized appreciation/depreciation | | | 3,629,766 | | | | (7,198,564) | |
| | | | | | | | |
Net increase in net assets resulting from operations | | | 21,598,561 | | | | 35,763,604 | |
|
| |
Dividends and/or Distributions to Shareholders | | | | | | | | |
Dividends from net investment income: | | | | | | | | |
Non-Service shares | | | (4,273,013) | | | | (5,107,178) | |
Service shares | | | (1,173,553) | | | | (1,549,784) | |
| | | | |
| | | (5,446,566) | | | | (6,656,962) | |
|
| |
Beneficial Interest Transactions | | | | | | | | |
Net decrease in net assets resulting from beneficial interest transactions: | | | | | | | | |
Non-Service shares | | | (22,300,027) | | | | (26,201,767) | |
Service shares | | | (9,586,563) | | | | (10,510,886) | |
| | | | | | | | |
| | | (31,886,590) | | | | (36,712,653) | |
| | | | | | | | |
| |
Net Assets | | | | | | | | |
Total decrease | | | (15,734,595) | | | | (7,606,011) | |
| |
Beginning of period | | | 283,298,340 | | | | 290,904,351 | |
| | | | | | | | |
| End of period (including accumulated net investment income of $5,500,006 and $5,608,389, respectively) | | $ | 267,563,745 | | | $ | 283,298,340 | |
| | | | |
See accompanying Notes to Financial Statements.
20 OPPENHEIMER CAPITAL INCOME FUND/VA
FINANCIAL HIGHLIGHTS
| | | | | | | | | | | | | | | | | | | | |
| Non-Service Shares | | Year Ended December
31, 2014 | | | Year Ended December
31, 2013 | | | Year Ended December
31, 2012 | | | Year Ended December
30, 20111 | | | Year Ended December
31, 2010 | |
| |
Per Share Operating Data | | | | | | | | | | | | | | | | | | | | |
Net asset value, beginning of period | | $ | 13.84 | | | $ | 12.52 | | | $ | 11.30 | | | $ | 11.47 | | | $ | 10.30 | |
| |
Income (loss) from investment operations: | | | | | | | | | | | | | | | | | | | | |
Net investment income2 | | | 0.29 | | | | 0.25 | | | | 0.29 | | | | 0.20 | | | | 0.23 | |
Net realized and unrealized gain (loss) | | | 0.83 | | | | 1.38 | | | | 1.09 | | | | (0.11) | | | | 1.09 | |
| | | | |
Total from investment operations | | | 1.12 | | | | 1.63 | | | | 1.38 | | | | 0.09 | | | | 1.32 | |
| |
Dividends and/or distributions to shareholders: | | | | | | | | | | | | | | | | | | | | |
Dividends from net investment income | | | (0.29) | | | | (0.31) | | | | (0.16) | | | | (0.26) | | | | (0.15) | |
| |
Net asset value, end of period | | $ | 14.67 | | | $ | 13.84 | | | $ | 12.52 | | | $ | 11.30 | | | $ | 11.47 | |
| | | | |
|
| |
Total Return, at Net Asset Value3 | | | 8.20% | | | | 13.17% | | | | 12.34% | | | | 0.72% | | | | 12.91% | |
|
| |
Ratios/Supplemental Data | | | | | | | | | | | | | | | | | | | | |
Net assets, end of period (in thousands) | | $ | 203,684 | | | $ | 213,697 | | | $ | 218,032 | | | $ | 128,383 | | | $ | 150,622 | |
| |
Average net assets (in thousands) | | $ | 208,556 | | | $ | 218,090 | | | $ | 191,416 | | | $ | 141,848 | | | $ | 151,620 | |
| |
Ratios to average net assets:4 | | | | | | | | | | | | | | | | | | | | |
Net investment income | | | 2.03% | | | | 1.87% | | | | 2.46% | | | | 1.70% | | | | 2.13% | |
Total expenses5 | | | 0.90% | | | | 0.89% | | | | 0.90% | | | | 0.91% | | | | 0.91% | |
| Expenses after payments, waivers and/or reimbursements and reduction to custodian expenses | | | 0.67% | | | | 0.66% | | | | 0.66% | | | | 0.67% | | | | 0.65% | |
| |
Portfolio turnover rate6 | | | 98% | | | | 187% | | | | 110% | | | | 102% | | | | 54% | |
1. December 30, 2011 represents the last business day of the Fund’s 2011 fiscal year.
2. Per share amounts calculated based on the average shares outstanding during the period.
3. Assumes an initial investment on the business day before the first day of the fiscal period, with all dividends and distributions reinvested in additional shares on the reinvestment date, and redemption at the net asset value calculated on the last business day of the fiscal period. Total returns are not annualized for periods less than one full year. Total return information does not reflect expenses that apply at the separate account level or to related insurance products. Inclusion of these charges would reduce the total return figures for all periods shown. Returns do not reflect the deduction of taxes that a shareholder would pay on fund distributions or the redemption of fund shares.
4. Annualized for periods less than one full year.
5. Total expenses including indirect expenses from affiliated fund fees and expenses were as follows:
| | | | |
Year Ended December 31, 2014 | | | 0.90 | % |
Year Ended December 31, 2013 | | | 0.90 | % |
Year Ended December 31, 2012 | | | 0.91 | % |
Year Ended December 30, 2011 | | | 0.93 | % |
Year Ended December 31, 2010 | | | 0.92 | % |
6. The portfolio turnover rate excludes purchase and sale transactions of To Be Announced (TBA) mortgage-related securities as follows:
| | | | | | | | | | |
| | | | | Purchase Transactions | | | Sale Transactions | |
| | | |
| | Year Ended December 31, 2014 | | | $697,503,637 | | | | $678,765,376 | |
| | Year Ended December 31, 2013 | | | $794,398,216 | | | | $800,879,825 | |
| | Year Ended December 31, 2012 | | | $555,111,600 | | | | $549,805,766 | |
| | Year Ended December 30, 2011 | | | $450,804,195 | | | | $453,759,282 | |
| | Year Ended December 31, 2010 | | | $412,930,431 | | | | $414,511,903 | |
See accompanying Notes to Financial Statements.
21 OPPENHEIMER CAPITAL INCOME FUND/VA
FINANCIAL HIGHLIGHTS Continued
| | | | | | | | | | | | | | | | | | | | |
| Service Shares | | Year Ended December
31, 2014 | | | Year Ended December 31, 2013 | | | Year Ended December
31, 2012 | | | Year Ended December
30, 20111 | | | Year Ended December
31, 2010 | |
| |
Per Share Operating Data | | | | | | | | | | | | | | | | | | | | |
Net asset value, beginning of period | | $ | 13.66 | | | $ | 12.37 | | | $ | 11.17 | | | $ | 11.35 | | | $ | 10.19 | |
| |
Income (loss) from investment operations: | | | | | | | | | | | | | | | | | | | | |
Net investment income2 | | | 0.25 | | | | 0.21 | | | | 0.26 | | | | 0.16 | | | | 0.20 | |
Net realized and unrealized gain (loss) | | | 0.84 | | | | 1.36 | | | | 1.08 | | | | (0.11) | | | | 1.08 | |
| | | | |
Total from investment operations | | | 1.09 | | | | 1.57 | | | | 1.34 | | | | 0.05 | | | | 1.28 | |
| |
Dividends and/or distributions to shareholders: | | | | | | | | | | | | | | | | | | | | |
Dividends from net investment income | | | (0.26) | | | | (0.28) | | | | (0.14) | | | | (0.23) | | | | (0.12) | |
| |
Net asset value, end of period | | $ | 14.49 | | | $ | 13.66 | | | $ | 12.37 | | | $ | 11.17 | | | $ | 11.35 | |
| | | | |
|
| |
Total Return, at Net Asset Value3 | | | 8.02% | | | | 12.83% | | | | 12.11% | | | | 0.38% | | | | 12.68% | |
|
| |
Ratios/Supplemental Data | | | | | | | | | | | | | | | | | | | | |
Net assets, end of period (in thousands) | | $ | 63,880 | | | $ | 69,601 | | | $ | 72,872 | | | $ | 77,551 | | | $ | 89,580 | |
| |
Average net assets (in thousands) | | $ | 65,450 | | | $ | 72,332 | | | $ | 76,257 | | | $ | 85,157 | | | $ | 87,280 | |
| |
Ratios to average net assets:4 | | | | | | | | | | | | | | | | | | | | |
Net investment income | | | 1.78% | | | | 1.62% | | | | 2.18% | | | | 1.45% | | | | 1.87% | |
Total expenses5 | | | 1.15% | | | | 1.15% | | | | 1.16% | | | | 1.16% | | | | 1.16% | |
| Expenses after payments, waivers and/or reimbursements and reduction to custodian expenses | | | 0.92% | | | | 0.92% | | | | 0.92% | | | | 0.92% | | | | 0.90% | |
| |
Portfolio turnover rate6 | | | 98% | | | | 187% | | | | 110% | | | | 102% | | | | 54% | |
1. December 30, 2011 represents the last business day of the Fund’s 2011 fiscal year.
2. Per share amounts calculated based on the average shares outstanding during the period.
3. Assumes an initial investment on the business day before the first day of the fiscal period, with all dividends and distributions reinvested in additional shares on the reinvestment date, and redemption at the net asset value calculated on the last business day of the fiscal period. Total returns are not annualized for periods less than one full year. Total return information does not reflect expenses that apply at the separate account level or to related insurance products. Inclusion of these charges would reduce the total return figures for all periods shown. Returns do not reflect the deduction of taxes that a shareholder would pay on fund distributions or the redemption of fund shares.
4. Annualized for periods less than one full year.
5. Total expenses including indirect expenses from affiliated fund fees and expenses were as follows:
| | | | |
Year Ended December 31, 2014 | | | 1.15 | % |
Year Ended December 31, 2013 | | | 1.16 | % |
Year Ended December 31, 2012 | | | 1.17 | % |
Year Ended December 30, 2011 | | | 1.18 | % |
Year Ended December 31, 2010 | | | 1.17 | % |
6. The portfolio turnover rate excludes purchase and sale transactions of To Be Announced (TBA) mortgage-related securities as follows:
| | | | | | | | | | |
| | | | | Purchase Transactions | | | Sale Transactions | |
| | | |
| | Year Ended December 31, 2014 | | | $697,503,637 | | | | $678,765,376 | |
| | Year Ended December 31, 2013 | | | $794,398,216 | | | | $800,879,825 | |
| | Year Ended December 31, 2012 | | | $555,111,600 | | | | $549,805,766 | |
| | Year Ended December 30, 2011 | | | $450,804,195 | | | | $453,759,282 | |
| | Year Ended December 31, 2010 | | | $412,930,431 | | | | $414,511,903 | |
See accompanying Notes to Financial Statements.
22 OPPENHEIMER CAPITAL INCOME FUND/VA
| | |
NOTES TO FINANCIAL STATEMENTS December 31, 2014 |
1. Organization
Oppenheimer Capital Income Fund/VA (the “Fund”), a separate series of Oppenheimer Variable Account Funds, is a diversified open-end management investment company registered under the Investment Company Act of 1940 (“1940 Act”), as amended. The Fund’s investment objective is to seek total return. The Fund’s investment adviser is OFI Global Asset Management, Inc. (“OFI Global” or the “Manager”), a wholly-owned subsidiary of OppenheimerFunds, Inc. (“OFI” or the “Sub-Adviser”). The Manager has entered into a sub-advisory agreement with OFI. Shares of the Fund are sold only to separate accounts of life insurance companies.
The Fund offers two classes of shares. Both classes are sold at their offering price, which is the net asset value per share, to separate investment accounts of participating insurance companies as an underlying investment for variable life insurance policies, variable annuity contracts or other investment products. The class of shares designated as Service shares is subject to a distribution and service plan. Both classes of shares have identical rights and voting privileges with respect to the Fund in general and exclusive voting rights on matters that affect that class alone. Earnings, net assets and net asset value per share may differ due to each class having its own expenses, such as transfer and shareholder servicing agent fees and shareholder communications, directly attributable to that class.
The following is a summary of significant accounting policies consistently followed by the Fund.
2. Significant Accounting Policies
Security Valuation. All investments in securities are recorded at their estimated fair value, as described in Note 3.
Foreign Currency Translation. The Fund’s accounting records are maintained in U.S. dollars. The values of securities denominated in foreign currencies and amounts related to the purchase and sale of foreign securities and foreign investment income are translated into U.S. dollars as of the close of the New York Stock Exchange (the “Exchange”), normally 4:00 P.M. Eastern time, on each day the Exchange is open for trading. Foreign exchange rates may be valued primarily using a reliable bank, dealer or service authorized by the Board of Trustees.
Reported net realized gains and losses from foreign currency transactions arise from sales of portfolio securities, sales and maturities of short-term securities, sales of foreign currencies, exchange rate fluctuations between the trade and settlement dates on securities transactions, and the difference between the amounts of dividends, interest, and foreign withholding taxes recorded on the Fund’s books and the U.S. dollar equivalent of the amounts actually received or paid. Net unrealized appreciation and depreciation on the translation of assets and liabilities denominated in foreign currencies arise from changes in the values of assets and liabilities, including investments in securities at fiscal period end, resulting from changes in exchange rates.
The effect of changes in foreign currency exchange rates on investments is separately identified from the fluctuations arising from changes in market values of securities held and reported with all other foreign currency gains and losses in the Fund’s Statement of Operations.
Allocation of Income, Expenses, Gains and Losses. Income, expenses (other than those attributable to a specific class), gains and losses are allocated on a daily basis to each class of shares based upon the relative proportion of net assets represented by such class. Operating expenses directly attributable to a specific class are charged against the operations of that class.
Dividends and Distributions to Shareholders. Dividends and distributions to shareholders, which are determined in accordance with income tax regulations and may differ from U.S. generally accepted accounting principles, are recorded on the ex-dividend date. Income and capital gain distributions, if any, are declared and paid annually or at other times as deemed necessary by the Manager.
Investment Income. Dividend income is recorded on the ex-dividend date or upon ex-dividend notification in the case of certain foreign dividends where the ex-dividend date may have passed. Non-cash dividends included in dividend income, if any, are recorded at the fair market value of the securities received. Interest income is recognized on an accrual basis. Discount and premium, which are included in interest income on the Statement of Operations, are amortized or accreted daily.
Custodian Fees. “Custodian fees and expenses” in the Statement of Operations may include interest expense incurred by the Fund on any cash overdrafts of its custodian account during the period. Such cash overdrafts may result from the effects of failed trades in portfolio securities and from cash outflows resulting from unanticipated shareholder redemption activity. The Fund pays interest to its custodian on such cash overdrafts, to the extent they are not offset by positive cash balances maintained by the Fund, at a rate equal to the Federal Funds Rate plus 0.50%. The “Reduction to custodian expenses” line item, if applicable, represents earnings on cash balances maintained by the Fund during the period. Such interest expense and other custodian fees may be paid with these earnings.
Security Transactions. Security transactions are recorded on the trade date. Realized gains and losses on securities sold are determined on the basis of identified cost.
Indemnifications. The Fund’s organizational documents provide current and former Trustees and officers with a limited indemnification against liabilities arising in connection with the performance of their duties to the Fund. In the normal course of business, the Fund may also enter into contracts that provide general indemnifications. The Fund’s maximum exposure under these arrangements is unknown as this would be dependent on future claims that may be made against the Fund. The risk of material loss from such claims is considered remote.
Federal Taxes. The Fund intends to comply with provisions of the Internal Revenue Code applicable to regulated investment companies and to distribute substantially all of its investment company taxable income, including any net realized gain on investments not offset by capital loss
23 OPPENHEIMER CAPITAL INCOME FUND/VA
| | |
NOTES TO FINANCIAL STATEMENTS Continued |
2. Significant Accounting Policies (Continued)
carryforwards, if any, to shareholders. Therefore, no federal income or excise tax provision is required. The Fund files income tax returns in U.S. federal and applicable state jurisdictions. The statute of limitations on the Fund’s tax return filings generally remain open for the three preceding fiscal reporting period ends.
The tax components of capital shown in the following table represent distribution requirements the Fund must satisfy under the income tax regulations, losses the Fund may be able to offset against income and gains realized in future years and unrealized appreciation or depreciation of securities and other investments for federal income tax purposes.
| | | | | | | | | | | | |
Undistributed Net Investment Income | | Undistributed Long-Term Gain | | | Accumulated Loss Carryforward1,2,3,4,5 | | | Net Unrealized Appreciation Based on cost of Securities and Other Investments for Federal Income Tax Purposes | |
| |
$5,536,007 | | | $— | | | | $19,904,306 | | | | $19,487,201 | |
1. As of December 31, 2014, the Fund had $19,530,266 of net capital loss carryforward available to offset future realized capital gains, if any, and thereby reduce future taxable gain distributions. Details of the capital loss carryforwards are included in the table below. Capital loss carryovers with no expiration, if any, must be utilized prior to those with expiration dates.
| | | | |
| Expiring | | | |
| |
2015 | | $ | 3,323,244 | |
2016 | | | 3,323,244 | |
2017 | | | 12,883,778 | |
| | | | |
Total | | $ | 19,530,266 | |
| | | | |
Of these losses, $6,646,488 are subject to loss limitation rules resulting from merger activity. These limitations generally reduce the utilization of these losses to a maximum of $3,323,244 per year.
2. As of December 31, 2014, the Fund had $371,625 of post-October losses available to offset future realized capital gains, if any.
3. The Fund had $2,415 of straddle losses which were deferred.
4. During the fiscal year ended December 31, 2014, the Fund utilized $13,105,097 of capital loss carryforward to offset capital gains realized in that fiscal year.
5. During the fiscal year ended December 31, 2013, the Fund utilized $36,465,772 of capital loss carryforward to offset capital gains realized in that fiscal year.
Net investment income (loss) and net realized gain (loss) may differ for financial statement and tax purposes. The character of dividends and distributions made during the fiscal year from net investment income or net realized gains may differ from their ultimate characterization for federal income tax purposes. Also, due to timing of dividends and distributions, the fiscal year in which amounts are distributed may differ from the fiscal year in which the income or net realized gain was recorded by the Fund.
Accordingly, the following amounts have been reclassified for December 31, 2014. Net assets of the Fund were unaffected by the reclassifications.
| | | | | | | | |
Increase to Paid-in Capital | | Reduction to Accumulated Net Investment Income | | | Reduction to Accumulated Net Realized Loss on Investments | |
| |
$5,734 | | | $57,073 | | | | $51,339 | |
The tax character of distributions paid during the years ended December 31, 2014 and December 31, 2013 was as follows:
| | | | | | | | |
| | | Year Ended | | | Year Ended | |
| | | December 31, 2014 | | | December 31, 2013 | |
| |
Distributions paid from: | | | | | | | | |
Ordinary income | | $ | 5,446,566 | | | $ | 6,656,962 | |
The aggregate cost of securities and other investments and the composition of unrealized appreciation and depreciation of securities and other investments for federal income tax purposes as of December 31, 2014 are noted in the following table. The primary difference between book and tax appreciation or depreciation of securities and other investments, if applicable, is attributable to the tax deferral of losses or tax realization of financial statement unrealized gain or loss.
| | | | |
Federal tax cost of securities | | $ | 296,824,025 | |
Federal tax cost of other investments | | | 303,540 | |
| | | | |
Total federal tax cost | | $ | 297,127,565 | |
| | | | |
Gross unrealized appreciation | | $ | 22,641,096 | |
Gross unrealized depreciation | | | (3,153,895) | |
| | | | |
Net unrealized appreciation | | $ | 19,487,201 | |
| | | | |
24 OPPENHEIMER CAPITAL INCOME FUND/VA
2. Significant Accounting Policies (Continued)
Use of Estimates. The preparation of financial statements in conformity with accounting principles generally accepted in the United States of America requires management to make estimates and assumptions that affect the reported amounts of assets and liabilities and disclosure of contingent assets and liabilities at the date of the financial statements and the reported amounts of increases and decreases in net assets from operations during the reporting period. Actual results could differ from those estimates.
3. Securities Valuation
The Fund calculates the net asset value of its shares as of the close of the New York Stock Exchange (the “Exchange”), normally 4:00 P.M. Eastern time, on each day the Exchange is open for trading.
The Fund’s Board has adopted procedures for the valuation of the Fund’s securities and has delegated the day-to-day responsibility for valuation determinations under those procedures to the Manager. The Manager has established a Valuation Committee which is responsible for determining a “fair valuation” for any security for which market quotations are not “readily available.” The Valuation Committee’s fair valuation determinations are subject to review, approval and ratification by the Fund’s Board at its next regularly scheduled meeting covering the calendar quarter in which the fair valuation was determined.
Valuation Methods and Inputs
Securities are valued using unadjusted quoted market prices, when available, as supplied primarily by third party pricing services or dealers.
The following methodologies are used to determine the market value or the fair value of the types of securities described below:
Securities traded on a registered U.S. securities exchange (including exchange-traded derivatives other than futures and futures options) are valued based on the last sale price of the security reported on the principal exchange on which it is traded, prior to the time when the Fund’s assets are valued. In the absence of a sale, the security is valued at the last sale price on the prior trading day, if it is within the spread of the current day’s closing “bid” and “asked” prices, and if not, at the current day’s closing bid price. A security of a foreign issuer traded on a foreign exchange, but not listed on a registered U.S. securities exchange, is valued based on the last sale price on the principal exchange on which the security is traded, as identified by the third party pricing service used by the Manager, prior to the time when the Fund’s assets are valued. If the last sale price is unavailable, the security is valued at the most recent official closing price on the principal exchange on which it is traded. If the last sales price or official closing price for a foreign security is not available, the security is valued at the mean between the bid and asked price per the exchange or, if not available from the exchange, obtained from two dealers. If bid and asked prices are not available from either the exchange or two dealers, the security is valued by using one of the following methodologies (listed in order of priority): (1) using a bid from the exchange, (2) the mean between the bid and asked price as provided by a single dealer, or (3) a bid from a single dealer.
Shares of a registered investment company that are not traded on an exchange are valued at that investment company’s net asset value per share.
Corporate and government debt securities (of U.S. or foreign issuers) and municipal debt securities, event-linked bonds, loans, mortgage-backed securities, collateralized mortgage obligations, and asset-backed securities are valued at the mean between the “bid” and “asked” prices utilizing evaluated prices obtained from third party pricing services or broker-dealers who may use matrix pricing methods to determine the evaluated prices.
Short-term money market type debt securities with a remaining maturity of sixty days or less are valued at cost adjusted by the amortization of discount or premium to maturity (amortized cost), which approximates market value. Short-term debt securities with a remaining maturity in excess of sixty days are valued at the mean between the “bid” and “asked” prices utilizing evaluated prices obtained from third party pricing services or broker-dealers.
Futures contracts and futures options traded on a commodities or futures exchange will be valued at the final settlement price or official closing price on the principal exchange as reported by such principal exchange at its trading session ending at, or most recently prior to, the time when the Fund’s assets are valued.
A description of the standard inputs that may generally be considered by the third party pricing vendors in determining their evaluated prices is provided below.
| | |
| Security Type | | Standard inputs generally considered by third-party pricing
vendors |
| Corporate debt, government debt, municipal, mortgage-backed and asset-backed securities | | Reported trade data, broker-dealer price quotations, benchmark yields, issuer spreads on comparable securities, the credit quality, yield, maturity, and other appropriate factors. |
Loans | | Information obtained from market participants regarding reported trade data and broker-dealer price quotations. |
Event-linked bonds | | Information obtained from market participants regarding reported trade data and broker-dealer price quotations. |
If a market value or price cannot be determined for a security using the methodologies described above, or if, in the “good faith” opinion of the Manager, the market value or price obtained does not constitute a “readily available market quotation,” or a significant event has occurred that would materially affect the value of the security the security is fair valued either (i) by a standardized fair valuation methodology applicable to the security type or the significant event as previously approved by the Valuation Committee and the Fund’s Board or (ii) as determined in good faith by the Manager’s Valuation Committee. The Valuation Committee considers all relevant facts that are reasonably available, through either public information or information available to the Manager, when determining the fair value of a security. Fair value determinations by the Manager are subject to review, approval and ratification by the Fund’s Board at its next regularly scheduled meeting covering the calendar quarter in which the fair valuation was determined. Those fair valuation standardized methodologies include, but are not limited to, valuing securities at the last sale price or initially at cost and
25 OPPENHEIMER CAPITAL INCOME FUND/VA
NOTESTO FINANCIAL STATEMENTS Continued
3. Securities Valuation (Continued)
subsequently adjusting the value based on: changes in company specific fundamentals, changes in an appropriate securities index, or changes in the value of similar securities which may be further adjusted for any discounts related to security-specific resale restrictions. When possible, such methodologies use observable market inputs such as unadjusted quoted prices of similar securities, observable interest rates, currency rates and yield curves. The methodologies used for valuing securities are not necessarily an indication of the risks associated with investing in those securities nor can it be assured that the Fund can obtain the fair value assigned to a security if it were to sell the security.
To assess the continuing appropriateness of security valuations, the Manager, or its third party service provider who is subject to oversight by the Manager, regularly compares prior day prices, prices on comparable securities, and sale prices to the current day prices and challenges those prices exceeding certain tolerance levels with the third party pricing service or broker source. For those securities valued by fair valuations, whether through a standardized fair valuation methodology or a fair valuation determination, the Valuation Committee reviews and affirms the reasonableness of the valuations based on such methodologies and fair valuation determinations on a regular basis after considering all relevant information that is reasonably available.
Classifications
Each investment asset or liability of the Fund is assigned a level at measurement date based on the significance and source of the inputs to its valuation. Various data inputs are used in determining the value of each of the Fund’s investments as of the reporting period end. These data inputs are categorized in the following hierarchy under applicable financial accounting standards:
1) Level 1-unadjusted quoted prices in active markets for identical assets or liabilities (including securities actively traded on a securities exchange)
2) Level 2-inputs other than unadjusted quoted prices that are observable for the asset or liability (such as unadjusted quoted prices for similar assets and market corroborated inputs such as interest rates, prepayment speeds, credit risks, etc.)
3) Level 3-significant unobservable inputs (including the Manager’s own judgments about assumptions that market participants would use in pricing the asset or liability).
The inputs used for valuing securities are not necessarily an indication of the risks associated with investing in those securities.
The table below categorizes amounts that are included in the Fund’s Statement of Assets and Liabilities as of December 31, 2014 based on valuation input level:
| | | | | | | | | | | | | | | | |
| | | Level 1— Unadjusted Quoted Prices | | | Level 2— Other Significant Observable Inputs | | | Level 3— Significant Unobservable Inputs | | | Value | |
| |
Assets Table | | | | | | | | | | | | | | | | |
Investments, at Value: | | | | | | | | | | | | | | | | |
Common Stocks | | | | | | | | | | | | | | | | |
Consumer Discretionary | | $ | 11,155,775 | | | $ | — | | | $ | — | | | $ | 11,155,775 | |
Consumer Staples | | | 4,461,491 | | | | 3,026,641 | | | | — | | | | 7,488,132 | |
Energy | | | 7,759,968 | | | | — | | | | — | | | | 7,759,968 | |
Financials | | | 15,537,275 | | | | — | | | | — | | | | 15,537,275 | |
Health Care | | | 13,624,693 | | | | — | | | | — | | | | 13,624,693 | |
Industrials | | | 10,810,112 | | | | — | | | | — | | | | 10,810,112 | |
Information Technology | | | 18,357,282 | | | | — | | | | — | | | | 18,357,282 | |
Materials | | | 3,342,345 | | | | — | | | | — | | | | 3,342,345 | |
Telecommunication Services | | | 1,473,684 | | | | — | | | | — | | | | 1,473,684 | |
Utilities | | | 1,069,461 | | | | — | | | | — | | | | 1,069,461 | |
Asset-Backed Securities | | | — | | | | 28,582,131 | | | | — | | | | 28,582,131 | |
Mortgage-Backed Obligations | | | — | | | | 102,759,696 | | | | — | | | | 102,759,696 | |
U.S. Government Obligations | | | — | | | | 816,289 | | | | — | | | | 816,289 | |
Non-Convertible Corporate Bonds and Notes | | | — | | | | 88,169,237 | | | | — | | | | 88,169,237 | |
Investment Company | | | 5,367,607 | | | | — | | | | — | | | | 5,367,607 | |
| | | | |
Total Investments, at Value | | | 92,959,693 | | | | 223,353,994 | | | | — | | | | 316,313,687 | |
Other Financial Instruments: | | | | | | | | | | | | | | | | |
Futures contracts | | | 311,828 | | | | — | | | | — | | | | 311,828 | |
| | | | |
Total Assets | | $ | 93,271,521 | | | $ | 223,353,994 | | | $ | — | | | $ | 316,625,515 | |
| | | | |
| | | | |
Liabilities Table | | | | | | | | | | | | | | | | |
Other Financial Instruments: | | | | | | | | | | | | | | | | |
Futures contracts | | $ | (8,287 | ) | | $ | — | | | $ | — | | | $ | (8,287) | |
| | | | |
Total Liabilities | | $ | (8,287 | ) | | $ | — | | | $ | — | | | $ | (8,287) | |
| | | | |
Forward currency exchange contracts and futures contracts, if any, are reported at their unrealized appreciation/depreciation at measurement date, which represents the change in the contract’s value from trade date. All additional assets and liabilities included in the above table are reported at their market value at measurement date.
26 OPPENHEIMER CAPITAL INCOME FUND/VA
4. Investments and Risks
Investment in Oppenheimer Institutional Money Market Fund. The Fund is permitted to invest daily available cash balances in an affiliated money market fund. The Fund may invest the available cash in Class E shares of Oppenheimer Institutional Money Market Fund (“IMMF”) to seek current income while preserving liquidity or for defensive purposes. IMMF is a registered open-end management investment company, regulated as a money market fund under the 1940 Act. The Manager is the investment adviser of IMMF, and the Sub-Adviser provides investment and related advisory services to IMMF. When applicable, the Fund’s investment in IMMF is included in the Statement of Investments. Shares of IMMF are valued at their net asset value per share. As a shareholder, the Fund is subject to its proportional share of IMMF’s Class E expenses, including its management fee. The Manager will waive fees and/or reimburse Fund expenses in an amount equal to the indirect management fees incurred through the Fund’s investment in IMMF.
Securities on a When-Issued or Delayed Delivery Basis. The Fund may purchase securities on a “when-issued” basis, and may purchase or sell securities on a “delayed delivery” basis. “When-issued” or “delayed delivery” refers to securities whose terms and indenture are available and for which a market exists, but which are not available for immediate delivery. Delivery and payment for securities that have been purchased by the Fund on a when-issued basis normally takes place within six months and possibly as long as two years or more after the trade date. During this period, such securities do not earn interest, are subject to market fluctuation and may increase or decrease in value prior to their delivery. The purchase of securities on a when-issued basis may increase the volatility of the Fund’s net asset value to the extent the Fund executes such transactions while remaining substantially fully invested. When the Fund engages in when-issued or delayed delivery transactions, it relies on the buyer or seller, as the case may be, to complete the transaction. Their failure to do so may cause the Fund to lose the opportunity to obtain or dispose of the security at a price and yield it considers advantageous. The Fund may also sell securities that it purchased on a when-issued basis or forward commitment prior to settlement of the original purchase.
As of December 31, 2014, the Fund had purchased securities issued on a when-issued or delayed delivery basis and sold securities issued on a delayed delivery basis as follows:
| | | | |
| | | When-Issued or
Delayed Delivery Basis Transactions | |
| |
Purchased securities | | | $66,523,603 | |
Sold securities | | | 5,185,100 | |
The Fund may enter into “forward roll” transactions with respect to mortgage-related securities. In this type of transaction, the Fund sells a mortgage-related security to a buyer and simultaneously agrees to repurchase a similar security (same type, coupon and maturity) at a later date at a set price. During the period between the sale and the repurchase, the Fund will not be entitled to receive interest and principal payments on the securities that have been sold. The Fund records the incremental difference between the forward purchase and sale of each forward roll as realized gain (loss) on investments or as fee income in the case of such transactions that have an associated fee in lieu of a difference in the forward purchase and sale price.
Forward roll transactions may be deemed to entail embedded leverage since the Fund purchases mortgage-related securities with extended settlement dates rather than paying for the securities under a normal settlement cycle. This embedded leverage increases the Fund’s market value of investments relative to its net assets which can incrementally increase the volatility of the Fund’s performance. Forward roll transactions can be replicated over multiple settlement periods.
Risks of entering into forward roll transactions include the potential inability of the counterparty to meet the terms of the agreement; the potential of the Fund to receive inferior securities at redelivery as compared to the securities sold to the counterparty; and counterparty credit risk.
Restricted Securities. As of December 31, 2014, investments in securities included issues that are restricted. A restricted security may have a contractual restriction on its resale and is valued under methods approved by the Board of Trustees as reflecting fair value. Securities that are restricted are marked with an applicable footnote on the Statement of Investments. Restricted securities are reported on a schedule following the Statement of Investments.
Equity Security Risk. Stocks and other equity securities fluctuate in price. The value of the Fund’s portfolio may be affected by changes in the equity markets generally. Equity markets may experience significant short-term volatility and may fall sharply at times. Different markets may behave differently from each other and U.S. equity markets may move in the opposite direction from one or more foreign stock markets.
The prices of individual equity securities generally do not all move in the same direction at the same time and a variety of factors can affect the price of a particular company’s securities. These factors may include, but are not limited to, poor earnings reports, a loss of customers, litigation against the company, general unfavorable performance of the company’s sector or industry, or changes in government regulations affecting the company or its industry.
5. Risk Exposures and the Use of Derivative Instruments
The Fund’s investment objective not only permits the Fund to purchase investment securities, it also allows the Fund to enter into various types of derivatives contracts, including, but not limited to, futures contracts, forward currency exchange contracts, credit default swaps, interest rate swaps, total return swaps, variance swaps and purchased and written options. In doing so, the Fund will employ strategies in differing combinations to permit it to increase, decrease, or change the level or types of exposure to market risk factors. These instruments may allow the Fund to pursue its objectives more
27 OPPENHEIMER CAPITAL INCOME FUND/VA
NOTESTO FINANCIAL STATEMENTS Continued
5. Risk Exposures and the Use of Derivative Instruments (Continued)
quickly and efficiently than if it were to make direct purchases or sales of securities capable of effecting a similar response to market factors. Such contracts may be entered into through a bilateral over-the-counter (“OTC”) transaction, or through a securities or futures exchange and cleared through a clearinghouse.
Market Risk Factors. In accordance with its investment objectives, the Fund may use derivatives to increase or decrease its exposure to one or more of the following market risk factors:
Commodity Risk. Commodity risk relates to the change in value of commodities or commodity indexes as they relate to increases or decreases in the commodities market. Commodities are physical assets that have tangible properties. Examples of these types of assets are crude oil, heating oil, metals, livestock, and agricultural products.
Credit Risk. Credit risk relates to the ability of the issuer to meet interest and principal payments, or both, as they come due. In general, lower-grade, higher-yield bonds are subject to credit risk to a greater extent than lower-yield, higher-quality bonds.
Equity Risk. Equity risk relates to the change in value of equity securities as they relate to increases or decreases in the general market.
Foreign Exchange Rate Risk. Foreign exchange rate risk relates to the change in the U.S. dollar value of a security held that is denominated in a foreign currency. The U.S. dollar value of a foreign currency denominated security will decrease as the dollar appreciates against the currency, while the U.S. dollar value will increase as the dollar depreciates against the currency.
Interest Rate Risk. Interest rate risk refers to the fluctuations in value of fixed-income securities resulting from the inverse relationship between price and yield. For example, an increase in general interest rates will tend to reduce the market value of already issued fixed-income investments, and a decline in general interest rates will tend to increase their value. In addition, debt securities with longer maturities, which tend to have higher yields, are subject to potentially greater fluctuations in value from changes in interest rates than obligations with shorter maturities.
Volatility Risk. Volatility risk refers to the magnitude of the movement, but not the direction of the movement, in a financial instrument’s price over a defined time period. Large increases or decreases in a financial instrument’s price over a relative time period typically indicate greater volatility risk, while small increases or decreases in its price typically indicate lower volatility risk.
Derivatives may have little or no initial cash investment relative to their market value exposure and therefore can produce significant gains or losses in excess of their cost due to unanticipated changes in the market risk factors and the overall market. This use of embedded leverage allows the Fund to increase its market value exposure relative to its net assets and can substantially increase the volatility of the Fund’s performance. In instances where the Fund is using derivatives to decrease, or hedge, exposures to market risk factors for securities held by the Fund, there are also risks that those derivatives may not perform as expected resulting in losses for the combined or hedged positions. Some derivatives have the potential for unlimited loss, regardless of the size of the Fund’s initial investment.
Additional associated risks from investing in derivatives also exist and potentially could have significant effects on the valuation of the derivative and the Fund. Typically, the associated risks are not the risks that the Fund is attempting to increase or decrease exposure to, per its investment objectives, but are the additional risks from investing in derivatives. Examples of these associated risks are liquidity risk, which is the risk that the Fund will not be able to sell the derivative in the open market in a timely manner, and counterparty credit risk, which is the risk that the counterparty will not fulfill its obligation to the Fund.
The Fund’s actual exposures to these market risk factors and associated risks during the period are discussed in further detail, by derivative type, below.
Futures Contracts
A futures contract is a commitment to buy or sell a specific amount of a commodity, financial instrument or currency at a negotiated price on a stipulated future date. The Fund may buy and sell futures contracts and may also buy or write put or call options on these futures contracts. Futures contracts and options thereon are generally entered into on a regulated futures exchange and cleared through a clearinghouse associated with the exchange.
Upon entering into a futures contract, the Fund is required to deposit either cash or securities (initial margin) in an amount equal to a certain percentage of the contract value in an account registered in the futures commission merchant’s name. Subsequent payments (variation margin) are paid to or from the futures commission merchant each day equal to the daily changes in the contract value. Such payments are recorded as unrealized gains and losses. Should the Fund fail to make requested variation margin payments, the futures commission merchant can gain access to the initial margin to satisfy the Fund’s payment obligations.
Futures contracts are reported on a schedule following the Statement of Investments. Securities held by a futures commission merchant to cover initial margin requirements on open futures contracts are noted in the Statement of Investments. Cash held by a futures commission merchant to cover initial margin requirements on open futures contracts and the receivable and/or payable for the daily mark to market for the variation margin are noted in the Statement of Assets and Liabilities. The net change in unrealized appreciation and depreciation is reported in the Statement of Operations. Realized gains (losses) are reported in the Statement of Operations at the closing or expiration of futures contracts.
The Fund has purchased futures contracts on various bonds and notes to increase exposure to interest rate risk.
The Fund has sold futures contracts on various bonds and notes to decrease exposure to interest rate risk.
During the year ended December 31, 2014, the Fund had an ending monthly average market value of $12,881,320 and $28,102,359 on futures contracts purchased and sold, respectively.
Additional associated risks of entering into futures contracts (and related options) include the possibility that there may be an illiquid market where the Fund is unable to liquidate the contract or enter into an offsetting position and, if used for hedging purposes, the risk that the price of the contract will correlate imperfectly with the prices of the Fund’s securities.
28 OPPENHEIMER CAPITAL INCOME FUND/VA
5. Risk Exposures and the Use of Derivative Instruments (Continued)
Swaption Transactions
The Fund may enter into a swaption contract which grants the purchaser the right, but not the obligation, to enter into a swap transaction at preset terms detailed in the underlying agreement within a specified period of time. The purchaser pays a premium to the swaption writer who bears the risk of unfavorable changes in the preset terms on the underlying swap.
Purchased swaptions are reported as a component of investments in the Statement of Investments and the Statement of Assets and Liabilities. Written swaptions are reported on a schedule following the Statement of Investments and their value is reported as a separate asset or liability line item in the Statement of Assets and Liabilities. The net change in unrealized appreciation or depreciation on written swaptions is separately reported in the Statement of Operations. When a swaption is exercised, the cost of the swap is adjusted by the amount of premium paid or received. Upon the expiration or closing of an unexercised swaption contract, a gain or loss is reported in the Statement of Operations for the amount of the premium paid or received.
The Fund generally will incur a greater risk when it writes a swaption than when it purchases a swaption. When the Fund writes a swaption it will become obligated, upon exercise of the swaption, according to the terms of the underlying agreement. Swaption contracts written by the Fund do not give rise to counterparty credit risk prior to exercise as they obligate the Fund, not its counterparty, to perform. When the Fund purchases a swaption it only risks losing the amount of the premium it paid if the swaption expires unexercised. However, when the Fund exercises a purchased swaption there is a risk that the counterparty will fail to perform or otherwise default on its obligations under the swaption contract.
The Fund has purchased swaptions which gives it the option to buy credit protection through credit default swaps in order to decrease exposure to the credit risk of individual issuers and/or indexes of issuers. A purchased swaption of this type becomes more valuable as the likelihood of a credit event on the reference asset increases.
During the year ended December 31, 2014, the Fund had an ending monthly average market value of $16,659 on purchased swaptions.
Counterparty Credit Risk. Derivative positions are subject to the risk that the counterparty will not fulfill its obligation to the Fund. The Fund intends to enter into derivative transactions with counterparties that the Manager believes to be creditworthy at the time of the transaction.
The Fund’s risk of loss from counterparty credit risk on OTC derivatives is generally limited to the aggregate unrealized gain netted against any collateral held by the Fund. For OTC options purchased, the Fund bears the risk of loss of the amount of the premiums paid plus the positive change in market values net of any collateral held by the Fund should the counterparty fail to perform under the contracts. Options written by the Fund do not typically give rise to counterparty credit risk, as options written generally obligate the Fund and not the counterparty to perform.
To reduce counterparty risk with respect to OTC transactions, the Fund has entered into master netting arrangements, established within the Fund’s International Swap and Derivatives Association, Inc. (“ISDA”) master agreements, which allow the Fund to make (or to have an entitlement to receive) a single net payment in the event of default (close-out netting) for outstanding payables and receivables with respect to certain OTC positions in swaps, options, swaptions, and forward currency exchange contracts for each individual counterparty. In addition, the Fund may require that certain counterparties post cash and/or securities in collateral accounts to cover their net payment obligations for those derivative contracts subject to ISDA master agreements. If the counterparty fails to perform under these contracts and agreements, the cash and/or securities will be made available to the Fund.
ISDA master agreements include credit related contingent features which allow counterparties to OTC derivatives to terminate derivative contracts prior to maturity in the event that, for example, the Fund’s net assets decline by a stated percentage or the Fund fails to meet the terms of its ISDA master agreements, which would cause the Fund to accelerate payment of any net liability owed to the counterparty.
For financial reporting purposes, the Fund does not offset derivative assets and derivative liabilities that are subject to netting arrangements in the Statement of Assets and Liabilities. Bankruptcy or insolvency laws of a particular jurisdiction may impose restrictions on or prohibitions against the right of offset in bankruptcy, insolvency or other events.
The Fund’s risk of loss from counterparty credit risk on exchange-traded derivatives cleared through a clearinghouse and for centrally cleared swaps is generally considered lower than as compared to OTC derivatives. However, counterparty credit risk exists with respect to initial and variation margin deposited/paid by the Fund that is held in futures commission merchant, broker and/or clearinghouse accounts for such exchange-traded derivatives and for centrally cleared swaps.
With respect to centrally cleared swaps, such transactions will be submitted for clearing, and if cleared, will be held in accounts at futures commission merchants or brokers that are members of clearinghouses. While brokers, futures commission merchants and clearinghouses are required to segregate customer margin from their own assets, in the event that a broker, futures commission merchant or clearinghouse becomes insolvent or goes into bankruptcy and at that time there is a shortfall in the aggregate amount of margin held by the broker, futures commission merchant or clearinghouse for all its customers, U.S. bankruptcy laws will typically allocate that shortfall on a pro-rata basis across all the broker’s, futures commission merchant’s or clearinghouse’s customers, potentially resulting in losses to the Fund.
There is the risk that a broker, futures commission merchant or clearinghouse will decline to clear a transaction on the Fund’s behalf, and the Fund may be required to pay a termination fee to the executing broker with whom the Fund initially enters into the transaction. Clearinghouses may also be permitted to terminate centrally cleared swaps at any time. The Fund is also subject to the risk that the broker or futures commission merchant will improperly use the Fund’s assets deposited/paid as initial or variation margin to satisfy payment obligations of another customer. In the event of a default by another customer of the broker or futures commission merchant, the Fund might not receive its variation margin payments from the clearinghouse, due to the manner in which variation margin payments are aggregated for all customers of the broker/futures commission merchant.
Collateral and margin requirements differ by type of derivative. Margin requirements are established by the broker, futures commission merchant or clearinghouse for exchange-traded and cleared derivatives, including centrally cleared swaps. Brokers, futures commission merchants and clearinghouses can ask for margin in excess of the regulatory minimum, or increase the margin amount, in certain circumstances.
29 OPPENHEIMER CAPITAL INCOME FUND/VA
NOTESTO FINANCIAL STATEMENTS Continued
5. Risk Exposures and the Use of Derivative Instruments (Continued)
Collateral terms are contract specific for OTC derivatives. For derivatives traded under an ISDA master agreement, the collateral requirements are typically calculated by netting the mark to market amount for each transaction under such agreement and comparing that amount to the value of any collateral currently pledged by the Fund or the counterparty.
For financial reporting purposes, cash collateral that has been pledged to cover obligations of the Fund, if any, is reported separately on the Statement of Assets and Liabilities as cash pledged as collateral. Non-cash collateral pledged by the Fund, if any, is noted in the Statement of Investments. Generally, the amount of collateral due from or to a party must exceed a minimum transfer amount threshold (e.g. $250,000) before a transfer has to be made. To the extent amounts due to the Fund from its counterparties are not fully collateralized, contractually or otherwise, the Fund bears the risk of loss from counterparty nonperformance.
The following table presents the valuations of derivative instruments by risk exposure as reported within the Statement of Assets and Liabilities as of December 31, 2014:
| | | | | | | | |
| | | Asset Derivatives | | Liability Derivatives |
Derivatives Not Accounted for as
Hedging Instruments | | Statement of Assets and
Liabilities Location | | Value | | Statement of Assets and
Liabilities Location | | Value |
|
Interest rate contracts | | Variation margin receivable | | $ 17,813* | | Variation margin payable | | $ 23,691* |
*Includes only the current day’s variation margin. Prior variation margin movements have been reflected in cash on the Statement of Assets and Liabilities upon receipt or payment.
The effect of derivative instruments on the Statement of Operations is as follows:
| | | | | | | | | | | | |
| Amount of Realized Gain or (Loss) Recognized on Derivatives | |
| |
| Derivatives Not Accounted for as Hedging Instruments | | Investment from
unaffiliated companies | | Closing and expiration
of futures contracts | | | Total | |
| |
Credit contracts | | | | $ (111,023) | | | $ — | | | | $ (111,023) | |
Interest Rate contracts | | | | — | | | 1,463,966 | | | | 1,463,966 | |
| | | | | |
Total | | | | $ (111,023) | | | $ 1,463,966 | | | | $ 1,352,943 | |
| | | | | |
| | |
| Amount of Change in Unrealized Gain or (Loss) Recognized on Derivatives |
|
| Derivatives Not Accounted for as Hedging Instruments | | Futures contracts |
|
Interest rate contracts | | $ 358,972 |
6. Shares of Beneficial Interest
The Fund has authorized an unlimited number of $0.001 par value shares of beneficial interest of each class. Transactions in shares of beneficial interest were as follows:
| | | | | | | | | | | | | | | | |
| | | Year Ended December 31, 2014 | | | Year Ended December 31, 2013 | |
| | | Shares | | | Amount | | | Shares | | | Amount | |
| |
Non-Service Shares | | | | | | | | | | | | | | | | |
Sold | | | 249,594 | | | $ | 3,564,995 | | | | 172,668 | | | $ | 2,290,240 | |
Dividends and/or distributions reinvested | | | 300,916 | | | | 4,273,013 | | | | 387,201 | | | | 5,107,178 | |
Redeemed | | | (2,114,253 | ) | | | (30,138,035 | ) | | | (2,531,989 | ) | | | (33,599,185) | |
| | | | |
Net decrease | | | (1,563,743 | ) | | $ | (22,300,027 | ) | | | (1,972,120 | ) | | $ | (26,201,767) | |
| | | | |
| | | | | | | | | | | | | | | | |
| |
Service Shares | | | | | | | | | | | | | | | | |
Sold | | | 373,936 | | | $ | 5,300,928 | | | | 183,862 | | | $ | 2,416,107 | |
Dividends and/or distributions reinvested | | | 83,586 | | | | 1,173,553 | | | | 118,848 | | | | 1,549,784 | |
Redeemed | | | (1,142,911 | ) | | | (16,061,044 | ) | | | (1,100,257 | ) | | | (14,476,777) | |
| | | | |
Net decrease | | | (685,389 | ) | | $ | (9,586,563 | ) | | | (797,547 | ) | | $ | (10,510,886) | |
| | | | |
7. Purchases and Sales of Securities
The aggregate cost of purchases and proceeds from sales of securities, other than short-term obligations and investments in IMMF, for the year ended December 31, 2014 were as follows:
| | | | |
| | | Purchases | | Sales |
|
Investment securities | | $198,662,294 | | $193,064,950 |
U.S. government and government agency obligations | | 55,023,606 | | 56,004,207 |
To Be Announced (TBA) mortgage-related securities | | 697,503,637 | | 678,765,376 |
8. Fees and Other Transactions with Affiliates
Management Fees. Under the investment advisory agreement, the Fund pays the Manager a management fee based on the daily net assets of the Fund at an annual rate as shown in the following table:
30 OPPENHEIMER CAPITAL INCOME FUND/VA
8. Fees and Other Transactions with Affiliates (Continued)
| | | | |
| Fee Schedule | | | |
| |
Up to $200 million | | | 0.75% | |
Next $200 million | | | 0.72 | |
Next $200 million | | | 0.69 | |
Next $200 million | | | 0.66 | |
Over $800 million | | | 0.60 | |
The Fund’s management fee for the fiscal year ended December 31, 2014 was 0.74% of average annual net assets before any applicable waivers.
Sub-Adviser Fees. The Manager has retained the Sub-Adviser to provide the day-to-day portfolio management of the Fund. Under the Sub-Advisory Agreement, the Manager pays the Sub-Adviser an annual fee in monthly installments, equal to a percentage of the investment management fee collected by the Manager from the Fund, which shall be calculated after any investment management fee waivers. The fee paid to the Sub-Adviser is paid by the Manager, not by the Fund.
Transfer Agent Fees. OFI Global (the “Transfer Agent”) serves as the transfer and shareholder servicing agent for the Fund. The Fund pays the Transfer Agent a fee based on annual net assets. Fees incurred and average net assets for each class with respect to these services are detailed in the Statement of Operations and Financial Highlights, respectively.
Sub-Transfer Agent Fees. The Transfer Agent has retained Shareholder Services, Inc., a wholly-owned subsidiary of OFI (the “Sub-Transfer Agent”), to provide the day-to-day transfer agent and shareholder servicing of the Fund. Under the Sub-Transfer Agency Agreement, the Transfer Agent pays the Sub-Transfer Agent an annual fee in monthly installments, equal to a percentage of the transfer agent fee collected by the Transfer Agent from the Fund, which shall be calculated after any applicable fee waivers. The fee paid to the Sub-Transfer Agent is paid by the Transfer Agent, not by the Fund.
Trustees’ Compensation. The Fund’s Board of Trustees (“Board”) has adopted a compensation deferral plan for Independent Trustees that enables Trustees to elect to defer receipt of all or a portion of the annual compensation they are entitled to receive from the Fund. For purposes of determining the amount owed to the Trustee under the plan, deferred amounts are treated as though equal dollar amounts had been invested in shares of the Fund or in other Oppenheimer funds selected by the Trustee. The Fund purchases shares of the funds selected for deferral by the Trustee in amounts equal to his or her deemed investment, resulting in a Fund asset equal to the deferred compensation liability. Such assets are included as a component of “Other” within the asset section of the Statement of Assets and Liabilities. Deferral of Trustees’ fees under the plan will not affect the net assets of the Fund and will not materially affect the Fund’s assets, liabilities or net investment income per share. Amounts will be deferred until distributed in accordance with the compensation deferral plan.
Distribution and Service Plan for Service Shares. The Fund has adopted a Distribution and Service Plan (the “Plan”) pursuant to Rule 12b-1 under the 1940 Act for Service shares to pay OppenheimerFunds Distributor, Inc. (the “Distributor”), for distribution related services, personal service and account maintenance for the Fund’s Service shares. Under the Plan, payments are made periodically at an annual rate of 0.25% of the daily net assets of Service shares of the Fund. The Distributor currently uses all of those fees to compensate sponsors of the insurance product that offers Fund shares, for providing personal service and maintenance of accounts of their variable contract owners that hold Service shares. These fees are paid out of the Fund’s assets on an on-going basis and increase operating expenses of the Service shares, which results in lower performance compared to the Fund’s shares that are not subject to a service fee. Fees incurred by the Fund under the Plan are detailed in the Statement of Operations.
Waivers and Reimbursements of Expenses. The Manager has contractually agreed to limit the Fund’s expenses after payments, waivers and/or reimbursements and reduction to custodian expenses, excluding expenses incurred directly or indirectly by the Fund as a result of investments in other investment companies, wholly-owned subsidiaries and pooled investment vehicles; so that those expenses, as percentages of daily net assets, will not exceed the annual rate of 0.67% for Non-Service shares and 0.92% for Service shares. During the year ended December 31, 2014, the Manager waived fees and/or reimbursed the Fund $467,661 and $146,566 for Non-Service and Service shares, respectively.
The Manager will waive fees and/or reimburse Fund expenses in an amount equal to the indirect management fees incurred through the Fund’s investment in IMMF. During the year ended December 31, 2014, the Manager waived fees and/or reimbursed the Fund $13,477 for IMMF management fees.
These undertakings may be modified or terminated as set forth according to the terms in the prospectus.
9. Pending Litigation
In 2009, seven class action lawsuits were filed in the U.S. District Court for the District of Colorado against OppenheimerFunds, Inc. (“OFI”), OppenheimerFunds Distributor, Inc., the Fund’s principal underwriter and distributor (the “Distributor”), and certain funds (but not including the Fund) advised by OFI Global Asset Management, Inc. and distributed by the Distributor (the “Defendant Funds”). The lawsuits also named as defendants certain officers and current and former trustees of the respective Defendant Funds. The lawsuits raised claims under federal securities laws and alleged, among other things, that the disclosure documents of the respective Defendant Funds contained misrepresentations and omissions and that the respective Defendant Funds’ investment policies were not followed. The plaintiffs in these actions sought unspecified damages, equitable relief and awards of attorneys’ fees and litigation expenses. The Defendant Funds’ Boards of Trustees also engaged counsel to represent the Funds and the present
31 OPPENHEIMER CAPITAL INCOME FUND/VA
NOTES TO FINANCIAL STATEMENTS Continued
9. Pending Litigation (Continued)
and former Independent Trustees named in those suits. In March 2014, the parties in six of these lawsuits executed stipulations and agreements of settlement resolving those actions. In July 2014, the court entered an order and final judgment approving the settlements as fair, reasonable and adequate. The settlements do not resolve a seventh outstanding lawsuit relating to Oppenheimer Rochester California Municipal Fund (the “California Fund Suit”). OFI believes the California Fund Suit is without legal merit and is defending the suit vigorously. While it is premature to render any opinion as to the outcome in the California Fund Suit, or whether any costs that OFI may bear in defending the California Fund Suit might not be reimbursed by insurance, OFI believes the California Fund Suit should not impair the ability of OFI or the Distributor to perform their respective duties to the Fund, and that the outcome of the California Fund Suit should not have any material effect on the operations of any of the Oppenheimer funds.
32 OPPENHEIMER CAPITAL INCOME FUND/VA
REPORT OF INDEPENDENT REGISTERED PUBLIC ACCOUNTING FIRM
The Board of Trustees and Shareholders of Oppenheimer Variable Account Funds:
We have audited the accompanying statement of assets and liabilities of Oppenheimer Capital Income Fund/VA (a separate series of Oppenheimer Variable Account Funds), including the statement of investments, as of December 31, 2014, and the related statement of operations for the year then ended, the statements of changes in net assets for each of the years in the two-year period then ended, and the financial highlights for each of the years in the five-year period then ended. These financial statements and financial highlights are the responsibility of the Fund’s management. Our responsibility is to express an opinion on these financial statements and financial highlights based on our audits.
We conducted our audits in accordance with the standards of the Public Company Accounting Oversight Board (United States). Those standards require that we plan and perform the audit to obtain reasonable assurance about whether the financial statements and financial highlights are free of material misstatement. An audit includes examining, on a test basis, evidence supporting the amounts and disclosures in the financial statements. Our procedures included confirmation of securities owned as of December 31, 2014, by correspondence with the custodian, transfer agent and brokers, or by other appropriate auditing procedures where replies from brokers were not received. An audit also includes assessing the accounting principles used and significant estimates made by management, as well as evaluating the overall financial statement presentation. We believe that our audits provide a reasonable basis for our opinion.
In our opinion, the financial statements and financial highlights referred to above present fairly, in all material respects, the financial position of Oppenheimer Capital Income Fund/VA as of December 31, 2014, the results of its operations for the year then ended, the changes in its net assets for each of the years in the two-year period then ended, and the financial highlights for each of the years in the five-year period then ended, in conformity with U.S. generally accepted accounting principles.
KPMGLLP
Denver, Colorado
February 13, 2015
33 OPPENHEIMER CAPITAL INCOME FUND/VA
FEDERAL INCOME TAX INFORMATION Unaudited
In early 2015, if applicable, shareholders of record received information regarding all dividends and distributions paid to them by the Fund during calendar year 2014.
Dividends, if any, paid by the Fund during the fiscal year ended December 31, 2014 which are not designated as capital gain distributions should be multiplied by the maximum amount allowable but not less than 22.43% to arrive at the amount eligible for the corporate dividend-received deduction.
The foregoing information is presented to assist shareholders in reporting distributions received from the Fund to the Internal Revenue Service. Because of the complexity of the federal regulations which may affect your individual tax return and the many variations in state and local tax regulations, we recommend that you consult your tax advisor for specific guidance.
34 OPPENHEIMER CAPITAL INCOME FUND/VA
BOARD APPROVAL OF THE FUND’S INVESTMENT ADVISORY AND SUB-ADVISORY AGREEMENTS Unaudited
The Fund has entered into an investment advisory agreement with OFI Global Asset Management, Inc. (“OFI Global” or the “Adviser”), a wholly-owned subsidiary of OppenheimerFunds, Inc. (“OFI” or the “Sub-Adviser”) (“OFI Global” and “OFI” together the “Managers”) and OFI Global has entered into a sub-advisory agreement with OFI whereby OFI provides investment sub-advisory services to the Fund (collectively, the “Agreements”). Each year, the Board of Trustees (the “Board”), including a majority of the independent Trustees, is required to determine whether to renew the Agreements. The Investment Company Act of 1940, as amended, requires that the Board request and evaluate, and that the Managers provide, such information as may be reasonably necessary to evaluate the terms of the Agreements. The Board employs an independent consultant to prepare a report that provides information, including comparative information that the Board requests for that purpose. In addition to in-person meetings focused on this evaluation, the Board receives information throughout the year regarding Fund services, fees, expenses and performance.
The Adviser, Sub-Adviser and the independent consultant provided information to the Board on the following factors: (i) the nature, quality and extent of the Managers’ services, (ii) the investment performance of the Fund and the Managers, (iii) the fees and expenses of the Fund, including comparative expense information, (iv) the profitability of the Managers and their affiliates, including an analysis of the cost of providing services, (v) whether economies of scale are realized as the Fund grows and whether fee levels reflect these economies of scale for Fund investors and (vi) other benefits to the Managers from their relationship with the Fund. The Board was aware that there are alternatives to retaining the Managers.
Outlined below is a summary of the principal information considered by the Board as well as the Board’s conclusions.
Nature, Quality and Extent of Services. The Board considered information about the nature, quality and extent of the services provided to the Fund and information regarding the Managers’ key personnel who provide such services. The Sub-Adviser’s duties include providing the Fund with the services of the portfolio managers and the Sub-Adviser’s investment team, who provide research, analysis and other advisory services in regard to the Fund’s investments; securities trading services; oversight of third-party service providers; monitoring compliance with applicable Fund policies and procedures and adherence to the Fund’s investment restrictions; and risk management. The Managers are responsible for providing certain administrative services to the Fund as well. Those services include providing and supervising all administrative and clerical personnel who are necessary in order to provide effective corporate administration for the Fund; compiling and maintaining records with respect to the Fund’s operations; preparing and filing reports required by the Securities and Exchange Commission; preparing periodic reports regarding the operations of the Fund for its shareholders; preparing proxy materials for shareholder meetings; and preparing the registration statements required by Federal and state securities laws for the sale of the Fund’s shares. The Managers also provide the Fund with office space, facilities and equipment.
The Board also considered the quality of the services provided and the quality of the Managers’ resources that are available to the Fund. The Board took account of the fact that the Sub-Adviser has had over fifty years of experience as an investment adviser and that its assets under management rank it among the top mutual fund managers in the United States. The Board evaluated the Sub-Adviser’s advisory, administrative, accounting, legal, compliance services and risk management, and information the Board has received regarding the experience and professional qualifications of the Managers’ key personnel and the size and functions of its staff. In its evaluation of the quality of the portfolio management services provided, the Board considered the experience of Krishna Memani and Magnus Krantz, the portfolio managers for the Fund, and the Sub-Adviser’s investment team and analysts. The Board members also considered the totality of their experiences with the Managers as directors or trustees of the Fund and other funds advised by the Managers. The Board considered information regarding the quality of services provided by affiliates of the Managers, which its members have become knowledgeable about in connection with the renewal of the Fund’s service agreements. The Board concluded, in light of the Managers’ experience, reputation, personnel, operations and resources that the Fund benefits from the services provided under the Agreements.
Investment Performance of the Fund, the Adviser and the Sub-Adviser. Throughout the year, the Manager provided information on the investment performance of the Fund, including comparative performance information. The Board also reviewed information, prepared by the Manager and by the independent consultant, comparing the Fund’s historical performance to relevant market indices and to the performance of other moderate allocation funds underlying variable insurance products. The Board considered that the Fund underperformed its performance category during the one-, three-, five- and ten-year periods. The Board also considered that on April 30, 2013, the Fund changed its name and investment strategy to Capital Income Fund/VA from Balanced Fund/VA, and Magnus Krantz took over as portfolio manager of the equity portion of the Fund while Krishna Memani remained as the fixed income portfolio manager. The Board noted the Manager’s assertion that the performance of the Fund prior to April 30, 2013 was reflective of a different investment strategy and a different portfolio management team. The Board further noted that the Fund has a higher fixed income allocation than funds in its performance category and will tend to underperform the category average in a strong equity market environment. The Board considered that the Fund has performed well in 2014, ranking in the 21st percentile of its performance category for the year-to-date period ended April 30, 2014, as the bond markets have outperformed the equity markets.
Costs of Services by the Adviser. The Board reviewed the fees paid to the Manager and the other expenses borne by the Fund. The Board noted that the Manager, not the Fund, pays the Sub-Adviser’s fee under the sub-advisory agreement. The independent consultant provided comparative data in regard to the fees and expenses of the Fund and other moderate allocation funds underlying variable insurance products. In reviewing the fees and expenses charged to the VA funds, the Board considered the Manager’s assertion that, because there is much greater disparity in the fees and services that may be provided by a manager to a VA fund as opposed to a retail fund, when comparing the expenses of the various VA funds to those of retail funds, it is most appropriate to focus on total expenses (rather than on the management fees). Accordingly, while the Board reviewed and considered all expenses, it focused on total expenses. The Board considered that the Fund’s total expenses, after waivers, were lower than its peer group median and category median. The Board also considered that the Fund’s contractual management fee was higher than its peer group median and category median. Within the total asset range of $250 million to $500 million, the Fund’s effective management fee rate was higher than its peer group median and category median. The Board noted that the Manager has contractually agreed to limit the Fund’s total annual operating expenses so that those expenses, as percentages of daily net assets, will not exceed the annual rate of 0.67% for Non-Service Shares and 0.92% for Service Shares. This contractual expense limitation may not be amended or withdrawn until one year after the date of the Fund’s prospectus, unless approved by the Board.
35 OPPENHEIMER CAPITAL INCOME FUND/VA
BOARD APPROVAL OF THE FUND’S INVESTMENT ADVISORY AND SUB-ADVISORY AGREEMENTS Unaudited / Continued
Economies of Scale and Profits Realized by the Adviser and Sub-Adviser. The Board considered information regarding the Managers’ costs in serving as the Fund’s investment adviser and sub-adviser, including the costs associated with the personnel and systems necessary to manage the Fund, and information regarding the Managers’ profitability from their relationship with the Fund. The Board reviewed whether the Managers may realize economies of scale in managing and supporting the Fund. The Board noted that the Fund currently has management fee breakpoints, which are intended to share with Fund shareholders economies of scale that may exist as the Fund’s assets grow.
Other Benefits to the Managers. In addition to considering the profits realized by the Managers, the Board considered information that was provided regarding the direct and indirect benefits the Managers receive as a result of their relationship with the Fund, including compensation paid to the Managers’ affiliates and research provided to the Adviser in connection with permissible brokerage arrangements (soft dollar arrangements).The Board also considered that the Managers must be able to pay and retain experienced professional personnel at competitive rates to provide quality services to the Fund.
Conclusions. These factors were also considered by the independent Trustees meeting separately from the full Board, assisted by experienced counsel to the Fund and to the independent Trustees. Fund counsel and the independent Trustees’ counsel are independent of the Managers within the meaning and intent of the Securities and Exchange Commission Rules.
Based on its review of the information it received and its evaluations described above, the Board, including a majority of the independent Trustees, decided to continue the Agreements through August 31, 2015. In arriving at its decision, the Board did not identify any factor or factors as being more important than others, but considered all of the above information, and considered the terms and conditions of the Agreements, including the management fees, in light of all the surrounding circumstances.
36 OPPENHEIMER CAPITAL INCOME FUND/VA
PORTFOLIO PROXY VOTING POLICIES AND PROCEDURES; UPDATES TO STATEMENTS OF INVESTMENTS Unaudited
The Fund has adopted Portfolio Proxy Voting Policies and Procedures under which the Fund votes proxies relating to securities (“portfolio proxies”) held by the Fund. A description of the Fund’s Portfolio Proxy Voting Policies and Procedures is available (i) without charge, upon request, by calling the Fund toll-free at 1.800.525.7048, (ii) on the Fund’s website at www.oppenheimerfunds.com, and (iii) on the SEC’s website at www.sec.gov. In addition, the Fund is required to file Form N-PX, with its complete proxy voting record for the 12 months ended June 30th, no later than August 31st of each year. The Fund’s voting record is available (i) without charge, upon request, by calling the Fund toll-free at 1.800.525.7048, and (ii) in the Form N-PX filing on the SEC’s website at www.sec.gov.
The Fund files its complete schedule of portfolio holdings with the SEC for the first quarter and the third quarter of each fiscal year on Form N-Q. The Fund’s Form N-Q filings are available on the SEC’s website at www.sec.gov. Those forms may be reviewed and copied at the SEC’s Public Reference Room in Washington, D.C. Information on the operation of the Public Reference Room may be obtained by calling 1-800-SEC-0330.
37 OPPENHEIMER CAPITAL INCOME FUND/VA
TRUSTEES AND OFFICERS Unaudited
| | |
Name, Position(s) Held with the Fund, Length of
Service, Year of Birth | | Principal Occupation(s) During the Past 5 Years; Other Trusteeships/Directorships Held;
Number of Portfolios in the Fund Complex Currently Overseen |
| |
| INDEPENDENT TRUSTEES | | The address of each Trustee in the chart below is 6803 S. Tucson Way, Centennial, Colorado 80112-3924. Each Trustee serves for an indefinite term, or until his or her resignation, retirement, death or removal. |
| |
Sam Freedman, Chairman of the Board of Trustees (since 2012) and Trustee (since 1996) Year of Birth: 1940 | | Director of Colorado UpLIFT (charitable organization) (since September 1984). Mr. Freedman held several positions with the Sub-Adviser and with subsidiary or affiliated companies of the Sub-Adviser (until October 1994). Oversees 38 portfolios in the OppenheimerFunds complex. Mr. Freedman has served on the Boards of certain Oppenheimer funds since 1996, during which time he has become familiar with the Fund’s (and other Oppenheimer funds’) financial, accounting, regulatory and investment matters and has contributed to the Boards’ deliberations. |
| |
Jon S. Fossel, Trustee (since 1990) Year of Birth: 1942 | | Chairman of the Board of Jack Creek Preserve Foundation (non-profit organization) (since 2005); Chairman of the Board (2006-December 2011) and Director (June 2002-December 2011) of UNUMProvident (insurance company); Director of Northwestern Energy Corp. (public utility corporation) (November 2004-December 2009); Director of P.R. Pharmaceuticals (October 1999-October 2003); Director of Rocky Mountain Elk Foundation (non-profit organization) (February 1998-February 2003 and February 2005-February 2007); Chairman and Director (until October 1996) and President and Chief Executive Officer (until October 1995) of the Sub-Adviser; President, Chief Executive Officer and Director of the following: Oppenheimer Acquisition Corp. (“OAC”) (parent holding company of the Sub-Adviser), Shareholder Services, Inc. and Shareholder Financial Services, Inc. (until October 1995). Oversees 38 portfolios in the OppenheimerFunds complex. Mr. Fossel has served on the Boards of certain Oppenheimer funds since 1990, during which time he has become familiar with the Fund’s (and other Oppenheimer funds’) financial, accounting, regulatory and investment matters and has contributed to the Boards’ deliberations. |
| |
Richard F. Grabish, Trustee (since 2012) Year of Birth: 1948 | | Formerly Senior Vice President and Assistant Director of Sales and Marketing (March 1997-December 2007), Director (March 1987-December 2007) and Manager of Private Client Services (June 1985-June 2005) of A.G. Edwards & Sons, Inc. (broker/dealer and investment firm); Chairman and Chief Executive Officer of A.G. Edwards Trust Company, FSB (March 2001-December 2007); President and Vice Chairman of A.G. Edwards Trust Company, FSB (investment adviser) (April 1987-March 2001); President of A.G. Edwards Trust Company, FSB (investment adviser) (June 2005-December 2007). Oversees 38 portfolios in the OppenheimerFunds complex. Mr. Grabish has served on the Boards of certain Oppenheimer funds since 2001, during which time he has become familiar with the Fund’s (and other Oppenheimer funds’) financial, accounting, regulatory and investment matters and has contributed to the Boards’ deliberations. |
| |
Beverly L. Hamilton, Trustee (since 2002) Year of Birth: 1946 | | Trustee of Monterey Institute for International Studies (educational organization) (since February 2000); Board Member of Middlebury College (educational organization) (December 2005-June 2011); Chairman (since 2010) of American Funds’ Emerging Markets Growth Fund, Inc. (mutual fund); Director of The California Endowment (philanthropic organization) (April 2002-April 2008); Director (February 2002-2005) and Chairman of Trustees (2006-2007) of the Community Hospital of Monterey Peninsula; Director (October 1991-2005); Vice Chairman (2006-2009) of American Funds’ Emerging Markets Growth Fund, Inc. (mutual fund); President of ARCO Investment Management Company (February 1991-April 2000); Member of the investment committees of The Rockefeller Foundation (2001-2006) and The University of Michigan (since 2000); Advisor at Credit Suisse First Boston’s Sprout venture capital unit (venture capital fund) (1994-January 2005); Trustee of MassMutual Institutional Funds (investment company) (1996-June 2004); Trustee of MML Series Investment Fund (investment company) (April 1989-June 2004); Member of the investment committee of Hartford Hospital (2000-2003); and Advisor to Unilever (Holland) pension fund (2000-2003). Oversees 38 portfolios in the OppenheimerFunds complex. Ms. Hamilton has served on the Boards of certain Oppenheimer funds since 2002, during which time she has become familiar with the Fund’s (and other Oppenheimer funds’) financial, accounting, regulatory and investment matters and has contributed to the Boards’ deliberations. |
| |
Victoria J. Herget, Trustee (since 2012) Year of Birth:1951 | | Board Chair (2008-Present) and Director (2004-Present), United Educators (insurance company); Trustee (since 2000) and Chair (since 2010), Newberry Library (independent research library); Trustee, Mather LifeWays (senior living organization) (since 2001); Independent Director of the First American Funds (mutual fund family) (2003-2011); former Managing Director (1993-2001), Principal (1985-1993), Vice President (1978-1985) and Assistant Vice President (1973-1978) of Zurich Scudder Investments (investment adviser) (and its predecessor firms); Trustee (1992-2007), Chair of the Board of Trustees (1999-2007), Investment Committee Chair (1994-1999) and Investment Committee member (2007-2010) of Wellesley College; Trustee, BoardSource (non-profit organization) (2006-2009) and Chicago City Day School (K-8 School) (1994-2005). Oversees 38 portfolios in the OppenheimerFunds complex. Ms. Herget has served on the Boards of certain Oppenheimer funds since 2012, during which time she has become familiar with the Fund’s (and other Oppenheimer funds’) financial, accounting, regulatory and investment matters and has contributed to the Boards’ deliberations. |
| |
Robert J. Malone, Trustee (since 2002) Year of Birth: 1944 | | Chairman of the Board (since 2012) and Director (since August 2005) of Jones International University (educational organization); Chairman, Chief Executive Officer and Director of Steele Street Bank Trust (commercial banking) (since August 2003); Trustee of the Gallagher Family Foundation (non-profit organization) (since 2000); Board of Directors of Opera Colorado Foundation (non-profit organization) (2008-2012); Director of Colorado UpLIFT (charitable organization) (1986-2010); Director of Jones Knowledge, Inc. (2006-2010); Former Chairman of U.S. Bank-Colorado (subsidiary of U.S. Bancorp and formerly Colorado National Bank) (July 1996-April 1999); Director of Commercial Assets, Inc. (real estate investment trust) (1993-2000); Director of U.S. Exploration, Inc. (oil and gas exploration) (1997-February 2004); Chairman of the Board (1991-1994) and Trustee (1985-1994) of Regis University; and Chairman of the Board (1990- |
38 OPPENHEIMER CAPITAL INCOME FUND/VA
| | |
Robert J. Malone, Continued | | 1991 and Trustee (1984-1999) of Young Presidents Organization. Oversees 38 portfolios in the OppenheimerFunds complex. Mr. Malone has served on the Boards of certain Oppenheimer funds since 2002, during which time he has become familiar with the Fund’s (and other Oppenheimer funds’) financial, accounting, regulatory and investment matters and has contributed to the Boards’ deliberations. |
| |
F. William Marshall, Jr., Trustee (since 2000) Year of Birth: 1942 | | Trustee Emeritus of Worcester Polytech Institute (WPI) (private university) (since 2009); Trustee of MassMutual Select Funds (formerly MassMutual Institutional Funds) (investment company) (since 1996), MML Series Investment Fund (investment company) (since 1996) and Mass Mutual Premier Funds (investment company) (since January 2012); President and Treasurer of the SIS Fund (private charitable fund) (January 1999 – March 2011); Former Trustee of WPI (1985-2008); Former Chairman of the Board (2004-2006) and Former Chairman of the Investment Committee of WPI (1994-2008); Chairman of SIS & Family Bank, F.S.B. (formerly SIS Bank) (commercial bank) (January 1999-July 1999); Executive Vice President of Peoples Heritage Financial Group, Inc. (commercial bank) (January 1999-July 1999); and Former President and Chief Executive Officer of SIS Bancorp. (1993-1999). Oversees 42 portfolios in the OppenheimerFunds complex. Mr. Marshall has served on the Boards of certain Oppenheimer funds since 2000, during which time he has become familiar with the Fund’s (and other Oppenheimer funds’) financial, accounting, regulatory and investment matters and has contributed to the Boards’ deliberations. |
| |
Karen L. Stuckey, Trustee (since 2012) Year of Birth: 1953 | | Partner (1990-2012) of PricewaterhouseCoopers LLP (professional services firm) (held various positions 1975- 1990); Trustee (1992-2006) and member of Executive, Nominating and Audit Committees and Chair of Finance Committee of Lehigh University; and member, Women’s Investment Management Forum (professional organization) since inception. Oversees 38 portfolios in the OppenheimerFunds complex. Ms. Stuckey has served on the Boards of certain Oppenheimer funds since 2012, during which time she has become familiar with the Fund’s (and other Oppenheimer funds’) financial, accounting, regulatory and investment matters and has contributed to the Boards’ deliberations. |
| |
James D. Vaughn, Trustee (since 2012) Year of Birth: 1945 | | Retired; former managing partner (1994-2001) of Denver office of Deloitte & Touche LLP, (held various positions 1969-1993); Trustee and Chairman of the Audit Committee of Schroder Funds (2003-2012); Board member and Chairman of Audit Committee of AMG National Trust Bank (since 2005); Trustee and Investment Committee member, University of South Dakota Foundation (since 1996); Board member, Audit Committee Member and past Board Chair, Junior Achievement (since 1993); former Board member, Mile High United Way, Boys and Girls Clubs, Boy Scouts, Colorado Business Committee for the Arts, Economic Club of Colorado and Metro Denver Network. Oversees 38 portfolios in the OppenheimerFunds complex. Mr. Vaughn has served on the Boards of certain Oppenheimer funds since 2012, during which time he has become familiar with the Fund’s (and other Oppenheimer funds’) financial, accounting, regulatory and investment matters and has contributed to the Boards’ deliberations. |
|
| INTERESTED TRUSTEE | | Mr. Glavin is an “Interested Trustee” because he is affiliated with the Manager and the Sub-Adviser by virtue of his positions as director of the Sub-Adviser, and as a shareholder of the Sub-Adviser’s parent company. As a Trustee, he serves for an indefinite term, or until his resignation, retirement, death or removal. Mr. Glavin’s address is 225 Liberty Street, 11th Floor, New York, New York 10281-1008. |
| |
William F. Glavin, Jr., Trustee (since 2009) Year of Birth: 1958 | | Chairman of the Sub-Adviser (July 2014-December 2014 and December 2009-December 2012) and Director of the Sub-Adviser (since January 2009); Chairman, Director and Chief Executive Officer (January 2013-June 2014) of the Manager; President of the Manager (January 2013-May 2013); Chief Executive Officer (January 2009-December 2012); President of the Sub-Adviser (May 2009-December 2012); Management Director (June 2009-June 2014), President (December 2009-June 2014) and Chief Executive Officer (January 2011-June 2014) of Oppenheimer Acquisition Corp. (“OAC”) (the Sub-Adviser’s parent holding company); Director of Oppenheimer Real Asset Management, Inc. (March 2010-June 2014); Executive Vice President (March 2006-February 2009) and Chief Operating Officer (July 2007-February 2009) of Massachusetts Mutual Life Insurance Company (OAC’s parent company); Director (May 2004-March 2006) and Chief Operating Officer and Chief Compliance Officer (May 2004-January 2005), President (January 2005-March 2006) and Chief Executive Officer (June 2005-March 2006) of Babson Capital Management LLC; Director (March 2005-March 2006), President (May 2003-March 2006) and Chief Compliance Officer (July 2005-March 2006) of Babson Capital Securities, Inc. (a broker-dealer); President (May 2003-March 2006) of Babson Investment Company, Inc.; Director (May 2004-August 2006) of Babson Capital Europe Limited; Director (May 2004-October 2006) of Babson Capital Guernsey Limited; Director (May 2004-March 2006) of Babson Capital Management LLC; Non-Executive Director (March 2005-March 2007) of Baring Asset Management Limited; Director (February 2005-June 2006) Baring Pension Trustees Limited; Director and Treasurer (December 2003-November 2006) of Charter Oak Capital Management, Inc.; Director (May 2006-September 2006) of C.M. Benefit Insurance Company; Director (May 2008-June 2009) and Executive Vice President (June 2007-July 2009) of C.M. Life Insurance Company; President (March 2006-May 2007) of MassMutual Assignment Company; Director (January 2005-December 2006), Deputy Chairman (March 2005-December 2006) and President (February 2005-March 2005) of MassMutual Holdings (Bermuda) Limited; Director (May 2008-June 2009) and Executive Vice President (June 2007-July 2009) of MML Bay State Life Insurance Company; Chief Executive Officer and President (April 2007-January 2009) of MML Distributors, LLC; and Chairman (March 2006-December 2008) and Chief Executive Officer (May 2007-December 2008) of MML Investors Services, Inc. An officer of 91 portfolios in the OppenheimerFunds complex. Mr. Glavin has served on the Boards of certain Oppenheimer funds since December 2009, during which time he has become familiar with the Fund’s (and other Oppenheimer funds’) financial, accounting, regulatory and investment matters and has contributed to the Boards’ deliberations. |
| | |
| OTHER OFFICERS OF THE FUND | | The addresses of the Officers in the chart below are as follows: for Messrs. Memani, Krantz, Steinmetz, Gabinet, Mss. Sexton and Picciotto, 225 Liberty Street, New York, New York 10281-1008, for Mr. Wixted, 6803 S. Tucson Way, Centennial, Colorado 80112-3924. Each Officer serves for an indefinite term or until his or her resignation, retirement, death or removal. |
39 OPPENHEIMER CAPITAL INCOME FUND/VA
TRUSTEES AND OFFICERS Unaudited / Continued
| | |
Krishna Memani, Vice President (since 2009) Year of Birth: 1960 | | President of the Sub-Adviser (since January 2013); Executive Vice President of the Manager (since January 2014) and Chief Investment Officer of the OppenheimerFunds advisory entities (since January 2014). Chief Investment Officer, Fixed Income of the Sub-Adviser (January 2013-December 2013); Head of the Investment Grade Fixed Income Team of the Sub-Adviser (March 2009-January 2014); Director of Fixed Income of the Sub-Adviser (October 2010-December 2012); Senior Vice President of the Sub-Adviser (March 2009-December 2012) and Senior Vice President of OFI Global Institutional, Inc. (April 2009-December 2012). Managing Director and Head of the U.S. and European Credit Analyst Team at Deutsche Bank Securities (June 2006-January 2009). Chief Credit Strategist at Credit Suisse Securities (August 2002-March 2006). Managing Director and Senior Portfolio Manager at Putnam Investments (September 1998-June 2002). A portfolio manager and an officer of other portfolios in the OppenheimerFunds complex. |
| |
Magnus Krantz, Vice President (since 2013) Year of Birth: 1967 | | Vice President of the Sub-Adviser (since May 2009) and a portfolio manager of the Sub-Adviser (since November 2012); sector manager for technology for the Sub-Adviser’s Main Street Investment Team (since May 2009). Prior to joining the Sub-Adviser, Mr. Krantz was a sector manager at RS Investment and Guardian Life Insurance Company. Mr. Krantz joined Guardian Life Insurance Company in December 2005 and transitioned to RS Investments in October 2006 in connection with Guardian Life Insurance Company’s acquisition of an interest in RS Investments. Portfolio manager and analyst at Citigroup Asset Management (1998-2005) and as a consultant at Price Waterhouse (1997-1998). He also served as product development engineer at Newbridge Networks (1993-1996) and as a software engineer at Mitel Corporation (1990-1993). A portfolio manager and officer of other portfolios in the OppenheimerFunds complex. |
| |
Arthur P. Steinmetz, President and Principal Executive Officer (since 2014) Year of Birth: 1958 | | Chairman of the Sub-Adviser (since January 2015); CEO and Chairman of the Manager (since July 2014), President of the Manager (since May 2013), a Director of the Manager (since January 2013), Director of the Sub-Adviser (since July 2014), President, Management Director and CEO of Oppenheimer Acquisition Corp. (the Sub-Adviser’s parent holding company) (since July 2014), and President and Director of OFI SteelPath, Inc. (since January 2013). Chief Investment Officer of the OppenheimerFunds advisory entities from (January 2013-December 2013); Executive Vice President of the Manager (January 2013-May 2013); Chief Investment Officer of the Sub-Adviser (October 2010-December 2012); Chief Investment Officer, Fixed-Income, of the Sub-Adviser (April 2009-October 2010); Executive Vice President of the Sub-Adviser (October 2009-December 2012); Director of Fixed Income of the Sub-Adviser (January 2009-April 2009); and a Senior Vice President of the Sub-Adviser (March 1993-September 2009). An officer of 91 portfolios in the OppenheimerFunds complex. |
| |
Arthur S. Gabinet, Secretary and Chief Legal Officer (since 2011) Year of Birth: 1958 | | Executive Vice President, Secretary and General Counsel of the Manager (since January 2013); General Counsel OFI SteelPath, Inc. (since January 2013); Executive Vice President (May 2010-December 2012) and General Counsel (since January 2011) of the Sub-Adviser; General Counsel of the Distributor (since January 2011); General Counsel of Centennial Asset Management Corporation (January 2011-December 2012); Executive Vice President (January 2011-December 2012) and General Counsel of HarbourView Asset Management Corporation (since January 2011); Assistant Secretary (since January 2011) and Director (since January 2011) of OppenheimerFunds International Ltd. and OppenheimerFunds plc; Director of Oppenheimer Real Asset Management, Inc. (January 2011-December 2012) and General Counsel (since January 2011); Executive Vice President (January 2011-December 2011) and General Counsel of Shareholder Financial Services, Inc. and Shareholder Services, Inc. (since January 2011); Executive Vice President (January 2011-December 2012) and General Counsel of OFI Private Investments Inc. (since January 2011); Vice President of OppenheimerFunds Legacy Program (January 2011-December 2011); Executive Vice President (January 2011-December 2012) and General Counsel of OFI Institutional Asset Management, Inc. (since January 2011); General Counsel, Asset Management of the Sub-Adviser (May 2010-December 2010); Principal, The Vanguard Group (November 2005-April 2010); District Administrator, U.S. Securities and Exchange Commission (January 2003-October 2005). An officer of 91 portfolios in the OppenheimerFunds complex. |
| |
Jennifer Sexton, Vice President and Chief Business Officer (since 2014) Year of Birth: 1969 | | Senior Vice President of OppenheimerFunds Distributor, Inc. (since June 2014); Vice President of OppenheimerFunds Distributor, Inc. (April 2006-June 2014); Vice President of the Sub-Adviser (January 1998-March 2006); Assistant Vice President of the Sub-Adviser (October 1991-December 1998). An officer of 91 portfolios in the OppenheimerFunds complex. |
| |
Mary Ann Picciotto, Chief Compliance Officer and Chief Anti-Money Laundering Officer (since 2014) Year of Birth: 1973 | | Senior Vice President and Chief Compliance Officer of the Manager (since March 2014); Chief Compliance Officer of the Sub-Adviser, OFI SteelPath, Inc., OFI Global Trust Company, OFI Global Institutional, Inc., Oppenheimer Real Asset Management, Inc., OFI Private Investments, Inc., Harborview Asset Management Corporation, Trinity Investment Management Corporation, and Shareholder Services, Inc. (since March 2014); Managing Director of Morgan Stanley Investment Management Inc. and certain of its various affiliated entities; Chief Compliance Officer of various Morgan Stanley Funds (May 2010-January 2014); Chief Compliance Officer of Morgan Stanley Investment Management Inc. (April 2007-January 2014). An officer of 91 portfolios in the OppenheimerFunds complex. |
| |
Brian W. Wixted, Treasurer and Principal Financial & Accounting Officer (since 1999) Year of Birth: 1959 | | Senior Vice President of the Manager (since January 2013); Treasurer of the Sub-Adviser, HarbourView Asset Management Corporation, Shareholder Financial Services, Inc., Shareholder Services, Inc., and Oppenheimer Real Asset Management, Inc. (March 1999-June 2008), OFI Private Investments, Inc. (March 2000-June 2008), OppenheimerFunds International Ltd. and OppenheimerFunds plc (since May 2000), OFI Institutional Asset Management, Inc. (November 2000-June 2008), and OppenheimerFunds Legacy Program (charitable trust program established by the Sub-Adviser) (June 2003-December 2011); Treasurer and Chief Financial Officer of OFI Trust Company (since May 2000); Assistant Treasurer of Oppenheimer Acquisition Corporation (March 1999-June 2008). An officer of 91 portfolios in the OppenheimerFunds complex. |
The Fund’s Statement of Additional Information contains additional information about the Fund’s Trustees and Officers and is available without charge, upon request, by calling 1.800.988.8287.
40 OPPENHEIMER CAPITAL INCOME FUND/VA
THIS PAGE INTENTIONALLY LEFT BLANK.
41 OPPENHEIMER CAPITAL INCOME FUND/VA
THIS PAGE INTENTIONALLY LEFT BLANK.
42 OPPENHEIMER CAPITAL INCOME FUND/VA
THIS PAGE INTENTIONALLY LEFT BLANK.
43 OPPENHEIMER CAPITAL INCOME FUND/VA
OPPENHEIMER CAPITAL INCOME FUND/VA
A Series of Oppenheimer Variable Account Funds
| | |
| Manager | | OFI Global Asset Management, Inc. |
| |
| Sub-Adviser | | OppenheimerFunds, Inc. |
| |
| Distributor | | OppenheimerFunds Distributor, Inc. |
| |
| Transfer and | | OFI Global Asset Management, Inc. |
| Shareholder | | |
| Servicing Agent | | |
| |
| Sub-Transfer Agent | | Shareholder Services, Inc. |
| | DBA OppenheimerFunds Services |
| |
| Independent | | KPMG LLP |
| Registered | | |
| Public | | |
| Accounting | | |
| Firm | | |
| |
| Counsel | | K&L Gates LLP |
| |
| | Before investing in any of the Oppenheimer funds, investors should carefully consider a fund’s investment objectives, risks, charges and expenses. Fund prospectuses and summary prospectuses contain this and other information about the funds, and may be obtained by asking your financial advisor, or calling us at 1.800.988.8287. Read prospectuses and summary prospectuses carefully before investing. |
| |
| | © 2015 OppenheimerFunds, Inc. All rights reserved. Oppenheimer funds are distributed by OppenheimerFunds Distributor, Inc. |
| | |
| | 
The Right Way to Invest |

December 31, 2014

ANNUAL REPORT
Listing of Top Holdings
Fund Performance Discussion
Financial Statements
Fund Performance Discussion
PORTFOLIO MANAGER: Michael Kotlarz
AVERAGE ANNUAL TOTAL RETURNS FOR THE PERIODS ENDED 12/31/14
| | | | | | | | |
| | | Inception Date | | 1-Year | | 5-Year | | 10-Year |
Non-Service Shares | | 4/3/85 | | 15.41% | | 13.07% | | 6.54% |
|
Service Shares | | 9/18/01 | | 15.13 | | 12.79 | | 6.28 |
|
S&P 500 Index | | | | 13.69 | | 15.45 | | 7.67 |
|
Russell 1000 Growth Index | | | | 13.05 | | 15.81 | | 8.49 |
|
Performance data quoted represents past performance, which does not guarantee future results. The investment return and principal value of an investment in the Fund will fluctuate so that an investor’s shares, when redeemed, may be worth more or less than their original cost. Current performance may be lower or higher than the performance quoted. For performance data current to the most recent month end, call us at 1.800.988.8287. The Fund’s total returns should not be expected to be the same as the returns of other funds, whether or not both funds have the same portfolio managers and/or similar names. The Fund’s total returns include changes in share price and reinvested distributions but do not include the charges associated with the separate account products that offer this Fund. Such performance would have been lower if such charges were taken into account.
TOP TEN COMMON STOCK HOLDINGS
| | | | |
| |
Apple, Inc. | | | 6.1% | |
| |
Biogen Idec, Inc. | | | 4.8 | |
| |
Facebook, Inc., Cl. A | | | 4.1 | |
| |
Gilead Sciences, Inc. | | | 3.7 | |
| |
Actavis plc | | | 3.6 | |
| |
LinkedIn Corp., Cl. A | | | 3.1 | |
| |
Celgene Corp. | | | 2.8 | |
| |
MasterCard, Inc., Cl. A | | | 2.8 | |
| |
Twenty-First Century Fox, Inc., Cl. B | | | 2.8 | |
| |
Visa, Inc., Cl. A | | | 2.5 | |
| |
Portfolio holdings and allocations are subject to change. Percentages are as of December 31, 2014, and are based on net assets. For more current Fund holdings, please visit oppenheimerfunds.com.
SECTOR ALLOCATION
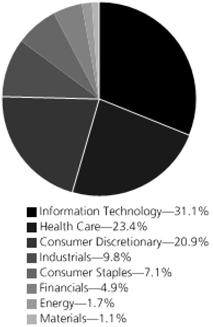
Portfolio holdings and allocations are subject to change. Percentages are as of December 31, 2014, and are based on the total market value of common stocks.
2 OPPENHEIMER CAPITAL APPRECIATION FUND/VA
Fund Performance Discussion
The Fund’s Non-Service shares produced a return of 15.41% during the reporting period, outperforming the Russell 1000 Growth Index (the “Index”), which returned 13.05% for the same period. The Fund’s outperformance stemmed primarily from stronger relative stock selection in the information technology and consumer discretionary sectors, along with an underweight position in energy and an overweight position in health care. The Fund underperformed the Index primarily within the industrials and materials sectors, as a result of weaker relative stock selection. The Fund also outperformed the S&P 500 Index, which returned 13.69% this reporting period.
MARKET OVERVIEW
Domestic equities were among the top performing asset classes in 2014, outperforming foreign equities, including those domiciled in Europe, Japan and emerging markets. In the U.S., the Federal Reserve (the “Fed”) began tapering its most recent quantitative easing (“QE”) program in January 2014 and completed the process at the end of October, thereby ending the program’s purchases. The Fed reduced its monthly bond purchases in steady $10 billion increments, which helped reduce market volatility and enabled investors to prepare for a post-QE market environment. Although data in the U.S. softened for the first quarter, partially attributed to cold weather effects across much of the country, it was positive in the second and third quarters of 2014, with Gross Domestic Product (“GDP”) growing at 4.6% and an estimated 5.0%, respectively.
Outside of the U.S., the positive data points that had emerged in Europe in 2013 and early 2014 largely reversed themselves later in the reporting period and the European Central Bank (the “ECB”) came under even greater pressure to provide a credible plan to boost growth and avoid deflation. In response, the ECB adopted a number of policies designed to stimulate growth. In Japan, which has been mired in economic weakness for years, the Abe administration has adopted even more aggressive economic policies with the Bank of Japan (the “BoJ”) executing a massive QE program. However, the results have not been particularly impressive, with that economy slipping back into recession in the third quarter of 2014 following the consumption tax increase. Emerging markets’ economic growth was mixed, as certain regions such as Eastern Europe and the Middle East remained burdened by geopolitical turmoil. Many commodity producing emerging market economies also struggled as prices for most commodities fell. Countries such as India and Indonesia have benefited from business-friendly new administrations.
TOP INDIVIDUAL CONTRIBUTORS
During the reporting period, top performing holdings included information technology stocks Apple, Inc. and Facebook, Inc., and health care holding Gilead Sciences, Inc. Apple rallied after iPhone sales came in higher than analysts anticipated and the company announced a 7-for-1 stock split and increased both its dividend and share repurchases. In addition, the introduction of two new iPhones, and the upcoming introduction of a new Apple Watch product, resulted in strong performance. Facebook, the world’s number one social network, delivered strong evidence that it can thrive on smartphones and tablets, with increases in mobile advertising revenue. Gilead Sciences is a research-based biopharmaceutical company that discovers, develops and commercializes medicines. The company benefited from sales of its new hepatitis C drug Sovaldi and its flagship HIV drugs. Gilead also announced that the U.S. Food and Drug Administration had approved Zydelig for treatment of patients with three types of blood cancers.
TOP INDIVIDUAL DETRACTORS
Detractors from performance this reporting period included Amazon.com, Inc., Cameron International Corp. and Wynn Resorts Ltd. Amazon.com experienced declines this reporting period as increased spending limited profit growth, the newly launched Fire phone was greeted with poor reception, and a drop in the usage of Amazon Web Services led to a miss in revenue as compared to Wall Street expectations. Cameron International is a drilling equipment manufacturer that fell on weakness in the energy sector and a negative outlook on subsea drilling orders in upcoming years. We exited our position in Cameron International during the reporting period. Wynn Resorts is an operator of destination casino resorts in Las Vegas and Macau. Weakness in Macau gambling revenues negatively impacted the stock during the reporting period.
STRATEGY & OUTLOOK
Volatility in financial markets has resurfaced as the fragile global macroeconomic synchronization has stalled. Continued deceleration in China, as well as economic uncertainty in Europe has dented the market’s confidence in the fragile global economic recovery. The uncertainty of global demand, combined with the unconventional energy revolution in the U.S., has catalyzed a downward spiral in oil prices which has further clouded the outlook for emerging market economies dependent on commodities. Accordingly, we have seen a flight to quality and to safety as the U.S. dollar soars, U.S. Treasuries rally and yields plunge. The relative attractiveness of the U.S. economy, and those equities exposed to it, continue to shine, with slowly improving employment, stable to improving
3 OPPENHEIMER CAPITAL APPRECIATION FUND/VA
consumption rates and a strengthening dollar. Perhaps the greatest risk we see in the near-term is the translation effect of overseas income into dollars, but these periods of dollar strength also correlate well with rising valuations in the U.S. financial markets. Our conviction has been reinforced that companies with capital discipline, strong management and sustainable competitive advantages have the greatest prospects for outperformance over time.
Investors should consider the Fund’s investment objective, risks, charges and expenses carefully before investing. The Fund’s prospectus and summary prospectus contain this and other information about the Fund, and may be obtained by asking your financial advisor or calling us at 1.800.988.8287. Read prospectuses and summary prospectuses carefully before investing.
Total returns include changes in share price and reinvestment of dividends and capital gains distributions in a hypothetical investment for the periods shown.
The Fund’s investment strategy and focus can change over time. The mention of specific fund holdings does not constitute a recommendation by OppenheimerFunds, Inc. or its affiliates.
Shares of Oppenheimer funds are not deposits or obligations of any bank, are not guaranteed by any bank, are not insured by the FDIC or any other agency, and involve investment risks, including the possible loss of the principal amount invested.
Comparing the Fund’s Performance to the Market. The graphs that follow show the performance of a hypothetical $10,000 investment in each share class of the Fund held until December 31, 2014. Performance is measured over a ten-fiscal-year period for both Classes. Performance information does not reflect charges that apply to separate accounts investing in the Fund. If these charges were taken into account, performance would be lower. The graphs assume that all dividends and capital gains distributions were reinvested in additional shares.
The Fund’s performance is compared to the performance of the S&P 500 Index and the Russell 1000 Growth Index. The S&P 500 Index is a capitalization-weighted index of 500 stocks intended to be a representative sample of leading companies in leading industries within the U.S. economy. The Russell 1000 Growth Index measures the performance of the large-cap growth segment of the U.S. equity universe. It includes those Russell 1000 companies with higher price-to-book ratios and higher forecasted growth values. The indices are unmanaged and cannot be purchased directly by investors. While index comparisons may be useful to provide a benchmark for the Fund’s performance, it must be noted that the Fund’s investments are not limited to the investments comprising the indices. Index performance includes reinvestment of income, but does not reflect transaction costs, fees, expenses or taxes. Index performance is shown for illustrative purposes only as a benchmark for the Fund’s performance, and does not predict or depict performance of the Fund. The Fund’s performance reflects the effects of the Fund’s business and operating expenses.
4 OPPENHEIMER CAPITAL APPRECIATION FUND/VA

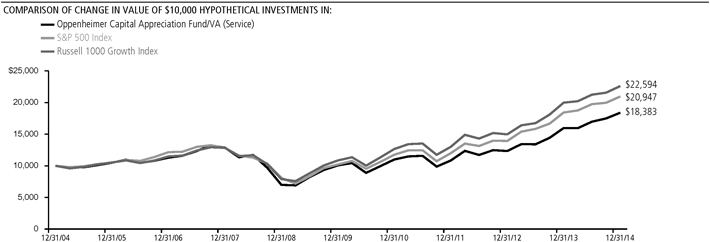
Performance data quoted represents past performance, which does not guarantee future results. The investment return and principal value of an investment in the Fund will fluctuate so that an investor’s shares, when redeemed, may be worth more or less than their original cost. Current performance may be lower or higher than the performance quoted. For performance data current to the most recent month end, call us at 1.800. 988.8287. The Fund’s total returns should not be expected to be the same as the returns of other funds, whether or not both funds have the same portfolio managers and/or similar names. The Fund’s total returns include changes in share price and reinvested distributions but do not include the charges associated with the separate account products that offer this Fund. Such performance would have been lower if such charges were taken into account.
5 OPPENHEIMER CAPITAL APPRECIATION FUND/VA
Fund Expenses
Fund Expenses. As a shareholder of the Fund, you incur two types of costs: (1) transaction costs and (2) ongoing costs, including management fees; distribution and service fees; and other Fund expenses. These examples are intended to help you understand your ongoing costs (in dollars) of investing in the Fund and to compare these costs with the ongoing costs of investing in other mutual funds.
The examples are based on an investment of $1,000.00 invested at the beginning of the period and held for the entire 6-month period ended December 31, 2014.
Actual Expenses. The first section of the table provides information about actual account values and actual expenses. You may use the information in this section for the class of shares you hold, together with the amount you invested, to estimate the expense that you paid over the period. Simply divide your account value by $1,000.00 (for example, an $8,600.00 account value divided by $1,000.00 = 8.60), then multiply the result by the number in the first section under the heading entitled “Expenses Paid During Period” to estimate the expenses you paid on your account during this period.
Hypothetical Example for Comparison Purposes.
The second section of the table provides information about hypothetical account values and hypothetical expenses based on the Fund’s actual expense ratio for each class of shares, and an assumed rate of return of 5% per year for each class before expenses, which is not the actual return. The hypothetical account values and expenses may not be used to estimate the actual ending account balance or expenses you paid for the period. You may use this information to compare the ongoing costs of investing in the Fund and other funds. To do so, compare this 5% hypothetical example for the class of shares you hold with the 5% hypothetical examples that appear in the shareholder reports of the other funds.
Please note that the expenses shown in the table are meant to highlight your ongoing costs only and do not reflect any charges associated with the separate accounts that offer this Fund. Therefore, the “hypothetical” lines of the table are useful in comparing ongoing costs only, and will not help you determine the relative total costs of owning different funds. In addition, if these separate account charges were included your costs would have been higher.
| | | | | | | | | | | | |
| Actual | | Beginning
Account Value
July 1, 2014 | | | Ending Account Value
December 31, 2014 | | | Expenses Paid During 6 Months Ended
December 31, 2014 | |
| |
Non-Service shares | | $ | 1,000.00 | | | $ | 1,084.60 | | | $ | 4.21 | |
| |
Service shares | | | 1,000.00 | | | | 1,083.20 | | | | 5.53 | |
| |
| | | |
| Hypothetical | | | | | | | | | |
| (5% return before expenses) | | | | | | | | | |
Non-Service shares | | | 1,000.00 | | | | 1,021.17 | | | | 4.08 | |
| |
Service shares | | | 1,000.00 | | | | 1,019.91 | | | | 5.36 | |
| |
Expenses are equal to the Fund’s annualized expense ratio for that class, multiplied by the average account value over the period, multiplied by 184/365 (to reflect the one-half year period). Those annualized expense ratios, excluding indirect expenses from affiliated funds, based on the 6-month period ended December 31, 2014 are as follows:
| | | | |
| Class | | Expense Ratios | |
| |
Non-Service shares | | | 0.80% | |
| |
Service shares | | | 1.05 | |
| |
The expense ratios reflect voluntary and/or contractual waivers and/or reimbursements of expenses by the Fund’s Manager. Some of these undertakings may be modified or terminated at any time, as indicated in the Fund’s prospectus. The “Financial Highlights” tables in the Fund’s financial statements, included in this report, also show the gross expense ratios, without such waivers or reimbursements and reduction to custodian expenses, if applicable.
6 OPPENHEIMER CAPITAL APPRECIATION FUND/VA
STATEMENT OF INVESTMENTS December 31, 2014
| | | | | | | | |
| | | | | | | | |
| | | Shares | | | Value | |
| |
Common Stocks—99.9% | |
| |
Consumer Discretionary—20.9% | | | | | |
| |
Auto Components—0.7% | | | | | | | | |
| |
Magna International, Inc. | | | 65,650 | | | $ | 7,135,499 | |
| |
Hotels, Restaurants & Leisure—1.9% | |
| |
Chipotle Mexican Grill, Inc., Cl. A1 | | | 15,460 | | | | 10,582,525 | |
| |
Dunkin’ Brands Group, Inc. | | | 127,050 | | | | 5,418,682 | |
| |
Wynn Resorts Ltd. | | | 12,950 | | | | 1,926,442 | |
| | | | | | | | |
| | | | | | | 17,927,649 | |
| |
Household Durables—1.2% | | | | | | | | |
| |
Harman International Industries, Inc. | | | 103,970 | | | | 11,094,639 | |
| |
Internet & Catalog Retail—1.2% | | | | | | | | |
| |
Amazon.com, Inc.1 | | | 4,734 | | | | 1,469,197 | |
| |
TripAdvisor, Inc.1 | | | 139,430 | | | | 10,409,844 | |
| | | | | | | | |
| | | | | | | 11,879,041 | |
| |
Media—5.6% | | | | | | | | |
| |
Time Warner, Inc. | | | 238,975 | | | | 20,413,244 | |
| |
Twenty-First Century Fox, Inc., Cl. B | | | 712,340 | | �� | | 26,278,223 | |
| |
Walt Disney Co. (The) | | | 72,030 | | | | 6,784,506 | |
| | | | | | | | |
| | | | | | | 53,475,973 | |
| |
Multiline Retail—2.2% | | | | | | | | |
| |
Macy’s, Inc. | | | 316,370 | | | | 20,801,327 | |
| |
Specialty Retail—4.1% | | | | | | | | |
| |
Tiffany & Co. | | | 150,400 | | | | 16,071,744 | |
| |
TJX Cos., Inc. (The) | | | 338,130 | | | | 23,188,955 | |
| | | | | | | | |
| | | | | | | 39,260,699 | |
| |
Textiles, Apparel & Luxury Goods—4.0% | |
| |
NIKE, Inc., Cl. B | | | 63,700 | | | | 6,124,755 | |
| |
Ralph Lauren Corp., Cl. A | | | 44,040 | | | | 8,154,446 | |
| |
VF Corp. | | | 313,090 | | | | 23,450,441 | |
| | | | | | | | |
| | | | | | | 37,729,642 | |
| |
Consumer Staples—7.1% | | | | | | | | |
| |
Beverages—1.6% | | | | | | | | |
| |
Brown-Forman Corp., Cl. B | | | 59,055 | | | | 5,187,391 | |
| |
SABMiller plc | | | 189,450 | | | | 9,804,467 | |
| | | | | | | | |
| | | | | | | 14,991,858 | |
| |
Food & Staples Retailing—4.3% | | | | | | | | |
| |
Costco Wholesale Corp. | | | 155,130 | | | | 21,989,677 | |
| |
CVS Health Corp. | | | 200,270 | | | | 19,288,004 | |
| | | | | | | | |
| | | | | | | 41,277,681 | |
| |
Food Products—1.2% | | | | | | | | |
| |
Hershey Co. (The) | | | 107,310 | | | | 11,152,728 | |
| |
Energy—1.7% | | | | | | | | |
| |
Energy Equipment & Services—0.4% | |
| |
Halliburton Co. | | | 97,730 | | | | 3,843,721 | |
| |
Oil, Gas & Consumable Fuels—1.3% | |
| |
Antero Resources Corp.1 | | | 68,930 | | | | 2,797,180 | |
| |
Cimarex Energy Co. | | | 18,120 | | | | 1,920,720 | |
| |
EOG Resources, Inc. | | | 54,620 | | | | 5,028,863 | |
| |
Pioneer Natural Resources Co. | | | 19,840 | | | | 2,953,184 | |
| | | | | | | | |
| | | | | | | 12,699,947 | |
| |
Financials—4.9% | | | | | | | | |
| |
Capital Markets—3.3% | | | | | | | | |
| |
Ameriprise Financial, Inc. | | | 45,050 | | | | 5,957,863 | |
| |
Charles Schwab Corp. (The) | | | 584,660 | | | | 17,650,885 | |
| |
Invesco Ltd. | | | 199,300 | | | | 7,876,336 | |
| | | | | | | | |
| | | | | | | 31,485,084 | |
| |
Consumer Finance—0.9% | | | | | | | | |
| |
Discover Financial Services | | | 137,700 | | | | 9,017,973 | |
| | | | | | | | | | |
| | | | | | | | | | | |
| | | | | Shares | | | Value | |
| | | | |
| | | Insurance—0.7% | | | | | | | | |
| | | | |
| | | Aon plc | | | 68,610 | | | $ | 6,506,286 | |
| | | | |
| | | Health Care—23.4% | | | | | | | | |
| | | | |
| | | Biotechnology—11.6% | | | | | | | | |
| | | | |
| | | Biogen Idec, Inc.1 | | | 133,790 | | | | 45,415,015 | |
| | | | |
| | | Celgene Corp.1 | | | 242,664 | | | | 27,144,395 | |
| | | | |
| | | Gilead Sciences, Inc.1 | | | 375,710 | | | | 35,414,425 | |
| | | | |
| | | Vertex Pharmaceuticals, Inc.1 | | | 23,645 | | | | 2,809,026 | |
| | | | | | | | | | | |
| | | | | | | | | | 110,782,861 | |
| | | | |
| | | Health Care Equipment & Supplies—0.2% | |
| | | | |
| | | ResMed, Inc. | | | 34,440 | | | | 1,930,707 | |
| | | | |
| | | Life Sciences Tools & Services—2.0% | |
| | | | |
| | | Illumina, Inc.1 | | | 81,060 | | | | 14,962,055 | |
| | | | |
| | | Thermo Fisher Scientific, Inc. | | | 33,750 | | | | 4,228,537 | |
| | | | | | | | | | | |
| | | | | | | | | | 19,190,592 | |
| | | | |
| | | Pharmaceuticals—9.6% | | | | | | | | |
| | | | |
| | | Actavis plc1 | | | 133,060 | | | | 34,250,975 | |
| | | | |
| | | Allergan, Inc. | | | 50,950 | | | | 10,831,460 | |
| | | | |
| | | Bristol-Myers Squibb Co. | | | 258,760 | | | | 15,274,603 | |
| | | | |
| | | Novo Nordisk AS, Sponsored ADR | | | 60,710 | | | | 2,569,247 | |
| | | | |
| | | Perrigo Co. plc | | | 86,250 | | | | 14,417,550 | |
| | | | |
| | | Valeant Pharmaceuticals International, Inc.1 | | | 95,797 | | | | 13,709,509 | |
| | | | | | | | | | | |
| | | | | | | | | | 91,053,344 | |
| | | | |
| | | Industrials—9.7% | | | | | | | | |
| | | | |
| | | Aerospace & Defense—0.7% | | | | | | | | |
| | | | |
| | | Raytheon Co. | | | 63,260 | | | | 6,842,834 | |
| | | | |
| | | Airlines—1.1% | | | | | | | | |
| | | | |
| | | Delta Air Lines, Inc. | | | 216,170 | | | | 10,633,402 | |
| | | | |
| | | Building Products—0.5% | | | | | | | | |
| | | | |
| | | Allegion plc | | | 96,170 | | | | 5,333,588 | |
| | | | |
| | | Commercial Services & Supplies—2.0% | |
| | | | |
| | | Cintas Corp. | | | 105,940 | | | | 8,309,934 | |
| | | | |
| | | Tyco International plc | | | 242,970 | | | | 10,656,664 | |
| | | | | | | | | | | |
| | | | | | | | | | 18,966,598 | |
| | | | |
| | | Machinery—3.6% | | | | | | | | |
| | | | |
| | | Pall Corp. | | | 136,520 | | | | 13,817,189 | |
| | | | |
| | | Parker-Hannifin Corp. | | | 120,210 | | | | 15,501,080 | |
| | | | |
| | | Pentair plc | | | 76,036 | | | | 5,050,311 | |
| | | | | | | | | | | |
| | | | | | | | | | 34,368,580 | |
| | | | |
| | | Road & Rail—1.2% | | | | | | | | |
| | | | |
| | | Canadian Pacific Railway Ltd. | | | 58,300 | | | | 11,233,827 | |
| | | | |
| | | Trading Companies & Distributors—0.6% | |
| | | | |
| | | United Rentals, Inc.1 | | | 56,580 | | | | 5,771,726 | |
| | | | |
| | | Information Technology—31.1% | |
| | | | |
| | | Communications Equipment—1.4% | |
| | | | |
| | | Cisco Systems, Inc. | | | 472,450 | | | | 13,141,197 | |
| | | | |
| | | Internet Software & Services—8.8% | |
| | | | |
| | | Alibaba Group Holding Ltd., Sponsored ADR1 | | | 52,400 | | | | 5,446,456 | |
| | | | |
| | | Facebook, Inc., Cl. A1 | | | 497,380 | | | | 38,805,587 | |
| | | | |
| | | Google, Inc., Cl. A1 | | | 18,020 | | | | 9,562,493 | |
| | | | |
| | | LinkedIn Corp., Cl. A1 | | | 129,870 | | | | 29,832,438 | |
| | | | | | | | | | | |
| | | | | | | | | | 83,646,974 | |
| | | | |
| | | IT Services—6.4% | | | | | | | | |
| | | | |
| | | Computer Sciences Corp. | | | 162,300 | | | | 10,233,015 | |
| | | | |
| | | MasterCard, Inc., Cl. A | | | 307,790 | | | | 26,519,187 | |
| | | | |
| | | Visa, Inc., Cl. A | | | 91,617 | | | | 24,021,977 | |
| | | | | | | | | | | |
| | | | | | | | | | 60,774,179 | |
| | | | |
| | | Software—5.0% | | | | | | | | |
| | | | |
| | | Oracle Corp. | | | 498,870 | | | | 22,434,184 | |
7 OPPENHEIMER CAPITAL APPRECIATION FUND/VA
STATEMENT OF INVESTMENTS Continued
| | | | | | | | |
| | | | | | | | |
| | | Shares | | | Value | |
| |
Software (Continued) | | | | | | | | |
| |
ServiceNow, Inc.1 | | | 114,460 | | | $ | 7,766,111 | |
| |
Splunk, Inc.1 | | | 123,930 | | | | 7,305,673 | |
| |
Workday, Inc., Cl. A1 | | | 123,980 | | | | 10,118,008 | |
| | | | | | | | |
| | | | | | | 47,623,976 | |
| |
Technology Hardware, Storage & Peripherals—9.5% | |
| |
Apple, Inc. | | | 529,440 | | | | 58,439,587 | |
| |
EMC Corp. | | | 576,400 | | | | 17,142,136 | |
| |
Western Digital Corp. | | | 141,790 | | | | 15,696,153 | |
| | | | | | | | |
| | | | | | | 91,277,876 | |
| |
Materials—1.1% | | | | | | | | |
| |
Chemicals—1.1% | | | | | | | | |
| |
Dow Chemical Co. (The) | | | 62,870 | | | | 2,867,500 | |
| |
Sherwin-Williams Co. (The) | | | 27,770 | | | | 7,304,621 | |
| | | | | | | | |
| | | | | | | 10,172,121 | |
| | | | | | | | |
Total Common Stocks (Cost $686,330,741) | | | | 953,024,129 | |
| | | | | | | | | | |
| | | | | | | | | | | |
| | | | | Shares | | | Value | |
| | | | |
| | | Investment Company—0.3% | | | | | | | | |
| | | | |
| | | Oppenheimer Institutional Money Market Fund, Cl. E, 0.10%2,3 (Cost $3,087,900) | | | 3,087,900 | | | $ | 3,087,900 | |
| | | | |
| | | Total Investments, at Value (Cost $689,418,641) | | | 100.2% | | | | 956,112,029 | |
| | | | |
| | | Net Other Assets (Liabilities) | | | (0.2) | | | | (1,931,661) | |
| | | | | | | |
| | | Net Assets | | | 100.0% | | | $ | 954,180,368 | |
| | | | | | | |
| | | | | | | | | | | |
| | | | | | | | | | | |
| | | | | | | | | | | |
| | | | | | | | | | | |
| | | | | | | | | | | |
| | | | | | | | | | | |
| | | | | | | | | | | |
| | | | | | | | | | | |
| | | | | | | | | | | |
| | | | | | | | | | | |
Footnotes to Statement of Investments
1. Non-income producing security.
2. Rate shown is the 7-day yield as of December 31, 2014.
3. Is or was an affiliate, as defined in the Investment Company Act of 1940, as amended, at or during the period ended December 31, 2014, by virtue of the Fund owning at least 5% of the voting securities of the issuer or as a result of the Fund and the issuer having the same investment adviser. Transactions during the period in which the issuer was an affiliate are as follows:
| | | | | | | | |
| | | Shares
December 31, 2013 | | Gross
Additions | | Gross Reductions | | Shares
December 31, 2014 |
|
Oppenheimer Institutional Money Market Fund, Cl. E | | 3,644,176 | | 250,187,687 | | 250,743,963 | | 3,087,900 |
| | | | |
| | | | | | | Value | | Income |
|
Oppenheimer Institutional Money Market Fund, Cl. E | | | | | | $ 3,087,900 | | $ 8,319 |
See accompanying Notes to Financial Statements.
8 OPPENHEIMER CAPITAL APPRECIATION FUND/VA
STATEMENTOFASSETSANDLIABILITIES December 31, 2014
| | | | |
| |
Assets | | | | |
Investments, at value—see accompanying statement of investments: | | | | |
Unaffiliated companies (cost $686,330,741) | | $ | 953,024,129 | |
Affiliated companies (cost $3,087,900) | | | 3,087,900 | |
| | | | |
| | | 956,112,029 | |
| |
Cash | | | 2,000,000 | |
| |
Receivables and other assets: | | | | |
Dividends | | | 813,357 | |
Shares of beneficial interest sold | | | 88,195 | |
Other | | | 68,050 | |
| | | | |
Total assets | | | 959,081,631 | |
| |
Liabilities | | | | |
Payables and other liabilities: | | | | |
Shares of beneficial interest redeemed | | | 4,681,635 | |
Distribution and service plan fees | | | 72,107 | |
Trustees’ compensation | | | 66,926 | |
Shareholder communications | | | 19,794 | |
Other | | | 60,801 | |
| | | | |
Total liabilities | | | 4,901,263 | |
| |
Net Assets | | $ | 954,180,368 | |
| | | | |
|
| |
Composition of Net Assets | | | | |
Par value of shares of beneficial interest | | $ | 14,756 | |
| |
Additional paid-in capital | | | 523,415,256 | |
| |
Accumulated net investment loss | | | (837,141) | |
| |
Accumulated net realized gain on investments and foreign currency transactions | | | 164,911,833 | |
| |
Net unrealized appreciation on investments and translation of assets and liabilities denominated in foreign currencies | | | 266,675,664 | |
| | | | |
Net Assets | | $ | 954,180,368 | |
| | | | |
| | | | |
| |
Net Asset Value Per Share | | | | |
Non-Service Shares: | | | | |
Net asset value, redemption price per share and offering price per share (based on net assets of $616,862,207 and 9,509,254 shares of beneficial interest outstanding) | | | $64.87 | |
| |
Service Shares: | | | | |
Net asset value, redemption price per share and offering price per share (based on net assets of $337,318,161 and 5,246,317 shares of beneficial interest outstanding) | | | $64.30 | |
See accompanying Notes to Financial Statements.
9 OPPENHEIMER CAPITAL APPRECIATION FUND/VA
STATEMENT OF OPERATIONS For the Year Ended December 31, 2014
| | | | |
| |
Investment Income | | | | |
Dividends: | | | | |
Unaffiliated companies (net of foreign withholding taxes of $76,560) | | $ | 9,081,231 | |
Affiliated companies | | | 8,319 | |
| |
Interest | | | 52 | |
| | | | |
Total investment income | | | 9,089,602 | |
| |
Expenses | | | | |
Management fees | | | 6,567,456 | |
| |
Distribution and service plan fees - Service shares | | | 855,769 | |
| |
Transfer and shareholder servicing agent fees: | | | | |
Non-Service shares | | | 612,637 | |
Service shares | | | 342,324 | |
| |
Shareholder communications: | | | | |
Non-Service shares | | | 41,501 | |
Service shares | | | 23,158 | |
| |
Trustees’ compensation | | | 37,478 | |
| |
Custodian fees and expenses | | | 14,835 | |
| |
Other | | | 65,321 | |
| | | | |
Total expenses | | | 8,560,479 | |
Less reduction to custodian expenses | | | (290) | |
Less waivers and reimbursements of expenses | | | (64,710) | |
| | | | |
Net expenses | | | 8,495,479 | |
| |
Net Investment Income | | | 594,123 | |
| |
Realized and Unrealized Gain (Loss) | | | | |
Net realized gain (loss) on: | | | | |
Investments from unaffiliated companies | | | 183,611,397 | |
Foreign currency transactions | | | (8,182) | |
| | | | |
Net realized gain | | | 183,603,215 | |
| |
Net change in unrealized appreciation/depreciation on: | | | | |
Investments | | | (46,302,474) | |
Translation of assets and liabilities denominated in foreign currencies | | | (2,214,126) | |
| | | | |
Net change in unrealized appreciation/depreciation | | | (48,516,600) | |
| |
Net Increase in Net Assets Resulting from Operations | | $ | 135,680,738 | |
| | | | |
See accompanying Notes to Financial Statements.
10 OPPENHEIMER CAPITAL APPRECIATION FUND/VA
STATEMENTS OF CHANGES IN NET ASSETS
| | | | | | | | |
| | | Year Ended
December 31, 2014 | | | Year Ended
December 31, 2013 | |
| |
Operations | | | | | | | | |
Net investment income | | $ | 594,123 | | | $ | 3,375,027 | |
| |
Net realized gain | | | 183,603,215 | | | | 226,957,048 | |
| |
Net change in unrealized appreciation/depreciation | | | (48,516,600) | | | | 19,646,381 | |
| | | | | | | | |
Net increase in net assets resulting from operations | | | 135,680,738 | | | | 249,978,456 | |
| |
Dividends and/or Distributions to Shareholders | | | | | | | | |
Dividends from net investment income: | | | | | | | | |
Non-Service shares | | | (2,755,561) | | | | (5,856,634) | |
Service shares | | | (632,322) | | | | (2,798,285) | |
| | | | |
| | | (3,387,883) | | | | (8,654,919) | |
| |
Distributions from net realized gain: | | | | | | | | |
Non-Service shares | | | (15,002,872) | | | | — | |
Service shares | | | (8,466,690) | | | | — | |
| | | | |
| | | (23,469,562) | | | | — | |
| |
Beneficial Interest Transactions | | | | | | | | |
Net increase (decrease) in net assets resulting from beneficial interest transactions: | | | | | | | | |
Non-Service shares | | | (80,263,666) | | | | (96,658,801) | |
Service shares | | | (65,500,468) | | | | (93,891,544) | |
| | | | | | | | |
| | | (145,764,134) | | | | (190,550,345) | |
| |
Net Assets | | | | | | | | |
Total increase (decrease) | | | (36,940,841) | | | | 50,773,192 | |
| |
Beginning of period | | | 991,121,209 | | | | 940,348,017 | |
| | | | | | | | |
End of period (including accumulated net investment income (loss) of $(837,141) and $1,964,801, respectively) | | $ | 954,180,368 | | | $ | 991,121,209 | |
| | | | |
See accompanying Notes to Financial Statements.
11 OPPENHEIMER CAPITAL APPRECIATION FUND/VA
FINANCIAL HIGHLIGHTS
| | | | | | | | | | | | | | | | | | | | |
| Non-Service Shares | | Year Ended December 31, 2014 | | | Year Ended December 31, 2013 | | | Year Ended December 31, 2012 | | | Year Ended December 30, 20111 | | | Year Ended December 31, 2010 | |
| |
Per Share Operating Data | | | | | | | | | | | | | | | | | | | | |
Net asset value, beginning of period | | $ | 57.88 | | | $ | 45.06 | | | $ | 39.75 | | | $ | 40.35 | | | $ | 36.94 | |
| |
Income (loss) from investment operations: | | | | | | | | | | | | | | | | | | | | |
Net investment income2 | | | 0.09 | | | | 0.23 | | | | 0.42 | | | | 0.23 | | | | 0.11 | |
Net realized and unrealized gain (loss) | | | 8.64 | | | | 13.09 | | | | 5.18 | | | | (0.69) | | | | 3.36 | |
| | | | |
Total from investment operations | | | 8.73 | | | | 13.32 | | | | 5.60 | | | | (0.46) | | | | 3.47 | |
| |
Dividends and/or distributions to shareholders: | | | | | | | | | | | | | | | | | | | | |
Dividends from net investment income | | | (0.27) | | | | (0.50) | | | | (0.29) | | | | (0.14) | | | | (0.06) | |
Distributions from net realized gain | | | (1.47) | | | | 0.00 | | | | 0.00 | | | | 0.00 | | | | 0.00 | |
| | | | |
Total dividends and/or distributions to shareholders | | | (1.74) | | | | (0.50) | | | | (0.29) | | | | (0.14) | | | | (0.06) | |
| |
Net asset value, end of period | | $ | 64.87 | | | $ | 57.88 | | | $ | 45.06 | | | $ | 39.75 | | | $ | 40.35 | |
| | | | |
| | | | |
| |
Total Return, at Net Asset Value3 | | | 15.41% | | | | 29.74% | | | | 14.12% | | | | (1.15)% | | | | 9.42% | |
| |
Ratios/Supplemental Data | | | | | | | | | | | | | | | | | | | | |
Net assets, end of period (in thousands) | | $ | 616,862 | | | $ | 626,907 | | | $ | 573,684 | | | $ | 637,868 | | | $ | 771,086 | |
| |
Average net assets (in thousands) | | $ | 614,272 | | | $ | 595,912 | | | $ | 600,121 | | | $ | 713,770 | | | $ | 976,242 | |
| |
Ratios to average net assets:4 | | | | | | | | | | | | | | | | | | | | |
Net investment income | | | 0.15% | | | �� | 0.44% | | | | 0.95% | | | | 0.57% | | | | 0.31% | |
Total expenses5 | | | 0.80% | | | | 0.81% | | | | 0.81% | | | | 0.80% | | | | 0.79% | |
Expenses after payments, waivers and/or reimbursements and reduction to custodian expenses | | | 0.80% | | | | 0.80% | | | | 0.80% | | | | 0.80% | | | | 0.79% | |
| |
Portfolio turnover rate | | | 61% | | | | 77% | | | | 28% | | | | 27% | | | | 58% | |
1. December 30, 2011 represents the last business day of the Fund’s reporting period.
2. Per share amounts calculated based on the average shares outstanding during the period.
3. Assumes an initial investment on the business day before the first day of the fiscal period, with all dividends and distributions reinvested in additional shares on the reinvestment date, and redemption at the net asset value calculated on the last business day of the fiscal period. Total returns are not annualized for periods less than one full year. Total return information does not reflect expenses that apply at the separate account level or to related insurance products. Inclusion of these charges would reduce the total return figures for all periods shown. Returns do not reflect the deduction of taxes that a shareholder would pay on fund distributions or the redemption of fund shares.
4. Annualized for periods less than one full year.
5. Total expenses including indirect expenses from affiliated fund fees and expenses were as follows:
| | | | |
Year Ended December 31, 2014 | | 0.80% | | |
Year Ended December 31, 2013 | | 0.81% | | |
Year Ended December 31, 2012 | | 0.81% | | |
Year Ended December 30, 2011 | | 0.80% | | |
Year Ended December 31, 2010 | | 0.79% | | |
See accompanying Notes to Financial Statements.
12 OPPENHEIMER CAPITAL APPRECIATION FUND/VA
FINANCIAL HIGHLIGHTS Continued
| | | | | | | | | | | | | | | | | | | | |
| Service Shares | | Year Ended December 31, 2014 | | | Year Ended December 31, 2013 | | | Year Ended December 31, 2012 | | | Year Ended December 30, 20111 | | | Year Ended December 31, 2010 | |
| |
Per Share Operating Data | | | | | | | | | | | | | | | | | | | | |
Net asset value, beginning of period | | $ | 57.37 | | | $ | 44.66 | | | $ | 39.40 | | | $ | 39.99 | | | $ | 36.64 | |
| |
Income (loss) from investment operations: | | | | | | | | | | | | | | | | | | | | |
Net investment income (loss)2 | | | (0.06) | | | | 0.10 | | | | 0.31 | | | | 0.13 | | | | 0.02 | |
Net realized and unrealized gain (loss) | | | 8.57 | | | | 12.98 | | | | 5.12 | | | | (0.68) | | | | 3.33 | |
| | | | |
Total from investment operations | | | 8.51 | | | | 13.08 | | | | 5.43 | | | | (0.55) | | | | 3.35 | |
| |
Dividends and/or distributions to shareholders: | | | | | | | | | | | | | | | | | | | | |
Dividends from net investment income | | | (0.11) | | | | (0.37) | | | | (0.17) | | | | (0.04) | | | | 0.00 | |
Distributions from net realized gain | | | (1.47) | | | | 0.00 | | | | 0.00 | | | | 0.00 | | | | 0.00 | |
| | | | |
Total dividends and/or distributions to shareholders | | | (1.58) | | | | (0.37) | | | | (0.17) | | | | (0.04) | | | | 0.00 | |
| |
Net asset value, end of period | | $ | 64.30 | | | $ | 57.37 | | | $ | 44.66 | | | $ | 39.40 | | | $ | 39.99 | |
| | | | |
| | | | |
| |
Total Return, at Net Asset Value3 | | | 15.13% | | | | 29.43% | | | | 13.81% | | | | (1.37)% | | | | 9.15% | |
| |
Ratios/Supplemental Data | | | | | | | | | | | | | | | | | | | | |
Net assets, end of period (in thousands) | | $ | 337,318 | | | $ | 364,214 | | | $ | 366,664 | | | $ | 375,330 | | | $ | 423,989 | |
| |
Average net assets (in thousands) | | $ | 343,254 | | | $ | 367,615 | | | $ | 382,196 | | | $ | 407,413 | | | $ | 427,640 | |
| |
Ratios to average net assets:4 | | | | | | | | | | | | | | | | | | | | |
Net investment income (loss) | | | (0.10)% | | | | 0.20% | | | | 0.71% | | | | 0.32% | | | | 0.06% | |
Total expenses5 | | | 1.05% | | | | 1.06% | | | | 1.06% | | | | 1.05% | | | | 1.04% | |
Expenses after payments, waivers and/or reimbursements and reduction to custodian expenses | | | 1.05% | | | | 1.05% | | | | 1.05% | | | | 1.05% | | | | 1.04% | |
| |
Portfolio turnover rate | | | 61% | | | | 77% | | | | 28% | | | | 27% | | | | 58% | |
1. December 30, 2011 represents the last business day of the Fund’s reporting period.
2. Per share amounts calculated based on the average shares outstanding during the period.
3. Assumes an initial investment on the business day before the first day of the fiscal period, with all dividends and distributions reinvested in additional shares on the reinvestment date, and redemption at the net asset value calculated on the last business day of the fiscal period. Total returns are not annualized for periods less than one full year. Total return information does not reflect expenses that apply at the separate account level or to related insurance products. Inclusion of these charges would reduce the total return figures for all periods shown. Returns do not reflect the deduction of taxes that a shareholder would pay on fund distributions or the redemption of fund shares.
4. Annualized for periods less than one full year.
5. Total expenses including indirect expenses from affiliated fund fees and expenses were as follows:
| | | | |
Year Ended December 31, 2014 | | 1.05% | | |
Year Ended December 31, 2013 | | 1.06% | | |
Year Ended December 31, 2012 | | 1.06% | | |
Year Ended December 30, 2011 | | 1.05% | | |
Year Ended December 31, 2010 | | 1.04% | | |
See accompanying Notes to Financial Statements.
13 OPPENHEIMER CAPITAL APPRECIATION FUND/VA
NOTES TO FINANCIAL STATEMENTS December 31, 2014
1. Organization
Oppenheimer Capital Appreciation Fund/VA (the “Fund”), a separate series of Oppenheimer Variable Account Funds, is a diversified open-end management investment company registered under the Investment Company Act of 1940 (“1940Act”), as amended. The Fund’s investment objective is to seek capital appreciation. The Fund’s investment adviser is OFI Global Asset Management, Inc. (“OFI Global” or the “Manager”), a wholly-owned subsidiary of OppenheimerFunds, Inc. (“OFI” or the “Sub-Adviser”). The Manager has entered into a sub-advisory agreement with OFI. Shares of the Fund are sold only to separate accounts of life insurance companies.
The Fund offers two classes of shares. Both classes are sold at their offering price, which is the net asset value per share, to separate investment accounts of participating insurance companies as an underlying investment for variable life insurance policies, variable annuity contracts or other investment products. The class of shares designated as Service shares is subject to a distribution and service plan. Both classes of shares have identical rights and voting privileges with respect to the Fund in general and exclusive voting rights on matters that affect that class alone. Earnings, net assets and net asset value per share may differ due to each class having its own expenses, such as transfer and shareholder servicing agent fees and shareholder communications, directly attributable to that class.
The following is a summary of significant accounting policies consistently followed by the Fund.
2. Significant Accounting Policies
Security Valuation. All investments in securities are recorded at their estimated fair value, as described in Note 3.
Foreign Currency Translation. The Fund’s accounting records are maintained in U.S. dollars. The values of securities denominated in foreign currencies and amounts related to the purchase and sale of foreign securities and foreign investment income are translated into U.S. dollars as of the close of the New York Stock Exchange (the “Exchange”), normally 4:00 P.M. Eastern time, on each day the Exchange is open for trading. Foreign exchange rates may be valued primarily using a reliable bank, dealer or service authorized by the Board of Trustees.
Reported net realized gains and losses from foreign currency transactions arise from sales of portfolio securities, sales and maturities of short-term securities, sales of foreign currencies, exchange rate fluctuations between the trade and settlement dates on securities transactions, and the difference between the amounts of dividends, interest, and foreign withholding taxes recorded on the Fund’s books and the U.S. dollar equivalent of the amounts actually received or paid. Net unrealized appreciation and depreciation on the translation of assets and liabilities denominated in foreign currencies arise from changes in the values of assets and liabilities, including investments in securities at fiscal period end, resulting from changes in exchange rates.
The effect of changes in foreign currency exchange rates on investments is separately identified from the fluctuations arising from changes in market values of securities held and reported with all other foreign currency gains and losses in the Fund’s Statement of Operations.
Allocation of Income, Expenses, Gains and Losses. Income, expenses (other than those attributable to a specific class), gains and losses are allocated on a daily basis to each class of shares based upon the relative proportion of net assets represented by such class. Operating expenses directly attributable to a specific class are charged against the operations of that class.
Dividends and Distributions to Shareholders. Dividends and distributions to shareholders, which are determined in accordance with income tax regulations and may differ from U.S. generally accepted accounting principles, are recorded on the ex-dividend date. Income and capital gain distributions, if any, are declared and paid annually or at other times as deemed necessary by the Manager.
Investment Income. Dividend income is recorded on the ex-dividend date or upon ex-dividend notification in the case of certain foreign dividends where the ex-dividend date may have passed. Non-cash dividends included in dividend income, if any, are recorded at the fair market value of the securities received. Interest income is recognized on an accrual basis. Discount and premium, which are included in interest income on the Statement of Operations, are amortized or accreted daily.
Custodian Fees. “Custodian fees and expenses” in the Statement of Operations may include interest expense incurred by the Fund on any cash overdrafts of its custodian account during the period. Such cash overdrafts may result from the effects of failed trades in portfolio securities and from cash outflows resulting from unanticipated shareholder redemption activity. The Fund pays interest to its custodian on such cash overdrafts, to the extent they are not offset by positive cash balances maintained by the Fund, at a rate equal to the Federal Funds Rate plus 0.50%. The “Reduction to custodian expenses” line item, if applicable, represents earnings on cash balances maintained by the Fund during the period. Such interest expense and other custodian fees may be paid with these earnings.
Security Transactions. Security transactions are recorded on the trade date. Realized gains and losses on securities sold are determined on the basis of identified cost.
Indemnifications. The Fund’s organizational documents provide current and former Trustees and officers with a limited indemnification against liabilities arising in connection with the performance of their duties to the Fund. In the normal course of business, the Fund may also enter into contracts that provide general indemnifications. The Fund’s maximum exposure under these arrangements is unknown as this would be dependent on future claims that may be made against the Fund. The risk of material loss from such claims is considered remote.
Federal Taxes. The Fund intends to comply with provisions of the Internal Revenue Code applicable to regulated investment companies and to distribute substantially all of its investment company taxable income, including any net realized gain on investments not offset by capital loss
14 OPPENHEIMER CAPITAL APPRECIATION FUND/VA
2. Significant Accounting Policies (Continued)
carryforwards, if any, to shareholders. Therefore, no federal income or excise tax provision is required. The Fund files income tax returns in U.S. federal and applicable state jurisdictions. The statute of limitations on the Fund’s tax return filings generally remain open for the three preceding fiscal reporting period ends.
The tax components of capital shown in the following table represent distribution requirements the Fund must satisfy under the income tax regulations, losses the Fund may be able to offset against income and gains realized in future years and unrealized appreciation or depreciation of securities and other investments for federal income tax purposes.
| | | | | | | | | | | | |
Undistributed Net Investment Income | | Undistributed Long-Term Gain | | | Accumulated Loss Carryforward1,2 | | | Net Unrealized Appreciation Based on cost of Securities and Other Investments for Federal Income Tax Purposes | |
| |
$24,550,440 | | | $141,245,553 | | | | $— | | | | $266,203,894 | |
1. During the fiscal year ended December 31, 2014, the Fund did not utilize any capital loss carryforward.
2. During the fiscal year ended December 31, 2013, the Fund utilized $197,794,392 of capital loss carryforward to offset capital gains realized in that fiscal year.
Net investment income (loss) and net realized gain (loss) may differ for financial statement and tax purposes. The character of dividends and distributions made during the fiscal year from net investment income or net realized gains may differ from their ultimate characterization for federal income tax purposes. Also, due to timing of dividends and distributions, the fiscal year in which amounts are distributed may differ from the fiscal year in which the income or net realized gain was recorded by the Fund.
Accordingly, the following amounts have been reclassified for December 31, 2014. Net assets of the Fund were unaffected by the reclassifications.
| | | | | | | | |
Increase to Paid-in Capital | | Increase to Accumulated Net Investment Loss | | | Reduction to Accumulated Net Realized Gain on Investments3 | |
| |
$18,611,466 | | | $8,182 | | | | $18,603,284 | |
3. $18,611,466, including $16,181,730 of long-term capital gain, was distributed in connection with Fund share redemptions.
The tax character of distributions paid during the years ended December 31, 2014 and December 31, 2013 was as follows:
| | | | | | | | |
| | | Year Ended December 31, 2014 | | | Year Ended December 31, 2013 | |
| |
Distributions paid from: | | | | | | | | |
Ordinary income | | $ | 3,387,883 | | | $ | 8,654,919 | |
Long-term capital gain | | | 23,469,562 | | | | — | |
| | | | |
Total | | $ | 26,857,445 | | | $ | 8,654,919 | |
| | | | |
The aggregate cost of securities and other investments and the composition of unrealized appreciation and depreciation of securities and other investments for federal income tax purposes as of December 31, 2014 are noted in the following table. The primary difference between book and tax appreciation or depreciation of securities and other investments, if applicable, is attributable to the tax deferral of losses or tax realization of financial statement unrealized gain or loss.
| | | | |
Federal tax cost of securities | | $ | 689,890,411 | |
| | | | |
| |
Gross unrealized appreciation | | $ | 271,048,989 | |
Gross unrealized depreciation | | | (4,845,095) | |
| | | | |
Net unrealized appreciation | | $ | 266,203,894 | |
| | | | |
Use of Estimates. The preparation of financial statements in conformity with accounting principles generally accepted in the United States of America requires management to make estimates and assumptions that affect the reported amounts of assets and liabilities and disclosure of contingent assets and liabilities at the date of the financial statements and the reported amounts of increases and decreases in net assets from operations during the reporting period. Actual results could differ from those estimates.
3. Securities Valuation
The Fund calculates the net asset value of its shares as of the close of the New York Stock Exchange (the “Exchange”), normally 4:00 P.M. Eastern time, on each day the Exchange is open for trading.
The Fund’s Board has adopted procedures for the valuation of the Fund’s securities and has delegated the day-to-day responsibility for valuation determinations under those procedures to the Manager. The Manager has established a Valuation Committee which is responsible for determining a “fair valuation” for any security for which market quotations are not “readily available.” The Valuation Committee’s fair valuation determinations
15 OPPENHEIMER CAPITAL APPRECIATION FUND/VA
NOTES TO FINANCIAL STATEMENTS Continued
3. Securities Valuation (Continued)
subject to review, approval and ratification by the Fund’s Board at its next regularly scheduled meeting covering the calendar quarter in which the fair valuation was determined.
Valuation Methods and Inputs
Securities are valued using unadjusted quoted market prices, when available, as supplied primarily by third party pricing services or dealers.
The following methodologies are used to determine the market value or the fair value of the types of securities described below:
Securities traded on a registered U.S. securities exchange (including exchange-traded derivatives other than futures and futures options) are valued based on the last sale price of the security reported on the principal exchange on which it is traded, prior to the time when the Fund’s assets are valued. In the absence of a sale, the security is valued at the last sale price on the prior trading day, if it is within the spread of the current day’s closing “bid” and “asked” prices, and if not, at the current day’s closing bid price. A security of a foreign issuer traded on a foreign exchange, but not listed on a registered U.S. securities exchange, is valued based on the last sale price on the principal exchange on which the security is traded, as identified by the third party pricing service used by the Manager, prior to the time when the Fund’s assets are valued. If the last sale price is unavailable, the security is valued at the most recent official closing price on the principal exchange on which it is traded. If the last sales price or official closing price for a foreign security is not available, the security is valued at the mean between the bid and asked price per the exchange or, if not available from the exchange, obtained from two dealers. If bid and asked prices are not available from either the exchange or two dealers, the security is valued by using one of the following methodologies (listed in order of priority): (1) using a bid from the exchange, (2) the mean between the bid and asked price as provided by a single dealer, or (3) a bid from a single dealer.
Shares of a registered investment company that are not traded on an exchange are valued at that investment company’s net asset value per share.
Corporate and government debt securities (of U.S. or foreign issuers) and municipal debt securities, event-linked bonds, loans, mortgage-backed securities, collateralized mortgage obligations, and asset-backed securities are valued at the mean between the “bid” and “asked” prices utilizing evaluated prices obtained from third party pricing services or broker-dealers who may use matrix pricing methods to determine the evaluated prices.
Short-term money market type debt securities with a remaining maturity of sixty days or less are valued at cost adjusted by the amortization of discount or premium to maturity (amortized cost), which approximates market value. Short-term debt securities with a remaining maturity in excess of sixty days are valued at the mean between the “bid” and “asked” prices utilizing evaluated prices obtained from third party pricing services or broker-dealers.
A description of the standard inputs that may generally be considered by the third party pricing vendors in determining their evaluated prices is provided below.
| | |
| Security Type | | Standard inputs generally considered by third-party pricing vendors |
| Corporate debt, government debt, municipal, mortgage-backed and asset-backed securities | | Reported trade data, broker-dealer price quotations, benchmark yields, issuer spreads on comparable securities, the credit quality, yield, maturity, and other appropriate factors. |
| Loans | | Information obtained from market participants regarding reported trade data and broker-dealer price quotations. |
| Event-linked bonds | | Information obtained from market participants regarding reported trade data and broker-dealer price quotations. |
If a market value or price cannot be determined for a security using the methodologies described above, or if, in the “good faith” opinion of the Manager, the market value or price obtained does not constitute a “readily available market quotation,” or a significant event has occurred that would materially affect the value of the security the security is fair valued either (i) by a standardized fair valuation methodology applicable to the security type or the significant event as previously approved by the Valuation Committee and the Fund’s Board or (ii) as determined in good faith by the Manager’s Valuation Committee. The Valuation Committee considers all relevant facts that are reasonably available, through either public information or information available to the Manager, when determining the fair value of a security. Fair value determinations by the Manager are subject to review, approval and ratification by the Fund’s Board at its next regularly scheduled meeting covering the calendar quarter in which the fair valuation was determined. Those fair valuation standardized methodologies include, but are not limited to, valuing securities at the last sale price or initially at cost and subsequently adjusting the value based on: changes in company specific fundamentals, changes in an appropriate securities index, or changes in the value of similar securities which may be further adjusted for any discounts related to security-specific resale restrictions. When possible, such methodologies use observable market inputs such as unadjusted quoted prices of similar securities, observable interest rates, currency rates and yield curves. The methodologies used for valuing securities are not necessarily an indication of the risks associated with investing in those securities nor can it be assured that the Fund can obtain the fair value assigned to a security if it were to sell the security.
To assess the continuing appropriateness of security valuations, the Manager, or its third party service provider who is subject to oversight by the Manager, regularly compares prior day prices, prices on comparable securities, and sale prices to the current day prices and challenges those prices exceeding certain tolerance levels with the third party pricing service or broker source. For those securities valued by fair valuations, whether through a standardized fair valuation methodology or a fair valuation determination, the Valuation Committee reviews and affirms the reasonableness of the valuations based on such methodologies and fair valuation determinations on a regular basis after considering all relevant information that is reasonably available.
16 OPPENHEIMER CAPITAL APPRECIATION FUND/VA
3. Securities Valuation (Continued)
Classifications
Each investment asset or liability of the Fund is assigned a level at measurement date based on the significance and source of the inputs to its valuation. Various data inputs are used in determining the value of each of the Fund’s investments as of the reporting period end. These data inputs are categorized in the following hierarchy under applicable financial accounting standards:
1) Level 1-unadjusted quoted prices in active markets for identical assets or liabilities (including securities actively traded on a securities exchange)
2) Level 2-inputs other than unadjusted quoted prices that are observable for the asset or liability (such as unadjusted quoted prices for similar assets and market corroborated inputs such as interest rates, prepayment speeds, credit risks, etc.)
3) Level 3-significant unobservable inputs (including the Manager’s own judgments about assumptions that market participants would use in pricing the asset or liability).
The inputs used for valuing securities are not necessarily an indication of the risks associated with investing in those securities.
The table below categorizes amounts that are included in the Fund’s Statement of Assets and Liabilities as of December 31, 2014 based on valuation input level:
| | | | | | | | | | | | | | | | |
| | | Level 1— Unadjusted Quoted Prices | | | Level 2— Other Significant Observable Inputs | | | Level 3— Significant Unobservable Inputs | | | Value | |
| |
Assets Table | | | | | | | | | | | | | | | | |
Investments, at Value: | | | | | | | | | | | | | | | | |
Common Stocks | | | | | | | | | | | | | | | | |
Consumer Discretionary | | $ | 199,304,469 | | | $ | — | | | $ | — | | | $ | 199,304,469 | |
Consumer Staples | | | 57,617,800 | | | | 9,804,467 | | | | — | | | | 67,422,267 | |
Energy | | | 16,543,668 | | | | — | | | | — | | | | 16,543,668 | |
Financials | | | 47,009,343 | | | | — | | | | — | | | | 47,009,343 | |
Health Care | | | 222,957,504 | | | | — | | | | — | | | | 222,957,504 | |
Industrials | | | 93,150,555 | | | | — | | | | — | | | | 93,150,555 | |
Information Technology | | | 296,464,202 | | | | — | | | | — | | | | 296,464,202 | |
Materials | | | 10,172,121 | | | | — | | | | — | | | | 10,172,121 | |
Investment Company | | | 3,087,900 | | | | — | | | | — | | | | 3,087,900 | |
| | | | |
Total Assets | | $ | 946,307,562 | | | $ | 9,804,467 | | | $ | — | | | $ | 956,112,029 | |
| | | | |
Forward currency exchange contracts and futures contracts, if any, are reported at their unrealized appreciation/depreciation at measurement date, which represents the change in the contract’s value from trade date. All additional assets and liabilities included in the above table are reported at their market value at measurement date.
4. Investments and Risks
Investment in Oppenheimer Institutional Money Market Fund. The Fund is permitted to invest daily available cash balances in an affiliated money market fund. The Fund may invest the available cash in Class E shares of Oppenheimer Institutional Money Market Fund (“IMMF”) to seek current income while preserving liquidity or for defensive purposes. IMMF is a registered open-end management investment company, regulated as a money market fund under the 1940 Act. The Manager is the investment adviser of IMMF, and the Sub-Adviser provides investment and related advisory services to IMMF. When applicable, the Fund’s investment in IMMF is included in the Statement of Investments. Shares of IMMF are valued at their net asset value per share. As a shareholder, the Fund is subject to its proportional share of IMMF’s Class E expenses, including its management fee. The Manager will waive fees and/or reimburse Fund expenses in an amount equal to the indirect management fees incurred through the Fund’s investment in IMMF.
Equity Security Risk. Stocks and other equity securities fluctuate in price. The value of the Fund’s portfolio may be affected by changes in the equity markets generally. Equity markets may experience significant short-term volatility and may fall sharply at times. Different markets may behave differently from each other and U.S. equity markets may move in the opposite direction from one or more foreign stock markets.
The prices of individual equity securities generally do not all move in the same direction at the same time and a variety of factors can affect the price of a particular company’s securities. These factors may include, but are not limited to, poor earnings reports, a loss of customers, litigation against the company, general unfavorable performance of the company’s sector or industry, or changes in government regulations affecting the company or its industry.
5. Shares of Beneficial Interest
The Fund has authorized an unlimited number of $0.001 par value shares of beneficial interest of each class. Transactions in shares of beneficial interest were as follows:
17 OPPENHEIMER CAPITAL APPRECIATION FUND/VA
NOTES TO FINANCIAL STATEMENTS Continued
5. Shares of Beneficial Interest (Continued)
| | | | | | | | | | | | | | | | |
| | | Year Ended December 31, 2014 | | | Year Ended December 31, 2013 | |
| | | Shares | | | Amount | | | Shares | | | Amount | |
| |
Non-Service Shares | | | | | | | | | | | | | | | | |
Sold | | | 297,082 | | | $ | 17,790,087 | | | | 300,888 | | | $ | 15,140,401 | |
Dividends and/or distributions reinvested | | | 303,563 | | | | 17,758,433 | | | | 117,415 | | | | 5,856,634 | |
Redeemed | | | (1,922,275) | | | | (115,812,186) | | | | (2,319,735) | | | | (117,655,836) | |
| | | | |
Net decrease | | | (1,321,630) | | | $ | (80,263,666) | | | | (1,901,432) | | | $ | (96,658,801) | |
| | | | |
|
| |
Service Share | | | | | | | | | | | | | | | | |
Sold | | | 259,544 | | | $ | 15,480,606 | | | | 192,139 | | | $ | 9,432,352 | |
Dividends and/or distributions reinvested | | | 156,718 | | | | 9,099,012 | | | | 56,519 | | | | 2,798,285 | |
Redeemed | | | (1,518,264) | | | | (90,080,086) | | | | (2,109,967) | | | | (106,122,181) | |
| | | | |
Net decrease | | | (1,102,002) | | | $ | (65,500,468) | | | | (1,861,309) | | | $ | (93,891,544) | |
| | | | |
6. Purchases and Sales of Securities
The aggregate cost of purchases and proceeds from sales of securities, other than short-term obligations and investments in IMMF, for the year ended December 31, 2014 were as follows:
| | | | | | | | |
| | | Purchases | | | Sales | |
| |
Investment securities | | | $577,210,391 | | | | $754,432,275 | |
7. Fees and Other Transactions with Affiliates
Management Fees. Under the investment advisory agreement, the Fund pays the Manager a management fee based on the daily net assets of the Fund at an annual rate as shown in the following table:
| | |
| Fee Schedule |
|
Up to $200 million | | 0.75% |
Next $200 million | | 0.72 |
Next $200 million | | 0.69 |
Next $200 million | | 0.66 |
Next $200 million | | 0.60 |
Over $1 billion | | 0.58 |
The Fund’s management fee for the fiscal year ended December 31, 2014 was 0.69% of average annual net assets before any applicable waivers.
Sub-Adviser Fees. The Manager has retained the Sub-Adviser to provide the day-to-day portfolio management of the Fund. Under the Sub-Advisory Agreement, the Manager pays the Sub-Adviser an annual fee in monthly installments, equal to a percentage of the investment management fee collected by the Manager from the Fund, which shall be calculated after any investment management fee waivers. The fee paid to the Sub-Adviser is paid by the Manager, not by the Fund.
Transfer Agent Fees. OFI Global (the “Transfer Agent”) serves as the transfer and shareholder servicing agent for the Fund. The Fund pays the Transfer Agent a fee based on annual net assets. Fees incurred and average net assets for each class with respect to these services are detailed in the Statement of Operations and Financial Highlights, respectively.
Sub-Transfer Agent Fees. The Transfer Agent has retained Shareholder Services, Inc., a wholly-owned subsidiary of OFI (the “Sub-Transfer Agent”), to provide the day-to-day transfer agent and shareholder servicing of the Fund. Under the Sub-Transfer Agency Agreement, the Transfer Agent pays the Sub-Transfer Agent an annual fee in monthly installments, equal to a percentage of the transfer agent fee collected by the Transfer Agent from the Fund, which shall be calculated after any applicable fee waivers. The fee paid to the Sub-Transfer Agent is paid by the Transfer Agent, not by the Fund.
Trustees’ Compensation. The Fund’s Board of Trustees (“Board”) has adopted a compensation deferral plan for Independent Trustees that enables Trustees to elect to defer receipt of all or a portion of the annual compensation they are entitled to receive from the Fund. For purposes of determining the amount owed to the Trustee under the plan, deferred amounts are treated as though equal dollar amounts had been invested in shares of the Fund or in other Oppenheimer funds selected by the Trustee. The Fund purchases shares of the funds selected for deferral by the Trustee in amounts equal to his or her deemed investment, resulting in a Fund asset equal to the deferred compensation liability. Such assets are included as a component of “Other” within the asset section of the Statement of Assets and Liabilities. Deferral of Trustees’ fees under the plan will not affect the net assets of the Fund and will not materially affect the Fund’s assets, liabilities or net investment income per share. Amounts will be deferred until distributed in accordance with the compensation deferral plan.
Distribution and Service Plan for Service Shares. The Fund has adopted a Distribution and Service Plan (the “Plan”) pursuant to Rule 12b-1 under the 1940 Act for Service shares to pay OppenheimerFunds Distributor, Inc. (the “Distributor”), for distribution related services, personal service and account maintenance for the Fund’s Service shares. Under the Plan, payments are made periodically at an annual rate of 0.25% of the daily net assets of
18 OPPENHEIMER CAPITAL APPRECIATION FUND/VA
7. Fees and Other Transactions with Affiliates (Continued)
Service shares of the Fund. The Distributor currently uses all of those fees to compensate sponsors of the insurance product that offers Fund shares, for providing personal service and maintenance of accounts of their variable contract owners that hold Service shares. These fees are paid out of the Fund’s assets on an on-going basis and increase operating expenses of the Service shares, which results in lower performance compared to the Fund’s shares that are not subject to a service fee. Fees incurred by the Fund under the Plan are detailed in the Statement of Operations.
Waivers and Reimbursements of Expenses. The Manager has contractually agreed to limit the Fund’s expenses after payments, waivers and/or reimbursements and reduction to custodian expenses, excluding expenses incurred directly or indirectly by the Fund as a result of investments in other investment companies, wholly-owned subsidiaries and pooled investment vehicles; so that those expenses, as percentages of daily net assets, will not exceed the annual rate of 0.80% for Non-Service shares and 1.05% for Service shares. During the year ended December 31, 2014, the Manager waived fees and/or reimbursed the Fund $35,614 and $18,917 for Non-Service and Service shares, respectively.
The Manager will waive fees and/or reimburse Fund expenses in an amount equal to the indirect management fees incurred through the Fund’s investment in IMMF. During the year ended December 31, 2014, the Manager waived fees and/or reimbursed the Fund $10,179 for IMMF management fees.
These undertakings may be modified or terminated as set forth according to the terms in the prospectus.
8. Pending Litigation
In 2009, seven class action lawsuits were filed in the U.S. District Court for the District of Colorado against OppenheimerFunds, Inc. (“OFI”), OppenheimerFunds Distributor, Inc., the Fund’s principal underwriter and distributor (the “Distributor”), and certain funds (but not including the Fund) advised by OFI Global Asset Management, Inc. and distributed by the Distributor (the “Defendant Funds”). The lawsuits also named as defendants certain officers and current and former trustees of the respective Defendant Funds. The lawsuits raised claims under federal securities laws and alleged, among other things, that the disclosure documents of the respective Defendant Funds contained misrepresentations and omissions and that the respective Defendant Funds’ investment policies were not followed. The plaintiffs in these actions sought unspecified damages, equitable relief and awards of attorneys’ fees and litigation expenses. The Defendant Funds’ Boards of Trustees also engaged counsel to represent the Funds and the present and former Independent Trustees named in those suits. In March 2014, the parties in six of these lawsuits executed stipulations and agreements of settlement resolving those actions. In July 2014, the court entered an order and final judgment approving the settlements as fair, reasonable and adequate. The settlements do not resolve a seventh outstanding lawsuit relating to Oppenheimer Rochester California Municipal Fund (the “California Fund Suit”). OFI believes the California Fund Suit is without legal merit and is defending the suit vigorously. While it is premature to render any opinion as to the outcome in the California Fund Suit, or whether any costs that OFI may bear in defending the California Fund Suit might not be reimbursed by insurance, OFI believes the California Fund Suit should not impair the ability of OFI or the Distributor to perform their respective duties to the Fund, and that the outcome of the California Fund Suit should not have any material effect on the operations of any of the Oppenheimer funds.
19 OPPENHEIMER CAPITAL APPRECIATION FUND/VA
REPORT OF INDEPENDENT REGISTERED PUBLIC ACCOUNTING FIRM
The Board of Trustees and Shareholders of Oppenheimer Variable Account Funds:
We have audited the accompanying statement of assets and liabilities of Oppenheimer Capital Appreciation Fund/VA (a separate series of Oppenheimer Variable Account Funds), including the statement of investments, as of December 31, 2014, and the related statement of operations for the year then ended, the statements of changes in net assets for each of the years in the two-year period then ended, and the financial highlights for each of the years in the five-year period then ended. These financial statements and financial highlights are the responsibility of the Fund’s management. Our responsibility is to express an opinion on these financial statements and financial highlights based on our audits.
We conducted our audits in accordance with the standards of the Public Company Accounting Oversight Board (United States). Those standards require that we plan and perform the audit to obtain reasonable assurance about whether the financial statements and financial highlights are free of material misstatement. An audit includes examining, on a test basis, evidence supporting the amounts and disclosures in the financial statements. Our procedures included confirmation of securities owned as of December 31, 2014, by correspondence with the custodian, transfer agent and brokers, or by other appropriate auditing procedures where replies from brokers were not received. An audit also includes assessing the accounting principles used and significant estimates made by management, as well as evaluating the overall financial statement presentation. We believe that our audits provide a reasonable basis for our opinion.
In our opinion, the financial statements and financial highlights referred to above present fairly, in all material respects, the financial position of Oppenheimer Capital Appreciation Fund/VA as of December 31, 2014, the results of its operations for the year then ended, the changes in its net assets for each of the years in the two-year period then ended, and the financial highlights for each of the years in the five-year period then ended, in conformity with U.S. generally accepted accounting principles.
KPMG LLP
Denver, Colorado
February 13, 2015
20 OPPENHEIMER CAPITAL APPRECIATION FUND/VA
FEDERAL INCOME TAX INFORMATION Unaudited
In early 2015, if applicable, shareholders of record received information regarding all dividends and distributions paid to them by the Fund during calendar year 2014.
Capital gain distributions of $1.4691 per share were paid to Non-Service and Service shareholders, respectively, on June 18, 2014. Whether received in stock or in cash, the capital gain distribution should be treated by shareholders as a gain from the sale of the capital assets held for more than one year (long-term capital gains).
Dividends, if any, paid by the Fund during the fiscal year ended December 31, 2014 which are not designated as capital gain distributions should be multiplied by the maximum amount allowable but not less than 28.95% to arrive at the amount eligible for the corporate dividend-received deduction.
The foregoing information is presented to assist shareholders in reporting distributions received from the Fund to the Internal Revenue Service. Because of the complexity of the federal regulations which may affect your individual tax return and the many variations in state and local tax regulations, we recommend that you consult your tax advisor for specific guidance.
21 OPPENHEIMER CAPITAL APPRECIATION FUND/VA
BOARD APPROVAL OF THE FUND’S INVESTMENT ADVISORY AND SUB-ADIVSORY AGREEMENTS Unaudited
The Fund has entered into an investment advisory agreement with OFI Global Asset Management, Inc. (“OFI Global” or the “Adviser”), a wholly-owned subsidiary of OppenheimerFunds, Inc. (“OFI” or the “Sub-Adviser”) (“OFI Global” and “OFI” together the “Managers”) and OFI Global has entered into a sub-advisory agreement with OFI whereby OFI provides investment sub-advisory services to the Fund (collectively, the “Agreements”). Each year, the Board of Trustees (the “Board”), including a majority of the independent Trustees, is required to determine whether to renew the Agreements. The Investment Company Act of 1940, as amended, requires that the Board request and evaluate, and that the Managers provide, such information as may be reasonably necessary to evaluate the terms of the Agreements. The Board employs an independent consultant to prepare a report that provides information, including comparative information that the Board requests for that purpose. In addition to in-person meetings focused on this evaluation, the Board receives information throughout the year regarding Fund services, fees, expenses and performance.
The Adviser, Sub-Adviser and the independent consultant provided information to the Board on the following factors: (i) the nature, quality and extent of the Managers’ services, (ii) the investment performance of the Fund and the Managers, (iii) the fees and expenses of the Fund, including comparative expense information, (iv) the profitability of the Managers and their affiliates, including an analysis of the cost of providing services, (v) whether economies of scale are realized as the Fund grows and whether fee levels reflect these economies of scale for Fund investors and (vi) other benefits to the Managers from their relationship with the Fund. The Board was aware that there are alternatives to retaining the Managers.
Outlined below is a summary of the principal information considered by the Board as well as the Board’s conclusions.
Nature, Quality and Extent of Services. The Board considered information about the nature, quality and extent of the services provided to the Fund and information regarding the Managers’ key personnel who provide such services. The Sub-Adviser’s duties include providing the Fund with the services of the portfolio manager and the Sub-Adviser’s investment team, who provide research, analysis and other advisory services in regard to the Fund’s investments; securities trading services; oversight of third-party service providers; monitoring compliance with applicable Fund policies and procedures and adherence to the Fund’s investment restrictions; and risk management. The Managers are responsible for providing certain administrative services to the Fund as well. Those services include providing and supervising all administrative and clerical personnel who are necessary in order to provide effective corporate administration for the Fund; compiling and maintaining records with respect to the Fund’s operations; preparing and filing reports required by the Securities and Exchange Commission; preparing periodic reports regarding the operations of the Fund for its shareholders; preparing proxy materials for shareholder meetings; and preparing the registration statements required by Federal and state securities laws for the sale of the Fund’s shares. The Managers also provide the Fund with office space, facilities and equipment.
The Board also considered the quality of the services provided and the quality of the Managers’ resources that are available to the Fund. The Board took account of the fact that the Sub-Adviser has had over fifty years of experience as an investment adviser and that its assets under management rank it among the top mutual fund managers in the United States. The Board evaluated the Sub-Adviser’s advisory, administrative, accounting, legal, compliance services and risk management, and information the Board has received regarding the experience and professional qualifications of the Managers’ key personnel and the size and functions of its staff. In its evaluation of the quality of the portfolio management services provided, the Board considered the experience of Michael Kotlarz, the portfolio manager for the Fund, and the Sub-Adviser’s investment team and analysts. The Board members also considered the totality of their experiences with the Managers as directors or trustees of the Fund and other funds advised by the Managers. The Board considered information regarding the quality of services provided by affiliates of the Managers, which its members have become knowledgeable about in connection with the renewal of the Fund’s service agreements. The Board concluded, in light of the Managers’ experience, reputation, personnel, operations and resources that the Fund benefits from the services provided under the Agreements.
Investment Performance of the Manager, the Sub-Adviser and the Fund. Throughout the year, the Manager provided information on the investment performance of the Fund, including comparative performance information. The Board also reviewed information, prepared by the Manager and by the independent consultant, comparing the Fund’s historical performance to relevant market indices and to the performance of other large growth funds underlying variable insurance products. The Board noted that the Fund underperformed its category median during the one-, three-, five- and ten-year periods. The Board considered the Fund’s change in portfolio management in May and June 2013. It also considered the Manager’s assertion that the fourth quarter of 2013 was marked by a strong “risk-off” shift in the equity markets, as investors moved away from growth equity stocks, which was a significant headwind for the Fund’s investment strategy. The Board also considered the top detractors from the Fund’s performance in the fourth quarter of 2013. The Board noted that Fund experienced improved performance in 2014, with the Fund’s year-to-date return ranking in the 56th percentile as of April 30, 2014.
Costs of Services by the Manager. The Board reviewed the fees paid to the Manager and the Sub-Adviser and the other expenses borne by the Fund. The Board noted that the Manager, not the Fund, pays the Sub-Adviser’s fee under the sub-advisory agreement. The independent consultant provided comparative data in regard to the fees and expenses of the Fund and other large growth funds underlying variable insurance products. In reviewing the fees and expenses charged to the VA funds, the Board considered the Manager’s assertion that, because there is much greater disparity in the fees and services that may be provided by a manager to a VA fund as opposed to a retail fund, when comparing the expenses of the various VA funds to those of retail funds, it is most appropriate to focus on total expenses (rather than on the management fees). Accordingly, while the Board reviewed and considered all expenses, it focused on total expenses. The Board considered that the Fund’s total expenses were higher than its peer group median and its category median and that its contractual management fees were lower than its peer group median and category median. The Board also considered that although the Fund’s total expenses rank in the fourth quintile, they are only seven basis points above the peer group median, as noted in the independent consultant’s report. Within the total asset range of $500 million to $1 billion, the Fund’s effective management fee rate was equal to its peer group median and slightly lower than its category median. The Manager has contractually agreed to limit the Fund’s total annual operating expenses so that those expenses, as percentages of daily net assets, will not exceed the annual rate of 0.80% for Non-Service Shares and 1.05% for Service Shares. This waiver and/or reimbursement may not be amended or withdrawn for one year from the date of the Fund’s prospectus, unless approved by the Board.
22 OPPENHEIMER CAPITAL APPRECIATION FUND/VA
Economies of Scale and Profits Realized by the Manager and Sub-Adviser. The Board considered information regarding the Managers’ costs in serving as the Fund’s investment adviser and sub-adviser, including the costs associated with the personnel and systems necessary to manage the Fund, and information regarding the Managers’ profitability from their relationship with the Fund. The Board reviewed whether the Manager may realize economies of scale in managing and supporting the Fund. The Board noted that the Fund currently has management fee breakpoints, which are intended to share with Fund shareholders economies of scale that may exist as the Fund’s assets grow.
Other Benefits to the Managers. In addition to considering the profits realized by the Managers, the Board considered information that was provided regarding the direct and indirect benefits the Managers receive as a result of their relationship with the Fund, including compensation paid to the Managers’ affiliates and research provided to the Adviser in connection with permissible brokerage arrangements (soft dollar arrangements). The Board also considered that the Managers must be able to pay and retain experienced professional personnel at competitive rates to provide quality services to the Fund.
Conclusions. These factors were also considered by the independent Trustees meeting separately from the full Board, assisted by experienced counsel to the Fund and to the independent Trustees. Fund counsel and the independent Trustees’ counsel are independent of the Managers within the meaning and intent of the Securities and Exchange Commission Rules.
Based on its review of the information it received and its evaluations described above, the Board, including a majority of the independent Trustees, decided to continue the Agreements through August 31, 2015. In arriving at its decision, the Board did not identify any factor or factors as being more important than others, but considered all of the above information, and considered the terms and conditions of the Agreements, including the management fees, in light of all the surrounding circumstances.
23 OPPENHEIMER CAPITAL APPRECIATION FUND/VA
PORTFOLIO PROXY VOTING POLICIES AND PROCEDURES; UPDATES TO STATEMENTS OF INVESTMENTS Unaudited
The Fund has adopted Portfolio Proxy Voting Policies and Procedures under which the Fund votes proxies relating to securities (“portfolio proxies”) held by the Fund. A description of the Fund’s Portfolio Proxy Voting Policies and Procedures is available (i) without charge, upon request, by calling the Fund toll-free at 1.800.525.7048, (ii) on the Fund’s website at www.oppenheimerfunds.com, and (iii) on the SEC’s website at www.sec.gov. In addition, the Fund is required to file Form N-PX, with its complete proxy voting record for the 12 months ended June 30th, no later than August 31st of each year. The Fund’s voting record is available (i) without charge, upon request, by calling the Fund toll-free at 1.800.525.7048, and (ii) in the Form N-PX filing on the SEC’s website at www.sec.gov.
The Fund files its complete schedule of portfolio holdings with the SEC for the first quarter and the third quarter of each fiscal year on Form N-Q. The Fund’s Form N-Q filings are available on the SEC’s website at www.sec.gov. Those forms may be reviewed and copied at the SEC’s Public Reference Room in Washington, D.C. Information on the operation of the Public Reference Room may be obtained by calling 1-800-SEC-0330.
24 OPPENHEIMER CAPITAL APPRECIATION FUND/VA
TRUSTEES AND OFFICERS Unaudited
| | |
| Name, Position(s) Held with the Fund, Length of Service, Year of Birth | | Principal Occupation(s) During the Past 5 Years; Other Trusteeships/Directorships Held; Number of Portfolios in the Fund Complex Currently Overseen |
| |
| INDEPENDENT TRUSTEES | | The address of each Trustee in the chart below is 6803 S. Tucson Way, Centennial, Colorado 80112-3924. Each Trustee serves for an indefinite term, or until his or her resignation, retirement, death or removal. |
| |
Sam Freedman, Chairman of the Board of Trustees (since 2013) and Trustee (since 1996) Year of Birth: 1940 | | Director of Colorado UpLIFT (charitable organization) (since September 1984). Mr. Freedman held several positions with the Sub-Adviser and with subsidiary or affiliated companies of the Sub-Adviser (until October 1994). Oversees 38 portfolios in the OppenheimerFunds complex. Mr. Freedman has served on the Boards of certain Oppenheimer funds since 1996, during which time he has become familiar with the Fund’s (and other Oppenheimer funds’) financial, accounting, regulatory and investment matters and has contributed to the Boards’ deliberations. |
| |
Jon S. Fossel, Trustee (since 1990) Year of Birth: 1942 | | Chairman of the Board of Jack Creek Preserve Foundation (non-profit organization) (since 2005); Chairman of the Board (2006-December 2011) and Director (June 2002-December 2011) of UNUMProvident (insurance company); Director of Northwestern Energy Corp. (public utility corporation) (November 2004-December 2009); Director of P.R. Pharmaceuticals (October 1999-October 2003); Director of Rocky Mountain Elk Foundation (non-profit organization) (February 1998-February 2003 and February 2005-February 2007); Chairman and Director (until October 1996) and President and Chief Executive Officer (until October 1995) of the Sub-Adviser; President, Chief Executive Officer and Director of the following: Oppenheimer Acquisition Corp. (“OAC”) (parent holding company of the Sub-Adviser), Shareholder Services, Inc. and Shareholder Financial Services, Inc. (until October 1995). Oversees 38 portfolios in the OppenheimerFunds complex. Mr. Fossel has served on the Boards of certain Oppenheimer funds since 1990, during which time he has become familiar with the Fund’s (and other Oppenheimer funds’) financial, accounting, regulatory and investment matters and has contributed to the Boards’ deliberations. |
| |
Richard F. Grabish, Trustee (since 2012) Year of Birth: 1948 | | Formerly Senior Vice President and Assistant Director of Sales and Marketing (March 1997-December 2007), Director (March 1987-December 2007) and Manager of Private Client Services (June 1985-June 2005) of A.G. Edwards & Sons, Inc. (broker/dealer and investment firm); Chairman and Chief Executive Officer of A.G. Edwards Trust Company, FSB (March 2001-December 2007); President and Vice Chairman of A.G. Edwards Trust Company, FSB (investment adviser) (April 1987-March 2001); President of A.G. Edwards Trust Company, FSB (investment adviser) (June 2005-December 2007). Oversees 38 portfolios in the OppenheimerFunds complex. Mr. Grabish has served on the Boards of certain Oppenheimer funds since 2001, during which time he has become familiar with the Fund’s (and other Oppenheimer funds’) financial, accounting, regulatory and investment matters and has contributed to the Boards’ deliberations. |
| |
Beverly L. Hamilton, Trustee (since 2002) Year of Birth: 1946 | | Trustee of Monterey Institute for International Studies (educational organization) (since February 2000); Board Member of Middlebury College (educational organization) (December 2005-June 2011); Chairman (since 2010) of American Funds’ Emerging Markets Growth Fund, Inc. (mutual fund); Director of The California Endowment (philanthropic organization) (April 2002-April 2008); Director (February 2002-2005) and Chairman of Trustees (2006-2007) of the Community Hospital of Monterey Peninsula; Director (October 1991-2005); Vice Chairman (2006-2009) of American Funds’ Emerging Markets Growth Fund, Inc. (mutual fund); President of ARCO Investment Management Company (February 1991-April 2000); Member of the investment committees of The Rockefeller Foundation (2001-2006) and The University of Michigan (since 2000); Advisor at Credit Suisse First Boston’s Sprout venture capital unit (venture capital fund) (1994-January 2005); Trustee of MassMutual Institutional Funds (investment company) (1996-June 2004); Trustee of MML Series Investment Fund (investment company) (April 1989-June 2004); Member of the investment committee of Hartford Hospital (2000-2003); and Advisor to Unilever (Holland) pension fund (2000-2003). Oversees 38 portfolios in the OppenheimerFunds complex. Ms. Hamilton has served on the Boards of certain Oppenheimer funds since 2002, during which time she has become familiar with the Fund’s (and other Oppenheimer funds’) financial, accounting, regulatory and investment matters and has contributed to the Boards’ deliberations. |
| |
Victoria J. Herget, Trustee (since 2012) Year of Birth: 1951 | | Board Chair (2008-Present) and Director (2004-Present), United Educators (insurance company); Trustee (since 2000) and Chair (since 2010), Newberry Library (independent research library); Trustee, Mather LifeWays (senior living organization) (since 2001); Independent Director of the First American Funds (mutual fund family) (2003-2011); former Managing Director (1993-2001), Principal (1985-1993), Vice President (1978-1985) and Assistant Vice President (1973-1978) of Zurich Scudder Investments (investment adviser) (and its predecessor firms); Trustee (1992-2007), Chair of the Board of Trustees (1999-2007), Investment Committee Chair (1994-1999) and Investment Committee member (2007-2010) of Wellesley College; Trustee, BoardSource (non-profit organization) (2006-2009) and Chicago City Day School (K-8 School) (1994-2005). Oversees 38 portfolios in the OppenheimerFunds complex. Ms. Herget has served on the Boards of certain Oppenheimer funds since 2012, during which time she has become familiar with the Fund’s (and other Oppenheimer funds’) financial, accounting, regulatory and investment matters and has contributed to the Boards’ deliberations. |
| |
Robert J. Malone, Trustee (since 2002) Year of Birth: 1944 | | Chairman of the Board (since 2012) and Director (since August 2005) of Jones International University (educational organization); Chairman, Chief Executive Officer and Director of Steele Street Bank Trust (commercial banking) (since August 2003); Trustee of the Gallagher Family Foundation (non-profit organization) (since 2000); Board of Directors of Opera Colorado Foundation (non-profit organization) (2008-2012); Director of Colorado UpLIFT (charitable organization) (1986-2010); Director of Jones Knowledge, Inc. (2006-2010); Former Chairman of U.S. Bank-Colorado (subsidiary of U.S. Bancorp and formerly Colorado National Bank) (July 1996-April 1999); Director of Commercial Assets, Inc. (real estate investment trust) (1993-2000); Director of U.S. Exploration, Inc. (oil and gas exploration) (1997-February 2004); Chairman of the Board (1991-1994) and Trustee (1985-1994) of Regis University; and Chairman of the Board (1990-1991 and Trustee (1984-1999) of Young Presidents Organization. Oversees 38 portfolios in the OppenheimerFunds complex. Mr. |
25 OPPENHEIMER CAPITAL APPRECIATION FUND/VA
TRUSTEES AND OFFICERS Unaudited / Continued
| | |
Robert J. Malone, Continued | | Malone has served on the Boards of certain Oppenheimer funds since 2002, during which time he has become familiar with the Fund’s (and other Oppenheimer funds’) financial, accounting, regulatory and investment matters and has contributed to the Boards’ deliberations. |
| |
F. William Marshall, Jr., Trustee (since 2000) Year of Birth: 1942 | | Trustee Emeritus of Worcester Polytech Institute (WPI) (private university) (since 2009); Trustee of MassMutual Select Funds (formerly MassMutual Institutional Funds) (investment company) (since 1996), MML Series Investment Fund (investment company) (since 1996) and Mass Mutual Premier Funds (investment company) (since January 2012); President and Treasurer of the SIS Fund (private charitable fund) (January 1999 – March 2011); Former Trustee of WPI (1985-2008); Former Chairman of the Board (2004-2006) and Former Chairman of the Investment Committee of WPI (1994-2008); Chairman of SIS & Family Bank, F.S.B. (formerly SIS Bank) (commercial bank) (January 1999-July 1999); Executive Vice President of Peoples Heritage Financial Group, Inc. (commercial bank) (January 1999-July 1999); and Former President and Chief Executive Officer of SIS Bancorp. (1993-1999). Oversees 42 portfolios in the OppenheimerFunds complex. Mr. Marshall has served on the Boards of certain Oppenheimer funds since 2000, during which time he has become familiar with the Fund’s (and other Oppenheimer funds’) financial, accounting, regulatory and investment matters and has contributed to the Boards’ deliberations. |
| |
Karen L. Stuckey, Trustee (since 2012) Year of Birth: 1953 | | Partner (1990-2012) of PricewaterhouseCoopers LLP (professional services firm) (held various positions 1975- 1990); Trustee (1992-2006) and member of Executive, Nominating and Audit Committees and Chair of Finance Committee of Lehigh University; and member, Women’s Investment Management Forum (professional organization) since inception. Oversees 38 portfolios in the OppenheimerFunds complex. Ms. Stuckey has served on the Boards of certain Oppenheimer funds since 2012, during which time she has become familiar with the Fund’s (and other Oppenheimer funds’) financial, accounting, regulatory and investment matters and has contributed to the Boards’ deliberations. |
| |
James D. Vaughn, Trustee (since 2012) Year of Birth: 1945 | | Retired; former managing partner (1994-2001) of Denver office of Deloitte & Touche LLP, (held various positions 1969-1993); Trustee and Chairman of the Audit Committee of Schroder Funds (2003-2012); Board member and Chairman of Audit Committee of AMG National Trust Bank (since 2005); Trustee and Investment Committee member, University of South Dakota Foundation (since 1996); Board member, Audit Committee Member and past Board Chair, Junior Achievement (since 1993); former Board member, Mile High United Way, Boys and Girls Clubs, Boy Scouts, Colorado Business Committee for the Arts, Economic Club of Colorado and Metro Denver Network. Oversees 38 portfolios in the OppenheimerFunds complex. Mr. Vaughn has served on the Boards of certain Oppenheimer funds since 2012, during which time he has become familiar with the Fund’s (and other Oppenheimer funds’) financial, accounting, regulatory and investment matters and has contributed to the Boards’ deliberations. |
|
| INTERESTED TRUSTEE | | Mr. Glavin is an “Interested Trustee” because he is affiliated with the Manager and the Sub-Adviser by virtue of his positions as director of the Sub-Adviser, and as a shareholder of the Sub-Adviser’s parent company. As a Trustee, he serves for an indefinite term, or until his resignation, retirement, death or removal. Mr. Glavin’s address is 225 Liberty Street, 11th Floor, New York, New York 10281-1008. |
| |
William F. Glavin, Jr., Trustee (since 2009) Year of Birth: 1958 | | Chairman of the Sub-Adviser (July 2014-December 2014 and December 2009-December 2012) and Director of the Sub-Adviser (since January 2009); Chairman, Director and Chief Executive Officer (January 2013-June 2014) of the Manager; President of the Manager (January 2013-May 2013); Chief Executive Officer (January 2009-December 2012); President of the Sub-Adviser (May 2009-December 2012); Management Director (June 2009-June 2014), President (December 2009-June 2014) and Chief Executive Officer (January 2011-June 2014) of Oppenheimer Acquisition Corp. (“OAC”) (the Sub-Adviser’s parent holding company); Director of Oppenheimer Real Asset Management, Inc. (March 2010-June 2014); Executive Vice President (March 2006-February 2009) and Chief Operating Officer (July 2007-February 2009) of Massachusetts Mutual Life Insurance Company (OAC’s parent company); Director (May 2004-March 2006) and Chief Operating Officer and Chief Compliance Officer (May 2004-January 2005), President (January 2005-March 2006) and Chief Executive Officer (June 2005-March 2006) of Babson Capital Management LLC; Director (March 2005-March 2006), President (May 2003-March 2006) and Chief Compliance Officer (July 2005-March 2006) of Babson Capital Securities, Inc. (a broker-dealer); President (May 2003-March 2006) of Babson Investment Company, Inc.; Director (May 2004-August 2006) of Babson Capital Europe Limited; Director (May 2004-October 2006) of Babson Capital Guernsey Limited; Director (May 2004-March 2006) of Babson Capital Management LLC; Non-Executive Director (March 2005-March 2007) of Baring Asset Management Limited; Director (February 2005-June 2006) Baring Pension Trustees Limited; Director and Treasurer (December 2003-November 2006) of Charter Oak Capital Management, Inc.; Director (May 2006-September 2006) of C.M. Benefit Insurance Company; Director (May 2008-June 2009) and Executive Vice President (June 2007-July 2009) of C.M. Life Insurance Company; President (March 2006-May 2007) of MassMutual Assignment Company; Director (January 2005-December 2006), Deputy Chairman (March 2005-December 2006) and President (February 2005-March 2005) of MassMutual Holdings (Bermuda) Limited; Director (May 2008-June 2009) and Executive Vice President (June 2007-July 2009) of MML Bay State Life Insurance Company; Chief Executive Officer and President (April 2007-January 2009) of MML Distributors, LLC; and Chairman (March 2006-December 2008) and Chief Executive Officer (May 2007-December 2008) of MML Investors Services, Inc. An officer of 91 portfolios in the OppenheimerFunds complex. Mr. Glavin has served on the Boards of certain Oppenheimer funds since December 2009, during which time he has become familiar with the Fund’s (and other Oppenheimer funds’) financial, accounting, regulatory and investment matters and has contributed to the Boards’ deliberations. |
|
| OTHER OFFICERS OF THE FUND | | The addresses of the Officers in the chart below are as follows: for Messrs. Kotlarz, Steinmetz, Gabinet, Mss. Sexton and Picciotto, 225 Liberty Street, New York, New York 10281-1008, for Mr. Wixted, 6803 S. Tucson Way, Centennial, Colorado 80112-3924. Each Officer serves for an indefinite term or until his or her resignation, retirement, death or removal. |
26 OPPENHEIMER CAPITAL APPRECIATION FUND/VA
| | |
Michael Kotlarz, Vice President (since 2012) Year of Birth: 1972 | | Vice President of the Sub-Adviser (since March 2008). Senior Research Analyst of the Sub-Adviser (March 2008-May 2013). Managing Director of Equity Research at Ark Asset Management (March 2000-March 2008). A portfolio manager and officer of other portfolios in the OppenheimerFunds complex. |
| |
Arthur P. Steinmetz, President and Principal Executive Officer (since 2014) Year of Birth: 1958 | | Chairman of the Sub-Adviser (since January 2015); CEO and Chairman of the Manager (since July 2014), President of the Manager (since May 2013), a Director of the Manager (since January 2013), Director of the Sub-Adviser (since July 2014), President, Management Director and CEO of Oppenheimer Acquisition Corp. (the Sub-Adviser’s parent holding company) (since July 2014), and President and Director of OFI SteelPath, Inc. (since January 2013). Chief Investment Officer of the OppenheimerFunds advisory entities from (January 2013-December 2013); Executive Vice President of the Manager (January 2013-May 2013); Chief Investment Officer of the Sub-Adviser (October 2010-December 2012); Chief Investment Officer, Fixed-Income, of the Sub-Adviser (April 2009-October 2010); Executive Vice President of the Sub-Adviser (October 2009-December 2012); Director of Fixed Income of the Sub-Adviser (January 2009-April 2009); and a Senior Vice President of the Sub-Adviser (March 1993-September 2009). An officer of 91 portfolios in the OppenheimerFunds complex. |
| |
Arthur S. Gabinet, Secretary and Chief Legal Officer (since 2011) Year of Birth: 1958 | | Executive Vice President, Secretary and General Counsel of the Manager (since January 2013); General Counsel OFI SteelPath, Inc. (since January 2013); Executive Vice President (May 2010-December 2012) and General Counsel (since January 2011) of the Sub-Adviser; General Counsel of the Distributor (since January 2011); General Counsel of Centennial Asset Management Corporation (January 2011-December 2012); Executive Vice President (January 2011-December 2012) and General Counsel of HarbourView Asset Management Corporation (since January 2011); Assistant Secretary (since January 2011) and Director (since January 2011) of OppenheimerFunds International Ltd. and OppenheimerFunds plc; Director of Oppenheimer Real Asset Management, Inc. (January 2011-December 2012) and General Counsel (since January 2011); Executive Vice President (January 2011-December 2011) and General Counsel of Shareholder Financial Services, Inc. and Shareholder Services, Inc. (since January 2011); Executive Vice President (January 2011-December 2012) and General Counsel of OFI Private Investments Inc. (since January 2011); Vice President of OppenheimerFunds Legacy Program (January 2011-December 2011); Executive Vice President (January 2011-December 2012) and General Counsel of OFI Institutional Asset Management, Inc. (since January 2011); General Counsel, Asset Management of the Sub-Adviser (May 2010-December 2010); Principal, The Vanguard Group (November 2005-April 2010); District Administrator, U.S. Securities and Exchange Commission (January 2003-October 2005). An officer of 91 portfolios in the OppenheimerFunds complex. |
| |
Jennifer Sexton, Vice President and Chief Business Officer (since 2014) Year of Birth: 1969 | | Senior Vice President of OppenheimerFunds Distributor, Inc. (since June 2014); Vice President of OppenheimerFunds Distributor, Inc. (April 2006-June 2014); Vice President of the Sub-Adviser (January 1998-March 2006); Assistant Vice President of the Sub-Adviser (October 1991-December 1998). An officer of 91 portfolios in the OppenheimerFunds complex. |
| |
Mary Ann Picciotto, Chief Compliance Officer and Chief Anti-Money Laundering Officer (since 2014) Year of Birth: 1973 | | Senior Vice President and Chief Compliance Officer of the Manager (since March 2014); Chief Compliance Officer of the Sub-Adviser, OFI SteelPath, Inc., OFI Global Trust Company, OFI Global Institutional, Inc., Oppenheimer Real Asset Management, Inc., OFI Private Investments, Inc., Harborview Asset Management Corporation, Trinity Investment Management Corporation, and Shareholder Services, Inc. (since March 2014); Managing Director of Morgan Stanley Investment Management Inc. and certain of its various affiliated entities; Chief Compliance Officer of various Morgan Stanley Funds (May 2010-January 2014); Chief Compliance Officer of Morgan Stanley Investment Management Inc. (April 2007-January 2014). An officer of 91 portfolios in the OppenheimerFunds complex. |
| |
Brian W. Wixted, Treasurer and Principal Financial & Accounting Officer (since 1999) Year of Birth: 1959 | | Senior Vice President of the Manager (since January 2013); Treasurer of the Sub-Adviser, HarbourView Asset Management Corporation, Shareholder Financial Services, Inc., Shareholder Services, Inc., and Oppenheimer Real Asset Management, Inc. (March 1999-June 2008), OFI Private Investments, Inc. (March 2000-June 2008), OppenheimerFunds International Ltd. and OppenheimerFunds plc (since May 2000), OFI Institutional Asset Management, Inc. (November 2000-June 2008), and OppenheimerFunds Legacy Program (charitable trust program established by the Sub-Adviser) (June 2003-December 2011); Treasurer and Chief Financial Officer of OFI Trust Company (since May 2000); Assistant Treasurer of Oppenheimer Acquisition Corporation (March 1999-June 2008). An officer of 91 portfolios in the OppenheimerFunds complex. |
The Fund’s Statement of Additional Information contains additional information about the Fund’s Trustees and Officers and is available without charge, upon request, by calling 1.800. 988.8287.
27 OPPENHEIMER CAPITAL APPRECIATION FUND/VA
OPPENHEIMER CAPITAL APPRECIATION FUND/VA
A Series of Oppenheimer Variable Account Funds
| | |
| Manager | | OFI Global Asset Management, Inc. |
| |
| Sub-Adviser | | OppenheimerFunds, Inc. |
| |
| Distributor | | OppenheimerFunds Distributor, Inc. |
| |
Transfer and
Shareholder
Servicing Agent | | OFI Global Asset Management, Inc. |
| |
| Sub-Transfer Agent | | Shareholder Services, Inc. DBA OppenheimerFunds Services |
| |
| Independent | | KPMG LLP |
Registered
Public
Accounting
Firm | | |
| |
| Counsel | | K&L Gates LLP |
| |
| | Before investing in any of the Oppenheimer funds, investors should carefully consider a fund’s investment objectives, risks, charges and expenses. Fund prospectuses and summary prospectuses contain this and other information about the funds, and may be obtained by asking your financial advisor, or calling us at 1.800.988.8287. Read prospectuses and summary prospectuses carefully before investing. |
| |
| | © 2015 OppenheimerFunds, Inc. All rights reserved. Oppenheimer funds are distributed by OppenheimerFunds Distributor, Inc. |

PORTFOLIO MANAGERS: Krishna Memani and Peter A. Strzalkowski, CFA
AVERAGE ANNUAL TOTAL RETURNS FOR THE PERIODS ENDED 12/31/14
| | | | | | | | |
| | | Inception
Date | | 1-Year | | 5-Year | | 10-Year |
Non-Service Shares | | 4/3/85 | | 7.27% | | 7.35% | | 0.72% |
Service Shares | | 5/1/02 | | 6.93 | | 7.11 | | 0.46 |
Barclays Credit Index | | | | 7.53 | | 6.25 | | 5.46 |
Barclays U.S. Aggregate Bond Index | | | | 5.97 | | 4.45 | | 4.71 |
Citigroup Broad Investment Grade Bond Index | | | | 5.91 | | 4.39 | | 4.81 |
Performance data quoted represents past performance, which does not guarantee future results. The investment return and principal value of an investment in the Fund will fluctuate so that an investor’s shares, when redeemed, may be worth more or less than their original cost. Current performance may be lower or higher than the performance quoted. For performance data current to the most recent month end, call us at 1.800.988.8287. The Fund’s total returns should not be expected to be the same as the returns of other funds, whether or not both funds have the same portfolio managers and/or similar names. The Fund’s total returns include changes in share price and reinvested distributions but do not include the charges associated with the separate account products that offer this Fund. Such performance would have been lower if such charges were taken into account.
CORPORATE BONDS & NOTES - TOP TEN INDUSTRIES
| | | | |
Commercial Banks | | | 6.2 | % |
Oil, Gas & Consumable Fuels | | | 3.5 | |
Capital Markets | | | 3.0 | |
Insurance | | | 2.9 | |
Diversified Telecommunication Services | | | 2.9 | |
Media | | | 2.3 | |
Automobiles | | | 1.8 | |
Electric Utilities | | | 1.5 | |
Food Products | | | 1.3 | |
Beverages | | | 1.2 | |
Portfolio holdings and allocations are subject to change. Percentages are as of December 31, 2014, and are based on net assets.
| | |
CREDIT RATING BREAKDOWN | | NRSRO ONLY TOTAL |
AAA | | 38.5% |
AA | | 5.3 |
A | | 14.4 |
BBB | | 29.4 |
BB | | 8.1 |
B | | 1.7 |
CCC | | 1.5 |
CC | | 0.3 |
D | | 0.8 |
Unrated | | 0.0 |
Total | | 100.0% |
The percentages above are based on the market value of the Fund’s securities as of December 31, 2014, and are subject to change. Except for securities labeled and “Unrated,” and except for certain securities issued or guaranteed by a foreign sovereign, all securities have been rated by at least one Nationally Recognized Statistical Rating Organization (“NRSRO”), such as Standard & Poor’s (“S&P”). For securities rated only by an NRSRO other than S&P, OppenheimerFunds, Inc. (the “Sub-Adviser”) converts that rating to the equivalent S&P rating. If two or more NRSROs have assigned a rating to a security, the highest S&P equivalent rating is used. Unrated securities issued or guaranteed by a foreign sovereign are assigned a credit rating equal to the highest NRSRO rating assigned to that foreign sovereign. For securities not rated by an NRSRO, the Sub-Adviser uses its own credit analysis to assign ratings in categories similar to those of S&P. The use of similar categories is not an indication that the Sub-Adviser’s credit analysis process is consistent or comparable with any NRSRO’s process were that NRSRO to rate the same security. Fund assets invested in Oppenheimer Institutional Money Market Fund are assigned that fund’s S&P rating, which is currently AAA. For the purposes of this table, “investment-grade” securities are securities rated within the NRSROs’ four highest rating categories (AAA, AA, A and BBB). Unrated securities do not necessarily indicate low credit quality, and may or may not be the equivalent of investment-grade. Please consult the Fund’s prospectus and Statement of Additional Information for further information.
|
| 2 OPPENHEIMER CORE BOND FUND/VA |
Fund Performance Discussion
The Fund’s Non-Service shares returned 7.27% during the reporting period. On a relative basis, the Barclays U.S. Aggregate Bond Index (the “Index”), the Barclays Credit Index and the Citigroup Broad Investment Grade Bond Index returned 5.97%, 7.53% and 5.91%, respectively. The Fund’s positive performance was driven largely by its investments in investment-grade corporate debt and mortgages.
MARKET OVERVIEW
To start 2014, the U.S. Federal Reserve (the “Fed”) began reducing its monthly purchases of U.S. government Treasuries and mortgage-backed securities (“MBS”) in steady $10 billion increments, and completed the process at the end of October, thereby ending the quantitative easing (“QE”) program’s purchases. Tapering the QE program in increments helped reduce market volatility and enabled investors to prepare for a post-QE market environment. Although data in the U.S. softened for the first quarter, partially attributed to cold weather effects across much of the country, it was positive in the second and third quarters of 2014, with Gross Domestic Product (“GDP”) growing at 4.6% and an estimated 5.0%, respectively.
While economic growth in the U.S. remained largely on track, it slowed in other areas, including Europe, parts of both Latin America and the Asia Pacific region. In Europe, positive data points that had emerged in 2013 and early 2014 largely reversed themselves later in the reporting period and the European Central Bank (the “ECB”) came under even greater pressure to provide a credible plan to boost growth and avoid deflation. In response, the ECB adopted a number of policies designed to stimulate growth. In Japan, which has been mired in economic weakness for years, the Abe administration has adopted even more aggressive economic policies with the Bank of Japan (the “BoJ”) executing a massive QE program. However, the results have not been particularly impressive, with that economy slipping back into recession in the third quarter of 2014 following the consumption tax increase. Emerging markets’ economic growth was mixed, as certain regions like Eastern Europe and the Middle East remained burdened by geopolitical turmoil. Many commodity producing emerging market economies also struggled as prices for most commodities fell. Oil prices fell significantly on oversupply combined with greater production of shale oil in North America.
Against this backdrop, the Treasury curve flattened in 2014 as strong demand pushed up prices on the 30-year bond as well as the 10-year note, although to a lesser degree. This can largely be attributed to anticipation by the financial markets that the Fed may move short-term rates higher at some point during 2015. Although, it is certainly worth noting that the Fed maintained its current forward guidance for interest rates by maintaining that it can be “patient in beginning to normalize the stance of monetary policy”. The last consumer price index (CPI) news release of the reporting period showed the annual inflation rate at 1.3% for the year ended November 30, 2014, which would indicate that inflation pressures are not heating up to any great extent in the U.S. economy.
FUND REVIEW
The Fund continued to favor corporate bonds, mortgages and other securitized products over government bonds this reporting period, which benefited performance as corporate bonds outperformed U.S. Treasuries during the reporting period. Top performing areas for the Fund on an absolute basis and relative to the Index included investment-grade corporate bonds and mortgages.
Among corporate bonds, the Fund benefited from its overweight relative to the Index in financials, which proved to be one of the better performing sectors of the year for both the Index and the Fund. In addition, the Fund’s holdings in the utilities sector performed positively, beating the modestly negative returns of the Index’s holdings in this sector. The Fund’s holdings in the telecommunications sector also outperformed, generating a positive return for the Fund during the year compared to a more sizeable loss for the Index.
Shortly after the July reversal in credit spreads, the market saw pressure on most corporate bond sectors, but in particular on the most directly commodity-sensitive sectors. Energy was hit particularly hard due to dramatically falling oil prices, but basic materials such as metals and mining and chemicals were also negatively impacted. While the Fund was not overweight these sectors, it was a challenge to further pare back the Fund’s exposure as quickly as possible as spreads in these sectors began to widen materially. Because the Fund had seen positive results from its holdings in the energy sector for the first half of the year, and we were quick to pare back risk when the sector came under pressure, the Fund was able to end the year with a positive contribution from the energy sector overall. However, basic materials had not seen the same amount of relative strength prior to the credit spread reversal and the Fund’s holdings in that area detracted from performance for the calendar year.
Among mortgages, the Fund had its largest exposure to government agency MBS, with a smaller allocation to non-agency MBS. The Fund also had positions in commercial MBS and asset-backed securities (“ABS”). Each of these positions produced positive results this reporting period as they offered relatively attractive yields, sparking greater demand as investors resumed their search for more competitive levels of current income.
3 OPPENHEIMER CORE BOND FUND/VA
During the reporting period, we decreased our allocation to agency debt and moved a portion of those assets into U.S. Treasuries to maintain liquidity in the Fund. While we increased our exposure to U.S. Treasuries, we maintained a significant underweight position in them, and our U.S. Treasury position minimally detracted from performance versus the Index. Our lack of exposure to foreign sovereign bonds denominated in U.S. dollars also detracted from relative performance. While these sovereign bonds performed positively for the Index this reporting period, we have avoided them in an attempt to limit volatility.
STRATEGY & OUTLOOK
Despite the end of the Fed’s asset purchase program and the potentially increasing likelihood that the Fed begins to hike rates sometime in 2015, central banks around the globe are either continuing or expected to begin implementing their own versions of extraordinary monetary policy in the face of global growth concerns and corresponding deflationary threats. Such policies provide the financial markets with ample liquidity and have pushed global interest rates lower. Lower global rates have made higher-yielding U.S. fixed income instruments more attractive to investors and the ensuing purchasing of such securities has resulted in lower U.S. interest rates as well. This sort of continuum may potentially keep rates low for some time.
Meanwhile, the U.S. economy continues to grow at a steady pace with credit growth continuing at moderate levels far below those which preceded the financial crisis. With consumers continuing to de-lever and companies generating solid free cash flow to support investments, acquisitions, debt levels, dividends, and share buybacks, we believe this trend could continue. As a result, we remain constructive on credit spreads which still provide good value relative to Treasuries and provide the Fund with carry, or yield advantage, which may prove beneficial in this environment. While rates may remain low, we acknowledge that they do have the potential to increase.
Investors should consider the Fund’s investment objective, risks, charges and expenses carefully before investing. The Fund’s prospectus and summary prospectus contain this and other information about the Fund, and may be obtained by asking your financial advisor or calling us at 1.800.988.8287. Read prospectuses and summary prospectuses carefully before investing.
Total returns include changes in share price and reinvestment of dividends and capital gains distributions in a hypothetical investment for the periods shown.
The Fund’s investment strategy and focus can change over time. The mention of specific fund holdings does not constitute a recommendation by OppenheimerFunds, Inc. and its affiliates.
Shares of Oppenheimer funds are not deposits or obligations of any bank, are not guaranteed by any bank, are not insured by the FDIC or any other agency, and involve investment risks, including the possible loss of the principal amount invested.
Comparing the Fund’s Performance to the Market. The graphs that follow show the performance of a hypothetical $10,000 investment in each share class of the Fund held until December 31, 2014. Performance is measured over a ten-fiscal-year period for both Classes. Performance information does not reflect charges that apply to separate accounts investing in the Fund. If these charges were taken into account, performance would be lower. The graphs assume that all dividends and capital gains distributions were reinvested in additional shares.
The Fund’s performance is compared to the performance of the Citigroup Broad Investment Grade Bond Index, the Barclays U.S. Aggregate Bond Index and the Barclays Credit Index. The Citigroup Broad Investment Grade Bond Index is an index of institutionally traded U.S. Treasury Bonds, government-sponsored bonds, mortgage-backed securities and corporate securities. The Barclays U.S. Aggregate Bond Index is an index of U.S. corporate and government bonds. The Barclays Credit Index is an index of non-convertible U.S. investment grade corporate bonds. The indices are unmanaged and cannot be purchased directly by investors. While index comparisons may be useful to provide a benchmark for the Fund’s performance, it must be noted that the Fund’s investments are not limited to the investments comprising the indices. Index performance includes reinvestment of income, but does not reflect transaction costs, fees, expenses or taxes. Index performance is shown for illustrative purposes only as a benchmark for the Fund’s performance, and does not predict or depict performance of the Fund. The Fund’s performance reflects the effects of the Fund’s business and operating expenses.
4 OPPENHEIMER CORE BOND FUND/VA
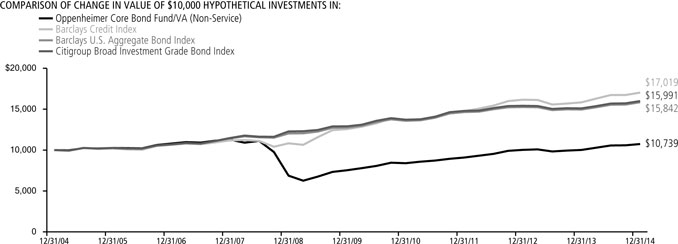
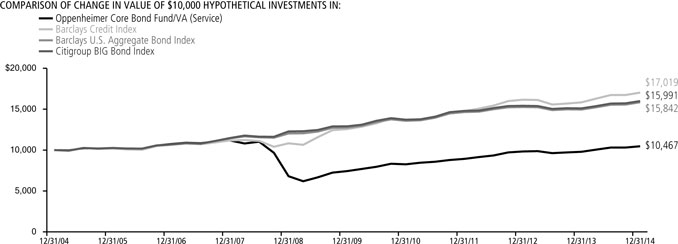
Performance data quoted represents past performance, which does not guarantee future results. The investment return and principal value of an investment in the Fund will fluctuate so that an investor’s shares, when redeemed, may be worth more or less than their original cost. Current performance may be lower or higher than the performance quoted. For performance data current to the most recent month end, call us at 1.800.988.8287. The Fund’s total returns should not be expected to be the same as the returns of other funds, whether or not both funds have the same portfolio managers and/or similar names. The Fund’s total returns include changes in share price and reinvested distributions but do not include the charges associated with the separate account products that offer this Fund. Such performance would have been lower if such charges were taken into account.
5 OPPENHEIMER CORE BOND FUND/VA
Fund Expenses
Fund Expenses. As a shareholder of the Fund, you incur two types of costs: (1) transaction costs and (2) ongoing costs, including management fees; distribution and service fees; and other Fund expenses. These examples are intended to help you understand your ongoing costs (in dollars) of investing in the Fund and to compare these costs with the ongoing costs of investing in other mutual funds.
The examples are based on an investment of $1,000.00 invested at the beginning of the period and held for the entire 6-month period ended December 31, 2014.
Actual Expenses. The first section of the table provides information about actual account values and actual expenses. You may use the information in this section for the class of shares you hold, together with the amount you invested, to estimate the expense that you paid over the period. Simply divide your account value by $1,000.00 (for example, an $8,600.00 account value divided by $1,000.00 = 8.60), then multiply the result by the number in the first section under the heading entitled “Expenses Paid During Period” to estimate the expenses you paid on your account during this period.
Hypothetical Example for Comparison Purposes.
The second section of the table provides information about hypothetical account values and hypothetical expenses based on the Fund’s actual expense ratio for each class of shares, and an assumed rate of return of 5% per year for each class before expenses, which is not the actual return. The hypothetical account values and expenses may not be used to estimate the actual ending account balance or expenses you paid for the period. You may use this information to compare the ongoing costs of investing in the Fund and other funds. To do so, compare this 5% hypothetical example for the class of shares you hold with the 5% hypothetical examples that appear in the shareholder reports of the other funds.
Please note that the expenses shown in the table are meant to highlight your ongoing costs only and do not reflect any charges associated with the separate accounts that offer this Fund. Therefore, the “hypothetical” lines of the table are useful in comparing ongoing costs only, and will not help you determine the relative total costs of owning different funds. In addition, if these separate account charges were included your costs would have been higher.
| | | | | | | | | | | | |
| Actual | | Beginning
Account Value
July 1, 2014 | | | Ending Account Value
December 31, 2014 | | | Expenses Paid During 6 Months Ended
December 31, 2014 | |
Non-Service shares | | $ | 1,000.00 | | | $ | 1,016.60 | | | $ | 3.82 | |
Service shares | | | 1,000.00 | | | | 1,015.50 | | | | 5.09 | |
| | | |
Hypothetical | | | | | | | | | | | | |
(5% return before expenses) | | | | | | | | | | | | |
Non-Service shares | | | 1,000.00 | | | | 1,021.42 | | | | 3.83 | |
Service shares | | | 1,000.00 | | | | 1,020.16 | | | | 5.10 | |
Expenses are equal to the Fund’s annualized expense ratio for that class, multiplied by the average account value over the period, multiplied by 184/365 (to reflect the one-half year period). Those annualized expense ratios, excluding indirect expenses from affiliated funds, based on the 6-month period ended December 31, 2014 are as follows:
| | |
| Class | | Expense Ratios |
Non-Service shares | | 0 .75% |
Service shares | | 1 .00 |
The expense ratios reflect voluntary and/or contractual waivers and/or reimbursements of expenses by the Fund’s Manager. Some of these undertakings may be modified or terminated at any time, as indicated in the Fund’s prospectus. The “Financial Highlights” tables in the Fund’s financial statements, included in this report, also show the gross expense ratios, without such waivers or reimbursements and reduction to custodian expenses, if applicable.
6 OPPENHEIMER CORE BOND FUND/VA
| | | | |
| | |
| | STATEMENT OF INVESTMENTS December 31, 2014 | | |
| | | | |
| | | | | | | | |
| | | Principal
Amount | | | Value | |
Asset-Backed Securities—16.1% | |
Auto Loan—14.7% | |
| American Credit Acceptance Receivables Trust: | | | | | | | | |
| Series 2012-2, Cl. D, 5.91%, 7/15/191 | | $ | 260,000 | | | $ | 261,632 | |
| Series 2012-3, Cl. C, 2.78%, 9/17/181 | | | 90,000 | | | | 90,208 | |
| Series 2013-2, Cl. B, 2.84%, 5/15/191 | | | 381,000 | | | | 384,435 | |
| Series 2014-1, Cl. B, 2.39%, 11/12/191 | | | 520,000 | | | | 521,652 | |
| Series 2014-2, Cl. A, 0.99%, 10/10/171 | | | 251,890 | | | | 251,727 | |
| Series 2014-2, Cl. B, 2.26%, 3/10/201 | | | 135,000 | | | | 134,915 | |
| Series 2014-3, Cl. B, 2.43%, 6/10/201 | | | 295,000 | | | | 297,094 | |
| Series 2014-4, Cl. B, 2.60%, 10/12/201 | | | 145,000 | | | | 145,087 | |
| AmeriCredit Automobile Receivables Trust: | | | | | | | | |
| Series 2012-2, Cl. E, 4.85%, 8/8/191 | | | 305,000 | | | | 315,237 | |
| Series 2012-4, Cl. D, 2.68%, 10/9/18 | | | 75,000 | | | | 75,628 | |
| Series 2012-5, Cl. C, 1.69%, 11/8/18 | | | 255,000 | | | | 255,765 | |
| Series 2012-5, Cl. D, 2.35%, 12/10/18 | | | 365,000 | | | | 367,723 | |
| Series 2013-1, Cl. C, 1.57%, 1/8/19 | | | 490,000 | | | | 489,041 | |
| Series 2013-2, Cl. E, 3.41%, 10/8/201 | | | 345,000 | | | | 347,883 | |
| Series 2013-4, Cl. D, 3.31%, 10/8/19 | | | 30,000 | | | | 30,516 | |
| Series 2013-5, Cl. D, 2.86%, 12/8/19 | | | 225,000 | | | | 225,098 | |
| Series 2014-2, Cl. D, 2.57%, 7/8/20 | | | 190,000 | | | | 187,666 | |
| Series 2014-3, Cl. D, 3.13%, 10/8/20 | | | 155,000 | | | | 156,064 | |
| Series 2014-4, Cl. D, 3.07%, 11/9/20 | | | 160,000 | | | | 160,165 | |
| California Republic Auto Receivables Trust: | | | | | | | | |
| Series 2013-2, Cl. C, 3.32%, 8/17/20 | | | 230,000 | | | | 231,057 | |
| Series 2014-2, Cl. C, 3.29%, 3/15/21 | | | 80,000 | | | | 79,656 | |
| Series 2014-4, Cl. C, 3.56%, 9/15/21 | | | 100,000 | | | | 99,982 | |
| Capital Auto Receivables Asset Trust: | |
| Series 2013-4, Cl. D, 3.22%, 5/20/19 | | | 105,000 | | | | 106,616 | |
| Series 2014-1, Cl. D, 3.39%, 7/22/19 | | | 115,000 | | | | 117,083 | |
| Series 2014-3, Cl. D, 3.14%, 2/20/20 | | | 160,000 | | | | 160,770 | |
| CarFinance Capital Auto Trust: | | | | | | | | |
| Series 2013-1A, Cl. A, 1.65%, 7/17/171 | | | 30,330 | | | | 30,365 | |
| Series 2013-2A, Cl. B, 3.15%, 8/15/191 | | | 530,000 | | | | 537,543 | |
| Series 2014-1A, Cl. A, 1.46%, 12/17/181 | | | 102,275 | | | | 102,439 | |
| Centre Point Funding LLC, Series 2010-1A, Cl. 1, | |
| 5.43%, 7/20/161 | | | 33,934 | | | | 34,384 | |
| CPS Auto Receivables Trust: | | | | | | | | |
| Series 2012-B, Cl. A, 2.52%, 9/16/191 | | | 202,610 | | | | 203,831 | |
| Series 2014-A, Cl. A, 1.21%, 8/15/181 | | | 367,334 | | | | 366,453 | |
| Series 2014-B, Cl. A, 1.11%, 11/15/181 | | | 234,757 | | | | 233,712 | |
| Series 2014-C, Cl. A, 1.31%, 2/15/191 | | | 282,069 | | | | 281,255 | |
| Credit Acceptance Auto Loan Trust: | | | | | | | | |
| Series 2013-1A, Cl. B, 1.83%, 4/15/211 | | | 235,000 | | | | 234,724 | |
| Series 2013-2A, Cl. B, 2.26%, 10/15/211 | | | 260,000 | | | | 261,521 | |
| Series 2014-1A, Cl. B, 2.29%, 4/15/221 | | | 200,000 | | | | 200,382 | |
| Series 2014-2A, Cl. B, 2.67%, 9/15/221 | | | 160,000 | | | | 159,859 | |
| DT Auto Owner Trust: | | | | | | | | |
| Series 2012-1A, Cl. D, 4.94%, 7/16/181 | | | 16,550 | | | | 16,792 | |
| Series 2013-1A, Cl. D, 3.74%, 5/15/201 | | | 175,000 | | | | 177,172 | |
| Series 2013-2A, Cl. D, 4.18%, 6/15/201 | | | 485,000 | | | | 490,125 | |
| Series 2014-1A, Cl. D, 3.98%, 1/15/211 | | | 360,000 | | | | 359,531 | |
| Series 2014-2A, Cl. D, 3.68%, 4/15/211 | | | 525,000 | | | | 516,894 | |
| Series 2014-3A, Cl. D, 4.47%, 11/15/211 | | | 205,000 | | | | 205,033 | |
| Exeter Automobile Receivables Trust: | | | | | | | | |
| Series 2012-2A, Cl. B, 2.22%, 12/15/171 | | | 205,000 | | | | 206,121 | |
| Series 2012-2A, Cl. C, 3.06%, 7/16/181 | | | 35,000 | | | | 35,268 | |
| Series 2013-2A, Cl. B, 3.09%, 7/16/181 | | | 595,000 | | | | 602,043 | |
| Series 2013-2A, Cl. C, 4.35%, 1/15/191 | | | 320,000 | | | | 324,377 | |
| Series 2014-1A, Cl. B, 2.42%, 1/15/191 | | | 230,000 | | | | 229,971 | |
| Series 2014-1A, Cl. C, 3.57%, 7/15/191 | | | 230,000 | | | | 228,486 | |
| Series 2014-2A, Cl. A, 1.06%, 8/15/181 | | | 78,602 | | | | 78,493 | |
| Series 2014-2A, Cl. C, 3.26%, 12/16/191 | | | 110,000 | | | | 107,741 | |
| First Investors Auto Owner Trust: | | | | | | | | |
| Series 2012-1A, Cl. C, 3.54%, 11/15/171 | | | 60,000 | | | | 60,976 | |
| Series 2012-1A, Cl. D, 5.65%, 4/15/181 | | | 155,000 | | | | 160,240 | |
| Series 2013-3A, Cl. B, 2.32%, 10/15/191 | | | 385,000 | | | | 387,494 | |
| Series 2013-3A, Cl. C, 2.91%, 1/15/201 | | | 165,000 | | | | 166,088 | |
| Series 2013-3A, Cl. D, 3.67%, 5/15/201 | | | 125,000 | | | | 125,490 | |
| Series 2014-1A, Cl. D, 3.28%, 4/15/211 | | | 225,000 | | | | 222,298 | |
| Series 2014-3A, Cl. D, 3.85%, 2/15/221 | | | 140,000 | | | | 139,910 | |
| | | | | | | | |
| | | Principal
Amount | | | Value | |
Auto Loan (Continued) | |
| Flagship Credit Auto Trust: | | | | | | | | |
| Series 2014-1, Cl. A, 1.21%, 4/15/191 | | $ | 169,390 | | | $ | 169,005 | |
| Series 2014-2, Cl. A, 1.43%, 12/16/191 | | | 308,203 | | | | 307,908 | |
| Ford Credit Floorplan Master Owner Trust A, Series | | | | | | | | |
| 2012-2, Cl. C, 2.86%, 1/15/19 | | | 295,000 | | | | 303,705 | |
| GM Financial Automobile Leasing Trust, Series | | | | | | | | |
| 2014-1A, Cl. D, 2.51%, 3/20/191 | | | 545,000 | | | | 546,224 | |
| Navistar Financial Dealer Note Master Owner Trust | | | | | | | | |
| II, Series 2014-1, Cl. D, 2.47%, 10/25/191,2 | | | 125,000 | | | | 125,517 | |
| Navistar Financial Dealer Note Master Trust, Series | | | | | | | | |
| 2013-2, Cl. D, 2.42%, 9/25/181,2 | | | 385,000 | | | | 385,339 | |
| Santander Drive Auto Receivables Trust: | | | | | | | | |
| Series 2012-5, Cl. D, 3.30%, 9/17/18 | | | 835,000 | | | | 860,267 | |
| Series 2012-6, Cl. D, 2.52%, 9/17/18 | | | 880,000 | | | | 884,438 | |
| Series 2012-AA, Cl. D, 2.46%, 12/17/181 | | | 480,000 | | | | 480,022 | |
| Series 2013-1, Cl. D, 2.27%, 1/15/19 | | | 240,000 | | | | 238,621 | |
| Series 2013-2, Cl. D, 2.57%, 3/15/19 | | | 325,000 | | | | 329,273 | |
| Series 2013-3, Cl. C, 1.81%, 4/15/19 | | | 100,000 | | | | 99,990 | |
| Series 2013-4, Cl. D, 3.92%, 1/15/20 | | | 110,000 | | | | 114,797 | |
| Series 2013-4, Cl. E, 4.67%, 1/15/201 | | | 360,000 | | | | 376,739 | |
| Series 2013-5, Cl. C, 2.25%, 6/17/19 | | | 35,000 | | | | 35,350 | |
| Series 2013-5, Cl. D, 2.73%, 10/15/19 | | | 215,000 | | | | 215,744 | |
| Series 2013-A, Cl. C, 3.12%, 10/15/191 | | | 780,000 | | | | 799,313 | |
| Series 2013-A, Cl. E, 4.71%, 1/15/211 | | | 270,000 | | | | 279,857 | |
| Series 2014-1, Cl. D, 2.91%, 4/15/20 | | | 160,000 | | | | 160,559 | |
| Series 2014-4, Cl. D, 3.10%, 11/16/20 | | | 185,000 | | | | 185,422 | |
| SNAAC Auto Receivables Trust: | | | | | | | | |
| Series 2012-1A, Cl. C, 4.38%, 6/15/171 | | | 140,318 | | | | 140,844 | |
| Series 2013-1A, Cl. C, 3.07%, 8/15/181 | | | 145,000 | | | | 147,311 | |
| Series 2014-1A, Cl. A, 1.03%, 9/17/181 | | | 124,622 | | | | 124,604 | |
| Series 2014-1A, Cl. D, 2.88%, 1/15/201 | | | 140,000 | | | | 140,915 | |
| TCF Auto Receivables Owner Trust, Series 2014-1A, | | | | | | | | |
| Cl. C, 3.12%, 4/15/211 | | | 100,000 | | | | 99,390 | |
| United Auto Credit Securitization Trust: | | | | | | | | |
| Series 2013-1, Cl. C, 2.22%, 12/15/171 | | | 145,000 | | | | 145,345 | |
| Series 2014-1, Cl. D, 2.38%, 10/15/181 | | | 160,000 | | | | 157,658 | |
| Westlake Automobile Receivables Trust: | | | | | | | | |
| Series 2014-1A, Cl. D, 2.20%, 2/15/211 | | | 155,000 | | | | 153,548 | |
| Series 2014-2A, Cl. D, 2.86%, 7/15/211 | | | 165,000 | | | | 164,971 | |
| | | | | | | | |
| | | | | | | | 21,152,387 | |
| Equipment—0.9% | |
| CLI Funding V LLC: | | | | | | | | |
| Series 2014-1A, Cl. A, 3.29%, 6/18/291 | | | 294,030 | | | | 293,049 | |
| Series 2014-2A, Cl. A, 3.38%, 10/18/291 | | | 349,083 | | | | 347,281 | |
| Cronos Containers Program I Ltd., Series 2014-2A, | | | | | | | | |
| Cl. A, 3.27%, 11/18/291 | | | 450,787 | | | | 450,960 | |
| FRS I LLC, Series 2013-1A, Cl. A1, 1.80%, 4/15/431 | | | 81,702 | | | | 80,795 | |
| Trip Rail Master Funding LLC, Series 2014-1A, Cl. | | | | | | | | |
| A1, 2.863%, 4/15/441 | | | 94,539 | | | | 94,030 | |
| | | | | | | | |
| | | | | | | | 1,266,115 | |
| Home Equity Loan—0.5% | |
| Element Rail Leasing I LLC, Series 2014-1A, Cl. A1, | | | | | | | | |
| 2.299%, 4/19/441 | | | 284,213 | | | | 282,451 | |
| TAL Advantage V LLC: | | | | | | | | |
| Series 2014-1A, Cl. A, 3.51%, 2/22/391 | | | 352,917 | | | | 354,902 | |
| Series 2014-2A, Cl. A1, 1.70%, 5/20/391 | | | 110,644 | | | | 109,934 | |
| | | | | | | | |
| | | | | | | 747,287 | |
| | | | | | | | |
| Total Asset-Backed Securities (Cost $23,131,447) | | | | | | | 23,165,789 | |
| Mortgage-Backed Obligations—59.6% | |
| Government Agency—43.7% | |
| FHLMC/FNMA/FHLB/Sponsored—43.5% | |
| Federal Home Loan Mortgage Corp. Gold Pool: | | | | | | | | |
| 5.00%, 12/1/34 | | | 6,979 | | | | 7,733 | |
| 5.50%, 9/1/39 | | | 615,577 | | | | 688,583 | |
| 6.00%, 5/1/18-10/1/29 | | | 935,972 | | | | 1,056,015 | |
| 6.50%, 4/1/18-4/1/34 | | | 237,405 | | | | 268,764 | |
| 7.00%, 8/1/16-10/1/37 | | | 291,103 | | | | 335,917 | |
7 OPPENHEIMER CORE BOND FUND/VA
| | | | |
| | |
| | STATEMENT OF INVESTMENTS Continued | | |
| | | | |
| | | | | | | | |
| | | Principal Amount | | | Value | |
FHLMC/FNMA/FHLB/Sponsored (Continued) | |
| Federal Home Loan Mortgage Corp. Gold Pool: (Continued) | | | | | | | | |
| 8.00%, 4/1/16 | | $ | 17,651 | | | $ | 17,941 | |
| 9.00%, 8/1/22-5/1/25 | | | 23,140 | | | | 25,572 | |
| Federal Home Loan Mortgage Corp. Non Gold Pool, | |
| 10.50%, 10/1/20 | | | 1,669 | | | | 1,882 | |
| Federal Home Loan Mortgage Corp., Interest-Only Stripped Mtg.-Backed Security: | |
| Series 205, Cl. IO, 10.923%, 9/1/293 | | | 9,587 | | | | 1,867 | |
| Series 206, Cl. IO, 0.00%, 12/1/293,4 | | | 147,548 | | | | 36,575 | |
| Series 243, Cl. 6, 0.00%, 12/15/323,4 | | | 112,943 | | | | 20,586 | |
| Federal Home Loan Mortgage Corp., Mtg.-Linked | |
| Amortizing Global Debt Securities, Series 2012-1, | |
| Cl. A10, 2.06%, 1/15/22 | | | 293,747 | | | | 299,471 | |
| Federal Home Loan Mortgage Corp., Principal-Only | |
| Stripped Mtg.-Backed Security, Series 176, Cl. PO, | |
| 4.284%, 6/1/265 | | | 53,158 | | | | 49,770 | |
| Federal Home Loan Mortgage Corp., Real Estate Mtg. Investment Conduit Multiclass | |
| Pass-Through Certificates: | | | | | | | | |
| Series 151, Cl. F, 9.00%, 5/15/21 | | | 6,507 | | | | 7,259 | |
| Series 1674, Cl. Z, 6.75%, 2/15/24 | | | 18,742 | | | | 20,748 | |
| Series 2034, Cl. Z, 6.50%, 2/15/28 | | | 2,765 | | | | 3,065 | |
| Series 2042, Cl. N, 6.50%, 3/15/28 | | | 7,126 | | | | 7,930 | |
| Series 2043, Cl. ZP, 6.50%, 4/15/28 | | | 336,290 | | | | 376,133 | |
| Series 2046, Cl. G, 6.50%, 4/15/28 | | | 20,136 | | | | 22,457 | |
| Series 2053, Cl. Z, 6.50%, 4/15/28 | | | 2,951 | | | | 3,271 | |
| Series 2066, Cl. Z, 6.50%, 6/15/28 | | | 352,502 | | | | 388,353 | |
| Series 2195, Cl. LH, 6.50%, 10/15/29 | | | 261,643 | | | | 291,097 | |
| Series 2220, Cl. PD, 8.00%, 3/15/30 | | | 1,647 | | | | 1,943 | |
| Series 2326, Cl. ZP, 6.50%, 6/15/31 | | | 72,483 | | | | 81,163 | |
| Series 2461, Cl. PZ, 6.50%, 6/15/32 | | | 315,137 | | | | 352,670 | |
| Series 2470, Cl. LF, 1.161%, 2/15/322 | | | 2,513 | | | | 2,585 | |
| Series 2500, Cl. FD, 0.661%, 3/15/322 | | | 75,893 | | | | 76,936 | |
| Series 2526, Cl. FE, 0.561%, 6/15/292 | | | 100,874 | | | | 101,898 | |
| Series 2538, Cl. F, 0.761%, 12/15/322 | | | 270,775 | | | | 274,718 | |
| Series 2551, Cl. FD, 0.561%, 1/15/332 | | | 60,403 | | | | 60,963 | |
| Series 2564, Cl. MP, 5.00%, 2/15/18 | | | 133,259 | | | | 139,954 | |
| Series 2585, Cl. HJ, 4.50%, 3/15/18 | | | 74,722 | | | | 77,916 | |
| Series 2635, Cl. AG, 3.50%, 5/15/32 | | | 48,796 | | | | 50,887 | |
| Series 2707, Cl. QE, 4.50%, 11/15/18 | | | 25,748 | | | | 27,090 | |
| Series 2770, Cl. TW, 4.50%, 3/15/19 | | | 15,532 | | | | 16,392 | |
| Series 3010, Cl. WB, 4.50%, 7/15/20 | | | 36,748 | | | | 38,853 | |
| Series 3025, Cl. SJ, 24.16%, 8/15/352 | | | 27,530 | | | | 39,063 | |
| Series 3030, Cl. FL, 0.561%, 9/15/352 | | | 3,976 | | | | 4,008 | |
| Series 3645, Cl. EH, 3.00%, 12/15/20 | | | 135,557 | | | | 139,709 | |
| Series 3741, Cl. PA, 2.15%, 2/15/35 | | | 345,331 | | | | 351,817 | |
| Series 3815, Cl. BD, 3.00%, 10/15/20 | | | 8,826 | | | | 9,053 | |
| Series 3822, Cl. JA, 5.00%, 6/15/40 | | | 13,016 | | | | 13,690 | |
| Series 3840, Cl. CA, 2.00%, 9/15/18 | | | 6,576 | | | | 6,666 | |
| Series 3848, Cl. WL, 4.00%, 4/15/40 | | | 52,720 | | | | 54,081 | |
| Series 3857, Cl. GL, 3.00%, 5/15/40 | | | 10,658 | | | | 10,908 | |
| Series 4221, Cl. HJ, 1.50%, 7/15/23 | | | 124,701 | | | | 125,168 | |
| Federal Home Loan Mortgage Corp., Real Estate Mtg. Investment Conduit Multiclass | |
| Pass-Through Certificates, Interest-Only Stripped Mtg.-Backed Security: | | | | | | | | |
| Series 2074, Cl. S, 48.104%, 7/17/283 | | | 2,114 | | | | 485 | |
| Series 2079, Cl. S, 0.00%, 7/17/283,4 | | | 3,888 | | | | 913 | |
| Series 2130, Cl. SC, 49.556%, 3/15/293 | | | 153,132 | | | | 30,723 | |
| Series 2526, Cl. SE, 26.823%, 6/15/293 | | | 4,556 | | | | 878 | |
| Series 2796, Cl. SD, 49.444%, 7/15/263 | | | 226,358 | | | | 49,626 | |
| Series 2920, Cl. S, 52.13%, 1/15/353 | | | 850,664 | | | | 136,635 | |
| Series 2922, Cl. SE, 4.896%, 2/15/353 | | | 102,090 | | | | 16,348 | |
| Series 3004, Cl. SB, 0.00%, 7/15/353,4 | | | 43,702 | | | | 7,683 | |
| Series 3201, Cl. SG, 1.514%, 8/15/363 | | | 256,198 | | | | 41,848 | |
| Series 3397, Cl. GS, 14.828%, 12/15/373 | | | 21,647 | | | | 3,736 | |
| Series 3424, Cl. EI, 8.466%, 4/15/383 | | | 27,414 | | | | 3,128 | |
| Series 3450, Cl. BI, 8.461%, 5/15/383 | | | 555,508 | | | | 72,189 | |
| Series 3606, Cl. SN, 0.411%, 12/15/393 | | | 148,324 | | | | 26,496 | |
| Federal National Mortgage Assn.: | |
| 3.50%, 1/15/456 | | | 5,415,000 | | | | 5,642,445 | |
| 4.00%, 1/25/456 | | | 16,660,000 | | | | 17,776,004 | |
| 4.50%, 1/15/456 | | | 20,405,000 | | | | 22,147,751 | |
| 5.00%, 1/1/456 | | | 2,760,000 | | | | 3,049,418 | |
| 6.00%, 1/1/456 | | | 160,000 | | | | 181,464 | |
| | | | | | | | |
| | | Principal
Amount | | | Value | |
FHLMC/FNMA/FHLB/Sponsored (Continued) | |
| Federal National Mortgage Assn. Pool: | | | | | | | | |
| 3.50%, 12/1/20-2/1/22 | | $ | 297,751 | | | $ | 315,016 | |
| 5.00%, 3/1/21-7/1/22 | | | 20,183 | | | | 21,308 | |
| 5.50%, 2/1/35-5/1/36 | | | 243,163 | | | | 273,449 | |
| 6.50%, 5/1/17-1/1/34 | | | 270,847 | | | | 284,479 | |
| 7.00%, 11/1/17-7/1/35 | | | 92,153 | | | | 100,289 | |
| 7.50%, 1/1/33 | | | 6,045 | | | | 7,095 | |
| 8.50%, 7/1/32 | | | 14,206 | | | | 16,394 | |
| Federal National Mortgage Assn., Interest-Only Stripped Mtg.-Backed Security: | |
| Series 221, Cl. 2, 39.023%, 5/25/233 | | | 3,462 | | | | 565 | |
| Series 222, Cl. 2, 16.943%, 6/25/233 | | | 362,880 | | | | 77,553 | |
| Series 252, Cl. 2, 37.366%, 11/25/233 | | | 357,557 | | | | 59,244 | |
| Series 294, Cl. 2, 9.848%, 2/25/283 | | | 38,543 | | | | 6,547 | |
| Series 301, Cl. 2, 0.00%, 4/25/293,4 | | | 3,451 | | | | 594 | |
| Series 303, Cl. IO, 7.796%, 11/25/293 | | | 68,245 | | | | 12,747 | |
| Series 320, Cl. 2, 5.291%, 4/25/323 | | | 256,850 | | | | 48,168 | |
| Series 321, Cl. 2, 0.00%, 4/25/323,4 | | | 707,871 | | | | 123,137 | |
| Series 324, Cl. 2, 0.00%, 7/25/323,4 | | | 7,438 | | | | 1,296 | |
| Series 331, Cl. 5, 0.00%, 2/25/333,4 | | | 10,589 | | | | 2,363 | |
| Series 331, Cl. 9, 10.871%, 2/25/333 | | | 220,709 | | | | 47,807 | |
| Series 334, Cl. 12, 0.00%, 3/25/333,4 | | | 17,557 | | | | 3,826 | |
| Series 334, Cl. 17, 18.481%, 2/25/333 | | | 149,264 | | | | 30,896 | |
| Series 339, Cl. 12, 0.00%, 6/25/333,4 | | | 246,700 | | | | 47,918 | |
| Series 339, Cl. 7, 0.00%, 11/25/333,4 | | | 533,612 | | | | 97,426 | |
| Series 343, Cl. 13, 0.00%, 9/25/333,4 | | | 243,603 | | | | 41,034 | |
| Series 343, Cl. 18, 0.00%, 5/25/343,4 | | | 63,435 | | | | 10,456 | |
| Series 345, Cl. 9, 0.00%, 1/25/343,4 | | | 177,657 | | | | 35,136 | |
| Series 351, Cl. 10, 0.00%, 4/25/343,4 | | | 85,720 | | | | 14,065 | |
| Series 351, Cl. 8, 0.00%, 4/25/343,4 | | | 139,295 | | | | 22,672 | |
| Series 356, Cl. 10, 0.00%, 6/25/353,4 | | | 103,895 | | | | 19,365 | |
| Series 356, Cl. 12, 0.00%, 2/25/353,4 | | | 50,571 | | | | 8,079 | |
| Series 362, Cl. 13, 0.00%, 8/25/353,4 | | | 189,977 | | | | 33,013 | |
| Series 364, Cl. 15, 0.00%, 9/25/353,4 | | | 10,111 | | | | 1,740 | |
| Series 364, Cl. 16, 0.00%, 9/25/353,4 | | | 206,804 | | | | 34,157 | |
| Series 365, Cl. 16, 0.00%, 3/25/363,4 | | | 304,505 | | | | 44,703 | |
| Federal National Mortgage Assn., Real Estate Mtg. Investment Conduit Multiclass | |
| Pass-Through Certificates: | | | | | | | | |
| Series 1993-87, Cl. Z, 6.50%, 6/25/23 | | | 253,807 | | | | 281,347 | |
| Series 1998-58, Cl. PC, 6.50%, 10/25/28 | | | 191,510 | | | | 213,406 | |
| Series 1998-61, Cl. PL, 6.00%, 11/25/28 | | | 96,777 | | | | 106,111 | |
| Series 1999-54, Cl. LH, 6.50%, 11/25/29 | | | 159,289 | | | | 175,446 | |
| Series 2001-44, Cl. QC, 6.00%, 9/25/16 | | | 3,608 | | | | 3,717 | |
| Series 2001-51, Cl. OD, 6.50%, 10/25/31 | | | 12,377 | | | | 13,563 | |
| Series 2001-74, Cl. QE, 6.00%, 12/25/31 | | | 240,504 | | | | 268,397 | |
| Series 2002-12, Cl. PG, 6.00%, 3/25/17 | | | 2,225 | | | | 2,309 | |
| Series 2003-100, Cl. PA, 5.00%, 10/25/18 | | | 270,407 | | | | 285,622 | |
| Series 2003-28, Cl. KG, 5.50%, 4/25/23 | | | 846,186 | | | | 930,259 | |
| Series 2003-84, Cl. GE, 4.50%, 9/25/18 | | | 12,973 | | | | 13,554 | |
| Series 2004-101, Cl. BG, 5.00%, 1/25/20 | | | 277,201 | | | | 286,471 | |
| Series 2004-25, Cl. PC, 5.50%, 1/25/34 | | | 9,420 | | | | 9,973 | |
| Series 2005-73, Cl. DF, 0.42%, 8/25/352 | | | 14,167 | | | | 14,228 | |
| Series 2006-11, Cl. PS, 23.945%, 3/25/362 | | | 136,477 | | | | 195,295 | |
| Series 2006-46, Cl. SW, 23.578%, 6/25/362 | | | 101,479 | | | | 143,655 | |
| Series 2006-50, Cl. KS, 23.579%, 6/25/362 | | | 145,857 | | | | 208,666 | |
| Series 2008-14, Cl. BA, 4.25%, 3/25/23 | | | 43,575 | | | | 45,568 | |
| Series 2008-75, Cl. DB, 4.50%, 9/25/23 | | | 84,054 | | | | 87,946 | |
| Series 2009-113, Cl. DB, 3.00%, 12/25/20 | | | 279,318 | | | | 287,112 | |
| Series 2009-36, Cl. FA, 1.11%, 6/25/372 | | | 125,373 | | | | 128,685 | |
| Series 2009-70, Cl. NT, 4.00%, 8/25/19 | | | 5,859 | | | | 6,071 | |
| Series 2009-70, Cl. TL, 4.00%, 8/25/19 | | | 130,211 | | | | 134,909 | |
| Series 2010-43, Cl. KG, 3.00%, 1/25/21 | | | 75,214 | | | | 77,442 | |
| Series 2011-3, Cl. EL, 3.00%, 5/25/20 | | | 461,949 | | | | 474,992 | |
| Series 2011-38, Cl. AH, 2.75%, 5/25/20 | | | 7,705 | | | | 7,889 | |
| Series 2011-82, Cl. AD, 4.00%, 8/25/26 | | | 147,687 | | | | 153,827 | |
| Federal National Mortgage Assn., Real Estate Mtg. Investment Conduit Multiclass | |
| Pass-Through Certificates, Interest-Only Stripped Mtg.-Backed Security: | |
| Series 2001-61, Cl. SH, 27.444%, 11/18/313 | | | 9,061 | | | | 1,716 | |
| Series 2001-63, Cl. SD, 28.389%, 12/18/313 | | | 3,296 | | | | 776 | |
| Series 2001-65, Cl. S, 26.892%, 11/25/313 | | | 227,340 | | | | 42,915 | |
| Series 2001-68, Cl. SC, 19.132%, 11/25/313 | | | 2,094 | | | | 406 | |
| Series 2001-81, Cl. S, 23.783%, 1/25/323 | | | 67,569 | | | | 14,685 | |
8 OPPENHEIMER CORE BOND FUND/VA
| | | | | | | | |
| | | Principal Amount | | | Value | |
FHLMC/FNMA/FHLB/Sponsored (Continued) | |
| Federal National Mortgage Assn., Real Estate Mtg. Investment Conduit Multiclass Pass-Through Certificates, Interest-Only Stripped Mtg.-Backed Security: (Continued) | |
| Series 2002-28, Cl. SA, 33.12%, 4/25/323 | | $ | 2,061 | | | $ | 393 | |
| Series 2002-38, Cl. SO, 43.02%, 4/25/323 | | | 5,702 | | | | 1,003 | |
| Series 2002-39, Cl. SD, 34.171%, 3/18/323 | | | 3,770 | | | | 847 | |
| Series 2002-47, Cl. NS, 29.536%, 4/25/323 | | | 205,089 | | | | 41,485 | |
| Series 2002-48, Cl. S, 28.807%, 7/25/323 | | | 3,412 | | | | 663 | |
| Series 2002-51, Cl. S, 29.751%, 8/25/323 | | | 188,272 | | | | 37,227 | |
| Series 2002-52, Cl. SD, 32.272%, 9/25/323 | | | 265,363 | | | | 54,888 | |
| Series 2002-52, Cl. SL, 31.316%, 9/25/323 | | | 2,130 | | | | 419 | |
| Series 2002-53, Cl. SK, 29.473%, 4/25/323 | | | 13,137 | | | | 2,882 | |
| Series 2002-56, Cl. SN, 30.541%, 7/25/323 | | | 4,652 | | | | 1,036 | |
| Series 2002-60, Cl. SM, 28.718%, 8/25/323 | | | 30,221 | | | | 4,802 | |
| Series 2002-7, Cl. SK, 25.247%, 1/25/323 | | | 14,343 | | | | 2,481 | |
| Series 2002-77, Cl. BS, 23.376%, 12/18/323 | | | 18,822 | | | | 4,676 | |
| Series 2002-77, Cl. IS, 38.588%, 12/18/323 | | | 9,714 | | | | 2,220 | |
| Series 2002-77, Cl. SH, 30.753%, 12/18/323 | | | 97,160 | | | | 19,099 | |
| Series 2002-84, Cl. SA, 33.159%, 12/25/323 | | | 222,688 | | | | 41,787 | |
| Series 2002-9, Cl. MS, 24.871%, 3/25/323 | | | 3,585 | | | | 730 | |
| Series 2002-90, Cl. SN, 29.819%, 8/25/323 | | | 15,547 | | | | 2,482 | |
| Series 2002-90, Cl. SY, 35.423%, 9/25/323 | | | 11,145 | | | | 1,759 | |
| Series 2003-26, Cl. DI, 5.126%, 4/25/333 | | | 10,524 | | | | 1,859 | |
| Series 2003-33, Cl. SP, 27.698%, 5/25/333 | | | 232,379 | | | | 50,450 | |
| Series 2003-4, Cl. S, 29.315%, 2/25/333 | | | 148,237 | | | | 30,773 | |
| Series 2004-54, Cl. DS, 36.63%, 11/25/303 | | | 191,141 | | | | 31,534 | |
| Series 2005-12, Cl. SC, 7.003%, 3/25/353 | | | 51,159 | | | | 8,511 | |
| Series 2005-14, Cl. SE, 36.443%, 3/25/353 | | | 150,169 | | | | 23,248 | |
| Series 2005-40, Cl. SA, 46.194%, 5/25/353 | | | 444,471 | | | | 87,416 | |
| Series 2005-40, Cl. SB, 50.56%, 5/25/353 | | | 20,244 | | | | 4,113 | |
| Series 2005-52, Cl. JH, 0.953%, 5/25/353 | | | 106,196 | | | | 18,622 | |
| Series 2005-93, Cl. SI, 11.403%, 10/25/353 | | | 346,659 | | | | 56,626 | |
| Series 2008-55, Cl. SA, 13.829%, 7/25/383 | | | 27,177 | | | | 3,745 | |
| Series 2009-8, Cl. BS, 0.00%, 2/25/243,4 | | | 136,571 | | | | 9,265 | |
| Series 2012-40, Cl. PI, 0.496%, 4/25/413 | | | 191,200 | | | | 31,007 | |
| Federal National Mortgage Assn., Real Estate Mtg. Investment Conduit Multiclass Pass-Through Certificates, Principal-Only Stripped Mtg.-Backed Security, Series 1993-184, Cl. M, 5.165%, 9/25/235 | | | 115,379 | | | | 110,151 | |
| | | | | | | | 62,324,584 | |
| GNMA/Guaranteed—0.2% | | | | | | | | |
| Government National Mortgage Assn. I Pool: | | | | | | | | |
| 7.00%, 12/15/23-3/15/26 | | | 12,017 | | | | 13,507 | |
| 8.50%, 8/15/17-12/15/17 | | | 26,938 | | | | 28,513 | |
| Government National Mortgage Assn., Interest-Only Stripped Mtg.-Backed Security: | |
| Series 2002-15, Cl. SM, 60.833%, 2/16/323 | | | 329,525 | | | | 54,458 | |
| Series 2007-17, Cl. AI, 13.251%, 4/16/373 | | | 99,276 | | | | 20,469 | |
| Series 2011-52, Cl. HS, 9.034%, 4/16/413 | | | 663,626 | | | | 139,995 | |
| Government National Mortgage Assn., Real Estate Mtg. Investment Conduit Multiclass | |
| Pass-Through Certificates: | | | | | | | | |
| Series 1999-32, Cl. ZB, 8.00%, 9/16/29 | | | 46,382 | | | | 54,452 | |
| Series 2000-7, Cl. Z, 8.00%, 1/16/30 | | | 17,291 | | | | 19,872 | |
| | | | | | | | 331,266 | |
| Non-Agency—15.9% | | | | | | | | |
| Commercial—13.9% | | | | | | | | |
| Asset Securitization Corp., Interest-Only Stripped | | | | | | | | |
| Mtg.-Backed Security, Series 1997-D4, Cl. PS1, 0%, | | | | | | | | |
| 4/14/293,4 | | | 1,705,468 | | | | 56,348 | |
| Banc of America Commercial Mortgage Trust: | |
| Series 2006-5, Cl. AM, 5.448%, 9/10/47 | | | 425,000 | | | | 445,739 | |
| Series 2006-6, Cl. AM, 5.39%, 10/10/45 | | | 685,000 | | | | 728,447 | |
| Banc of America Funding Trust, Series 2006-G, Cl. | | | | | | | | |
| 2A4, 0.455%, 7/20/362 | | | 795,000 | | | | 739,781 | |
| BCAP LLC Trust, Series 2011-R11, Cl. 18A5, | | | | | | | | |
| 2.24%, 9/26/351,2 | | | 226,087 | | | | 230,653 | |
| Bear Stearns ARM Trust: | | | | | | | | |
| Series 2005-2, Cl. A1, 2.58%, 3/25/352 | | | 249,594 | | | | 252,759 | |
| Series 2005-9, Cl. A1, 2.43%, 10/25/352 | | | 270,837 | | | | 267,834 | |
| Bear Stearns Commercial Mortgage Securities Trust, | | | | | | | | |
| Series 2006-T24, Cl. AM, 5.568%, 10/12/412 | | | 295,000 | | | | 313,755 | |
| | | | | | | | |
| | | Principal
Amount | | | Value | |
Commercial (Continued) | | | | | | | | |
| Capital Lease Funding Securitization LP, Interest- Only Commercial Mtg. Pass-Through Certificates, Series 1997-CTL1, Cl. IO, 0%, 6/22/241,3,4 | | $ | 1,511,216 | | | $ | 64,805 | |
| CD Commercial Mortgage Trust, Series 2006-CD2, Cl. AM, 5.346%, 1/15/462 | | | 420,000 | | | | 437,151 | |
| Chase Mortgage Finance Trust, Series 2005-A2, Cl. 1A3, 2.483%, 1/25/362 | | | 180,258 | | | | 171,054 | |
| CHL Mortgage Pass-Through Trust, Series 2005-17, Cl. 1A8, 5.50%, 9/25/35 | | | 31,080 | | | | 30,675 | |
| Citigroup Commercial Mortgage Trust: | | | | | | | | |
| Series 2008-C7, Cl. AM, 6.142%, 12/10/492 | | | 410,000 | | | | 449,390 | |
| Series 2013-GC11, Cl. D, 4.458%, 4/10/461,2 | | | 160,000 | | | | 154,270 | |
| Citigroup Mortgage Loan Trust, Inc., Series 2006- AR1, Cl. 1A1, 2.50%, 10/25/352 | | | 466,972 | | | | 464,216 | |
| COMM Mortgage Trust: | | | | | | | | |
| Series 2006-C7, Cl. AM, 5.781%, 6/10/462 | | | 695,000 | | | | 734,611 | |
| Series 2012-CR4, Cl. D, 4.575%, 10/15/451,2 | | | 50,000 | | | | 50,178 | |
| Series 2012-CR5, Cl. E, 4.335%, 12/10/451,2 | | | 75,000 | | | | 74,251 | |
| Series 2013-CR7, Cl. D, 4.354%, 3/10/461,2 | | | 175,000 | | | | 165,823 | |
| Series 2014-CR21, Cl. AM, 3.987%, 12/10/47 | | | 710,000 | | | | 743,090 | |
| COMM Mortgage Trust, Interest-Only Stripped Mtg.-Backed Security, Series 2012-CR5, Cl. XA, 0%, 12/10/453,4 | | | 2,746,769 | | | | 259,909 | |
| Commercial Mortgage Trust: | | | | | | | | |
| Series 2006-GG7, Cl. AM, 5.819%, 7/10/382 | | | 35,000 | | | | 36,916 | |
| Series 2007-GG11, Cl. AM, 5.867%, 12/10/492 | | | 475,000 | | | | 515,663 | |
| Series 2007-GG9, Cl. AM, 5.475%, 3/10/39 | | | 220,000 | | | | 230,925 | |
| Credit Suisse Commercial Mortgage Trust: | | | | | | | | |
| Series 2006-C1, Cl. AJ, 5.467%, 2/15/392 | | | 275,000 | | | | 286,106 | |
| Series 2006-C4, Cl. AM, 5.509%, 9/15/39 | | | 155,000 | | | | 164,053 | |
| Credit Suisse First Boston Mortgage Securities Corp., Series 2005-C6, Cl. AJ, 5.23%, 12/15/402 | | | 410,000 | | | | 420,567 | |
| CSMC: | | | | | | | | |
| Series 2006-6, Cl. 1A4, 6.00%, 7/25/36 | | | 264,953 | | | | 206,449 | |
| Series 2009-13R, Cl. 4A1, 2.618%, 9/26/361,2 | | | 80,944 | | | | 81,668 | |
| DBUBS Mortgage Trust, Series 2011-LC1A, Cl. E, 5.557%, 11/10/461,2 | | | 75,000 | | | | 81,588 | |
| First Horizon Alternative Mortgage Securities Trust: | |
| Series 2004-FA2, Cl. 3A1, 6.00%, 1/25/35 | | | 228,269 | | | | 220,002 | |
| Series 2005-FA8, Cl. 1A6, 0.82%, 11/25/352 | | | 247,057 | | | | 185,098 | |
| FREMF Mortgage Trust: | | | | | | | | |
| Series 2012-K501, Cl. C, 3.458%, 11/25/461,2 | | | 35,000 | | | | 35,566 | |
| Series 2013-K25, Cl. C, 3.743%, 11/25/451,2 | | | 90,000 | | | | 87,398 | |
| Series 2013-K26, Cl. C, 3.60%, 12/25/451,2 | | | 60,000 | | | | 58,132 | |
| Series 2013-K27, Cl. C, 3.497%, 1/25/461,2 | | | 95,000 | | | | 89,611 | |
| Series 2013-K28, Cl. C, 3.494%, 6/25/461,2 | | | 285,000 | | | | 268,001 | |
| Series 2013-K502, Cl. C, 3.195%, 3/25/451,2 | | | 175,000 | | | | 174,037 | |
| Series 2013-K712, Cl. C, 3.368%, 5/25/451,2 | | | 75,000 | | | | 74,122 | |
| Series 2013-K713, Cl. C, 3.165%, 4/25/461,2 | | | 115,000 | | | | 112,272 | |
| Series 2014-K715, Cl. C, 4.124%, 2/25/461,2 | | | 50,000 | | | | 49,774 | |
| GE Capital Commercial Mortgage Corp., Series | | | | | | | | |
| 2005-C4, Cl. AJ, 5.312%, 11/10/452 | | | 50,000 | | | | 50,380 | |
| GS Mortgage Securities Trust, Series 2006-GG6, Cl. AM, 5.553%, 4/10/382 | | | 165,000 | | | | 171,452 | |
| GSMSC Pass-Through Trust, Series 2009-3R, Cl. 1A2, 6%, 4/25/371,2 | | | 448,379 | | | | 412,011 | |
| GSR Mortgage Loan Trust, Series 2005-AR4, Cl. | | | | | | | | |
| 6A1, 5.226%, 7/25/352 | | | 159,417 | | | | 158,083 | |
| JP Morgan Chase Commercial Mortgage Securities Trust: | | | | | | | | |
| Series 2005-CB13, Cl. AM, 5.284%, 1/12/432 | | | 30,000 | | | | 30,857 | |
| Series 2006-CB16, Cl. AJ, 5.623%, 5/12/45 | | | 415,000 | | | | 425,925 | |
| Series 2006-LDP8, Cl. AJ, 5.48%, 5/15/452 | | | 275,000 | | | | 288,453 | |
| JP Morgan Mortgage Trust: | | | | | | | | |
| Series 2007-A1, Cl. 5A1, 2.576%, 7/25/352 | | | 109,731 | | | | 109,472 | |
| Series 2007-S3, Cl. 1A90, 7.00%, 8/25/37 | | | 401,816 | | | | 374,308 | |
| JP Morgan Resecuritization Trust: | | | | | | | | |
| Series 2009-11, Cl. 5A1, 2.618%, 9/26/361,2 | | | 308,243 | | | | 309,100 | |
| Series 2009-5, Cl. 1A2, 2.607%, 7/26/361,2 | | | 406,510 | | | | 351,949 | |
| JPMBB Commercial Mortgage Securities Trust: | |
| Series 2014-C25, Cl. AS, 4.065%, 11/15/47 | | | 300,000 | | | | 314,963 | |
9 OPPENHEIMER CORE BOND FUND/VA
| | | | |
| | |
| | STATEMENT OF INVESTMENTS Continued | | |
| | | | |
| | | | | | | | |
| | | Principal Amount | | | Value | |
| Commercial (Continued) | | | | | | | | |
| JPMBB Commercial Mortgage Securities Trust: (Continued) | | | | | |
| Series 2014-C26, Cl. AS, 3.80%, 1/15/48 | | $ | 145,000 | | | $ | 149,338 | |
| LB Commercial Conduit Mortgage Trust, Interest- | | | | | | | | |
| Only Stripped Mtg.-Backed Security, Series 1998- | | | | | | | | |
| C1, Cl. IO, 0%, 2/18/303,4 | | | 632,484 | | | | 14,304 | |
| LB-UBS Commercial Mortgage Trust, Series 2006- | | | | | | | | |
| C4, Cl. AM, 5.853%, 6/15/382 | | | 185,000 | | | | 196,494 | |
| Lehman Structured Securities Corp., Series 2002- | | | | | | | | |
| GE1, Cl. A, 2.514%, 7/26/241,2 | | | 68,406 | | | | 59,625 | |
| Merrill Lynch Mortgage Trust, Series 2006-C2, Cl. | | | | | | | | |
| AM, 5.782%, 8/12/432 | | | 565,000 | | | | 599,488 | |
| Morgan Stanley Bank of America Merrill Lynch Trust: | | | | | | | | |
| Series 2012-C6, Cl. E, 4.662%, 11/15/451,2 | | | 145,000 | | | | 145,443 | |
| Series 2013-C7, Cl. D, 4.302%, 2/15/461,2 | | | 175,000 | | | | 169,151 | |
| Series 2013-C8, Cl. D, 4.171%, 12/15/481,2 | | | 130,000 | | | | 124,581 | |
| Series 2014-C19, Cl. AS, 3.832%, 12/15/47 | | | 595,000 | | | | 615,105 | |
| Morgan Stanley Capital I Trust: | | | | | | | | |
| Series 2007-IQ13, Cl. AM, 5.406%, 3/15/44 | | | 540,000 | | | | 575,594 | |
| Series 2007-IQ15, Cl. AM, 5.908%, 6/11/492 | | | 490,000 | | | | 527,289 | |
| Morgan Stanley Reremic Trust, Series 2012-R3, Cl. | | | | | | | | |
| 1B, 1.957%, 11/26/361,2 | | | 459,335 | | | | 325,619 | |
| Morgan Stanley Resecuritization Trust, Series 2013- | | | | | | | | |
| R9, Cl. 3A, 2.362%, 6/26/461,2 | | | 383,542 | | | | 387,609 | |
| Salomon Brothers Mortgage Securities VII, Inc., | | | | | | | | |
| Interest-Only Stripped Mtg.-Backed Security, Series | | | | | | | | |
| 1999-C1, Cl. X, 0%, 5/18/323,4 | | | 3,195,670 | | | | 32 | |
| Structured Adjustable Rate Mortgage Loan Trust, | | | | | | | | |
| Series 2007-6, Cl. 3A1, 4.544%, 7/25/372 | | | 380,970 | | | | 295,235 | |
| UBS-Barclays Commercial Mortgage Trust, Series | | | | | | | | |
| 2012-C2, Cl. E, 4.889%, 5/10/631,2 | | | 65,000 | | | | 64,837 | |
| Wachovia Bank Commercial Mortgage Trust: | | | | | | | | |
| Series 2005-C17, Cl. AJ, 5.224%, 3/15/422 | | | 175,000 | | | | 175,100 | |
| Series 2005-C22, Cl. AM, 5.319%, 12/15/442 | | | 260,000 | | | | 267,861 | |
| WaMu Mortgage Pass-Through Certificates Trust: | | | | | | | | |
| Series 2005-AR14, Cl. 1A4, 2.342%, 12/25/352 | | | 299,731 | | | | 291,137 | |
| Series 2005-AR16, Cl. 1A1, 2.339%, 12/25/352 | | | 132,945 | | | | 127,117 | |
| Wells Fargo Mortgage-Backed Securities Trust: | | | | | | | | |
| Series 2005-AR10, Cl. 1A1, 2.614%, 6/25/352 | | | 632,102 | | | | 643,730 | |
| Series 2005-AR15, Cl. 1A6, 2.613%, 9/25/352 | | | 75,046 | | | | 71,576 | |
| Series 2006-AR8, Cl. 2A4, 2.60%, 4/25/362 | | | 178,886 | | | | 174,803 | |
| Series 2007-16, Cl. 1A1, 6.00%, 12/28/37 | | | 192,879 | | | | 199,894 | |
| Series 2007-AR3, Cl. A4, 5.702%, 4/25/372 | | | 85,907 | | | | 84,455 | |
| Series 2007-AR8, Cl. A1, 2.608%, 11/25/372 | | | 215,824 | | | | 190,772 | |
| WF-RBS Commercial Mortgage Trust: | | | | | | | | |
| Series 2012-C10, Cl. D, 4.458%, 12/15/451,2 | | | 75,000 | | | | 73,213 | |
| Series 2012-C7, Cl. E, 4.845%, 6/15/451,2 | | | 120,000 | | | | 120,870 | |
| Series 2013-C11, Cl. D, 4.182%, 3/15/451,2 | | | 74,000 | | | | 71,026 | |
| | | | | | | 19,950,938 | |
| | |
| | | | | | | | | |
| Multi-Family—0.4% | | | | | | | | |
| Citigroup Mortgage Loan Trust, Inc., Series 2006- | | | | | | | | |
| AR3, Cl. 1A2A, 5.334%, 6/25/362 | | | 218,541 | | | | 201,420 | |
| Wells Fargo Mortgage-Backed Securities Trust: | | | | | | | | |
| Series 2005-AR15, Cl. 1A2, 2.613%, 9/25/352 | | | 188,471 | | | | 184,850 | |
| Series 2006-AR2, Cl. 2A3, 2.612%, 3/25/362 | | | 160,144 | | | | 158,871 | |
| | | | | | | 545,141 | |
| | |
| | | | | | | | | |
| Residential—1.6% | | | | | | | | |
| Banc of America Funding Trust: | | | | | | | | |
| Series 2007-1, Cl. 1A3, 6.00%, 1/25/37 | | | 222,446 | | | | 202,567 | |
| Series 2007-C, Cl. 1A4, 5.293%, 5/20/362 | | | 88,251 | | | | 85,606 | |
| Banc of America Mortgage Trust, Series 2007-1, Cl. | | | | | | | | |
| 1A24, 6%, 3/25/37 | | | 142,108 | | | | 133,897 | |
| Bear Stearns ARM Trust, Series 2006-1, Cl. A1, | | | | | | | | |
| 2.36%, 2/25/362 | | | 310,067 | | | | 309,921 | |
| Carrington Mortgage Loan Trust, Series 2006-FRE1, | | | | | | | | |
| Cl. A2, 0.28%, 7/25/362 | | | 161,733 | | | | 159,057 | |
| CD Commercial Mortgage Trust, Series 2007-CD4, | | | | | | | | |
| Cl. AMFX, 5.366%, 12/11/492 | | | 115,000 | | | | 119,486 | |
| | | | | | | | |
| | | Principal Amount | | | Value | |
Residential (Continued) | | | | | | | | |
| CHL Mortgage Pass-Through Trust: | | | | | | | | |
| Series 2005-26, Cl. 1A8, 5.50%, 11/25/35 | | $ | 168,775 | | | $ | 161,363 | |
| Series 2005-J4, Cl. A7, 5.50%, 11/25/35 | | | 23,531 | | | | 24,791 | |
| GSR Mortgage Loan Trust, Series 2006-5F, Cl. 2A1, | | | | | | | | |
| 6%, 6/25/36 | | | 130,519 | | | | 124,242 | |
| MASTR Asset Backed Securities Trust, Series 2006- | | | | | | | | |
| WMC3, Cl. A3, 0.27%, 8/25/362 | | | 54,564 | | | | 27,041 | |
| NC Finance Trust, Series 1999-I, Cl. D, 8.75%, | | | | | | | | |
| 1/25/297,8 | | | 3,370,016 | | | | 512,243 | |
| RALI Trust: | | | | | | | | |
| Series 2003-QS1, Cl. A2, 5.75%, 1/25/33 | | | 42,636 | | | | 43,072 | |
| Series 2006-QS13, Cl. 1A8, 6.00%, 9/25/36 | | | 1,245 | | | | 1,003 | |
| Series 2007-QS6, Cl. A28, 5.75%, 4/25/37 | | | 15,333 | | | | 12,381 | |
| WaMu Mortgage Pass-Through Certificates Trust, | | | | | | | | |
| Series 2003-AR10, Cl. A7, 2.419%, 10/25/332 | | | 158,514 | | | | 162,319 | |
| Wells Fargo Mortgage-Backed Securities Trust, | | | | | | | | |
| Series 2006-AR14, Cl. 1A2, 5.724%, 10/25/362 | | | 203,682 | | | | 198,325 | |
| | | | | | | 2,277,314 | |
| Total Mortgage-Backed Obligations (Cost $89,167,628) | | | | 85,429,243 | |
| | |
| | | | | | | | | |
| U.S. Government Obligations—1.2% | | | | | |
| Federal National Mortgage Assn. Nts., 1%, 9/27/17 | | | 259,000 | | | | 258,199 | |
| United States Treasury Nts., 1.625%, 4/30/19 | | | 1,438,000 | | | | 1,442,944 | |
| Total U.S. Government Obligations (Cost $1,694,727) | | | | | | | 1,701,143 | |
| | |
| | | | | | | | | |
| Corporate Bonds and Notes—51.1% | | | | | |
| Consumer Discretionary—8.5% | | | | | |
| Auto Components—0.7% | | | | | |
| Dana Holding Corp., 6.75% Sr. Unsec. Nts., 2/15/21 | | | 354,000 | | | | 376,125 | |
| Johnson Controls, Inc., 4.625% Sr. Unsec. | | | | | | | | |
| Nts., 7/2/44 | | | 200,000 | | | | 206,645 | |
| TRW Automotive, Inc., 7.25% Sr. Unsec. | | | | | | | | |
| Nts., 3/15/177 | | | 328,000 | | | | 364,080 | |
| | | | | | | 946,850 | |
| |
| | | | | | |
| Automobiles—1.8% | | | | | |
| Daimler Finance North America LLC: | | | | | | | | |
| 1.30% Sr. Unsec. Nts., 7/31/151 | | | 316,000 | | | | 317,363 | |
| 8.50% Sr. Unsec. Unsub. Nts., 1/18/31 | | | 237,000 | | | | 363,416 | |
| Ford Motor Credit Co. LLC, 3.664% Sr. | | | | | | | | |
| Unsec. Nts., 9/8/24 | | | 796,000 | | | | 799,205 | |
| General Motors Co., 6.25% Sr. Unsec. Nts., | | | | | | | | |
| 10/2/43 | | | 363,000 | | | | 435,455 | |
| Hyundai Capital America, 1.45% Sr. Unsec. | | | | | | | | |
| Nts., 2/6/171 | | | 392,000 | | | | 390,853 | |
| Kia Motors Corp., 3.625% Sr. Unsec. Nts., | | | | | | | | |
| 6/14/161 | | | 284,000 | | | | 292,983 | |
| | | | | | | 2,599,275 | |
| |
| | | | | | |
| Diversified Consumer Services—0.2% | | | | | |
| Service Corp. International, 4.50% Sr. Unsec. Unsub. Nts., 11/15/20 | | | 365,000 | | | | 360,438 | |
| |
| | | | | | |
| Hotels, Restaurants & Leisure—1.1% | | | | | |
| Brinker International, Inc., 2.60% Sr. Unsec. | | | | | | | | |
| Nts., 5/15/18 | | | 134,000 | | | | 133,862 | |
| Carnival Corp., 1.20% Sr. Unsec. Nts., 2/5/16 | | | 386,000 | | | | 385,945 | |
| Hyatt Hotels Corp., 3.875% Sr. Unsec. | | | | | | | | |
| Unsub. Nts., 8/15/16 | | | 65,000 | | | | 67,475 | |
| Starwood Hotels & Resorts Worldwide, Inc., | | | | | | | | |
| 7.15% Sr. Unsec. Unsub. Nts., 12/1/19 | | | 261,000 | | | | 307,931 | |
| Wyndham Worldwide Corp., 6% Sr. Unsec. | | | | | | | | |
| Nts., 12/1/16 | | | 335,000 | | | | 360,492 | |
| Yum! Brands, Inc., 4.25% Sr. Unsec. Nts., 9/15/15 | | | 352,000 | | | | 360,311 | |
| | | | | | | 1,616,016 | |
10 OPPENHEIMER CORE BOND FUND/VA
| | | | | | | | |
| | | Principal Amount | | | Value | |
Household Durables—0.9% | | | | | |
| Jarden Corp., 6.125% Sr. Unsec. Nts., 11/15/22 | | $ | 354,000 | | | $ | 370,815 | |
| Lennar Corp., 4.75% Sr. Unsec. Nts., 11/15/22 | | | 365,000 | | | | 359,525 | |
| Toll Brothers Finance Corp., 4% Sr. Unsec. | | | | | | | | |
| Nts., 12/31/18 | | | 364,000 | | | | 365,820 | |
| Whirlpool Corp.: | | | | | | | | |
| 1.35% Sr. Unsec. Nts., 3/1/17 | | | 104,000 | | | | 103,775 | |
| 1.65% Sr. Unsec. Nts., 11/1/17 | | | 85,000 | | | | 84,783 | |
| | | | | | | 1,284,718 | |
| | |
| | | | | | | | | |
| Media—2.3% | | | | | | | | |
| 21st Century Fox America, Inc., 6.15% Sr. | | | | | | | | |
| Unsec. Nts., 2/15/41 | | | 162,000 | | | | 206,915 | |
| CCO Holdings LLC/CCO Holdings Capital | | | | | | | | |
| Corp., 6.50% Sr. Unsec. Nts., 4/30/21 | | | 338,000 | | | | 356,167 | |
| Comcast Cable Communications Holdings, | | | | | | | | |
| Inc., 9.455% Sr. Unsec. Nts., 11/15/22 | | | 242,000 | | | | 348,434 | |
| Comcast Corp., 4.65% Sr. Unsec. Unsub. | | | | | | | | |
| Nts., 7/15/42 | | | 130,000 | | | | 142,858 | |
| DIRECTV Holdings LLC/DIRECTV Financing | | | | | | | | |
| Co., Inc., 5.15% Sr. Unsec. Nts., 3/15/42 | | | 235,000 | | | | 243,738 | |
| Historic TW, Inc.: | | | | | | | | |
| 8.05% Sr. Unsec. Nts., 1/15/16 | | | 64,000 | | | | 68,441 | |
| 9.15% Debs., 2/1/23 | | | 96,000 | | | | 130,770 | |
| Interpublic Group of Cos., Inc. (The), 4.20% | | | | | | | | |
| Sr. Unsec. Nts., 4/15/24 | | | 191,000 | | | | 195,731 | |
| Lamar Media Corp., 5% Sr. Unsec. Sub. | | | | | | | | |
| Nts., 5/1/23 | | | 373,000 | | | | 371,135 | |
| Numericable-SFR, 4.875% Sr. Sec. Nts., | | | | | | | | |
| 5/15/191 | | | 381,000 | | | | 379,095 | |
| Pearson Funding Two plc, 4% Sr. Unsec. | | | | | | | | |
| Nts., 5/17/161 | | | 85,000 | | | | 88,401 | |
| Sky plc, 3.75% Sr. Unsec. Nts., 9/16/241 | | | 165,000 | | | | 166,346 | |
| Time Warner Cable, Inc., 4.50% Sr. Unsec. | | | | | | | | |
| Unsub. Nts., 9/15/42 | | | 381,000 | | | | 393,209 | |
| Viacom, Inc.: | | | | | | | | |
| 2.50% Sr. Unsec. Nts., 12/15/16 | | | 155,000 | | | | 158,490 | |
| 4.85% Sr. Unsec. Nts., 12/15/34 | | | 119,000 | | | | 122,164 | |
| | | | | | | 3,371,894 | |
| | |
| | | | | | | | | |
| Multiline Retail—0.1% | | | | | | | | |
| Macy’s Retail Holdings, Inc., 4.50% Sr. | | | | | | | | |
| Unsec. Nts., 12/15/34 | | | 87,000 | | | | 87,888 | |
| | |
| | | | | | | | | |
| Specialty Retail—0.9% | | | | | | | | |
| Bed Bath & Beyond, Inc., 5.165% Sr. Unsec. | | | | | | | | |
| Nts., 8/1/44 | | | 102,000 | | | | 106,640 | |
| Best Buy Co., Inc., 5.50% Sr. Unsec. Nts., | | | | | | | | |
| 3/15/21 | | | 349,000 | | | | 364,705 | |
| Home Depot, Inc. (The), 4.875% Sr. Unsec. | | | | | | | | |
| Nts., 2/15/44 | | | 142,000 | | | | 165,721 | |
| L Brands, Inc., 7% Sr. Unsec. Nts., 5/1/20 | | | 42,000 | | | | 47,880 | |
| Ross Stores, Inc., 3.375% Sr. Unsec. Nts., | | | | | | | | |
| 9/15/24 | | | 355,000 | | | | 356,044 | |
| Sally Holdings LLC/Sally Capital, Inc., 5.75% | | | | | | | | |
| Sr. Unsec. Nts., 6/1/22 | | | 5,000 | | | | 5,262 | |
| Signet UK Finance plc, 4.70% Sr. Unsec. | | | | | | | | |
| Nts., 6/15/24 | | | 192,000 | | | | 185,614 | |
| | | | | | | 1,231,866 | |
| | |
| | | | | | | | | |
| Textiles, Apparel & Luxury Goods—0.5% | | | | | |
| Levi Strauss & Co., 6.875% Sr. Unsec. Nts., | | | | | | | | |
| 5/1/22 | | | 335,000 | | | | 361,800 | |
| PVH Corp., 4.50% Sr. Unsec. Unsub. Nts., | | | | | | | | |
| 12/15/22 | | | 371,000 | | | | 368,217 | |
| | | | | | | 730,017 | |
| | | | | | | | |
| | | Principal
Amount | | | Value | |
Consumer Staples—3.6% | | | | | | | | |
Beverages—1.2% | | | | | | | | |
| Anheuser-Busch InBev Worldwide, Inc., | | | | | | | | |
| 8.20% Sr. Unsec. Unsub. Nts., 1/15/39 | | $ | 324,000 | | | $ | 501,824 | |
| Constellation Brands, Inc., 3.75% Sr. Unsec. | | | | | | | | |
| Nts., 5/1/21 | | | 423,000 | | | | 419,827 | |
| Pernod Ricard SA: | | | | | | | | |
| 2.95% Sr. Unsec. Nts., 1/15/171 | | | 357,000 | | | | 365,462 | |
| 4.25% Sr. Unsec. Nts., 7/15/221 | | | 215,000 | | | | 227,645 | |
| SABMiller Holdings, Inc., 4.95% Sr. Unsec. | | | | | | | | |
| Unsub. Nts., 1/15/421 | | | 206,000 | | | | 232,965 | |
| | | | | | | 1,747,723 | |
| | |
| | | | | | | | | |
| Food & Staples Retailing—0.6% | | | | | | | | |
| CVS Health Corp., 5.30% Sr. Unsec. Nts., | | | | | | | | |
| 12/5/43 | | | 84,000 | | | | 100,814 | |
| Delhaize Group SA, 5.70% Sr. Unsec. Nts., | | | | | | | | |
| 10/1/40 | | | 215,000 | | | | 226,344 | |
| Kroger Co., 6.90% Sr. Unsec. Nts., 4/15/38 | | | 90,000 | | | | 120,153 | |
| Kroger Co. (The), 6.40% Sr. Unsec. Nts., | | | | | | | | |
| 8/15/17 | | | 319,000 | | | | 356,799 | |
| | | | | | | 804,110 | |
| | |
| | | | | | | | | |
| Food Products—1.3% | | | | | | | | |
| Bunge Ltd. Finance Corp.: | | | | | | | | |
| 5.10% Sr. Unsec. Unsub. Nts., 7/15/15 | | | 332,000 | | | | 339,282 | |
| 8.50% Sr. Unsec. Nts., 6/15/19 | | | 289,000 | | | | 354,856 | |
| ConAgra Foods, Inc., 1.35% Sr. Unsec. Nts., | | | | | | | | |
| 9/10/15 | | | 221,000 | | | | 221,952 | |
| Kraft Foods Group, Inc., 5% Sr. Unsec. Nts., | | | | | | | | |
| 6/4/42 | | | 89,000 | | | | 98,351 | |
| TreeHouse Foods, Inc., 4.875% Sr. Unsec. | | | | | | | | |
| Nts., 3/15/22 | | | 365,000 | | | | 370,475 | |
| Tyson Foods, Inc.: | | | | | | | | |
| 4.875% Sr. Unsec. Nts., 8/15/34 | | | 118,000 | | | | 129,855 | |
| 6.60% Sr. Unsec. Nts., 4/1/16 | | | 341,000 | | | | 363,686 | |
| | | | | | | 1,878,457 | |
| | |
| | | | | | | | | |
| Tobacco—0.5% | | | | | | | | |
| Altria Group, Inc., 10.20% Sr. Unsec. Nts., | | | | | | | | |
| 2/6/39 | | | 202,000 | | | | 352,786 | |
| Reynolds American, Inc., 6.75% Sr. Unsec. | | | | | | | | |
| Nts., 6/15/17 | | | 325,000 | | | | 362,257 | |
| | | | | | | 715,043 | |
| | |
| | | | | | | | | |
| Energy—4.0% | | | | | | | | |
| Energy Equipment & Services—0.5% | | | | | |
| Nabors Industries, Inc.: | | | | | | | | |
| 2.35% Sr. Unsec. Nts., 9/15/16 | | | 294,000 | | | | 291,002 | |
| 4.625% Sr. Unsec. Nts., 9/15/21 | | | 155,000 | | | | 145,834 | |
| Rowan Cos., Inc., 4.875% Sr. Unsec. Unsub. | | | | | | | | |
| Nts., 6/1/22 | | | 153,000 | | | | 149,109 | |
| Weatherford International Ltd., 5.95% Sr. | �� | | | | | | | |
| Unsec. Nts., 4/15/42 | | | 97,000 | | | | 82,385 | |
| | | | | | | 668,330 | |
| | |
| | | | | | | | | |
| Oil, Gas & Consumable Fuels—3.5% | | | | | |
| Anadarko Petroleum Corp., 6.20% Sr. | | | | | | | | |
| Unsec. Nts., 3/15/40 | | | 163,000 | | | | 191,599 | |
| CNOOC Nexen Finance 2014 ULC, 1.625% | | | | | | | | |
| Sr. Unsec. Nts., 4/30/17 | | | 373,000 | | | | 371,411 | |
| DCP Midstream LLC, 5.375% Sr. Unsec. | | | | | | | | |
| Nts., 10/15/151 | | | 290,000 | | | | 299,078 | |
| Devon Energy Corp., 4.75% Sr. Unsec. Nts., | | | | | | | | |
| 5/15/42 | | | 162,000 | | | | 163,701 | |
| El Paso Pipeline Partners Operating Co. LLC, | | | | | | | | |
| 4.10% Sr. Unsec. Nts., 11/15/15 | | | 152,000 | | | | 155,555 | |
| EnLink Midstream Partners LP, 2.70% Sr. | | | | | | | | |
| Unsec. Nts., 4/1/19 | | | 299,000 | | | | 294,730 | |
| Enterprise Products Operating LLC, 3.75% | | | | | | | | |
| Sr. Unsec. Nts., 2/15/25 | | | 164,000 | | | | 164,962 | |
11 OPPENHEIMER CORE BOND FUND/VA
| | | | |
| | |
| | STATEMENT OF INVESTMENTS Continued | | |
| | | | |
| | | | | | | | |
| | | Principal
Amount | | | Value | |
| |
Oil, Gas & Consumable Fuels (Continued) | | | | | |
| |
| Kinder Morgan Energy Partners LP, 4.15% Sr. Unsec. Nts., 2/1/24 | | $ | 167,000 | | | $ | 166,885 | |
| |
| Kinder Morgan, Inc.: | | | | | | | | |
| 3.05% Sr. Unsec. Nts., 12/1/19 | | | 289,000 | | | | 287,026 | |
| 5.00% Sr. Unsec. Nts., 2/15/211 | | | 437,000 | | | | 455,224 | |
| |
| Noble Energy, Inc., 5.05% Sr. Unsec. Nts., 11/15/44 | | | 102,000 | | | | 101,205 | |
| |
| Origin Energy Finance Ltd.: | | | | | | | | |
| 3.50% Sr. Unsec. Nts., 10/9/181 | | | 394,000 | | | | 402,362 | |
| 5.45% Sr. Unsec. Nts., 10/14/211 | | | 245,000 | | | | 268,176 | |
| |
| Phillips 66, 4.30% Sr. Unsec. Unsub. Nts., 4/1/22 | | | 155,000 | | | | 163,887 | |
| |
| Pioneer Natural Resources Co.: | | | | | | | | |
| 3.95% Sr. Unsec. Nts., 7/15/22 | | | 157,000 | | | | 155,649 | |
| 6.65% Sr. Unsec. Nts., 3/15/17 | | | 301,000 | | | | 329,948 | |
| |
| Spectra Energy Partners LP: | | | | | | | | |
| 4.60% Sr. Unsec. Nts., 6/15/21 | | | 238,000 | | | | 257,978 | |
| 4.75% Sr. Unsec. Nts., 3/15/24 | | | 194,000 | | | | 208,333 | |
| |
| Western Gas Partners LP, 4% Sr. Unsec. Nts., 7/1/22 | | | 182,000 | | | | 184,764 | |
| |
| Williams Partners LP, 4.50% Sr. Unsec. Nts., 11/15/23 | | | 194,000 | | | | 196,127 | |
| |
| Woodside Finance Ltd., 4.60% Sr. Unsec. Unsub. Nts., 5/10/211 | | | 274,000 | | | | 292,308 | |
| | | | | | | | |
| | | | | | | 5,110,908 | |
| | | | | | | | |
| |
| Financials—14.8% | | | | | | | | |
| |
| Capital Markets—3.0% | | | | | | | | |
| |
| Apollo Management Holdings LP, 4% Sr. Unsec. Nts., 5/30/241 | | | 312,000 | | | | 318,151 | |
| |
| Blackstone Holdings Finance Co. LLC, 5% Sr. Unsec. Nts., 6/15/441 | | | 382,000 | | | | 411,966 | |
| |
| Carlyle Holdings II Finance LLC, 5.625% Sr. Sec. Nts., 3/30/431 | | | 209,000 | | | | 243,555 | |
| |
| Credit Suisse, New York, 3.625% Sr. Unsec. Nts., 9/9/24 | | | 498,000 | | | | 507,203 | |
| |
| Goldman Sachs Group, Inc. (The), 5.70% Jr. Sub. Perpetual Bonds, Series L2,9 | | | 381,000 | | | | 386,810 | |
| |
| Lazard Group LLC, 4.25% Sr. Unsec. Nts., 11/14/20 | | | 337,000 | | | | 355,642 | |
| |
| Morgan Stanley: | | | | | | | | |
| 5.00% Sub. Nts., 11/24/25 | | | 332,000 | | | | 354,731 | |
| 5.45% Jr. Sub. Perpetual Bonds, Series H2,9 | | | 355,000 | | | | 356,083 | |
| |
| Nomura Holdings, Inc., 2% Sr. Unsec. Nts., 9/13/16 | | | 373,000 | | | | 376,263 | |
| |
| Raymond James Financial, Inc., 5.625% Sr. Unsec. Unsub. Nts., 4/1/24 | | | 417,000 | | | | 475,827 | |
| |
| UBS Preferred Funding Trust V, 6.243% Jr. Sub. Perpetual Bonds, Series 12,9 | | | 556,000 | | | | 575,465 | |
| | | | | | | | |
| | | | | | | 4,361,696 | |
| | | | | | | | |
| |
| Commercial Banks—6.2% | | | | | | | | |
| |
| Bank of America Corp.: | | | | | | | | |
| 7.75% Jr. Sub. Nts., 5/14/38 | | | 354,000 | | | | 501,545 | |
| 8.00% Jr. Sub. Perpetual Bonds, Series K2,9 | | | 339,000 | | | | 365,696 | |
| |
| BNP Paribas SA, 3.25% Sr. Unsec. Nts., 3/3/23 | | | 421,000 | | | | 429,970 | |
| |
| Citigroup, Inc.: | | | | | | | | |
| 6.675% Sub. Nts., 9/13/43 | | | 344,000 | | | | 446,431 | |
| 5.95% Jr. Sub. Perpetual Bonds, Series D2,9 | | | 368,000 | | | | 362,940 | |
| |
| Commerzbank AG, 8.125% Sub. Nts., 9/19/231 | | | 313,000 | | | | 361,077 | |
| |
| Credit Agricole SA, 8.375% Jr. Sub. Perpetual Bonds2,7,9 | | | 320,000 | | | | 370,400 | |
| |
| FirstMerit Bank NA, 4.27% Sub. Nts., 11/25/26 | | | 362,000 | | | | 368,453 | |
| |
| HSBC Finance Capital Trust IX, 5.911% Unsec. Sub. Nts., 11/30/352 | | | 890,000 | | | | 903,350 | |
| |
| Intesa Sanpaolo SpA, 5.017% Sub. Nts., 6/26/241 | | | 370,000 | | | | 359,757 | |
| | | | | | | | |
| | | Principal
Amount | | | Value | |
| |
| Commercial Banks (Continued) | | | | | | | | |
| |
| JPMorgan Chase & Co.: | | | | | | | | |
| 3.625% Sr. Unsec. Nts., 5/13/24 | | $ | 710,000 | | | $ | 727,621 | |
| 6.75% Jr. Sub. Perpetual Bonds, Series S2,9 | | | 344,000 | | | | 365,070 | |
| |
| Lloyds Banking Group plc, 6.657% Jr. Sub. Perpetual Bonds1,2,9 | | | 334,000 | | | | 357,380 | |
| |
| Rabobank Capital Funding Trust III, 5.254% Jr. Sub. Perpetual Bonds2,7,9 | | | 667,000 | | | | 695,681 | |
| |
| Regions Bank, Birmingham AL, 6.45% Sub. Nts., 6/26/37 | | | 283,000 | | | | 356,057 | |
| |
| Royal Bank of Scotland Group plc, 7.64% Jr. Sub. Perpetual Bonds, Series U2,9 | | | 300,000 | | | | 316,500 | |
| |
| Societe Generale SA, 5.922% Jr. Sub. Perpetual Bonds1,2,9 | | | 370,000 | | | | 385,495 | |
| |
| SunTrust Banks, Inc.: | | | | | | | | |
| 3.60% Sr. Unsec. Nts., 4/15/16 | | | 385,000 | | | | 397,291 | |
| 5.625% Jr. Sub. Perpetual Bonds2,9 | | | 370,000 | | | | 372,081 | |
| |
| Wells Fargo & Co., 5.90% Jr. Sub. Perpetual Bonds, Series S2,9 | | | 383,000 | | | | 386,830 | |
| | | | | | | | |
| | | | | | | 8,829,625 | |
| |
| Consumer Finance—0.9% | | | | | | | | |
| |
| Ally Financial, Inc., 8% Sr. Unsec. Nts., 11/1/31 | | | 283,000 | | | | 361,533 | |
| |
| American Express Co., 5.20% Jr. Sub. Perpetual Bonds2,9 | | | 369,000 | | | | 376,718 | |
| |
| Discover Financial Services, 3.95% Sr. Unsec. Nts., 11/6/24 | | | 280,000 | | | | 282,026 | |
| |
| Synchrony Financial: | | | | | | | | |
| 3.00% Sr. Unsec. Nts., 8/15/19 | | | 171,000 | | | | 172,980 | |
| 3.75% Sr. Unsec. Nts., 8/15/21 | | | 135,000 | | | | 138,019 | |
| | | | | | | | |
| | | | | | | 1,331,276 | |
| |
| Diversified Financial Services—0.9% | | | | | |
| |
| Berkshire Hathaway Energy Co., 4.50% Sr. Unsec. Nts., 2/1/451 | | | 185,000 | | | | 194,386 | |
| |
| Burlington Northern Santa Fe LLC, 3% Sr. Unsec. Nts., 3/15/23 | | | 309,000 | | | | 308,572 | |
| |
| Leucadia National Corp., 5.50% Sr. Unsec. Nts., 10/18/236 | | | 383,000 | | | | 393,600 | |
| |
| Voya Financial, Inc., 5.65% Jr. Sub. Nts., 5/15/532 | | | 355,000 | | | | 353,225 | |
| | | | | | | | |
| | | | | | | 1,249,783 | |
| |
| Insurance—2.9% | | | | | | | | |
| |
| AIA Group Ltd., 4.875% Sr. Unsec. Nts., 3/11/441 | | | 292,000 | | | | 333,249 | |
| |
| AXIS Specialty Finance plc, 5.15% Sr. Unsec. Nts., 4/1/45 | | | 308,000 | | | | 334,932 | |
| |
| Five Corners Funding Trust, 4.419% Unsec. Nts., 11/15/231 | | | 310,000 | | | | 328,403 | |
| |
| Liberty Mutual Group, Inc.: | | | | | | | | |
| 4.25% Sr. Unsec. Nts., 6/15/231 | | | 456,000 | | | | 470,730 | |
| 4.85% Sr. Unsec. Nts., 8/1/441 | | | 224,000 | | | | 228,589 | |
| |
| Lincoln National Corp., 6.05% Jr. Unsec. Sub. Nts., 4/20/672 | | | 688,000 | | | | 691,440 | |
| |
| Prudential Financial, Inc., 5.20% Jr. Sub. Nts., 3/15/442 | | | 300,000 | | | | 298,125 | |
| |
| Swiss Re Capital I LP, 6.854% Jr. Sub. Perpetual Bonds2,7,9 | | | 663,000 | | | | 696,150 | |
| |
| TIAA Asset Management Finance Co. LLC, 4.125% Sr. Unsec. Nts., 11/1/241 | | | 371,000 | | | | 380,823 | |
| |
| ZFS Finance USA Trust V, 6.50% Jr. Sub. Nts., 5/9/372,7 | | | 365,000 | | | | 390,550 | |
| | | | | | | | |
| | | | | | | 4,152,991 | |
| |
| Real Estate—0.1% | | | | | | | | |
| |
| Ventas Realty LP, 1.25% Sr. Unsec. Nts., 4/17/17 | | | 151,000 | | | | 149,730 | |
| |
| Real Estate Investment Trusts (REITs)—0.8% | | | | | |
| |
| American Tower Corp.: | | | | | | | | |
| 5.05% Sr. Unsec. Unsub. Nts., 9/1/20 | | | 149,000 | | | | 161,856 | |
12 OPPENHEIMER CORE BOND FUND/VA
| | | | | | | | |
| | | Principal
Amount | | | Value | |
| |
| Real Estate Investment Trusts (REITs) (Continued) | | | | | |
| |
| American Tower Corp.: (Continued) | | | | | | | | |
| 5.90% Sr. Unsec. Nts., 11/1/21 | | $ | 200,000 | | | $ | 225,452 | |
| |
| Corrections Corp. of America, 4.125% Sr. Unsec. Nts., 4/1/20 | | | 381,000 | | | | 372,428 | |
| |
| Hospitality Properties Trust, 4.65% Sr. Unsec. Nts., 3/15/24 | | | 186,000 | | | | 190,863 | |
| |
| Liberty Property LP, 5.50% Sr. Unsec. Nts., 12/15/16 | | | 228,000 | | | | 244,986 | |
| | | | | | | | |
| | | | | | | 1,195,585 | |
| | | | | | | | |
| |
| Health Care—3.3% | | | | | | | | |
| |
| Biotechnology—0.2% | | | | | | | | |
| |
| Gilead Sciences, Inc., 5.65% Sr. Unsec. Unsub. Nts., 12/1/41 | | | 232,000 | | | | 288,335 | |
| | | | | | | | |
| |
| Health Care Equipment & Supplies—0.8% | | | | | |
| |
| Becton Dickinson & Co., 4.685% Sr. Unsec. Nts., 12/15/44 | | | 202,000 | | | | 218,440 | |
| |
| CareFusion Corp.: | | | | | | | | |
| 1.45% Sr. Unsec. Nts., 5/15/17 | | | 384,000 | | | | 381,642 | |
| 3.875% Sr. Unsec. Nts., 5/15/24 | | | 188,000 | | | | 194,386 | |
| |
| DENTSPLY International, Inc., 2.75% Sr. Unsec. Nts., 8/15/16 | | | 352,000 | | | | 359,921 | |
| | | | | | | | |
| | | | | | | 1,154,389 | |
| | | | | | | | |
| |
| Health Care Providers & Services—1.1% | | | | | |
| |
| Cardinal Health, Inc., 3.50% Sr. Unsec. Nts., 11/15/24 | | | 180,000 | | | | 179,864 | |
| |
| CHS/Community Health Systems, Inc., 5.125% Sr. Sec. Nts., 8/1/21 | | | 345,000 | | | | 359,663 | |
| |
| Express Scripts Holding Co., 3.50% Sr. Unsec. Nts., 6/15/24 | | | 185,000 | | | | 184,719 | |
| |
| Fresenius Medical Care US Finance II, Inc., 5.875% Sr. Unsec. Nts., 1/31/221 | | | 350,000 | | | | 381,500 | |
| |
| LifePoint Hospitals, Inc., 5.50% Sr. Unsec. Nts., 12/1/21 | | | 350,000 | | | | 359,625 | |
| |
| McKesson Corp., 4.883% Sr. Unsec. Nts., 3/15/44 | | | 89,000 | | | | 98,433 | |
| | | | | | | | |
| | | | | | | 1,563,804 | |
| | | | | | | | |
| |
| Life Sciences Tools & Services—0.4% | | | | | | | | |
| |
| Life Technologies Corp., 3.50% Sr. Unsec. Nts., 1/15/16 | | | 23,000 | | | | 23,288 | |
| |
| Thermo Fisher Scientific, Inc.: | | | | | | | | |
| 4.15% Sr. Unsec. Nts., 2/1/24 | | | 121,000 | | | | 127,846 | |
| 5.00% Sr. Unsec. Nts., 6/1/15 | | | 165,000 | | | | 167,914 | |
| 5.30% Sr. Unsec. Nts., 2/1/44 | | | 140,000 | | | | 161,423 | |
| | | | | | | | |
| | | | | | | 480,471 | |
| | | | | | | | |
| |
| Pharmaceuticals—0.8% | | | | | | | | |
| |
| Actavis Funding SCS, 1.30% Sr. Unsec. Nts., 6/15/17 | | | 243,000 | | | | 238,806 | |
| |
| Hospira, Inc., 5.20% Sr. Unsec. Nts., 8/12/20 | | | 373,000 | | | | 400,651 | |
| |
| Mallinckrodt International Finance SA, 3.50% Sr. Unsec. Nts., 4/15/18 | | | 386,000 | | | | 374,902 | |
| |
| Perrigo Finance plc, 3.90% Sr. Unsec. Nts., 12/15/24 | | | 178,000 | | | | 181,475 | |
| | | | | | | | |
| | | | | | | 1,195,834 | |
| | | | | | | | |
| |
| Industrials—4.9% | | | | | | | | |
| |
| Aerospace & Defense—0.9% | | | | | | | | |
| |
| BAE Systems Holdings, Inc., 3.80% Sr. Unsec. Nts., 10/7/241 | | | 164,000 | | | | 168,455 | |
| |
| Huntington Ingalls Industries, Inc., 7.125% Sr. Unsec. Unsub. Nts., 3/15/21 | | | 342,000 | | | | 371,070 | |
| |
| L-3 Communications Corp.: | | | | | | | | |
| 1.50% Sr. Unsec. Nts., 5/28/17 | | | 100,000 | | | | 99,111 | |
| 3.95% Sr. Unsec. Nts., 5/28/24 | | | 223,000 | | | | 225,284 | |
| |
| Northrop Grumman Corp., 4.75% Sr. Unsec. Nts., 6/1/43 | | | 85,000 | | | | 95,285 | |
| | | | | | | | |
| | | Principal
Amount | | | Value | |
| |
| Aerospace & Defense (Continued) | | | | | |
| |
| Textron, Inc.: | | | | | | | | |
| 3.875% Sr. Unsec. Nts., 3/1/25 | | $ | 111,000 | | | $ | 111,422 | |
| 4.30% Sr. Unsec. Nts., 3/1/24 | | | 189,000 | | | | 197,843 | |
| 6.20% Sr. Unsec. Nts., 3/15/15 | | | 28,000 | | | | 28,282 | |
| | | | | | | | |
| | | | | | | 1,296,752 | |
| | | | | | | | |
| |
| Building Products—0.3% | | | | | | | | |
| |
| Owens Corning, 4.20% Sr. Unsec. Nts., 12/15/22 | | | 422,000 | | | | 428,979 | |
| | | | | | | | |
| |
| Commercial Services & Supplies—0.8% | | | | | |
| |
| Clean Harbors, Inc., 5.25% Sr. Unsec. Unsub. Nts., 8/1/20 | | | 395,000 | | | | 398,950 | |
| |
| Pitney Bowes, Inc., 4.625% Sr. Unsec. Nts., 3/15/24 | | | 255,000 | | | | 261,497 | |
| |
| Republic Services, Inc., 5.70% Sr. Unsec. Nts., 5/15/41 | | | 84,000 | | | | 103,956 | |
| |
| RR Donnelley & Sons Co., 7.625% Sr. Unsec. Nts., 6/15/20 | | | 315,000 | | | | 347,288 | |
| | | | | | | | |
| | | | | | | 1,111,691 | |
| | | | | | | | |
| |
| Electrical Equipment—0.2% | | | | | | | | |
| |
| Sensata Technologies BV, 4.875% Sr. Unsec. Nts., 10/15/231 | | | 294,000 | | | | 294,000 | |
| | | | | | | | |
| |
| Industrial Conglomerates—0.4% | | | | | | | | |
| |
| General Electric Capital Corp., 6.25% Jr. Sub. Perpetual Bonds, Series B2,9 | | | 574,000 | | | | 627,813 | |
| | | | | | | | |
| |
| Machinery—0.7% | | | | | | | | |
| |
| Crane Co., 4.45% Sr. Unsec. Nts., 12/15/23 | | | 193,000 | | | | 203,842 | |
| |
| Ingersoll-Rand Global Holding Co. Ltd., 4.25% Sr. Unsec. Nts., 6/15/23 | | | 340,000 | | | | 359,031 | |
| |
| Starwood Hotels & Resorts Worldwide, Inc., 7.375% Sr. Unsec. Nts., 11/15/15 | | | 323,000 | | | | 338,998 | |
| |
| Trinity Industries, Inc., 4.55% Sr. Unsec. Nts., 10/1/24 | | | 153,000 | | | | 148,895 | |
| | | | | | | | |
| | | | | | | 1,050,766 | |
| | | | | | | | |
| |
| Professional Services—0.3% | | | | | | | | |
| |
| Experian Finance plc, 2.375% Sr. Unsec. Nts., 6/15/171 | | | 361,000 | | | | 364,439 | |
| | | | | | | | |
| |
| Road & Rail—0.8% | | | | | | | | |
| |
| ERAC USA Finance LLC, 3.85% Sr. Unsec. Nts., 11/15/241 | | | 177,000 | | | | 179,863 | |
| |
| Kansas City Southern de Mexico SA de CV, 3% Sr. Unsec. Nts., 5/15/23 | | | 315,000 | | | | 306,814 | |
| |
| Penske Truck Leasing Co. LP/PTL Finance Corp.: | | | | | | | | |
| 2.50% Sr. Unsec. Nts., 3/15/161 | | | 368,000 | | | | 373,244 | |
| 4.25% Sr. Unsec. Nts., 1/17/231 | | | 230,000 | | | | 239,141 | |
| | | | | | | | |
| | | | | | | 1,099,062 | |
| | | | | | | | |
| |
| Trading Companies & Distributors—0.5% | | | | | |
| |
| Air Lease Corp., 3.875% Sr. Unsec. Nts., 4/1/21 | | | 383,000 | | | | 386,830 | |
| |
| International Lease Finance Corp., 5.875% Sr. Unsec. Unsub. Nts., 4/1/19 | | | 376,000 | | | | 406,080 | |
| | | | | | | | |
| | | | | | | 792,910 | |
| | | | | | | | |
| |
| Information Technology—2.3% | | | | | | | | |
| |
| Communications Equipment—0.2% | | | | | |
| |
| Motorola Solutions, Inc., 3.50% Sr. Unsec. Nts., 3/1/23 | | | 212,000 | | | | 209,049 | |
| | | | | | | | |
| |
| Electronic Equipment, Instruments, & Components—0.6% | |
| |
| Arrow Electronics, Inc., 5.125% Sr. Unsec. Unsub. Nts., 3/1/21 | | | 407,000 | | | | 440,756 | |
| |
| Avnet, Inc., 4.875% Sr. Unsec. Unsub. Nts., 12/1/22 | | | 405,000 | | | | 430,519 | |
| | | | | | | | |
| | | | | | | 871,275 | |
13 OPPENHEIMER CORE BOND FUND/VA
| | | | |
| | |
| | STATEMENT OF INVESTMENTS Continued | | |
| | | | |
| | | | | | | | |
| | | Principal
Amount | | | Value | |
| |
| IT Services—0.6% | | | | | | | | |
| |
| Fidelity National Information Services, Inc.: | | | | | | | | |
| 1.45% Sr. Unsec. Nts., 6/5/17 | | $ | 297,000 | | | $ | 295,621 | |
| 3.50% Sr. Unsec. Nts., 4/15/23 | | | 207,000 | | | | 206,126 | |
| |
| Xerox Corp., 4.25% Sr. Unsec. Nts., 2/15/15 | | | 391,000 | | | | 392,562 | |
| | | | | | | | |
| | | | | | | 894,309 | |
| |
| Software—0.2% | | | | | | | | |
| |
| Oracle Corp., 3.40% Sr. Unsec. Nts., 7/8/24 | | | 269,000 | | | | 275,264 | |
| | | | | | | | |
| |
| Technology Hardware, Storage & Peripherals—0.7% | | | | | |
| |
| Apple, Inc., 4.45% Sr. Unsec. Nts., 5/6/44 | | | 211,000 | | | | 233,107 | |
| |
| Hewlett-Packard Co., 2.65% Sr. Unsec. Unsub. Nts., 6/1/16 | | | 367,000 | | | | 374,170 | |
| |
| Seagate HDD Cayman: | | | | | | | | |
| 3.75% Sr. Unsec. Nts., 11/15/181 | | | 340,000 | | | | 349,775 | |
| 4.75% Sr. Unsec. Nts., 1/1/251,6 | | | 50,000 | | | | 51,693 | |
| | | | | | | | |
| | | | | | | 1,008,745 | |
| | | | | | | | |
| |
| Materials—3.6% | | | | | | | | |
| |
| Chemicals—1.1% | | | | | | | | |
| |
| Agrium, Inc., 3.50% Sr. Unsec. Nts., 6/1/23 | | | 222,000 | | | | 219,305 | |
| |
| Eastman Chemical Co.: | | | | | | | | |
| 3.00% Sr. Unsec. Nts., 12/15/15 | | | 182,000 | | | | 185,520 | |
| 4.65% Sr. Unsec. Nts., 10/15/44 | | | 92,000 | | | | 94,523 | |
| |
| LYB International Finance BV, 5.25% Sr. Unsec. Nts., 7/15/43 | | | 123,000 | | | | 134,169 | |
| |
| Methanex Corp., 4.25% Sr. Unsec. Nts., 12/1/24 | | | 184,000 | | | | 183,564 | |
| |
| Rockwood Specialties Group, Inc., 4.625% Sr. Unsec. Nts., 10/15/20 | | | 380,000 | | | | 393,775 | |
| |
| RPM International, Inc., 3.45% Sr. Unsec. Unsub. Nts., 11/15/22 | | | 306,000 | | | | 301,866 | |
| | | | | | | | |
| | | | | | | 1,512,722 | |
| | | | | | | | |
| |
| Construction Materials—0.3% | | | | | |
| |
| CRH America, Inc., 4.125% Sr. Unsec. Nts., 1/15/16 | | | 365,000 | | | | 375,765 | |
| | | | | | | | |
| |
| Containers & Packaging—0.9% | | | | | |
| |
| Packaging Corp. of America: | | | | | | | | |
| 3.65% Sr. Unsec. Nts., 9/15/24 | | | 94,000 | | | | 92,720 | |
| 4.50% Sr. Unsec. Nts., 11/1/23 | | | 300,000 | | | | 314,812 | |
| |
| Rock-Tenn Co., 3.50% Sr. Unsec. Unsub. Nts., 3/1/20 | | | 617,000 | | | | 626,857 | |
| |
| Silgan Holdings, Inc., 5% Sr. Unsec. Nts., 4/1/20 | | | 308,000 | | | | 314,160 | |
| | | | | | | | |
| | | | | | | 1,348,549 | |
| | | | | | | | |
| |
| Metals & Mining—1.2% | | | | | |
| |
| Alcoa, Inc., 5.125% Sr. Unsec. Nts., 10/1/24 | | | 355,000 | | | | 376,928 | |
| Carpenter Technology Corp., 4.45% Sr. Unsec. Unsub. Nts., 3/1/23 | | | 145,000 | | | | 147,916 | |
| |
| Freeport-McMoRan, Inc., 3.875% Sr. Unsec. Nts., 3/15/23 | | | 215,000 | | | | 202,920 | |
| |
| Glencore Canada Corp., 6% Sr. Unsec. Unsub. Nts., 10/15/15 | | | 370,000 | | | | 382,560 | |
| |
| Glencore Funding LLC, 4.625% Sr. Unsec. Nts., 4/29/241 | | | 284,000 | | | | 286,528 | |
| |
| Rio Tinto Finance USA plc, 4.125% Sr. Unsec. Nts., 8/21/42 | | | 105,000 | | | | 102,364 | |
| |
| Yamana Gold, Inc., 4.95% Sr. Unsec. Nts., 7/15/24 | | | 193,000 | | | | 188,716 | |
| | | | | | | | |
| | | | | | | 1,687,932 | |
| | | | | | | | |
| |
| Paper & Forest Products—0.1% | | | | | |
| |
| International Paper Co., 4.80% Sr. Unsec. Nts., 6/15/44 | | | 153,000 | | | | 156,859 | |
| |
| Telecommunication Services—3.2% | | | | | |
| |
| Diversified Telecommunication Services—2.9% | | | | | |
| |
| AT&T, Inc., 4.35% Sr. Unsec. Nts., 6/15/45 | | | 252,000 | | | | 238,549 | |
| | | | | | | | |
| | | Principal
Amount | | | Value | |
| |
| Diversified Telecommunication Services (Continued) | |
| |
| British Telecommunications plc, 9.625% Sr. Unsec. Nts., 12/15/30 | | $ | 247,000 | | | $ | 388,749 | |
| |
| CenturyLink, Inc., 6.45% Sr. Unsec. Nts., 6/15/21 | | | 335,000 | | | | 360,963 | |
| |
| Cox Communications, Inc., 3.85% Sr. Unsec. Nts., 2/1/251 | | | 201,000 | | | | 203,306 | |
| |
| Deutsche Telekom International Finance BV, 5.75% Sr. Unsec. Nts., 3/23/16 | | | 325,000 | | | | 343,365 | |
| |
| Frontier Communications Corp., 8.50% Sr. Unsec. Nts., 4/15/20 | | | 344,000 | | | | 385,280 | |
| |
| Telecom Italia Capital SA, 7.721% Sr. Unsec. Unsub. Nts., 6/4/38 | | | 230,000 | | | | 257,600 | |
| |
| Telefonica Emisiones SAU, 7.045% Sr. Unsec. Unsub. Nts., 6/20/36 | | | 142,000 | | | | 187,377 | |
| |
| T-Mobile USA, Inc., 6.25% Sr. Unsec. Nts., 4/1/21 | | | 316,000 | | | | 324,611 | |
| |
| Verizon Communications, Inc.: | | | | | | | | |
| 3.50% Sr. Unsec. Nts., 11/1/24 | | | 163,000 | | | | 160,477 | |
| 4.50% Sr. Unsec. Nts., 9/15/20 | | | 891,000 | | | | 968,141 | |
| 5.012% Sr. Unsec. Nts., 8/21/541 | | | 50,000 | | | | 51,954 | |
| 6.40% Sr. Unsec. Nts., 2/15/38 | | | 195,000 | | | | 241,394 | |
| | | | | | | | |
| | | | | | | 4,111,766 | |
| | | | | | | | |
| |
| Wireless Telecommunication Services—0.3% | | | | | |
| |
| America Movil SAB de CV, 4.375% Sr. Unsec. Unsub. Nts., 7/16/42 | | | 138,000 | | | | 132,894 | |
| |
| Rogers Communications, Inc., 6.75% Sr. Unsec. Nts., 3/15/15 | | | 102,000 | | | | 103,193 | |
| |
| Vodafone Group plc: | | | | | | | | |
| 4.375% Sr. Unsec. Unsub. Nts., 2/19/43 | | | 119,000 | | | | 116,439 | |
| 6.25% Sr. Unsec. Nts., 11/30/32 | | | 125,000 | | | | 153,073 | |
| | | | | | | | |
| | | | | | | 505,599 | |
| | | | | | | | |
| |
| Utilities—2.9% | | | | | | | | |
| |
| Electric Utilities—1.5% | | | | | |
| |
| American Transmission Systems, Inc., 5% Sr. Unsec. Nts., 9/1/441 | | | 99,000 | | | | 106,328 | |
| |
| EDP Finance BV, 6% Sr. Unsec. Nts., 2/2/181 | | | 340,000 | | | | 368,818 | |
| |
| ITC Holdings Corp.: | | | | | | | | |
| 3.65% Sr. Unsec. Nts., 6/15/24 | | | 329,000 | | | | 334,289 | |
| 5.30% Sr. Unsec. Nts., 7/1/43 | | | 78,000 | | | | 91,303 | |
| |
| Jersey Central Power & Light Co., 4.70% Sr. Unsec. Nts., 4/1/241 | | | 198,000 | | | | 211,779 | |
| |
| Pennsylvania Electric Co., 5.20% Sr. Unsec. Nts., 4/1/20 | | | 73,000 | | | | 80,575 | |
| |
| PPL Capital Funding, Inc.: | | | | | | | | |
| 3.50% Sr. Unsec. Unsub. Nts., 12/1/22 | | | 204,000 | | | | 206,972 | |
| 4.20% Sr. Sec. Nts., 6/15/226 | | | 38,000 | | | | 40,320 | |
| |
| PPL WEM Holdings Ltd., 5.375% Sr. Unsec. Unsub. Nts., 5/1/211 | | | 429,000 | | | | 482,797 | |
| |
| Trans-Allegheny Interstate Line Co., 3.85% Sr. Unsec. Nts., 6/1/251 | | | 226,000 | | | | 230,296 | |
| | | | | | | | |
| | | | | | | 2,153,477 | |
| | | | | | | | |
| |
| Independent Power and Renewable Electricity Producers—0.2% | | | | | |
| |
| Dayton Power & Light Co. (The), 1.875% Sec. Nts., 9/15/16 | | | 272,000 | | | | 275,192 | |
| |
| NRG Yield Operating LLC, 5.375% Sr. Unsec. Nts., 8/15/241 | | | 57,000 | | | | 58,140 | |
| | | | | | | | |
| | | | | | | 333,332 | |
| | | | | | | | |
| |
| Multi-Utilities—1.2% | | | | | | | | |
| |
| CenterPoint Energy, Inc., 5.95% Sr. Unsec. Nts., 2/1/17 | | | 327,000 | | | | 356,742 | |
| |
| CMS Energy Corp.: | | | | | | | | |
| 3.875% Sr. Unsec. Nts., 3/1/24 | | | 202,000 | | | | 210,150 | |
| 5.05% Sr. Unsec. Unsub. Nts., 3/15/22 | | | 286,000 | | | | 321,127 | |
| |
| Consolidated Edison Co. of New York, Inc., 4.625% Sr. Unsec. Nts., 12/1/54 | | | 84,000 | | | | 92,436 | |
| |
| Dominion Gas Holdings LLC, 4.60% Sr. Unsec. Nts., 12/15/44 | | | 141,000 | | | | 148,311 | |
14 OPPENHEIMER CORE BOND FUND/VA
| | | | | | | | |
| | | Principal
Amount | | | Value | |
| |
| Multi-Utilities (Continued) | | | | | | | | |
| |
| Dominion Resources, Inc., 2.50% Sr. Unsec. Nts., 12/1/19 | | $ | 259,000 | | | $ | 260,055 | |
| |
| NiSource Finance Corp., 4.80% Sr. Unsec. Nts., 2/15/44 | | | 90,000 | | | | 96,272 | |
| |
| TECO Finance, Inc., 6.75% Sr. Unsec. Nts., 5/1/15 | | | 216,000 | | | | 220,084 | |
| | | | | | | | |
| | | | | | | 1,705,177 | |
| | | | | | | | |
Total Corporate Bonds and Notes
(Cost $70,889,761) | | | | | | | 73,323,284 | |
| | | | | | | | |
| | | Shares | | | | |
| |
| Investment Company—4.5% | | | | | | | | |
| |
| Oppenheimer Institutional Money Market Fund, Cl. E, 0.10%10,11 (Cost $6,496,088) | | | 6,496,088 | | | | 6,496,088 | |
| | | | | | | | |
| |
Total Investments, at Value
(Cost $191,379,651) | | | 132.5% | | | | 190,115,547 | |
| |
| Net Other Assets (Liabilities) | | | (32.5) | | | | (46,683,804) | |
| | | | |
| Net Assets | | | 100.0% | | | $ | 143,431,743 | |
| | | | |
Footnotes to Statement of Investments
1. Represents securities sold under Rule 144A, which are exempt from registration under the Securities Act of 1933, as amended. These securities have been determined to be liquid under guidelines established by the Board of Trustees. These securities amount to $34,415,854 or 23.99% of the Fund’s net assets as of December 31, 2014.
2. Represents the current interest rate for a variable or increasing rate security.
3. Interest-Only Strips represent the right to receive the monthly interest payments on an underlying pool of mortgage loans. These securities typically decline in price as interest rates decline. Most other fixed income securities increase in price when interest rates decline. The principal amount of the underlying pool represents the notional amount on which current interest is calculated. The price of these securities is typically more sensitive to changes in prepayment rates than traditional mortgage-backed securities (for example, GNMA pass-throughs). Interest rates disclosed represent current yields based upon the current cost basis and estimated timing and amount of future cash flows. These securities amount to $2,523,089 or 1.76% of the Fund’s net assets as of December 31, 2014.
4. Interest rate is less than 0.0005%.
5. Principal-Only Strips represent the right to receive the monthly principal payments on an underlying pool of mortgage loans. The value of these securities generally increases as interest rates decline and prepayment rates rise. The price of these securities is typically more volatile than that of coupon-bearing bonds of the same maturity. Interest rates disclosed represent current yields based upon the current cost basis and estimated timing of future cash flows. These securities amount to $159,921 or 0.11% of the Fund’s net assets as of December 31, 2014.
6. All or a portion of the security position is when-issued or delayed delivery to be delivered and settled after December 31, 2014. See Note 4 of the accompanying Notes.
7. Restricted security. The aggregate value of restricted securities as of December 31, 2014 was $3,029,104, which represents 2.11% of the Fund’s net assets. See Note 4 of the accompanying Notes. Information concerning restricted securities is as follows:
| | | | | | | | | | | | | | | | |
| Security | | Acquisition
Dates | | | Cost | | | Value | | | Unrealized Appreciation/
(Depreciation) | |
| |
Credit Agricole SA, 8.375% Jr. Sub. Perpetual Bonds | | | 10/27/14-11/13/14 | | | $ | 369,655 | | | $ | 370,400 | | | $ | 745 | |
NC Finance Trust, Series 1999-I, Cl. D, 8.75%, 1/25/29 | | | 8/10/10 | | | | 3,281,116 | | | | 512,243 | | | | (2,768,873) | |
Rabobank Capital Funding Trust III, 5.254% Jr. Sub. Perpetual Bonds | | | 5/1/13-5/8/13 | | | | 676,311 | | | | 695,681 | | | | 19,370 | |
Swiss Re Capital I LP, 6.854% Jr. Sub. Perpetual Bonds | | | 3/10/10-2/16/12 | | | | 607,808 | | | | 696,150 | | | | 88,342 | |
TRW Automotive, Inc., 7.25% Sr. Unsec. Nts., 3/15/17 | | | 3/31/14-4/8/14 | | | | 365,151 | | | | 364,080 | | | | (1,071) | |
ZFS Finance USA Trust V, 6.50% Jr. Sub. Nts., 5/9/37 | | | 11/20/13 | | | | 381,200 | | | | 390,550 | | | | 9,350 | |
| | | | | | | | |
| | | | | | $ | 5,681,241 | | | $ | 3,029,104 | | | $ | (2,652,137) | |
| | | | | | | | |
8. This security is not accruing income because the issuer has missed an interest payment on it and/or is not anticipated to make future interest and or principal payments. The rate shown is the original contractual interest rate. See Note 4 of the accompanying Notes.
9. This bond has no contractual maturity date, is not redeemable and contractually pays an indefinite stream of interest. Rate reported represents the current interest rate for this variable rate security.
10. Is or was an affiliate, as defined in the Investment Company Act of 1940, as amended, at or during the period ended December 31, 2014, by virtue of the Fund owning at least 5% of the voting securities of the issuer or as a result of the Fund and the issuer having the same investment adviser. Transactions during the period in which the issuer was an affiliate are as follows:
| | | | | | | | | | | | | | | | |
| | | Shares
December 31, 2013 | | | Gross
Additions | | | Gross
Reductions | | | Shares
December 31, 2014 | |
| |
Oppenheimer Institutional Money Market Fund, Cl. E | | | 22,407,494 | | | | 55,906,841 | | | | 71,818,247 | | | | 6,496,088 | |
| | | | | | | | |
| | | Value | | | Income | |
| |
Oppenheimer Institutional Money Market Fund, Cl. E | | $ | 6,496,088 | | | $ | 6,445 | |
11. Rate shown is the 7-day yield as of December 31, 2014.
| | | | | | | | | | | | | | | | | | | | | | | | |
| |
| Futures Contracts as of December 31, 2014 | | | | | | | | | | | | | | | | | | |
| Description | | Exchange | | | Buy/Sell | | | Expiration Date | | | Number of
Contracts | | | Value | | | Unrealized Appreciation
(Depreciation) | |
| |
United States Treasury Long Bonds | | | CBT | | | | Sell | | | | 3/20/15 | | | | 73 | | | $ | 10,553,063 | | | $ | (112,046) | |
United States Treasury Nts., 10 yr. | | | CBT | | | | Sell | | | | 3/20/15 | | | | 6 | | | | 760,781 | | | | 1,486 | |
United States Treasury Nts., 2 yr. | | | CBT | | | | Sell | | | | 3/31/15 | | | | 133 | | | | 29,072,969 | | | | 50,150 | |
United States Treasury Nts., 5 yr. | | | CBT | | | | Buy | | | | 3/31/15 | | | | 3 | | | | 356,789 | | | | (857) | |
United States Treasury Ultra Bonds | | | CBT | | | | Buy | | | | 3/20/15 | | | | 67 | | | | 11,067,563 | | | | 420,142 | |
| | | | | | | | | | | | | | | | | | | | | | | | |
| | | | | | | | | | | | | | | | | | | | | | $ | 358,875 | |
| | | | | | | | | | | | | | | | | | | | | | | | |
See accompanying Notes to Financial Statements.
15 OPPENHEIMER CORE BOND FUND/VA
| | |
| |
| STATEMENT OF ASSETS AND LIABILITIES December 31, 2014 | | |
| | | | |
Assets | | | | |
Investments, at value—see accompanying statement of investments: | | | | |
Unaffiliated companies (cost $184,883,563) | | $ | 183,619,459 | |
Affiliated companies (cost $6,496,088) | | | 6,496,088 | |
| | | | |
| | | | 190,115,547 | |
Cash | | | 492,719 | |
Cash used for collateral on futures | | | 200,000 | |
Receivables and other assets: | | | | |
Investments sold on a when-issued or delayed delivery basis | | | 3,804,418 | |
Interest, dividends and principal paydowns | | | 953,109 | |
Shares of beneficial interest sold | | | 159,690 | |
Variation margin receivable | | | 23,500 | |
Other | | | 28,603 | |
| | | | |
Total assets | | | 195,777,586 | |
Liabilities | | | | |
Payables and other liabilities: | | | | |
Investments purchased on a when-issued or delayed delivery basis | | | 52,190,099 | |
Shares of beneficial interest redeemed | | | 36,486 | |
Variation margin payable | | | 28,955 | |
Trustees’ compensation | | | 27,828 | |
Shareholder communications | | | 11,347 | |
Distribution and service plan fees | | | 11,212 | |
Other | | | 39,916 | |
| | | | |
Total liabilities | | | 52,345,843 | |
Net Assets | | $ | 143,431,743 | |
| | | | |
| | | | |
Composition of Net Assets | | | | |
Par value of shares of beneficial interest | | $ | 18,112 | |
Additional paid-in capital | | | 220,331,954 | |
Accumulated net investment income | | | 4,847,120 | |
Accumulated net realized loss on investments | | | (80,860,214) | |
Net unrealized depreciation on investments | | | (905,229) | |
| | | | |
Net Assets | | $ | 143,431,743 | |
| | | | |
| | | | |
Net Asset Value Per Share | | | | |
Non-Service Shares: | | | | |
| Net asset value, redemption price per share and offering price per share (based on net assets of $90,756,413 and 11,407,863 shares of beneficial interest outstanding) | | | $7.96 | |
| Service Shares: | | | | |
| Net asset value, redemption price per share and offering price per share (based on net assets of $52,675,330 and 6,703,681 shares of beneficial interest outstanding) | | | $7.86 | |
See accompanying Notes to Financial Statements.
16 OPPENHEIMER CORE BOND FUND/VA
STATEMENT OF OPERATIONS For the Year Ended December 31, 2014
| | | | |
Investment Income | | | | |
Interest - Unaffiliated companies | | $ | 5,638,449 | |
Fee income on when-issued securities | | | 1,032,930 | |
Dividends - affiliated companies | | | 6,445 | |
| | | | |
Total investment income | | | 6,677,824 | |
Expenses | | | | |
Management fees | | | 894,939 | |
Distribution and service plan fees - Service shares | | | 137,684 | |
Transfer and shareholder servicing agent fees: | | | | |
Non-Service shares | | | 94,084 | |
Service shares | | | 55,072 | |
Shareholder communications: | | | | |
Non-Service shares | | | 21,362 | |
Service shares | | | 12,509 | |
Custodian fees and expenses | | | 36,411 | |
Trustees’ compensation | | | 17,129 | |
Other | | | 57,986 | |
| | | | |
Total expenses | | | 1,327,176 | |
Less reduction to custodian expenses | | | (12) | |
Less waivers and reimbursements of expenses | | | (70,810) | |
| | | | |
Net expenses | | | 1,256,354 | |
Net Investment Income | | | 5,421,470 | |
Realized and Unrealized Gain | | | | |
Net realized gain on: | | | | |
Investments from unaffiliated companies | | | 2,222,235 | |
Closing and expiration of futures contracts | | | 936,466 | |
| | | | |
Net realized gain | | | 3,158,701 | |
Net change in unrealized appreciation/depreciation on: | | | | |
Investments | | | 1,376,017 | |
Futures contracts | | | 351,257 | |
| | | | |
Net change in unrealized appreciation/depreciation | | | 1,727,274 | |
Net Increase in Net Assets Resulting from Operations | | $ | 10,307,445 | |
| | | | |
See accompanying Notes to Financial Statements.
17 OPPENHEIMER CORE BOND FUND/VA
STATEMENTS OF CHANGES IN NET ASSETS
| | | | | | | | |
| | | Year Ended
December 31, 2014 | | | Year Ended
December 31, 2013 | |
Operations | | | | | | | | |
Net investment income | | $ | 5,421,470 | | | $ | 7,267,680 | |
Net realized gain | | | 3,158,701 | | | | 125,040 | |
Net change in unrealized appreciation/depreciation | | | 1,727,274 | | | | (7,829,173 | ) |
| | | | |
Net increase (decrease) in net assets resulting from operations | | | 10,307,445 | | | | (436,453 | ) |
Dividends and/or Distributions to Shareholders | | | | | | | | |
Dividends from net investment income: | | | | | | | | |
Non-Service shares | | | (4,942,642 | ) | | | (5,333,237 | ) |
Service shares | | | (2,786,126 | ) | | | (3,004,980 | ) |
| | | | |
| | | (7,728,768 | ) | | | (8,338,217 | ) |
Beneficial Interest Transactions | | | | | | | | |
Net decrease in net assets resulting from beneficial interest transactions: | | | | | | | | |
Non-Service shares | | | (7,710,673 | ) | | | (14,737,860 | ) |
Service shares | | | (3,167,239 | ) | | | (6,439,915 | ) |
| | | | |
| | | (10,877,912 | ) | | | (21,177,775 | ) |
Net Assets | | | | | | | | |
Total decrease | | | (8,299,235 | ) | | | (29,952,445 | ) |
Beginning of period | | | 151,730,978 | | | | 181,683,423 | |
| | | | |
End of period (including accumulated net investment income of $4,847,120 and $7,270,382, respectively) | | $ | 143,431,743 | | | $ | 151,730,978 | |
| | | | |
See accompanying Notes to Financial Statements.
18 OPPENHEIMER CORE BOND FUND/VA
FINANCIAL HIGHLIGHTS
| | | | | | | | | | | | | | | | | | | | |
| Non-Service Shares | | Year Ended
December
31, 2014 | | | Year Ended
December
31, 2013 | | | Year Ended
December
31, 2012 | | | Year Ended
December
30, 20111 | | | Year Ended
December
31, 2010 | |
Per Share Operating Data | | | | | | | | | | | | | | | | | | | | |
Net asset value, beginning of period | | $ | 7 .83 | | | $ | 8 .26 | | | $ | 7 .88 | | | $ | 7 .73 | | | $ | 7 .07 | |
Income (loss) from investment operations: | | | | | | | | | | | | | | | | | | | | |
Net investment income2 | | | 0 .30 | | | | 0 .36 | | | | 0 .35 | | | | 0 .36 | | | | 0 .40 | |
Net realized and unrealized gain (loss) | | | 0 .26 | | | | (0 .37) | | | | 0 .44 | | | | 0 .25 | | | | 0 .40 | |
| | | | |
Total from investment operations | | | 0 .56 | | | | (0 .01) | | | | 0 .79 | | | | 0 .61 | | | | 0 .80 | |
Dividends and/or distributions to shareholders: | | | | | | | | | | | | | | | | | | | | |
Dividends from net investment income | | | (0 .43) | | | | (0 .42) | | | | (0 .41) | | | | (0 .46) | | | | (0 .14) | |
Net asset value, end of period | | $ | 7 .96 | | | $ | 7 .83 | | | $ | 8 .26 | | | $ | 7 .88 | | | $ | 7 .73 | |
| | | | |
| | | | |
Total Return, at Net Asset Value3 | | | 7 .27% | | | | (0 .10)% | | | | 10 .29% | | | | 8 .27% | | | | 11 .42% | |
| | | | | | | | | | | | | | | | | | | | |
Ratios/Supplemental Data | | | | | | | | | | | | | | | | | | | | |
Net assets, end of period (in thousands) | | $ | 90,757 | | | $ | 96,785 | | | $ | 116,989 | | | $ | 122,271 | | | $ | 132,557 | |
Average net assets (in thousands) | | $ | 94,336 | | | $ | 105,012 | | | $ | 119,547 | | | $ | 127,341 | | | $ | 136,333 | |
Ratios to average net assets:4 | | | | | | | | | | | | | | | | | | | | |
Net investment income | | | 3 .72% | | | | 4 .51% | | | | 4 .34% | | | | 4 .71% | | | | 5 .32% | |
Total expenses5 | | | 0 .80% | | | | 0 .80% | | | | 0 .77% | | | | 0 .77% | | | | 0 .79% | |
| Expenses after payments, waivers and/or reimbursements and reduction to custodian expenses | | | 0 .75% | | | | 0 .75% | | | | 0 .75% | | | | 0 .75% | | | | 0 .70% | |
Portfolio turnover rate6 | | | 127% | | | | 115% | | | | 140% | | | | 99% | | | | 98% | |
1. December 30, 2011 represents the last business day of the Fund’s reporting period.
2. Per share amounts calculated based on the average shares outstanding during the period.
3. Assumes an initial investment on the business day before the first day of the fiscal period, with all dividends and distributions reinvested in additional shares on the reinvestment date, and redemption at the net asset value calculated on the last business day of the fiscal period. Total returns are not annualized for periods less than one full year. Total return information does not reflect expenses that apply at the separate account level or to related insurance products. Inclusion of these charges would reduce the total return figures for all periods shown. Returns do not reflect the deduction of taxes that a shareholder would pay on fund distributions or the redemption of fund shares.
4. Annualized for periods less than one full year.
5. Total expenses including indirect expenses from affiliated fund fees and expenses were as follows:
| | | | | | | | |
| | Year Ended December 31, 2014 | | | 0 .81 | % | | |
| | Year Ended December 31, 2013 | | | 0 .81 | % | | |
| | Year Ended December 31, 2012 | | | 0 .79 | % | | |
| | Year Ended December 30, 2011 | | | 0 .79 | % | | |
| | Year Ended December 31, 2010 | | | 0 .80 | % | | |
6. The portfolio turnover rate excludes purchase and sale transactions of To Be Announced (TBA) mortgage-related
securities as follows:
| | | | | | | | |
| | | Purchase Transactions | | | Sale Transactions | |
Year Ended December 31, 2014 | | | $560,409,975 | | | | $543,669,748 | |
Year Ended December 31, 2013 | | | $776,927,298 | | | | $806,883,121 | |
Year Ended December 31, 2012 | | | $930,202,858 | | | | $942,406,652 | |
Year Ended December 31, 2011 | | | $911,850,847 | | | | $909,531,196 | |
Year Ended December 31, 2010 | | | $775,240,942 | | | | $766,486,357 | |
Year Ended December 31, 2009 | | | $977,840,247 | | | | $1,009,549,121 | |
See accompanying Notes to Financial Statements.
19 OPPENHEIMER CORE BOND FUND/VA
| | |
| |
| FINANCIAL HIGHLIGHTS Continued | | |
| | | | | | | | | | | | | | | | | | | | |
| Service Shares | | Year Ended
December
31, 2014 | | | Year Ended
December
31, 2013 | | | Year Ended
December
31, 2012 | | | Year Ended
December
30, 20111 | | | Year Ended
December
31, 2010 | |
Per Share Operating Data | | | | | | | | | | | | | | | | | | | | |
Net asset value, beginning of period | | $ | 7 .74 | | | $ | 8 .17 | | | $ | 7 .79 | | | $ | 7 .65 | | | $ | 6 .99 | |
Income (loss) from investment operations: | | | | | | | | | | | | | | | | | | | | |
Net investment income2 | | | 0 .27 | | | | 0 .34 | | | | 0 .33 | | | | 0 .34 | | | | 0 .37 | |
Net realized and unrealized gain (loss) | | | 0 .26 | | | | (0 .37) | | | | 0 .44 | | | | 0 .24 | | | | 0 .41 | |
| | | | |
Total from investment operations | | | 0 .53 | | | | (0 .03) | | | | 0 .77 | | | | 0 .58 | | | | 0 .78 | |
Dividends and/or distributions to shareholders: | | | | | | | | | | | | | | | | | | | | |
Dividends from net investment income | | | (0 .41) | | | | (0 .40) | | | | (0 .39) | | | | (0 .44) | | | | (0 .12) | |
Net asset value, end of period | | $ | 7 .86 | | | $ | 7 .74 | | | $ | 8 .17 | | | $ | 7 .79 | | | $ | 7 .65 | |
| | | | |
| | | | |
Total Return, at Net Asset Value3 | | | 6 .93% | | | | (0.38)% | | | | 10.17% | | | | 7 .93% | | | | 11.28% | |
Ratios/Supplemental Data | | | | | | | | | | | | | | | | | | | | |
Net assets, end of period (in thousands) | | $ | 52,675 | | | $ | 54,946 | | | $ | 64,694 | | | $ | 62,294 | | | $ | 56,562 | |
Average net assets (in thousands) | | $ | 55,215 | | | $ | 59,523 | | | $ | 67,116 | | | $ | 58,629 | | | $ | 57,313 | |
Ratios to average net assets:4 | | | | | | | | | | | | | | | | | | | | |
Net investment income | | | 3 .47% | | | | 4 .26% | | | | 4 .07% | | | | 4 .42% | | | | 5 .06% | |
Total expenses5 | | | 1 .04% | | | | 1 .05% | | | | 1 .02% | | | | 1 .02% | | | | 1 .04% | |
| Expenses after payments, waivers and/or reimbursements and reduction to custodian expenses | | | 1 .00% | | | | 1 .00% | | | | 1 .00% | | | | 1 .00% | | | | 0 .95% | |
Portfolio turnover rate6 | | | 127% | | | | 115% | | | | 140% | | | | 99% | | | | 98% | |
1. December 30, 2011 represents the last business day of the Fund’s reporting period.
2. Per share amounts calculated based on the average shares outstanding during the period.
3. Assumes an initial investment on the business day before the first day of the fiscal period, with all dividends and distributions reinvested in additional shares on the reinvestment date, and redemption at the net asset value calculated on the last business day of the fiscal period. Total returns are not annualized for periods less than one full year. Total return information does not reflect expenses that apply at the separate account level or to related insurance products. Inclusion of these charges would reduce the total return figures for all periods shown. Returns do not reflect the deduction of taxes that a shareholder would pay on fund distributions or the redemption of fund shares.
4. Annualized for periods less than one full year.
5. Total expenses including indirect expenses from affiliated fund fees and expenses were as follows:
| | | | | | | | |
| | Year Ended December 31, 2014 | | | 1 .05 | % | | |
| | Year Ended December 31, 2013 | | | 1 .06 | % | | |
| | Year Ended December 31, 2012 | | | 1 .04 | % | | |
| | Year Ended December 30, 2011 | | | 1 .04 | % | | |
| | Year Ended December 31, 2010 | | | 1 .05 | % | | |
6. The portfolio turnover rate excludes purchase and sale transactions of To Be Announced (TBA) mortgage-related
securities as follows:
| | | | | | | | |
| | | Purchase Transactions | | | Sale Transactions | |
Year Ended December 31, 2014 | | | $560,409,975 | | | | $543,669,748 | |
Year Ended December 31, 2013 | | | $776,927,298 | | | | $806,883,121 | |
Year Ended December 31, 2012 | | | $930,202,858 | | | | $942,406,652 | |
Year Ended December 31, 2011 | | | $911,850,847 | | | | $909,531,196 | |
Year Ended December 31, 2010 | | | $775,240,942 | | | | $766,486,357 | |
Year Ended December 31, 2009 | | | $977,840,247 | | | | $1,009,549,121 | |
See accompanying Notes to Financial Statements.
20 OPPENHEIMER CORE BOND FUND/VA
NOTES TO FINANCIAL STATEMENTS December 31, 2014
1. Organization
Oppenheimer Core Bond Fund/VA (the “Fund”), a separate series of Oppenheimer Variable Account Funds, is a diversified open-end management investment company registered under the Investment Company Act of 1940 (“1940 Act”), as amended. The Fund’s main investment objective is to seek total return. The Fund’s investment adviser is OFI Global Asset Management, Inc. (“OFI Global” or the “Manager”), a wholly-owned subsidiary of OppenheimerFunds, Inc. (“OFI” or the “Sub-Adviser”). The Manager has entered into a sub-advisory agreement with OFI. Shares of the Fund are sold only to separate accounts of life insurance companies.
The Fund offers two classes of shares. Both classes are sold at their offering price, which is the net asset value per share, to separate investment accounts of participating insurance companies as an underlying investment for variable life insurance policies, variable annuity contracts or other investment products. The class of shares designated as Service shares is subject to a distribution and service plan. Both classes of shares have identical rights and voting privileges with respect to the Fund in general and exclusive voting rights on matters that affect that class alone. Earnings, net assets and net asset value per share may differ due to each class having its own expenses, such as transfer and shareholder servicing agent fees and shareholder communications, directly attributable to that class.
The following is a summary of significant accounting policies consistently followed by the Fund.
2. Significant Accounting Policies
Security Valuation. All investments in securities are recorded at their estimated fair value, as described in Note 3.
Allocation of Income, Expenses, Gains and Losses. Income, expenses (other than those attributable to a specific class), gains and losses are allocated on a daily basis to each class of shares based upon the relative proportion of net assets represented by such class. Operating expenses directly attributable to a specific class are charged against the operations of that class.
Dividends and Distributions to Shareholders. Dividends and distributions to shareholders, which are determined in accordance with income tax regulations and may differ from U.S. generally accepted accounting principles, are recorded on the ex-dividend date. Income and capital gain distributions, if any, are declared and paid annually or at other times as deemed necessary by the Manager.
Investment Income. Dividend income is recorded on the ex-dividend date or upon ex-dividend notification in the case of certain foreign dividends where the ex-dividend date may have passed. Non-cash dividends included in dividend income, if any, are recorded at the fair market value of the securities received. Interest income is recognized on an accrual basis. Discount and premium, which are included in interest income on the Statement of Operations, are amortized or accreted daily.
Custodian Fees. “Custodian fees and expenses” in the Statement of Operations may include interest expense incurred by the Fund on any cash overdrafts of its custodian account during the period. Such cash overdrafts may result from the effects of failed trades in portfolio securities and from cash outflows resulting from unanticipated shareholder redemption activity. The Fund pays interest to its custodian on such cash overdrafts, to the extent they are not offset by positive cash balances maintained by the Fund, at a rate equal to the Federal Funds Rate plus 0.50%. The “Reduction to custodian expenses” line item, if applicable, represents earnings on cash balances maintained by the Fund during the period. Such interest expense and other custodian fees may be paid with these earnings.
Security Transactions. Security transactions are recorded on the trade date. Realized gains and losses on securities sold are determined on the basis of identified cost.
Indemnifications. The Fund’s organizational documents provide current and former Trustees and officers with a limited indemnification against liabilities arising in connection with the performance of their duties to the Fund. In the normal course of business, the Fund may also enter into contracts that provide general indemnifications. The Fund’s maximum exposure under these arrangements is unknown as this would be dependent on future claims that may be made against the Fund. The risk of material loss from such claims is considered remote.
Federal Taxes. The Fund intends to comply with provisions of the Internal Revenue Code applicable to regulated investment companies and to distribute substantially all of its investment company taxable income, including any net realized gain on investments not offset by capital loss carryforwards, if any, to shareholders. Therefore, no federal income or excise tax provision is required. The Fund files income tax returns in U.S. federal and applicable state jurisdictions. The statute of limitations on the Fund’s tax return filings generally remain open for the three preceding fiscal reporting period ends.
The tax components of capital shown in the following table represent distribution requirements the Fund must satisfy under the income tax regulations, losses the Fund may be able to offset against income and gains realized in future years and unrealized appreciation or depreciation of securities and other investments for federal income tax purposes.
21 OPPENHEIMER CORE BOND FUND/VA
| | |
| NOTES TO FINANCIAL STATEMENTS Continued | | |
| | |
2. Significant Accounting Policies (Continued)
| | | | | | | | | | | | |
Undistributed Net Investment Income | | Undistributed
Long-Term
Gain | | | Accumulated
Loss
Carryforward1,2,3,4,5 | | | Net Unrealized
Depreciation
Based on cost of
Securities and
Other Investments
for Federal Income
Tax Purposes | |
$5,718,172 | | | $— | | | | $80,452,055 | | | | $1,326,529 | |
1. As of December 31, 2014, the Fund had $80,341,294 of net capital loss carryforward available to offset future realized capital gains, if any, and thereby reduce future taxable gain distributions. Details of the capital loss carryforwards are included in the table below. Capital loss carryovers with no expiration, if any, must be utilized prior to those with expiration dates.
| | | | |
| Expiring | |
2016 | | $ | 5,271,444 | |
2017 | | | 75,069,850 | |
| | | | |
Total | | $ | 80,341,294 | |
| | | | |
2. As of December 31, 2014, the Fund had $104,469 of post-October losses available to offset future realized capital gains, if any.
3. The Fund had $6,292 of straddle losses which were deferred.
4 During the fiscal year ended December 31, 2014, the Fund utilized $3,087,162 capital loss carryforward to offset capital gains realized in that fiscal year.
5. During the fiscal year ended December 31, 2013, the Fund utilized $329,285 of capital loss carryforward to offset capital gains realized in that fiscal year.
Net investment income (loss) and net realized gain (loss) may differ for financial statement and tax purposes. The character of dividends and distributions made during the fiscal year from net investment income or net realized gains may differ from their ultimate characterization for federal income tax purposes. Also, due to timing of dividends and distributions, the fiscal year in which amounts are distributed may differ from the fiscal year in which the income or net realized gain was recorded by the Fund.
Accordingly, the following amounts have been reclassified for December 31, 2014. Net assets of the Fund were unaffected by the reclassifications.
| | | | |
Reduction to Accumulated Net Investment Income | | Reduction to Accumulated Net
Realized Loss on Investments | |
| |
$115,964 | | | $115,964 | |
The tax character of distributions paid during the years ended December 31, 2014 and December 31, 2013 was as follows:
| | | | | | | | |
| | | Year Ended
December 31, 2014 | | | Year Ended
December 31, 2013 | |
| |
Distributions paid from: | | | | | | | | |
Ordinary income | | $ | 7,728,768 | | | $ | 8,338,217 | |
The aggregate cost of securities and other investments and the composition of unrealized appreciation and depreciation of securities and other investments for federal income tax purposes as of December 31, 2014 are noted in the following table. The primary difference between book and tax appreciation or depreciation of securities and other investments, if applicable, is attributable to the tax deferral of losses or tax realization of financial statement unrealized gain or loss.
| | | | |
Federal tax cost of securities | | $ | 191,442,076 | |
Federal tax cost of other investments | | | 358,875 | |
| | | | |
Total federal tax cost | | $ | 191,800,951 | |
| | | | |
Gross unrealized appreciation | | $ | 4,589,406 | |
Gross unrealized depreciation | | | (5,915,935 | ) |
| | | | |
Net unrealized depreciation | | $ | (1,326,529 | ) |
| | | | |
Use of Estimates. The preparation of financial statements in conformity with accounting principles generally accepted in the United States of America requires management to make estimates and assumptions that affect the reported amounts of assets and liabilities and disclosure of contingent assets and liabilities at the date of the financial statements and the reported amounts of increases and decreases in net assets from operations during the reporting period. Actual results could differ from those estimates.
3. Securities Valuation
The Fund calculates the net asset value of its shares as of the close of the New York Stock Exchange (the “Exchange”), normally 4:00 P.M. Eastern time, on each day the Exchange is open for trading.
The Fund’s Board has adopted procedures for the valuation of the Fund’s securities and has delegated the day-to-day responsibility for valuation determinations under those procedures to the Manager. The Manager has established a Valuation Committee which is responsible for determining a “fair valuation” for any security for which market quotations are not “readily available.” The Valuation Committee’s fair valuation determinations are subject to review, approval and ratification by the Fund’s Board at its next regularly scheduled meeting covering the calendar quarter in which the fair valuation was determined.
22 OPPENHEIMER CORE BOND FUND/VA
3. Securities Valuation (Continued)
Valuation Methods and Inputs
Securities are valued using unadjusted quoted market prices, when available, as supplied primarily by third party pricing services or dealers.
The following methodologies are used to determine the market value or the fair value of the types of securities described below:
Securities traded on a registered U.S. securities exchange (including exchange-traded derivatives other than futures and futures options) are valued based on the last sale price of the security reported on the principal exchange on which it is traded, prior to the time when the Fund’s assets are valued. In the absence of a sale, the security is valued at the last sale price on the prior trading day, if it is within the spread of the current day’s closing “bid” and “asked” prices, and if not, at the current day’s closing bid price. A security of a foreign issuer traded on a foreign exchange, but not listed on a registered U.S. securities exchange, is valued based on the last sale price on the principal exchange on which the security is traded, as identified by the third party pricing service used by the Manager, prior to the time when the Fund’s assets are valued. If the last sale price is unavailable, the security is valued at the most recent official closing price on the principal exchange on which it is traded. If the last sales price or official closing price for a foreign security is not available, the security is valued at the mean between the bid and asked price per the exchange or, if not available from the exchange, obtained from two dealers. If bid and asked prices are not available from either the exchange or two dealers, the security is valued by using one of the following methodologies (listed in order of priority): (1) using a bid from the exchange, (2) the mean between the bid and asked price as provided by a single dealer, or (3) a bid from a single dealer.
Shares of a registered investment company that are not traded on an exchange are valued at that investment company’s net asset value per share.
Corporate and government debt securities (of U.S. or foreign issuers) and municipal debt securities, event-linked bonds, loans, mortgage-backed securities, collateralized mortgage obligations, and asset-backed securities are valued at the mean between the “bid” and “asked” prices utilizing evaluated prices obtained from third party pricing services or broker-dealers who may use matrix pricing methods to determine the evaluated prices.
Short-term money market type debt securities with a remaining maturity of sixty days or less are valued at cost adjusted by the amortization of discount or premium to maturity (amortized cost), which approximates market value. Short-term debt securities with a remaining maturity in excess of sixty days are valued at the mean between the “bid” and “asked” prices utilizing evaluated prices obtained from third party pricing services or broker-dealers.
Structured securities, swaps, swaptions, and other over-the-counter derivatives are valued utilizing evaluated prices obtained from third party pricing services or broker-dealers.
Futures contracts and futures options traded on a commodities or futures exchange will be valued at the final settlement price or official closing price on the principal exchange as reported by such principal exchange at its trading session ending at, or most recently prior to, the time when the Fund’s assets are valued.
A description of the standard inputs that may generally be considered by the third party pricing vendors in determining their evaluated prices is provided below.
| | |
| Security Type | | Standard inputs generally considered by third-party pricing vendors |
| Corporate debt, government debt, municipal, mortgage-backed and asset-backed securities | | Reported trade data, broker-dealer price quotations, benchmark yields, issuer spreads on comparable securities, the credit quality, yield, maturity, and other appropriate factors. |
| Loans | | Information obtained from market participants regarding reported trade data and broker-dealer price quotations. |
| Event-linked bonds | | Information obtained from market participants regarding reported trade data and broker-dealer price quotations. |
| Structured securities | | Relevant market information such as the price of underlying financial instruments, stock market indices, foreign currencies, interest rate spreads, commodities, or the occurrence of other specific events. |
| Swaps | | Relevant market information, including underlying reference assets such as credit spreads, credit event probabilities, index values, individual security values, forward interest rates, variable interest rates, volatility measures, and forward currency rates. |
If a market value or price cannot be determined for a security using the methodologies described above, or if, in the “good faith” opinion of the Manager, the market value or price obtained does not constitute a “readily available market quotation,” or a significant event has occurred that would materially affect the value of the security the security is fair valued either (i) by a standardized fair valuation methodology applicable to the security type or the significant event as previously approved by the Valuation Committee and the Fund’s Board or (ii) as determined in good faith by the Manager’s Valuation Committee. The Valuation Committee considers all relevant facts that are reasonably available, through either public information or information available to the Manager, when determining the fair value of a security. Fair value determinations by the Manager are subject to review, approval and ratification by the Fund’s Board at its next regularly scheduled meeting covering the calendar quarter in which the fair valuation was determined. Those fair valuation standardized methodologies include, but are not limited to, valuing securities at the last sale price or initially at cost and subsequently adjusting the value based on: changes in company specific fundamentals, changes in an appropriate securities index, or changes in the value of similar securities which may be further adjusted for any discounts related to security-specific resale restrictions. When possible, such methodologies use observable market inputs such as unadjusted quoted prices of similar securities, observable interest rates, currency rates and yield curves. The methodologies used for valuing securities are not necessarily an indication of the risks associated with investing in those securities nor can it be assured that the Fund can obtain the fair value assigned to a security if it were to sell the security.
23 OPPENHEIMER CORE BOND FUND/VA
| | |
| NOTES TO FINANCIAL STATEMENTS Continued | | |
| | |
3. Securities Valuation (Continued)
To assess the continuing appropriateness of security valuations, the Manager, or its third party service provider who is subject to oversight by the Manager, regularly compares prior day prices, prices on comparable securities, and sale prices to the current day prices and challenges those prices exceeding certain tolerance levels with the third party pricing service or broker source. For those securities valued by fair valuations, whether through a standardized fair valuation methodology or a fair valuation determination, the Valuation Committee reviews and affirms the reasonableness of the valuations based on such methodologies and fair valuation determinations on a regular basis after considering all relevant information that is reasonably available.
Classifications
Each investment asset or liability of the Fund is assigned a level at measurement date based on the significance and source of the inputs to its valuation. Various data inputs are used in determining the value of each of the Fund’s investments as of the reporting period end. These data inputs are categorized in the following hierarchy under applicable financial accounting standards:
| | 1) | Level 1-unadjusted quoted prices in active markets for identical assets or liabilities (including securities actively traded on a securities exchange) |
| | 2) | Level 2-inputs other than unadjusted quoted prices that are observable for the asset or liability (such as unadjusted quoted prices for similar assets and market corroborated inputs such as interest rates, prepayment speeds, credit risks, etc.) |
| | 3) | Level 3-significant unobservable inputs (including the Manager’s own judgments about assumptions that market participants would use in pricing the asset or liability). |
The inputs used for valuing securities are not necessarily an indication of the risks associated with investing in those securities.
The table below categorizes amounts that are included in the Fund’s Statement of Assets and Liabilities as of December 31, 2014 based on valuation input level:
| | | | | | | | | | | | | | | | |
| | | Level 1—
Unadjusted
Quoted Prices | | | Level 2— Other Significant
Observable Inputs | | | Level 3—
Significant
Unobservable
Inputs | | | Value | |
Assets Table | | | | | | | | | | | | | | | | |
Investments, at Value: | | | | | | | | | | | | | | | | |
Asset-Backed Securities | | $ | — | | | $ | 23,165,789 | | | $ | — | | | $ | 23,165,789 | |
Mortgage-Backed Obligations | | | — | | | | 84,792,570 | | | | 636,673 | | | | 85,429,243 | |
U.S. Government Obligations | | | — | | | | 1,701,143 | | | | — | | | | 1,701,143 | |
Corporate Bonds and Notes | | | — | | | | 73,323,284 | | | | — | | | | 73,323,284 | |
Investment Company | | | 6,496,088 | | | | — | | | | — | | | | 6,496,088 | |
| | | | |
Total Investments, at Value | | | 6,496,088 | | | | 182,982,786 | | | | 636,673 | | | | 190,115,547 | |
Other Financial Instruments: | | | | | | | | | | | | | | | | |
Futures contracts | | | 471,778 | | | | — | | | | — | | | | 471,778 | |
| | | | |
Total Assets | | $ | 6,967,866 | | | $ | 182,982,786 | | | $ | 636,673 | | | $ | 190,587,325 | |
| | | | |
Liabilities Table | | | | | | | | | | | | | | | | |
Other Financial Instruments: | | | | | | | | | | | | | | | | |
Futures contracts | | $ | (112,903 | ) | | $ | — | | | $ | — | | | $ | (112,903) | |
| | | | |
Total Liabilities | | $ | (112,903 | ) | | $ | — | | | $ | — | | | $ | (112,903) | |
| | | | |
Forward currency exchange contracts and futures contracts, if any, are reported at their unrealized appreciation/depreciation at measurement date, which represents the change in the contract’s value from trade date. All additional assets and liabilities included in the above table are reported at their market value at measurement date.
The table below shows the transfers between Level 2 and Level 3. The Fund’s policy is to recognize transfers in and transfers out as of the beginning of the reporting period.
| | | | | | | | |
| | | Transfers out of Level 2* | | | Transfers into Level 3* | |
Assets Table | | | | | | | | |
Investments, at Value: | | | | | | | | |
Mortgage-Backed Obligations | | | $ (82,693) | | | | $ 82,693 | |
* Transferred from Level 2 to Level 3 because of the lack of observable market data due to a decrease in market activity for these securities.
4. Investments and Risks
Investment in Oppenheimer Institutional Money Market Fund. The Fund is permitted to invest daily available cash balances in an affiliated money market fund. The Fund may invest the available cash in Class E shares of Oppenheimer Institutional Money Market Fund (“IMMF”) to seek current income while preserving liquidity or for defensive purposes. IMMF is a registered open-end management investment company, regulated as a money market fund under the 1940 Act. The Manager is the investment adviser of IMMF, and the Sub-Adviser provides investment and related advisory services to IMMF. When applicable, the Fund’s investment in IMMF is included in the Statement of Investments. Shares of IMMF are valued at their net asset value per share. As a shareholder, the Fund is subject to its proportional share of IMMF’s Class E expenses, including its management fee. The Manager will waive fees and/or reimburse Fund expenses in an amount equal to the indirect management fees incurred through the Fund’s investment in IMMF.
24 OPPENHEIMER CORE BOND FUND/VA
4. Investments and Risks (Continued)
Securities on a When-Issued or Delayed Delivery Basis. The Fund may purchase securities on a “when-issued” basis, and may purchase or sell securities on a “delayed delivery” basis. “When-issued” or “delayed delivery” refers to securities whose terms and indenture are available and for which a market exists, but which are not available for immediate delivery. Delivery and payment for securities that have been purchased by the Fund on a when-issued basis normally takes place within six months and possibly as long as two years or more after the trade date. During this period, such securities do not earn interest, are subject to market fluctuation and may increase or decrease in value prior to their delivery. The purchase of securities on a when-issued basis may increase the volatility of the Fund’s net asset value to the extent the Fund executes such transactions while remaining substantially fully invested. When the Fund engages in when-issued or delayed delivery transactions, it relies on the buyer or seller, as the case may be, to complete the transaction. Their failure to do so may cause the Fund to lose the opportunity to obtain or dispose of the security at a price and yield it considers advantageous. The Fund may also sell securities that it purchased on a when-issued basis or forward commitment prior to settlement of the original purchase.
As of December 31, 2014, the Fund had purchased securities issued on a when-issued or delayed delivery basis and sold securities issued on a delayed delivery basis as follows:
| | | | |
| | | When-Issued or
Delayed Delivery
Basis Transactions | |
Purchased securities | | | $52,190,099 | |
Sold securities | | | 3,804,418 | |
The Fund may enter into “forward roll” transactions with respect to mortgage-related securities. In this type of transaction, the Fund sells a mortgage-related security to a buyer and simultaneously agrees to repurchase a similar security (same type, coupon and maturity) at a later date at a set price. During the period between the sale and the repurchase, the Fund will not be entitled to receive interest and principal payments on the securities that have been sold. The Fund records the incremental difference between the forward purchase and sale of each forward roll as realized gain (loss) on investments or as fee income in the case of such transactions that have an associated fee in lieu of a difference in the forward purchase and sale price.
Forward roll transactions may be deemed to entail embedded leverage since the Fund purchases mortgage-related securities with extended settlement dates rather than paying for the securities under a normal settlement cycle. This embedded leverage increases the Fund’s market value of investments relative to its net assets which can incrementally increase the volatility of the Fund’s performance. Forward roll transactions can be replicated over multiple settlement periods.
Risks of entering into forward roll transactions include the potential inability of the counterparty to meet the terms of the agreement; the potential of the Fund to receive inferior securities at redelivery as compared to the securities sold to the counterparty; and counterparty credit risk.
Restricted Securities. As of December 31, 2014, investments in securities included issues that are restricted. A restricted security may have a contractual restriction on its resale and is valued under methods approved by the Board of Trustees as reflecting fair value. Securities that are restricted are marked with an applicable footnote on the Statement of Investments. Restricted securities are reported on a schedule following the Statement of Investments.
Credit Risk. The Fund invests in high-yield, non-investment-grade bonds, which may be subject to a greater degree of credit risk. Credit risk relates to the ability of the issuer to meet interest or principal payments or both as they become due. The Fund may acquire securities that have missed an interest payment, and is not obligated to dispose of securities whose issuers or underlying obligors subsequently miss an interest payment. Information concerning securities not accruing interest as of December 31, 2014 is as follows:
| | | | | | |
| | Cost | | $ | 3,281,116 | |
| | Market Value | | $ | 512,243 | |
| | Market value as % of Net Assets | | | 0.36% | |
5. Risk Exposures and the Use of Derivative Instruments
The Fund’s investment objective not only permits the Fund to purchase investment securities, it also allows the Fund to enter into various types of derivatives contracts, including, but not limited to, futures contracts, forward currency exchange contracts, credit default swaps, interest rate swaps, total return swaps, variance swaps and purchased and written options. In doing so, the Fund will employ strategies in differing combinations to permit it to increase, decrease, or change the level or types of exposure to market risk factors. These instruments may allow the Fund to pursue its objectives more quickly and efficiently than if it were to make direct purchases or sales of securities capable of effecting a similar response to market factors. Such contracts may be entered into through a bilateral over-the-counter (“OTC”) transaction, or through a securities or futures exchange and cleared through a clearinghouse.
Market Risk Factors. In accordance with its investment objectives, the Fund may use derivatives to increase or decrease its exposure to one or more of the following market risk factors:
Commodity Risk. Commodity risk relates to the change in value of commodities or commodity indexes as they relate to increases or decreases in the commodities market. Commodities are physical assets that have tangible properties. Examples of these types of assets are crude oil, heating oil, metals, livestock, and agricultural products.
25 OPPENHEIMER CORE BOND FUND/VA
| | |
| NOTES TO FINANCIAL STATEMENTS Continued | | |
| | |
5. Risk Exposures and the Use of Derivative Instruments (Continued)
Credit Risk. Credit risk relates to the ability of the issuer to meet interest and principal payments, or both, as they come due. In general, lower-grade, higher-yield bonds are subject to credit risk to a greater extent than lower-yield, higher-quality bonds.
Equity Risk. Equity risk relates to the change in value of equity securities as they relate to increases or decreases in the general market.
Foreign Exchange Rate Risk. Foreign exchange rate risk relates to the change in the U.S. dollar value of a security held that is denominated in a foreign currency. The U.S. dollar value of a foreign currency denominated security will decrease as the dollar appreciates against the currency, while the U.S. dollar value will increase as the dollar depreciates against the currency.
Interest Rate Risk. Interest rate risk refers to the fluctuations in value of fixed-income securities resulting from the inverse relationship between price and yield. For example, an increase in general interest rates will tend to reduce the market value of already issued fixed-income investments, and a decline in general interest rates will tend to increase their value. In addition, debt securities with longer maturities, which tend to have higher yields, are subject to potentially greater fluctuations in value from changes in interest rates than obligations with shorter maturities.
Volatility Risk. Volatility risk refers to the magnitude of the movement, but not the direction of the movement, in a financial instrument’s price over a defined time period. Large increases or decreases in a financial instrument’s price over a relative time period typically indicate greater volatility risk, while small increases or decreases in its price typically indicate lower volatility risk.
Derivatives may have little or no initial cash investment relative to their market value exposure and therefore can produce significant gains or losses in excess of their cost due to unanticipated changes in the market risk factors and the overall market. This use of embedded leverage allows the Fund to increase its market value exposure relative to its net assets and can substantially increase the volatility of the Fund’s performance. In instances where the Fund is using derivatives to decrease, or hedge, exposures to market risk factors for securities held by the Fund, there are also risks that those derivatives may not perform as expected resulting in losses for the combined or hedged positions. Some derivatives have the potential for unlimited loss, regardless of the size of the Fund’s initial investment.
Additional associated risks from investing in derivatives also exist and potentially could have significant effects on the valuation of the derivative and the Fund. Typically, the associated risks are not the risks that the Fund is attempting to increase or decrease exposure to, per its investment objectives, but are the additional risks from investing in derivatives. Examples of these associated risks are liquidity risk, which is the risk that the Fund will not be able to sell the derivative in the open market in a timely manner, and counterparty credit risk, which is the risk that the counterparty will not fulfill its obligation to the Fund.
The Fund’s actual exposures to these market risk factors and associated risks during the period are discussed in further detail, by derivative type, below.
Futures Contracts
A futures contract is a commitment to buy or sell a specific amount of a commodity, financial instrument or currency at a negotiated price on a stipulated future date. The Fund may buy and sell futures contracts and may also buy or write put or call options on these futures contracts. Futures contracts and options thereon are generally entered into on a regulated futures exchange and cleared through a clearinghouse associated with the exchange.
Upon entering into a futures contract, the Fund is required to deposit either cash or securities (initial margin) in an amount equal to a certain percentage of the contract value in an account registered in the futures commission merchant’s name. Subsequent payments (variation margin) are paid to or from the futures commission merchant each day equal to the daily changes in the contract value. Such payments are recorded as unrealized gains and losses. Should the Fund fail to make requested variation margin payments, the futures commission merchant can gain access to the initial margin to satisfy the Fund’s payment obligations.
Futures contracts are reported on a schedule following the Statement of Investments. Securities held by a futures commission merchant to cover initial margin requirements on open futures contracts are noted in the Statement of Investments. Cash held by a futures commission merchant to cover initial margin requirements on open futures contracts and the receivable and/or payable for the daily mark to market for the variation margin are noted in the Statement of Assets and Liabilities. The net change in unrealized appreciation and depreciation is reported in the Statement of Operations. Realized gains (losses) are reported in the Statement of Operations at the closing or expiration of futures contracts.
The Fund has purchased futures contracts on various bonds and notes to increase exposure to interest rate risk.
The Fund has sold futures contracts on various bonds and notes to decrease exposure to interest rate risk.
During the year ended December 31, 2014, the Fund had an ending monthly average market value of $10,726,008 and $33,576,371 on futures contracts purchased and sold, respectively.
Additional associated risks of entering into futures contracts (and related options) include the possibility that there may be an illiquid market where the Fund is unable to liquidate the contract or enter into an offsetting position and, if used for hedging purposes, the risk that the price of the contract will correlate imperfectly with the prices of the Fund’s securities.
Swaption Transactions
The Fund may enter into a swaption contract which grants the purchaser the right, but not the obligation, to enter into a swap transaction at preset terms detailed in the underlying agreement within a specified period of time. The purchaser pays a premium to the swaption writer who bears the risk of unfavorable changes in the preset terms on the underlying swap.
Purchased swaptions are reported as a component of investments in the Statement of Investments and the Statement of Assets and Liabilities. Written swaptions are reported on a schedule following the Statement of Investments and their value is reported as a separate asset or liability line item in the Statement of Assets and Liabilities. The net change in unrealized appreciation or depreciation on written swaptions is separately reported in the
26 OPPENHEIMER CORE BOND FUND/VA
5. Risk Exposures and the Use of Derivative Instruments (Continued)
Statement of Operations. When a swaption is exercised, the cost of the swap is adjusted by the amount of premium paid or received. Upon the expiration or closing of an unexercised swaption contract, a gain or loss is reported in the Statement of Operations for the amount of the premium paid or received.
The Fund generally will incur a greater risk when it writes a swaption than when it purchases a swaption. When the Fund writes a swaption it will become obligated, upon exercise of the swaption, according to the terms of the underlying agreement. Swaption contracts written by the Fund do not give rise to counterparty credit risk prior to exercise as they obligate the Fund, not its counterparty, to perform. When the Fund purchases a swaption it only risks losing the amount of the premium it paid if the swaption expires unexercised. However, when the Fund exercises a purchased swaption there is a risk that the counterparty will fail to perform or otherwise default on its obligations under the swaption contract.
The Fund has purchased swaptions which gives it the option to buy credit protection through credit default swaps in order to decrease exposure to the credit risk of individual issuers and/or indexes of issuers. A purchased swaption of this type becomes more valuable as the likelihood of a credit event on the reference asset increases.
During the year ended December 31, 2014, the Fund had an ending monthly average market value of $14,022 on purchased swaptions.
Counterparty Credit Risk. Derivative positions are subject to the risk that the counterparty will not fulfill its obligation to the Fund. The Fund intends to enter into derivative transactions with counterparties that the Manager believes to be creditworthy at the time of the transaction.
The Fund’s risk of loss from counterparty credit risk on OTC derivatives is generally limited to the aggregate unrealized gain netted against any collateral held by the Fund. For OTC options purchased, the Fund bears the risk of loss of the amount of the premiums paid plus the positive change in market values net of any collateral held by the Fund should the counterparty fail to perform under the contracts. Options written by the Fund do not typically give rise to counterparty credit risk, as options written generally obligate the Fund and not the counterparty to perform.
To reduce counterparty risk with respect to OTC transactions, the Fund has entered into master netting arrangements, established within the Fund’s International Swap and Derivatives Association, Inc. (“ISDA”) master agreements, which allow the Fund to make (or to have an entitlement to receive) a single net payment in the event of default (close-out netting) for outstanding payables and receivables with respect to certain OTC positions in swaps, options, swaptions, and forward currency exchange contracts for each individual counterparty. In addition, the Fund may require that certain counterparties post cash and/or securities in collateral accounts to cover their net payment obligations for those derivative contracts subject to ISDA master agreements. If the counterparty fails to perform under these contracts and agreements, the cash and/or securities will be made available to the Fund.
ISDA master agreements include credit related contingent features which allow counterparties to OTC derivatives to terminate derivative contracts prior to maturity in the event that, for example, the Fund’s net assets decline by a stated percentage or the Fund fails to meet the terms of its ISDA master agreements, which would cause the Fund to accelerate payment of any net liability owed to the counterparty.
For financial reporting purposes, the Fund does not offset derivative assets and derivative liabilities that are subject to netting arrangements in the Statement of Assets and Liabilities. Bankruptcy or insolvency laws of a particular jurisdiction may impose restrictions on or prohibitions against the right of offset in bankruptcy, insolvency or other events.
The Fund’s risk of loss from counterparty credit risk on exchange-traded derivatives cleared through a clearinghouse and for centrally cleared swaps is generally considered lower than as compared to OTC derivatives. However, counterparty credit risk exists with respect to initial and variation margin deposited/paid by the Fund that is held in futures commission merchant, broker and/or clearinghouse accounts for such exchange-traded derivatives and for centrally cleared swaps.
With respect to centrally cleared swaps, such transactions will be submitted for clearing, and if cleared, will be held in accounts at futures commission merchants or brokers that are members of clearinghouses. While brokers, futures commission merchants and clearinghouses are required to segregate customer margin from their own assets, in the event that a broker, futures commission merchant or clearinghouse becomes insolvent or goes into bankruptcy and at that time there is a shortfall in the aggregate amount of margin held by the broker, futures commission merchant or clearinghouse for all its customers, U.S. bankruptcy laws will typically allocate that shortfall on a pro-rata basis across all the broker’s, futures commission merchant’s or clearinghouse’s customers, potentially resulting in losses to the Fund.
There is the risk that a broker, futures commission merchant or clearinghouse will decline to clear a transaction on the Fund’s behalf, and the Fund may be required to pay a termination fee to the executing broker with whom the Fund initially enters into the transaction. Clearinghouses may also be permitted to terminate centrally cleared swaps at any time. The Fund is also subject to the risk that the broker or futures commission merchant will improperly use the Fund’s assets deposited/paid as initial or variation margin to satisfy payment obligations of another customer. In the event of a default by another customer of the broker or futures commission merchant, the Fund might not receive its variation margin payments from the clearinghouse, due to the manner in which variation margin payments are aggregated for all customers of the broker/futures commission merchant.
Collateral and margin requirements differ by type of derivative. Margin requirements are established by the broker, futures commission merchant or clearinghouse for exchange-traded and cleared derivatives, including centrally cleared swaps. Brokers, futures commission merchants and clearinghouses can ask for margin in excess of the regulatory minimum, or increase the margin amount, in certain circumstances.
Collateral terms are contract specific for OTC derivatives. For derivatives traded under an ISDA master agreement, the collateral requirements are typically calculated by netting the mark to market amount for each transaction under such agreement and comparing that amount to the value of any collateral currently pledged by the Fund or the counterparty.
27 OPPENHEIMER CORE BOND FUND/VA
| | |
| NOTES TO FINANCIAL STATEMENTS Continued | | |
| | |
5. Risk Exposures and the Use of Derivative Instruments (Continued)
For financial reporting purposes, cash collateral that has been pledged to cover obligations of the Fund, if any, is reported separately on the Statement of Assets and Liabilities as cash pledged as collateral. Non-cash collateral pledged by the Fund, if any, is noted in the Statement of Investments. Generally, the amount of collateral due from or to a party must exceed a minimum transfer amount threshold (e.g. $250,000) before a transfer has to be made. To the extent amounts due to the Fund from its counterparties are not fully collateralized, contractually or otherwise, the Fund bears the risk of loss from counterparty nonperformance.
The following table presents the valuations of derivative instruments by risk exposure as reported within the Statement of Assets and Liabilities as of December 31, 2014:
| | | | | | | | | | | | |
| | | Asset Derivatives | | | | | Liability Derivatives | | | |
| Derivatives Not Accounted for as Hedging Instruments | | Statement of Assets and Liabilities Location | | Value | | | Statement of Assets and Liabilities Location | | Value | |
Interest rate contracts | | Variation margin receivable | | $ | 23,500 | * | | Variation margin payable | | $ | 28,955 | * |
*Includes only the current day’s variation margin. Prior variation margin movements have been reflected in cash on the Statement of Assets and Liabilities upon receipt or payment.
The effect of derivative instruments on the Statement of Operations is as follows:
| | | | | | | | | | | | |
| | | Amount of Realized Gain or (Loss) Recognized on Derivatives | | | | |
| Derivatives Not Accounted for as Hedging Instruments | | Investment from unaffiliated
companies* | | | Closing and expiration of futures
contracts | | | Total | |
Credit contracts | | | (93,522 | ) | | | — | | | | (93,522) | |
Interest rate contracts | | | — | | | | 936,466 | | | | 936,466 | |
| | | | |
Total | | $ | (93,522 | ) | | $ | 936,466 | | | $ | 842,944 | |
| | | | |
*Includes purchased option contracts and purchased swaption contracts, if any.
| | | | |
| Amount of Change in Unrealized Gain or (Loss) Recognized on Derivatives | |
| Derivatives Not Accounted for as Hedging Instruments | | Futures contracts | |
Interest rate contracts | | $ | 351,257 | |
6. Shares of Beneficial Interest
The Fund has authorized an unlimited number of $0.001 par value shares of beneficial interest of each class. Transactions in shares of beneficial interest were as follows:
| | | | | | | | | | | | | | | | |
| | | Year Ended December 31, 2014 | | | Year Ended December 31, 2013 | |
| | | Shares | | | Amount | | | Shares | | | Amount | |
Non-Service Shares | | | | | | | | | | | | | | | | |
Sold | | | 473,147 | | | $ | 3,766,474 | | | | 533,702 | | | $ | 4,292,431 | |
Dividends and/or distributions reinvested | | | 636,119 | | | | 4,942,642 | | | | 682,873 | | | | 5,333,237 | |
Redeemed | | | (2,061,362 | ) | | | (16,419,789 | ) | | | (3,017,265 | ) | | | (24,363,528) | |
| | | | |
Net decrease | | | (952,096 | ) | | $ | (7,710,673 | ) | | | (1,800,690 | ) | | $ | (14,737,860) | |
| | | | |
| | | | |
| | | | | | | | | | | | | | | | | |
Service Shares | | | | | | | | | | | | | | | | |
Sold | | | 1,990,358 | | | $ | 15,655,488 | | | | 1,641,559 | | | $ | 13,196,539 | |
Dividends and/or distributions reinvested | | | 362,777 | | | | 2,786,126 | | | | 388,743 | | | | 3,004,980 | |
Redeemed | | | (2,750,766 | ) | | | (21,608,853 | ) | | | (2,851,850 | ) | | | (22,641,434) | |
| | | | |
Net decrease | | | (397,631 | ) | | $ | (3,167,239 | ) | | | (821,548 | ) | | $ | (6,439,915) | |
| | | | |
7. Purchases and Sales of Securities
The aggregate cost of purchases and proceeds from sales of securities, other than short-term obligations and investments in IMMF, for the year ended December 31, 2014 were as follows:
| | | | | | | | | | | | |
| | | | | Purchases | | | | | Sales | |
| | | |
| | Investment securities | | $ | 133,919,440 | | | | | $ | 126,510,975 | |
| | U.S. government and government agency obligations | | | 48,805,064 | | | | | | 51,240,615 | |
| | To Be Announced (TBA) mortgage-related securities | | | 560,409,975 | | | | | | 543,669,748 | |
8. Fees and Other Transactions with Affiliates
Management Fees. Under the investment advisory agreement, the Fund pays the Manager a management fee based on the daily net assets of the Fund at an annual rate as shown in the following table:
| | | | |
| Fee Schedule | | | |
Up to $1 billion | | | 0.60% | |
Over $1 billion | | | 0.50 | |
The Fund’s management fee for the fiscal year ended December 31, 2014 was 0.60% of average annual net assets before any applicable waivers.
28 OPPENHEIMER CORE BOND FUND/VA
8. Fees and Other Transactions with Affiliates (Continued)
Sub-Adviser Fees. The Manager has retained the Sub-Adviser to provide the day-to-day portfolio management of the Fund. Under the Sub-Advisory Agreement, the Manager pays the Sub-Adviser an annual fee in monthly installments, equal to a percentage of the investment management fee collected by the Manager from the Fund, which shall be calculated after any investment management fee waivers. The fee paid to the Sub-Adviser is paid by the Manager, not by the Fund.
Transfer Agent Fees. OFI Global (the “Transfer Agent”) serves as the transfer and shareholder servicing agent for the Fund. The Fund pays the Transfer Agent a fee based on annual net assets. Fees incurred and average net assets for each class with respect to these services are detailed in the Statement of Operations and Financial Highlights, respectively.
Sub-Transfer Agent Fees. The Transfer Agent has retained Shareholder Services, Inc., a wholly-owned subsidiary of OFI (the “Sub-Transfer Agent”), to provide the day-to-day transfer agent and shareholder servicing of the Fund. Under the Sub-Transfer Agency Agreement, the Transfer Agent pays the Sub-Transfer Agent an annual fee in monthly installments, equal to a percentage of the transfer agent fee collected by the Transfer Agent from the Fund, which shall be calculated after any applicable fee waivers. The fee paid to the Sub-Transfer Agent is paid by the Transfer Agent, not by the Fund.
Trustees’ Compensation. The Fund’s Board of Trustees (“Board”) has adopted a compensation deferral plan for Independent Trustees that enables Trustees to elect to defer receipt of all or a portion of the annual compensation they are entitled to receive from the Fund. For purposes of determining the amount owed to the Trustee under the plan, deferred amounts are treated as though equal dollar amounts had been invested in shares of the Fund or in other Oppenheimer funds selected by the Trustee. The Fund purchases shares of the funds selected for deferral by the Trustee in amounts equal to his or her deemed investment, resulting in a Fund asset equal to the deferred compensation liability. Such assets are included as a component of “Other” within the asset section of the Statement of Assets and Liabilities. Deferral of Trustees’ fees under the plan will not affect the net assets of the Fund and will not materially affect the Fund’s assets, liabilities or net investment income per share. Amounts will be deferred until distributed in accordance with the compensation deferral plan.
Distribution and Service Plan for Service Shares. The Fund has adopted a Distribution and Service Plan (the “Plan”) pursuant to Rule 12b-1 under the 1940 Act for Service shares to pay OppenheimerFunds Distributor, Inc. (the “Distributor”), for distribution related services, personal service and account maintenance for the Fund’s Service shares. Under the Plan, payments are made periodically at an annual rate of 0.25% of the daily net assets of Service shares of the Fund. The Distributor currently uses all of those fees to compensate sponsors of the insurance product that offers Fund shares, for providing personal service and maintenance of accounts of their variable contract owners that hold Service shares. These fees are paid out of the Fund’s assets on an on-going basis and increase operating expenses of the Service shares, which results in lower performance compared to the Fund’s shares that are not subject to a service fee. Fees incurred by the Fund under the Plan are detailed in the Statement of Operations.
Waivers and Reimbursements of Expenses. The Manager has contractually agreed to limit the Fund’s expenses after payments, waivers and/or reimbursements and reduction to custodian expenses, excluding expenses incurred directly or indirectly by the Fund as a result of investments in other investment companies, wholly-owned subsidiaries and pooled investment vehicles; so that those expenses, as percentages of daily net assets, will not exceed the annual rate of 0.75% for Non-Service shares and 1.00% for Service shares. During the year ended December 31, 2014, the Manager waived fees and/or reimbursed the Fund $39,878 and $23,366 for Non-Service and Service shares, respectively.
The Manager will waive fees and/or reimburse Fund expenses in an amount equal to the indirect management fees incurred through the Fund’s investment in IMMF. During the year ended December 31, 2014, the Manager waived fees and/or reimbursed the Fund $7,566 for IMMF management fees.
These undertakings may be modified or terminated as set forth according to the terms in the prospectus.
9. Pending Litigation
In 2009, seven class action lawsuits were filed in the U.S. District Court for the District of Colorado against OppenheimerFunds, Inc. (“OFI”), OppenheimerFunds Distributor, Inc., the Fund’s principal underwriter and distributor (the “Distributor”), and certain funds (but not including the Fund) advised by OFI Global Asset Management, Inc. and distributed by the Distributor (the “Defendant Funds”). The lawsuits also named as defendants certain officers and current and former trustees of the respective Defendant Funds. The lawsuits raised claims under federal securities laws and alleged, among other things, that the disclosure documents of the respective Defendant Funds contained misrepresentations and omissions and that the respective Defendant Funds’ investment policies were not followed. The plaintiffs in these actions sought unspecified damages, equitable relief and awards of attorneys’ fees and litigation expenses. The Defendant Funds’ Boards of Trustees also engaged counsel to represent the Funds and the present and former Independent Trustees named in those suits. In March 2014, the parties in six of these lawsuits executed stipulations and agreements of settlement resolving those actions. In July 2014, the court entered an order and final judgment approving the settlements as fair, reasonable and adequate. The settlements do not resolve a seventh outstanding lawsuit relating to Oppenheimer Rochester California Municipal Fund (the “California Fund Suit”). OFI believes the California Fund Suit is without legal merit and is defending the suit vigorously. While it is premature to render any opinion as to the outcome in the California Fund Suit, or whether any costs that OFI may bear in defending the California Fund Suit might not be reimbursed by insurance, OFI believes the California Fund Suit should not impair the ability of OFI or the Distributor to perform their respective duties to the Fund, and that the outcome of the California Fund Suit should not have any material effect on the operations of any of the Oppenheimer funds.
29 OPPENHEIMER CORE BOND FUND/VA
REPORT OF INDEPENDENT REGISTERED PUBLIC ACCOUNTING FIRM
The Board of Trustees and Shareholders of Oppenheimer Variable Account Funds:
We have audited the accompanying statement of assets and liabilities of Oppenheimer Core Bond Fund/VA (a separate series of Oppenheimer Variable Account Funds), including the statement of investments, as of December 31, 2014, and the related statement of operations for the year then ended, the statements of changes in net assets for each of the years in the two-year period then ended, and the financial highlights for each of the years in the five-year period then ended. These financial statements and financial highlights are the responsibility of the Fund’s management. Our responsibility is to express an opinion on these financial statements and financial highlights based on our audits.
We conducted our audits in accordance with the standards of the Public Company Accounting Oversight Board (United States). Those standards require that we plan and perform the audit to obtain reasonable assurance about whether the financial statements and financial highlights are free of material misstatement. An audit includes examining, on a test basis, evidence supporting the amounts and disclosures in the financial statements. Our procedures included confirmation of securities owned as of December 31, 2014, by correspondence with the custodian, transfer agent and brokers, or by other appropriate auditing procedures where replies from brokers were not received. An audit also includes assessing the accounting principles used and significant estimates made by management, as well as evaluating the overall financial statement presentation. We believe that our audits provide a reasonable basis for our opinion.
In our opinion, the financial statements and financial highlights referred to above present fairly, in all material respects, the financial position of Oppenheimer Core Bond Fund/VA as of December 31, 2014, the results of its operations for the year then ended, the changes in its net assets for each of the years in the two-year period then ended, and the financial highlights for each of the years in the five-year period then ended, in conformity with U.S. generally accepted accounting principles.
KPMGLLP
Denver, Colorado
February 13, 2015
30 OPPENHEIMER CORE BOND FUND/VA
| | |
| FEDERAL INCOME TAX INFORMATION Unaudited | | |
| |
| | |
In early 2015, if applicable, shareholders of record received information regarding all dividends and distributions paid to them by the Fund during calendar year 2014.
The foregoing information is presented to assist shareholders in reporting distributions received from the Fund to the Internal Revenue Service. Because of the complexity of the federal regulations which may affect your individual tax return and the many variations in state and local tax regulations, we recommend that you consult your tax advisor for specific guidance.
31 OPPENHEIMER CORE BOND FUND/VA
| | |
| BOARD APPROVAL OF THE FUND’S INVESTMENT ADVISORY AND SUB-ADVISORY AGREEMENTS Unaudited |
|
|
The Fund has entered into an investment advisory agreement with OFI Global Asset Management, Inc. (“OFI Global” or the “Adviser”), a wholly-owned subsidiary of OppenheimerFunds, Inc. (“OFI” or the “Sub-Adviser”) (“OFI Global” and “OFI” together the “Managers”) and OFI Global has entered into a sub-advisory agreement with OFI whereby OFI provides investment sub-advisory services to the Fund (collectively, the “Agreements”). Each year, the Board of Trustees (the “Board”), including a majority of the independent Trustees, is required to determine whether to renew the Agreements. The Investment Company Act of 1940, as amended, requires that the Board request and evaluate, and that the Managers provide, such information as may be reasonably necessary to evaluate the terms of the Agreements. The Board employs an independent consultant to prepare a report that provides information, including comparative information that the Board requests for that purpose. In addition to in-person meetings focused on this evaluation, the Board receives information throughout the year regarding Fund services, fees, expenses and performance.
The Adviser, Sub-Adviser and the independent consultant provided information to the Board on the following factors: (i) the nature, quality and extent of the Managers’ services, (ii) the investment performance of the Fund and the Managers, (iii) the fees and expenses of the Fund, including comparative expense information, (iv) the profitability of the Managers and their affiliates, including an analysis of the cost of providing services, (v) whether economies of scale are realized as the Fund grows and whether fee levels reflect these economies of scale for Fund investors and (vi) other benefits to the Managers from their relationship with the Fund. The Board was aware that there are alternatives to retaining the Managers.
Outlined below is a summary of the principal information considered by the Board as well as the Board’s conclusions.
Nature, Quality and Extent of Services. The Board considered information about the nature, quality and extent of the services provided to the Fund and information regarding the Managers’ key personnel who provide such services. The Sub-Adviser’s duties include providing the Fund with the services of the portfolio managers and the Sub-Adviser’s investment team, who provide research, analysis and other advisory services in regard to the Fund’s investments; securities trading services; oversight of third-party service providers; monitoring compliance with applicable Fund policies and procedures and adherence to the Fund’s investment restrictions; and risk management. The Managers are responsible for providing certain administrative services to the Fund as well. Those services include providing and supervising all administrative and clerical personnel who are necessary in order to provide effective corporate administration for the Fund; compiling and maintaining records with respect to the Fund’s operations; preparing and filing reports required by the Securities and Exchange Commission; preparing periodic reports regarding the operations of the Fund for its shareholders; preparing proxy materials for shareholder meetings; and preparing the registration statements required by Federal and state securities laws for the sale of the Fund’s shares. The Managers also provide the Fund with office space, facilities and equipment.
The Board also considered the quality of the services provided and the quality of the Managers’ resources that are available to the Fund. The Board took account of the fact that the Sub-Adviser has had over fifty years of experience as an investment adviser and that its assets under management rank it among the top mutual fund managers in the United States. The Board evaluated the Sub-Adviser’s advisory, administrative, accounting, legal, compliance services and risk management, and information the Board has received regarding the experience and professional qualifications of the Managers’ key personnel and the size and functions of its staff. In its evaluation of the quality of the portfolio management services provided, the Board considered the experience of Krishna Memani and Peter Strzalkowski, the portfolio managers for the Fund, and the Sub-Adviser’s investment team and analysts. The Board members also considered the totality of their experiences with the Managers as directors or trustees of the Fund and other funds advised by the Managers. The Board considered information regarding the quality of services provided by affiliates of the Managers, which its members have become knowledgeable about in connection with the renewal of the Fund’s service agreements. The Board concluded, in light of the Managers’ experience, reputation, personnel, operations and resources that the Fund benefits from the services provided under the Agreements.
Investment Performance of the Fund, the Adviser and the Sub-Adviser. Throughout the year, the Manager provided information on the investment performance of the Fund, including comparative performance information. The Board also reviewed information, prepared by the Manager and by the independent consultant, comparing the Fund’s historical performance to relevant market indices and to the performance of other intermediate-term bond funds underlying variable insurance products. The Board considered that the Fund outperformed its performance category median during the one-, three- and five-year periods, although it underperformed for the ten-year period. The Board also considered the appointment of new portfolio managers, Krishna Memani and Peter Strzalkowski, on April 1, 2009. The Board considered that the performance of the Fund has greatly improved since the new portfolio managers took over, and noted that the Fund ranked in the first quintile of its performance category for the one-, three- and five-year periods.
Costs of Services by the Adviser. The Board reviewed the fees paid to the Manager and the other expenses borne by the Fund. The Board noted that the Manager, not the Fund, pays the Sub-Adviser’s fee under the sub-advisory agreement. The independent consultant provided comparative data in regard to the fees and expenses of the Fund and other intermediate-term bond funds underlying variable insurance products. In reviewing the fees and expenses charged to the VA funds, the Board considered the Manager’s assertion that, because there is much greater disparity in the fees and services that may be provided by a manager to a VA fund as opposed to a retail fund, when comparing the expenses of the various VA funds to those of retail funds, it is most appropriate to focus on total expenses (rather than on the management fees). Accordingly, while the Board reviewed and considered all expenses, it focused on total expenses. The Board considered that the Fund’s total expenses were higher than its peer group median and category median. The Board also considered that the Fund’s contractual management fee was higher than its peer group median and its category median. Within the total asset range of $100 million to $250 million, the Fund’s effective management fee rate was higher than its peer group median and category median. The Board considered that the Manager has contractually agreed to limit the Fund’s total annual operating expenses so that those expenses, as percentages of daily net assets, will not exceed that annual rate of 0.75% for Non-Service Shares and 1.00% for Service Shares. This contractual expense limitation may not be amended or withdrawn until one year after the date of the Fund’s prospectus, unless approved by the Board.
Economies of Scale and Profits Realized by the Adviser and Sub-Adviser. The Board considered information regarding the Managers’ costs in serving as the Fund’s investment adviser and sub-adviser, including the costs associated with the personnel and systems necessary to manage the Fund, and information regarding the Managers’ profitability from their relationship with the Fund. The Board reviewed whether the Managers may realize economies of scale in managing and supporting the Fund. The Board noted that the Fund currently has management fee breakpoints, which are intended to share with Fund shareholders economies of scale that may exist as the Fund’s assets grow.
32 OPPENHEIMER CORE BOND FUND/VA
Other Benefits to the Managers. In addition to considering the profits realized by the Managers, the Board considered information that was provided regarding the direct and indirect benefits the Managers receive as a result of their relationship with the Fund, including compensation paid to the Managers’ affiliates. The Board also considered that the Managers must be able to pay and retain experienced professional personnel at competitive rates to provide quality services to the Fund.
Conclusions. These factors were also considered by the independent Trustees meeting separately from the full Board, assisted by experienced counsel to the Fund and to the independent Trustees. Fund counsel and the independent Trustees’ counsel are independent of the Managers within the meaning and intent of the Securities and Exchange Commission Rules.
Based on its review of the information it received and its evaluations described above, the Board, including a majority of the independent Trustees, decided to continue the Agreements through August 31, 2015. In arriving at its decision, the Board did not identify any factor or factors as being more important than others, but considered all of the above information, and considered the terms and conditions of the Agreements, including the management fees, in light of all the surrounding circumstances.
33 OPPENHEIMER CORE BOND FUND/VA
| | |
| PORTFOLIO PROXY VOTING POLICIES AND PROCEDURES; UPDATES TO STATEMENTS OF INVESTMENTS Unaudited |
|
|
The Fund has adopted Portfolio Proxy Voting Policies and Procedures under which the Fund votes proxies relating to securities (“portfolio proxies”) held by the Fund. A description of the Fund’s Portfolio Proxy Voting Policies and Procedures is available (i) without charge, upon request, by calling the Fund toll-free at 1.800.525.7048, (ii) on the Fund’s website at www.oppenheimerfunds.com, and (iii) on the SEC’s website at www.sec.gov. In addition, the Fund is required to file Form N-PX, with its complete proxy voting record for the 12 months ended June 30th, no later than August 31st of each year. The Fund’s voting record is available (i) without charge, upon request, by calling the Fund toll-free at 1.800.525.7048, and (ii) in the Form N-PX filing on the SEC’s website at www.sec.gov.
The Fund files its complete schedule of portfolio holdings with the SEC for the first quarter and the third quarter of each fiscal year on Form N-Q. The Fund’s Form N-Q filings are available on the SEC’s website at www.sec.gov. Those forms may be reviewed and copied at the SEC’s Public Reference Room in Washington, D.C. Information on the operation of the Public Reference Room may be obtained by calling 1-800-SEC-0330.
34 OPPENHEIMER CORE BOND FUND/VA
| | |
| TRUSTEES AND OFFICERS Unaudited |
|
|
| | |
| Name, Position(s) Held with the Fund, Length of Service, Year of Birth | | Principal Occupation(s) During the Past 5 Years; Other Trusteeships/Directorships Held; Number of Portfolios in the Fund Complex Currently Overseen |
| |
INDEPENDENT TRUSTEES | | The address of each Trustee in the chart below is 6803 S. Tucson Way, Centennial, Colorado 80112-3924. Each Trustee serves for an indefinite term, or until his or her resignation, retirement, death or removal. |
| |
Sam Freedman, Chairman of the Board of Trustees (since 2012) and Trustee (since 1996) Year of Birth: 1940 | | Director of Colorado UpLIFT (charitable organization) (since September 1984). Mr. Freedman held several positions with the Sub-Adviser and with subsidiary or affiliated companies of the Sub-Adviser (until October 1994). Oversees 38 portfolios in the OppenheimerFunds complex. Mr. Freedman has served on the Boards of certain Oppenheimer funds since 1996, during which time he has become familiar with the Fund’s (and other Oppenheimer funds’) financial, accounting, regulatory and investment matters and has contributed to the Boards’ deliberations. |
| |
Jon S. Fossel, Trustee (since 1990) Year of Birth: 1942 | | Chairman of the Board of Jack Creek Preserve Foundation (non-profit organization) (since 2005); Chairman of the Board (2006-December 2011) and Director (June 2002-December 2011) of UNUMProvident (insurance company); Director of Northwestern Energy Corp. (public utility corporation) (November 2004-December 2009); Director of P.R. Pharmaceuticals (October 1999-October 2003); Director of Rocky Mountain Elk Foundation (non-profit organization) (February 1998-February 2003 and February 2005-February 2007); Chairman and Director (until October 1996) and President and Chief Executive Officer (until October 1995) of the Sub-Adviser; President, Chief Executive Officer and Director of the following: Oppenheimer Acquisition Corp. (“OAC”) (parent holding company of the Sub-Adviser), Shareholder Services, Inc. and Shareholder Financial Services, Inc. (until October 1995). Oversees 38 portfolios in the OppenheimerFunds complex. Mr. Fossel has served on the Boards of certain Oppenheimer funds since 1990, during which time he has become familiar with the Fund’s (and other Oppenheimer funds’) financial, accounting, regulatory and investment matters and has contributed to the Boards’ deliberations. |
| |
Richard Grabish, Trustee (since 2012) Year of Birth: 1948 | | Formerly Senior Vice President and Assistant Director of Sales and Marketing (March 1997-December 2007), Director (March 1987-December 2007) and Manager of Private Client Services (June 1985-June 2005) of A.G. Edwards & Sons, Inc. (broker/dealer and investment firm); Chairman and Chief Executive Officer of A.G. Edwards Trust Company, FSB (March 2001-December 2007); President and Vice Chairman of A.G. Edwards Trust Company, FSB (investment adviser) (April 1987-March 2001); President of A.G. Edwards Trust Company, FSB (investment adviser) (June 2005-December 2007). Oversees 38 portfolios in the OppenheimerFunds complex. Mr. Grabish has served on the Boards of certain Oppenheimer funds since 2001, during which time he has become familiar with the Fund’s (and other Oppenheimer funds’) financial, accounting, regulatory and investment matters and has contributed to the Boards’ deliberations. |
| |
Beverly L. Hamilton, Trustee (since 2002) Year of Birth: 1946 | | Trustee of Monterey Institute for International Studies (educational organization) (since February 2000); Board Member of Middlebury College (educational organization) (December 2005-June 2011); Chairman (since 2010) of American Funds’ Emerging Markets Growth Fund, Inc. (mutual fund); Director of The California Endowment (philanthropic organization) (April 2002-April 2008); Director (February 2002-2005) and Chairman of Trustees (2006-2007) of the Community Hospital of Monterey Peninsula; Director (October 1991-2005); Vice Chairman (2006-2009) of American Funds’ Emerging Markets Growth Fund, Inc. (mutual fund); President of ARCO Investment Management Company (February 1991-April 2000); Member of the investment committees of The Rockefeller Foundation (2001-2006) and The University of Michigan (since 2000); Advisor at Credit Suisse First Boston’s Sprout venture capital unit (venture capital fund) (1994-January 2005); Trustee of MassMutual Institutional Funds (investment company) (1996-June 2004); Trustee of MML Series Investment Fund (investment company) (April 1989-June 2004); Member of the investment committee of Hartford Hospital (2000-2003); and Advisor to Unilever (Holland) pension fund (2000-2003). Oversees 38 portfolios in the OppenheimerFunds complex. Ms. Hamilton has served on the Boards of certain Oppenheimer funds since 2002, during which time she has become familiar with the Fund’s (and other Oppenheimer funds’) financial, accounting, regulatory and investment matters and has contributed to the Boards’ deliberations. |
| |
Victoria J. Herget, Trustee (since 2012) Year of Birth:1951 | | Board Chair (2008-Present) and Director (2004-Present), United Educators (insurance company); Trustee (since 2000) and Chair (since 2010), Newberry Library (independent research library); Trustee, Mather LifeWays (senior living organization) (since 2001); Independent Director of the First American Funds (mutual fund family) (2003-2011); former Managing Director (1993-2001), Principal (1985-1993), Vice President (1978-1985) and Assistant Vice President (1973-1978) of Zurich Scudder Investments (investment adviser) (and its predecessor firms); Trustee (1992-2007), Chair of the Board of Trustees (1999-2007), Investment Committee Chair (1994-1999) and Investment Committee member (2007-2010) of Wellesley College; Trustee, BoardSource (non-profit organization) (2006-2009) and Chicago City Day School (K-8 School) (1994-2005). Oversees 38 portfolios in the OppenheimerFunds complex. Ms. Herget has served on the Boards of certain Oppenheimer funds since 2012, during which time she has become familiar with the Fund’s (and other Oppenheimer funds’) financial, accounting, regulatory and investment matters and has contributed to the Boards’ deliberations. |
| |
Robert J. Malone, Trustee (since 2002) Year of Birth: 1944 | | Chairman of the Board (since 2012) and Director (since August 2005) of Jones International University (educational organization); Chairman, Chief Executive Officer and Director of Steele Street Bank Trust (commercial banking) (since August 2003); Trustee of the Gallagher Family Foundation (non-profit organization) (since 2000); Board of Directors of Opera Colorado Foundation (non-profit organization) (2008-2012); Director of Colorado UpLIFT (charitable organization) (1986-2010); Director of Jones Knowledge, Inc. (2006-2010); Former Chairman of U.S. Bank-Colorado (subsidiary of U.S. Bancorp and formerly Colorado National Bank) (July 1996-April 1999); Director of Commercial Assets, Inc. (real estate investment trust) (1993-2000); Director of U.S. Exploration, Inc. (oil and gas exploration) (1997-February 2004); Chairman of the Board (1991-1994) and Trustee (1985-1994) of Regis University; and Chairman of the Board (1990-1991 and Trustee (1984-1999) of Young Presidents Organization. Oversees 38 portfolios in the OppenheimerFunds complex. Mr. Malone has served on the Boards of certain Oppenheimer funds since 2002, during which time he has become familiar with the Fund’s (and other Oppenheimer funds’) financial, accounting, regulatory and investment matters and has contributed to the Boards’ deliberations. |
35 OPPENHEIMER CORE BOND FUND/VA
|
| TRUSTEES AND OFFICERS Unaudited / Continued |
|
|
| | |
F. William Marshall, Jr., Trustee (since 2000) Year of Birth: 1942 | | Trustee Emeritus of Worcester Polytech Institute (WPI) (private university) (since 2009); Trustee of MassMutual Select Funds (formerly MassMutual Institutional Funds) (investment company) (since 1996), MML Series Investment Fund (investment company) (since 1996) and Mass Mutual Premier Funds (investment company) (since January 2012); President and Treasurer of the SIS Fund (private charitable fund) (January 1999 – March 2011); Former Trustee of WPI (1985-2008); Former Chairman of the Board (2004-2006) and Former Chairman of the Investment Committee of WPI (1994-2008); Chairman of SIS & Family Bank, F.S.B. (formerly SIS Bank) (commercial bank) (January 1999-July 1999); Executive Vice President of Peoples Heritage Financial Group, Inc. (commercial bank) (January 1999-July 1999); and Former President and Chief Executive Officer of SIS Bancorp. (1993-1999). Oversees 42 portfolios in the OppenheimerFunds complex. Mr. Marshall has served on the Boards of certain Oppenheimer funds since 2000, during which time he has become familiar with the Fund’s (and other Oppenheimer funds’) financial, accounting, regulatory and investment matters and has contributed to the Boards’ deliberations. |
| |
Karen L. Stuckey, Trustee (since 2012) Year of Birth: 1953 | | Partner (1990-2012) of PricewaterhouseCoopers LLP (professional services firm) (held various positions 1975- 1990); Trustee (1992-2006) and member of Executive, Nominating and Audit Committees and Chair of Finance Committee of Lehigh University; and member, Women���s Investment Management Forum (professional organization) since inception. Oversees 38 portfolios in the OppenheimerFunds complex. Ms. Stuckey has served on the Boards of certain Oppenheimer funds since 2012, during which time she has become familiar with the Fund’s (and other Oppenheimer funds’) financial, accounting, regulatory and investment matters and has contributed to the Boards’ deliberations. |
| |
James D. Vaughn, Trustee (since 2012) Year of Birth: 1945 | | Retired; former managing partner (1994-2001) of Denver office of Deloitte & Touche LLP, (held various positions 1969-1993); Trustee and Chairman of the Audit Committee of Schroder Funds (2003-2012); Board member and Chairman of Audit Committee of AMG National Trust Bank (since 2005); Trustee and Investment Committee member, University of South Dakota Foundation (since 1996); Board member, Audit Committee Member and past Board Chair, Junior Achievement (since 1993); former Board member, Mile High United Way, Boys and Girls Clubs, Boy Scouts, Colorado Business Committee for the Arts, Economic Club of Colorado and Metro Denver Network. Oversees 38 portfolios in the OppenheimerFunds complex. Mr. Vaughn has served on the Boards of certain Oppenheimer funds since 2012, during which time he has become familiar with the Fund’s (and other Oppenheimer funds’) financial, accounting, regulatory and investment matters and has contributed to the Boards’ deliberations. |
| |
INTERESTED TRUSTEE | | Mr. Glavin is an “Interested Trustee” because he is affiliated with the Manager and the Sub-Adviser by virtue of his positions as director of the Sub-Adviser, and as a shareholder of the Sub-Adviser’s parent company. As a Trustee, he serves for an indefinite term, or until his resignation, retirement, death or removal. Mr. Glavin’s address is 225 Liberty Street, 11th Floor, New York, New York 10281-1008. |
| |
William F. Glavin, Jr., Trustee (since 2009) Year of Birth: 1958 | | Chairman of the Sub-Adviser (July 2014-December 2014 and December 2009-December 2012) and Director of the Sub-Adviser (since January 2009); Chairman, Director and Chief Executive Officer (January 2013-June 2014) of the Manager; President of the Manager (January 2013-May 2013); Chief Executive Officer (January 2009-December 2012); President of the Sub-Adviser (May 2009-December 2012); Management Director (June 2009-June 2014), President (December 2009-June 2014) and Chief Executive Officer (January 2011-June 2014) of Oppenheimer Acquisition Corp. (“OAC”) (the Sub-Adviser’s parent holding company); Director of Oppenheimer Real Asset Management, Inc. (March 2010-June 2014); Executive Vice President (March 2006-February 2009) and Chief Operating Officer (July 2007-February 2009) of Massachusetts Mutual Life Insurance Company (OAC’s parent company); Director (May 2004-March 2006) and Chief Operating Officer and Chief Compliance Officer (May 2004-January 2005), President (January 2005-March 2006) and Chief Executive Officer (June 2005-March 2006) of Babson Capital Management LLC; Director (March 2005-March 2006), President (May 2003-March 2006) and Chief Compliance Officer (July 2005-March 2006) of Babson Capital Securities, Inc. (a broker-dealer); President (May 2003-March 2006) of Babson Investment Company, Inc.; Director (May 2004-August 2006) of Babson Capital Europe Limited; Director (May 2004-October 2006) of Babson Capital Guernsey Limited; Director (May 2004-March 2006) of Babson Capital Management LLC; Non-Executive Director (March 2005-March 2007) of Baring Asset Management Limited; Director (February 2005-June 2006) Baring Pension Trustees Limited; Director and Treasurer (December 2003-November 2006) of Charter Oak Capital Management, Inc.; Director (May 2006-September 2006) of C.M. Benefit Insurance Company; Director (May 2008-June 2009) and Executive Vice President (June 2007-July 2009) of C.M. Life Insurance Company; President (March 2006-May 2007) of MassMutual Assignment Company; Director (January 2005-December 2006), Deputy Chairman (March 2005-December 2006) and President (February 2005-March 2005) of MassMutual Holdings (Bermuda) Limited; Director (May 2008-June 2009) and Executive Vice President (June 2007-July 2009) of MML Bay State Life Insurance Company; Chief Executive Officer and President (April 2007-January 2009) of MML Distributors, LLC; and Chairman (March 2006-December 2008) and Chief Executive Officer (May 2007-December 2008) of MML Investors Services, Inc. An officer of 91 portfolios in the OppenheimerFunds complex. Mr. Glavin has served on the Boards of certain Oppenheimer funds since December 2009, during which time he has become familiar with the Fund’s (and other Oppenheimer funds’) financial, accounting, regulatory and investment matters and has contributed to the Boards’ deliberations. |
| |
OTHER OFFICERS OF THE FUND | | The addresses of the Officers in the chart below are as follows: for Messrs. Memani, Strzalkowski, Steinmetz, Gabinet, Mss. Sexton and Picciotto, 225 Liberty Street, New York, New York 10281-1008, for Mr. Wixted, 6803 S. Tucson Way, Centennial, Colorado 80112-3924. Each Officer serves for an indefinite term or until his or her resignation, retirement, death or removal. |
36 OPPENHEIMER CORE BOND FUND/VA
| | |
Krishna Memani, Vice President (since 2009) Year of Birth: 1960 | | President of the Sub-Adviser (since January 2013); Executive Vice President of the Manager (since January 2014) and Chief Investment Officer of the OppenheimerFunds advisory entities (since January 2014). Chief Investment Officer, Fixed Income of the Sub-Adviser (January 2013-December 2013); Head of the Investment Grade Fixed Income Team of the Sub-Adviser (March 2009-January 2014); Director of Fixed Income of the Sub-Adviser (October 2010-December 2012); Senior Vice President of the Sub-Adviser (March 2009-December 2012) and Senior Vice President of OFI Global Institutional, Inc. (April 2009-December 2012). Managing Director and Head of the U.S. and European Credit Analyst Team at Deutsche Bank Securities (June 2006-January 2009). Chief Credit Strategist at Credit Suisse Securities (August 2002-March 2006). Managing Director and Senior Portfolio Manager at Putnam Investments (September 1998-June 2002). A portfolio manager and an officer of other portfolios in the OppenheimerFunds complex. |
| |
Peter A. Strzalkowski, Vice President (since 2009) Year of Birth: 1965 | | Vice President and Senior Portfolio Manager of the Sub-Adviser (since August 2007) and co-Team Leader for the Sub-Adviser’s Investment Grade Fixed Income Team (since January 2014). A member of the Sub-Adviser’s Investment Grade Fixed Income Team (April 2009-January 2014). Managing Partner and Chief Investment Officer of Vector Capital Management, LLC, a structured products money management firm he founded, (July 2006-August 2007). Senior Portfolio Manager at Highland Capital Management, L.P. (June 2005-July 2006) and a Senior Fixed Income Portfolio Manager at Microsoft Corp. (June 2003-June 2005). Vice President and Senior Fixed Income Portfolio Manager at First Citizens Bank Trust, Capital Management Group (April 2000-June 2003) and a Vice President and Fixed Income Portfolio Manager at Centura Banks (November 1998-April 2000). A portfolio manager and officer of other portfolios in the OppenheimerFunds complex. |
| |
Arthur P. Steinmetz, President and Principal Executive Officer (since 2014) Year of Birth: 1958 | | Chairman of the Sub-Adviser (since January 2015); CEO and Chairman of the Manager (since July 2014), President of the Manager (since May 2013), a Director of the Manager (since January 2013), Director of the Sub-Adviser (since July 2014), President, Management Director and CEO of Oppenheimer Acquisition Corp. (the Sub-Adviser’s parent holding company) (since July 2014), and President and Director of OFI SteelPath, Inc. (since January 2013). Chief Investment Officer of the OppenheimerFunds advisory entities from (January 2013-December 2013); Executive Vice President of the Manager (January 2013-May 2013); Chief Investment Officer of the Sub-Adviser (October 2010-December 2012); Chief Investment Officer, Fixed-Income, of the Sub-Adviser (April 2009-October 2010); Executive Vice President of the Sub-Adviser (October 2009-December 2012); Director of Fixed Income of the Sub-Adviser (January 2009-April 2009); and a Senior Vice President of the Sub-Adviser (March 1993-September 2009). An officer of 91 portfolios in the OppenheimerFunds complex. |
| |
Arthur S. Gabinet, Secretary and Chief Legal Officer (since 2011) Year of Birth: 1958 | | Executive Vice President, Secretary and General Counsel of the Manager (since January 2013); General Counsel OFI SteelPath, Inc. (since January 2013); Executive Vice President (May 2010-December 2012) and General Counsel (since January 2011) of the Sub-Adviser; General Counsel of the Distributor (since January 2011); General Counsel of Centennial Asset Management Corporation (January 2011-December 2012); Executive Vice President (January 2011-December 2012) and General Counsel of HarbourView Asset Management Corporation (since January 2011); Assistant Secretary (since January 2011) and Director (since January 2011) of OppenheimerFunds International Ltd. and OppenheimerFunds plc; Director of Oppenheimer Real Asset Management, Inc. (January 2011-December 2012) and General Counsel (since January 2011); Executive Vice President (January 2011-December 2011) and General Counsel of Shareholder Financial Services, Inc. and Shareholder Services, Inc. (since January 2011); Executive Vice President (January 2011-December 2012) and General Counsel of OFI Private Investments Inc. (since January 2011); Vice President of OppenheimerFunds Legacy Program (January 2011-December 2011); Executive Vice President (January 2011-December 2012) and General Counsel of OFI Institutional Asset Management, Inc. (since January 2011); General Counsel, Asset Management of the Sub-Adviser (May 2010-December 2010); Principal, The Vanguard Group (November 2005-April 2010); District Administrator, U.S. Securities and Exchange Commission (January 2003-October 2005). An officer of 91 portfolios in the OppenheimerFunds complex. |
| |
Jennifer Sexton, Vice President and Chief Business Officer (since 2014) Year of Birth: 1969 | | Senior Vice President of OppenheimerFunds Distributor, Inc. (since June 2014); Vice President of OppenheimerFunds Distributor, Inc. (April 2006-June 2014); Vice President of the Sub-Adviser (January 1998-March 2006); Assistant Vice President of the Sub-Adviser (October 1991-December 1998). An officer of 91 portfolios in the OppenheimerFunds complex. |
| |
Mary Ann Picciotto, Chief Compliance Officer and Chief Anti-Money Laundering Officer (since 2014) Year of Birth: 1973 | | Senior Vice President and Chief Compliance Officer of the Manager (since March 2014); Chief Compliance Officer of the Sub-Adviser, OFI SteelPath, Inc., OFI Global Trust Company, OFI Global Institutional, Inc., Oppenheimer Real Asset Management, Inc., OFI Private Investments, Inc., Harborview Asset Management Corporation, Trinity Investment Management Corporation, and Shareholder Services, Inc. (since March 2014); Managing Director of Morgan Stanley Investment Management Inc. and certain of its various affiliated entities; Chief Compliance Officer of various Morgan Stanley Funds (May 2010-January 2014); Chief Compliance Officer of Morgan Stanley Investment Management Inc. (April 2007-January 2014). An officer of 91 portfolios in the OppenheimerFunds complex. |
| |
Brian W. Wixted, Treasurer and Principal Financial & Accounting Officer (since 1999) Year of Birth: 1959 | | Senior Vice President of the Manager (since January 2013); Treasurer of the Sub-Adviser, HarbourView Asset Management Corporation, Shareholder Financial Services, Inc., Shareholder Services, Inc., and Oppenheimer Real Asset Management, Inc. (March 1999-June 2008), OFI Private Investments, Inc. (March 2000-June 2008), OppenheimerFunds International Ltd. and OppenheimerFunds plc (since May 2000), OFI Institutional Asset Management, Inc. (November 2000-June 2008), and OppenheimerFunds Legacy Program (charitable trust program established by the Sub-Adviser) (June 2003-December 2011); Treasurer and Chief Financial Officer of OFI Trust Company (since May 2000); Assistant Treasurer of Oppenheimer Acquisition Corporation (March 1999-June 2008). An officer of 91 portfolios in the OppenheimerFunds complex. |
The Fund’s Statement of Additional Information contains additional information about the Fund’s Trustees and Officers and is available without charge, upon request, by calling 1.800.988.8287.
37 OPPENHEIMER CORE BOND FUND/VA
THIS PAGE INTENTIONALLY LEFT BLANK.
38 OPPENHEIMER CORE BOND FUND/VA
THIS PAGE INTENTIONALLY LEFT BLANK.
39 OPPENHEIMER CORE BOND FUND/VA
OPPENHEIMER CORE BOND FUND/VA
A Series of Oppenheimer Variable Account Funds
| | |
| Manager | | OFI Global Asset Management, Inc. |
| |
| Sub-Adviser | | OppenheimerFunds, Inc. |
| |
| Distributor | | OppenheimerFunds Distributor, Inc. |
| |
Transfer and Shareholder Servicing Agent | | OFI Global Asset Management, Inc. |
| |
| Sub-Transfer Agent | | Shareholder Services, Inc. |
| | DBA OppenheimerFunds Services |
| |
Independent Registered Public Accounting Firm | | KPMG LLP |
| |
| Counsel | | K&L Gates LLP |
| |
| | Before investing in any of the Oppenheimer funds, investors should carefully consider a fund’s investment objectives, risks, charges and expenses. Fund prospectuses and summary prospectuses contain this and other information about the funds, and may be obtained by asking your financial advisor, or calling us at 1.800.988.8287. Read prospectuses and summary prospectuses carefully before investing. |
| |
| | © 2015 OppenheimerFunds, Inc. All rights reserved. Oppenheimer funds are distributed by OppenheimerFunds Distributor, Inc. |

ANNUAL REPORT
Listing of Top Holdings
Fund Performance Discussion
Financial Statements
PORTFOLIO MANAGER: Rajeev Bhaman, CFA
AVERAGE ANNUAL TOTAL RETURNS FOR THE PERIODS ENDED 12/31/14
| | | | | | | | |
| | | Inception Date | | 1-Year | | 5-Year | | 10-Year |
Non-Service Shares | | 11/12/90 | | 2.29% | | 10.93% | | 7.22% |
Service Shares | | 7/13/00 | | 2.06 | | 10.65 | | 6.96 |
MSCI All Country World Index | | | | 4.16 | | 9.17 | | 6.09 |
Performance data quoted represents past performance, which does not guarantee future results. The investment return and principal value of an investment in the Fund will fluctuate so that an investor’s shares, when redeemed, may be worth more or less than their original cost. Current performance may be lower or higher than the performance quoted. For performance data current to the most recent month end, call us at 1.800.988.8287. The Fund’s total returns should not be expected to be the same as the returns of other funds, whether or not both funds have the same portfolio managers and/or similar names. The Fund’s total returns include changes in share price and reinvested distributions but do not include the charges associated with the separate account products that offer this Fund. Such performance would have been lower if such charges were taken into account.
TOP TEN COMMON STOCK HOLDINGS
| | |
Telefonaktiebolaget LM Ericsson, Cl. B | | 2.6% |
McGraw Hill Financial, Inc. | | 2.5 |
Walt Disney Co. (The) | | 2.3 |
eBay, Inc. | | 2.3 |
Citigroup, Inc. | | 2.1 |
Colgate-Palmolive Co. | | 2.0 |
Murata Manufacturing Co. Ltd. | | 1.9 |
Aetna, Inc. | | 1.9 |
Altera Corp. | | 1.9 |
Anthem, Inc. | | 1.8 |
Portfolio holdings and allocations are subject to change. Percentages are as of December 31, 2014, and are based on net assets. For more current Fund holdings, please visit oppenheimerfunds.com.
REGIONAL ALLOCATION
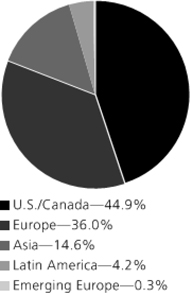
Portfolio holdings and allocations are subject to change. Percentages are as of December 31, 2014, and are based on the total market value of investments.
2 OPPENHEIMER GLOBAL FUND/VA
Fund Performance Discussion
The Fund’s Non-Service shares produced a return of 2.29% during the reporting period, underperforming the MSCI All Country World Index (the “Index”), which returned 4.16%. The Fund’s underperformance stemmed primarily from weaker relative stock selection in the financials, industrials and consumer discretionary sectors. The strongest outperforming sectors for the Fund were health care, where both stock selection and an overweight position contributed, and energy, where we have a systemic underweight position.
MARKET OVERVIEW
Domestic equities were among the top performing asset classes in 2014, outperforming foreign equities, including those domiciled in Europe, Japan and emerging markets. In the U.S., the Federal Reserve (the “Fed”) began tapering its most recent quantitative easing (“QE”) program in January 2014 and completed the process at the end of October, thereby ending the program’s purchases. The Fed reduced its monthly bond purchases in steady $10 billion increments, which helped reduce market volatility and enabled investors to prepare for a post-QE market environment. Although data in the U.S. softened for the first quarter, partially attributed to cold weather effects across much of the country, it was positive in the second and third quarters of 2014, with Gross Domestic Product (“GDP”) growing at 4.6% and an estimated 5.0%, respectively.
Outside of the U.S., the positive data points that had emerged in Europe in 2013 and early 2014 largely reversed themselves later in the reporting period and the European Central Bank (the “ECB”) came under even greater pressure to provide a credible plan to boost growth and avoid deflation. In response, the ECB adopted a number of policies designed to stimulate growth. In Japan, which has been mired in economic weakness for years, the Abe administration has adopted even more aggressive economic policies with the Bank of Japan (the “BoJ”) executing a massive QE program. However, the results have not been particularly impressive, with that economy slipping back into recession in the third quarter of 2014 following the consumption tax increase. Emerging markets’ economic growth was mixed, as certain regions such as Eastern Europe and the Middle East remained burdened by geopolitical turmoil. Many commodity producing emerging market economies also struggled as prices for most commodities fell. Countries such as India and Indonesia have benefited from business-friendly new administrations.
While we do not disregard macro events, our main focus tends to be on the microeconomic characteristics of individual companies and their valuations. Regardless of how macro events unfold, we believe companies with strong, durable, economic traits, purchased at sensible prices are likely to have good long-run return structures. We don’t construct portfolios to be optimized for specific predictions of the economic environment. We seek to hold a portfolio of investments that is robust in a wide array of environments. In effect, we seek to be a Fund for all seasons.
TOP INDIVIDUAL CONTRIBUTORS
Top contributors to performance this reporting period included ICICI Bank Ltd., Allergan, Inc. and Anthem, Inc. ICICI Bank is the largest private sector bank in India, a country where about half the banking sector is state-owned. In an environment where the public sector banks are inadequately capitalized for the level of non-performing loans on their books and the government’s ability to continually inject new capital is impaired as a result of its financial position, ICICI has the potential to grow faster than the market with less competition. Both assets and liabilities can grow, and with growth in the economy accelerating over the next few years, asset quality improvements should also add to earnings. A new government headed by Narendra Modi as Prime Minister with a very broad popular mandate for change has led to optimism and good performance for the Indian stock market. Allergan is a leading maker of eye care, skin care and aesthetic products, including Botox. While Allergan has outgrown the pharmaceutical industry over a long period of time, the recent surge in its stock price was a result of a takeover attempt by Valeant which was repulsed and a subsequent agreement to be taken over by Actavis. Our investment thesis on health benefit company Anthem (formerly called WellPoint) was predicated on our belief that the company would be part of the solution to rising healthcare costs, and that Obamacare would not supplant the entire private insurance market. Furthermore, we thought that the growth of the numbers of people entering the insured space as coverage was made broadly universal would add to both revenues and profits. This proved to be correct. In a consolidating industry, we believe Anthem’s scale and cost advantage should enable it to be one of the few survivors.
TOP INDIVIDUAL DETRACTORS
Top detractors from performance this reporting period included Airbus Group NV, Deutsche Bank AG and Technip SA. Airbus Group and Boeing constitute a global duopoly in the large jet airplane market. It has a product refresh coming with the re-engining of both its single aisle A320 and dual aisle A330 products that we believe has the potential to improve profitability over the next several years. The newest Airbus product, the Airbus A350 was delivered to its first customer, Qatar Airways, just before the year end. Concerns about the near-term impact on margins of these developments led to a pullback in the shares after
3 OPPENHEIMER GLOBAL FUND/VA
a strong run of performance. We continue to believe that the industry construct combined with approximately nine years of backlog make the shares an attractive proposition at this time. Moreover, a lower oil price should boost airline profitability and passenger traffic, which is a positive for Airbus.
Continued prosecutorial activism and litigation activity has led to the financial industry paying significant fines for past transgressions. Heightened concerns about the persistence of such fines and their increasing magnitude have led to worries about the adequacy of capital at global investment banks in particular. This, combined with low levels of market activity that detracted from profits, led to Deutsche Bank’s underperformance. During the reporting period, Deutsche Bank raised over $10 billion in fresh capital, increasing its equity level significantly. In our opinion, the stock is trading at attractive valuations. Technip is a supplier of critical parts and services to the oil and gas industry. It is one of the three world leaders in underwater construction of oil and gas production facilities; it is the world’s largest manufacturer of flexible pipe; and it is the world leader in the liquefaction of natural gas. Technip’s share price has been buffeted by a number of things in the reporting period, including developments in Russia, where it has a meaningful project underway, concerns about the capital spending plans of the major oil companies, and lower margin guidance for its subsea segment. However, the company has a very substantial backlog of projects, and we do not see this changing. In our opinion, Technip is a best-in-class supplier of critical services to key areas of the oil and gas industry and is positioned to benefit from the world’s continuing demand for energy. The company is meaningfully undervalued, in our opinion.
STRATEGY
The Fund is a long-term, growth oriented investment portfolio. We use a bottom-up, fundamental approach combined with an understanding of longer-term macroeconomic trends in seeking to identify the high-quality companies with superior, sustainable characteristics, which we favor. We seek to add value via our individual stock selection, and make no effort to mimic Index weights for industries, sectors, regions or countries. Valuation is critical to our investment decisions. Assuming we properly understand a given set of business economics, our return structure is principally a function of paying an appropriate price for the growth and returns inherent in a company.
Investors should consider the Fund’s investment objective, risks, charges and expenses carefully before investing. The Fund’s prospectus and summary prospectus contain this and other information about the Fund, and may be obtained by asking your financial advisor or calling us at 1.800.988.8287. Read prospectuses and summary prospectuses carefully before investing.
Total returns include changes in share price and reinvestment of dividends and capital gains distributions in a hypothetical investment for the periods shown.
The Fund’s investment strategy and focus can change over time. The mention of specific fund holdings does not constitute a recommendation by OppenheimerFunds, Inc. or its affiliates.
Shares of Oppenheimer funds are not deposits or obligations of any bank, are not guaranteed by any bank, are not insured by the FDIC or any other agency, and involve investment risks, including the possible loss of the principal amount invested.
Comparing the Fund’s Performance to the Market. The graphs that follow show the performance of a hypothetical $10,000 investment in each share class of the Fund held until December 31, 2014. In the case of Non-Service shares and Service shares, performance is measured over a ten-fiscal-year period. Performance information does not reflect charges that apply to separate accounts investing in the Fund. If these charges were taken into account, performance would be lower. The graphs assume that all dividends and capital gains distributions were reinvested in additional shares.
The Fund’s performance is compared to the performance of the MSCI All Country World Index, a free float-adjusted market capitalization weighted index that is designed to measure the equity market performance of developed and emerging markets. The Index is unmanaged and cannot be purchased directly by investors. While index comparisons may be useful to provide a benchmark for the Fund’s performance, it must be noted that the Fund’s investments are not limited to the investments comprising the Index. Index performance includes reinvestment of income, but does not reflect transaction costs, fees, expenses or taxes. Index performance is shown for illustrative purposes only as a benchmark for the Fund’s performance, and does not predict or depict performance of the Fund. The Fund’s performance reflects the effects of the Fund’s business and operating expenses.
4 OPPENHEIMER GLOBAL FUND/VA
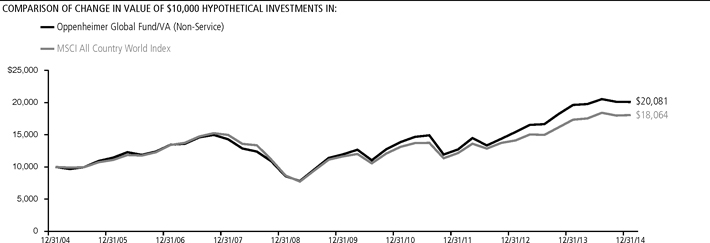
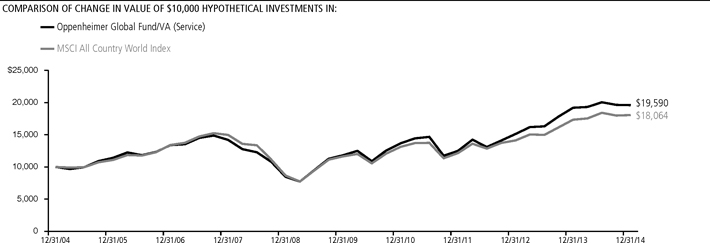
Performance data quoted represents past performance, which does not guarantee future results. The investment return and principal value of an investment in the Fund will fluctuate so that an investor’s shares, when redeemed, may be worth more or less than their original cost. Current performance may be lower or higher than the performance quoted. For performance data current to the most recent month end, call us at 1.800.988.8287. The Fund’s total returns should not be expected to be the same as the returns of other funds, whether or not both funds have the same portfolio managers and/or similar names. The Fund’s total returns include changes in share price and reinvested distributions but do not include the charges associated with the separate account products that offer this Fund. Such performance would have been lower if such charges were taken into account.
5 OPPENHEIMER GLOBAL FUND/VA
Fund Expenses
Fund Expenses. As a shareholder of the Fund, you incur two types of costs: (1) transaction costs and (2) ongoing costs, including management fees; distribution and service fees; and other Fund expenses. These examples are intended to help you understand your ongoing costs (in dollars) of investing in the Fund and to compare these costs with the ongoing costs of investing in other mutual funds.
The examples are based on an investment of $1,000.00 invested at the beginning of the period and held for the entire 6-month period ended December 31, 2014.
Actual Expenses. The first section of the table provides information about actual account values and actual expenses. You may use the information in this section for the class of shares you hold, together with the amount you invested, to estimate the expense that you paid over the period. Simply divide your account value by $1,000.00 (for example, an $8,600.00 account value divided by $1,000.00 = 8.60), then multiply the result by the number in the first section under the heading entitled “Expenses Paid During Period” to estimate the expenses you paid on your account during this period.
Hypothetical Example for Comparison Purposes.
The second section of the table provides information about hypothetical account values and hypothetical expenses based on the Fund’s actual expense ratio for each class of shares, and an assumed rate of return of 5% per year for each class before expenses, which is not the actual return. The hypothetical account values and expenses may not be used to estimate the actual ending account balance or expenses you paid for the period. You may use this information to compare the ongoing costs of investing in the Fund and other funds. To do so, compare this 5% hypothetical example for the class of shares you hold with the 5% hypothetical examples that appear in the shareholder reports of the other funds.
Please note that the expenses shown in the table are meant to highlight your ongoing costs only and do not reflect any charges associated with the separate accounts that offer this Fund. Therefore, the “hypothetical” lines of the table are useful in comparing ongoing costs only, and will not help you determine the relative total costs of owning different funds. In addition, if these separate account charges were included your costs would have been higher.
| | | | | | | | | | | | |
| Actual | | Beginning Account Value July 1, 2014 | | | Ending
Account
Value
December 31, 2014 | | | Expenses Paid During 6 Months Ended December 31, 2014 | |
Non-Service shares | | | $ 1,000.00 | | | | $ 978.20 | | | | $ 3.80 | |
Service shares | | | 1,000.00 | | | | 977.00 | | | | 5.05 | |
| | | |
Hypothetical (5% return before expenses) | | | | | | | | | |
Non-Service shares | | | 1,000.00 | | | | 1,021.37 | | | | 3.88 | |
Service shares | | | 1,000.00 | | | | 1,020.11 | | | | 5 ..16 | |
Expenses are equal to the Fund’s annualized expense ratio for that class, multiplied by the average account value over the period, multiplied by 184/365 (to reflect the one-half year period). Those annualized expense ratios, excluding indirect expenses from affiliated funds, based on the 6-month period ended December 31, 2014 are as follows:
| | | | | | |
| Class | | Expense Ratios | | | |
Non-Service shares | | | 0.76 | % | | |
Service shares | | | 1.01 | | | |
The expense ratios reflect voluntary and/or contractual waivers and/or reimbursements of expenses by the Fund’s Manager. Some of these undertakings may be modified or terminated at any time, as indicated in the Fund’s prospectus. The “Financial Highlights” tables in the Fund’s financial statements, included in this report, also show the gross expense ratios, without such waivers or reimbursements and reduction to custodian expenses, if applicable.
6 OPPENHEIMER GLOBAL FUND/VA
STATEMENT OF INVESTMENTS December 31, 2014
| | | | | | | | | | |
| | | Shares | | | Value | | | |
| | | |
Common Stocks—97.3% | | | | | | | |
| | | |
Consumer Discretionary—12.1% | | | | | | | |
|
Hotels, Restaurants & Leisure—1.3% | | | | | | | |
|
GTECH SpA | | | 581,820 | | | | $ 13,016,510 | | | |
| | | |
McDonald’s Corp. | | | 236,260 | | | | 22,137,562 | | | |
| | | | | | | | | | |
| | | | 35,154,072 | | | |
| |
| | | |
Internet & Catalog Retail—0.4% | | | | | | | |
| | | |
JD.com, Inc., ADR1 | | | 476,429 | | | | 11,024,567 | | | |
| |
| | | |
Media—3.1% | | | | | | | |
| | | |
Walt Disney Co. (The) | | | 663,610 | | | | 62,505,426 | | | |
| | | |
Zee Entertainment Enterprises Ltd. | | | 3,397,835 | | | | 20,403,595 | | | |
| | | | | | | | | | |
| | | | 82,909,021 | | | |
| |
| | | |
Specialty Retail—3.3% | | | | | | | |
| | | |
Inditex SA | | | 1,526,260 | | | | 43,731,837 | | | |
| | | |
Tiffany & Co. | | | 405,420 | | | | 43,323,181 | | | |
| | | | | | | | | | |
| | | | 87,055,018 | | | |
| |
| | | |
Textiles, Apparel & Luxury Goods—4.0% | | | |
| | | |
Brunello Cucinelli SpA | | | 78,468 | | | | 1,759,281 | | | |
| | | |
Hermes International | | | 13,826 | | | | 4,929,992 | | | |
| | | |
Kering | | | 222,460 | | | | 42,769,624 | | | |
| | | |
LVMH Moet Hennessy Louis Vuitton SA | | | 283,450 | | | | 44,823,095 | | | |
| | | |
Tod’s SpA | | | 160,490 | | | | 13,927,320 | | | |
| | | | | | | | | | |
| | | | 108,209,312 | | | |
| |
| | | |
Consumer Staples—6.1% | | | | | | | |
|
Beverages—1.4% | | | | | | | |
| | | |
Ambev S.A., ADR | | | 2,649,545 | | | | 16,480,170 | | | |
| | | |
Fomento Economico Mexicano SAB de CV, ADR1 | | | 221,125 | | | | 19,465,634 | | | |
| | | | | | | | | | |
| | | | 35,945,804 | | | |
| |
| | | |
Food Products—2.7% | | | | | | | |
| | | |
Nestle SA | | | 368,011 | | | | 26,975,774 | | | |
| | | |
Unilever plc | | | 1,120,643 | | | | 45,521,343 | | | |
| | | | | | | | | | |
| | | | 72,497,117 | | | |
| |
| | | |
Household Products—2.0% | | | | | | | |
| | | |
Colgate-Palmolive Co. | | | 784,700 | | | | 54,293,393 | | | |
| |
| | | |
Energy—1.6% | | | | | | | |
|
Energy Equipment & Services—1.0% | | | | | | | |
| | | |
Technip SA | | | 439,600 | | | | 26,250,124 | | | |
| |
| | | |
Oil, Gas & Consumable Fuels—0.6% | | | | | | | |
| | | |
Repsol SA | | | 889,699 | | | | 16,537,862 | | | |
| |
| | | |
Financials—22.2% | | | | | | | |
|
Capital Markets—5.3% | | | | | | | |
| | | |
Credit Suisse Group AG1 | | | 1,238,746 | | | | 31,053,907 | | | |
| | | |
Deutsche Bank AG | | | 690,614 | | | | 20,874,328 | | | |
| | | |
Goldman Sachs Group, Inc. (The) | | | 220,370 | | | | 42,714,317 | | | |
| | | |
UBS Group AG1 | | | 2,755,083 | | | | 47,359,051 | | | |
| | | | | | | | | | |
| | | | 142,001,603 | | | |
| |
| | | |
Commercial Banks—7.4% | | | | | | | |
| | | |
Banco Bilbao Vizcaya Argentaria SA | | | 3,144,096 | | | | 29,590,717 | | | |
| | | |
Citigroup, Inc. | | | 1,041,570 | | | | 56,359,353 | | | |
| | | |
ICICI Bank Ltd., Sponsored ADR | | | 4,048,550 | | | | 46,760,752 | | | |
| | | |
Itau Unibanco Holding SA, Preference, ADR | | | 1,798,274 | | | | 23,395,545 | | | |
| | | |
Societe Generale SA | | | 456,109 | | | | 19,166,292 | | | |
| | | |
Sumitomo Mitsui Financial Group, Inc. | | | 637,000 | | | | 23,016,404 | | | |
| | | | | | | | | | |
| | | | 198,289,063 | | | |
| |
| | | |
Diversified Financial Services—3.1% | | | | | | | |
| | | |
BM&FBovespa SA | | | 3,959,500 | | | | 14,667,849 | | | |
| | | |
FNFV Group1 | | | 78,900 | | | | 1,241,886 | | | |
| | | |
McGraw Hill Financial, Inc. | | | 748,090 | | | | 66,565,048 | | | |
| | | | | | | | | | |
| | | | 82,474,783 | | | |
| | | | | | | | |
| | | Shares | | | Value | |
| |
Insurance—5.5% | | | | | |
| |
Allianz SE | | | 274,207 | | | | $ 45,560,498 | |
| |
Dai-ichi Life Insurance Co. Ltd. (The) | | | 2,068,300 | | | | 31,385,851 | |
| |
FNF Group | | | 589,440 | | | | 20,306,208 | |
| |
Prudential plc | | | 2,131,387 | | | | 49,047,778 | |
| | | | | | | | |
| | | | 146,300,335 | |
|
| |
Real Estate Management & Development—0.9% | |
| |
DLF Ltd. | | | 11,744,039 | | | | 25,234,915 | |
|
| |
Health Care—17.1% | | | | | |
| |
Biotechnology—6.8% | | | | | |
| |
Biogen Idec, Inc.1 | | | 70,770 | | | | 24,022,876 | |
| |
BioMarin Pharmaceutical, Inc.1 | | | 208,170 | | | | 18,818,568 | |
| |
Bluebird Bio, Inc.1 | | | 77,630 | | | | 7,120,224 | |
| |
Celldex Therapeutics, Inc.1 | | | 1,205,150 | | | | 21,993,987 | |
| |
Circassia Pharmaceuticals plc1 | | | 2,706,070 | | | | 11,683,562 | |
| |
Clovis Oncology, Inc.1 | | | 253,630 | | | | 14,203,280 | |
| |
Gilead Sciences, Inc.1 | | | 357,460 | | | | 33,694,180 | |
| |
Medivation, Inc.1 | | | 131,590 | | | | 13,107,680 | |
| |
Vertex Pharmaceuticals, Inc.1 | | | 305,830 | | | | 36,332,604 | |
| | | | | | | | |
| | | | 180,976,961 | |
|
| |
Health Care Equipment & Supplies—1.8% | | | | | |
| |
St. Jude Medical, Inc. | | | 266,940 | | | | 17,359,108 | |
| |
Zimmer Holdings, Inc. | | | 279,440 | | | | 31,694,085 | |
| | | | | | | | |
| | | | 49,053,193 | |
|
| |
Health Care Providers & Services—3.7% | | | | | |
| |
Aetna, Inc. | | | 557,640 | | | | 49,535,161 | |
| |
Anthem, Inc. | | | 390,545 | | | | 49,079,790 | |
| | | | | | | | |
| | | | 98,614,951 | |
|
| |
Pharmaceuticals—4.8% | | | | | |
| |
Allergan, Inc. | | | 118,740 | | | | 25,242,937 | |
| |
Bayer AG | | | 312,130 | | | | 42,671,103 | |
| |
Roche Holding AG | | | 116,615 | | | | 31,607,384 | |
| |
Shire plc | | | 230,360 | | | | 16,298,711 | |
| |
Theravance Biopharma, Inc.1 | | | 157,022 | | | | 2,342,768 | |
| |
Theravance, Inc. | | | 622,260 | | | | 8,804,979 | |
| | | | | | | | |
| | | | 126,967,882 | |
|
| |
Industrials—12.0% | | | | | |
| |
Aerospace & Defense—2.6% | | | | | |
| |
Airbus Group NV | | | 912,360 | | | | 45,314,371 | |
| |
Embraer SA, Sponsored ADR | | | 635,873 | | | | 23,438,279 | |
| | | | | | | | |
| | | | 68,752,650 | |
|
| |
Air Freight & Couriers—1.3% | | | | | |
| |
United Parcel Service, Inc., Cl. B | | | 310,660 | | | | 34,536,072 | |
|
| |
Building Products—1.6% | | | | | |
| |
Assa Abloy AB, Cl. B | | | 796,498 | | | | 42,092,450 | |
|
| |
Construction & Engineering—0.4% | | | | | |
| |
FLSmidth & Co. AS | | | 252,508 | | | | 11,076,702 | |
|
| |
Electrical Equipment—2.5% | | | | | |
| |
Emerson Electric Co. | | | 375,050 | | | | 23,151,836 | |
| |
Nidec Corp. | | | 555,400 | | | | 36,024,640 | |
| |
Prysmian SpA | | | 500,635 | | | | 9,112,158 | |
| | | | | | | | |
| | | | 68,288,634 | |
|
| |
Industrial Conglomerates—2.9% | | | | | |
| |
3M Co. | | | 248,020 | | | | 40,754,646 | |
| |
Seibu Holdings, Inc. | | | 346,100 | | | | 7,061,119 | |
| |
Siemens AG | | | 263,918 | | | | 29,930,992 | |
| | | | | | | | |
| | | | 77,746,757 | |
|
| |
Machinery—0.7% | | | | | |
| |
FANUC Corp. | | | 106,700 | | | | 17,609,622 | |
7 OPPENHEIMER GLOBAL FUND/VA
STATEMENT OF INVESTMENTS Continued
| | | | | | | | | | |
| | | Shares | | | Value | | | |
| | | |
Information Technology—23.0% | | | | | | | |
| | | |
Communications Equipment—2.6% | | | | | | | |
| | | |
| Telefonaktiebolaget LM Ericsson, Cl. B | | | 5,707,074 | | | | $ 69,118,019 | | | |
| |
| | | |
Electronic Equipment, Instruments, & Components—4.5% | | | |
| | | |
Keyence Corp. | | | 92,711 | | | | 41,065,214 | | | |
| | | |
Kyocera Corp. | | | 609,800 | | | | 27,949,451 | | | |
| | | |
Murata Manufacturing Co. Ltd. | | | 475,300 | | | | 51,918,691 | | | |
| | | | | | | | | | |
| | | | 120,933,356 | | | |
| |
| | | |
Internet Software & Services—6.8% | | | |
| | | |
Alibaba Group Holding Ltd., Sponsored ADR1 | | | 52,800 | | | | 5,488,032 | | | |
| | | |
eBay, Inc.1 | | | 1,072,340 | | | | 60,179,721 | | | |
| | | |
Facebook, Inc., Cl. A1 | | | 530,880 | | | | 41,419,257 | | | |
| | | |
Google, Inc., Cl. A1 | | | 69,600 | | | | 36,933,936 | | | |
| | | |
Google, Inc., Cl. C1 | | | 69,600 | | | | 36,637,440 | | | |
| | | | | | | | | | |
| | | | 180,658,386 | | | |
| |
| | | |
IT Services—0.2% | | | | | | | | | | |
| | | |
Earthport plc1 | | | 6,163,219 | | | | 4,206,138 | | | |
| | | |
Semiconductors & Semiconductor Equipment—3.5% | | | |
| | | |
Altera Corp. | | | 1,352,940 | | | | 49,977,604 | | | |
| | | |
Maxim Integrated Products, Inc. | | | 1,403,385 | | | | 44,725,880 | | | |
| | | | | | | | | | |
| | | | 94,703,484 | | | |
| |
| | | |
Software—5.4% | | | | | | | | | | |
| | | |
Adobe Systems, Inc.1 | | | 665,013 | | | | 48,346,445 | | | |
| | | |
Intuit, Inc. | | | 525,390 | | | | 48,435,704 | | | |
| | | |
SAP SE | | | 685,011 | | | | 48,434,031 | | | |
| | | | | | | | | | |
| | | | 145,216,180 | | | |
| |
| | | |
Materials—1.6% | | | | | | | | | | |
| | | |
Chemicals—1.0% | | | | | | | | | | |
| | | |
Linde AG | | | 146,415 | | | | 27,309,287 | | | |
| | | | | | | | |
| | | Shares | | | Value | |
| |
| Metals & Mining—0.6% | | | | | | | | |
| |
Alrosa AO | | | 8,201,668 | | | $ | 9,247,717 | |
| |
Vale SA, Cl. B, Sponsored ADR | | | 808,960 | | | | 6,617,293 | |
| | | | | | | | |
| | | | 15,865,010 | |
|
| |
| Telecommunication Services—1.6% | |
| |
| Wireless Telecommunication Services—1.6% | |
| |
KDDI Corp. | | | 685,700 | | | | 42,904,403 | |
| | | | | | | | |
Total Common Stocks (Cost $1,472,620,485) | | | | | | | 2,600,807,126 | |
|
| |
Preferred Stocks—1.9% | | | | | |
| |
| Bayerische Motoren Werke (BMW) AG, Preference | | | 600,767 | | | | 49,305,741 | |
| |
| Zee Entertainment Enterprises Ltd., 6% Cum. Non-Cv. | | | 79,253,601 | | | | 1,092,331 | |
| | | | | | | | |
| Total Preferred Stocks (Cost $19,444,594) | | | | | | | 50,398,072 | |
| | |
| | | Units | | | | |
| |
Rights, Warrants and Certificates—0.0% | | | | | |
| |
| Banco Bilbao Vizcaya Argentaria SA Rts., Strike Price 1EUR, Exp. 1/7/151 | | | 3,144,096 | | | | 300,557 | |
| |
| Gtech SpA Rts., Strike Price 19.17EUR, Exp. 1/9/151 | | | 581,820 | | | | 17,178 | |
| |
| Repsol SA Rts., Strike Price 1EUR, Exp. 1/8/151 | | | 889,699 | | | | 491,997 | |
| | | | | | | | |
Total Rights, Warrants and Certificates (Cost $—) | | | | | | | 809,732 | |
| | |
| | | Shares | | | | |
| |
Investment Company—0.5% | | | | | |
| |
| Oppenheimer Institutional Money Market Fund, Cl. E, 0.10%2,3 (Cost $12,394,365) | | | 12,394,365 | | | | 12,394,365 | |
| |
| Total Investments, at Value (Cost $1,504,459,444) | | | 99.7% | | | | 2,664,409,295 | |
| |
Net Other Assets (Liabilities) | | | 0.3 | | | | 8,076,601 | |
| | | | |
| Net Assets | | | 100.0% | | | $ | 2,672,485,896 | |
| | | | |
Footnotes to Statement of Investments
Strike price is reported in U.S. Dollars, except for those denoted in the following currency:
EUR European Dollar
1. Non-income producing security.
2. Is or was an affiliate, as defined in the Investment Company Act of 1940, as amended, at or during the period ended December 31, 2014, by virtue of the Fund owning at least 5% of the voting securities of the issuer or as a result of the Fund and the issuer having the same investment adviser. Transactions during the period in which the issuer was an affiliate are as follows:
| | | | | | | | | | | | | | | | |
| | | Shares
December 31, 2013 | | | Gross Additions | | | Gross Reductions | | | Shares December 31, 2014 | |
| |
| Oppenheimer Institutional Money Market Fund, Cl. E | | | 9,026,377 | | | | 365,185,360 | | | | 361,817,372 | | | | 12,394,365 | |
| | | | |
| | | | | | | | | Value | | | Income | |
| |
| Oppenheimer Institutional Money Market Fund, Cl. E | | | | | | | | | | $ | 12,394,365 | | | $ | 17,406 | |
3. Rate shown is the 7-day yield as of December 31, 2014.
Distribution of investments representing geographic holdings, as a percentage of total investments at value, is as follows:
| | | | | | | | |
| Geographic Holdings | | Value | | | Percent | |
| |
United States | | $ | 1,197,948,740 | | | | 45.0% | |
Japan | | | 278,935,395 | | | | 10.5 | |
Germany | | | 264,085,980 | | | | 9.9 | |
France | | | 137,939,127 | | | | 5.2 | |
Switzerland | | | 136,996,116 | | | | 5.1 | |
Sweden | | | 111,210,469 | | | | 4.2 | |
United Kingdom | | | 110,458,821 | | | | 4.1 | |
India | | | 93,491,593 | | | | 3.5 | |
Spain | | | 90,652,970 | | | | 3.4 | |
Brazil | | | 84,599,135 | | | | 3.2 | |
Netherlands | | | 45,314,371 | | | | 1.7 | |
Italy | | | 37,832,447 | | | | 1.4 | |
Mexico | | | 19,465,634 | | | | 0.7 | |
China | | | 16,512,599 | | | | 0.6 | |
8 OPPENHEIMER GLOBAL FUND/VA
| | | | | | | | |
| Geographic Holdings (Continued) | | Value | | | Percent | |
| |
Ireland | | $ | 16,298,711 | | | | 0.6% | |
Denmark | | | 11,076,702 | | | | 0.4 | |
Russia | | | 9,247,717 | | | | 0.4 | |
Cayman Islands | | | 2,342,768 | | | | 0.1 | |
| | | | |
Total | | $ | 2,664,409,295 | | | | 100.0% | |
| | | | |
See accompanying Notes to Financial Statements.
9 OPPENHEIMER GLOBAL FUND/VA
STATEMENT OF ASSETS AND LIABILITIES December 31, 2014
| | | | |
| |
Assets | | | | |
Investments, at value—see accompanying statement of investments: | | | | |
Unaffiliated companies (cost $1,492,065,079) | | $ | 2,652,014,930 | |
Affiliated companies (cost $12,394,365) | | | 12,394,365 | |
| | | | |
| | | 2,664,409,295 | |
| |
Cash | | | 1,390,776 | |
| |
Cash—foreign currencies (cost $24,732) | | | 24,835 | |
| |
Receivables and other assets: | | | | |
Shares of beneficial interest sold | | | 4,855,465 | |
Dividends | | | 4,198,808 | |
Investments sold | | | 729,092 | |
Other | | | 95,636 | |
| | | | |
Total assets | | | 2,675,703,907 | |
|
| |
Liabilities | | | | |
Payables and other liabilities: | | | | |
Shares of beneficial interest redeemed | | | 2,499,488 | |
Distribution and service plan fees | | | 261,824 | |
Foreign capital gains tax | | | 170,470 | |
Trustees’ compensation | | | 92,437 | |
Shareholder communications | | | 74,314 | |
Investments purchased | | | 10,737 | |
Other | | | 108,741 | |
| | | | |
Total liabilities | | | 3,218,011 | |
|
| |
Net Assets | | $ | 2,672,485,896 | |
| | | | |
|
| |
Composition of Net Assets | | | | |
Par value of shares of beneficial interest | | $ | 67,968 | |
| |
Additional paid-in capital | | | 1,327,289,715 | |
| |
Accumulated net investment income | | | 31,095,795 | |
| |
Accumulated net realized gain on investments and foreign currency transactions | | | 154,554,859 | |
| |
Net unrealized appreciation on investments and translation of assets and liabilities denominated in foreign currencies | | | 1,159,477,559 | |
| | | | |
Net Assets | | $ | 2,672,485,896 | |
| | | | |
|
| |
Net Asset Value Per Share | | | | |
Non-Service Shares: | | | | |
| Net asset value, redemption price per share and offering price per share (based on net assets of $1,468,106,756 and 37,169,360 shares of beneficial interest outstanding) | | | $39.50 | |
| |
| |
Service Shares: | | | | |
| Net asset value, redemption price per share and offering price per share (based on net assets of $1,204,379,140 and 30,798,651 shares of beneficial interest outstanding) | | | $39.10 | |
See accompanying Notes to Financial Statements.
10 OPPENHEIMER GLOBAL FUND/VA
STATEMENT OF OPERATIONS For the Year Ended December 31, 2014
| | | | |
| |
Investment Income | | | | |
Dividends: | | | | |
Unaffiliated companies (net of foreign withholding taxes of $4,914,541) | | $ | 55,408,514 | |
Affiliated companies | | | 17,406 | |
| |
Interest | | | 51 | |
| |
Portfolio lending fees | | | 442,768 | |
| | | | |
Total investment income | | | 55,868,739 | |
|
| |
Expenses | | | | |
Management fees | | | 17,582,863 | |
| |
Distribution and service plan fees - Service shares | | | 3,135,773 | |
| |
Transfer and shareholder servicing agent fees: | | | | |
Non-Service shares | | | 1,528,503 | |
Service shares | | | 1,262,358 | |
| |
Shareholder communications: | | | | |
Non-Service shares | | | 111,772 | |
Service shares | | | 92,342 | |
| |
Custodian fees and expenses | | | 235,409 | |
| |
Trustees’ compensation | | | 62,804 | |
| |
Other | | | 319,738 | |
| | | | |
Total expenses | | | 24,331,562 | |
Less reduction to custodian expenses | | | (414) | |
Less waivers and reimbursements of expenses | | | (20,175) | |
| | | | |
Net expenses | | | 24,310,973 | |
|
| |
Net Investment Income | | | 31,557,766 | |
|
| |
Realized and Unrealized Gain (Loss) | | | | |
Net realized gain (loss) on: | | | | |
Investments from unaffiliated companies | | | 197,919,704 | |
Foreign currency transactions | | | (175,261) | |
| | | | |
Net realized gain | | | 197,744,443 | |
| |
Net change in unrealized appreciation/depreciation on: | | | | |
Investments | | | (78,646,642) | |
Translation of assets and liabilities denominated in foreign currencies | | | (93,963,833) | |
| | | | |
Net change in unrealized appreciation/depreciation | | | (172,610,475) | |
|
| |
Net Increase in Net Assets Resulting from Operations | | $ | 56,691,734 | |
| | | | |
See accompanying Notes to Financial Statements.
11 OPPENHEIMER GLOBAL FUND/VA
STATEMENTS OF CHANGES IN NET ASSETS
| | | | | | | | |
| | | Year Ended
December 31, 2014 | | | Year Ended
December 31, 2013 | |
| |
Operations | | | | | | | | |
Net investment income | | $ | 31,557,766 | | | $ | 28,157,519 | |
| |
Net realized gain | | | 197,744,443 | | | | 152,735,701 | |
| |
Net change in unrealized appreciation/depreciation | | | (172,610,475) | | | | 483,471,092 | |
| | | | | | | | |
Net increase in net assets resulting from operations | | | 56,691,734 | | | | 664,364,312 | |
|
| |
Dividends and/or Distributions to Shareholders | | | | | | | | |
Dividends from net investment income: | | | | | | | | |
Non-Service shares | | | (16,920,293) | | | | (18,448,869) | |
Service shares | | | (10,958,436) | | | | (13,851,660) | |
Class 3 shares1 | | | — | | | | (2,430,857) | |
Class 4 shares1 | | | — | | | | (953,729) | |
| | | | |
| | | (27,878,729) | | | | (35,685,115) | |
|
| |
Distributions from net realized gain: | | | | | | | | |
Non-Service shares | | | (69,030,952) | | | | — | |
Service shares | | | (57,658,820) | | | | — | |
| | | | |
| | | (126,689,772) | | | | — | |
|
| |
Beneficial Interest Transactions | | | | | | | | |
Net increase (decrease) in net assets resulting from beneficial interest transactions: | | | | | | | | |
Non-Service shares | | | (70,199,522) | | | | (158,236,204) | |
Service shares | | | (60,956,871) | | | | (180,268,543) | |
Class 3 shares1 | | | — | | | | (12,837,160) | |
Class 4 shares1 | | | — | | | | 1,813,300 | |
| | | | | | | | |
| | | (131,156,393) | | | | (349,528,607) | |
|
| |
Net Assets | | | | | | | | |
Total increase (decrease) | | | (229,033,160) | | | | 279,150,590 | |
| |
Beginning of period | | | 2,901,519,056 | | | | 2,622,368,466 | |
| | | | | | | | |
End of period (including accumulated net investment income of $31,095,795 and $27,585,632, respectively) | | $ | 2,672,485,896 | | | $ | 2,901,519,056 | |
| | | | |
1. Effective April 30, 2014, Class 3 and Class 4 shares of the Fund were reclassified as Non-Service shares and Service shares, respectively.
See accompanying Notes to Financial Statements.
12 OPPENHEIMER GLOBAL FUND/VA
FINANCIAL HIGHLIGHTS
| | | | | | | | | | | | | | | | | | | | |
| Non-Service Shares | | Year Ended
December 31,
2014 | | | Year Ended
December 31,
2013 | | | Year Ended
December 31,
2012 | | | Year Ended
December 30,
20111 | | | Year Ended
December 31,
2010 | |
| |
Per Share Operating Data | | | | | | | | | | | | | | | | | | | | |
Net asset value, beginning of period | | $ | 40.86 | | | $ | 32.55 | | | $ | 27.46 | | | $ | 30.30 | | | $ | 26.50 | |
| |
Income (loss) from investment operations: | | | | | | | | | | | | | | | | | | | | |
Net investment income2 | | | 0.50 | | | | 0.41 | | | | 0.44 | | | | 0.65 | | | | 0.33 | |
Net realized and unrealized gain (loss) | | | 0.46 | | | | 8.40 | | | | 5.29 | | | | (3.11) | | | | 3.85 | |
| | | | |
Total from investment operations | | | 0.96 | | | | 8.81 | | | | 5.73 | | | | (2.46) | | | | 4.18 | |
| |
Dividends and/or distributions to shareholders: | | | | | | | | | | | | | | | | | | | | |
Dividends from net investment income | | | (0.46) | | | | (0.50) | | | | (0.64) | | | | (0.38) | | | | (0.38) | |
Distributions from net realized gain | | | (1.86) | | | | 0.00 | | | | 0.00 | | | | 0.00 | | | | 0.00 | |
| | | | |
Total dividends and/or distributions to shareholders | | | (2.32) | | | | (0.50) | | | | (0.64) | | | | (0.38) | | | | (0.38) | |
| |
Net asset value, end of period | | $ | 39.50 | | | $ | 40.86 | | | $ | 32.55 | | | $ | 27.46 | | | $ | 30.30 | |
| | | | |
|
| |
Total Return, at Net Asset Value3 | | | 2.29% | | | | 27.31% | | | | 21.27% | | | | (8.29)% | | | | 15.96% | |
| |
Ratios/Supplemental Data | | | | | | | | | | | | | | | | | | | | |
Net assets, end of period (in thousands) | | $ | 1,468,107 | | | $ | 1,397,026 | | | $ | 1,252,127 | | | $ | 1,165,141 | | | $ | 1,410,764 | |
| |
Average net assets (in thousands) | | $ | 1,532,383 | | | $ | 1,333,848 | | | $ | 1,206,244 | | | $ | 1,335,403 | | | $ | 1,336,110 | |
| |
Ratios to average net assets:4 | | | | | | | | | | | | | | | | | | | | |
Net investment income | | | 1.24% | | | | 1.13% | | | | 1.48% | | | | 2.17% | | | | 1.22% | |
Total expenses5 | | | 0.76% | | | | 0.77% | | | | 0.76% | | | | 0.76% | | | | 0.76% | |
| Expenses after payments, waivers and/or reimbursements and reduction to custodian expenses | | | 0.76% | | | | 0.77% | | | | 0.76% | | | | 0.76% | | | | 0.76% | |
| |
Portfolio turnover rate | | | 13% | | | | 11% | | | | 14% | | | | 13% | | | | 15% | |
1. December 30, 2011 represents the last business day of the Fund’s reporting period.
2. Per share amounts calculated based on the average shares outstanding during the period.
3. Assumes an initial investment on the business day before the first day of the fiscal period, with all dividends and distributions reinvested in additional shares on the reinvestment date, and redemption at the net asset value calculated on the last business day of the fiscal period. Total returns are not annualized for periods less than one full year. Total return information does not reflect expenses that apply at the separate account level or to related insurance products. Inclusion of these charges would reduce the total return figures for all periods shown. Returns do not reflect the deduction of taxes that a shareholder would pay on fund distributions or the redemption of fund shares.
4. Annualized for periods less than one full year.
5. Total expenses including indirect expenses from affiliated fund fees and expenses were as follows:
| | | | |
Year Ended December 31, 2014 | | | 0.76 | % |
Year Ended December 31, 2013 | | | 0.77 | % |
Year Ended December 31, 2012 | | | 0.76 | % |
Year Ended December 30, 2011 | | | 0.76 | % |
Year Ended December 31, 2010 | | | 0.76 | % |
See accompanying Notes to Financial Statements.
13 OPPENHEIMER GLOBAL FUND/VA
FINANCIAL HIGHLIGHTS Continued
| | | | | | | | | | | | | | | | | | | | |
| Service Shares | | Year Ended
December 31,
2014 | | | Year Ended
December 31,
2013 | | | Year Ended
December 31,
2012 | | | Year Ended
December 30,
20111 | | | Year Ended
December 31,
2010 | |
| |
Per Share Operating Data | | | | | | | | | | | | | | | | | | | | |
Net asset value, beginning of period | | $ | 40.47 | | | $ | 32.25 | | | $ | 27.21 | | | $ | 30.04 | | | $ | 26.28 | |
| |
Income (loss) from investment operations: | | | | | | | | | | | | | | | | | | | | |
Net investment income2 | | | 0.40 | | | | 0.32 | | | | 0.36 | | | | 0.56 | | | | 0.26 | |
Net realized and unrealized gain (loss) | | | 0.44 | | | | 8.32 | | | | 5.25 | | | | (3.08) | | | | 3.82 | |
| | | | |
Total from investment operations | | | 0.84 | | | | 8.64 | | | | 5.61 | | | | (2.52) | | | | 4.08 | |
| |
Dividends and/or distributions to shareholders: | | | | | | | | | | | | | | | | | | | | |
Dividends from net investment income | | | (0.35) | | | | (0.42) | | | | (0.57) | | | | (0.31) | | | | (0.32) | |
Distributions from net realized gain | | | (1.86) | | | | 0.00 | | | | 0.00 | | | | 0.00 | | | | 0.00 | |
| | | | |
Total dividends and/or distributions to shareholders | | | (2.21) | | | | (0.42) | | | | (0.57) | | | | (0.31) | | | | (0.32) | |
| |
Net asset value, end of period | | $ | 39.10 | | | $ | 40.47 | | | $ | 32.25 | | | $ | 27.21 | | | $ | 30.04 | |
| | | | |
|
| |
Total Return, at Net Asset Value3 | | | 2.06% | | | | 26.99% | | | | 20.95% | | | | (8.53)% | | | | 15.70% | |
| |
Ratios/Supplemental Data | | | | | | | | | | | | | | | | | | | | |
Net assets, end of period (in thousands) | | $ | 1,204,379 | | | $ | 1,216,285 | | | $ | 1,130,388 | | | $ | 1,003,839 | | | $ | 1,101,584 | |
| |
Average net assets (in thousands) | | $ | 1,265,528 | | | $ | 1,174,119 | | | $ | 1,069,295 | | | $ | 1,091,128 | | | $ | 997,627 | |
| |
Ratios to average net assets:4 | | | | | | | | | | | | | | | | | | | | |
Net investment income | | | 0.99% | | | | 0.89% | | | | 1.23% | | | | 1.90% | | | | 0.96% | |
Total expenses5 | | | 1.01% | | | | 1.02% | | | | 1.01% | | | | 1.01% | | | | 1.01% | |
| Expenses after payments, waivers and/or reimbursements and reduction to custodian expenses | | | 1.01% | | | | 1.02% | | | | 1.01% | | | | 1.01% | | | | 1.01% | |
| |
Portfolio turnover rate | | | 13% | | | | 11% | | | | 14% | | | | 13% | | | | 15% | |
1. December 30, 2011 represents the last business day of the Fund’s reporting period.
2. Per share amounts calculated based on the average shares outstanding during the period.
3. Assumes an initial investment on the business day before the first day of the fiscal period, with all dividends and distributions reinvested in additional shares on the reinvestment date, and redemption at the net asset value calculated on the last business day of the fiscal period. Total returns are not annualized for periods less than one full year. Total return information does not reflect expenses that apply at the separate account level or to related insurance products. Inclusion of these charges would reduce the total return figures for all periods shown. Returns do not reflect the deduction of taxes that a shareholder would pay on fund distributions or the redemption of fund shares.
4. Annualized for periods less than one full year.
5. Total expenses including indirect expenses from affiliated fund fees and expenses were as follows:
| | | | |
Year Ended December 31, 2014 | | | 1.01 | % |
Year Ended December 31, 2013 | | | 1.03 | % |
Year Ended December 31, 2012 | | | 1.01 | % |
Year Ended December 30, 2011 | | | 1.01 | % |
Year Ended December 31, 2010 | | | 1.01 | % |
See accompanying Notes to Financial Statements.
14 OPPENHEIMER GLOBAL FUND/VA
|
| NOTES TO FINANCIAL STATEMENTS December 31, 2014 |
1. Organization
Oppenheimer Global Fund/VA (the “Fund”), a separate series of Oppenheimer Variable Account Funds, is a diversified open-end management investment company registered under the Investment Company Act of 1940 (“1940 Act”), as amended. The Fund’s investment objective is to seek capital appreciation. The Fund’s investment adviser is OFI Global Asset Management, Inc. (“OFI Global” or the “Manager”), a wholly-owned subsidiary of OppenheimerFunds, Inc. (“OFI” or the “Sub-Adviser”). The Manager has entered into a sub-advisory agreement with OFI. Shares of the Fund are sold only to separate accounts of life insurance companies.
The Fund offers Non-Service and Service shares, and previously offered Class 3 and Class 4 shares. Effective April 30, 2014, Class 3 and Class 4 shares were reclassified as Non-Service and Service shares, respectively. All classes are sold at their offering price, which is the net asset value per share, to separate investment accounts of participating insurance companies as an underlying investment for variable life insurance policies, variable annuity contracts or other investment products. The classes of shares being designated as Service shares are subject to a distribution and service plan. Both classes of shares have identical rights and voting privileges with respect to the Fund in general and exclusive voting rights on matters that affect that class alone. Earnings, net assets and net asset value per share may differ due to each class having its own expenses, such as transfer and shareholder servicing agent fees and shareholder communications, directly attributable to that class.
2. Significant Accounting Policies
Security Valuation. All investments in securities are recorded at their estimated fair value, as described in Note 3.
Foreign Currency Translation. The Fund’s accounting records are maintained in U.S. dollars. The values of securities denominated in foreign currencies and amounts related to the purchase and sale of foreign securities and foreign investment income are translated into U.S. dollars as of the close of the New York Stock Exchange (the “Exchange”), normally 4:00 P.M. Eastern time, on each day the Exchange is open for trading. Foreign exchange rates may be valued primarily using a reliable bank, dealer or service authorized by the Board of Trustees.
Reported net realized gains and losses from foreign currency transactions arise from sales of portfolio securities, sales and maturities of short-term securities, sales of foreign currencies, exchange rate fluctuations between the trade and settlement dates on securities transactions, and the difference between the amounts of dividends, interest, and foreign withholding taxes recorded on the Fund’s books and the U.S. dollar equivalent of the amounts actually received or paid. Net unrealized appreciation and depreciation on the translation of assets and liabilities denominated in foreign currencies arise from changes in the values of assets and liabilities, including investments in securities at fiscal period end, resulting from changes in exchange rates.
The effect of changes in foreign currency exchange rates on investments is separately identified from the fluctuations arising from changes in market values of securities held and reported with all other foreign currency gains and losses in the Fund’s Statement of Operations.
Allocation of Income, Expenses, Gains and Losses. Income, expenses (other than those attributable to a specific class), gains and losses are allocated on a daily basis to each class of shares based upon the relative proportion of net assets represented by such class. Operating expenses directly attributable to a specific class are charged against the operations of that class.
Dividends and Distributions to Shareholders. Dividends and distributions to shareholders, which are determined in accordance with income tax regulations and may differ from U.S. generally accepted accounting principles, are recorded on the ex-dividend date. Income and capital gain distributions, if any, are declared and paid annually or at other times as deemed necessary by the Manager.
Investment Income. Dividend income is recorded on the ex-dividend date or upon ex-dividend notification in the case of certain foreign dividends where the ex-dividend date may have passed. Non-cash dividends included in dividend income, if any, are recorded at the fair market value of the securities received. Interest income is recognized on an accrual basis. Discount and premium, which are included in interest income on the Statement of Operations, are amortized or accreted daily.
Custodian Fees. “Custodian fees and expenses” in the Statement of Operations may include interest expense incurred by the Fund on any cash overdrafts of its custodian account during the period. Such cash overdrafts may result from the effects of failed trades in portfolio securities and from cash outflows resulting from unanticipated shareholder redemption activity. The Fund pays interest to its custodian on such cash overdrafts, to the extent they are not offset by positive cash balances maintained by the Fund, at a rate equal to the Federal Funds Rate plus 0.50%. The “Reduction to custodian expenses” line item, if applicable, represents earnings on cash balances maintained by the Fund during the period. Such interest expense and other custodian fees may be paid with these earnings.
Security Transactions. Security transactions are recorded on the trade date. Realized gains and losses on securities sold are determined on the basis of identified cost.
Indemnifications. The Fund’s organizational documents provide current and former Trustees and officers with a limited indemnification against liabilities arising in connection with the performance of their duties to the Fund. In the normal course of business, the Fund may also enter into contracts that provide general indemnifications. The Fund’s maximum exposure under these arrangements is unknown as this would be dependent on future claims that may be made against the Fund. The risk of material loss from such claims is considered remote.
15 OPPENHEIMER GLOBAL FUND/VA
NOTES TO FINANCIAL STATEMENTS Continued
2. Significant Accounting Policies (Continued)
Federal Taxes. The Fund intends to comply with provisions of the Internal Revenue Code applicable to regulated investment companies and to distribute substantially all of its investment company taxable income, including any net realized gain on investments not offset by capital loss carryforwards, if any, to shareholders. Therefore, no federal income or excise tax provision is required. The Fund files income tax returns in U.S. federal and applicable state jurisdictions. The statute of limitations on the Fund’s tax return filings generally remain open for the three preceding fiscal reporting period ends.
The tax components of capital shown in the following table represent distribution requirements the Fund must satisfy under the income tax regulations, losses the Fund may be able to offset against income and gains realized in future years and unrealized appreciation or depreciation of securities and other investments for federal income tax purposes.
| | | | | | | | | | | | |
Undistributed Net Investment Income | | Undistributed
Long-Term
Gain | | | Accumulated
Loss
Carryforward1,2 | | | Net Unrealized
Appreciation
Based on cost of
Securities and
Other Investments
for Federal Income Tax Purposes | |
| |
$32,703,462 | | | $178,596,027 | | | | $— | | | | $1,133,921,006 | |
1. During the fiscal year ended December 31, 2014, the Fund did not utilize any capital loss carryforward.
2. During the fiscal year ended December 31, 2013, the Fund utilized $9,934,353 of capital loss carryforward to offset capital gains realized in that fiscal year.
Net investment income (loss) and net realized gain (loss) may differ for financial statement and tax purposes. The character of dividends and distributions made during the fiscal year from net investment income or net realized gains may differ from their ultimate characterization for federal income tax purposes. Also, due to timing of dividends and distributions, the fiscal year in which amounts are distributed may differ from the fiscal year in which the income or net realized gain was recorded by the Fund.
Accordingly, the following amounts have been reclassified for December 31, 2014. Net assets of the Fund were unaffected by the reclassifications.
| | | | | | | | |
Increase to Paid-in Capital | | Reduction to Accumulated
Net Investment
Income | | | Reduction to Accumulated Net Realized Gain on
Investments3 | |
| |
$18,578,087 | | | $168,874 | | | | $18,409,213 | |
3. $18,578,087, all of which was long-term capital gain, was distributed in connection with Fund share redemptions.
The tax character of distributions paid during the years ended December 31, 2014 and December 31, 2013 was as follows:
| | | | | | | | |
| | | Year Ended December 31, 2014 | | | Year Ended December 31, 2013 | |
| |
Distributions paid from: | | | | | | | | |
Ordinary income | | $ | 27,878,729 | | | $ | 35,685,115 | |
Long-term capital gain | | | 126,689,772 | | | | — | |
| | | | |
Total | | $ | 154,568,501 | | | $ | 35,685,115 | |
| | | | |
The aggregate cost of securities and other investments and the composition of unrealized appreciation and depreciation of securities and other investments for federal income tax purposes as of December 31, 2014 are noted in the following table. The primary difference between book and tax appreciation or depreciation of securities and other investments, if applicable, is attributable to the tax deferral of losses or tax realization of financial statement unrealized gain or loss.
| | | | |
Federal tax cost of securities | | $ | 1,530,015,997 | |
| | | | |
Gross unrealized appreciation | | $ | 1,228,934,123 | |
Gross unrealized depreciation | | | (95,013,117) | |
| | | | |
Net unrealized appreciation | | $ | 1,133,921,006 | |
| | | | |
Certain foreign countries impose a tax on capital gains which is accrued by the Fund based on unrealized appreciation, if any, on affected securities. The tax is paid when the gain is realized.
Use of Estimates. The preparation of financial statements in conformity with accounting principles generally accepted in the United States of America requires management to make estimates and assumptions that affect the reported amounts of assets and liabilities and disclosure of contingent assets and liabilities at the date of the financial statements and the reported amounts of increases and decreases in net assets from operations during the reporting period. Actual results could differ from those estimates.
16 OPPENHEIMER GLOBAL FUND/VA
3. Securities Valuation
The Fund calculates the net asset value of its shares as of the close of the New York Stock Exchange (the “Exchange”), normally 4:00 P.M. Eastern time, on each day the Exchange is open for trading.
The Fund’s Board has adopted procedures for the valuation of the Fund’s securities and has delegated the day-to-day responsibility for valuation determinations under those procedures to the Manager. The Manager has established a Valuation Committee which is responsible for determining a “fair valuation” for any security for which market quotations are not “readily available.” The Valuation Committee’s fair valuation determinations are subject to review, approval and ratification by the Fund’s Board at its next regularly scheduled meeting covering the calendar quarter in which the fair valuation was determined.
Valuation Methods and Inputs
Securities are valued using unadjusted quoted market prices, when available, as supplied primarily by third party pricing services or dealers.
The following methodologies are used to determine the market value or the fair value of the types of securities described below:
Securities traded on a registered U.S. securities exchange (including exchange-traded derivatives other than futures and futures options) are valued based on the last sale price of the security reported on the principal exchange on which it is traded, prior to the time when the Fund’s assets are valued. In the absence of a sale, the security is valued at the last sale price on the prior trading day, if it is within the spread of the current day’s closing “bid” and “asked” prices, and if not, at the current day’s closing bid price. A security of a foreign issuer traded on a foreign exchange, but not listed on a registered U.S. securities exchange, is valued based on the last sale price on the principal exchange on which the security is traded, as identified by the third party pricing service used by the Manager, prior to the time when the Fund’s assets are valued. If the last sale price is unavailable, the security is valued at the most recent official closing price on the principal exchange on which it is traded. If the last sales price or official closing price for a foreign security is not available, the security is valued at the mean between the bid and asked price per the exchange or, if not available from the exchange, obtained from two dealers. If bid and asked prices are not available from either the exchange or two dealers, the security is valued by using one of the following methodologies (listed in order of priority): (1) using a bid from the exchange, (2) the mean between the bid and asked price as provided by a single dealer, or (3) a bid from a single dealer.
Shares of a registered investment company that are not traded on an exchange are valued at that investment company’s net asset value per share.
Corporate and government debt securities (of U.S. or foreign issuers) and municipal debt securities, event-linked bonds, loans, mortgage-backed securities, collateralized mortgage obligations, and asset-backed securities are valued at the mean between the “bid” and “asked” prices utilizing evaluated prices obtained from third party pricing services or broker-dealers who may use matrix pricing methods to determine the evaluated prices.
Short-term money market type debt securities with a remaining maturity of sixty days or less are valued at cost adjusted by the amortization of discount or premium to maturity (amortized cost), which approximates market value. Short-term debt securities with a remaining maturity in excess of sixty days are valued at the mean between the “bid” and “asked” prices utilizing evaluated prices obtained from third party pricing services or broker-dealers.
A description of the standard inputs that may generally be considered by the third party pricing vendors in determining their evaluated prices is provided below.
| | |
| Security Type | | Standard inputs generally considered by third-party pricing vendors |
| Corporate debt, government debt, municipal, mortgage-backed and asset-backed securities | | Reported trade data, broker-dealer price quotations, benchmark yields, issuer spreads on comparable securities, the credit quality, yield, maturity, and other appropriate factors. |
| Loans | | Information obtained from market participants regarding reported trade data and broker-dealer price quotations. |
| Event-linked bonds | | Information obtained from market participants regarding reported trade data and broker-dealer price quotations. |
If a market value or price cannot be determined for a security using the methodologies described above, or if, in the “good faith” opinion of the Manager, the market value or price obtained does not constitute a “readily available market quotation,” or a significant event has occurred that would materially affect the value of the security the security is fair valued either (i) by a standardized fair valuation methodology applicable to the security type or the significant event as previously approved by the Valuation Committee and the Fund’s Board or (ii) as determined in good faith by the Manager’s Valuation Committee. The Valuation Committee considers all relevant facts that are reasonably available, through either public information or information available to the Manager, when determining the fair value of a security. Fair value determinations by the Manager are subject to review, approval and ratification by the Fund’s Board at its next regularly scheduled meeting covering the calendar quarter in which the fair valuation was determined. Those fair valuation standardized methodologies include, but are not limited to, valuing securities at the last sale price or initially at cost and subsequently adjusting the value based on: changes in company specific fundamentals, changes in an appropriate securities index, or changes in the value of similar securities which may be further adjusted for any discounts related to security-specific resale restrictions. When possible, such methodologies use observable market inputs such as unadjusted quoted prices of similar securities, observable interest rates, currency rates and yield curves. The methodologies used for valuing securities are not necessarily an indication of the risks associated with investing in those securities nor can it be assured that the Fund can obtain the fair value assigned to a security if it were to sell the security.
To assess the continuing appropriateness of security valuations, the Manager, or its third party service provider who is subject to oversight by the Manager, regularly compares prior day prices, prices on comparable securities, and sale prices to the current day prices and challenges those prices exceeding certain tolerance levels with the third party pricing service or broker source. For those securities valued by fair valuations, whether through a standardized fair valuation methodology or a fair valuation determination, the Valuation Committee reviews and affirms the reasonableness of the valuations based on such methodologies and fair valuation determinations on a regular basis after considering all relevant information that is reasonably available.
17 OPPENHEIMER GLOBAL FUND/VA
NOTES TO FINANCIAL STATEMENTS Continued
3. Securities Valuation (Continued)
Classifications
Each investment asset or liability of the Fund is assigned a level at measurement date based on the significance and source of the inputs to its valuation. Various data inputs are used in determining the value of each of the Fund’s investments as of the reporting period end. These data inputs are categorized in the following hierarchy under applicable financial accounting standards:
1) Level 1-unadjusted quoted prices in active markets for identical assets or liabilities (including securities actively traded on a securities exchange)
2) Level 2-inputs other than unadjusted quoted prices that are observable for the asset or liability (such as unadjusted quoted prices for similar assets and market corroborated inputs such as interest rates, prepayment speeds, credit risks, etc.)
3) Level 3-significant unobservable inputs (including the Manager’s own judgments about assumptions that market participants would use in pricing the asset or liability).
The inputs used for valuing securities are not necessarily an indication of the risks associated with investing in those securities.
The table below categorizes amounts that are included in the Fund’s Statement of Assets and Liabilities as of December 31, 2014 based on valuation input level:
| | | | | | | | | | | | | | | | |
| | | Level 1— Unadjusted Quoted Prices | | | Level 2— Other Significant
Observable Inputs | | | Level 3—
Significant
Unobservable
Inputs | | | Value | |
| |
Assets Table | | | | | | | | | | | | | | | | |
Investments, at Value: | | | | | | | | | | | | | | | | |
Common Stocks | | | | | | | | | | | | | | | | |
Consumer Discretionary | | $ | 138,990,736 | | | $ | 185,361,254 | | | $ | — | | | $ | 324,351,990 | |
Consumer Staples | | | 90,239,197 | | | | 72,497,117 | | | | — | | | | 162,736,314 | |
Energy | | | — | | | | 42,787,986 | | | | — | | | | 42,787,986 | |
Financials | | | 304,702,160 | | | | 289,598,539 | | | | — | | | | 594,300,699 | |
Health Care | | | 353,352,227 | | | | 102,260,760 | | | | — | | | | 455,612,987 | |
Industrials | | | 121,880,833 | | | | 198,222,054 | | | | — | | | | 320,102,887 | |
Information Technology | | | 372,144,019 | | | | 242,691,544 | | | | — | | | | 614,835,563 | |
Materials | | | 6,617,293 | | | | 36,557,004 | | | | — | | | | 43,174,297 | |
Telecommunication Services | | | — | | | | 42,904,403 | | | | — | | | | 42,904,403 | |
Preferred Stocks | | | 1,092,331 | | | | 49,305,741 | | | | — | | | | 50,398,072 | |
Rights, Warrants and Certificates | | | — | | | | 809,732 | | | | — | | | | 809,732 | |
Investment Company | | | 12,394,365 | | | | — | | | | — | | | | 12,394,365 | |
| | | | |
Total Assets | | $ | 1,401,413,161 | | | $ | 1,262,996,134 | | | $ | — | | | $ | 2,664,409,295 | |
| | | | |
Forward currency exchange contracts and futures contracts, if any, are reported at their unrealized appreciation/depreciation at measurement date, which represents the change in the contract’s value from trade date. All additional assets and liabilities included in the above table are reported at their market value at measurement date.
4. Investments and Risks
Investment in Oppenheimer Institutional Money Market Fund. The Fund is permitted to invest daily available cash balances in an affiliated money market fund. The Fund may invest the available cash in Class E shares of Oppenheimer Institutional Money Market Fund (“IMMF”) to seek current income while preserving liquidity or for defensive purposes. IMMF is a registered open-end management investment company, regulated as a money market fund under the 1940 Act. The Manager is the investment adviser of IMMF, and the Sub-Adviser provides investment and related advisory services to IMMF. When applicable, the Fund’s investment in IMMF is included in the Statement of Investments. Shares of IMMF are valued at their net asset value per share. As a shareholder, the Fund is subject to its proportional share of IMMF’s Class E expenses, including its management fee. The Manager will waive fees and/or reimburse Fund expenses in an amount equal to the indirect management fees incurred through the Fund’s investment in IMMF.
Equity Security Risk. Stocks and other equity securities fluctuate in price. The value of the Fund’s portfolio may be affected by changes in the equity markets generally. Equity markets may experience significant short-term volatility and may fall sharply at times. Different markets may behave differently from each other and U.S. equity markets may move in the opposite direction from one or more foreign stock markets.
The prices of individual equity securities generally do not all move in the same direction at the same time and a variety of factors can affect the price of a particular company’s securities. These factors may include, but are not limited to, poor earnings reports, a loss of customers, litigation against the company, general unfavorable performance of the company’s sector or industry, or changes in government regulations affecting the company or its industry.
5. Shares of Beneficial Interest
The Fund has authorized an unlimited number of $0.001 par value shares of beneficial interest of each class. Transactions in shares of beneficial interest were as follows:
18 OPPENHEIMER GLOBAL FUND/VA
5. Shares of Beneficial Interest (Continued)
| | | | | | | | | | | | | | | | | | | | | | |
| | | Year Ended December 31, 2014 | | | | | | | Year Ended December 31, 2013 | | | |
| | | Shares | | | Amount | | | | | | | Shares | | | Amount | | | |
|
Non-Service Shares | | | | | | | | | | | | | | | | | | | | | | |
Sold | | | 6,078,139 | | | $ | 247,743,232 | | | | | | | | 2,054,395 | | | $ | 74,312,252 | | | |
Dividends and/or distributions reinvested | | | 2,154,167 | | | | 85,951,245 | | | | | | | | 517,530 | | | | 18,448,869 | | | |
Redeemed | | | (9,920,341 | ) | | | (403,893,999 | )1 | | | | | | | (6,851,884 | ) | | | (250,997,325 | ) | | |
| | | |
Net decrease | | | (1,688,035 | ) | | $ | (70,199,522 | ) | | | | | | | (4,279,959 | ) | | $ | (158,236,204 | ) | | |
| | | |
| | | |
|
Service Shares | | | | | | | | | | | | | | | | | | | | | | |
Sold | | | 6,195,494 | | | $ | 248,008,573 | | | | | | | | 1,803,731 | | | $ | 65,522,799 | | | |
Dividends and/or distributions reinvested | | | 1,734,511 | | | | 68,617,256 | | | | | | | | 391,733 | | | | 13,851,660 | | | |
Redeemed | | | (9,552,933 | ) | | | (377,582,700 | )1 | | | | | | | (7,192,815 | ) | | | (259,643,002 | ) | | |
| | | |
Net decrease | | | (1,622,928 | ) | | $ | (60,956,871 | ) | | | | | | | (4,997,351 | ) | | $ | (180,268,543 | ) | | |
| | | |
| | | |
|
Class 3 Shares2 | | | | | | | | | | | | | | | | | | | | | | |
Sold | | | — | | | $ | — | | | | | | | | 274,924 | | | $ | 9,972,302 | | | |
Dividends and/or distributions reinvested | | | — | | | | — | | | | | | | | 67,712 | | | | 2,430,857 | | | |
Redeemed | | | — | | | | — | | | | | | | | (693,858 | ) | | | (25,240,319 | )3 | | |
| | | |
Net decrease | | | — | | | $ | — | | | | | | | | (351,222 | ) | | $ | (12,837,160 | ) | | |
| | | |
| | | |
|
Class 4 Shares2 | | | | | | | | | | | | | | | | | | | | | | |
Sold | | | — | | | $ | — | | | | | | | | 301,288 | | | $ | 11,069,712 | | | |
Dividends and/or distributions reinvested | | | — | | | | — | | | | | | | | 26,919 | | | | 953,729 | | | |
Redeemed | | | — | | | | — | | | | | | | | (289,896 | ) | | | (10,210,141 | )3 | | |
| | | |
Net increase | | | — | | | $ | — | | | | | | | | 38,311 | | | $ | 1,813,300 | | | |
| | | |
1. Net of redemption fees of $1,517 and $1,367 for Non-Service and Service shares, respectively.
2. Effective April 30, 2014, Class 3 and Class 4 shares of the Fund were reclassified as Non-Service shares and Service shares, respectively.
3. Net of redemption fees of $11,326 and $4,748 for Class 3 and Class 4, respectively.
6. Purchases and Sales of Securities
The aggregate cost of purchases and proceeds from sales of securities, other than short-term obligations and investments in IMMF, for the year ended December 31, 2014 were as follows:
| | | | | | | | |
| | | | | Purchases | | Sales | | |
| | | | |
| | Investment securities | | $365,880,830 | | $647,783,446 | | |
7. Fees and Other Transactions with Affiliates
Management Fees. Under the investment advisory agreement, the Fund pays the Manager a management fee based on the daily net assets of the Fund at an annual rate as shown in the following table:
| | | | |
| Fee Schedule | | | |
| |
Up to $200 million | | | 0.75% | |
Next $200 million | | | 0.72 | |
Next $200 million | | | 0.69 | |
Next $200 million | | | 0.66 | |
Next $4.2 billion | | | 0.60 | |
Over $5 billion | | | 0.58 | |
The Fund’s management fee for the fiscal year ended December 31, 2014 was 0.63% of average annual net assets before any applicable waivers.
Sub-Adviser Fees. The Manager has retained the Sub-Adviser to provide the day-to-day portfolio management of the Fund. Under the Sub-Advisory Agreement, the Manager pays the Sub-Adviser an annual fee in monthly installments, equal to a percentage of the investment management fee collected by the Manager from the Fund, which shall be calculated after any investment management fee waivers. The fee paid to the Sub-Adviser is paid by the Manager, not by the Fund.
Transfer Agent Fees. OFI Global (the “Transfer Agent”) serves as the transfer and shareholder servicing agent for the Fund. The Fund pays the Transfer Agent a fee based on annual net assets. Fees incurred and average net assets for each class with respect to these services are detailed in the Statement of Operations and Financial Highlights, respectively.
19 OPPENHEIMER GLOBAL FUND/VA
NOTES TO FINANCIAL STATEMENTS Continued
7. Fees and Other Transactions with Affiliates (Continued)
Sub-Transfer Agent Fees. The Transfer Agent has retained Shareholder Services, Inc., a wholly-owned subsidiary of OFI (the “Sub-Transfer Agent”), to provide the day-to-day transfer agent and shareholder servicing of the Fund. Under the Sub-Transfer Agency Agreement, the Transfer Agent pays the Sub-Transfer Agent an annual fee in monthly installments, equal to a percentage of the transfer agent fee collected by the Transfer Agent from the Fund, which shall be calculated after any applicable fee waivers. The fee paid to the Sub-Transfer Agent is paid by the Transfer Agent, not by the Fund.
Trustees’ Compensation. The Fund’s Board of Trustees (“Board”) has adopted a compensation deferral plan for Independent Trustees that enables Trustees to elect to defer receipt of all or a portion of the annual compensation they are entitled to receive from the Fund. For purposes of determining the amount owed to the Trustee under the plan, deferred amounts are treated as though equal dollar amounts had been invested in shares of the Fund or in other Oppenheimer funds selected by the Trustee. The Fund purchases shares of the funds selected for deferral by the Trustee in amounts equal to his or her deemed investment, resulting in a Fund asset equal to the deferred compensation liability. Such assets are included as a component of “Other” within the asset section of the Statement of Assets and Liabilities. Deferral of Trustees’ fees under the plan will not affect the net assets of the Fund and will not materially affect the Fund’s assets, liabilities or net investment income per share. Amounts will be deferred until distributed in accordance with the compensation deferral plan.
Distribution and Service Plan for Service Shares. The Fund has adopted a Distribution and Service Plan (the “Plan”) pursuant to Rule 12b-1 under the 1940 Act for Service shares to pay OppenheimerFunds Distributor, Inc. (the “Distributor”), for distribution related services, personal service and account maintenance for the Fund’s Service shares. Under the Plan, payments are made periodically at an annual rate of 0.25% of the daily net assets of Service shares of the Fund. The Distributor currently uses all of those fees to compensate sponsors of the insurance product that offers Fund shares, for providing personal service and maintenance of accounts of their variable contract owners that hold Service shares. These fees are paid out of the Fund’s assets on an on-going basis and increase operating expenses of the Service shares, which results in lower performance compared to the Fund’s shares that are not subject to a service fee. Fees incurred by the Fund under the Plan are detailed in the Statement of Operations.
Waivers and Reimbursements of Expenses. The Manager has contractually agreed to limit the Fund’s expenses after payments, waivers and/or reimbursements and reduction to custodian expenses, excluding expenses incurred directly or indirectly by the Fund as a result of investments in other investment companies, wholly-owned subsidiaries and pooled investment vehicles; so that those expenses, as percentages of daily net assets, will not exceed the annual rate of 1.00% for Non-Service shares and 1.25% for Service shares.
The Manager will waive fees and/or reimburse Fund expenses in an amount equal to the indirect management fees incurred through the Fund’s investment in IMMF. During the year ended December 31, 2014, the Manager waived fees and/or reimbursed the Fund $20,175 for IMMF management fees.
These undertakings may be modified or terminated as set forth according to the terms in the prospectus.
8. Borrowings and Other Financing
Securities Lending. The Fund lends portfolio securities from time to time in order to earn additional income in the form of fees, or interest on cash or securities received as collateral. The loans are secured by collateral (either securities, letters of credit, or cash) in an amount of at least 102% of the market value of the loaned U.S. securities, and at least 105% of the market value of loaned foreign securities during the period of the loan. The market value of the loaned securities is determined at the close of each business day and any additional required collateral is delivered to the Fund on the next business day. If the borrower defaults on its obligation to return the securities loaned because of insolvency or other reasons, the Fund could experience delays and cost in recovering the securities loaned or in gaining access to the collateral. The Fund continues to receive the economic benefit of interest or dividends paid on the securities loaned in the form of a substitute payment received from the borrower and recognizes the change in the fair value of the securities loaned that may occur during the term of the loan. The Fund has the right under the lending agreement to recover the securities from the borrower on demand. As of December 31, 2014, the Fund had no securities on loan.
9. Pending Litigation
In 2009, seven class action lawsuits were filed in the U.S. District Court for the District of Colorado against OppenheimerFunds, Inc. (“OFI”), OppenheimerFunds Distributor, Inc., the Fund’s principal underwriter and distributor (the “Distributor”), and certain funds (but not including the Fund) advised by OFI Global Asset Management, Inc. and distributed by the Distributor (the “Defendant Funds”). The lawsuits also named as defendants certain officers and current and former trustees of the respective Defendant Funds. The lawsuits raised claims under federal securities laws and alleged, among other things, that the disclosure documents of the respective Defendant Funds contained misrepresentations and omissions and that the respective Defendant Funds’ investment policies were not followed. The plaintiffs in these actions sought unspecified damages, equitable relief and awards of attorneys’ fees and litigation expenses. The Defendant Funds’ Boards of Trustees also engaged counsel to represent the Funds and the present and former Independent Trustees named in those suits. In March 2014, the parties in six of these lawsuits executed stipulations and agreements of settlement resolving those actions. In July 2014, the court entered an order and final judgment approving the settlements as fair, reasonable and adequate. The settlements do not resolve a seventh outstanding lawsuit relating to Oppenheimer Rochester California Municipal Fund (the “California Fund Suit”). OFI believes the California Fund Suit is without legal merit and is defending the suit vigorously. While it is premature to render any opinion as to the outcome in the California Fund Suit, or whether any costs that OFI may bear in defending the California Fund Suit might not be reimbursed by insurance, OFI believes the California Fund Suit should not impair the ability of OFI or the Distributor to perform their respective duties to the Fund, and that the outcome of the California Fund Suit should not have any material effect on the operations of any of the Oppenheimer funds.
20 OPPENHEIMER GLOBAL FUND/VA
REPORT OF INDEPENDENT REGISTERED PUBLIC ACCOUNTING FIRM
The Board of Trustees and Shareholders of Oppenheimer Variable Account Funds:
We have audited the accompanying statement of assets and liabilities of Oppenheimer Global Fund/VA (a separate series of Oppenheimer Variable Account Funds), including the statement of investments, as of December 31, 2014, and the related statement of operations for the year then ended, the statements of changes in net assets for each of the years in the two-year period then ended, and the financial highlights for each of the years in the five-year period then ended. These financial statements and financial highlights are the responsibility of the Fund’s management. Our responsibility is to express an opinion on these financial statements and financial highlights based on our audits.
We conducted our audits in accordance with the standards of the Public Company Accounting Oversight Board (United States). Those standards require that we plan and perform the audit to obtain reasonable assurance about whether the financial statements and financial highlights are free of material misstatement. An audit includes examining, on a test basis, evidence supporting the amounts and disclosures in the financial statements. Our procedures included confirmation of securities owned as of December 31, 2014, by correspondence with the custodian, transfer agent and brokers, or by other appropriate auditing procedures where replies from brokers were not received. An audit also includes assessing the accounting principles used and significant estimates made by management, as well as evaluating the overall financial statement presentation. We believe that our audits provide a reasonable basis for our opinion.
In our opinion, the financial statements and financial highlights referred to above present fairly, in all material respects, the financial position of Oppenheimer Global Fund/VA as of December 31, 2014, the results of its operations for the year then ended, the changes in its net assets for each of the years in the two-year period then ended, and the financial highlights for each of the years in the five-year period then ended, in conformity with U.S. generally accepted accounting principles.
KPMGLLP
Denver, Colorado
February 13, 2015
21 OPPENHEIMER GLOBAL FUND/VA
FEDERALINCOMETAXINFORMATION Unaudited
In early 2015, if applicable, shareholders of record received information regarding all dividends and distributions paid to them by the Fund during calendar year 2014.
Capital gain distributions of $1.86322 per share were paid to Non-Service and Service shareholders, respectively, on June 18, 2014. Whether received in stock or in cash, the capital gain distribution should be treated by shareholders as a gain from the sale of the capital assets held for more than one year (long-term capital gains).
Dividends, if any, paid by the Fund during the fiscal year ended December 31, 2014 which are not designated as capital gain distributions should be multiplied by the maximum amount allowable but not less than 43.56% to arrive at the amount eligible for the corporate dividend-received deduction.
The Fund has elected the application of Section 853 of the Internal Revenue Code to permit shareholders to take a federal income tax credit or deduction, at their option, on a per share basis. The maximum amount allowable but not less than $4,913,512 of foreign income taxes were paid by the Fund during the fiscal year ended December 31, 2014. A separate notice will be mailed to each shareholder, which will reflect the proportionate share of such foreign taxes which must be treated by shareholders as gross income for federal income tax purposes.
Gross income of the maximum amount allowable but not less than $29,590,202 was derived from sources within foreign countries or possessions of the United States.
The foregoing information is presented to assist shareholders in reporting distributions received from the Fund to the Internal Revenue Service. Because of the complexity of the federal regulations which may affect your individual tax return and the many variations in state and local tax regulations, we recommend that you consult your tax advisor for specific guidance.
22 OPPENHEIMER GLOBAL FUND/VA
BOARD APPROVAL OF THE FUND’S INVESTMENT ADVISORY AND SUB-ADVISORY AGREEMENTS Unaudited
The Fund has entered into an investment advisory agreement with OFI Global Asset Management, Inc. (“OFI Global” or the “Adviser”), a wholly-owned subsidiary of OppenheimerFunds, Inc. (“OFI” or the “Sub-Adviser”) (“OFI Global” and “OFI” together the “Managers”) and OFI Global has entered into a sub-advisory agreement with OFI whereby OFI provides investment sub-advisory services to the Fund (collectively, the “Agreements”). Each year, the Board of Trustees (the “Board”), including a majority of the independent Trustees, is required to determine whether to renew the Agreements. The Investment Company Act of 1940, as amended, requires that the Board request and evaluate, and that the Managers provide, such information as may be reasonably necessary to evaluate the terms of the Agreements. The Board employs an independent consultant to prepare a report that provides information, including comparative information that the Board requests for that purpose. In addition to in-person meetings focused on this evaluation, the Board receives information throughout the year regarding Fund services, fees, expenses and performance.
The Adviser, Sub-Adviser and the independent consultant provided information to the Board on the following factors: (i) the nature, quality and extent of the Managers’ services, (ii) the investment performance of the Fund and the Managers, (iii) the fees and expenses of the Fund, including comparative expense information, (iv) the profitability of the Managers and their affiliates, including an analysis of the cost of providing services, (v) whether economies of scale are realized as the Fund grows and whether fee levels reflect these economies of scale for Fund investors and (vi) other benefits to the Managers from their relationship with the Fund. The Board was aware that there are alternatives to retaining the Managers.
Outlined below is a summary of the principal information considered by the Board as well as the Board’s conclusions.
Nature, Quality and Extent of Services. The Board considered information about the nature, quality and extent of the services provided to the Fund and information regarding the Managers’ key personnel who provide such services. The Sub-Adviser’s duties include providing the Fund with the services of the portfolio manager and the Sub-Adviser’s investment team, who provide research, analysis and other advisory services in regard to the Fund’s investments; securities trading services; oversight of third-party service providers; monitoring compliance with applicable Fund policies and procedures and adherence to the Fund’s investment restrictions; and risk management. The Managers are responsible for providing certain administrative services to the Fund as well. Those services include providing and supervising all administrative and clerical personnel who are necessary in order to provide effective corporate administration for the Fund; compiling and maintaining records with respect to the Fund’s operations; preparing and filing reports required by the Securities and Exchange Commission; preparing periodic reports regarding the operations of the Fund for its shareholders; preparing proxy materials for shareholder meetings; and preparing the registration statements required by Federal and state securities laws for the sale of the Fund’s shares. The Managers also provide the Fund with office space, facilities and equipment.
The Board also considered the quality of the services provided and the quality of the Managers’ resources that are available to the Fund. The Board took account of the fact that the Sub-Adviser has had over fifty years of experience as an investment adviser and that its assets under management rank it among the top mutual fund managers in the United States. The Board evaluated the Sub-Adviser’s advisory, administrative, accounting, legal, compliance services and risk management, and information the Board has received regarding the experience and professional qualifications of the Managers’ key personnel and the size and functions of its staff. In its evaluation of the quality of the portfolio management services provided, the Board considered the experience of Rajeev Bhaman, the portfolio manager for the Fund, and the Sub-Adviser’s investment team and analysts. The Board members also considered the totality of their experiences with the Managers as directors or trustees of the Fund and other funds advised by the Managers. The Board considered information regarding the quality of services provided by affiliates of the Managers, which its members have become knowledgeable about in connection with the renewal of the Fund’s service agreements. The Board concluded, in light of the Managers’ experience, reputation, personnel, operations and resources that the Fund benefits from the services provided under the Agreements.
Investment Performance of the Fund, the Adviser and the Sub-Adviser. Throughout the year, the Manager provided information on the investment performance of the Fund, including comparative performance information. The Board also reviewed information, prepared by the Manager and by the independent consultant, comparing the Fund’s historical performance to relevant market indices and to the performance of other world stock funds underlying variable insurance products. The Board considered that the Fund outperformed its performance category median during the one-,
three-, five- and ten-year periods. The Board also considered that the Fund ranked in the third quintile of its performance category for the one-year period, the second quintile for the three- and ten-year periods and the first quintile for the five-year period.
Costs of Services by the Adviser. The Board reviewed the fees paid to the Manager and the other expenses borne by the Fund. The Board noted that the Manager, not the Fund, pays the Sub-Adviser’s fee under the sub-advisory agreement. The independent consultant provided comparative data in regard to the fees and expenses of the Fund and other world stock funds underlying variable insurance products. In reviewing the fees and expenses charged to the VA funds, the Board considered the Manager’s assertion that, because there is much greater disparity in the fees and services that may be provided by a manager to a VA fund as opposed to a retail fund, when comparing the expenses of the various VA funds to those of retail funds, it is most appropriate to focus on total expenses (rather than on the management fees). Accordingly, while the Board reviewed and considered all expenses, it focused on total expenses. The Board considered that the Fund’s total expenses were lower than its peer group median and its category median. The Board also considered that the Fund’s contractual management fee was lower than its peer group median and category median. Within the total asset range of $2 billion to $5 billion, the Fund’s effective management fee rate was lower than its peer group median and category median. The Board further considered that the Manager has voluntarily agreed to limit the Fund’s total annual operating expenses so that those expenses, as percentages of daily net assets, will not exceed the annual rate of 1.00% for Non-Service Shares and 1.25% for Service Shares. This voluntary expense limitation may be amended or withdrawn at any time without prior notice to shareholders.
Economies of Scale and Profits Realized by the Adviser and Sub-Adviser. The Board considered information regarding the Manager’s costs in serving as the Fund’s investment adviser, including the costs associated with the personnel and systems necessary to manage the Fund, and information regarding the Manager’s profitability from its relationship with the Fund. The Board reviewed whether the Manager may realize economies of scale in managing and supporting the Fund. The Board noted that the Fund currently has management fee breakpoints, which are intended to share with Fund shareholders economies of scale that may exist as the Fund’s assets grow. The Board further noted that on November 1, 2013, an additional fee breakpoint of 0.58% for assets in excess of $5 billion was added to the Fund’s breakpoint schedule.
23 OPPENHEIMER GLOBAL FUND/VA
BOARD APPROVAL OF THE FUND’S INVESTMENT ADVISORY AND SUB-ADVISORY AGREEMENTS Unaudited / Continued
Other Benefits to the Managers. In addition to considering the profits realized by the Managers, the Board considered information that was provided regarding the direct and indirect benefits the Managers receive as a result of their relationship with the Fund, including compensation paid to the Managers’ affiliates and research provided to the Adviser in connection with permissible brokerage arrangements (soft dollar arrangements). The Board also considered that the Managers must be able to pay and retain experienced professional personnel at competitive rates to provide quality services to the Fund.
Conclusions. These factors were also considered by the independent Trustees meeting separately from the full Board, assisted by experienced counsel to the Fund and to the independent Trustees. Fund counsel and the independent Trustees’ counsel are independent of the Managers within the meaning and intent of the Securities and Exchange Commission Rules.
Based on its review of the information it received and its evaluations described above, the Board, including a majority of the independent Trustees, decided to continue the Agreements through August 31, 2015. In arriving at its decision, the Board did not identify any factor or factors as being more important than others, but considered all of the above information, and considered the terms and conditions of the Agreements, including the management fees, in light of all the surrounding circumstances.
24 OPPENHEIMER GLOBAL FUND/VA
PORTFOLIO PROXY VOTING POLICIES AND PROCEDURES; UPDATES TO STATEMENTS OF INVESTMENTS Unaudited
The Fund has adopted Portfolio Proxy Voting Policies and Procedures under which the Fund votes proxies relating to securities (“portfolio proxies”) held by the Fund. A description of the Fund’s Portfolio Proxy Voting Policies and Procedures is available (i) without charge, upon request, by calling the Fund toll-free at 1.800.525.7048, (ii) on the Fund’s website at www.oppenheimerfunds.com, and (iii) on the SEC’s website at www.sec.gov. In addition, the Fund is required to file Form N-PX, with its complete proxy voting record for the 12 months ended June 30th, no later than August 31st of each year. The Fund’s voting record is available (i) without charge, upon request, by calling the Fund toll-free at 1.800.525.7048, and (ii) in the Form N-PX filing on the SEC’s website at www.sec.gov.
The Fund files its complete schedule of portfolio holdings with the SEC for the first quarter and the third quarter of each fiscal year on Form N-Q. The Fund’s Form N-Q filings are available on the SEC’s website at www.sec.gov. Those forms may be reviewed and copied at the SEC’s Public Reference Room in Washington, D.C. Information on the operation of the Public Reference Room may be obtained by calling 1-800-SEC-0330.
25 OPPENHEIMER GLOBAL FUND/VA
TRUSTEES AND OFFICERS Unaudited
| | |
Name, Position(s) Held with the Fund, Length of
Service, Year of Birth | | Principal Occupation(s) During the Past 5 Years; Other Trusteeships/Directorships
Held; Number of Portfolios in the Fund Complex Currently Overseen |
| |
| INDEPENDENT TRUSTEES | | The address of each Trustee in the chart below is 6803 S. Tucson Way, Centennial, Colorado 80112-3924. Each Trustee serves for an indefinite term, or until his or her resignation, retirement, death or removal. |
| |
Sam Freedman, Chairman of the Board of Trustees (since 2013) and Trustee (since 1996) Year of Birth: 1940 | | Director of Colorado UpLIFT (charitable organization) (since September 1984). Mr. Freedman held several positions with the Sub-Adviser and with subsidiary or affiliated companies of the Sub-Adviser (until October 1994). Oversees 38 portfolios in the OppenheimerFunds complex. Mr. Freedman has served on the Boards of certain Oppenheimer funds since 1996, during which time he has become familiar with the Fund’s (and other Oppenheimer funds’) financial, accounting, regulatory and investment matters and has contributed to the Boards’ deliberations. |
| |
Jon S. Fossel, Trustee (since 1990) Year of Birth: 1942 | | Chairman of the Board of Jack Creek Preserve Foundation (non-profit organization) (since 2005); Chairman of the Board (2006-December 2011) and Director (June 2002-December 2011) of UNUMProvident (insurance company); Director of Northwestern Energy Corp. (public utility corporation) (November 2004-December 2009); Director of P.R. Pharmaceuticals (October 1999-October 2003); Director of Rocky Mountain Elk Foundation (non-profit organization) (February 1998-February 2003 and February 2005-February 2007); Chairman and Director (until October 1996) and President and Chief Executive Officer (until October 1995) of the Sub-Adviser; President, Chief Executive Officer and Director of the following: Oppenheimer Acquisition Corp. (“OAC”) (parent holding company of the Sub-Adviser), Shareholder Services, Inc. and Shareholder Financial Services, Inc. (until October 1995). Oversees 38 portfolios in the OppenheimerFunds complex. Mr. Fossel has served on the Boards of certain Oppenheimer funds since 1990, during which time he has become familiar with the Fund’s (and other Oppenheimer funds’) financial, accounting, regulatory and investment matters and has contributed to the Boards’ deliberations. |
| |
Richard F. Grabish, Trustee (since 2008) Year of Birth: 1948 | | Formerly Senior Vice President and Assistant Director of Sales and Marketing (March 1997-December 2007), Director (March 1987-December 2007) and Manager of Private Client Services (June 1985-June 2005) of A.G. Edwards & Sons, Inc. (broker/dealer and investment firm); Chairman and Chief Executive Officer of A.G. Edwards Trust Company, FSB (March 2001-December 2007); President and Vice Chairman of A.G. Edwards Trust Company, FSB (investment adviser) (April 1987-March 2001); President of A.G. Edwards Trust Company, FSB (investment adviser) (June 2005-December 2007). Oversees 38 portfolios in the OppenheimerFunds complex. Mr. Grabish has served on the Boards of certain Oppenheimer funds since 2001, during which time he has become familiar with the Fund’s (and other Oppenheimer funds’) financial, accounting, regulatory and investment matters and has contributed to the Boards’ deliberations. |
| |
Beverly L. Hamilton, Trustee (since 2002) Year of Birth: 1946 | | Trustee of Monterey Institute for International Studies (educational organization) (since February 2000); Board Member of Middlebury College (educational organization) (December 2005-June 2011); Chairman (since 2010) of American Funds’ Emerging Markets Growth Fund, Inc. (mutual fund); Director of The California Endowment (philanthropic organization) (April 2002-April 2008); Director (February 2002-2005) and Chairman of Trustees (2006-2007) of the Community Hospital of Monterey Peninsula; Director (October 1991-2005); Vice Chairman (2006-2009) of American Funds’ Emerging Markets Growth Fund, Inc. (mutual fund); President of ARCO Investment Management Company (February 1991-April 2000); Member of the investment committees of The Rockefeller Foundation (2001-2006) and The University of Michigan (since 2000); Advisor at Credit Suisse First Boston’s Sprout venture capital unit (venture capital fund) (1994-January 2005); Trustee of MassMutual Institutional Funds (investment company) (1996-June 2004); Trustee of MML Series Investment Fund (investment company) (April 1989-June 2004); Member of the investment committee of Hartford Hospital (2000-2003); and Advisor to Unilever (Holland) pension fund (2000-2003). Oversees 38 portfolios in the OppenheimerFunds complex. Ms. Hamilton has served on the Boards of certain Oppenheimer funds since 2002, during which time she has become familiar with the Fund’s (and other Oppenheimer funds’) financial, accounting, regulatory and investment matters and has contributed to the Boards’ deliberations. |
| |
Victoria J. Herget, Trustee (since 2012) Year of Birth:1951 | | Board Chair (2008-Present) and Director (2004-Present), United Educators (insurance company); Trustee (since 2000) and Chair (since 2010), Newberry Library (independent research library); Trustee, Mather LifeWays (senior living organization) (since 2001); Independent Director of the First American Funds (mutual fund family) (2003-2011); former Managing Director (1993-2001), Principal (1985-1993), Vice President (1978-1985) and Assistant Vice President (1973-1978) of Zurich Scudder Investments (investment adviser) (and its predecessor firms); Trustee (1992-2007), Chair of the Board of Trustees (1999-2007), Investment Committee Chair (1994-1999) and Investment Committee member (2007-2010) of Wellesley College; Trustee, BoardSource (non-profit organization) (2006-2009) and Chicago City Day School (K-8 School) (1994-2005). Oversees 38 portfolios in the OppenheimerFunds complex. Ms. Herget has served on the Boards of certain Oppenheimer funds since 2012, during which time she has become familiar with the Fund’s (and other Oppenheimer funds’) financial, accounting, regulatory and investment matters and has contributed to the Boards’ deliberations. |
| |
Robert J. Malone, Trustee (since 2002) Year of Birth: 1944 | | Chairman of the Board (since 2012) and Director (since August 2005) of Jones International University (educational organization); Chairman, Chief Executive Officer and Director of Steele Street Bank Trust (commercial banking) (since August 2003); Trustee of the Gallagher Family Foundation (non-profit organization) (since 2000); Board of Directors of Opera Colorado Foundation (non-profit organization) (2008-2012); Director of Colorado UpLIFT (charitable organization) (1986-2010); Director of Jones Knowledge, Inc. (2006-2010); Former Chairman of U.S. Bank-Colorado (subsidiary of U.S. Bancorp and formerly Colorado National Bank) (July 1996-April 1999); Director of Commercial Assets, Inc. (real estate investment trust) (1993-2000); Director of U.S. Exploration, Inc. (oil and gas exploration) (1997-February 2004); Chairman of the Board (1991-1994) and Trustee (1985-1994) of Regis University; and Chairman of the Board (1990-1991 and Trustee (1984-1999) of Young Presidents Organization. Oversees 38 portfolios in the OppenheimerFunds complex. Mr. Malone has served on the |
26 OPPENHEIMER GLOBAL FUND/VA
| | |
Robert J. Malone, Continued | | Boards of certain Oppenheimer funds since 2002, during which time he has become familiar with the Fund’s (and other Oppenheimer funds’) financial, accounting, regulatory and investment matters and has contributed to the Boards’ deliberations. |
| |
F. William Marshall, Jr., Trustee (since 2000) Year of Birth: 1942 | | Trustee Emeritus of Worcester Polytech Institute (WPI) (private university) (since 2009); Trustee of MassMutual Select Funds (formerly MassMutual Institutional Funds) (investment company) (since 1996), MML Series Investment Fund (investment company) (since 1996) and Mass Mutual Premier Funds (investment company) (since January 2012); President and Treasurer of the SIS Fund (private charitable fund) (January 1999 – March 2011); Former Trustee of WPI (1985-2008); Former Chairman of the Board (2004-2006) and Former Chairman of the Investment Committee of WPI (1994-2008); Chairman of SIS & Family Bank, F.S.B. (formerly SIS Bank) (commercial bank) (January 1999-July 1999); Executive Vice President of Peoples Heritage Financial Group, Inc. (commercial bank) (January 1999-July 1999); and Former President and Chief Executive Officer of SIS Bancorp. (1993-1999). Oversees 42 portfolios in the OppenheimerFunds complex. Mr. Marshall has served on the Boards of certain Oppenheimer funds since 2000, during which time he has become familiar with the Fund’s (and other Oppenheimer funds’) financial, accounting, regulatory and investment matters and has contributed to the Boards’ deliberations. |
| |
Karen L. Stuckey, Trustee (since 2012) Year of Birth: 1953 | | Partner (1990-2012) of PricewaterhouseCoopers LLP (professional services firm) (held various positions 1975- 1990); Trustee (1992-2006) and member of Executive, Nominating and Audit Committees and Chair of Finance Committee of Lehigh University; and member, Women’s Investment Management Forum (professional organization) since inception. Oversees 38 portfolios in the OppenheimerFunds complex. Ms. Stuckey has served on the Boards of certain Oppenheimer funds since 2012, during which time she has become familiar with the Fund’s (and other Oppenheimer funds’) financial, accounting, regulatory and investment matters and has contributed to the Boards’ deliberations. |
| |
James D. Vaughn, Trustee (since 2012) Year of Birth:1945 | | Retired; former managing partner (1994-2001) of Denver office of Deloitte & Touche LLP, (held various positions 1969-1993); Trustee and Chairman of the Audit Committee of Schroder Funds (2003-2012); Board member and Chairman of Audit Committee of AMG National Trust Bank (since 2005); Trustee and Investment Committee member, University of South Dakota Foundation (since 1996); Board member, Audit Committee Member and past Board Chair, Junior Achievement (since 1993); former Board member, Mile High United Way, Boys and Girls Clubs, Boy Scouts, Colorado Business Committee for the Arts, Economic Club of Colorado and Metro Denver Network. Oversees 38 portfolios in the OppenheimerFunds complex. Mr. Vaughn has served on the Boards of certain Oppenheimer funds since 2012, during which time he has become familiar with the Fund’s (and other Oppenheimer funds’) financial, accounting, regulatory and investment matters and has contributed to the Boards’ deliberations. |
|
|
| |
| INTERESTED TRUSTEE | | Mr. Glavin is an “Interested Trustee” because he is affiliated with the Manager and the Sub-Adviser by virtue of his positions as director of the Sub-Adviser, and as a shareholder of the Sub-Adviser’s parent company. As a Trustee, he serves for an indefinite term, or until his resignation, retirement, death or removal. Mr. Glavin’s address is 225 Liberty Street, 11th Floor, New York, New York 10281-1008. |
| |
William F. Glavin, Jr., Trustee (since 2009) Year of Birth: 1958 | | Chairman of the Sub-Adviser (July 2014-December 2014 and December 2009-December 2012) and Director of the Sub-Adviser (since January 2009); Chairman, Director and Chief Executive Officer (January 2013-June 2014) of the Manager; President of the Manager (January 2013-May 2013); Chief Executive Officer (January 2009-December 2012); President of the Sub-Adviser (May 2009-December 2012); Management Director (June 2009-June 2014), President (December 2009-June 2014) and Chief Executive Officer (January 2011-June 2014) of Oppenheimer Acquisition Corp. (“OAC”) (the Sub-Adviser’s parent holding company); Director of Oppenheimer Real Asset Management, Inc. (March 2010-June 2014); Executive Vice President (March 2006-February 2009) and Chief Operating Officer (July 2007-February 2009) of Massachusetts Mutual Life Insurance Company (OAC’s parent company); Director (May 2004-March 2006) and Chief Operating Officer and Chief Compliance Officer (May 2004-January 2005), President (January 2005-March 2006) and Chief Executive Officer (June 2005-March 2006) of Babson Capital Management LLC; Director (March 2005-March 2006), President (May 2003-March 2006) and Chief Compliance Officer (July 2005-March 2006) of Babson Capital Securities, Inc. (a broker-dealer); President (May 2003-March 2006) of Babson Investment Company, Inc.; Director (May 2004-August 2006) of Babson Capital Europe Limited; Director (May 2004-October 2006) of Babson Capital Guernsey Limited; Director (May 2004-March 2006) of Babson Capital Management LLC; Non-Executive Director (March 2005-March 2007) of Baring Asset Management Limited; Director (February 2005-June 2006) Baring Pension Trustees Limited; Director and Treasurer (December 2003-November 2006) of Charter Oak Capital Management, Inc.; Director (May 2006-September 2006) of C.M. Benefit Insurance Company; Director (May 2008-June 2009) and Executive Vice President (June 2007-July 2009) of C.M. Life Insurance Company; President (March 2006-May 2007) of MassMutual Assignment Company; Director (January 2005-December 2006), Deputy Chairman (March 2005-December 2006) and President (February 2005-March 2005) of MassMutual Holdings (Bermuda) Limited; Director (May 2008-June 2009) and Executive Vice President (June 2007-July 2009) of MML Bay State Life Insurance Company; Chief Executive Officer and President (April 2007-January 2009) of MML Distributors, LLC; and Chairman (March 2006-December 2008) and Chief Executive Officer (May 2007-December 2008) of MML Investors Services, Inc. An officer of 91 portfolios in the OppenheimerFunds complex. Mr. Glavin has served on the Boards of certain Oppenheimer funds since December 2009, during which time he has become familiar with the Fund’s (and other Oppenheimer funds’) financial, accounting, regulatory and investment matters and has contributed to the Boards’ deliberations. |
|
|
| |
| OTHER OFFICERS OF THE FUND | | The addresses of the Officers in the chart below are as follows: for Messrs. Bhaman, Steinmetz, Gabinet, Mss. Sexton and Picciotto, 225 Liberty Street, New York, New York 10281-1008, for Mr. Wixted, 6803 S. Tucson Way, Centennial, Colorado 80112-3924. Each Officer serves for an indefinite term or until his or her resignation, retirement, death or removal. |
| |
Rajeev Bhaman, Vice President (since 2004) Year of Birth: 1963 | | Director of Global Equities of the Sub-Adviser (since January 2013); Senior Vice President of the Sub-Adviser (since May 2006); Vice President of the Sub-Adviser (January 1997-May 2006). An officer of other portfolios in the OppenheimerFunds complex. |
27 OPPENHEIMER GLOBAL FUND/VA
TRUSTEES AND OFFICERS Unaudited / Continued
| | |
Arthur P. Steinmetz, President and Principal Executive Officer (since 2014) Year of Birth: 1958 | | Chairman of the Sub-Adviser (since January 2015); CEO and Chairman of the Manager (since July 2014), President of the Manager (since May 2013), a Director of the Manager (since January 2013), Director of the Sub-Adviser (since July 2014), President, Management Director and CEO of Oppenheimer Acquisition Corp. (the Sub-Adviser’s parent holding company) (since July 2014), and President and Director of OFI SteelPath, Inc. (since January 2013). Chief Investment Officer of the OppenheimerFunds advisory entities from (January 2013-December 2013); Executive Vice President of the Manager (January 2013-May 2013); Chief Investment Officer of the Sub-Adviser (October 2010-December 2012); Chief Investment Officer, Fixed-Income, of the Sub-Adviser (April 2009-October 2010); Executive Vice President of the Sub-Adviser (October 2009-December 2012); Director of Fixed Income of the Sub-Adviser (January 2009-April 2009); and a Senior Vice President of the Sub-Adviser (March 1993-September 2009). An officer of 91 portfolios in the OppenheimerFunds complex. |
| |
Arthur S. Gabinet, Secretary and Chief Legal Officer (since 2011) Year of Birth: 1958 | | Executive Vice President, Secretary and General Counsel of the Manager (since January 2013); General Counsel OFI SteelPath, Inc. (since January 2013); Executive Vice President (May 2010-December 2012) and General Counsel (since January 2011) of the Sub-Adviser; General Counsel of the Distributor (since January 2011); General Counsel of Centennial Asset Management Corporation (January 2011-December 2012); Executive Vice President (January 2011-December 2012) and General Counsel of HarbourView Asset Management Corporation (since January 2011); Assistant Secretary (since January 2011) and Director (since January 2011) of OppenheimerFunds International Ltd. and OppenheimerFunds plc; Director of Oppenheimer Real Asset Management, Inc. (January 2011-December 2012) and General Counsel (since January 2011); Executive Vice President (January 2011-December 2011) and General Counsel of Shareholder Financial Services, Inc. and Shareholder Services, Inc. (since January 2011); Executive Vice President (January 2011-December 2012) and General Counsel of OFI Private Investments Inc. (since January 2011); Vice President of OppenheimerFunds Legacy Program (January 2011-December 2011); Executive Vice President (January 2011-December 2012) and General Counsel of OFI Institutional Asset Management, Inc. (since January 2011); General Counsel, Asset Management of the Sub-Adviser (May 2010-December 2010); Principal, The Vanguard Group (November 2005-April 2010); District Administrator, U.S. Securities and Exchange Commission (January 2003-October 2005). An officer of 91 portfolios in the OppenheimerFunds complex. |
| |
Jennifer Sexton, Vice President and Chief Business Officer (since 2014) Year of Birth: 1969 | | Senior Vice President of OppenheimerFunds Distributor, Inc. (since June 2014); Vice President of OppenheimerFunds Distributor, Inc. (April 2006-June 2014); Vice President of the Sub-Adviser (January 1998-March 2006); Assistant Vice President of the Sub-Adviser (October 1991-December 1998). An officer of 91 portfolios in the OppenheimerFunds complex. |
| |
Mary Ann Picciotto, Chief Compliance Officer and Chief Anti-Money Laundering Officer (since 2014) Year of Birth: 1973 | | Senior Vice President and Chief Compliance Officer of the Manager (since March 2014); Chief Compliance Officer of the Sub-Adviser, OFI SteelPath, Inc., OFI Global Trust Company, OFI Global Institutional, Inc., Oppenheimer Real Asset Management, Inc., OFI Private Investments, Inc., Harborview Asset Management Corporation, Trinity Investment Management Corporation, and Shareholder Services, Inc. (since March 2014); Managing Director of Morgan Stanley Investment Management Inc. and certain of its various affiliated entities; Chief Compliance Officer of various Morgan Stanley Funds (May 2010-January 2014); Chief Compliance Officer of Morgan Stanley Investment Management Inc. (April 2007-January 2014). An officer of 91 portfolios in the OppenheimerFunds complex. |
| |
Brian W. Wixted, Treasurer and Principal Financial & Accounting Officer (since 1999) Year of Birth: 1959 | | Senior Vice President of the Manager (since January 2013); Treasurer of the Sub-Adviser, HarbourView Asset Management Corporation, Shareholder Financial Services, Inc., Shareholder Services, Inc., and Oppenheimer Real Asset Management, Inc. (March 1999-June 2008), OFI Private Investments, Inc. (March 2000-June 2008), OppenheimerFunds International Ltd. and OppenheimerFunds plc (since May 2000), OFI Institutional Asset Management, Inc. (November 2000-June 2008), and OppenheimerFunds Legacy Program (charitable trust program established by the Sub-Adviser) (June 2003-December 2011); Treasurer and Chief Financial Officer of OFI Trust Company (since May 2000); Assistant Treasurer of Oppenheimer Acquisition Corporation (March 1999-June 2008). An officer of 91 portfolios in the OppenheimerFunds complex. |
The Fund’s Statement of Additional Information contains additional information about the Fund’s Trustees and Officers and is available without charge, upon request, by calling 1.800.988.8287.
28 OPPENHEIMER GLOBAL FUND/VA
THIS PAGE INTENTIONALLY LEFT BLANK.
29 OPPENHEIMER GLOBAL FUND/VA
THIS PAGE INTENTIONALLY LEFT BLANK.
30 OPPENHEIMER GLOBAL FUND/VA
THIS PAGE INTENTIONALLY LEFT BLANK.
31 OPPENHEIMER GLOBAL FUND/VA
OPPENHEIMERGLOBALFUND/VA
A Series of Oppenheimer Variable Account Funds
| | |
Manager | | OFI Global Asset Management, Inc. |
| |
Sub-Adviser | | OppenheimerFunds, Inc. |
| |
Distributor | | OppenheimerFunds Distributor, Inc. |
| |
Transfer and | | OFI Global Asset Management, Inc. |
Shareholder | | |
Servicing Agent | | |
| |
Sub-Transfer Agent | | Shareholder Services, Inc. |
| | DBA OppenheimerFunds Services |
| |
Independent | | KPMG LLP |
Registered | | |
Public | | |
Accounting | | |
Firm | | |
| |
Counsel | | K&L Gates LLP |
| |
| | Before investing in any of the Oppenheimer funds, investors should carefully consider a fund’s investment objectives, risks, charges and expenses. Fund prospectuses and summary prospectuses contain this and other information about the funds, and may be obtained by asking your financial advisor, or calling us at 1.800.988.8287. Read prospectuses and summary prospectuses carefully before investing. |
| |
| | © 2015 OppenheimerFunds, Inc. All rights reserved. Oppenheimer funds are distributed by OppenheimerFunds Distributor, Inc. |
| | | | |
| | | |  |
| | | | The Right Way to Invest |

PORTFOLIO MANAGERS: Manind (“Mani”) Govil, CFA, Benjamin Ram and Paul Larson1
AVERAGE ANNUAL TOTAL RETURNS FOR THE PERIODS ENDED 12/31/14
| | | | | | | | | | | | | | |
| | | Inception
Date | | 1-Year | | | 5-Year | | | 10-Year | |
Non-Service Shares | | 7/5/95 | | | 10.70 | % | | | 14.63 | % | | | 7.12 | % |
Service Shares | | 7/13/00 | | | 10.40 | | | | 14.33 | | | | 6.85 | |
S&P 500 Index | | | | | 13.69 | | | | 15.45 | | | | 7.67 | |
Performance data quoted represents past performance, which does not guarantee future results. The investment return and principal value of an investment in the Fund will fluctuate so that an investor’s shares, when redeemed, may be worth more or less than their original cost. Current performance may be lower or higher than the performance quoted. For performance data current to the most recent month end, call us at 1.800.988.8287. The Fund’s total returns should not be expected to be the same as the returns of other funds, whether or not both funds have the same portfolio managers and/or similar names. The Fund’s total returns include changes in share price and reinvested distributions but do not include the charges associated with the separate account products that offer this Fund. Such performance would have been lower if such charges were taken into account.
TOP TEN COMMON STOCK HOLDINGS
| | | | | | |
Apple, Inc. | | | 4.0 | % | | |
Citigroup, Inc. | | | 3.5 | | | |
Mondelez International, Inc., Cl. A | | | 3.1 | | | |
Comcast Corp., Cl. A | | | 2.9 | | | |
General Electric Co. | | | 2.8 | | | |
Google, Inc., Cl. C | | | 2.7 | | | |
Actavis plc | | | 2.6 | | | |
Deere & Co. | | | 2.6 | | | |
Tyco International plc | | | 2.5 | | | |
Philip Morris International, Inc. | | | 2.5 | | | |
Portfolio holdings and allocations are subject to change. Percentages are as of December 31, 2014, and are based on net assets. For more current Fund holdings, please visit oppenheimerfunds.com.
SECTOR ALLOCATION
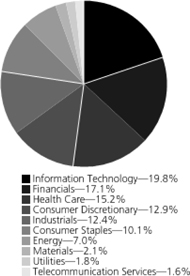
Portfolio holdings and allocations are subject to change. Percentages are as of December 31, 2014, and are based on the total market value of common stocks.
1. Paul Larson became a portfolio manager in April 2014.
2 OPPENHEIMER MAIN STREET FUND/VA
Fund Performance Discussion
During the reporting period, the Fund’s Non-Service shares produced a return of 10.70%. In comparison, the Fund underperformed the S&P 500 Index (the “Index”), which returned 13.69%. The Fund underperformed the Index primarily in the consumer staples, financials and information technology sectors as a result of less favorable stock selection. Stronger relative stock selection in health care and consumer discretionary sectors benefited the Fund this period. An overweight position in health care and underweight position in consumer discretionary also benefited the Fund’s relative performance.
MARKET OVERVIEW
During the past year domestic equity — as an asset class — once again distinguished itself as stocks appreciated in value across all capitalizations. In 2014, the U.S. economy provided a favorable backdrop for the outperformance of equities with steady, albeit modest growth, continued little wage inflation, and interest rates that remained low — in fact, well below initial expectations. Under these economic conditions most companies were able to demonstrate ongoing improvement with the majority beating expectations — on both the top and bottom lines.
The ride throughout the year, however, was anything but smooth. Macro influences —particularly the strengthening dollar, flattening yield curve, and tumbling oil price — played a significant role in determining which equities out- or underperformed. Accommodation by the Federal Reserve (the “Fed”), which officially ended its bond-buying stimulus program in October, helped to fuel demand for high-dividend paying stocks such as utilities and real estate investment trusts (“REITs”), while a step-up in merger and acquisition activity — spurred on by the desire to relocate to advantageous low tax jurisdictions — boosted stocks primarily in the health care sector. But not all was rosy. The Fed’s accommodative behavior proved a headwind for many financials as long yields declined, hurting the profitability of banks. The strengthening U.S. dollar also proved a headwind, especially for multi-national companies where translation from local currencies to the greenback negatively impacted the bottom line. Consequently, stocks with international businesses broadly underperformed stocks with mostly domestic exposure.
Geopolitical risks, including those concentrated in Ukraine and Russia and the ever-present turmoil in the Middle East, caused investors to fret and resulted in, at times, quite the roller coaster ride. Add to this the fact that growth outside of the U.S. was anemic, at best, leading investors to worry intermittently about the global outlook and its impact on domestic stocks. And, a new concern raised its very ugly head as the Ebola epidemic in Western Africa spooked investors further. Though volatility remained below historical averages, these issues caused it to it to spike on a number of occasions throughout the year.
TOP INDIVIDUAL CONTRIBUTORS
Top contributors to performance this period included Apple, Inc., Allergan, Inc. and Actavis plc. Apple rallied after iPhone sales came in higher than analysts anticipated and the company announced a 7-for-1 stock split and increased both its dividend and share repurchases. In addition, the introduction of two new iPhones, and the upcoming introduction of a new Apple Watch product, resulted in strong performance. Allergan is a leading maker of eye care, skin care and aesthetic products, including Botox. Allergan’s stock price jumped when pharmaceutical firm Valeant, in conjunction with activist investor Bill Ackman of Pershing Square, announced their intention to acquire the company. Allergan’s management resisted this overture, on the premise that the acquisition price underestimates the company’s worth. Later in the reporting period, Allergan agreed to a $66 billion bid from Actavis, ending the pursuit by Valeant and Pershing Square. In addition to acquiring Allergan, Actavis shares reacted favorably after management pre-announced a positive earnings surprise due mostly to revenue synergies and cost savings from a recent merger with Warner Chilcott. Free cash generation was above expectations as well, and was used to pay down debt. This reduced balance sheet leverage, thus providing financial flexibility for additional acquisitions to further the company’s growth initiatives. The company also announced the acquisition of Forest Labs, which was well received as Forest not only accelerates the revenue growth potential for Actavis, but also has the potential to result in increased profitability as higher margin branded drugs become a larger percentage of the company’s business.
TOP INDIVIDUAL DETRACTORS
Top detractors from the Fund’s performance included Noble Energy, Inc., Genworth Financial, Inc. and Google, Inc. Noble has a high sensitivity to oil price changes as it has significant exploration and production operations globally. Growth projections are expected to decline as the company adjusts both its cash flow expectations and balance sheet to reflect a diminished outlook for global energy prices. We have maintained our position and continue to have confidence in management’s ability to execute well at period end. Genworth, which provides insurance for the life, mortgage, and long-term care markets, disappointed investors when it reported third quarter results. Management announced a larger than projected charge to reflect a step-up in claims from holders of its long-term care policies. Additionally, the company disclosed that it would conduct a comprehensive review of all policies, adding to investor concerns. We think the company is currently undervalued by the market — especially given the sell-off in the stock — and we have maintained our position. Search engine giant Google fell over the fourth quarter after it released earnings that missed analysts’ expectations. The earnings miss was due largely to a deceleration in paid clicks on advertisements that appear on its sites. In addition, the company faced foreign exchange headwinds — as did most companies that had exposure out of the U.S. this reporting period — and we slightly reduced our position in Google as a result.
3 OPPENHEIMER MAIN STREET FUND/VA
STRATEGY & OUTLOOK
While we have no crystal ball, we believe domestic equities should continue to be an attractive investment. The U.S. economic outlook remains favorable, with ongoing moderate real growth, low inflationary pressures and little expected impact from the Fed’s initial tightening of the yield curve’s short-end. We believe profit margins, which have expanded to peak historical levels, are unlikely to expand significantly further, but quite probably can be sustained at current levels. With interest rates remaining low, combined with the fall in oil prices, consumer spending — which is the majority of GDP — should support our outlook for moderate growth.
Shocks to the market — whether economic or geopolitical in nature — will no doubt continue and could result in rising volatility. If true, we expect investors may favor stocks characterized by “higher quality” — those that have pricing power, control over costs, and exhibit both improving returns on invested capital and generate excess cash flow. We believe this market environment can favor our consistent approach, which aims to construct an “all weather” portfolio by targeting companies we believe have: 1) sustainable competitive advantages; 2) skilled management with a proven track record of executing effectively; and 3) financial resources with the potential to generate improving profitability, gain market share, and/or return significant cash to shareholders. During times of volatile or slow economic growth such companies frequently widen their lead over weaker competitors. We seek to invest in companies characterized by these qualities at compelling valuations, and believe this disciplined approach is essential in seeking to generate superior long-term performance.
Investors should consider the Fund’s investment objective, risks, charges and expenses carefully before investing. The Fund’s prospectus and summary prospectus contain this and other information about the Fund, and may be obtained by asking your financial advisor or calling us at 1.800.988.8287. Read prospectuses and summary prospectuses carefully before investing.
Total returns include changes in share price and reinvestment of dividends and capital gains distributions in a hypothetical investment for the periods shown.
The Fund’s investment strategy and focus can change over time. The mention of specific fund holdings does not constitute a recommendation by OppenheimerFunds, Inc. or its affiliates.
Shares of Oppenheimer funds are not deposits or obligations of any bank, are not guaranteed by any bank, are not insured by the FDIC or any other agency, and involve investment risks, including the possible loss of the principal amount invested.
Comparing the Fund’s Performance to the Market. The graphs that follow show the performance of a hypothetical $10,000 investment in each share class of the Fund held until December 31, 2014. Performance is measured over a ten-fiscal-year period for both Classes. Performance information does not reflect charges that apply to separate accounts investing in the Fund. If these charges were taken into account, performance would be lower. The graphs assume that all dividends and capital gains distributions were reinvested in additional shares.
The Fund’s performance is compared to the performance of the S&P 500 Index, an index of large-capitalization equity securities that is a measure of the general domestic stock market. The Index is unmanaged and cannot be purchased directly by investors. While index comparisons may be useful to provide a benchmark for the Fund’s performance, it must be noted that the Fund’s investments are not limited to the investments comprising the Index. Index performance includes reinvestment of income, but does not reflect transaction costs, fees, expenses or taxes. Index performance is shown for illustrative purposes only as a benchmark for the Fund’s performance, and does not predict or depict performance of the Fund. The Fund’s performance reflects the effects of the Fund’s business and operating expenses.
4 OPPENHEIMER MAIN STREET FUND/VA
COMPARISON OF CHANGE IN VALUE OF $10,000 HYPOTHETICAL INVESTMENTS IN:
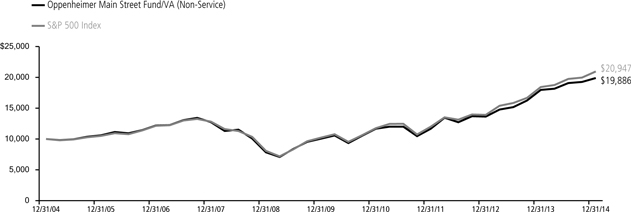
COMPARISON OF CHANGE IN VALUE OF $10,000 HYPOTHETICAL INVESTMENTS IN:
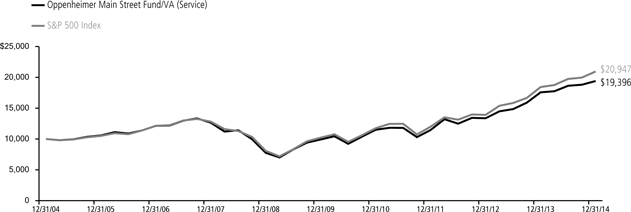
The performance data quoted represents past performance, which does not guarantee future results. The investment return and principal value of an investment in the Fund will fluctuate so that an investor’s shares, when redeemed, may be worth more or less than their original cost. Current performance may be lower or higher than the performance quoted. For performance data current to the most recent month end, call us at 1.800.988.8287. The Fund’s total returns should not be expected to be the same as the returns of other funds, whether or not both funds have the same portfolio managers and/or similar names. The Fund’s total returns include changes in share price and reinvested distributions but do not include the charges associated with the separate account products that offer this Fund. Such performance would have been lower if such charges were taken into account.
5 OPPENHEIMER MAIN STREET FUND/VA
Fund Expenses
Fund Expenses. As a shareholder of the Fund, you incur two types of costs: (1) transaction costs and (2) ongoing costs, including management fees; distribution and service fees; and other Fund expenses. These examples are intended to help you understand your ongoing costs (in dollars) of investing in the Fund and to compare these costs with the ongoing costs of investing in other mutual funds.
The examples are based on an investment of $1,000.00 invested at the beginning of the period and held for the entire 6-month period ended December 31, 2014.
Actual Expenses. The first section of the table provides information about actual account values and actual expenses. You may use the information in this section for the class of shares you hold, together with the amount you invested, to estimate the expense that you paid over the period. Simply divide your account value by $1,000.00 (for example, an $8,600.00 account value divided by $1,000.00 = 8.60), then multiply the result by the number in the first section under the heading entitled “Expenses Paid During Period” to estimate the expenses you paid on your account during this period.
Hypothetical Example for Comparison Purposes.
The second section of the table provides information about hypothetical account values and hypothetical expenses based on the Fund’s actual expense ratio for each class of shares, and an assumed rate of return of 5% per year for each class before expenses, which is not the actual return. The hypothetical account values and expenses may not be used to estimate the actual ending account balance or expenses you paid for the period. You may use this information to compare the ongoing costs of investing in the Fund and other funds. To do so, compare this 5% hypothetical example for the class of shares you hold with the 5% hypothetical examples that appear in the shareholder reports of the other funds.
Please note that the expenses shown in the table are meant to highlight your ongoing costs only and do not reflect any charges associated with the separate accounts that offer this Fund. Therefore, the “hypothetical” lines of the table are useful in comparing ongoing costs only, and will not help you determine the relative total costs of owning different funds. In addition, if these separate account charges were included your costs would have been higher.
| | | | | | | | | | | | | | | | | | | | | | |
| Actual | | Beginning Account Value July 1, 2014 | | | | | | Ending Account Value
December 31, 2014 | | | | Expenses Paid During 6 Months Ended December 31, 2014 | | |
Non-Service shares | | $ 1,000.00 | | | | $ | 1,042.50 | | | | | | | $ | 3.97 | | | | | |
Service shares | | 1,000.00 | | | | | 1,040.90 | | | | | | | | 5.26 | | | | | |
| | | | | | | | | |
Hypothetical | | | | | | | | | | | | | | | | | | | | | | |
(5% return before expenses) | | | | | | | | | | | | | | | | | | | | | | |
Non-Service shares | | 1,000.00 | | | | | 1,021.32 | | | | | | | | 3.93 | | | | | |
Service shares | | 1,000.00 | | | | | 1,020.06 | | | | | | | | 5.21 | | | | | |
Expenses are equal to the Fund’s annualized expense ratio for that class, multiplied by the average account value over the period, multiplied by 184/365 (to reflect the one-half year period). Those annualized expense ratios, excluding indirect expenses from affiliated funds, based on the 6-month period ended December 31, 2014 are as follows:
| | | | | | | | |
| Class | | Expense Ratios | | |
Non-Service shares | | | 0.77 | % | | | | |
Service shares | | | 1.02 | | | | | |
The expense ratios reflect voluntary and/or contractual waivers and/or reimbursements of expenses by the Fund’s Manager. Some of these undertakings may be modified or terminated at any time, as indicated in the Fund’s prospectus. The “Financial Highlights” tables in the Fund’s financial statements, included in this report, also show the gross expense ratios, without such waivers or reimbursements and reduction to custodian expenses, if applicable.
6�� OPPENHEIMER MAIN STREET FUND/VA
| | |
| |
| STATEMENT OF INVESTMENTS December 31, 2014 | | |
| | | | | | | | |
| | | | | | | | |
| | | Shares | | | Value | |
Common Stocks—98.2% | | | | | | | | |
Consumer Discretionary—12.7% | | | | | | | | |
Auto Components—1.7% | | | | | | | | |
Delphi Automotive plc | | | 312,290 | | | $ | 22,709,729 | |
| | | | | | | | |
Automobiles—1.3% | | | | | | | | |
General Motors Co. | | | 519,422 | | | | 18,133,022 | |
| | | | | | | | |
Hotels, Restaurants & Leisure—0.5% | |
Dunkin’ Brands Group, Inc. | | | 158,490 | | | | 6,759,598 | |
| | | | | | | | |
Media—3.8% | | | | | | | | |
Comcast Corp., Cl. A | | | 694,585 | | | | 40,292,876 | |
Twenty-First Century Fox, Inc., Cl. A | | | 313,250 | | | | 12,030,366 | |
| | | | | | | 52,323,242 | |
| | | | | | | | |
Specialty Retail—4.8% | | | | | | | | |
AutoZone, Inc.1 | | | 43,460 | | | | 26,906,521 | |
Home Depot, Inc. (The) | | | 259,527 | | | | 27,242,549 | |
TJX Cos., Inc. (The) | | | 153,890 | | | | 10,553,776 | |
| | | | | | | 64,702,846 | |
| | | | | | | | |
Textiles, Apparel & Luxury Goods—0.6% | | | | | |
PVH Corp. | | | 66,410 | | | | 8,511,770 | |
| | | | | | | | |
Consumer Staples—9.9% | | | | | | | | |
Beverages—2.0% | | | | | | | | |
Diageo plc | | | 934,230 | | | | 26,794,771 | |
| | | | | | | | |
Food Products—3.1% | | | | | | | | |
Mondelez International, Inc., Cl. A | | | 1,147,900 | | | | 41,697,468 | |
| | | | | | | | |
Household Products—2.3% | | | | | | | | |
Henkel AG & Co. KGaA | | | 327,047 | | | | 31,846,349 | |
| | | | | | | | |
Tobacco—2.5% | | | | | | | | |
Philip Morris International, Inc. | | | 422,139 | | | | 34,383,221 | |
| | | | | | | | |
Energy—6.9% | | | | | | | | |
Energy Equipment & Services—2.4% | | | | | | | | |
National Oilwell Varco, Inc. | | | 509,080 | | | | 33,360,012 | |
| | | | | | | | |
Oil, Gas & Consumable Fuels—4.5% | | | | | | | | |
Chevron Corp. | | | 294,570 | | | | 33,044,863 | |
Noble Energy, Inc. | | | 586,500 | | | | 27,817,695 | |
| | | | | | | 60,862,558 | |
| | | | | | | | |
Financials—16.7% | |
Commercial Banks—6.6% | |
CIT Group, Inc. | | | 355,710 | | | | 17,013,609 | |
Citigroup, Inc. | | | 870,378 | | | | 47,096,154 | |
JPMorgan Chase & Co. | | | 421,310 | | | | 26,365,580 | |
| | | | | | | 90,475,343 | |
| | | | | | | | |
Consumer Finance—1.6% | | | | | | | | |
Discover Financial Services | | | 340,263 | | | | 22,283,824 | |
| | | | | | | | |
Diversified Financial Services—3.5% | | | | | | | | |
CME Group, Inc., Cl. A | | | 325,340 | | | | 28,841,391 | |
McGraw Hill Financial, Inc. | | | 209,971 | | | | 18,683,219 | |
| | | | | | | 47,524,610 | |
| | | | | | | | |
Insurance—4.6% | | | | | | | | |
American International Group, Inc. | | | 478,800 | | | | 26,817,588 | |
Genworth Financial, Inc., Cl. A1 | | | 1,037,370 | | | | 8,817,645 | |
Lincoln National Corp. | | | 182,890 | | | | 10,547,266 | |
Marsh & McLennan Cos., Inc. | | | 302,670 | | | | 17,324,831 | |
| | | | | | | 63,507,330 | |
| | | | | | | | |
Real Estate Investment Trusts (REITs)—0.4% | |
Digital Realty Trust, Inc. | | | 76,960 | | | | 5,102,448 | |
| | | | | | | | | | |
| | | | | | | | | | | |
| | | | | Shares | | | Value | |
| | | Health Care—14.9% | |
| | | Biotechnology—1.7% | |
| | | Gilead Sciences, Inc.1 | | | 242,130 | | | $ | 22,823,174 | |
| | | | | | | | | | | |
| | | Health Care Providers & Services—5.2% | |
| | | Express Scripts Holding Co.1 | | | 325,967 | | | | 27,599,626 | |
| | | HCA Holdings, Inc.1 | | | 301,780 | | | | 22,147,634 | |
| | | UnitedHealth Group, Inc. | | | 212,580 | | | | 21,489,712 | |
| | | | | | | | | | 71,236,972 | |
| | | | | | | | | | | |
| | | Pharmaceuticals—8.0% | |
| | | AbbVie, Inc. | | | 392,125 | | | | 25,660,660 | |
| | | Actavis plc1 | | | 139,980 | | | | 36,032,252 | |
| | | Bristol-Myers Squibb Co. | | | 376,720 | | | | 22,237,781 | |
| | | Salix Pharmaceuticals Ltd.1 | | | 88,770 | | | | 10,203,224 | |
| | | Zoetis, Inc., Cl. A | | | 354,437 | | | | 15,251,424 | |
| | | | | | | | | | 109,385,341 | |
| | | | | | | | | | | |
| | | Industrials—12.2% | |
| | | Commercial Services & Supplies—3.5% | |
| | | Republic Services, Inc., Cl. A | | | 323,570 | | | | 13,023,692 | |
| | | Tyco International plc | | | 785,295 | | | | 34,443,039 | |
| | | | | | | | | | 47,466,731 | |
| | | | | | | | | | | |
| | | Industrial Conglomerates—2.8% | |
| | | General Electric Co. | | | 1,533,630 | | | | 38,754,830 | |
| | | | | | | | | | | |
| | | Machinery—2.6% | |
| | | Deere & Co. | | | 399,300 | | | | 35,326,071 | |
| | | | | | | | | | | |
| | | Professional Services—1.1% | |
| | | Nielsen NV | | | 337,880 | | | | 15,113,373 | |
| | | | | | | | | | | |
| | | Road & Rail—2.2% | |
| | | Canadian National Railway Co. | | | 254,150 | | | | 17,513,477 | |
| | | CSX Corp. | | | 168,880 | | | | 6,118,522 | |
| | | Norfolk Southern Corp. | | | 54,310 | | | | 5,952,919 | |
| | | | | | | | | | 29,584,918 | |
| | | | | | | | | | | |
| | | Information Technology—19.4% | |
| | | Internet Software & Services—8.1% | | | | | |
| | | eBay, Inc.1 | | | 566,865 | | | | 31,812,464 | |
| | | Facebook, Inc., Cl. A1 | | | 313,730 | | | | 24,477,215 | |
| | | Google, Inc., Cl. A1 | | | 33,920 | | | | 17,999,987 | |
| | | Google, Inc., Cl. C1 | | | 69,190 | | | | 36,421,616 | |
| | | | | | | | | | 110,711,282 | |
| | | | | | | | | | | |
| | | IT Services—5.0% | |
| | | Amdocs Ltd. | | | 500,000 | | | | 23,327,500 | |
| | | MasterCard, Inc., Cl. A | | | 320,930 | | | | 27,651,329 | |
| | | Xerox Corp. | | | 1,254,807 | | | | 17,391,625 | |
| | | | | | | | | | 68,370,454 | |
| | | | | | | | | | | |
| | | Semiconductors & Semiconductor Equipment—1.3% | |
| | | Applied Materials, Inc. | | | 708,970 | | | | 17,667,532 | |
| | | | | | | | | | | |
| | | Technology Hardware, Storage & Peripherals—5.0% | |
| | | Apple, Inc. | | | 498,426 | | | | 55,016,262 | |
| | | Western Digital Corp. | | | 122,150 | | | | 13,522,005 | |
| | | | | | | | | | 68,538,267 | |
| | | | | | | | | | | |
| | | Materials—2.1% | |
| | | Construction Materials—1.7% | |
| | | Vulcan Materials Co. | | | 357,120 | | | | 23,473,498 | |
| | | | | | | | | | | |
| | | Metals & Mining—0.4% | | | | | | | | |
| | | Teck Resources Ltd., Cl. B | | | 354,900 | | | | 4,840,836 | |
| | | | | | | | | | | |
| | | Telecommunication Services—1.6% | |
| | | Diversified Telecommunication Services—1.6% | |
| | | Verizon Communications, Inc. | | | 464,270 | | | | 21,718,551 | |
| | | | | | | | | | | |
|
| 7 OPPENHEIMER MAIN STREET FUND/VA |
| | |
| |
| STATEMENT OF INVESTMENTS Continued | | |
| | | | | | | | |
| | | Shares | | | Value | |
Utilities—1.8% | | | | | | | | |
Electric Utilities—1.8% | | | | | | | | |
Exelon Corp. | | | 619,927 | | | $ | 22,986,893 | |
ITC Holdings Corp. | | | 36,140 | | | | 1,461,140 | |
| | | | | | | 24,448,033 | |
Total Common Stocks (Cost $945,165,928) | | | | | | | 1,340,438,004 | |
| | | | | | | | | | |
| | | | | Shares | | | Value | |
| | | Investment Company—1.9% | | | | | | | | |
| | | Oppenheimer Institutional Money Market Fund, Cl. E, 0.10%2,3 (Cost $26,546,400) | | | 26,546,400 | | | | 26,546,400 | |
| | | Total Investments, at Value (Cost $971,712,328) | | | 100.1 | % | | | 1,366,984,404 | |
| | | Net Other Assets (Liabilities) | | | (0.1 | ) | | | (1,028,758 | ) |
| | | | | | | |
| | | Net Assets | | | 100.0 | % | | $ | 1,365,955,646 | |
| | | | | | | |
Footnotes to Statement of Investments
1. Non-income producing security.
2. Is or was an affiliate, as defined in the Investment Company Act of 1940, as amended, at or during the period ended December 31, 2014, by virtue of the Fund owning at least 5% of the voting securities of the issuer or as a result of the Fund and the issuer having the same investment adviser. Transactions during the period in which the issuer was an affiliate are as follows:
| | | | | | | | | | | | | | | | |
| | | Shares
December 31, 2013 | | | Gross
Additions | | | Gross
Reductions | | | Shares
December 31, 2014 | |
Oppenheimer Institutional Money Market Fund, Cl. E | | | 28,023,569 | | | | 348,767,660 | | | | 350,244,829 | | | | 26,546,400 | |
| | | | |
| | | | | | | | | Value | | | Income | |
Oppenheimer Institutional Money Market Fund, Cl. E | | | | | | | | | | $ | 26,546,400 | | | $ | 10,976 | |
3. Rate shown is the 7-day yield as of December 31, 2014.
See accompanying Notes to Financial Statements.
8 OPPENHEIMER MAIN STREET FUND/VA
STATEMENT OF ASSETS AND LIABILITIES December 31, 2014
| | | | |
| |
Assets | | | | |
Investments, at value—see accompanying statement of investments: | | | | |
Unaffiliated companies (cost $945,165,928) | | $ | 1,340,438,004 | |
Affiliated companies (cost $26,546,400) | | | 26,546,400 | |
| | | | |
| | | 1,366,984,404 | |
| |
Cash | | | 749,054 | |
| |
Receivables and other assets: | | | | |
Dividends | | | 2,542,403 | |
Other | | | 83,448 | |
| | | | |
Total assets | | | 1,370,359,309 | |
| |
Liabilities | | | | |
Payables and other liabilities: | | | | |
Shares of beneficial interest redeemed | | | 2,157,565 | |
Investments purchased | | | 1,890,322 | |
Distribution and service plan fees | | | 173,772 | |
Trustees’ compensation | | | 83,051 | |
Shareholder communications | | | 70,682 | |
Other | | | 28,271 | |
| | | | |
Total liabilities | | | 4,403,663 | |
| |
Net Assets | | $ | 1,365,955,646 | |
| | | | |
| | | | |
| |
Composition of Net Assets | | | | |
Par value of shares of beneficial interest | | $ | 40,842 | |
| |
Additional paid-in capital | | | 770,512,739 | |
| |
Accumulated net investment income | | | 9,807,537 | |
| |
Accumulated net realized gain on investments and foreign currency transactions | | | 190,330,362 | |
| |
Net unrealized appreciation on investments and translation of assets and liabilities denominated in foreign currencies | | | 395,264,166 | |
| | | | |
Net Assets | | $ | 1,365,955,646 | |
| | | | |
| | | | |
| |
Net Asset Value Per Share | | | | |
Non-Service Shares: | | | | |
| Net asset value, redemption price per share and offering price per share (based on net assets of $559,933,101 and 16,661,982 shares of beneficial interest outstanding) | | | $33.61 | |
| |
Service Shares: | | | | |
| Net asset value, redemption price per share and offering price per share (based on net assets of $806,022,545 and 24,179,670 shares of beneficial interest outstanding) | | | $33.33 | |
See accompanying Notes to Financial Statements.
9 OPPENHEIMER MAIN STREET FUND/VA
STATEMENTOFOPERATIONS For the Year Ended December 31, 2014
| | | | |
| |
Investment Income | | | | |
Dividends: | | | | |
Unaffiliated companies (net of foreign withholding taxes of $116,838) | | $ | 22,958,995 | |
Affiliated companies | | | 10,976 | |
| | | | |
Total investment income | | | 22,969,971 | |
| |
Expenses | | | | |
Management fees | | | 9,198,662 | |
| |
Distribution and service plan fees—Service shares | | | 2,135,400 | |
| |
Transfer and shareholder servicing agent fees: | | | | |
Non-Service shares | | | 553,016 | |
Service shares | | | 854,141 | |
| |
Shareholder communications: | | | | |
Non-Service shares | | | 57,969 | |
Service shares | | | 89,239 | |
| |
Custodian fees and expenses | | | 11,006 | |
| |
Trustees’ compensation | | | 50,881 | |
| |
Other | | | 72,735 | |
| | | | |
Total expenses | | | 13,023,049 | |
Less reduction to custodian expenses | | | (73) | |
Less waivers and reimbursements of expenses | | | (13,188) | |
| | | | |
Net expenses | | | 13,009,788 | |
| |
Net Investment Income | | | 9,960,183 | |
| |
Realized and Unrealized Gain (Loss) | | | | |
Net realized gain (loss) on: | | | | |
Investments from unaffiliated companies | | | 220,248,023 | |
Foreign currency transactions | | | (14,964) | |
| | | | |
Net realized gain | | | 220,233,059 | |
| |
Net change in unrealized appreciation/depreciation on: | | | | |
Investments | | | (83,363,674) | |
Translation of assets and liabilities denominated in foreign currencies | | | (6,478,616) | |
| | | | |
Net change in unrealized appreciation/depreciation | | | (89,842,290) | |
| |
Net Increase in Net Assets Resulting from Operations | | $ | 140,350,952 | |
| | | | |
See accompanying Notes to Financial Statements.
10 OPPENHEIMER MAIN STREET FUND/VA
STATEMENTSOFCHANGESINNETASSETS
| | | | | | | | |
| | | Year Ended
December 31, 2014 | | | Year Ended
December 31, 2013 | |
| |
Operations | | | | | | | | |
Net investment income | | $ | 9,960,183 | | | $ | 9,996,436 | |
| |
Net realized gain | | | 220,233,059 | | | | 233,270,981 | |
| |
Net change in unrealized appreciation/depreciation | | | (89,842,290) | | | | 144,474,017 | |
| | | | |
Net increase in net assets resulting from operations | | | 140,350,952 | | | | 387,741,434 | |
| |
Dividends and/or Distributions to Shareholders | | | | | | | | |
Dividends from net investment income: | | | | | | | | |
Non-Service shares | | | (4,609,193) | | | | (5,738,189) | |
Service shares | | | (4,984,596) | | | | (7,658,030) | |
| | | | |
| | | (9,593,789) | | | | (13,396,219) | |
| |
Distributions from net realized gain: | | | | | | | | |
Non-Service shares | | | (11,141,625) | | | | — | |
Service shares | | | (17,524,841) | | | | — | |
| | | | |
| | | (28,666,466) | | | | — | |
| |
Beneficial Interest Transactions | | | | | | | | |
Net increase (decrease) in net assets resulting from beneficial interest transactions: | | | | | | | | |
Non-Service shares | | | (41,637,582) | | | | (57,546,662) | |
Service shares | | | (170,539,977) | | | | (191,217,253) | |
| | | | |
| | | (212,177,559) | | | | (248,763,915) | |
| |
Net Assets | | | | | | | | |
Total increase (decrease) | | | (110,086,862) | | | | 125,581,300 | |
| |
Beginning of period | | | 1,476,042,508 | | | | 1,350,461,208 | |
| | | | |
| End of period (including accumulated net investment income of $9,807,537 and $9,456,107 respectively) | | $ | 1,365,955,646 | | | $ | 1,476,042,508 | |
| | | | |
See accompanying Notes to Financial Statements.
11 OPPENHEIMER MAIN STREET FUND/VA
FINANCIALHIGHLIGHTS
| | | | | | | | | | | | | | | | | | | | |
| Non-Service Shares | | Year Ended
December
31, 2014 | | | Year Ended
December
31, 2013 | | | Year Ended
December
31, 2012 | | | Year Ended
December
30, 20111 | | | Year Ended
December
31, 2010 | |
| |
Per Share Operating Data | | | | | | | | | | | | | | | | | | | | |
Net asset value, beginning of period | | $ | 31.24 | | | $ | 23.97 | | | $ | 20.71 | | | $ | 20.88 | | | $ | 18.18 | |
| |
Income (loss) from investment operations: | | | | | | | | | | | | | | | | | | | | |
Net investment income2 | | | 0.28 | | | | 0.24 | | | | 0.26 | | | | 0.16 | | | | 0.17 | |
Net realized and unrealized gain (loss) | | | 3.01 | | | | 7.33 | | | | 3.22 | | | | (0.16) | | | | 2.73 | |
| | | | |
Total from investment operations | | | 3.29 | | | | 7.57 | | | | 3.48 | | | | 0.00 | | | | 2.90 | |
| |
Dividends and/or distributions to shareholders: | | | | | | | | | | | | | | | | | | | | |
Dividends from net investment income | | | (0.27) | | | | (0.30) | | | | (0.22) | | | | (0.17) | | | | (0.20) | |
Distributions from net realized gain | | | (0.65) | | | | 0.00 | | | | 0.00 | | | | 0.00 | | | | 0.00 | |
| | | | |
Total dividends and/or distributions to shareholders | | | (0.92) | | | | (0.30) | | | | (0.22) | | | | (0.17) | | | | (0.20) | |
| |
Net asset value, end of period | | $ | 33.61 | | | $ | 31.24 | | | $ | 23.97 | | | $ | 20.71 | | | $ | 20.88 | |
| | | | |
| | | | |
| |
Total Return, at Net Asset Value3 | | | 10.70% | | | | 31.77% | | | | 16.87% | | | | (0.01)% | | | | 16.11% | |
| |
Ratios/Supplemental Data | | | | | | | | | | | | | | | | | | | | |
Net assets, end of period (in thousands) | | $ | 559,933 | | | $ | 561,016 | | | $ | 481,089 | | | $ | 392,861 | | | $ | 469,720 | |
| |
Average net assets (in thousands) | | $ | 554,449 | | | $ | 517,750 | | | $ | 466,231 | | | $ | 426,354 | | | $ | 454,937 | |
| |
Ratios to average net assets:4 | | | | | | | | | | | | | | | | | | | | |
Net investment income | | | 0.86% | | | | 0.87% | | | | 1.12% | | | | 0.79% | | | | 0.93% | |
Total expenses5 | | | 0.77% | | | | 0.78% | | | | 0.78% | | | | 0.78% | | | | 0.78% | |
| Expenses after payments, waivers and/or reimbursements and reduction to custodian expenses | | | 0.77% | | | | 0.78% | | | | 0.78% | | | | 0.78% | | | | 0.78% | |
| |
Portfolio turnover rate | | | 43% | | | | 49% | | | | 37% | | | | 38% | | | | 45% | |
1. December 30, 2011 represents the last business day of the Fund’s reporting period.
2. Per share amounts calculated based on the average shares outstanding during the period.
3. Assumes an initial investment on the business day before the first day of the fiscal period, with all dividends and distributions reinvested in additional shares on the reinvestment date, and redemption at the net asset value calculated on the last business day of the fiscal period. Total returns are not annualized for periods less than one full year. Total return information does not reflect expenses that apply at the separate account level or to related insurance products. Inclusion of these charges would reduce the total return figures for all periods shown. Returns do not reflect the deduction of taxes that a shareholder would pay on fund distributions or the redemption of fund shares.
4. Annualized for periods less than one full year.
5. Total expenses including indirect expenses from affiliated fund fees and expenses were as follows:
| | | | | | | | |
| | | Year Ended December 31, 2014 | | 0.77% | | | | |
| | Year Ended December 31, 2013 | | 0.78% | | | | |
| | | Year Ended December 31, 2012 | | 0.78% | | | | |
| | Year Ended December 30, 2011 | | 0.78% | | | | |
| | | Year Ended December 31, 2010 | | 0.78% | | | | |
See accompanying Notes to Financial Statements.
12 OPPENHEIMER MAIN STREET FUND/VA
| | | | | | | | | | | | | | | | | | | | |
| Service Shares | | Year Ended
December
31, 2014 | | | Year Ended
December
31, 2013 | | | Year Ended
December
31, 2012 | | | Year Ended
December
30, 20111 | | | Year Ended
December
31, 2010 | |
| |
Per Share Operating Data | | | | | | | | | | | | | | | | | | | | |
Net asset value, beginning of period | | $ | 30.99 | | | $ | 23.78 | | | $ | 20.53 | | | $ | 20.71 | | | $ | 18.04 | |
| |
Income (loss) from investment operations: | | | | | | | | | | | | | | | | | | | | |
Net investment income2 | | | 0.19 | | | | 0.17 | | | | 0.20 | | | | 0.11 | | | | 0.13 | |
Net realized and unrealized gain (loss) | | | 2.99 | | | | 7.27 | | | | 3.20 | | | | (0.17) | | | | 2.70 | |
| | | | |
Total from investment operations | | | 3.18 | | | | 7.44 | | | | 3.40 | | | | (0.06) | | | | 2.83 | |
| |
Dividends and/or distributions to shareholders: | | | | | | | | | | | | | | | | | | | | |
Dividends from net investment income | | | (0.19) | | | | (0.23) | | | | (0.15) | | | | (0.12) | | | | (0.16) | |
Distributions from net realized gain | | | (0.65) | | | | 0.00 | | | | 0.00 | | | | 0.00 | | | | 0.00 | |
| | | | |
Total dividends and/or distributions to shareholders | | | (0.84) | | | | (0.23) | | | | (0.15) | | | | (0.12) | | | | (0.16) | |
| |
Net asset value, end of period | | $ | 33.33 | | | $ | 30.99 | | | $ | 23.78 | | | $ | 20.53 | | | $ | 20.71 | |
| | | | |
| | | | |
| |
Total Return, at Net Asset Value3 | | | 10.40% | | | | 31.44% | | | | 16.61% | | | | (0.32)% | | | | 15.83% | |
| |
Ratios/Supplemental Data | | | | | | | | | | | | | | | | | | | | |
Net assets, end of period (in thousands) | | $ | 806,023 | | | $ | 915,027 | | | $ | 869,372 | | | $ | 1,003,184 | | | $ | 1,185,456 | |
| |
Average net assets (in thousands) | | $ | 856,467 | | | $ | 895,073 | | | $ | 913,871 | | | $ | 1,094,254 | | | $ | 1,193,630 | |
| |
Ratios to average net assets:4 | | | | | | | | | | | | | | | | | | | | |
Net investment income | | | 0.61% | | | | 0.62% | | | | 0.85% | | | | 0.54% | | | | 0.68% | |
Total expenses5 | | | 1.02% | | | | 1.04% | | | | 1.03% | | | | 1.03% | | | | 1.03% | |
Expenses after payments, waivers and/or reimbursements and reduction to custodian expenses | | | 1.02% | | | | 1.04% | | | | 1.03% | | | | 1.03% | | | | 1.03% | |
| |
Portfolio turnover rate | | | 43% | | | | 49% | | | | 37% | | | | 38% | | | | 45% | |
1. December 30, 2011 represents the last business day of the Fund’s reporting period.
2. Per share amounts calculated based on the average shares outstanding during the period.
3. Assumes an initial investment on the business day before the first day of the fiscal period, with all dividends and distributions reinvested in additional shares on the reinvestment date, and redemption at the net asset value calculated on the last business day of the fiscal period. Total returns are not annualized for periods less than one full year. Total return information does not reflect expenses that apply at the separate account level or to related insurance products. Inclusion of these charges would reduce the total return figures for all periods shown. Returns do not reflect the deduction of taxes that a shareholder would pay on fund distributions or the redemption of fund shares.
4. Annualized for periods less than one full year.
5. Total expenses including indirect expenses from affiliated fund fees and expenses were as follows:
| | | | | | | | |
| | | Year Ended December 31, 2014 | | 1.02% | | | | |
| | Year Ended December 31, 2013 | | 1.04% | | | | |
| | | Year Ended December 31, 2012 | | 1.03% | | | | |
| | Year Ended December 30, 2011 | | 1.03% | | | | |
| | | Year Ended December 31, 2010 | | 1.03% | | | | |
See accompanying Notes to Financial Statements.
13 OPPENHEIMER MAIN STREET FUND/VA
NOTES TO FINANCIAL STATEMENTS December 31, 2014
1. Organization
Oppenheimer Main Street Fund/VA (the “Fund”), a separate series of Oppenheimer Variable Account Funds, is a diversified open-end management investment company registered under the Investment Company Act of 1940 (“1940 Act”), as amended. The Fund’s investment objective is to seek capital appreciation. The Fund’s investment adviser is OFI Global Asset Management, Inc. (“OFI Global” or the “Manager”), a wholly-owned subsidiary of OppenheimerFunds, Inc. (“OFI” or the “Sub-Adviser”). The Manager has entered into a sub-advisory agreement with OFI. Shares of the Fund are sold only to separate accounts of life insurance companies.
The Fund offers two classes of shares. Both classes are sold at their offering price, which is the net asset value per share, to separate investment accounts of participating insurance companies as an underlying investment for variable life insurance policies, variable annuity contracts or other investment products. The class of shares designated as Service shares is subject to a distribution and service plan. Both classes of shares have identical rights and voting privileges with respect to the Fund in general and exclusive voting rights on matters that affect that class alone. Earnings, net assets and net asset value per share may differ due to each class having its own expenses, such as transfer and shareholder servicing agent fees and shareholder communications, directly attributable to that class.
The following is a summary of significant accounting policies consistently followed by the Fund.
2. Significant Accounting Policies
Security Valuation. All investments in securities are recorded at their estimated fair value, as described in Note 3.
Foreign Currency Translation. The Fund’s accounting records are maintained in U.S. dollars. The values of securities denominated in foreign currencies and amounts related to the purchase and sale of foreign securities and foreign investment income are translated into U.S. dollars as of the close of the New York Stock Exchange (the “Exchange”), normally 4:00 P.M. Eastern time, on each day the Exchange is open for trading. Foreign exchange rates may be valued primarily using a reliable bank, dealer or service authorized by the Board of Trustees.
Reported net realized gains and losses from foreign currency transactions arise from sales of portfolio securities, sales and maturities of short-term securities, sales of foreign currencies, exchange rate fluctuations between the trade and settlement dates on securities transactions, and the difference between the amounts of dividends, interest, and foreign withholding taxes recorded on the Fund’s books and the U.S. dollar equivalent of the amounts actually received or paid. Net unrealized appreciation and depreciation on the translation of assets and liabilities denominated in foreign currencies arise from changes in the values of assets and liabilities, including investments in securities at fiscal period end, resulting from changes in exchange rates.
The effect of changes in foreign currency exchange rates on investments is separately identified from the fluctuations arising from changes in market values of securities held and reported with all other foreign currency gains and losses in the Fund’s Statement of Operations.
Allocation of Income, Expenses, Gains and Losses. Income, expenses (other than those attributable to a specific class), gains and losses are allocated on a daily basis to each class of shares based upon the relative proportion of net assets represented by such class. Operating expenses directly attributable to a specific class are charged against the operations of that class.
Dividends and Distributions to Shareholders. Dividends and distributions to shareholders, which are determined in accordance with income tax regulations and may differ from U.S. generally accepted accounting principles, are recorded on the ex-dividend date. Income and capital gain distributions, if any, are declared and paid annually or at other times as deemed necessary by the Manager.
Investment Income. Dividend income is recorded on the ex-dividend date or upon ex-dividend notification in the case of certain foreign dividends where the ex-dividend date may have passed. Non-cash dividends included in dividend income, if any, are recorded at the fair market value of the securities received. Interest income is recognized on an accrual basis. Discount and premium, which are included in interest income on the Statement of Operations, are amortized or accreted daily.
Custodian Fees. “Custodian fees and expenses” in the Statement of Operations may include interest expense incurred by the Fund on any cash overdrafts of its custodian account during the period. Such cash overdrafts may result from the effects of failed trades in portfolio securities and from cash outflows resulting from unanticipated shareholder redemption activity. The Fund pays interest to its custodian on such cash overdrafts, to the extent they are not offset by positive cash balances maintained by the Fund, at a rate equal to the Federal Funds Rate plus 0.50%. The “Reduction to custodian expenses” line item, if applicable, represents earnings on cash balances maintained by the Fund during the period. Such interest expense and other custodian fees may be paid with these earnings.
Security Transactions. Security transactions are recorded on the trade date. Realized gains and losses on securities sold are determined on the basis of identified cost.
Indemnifications. The Fund’s organizational documents provide current and former Trustees and officers with a limited indemnification against liabilities arising in connection with the performance of their duties to the Fund. In the normal course of business, the Fund may also enter into contracts that provide general indemnifications. The Fund’s maximum exposure under these arrangements is unknown as this would be dependent on future claims that may be made against the Fund. The risk of material loss from such claims is considered remote.
Federal Taxes. The Fund intends to comply with provisions of the Internal Revenue Code applicable to regulated investment companies and to distribute substantially all of its investment company taxable income, including any net realized gain on investments not offset by capital loss
14 OPPENHEIMER MAIN STREET FUND/VA
2. Significant Accounting Policies (Continued)
carryforwards, if any, to shareholders. Therefore, no federal income or excise tax provision is required. The Fund files income tax returns in U.S. federal and applicable state jurisdictions. The statute of limitations on the Fund’s tax return filings generally remain open for the three preceding fiscal reporting period ends.
The tax components of capital shown in the following table represent distribution requirements the Fund must satisfy under the income tax regulations, losses the Fund may be able to offset against income and gains realized in future years and unrealized appreciation or depreciation of securities and other investments for federal income tax purposes.
| | | | | | | | | | | | |
Undistributed Net Investment Income | | Undistributed
Long-Term
Gain | | | Accumulated
Loss
Carryforward1,2,3 | | | Net Unrealized
Appreciation
Based on cost of
Securities and
Other Investments
for Federal Income
Tax Purposes | |
$39,072,955 | | | $167,103,985 | | | | $5,027,976 | | | | $394,336,145 | |
1. As of December 31, 2014, the Fund had $5,027,976 of net capital loss carryforward available to offset future realized capital gains, if any, and thereby reduce future taxable gain distributions. Details of the capital loss carryforwards are included in the table below. Capital loss carryovers with no expiration, if any, must be utilized prior to those with expiration dates.
| | | | |
| Expiring | |
2015 | | $ | 2,513,988 | |
2016 | | | 2,513,988 | |
| | | | |
Total | | $ | 5,027,976 | |
| | | | |
Of these losses, $5,027,976 are subject to loss limitation rules resulting from merger activity. These limitations generally reduce the utilization of these losses to a maximum of $2,513,988 per year.
2. During the fiscal year ended December 31, 2014, the Fund utilized $2,513,988 of capital loss carryforward to offset capital gains realized in that fiscal year.
3. During the fiscal year ended December 31, 2013, the Fund utilized $198,916,700 of capital loss carryforward to offset capital gains realized in that fiscal year.
Net investment income (loss) and net realized gain (loss) may differ for financial statement and tax purposes. The character of dividends and distributions made during the fiscal year from net investment income or net realized gains may differ from their ultimate characterization for federal income tax purposes. Also, due to timing of dividends and distributions, the fiscal year in which amounts are distributed may differ from the fiscal year in which the income or net realized gain was recorded by the Fund.
Accordingly, the following amounts have been reclassified for December 31, 2014. Net assets of the Fund were unaffected by the reclassifications.
| | | | | | | | |
Increase to Paid-in Capital | | Reduction
to Accumulated
Net Investment
Income | | | Reduction
to Accumulated Net
Realized
on Investments4 | |
$21,137,101 | | | $14,964 | | | | $21,122,137 | |
4. $21,137,101, including $17,994,597 of long-term capital gain, was distributed in connection with Fund share redemptions.
The tax character of distributions paid during the years ended December 31, 2014 and December 31, 2013 was as follows:
| | | | | | | | |
| | | Year Ended
December 31, 2014 | | | Year Ended
December 31, 2013 | |
Distributions paid from: | | | | | | | | |
Ordinary income | | $ | 9,593,789 | | | $ | 13,396,219 | |
Long-term capital gain | | | 28,666,466 | | | | — | |
| | | | |
Total | | $ | 38,260,255 | | | $ | 13,396,219 | |
| | | | |
The aggregate cost of securities and other investments and the composition of unrealized appreciation and depreciation of securities and other investments for federal income tax purposes as of December 31, 2014 are noted in the following table. The primary difference between book and tax appreciation or depreciation of securities and other investments, if applicable, is attributable to the tax deferral of losses or tax realization of financial statement unrealized gain or loss.
| | | | |
Federal tax cost of securities | | $ | 972,640,349 | |
| | | | |
Gross unrealized appreciation | | $ | 412,926,189 | |
Gross unrealized depreciation | | | (18,590,044) | |
| | | | |
Net unrealized appreciation | | $ | 394,336,145 | |
| | | | |
15 OPPENHEIMER MAIN STREET FUND/VA
| | |
| NOTES TO FINANCIAL STATEMENTS Continued | | |
| | |
2. Significant Accounting Policies (Continued)
Use of Estimates. The preparation of financial statements in conformity with accounting principles generally accepted in the United States of America requires management to make estimates and assumptions that affect the reported amounts of assets and liabilities and disclosure of contingent assets and liabilities at the date of the financial statements and the reported amounts of increases and decreases in net assets from operations during the reporting period. Actual results could differ from those estimates.
3. Securities Valuation
The Fund calculates the net asset value of its shares as of the close of the New York Stock Exchange (the “Exchange”), normally 4:00 P.M. Eastern time, on each day the Exchange is open for trading.
The Fund’s Board has adopted procedures for the valuation of the Fund’s securities and has delegated the day-to-day responsibility for valuation determinations under those procedures to the Manager. The Manager has established a Valuation Committee which is responsible for determining a “fair valuation” for any security for which market quotations are not “readily available.” The Valuation Committee’s fair valuation determinations are subject to review, approval and ratification by the Fund’s Board at its next regularly scheduled meeting covering the calendar quarter in which the fair valuation was determined.
Valuation Methods and Inputs
Securities are valued using unadjusted quoted market prices, when available, as supplied primarily by third party pricing services or dealers.
The following methodologies are used to determine the market value or the fair value of the types of securities described below:
Securities traded on a registered U.S. securities exchange (including exchange-traded derivatives other than futures and futures options) are valued based on the last sale price of the security reported on the principal exchange on which it is traded, prior to the time when the Fund’s assets are valued. In the absence of a sale, the security is valued at the last sale price on the prior trading day, if it is within the spread of the current day’s closing “bid” and “asked” prices, and if not, at the current day’s closing bid price. A security of a foreign issuer traded on a foreign exchange, but not listed on a registered U.S. securities exchange, is valued based on the last sale price on the principal exchange on which the security is traded, as identified by the third party pricing service used by the Manager, prior to the time when the Fund’s assets are valued. If the last sale price is unavailable, the security is valued at the most recent official closing price on the principal exchange on which it is traded. If the last sales price or official closing price for a foreign security is not available, the security is valued at the mean between the bid and asked price per the exchange or, if not available from the exchange, obtained from two dealers. If bid and asked prices are not available from either the exchange or two dealers, the security is valued by using one of the following methodologies (listed in order of priority): (1) using a bid from the exchange, (2) the mean between the bid and asked price as provided by a single dealer, or (3) a bid from a single dealer.
Shares of a registered investment company that are not traded on an exchange are valued at that investment company’s net asset value per share.
Corporate and government debt securities (of U.S. or foreign issuers) and municipal debt securities, event-linked bonds, loans, mortgage-backed securities, collateralized mortgage obligations, and asset-backed securities are valued at the mean between the “bid” and “asked” prices utilizing evaluated prices obtained from third party pricing services or broker-dealers who may use matrix pricing methods to determine the evaluated prices.
Short-term money market type debt securities with a remaining maturity of sixty days or less are valued at cost adjusted by the amortization of discount or premium to maturity (amortized cost), which approximates market value. Short-term debt securities with a remaining maturity in excess of sixty days are valued at the mean between the “bid” and “asked” prices utilizing evaluated prices obtained from third party pricing services or broker-dealers.
A description of the standard inputs that may generally be considered by the third party pricing vendors in determining their evaluated prices is provided below.
| | |
| Security Type | | Standard inputs generally considered by third-party pricing vendors |
|
| Corporate debt, government debt, municipal, mortgage-backed and asset-backed securities | | Reported trade data, broker-dealer price quotations, benchmark yields, issuer spreads on comparable securities, the credit quality, yield, maturity, and other appropriate factors. |
|
| Loans | | Information obtained from market participants regarding reported trade data and broker-dealer price quotations. |
|
| Event-linked bonds | | Information obtained from market participants regarding reported trade data and broker-dealer price quotations. |
If a market value or price cannot be determined for a security using the methodologies described above, or if, in the “good faith” opinion of the Manager, the market value or price obtained does not constitute a “readily available market quotation,” or a significant event has occurred that would materially affect the value of the security the security is fair valued either (i) by a standardized fair valuation methodology applicable to the security type or the significant event as previously approved by the Valuation Committee and the Fund’s Board or (ii) as determined in good faith by the Manager’s Valuation Committee. The Valuation Committee considers all relevant facts that are reasonably available, through either public information or information available to the Manager, when determining the fair value of a security. Fair value determinations by the Manager are subject to review, approval and ratification by the Fund’s Board at its next regularly scheduled meeting covering the calendar quarter in which the fair valuation was determined. Those fair valuation standardized methodologies include, but are not limited to, valuing securities at the last sale price or initially at cost and subsequently adjusting the value based on: changes in company specific fundamentals, changes in an appropriate securities index, or changes in the value of similar securities which may be further adjusted for any discounts related to security-specific resale restrictions. When possible, such
16 OPPENHEIMER MAIN STREET FUND/VA
3. Securities Valuation (Continued)
methodologies use observable market inputs such as unadjusted quoted prices of similar securities, observable interest rates, currency rates and yield curves. The methodologies used for valuing securities are not necessarily an indication of the risks associated with investing in those securities nor can it be assured that the Fund can obtain the fair value assigned to a security if it were to sell the security.
To assess the continuing appropriateness of security valuations, the Manager, or its third party service provider who is subject to oversight by the Manager, regularly compares prior day prices, prices on comparable securities, and sale prices to the current day prices and challenges those prices exceeding certain tolerance levels with the third party pricing service or broker source. For those securities valued by fair valuations, whether through a standardized fair valuation methodology or a fair valuation determination, the Valuation Committee reviews and affirms the reasonableness of the valuations based on such methodologies and fair valuation determinations on a regular basis after considering all relevant information that is reasonably available.
Classifications
Each investment asset or liability of the Fund is assigned a level at measurement date based on the significance and source of the inputs to its valuation. Various data inputs are used in determining the value of each of the Fund’s investments as of the reporting period end. These data inputs are categorized in the following hierarchy under applicable financial accounting standards:
1) Level 1-unadjusted quoted prices in active markets for identical assets or liabilities (including securities actively traded on a securities exchange)
2) Level 2-inputs other than unadjusted quoted prices that are observable for the asset or liability (such as unadjusted quoted prices for similar assets and market corroborated inputs such as interest rates, prepayment speeds, credit risks, etc.)
3) Level 3-significant unobservable inputs (including the Manager’s own judgments about assumptions that market participants would use in pricing the asset or liability).
The inputs used for valuing securities are not necessarily an indication of the risks associated with investing in those securities.
The table below categorizes amounts that are included in the Fund’s Statement of Assets and Liabilities as of December 31, 2014 based on valuation input level:
| | | | | | | | | | | | | | | | |
| | | Level 1—
Unadjusted
Quoted Prices | | | Level 2— Other Significant
Observable Inputs | | | Level 3—
Significant
Unobservable
Inputs | | | Value | |
Assets Table | | | | | | | | | | | | | | | | |
Investments, at Value: | | | | | | | | | | | | | | | | |
Common Stocks | | | | | | | | | | | | | | | | |
Consumer Discretionary | | $ | 173,140,207 | | | $ | — | | | $ | — | | | $ | 173,140,207 | |
Consumer Staples | | | 76,080,689 | | | | 58,641,120 | | | | — | | | | 134,721,809 | |
Energy | | | 94,222,570 | | | | — | | | | — | | | | 94,222,570 | |
Financials | | | 228,893,555 | | | | — | | | | — | | | | 228,893,555 | |
Health Care | | | 203,445,487 | | | | — | | | | — | | | | 203,445,487 | |
Industrials | | | 166,245,923 | | | | — | | | | — | | | | 166,245,923 | |
Information Technology | | | 265,287,535 | | | | — | | | | — | | | | 265,287,535 | |
Materials | | | 28,314,334 | | | | — | | | | — | | | | 28,314,334 | |
Telecommunication Services | | | 21,718,551 | | | | — | | | | — | | | | 21,718,551 | |
Utilities | | | 24,448,033 | | | | — | | | | — | | | | 24,448,033 | |
Investment Company | | | 26,546,400 | | | | — | | | | — | | | | 26,546,400 | |
Total Assets | | $ | 1,308,343,284 | | | $ | 58,641,120 | | | $ | — | | | $ | 1,366,984,404 | |
Forward currency exchange contracts and futures contracts, if any, are reported at their unrealized appreciation/depreciation at measurement date, which represents the change in the contract’s value from trade date. All additional assets and liabilities included in the above table are reported at their market value at measurement date.
4. Investments and Risks
Investment in Oppenheimer Institutional Money Market Fund. The Fund is permitted to invest daily available cash balances in an affiliated money market fund. The Fund may invest the available cash in Class E shares of Oppenheimer Institutional Money Market Fund (“IMMF”) to seek current income while preserving liquidity or for defensive purposes. IMMF is a registered open-end management investment company, regulated as a money market fund under the 1940 Act. The Manager is the investment adviser of IMMF, and the Sub-Adviser provides investment and related advisory services to IMMF. When applicable, the Fund’s investment in IMMF is included in the Statement of Investments. Shares of IMMF are valued at their net asset value per share. As a shareholder, the Fund is subject to its proportional share of IMMF’s Class E expenses, including its management fee. The Manager will waive fees and/or reimburse Fund expenses in an amount equal to the indirect management fees incurred through the Fund’s investment in IMMF.
Equity Security Risk. Stocks and other equity securities fluctuate in price. The value of the Fund’s portfolio may be affected by changes in the equity markets generally. Equity markets may experience significant short-term volatility and may fall sharply at times. Different markets may behave differently from each other and U.S. equity markets may move in the opposite direction from one or more foreign stock markets.
17 OPPENHEIMER MAIN STREET FUND/VA
| | |
| NOTES TO FINANCIAL STATEMENTS Continued | | |
| | |
4. Investments and Risks (Continued)
The prices of individual equity securities generally do not all move in the same direction at the same time and a variety of factors can affect the price of a particular company’s securities. These factors may include, but are not limited to, poor earnings reports, a loss of customers, litigation against the company, general unfavorable performance of the company’s sector or industry, or changes in government regulations affecting the company or its industry.
5. Shares of Beneficial Interest
The Fund has authorized an unlimited number of $0.001 par value shares of beneficial interest of each class. Transactions in shares of beneficial interest were as follows:
| | | | | | | | | | | | | | | | |
| | | Year Ended December 31, 2014 | | | Year Ended December 31, 2013 | |
| | | Shares | | | Amount | | | Shares | | | Amount | |
| |
Non-Service Shares | | | | | | | | | | | | | | | | |
Sold | | | 649,656 | | | $ | 20,858,404 | | | | 1,001,432 | | | $ | 27,082,174 | |
Dividends and/or distributions reinvested | | | 493,447 | | | | 15,750,818 | | | | 211,118 | | | | 5,738,189 | |
Redeemed | | | (2,439,387 | ) | | | (78,246,804 | ) | | | (3,327,965 | ) | | | (90,367,025 | ) |
| | | | |
Net decrease | | | (1,296,284 | ) | | $ | (41,637,582 | ) | | | (2,115,415 | ) | | $ | (57,546,662 | ) |
| | | | |
| | | | |
| |
Service Shares | | | | | | | | | | | | | | | | |
Sold | | | 485,595 | | | $ | 15,571,150 | | | | 590,719 | | | $ | 15,489,645 | |
Dividends and/or distributions reinvested | | | 709,853 | | | | 22,509,437 | | | | 283,631 | | | | 7,658,030 | |
Redeemed | | | (6,541,357 | ) | | | (208,620,564 | ) | | | (7,913,253 | ) | | | (214,364,928 | ) |
| | | | |
Net decrease | | | (5,345,909 | ) | | $ | (170,539,977 | ) | | | (7,038,903 | ) | | $ | (191,217,253 | ) |
| | | | |
6. Purchases and Sales of Securities
The aggregate cost of purchases and proceeds from sales of securities, other than short-term obligations and investments in IMMF, for the year ended December 31, 2014 were as follows:
| | | | | | | | | | |
| | | Purchases | | | | | Sales | |
Investment securities | | $ | 602,070,206 | | | | | $ | 844,010,672 | |
7. Fees and Other Transactions with Affiliates
Management Fees. Under the investment advisory agreement, the Fund pays the Manager a management fee based on the daily net assets of the Fund at an annual rate as shown in the following table:
| | |
| Fee Schedule | | |
Up to $200 million | | 0.75% |
Next $200 million | | 0.72 |
Next $200 million | | 0.69 |
Next $200 million | | 0.66 |
Next $200 million | | 0.60 |
Over $1 billion | | 0.58 |
The Fund’s management fee for the fiscal year ended December 31, 2014 was 0.65% of average annual net assets before any applicable waivers.
Sub-Adviser Fees. The Manager has retained the Sub-Adviser to provide the day-to-day portfolio management of the Fund. Under the Sub-Advisory Agreement, the Manager pays the Sub-Adviser an annual fee in monthly installments, equal to a percentage of the investment management fee collected by the Manager from the Fund, which shall be calculated after any investment management fee waivers. The fee paid to the Sub-Adviser is paid by the Manager, not by the Fund.
Transfer Agent Fees. OFI Global (the “Transfer Agent”) serves as the transfer and shareholder servicing agent for the Fund. The Fund pays the Transfer Agent a fee based on annual net assets. Fees incurred and average net assets for each class with respect to these services are detailed in the Statement of Operations and Financial Highlights, respectively.
Sub-Transfer Agent Fees. The Transfer Agent has retained Shareholder Services, Inc., a wholly-owned subsidiary of OFI (the “Sub-Transfer Agent”), to provide the day-to-day transfer agent and shareholder servicing of the Fund. Under the Sub-Transfer Agency Agreement, the Transfer Agent pays the Sub-Transfer Agent an annual fee in monthly installments, equal to a percentage of the transfer agent fee collected by the Transfer Agent from the Fund, which shall be calculated after any applicable fee waivers. The fee paid to the Sub-Transfer Agent is paid by the Transfer Agent, not by the Fund.
Trustees’ Compensation. The Fund’s Board of Trustees (“Board”) has adopted a compensation deferral plan for Independent Trustees that enables Trustees to elect to defer receipt of all or a portion of the annual compensation they are entitled to receive from the Fund. For purposes of determining the amount owed to the Trustee under the plan, deferred amounts are treated as though equal dollar amounts had been invested in shares of the Fund
18 OPPENHEIMER MAIN STREET FUND/VA
7. Fees and Other Transactions with Affiliates (Continued)
or in other Oppenheimer funds selected by the Trustee. The Fund purchases shares of the funds selected for deferral by the Trustee in amounts equal to his or her deemed investment, resulting in a Fund asset equal to the deferred compensation liability. Such assets are included as a component of “Other” within the asset section of the Statement of Assets and Liabilities. Deferral of Trustees’ fees under the plan will not affect the net assets of the Fund and will not materially affect the Fund’s assets, liabilities or net investment income per share. Amounts will be deferred until distributed in accordance with the compensation deferral plan.
Distribution and Service Plan for Service Shares. The Fund has adopted a Distribution and Service Plan (the “Plan”) pursuant to Rule 12b-1 under the 1940 Act for Service shares to pay OppenheimerFunds Distributor, Inc. (the “Distributor”), for distribution related services, personal service and account maintenance for the Fund’s Service shares. Under the Plan, payments are made periodically at an annual rate of 0.25% of the daily net assets of Service shares of the Fund. The Distributor currently uses all of those fees to compensate sponsors of the insurance product that offers Fund shares, for providing personal service and maintenance of accounts of their variable contract owners that hold Service shares. These fees are paid out of the Fund’s assets on an on-going basis and increase operating expenses of the Service shares, which results in lower performance compared to the Fund’s shares that are not subject to a service fee. Fees incurred by the Fund under the Plan are detailed in the Statement of Operations.
Waivers and Reimbursements of Expenses. The Manager has voluntarily agreed to limit the Fund’s expenses after payments, waivers and/or reimbursements and reduction to custodian expenses, excluding expenses incurred directly or indirectly by the Fund as a result of investments in other investment companies, wholly-owned subsidiaries and pooled investment vehicles; so that those expenses, as percentages of daily net assets, will not exceed the annual rate of 0.80% for Non-Service shares and 1.05% for Service shares. During the year ended December 31, 2014, the Manager waived fees and/or reimbursed the Fund $5,177 for Non-Service shares.
The Manager will waive fees and/or reimburse Fund expenses in an amount equal to the indirect management fees incurred through the Fund’s investment in IMMF. During the year ended December 31, 2014, the Manager waived fees and/or reimbursed the Fund $8,011 for IMMF management fees.
These undertakings may be modified or terminated as set forth according to the terms in the prospectus.
8. Pending Litigation
In 2009, seven class action lawsuits were filed in the U.S. District Court for the District of Colorado against OppenheimerFunds, Inc. (“OFI”), OppenheimerFunds Distributor, Inc., the Fund’s principal underwriter and distributor (the “Distributor”), and certain funds (but not including the Fund) advised by OFI Global Asset Management, Inc. and distributed by the Distributor (the “Defendant Funds”). The lawsuits also named as defendants certain officers and current and former trustees of the respective Defendant Funds. The lawsuits raised claims under federal securities laws and alleged, among other things, that the disclosure documents of the respective Defendant Funds contained misrepresentations and omissions and that the respective Defendant Funds’ investment policies were not followed. The plaintiffs in these actions sought unspecified damages, equitable relief and awards of attorneys’ fees and litigation expenses. The Defendant Funds’ Boards of Trustees also engaged counsel to represent the Funds and the present and former Independent Trustees named in those suits. In March 2014, the parties in six of these lawsuits executed stipulations and agreements of settlement resolving those actions. In July 2014, the court entered an order and final judgment approving the settlements as fair, reasonable and adequate. The settlements do not resolve a seventh outstanding lawsuit relating to Oppenheimer Rochester California Municipal Fund (the “California Fund Suit”). OFI believes the California Fund Suit is without legal merit and is defending the suit vigorously. While it is premature to render any opinion as to the outcome in the California Fund Suit, or whether any costs that OFI may bear in defending the California Fund Suit might not be reimbursed by insurance, OFI believes the California Fund Suit should not impair the ability of OFI or the Distributor to perform their respective duties to the Fund, and that the outcome of the California Fund Suit should not have any material effect on the operations of any of the Oppenheimer funds.
19 OPPENHEIMER MAIN STREET FUND/VA
REPORT OF INDEPENDENT REGISTERED PUBLIC ACCOUNTING FIRM
The Board of Trustees and Shareholders of Oppenheimer Variable Account Funds:
We have audited the accompanying statement of assets and liabilities of Oppenheimer Main Street Fund/VA (a separate series of Oppenheimer Variable Account Funds), including the statement of investments, as of December 31, 2014, and the related statement of operations for the year then ended, the statements of changes in net assets for each of the years in the two-year period then ended, and the financial highlights for each of the years in the five-year period then ended. These financial statements and financial highlights are the responsibility of the Fund’s management. Our responsibility is to express an opinion on these financial statements and financial highlights based on our audits.
We conducted our audits in accordance with the standards of the Public Company Accounting Oversight Board (United States). Those standards require that we plan and perform the audit to obtain reasonable assurance about whether the financial statements and financial highlights are free of material misstatement. An audit includes examining, on a test basis, evidence supporting the amounts and disclosures in the financial statements. Our procedures included confirmation of securities owned as of December 31, 2014, by correspondence with the custodian, transfer agent and brokers, or by other appropriate auditing procedures where replies from brokers were not received. An audit also includes assessing the accounting principles used and significant estimates made by management, as well as evaluating the overall financial statement presentation. We believe that our audits provide a reasonable basis for our opinion.
In our opinion, the financial statements and financial highlights referred to above present fairly, in all material respects, the financial position of Oppenheimer Main Street Fund/VA as of December 31, 2014, the results of its operations for the year then ended, the changes in its net assets for each of the years in the two-year period then ended, and the financial highlights for each of the years in the five-year period then ended, in conformity with U.S. generally accepted accounting principles.
KPMG LLP
Denver, Colorado
February 13, 2015
20 OPPENHEIMER MAIN STREET FUND/VA
FEDERAL INCOME TAX INFORMATION Unaudited
In early 2015, if applicable, shareholders of record received information regarding all dividends and distributions paid to them by the Fund during calendar year 2014.
Capital gain distributions of $0.6541 per share were paid to Non-Service and Service shareholders, respectively, on June 18, 2014. Whether received in stock or in cash, the capital gain distribution should be treated by shareholders as a gain from the sale of the capital assets held for more than one year (long-term capital gains).
Dividends, if any, paid by the Fund during the fiscal year ended December 31, 2014 which are not designated as capital gain distributions should be multiplied by the maximum amount allowable but not less than 46.69% to arrive at the amount eligible for the corporate dividend-received deduction.
The foregoing information is presented to assist shareholders in reporting distributions received from the Fund to the Internal Revenue Service. Because of the complexity of the federal regulations which may affect your individual tax return and the many variations in state and local tax regulations, we recommend that you consult your tax advisor for specific guidance.
21 OPPENHEIMER MAIN STREET FUND/VA
BOARD APPROVAL OF THE FUND’S INVESTMENT ADVISORY AND SUB-ADVISORY AGREEMENTS Unaudited
The Fund has entered into an investment advisory agreement with OFI Global Asset Management, Inc. (“OFI Global” or the “Adviser”), a wholly-owned subsidiary of OppenheimerFunds, Inc. (“OFI” or the “Sub-Adviser”) (“OFI Global” and “OFI” together the “Managers”) and OFI Global has entered into a sub-advisory agreement with OFI whereby OFI provides investment sub-advisory services to the Fund (collectively, the “Agreements”). Each year, the Board of Trustees (the “Board”), including a majority of the independent Trustees, is required to determine whether to renew the Agreements. The Investment Company Act of 1940, as amended, requires that the Board request and evaluate, and that the Managers provide, such information as may be reasonably necessary to evaluate the terms of the Agreements. The Board employs an independent consultant to prepare a report that provides information, including comparative information that the Board requests for that purpose. In addition to in-person meetings focused on this evaluation, the Board receives information throughout the year regarding Fund services, fees, expenses and performance.
The Adviser, Sub-Adviser and the independent consultant provided information to the Board on the following factors: (i) the nature, quality and extent of the Managers’ services, (ii) the investment performance of the Fund and the Managers, (iii) the fees and expenses of the Fund, including comparative expense information, (iv) the profitability of the Managers and their affiliates, including an analysis of the cost of providing services, (v) whether economies of scale are realized as the Fund grows and whether fee levels reflect these economies of scale for Fund investors and (vi) other benefits to the Managers from their relationship with the Fund. The Board was aware that there are alternatives to retaining the Managers.
Outlined below is a summary of the principal information considered by the Board as well as the Board’s conclusions.
Nature, Quality and Extent of Services. The Board considered information about the nature, quality and extent of the services provided to the Fund and information regarding the Managers’ key personnel who provide such services. The Sub-Adviser’s duties include providing the Fund with the services of the portfolio managers and the Sub-Adviser’s investment team, who provide research, analysis and other advisory services in regard to the Fund’s investments; securities trading services; oversight of third-party service providers; monitoring compliance with applicable Fund policies and procedures and adherence to the Fund’s investment restrictions; and risk management. The Managers are responsible for providing certain administrative services to the Fund as well. Those services include providing and supervising all administrative and clerical personnel who are necessary in order to provide effective corporate administration for the Fund; compiling and maintaining records with respect to the Fund’s operations; preparing and filing reports required by the Securities and Exchange Commission; preparing periodic reports regarding the operations of the Fund for its shareholders; preparing proxy materials for shareholder meetings; and preparing the registration statements required by Federal and state securities laws for the sale of the Fund’s shares. The Managers also provide the Fund with office space, facilities and equipment.
The Board also considered the quality of the services provided and the quality of the Managers’ resources that are available to the Fund. The Board took account of the fact that the Sub-Adviser has had over fifty years of experience as an investment adviser and that its assets under management rank it among the top mutual fund managers in the United States. The Board evaluated the Sub-Adviser’s advisory, administrative, accounting, legal, compliance services and risk management, and information the Board has received regarding the experience and professional qualifications of the Managers’ key personnel and the size and functions of its staff. In its evaluation of the quality of the portfolio management services provided, the Board considered the experience of Manind (“Mani”) Govil, Benjamin Ram, and Paul Larson, the portfolio managers for the Fund, and the Sub-Adviser’s investment team and analysts. The Board members also considered the totality of their experiences with the Managers as directors or trustees of the Fund and other funds advised by the Managers. The Board considered information regarding the quality of services provided by affiliates of the Managers, which its members have become knowledgeable about in connection with the renewal of the Fund’s service agreements. The Board concluded, in light of the Managers’ experience, reputation, personnel, operations and resources that the Fund benefits from the services provided under the Agreements.
Investment Performance of the Fund, the Adviser and the Sub-Adviser. Throughout the year, the Manager provided information on the investment performance of the Fund, including comparative performance information. The Board also reviewed information, prepared by the Manager and by the independent consultant, comparing the Fund’s historical performance to relevant market indices and to the performance of other large blend funds underlying variable insurance products. The Board considered that the Fund outperformed its performance category median during the three-and five-year periods but underperformed for the one- and ten-year periods.
Costs of Services by the Adviser. The Board reviewed the fees paid to the Manager and the other expenses borne by the Fund. The Board noted that the Manager, not the Fund, pays the Sub-Adviser’s fee under the sub-advisory agreement. The independent consultant provided comparative data in regard to the fees and expenses of the Fund and other large blend funds underlying variable insurance products. In reviewing the fees and expenses charged to the VA funds, the Board considered the Manager’s assertion that, because there is much greater disparity in the fees and services that may be provided by a manager to a VA fund as opposed to a retail fund, when comparing the expenses of the various VA funds to those of retail funds, it is most appropriate to focus on total expenses (rather than on the management fees). Accordingly, while the Board reviewed and considered all expenses, it focused on total expenses. The Board considered that the Fund’s total expenses were higher than its peer group median and category median. The Board also considered that the Fund’s contractual management fee was lower than its peer group median and category median. Within the total asset range of $1 billion to $2 billion, the Fund’s effective management fee rate was higher than its peer group median and lower than its category median. The Board noted that the Manager has voluntarily agreed to limit the Fund’s total annual operating expenses so that those expenses, as percentages of daily net assets, will not exceed the annual rate of 0.80% for Non-Service Shares and 1.05% for Service Shares. This voluntary expense limitation may be amended or withdrawn at any time without prior notice to shareholders.
Economies of Scale and Profits Realized by the Adviser and Sub-Adviser. The Board considered information regarding the Manager’s costs in serving as the Fund’s investment adviser, including the costs associated with the personnel and systems necessary to manage the Fund, and information regarding the Manager’s profitability from its relationship with the Fund. The Board reviewed whether the Manager may realize economies of scale in managing and supporting the Fund. The Board noted that the Fund currently has management fee breakpoints, which are intended to share with Fund shareholders economies of scale that may exist as the Fund’s assets grow. The Board further noted that on November 1, 2013, an additional fee breakpoint of 0.58% for assets in excess of $1 billion was added to the Fund’s breakpoint schedule.
Other Benefits to the Managers. In addition to considering the profits realized by the Managers, the Board considered information that was provided regarding the direct and indirect benefits the Managers receive as a result of their relationship with the Fund, including compensation paid to the Managers’ affiliates and research provided to the Adviser in connection with permissible brokerage arrangements (soft dollar arrangements). The Board also considered that the Managers must be able to pay and retain experienced professional personnel at competitive rates to provide quality services to the Fund.
22 OPPENHEIMER MAIN STREET FUND/VA
Conclusions. These factors were also considered by the independent Trustees meeting separately from the full Board, assisted by experienced counsel to the Fund and to the independent Trustees. Fund counsel and the independent Trustees’ counsel are independent of the Managers within the meaning and intent of the Securities and Exchange Commission Rules.
Based on its review of the information it received and its evaluations described above, the Board, including a majority of the independent Trustees, decided to continue the Agreements through August 31, 2015. In arriving at its decision, the Board did not identify any factor or factors as being more important than others, but considered all of the above information, and considered the terms and conditions of the Agreements, including the management fees, in light of all the surrounding circumstances.
23 OPPENHEIMER MAIN STREET FUND/VA
PORTFOLIO PROXY VOTING POLICIES AND PROCEDURES; UPDATES TO STATEMENTS OF INVESTMENTS Unaudited
The Fund has adopted Portfolio Proxy Voting Policies and Procedures under which the Fund votes proxies relating to securities (“portfolio proxies”) held by the Fund. A description of the Fund’s Portfolio Proxy Voting Policies and Procedures is available (i) without charge, upon request, by calling the Fund toll-free at 1.800.525.7048, (ii) on the Fund’s website at www.oppenheimerfunds.com, and (iii) on the SEC’s website at www.sec.gov. In addition, the Fund is required to file Form N-PX, with its complete proxy voting record for the 12 months ended June 30th, no later than August 31st of each year. The Fund’s voting record is available (i) without charge, upon request, by calling the Fund toll-free at 1.800.525.7048, and (ii) in the Form N-PX filing on the SEC’s website at www.sec.gov.
The Fund files its complete schedule of portfolio holdings with the SEC for the first quarter and the third quarter of each fiscal year on Form N-Q. The Fund’s Form N-Q filings are available on the SEC’s website at www.sec.gov. Those forms may be reviewed and copied at the SEC’s Public Reference Room in Washington, D.C. Information on the operation of the Public Reference Room may be obtained by calling 1-800-SEC-0330.
24 OPPENHEIMER MAIN STREET FUND/VA
TRUSTEES AND OFFICERS Unaudited
| | | | |
| | Name, Position(s) Held with the Fund, Length of Service, Year of Birth | | Principal Occupation(s) During the Past 5 Years; Other Trusteeships/Directorships Held; Number of Portfolios in the Fund Complex Currently Overseen |
| | |
| | INDEPENDENT TRUSTEES | | The address of each Trustee in the chart below is 6803 S. Tucson Way, Centennial, Colorado 80112-3924. Each Trustee serves for an indefinite term, or until his or her resignation, retirement, death or removal. |
| | |
| | Sam Freedman, Chairman of the Board of Trustees (since 2013) and Trustee (since 1996) Year of Birth: 1940 | | Director of Colorado UpLIFT (charitable organization) (since September 1984). Mr. Freedman held several positions with the Sub-Adviser and with subsidiary or affiliated companies of the Sub-Adviser (until October 1994). Oversees 38 portfolios in the OppenheimerFunds complex. Mr. Freedman has served on the Boards of certain Oppenheimer funds since 1996, during which time he has become familiar with the Fund’s (and other Oppenheimer funds’) financial, accounting, regulatory and investment matters and has contributed to the Boards’ deliberations. |
| | |
| | Jon S. Fossel, Trustee (since 1995) Year of Birth: 1942 | | Chairman of the Board of Jack Creek Preserve Foundation (non-profit organization) (since 2005); Chairman of the Board (2006-December 2011) and Director (June 2002-December 2011) of UNUMProvident (insurance company); Director of Northwestern Energy Corp. (public utility corporation) (November 2004-December 2009); Director of P.R. Pharmaceuticals (October 1999-October 2003); Director of Rocky Mountain Elk Foundation (non-profit organization) (February 1998-February 2003 and February 2005-February 2007); Chairman and Director (until October 1996) and President and Chief Executive Officer (until October 1995) of the Sub-Adviser; President, Chief Executive Officer and Director of the following: Oppenheimer Acquisition Corp. (“OAC”) (parent holding company of the Sub-Adviser), Shareholder Services, Inc. and Shareholder Financial Services, Inc. (until October 1995). Oversees 38 portfolios in the OppenheimerFunds complex. Mr. Fossel has served on the Boards of certain Oppenheimer funds since 1990, during which time he has become familiar with the Fund’s (and other Oppenheimer funds’) financial, accounting, regulatory and investment matters and has contributed to the Boards’ deliberations. |
| | |
| | Richard F. Grabish, Trustee (since 2012) Year of Birth: 1948 | | Formerly Senior Vice President and Assistant Director of Sales and Marketing (March 1997-December 2007), Director (March 1987-December 2007) and Manager of Private Client Services (June 1985-June 2005) of A.G. Edwards & Sons, Inc. (broker/dealer and investment firm); Chairman and Chief Executive Officer of A.G. Edwards Trust Company, FSB (March 2001-December 2007); President and Vice Chairman of A.G. Edwards Trust Company, FSB (investment adviser) (April 1987-March 2001); President of A.G. Edwards Trust Company, FSB (investment adviser) (June 2005-December 2007). Oversees 38 portfolios in the OppenheimerFunds complex. Mr. Grabish has served on the Boards of certain Oppenheimer funds since 2001, during which time he has become familiar with the Fund’s (and other Oppenheimer funds’) financial, accounting, regulatory and investment matters and has contributed to the Boards’ deliberations. |
| | |
| | Beverly L. Hamilton, Trustee (since 2002) Year of Birth: 1946 | | Trustee of Monterey Institute for International Studies (educational organization) (since February 2000); Board Member of Middlebury College (educational organization) (December 2005-June 2011); Chairman (since 2010) of American Funds’ Emerging Markets Growth Fund, Inc. (mutual fund); Director of The California Endowment (philanthropic organization) (April 2002-April 2008); Director (February 2002-2005) and Chairman of Trustees (2006-2007) of the Community Hospital of Monterey Peninsula; Director (October 1991-2005); Vice Chairman (2006-2009) of American Funds’ Emerging Markets Growth Fund, Inc. (mutual fund); President of ARCO Investment Management Company (February 1991-April 2000); Member of the investment committees of The Rockefeller Foundation (2001-2006) and The University of Michigan (since 2000); Advisor at Credit Suisse First Boston’s Sprout venture capital unit (venture capital fund) (1994-January 2005); Trustee of MassMutual Institutional Funds (investment company) (1996-June 2004); Trustee of MML Series Investment Fund (investment company) (April 1989-June 2004); Member of the investment committee of Hartford Hospital (2000-2003); and Advisor to Unilever (Holland) pension fund (2000-2003). Oversees 38 portfolios in the OppenheimerFunds complex. Ms. Hamilton has served on the Boards of certain Oppenheimer funds since 2002, during which time she has become familiar with the Fund’s (and other Oppenheimer funds’) financial, accounting, regulatory and investment matters and has contributed to the Boards’ deliberations. |
| | |
| | Victoria J. Herget, Trustee (since 2012) Year of Birth: 1951 | | Board Chair (2008-Present) and Director (2004-Present), United Educators (insurance company); Trustee (since 2000) and Chair (since 2010), Newberry Library (independent research library); Trustee, Mather LifeWays (senior living organization) (since 2001); Independent Director of the First American Funds (mutual fund family) (2003-2011); former Managing Director (1993-2001), Principal (1985-1993), Vice President (1978-1985) and Assistant Vice President (1973-1978) of Zurich Scudder Investments (investment adviser) (and its predecessor firms); Trustee (1992-2007), Chair of the Board of Trustees (1999-2007), Investment Committee Chair (1994-1999) and Investment Committee member (2007-2010) of Wellesley College; Trustee, BoardSource (non-profit organization) (2006-2009) and Chicago City Day School (K-8 School) (1994-2005). Oversees 38 portfolios in the OppenheimerFunds complex. Ms. Herget has served on the Boards of certain Oppenheimer funds since 2012, during which time she has become familiar with the Fund’s (and other Oppenheimer funds’) financial, accounting, regulatory and investment matters and has contributed to the Boards’ deliberations. |
| | |
| | Robert J. Malone, Trustee (since 2002) Year of Birth: 1944 | | Chairman of the Board (since 2012) and Director (since August 2005) of Jones International University (educational organization); Chairman, Chief Executive Officer and Director of Steele Street Bank Trust (commercial banking) (since August 2003); Trustee of the Gallagher Family Foundation (non-profit organization) (since 2000); Board of Directors of Opera Colorado Foundation (non-profit organization) (2008-2012); Director of Colorado UpLIFT (charitable organization) (1986-2010); Director of Jones Knowledge, Inc. (2006-2010); Former Chairman of U.S. Bank-Colorado (subsidiary of U.S. Bancorp and formerly Colorado National Bank) (July 1996-April 1999); Director of Commercial Assets, Inc. (real estate investment trust) (1993-2000); Director of U.S. Exploration, Inc. (oil and gas exploration) (1997-February 2004); Chairman of the Board (1991-1994) and Trustee (1985-1994) of Regis University; and Chairman of the Board (1990-1991 and Trustee (1984-1999) of Young Presidents Organization. Oversees 38 portfolios in the OppenheimerFunds complex. Mr. |
25 OPPENHEIMER MAIN STREET FUND/VA
TRUSTEES AND OFFICERS Unaudited / Continued
| | | | |
| | |
| | Robert J. Malone, Continued | | Malone has served on the Boards of certain Oppenheimer funds since 2002, during which time he has become familiar with the Fund’s (and other Oppenheimer funds’) financial, accounting, regulatory and investment matters and has contributed to the Boards’ deliberations. |
| | |
| | F. William Marshall, Jr., Trustee (since 2000) Year of Birth: 1942 | | Trustee Emeritus of Worcester Polytech Institute (WPI) (private university) (since 2009); Trustee of MassMutual Select Funds (formerly MassMutual Institutional Funds) (investment company) (since 1996), MML Series Investment Fund (investment company) (since 1996) and Mass Mutual Premier Funds (investment company) (since January 2012); President and Treasurer of the SIS Fund (private charitable fund) (January 1999 – March 2011); Former Trustee of WPI (1985-2008); Former Chairman of the Board (2004-2006) and Former Chairman of the Investment Committee of WPI (1994-2008); Chairman of SIS & Family Bank, F.S.B. (formerly SIS Bank) (commercial bank) (January 1999-July 1999); Executive Vice President of Peoples Heritage Financial Group, Inc. (commercial bank) (January 1999-July 1999); and Former President and Chief Executive Officer of SIS Bancorp. (1993-1999). Oversees 42 portfolios in the OppenheimerFunds complex. Mr. Marshall has served on the Boards of certain Oppenheimer funds since 2000, during which time he has become familiar with the Fund’s (and other Oppenheimer funds’) financial, accounting, regulatory and investment matters and has contributed to the Boards’ deliberations. |
| | |
| | Karen L. Stuckey, Trustee (since 2012) Year of Birth: 1953 | | Partner (1990-2012) of PricewaterhouseCoopers LLP (professional services firm) (held various positions 1975- 1990); Trustee (1992-2006) and member of Executive, Nominating and Audit Committees and Chair of Finance Committee of Lehigh University; and member, Women’s Investment Management Forum (professional organization) since inception. Oversees 38 portfolios in the OppenheimerFunds complex. Ms. Stuckey has served on the Boards of certain Oppenheimer funds since 2012, during which time she has become familiar with the Fund’s (and other Oppenheimer funds’) financial, accounting, regulatory and investment matters and has contributed to the Boards’ deliberations. |
| | |
| | James D. Vaughn, Trustee (since 2012) Year of Birth: 1945 | | Retired; former managing partner (1994-2001) of Denver office of Deloitte & Touche LLP, (held various positions 1969-1993); Trustee and Chairman of the Audit Committee of Schroder Funds (2003-2012); Board member and Chairman of Audit Committee of AMG National Trust Bank (since 2005); Trustee and Investment Committee member, University of South Dakota Foundation (since 1996); Board member, Audit Committee Member and past Board Chair, Junior Achievement (since 1993); former Board member, Mile High United Way, Boys and Girls Clubs, Boy Scouts, Colorado Business Committee for the Arts, Economic Club of Colorado and Metro Denver Network. Oversees 38 portfolios in the OppenheimerFunds complex. Mr. Vaughn has served on the Boards of certain Oppenheimer funds since 2012, during which time he has become familiar with the Fund’s (and other Oppenheimer funds’) financial, accounting, regulatory and investment matters and has contributed to the Boards’ deliberations. |
|
| | |
| | INTERESTED TRUSTEE | | Mr. Glavin is an “Interested Trustee” because he is affiliated with the Manager and the Sub-Adviser by virtue of his positions as director of the Sub-Adviser, and as a shareholder of the Sub-Adviser’s parent company. As a Trustee, he serves for an indefinite term, or until his resignation, retirement, death or removal. Mr. Glavin’s address is 225 Liberty Street, 11th Floor, New York, New York 10281-1008. |
| | |
| | William F. Glavin, Jr., Trustee (since 2009) Year of Birth: 1958 | | Chairman of the Sub-Adviser (July 2014-December 2014 and December 2009-December 2012) and Director of the Sub-Adviser (since January 2009); Chairman, Director and Chief Executive Officer (January 2013-June 2014) of the Manager; President of the Manager (January 2013-May 2013); Chief Executive Officer (January 2009-December 2012); President of the Sub-Adviser (May 2009-December 2012); Management Director (June 2009-June 2014), President (December 2009-June 2014) and Chief Executive Officer (January 2011-June 2014) of Oppenheimer Acquisition Corp. (“OAC”) (the Sub-Adviser’s parent holding company); Director of Oppenheimer Real Asset Management, Inc. (March 2010-June 2014); Executive Vice President (March 2006-February 2009) and Chief Operating Officer (July 2007-February 2009) of Massachusetts Mutual Life Insurance Company (OAC’s parent company); Director (May 2004-March 2006) and Chief Operating Officer and Chief Compliance Officer (May 2004-January 2005), President (January 2005-March 2006) and Chief Executive Officer (June 2005-March 2006) of Babson Capital Management LLC; Director (March 2005-March 2006), President (May 2003-March 2006) and Chief Compliance Officer (July 2005-March 2006) of Babson Capital Securities, Inc. (a broker-dealer); President (May 2003-March 2006) of Babson Investment Company, Inc.; Director (May 2004-August 2006) of Babson Capital Europe Limited; Director (May 2004-October 2006) of Babson Capital Guernsey Limited; Director (May 2004-March 2006) of Babson Capital Management LLC; Non-Executive Director (March 2005-March 2007) of Baring Asset Management Limited; Director (February 2005-June 2006) Baring Pension Trustees Limited; Director and Treasurer (December 2003-November 2006) of Charter Oak Capital Management, Inc.; Director (May 2006-September 2006) of C.M. Benefit Insurance Company; Director (May 2008-June 2009) and Executive Vice President (June 2007-July 2009) of C.M. Life Insurance Company; President (March 2006-May 2007) of MassMutual Assignment Company; Director (January 2005-December 2006), Deputy Chairman (March 2005-December 2006) and President (February 2005-March 2005) of MassMutual Holdings (Bermuda) Limited; Director (May 2008-June 2009) and Executive Vice President (June 2007-July 2009) of MML Bay State Life Insurance Company; Chief Executive Officer and President (April 2007-January 2009) of MML Distributors, LLC; and Chairman (March 2006-December 2008) and Chief Executive Officer (May 2007-December 2008) of MML Investors Services, Inc. An officer of 91 portfolios in the OppenheimerFunds complex. Mr. Glavin has served on the Boards of certain Oppenheimer funds since December 2009, during which time he has become familiar with the Fund’s (and other Oppenheimer funds’) financial, accounting, regulatory and investment matters and has contributed to the Boards’ deliberations. |
|
| | |
| | OTHER OFFICERS OF THE FUND | | The addresses of the Officers in the chart below are as follows: for Messrs. Govil, Ram, Larson, Steinmetz, Gabinet, Mss. Sexton and Picciotto, 225 Liberty Street, New York, New York 10281-1008, for Mr. Wixted, 6803 S. Tucson Way, Centennial, Colorado 80112-3924. Each Officer serves for an indefinite term or until his or her resignation, retirement, death or removal. |
26 OPPENHEIMER MAIN STREET FUND/VA
| | | | |
| | |
| | Manind Govil, Vice President (since 2009) Year of Birth: 1969 | | Senior Vice President, the Main Street Team Leader and a portfolio manager of the Sub-Adviser (since May 2009). Portfolio manager with RS Investment Management Co. LLC (October 2006-March 2009). Head of equity investments at The Guardian Life Insurance Company of America (August 2005-October 2006) when Guardian Life Insurance acquired an interest in RS Investment Management Co. LLC. Lead portfolio manager - large cap blend/core equity, co-head of equities and head of equity research (2001-July 2005), and was lead portfolio manager - core equity (April 1996-July 2005), at Mercantile Capital Advisers, Inc. A portfolio manager and officer of other portfolios in the OppenheimerFunds complex. |
| | |
| | Benjamin Ram, Vice President (since 2009) Year of Birth: 1972 | | Vice President of the Sub-Adviser (since May 2009); Senior Portfolio Manager of the Sub-Adviser (since January 2011) and Portfolio Manager of the Sub-Adviser (May 2009-December 2010). Sector manager for financial investments and a co portfolio manager for mid-cap portfolios with the RS Core Equity Team of RS Investment Management Co. LLC (October 2006-May 2009). Portfolio Manager of Mid Cap Strategies, Sector Manager Financials at The Guardian Life Insurance Company of America (January 2006-October 2006) when Guardian Life Insurance acquired an interest in RS Investment Management Co. LLC. Financial analyst (2003-2005), and co-portfolio manager (2005-2006) at Mercantile Capital Advisers, Inc.; bank analyst at Legg Mason Securities (2000-2003) and a senior financial analyst at the CitiFinancial division of Citigroup, Inc. (1997-2000). A portfolio manager and officer of other portfolios in the OppenheimerFunds complex. |
| | |
| | Paul Larson, Vice President (since 2014) Year of Birth: 1971 | | Vice President of the Sub-Adviser (since January 2013). Prior to joining the Sub-Adviser, he was a portfolio manager and Chief Equity Strategist at Morningstar. He was previously an analyst at Morningstar covering the energy sector and oversaw the firm’s natural resources analysts. Prior to joining Morningstar in 2002, Mr. Larson was an analyst with The Motley Fool. A portfolio manager and officer of other portfolios in the OppenheimerFunds complex. |
| | |
| | Arthur P. Steinmetz, President and Principal Executive Officer (since 2014) Year of Birth: 1958 | | Chairman of the Sub-Adviser (since January 2015); CEO and Chairman of the Manager (since July 2014), President of the Manager (since May 2013), a Director of the Manager (since January 2013), Director of the Sub-Adviser (since July 2014), President, Management Director and CEO of Oppenheimer Acquisition Corp. (the Sub-Adviser’s parent holding company) (since July 2014), and President and Director of OFI SteelPath, Inc. (since January 2013). Chief Investment Officer of the OppenheimerFunds advisory entities from (January 2013-December 2013); Executive Vice President of the Manager (January 2013-May 2013); Chief Investment Officer of the Sub-Adviser (October 2010-December 2012); Chief Investment Officer, Fixed-Income, of the Sub-Adviser (April 2009-October 2010); Executive Vice President of the Sub-Adviser (October 2009-December 2012); Director of Fixed Income of the Sub-Adviser (January 2009-April 2009); and a Senior Vice President of the Sub-Adviser (March 1993-September 2009). An officer of 91 portfolios in the OppenheimerFunds complex. |
| | |
| | Arthur S. Gabinet, Secretary and Chief Legal Officer (since 2011) Year of Birth: 1958 | | Executive Vice President, Secretary and General Counsel of the Manager (since January 2013); General Counsel OFI SteelPath, Inc. (since January 2013); Executive Vice President (May 2010-December 2012) and General Counsel (since January 2011) of the Sub-Adviser; General Counsel of the Distributor (since January 2011); General Counsel of Centennial Asset Management Corporation (January 2011-December 2012); Executive Vice President (January 2011-December 2012) and General Counsel of HarbourView Asset Management Corporation (since January 2011); Assistant Secretary (since January 2011) and Director (since January 2011) of OppenheimerFunds International Ltd. and OppenheimerFunds plc; Director of Oppenheimer Real Asset Management, Inc. (January 2011-December 2012) and General Counsel (since January 2011); Executive Vice President (January 2011-December 2011) and General Counsel of Shareholder Financial Services, Inc. and Shareholder Services, Inc. (since January 2011); Executive Vice President (January 2011-December 2012) and General Counsel of OFI Private Investments Inc. (since January 2011); Vice President of OppenheimerFunds Legacy Program (January 2011-December 2011); Executive Vice President (January 2011-December 2012) and General Counsel of OFI Institutional Asset Management, Inc. (since January 2011); General Counsel, Asset Management of the Sub-Adviser (May 2010-December 2010); Principal, The Vanguard Group (November 2005-April 2010); District Administrator, U.S. Securities and Exchange Commission (January 2003-October 2005). An officer of 91 portfolios in the OppenheimerFunds complex. |
| | |
| | Jennifer Sexton, Vice President and Chief Business Officer (since 2014) Year of Birth: 1969 | | Senior Vice President of OppenheimerFunds Distributor, Inc. (since June 2014); Vice President of OppenheimerFunds Distributor, Inc. (April 2006-June 2014); Vice President of the Sub-Adviser (January 1998-March 2006); Assistant Vice President of the Sub-Adviser (October 1991-December 1998). An officer of 91 portfolios in the OppenheimerFunds complex. |
| | |
| | Mary Ann Picciotto, Chief Compliance Officer and Chief Anti-Money Laundering Officer (since 2014) Year of Birth: 1973 | | Senior Vice President and Chief Compliance Officer of the Manager (since March 2014); Chief Compliance Officer of the Sub-Adviser, OFI SteelPath, Inc., OFI Global Trust Company, OFI Global Institutional, Inc., Oppenheimer Real Asset Management, Inc., OFI Private Investments, Inc., Harborview Asset Management Corporation, Trinity Investment Management Corporation, and Shareholder Services, Inc. (since March 2014); Managing Director of Morgan Stanley Investment Management Inc. and certain of its various affiliated entities; Chief Compliance Officer of various Morgan Stanley Funds (May 2010-January 2014); Chief Compliance Officer of Morgan Stanley Investment Management Inc. (April 2007-January 2014). An officer of 91 portfolios in the OppenheimerFunds complex. |
| | |
| | Brian W. Wixted, Treasurer and Principal Financial & Accounting Officer (since 1999) Year of Birth: 1959 | | Senior Vice President of the Manager (since January 2013); Treasurer of the Sub-Adviser, HarbourView Asset Management Corporation, Shareholder Financial Services, Inc., Shareholder Services, Inc., and Oppenheimer Real Asset Management, Inc. (March 1999-June 2008), OFI Private Investments, Inc. (March 2000-June 2008), OppenheimerFunds International Ltd. and OppenheimerFunds plc (since May 2000), OFI Institutional Asset Management, Inc. (November 2000-June 2008), and OppenheimerFunds Legacy Program (charitable trust program established by the Sub-Adviser) (June 2003-December 2011); Treasurer and Chief Financial Officer of OFI Trust Company (since May 2000); Assistant Treasurer of Oppenheimer Acquisition Corporation (March 1999-June 2008). An officer of 91 portfolios in the OppenheimerFunds complex. |
The Fund’s Statement of Additional Information contains additional information about the Fund’s Trustees and Officers and is available without charge, upon request, by calling 1.800.988.8287.
27 OPPENHEIMER MAIN STREET FUND/VA
OPPENHEIMER MAIN STREET FUND/VA
A Series of Oppenheimer Variable Account Funds
| | |
| Manager | | OFI Global Asset Management, Inc. |
| |
| Sub-Adviser | | OppenheimerFunds, Inc. |
| |
| Distributor | | OppenheimerFunds Distributor, Inc. |
| |
| Transfer and | | OFI Global Asset Management, Inc. |
| Shareholder | | |
| Servicing Agent | | |
| |
| Sub-Transfer Agent | | Shareholder Services, Inc. |
| | DBA OppenheimerFunds Services |
| |
| Independent | �� | KPMG LLP |
| Registered | | |
| Public | | |
| Accounting | | |
| Firm | | |
| |
| Counsel | | K&L Gates LLP |
| |
| | Before investing in any of the Oppenheimer funds, investors should carefully consider a fund’s investment objectives, risks, charges and expenses. Fund prospectuses and summary prospectuses contain this and other information about the funds, and may be obtained by asking your financial advisor, or calling us at 1.800.988.8287. Read prospectuses and summary prospectuses carefully before investing. |
| |
| | © 2015 OppenheimerFunds, Inc. All rights reserved. Oppenheimer funds are distributed by OppenheimerFunds Distributor, Inc. |

PORTFOLIO MANAGERS: Matthew P. Ziehl, CFA, Raymond Anello, CFA, Raman Vardharaj, CFA, Joy Budzinski, Kristin Ketner, Magnus Krantz and Adam Weiner
AVERAGE ANNUAL TOTAL RETURNS FOR THE PERIODS ENDED 12/31/14
| | | | | | | | | | | | | | |
| | Inception
Date | | | 1-Year | | | | 5-Year | | | | 10-Year | |
Non-Service Shares | | 5/1/98 | | | 11.93 | % | | | 17.58 | % | | | 9.12 | % |
Service Shares | | 7/16/01 | | | 11.66 | | | | 17.29 | | | | 8.86 | |
Russell 2000 Index | | | | | 4.89 | | | | 15.55 | | | | 7.77 | |
The performance data quoted represents past performance, which does not guarantee future results. The investment return and principal value of an investment in the Fund will fluctuate so that an investor’s shares, when redeemed, may be worth more or less than their original cost. Current performance may be lower or higher than the performance quoted. For performance data current to the most recent month end, call us at 1.800.988.8287. The Fund’s total returns should not be expected to be the same as the returns of other funds, whether or not both funds have the same portfolio managers and/or similar names. The Fund’s total returns include changes in share price and reinvested distributions but do not include the charges associated with the separate account products that offer this Fund. Such performance would have been lower if such charges were taken into account.
TOP TEN COMMON STOCK HOLDINGS
| | | | | | |
LaSalle Hotel Properties | | | 2.2 | % | | |
Korn/Ferry International | | | 2.1 | | | |
Dana Holding Corp. | | | 2.0 | | | |
KAR Auction Services, Inc. | | | 2.0 | | | |
STAG Industrial, Inc. | | | 2.0 | | | |
Prestige Brands Holdings, Inc. | | | 2.0 | | | |
Western Refining, Inc. | | | 1.9 | | | |
WellCare Health Plans, Inc. | | | 1.9 | | | |
Mattress Firm Holding Corp. | | | 1.7 | | | |
Chatham Lodging Trust | | | 1.7 | | | |
Portfolio holdings and allocations are subject to change. Percentages are as of December 31, 2014, and are based on net assets. For more current Fund holdings, please visit oppenheimerfunds.com.
SECTOR ALLOCATION
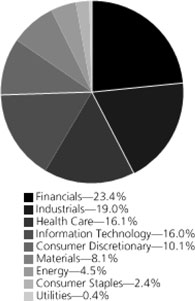
Portfolio holdings and allocations are subject to change. Percentages are as of December 31, 2014, and are based on the total market value of common stocks.
2 OPPENHEIMER MAIN STREET SMALL CAP FUND/VA
Fund Performance Discussion
The Fund’s Non-Service shares produced a return of 11.93% during the reporting period, outperforming the Russell 2000 Index (the “Index”), which returned 4.89%. The Fund’s outperformance stemmed primarily from stronger relative stock selection in the industrials, energy, consumer discretionary and materials sectors. Conversely, the Fund underperformed the Index in the health care and consumer staples sectors due to less favorable stock selection, and in the utilities sector as a result of an underweight position.
MARKET OVERVIEW
During the past year domestic equity — as an asset class — once again distinguished itself as stocks appreciated in value across all capitalizations. In 2014, the U.S. economy provided a favorable backdrop for the outperformance of equities with steady, albeit modest growth, continued little wage inflation, and interest rates that remained low — in fact, well below initial expectations. Under these economic conditions most companies were able to demonstrate ongoing improvement with the majority beating expectations — on both the top and bottom lines.
The ride throughout the year, however, was anything but smooth. Macro influences —particularly the strengthening dollar, flattening yield curve, and tumbling oil price — played a significant role in determining which equities out- or underperformed. Accommodation by the Federal Reserve (the “Fed”), which officially ended its bond-buying stimulus program in October, helped to fuel demand for high-dividend paying stocks such as utilities and real estate investment trusts (“REITs”), while a step-up in merger and acquisition activity — spurred on by the desire to relocate to advantageous low tax jurisdictions — boosted stocks primarily in the health care sector. But not all was rosy. The Fed’s accommodative behavior proved a headwind for many financials as long yields declined, hurting the profitability of banks. The strengthening U.S. dollar also proved a headwind, especially for multi-national companies where translation from local currencies to the greenback negatively impacted the bottom line. Consequently, stocks with international businesses broadly underperformed stocks with mostly domestic exposure.
Geopolitical risks, including those concentrated in Ukraine and Russia and the ever-present turmoil in the Middle East, caused investors to fret and resulted in, at times, quite the roller coaster ride. Add to this the fact that growth outside of the U.S. was anemic, at best, leading investors to worry intermittently about the global outlook and its impact on domestic stocks. And, a new concern raised its very ugly head as the Ebola epidemic in Western Africa spooked investors further. Though volatility remained below historical averages, these issues caused it to it to spike on a number of occasions throughout the year.
TOP INDIVIDUAL CONTRIBUTORS
Fund holdings that were contributors to performance this period included Cavium, Inc., Century Aluminum Co. and LaSalle Hotel Properties. Cavium is a provider of integrated semiconductor processors enabling processing for networks, communications, storage, wireless, security and video applications. Expectations for accelerating revenue growth propelled this stock higher during the reporting period. The improving outlook reflects a solid pipeline of products to be delivered to enterprise and wireless customers, plus promising new product designs that have the potential to further fuel demand coming from wireless infrastructure and data center providers. We believe Cavium is at a positive inflection point in its revenue cycle, and added to our position size to reflect the strengthening fundamentals. The stock of Century Aluminum was propelled higher due to several factors during the reporting period. Century benefited from rising London Metal Exchange aluminum prices — leading to the strongest reported earnings in three years. Additionally, investors have become increasingly aware of the evolving secular growth opportunity as aluminum gains greater content penetration in automotive manufacturing. These factors resulted in several Wall Street analyst upgrades, helping to support the rising stock price. LaSalle Hotel Properties is a real estate investment trust (“REIT”) focused primarily on upmarket full service hotel properties. REITs, which have historically had high payout yields, have been among the best performing stocks year-to-date as investors seek sources of attractive current income. During the period, the company announced sales and profits that topped expectations. Additionally, a recently closed purchase of a hotel in San Francisco has added to the future growth outlook.
TOP INDIVIDUAL DETRACTORS
Top detractors from performance included information technology stocks Infoblox, Inc., Web.com Group, Inc. and Finisar Corp. We exited our position in these holdings by period end. Infoblox is a leader in “automated network control” solutions and security — allowing companies to manage large and complex data networks, and the proliferation of mobile devices connected to them. The stock suffered a setback after management preannounced a deceleration in growth and guided to a further slowdown for the full fiscal year. As a result, analyst estimates were revised down significantly, putting selling pressure on the company’s stock. The disappointing guidance for both revenues and earnings was largely attributable to a “slippage” of large deal signings and ongoing weakness in business with the U.S. federal government. We exited the position after another disappointing report and the CEO’s unexpected departure. Web.com Group, Inc. is a provider of Internet services and online marketing solutions, primarily to small businesses. Over the fourth quarter of 2014, the company disappointed
3 OPPENHEIMER MAIN STREET SMALL CAP FUND/VA
investors for a second consecutive quarter when it reported results. Decelerating growth in its core “Do-It-For-Me” business — a key contributor to the company’s revenue over the past several years — was the prime culprit leading to the shortfall in earnings. This disappointment was a violation of our investment thesis that was predicated on customers continuing to migrate up the value chain, leading to both accelerating revenue growth and improved profitability. As a consequence, we have eliminated our holdings in this stock. Finisar’s products enable high-speed data communications over both local and storage area networks. A disappointing quarterly result, with earnings that missed estimates, combined with lowered guidance from management, drove this stock’s negative results. While revenues were generally in-line with expectations, gross margins fell short due to a less favorable revenue mix stemming from lower margin data-com sales to markets such as China.
STRATEGY & OUTLOOK
While we have no crystal ball, we believe domestic equities should continue to be an attractive investment. The U.S. economic outlook remains favorable, with ongoing moderate real growth, low inflationary pressures and little expected impact from the Fed’s initial tightening of the yield curve’s short-end. We believe profit margins, which have expanded to peak historical levels, are unlikely to expand significantly further, but quite probably can be sustained at current levels. With interest rates remaining low, combined with the fall in oil prices, consumer spending — which is the majority of GDP — should support our outlook for moderate growth.
Shocks to the market — whether economic or geopolitical in nature — will no doubt continue and could result in rising volatility. If true, we expect investors may favor stocks characterized by “higher quality” — those that have pricing power, control over costs, and exhibit both improving returns on invested capital and generate excess cash flow. We believe this market environment can favor our consistent approach, which aims to construct an “all weather” portfolio by targeting companies we believe have: 1) sustainable competitive advantages; 2) skilled management with a proven track record of executing effectively; and 3) financial resources with the potential to generate improving profitability, gain market share, and/or return significant cash to shareholders. During times of volatile or slow economic growth such companies frequently widen their lead over weaker competitors. We seek to invest in companies characterized by these qualities at compelling valuations, and believe this disciplined approach is essential in seeking to generate superior long-term performance.
Investors should consider the Fund’s investment objective, risks, charges and expenses carefully before investing. The Fund’s prospectus and summary prospectus contain this and other information about the Fund, and may be obtained by asking your financial advisor or calling us at 1.800.988.8287. Read prospectuses and summary prospectuses carefully before investing.
Total returns include changes in share price and reinvestment of dividends and capital gains distributions in a hypothetical investment for the periods shown.
The Fund’s investment strategy and focus can change over time. The mention of specific fund holdings does not constitute a recommendation by OppenheimerFunds, Inc. or its affiliates.
Shares of Oppenheimer funds are not deposits or obligations of any bank, are not guaranteed by any bank, are not insured by the FDIC or any other agency, and involve investment risks, including the possible loss of the principal amount invested.
Comparing the Fund’s Performance to the Market. The graphs that follow show the performance of a hypothetical $10,000 investment in each share class of the Fund held until December 31, 2014. Performance is measured over a ten-fiscal-year period for both Classes. Performance information does not reflect charges that apply to separate accounts investing in the Fund. If these charges were taken into account, performance would be lower. The graphs assume that all dividends and capital gains distributions were reinvested in additional shares.
The Fund’s performance is compared to the performance of the Russell 2000 Index. The Russell 2000 Index is an index of equity securities of small capitalization companies that is a measure of the small company market. The Index is unmanaged and cannot be purchased directly by investors. While index comparisons may be useful to provide a benchmark for the Fund’s performance, it must be noted that the Fund’s investments are not limited to the investments comprising the Index. Index performance includes reinvestment of income, but does not reflect transaction costs, fees, expenses or taxes. Index performance is shown for illustrative purposes only as a benchmark for the Fund’s performance, and does not predict or depict performance of the Fund. The Fund’s performance reflects the effects of the Fund’s business and operating expenses.
4 OPPENHEIMER MAIN STREET SMALL CAP FUND/VA
COMPARISON OF CHANGE IN VALUE OF $10,000 HYPOTHETICAL INVESTMENTS IN:
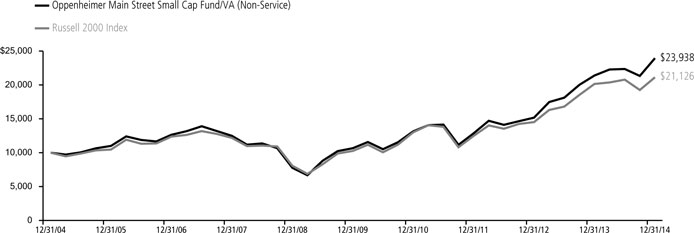
COMPARISON OF CHANGE IN VALUE OF $10,000 HYPOTHETICAL INVESTMENTS IN:
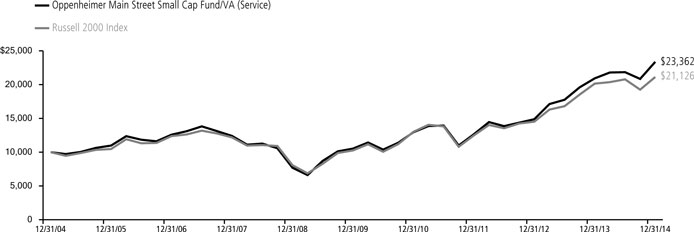
The performance data quoted represents past performance, which does not guarantee future results. The investment return and principal value of an investment in the Fund will fluctuate so that an investor’s shares, when redeemed, may be worth more or less than their original cost. Current performance may be lower or higher than the performance quoted. For performance data current to the most recent month end, call us at 1.800.988.8287. The Fund’s total returns should not be expected to be the same as the returns of other funds, whether or not both funds have the same portfolio managers and/or similar names. The Fund’s total returns include changes in share price and reinvested distributions but do not include the charges associated with the separate account products that offer this Fund. Such performance would have been lower if such charges were taken into account.
5 OPPENHEIMER MAIN STREET SMALL CAP FUND/VA
Fund Expenses
Fund Expenses. As a shareholder of the Fund, you incur two types of costs: (1) transaction costs and (2) ongoing costs, including management fees; distribution and service fees; and other Fund expenses. These examples are intended to help you understand your ongoing costs (in dollars) of investing in the Fund and to compare these costs with the ongoing costs of investing in other mutual funds.
The examples are based on an investment of $1,000.00 invested at the beginning of the period and held for the entire 6-month period ended December 31, 2014.
Actual Expenses. The first section of the table provides information about actual account values and actual expenses. You may use the information in this section for the class of shares you hold, together with the amount you invested, to estimate the expense that you paid over the period. Simply divide your account value by $1,000.00 (for example, an $8,600.00 account value divided by $1,000.00 = 8.60), then multiply the result by the number in the first section under the heading entitled “Expenses Paid During Period” to estimate the expenses you paid on your account during this period.
Hypothetical Example for Comparison Purposes.
The second section of the table provides information about hypothetical account values and hypothetical expenses based on the Fund’s actual expense ratio for each class of shares, and an assumed rate of return of 5% per year for each class before expenses, which is not the actual return. The hypothetical account values and expenses may not be used to estimate the actual ending account balance or expenses you paid for the period. You may use this information to compare the ongoing costs of investing in the Fund and other funds. To do so, compare this 5% hypothetical example for the class of shares you hold with the 5% hypothetical examples that appear in the shareholder reports of the other funds.
Please note that the expenses shown in the table are meant to highlight your ongoing costs only and do not reflect any charges associated with the separate accounts that offer this Fund. Therefore, the “hypothetical” lines of the table are useful in comparing ongoing costs only, and will not help you determine the relative total costs of owning different funds. In addition, if these separate account charges were included your costs would have been higher.
| | | | | | | | | | | | |
| Actual | | Beginning Account Value July 1, 2014 | | | Ending Account Value December 31, 2014 | | | Expenses Paid During 6 Months Ended
December 31, 2014 | |
Non-Service shares | | $ | 1,000.00 | | | $ | 1,071.00 | | | $ | 4.18 | |
Service shares | | | 1,000.00 | | | | 1,069.70 | | | | 5.49 | |
| | | |
Hypothetical | | | | | | | | | | | | |
(5% return before expenses) | | | | | | | | | | | | |
Non-Service shares | | | 1,000.00 | | | | 1,021.17 | | | | 4.08 | |
Service shares | | | 1,000.00 | | | | 1,019.91 | | | | 5.36 | |
Expenses are equal to the Fund’s annualized expense ratio for that class, multiplied by the average account value over the period, multiplied by 184/365 (to reflect the one-half year period). Those annualized expense ratios, excluding indirect expenses from affiliated funds, based on the 6-month period ended December 31, 2014 are as follows:
| | |
| Class | | Expense Ratios |
Non-Service shares | | 0.80% |
Service shares | | 1.05 |
The expense ratios reflect voluntary and/or contractual waivers and/or reimbursements of expenses by the Fund’s Manager. Some of these undertakings may be modified or terminated at any time, as indicated in the Fund’s prospectus. The “Financial Highlights” tables in the Fund’s financial statements, included in this report, also show the gross expense ratios, without such waivers or reimbursements and reduction to custodian expenses, if applicable.
6 OPPENHEIMER MAIN STREET SMALL CAP FUND/VA
| | |
| STATEMENT OF INVESTMENTS December 31, 2014 | | |
| | | | | | | | |
| | | Shares | | | Value | |
| Common Stocks—99.3% | |
| Consumer Discretionary—10.0% | |
| Auto Components—2.0% | |
| Dana Holding Corp. | | | 1,029,993 | | | $ | 22,392,048 | |
| Diversified Consumer Services—1.1% | |
| LifeLock, Inc.1 | | | 632,840 | | | | 11,713,868 | |
| Hotels, Restaurants & Leisure—3.8% | |
| Brinker International, Inc. | | | 192,860 | | | | 11,318,953 | |
| International Speedway Corp., Cl. A | | | 260,497 | | | | 8,244,730 | |
| Popeyes Louisiana Kitchen, Inc.1 | | | 195,370 | | | | 10,993,470 | |
| Texas Roadhouse, Inc., Cl. A | | | 350,760 | | | | 11,841,658 | |
| | | | | | | | 42,398,811 | |
| Household Durables—0.9% | |
| KB Home | | | 602,720 | | | | 9,975,016 | |
| Specialty Retail—1.7% | |
| Mattress Firm Holding Corp.1 | | | 329,563 | | | | 19,141,019 | |
| Textiles, Apparel & Luxury Goods—0.5% | |
| Iconix Brand Group, Inc.1 | | | 171,040 | | | | 5,779,442 | |
| Consumer Staples—2.4% | |
| Food Products—1.9% | |
| Flowers Foods, Inc. | | | 199,550 | | | | 3,829,365 | |
| Pinnacle Foods, Inc. | | | 492,510 | | | | 17,385,603 | |
| | | | | | | | 21,214,968 | |
| Personal Products—0.5% | |
| Nu Skin Enterprises, Inc., Cl. A | | | 129,680 | | | | 5,667,016 | |
| Energy—4.4% | |
| Energy Equipment & Services—0.5% | |
| RigNet, Inc.1 | | | 144,270 | | | | 5,919,398 | |
| Oil, Gas & Consumable Fuels—3.9% | |
| Cone Midstream Partners LP1 | | | 535,511 | | | | 12,916,525 | |
| Renewable Energy Group, Inc.1 | | | 941,473 | | | | 9,141,703 | |
| Western Refining, Inc. | | | 564,521 | | | | 21,327,604 | |
| | | | | | | | 43,385,832 | |
| Financials—23.3% | |
| Capital Markets—0.6% | |
| Investment Technology Group, Inc.1 | | | 313,900 | | | | 6,535,398 | |
| Commercial Banks—8.8% | |
| BancorpSouth, Inc. | | | 692,880 | | | | 15,596,729 | |
| BankUnited, Inc. | | | 505,935 | | | | 14,656,937 | |
| First Niagara Financial Group, Inc. | | | 1,875,290 | | | | 15,808,695 | |
| FirstMerit Corp. | | | 724,186 | | | | 13,679,873 | |
| MB Financial, Inc. | | | 501,070 | | | | 16,465,160 | |
| Talmer Bancorp, Inc., Cl. A | | | 416,640 | | | | 5,849,625 | |
| Webster Financial Corp. | | | 476,090 | | | | 15,487,208 | |
| | | | | | | | 97,544,227 | |
| Insurance—2.0% | |
| Endurance Specialty Holdings Ltd. | | | 186,490 | | | | 11,159,561 | |
| James River Group Holdings Ltd.1 | | | 257,820 | | | | 5,867,983 | |
| Old Republic International Corp. | | | 357,590 | | | | 5,231,542 | |
| | | | | | | | 22,259,086 | |
| Real Estate Investment Trusts (REITs)—10.2% | |
| Apollo Commercial Real Estate Finance, Inc. | | | 831,402 | | | | 13,601,737 | |
| Chatham Lodging Trust | | | 660,450 | | | | 19,133,237 | |
| DuPont Fabros Technology, Inc. | | | 373,590 | | | | 12,418,132 | |
| LaSalle Hotel Properties | | | 603,656 | | | | 24,429,958 | |
| Mid-America Apartment Communities, Inc. | | | 98,775 | | | | 7,376,517 | |
| Redwood Trust, Inc. | | | 395,130 | | | | 7,784,061 | |
| STAG Industrial, Inc. | | | 895,490 | | | | 21,939,505 | |
| Starwood Property Trust, Inc. | | | 239,802 | | | | 5,572,998 | |
| | | | | | | 112,256,145 | |
| | | | | | | | |
| | | Shares | | | Value | |
| Thrifts & Mortgage Finance—1.7% | |
| Flagstar Bancorp, Inc.1 | | | 657,367 | | | $ | 10,340,383 | |
| Oritani Financial Corp. | | | 549,710 | | | | 8,465,534 | |
| | | | | | | | 18,805,917 | |
| Health Care—16.1% | |
| Biotechnology—1.6% | |
| Celldex Therapeutics, Inc.1 | | | 228,570 | | | | 4,171,403 | |
| Keryx Biopharmaceuticals, Inc.1 | | | 539,830 | | | | 7,638,595 | |
| Kite Pharma, Inc.1 | | | 48,460 | | | | 2,794,688 | |
| Ultragenyx Pharmaceutical, Inc.1 | | | 69,280 | | | | 3,040,006 | |
| | | | | | | | 17,644,692 | |
| Health Care Equipment & Supplies—4.4% | |
| DexCom, Inc.1 | | | 146,370 | | | | 8,057,669 | |
| Greatbatch, Inc.1 | | | 158,631 | | | | 7,820,508 | |
| Integra LifeSciences Holdings Corp.1 | | | 191,540 | | | | 10,387,214 | |
| NxStage Medical, Inc.1 | | | 377,930 | | | | 6,776,285 | |
| Spectranetics Corp. (The)1 | | | 441,260 | | | | 15,258,771 | |
| | | | | | | | 48,300,447 | |
| Health Care Providers & Services—5.4% | |
| Acadia Healthcare Co., Inc.1 | | | 161,470 | | | | 9,883,579 | |
| HealthSouth Corp. | | | 404,660 | | | | 15,563,223 | |
| Team Health Holdings, Inc.1 | | | 238,270 | | | | 13,707,673 | |
| WellCare Health Plans, Inc.1 | | | 250,231 | | | | 20,533,956 | |
| | | | | | | | 59,688,431 | |
| Health Care Technology—0.9% | |
| HMS Holdings Corp.1 | | | 491,466 | | | | 10,389,591 | |
| Life Sciences Tools & Services—1.1% | |
| MorphoSys AG1 | | | 47,527 | | | | 4,400,428 | |
| VWR Corp.1 | | | 287,730 | | | | 7,443,575 | |
| | | | | | | | 11,844,003 | |
| Pharmaceuticals—2.7% | |
| AcelRx Pharmaceuticals, Inc.1 | | | 344,980 | | | | 2,321,715 | |
| Aratana Therapeutics, Inc.1 | | | 303,420 | | | | 5,406,944 | |
| Prestige Brands Holdings, Inc.1 | | | 629,766 | | | | 21,865,476 | |
| | | | | | | | 29,594,135 | |
| Industrials—18.7% | |
| Aerospace & Defense—0.6% | |
| AAR Corp. | | | 224,795 | | | | 6,244,805 | |
| Air Freight & Couriers—0.7% | |
| XPO Logistics, Inc.1 | | | 204,030 | | | | 8,340,746 | |
| Airlines—0.8% | |
| Spirit Airlines, Inc.1 | | | 111,400 | | | | 8,419,612 | |
| Commercial Services & Supplies—5.5% | |
| ABM Industries, Inc. | | | 325,660 | | | | 9,330,159 | |
| ACCO Brands Corp.1 | | | 1,432,727 | | | | 12,908,870 | |
| KAR Auction Services, Inc. | | | 636,290 | | | | 22,047,449 | |
| Matthews International Corp., Cl. A | | | 161,770 | | | | 7,873,346 | |
| Waste Connections, Inc. | | | 188,790 | | | | 8,304,872 | |
| | | | | | | | 60,464,696 | |
| Construction & Engineering—1.5% | |
| AECOM Technology Corp.1 | | | 285,873 | | | | 8,681,963 | |
| MasTec, Inc.1 | | | 331,320 | | | | 7,491,145 | |
| | | | | | | | 16,173,108 | |
| Electrical Equipment—1.1% | |
| Generac Holdings, Inc.1 | | | 170,630 | | | | 7,978,659 | |
| General Cable Corp. | | | 265,720 | | | | 3,959,228 | |
| | | | | | | | 11,937,887 | |
| Machinery—1.4% | |
| Greenbrier Cos., Inc. (The) | | | 136,180 | | | | 7,316,952 | |
7 OPPENHEIMER MAIN STREET SMALL CAP FUND/VA
| | | | | | | | |
| | | Shares | | | Value | |
| Machinery (Continued) | |
| Rexnord Corp.1 | | | 305,230 | | | $ | 8,610,538 | |
| | | | | | | | 15,927,490 | |
| Professional Services—4.1% | |
| Korn/Ferry International1 | | | 817,201 | | | | 23,502,701 | |
| On Assignment, Inc.1 | | | 346,560 | | | | 11,502,326 | |
| Paylocity Holding Corp.1 | | | 418,090 | | | | 10,916,330 | |
| | | | | | | | 45,921,357 | |
| Road & Rail—1.9% | |
| Saia, Inc.1 | | | 151,290 | | | | 8,375,414 | |
| Swift Transportation Co., Cl. A1 | | | 426,774 | | | | 12,218,540 | |
| | | | | | | | 20,593,954 | |
| Trading Companies & Distributors—1.1% | |
| NOW, Inc.1 | | | 458,200 | | | | 11,789,486 | |
| Information Technology—15.9% | |
| Electronic Equipment, Instruments, & Components—1.9% | |
| IPG Photonics Corp.1 | | | 71,650 | | | | 5,368,018 | |
| SYNNEX Corp. | | | 199,040 | | | | 15,556,966 | |
| | | | | | | | 20,924,984 | |
| Internet Software & Services—1.7% | |
| Cornerstone OnDemand, Inc.1 | | | 181,400 | | | | 6,385,280 | |
| j2 Global, Inc. | | | 207,323 | | | | 12,854,026 | |
| | | | | | | | 19,239,306 | |
| IT Services—1.7% | |
| Booz Allen Hamilton Holding Corp., Cl. A | | | 300,070 | | | | 7,960,857 | |
| CACI International, Inc., Cl. A1 | | | 121,310 | | | | 10,454,496 | |
| | | | | | | | 18,415,353 | |
| Semiconductors & Semiconductor Equipment—4.6% | |
| Cavium, Inc.1 | | | 283,470 | | | | 17,524,115 | |
| MKS Instruments, Inc. | | | 305,650 | | | | 11,186,790 | |
| Semtech Corp.1 | | | 312,798 | | | | 8,623,841 | |
| Spansion, Inc., Cl. A1 | | | 393,300 | | | | 13,458,726 | |
| | | | | | | 50,793,472 | |
| | | | | | | | |
| | | Shares | | | Value | |
| Software—6.0% | |
| FleetMatics Group plc1 | | | 144,140 | | | $ | 5,115,528 | |
| Fortinet, Inc.1 | | | 499,051 | | | | 15,300,904 | |
| Guidewire Software, Inc.1 | | | 317,160 | | | | 16,057,811 | |
| Imperva, Inc.1 | | | 375,490 | | | | 18,560,471 | |
| Proofpoint, Inc.1 | | | 226,950 | | | | 10,945,798 | |
| | | | | | | | 65,980,512 | |
| Materials—8.1% | |
| Chemicals—3.0% | |
| A. Schulman, Inc. | | | 191,388 | | | | 7,756,956 | |
| Cytec Industries, Inc. | | | 165,756 | | | | 7,652,955 | |
| Intrepid Potash, Inc.1 | | | 570,780 | | | | 7,922,426 | |
| Tronox Ltd., Cl. A | | | 422,580 | | | | 10,091,210 | |
| | | | | | | | 33,423,547 | |
| Metals & Mining—2.4% | |
| AK Steel Holding Corp.1 | | | 973,990 | | | | 5,785,501 | |
| Century Aluminum Co.1 | | | 281,670 | | | | 6,872,748 | |
| Kaiser Aluminum Corp. | | | 199,310 | | | | 14,236,713 | |
| | | | | | | | 26,894,962 | |
| Paper & Forest Products—2.7% | |
| Boise Cascade Co.1 | | | 294,810 | | | | 10,952,192 | |
| PH Glatfelter Co. | | | 727,623 | | | | 18,605,320 | |
| | | | | | | | 29,557,512 | |
| Utilities—0.4% | |
| Water Utilities—0.4% | |
| Aqua America, Inc. | | | 147,223 | | | | 3,930,854 | |
| Total Common Stocks (Cost $858,584,196) | | | | | | | 1,097,423,133 | |
| Investment Company—0.4% | |
| Oppenheimer Institutional Money Market Fund, Cl. E, 0.10%2,3 (Cost $3,962,569) | | | 3,962,569 | | | | 3,962,569 | |
| Total Investments, at Value (Cost $862,546,765) | | | 99.7 | % | | | 1,101,385,702 | |
| Net Other Assets (Liabilities) | | | 0.3 | | | | 3,653,624 | |
| | | | |
| Net Assets | | | 100.0 | % | | $ | 1,105,039,326 | |
| | | | |
Footnotes to Statement of Investments
1. Non-income producing security.
2. Is or was an affiliate, as defined in the Investment Company Act of 1940, as amended, at or during the period ended December 31, 2014, by virtue of the Fund owning at least 5% of the voting securities of the issuer or as a result of the Fund and the issuer having the same investment adviser. Transactions during the period in which the issuer was an affiliate are as follows:
| | | | | | | | | | | | | | | | |
| | | Shares
December 31, 2013 | | | Gross
Additions | | | Gross
Reductions | | | Shares
December 31, 2014 | |
| Oppenheimer Institutional Money Market Fund, Cl. E | | | 33,794,445 | | | | 398,073,396 | | | | 427,905,272 | | | | 3,962,569 | |
| | | | | | | | |
| | | Value | | | Income | |
| Oppenheimer Institutional Money Market Fund, Cl. E | | $ | 3,962,569 | | | $ | 13,361 | |
3. Rate shown is the 7-day yield as of December 31, 2014
See accompanying Notes to Financial Statements.
8 OPPENHEIMER MAIN STREET SMALL CAP FUND/VA
STATEMENT OF ASSETS AND LIABILITIES December 31, 2014
| | | | |
| Assets | | | | |
| Investments, at value—see accompanying statement of investments: | | | | |
| Unaffiliated companies (cost $858,584,196) | | $ | 1,097,423,133 | |
| Affiliated companies (cost $3,962,569) | | | 3,962,569 | |
| | | | |
| | | 1,101,385,702 | |
| Cash | | | 1,000,000 | |
| Receivables and other assets: | | | | |
| Investments sold | | | 15,570,562 | |
| Dividends | | | 1,755,582 | |
| Other | | | 39,350 | |
| | | | |
| Total assets | | | 1,119,751,196 | |
| Liabilities | | | | |
| Payables and other liabilities: | | | | |
| Investments purchased | | | 13,394,210 | |
| Shares of beneficial interest redeemed | | | 948,276 | |
| Distribution and service plan fees | | | 203,731 | |
| Shareholder communications | | | 100,467 | |
| Trustees’ compensation | | | 38,187 | |
| Other | | | 26,999 | |
| | | | |
| Total liabilities | | | 14,711,870 | |
| Net Assets | | $ | 1,105,039,326 | |
| | | | |
| | | | |
| Composition of Net Assets | | | | |
| Par value of shares of beneficial interest | | $ | 42,026 | |
| Additional paid-in capital | | | 704,705,850 | |
| Accumulated net investment income | | | 6,499,588 | |
| Accumulated net realized gain on investments and foreign currency transactions | | | 154,952,925 | |
| Net unrealized appreciation on investments and translation of assets and liabilities denominated in foreign currencies | | | 238,838,937 | |
| | | | |
Net Assets | | $ | 1,105,039,326 | |
| | | | |
| | | | |
| Net Asset Value Per Share | | | | |
Non-Service Shares: | | | | |
| Net asset value, redemption price per share and offering price per share (based on net assets of $136,401,995 and 5,136,321 shares of beneficial interest outstanding) | | | $26.56 | |
| Service Shares: | | | | |
| Net asset value, redemption price per share and offering price per share (based on net assets of $968,637,331 and 36,890,006 shares of beneficial interest outstanding) | | | $26.26 | |
See accompanying Notes to Financial Statements.
9 OPPENHEIMER MAIN STREET SMALL CAP FUND/VA
STATEMENT OF OPERATIONS For the Year Ended December 31, 2014
| | | | |
| Investment Income | | | | |
| Dividends: | | | | |
| Unaffiliated companies | | $ | 19,530,001 | |
| Affiliated companies | | | 13,361 | |
| Interest | | | 9,469 | |
| | | | |
| Total investment income | | | 19,552,831 | |
| Expenses | | | | |
| Management fees | | | 7,351,685 | |
| Distribution and service plan fees - Service shares | | | 2,388,222 | |
| Transfer and shareholder servicing agent fees: | | | | |
| Non-Service shares | | | 133,502 | |
| Service shares | | | 955,221 | |
| Shareholder communications: | | | | |
| Non-Service shares | | | 21,619 | |
| Service shares | | | 155,266 | |
| Trustees’ compensation | | | 41,433 | |
| Custodian fees and expenses | | | 5,980 | |
| Other | | | 106,928 | |
| | | | |
| Total expenses | | | 11,159,856 | |
| Less reduction to custodian expenses | | | (116) | |
| Less waivers and reimbursements of expenses | | | (89,922) | |
| | | | |
| Net expenses | | | 11,069,818 | |
| Net Investment Income | | | 8,483,013 | |
| Realized and Unrealized Gain (Loss) | | | | |
| Net realized gain on: | | | | |
| Investments from: | | | | |
| Unaffiliated companies | | | 178,981,721 | |
| Foreign currency transactions | | | 4,645 | |
| | | | |
| Net realized gain | | | 178,986,366 | |
| Net change in unrealized appreciation/depreciation on: | | | | |
| Investments | | | (66,148,216) | |
| Translation of assets and liabilities denominated in foreign currencies | | | (538,053) | |
| | | | |
| Net change in unrealized appreciation/depreciation | | | (66,686,269) | |
| Net Increase in Net Assets Resulting from Operations | | $ | 120,783,110 | |
| | | | |
See accompanying Notes to Financial Statements.
10 OPPENHEIMER MAIN STREET SMALL CAP FUND/VA
STATEMENTS OF CHANGES IN NET ASSETS
| | | | | | |
| | | Year Ended | | Year Ended | |
| | | December 31, 2014 | | December 31, 2013 | |
| Operations | | | | | | |
| Net investment income | | $ 8,483,013 | | $ | 4,792,644 | |
| Net realized gain | | 178,986,366 | | | 175,049,148 | |
| Net change in unrealized appreciation/depreciation | | (66,686,269) | | | 173,986,568 | |
| | | | | | |
| Net increase in net assets resulting from operations | | 120,783,110 | | | 353,828,360 | |
| Dividends and/or Distributions to Shareholders | | | | | | |
Dividends from net investment income: | | | | | | |
| Non-Service shares | | (1,181,678) | | | (978,410) | |
| Service shares | | (6,176,380) | | | (6,606,031) | |
| | | |
| | | (7,358,058) | | | (7,584,441) | |
| Distributions from net realized gain: | | | | | | |
| Non-Service shares | | (18,983,832) | | | (1,288,110) | |
| Service shares | | (137,086,830) | | | (11,405,204) | |
| | | |
| | (156,070,662) | | | (12,693,314) | |
| Beneficial Interest Transactions | | | | | | |
| Net increase (decrease) in net assets resulting from beneficial interest transactions: | | | | | | |
| Non-Service shares | | 6,791,213 | | | 11,660,720 | |
| | | | | | |
| Service shares | | 16,033,807 | | | (157,538,740) | |
| | 22,825,020 | | | (145,878,020) | |
| Net Assets | | | | | | |
| Total increase (decrease) | | (19,820,590) | | | 187,672,585 | |
| Beginning of period | | 1,124,859,916 | | | 937,187,331 | |
| | | | | | |
| End of period (including accumulated net investment income of $6,499,588 and $3,488,652, respectively) | | $ 1,105,039,326 | | $ | 1,124,859,916 | |
| | | |
See accompanying Notes to Financial Statements.
11 OPPENHEIMER MAIN STREET SMALL CAP FUND/VA
FINANCIAL HIGHLIGHTS
| | | | | | | | | | | | | | | | | | | | |
| Non-Service Shares | | Year Ended
December
31, 2014 | | | Year Ended
December
31, 2013 | | | Year Ended
December
31, 2012 | | | Year Ended
December
30, 20111 | | | Year Ended
December
31, 2010 | |
| Per Share Operating Data | | | | | | | | | | | | | | | | | | | | |
| Net asset value, beginning of period | | $ | 27 .80 | | | $ | 20 .14 | | | $ | 17 .17 | | | $ | 17 .66 | | | $ | 14 .40 | |
| Income (loss) from investment operations: | | | | | | | | | | | | | | | | | | | | |
| Net investment income2 | | | 0 .26 | | | | 0 .16 | | | | 0 .21 | | | | 0 .10 | | | | 0 .10 | |
| Net realized and unrealized gain (loss) | | | 2 .74 | | | | 8 .01 | | | | 2 .87 | | | | (0 .48) | | | | 3 .25 | |
| | | | |
| Total from investment operations | | | 3 .00 | | | | 8 .17 | | | | 3 .08 | | | | (0 .38) | | | | 3 .35 | |
| Dividends and/or distributions to shareholders: | | | | | | | | | | | | | | | | | | | | |
| Dividends from net investment income | | | (0 .25) | | | | (0 .22) | | | | (0 .11) | | | | (0 .11) | | | | (0 .09) | |
| Distributions from net realized gain | | | (3 .99) | | | | (0 .29) | | | | 0 .00 | | | | 0 .00 | | | | 0 .00 | |
| | | | |
| Total dividends and/or distributions to shareholders | | | (4 .24) | | | | (0 .51) | | | | (0 .11) | | | | (0 .11) | | | | (0 .09) | |
| Net asset value, end of period | | $ | 26 .56 | | | $ | 27 .80 | | | $ | 20 .14 | | | $ | 17 .17 | | | $ | 17 .66 | |
| | | | |
| Total Return, at Net Asset Value3 | | | 11 .93% | | | | 41 .01% | | | | 17.99% | | | | (2.21)% | | | | 23.41% | |
| | | | | | | | | | | | | | | | | | | | | |
| Ratios/Supplemental Data | | | | | | | | | | | | | | | | | | | | |
| Net assets, end of period (in thousands) | | $ | 136,402 | | | $ | 134,692 | | | $ | 87,267 | | | $ | 79,722 | | | $ | 95,576 | |
| Average net assets (in thousands) | | $ | 133,864 | | | $ | 113,522 | | | $ | 83,790 | | | $ | 86,796 | | | $ | 88,063 | |
| Ratios to average net assets:4 | | | | | | | | | | | | | | | | | | | | |
| Net investment income | | | 0 .99% | | | | 0 .67% | | | | 1 .09% | | | | 0 .58% | | | | 0 .68% | |
| Total expenses5 | | | 0 .80% | | | | 0 .81% | | | | 0 .83% | | | | 0 .83% | | | | 0 .85% | |
| Expenses after payments, waivers and/or reimbursements and reduction to custodian expenses | | | 0 .79% | | | | 0 .80% | | | | 0 .80% | | | | 0 .80% | | | | 0 .80% | |
| Portfolio turnover rate | | | 65% | | | | 60% | | | | 92% | | | | 108% | | | | 73% | |
1. December 30, 2011 represents the last business day of the Fund’s reporting period.
2. Per share amounts calculated based on the average shares outstanding during the period.
3. Assumes an initial investment on the business day before the first day of the fiscal period, with all dividends and distributions reinvested in additional shares on the reinvestment date, and redemption at the net asset value calculated on the last business day of the fiscal period. Total returns are not annualized for periods less than one full year. Total return information does not reflect expenses that apply at the separate account level or to related insurance products. Inclusion of these charges would reduce the total return figures for all periods shown. Returns do not reflect the deduction of taxes that a shareholder would pay on fund distributions or the redemption of fund shares.
4. Annualized for periods less than one full year.
5. Total expenses including indirect expenses from affiliated fund fees and expenses were as follows:
| | | | | | |
| | Year Ended December 31, 2014 | | | 0.80 | % |
| | Year Ended December 31, 2013 | | | 0.81 | % |
| | Year Ended December 31, 2012 | | | 0.83 | % |
| | Year Ended December 30, 2011 | | | 0.83 | % |
| | Year Ended December 31, 2010 | | | 0.85 | % |
See accompanying Notes to Financial Statements.
12 OPPENHEIMER MAIN STREET SMALL CAP FUND/VA
| | | | | | | | | | | | | | | | | | | | |
| Service Shares | | Year Ended
December
31, 2014 | | | Year Ended
December
31, 2013 | | | Year Ended
December
31, 2012 | | | Year Ended
December
30, 20111 | | | Year Ended
December
31, 2010 | |
| Per Share Operating Data | | | | | | | | | | | | | | | | | | | | |
| Net asset value, beginning of period | | $ | 27 .53 | | | $ | 19 .96 | | | $ | 17 .02 | | | $ | 17 .50 | | | $ | 14 .28 | |
| Income (loss) from investment operations: | | | | | | | | | | | | | | | | | | | | |
| Net investment income2 | | | 0 .19 | | | | 0 .10 | | | | 0 .15 | | | | 0 .06 | | | | 0 .07 | |
| Net realized and unrealized gain (loss) | | | 2 .71 | | | | 7 .93 | | | | 2 .85 | | | | (0 .47) | | | | 3 .21 | |
| | | | |
| Total from investment operations | | | 2 .90 | | | | 8 .03 | | | | 3 .00 | | | | (0 .41) | | | | 3 .28 | |
| Dividends and/or distributions to shareholders: | | | | | | | | | | | | | | | | | | | | |
| Dividends from net investment income | | | (0 .18) | | | | (0 .17) | | | | (0 .06) | | | | (0 .07) | | | | (0 .06) | |
| Distributions from net realized gain | | | (3 .99) | | | | (0 .29) | | | | 0 .00 | | | | 0 .00 | | | | 0 .00 | |
| | | | |
| Total dividends and/or distributions to shareholders | | | (4 .17) | | | | (0 .46) | | | | (0 .06) | | | | (0 .07) | | | | (0 .06) | |
| Net asset value, end of period | | $ | 26 .26 | | | $ | 27 .53 | | | $ | 19 .96 | | | $ | 17 .02 | | | $ | 17 .50 | |
| | | | |
| Total Return, at Net Asset Value3 | | | 11 .66% | | | | 40 .62% | | | | 17 .67% | | | | (2 .38)% | | | | 23 .06% | |
| | | | | | | | | | | | | | | | | | | | | |
| Ratios/Supplemental Data | | | | | | | | | | | | | | | | | | | | |
| Net assets, end of period (in thousands) | | $ | 968,637 | | | $ | 990,168 | | | $ | 849,920 | | | $ | 790,752 | | | $ | 859,710 | |
| Average net assets (in thousands) | | $ | 957,874 | | | $ | 935,083 | | | $ | 836,487 | | | $ | 823,201 | | | $ | 730,069 | |
| Ratios to average net assets:4 | | | | | | | | | | | | | | | | | | | | |
| Net investment income | | | 0 .75% | | | | 0 .43% | | | | 0 .82% | | | | 0 .34% | | | | 0 .45% | |
| Total expenses5 | | | 1 .05% | | | | 1 .06% | | | | 1 .08% | | | | 1 .08% | | | | 1 .10% | |
| Expenses after payments, waivers and/or reimbursements and reduction to custodian expenses | | | 1 .04% | | | | 1 .05% | | | | 1 .05% | | | | 1 .05% | | | | 1 .05% | |
| Portfolio turnover rate | | | 65% | | | | 60% | | | | 92% | | | | 108% | | | | 73% | |
1. December 30, 2011 represents the last business day of the Fund’s reporting period.
2. Per share amounts calculated based on the average shares outstanding during the period.
3. Assumes an initial investment on the business day before the first day of the fiscal period, with all dividends and distributions reinvested in additional shares on the reinvestment date, and redemption at the net asset value calculated on the last business day of the fiscal period. Total returns are not annualized for periods less than one full year. Total return information does not reflect expenses that apply at the separate account level or to related insurance products. Inclusion of these charges would reduce the total return figures for all periods shown. Returns do not reflect the deduction of taxes that a shareholder would pay on fund distributions or the redemption of fund shares.
4. Annualized for periods less than one full year.
5. Total expenses including indirect expenses from affiliated fund fees and expenses were as follows:
| | | | | | |
| | Year Ended December 31, 2014 | | | 1.05 | % |
| | Year Ended December 31, 2013 | | | 1.06 | % |
| | Year Ended December 31, 2012 | | | 1.08 | % |
| | Year Ended December 30, 2011 | | | 1.08 | % |
| | Year Ended December 31, 2010 | | | 1.10 | % |
See accompanying Notes to Financial Statements.
13 OPPENHEIMER MAIN STREET SMALL CAP FUND/VA
| | |
| NOTES TO FINANCIAL STATEMENTS December 31, 2014 | | |
1. Organization
Oppenheimer Main Street Small Cap Fund/VA (the “Fund”), a separate series of Oppenheimer Variable Account Funds, is a diversified open-end management investment company registered under the Investment Company Act of 1940 (“1940 Act”), as amended. The Fund’s investment objective is to seek capital appreciation. The Fund’s investment adviser is OFI Global Asset Management, Inc. (“OFI Global” or the “Manager”), a wholly-owned subsidiary of OppenheimerFunds, Inc. (“OFI” or the “Sub-Adviser”). The Manager has entered into a sub-advisory agreement with OFI. Shares of the Fund are sold only to separate accounts of life insurance companies.
The Fund offers two classes of shares. Both classes are sold at their offering price, which is the net asset value per share, to separate investment accounts of participating insurance companies as an underlying investment for variable life insurance policies, variable annuity contracts or other investment products. The class of shares designated as Service shares is subject to a distribution and service plan. Both classes of shares have identical rights and voting privileges with respect to the Fund in general and exclusive voting rights on matters that affect that class alone. Earnings, net assets and net asset value per share may differ due to each class having its own expenses, such as transfer and shareholder servicing agent fees and shareholder communications, directly attributable to that class.
The following is a summary of significant accounting policies consistently followed by the Fund.
2. Significant Accounting Policies
Security Valuation. All investments in securities are recorded at their estimated fair value, as described in Note 3.
Allocation of Income, Expenses, Gains and Losses. Income, expenses (other than those attributable to a specific class), gains and losses are allocated on a daily basis to each class of shares based upon the relative proportion of net assets represented by such class. Operating expenses directly attributable to a specific class are charged against the operations of that class.
Dividends and Distributions to Shareholders. Dividends and distributions to shareholders, which are determined in accordance with income tax regulations and may differ from U.S. generally accepted accounting principles, are recorded on the ex-dividend date. Income and capital gain distributions, if any, are declared and paid annually or at other times as deemed necessary by the Manager.
Investment Income. Dividend income is recorded on the ex-dividend date or upon ex-dividend notification in the case of certain foreign dividends where the ex-dividend date may have passed. Non-cash dividends included in dividend income, if any, are recorded at the fair market value of the securities received. Interest income is recognized on an accrual basis. Discount and premium, which are included in interest income on the Statement of Operations, are amortized or accreted daily.
Custodian Fees. “Custodian fees and expenses” in the Statement of Operations may include interest expense incurred by the Fund on any cash overdrafts of its custodian account during the period. Such cash overdrafts may result from the effects of failed trades in portfolio securities and from cash outflows resulting from unanticipated shareholder redemption activity. The Fund pays interest to its custodian on such cash overdrafts, to the extent they are not offset by positive cash balances maintained by the Fund, at a rate equal to the Federal Funds Rate plus 0.50%. The “Reduction to custodian expenses” line item, if applicable, represents earnings on cash balances maintained by the Fund during the period. Such interest expense and other custodian fees may be paid with these earnings.
Security Transactions. Security transactions are recorded on the trade date. Realized gains and losses on securities sold are determined on the basis of identified cost.
Indemnifications. The Fund’s organizational documents provide current and former Trustees and officers with a limited indemnification against liabilities arising in connection with the performance of their duties to the Fund. In the normal course of business, the Fund may also enter into contracts that provide general indemnifications. The Fund’s maximum exposure under these arrangements is unknown as this would be dependent on future claims that may be made against the Fund. The risk of material loss from such claims is considered remote.
Federal Taxes. The Fund intends to comply with provisions of the Internal Revenue Code applicable to regulated investment companies and to distribute substantially all of its investment company taxable income, including any net realized gain on investments not offset by capital loss carryforwards, if any, to shareholders. Therefore, no federal income or excise tax provision is required. The Fund files income tax returns in U.S. federal and applicable state jurisdictions. The statute of limitations on the Fund’s tax return filings generally remain open for the three preceding fiscal reporting period ends.
The tax components of capital shown in the following table represent distribution requirements the Fund must satisfy under the income tax regulations, losses the Fund may be able to offset against income and gains realized in future years and unrealized appreciation or depreciation of securities and other investments for federal income tax purposes.
14 OPPENHEIMER MAIN STREET SMALL FUND/VA
2. Significant Accounting Policies (Continued)
| | | | | | | | | | | | |
Undistributed Net Investment Income | | Undistributed
Long-Term
Gain | | | Accumulated
Loss
Carryforward1,2 | | | Net Unrealized
Appreciation
Based on cost of
Securities and
Other Investments
for Federal Income
Tax Purposes | |
$10,746,624 | | | $152,163,952 | | | | $— | | | | $237,419,061 | |
1. During the fiscal year ended December 31, 2014, the Fund did not utilize any capital loss carryforward.
2. During the fiscal year ended December 31, 2013, the Fund did not utilize any capital loss carryforward.
Net investment income (loss) and net realized gain (loss) may differ for financial statement and tax purposes. The character of dividends and distributions made during the fiscal year from net investment income or net realized gains may differ from their ultimate characterization for federal income tax purposes. Also, due to timing of dividends and distributions, the fiscal year in which amounts are distributed may differ from the fiscal year in which the income or net realized gain was recorded by the Fund.
Accordingly, the following amounts have been reclassified for December 31, 2014. Net assets of the Fund were unaffected by the reclassifications.
| | | | | | | | |
Increase to Paid-in Capital | | Increase to Accumulated
Net Investment
Income | | | Reduction to Accumulated Net
Realized Gain on Investments3 | |
$21,012,227 | | | $1,885,981 | | | | $22,898,208 | |
3. $21,062,159, including $20,495,261 of long-term capital gain, was distributed in connection with Fund share redemptions.
The tax character of distributions paid during the years ended December 31, 2014 and December 31, 2013 was as follows:
| | | | | | | | |
| | | Year Ended
December 31, 2014 | | | Year Ended
December 31, 2013 | |
Distributions paid from: | | | | | | | | |
Ordinary income | | $ | 82,496,622 | | | $ | 7,584,441 | |
Long-term capital gain | | | 80,932,098 | | | | 12,693,314 | |
| | | | |
Total | | $ | 163,428,720 | | | $ | 20,277,755 | |
| | | | |
The aggregate cost of securities and other investments and the composition of unrealized appreciation and depreciation of securities and other investments for federal income tax purposes as of December 31, 2014 are noted in the following table. The primary difference between book and tax appreciation or depreciation of securities and other investments, if applicable, is attributable to the tax deferral of losses or tax realization of financial statement unrealized gain or loss.
| | | | |
Federal tax cost of securities | | $ | 863,966,641 | |
| | | | |
Gross unrealized appreciation | | $ | 253,876,798 | |
Gross unrealized depreciation | | | (16,457,737) | |
| | | | |
Net unrealized appreciation | | $ | 237,419,061 | |
| | | | |
Use of Estimates. The preparation of financial statements in conformity with accounting principles generally accepted in the United States of America requires management to make estimates and assumptions that affect the reported amounts of assets and liabilities and disclosure of contingent assets and liabilities at the date of the financial statements and the reported amounts of increases and decreases in net assets from operations during the reporting period. Actual results could differ from those estimates.
3. Securities Valuation
The Fund calculates the net asset value of its shares as of the close of the New York Stock Exchange (the “Exchange”), normally 4:00 P.M. Eastern time, on each day the Exchange is open for trading.
The Fund’s Board has adopted procedures for the valuation of the Fund’s securities and has delegated the day-to-day responsibility for valuation determinations under those procedures to the Manager. The Manager has established a Valuation Committee which is responsible for determining a “fair valuation” for any security for which market quotations are not “readily available.” The Valuation Committee’s fair valuation determinations are subject to review, approval and ratification by the Fund’s Board at its next regularly scheduled meeting covering the calendar quarter in which the fair valuation was determined.
Valuation Methods and Inputs
Securities are valued using unadjusted quoted market prices, when available, as supplied primarily by third party pricing services or dealers.
The following methodologies are used to determine the market value or the fair value of the types of securities described below:
15 OPPENHEIMER MAIN STREET SMALL FUND/VA
| | |
| NOTES TO FINANCIAL STATEMENTS Continued | | |
| | |
3. Securities Valuation (Continued)
Securities traded on a registered U.S. securities exchange (including exchange-traded derivatives other than futures and futures options) are valued based on the last sale price of the security reported on the principal exchange on which it is traded, prior to the time when the Fund’s assets are valued. In the absence of a sale, the security is valued at the last sale price on the prior trading day, if it is within the spread of the current day’s closing “bid” and “asked” prices, and if not, at the current day’s closing bid price. A security of a foreign issuer traded on a foreign exchange, but not listed on a registered U.S. securities exchange, is valued based on the last sale price on the principal exchange on which the security is traded, as identified by the third party pricing service used by the Manager, prior to the time when the Fund’s assets are valued. If the last sale price is unavailable, the security is valued at the most recent official closing price on the principal exchange on which it is traded. If the last sales price or official closing price for a foreign security is not available, the security is valued at the mean between the bid and asked price per the exchange or, if not available from the exchange, obtained from two dealers. If bid and asked prices are not available from either the exchange or two dealers, the security is valued by using one of the following methodologies (listed in order of priority): (1) using a bid from the exchange, (2) the mean between the bid and asked price as provided by a single dealer, or (3) a bid from a single dealer.
Shares of a registered investment company that are not traded on an exchange are valued at that investment company’s net asset value per share.
Corporate and government debt securities (of U.S. or foreign issuers) and municipal debt securities, event-linked bonds, loans, mortgage-backed securities, collateralized mortgage obligations, and asset-backed securities are valued at the mean between the “bid” and “asked” prices utilizing evaluated prices obtained from third party pricing services or broker-dealers who may use matrix pricing methods to determine the evaluated prices.
Short-term money market type debt securities with a remaining maturity of sixty days or less are valued at cost adjusted by the amortization of discount or premium to maturity (amortized cost), which approximates market value. Short-term debt securities with a remaining maturity in excess of sixty days are valued at the mean between the “bid” and “asked” prices utilizing evaluated prices obtained from third party pricing services or broker-dealers.
A description of the standard inputs that may generally be considered by the third party pricing vendors in determining their evaluated prices is provided below.
| | |
| Security Type | | Standard inputs generally considered by third-party pricing vendors |
|
| Corporate debt, government debt, municipal, mortgage-backed and asset-backed securities | | Reported trade data, broker-dealer price quotations, benchmark yields, issuer spreads on comparable securities, the credit quality, yield, maturity, and other appropriate factors. |
|
| Loans | | Information obtained from market participants regarding reported trade data and broker-dealer price quotations. |
|
| Event-linked bonds | | Information obtained from market participants regarding reported trade data and broker-dealer price quotations. |
If a market value or price cannot be determined for a security using the methodologies described above, or if, in the “good faith” opinion of the Manager, the market value or price obtained does not constitute a “readily available market quotation,” or a significant event has occurred that would materially affect the value of the security the security is fair valued either (i) by a standardized fair valuation methodology applicable to the security type or the significant event as previously approved by the Valuation Committee and the Fund’s Board or (ii) as determined in good faith by the Manager’s Valuation Committee. The Valuation Committee considers all relevant facts that are reasonably available, through either public information or information available to the Manager, when determining the fair value of a security. Fair value determinations by the Manager are subject to review, approval and ratification by the Fund’s Board at its next regularly scheduled meeting covering the calendar quarter in which the fair valuation was determined. Those fair valuation standardized methodologies include, but are not limited to, valuing securities at the last sale price or initially at cost and subsequently adjusting the value based on: changes in company specific fundamentals, changes in an appropriate securities index, or changes in the value of similar securities which may be further adjusted for any discounts related to security-specific resale restrictions. When possible, such methodologies use observable market inputs such as unadjusted quoted prices of similar securities, observable interest rates, currency rates and yield curves. The methodologies used for valuing securities are not necessarily an indication of the risks associated with investing in those securities nor can it be assured that the Fund can obtain the fair value assigned to a security if it were to sell the security.
To assess the continuing appropriateness of security valuations, the Manager, or its third party service provider who is subject to oversight by the Manager, regularly compares prior day prices, prices on comparable securities, and sale prices to the current day prices and challenges those prices exceeding certain tolerance levels with the third party pricing service or broker source. For those securities valued by fair valuations, whether through a standardized fair valuation methodology or a fair valuation determination, the Valuation Committee reviews and affirms the reasonableness of the valuations based on such methodologies and fair valuation determinations on a regular basis after considering all relevant information that is reasonably available.
Classifications
Each investment asset or liability of the Fund is assigned a level at measurement date based on the significance and source of the inputs to its valuation. Various data inputs are used in determining the value of each of the Fund’s investments as of the reporting period end. These data inputs are categorized in the following hierarchy under applicable financial accounting standards:
1) Level 1-unadjusted quoted prices in active markets for identical assets or liabilities (including securities actively traded on a securities exchange)
2) Level 2-inputs other than unadjusted quoted prices that are observable for the asset or liability (such as unadjusted quoted prices for similar assets and market corroborated inputs such as interest rates, prepayment speeds, credit risks, etc.)
3) Level 3-significant unobservable inputs (including the Manager’s own judgments about assumptions that market participants would use in pricing the asset or liability).
16 OPPENHEIMER MAIN STREET SMALL FUND/VA
3. Securities Valuation (Continued)
The inputs used for valuing securities are not necessarily an indication of the risks associated with investing in those securities.
The table below categorizes amounts that are included in the Fund’s Statement of Assets and Liabilities as of December 31, 2014 based on valuation input level:
| | | | | | | | | | | | | | | | |
| | | Level 1— Unadjusted Quoted Prices | | | Level 2— Other Significant
Observable Inputs | | | Level 3—
Significant
Unobservable
Inputs | | | Value | |
| |
Assets Table | | | | | | | | | | | | | | | | |
Investments, at Value: | | | | | | | | | | | | | | | | |
Common Stocks | | | | | | | | | | | | | | | | |
Consumer Discretionary | | $ | 111,400,204 | | | $ | — | | | $ | — | | | $ | 111,400,204 | |
Consumer Staples | | | 26,881,984 | | | | — | | | | — | | | | 26,881,984 | |
Energy | | | 49,305,230 | | | | — | | | | — | | | | 49,305,230 | |
Financials | | | 257,400,773 | | | | — | | | | — | | | | 257,400,773 | |
Health Care | | | 173,060,871 | | | | 4,400,428 | | | | — | | | | 177,461,299 | |
Industrials | | | 205,813,141 | | | | — | | | | — | | | | 205,813,141 | |
Information Technology | | | 175,353,627 | | | | — | | | | — | | | | 175,353,627 | |
Materials | | | 89,876,021 | | | | — | | | | — | | | | 89,876,021 | |
Utilities | | | 3,930,854 | | | | — | | | | — | | | | 3,930,854 | |
Investment Company | | | 3,962,569 | | | | — | | | | — | | | | 3,962,569 | |
| | | | |
Total Assets | | $ | 1,096,985,274 | | | $ | 4,400,428 | | | $ | — | | | $ | 1,101,385,702 | |
| | | | |
Forward currency exchange contracts and futures contracts, if any, are reported at their unrealized appreciation/depreciation at measurement date, which represents the change in the contract’s value from trade date. All additional assets and liabilities included in the above table are reported at their market value at measurement date.
4. Investments and Risks
Investment in Oppenheimer Institutional Money Market Fund. The Fund is permitted to invest daily available cash balances in an affiliated money market fund. The Fund may invest the available cash in Class E shares of Oppenheimer Institutional Money Market Fund (“IMMF”) to seek current income while preserving liquidity or for defensive purposes. IMMF is a registered open-end management investment company, regulated as a money market fund under the 1940 Act. The Manager is the investment adviser of IMMF, and the Sub-Adviser provides investment and related advisory services to IMMF. When applicable, the Fund’s investment in IMMF is included in the Statement of Investments. Shares of IMMF are valued at their net asset value per share. As a shareholder, the Fund is subject to its proportional share of IMMF’s Class E expenses, including its management fee. The Manager will waive fees and/or reimburse Fund expenses in an amount equal to the indirect management fees incurred through the Fund’s investment in IMMF.
Equity Security Risk. Stocks and other equity securities fluctuate in price. The value of the Fund’s portfolio may be affected by changes in the equity markets generally. Equity markets may experience significant short-term volatility and may fall sharply at times. Different markets may behave differently from each other and U.S. equity markets may move in the opposite direction from one or more foreign stock markets.
The prices of individual equity securities generally do not all move in the same direction at the same time and a variety of factors can affect the price of a particular company’s securities. These factors may include, but are not limited to, poor earnings reports, a loss of customers, litigation against the company, general unfavorable performance of the company’s sector or industry, or changes in government regulations affecting the company or its industry.
5. Shares of Beneficial Interest
The Fund has authorized an unlimited number of $0.001 par value shares of beneficial interest of each class. Transactions in shares of beneficial interest were as follows:
| | | | | | | | | | | | | | | | |
| | | Year Ended December 31, 2014 | | | Year Ended December 31, 2013 | |
| | | Shares | | | Amount | | | Shares | | | Amount | |
| |
Non-Service Shares | | | | | | | | | | | | | | | | |
Sold | | | 1,046,887 | | | $ | 27,673,554 | | | | 2,050,901 | | | $ | 49,473,567 | |
Dividends and/or distributions reinvested | | | 817,408 | | | | 20,165,510 | | | | 95,274 | | | | 2,266,520 | |
Redeemed | | | (1,573,636) | | | | (41,047,851) | | | | (1,633,467) | | | | (40,079,367) | |
| | | | |
Net increase | | | 290,659 | | | $ | 6,791,213 | | | | 512,708 | | | $ | 11,660,720 | |
| | | | |
| | | | | | | | | | | | | | | | |
| |
Service Shares | | | | | | | | | | | | | | | | |
Sold | | | 3,683,961 | | | $ | 93,934,405 | | | | 3,333,649 | | | $ | 79,750,169 | |
Dividends and/or distributions reinvested | | | 5,866,634 | | | | 143,263,210 | | | | 763,535 | | | | 18,011,235 | |
Redeemed | | | (8,630,744) | | | | (221,163,808) | | | | (10,718,072) | | | | (255,300,144) | |
| | | | |
Net increase (decrease) | | | 919,851 | | | $ | 16,033,807 | | | | (6,620,888) | | | $ | (157,538,740) | |
| | | | |
17 OPPENHEIMER MAIN STREET SMALL FUND/VA
| | |
| NOTES TO FINANCIAL STATEMENTS Continued | | |
| | |
6. Purchases and Sales of Securities
The aggregate cost of purchases and proceeds from sales of securities, other than short-term obligations and investments in IMMF, for the year ended December 31, 2014 were as follows:
| | | | | | | | | | |
| | | Purchases | | | | | Sales | |
| |
Investment securities | | $ | 697,022,651 | | | | | $ | 788,822,683 | |
7. Fees and Other Transactions with Affiliates
Management Fees. Under the investment advisory agreement, the Fund pays the Manager a management fee based on the daily net assets of the Fund at an annual rate as shown in the following table:
| | | | |
| Fee Schedule | |
| |
Up to $200 million | | | 0.75% | |
Next $200 million | | | 0.72 | |
Next $200 million | | | 0.69 | |
Next $200 million | | | 0.66 | |
Next $200 million | | | 0.60 | |
Over $1 billion | | | 0.58 | |
The Fund’s management fee for the fiscal year ended December 31, 2014 was 0.67% of average annual net assets before any applicable waivers.
Sub-Adviser Fees. The Manager has retained the Sub-Adviser to provide the day-to-day portfolio management of the Fund. Under the Sub-Advisory Agreement, the Manager pays the Sub-Adviser an annual fee in monthly installments, equal to a percentage of the investment management fee collected by the Manager from the Fund, which shall be calculated after any investment management fee waivers. The fee paid to the Sub-Adviser is paid by the Manager, not by the Fund.
Transfer Agent Fees. OFI Global (the “Transfer Agent”) serves as the transfer and shareholder servicing agent for the Fund. The Fund pays the Transfer Agent a fee based on annual net assets. Fees incurred and average net assets for each class with respect to these services are detailed in the Statement of Operations and Financial Highlights, respectively.
Sub-Transfer Agent Fees. The Transfer Agent has retained Shareholder Services, Inc., a wholly-owned subsidiary of OFI (the “Sub-Transfer Agent”), to provide the day-to-day transfer agent and shareholder servicing of the Fund. Under the Sub-Transfer Agency Agreement, the Transfer Agent pays the Sub-Transfer Agent an annual fee in monthly installments, equal to a percentage of the transfer agent fee collected by the Transfer Agent from the Fund, which shall be calculated after any applicable fee waivers. The fee paid to the Sub-Transfer Agent is paid by the Transfer Agent, not by the Fund.
Trustees’ Compensation. The Fund’s Board of Trustees (“Board”) has adopted a compensation deferral plan for Independent Trustees that enables Trustees to elect to defer receipt of all or a portion of the annual compensation they are entitled to receive from the Fund. For purposes of determining the amount owed to the Trustee under the plan, deferred amounts are treated as though equal dollar amounts had been invested in shares of the Fund or in other Oppenheimer funds selected by the Trustee. The Fund purchases shares of the funds selected for deferral by the Trustee in amounts equal to his or her deemed investment, resulting in a Fund asset equal to the deferred compensation liability. Such assets are included as a component of “Other” within the asset section of the Statement of Assets and Liabilities. Deferral of Trustees’ fees under the plan will not affect the net assets of the Fund and will not materially affect the Fund’s assets, liabilities or net investment income per share. Amounts will be deferred until distributed in accordance with the compensation deferral plan.
Distribution and Service Plan for Service Shares. The Fund has adopted a Distribution and Service Plan (the “Plan”) pursuant to Rule 12b-1 under the 1940 Act for Service shares to pay OppenheimerFunds Distributor, Inc. (the “Distributor”), for distribution related services, personal service and account maintenance for the Fund’s Service shares. Under the Plan, payments are made periodically at an annual rate of 0.25% of the daily net assets of Service shares of the Fund. The Distributor currently uses all of those fees to compensate sponsors of the insurance product that offers Fund shares, for providing personal service and maintenance of accounts of their variable contract owners that hold Service shares. These fees are paid out of the Fund’s assets on an on-going basis and increase operating expenses of the Service shares, which results in lower performance compared to the Fund’s shares that are not subject to a service fee. Fees incurred by the Fund under the Plan are detailed in the Statement of Operations.
Waivers and Reimbursements of Expenses. The Manager has contractually agreed to limit the Fund’s expenses after payments, waivers and/or reimbursements and reduction to custodian expenses, excluding expenses incurred directly or indirectly by the Fund as a result of investments in other investment companies, wholly-owned subsidiaries and pooled investment vehicles; so that those expenses, as percentages of daily net assets, will not exceed the annual rate of 0.80% for Non-Service shares and 1.05% for Service shares. During the year ended December 31, 2014, the Manager waived fees and/or reimbursed the Fund $9,046 for Non-Service shares and $64,235 for Service shares, respectively.
The Manager will waive fees and/or reimburse Fund expenses in an amount equal to the indirect management fees incurred through the Fund’s investment in IMMF. During the year ended December 31, 2014, the Manager waived fees and/or reimbursed the Fund $16,641 for IMMF management fees.
These undertakings may be modified or terminated as set forth according to the terms in the prospectus.
18 OPPENHEIMER MAIN STREET SMALL FUND/VA
8. Pending Litigation
In 2009, seven class action lawsuits were filed in the U.S. District Court for the District of Colorado against OppenheimerFunds, Inc. (“OFI”), OppenheimerFunds Distributor, Inc., the Fund’s principal underwriter and distributor (the “Distributor”), and certain funds (but not including the Fund) advised by OFI Global Asset Management, Inc. and distributed by the Distributor (the “Defendant Funds”). The lawsuits also named as defendants certain officers and current and former trustees of the respective Defendant Funds. The lawsuits raised claims under federal securities laws and alleged, among other things, that the disclosure documents of the respective Defendant Funds contained misrepresentations and omissions and that the respective Defendant Funds’ investment policies were not followed. The plaintiffs in these actions sought unspecified damages, equitable relief and awards of attorneys’ fees and litigation expenses. The Defendant Funds’ Boards of Trustees also engaged counsel to represent the Funds and the present and former Independent Trustees named in those suits. In March 2014, the parties in six of these lawsuits executed stipulations and agreements of settlement resolving those actions. In July 2014, the court entered an order and final judgment approving the settlements as fair, reasonable and adequate. The settlements do not resolve a seventh outstanding lawsuit relating to Oppenheimer Rochester California Municipal Fund (the “California Fund Suit”). OFI believes the California Fund Suit is without legal merit and is defending the suit vigorously. While it is premature to render any opinion as to the outcome in the California Fund Suit, or whether any costs that OFI may bear in defending the California Fund Suit might not be reimbursed by insurance, OFI believes the California Fund Suit should not impair the ability of OFI or the Distributor to perform their respective duties to the Fund, and that the outcome of the California Fund Suit should not have any material effect on the operations of any of the Oppenheimer funds.
19 OPPENHEIMER MAIN STREET SMALL FUND/VA
| | |
REPORT OF INDEPENDENT REGISTERED PUBLIC ACCOUNTING FIRM | | |
| | |
The Board of Trustees and Shareholders of Oppenheimer Variable Account Funds:
We have audited the accompanying statement of assets and liabilities of Oppenheimer Main Street Small Cap Fund/VA (a separate series of Oppenheimer Variable Account Funds), including the statement of investments, as of December 31, 2014, and the related statement of operations for the year then ended, the statements of changes in net assets for each of the years in the two-year period then ended, and the financial highlights for each of the years in the five-year period then ended. These financial statements and financial highlights are the responsibility of the Fund’s management. Our responsibility is to express an opinion on these financial statements and financial highlights based on our audits.
We conducted our audits in accordance with the standards of the Public Company Accounting Oversight Board (United States). Those standards require that we plan and perform the audit to obtain reasonable assurance about whether the financial statements and financial highlights are free of material misstatement. An audit includes examining, on a test basis, evidence supporting the amounts and disclosures in the financial statements. Our procedures included confirmation of securities owned as of December 31, 2014, by correspondence with the custodian, transfer agent and brokers, or by other appropriate auditing procedures where replies from brokers were not received. An audit also includes assessing the accounting principles used and significant estimates made by management, as well as evaluating the overall financial statement presentation. We believe that our audits provide a reasonable basis for our opinion.
In our opinion, the financial statements and financial highlights referred to above present fairly, in all material respects, the financial position of Oppenheimer Main Street Small Cap Fund/VA as of December 31, 2014, the results of its operations for the year then ended, the changes in its net assets for each of the years in the two-year period then ended, and the financial highlights for each of the years in the five-year period then ended, in conformity with U.S. generally accepted accounting principles.
KPMG LLP
Denver, Colorado
February 13, 2015
20 OPPENHEIMER MAIN STREET SMALL CAP FUND/VA
| | |
| FEDERAL INCOME TAX INFORMATION Unaudited | | |
| | |
In early 2015, if applicable, shareholders of record received information regarding all dividends and distributions paid to them by the Fund during calendar year 2014.
Capital gain distributions of $2.06653 per share were paid to Non-Service and Service shareholders, respectively, on June 18, 2014. Whether received in stock or in cash, the capital gain distribution should be treated by shareholders as a gain from the sale of the capital assets held for more than one year (long-term capital gains).
Dividends, if any, paid by the Fund during the fiscal year ended December 31, 2014 which are not designated as capital gain distributions should be multiplied by the maximum amount allowable but not less than 82.71% to arrive at the amount eligible for the corporate dividend-received deduction.
The foregoing information is presented to assist shareholders in reporting distributions received from the Fund to the Internal Revenue Service. Because of the complexity of the federal regulations which may affect your individual tax return and the many variations in state and local tax regulations, we recommend that you consult your tax advisor for specific guidance.
21 OPPENHEIMER MAIN STREET SMALL CAP FUND/VA
| | |
| BOARD APPROVAL OF THE FUND’S INVESTMENT ADVISORY AND SUB-ADVISORY AGREEMENTS Unaudited | | |
| | |
The Fund has entered into an investment advisory agreement with OFI Global Asset Management, Inc. (“OFI Global” or the “Adviser”), a wholly-owned subsidiary of OppenheimerFunds, Inc. (“OFI” or the “Sub-Adviser”) (“OFI Global” and “OFI” together the “Managers”) and OFI Global has entered into a sub-advisory agreement with OFI whereby OFI provides investment sub-advisory services to the Fund (collectively, the “Agreements”). Each year, the Board of Trustees (the “Board”), including a majority of the independent Trustees, is required to determine whether to renew the Agreements. The Investment Company Act of 1940, as amended, requires that the Board request and evaluate, and that the Managers provide, such information as may be reasonably necessary to evaluate the terms of the Agreements. The Board employs an independent consultant to prepare a report that provides information, including comparative information that the Board requests for that purpose. In addition to in-person meetings focused on this evaluation, the Board receives information throughout the year regarding Fund services, fees, expenses and performance.
The Adviser, Sub-Adviser and the independent consultant provided information to the Board on the following factors: (i) the nature, quality and extent of the Managers’ services, (ii) the investment performance of the Fund and the Managers, (iii) the fees and expenses of the Fund, including comparative expense information, (iv) the profitability of the Managers and their affiliates, including an analysis of the cost of providing services, (v) whether economies of scale are realized as the Fund grows and whether fee levels reflect these economies of scale for Fund investors and (vi) other benefits to the Managers from their relationship with the Fund. The Board was aware that there are alternatives to retaining the Managers.
Outlined below is a summary of the principal information considered by the Board as well as the Board’s conclusions.
Nature, Quality and Extent of Services. The Board considered information about the nature, quality and extent of the services provided to the Fund and information regarding the Managers’ key personnel who provide such services. The Sub-Adviser’s duties include providing the Fund with the services of the portfolio managers and the Sub-Adviser’s investment team, who provide research, analysis and other advisory services in regard to the Fund’s investments; securities trading services; oversight of third-party service providers; monitoring compliance with applicable Fund policies and procedures and adherence to the Fund’s investment restrictions; and risk management. The Managers are responsible for providing certain administrative services to the Fund as well. Those services include providing and supervising all administrative and clerical personnel who are necessary in order to provide effective corporate administration for the Fund; compiling and maintaining records with respect to the Fund’s operations; preparing and filing reports required by the Securities and Exchange Commission; preparing periodic reports regarding the operations of the Fund for its shareholders; preparing proxy materials for shareholder meetings; and preparing the registration statements required by Federal and state securities laws for the sale of the Fund’s shares. The Managers also provide the Fund with office space, facilities and equipment.
The Board also considered the quality of the services provided and the quality of the Managers’ resources that are available to the Fund. The Board took account of the fact that the Sub-Adviser has had over fifty years of experience as an investment adviser and that its assets under management rank it among the top mutual fund managers in the United States. The Board evaluated the Sub-Adviser’s advisory, administrative, accounting, legal, compliance services and risk management, and information the Board has received regarding the experience and professional qualifications of the Managers’ key personnel and the size and functions of its staff. In its evaluation of the quality of the portfolio management services provided, the Board considered the experience of Matthew Ziehl, Raymond Anello, Raman Vardharaj, Joy Budzinski, Kristin Ketner Pak, Magnus Krantz, and Adam Weiner, the portfolio managers for the Fund, and the Sub-Adviser’s investment team and analysts. The Board members also considered the totality of their experiences with the Managers as directors or trustees of the Fund and other funds advised by the Managers. The Board considered information regarding the quality of services provided by affiliates of the Managers, which its members have become knowledgeable about in connection with the renewal of the Fund’s service agreements. The Board concluded, in light of the Managers’ experience, reputation, personnel, operations and resources that the Fund benefits from the services provided under the Agreements.
Investment Performance of the Manager and the Fund. Throughout the year, the Manager provided information on the investment performance of the Fund, including comparative performance information. The Board also reviewed information, prepared by the Manager and by the independent consultant, comparing the Fund’s historical performance to relevant market indices and to the performance of other small blend funds underlying variable insurance products. The Board noted that the Fund outperformed its performance category median for each of the one-, three-, five- and ten-year periods. The Board also noted that the Fund performed in the first quintile of its performance category for the three-, five- and ten-year periods and performed in the second quintile for the one-year period.
Costs of Services by the Manager. The Board reviewed the fees paid to the Manager and the other expenses borne by the Fund. The Board noted that the Manager, not the Fund, pays the Sub-Adviser’s fee under the sub-advisory agreement. The independent consultant provided comparative data in regard to the fees and expenses of the Fund and other small blend funds underlying variable insurance products. In reviewing the fees and expenses charged to the VA funds, the Board considered the Manager’s assertion that, because there is much greater disparity in the fees and services that may be provided by a manager to a VA fund as opposed to a retail fund, when comparing the expenses of the various VA funds to those of retail funds, it is most appropriate to focus on total expenses (rather than on the management fees). Accordingly, while the Board reviewed and considered all expenses, it focused on total expenses. The Board considered that the Fund’s contractual management fee and total expenses were lower than its peer group median and category median. Within the total asset range of $1 billion to $2 billion, the Fund’s effective management fee rate was lower than its peer group median and category median. The Board also considered that the Manager has contractually agreed to limit the Fund’s total annual operating expenses so that those expenses, as percentages of daily net assets, will not exceed the annual rate of 0.80% for Non-Service Shares and 1.05% for Service Shares. This contractual expense limitation may not be amended or withdrawn until one year after the date of the Fund’s prospectus, unless approved by the Board.
Economies of Scale and Profits Realized by the Manager. The Board considered information regarding the Manager’s costs in serving as the Fund’s investment adviser, including the costs associated with the personnel and systems necessary to manage the Fund, and information regarding the Manager’s profitability from its relationship with the Fund. The Board reviewed whether the Manager may realize economies of scale in managing and supporting the Fund. The Board noted that the Fund currently has management fee breakpoints, which are intended to share with Fund shareholders economies of scale that may exist as the Fund’s assets grow. The Board further noted that on November 1, 2013, an additional fee breakpoint of 0.58% for assets in excess of $1 billion was added to the Fund’s breakpoint schedule.
22 OPPENHEIMER MAIN STREET SMALL CAP FUND/VA
Other Benefits to the Managers. In addition to considering the profits realized by the Managers, the Board considered information that was provided regarding the direct and indirect benefits the Managers receive as a result of their relationship with the Fund, including compensation paid to the Managers’ affiliates and research provided to the Adviser in connection with permissible brokerage arrangements (soft dollar arrangements). The Board also considered that the Managers must be able to pay and retain experienced professional personnel at competitive rates to provide quality services to the Fund.
Conclusions. These factors were also considered by the independent Trustees meeting separately from the full Board, assisted by experienced counsel to the Fund and to the independent Trustees. Fund counsel and the independent Trustees’ counsel are independent of the Managers within the meaning and intent of the Securities and Exchange Commission Rules.
Based on its review of the information it received and its evaluations described above, the Board, including a majority of the independent Trustees, decided to continue the Agreements through August 31, 2015. In arriving at its decision, the Board did not identify any factor or factors as being more important than others, but considered all of the above information, and considered the terms and conditions of the Agreements, including the management fees, in light of all the surrounding circumstances.
23 OPPENHEIMER MAIN STREET SMALL CAP FUND/VA
| | |
| PORTFOLIO PROXY VOTING POLICIES AND PROCEDURES; UPDATES TO STATEMENTS OF INVESTMENTS Unaudited | | |
| | |
The Fund has adopted Portfolio Proxy Voting Policies and Procedures under which the Fund votes proxies relating to securities (“portfolio proxies”) held by the Fund. A description of the Fund’s Portfolio Proxy Voting Policies and Procedures is available (i) without charge, upon request, by calling the Fund toll-free at 1.800.525.7048, (ii) on the Fund’s website at www.oppenheimerfunds.com, and (iii) on the SEC’s website at www.sec.gov. In addition, the Fund is required to file Form N-PX, with its complete proxy voting record for the 12 months ended June 30th, no later than August 31st of each year. The Fund’s voting record is available (i) without charge, upon request, by calling the Fund toll-free at 1.800.525.7048, and (ii) in the Form N-PX filing on the SEC’s website at www.sec.gov.
The Fund files its complete schedule of portfolio holdings with the SEC for the first quarter and the third quarter of each fiscal year on Form N-Q. The Fund’s Form N-Q filings are available on the SEC’s website at www.sec.gov. Those forms may be reviewed and copied at the SEC’s Public Reference Room in Washington, D.C. Information on the operation of the Public Reference Room may be obtained by calling 1-800-SEC-0330.
24 OPPENHEIMER MAIN STREET SMALL CAP FUND/VA
TRUSTEES AND OFFICERS Unaudited
| | |
| Name, Position(s) Held with the Fund, Length of Service, Year of Birth | | Principal Occupation(s) During the Past 5 Years; Other Trusteeships/Directorships Held; Number of Portfolios in the Fund Complex Currently Overseen |
| |
INDEPENDENT TRUSTEES | | The address of each Trustee in the chart below is 6803 S. Tucson Way, Centennial, Colorado 80112-3924. Each Trustee serves for an indefinite term, or until his or her resignation, retirement, death or removal. |
| |
Sam Freedman, Chairman of the Board of Trustees (since 2013) and Trustee (since 1998) Year of Birth: 1940 | | Director of Colorado UpLIFT (charitable organization) (since September 1984). Mr. Freedman held several positions with the Sub-Adviser and with subsidiary or affiliated companies of the Sub-Adviser (until October 1994). Oversees 38 portfolios in the OppenheimerFunds complex. Mr. Freedman has served on the Boards of certain Oppenheimer funds since 1996, during which time he has become familiar with the Fund’s (and other Oppenheimer funds’) financial, accounting, regulatory and investment matters and has contributed to the Boards’ deliberations. |
| |
Jon S. Fossel, Trustee (since 1998) Year of Birth: 1942 | | Chairman of the Board of Jack Creek Preserve Foundation (non-profit organization) (since 2005); Chairman of the Board (2006-December 2011) and Director (June 2002-December 2011) of UNUMProvident (insurance company); Director of Northwestern Energy Corp. (public utility corporation) (November 2004-December 2009); Director of P.R. Pharmaceuticals (October 1999-October 2003); Director of Rocky Mountain Elk Foundation (non-profit organization) (February 1998-February 2003 and February 2005-February 2007); Chairman and Director (until October 1996) and President and Chief Executive Officer (until October 1995) of the Sub-Adviser; President, Chief Executive Officer and Director of the following: Oppenheimer Acquisition Corp. (“OAC”) (parent holding company of the Sub-Adviser), Shareholder Services, Inc. and Shareholder Financial Services, Inc. (until October 1995). Oversees 38 portfolios in the OppenheimerFunds complex. Mr. Fossel has served on the Boards of certain Oppenheimer funds since 1990, during which time he has become familiar with the Fund’s (and other Oppenheimer funds’) financial, accounting, regulatory and investment matters and has contributed to the Boards’ deliberations. |
| |
Richard F. Grabish, Trustee (since 2012) Year of Birth: 1948 | | Formerly Senior Vice President and Assistant Director of Sales and Marketing (March 1997-December 2007), Director (March 1987-December 2007) and Manager of Private Client Services (June 1985-June 2005) of A.G. Edwards & Sons, Inc. (broker/dealer and investment firm); Chairman and Chief Executive Officer of A.G. Edwards Trust Company, FSB (March 2001-December 2007); President and Vice Chairman of A.G. Edwards Trust Company, FSB (investment adviser) (April 1987-March 2001); President of A.G. Edwards Trust Company, FSB (investment adviser) (June 2005-December 2007). Oversees 38 portfolios in the OppenheimerFunds complex. Mr. Grabish has served on the Boards of certain Oppenheimer funds since 2001, during which time he has become familiar with the Fund’s (and other Oppenheimer funds’) financial, accounting, regulatory and investment matters and has contributed to the Boards’ deliberations. |
| |
Beverly L. Hamilton, Trustee (since 2002) Year of Birth: 1946 | | Trustee of Monterey Institute for International Studies (educational organization) (since February 2000); Board Member of Middlebury College (educational organization) (December 2005-June 2011); Chairman (since 2010) of American Funds’ Emerging Markets Growth Fund, Inc. (mutual fund); Director of The California Endowment (philanthropic organization) (April 2002-April 2008); Director (February 2002-2005) and Chairman of Trustees (2006-2007) of the Community Hospital of Monterey Peninsula; Director (October 1991-2005); Vice Chairman (2006-2009) of American Funds’ Emerging Markets Growth Fund, Inc. (mutual fund); President of ARCO Investment Management Company (February 1991-April 2000); Member of the investment committees of The Rockefeller Foundation (2001-2006) and The University of Michigan (since 2000); Advisor at Credit Suisse First Boston’s Sprout venture capital unit (venture capital fund) (1994-January 2005); Trustee of MassMutual Institutional Funds (investment company) (1996-June 2004); Trustee of MML Series Investment Fund (investment company) (April 1989-June 2004); Member of the investment committee of Hartford Hospital (2000-2003); and Advisor to Unilever (Holland) pension fund (2000-2003). Oversees 38 portfolios in the OppenheimerFunds complex. Ms. Hamilton has served on the Boards of certain Oppenheimer funds since 2002, during which time she has become familiar with the Fund’s (and other Oppenheimer funds’) financial, accounting, regulatory and investment matters and has contributed to the Boards’ deliberations. |
| |
Victoria J. Herget, Trustee (since 2012) Year of Birth: 1951 | | Board Chair (2008-Present) and Director (2004-Present), United Educators (insurance company); Trustee (since 2000) and Chair (since 2010), Newberry Library (independent research library); Trustee, Mather LifeWays (senior living organization) (since 2001); Independent Director of the First American Funds (mutual fund family) (2003-2011); former Managing Director (1993-2001), Principal (1985-1993), Vice President (1978-1985) and Assistant Vice President (1973-1978) of Zurich Scudder Investments (investment adviser) (and its predecessor firms); Trustee (1992-2007), Chair of the Board of Trustees (1999-2007), Investment Committee Chair (1994-1999) and Investment Committee member (2007-2010) of Wellesley College; Trustee, BoardSource (non-profit organization) (2006-2009) and Chicago City Day School (K-8 School) (1994-2005). Oversees 38 portfolios in the OppenheimerFunds complex. Ms. Herget has served on the Boards of certain Oppenheimer funds since 2012, during which time she has become familiar with the Fund’s (and other Oppenheimer funds’) financial, accounting, regulatory and investment matters and has contributed to the Boards’ deliberations. |
| |
Robert J. Malone, Trustee (since 2002) Year of Birth: 1944 | | Chairman of the Board (since 2012) and Director (since August 2005) of Jones International University (educational organization); Chairman, Chief Executive Officer and Director of Steele Street Bank Trust (commercial banking) (since August 2003); Trustee of the Gallagher Family Foundation (non-profit organization) (since 2000); Board of Directors of Opera Colorado Foundation (non-profit organization) (2008-2012); Director of Colorado UpLIFT (charitable organization) (1986-2010); Director of Jones Knowledge, Inc. (2006-2010); Former Chairman of U.S. Bank-Colorado (subsidiary of U.S. Bancorp and formerly Colorado National Bank) (July 1996-April 1999); Director of Commercial Assets, Inc. (real estate investment trust) (1993-2000); Director of U.S. Exploration, Inc. (oil and gas exploration) (1997-February 2004); Chairman of the Board (1991-1994) and Trustee (1985-1994) of Regis University; and Chairman of the Board (1990-1991 and Trustee (1984-1999) of Young Presidents Organization. Oversees 38 portfolios in the OppenheimerFunds complex. Mr. Malone has served on the Boards of certain Oppenheimer funds since 2002, during which time he has become familiar with the Fund’s (and other Oppenheimer funds’) financial, accounting, regulatory and investment matters and has contributed to the Boards’ deliberations. |
25 OPPENHEIMER MAIN STREET SMALL CAP FUND/VA
| | |
| |
| TRUSTEES AND OFFICERS Unaudited / Continued | | |
| | |
F. William Marshall, Jr., Trustee (since 2000) Year of Birth: 1942 | | Trustee Emeritus of Worcester Polytech Institute (WPI) (private university) (since 2009); Trustee of MassMutual Select Funds (formerly MassMutual Institutional Funds) (investment company) (since 1996), MML Series Investment Fund (investment company) (since 1996) and Mass Mutual Premier Funds (investment company) (since January 2012); President and Treasurer of the SIS Fund (private charitable fund) (January 1999 – March 2011); Former Trustee of WPI (1985-2008); Former Chairman of the Board (2004-2006) and Former Chairman of the Investment Committee of WPI (1994-2008); Chairman of SIS & Family Bank, F.S.B. (formerly SIS Bank) (commercial bank) (January 1999-July 1999); Executive Vice President of Peoples Heritage Financial Group, Inc. (commercial bank) (January 1999-July 1999); and Former President and Chief Executive Officer of SIS Bancorp. (1993-1999). Oversees 42 portfolios in the OppenheimerFunds complex. Mr. Marshall has served on the Boards of certain Oppenheimer funds since 2000, during which time he has become familiar with the Fund’s (and other Oppenheimer funds’) financial, accounting, regulatory and investment matters and has contributed to the Boards’ deliberations. |
| |
Karen L. Stuckey, Trustee (since 2012) Year of Birth: 1953 | | Partner (1990-2012) of PricewaterhouseCoopers LLP (professional services firm) (held various positions 1975- 1990); Trustee (1992-2006) and member of Executive, Nominating and Audit Committees and Chair of Finance Committee of Lehigh University; and member, Women’s Investment Management Forum (professional organization) since inception. Oversees 38 portfolios in the OppenheimerFunds complex. Ms. Stuckey has served on the Boards of certain Oppenheimer funds since 2012, during which time she has become familiar with the Fund’s (and other Oppenheimer funds’) financial, accounting, regulatory and investment matters and has contributed to the Boards’ deliberations. |
| |
James D. Vaughn, Trustee (since 2012) Year of Birth: 1945 | | Retired; former managing partner (1994-2001) of Denver office of Deloitte & Touche LLP, (held various positions 1969-1993); Trustee and Chairman of the Audit Committee of Schroder Funds (2003-2012); Board member and Chairman of Audit Committee of AMG National Trust Bank (since 2005); Trustee and Investment Committee member, University of South Dakota Foundation (since 1996); Board member, Audit Committee Member and past Board Chair, Junior Achievement (since 1993); former Board member, Mile High United Way, Boys and Girls Clubs, Boy Scouts, Colorado Business Committee for the Arts, Economic Club of Colorado and Metro Denver Network. Oversees 38 portfolios in the OppenheimerFunds complex. Mr. Vaughn has served on the Boards of certain Oppenheimer funds since 2012, during which time he has become familiar with the Fund’s (and other Oppenheimer funds’) financial, accounting, regulatory and investment matters and has contributed to the Boards’ deliberations. |
| |
| | | |
| |
INTERESTED TRUSTEE | | Mr. Glavin is an “Interested Trustee” because he is affiliated with the Manager and the Sub-Adviser by virtue of his positions as director of the Sub-Adviser, and as a shareholder of the Sub-Adviser’s parent company. As a Trustee, he serves for an indefinite term, or until his resignation, retirement, death or removal. Mr. Glavin’s address is 225 Liberty Street, 11th Floor, New York, New York 10281-1008. |
| |
William F. Glavin, Jr., Trustee (since 2009) Year of Birth: 1958 | | Chairman of the Sub-Adviser (July 2014-December 2014 and December 2009-December 2012) and Director of the Sub-Adviser (since January 2009); Chairman, Director and Chief Executive Officer (January 2013-June 2014) of the Manager; President of the Manager (January 2013-May 2013); Chief Executive Officer (January 2009-December 2012); President of the Sub-Adviser (May 2009-December 2012); Management Director (June 2009-June 2014), President (December 2009-June 2014) and Chief Executive Officer (January 2011-June 2014) of Oppenheimer Acquisition Corp. (“OAC”) (the Sub-Adviser’s parent holding company); Director of Oppenheimer Real Asset Management, Inc. (March 2010-June 2014); Executive Vice President (March 2006-February 2009) and Chief Operating Officer (July 2007-February 2009) of Massachusetts Mutual Life Insurance Company (OAC’s parent company); Director (May 2004-March 2006) and Chief Operating Officer and Chief Compliance Officer (May 2004-January 2005), President (January 2005-March 2006) and Chief Executive Officer (June 2005-March 2006) of Babson Capital Management LLC; Director (March 2005-March 2006), President (May 2003-March 2006) and Chief Compliance Officer (July 2005-March 2006) of Babson Capital Securities, Inc. (a broker-dealer); President (May 2003-March 2006) of Babson Investment Company, Inc.; Director (May 2004-August 2006) of Babson Capital Europe Limited; Director (May 2004-October 2006) of Babson Capital Guernsey Limited; Director (May 2004-March 2006) of Babson Capital Management LLC; Non-Executive Director (March 2005-March 2007) of Baring Asset Management Limited; Director (February 2005-June 2006) Baring Pension Trustees Limited; Director and Treasurer (December 2003-November 2006) of Charter Oak Capital Management, Inc.; Director (May 2006-September 2006) of C.M. Benefit Insurance Company; Director (May 2008-June 2009) and Executive Vice President (June 2007-July 2009) of C.M. Life Insurance Company; President (March 2006-May 2007) of MassMutual Assignment Company; Director (January 2005-December 2006), Deputy Chairman (March 2005-December 2006) and President (February 2005-March 2005) of MassMutual Holdings (Bermuda) Limited; Director (May 2008-June 2009) and Executive Vice President (June 2007-July 2009) of MML Bay State Life Insurance Company; Chief Executive Officer and President (April 2007-January 2009) of MML Distributors, LLC; and Chairman (March 2006-December 2008) and Chief Executive Officer (May 2007-December 2008) of MML Investors Services, Inc. An officer of 91 portfolios in the OppenheimerFunds complex. Mr. Glavin has served on the Boards of certain Oppenheimer funds since December 2009, during which time he has become familiar with the Fund’s (and other Oppenheimer funds’) financial, accounting, regulatory and investment matters and has contributed to the Boards’ deliberations. |
| |
| | | |
| |
| OTHER OFFICERS OF THE FUND | | The addresses of the Officers in the chart below are as follows: for Messrs. Ziehl, Vardharaj, Anello, Krantz, Weiner, Steinmetz, Gabinet, Mss. Budzinski, Ketner, Sexton and Picciotto, 225 Liberty Street, New York, New York 10281-1008, for Mr. Wixted, 6803 S. Tucson Way, Centennial, Colorado 80112-3924. Each Officer serves for an indefinite term or until his or her resignation, retirement, death or removal. |
| |
Matthew P. Ziehl, Vice President (since 2009) Year of Birth: 1967 | | Vice President and Senior Portfolio Manager of the Sub-Adviser (since May 2009). Portfolio manager with RS Investment Management Co. LLC (October 2006-May 2009); Managing Director at The Guardian Life Insurance Company (December 2001-October 2006) when Guardian Life Insurance acquired an interest in RS Investment Management Co. LLC. Team leader and co portfolio manager with Salomon Brothers Asset Management, Inc. for small growth portfolios (January 2001-December 2001). A portfolio manager and officer of other portfolios in the OppenheimerFunds complex. |
26 OPPENHEIMER MAIN STREET SMALL CAP FUND/VA
| | |
Raman Vardharaj, Vice President (since 2009) Year of Birth: 1971 | | Vice President and portfolio manager of the Sub-Adviser (since May 2009). Sector manager and a senior quantitative analyst creating stock selection models, monitoring portfolio risks and analyzing portfolio performance across the RS Core Equity Team of RS Investment Management Co. LLC (October 2006-May 2009). Quantitative analyst at The Guardian Life Insurance Company of America (1998-October 2006) when Guardian Life Insurance acquired an interest in RS Investment Management Co. LLC. A portfolio manager and officer of other portfolios in the OppenheimerFunds complex. |
| |
Raymond Anello, Vice President (since 2011) Year of Birth: 1964 | | Vice President of the Sub-Adviser (since May 2009) and a portfolio manager of the Sub-Adviser (since April 2011). Sector manager for energy and utilities for the Sub-Adviser’s Main Street Investment Team (since May 2009). Portfolio Manager of the RS All Cap Dividend product (from its inception in July 2007-April 2009) and served as a sector manager for energy and utilities for various other RS Investments products. Guardian Life Insurance Company (October 1999) and transitioned to RS Investments (October 2006) in connection with Guardian Life Insurance Company’s acquisition of an interest in RS Investments. Mr. Anello served as an equity portfolio manager/analyst and high yield analyst at Orion Capital (1995-1998) and an assistant portfolio manager at the Garrison Bradford portfolio management firm (1988-1995). A portfolio manager and officer of other portfolios in the OppenheimerFunds complex. |
| |
Joy Budzinski, Vice President (since 2012) Year of Birth: 1968 | | Vice President of the Sub-Adviser (since May 2009) and a portfolio manager of the Sub-Adviser (since November 2012). Sector manager for healthcare for the Sub-Adviser’s Main Street Investment Team (since May 2009). Healthcare sector manager at RS Investment and Guardian Life Insurance Company. Guardian Life Insurance Company (August 2006) and transitioned to RS Investments (October 2006) in connection with Guardian Life Insurance Company’s acquisition of an interest in RS Investments. Senior equity analyst at Bank of New York BNY Asset Management (2001 -2006); portfolio manager and analyst at Alliance of America (1999-2001); portfolio manager and analyst at JP Morgan Chase (1993-1997); analyst at Prudential Investments (1997-1998). A portfolio manager and officer of other portfolios in the OppenheimerFunds complex. |
| |
Kristin Ketner, Vice President (since 2012) Year of Birth: 1965 | | Vice President of the Sub-Adviser (since June 2009) and a portfolio manager of the Sub-Adviser (since November 2012). Sector manager for consumer discretionary and consumer staples for the Sub-Adviser’s Main Street Investment Team (since May 2009). Sector manager at RS Investment and Guardian Life Insurance Company. Guardian Life Insurance Company in February 2006 and transitioned to RS Investments in October 2006 in connection with Guardian Life Insurance Company’s acquisition of an interest in RS Investments. Portfolio Manager at Solstice Equity Management (2002-2005); retail analyst at Goldman Sachs (1999-2001); Director of Strategy and Integration at Staples (1997-1999); investment banker at Merrill Lynch (1987-1992 and 1995-1997) and Montgomery Securities (1994-1995). A portfolio manager and officer of other portfolios in the OppenheimerFunds complex. |
| |
Magnus Krantz, Vice President (since 2012) Year of Birth: 1967 | | Vice President of the Sub-Adviser (since May 2009) and a portfolio manager of the Sub-Adviser (since November 2012); sector manager for technology for the Sub-Adviser’s Main Street Investment Team (since May 2009). Prior to joining the Sub-Adviser, Mr. Krantz was a sector manager at RS Investment and Guardian Life Insurance Company. Mr. Krantz joined Guardian Life Insurance Company in December 2005 and transitioned to RS Investments in October 2006 in connection with Guardian Life Insurance Company’s acquisition of an interest in RS Investments. Portfolio manager and analyst at Citigroup Asset Management (1998-2005) and as a consultant at Price Waterhouse (1997-1998). He also served as product development engineer at Newbridge Networks (1993-1996) and as a software engineer at Mitel Corporation (1990-1993). A portfolio manager and officer of other portfolios in the OppenheimerFunds complex. |
| |
Adam Weiner, Vice President (since 2012) Year of Birth: 1969 | | Vice President of the Sub-Adviser (since May 2009) and a portfolio manager of the Sub-Adviser (since November 2012). Sector manager for industrials and materials for the Sub-Adviser’s Main Street Investment Team (since May 2009). Sector manager at RS Investment for industrials and materials (January 2007-April 2009). Director and senior equity analyst at Credit Suisse Asset Management (CSAM) (September 2004-December 2006). Equity analyst at Credit Suisse First Boston 2004-2006 (buy-side) and 1999-2004 (sell-side) and Morgan Stanley (1996-1999); internal auditor at Dun and Bradstreet (1992-1996). Budget analyst, Information Resources Division of the Executive Office of the President (1990-1992). A portfolio manager and officer of other portfolios in the OppenheimerFunds complex. |
| |
Arthur P. Steinmetz, President and Principal Executive Officer (since 2014) Year of Birth: 1958 | | Chairman of the Sub-Adviser (since January 2015); CEO and Chairman of the Manager (since July 2014), President of the Manager (since May 2013), a Director of the Manager (since January 2013), Director of the Sub-Adviser (since July 2014), President, Management Director and CEO of Oppenheimer Acquisition Corp. (the Sub-Adviser’s parent holding company) (since July 2014), and President and Director of OFI SteelPath, Inc. (since January 2013). Chief Investment Officer of the OppenheimerFunds advisory entities from (January 2013-December 2013); Executive Vice President of the Manager (January 2013-May 2013); Chief Investment Officer of the Sub-Adviser (October 2010-December 2012); Chief Investment Officer, Fixed-Income, of the Sub-Adviser (April 2009-October 2010); Executive Vice President of the Sub-Adviser (October 2009-December 2012); Director of Fixed Income of the Sub-Adviser (January 2009-April 2009); and a Senior Vice President of the Sub-Adviser (March 1993-September 2009). An officer of 91 portfolios in the OppenheimerFunds complex. |
| |
Arthur S. Gabinet, Secretary and Chief Legal Officer (since 2011) Year of Birth: 1958 | | Executive Vice President, Secretary and General Counsel of the Manager (since January 2013); General Counsel OFI SteelPath, Inc. (since January 2013); Executive Vice President (May 2010-December 2012) and General Counsel (since January 2011) of the Sub-Adviser; General Counsel of the Distributor (since January 2011); General Counsel of Centennial Asset Management Corporation (January 2011-December 2012); Executive Vice President (January 2011-December 2012) and General Counsel of HarbourView Asset Management Corporation (since January 2011); Assistant Secretary (since January 2011) and Director (since January 2011) of OppenheimerFunds International Ltd. and OppenheimerFunds plc; Director of Oppenheimer Real Asset Management, Inc. (January 2011-December 2012) and General Counsel (since January 2011); Executive Vice President (January 2011-December 2011) and General Counsel of Shareholder Financial Services, Inc. and Shareholder Services, Inc. (since January 2011); Executive Vice President (January 2011-December 2012) and General Counsel of OFI Private Investments Inc. (since January 2011); Vice President of OppenheimerFunds Legacy Program (January 2011-December 2011); Executive |
27 OPPENHEIMER MAIN STREET SMALL CAP FUND/VA
| | |
| |
| TRUSTEES AND OFFICERS Unaudited / Continued | | |
| | |
Arthur S. Gabinet, Continued | | Vice President (January 2011-December 2012) and General Counsel of OFI Institutional Asset Management, Inc. (since January 2011); General Counsel, Asset Management of the Sub-Adviser (May 2010-December 2010); Principal, The Vanguard Group (November 2005-April 2010); District Administrator, U.S. Securities and Exchange Commission (January 2003-October 2005). An officer of 91 portfolios in the OppenheimerFunds complex. |
| |
Jennifer Sexton, Vice President and Chief Business Officer (since 2014) Year of Birth: 1969 | | Senior Vice President of OppenheimerFunds Distributor, Inc. (since June 2014); Vice President of OppenheimerFunds Distributor, Inc. (April 2006-June 2014); Vice President of the Sub-Adviser (January 1998-March 2006); Assistant Vice President of the Sub-Adviser (October 1991-December 1998). An officer of 91 portfolios in the OppenheimerFunds complex. |
| |
Mary Ann Picciotto, Chief Compliance Officer and Chief Anti-Money Laundering Officer (since 2014) Year of Birth: 1973 | | Senior Vice President and Chief Compliance Officer of the Manager (since March 2014); Chief Compliance Officer of the Sub-Adviser, OFI SteelPath, Inc., OFI Global Trust Company, OFI Global Institutional, Inc., Oppenheimer Real Asset Management, Inc., OFI Private Investments, Inc., Harborview Asset Management Corporation, Trinity Investment Management Corporation, and Shareholder Services, Inc. (since March 2014); Managing Director of Morgan Stanley Investment Management Inc. and certain of its various affiliated entities; Chief Compliance Officer of various Morgan Stanley Funds (May 2010-January 2014); Chief Compliance Officer of Morgan Stanley Investment Management Inc. (April 2007-January 2014). An officer of 91 portfolios in the OppenheimerFunds complex. |
| |
Brian W. Wixted, Treasurer and Principal Financial & Accounting Officer (since 1999) Year of Birth: 1959 | | Senior Vice President of the Manager (since January 2013); Treasurer of the Sub-Adviser, HarbourView Asset Management Corporation, Shareholder Financial Services, Inc., Shareholder Services, Inc., and Oppenheimer Real Asset Management, Inc. (March 1999-June 2008), OFI Private Investments, Inc. (March 2000-June 2008), OppenheimerFunds International Ltd. and OppenheimerFunds plc (since May 2000), OFI Institutional Asset Management, Inc. (November 2000-June 2008), and OppenheimerFunds Legacy Program (charitable trust program established by the Sub-Adviser) (June 2003-December 2011); Treasurer and Chief Financial Officer of OFI Trust Company (since May 2000); Assistant Treasurer of Oppenheimer Acquisition Corporation (March 1999-June 2008). An officer of 91 portfolios in the OppenheimerFunds complex. |
|
| The Fund’s Statement of Additional Information contains additional information about the Fund’s Trustees and Officers and is available without charge, upon request, by calling 1.800.988.8287. |
28 OPPENHEIMER MAIN STREET SMALL CAP FUND/VA
THIS PAGE INTENTIONALLY LEFT BLANK.
29 OPPENHEIMER MAIN STREET SMALL CAP FUND/VA
THIS PAGE INTENTIONALLY LEFT BLANK.
30 OPPENHEIMER MAIN STREET SMALL CAP FUND/VA
THIS PAGE INTENTIONALLY LEFT BLANK.
31 OPPENHEIMER MAIN STREET SMALL CAP FUND/VA
OPPENHEIMER MAIN STREET SMALL CAP FUND/VA
A Series of Oppenheimer Variable Account Funds
| | |
| Manager | | OFI Global Asset Management, Inc. |
| |
| Sub-Adviser | | OppenheimerFunds, Inc. |
| |
| Distributor | | OppenheimerFunds Distributor, Inc. |
| |
Transfer and Shareholder Servicing Agent | | OFI Global Asset Management, Inc. |
| |
| Sub-Transfer Agent | | Shareholder Services, Inc. |
| | DBA OppenheimerFunds Services |
| |
Independent Registered Public Accounting Firm | | KPMG LLP |
| |
| Counsel | | K&L Gates LLP |
| |
| | Before investing in any of the Oppenheimer funds, investors should carefully consider a fund’s investment objectives, risks, charges and expenses. Fund prospectuses and summary prospectuses contain this and other information about the funds, and may be obtained by asking your financial advisor, or calling us at 1.800.988.8287. Read prospectuses and summary prospectuses carefully before investing. |
| |
| | © 2015 OppenheimerFunds, Inc. All rights reserved. Oppenheimer funds are distributed by OppenheimerFunds Distributor, Inc. |


December 31, 2014

ANNUAL REPORT
Listing of Top Holdings
Fund Performance Discussion
Financial Statements
Fund Performance Discussion
PORTFOLIO MANAGERS: Christopher Proctor, CFA and Adam S. Wilde, CFA
| | | | |
| | | |
Current Yield | |
For the 7-Day Period Ended 12/31/14 | |
With Compounding | | 0.01% | |
Without Compounding | | 0.01% | |
| | |
For the 12-Month Period Ended 12/31/14 | |
With Compounding | | 0.01% | |
Without Compounding | | 0.01% | |
The performance data quoted represents past performance, which does not guarantee future results. Yields include dividends in a hypothetical investment for the periods shown. Current performance may be lower or higher than the performance quoted. For performance data current to the most recent month end, call us at 1.800.988.8287. The yields take into account voluntary fee waivers and/or expense reimbursements, without which yields would have been lower. Some of these undertakings may be modified at any time, as indicated in the prospectus. There is no guarantee that the Fund will maintain a positive yield. The Fund’s performance should not be expected to be the same as the returns of other funds, whether or not both funds have the same portfolio managers and/or similar names. The Fund’s performance does not include the charges associated with the separate account products that offer this Fund. Such performance would have been lower if such charges were taken into account.
| | | | |
PORTFOLIO ALLOCATION | | | | |
Short-Term Notes/Commercial Paper | | 50.1% | |
Certificates of Deposit | | 25.2 | |
Direct Bank Obligations | | 18.4 | |
Investment Company | | 6.3 | |
Portfolio holdings and allocations are subject to change. Percentages are as of December 31, 2014, and are based on the total market value of investments. | |
2 OPPENHEIMER MONEY FUND/VA
Fund Performance Discussion
Despite volatility among long-term interest rates stemming from changing economic expectations and a shift in U.S. monetary policy, short-term rates and money market yields remained relatively stable, anchored by the Federal Reserve’s (the “Fed”) unchanged target of between 0% and 0.25% for the overnight federal funds rate.
MARKET OVERVIEW
Throughout the reporting period, the Fed continued to taper its large scale asset purchase program by $10 billion per month, and eventually ended the program in late October 2014. Despite the Fed’s tapering, other central banks throughout the globe executed exceedingly loose monetary policies, providing plenty of liquidity to the markets. In addition, the Securities and Exchange Commission approved new rules for money market funds, which we discuss in greater detail in the Fund Review section of this report.
In the U.S., although data in the U.S. softened for the first quarter due partially to cold weather effects across much of the country, it was positive in the second and third quarters of 2014, with Gross Domestic Product (“GDP”) growing at 4.6% and an estimated 5.0%, respectively.
Outside of the U.S., the positive data points that had emerged in Europe in 2013 and early 2014 largely reversed themselves later in the reporting period and the European Central Bank (the “ECB”) came under even greater pressure to provide a credible plan to boost growth and avoid deflation. In response, the ECB adopted a number of policies designed to stimulate growth. In Japan, which has been mired in economic weakness for years, the Abe administration has adopted even more aggressive economic policies with the Bank of Japan (the “BoJ”) executing a massive quantitative easing (“QE”) program. However, the results have not been particularly impressive, with that economy slipping back into recession in the third quarter of 2014 following the consumption tax increase. Emerging markets’ economic growth was mixed, as certain regions such as Eastern Europe and the Middle East remained burdened by geopolitical turmoil. Many commodity producing emerging market economies also struggled as prices for most commodities fell. Countries such as India and Indonesia have benefited from business-friendly new administrations.
Despite numerous changes and macroeconomic concerns this reporting period, money market yields largely remained unchanged.
FUND REVIEW
In July, the Securities and Exchange Commission voted to adopt the long awaited and much anticipated rules for money market funds. The most significant changes require institutional prime money market funds to maintain a variable net asset value (VNAV) instead of the current stable NAV. Further, all prime money-market funds (retail and institutional) now have the ability to impose liquidity fees and/or gates. While these are big changes to the industry, they come as no big surprise. Supply and demand factors, coupled with the Fed’s actions, continue to play a significant role on yields. Given the abovementioned circumstances, the Fund continued to generate consistent and competitive levels of current income.
During the reporting period, we maintained the Fund’s weighted average maturity at a level that was below market averages. With the below weighted average maturity, we were able to meet all cash flow needs of the Fund. From a portfolio composition perspective, we continued to avoid repurchase agreements due to the uncertainty surrounding potential regulatory changes. Instead, we have continued to favor commercial paper issued by global banks meeting our stringent credit criteria. We also increased the Fund’s exposure to floating rate securities on which yields are reset monthly or quarterly. In light of their low yields, and continued uncertainty around the debt ceiling, the Fund had no exposure to U.S. Treasury securities over the reporting period.
Additionally, while the Fund did not partake in the Fed’s reverse repurchase program, the Fund experienced benefits from it this reporting period. The Fed’s reverse repurchase program was introduced as a method to help control short-term interest rates by setting a floor on overnight lending rates. Under the program, the Fed borrows funds overnight from money market funds, banks and other entities, offering Treasury securities as collateral. The structure of the Fed’s reverse repurchase program had minor changes in the reporting period. The program now uses a Dutch-auction process, while capping the program at $300 billion. Further, the Fed has begun a second facility, the Term Deposit Facility. When combined, these facilities are increasingly becoming an effective reserve-management tool. As other market participants chose to participate in the Fed’s programs instead of purchasing commercial paper and other assets that the Fund seeks to invest in, we benefited indirectly from the increased supply of investment options.
3 OPPENHEIMER MONEY FUND/VA
STRATEGY & OUTLOOK
At period end, there has been a slight change in the current imbalance of supply-and-demand dynamics; however, supply remains compressed. Consequently, we expect money market yields to remain range-bound for the foreseeable future. Over the longer term, we have begun to see some light at the end of the tunnel with regard to short-term interest rates. The market continues to factor in a base case scenario of June 2015 for a rise in rates. We remain focused on our fundamental analysis and seek to ensure only high-quality names make it into the portfolio.
An investment in the Fund is not insured or guaranteed by the Federal Deposit Insurance Corporation or any other government agency. Although the Fund seeks to preserve the value of your investment at $1.00 per share, it is possible to lose money by investing in the Fund.
Investors should consider the Fund’s investment objective, risks, charges and expenses carefully before investing. The Fund’s prospectus and summary prospectus contain this and other information about the Fund, and may be obtained by asking your financial advisor or calling us at 1.800.988.8287. Read prospectuses and summary prospectuses carefully before investing.
Shares of Oppenheimer funds are not deposits or obligations of any bank, are not guaranteed by any bank, are not insured by the FDIC or any other agency, and involve investment risks, including the possible loss of the principal amount invested.
4 OPPENHEIMER MONEY FUND/VA
Fund Expenses
Fund Expenses. As a shareholder of the Fund, you incur ongoing costs, including management fees; and other Fund expenses. These examples are intended to help you understand your ongoing costs (in dollars) of investing in the Fund and to compare these costs with the ongoing costs of investing in other mutual funds.
The examples are based on an investment of $1,000.00 invested at the beginning of the period and held for the entire 6-month period ended December 31, 2014.
Actual Expenses. The first section of the table provides information about actual account values and actual expenses. You may use the information in this section, together with the amount you invested, to estimate the expense that you paid over the period. Simply divide your account value by $1,000.00 (for example, an $8,600.00 account value divided by $1,000.00 = 8.60), then multiply the result by the number in the first section under the heading entitled “Expenses Paid During Period” to estimate the expenses you paid on your account during this period.
Hypothetical Example for Comparison Purposes.
The second section of the table provides information about hypothetical account values and hypothetical expenses based on the Fund’s actual expense ratio, and an assumed rate of return of 5% per year for each class before expenses, which is not the actual return. The hypothetical account values and expenses may not be used to estimate the actual ending account balance or expenses you paid for the period. You may use this information to compare the ongoing costs of investing in the Fund and other funds. To do so, compare this 5% hypothetical example with the 5% hypothetical examples that appear in the shareholder reports of the other funds.
Please note that the expenses shown in the table are meant to highlight your ongoing costs only and do not reflect any charges associated with the separate accounts that offer this Fund. Therefore, the “hypothetical” lines of the table are useful in comparing ongoing costs only, and will not help you determine the relative total costs of owning different funds. In addition, if these separate account charges were included your costs would have been higher.
| | | | | | | | |
| Actual | | Beginning Account Value July 1, 2014 | | | Ending Account Value
December 31, 2014 | | Expenses Paid During 6 Months Ended
December 31, 2014 |
| | $ | 1,000.00 | | | $ 1,000.10 | | $ 0.71 |
| | | |
Hypothetical | | | | | | | | |
(5% return before expenses) | | | | | | | | |
| | | 1,000.00 | | | 1,024.50 | | 0.71 |
Expenses are equal to the Fund’s annualized expense ratio, multiplied by the average account value over the period, multiplied by 184/365 (to reflect the one-half year period). The annualized expense ratio, excluding indirect expenses from affiliated funds, based on the 6-month period ended December 31, 2014 are as follows:
The expense ratio reflects voluntary and/or contractual waivers and/or reimbursements of expenses by the Fund’s Manager. Some of these undertakings may be modified or terminated at any time, as indicated in the Fund’s prospectus. The “Financial Highlights” table in the Fund’s financial statements, included in this report, also show the gross expense ratio, without such waivers or reimbursements and reduction to custodian expenses, if applicable.
5 OPPENHEIMER MONEY FUND/VA
STATEMENTOFINVESTMENTS December 31, 2014
| | | | | | | | | | | | | | | | |
| | | Maturity Date* | | | Final Legal
Maturity Date** | | | Principal Amount | | | Value | |
| |
Certificates of Deposit—17.9% | | | | | | | | | | | | | | | | |
Yankee Certificates of Deposit—17.9% | | | | | | | | | | | | | | | | |
Bank of Montreal, Chicago, 0.08% | | | 1/6/15 | | | | 1/6/15 | | | $ | 15,000,000 | | | | $ 15,000,000 | |
| |
Bank of Nova Scotia, Houston TX: | | | | | | | | | | | | | | | | |
0.242%1 | | | 2/20/15 | | | | 2/20/15 | | | | 2,300,000 | | | | 2,300,000 | |
0.25% | | | 1/5/15 | | | | 1/5/15 | | | | 2,000,000 | | | | 2,000,000 | |
0.413%1 | | | 1/29/15 | | | | 1/29/15 | | | | 4,700,000 | | | | 4,700,618 | |
0.48%1 | | | 1/14/15 | | | | 1/14/15 | | | | 900,000 | | | | 900,079 | |
1.179%1 | | | 1/10/15 | | | | 1/12/15 | | | | 1,500,000 | | | | 1,500,420 | |
| |
Canadian Imperial Bank of Commerce NY: | | | | | | | | | | | | | | | | |
0.235%1 | | | 1/22/15 | | | | 7/22/15 | | | | 3,000,000 | | | | 3,000,000 | |
0.251%1 | | | 1/14/15 | | | | 9/14/15 | | | | 3,000,000 | | | | 3,000,000 | |
| |
Commonwealth Bank of Australia, 0.261%1,2 | | | 1/12/15 | | | | 12/7/15 | | | | 3,000,000 | | | | 3,000,000 | |
| |
Rabobank Nederland NV, New York: | | | | | | | | | | | | | | | | |
0.257%1 | | | 1/7/15 | | | | 3/9/15 | | | | 4,000,000 | | | | 4,000,000 | |
0.281%1 | | | 1/20/15 | | | | 7/17/15 | | | | 1,800,000 | | | | 1,800,000 | |
| |
Royal Bank of Canada, New York: | | | | | | | | | | | | | | | | |
0.242%1 | | | 1/18/15 | | | | 2/18/15 | | | | 2,000,000 | | | | 2,000,000 | |
0.251%1 | | | 1/13/15 | | | | 8/13/15 | | | | 3,300,000 | | | | 3,300,003 | |
| |
Sumitomo Mutsui Bank NY, 0.22% | | | 4/1/15 | | | | 4/1/15 | | | | 10,000,000 | | | | 10,000,000 | |
| |
Svenska Handelsbanken, New York: | | | | | | | | | | | | | | | | |
0.20% | | | 1/15/15 | | | | 1/15/15 | | | | 2,600,000 | | | | 2,600,000 | |
0.215% | | | 1/26/15 | | | | 1/26/15 | | | | 1,500,000 | | | | 1,500,000 | |
| |
Toronto Dominion Bank, New York: | | | | | | | | | | | | | | | | |
0.23% | | | 6/3/15 | | | | 6/3/15 | | | | 8,500,000 | | | | 8,500,000 | |
0.27% | | | 6/1/15 | | | | 6/1/15 | | | | 1,500,000 | | | | 1,500,000 | |
| |
Wells Fargo Bank NA: | | | | | | | | | | | | | | | | |
0.244%1 | | | 1/20/15 | | | | 5/19/15 | | | | 3,500,000 | | | | 3,500,000 | |
0.31%1 | | | 1/2/15 | | | | 10/22/15 | | | | 3,500,000 | | | | 3,500,000 | |
| |
Westpac Banking Corp., New York: | | | | | | | | | | | | | | | | |
0.265%1 | | | 1/21/15 | | | | 10/21/15 | | | | 5,000,000 | | | | 5,000,000 | |
0.27%1 | | | 1/26/15 | | | | 10/26/15 | | | | 5,000,000 | | | | 5,000,000 | |
0.271%1 | | | 1/7/15 | | | | 1/7/15 | | | | 4,700,000 | | | | 4,700,000 | |
| | | | | | | | | | | | | | | | |
Total Certificates of Deposit (Cost $92,301,120) | | | | | | | | | | | | | | | 92,301,120 | |
| | | | | | | | | | | | | | | | |
| |
Direct Bank Obligations—13.1% | | | | | | | | | | | | | | | | |
Bank of Tokyo-Mitsubishi UFJ NY: | | | | | | | | | | | | | | | | |
0.12%3 | | | 1/6/15 | | | | 1/6/15 | | | | 3,000,000 | | | | 2,999,950 | |
0.14%3 | | | 1/2/15 | | | | 1/2/15 | | | | 3,000,000 | | | | 2,999,988 | |
| |
Credit Agricole & Investment Bank, New York Branch, 0.05% | | | 1/2/15 | | | | 1/2/15 | | | | 10,000,000 | | | | 9,999,986 | |
| |
DNB Bank ASA, 0.12%2 | | | 1/6/15 | | | | 1/6/15 | | | | 9,300,000 | | | | 9,299,845 | |
| |
HSBC USA, Inc.: | | | | | | | | | | | | | | | | |
0.17% | | | 1/22/15 | | | | 1/22/15 | | | | 500,000 | | | | 499,950 | |
0.24% | | | 5/4/15 | | | | 5/4/15 | | | | 10,500,000 | | | | 10,491,390 | |
0.25% | | | 4/1/15 | | | | 4/1/15 | | | | 3,700,000 | | | | 3,697,687 | |
| |
PNC Bank NA: | | | | | | | | | | | | | | | | |
0.281% | | | 7/1/15 | | | | 7/1/15 | | | | 6,000,000 | | | | 5,991,553 | |
0.31% | | | 2/23/15 | | | | 2/23/15 | | | | 5,000,000 | | | | 5,000,000 | |
| |
Skandinviska Enskilda BankenAB: | | | | | | | | | | | | | | | | |
0.20%2 | | | 2/19/15 | | | | 2/19/15 | | | | 2,100,000 | | | | 2,099,428 | |
0.20%2 | | | 3/11/15 | | | | 3/11/15 | | | | 1,000,000 | | | | 999,617 | |
| |
Swedbank AB: | | | | | | | | | | | | | | | | |
0.16% | | | 1/5/15 | | | | 1/5/15 | | | | 13,300,000 | | | | 13,299,764 | |
0.24% | | | 3/27/15 | | | | 3/27/15 | | | | 250,000 | | | | 249,858 | |
| | | | | | | | | | | | | | | | |
Total Direct Bank Obligations (Cost $67,629,016) | | | | | | | | | | | | | | | 67,629,016 | |
| | | | | | | | | | | | | | | | |
| |
Short-Term Notes/Commercial Paper—35.7% | | | | | | | | | | | | | | | | |
Diversified Financial Services—1.2% | | | | | | | | | | | | | | | | |
General Electric Capital Corp.: | | | | | | | | | | | | | | | | |
0.21% | | | 5/26/15 | | | | 5/26/15 | | | | 5,000,000 | | | | 4,995,771 | |
0.25% | | | 5/1/15 | | | | 5/1/15 | | | | 835,000 | | | | 834,304 | |
| | | | | | | | | | | | | | | | |
| | | | | | | | | | | | | | | 5,830,075 | |
| | | | | | | | | | | | | | | | |
| |
Leasing & Factoring—3.0% | | | | | | | | | | | | | | | | |
American Honda Finance Corp.: | | | | | | | | | | | | | | | | |
0.235%1 | | | 3/4/15 | | | | 6/4/15 | | | | 5,000,000 | | | | 5,000,000 | |
1.45%3 | | | 2/27/15 | | | | 2/27/15 | | | | 5,000,000 | | | | 5,009,325 | |
| |
Toyota Motor Credit Corp.: | | | | | | | | | | | | | | | | |
0.23%1 | | | 1/14/15 | | | | 1/14/15 | | | | 2,000,000 | | | | 2,000,000 | |
0.23% | | | 2/9/15 | | | | 2/9/15 | | | | 4,000,000 | | | | 3,999,003 | |
| | | | | | | | | | | | | | | | |
| | | | | | | | | | | | | | | 16,008,328 | |
6 OPPENHEIMER MONEY FUND/VA
| | | | | | | | | | | | | | | | |
| | | Maturity Date* | | | Final Legal
Maturity Date** | | | Principal Amount | | | Value | |
| |
Municipal—3.1% | | | | | | | | | | | | | | | | |
CA Pollution Control Finance Authority Solid Waste Disposal Revenue Bonds, Zerep Management Corp., Series 2014, 0.08%1 | | | 1/7/15 | | | | 1/7/15 | | | $ | 3,150,000 | | | | $ 3,150,000 | |
| |
Calcasieu Parish, LA Public Trust Authority Solid Waste Disposal Revenue Bonds, WPT Corp. Project, Series 1997, 0.05%1 | | | 1/7/15 | | | | 1/7/15 | | | | 5,600,000 | | | | 5,600,000 | |
| |
Des Moines, IA Facilities Revenue Bonds, Elliott Aviation Project, Series 2007, 0.09%1 | | | 1/7/15 | | | | 1/7/15 | | | | 4,410,000 | | | | 4,410,000 | |
| |
San Antonio, TX Industrial Development Authority Revenue Bonds, Tindall Corp. Project, 0.21%1 | | | 1/7/15 | | | | 1/7/15 | | | | 1,700,000 | | | | 1,700,000 | |
| |
St. Paul, MN Bonds, Rivercentre Arena Project, Series 2009A, 0.16%1 | | | 1/7/15 | | | | 1/7/15 | | | | 1,000,000 | | | | 1,000,000 | |
| | | | | | | | | | | | | | | | |
| | | | | | | | | | | | | | | 15,860,000 | |
| | | | | | | | | | | | | | | | |
| |
Oil, Gas & Consumable Fuels—5.9% | | | | | | | | | | | | | | | | |
ExxonMobil Corp.: | | | | | | | | | | | | | | | | |
0.062% | | | 1/2/15 | | | | 1/2/15 | | | | 19,000,000 | | | | 18,999,968 | |
0.12% | | | 1/14/15 | | | | 1/14/15 | | | | 5,000,000 | | | | 4,999,783 | |
| |
Total Capital Canada, 0.13%2 | | | 1/5/15 | | | | 1/5/15 | | | | 5,985,000 | | | | 5,984,914 | |
| | | | | | | | | | | | | | | | |
| | | | | | | | | | | | | | | 29,984,665 | |
| | | | | | | | | | | | | | | | |
| |
Personal Products—1.0% | | | | | | | | | | | | | | | | |
Reckitt Benckiser Treasury Services plc: | | | | | | | | | | | | | | | | |
0.22%2 | | | 2/12/15 | | | | 2/12/15 | | | | 1,100,000 | | | | 1,099,718 | |
0.26%2 | | | 5/21/15 | | | | 5/21/15 | | | | 4,000,000 | | | | 3,995,956 | |
| | | | | | | | | | | | | | | | |
| | | | | | | | | | | | | | | 5,095,674 | |
| | | | | | | | | | | | | | | | |
| |
Receivables Finance—8.7% | | | | | | | | | | | | | | | | |
CAFCO LLC: | | | | | | | | | | | | | | | | |
0.18%2 | | | 2/4/15 | | | | 2/4/15 | | | | 3,000,000 | | | | 2,999,490 | |
0.20%2 | | | 3/23/15 | | | | 3/23/15 | | | | 10,000,000 | | | | 9,995,500 | |
| |
CRC Funding LLC, 0.22% | | | 3/30/15 | | | | 3/30/15 | | | | 10,000,000 | | | | 9,994,622 | |
| |
Gotham Funding Corp., 0.18%2 | | | 1/28/15 | | | | 1/28/15 | | | | 3,000,000 | | | | 2,999,595 | |
| |
Manhattan Asset Funding Co., 0.13%2 | | | 1/2/15 | | | | 1/2/15 | | | | 4,000,000 | | | | 3,999,986 | |
| |
Old Line Funding Corp.: | | | | | | | | | | | | | | | | |
0.22%2 | | | 2/18/15 | | | | 2/18/15 | | | | 1,650,000 | | | | 1,649,516 | |
0.22%2 | | | 1/20/15 | | | | 1/20/15 | | | | 1,300,000 | | | | 1,299,849 | |
| |
Victory Receivables Corp., 0.16%2 | | | 1/22/15 | | | | 1/22/15 | | | | 12,000,000 | | | | 11,998,880 | |
| | | | | | | | | | | | | | | | |
| | | | | | | | | | | | | | | 44,937,438 | |
| | | | | | | | | | | | | | | | |
| |
Special Purpose Financial—12.8% | | | | | | | | | | | | | | | | |
Anglesea Funding LLC: | | | | | | | | | | | | | | | | |
0.20%3 | | | 1/6/15 | | | | 1/6/15 | | | | 5,000,000 | | | | 4,999,861 | |
0.20%3 | | | 1/5/15 | | | | 1/5/15 | | | | 5,000,000 | | | | 4,999,889 | |
| |
Cedar Springs Capital Co. LLC, 0.25% | | | 1/16/15 | | | | 1/16/15 | | | | 1,800,000 | | | | 1,799,813 | |
| |
Concord Minutemen Cap. Corp. LLC, 0.20% | | | 2/9/15 | | | | 2/9/15 | | | | 12,000,000 | | | | 11,997,400 | |
| |
Crown Point Capital Co.: | | | | | | | | | | | | | | | | |
0.20% | | | 2/9/15 | | | | 2/9/15 | | | | 9,500,000 | | | | 9,497,942 | |
0.20% | | | 2/10/15 | | | | 2/10/15 | | | | 4,700,000 | | | | 4,698,956 | |
| |
Govco LLC: | | | | | | | | | | | | | | | | |
0.18%2 | | | 1/15/15 | | | | 1/15/15 | | | | 1,000,000 | | | | 999,930 | |
0.20%2 | | | 3/19/15 | | | | 3/19/15 | | | | 10,000,000 | | | | 9,995,722 | |
| |
Lexington Parker Capital Co. LLC, 0.20%2 | | | 2/9/15 | | | | 2/9/15 | | | | 14,200,000 | | | | 14,196,923 | |
| |
Ridgefield Funding Co. LLC, 0.227%1 | | | 1/5/15 | | | | 2/4/15 | | | | 3,000,000 | | | | 3,000,000 | |
| | | | | | | | | | | | | | | | |
| | | | | | | | | | | | | | | 66,186,436 | |
| | | | | | | | | | | | | | | | |
Total Short-Term Notes/Commercial Paper (Cost $183,902,616) | | | | | | | | | | | | | | | 183,902,616 | |
| | | | |
| | | | | | | | | Shares | | | | |
| |
Investment Company—4.5% | | | | | | | | | | | | | | | | |
Oppenheimer Institutional Money Market Fund, Cl. E, 0.10%4,5 (Cost $23,255,744) | | | 1/2/15 | | | | 1/2/15 | | | | 23,255,744 | | | | 23,255,744 | |
| |
Total Investments, at Value (Cost $367,088,496) | | | | | | | | | | | 71.2% | | | | 367,088,496 | |
| |
Net Other Assets (Liabilities) | | | | | | | | | | | 28.8 | | | | 148,208,168 | |
| | | | | | | | | | | | |
Net Assets | | | | | | | | | | | 100.0% | | | $ | 515,296,664 | |
| | | | | | | | | | | | |
7 OPPENHEIMER MONEY FUND/VA
STATEMENT OF INVESTMENTS Continued
Footnotes to Statement of Investments
Short-term notes and direct bank obligations are generally traded on a discount basis; the interest rate shown is the discount rate received by the Fund at the time of purchase. Other securities normally bear interest at the rates shown.
*. The Maturity Date represents the date used to calculate the Fund’s weighted average maturity as determined under Rule 2a-7.
**. If different from the Maturity Date, the Final Legal Maturity Date includes any maturity date extensions which may be affected at the option of the issuer or unconditional payments of principal by the issuer which may be affected at the option of the Fund, and represents the date used to calculate the Fund’s weighted average life as determined under Rule 2a-7.
1. Represents the current interest rate for a variable or increasing rate security.
2. Security issued in an exempt transaction without registration under the Securities Act of 1933. Such securities amount to $86,614,869 or 16.81% of the Fund’s net assets, and have been determined to be liquid pursuant to guidelines adopted by the Board of Trustees.
3. Represents securities sold under Rule 144A, which are exempt from registration under the Securities Act of 1933, as amended. These securities have been determined to be liquid under guidelines established by the Board of Trustees. These securities amount to $21,009,013 or 4.08% of the Fund’s net assets as of December 31, 2014.
4. Is or was an affiliate, as defined in the Investment Company Act of 1940, as amended, at or during the period ended December 31, 2014, by virtue of the Fund owning at least 5% of the voting securities of the issuer or as a result of the Fund and the issuer having the same investment adviser. Transactions during the period in which the issuer was an affiliate are as follows:
| | | | | | | | | | | | | | | | |
| | | Shares December 31, 2013 | | | Gross Additions | | | Gross Reductions | | | Shares December 31, 2014 | |
| |
Oppenheimer Institutional Money Market Fund, Cl. E | | | — | | | | 76,955,744 | | | | 53,700,000 | | | | 23,255,744 | |
| | | | |
| | | | | | | | | Value | | | Income | |
| |
Oppenheimer Institutional Money Market Fund, Cl. E | | | | | | | | | | $ | 23,255,744 | | | $ | 7,263 | |
5. Rate shown is the 7-day yield as of December 31, 2014.
See accompanying Notes to Financial Statements.
8 OPPENHEIMER MONEY FUND/VA
STATEMENT OF ASSETS AND LIABILITIES December 31, 2014
| | | | |
| |
Assets | | | | |
Investments, at value—see accompanying statement of investments: | | | | |
Unaffiliated companies (cost $343,832,752) | | $ | 343,832,752 | |
Affiliated companies (cost $23,255,744) | | | 23,255,744 | |
| | | | |
| | | 367,088,496 | |
| |
Cash | | | 141,300,331 | |
| |
Receivables and other assets: | | | | |
Shares of beneficial interest sold | | | 6,861,953 | |
Interest | | | 68,013 | |
Other | | | 26,228 | |
| | | | |
Total assets | | | 515,345,021 | |
| |
Liabilities | | | | |
Payables and other liabilities: | | | | |
Legal, auditing and other professional fees | | | 20,348 | |
Trustees’ compensation | | | 19,391 | |
Shareholder communications | | | 5,729 | |
Dividends | | | 1,338 | |
Shares of beneficial interest redeemed | | | 1,135 | |
Other | | | 416 | |
| | | | |
Total liabilities | | | 48,357 | |
| |
Net Assets | | $ | 515,296,664 | |
| | | | |
| | | | |
| |
Composition of Net Assets | | | | |
Par value of shares of beneficial interest | | $ | 515,282 | |
| |
Additional paid-in capital | | | 514,772,775 | |
| |
Accumulated net investment income | | | 8,607 | |
| | | | |
Net Assets - applicable to 515,281,635 shares of beneficial interest outstanding | | $ | 515,296,664 | |
| | | | |
| |
| | | | |
| |
Net Asset Value, Redemption Price Per Share and Offering Price Per Share | | | $1.00 | |
See accompanying Notes to Financial Statements.
9 OPPENHEIMER MONEY FUND/VA
STATEMENT OF OPERATIONS For the Year Ended December 31, 2014
| | | | |
Investment Income | | | | |
Interest | | $ | 514,666 | |
| |
Dividends from affiliated companies | | | 7,263 | |
| | | | |
Total investment income | | | 521,929 | |
| |
Expenses | | | | |
Management fees | | | 1,450,286 | |
| |
Transfer and shareholder servicing agent fees | | | 327,634 | |
| |
Trustees’ compensation | | | 28,267 | |
| |
Shareholder communications | | | 20,893 | |
| |
Custodian fees and expenses | | | 1,272 | |
| |
Other | | | 47,349 | |
| | | | |
Total expenses | | | 1,875,701 | |
Less reduction to custodian expenses | | | (83) | |
Less waivers and reimbursements of expenses | | | (1,386,544) | |
| | | | |
Net expenses | | | 489,074 | |
| |
Net Investment Income | | | 32,855 | |
| |
Realized gain | | | 11,471 | |
| |
Net Increase in Net Assets Resulting from Operations | | $ | 44,326 | |
| | | | |
See accompanying Notes to Financial Statements.
10 OPPENHEIMER MONEY FUND/VA
STATEMENTS OF CHANGES IN NET ASSETS
| | | | | | | | |
| | | Year Ended | | | Year Ended | |
| | | December 31, 2014 | | | December 31, 2013 | |
| |
Operations | | | | | | | | |
Net investment income | | $ | 32,855 | | | $ | 18,234 | |
| |
Net realized gain | | | 11,471 | | | | 2,445 | |
| | | | | | | | |
Net increase in net assets resulting from operations | | | 44,326 | | | | 20,679 | |
| |
Dividends and/or Distributions to Shareholders | | | | | | | | |
Dividends from net investment income | | | (34,163) | | | | (24,504) | |
| | |
| | | | | | | | |
| |
Beneficial Interest Transactions | | | | | | | | |
Net increase in net assets resulting from beneficial interest transactions | | | 338,260,098 | | | | 2,601,903 | |
| | | | | | | | |
| |
Net Assets | | | | | | | | |
Total increase | | | 338,270,261 | | | | 2,598,078 | |
| |
Beginning of period | | | 177,026,403 | | | | 174,428,325 | |
| | | | | | | | |
End of period (including accumulated net investment income of $ 8,607 and $ 251, respectively) | | $ | 515,296,664 | | | $ | 177,026,403 | |
| | | | |
See accompanying Notes to Financial Statements.
11 OPPENHEIMER MONEY FUND/VA
FINANCIAL HIGHLIGHTS
| | | | | | | | | | | | | | | | | | | | |
| | | Year Ended
December 31,
2014 | | | Year Ended
December 31,
2013 | | | Year Ended
December 31,
2012 | | | Year Ended
December 30,
20111 | | | Year Ended
December 31,
2010 | |
| |
Per Share Operating Data | | | | | | | | | | | | | | | | | | | | |
Net asset value, beginning of period | | $ | 1.00 | | | $ | 1.00 | | | $ | 1.00 | | | $ | 1.00 | | | $ | 1.00 | |
| |
Income (loss) from investment operations -net investment income and net realized gain2 | | | 0.003 | | | | 0.003 | | | | 0.003 | | | | 0.003 | | | | 0.003 | |
| |
Dividends and/or distributions to shareholders: | | | | | | | | | | | | | | | | | | | | |
Dividends from net investment income | | | 0.003 | | | | 0.003 | | | | 0.003 | | | | 0.003 | | | | 0.003 | |
| |
Net asset value, end of period | | $ | 1 .00 | | | $ | 1 .00 | | | $ | 1 .00 | | | $ | 1 .00 | | | $ | 1 .00 | |
| | | | |
| | | | | | | | | | | | | | | | | | | | |
| | | | | | | | | | | | | | | | | | | | |
| | | | | | | | | | | | | | | | | | | | |
| |
Total Return, at Net Asset Value4 | | | 0.01% | | | | 0.01% | | | | 0.01% | | | | 0.01% | | | | 0.03% | |
| | | | | |
| | | | | | | | | | | | | | | | | | | | |
| |
Ratios/Supplemental Data | | | | | | | | | | | | | | | | | | | | |
Net assets, end of period (in thousands) | | $ | 515,297 | | | $ | 177,026 | | | $ | 174,428 | | | $ | 163,973 | | | $ | 149,697 | |
| |
Average net assets (in thousands) | | $ | 329,045 | | | $ | 178,263 | | | $ | 164,276 | | | $ | 156,127 | | | $ | 164,258 | |
| |
Ratios to average net assets:5 | | | | | | | | | | | | | | | | | | | | |
Net investment income | | | 0.01% | | | | 0.01% | | | | 0.01% | | | | 0.01% | | | | 0.01% | |
Total expenses6 | | | 0.57% | | | | 0.61% | | | | 0.62% | | | | 0.61% | | | | 0.61% | |
Expenses after payments, waivers and/or reimbursements and reduction to custodian expenses | | | 0.15% | | | | 0.22% | | | | 0.30% | | | | 0.29% | | | | 0.35% | |
1. December 30, 2011 represents the last business day of the Fund’s reporting period.
2. Per share amounts calculated based on the average shares outstanding during the period.
3. Less than $0.005 per share.
4. Assumes an initial investment on the business day before the first day of the fiscal period, with all dividends and distributions reinvested in additional shares on the reinvestment date, and redemption at the net asset value calculated on the last business day of the fiscal period. Total returns are not annualized for periods less than one full year. Total return information does not reflect expenses that apply at the separate account level or to related insurance products. Inclusion of these charges would reduce the total return figures for all periods shown. Returns do not reflect the deduction of taxes that a shareholder would pay on fund distributions or the redemption of fund shares.
5. Annualized for periods less than one full year.
6. Total expenses including indirect expenses from affiliated fund fees and expenses were as follows:
|
Year Ended December 31, 2014 0.57% |
See accompanying Notes to Financial Statements.
12 OPPENHEIMER MONEY FUND/VA
NOTES TO FINANCIAL STATEMENTS December 31, 2014
1. Organization
Oppenheimer Money Fund/VA (the “Fund”), a separate series of Oppenheimer Variable Account Funds, is a diversified open-end management investment company registered under the Investment Company Act of 1940 (“1940 Act”), as amended. The Fund’s investment objective is to seek income consistent with stability of principal. The Fund’s investment adviser is OFI Global Asset Management, Inc. (“OFI Global” or the “Manager”), a wholly-owned subsidiary of OppenheimerFunds Inc. (“OFI” or the “Sub-Adviser”). The Manager has entered into a sub-advisory agreement with OFI. Shares of the Fund are sold only to separate accounts of life insurance companies.
The following is a summary of significant accounting policies consistently followed by the Fund.
2. Significant Accounting Policies
Security Valuation. All investments in securities are recorded at their estimated fair value, as described in Note 3.
Dividends and Distributions to Shareholders. Dividends and distributions to shareholders, which are determined in accordance with income tax regulations and may differ from U.S. generally accepted accounting principles, are recorded on the ex-dividend date. Income distributions, if any, are declared daily and paid monthly. Capital gain distributions, if any, are declared and paid annually but may be paid at other times to maintain the net asset value per share at $1.00.
Investment Income. Interest income is recognized on an accrual basis. Discount and premium, which are included in interest income on the Statement of Operations, are amortized or accreted daily.
Custodian Fees. “Custodian fees and expenses” in the Statement of Operations may include interest expense incurred by the Fund on any cash overdrafts of its custodian account during the period. Such cash overdrafts may result from the effects of failed trades in portfolio securities and from cash outflows resulting from unanticipated shareholder redemption activity. The Fund pays interest to its custodian on such cash overdrafts, to the extent they are not offset by positive cash balances maintained by the Fund, at a rate equal to the Federal Funds Rate plus 0.50%. The “Reduction to custodian expenses” line item, if applicable, represents earnings on cash balances maintained by the Fund during the period. Such interest expense and other custodian fees may be paid with these earnings.
Security Transactions. Security transactions are recorded on the trade date. Realized gains and losses on securities sold are determined on the basis of identified cost.
Indemnifications. The Fund’s organizational documents provide current and former Trustees and officers with a limited indemnification against liabilities arising in connection with the performance of their duties to the Fund. In the normal course of business, the Fund may also enter into contracts that provide general indemnifications. The Fund’s maximum exposure under these arrangements is unknown as this would be dependent on future claims that may be made against the Fund. The risk of material loss from such claims is considered remote.
Federal Taxes. The Fund intends to comply with provisions of the Internal Revenue Code applicable to regulated investment companies and to distribute substantially all of its investment company taxable income to shareholders. Therefore, no federal income or excise tax provision is required. The Fund files income tax returns in U.S. federal and applicable state jurisdictions. The statute of limitations on the Fund’s tax return filings generally remain open for the three preceding fiscal reporting period ends.
The tax components of capital shown in the following table represent distribution requirements the Fund must satisfy under the income tax regulations, losses the Fund may be able to offset against income and gains realized in future years for federal income tax purposes.
| | | | | | | | |
Undistributed Net Investment Income | | Undistributed Long-Term Gain | | | Accumulated Loss Carryforward | |
| |
$31,968 | | | $— | | | | $— | |
Net investment income (loss) and net realized gain (loss) may differ for financial statement and tax purposes. The character of dividends and distributions made during the fiscal year from net investment income or net realized gains may differ from their ultimate characterization for federal income tax purposes. Also, due to timing of dividends and distributions, the fiscal year in which amounts are distributed may differ from the fiscal year in which the income or net realized gain was recorded by the Fund.
Accordingly, the following amounts have been reclassified for December 31, 2014. Net assets of the Fund were unaffected by the reclassifications.
| | | | | | | | |
Increase to Paid-in Capital | | Reduction to Accumulated Net Investment Loss | | | Reduction to Accumulated Net Realized Gain on Investments | |
| |
$1,807 | | | $9,664 | | | | $11,471 | |
13 OPPENHEIMER MONEY FUND/VA
NOTES TO FINANCIAL STATEMENTS Continued
2. Significant Accounting Policies (Continued)
The tax character of distributions paid during the years ended December 31, 2014 and December 31, 2013:
| | | | | | | | |
| | | Year Ended
December 31, 2014 | | | Year Ended
December 31, 2013 | |
| |
Distributions paid from: | | | | | | | | |
Ordinary income | | $ | 34,163 | | | $ | 24,504 | |
Use of Estimates. The preparation of financial statements in conformity with accounting principles generally accepted in the United States of America requires management to make estimates and assumptions that affect the reported amounts of assets and liabilities and disclosure of contingent assets and liabilities at the date of the financial statements and the reported amounts of increases and decreases in net assets from operations during the reporting period. Actual results could differ from those estimates.
3. Securities Valuation
The Fund calculates the net asset value of its shares as of the close of the New York Stock Exchange (the “Exchange”), normally 4:00 P.M. Eastern time, on each day the Exchange is open for trading.
The Fund’s Board has adopted procedures for the valuation of the Fund’s securities and has delegated the day-to-day responsibility for valuation determinations under those procedures to the Manager. The Manager has established a Valuation Committee which is responsible for determining a “fair valuation” for any security for which market quotations are not “readily available.” The Valuation Committee’s fair valuation determinations are subject to review, approval and ratification by the Fund’s Board at its next regularly scheduled meeting covering the calendar quarter in which the fair valuation was determined.
Valuation Methods and Inputs
Securities are valued at cost adjusted by the amortization of discount or premium to maturity (amortized cost), which approximates market value. If amortized cost is determined not to approximate market value, the fair value of the portfolio securities will be determined under procedures approved by the Fund’s Board of Trustees.
If a market value or price cannot be determined for a security using the methodologies described above, or if, in the “good faith” opinion of the Manager, the market value or price obtained does not constitute a “readily available market quotation,” or a significant event has occurred that would materially affect the value of the security the security is fair valued either (i) by a standardized fair valuation methodology applicable to the security type or the significant event as previously approved by the Valuation Committee and the Fund’s Board or (ii) as determined in good faith by the Manager’s Valuation Committee. The Valuation Committee considers all relevant facts that are reasonably available, through either public information or information available to the Manager, when determining the fair value of a security. Fair value determinations by the Manager are subject to review, approval and ratification by the Fund’s Board at its next regularly scheduled meeting covering the calendar quarter in which the fair valuation was determined. Those fair valuation standardized methodologies include, but are not limited to, valuing securities at the last sale price or initially at cost and subsequently adjusting the value based on: changes in company specific fundamentals, changes in an appropriate securities index, or changes in the value of similar securities which may be further adjusted for any discounts related to security-specific resale restrictions. When possible, such methodologies use observable market inputs such as unadjusted quoted prices of similar securities, observable interest rates, currency rates and yield curves. The methodologies used for valuing securities are not necessarily an indication of the risks associated with investing in those securities nor can it be assured that the Fund can obtain the fair value assigned to a security if it were to sell the security.
To assess the continuing appropriateness of security valuations, the Manager, or its third party service provider who is subject to oversight by the Manager, regularly compares prior day prices, prices on comparable securities, and sale prices to the current day prices and challenges those prices exceeding certain tolerance levels with the third party pricing service or broker source. For those securities valued by fair valuations, whether through a standardized fair valuation methodology or a fair valuation determination, the Valuation Committee reviews and affirms the reasonableness of the valuations based on such methodologies and fair valuation determinations on a regular basis after considering all relevant information that is reasonably available.
Classifications
Each investment asset or liability of the Fund is assigned a level at measurement date based on the significance and source of the inputs to its valuation. Various data inputs are used in determining the value of each of the Fund’s investments as of the reporting period end. These data inputs are categorized in the following hierarchy under applicable financial accounting standards:
1) Level 1-unadjusted quoted prices in active markets for identical assets or liabilities (including securities actively traded on a securities exchange)
2) Level 2-inputs other than unadjusted quoted prices that are observable for the asset or liability (such as unadjusted quoted prices for similar assets and market corroborated inputs such as interest rates, prepayment speeds, credit risks, etc.)
3) Level 3-significant unobservable inputs (including the Manager’s own judgments about assumptions that market participants would use in pricing the asset or liability).
The inputs used for valuing securities are not necessarily an indication of the risks associated with investing in those securities.
The table below categorizes amounts that are included in the Fund’s Statement of Assets and Liabilities as of December 31, 2014 based on valuation input level:
14 OPPENHEIMER MONEY FUND/VA
3. Securities Valuation (Continued)
| | | | | | | | | | | | | | | | |
| | | Level 1—
Unadjusted
Quoted Prices | | | Level 2— Other Significant
Observable Inputs | | | Level 3—
Significant
Unobservable
Inputs | | | Value | |
| |
Assets Table | | | | | | | | | | | | | | | | |
Investments, at Value: | | | | | | | | | | | | | | | | |
Certificates of Deposit | | $ | — | | | $ | 92,301,120 | | | $ | — | | | $ | 92,301,120 | |
Direct Bank Obligations | | | — | | | | 67,629,016 | | | | — | | | | 67,629,016 | |
Short-Term Notes/Commercial Paper | | | — | | | | 183,902,616 | | | | — | | | | 183,902,616 | |
Investment Company | | | 23,255,744 | | | | — | | | | — | | | | 23,255,744 | |
| | | | |
Total Assets | | $ | 23,255,744 | | | $ | 343,832,752 | | | $ | — | | | $ | 367,088,496 | |
| | | | |
4. Investments and Risks
Investment in Oppenheimer Institutional Money Market Fund. The Fund is permitted to invest daily available cash balances in an affiliated money market fund. The Fund may invest the available cash in Class E shares of Oppenheimer Institutional Money Market Fund (“IMMF”) to seek current income while preserving liquidity or for defensive purposes. IMMF is a registered open-end management investment company, regulated as a money market fund under the 1940 Act. The Manager is the investment adviser of IMMF, and the Sub-Adviser provides investment and related advisory services to IMMF. When applicable, the Fund’s investment in IMMF is included in the Statement of Investments. Shares of IMMF are valued at their net asset value per share. As a shareholder, the Fund is subject to its proportional share of IMMF’s Class E expenses, including its management fee. The Manager will waive fees and/or reimburse Fund expenses in an amount equal to the indirect management fees incurred through the Fund’s investment in IMMF.
5. Shares of Beneficial Interest
The Fund has authorized an unlimited number of $0.001 par value shares of beneficial interest of each class. Transactions in shares of beneficial interest were as follows:
| | | | | | | | | | | | | | | | |
| | | Year Ended December 31, 2014 | | | Year Ended December 31, 2013 | |
| | | Shares | | | Amount | | | Shares | | | Amount | |
| |
Sold | | | 1,568,851,985 | | | $ | 1,568,851,985 | | | | 101,203,375 | | | $ | 101,203,375 | |
Dividends and/or distributions reinvested | | | 34,163 | | | | 34,163 | | | | 24,504 | | | | 24,504 | |
Redeemed | | | (1,230,626,050 | ) | | | (1,230,626,050) | | | | (98,625,976 | ) | | | (98,625,976) | |
| | | | |
Net increase | | | 338,260,098 | | | $ | 338,260,098 | | | | 2,601,903 | | | $ | 2,601,903 | |
| | | | |
6. Fees and Other Transactions with Affiliates
Management Fees. Under the investment advisory agreement, the Fund pays the Manager a management fee based on the daily net assets of the Fund at an annual rate as shown in the following table:
| | |
| Fee Schedule | | |
|
Up to $500 million | | 0.450% |
Next $500 million | | 0.425 |
Next $500 million | | 0.400 |
Over $1.5 billion | | 0.375 |
The Fund’s management fee for the fiscal year ended December 31, 2014 was 0.44% of average annual net assets before any applicable waivers.
Sub-Adviser Fees. The Manager has retained the Sub-Adviser to provide the day-to-day portfolio management of the Fund. Under the Sub-Advisory Agreement, the Manager pays the Sub-Adviser an annual fee in monthly installments, equal to a percentage of the investment management fee collected by the Manager from the Fund, which shall be calculated after any investment management fee waivers. The fee paid to the Sub-Adviser is paid by the Manager, not by the Fund.
Transfer Agent Fees. OFI Global (the “Transfer Agent”) serves as the transfer and shareholder servicing agent for the Fund. The Fund pays the Transfer Agent a fee based on annual net assets. Fees incurred and average net assets for each class with respect to these services are detailed in the Statement of Operations and Financial Highlights, respectively.
Sub-Transfer Agent Fees. The Transfer Agent has retained Shareholder Services, Inc., a wholly-owned subsidiary of OFI (the “Sub-Transfer Agent”), to provide the day-to-day transfer agent and shareholder servicing of the Fund. Under the Sub-Transfer Agency Agreement, the Transfer Agent pays the Sub-Transfer Agent an annual fee in monthly installments, equal to a percentage of the transfer agent fee collected by the Transfer Agent from the Fund, which shall be calculated after any applicable fee waivers. The fee paid to the Sub-Transfer Agent is paid by the Transfer Agent, not by the Fund.
Trustees’ Compensation. The Fund’s Board of Trustees (“Board”) has adopted a compensation deferral plan for Independent Trustees that enables Trustees to elect to defer receipt of all or a portion of the annual compensation they are entitled to receive from the Fund. For purposes of determining the amount owed to the Trustee under the plan, deferred amounts are treated as though equal dollar amounts had been invested in shares of the Fund
15 OPPENHEIMER MONEY FUND/VA
NOTES TO FINANCIAL STATEMENTS Continued
6. Fees and Other Transactions with Affiliates (Continued)
or in other Oppenheimer funds selected by the Trustee. The Fund purchases shares of the funds selected for deferral by the Trustee in amounts equal to his or her deemed investment, resulting in a Fund asset equal to the deferred compensation liability. Such assets are included as a component of “Other” within the asset section of the Statement of Assets and Liabilities. Deferral of Trustees’ fees under the plan will not affect the net assets of the Fund and will not materially affect the Fund’s assets, liabilities or net investment income per share. Amounts will be deferred until distributed in accordance with the compensation deferral plan.
Waivers and Reimbursements of Expenses. The Manager has voluntarily undertaken to waive fees and/or reimburse expenses to the extent necessary to assist the Fund in attempting to maintain a positive yield. There is no guarantee that the Fund will maintain a positive yield. During the year ended December 31, 2014, the Manager waived fees and/or reimbursed the Fund $1,148,123.
The Manager has contractually agreed to limit the Fund’s expenses after payments, waivers and/or reimbursements and reduction to custodian expenses, excluding expenses incurred directly or indirectly by the Fund as a result of investments in other investment companies, wholly-owned subsidiaries and pooled investment vehicles; so that those expenses, as percentages of daily net assets, will not exceed the annual rate of 0.50%. As a result of this limitation, the Manager waived $230,475 for the reporting period ended December 31, 2014.
The Manager is permitted to recapture previously waived and/or reimbursed fees in any given fiscal year if the recapture would not: 1) cause the Fund to generate a negative daily yield, and 2) exceed amounts previously waived and/or reimbursed under this arrangement during the current and prior three fiscal years. The reimbursement to the Manager of such previous waivers and reimbursements would not include any portion of distribution and/or service fees. As of December 31, 2014, the following waived and/or reimbursed amounts are eligible for recapture:
| | | | |
| Expires | | | |
| |
December 31, 2016 | | | $486,156 | |
December 31, 2017 | | | $1,378,598 | |
The Manager has not recaptured any previously waived and/or reimbursed amounts during the year ended December 31, 2014.
The Manager will waive fees and/or reimburse Fund expenses in an amount equal to the indirect management fees incurred through the Fund’s investment in IMMF. During the year ended December 31, 2014, the Manager waived fees and/or reimbursed the Fund $7,946 for IMMF management fees.
These undertakings may be modified or terminated as set forth according to the terms in the prospectus.
7. Pending Litigation
In 2009, seven class action lawsuits were filed in the U.S. District Court for the District of Colorado against OppenheimerFunds, Inc. (“OFI”), OppenheimerFunds Distributor, Inc., the Fund’s principal underwriter and distributor (the “Distributor”), and certain funds (but not including the Fund) advised by OFI Global Asset Management, Inc. and distributed by the Distributor (the “Defendant Funds”). The lawsuits also named as defendants certain officers and current and former trustees of the respective Defendant Funds. The lawsuits raised claims under federal securities laws and alleged, among other things, that the disclosure documents of the respective Defendant Funds contained misrepresentations and omissions and that the respective Defendant Funds’ investment policies were not followed. The plaintiffs in these actions sought unspecified damages, equitable relief and awards of attorneys’ fees and litigation expenses. The Defendant Funds’ Boards of Trustees also engaged counsel to represent the Funds and the present and former Independent Trustees named in those suits. In March 2014, the parties in six of these lawsuits executed stipulations and agreements of settlement resolving those actions. In July 2014, the court entered an order and final judgment approving the settlements as fair, reasonable and adequate. The settlements do not resolve a seventh outstanding lawsuit relating to Oppenheimer Rochester California Municipal Fund (the “California Fund Suit”). OFI believes the California Fund Suit is without legal merit and is defending the suit vigorously. While it is premature to render any opinion as to the outcome in the California Fund Suit, or whether any costs that OFI may bear in defending the California Fund Suit might not be reimbursed by insurance, OFI believes the California Fund Suit should not impair the ability of OFI or the Distributor to perform their respective duties to the Fund, and that the outcome of the California Fund Suit should not have any material effect on the operations of any of the Oppenheimer funds.
16 OPPENHEIMER MONEY FUND/VA
REPORT OF INDEPENDENT REGISTERED PUBLIC ACCOUNTING FIRM
The Board of Trustees and Shareholders of Oppenheimer Variable Account Funds:
We have audited the accompanying statement of assets and liabilities of Oppenheimer Money Fund/VA (a separate series of Oppenheimer Variable Account Funds), including the statement of investments, as of December 31, 2014, and the related statement of operations for the year then ended, the statements of changes in net assets for each of the years in the two-year period then ended, and the financial highlights for each of the years in the five-year period then ended. These financial statements and financial highlights are the responsibility of the Fund’s management. Our responsibility is to express an opinion on these financial statements and financial highlights based on our audits.
We conducted our audits in accordance with the standards of the Public Company Accounting Oversight Board (United States). Those standards require that we plan and perform the audit to obtain reasonable assurance about whether the financial statements and financial highlights are free of material misstatement. An audit includes examining, on a test basis, evidence supporting the amounts and disclosures in the financial statements. Our procedures included confirmation of securities owned as of December 31, 2014, by correspondence with the custodian and transfer agent. An audit also includes assessing the accounting principles used and significant estimates made by management, as well as evaluating the overall financial statement presentation. We believe that our audits provide a reasonable basis for our opinion.
In our opinion, the financial statements and financial highlights referred to above present fairly, in all material respects, the financial position of Oppenheimer Money Fund/VA as of December 31, 2014, the results of its operations for the year then ended, the changes in its net assets for each of the years in the two-year period then ended, and the financial highlights for each of the years in the five-year period then ended, in conformity with U.S. generally accepted accounting principles.
KPMG LLP
Denver, Colorado
February 13, 2015
17 OPPENHEIMER MONEY FUND/VA
FEDERAL INCOME TAX INFORMATION Unaudited
In early 2015, if applicable, shareholders of record received information regarding all dividends and distributions paid to them by the Fund during calendar year 2014.
The foregoing information is presented to assist shareholders in reporting distributions received from the Fund to the Internal Revenue Service. Because of the complexity of the federal regulations which may affect your individual tax return and the many variations in state and local tax regulations, we recommend that you consult your tax advisor for specific guidance.
18 OPPENHEIMER MONEY FUND/VA
BOARD APPROVAL OF THE FUND’S INVESTMENT ADVISORY AND SUB-ADIVSORY AGREEMENTS Unaudited
The Fund has entered into an investment advisory agreement with OFI Global Asset Management, Inc. (“OFI Global” or the “Adviser”), a wholly-owned subsidiary of OppenheimerFunds, Inc. (“OFI” or the “Sub-Adviser”) (“OFI Global” and “OFI” together the “Managers”) and OFI Global has entered into a sub-advisory agreement with OFI whereby OFI provides investment sub-advisory services to the Fund (collectively, the “Agreements”). Each year, the Board of Trustees (the “Board”), including a majority of the independent Trustees, is required to determine whether to renew the Agreements. The Investment Company Act of 1940, as amended, requires that the Board request and evaluate, and that the Managers provide, such information as may be reasonably necessary to evaluate the terms of the Agreements. The Board employs an independent consultant to prepare a report that provides information, including comparative information that the Board requests for that purpose. In addition to in-person meetings focused on this evaluation, the Board receives information throughout the year regarding Fund services, fees, expenses and performance.
The Adviser, Sub-Adviser and the independent consultant provided information to the Board on the following factors: (i) the nature, quality and extent of the Managers’ services, (ii) the investment performance of the Fund and the Managers, (iii) the fees and expenses of the Fund, including comparative expense information, (iv) the profitability of the Managers and their affiliates, including an analysis of the cost of providing services, (v) whether economies of scale are realized as the Fund grows and whether fee levels reflect these economies of scale for Fund investors and (vi) other benefits to the Managers from their relationship with the Fund. The Board was aware that there are alternatives to retaining the Managers.
Outlined below is a summary of the principal information considered by the Board as well as the Board’s conclusions.
Nature, Quality and Extent of Services. The Board considered information about the nature, quality and extent of the services provided to the Fund and information regarding the Managers’ key personnel who provide such services. The Sub-Adviser’s duties include providing the Fund with the services of the portfolio managers and the Sub-Adviser’s investment team, who provide research, analysis and other advisory services in regard to the Fund’s investments; securities trading services; oversight of third-party service providers; monitoring compliance with applicable Fund policies and procedures and adherence to the Fund’s investment restrictions; and risk management. The Managers are responsible for providing certain administrative services to the Fund as well. Those services include providing and supervising all administrative and clerical personnel who are necessary in order to provide effective corporate administration for the Fund; compiling and maintaining records with respect to the Fund’s operations; preparing and filing reports required by the Securities and Exchange Commission; preparing periodic reports regarding the operations of the Fund for its shareholders; preparing proxy materials for shareholder meetings; and preparing the registration statements required by Federal and state securities laws for the sale of the Fund’s shares. The Managers also provide the Fund with office space, facilities and equipment.
The Board also considered the quality of the services provided and the quality of the Managers’ resources that are available to the Fund. The Board took account of the fact that the Sub-Adviser has had over fifty years of experience as an investment adviser and that its assets under management rank it among the top mutual fund managers in the United States. The Board evaluated the Sub-Adviser’s advisory, administrative, accounting, legal, compliance services and risk management, and information the Board has received regarding the experience and professional qualifications of the Managers’ key personnel and the size and functions of its staff. In its evaluation of the quality of the portfolio management services provided, the Board considered the experience of Christopher Proctor and Adam Wilde, the portfolio managers for the Fund, and the Sub-Adviser’s investment team and analysts. The Board members also considered the totality of their experiences with the Managers as directors or trustees of the Fund and other funds advised by the Managers. The Board considered information regarding the quality of services provided by affiliates of the Managers, which its members have become knowledgeable about in connection with the renewal of the Fund’s service agreements. The Board concluded, in light of the Managers’ experience, reputation, personnel, operations and resources that the Fund benefits from the services provided under the Agreements.
Investment Performance of the Fund, the Adviser and the Sub-Adviser. Throughout the year, the Manager provided information on the investment performance of the Fund, including comparative performance information. The Board also reviewed information, prepared by the Manager and by the independent consultant, comparing the Fund’s historical performance to relevant market indices and to the performance of other money market tax-free funds underlying variable insurance products. The Board considered that the Fund outperformed its performance category median during the one-, three-, five-, and ten-year periods. The Board also considered that the Fund performed in the first quintile of its performance category for the one- and ten-year periods and performed in the second quintile for the three- and five-year periods.
Costs of Services by the Adviser. The Board reviewed the fees paid to the Manager and the other expenses borne by the Fund. The Board noted that the Manager, not the Fund, pays the Sub-Adviser’s fee under the sub-advisory agreement. The independent consultant provided comparative data in regard to the fees and expenses of the Fund and other money market tax-free funds underlying variable insurance products. In reviewing the fees and expenses charged to the VA funds, the Board considered the Manager’s assertion that, because there is much greater disparity in the fees and services that may be provided by a manager to a VA fund as opposed to a retail fund, when comparing the expenses of the various VA funds to those of retail funds, it is most appropriate to focus on total expenses (rather than on the management fees). Accordingly, while the Board reviewed and considered all expenses, it focused on total expenses. The Board considered that the Fund’s total expenses were higher than its peer group median and category median. The Board also considered that the Fund’s contractual management fee was equal to its peer group median and category median. Within the total asset range of $100 million to $250 million, the Fund’s effective management fee rate was higher than its peer group median and category median. The Board noted that the Manager has contractually agreed to limit the Fund’s total annual operating expenses so that those expenses, as a percentage of daily net assets, will not exceed the annual rate of 0.50%. This contractual expense limitation may not be amended or withdrawn until one year after the date of the Fund’s prospectus, unless approved by the Board. The Board also considered that the Manager voluntarily agreed to waive fees to the extent necessary to help to attempt to maintain a positive yield, although there is no guarantee that the Fund will maintain a positive yield. This voluntary fee waiver may be amended or withdrawn at any time without prior notice to shareholders.
Economies of Scale and Profits Realized by the Adviser and Sub-Adviser. The Board considered information regarding the Managers’ costs in serving as the Fund’s investment adviser and sub-adviser, including the costs associated with the personnel and systems necessary to manage the Fund, and information regarding the Managers’ profitability from their relationship with the Fund. The Board reviewed whether the Managers may realize economies of scale in managing and supporting the Fund. The Board noted that the Fund currently has management fee breakpoints, which are intended to share with Fund shareholders economies of scale that may exist as the Fund’s assets grow.
19 OPPENHEIMER MONEY FUND/VA
BOARD APPROVAL OF THE FUND’S INVESTMENT ADVISORY AND SUB-ADIVSORY AGREEMENTS Unaudited / Continued
Other Benefits to the Managers. In addition to considering the profits realized by the Managers, the Board considered information that was provided regarding the direct and indirect benefits the Managers receive as a result of their relationship with the Fund, including compensation paid to the Managers’ affiliates. The Board also considered that the Managers must be able to pay and retain experienced professional personnel at competitive rates to provide quality services to the Fund.
Conclusions. These factors were also considered by the independent Trustees meeting separately from the full Board, assisted by experienced counsel to the Fund and to the independent Trustees. Fund counsel and the independent Trustees’ counsel are independent of the Managers within the meaning and intent of the Securities and Exchange Commission Rules.
Based on its review of the information it received and its evaluations described above, the Board, including a majority of the independent Trustees, decided to continue the Agreements through August 31, 2015. In arriving at its decision, the Board did not identify any factor or factors as being more important than others, but considered all of the above information, and considered the terms and conditions of the Agreements, including the management fees, in light of all the surrounding circumstances.
20 OPPENHEIMER MONEY FUND/VA
PORTFOLIO PROXY VOTING POLICIES AND PROCEDURES; UPDATES TO STATEMENTS OF INVESTMENTS Unaudited
The Fund has adopted Portfolio Proxy Voting Policies and Procedures under which the Fund votes proxies relating to securities (“portfolio proxies”) held by the Fund. A description of the Fund’s Portfolio Proxy Voting Policies and Procedures is available (i) without charge, upon request, by calling the Fund toll-free at 1.800.525.7048, (ii) on the Fund’s website at www.oppenheimerfunds.com, and (iii) on the SEC’s website at www.sec.gov. In addition, the Fund is required to file Form N-PX, with its complete proxy voting record for the 12 months ended June 30th, no later than August 31st of each year. The Fund’s voting record is available (i) without charge, upon request, by calling the Fund toll-free at 1.800.525.7048, and (ii) in the Form N-PX filing on the SEC’s website at www.sec.gov.
The Fund files its complete schedule of portfolio holdings with the SEC for the first quarter and the third quarter of each fiscal year on Form N-Q. The Fund’s Form N-Q filings are available on the SEC’s website at www.sec.gov. Those forms may be reviewed and copied at the SEC’s Public Reference Room in Washington, D.C. Information on the operation of the Public Reference Room may be obtained by calling 1-800-SEC-0330.
21 OPPENHEIMER MONEY FUND/VA
TRUSTEES AND OFFICERS Unaudited
| | |
Name, Position(s) Held with the Fund, Length of Service, Year of Birth | | Principal Occupation(s) During the Past 5 Years; Other Trusteeships/Directorships Held; Number of Portfolios in the Fund Complex Currently Overseen |
| |
| INDEPENDENT TRUSTEES | | The address of each Trustee in the chart below is 6803 S. Tucson Way, Centennial, Colorado 80112-3924. Each Trustee serves for an indefinite term, or until his or her resignation, retirement, death or removal. |
| |
Sam Freedman, Chairman of the Board of Trustees (since 2013) and Trustee (since 1996) Year of Birth: 1940 | | Director of Colorado UpLIFT (charitable organization) (since September 1984). Mr. Freedman held several positions with the Sub-Adviser and with subsidiary or affiliated companies of the Sub-Adviser (until October 1994). Oversees 38 portfolios in the OppenheimerFunds complex. Mr. Freedman has served on the Boards of certain Oppenheimer funds since 1996, during which time he has become familiar with the Fund’s (and other Oppenheimer funds’) financial, accounting, regulatory and investment matters and has contributed to the Boards’ deliberations. |
| |
Jon S. Fossel, Trustee (since 1990) Year of Birth: 1942 | | Chairman of the Board of Jack Creek Preserve Foundation (non-profit organization) (since 2005); Chairman of the Board (2006-December 2011) and Director (June 2002-December 2011) of UNUMProvident (insurance company); Director of Northwestern Energy Corp. (public utility corporation) (November 2004-December 2009); Director of P.R. Pharmaceuticals (October 1999-October 2003); Director of Rocky Mountain Elk Foundation (non-profit organization) (February 1998-February 2003 and February 2005-February 2007); Chairman and Director (until October 1996) and President and Chief Executive Officer (until October 1995) of the Sub-Adviser; President, Chief Executive Officer and Director of the following: Oppenheimer Acquisition Corp. (“OAC”) (parent holding company of the Sub-Adviser), Shareholder Services, Inc. and Shareholder Financial Services, Inc. (until October 1995). Oversees 38 portfolios in the OppenheimerFunds complex. Mr. Fossel has served on the Boards of certain Oppenheimer funds since 1990, during which time he has become familiar with the Fund’s (and other Oppenheimer funds’) financial, accounting, regulatory and investment matters and has contributed to the Boards’ deliberations. |
| |
Richard F. Grabish, Trustee (since 2012) Year of Birth: 1948 | | Formerly Senior Vice President and Assistant Director of Sales and Marketing (March 1997-December 2007), Director (March 1987-December 2007) and Manager of Private Client Services (June 1985-June 2005) of A.G. Edwards & Sons, Inc. (broker/dealer and investment firm); Chairman and Chief Executive Officer of A.G. Edwards Trust Company, FSB (March 2001-December 2007); President and Vice Chairman of A.G. Edwards Trust Company, FSB (investment adviser) (April 1987-March 2001); President of A.G. Edwards Trust Company, FSB (investment adviser) (June 2005-December 2007). Oversees 38 portfolios in the OppenheimerFunds complex. Mr. Grabish has served on the Boards of certain Oppenheimer funds since 2001, during which time he has become familiar with the Fund’s (and other Oppenheimer funds’) financial, accounting, regulatory and investment matters and has contributed to the Boards’ deliberations. |
| |
Beverly L. Hamilton, Trustee (since 2002) Year of Birth: 1946 | | Trustee of Monterey Institute for International Studies (educational organization) (since February 2000); Board Member of Middlebury College (educational organization) (December 2005-June 2011); Chairman (since 2010) of American Funds’ Emerging Markets Growth Fund, Inc. (mutual fund); Director of The California Endowment (philanthropic organization) (April 2002-April 2008); Director (February 2002-2005) and Chairman of Trustees (2006-2007) of the Community Hospital of Monterey Peninsula; Director (October 1991-2005); Vice Chairman (2006-2009) of American Funds’ Emerging Markets Growth Fund, Inc. (mutual fund); President of ARCO Investment Management Company (February 1991-April 2000); Member of the investment committees of The Rockefeller Foundation (2001-2006) and The University of Michigan (since 2000); Advisor at Credit Suisse First Boston’s Sprout venture capital unit (venture capital fund) (1994-January 2005); Trustee of MassMutual Institutional Funds (investment company) (1996-June 2004); Trustee of MML Series Investment Fund (investment company) (April 1989-June 2004); Member of the investment committee of Hartford Hospital (2000-2003); and Advisor to Unilever (Holland) pension fund (2000-2003). Oversees 38 portfolios in the OppenheimerFunds complex. Ms. Hamilton has served on the Boards of certain Oppenheimer funds since 2002, during which time she has become familiar with the Fund’s (and other Oppenheimer funds’) financial, accounting, regulatory and investment matters and has contributed to the Boards’ deliberations. |
| |
Victoria J. Herget, Trustee (since 2012) Year of Birth: 1951 | | Board Chair (2008-Present) and Director (2004-Present), United Educators (insurance company); Trustee (since 2000) and Chair (since 2010), Newberry Library (independent research library); Trustee, Mather LifeWays (senior living organization) (since 2001); Independent Director of the First American Funds (mutual fund family) (2003-2011); former Managing Director (1993-2001), Principal (1985-1993), Vice President (1978-1985) and Assistant Vice President (1973-1978) of Zurich Scudder Investments (investment adviser) (and its predecessor firms); Trustee (1992-2007), Chair of the Board of Trustees (1999-2007), Investment Committee Chair (1994-1999) and Investment Committee member (2007-2010) of Wellesley College; Trustee, BoardSource (non-profit organization) (2006-2009) and Chicago City Day School (K-8 School) (1994-2005). Oversees 38 portfolios in the OppenheimerFunds complex. Ms. Herget has served on the Boards of certain Oppenheimer funds since 2012, during which time she has become familiar with the Fund’s (and other Oppenheimer funds’) financial, accounting, regulatory and investment matters and has contributed to the Boards’ deliberations. |
| |
Robert J. Malone, Trustee (since 2002) Year of Birth: 1944 | | Chairman of the Board (since 2012) and Director (since August 2005) of Jones International University (educational organization); Chairman, Chief Executive Officer and Director of Steele Street Bank Trust (commercial banking) (since August 2003); Trustee of the Gallagher Family Foundation (non-profit organization) (since 2000); Board of Directors of Opera Colorado Foundation (non-profit organization) (2008-2012); Director of Colorado UpLIFT (charitable organization) (1986-2010); Director of Jones Knowledge, Inc. (2006-2010); Former Chairman of U.S. Bank-Colorado (subsidiary of U.S. Bancorp and formerly Colorado National Bank) (July 1996-April 1999); Director of Commercial Assets, Inc. (real estate investment trust) (1993-2000); Director of U.S. Exploration, Inc. (oil and gas exploration) (1997-February 2004); Chairman of the Board (1991-1994) and Trustee (1985-1994) of Regis University; and Chairman of the Board (1990-1991 and Trustee (1984-1999) of Young Presidents Organization. Oversees 38 portfolios in the OppenheimerFunds complex. Mr. Malone has served on the Boards of certain Oppenheimer funds since 2002, during which time he has become familiar with the Fund’s (and other Oppenheimer funds’) financial, accounting, regulatory and investment matters and has contributed to the Boards’ deliberations. |
22 OPPENHEIMER MONEY FUND/VA
| | |
F. William Marshall, Jr., Trustee (since 2000) Year of Birth: 1942 | | Trustee Emeritus of Worcester Polytech Institute (WPI) (private university) (since 2009); Trustee of MassMutual Select Funds (formerly MassMutual Institutional Funds) (investment company) (since 1996), MML Series Investment Fund (investment company) (since 1996) and Mass Mutual Premier Funds (investment company) (since January 2012); President and Treasurer of the SIS Fund (private charitable fund) (January 1999 – March 2011); Former Trustee of WPI (1985-2008); Former Chairman of the Board (2004-2006) and Former Chairman of the Investment Committee of WPI (1994-2008); Chairman of SIS & Family Bank, F.S.B. (formerly SIS Bank) (commercial bank) (January 1999-July 1999); Executive Vice President of Peoples Heritage Financial Group, Inc. (commercial bank) (January 1999-July 1999); and Former President and Chief Executive Officer of SIS Bancorp. (1993-1999). Oversees 42 portfolios in the OppenheimerFunds complex. Mr. Marshall has served on the Boards of certain Oppenheimer funds since 2000, during which time he has become familiar with the Fund’s (and other Oppenheimer funds’) financial, accounting, regulatory and investment matters and has contributed to the Boards’ deliberations. |
| |
Karen L. Stuckey, Trustee (since 2012) Year of Birth: 1953 | | Partner (1990-2012) of PricewaterhouseCoopers LLP (professional services firm) (held various positions 1975- 1990); Trustee (1992-2006) and member of Executive, Nominating and Audit Committees and Chair of Finance Committee of Lehigh University; and member, Women’s Investment Management Forum (professional organization) since inception. Oversees 38 portfolios in the OppenheimerFunds complex. Ms. Stuckey has served on the Boards of certain Oppenheimer funds since 2012, during which time she has become familiar with the Fund’s (and other Oppenheimer funds’) financial, accounting, regulatory and investment matters and has contributed to the Boards’ deliberations. |
| |
James D. Vaughn, Trustee (since 2012) Year of Birth: 1945 | | Retired; former managing partner (1994-2001) of Denver office of Deloitte & Touche LLP, (held various positions 1969-1993); Trustee and Chairman of the Audit Committee of Schroder Funds (2003-2012); Board member and Chairman of Audit Committee of AMG National Trust Bank (since 2005); Trustee and Investment Committee member, University of South Dakota Foundation (since 1996); Board member, Audit Committee Member and past Board Chair, Junior Achievement (since 1993); former Board member, Mile High United Way, Boys and Girls Clubs, Boy Scouts, Colorado Business Committee for the Arts, Economic Club of Colorado and Metro Denver Network. Oversees 38 portfolios in the OppenheimerFunds complex. Mr. Vaughn has served on the Boards of certain Oppenheimer funds since 2012, during which time he has become familiar with the Fund’s (and other Oppenheimer funds’) financial, accounting, regulatory and investment matters and has contributed to the Boards’ deliberations. |
| | |
| INTERESTED TRUSTEE | | Mr. Glavin is an “Interested Trustee” because he is affiliated with the Manager and the Sub-Adviser by virtue of his positions as director of the Sub-Adviser, and as a shareholder of the Sub-Adviser’s parent company. As a Trustee, he serves for an indefinite term, or until his resignation, retirement, death or removal. Mr. Glavin’s address is 225 Liberty Street, 11th Floor, New York, New York 10281-1008. |
| |
William F. Glavin, Jr., Trustee (since 2009) Year of Birth: 1958 | | Chairman of the Sub-Adviser (July 2014-December 2014 and December 2009-December 2012) and Director of the Sub-Adviser (since January 2009); Chairman, Director and Chief Executive Officer (January 2013-June 2014) of the Manager; President of the Manager (January 2013-May 2013); Chief Executive Officer (January 2009-December 2012); President of the Sub-Adviser (May 2009-December 2012); Management Director (June 2009-June 2014), President (December 2009-June 2014) and Chief Executive Officer (January 2011-June 2014) of Oppenheimer Acquisition Corp. (“OAC”) (the Sub-Adviser’s parent holding company); Director of Oppenheimer Real Asset Management, Inc. (March 2010-June 2014); Executive Vice President (March 2006-February 2009) and Chief Operating Officer (July 2007-February 2009) of Massachusetts Mutual Life Insurance Company (OAC’s parent company); Director (May 2004-March 2006) and Chief Operating Officer and Chief Compliance Officer (May 2004-January 2005), President (January 2005-March 2006) and Chief Executive Officer (June 2005-March 2006) of Babson Capital Management LLC; Director (March 2005-March 2006), President (May 2003-March 2006) and Chief Compliance Officer (July 2005-March 2006) of Babson Capital Securities, Inc. (a broker-dealer); President (May 2003-March 2006) of Babson Investment Company, Inc.; Director (May 2004-August 2006) of Babson Capital Europe Limited; Director (May 2004-October 2006) of Babson Capital Guernsey Limited; Director (May 2004-March 2006) of Babson Capital Management LLC; Non-Executive Director (March 2005-March 2007) of Baring Asset Management Limited; Director (February 2005-June 2006) Baring Pension Trustees Limited; Director and Treasurer (December 2003-November 2006) of Charter Oak Capital Management, Inc.; Director (May 2006-September 2006) of C.M. Benefit Insurance Company; Director (May 2008-June 2009) and Executive Vice President (June 2007-July 2009) of C.M. Life Insurance Company; President (March 2006-May 2007) of MassMutual Assignment Company; Director (January 2005-December 2006), Deputy Chairman (March 2005-December 2006) and President (February 2005-March 2005) of MassMutual Holdings (Bermuda) Limited; Director (May 2008-June 2009) and Executive Vice President (June 2007-July 2009) of MML Bay State Life Insurance Company; Chief Executive Officer and President (April 2007-January 2009) of MML Distributors, LLC; and Chairman (March 2006-December 2008) and Chief Executive Officer (May 2007-December 2008) of MML Investors Services, Inc. An officer of 91 portfolios in the OppenheimerFunds complex. Mr. Glavin has served on the Boards of certain Oppenheimer funds since December 2009, during which time he has become familiar with the Fund’s (and other Oppenheimer funds’) financial, accounting, regulatory and investment matters and has contributed to the Boards’ deliberations. |
| | |
| OTHER OFFICERS OF THE FUND | | The addresses of the Officers in the chart below are as follows: for Messrs. Steinmetz, Gabinet, Mss. Sexton and Picciotto, 225 Liberty Street, New York, New York 10281-1008, for Messrs. Proctor, Wilde and Wixted, 6803 S. Tucson Way, Centennial, Colorado 80112-3924. Each Officer serves for an indefinite term or until his or her resignation, retirement, death or removal. |
23 OPPENHEIMER MONEY FUND/VA
TRUSTEES AND OFFICERS Unaudited / Continued
| | |
Christopher Proctor, Vice President (since 2010) Year of Birth: 1968 | | Head of the Cash Strategies Team (since July 2013); Senior Vice President of the Sub-Adviser (since July 2013) and Senior Portfolio Manager of the Sub-Adviser (since January 2010). Vice President of the Sub-Adviser (August 2008-July 2013). Vice President at Calamos Asset Management (January 2007-March 2008) and Scudder-Kemper Investments (1999-2002). Managing Director and Co-Founder of Elmhurst Capital Management (June 2004-January 2007); Senior Manager of Research for Etrade Global Asset Management (2002-2004). A portfolio manager and officer of other portfolios in the OppenheimerFunds complex. |
| |
Adam S. Wilde, Vice President (since 2013) Year of Birth: 1978 | | Mr. Wilde has been a Vice President of the Sub-Adviser since May 2011 and a Portfolio Manager of the Sub-Adviser since July 2013. He served as the head of credit research for the cash strategies team of the Sub-Adviser from 2011 to 2013, and as an Assistant Vice President and senior research analyst of the Sub-Adviser from 2008 to 2011. Mr. Wilde served as an intermediate research analyst of the Sub-Adviser from 2007 to 2008 and served in other analyst roles of the Sub-Adviser since 2002. Mr. Wilde joined the Sub-Adviser in 2001. A portfolio manager and officer of other portfolios in the OppenheimerFunds complex. |
| |
Arthur P. Steinmetz, President and Principal Executive Officer (since 2014) Year of Birth: 1958 | | Chairman of the Sub-Adviser (since January 2015); CEO and Chairman of the Manager (since July 2014), President of the Manager (since May 2013), a Director of the Manager (since January 2013), Director of the Sub-Adviser (since July 2014), President, Management Director and CEO of Oppenheimer Acquisition Corp. (the Sub-Adviser’s parent holding company) (since July 2014), and President and Director of OFI SteelPath, Inc. (since January 2013). Chief Investment Officer of the OppenheimerFunds advisory entities from (January 2013-December 2013); Executive Vice President of the Manager (January 2013-May 2013); Chief Investment Officer of the Sub-Adviser (October 2010-December 2012); Chief Investment Officer, Fixed-Income, of the Sub-Adviser (April 2009-October 2010); Executive Vice President of the Sub-Adviser (October 2009-December 2012); Director of Fixed Income of the Sub-Adviser (January 2009-April 2009); and a Senior Vice President of the Sub-Adviser (March 1993-September 2009). An officer of 91 portfolios in the OppenheimerFunds complex. |
| |
Arthur S. Gabinet, Secretary and Chief Legal Officer (since 2011) Year of Birth: 1958 | | Executive Vice President, Secretary and General Counsel of the Manager (since January 2013); General Counsel OFI SteelPath, Inc. (since January 2013); Executive Vice President (May 2010-December 2012) and General Counsel (since January 2011) of the Sub-Adviser; General Counsel of the Distributor (since January 2011); General Counsel of Centennial Asset Management Corporation (January 2011-December 2012); Executive Vice President (January 2011-December 2012) and General Counsel of HarbourView Asset Management Corporation (since January 2011); Assistant Secretary (since January 2011) and Director (since January 2011) of OppenheimerFunds International Ltd. and OppenheimerFunds plc; Director of Oppenheimer Real Asset Management, Inc. (January 2011-December 2012) and General Counsel (since January 2011); Executive Vice President (January 2011-December 2011) and General Counsel of Shareholder Financial Services, Inc. and Shareholder Services, Inc. (since January 2011); Executive Vice President (January 2011-December 2012) and General Counsel of OFI Private Investments Inc. (since January 2011); Vice President of OppenheimerFunds Legacy Program (January 2011-December 2011); Executive Vice President (January 2011-December 2012) and General Counsel of OFI Institutional Asset Management, Inc. (since January 2011); General Counsel, Asset Management of the Sub-Adviser (May 2010-December 2010); Principal, The Vanguard Group (November 2005-April 2010); District Administrator, U.S. Securities and Exchange Commission (January 2003-October 2005). An officer of 91 portfolios in the OppenheimerFunds complex. |
| |
Jennifer Sexton, Vice President and Chief Business Officer (since 2014) Year of Birth: 1969 | | Senior Vice President of OppenheimerFunds Distributor, Inc. (since June 2014); Vice President of OppenheimerFunds Distributor, Inc. (April 2006-June 2014); Vice President of the Sub-Adviser (January 1998-March 2006); Assistant Vice President of the Sub-Adviser (October 1991-December 1998). An officer of 91 portfolios in the OppenheimerFunds complex. |
| |
Mary Ann Picciotto, Chief Compliance Officer and Chief Anti-Money Laundering Officer (since 2014) Year of Birth: 1973 | | Senior Vice President and Chief Compliance Officer of the Manager (since March 2014); Chief Compliance Officer of the Sub-Adviser, OFI SteelPath, Inc., OFI Global Trust Company, OFI Global Institutional, Inc., Oppenheimer Real Asset Management, Inc., OFI Private Investments, Inc., Harborview Asset Management Corporation, Trinity Investment Management Corporation, and Shareholder Services, Inc. (since March 2014); Managing Director of Morgan Stanley Investment Management Inc. and certain of its various affiliated entities; Chief Compliance Officer of various Morgan Stanley Funds (May 2010-January 2014); Chief Compliance Officer of Morgan Stanley Investment Management Inc. (April 2007-January 2014). An officer of 91 portfolios in the OppenheimerFunds complex. |
| |
Brian W. Wixted, Treasurer and Principal Financial & Accounting Officer (since 1999) Year of Birth: 1959 | | Senior Vice President of the Manager (since January 2013); Treasurer of the Sub-Adviser, HarbourView Asset Management Corporation, Shareholder Financial Services, Inc., Shareholder Services, Inc., and Oppenheimer Real Asset Management, Inc. (March 1999-June 2008), OFI Private Investments, Inc. (March 2000-June 2008), OppenheimerFunds International Ltd. and OppenheimerFunds plc (since May 2000), OFI Institutional Asset Management, Inc. (November 2000-June 2008), and OppenheimerFunds Legacy Program (charitable trust program established by the Sub-Adviser) (June 2003-December 2011); Treasurer and Chief Financial Officer of OFI Trust Company (since May 2000); Assistant Treasurer of Oppenheimer Acquisition Corporation (March 1999-June 2008). An officer of 91 portfolios in the OppenheimerFunds complex. |
The Fund’s Statement of Additional Information contains additional information about the Fund’s Trustees and Officers and is available without charge, upon request, by calling 1.800.988.8287.
24 OPPENHEIMER MONEY FUND/VA
THIS PAGE INTENTIONALLY LEFT BLANK.
25 OPPENHEIMER MONEY FUND/VA
THIS PAGE INTENTIONALLY LEFT BLANK.
26 OPPENHEIMER MONEY FUND/VA
THIS PAGE INTENTIONALLY LEFT BLANK.
27 OPPENHEIMER MONEY FUND/VA
OPPENHEIMER MONEY FUND/VA
A Series of Oppenheimer Variable Account Funds
| | |
| Manager | | OFI Global Asset Management, Inc. |
| |
| Sub-Adviser | | OppenheimerFunds, Inc. |
| |
| Distributor | | OppenheimerFunds Distributor, Inc. |
| |
| Transfer and | | OFI Global Asset Management, Inc. |
| Shareholder | | |
| Servicing Agent | | |
| |
| Sub-Transfer Agent | | Shareholder Services, Inc. |
| | DBA OppenheimerFunds Services |
| |
| Independent | | KPMG LLP |
| Registered | | |
| Public | | |
| Accounting | | |
| Firm | | |
| |
| Counsel | | K&L Gates LLP |
| |
| | Before investing in any of the Oppenheimer funds, investors should carefully consider a fund’s investment objectives, risks, charges and expenses. Fund prospectuses and summary prospectuses contain this and other information about the funds, and may be obtained by asking your financial advisor, or calling us at 1.800.988.8287. Read prospectuses and summary prospectuses carefully before investing. |
| |
| | © 2015 OppenheimerFunds, Inc. All rights reserved. Oppenheimer funds are distributed by OppenheimerFunds Distributor, Inc. |

| | |
| | 
|
| | December 31, 2014 |

|
| | ANNUAL REPORT Listing of Top Holdings Fund Performance Discussion Financial Statements |
PORTFOLIO MANAGERS: Michael Mata1, Krishna Memani, Sara J. Zervos, Ph.D. and Jack Brown, CFA
AVERAGE ANNUAL TOTAL RETURNS FOR THE PERIODS ENDED 12/31/14
| | | | | | | | | | | | | | |
| | | Inception
Date | | 1-Year | | | 5-Year | | | 10-Year | |
Non-Service Shares | | 5/3/93 | | | 2.84 | % | | | 6.22 | % | | | 5.25 | % |
Service Shares | | 3/19/01 | | | 2.49 | | | | 5.94 | | | | 4.99 | |
Barclays U.S. Aggregate Bond Index | | | | | 5.97 | | | | 4.45 | | | | 4.71 | |
Citigroup World Government Bond Index | | | | | -0.48 | | | | 1.67 | | | | 3.08 | |
Citigroup Non U.S. World Government Bond Index | | | | | -2.68 | | | | 0.85 | | | | 2.64 | |
J.P. Morgan Domestic High Yield Index | | | | | 2.18 | | | | 9.38 | | | | 7.87 | |
Reference Index | | | | | 1.36 | | | | 4.52 | | | | 4.92 | |
Performance data quoted represents past performance, which does not guarantee future results. The investment return and principal value of an investment in the Fund will fluctuate so that an investor’s shares, when redeemed, may be worth more or less than their original cost. Current performance and expense ratios may be lower or higher than the data quoted. For performance data current to the most recent month end, call us at 1.800.988.8287. The Fund’s total returns should not be expected to be the same as the returns of other funds, whether or not both funds have the same portfolio managers and/or similar names. The Fund’s total returns include changes in share price and reinvested distributions but do not include the charges associated with the separate account products that offer this Fund. Such performance would have been lower if such charges were taken into account.
| | | | |
PORTFOLIO ALLOCATION | | | | |
Non-Convertible Corporate Bonds and Notes | | | 49.6 | % |
Mortgage-Backed Obligations | | | | |
Government Agency | | | 7.4 | |
Non-Agency | | | 8.2 | |
Foreign Government Obligations | | | 13.3 | |
Investment Companies | | | | |
Oppenheimer Institutional Money Market Fund | | | 2.5 | |
Oppenheimer Master Event-Linked Bond Fund, LLC | | | 2.1 | |
Oppenheimer Master Loan Fund, LLC | | | 5.6 | |
Oppenheimer Ultra-Short Duration Fund | | | 2.1 | |
Corporate Loans | | | 3.7 | |
Asset-Backed Securities | | | 2.3 | |
U.S. Government Obligations | | | 1.5 | |
Structured Securities | | | 0.8 | |
Short-Term Notes | | | 0.4 | |
Preferred Stocks | | | 0.2 | |
Common Stocks | | | 0.2 | |
Over-the-Counter Options Purchased | | | 0.1 | |
Exchange-Traded Options Purchased | | | —* | |
Over-the-Counter Interest Rate Swaptions Purchased | | | —* | |
Rights, Warrants and Certificates | | | — | |
* Represents less than 0.005%.
Portfolio holdings and allocations are subject to change. Percentages are as of December 31, 2014, and are based on the total market value of investments.
1. Michael Mata became a portfolio manager in November 2014.
| | | | | |
CREDIT RATING BREAKDOWN | | | | NRSRO ONLY TOTAL | |
AAA | | | | 11.3% | |
AA | | | | 1.3 | |
A | | | | 5.2 | |
BBB | | | | 20.9 | |
BB | | | | 18.6 | |
B | | | | 22.5 | |
CCC | | | | 7.9 | |
CC | | | | 0.4 | |
C | | | | 0.0 | |
D | | | | 0.4 | |
Unrated | | | | 11.0 | |
Total | | | | 100.0% | |
The percentages above are based on the market value of the Fund’s securities as of December 31, 2014, and are subject to change. Except for securities labeled “Unrated,” and except for certain securities issued or guaranteed by a foreign sovereign, all securities have been rated by at least one Nationally Recognized Statistical Rating Organization (“NRSRO”), such as Standard & Poor’s (“S&P”). For securities rated only by an NRSRO other than S&P, OppenheimerFunds, Inc. (the “Sub-Adviser”) converts that rating to the equivalent S&P rating. If two or more NRSROs have assigned a rating to a security, the highest S&P equivalent rating is used. Unrated securities issued or guaranteed by a foreign sovereign are assigned a credit rating equal to the highest NRSRO rating assigned to that foreign sovereign. For securities not rated by an NRSRO, the Sub-Adviser uses its own credit analysis to assign ratings in categories similar to those of S&P. The use of similar categories is not an indication that the Sub-Adviser’s credit analysis process is consistent or comparable with any NRSRO’s process were that NRSRO to rate the same security. Fund assets invested in Oppenheimer Institutional Money Market Fund are assigned that fund’s S&P rating, which is currently AAA. For the purposes of this table, “investment-grade” securities are securities rated within the NRSROs’ four highest rating categories (AAA, AA, A and BBB). Unrated securities do not necessarily indicate low credit quality, and may or may not be the equivalent of investment-grade. Please consult the Fund’s prospectus and Statement of Additional Information for further information.
2 OPPENHEIMER GLOBAL STRATEGIC INCOME FUND/VA
Fund Performance Discussion
The Fund’s Non-Service shares produced a total return of 2.84% during the reporting period. In comparison, the Fund outperformed the 1.36% return of its Reference Index (the “Index”), which currently is comprised of the following broad-based securities indices: 40% Citigroup Non-U.S. World Government Bond Index, 30% J.P. Morgan Domestic High Yield Index, and 30% Barclays U.S. Aggregate Bond Index. The Fund’s investments in U.S. mortgage-backed securities (“MBS”) and its low foreign currency exposure helped drive its outperformance versus the Index.
MARKET OVERVIEW
To start 2014, the U.S. Federal Reserve (the “Fed”) began reducing its monthly purchases of U.S. government Treasuries and mortgage-backed securities (“MBS”) in steady $10 billion increments, and completed the process at the end of October, thereby ending the quantitative easing (“QE”) program’s purchases. Tapering the QE program in increments helped reduce market volatility and enabled investors to prepare for a post-QE market environment. Although data in the U.S. softened for the first quarter, partially attributed to cold weather effects across much of the country, it was positive in the second and third quarters of 2014, with Gross Domestic Product (“GDP”) growing at 4.6% and an estimated 5.0%, respectively.
While economic growth in the U.S. remained largely on track, it slowed in other areas, including Europe, parts of both Latin America and Asia Pacific. Interest rates in core Europe dropped significantly, and turned negative in many cases. The U.S. dollar rallied strongly against most currencies, but especially the Russian ruble, Brazilian real, the euro, and Japanese yen. In many cases, the large move in currencies represented buying of the U.S. dollar due to a positive U.S. economic outlook compared to weakening growth prospects elsewhere, in addition to anticipated higher rates in the U.S. The euro was challenged by persistent weakness in Europe and elevated concerns about deflation. Other nations faced headwinds as well. Japan’s economy remained moribund while Brazil faced a quadruple threat of recession, election uncertainty, inflation and a current account deficit. Falling commodity prices pressured natural resource exporters like Brazil, Russia and Australia. Russia was also under pressure due to sanctions related to hostilities in eastern Ukraine and Crimea, and the precipitous drop in oil prices. Even countries with positive economic fundamentals saw their currencies drop versus the dollar. Finally, the Chinese central bank moved to inject liquidity into the economy.
FUND REVIEW
The Fund received strong absolute and relative results from mortgages this reporting period. These investment-grade securities offered relatively attractive yields, sparking greater demand when investors resumed their search for more competitive levels of current income. However, we began to reduce the Fund’s exposure to MBS during the reporting period when valuations rose to richer levels and re-allocated the capital into high yield. The Fund’s investments in mortgages at period end included new vintage collateralized mortgage-backed securities (“CMBS”) and some older subprime CMBS. Although high yield spreads are tighter than they were a year ago, we continue to believe high yield has some of the most attractive fundamentals in the fixed income universe. The high yield portfolio produced positive absolute results during the reporting period. However, the high yield portfolio underperformed the J.P. Morgan Domestic High Yield Index. The sharp drop in oil hurt our positions in the energy sector, where we had an approximate 5.5% exposure in the portfolio. We expect to reduce that exposure to roughly 4% in the near term. Overall, the Fund has maintained a focus on lower-rated bonds at period end, favoring B-rated bonds over BB-rated bonds, and also maintained an allocation to CCC-rated bonds. While the performance of lower-rated bonds was positive on an absolute basis, this positioning detracted from performance versus the J.P. Morgan Domestic High Yield Index as lower-rated bonds generally underperformed higher-rated bonds.
Our allocation to European credit and our lack of exposure to developed market sovereign debt also contributed to performance this reporting period. In addition, our low foreign currency exposure benefited performance as the U.S. dollar rallied steadily. The Fund’s overall exposure to foreign currencies has been below neutral for some time. We analyze our currency exposures from a total return perspective, and recognize that while emerging market rates may look attractive, emerging market currency exposure subjects the portfolio to significant volatility. In light of this, and consistent with our overall assessment of the market, we expect our emerging market foreign currency exposure to fluctuate around zero for the foreseeable future—sometimes marginally positive, sometimes flat and sometimes net short. After the U.S. dollar’s strong performance in 2014, we currently have a preference for relative value trades in currencies rather than outright short positions. We continue to have much higher conviction in our views on credit than on currencies.
Finally, we ended the reporting period with duration at 3.85 years, or roughly 2.2 years shorter than the Index. We analyze duration by interest rate curve, and much of our short position comes from our minimal exposure to European and Japanese sovereign debt. Our duration from U.S. exposures is roughly 3.5 years, slightly longer than the U.S. component of the Index. As a result, a rise in U.S. rates would probably not hurt the Fund’s performance meaningfully, although a significant widening of spreads could. Our short duration positioning contributed to performance in 2013 but detracted in 2014 as rates rallied. While we expect rates to oscillate between 1.50% and 2.00% in early 2015, over time we expect rates to rise, although with some volatility. As a result, we expect to be
3 OPPENHEIMER GLOBAL STRATEGIC INCOME FUND/VA
short duration versus the Index for some time. As a reminder, the investment team generally buys the bonds it wants to own, and then independently adjusts duration to the level it wants.
STRATEGY & OUTLOOK
As we enter 2015, the U.S. economy continues to show momentum while growth is slowing in many other parts of the world. Geopolitical risk remains elevated ahead of Greek elections and the European Central Bank’s (“ECB”) announcement of the details on its QE program. In addition, commodity producers (including Russia and Brazil) are coming under increasing pressure from the sharp drop in oil and other commodities. We expect the market to trend sideways in the first quarter of 2015 and believe the ride could get bumpier. We believe the market will continue to react strongly to changes in expectations about the rate of growth in the U.S. and how aggressive the Fed is when it starts to tighten. We expect that tightening to begin in mid to later 2015, but we believe the risks are tilted toward the Fed’s raising rates less, and doing so later, than the market currently expects. (We expect to see a greater rise in rates in 2016.) We also anticipate the dollar will continue strengthening, although we believe it will pause along the way against various currencies. This should be a good environment for credit and spread products. If our views prove correct, our long position in credit, our short duration posture and our minimal exposure to foreign currencies have the potential to help performance. Our highest conviction views are in credit, and they are expressed clearly in the portfolio. We continue to believe interest rates are headed higher over time, probably over a matter of years. While we do not expect them to spike meaningfully in the near term, we can reduce duration further if needed.
Finally, we believe most key policy changes this year will likely originate elsewhere, not in the U.S. The Fed was on a steady path of tapering, it concluded the latest round of QE on schedule, and we expect there will be consistency in domestic monetary policy. We anticipate potentially positive changes coming from other regions. For example, the ECB could surprise with a larger or more effective QE program than the market currently expects to address anemic growth and low inflation in Europe. Japan has gone “all in” on its aggressive economic policies (Abenomics) as that country struggles to emerge from its fourth recession in six years. China had a surprise rate cut in the fourth quarter, and we expect more monetary and fiscal stimulus in 2015. India and Switzerland also surprised the markets in early 2015 with rate cuts of their own in an effort to stimulate growth. A number of emerging market countries are at or near the end of their tightening cycles and contemplating a move toward easing. We believe the portfolio is currently positioned to benefit in each of these scenarios.
Investors should consider the Fund’s investment objective, risks, charges and expenses carefully before investing. The Fund’s prospectus and summary prospectus contain this and other information about the Fund, and may be obtained by asking your financial advisor or calling us at 1.800.988.8287. Read prospectuses and summary prospectuses carefully before investing.
Total returns include changes in share price and reinvestment of dividends and capital gains distributions in a hypothetical investment for the periods shown.
The Fund’s investment strategy and focus can change over time. The mention of specific fund holdings does not constitute a recommendation by OppenheimerFunds, Inc. or its affiliates.
Shares of Oppenheimer funds are not deposits or obligations of any bank, are not guaranteed by any bank, are not insured by the FDIC or any other agency, and involve investment risks, including the possible loss of the principal amount invested.
Comparing the Fund’s Performance to the Market. The graphs that follow show the performance of a hypothetical $10,000 investment in each share class of the Fund held until December 31, 2014. Performance is measured over a ten-fiscal-year period for both Classes. Performance information does not reflect charges that apply to separate accounts investing in the Fund. If these charges were taken into account, performance would be lower. The graphs assume that all dividends and capital gains distributions were reinvested in additional shares.
The Fund’s performance is compared to the performance of the Barclays U.S. Aggregate Bond Index, the Citigroup World Government Bond Index, the Citigroup Non-U.S. World Government Bond Index, J.P. Morgan Domestic High Yield Index and its Reference Index. The Barclays U.S. Aggregate Bond Index is an index of U.S dollar-denominated, investment-grade U.S. corporate government and mortgage-backed securities. The Citigroup World Government Bond Index is an index of debt securities of major foreign government bond markets. The Citigroup Non-U.S. World Government Bond Index is an index of fixed rate government bonds with a maturity of one year or longer and amounts outstanding of at least U.S. $25 million. The J. P. Morgan Domestic High Yield Index is an unmanaged index of high yield fixed income securities issued by developed countries. The Fund’s Reference Index is a customized weighted index currently comprised of the following underlying broad-based security indices: 40% Citigroup Non-U.S. World Government Bond Index, 30% J. P. Morgan Domestic High Yield Index, and
4 OPPENHEIMER GLOBAL STRATEGIC INCOME FUND/VA
30% Barclays U.S. Aggregate Bond Index. The indices are unmanaged and cannot be purchased directly by investors. While index comparisons may be useful to provide a benchmark for the Fund’s performance, it must be noted that the Fund’s investments are not limited to the investments comprising the indices. Index performance includes reinvestment of income, but does not reflect transaction costs, fees, expenses or taxes. Index performance is shown for illustrative purposes only as a benchmark for the Fund’s performance, and does not predict or depict performance of the Fund. The Fund’s performance reflects the effects of the Fund’s business and operating expenses.
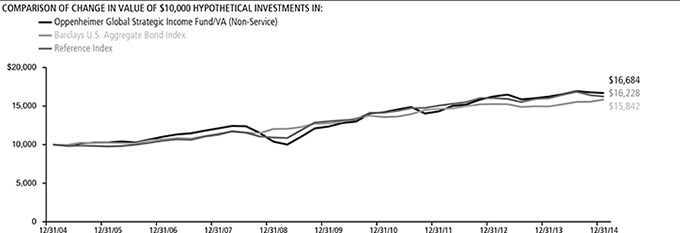
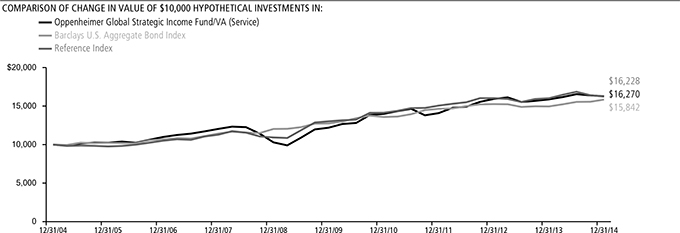
Performance data quoted represents past performance, which does not guarantee future results. The investment return and principal value of an investment in the Fund will fluctuate so that an investor’s shares, when redeemed, may be worth more or less than their original cost. Current performance may be lower or higher than the performance quoted. For performance data current to the most recent month end, call us at 1.800.988.8287. The Fund’s total returns should not be expected to be the same as the returns of other funds, whether or not both funds have the same portfolio managers and/or similar names. The Fund’s total returns include changes in share price and reinvested distributions but do not include the charges associated with the separate account products that offer this Fund. Such performance would have been lower if such charges were taken into account.
5 OPPENHEIMER GLOBAL STRATEGIC INCOME FUND/VA
Fund Expenses
Fund Expenses. As a shareholder of the Fund, you incur two types of costs: (1) transaction costs and (2) ongoing costs, including management fees; distribution and service fees; and other Fund expenses. These examples are intended to help you understand your ongoing costs (in dollars) of investing in the Fund and to compare these costs with the ongoing costs of investing in other mutual funds.
The examples are based on an investment of $1,000.00 invested at the beginning of the period and held for the entire 6-month period ended December 31, 2014.
Actual Expenses. The first section of the table provides information about actual account values and actual expenses. You may use the information in this section for the class of shares you hold, together with the amount you invested, to estimate the expense that you paid over the period. Simply divide your account value by $1,000.00 (for example, an $8,600.00 account value divided by $1,000.00 = 8.60), then multiply the result by the number in the first section under the heading entitled “Expenses Paid During Period” to estimate the expenses you paid on your account during this period.
Hypothetical Example for Comparison Purposes.
The second section of the table provides information about hypothetical account values and hypothetical expenses based on the Fund’s actual expense ratio for each class of shares, and an assumed rate of return of 5% per year for each class before expenses, which is not the actual return. The hypothetical account values and expenses may not be used to estimate the actual ending account balance or expenses you paid for the period. You may use this information to compare the ongoing costs of investing in the Fund and other funds. To do so, compare this 5% hypothetical example for the class of shares you hold with the 5% hypothetical examples that appear in the shareholder reports of the other funds.
Please note that the expenses shown in the table are meant to highlight your ongoing costs only and do not reflect any charges associated with the separate accounts that offer this Fund. Therefore, the “hypothetical” lines of the table are useful in comparing ongoing costs only, and will not help you determine the relative total costs of owning different funds. In addition, if these separate account charges were included your costs would have been higher.
| | | | | | | | | | | | |
| Actual | | Beginning
Account
Value
July 1, 2014 | | | Ending
Account
Value
December 31, 2014 | | | Expenses
Paid During
6 Months Ended
December 31, 2014 | |
Non-Service shares | | $ | 1,000.00 | | | $ | 985.10 | | | $ | 3.61 | |
Service shares | | | 1,000.00 | | | | 983.70 | | | | 4.86 | |
| | | |
Hypothetical (5% return before expenses) | | | | | | | | | |
Non-Service shares | | | 1,000.00 | | | | 1,021.58 | | | | 3.68 | |
Service shares | | | 1,000.00 | | | | 1,020.32 | | | | 4.95 | |
Expenses are equal to the Fund’s annualized expense ratio for that class, multiplied by the average account value over the period, multiplied by 184/365 (to reflect the one-half year period). Those annualized expense ratios, excluding indirect expenses from affiliated funds, based on the 6-month period ended December 31, 2014 are as follows:
| | | | | | |
| Class | | Expense Ratios | | | |
Non-Service shares | | | 0.72% | | | |
Service shares | | | 0.97 | | | |
The expense ratios reflect voluntary waivers and/or reimbursements of expenses by the Fund’s Manager. Some of these undertakings may be modified or terminated at any time, as indicated in the Fund’s prospectus. The “Financial Highlights” tables in the Fund’s financial statements, included in this report, also show the gross expense ratios, without such waivers or reimbursements and reduction to custodian expenses, if applicable.
6 OPPENHEIMER GLOBAL STRATEGIC INCOME FUND/VA
CONSOLIDATED STATEMENT OF INVESTMENTS December 31, 2014
| | | | | | | | | | |
| | | Principal Amount | | | Value | | | |
| | | |
Asset-Backed Securities—2.3% | | | |
| | | |
| American Credit Acceptance Receivables Trust: | | | |
| Series 2012-2, Cl. D, 5.91%, 7/15/191 | | $ | 410,000 | | | $ | 412,573 | | | |
| Series 2012-3, Cl. C, 2.78%, 9/17/181 | | | 125,000 | | | | 125,289 | | | |
| Series 2014-3, Cl. B, 2.43%, 6/10/201 | | | 480,000 | | | | 483,408 | | | |
| Series 2014-4, Cl. B, 2.60%, 10/12/201 | | | 205,000 | | | | 205,123 | | | |
| | | |
| AmeriCredit Automobile Receivables Trust: | | | | | | | |
| Series 2012-3, Cl. E, 4.46%, 11/8/191 | | | 360,000 | | | | 374,959 | | | |
| Series 2012-4, Cl. D, 2.68%, 10/9/18 | | | 220,000 | | | | 221,843 | | | |
| Series 2013-2, Cl. E, 3.41%, 10/8/201 | | | 560,000 | | | | 564,680 | | | |
| Series 2013-3, Cl. D, 3.00%, 7/8/19 | | | 440,000 | | | | 447,821 | | | |
| Series 2013-5, Cl. D, 2.86%, 12/8/19 | | | 220,000 | | | | 220,096 | | | |
| Series 2014-2, Cl. D, 2.57%, 7/8/20 | | | 300,000 | | | | 296,315 | | | |
| Series 2014-3, Cl. D, 3.13%, 10/8/20 | | | 260,000 | | | | 261,785 | | | |
| Series 2014-4, Cl. D, 3.07%, 11/9/20 | | | 230,000 | | | | 230,237 | | | |
| | | |
| Avoca CLO VIII Ltd., Series VIII-X, Cl. E, 4.432%, 10/15/232 | | EUR | 1,630,000 | | | | 1,774,855 | | | |
| | | |
| Axius Europe CLO SA, Series 2007-1X, Cl. E, 4.678%, 11/15/232 | | EUR | 212,712 | | | | 238,172 | | | |
| | | |
| Cadogan Square CLO IV BV, Series 4X, Cl. D, 1.855%, 7/24/232 | | EUR | 1,200,000 | | | | 1,340,871 | | | |
| | | |
| California Republic Auto Receivables Trust: | | | | | | | |
| Series 2013-2, Cl. C, 3.32%, 8/17/20 | | | 365,000 | | | | 366,677 | | | |
| Series 2014-2, Cl. C, 3.29%, 3/15/21 | | | 130,000 | | | | 129,441 | | | |
| Series 2014-4, Cl. C, 3.56%, 9/15/21 | | | 145,000 | | | | 144,974 | | | |
| | | |
| Capital Auto Receivables Asset Trust: | | | | | | | |
| Series 2013-4, Cl. D, 3.22%, 5/20/19 | | | 170,000 | | | | 172,616 | | | |
| Series 2014-1, Cl. D, 3.39%, 7/22/19 | | | 185,000 | | | | 188,352 | | | |
| Series 2014-3, Cl. D, 3.14%, 2/20/20 | | | 255,000 | | | | 256,227 | | | |
| | | |
| Capital Auto Receivables Asset Trust/Ally Financial, Inc., Series 2013-1, Cl. D, 2.19%, 9/20/21 | | | 275,000 | | | | 275,559 | | | |
| | | |
| CarMax Auto Owner Trust, Series 2014-2, Cl. D, 2.58%, 11/16/20 | | | 450,000 | | | | 451,036 | | | |
| | | |
| CLI Funding V LLC, Series 2014-2A, Cl. A, 3.38%, 10/18/291 | | | 516,250 | | | | 513,585 | | | |
| | | |
| CPS Auto Receivables Trust: | | | | | | | |
| Series 2014-C, Cl. A, 1.31%, 2/15/191 | | | 445,851 | | | | 444,565 | | | |
| Series 2014-D, Cl. A, 1.49%, 4/15/191 | | | 890,000 | | | | 888,061 | | | |
| | | |
| CPS Auto Trust, Series 2012-C, Cl. A, 1.82%, 12/16/191 | | | 87,769 | | | | 88,282 | | | |
| | | |
| Cronos Containers Program I Ltd., Series 2014-2A, Cl. A, 3.27%, 11/18/291 | | | 643,981 | | | | 644,229 | | | |
| | | |
| DT Auto Owner Trust: | | | | | | | |
| Series 2012-2A, Cl. D, 4.35%, 3/15/191 | | | 596,406 | | | | 601,630 | | | |
| Series 2013-1A, Cl. D, 3.74%, 5/15/201 | | | 265,000 | | | | 268,289 | | | |
| Series 2013-2A, Cl. D, 4.18%, 6/15/201 | | | 675,000 | | | | 682,133 | | | |
| Series 2014-1A, Cl. D, 3.98%, 1/15/211 | | | 580,000 | | | | 579,244 | | | |
| Series 2014-3A, Cl. D, 4.47%, 11/15/211 | | | 290,000 | | | | 290,046 | | | |
| | | |
| Exeter Automobile Receivables Trust: | | | | | | | |
| Series 2012-2A, Cl. C, 3.06%, 7/16/181 | | | 65,000 | | | | 65,498 | | | |
| Series 2013-2A, Cl. C, 4.35%, 1/15/191 | | | 500,000 | | | | 506,839 | | | |
| Series 2014-1A, Cl. B, 2.42%, 1/15/191 | | | 370,000 | | | | 369,953 | | | |
| Series 2014-1A, Cl. C, 3.57%, 7/15/191 | | | 370,000 | | | | 367,564 | | | |
| Series 2014-2A, Cl. A, 1.06%, 8/15/181 | | | 128,621 | | | | 128,443 | | | |
| Series 2014-2A, Cl. C, 3.26%, 12/16/191 | | | 180,000 | | | | 176,304 | | | |
| | | |
| First Investors Auto Owner Trust: | | | | | | | |
| Series 2012-1A, Cl. D, 5.65%, 4/15/181 | | | 285,000 | | | | 294,634 | | | |
| | | | | | | | |
| | | Principal Amount | | | Value | |
| |
Asset-Backed Securities (Continued) | |
| |
| First Investors Auto Owner Trust: (Continued) | |
| Series 2013-3A, Cl. C, 2.91%, 1/15/201 | | $ | 265,000 | | | $ | 266,747 | |
| Series 2013-3A, Cl. D, 3.67%, 5/15/201 | | | 195,000 | | | | 195,764 | |
| Series 2014-3A, Cl. D, 3.85%, 2/15/221 | | | 210,000 | | | | 209,865 | |
| |
| Flagship Credit Auto Trust, Series 2014-2, Cl. A, 1.43%, 12/16/191 | | | 445,709 | | | | 445,283 | |
| |
| GM Financial Automobile Leasing Trust, Series 2014-1A, Cl. D, 2.51%, 3/20/191 | | | 305,000 | | | | 305,685 | |
| |
| Halcyon Structured Asset Management European CLO BV, Series 2006-IIX, Cl. E, 4.158%, 1/25/232 | | EUR | 1,405,000 | | | | 1,574,651 | |
| |
| Harvest CLO IA SA: | |
| Series I-X, Cl. C, 1.983%, 3/29/172 | | EUR | 14,549 | | | | 17,603 | |
| Series I-X, Cl. D, 3.083%, 3/29/172 | | EUR | 595,000 | | | | 719,662 | |
| Series I-X, Cl. E, 7.683%, 3/29/172 | | EUR | 595,000 | | | | 708,404 | |
| |
| Highlander Euro CDO II Cayman Ltd., Series 2006-2CX, Cl. E, 3.679%, 12/14/222 | | EUR | 1,388,921 | | | | 1,515,645 | |
| |
| ICE EM CLO: | |
| Series 2007-1A, Cl. B, 2.031%, 8/15/222,3 | | | 7,870,000 | | | | 7,323,822 | |
| Series 2007-1A, Cl. C, 3.331%, 8/15/222,3 | | | 5,270,000 | | | | 4,957,489 | |
| Series 2007-1A, Cl. D, 5.331%, 8/15/222,3 | | | 5,270,000 | | | | 4,859,994 | |
| |
| Navistar Financial Dealer Note Master Owner Trust II, Series 2014-1, Cl. D, 2.47%, 10/25/191,2 | | | 180,000 | | | | 180,745 | |
| |
| Santander Drive Auto Receivables Trust: | |
| Series 2012-5, Cl. D, 3.30%, 9/17/18 | | | 540,000 | | | | 556,340 | |
| Series 2012-AA, Cl. D, 2.46%, 12/17/181 | | | 825,000 | | | | 825,038 | |
| Series 2013-1, Cl. D, 2.27%, 1/15/19 | | | 920,000 | | | | 914,714 | |
| Series 2013-2, Cl. D, 2.57%, 3/15/19 | | | 1,110,000 | | | | 1,124,594 | |
| Series 2013-4, Cl. E, 4.67%, 1/15/201 | | | 520,000 | | | | 544,178 | |
| Series 2013-5, Cl. D, 2.73%, 10/15/19 | | | 520,000 | | | | 521,801 | |
| Series 2013-A, Cl. C, 3.12%, 10/15/191 | | | 1,195,000 | | | | 1,224,588 | |
| Series 2013-A, Cl. E, 4.71%, 1/15/211 | | | 405,000 | | | | 419,786 | |
| Series 2014-4, Cl. D, 3.10%, 11/16/20 | | | 300,000 | | | | 300,685 | |
| |
| SNAAC Auto Receivables Trust: | |
| Series 2012-1A, Cl. C, 4.38%, 6/15/171 | | | 36,926 | | | | 37,064 | |
| Series 2013-1A, Cl. C, 3.07%, 8/15/181 | | | 220,000 | | | | 223,507 | |
| |
| Stichting Halcyon Structured Asset Management European, Series 2007-IX, Cl. E, 4.105%, 7/24/232 | | EUR | 706,933 | | | | 791,191 | |
| |
| TAL Advantage V LLC, Series 2014-2A, Cl. A1, 1.70%, 5/20/391 | | | 178,733 | | | | 177,586 | |
| |
| Theseus European CLO SA, Series 2006-1X, Cl. E, 4.288%, 8/27/222 | | EUR | 1,490,000 | | | | 1,681,968 | |
| |
| Trip Rail Master Funding LLC, Series 2014-1A, Cl. A1, 2.863%, 4/15/441 | | | 146,536 | | | | 145,746 | |
| |
| United Auto Credit Securitization Trust: | |
| Series 2013-1, Cl. C, 2.22%, 12/15/171 | | | 230,000 | | | | 230,548 | |
| Series 2014-1, Cl. D, 2.38%, 10/15/181 | | | 260,000 | | | | 256,194 | |
| |
| Westlake Automobile Receivables Trust: | |
| Series 2014-1A, Cl. D, 2.20%, 2/15/211 | | | 245,000 | | | | 242,705 | |
7 OPPENHEIMER GLOBAL STRATEGIC INCOME FUND/VA
CONSOLIDATED STATEMENT OF INVESTMENTS Continued
| | | | | | | | | | |
| | | Principal Amount | | | Value | | | |
| | | |
Asset-Backed Securities (Continued) | | | |
| | | |
| Westlake Automobile Receivables Trust: (Continued) | | | |
| Series 2014-2A, Cl. D, 2.86%, 7/15/211 | | $ | 245,000 | | | $ | 244,957 | | | |
| | | | | | | | | | |
Total Asset-Backed Securities (Cost $51,456,999) | | | | | | | 49,836,757 | | | |
| | | |
Mortgage-Backed Obligations—15.9% | | | |
| | | |
Government Agency—7.5% | | | |
| | | |
FHLMC/FNMA/FHLB/Sponsored—7.4% | | | |
| | | |
| Federal Home Loan Mortgage Corp. Gold Pool: | | | |
| 5.00%, 9/1/33 | | | 522,205 | | | | 578,013 | | | |
| 5.50%, 9/1/39 | | | 670,081 | | | | 749,552 | | | |
| 6.00%, 5/1/18-11/1/21 | | | 154,025 | | | | 171,280 | | | |
| 6.50%, 3/1/18-8/1/32 | | | 645,292 | | | | 735,192 | | | |
| 7.00%, 10/1/31-10/1/37 | | | 140,509 | | | | 159,894 | | | |
| 7.50%, 1/1/32 | | | 404,276 | | | | 494,041 | | | |
| | | |
| Federal Home Loan Mortgage Corp., Interest-Only Stripped Mtg.-Backed Security: | | | |
| Series 192,Cl. IO, 4.752%, 2/1/284 | | | 10,184 | | | | 1,873 | | | |
| Series 205,Cl. IO, 10.001%, 9/1/294 | | | 59,230 | | | | 11,535 | | | |
| Series 243,Cl. 6, 0.00%, 12/15/324,5 | | | 137,146 | | | | 24,997 | | | |
| | | |
| Federal Home Loan Mortgage Corp., Mtg.-Linked Amortizing Global Debt Securities, Series 2012-1, Cl. A10, 2.06%, 1/15/22 | | | 1,365,185 | | | | 1,391,787 | | | |
| | | |
| Federal Home Loan Mortgage Corp., Multifamily Structured Pass Through Certificates: | | | |
| Series K015,Cl. A1, 2.257%, 10/25/20 | | | 152,764 | | | | 155,686 | | | |
| Series K040,Cl. A1, 2.768%, 4/25/24 | | | 1,450,912 | | | | 1,489,193 | | | |
| Series K041,Cl. A1, 2.72%, 8/25/24 | | | 1,235,000 | | | | 1,259,700 | | | |
| Series K503,Cl. A1, 1.384%, 1/25/19 | | | 1,942,662 | | | | 1,929,432 | | | |
| Series K709,Cl. A1, 1.56%, 10/25/18 | | | 323,209 | | | | 325,848 | | | |
| Series K717,Cl. A1, 2.342%, 2/25/21 | | | 955,000 | | | | 974,756 | | | |
| | | |
| Federal Home Loan Mortgage Corp., Real Estate Mtg. Investment Conduit Multiclass Pass-Through Certificates: | | | |
| Series 1360,Cl. PZ, 7.50%, 9/15/22 | | | 435,157 | | | | 484,425 | | | |
| Series 151,Cl. F, 9.00%, 5/15/21 | | | 9,761 | | | | 10,889 | | | |
| Series 1674,Cl. Z, 6.75%, 2/15/24 | | | 253,023 | | | | 280,091 | | | |
| Series 1897,Cl. K, 7.00%, 9/15/26 | | | 803,473 | | | | 901,239 | | | |
| Series 2043,Cl. ZP, 6.50%, 4/15/28 | | | 298,924 | | | | 334,340 | | | |
| Series 2106,Cl. FG, 0.611%, 12/15/282 | | | 511,355 | | | | 517,290 | | | |
| Series 2122,Cl. F, 0.611%, 2/15/292 | | | 14,044 | | | | 14,207 | | | |
| Series 2148,Cl. ZA, 6.00%, 4/15/29 | | | 333,264 | | | | 365,607 | | | |
| Series 2195,Cl. LH, 6.50%, 10/15/29 | | | 209,175 | | | | 232,723 | | | |
| Series 2326,Cl. ZP, 6.50%, 6/15/31 | | | 27,878 | | | | 31,217 | | | |
| Series 2344,Cl. FP, 1.111%, 8/15/312 | | | 132,724 | | | | 136,558 | | | |
| Series 2368,Cl. PR, 6.50%, 10/15/31 | | | 106,360 | | | | 119,169 | | | |
| Series 2412,Cl. GF, 1.111%, 2/15/322 | | | 222,743 | | | | 229,241 | | | |
| Series 2449,Cl. FL, 0.711%, 1/15/322 | | | 158,081 | | | | 160,395 | | | |
| Series 2451,Cl. FD, 1.161%, 3/15/322 | | | 82,880 | | | | 85,437 | | | |
| Series 2453,Cl. BD, 6.00%, 5/15/17 | | | 20,354 | | | | 21,400 | | | |
| Series 2461,Cl. PZ, 6.50%, 6/15/32 | | | 379,604 | | | | 424,815 | | | |
| Series 2464,Cl. FI, 1.161%, 2/15/322 | | | 69,512 | | | | 71,530 | | | |
| Series 2470,Cl. AF, 1.161%, 3/15/322 | | | 142,202 | | | | 146,594 | | | |
| Series 2470,Cl. LF, 1.161%, 2/15/322 | | | 71,135 | | | | 73,201 | | | |
| Series 2471,Cl. FD, 1.161%, 3/15/322 | | | 104,113 | | | | 107,163 | | | |
| Series 2477,Cl. FZ, 0.711%, 6/15/312 | | | 292,313 | | | | 296,439 | | | |
| Series 2500,Cl. FD, 0.661%, 3/15/322 | | | 12,746 | | | | 12,922 | | | |
| Series 2517,Cl. GF, 1.161%, 2/15/322 | | | 61,848 | | | | 63,644 | | | |
| Series 2526,Cl. FE, 0.561%, 6/15/292 | | | 22,290 | | | | 22,516 | | | |
| Series 2551,Cl. FD, 0.561%, 1/15/332 | | | 9,345 | | | | 9,431 | | | |
| Series 2635,Cl. AG, 3.50%, 5/15/32 | | | 94,449 | | | | 98,497 | | | |
| Series 2668,Cl. AZ, 4.00%, 9/15/18 | | | 46,843 | | | | 48,623 | | | |
| Series 2676,Cl. KY, 5.00%, 9/15/23 | | | 1,216,559 | | | | 1,317,427 | | | |
| Series 2707,Cl. QE, 4.50%, 11/15/18 | | | 167,364 | | | | 176,085 | | | |
| Series 2770,Cl. TW, 4.50%, 3/15/19 | | | 23,298 | | | | 24,587 | | | |
| Series 3025,Cl. SJ, 24.16%, 8/15/352 | | | 184,016 | | | | 261,108 | | | |
| Series 3465,Cl. HA, 4.00%, 7/15/17 | | | 11,600 | | | | 11,695 | | | |
| Series 3617,Cl. DC, 4.00%, 7/15/27 | | | 16,828 | | | | 16,876 | | | |
| Series 3741,Cl. PA, 2.15%, 2/15/35 | | | 851,817 | | | | 867,816 | | | |
| Series 3815,Cl. BD, 3.00%, 10/15/20 | | | 27,580 | | | | 28,290 | | | |
| Series 3822,Cl. JA, 5.00%, 6/15/40 | | | 38,048 | | | | 40,016 | | | |
| Series 3840,Cl. CA, 2.00%, 9/15/18 | | | 20,824 | | | | 21,109 | | | |
| Series 3848,Cl. WL, 4.00%, 4/15/40 | | | 387,289 | | | | 397,289 | | | |
| | | | | | | | |
| | | Principal Amount | | | Value | |
| |
FHLMC/FNMA/FHLB/Sponsored (Continued) | |
| |
| Federal Home Loan Mortgage Corp., Real Estate Mtg. Investment Conduit Multiclass Pass-Through Certificates: (Continued) | |
| Series 3857,Cl. GL, 3.00%, 5/15/40 | | $ | 15,987 | | | $ | 16,362 | |
| Series 3917,Cl. BA, 4.00%, 6/15/38 | | | 230,499 | | | | 239,989 | |
| Series 4221,Cl. HJ, 1.50%, 7/15/23 | | | 446,510 | | | | 448,181 | |
| |
| Federal Home Loan Mortgage Corp., Real Estate Mtg. Investment Conduit Multiclass Pass-Through Certificates, Interest-Only Stripped Mtg.-Backed Security: | |
| Series 2074,Cl. S, 48.42%, 7/17/284 | | | 16,204 | | | | 3,721 | |
| Series 2079,Cl. S, 0.00%, 7/17/284,5 | | | 29,229 | | | | 6,865 | |
| Series 2136,Cl. SG, 63.567%, 3/15/294 | | | 705,073 | | | | 164,760 | |
| Series 2399,Cl. SG, 54.081%, 12/15/264 | | | 420,123 | | | | 97,425 | |
| Series 2437,Cl. SB, 68.227%, 4/15/324 | | | 1,435,208 | | | | 373,396 | |
| Series 2526,Cl. SE, 24.953%, 6/15/294 | | | 27,985 | | | | 5,393 | |
| Series 2682,Cl. TQ, 99.999%, 10/15/334 | | | 264,956 | | | | 60,988 | |
| Series 2795,Cl. SH, 9.434%, 3/15/244 | | | 594,751 | | | | 81,109 | |
| Series 2920,Cl. S, 46.042%, 1/15/354 | | | 277,224 | | | | 44,528 | |
| Series 2922,Cl. SE, 4.035%, 2/15/354 | | | 47,291 | | | | 7,573 | |
| Series 2981,Cl. BS, 99.999%, 5/15/354 | | | 513,478 | | | | 112,499 | |
| Series 3201,Cl. SG, 1.968%, 8/15/364 | | | 259,554 | | | | 42,397 | |
| Series 3397,Cl. GS, 12.274%, 12/15/374 | | | 201,241 | | | | 34,730 | |
| Series 3424,Cl. EI, 1.976%, 4/15/384 | | | 106,131 | | | | 12,111 | |
| Series 3450,Cl. BI, 6.511%, 5/15/384 | | | 330,511 | | | | 42,950 | |
| Series 3606,Cl. SN, 0.00%, 12/15/394,5 | | | 101,056 | | | | 18,052 | |
| Series 3659,Cl. IE, 0.00%, 3/15/194,5 | | | 460,103 | | | | 30,903 | |
| Series 3685,Cl. EI, 0.00%, 3/15/194,5 | | | 339,925 | | | | 19,910 | |
| |
| Federal Home Loan Mortgage Corp., Structured Agency Credit Risk Debt Nts.: | |
| Series 2014-DN4,Cl. M3, 4.72%, 10/25/242 | | | 4,315,000 | | | | 4,261,915 | |
| Series 2014-HQ2,Cl. M3, 3.92%, 9/25/242 | | | 5,430,000 | | | | 4,963,862 | |
| |
| Federal National Mortgage Assn.: | |
| 3.50%, 1/15/456 | | | 12,710,000 | | | | 13,243,855 | |
| 4.00%, 1/25/456 | | | 36,485,000 | | | | 38,929,022 | |
| 4.50%, 1/1/30-1/15/456 | | | 40,860,000 | | | | 44,283,679 | |
| 5.00%, 1/1/456 | | | 2,935,000 | | | | 3,242,769 | |
| 6.00%, 1/1/456 | | | 4,305,000 | | | | 4,882,512 | |
| |
| Federal National Mortgage Assn. Pool: | |
| 3.50%, 12/1/20-2/1/22 | | | 710,395 | | | | 751,608 | |
| 5.00%, 2/1/18-7/1/33 | | | 1,872,994 | | | | 2,004,916 | |
| 5.50%, 4/1/21-5/1/36 | | | 365,862 | | | | 408,071 | |
| 6.00%, 10/1/16-1/1/19 | | | 91,895 | | | | 95,181 | |
| 6.50%, 4/1/17-1/1/34 | | | 945,967 | | | | 1,083,807 | |
| 7.00%, 11/1/17-6/1/34 | | | 1,092,135 | | | | 1,265,462 | |
| 7.50%, 2/1/27-3/1/33 | | | 1,329,558 | | | | 1,587,521 | |
| 8.50%, 7/1/32 | | | 2,081 | | | | 2,401 | |
| |
| Federal National Mortgage Assn., Connecticut Avenue Securities, Series 2014-C03, Cl. 2M2, 3.07%, 7/25/242 | | | 3,110,000 | | | | 2,788,386 | |
| |
| Federal National Mortgage Assn., Interest-Only Stripped Mtg.-Backed Security: | |
| Series 214,Cl. 2, 37.402%, 3/25/234 | | | 171,988 | | | | 27,148 | |
| Series 221,Cl. 2, 40.952%, 5/25/234 | | | 20,741 | | | | 3,386 | |
| Series 254,Cl. 2, 30.671%, 1/25/244 | | | 345,895 | | | | 50,351 | |
| Series 301,Cl. 2, 0.00%, 4/25/294,5 | | | 63,210 | | | | 10,876 | |
| Series 313,Cl. 2, 3.219%, 6/25/314 | | | 618,801 | | | | 88,668 | |
| Series 319,Cl. 2, 0.00%, 2/25/324,5 | | | 301,431 | | | | 51,811 | |
| Series 321,Cl. 2, 1.967%, 4/25/324 | | | 86,114 | | | | 14,980 | |
| Series 324,Cl. 2, 0.00%, 7/25/324,5 | | | 90,806 | | | | 15,821 | |
| Series 328,Cl. 2, 0.00%, 12/25/324,5 | | | 184,373 | | | | 21,963 | |
| Series 331,Cl. 5, 0.00%, 2/25/334,5 | | | 346,370 | | | | 77,301 | |
| Series 332,Cl. 2, 0.00%, 3/25/334,5 | | | 1,456,317 | | | | 335,183 | |
| Series 334,Cl. 12, 0.00%, 3/25/334,5 | | | 282,038 | | | | 61,462 | |
| Series 339,Cl. 15, 1.637%, 10/25/334 | | | 856,578 | | | | 171,649 | |
| Series 345,Cl. 9, 0.00%, 1/25/344,5 | | | 248,740 | | | | 49,195 | |
| Series 351,Cl. 10, 0.00%, 4/25/344,5 | | | 168,295 | | | | 27,615 | |
| Series 351,Cl. 8, 0.00%, 4/25/344,5 | | | 283,854 | | | | 46,201 | |
| Series 356,Cl. 10, 0.00%, 6/25/354,5 | | | 212,492 | | | | 39,606 | |
| Series 356,Cl. 12, 0.00%, 2/25/354,5 | | | 103,670 | | | | 16,562 | |
| Series 362,Cl. 13, 0.00%, 8/25/354,5 | | | 131,302 | | | | 22,817 | |
| |
| Federal National Mortgage Assn., Real Estate Mtg. Investment Conduit Multiclass Pass-Through Certificates: | |
| Series 1999-54,Cl. LH, 6.50%, 11/25/29 | | | 191,797 | | | | 211,252 | |
| Series 2001-51,Cl. OD, 6.50%, 10/25/31 | | | 105,206 | | | | 115,287 | |
| Series 2001-69,Cl. PF, 1.17%, 12/25/312 | | | 167,140 | | | | 172,037 | |
8 OPPENHEIMER GLOBAL STRATEGIC INCOME FUND/VA
| | | | | | | | | | | | |
| | | | | Principal Amount | | | Value | | | |
| | | |
FHLMC/FNMA/FHLB/Sponsored (Continued) | | | |
| | | |
| Federal National Mortgage Assn., Real Estate Mtg. Investment Conduit Multiclass Pass-Through Certificates: (Continued) | | | |
| Series 2001-80,Cl. ZB, 6.00%, 1/25/32 | | | | $ | 190,168 | | | $ | 206,563 | | | |
| Series 2002-12,Cl. PG, 6.00%, 3/25/17 | | | | | 60,289 | | | | 62,585 | | | |
| Series 2002-29,Cl. F, 1.17%, 4/25/322 | | | | | 73,940 | | | | 76,103 | | | |
| Series 2002-60,Cl. FH, 1.17%, 8/25/322 | | | | | 148,099 | | | | 152,425 | | | |
| Series 2002-64,Cl. FJ, 1.17%, 4/25/322 | | | | | 22,769 | | | | 23,435 | | | |
| Series 2002-68,Cl. FH, 0.662%, 10/18/322 | | | | | 51,058 | | | | 51,708 | | | |
| Series 2002-84,Cl. FB, 1.17%, 12/25/322 | | | | | 331,996 | | | | 341,720 | | | |
| Series 2002-9,Cl. PC, 6.00%, 3/25/17 | | | | | 60,492 | | | | 63,014 | | | |
| Series 2002-9,Cl. PR, 6.00%, 3/25/17 | | | | | 74,069 | | | | 76,852 | | | |
| Series 2002-90,Cl. FH, 0.67%, 9/25/322 | | | | | 185,752 | | | | 188,003 | | | |
| Series 2003-100,Cl. PA, 5.00%, 10/25/18 | | | | | 300,626 | | | | 317,542 | | | |
| Series 2003-11,Cl. FA, 1.17%, 9/25/322 | | | | | 332,004 | | | | 341,728 | | | |
| Series 2003-112,Cl. AN, 4.00%, 11/25/18 | | | | | 100,768 | | | | 104,804 | | | |
| Series 2003-116,Cl. FA, 0.57%, 11/25/332 | | | | | 33,132 | | | | 33,351 | | | |
| Series 2003-119,Cl. FK, 0.67%, 5/25/182 | | | | | 528,981 | | | | 532,111 | | | |
| Series 2003-84,Cl. GE, 4.50%, 9/25/18 | | | | | 43,242 | | | | 45,179 | | | |
| Series 2004-101,Cl. BG, 5.00%, 1/25/20 | | | | | 256,147 | | | | 264,714 | | | |
| Series 2004-25,Cl. PC, 5.50%, 1/25/34 | | | | | 89,495 | | | | 94,746 | | | |
| Series 2005-109,Cl. AH, 5.50%, 12/25/25 | | | | | 1,541,760 | | | | 1,682,478 | | | |
| Series 2005-31,Cl. PB, 5.50%, 4/25/35 | | | | | 560,000 | | | | 665,683 | | | |
| Series 2005-71,Cl. DB, 4.50%, 8/25/25 | | | | | 224,425 | | | | 240,486 | | | |
| Series 2006-11,Cl. PS, 23.945%, 3/25/362 | | | | | 158,094 | | | | 226,228 | | | |
| Series 2006-46,Cl. SW, 23.578%, 6/25/362 | | | | | 267,504 | | | | 378,684 | | | |
| Series 2008-14,Cl. BA, 4.25%, 3/25/23 | | | | | 183,981 | | | | 192,398 | | | |
| Series 2008-75,Cl. DB, 4.50%, 9/25/23 | | | | | 140,090 | | | | 146,576 | | | |
| Series 2009-113,Cl. DB, 3.00%, 12/25/20 | | | | | 417,995 | | | | 429,658 | | | |
| Series 2009-114,Cl. AC, 2.50%, 12/25/23 | | | | | 79,892 | | | | 81,207 | | | |
| Series 2009-36,Cl. FA, 1.11%, 6/25/372 | | | | | 85,687 | | | | 87,950 | | | |
| Series 2009-70,Cl. NT, 4.00%, 8/25/19 | | | | | 18,229 | | | | 18,887 | | | |
| Series 2009-70,Cl. TL, 4.00%, 8/25/19 | | | | | 531,910 | | | | 551,102 | | | |
| Series 2010-43,Cl. KG, 3.00%, 1/25/21 | | | | | 196,442 | | | | 202,260 | | | |
| Series 2011-122,Cl. EC, 1.50%, 1/25/20 | | | | | 259,366 | | | | 261,062 | | | |
| Series 2011-15,Cl. DA, 4.00%, 3/25/41 | | | | | 207,864 | | | | 217,025 | | | |
| Series 2011-3,Cl. EL, 3.00%, 5/25/20 | | | | | 691,298 | | | | 710,816 | | | |
| Series 2011-3,Cl. KA, 5.00%, 4/25/40 | | | | | 341,453 | | | | 374,019 | | | |
| Series 2011-38,Cl. AH, 2.75%, 5/25/20 | | | | | 22,013 | | | | 22,540 | | | |
| Series 2011-6,Cl. BA, 2.75%, 6/25/20 | | | | | 280,664 | | | | 289,345 | | | |
| Series 2011-69,Cl. EA, 3.00%, 11/25/29 | | | | | 222,209 | | | | 225,970 | | | |
| Series 2011-82,Cl. AD, 4.00%, 8/25/26 | | | | | 396,134 | | | | 412,602 | | | |
| Series 2012-20,Cl. FD, 0.57%, 3/25/422 | | | | | 610,429 | | | | 613,461 | | | |
| | | |
| Federal National Mortgage Assn., Real Estate Mtg. Investment Conduit Multiclass Pass-Through Certificates, Interest-Only Stripped Mtg.-Backed Security: | | | |
| Series 2001-61,Cl. SH, 20.462%, 11/18/314 | | | | | 83,249 | | | | 15,770 | | | |
| Series 2001-63,Cl. SD, 24.722%, 12/18/314 | | | | | 23,671 | | | | 5,576 | | | |
| Series 2001-68,Cl. SC, 15.819%, 11/25/314 | | | | | 15,008 | | | | 2,909 | | | |
| Series 2001-81,Cl. S, 18.094%, 1/25/324 | | | | | 18,382 | | | | 3,995 | | | |
| Series 2002-28,Cl. SA, 28.358%, 4/25/324 | | | | | 13,093 | | | | 2,497 | | | |
| Series 2002-38,Cl. SO, 39.582%, 4/25/324 | | | | | 80,267 | | | | 14,114 | | | |
| Series 2002-48,Cl. S, 24.031%, 7/25/324 | | | | | 20,604 | | | | 4,002 | | | |
| Series 2002-52,Cl. SL, 26.897%, 9/25/324 | | | | | 13,157 | | | | 2,590 | | | |
| Series 2002-56,Cl. SN, 25.567%, 7/25/324 | | | | | 28,313 | | | | 6,304 | | | |
| Series 2002-77,Cl. IS, 35.376%, 12/18/324 | | | | | 136,751 | | | | 31,248 | | | |
| Series 2002-77,Cl. SH, 28.788%, 12/18/324 | | | | | 27,900 | | | | 5,485 | | | |
| Series 2002-9,Cl. MS, 20.573%, 3/25/324 | | | | | 25,193 | | | | 5,129 | | | |
| Series 2003-13,Cl. IO, 4.778%, 3/25/334 | | | | | 253,783 | | | | 48,989 | | | |
| Series 2003-26,Cl. DI, 6.223%, 4/25/334 | | | | | 213,425 | | | | 37,699 | | | |
| Series 2003-33,Cl. SP, 22.274%, 5/25/334 | | | | | 151,429 | | | | 32,875 | | | |
| Series 2003-38,Cl. SA, 0.00%, 3/25/234,5 | | | | | 125,768 | | | | 8,357 | | | |
| Series 2003-4,Cl. S, 24.106%, 2/25/334 | | | | | 44,306 | | | | 9,198 | | | |
| Series 2004-56,Cl. SE, 8.065%, 10/25/334 | | | | | 734,043 | | | | 124,532 | | | |
| Series 2005-12,Cl. SC, 5.999%, 3/25/354 | | | | | 23,702 | | | | 3,943 | | | |
| Series 2005-14,Cl. SE, 31.172%, 3/25/354 | | | | | 812,869 | | | | 125,841 | | | |
| Series 2005-40,Cl. SA, 41.818%, 5/25/354 | | | | | 723,895 | | | | 142,371 | | | |
| Series 2005-40,Cl. SB, 56.134%, 5/25/354 | | | | | 1,156,630 | | | | 235,015 | | | |
| Series 2005-52,Cl. JH, 2.257%, 5/25/354 | | | | | 394,667 | | | | 69,208 | | | |
| Series 2005-63,Cl. SA, 41.948%, 10/25/314 | | | | | 41,018 | | | | 7,169 | | | |
| Series 2006-90,Cl. SX, 0.00%, 9/25/364,7 | | | | | 717,207 | | | | 130,721 | | | |
| Series 2007-88,Cl. XI, 25.118%, 6/25/374 | | | | | 918,700 | | | | 126,357 | | | |
| Series 2008-55,Cl. SA, 0.00%, 7/25/384,5 | | | | | 83,117 | | | | 11,455 | | | |
| | | | | | | | | | |
| | | | | Principal Amount | | | Value | |
| |
FHLMC/FNMA/FHLB/Sponsored (Continued) | | | | | |
| |
| Federal National Mortgage Assn., Real Estate Mtg. Investment Conduit Multiclass Pass-Through Certificates, Interest-Only Stripped Mtg.-Backed Security: (Continued) | |
| Series 2009-8,Cl. BS, 0.00%, 2/25/244,5 | | | | $ | 135,113 | | | $ | 9,166 | |
| Series 2010-95,Cl. DI, 0.00%, 11/25/204,5 | | | | | 604,687 | | | | 39,125 | |
| Series 2012-40,Cl. PI, 0.889%, 4/25/414 | | | | | 1,529,604 | | | | 248,057 | |
| |
| Federal National Mortgage Assn., Stripped Mtg.-Backed Security, Series 302, Cl. 2, 6%, 5/1/29 | | | | | 3 | | | | — | |
| | | | | | | | | | |
| | | | | | | | | 158,721,377 | |
| |
GNMA/Guaranteed—0.1% | | | | | |
| |
| Government National Mortgage Assn. I Pool: | |
| 7.00%, 3/15/28-7/15/28 | | | | | 123,096 | | | | 138,341 | |
| 7.50%, 2/15/27 | | | | | 5,032 | | | | 5,175 | |
| 8.00%, 11/15/25-5/15/26 | | | | | 32,771 | | | | 33,033 | |
| |
| Government National Mortgage Assn. II Pool, 1.625%, 11/20/252 | | | | | 3,703 | | | | 3,824 | |
| |
| Government National Mortgage Assn., Interest-Only Stripped Mtg.-Backed Security: | |
| Series 1998-6,Cl. SA, 53.719%, 3/16/284 | | | | | 38,055 | | | | 8,556 | |
| Series 2007-17,Cl. AI, 12.917%, 4/16/374 | | | | | 354,207 | | | | 73,033 | |
| Series 2011-52,Cl. HS, 9.159%, 4/16/414 | | | | | 604,035 | | | | 127,424 | |
| |
| Government National Mortgage Assn., Real Estate Mtg. Investment Conduit Multiclass Pass-Through Certificates: | |
| Series 1999-32,Cl. ZB, 8.00%, 9/16/29 | | | | | 585,572 | | | | 687,451 | |
| Series 2000-12,Cl. ZA, 8.00%, 2/16/30 | | | | | 1,272,897 | | | | 1,473,576 | |
| | | | | | | | | | |
| | | | | | | | | 2,550,413 | |
| |
Non-Agency—8.4% | | | | | | | | | | |
| |
Commercial—7.4% | | | | | | | | | | |
| |
| Banc of America Funding Trust, Series 2006-G, Cl. 2A4, 0.455%, 7/20/362 | | | | | 1,275,000 | | | | 1,186,441 | |
| |
| BCAP LLC Trust: | | | | | |
| Series 2011-R11,Cl. 18A5, 2.24%, 9/26/351,2 | | | | | 246,829 | | | | 251,814 | |
| Series 2012-RR2,Cl. 6A3, 2.691%, 9/26/351,2 | | | | | 433,808 | | | | 435,910 | |
| Series 2012-RR6,2.404%, 11/26/361 | | | | | 349,349 | | | | 343,785 | |
| Series 2013-RR2,Cl. 5A2, 2.629%, 3/26/361,2 | | | | | 7,351,575 | | | | 6,207,373 | |
| |
| Bear Stearns ARM Trust, Series 2005-2, Cl. A1, 2.58%, 3/25/352 | | | | | 204,502 | | | | 207,096 | |
| |
| Chase Mortgage Finance Trust, Series 2005-A2, Cl. 1A3, 2.483%, 1/25/362 | | | | | 24,994 | | | | 23,718 | |
| |
| CHL Mortgage Pass-Through Trust, Series 2005-17, Cl. 1A8, 5.50%, 9/25/35 | | | | | 1,452,998 | | | | 1,434,043 | |
| |
| Citigroup Commercial Mortgage Trust, Series 2013-GC11, Cl. D, 4.458%, 4/10/461,2 | | | | | 3,125,000 | | | | 3,013,075 | |
| |
| Citigroup Mortgage Loan Trust, Inc.: | | | | | | | | | | |
| Series 2009-8,Cl. 7A2, 2.612%, 3/25/361,2 | | | | | 10,474,197 | | | | 9,368,307 | |
| Series 2012-8,Cl. 1A1, 2.71%, 10/25/351,2 | | | | | 784,322 | | | | 792,077 | |
| Series 2014-8,Cl. 1A2, 0.446%, 7/20/362,3 | | | | | 3,400,000 | | | | 2,832,625 | |
| |
| COMM Mortgage Trust: | |
| Series 2012-CR4,Cl. D, 4.575%, 10/15/451,2 | | | | | 70,000 | | | | 70,249 | |
| Series 2012-CR5,Cl. E, 4.335%, 12/10/451,2 | | | | | 2,970,000 | | | | 2,940,324 | |
| Series 2013-CR6,Cl. D, 4.174%, 3/10/461,2 | | | | | 1,525,000 | | | | 1,443,197 | |
| Series 2013-CR7,Cl. D, 4.354%, 3/10/461,2 | | | | | 3,245,000 | | | | 3,074,839 | |
| Series 2013-CR9,Cl. D, 4.259%, 7/10/451,2 | | | | | 2,685,000 | | | | 2,555,614 | |
| Series 2013-LC13,Cl. D, 5.048%, 8/10/461,2 | | | | | 3,579,000 | | | | 3,608,083 | |
| Series 2014-UBS3,Cl. D, 4.815%, 6/10/471,2 | | | | | 8,895,000 | | | | 8,340,868 | |
| |
| COMM Mortgage Trust, Interest-Only Stripped Mtg.-Backed Security, Series 2012-CR5, Cl. XA, 0.00%, 12/10/454,5 | | | | | 3,462,476 | | | | 327,632 | |
| |
| Commercial Mortgage Trust, Series 2007-GG9, Cl. AM, 5.475%, 3/10/39 | | | | | 660,000 | | | | 692,776 | |
| |
| Credit Suisse Commercial Mortgage Trust, Series 2006-C1, Cl. AJ, 5.467%, 2/15/392 | | | | | 695,000 | | | | 723,069 | |
| |
| Credit Suisse First Boston Mortgage Securities Corp., Series 2005-C6, Cl. AJ, 5.23%, 12/15/402 | | | | | 600,000 | | | | 615,464 | |
| |
| CSMC, Series 2009-13R, Cl. 4A1, 2.618%, 9/26/361,2 | | | | | 69,010 | | | | 69,627 | |
| |
| DBUBS Mortgage Trust, Series 2011-LC1A, Cl. E, 5.557%, 11/10/461,2 | | | | | 100,000 | | | | 108,784 | |
|
| 9 OPPENHEIMER GLOBAL STRATEGIC INCOME FUND/VA |
CONSOLIDATEDSTATEMENTOFINVESTMENTS Continued
| | | | | | | | | | |
| | | Principal Amount | | | Value | | | |
| | | |
| Commercial (Continued) | | | |
| | | |
| Deutsche Alt-B Securities, Inc. Mortgage Loan Trust, Series 2006-AB2, Cl. A1, 5.888%, 6/25/362 | | | $ 87,997 | | | | $ 71,058 | | | |
| | | |
| Deutsche Mortgage Securities, Inc., Series 2013-RS1, Cl. 1A2, 0.385%, 7/22/361,2 | | | 5,060,144 | | | | 4,318,767 | | | |
| | | |
| FREMF Mortgage Trust: | | | |
| Series 2012-K501,Cl. C, 3.458%, 11/25/461,2 | | | 40,000 | | | | 40,647 | | | |
| Series 2013-K25,Cl. C, 3.743%, 11/25/451,2 | | | 2,000,000 | | | | 1,942,184 | | | |
| Series 2013-K26,Cl. C, 3.60%, 12/25/451,2 | | | 1,040,000 | | | | 1,007,622 | | | |
| Series 2013-K27,Cl. C, 3.497%, 1/25/461,2 | | | 1,630,000 | | | | 1,537,529 | | | |
| Series 2013-K28,Cl. C, 3.494%, 6/25/461,2 | | | 1,605,000 | | | | 1,509,270 | | | |
| Series 2013-K502,Cl. C, 3.195%, 3/25/451,2 | | | 220,000 | | | | 218,790 | | | |
| Series 2013-K712,Cl. C, 3.368%, 5/25/451,2 | | | 265,000 | | | | 261,898 | | | |
| Series 2013-K713,Cl. C, 3.165%, 4/25/461,2 | | | 535,000 | | | | 522,310 | | | |
| | | |
| GE Capital Commercial Mortgage Corp., Series 2005-C4, Cl. AJ, 5.312%, 11/10/452 | | | 845,000 | | | | 851,416 | | | |
| | | |
| GS Mortgage Securities Trust, Series 2014-GC22, Cl. D, 4.646%, 6/10/471,2 | | | 1,515,000 | | | | 1,411,985 | | | |
| | | |
| GSR Mortgage Loan Trust, Series 2005-AR4, Cl. 6A1, 5.226%, 7/25/352 | | | 33,458 | | | | 33,178 | | | |
| | | |
| JP Morgan Chase Commercial Mortgage Securities Corp., Series 2012-LC9, Cl. E, 4.425%, 12/15/471,2 | | | 3,025,000 | | | | 2,967,534 | | | |
| | | |
| JP Morgan Chase Commercial Mortgage Securities Trust: | | | |
| Series 2006-CB16,Cl. AJ, 5.623%, 5/12/45 | | | 2,695,000 | | | | 2,765,945 | | | |
| Series 2006-LDP8,Cl. AJ, 5.48%, 5/15/452 | | | 645,000 | | | | 676,554 | | | |
| Series 2007-CB18,Cl. AJ, 5.502%, 6/12/472 | | | 4,031,000 | | | | 4,031,699 | | | |
| Series 2013-C10,Cl. D, 4.159%, 12/15/472 | | | 4,665,000 | | | | 4,486,097 | | | |
| | | |
| JP Morgan Mortgage Trust, Series 2007-A1, Cl. 5A1, 2.576%, 7/25/352 | | | 92,133 | | | | 91,915 | | | |
| | | |
| JP Morgan Resecuritization Trust: | | | |
| Series 2009-11,Cl. 5A1, 2.618%, 9/26/361,2 | | | 261,539 | | | | 262,266 | | | |
| Series 2009-5,Cl. 1A2, 2.607%, 7/26/361,2 | | | 5,146,052 | | | | 4,455,335 | | | |
| | | |
| JPMBB Commercial Mortgage Securities Trust: | | | |
| Series 2013-C14,Cl. D, 4.561%, 8/15/461,2 | | | 2,500,000 | | | | 2,441,724 | | | |
| Series 2013-C15,Cl. D, 5.081%, 11/15/451,2 | | | 1,245,000 | | | | 1,256,341 | | | |
| Series 2014-C21,Cl. D, 4.661%, 8/15/472 | | | 4,953,000 | | | | 4,693,324 | | | |
| | | |
| Merrill Lynch Mortgage Trust, Series 2006-C1, Cl. AJ, 5.677%, 5/12/392 | | | 6,860,000 | | | | 6,903,815 | | | |
| | | |
| Morgan Stanley Bank of America Merrill Lynch Trust: | | | | | | | | | | |
| Series 2012-C6,Cl. E, 4.662%, 11/15/451,2 | | | 2,290,000 | | | | 2,296,991 | | | |
| Series 2013-C12,Cl. D, 4.769%, 10/15/461,2 | | | 2,370,000 | | | | 2,330,656 | | | |
| Series 2013-C13,Cl. D, 4.895%, 11/15/461,2 | | | 570,000 | | | | 561,533 | | | |
| Series 2013-C7,Cl. D, 4.302%, 2/15/461,2 | | | 4,435,000 | | | | 4,286,776 | | | |
| Series 2013-C8,Cl. D, 4.171%, 12/15/481,2 | | | 2,020,000 | | | | 1,935,790 | | | |
| Series 2014-C14,Cl. D, 4.834%, 2/15/471,2 | | | 5,060,000 | | | | 4,913,852 | | | |
| | | |
| Morgan Stanley Capital I Trust, Series 2007-IQ13, Cl. AM, 5.406%, 3/15/44 | | | 765,000 | | | | 815,424 | | | |
| | | |
| Morgan Stanley Re-Remic Trust, Series 2012-R3, Cl. 1A, 1.957%, 11/26/361,2 | | | 33,663 | | | | 33,384 | | | |
| | | |
| Morgan Stanley Resecuritization Trust, Series 2013-R9, Cl. 3A, 2.362%, 6/26/461,2 | | | 336,726 | | | | 341,764 | | | |
| | | |
| RALI Trust, Series 2005-QA4, Cl. A32, 3.056%, 4/25/352 | | | 52,292 | | | | 7,829 | | | |
| | | |
| Structured Adjustable Rate Mortgage Loan Trust: | | | | | | | | | | |
| Series 2004-10,Cl. 2A, 2.391%, 8/25/342 | | | 5,778,356 | | | | 5,708,004 | | | |
| Series 2007-6,Cl. 3A1, 4.544%, 7/25/372 | | | 4,502,368 | | | | 3,489,146 | | | |
| | | |
| UBS-Barclays Commercial Mortgage Trust: | | | | | | | | | | |
| Series 2012-C2,Cl. E, 4.889%, 5/10/631,2 | | | 3,450,000 | | | | 3,441,328 | | | |
| Series 2013-C5,Cl. D, 4.092%, 3/10/461,2 | | | 4,200,000 | | | | 3,943,107 | | | |
| | | |
| Wachovia Bank Commercial Mortgage Trust, Series 2007-C30, Cl. AM, 5.383%, 12/15/43 | | | 140,000 | | | | 148,745 | | | |
| | | |
| WaMu Mortgage Pass-Through Certificates Trust, Series 2005-AR16, Cl. 1A1, 2.339%, 12/25/352 | | | 17,258 | | | | 16,501 | | | |
| | | |
| Washington Mutual Mortgage Pass-Through Certificates Trust, Series 2007-OA3, Cl. 5A, 1.913%, 4/25/472 | | | 535,719 | | | | 411,797 | | | |
| | | | | | | | |
| | | Principal Amount | | | Value | |
| |
| Commercial (Continued) | |
| |
| Wells Fargo Mortgage-Backed Securities Trust: | | | | | |
| Series 2005-AR1,Cl. 1A1, 2.611%, 2/25/352 | | | $ 2,223,913 | | | | $ 2,240,154 | |
| Series 2005-AR10,Cl. 1A1, 2.614%, 6/25/352 | | | 1,021,088 | | | | 1,039,872 | |
| Series 2005-AR15,Cl. 1A6, 2.613%, 9/25/352 | | | 4,530,287 | | | | 4,320,789 | |
| Series 2006-8,Cl. A15, 6.00%, 7/25/36 | | | 2,300,974 | | | | 2,312,948 | |
| Series 2006-AR7,Cl. 2A4, 2.613%, 5/25/362 | | | 1,891,891 | | | | 1,796,148 | |
| Series 2007-AR3,Cl. A4, 5.702%, 4/25/372 | | | 1,147,038 | | | | 1,127,658 | |
| |
| WF-RBS Commercial Mortgage Trust: | |
| Series 2012-C10,Cl. D, 4.458%, 12/15/451,2 | | | 105,000 | | | | 102,498 | |
| Series 2012-C7,Cl. E, 4.845%, 6/15/451,2 | | | 2,040,000 | | | | 2,054,783 | |
| Series 2012-C8,Cl. E, 4.876%, 8/15/451,2 | | | 2,275,000 | | | | 2,312,523 | |
| Series 2013-C11,Cl. D, 4.182%, 3/15/451,2 | | | 1,168,000 | | | | 1,121,064 | |
| Series 2013-C15,Cl. D, 4.483%, 8/15/461,2 | | | 4,445,000 | | | | 4,282,906 | |
| |
| WF-RBS Commercial Mortgage Trust, Interest-Only Commercial Mtg. Pass-Through Certificates, Series 2011-C3, Cl. XA, 0.00%, 3/15/441,4,5 | | | 5,691,789 | | | | 310,524 | |
| | | | | | | | |
| | | | 157,130,487 | |
|
| |
| Multi-Family—0.3% | | | | | | | | |
| |
| Citigroup Mortgage Loan Trust, Inc., Series 2006-AR3, Cl. 1A2A, 5.334%, 6/25/362 | | | 3,208,476 | | | | 2,957,111 | |
| |
| Wells Fargo Mortgage-Backed Securities Trust: | | | | | | | | |
| Series 2005-AR15,Cl. 1A2, 2.613%, 9/25/352 | | | 364,376 | | | | 357,377 | |
| Series 2006-AR2,Cl. 2A3, 2.612%, 3/25/362 | | | 3,798,885 | | | | 3,768,697 | |
| | | | | | | | |
| | | | 7,083,185 | |
|
| |
| Residential—0.7% | | | | | | | | |
| |
| Banc of America Funding Trust: | |
| Series 2007-1,Cl. 1A3, 6.00%, 1/25/37 | | | 1,347,917 | | | | 1,227,462 | |
| Series 2007-C,Cl. 1A4, 5.293%, 5/20/362 | | | 1,152,959 | | | | 1,118,405 | |
| |
| Bear Stearns ARM Trust, Series 2006-1, Cl. A1, 2.36%, 2/25/362 | | | 50,509 | | | | 50,485 | |
| |
| CHL Mortgage Pass-Through Trust, Series 2005-J4, Cl. A7, 5.50%, 11/25/35 | | | 1,241,269 | | | | 1,307,703 | |
| |
| Citigroup Mortgage Loan Trust, Inc.: | |
| Series 2005-2,Cl. 1A3, 2.672%, 5/25/352 | | | 1,636,176 | | | | 1,633,990 | |
| Series 2005-3,Cl. 2A4, 2.709%, 8/25/352 | | | 2,892,033 | | | | 2,472,231 | |
| |
| CWHEQ Revolving Home Equity Loan Trust: | | | | | | | | |
| Series 2005-G,Cl. 2A, 0.391%, 12/15/352 | | | 88,447 | | | | 76,735 | |
| Series 2006-H,Cl. 2A1A, 0.311%, 11/15/362 | | | 39,404 | | | | 28,568 | |
| |
| GSR Mortgage Loan Trust, Series 2006-5F, Cl. 2A1, 6%, 6/25/36 | | | 362,888 | | | | 345,436 | |
| |
| Home Equity Mortgage Trust, Series 2005-1, Cl. M6, 5.863%, 6/25/352 | | | 758,403 | | | | 773,336 | |
| |
| MASTR Asset Backed Securities Trust, Series 2006-WMC3, Cl. A3, 0.27%, 8/25/362 | | | 1,021,133 | | | | 506,058 | |
| |
| NC Finance Trust, Series 1999-I, Cl. D, 8.75%, 1/25/293,8 | | | 66,744 | | | | 10,145 | |
| |
| RALI Trust, Series 2006-QS13, Cl. 1A8, 6%, 9/25/36 | | | 24,894 | | | | 20,055 | |
| |
| Residential Asset Securitization Trust, Series 2005-A6CB, Cl. A7, 6%, 6/25/35 | | | 3,169,292 | | | | 3,028,823 | |
| |
| WaMu Mortgage Pass-Through Certificates Trust, Series 2003-AR10, Cl. A7, 2.419%, 10/25/332 | | | 130,458 | | | | 133,590 | |
| |
| Wells Fargo Mortgage-Backed Securities Trust, Series 2006-AR14, Cl. 1A2, 5.724%, 10/25/362 | | | 1,853,419 | | | | 1,804,668 | |
| | | | | | | | |
| | | | 14,537,690 | |
| | | | | | | | |
Total Mortgage-Backed Obligations
(Cost $330,245,755) | | | | 340,023,152 | |
|
| |
| |
U.S. Government Obligations—1.6% | |
| |
| Federal National Mortgage Assn. Nts., 1%, 9/27/17 | | | 848,000 | | | | 845,377 | |
10 OPPENHEIMER GLOBAL STRATEGIC INCOME FUND/VA
| | | | | | | | | | |
| | | Principal Amount | | | Value | | | |
U.S. Government Obligations (Continued) | | | | | | | |
| United States Treasury Nts.: | | | |
| 1.00%, 12/15/17 | | $ | 3,659,000 | | | $ | 3,650,851 | | | |
| 1.375%, 9/30/189,10 | | | 16,696,000 | | | | 16,677,735 | | | |
| 2.00%, 9/30/2010 | | | 9,509,000 | | | | 9,602,977 | | | |
| 2.50%, 8/15/23 | | | 735,000 | | | | 758,285 | | | |
| United States Treasury Nts. Strips, 6.16%, 2/15/16 | | | 2,116,000 | | | | 2,106,980 | | | |
| Total U.S. Government Obligations (Cost $33,426,672) | | | | | | | 33,642,205 | | | |
| | | | | | | | | | |
Foreign Government Obligations—13.5% | | | | | | | |
| Angola—0.0% | | | | | | | | | | |
| Republic of Angola Via Northern Lights III BV Sr. Unsec. Nts., 7%, 8/16/19 | | | 725,000 | | | | 723,834 | | | |
| | | | | | | | | | |
| Brazil—0.8% | | | | | | | | | | |
| Brazil Minas SPE via State of Minas Gerais Sec. Bonds, 5.333%, 2/15/281 | | | 1,010,000 | | | | 1,002,425 | | | |
| Federative Republic of Brazil International Bonds: | | | | | | | | | | |
| 4.25%, 1/7/25 | | | 2,525,000 | | | | 2,528,156 | | | |
| 5.625%, 1/7/41 | | | 1,310,000 | | | | 1,418,075 | | | |
| Federative Republic of Brazil Letra Tesouro Nacional Treasury Bills, 10.847%, 4/1/1514 | | BRL | 13,740,000 | | | | 5,024,657 | | | |
| Federative Republic of Brazil Nota Do Tesouro Nacional Unsec. Nts., 13.288%, 8/15/50 | | BRL | 4,560,000 | | | | 4,202,884 | | | |
| Federative Republic of Brazil Sr. Unsec. Nts., 4.875%, 1/22/21 | | | 2,027,000 | | | | 2,163,823 | | | |
| | | | | | | 16,340,020 | | | |
| | | | | | | | | | |
| China—0.1% | | | | | | | | | | |
| Export-Import Bank of China (The) Sr. Unsec. Nts., 3.625%, 7/31/241 | | | 2,175,000 | | | | 2,200,641 | | | |
| | | | | | | | | | |
| Colombia—1.0% | | | | | | | | | | |
| Republic of Colombia Sr. Unsec. Nts.: | | | | | | | | | | |
| 4.00%, 2/26/24 | | | 1,810,000 | | | | 1,855,250 | | | |
| 4.375%, 7/12/21 | | | 2,265,000 | | | | 2,400,900 | | | |
| 5.625%, 2/26/44 | | | 1,305,000 | | | | 1,474,650 | | | |
| 8.125%, 5/21/24 | | | 970,000 | | | | 1,292,525 | | | |
| Series B, 10.00%, 7/24/24 | | COP | 28,650,000,000 | | | | 14,401,553 | | | |
| Republic of Colombia Bonds, 7.375%, 9/18/37 | | | 435,000 | | | | 589,425 | | | |
| | | | | | | 22,014,303 | | | |
| | | | | | | | | | |
| Croatia—0.2% | | | | | | | | | | |
| Republic of Croatia Sr. Unsec. Nts.: | | | | | | | | | | |
| 5.50%, 4/4/231 | | | 2,815,000 | | | | 2,930,415 | | | |
| 6.375%, 3/24/211 | | | 475,000 | | | | 521,312 | | | |
| 6.75%, 11/5/191 | | | 285,000 | | | | 313,500 | | | |
| | | | | | | 3,765,227 | | | |
| | | | | | | | | | |
| Dominican Republic—0.2% | | | | | | | | | | |
| Banco de Reservas de la Republica Dominicana Sub. Nts., 7%, 2/1/231 | | | 1,310,000 | | | | 1,305,625 | | | |
| Dominican Republic Sr. Unsec. Bonds: | | | | | | | | | | |
| 5.875%, 4/18/241 | | | 410,000 | | | | 420,250 | | | |
| 6.60%, 1/28/241 | | | 1,135,000 | | | | 1,211,612 | | | |
| 7.45%, 4/30/441 | | | 490,000 | | | | 538,221 | | | |
| | | | | | | 3,475,708 | | | |
| | | | | | | | | | |
| Ecuador—0.0% | | | | | | | | | | |
| Republic of Ecuador Sr. Unsec. Bonds, 7.95%, 6/20/241 | | | 560,000 | | | | 481,600 | | | |
| | | | | | | | | | |
| Egypt—0.0% | | | | | | | | | | |
| Arab Republic of Egypt Bonds, 6.875%, 4/30/401 | | | 280,000 | | | | 289,100 | | | |
| | | | | | | | |
| | | Principal Amount | | | Value | |
| Gabon—0.0% | | | | | | | | |
| Gabonese Republic Unsec. Bonds, 6.375%, 12/12/241 | | $ | 1,050,000 | | | $ | 1,002,750 | |
| Greece—0.8% | | | | | | | | |
| Athens Urban Transportation Organisation Sr. Unsec. Nts., 4.851%, 9/19/16 | | EUR | 1,005,000 | | | | 1,045,834 | |
| Hellenic Republic Sr. Unsec. Bonds: | | | | | | | | |
| 5.20%, 7/17/34 | | EUR | 5,795,000 | | | | 4,695,396 | |
| 6.14%, 4/14/28 | | EUR | 6,580,000 | | | | 5,486,066 | |
| Hellenic Republic Sr. Unsec. Nts., 3.80%, 8/8/17 | | JPY | 867,000,000 | | | | 5,950,574 | |
| | | | | | | 17,177,870 | |
| | | | | | | | |
| Hungary—0.4% | | | | | | | | |
| Hungary Sr. Unsec. Bonds, 8%, 2/12/15 | | HUF | 191,000,000 | | | | 734,487 | |
| Hungary Sr. Unsec. Nts.: | |
| 5.375%, 2/21/23 | | | 1,595,000 | | | | 1,726,587 | |
| 5.375%, 3/25/24 | | | 895,000 | | | | 971,075 | |
| 7.625%, 3/29/41 | | | 375,000 | | | | 500,437 | |
| Hungary Unsec. Bonds: | | | | | |
| Series 20/A, 7.50%, 11/12/20 | | HUF | 392,000,000 | | | | 1,834,018 | |
| Series 23/A, 6.00%, 11/24/23 | | HUF | 512,000,000 | | | | 2,326,386 | |
| | | | | | | 8,092,990 | |
| | | | | | | | |
| India—1.0% | | | | | | | | |
| Republic of India Sr. Unsec. Bonds: | | | | | | | | |
| 7.28%, 6/3/19 | | INR | 839,000,000 | | | | 12,856,328 | |
| 8.83%, 11/25/23 | | INR | 549,000,000 | | | | 9,166,859 | |
| | | | | | | 22,023,187 | |
| | | | | | | | |
| Indonesia—1.3% | | | | | | | | |
| Perusahaan Penerbit SBSN Indonesia III Sr. Unsec. Nts., 4%, 11/21/181 | | | 930,000 | | | | 963,712 | |
| Perusahaan Penerbit SBSN Indonesia III Unsec. Nts.: | | | | | | | | |
| 4.35%, 9/10/241 | | | 610,000 | | | | 614,575 | |
| 6.125%, 3/15/191 | | | 2,045,000 | | | | 2,269,950 | |
| Republic of Indonesia Sr. Unsec. Bonds: | | | | | | | | |
| 3.375%, 4/15/231 | | | 1,040,000 | | | | 988,000 | |
| 4.625%, 4/15/431 | | | 540,000 | | | | 502,875 | |
| 4.875%, 5/5/211 | | | 2,475,000 | | | | 2,626,594 | |
| 5.375%, 10/17/231 | | | 880,000 | | | | 963,600 | |
| 5.875%, 1/15/241 | | | 1,230,000 | | | | 1,392,975 | |
| 6.75%, 1/15/441 | | | 345,000 | | | | 427,800 | |
| 11.625%, 3/4/191 | | | 560,000 | | | | 742,700 | |
| Republic of Indonesia Treasury Bonds, 8.375%, Series FR70, 3/15/24 | | IDR | 206,000,000,000 | | | | 17,419,666 | |
| | | | | | | 28,912,447 | |
| | | | | | | | |
| Ivory Coast—0.2% | | | | | |
| Republic of Cote d’Ivoire Sr. Unsec. Bonds, 5.75%, 12/31/322 | | | 3,920,000 | | | | 3,781,491 | |
| | | | | | | | |
| Kenya—0.1% | | | | | | | | |
| Republic of Kenya Sr. Unsec. Bonds: | | | | | | | | |
| 5.875%, 6/24/191 | | | 560,000 | | | | 568,400 | |
| 6.875%, 6/24/241 | | | 1,165,000 | | | | 1,226,163 | |
| | | | | | | 1,794,563 | |
| | | | | | | | |
| Latvia—0.1% | | | | | | | | |
| Republic of Latvia Sr. Unsec. Nts., 5.25%, 6/16/211 | | | 1,095,000 | | | | 1,230,506 | |
| | | | | | | | |
| Lebanon—0.1% | | | | | | | | |
| Lebanese Republic International Bonds: | | | | | | | | |
| 5.45%, 11/28/19 | | | 480,000 | | | | 482,640 | |
| 6.00%, 1/27/23 | | | 295,000 | | | | 297,272 | |
| 6.10%, 10/4/22 | | | 625,000 | | | | 639,062 | |
| 6.60%, 11/27/26 | | | 695,000 | | | | 721,063 | |
| | | | | | | 2,140,037 | |
11 OPPENHEIMER GLOBAL STRATEGIC INCOME FUND/VA
CONSOLIDATED STATEMENT OF INVESTMENTS Continued
| | | | | | | | | | |
| | | Principal Amount | | | Value | | | |
| | | |
| Lithuania—0.1% | | | |
| Republic of Lithuania Sr. Unsec. Bonds, 6.125%, 3/9/211 | | $ | 2,675,000 | | | $ | 3,124,748 | | | |
| |
| | | |
| Mexico—2.4% | | | | | | | | | | |
| United Mexican States Bonds: | | | | | | | | | | |
| 3.60%, 1/30/25 | | | 1,735,000 | | | | 1,737,603 | | | |
| 8.50%, 12/13/18 | | MXN | 300,200,000 | | | | 22,947,071 | | | |
| | | |
| United Mexican States Unsec. Bonds: | | | | | | | | | | |
| Series M, 6.50%, 6/9/22 | | MXN | 187,900,000 | | | | 13,384,962 | | | |
| Series M, 8.00%, 12/7/23 | | MXN | 155,900,000 | | | | 12,165,267 | | | |
| Series M20, 4.75%, 3/8/44 | | | 435,000 | | | | 455,663 | | | |
| | | | | | | | | | |
| | | | 50,690,566 | | | |
| |
| | | |
| Morocco—0.1% | | | | | | | |
| Kingdom of Morocco Sr. Unsec. Bonds, 5.50%, 12/11/421 | | | 1,305,000 | | | | 1,349,409 | | | |
| | | |
| Kingdom of Morocco Sr. Unsec. Nts., 4.25%, 12/11/221 | | | 1,175,000 | | | | 1,195,563 | | | |
| | | | | | | | | | |
| | | | 2,544,972 | | | |
| |
| | | |
| Panama—0.2% | | | | | | | |
| Republic of Panama Sr. Unsec. Bonds: | | | | | | | | | | |
| 4.00%, 9/22/24 | | | 610,000 | | | | 629,825 | | | |
| 5.20%, 1/30/20 | | | 1,045,000 | | | | 1,157,338 | | | |
| 6.70%, 1/26/36 | | | 620,000 | | | | 804,450 | | | |
| 9.375%, 4/1/29 | | | 580,000 | | | | 883,050 | | | |
| | | | | | | | | | |
| | | | 3,474,663 | | | |
| |
| | | |
| Paraguay—0.1% | | | | | | | |
| Republic of Paraguay Sr. Unsec. Bonds, 6.10%, 8/11/441 | | | 1,220,000 | | | | 1,305,400 | | | |
| |
| | | |
| Peru—0.1% | | | | | | | | | | |
| Republic of Peru Sr. Unsec. Bonds: | | | | | | | | | | |
| 5.625%, 11/18/50 | | | 870,000 | | | | 1,028,775 | | | |
| 7.35%, 7/21/25 | | | 1,010,000 | | | | 1,345,825 | | | |
| | | | | | | | | | |
| | | | 2,374,600 | | | |
| |
| | | |
| Philippines—0.3% | | | | | | | |
| Republic of the Philippines Sr. Unsec. Bonds: | | | | | | | | | | |
| 6.375%, 1/15/32 | | | 1,935,000 | | | | 2,542,106 | | | |
| 6.375%, 10/23/34 | | | 2,350,000 | | | | 3,154,875 | | | |
| | | | | | | | | | |
| | | | 5,696,981 | | | |
| |
| | | |
| Poland—0.3% | | | | | | | |
| Republic of Poland Sr. Unsec. Bonds: | | | | | | | | | | |
| 3.00%, 3/17/23 | | | 4,185,000 | | | | 4,178,111 | | | |
| 5.125%, 4/21/21 | | | 1,755,000 | | | | 1,978,412 | | | |
| | | | | | | | | | |
| | | | 6,156,523 | | | |
| |
| | | |
| Portugal—0.1% | | | | | | | |
| Republic of Portugal Obrigacoes do Tesouro OT Sr. Unsec. Bonds, 4.75%, 6/14/19 | | EUR | 1,975,000 | | | | 2,727,228 | | | |
| |
| | | |
| Romania—0.3% | | | | | | | |
| Romania Sr. Unsec. Bonds: | | | | | | | | | | |
| 4.875%, 1/22/241 | | | 800,000 | | | | 876,000 | | | |
| 6.125%, 1/22/441 | | | 1,070,000 | | | | 1,298,713 | | | |
| 6.75%, 2/7/221 | | | 3,150,000 | | | | 3,803,247 | | | |
| | | | | | | | | | |
| | | | 5,977,960 | | | |
| |
| | | |
| Russia—0.1% | | | | | | | |
| Russian Federation Sr. Unsec. Bonds, 4.875%, 9/16/231 | | | 1,730,000 | | | | 1,550,080 | | | |
| | | |
| Russian Federation Sr. Unsec. Nts., 5%, 4/29/201 | | | 1,420,000 | | | | 1,327,345 | | | |
| | | | | | | | | | |
| | | | 2,877,425 | | | |
| | | |
| Senegal—0.0% | | | | | | | |
| Republic of Senegal Unsec. Bonds, 6.25%, 7/30/241 | | | 800,000 | | | | 766,160 | | | |
| | | | | | | | |
| | | Principal Amount | | | Value | |
| |
| Serbia—0.1% | |
| Republic of Serbia Sr. Unsec. Bonds, 5.25%, 11/21/171 | | $ | 1,425,000 | | | $ | 1,470,600 | |
| |
| Republic of Serbia Unsec. Bonds, 5.875%, 12/3/181 | | | 1,510,000 | | | | 1,581,725 | |
| | | | | | | | |
| | | | 3,052,325 | |
|
| |
| South Africa—0.5% | | | | | |
| Republic of South Africa Sr. Unsec. Bonds: | | | | | | | | |
| 5.375%, 7/24/44 | | | 1,165,000 | | | | 1,232,716 | |
| 5.875%, 9/16/25 | | | 2,170,000 | | | | 2,450,472 | |
| |
| Republic of South Africa Unsec. Bonds, 10.50%, Series R186, 12/21/26 | | ZAR | 69,000,000 | | | | 7,178,678 | |
| | | | | | | | |
| | | | 10,861,866 | |
|
| |
| Sri Lanka—0.2% | | | | | |
| Democratic Socialist Republic of Sri Lanka Sr. Unsec. Bonds: | | | | | | | | |
| 5.875%, 7/25/221 | | | 1,010,000 | | | | 1,036,513 | |
| 6.00%, 1/14/191 | | | 1,090,000 | | | | 1,136,325 | |
| 6.25%, 10/4/201 | | | 1,225,000 | | | | 1,287,781 | |
| |
| Democratic Socialist Republic of Sri Lanka Unsec. Bonds, 7.40%, 1/22/151 | | | 810,000 | | | | 811,012 | |
| | | | | | | | |
| | | | 4,271,631 | |
|
| |
| Tanzania—0.1% | | | | | |
| United Republic of Tanzania Sr. Unsec. Nts., 6.329%, 3/9/202 | | | 1,435,000 | | | | 1,506,358 | |
|
| |
| Turkey—2.0% | | | | | |
| Republic of Turkey Bonds: | | | | | | | | |
| 4.875%, 4/16/43 | | | 710,000 | | | | 710,767 | |
| 10.50%, 1/15/20 | | TRY | 75,450,000 | | | | 35,905,028 | |
| |
| Republic of Turkey Sr. Unsec. Bonds: | | | | | | | | |
| 4.35%, 11/12/21 | | EUR | 1,040,000 | | | | 1,379,356 | |
| 6.25%, 9/26/22 | | | 2,145,000 | | | | 2,453,344 | |
| 6.625%, 2/17/45 | | | 345,000 | | | | 425,126 | |
| 6.875%, 3/17/36 | | | 880,000 | | | | 1,091,200 | |
| | | | | | | | |
| | | | 41,964,821 | |
|
| |
| Ukraine—0.0% | | | | | | | | |
| Ukraine International Bonds, 7.80%, 11/28/221 | | | 640,000 | | | | 396,800 | |
|
| |
| United Arab Emirates—0.0% | | | | | |
| Emirate of Dubai Sr. Unsec. International Bonds, 5.25%, 1/30/43 | | | 620,000 | | | | 571,724 | |
|
| |
| Uruguay—0.1% | | | | | |
| Oriental Republic of Uruguay Sr. Unsec. Bonds, 5.10%, 6/18/50 | | | 1,430,000 | | | | 1,455,025 | |
|
| |
| Venezuela—0.1% | | | | | |
| Bolivarian Republic of Venezuela Sr. Unsec. Bonds: | | | | | | | | |
| 7.75%, 10/13/19 | | | 510,000 | | | | 228,990 | |
| 8.25%, 10/13/24 | | | 325,000 | | | | 143,000 | |
| 13.625%, 8/15/181 | | | 2,265,000 | | | | 1,150,620 | |
| | | | | | | | |
| | | | 1,522,610 | |
|
| |
| Vietnam—0.0% | | | | | |
| Socialist Republic of Vietnam Bonds, 4.80%, 11/19/241 | | | 800,000 | | | | 826,000 | |
| | | | | | | | |
| Total Foreign Government Obligations (Cost $305,727,269) | | | | 289,592,660 | |
|
| |
| Corporate Loans—3.8% | |
| |
| Accellent, Inc., Sr. Sec. Credit Facilities 2nd Lien Term Loan, 7.50%, 3/11/222 | | | 1,360,000 | | | | 1,285,200 | |
| |
| Affinion Group, Inc., Sr. Sec. Credit Facilities 1st Lien Term Loan, 6.75%, 4/30/182 | | | 797,350 | | | | 748,512 | |
12 OPPENHEIMER GLOBAL STRATEGIC INCOME FUND/VA
| | | | | | | | |
| | | Principal Amount | | | Value | |
| |
Corporate Loans (Continued) | | | | | |
| |
| Affinion Group, Inc., Sr. Sec. Credit Facilities 2nd Lien Term Loan, 8.50%, 10/31/182,6 | | $ | 1,237,587 | | | $ | 1,116,149 | |
| |
| Amaya BV, Sr. Sec. Credit Facilities 2nd Lien Term Loan, 8.00%, 7/29/222 | | | 2,265,000 | | | | 2,248,013 | |
| |
| Asurion LLC, Sr. Sec. Credit Facilities 2nd Lien Term Loan, 8.50%, 3/3/212 | | | 5,945,247 | | | | 5,930,384 | |
| |
| AZ Chem US, Inc., Sr. Sec. Credit Facilities 2nd Lien Term Loan, 7.50%, 6/10/222 | | | 1,180,000 | | | | 1,168,200 | |
| |
| BJ’s Wholesale Club, Inc., Sr. Sec. Credit Facilities 2nd Lien Term Loan, 8.50%, 3/26/202 | | | 1,775,000 | | | | 1,751,334 | |
| |
| Blue Coat Systems, Inc., Sr. Sec. Credit Facilities 2nd Lien Term Loan, 9.50%, 6/26/202 | | | 895,000 | | | | 881,575 | |
| |
| Brock Holdings III, Inc., Sr. Sec. Credit Facilities 2nd Lien Term Loan, 10.00%, 3/16/182 | | | 775,000 | | | | 614,187 | |
| |
| Caesars Entertainment Operating Co., Inc., Sr. Sec. Credit Facilities 1st Lien Term Loan, 9.75%, 1/29/182 | | | 1,084,550 | | | | 961,996 | |
| |
| Caesars Entertainment Resort Properties LLC, Sr. Sec. Credit Facilities 1st Lien Term Loan, 7.00%, 10/11/202 | | | 4,355,690 | | | | 4,134,277 | |
| |
| Caesars Growth Properties Holdings LLC, Sr. Sec. Credit Facilities 1st Lien Term Loan, 6.25%, 5/10/212 | | | 1,060,670 | | | | 984,655 | |
| |
| Clear Channel Communications, Inc., Extended Sr. Sec. Credit Facilities 1st Lien Term Loan, 6.919%, 1/30/192 | | | 7,103,532 | | | | 6,710,621 | |
| |
| Clear Channel Communications, Inc., Sr. Sec. Credit Facilities 1st Lien Term Loan: | |
| Tranche B, 3.819%, 1/29/16 | | | 24,300 | | | | 24,049 | |
| Tranche E, 7.669%, 7/30/19 | | | 926,326 | | | | 890,431 | |
| |
| Connolly Corp., Sr. Sec. Credit Facilities 2nd Lien Term Loan, 8.00%, 5/9/222 | | | 1,880,000 | | | | 1,870,600 | |
| |
| CRC Health Corp., Sr. Sec. Credit Facilities 2nd Lien Term Loan, 9.00%, 9/28/212 | | | 2,325,000 | | | | 2,381,672 | |
| |
| Del Monte Foods Co., Inc., Sr. Sec. Credit Facilities 2nd Lien Term Loan, 8.25%, 8/18/212,6 | | | 1,310,000 | | | | 1,126,600 | |
| |
| Deltek, Inc., Sr. Sec. Credit Facilities 2nd Lien Term Loan, 10.00%, 10/10/192 | | | 1,620,000 | | | | 1,632,150 | |
| |
| Deluxe Entertainment Services, Sr. Sec. Credit Facilities 1st Lien Term Loan, 6.50%, 2/26/202 | | | 736,576 | | | | 682,253 | |
| |
| Dialysis Newco, Inc., Sr. Sec. Credit Facilities 2nd Lien Term Loan, 7.75%, 10/21/212 | | | 2,835,000 | | | | 2,827,913 | |
| |
| Entegra TC LLC, Sr. Sec. Credit Facilities Exit 3rd Lien Term Loan, 9.25%, 10/3/202,12 | | | 1,633,426 | | | | 1,576,256 | |
| |
| FairPoint Communications, Inc., Sr. Sec. Credit Facilities 1st Lien Term Loan, 7.50%, 2/14/192 | | | 1,797,136 | | | | 1,792,643 | |
| |
| Fieldwood Energy LLC, Sr. Sec. Credit Facilities 2nd Lien Term Loan, 8.375%, 9/30/202,6 | | | 872,184 | | | | 642,363 | |
| |
| Flint Group GmbH, Sr. Sec. Credit Facilities 2nd Lien Term Loan, 8.25%, 9/5/222 | | | 710,000 | | | | 674,500 | |
| |
| GYP Holdings III Corp., Sr. Sec. Credit Facilities 2nd Lien Term Loan, 7.75%, 3/27/222 | | | 2,325,000 | | | | 2,295,938 | |
| |
| Internet Brands, Sr. Sec. Credit Facilities 2nd Lien Term Loan, 8.50%, 7/8/222 | | | 2,120,000 | | | | 2,082,900 | |
| | | | | | | | |
| | | Principal Amount | | | Value | |
| |
Corporate Loans (Continued) | | | | | |
| |
| IPC Systems, Inc., Sr. Sec. Credit Facilities 1st Lien Term Loan, 6.00%, 11/9/202 | | $ | 1,572,100 | | | $ | 1,566,205 | |
| |
| IPC Systems, Inc., Sr. Sec. Credit Facilities 2nd Lien Term Loan, 9.50%, 5/10/212 | | | 860,000 | | | | 894,400 | |
| |
| iStar Financial, Inc., Sr. Sec. Credit Facilities 1st Lien Term Loan, 7.00%, 3/19/172 | | | 834,309 | | | | 857,774 | |
| |
| Liberty Cablevision of Puerto Rico LLC, Sr. Sec. Credit Facilities 2nd Lien Term Loan, 7.75%, 7/7/232 | | | 1,440,000 | | | | 1,404,000 | |
| |
| Moxie Patriot LLC, Sr. Sec. Credit Facilities 1st Lien Term Loan, 6.75%, 12/19/202 | | | 1,370,000 | | | | 1,375,138 | |
| |
| NewPage Corp., Sr. Sec. Credit Facilities 1st Lien Term Loan, 9.50%, 2/5/212 | | | 3,555,000 | | | | 3,412,800 | |
| |
| NFR Energy LLC, Sr. Sec. Credit Facilities 2nd Lien Term Loan, 8.75%, 12/31/182 | | | 3,590,000 | | | | 2,925,850 | |
| |
| NTELOS, Inc., Sr. Sec. Credit Facilities 1st Lien Term Loan, 5.75%, 11/9/192 | | | 1,103,161 | | | | 970,782 | |
| |
| Orchard Acquisition Co., Sr. Sec. Credit Facilities 1st Lien Term Loan, 7.00%, 2/8/192 | | | 300,970 | | | | 298,712 | |
| |
| Quicksilver Resources, Inc., Sr. Sec. Credit Facilities 2nd Lien Term Loan, 7.00%, 6/21/192,6 | | | 4,151,000 | | | | 3,154,760 | |
| |
| Radnet Management, Inc., Sr. Sec. Credit Facilities 2nd Lien Term Loan, 8.00%, 3/25/212 | | | 1,740,000 | | | | 1,731,300 | |
| |
| Revel Entertainment, Inc., Sr. Sec. Credit Facilities 2nd Lien Exit Term Loan, 14.50%, 5/20/182, 8,12 | | | 1,490,134 | | | | 7,452 | |
| |
| Rexam plc, Sr. Sec. Credit Facilities 2nd Lien Term Loan, 8.00%, 5/2/222 | | | 1,860,000 | | | | 1,846,050 | |
| |
| Road Infrastructure Investment LLC, Sr. Sec. Credit Facilities 2nd Lien Term Loan, 7.75%, 9/21/212 | | | 1,860,000 | | | | 1,698,799 | |
| |
| RP Crown Parent LLC, Sr. Sec. Credit Facilities 1st Lien Term Loan, 6.00%, 12/21/182 | | | 2,055,736 | | | | 1,913,119 | |
| |
| RP Crown Parent LLC, Sr. Sec. Credit Facilities 2nd Lien Term Loan, 11.25%, 12/21/192 | | | 720,000 | | | | 617,625 | |
| |
| Sun Products Corp. (The), Sr. Sec. Credit Facilities 1st Lien Term Loan, 5.50%, 3/23/202 | | | 1,450,000 | | | | 1,355,750 | |
| |
| Templar Energy LLC, Sr. Sec. Credit Facilities 2nd Lien Term Loan, 8.50%, 11/25/202 | | | 5,783,500 | | | | 4,178,579 | |
| |
| TWCC Holding Corp., Sr. Sec. Credit Facilities 2nd Lien Term Loan, 7.00%, 6/26/202 | | | 2,185,000 | | | | 2,086,675 | |
| | | | | | | | |
Total Corporate Loans
(Cost $87,596,651) | | | | | | | 81,331,141 | |
| |
Corporate Bonds and Notes—50.7% | | | | | |
| |
Consumer Discretionary—9.5% | | | | | |
| |
Auto Components—1.2% | | | | | |
| |
| Affinia Group, Inc., 7.75% Sr. Unsec. Nts., 5/1/21 | | | 2,615,000 | | | | 2,706,525 | |
| |
| Gates Global LLC/Gates Global Co., 6% Sr. Unsec. Nts., 7/15/221 | | | 3,805,000 | | | | 3,663,074 | |
| |
| GKN Holdings plc: | | | | | | | | |
| 5.375% Sr. Unsec. Nts., 9/19/22 | | GBP | 795,000 | | | | 1,428,750 | |
| 6.75% Sr. Unsec. Nts., 10/28/19 | | GBP | 1,465,000 | | | | 2,720,272 | |
13 OPPENHEIMER GLOBAL STRATEGIC INCOME FUND/VA
CONSOLIDATED STATEMENT OF INVESTMENTS Continued
| | | | | | | | | | | | |
| | | | | | Principal Amount | | | Value | |
| |
Auto Components (Continued) | |
| |
| Goodyear Tire & Rubber Co., 8.25% Sr. Unsec. Nts., 8/15/20 | | | | | | $ | 3,410,000 | | | $ | 3,631,650 | |
| |
| Icahn Enterprises LP/Icahn Enterprises Finance Corp., 5.875% Sr. Unsec. Nts., 2/1/22 | | | | | | | 4,035,000 | | | | 4,072,828 | |
| |
| Lear Corp., 4.75% Sr. Unsec. Nts., 1/15/23 | | | | | | | 2,925,000 | | | | 2,932,313 | |
| |
| MPG Holdco I, Inc., 7.375% Sr. Unsec. Nts., 10/15/221 | | | | | | | 3,675,000 | | | | 3,803,625 | |
| | | | | | | | | | | | |
| | | | | | | | | | | 24,959,037 | |
|
| |
Automobiles—0.4% | |
| |
| Daimler Finance North America LLC, 2.375% Sr. Unsec. Nts., 8/1/181 | | | | | | | 1,375,000 | | | | 1,395,481 | |
| |
| Geely Automobile Holdings Ltd., 5.25% Sr. Unsec. Nts., 10/6/191 | | | | | | | 195,000 | | | | 189,638 | |
| |
| General Motors Co., 5% Sr. Unsec. Nts., 4/1/35 | | | | | | | 2,865,000 | | | | 2,992,750 | |
| |
| Jaguar Land Rover Automotive plc, 5.625% Sr. Unsec. Nts., 2/1/231 | | | | | | | 2,065,000 | | | | 2,181,156 | |
| |
| Volkswagen International Finance NV, 3.875% Jr. Sub. Perpetual Bonds2,11 | | | EUR | | | | 1,125,000 | | | | 1,449,682 | |
| | | | | | | | | | | | |
| | | | | | | | | | | 8,208,707 | |
|
| |
Diversified Consumer Services—0.1% | |
| |
| Monitronics International, Inc., 9.125% Sr. Unsec. Nts., 4/1/20 | | | | | | | 2,865,000 | | | | 2,719,959 | |
|
| |
Hotels, Restaurants & Leisure—1.8% | |
| |
| 1011778 B.C. ULC/New Red Finance, Inc., 6% Sec. Nts., 4/1/221 | | | | | | | 2,285,000 | | | | 2,353,550 | |
| |
| Boyd Gaming Corp., 9.125% Sr. Unsec. Nts., 12/1/18 | | | | | | | 900,000 | | | | 927,000 | |
| |
| Caesars Entertainment Resort Properties LLC, 11% Sec. Nts., 10/1/211 | | | | | | | 1,725,000 | | | | 1,578,375 | |
| |
| Caesars Growth Properties Holdings LLC/Caesars Growth Properties Finance, Inc., 9.375% Sec. Nts., 5/1/221 | | | | | | | 1,885,000 | | | | 1,668,225 | |
| |
| Churchill Downs, Inc., 5.375% Sr. Unsec. Nts., 12/15/21 | | | | | | | 1,650,000 | | | | 1,658,250 | |
| |
| Greektown Holdings LLC/Greektown Mothership Corp., 8.875% Sr. Sec. Nts., 3/15/191 | | | | | | | 3,150,000 | | | | 3,157,875 | |
| |
| GTECH SpA, 8.25% Jr. Sub. Nts., 3/31/661,2 | | | EUR | | | | 1,643,000 | | | | 2,164,557 | |
| |
| Isle of Capri Casinos, Inc., 7.75% Sr. Unsec. Nts., 3/15/19 | | | | | | | 3,070,000 | | | | 3,192,800 | |
| |
| Landry’s, Inc., 9.375% Sr. Unsec. Nts., 5/1/201 | | | | | | | 4,315,000 | | | | 4,595,475 | |
| |
| MCE Finance Ltd., 5% Sr. Unsec. Nts., 2/15/211 | | | | | | | 2,465,000 | | | | 2,317,100 | |
| |
MGM Resorts International: 6.625% Sr. Unsec. Nts. 12/15/21 | | | | | | | 2,100,000 | | | | 2,215,500 | |
| 6.75% Sr. Unsec. Nts., 10/1/20 | | | | | | | 1,650,000 | | | | 1,736,625 | |
| |
MTR Gaming Group, Inc., 11.50% Sec. Nts., 8/1/19 | | | | | | | 2,510,825 | | | | 2,730,522 | |
| |
| NCL Corp. Ltd., 5.25% Sr. Unsec. Nts., 11/15/191 | | | | | | | 1,380,000 | | | | 1,397,250 | |
| |
| PF Chang’s China Bistro, Inc., 10.25% Sr. Unsec. Nts., 6/30/201 | | | | | | | 1,340,000 | | | | 1,343,350 | |
| |
| Pinnacle Entertainment, Inc., 6.375% Sr. Unsec. Nts., 8/1/21 | | | | | | | 1,670,000 | | | | 1,728,450 | |
| |
| Premier Cruises Ltd., 11% Sr. Unsec. Nts., 3/15/083,8 | | | | | | | 250,000 | | | | — | |
| |
| Sugarhouse HSP Gaming Prop Mezz LP/Sugarhouse HSP Gaming Finance Corp., 6.375% Sr. Sec. Nts., 6/1/211 | | | | | | | 1,250,000 | | | | 1,143,750 | |
| | | | | | | | | | | | |
| | | | | | Principal Amount | | | Value | |
| |
Hotels, Restaurants & Leisure (Continued) | |
| |
| Viking Cruises Ltd., 8.50% Sr. Unsec. Nts., 10/15/221 | | | | | | $ | 2,135,000 | | | $ | 2,321,813 | |
| | | | | | | | | | | | |
| | | | | | | | | | | 38,230,467 | |
|
| |
Household Durables—0.7% | |
| |
| Arcelik AS, 5% Sr. Unsec. Nts., 4/3/231 | | | | | | | 320,000 | | | | 309,792 | |
| |
| Beazer Homes USA, Inc., 9.125% Sr. Unsec. Nts., 5/15/19 | | | | | | | 2,815,000 | | | | 2,952,231 | |
| |
| Jarden Corp., 6.125% Sr. Unsec. Nts., 11/15/22 | | | | | | | 1,080,000 | | | | 1,131,300 | |
| |
K Hovnanian Enterprises, Inc.: 7.00% Sr. Unsec. Nts., 1/15/191 | | | | | | | 1,200,000 | | | | 1,149,750 | |
| 9.125% Sec. Nts., 11/15/203 | | | | | | | 1,790,000 | | | | 1,915,300 | |
| |
| KB Home, 7% Sr. Unsec. Nts., 12/15/21 | | | | | | | 1,965,000 | | | | 2,071,847 | |
| |
| Meritage Homes Corp., 7.15% Sr. Unsec. Nts., 4/15/20 | | | | | | | 3,270,000 | | | | 3,531,600 | |
| |
| Taylor Morrison Communities, Inc./Monarch Communities, Inc.: | | | | | | | | | | | | |
| 5.25% Sr. Unsec. Nts., 4/15/211 | | | | | | | 1,050,000 | | | | 1,039,500 | |
| 5.625% Sr. Unsec. Nts., 3/1/241 | | | | | | | 274,000 | | | | 265,780 | |
| | | | | | | | | | | | |
| | | | | | | | | | | 14,367,100 | |
|
| |
Media—3.5% | |
| |
| Altice Financing SA, 6.50% Sec. Nts., 1/15/221 | | | | | | | 4,600,000 | | | | 4,508,000 | |
| |
| Altice Finco SA, 8.125% Sec. Nts., 1/15/241 | | | | | | | 1,785,000 | | | | 1,749,300 | |
| |
| Altice SA, 7.25% Sr. Sec. Nts., 5/15/221 | | | EUR | | | | 4,220,000 | | | | 5,186,985 | |
| |
| Belo Corp., 7.75% Sr. Unsec. Nts., 6/1/27 | | | | | | | 3,132,000 | | | | 3,460,860 | |
| |
| CCO Holdings LLC/CCO Holdings Capital Corp., 5.75% Sr. Unsec. Nts., 9/1/23 | | | | | | | 2,000,000 | | | | 2,032,500 | |
| |
| CCOH Safari LLC, 5.75% Sr. Unsec. Nts., 12/1/24 | | | | | | | 6,705,000 | | | | 6,797,194 | |
| |
| Cumulus Media Holdings, Inc., 7.75% Sr. Unsec. Nts., 5/1/19 | | | | | | | 1,715,000 | | | | 1,738,581 | |
| |
| DISH DBS Corp.: | | | | | | | | | | | | |
| 5.875% Sr. Unsec. Nts., 11/15/241 | | | | | | | 2,530,000 | | | | 2,548,975 | |
| 6.75% Sr. Unsec. Nts., 6/1/21 | | | | | | | 835,000 | | | | 899,712 | |
| |
| DreamWorks Animation SKG, Inc., | | | | | | | | | | | | |
| 6.875% Sr. Unsec. Nts., 8/15/201 | | | | | | | 1,260,000 | | | | 1,297,800 | |
| |
| Entercom Radio LLC, 10.50% Sr. Unsec. Nts., 12/1/19 | | | | | | | 1,125,000 | | | | 1,226,250 | |
| |
| Gannett Co., Inc.: | | | | | | | | | | | | |
| 5.125% Sr. Unsec. Nts., 7/15/20 | | | | | | | 1,740,000 | | | | 1,783,500 | |
| 5.50% Sr. Unsec. Nts., 9/15/241 | | | | | | | 475,000 | | | | 477,375 | |
| |
| Gray Television, Inc., 7.50% Sr. Unsec. Nts., 10/1/20 | | | | | | | 4,435,000 | | | | 4,590,225 | |
| |
| iHeartCommunications, Inc., 9% Sr. Sec. Nts., 12/15/19 | | | | | | | 875,000 | | | | 865,156 | |
| |
| LIN Television Corp., 5.875% Sr. Unsec. Nts., 11/15/221 | | | | | | | 2,260,000 | | | | 2,243,050 | |
| |
| Myriad International Holdings BV, 6% Sr. Unsec. Nts., 7/18/201 | | | | | | | 1,040,000 | | | | 1,141,400 | |
| |
| Nexstar Broadcasting, Inc., 6.875% Sr. Unsec. Nts., 11/15/20 | | | | | | | 2,305,000 | | | | 2,402,963 | |
| |
| Numericable-SFR, 6% Sr. Sec. Nts., 5/15/221 | | | | | | | 5,995,000 | | | | 6,035,466 | |
| |
| Sinclair Television Group, Inc.: | | | | | | | | | | | | |
| 5.375% Sr. Unsec. Nts., 4/1/21 | | | | | | | 1,800,000 | | | | 1,795,500 | |
| 5.625% Sr. Unsec. Nts., 8/1/241 | | | | | | | 1,180,000 | | | | 1,147,550 | |
| 6.125% Sr. Unsec. Nts., 10/1/22 | | | | | | | 2,410,000 | | | | 2,464,225 | |
| |
| Univision Communications, Inc., 8.50% Sr. Unsec. Nts., 5/15/211 | | | | | | | 1,590,000 | | | | 1,701,300 | |
| |
| UPC Holding BV, 6.75% Sr. Unsec. Nts., 3/15/231 | | | EUR | | | | 2,720,000 | | | | 3,607,956 | |
14 OPPENHEIMER GLOBAL STRATEGIC INCOME FUND/VA
| | | | | | | | | | |
| | | Principal Amount | | | Value | | | |
| | | |
| Media (Continued) | | | |
| | | |
| UPCB Finance V Ltd., 7.25% Sr. Sec. Nts., 11/15/211 | | $ | 3,235,000 | | | $ | 3,554,456 | | | |
| | | |
| UPCB Finance VI Ltd., 6.875% Sr. Sec. Nts., 1/15/221 | | | 3,275,000 | | | | 3,577,938 | | | |
| | | |
| Virgin Media Finance plc, 7% Sr. Unsec. Nts., 4/15/231 | | GBP | 755,000 | | | | 1,282,599 | | | |
| | | |
| Virgin Media Secured Finance plc, 6% Sr. Sec. Nts., 4/15/211 | | GBP | 2,470,000 | | | | 4,070,844 | | | |
| | | |
| VTR Finance BV, 6.875% Sr. Sec. Nts., 1/15/241 | | | 920,000 | | | | 940,700 | | | |
| | | | | | | | | | |
| | | | 75,128,360 | | | |
| |
| | | |
| Multiline Retail—0.2% | | | |
| | | |
| Neiman Marcus Group Ltd., Inc.: | | | | | | | | | | |
| 8.00% Sr. Unsec. Nts., 10/15/211 | | | 220,000 | | | | 233,750 | | | |
| 8.75% Sr. Unsec. Nts., 10/15/211,12 | | | 4,255,000 | | | | 4,531,575 | | | |
| | | |
| SACI Falabella, 4.375% Sr. Unsec. Nts., 1/27/251 | | | 700,000 | | | | 687,491 | | | |
| | | | | | | | | | |
| | | | 5,452,816 | | | |
| |
| | | |
| Specialty Retail—1.2% | | | |
| | | |
| Apex Tool Group LLC, 7% Sr. Unsec. Nts., 2/1/211 | | | 4,035,000 | | | | 3,470,100 | | | |
| | | |
| Claire’s Stores, Inc., 8.875% Sr. Unsec. Nts., 3/15/19 | | | 5,070,000 | | | | 4,132,050 | | | |
| | | |
| GameStop Corp., 5.50% Sr. Unsec. Nts., 10/1/191 | | | 2,540,000 | | | | 2,559,050 | | | |
| | | |
| Hot Topic, Inc., 9.25% Sr. Sec. Nts., 6/15/211 | | | 1,130,000 | | | | 1,214,750 | | | |
| | | |
| L Brands, Inc., 6.625% Sr. Unsec. Nts., 4/1/21 | | | 3,895,000 | | | | 4,401,350 | | | |
| | | |
| Michaels Stores, Inc., 5.875% Sr. Sub. Nts., 12/15/201 | | | 3,955,000 | | | | 4,014,325 | | | |
| | | |
| Party City Holdings, Inc., 8.875% Sr. Unsec. Nts., 8/1/20 | | | 770,000 | | | | 825,825 | | | |
| | | |
| Sally Holdings LLC/Sally Capital, Inc., 5.75% Sr. Unsec. Nts., 6/1/22 | | | 1,880,000 | | | | 1,978,700 | | | |
| | | |
| Stackpole International Intermediate Co., 7.75% Sr. Sec. Nts., 10/15/211 | | | 3,360,000 | | | | 3,376,800 | | | |
| | | | | | | | | | |
| | | | 25,972,950 | | | |
| |
| | | |
| Textiles, Apparel & Luxury Goods—0.4% | | | |
| | | |
| American Achievement Corp., 10.875% Sec. Nts., 4/15/161 | | | 1,290,000 | | | | 1,238,400 | | | |
| | | |
| Polymer Group, Inc., 6.875% Sr. Unsec. Nts., 6/1/191 | | | 705,000 | | | | 679,444 | | | |
| | | |
| Springs Industries, Inc., 6.25% Sr. Sec. Nts., 6/1/21 | | | 5,715,000 | | | | 5,715,000 | | | |
| | | | | | | | | | |
| | | | 7,632,844 | | | |
| |
| | | |
| Consumer Staples—1.6% | | | |
| | | |
| Beverages—0.3% | | | |
| | | |
| Compania Brasileira de Aluminio, 4.75% Sr. Unsec. Nts., 6/17/241 | | | 2,565,000 | | | | 2,504,081 | | | |
| | | |
| Constellation Brands, Inc., 4.75% Sr. Unsec. Nts., 11/15/24 | | | 2,270,000 | | | | 2,304,050 | | | |
| | | |
| Pernod Ricard SA: | | | | | | | | | | |
| 4.45% Sr. Unsec. Nts., 1/15/221 | | | 695,000 | | | | 745,247 | | | |
| 5.75% Sr. Unsec. Nts., 4/7/211 | | | 585,000 | | | | 672,873 | | | |
| | | | | | | | | | |
| | | | 6,226,251 | | | |
| |
| | | |
| Food & Staples Retailing—0.3% | | | |
| | | |
| BI-LO LLC/BI-LO Finance Corp., 8.625% Sr. Unsec. Nts., 9/15/181,12 | | | 3,335,000 | | | | 2,517,925 | | | |
| | | |
| Rite Aid Corp., 6.75% Sr. Unsec. Nts., 6/15/21 | | | 2,415,000 | | | | 2,505,563 | | | |
| | | |
| Walgreens Boots Alliance, Inc., 2.125% Sr. Unsec. Nts., 11/20/26 | | EUR | 1,400,000 | | | | 1,728,505 | | | |
| | | | | | | | | | |
| | | | 6,751,993 | | | |
| | | | | | | | |
| | | Principal Amount | | | Value | |
| |
| Food Products—0.7% | |
| |
| ASG Consolidated LLC/ASG Finance, Inc., 15% Sr. Unsec. Nts., 5/15/173,12 | | $ | 3,229,659 | | | $ | 2,293,058 | |
| |
| BRF SA, 4.75% Sr. Unsec. Nts., 5/22/241 | | | 715,000 | | | | 696,231 | |
| |
| Bumble Bee Holdings, Inc., 9% Sr. Sec. Nts., 12/15/171 | | | 1,269,000 | | | | 1,334,353 | |
| |
| Chiquita Brands International, Inc./Chiquita Brands LLC, 7.875% Sr. Sec. Nts., 2/1/21 | | | 2,236,000 | | | | 2,412,085 | |
| |
| Gruma SAB de CV, 4.875% Sr. Unsec. Nts., 12/1/241 | | | 500,000 | | | | 518,750 | |
| |
| HJ Heinz Co., 4.25% Sec. Nts., 10/15/20 | | | 2,235,000 | | | | 2,262,937 | |
| |
| Marfrig Holding Europe BV, 6.875% Sr. Unsec. Nts., 6/24/191 | | | 440,000 | | | | 410,300 | |
| |
| Minerva Luxembourg SA, 7.75% Sr. Unsec. Nts., 1/31/231 | | | 385,000 | | | | 378,263 | |
| |
| Post Holdings, Inc., 7.375% Sr. Unsec. Nts., 2/15/22 | | | 2,265,000 | | | | 2,270,663 | |
| |
| Wells Enterprises, Inc., 6.75% Sr. Sec. Nts., 2/1/201 | | | 912,000 | | | | 937,080 | |
| | | | | | | | |
| | | | 13,513,720 | |
|
| |
| Household Products—0.1% | |
| |
| Spectrum Brands, Inc.: | | | | | | | | |
| 6.125% Sr. Unsec. Nts., 12/15/241 | | | 330,000 | | | | 336,600 | |
| 6.375% Sr. Unsec. Nts., 11/15/20 | | | 1,420,000 | | | | 1,487,450 | |
| | | | | | | | |
| | | | 1,824,050 | |
|
| |
| Personal Products—0.1% | |
| |
| Revlon Consumer Products Corp., 5.75% Sr. Unsec. Nts., 2/15/21 | | | 2,380,000 | | | | 2,391,900 | |
|
| |
| Tobacco—0.1% | |
| |
| Vector Group Ltd., 7.75% Sr. Sec. Nts., 2/15/21 | | | 2,620,000 | | | | 2,767,375 | |
|
| |
| Energy—7.4% | |
| |
| Energy Equipment & Services—1.0% | |
| |
| American Energy-Permian Basin LLC/AEPB Finance Corp., 7.125% Sr. Unsec. Nts., 11/1/201 | | | 1,890,000 | | | | 1,408,050 | |
| |
| Compressco Partners LP/Compressco Finance, Inc., 7.25% Sr. Unsec. Nts., 8/15/221 | | | 2,365,000 | | | | 2,057,550 | |
| |
| Eletson Holdings, 9.625% Sr. Sec. Nts., 1/15/223 | | | 1,875,000 | | | | 1,846,875 | |
| |
| Exterran Partners LP/EXLP Finance Corp., 6% Sr. Unsec. Nts., 4/1/21 | | | 1,525,000 | | | | 1,342,000 | |
| |
| Forbes Energy Services Ltd., 9% Sr. Unsec. Nts., 6/15/19 | | | 1,520,000 | | | | 919,600 | |
| |
| GNL Quintero SA, 4.634% Sr. Unsec. Nts., 7/31/291 | | | 700,000 | | | | 710,337 | |
| |
| Hornbeck Offshore Services, Inc., 5.875% Sr. Unsec. Nts., 4/1/20 | | | 2,360,000 | | | | 2,112,200 | |
| |
| Offshore Group Investment Ltd., 7.50% Sr. Sec. Nts., 11/1/19 | | | 1,140,000 | | | | 855,000 | |
| |
| Pertamina Persero PT, 5.625% Sr. Unsec. Nts., 5/20/431 | | | 2,385,000 | | | | 2,253,825 | |
| |
| Precision Drilling Corp., 6.625% Sr. Unsec. Nts., 11/15/20 | | | 1,395,000 | | | | 1,262,475 | |
| |
| Seadrill Ltd.: | | | | | | | | |
| 6.125% Sr. Unsec. Nts., 9/15/171 | | | 2,315,000 | | | | 2,060,350 | |
| 6.50% Sr. Unsec. Nts., 10/5/15 | | | 515,000 | | | | 516,288 | |
| |
| Seventy Seven Operating LLC, 6.625% Sr. Unsec. Nts., 11/15/19 | | | 240,000 | | | | 183,600 | |
| |
| Sinopec Group Overseas Development 2013 Ltd., 4.375% Sr. Unsec. Nts., 10/17/231 | | | 1,320,000 | | | | 1,386,837 | |
15 OPPENHEIMER GLOBAL STRATEGIC INCOME FUND/VA
CONSOLIDATED STATEMENT OF INVESTMENTS Continued
| | | | | | | | | | |
| | | Principal Amount | | | Value | | | |
| | | |
Energy Equipment & Services (Continued) | | | |
| | | |
| Sinopec Group Overseas Development 2014 Ltd., 2.75% Sr. Unsec. Nts., 4/10/191 | | $ | 1,760,000 | | | $ | 1,756,800 | | | |
| | | | | | | | | | |
| | | | 20,671,787 | | | |
| |
| | | |
Oil, Gas & Consumable Fuels—6.4% | | | |
| | | |
| Access Midstream Partners LP/ACMP Finance Corp.: | | | | | | | | | | |
| 4.875% Sr. Unsec. Nts., 3/15/24 | | | 680,000 | | | | 691,900 | | | |
| 6.125% Sr. Unsec. Nts., 7/15/22 | | | 1,390,000 | | | | 1,483,825 | | | |
| | | |
| Antero Resources Finance Corp., 6% Sr. Unsec. Nts., 12/1/20 | | | 1,810,000 | | | | 1,814,525 | | | |
| | | |
| Arch Coal, Inc.: | | | | | | | | | | |
| 7.25% Sr. Unsec. Nts., 6/15/21 | | | 505,000 | | | | 149,606 | | | |
| 8.00% Sec. Nts., 1/15/191 | | | 1,760,000 | | | | 985,600 | | | |
| | | |
| Atlas Pipeline Partners LP/Atlas Pipeline Finance Corp.: | | | | | | | | | | |
| 5.875% Sr. Unsec. Nts., 8/1/23 | | | 1,280,000 | | | | 1,273,600 | | | |
| 6.625% Sr. Unsec. Nts., 10/1/20 | | | 1,435,000 | | | | 1,467,287 | | | |
| | | |
| Baytex Energy Corp., 5.125% Sr. Unsec. Nts., 6/1/211 | | | 705,000 | | | | 602,775 | | | |
| | | |
| Bill Barrett Corp., 7.625% Sr. Unsec. Nts., 10/1/19 | | | 2,355,000 | | | | 2,154,825 | | | |
| | | |
| Blue Racer Midstream LLC/Blue Racer Finance Corp., 6.125% Sr. Unsec. Nts., 11/15/221 | | | 690,000 | | | | 667,575 | | | |
| | | |
| BreitBurn Energy Partners LP/BreitBurn Finance Corp., 8.625% Sr. Unsec. Nts., 10/15/20 | | | 2,705,000 | | | | 2,339,825 | | | |
| | | |
| California Resources Corp.: | | | | | | | | | | |
| 5.00% Sr. Unsec. Nts., 1/15/201 | | | 2,005,000 | | | | 1,749,362 | | | |
| 5.50% Sr. Unsec. Nts., 9/15/211 | | | 2,805,000 | | | | 2,412,300 | | | |
| 6.00% Sr. Unsec. Nts., 11/15/241 | | | 230,000 | | | | 195,500 | | | |
| | | |
| Chaparral Energy, Inc., 7.625% Sr. Unsec. Nts., 11/15/22 | | | 1,400,000 | | | | 931,000 | | | |
| | | |
| Chesapeake Energy Corp.: | | | | | | | | | | |
| 4.875% Sr. Unsec. Nts., 4/15/22 | | | 2,110,000 | | | | 2,062,525 | | | |
| 5.375% Sr. Unsec. Nts., 6/15/21 | | | 1,320,000 | | | | 1,325,775 | | | |
| 5.75% Sr. Unsec. Nts., 3/15/23 | | | 1,425,000 | | | | 1,474,875 | | | |
| | | |
| Cimarex Energy Co., 4.375% Sr. Unsec. Nts., 6/1/24 | | | 912,000 | | | | 873,240 | | | |
| | | |
| Cloud Peak Energy Resources LLC/Cloud Peak Energy Finance Corp.: | | | | | | | | | | |
| 6.375% Sr. Unsec. Nts., 3/15/24 | | | 1,740,000 | | | | 1,626,900 | | | |
| 8.50% Sr. Unsec. Nts., 12/15/19 | | | 485,000 | | | | 506,825 | | | |
| | | |
| CNOOC Curtis Funding No 1 Pty Ltd., 4.50% Sr. Unsec. Nts., 10/3/231 | | | 1,310,000 | | | | 1,379,882 | | | |
| | | |
| Concho Resources, Inc., 5.50% Sr. Unsec. Unsub. Nts., 4/1/23 | | | 2,665,000 | | | | 2,690,850 | | | |
| | | |
| CONSOL Energy, Inc., 5.875% Sr. Unsec. Nts., 4/15/221 | | | 1,440,000 | | | | 1,346,400 | | | |
| | | |
| Cosan Luxembourg SA, 5% Sr. Unsec. Nts., 3/14/231 | | | 380,000 | | | | 339,150 | | | |
| | | |
| Crestwood Midstream Partners LP/Crestwood Midstream Finance Corp.: | | | | | | | | | | |
| 6.00% Sr. Unsec. Nts., 12/15/20 | | | 495,000 | | | | 476,437 | | | |
| 6.125% Sr. Unsec. Nts., 3/1/22 | | | 2,055,000 | | | | 1,972,800 | | | |
| | | |
| Delek & Avner Tamar Bond Ltd., 5.082% Sr. Sec. Nts., 12/30/231 | | | 610,000 | | | | 609,754 | | | |
| | | |
| Empresa Nacional del Petroleo: | | | | | | | | | | |
| 4.375% Sr. Unsec. Nts., 10/30/241 | | | 1,310,000 | | | | 1,284,230 | | | |
| 4.75% Sr. Unsec. Nts., 12/6/211 | | | 725,000 | | | | 737,690 | | | |
| | | |
| Energy Transfer Equity LP: | | | | | | | | | | |
| 5.875% Sr. Sec. Nts., 1/15/24 | | | 1,175,000 | | | | 1,198,500 | | | |
| 7.50% Sr. Sec. Nts., 10/15/20 | | | 1,975,000 | | | | 2,202,125 | | | |
| | | |
| EP Energy LLC/Everest Acquisition Finance, Inc., 7.75% Sr. Unsec. Nts., 9/1/22 | | | 2,665,000 | | | | 2,505,100 | | | |
| | | |
| EXCO Resources, Inc., 7.50% Sr. Unsec. Nts., 9/15/18 | | | 2,670,000 | | | | 2,054,231 | | | |
| | | |
| Gazprom OAO Via Gaz Capital SA: | | | | | | | | | | |
| 4.30% Sr. Unsec. Nts., 11/12/151 | | | 1,300,000 | | | | 1,277,189 | | | |
| 4.95% Sr. Unsec. Nts., 7/19/221 | | | 1,060,000 | | | | 863,900 | | | |
| | | | | | | | |
| | | Principal Amount | | | Value | |
| |
Oil, Gas & Consumable Fuels (Continued) | | | | | |
| |
| Genesis Energy LP/Genesis Energy Finance Corp., 5.75% Sr. Unsec. Nts., 2/15/21 | | $ | 1,720,000 | | | $ | 1,608,200 | |
| |
| Halcon Resources Corp.: | | | | | | | | |
| 8.875% Sr. Unsec. Nts., 5/15/21 | | | 3,955,000 | | | | 2,995,912 | |
| 9.75% Sr. Unsec. Nts., 7/15/20 | | | 1,225,000 | | | | 924,875 | |
| |
| Hiland Partners LP/Hiland Partners Finance Corp., 7.25% Sr. Unsec. Nts., 10/1/201 | | | 1,430,000 | | | | 1,365,650 | |
| |
| KazMunayGas National Co. JSC, 5.75% Sr. Unsec. Nts., 4/30/431 | | | 1,125,000 | | | | 950,625 | |
| |
| Kodiak Oil & Gas Corp., 5.50% Sr. Unsec. Nts., 1/15/21 | | | 1,735,000 | | | | 1,748,012 | |
| |
| Laredo Petroleum, Inc., 5.625% Sr. Unsec. Nts., 1/15/22 | | | 1,765,000 | | | | 1,553,200 | |
| |
| LBC Tank Terminals Holding Netherlands BV, 6.875% Sr. Unsec. Nts., 5/15/233 | | | 1,530,000 | | | | 1,545,300 | |
| |
| Lightstream Resources Ltd., 8.625% Sr. Unsec. Nts., 2/1/201 | | | 1,765,000 | | | | 1,244,325 | |
| |
| Linn Energy LLC/Linn Energy Finance Corp.: | | | | | | | | |
| 7.75% Sr. Unsec. Nts., 2/1/21 | | | 3,370,000 | | | | 2,856,075 | |
| 8.625% Sr. Unsec. Nts., 4/15/20 | | | 1,370,000 | | | | 1,198,750 | |
| |
| MarkWest Energy Partners LP/MarkWest Energy Finance Corp., 4.50% Sr. Unsec. Nts., 7/15/23 | | | 2,190,000 | | | | 2,118,825 | |
| |
| MEG Energy Corp., 6.50% Sr. Unsec. Nts., 3/15/211 | | | 7,785,000 | | | | 7,142,738 | |
| |
| Memorial Production Partners LP/Memorial Production Finance Corp., 7.625% Sr. Unsec. Nts., 5/1/21 | | | 1,425,000 | | | | 1,147,125 | |
| |
| Midstates Petroleum Co., Inc./Midstates Petroleum Co. LLC, 9.25% Sr. Unsec. Nts., 6/1/21 | | | 1,440,000 | | | | 734,400 | |
| |
| Murray Energy Corp.: | | | | | | | | |
| 8.625% Sr. Sec. Nts., 6/15/211 | | | 635,000 | | | | 609,600 | |
| 9.50% Sr. Sec. Nts., 12/5/201 | | | 2,820,000 | | | | 2,834,100 | |
| |
| Navios Maritime Acquisition Corp./Navios Acquisition Finance US, Inc., 8.125% Sr. Sec. Nts., 11/15/211 | | | 1,245,000 | | | | 1,220,100 | |
| |
| NGPL PipeCo LLC, 7.119% Sr. Sec. Nts., 12/15/171 | | | 1,945,000 | | | | 1,920,688 | |
| |
| Novatek OAO via Novatek Finance Ltd., 4.422% Sr. Unsec. Nts., 12/13/221 | | | 915,000 | | | | 686,250 | |
| |
| Oasis Petroleum, Inc., 6.875% Sr. Unsec. Nts., 1/15/23 | | | 2,580,000 | | | | 2,360,700 | |
| |
| Origin Energy Finance Ltd.: | | | | | | | | |
| 3.50% Sr. Unsec. Nts., 10/9/181 | | | 2,114,000 | | | | 2,158,863 | |
| 5.45% Sr. Unsec. Nts., 10/14/211 | | | 1,372,000 | | | | 1,501,784 | |
| |
| Pacific Rubiales Energy Corp., 5.625% Sr. Unsec. Nts., 1/19/251 | | | 955,000 | | | | 735,350 | |
| |
| Parsley Energy LLC/Parsley Finance Corp., 7.50% Sr. Unsec. Nts., 2/15/221 | | | 1,065,000 | | | | 1,014,413 | |
| |
| Peabody Energy Corp., 6.25% Sr. Unsec. Nts., 11/15/21 | | | 1,735,000 | | | | 1,489,931 | |
| |
| Penn Virginia Corp., 8.50% Sr. Unsec. Nts., 5/1/20 | | | 1,715,000 | | | | 1,380,575 | |
| |
| Petroleos de Venezuela SA, 6% Sr. Unsec. Nts., 11/15/261 | | | 2,190,000 | | | | 810,300 | |
| |
| Petroleos Mexicanos: | | | | | | | | |
| 1.95% Sr. Unsec. Nts., 12/20/22 | | | 148,000 | | | | 145,870 | |
| 2.00% Sec. Nts., 12/20/22 | | | 732,000 | | | | 722,928 | |
| 3.50% Sr. Unsec. Nts., 1/30/23 | | | 1,820,000 | | | | 1,745,380 | |
| 5.50% Sr. Unsec. Nts., 6/27/441 | | | 1,720,000 | | | | 1,763,000 | |
| 6.375% Sr. Unsec. Nts., 1/23/45 | | | 1,670,000 | | | | 1,899,625 | |
| 6.625% Sr. Unsec. Nts., 6/15/35 | | | 1,235,000 | | | | 1,432,600 | |
| 8.00% Sr. Unsec. Nts., 5/3/19 | | | 4,010,000 | | | | 4,761,875 | |
16 OPPENHEIMER GLOBAL STRATEGIC INCOME FUND/VA
| | | | | | | | | | |
| | | Principal Amount | | | Value | | | |
Oil, Gas & Consumable Fuels (Continued) | | | |
| Petroleum Co. of Trinidad & Tobago Ltd.: | | | |
| 6.00% Sr. Unsec. Nts., 5/8/221 | | $ | 325,000 | | | $ | 331,500 | | | |
| 9.75% Sr. Unsec. Nts., 8/14/191 | | | 515,000 | | | | 610,275 | | | |
| Petronas Capital Ltd., 7.875% Sr. Unsec. Nts., 5/22/221 | | | 1,005,000 | | | | 1,304,300 | | | |
| Range Resources Corp.: | | | |
| 5.00% Sr. Sub. Nts., 8/15/22 | | | 1,160,000 | | | | 1,165,800 | | | |
| 5.00% Sr. Sub. Nts., 3/15/23 | | | 325,000 | | | | 326,625 | | | |
| Regency Energy Partners LP/Regency Energy Finance Corp., 5% Sr. Unsec. Nts., 10/1/22 | | | 1,895,000 | | | | 1,800,250 | | | |
| Rice Energy, Inc., 6.25% Sr. Unsec. Nts., 5/1/221 | | | 1,565,000 | | | | 1,463,275 | | | |
| Rosetta Resources, Inc., 5.625% Sr. Unsec. Nts., 5/1/21 | | | 1,525,000 | | | | 1,403,153 | | | |
| Sabine Pass Liquefaction LLC, 5.75% Sr. Sec. Nts., 5/15/24 | | | 575,000 | | | | 567,094 | | | |
| Sanchez Energy Corp.: | | | |
| 6.125% Sr. Unsec. Nts., 1/15/231 | | | 1,385,000 | | | | 1,166,863 | | | |
| 7.75% Sr. Unsec. Nts., 6/15/21 | | | 1,695,000 | | | | 1,584,825 | | | |
| SandRidge Energy, Inc.: | | | |
| 7.50% Sr. Unsec. Nts., 2/15/23 | | | 1,090,000 | | | | 703,050 | | | |
| 7.51% Sr. Unsec. Nts., 3/15/21 | | | 1,497,000 | | | | 965,565 | | | |
| Seven Energy Ltd., 10.25% Sr. Sec. Nts., 10/11/211 | | | 380,000 | | | | 351,025 | | | |
| SM Energy Co., 6.50% Sr. Unsec. Nts., 1/1/23 | | | 1,990,000 | | | | 1,920,350 | | | |
| Summit Midstream Holdings LLC/Summit Midstream Finance Corp., 5.50% Sr. Unsec. Nts., 8/15/22 | | | 1,420,000 | | | | 1,356,100 | | | |
| Targa Resources Partners LP/Targa Resources Partners Finance Corp., 4.125% Sr. Unsec. Nts., 11/15/191 | | | 930,000 | | | | 899,775 | | | |
| Tesoro Logistics LP/Tesoro Logistics Finance Corp.: | | | |
| 5.875% Sr. Unsec. Nts., 10/1/20 | | | 1,154,000 | | | | 1,162,655 | | | |
| 6.25% Sr. Unsec. Nts., 10/15/221 | | | 935,000 | | | | 937,338 | | | |
| Triangle USA Petroleum Corp., 6.75% Sr. Unsec. Nts., 7/15/221 | | | 1,890,000 | | | | 1,256,850 | | | |
| Tullow Oil plc, 6% Sr. Unsec. Nts., 11/1/201 | | | 1,301,000 | | | | 1,092,840 | | | |
| US Shale Solutions, Inc., 12.50% Sr. Sec. Nts., 9/1/173 | | | 1,895 | | | | 1,459,150 | | | |
| Whiting Petroleum Corp., 5.75% Sr. Unsec. Nts., 3/15/21 | | | 2,195,000 | | | | 2,041,350 | | | |
| WPX Energy, Inc.: | | | |
| 5.25% Sr. Unsec. Nts., 9/15/24 | | | 945,000 | | | | 883,575 | | | |
| 6.00% Sr. Unsec. Nts., 1/15/22 | | | 1,375,000 | | | | 1,330,313 | | | |
| | | | | | | 136,139,723 | | | |
| | | | | | | | | | |
| Financials—9.1% | | | | | | | |
| Capital Markets—1.3% | | | | | | | |
| American Capital Ltd., 6.50% Sr. Unsec. Nts., 9/15/181 | | | 1,315,000 | | | | 1,380,750 | | | |
| Axalta Coating Systems Dutch Holding BV, 7.375% Sr. Unsec. Nts., 5/1/211 | | | 1,675,000 | | | | 1,783,875 | | | |
| Cantor Commercial Real Estate Co. LP/CCRE Finance Corp., 7.75% Sr. Unsec. Nts., 2/15/181 | | | 1,880,000 | | | | 1,950,500 | | | |
| Deutsche Bank AG, 7.50% Jr. Sub. Perpetual Bonds2,11 | | | 795,000 | | | | 765,187 | | | |
| Drawbridge Special Opportunities Fund LP/Drawbridge Special Opportunities Finance Corp., 5% Sr. Unsec. Nts., 8/1/211 | | | 3,145,000 | | | | 3,148,931 | | | |
| Fermaca Enterprises S de RL de CV, 6.375% Sr. Sec. Nts., 3/30/381 | | | 1,035,000 | | | | 1,058,288 | | | |
| Hilton Worldwide Finance LLC/Hilton Worldwide Finance Corp., 5.625% Sr. Unsec. Nts., 10/15/21 | | | 1,035,000 | | | | 1,086,750 | | | |
| | | | | | | | |
| | | Principal Amount | | | Value | |
| Capital Markets (Continued) | |
| Is Yatirim Menkul Degerler AS, 9.786% Unsec. Nts., 2/24/1514 | | TRY | 2,720,000 | | | | $ 1,149,146 | |
| MPH Acquisition Holdings LLC, 6.625% Sr. Unsec. Nts., 4/1/221 | | | 700,000 | | | | 717,500 | |
| Nationstar Mortgage LLC/Nationstar Capital Corp.: | | | | | | | | |
| 6.50% Sr. Unsec. Nts., 8/1/18 | | | 430,000 | | | | 411,725 | |
| 7.875% Sr. Unsec. Nts., 10/1/20 | | | 2,255,000 | | | | 2,176,075 | |
| Prospect Medical Holdings, Inc., 8.375% Sr. Sec. Nts., 5/1/191 | | | 2,160,000 | | | | 2,316,600 | |
| Signode Industrial Group Lux SA/Signode Industrial Group US, Inc., 6.375% Sr. Unsec. Nts., 5/1/221 | | | 1,165,000 | | | | 1,141,700 | |
| Springleaf Finance Corp., 5.25% Sr. Unsec. Nts., 12/15/19 | | | 1,090,000 | | | | 1,070,925 | |
| UBS AG (Jersey Branch), 7.25% Sub. Nts., 2/22/222 | | | 3,520,000 | | | | 3,782,831 | |
| Walter Investment Management Corp., 7.875% Sr. Unsec. Nts., 12/15/21 | | | 3,200,000 | | | | 2,872,000 | |
| | | | | | | 26,812,783 | |
| | | | | | | | |
| Commercial Banks—3.9% | | | | | |
| Banco Bilbao Vizcaya Argentaria SA, 9% Jr. Sub. Perpetual Bonds2,11 | | | 145,000 | | | | 155,513 | |
| Banco del Estado de Chile, 4.125% Sr. Unsec. Nts., 10/7/201 | | | 2,060,000 | | | | 2,163,196 | |
| Banco Santander SA: | | | | | | | | |
| 6.25% Jr. Sub. Perpetual Bonds2,11 | | EUR | 250,000 | | | | 293,324 | |
| 6.375% Jr. Sub. Perpetual Bonds2,11 | | | 1,435,000 | | | | 1,405,491 | |
| Barclays plc: | | | | | | | | |
| 6.625% Jr. Sub. Perpetual Bonds2,11 | | | 440,000 | | | | 421,985 | |
| 7.00% Jr. Sub. Perpetual Bonds2,11 | | GBP | 3,666,000 | | | | 5,491,554 | |
| BNP Paribas SA, 5.945% Jr. Sub. Perpetual Bonds2,11 | | GBP | 3,190,000 | | | | 5,065,158 | |
| BPCE SA, 9% Jr. Sub. Perpetual Bonds2,11 | | EUR | 1,985,000 | | | | 2,437,940 | |
| Brazil Loan Trust 1, 5.477% Sec. Nts., 7/24/233 | | | 1,465,000 | | | | 1,486,407 | |
| CIT Group, Inc.: | | | | | | | | |
| 4.25% Sr. Unsec. Nts., 8/15/17 | | | 575,000 | | | | 587,937 | |
| 5.00% Sr. Unsec. Nts., 8/15/22 | | | 3,205,000 | | | | 3,305,156 | |
| Commerzbank AG, 8.125% Sub. Nts., 9/19/231 | | | 5,050,000 | | | | 5,825,680 | |
| Corp. Financiera de Desarrollo SA, 4.75% Sr. Unsec. Nts., 2/8/221 | | | 1,330,000 | | | | 1,386,525 | |
| Corpbanca SA, 3.875% Sr. Unsec. Nts., 9/22/191 | | | 1,055,000 | | | | 1,059,899 | |
| CorpGroup Banking SA, 6.75% Sr. Unsec. Nts., 3/15/231 | | | 950,000 | | | | 941,011 | |
| Credit Agricole SA: | | | | | | | | |
| 6.637% Jr. Sub. Perpetual Bonds1,2,11 | | | 3,480,000 | | | | 3,650,701 | |
| 8.375% Jr. Sub. Perpetual Bonds2,3,11 | | | 1,855,000 | | | | 2,147,162 | |
| Danske Bank: | | | | | | | | |
| 5.684% Jr. Sub. Perpetual Bonds2,11 | | GBP | 2,250,000 | | | | 3,605,042 | |
| 5.75% Jr. Sub. Perpetual Bonds2,11 | | EUR | 145,000 | | | | 177,767 | |
| Export-Import Bank of India, 4% Sr. Unsec. Nts., 1/14/23 | | | 690,000 | | | | 693,533 | |
| Finansbank AS, 6.25% Sr. Unsec. Nts., 4/30/191 | | | 810,000 | | | | 842,562 | |
| Grupo Aval Ltd., 4.75% Sr. Unsec. Nts., 9/26/221 | | | 2,190,000 | | | | 2,124,300 | |
| HBOS Capital Funding LP, 6.461% Jr. Sub. Perpetual Bonds2,11 | | GBP | 1,085,000 | | | | 1,776,058 | |
| HSBC Holdings plc, 6.375% Jr. Sub. Perpetual Bonds2,11 | | | 2,680,000 | | | | 2,710,150 | |
| ICICI Bank Ltd., 6.375% Jr. Sub. Nts., 4/30/221,2 | | | 925,000 | | | | 955,062 | |
| ICICI Bank Ltd. (Hong Kong), 5.75% Sr. Unsec. Nts., 11/16/201 | | | 1,920,000 | | | | 2,136,029 | |
17 OPPENHEIMER GLOBAL STRATEGIC INCOME FUND/VA
CONSOLIDATEDSTATEMENTOFINVESTMENTS Continued
| | | | | | | | | | |
| | | Principal Amount | | | Value | | | |
| | | |
| Commercial Banks (Continued) | | | |
| | | |
| Intesa Sanpaolo SpA, 5.017% Sub. Nts., 6/26/241 | | $ | 2,820,000 | | | $ | 2,741,934 | | | |
| | | |
| Jones Energy Holdings LLC/Jones Energy Finance Corp., 6.75% Sr. Unsec. Nts., 4/1/221 | | | 1,195,000 | | | | 920,150 | | | |
| | | |
| Lloyds Banking Group plc, 7.625% Jr. Sub. Perpetual Bonds2,11 | | GBP | 1,170,000 | | | | 1,826,033 | | | |
| | | |
| MFB Magyar Fejlesztesi Bank Zrt, 6.25% Sr. Unsec. Nts., 10/21/201 | | | 1,670,000 | | | | 1,853,700 | | | |
| | | |
| Mizuho Bank Ltd., 2.45% Sr. Unsec. Nts., 4/16/191 | | | 1,275,000 | | | | 1,267,984 | | | |
| | | |
| Nordea Bank AB: | | | | | | | | | | |
| 5.50% Jr. Sub. Perpetual Bonds1,2,11 | | | 1,710,000 | | | | 1,690,762 | | | |
| 6.125% Jr. Sub. Perpetual Bonds1,2,11 | | | 1,065,000 | | | | 1,057,624 | | | |
| | | |
| Rabobank Capital Funding Trust IV, 5.556% Jr. Sub. Perpetual Bonds1,2,11 | | GBP | 150,000 | | | | 245,554 | | | |
| | | |
| RBS Capital Trust III, 2.095% Jr. Sub. Perpetual Bonds2,11 | | | 1,445,000 | | | | 1,444,277 | | | |
| | | |
| Royal Bank of Scotland Group plc, 6% Sub. Nts., 12/19/23 | | | 2,795,000 | | | | 3,030,582 | | | |
| | | |
| Scottish Widows plc, 5.125% Jr. Sub. Perpetual Bonds2,11 | | GBP | 565,000 | | | | 885,489 | | | |
| | | |
| Skandinaviska Enskilda Banken AB, 2.375% Sr. Unsec. Nts., 11/20/181 | | | 1,410,000 | | | | 1,427,595 | | | |
| | | |
| Societe Generale SA, 5.922% Jr. Sub. Perpetual Bonds1,2,11 | | | 4,000,000 | | | | 4,167,520 | | | |
| | | |
| State Bank of India (London), 4.875% Sr. Unsec. Nts., 4/17/241 | | | 720,000 | | | | 767,589 | | | |
| | | |
| TC Ziraat Bankasi AS, 4.25% Sr. Unsec. Nts., 7/3/191 | | | 2,175,000 | | | | 2,173,477 | | | |
| | | |
| Toronto-Dominion Bank (The), 2.625% Sr. Unsec. Nts., 9/10/18 | | | 1,395,000 | | | | 1,431,690 | | | |
| | | |
| Turkiye Halk Bankasi AS, 4.75% Sr. Unsec. Nts., 6/4/191 | | | 860,000 | | | | 873,158 | | | |
| | | |
| Turkiye Is Bankasi AS: | | | | | | | | | | |
| 5.00% Sr. Unsec. Nts., 4/30/201 | | | 1,055,000 | | | | 1,080,056 | | | |
| 8.864% Unsec. Nts., 2/9/1514 | | TRY | 2,700,000 | | | | 1,146,023 | | | |
| | | |
| Turkiye Sise ve Cam Fabrikalari AS, 4.25% Sr. Unsec. Nts., 5/9/201 | | | 705,000 | | | | 691,566 | | | |
| | | |
| UniCredit SpA, 8% Jr. Sub. Perpetual Bonds2,11 | | | 295,000 | | | | 287,921 | | | |
| | | | | | | | | | |
| | | | | | | 83,855,826 | | | |
| |
| | | |
| Consumer Finance—0.8% | | | |
| | | |
| Ahern Rentals, Inc., 9.50% Sec. Nts., 6/15/181 | | | 1,460,000 | | | | 1,518,400 | | | |
| | | |
| Ally Financial, Inc.: | | | | | | | | | | |
| 5.125% Sr. Unsec. Nts., 9/30/24 | | | 2,135,000 | | | | 2,172,363 | | | |
| 7.50% Sr. Unsec. Nts., 9/15/20 | | | 939,000 | | | | 1,103,325 | | | |
| | | |
| Astana Finance JSC, 9.16% Sr. Unsec. Nts., 3/14/128 | | | 7,200,000 | | | | 414,000 | | | |
| | | |
| Cash America International, Inc., 5.75% Sr. Unsec. Nts., 5/15/18 | | | 1,045,000 | | | | 1,086,800 | | | |
| | | |
| Enova International, Inc., 9.75% Sr. Nts., 6/1/211 | | | 1,880,000 | | | | 1,856,500 | | | |
| | | |
| Navient Corp.: | | | | | | | | | | |
| 6.125% Sr. Unsec. Nts., 3/25/24 | | | 2,640,000 | | | | 2,600,400 | | | |
| 7.25% Sr. Unsec. Nts., 1/25/22 | | | 2,230,000 | | | | 2,425,125 | | | |
| | | |
| Speedy Cash Intermediate Holdings Corp., 10.75% Sec. Nts., 5/15/181 | | | 1,735,000 | | | | 1,708,975 | | | |
| | | |
| TMX Finance LLC/TitleMax Finance Corp., 8.50% Sr. Sec. Nts., 9/15/181 | | | 2,285,000 | | | | 1,930,825 | | | |
| | | | | | | | | | |
| | | | 16,816,713 | | | |
| |
| | | |
| Diversified Financial Services—1.5% | | | |
| | | |
| ABN AMRO Bank NV, 4.31% Jr. Sub. Perpetual Bonds2,11 | | EUR | 4,340,000 | | | | 5,343,468 | | | |
| | | |
| Baggot Securities Ltd., 10.24% Sec. Perpetual Bonds1,11 | | EUR | 2,935,000 | | | | 3,729,072 | | | |
| | | | | | | | |
| | | Principal Amount | | | Value | |
| |
| Diversified Financial Services (Continued) | |
| |
| Banco BTG Pactual SA (Cayman Islands), 4% Sr. Unsec. Nts., 1/16/201 | | $ | 1,260,000 | | | $ | 1,127,700 | |
| |
| Capsugel SA, 7% Sr. Unsec. Nts., 5/15/191,12 | | | 1,500,000 | | | | 1,517,812 | |
| |
| Corp. Financiera de Desarrollo SA, 5.25% Sub. Nts., 7/15/291,2 | | | 415,000 | | | | 422,345 | |
| |
| Export Credit Bank of Turkey, 5.875% Sr. Unsec. Nts., 4/24/191 | | | 3,270,000 | | | | 3,499,063 | |
| |
| FTE Verwaltungs GmbH, 9% Sr. Sec. Nts., 7/15/201 | | EUR | 1,545,000 | | | | 1,849,664 | |
| |
| Global Bank Corp., 5.125% Sr. Unsec. Nts., 10/30/191 | | | 985,000 | | | | 995,072 | |
| |
| InRetail Consumer, 5.25% Sr. Unsec. Nts., 10/10/211 | | | 380,000 | | | | 387,600 | |
| |
| Jefferies Finance LLC/JFIN Co.-Issuer Corp., 7.375% Sr. Unsec. Nts., 4/1/201 | | | 1,715,000 | | | | 1,603,525 | |
| |
| Jefferies LoanCore LLC/JLC Finance Corp., 6.875% Sr. Unsec. Nts., 6/1/201 | | | 1,470,000 | | | | 1,348,725 | |
| |
| JPMorgan Hipotecaria su Casita, 6.47% Sec. Nts., 8/26/353,15 | | MXN | 5,808,600 | | | | 39,746 | |
| |
| Magyar Export-Import Bank Zrt, 5.50% Sr. Unsec. Nts., 2/12/181 | | | 1,310,000 | | | | 1,396,795 | |
| |
| MSCI, Inc., 5.25% Sr. Unsec. Nts., 11/15/241 | | | 1,840,000 | | | | 1,909,000 | |
| |
| National Savings Bank, 8.875% Sr. Unsec. Nts., 9/18/181 | | | 1,335,000 | | | | 1,491,862 | |
| |
| Odebrecht Finance Ltd., 5.25% Sr. Unsec. Nts., 6/27/291 | | | 705,000 | | | | 623,572 | |
| |
| Opal Acquisition, Inc., 8.875% Sr. Unsec. Nts., 12/15/211 | | | 610,000 | | | | 621,438 | |
| |
| Samson Investment Co., 9.75% Sr. Unsec. Nts., 2/15/20 | | | 3,900,000 | | | | 1,635,563 | |
| |
| SPCM SA, 5.50% Sr. Unsec. Nts., 6/15/201 | | EUR | 270,000 | | | | 346,408 | |
| |
| State Grid Overseas Investment 2014 Ltd., 4.125% Sr. Unsec. Nts., 5/7/241 | | | 1,650,000 | | | | 1,738,579 | |
| | | | | | | | |
| | | | | | | 31,627,009 | |
|
| |
Insurance—0.6% | |
| |
| Aviva plc: | | | | | | | | |
| 5.902% Jr. Sub. Perpetual Bonds2,11 | | GBP | 750,000 | | | | 1,225,337 | |
| 6.125% Jr. Sub. Perpetual Bonds2,11 | | GBP | 1,545,000 | | | | 2,565,768 | |
| |
| Hockey Merger Sub 2, Inc., 7.875% Sr. Unsec. Nts., 10/1/211 | | | 2,695,000 | | | | 2,688,262 | |
| |
| National Financial Partners Corp., 9% Sr. Unsec. Nts., 7/15/211 | | | 2,510,000 | | | | 2,641,775 | |
| |
| Swiss Re Capital I LP, 6.854% Jr. Sub. Perpetual Bonds2,3,11 | | | 1,103,000 | | | | 1,158,150 | |
| |
| Swiss Reinsurance Co. via ELM BV, 6.302% Sub. Perpetual Bonds2,11 | | GBP | 1,510,000 | | | | 2,567,665 | |
| | | | | | | | |
| | | | | | | 12,846,957 | |
|
| |
Real Estate Investment Trusts (REITs)—0.4% | |
| |
| Banco Invex SA/Hipotecaria Credito y Casa SA de CV, 6.45% Sec. Nts., 3/13/348 | | MXN | 4,830,531 | | | | — | |
| |
| CBS Outdoor Americas Capital LLC/CBS Outdoor Americas Capital Corp., 5.875% Sr. Unsec. Nts., 3/15/251 | | | 2,040,000 | | | | 2,060,400 | |
| |
| CTR Partnership LP/CareTrust Capital Corp., 5.875% Sr. Unsec. Nts., 6/1/21 | | | 1,645,000 | | | | 1,673,788 | |
| |
| DuPont Fabros Technology LP, 5.875% Sr. Unsec. Nts., 9/15/21 | | | 1,535,000 | | | | 1,571,456 | |
| |
| iStar Financial, Inc., 4.875% Sr. Unsec. Nts., 7/1/18 | | | 2,145,000 | | | | 2,115,506 | |
18 OPPENHEIMER GLOBAL STRATEGIC INCOME FUND/VA
| | | | | | | | | | |
| | | Principal Amount | | | Value | | | |
Real Estate Investment Trusts (REITs) (Continued) | | | |
TRUST F/1401, 5.25% Sr. Unsec. Nts., 12/15/241 | | $ | 1,245,000 | | | $ | 1,285,587 | | | |
| | | | | | | | | | |
| | | | 8,706,737 | | | |
| | | | | | | | |
Real Estate Management & Development—0.6% | | | |
Country Garden Holdings Co. Ltd., 7.875% Sr. Unsec. Nts., 5/27/191 | | | 775,000 | | | | 785,463 | | | |
EMG SUKUK Ltd., 4.564% Sr. Unsec. Nts., 6/18/24 | | | 1,415,000 | | | | 1,450,170 | | | |
Fondo MIVIVIENDA SA, 3.50% Sr. Unsec. Nts., 1/31/231 | | | 2,045,000 | | | | 1,952,975 | | | |
Franshion Brilliant Ltd., 5.75% Sr. Unsec. Nts., 3/19/19 | | | 730,000 | | | | 749,837 | | | |
Jafz Sukuk Ltd., 7% Sr. Unsec. Nts., 6/19/19 | | | 860,000 | | | | 980,400 | | | |
Realogy Group LLC: | | | | | | | | | | |
7.625% Sr. Sec. Nts., 1/15/201 | | | 1,330,000 | | | | 1,429,750 | | | |
9.00% Sr. Sec. Nts., 1/15/203 | | | 865,000 | | | | 951,500 | | | |
Realogy Group LLC/Realogy Co.-Issuer Corp., 5.25% Sr. Unsec. Nts., 12/1/211 | | | 1,605,000 | | | | 1,566,881 | | | |
Sukuk Funding No. 3 Ltd., 4.348% Sr. Unsec. Nts., 12/3/18 | | | 810,000 | | | | 846,215 | | | |
Techem GmbH, 6.125% Sr. Sec. Nts., 10/1/191 | | EUR | 1,025,000 | | | | 1,327,090 | | | |
| | | | | | | | | | |
| | | | 12,040,281 | | | |
| | | | | | | | | | | |
Thrifts & Mortgage Finance—0.0% | | | |
Jefferies Finance LLC/JFIN Co.-Issuer Corp., 6.875% Sr. Unsec. Nts., 4/15/221 | | | 1,165,000 | | | | 1,071,800 | | | |
| | | | | | | | | | | |
Health Care—2.7% | | | |
Biotechnology—0.1% | | | |
Universal Hospital Services, Inc., 7.625% Sec. Nts., 8/15/20 | | | 1,570,000 | | | | 1,358,050 | | | |
| | | | | | | | | | |
Health Care Equipment & Supplies—0.3% | | | |
Alere, Inc., 6.50% Sr. Sub. Nts., 6/15/20 | | | 1,045,000 | | | | 1,058,063 | | | |
Crimson Merger Sub, Inc., 6.625% Sr. Unsec. Nts., 5/15/221 | | | 3,590,000 | | | | 3,231,000 | | | |
DJO Finance LLC/DJO Finance Corp., 8.75% Sec. Nts., 3/15/18 | | | 1,125,000 | | | | 1,175,625 | | | |
Hologic, Inc., 6.25% Sr. Unsec. Nts., 8/1/20 | | | 185,000 | | | | 193,325 | | | |
Kinetic Concepts, Inc./KCI USA, Inc., 10.50% Sec. Nts., 11/1/18 | | | 1,840,000 | | | | 2,005,600 | | | |
| | | | | | | | | | |
| | | | 7,663,613 | | | |
| | | | | | | | | | | |
Health Care Providers & Services—2.0% | | | |
Acadia Healthcare Co., Inc., 6.125% Sr. Unsec. Nts., 3/15/21 | | | 440,000 | | | | 451,000 | | | |
Amsurg Corp., 5.625% Sr. Unsec. Nts., 7/15/221 | | | 945,000 | | | | 973,350 | | | |
CHS/Community Health Systems, Inc.: | | | | | | | | | | |
6.875% Sr. Unsec. Nts., 2/1/22 | | | 4,290,000 | | | | 4,566,169 | | | |
7.125% Sr. Unsec. Nts., 7/15/20 | | | 970,000 | | | | 1,035,475 | | | |
DaVita HealthCare Partners, Inc.: | | | | | | | | | | |
5.125% Sr. Unsec. Nts., 7/15/24 | | | 2,620,000 | | | | 2,677,312 | | | |
5.75% Sr. Unsec. Nts., 8/15/22 | | | 895,000 | | | | 952,056 | | | |
Envision Healthcare Corp., 5.125% Sr. Unsec. Nts., 7/1/221 | | | 590,000 | | | | 587,050 | | | |
FGI Operating Co. LLC/FGI Finance, Inc., 7.875% Sec. Nts., 5/1/20 | | | 3,945,000 | | | | 3,570,225 | | | |
Fresenius Medical Care US Finance II, Inc.: | | | | | | | | | | |
4.75% Sr. Unsec. Nts., 10/15/241 | | | 1,290,000 | | | | 1,309,350 | | | |
5.875% Sr. Unsec. Nts., 1/31/221 | | | 405,000 | | | | 441,450 | | | |
Gentiva Health Services, Inc., 11.50% Sr. Unsec. Nts., 9/1/18 | | | 1,370,000 | | | | 1,459,393 | | | |
| | | | | | | | |
| | | Principal Amount | | | Value | |
Health Care Providers & Services (Continued) | |
HCA, Inc.: | | | | | | | | |
5.00% Sr. Sec. Nts., 3/15/24 | | $ | 1,820,000 | | | $ | 1,874,600 | |
5.875% Sr. Unsec. Nts., 5/1/23 | | | 3,480,000 | | | | 3,675,750 | |
7.50% Sr. Unsec. Nts., 2/15/22 | | | 2,695,000 | | | | 3,085,775 | |
IASIS Healthcare LLC/IASIS Capital Corp., 8.375% Sr. Unsec. Nts., 5/15/19 | | | 2,270,000 | | | | 2,389,175 | |
Kindred Healthcare, Inc., 6.375% Sr. Unsec. Nts., 4/15/221 | | | 1,395,000 | | | | 1,335,713 | |
LifePoint Hospitals, Inc., 5.50% Sr. Unsec. Nts., 12/1/21 | | | 3,070,000 | | | | 3,154,425 | |
Omnicare, Inc., 4.75% Sr. Unsec. Nts., 12/1/22 | | | 920,000 | | | | 936,100 | |
Select Medical Corp., 6.375% Sr. Unsec. Nts., 6/1/21 | | | 1,750,000 | | | | 1,785,000 | |
Tenet Healthcare Corp.: | | | | | | | | |
6.00% Sr. Sec. Nts., 10/1/20 | | | 3,725,000 | | | | 4,009,329 | |
8.125% Sr. Unsec. Nts., 4/1/22 | | | 1,445,000 | | | | 1,618,400 | |
| | | | | | | | |
| | | | 41,887,097 | |
| | | | | |
Pharmaceuticals—0.3% | | | | | |
Endo Finance LLC & Endo Finco, Inc., 5.375% Sr. Unsec. Nts., 1/15/231 | | | 2,500,000 | | | | 2,456,250 | |
JLL/Delta Dutch Newco BV, 7.50% Sr. Unsec. Nts., 2/1/221 | | | 1,265,000 | | | | 1,288,719 | |
Mallinckrodt International Finance SA/Mallinckrodt CB LLC, 5.75% Sr. Unsec. Nts., 8/1/221 | | | 790,000 | | | | 812,712 | |
Valeant Pharmaceuticals International, Inc.: | | | | | | | | |
6.375% Sr. Unsec. Nts., 10/15/201 | | | 920,000 | | | | 964,850 | |
7.25% Sr. Unsec. Nts., 7/15/221 | | | 1,795,000 | | | | 1,920,650 | |
| | | | | | | | |
| | | | 7,443,181 | |
| | | | | |
Industrials—6.9% | | | | | | | | |
Aerospace & Defense—1.2% | | | | | |
CBC Ammo LLC/CBC FinCo, Inc., 7.25% Sr. Unsec. Nts., 11/15/211 | | | 5,860,000 | | | | 5,545,025 | |
Erickson, Inc., 8.25% Sec. Nts., 5/1/20 | | | 3,057,000 | | | | 2,705,445 | |
GenCorp, Inc., 7.125% Sec. Nts., 3/15/21 | | | 3,980,000 | | | | 4,188,154 | |
Huntington Ingalls Industries, Inc., 7.125% Sr. Unsec. Unsub. Nts., 3/15/21 | | | 1,940,000 | | | | 2,104,900 | |
KLX, Inc., 5.875% Sr. Unsec. Nts., 12/1/221 | | | 2,285,000 | | | | 2,313,562 | |
Kratos Defense & Security Solutions, Inc., 7% Sr. Sec. Nts., 5/15/19 | | | 2,240,000 | | | | 1,915,200 | |
Spirit AeroSystems, Inc., 5.25% Sr. Unsec. Nts., 3/15/22 | | | 2,165,000 | | | | 2,213,713 | |
TransDigm, Inc., 6% Sr. Sub. Nts., 7/15/22 | | | 1,810,000 | | | | 1,814,525 | |
Triumph Group, Inc., 5.25% Sr. Unsec. Nts., 6/1/22 | | | 2,555,000 | | | | 2,561,388 | |
| | | | | | | | |
| | | | 25,361,912 | |
| | | | | |
Air Freight & Couriers—0.6% | | | | | |
CEVA Group plc, 7% Sr. Sec. Nts., 3/1/211 | | | 7,950,000 | | | | 7,711,500 | |
Kazakhstan Temir Zholy Finance BV, 6.95% Sr. Unsec. Nts., 7/10/421 | | | 190,000 | | | | 184,205 | |
SPL Logistics Escrow LLC/SPL Logistics Finance Corp., 8.875% Sr. Sec. Nts., 8/1/201 | | | 2,560,000 | | | | 2,726,400 | |
XPO Logistics, Inc., 7.875% Sr. Unsec. Nts., 9/1/191 | | | 1,190,000 | | | | 1,249,500 | |
| | | | | | | | |
| | | | 11,871,605 | |
| | | | | |
Airlines—0.2% | | | | | | | | |
Air Canada, 6.75% Sr. Sec. Nts., 10/1/191 | | | 2,165,000 | | | | 2,257,012 | |
19 OPPENHEIMER GLOBAL STRATEGIC INCOME FUND/VA
CONSOLIDATEDSTATEMENTOFINVESTMENTS Continued
| | | | | | | | | | |
| | | Principal Amount | | | Value | | | |
| | | |
| Airlines (Continued) | | | |
| | | |
| Emirates Airline, 4.50% Sr. Unsec. Nts., 2/6/251 | | $ | 1,215,000 | | | $ | 1,224,113 | | | |
| | | |
| US Airways 2011-1 Class A Pass Through Trust, 7.125% Pass-Through Certificates, 10/22/23 | | | 1,124,841 | | | | 1,304,816 | | | |
| | | | | | | | | | |
| | | | 4,785,941 | | | |
| | | |
| Building Products—0.3% | | | |
| | | |
| Building Materials Corp. of America, 5.375% Sr. Unsec. Nts., 11/15/241 | | | 1,860,000 | | | | 1,864,650 | | | |
| | | |
| Nortek, Inc., 8.50% Sr. Unsec. Nts., 4/15/21 | | | 3,840,000 | | | | 4,128,000 | | | |
| | | | | | | | | | |
| | | | 5,992,650 | | | |
| | | |
| Commercial Services & Supplies—1.5% | | | |
| | | |
| ADT Corp. (The), 5.25% Sr. Unsec. Nts., 3/15/20 | | | 2,965,000 | | | | 3,016,888 | | | |
| | | |
| Affinion Group, Inc., 7.875% Sr. Unsec. Nts., 12/15/18 | | | 3,020,000 | | | | 2,219,700 | | | |
| | | |
| Brand Energy & Infrastructure Services, Inc., 8.50% Sr. Unsec. Nts., 12/1/213 | | | 3,070,000 | | | | 2,778,350 | | | |
| | | |
| Cenveo Corp.: | | | | | | | | | | |
| 6.00% Sr. Sec. Nts., 8/1/191 | | | 2,925,000 | | | | 2,661,750 | | | |
| 8.50% Sec. Nts., 9/15/221 | | | 2,550,000 | | | | 1,925,250 | | | |
| | | |
| First Data Corp., 6.75% Sr. Sec. Nts., 11/1/201 | | | 4,319,000 | | | | 4,621,330 | | | |
| | | |
| Quad Graphics, Inc., 7% Sr. Unsec. Nts., 5/1/221 | | | 2,745,000 | | | | 2,607,750 | | | |
| | | |
| R.R. Donnelley & Sons Co., 7.875% Sr. Unsec. Nts., 3/15/21 | | | 1,970,000 | | | | 2,186,700 | | | |
| | | |
| Tervita Corp., 8% Sr. Sec. Nts., 11/15/181 | | | 2,500,000 | | | | 2,150,000 | | | |
| | | |
| West Corp., 5.375% Sr. Unsec. Nts., 7/15/221 | | | 7,270,000 | | | | 6,979,200 | | | |
| | | | | | | | | | |
| | | | 31,146,918 | | | |
| | | |
| Construction & Engineering—0.0% | | | |
| | | |
| Consolidated Energy Finance SA, 6.75% Sr. Unsec. Nts., 10/15/191 | | | 380,000 | | | | 373,350 | | | |
| | | |
| Empresas ICA SAB de CV, 8.875% Sr. Unsec. Nts., 5/29/241 | | | 380,000 | | | | 348,650 | | | |
| | | |
| OAS Financial Ltd., 8% Sr. Unsec. Nts., 7/2/211 | | | 365,000 | | | | 125,925 | | | |
| | | | | | | | | | |
| | | | 847,925 | | | |
| | | |
| Electrical Equipment—0.2% | | | |
| | | |
| ESAL GmbH, 6.25% Sr. Unsec. Nts., 2/5/231 | | | 125,000 | | | | 119,062 | | | |
| | | |
| General Cable Corp., 5.75% Sr. Unsec. Nts., 10/1/22 | | | 2,615,000 | | | | 1,922,025 | | | |
| | | |
| Sensata Technologies BV, 5.625% Sr. Unsec. Nts., 11/1/241 | | | 2,725,000 | | | | 2,832,297 | | | |
| | | | | | | | | | |
| | | | 4,873,384 | | | |
| | | |
| Industrial Conglomerates—0.2% | | | |
| | | |
| Alfa SAB de CV, 5.25% Sr. Unsec. Nts., 3/25/241 | | | 835,000 | | | | 870,487 | | | |
| | | |
| KOC Holding AS, 3.50% Sr. Unsec. Nts., 4/24/201 | | | 1,035,000 | | | | 1,005,503 | | | |
| | | |
| Milestone Aviation Group Ltd. (The), 8.625% Sr. Unsec. Nts., 12/15/171 | | | 1,380,000 | | | | 1,497,300 | | | |
| | | | | | | | | | |
| | | | 3,373,290 | | | |
| | | |
| Machinery—1.2% | | | |
| | | |
| Actuant Corp., 5.625% Sr. Unsec. Nts., 6/15/22 | | | 2,875,000 | | | | 2,997,187 | | | |
| | | |
| Amsted Industries, Inc., 5% Sr. Unsec. Nts., 3/15/223 | | | 3,010,000 | | | | 2,968,612 | | | |
| | | |
| Cleaver-Brooks, Inc., 8.75% Sr. Sec. Nts., 12/15/191 | | | 2,870,000 | | | | 3,035,025 | | | |
| | | | | | | | |
| | | Principal Amount | | | Value | |
| |
Machinery (Continued) | |
| |
EnPro Industries, Inc., 5.875% Sr. Unsec. Nts., 9/15/221 | | $ | 1,890,000 | | | $ | 1,915,988 | |
| |
KION Finance SA, 6.75% Sr. Sec. Nts., 2/15/201 | | EUR | 1,650,000 | | | | 2,160,089 | |
| |
Meritor, Inc., 6.25% Sr. Unsec. Nts., 2/15/24 | | | 3,585,000 | | | | 3,656,700 | |
| |
Navistar International Corp., 8.25% Sr. Unsec. Nts., 11/1/21 | | | 2,070,000 | | | | 2,049,300 | |
| |
Servus Luxembourg Holding SCA, 7.75% Sr. Sec. Nts., 6/15/181 | | EUR | 1,821,319 | | | | 2,330,170 | |
| |
Terex Corp., 6% Sr. Unsec. Nts., 5/15/21 | | | 2,640,000 | | | | 2,706,000 | |
| |
Xerium Technologies, Inc., 8.875% Sr. Unsec. Nts., 6/15/18 | | | 1,580,000 | | | | 1,662,950 | |
| | | | | | | | |
| | | | 25,482,021 | |
| |
Marine—0.1% | |
| |
Drill Rigs Holdings, Inc., 6.50% Sr. Sec. Nts., 10/1/171 | | | 930,000 | | | | 776,550 | |
| |
Navios Maritime Holdings, Inc./Navios Maritime Finance II US, Inc., 7.375% Sr. Nts., 1/15/221 | | | 1,330,000 | | | | 1,236,900 | |
| | | | | | | | |
| | | | 2,013,450 | |
| |
Professional Services—0.1% | |
| |
FTI Consulting, Inc., 6% Sr. Unsec. Nts., 11/15/22 | | | 2,740,000 | | | | 2,815,350 | |
| | | | | | | | |
| |
Road & Rail—0.4% | |
| |
Kazakhstan Temir Zholy Finance BV, 6.375% Sr. Unsec. Nts., 10/6/201 | | | 955,000 | | | | 945,450 | |
| |
Kenan Advantage Group, Inc. (The), 8.375% Sr. Unsec. Nts., 12/15/183 | | | 2,265,000 | | | | 2,344,275 | |
| |
REFER-Rede Ferroviaria Nacional, 4% Sr. Unsec. Nts., 3/16/15 | | EUR | 540,000 | | | | 658,654 | |
| |
Western Express, Inc., 12.50% Sr. Sec. Nts., 4/15/153 | | | 4,775,000 | | | | 4,512,375 | |
| | | | | | | | |
| | | | 8,460,754 | |
| |
Trading Companies & Distributors—0.8% | |
| |
AerCap Ireland Capital Ltd./AerCap Global Aviation Trust, 4.50% Sr. Unsec. Nts., 5/15/211 | | | 1,645,000 | | | | 1,667,619 | |
| |
American Builders & Contractors Supply Co., Inc., 5.625% Sr. Unsec. Nts., 4/15/211 | | | 2,000,000 | | | | 2,015,000 | |
| |
Fly Leasing Ltd.: | | | | | | | | |
6.375% Sr. Unsec. Nts., 10/15/21 | | | 1,845,000 | | | | 1,821,938 | |
6.75% Sr. Unsec. Nts., 12/15/20 | | | 3,035,000 | | | | 3,072,937 | |
| |
HD Supply, Inc.: | | | | | | | | |
5.25% Sr. Sec. Nts., 12/15/211 | | | 2,205,000 | | | | 2,249,100 | |
7.50% Sr. Unsec. Nts., 7/15/20 | | | 3,620,000 | | | | 3,810,050 | |
| |
Jurassic Holdings III, Inc., 6.875% Sec. Nts., 2/15/211 | | | 3,780,000 | | | | 3,534,300 | |
| | | | | | | | |
| | | | 18,170,944 | |
| |
Transportation Infrastructure—0.1% | |
| |
DP World Ltd., 6.85% Sr. Unsec. Nts., 7/2/371 | | | 1,695,000 | | | | 1,920,062 | |
| |
Empresa de Transporte de Pasajeros Metro SA, 4.75% Unsec. Nts., 2/4/241 | | | 720,000 | | | | 760,157 | |
| | | | | | | | |
| | | | 2,680,219 | |
| |
Information Technology—3.3% | |
| |
Communications Equipment—0.6% | |
| |
Alcatel-Lucent USA, Inc., 6.75% Sr. Unsec. Nts., 11/15/201 | | | 4,460,000 | | | | 4,729,830 | |
| |
Avaya, Inc., 7% Sr. Sec. Nts., 4/1/191 | | | 4,585,000 | | | | 4,493,300 | |
20 OPPENHEIMER GLOBAL STRATEGIC INCOME FUND/VA
| | | | | | | | | | |
| | | Principal Amount | | | Value | | | |
| | | |
Communications Equipment (Continued) | | | |
| | | |
| ViaSat, Inc., 6.875% Sr. Unsec. Nts., 6/15/20 | | $ | 2,866,000 | | | $ | 2,994,970 | | | |
| | | | | | | | | | |
| | | | | | | 12,218,100 | | | |
| |
| | | |
Electronic Equipment, Instruments, & Components—0.3% | | | |
| | | |
| Anixter, Inc., 5.625% Sr. Unsec. Nts., 5/1/19 | | | 2,135,000 | | | | 2,263,100 | | | |
| | | |
| Belden, Inc., 5.50% Sr. Sub. Nts., 9/1/221 | | | 2,090,000 | | | | 2,084,775 | | | |
| | | |
| Zebra Technologies Corp., 7.25% Sr. Unsec. Nts., 10/15/221 | | | 1,195,000 | | | | 1,257,737 | | | |
| | | | | | | | | | |
| | | | | | | 5,605,612 | | | |
| |
| | | |
Internet Software & Services—0.6% | | | |
| | | |
| Alibaba Group Holding Ltd.: | | | | | | | | | | |
| 2.50% Sr. Unsec. Nts., 11/28/191 | | | 1,390,000 | | | | 1,372,827 | | | |
| 3.125% Sr. Unsec. Nts., 11/28/211 | | | 1,385,000 | | | | 1,370,453 | | | |
| | | |
| Cerved Group SpA, 6.375% Sr. Sec. Nts., 1/15/201 | | EUR | 1,705,000 | | | | 2,197,200 | | | |
| | | |
| EarthLink Holdings Corp., 7.375% Sr. Sec. Nts., 6/1/20 | | | 3,160,000 | | | | 3,223,200 | | | |
| | | |
| Equinix, Inc.: | | | | | | | | | | |
| 4.875% Sr. Unsec. Nts., 4/1/20 | | | 1,220,000 | | | | 1,220,000 | | | |
| 5.375% Sr. Unsec. Nts., 1/1/22 | | | 2,200,000 | | | | 2,231,680 | | | |
| | | |
| IAC/InterActiveCorp, 4.75% Sr. Unsec. Nts., 12/15/22 | | | 1,255,000 | | | | 1,226,762 | | | |
| | | |
| Tencent Holdings Ltd., 3.375% Sr. Unsec. Nts., 5/2/191 | | | 1,200,000 | | | | 1,220,946 | | | |
| | | | | | | | | | |
| | | | | | | 14,063,068 | | | |
| |
| | | |
IT Services—0.6% | | | |
| | | |
| First Data Corp.: | | | | | | | | | | |
| 8.25% Sec. Nts., 1/15/211 | | | 3,830,000 | | | | 4,117,250 | | | |
| 10.625% Sr. Unsec. Nts., 6/15/21 | | | 3,996,000 | | | | 4,545,450 | | | |
| | | |
| Harland Clarke Holdings Corp., 6.875% Sr. Sec. Nts., 3/1/201 | | | 1,940,000 | | | | 1,901,200 | | | |
| | | |
| Rolta Americas LLC, 8.875% Sr. Unsec. Nts., 7/24/191 | | | 545,000 | | | | 472,106 | | | |
| | | |
| Sabre GLBL, Inc., 8.50% Sr. Sec. Nts., 5/15/191 | | | 1,281,000 | | | | 1,375,474 | | | |
| | | | | | | | | | |
| | | | | | | 12,411,480 | | | |
| |
| | | |
Semiconductors & Semiconductor Equipment—0.4% | | | |
| | | |
| Freescale Semiconductor, Inc.: | | | | | | | | | | |
| 6.00% Sr. Sec. Nts., 1/15/221 | | | 4,455,000 | | | | 4,666,612 | | | |
| 8.05% Sr. Unsec. Nts., 2/1/20 | | | 266,000 | | | | 281,295 | | | |
| 10.75% Sr. Unsec. Nts., 8/1/20 | | | 1,708,000 | | | | 1,870,260 | | | |
| | | |
| Micron Technology, Inc., 5.875% Sr. Unsec. Nts., 2/15/221 | | | 1,385,000 | | | | 1,457,713 | | | |
| | | | | | | | | | |
| | | | | | | 8,275,880 | | | |
| |
| | | |
Software—0.7% | | | |
| | | |
| Blackboard, Inc., 7.75% Sr. Unsec. Nts., 11/15/193 | | | 3,140,000 | | | | 3,163,550 | | | |
| | | |
| BMC Software Finance, Inc., 8.125% Sr. Unsec. Nts., 7/15/211 | | | 4,555,000 | | | | 4,304,475 | | | |
| | | |
| Interactive Data Corp., 5.875% Sr. Unsec. Nts., 4/15/191 | | | 3,975,000 | | | | 3,960,094 | | | |
| | | |
| Sixsigma Networks Mexico SA de CV, 8.25% Sr. Unsec. Nts., 11/7/211 | | | 505,000 | | | | 513,585 | | | |
| | | |
| TIBCO Software, Inc., 11.375% Sr. Unsec. Nts., 12/1/211 | | | 3,435,000 | | | | 3,331,950 | | | |
| | | | | | | | | | |
| | | | | | | 15,273,654 | | | |
| |
| | | |
Technology Hardware, Storage & Peripherals—0.1% | | | |
| | | |
| Denali Borrower LLC/Denali Finance Corp., 5.625% Sr. Sec. Nts., 10/15/201 | | | 3,030,000 | | | | 3,160,290 | | | |
| | | | | | | | |
| | | Principal Amount | | | Value | |
| |
Materials—3.8% | |
| |
Chemicals—0.7% | |
| |
| ADS Waste Holdings, Inc., 8.25% Sr. Unsec. Nts., 10/1/20 | | $ | 1,075,000 | | | $ | 1,080,375 | |
| |
| Braskem Finance Ltd., 5.375% Sr. Unsec. Nts., 5/2/221 | | | 1,110,000 | | | | 1,079,475 | |
| |
| Hexion US Finance Corp., 6.625% Sr. Sec. Nts., 4/15/20 | | | 1,185,000 | | | | 1,167,225 | |
| |
| Hexion US Finance Corp./Hexion Nova Scotia Finance ULC, 8.875% Sr. Sec. Nts., 2/1/18 | | | 680,000 | | | | 606,900 | |
| |
| INEOS Group Holdings SA, 6.125% Sr. Unsec. Nts., 8/15/181 | | | 1,465,000 | | | | 1,413,725 | |
| |
| Mexichem SAB de CV, 4.875% Sr. Unsec. Nts., 9/19/221 | | | 1,635,000 | | | | 1,692,225 | |
| |
| Momentive Performance Materials, Inc., 3.88% Sr. Sec. Nts., 10/24/21 | | | 2,245,000 | | | | 1,913,862 | |
| |
| NOVA Chemicals Corp., 5% Sr. Unsec. Nts., 5/1/251 | | | 990,000 | | | | 985,050 | |
| |
| PetroLogistics LP/PetroLogistics Finance Corp., 6.25% Sr. Unsec. Nts., 4/1/20 | | | 891,000 | | | | 964,508 | |
| |
| PQ Corp., 8.75% Sec. Nts., 5/1/181 | | | 1,140,000 | | | | 1,184,175 | |
| |
| Rentech Nitrogen Partners LP/Rentech Nitrogen Finance Corp., 6.50% Sec. Nts., 4/15/211 | | | 1,555,000 | | | | 1,391,725 | |
| |
| Trinseo Materials Operating SCA/Trinseo Materials Finance, Inc., 8.75% Sr. Sec. Nts., 2/1/19 | | | 1,301,000 | | | | 1,325,394 | |
| | | | | | | | |
| | | | | | | 14,804,639 | |
|
| |
Construction Materials—0.4% | |
| |
| Building Materials Corp. of America, 6.75% Sr. Unsec. Nts., 5/1/213 | | | 2,455,000 | | | | 2,602,300 | |
| |
| Calcipar SA, 6.875% Sr. Sec. Nts., 5/1/183 | | | 90,000 | | | | 90,900 | |
| |
| Cemex SAB de CV: | | | | | | | | |
| 4.75% Sr. Sec. Nts., 1/11/221 | | EUR | 250,000 | | | | 297,597 | |
| 5.70% Sr. Sec. Nts., 1/11/251 | | | 545,000 | | | | 530,012 | |
| |
| CIMPOR Financial Operations BV, 5.75% Sr. Unsec. Nts., 7/17/241 | | | 420,000 | | | | 369,558 | |
| |
| Elementia SAB de CV, 5.50% Sr. Unsec. Nts., 1/15/251 | | | 375,000 | | | | 360,937 | |
| |
| HeidelbergCement Finance Luxembourg SA: | | | | | | | | |
| 3.25% Sr. Unsec. Nts., 10/21/21 | | EUR | 625,000 | | | | 830,003 | |
| 7.50% Sr. Unsec. Nts., 4/3/20 | | EUR | 570,000 | | | | 893,267 | |
| 8.00% Sr. Unsec. Nts., 1/31/17 | | EUR | 655,000 | | | | 906,361 | |
| |
| Lafarge SA, 5.375% Sr. Unsec. Nts., 6/26/17 | | EUR | 495,000 | | | | 664,425 | |
| |
| Union Andina de Cementos SAA, 5.875% Sr. Unsec. Nts., 10/30/211 | | | 510,000 | | | | 518,670 | |
| | | | | | | | |
| | | | | | | 8,064,030 | |
|
| |
Containers & Packaging—1.2% | |
| |
| Ardagh Packaging Finance plc/Ardagh Holdings USA, Inc.: | | | | | | | | |
| 6.00% Sr. Unsec. Nts., 6/30/211 | | | 1,895,000 | | | | 1,814,462 | |
| 6.75% Sr. Unsec. Nts., 1/31/211 | | | 1,150,000 | | | | 1,147,125 | |
| |
| Ardagh Packaging Finance plc/Ardagh MP Holdings USA, Inc., 7% Sr. Unsec. Nts., 11/15/201 | | | 541,765 | | | | 549,891 | |
| |
| Berry Plastics Corp., 5.50% Sec. Nts., 5/15/22 | | | 1,405,000 | | | | 1,427,831 | |
| |
| BWAY Holding Co., 9.125% Sr. Unsec. Nts., 8/15/211 | | | 1,895,000 | | | | 1,904,475 | |
| |
| Cascades, Inc., 7.875% Sr. Unsec. Nts., 1/15/20 | | | 1,955,000 | | | | 2,042,975 | |
| |
| Consolidated Container Co. LLC/Consolidated Container Capital, Inc., 10.125% Sr. Unsec. Nts., 7/15/201 | | | 590,000 | | | | 551,650 | |
21 OPPENHEIMER GLOBAL STRATEGIC INCOME FUND/VA
CONSOLIDATED STATEMENT OF INVESTMENTS Continued
| | | | | | | | | | |
| | | Principal Amount | | | Value | | | |
| | | |
Containers & Packaging (Continued) | | | |
| | | |
| Coveris Holdings SA, 7.875% Sr. Unsec. Nts., 11/1/193 | | $ | 1,335,000 | | | $ | 1,381,725 | | | |
| | | |
| Crown Americas LLC/Crown Americas Capital Corp. IV, 4.50% Sr. Unsec. Nts., 1/15/23 | | | 890,000 | | | | 867,750 | | | |
| | | |
| Graphic Packaging International, Inc., 4.875% Sr. Unsec. Nts., 11/15/22 | | | 465,000 | | | | 468,488 | | | |
| | | |
| Klabin Finance SA, 5.25% Sr. Unsec. Nts., 7/16/241 | | | 1,310,000 | | | | 1,267,425 | | | |
| | | |
| Owens-Brockway Glass Container, Inc., 5% Sr. Unsec. Nts., 1/15/221 | | | 920,000 | | | | 939,550 | | | |
| | | |
| Polymer Group, Inc., 7.75% Sr. Sec. Nts., 2/1/19 | | | 1,386,000 | | | | 1,443,173 | | | |
| | | |
| Reynolds Group Issuer, Inc./Reynolds Group Issuer LLC/Reynolds Group Issuer Luxembourg SA, 5.75% Sr. Sec. Nts., 10/15/20 | | | 4,420,000 | | | | 4,552,600 | | | |
| | | |
| Sealed Air Corp.: | | | | | | | | | | |
| 4.875% Sr. Unsec. Nts., 12/1/221 | | | 1,150,000 | | | | 1,144,250 | | | |
| 5.125% Sr. Unsec. Nts., 12/1/241 | | | 1,150,000 | | | | 1,164,375 | | | |
| 6.50% Sr. Unsec. Nts., 12/1/201 | | | 1,555,000 | | | | 1,710,500 | | | |
| | | |
| Smurfit Kappa Acquisitions, 4.875% Sr. Sec. Nts., 9/15/181 | | | 1,280,000 | | | | 1,331,200 | | | |
| | | | | | | | | | |
| | | | 25,709,445 | | | |
| |
| | | |
Metals & Mining—1.3% | | | |
| | | |
| Aleris International, Inc.: | | | | | | | | | | |
| 7.625% Sr. Unsec. Nts., 2/15/18 | | | 2,765,000 | | | | 2,796,106 | | | |
| 7.875% Sr. Unsec. Nts., 11/1/20 | | | 2,870,000 | | | | 2,870,000 | | | |
| | | |
| ArcelorMittal, 5% Sr. Unsec. Nts., 2/25/17 | | | 1,505,000 | | | | 1,568,963 | | | |
| | | |
| Constellium NV, 5.75% Sr. Unsec. Nts., 5/15/241 | | | 2,420,000 | | | | 2,117,500 | | | |
| | | |
| First Quantum Minerals Ltd., 7.25% Sr. Unsec. Nts., 5/15/221 | | | 3,340,000 | | | | 3,014,350 | | | |
| | | |
| FMG Resources August 2006 Pty Ltd.: | | | | | | | | | | |
| 6.875% Sr. Unsec. Nts., 2/1/181 | | | 691,111 | | | | 628,911 | | | |
| 6.875% Sr. Unsec. Nts., 4/1/221 | | | 1,685,000 | | | | 1,409,081 | | | |
| 8.25% Sr. Unsec. Nts., 11/1/191 | | | 1,180,000 | | | | 1,078,225 | | | |
| | | |
| Gestamp Funding Luxembourg SA: | | | | | | | | | | |
| 5.875% Sr. Sec. Nts., 5/31/201 | | EUR | 1,835,000 | | | | 2,361,395 | | | |
| 5.875% Sr. Sec. Nts., 5/31/20 | | EUR | 105,000 | | | | 135,121 | | | |
| | | |
| Glencore Finance Canada Ltd.: | | | | | | | | | | |
| 2.05% Sr. Unsec. Nts., 10/23/151 | | | 1,383,000 | | | | 1,392,263 | | | |
| 4.95% Sr. Unsec. Nts., 11/15/211 | | | 560,000 | | | | 591,647 | | | |
| | | |
| GTL Trade Finance, Inc., 5.893% Sr. Unsec. Nts., 4/29/241 | | | 1,115,000 | | | | 1,078,763 | | | |
| | | |
| JMC Steel Group, Inc., 8.25% Sr. Nts., 3/15/181 | | | 1,575,000 | | | | 1,502,156 | | | |
| | | |
| Metalloinvest Finance Ltd., 5.625% Unsec. Nts., 4/17/201 | | | 330,000 | | | | 252,061 | | | |
| | | |
| MMC Norilsk Nickel OJSC via MMC Finance Ltd., 5.55% Sr. Unsec. Nts., 10/28/201 | | | 280,000 | | | | 255,080 | | | |
| | | |
| Novelis, Inc., 8.75% Sr. Unsec. Nts., 12/15/20 | | | 1,285,000 | | | | 1,368,525 | | | |
| | | |
| Thompson Creek Metals Co., Inc., 7.375% Sr. Unsec. Nts., 6/1/18 | | | 2,345,000 | | | | 1,934,625 | | | |
| | | |
| Wise Metals Group LLC/Wise Alloys Finance Corp., 8.75% Sr. Sec. Nts., 12/15/181 | | | 905,000 | | | | 954,775 | | | |
| | | | | | | | | | |
| | | | 27,309,547 | | | |
| |
| | | |
Paper & Forest Products—0.2% | | | |
| | | |
| Fibria Overseas Finance Ltd., 5.25% Sr. Unsec. Nts., 5/12/24 | | | 735,000 | | | | 732,060 | | | |
| | | |
| Inversiones CMPC SA, 4.75% Sr. Unsec. Nts., 9/15/241 | | | 985,000 | | | | 991,610 | | | |
| | | |
| | | | | | | | |
| | | Principal Amount | | | Value | |
| |
Paper & Forest Products (Continued) | |
| |
| PaperWorks Industries, Inc., 9.50% Sr. Sec. Nts., 8/15/191 | | $ | 1,890,000 | | | $ | 1,897,088 | |
| |
| Sappi Papier Holding GmbH, 6.625% Sr. Sec. Nts., 4/15/211 | | | 1,730,000 | | | | 1,781,900 | |
| |
| Suzano Trading Ltd., 5.875% Sr. Unsec. Nts., 1/23/211 | | | 450,000 | | | | 464,400 | |
| | | | | | | | |
| | | | 5,867,058 | |
|
| |
Telecommunication Services—3.2% | |
| |
Diversified Telecommunication Services—2.5% | |
| |
| Cequel Communications Holdings I LLC/Cequel Capital Corp., 6.375% Sr. Unsec. Nts., 9/15/201 | | | 6,865,000 | | | | 7,139,600 | |
| |
| Colombia Telecomunicaciones SA ESP, 5.375% Sr. Unsec. Nts., 9/27/221 | | | 605,000 | | | | 591,387 | |
| |
| Columbus International, Inc., 7.375% Sr. Unsec. Nts., 3/30/211 | | | 785,000 | | | | 819,344 | |
| |
| FairPoint Communications, Inc., 8.75% Sr. Sec. Nts., 8/15/191 | | | 3,600,000 | | | | 3,636,000 | |
| |
| Frontier Communications Corp.: | | | | | | | | |
| 7.125% Sr. Unsec. Nts., 1/15/23 | | | 2,190,000 | | | | 2,239,275 | |
| 7.625% Sr. Unsec. Nts., 4/15/24 | | | 2,850,000 | | | | 2,949,750 | |
| |
| Intelsat Luxembourg SA, 7.75% Sr. Unsec. Nts., 6/1/21 | | | 3,400,000 | | | | 3,421,250 | |
| |
| Koninklijke KPN NV, 8.375% Sr. Unsec. Nts., 10/1/30 | | | 3,005,000 | | | | 4,235,454 | |
| |
| Koninklijke KPN NV, 6.125% Sr. Sub. Perpetual Bonds2,11 | | EUR | 2,265,000 | | | | 2,935,933 | |
| |
| Level 3 Escrow II, Inc., 5.375% Sr. Unsec. Nts., 8/15/221 | | | 1,310,000 | | | | 1,319,825 | |
| |
| Oi SA, 5.75% Sr. Unsec. Nts., 2/10/221 | | | 260,000 | | | | 240,500 | |
| |
| Ooredoo International Finance Ltd., 3.25% Sr. Unsec. Nts., 2/21/231 | | | 990,000 | | | | 956,422 | |
| |
| Telecom Italia Capital SA, 7.721% Sr. Unsec. Unsub. Nts., 6/4/38 | | | 4,863,000 | | | | 5,446,560 | |
| |
| Telecom Italia SpA, 5.25% Sr. Unsec. Nts., 2/10/22 | | EUR | 1,265,000 | | | | 1,746,819 | |
| |
| Telefonica Europe BV, 6.50% Jr. Sub. Perpetual Bonds2,11 | | EUR | 3,760,000 | | | | 4,989,871 | |
| |
| T-Mobile USA, Inc.: | | | | | | | | |
| 6.25% Sr. Unsec. Nts., 4/1/21 | | | 2,670,000 | | | | 2,742,757 | |
| 6.625% Sr. Unsec. Nts., 11/15/20 | | | 2,020,000 | | | | 2,062,925 | |
| |
| Turk Telekomunikasyon AS, 3.75% Sr. Unsec. Nts., 6/19/191 | | | 245,000 | | | | 246,501 | |
| |
| Windstream Corp.: | | | | | | | | |
| 6.375% Sr. Unsec. Nts., 8/1/23 | | | 1,155,000 | | | | 1,073,111 | |
| 7.75% Sr. Unsec. Nts., 10/15/20 | | | 1,645,000 | | | | 1,698,463 | |
| 7.75% Sr. Unsec. Nts., 10/1/21 | | | 2,180,000 | | | | 2,234,500 | |
| | | | | | | | |
| | | | 52,726,247 | |
|
| |
Wireless Telecommunication Services—0.7% | |
| |
| Bharti Airtel International Netherlands BV, 5.35% Sr. Unsec. Nts., 5/20/241 | | | 870,000 | | | | 946,351 | |
| |
| Digicel Group Ltd., 7.125% Sr. Unsec. Nts., 4/1/221 | | | 915,000 | | | | 853,238 | |
| |
| ENTEL Chile SA, 4.75% Sr. Unsec. Nts., 8/1/261 | | | 1,255,000 | | | | 1,250,215 | |
| |
| Millicom International Cellular SA, 6.625% Sr. Unsec. Nts., 10/15/211 | | | 780,000 | | | | 815,100 | |
| |
| Mobile Telesystems OJSC via MTS International Funding Ltd., 5% Sr. Unsec. Nts., 5/30/231 | | | 650,000 | | | | 516,750 | |
| |
| Sprint Corp.: | | | | | | | | |
| 7.25% Sr. Unsec. Nts., 9/15/21 | | | 3,820,000 | | | | 3,805,675 | |
| 7.875% Sr. Unsec. Nts., 9/15/23 | | | 4,070,000 | | | | 4,038,254 | |
| |
| Telekom Austria AG, 5.625% Jr. Sub. Perpetual Bonds2,11 | | EUR | 1,435,000 | | | | 1,866,556 | |
22 OPPENHEIMER GLOBAL STRATEGIC INCOME FUND/VA
| | | | | | | | | | |
| | | Principal Amount | | | Value | | | |
| | | |
| Wireless Telecommunication Services (Continued) | | | |
| | | |
| Wind Acquisition Finance SA, 4% Sr. Sec. Nts., 7/15/201 | | EUR | 1,405,000 | | | $ | 1,673,632 | | | |
| | | | | | | | | | |
| | | | | | | 15,765,771 | | | |
| |
| | | |
| Utilities—3.2% | | | |
| | | |
| Electric Utilities—1.4% | | | |
| | | |
| E.CL SA, 4.50% Sr. Unsec. Nts., 1/29/251 | | | 705,000 | | | | 709,171 | | | |
| | | |
| EDP Finance BV: | | | | | | | | | | |
| 5.25% Sr. Unsec. Nts., 1/14/211 | | | 1,380,000 | | | | 1,455,569 | | | |
| 6.00% Sr. Unsec. Nts., 2/2/181 | | | 2,300,000 | | | | 2,494,948 | | | |
| | | |
| Electricite de France SA: | | | | | | | | | | |
| 5.25% Jr. Sub. Perpetual Bonds1,2,11 | | | 1,292,000 | | | | 1,327,530 | | | |
| 5.625% Jr. Sub. Perpetual Bonds1,2,11 | | | 990,000 | | | | 1,043,460 | | | |
| 6.00% Jr. Sub. Perpetual Bonds2,11 | | GBP | 425,000 | | | | 705,928 | | | |
| | | |
| Empresas Publicas de Medellin ESP, 7.625% Sr. Unsec. Nts., 7/29/191 | | | 1,770,000 | | | | 2,088,600 | | | |
| | | |
| EnBW Energie Baden-Wuerttemberg AG, 3.625% Jr. Sub. Nts., 4/2/762 | | EUR | 285,000 | | | | 349,367 | | | |
| | | |
| Enel SpA, 5% Sub. Nts., 1/15/752 | | EUR | 2,465,000 | | | | 3,164,946 | | | |
| | | |
| Eskom Holdings Ltd., 6.75% Sr. Unsec. Nts., 8/6/231 | | | 1,345,000 | | | | 1,402,163 | | | |
| | | |
| Iberdrola International BV, 5.75% Sub. Perpetual Bonds2,11 | | EUR | 2,935,000 | | | | 3,879,722 | | | |
| | | |
| Israel Electric Corp. Ltd., 7.25% Sr. Sec. Nts., 1/15/191 | | | 3,080,000 | | | | 3,445,904 | | | |
| | | |
| MMC Energy. Inc., 8.875% Sr. Unsec. Nts., 10/15/208 | | | 2,245,000 | | | | 225 | | | |
| | | |
| National Power Corp., 5.875% Sr. Unsec. Nts., 12/19/16 | | PHP
|
109,600,000 |
| | | 2,578,016 | | | |
| | | |
| Perusahaan Listrik Negara PT, 5.50% Sr. Unsec. Nts., 11/22/211 | | | 3,670,000 | | | | 3,844,325 | | | |
| | | |
| Saudi Electricity Global Sukuk Co. 3, 4% Sr. Unsec. Nts., 4/8/241 | | | 1,030,000 | | | | 1,069,964 | | | |
| | | | | | | | | | |
| | | | | | | 29,559,838 | | | |
| |
| | | |
| Gas Utilities—0.3% | | | |
| | | |
| Empresa de Energia de Bogota SA, 6.125% Sr. Unsec. Nts., 11/10/211 | | | 1,620,000 | | | | 1,725,624 | | | |
| | | |
| Ferrellgas LP/Ferrellgas Finance Corp., 6.50% Sr. Unsec. Nts., 5/1/21 | | | 1,670,000 | | | | 1,636,600 | | | |
| | | |
| Gas Natural Capital Markets SA, 4.375% Sr. Unsec. Nts., 11/2/16 | | EUR | 895,000 | | | | 1,162,432 | | | |
| | | |
| Gas Natural de Lima y Callao SA, 4.375% Sr. Unsec. Nts., 4/1/231 | | | 840,000 | | | | 823,200 | | | |
| | | |
| Perusahaan Gas Negara Persero Tbk PT, 5.125% Sr. Unsec. Nts., 5/16/241 | | | 1,545,000 | | | | 1,599,848 | | | |
| | | | | | | | | | |
| | | | | | | 6,947,704 | | | |
| |
| | | |
| Independent Power and Renewable Electricity Producers—1.1% | | | |
| | | |
| AES Corp., 7.375% Sr. Unsec. Nts., 7/1/21 | | | 1,045,000 | | | | 1,186,075 | | | |
| | | |
| Atlantic Power Corp., 9% Sr. Unsec. Nts., 11/15/18 | | | 1,390,000 | | | | 1,383,050 | | | |
| | | |
| Calpine Corp.: | | | | | | | | | | |
| 5.375% Sr. Unsec. Nts., 1/15/23 | | | 2,365,000 | | | | 2,391,606 | | | |
| 7.875% Sr. Sec. Nts., 1/15/231 | | | 773,000 | | | | 856,098 | | | |
| | | |
| Colbun SA, 4.50% Sr. Unsec. Nts., 7/10/241 | | | 980,000 | | | | 983,036 | | | |
| | | |
| Comision Federal de Electricidad, 4.875% Sr. Unsec. Nts., 1/15/241 | | | 1,690,000 | | | | 1,770,275 | | | |
| | | |
| Dynegy, Inc., 5.875% Sr. Unsec. Nts., 6/1/23 | | | 420,000 | | | | 401,100 | | | |
| | | |
| Edison SpA, 3.875% Sr. Unsec. Nts., 11/10/17 | | EUR | 745,000 | | | | 988,237 | | | |
| | | |
| GenOn Energy, Inc., 9.50% Sr. Unsec. Nts., 10/15/18 | | | 3,230,000 | | | | 3,230,000 | | | |
| | | |
| Infinis plc, 7% Sr. Sec. Nts., 2/15/193 | | GBP | 1,285,000 | | | | 2,117,962 | | | |
| | | | | | | | | | |
| | | | | | | | | | |
| | | | | | | | | | |
| | | | | | | | | | |
| | | | | | | | |
| | | Principal Amount | | | Value | |
| |
| Independent Power and Renewable Electricity Producers (Continued) | |
| |
| Miran Mid-Atlantic Trust, 10.06% Sec. Pass-Through Certificates, Series C, 12/30/28 | | $ | 1,573,485 | | | $ | 1,696,414 | |
| |
| NRG Energy, Inc.: | | | | | | | | |
| 6.25% Sr. Unsec. Nts., 7/15/22 | | | 1,605,000 | | | | 1,649,138 | |
| 6.25% Sr. Unsec. Nts., 5/1/241 | | | 2,220,000 | | | | 2,269,950 | |
| 6.625% Sr. Unsec. Nts., 3/15/23 | | | 1,455,000 | | | | 1,520,475 | |
| |
| Power Sector Assets & Liabilities Management Corp., 7.39% Sr. Unsec. Nts., 12/2/241 | | | 1,785,000 | | | | 2,334,780 | |
| | | | | | | | |
| | | | | | | 24,778,196 | |
|
| |
| Multi-Utilities—0.4% | |
| |
| InterGen NV, 7% Sr. Sec. Nts., 6/30/231 | | | 3,185,000 | | | | 3,041,675 | |
| |
| National Grid North America, Inc., 1.75% Sr. Unsec. Nts., 2/20/18 | | EUR | 990,000 | | | | 1,245,053 | |
| |
| NGG Finance plc, 4.25% Sub. Nts., 6/18/762 | | EUR | 2,630,000 | | | | 3,455,544 | |
| | | | | | | | |
| | | | | | | 7,742,272 | |
| | | | | | | | |
| Total Corporate Bonds and Notes (Cost $1,126,202,282) | | | | | | | 1,083,248,280 | |
| | |
| | | Shares | | | | |
| |
| Preferred Stock—0.2% | |
| |
| Ally Financial, Inc., 7% Cum., Series G, Non-Vtg.1 (Cost $4,368,270) | | | 4,519 | | | | 4,539,759 | |
| |
| Common Stocks—0.2% | |
| |
| Arco Capital Corp. Ltd.3,13 | | | 690,638 | | | | — | |
| |
| Astana Finance JSC, ADR3,13 | | | 60,552 | | | | — | |
| |
| Entegra Etc., Series A13 | | | 5,233 | | | | 1,491,405 | |
| |
| Kaiser Aluminum Corp. | | | 206 | | | | 14,715 | |
| |
| Nortek, Inc.13 | | | 24,095 | | | | 1,959,646 | |
| |
| Premier Holdings Ltd.13 | | | 18,514 | | | | — | |
| |
| Revel Entertainment, Inc.13 | | | 16,153 | | | | — | |
| |
| Wallace Theater Holdings, Inc.3,13 | | | 1,525 | | | | 15 | |
| | | | | | | | |
| Total Common Stocks (Cost $4,777,077) | | | | | | | 3,465,781 | |
| | |
| | | Units | | | | |
| |
| Rights, Warrants and Certificates—0.0% | |
| |
| MediaNews Group, Inc. Wts., Strike Price $48.72, Exp. 3/19/1713 (Cost $6,331,150) | | | 22,685 | | | | — | |
| | |
| | | Principal Amount | | | | |
| |
| Structured Securities—0.8% | |
| |
| Credit Suisse First Boston International, Moitk Total Return Linked Nts., 21%, 3/30/118 | | RUB | 53,910,000 | | | | — | |
| |
| Credit Suisse First Boston, Inc. (Nassau Branch), Russian Specialized Construction & Installation Administration Total Return Linked Nts., 13%, 5/24/108 | | RUB | 97,250,000 | | | | — | |
| |
| Deutsche Bank AG, Coriolanus Ltd. Sec. Credit Linked Bonds: | |
| 3.01%, 4/30/251,14 | | | 1,424,366 | | | | 911,470 | |
| 3.138%, 4/30/251,14 | | | 1,400,559 | | | | 896,236 | |
| 3.191%, 4/30/251,14 | | | 1,743,810 | | | | 1,115,887 | |
| 3.242%, 4/30/251,14 | | | 1,990,294 | | | | 1,273,615 | |
| 3.269%, 4/30/251,14 | | | 1,590,012 | | | | 1,017,470 | |
| 3.346%, 4/30/251,14 | | | 1,494,544 | | | | 956,378 | |
| 3.905%, 4/30/251,14 | | | 1,814,861 | | | | 1,161,353 | |
| 4.005%, 4/30/251,14 | | | 1,566,842 | | | | 1,002,643 | |
| 26.561%, 12/31/173,15 | | BRL | 10,280,000 | | | | 6,285,295 | |
| |
| Deutsche Bank AG, Opic Reforma I Credit Linked Nts.: | | | | | | | | |
| Cl. 2A, 7.208%, 5/22/152,3 | | MXN | 697,693 | | | | 43,743 | |
| Cl. 2B, 7.208%, 5/22/152,3 | | MXN | 1,220,632 | | | | 76,529 | |
| Cl. 2C, 7.208%, 5/22/152,3 | | MXN | 18,404,162 | | | | 1,153,866 | |
| Cl. 2D, 7.208%, 5/22/152,3 | | MXN | 1,341,270 | | | | 84,092 | |
23 OPPENHEIMER GLOBAL STRATEGIC INCOME FUND/VA
CONSOLIDATEDSTATEMENTOFINVESTMENTS Continued
| | | | | | | | | | |
| | | Principal Amount | | | Value | | | |
| | | |
Structured Securities (Continued) | | | | | | | |
| | | |
| Deutsche Bank AG, Opic Reforma I Credit Linked Nts.: (Continued) | | | |
| Cl. 2E, 7.208%, 5/22/152,3 | | MXN | 974,458 | | | $ | 61,095 | | | |
| Cl. 2F, 7.208%, 5/22/152,3 | | MXN | 622,337 | | | | 39,018 | | | |
| Cl. 2G, 7.208%, 5/22/152,3 | | MXN | 114,609 | | | | 7,185 | | | |
| | | |
| LB Peru Trust II Certificates, Series 1998-A, 3.796%, 2/28/168,14 | | | 2,994 | | | | — | | | |
| | | |
| Morgan Stanley, Russian Federation Total Return Linked Bonds, Series 007, Cl. VR, 5%, 8/22/34 | | RUB | 40,076,627 | | | | 291,243 | | | |
| | | | | | | | | | |
Total Structured Securities (Cost $23,279,340) | | | | | | | 16,377,118 | | | |
| |
| | | |
| Short-Term Note—0.4% | | | | | | | |
| | | |
| United States Treasury Bills, 0.06%, 5/14/1514 (Cost $9,027,998) | | | 9,030,000 | | | | 9,028,591 | | | |
| | | | | | | | |
| | | Shares | | | Value | |
| |
Investment Companies—12.6% | |
| |
| Oppenheimer Institutional Money Market Fund, Cl. E, 0.10%16,17 | | | 55,210,591 | | | $ | 55,210,591 | |
| |
| Oppenheimer Master Event-Linked Bond Fund, LLC16 | | | 3,158,849 | | | | 45,963,965 | |
| |
| Oppenheimer Master Loan Fund, LLC16 | | | 8,486,824 | | | | 122,462,202 | |
| |
| Oppenheimer Ultra-Short Duration Fund, Cl. Y16 | | | 4,508,180 | | | | 45,126,880 | |
| | | | | | | | |
Total Investment Companies (Cost $272,924,347) | | | | | | | 268,763,638 | |
| | | | | | | | | | | | | | | | | | | | | | | | | | | | | | | | |
| | | | | | | | | Exercise Price | | | | | | Expiration Date | | | Contracts | | | | |
| |
Exchange-Traded Option Purchased—0.0% | | | | | | | | | | | | | | | | | | | | | |
| |
| SX5E Index Call13 (Cost $426,594) | | | | EUR | | | | 3,290.000 | | | | | | | | 6/19/15 | | | | EUR | | | | 11,671 | | | | 611,965 | |
| | | | | | | |
| | | Counterparty | | | | | | Exercise Price | | | | | | Expiration Date | | | Contracts | | | | |
| |
Over-the-Counter Options Purchased—0.1% | | | | | | | | | | | | | | | | | | | | | |
| |
| EUR Currency Put13 | | | DEU | | | | USD | | | | 1 .240 | | | | | | | | 2/24/15 | | | | EUR | | | | 24,000,000 | | | | 850,104 | |
| |
| EUR Currency Put13 | | | DEU | | | | USD | | | | 1 .200 | | | | | | | | 1/30/15 | | | | EUR | | | | 3,508,833 | | | | 31,393 | |
| |
| TRY Currency Call13 | | | HSBC | | | | TRY | | | | 2 .269 | | | | | | | | 2/16/15 | | | | TRY | | | | 50,350,000 | | | | 74,921 | |
| | | | | | | | | | | | | | | | | | | | | | | | | | | | | | | | |
| Total Over-the-Counter Options Purchased (Cost $1,033,896) | | | | | | | | | | | | | | | | 956,418 | |
| | | | | | | |
| | | Counterparty | | | Pay / Receive Floating Rate | | | Floating Rate | | | Fixed Rate | | | Expiration Date | | | Notional Amount (000’s) | | | | |
| |
Over-the-Counter Interest Rate Swaptions Purchased—0.0% | | | | | |
| |
| Interest Rate Swap maturing 7/21/25 Call13 | | | GSG | | | | Receive | | |
| Six-Month EUR
EURIBOR |
| | | 2.750 | % | | | 7/17/15 | | | | EUR | | | | 43,410 | | | | 12,084 | |
| |
| Interest Rate Swap maturing 10/6/25 Call13 | | | BOA | | | | Pay | | |
| Three-Month USD
BBA LIBOR |
| | | 2.885 | | | | 10/2/15 | | | | USD | | | | 53,000 | | | | 639,272 | |
| |
| Interest Rate Swap maturing 5/30/33 Call13 | | | BAC | | | | Pay | | |
| Six-Month GBP BBA
LIBOR |
| | | 3.990 | | | | 5/30/23 | | | | GBP | | | | 1,235 | | | | 64,255 | |
| |
| Interest Rate Swap maturing 7/21/25 Call13 | | | UBS | | | | Receive | | |
| Six-Month EUR
EURIBOR |
| | | 1.821 | | | | 7/17/15 | | | | EUR | | | | 19,040 | | | | 28,550 | |
| | | | | | | | | | | | | | | | | | | | | | | | | | | | | | | | |
| Total Over-the-Counter Interest Rate Swaptions Purchased (Cost $2,411,652) | | | | | | | | | | | | | | | | 744,161 | |
|
| |
| Total Investments, at Value (Cost $2,259,235,952) | | | | | | | | | | | | 102.1 | % | | | 2,182,161,626 | |
| |
| Net Other Assets (Liabilities) | | | | | | | | | | | | (2.1 | ) | | | (43,963,513) | |
| | | | | | | | | | | | | | | | | | | | | | | | | | | | |
| Net Assets | | | | | | | | | | | | | | | | | | | | | | | | | | | 100.0 | % | | $ | 2,138,198,113 | |
| | | | | | | | | | | | | | | | | | | | | | | | | | | | |
Footnotes to Consolidated Statement of Investments
1. Represents securities sold under Rule 144A, which are exempt from registration under the Securities Act of 1933, as amended. These securities have been determined to be liquid under guidelines established by the Board of Trustees. These securities amount to $705,262,235 or 32.98% of the Fund’s net assets as of December 31, 2014.
2. Represents the current interest rate for a variable or increasing rate security.
3. Restricted security. The aggregate value of restricted securities as of December 31, 2014 was $64,537,610, which represents 3.02% of the Fund’s net assets. See Note 4 of the accompanying Consolidated Notes. Information concerning restricted securities is as follows:
| | | | | | | | | | | | | | | | |
| Security | | Acquisition Dates | | | Cost | | | Value | | | Unrealized Appreciation/ (Depreciation) | |
| |
| Amsted Industries, Inc., 5% Sr. Unsec. Nts., 3/15/22 | | | 3/3/14 - 12/30/14 | | | $ | 3,008,791 | | | $ | 2,968,612 | | | $ | (40,179 | ) |
| Arco Capital Corp. Ltd. | | | 6/28/13 | | | | — | | | | — | | | | — | |
| ASG Consolidated LLC/ASG Finance, Inc., 15% Sr. Unsec. Nts., 5/15/17 | | | 8/19/10 - 11/20/14 | | | | 3,113,755 | | | | 2,293,058 | | | | (820,697 | ) |
| Astana Finance JSC, ADR | | | 5/8/14 | | | | — | | | | — | | | | — | |
| Blackboard, Inc., 7.75% Sr. Unsec. Nts., 11/15/19 | | | 10/24/13 - 10/16/14 | | | | 3,175,224 | | | | 3,163,550 | | | | (11,674 | ) |
| Brand Energy & Infrastructure Services, Inc., 8.50% Sr. Unsec. Nts., 12/1/21 | | | 11/22/13 - 11/25/13 | | | | 3,098,544 | | | | 2,778,350 | | | | (320,194 | ) |
| Brazil Loan Trust 1, 5.477% Sec. Nts., 7/24/23 | | | 7/25/13 - 7/25/14 | | | | 1,508,262 | | | | 1,486,407 | | | | (21,855 | ) |
| Building Materials Corp. of America, 6.75% Sr. Unsec. Nts., 5/1/21 | | | 4/26/11 - 10/8/14 | | | | 2,465,450 | | | | 2,602,300 | | | | 136,850 | |
24 OPPENHEIMER GLOBAL STRATEGIC INCOME FUND/VA
| | | | | | | | | | | | | | | | |
| Security | | Acquisition Dates | | | Cost | | | Value | | | Unrealized Appreciation/ (Depreciation) | |
| |
| Calcipar SA, 6.875% Sr. Sec. Nts., 5/1/18 | | | 11/21/13 | | | $ | 93,851 | | | $ | 90,900 | | | $ | (2,951) | |
| Citigroup Mortgage Loan Trust, Inc., Collateralized Mtg. Obligations, Series 2014-8, Cl. 1A2, 0.446%, 7/20/36 | | | 7/11/14 | | | | 2,846,948 | | | | 2,832,625 | | | | (14,323) | |
| Coveris Holdings SA, 7.875% Sr. Unsec. Nts., 11/1/19 | | | 10/24/13 | | | | 1,335,000 | | | | 1,381,725 | | | | 46,725 | |
| Credit Agricole SA, 8.375% Jr. Sub. Perpetual Bonds | | | 7/17/13 | | | | 1,983,363 | | | | 2,147,162 | | | | 163,799 | |
| Deutsche Bank AG, Coriolanus Ltd. Sec. Credit Linked Bonds, 26.561% Sr. Sec. Nts., 12/31/17 | | | 9/19/07 | | | | 4,946,730 | | | | 6,285,295 | | | | 1,338,565 | |
| Deutsche Bank AG, Opic Reforma I Credit Linked Nts., Cl. 2A, 7.208%, 5/22/15 | | | 5/21/08 | | | | 67,218 | | | | 43,743 | | | | (23,475) | |
| Deutsche Bank AG, Opic Reforma I Credit Linked Nts., Cl. 2B, 7.208%, 5/22/15 | | | 6/12/08 | | | | 117,590 | | | | 76,529 | | | | (41,061) | |
| Deutsche Bank AG, Opic Reforma I Credit Linked Nts., Cl. 2C, 7.208%, 5/22/15 | | | 6/18/08 | | | | 1,784,105 | | | | 1,153,866 | | | | (630,239) | |
| Deutsche Bank AG, Opic Reforma I Credit Linked Nts., Cl. 2D, 7.208%, 5/22/15 | | | 7/8/08 | | | | 129,928 | | | | 84,092 | | | | (45,836) | |
| Deutsche Bank AG, Opic Reforma I Credit Linked Nts., Cl. 2E, 7.208%, 5/22/15 | | | 7/15/08 | | | | 94,552 | | | | 61,095 | | | | (33,457) | |
| Deutsche Bank AG, Opic Reforma I Credit Linked Nts., Cl. 2F, 7.208%, 5/22/15 | | | 8/8/08 | | | | 61,214 | | | | 39,018 | | | | (22,196) | |
| Deutsche Bank AG, Opic Reforma I Credit Linked Nts., Cl. 2G, 7.208%, 5/22/15 | | | 8/22/08 | | | | 11,295 | | | | 7,185 | | | | (4,110) | |
| Eletson Holdings, 9.625% Sr. Sec. Nts., 1/15/22 | | | 12/12/13 - 10/28/14 | | | | 1,859,316 | | | | 1,846,875 | | | | (12,441) | |
| ICE EM CLO, Series 2007-1A, Cl. B, 2.031%, 8/15/22 | | | 11/6/07 | | | | 7,280,713 | | | | 7,323,822 | | | | 43,109 | |
| ICE EM CLO, Series 2007-1A, Cl. C, 3.331%, 8/15/22 | | | 6/8/07 | | | | 5,270,000 | | | | 4,957,489 | | | | (312,511) | |
| ICE EM CLO, Series 2007-1A, Cl. D, 5.331%, 8/15/22 | | | 6/8/07 | | | | 5,270,000 | | | | 4,859,994 | | | | (410,006) | |
| Infinis plc, 7% Sr. Sec. Nts., 2/15/19 | | | 10/2/13 - 5/12/14 | | | | 2,211,702 | | | | 2,117,962 | | | | (93,740) | |
| JPMorgan Hipotecaria su Casita, 6.47% Sec. Nts., 8/26/35 | | | 3/21/07 | | | | 528,973 | | | | 39,746 | | | | (489,227) | |
| K Hovnanian Enterprises, Inc., 9.125% Sec. Nts., 11/15/20 | | | 9/19/12 - 12/6/13 | | | | 1,900,193 | | | | 1,915,300 | | | | 15,107 | |
| Kenan Advantage Group, Inc. (The), 8.375% Sr. Unsec. Nts., 12/15/18 | | | 12/7/12 - 12/12/13 | | | | 2,306,674 | | | | 2,344,275 | | | | 37,601 | |
| LBC Tank Terminals Holding Netherlands BV, 6.875% Sr. Unsec. Nts., 5/15/23 | | | 5/8/13 - 4/17/14 | | | | 1,585,799 | | | | 1,545,300 | | | | (40,499) | |
| NC Finance Trust, Series 1999-I, Cl. D, 8.75%, 1/25/29 | | | 8/10/10 | | | | 66,025 | | | | 10,145 | | | | (55,880) | |
| Premier Cruises Ltd., 11% Sr. Unsec. Nts., 3/15/08 | | | 3/6/98 | | | | 242,675 | | | | — | | | | (242,675) | |
| Realogy Group LLC, 9% Sr. Sec. Nts., 1/15/20 | | | 1/25/12 - 2/1/12 | | | | 862,550 | | | | 951,500 | | | | 88,950 | |
| Swiss Re Capital I LP, 6.854% Jr. Sub. Perpetual Bonds | | | 11/14/13 - 1/13/14 | | | | 1,150,246 | | | | 1,158,150 | | | | 7,904 | |
| US Shale Solutions, Inc., 12.50% Sr. Sec. Nts., 9/1/17 | | | 8/7/14 | | | | 1,844,085 | | | | 1,459,150 | | | | (384,935) | |
| Wallace Theater Holdings, Inc. | | | 3/28/13 | | | | 15 | | | | 15 | | | | — | |
| Western Express, Inc., 12.50% Sr. Sec. Nts., 4/15/15 | | | 4/9/10 - 5/4/11 | | | | 4,769,024 | | | | 4,512,375 | | | | (256,649) | |
| | | | | | | | |
| | | | | | $ | 66,989,810 | | | $ | 64,537,610 | | | $ | (2,452,200) | |
| | | | | | | | |
4. Interest-Only Strips represent the right to receive the monthly interest payments on an underlying pool of mortgage loans. These securities typically decline in price as interest rates decline. Most other fixed income securities increase in price when interest rates decline. The principal amount of the underlying pool represents the notional amount on which current interest is calculated. The price of these securities is typically more sensitive to changes in prepayment rates than traditional mortgage-backed securities (for example, GNMA pass-throughs). Interest rates disclosed represent current yields based upon the current cost basis and estimated timing and amount of future cash flows. These securities amount to $4,687,176 or 0.22% of the Fund’s net assets as of December 31, 2014.
5. Interest rate is less than 0.0005%.
6. All or a portion of the security position is when-issued or delayed delivery to be delivered and settled after December 31, 2014. See Note 4 of the accompanying Consolidated Notes.
7. The current amortization rate of the security’s cost basis exceeds the future interest payments currently estimated to be received. Both the amortization rate and interest payments are contingent on future mortgage pre-payment speeds and are therefore subject to change.
8. This security is not accruing income because the issuer has missed an interest payment on it and/or is not anticipated to make future interest and or principal payments. The rate shown is the original contractual interest rate. See Note 4 of the accompanying Notes.
9. All or a portion of the security position is held in accounts at a futures clearing merchant and pledged to cover margin requirements on open futures contracts and written options on futures, if applicable. The aggregate market value of such securities is $1,997,812. See Note 5 of the accompanying Consolidated Notes.
10. All or a portion of the security position is held in segregated accounts and pledged to cover margin requirements under certain derivative contracts. The aggregate market value of such securities is $1,995,924. See Note 5 of the accompanying Consolidated Notes.
11. This bond has no contractual maturity date, is not redeemable and contractually pays an indefinite stream of interest. Rate reported represents the current interest rate for this variable rate security.
25 OPPENHEIMER GLOBAL STRATEGIC INCOME FUND/VA
CONSOLIDATEDSTATEMENTOFINVESTMENTS Continued
Footnotes to Consolidated Statement of Investments (Continued)
12. Interest or dividend is paid-in-kind, when applicable.
13. Non-income producing security.
14. Zero coupon bond reflects effective yield on the date of purchase.
15. Denotes an inflation-indexed security: coupon or principal are indexed to a consumer price index.
16. Is or was an affiliate, as defined in the Investment Company Act of 1940, as amended, at or during the period ended December 31, 2014, by virtue of the Fund owning at least 5% of the voting securities of the issuer or as a result of the Fund and the issuer having the same investment adviser. Transactions during the period in which the issuer was an affiliate are as follows:
| | | | | | | | | | | | | | | | |
| | | Shares
December 31, 2013 | | | Gross Additions | | | Gross Reductions | | | Shares December 31, 2014 | |
| |
| Oppenheimer Institutional Money Market Fund, Cl. E | | | 33,054,028 | | | | 908,959,408 | | | | 886,802,845 | | | | 55,210,591 | |
| Oppenheimer Master Event-Linked Bond Fund, LLC | | | 4,827,322 | | | | — | | | | 1,668,473 | | | | 3,158,849 | |
| Oppenheimer Master Loan Fund, LLC | | | 1,023,461 | | | | 8,129,838 | | | | 666,475 | | | | 8,486,824 | |
| Oppenheimer Ultra-Short Duration Fund, Cl. Y | | | 3,707,723 | | | | 1,900,357 | | | | 1,099,900 | | | | 4,508,180 | |
| | | | |
| | | | | | Value | | | Income | | | Realized Gain | |
| |
| Oppenheimer Institutional Money Market Fund, Cl. E | | | | | | $ | 55,210,591 | | | $ | 37,624 | | | $ | — | |
| Oppenheimer Master Event-Linked Bond Fund, LLC | | | | | | | 45,963,965 | | | | 3,476,368 a | | | | 666,023 a | |
| Oppenheimer Master Loan Fund, LLC | | | | | | | 122,462,202 | | | | 6,440,999 b | | | | 152,461 b | |
| Oppenheimer Ultra-Short Duration Fund, Cl. Y | | | | | | | 45,126,880 | | | | 146,622 | | | | 42,945 | |
| | | | | | | | |
| Total | | | $ | 268,763,638 | | | $ | 10,101,613 | | | $ | 861,429 | |
| | | | | | | | |
a. Represents the amount allocated to the Fund from Oppenheimer Master Event-Linked Bond Fund, LLC.
b. Represents the amount allocated to the Fund from Oppenheimer Master Loan Fund, LLC.
17. Rate shown is the 7-day yield as of December 31, 2014.
Distribution of investments representing geographic holdings, as a percentage of total investments at value, is as follows:
| | | | | | | | |
| Geographic Holdings | | Value | | | Percent | |
United States | | $ | 1,430,069,558 | | | | 65.5% | |
Mexico | | | 73,913,511 | | | | 3.4 | |
Turkey | | | 55,056,589 | | | | 2.5 | |
United Kingdom | | | 50,762,732 | | | | 2.3 | |
Netherlands | | | 37,201,403 | | | | 1.7 | |
Indonesia | | | 36,610,445 | | | | 1.7 | |
Brazil | | | 35,668,187 | | | | 1.6 | |
Canada | | | 31,768,300 | | | | 1.5 | |
Colombia | | | 30,094,664 | | | | 1.4 | |
India | | | 29,362,382 | | | | 1.3 | |
France | | | 29,009,818 | | | | 1.3 | |
Greece | | | 19,801,295 | | | | 0.9 | |
Italy | | | 20,411,807 | | | | 0.9 | |
Germany | | | 20,177,171 | | | | 0.9 | |
Supranational | | | 17,141,305 | | | | 0.8 | |
China | | | 16,279,364 | | | | 0.8 | |
Peru | | | 16,200,968 | | | | 0.7 | |
Israel | | | 15,499,943 | | | | 0.7 | |
South Africa | | | 15,187,329 | | | | 0.7 | |
Ireland | | | 14,691,589 | | | | 0.7 | |
Spain | | | 14,382,869 | | | | 0.7 | |
Luxembourg | | | 14,407,451 | | | | 0.7 | |
Chile | | | 13,218,744 | | | | 0.6 | |
Hungary | | | 11,343,486 | | | | 0.5 | |
Philippines | | | 10,609,778 | | | | 0.5 | |
Switzerland | | | 7,508,646 | | | | 0.3 | |
Portugal | | | 7,336,400 | | | | 0.3 | |
Russia | | | 7,019,898 | | | | 0.3 | |
United Arab Emirates | | | 6,992,684 | | | | 0.3 | |
Australia | | | 6,776,865 | | | | 0.3 | |
Poland | | | 6,156,523 | | | | 0.3 | |
Romania | | | 5,977,959 | | | | 0.3 | |
Sri Lanka | | | 5,763,494 | | | | 0.3 | |
Panama | | | 4,469,734 | | | | 0.2 | |
Sweden | | | 4,175,982 | | | | 0.2 | |
Denmark | �� | | 3,782,809 | | | | 0.2 | |
Ivory Coast | | | 3,781,491 | | | | 0.2 | |
Croatia | | | 3,765,227 | | | | 0.2 | |
Dominican Republic | | | 3,475,708 | | | | 0.2 | |
Lithuania | | | 3,124,748 | | | | 0.1 | |
Serbia | | | 3,052,325 | | | | 0.1 | |
Norway | | | 2,576,637 | | | | 0.1 | |
26 OPPENHEIMER GLOBAL STRATEGIC INCOME FUND/VA
| | | | | | | | |
| Geographic Holdings (Continued) | | Value | | | Percent | |
Morocco | | $ | 2,544,972 | | | | 0.1% | |
Kazakhstan | | | 2,494,280 | | | | 0.1 | |
Venezuela | | | 2,332,910 | | | | 0.1 | |
Lebanon | | | 2,140,036 | | | | 0.1 | |
Austria | | | 1,866,556 | | | | 0.1 | |
Kenya | | | 1,794,562 | | | | 0.1 | |
Belgium | | | 1,545,300 | | | | 0.1 | |
Eurozone | | | 1,534,097 | | | | 0.1 | |
Jersey, Channel Islands | | | 1,515,645 | | | | 0.1 | |
Tanzania | | | 1,506,358 | | | | 0.1 | |
Uruguay | | | 1,455,025 | | | | 0.1 | |
Puerto Rico | | | 1,404,000 | | | | 0.1 | |
Paraguay | | | 1,305,400 | | | | 0.1 | |
Malaysia | | | 1,304,300 | | | | 0.1 | |
Japan | | | 1,267,984 | | | | 0.1 | |
Latvia | | | 1,230,506 | | | | 0.1 | |
Saudi Arabia | | | 1,069,964 | | | | 0.1 | |
Gabon | | | 1,002,750 | | | | 0.1 | |
Qatar | | | 956,422 | | | | 0.0 | |
Trinidad | | | 941,775 | | | | 0.0 | |
Jamaica | | | 853,237 | | | | 0.0 | |
Vietnam | | | 826,000 | | | | 0.0 | |
Barbados | | | 819,344 | | | | 0.0 | |
Senegal | | | 766,160 | | | | 0.0 | |
Angola | | | 723,834 | | | | 0.0 | |
Bermuda | | | 644,229 | | | | 0.0 | |
Ecuador | | | 481,600 | | | | 0.0 | |
Ukraine | | | 396,800 | | | | 0.0 | |
Nigeria | | | 351,025 | | | | 0.0 | |
Egypt | | | 289,100 | | | | 0.0 | |
Hong Kong | | | 189,637 | | | | 0.0 | |
| | | | |
Total | | $ | 2,182,161,626 | | | | 100.0% | |
| | | | |
| | | | | | | | | | | | | | | | | | | | | | | | |
Forward Currency Exchange Contracts as of December 31, 2014 | |
Counterparty | | Settlement Month(s) | | | Currency Purchased (000’s) | | | Currency Sold (000’s) | | | Unrealized Appreciation | | | Unrealized Depreciation | |
BAC | | | 01/2015 | | | BRL | | | 33,520 | | | USD | | | 12,620 | | | $ | – | | | $ | 9,495 | |
BAC | | | 05/2015 | | | IDR | | | 136,542,000 | | | USD | | | 10,976 | | | | – | | | | 252,503 | |
BAC | | | 02/2015 | | | KRW | | | 4,515,000 | | | USD | | | 4,193 | | | | – | | | | 95,490 | |
BAC | | | 02/2015 | | | MYR | | | 12,060 | | | USD | | | 3,746 | | | | – | | | | 318,390 | |
BAC | | | 04/2015 | | | SEK | | | 165,850 | | | USD | | | 23,206 | | | | – | | | | 1,922,370 | |
BAC | | | 02/2015 | | | TRY | | | 32,040 | | | USD | | | 13,888 | | | | – | | | | 319,399 | |
BAC | | | 01/2015 - 04/2015 | | | USD | | | 18,082 | | | BRL | | | 45,570 | | | | 1,049,687 | | | | – | |
BAC | | | 04/2015 | | | USD | | | 23,241 | | | EUR | | | 18,300 | | | | 1,076,037 | | | | – | |
BAC | | | 03/2015 | | | USD | | | 4,381 | | | HUF | | | 1,094,000 | | | | 206,745 | | | | – | |
BAC | | | 05/2015 | | | USD | | | 10,968 | | | IDR | | | 136,442,000 | | | | 252,317 | | | | – | |
BAC | | | 03/2015 | | | USD | | | 10,942 | | | KRW | | | 12,258,000 | | | | – | | | | 180,052 | |
BAC | | | 02/2015 | | | USD | | | 11,316 | | | MYR | | | 37,129 | | | | 762,981 | | | | – | |
BAC | | | 01/2015 | | | USD | | | 497 | | | RUB | | | 20,700 | | | | 155,871 | | | | – | |
BAC | | | 04/2015 | | | USD | | | 23,021 | | | SEK | | | 165,850 | | | | 1,737,330 | | | | – | |
BAC | | | 02/2015 | | | USD | | | 62 | | | TRY | | | 140 | | | | 2,400 | | | | – | |
BNP | | | 06/2015 | | | NOK | | | 1,970 | | | USD | | | 278 | | | | – | | | | 14,653 | |
BNP | | | 06/2015 | | | USD | | | 651 | | | NOK | | | 4,600 | | | | 36,012 | | | | – | |
BOA | | | 01/2015 | | | BRL | | | 178,145 | | | USD | | | 70,193 | | | | – | | | | 3,175,856 | |
BOA | | | 01/2015 | | | EUR | | | 580 | | | USD | | | 722 | | | | – | | | | 19,693 | |
BOA | | | 05/2015 | | | IDR | | | 136,442,000 | | | USD | | | 10,972 | | | | – | | | | 256,375 | |
BOA | | | 01/2015 | | | INR | | | 1,518,250 | | | USD | | | 24,544 | | | | – | | | | 513,334 | |
BOA | | | 02/2015 | | | KRW | | | 16,175,000 | | | USD | | | 15,393 | | | | – | | | | 714,169 | |
BOA | | | 01/2015 | | | PHP | | | 118,000 | | | USD | | | 2,628 | | | | 4,913 | | | | – | |
BOA | | | 01/2015 | | | USD | | | 68,677 | | | BRL | | | 178,145 | | | | 1,659,742 | | | | – | |
BOA | | | 01/2015 | | | USD | | | 790 | | | EUR | | | 580 | | | | 88,115 | | | | – | |
BOA | | | 01/2015 | | | USD | | | 18,978 | | | INR | | | 1,177,000 | | | | 348,225 | | | | – | |
BOA | | | 02/2015 - 03/2015 | | | USD | | | 28,516 | | | KRW | | | 31,399,000 | | | | 208,078 | | | | 184,332 | |
BOA | | | 01/2015 | | | USD | | | 38,459 | | | MXN | | | 519,500 | | | | 3,251,339 | | | | – | |
BOA | | | 05/2015 | | | USD | | | 10,788 | | | MYR | | | 36,640 | | | | 449,713 | | | | – | |
BOA | | | 01/2015 - 04/2015 | | | USD | | | 5,333 | | | PHP | | | 236,000 | | | | 76,554 | | | | 2,218 | |
CITNA-B | | | 01/2015 | | | BRL | | | 66,150 | | | USD | | | 25,190 | | | | – | | | | 305,143 | |
CITNA-B | | | 06/2015 | | | EUR | | | 110 | | | USD | | | 136 | | | | – | | | | 2,387 | |
27 OPPENHEIMER GLOBAL STRATEGIC INCOME FUND/VA
CONSOLIDATEDSTATEMENTOFINVESTMENTS Continued
| | | | | | | | | | | | | | | | | | | | | | | | | | | | |
Forward Currency Exchange Contracts (Continued) | |
| Counterparty | | Settlement Month(s) | | | Currency Purchased (000’s) | | | Currency Sold (000’s) | | | Unrealized
Appreciation | | | Unrealized
Depreciation | |
| |
CITNA-B | | | 01/2015 | | | | MXN | | | | 15,500 | | | | USD | | | | 1,145 | | | $ | – | | | $ | 94,701 | |
CITNA-B | | | 02/2015 | | | | TRY | | | | 2,700 | | | | USD | | | | 1,149 | | | | – | | | | 1,751 | |
CITNA-B | | | 01/2015 | | | | USD | | | | 24,904 | | | | BRL | | | | 66,150 | | | | 18,737 | | | | – | |
CITNA-B | | | 06/2015 | | | | USD | | | | 53,719 | | | | EUR | | | | 43,300 | | | | 1,247,154 | | | | – | |
CITNA-B | | | 06/2015 | | | | USD | | | | 2,116 | | | | GBP | | | | 1,350 | | | | 14,046 | | | | – | |
CITNA-B | | | 02/2015 | | | | USD | | | | 802 | | | | HUF | | | | 191,000 | | | | 73,136 | | | | – | |
CITNA-B | | | 01/2015 | | | | USD | | | | 11,100 | | | | NZD | | | | 14,070 | | | | 146,450 | | | | – | |
CITNA-B | | | 02/2015 | | | | USD | | | | 28,351 | | | | TRY | | | | 64,790 | | | | 915,004 | | | | – | |
DEU | | | 01/2015 | | | | MXN | | | | 64,730 | | | | USD | | | | 4,782 | | | | – | | | | 395,112 | |
DEU | | | 02/2015 | | | | TRY | | | | 13,340 | | | | USD | | | | 5,853 | | | | – | | | | 204,032 | |
DEU | | | 06/2015 | | | | USD | | | | 36,463 | | | | GBP | | | | 23,275 | | | | 231,647 | | | | – | |
DEU | | | 02/2015 | | | | USD | | | | 19,872 | | | | TRY | | | | 45,480 | | | | 610,303 | | | | – | |
GSCO-OT | | | 01/2015 - 04/2015 | | | | BRL | | | | 142,950 | | | | USD | | | | 54,798 | | | | – | | | | 1,147,269 | |
GSCO-OT | | | 01/2015 | | | | JPY | | | | 2,588,000 | | | | USD | | | | 21,428 | | | | 181,381 | | | | – | |
GSCO-OT | | | 01/2015 - 04/2015 | | | | USD | | | | 58,582 | | | | BRL | | | | 142,950 | | | | 4,931,175 | | | | – | |
JPM | | | 01/2015 | | | | BRL | | | | 52,920 | | | | USD | | | | 19,946 | | | | 71,992 | | | | 109,651 | |
JPM | | | 01/2016 | | | | CNH | | | | 55,600 | | | | USD | | | | 9,041 | | | | – | | | | 324,414 | |
JPM | | | 06/2015 | | | | EUR | | | | 1,825 | | | | USD | | | | 2,245 | | | | – | | | | 33,518 | |
JPM | | | 05/2015 | | | | IDR | | | | 132,658,000 | | | | USD | | | | 10,655 | | | | – | | | | 248,127 | |
JPM | | | 01/2015 | | | | INR | | | | 476,000 | | | | USD | | | | 7,663 | | | | – | | | | 128,474 | |
JPM | | | 02/2015 | | | | MYR | | | | 41,410 | | | | USD | | | | 12,952 | | | | – | | | | 1,181,758 | |
JPM | | | 01/2015 | | | | RON | | | | 25,620 | | | | USD | | | | 7,289 | | | | – | | | | 373,401 | |
JPM | | | 01/2015 - 02/2015 | | | | USD | | | | 30,587 | | | | BRL | | | | 81,690 | | | | 14,991 | | | | 72,762 | |
JPM | | | 01/2016 | | | | USD | | | | 8,825 | | | | CNH | | | | 55,600 | | | | 108,425 | | | | – | |
JPM | | | 06/2015 | | | | USD | | | | 52,748 | | | | EUR | | | | 42,550 | | | | 1,181,689 | | | | – | |
JPM | | | 05/2015 | | | | USD | | | | 17,044 | | | | IDR | | | | 218,365,000 | | | | – | | | | 96,545 | |
JPM | | | 01/2015 | | | | USD | | | | 13,032 | | | | INR | | | | 817,250 | | | | 96,801 | | | | – | |
JPM | | | 02/2015 | | | | USD | | | | 12,329 | | | | KRW | | | | 13,737,000 | | | | 51,123 | | | | 188,306 | |
JPM | | | 01/2015 | | | | USD | | | | 7,251 | | | | RON | | | | 25,620 | | | | 335,467 | | | | – | |
JPM | | | 02/2015 | | | | USD | | | | 12,645 | | | | TRY | | | | 29,110 | | | | 317,311 | | | | – | |
MSCO | | | 01/2015 | | | | BRL | | | | 1,950 | | | | USD | | | | 734 | | | | – | | | | 552 | |
MSCO | | | 06/2015 | | | | EUR | | | | 65 | | | | USD | | | | 80 | | | | – | | | | 1,700 | |
MSCO | | | 01/2015 | | | | MXN | | | | 704,300 | | | | USD | | | | 51,678 | | | | – | | | | 3,946,943 | |
MSCO | | | 02/2015 | | | | MYR | | | | 74,550 | | | | USD | | | | 22,629 | | | | – | | | | 1,438,853 | |
MSCO | | | 01/2015 | | | | NZD | | | | 14,070 | | | | USD | | | | 10,961 | | | | – | | | | 6,819 | |
MSCO | | | 02/2015 | | | | TRY | | | | 2,720 | | | | USD | | | | 1,153 | | | | – | | | | 979 | |
MSCO | | | 01/2015 | | | | USD | | | | 789 | | | | BRL | | | | 1,950 | | | | 55,192 | | | | – | |
MSCO | | | 03/2015 - 06/2015 | | | | USD | | | | 43,262 | | | | EUR | | | | 34,145 | | | | 1,914,618 | | | | – | |
MSCO | | | 01/2015 | | | | USD | | | | 23,040 | | | | JPY | | | | 2,588,000 | | | | 1,430,132 | | | | – | |
MSCO | | | 01/2015 | | | | USD | | | | 46,751 | | | | MXN | | | | 637,430 | | | | 3,551,026 | | | | – | |
MSCO | | | 02/2015 | | | | USD | | | | 16,230 | | | | MYR | | | | 53,470 | | | | 1,031,998 | | | | – | |
MSCO | | | 02/2015 | | | | USD | | | | 1,119 | | | | TRY | | | | 2,640 | | | | 950 | | | | – | |
NOM | | | 02/2015 | | | | USD | | | | 11,401 | | | | MYR | | | | 37,421 | | | | 764,809 | | | | – | |
TDB | | | 01/2015 | | | | BRL | | | | 71,680 | | | | USD | | | | 26,986 | | | | – | | | | 20,304 | |
TDB | | | 02/2015 | | | | HUF | | | | 191,000 | | | | USD | | | | 787 | | | | – | | | | 57,889 | |
TDB | | | 01/2015 | | | | MXN | | | | 1,400 | | | | USD | | | | 103 | | | | – | | | | 8,076 | |
TDB | | | 01/2015 - 04/2015 | | | | USD | | | | 29,673 | | | | BRL | | | | 73,370 | | | | 2,087,520 | | | | – | |
TDB | | | 02/2015 | | | | USD | | | | 15,259 | | | | COP | | | | 36,876,000 | | | | – | | | | 223,968 | |
TDB | | | 02/2015 | | | | USD | | | | 845 | | | | HUF | | | | 205,000 | | | | 62,133 | | | | – | |
TDB | | | 06/2015 | | | | USD | | | | 6,878 | | | | JPY | | | | 818,000 | | | | 37,612 | | | | – | |
TDB | | | 01/2015 | | | | USD | | | | 13,638 | | | | MXN | | | | 184,800 | | | | 1,113,510 | | | | – | |
TDB | | | 03/2015 | | | | USD | | | | 7,561 | | | | ZAR | | | | 87,200 | | | | 104,831 | | | | – | |
| | | | | | | | | | | | | | | | | | | | | | | | |
Total Unrealized Appreciation and Depreciation | | | $ | 34,067,222 | | | $ | 18,591,763 | |
| | | | | | | | | | | | | | | | | | | | | | | | |
| | | | | | | | | | | | | | | | | | | | | | |
|
Futures Contracts as of December 31, 2014 |
| Description | | Exchange | | | Buy/Sell | | | Expiration Date | | | Number of Contracts | | | Value | | | Unrealized Appreciation
(Depreciation) |
|
United States Treasury Long Bonds | | | CBT | | | | Sell | | | | 3/20/15 | | | | 109 | | | $ | 15,757,313 | | | $(265,079) |
United States Treasury Long Bonds | | | CBT | | | | Buy | | | | 3/20/15 | | | | 75 | | | | 10,842,188 | | | 230,547 |
United States Treasury Nts., 10 yr. | | | CBT | | | | Sell | | | | 3/20/15 | | | | 332 | | | | 42,096,563 | | | (168,189) |
United States Treasury Nts., 10 yr. | | | CBT | | | | Buy | | | | 3/20/15 | | | | 779 | | | | 98,774,766 | | | 52,778 |
United States Treasury Nts., 2 yr. | | | CBT | | | | Sell | | | | 3/31/15 | | | | 248 | | | | 54,211,250 | | | 82,864 |
United States Treasury Nts., 2 yr. | | | CBT | | | | Buy | | | | 3/31/15 | | | | 445 | | | | 97,274,219 | | | (138,528) |
United States Treasury Nts., 5 yr. | | | CBT | | | | Sell | | | | 3/31/15 | | | | 1,100 | | | | 130,822,657 | | | (389,615) |
United States Treasury Ultra Bonds | | | CBT | | | | Buy | | | | 3/20/15 | | | | 197 | | | | 32,541,938 | | | 1,444,842 |
| | | | | | | | | | | | | | | | | | | | | | |
| | | | | | | | | | | | | | | | | | | | | | $ 849,620 |
| | | | | | | | | | | | | | | | | | | | | | |
28 OPPENHEIMER GLOBAL STRATEGIC INCOME FUND/VA
| | | | | | | | | | | | | | | | | | | | | | | | | | | | | | |
Over-the-Counter Options Written at December 31, 2014 |
| Description | | Counterparty | | | | | | Exercise Price | | | Expiration Date | | | Number of Contracts | | | Premiums Received | | | Value |
|
| EUR Currency Put | | | DEU | | | | USD | | | | 1.190 | | | | 2/24/15 | | | | EUR | | | | (24,000,000 | ) | | $ | 128,381 | | | $ (230,400) |
|
| EUR Currency Call | | | DEU | | | | USD | | | | 1.280 | | | | 2/24/15 | | | | EUR | | | | (24,000,000 | ) | | | 171,672 | | | (21,144) |
|
| Portuguese Government Bonds Put | | | JPM | | | | EUR | | | | 121.580 | | | | 3/2/15 | | | | EUR | | | | (7,000,000 | ) | | | 136,304 | | | (93,421) |
|
| TRY Currency Put | | | HSBC | | | | TRY | | | | 2.414 | | | | 2/16/15 | | | | TRY | | | | (53,580,000 | ) | | | 164,467 | | | (237,895) |
| | | | | | | | | | | | | | | | | | | | | | | | | | | |
| Total Over-the-Counter Options Written | | | $ | 600,824 | | | $ (582,860) |
| | | | | | | | | | | | | | | | | | | | | | | | | | | |
| | | | | | | | | | | | | | | | | | | | | | | | | | | | | | |
Centrally Cleared Credit Default Swaps at December 31, 2014 |
| Reference Asset | | | Buy/Sell
Protection | | | Fixed Rate | | | Maturity Date | | | Notional Amount
(000’s) | | | Premiums Received/(Paid) | | | Value |
|
CDX.HY.23 | | | | Sell | | | | 5.000 | % | | | 12/20/19 | | | | USD | | | | 10,000 | | | $ | (647,211 | ) | | $620,725 |
Over-the-Counter Credit Default Swaps at December 31, 2014 |
| Reference Asset | | Counterparty | | | Buy/Sell
Protection | | | Fixed Rate | | | Maturity Date | | | Notional Amount
(000’s) | | | Premiums Received/(Paid) | | | Value |
|
| Banco Bilbao Vizcaya Argentaria Sociedad Anonima | | | UBS | | | | Sell | | | | 3.000 | % | | | 12/20/17 | | | | EUR | | | | 125 | | | $ | (60 | ) | | $11,256 |
|
| Banco Bilbao Vizcaya Argentaria Sociedad Anonima | | | UBS | | | | Sell | | | | 3.000 | | | | 12/20/17 | | | | EUR | | | | 125 | | | | (60 | ) | | 11,256 |
|
Banco Santander SA | | | UBS | | | | Sell | | | | 3.000 | | | | 9/20/17 | | | | EUR | | | | 250 | | | | (997 | ) | | 20,067 |
|
Bolivarian Republic of Venezuela | | | FIB | | | | Buy | | | | 5.000 | | | | 6/20/19 | | | | USD | | | | 2,170 | | | | (404,122 | ) | | 1,298,032 |
|
Hellenic Republic | | | GSG | | | | Buy | | | | 1.000 | | | | 12/20/15 | | | | USD | | | | 2,950 | | | | (228,789 | ) | | 409,930 |
|
Hellenic Republic | | | GSG | | | | Buy | | | | 1.000 | | | | 12/20/15 | | | | USD | | | | 2,215 | | | | (182,861 | ) | | 307,795 |
|
Hellenic Republic | | | GSG | | | | Buy | | | | 1.000 | | | | 12/20/15 | | | | USD | | | | 730 | | | | (105,891 | ) | | 101,440 |
|
Hellenic Republic | | | GSG | | | | Buy | | | | 1.000 | | | | 12/20/15 | | | | USD | | | | 735 | | | | (110,291 | ) | | 104,041 |
|
Hellenic Republic | | | GSG | | | | Buy | | | | 1.000 | | | | 12/20/15 | | | | EUR | | | | 3,695 | | | | (189,760 | ) | | 621,525 |
|
Hellenic Republic | | | GSG | | | | Buy | | | | 1.000 | | | | 12/20/15 | | | | USD | | | | 1,465 | | | | (190,532 | ) | | 203,576 |
|
Hellenic Republic | | | GSG | | | | Sell | | | | 1.000 | | | | 12/20/19 | | | | USD | | | | 1,465 | | | | 439,581 | | | (533,648) |
|
Hellenic Republic | | | GSG | | | | Sell | | | | 1.000 | | | | 12/20/19 | | | | USD | | | | 740 | | | | 135,118 | | | (269,556) |
|
Republic of Ireland | | | GSG | | | | Buy | | | | 1.000 | | | | 3/20/18 | | | | USD | | | | 660 | | | | (27,725 | ) | | (14,188) |
|
Republic of Ireland | | | GSG | | | | Buy | | | | 1.000 | | | | 3/20/18 | | | | EUR | | | | 585 | | | | (21,618 | ) | | (15,159) |
|
Republic of Italy | | | GSG | | | | Sell | | | | 1.000 | | | | 3/20/23 | | | | USD | | | | 660 | | | | 105,519 | | | (37,153) |
|
State Bank of India | | | BNP | | | | Sell | | | | 1.000 | | | | 9/20/19 | | | | USD | | | | 1,740 | | | | 71,791 | | | (44,823) |
| | | | | | | | | | | | | | | | | | | | | | | | | | | |
Total Over-the-Counter Credit Default Swaps | | | $ | (710,697 | ) | | $ 2,174,391 |
| | | | | | | | | | | | | | | | | | | | | | | | | | | |
| | | | | | | | | | | | | | | | | | |
The table that follows shows the undiscounted maximum potential payment by the Fund related to selling credit protection in credit default swaps: |
Type of Reference Asset on which the Fund Sold Protection | | Total Maximum Potential
Payments for Selling
Credit Protection
(Undiscounted) | | | | | | Amount Recoverable* | | | | | | Reference Asset
Rating Range** |
|
| Non-Investment Grade Corporate Debt Indexes | | $ | 10,000,000 | | | | | | | $ | — | | | | | | | B+ |
Investment Grade Single Name Corporate Debt | | $ | 1,740,000 | | | | | | | $ | — | | | | | | | BBB- |
Investment Grade Single Name Corporate Debt | | | 500,000 | | | | EUR | | | | — | | | | EUR | | | BBB- to BBB |
| Investment Grade Sovereign Debt | | $ | 660,000 | | | | | | | $ | — | | | | | | | BBB |
| Non-Investment Grade Sovereign Debt | | $ | 2,205,000 | | | | | | | $ | 8,905,000 | | | | | | | B |
| Non-Investment Grade Sovereign Debt | | | — | | | | EUR | | | | 3,695,000 | | | | EUR | | | B |
| | | | | | | | | | | | | | | | | | |
| Total | | $ | 14,605,000 | | | | | | | $ | 8,095,000 | | | | | | | |
| | | | | | | | | | | | | | | | | | |
Total EUR | | | 500,000 | | | | EUR | | | | 3,695,000 | | | | EUR | | | |
| | | | | | | | | | | | | | | | | | |
* Amounts recoverable includes potential payments from related purchased protection for instances where the Fund is the seller of protection. In addition, the Fund has no recourse provisions under the credit derivatives and holds no collateral which can offset or reduce potential payments under a triggering event.
** The period end reference asset security ratings, as rated by any rating organization, are included in the equivalent Standard & Poor’s rating category. The reference asset rating represents the likelihood of a potential credit event on the reference asset which would result in a related payment by the Fund.
| | | | | | | | | | | | | | | | | | | | | | | | | | | | | | |
Centrally Cleared Interest Rate Swaps at December 31, 2014 |
| Counterparty | | Pay/Receive
Floating Rate | | | Floating Rate | | | Fixed Rate | | | Maturity Date | | | Notional Amount
(000’s) | | | Premiums
Received / (Paid) | | | Value |
|
GSG | | | Pay | | |
| Three-Month USD
BBA LIBOR |
| | | 2.460 | % | | | 11/24/24 | | | | USD | | | | 34,100 | | | $ | — | | | $(646,042) |
|
JPM | | | Receive | | |
| Three-Month USD
BBA LIBOR |
| | | 2.570 | | | | 8/15/24 | | | | USD | | | | 2,090 | | | | — | | | (77,062) |
|
JPM | | | Receive | | |
| Three-Month USD
BBA LIBOR |
| | | 2.550 | | | | 8/12/24 | | | | USD | | | | 2,090 | | | | — | | | (73,658) |
|
JPM | | | Pay | | |
| MXN TIIE
BANXICO |
| | | 6.090 | | | | 7/29/24 | | | | MXN | | | | 31,300 | | | | (11) | | | 5,636 |
|
JPM | | | Pay | | |
| MXN TIIE
BANXICO |
| | | 6.070 | | | | 8/1/24 | | | | MXN | | | | 30,400 | | | | (9) | | | 6,297 |
| | | | | | | | | | | | | | | | | | | | | | | | | | | |
Total Cleared Interest Rate Swaps | | | | | | | $ | (20) | | | $ (784,829) |
| | | | | | | | | | | | | | | | | | | | | | | | | | | |
29 OPPENHEIMER GLOBAL STRATEGIC INCOME FUND/VA
CONSOLIDATEDSTATEMENTOFINVESTMENTS Continued
| | | | | | | | | | | | | | | | | | | | | | | | | | | | |
Over-the-Counter Interest Rate Swaps at December 31, 2014 | |
| Counterparty | | Pay/Receive Floating Rate | | | Floating Rate | | | Fixed Rate | | | Maturity Date | | | Notional Amount (000’s) | | | Value | |
| |
GSG | | | Pay | | | | MXN TIIE BANXICO | | | | 4.260 | % | | | 6/15/16 | | | | MXN | | | | 126,300 | | | $ | 2,151 | |
| |
JPM | | | Pay | | | | MXN TIIE BANXICO | | | | 4.280 | | | | 6/15/16 | | | | MXN | | | | 125,400 | | | | 3,790 | |
| | | | | | | | | | | | | | | | | | | | | | | | | | | | |
Total Over-the-Counter Interest Rate Swaps | | | $ | 5,941 | |
| | | | | | | | | | | | | | | | | | | | | | | | | | | | |
| | | | | | | | | | | | | | | | | | | | | | | | | | | | | | | | | | | | |
Over-the-Counter Interest Rate Swaptions Written at December 31, 2014 | |
| Description | | Counterparty | | | Pay/Receive
Floating Rate | | | Floating Rate | | | Fixed
Rate | | | Expiration
Date | | | Notional Amount
(000’s) | | | Premiums Received | | | Value | |
| |
| Interest Rate Swap maturing 10/6/20 Call | | | BOA | | | | Receive | | |
| Six-Month
EUR EURIBOR |
| | | 0.655 | % | | | 10/2/15 | | | | EUR | | | | 46,000 | | | $ | 401,622 | | | $ | (716,044) | |
| |
| Interest Rate Swap maturing 7/21/25 Call | | | UBS | | | | Receive | | |
| Six-Month
EUR EURIBOR |
| | | 1.421 | | | | 7/17/15 | | | | EUR | | | | 19,040 | | | | 308,859 | | | | (1,249,530) | |
| | | | | | | | | | | | | | | | | | | | | | | | | | | | | | | | |
| Total Over-the-Counter Interest Rate Swaptions Written | | | $ | 710,481 | | | $ | (1,965,574) | |
| | | | | | | | | | | | | | | | | | | | | | | | | | | | | | | | |
| | |
| Glossary: | | |
| Counterparty Abbreviations |
| BAC | | Barclays Bank plc |
| BNP | | BNP Paribas |
| BOA | | Bank of America NA |
| CITNA-B | | Citibank NA |
| DEU | | Deutsche Bank AG |
| FIB | | Credit Suisse International |
| GSCO-OT | | Goldman Sachs Bank USA |
| GSG | | Goldman Sachs Group, Inc. (The) |
| HSBC | | HSBC Bank USA NA |
| JPM | | JPMorgan Chase Bank NA |
| MSCO | | Morgan Stanley Capital Services, Inc. |
| NOM | | Nomura Global Financial Products, Inc. |
| TDB | | Toronto Dominion Bank |
| UBS | | UBS AG |
|
| Currency abbreviations indicate amounts reporting in currencies |
| BRL | | Brazilian Real |
| CNH | | Offshore Chinese Renminbi |
| COP | | Colombian Peso |
| EUR | | Euro |
| GBP | | British Pound Sterling |
| HUF | | Hungarian Forint |
| IDR | | Indonesia Rupiah |
| INR | | Indian Rupee |
| JPY | | Japanese Yen |
| KRW | | South Korean Won |
| MXN | | Mexican Nuevo Peso |
| MYR | | Malaysian Ringgit |
| NOK | | Norwegian Krone |
| NZD | | New Zealand Dollar |
| PHP | | Philippines Peso |
| RON | | New Romanian Leu |
| RUB | | Russian Ruble |
| SEK | | Swedish Krona |
| TRY | | New Turkish Lira |
| ZAR | | South African Rand |
|
| Definitions |
| BANXICO | | Banco de Mexico |
| BBA LIBOR | | British Bankers’ Association London - Interbank Offered Rate |
| CDX.HY.23 | | Markit CDX High Yield Index |
| EURIBOR | | Euro Interbank Offered Rate |
| SX5E | | Euro Stoxx 50 Index |
| TIIE | | Interbank Equilibrium Interest Rate |
|
| Exchange Abbreviations |
| CBT | | Chicago Board of Trade |
See accompanying Consolidated Notes to Financial Statements.
30 OPPENHEIMER GLOBAL STRATEGIC INCOME FUND/VA
CONSOLIDATEDSTATEMENTOFASSETSANDLIABILITIES December 31, 2014
| | | | |
| |
Assets | | | | |
Investments, at value—see accompanying consolidated statement of investments: | | | | |
Unaffiliated companies (cost $1,986,311,605) | | $ | 1,913,397,988 | |
Affiliated companies (cost $272,924,347) | | | 268,763,638 | |
| | | | |
| | | 2,182,161,626 | |
| |
Cash | | | 12,601,199 | |
| |
Cash used for collateral on centrally cleared swaps | | | 2,794,484 | |
| |
Unrealized appreciation on foreign currency exchange contracts | | | 34,067,222 | |
| |
Swaps, at value (premiums paid $1,413,363) | | | 3,094,859 | |
| |
Centrally cleared swaps, at value (premiums paid $647,231) | | | 632,658 | |
| |
Receivables and other assets: | | | | |
Interest, dividends and principal paydowns | | | 26,525,489 | |
Investments sold (including $8,328,060 sold on a when-issued or delayed delivery basis) | | | 9,119,640 | |
Shares of beneficial interest sold | | | 6,930,959 | |
Variation margin receivable | | | 173,568 | |
Other | | | 170,556 | |
| | | | |
Total assets | | | 2,278,272,260 | |
|
| |
Liabilities | | | | |
Bank overdraft-foreign | | | 412,862 | |
| |
Unrealized depreciation on foreign currency exchange contracts | | | 18,591,763 | |
| |
Options written, at value (premiums received $600,824) | | | 582,860 | |
| |
Swaps, at value (upfront payments received $702,666) | | | 914,527 | |
| |
Centrally cleared swaps, at value | | | 796,762 | |
| |
Swaptions written, at value (net premiums received $710,481) | | | 1,965,574 | |
| |
Payables and other liabilities: | | | | |
Investments purchased (including $111,876,062 purchased on a when-issued or delayed delivery basis) | | | 114,411,317 | |
Shares of beneficial interest redeemed | | | 1,411,222 | |
Distribution and service plan fees | | | 330,117 | |
Shareholder communications | | | 183,724 | |
Variation margin payable | | | 182,013 | |
Trustees’ compensation | | | 91,331 | |
Other | | | 200,075 | |
| | | | |
Total liabilities | | | 140,074,147 | |
|
| |
Net Assets | | $ | 2,138,198,113 | |
| | | | |
|
| |
Composition of Net Assets | | | | |
Par value of shares of beneficial interest | | $ | 397,138 | |
| |
Additional paid-in capital | | | 2,159,126,588 | |
| |
Accumulated net investment income | | | 104,708,911 | |
| |
Accumulated net realized loss on investments and foreign currency transactions | | | (64,301,594) | |
| |
Net unrealized depreciation on investments and translation of assets and liabilities denominated in foreign currencies | | | (61,732,930) | |
| | | | |
Net Assets | | $ | 2,138,198,113 | |
| | | | |
|
| |
Net Asset Value Per Share | | | | |
Non-Service Shares: | | | | |
| Net asset value, redemption price per share and offering price per share (based on net assets of $586,950,590 and 110,843,299 shares of beneficial interest outstanding) | | | $5.30 | |
| |
Service Shares: | | | | |
| Net asset value, redemption price per share and offering price per share (based on net assets of $1,551,247,523 and 286,294,894 shares of beneficial interest outstanding) | | | $5.42 | |
See accompanying Consolidated Notes to Financial Statements.
31 OPPENHEIMER GLOBAL STRATEGIC INCOME FUND/VA
CONSOLIDATEDSTATEMENTOFOPERATIONS For the Year Ended December 31, 2014
| | | | |
| |
Allocation of Income and Expenses from Master Funds1 | | | | |
Net investment income allocated from Oppenheimer Master Event-Linked Bond Fund, LLC: | | | | |
Interest | | $ | 3,475,793 | |
Dividends | | | 575 | |
Net expenses | | | (224,756) | |
| | | | |
Net investment income allocated from Oppenheimer Master Event-Linked Bond Fund, LLC | | | 3,251,612 | |
| |
Net investment income allocated from Oppenheimer Master Loan Fund, LLC: | | | | |
Interest | | | 6,380,653 | |
Dividends | | | 60,346 | |
Net expenses | | | (402,864) | |
| | | | |
Net investment income allocated from Oppenheimer Master Loan Fund, LLC | | | 6,038,135 | |
| | | | |
Total allocation of net investment income from master funds | | | 9,289,747 | |
|
| |
Investment Income | | | | |
Interest - unaffiliated companies (net of foreign withholding taxes of $440,080) | | | 114,925,726 | |
| |
Fee income on when-issued securities | | | 2,661,894 | |
| |
Dividends: | | | | |
Unaffiliated companies (net of foreign withholding taxes of $(83,597)) | | | 339,402 | |
Affiliated companies | | | 184,246 | |
| | | | |
Total investment income | | | 118,111,268 | |
|
| |
Expenses | | | | |
Management fees | | | 13,590,052 | |
| |
Distribution and service plan fees: | | | | |
Service shares | | | 4,105,081 | |
| |
Transfer and shareholder servicing agent fees: | | | | |
Non-Service shares | | | 706,078 | |
Service shares | | | 1,642,896 | |
| |
Shareholder communications: | | | | |
Non-Service shares | | | 111,894 | |
Service shares | | | 264,087 | |
| |
Custodian fees and expenses | | | 302,544 | |
| |
Trustees’ compensation | | | 67,271 | |
| |
Other | | | 207,606 | |
| | | | |
Total expenses | | | 20,997,509 | |
Less reduction to custodian expenses | | | (1,805) | |
Less waivers and reimbursements of expenses | | | (819,011) | |
| | | | |
Net expenses | | | 20,176,693 | |
|
| |
Net Investment Income | | | 107,224,322 | |
32 OPPENHEIMER GLOBAL STRATEGIC INCOME FUND/VA
| | | | |
| |
Realized and Unrealized Gain (Loss) | | | | |
Net realized gain (loss) on: | | | | |
Investments from: | | | | |
Unaffiliated companies (including premiums on options and swaptions exercised) (net of foreign capital gains tax of $37,013) | | $ | (1,165,255) | |
Affiliated companies | | | 42,945 | |
Closing and expiration of option contracts written | | | 1,360,871 | |
Closing and expiration of futures contracts | | | 8,959,190 | |
Foreign currency transactions | | | (15,197,796) | |
Swap contracts | | | (2,160,825) | |
Swaption contracts | | | 1,882,754 | |
| |
Net realized gain allocated from: | | | | |
Oppenheimer Master Event-Linked Bond Fund, LLC | | | 666,023 | |
Oppenheimer Master Loan Fund, LLC | | | 152,461 | |
| | | | |
Net realized loss | | | (5,459,632) | |
| |
Net change in unrealized appreciation/depreciation on: | | | | |
Investments | | | (40,099,457) | |
Translation of assets and liabilities denominated in foreign currencies | | | 6,302,196 | |
Futures contracts | | | 3,473,666 | |
Option contracts written | | | (490,254) | |
Swap contracts | | | 264,587 | |
Swaption contracts written | | | 394,063 | |
| |
Net change in unrealized appreciation/depreciation allocated from: | | | | |
Oppenheimer Master Event-Linked Bond Fund, LLC | | | (1,030,658) | |
Oppenheimer Master Loan Fund, LLC | | | (4,965,979) | |
| | | | |
Net change in unrealized appreciation/depreciation | | | (36,151,836) | |
|
| |
Net Increase in Net Assets Resulting from Operations | | $ | 65,612,854 | |
| | | | |
1. The Fund invests in certain affiliated mutual funds that expect to be treated as partnerships for tax purposes. See Note 4 of the accompanying Consolidated Notes.
See accompanying Consolidated Notes to Financial Statements.
33 OPPENHEIMER GLOBAL STRATEGIC INCOME FUND/VA
CONSOLIDATEDSTATEMENTSOFCHANGESINNETASSETS
| | | | | | | | |
| | | Year Ended
December 31, 2014 | | | Year Ended
December 31, 2013 | |
| |
Operations | | | | | | | | |
Net investment income | | $ | 107,224,322 | | | $ | 125,129,462 | |
| |
Net realized gain (loss) | | | (5,459,632) | | | | (60,454,641) | |
| |
Net change in unrealized appreciation/depreciation | | | (36,151,836) | | | | (73,550,244) | |
| | | | | | | | |
Net increase (decrease) in net assets resulting from operations | | | 65,612,854 | | | | (8,875,423) | |
|
| |
Dividends and/or Distributions to Shareholders | | | | | | | | |
Dividends from net investment income: | | | | | | | | |
Non-Service shares | | | (31,299,751) | | | | (36,272,242) | |
Service shares | | | (63,703,194) | | | | (83,922,335) | |
| | | | |
| | | (95,002,945) | | | | (120,194,577) | |
|
| |
Beneficial Interest Transactions | | | | | | | | |
Net increase (decrease) in net assets resulting from beneficial interest transactions: | | | | | | | | |
Non-Service shares | | | (142,634,078) | | | | 33,900,242 | |
Service shares | | | (144,544,896) | | | | (32,780,220) | |
| | | | | | | | |
| | | (287,178,974) | | | | 1,120,022 | |
|
| |
Net Assets | | | | | | | | |
Total decrease | | | (316,569,065) | | | | (127,949,978) | |
| |
Beginning of period | | | 2,454,767,178 | | | | 2,582,717,156 | |
| | | | | | | | |
| | |
| End of period (including accumulated net investment income of $104,708,911 and $119,930,049, respectively) | | $ | 2,138,198,113 | | | $ | 2,454,767,178 | |
| | | | |
See accompanying Consolidated Notes to Financial Statements.
34 OPPENHEIMER GLOBAL STRATEGIC INCOME FUND/VA
CONSOLIDATEDFINANCIALHIGHLIGHTS
| | | | | | | | | | | | | | | | | | | | |
| Non-Service Shares | | Year Ended
December
31, 2014 | | | Year Ended December
31, 2013 | | | Year Ended December
31, 2012 | | | Year Ended December
30, 20111 | | | Year Ended December
31, 2010 | |
| |
Per Share Operating Data | | | | | | | | | | | | | | | | | | | | |
Net asset value, beginning of period | | $ | 5.38 | | | $ | 5.67 | | | $ | 5.38 | | | $ | 5.58 | | | $ | 5.30 | |
| |
Income (loss) from investment operations: | | | | | | | | | | | | | | | | | | | | |
Net investment income2 | | | 0.26 | | | | 0.28 | | | | 0.33 | | | | 0.36 | | | | 0.34 | |
Net realized and unrealized gain (loss) | | | (0.11) | | | | (0.29) | | | | 0.36 | | | | (0.31) | | | | 0.40 | |
| | | | |
Total from investment operations | | | 0.15 | | | | (0.01) | | | | 0.69 | | | | 0.05 | | | | 0.74 | |
| |
Dividends and/or distributions to shareholders: | | | | | | | | | | | | | | | | | | | | |
Dividends from net investment income | | | (0.23) | | | | (0.28) | | | | (0.34) | | | | (0.18) | | | | (0.46) | |
Distributions from net realized gain | | | 0.00 | | | | 0.00 | | | | (0.06) | | | | (0.07) | | | | 0.00 | |
| | | | |
Total dividends and distributions to shareholders | | | (0.23) | | | | (0.28) | | | | (0.40) | | | | (0.25) | | | | (0.46) | |
| |
Net asset value, end of period | | $ | 5.30 | | | $ | 5.38 | | | $ | 5.67 | | | $ | 5.38 | | | $ | 5.58 | |
| | | | |
|
| |
Total Return, at Net Asset Value3 | | | 2.84% | | | | (0.13)% | | | | 13.53% | | | | 0.85% | | | | 14.97% | |
|
| |
Ratios/Supplemental Data | | | | | | | | | | | | | | | | | | | | |
Net assets, end of period (in thousands) | | $ | 586,951 | | | $ | 738,741 | | | $ | 741,996 | | | $ | 648,084 | | | $ | 771,755 | |
| |
Average net assets (in thousands) | | $ | 707,673 | | | $ | 734,707 | | | $ | 690,351 | | | $ | 694,868 | | | $ | 737,071 | |
| |
Ratios to average net assets:4,5 | | | | | | | | | | | | | | | | | | | | |
Net investment income | | | 4.73% | | | | 5.12% | | | | 6.01% | | | | 6.50% | | | | 6.47% | |
Total expenses6 | | | 0.74% | | | | 0.74% | | | | 0.77% | | | | 0.77% | | | | 0.75% | |
| Expenses after payments, waivers and/or reimbursements and reduction to custodian expenses | | | 0.71% | | | | 0.72% | | | | 0.71% | | | | 0.71% | | | | 0.71% | |
| |
Portfolio turnover rate7 | | | 93% | | | | 107% | | | | 78% | | | | 49% | | | | 99% | |
1. December 30, 2011 represents the last business day of the Fund’s reporting period.
2. Per share amounts calculated based on the average shares outstanding during the period.
3. Assumes an initial investment on the business day before the first day of the fiscal period, with all dividends and distributions reinvested in additional shares on the reinvestment date, and redemption at the net asset value calculated on the last business day of the fiscal period. Total returns are not annualized for periods less than one full year. Total return information does not reflect expenses that apply at the separate account level or to related insurance products. Inclusion of these charges would reduce the total return figures for all periods shown. Returns do not reflect the deduction of taxes that a shareholder would pay on fund distributions or the redemption of fund shares.
4. Annualized for periods less than one full year.
5. Includes the Fund’s share of the allocated expenses and/or net investment income from the master funds.
6. Total expenses including indirect expenses from affiliated fund fees and expenses were as follows:
| | | | |
Year Ended December 31, 2014 | | | 0.75 | % |
Year Ended December 31, 2013 | | | 0.74 | % |
Year Ended December 31, 2012 | | | 0.77 | % |
Year Ended December 30, 2011 | | | 0.77 | % |
Year Ended December 31, 2010 | | | 0.75 | % |
7. The portfolio turnover rate excludes purchase and sale transactions of To Be Announced (TBA) mortgage-related securities as follows:
| | | | | | | | | | |
| | | | | Purchase Transactions | | | Sale Transactions | |
| | | |
| | Year Ended December 31, 2014 | | | $1,348,552,640 | | | | $1,337,346,996 | |
| | Year Ended December 31, 2013 | | | $4,294,357,677 | | | | $4,679,296,373 | |
| | Year Ended December 31, 2012 | | | $3,862,820,437 | | | | $3,466,796,233 | |
| | Year Ended December 30, 2011 | | | $1,050,654,783 | | | | $1,039,506,614 | |
| | Year Ended December 31, 2010 | | | $1,034,550,699 | | | | $1,085,289,655 | |
See accompanying Consolidated Notes to Financial Statements.
35 OPPENHEIMER GLOBAL STRATEGIC INCOME FUND/VA
CONSOLIDATED FINANCIAL HIGHLIGHTS Continued
| | | | | | | | | | | | | | | | | | | | |
| Service Shares | | Year Ended
December 31,
2014 | | | Year Ended
December 31,
2013 | | | Year Ended
December 31,
2012 | | | Year Ended
December 30,
20111 | | | Year Ended
December 31,
2010 | |
| |
Per Share Operating Data | | | | | | | | | | | | | | | | | | | | |
Net asset value, beginning of period | | $ | 5.50 | | | $ | 5.79 | | | $ | 5.49 | | | $ | 5.68 | | | $ | 5.38 | |
| |
Income (loss) from investment operations: | | | | | | | | | | | | | | | | | | | | |
Net investment income2 | | | 0.25 | | | | 0.27 | | | | 0.33 | | | | 0.35 | | | | 0.33 | |
Net realized and unrealized gain (loss) | | | (0.11) | | | | (0.29) | | | | 0.36 | | | | (0.31) | | | | 0.42 | |
Total from investment operations | | | 0.14 | | | | (0.02) | | | | 0.69 | | | | 0.04 | | | | 0.75 | |
| |
Dividends and/or distributions to shareholders: | | | | | | | | | | | | | | | | | | | | |
Dividends from net investment income | | | (0.22) | | | | (0.27) | | | | (0.33) | | | | (0.16) | | | | (0.45) | |
Distributions from net realized gain | | | 0.00 | | | | 0.00 | | | | (0.06) | | | | (0.07) | | | | 0.00 | |
| | | | |
Total dividends and distributions to shareholders | | | (0.22) | | | | (0.27) | | | | (0.39) | | | | (0.23) | | | | (0.45) | |
| |
Net asset value, end of period | | $ | 5.42 | | | $ | 5.50 | | | $ | 5.79 | | | $ | 5.49 | | | $ | 5.68 | |
| | | | |
|
| |
Total Return, at Net Asset Value3 | | | 2.49% | | | | (0.37)% | | | | 13.15% | | | | 0.65% | | | | 14.77% | |
|
| |
Ratios/Supplemental Data | | | | | | | | | | | | | | | | | | | | |
Net assets, end of period (in thousands) | | $ | 1,551,247 | | | $ | 1,716,026 | | | $ | 1,840,721 | | | $ | 1,604,906 | | | $ | 1,670,340 | |
| |
Average net assets (in thousands) | | $ | 1,646,615 | | | $ | 1,794,640 | | | $ | 1,715,995 | | | $ | 1,673,715 | | | $ | 2,485,427 | |
| |
Ratios to average net assets:4,5 | | | | | | | | | | | | | | | | | | | | |
Net investment income | | | 4.48% | | | | 4.88% | | | | 5.76% | | | | 6.25% | | | | 6.15% | |
Total expenses6 | | | 0.99% | | | | 0.99% | | | | 1.02% | | | | 1.02% | | | | 0.99% | |
| Expenses after payments, waivers and/or reimbursements and reduction to custodian expenses | | | 0.96% | | | | 0.97% | | | | 0.96% | | | | 0.96% | | | | 0.95% | |
| |
Portfolio turnover rate7 | | | 93% | | | | 107% | | | | 78% | | | | 49% | | | | 99% | |
1. December 30, 2011 represents the last business day of the Fund’s reporting period.
2. Per share amounts calculated based on the average shares outstanding during the period.
3. Assumes an initial investment on the business day before the first day of the fiscal period, with all dividends and distributions reinvested in additional shares on the reinvestment date, and redemption at the net asset value calculated on the last business day of the fiscal period. Total returns are not annualized for periods less than one full year. Total return information does not reflect expenses that apply at the separate account level or to related insurance products. Inclusion of these charges would reduce the total return figures for all periods shown. Returns do not reflect the deduction of taxes that a shareholder would pay on fund distributions or the redemption of fund shares.
4. Annualized for periods less than one full year.
5. Includes the Fund’s share of the allocated expenses and/or net investment income from the master funds.
6. Total expenses including indirect expenses from affiliated fund fees and expenses were as follows:
| | | | |
Year Ended December 31, 2014 | | | 1.00 | % |
Year Ended December 31, 2013 | | | 0.99 | % |
Year Ended December 31, 2012 | | | 1.02 | % |
Year Ended December 30, 2011 | | | 1.02 | % |
Year Ended December 31, 2010 | | | 0.99 | % |
7. The portfolio turnover rate excludes purchase and sale transactions of To Be Announced (TBA) mortgage-related securities as follows:
| | | | | | | | | | |
| | | | | Purchase Transactions | | | Sale Transactions | |
| | | |
| | Year Ended December 31, 2014 | | | $1,348,552,640 | | | | $1,337,346,996 | |
| | Year Ended December 31, 2013 | | | $4,294,357,677 | | | | $4,679,296,373 | |
| | Year Ended December 31, 2012 | | | $3,862,820,437 | | | | $3,466,796,233 | |
| | Year Ended December 30, 2011 | | | $1,050,654,783 | | | | $1,039,506,614 | |
| | Year Ended December 31, 2010 | | | $1,034,550,699 | | | | $1,085,289,655 | |
See accompanying Consolidated Notes to Financial Statements.
36 OPPENHEIMER GLOBAL STRATEGIC INCOME FUND/VA
NOTESTOCONSOLIDATEDFINANCIALSTATEMENTS December 31, 2014
1. Organization
Oppenheimer Global Strategic Income Fund/VA (the “Fund”), a separate series of Oppenheimer Variable Account Funds, is a diversified open-end management investment company registered under the Investment Company Act of 1940 (“1940 Act”), as amended. The Fund’s main investment objective is to seek total return. The Fund’s investment adviser is OFI Global Asset Management, Inc. (“OFI Global” or the “Manager”), a wholly-owned subsidiary of OppenheimerFunds, Inc. (“OFI” or the “Sub-Adviser”). The Manager has entered into a sub-advisory agreement with OFI. Shares of the Fund are sold only to separate accounts of life insurance companies.
The Fund offers two classes of shares. Both classes are sold at their offering price, which is the net asset value per share, to separate investment accounts of participating insurance companies as an underlying investment for variable life insurance policies, variable annuity contracts or other investment products. The class of shares designated as Service shares is subject to a distribution and service plan. Both classes of shares have identical rights and voting privileges with respect to the Fund in general and exclusive voting rights on matters that affect that class alone. Earnings, net assets and net asset value per share may differ due to each class having its own expenses, such as transfer and shareholder servicing agent fees and shareholder communications, directly attributable to that class.
The following is a summary of significant accounting policies consistently followed by the Fund.
2. Significant Accounting Policies
Security Valuation. All investments in securities are recorded at their estimated fair value, as described in Note 3.
Basis for Consolidation. The Fund has established a Cayman Islands exempted company, Oppenheimer Global Strategic Income Fund (Cayman) Ltd., which is wholly-owned and controlled by the Fund (the “Subsidiary”). The Fund and Subsidiary are both managed by the Manager. The Fund may invest up to 25% of its total assets in the Subsidiary. The Subsidiary invests primarily in commodity-linked derivatives (including commodity futures, financial futures, options and swap contracts) and exchange traded funds related to gold or other special minerals (“Gold ETFs”). The Subsidiary is subject to the same investment restrictions and guidelines, and follows the same compliance policies and procedures, as the Fund.
The financial statements have been consolidated and include accounts of the Fund and the Subsidiary. Accordingly, all inter-company transactions and balances have been eliminated. At December 31, 2014, the Fund owned 15,000 shares with net assets of $1,347,862.
Other financial information at December 31, 2014:
| | | | |
Total market value of investments | | $ | — | |
Net assets | | $ | 1,347,862 | |
Net income (loss) | | $ | (42,267 | ) |
Net realized gain (loss) | | $ | — | |
Net change in unrealized appreciation/depreciation | | $ | — | |
Foreign Currency Translation. The Fund’s accounting records are maintained in U.S. dollars. The values of securities denominated in foreign currencies and amounts related to the purchase and sale of foreign securities and foreign investment income are translated into U.S. dollars as of the close of the New York Stock Exchange (the “Exchange”), normally 4:00 P.M. Eastern time, on each day the Exchange is open for trading. Foreign exchange rates may be valued primarily using a reliable bank, dealer or service authorized by the Board of Trustees.
Reported net realized gains and losses from foreign currency transactions arise from sales of portfolio securities, sales and maturities of short-term securities, sales of foreign currencies, exchange rate fluctuations between the trade and settlement dates on securities transactions, and the difference between the amounts of dividends, interest, and foreign withholding taxes recorded on the Fund’s books and the U.S. dollar equivalent of the amounts actually received or paid. Net unrealized appreciation and depreciation on the translation of assets and liabilities denominated in foreign currencies arise from changes in the values of assets and liabilities, including investments in securities at fiscal period end, resulting from changes in exchange rates.
The effect of changes in foreign currency exchange rates on investments is separately identified from the fluctuations arising from changes in market values of securities held and reported with all other foreign currency gains and losses in the Fund’s Consolidated Statement of Operations.
Allocation of Income, Expenses, Gains and Losses. Income, expenses (other than those attributable to a specific class), gains and losses are allocated on a daily basis to each class of shares based upon the relative proportion of net assets represented by such class. Operating expenses directly attributable to a specific class are charged against the operations of that class.
Dividends and Distributions to Shareholders. Dividends and distributions to shareholders, which are determined in accordance with income tax regulations and may differ from U.S. generally accepted accounting principles, are recorded on the ex-dividend date. Income and capital gain distributions, if any, are declared and paid annually or at other times as deemed necessary by the Manager.
Investment Income. Dividend income is recorded on the ex-dividend date or upon ex-dividend notification in the case of certain foreign dividends where the ex-dividend date may have passed. Upon receipt of notification from the issuer, subsequent to the ex-dividend date, some of the dividend income originally recorded from a real estate investment trust (“REIT”) may be reclassified as a reduction of the cost of the related investment and/or realized gain. Non-cash dividends included in dividend income, if any, are recorded at the fair market value of the securities received. Interest income is recognized on an accrual basis. Discount and premium, which are included in interest income on the Statement of Operations, are amortized or accreted daily.
37 OPPENHEIMER GLOBAL STRATEGIC INCOME FUND/VA
| | |
| NOTESTOCONSOLIDATEDFINANCIALSTATEMENTS Continued |
2. Significant Accounting Policies (Continued)
Custodian Fees. “Custodian fees and expenses” in the Consolidated Statement of Operations may include interest expense incurred by the Fund on any cash overdrafts of its custodian account during the period. Such cash overdrafts may result from the effects of failed trades in portfolio securities and from cash outflows resulting from unanticipated shareholder redemption activity. The Fund pays interest to its custodian on such cash overdrafts, to the extent they are not offset by positive cash balances maintained by the Fund, at a rate equal to the Federal Funds Rate plus 0.50%. The “Reduction to custodian expenses” line item, if applicable, represents earnings on cash balances maintained by the Fund during the period. Such interest expense and other custodian fees may be paid with these earnings.
Security Transactions. Security transactions are recorded on the trade date. Realized gains and losses on securities sold are determined on the basis of identified cost.
Indemnifications. The Fund’s organizational documents provide current and former Trustees and officers with a limited indemnification against liabilities arising in connection with the performance of their duties to the Fund. In the normal course of business, the Fund may also enter into contracts that provide general indemnifications. The Fund’s maximum exposure under these arrangements is unknown as this would be dependent on future claims that may be made against the Fund. The risk of material loss from such claims is considered remote.
Federal Taxes. The Fund intends to comply with provisions of the Internal Revenue Code applicable to regulated investment companies and to distribute substantially all of its investment company taxable income, including any net realized gain on investments not offset by capital loss carryforwards, if any, to shareholders. Therefore, no federal income or excise tax provision is required. The Fund files income tax returns in U.S. federal and applicable state jurisdictions. The statute of limitations on the Fund’s tax return filings generally remain open for the three preceding fiscal reporting period ends.
Subchapter M requires, among other things, that at least 90% of the Fund’s gross income be derived from securities or derived with respect to its business of investing in securities (typically referred to as “qualifying income”). Income from commodity-linked derivatives may not be treated as “qualifying income” for purposes of the 90% gross income requirement. The Internal Revenue Service (IRS) has previously issued a number of private letter rulings which conclude that income derived from commodity index-linked notes and investments in a wholly-owned subsidiary will be “qualifying income.” As a result, the Fund will gain exposure to commodities through commodity-linked notes and its wholly-owned subsidiary.
The IRS has suspended the granting of private letter rulings pending further review. As a result, there can be no assurance that the IRS will not change its position with respect to commodity-linked notes and wholly-owned subsidiaries. In addition, future legislation and guidance from Treasury and the IRS may adversely affect the fund’s ability to gain exposure to commodities through commodity-linked notes and its wholly-owned subsidiary.
The Fund is required to include in income for federal income tax purposes all of the subsidiary’s net income and gains whether or not such income is distributed by the subsidiary. Net income and gains from the subsidiary are generally treated as ordinary income by the Fund, regardless of the character of the subsidiary’s underlying income. Net losses from the subsidiary do not pass through to the Fund for federal income tax purposes.
The tax components of capital shown in the following table represent distribution requirements the Fund must satisfy under the income tax regulations, losses the Fund may be able to offset against income and gains realized in future years and unrealized appreciation or depreciation of securities and other investments for federal income tax purposes.
| | | | | | | | | | | | |
Undistributed Net Investment Income | | Undistributed
Long-Term
Gain | | | Accumulated
Loss
Carryforward1,2,3,4 | | | Net Unrealized
Depreciation
Based on cost of
Securities and
Other Investments
for Federal Income
Tax Purposes | |
| |
$110,347,583 | | | $— | | | | $50,638,554 | | | | $78,534,257 | |
1. As of December 31, 2014, the Fund had $50,374,428 of net capital loss carryforward available to offset future realized capital gains, if any, and thereby reduce future taxable gain distributions. Details of the capital loss carryforwards are included in the table below. Capital loss carryovers with no expiration, if any, must be utilized prior to those with expiration dates.
| | | | |
| Expiring | | | |
| |
2015 | | $ | 5,751,368 | |
2016 | | | 3,339,490 | |
No expiration | | | 41,283,570 | |
| | | | |
Total | | $ | 50,374,428 | |
| | | | |
Of these losses, $6,678,980 are subject to Sec. 382 loss limitation rules resulting from merger activity. These limitations generally reduce the utilization of these losses to a maximum of $3,339,490 per year.
2. The Fund had $264,126 of straddle losses which were deferred.
3. During the fiscal year ended December 31, 2014, the Fund utilized $12,716,558 of capital loss carryforward to offset capital gains realized in that fiscal year.
4. During the fiscal year ended December 31, 2013, the Fund utilized $3,174,670 of capital loss carryforward to offset capital gains realized in that fiscal year.
Net investment income (loss) and net realized gain (loss) may differ for financial statement and tax purposes. The character of dividends and distributions made during the fiscal year from net investment income or net realized gains may differ from their ultimate characterization for federal income tax
38 OPPENHEIMER GLOBAL STRATEGIC INCOME FUND/VA
2. Significant Accounting Policies (Continued)
purposes. Also, due to timing of dividends and distributions, the fiscal year in which amounts are distributed may differ from the fiscal year in which the income or net realized gain was recorded by the Fund.
Accordingly, the following amounts have been reclassified for December 31, 2014. Net assets of the Fund were unaffected by the reclassifications.
| | | | | | | | |
Increase to Paid-in Capital | | Reduction
to Accumulated
Net Investment
Income | | | Reduction
to Accumulated Net
Realized Loss on
Investments | |
| |
$2,236,117 | | | $27,442,515 | | | | $25,206,398 | |
The tax character of distributions paid during the years ended December 31, 2014 and December 31, 2013 was as follows:
| | | | | | | | |
| | | Year Ended | | | Year Ended | |
| | | December 31, 2014 | | | December 31, 2013 | |
| |
Distributions paid from: | | | | | | | | |
Ordinary income | | $ | 95,002,945 | | | $ | 120,194,577 | |
The aggregate cost of securities and other investments and the composition of unrealized appreciation and depreciation of securities and other investments for federal income tax purposes as of December 31, 2014 are noted in the following table. The primary difference between book and tax appreciation or depreciation of securities and other investments, if applicable, is attributable to the tax deferral of losses or tax realization of financial statement unrealized gain or loss.
| | | | |
Federal tax cost of securities | | $ | 2,257,376,809 | |
Federal tax cost of other investments | | | 13,990,151 | |
| | | | |
Total federal tax cost | | $ | 2,271,366,960 | |
| | | | |
Gross unrealized appreciation | | $ | 119,679,447 | |
Gross unrealized depreciation | | | (198,213,704) | |
| | | | |
Net unrealized depreciation | | $ | (78,534,257) | |
| | | | |
Use of Estimates. The preparation of financial statements in conformity with accounting principles generally accepted in the United States of America requires management to make estimates and assumptions that affect the reported amounts of assets and liabilities and disclosure of contingent assets and liabilities at the date of the financial statements and the reported amounts of increases and decreases in net assets from operations during the reporting period. Actual results could differ from those estimates.
3. Securities Valuation
The Fund calculates the net asset value of its shares as of the close of the New York Stock Exchange (the “Exchange”), normally 4:00 P.M. Eastern time, on each day the Exchange is open for trading.
The Fund’s Board has adopted procedures for the valuation of the Fund’s securities and has delegated the day-to-day responsibility for valuation determinations under those procedures to the Manager. The Manager has established a Valuation Committee which is responsible for determining a “fair valuation” for any security for which market quotations are not “readily available.” The Valuation Committee’s fair valuation determinations are subject to review, approval and ratification by the Fund’s Board at its next regularly scheduled meeting covering the calendar quarter in which the fair valuation was determined.
Valuation Methods and Inputs
Securities are valued using unadjusted quoted market prices, when available, as supplied primarily by third party pricing services or dealers.
The following methodologies are used to determine the market value or the fair value of the types of securities described below:
Securities traded on a registered U.S. securities exchange (including exchange-traded derivatives other than futures and futures options) are valued based on the last sale price of the security reported on the principal exchange on which it is traded, prior to the time when the Fund’s assets are valued. In the absence of a sale, the security is valued at the last sale price on the prior trading day, if it is within the spread of the current day’s closing “bid” and “asked” prices, and if not, at the current day’s closing bid price. A security of a foreign issuer traded on a foreign exchange, but not listed on a registered U.S. securities exchange, is valued based on the last sale price on the principal exchange on which the security is traded, as identified by the third party pricing service used by the Manager, prior to the time when the Fund’s assets are valued. If the last sale price is unavailable, the security is valued at the most recent official closing price on the principal exchange on which it is traded. If the last sales price or official closing price for a foreign security is not available, the security is valued at the mean between the bid and asked price per the exchange or, if not available from the exchange, obtained from two dealers. If bid and asked prices are not available from either the exchange or two dealers, the security is valued by using one of the following methodologies (listed in order of priority): (1) using a bid from the exchange, (2) the mean between the bid and asked price as provided by a single dealer, or (3) a bid from a single dealer.
Shares of a registered investment company that are not traded on an exchange are valued at that investment company’s net asset value per share.
Corporate and government debt securities (of U.S. or foreign issuers) and municipal debt securities, event-linked bonds, loans, mortgage-backed securities, collateralized mortgage obligations, and asset-backed securities are valued at the mean between the “bid” and “asked” prices utilizing
39 OPPENHEIMER GLOBAL STRATEGIC INCOME FUND/VA
| | |
NOTESTOCONSOLIDATEDFINANCIALSTATEMENTS Continued |
3. Securities Valuation (Continued)
evaluated prices obtained from third party pricing services or broker-dealers who may use matrix pricing methods to determine the evaluated prices.
Short-term money market type debt securities with a remaining maturity of sixty days or less are valued at cost adjusted by the amortization of discount or premium to maturity (amortized cost), which approximates market value. Short-term debt securities with a remaining maturity in excess of sixty days are valued at the mean between the “bid” and “asked” prices utilizing evaluated prices obtained from third party pricing services or broker-dealers.
Structured securities, swaps, swaptions, and other over-the-counter derivatives are valued utilizing evaluated prices obtained from third party pricing services or broker-dealers.
Forward foreign currency exchange contracts are valued utilizing current and forward currency rates obtained from third party pricing services. When the settlement date of a contract is an interim date for which a quotation is not available, interpolated values are derived using the nearest dated forward currency rate.
Futures contracts and futures options traded on a commodities or futures exchange will be valued at the final settlement price or official closing price on the principal exchange as reported by such principal exchange at its trading session ending at, or most recently prior to, the time when the Fund’s assets are valued.
A description of the standard inputs that may generally be considered by the third party pricing vendors in determining their evaluated prices is provided below.
| | |
| Security Type | | Standard inputs generally considered by third-party pricing vendors |
| Corporate debt, government debt, municipal, mortgage-backed and asset-backed securities | | Reported trade data, broker-dealer price quotations, benchmark yields, issuer spreads on comparable securities, the credit quality, yield, maturity, and other appropriate factors. |
Loans | | Information obtained from market participants regarding reported trade data and broker-dealer price quotations. |
Event-linked bonds | | Information obtained from market participants regarding reported trade data and broker-dealer price quotations. |
Structured securities | | Relevant market information such as the price of underlying financial instruments, stock market indices, foreign currencies, interest rate spreads, commodities, or the occurrence of other specific events. |
Swaps | | Relevant market information, including underlying reference assets such as credit spreads, credit event probabilities, index values, individual security values, forward interest rates, variable interest rates, volatility measures, and forward currency rates. |
If a market value or price cannot be determined for a security using the methodologies described above, or if, in the “good faith” opinion of the Manager, the market value or price obtained does not constitute a “readily available market quotation,” or a significant event has occurred that would materially affect the value of the security the security is fair valued either (i) by a standardized fair valuation methodology applicable to the security type or the significant event as previously approved by the Valuation Committee and the Fund’s Board or (ii) as determined in good faith by the Manager’s Valuation Committee. The Valuation Committee considers all relevant facts that are reasonably available, through either public information or information available to the Manager, when determining the fair value of a security. Fair value determinations by the Manager are subject to review, approval and ratification by the Fund’s Board at its next regularly scheduled meeting covering the calendar quarter in which the fair valuation was determined. Those fair valuation standardized methodologies include, but are not limited to, valuing securities at the last sale price or initially at cost and subsequently adjusting the value based on: changes in company specific fundamentals, changes in an appropriate securities index, or changes in the value of similar securities which may be further adjusted for any discounts related to security-specific resale restrictions. When possible, such methodologies use observable market inputs such as unadjusted quoted prices of similar securities, observable interest rates, currency rates and yield curves. The methodologies used for valuing securities are not necessarily an indication of the risks associated with investing in those securities nor can it be assured that the Fund can obtain the fair value assigned to a security if it were to sell the security.
To assess the continuing appropriateness of security valuations, the Manager, or its third party service provider who is subject to oversight by the Manager, regularly compares prior day prices, prices on comparable securities, and sale prices to the current day prices and challenges those prices exceeding certain tolerance levels with the third party pricing service or broker source. For those securities valued by fair valuations, whether through a standardized fair valuation methodology or a fair valuation determination, the Valuation Committee reviews and affirms the reasonableness of the valuations based on such methodologies and fair valuation determinations on a regular basis after considering all relevant information that is reasonably available.
Classifications
Each investment asset or liability of the Fund is assigned a level at measurement date based on the significance and source of the inputs to its valuation. Various data inputs are used in determining the value of each of the Fund’s investments as of the reporting period end. These data inputs are categorized in the following hierarchy under applicable financial accounting standards:
1) Level 1-unadjusted quoted prices in active markets for identical assets or liabilities (including securities actively traded on a securities exchange)
2) Level 2-inputs other than unadjusted quoted prices that are observable for the asset or liability (such as unadjusted quoted prices for similar assets and market corroborated inputs such as interest rates, prepayment speeds, credit risks, etc.)
3) Level 3-significant unobservable inputs (including the Manager’s own judgments about assumptions that market participants would use in pricing the asset or liability).
The inputs used for valuing securities are not necessarily an indication of the risks associated with investing in those securities.
40 OPPENHEIMER GLOBAL STRATEGIC INCOME FUND/VA
3. Securities Valuation (Continued)
The table below categorizes amounts that are included in the Fund’s Consolidated Statement of Assets and Liabilities as of December 31, 2014 based on valuation input level:
| | | | | | | | | | | | | | | | |
| | | Level 1— Unadjusted Quoted Prices | | | Level 2— Other Significant
Observable Inputs | | | Level 3— Significant
Unobservable Inputs | | | Value | |
| |
Assets Table | |
Investments, at Value: | |
Asset-Backed Securities | | $ | — | | | $ | 32,695,452 | | | $ | 17,141,305 | | | $ | 49,836,757 | |
Mortgage-Backed Obligations | | | — | | | | 337,180,382 | | | | 2,842,770 | | | | 340,023,152 | |
U.S. Government Obligations | | | — | | | | 33,642,205 | | | | — | | | | 33,642,205 | |
Foreign Government Obligations | | | — | | | | 289,592,660 | | | | — | | | | 289,592,660 | |
Corporate Loans | | | — | | | | 81,323,689 | | | | 7,452 | | | | 81,331,141 | |
Corporate Bonds and Notes | | | — | | | | 1,080,256,039 | | | | 2,992,241 | | | | 1,083,248,280 | |
Preferred Stock | | | — | | | | 4,539,759 | | | | — | | | | 4,539,759 | |
Common Stocks | | | 1,974,301 | | | | 1,491,465 | | | | 15 | | | | 3,465,781 | |
Rights, Warrants and Certificates | | | — | | | | — | | | | — | | | | — | |
Structured Securities | | | — | | | | 8,335,052 | | | | 8,042,066 | | | | 16,377,118 | |
Short-Term Note | | | — | | | | 9,028,591 | | | | — | | | | 9,028,591 | |
Investment Companies | | | 100,337,471 | | | | 168,426,167 | | | | — | | | | 268,763,638 | |
Exchange-Traded Option Purchased | | | — | | | | 611,965 | | | | — | | | | 611,965 | |
Over-the-Counter Options Purchased | | | — | | | | 956,418 | | | | — | | | | 956,418 | |
Over-the-Counter Interest Rate Swaptions Purchased | | | — | | | | 744,161 | | | | — | | | | 744,161 | |
| | | | |
Total Investments, at Value | | | 102,311,772 | | | | 2,048,824,005 | | | | 31,025,849 | | | | 2,182,161,626 | |
Other Financial Instruments: | | | | | | | | | | | | | | | | |
Swaps, at value | | | — | | | | 3,094,859 | | | | — | | | | 3,094,859 | |
Centrally cleared swaps, at value | | | — | | | | 632,658 | | | | — | | | | 632,658 | |
Futures contracts | | | 1,811,031 | | | | — | | | | — | | | | 1,811,031 | |
Foreign currency exchange contracts | | | — | | | | 34,067,222 | | | | — | | | | 34,067,222 | |
| | | | |
Total Assets | | $ | 104,122,803 | | | $ | 2,086,618,744 | | | $ | 31,025,849 | | | $ | 2,221,767,396 | |
| | | | |
| | | | |
Liabilities Table | | | | | | | | | | | | | | | | |
Other Financial Instruments: | | | | | | | | | | | | | | | | |
Swaps, at value | | $ | — | | | $ | (914,527 | ) | | $ | — | | | $ | (914,527) | |
Centrally cleared swaps, at value | | | — | | | | (796,762 | ) | | | — | | | | (796,762) | |
Options written, at value | | | — | | | | (582,860 | ) | | | — | | | | (582,860) | |
Futures contracts | | | (961,411 | ) | | | — | | | | — | | | | (961,411) | |
Foreign currency exchange contracts | | | — | | | | (18,591,763 | ) | | | — | | | | (18,591,763) | |
Swaptions written, at value | | | — | | | | (1,965,574 | ) | | | — | | | | (1,965,574) | |
| | | | |
Total Liabilities | | $ | (961,411 | ) | | $ | (22,851,486 | ) | | $ | — | | | $ | (23,812,897) | |
| | | | |
Forward currency exchange contracts and futures contracts, if any, are reported at their unrealized appreciation/depreciation at measurement date, which represents the change in the contract’s value from trade date. All additional assets and liabilities included in the above table are reported at their market value at measurement date.
The table below shows the transfers between Level 2 and Level 3. The Fund’s policy is to recognize transfers in and transfers out as of the beginning of the reporting period.
| | | | | | | | |
| | | Transfers out of Level 2* | | | Transfers into Level 3* | |
| |
Assets Table | | | | | | | | |
Investments, at Value: | | | | | | | | |
Corporate Loans | | $ | (1,264,526) | | | $ | 1,264,526 | |
| | | | |
Total Assets | | $ | (1,264,526) | | | $ | 1,264,526 | |
| | | | |
* Transferred from Level 2 to Level 3 because of the lack of observable market data.
The following is a reconciliation of assets in which significant unobservable inputs (level 3) were used in determining fair value:
| | | | | | | | | | | | | | | | |
| | | Value as of December 31, 2013 | | | Realized gain (loss) | | | Change in unrealized appreciation/ depreciation | | | Accretion/ (amortization) of premium/ discounta | |
| |
Assets Table | |
Investments, at Value: | |
Asset-Backed Securities | | $ | 16,206,250 | | | $ | — | | | $ | 790,518 | | | $ | 144,537 | |
Mortgage-Backed Obligations | | | 4,005 | | | | — | | | | (8,183) | | | | 14,323 | |
Corporate Loans | | | — | | | | 60 | | | | (1,333,444) | | | | — | |
Corporate Bonds and Notes | | | 5,631,399 | | | | (23,725) | | | | (396,095) | | | | 1,794 | |
Common Stocks | | | 15,296 | | | | — | | | | (15,281) | | | | — | |
Structured Securities | | | 10,216,769 | | | | 233,264 | | | | (902,103) | | | | 144,578 | |
| | | | |
Total Assets | | $ | 32,073,719 | | | $ | 209,599 | | | $ | (1,864,588) | | | $ | 305,232 | |
| | | | |
41 OPPENHEIMER GLOBAL STRATEGIC INCOME FUND/VA
| | |
NOTESTOCONSOLIDATEDFINANCIALSTATEMENTS Continued |
3. Securities Valuation (Continued)
| | | | | | | | | | | | | | | | |
| | | Purchases | | | Sales | | | Transfers into Level 3 | | | Value as of
December 31, 2014 | |
| |
Assets Table (Continued) | |
Investments, at Value: | |
Asset-Backed Securities | | $ | — | | | $ | — | | | $ | — | | | $ | 17,141,305 | |
Mortgage-Backed Obligations | | | 2,832,625 | | | | — | | | | — | | | | 2,842,770 | |
Corporate Loans | | | 79,622 | | | | (3,312) | | | | 1,264,526 | | | | 7,452 | |
Corporate Bonds and Notes | | | — | | | | (2,221,132) | | | | — | | | | 2,992,241 | |
Common Stocks | | | — | | | | — | | | | — | | | | 15 | |
Structured Securities | | | — | | | | (1,650,442) | | | | — | | | | 8,042,066 | |
| | | | |
Total Assets | | $ | 2,912,247 | | | $ | (3,874,886) | | | $ | 1,264,526 | | | $ | 31,025,849 | |
| | | | |
a. Included in net investment income.
The total change in unrealized appreciation/depreciation included in the Consolidated Statement of Operations attributable to Level 3 investments still held at December 31, 2014:
| | | | |
| | | Change in
unrealized
appreciation/
depreciation | |
| |
Asset-Backed Securities | | $ | 790,518 | |
Mortgage-Backed Obligations | | | (8,183) | |
Corporate Loans | | | (1,333,444) | |
Corporate Bonds and Notes | | | (173,769) | |
Common Stocks | | | (15,281) | |
Structured Securities | | | (902,103) | |
| | | | |
Total Assets | | $ | (1,642,262) | |
| | | | |
The following table summarizes the valuation techniques and significant unobservable inputs used in determining fair value measurements for those investments classified as Level 3 as of December 31, 2014:
| | | | | | | | | | | | | | | | | | |
| | | Value as of December 31, 2014 | | | Valuation Technique | | | Unobservable input | | | Range of
Unobservable Inputs | | Unobservable
Input Used | | |
|
Assets Table | | | | | | | | | | | | | | | | | | |
Investments, at Value: | | | | | | | | | | | | | | | | | | |
| Asset-Backed Securities | | $ | 17,141,305 | | | | Broker quotes | | | | N/A | | | N/A | | N/A | | (a) |
| Mortgage-Backed Obligations | | | 2,842,770 | | | | Broker quotes | | | | N/A | | | N/A | | N/A | | (a) |
| Corporate Bonds and Notes | | | 2,578,016 | | | | Broker quotes | | | | N/A | | | N/A | | N/A | | (a) |
| Corporate Bonds and Notes | | | 414,000 | | | | Pricing service | | | | N/A | | | N/A | | N/A | | (a) |
| Corporate Bonds and Notes | | | 225 | | |
| Estimated Recovery
proceeds |
| | | Nominal Value | | | N/A | | $0.01/share | | (b) |
| Corporate Loans | | | 7,452 | | | | Pricing service | | | | N/A | | | N/A | | N/A | | (a) |
| Common Stock | | | 15 | | |
| Estimated Recovery
proceeds |
| | | Nominal Value | | | N/A | | $0.01/share | | (c) |
| Structured Securities | | | 8,042,066 | | | | Broker quotes | | | | N/A | | | N/A | | N/A | | (a) |
| | | | | | | | | | | | | | | | | | |
| Total | | $ | 31,025,849 | | | | | | | | | | | | | | | |
| | | | | | | | | | | | | | | | | | |
(a) Securities classified as Level 3 whose unadjusted values were provided by a pricing service or broker-dealer for which such inputs are unobservable. The Manager periodically reviews pricing vendor and broker methodologies and inputs to confirm they are determined using unobservable inputs and have been appropriately classified. Such securities’ fair valuations could change significantly based on changes in unobservable inputs used by the pricing service or broker.
(b) The Fund fair values certain corporate bonds and notes received from a bond restructuring using a nominal value per share to reflect the low probability of future value. The Manager monitors such investments for additional market information or the occurrence of a significant event which would warrant a re-evaluation of the security’s fair valuation.
(c) The Fund fair values certain common stocks held at a nominal value to reflect the low probability of receipt of future payments to be received as a result of a merger. The Manager monitors such investments for additional market information or the occurrence of a significant event which would warrant a re-evaluation of the security’s fair valuation. A significant increase (decrease) in the future distribution amount, or a significant increase (decrease) to the probability of payment rate, will result in a significant increase (decrease) to the fair value of the investment.
4. Investments and Risk
Investment in Oppenheimer Institutional Money Market Fund. The Fund is permitted to invest daily available cash balances in an affiliated money market fund. The Fund may invest the available cash in Class E shares of Oppenheimer Institutional Money Market Fund (“IMMF”) to seek current income while preserving liquidity or for defensive purposes. IMMF is a registered open-end management investment company, regulated as a money market fund under the 1940 Act. The Manager is the investment adviser of IMMF, and the Sub-Adviser provides investment and related advisory services to IMMF. When applicable, the Fund’s investment in IMMF is included in the Consolidated Statement of Investments. Shares of IMMF are valued at their net asset value per share. As a shareholder, the Fund is subject to its proportional share of IMMF’s Class E expenses, including its management fee. The Manager will waive fees and/or reimburse Fund expenses in an amount equal to the indirect management fees incurred through the Fund’s investment in IMMF.
42 OPPENHEIMER GLOBAL STRATEGIC INCOME FUND/VA
4. Investments and Risk (Continued)
Investment in Oppenheimer Master Funds. The Fund is permitted to invest in entities sponsored and/or advised by the Manager or an affiliate. Certain of these entities in which the Fund invests are mutual funds registered under the Investment Company Act of 1940 that expect to be treated as partnerships for tax purposes, specifically Oppenheimer Master Loan Fund, LLC and Oppenheimer Master Event-Linked Bond Fund, LLC (the “Master Funds”). Each Master Fund has its own investment risks, and those risks can affect the value of the Fund’s investments and therefore the value of the Fund’s shares. To the extent that the Fund invests more of its assets in one Master Fund than in another, the Fund will have greater exposure to the risks of that Master Fund.
The investment objective of Oppenheimer Master Loan Fund, LLC is to seek income. The investment objective of Oppenheimer Master Event-Linked Bond Fund, LLC is to seek total return. The Fund’s investments in the Master Funds are included in the Consolidated Statement of Investments. The Fund recognizes income and gain/(loss) on its investments in each Master Fund according to its allocated pro-rata share, based on its relative proportion of total outstanding Master Fund shares held, of the total net income earned and the net gain/(loss) realized on investments sold by the Master Funds. As a shareholder, the Fund is subject to its proportional share of the Master Funds’ expenses, including their management fee. The Manager will waive fees and/or reimburse Fund expenses in an amount equal to the indirect management fees incurred through the Fund’s investment in the Master Funds.
Structured Securities. The Fund invests in structured securities whose market values, interest rates and/or redemption prices are linked to the performance of underlying foreign currencies, interest rate spreads, stock market indices, prices of individual securities, commodities or other financial instruments or the occurrence of other specific events. The structured securities are often leveraged, increasing the volatility of each note’s market value relative to the change in the underlying linked financial element or event. Fluctuations in value of these securities are recorded as unrealized gains and losses in the accompanying Consolidated Statement of Operations. The Fund records a realized gain or loss when a structured security is sold or matures.
Securities on a When-Issued or Delayed Delivery Basis. The Fund may purchase securities on a “when-issued” basis, and may purchase or sell securities on a “delayed delivery” basis. “When-issued” or “delayed delivery” refers to securities whose terms and indenture are available and for which a market exists, but which are not available for immediate delivery. Delivery and payment for securities that have been purchased by the Fund on a when-issued basis normally takes place within six months and possibly as long as two years or more after the trade date. During this period, such securities do not earn interest, are subject to market fluctuation and may increase or decrease in value prior to their delivery. The purchase of securities on a when-issued basis may increase the volatility of the Fund’s net asset value to the extent the Fund executes such transactions while remaining substantially fully invested. When the Fund engages in when-issued or delayed delivery transactions, it relies on the buyer or seller, as the case may be, to complete the transaction. Their failure to do so may cause the Fund to lose the opportunity to obtain or dispose of the security at a price and yield it considers advantageous. The Fund may also sell securities that it purchased on a when-issued basis or forward commitment prior to settlement of the original purchase.
As of December 31, 2014, the Fund had purchased securities issued on a when-issued or delayed delivery basis and sold securities issued on a delayed delivery basis as follows:
| | | | |
| | | When-Issued or
Delayed Delivery
Basis Transactions | |
| |
Purchased securities | | | $111,876,062 | |
Sold securities | | | 8,328,060 | |
The Fund may enter into “forward roll” transactions with respect to mortgage-related securities. In this type of transaction, the Fund sells a mortgage-related security to a buyer and simultaneously agrees to repurchase a similar security (same type, coupon and maturity) at a later date at a set price. During the period between the sale and the repurchase, the Fund will not be entitled to receive interest and principal payments on the securities that have been sold. The Fund records the incremental difference between the forward purchase and sale of each forward roll as realized gain (loss) on investments or as fee income in the case of such transactions that have an associated fee in lieu of a difference in the forward purchase and sale price.
Forward roll transactions may be deemed to entail embedded leverage since the Fund purchases mortgage-related securities with extended settlement dates rather than paying for the securities under a normal settlement cycle. This embedded leverage increases the Fund’s market value of investments relative to its net assets which can incrementally increase the volatility of the Fund’s performance. Forward roll transactions can be replicated over multiple settlement periods.
Risks of entering into forward roll transactions include the potential inability of the counterparty to meet the terms of the agreement; the potential of the Fund to receive inferior securities at redelivery as compared to the securities sold to the counterparty; and counterparty credit risk.
Restricted Securities. As of December 31, 2014, investments in securities included issues that are restricted. A restricted security may have a contractual restriction on its resale and is valued under methods approved by the Board of Trustees as reflecting fair value. Securities that are restricted are marked with an applicable footnote on the Consolidated Statement of Investments. Restricted securities are reported on a schedule following the Consolidated Statement of Investments.
Equity Security Risk. Stocks and other equity securities fluctuate in price. The value of the Fund’s portfolio may be affected by changes in the equity markets generally. Equity markets may experience significant short-term volatility and may fall sharply at times. Different markets may behave differently from each other and U.S. equity markets may move in the opposite direction from one or more foreign stock markets.
43 OPPENHEIMER GLOBAL STRATEGIC INCOME FUND/VA
NOTESTOCONSOLIDATEDFINANCIALSTATEMENTS Continued
4. Investments and Risk (Continued)
The prices of individual equity securities generally do not all move in the same direction at the same time and a variety of factors can affect the price of a particular company’s securities. These factors may include, but are not limited to, poor earnings reports, a loss of customers, litigation against the company, general unfavorable performance of the company’s sector or industry, or changes in government regulations affecting the company or its industry.
Credit Risk. The Fund invests in high-yield, non-investment-grade bonds, which may be subject to a greater degree of credit risk. Credit risk relates to the ability of the issuer to meet interest or principal payments or both as they become due. The Fund may acquire securities that have missed an interest payment, and is not obligated to dispose of securities whose issuers or underlying obligors subsequently miss an interest payment. Information concerning securities not accruing interest as of December 31, 2014 is as follows:
| | | | |
Cost | | | $15,736,861 | |
Market Value | | | $431,822 | |
Market value as % of Net Assets | | | 0.02% | |
Sovereign Debt Risk. The Fund invests in sovereign debt securities, which are subject to certain special risks. These risks include, but are not limited to, the risk that a governmental entity may delay or refuse, or otherwise be unable, to pay interest or repay the principal on its sovereign debt. There may also be no legal process for collecting sovereign debt that a government does not pay or bankruptcy proceedings through which all or part of such sovereign debt may be collected. In addition, a restructuring or default of sovereign debt may also cause additional impacts to the financial markets, such as downgrades to credit ratings, reduced liquidity and increased volatility, among others.
5. Risk Exposures and the Use of Derivative Instruments
The Fund’s investment objective not only permits the Fund to purchase investment securities, it also allows the Fund to enter into various types of derivatives contracts, including, but not limited to, futures contracts, forward currency exchange contracts, credit default swaps, interest rate swaps, total return swaps, variance swaps and purchased and written options. In doing so, the Fund will employ strategies in differing combinations to permit it to increase, decrease, or change the level or types of exposure to market risk factors. These instruments may allow the Fund to pursue its objectives more quickly and efficiently than if it were to make direct purchases or sales of securities capable of effecting a similar response to market factors. Such contracts may be entered into through a bilateral over-the-counter (“OTC”) transaction, or through a securities or futures exchange and cleared through a clearinghouse.
Market Risk Factors. In accordance with its investment objectives, the Fund may use derivatives to increase or decrease its exposure to one or more of the following market risk factors:
Commodity Risk. Commodity risk relates to the change in value of commodities or commodity indexes as they relate to increases or decreases in the commodities market. Commodities are physical assets that have tangible properties. Examples of these types of assets are crude oil, heating oil, metals, livestock, and agricultural products.
Credit Risk. Credit risk relates to the ability of the issuer to meet interest and principal payments, or both, as they come due. In general, lower-grade, higher-yield bonds are subject to credit risk to a greater extent than lower-yield, higher-quality bonds.
Equity Risk. Equity risk relates to the change in value of equity securities as they relate to increases or decreases in the general market.
Foreign Exchange Rate Risk. Foreign exchange rate risk relates to the change in the U.S. dollar value of a security held that is denominated in a foreign currency. The U.S. dollar value of a foreign currency denominated security will decrease as the dollar appreciates against the currency, while the U.S. dollar value will increase as the dollar depreciates against the currency.
Interest Rate Risk. Interest rate risk refers to the fluctuations in value of fixed-income securities resulting from the inverse relationship between price and yield. For example, an increase in general interest rates will tend to reduce the market value of already issued fixed-income investments, and a decline in general interest rates will tend to increase their value. In addition, debt securities with longer maturities, which tend to have higher yields, are subject to potentially greater fluctuations in value from changes in interest rates than obligations with shorter maturities.
Volatility Risk. Volatility risk refers to the magnitude of the movement, but not the direction of the movement, in a financial instrument’s price over a defined time period. Large increases or decreases in a financial instrument’s price over a relative time period typically indicate greater volatility risk, while small increases or decreases in its price typically indicate lower volatility risk.
Derivatives may have little or no initial cash investment relative to their market value exposure and therefore can produce significant gains or losses in excess of their cost due to unanticipated changes in the market risk factors and the overall market. This use of embedded leverage allows the Fund to increase its market value exposure relative to its net assets and can substantially increase the volatility of the Fund’s performance. In instances where the Fund is using derivatives to decrease, or hedge, exposures to market risk factors for securities held by the Fund, there are also risks that those derivatives may not perform as expected resulting in losses for the combined or hedged positions. Some derivatives have the potential for unlimited loss, regardless of the size of the Fund’s initial investment.
Additional associated risks from investing in derivatives also exist and potentially could have significant effects on the valuation of the derivative and the Fund. Typically, the associated risks are not the risks that the Fund is attempting to increase or decrease exposure to, per its investment objectives, but are the additional risks from investing in derivatives. Examples of these associated risks are liquidity risk, which is the risk that the Fund will not be able to sell the derivative in the open market in a timely manner, and counterparty credit risk, which is the risk that the counterparty will not fulfill its obligation to the Fund.
44 OPPENHEIMER GLOBAL STRATEGIC INCOME FUND/VA
5. Risk Exposures and the Use of Derivative Instruments (Continued)
The Fund’s actual exposures to these market risk factors and associated risks during the period are discussed in further detail, by derivative type, below.
Forward Currency Exchange Contracts
The Fund may enter into forward currency exchange contracts (“forward contracts”) for the purchase or sale of a foreign currency at a negotiated rate at a future date. Such contracts are traded in the OTC inter-bank currency dealer market.
Forward contracts are reported on a schedule following the Consolidated Statement of Investments. The unrealized appreciation (depreciation) is reported in the Consolidated Statement of Assets and Liabilities as a receivable (or payable) and in the Consolidated Statement of Operations within the change in unrealized appreciation (depreciation). At contract close, the difference between the original cost of the contract and the value at the close date is recorded as a realized gain (loss) in the Consolidated Statement of Operations.
The Fund has entered into forward contracts with the obligation to purchase specified foreign currencies in the future at a currently negotiated forward rate in order to take a positive investment perspective on the related currency. These forward contracts seek to increase exposure to foreign exchange rate risk.
The Fund has entered into forward contracts with the obligation to purchase specified foreign currencies in the future at a currently negotiated forward rate in order to decrease exposure to foreign exchange rate risk associated with foreign currency denominated securities held by the Fund.
The Fund has entered into forward contracts with the obligation to sell specified foreign currencies in the future at a currently negotiated forward rate in order to take a negative investment perspective on the related currency. These forward contracts seek to increase exposure to foreign exchange rate risk.
The Fund has entered into forward contracts with the obligation to sell specified foreign currencies in the future at a currently negotiated forward rate in order to decrease exposure to foreign exchange rate risk associated with foreign currency denominated securities held by the Fund.
During the year ended December 31, 2014, the Fund had daily average contract amounts on forward contracts to buy and sell of $351,974,743 and $642,726,245, respectively.
Additional associated risk to the Fund includes counterparty credit risk. Counterparty credit risk arises from the possibility that the counterparty to a forward contract will default and fail to perform its obligations to the Fund.
Futures Contracts
A futures contract is a commitment to buy or sell a specific amount of a commodity, financial instrument or currency at a negotiated price on a stipulated future date. The Fund may buy and sell futures contracts and may also buy or write put or call options on these futures contracts. Futures contracts and options thereon are generally entered into on a regulated futures exchange and cleared through a clearinghouse associated with the exchange.
Upon entering into a futures contract, the Fund is required to deposit either cash or securities (initial margin) in an amount equal to a certain percentage of the contract value in an account registered in the futures commission merchant’s name. Subsequent payments (variation margin) are paid to or from the futures commission merchant each day equal to the daily changes in the contract value. Such payments are recorded as unrealized gains and losses. Should the Fund fail to make requested variation margin payments, the futures commission merchant can gain access to the initial margin to satisfy the Fund’s payment obligations.
Futures contracts are reported on a schedule following the Consolidated Statement of Investments. Securities held by a futures commission merchant to cover initial margin requirements on open futures contracts are noted in the Consolidated Statement of Investments. Cash held by a futures commission merchant to cover initial margin requirements on open futures contracts and the receivable and/or payable for the daily mark to market for the variation margin are noted in the Consolidated Statement of Assets and Liabilities. The net change in unrealized appreciation and depreciation is reported in the Consolidated Statement of Operations. Realized gains (losses) are reported in the Consolidated Statement of Operations at the closing or expiration of futures contracts.
The Fund has purchased futures contracts on various bonds and notes to increase exposure to interest rate risk.
The Fund has sold futures contracts on various bonds and notes to decrease exposure to interest rate risk.
During the year ended December 31, 2014, the Fund had an ending monthly average market value of $184,476,192 and $82,251,355 on futures contracts purchased and sold, respectively.
Additional associated risks of entering into futures contracts (and related options) include the possibility that there may be an illiquid market where the Fund is unable to liquidate the contract or enter into an offsetting position and, if used for hedging purposes, the risk that the price of the contract will correlate imperfectly with the prices of the Fund’s securities.
Option Activity
The Fund may buy and sell put and call options, or write put and call options. When an option is written, the Fund receives a premium and becomes obligated to sell or purchase the underlying security, currency or other underlying financial instrument at a fixed price, upon exercise of the option.
Options can be traded through an exchange or through a privately negotiated arrangement with a dealer in an OTC transaction. Options traded through an exchange are generally cleared through a clearinghouse (such as The Options Clearing Corporation). The difference between the premium received or paid, and market value of the option, is recorded as unrealized appreciation or depreciation. The net change in unrealized appreciation or depreciation is reported in the Consolidated Statement of Operations. When an option is exercised, the cost of the security purchased or the proceeds of the security sale are adjusted by the amount of premium received or paid. Upon the expiration or closing of the option transaction, a gain or loss is reported in the Consolidated Statement of Operations.
The Fund has purchased call options on currencies to increase exposure to foreign exchange rate risk. A purchased call option becomes more valuable as the price of the underlying financial instrument appreciates relative to the strike price.
45 OPPENHEIMER GLOBAL STRATEGIC INCOME FUND/VA
NOTESTOCONSOLIDATEDFINANCIALSTATEMENTS Continued
5. Risk Exposures and the Use of Derivative Instruments (Continued)
The Fund has purchased put options on currencies to decrease exposure to foreign exchange rate risk. A purchased put option becomes more valuable as the price of the underlying financial instrument depreciates relative to the strike price.
The Fund has purchased call options on treasury and/or euro futures to increase exposure to interest rate risk. A purchased call option becomes more valuable as the price of the underlying financial instrument appreciates relative to the strike price.
The Fund has purchased call options on individual equity securities and/or equity indexes to increase exposure to equity risk. A purchased call option becomes more valuable as the price of the underlying financial instrument appreciates relative to the strike price.
The Fund has purchased call options on volatility indexes to increase exposure to volatility risk. A purchased call option becomes more valuable as the level of the underlying volatility index increases relative to the strike price.
During the year ended December 31, 2014, the Fund had an ending monthly average market value of $799,100 and $492,603 on purchased call options and purchased put options, respectively.
Options written, if any, are reported in a schedule following the Consolidated Statement of Investments and as a liability in the Consolidated Statement of Assets and Liabilities. Securities held in collateral accounts to cover potential obligations with respect to outstanding written options are noted in the Consolidated Statement of Investments.
The risk in writing a call option is that the market price of the security increases and if the option is exercised, the Fund must either purchase the security at a higher price for delivery or, if the Fund owns the underlying security, give up the opportunity for profit. The risk in writing a put option is that the Fund may incur a loss if the market price of the security decreases and the option is exercised. The risk in buying an option is that the Fund pays a premium whether or not the option is exercised. The Fund also has the additional risk that there may be an illiquid market where the Fund is unable to close the contract.
The Fund has written put options on currencies to increase exposure to foreign exchange rate risk. A written put option becomes more valuable as the price of the underlying financial instrument appreciates relative to the strike price.
The Fund has written call options on currencies to decrease exposure to foreign exchange rate risk. A written call option becomes more valuable as the price of the underlying financial instrument depreciates relative to the strike price.
The Fund has written call options on treasury and/or euro futures to decrease exposure to interest rate risk. A written call option becomes more valuable as the price of the underlying financial instrument depreciates relative to the strike price.
The Fund has written put options on treasury and/or euro futures to increase exposure to interest rate risk. A written put option becomes more valuable as the price of the underlying financial instrument appreciates relative to the strike price.
The Fund has written call options on volatility indexes to decrease exposure to volatility risk. A written call option becomes more valuable as the level of the underlying volatility index decreases relative to the strike price.
During the year ended December 31, 2014, the Fund had an ending monthly average market value of $149,951 and $329,375 on written call options and written put options, respectively.
Additional associated risks to the Fund include counterparty credit risk and liquidity risk.
Written option activity for the year ended December 31, 2014 was as follows:
| | | | | | | | | | |
| | | Number of Contracts | | | | | Amount of Premiums | |
| |
Options outstanding as of December 31, 2013 | | | 2,287,735,000 | | | $ | | | 903,847 | |
Options written | | | 196,853,446,263 | | | | | | 6,602,817 | |
Options closed or expired | | | (40,920,274,860) | | | | | | (1,360,871) | |
Options exercised | | | (158,112,326,403) | | | | | | (5,544,969) | |
| | | | |
Options outstanding as of December 31, 2014 | | | 108,580,000 | | | $ | | | 600,824 | |
| | | | |
Swap Contracts
The Fund may enter into swap contract agreements with a counterparty to exchange a series of cash flows based on either specified reference rates, the price or volatility of asset or non-asset references, or the occurrence of a credit event, over a specified period. Swaps can be executed in a bi-lateral privately negotiated arrangement with a dealer in an OTC transaction (“OTC swaps”) or executed on a regulated market. Certain swaps, regardless of the venue of their execution, are required to be cleared through a clearinghouse (“centrally cleared swaps”). Swap contracts may include interest rate, equity, debt, index, total return, credit default, currency, and volatility swaps.
Swap contracts are reported on a schedule following the Consolidated Statement of Investments. The values of centrally cleared swap and OTC swap contracts are aggregated by positive and negative values and disclosed separately on the Consolidated Statement of Assets and Liabilities. The unrealized appreciation (depreciation) related to the change in the valuation of the notional amount of the swap is combined with the accrued interest due to (owed by) the Fund, if any, at termination or settlement. The net change in this amount during the period is included on the Consolidated Statement of Operations. The Fund also records any periodic payments received from (paid to) the counterparty, including at termination, under such contracts as realized gain (loss) on the Consolidated Statement of Operations.
Swap contract agreements are exposed to the market risk factor of the specific underlying reference rate or asset. Swap contracts are typically more attractively priced compared to similar investments in related cash securities because they isolate the risk to one market risk factor and eliminate the ther market risk factors. Investments in cash securities (for instance bonds) have exposure to multiple risk factors (credit and interest rate risk). Because swaps have embedded leverage, they can expose the Fund to substantial risk in the isolated market risk factor.
46 OPPENHEIMER GLOBAL STRATEGIC INCOME FUND/VA
5. Risk Exposures and the Use of Derivative Instruments (Continued)
Credit Default Swap Contracts. A credit default swap is a contract that enables an investor to buy or sell protection against a defined-issuer credit event, such as the issuer’s failure to make timely payments of interest or principal on a debt security, bankruptcy or restructuring. The Fund may enter into credit default swaps either by buying or selling protection on a corporate issuer, sovereign issuer, or a basket or index of issuers (the “reference asset”).
The buyer of protection pays a periodic fee to the seller of protection based on the notional amount of the swap contract. The seller of protection agrees to compensate the buyer of protection for future potential losses as a result of a credit event on the reference asset. The contract effectively transfers the credit event risk of the reference asset from the buyer of protection to the seller of protection.
The ongoing value of the contract will fluctuate throughout the term of the contract based primarily on the credit risk of the reference asset. If the credit quality of the reference asset improves relative to the credit quality at contract initiation, the buyer of protection may have an unrealized loss greater than the anticipated periodic fee owed. This unrealized loss would be the result of current credit protection being cheaper than the cost of credit protection at contract initiation. If the buyer elects to terminate the contract prior to its maturity, and there has been no credit event, this unrealized loss will become realized. If the contract is held to maturity, and there has been no credit event, the realized loss will be equal to the periodic fee paid over the life of the contract.
If there is a credit event, the buyer of protection can exercise its rights under the contract and receive a payment from the seller of protection equal to the notional amount of the swap less the market value of specified debt securities issued by the reference asset. Upon exercise of the contract the difference between such value and the notional amount is recorded as realized gain (loss) and is included on the Consolidated Statement of Operations.
The Fund has sold credit protection through credit default swaps to increase exposure to the credit risk of individual issuers and/or indexes of issuers that are either unavailable or considered to be less attractive in the bond market.
The Fund has purchased credit protection through credit default swaps to decrease exposure to the credit risk of individual issuers and/or indexes of issuers.
The Fund has engaged in spread curve trades by simultaneously purchasing and selling protection through credit default swaps referenced to the same reference asset but with different maturities. Spread curve trades attempt to gain exposure to credit risk on a forward basis by realizing gains on the expected differences in spreads.
For the year ended December 31, 2014, the Fund had ending monthly average notional amounts of $7,578,727 and $4,865,988 on credit default swaps to buy protection and credit default swaps to sell protection, respectively.
Additional associated risks to the Fund include counterparty credit risk and liquidity risk.
Currency Swap Contracts. A currency swap contract is an agreement between counterparties to exchange different currencies at contract inception that are equivalent to a notional value. The exchange at contract inception is made at the current spot rate. The contract also includes an agreement to reverse the exchange of the same notional values of those currencies at contract termination. The re-exchange at contract termination may take place at the same exchange rate, a specified rate or the then current spot rate. Certain currency swap contracts provide for exchanging the currencies only at contract termination and can provide for only a net payment in the settlement currency, typically USD. A currency swap contract may also include the exchange of periodic payments, between the counterparties, that are based on interest rates available in the respective currencies at contract inception. Other currency swap contracts may not provide for exchanging the different currencies at all, and only for exchanging interest cash flows based on the notional value in the contract.
The Fund has entered into currency swap contracts with the obligation to pay an interest rate on the dollar notional amount and receive an interest rate on the various foreign currency notional amounts in order to take a positive investment perspective on the related currencies for which the Fund receives a payment. These currency swap contracts increase exposure to foreign exchange rate risk.
For the year ended December 31, 2014, the Fund had ending monthly average notional amounts of $4,783,942 on currency swaps which receive a fixed rate.
Additional associated risks to the Fund include counterparty credit risk and liquidity risk.
Interest Rate Swap Contracts. An interest rate swap is an agreement between counterparties to exchange periodic payments based on interest rates. One cash flow stream will typically be a floating rate payment based upon a specified floating interest rate while the other is typically a fixed interest rate.
The Fund has entered into interest rate swaps in which it pays a floating interest rate and receives a fixed interest rate in order to increase exposure to interest rate risk. Typically, if relative interest rates rise, payments made by the Fund under a swap agreement will be greater than the payments received by the Fund.
The Fund has entered into interest rate swaps in which it pays a fixed interest rate and receives a floating interest rate in order to decrease exposure to interest rate risk. Typically, if relative interest rates rise, payments received by the Fund under the swap agreement will be greater than the payments made by the Fund.
For the year ended December 31, 2014, the Fund had ending monthly average notional amounts of $40,384,372 and $142,391,615 on interest rate swaps which pay a fixed rate and interest rate swaps which receive a fixed rate, respectively.
Additional associated risks to the Fund include counterparty credit risk and liquidity risk.
Swaption Transactions
The Fund may enter into a swaption contract which grants the purchaser the right, but not the obligation, to enter into a swap transaction at preset terms detailed in the underlying agreement within a specified period of time. The purchaser pays a premium to the swaption writer who bears the risk of unfavorable changes in the preset terms on the underlying swap.
47 OPPENHEIMER GLOBAL STRATEGIC INCOME FUND/VA
| | |
| NOTESTOCONSOLIDATEDFINANCIALSTATEMENTS Continued |
5. Risk Exposures and the Use of Derivative Instruments (Continued)
Purchased swaptions are reported as a component of investments in the Consolidated Statement of Investments and the Consolidated Statement of Assets and Liabilities. Written swaptions are reported on a schedule following the Consolidated Statement of Investments and their value is reported as a separate asset or liability line item in the Consolidated Statement of Assets and Liabilities. The net change in unrealized appreciation or depreciation on written swaptions is separately reported in the Consolidated Statement of Operations. When a swaption is exercised, the cost of the swap is adjusted by the amount of premium paid or received. Upon the expiration or closing of an unexercised swaption contract, a gain or loss is reported in the Consolidated Statement of Operations for the amount of the premium paid or received.
The Fund generally will incur a greater risk when it writes a swaption than when it purchases a swaption. When the Fund writes a swaption it will become obligated, upon exercise of the swaption, according to the terms of the underlying agreement. Swaption contracts written by the Fund do not give rise to counterparty credit risk prior to exercise as they obligate the Fund, not its counterparty, to perform. When the Fund purchases a swaption it only risks losing the amount of the premium it paid if the swaption expires unexercised. However, when the Fund exercises a purchased swaption there is a risk that the counterparty will fail to perform or otherwise default on its obligations under the swaption contract.
The Fund has purchased swaptions which gives it the option to enter into an interest rate swap in which it pays a floating interest rate and receives a fixed interest rate in order to increase exposure to interest rate risk. A purchased swaption of this type becomes more valuable as the reference interest rate decreases relative to the preset interest rate.
The Fund has purchased swaptions which gives it the option to enter into an interest rate swap in which it pays a fixed interest rate and receives a floating interest rate in order to decrease exposure to interest rate risk. A purchased swaption of this type becomes more valuable as the reference interest rate increases relative to the preset interest rate.
The Fund has purchased swaptions which gives it the option to buy credit protection through credit default swaps in order to decrease exposure to the credit risk of individual issuers and/or indexes of issuers. A purchased swaption of this type becomes more valuable as the likelihood of a credit event on the reference asset increases.
The Fund has written swaptions which gives it the obligation, if exercised by the purchaser, to enter into an interest rate swap in which it pays a floating interest rate and receives a fixed interest rate in order to increase exposure to interest rate risk. A written swaption of this type becomes more valuable as the reference interest rate decreases relative to the preset interest rate.
The Fund has written swaptions which gives it the obligation, if exercised by the purchaser, to enter into an interest rate swap in which it pays a fixed interest rate and receives a floating interest rate in order to decrease exposure to interest rate risk. A written swaption of this type becomes more valuable as the reference interest rate increases relative to the preset interest rate.
The Fund has written swaptions which give it the obligation, if exercised by the purchaser, to sell credit protection through credit default swaps in order to increase exposure to the credit risk of individual issuers and/or indexes of issuers. A written swaption of this type becomes more valuable as the likelihood of a credit event on the reference asset decreases.
The Fund has written swaptions which give it the obligation, if exercised by the purchaser, to buy credit protection through credit default swaps in order to decrease exposure to the credit risk of individual issuers and/or, indexes of issuers. A written swaption of this type becomes more valuable as the likelihood of a credit event on the reference asset increases.
During the year ended December 31, 2014, the Fund had an ending monthly average market value of $1,551,794 and $2,344,530 on purchased and written swaptions, respectively.
Written swaption activity for the year ended December 31, 2014 was as follows:
| | | | | | | | | | | | |
| | | Notional Amount | | | | | | Amount of
Premiums | |
| |
Swaptions outstanding as of December 31, 2013 | | | 472,545,000 | | | $ | | | | | 4,075,481 | |
Swaptions written | | | 2,852,942,000 | | | | | | | | 11,744,297 | |
Swaptions closed or expired | | | (567,387,000 | ) | | | | | | | (1,882,754 | ) |
Swaptions exercised | | | (2,693,060,000 | ) | | | | | | | (13,226,543 | ) |
| | | | |
Swaptions outstanding as of December 31, 2014 | | | 65,040,000 | | | $ | | | | | 710,481 | |
| | | | |
Counterparty Credit Risk. Derivative positions are subject to the risk that the counterparty will not fulfill its obligation to the Fund. The Fund intends to enter into derivative transactions with counterparties that the Manager believes to be creditworthy at the time of the transaction.
The Fund’s risk of loss from counterparty credit risk on OTC derivatives is generally limited to the aggregate unrealized gain netted against any collateral held by the Fund. For OTC options purchased, the Fund bears the risk of loss of the amount of the premiums paid plus the positive change in market values net of any collateral held by the Fund should the counterparty fail to perform under the contracts. Options written by the Fund do not typically give rise to counterparty credit risk, as options written generally obligate the Fund and not the counterparty to perform.
To reduce counterparty risk with respect to OTC transactions, the Fund has entered into master netting arrangements, established within the Fund’s International Swap and Derivatives Association, Inc. (“ISDA”) master agreements, which allow the Fund to make (or to have an entitlement to receive) a single net payment in the event of default (close-out netting) for outstanding payables and receivables with respect to certain OTC positions in swaps, options, swaptions, and forward currency exchange contracts for each individual counterparty. In addition, the Fund may require that certain counterparties post cash and/or securities in collateral accounts to cover their net payment obligations for those derivative contracts subject to ISDA master agreements. If the counterparty fails to perform under these contracts and agreements, the cash and/or securities will be made available to the Fund.
As of December 31, 2014, the Fund has required certain counterparties to post collateral of $17,231,108.
48 OPPENHEIMER GLOBAL STRATEGIC INCOME FUND/VA
5. Risk Exposures and the Use of Derivative Instruments (Continued)
ISDA master agreements include credit related contingent features which allow counterparties to OTC derivatives to terminate derivative contracts prior to maturity in the event that, for example, the Fund’s net assets decline by a stated percentage or the Fund fails to meet the terms of its ISDA master agreements, which would cause the Fund to accelerate payment of any net liability owed to the counterparty.
For financial reporting purposes, the Fund does not offset derivative assets and derivative liabilities that are subject to netting arrangements in the Consolidated Statement of Assets and Liabilities. Bankruptcy or insolvency laws of a particular jurisdiction may impose restrictions on or prohibitions against the right of offset in bankruptcy, insolvency or other events.
The Fund’s risk of loss from counterparty credit risk on exchange-traded derivatives cleared through a clearinghouse and for centrally cleared swaps is generally considered lower than as compared to OTC derivatives. However, counterparty credit risk exists with respect to initial and variation margin deposited/paid by the Fund that is held in futures commission merchant, broker and/or clearinghouse accounts for such exchange-traded derivatives and for centrally cleared swaps.
With respect to centrally cleared swaps, such transactions will be submitted for clearing, and if cleared, will be held in accounts at futures commission merchants or brokers that are members of clearinghouses. While brokers, futures commission merchants and clearinghouses are required to segregate customer margin from their own assets, in the event that a broker, futures commission merchant or clearinghouse becomes insolvent or goes into bankruptcy and at that time there is a shortfall in the aggregate amount of margin held by the broker, futures commission merchant or clearinghouse for all its customers, U.S. bankruptcy laws will typically allocate that shortfall on a pro-rata basis across all the broker’s, futures commission merchant’s or clearinghouse’s customers, potentially resulting in losses to the Fund.
There is the risk that a broker, futures commission merchant or clearinghouse will decline to clear a transaction on the Fund’s behalf, and the Fund may be required to pay a termination fee to the executing broker with whom the Fund initially enters into the transaction. Clearinghouses may also be permitted to terminate centrally cleared swaps at any time. The Fund is also subject to the risk that the broker or futures commission merchant will improperly use the Fund’s assets deposited/paid as initial or variation margin to satisfy payment obligations of another customer. In the event of a default by another customer of the broker or futures commission merchant, the Fund might not receive its variation margin payments from the clearinghouse, due to the manner in which variation margin payments are aggregated for all customers of the broker/futures commission merchant.
Collateral and margin requirements differ by type of derivative. Margin requirements are established by the broker, futures commission merchant or clearinghouse for exchange-traded and cleared derivatives, including centrally cleared swaps. Brokers, futures commission merchants and clearinghouses can ask for margin in excess of the regulatory minimum, or increase the margin amount, in certain circumstances.
Collateral terms are contract specific for OTC derivatives. For derivatives traded under an ISDA master agreement, the collateral requirements are typically calculated by netting the mark to market amount for each transaction under such agreement and comparing that amount to the value of any collateral currently pledged by the Fund or the counterparty.
For financial reporting purposes, cash collateral that has been pledged to cover obligations of the Fund, if any, is reported separately on the Consolidated Statement of Assets and Liabilities as cash pledged as collateral. Non-cash collateral pledged by the Fund, if any, is noted in the Consolidated Statement of Investments. Generally, the amount of collateral due from or to a party must exceed a minimum transfer amount threshold (e.g. $250,000) before a transfer has to be made. To the extent amounts due to the Fund from its counterparties are not fully collateralized, contractually or otherwise, the Fund bears the risk of loss from counterparty nonperformance.
The following table presents by counterparty the Fund’s OTC derivative assets net of the related collateral posted for the benefit of the Fund at December 31, 2014:
| | | | | | | | | | | | | | | | | | | | |
| | | | | | Gross Amounts Not Offset in the Consolidated Statement of
Assets & Liabilities | | | | |
| Counterparty | | Gross Amount of Assets
in the Consolidated
Statement of Assets &
Liabilities* | | | Financial Instruments
Available for Offset | | | Financial Instruments
Collateral Received** | | | Cash Collateral
Received** | | | Net Amount | |
| |
| Bank of America NA | | $ | 6,725,951 | | | $ | (5,582,021 | ) | | $ | (1,017,932 | ) | | $ | — | | | $ | 125,998 | |
| Barclays Bank plc | | | 5,307,623 | | | | (3,097,699 | ) | | | (2,209,924 | ) | | | — | | | | — | |
| BNP Paribas | | | 36,012 | | | | (36,012 | ) | | | — | | | | — | | | | — | |
| Citibank NA | | | 2,414,527 | | | | (403,982 | ) | | | (1,128,654 | ) | | | — | | | | 881,891 | |
| Credit Suisse International | | | 1,298,032 | | | | — | | | | (1,298,032 | ) | | | — | | | | — | |
| Deutsche Bank AG | | | 1,723,447 | | | | (850,688 | ) | | | — | | | | (553,310 | ) | | | 319,449 | |
| Goldman Sachs Bank USA | | | 5,112,556 | | | | (1,147,269 | ) | | | (3,409,126 | ) | | | — | | | | 556,161 | |
| Goldman Sachs Group, Inc. (The) | | | 1,762,542 | | | | (869,704 | ) | | | (712,561 | ) | | | — | | | | 180,277 | |
| HSBC Bank USA NA | | | 74,921 | | | | (74,921 | ) | | | — | | | | — | | | | — | |
| JPMorgan Chase Bank NA | | | 2,181,589 | | | | (2,181,589 | ) | | | — | | | | — | | | | — | |
| Morgan Stanley Capital Services, Inc. | | | 7,983,916 | | | | (5,395,846 | ) | | | (40,034 | ) | | | (2,327,242 | ) | | | 220,794 | |
| Nomura Global Financial Products, Inc. | | | 764,809 | | | | — | | | | (647,020 | ) | | | — | | | | 117,789 | |
| Toronto Dominion Bank | | | 3,405,606 | | | | (310,237 | ) | | | (3,095,369 | ) | | | — | | | | — | |
| UBS AG | | | 71,129 | | | | (71,129 | ) | | | — | | | | — | | | | — | |
| | | | |
| | $ | 38,862,660 | | | $ | (20,021,097 | ) | | $ | (13,558,652 | ) | | $ | (2,880,552 | ) | | $ | 2,402,359 | |
| | | | |
* OTC derivatives are reported gross on the Consolidated Statement of Assets and Liabilities. Exchange traded options and margin related to centrally cleared swaps and futures are excluded from these reported amounts.
** Reported collateral posted for the benefit of the Fund within this table is limited to the net outstanding amount due from an individual counterparty. The collateral posted for the benefit of the Fund may exceed these amounts.
49 OPPENHEIMER GLOBAL STRATEGIC INCOME FUND/VA
| | |
| NOTESTOCONSOLIDATEDFINANCIALSTATEMENTS Continued |
5. Risk Exposures and the Use of Derivative Instruments (Continued)
The following table presents by counterparty the Fund’s OTC derivative liabilities net of the related collateral pledged by the Fund at December 31, 2014:
| | | | | | | | | | | | | | | | | | | | |
| | | | | | Gross Amounts Not Offset in the Consolidated Statement of
Assets & Liabilities | | | | |
| Counterparty | | Gross Amount of
Liabilities in the
Consolidated Statement of Assets & Liabilities* | | | Financial Instruments
Available for Offset | | | Financial Instruments Collateral Pledged** | | | Cash Collateral Pledged** | | | Net Amount | |
| |
| Bank of America NA | | $ | (5,582,021 | ) | | $ | 5,582,021 | | | $ | — | | | $ | — | | | $ | — | |
| Barclays Bank plc | | | (3,097,699 | ) | | | 3,097,699 | | | | — | | | | — | | | | — | |
| BNP Paribas | | | (59,476 | ) | | | 36,012 | | | | — | | | | — | | | | (23,464 | ) |
| Citibank NA | | | (403,982 | ) | | | 403,982 | | | | — | | | | — | | | | — | |
| Deutsche Bank AG | | | (850,688 | ) | | | 850,688 | | | | — | | | | — | | | | — | |
| Goldman Sachs Bank USA | | | (1,147,269 | ) | | | 1,147,269 | | | | — | | | | — | | | | — | |
| Goldman Sachs Group, Inc. (The) | | | (869,704 | ) | | | 869,704 | | | | — | | | | — | | | | — | |
| HSBC Bank USA NA | | | (237,895 | ) | | | 74,921 | | | | 162,974 | | | | — | | | | — | |
| JPMorgan Chase Bank NA | | | (2,850,377 | ) | | | 2,181,589 | | | | 634,514 | | | | — | | | | (34,274 | ) |
| Morgan Stanley Capital Services, Inc. | | | (5,395,846 | ) | | | 5,395,846 | | | | — | | | | — | | | | — | |
| Toronto Dominion Bank | | | (310,237 | ) | | | 310,237 | | | | — | | | | — | | | | — | |
| UBS AG | | | (1,249,530 | ) | | | 71,129 | | | | 1,084,713 | | | | — | | | | (93,688 | ) |
| | | | |
| | $ | (22,054,724 | ) | | $ | 20,021,097 | | | $ | 1,882,201 | | | $ | — | | | $ | (151,426 | ) |
| | | | |
* OTC derivatives are reported gross on the Consolidated Statement of Assets and Liabilities. Exchange traded options and margin related to centrally cleared swaps and futures are excluded from these reported amounts.
** Reported collateral pledged within this table is limited to the net outstanding amount due from the Fund. The securities pledged as collateral by the Fund as reported on the Consolidated Statements of Investments may exceed these amounts.
The following table presents the valuations of derivative instruments by risk exposure as reported within the Consolidated Statement of Assets and Liabilities as of December 31, 2014:
| | | | | | | | | | | | |
| | | Asset Derivatives | | | Liability Derivatives | |
Derivatives Not Accounted for as
Hedging Instruments | | Consolidated Statement of Assets and Liabilities Location | | Value | | | Consolidated Statement of Assets and Liabilities Location | | Value | |
Credit contracts | | Swaps, at value | | $ | 3,088,918 | | | Swaps, at value | | $ | 914,527 | |
Interest rate contracts | | Swaps, at value | | | 5,941 | | | | | | | |
Credit contracts | | Centrally cleared swaps, at value | | | 620,725 | | | | | | | |
Interest rate contracts | | Centrally cleared swaps, at value | | | 11,933 | | | Centrally cleared swaps, at value | | | 796,762 | |
Interest rate contracts | | Variation margin receivable | | | 173,568* | | | Variation margin payable | | | 182,013* | |
Foreign exchange contracts | | Unrealized appreciation on foreign currency exchange contracts | | | 34,067,222 | | | Unrealized depreciation on foreign currency exchange contracts | | | 18,591,763 | |
Foreign exchange contracts | | | | | | | | Options written, at value | | | 489,439 | |
Interest rate contracts | | | | | | | | Options written, at value | | | 93,421 | |
Interest rate contracts | | | | | | | | Swaptions written, at value | | | 1,965,574 | |
Equity contracts | | Investments, at value | | | 611,965** | | | | | | | |
Foreign exchange contracts | | Investments, at value | | | 956,418** | | | | | | | |
Interest rate contracts | | Investments, at value | | | 744,161** | | | | | | | |
| | | | | | | | | | | | |
Total | | | | $ | 40,280,851 | | | | | $ | 23,033,499 | |
| | | | | | | | | | | | |
* Includes only the current day’s variation margin. Prior variation margin movements have been reflected in cash on the Consolidated Statement of Assets and Liabilities upon receipt or payment.
** Amounts relate to purchased option contracts and purchased swaption contracts.
The effect of derivative instruments on the Consolidated Statement of Operations is as follows:
| | | | | | | | | | | | | | | | | | | | | | | | | | | | |
| Amount of Realized Gain or (Loss) Recognized on Derivatives | |
| |
Derivatives Not Accounted for as Hedging Instruments | | Investment from
unaffiliated
companies
(including
premiums on
options and
swaptions
exercised)* | | | Closing and expiration of swaption contracts
written | | | Closing and
expiration of option contracts written | | | Closing and
expiration of futures contracts | | | Foreign currency
transactions | | | Swap contracts | | | Total | |
| |
Credit contracts | | $ | (269,785 | ) | | $ | 900,953 | | | $ | — | | | $ | — | | | $ | — | | | $ | (564,267 | ) | | $ | 66,901 | |
Foreign exchange contracts | | | (1,642,548 | ) | | | — | | | | 822,071 | | | | — | | | | 24,766,294 | | | | 609,164 | | | | 24,554,981 | |
Interest rate contracts | | | (6,523,788 | ) | | | 981,801 | | | | — | | | | 8,959,190 | | | | — | | | | (2,205,722 | ) | | | 1,211,481 | |
Volatility contracts | | | (1,785,217 | ) | | | — | | | | 538,800 | | | | — | | | | — | | | | — | | | | (1,246,417) | |
| | | | |
Total | | $ | (10,221,338 | ) | | $ | 1,882,754 | | | $ | 1,360,871 | | | $ | 8,959,190 | | | $ | 24,766,294 | | | $ | (2,160,825 | ) | | $ | 24,586,946 | |
| | | | |
* Includes purchased option contracts, purchased swaption contracts, written option contracts exercised and written swaption contracts exercised, if any.
50 OPPENHEIMER GLOBAL STRATEGIC INCOME FUND/VA
5. Risk Exposures and the Use of Derivative Instruments (Continued)
| | | | | | | | | | | | | | | | | | | | | | | | | | | | |
| Amount of Change in Unrealized Gain or (Loss) Recognized on Derivatives | |
| |
Derivatives Not Accounted for as Hedging Instruments | | Investments* | | | Option contracts
written | | | Swaption contracts
written | | | Futures contracts | | | Translation of assets and liabilities denominated in foreign currencies | | | Swap contracts | | | Total | |
| |
Credit contracts | | $ | 91,938 | | | $ | — | | | $ | 20,867 | | | $ | — | | | $ | — | | | $ | 1,539,616 | | | $ | 1,652,421 | |
Equity contracts | | | 185,371 | | | | — | | | | — | | | | — | | | | — | | | | — | | | | 185,371 | |
Foreign exchange contracts | | | 311,995 | | | | (533,137 | ) | | | — | | | | — | | | | 18,683,092 | | | | — | | | | 18,461,950 | |
Interest rate contracts | | | (2,769,397 | ) | | | 42,883 | | | | 373,196 | | | | 3,473,666 | | | | — | | | | (1,275,029 | ) | | | (154,681 | ) |
| | | | |
Total | | $ | (2,180,093 | ) | | $ | (490,254 | ) | | $ | 394,063 | | | $ | 3,473,666 | | | $ | 18,683,092 | | | $ | 264,587 | | | $ | 20,145,061 | |
| | | | |
* Includes purchased option contracts and purchased swaption contracts, if any.
6. Shares of Beneficial Interest
The Fund has authorized an unlimited number of $0.001 par value shares of beneficial interest of each class. Transactions in shares of beneficial interest were as follows:
| | | | | | | | | | | | | | | | |
| | | Year Ended December 31, 2014 | | | Year Ended December 31, 2013 | |
| | | Shares | | | Amount | | | Shares | | | Amount | |
| |
Class Non-Service | | | | | | | | | | | | | | | | |
Sold | | | 9,006,106 | | | $ | 48,748,110 | | | | 20,825,193 | | | $ | 114,175,644 | |
Dividends and/or distributions reinvested | | | 5,850,421 | | | | 31,299,751 | | | | 6,754,607 | | | | 36,272,242 | |
Redeemed | | | (41,379,216 | ) | | | (222,681,939 | ) | | | (21,107,392 | ) | | | (116,547,644) | |
| | | | |
Net increase (decrease) | | | (26,522,689 | ) | | $ | (142,634,078 | ) | | | 6,472,408 | | | $ | 33,900,242 | |
| | | | |
| | | | | | | | | | | | | | | | |
| |
Class Service | | | | | | | | | | | | | | | | |
Sold | | | 11,185,648 | | | $ | 61,790,733 | | | | 32,262,956 | | | $ | 181,229,821 | |
Dividends and/or distributions reinvested | | | 11,624,671 | | | | 63,703,194 | | | | 15,286,400 | | | | 83,922,335 | |
Redeemed | | | (48,724,577 | ) | | | (270,038,823 | ) | | | (53,354,375 | ) | | | (297,932,376) | |
| | | | |
Net decrease | | | (25,914,258 | ) | | $ | (144,544,896 | ) | | | (5,805,019 | ) | | $ | (32,780,220) | |
| | | | |
7. Purchases and Sales of Securities
The aggregate cost of purchases and proceeds from sales of securities, other than short-term obligations and investments in IMMF, for the year ended December 31, 2014 were as follows:
| | | | | | | | |
| | | Purchases | | | Sales | |
| |
Investment securities | | | $1,764,624,970 | | | | $1,612,655,548 | |
U.S. government and government agency obligations | | | 252,832,753 | | | | 361,588,303 | |
To Be Announced (TBA) mortgage-related securities | | | 1,348,552,640 | | | | 1,337,346,996 | |
8. Fees and Other Transactions with Affiliates
Management Fees. Under the investment advisory agreement, the Fund pays the Manager a management fee based on the daily net assets of the Fund at an annual rate as shown in the following table:
| | | | |
| Fee Schedule | | | |
Up to $200 million | | | 0.75% | |
Next $200 million | | | 0.72 | |
Next $200 million | | | 0.69 | |
Next $200 million | | | 0.66 | |
Next $200 million | | | 0.60 | |
Next $4 billion | | | 0.50 | |
Over $5 billion | | | 0.48 | |
The Manager also provides investment management related services to the Subsidiary. The Subsidiary pays the Manager a monthly management fee at an annual rate according to the above schedule. The Subsidiary also pays certain other expenses including custody and directors’ fees.
The Fund’s management fee for the fiscal year ended December 31, 2014 was 0.58% of average annual net assets before any Subsidiary management fees or any applicable waivers.
Sub-Adviser Fees. The Manager has retained the Sub-Adviser to provide the day-to-day portfolio management of the Fund. Under the Sub-Advisory Agreement, the Manager pays the Sub-Adviser an annual fee in monthly installments, equal to a percentage of the investment management fee collected by the Manager from the Fund, which shall be calculated after any investment management fee waivers. The fee paid to the Sub-Adviser is paid by the Manager, not by the Fund.
51 OPPENHEIMER GLOBAL STRATEGIC INCOME FUND/VA
NOTESTOCONSOLIDATEDFINANCIALSTATEMENTS Continued
8. Fees and Other Transactions with Affiliates (Continued)
Transfer Agent Fees. OFI Global (the “Transfer Agent”) serves as the transfer and shareholder servicing agent for the Fund. The Fund pays the Transfer Agent a fee based on annual net assets. Fees incurred and average net assets for each class with respect to these services are detailed in the Consolidated Statement of Operations and Consolidated Financial Highlights, respectively.
Sub-Transfer Agent Fees. The Transfer Agent has retained Shareholder Services, Inc., a wholly-owned subsidiary of OFI (the “Sub-Transfer Agent”), to provide the day-to-day transfer agent and shareholder servicing of the Fund. Under the Sub-Transfer Agency Agreement, the Transfer Agent pays the Sub-Transfer Agent an annual fee in monthly installments, equal to a percentage of the transfer agent fee collected by the Transfer Agent from the Fund, which shall be calculated after any applicable fee waivers. The fee paid to the Sub-Transfer Agent is paid by the Transfer Agent, not by the Fund.
Trustees’ Compensation. The Fund’s Board of Trustees (“Board”) has adopted a compensation deferral plan for Independent Trustees that enables Trustees to elect to defer receipt of all or a portion of the annual compensation they are entitled to receive from the Fund. For purposes of determining the amount owed to the Trustee under the plan, deferred amounts are treated as though equal dollar amounts had been invested in shares of the Fund or in other Oppenheimer funds selected by the Trustee. The Fund purchases shares of the funds selected for deferral by the Trustee in amounts equal to his or her deemed investment, resulting in a Fund asset equal to the deferred compensation liability. Such assets are included as a component of “Other” within the asset section of the Consolidated Statement of Assets and Liabilities. Deferral of Trustees’ fees under the plan will not affect the net assets of the Fund and will not materially affect the Fund’s assets, liabilities or net investment income per share. Amounts will be deferred until distributed in accordance with the compensation deferral plan.
Distribution and Service Plan for Service Shares. The Fund has adopted a Distribution and Service Plan (the “Plan”) pursuant to Rule 12b-1 under the 1940 Act for Service shares to pay OppenheimerFunds Distributor, Inc. (the “Distributor”), for distribution related services, personal service and account maintenance for the Fund’s Service shares. Under the Plan, payments are made periodically at an annual rate of 0.25% of the daily net assets of Service shares of the Fund. The Distributor currently uses all of those fees to compensate sponsors of the insurance product that offers Fund shares, for providing personal service and maintenance of accounts of their variable contract owners that hold Service shares. These fees are paid out of the Fund’s assets on an on-going basis and increase operating expenses of the Service shares, which results in lower performance compared to the Fund’s shares that are not subject to a service fee. Fees incurred by the Fund under the Plan are detailed in the Consolidated Statement of Operations.
Waivers and Reimbursements of Expenses. The Manager has voluntarily agreed to limit the Fund’s expenses after payments, waivers and/or reimbursements and reduction to custodian expenses, excluding expenses incurred directly or indirectly by the Fund as a result of investments in other investment companies, wholly-owned subsidiaries and pooled investment vehicles; so that those expenses, as percentages of daily net assets, will not exceed the annual rate of 0.75% for Non-Service shares and 1.00% for Service shares. During the year ended December 31, 2014, the manager waived fees and/or reimbursed the Fund $12,241 and $28,028 for Non-Service and Service shares, respectively.
The Manager has contractually agreed to waive the management fee it receives from the Fund in an amount equal to the management fee it receives from the Subsidiary. This undertaking will continue in effect for so long as the Fund invests in the Subsidiary and may not be terminated unless approved by the Fund’s Board of Trustees. During the year ended December 31, 2014, the Manager waived $10,225.
The Manager will waive fees and/or reimburse Fund expenses in an amount equal to the indirect management fees incurred through the Fund’s investment in IMMF, Oppenheimer Ultra-Short Duration Fund and the Master Funds. During the year ended December 31, 2014, the Manager waived fees and/or reimbursed the Fund $768,517 for management fees.
These undertakings may be modified or terminated as set forth according to the terms in the prospectus.
9. Pending Litigation
In 2009, seven class action lawsuits were filed in the U.S. District Court for the District of Colorado against OppenheimerFunds, Inc. (“OFI”), OppenheimerFunds Distributor, Inc., the Fund’s principal underwriter and distributor (the “Distributor”), and certain funds (but not including the Fund) advised by OFI Global Asset Management, Inc. and distributed by the Distributor (the “Defendant Funds”). The lawsuits also named as defendants certain officers and current and former trustees of the respective Defendant Funds. The lawsuits raised claims under federal securities laws and alleged, among other things, that the disclosure documents of the respective Defendant Funds contained misrepresentations and omissions and that the respective Defendant Funds’ investment policies were not followed. The plaintiffs in these actions sought unspecified damages, equitable relief and awards of attorneys’ fees and litigation expenses. The Defendant Funds’ Boards of Trustees also engaged counsel to represent the Funds and the present and former Independent Trustees named in those suits. In March 2014, the parties in six of these lawsuits executed stipulations and agreements of settlement resolving those actions. In July 2014, the court entered an order and final judgment approving the settlements as fair, reasonable and adequate. The settlements do not resolve a seventh outstanding lawsuit relating to Oppenheimer Rochester California Municipal Fund (the “California Fund Suit”). OFI believes the California Fund Suit is without legal merit and is defending the suit vigorously. While it is premature to render any opinion as to the outcome in the California Fund Suit, or whether any costs that OFI may bear in defending the California Fund Suit might not be reimbursed by insurance, OFI believes the California Fund Suit should not impair the ability of OFI or the Distributor to perform their respective duties to the Fund, and that the outcome of the California Fund Suit should not have any material effect on the operations of any of the Oppenheimer funds.
52 OPPENHEIMER GLOBAL STRATEGIC INCOME FUND/VA
REPORTOFINDEPENDENTREGISTEREDPUBLICACCOUNTINGFIRM
The Board of Trustees and Shareholders of Oppenheimer Variable Account Funds:
We have audited the accompanying consolidated statement of assets and liabilities of Oppenheimer Global Strategic Income Fund/VA (a separate series of Oppenheimer Variable Account Funds) and subsidiary, including the consolidated statement of investments, as of December 31, 2014, and the related consolidated statement of operations for the year then ended, the consolidated statements of changes in net assets for each of the years in the two-year period then ended, and the consolidated financial highlights for each of the years in the five-year period then ended. These consolidated financial statements and consolidated financial highlights are the responsibility of the Fund’s management. Our responsibility is to express an opinion on these consolidated financial statements and consolidated financial highlights based on our audits.
We conducted our audits in accordance with the standards of the Public Company Accounting Oversight Board (United States). Those standards require that we plan and perform the audit to obtain reasonable assurance about whether the financial statements and financial highlights are free of material misstatement. An audit includes examining, on a test basis, evidence supporting the amounts and disclosures in the financial statements. Our procedures included confirmation of securities owned as of December 31, 2014, by correspondence with the custodian, transfer agent and brokers, or by other appropriate auditing procedures where replies from brokers were not received. An audit also includes assessing the accounting principles used and significant estimates made by management, as well as evaluating the overall financial statement presentation. We believe that our audits provide a reasonable basis for our opinion.
In our opinion, the consolidated financial statements and consolidated financial highlights referred to above present fairly, in all material respects, the financial position of Oppenheimer Global Strategic Income Fund/VA and subsidiary as of December 31, 2014, the results of their operations for the year then ended, the changes in their net assets for each of the years in the two-year period then ended, and the consolidated financial highlights for each of the years in the five-year period then ended, in conformity with U.S. generally accepted accounting principles.
KPMGLLP
Denver, Colorado
February 19, 2015
53 OPPENHEIMER GLOBAL STRATEGIC INCOME FUND/VA
FEDERALINCOMETAXINFORMATION Unaudited
In early 2015, if applicable, shareholders of record received information regarding all dividends and distributions paid to them by the Fund during calendar year 2014.
Dividends, if any, paid by the Fund during the fiscal year ended December 31, 2014 which are not designated as capital gain distributions should be multiplied by the maximum amount allowable but not less than 0.22% to arrive at the amount eligible for the corporate dividend-received deduction.
The foregoing information is presented to assist shareholders in reporting distributions received from the Fund to the Internal Revenue Service. Because of the complexity of the federal regulations which may affect your individual tax return and the many variations in state and local tax regulations, we recommend that you consult your tax advisor for specific guidance.
54 OPPENHEIMER GLOBAL STRATEGIC INCOME FUND/VA
BOARD APPROVAL OF THE FUND’S INVESTMENT ADVISORY AND SUB-ADVISORY AGREEMENTS Unaudited
The Fund has entered into an investment advisory agreement with OFI Global Asset Management, Inc. (“OFI Global” or the “Adviser”), a wholly-owned subsidiary of OppenheimerFunds, Inc. (“OFI” or the “Sub-Adviser”) (“OFI Global” and “OFI” together the “Managers”) and OFI Global has entered into a sub-advisory agreement with OFI whereby OFI provides investment sub-advisory services to the Fund (collectively, the “Agreements”). Each year, the Board of Trustees (the “Board”), including a majority of the independent Trustees, is required to determine whether to renew the Agreements. The Investment Company Act of 1940, as amended, requires that the Board request and evaluate, and that the Managers provide, such information as may be reasonably necessary to evaluate the terms of the Agreements. The Board employs an independent consultant to prepare a report that provides information, including comparative information that the Board requests for that purpose. In addition to in-person meetings focused on this evaluation, the Board receives information throughout the year regarding Fund services, fees, expenses and performance.
The Adviser, Sub-Adviser and the independent consultant provided information to the Board on the following factors: (i) the nature, quality and extent of the Managers’ services, (ii) the investment performance of the Fund and the Managers, (iii) the fees and expenses of the Fund, including comparative expense information, (iv) the profitability of the Managers and their affiliates, including an analysis of the cost of providing services, (v) whether economies of scale are realized as the Fund grows and whether fee levels reflect these economies of scale for Fund investors and (vi) other benefits to the Managers from their relationship with the Fund. The Board was aware that there are alternatives to retaining the Managers.
Outlined below is a summary of the principal information considered by the Board as well as the Board’s conclusions.
Nature, Quality and Extent of Services. The Board considered information about the nature, quality and extent of the services provided to the Fund and information regarding the Managers’ key personnel who provide such services. The Sub-Adviser’s duties include providing the Fund with the services of the portfolio managers and the Sub-Adviser’s investment team, who provide research, analysis and other advisory services in regard to the Fund’s investments; securities trading services; oversight of third-party service providers; monitoring compliance with applicable Fund policies and procedures and adherence to the Fund’s investment restrictions; and risk management. The Managers are responsible for providing certain administrative services to the Fund as well. Those services include providing and supervising all administrative and clerical personnel who are necessary in order to provide effective corporate administration for the Fund; compiling and maintaining records with respect to the Fund’s operations; preparing and filing reports required by the Securities and Exchange Commission; preparing periodic reports regarding the operations of the Fund for its shareholders; preparing proxy materials for shareholder meetings; and preparing the registration statements required by Federal and state securities laws for the sale of the Fund’s shares. The Managers also provide the Fund with office space, facilities and equipment.
The Board also considered the quality of the services provided and the quality of the Managers’ resources that are available to the Fund. The Board took account of the fact that the Sub-Adviser has had over fifty years of experience as an investment adviser and that its assets under management rank it among the top mutual fund managers in the United States. The Board evaluated the Sub-Adviser’s advisory, administrative, accounting, legal, compliance services and risk management, and information the Board has received regarding the experience and professional qualifications of the Managers’ key personnel and the size and functions of its staff. In its evaluation of the quality of the portfolio management services provided, the Board considered the experience of Krishna Memani, Sara Zervos and Jack Brown, the portfolio managers for the Fund, and the Sub-Adviser’s investment team and analysts. The Board members also considered the totality of their experiences with the Managers as directors or trustees of the Fund and other funds advised by the Managers. The Board considered information regarding the quality of services provided by affiliates of the Managers, which its members have become knowledgeable about in connection with the renewal of the Fund’s service agreements. The Board concluded, in light of the Managers’ experience, reputation, personnel, operations and resources that the Fund benefits from the services provided under the Agreements.
Investment Performance of the Manager and the Fund. Throughout the year, the Manager provided information on the investment performance of the Fund, including comparative performance information. The Board also reviewed information, prepared by the Manager and by the independent consultant, comparing the Fund’s historical performance to relevant market indices and to the performance of other multisector bond funds underlying variable insurance products. The Board considered that the Fund underperformed its category median during the one-, three-, five- and ten-year periods. The Board took into account the Manager’s assertion that the Fund has underperformed its performance category due to several asset allocation decisions relative to peer funds, including the Fund’s large relative position in emerging market debt over the last three years, a period of poor performance in emerging markets, and the Fund’s low average weighting in domestic high yield during a period where domestic high yield was a very strong performer in the fixed income universe. The Board further considered the Manager’s statement that based on the macro environment and underlying fundamentals, it will continue to favor credit, high real yields and emerging markets in managing the Fund’s investments. The Board noted the Manager’s assertion that the Fund is currently long credit, short duration, and underweight currencies with a focus on delivering a robust stream of income in a rising rate environment.
Costs of Services by the Manager. The Board reviewed the fees paid to the Manager and the other expenses borne by the Fund. The Board noted that the Manager, not the Fund, pays the Sub-Adviser’s fee under the sub-advisory agreement. The independent consultant provided comparative data in regard to the fees and expenses of the Fund and other multisector bond funds underlying variable insurance products. In reviewing the fees and expenses charged to the VA funds, the Board considered the Manager’s assertion that, because there is much greater disparity in the fees and services that may be provided by a manager to a VA fund as opposed to a retail fund, when comparing the expenses of the various VA funds to those of retail funds, it is most appropriate to focus on total expenses (rather than on the management fees). Accordingly, while the Board reviewed and considered all expenses, it focused on total expenses. The Board considered that the Fund’s total expenses, after waivers, were lower than its peer group median and category median. The Board also considered that the Fund’s contractual management fee was lower than its peer group median and category median. Within the total asset range of $2 billion to $5 billion, the Fund’s effective management fee rate was lower than its peer group median and category median. The Board noted that the Manager has voluntarily agreed to limit the Fund’s total annual operating expenses so that those expenses, as percentages of daily net assets, will not exceed the annual rate of 0.75% for Non-Service Shares and 1.00% for Service Shares. This voluntary expense limitation may be amended or withdrawn at any time without prior notice to shareholders.
55 OPPENHEIMER GLOBAL STRATEGIC INCOME FUND/VA
Economies of Scale and Profits Realized by the Manager. The Board considered information regarding the Manager’s costs in serving as the Fund’s investment adviser, including the costs associated with the personnel and systems necessary to manage the Fund, and information regarding the Manager’s profitability from its relationship with the Fund. The Board reviewed whether the Manager may realize economies of scale in managing and supporting the Fund. The Board noted that the Fund currently has management fee breakpoints, which are intended to share with Fund shareholders economies of scale that may exist as the Fund’s assets grow. The Board further noted that on November 1, 2013, an additional fee breakpoint of 0.48% for assets in excess of $5 billion was added to the Fund’s breakpoint schedule.
Other Benefits to the Managers. In addition to considering the profits realized by the Managers, the Board considered information that was provided regarding the direct and indirect benefits the Managers receive as a result of their relationship with the Fund, including compensation paid to the Managers’ affiliates. The Board also considered that the Managers must be able to pay and retain experienced professional personnel at competitive rates to provide quality services to the Fund.
Conclusions. These factors were also considered by the independent Trustees meeting separately from the full Board, assisted by experienced counsel to the Fund and to the independent Trustees. Fund counsel and the independent Trustees’ counsel are independent of the Managers within the meaning and intent of the Securities and Exchange Commission Rules.
Based on its review of the information it received and its evaluations described above, the Board, including a majority of the independent Trustees, decided to continue the Agreements through August 31, 2015. In arriving at its decision, the Board did not identify any factor or factors as being more important than others, but considered all of the above information, and considered the terms and conditions of the Agreements, including the management fees, in light of all the surrounding circumstances.
56 OPPENHEIMER GLOBAL STRATEGIC INCOME FUND/VA
PORTFOLIOPROXYVOTINGPOLICIESANDPROCEDURES;UPDATESTOSTATEMENTSOFINVESTMENTS Unaudited
The Fund has adopted Portfolio Proxy Voting Policies and Procedures under which the Fund votes proxies relating to securities (“portfolio proxies”) held by the Fund. A description of the Fund’s Portfolio Proxy Voting Policies and Procedures is available (i) without charge, upon request, by calling the Fund toll-free at 1.800.525.7048, (ii) on the Fund’s website at www.oppenheimerfunds.com, and (iii) on the SEC’s website at www.sec.gov. In addition, the Fund is required to file Form N-PX, with its complete proxy voting record for the 12 months ended June 30th, no later than August 31st of each year. The Fund’s voting record is available (i) without charge, upon request, by calling the Fund toll-free at 1.800.525.7048, and (ii) in the Form N-PX filing on the SEC’s website at www.sec.gov.
The Fund files its complete schedule of portfolio holdings with the SEC for the first quarter and the third quarter of each fiscal year on Form N-Q. The Fund’s Form N-Q filings are available on the SEC’s website at www.sec.gov. Those forms may be reviewed and copied at the SEC’s Public Reference Room in Washington, D.C. Information on the operation of the Public Reference Room may be obtained by calling 1-800-SEC-0330.
57 OPPENHEIMER GLOBAL STRATEGIC INCOME FUND/VA
TRUSTEESANDOFFICERS Unaudited
| | |
| |
Name, Position(s) Held with the Fund, Length of
Service, Year of Birth | | Principal Occupation(s) During the Past 5 Years; Other Trusteeships/Directorships Held;
Number of Portfolios in the Fund Complex Currently Overseen |
| |
| INDEPENDENT TRUSTEES | | The address of each Trustee in the chart below is 6803 S. Tucson Way, Centennial, Colorado 80112-3924. Each Trustee serves for an indefinite term, or until his or her resignation, retirement, death or removal. |
| |
Sam Freedman, Chairman of the Board of Trustees (since 2013) and Trustee (since 1996) Year of Birth: 1940 | | Director of Colorado UpLIFT (charitable organization) (since September 1984). Mr. Freedman held several positions with the Sub-Adviser and with subsidiary or affiliated companies of the Sub-Adviser (until October 1994). Oversees 38 portfolios in the OppenheimerFunds complex. Mr. Freedman has served on the Boards of certain Oppenheimer funds since 1996, during which time he has become familiar with the Fund’s (and other Oppenheimer funds’) financial, accounting, regulatory and investment matters and has contributed to the Boards’ deliberations. |
| |
Jon S. Fossel, Trustee (since 1993) Year of Birth: 1942 | | Chairman of the Board of Jack Creek Preserve Foundation (non-profit organization) (since 2005); Chairman of the Board (2006-December 2011) and Director (June 2002-December 2011) of UNUMProvident (insurance company); Director of Northwestern Energy Corp. (public utility corporation) (November 2004-December 2009); Director of P.R. Pharmaceuticals (October 1999-October 2003); Director of Rocky Mountain Elk Foundation (non-profit organization) (February 1998-February 2003 and February 2005-February 2007); Chairman and Director (until October 1996) and President and Chief Executive Officer (until October 1995) of the Sub-Adviser; President, Chief Executive Officer and Director of the following: Oppenheimer Acquisition Corp. (“OAC”) (parent holding company of the Sub-Adviser), Shareholder Services, Inc. and Shareholder Financial Services, Inc. (until October 1995). Oversees 38 portfolios in the OppenheimerFunds complex. Mr. Fossel has served on the Boards of certain Oppenheimer funds since 1990, during which time he has become familiar with the Fund’s (and other Oppenheimer funds’) financial, accounting, regulatory and investment matters and has contributed to the Boards’ deliberations. |
| |
Richard F. Grabish, Trustee (since 2012) Year of Birth: 1948 | | Formerly Senior Vice President and Assistant Director of Sales and Marketing (March 1997-December 2007), Director (March 1987-December 2007) and Manager of Private Client Services (June 1985-June 2005) of A.G. Edwards & Sons, Inc. (broker/dealer and investment firm); Chairman and Chief Executive Officer of A.G. Edwards Trust Company, FSB (March 2001-December 2007); President and Vice Chairman of A.G. Edwards Trust Company, FSB (investment adviser) (April 1987-March 2001); President of A.G. Edwards Trust Company, FSB (investment adviser) (June 2005-December 2007). Oversees 38 portfolios in the OppenheimerFunds complex. Mr. Grabish has served on the Boards of certain Oppenheimer funds since 2001, during which time he has become familiar with the Fund’s (and other Oppenheimer funds’) financial, accounting, regulatory and investment matters and has contributed to the Boards’ deliberations. |
| |
Beverly L. Hamilton, Trustee (since 2002) Year of Birth: 1946 | | Trustee of Monterey Institute for International Studies (educational organization) (since February 2000); Board Member of Middlebury College (educational organization) (December 2005-June 2011); Chairman (since 2010) of American Funds’ Emerging Markets Growth Fund, Inc. (mutual fund); Director of The California Endowment (philanthropic organization) (April 2002-April 2008); Director (February 2002-2005) and Chairman of Trustees (2006-2007) of the Community Hospital of Monterey Peninsula; Director (October 1991-2005); Vice Chairman (2006-2009) of American Funds’ Emerging Markets Growth Fund, Inc. (mutual fund); President of ARCO Investment Management Company (February 1991-April 2000); Member of the investment committees of The Rockefeller Foundation (2001-2006) and The University of Michigan (since 2000); Advisor at Credit Suisse First Boston’s Sprout venture capital unit (venture capital fund) (1994-January 2005); Trustee of MassMutual Institutional Funds (investment company) (1996-June 2004); Trustee of MML Series Investment Fund (investment company) (April 1989-June 2004); Member of the investment committee of Hartford Hospital (2000-2003); and Advisor to Unilever (Holland) pension fund (2000-2003). Oversees 38 portfolios in the OppenheimerFunds complex. Ms. Hamilton has served on the Boards of certain Oppenheimer funds since 2002, during which time she has become familiar with the Fund’s (and other Oppenheimer funds’) financial, accounting, regulatory and investment matters and has contributed to the Boards’ deliberations. |
| |
Victoria J. Herget, Trustee (since 2012) Year of Birth:1951 | | Board Chair (2008-Present) and Director (2004-Present), United Educators (insurance company); Trustee (since 2000) and Chair (since 2010), Newberry Library (independent research library); Trustee, Mather LifeWays (senior living organization) (since 2001); Independent Director of the First American Funds (mutual fund family) (2003-2011); former Managing Director (1993-2001), Principal (1985-1993), Vice President (1978-1985) and Assistant Vice President (1973-1978) of Zurich Scudder Investments (investment adviser) (and its predecessor firms); Trustee (1992-2007), Chair of the Board of Trustees (1999-2007), Investment Committee Chair (1994-1999) and Investment Committee member (2007-2010) of Wellesley College; Trustee, BoardSource (non-profit organization) (2006-2009) and Chicago City Day School (K-8 School) (1994-2005). Oversees 38 portfolios in the OppenheimerFunds complex. Ms. Herget has served on the Boards of certain Oppenheimer funds since 2012, during which time she has become familiar with the Fund’s (and other Oppenheimer funds’) financial, accounting, regulatory and investment matters and has contributed to the Boards’ deliberations. |
| |
Robert J. Malone, Trustee (since 2002) Year of Birth: 1944 | | Chairman of the Board (since 2012) and Director (since August 2005) of Jones International University (educational organization); Chairman, Chief Executive Officer and Director of Steele Street Bank Trust (commercial banking) (since August 2003); Trustee of the Gallagher Family Foundation (non-profit organization) (since 2000); Board of Directors of Opera Colorado Foundation (non-profit organization) (2008-2012); Director of Colorado UpLIFT (charitable organization) (1986-2010); Director of Jones Knowledge, Inc. (2006-2010); Former Chairman of U.S. Bank-Colorado (subsidiary of U.S. Bancorp and formerly Colorado National Bank) (July 1996-April 1999); Director of Commercial Assets, Inc. (real estate investment trust) (1993-2000); Director of U.S. Exploration, Inc. (oil and gas exploration) (1997-February 2004); Chairman of the Board (1991-1994) and Trustee (1985-1994) of Regis University; and Chairman of the Board (1990-1991 and Trustee (1984-1999) of Young Presidents Organization. Oversees 38 portfolios in the OppenheimerFunds complex. Mr. Malone has served on the Boards of certain Oppenheimer funds since 2002, during which time he has become familiar with the Fund’s (and other Oppenheimer funds’) financial, accounting, regulatory and investment matters and has contributed to the Boards’ deliberations. |
58 OPPENHEIMER GLOBAL STRATEGIC INCOME FUND/VA
| | |
| |
F. William Marshall, Jr., Trustee (since 2000) Year of Birth: 1942 | | Trustee Emeritus of Worcester Polytech Institute (WPI) (private university) (since 2009); Trustee of MassMutual Select Funds (formerly MassMutual Institutional Funds) (investment company) (since 1996), MML Series Investment Fund (investment company) (since 1996) and Mass Mutual Premier Funds (investment company) (since January 2012); President and Treasurer of the SIS Fund (private charitable fund) (January 1999 – March 2011); Former Trustee of WPI (1985-2008); Former Chairman of the Board (2004-2006) and Former Chairman of the Investment Committee of WPI (1994-2008); Chairman of SIS & Family Bank, F.S.B. (formerly SIS Bank) (commercial bank) (January 1999-July 1999); Executive Vice President of Peoples Heritage Financial Group, Inc. (commercial bank) (January 1999-July 1999); and Former President and Chief Executive Officer of SIS Bancorp. (1993-1999). Oversees 42 portfolios in the OppenheimerFunds complex. Mr. Marshall has served on the Boards of certain Oppenheimer funds since 2000, during which time he has become familiar with the Fund’s (and other Oppenheimer funds’) financial, accounting, regulatory and investment matters and has contributed to the Boards’ deliberations. |
| |
Karen L. Stuckey, Trustee (since 2012) Year of Birth: 1953 | | Partner (1990-2012) of PricewaterhouseCoopers LLP (professional services firm) (held various positions 1975- 1990); Trustee (1992-2006) and member of Executive, Nominating and Audit Committees and Chair of Finance Committee of Lehigh University; and member, Women’s Investment Management Forum (professional organization) since inception. Oversees 38 portfolios in the OppenheimerFunds complex. Ms. Stuckey has served on the Boards of certain Oppenheimer funds since 2012, during which time she has become familiar with the Fund’s (and other Oppenheimer funds’) financial, accounting, regulatory and investment matters and has contributed to the Boards’ deliberations. |
| |
James D. Vaughn, Trustee (since 2012) Year of Birth:1945 | | Retired; former managing partner (1994-2001) of Denver office of Deloitte & Touche LLP, (held various positions 1969-1993); Trustee and Chairman of the Audit Committee of Schroder Funds (2003-2012); Board member and Chairman of Audit Committee of AMG National Trust Bank (since 2005); Trustee and Investment Committee member, University of South Dakota Foundation (since 1996); Board member, Audit Committee Member and past Board Chair, Junior Achievement (since 1993); former Board member, Mile High United Way, Boys and Girls Clubs, Boy Scouts, Colorado Business Committee for the Arts, Economic Club of Colorado and Metro Denver Network. Oversees 38 portfolios in the OppenheimerFunds complex. Mr. Vaughn has served on the Boards of certain Oppenheimer funds since 2012, during which time he has become familiar with the Fund’s (and other Oppenheimer funds’) financial, accounting, regulatory and investment matters and has contributed to the Boards’ deliberations. |
|
| |
| INTERESTED TRUSTEE | | Mr. Glavin is an “Interested Trustee” because he is affiliated with the Manager and the Sub-Adviser by virtue of his positions as director of the Sub-Adviser, and as a shareholder of the Sub-Adviser’s parent company. As a Trustee, he serves for an indefinite term, or until his resignation, retirement, death or removal. Mr. Glavin’s address is 225 Liberty Street, 11th Floor, New York, New York 10281-1008. |
| |
William F. Glavin, Jr., Trustee (since 2009) Year of Birth: 1958 | | Chairman of the Sub-Adviser (July 2014-December 2014 and December 2009-December 2012) and Director of the Sub-Adviser (since January 2009); Chairman, Director and Chief Executive Officer (January 2013-June 2014) of the Manager; President of the Manager (January 2013-May 2013); Chief Executive Officer (January 2009-December 2012); President of the Sub-Adviser (May 2009-December 2012); Management Director (June 2009-June 2014), President (December 2009-June 2014) and Chief Executive Officer (January 2011-June 2014) of Oppenheimer Acquisition Corp. (“OAC”) (the Sub-Adviser’s parent holding company); Director of Oppenheimer Real Asset Management, Inc. (March 2010-June 2014); Executive Vice President (March 2006-February 2009) and Chief Operating Officer (July 2007-February 2009) of Massachusetts Mutual Life Insurance Company (OAC’s parent company); Director (May 2004-March 2006) and Chief Operating Officer and Chief Compliance Officer (May 2004-January 2005), President (January 2005-March 2006) and Chief Executive Officer (June 2005-March 2006) of Babson Capital Management LLC; Director (March 2005-March 2006), President (May 2003-March 2006) and Chief Compliance Officer (July 2005-March 2006) of Babson Capital Securities, Inc. (a broker-dealer); President (May 2003-March 2006) of Babson Investment Company, Inc.; Director (May 2004-August 2006) of Babson Capital Europe Limited; Director (May 2004-October 2006) of Babson Capital Guernsey Limited; Director (May 2004-March 2006) of Babson Capital Management LLC; Non-Executive Director (March 2005-March 2007) of Baring Asset Management Limited; Director (February 2005-June 2006) Baring Pension Trustees Limited; Director and Treasurer (December 2003-November 2006) of Charter Oak Capital Management, Inc.; Director (May 2006-September 2006) of C.M. Benefit Insurance Company; Director (May 2008-June 2009) and Executive Vice President (June 2007-July 2009) of C.M. Life Insurance Company; President (March 2006-May 2007) of MassMutual Assignment Company; Director (January 2005-December 2006), Deputy Chairman (March 2005-December 2006) and President (February 2005-March 2005) of MassMutual Holdings (Bermuda) Limited; Director (May 2008-June 2009) and Executive Vice President (June 2007-July 2009) of MML Bay State Life Insurance Company; Chief Executive Officer and President (April 2007-January 2009) of MML Distributors, LLC; and Chairman (March 2006-December 2008) and Chief Executive Officer (May 2007-December 2008) of MML Investors Services, Inc. An officer of 91 portfolios in the OppenheimerFunds complex. Mr. Glavin has served on the Boards of certain Oppenheimer funds since December 2009, during which time he has become familiar with the Fund’s (and other Oppenheimer funds’) financial, accounting, regulatory and investment matters and has contributed to the Boards’ deliberations. |
|
| OTHER OFFICERS OF THE FUND | | The addresses of the Officers in the chart below are as follows: for Messrs. Mata, Memani, Steinmetz, Gabinet, Mss. Zervos, Sexton and Picciotto, 225 Liberty Street, New York, New York 10281-1008, for Messrs. Brown and Wixted, 6803 S. Tucson Way, Centennial, Colorado 80112-3924. Each Officer serves for an indefinite term or until his or her resignation, retirement, death or removal. |
59 OPPENHEIMER GLOBAL STRATEGIC INCOME FUND/VA
TRUSTEESANDOFFICERS Unaudited / Continued
| | |
| |
Michael Mata, Vice President (since 2014) Year of Birth: 1963 | | Senior Vice President of the Sub-Adviser and the Head of Multi-Sector Fixed Income (since July 2014). Portfolio manager with ING Investment Management and Head of Multi-Sector Fixed-Income (August 2004-December 2013), managing the Global Bond and Core Plus strategies and the macro and quantitative research teams, along with the emerging markets sovereign team. Senior Vice President and Senior Risk Manager at Putnam Investments (March 2000-August 2004) and a Vice President and Risk Manager for Fixed Income Trading at Lehman Brothers (September 1994-March 2000). A portfolio manager and an officer of other portfolios in the OppenheimerFunds complex. |
| |
Krishna Memani, Vice President (since 2009) Year of Birth: 1960 | | President of the Sub-Adviser (since January 2013); Executive Vice President of the Manager (since January 2014) and Chief Investment Officer of the OppenheimerFunds advisory entities (since January 2014). Chief Investment Officer, Fixed Income of the Sub-Adviser (January 2013-December 2013); Head of the Investment Grade Fixed Income Team of the Sub-Adviser (March 2009-January 2014); Director of Fixed Income of the Sub-Adviser (October 2010-December 2012); Senior Vice President of the Sub-Adviser (March 2009-December 2012) and Senior Vice President of OFI Global Institutional, Inc. (April 2009-December 2012). Managing Director and Head of the U.S. and European Credit Analyst Team at Deutsche Bank Securities (June 2006-January 2009). Chief Credit Strategist at Credit Suisse Securities (August 2002-March 2006). Managing Director and Senior Portfolio Manager at Putnam Investments (September 1998-June 2002). A portfolio manager and an officer of other portfolios in the OppenheimerFunds complex. |
| |
Sara J. Zervos, Ph.D. Vice President (since 2010) Year of Birth: 1969 | | Senior Vice President of the Sub-Adviser (since January 2011); Head of the Global Debt Team (since October 2010) and the team’s Director of International Research. Ms. Zervos serves on the Board of the Emerging Market Trade Association (EMTA) (since January 2014) and is a member of the Federal Reserve Bank of New York Foreign Exchange Committee (since January 2014). Vice President of the Sub-Adviser (April 2008-December 2010). Portfolio manager with Sailfish Capital Management (May 2007-February 2008) and a portfolio manager for emerging market debt at Dillon Read Capital Management and OTA Asset Management (June 2004-April 2007). A portfolio manager and officer of other portfolios in the OppenheimerFunds complex. |
| |
Jack Brown, Vice President (since 2013) Year of Birth: 1973 | | Vice President of the Sub-Adviser (since May 2009) and was a senior analyst for the High Yield Corporate Debt team (from 2000-2012). He joined the Sub-Adviser (in 1995) and has held numerous positions including fixed income liaison, analyst and senior analyst. A portfolio manager and officer of other portfolios in the OppenheimerFunds complex. |
| |
Arthur P. Steinmetz, President and Principal Executive Officer (since 2014) Year of Birth: 1958 | | Chairman of the Sub-Adviser (since January 2015); CEO and Chairman of the Manager (since July 2014), President of the Manager (since May 2013), a Director of the Manager (since January 2013), Director of the Sub-Adviser (since July 2014), President, Management Director and CEO of Oppenheimer Acquisition Corp. (the Sub-Adviser’s parent holding company) (since July 2014), and President and Director of OFI SteelPath, Inc. (since January 2013). Chief Investment Officer of the OppenheimerFunds advisory entities from (January 2013-December 2013); Executive Vice President of the Manager (January 2013-May 2013); Chief Investment Officer of the Sub-Adviser (October 2010-December 2012); Chief Investment Officer, Fixed-Income, of the Sub-Adviser (April 2009-October 2010); Executive Vice President of the Sub-Adviser (October 2009-December 2012); Director of Fixed Income of the Sub-Adviser (January 2009-April 2009); and a Senior Vice President of the Sub-Adviser (March 1993-September 2009). An officer of 91 portfolios in the OppenheimerFunds complex. |
| |
Arthur S. Gabinet, Secretary and Chief Legal Officer (since 2011) Year of Birth: 1958 | | Executive Vice President, Secretary and General Counsel of the Manager (since January 2013); General Counsel OFI SteelPath, Inc. (since January 2013); Executive Vice President (May 2010-December 2012) and General Counsel (since January 2011) of the Sub-Adviser; General Counsel of the Distributor (since January 2011); General Counsel of Centennial Asset Management Corporation (January 2011-December 2012); Executive Vice President (January 2011-December 2012) and General Counsel of HarbourView Asset Management Corporation (since January 2011); Assistant Secretary (since January 2011) and Director (since January 2011) of OppenheimerFunds International Ltd. and OppenheimerFunds plc; Director of Oppenheimer Real Asset Management, Inc. (January 2011-December 2012) and General Counsel (since January 2011); Executive Vice President (January 2011-December 2011) and General Counsel of Shareholder Financial Services, Inc. and Shareholder Services, Inc. (since January 2011); Executive Vice President (January 2011-December 2012) and General Counsel of OFI Private Investments Inc. (since January 2011); Vice President of OppenheimerFunds Legacy Program (January 2011-December 2011); Executive Vice President (January 2011-December 2012) and General Counsel of OFI Institutional Asset Management, Inc. (since January 2011); General Counsel, Asset Management of the Sub-Adviser (May 2010-December 2010); Principal, The Vanguard Group (November 2005-April 2010); District Administrator, U.S. Securities and Exchange Commission (January 2003-October 2005). An officer of 91 portfolios in the OppenheimerFunds complex. |
| |
Jennifer Sexton, Vice President and Chief Business Officer (since 2014) Year of Birth: 1969 | | Senior Vice President of OppenheimerFunds Distributor, Inc. (since June 2014); Vice President of OppenheimerFunds Distributor, Inc. (April 2006-June 2014); Vice President of the Sub-Adviser (January 1998-March 2006); Assistant Vice President of the Sub-Adviser (October 1991-December 1998). An officer of 91 portfolios in the OppenheimerFunds complex. |
| |
Mary Ann Picciotto, Chief Compliance Officer and Chief Anti-Money Laundering Officer (since 2014) Year of Birth: 1973 | | Senior Vice President and Chief Compliance Officer of the Manager (since March 2014); Chief Compliance Officer of the Sub-Adviser, OFI SteelPath, Inc., OFI Global Trust Company, OFI Global Institutional, Inc., Oppenheimer Real Asset Management, Inc., OFI Private Investments, Inc., Harborview Asset Management Corporation, Trinity Investment Management Corporation, and Shareholder Services, Inc. (since March 2014); Managing Director of Morgan Stanley Investment Management Inc. and certain of its various affiliated entities; Chief Compliance Officer of various Morgan Stanley Funds (May 2010-January 2014); Chief Compliance Officer of Morgan Stanley Investment Management Inc. (April 2007-January 2014). An officer of 91 portfolios in the OppenheimerFunds complex. |
60 OPPENHEIMER GLOBAL STRATEGIC INCOME FUND/VA
| | |
| |
Brian W. Wixted, Treasurer and Principal Financial & Accounting Officer (since 1999) Year of Birth: 1959 | | Senior Vice President of the Manager (since January 2013); Treasurer of the Sub-Adviser, HarbourView Asset Management Corporation, Shareholder Financial Services, Inc., Shareholder Services, Inc., and Oppenheimer Real Asset Management, Inc. (March 1999-June 2008), OFI Private Investments, Inc. (March 2000-June 2008), OppenheimerFunds International Ltd. and OppenheimerFunds plc (since May 2000), OFI Institutional Asset Management, Inc. (November 2000-June 2008), and OppenheimerFunds Legacy Program (charitable trust program established by the Sub-Adviser) (June 2003-December 2011); Treasurer and Chief Financial Officer of OFI Trust Company (since May 2000); Assistant Treasurer of Oppenheimer Acquisition Corporation (March 1999-June 2008). An officer of 91 portfolios in the OppenheimerFunds complex. |
The Fund’s Statement of Additional Information contains additional information about the Fund’s Trustees and Officers and is available without charge, upon request, by calling 1.800.988.8287.
61 OPPENHEIMER GLOBAL STRATEGIC INCOME FUND/VA
THIS PAGE INTENTIONALLY LEFT BLANK.
62 OPPENHEIMER GLOBAL STRATEGIC INCOME FUND/VA
THIS PAGE INTENTIONALLY LEFT BLANK.
63 OPPENHEIMER GLOBAL STRATEGIC INCOME FUND/VA
OPPENHEIMERGLOBALSTRATEGICINCOMEFUND/VA
A Series of Oppenheimer Variable Account Funds
| | |
| Manager | | OFI Global Asset Management, Inc. |
| |
| Sub-Adviser | | OppenheimerFunds, Inc. |
| |
| Distributor | | OppenheimerFunds Distributor, Inc. |
| |
| Transfer and | | OFI Global Asset Management, Inc. |
| Shareholder | | |
| Servicing Agent | | |
| |
| Sub-Transfer Agent | | Shareholder Services, Inc. |
| | DBA OppenheimerFunds Services |
| |
| Independent | | KPMG LLP |
| Registered Public | | |
| Accounting Firm | | |
| |
| Counsel | | K&L Gates LLP |
| |
| | Before investing in any of the Oppenheimer funds, investors should carefully consider a fund’s investment objectives, risks, charges and expenses. Fund prospectuses and summary prospectuses contain this and other information about the funds, and may be obtained by asking your financial advisor, or calling us at 1.800.988.8287. Read prospectuses and summary prospectuses carefully before investing. |
| |
| | © 2015 OppenheimerFunds, Inc. All rights reserved. Oppenheimer funds are distributed by OppenheimerFunds Distributor, Inc. |

PORTFOLIO MANAGER: Michael S. Levine, CFA
AVERAGE ANNUAL TOTAL RETURNS FOR THE PERIODS ENDED 12/31/14
| | | | | | | | | | | | | | |
| | | Inception
Date | | 1-Year | | | 5-Year | | | 10-Year | |
Non-Service Shares | | 1/2/03 | | | 11.08 | % | | | 13.43 | % | | | 8.28 | % |
Service Shares | | 9/18/06 | | | 10.73 | | | | 12.06 | | | | 5.38 | * |
Russell 1000 Value Index | | | | | 13.45 | | | | 15.42 | | | | 7.30 | |
S&P 500 Index | | | | | 13.69 | | | | 15.45 | | | | 7.67 | |
*Shows performance since inception.
Performance data quoted represents past performance, which does not guarantee future results. The investment return and principal value of an investment in the Fund will fluctuate so that an investor’s shares, when redeemed, may be worth more or less than their original cost. Current performance may be lower or higher than the performance quoted. For performance data current to the most recent month end, call us at 1.800.988.8287. The Fund’s total returns should not be expected to be the same as the returns of other funds, whether or not both funds have the same portfolio managers and/or similar names. The Fund’s total returns include changes in share price and reinvested distributions but do not include the charges associated with the separate account products that offer this Fund. Such performance would have been lower if such charges were taken into account.
TOP TEN COMMON STOCK HOLDINGS
| | | | | | |
Citigroup, Inc. | | | 4.5 | % | | |
JPMorgan Chase & Co. | | | 4.1 | | | |
Chevron Corp. | | | 2.6 | | | |
Apple, Inc. | | | 2.5 | | | |
Assured Guaranty Ltd. | | | 2.4 | | | |
Ford Motor Co. | | | 2.4 | | | |
MetLife, Inc. | | | 2.4 | | | |
Kinder Morgan, Inc. | | | 2.3 | | | |
General Motors Co. | | | 2.3 | | | |
Best Buy Co., Inc. | | | 2.2 | | | |
Portfolio holdings and allocations are subject to change. Percentages are as of December 31, 2014, and are based on net assets. For more current Fund holdings, please visit oppenheimerfunds.com.
SECTOR ALLOCATION

Portfolio holdings and allocations are subject to change. Percentages are as of December 31, 2014, and are based on the total market value of common stocks.
2 OPPENHEIMER EQUITY INCOME FUND/VA
Fund Performance Discussion
The Fund’s Non-Service shares produced a return of 11.08% during the reporting period, underperforming the Russell 1000 Value Index (the “Index”), which returned 13.45% during the same period. The Fund’s underperformance stemmed primarily from less favorable stock selection in the financials and consumer discretionary sectors, and an underweight position in the health care sector. The Fund outperformed the Index in the telecommunication services, information technology, industrials and consumer staples sectors due to stronger relative stock selection.
MARKET OVERVIEW
Domestic equities were among the top performing asset classes in 2014, outperforming foreign equities, including those domiciled in Europe, Japan and emerging markets. In the U.S., the Federal Reserve (the “Fed”) began tapering its most recent quantitative easing (“QE”) program in January 2014 and completed the process at the end of October, thereby ending the program’s purchases. The Fed reduced its monthly bond purchases in steady $10 billion increments, which helped reduce market volatility and enabled investors to prepare for a post-QE market environment. Although data in the U.S. softened for the first quarter, partially attributed to cold weather effects across much of the country, it was positive in the second and third quarters of 2014, with Gross Domestic Product (“GDP”) growing at 4.6% and an estimated 5.0%, respectively.
Outside of the U.S., the positive data points that had emerged in Europe in 2013 and early 2014 largely reversed themselves later in the reporting period and the European Central Bank (the “ECB”) came under even greater pressure to provide a credible plan to boost growth and avoid deflation. In response, the ECB adopted a number of policies designed to stimulate growth. In Japan, which has been mired in economic weakness for years, the Abe administration has adopted even more aggressive economic policies with the Bank of Japan (the “BoJ”) executing a massive QE program. However, the results have not been particularly impressive, with that economy slipping back into recession in the third quarter of 2014 following the consumption tax increase. Emerging markets’ economic growth was mixed, as certain regions such as Eastern Europe and the Middle East remained burdened by geopolitical turmoil. Many commodity producing emerging market economies also struggled as prices for most commodities fell. Countries such as India and Indonesia have benefited from business-friendly new administrations.
TOP INDIVIDUAL CONTRIBUTORS
Top performing holdings for the Fund this reporting period included Apple, Inc., United Airlines, Inc. and CenturyLink, Inc. Apple rallied after iPhone sales came in higher than analysts anticipated and the company announced a 7-for-1 stock split and increased both its dividend and share repurchases. In addition, the introduction of two new iPhones, and the upcoming introduction of a new Apple Watch product, resulted in strong performance. United Airlines and the airline industry in general benefited as the industry has consolidated and the major players (United Airlines, Delta Air Lines and American Airlines) are focusing on profitability instead of growth. In addition, airlines benefited from the low cost of jet fuel, driven by falling oil prices. CenturyLink is a leading RLEC, or regional local exchange company (also known as a local telephone company). Most RLEC’s have high dividend yields and the group has performed well as interest rates continue to remain low. Also, Windstream, another RLEC, announced plans to form a real estate investment trust (“REIT”) during the reporting period. This drove strength in the name as the tax benefits of the REIT structure should result in a lower cost of capital.
TOP INDIVIDUAL DETRACTORS
Top detractors this reporting period included General Cable Corp., Ensco plc and General Motors Co. (“GM”). General Cable is a leading manufacturer and distributor of copper wire and cable for the telecom and utility industries. Inconsistent results and weak copper prices have driven the stock and convertible bond lower during the past few months. The company has initiated a restructuring program to reduce costs and we believe that pent up demand for utility spending should materialize in the near future. Ensco is a leading drilling company with a large presence in the Gulf of Mexico. Commodity weakness along with new supply has weakened pricing on new drilling contracts. While we expect this pricing weakness to continue, we believe that Ensco remains an attractive long-term play on energy demand. Ensco has a very attractive dividend which we believe is sustainable through the soft market. Auto stocks, such as GM, suffered over the first quarter of 2014 as investors became concerned that the sales momentum from last year would not be sustained. GM was also negatively impacted by recalls announced during the reporting period, as they hurt both the consumer’s perception of manufacturing quality and the company’s profitability. While GM’s recall may negatively impact the short-term outlook, longer term we believe the company can regain its sales momentum. We also remain positive on the outlook for autos in general because we expect pent-up demand to continue to drive sales higher.
3 OPPENHEIMER EQUITY INCOME FUND/VA
STRATEGY & OUTLOOK
The Fund invests primarily in the common stocks of large, dividend-paying companies, but may also own income-oriented investments such as preferred shares, convertible bonds and other types of fixed income securities. Through intensive fundamental research and the careful management of portfolio risks, the Fund aims to deliver strong returns compared to its peers.
While we were surprised by the extent of the market weakness over the second half of 2014, we remain optimistic about the market as we enter 2015. While Europe’s weakness is a concern, we believe the strength in the U.S. economy can continue to improve, driven by low interest rates, easy monetary policy, strong corporate balance sheets and profitability, and better consumer balance sheets. We believe corporate earnings should continue to improve and dividends should continue to increase in line with earnings. We expect interest rates to ultimately begin to move higher, which can result in flat to negative returns for most fixed income asset classes and make equities look even more appealing. Wildcards remain, including commodity prices and geopolitical risk, but overall our outlook for equities remains constructive at period end.
Investors should consider the Fund’s investment objective, risks, charges and expenses carefully before investing. The Fund’s prospectus and summary prospectus contain this and other information about the Fund, and may be obtained by asking your financial advisor or calling us at 1.800.988.8287. Read prospectuses and summary prospectuses carefully before investing.
Total returns include changes in share price and reinvestment of dividends and capital gains distributions in a hypothetical investment for the periods shown.
The Fund’s investment strategy and focus can change over time. The mention of specific fund holdings does not constitute a recommendation by OppenheimerFunds, Inc. or its affiliates.
Shares of Oppenheimer funds are not deposits or obligations of any bank, are not guaranteed by any bank, are not insured by the FDIC or any other agency, and involve investment risks, including the possible loss of the principal amount invested.
Comparing the Fund’s Performance to the Market. The graphs that follow show the performance of a hypothetical $10,000 investment in each share class of the Fund held until December 31, 2014. In the case of Non-Service shares, performance is measured over a ten-fiscal-year period. In the case of Service shares, performance is measured from inception of the Class on September 18, 2006. Performance information does not reflect charges that apply to separate accounts investing in the Fund. If these charges were taken into account, performance would be lower. The graphs assume that all dividends and capital gains distributions were reinvested in additional shares.
The Fund’s performance is compared to the performance of the Russell 1000 Value Index and the S&P 500 Index. The Russell 1000 Value Index measures the performance of the large-cap value segment of the U.S. equity universe. It includes those Russell 1000 companies with lower price-to-book ratios and lower expected growth values. The S&P 500 Index is a capitalization-weighted index of 500 stocks intended to be a representative sample of leading companies in leading industries within the U.S. economy. The indices are unmanaged and cannot be purchased directly by investors. While index comparisons may be useful to provide a benchmark for the Fund’s performance, it must be noted that the Fund’s investments are not limited to the investments comprising the indices. Index performance includes reinvestment of income, but does not reflect transaction costs, fees, expenses or taxes. Index performance is shown for illustrative purposes only as a benchmark for the Fund’s performance, and does not predict or depict performance of the Fund. The Fund’s performance reflects the effects of the Fund’s business and operating expenses.
4 OPPENHEIMER EQUITY INCOME FUND/VA
COMPARISON OF CHANGE IN VALUE OF $10,000 HYPOTHETICAL INVESTMENTS IN:
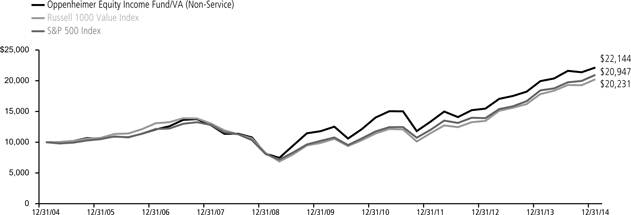
COMPARISON OF CHANGE IN VALUE OF $10,000 HYPOTHETICAL INVESTMENTS IN:
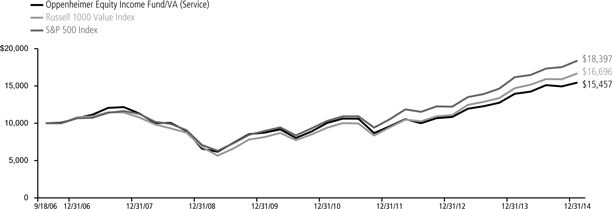
Performance data quoted represents past performance, which does not guarantee future results. The investment return and principal value of an investment in the Fund will fluctuate so that an investor’s shares, when redeemed, may be worth more or less than their original cost. Current performance may be lower or higher than the performance quoted. For performance data current to the most recent month end, call us at 1.800.988.8287. The Fund’s total returns should not be expected to be the same as the returns of other funds, whether or not both funds have the same portfolio managers and/or similar names. The Fund’s total returns include changes in share price and reinvested distributions but do not include the charges associated with the separate account products that offer this Fund. Such performance would have been lower if such charges were taken into account.
5 OPPENHEIMER EQUITY INCOME FUND/VA
Fund Expenses
Fund Expenses. As a shareholder of the Fund, you incur two types of costs: (1) transaction costs and (2) ongoing costs, including management fees; distribution and service fees; and other Fund expenses. These examples are intended to help you understand your ongoing costs (in dollars) of investing in the Fund and to compare these costs with the ongoing costs of investing in other mutual funds.
The examples are based on an investment of $1,000.00 invested at the beginning of the period and held for the entire 6-month period ended December 31, 2014.
Actual Expenses. The first section of the table provides information about actual account values and actual expenses. You may use the information in this section for the class of shares you hold, together with the amount you invested, to estimate the expense that you paid over the period. Simply divide your account value by $1,000.00 (for example, an $8,600.00 account value divided by $1,000.00 = 8.60), then multiply the result by the number in the first section under the heading entitled “Expenses Paid During Period” to estimate the expenses you paid on your account during this period.
Hypothetical Example for Comparison Purposes.
The second section of the table provides information about hypothetical account values and hypothetical expenses based on the Fund’s actual expense ratio for each class of shares, and an assumed rate of return of 5% per year for each class before expenses, which is not the actual return. The hypothetical account values and expenses may not be used to estimate the actual ending account balance or expenses you paid for the period. You may use this information to compare the ongoing costs of investing in the Fund and other funds. To do so, compare this 5% hypothetical example for the class of shares you hold with the 5% hypothetical examples that appear in the shareholder reports of the other funds.
Please note that the expenses shown in the table are meant to highlight your ongoing costs only and do not reflect any charges associated with the separate accounts that offer this Fund. Therefore, the “hypothetical” lines of the table are useful in comparing ongoing costs only, and will not help you determine the relative total costs of owning different funds. In addition, if these separate account charges were included your costs would have been higher.
| | | | | | | | | | | | | | | | | | |
| Actual | | Beginning Account Value July 1, 2014 | | Ending Account Value
December 31, 2014 | | Expenses
Paid During
6 Months Ended
December 31, 2014 |
Non-Service shares | | $ | 1,000.00 | | | | | $ | 1,024.60 | | | | | $ | 4.09 | | | |
Service shares | | | 1,000.00 | | | | | | 1,022.70 | | | | | | 5.37 | | | |
| | | | | | |
| Hypothetical | | | | | | | | | | | | | | | | | | |
(5% return before expenses) | | | | | | | | | | | | | | | | | | |
Non-Service shares | | | 1,000.00 | | | | | | 1,021.17 | | | | | | 4.08 | | | |
Service shares | | | 1,000.00 | | | | | | 1,019.91 | | | | | | 5.36 | | | |
Expenses are equal to the Fund’s annualized expense ratio for that class, multiplied by the average account value over the period, multiplied by 184/365 (to reflect the one-half year period). Those annualized expense ratios, excluding indirect expenses from affiliated funds, based on the 6-month period ended December 31, 2014 are as follows:
| | | | | | |
| Class | | Expense Ratios | | | |
Non-Service shares | | | 0.80% | | | |
Service shares | | | 1.05 | | | |
The expense ratios reflect voluntary and/or contractual waivers and/or reimbursements of expenses by the Fund’s Manager. Some of these undertakings may be modified or terminated at any time, as indicated in the Fund’s prospectus. The “Financial Highlights” tables in the Fund’s financial statements, included in this report, also show the gross expense ratios, without such waivers or reimbursements and reduction to custodian expenses, if applicable.
6 OPPENHEIMER EQUITY INCOME FUND/VA
| | |
| |
| STATEMENT OF INVESTMENTS December 31, 2014 | | |
| | | | | | | | |
| | | Shares | | | Value | |
Common Stocks—83.3% | |
Consumer Discretionary—15.2% | |
Auto Components—2.3% | |
American Axle & Manufacturing Holdings, Inc.1 | | | 2,200 | | | | $ 49,698 | |
Lear Corp. | | | 2,200 | | | | 215,776 | |
| | | | | | | 265,474 | |
| | |
| | | | | | | | | |
Automobiles—4.6% | |
Ford Motor Co. | | | 17,500 | | | | 271,250 | |
General Motors Co. | | | 7,525 | | | | 262,698 | |
| | | | | | | 533,948 | |
| | |
| | | | | | | | | |
Household Durables—1.9% | |
MDC Holdings, Inc. | | | 4,725 | | | | 125,071 | |
Standard Pacific Corp.1 | | | 12,450 | | | | 90,760 | |
| | | | | | | 215,831 | |
| | |
| | | | | | | | | |
Media—1.3% | |
Comcast Corp., Cl. A | | | 75 | | | | 4,351 | |
Time Warner Cable, Inc. | | | 920 | | | | 139,895 | |
| | | | | | | 144,246 | |
| | |
| | | | | | | | | |
Multiline Retail—1.8% | | | | | | | | |
J.C. Penney Co., Inc.1 | | | 3,113 | | | | 20,172 | |
Kohl’s Corp. | | | 1,800 | | | | 109,872 | |
Target Corp. | | | 1,000 | | | | 75,910 | |
| | | | | | | 205,954 | |
| | |
| | | | | | | | | |
Specialty Retail—3.3% | | | | | | | | |
Best Buy Co., Inc. | | | 6,500 | | | | 253,370 | |
Foot Locker, Inc. | | | 1,975 | | | | 110,955 | |
Staples, Inc. | | | 875 | | | | 15,855 | |
| | | | | | | 380,180 | |
| | |
| | | | | | | | | |
Consumer Staples—2.6% | | | | | | | | |
Beverages—0.5% | | | | | | | | |
Molson Coors Brewing Co., Cl. B | | | 600 | | | | 44,712 | |
PepsiCo, Inc. | | | 110 | | | | 10,402 | |
| | | | | | | 55,114 | |
| | |
| | | | | | | | | |
Food & Staples Retailing—0.6% | |
Walgreens Boots Alliance, Inc.1 | | | 1,000 | | | | 76,200 | |
| | |
| | | | | | | | | |
Food Products—0.9% | | | | | | | | |
Archer-Daniels-Midland Co. | | | 100 | | | | 5,200 | |
ConAgra Foods, Inc. | | | 1,150 | | | | 41,722 | |
Pinnacle Foods, Inc. | | | 1,625 | | | | 57,362 | |
| | | | | | | 104,284 | |
| | |
| | | | | | | | | |
Tobacco—0.6% | |
Philip Morris International, Inc. | | | 850 | | | | 69,232 | |
| | |
| | | | | | | | | |
Energy—10.7% | | | | | | | | |
Energy Equipment & Services—1.3% | | | | | | | | |
Baker Hughes, Inc. | | | 1,110 | | | | 62,238 | |
Ensco plc, Cl. A | | | 2,250 | | | | 67,387 | |
Halliburton Co. | | | 585 | | | | 23,008 | |
| | | | | | | 152,633 | |
| | |
| | | | | | | | | |
Oil, Gas & Consumable Fuels—9.4% | |
Apache Corp. | | | 1,000 | | | | 62,670 | |
BP plc, Sponsored ADR | | | 2,715 | | | | 103,496 | |
Chevron Corp. | | | 2,700 | | | | 302,886 | |
Exxon Mobil Corp. | | | 500 | | | | 46,225 | |
Kinder Morgan, Inc. | | | 6,341 | | | | 268,288 | |
Marathon Oil Corp. | | | 1,525 | | | | 43,142 | |
Royal Dutch Shell plc, Cl. A, Sponsored ADR | | | 1,765 | | | | 118,167 | |
Williams Cos., Inc. (The) | | | 2,965 | | | | 133,247 | |
| | | | | | | 1,078,121 | |
| | |
| | | | | | | | | |
Financials—25.5% | | | | | | | | |
Capital Markets—4.2% | | | | | | | | |
Apollo Global Management LLC, Cl. A | | | 550 | | | | 12,969 | |
| | | | | | | | | | |
| | | | | Shares | | | Value | |
| | | Capital Markets (Continued) | |
| | | Credit Suisse Group AG, Sponsored ADR1 | | | 1,100 | | | $ | 27,588 | |
| | | Goldman Sachs Group, Inc. (The) | | | 925 | | | | 179,293 | |
| | | KKR & Co. LP | | | 4,575 | | | | 106,186 | |
| | | Morgan Stanley | | | 3,900 | | | | 151,320 | |
| | | | | | | | | | 477,356 | |
| | | | | | | | | | | |
| | | Commercial Banks—10.9% | |
| | | Banco Bilbao Vizcaya Argentaria SA, Sponsored ADR | | | 2,575 | | | | 24,179 | |
| | | Bank of America Corp. | | | 2,675 | | | | 47,856 | |
| | | CIT Group, Inc. | | | 900 | | | | 43,047 | |
| | | Citigroup, Inc. | | | 9,525 | | | | 515,398 | |
| | | JPMorgan Chase & Co. | | | 7,525 | | | | 470,914 | |
| | | M&T Bank Corp. | | | 50 | | | | 6,281 | |
| | | Wells Fargo & Co. | | | 2,750 | | | | 150,755 | |
| | | | | | | | | | 1,258,430 | |
| | | | | | | | | | | |
| | | Insurance—6.2% | |
| | | American International Group, Inc. | | | 800 | | | | 44,808 | |
| | | Assured Guaranty Ltd. | | | 10,525 | | | | 273,545 | |
| | | Genworth Financial, Inc., Cl. A1 | | | 3,175 | | | | 26,987 | |
| | | MBIA, Inc.1 | | | 1,075 | | | | 10,256 | |
| | | MetLife, Inc. | | | 5,000 | | | | 270,450 | |
| | | XL Group plc, Cl. A | | | 2,585 | | | | 88,846 | |
| | | | | | | | | | 714,892 | |
| | | | | | | | | | | |
| | | Real Estate Investment Trusts (REITs)—3.9% | |
| | | Apollo Commercial Real Estate Finance, Inc. | | | 4,000 | | | | 65,440 | |
| | | Ashford Hospitality Trust, Inc. | | | 3,675 | | | | 38,514 | |
| | | Blackstone Mortgage Trust, Inc., Cl. A | | | 1,050 | | | | 30,597 | |
| | | Colony Financial, Inc. | | | 5,250 | | | | 125,055 | |
| | | Starwood Property Trust, Inc. | | | 5,550 | | | | 128,982 | |
| | | Two Harbors Investment Corp. | | | 5,650 | | | | 56,613 | |
| | | | | | | | | | 445,201 | |
| | | | | | | | | | | |
| | | Thrifts & Mortgage Finance—0.3% | |
| | | MGIC Investment Corp.1 | | | 2,450 | | | | 22,834 | |
| | | Radian Group, Inc. | | | 710 | | | | 11,871 | |
| | | | | | | | | | 34,705 | |
| | | | | | | | | | | |
| | | Health Care—7.8% | |
| | | Health Care Equipment & Supplies—1.5% | |
| | | Baxter International, Inc. | | | 775 | | | | 56,800 | |
| | | Covidien plc | | | 600 | | | | 61,368 | |
| | | Medtronic, Inc. | | | 780 | | | | 56,316 | |
| | | | | | | | | | 174,484 | |
| | | | | | | | | | | |
| | | Health Care Providers & Services—0.6% | |
| | | UnitedHealth Group, Inc. | | | 725 | | | | 73,290 | |
| | | | | | | | | | | |
| | | Pharmaceuticals—5.7% | |
| | | AbbVie, Inc. | | | 275 | | | | 17,996 | |
| | | GlaxoSmithKline plc, Sponsored ADR | | | 1,900 | | | | 81,206 | |
| | | Merck & Co., Inc. | | | 3,625 | | | | 205,864 | |
| | | Pfizer, Inc. | | | 6,950 | | | | 216,492 | |
| | | Roche Holding AG, Sponsored ADR | | | 1,400 | | | | 47,586 | |
| | | Teva Pharmaceutical Industries Ltd., Sponsored ADR | | | 1,425 | | | | 81,952 | |
| | | | | | | | | | 651,096 | |
| | | | |
| | | | | | | | | | | |
| | | Industrials—3.5% | |
| | | Aerospace & Defense—0.5% | |
| | | Boeing Co. (The) | | | 110 | | | | 14,298 | |
| | | Textron, Inc. | | | 1,000 | | | | 42,110 | |
| | | | | | | | | | 56,408 | |
| | | | | | | | | | | |
| | | Commercial Services & Supplies—0.8% | |
| | | R.R. Donnelley & Sons Co. | | | 5,375 | | | | 90,327 | |
| | | | | | | | | | | |
| | | Electrical Equipment—0.3% | |
| | | General Cable Corp. | | | 2,050 | | | | 30,545 | |
7 OPPENHEIMER EQUITY INCOME FUND/VA
| | |
| |
| STATEMENT OF INVESTMENTS Continued | | |
| | | | | | | | |
| | | Shares | | | Value | |
Industrial Conglomerates—0.9% | |
General Electric Co. | | | 4,250 | | | $ | 107,397 | |
| | |
| | | | | | | | | |
Machinery—0.5% | |
Navistar International Corp.1 | | | 1,648 | | | | 55,175 | |
| | |
| | | | | | | | | |
Marine—0.2% | |
Costamare, Inc. | | | 1,250 | | | | 22,013 | |
| | |
| | | | | | | | | |
Road & Rail—0.3% | |
CSX Corp. | | | 1,000 | | | | 36,230 | |
| | |
| | | | | | | | | |
Information Technology—6.1% | |
Communications Equipment—1.4% | |
Cisco Systems, Inc. | | | 3,000 | | | | 83,445 | |
QUALCOMM, Inc. | | | 1,000 | | | | 74,330 | |
| | | | | | | 157,775 | |
| | |
| | | | | | | | | |
Internet Software & Services—0.1% | |
Google, Inc., Cl. C1 | | | 25 | | | | 13,160 | |
| | |
| | | | | | | | | |
Semiconductors & Semiconductor Equipment—0.3% | |
Maxim Integrated Products, Inc. | | | 250 | | | | 7,968 | |
Micron Technology, Inc.1 | | | 720 | | | | 25,207 | |
| | | | | | | 33,175 | |
| | |
| | | | | | | | | |
Software—1.5% | |
CA, Inc. | | | 250 | | | | 7,612 | |
Microsoft Corp. | | | 3,500 | | | | 162,575 | |
| | | | | | | 170,187 | |
| | |
| | | | | | | | | |
Technology Hardware, Storage & Peripherals—2.8% | |
Apple, Inc. | | | 2,625 | | | | 289,747 | |
EMC Corp. | | | 590 | | | | 17,547 | |
Seagate Technology plc | | | 325 | | | | 21,613 | |
| | | | | | | 328,907 | |
| | |
| | | | | | | | | |
Materials—4.0% | |
Chemicals—1.1% | |
LyondellBasell Industries NV, Cl. A | | | 875 | | | | 69,466 | |
Mosaic Co. (The) | | | 550 | | | | 25,108 | |
Potash Corp. of Saskatchewan, Inc. | | | 875 | | | | 30,905 | |
| | | | | | | 125,479 | |
| | |
| | | | | | | | | |
Metals & Mining—0.8% | |
Allegheny Technologies, Inc. | | | 1,125 | | | | 39,116 | |
Freeport-McMoRan, Inc. | | | 2,000 | | | | 46,720 | |
| | | | | | | 85,836 | |
| | |
| | | | | | | | | |
Paper & Forest Products—2.1% | |
Domtar Corp. | | | 2,625 | | | | 105,578 | |
International Paper Co. | | | 1,695 | | | | 90,818 | |
Louisiana-Pacific Corp.1 | | | 3,045 | | | | 50,425 | |
| | | | | | | 246,821 | |
| | |
| | | | | | | | | |
Telecommunication Services—5.1% | |
Diversified Telecommunication Services—4.6% | |
AT&T, Inc. | | | 4,000 | | | | 134,360 | |
CenturyLink, Inc. | | | 3,800 | | | | 150,404 | |
Verizon Communications, Inc. | | | 3,375 | | | | 157,883 | |
Windstream Holdings, Inc. | | | 11,375 | | | | 93,730 | |
| | | | | | | 536,377 | |
| | |
| | | | | | | | | |
Wireless Telecommunication Services—0.5% | |
Telephone & Data Systems, Inc. | | | 2,125 | | | | 53,656 | |
| | |
| | | | | | | | | |
Utilities—2.8% | |
Electric Utilities—2.5% | |
American Electric Power Co., Inc. | | | 1,325 | | | | 80,454 | |
Edison International | | | 825 | | | | 54,021 | |
Exelon Corp. | | | 400 | | | | 14,832 | |
FirstEnergy Corp. | | | 1,650 | | | | 64,333 | |
| | | | | | | | | | |
| | | | | Shares | | | Value | |
| | | Electric Utilities (Continued) | |
| | | PPL Corp. | | | 2,050 | | | $ | 74,477 | |
| | | | | | | | | | 288,117 | |
| | | | | | | | | | | |
| | | Independent Power and Renewable Electricity Producers—0.3% | |
| | | NRG Energy, Inc. | | | 1,365 | | | | 36,787 | |
| | | Total Common Stocks (Cost $8,360,686) | | | | | | | 9,585,043 | |
| | | | |
| | | | | | | | | | | |
| | | Preferred Stocks—3.2% | |
| | | Alcoa, Inc., 5.375% Cv., Non-Vtg. | | | 335 | | | | 16,900 | |
| | | American Homes 4 Rent, 5% Cum., Series A, Non-Vtg. | | | 1,000 | | | | 24,680 | |
| | | American Homes 4 Rent, 5% Cum., Series B, Non-Vtg. | | | 1,300 | | | | 32,058 | |
| | | Beazer Homes USA, Inc., 7.50% Cv. | | | 3,100 | | | | 92,070 | |
| | | Dominion Resources, Inc., 6.375% Cv. | | | 275 | | | | 14,303 | |
| | | Exelon Corp., 6.50% Cv. | | | 140 | | | | 7,350 | |
| | | iStar Financial, Inc., 4.50% Cv., Non-Vtg. | | | 1,540 | | | | 91,430 | |
| | | Post Holdings, Inc., 2.50% Cv.2 | | | 265 | | | | 22,343 | |
| | | Post Holdings, Inc., 5.25% Cv. | | | 800 | | | | 70,816 | |
| | | Total Preferred Stocks (Cost $369,215) | | | | | | | 371,950 | |
| | | | | | | | | | | |
| | | | | Units | | | | |
| | | Rights, Warrants and Certificates—0.3% | |
| | | General Motors Co. Wts., Strike Price $18.33, Exp. 7/10/191 | | | 525 | | | | 8,993 | |
| | | Kinder Morgan, Inc. Wts., Strike Price $40, Exp. 5/25/171 | | | 5,075 | | | | 21,620 | |
| | | Total Rights, Warrants and Certificates (Cost $26,445) | | | | | | | 30,613 | |
| | | | | | | | | | | |
| | | | | Principal
Amount | | | | |
| | | Non-Convertible Corporate Bonds and Notes—0.6% | |
| | | J.C. Penney Corp., Inc., 5.65% Sr. Unsec. Nts., 6/1/20 | | $ | 32,000 | | | | 24,960 | |
| | | MBIA Insurance Corp., 11.491% Sub. Nts., 1/15/332,3 | | | 65,000 | | | | 39,650 | |
| | | Total Non-Convertible Corporate Bonds and Notes (Cost $73,239) | | | | | | | 64,610 | |
| | | | | | | | | | | |
| | | Convertible Corporate Bonds and Notes—8.4% | |
| | | General Cable Corp., 4.50% Cv. Unsec. Sub. Nts., 11/15/294 | | | 125,000 | | | | 90,703 | |
| | | iStar Financial, Inc., 3% Cv. Sr. Unsec. Nts., 11/15/16 | | | 60,000 | | | | 76,012 | |
| | | MGIC Investment Corp.: | | | | | | | | |
| | | 5.00% Cv. Sr. Unsec. Nts., 5/1/17 | | | 50,000 | | | | 56,406 | |
| | | 9.00% Cv. Jr. Sub. Nts., 4/1/632 | | | 185,000 | | | | 238,881 | |
| | | Micron Technology, Inc., 3% Cv. Sr. Unsec. Nts., 11/15/43 | | | 78,000 | | | | 103,009 | |
| | | Navistar International Corp.: | | | | | | | | |
| | | 4.50% Cv. Sr. Sub. Nts., 10/15/18 | | | 85,000 | | | | 80,556 | |
| | | 4.75% Cv. Sr. Sub. Nts., 4/15/192 | | | 35,000 | | | | 33,644 | |
| | | Peabody Energy Corp., 4.75% Cv. Jr. Sub. Nts., 12/15/41 | | | 95,000 | | | | 50,350 | |
| | | Radian Group, Inc., 2.25% Cv. Sr. Unsec. Nts., 3/1/19 | | | 62,000 | | | | 100,014 | |
| | | United Airlines, Inc., 4.50% Cv. Sr. Unsec. Nts., 1/15/15 | | | 40,000 | | | | 140,275 | |
| | | Total Convertible Corporate Bonds and Notes (Cost $860,084) | | | | | | | 969,850 | |
| | | | | | | | | | | |
| | | | | Shares | | | | |
| | | Structured Securities—3.5% | |
| | | Bank of America Corp., Teva Pharmaceutical Industries Ltd. Equity Linked Nts., 2/4/15 2 | | | 505 | | | | 29,501 | |
| | | Barclays Bank plc, Radian Group, Inc. Yield Enhanced Equity Linked Debt Securities, 5/26/15 | | | 1,491 | | | | 24,953 | |
| | | | |
| | | | | | | | | | | |
8 OPPENHEIMER EQUITY INCOME FUND/VA
| | | | | | | | |
| | | Shares | | | Value | |
Structured Securities (Continued) | |
| Citigroup, Inc., Apple, Inc. Equity Linked Nts., 3/30/15 2 | | | 245 | | | $ | 26,543 | |
| Citigroup, Inc., J.C. Penney Co., Inc. Equity Linked Nts., 6/2/15 2 | | | 2,587 | | | | 17,290 | |
| Credit Suisse AG (New York Branch), Apple, Inc. Equity Linked Nts., 3/11/15 | | | 151 | | | | 16,326 | |
| Credit Suisse AG (New York Branch), Louisiana-Pacific Corp. Equity Linked Nts., 5/1/15 | | | 1,053 | | | | 16,725 | |
| Credit Suisse AG (New York Branch), MBIA, Inc. Equity Linked Nts., 6/3/15 | | | 2,468 | | | | 23,972 | |
| Credit Suisse AG (New York Branch), Rite Aid Corp. Equity Linked Nts., 3/25/15 | | | 4,817 | | | | 28,897 | |
| Deutsche Bank AG (London Branch), American Axle & Manufacturing Holdings, Inc. Equity Linked Nts., 3/11/15 2 | | | 1,375 | | | | 28,993 | |
| Goldman Sachs Group, Inc. (The), Apple, Inc. Equity Linked Nts., 2/27/15 2 | | | 495 | | | | 53,754 | |
| Goldman Sachs Group, Inc. (The), Louisiana-Pacific Corp. Equity Linked Nts., 2/4/15 2 | | | 1,042 | | | | 16,977 | |
| Goldman Sachs Group, Inc. (The), MBIA, Inc. Equity Linked Nts., 2/4/15 2 | | | 1,420 | | | | 13,685 | |
| Goldman Sachs Group, Inc. (The), MBIA, Inc. Equity Linked Nts., 5/18/15 2 | | | 2,457 | | | | 23,713 | |
| Goldman Sachs Group, Inc. (The), MBIA, Inc. Equity Linked Nts., 1/2/15 2 | | | 1,266 | | | | 12,358 | |
| | | | | | | | | | |
| | | | | Shares | | | Value | |
| | | Structured Securities (Continued) | |
| | | Goldman Sachs Group, Inc. (The), Standard Pacific Corp. Equity Linked Nts., 3/9/15 2 | | | 3,000 | | | $ | 22,148 | |
| | | Morgan Stanley, Rite Aid Corp. Equity Linked Nts., 6/15/15 2 | | | 4,437 | | | | 28,855 | |
| | | Wells Fargo & Co., Navistar International Corp. Equity Linked Nts., 3/9/15 2 | | | 633 | | | | 21,395 | |
| | | Total Structured Securities (Cost $396,100) | | | | | | | 406,085 | |
| | | Investment Company—0.8% | |
| | | Oppenheimer Institutional Money Market Fund, Cl. E, 0.10%5,6 (Cost $96,193) | | | 96,193 | | | | 96,193 | |
| | | | | | | | | | | | | | | | | | | | |
| | | | | | | |
| | | | | | | Exercise
Price | | | Expiration
Date | | | Contracts | | | | |
| | | Exchange-Traded Option Purchased—0.0% | |
| | | Merck & Co., Inc. Put1 (Cost $153) | | | USD 55.000 | | | | 1/17/15 | | | | USD 4 | | | | 116 | |
| | | Total Investments, at Value (Cost $10,182,115) | | | | 100.1 | % | | | 11,524,460 | |
| | | Net Other Assets (Liabilities) | | | | (0.1 | ) | | | (16,865 | ) |
| | | | | | | | | | | | | | | | | |
| | | Net Assets | | | | | | | | 100.0 | % $ | | | 11,507,595 | |
| | | | | | | | | | | | | | | | | |
Footnotes to Statement of Investments
1. Non-income producing security.
2. Represents securities sold under Rule 144A, which are exempt from registration under the Securities Act of 1933, as amended. These securities have been determined to be liquid under guidelines established by the Board of Trustees. These securities amount to $629,730 or 5.47% of the Fund’s net assets as of December 31, 2014.
3. This security is not accruing income because the issuer has missed an interest payment on it and/or is not anticipated to make future interest and or principal payments. The rate shown is the original contractual interest rate. See Note 4 of the accompanying Notes.
4. Represents the current interest rate for a variable or increasing rate security.
5. Rate shown is the 7-day yield as of December 31, 2014.
6. Is or was an affiliate, as defined in the Investment Company Act of 1940, as amended, at or during the period ended December 31, 2014, by virtue of the Fund owning at least 5% of the voting securities of the issuer or as a result of the Fund and the issuer having the same investment adviser. Transactions during the period in which the issuer was an affiliate are as follows:
| | | | | | | | | | | | | | | | |
| | | Shares
December 31, 2013 | | | Gross
Additions | | | Gross
Reductions | | | Shares
December 31, 2014 | |
Oppenheimer Institutional Money Market Fund, Cl. E | | | 59,001 | | | | 3,024,056 | | | | 2,986,864 | | | | 96,193 | |
| | | | |
| | | | | | | | | Value | | | Income | |
Oppenheimer Institutional Money Market Fund, Cl. E | | | | | | | | | | $ | 96,193 | | | $ | 79 | |
| | | | | | | | | | | | | | | | | | | | | | | | | | | | |
Exchange-Traded Options Written at December 31, 2014 | |
| Description | | | | | Exercise Price | | | Expiration Date | | | | | | Number of Contracts | | | Premiums Received | | | Value | |
American Airlines Group Put | | | USD | | | | 45.000 | | | | 1/17/15 | | | | USD | | | | (4 | ) | | $ | 477 | | | $ | (56 | ) |
Best Buy, Inc. Call | | | USD | | | | 40.000 | | | | 1/17/15 | | | | USD | | | | (5 | ) | | | 599 | | | | (800 | ) |
Best Buy, Inc. Put | | | USD | | | | 32.000 | | | | 1/17/15 | | | | USD | | | | (4 | ) | | | 257 | | | | (100 | ) |
Covidien plc Put | | | USD | | | | 97.500 | | | | 1/17/15 | | | | USD | | | | (3 | ) | | | 863 | | | | (405 | ) |
CXS Corp. Call | | | USD | | | | 37.000 | | | | 1/17/15 | | | | USD | | | | (10 | ) | | | 898 | | | | (610 | ) |
Ensco plc Call | | | USD | | | | 32.000 | | | | 1/17/15 | | | | USD | | | | (4 | ) | | | 256 | | | | (200 | ) |
Genworth Financial, Inc. Put | | | USD | | | | 9.000 | | | | 1/17/15 | | | | USD | | | | (6 | ) | | | 690 | | | | (405 | ) |
International Paper Co. Call | | | USD | | | | 52.500 | | | | 1/17/15 | | | | USD | | | | (5 | ) | | | 1,090 | | | | (1,000 | ) |
MBIA, Inc. Put | | | USD | | | | 11.000 | | | | 1/17/15 | | | | USD | | | | (5 | ) | | | 420 | | | | (695 | ) |
MBIA, Inc. Put | | | USD | | | | 10.000 | | | | 1/17/15 | | | | USD | | | | (10 | ) | | | 1,599 | | | | (430 | ) |
Walgreen Co. Call | | | USD | | | | 75.000 | | | | 1/17/15 | | | | USD | | | | (4 | ) | | | 296 | | | | (872 | ) |
| | | | | | | | | | | | | | | | | | | | | | | | |
Total of Exchange-Traded Options Written | | | | | | | | | | | | | | | | | | | | | | $ | 7,445 | | | $ | (5,573 | ) |
| | | | | | | | | | | | | | | | | | | | | | | | |
See accompanying Notes to Financial Statements.
9 OPPENHEIMER EQUITY INCOME FUND/VA
STATEMENT OF ASSETS AND LIABILITIES December 31, 2014
| | | | |
Assets | | | | |
Investments, at value—see accompanying statement of investments: | | | | |
Unaffiliated companies (cost $10,085,922) | | $ | 11,428,267 | |
Affiliated companies (cost $96,193) | | | 96,193 | |
| | | | |
| | | 11,524,460 | |
| |
Cash | | | 1,942 | |
| |
Receivables and other assets: | | | | |
Interest and dividends | | | 30,594 | |
Shares of beneficial interest sold | | | 20,515 | |
Investments sold | | | 3,826 | |
Other | | | 10,780 | |
| | | | |
Total assets | | | 11,592,117 | |
| | | | |
| |
Liabilities | | | | |
Options written, at value (premiums received $7,445) | | | 5,573 | |
| |
Payables and other liabilities: | | | | |
Investments purchased | | | 40,218 | |
Legal, auditing and other professional fees | | | 18,857 | |
Trustees’ compensation | | | 9,876 | |
Shareholder communications | | | 4,986 | |
Distribution and service plan fees | | | 2,376 | |
Shares of beneficial interest redeemed | | | 2,224 | |
Other | | | 412 | |
| | | | |
Total liabilities | | | 84,522 | |
|
| |
Net Assets | | $ | 11,507,595 | |
| | | | |
|
| |
Composition of Net Assets | | | | |
Par value of shares of beneficial interest | | $ | 802 | |
| |
Additional paid-in capital | | | 9,261,766 | |
| |
Accumulated net investment income | | | 217,214 | |
| |
Accumulated net realized gain on investments | | | 683,596 | |
| |
Net unrealized appreciation on investments | | | 1,344,217 | |
| | | | |
Net Assets | | $ | 11,507,595 | |
| | | | |
|
| |
Net Asset Value Per Share | | | | |
Non-Service Shares: | | | | |
| Net asset value, redemption price per share and offering price per share (based on net assets of $301,429 and 24,939 shares of beneficial interest outstanding) | | | $12.09 | |
| |
| |
Service Shares: | | | | |
| Net asset value, redemption price per share and offering price per share (based on net assets of $11,206,166 and 776,565 shares of beneficial interest outstanding) | | | $14.43 | |
See accompanying Notes to Financial Statements.
10 OPPENHEIMER EQUITY INCOME FUND/VA
STATEMENT OF OPERATIONS For the Year Ended December 31, 2014
| | | | |
| | |
Investment Income | | | | |
| |
Dividends: | | | | |
Unaffiliated companies (net of foreign withholding taxes of $1,693) | | $ | 323,879 | |
Affiliated companies | | | 79 | |
| | | | |
Total investment income | | | 323,958 | |
|
| | |
Expenses | | | | |
Management fees | | | 84,397 | |
| |
Distribution and service plan fees - Service shares | | | 27,480 | |
| |
Transfer and shareholder servicing agent fees: | | | | |
Non-Service shares | | | 265 | |
Service shares | | | 10,988 | |
| |
Shareholder communications: | | | | |
Non-Service shares | | | 321 | |
Service shares | | | 13,409 | |
| |
Custodian fees and expenses | | | 1,374 | |
| |
Trustees’ compensation | | | 9,602 | |
| |
Legal, auditing and other professional fees | | | 36,437 | |
| |
Other | | | 3,512 | |
| | | | |
Total expenses | | | 187,785 | |
Less waivers and reimbursements of expenses | | | (70,288) | |
| | | | |
Net expenses | | | 117,497 | |
|
| |
Net Investment Income | | | 206,461 | |
|
| |
Realized and Unrealized Gain (Loss) | | | | |
Net realized gain on: | | | | |
Investments from unaffiliated companies (including premiums on written options exercised) | | | 790,255 | |
Closing and expiration of option contracts written | | | 87,066 | |
| | | | |
Net realized gain | | | 877,321 | |
| |
Net change in unrealized appreciation/depreciation on: | | | | |
Investments | | | 81,022 | |
Option contracts written | | | (2,856) | |
| | | | |
Net change in unrealized appreciation/depreciation | | | 78,166 | |
|
| |
Net Increase in Net Assets Resulting from Operations | | $ | 1,161,948 | |
| | | | |
See accompanying Notes to Financial Statements.
11 OPPENHEIMER EQUITY INCOME FUND/VA
STATEMENTS OF CHANGES IN NET ASSETS
| | | | | | | | |
| | | Year Ended December 31, 2014 | | | Year Ended
December 31, 2013 | |
Operations | | | | | | | | |
Net investment income | | $ | 206,461 | | | $ | 155,694 | |
| |
Net realized gain | | | 877,321 | | | | 1,528,329 | |
| |
Net change in unrealized appreciation/depreciation | | | 78,166 | | | | 491,763 | |
| | | | | | | | |
Net increase in net assets resulting from operations | | | 1,161,948 | | | | 2,175,786 | |
| | | | | | | | |
Dividends and/or Distributions to Shareholders | | | | | | | | |
Dividends from net investment income: | | | | | | | | |
Non-Service shares | | | (4,861 | ) | | | (2,605) | |
Service shares | | | (162,231 | ) | | | (91,168) | |
| | | | |
| | | (167,092 | ) | | | (93,773) | |
| | | | | | | | |
Distributions from net realized gain: | | | | | | | | |
Non-Service shares | | | (12,986 | ) | | | — | |
Service shares | | | (451,817 | ) | | | — | |
| | | | |
| | | (464,803 | ) | | | — | |
| | | | | | | | |
Beneficial Interest Transactions | | | | | | | | |
Net increase (decrease) in net assets resulting from beneficial interest transactions: | | | | | | | | |
Non-Service shares | | | 64,450 | | | | 26,808 | |
Service shares | | | (175,637 | ) | | | 1,928,572 | |
| | | | | | | | |
| | | (111,187 | ) | | | 1,955,380 | |
| | | | | | | | |
Net Assets | | | | | | | | |
Total increase | | | 418,866 | | | | 4,037,393 | |
| |
Beginning of period | | | 11,088,729 | | | | 7,051,336 | |
| | | | | | | | |
| | |
End of period (including accumulated net investment income of $217,214 and $148,523, respectively) | | $ | 11,507,595 | | | $ | 11,088,729 | |
| | | | |
See accompanying Notes to Financial Statements.
12 OPPENHEIMER EQUITY INCOME FUND/VA
FINANCIAL HIGHLIGHTS
| | | | | | | | | | | | | | | | | | | | |
| Non-Service Shares | | Year Ended
December
31, 2014 | | | Year Ended
December
31, 2013 | | | Year Ended
December
31, 2012 | | | Year Ended
December
30, 20111 | | | Year Ended
December
31, 2010 | |
| |
Per Share Operating Data | | | | | | | | | | | | | | | | | | | | |
Net asset value, beginning of period | | $ | 11.64 | | | $ | 9.15 | | | $ | 8.00 | | | $ | 8.49 | | | $ | 7.22 | |
| |
Income (loss) from investment operations: | | | | | | | | | | | | | | | | | | | | |
Net investment income2 | | | 0.25 | | | | 0.21 | | | | 0.16 | | | | 0.15 | | | | 0.11 | |
Net realized and unrealized gain (loss) | | | 1.01 | | | | 2.42 | | | | 1.11 | | | | (0.56 | ) | | | 1.24 | |
| | | | |
Total from investment operations | | | 1.26 | | | | 2.63 | | | | 1.27 | | | | (0.41 | ) | | | 1.35 | |
| |
Dividends and/or distributions to shareholders: | | | | | | | | | | | | | | | | | | | | |
Dividends from net investment income | | | (0.22 | ) | | | (0.14 | ) | | | (0.12 | ) | | | (0.08 | ) | | | (0.08) | |
Distributions from net realized gain | | | (0.59 | ) | | | 0.00 | | | | 0.00 | | | | 0.00 | | | | 0.00 | |
| | | | |
Total dividends and/or distributions to shareholders | | | (0.81 | ) | | | (0.14 | ) | | | (0.12 | ) | | | (0.08 | ) | | | (0.08) | |
| |
Net asset value, end of period | | $ | 12.09 | | | $ | 11.64 | | | $ | 9.15 | | | $ | 8.00 | | | $ | 8.49 | |
| | | | |
| |
Total Return, at Net Asset Value3 | | | 11.08 | % | | | 28.93 | % | | | 16.08 | % | | | (4.93 | )% | | | 18.85% | |
| |
Ratios/Supplemental Data | | | | | | | | | | | | | | | | | | | | |
Net assets, end of period (in thousands) | | $ | 302 | | | $ | 227 | | | $ | 154 | | | $ | 104 | | | $ | 92 | |
| |
Average net assets (in thousands) | | $ | 266 | | | $ | 195 | | | $ | 132 | | | $ | 101 | | | $ | 57 | |
| |
Ratios to average net assets:4 | | | | | | | | | | | | | | | | | | | | |
Net investment income | | | 2.08% | | | | 2.00% | | | | 1.82% | | | | 1.78% | | | | 1.46% | |
Total expenses5 | | | 1.42% | | | | 1.64% | | | | 1.75% | | | | 1.83% | | | | 2.05% | |
Expenses after payments, waivers and/or reimbursements and reduction to custodian expenses | | | 0.80% | | | | 0.80% | | | | 0.80% | | | | 0.80% | | | | 0.57% | |
| |
Portfolio turnover rate | | | 40% | | | | 159% | | | | 87% | | | | 86% | | | | 109% | |
1. December 30, 2011 represents the last business day of the Fund’s 2011 fiscal year.
2. Per share amounts calculated based on the average shares outstanding during the period.
3. Assumes an initial investment on the business day before the first day of the fiscal period, with all dividends and distributions reinvested in additional shares on the reinvestment date, and redemption at the net asset value calculated on the last business day of the fiscal period. Total returns are not annualized for periods less than one full year. Total return information does not reflect expenses that apply at the separate account level or to related insurance products. Inclusion of these charges would reduce the total return figures for all periods shown. Returns do not reflect the deduction of taxes that a shareholder would pay on fund distributions or the redemption of fund shares.
4. Annualized for periods less than one full year.
5. Total expenses including indirect expenses from affiliated fund fees and expenses were as follows:
| | | | | | | | |
| | Year Ended December 31, 2014 | | | 1.42 | % | | |
| | Year Ended December 31, 2013 | | | 1.64 | % | | |
| | Year Ended December 31, 2012 | | | 1.75 | % | | |
| | Year Ended December 30, 2011 | | | 1.83 | % | | |
| | Year Ended December 31, 2010 | | | 2.05 | % | | |
See accompanying Notes to Financial Statements.
13 OPPENHEIMER EQUITY INCOME FUND/VA
FINANCIAL HIGHLIGHTS Continued
| | | | | | | | | | | | | | | | | | | | |
| Service Shares | | Year Ended
December
31, 2014 | | | Year Ended
December
31, 2013 | | | Year Ended
December
31, 2012 | | | Year Ended
December
30, 20111 | | | Year Ended
December
31, 2010 | |
| |
Per Share Operating Data | | | | | | | | | | | | | | | | | | | | |
Net asset value, beginning of period | | $ | 13.78 | | | $ | 10.83 | | | $ | 9.69 | | | $ | 10.23 | | | $ | 8.99 | |
| |
Income (loss) from investment operations: | | | | | | | | | | | | | | | | | | | | |
Net investment income2 | | | 0.26 | | | | 0.22 | | | | 0.13 | | | | 0.11 | | | | 0.08 | |
Net realized and unrealized gain (loss) | | | 1.19 | | | | 2.87 | | | | 1.13 | | | | (0.56 | ) | | | 1.24 | |
| | | | |
Total from investment operations | | | 1.45 | | | | 3.09 | | | | 1.26 | | | | (0.45 | ) | | | 1.32 | |
| |
Dividends and/or distributions to shareholders: | | | | | | | | | | | | | | | | | | | | |
Dividends from net investment income | | | (0.21 | ) | | | (0.14 | ) | | | (0.12 | ) | | | (0.09 | ) | | | (0.08) | |
Distributions from net realized gain | | | (0.59 | ) | | | 0.00 | | | | 0.00 | | | | 0.00 | | | | 0.00 | |
| | | | |
Total dividends and/or distributions to shareholders | | | (0.80 | ) | | | (0.14 | ) | | | (0 .12 | ) | | | (0.09 | ) | | | (0.08) | |
| |
Net asset value, end of period | | $ | 14.43 | | | $ | 13.78 | | | $ | 10.83 | | | $ | 9.69 | | | $ | 10.23 | |
| | | | |
| |
Total Return, at Net Asset Value3 | | | 10.73 | % | | | 28.70 | % | | | 13.09 | % | | | (4.48 | )% | | | 14.81% | |
| |
Ratios/Supplemental Data | | | | | | | | | | | | | | | | | | | | |
Net assets, end of period (in thousands) | | $ | 11,206 | | | $ | 10,862 | | | $ | 6,897 | | | $ | 6,885 | | | $ | 7,311 | |
| |
Average net assets (in thousands) | | $ | 11,020 | | | $ | 8,549 | | | $ | 7,095 | | | $ | 7,449 | | | $ | 7,008 | |
| |
Ratios to average net assets:4 | | | | | | | | | | | | | | | | | | | | |
Net investment income | | | 1.82% | | | | 1.78% | | | | 1.26% | | | | 1.08% | | | | 0.85% | |
Total expenses5 | | | 1.67% | | | | 1.89% | | | | 1.93% | | | | 1.90% | | | | 2.08% | |
| Expenses after payments, waivers and/or reimbursements and reduction to custodian expenses | | | 1.05% | | | | 1.05% | | | | 1.04% | | | | 1.05% | | | | 0.93% | |
| |
Portfolio turnover rate | | | 40% | | | | 159% | | | | 87% | | | | 86% | | | | 109% | |
1. December 30, 2011 represents the last business day of the Fund’s 2011 fiscal year.
2. Per share amounts calculated based on the average shares outstanding during the period.
3. Assumes an initial investment on the business day before the first day of the fiscal period, with all dividends and distributions reinvested in additional shares on the reinvestment date, and redemption at the net asset value calculated on the last business day of the fiscal period. Total returns are not annualized for periods less than one full year. Total return information does not reflect expenses that apply at the separate account level or to related insurance products. Inclusion of these charges would reduce the total return figures for all periods shown. Returns do not reflect the deduction of taxes that a shareholder would pay on fund distributions or the redemption of fund shares.
4. Annualized for periods less than one full year.
5. Total expenses including indirect expenses from affiliated fund fees and expenses were as follows:
| | | | | | | | |
| | Year Ended December 31, 2014 | | | 1.67 | % | | |
| | Year Ended December 31, 2013 | | | 1.89 | % | | |
| | Year Ended December 31, 2012 | | | 1.93 | % | | |
| | Year Ended December 30, 2011 | | | 1.90 | % | | |
| | Year Ended December 31, 2010 | | | 2.08 | % | | |
See accompanying Notes to Financial Statements.
14 OPPENHEIMER EQUITY INCOME FUND/VA
| | |
| NOTES TO FINANCIAL STATEMENTS December 31, 2014 | | |
| | |
1. Organization
Oppenheimer Equity Income Fund/VA (the “Fund”), a separate series of Oppenheimer Variable Account Funds, is a diversified open-end management investment company registered under the Investment Company Act of 1940 (“1940 Act”), as amended. The Fund’s investment objective is to seek total return. The Fund’s investment adviser is OFI Global Asset Management, Inc. (“OFI Global” or the “Manager”), a wholly-owned subsidiary of OppenheimerFunds, Inc. (“OFI” or the “Sub-Adviser”). The Manager has entered into a sub-advisory agreement with OFI. Shares of the Fund are sold only to separate accounts of life insurance companies.
The Fund offers two classes of shares. Both classes are sold at their offering price, which is the net asset value per share, to separate investment accounts of participating insurance companies as an underlying investment for variable life insurance policies, variable annuity contracts or other investment products. The class of shares designated as Service shares is subject to a distribution and service plan. Both classes of shares have identical rights and voting privileges with respect to the Fund in general and exclusive voting rights on matters that affect that class alone. Earnings, net assets and net asset value per share may differ due to each class having its own expenses, such as transfer and shareholder servicing agent fees and shareholder communications, directly attributable to that class.
The following is a summary of significant accounting policies consistently followed by the Fund.
2. Significant Accounting Policies
Security Valuation. All investments in securities are recorded at their estimated fair value, as described in Note 3.
Foreign Currency Translation. The Fund’s accounting records are maintained in U.S. dollars. The values of securities denominated in foreign currencies and amounts related to the purchase and sale of foreign securities and foreign investment income are translated into U.S. dollars as of the close of the New York Stock Exchange (the “Exchange”), normally 4:00 P.M. Eastern time, on each day the Exchange is open for trading. Foreign exchange rates may be valued primarily using a reliable bank, dealer or service authorized by the Board of Trustees.
Reported net realized gains and losses from foreign currency transactions arise from sales of portfolio securities, sales and maturities of short-term securities, sales of foreign currencies, exchange rate fluctuations between the trade and settlement dates on securities transactions, and the difference between the amounts of dividends, interest, and foreign withholding taxes recorded on the Fund’s books and the U.S. dollar equivalent of the amounts actually received or paid. Net unrealized appreciation and depreciation on the translation of assets and liabilities denominated in foreign currencies arise from changes in the values of assets and liabilities, including investments in securities at fiscal period end, resulting from changes in exchange rates.
The effect of changes in foreign currency exchange rates on investments is separately identified from the fluctuations arising from changes in market values of securities held and reported with all other foreign currency gains and losses in the Fund’s Statement of Operations.
Allocation of Income, Expenses, Gains and Losses. Income, expenses (other than those attributable to a specific class), gains and losses are allocated on a daily basis to each class of shares based upon the relative proportion of net assets represented by such class. Operating expenses directly attributable to a specific class are charged against the operations of that class.
Dividends and Distributions to Shareholders. Dividends and distributions to shareholders, which are determined in accordance with income tax regulations and may differ from U.S. generally accepted accounting principles, are recorded on the ex-dividend date. Income and capital gain distributions, if any, are declared and paid annually or at other times as deemed necessary by the Manager.
Investment Income. Dividend income is recorded on the ex-dividend date or upon ex-dividend notification in the case of certain foreign dividends where the ex-dividend date may have passed. Non-cash dividends included in dividend income, if any, are recorded at the fair market value of the securities received. Interest income is recognized on an accrual basis. Discount and premium, which are included in interest income on the Statement of Operations, are amortized or accreted daily.
Custodian Fees. “Custodian fees and expenses” in the Statement of Operations may include interest expense incurred by the Fund on any cash overdrafts of its custodian account during the period. Such cash overdrafts may result from the effects of failed trades in portfolio securities and from cash outflows resulting from unanticipated shareholder redemption activity. The Fund pays interest to its custodian on such cash overdrafts, to the extent they are not offset by positive cash balances maintained by the Fund, at a rate equal to the Federal Funds Rate plus 0.50%. The “Reduction to custodian expenses” line item, if applicable, represents earnings on cash balances maintained by the Fund during the period. Such interest expense and other custodian fees may be paid with these earnings.
Security Transactions. Security transactions are recorded on the trade date. Realized gains and losses on securities sold are determined on the basis of identified cost.
Indemnifications. The Fund’s organizational documents provide current and former Trustees and officers with a limited indemnification against liabilities arising in connection with the performance of their duties to the Fund. In the normal course of business, the Fund may also enter into contracts that provide general indemnifications. The Fund’s maximum exposure under these arrangements is unknown as this would be dependent on future claims that may be made against the Fund. The risk of material loss from such claims is considered remote.
15 OPPENHEIMER EQUITY INCOME FUND/VA
| | |
| NOTES TO FINANCIAL STATEMENTS Continued | | |
| | |
2. Significant Accounting Policies (Continued)
Federal Taxes. The Fund intends to comply with provisions of the Internal Revenue Code applicable to regulated investment companies and to distribute substantially all of its investment company taxable income, including any net realized gain on investments not offset by capital loss carryforwards, if any, to shareholders. Therefore, no federal income or excise tax provision is required. The Fund files income tax returns in U.S. federal and applicable state jurisdictions. The statute of limitations on the Fund’s tax return filings generally remain open for the three preceding fiscal reporting period ends.
The tax components of capital shown in the following table represent distribution requirements the Fund must satisfy under the income tax regulations, losses the Fund may be able to offset against income and gains realized in future years and unrealized appreciation or depreciation of securities and other investments for federal income tax purposes.
| | | | | | | | | | | | |
Undistributed Net Investment Income | | Undistributed
Long-Term
Gain | | | Accumulated
Loss
Carryforward1,2 | | | Net Unrealized
Appreciation
Based on cost of
Securities and
Other Investments
for Federal Income
Tax Purposes | |
$632,456 | | | $425,405 | | | | $— | | | | $1,207,724 | |
1. During the fiscal year ended December 31, 2014, the Fund did not utilize any capital loss carryforward.
2. During the fiscal year ended December 31, 2013, the Fund utilized $973,499 of capital loss carryforward to offset capital gains realized in that fiscal year.
Net investment income (loss) and net realized gain (loss) may differ for financial statement and tax purposes. The character of dividends and distributions made during the fiscal year from net investment income or net realized gains may differ from their ultimate characterization for federal income tax purposes. Also, due to timing of dividends and distributions, the fiscal year in which amounts are distributed may differ from the fiscal year in which the income or net realized gain was recorded by the Fund.
Accordingly, the following amounts have been reclassified for December 31, 2014. Net assets of the Fund were unaffected by the reclassifications.
| | | | | | | | |
Increase to Paid-in Capital | | Increase
to Accumulated
Net Investment
Income | | | Reduction
to Accumulated Net
Realized Gain
on Investments3 | |
$83,593 | | | $29,322 | | | | $112,915 | |
3. $83,543 including $46,266 of long-term capital gain, was distributed in connection with Fund share redemptions.
The tax character of distributions paid during the years ended December 31, 2014 and December 31, 2013 was as follows:
| | | | | | | | |
| | | Year Ended
December 31, 2014 | | | Year Ended
December 31, 2013 | |
Distributions paid from: | | | | | | | | |
Ordinary income | | $ | 167,092 | | | $ | 93,773 | |
Long-term capital gain | | | 464,803 | | | | — | |
| | | | |
Total | | $ | 631,895 | | | $ | 93,773 | |
| | | | |
The aggregate cost of securities and other investments and the composition of unrealized appreciation and depreciation of securities and other investments for federal income tax purposes as of December 31, 2014 are noted in the following table. The primary difference between book and tax appreciation or depreciation of securities and other investments, if applicable, is attributable to the tax deferral of losses or tax realization of financial statement unrealized gain or loss.
| | | | |
Federal tax cost of securities | | $ | 10,318,608 | |
Federal tax cost of other investments | | | (7,445 | ) |
| | | | |
Total federal tax cost | | $ | 10,311,163 | |
| | | | |
Gross unrealized appreciation | | $ | 1,560,556 | |
Gross unrealized depreciation | | | (352,832 | ) |
| | | | |
Net unrealized appreciation | | $ | 1,207,724 | |
| | | | |
Use of Estimates. The preparation of financial statements in conformity with accounting principles generally accepted in the United States of America requires management to make estimates and assumptions that affect the reported amounts of assets and liabilities and disclosure of contingent assets and liabilities at the date of the financial statements and the reported amounts of increases and decreases in net assets from operations during the reporting period. Actual results could differ from those estimates.
3. Securities Valuation
The Fund calculates the net asset value of its shares as of the close of the New York Stock Exchange (the “Exchange”), normally 4:00 P.M. Eastern time, on each day the Exchange is open for trading.
16 OPPENHEIMER EQUITY INCOME FUND/VA
3. Securities Valuation (Continued)
The Fund’s Board has adopted procedures for the valuation of the Fund’s securities and has delegated the day-to-day responsibility for valuation determinations under those procedures to the Manager. The Manager has established a Valuation Committee which is responsible for determining a “fair valuation” for any security for which market quotations are not “readily available.” The Valuation Committee’s fair valuation determinations are subject to review, approval and ratification by the Fund’s Board at its next regularly scheduled meeting covering the calendar quarter in which the fair valuation was determined.
Valuation Methods and Inputs
Securities are valued using unadjusted quoted market prices, when available, as supplied primarily by third party pricing services or dealers.
The following methodologies are used to determine the market value or the fair value of the types of securities described below:
Securities traded on a registered U.S. securities exchange (including exchange-traded derivatives other than futures and futures options) are valued based on the last sale price of the security reported on the principal exchange on which it is traded, prior to the time when the Fund’s assets are valued. In the absence of a sale, the security is valued at the last sale price on the prior trading day, if it is within the spread of the current day’s closing “bid” and “asked” prices, and if not, at the current day’s closing bid price. A security of a foreign issuer traded on a foreign exchange, but not listed on a registered U.S. securities exchange, is valued based on the last sale price on the principal exchange on which the security is traded, as identified by the third party pricing service used by the Manager, prior to the time when the Fund’s assets are valued. If the last sale price is unavailable, the security is valued at the most recent official closing price on the principal exchange on which it is traded. If the last sales price or official closing price for a foreign security is not available, the security is valued at the mean between the bid and asked price per the exchange or, if not available from the exchange, obtained from two dealers. If bid and asked prices are not available from either the exchange or two dealers, the security is valued by using one of the following methodologies (listed in order of priority): (1) using a bid from the exchange, (2) the mean between the bid and asked price as provided by a single dealer, or (3) a bid from a single dealer.
Shares of a registered investment company that are not traded on an exchange are valued at that investment company’s net asset value per share.
Corporate and government debt securities (of U.S. or foreign issuers) and municipal debt securities, event-linked bonds, loans, mortgage-backed securities, collateralized mortgage obligations, and asset-backed securities are valued at the mean between the “bid” and “asked” prices utilizing evaluated prices obtained from third party pricing services or broker-dealers who may use matrix pricing methods to determine the evaluated prices.
Short-term money market type debt securities with a remaining maturity of sixty days or less are valued at cost adjusted by the amortization of discount or premium to maturity (amortized cost), which approximates market value. Short-term debt securities with a remaining maturity in excess of sixty days are valued at the mean between the “bid” and “asked” prices utilizing evaluated prices obtained from third party pricing services or broker-dealers.
Structured securities, swaps, swaptions, and other over-the-counter derivatives are valued utilizing evaluated prices obtained from third party pricing services or broker-dealers.
A description of the standard inputs that may generally be considered by the third party pricing vendors in determining their evaluated prices is provided below.
| | |
| Security Type | | Standard inputs generally considered by third-party pricing vendors |
|
| Corporate debt, government debt, municipal, mortgage-backed and asset-backed securities | | Reported trade data, broker-dealer price quotations, benchmark yields, issuer spreads on comparable securities, the credit quality, yield, maturity, and other appropriate factors. |
|
| Loans | | Information obtained from market participants regarding reported trade data and broker-dealer price quotations. |
|
| Event-linked bonds | | Information obtained from market participants regarding reported trade data and broker-dealer price quotations. |
|
| Structured securities | | Relevant market information such as the price of underlying financial instruments, stock market indices, foreign currencies, interest rate spreads, commodities, or the occurrence of other specific events. |
|
Swaps | | Relevant market information, including underlying reference assets such as credit spreads, credit event probabilities, index values, individual security values, forward interest rates, variable interest rates, volatility measures, and forward currency rates. |
If a market value or price cannot be determined for a security using the methodologies described above, or if, in the “good faith” opinion of the Manager, the market value or price obtained does not constitute a “readily available market quotation,” or a significant event has occurred that would materially affect the value of the security the security is fair valued either (i) by a standardized fair valuation methodology applicable to the security type or the significant event as previously approved by the Valuation Committee and the Fund’s Board or (ii) as determined in good faith by the Manager’s Valuation Committee. The Valuation Committee considers all relevant facts that are reasonably available, through either public information or information available to the Manager, when determining the fair value of a security. Fair value determinations by the Manager are subject to review, approval and ratification by the Fund’s Board at its next regularly scheduled meeting covering the calendar quarter in which the fair valuation was determined. Those fair valuation standardized methodologies include, but are not limited to, valuing securities at the last sale price or initially at cost and subsequently adjusting the value based on: changes in company specific fundamentals, changes in an appropriate securities index, or changes in the value of similar securities which may be further adjusted for any discounts related to security-specific resale restrictions. When possible, such methodologies use observable market inputs such as unadjusted quoted prices of similar securities, observable interest rates, currency rates and yield curves. The methodologies used for valuing securities are not necessarily an indication of the risks associated with investing in those securities nor can it be assured that the Fund can obtain the fair value assigned to a security if it were to sell the security.
17 OPPENHEIMER EQUITY INCOME FUND/VA
| | |
| NOTES TO FINANCIAL STATEMENTS Continued | | |
| | |
3. Securities Valuation (Continued)
To assess the continuing appropriateness of security valuations, the Manager, or its third party service provider who is subject to oversight by the Manager, regularly compares prior day prices, prices on comparable securities, and sale prices to the current day prices and challenges those prices exceeding certain tolerance levels with the third party pricing service or broker source. For those securities valued by fair valuations, whether through a standardized fair valuation methodology or a fair valuation determination, the Valuation Committee reviews and affirms the reasonableness of the valuations based on such methodologies and fair valuation determinations on a regular basis after considering all relevant information that is reasonably available.
Classifications
Each investment asset or liability of the Fund is assigned a level at measurement date based on the significance and source of the inputs to its valuation. Various data inputs are used in determining the value of each of the Fund’s investments as of the reporting period end. These data inputs are categorized in the following hierarchy under applicable financial accounting standards:
1) Level 1-unadjusted quoted prices in active markets for identical assets or liabilities (including securities actively traded on a securities exchange)
2) Level 2-inputs other than unadjusted quoted prices that are observable for the asset or liability (such as unadjusted quoted prices for similar assets and market corroborated inputs such as interest rates, prepayment speeds, credit risks, etc.)
3) Level 3-significant unobservable inputs (including the Manager’s own judgments about assumptions that market participants would use in pricing the asset or liability).
The inputs used for valuing securities are not necessarily an indication of the risks associated with investing in those securities.
The table below categorizes amounts that are included in the Fund’s Statement of Assets and Liabilities as of December 31, 2014 based on valuation input level:
| | | | | | | | | | | | | | | | |
| | | Level 1—
Unadjusted
Quoted Prices | | | Level 2— Other Significant
Observable Inputs | | | Level 3—
Significant
Unobservable
Inputs | | | Value | |
| |
Assets Table | | | | | | | | | | | | | | | | |
Investments, at Value: | | | | | | | | | | | | | | | | |
Common Stocks | | | | | | | | | | | | | | | | |
Consumer Discretionary | | $ | 1,745,633 | | | $ | — | | | $ | — | | | $ | 1,745,633 | |
Consumer Staples | | | 304,830 | | | | — | | | | — | | | | 304,830 | |
Energy | | | 1,230,754 | | | | — | | | | — | | | | 1,230,754 | |
Financials | | | 2,930,584 | | | | — | | | | — | | | | 2,930,584 | |
Health Care | | | 898,870 | | | | — | | | | — | | | | 898,870 | |
Industrials | | | 398,095 | | | | — | | | | — | | | | 398,095 | |
Information Technology | | | 703,204 | | | | — | | | | — | | | | 703,204 | |
Materials | | | 458,136 | | | | — | | | | — | | | | 458,136 | |
Telecommunication Services | | | 590,033 | | | | — | | | | — | | | | 590,033 | |
Utilities | | | 324,904 | | | | — | | | | — | | | | 324,904 | |
Preferred Stocks | | | 187,361 | | | | 184,589 | | | | — | | | | 371,950 | |
Rights, Warrants and Certificates | | | 30,613 | | | | — | | | | — | | | | 30,613 | |
Non-Convertible Corporate Bonds and Notes | | | — | | | | 64,610 | | | | — | | | | 64,610 | |
Convertible Corporate Bonds and Notes | | | — | | | | 969,850 | | | | — | | | | 969,850 | |
Structured Securities | | | — | | | | 406,085 | | | | — | | | | 406,085 | |
Investment Company | | | 96,193 | | | | — | | | | — | | | | 96,193 | |
Exchange-Traded Option Purchased | | | 116 | | | | — | | | | — | | | | 116 | |
| | | | |
Total Assets | | $ | 9,899,326 | | | $ | 1,625,134 | | | $ | — | | | $ | 11,524,460 | |
| | | | |
| | | | |
Liabilities Table | | | | | | | | | | | | | | | | |
Other Financial Instruments: | | | | | | | | | | | | | | | | |
Options written, at value | | $ | — | | | $ | (5,573 | ) | | $ | — | | | $ | (5,573) | |
| | | | |
Total Liabilities | | $ | — | | | $ | (5,573 | ) | | $ | — | | | $ | (5,573) | |
| | | | |
4. Investments and Risks
Investment in Oppenheimer Institutional Money Market Fund. The Fund is permitted to invest daily available cash balances in an affiliated money market fund. The Fund may invest the available cash in Class E shares of Oppenheimer Institutional Money Market Fund (“IMMF”) to seek current income while preserving liquidity or for defensive purposes. IMMF is a registered open-end management investment company, regulated as a money market fund under the 1940 Act. The Manager is the investment adviser of IMMF, and the Sub-Adviser provides investment and related advisory services to IMMF. When applicable, the Fund’s investment in IMMF is included in the Statement of Investments. Shares of IMMF are valued at their net asset value per share. As a shareholder, the Fund is subject to its proportional share of IMMF’s Class E expenses, including its management fee. The Manager will waive fees and/or reimburse Fund expenses in an amount equal to the indirect management fees incurred through the Fund’s investment in IMMF.
Structured Securities. The Fund invests in structured securities whose market values, interest rates and/or redemption prices are linked to the performance of underlying foreign currencies, interest rate spreads, stock market indices, prices of individual securities, commodities or other financial instruments or the occurrence of other specific events. The structured securities are often leveraged, increasing the volatility of each note’s market value
18 OPPENHEIMER EQUITY INCOME FUND/VA
4. Investments and Risks (Continued)
relative to the change in the underlying linked financial element or event. Fluctuations in value of these securities are recorded as unrealized gains and losses in the accompanying Statement of Operations. The Fund records a realized gain or loss when a structured security is sold or matures.
Equity Security Risk. Stocks and other equity securities fluctuate in price. The value of the Fund’s portfolio may be affected by changes in the equity markets generally. Equity markets may experience significant short-term volatility and may fall sharply at times. Different markets may behave differently from each other and U.S. equity markets may move in the opposite direction from one or more foreign stock markets.
The prices of individual equity securities generally do not all move in the same direction at the same time and a variety of factors can affect the price of a particular company’s securities. These factors may include, but are not limited to, poor earnings reports, a loss of customers, litigation against the company, general unfavorable performance of the company’s sector or industry, or changes in government regulations affecting the company or its industry.
Credit Risk. The Fund invests in high-yield, non-investment-grade bonds, which may be subject to a greater degree of credit risk. Credit risk relates to the ability of the issuer to meet interest or principal payments or both as they become due. The Fund may acquire securities that have missed an interest payment, and is not obligated to dispose of securities whose issuers or underlying obligors subsequently miss an interest payment. Information concerning securities not accruing interest as of December 31, 2014 is as follows:
| | | | |
Cost | | $ | 48,687 | |
Market Value | | $ | 39,650 | |
Market value as % of Net Assets | | | 0.34% | |
5. Risk Exposures and the Use of Derivative Instruments
The Fund’s investment objective not only permits the Fund to purchase investment securities, it also allows the Fund to enter into various types of derivatives contracts, including, but not limited to, futures contracts, forward currency exchange contracts, credit default swaps, interest rate swaps, total return swaps, variance swaps and purchased and written options. In doing so, the Fund will employ strategies in differing combinations to permit it to increase, decrease, or change the level or types of exposure to market risk factors. These instruments may allow the Fund to pursue its objectives more quickly and efficiently than if it were to make direct purchases or sales of securities capable of effecting a similar response to market factors. Such contracts may be entered into through a bilateral over-the-counter (“OTC”) transaction, or through a securities or futures exchange and cleared through a clearinghouse.
Market Risk Factors. In accordance with its investment objectives, the Fund may use derivatives to increase or decrease its exposure to one or more of the following market risk factors:
Commodity Risk. Commodity risk relates to the change in value of commodities or commodity indexes as they relate to increases or decreases in the commodities market. Commodities are physical assets that have tangible properties. Examples of these types of assets are crude oil, heating oil, metals, livestock, and agricultural products.
Credit Risk. Credit risk relates to the ability of the issuer to meet interest and principal payments, or both, as they come due. In general, lower-grade, higher-yield bonds are subject to credit risk to a greater extent than lower-yield, higher-quality bonds.
Equity Risk. Equity risk relates to the change in value of equity securities as they relate to increases or decreases in the general market.
Foreign Exchange Rate Risk. Foreign exchange rate risk relates to the change in the U.S. dollar value of a security held that is denominated in a foreign currency. The U.S. dollar value of a foreign currency denominated security will decrease as the dollar appreciates against the currency, while the U.S. dollar value will increase as the dollar depreciates against the currency.
Interest Rate Risk. Interest rate risk refers to the fluctuations in value of fixed-income securities resulting from the inverse relationship between price and yield. For example, an increase in general interest rates will tend to reduce the market value of already issued fixed-income investments, and a decline in general interest rates will tend to increase their value. In addition, debt securities with longer maturities, which tend to have higher yields, are subject to potentially greater fluctuations in value from changes in interest rates than obligations with shorter maturities.
Volatility Risk. Volatility risk refers to the magnitude of the movement, but not the direction of the movement, in a financial instrument’s price over a defined time period. Large increases or decreases in a financial instrument’s price over a relative time period typically indicate greater volatility risk, while small increases or decreases in its price typically indicate lower volatility risk.
Derivatives may have little or no initial cash investment relative to their market value exposure and therefore can produce significant gains or losses in excess of their cost due to unanticipated changes in the market risk factors and the overall market. This use of embedded leverage allows the Fund to increase its market value exposure relative to its net assets and can substantially increase the volatility of the Fund’s performance. In instances where the Fund is using derivatives to decrease, or hedge, exposures to market risk factors for securities held by the Fund, there are also risks that those derivatives may not perform as expected resulting in losses for the combined or hedged positions. Some derivatives have the potential for unlimited loss, regardless of the size of the Fund’s initial investment.
Additional associated risks from investing in derivatives also exist and potentially could have significant effects on the valuation of the derivative and the Fund. Typically, the associated risks are not the risks that the Fund is attempting to increase or decrease exposure to, per its investment objectives, but are the additional risks from investing in derivatives. Examples of these associated risks are liquidity risk, which is the risk that the Fund will not be able to sell the derivative in the open market in a timely manner, and counterparty credit risk, which is the risk that the counterparty will not fulfill its obligation to the Fund.
19 OPPENHEIMER EQUITY INCOME FUND/VA
| | |
| NOTES TO FINANCIAL STATEMENTS Continued | | |
| | |
5. Risk Exposures and the Use of Derivative Instruments (Continued)
The Fund’s actual exposures to these market risk factors and associated risks during the period are discussed in further detail, by derivative type, below.
Option Activity
The Fund may buy and sell put and call options, or write put and call options. When an option is written, the Fund receives a premium and becomes obligated to sell or purchase the underlying security, currency or other underlying financial instrument at a fixed price, upon exercise of the option.
Options can be traded through an exchange or through a privately negotiated arrangement with a dealer in an OTC transaction. Options traded through an exchange are generally cleared through a clearinghouse (such as The Options Clearing Corporation). The difference between the premium received or paid, and market value of the option, is recorded as unrealized appreciation or depreciation. The net change in unrealized appreciation or depreciation is reported in the Statement of Operations. When an option is exercised, the cost of the security purchased or the proceeds of the security sale are adjusted by the amount of premium received or paid. Upon the expiration or closing of the option transaction, a gain or loss is reported in the Statement of Operations.
The Fund has purchased call options on individual equity securities and/or equity indexes to increase exposure to equity risk. A purchased call option becomes more valuable as the price of the underlying financial instrument appreciates relative to the strike price.
The Fund has purchased put options on individual equity securities and/or equity indexes to decrease exposure to equity risk. A purchased put option becomes more valuable as the price of the underlying financial instrument depreciates relative to the strike price.
During the year ended December 31, 2014, the Fund had an ending monthly average market value of $402 on purchased put options.
Options written, if any, are reported in a schedule following the Statement of Investments and as a liability in the Statement of Assets and Liabilities. Securities held in collateral accounts to cover potential obligations with respect to outstanding written options are noted in the Statement of Investments.
The risk in writing a call option is that the market price of the security increases and if the option is exercised, the Fund must either purchase the security at a higher price for delivery or, if the Fund owns the underlying security, give up the opportunity for profit. The risk in writing a put option is that the Fund may incur a loss if the market price of the security decreases and the option is exercised. The risk in buying an option is that the Fund pays a premium whether or not the option is exercised. The Fund also has the additional risk that there may be an illiquid market where the Fund is unable to close the contract.
The Fund has written put options on individual equity securities and/or equity indexes to increase exposure to equity risk. A written put option becomes more valuable as the price of the underlying financial instrument appreciates relative to the strike price.
The Fund has written call options on individual equity securities and/or equity indexes to decrease exposure to equity risk. A written call option becomes more valuable as the price of the underlying financial instrument depreciates relative to the strike price.
During the year ended December 31, 2014, the Fund had an ending monthly average market value of $4,008 and $7,502 on written call options and written put options, respectively.
Additional associated risks to the Fund include counterparty credit risk and liquidity risk.
Written option activity for the year ended December 31, 2014 was as follows:
| | | | | | | | |
| | | Options | |
| | | Number of Contracts | | | Amount of Premiums | |
| |
Options outstanding as of December 31, 2013 | | | 110 | | | | $ 9,343 | |
Options written | | | 1,508 | | | | 139,336 | |
Options closed or expired | | | (957 | ) | | | (87,066 | ) |
Options exercised | | | (601 | ) | | | (54,168 | ) |
| | | | |
Options outstanding as of December 31, 2014 | | | 60 | | | | $ 7,445 | |
| | | | |
Counterparty Credit Risk. Derivative positions are subject to the risk that the counterparty will not fulfill its obligation to the Fund. The Fund intends to enter into derivative transactions with counterparties that the Manager believes to be creditworthy at the time of the transaction.
For financial reporting purposes, the Fund does not offset derivative assets and derivative liabilities that are subject to netting arrangements in the Statement of Assets and Liabilities. Bankruptcy or insolvency laws of a particular jurisdiction may impose restrictions on or prohibitions against the right of offset in bankruptcy, insolvency or other events.
The Fund’s risk of loss from counterparty credit risk on exchange-traded derivatives cleared through a clearinghouse and for centrally cleared swaps is generally considered lower than as compared to OTC derivatives. However, counterparty credit risk exists with respect to initial and variation margin deposited/paid by the Fund that is held in futures commission merchant, broker and/or clearinghouse accounts for such exchange-traded derivatives and for centrally cleared swaps.
With respect to centrally cleared swaps, such transactions will be submitted for clearing, and if cleared, will be held in accounts at futures commission merchants or brokers that are members of clearinghouses. While brokers, futures commission merchants and clearinghouses are required to segregate customer margin from their own assets, in the event that a broker, futures commission merchant or clearinghouse becomes insolvent or goes into bankruptcy and at that time there is a shortfall in the aggregate amount of margin held by the broker, futures commission merchant or clearinghouse for all its customers, U.S. bankruptcy laws will typically allocate that shortfall on a pro-rata basis across all the broker’s, futures commission merchant’s or clearinghouse’s customers, potentially resulting in losses to the Fund.
There is the risk that a broker, futures commission merchant or clearinghouse will decline to clear a transaction on the Fund’s behalf, and the Fund may be required to pay a termination fee to the executing broker with whom the Fund initially enters into the transaction. Clearinghouses may also be permitted to terminate centrally cleared swaps at any time. The Fund is also subject to the risk that the broker or futures commission merchant will
20 OPPENHEIMER EQUITY INCOME FUND/VA
5. Risk Exposures and the Use of Derivative Instruments (Continued)
improperly use the Fund’s assets deposited/paid as initial or variation margin to satisfy payment obligations of another customer. In the event of a default by another customer of the broker or futures commission merchant, the Fund might not receive its variation margin payments from the clearinghouse, due to the manner in which variation margin payments are aggregated for all customers of the broker/futures commission merchant.
Collateral and margin requirements differ by type of derivative. Margin requirements are established by the broker, futures commission merchant or clearinghouse for exchange-traded and cleared derivatives, including centrally cleared swaps. Brokers, futures commission merchants and clearinghouses can ask for margin in excess of the regulatory minimum, or increase the margin amount, in certain circumstances.
For financial reporting purposes, cash collateral that has been pledged to cover obligations of the Fund, if any, is reported separately on the Statement of Assets and Liabilities as cash pledged as collateral. Non-cash collateral pledged by the Fund, if any, is noted in the Statement of Investments. Generally, the amount of collateral due from or to a party must exceed a minimum transfer amount threshold (e.g. $250,000) before a transfer has to be made. To the extent amounts due to the Fund from its counterparties are not fully collateralized, contractually or otherwise, the Fund bears the risk of loss from counterparty nonperformance.
The following table presents the valuations of derivative instruments by risk exposure as reported within the Statement of Assets and Liabilities as of December 31, 2014:
| | | | | | | | | | | | |
| | | Asset Derivatives | | | Liability Derivatives | |
Derivatives Not Accounted for as
Hedging Instruments | | Statement of Assets and Liabilities Location | | Value | | | Statement of Assets and Liabilities Location | | Value | |
| |
Equity contracts | | Investments, at value | | $ | 116 | * | | Options written, at value | | $ | 5,573 | |
*Amounts relate to purchased option contracts and purchased swaption contracts.
The effect of derivative instruments on the Statement of Operations is as follows:
| | | | | | | | | | | | |
| Amount of Realized Gain or (Loss) Recognized on Derivatives | |
| |
Derivatives Not Accounted for as Hedging Instruments | | Investment from unaffiliated
companies* | | | Closing and expiration of option
contracts written | | | Total | |
| |
Equity contracts | | $ | (7,865) | | | $ | 87,066 | | | $ | 79,201 | |
|
| * Includes purchased option contracts and purchased swaption contracts and written option contracts exercised, if any. | |
|
| Amount of Change in Unrealized Gain or (Loss) Recognized on Derivatives | |
| |
Derivatives Not Accounted for as Hedging Instruments | | Investments* | | | Option contracts written | | | Total | |
| |
Equity contracts | | $ | (37) | | | $ | (2,856) | | | $ | (3,903) | |
*Includes purchased option contracts and purchased swaption contracts, if any.
6. Shares of Beneficial Interest
The Fund has authorized an unlimited number of $0.001 par value shares of beneficial interest of each class. Transactions in shares of beneficial interest were as follows:
| | | | | | | | | | | | | | | | |
| | | Year Ended December 31, 2014 | | | Year Ended December 31, 2013 | |
| | | Shares | | | Amount | | | Shares | | | Amount | |
| |
Non-Service Shares | | | | | | | | | | | | | | | | |
Sold | | | 6,123 | | | $ | 72,670 | | | | 4,307 | | | $ | 45,267 | |
Dividends and/or distributions reinvested | | | 1,525 | | | | 17,847 | | | | 247 | | | | 2,605 | |
Redeemed | | | (2,228 | ) | | | (26,067 | ) | | | (1,926 | ) | | | (21,064 | ) |
| | | | |
Net increase | | | 5,420 | | | $ | 64,450 | | | | 2,628 | | | $ | 26,808 | |
| | | | |
| | | | | | | | | | | | | | | | |
| |
Service Shares | | | | | | | | | | | | | | | | |
Sold | | | 91,016 | | | $ | 1,284,880 | | | | 274,115 | | | $ | 3,450,352 | |
Dividends and/or distributions reinvested | | | 43,892 | | | | 614,048 | | | | 7,299 | | | | 91,168 | |
Redeemed | | | (146,710 | ) | | | (2,074,565 | ) | | | (129,769 | ) | | | (1,612,948 | ) |
| | | | |
Net increase (decrease) | | | (11,802 | ) | | $ | (175,637 | ) | | | 151,645 | | | $ | 1,928,572 | |
| | | | |
7. Purchases and Sales of Securities
The aggregate cost of purchases and proceeds from sales of securities, other than short-term obligations and investments in IMMF, for the year ended December 31, 2014 were as follows:
| | | | | | | | |
| | | Purchases | | | Sales | |
| |
Investment securities | | $ | 4,531,280 | | | $ | 4,942,113 | |
8. Fees and Other Transactions with Affiliates
Management Fees. Under the investment advisory agreement, the Fund pays the Manager a management fee based on the daily net assets of the Fund at an annual rate as shown in the following table:
21 OPPENHEIMER EQUITY INCOME FUND/VA
| | |
| NOTES TO FINANCIAL STATEMENTS Continued | | |
| | |
8. Fees and Other Transactions with Affiliates (Continued)
| | | | | | |
| Fee Schedule | | | | | |
|
Up to $200 million | | | 0.75 | % | | |
Next $200 million | | | 0.72 | | | |
Next $200 million | | | 0.69 | | | |
Next $200 million | | | 0.66 | | | |
Over $800 million | | | 0.60 | | | |
The Fund’s management fee for the fiscal year ended December 31, 2014 was 0.75% of average annual net assets before any applicable waivers.
Sub-Adviser Fees. The Manager has retained the Sub-Adviser to provide the day-to-day portfolio management of the Fund. Under the Sub-Advisory Agreement, the Manager pays the Sub-Adviser an annual fee in monthly installments, equal to a percentage of the investment management fee collected by the Manager from the Fund, which shall be calculated after any investment management fee waivers. The fee paid to the Sub-Adviser is paid by the Manager, not by the Fund.
Transfer Agent Fees. OFI Global (the “Transfer Agent”) serves as the transfer and shareholder servicing agent for the Fund. The Fund pays the Transfer Agent a fee based on annual net assets. Fees incurred and average net assets for each class with respect to these services are detailed in the Statement of Operations and Financial Highlights, respectively.
Sub-Transfer Agent Fees. The Transfer Agent has retained Shareholder Services, Inc., a wholly-owned subsidiary of OFI (the “Sub-Transfer Agent”), to provide the day-to-day transfer agent and shareholder servicing of the Fund. Under the Sub-Transfer Agency Agreement, the Transfer Agent pays the Sub-Transfer Agent an annual fee in monthly installments, equal to a percentage of the transfer agent fee collected by the Transfer Agent from the Fund, which shall be calculated after any applicable fee waivers. The fee paid to the Sub-Transfer Agent is paid by the Transfer Agent, not by the Fund.
Trustees’ Compensation. The Fund’s Board of Trustees (“Board”) has adopted a compensation deferral plan for Independent Trustees that enables Trustees to elect to defer receipt of all or a portion of the annual compensation they are entitled to receive from the Fund. For purposes of determining the amount owed to the Trustee under the plan, deferred amounts are treated as though equal dollar amounts had been invested in shares of the Fund or in other Oppenheimer funds selected by the Trustee. The Fund purchases shares of the funds selected for deferral by the Trustee in amounts equal to his or her deemed investment, resulting in a Fund asset equal to the deferred compensation liability. Such assets are included as a component of “Other” within the asset section of the Statement of Assets and Liabilities. Deferral of Trustees’ fees under the plan will not affect the net assets of the Fund and will not materially affect the Fund’s assets, liabilities or net investment income per share. Amounts will be deferred until distributed in accordance with the compensation deferral plan.
Distribution and Service Plan for Service Shares. The Fund has adopted a Distribution and Service Plan (the “Plan”) pursuant to Rule 12b-1 under the 1940 Act for Service shares to pay OppenheimerFunds Distributor, Inc. (the “Distributor”), for distribution related services, personal service and account maintenance for the Fund’s Service shares. Under the Plan, payments are made periodically at an annual rate of 0.25% of the daily net assets of Service shares of the Fund. The Distributor currently uses all of those fees to compensate sponsors of the insurance product that offers Fund shares, for providing personal service and maintenance of accounts of their variable contract owners that hold Service shares. These fees are paid out of the Fund’s assets on an on-going basis and increase operating expenses of the Service shares, which results in lower performance compared to the Fund’s shares that are not subject to a service fee. Fees incurred by the Fund under the Plan are detailed in the Statement of Operations.
Waivers and Reimbursements of Expenses. The Manager has contractually agreed to limit the Fund’s expenses after payments, waivers and/or reimbursements and reduction to custodian expenses, excluding expenses incurred directly or indirectly by the Fund as a result of investments in other investment companies, wholly-owned subsidiaries and pooled investment vehicles; so that those expenses, as percentages of daily net assets, will not exceed the annual rate of 0.80% for Non-Service shares and 1.05% for Service shares. During the year ended December 31, 2014, the Manager waived fees and/or reimbursed the Fund $1,645 and $68,552 for Non-Service and Service shares, respectively.
The Manager will waive fees and/or reimburse Fund expenses in an amount equal to the indirect management fees incurred through the Fund’s investment in IMMF. During the year ended December 31, 2014, the Manager waived fees and/or reimbursed the Fund $91 for IMMF management fees.
These undertakings may be modified or terminated as set forth according to the terms in the prospectus.
9. Pending Litigation
In 2009, seven class action lawsuits were filed in the U.S. District Court for the District of Colorado against OppenheimerFunds, Inc. (“OFI”), OppenheimerFunds Distributor, Inc., the Fund’s principal underwriter and distributor (the “Distributor”), and certain funds (but not including the Fund) advised by OFI Global Asset Management, Inc. and distributed by the Distributor (the “Defendant Funds”). The lawsuits also named as defendants certain officers and current and former trustees of the respective Defendant Funds. The lawsuits raised claims under federal securities laws and alleged, among other things, that the disclosure documents of the respective Defendant Funds contained misrepresentations and omissions and that the respective Defendant Funds’ investment policies were not followed. The plaintiffs in these actions sought unspecified damages, equitable relief and awards of attorneys’ fees and litigation expenses. The Defendant Funds’ Boards of Trustees also engaged counsel to represent the Funds and the present and former Independent Trustees named in those suits. In March 2014, the parties in six of these lawsuits executed stipulations and agreements of
22 OPPENHEIMER EQUITY INCOME FUND/VA
9. Pending Litigation (Continued)
settlement resolving those actions. In July 2014, the court entered an order and final judgment approving the settlements as fair, reasonable and adequate. The settlements do not resolve a seventh outstanding lawsuit relating to Oppenheimer Rochester California Municipal Fund (the “California Fund Suit”). OFI believes the California Fund Suit is without legal merit and is defending the suit vigorously. While it is premature to render any opinion as to the outcome in the California Fund Suit, or whether any costs that OFI may bear in defending the California Fund Suit might not be reimbursed by insurance, OFI believes the California Fund Suit should not impair the ability of OFI or the Distributor to perform their respective duties to the Fund, and that the outcome of the California Fund Suit should not have any material effect on the operations of any of the Oppenheimer funds.
23 OPPENHEIMER EQUITY INCOME FUND/VA
REPORT OF INDEPENDENT REGISTERED PUBLIC ACCOUNTING FIRM
The Board of Trustees and Shareholders of Oppenheimer Variable Account Funds:
We have audited the accompanying statement of assets and liabilities of Oppenheimer Equity Income Fund/VA (a separate series of Oppenheimer Variable Account Funds), including the statement of investments, as of December 31, 2014, and the related statement of operations for the year then ended, the statements of changes in net assets for each of the years in the two-year period then ended, and the financial highlights for each of the years in the five-year period then ended. These financial statements and financial highlights are the responsibility of the Fund’s management. Our responsibility is to express an opinion on these financial statements and financial highlights based on our audits.
We conducted our audits in accordance with the standards of the Public Company Accounting Oversight Board (United States). Those standards require that we plan and perform the audit to obtain reasonable assurance about whether the financial statements and financial highlights are free of material misstatement. An audit includes examining, on a test basis, evidence supporting the amounts and disclosures in the financial statements. Our procedures included confirmation of securities owned as of December 31, 2014, by correspondence with the custodian, transfer agent and brokers, or by other appropriate auditing procedures where replies from brokers were not received. An audit also includes assessing the accounting principles used and significant estimates made by management, as well as evaluating the overall financial statement presentation. We believe that our audits provide a reasonable basis for our opinion.
In our opinion, the financial statements and financial highlights referred to above present fairly, in all material respects, the financial position of Oppenheimer Equity Income Fund/VA as of December 31, 2014, the results of its operations for the year then ended, the changes in its net assets for each of the years in the two-year period then ended, and the financial highlights for each of the years in the five-year period then ended, in conformity with U.S. generally accepted accounting principles.
KPMGLLP
Denver, Colorado
February 13, 2015
24 OPPENHEIMER EQUITY INCOME FUND/VA
FEDERAL INCOME TAX INFORMATION Unaudited
In early 2015, if applicable, shareholders of record received information regarding all dividends and distributions paid to them by the Fund during calendar year 2014.
Capital gain distributions of $0.59087 per share were paid to Non-Service and Service shareholders, respectively, on June 18, 2014. Whether received in stock or in cash, the capital gain distribution should be treated by shareholders as a gain from the sale of the capital assets held for more than one year (long-term capital gains).
Dividends, if any, paid by the Fund during the fiscal year ended December 31, 2014 which are not designated as capital gain distributions should be multiplied by the maximum amount allowable but not less than 36.24% to arrive at the amount eligible for the corporate dividend-received deduction.
The foregoing information is presented to assist shareholders in reporting distributions received from the Fund to the Internal Revenue Service. Because of the complexity of the federal regulations which may affect your individual tax return and the many variations in state and local tax regulations, we recommend that you consult your tax advisor for specific guidance.
25 OPPENHEIMER EQUITY INCOME FUND/VA
BOARD APPROVAL OF THE FUND’S INVESTMENT ADVISORY AND SUB-ADVISORY AGREEMENTS Unaudited
The Fund has entered into an investment advisory agreement with OFI Global Asset Management, Inc. (“OFI Global” or the “Adviser”), a wholly-owned subsidiary of OppenheimerFunds, Inc. (“OFI” or the “Sub-Adviser”) (“OFI Global” and “OFI” together the “Managers”) and OFI Global has entered into a sub-advisory agreement with OFI whereby OFI provides investment sub-advisory services to the Fund (collectively, the “Agreements”). Each year, the Board of Trustees (the “Board”), including a majority of the independent Trustees, is required to determine whether to renew the Agreements. The Investment Company Act of 1940, as amended, requires that the Board request and evaluate, and that the Managers provide, such information as may be reasonably necessary to evaluate the terms of the Agreements. The Board employs an independent consultant to prepare a report that provides information, including comparative information that the Board requests for that purpose. In addition to in-person meetings focused on this evaluation, the Board receives information throughout the year regarding Fund services, fees, expenses and performance.
The Adviser, Sub-Adviser and the independent consultant provided information to the Board on the following factors: (i) the nature, quality and extent of the Managers’ services, (ii) the investment performance of the Fund and the Managers, (iii) the fees and expenses of the Fund, including comparative expense information, (iv) the profitability of the Managers and their affiliates, including an analysis of the cost of providing services, (v) whether economies of scale are realized as the Fund grows and whether fee levels reflect these economies of scale for Fund investors and (vi) other benefits to the Managers from their relationship with the Fund. The Board was aware that there are alternatives to retaining the Managers.
Outlined below is a summary of the principal information considered by the Board as well as the Board’s conclusions.
Nature, Quality and Extent of Services. The Board considered information about the nature, quality and extent of the services provided to the Fund and information regarding the Managers’ key personnel who provide such services. The Sub-Adviser’s duties include providing the Fund with the services of the portfolio manager and the Sub-Adviser’s investment team, who provide research, analysis and other advisory services in regard to the Fund’s investments; securities trading services; oversight of third-party service providers; monitoring compliance with applicable Fund policies and procedures and adherence to the Fund’s investment restrictions; and risk management. The Managers are responsible for providing certain administrative services to the Fund as well. Those services include providing and supervising all administrative and clerical personnel who are necessary in order to provide effective corporate administration for the Fund; compiling and maintaining records with respect to the Fund’s operations; preparing and filing reports required by the Securities and Exchange Commission; preparing periodic reports regarding the operations of the Fund for its shareholders; preparing proxy materials for shareholder meetings; and preparing the registration statements required by Federal and state securities laws for the sale of the Fund’s shares. The Managers also provide the Fund with office space, facilities and equipment.
The Board also considered the quality of the services provided and the quality of the Managers’ resources that are available to the Fund. The Board took account of the fact that the Sub-Adviser has had over fifty years of experience as an investment adviser and that its assets under management rank it among the top mutual fund managers in the United States. The Board evaluated the Sub-Adviser’s advisory, administrative, accounting, legal, compliance services and risk management, and information the Board has received regarding the experience and professional qualifications of the Managers’ key personnel and the size and functions of its staff. In its evaluation of the quality of the portfolio management services provided, the Board considered the experience of Michael Levine, the portfolio manager for the Fund, and the Sub-Adviser’s investment team and analysts. The Board members also considered the totality of their experiences with the Managers as directors or trustees of the Fund and other funds advised by the Managers. The Board considered information regarding the quality of services provided by affiliates of the Managers, which its members have become knowledgeable about in connection with the renewal of the Fund’s service agreements. The Board concluded, in light of the Managers’ experience, reputation, personnel, operations and resources that the Fund benefits from the services provided under the Agreements.
Investment Performance of the Fund, the Adviser and the Sub-Adviser. Throughout the year, the Manager provided information on the investment performance of the Fund, including comparative performance information. The Board also reviewed information, prepared by the Manager and by the independent consultant, comparing the Fund’s historical performance to relevant market indices and to the performance of other large value funds underlying variable insurance products. The Board considered that the Fund performed below its performance category median during the one- and three-year periods, but outperformed its performance category median during the five- and ten-year periods. The Board also considered that the Fund performed in the first quintile of its performance category for the five- and ten-year periods. The Board noted that on April 30, 2013 the Fund changed its name and investment strategy to Oppenheimer Equity Income Fund/VA from Oppenheimer Value Fund/VA and, on that same date, Michael Levine took over as portfolio manager of the Fund. The Board further considered that the Fund outperformed its performance category average for the year-to-date period ended April 30, 2014, ranking in the 41st percentile over that period.
Costs of Services by the Adviser. The Board reviewed the fees paid to the Manager and the other expenses borne by the Fund. The Board noted that the Manager, not the Fund, pays the Sub-Adviser’s fee under the sub-advisory agreement. The independent consultant provided comparative data in regard to the fees and expenses of the Fund and other large value funds underlying variable insurance products. In reviewing the fees and expenses charged to the VA funds, the Board considered the Manager’s assertion that, because there is much greater disparity in the fees and services that may be provided by a manager to a VA fund as opposed to a retail fund, when comparing the expenses of the various VA funds to those of retail funds, it is most appropriate to focus on total expenses (rather than on the management fees). Accordingly, while the Board reviewed and considered all expenses, it focused on total expenses. The Board considered that the Fund’s total expenses, after waivers, were lower than its peer group median and higher than its category median. The Board also considered that the Fund’s contractual management fee was equal to its peer group median and higher than its category median. Within the total asset range of $0 to $50 million, the Fund’s effective management fee rate was higher than its peer group median and category median. The Board further noted that the Manager has contractually agreed to limit the Fund’s total annual operating expenses so that those expenses, as percentages of daily net assets, will not exceed the annual rate of 0.80% for Non-Service Shares and 1.05% for Service Shares. This contractual expense limitation may not be amended or withdrawn until one year after the date of the Fund’s prospectus, unless approved by the Board.
Economies of Scale and Profits Realized by the Adviser and Sub-Adviser. The Board considered information regarding the Managers’ costs in serving as the Fund’s investment adviser and sub-adviser, including the costs associated with the personnel and systems necessary to manage the Fund, and information regarding the Managers’ profitability from their relationship with the Fund. The Board reviewed whether the Managers may
26 OPPENHEIMER EQUITY INCOME FUND/VA
realize economies of scale in managing and supporting the Fund. The Board noted that the Fund currently has management fee breakpoints, which are intended to share with Fund shareholders economies of scale that may exist as the Fund’s assets grow.
Other Benefits to the Managers. In addition to considering the profits realized by the Managers, the Board considered information that was provided regarding the direct and indirect benefits the Managers receive as a result of their relationship with the Fund, including compensation paid to the Managers’ affiliates and research provided to the Adviser in connection with permissible brokerage arrangements (soft dollar arrangements).The Board also considered that the Managers must be able to pay and retain experienced professional personnel at competitive rates to provide quality services to the Fund.
Conclusions. These factors were also considered by the independent Trustees meeting separately from the full Board, assisted by experienced counsel to the Fund and to the independent Trustees. Fund counsel and the independent Trustees’ counsel are independent of the Managers within the meaning and intent of the Securities and Exchange Commission Rules.
Based on its review of the information it received and its evaluations described above, the Board, including a majority of the independent Trustees, decided to continue the Agreements through August 31, 2015. In arriving at its decision, the Board did not identify any factor or factors as being more important than others, but considered all of the above information, and considered the terms and conditions of the Agreements, including the management fees, in light of all the surrounding circumstances.
27 OPPENHEIMER EQUITY INCOME FUND/VA
PORTFOLIO PROXY VOTING POLICIES AND PROCEDURES; UPDATES TO STATEMENTS OF INVESTMENTS Unaudited
The Fund has adopted Portfolio Proxy Voting Policies and Procedures under which the Fund votes proxies relating to securities (“portfolio proxies”) held by the Fund. A description of the Fund’s Portfolio Proxy Voting Policies and Procedures is available (i) without charge, upon request, by calling the Fund toll-free at 1.800.525.7048, (ii) on the Fund’s website at www.oppenheimerfunds.com, and (iii) on the SEC’s website at www.sec.gov. In addition, the Fund is required to file Form N-PX, with its complete proxy voting record for the 12 months ended June 30th, no later than August 31st of each year. The Fund’s voting record is available (i) without charge, upon request, by calling the Fund toll-free at 1.800.525.7048, and (ii) in the Form N-PX filing on the SEC’s website at www.sec.gov.
The Fund files its complete schedule of portfolio holdings with the SEC for the first quarter and the third quarter of each fiscal year on Form N-Q. The Fund’s Form N-Q filings are available on the SEC’s website at www.sec.gov. Those forms may be reviewed and copied at the SEC’s Public Reference Room in Washington, D.C. Information on the operation of the Public Reference Room may be obtained by calling 1-800-SEC-0330.
28 OPPENHEIMER EQUITY INCOME FUND/VA
TRUSTEES AND OFFICERS Unaudited
| | |
| |
| Name, Position(s) Held with the Fund, Length of Service, Year of Birth | | Principal Occupation(s) During the Past 5 Years; Other Trusteeships/Directorships Held; Number of Portfolios in the Fund Complex Currently Overseen |
| |
| INDEPENDENT TRUSTEES | | The address of each Trustee in the chart below is 6803 S. Tucson Way, Centennial, Colorado 80112-3924. Each Trustee serves for an indefinite term, or until his or her resignation, retirement, death or removal. |
| |
Sam Freedman, Chairman of the Board of Trustees (since 2013) and Trustee (since 2002) Year of Birth: 1940 | | Director of Colorado UpLIFT (charitable organization) (since September 1984). Mr. Freedman held several positions with the Sub-Adviser and with subsidiary or affiliated companies of the Sub-Adviser (until October 1994). Oversees 38 portfolios in the OppenheimerFunds complex. Mr. Freedman has served on the Boards of certain Oppenheimer funds since 1996, during which time he has become familiar with the Fund’s (and other Oppenheimer funds’) financial, accounting, regulatory and investment matters and has contributed to the Boards’ deliberations. |
| |
Jon S. Fossel, Trustee (since 2002) Year of Birth: 1942 | | Chairman of the Board of Jack Creek Preserve Foundation (non-profit organization) (since 2005); Chairman of the Board (2006-December 2011) and Director (June 2002-December 2011) of UNUMProvident (insurance company); Director of Northwestern Energy Corp. (public utility corporation) (November 2004-December 2009); Director of P.R. Pharmaceuticals (October 1999-October 2003); Director of Rocky Mountain Elk Foundation (non-profit organization) (February 1998-February 2003 and February 2005-February 2007); Chairman and Director (until October 1996) and President and Chief Executive Officer (until October 1995) of the Sub-Adviser; President, Chief Executive Officer and Director of the following: Oppenheimer Acquisition Corp. (“OAC”) (parent holding company of the Sub-Adviser), Shareholder Services, Inc. and Shareholder Financial Services, Inc. (until October 1995). Oversees 38 portfolios in the OppenheimerFunds complex. Mr. Fossel has served on the Boards of certain Oppenheimer funds since 1990, during which time he has become familiar with the Fund’s (and other Oppenheimer funds’) financial, accounting, regulatory and investment matters and has contributed to the Boards’ deliberations. |
| |
Richard F. Grabish, Trustee (since 2012) Year of Birth: 1948 | | Formerly Senior Vice President and Assistant Director of Sales and Marketing (March 1997-December 2007), Director (March 1987-December 2007) and Manager of Private Client Services (June 1985-June 2005) of A.G. Edwards & Sons, Inc. (broker/dealer and investment firm); Chairman and Chief Executive Officer of A.G. Edwards Trust Company, FSB (March 2001-December 2007); President and Vice Chairman of A.G. Edwards Trust Company, FSB (investment adviser) (April 1987-March 2001); President of A.G. Edwards Trust Company, FSB (investment adviser) (June 2005-December 2007). Oversees 38 portfolios in the OppenheimerFunds complex. Mr. Grabish has served on the Boards of certain Oppenheimer funds since 2001, during which time he has become familiar with the Fund’s (and other Oppenheimer funds’) financial, accounting, regulatory and investment matters and has contributed to the Boards’ deliberations. |
| |
Beverly L. Hamilton, Trustee (since 2002) Year of Birth: 1946 | | Trustee of Monterey Institute for International Studies (educational organization) (since February 2000); Board Member of Middlebury College (educational organization) (December 2005-June 2011); Chairman (since 2010) of American Funds’ Emerging Markets Growth Fund, Inc. (mutual fund); Director of The California Endowment (philanthropic organization) (April 2002-April 2008); Director (February 2002-2005) and Chairman of Trustees (2006-2007) of the Community Hospital of Monterey Peninsula; Director (October 1991-2005); Vice Chairman (2006-2009) of American Funds’ Emerging Markets Growth Fund, Inc. (mutual fund); President of ARCO Investment Management Company (February 1991-April 2000); Member of the investment committees of The Rockefeller Foundation (2001-2006) and The University of Michigan (since 2000); Advisor at Credit Suisse First Boston’s Sprout venture capital unit (venture capital fund) (1994-January 2005); Trustee of MassMutual Institutional Funds (investment company) (1996-June 2004); Trustee of MML Series Investment Fund (investment company) (April 1989-June 2004); Member of the investment committee of Hartford Hospital (2000-2003); and Advisor to Unilever (Holland) pension fund (2000-2003). Oversees 38 portfolios in the OppenheimerFunds complex. Ms. Hamilton has served on the Boards of certain Oppenheimer funds since 2002, during which time she has become familiar with the Fund’s (and other Oppenheimer funds’) financial, accounting, regulatory and investment matters and has contributed to the Boards’ deliberations. |
| |
Victoria J. Herget, Trustee (since 2012) Year of Birth:1951 | | Board Chair (2008-Present) and Director (2004-Present), United Educators (insurance company); Trustee (since 2000) and Chair (since 2010), Newberry Library (independent research library); Trustee, Mather LifeWays (senior living organization) (since 2001); Independent Director of the First American Funds (mutual fund family) (2003-2011); former Managing Director (1993-2001), Principal (1985-1993), Vice President (1978-1985) and Assistant Vice President (1973-1978) of Zurich Scudder Investments (investment adviser) (and its predecessor firms); Trustee (1992-2007), Chair of the Board of Trustees (1999-2007), Investment Committee Chair (1994-1999) and Investment Committee member (2007-2010) of Wellesley College; Trustee, BoardSource (non-profit organization) (2006-2009) and Chicago City Day School (K-8 School) (1994-2005). Oversees 38 portfolios in the OppenheimerFunds complex. Ms. Herget has served on the Boards of certain Oppenheimer funds since 2012, during which time she has become familiar with the Fund’s (and other Oppenheimer funds’) financial, accounting, regulatory and investment matters and has contributed to the Boards’ deliberations. |
| |
Robert J. Malone, Trustee (since 2002) Year of Birth: 1944 | | Chairman of the Board (since 2012) and Director (since August 2005) of Jones International University (educational organization); Chairman, Chief Executive Officer and Director of Steele Street Bank Trust (commercial banking) (since August 2003); Trustee of the Gallagher Family Foundation (non-profit organization) (since 2000); Board of Directors of Opera Colorado Foundation (non-profit organization) (2008-2012); Director of Colorado UpLIFT (charitable organization) (1986-2010); Director of Jones Knowledge, Inc. (2006-2010); Former Chairman of U.S. Bank-Colorado (subsidiary of U.S. Bancorp and formerly Colorado National Bank) (July 1996-April 1999); Director of Commercial Assets, Inc. (real estate investment trust) (1993-2000); Director of U.S. Exploration, Inc. (oil and gas exploration) (1997-February 2004); Chairman of the Board (1991-1994) and Trustee (1985-1994) of Regis University; and Chairman of the Board (1990-1991 and Trustee (1984-1999) of Young Presidents Organization. Oversees 38 portfolios in the OppenheimerFunds complex. Mr. Malone has served on the Boards of certain Oppenheimer funds since 2002, during which time he has become familiar with the Fund’s (and other Oppenheimer funds’) financial, accounting, regulatory and investment matters and has contributed to the Boards’ deliberations. |
29 OPPENHEIMER EQUITY INCOME FUND/VA
TRUSTEES AND OFFICERS Unaudited / Continued
| | |
| |
F. William Marshall, Jr., Trustee (since 2002) Year of Birth: 1942 | | Trustee Emeritus of Worcester Polytech Institute (WPI) (private university) (since 2009); Trustee of MassMutual Select Funds (formerly MassMutual Institutional Funds) (investment company) (since 1996), MML Series Investment Fund (investment company) (since 1996) and Mass Mutual Premier Funds (investment company) (since January 2012); President and Treasurer of the SIS Fund (private charitable fund) (January 1999 – March 2011); Former Trustee of WPI (1985-2008); Former Chairman of the Board (2004-2006) and Former Chairman of the Investment Committee of WPI (1994-2008); Chairman of SIS & Family Bank, F.S.B. (formerly SIS Bank) (commercial bank) (January 1999-July 1999); Executive Vice President of Peoples Heritage Financial Group, Inc. (commercial bank) (January 1999-July 1999); and Former President and Chief Executive Officer of SIS Bancorp. (1993-1999). Oversees 42 portfolios in the OppenheimerFunds complex. Mr. Marshall has served on the Boards of certain Oppenheimer funds since 2000, during which time he has become familiar with the Fund’s (and other Oppenheimer funds’) financial, accounting, regulatory and investment matters and has contributed to the Boards’ deliberations. |
| |
Karen L. Stuckey, Trustee (since 2012) Year of Birth: 1953 | | Partner (1990-2012) of PricewaterhouseCoopers LLP (professional services firm) (held various positions 1975- 1990); Trustee (1992-2006) and member of Executive, Nominating and Audit Committees and Chair of Finance Committee of Lehigh University; and member, Women’s Investment Management Forum (professional organization) since inception. Oversees 38 portfolios in the OppenheimerFunds complex. Ms. Stuckey has served on the Boards of certain Oppenheimer funds since 2012, during which time she has become familiar with the Fund’s (and other Oppenheimer funds’) financial, accounting, regulatory and investment matters and has contributed to the Boards’ deliberations. |
| |
James D. Vaughn, Trustee (since 2012) Year of Birth:1945 | | Retired; former managing partner (1994-2001) of Denver office of Deloitte & Touche LLP, (held various positions 1969-1993); Trustee and Chairman of the Audit Committee of Schroder Funds (2003-2012); Board member and Chairman of Audit Committee of AMG National Trust Bank (since 2005); Trustee and Investment Committee member, University of South Dakota Foundation (since 1996); Board member, Audit Committee Member and past Board Chair, Junior Achievement (since 1993); former Board member, Mile High United Way, Boys and Girls Clubs, Boy Scouts, Colorado Business Committee for the Arts, Economic Club of Colorado and Metro Denver Network. Oversees 38 portfolios in the OppenheimerFunds complex. Mr. Vaughn has served on the Boards of certain Oppenheimer funds since 2012, during which time he has become familiar with the Fund’s (and other Oppenheimer funds’) financial, accounting, regulatory and investment matters and has contributed to the Boards’ deliberations. |
|
|
| |
| INTERESTED TRUSTEE | | Mr. Glavin is an “Interested Trustee” because he is affiliated with the Manager and the Sub-Adviser by virtue of his positions as director of the Sub-Adviser, and as a shareholder of the Sub-Adviser’s parent company. As a Trustee, he serves for an indefinite term, or until his resignation, retirement, death or removal. Mr. Glavin’s address is 225 Liberty Street, 11th Floor, New York, New York 10281-1008. |
| |
William F. Glavin, Jr., Trustee (since 2009) Year of Birth: 1958 | | Chairman of the Sub-Adviser (July 2014-December 2014 and December 2009-December 2012) and Director of the Sub-Adviser (since January 2009); Chairman, Director and Chief Executive Officer (January 2013-June 2014) of the Manager; President of the Manager (January 2013-May 2013); Chief Executive Officer (January 2009-December 2012); President of the Sub-Adviser (May 2009-December 2012); Management Director (June 2009-June 2014), President (December 2009-June 2014) and Chief Executive Officer (January 2011-June 2014) of Oppenheimer Acquisition Corp. (“OAC”) (the Sub-Adviser’s parent holding company); Director of Oppenheimer Real Asset Management, Inc. (March 2010-June 2014); Executive Vice President (March 2006-February 2009) and Chief Operating Officer (July 2007-February 2009) of Massachusetts Mutual Life Insurance Company (OAC’s parent company); Director (May 2004-March 2006) and Chief Operating Officer and Chief Compliance Officer (May 2004-January 2005), President (January 2005-March 2006) and Chief Executive Officer (June 2005-March 2006) of Babson Capital Management LLC; Director (March 2005-March 2006), President (May 2003-March 2006) and Chief Compliance Officer (July 2005-March 2006) of Babson Capital Securities, Inc. (a broker-dealer); President (May 2003-March 2006) of Babson Investment Company, Inc.; Director (May 2004-August 2006) of Babson Capital Europe Limited; Director (May 2004-October 2006) of Babson Capital Guernsey Limited; Director (May 2004-March 2006) of Babson Capital Management LLC; Non-Executive Director (March 2005-March 2007) of Baring Asset Management Limited; Director (February 2005-June 2006) Baring Pension Trustees Limited; Director and Treasurer (December 2003-November 2006) of Charter Oak Capital Management, Inc.; Director (May 2006-September 2006) of C.M. Benefit Insurance Company; Director (May 2008-June 2009) and Executive Vice President (June 2007-July 2009) of C.M. Life Insurance Company; President (March 2006-May 2007) of MassMutual Assignment Company; Director (January 2005-December 2006), Deputy Chairman (March 2005-December 2006) and President (February 2005-March 2005) of MassMutual Holdings (Bermuda) Limited; Director (May 2008-June 2009) and Executive Vice President (June 2007-July 2009) of MML Bay State Life Insurance Company; Chief Executive Officer and President (April 2007-January 2009) of MML Distributors, LLC; and Chairman (March 2006-December 2008) and Chief Executive Officer (May 2007-December 2008) of MML Investors Services, Inc. An officer of 91 portfolios in the OppenheimerFunds complex. Mr. Glavin has served on the Boards of certain Oppenheimer funds since December 2009, during which time he has become familiar with the Fund’s (and other Oppenheimer funds’) financial, accounting, regulatory and investment matters and has contributed to the Boards’ deliberations. |
|
|
| |
| OTHER OFFICERS OF THE FUND | | The addresses of the Officers in the chart below are as follows: for Messrs. Levine, Steinmetz, Gabinet, Mss. Sexton and Picciotto, 225 Liberty Street, New York, New York 10281-1008, for Mr. Wixted, 6803 S. Tucson Way, Centennial, Colorado 80112-3924. Each Officer serves for an indefinite term or until his or her resignation, retirement, death or removal. |
| |
Michael S. Levine, Vice President (since 2013) Year of Birth: 1965 | | Vice President of the Sub-Adviser (since June 1998) and Senior Portfolio Manager of the Sub-Adviser (since September 2000). A portfolio manager and an officer of other portfolios in the OppenheimerFunds complex. |
30 OPPENHEIMER EQUITY INCOME FUND/VA
| | |
| |
Arthur P. Steinmetz, President and Principal Executive Officer (since 2014) Year of Birth: 1958 | | Chairman of the Sub-Adviser (since January 2015); CEO and Chairman of the Manager (since July 2014), President of the Manager (since May 2013), a Director of the Manager (since January 2013), Director of the Sub-Adviser (since July 2014), President, Management Director and CEO of Oppenheimer Acquisition Corp. (the Sub-Adviser’s parent holding company) (since July 2014), and President and Director of OFI SteelPath, Inc. (since January 2013). Chief Investment Officer of the OppenheimerFunds advisory entities from (January 2013-December 2013); Executive Vice President of the Manager (January 2013-May 2013); Chief Investment Officer of the Sub-Adviser (October 2010-December 2012); Chief Investment Officer, Fixed-Income, of the Sub-Adviser (April 2009-October 2010); Executive Vice President of the Sub-Adviser (October 2009-December 2012); Director of Fixed Income of the Sub-Adviser (January 2009-April 2009); and a Senior Vice President of the Sub-Adviser (March 1993-September 2009). An officer of 91 portfolios in the OppenheimerFunds complex. |
| |
Arthur S. Gabinet, Secretary and Chief Legal Officer (since 2011) Year of Birth: 1958 | | Executive Vice President, Secretary and General Counsel of the Manager (since January 2013); General Counsel OFI SteelPath, Inc. (since January 2013); Executive Vice President (May 2010-December 2012) and General Counsel (since January 2011) of the Sub-Adviser; General Counsel of the Distributor (since January 2011); General Counsel of Centennial Asset Management Corporation (January 2011-December 2012); Executive Vice President (January 2011-December 2012) and General Counsel of HarbourView Asset Management Corporation (since January 2011); Assistant Secretary (since January 2011) and Director (since January 2011) of OppenheimerFunds International Ltd. and OppenheimerFunds plc; Director of Oppenheimer Real Asset Management, Inc. (January 2011-December 2012) and General Counsel (since January 2011); Executive Vice President (January 2011-December 2011) and General Counsel of Shareholder Financial Services, Inc. and Shareholder Services, Inc. (since January 2011); Executive Vice President (January 2011-December 2012) and General Counsel of OFI Private Investments Inc. (since January 2011); Vice President of OppenheimerFunds Legacy Program (January 2011-December 2011); Executive Vice President (January 2011-December 2012) and General Counsel of OFI Institutional Asset Management, Inc. (since January 2011); General Counsel, Asset Management of the Sub-Adviser (May 2010-December 2010); Principal, The Vanguard Group (November 2005-April 2010); District Administrator, U.S. Securities and Exchange Commission (January 2003-October 2005). An officer of 91 portfolios in the OppenheimerFunds complex. |
| |
Jennifer Sexton, Vice President and Chief Business Officer (since 2014) Year of Birth: 1969 | | Senior Vice President of OppenheimerFunds Distributor, Inc. (since June 2014); Vice President of OppenheimerFunds Distributor, Inc. (April 2006-June 2014); Vice President of the Sub-Adviser (January 1998-March 2006); Assistant Vice President of the Sub-Adviser (October 1991-December 1998). An officer of 91 portfolios in the OppenheimerFunds complex. |
| |
Mary Ann Picciotto, Chief Compliance Officer and Chief Anti-Money Laundering Officer (since 2014) Year of Birth: 1973 | | Senior Vice President and Chief Compliance Officer of the Manager (since March 2014); Chief Compliance Officer of the Sub-Adviser, OFI SteelPath, Inc., OFI Global Trust Company, OFI Global Institutional, Inc., Oppenheimer Real Asset Management, Inc., OFI Private Investments, Inc., Harborview Asset Management Corporation, Trinity Investment Management Corporation, and Shareholder Services, Inc. (since March 2014); Managing Director of Morgan Stanley Investment Management Inc. and certain of its various affiliated entities; Chief Compliance Officer of various Morgan Stanley Funds (May 2010-January 2014); Chief Compliance Officer of Morgan Stanley Investment Management Inc. (April 2007-January 2014). An officer of 91 portfolios in the OppenheimerFunds complex. |
| |
Brian W. Wixted, Treasurer and Principal Financial & Accounting Officer (since 2002) Year of Birth: 1959 | | Senior Vice President of the Manager (since January 2013); Treasurer of the Sub-Adviser, HarbourView Asset Management Corporation, Shareholder Financial Services, Inc., Shareholder Services, Inc., and Oppenheimer Real Asset Management, Inc. (March 1999-June 2008), OFI Private Investments, Inc. (March 2000-June 2008), OppenheimerFunds International Ltd. and OppenheimerFunds plc (since May 2000), OFI Institutional Asset Management, Inc. (November 2000-June 2008), and OppenheimerFunds Legacy Program (charitable trust program established by the Sub-Adviser) (June 2003-December 2011); Treasurer and Chief Financial Officer of OFI Trust Company (since May 2000); Assistant Treasurer of Oppenheimer Acquisition Corporation (March 1999-June 2008). An officer of 91 portfolios in the OppenheimerFunds complex. |
The Fund’s Statement of Additional Information contains additional information about the Fund’s Trustees and Officers and is available without charge, upon request, by calling 1.800.988.8287.
31 OPPENHEIMER EQUITY INCOME FUND/VA
OPPENHEIMER EQUITY INCOME FUND/VA
A Series of Oppenheimer Variable Account Funds
| | |
| Manager | | OFI Global Asset Management, Inc. |
| |
| Sub-Adviser | | OppenheimerFunds, Inc. |
| |
| Distributor | | OppenheimerFunds Distributor, Inc. |
| |
Transfer and Shareholder Servicing Agent | | OFI Global Asset Management, Inc. |
| |
| Sub-Transfer Agent | | Shareholder Services, Inc. DBA OppenheimerFunds Services |
| |
Independent Registered Public Accounting Firm | | KPMG LLP |
| |
| Counsel | | K&L Gates LLP |
| |
| | Before investing in any of the Oppenheimer funds, investors should carefully consider a fund’s investment objectives, risks, charges and expenses. Fund prospectuses and summary prospectuses contain this and other information about the funds, and may be obtained by asking your financial advisor, or calling us at 1.800.988.8287. Read prospectuses and summary prospectuses carefully before investing. |
| |
| | © 2015 OppenheimerFunds, Inc. All rights reserved. Oppenheimer funds are distributed by OppenheimerFunds Distributor, Inc. |

PORTFOLIO MANAGERS: Mark Hamilton; David Wharmby, CFA; Brian Watson, CFA; Benjamin Rockmuller, CFA; and Dokyoung Lee, CFA
AVERAGE ANNUAL TOTAL RETURNS FOR THE PERIODS ENDED 12/31/14
| | | | | | | | |
| | | Inception
Date | | 1-Year | | Since
Inception | |
Non-Service Shares | | 11/14/13 | | 6.02% | | | 4.67 | % |
Service Shares | | 11/14/13 | | 5.90 | | | 4.52 | |
Barclays U.S. Aggregate Bond Index | | | | 5.97 | | | 4.79 | |
BofA Merrill Lynch 3-Month U.S. Treasury Bill Index | | | | 0.03 | | | 0.05 | |
Performance data quoted represents past performance, which does not guarantee future results. The investment return and principal value of an investment in the Fund will fluctuate so that an investor’s shares, when redeemed, may be worth more or less than their original cost. Current performance may be lower or higher than the performance quoted. For performance data current to the most recent month end, call us at 1.800.988.8287. The Fund’s total returns should not be expected to be the same as the returns of other funds, whether or not both funds have the same portfolio managers and/or similar names. The Fund’s total returns include changes in share price and reinvested distributions but do not include the charges associated with the separate account products that offer this Fund. Such performance would have been lower if such charges were taken into account.
| | | | |
TOP TEN COMMON STOCK HOLDINGS | | | |
PPL Corp. | | | 0.5 | % |
Honeywell International, Inc. | | | 0.4 | |
Starwood Property Trust, Inc. | | | 0.4 | |
Simon Property Group, Inc. | | | 0.4 | |
BCE, Inc. | | | 0.4 | |
Macy’s, Inc. | | | 0.4 | |
Cinemark Holdings, Inc. | | | 0.3 | |
Brinker International, Inc. | | | 0.3 | |
Quanta Services, Inc. | | | 0.3 | |
Merck & Co., Inc. | | | 0.3 | |
Portfolio holdings and allocations are subject to change. Percentages are as of December 31, 2014, and are based on net assets. For more current Fund holdings, please visit oppenheimerfunds.com.
SECTOR ALLOCATION
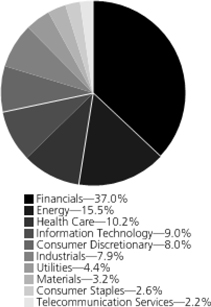
Portfolio holdings and allocations are subject to change. Percentages are as of December 31, 2014, and are based on the total market value of common stocks.
2 OPPENHEIMER DIVERSIFIED ALTERNATIVES FUND/VA
Fund Performance Discussion
The Fund’s Non-Service shares produced a return of 6.02% during the reporting period. In comparison, the Barclays U.S. Aggregate Bond Index and the BofA Merrill Lynch 3-Month U.S. Treasury Bill Index returned 5.97% and 0.03%, respectively, during the same period. The Fund’s outperformance occurred in a period when several of the alternative asset classes the Fund invests in outperformed the broader fixed income markets. Asset classes that drove the Fund’s performance this reporting period were master limited partnerships (“MLPs”), real estate investment trusts (“REITs”) and gold mining stocks.
During the reporting period, we adjusted our allocations in an effort to improve diversification, lower volatility and reduce equity beta. These adjustments included reducing our exposure to REITs, MLPs, commodities and gold miners, while increasing our exposure to leveraged loans, event-linked bonds and quantitative-driven alternative investment strategies. We also added a fundamental alpha-oriented alternative strategy that relies more on active management and less on the direction of major markets and economic factors to generate returns. In addition, we established exposure to currencies through a currency opportunities strategy. This is a total return strategy focused on fundamental dislocations across currency markets. This strategy can be long and/or short currencies against the U.S. dollar. It has a go-anywhere mandate across currencies and seeks opportunities regardless of dollar bull or bear market cycles.
MARKET OVERVIEW
To start 2014, the U.S. Federal Reserve (the “Fed”) began reducing its monthly purchases of U.S. government Treasuries and mortgage-backed securities (“MBS”) in steady $10 billion increments, and completed the process at the end of October, thereby ending the quantitative easing (“QE”) program’s purchases. Tapering the QE program in increments helped reduce market volatility and enabled investors to prepare for a post-QE market environment. Although data in the U.S. softened for the first quarter, partially attributed to cold weather effects across much of the country, it was positive in the second and third quarters of 2014, with Gross Domestic Product (“GDP”) growing at 4.6% and an estimated 5.0%, respectively.
While economic growth in the U.S. remained largely on track, it slowed in other areas, including Europe, parts of Latin America and the Asia Pacific region. Renewed concerns about economic instability in the emerging markets caused some analysts to question the sustainability of the global economic recovery, and the markets responded negatively to rising geopolitical tensions between Russia and Ukraine. In Europe, positive data points that had emerged in 2013 and early 2014 largely reversed themselves later in the reporting period and the European Central Bank (the “ECB”) came under even greater pressure to provide a credible plan to boost growth and avoid deflation. In response, the ECB adopted a number of policies designed to stimulate growth. In Japan, which has been mired in economic weakness for years, the Abe administration has adopted even more aggressive economic policies with the Bank of Japan executing a massive QE program. However, the results have not been particularly impressive, with that economy slipping back into recession in the third quarter of 2014 following the consumption tax increase. Emerging markets’ economic growth was mixed, as certain regions like Eastern Europe and the Middle East remained burdened by geopolitical turmoil. Many commodity producing emerging market economies also struggled as prices for most commodities fell.
As a result of U.S. economic strength, the U.S. dollar rallied strongly against most major currencies this reporting period, including the euro and Japanese yen.
FUND REVIEW
During the reporting period, the strongest performing areas of the Fund were MLPs, REITs and gold mining stocks. MLPs, which may offer price appreciation as well as a steady stream of income, performed well in 2014 despite experiencing volatility over the fourth quarter as energy commodities continued to weaken and drove prices lower on alternative assets. While energy infrastructure MLPs typically earn a fee for the majority of their revenues; they did exhibit heightened trading price correlation with energy commodities. With the pickup in volatility and correlation, we reduced our exposure to MLPs in an effort to manage volatility and diversification characteristics in the Fund. Over the long-term, we believe investor interest in income generating asset classes remains strong in a low-yield world, and MLPs are positioned to benefit.
The Fund’s allocation to REITs benefited performance in an environment of solid real estate fundamentals that were supported both by macroeconomic factors and the capital markets. We have a pro-cyclical tilt to the real estate portfolio, which we expect may perform well as global growth is positive despite the recent setback in Japan and Europe. We are seeing attractive valuations in Europe in conjunction with low rates and additional QE measures, which should provide additional support. Many investors remain interested in attractive yields, and we believe the combination of a positive growth environment, falling unemployment, growing demand for commercial real estate, tight supply and accommodative monetary policies should be positive for the asset class.
The Fund’s allocation to gold mining equities benefited performance over the first half of the period before we exited our position in the investments. After falling sharply in 2013, gold prices rose. This, combined with falling real interest rates, turmoil in the Middle East and elsewhere, and a renewed focus on geopolitical
3 OPPENHEIMER DIVERSIFIED ALTERNATIVES FUND/VA
risks, helped support both gold and the gold mining equities. However, we eliminated our exposure to gold mining equities over the second half of the reporting period. Increased volatility in the asset class along with falling global growth expectations and normalizing interest rates, (typically a headwind to gold and gold-mining equities), caused us to cut our exposure.
The most significant detractor from performance was our exposure to commodities, which we source through commodity futures, options, swaps and structured notes as well as U.S. Government and other fixed income securities. Many commodities suffered as a pickup in volatility caused large negative returns in commodity markets and particularly energy. Oil markets shrugged off geopolitical tensions and tumbled on perceptions of weak global demand and slower growth in China. Crude oil price weakness appears to be driven by increasing U.S. crude production at a time of questionable demand. With the pickup in volatility and downward pressure in commodities, we reduced our exposure in an effort to manage volatility and the diversification characteristics of the Fund.
STRATEGY & OUTLOOK
We have witnessed a strong bull market in U.S. equities over the last six years, and last year in particular the U.S. equity market surpassed many of its global counterparts. Going forward, we believe there is the potential for more measured returns and given that we are in a world with QE becoming the norm globally, we expect to see greater dispersion across financial assets. In this type of environment, further diversifying in alternatives can improve the risk and reward profile for an investor. Thus we believe that diversifying risk, controlling volatility and managing the downside will be the winning strategy going forward. Because the Fund is comprised of a number of different alternative assets and strategies, with diversifying properties as well as the potential to generate attractive total returns, we believe it can play a particularly valuable role in investors’ portfolios given such an environment.
Investors should consider the Fund’s investment objective, risks, charges and expenses carefully before investing. The Fund’s prospectus and summary prospectus contain this and other information about the Fund, and may be obtained by asking your financial advisor or calling us at 1.800.988.8287. Read prospectuses and summary prospectuses carefully before investing.
Total returns include changes in share price and reinvestment of dividends and capital gains distributions in a hypothetical investment for the periods shown.
The Fund’s investment strategy and focus can change over time. The mention of specific fund holdings does not constitute a recommendation by OppenheimerFunds, Inc. or its affiliates.
Shares of Oppenheimer funds are not deposits or obligations of any bank, are not guaranteed by any bank, are not insured by the FDIC or any other agency, and involve investment risks, including the possible loss of the principal amount invested.
Comparing the Fund’s Performance to the Market. The graphs that follow show the performance of a hypothetical $10,000 investment in each share class of the Fund held until December 31, 2014. Performance is measured from the inception of both Classes on November 14, 2013. Performance information does not reflect charges that apply to separate accounts investing in the Fund. If these charges were taken into account, performance would be lower. The graphs assume that all dividends and capital gains distributions were reinvested in additional shares.
The Fund’s performance is compared to the performance of the Barclays U.S. Aggregate Bond Index, an index of U.S. corporate and government bonds, and the BofA Merrill Lynch 3-Month U.S. Treasury Bill Index, an index of short-term U.S. Government securities with a remaining term to final maturity of less than three months. The indices are unmanaged and cannot be purchased directly by investors. While index comparisons may be useful to provide a benchmark for the Fund’s performance, it must be noted that the Fund’s investments are not limited to the investments comprising the indices. Index performance includes reinvestment of income, but does not reflect transaction costs, fees, expenses or taxes. Index performance is shown for illustrative purposes only as a benchmark for the Fund’s performance, and does not predict or depict performance of the Fund. The Fund’s performance reflects the effects of the Fund’s business and operating expenses.
4 OPPENHEIMER DIVERSIFIED ALTERNATIVES FUND/VA
COMPARISON OF CHANGE IN VALUE OF $10,000 HYPOTHETICAL INVESTMENTS IN:
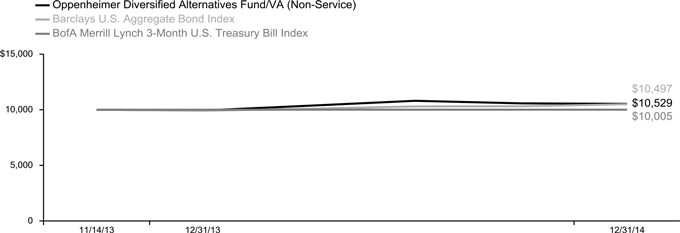
COMPARISON OF CHANGE IN VALUE OF $10,000 HYPOTHETICAL INVESTMENTS IN:
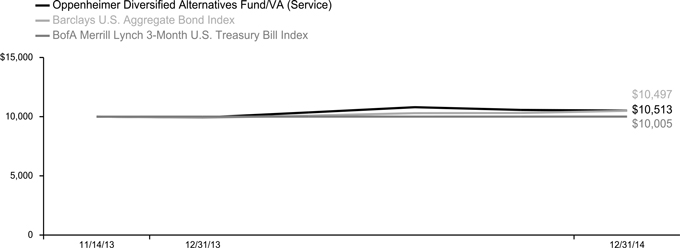
Performance data quoted represents past performance, which does not guarantee future results. The investment return and principal value of an investment in the Fund will fluctuate so that an investor’s shares, when redeemed, may be worth more or less than their original cost. Current performance may be lower or higher than the performance quoted. For performance data current to the most recent month end, call us at 1.800.988.8287. The Fund’s total returns should not be expected to be the same as the returns of other funds, whether or not both funds have the same portfolio managers and/or similar names. The Fund’s total returns include changes in share price and reinvested distributions but do not include the charges associated with the separate account products that offer this Fund. Such performance would have been lower if such charges were taken into account.
5 OPPENHEIMER DIVERSIFIED ALTERNATIVES FUND/VA
Fund Expenses
Fund Expenses. As a shareholder of the Fund, you incur two types of costs: (1) transaction costs and (2) ongoing costs, including management fees; distribution and service fees; and other Fund expenses. These examples are intended to help you understand your ongoing costs (in dollars) of investing in the Fund and to compare these costs with the ongoing costs of investing in other mutual funds.
The examples are based on an investment of $1,000.00 invested at the beginning of the period and held for the entire
6-month period ended December 31, 2014.
Actual Expenses. The first section of the table provides information about actual account values and actual expenses. You may use the information in this section for the class of shares you hold, together with the amount you invested, to estimate the expense that you paid over the period. Simply divide your account value by $1,000.00 (for example, an $8,600.00 account value divided by $1,000.00 = 8.60), then multiply the result by the number in the first section under the heading entitled “Expenses Paid During Period” to estimate the expenses you paid on your account during this period.
Hypothetical Example for Comparison Purposes.
The second section of the table provides information about hypothetical account values and hypothetical expenses based on the Fund’s actual expense ratio for each class of shares, and an assumed rate of return of 5% per year for each class before expenses, which is not the actual return. The hypothetical account values and expenses may not be used to estimate the actual ending account balance or expenses you paid for the period. You may use this information to compare the ongoing costs of investing in the Fund and other funds. To do so, compare this 5% hypothetical example for the class of shares you hold with the 5% hypothetical examples that appear in the shareholder reports of the other funds.
Please note that the expenses shown in the table are meant to highlight your ongoing costs only and do not reflect any charges associated with the separate accounts that offer this Fund. Therefore, the “hypothetical” lines of the table are useful in comparing ongoing costs only, and will not help you determine the relative total costs of owning different funds. In addition, if these separate account charges were included your costs would have been higher.
| | | | | | | | |
| Actual | | Beginning
Account
Value
July 1, 2014 | | Ending
Account
Value
December 31, 2014 | | Expenses
Paid During
6 Months Ended
December 31, 2014 | | |
Non-Service shares | | $ 1,000.00 | | $ 974.60 | | $ 6.99 | | |
Service shares | | 1,000.00 | | 973.50 | | 8.44 | | |
| | | | |
| Hypothetical | | | | | | | | |
(5% return before expenses) | | | | | | | | |
Non-Service shares | | 1,000.00 | | 1,018.15 | | 7.15 | | |
Service shares | | 1,000.00 | | 1,016.69 | | 8.63 | | |
Expenses are equal to the Fund’s annualized expense ratio for that class, multiplied by the average account value over the period, multiplied by 184/365 (to reflect the one-half year period). Those annualized expense ratios, excluding indirect expenses from affiliated funds, based on the 6-month period ended December 31, 2014 are as follows:
| | | | |
| Class | | Expense Ratios | |
Non-Service shares | | | 1.40 | % |
Service shares | | | 1.69 | |
The expense ratios reflect voluntary waivers and/or reimbursements of expenses by the Fund’s Manager. Some of these undertakings may be modified or terminated at any time, as indicated in the Fund’s prospectus. The “Financial Highlights” tables in the Fund’s consolidated financial statements, included in this report, also show the gross expense ratios, without such waivers or reimbursements and reduction to custodian expenses, if applicable.
6 OPPENHEIMER DIVERSIFIED ALTERNATIVES FUND/VA
| | |
| |
| CONSOLIDATED STATEMENT OF INVESTMENTS December 31, 2014 | | |
| | | | | | | | |
| | | Shares | | | Value | |
Common Stocks—18.8% | | | | | | | | |
Consumer Discretionary—1.5% | | | | | | | | |
Hotels, Restaurants & Leisure—0.3% | |
Brinker International, Inc.1,2 | | | 15,160 | | | $ | 889,740 | |
Starwood Hotels & Resorts Worldwide, Inc. | | | 700 | | | | 56,749 | |
| | | | | | | | |
| | | | | | | 946,489 | |
| | | | | | | | |
Media—0.5% | | | | | | | | |
Cinemark Holdings, Inc.2 | | | 25,155 | | | | 895,015 | |
Comcast Corp., Cl. A1,2 | | | 8,200 | | | | 475,682 | |
| | | | | | | | |
| | | | | | | 1,370,697 | |
| | | | | | | | |
Multiline Retail—0.6% | | | | | | | | |
Dollar General Corp.3 | | | 2,605 | | | | 184,174 | |
Macy’s, Inc.1,2 | | | 14,360 | | | | 944,170 | |
Target Corp. | | | 4,920 | | | | 373,477 | |
| | | | | | | | |
| | | | | | | 1,501,821 | |
| | | | | | | | |
Specialty Retail—0.1% | | | | | | | | |
PetSmart, Inc. | | | 1,944 | | | | 158,037 | |
| | | | | | | | |
Consumer Staples—0.5% | | | | | | | | |
Beverages—0.1% | | | | | | | | |
Coca-Cola Co. (The)1,2 | | | 8,370 | | | | 353,382 | |
| | | | | | | | |
Food & Staples Retailing—0.1% | | | | | | | | |
Pantry, Inc. (The)3 | | | 4,403 | | | | 163,175 | |
| | | | | | | | |
Tobacco—0.3% | | | | | | | | |
Altria Group, Inc.1,2 | | | 7,455 | | | | 367,308 | |
Philip Morris International, Inc.2 | | | 4,765 | | | | 388,109 | |
| | | | | | | | |
| | | | | | | 755,417 | |
| | | | | | | | |
Energy—2.9% | | | | | | | | |
Energy Equipment & Services—0.2% | |
Dresser-Rand Group, Inc.3 | | | 1,946 | | | | 159,183 | |
Schlumberger Ltd. | | | 3,180 | | | | 271,604 | |
Seadrill Partners LLC | | | 7,651 | | | | 124,175 | |
| | | | | | | | |
| | | | | | | 554,962 | |
| | | | | | | | |
Oil, Gas & Consumable Fuels—2.7% | |
Access Midstream Partners LP2 | | | 4,685 | | | | 253,927 | |
Apco Oil & Gas International, Inc.3 | | | 11,065 | | | | 155,242 | |
Atlas Pipeline Partners LP | | | 290 | | | | 7,905 | |
Buckeye Partners LP2 | | | 3,380 | | | | 255,731 | |
Canadian Natural Resources Ltd. | | | 4,865 | | | | 150,414 | |
Chevron Corp. | | | 2,620 | | | | 293,912 | |
ConocoPhillips1 | | | 5,190 | | | | 358,421 | |
DCP Midstream Partners LP1 | | | 4,000 | | | | 181,720 | |
Energy Transfer Equity LP1 | | | 6,220 | | | | 356,904 | |
Energy Transfer Partners LP2 | | | 2,855 | | | | 185,575 | |
Enterprise Products Partners LP2 | | | 12,545 | | | | 453,125 | |
EOG Resources, Inc. | | | 3,115 | | | | 286,798 | |
EQT Midstream Partners LP2 | | | 2,045 | | | | 179,960 | |
Genesis Energy LP2 | | | 2,900 | | | | 123,018 | |
Holly Energy Partners LP1,2 | | | 2,697 | | | | 80,667 | |
Magellan Midstream Partners LP1 | | | 4,965 | | | | 410,407 | |
MarkWest Energy Partners LP | | | 3,240 | | | | 217,696 | |
NGL Energy Partners LP1,2 | | | 4,910 | | | | 137,431 | |
Noble Energy, Inc.2 | | | 2,465 | | | | 116,915 | |
NuStar Energy LP | | | 250 | | | | 14,437 | |
NuStar GP Holdings LLC2 | | | 2,625 | | | | 90,353 | |
ONEOK Partners LP2 | | | 2,445 | | | | 96,895 | |
ONEOK, Inc. | | | 2,665 | | | | 132,690 | |
Plains All American Pipeline LP2 | | | 6,270 | | | | 321,776 | |
Plains GP Holdings LP, Cl. A | | | 100 | | | | 2,568 | |
Regency Energy Partners LP1,2 | | | 11,600 | | | | 278,400 | |
Shell Midstream Partners LP3 | | | 3,764 | | | | 154,249 | |
Spectra Energy Partners LP2 | | | 1,900 | | | | 108,243 | |
Summit Midstream Partners LP | | | 1,255 | | | | 47,690 | |
Sunoco Logistics Partners LP1,2 | | | 7,925 | | | | 331,107 | |
| | | | | | | | |
| | | Shares | | | Value | |
Oil, Gas & Consumable Fuels (Continued) | |
Targa Resources Corp. | | | 140 | | | $ | 14,847 | |
Targa Resources Partners LP2 | | | 3,355 | | | | 160,637 | |
TC PipeLines LP | | | 3,785 | | | | 269,568 | |
Tesoro Logistics LP | | | 2,485 | | | | 146,242 | |
TransMontaigne Partners LP | | | 1,455 | | | | 45,847 | |
Valero Energy Corp.1 | | | 9,835 | | | | 486,833 | |
Western Gas Partners LP | | | 1,255 | | | | 91,678 | |
Williams Cos., Inc. (The) | | | 2,770 | | | | 124,484 | |
| | | | | | | | |
| | | | | | | 7,124,312 | |
| | | | | | | | |
Financials—7.0% | | | | | | | | |
Capital Markets—0.0% | | | | | | | | |
Goldman Sachs Group, Inc. (The) | | | 406 | | | | 78,695 | |
| | | | | | | | |
Commercial Banks—0.5% | | | | | | | | |
Citigroup, Inc.2 | | | 6,580 | | | | 356,044 | |
JPMorgan Chase & Co.1 | | | 6,390 | | | | 399,886 | |
M&T Bank Corp. | | | 2,715 | | | | 341,058 | |
Wells Fargo & Co. | | | 2,530 | | | | 138,695 | |
| | | | | | | | |
| | | | | | | 1,235,683 | |
| | | | | | | | |
Diversified Financial Services—0.1% | |
MicroFinancial, Inc. | | | 15,796 | | | | 161,198 | |
| | | | | | | | |
Insurance—0.5% | | | | | | | | |
ACE Ltd. | | | 6,725 | | | | 772,568 | |
Allstate Corp. (The) | | | 3,980 | | | | 279,595 | |
Meadowbrook Insurance Group, Inc.3 | | | 18,552 | | | | 156,950 | |
| | | | | | | | |
| | | | | | | 1,209,113 | |
| | | | | | | | |
Real Estate Investment Trusts (REITs)—4.8% | | | | | | | | |
Acadia Realty Trust | | | 8,520 | | | | 272,896 | |
Alexandria Real Estate Equities, Inc. | | | 1,380 | | | | 122,461 | |
American Assets Trust, Inc. | | | 4,225 | | | | 168,197 | |
American Realty Capital Properties, Inc. | | | 4,340 | | | | 39,277 | |
AvalonBay Communities, Inc. | | | 3,437 | | | | 561,571 | |
Blackstone Mortgage Trust, Inc., Cl. A | | | 17,420 | | | | 507,619 | |
Boston Properties, Inc. | | | 2,440 | | | | 314,004 | |
Canadian Real Estate Investment Trust | | | 2,108 | | | | 83,083 | |
CapitaMall Trust | | | 66,000 | | | | 101,557 | |
Chatham Lodging Trust | | | 2,290 | | | | 66,341 | |
Chesapeake Lodging Trust | | | 8,650 | | | | 321,866 | |
Cousins Properties, Inc. | | | 10,500 | | | | 119,910 | |
CubeSmart | | | 9,340 | | | | 206,134 | |
Derwent London plc | | | 3,700 | | | | 172,816 | |
Dream Office Real Estate Investment Trust | | | 2,450 | | | | 53,036 | |
Education Realty Trust, Inc. | | | 3,543 | | | | 129,638 | |
Equity Residential | | | 6,810 | | | | 489,230 | |
Essex Property Trust, Inc. | | | 1,710 | | | | 353,286 | |
Eurocommercial Properties NV | | | 2,220 | | | | 94,172 | |
Extra Space Storage, Inc. | | | 4,370 | | | | 256,257 | |
FelCor Lodging Trust, Inc. | | | 17,580 | | | | 190,216 | |
First Industrial Realty Trust, Inc. | | | 5,740 | | | | 118,014 | |
General Growth Properties, Inc. | | | 7,770 | | | | 218,570 | |
GLP J-Reit | | | 173 | | | | 191,707 | |
Goodman Group | | | 32,000 | | | | 147,519 | |
GPT Group (The) | | | 38,900 | | | | 137,432 | |
Gramercy Property Trust, Inc. | | | 7,710 | | | | 53,199 | |
Great Portland Estates plc | | | 16,310 | | | | 186,403 | |
Hammerson plc | | | 16,510 | | | | 154,311 | |
Health Care REIT, Inc. | | | 2,590 | | | | 195,985 | |
Highwoods Properties, Inc. | | | 5,520 | | | | 244,426 | |
Host Hotels & Resorts, Inc. | | | 9,682 | | | | 230,141 | |
Invincible Investment Corp. | | | 401 | | | | 166,674 | |
Japan Retail Fund Investment Corp. | | | 56 | | | | 118,095 | |
Kilroy Realty Corp. | | | 3,340 | | | | 230,694 | |
Kite Realty Group Trust | | | 3,762 | | | | 108,120 | |
Klepierre | | | 3,970 | | | | 171,001 | |
7 OPPENHEIMER DIVERSIFIED ALTERNATIVES FUND/VA
| | |
| |
| CONSOLIDATED STATEMENT OF INVESTMENTS Continued | | |
| | | | | | | | |
| | | Shares | | | Value | |
Real Estate Investment Trusts (REITs) (Continued) | |
Land Securities Group plc | | | 12,890 | | | $ | 230,652 | |
LaSalle Hotel Properties | | | 4,440 | | | | 179,687 | |
Link REIT (The) | | | 15,500 | | | | 96,656 | |
Macerich Co. (The) | | | 6,230 | | | | 519,644 | |
Mirvac Group | | | 177,738 | | | | 256,690 | |
Morguard Real Estate Investment Trust | | | 4,530 | | | | 70,808 | |
Paramount Group, Inc.3 | | | 5,480 | | | | 101,873 | |
Prologis, Inc. | | | 7,710 | | | | 331,761 | |
Ramco-Gershenson Properties Trust | | | 6,670 | | | | 124,996 | |
Regency Centers Corp. | | | 3,610 | | | | 230,246 | |
Sabra Health Care REIT, Inc. | | | 2,930 | | | | 88,984 | |
Simon Property Group, Inc. | | | 5,270 | | | | 959,720 | |
STAG Industrial, Inc. | | | 2,577 | | | | 63,137 | |
Starwood Property Trust, Inc. | | | 44,020 | | | | 1,023,025 | |
Tanger Factory Outlet Centers, Inc. | | | 4,680 | | | | 172,973 | |
Unibail-Rodamco SE | | | 1,500 | | | | 383,381 | |
Vastned Retail NV | | | 1,481 | | | | 66,905 | |
Vornado Realty Trust | | | 2,130 | | | | 250,722 | |
Westfield Corp. | | | 30,153 | | | | 220,455 | |
| | | | | | | | |
| | | | | | | 12,668,173 | |
| | | | | | | | |
Real Estate Management & Development— 1.1% | |
CapitaLand Ltd. | | | 74,000 | | | | 183,860 | |
Daiwa House Industry Co. Ltd. | | | 9,000 | | | | 170,421 | |
Deutsche Annington Immobilien SE | | | 3,525 | | | | 119,904 | |
Global Logistic Properties Ltd. | | | 66,000 | | | | 123,434 | |
Hang Lung Properties Ltd. | | | 48,000 | | | | 133,771 | |
Helical Bar plc | | | 17,440 | | | | 104,067 | |
Hufvudstaden AB, Cl. A | | | 6,588 | | | | 85,516 | |
Keppel Land Ltd. | | | 33,000 | | | | 84,832 | |
Mitsubishi Estate Co. Ltd. | | | 9,100 | | | | 192,596 | |
Mitsui Fudosan Co. Ltd. | | | 19,000 | | | | 511,015 | |
Sino Land Co. Ltd. | | | 92,000 | | | | 146,730 | |
St. Modwen Properties plc | | | 16,640 | | | | 99,383 | |
Sumitomo Realty & Development Co. Ltd. | | | 8,400 | | | | 286,150 | |
Sun Hung Kai Properties Ltd. | | | 30,000 | | | | 453,642 | |
Unite Group plc (The) | | | 14,410 | | | | 104,410 | |
Wharf Holdings Ltd. (The) | | | 29,000 | | | | 208,256 | |
| | | | | | | | |
| | | | | | | 3,007,987 | |
| | | | | | | | |
Health Care—1.9% | |
Biotechnology—0.0% | |
Chelsea Therapeutics, Inc.3 | | | 10,531 | | | | — | |
Cubist Pharmaceuticals, Inc.3 | | | 1,614 | | | | 162,449 | |
| | | | | | | | |
| | | | | | | 162,449 | |
| | | | | | | | |
Health Care Equipment & Supplies—0.4% | |
Baxter International, Inc. | | | 7,690 | | | | 563,600 | |
Covidien plc | | | 2,670 | | | | 273,087 | |
Volcano Corp.3 | | | 8,953 | | | | 160,080 | |
| | | | | | | | |
| | | | | | | 996,767 | |
| | | | | | | | |
Health Care Providers & Services—0.4% | |
Gentiva Health Services, Inc.3 | | | 742 | | | | 14,135 | |
HCA Holdings, Inc.3 | | | 1,370 | | | | 100,545 | |
UnitedHealth Group, Inc.2 | | | 7,010 | | | | 708,641 | |
Universal Health Services, Inc., Cl. B | | | 2,185 | | | | 243,103 | |
| | | | | | | | |
| | | | | | | 1,066,424 | |
| | | | | | | | |
Pharmaceuticals—1.1% | |
Actavis plc3 | | | 2,470 | | | | 635,803 | |
Ambit Biosciences Corp.3 | | | 10,347 | | | | 6,208 | |
Avanir Pharmaceuticals, Inc.3 | | | 9,669 | | | | 163,890 | |
Durata Therapeutics3 | | | 6,530 | | | | — | |
Furiex Pharmaceuticals, Inc.3 | | | 636 | | | | 3,107 | |
Merck & Co., Inc.1,2 | | | 14,375 | | | | 816,356 | |
Novartis AG, ADR | | | 6,465 | | | | 599,047 | |
Roche Holding AG | | | 2,210 | | | | 598,999 | |
| | | | | | | | |
| | | Shares | | | Value | |
Pharmaceuticals (Continued) | |
Teva Pharmaceutical Industries Ltd.3 | | | 10 | | | $ | — | |
| | | | | | | | |
| | | | | | | 2,823,410 | |
| | | | | | | | |
Industrials—1.5% | |
Aerospace & Defense—0.5% | |
Honeywell International, Inc.1 | | | 10,340 | | | | 1,033,173 | |
Northrop Grumman Corp. | | | 2,355 | | | | 347,103 | |
| | | | | | | | |
| | | | | | | 1,380,276 | |
| | | | | | | | |
Airlines—0.1% | |
United Continental Holdings, Inc.3 | | | 2,820 | | | | 188,630 | |
| | | | | | | | |
Commercial Services & Supplies—0.1% | |
Tyco International plc2 | | | 7,315 | | | | 320,836 | |
| | | | | | | | |
Construction & Engineering—0.3% | |
Quanta Services, Inc.2,3 | | | 29,415 | | | | 835,092 | |
| | | | | | | | |
Machinery—0.1% | |
Flowserve Corp. | | | 5,585 | | | | 334,151 | |
| | | | | | | | |
Marine—0.1% | |
Horizon Lines, Inc., Cl. A3 | | | 241,493 | | | | 152,406 | |
| | | | | | | | |
Trading Companies & Distributors—0.3% | |
AerCap Holdings NV3 | | | 9,785 | | | | 379,854 | |
WESCO International, Inc.3 | | | 3,965 | | | | 302,172 | |
| | | | | | | | |
| | | | | | | 682,026 | |
| | | | | | | | |
Information Technology—1.7% | |
Communications Equipment—0.7% | |
Juniper Networks, Inc.2 | | | 23,980 | | | | 535,234 | |
QUALCOMM, Inc.1 | | | 9,845 | | | | 731,779 | |
Riverbed Technology, Inc.3 | | | 7,728 | | | | 157,728 | |
Telefonaktiebolaget LM Ericsson, Cl. B | | | 36,095 | | | | 437,144 | |
| | | | | | | | |
| | | | | | | 1,861,885 | |
| | | | | | | | |
Electronic Equipment, Instruments, & Components—0.1% | |
ChyronHego Corp.3 | | | 57,785 | | | | 161,798 | |
Elecsys Corp.3 | | | 9,242 | | | | 160,996 | |
| | | | | | | | |
| | | | | | | 322,794 | |
| | | | | | | | |
Internet Software & Services—0.3% | |
Digital River, Inc.3 | | | 6,165 | | | | 152,460 | |
Google, Inc., Cl. A3 | | | 525 | | | | 278,597 | |
Google, Inc., Cl. C3 | | | 525 | | | | 276,360 | |
World Energy Solutions, Inc.3 | | | 29,446 | | | | 161,953 | |
| | | | | | | | |
| | | | | | | 869,370 | |
| | | | | | | | |
IT Services—0.1% | |
Sapient Corp.3 | | | 6,468 | | | | 160,924 | |
| | | | | | | | |
Semiconductors & Semiconductor Equipment—0.2% | |
International Rectifier Corp.3 | | | 1,795 | | | | 71,621 | |
Xilinx, Inc.1 | | | 10,505 | | | | 454,761 | |
| | | | | | | | |
| | | | | | | 526,382 | |
| | | | | | | | |
Software—0.1% | |
Actuate Corp.3 | | | 25,014 | | | | 165,092 | |
| | | | | | | | |
Technology Hardware, Storage & Peripherals—0.2% | |
Apple, Inc. | | | 4,835 | | | | 533,687 | |
| | | | | | | | |
Materials—0.6% | |
Chemicals—0.6% | |
Celanese Corp., Series A, Cl. A | | | 5,585 | | | | 334,877 | |
LyondellBasell Industries NV, Cl. A1 | | | 7,242 | | | | 574,942 | |
Methanex Corp. | | | 8,395 | | | | 384,743 | |
Penford Corp.3 | | | 8,439 | | | | 157,725 | |
Sigma-Aldrich Corp. | | | 1,148 | | | | 157,586 | |
| | | | | | | | |
| | | | | | | 1,609,873 | |
| | | | | | | | |
8 OPPENHEIMER DIVERSIFIED ALTERNATIVES FUND/VA
| | | | | | | | | | | | |
| | | | | | Shares | | | Value | |
Telecommunication Services—0.4% | | | | | |
Diversified Telecommunication Services—0.4% | | | | | |
BCE, Inc. | | | | | | | 20,920 | | | $ | 959,391 | |
Verizon Communications, Inc. | | | | | | | 3,145 | | | | 147,123 | |
| | | | | | | | | | | | |
| | | | | | | | | | | 1,106,514 | |
| | | | | | | | | | | | |
Utilities—0.8% | | | | | | | | | | | | |
Electric Utilities—0.8% | | | | | |
Cleco Corp. | | | | | | | 2,873 | | | | 156,693 | |
Edison International1 | | | | | | | 10,795 | | | | 706,857 | |
PPL Corp.2 | | | | | | | 32,790 | | | | 1,191,261 | |
| | | | | | | | | | | | |
| | | | | | | | | | | 2,054,811 | |
| | | | | | | | | | | | |
Independent Power and Renewable Electricity Producers—0.0% | | | | | |
EME Reorganization Trust | | | | | | | 52,072 | | | | 1,354 | |
NRG Energy, Inc. | | | | | | | 171 | | | | 4,614 | |
| | | | | | | | | | | | |
| | | | | | | | | | | 5,968 | |
| | | | | | | | | | | | |
Multi-Utilities—0.0% | | | | | |
CMS Energy Corp. | | | | | | | 3,980 | | | | 138,305 | |
| | | | | | | | | | | | |
Total Common Stocks (Cost $47,944,912) | | | | 49,587,213 | |
| | | | | |
Preferred Stocks—0.5% | | | | | |
M&T Bank Corp., 6.375% Cum., Series A, Non-Vtg., 6.375%4 | | | | | | | 340 | | | | 340,000 | |
M&T Bank Corp., 6.375% Cum., Series C, Non-Vtg., 6.375%4 | | | | | | | 475 | | | | 475,000 | |
U.S. Bancorp, 6% Non-Cum., Series G, Non-Vtg., 6%4 | | | | | | | 18,700 | | | | 507,144 | |
| | | | | | | | | | | | |
Total Preferred Stocks (Cost $1,358,508) | | | | 1,322,144 | |
| | | |
| | | | | | Principal
Amount | | | | |
Asset-Backed Securities—3.0% | | | | | |
Airspeed Ltd., Series 2007-1A, Cl. G1, 0.431%, 6/15/324,5 | | | | | | $ | 2,241,145 | | | | 1,883,099 | |
Blade Engine Securitization Ltd., Series 2006-1AW, Cl. A1, 0.461%, 9/15/414,5 | | | | | | | 2,144,157 | | | | 1,646,494 | |
JP Morgan Mortgage Acquisition Corp., Series 2005-OPT2, Cl. M2, 0.62%, 12/25/354 | | | | | | | 1,836,000 | | | | 1,525,349 | |
Morgan Stanley ABS Capital I, Inc. Trust, Series 2006-NC1, Cl. M1, 0.55%, 12/25/354 | | | | | | | 1,780,000 | | | | 1,479,330 | |
New Century Home Equity Loan Trust, Series 2005-1, Cl. M2, 0.89%, 3/25/354 | | | | | | | 1,643,635 | | | | 1,446,696 | |
| | | | | | | | | | | | |
Total Asset-Backed Securities (Cost $8,189,637) | | | | | | | | | | | 7,980,968 | |
| | | | | | | | | | | | |
Foreign Government Obligations—21.2% | | | | | |
Brazil—4.5% | | | | | | | | | | | | |
Federative Republic of Brazil Unsec. Bonds, | | | | | | | | | | | | |
10.828%, 7/1/159 | | | BRL | | | | 33,400,000 | | | | 11,857,063 | |
Japan—1.1% | | | | | | | | | | | | |
Japan Sr. Unsec. Bonds, 0.10%, 9/15/15 | | | JPY | | | | 330,000,000 | | | | 2,757,305 | |
Malaysia—5.2% | | | | | | | | | | | | |
Federation of Malaysia Sr. Unsec. Bonds: | | | | | | | | | | | | |
3.197%, 10/15/15 | | | MYR | | | | 20,300,000 | | | | 5,788,713 | |
4.72%, 9/30/15 | | | MYR | | | | 27,700,000 | | | | 7,987,416 | |
| | | | | | | | | | | | |
| | | | | | | | | | | 13,776,129 | |
| | | | | | | | | | | | |
Singapore—4.5% | | | | | | | | | | | | |
Republic of Singapore Sr. Unsec. Bonds, 0.25%, 2/1/15 | | | SGD | | | | 15,800,000 | | | | 11,927,858 | |
South Korea—3.4% | | | | | | | | | | | | |
Republic of South Korea Treasury Bonds: | | | | | | | | | | | | |
2.75%, 12/10/15 | | | KRW | | | | 954,000,000 | | | | 873,430 | |
3.25%, 6/10/15 | | | KRW | | | | 8,889,000,000 | | | | 8,128,063 | |
| | | | | | | | | | | | |
| | | | | | | | | | | 9,001,493 | |
| | | | | | | | |
| | | Principal
Amount | | | Value | |
Spain—2.5% | | | | | | | | |
Kingdom of Spain Sr. Unsec. Bonds, 4.40%, 1/31/15 | | EUR | 5,500,000 | | | $ | 6,682,894 | |
| | | | | | | | |
Total Foreign Government Obligations (Cost | | | | | |
$61,640,377) | | | | | | | 56,002,742 | |
| | | | | | | | |
Non-Convertible Corporate Bonds and Notes—6.0% | |
Access Midstream Partners LP/ACMP Finance Corp., 4.875% Sr. Unsec. Nts., 5/15/23 | | | 100,000 | | | | 102,000 | |
Activision Blizzard, Inc., 5.625% Sr. Unsec. Nts., 9/15/216 | | | 100,000 | | | | 105,250 | |
Alcatel-Lucent USA, Inc., 6.45% Sr. Unsec. Nts., 3/15/29 | | | 100,000 | | | | 96,000 | |
Algeco Scotsman Global Finance plc, 8.50% Sr. Sec. Nts., 10/15/186 | | | 200,000 | | | | 194,000 | |
Alliance Oil Co. Ltd., 9.875% Sr. Unsec. Nts., 3/11/156 | | | 200,000 | | | | 167,000 | |
ALROSA Finance SA, 7.75% Sr. Unsec. Nts., 11/3/206 | | | 200,000 | | | | 190,000 | |
AngloGold Ashanti Holdings plc, 8.50% Sr. Unsec. Nts., 7/30/20 | | | 100,000 | | | | 105,375 | |
Appvion, Inc., 9% Sec. Nts., 6/1/206 | | | 60,000 | | | | 41,400 | |
Arch Coal, Inc., 7.25% Sr. Unsec. Nts., 6/15/21 | | | 100,000 | | | | 29,625 | |
Audatex North America, Inc., 6% Sr. Unsec. Nts., 6/15/216 | | | 100,000 | | | | 103,500 | |
Avaya, Inc.: | | | | | | | | |
7.00% Sr. Sec. Nts., 4/1/196 | | | 100,000 | | | | 98,000 | |
10.50% Sec. Nts., 3/1/216 | | | 100,000 | | | | 86,000 | |
Banco BMG SA, 8.875% Sub. Nts., 8/5/206 | | | 200,000 | | | | 202,600 | |
Banco do Brasil SA (Cayman), 9.25% Jr. Sub. Perpetual Bonds4,6,7 | | | 200,000 | | | | 192,500 | |
Banco Pan SA, 8.50% Sub. Nts., 4/23/206 | | | 100,000 | | | | 103,059 | |
Bancolombia SA, 5.125% Unsec. Sub. Nts., 9/11/22 | | | 200,000 | | | | 199,250 | |
Biomet, Inc., 6.50% Sr. Unsec. Nts., 8/1/20 | | | 100,000 | | | | 107,250 | |
BMC Software Finance, Inc., 8.125% Sr. Unsec. Nts., 7/15/216 | | | 100,000 | | | | 94,500 | |
Bombardier, Inc., 6.125% Sr. Unsec. Nts., 1/15/236 | | | 100,000 | | | | 102,250 | |
Caesars Entertainment Operating Co., Inc., 10% Sec. Nts., 12/15/18 | | | 50,000 | | | | 8,000 | |
CCO Holdings LLC/CCO Holdings Capital Corp., 6.50% Sr. Unsec. Nts., 4/30/21 | | | 100,000 | | | | 105,375 | |
Cemex Finance LLC, 6% Sr. Sec. Nts., 4/1/246 | | | 350,000 | | | | 342,125 | |
CenturyLink, Inc., 5.80% Sr. Unsec. Nts., 3/15/22 | | | 100,000 | | | | 104,250 | |
Cequel Communications Holdings I LLC/Cequel Capital Corp., 6.375% Sr. Unsec. Nts., 9/15/206 | | | 100,000 | | | | 104,000 | |
CHC Helicopter SA, 9.25% Sr. Sec. Nts., 10/15/20 | | | 90,000 | | | | 88,650 | |
Chrysler Group LLC/CG Co.-Issuer, Inc., 8.25% Sec. Nts., 6/15/21 | | | 200,000 | | | | 222,500 | |
CHS/Community Health Systems, Inc., 8% Sr. Unsec. Nts., 11/15/19 | | | 100,000 | | | | 107,000 | |
Claire’s Stores, Inc., 9% Sr. Sec. Nts., 3/15/196 | | | 100,000 | | | | 99,000 | |
Columbus International, Inc., 7.375% Sr. Unsec. Nts., 3/30/216 | | | 400,000 | | | | 417,500 | |
CONSOL Energy, Inc., 5.875% Sr. Unsec. Nts., 4/15/226 | | | 100,000 | | | | 93,500 | |
Country Garden Holdings Co. Ltd., 7.875% Sr. Unsec. Nts., 5/27/196 | | | 200,000 | | | | 202,700 | |
Crown Castle International Corp., 5.25% Sr. Unsec. Nts., 1/15/23 | | | 200,000 | | | | 205,000 | |
CSN Resources SA, 6.50% Sr. Unsec. Nts., 7/21/206 | | | 200,000 | | | | 185,000 | |
9 OPPENHEIMER DIVERSIFIED ALTERNATIVES FUND/VA
| | |
| |
| CONSOLIDATED STATEMENT OF INVESTMENTS Continued | | |
| | | | | | | | |
| | | Principal
Amount | | | Value | |
Non-Convertible Corporate Bonds and Notes (Continued) | |
DaVita HealthCare Partners, Inc., 5.75% Sr. Unsec. Nts., 8/15/22 | | $ | 150,000 | | | $ | 159,562 | |
Denali Borrower LLC/Denali Finance Corp., 5.625% Sr. Sec. Nts., 10/15/206 | | | 100,000 | | | | 104,300 | |
Denbury Resources, Inc., 4.625% Sr. Sub. Nts., 7/15/23 | | | 100,000 | | | | 87,250 | |
Digicel Group Ltd., 8.25% Sr. Unsec. Nts., 9/30/206 | | | 200,000 | | | | 195,000 | |
DISH DBS Corp., 5.875% Sr. Unsec. Nts., 7/15/22 | | | 100,000 | | | | 102,750 | |
Energy Transfer Equity LP, 7.50% Sr. Sec. Nts., 10/15/20 | | | 200,000 | | | | 223,000 | |
EP Energy LLC/Everest Acquisition Finance, Inc., 9.375% Sr. Unsec. Nts., 5/1/20 | | | 200,000 | | | | 203,000 | |
Evergrande Real Estate Group Ltd., 8.75% Sr. Unsec. Nts., 10/30/186 | | | 200,000 | | | | 184,500 | |
Ferrexpo Finance plc, 7.875% Sr. Unsec. Nts., 4/7/166 | | | 200,000 | | | | 155,000 | |
First Data Corp., 12.625% Sr. Unsec. Nts., 1/15/21 | | | 100,000 | | | | 119,000 | |
First Quantum Minerals Ltd.: | | | | | | | | |
6.75% Sr. Unsec. Nts., 2/15/206 | | | 28,000 | | | | 25,480 | |
7.00% Sr. Unsec. Nts., 2/15/216 | | | 128,000 | | | | 115,840 | |
FirstEnergy Corp., 7.375% Sr. Unsec. Nts., 11/15/31 | | | 100,000 | | | | 121,349 | |
FMG Resources August 2006 Pty Ltd., 8.25% Sr. Unsec. Nts., 11/1/196 | | | 100,000 | | | | 91,375 | |
Frontier Communications Corp., 8.50% Sr. Unsec. Nts., 4/15/20 | | | 100,000 | | | | 112,000 | |
Goldman Sachs Capital II, 4% Jr. Sub. Perpetual Bonds4,7 | | | 66,000 | | | | 48,840 | |
Halcon Resources Corp., 8.875% Sr. Unsec. Nts., 5/15/21 | | | 100,000 | | | | 75,750 | |
HD Supply, Inc., 7.50% Sr. Unsec. Nts., 7/15/20 | | | 100,000 | | | | 105,250 | |
Hexion US Finance Corp./Hexion Nova Scotia Finance ULC, 8.875% Sr. Sec. Nts., 2/1/18 | | | 100,000 | | | | 89,250 | |
Icahn Enterprises LP/Icahn Enterprises Finance Corp., 5.875% Sr. Unsec. Nts., 2/1/22 | | | 200,000 | | | | 201,875 | |
ICICI Bank Ltd., 6.375% Jr. Sub. Nts., 4/30/224,6 | | | 200,000 | | | | 206,500 | |
iHeartCommunications, Inc., 9% Sr. Sec. Nts., 3/1/21 | | | 100,000 | | | | 98,375 | |
Infor US, Inc., 9.375% Sr. Unsec. Nts., 4/1/19 | | | 100,000 | | | | 107,375 | |
Intelsat Jackson Holdings SA, 7.25% Sr. Unsec. Nts., 10/15/20 | | | 100,000 | | | | 105,875 | |
International Lease Finance Corp., 8.75% Sr. Unsec. Nts., 3/15/17 | | | 100,000 | | | | 111,000 | |
Intesa Sanpaolo SpA, 5.017% Sub. Nts., 6/26/246 | | | 200,000 | | | | 194,463 | |
Kaisa Group Holdings Ltd., 8.875% Sr. Unsec. Nts., 3/19/186 | | | 200,000 | | | | 134,500 | |
Kinetic Concepts, Inc./KCI USA, Inc., 10.50% Sec. Nts., 11/1/18 | | | 100,000 | | | | 109,000 | |
Laureate Education, Inc., 9.75% Sr. Unsec. Nts., 9/1/196 | | | 100,000 | | | | 103,500 | |
Level 3 Financing, Inc., 8.125% Sr. Unsec. Nts., 7/1/19 | | | 100,000 | | | | 106,750 | |
Linn Energy LLC/Linn Energy Finance Corp., 8.625% Sr. Unsec. Nts., 4/15/20 | | | 100,000 | | | | 87,500 | |
Lukoil International Finance BV, 6.125% Sr. Unsec. Nts., 11/9/206 | | | 904,000 | | | | 802,763 | |
Marfrig Holding Europe BV, 6.875% Sr. Unsec. Nts., 6/24/196 | | | 200,000 | | | | 186,500 | |
MGM Resorts International, 7.75% Sr. Unsec. Nts., 3/15/22 | | | 100,000 | | | | 111,000 | |
| | | | | | | | |
| | | Principal
Amount | | | Value | |
Non-Convertible Corporate Bonds and Notes (Continued) | |
MHP SA, 8.25% Sr. Unsec. Nts., 4/2/206 | | $ | 200,000 | | | $ | 138,000 | |
MMC Energy. Inc., 8.875% Sr. Unsec. Nts., 10/15/208 | | | 100,000 | | | | 10 | |
Mobile Telesystems OJSC via MTS International Funding Ltd., 5% Sr. Unsec. Nts., 5/30/236 | | | 200,000 | | | | 159,000 | |
Momentive Performance Materials, Inc., 3.88% Sr. Sec. Nts., 10/24/21 | | | 100,000 | | | | 85,250 | |
Navient Corp., 8.45% Sr. Unsec. Nts., 6/15/18 | | | 100,000 | | | | 111,750 | |
Navistar International Corp., 8.25% Sr. Unsec. Nts., 11/1/21 | | | 100,000 | | | | 99,000 | |
NGPL PipeCo LLC, 7.119% Sr. Sec. Nts., 12/15/176 | | | 100,000 | | | | 98,750 | |
Nielsen Finance LLC/Nielsen Finance Co., 5% Sr. Unsec. Nts., 4/15/226 | | | 100,000 | | | | 101,000 | |
NII Capital Corp., 7.625% Sr. Unsec. Nts., 4/1/218 | | | 50,000 | | | | 9,500 | |
Novelis, Inc., 8.75% Sr. Unsec. Nts., 12/15/20 | | | 100,000 | | | | 106,500 | |
Numericable-SFR, 6% Sr. Sec. Nts., 5/15/226 | | | 200,000 | | | | 201,350 | |
OAS Financial Ltd., 8% Sr. Unsec. Nts., 7/2/216 | | | 200,000 | | | | 69,000 | |
Offshore Group Investment Ltd., 7.50% Sr. Sec. Nts., 11/1/19 | | | 100,000 | | | | 75,000 | |
Petroleos de Venezuela SA, 12.75% Sr. Unsec. Nts., 2/17/226 | | | 200,000 | | | | 107,000 | |
Post Holdings, Inc., 7.375% Sr. Unsec. Nts., 2/15/22 | | | 200,000 | | | | 200,500 | |
Reynolds Group Issuer, Inc./Reynolds Group Issuer LLC/Reynolds Group Issuer Luxembourg SA, 5.75% Sr. Sec. Nts., 10/15/20 | | | 100,000 | | | | 103,000 | |
RJS Power Holdings LLC, 5.125% Sr. Unsec. Nts., 7/15/196 | | | 50,000 | | | | 49,625 | |
Rolta Americas LLC, 8.875% Sr. Unsec. Nts., 7/24/196 | | | 200,000 | | | | 173,250 | |
Royal Bank of Scotland Group plc, 6.125% Sub. Nts., 12/15/22 | | | 100,000 | | | | 109,013 | |
Sabine Pass Liquefaction LLC, 5.625% Sr. Sec. Nts., 2/1/21 | | | 100,000 | | | | 98,750 | |
Samson Investment Co., 9.75% Sr. Unsec. Nts., 2/15/20 | | | 200,000 | | | | 83,875 | |
SandRidge Energy, Inc., 7.51% Sr. Unsec. Nts., 3/15/21 | | | 100,000 | | | | 64,500 | |
Sears Holdings Corp., 6.625% Sec. Nts., 10/15/18 | | | 100,000 | | | | 92,500 | |
Sirius XM Radio, Inc., 6% Sr. Unsec. Nts., 7/15/246 | | | 100,000 | | | | 102,750 | |
Sistema JSFC via Sistema International Funding SA, 6.95% Sr. Unsec. Nts., 5/17/196 | | | 200,000 | | | | 141,000 | |
Springleaf Finance Corp., 6.90% Sr. Unsec. Nts., 12/15/17 | | | 100,000 | | | | 106,750 | |
Sprint Corp., 7.875% Sr. Unsec. Nts., 9/15/23 | | | 100,000 | | | | 99,220 | |
Tenet Healthcare Corp., 8.125% Sr. Unsec. Nts., 4/1/22 | | | 200,000 | | | | 224,000 | |
T-Mobile USA, Inc., 6.625% Sr. Unsec. Nts., 4/1/23 | | | 100,000 | | | | 102,900 | |
TransDigm, Inc., 6.50% Sr. Sub. Nts., 7/15/24 | | | 100,000 | | | | 101,000 | |
Trinseo Materials Operating SCA/Trinseo Materials Finance, Inc., 8.75% Sr. Sec. Nts., 2/1/19 | | | 190,000 | | | | 193,562 | |
Turk Telekomunikasyon AS, 4.875% Sr. Unsec. Nts., 6/19/246 | | | 200,000 | | | | 201,551 | |
Turkiye Sise ve Cam Fabrikalari AS, 4.25% Sr. Unsec. Nts., 5/9/206 | | | 200,000 | | | | 196,189 | |
10 OPPENHEIMER DIVERSIFIED ALTERNATIVES FUND/VA
| | | | | | | | |
| | | Principal
Amount | | | Value | |
Non-Convertible Corporate Bonds and Notes (Continued) | |
United Rentals North America, Inc., 7.625% Sr. Unsec. Nts., 4/15/22 | | $ | 200,000 | | | $ | 220,900 | |
Valeant Pharmaceuticals International, Inc., 6.375% Sr. Unsec. Nts., 10/15/206 | | | 200,000 | | | | 209,750 | |
Vedanta Resources plc, 6% Sr. Unsec. Nts., 1/31/196 | | | 200,000 | | | | 196,000 | |
Vimpel Communications Via VIP Finance Ireland Ltd. OJSC, 7.748% Sr. Unsec. Nts., 2/2/216 | | | 200,000 | | | | 168,200 | |
VimpelCom Holdings BV: 5.95% Sr. Unsec. Unsub. Nts., 2/13/236 | | | 200,000 | | | | 153,900 | |
7.504% Sr. Unsec. Nts., 3/1/226 | | | 200,000 | | | | 163,000 | |
VTR Finance BV, 6.875% Sr. Sec. Nts., 1/15/246 | | | 200,000 | | | | 204,500 | |
Wachovia Capital Trust III, 5.57% Jr. Sub. Perpetual Bonds4,7 | | | 667,000 | | | | 647,324 | |
Wynn Macau Ltd., 5.25% Sr. Unsec. Nts., 10/15/216 | | | 200,000 | | | | 189,000 | |
Yapi ve Kredi Bankasi AS, 6.75% Sr. Unsec. Nts., 2/8/176 | | | 200,000 | | | | 213,910 | |
| | | | | | | | |
Total Non-Convertible Corporate Bonds and Notes
(Cost $17,206,771) | | | | 15,761,160 | |
| | | | | | | | |
Convertible Corporate Bond and Note—0.1% | |
SEACOR Holdings, Inc., 2.50% Cv. Sr. Unsec. Nts., 12/15/27 (Cost $219,936) | | | 197,000 | | | | 209,313 | |
| | | | | | | | |
Corporate Loans—2.7% | |
Appvion, Inc., Sr. Sec. Credit Facilities 1st Lien Term Loan, 5.75%, 6/28/194 | | | 1,221,907 | | | | 1,208,924 | |
AZ Chem US, Inc., Sr. Sec. Credit Facilities 1st Lien Term Loan, 4.50%, 6/10/214 | | | 1,161,961 | | | | 1,148,163 | |
Celanese US Holdings LLC, Sr. Sec. Credit Facilities 1st Lien Term Loan, 2.25%, 10/31/184 | | | 1,221,938 | | | | 1,222,810 | |
Dynegy, Inc., Sr. Sec. Credit Facilities 1st Lien Term Loan, 4.00%, 4/23/204 | | | 1,218,813 | | | | 1,206,625 | |
Intelsat Jackson Holdings SA, Sr. Sec. Credit Facilities 1st Lien Term Loan, 3.75%, 6/30/194 | | | 1,225,000 | | | | 1,210,198 | |
International Lease Finance Corp., Sr. Sec. Credit Facilities Term Loan, 3.50%, 2/26/214 | | | 1,225,000 | | | | 1,217,855 | |
| | | | | | | | |
Total Corporate Loans (Cost $7,276,776) | | | | | | | 7,214,575 | |
| | | | | | | | |
Event-Linked Bonds—12.1% | |
Earthquake—2.6% | |
Bosphorus Re Ltd. Catastrophe Linked Nts., 2.53%, 5/3/164,6 | | | 400,000 | | | | 401,330 | |
Embarcadero Reinsurance Ltd. Catastrophe Linked Nts.: 5.03%, 8/7/154,6 7.412%, 2/13/154,6 | |
| 250,000
250,000 |
| |
| 250,875
250,550 |
|
Golden State RE II Ltd. Catastrophe Linked Nts., 2.23%, 1/8/194,6 | | | 500,000 | | | | 499,225 | |
Golden State Re Ltd. Catastrophe Linked Nts., 3.78%, 1/8/154,6 | | | 500,000 | | | | 501,100 | |
Kibou Ltd. Catastrophe Linked Nts., 5.28%, 2/17/154,6 | | | 250,000 | | | | 250,950 | |
Kilimanjaro Re Ltd. Catastrophe Linked Nts., 3.78%, 11/25/194,5 | | | 250,000 | | | | 250,062 | |
Kizuna II Re Ltd. Catastrophe Linked Nts.: 2.28%, 4/6/184,6 2.53%, 4/6/184,5 | |
| 750,000
250,000 |
| |
| 757,987
253,062 |
|
| | | | | | | | |
| | | Principal
Amount | | | Value | |
Earthquake (Continued) | |
Lakeside Re III Ltd. Catastrophe Linked Nts., 8.03%, 1/8/164,6 | | $ | 250,000 | | | $ | 259,656 | |
Merna Re V Ltd. Catastrophe Linked Nts., 2.03%, 4/7/174,6 | | | 750,000 | | | | 750,413 | |
Merna Reinsurance IV Ltd. Catastrophe Linked Nts., 2.53%, 4/8/164,6 | | | 250,000 | | | | 251,956 | |
MultiCat Mexico Ltd. 2012-I Catastrophe Linked Nts., 8.03%, 12/4/154,6 | | | 500,000 | | | | 512,363 | |
Nakama Re Ltd. Catastrophe Linked Nts.: 2.155%, 1/16/194,6 2.53%, 4/13/184,6 2.78%, 9/29/164,6 2.905%, 1/16/204,6 | |
| 250,000
500,000
500,000
250,000 |
| |
| 250,900
503,650
505,813
250,900 |
|
Ursa Re Ltd. Catastrophe Linked Nts., 5.03%, 12/7/174,6 | | | 250,000 | | | | 251,563 | |
| | | | | | | | |
| | | | | | | 6,952,355 | |
| | | | | | | | |
Longevity—0.1% | | | | | | | | |
Vita Capital V Ltd. Catastrophe Linked Nts., 3.426%, 1/15/174,6 | | | 250,000 | | | | 255,513 | |
| | | | | | | | |
Multiple Event—5.5% | |
ATLAS VI Capital Ltd. Catastrophe Linked Nts.: 12.535%, 1/8/154,6 15.285%, 1/8/154,6 | |
| 250,000
250,000 |
| |
| 250,600
250,650 |
|
Blue Danube II Ltd. Catastrophe Linked Nts., 4.279%, 5/23/164,6 | | | 250,000 | | | | 252,681 | |
Blue Danube Ltd. Catastrophe Linked Nts., 6.004%, 4/10/154,6 | | | 250,000 | | | | 251,700 | |
Caelus Re 2013 Ltd. Catastrophe Linked Nts.: 5.28%, 3/7/164,6 6.88%, 4/7/174,6 | |
| 250,000
250,000 |
| |
| 253,981
261,212 |
|
Citrus Re Ltd. Catastrophe Linked Nts.: 3.78%, 4/24/174,6 4.28%, 4/18/174,6 | |
| 250,000
500,000 |
| |
| 250,462
500,575 |
|
Combine Re Ltd. Catastrophe Linked Nts.: 4.53%, 1/7/154,6 10.03%, 1/7/154,6 17.78%, 1/7/154,6 | |
| 500,000
250,000
600,000 |
| |
| 501,150
250,600
601,560 |
|
Compass Re Ltd. Catastrophe Linked Nts.: 9.03%, 1/8/154,6 10.28%, 1/8/154,6 | |
| 500,000
250,000 |
| |
| 501,200
250,625 |
|
East Lane Re VI Ltd. Catastrophe Linked Nts., 2.78%, 3/14/184,6 | | | 500,000 | | | | 500,225 | |
Galileo Re Ltd. Catastrophe Linked Nts., 7.43%, 1/9/174,6 | | | 250,000 | | | | 258,412 | |
Kilimanjaro Re Ltd. Catastrophe Linked Nts.: 4.53%, 4/30/184,6 4.78%, 4/30/184,6 | |
| 250,000
500,000 |
| |
| 253,337
511,625 |
|
Loma Reinsurance Ltd. Catastrophe Linked Nts.: 12.03%, 1/8/184,6 17.03%, 1/8/184,6 | |
| 200,000
250,000 |
| |
| 211,070
264,987 |
|
Mythen Re Ltd. Catastrophe Linked Nts., 8.557%, 1/5/174,6 | | | 250,000 | | | | 266,187 | |
Queen Street VI Re Ltd. Catastrophe Linked Nts., 10.38%, 4/9/154,6 | | | 500,000 | | | | 507,500 | |
Residential Reinsurance 2011 Ltd. Catastrophe Linked Nts., 8.78%, 6/6/154,6 | | | 250,000 | | | | 256,425 | |
Residential Reinsurance 2012 Ltd. Catastrophe Linked Nts.: 4.53%, 12/6/164,6 12.78%, 12/6/164,6 19.03%, 12/6/164,6 22.03%, 6/6/164,6 | |
| 399,000
250,000
250,000
250,000 |
| |
| 412,985
273,537
281,013
289,306 |
|
Residential Reinsurance 2013 Ltd. Catastrophe Linked Nts., 8.03%, 6/6/174,6 | | | 250,000 | | | | 266,488 | |
Residential Reinsurance 2014 Ltd. Catastrophe Linked Nts.: 4.83%, 12/6/184,6 15.03%, 6/6/184,6 | |
| 500,000
250,000 |
| |
| 499,525
253,063 |
|
11 OPPENHEIMER DIVERSIFIED ALTERNATIVES FUND/VA
| | |
| |
| CONSOLIDATED STATEMENT OF INVESTMENTS Continued | | |
| | | | | | | | |
| | | Principal
Amount | | | Value | |
Multiple Event (Continued) | | | | | |
Riverfront Re Ltd. Catastrophe Linked Nts., 4.03%, 1/6/174,6 | | $ | 500,000 | | | $ | 503,175 | |
Sanders Re Ltd. Catastrophe Linked Nts.: | | | | | | | | |
3.03%, 5/25/184,6 | | | 250,000 | | | | 248,288 | |
3.28%, 5/25/184,6 | | | 250,000 | | | | 248,313 | |
3.93%, 6/7/174,6 | | | 250,000 | | | | 252,613 | |
3.93%, 5/28/194,6 | | | 250,000 | | | | 249,138 | |
4.03%, 5/5/174,6 | | | 500,000 | | | | 500,675 | |
Successor X Ltd. Catastrophe Linked Nts., 16.53%, 1/27/154,6 | | | 250,000 | | | | 251,375 | |
Tradewynd Re Ltd. Catastrophe Linked Nts.: | | | | | | | | |
0.78%, 1/8/184,6 | | | 250,000 | | | | 251,200 | |
0.78%, 1/8/164,6 | | | 250,000 | | | | 251,125 | |
6.25%, 1/8/154,6 | | | 250,000 | | | | 250,475 | |
6.28%, 1/9/174,6 | | | 500,000 | | | | 512,275 | |
7.03%, 1/9/174,6 | | | 250,000 | | | | 257,888 | |
Tramline Re II Ltd. Catastrophe Linked Nts., 9.78%, 1/4/194,6 | | | 250,000 | | | | 251,950 | |
VenTerra Re Ltd. Catastrophe Linked Nts., 3.78%, 1/9/174,6 | | | 750,000 | | | | 766,988 | |
| | | | | | | | |
| | | | | | | 14,478,159 | |
| | | | | | | | |
Other—0.2% | | | | | | | | |
Kortis Capital Ltd. Catastrophe Linked Nts., 5.046%, 1/15/174,6 | | | 250,000 | | | | 258,637 | |
Vitality Re III Ltd. Catastrophe Linked Nts., 4.23%, 1/7/154,6 | | | 250,000 | | | | 250,550 | |
| | | | | | | | |
| | | | | | | 509,187 | |
| | | | | | | | |
Windstorm—3.7% | | | | | | | | |
Akibare II Ltd. Catastrophe Linked Nts., 3.78%, 4/13/164,6 | | | 250,000 | | | | 255,131 | |
Alamo Re Ltd. Catastrophe Linked Nts., 6.38%, 6/7/174,6 | | | 500,000 | | | | 522,625 | |
Aozora Re Ltd. Catastrophe Linked Nts., 2.03%, 4/7/174,6 | | JPY | 51,000,000 | | | | 426,845 | |
Armor Re Ltd. Catastrophe Linked Nts., 4.03%, 12/15/164,6 | | | 750,000 | | | | 752,419 | |
ATLAS VI Capital Ltd. Catastrophe Linked Nts., 8%, 4/9/154,6 | | EUR | 250,000 | | | | 301,673 | |
Calypso Capital II Ltd. Catastrophe Linked Nts., 2.60%, 1/9/174,6 | | EUR | 500,000 | | | | 615,235 | |
East Lane Re V Ltd. Catastrophe Linked Nts., 10.78%, 3/16/164,6 | | | 250,000 | | | | 268,931 | |
Eurus Ltd. Catastrophe Linked Nts., 3.75%, 4/7/164,6 | | EUR | 250,000 | | | | 306,362 | |
Everglades Re Ltd. Catastrophe Linked Nts., 7.53%, 4/28/174,6 | | | 750,000 | | | | 789,112 | |
Foundation Re III Ltd. Catastrophe Linked Nts., 5.03%, 2/25/154,6 | | | 650,000 | | | | 654,290 | |
| | | | | | | | |
| | | Principal
Amount | | | Value | |
Windstorm (Continued) | | | | | | | | |
Gator Re Ltd. Catastrophe Linked Nts., 6.53%, 1/9/174,6 | | $ | 500,000 | | | | 410,125 | |
Green Fields II Capital Ltd. Catastrophe Linked Nts., 2.75%, 1/9/174,6 | | EUR | 250,000 | | | | 307,209 | |
Ibis Re II Ltd. Catastrophe Linked Nts., 13.53%, 2/5/154,6 | | | 250,000 | | | | 253,125 | |
Lion I Re Ltd. Catastrophe Linked Nts., 1.62%, 4/28/174,6 | | EUR | 250,000 | | | | 303,813 | |
MetroCat Re Ltd. Catastrophe Linked Nts., 4.53%, 8/5/164,6 | | | 250,000 | | | | 258,431 | |
MultiCat Mexico Ltd. 2012-I Catastrophe Linked Nts., 7.78%, 12/4/154,6 | | | 250,000 | | | | 257,531 | |
Mythen Re Ltd. Catastrophe Linked Nts., 11.787%, 11/10/164,6 | | | 250,000 | | | | 264,706 | |
Pelican Re Ltd. Catastrophe Linked Nts.: 6.03%, 5/15/174,6 | | | 250,000 | | | | 261,638 | |
13.78%, 4/13/154,6 | | | 250,000 | | | | 258,675 | |
Pylon II Capital Ltd. Catastrophe Linked Nts., 5.50%, 5/5/164 | | EUR | 250,000 | | | | 312,783 | |
Queen City Re Catastrophe Linked Nts., 3.53%, 1/6/174,6 | | | 500,000 | | | | 499,575 | |
Queen Street VIII Re Ltd. Catastrophe Linked Nts., 6.53%, 6/8/164,6 | | | 500,000 | | | | 508,363 | |
Successor X Ltd. Catastrophe Linked Nts.: 11.28%, 11/10/154,6 | | | 250,000 | | | | 260,850 | |
16.28%, 11/10/154,6 | | | 250,000 | | | | 258,075 | |
Tar Heel Re Ltd. Catastrophe Linked Nts., 8.53%, 5/9/164,6 | | | 500,000 | | | | 530,575 | |
| | | | | | | | |
| | | | | | | 9,838,097 | |
| | | | | | | | |
Total Event-Linked Bonds (Cost $32,421,212) | | | | 32,033,311 | |
| | | | | | | | |
Short-Term Notes—14.4% | | | | | | | | |
Mexico—4.8% | | | | | | | | |
United Mexican States Treasury Bills, 3.248%, 11/12/159 | | MXN | 191,000,000 | | | | 12,593,734 | |
United States—9.6% | | | | | | | | |
United States Treasury Bills: | | | | | | | | |
0.034%, 2/26/159 | | | 20,850,000 | | | | 20,848,930 | |
0.052%, 1/22/159,10 | | | 4,500,000 | | | | 4,499,866 | |
| | | | | | | | |
| | | | | | | 25,348,796 | |
| | | | | | | | |
Total Short-Term Notes (Cost $37,993,978) | | | | 37,942,530 | |
| | | | | | | | |
| | | Shares | | | | |
Investment Companies—15.8% | | | | | |
Oppenheimer Institutional Money Market Fund, Cl. E, 0.10%11,12,13 | | | 40,325,799 | | | | 40,325,799 | |
SPDR Gold Trust Exchange Traded Fund3,13 | | | 12,060 | | | | 1,369,775 | |
| | | | | | | | |
Total Investment Companies (Cost $41,782,054) | | | | 41,695,574 | |
| | | | | | | | | | | | | | | | | | | | | | | | | | | | |
| | | | | | | | | Exercise Price | | | Expiration Date | | | | | | Contracts | | | | |
Exchange-Traded Options Purchased—0.3% | |
S&P 500 Index Call3 | | | | | | | USD | | | | 2,110.000 | | | | 3/20/15 | | | | USD | | | | 225 | | | | 639,000 | |
United States Treasury Bonds, 10 yr. Futures, 3/15 Call3 | | | | | | | USD | | | | 123.000 | | | | 2/20/15 | | | | USD | | | | 7 | | | | 27,234 | |
| | | | | | | | | | | | | | | | | | | | | | | | | | | | |
Total Exchange-Traded Options Purchased (Cost $635,864) | | | | 666,234 | |
| | | | | | | |
| | | Counterparty | | | | | | Exercise Price | | | Expiration Date | | | | | | Contracts | | | | |
Over-the-Counter Options Purchased—0.1% | |
CAD Currency Put3 | | | BOA | | | | CAD | | | | 1.190 | | | | 6/17/15 | | | | CAD | | | | 13,951,340 | | | | 164,333 | |
EUR Currency Put3 | | | NOM | | | | USD | | | | 1.225 | | | | 1/8/15 | | | | EUR | | | | 8,000,000 | | | | 127,136 | |
INR Currency Call3 | | | NOM | | | | INR | | | | 62.500 | | | | 3/26/15 | | | | INR | | | | 989,500,000 | | | | 63,328 | |
PLN Currency Call3 | | | BOA | | | | PLN | | | | 3.350 | | | | 3/17/15 | | | | PLN | | | | 39,274,781 | | | | 42,966 | |
| | | | | | | | | | | | | | | | | | | | | | | | | | | | |
Total Over-the-Counter Options Purchased (Cost $664,719) | | | | 397,763 | |
12 OPPENHEIMER DIVERSIFIED ALTERNATIVES FUND/VA
| | | | | | | | | | | | | | | | | | | | | | | | | | | | |
| | | Counterparty | | | Pay / Receive
Floating Rate | | | Floating Rate | | | Fixed Rate | | | Expiration
Date | | | Notional
Amount (000’s) | | | Value | |
Over-the-Counter Interest Rate Swaptions Purchased—0.1% | | | | | | | | | | | | | |
Interest Rate Swap maturing 11/22/27 Call3 | | | GSG | | | | Pay | | |
| Six-Month JPY
BBA LIBOR |
| | | 1.070 | % | | | 11/20/17 | | | JPY | 424,000 | | | $ | 64,785 | |
Interest Rate Swap maturing 4/13/26 Call3 | | | JPM | | | | Pay | | |
| Three-Month USD
BBA LIBOR |
| | | 3.410 | | | | 4/11/16 | | | USD | 4,200 | | | | 49,600 | |
Interest Rate Swap maturing 4/13/26 Call3 | | | JPM | | | | Pay | | |
| Three-Month USD
BBA LIBOR |
| | | 3.410 | | | | 4/11/16 | | | USD | 1,750 | | | | 20,865 | |
Interest Rate Swap maturing 4/13/26 Call3 | | | JPM | | | | Pay | | |
| Three-Month USD
BBA LIBOR |
| | | 3.410 | | | | 4/11/16 | | | USD | 1,800 | | | | 21,461 | |
Interest Rate Swap maturing 4/13/26 Call3 | | | JPM | | | | Pay | | |
| Three-Month USD
BBA LIBOR |
| | | 3.410 | | | | 4/11/16 | | | USD | 1,800 | | | | 21,461 | |
| | | | | | | | | | | | | | | | | | | | | | | | | | | | |
Total Over-the-Counter Interest Rate Swaptions Purchased (Cost $337,456) | | | | | | | | | | | | 178,172 | |
| | | | | | | | | | | | | | | | | | | | | | | | | | | | | |
Total Investments, at Value (Cost $257,672,200) | | | | | | | | 95.1 | % | | | 250,991,699 | |
Net Other Assets (Liabilities) | | | | | | | | | | | | | | | | | | | | 4.9 | | | | 12,912,863 | |
| | | | | | | | | | | | | | | | | | | | | | | | |
Net Assets | | | | | | | | | | | | | | | | | | | | | | | 100.0 | % | | $ | 263,904,562 | |
| | | | | | | | | | | | | | | | | | | | | | | | |
Footnotes to Consolidated Statement of Investments
1. All or a portion of the security position is held in segregated accounts and pledged to cover margin requirements with respect to outstanding written options. The aggregate market value of such securities is $7,966,505. See Note 5 of the accompanying Consolidated Notes.
2. All or portion of the security position is held in segregated accounts and pledged to cover margin requirements with respect to securities sold short. The aggregate market value of such securities is $4,358,486. See Note 9 of accompanying Consolidated Notes.
3. Non-income producing security.
4. Represents the current interest rate for a variable or increasing rate security.
5. Restricted security. The aggregate value of restricted securities as of December 31, 2014 was $4,032,717, which represents 1.53% of the Fund’s net assets. See Note 4 of the accompanying Consolidated Notes. Information concerning restricted securities is as follows:
| | | | | | | | | | | | | | | | |
| Security | | Acquisition
Dates | | | Cost | | | Value | | | Unrealized
Appreciation/
(Depreciation) | |
Airspeed Ltd., Series 2007-1A, Cl. G1, 0.431%, 6/15/32 | | | 7/24/14-8/27/14 | | | $ | 1,926,673 | | | $ | 1,883,099 | | | $ | (43,574 | ) |
Blade Engine Securitization Ltd., Series 2006-1AW, Cl. A1, 0.461%, 9/15/41 | | | 7/25/14-8/28/14 | | | | 1,727,082 | | | | 1,646,494 | | | | (80,588 | ) |
Kilimanjaro Re Ltd. Catastrophe Linked Nts., 3.78%, 11/25/19 | | | 11/7/14 | | | | 250,000 | | | | 250,062 | | | | 62 | |
Kizuna II Re Ltd. Catastrophe Linked Nts., 2.53%, 4/6/18 | | | 5/2/14 | | | | 252,477 | | | | 253,062 | | | | 585 | |
| | | | | | | | |
| | | | | | $ | 4,156,232 | | | $ | 4,032,717 | | | $ | (123,515 | ) |
| | | | | | | | |
6. Represents securities sold under Rule 144A, which are exempt from registration under the Securities Act of 1933, as amended. These securities have been determined to be liquid under guidelines established by the Board of Trustees. These securities amount to $40,077,734 or 15.19% of the Fund’s net assets as of December 31, 2014.
7. This bond has no contractual maturity date, is not redeemable and contractually pays an indefinite stream of interest. Rate reported represents the current interest rate for this variable rate security.
8. This security is not accruing income because the issuer has missed an interest payment on it and/or is not anticipated to make future interest and or principal payments. The rate shown is the original contractual interest rate. See Note 4 of the accompanying Notes.
9. Zero coupon bond reflects effective yield on the date of purchase.
10. All or a portion of the security position is held in accounts at a futures clearing merchant and pledged to cover margin requirements on open futures contracts and written options on futures, if applicable. The aggregate market value of such securities is $1,749,948. See Note 5 of the accompanying Consolidated Notes.
11. Is or was an affiliate, as defined in the Investment Company Act of 1940, as amended, at or during the period ended December 31, 2014, by virtue of the Fund owning at least 5% of the voting securities of the issuer or as a result of the Fund and the issuer having the same investment adviser. Transactions during the period in which the issuer was an affiliate are as follows:
| | | | | | | | | | | | | | | | |
| | | Shares
December 31, 2013 | | | Gross
Additions | | | Gross
Reductions | | | Shares
December 31, 2014 | |
Oppenheimer Institutional Money Market Fund, Cl. E | | | 2,007,344 | | | | 532,040,044 | | | | 493,721,589 | | | | 40,325,799 | |
Oppenheimer Master Event-Linked Bond Fund, LLC | | | 10,967 | | | | — | | | | 10,967 | | | | — | |
Oppenheimer Master Loan Fund, LLC | | | 3,578 | | | | — | | | | 3,578 | | | | — | |
| | | | |
| | | | | | Value | | | Income | | | Realized Gain (Loss) | |
Oppenheimer Institutional Money Market Fund, Cl. E | | | | | | $ | 40,325,799 | | | $ | 28,243 | | | $ | — | |
Oppenheimer Master Event-Linked Bond Fund, LLC | | | | | | | — | | | | 207 | a | | | (193 | )a |
Oppenheimer Master Loan Fund, LLC | | | | | | | — | | | | 141 | b | | | 634 | b |
| | | | | | | | |
Total | | | | | | $ | 40,325,799 | | | $ | 28,591 | | | $ | 441 | |
| | | | | | | | |
a. Represents the amount allocated to the Fund from Oppenheimer Master Event-Linked Bond Fund, LLC.
b. Represents the amount allocated to the Fund from Oppenheimer Master Loan Fund, LLC.
12. Rate shown is the 7-day yield as of December 31, 2014.
13. All or a portion of this security is owned by the subsidiary. See Note 2 of the accompanying Consolidated Notes.
13 OPPENHEIMER DIVERSIFIED ALTERNATIVES FUND/VA
| | |
| |
| CONSOLIDATED STATEMENT OF INVESTMENTS Continued | | |
| | | | | | | | |
| | | Shares Sold Short | | | Value | |
Securities Sold Short—(4.6)% | | | | | | | | |
Common Stock Securities Sold Short—(4.6)% | | | | | | | | |
Aflac, Inc. | | | (9,645 | ) | | $ | (589,214 | ) |
Air Lease Corp., Cl. A | | | (12,195 | ) | | | (418,410 | ) |
Aircastle Ltd. | | | (11,485 | ) | | | (245,435 | ) |
Assurant, Inc. | | | (4,400 | ) | | | (301,092 | ) |
BHP Billiton Ltd., Sponsored ADR | | | (9,680 | ) | | | (458,058 | ) |
Boeing Co. (The) | | | (5,120 | ) | | | (665,498 | ) |
Camden Property Trust | | | (4,110 | ) | | | (303,482 | ) |
Caterpillar, Inc. | | | (2,920 | ) | | | (267,268 | ) |
CBL & Associates Properties, Inc. | | | (25,140 | ) | | | (488,219 | ) |
Chesapeake Energy Corp. | | | (11,125 | ) | | | (217,716 | ) |
Cie Financiere Richemont SA | | | (3,105 | ) | | | (275,033 | ) |
Comerica, Inc. | | | (5,792 | ) | | | (271,297 | ) |
Commerce Bancshares, Inc. | | | (5,008 | ) | | | (217,798 | ) |
Ensco plc, Cl. A | | | (11,360 | ) | | | (340,232 | ) |
First Niagara Financial Group, Inc. | | | (27,445 | ) | | | (231,361 | ) |
First Quantum Minerals Ltd. | | | (16,551 | ) | | | (235,201 | ) |
FirstMerit Corp. | | | (10,800 | ) | | | (204,012 | ) |
KCG Holdings, Inc., Cl. A | | | (13,870 | ) | | | (161,586 | ) |
Kohl’s Corp. | | | (6,470 | ) | | | (394,929 | ) |
Montpelier Re Holdings Ltd. | | | (8,410 | ) | | | (301,246 | ) |
NASDAQ OMX Group, Inc. (The) | | | (11,825 | ) | | | (567,127 | ) |
Nationstar Mortgage Holdings, Inc. | | | (6,940 | ) | | | (195,639 | ) |
Oracle Corp. | | | (7,905 | ) | | | (355,488 | ) |
Pennsylvania Real Estate Investment Trust | | | (29,800 | ) | | | (699,108 | ) |
Rio Tinto plc, Sponsored ADR | | | (4,990 | ) | | | (229,839 | ) |
Rouse Properties, Inc. | | | (14,170 | ) | | | (262,428 | ) |
SanDisk Corp. | | | (8,790 | ) | | | (861,244 | ) |
SandRidge Energy, Inc. | | | (53,760 | ) | | | (97,843 | ) |
Southern Copper Corp. | | | (27,095 | ) | | | (764,079 | ) |
Tiffany & Co. | | | (2,690 | ) | | | (287,453 | ) |
Transocean Ltd. | | | (21,468 | ) | | | (393,508 | ) |
United Technologies Corp. | | | (1,850 | ) | | | (212,750 | ) |
Walter Energy, Inc. | | | (8,755 | ) | | | (12,082 | ) |
Weingarten Realty Investors | | | (13,690 | ) | | | (478,055 | ) |
| | | | | | | | |
Total Securities Sold Short (Proceeds $12,931,204) | | | | | | $ | (12,003,730 | ) |
| | | | | | | | |
| | | | | | | | | | | | | | | | | | | | | | | | |
Forward Currency Exchange Contracts as of December 31, 2014 | | | | | | | | | | | | | | | | | | |
| Counterparty | | Settlement Month(s) | | | Currency Purchased (000’s) | | | Currency Sold (000’s) | | | Unrealized
Appreciation | | | Unrealized
Depreciation | |
BAC | | | 01/2015 | | | AUD | | | 150 | | | USD | | | 137 | | | $ | – | | | $ | 14,632 | |
BAC | | | 01/2015 | | | CAD | | | 128 | | | USD | | | 116 | | | | – | | | | 5,543 | |
BAC | | | 01/2015 | | | CHF | | | 25 | | | USD | | | 28 | | | | – | | | | 3,044 | |
BAC | | | 01/2015 - 06/2015 | | | INR | | | 219,000 | | | USD | | | 3,443 | | | | 6,934 | | | | 43,258 | |
BAC | | | 01/2015 | | | JPY | | | 17,000 | | | USD | | | 166 | | | | – | | | | 24,231 | |
BAC | | | 01/2015 | | | MXN | | | 6,800 | | | USD | | | 514 | | | | – | | | | 53,160 | |
BAC | | | 01/2015 | | | SEK | | | 21,800 | | | USD | | | 3,091 | | | | – | | | | 294,664 | |
BAC | | | 01/2015 | | | TRY | | | 1,660 | | | USD | | | 745 | | | | – | | | | 34,872 | |
BAC | | | 01/2015 | | | USD | | | 352 | | | AUD | | | 395 | | | | 30,027 | | | | – | |
BAC | | | 01/2015 - 06/2015 | | | USD | | | 3,359 | | | CAD | | | 3,860 | | | | 44,469 | | | | 71 | |
BAC | | | 01/2015 | | | USD | | | 58 | | | GBP | | | 35 | | | | 3,264 | | | | – | |
BAC | | | 01/2015 | | | USD | | | 105 | | | JPY | | | 11,000 | | | | 12,765 | | | | – | |
BAC | | | 01/2015 | | | USD | | | 343 | | | TRY | | | 790 | | | | 5,992 | | | | – | |
BAC | | | 01/2015 | | | USD | | | 3,151 | | | TWD | | | 94,900 | | | | 150,528 | | | | – | |
BNP | | | 01/2015 | | | MXN | | | 15,400 | | | USD | | | 1,168 | | | | – | | | | 125,159 | |
BNP | | | 06/2015 | | | MYR | | | 1,285 | | | USD | | | 396 | | | | – | | | | 34,480 | |
BNP | | | 01/2015 | | | TWD | | | 31,900 | | | USD | | | 1,069 | | | | – | | | | 60,573 | |
BNP | | | 06/2015 | | | USD | | | 268 | | | MYR | | | 870 | | | | 22,939 | | | | – | |
BOA | | | 01/2015 - 01/2015 | | | AUD | | | 730 | | | USD | | | 672 | | | | – | | | | 76,001 | |
BOA | | | 01/2015 | | | CAD | | | 250 | | | USD | | | 233 | | | | – | | | | 18,025 | |
BOA | | | 01/2015 | | | CHF | | | 20 | | | USD | | | 23 | | | | – | | | | 2,468 | |
BOA | | | 01/2015 | | | EUR | | | 3,055 | | | USD | | | 3,894 | | | | – | | | | 196,538 | |
BOA | | | 01/2015 | | | GBP | | | 50 | | | USD | | | 83 | | | | – | | | | 4,920 | |
BOA | | | 01/2015 | | | INR | | | 228,500 | | | USD | | | 3,691 | | | | – | | | | 86,573 | |
BOA | | | 01/2015 | | | JPY | | | 37,000 | | | USD | | | 362 | | | | – | | | | 53,383 | |
BOA | | | 01/2015 | | | KRW | | | 1,740,000 | | | USD | | | 1,699 | | | | – | | | | 117,105 | |
BOA | | | 01/2015 | | | NOK | | | 21,250 | | | USD | | | 3,331 | | | | – | | | | 480,668 | |
BOA | | | 01/2015 | | | NZD | | | 3,190 | | | USD | | | 2,576 | | | | 8,376 | | | | 100,738 | |
14 OPPENHEIMER DIVERSIFIED ALTERNATIVES FUND/VA
| | | | | | | | | | | | | | | | | | | | | | | | |
Forward Currency Exchange Contracts (Continued) | | | | | | | | | | | | | | | | | | |
| Counterparty | | Settlement Month(s) | | | Currency Purchased (000’s) | | | Currency Sold (000’s) | | | Unrealized
Appreciation | | | Unrealized
Depreciation | |
BOA | | | 01/2015 | | | SEK | | | 11,310 | | | USD | | | 1,657 | | | $ | – | | | $ | 206,551 | |
BOA | | | 06/2015 | | | THB | | | 66,000 | | | USD | | | 1,983 | | | | 9,377 | | | | – | |
BOA | | | 01/2015 | | | TRY | | | 4,420 | | | USD | | | 1,954 | | | | – | | | | 67,950 | |
BOA | | | 01/2015 | | | TWD | | | 10,000 | | | USD | | | 337 | | | | – | | | | 20,608 | |
BOA | | | 01/2015 | | | USD | | | 165 | | | AUD | | | 180 | | | | 18,781 | | | | – | |
BOA | | | 07/2015 | | | USD | | | 13,083 | | | BRL | | | 32,125 | | | | 1,594,925 | | | | – | |
BOA | | | 01/2015 | | | USD | | | 1,027 | | | CAD | | | 1,105 | | | | 75,706 | | | | – | |
BOA | | | 01/2015 | | | USD | | | 1,095 | | | CHF | | | 1,010 | | | | 78,757 | | | | – | |
BOA | | | 01/2015 | | | USD | | | 841 | | | CLP | | | 472,000 | | | | 64,438 | | | | – | |
BOA | | | 01/2015 | | | USD | | | 1,308 | | | CZK | | | 27,900 | | | | 89,260 | | | | – | |
BOA | | | 01/2015 - 02/2015 | | | USD | | | 6,537 | | | EUR | | | 5,005 | | | | 479,093 | | | | – | |
BOA | | | 01/2015 | | | USD | | | 34 | | | GBP | | | 20 | | | | 2,919 | | | | – | |
BOA | | | 01/2015 | | | USD | | | 231 | | | HUF | | | 53,000 | | | | 28,295 | | | | – | |
BOA | | | 01/2015 | | | USD | | | 2,424 | | | INR | | | 156,500 | | | | – | | | | 44,252 | |
BOA | | | 01/2015 | | | USD | | | 472 | | | JPY | | | 48,000 | | | | 71,335 | | | | – | |
BOA | | | 01/2015 - 06/2015 | | | USD | | | 11,566 | | | KRW | | | 12,022,666 | | | | 685,757 | | | | – | |
BOA | | | 03/2015 - 10/2015 | | | USD | | | 6,954 | | | MYR | | | 22,850 | | | | 562,662 | | | | – | |
BOA | | | 01/2015 | | | USD | | | 1,214 | | | NOK | | | 7,560 | | | | 200,551 | | | | – | |
BOA | | | 01/2015 | | | USD | | | 3,409 | | | NZD | | | 3,980 | | | | 310,401 | | | | – | |
BOA | | | 01/2015 | | | USD | | | 3,849 | | | PLN | | | 12,850 | | | | 222,697 | | | | – | |
BOA | | | 01/2015 | | | USD | | | 3,574 | | | SEK | | | 25,604 | | | | 289,003 | | | | – | |
BOA | | | 02/2015 | | | USD | | | 4,783 | | | SGD | | | 5,940 | | | | 302,104 | | | | – | |
BOA | | | 01/2015 | | | USD | | | 2,089 | | | TRY | | | 4,920 | | | | 12,567 | | | | 23,194 | |
CITNA-B | | | 01/2015 - 06/2015 | | | CAD | | | 8,120 | | | USD | | | 7,145 | | | | 4,474 | | | | 172,107 | |
CITNA-B | | | 01/2015 | | | CZK | | | 143,570 | | | USD | | | 6,753 | | | | – | | | | 480,251 | |
CITNA-B | | | 01/2015 | | | EUR | | | 3,280 | | | USD | | | 4,422 | | | | – | | | | 452,496 | |
CITNA-B | | | 01/2015 | | | GBP | | | 155 | | | USD | | | 255 | | | | – | | | | 13,060 | |
CITNA-B | | | 01/2015 | | | HUF | | | 515,000 | | | USD | | | 2,115 | | | | – | | | | 146,929 | |
CITNA-B | | | 01/2015 | | | NZD | | | 2,185 | | | USD | | | 1,731 | | | | – | | | | 28,232 | |
CITNA-B | | | 01/2015 | | | PLN | | | 15,760 | | | USD | | | 4,967 | | | | – | | | | 518,738 | |
CITNA-B | | | 06/2015 | | | THB | | | 65,000 | | | USD | | | 1,947 | | | | 15,191 | | | | – | |
CITNA-B | | | 01/2015 | | | TRY | | | 3,240 | | | USD | | | 1,433 | | | | – | | | | 46,528 | |
CITNA-B | | | 01/2015 | | | USD | | | 394 | | | AUD | | | 425 | | | | 47,470 | | | | – | |
CITNA-B | | | 01/2015 - 06/2015 | | | USD | | | 6,750 | | | CAD | | | 7,567 | | | | 248,018 | | | | – | |
CITNA-B | | | 01/2015 | | | USD | | | 5,601 | | | CZK | | | 115,670 | | | | 547,530 | | | | – | |
CITNA-B | | | 01/2015 | | | USD | | | 4,108 | | | EUR | | | 3,060 | | | | 404,468 | | | | – | |
CITNA-B | | | 01/2015 | | | USD | | | 450 | | | GBP | | | 270 | | | | 29,321 | | | | – | |
CITNA-B | | | 01/2015 | | | USD | | | 2,404 | | | HUF | | | 595,000 | | | | 129,944 | | | | – | |
CITNA-B | | | 01/2015 | | | USD | | | 77 | | | JPY | | | 8,000 | | | | 9,942 | | | | – | |
CITNA-B | | | 01/2015 | | | USD | | | 2,093 | | | MXN | | | 28,500 | | | | 161,481 | | | | – | |
CITNA-B | | | 01/2015 | | | USD | | | 4,088 | | | NOK | | | 26,030 | | | | 596,484 | | | | – | |
CITNA-B | | | 01/2015 - 06/2015 | | | USD | | | 2,988 | | | NZD | | | 3,905 | | | | – | | | | 27,040 | |
CITNA-B | | | 01/2015 - 03/2015 | | | USD | | | 6,780 | | | PLN | | | 22,560 | | | | 419,253 | | | | – | |
CITNA-B | | | 01/2015 | | | USD | | | 529 | | | SGD | | | 660 | | | | 30,459 | | | | – | |
CITNA-B | | | 01/2015 | | | USD | | | 2,015 | | | TRY | | | 4,650 | | | | 29,955 | | | | 4,873 | |
CITNA-B | | | 01/2015 - 06/2015 | | | USD | | | 3,310 | | | ZAR | | | 39,030 | | | | 16,890 | | | | 25,735 | |
CITNA-B | | | 01/2015 - 06/2015 | | | ZAR | | | 42,540 | | | USD | | | 3,672 | | | | 18,566 | | | | 67,887 | |
DEU | | | 01/2015 | | | AUD | | | 250 | | | USD | | | 231 | | | | – | | | | 27,276 | |
DEU | | | 01/2015 | | | CHF | | | 4,122 | | | USD | | | 4,339 | | | | – | | | | 192,224 | |
DEU | | | 01/2015 | | | EUR | | | 610 | | | USD | | | 840 | | | | – | | | | 101,781 | |
DEU | | | 01/2015 | | | GBP | | | 1,125 | | | USD | | | 1,893 | | | | – | | | | 140,194 | |
DEU | | | 01/2015 | | | JPY | | | 628,500 | | | USD | | | 5,567 | | | | – | | | | 318,738 | |
DEU | | | 01/2015 | | | NOK | | | 20,000 | | | USD | | | 3,148 | | | | – | | | | 465,863 | |
DEU | | | 01/2015 | | | NZD | | | 1,370 | | | USD | | | 1,067 | | | | 756 | | | | – | |
DEU | | | 01/2015 - 06/2015 | | | PLN | | | 26,280 | | | USD | | | 7,811 | | | | 2,136 | | | | 410,439 | |
DEU | | | 01/2015 | | | SEK | | | 40,140 | | | USD | | | 5,859 | | | | – | | | | 710,112 | |
DEU | | | 01/2015 | | | TRY | | | 790 | | | USD | | | 351 | | | | – | | | | 14,732 | |
DEU | | | 01/2015 | | | USD | | | 1,026 | | | AUD | | | 1,145 | | | | 91,797 | | | | – | |
DEU | | | 01/2015 | | | USD | | | 3,331 | | | CHF | | | 2,972 | | | | 341,064 | | | | – | |
DEU | | | 01/2015 - 02/2015 | | | USD | | | 2,057 | | | EUR | | | 1,505 | | | | 235,291 | | | | – | |
DEU | | | 01/2015 | | | USD | | | 1,819 | | | GBP | | | 1,105 | | | | 96,652 | | | | – | |
DEU | | | 01/2015 - 09/2015 | | | USD | | | 6,742 | | | JPY | | | 758,000 | | | | 403,413 | | | | – | |
DEU | | | 01/2015 | | | USD | | | 1,662 | | | MXN | | | 23,245 | | | | 88,182 | | | | – | |
DEU | | | 01/2015 | | | USD | | | 4,273 | | | NOK | | | 26,620 | | | | 703,107 | | | | – | |
DEU | | | 06/2015 | | | USD | | | 1,967 | | | NZD | | | 2,550 | | | | 7,908 | | | | – | |
DEU | | | 01/2015 | | | USD | | | 2,727 | | | PLN | | | 8,900 | | | | 215,360 | | | | – | |
DEU | | | 01/2015 | | | USD | | | 6,744 | | | SEK | | | 48,713 | | | | 495,072 | | | | – | |
DEU | | | 02/2015 | | | USD | | | 7,278 | | | SGD | | | 9,200 | | | | 338,046 | | | | – | |
DEU | | | 01/2015 | | | USD | | | 427 | | | TRY | | | 950 | | | | 20,900 | | | | – | |
FIB | | | 01/2015 | | | MXN | | | 13,700 | | | USD | | | 1,044 | | | | – | | | | 116,060 | |
15 OPPENHEIMER DIVERSIFIED ALTERNATIVES FUND/VA
| | |
| |
| CONSOLIDATED STATEMENT OF INVESTMENTS Continued | | |
| | | | | | | | | | | | | | | | | | | | | | | | |
Forward Currency Exchange Contracts (Continued) | | | | | | | | | | | | | | | | | | |
| Counterparty | | Settlement Month(s) | | | Currency Purchased (000’s) | | | Currency Sold (000’s) | | | Unrealized
Appreciation | | | Unrealized
Depreciation | |
FIB | | | 01/2015 | | | USD | | | 459 | | | JPY | | | 46,500 | | | $ | 70,388 | | | $ | – | |
GSCO-OT | | | 01/2015 | | | AUD | | | 45 | | | USD | | | 41 | | | | – | | | | 4,506 | |
GSCO-OT | | | 01/2015 | | | BRL | | | 1,340 | | | USD | | | 504 | | | | – | | | | 380 | |
GSCO-OT | | | 06/2015 | | | IDR | | | 24,474,000 | | | USD | | | 1,932 | | | | – | | | | 18,013 | |
GSCO-OT | | | 01/2015 | | | KRW | | | 797,000 | | | USD | | | 772 | | | | – | | | | 47,391 | |
GSCO-OT | | | 01/2015 | | | PLN | | | 6,810 | | | USD | | | 1,996 | | | | – | | | | 73,685 | |
GSCO-OT | | | 01/2015 | | | USD | | | 26 | | | AUD | | | 30 | | | | 1,757 | | | | – | |
GSCO-OT | | | 01/2015 - 07/2015 | | | USD | | | 978 | | | BRL | | | 2,610 | | | | 20,310 | | | | 357 | |
GSCO-OT | | | 01/2015 | | | USD | | | 1,370 | | | EUR | | | 1,005 | | | | 153,710 | | | | – | |
GSCO-OT | | | 06/2015 | | | USD | | | 1,866 | | | IDR | | | 24,474,000 | | | | – | | | | 48,009 | |
GSCO-OT | | | 01/2015 | | | USD | | | 157 | | | JPY | | | 16,000 | | | | 23,395 | | | | – | |
GSCO-OT | | | 01/2015 | | | USD | | | 3,826 | | | KRW | | | 4,086,000 | | | | 112,267 | | | | – | |
JPM | | | 01/2015 | | | BRL | | | 1,340 | | | USD | | | 501 | | | | 3,353 | | | | – | |
JPM | | | 01/2015 | | | EUR | | | 250 | | | USD | | | 318 | | | | – | | | | 15,224 | |
JPM | | | 01/2015 | | | GBP | | | 100 | | | USD | | | 167 | | | | – | | | | 11,458 | |
JPM | | | 01/2015 - 06/2015 | | | KRW | | | 2,670,000 | | | USD | | | 2,529 | | | | – | | | | 104,365 | |
JPM | | | 01/2015 | | | PLN | | | 3,875 | | | USD | | | 1,261 | | | | – | | | | 167,141 | |
JPM | | | 01/2015 | | | SEK | | | 1,610 | | | USD | | | 230 | | | | – | | | | 23,494 | |
JPM | | | 01/2015 | | | TWD | | | 53,000 | | | USD | | | 1,778 | | | | – | | | | 102,587 | |
JPM | | | 01/2015 - 02/2015 | | | USD | | | 1,001 | | | BRL | | | 2,680 | | | | 380 | | | | 3,389 | |
JPM | | | 01/2015 | | | USD | | | 1,032 | | | CAD | | | 1,170 | | | | 26,100 | | | | 632 | |
JPM | | | 01/2015 | | | USD | | | 634 | | | EUR | | | 500 | | | | 28,613 | | | | – | |
JPM | | | 01/2015 | | | USD | | | 114 | | | GBP | | | 70 | | | | 5,400 | | | | – | |
JPM | | | 09/2015 | | | USD | | | 8,501 | | | MYR | | | 27,700 | | | | 754,595 | | | | – | |
JPM | | | 01/2015 | | | USD | | | 2,922 | | | ZAR | | | 32,740 | | | | 93,704 | | | | – | |
JPM | | | 01/2015 | | | ZAR | | | 16,220 | | | USD | | | 1,456 | | | | – | | | | 54,544 | |
MSCO | | | 01/2015 | | | AUD | | | 230 | | | USD | | | 197 | | | | – | | | | 9,810 | |
MSCO | | | 01/2015 | | | CHF | | | 2,895 | | | USD | | | 2,996 | | | | – | | | | 83,148 | |
MSCO | | | 06/2015 | | | EUR | | | 995 | | | USD | | | 1,241 | | | | – | | | | 34,979 | |
MSCO | | | 01/2015 | | | JPY | | | 337,000 | | | USD | | | 2,870 | | | | – | | | | 56,212 | |
MSCO | | | 01/2015 | | | MXN | | | 74,700 | | | USD | | | 5,593 | | | | – | | | | 533,013 | |
MSCO | | | 01/2015 | | | NOK | | | 39,060 | | | USD | | | 5,911 | | | | – | | | | 672,993 | |
MSCO | | | 01/2015 - 06/2015 | | | NZD | | | 5,330 | | | USD | | | 4,127 | | | | 9,663 | | | | 12,260 | |
MSCO | | | 01/2015 | | | USD | | | 620 | | | AUD | | | 675 | | | | 69,663 | | | | – | |
MSCO | | | 01/2015 | | | USD | | | 1,115 | | | CAD | | | 1,220 | | | | 65,352 | | | | – | |
MSCO | | | 01/2015 | | | USD | | | 1,164 | | | CHF | | | 1,135 | | | | 22,459 | | | | – | |
MSCO | | | 01/2015 | | | USD | | | 946 | | | CLP | | | 532,510 | | | | 69,879 | | | | – | |
MSCO | | | 01/2015 | | | USD | | | 231 | | | EUR | | | 170 | | | | 25,777 | | | | – | |
MSCO | | | 01/2015 - 06/2015 | | | USD | | | 6,461 | | | JPY | | | 740,900 | | | | 271,786 | | | | – | |
MSCO | | | 01/2015 - 11/2015 | | | USD | | | 16,470 | | | MXN | | | 239,300 | | | | 513,563 | | | | – | |
MSCO | | | 01/2015 | | | USD | | | 2,891 | | | NZD | | | 3,510 | | | | 156,319 | | | | – | |
MSCO | | | 01/2015 | | | USD | | | 2,979 | | | SEK | | | 21,133 | | | | 267,651 | | | | – | |
NOM | | | 01/2015 | | | USD | | | 5,285 | | | INR | | | 331,000 | | | | 63,686 | | | | – | |
RBS | | | 01/2015 - 01/2015 | | | CAD | | | 3,003 | | | USD | | | 2,698 | | | | – | | | | 114,662 | |
RBS | | | 01/2015 | | | CLP | | | 1,004,510 | | | USD | | | 1,721 | | | | – | | | | 69,167 | |
RBS | | | 01/2015 | | | EUR | | | 1,135 | | | USD | | | 1,545 | | | | – | | | | 170,964 | |
RBS | | | 01/2015 | | | GBP | | | 135 | | | USD | | | 231 | | | | – | | | | 20,451 | |
RBS | | | 01/2015 | | | INR | | | 167,000 | | | USD | | | 2,701 | | | | – | | | | 66,713 | |
RBS | | | 01/2015 | | | JPY | | | 74,000 | | | USD | | | 727 | | | | – | | | | 108,648 | |
RBS | | | 01/2015 | | | KRW | | | 1,608,000 | | | USD | | | 1,570 | | | | – | | | | 108,526 | |
RBS | | | 01/2015 | | | MXN | | | 16,900 | | | USD | | | 1,276 | | | | – | | | | 131,601 | |
RBS | | | 01/2015 | | | NOK | | | 4,100 | | | USD | | | 660 | | | | – | | | | 109,808 | |
RBS | | | 01/2015 | | | SEK | | | 16,830 | | | USD | | | 2,376 | | | | – | | | | 216,482 | |
RBS | | | 01/2015 | | | USD | | | 83 | | | AUD | | | 90 | | | | 9,547 | | | | – | |
RBS | | | 01/2015 | | | USD | | | 1,123 | | | CAD | | | 1,235 | | | | 60,123 | | | | – | |
RBS | | | 01/2015 | | | USD | | | 2,698 | | | CHF | | | 2,470 | | | | 213,361 | | | | – | |
RBS | | | 01/2015 - 06/2015 | | | USD | | | 9,888 | | | EUR | | | 7,457 | | | | 859,526 | | | | – | |
RBS | | | 01/2015 | | | USD | | | 651 | | | GBP | | | 390 | | | | 42,705 | | | | – | |
RBS | | | -01/2015 | | | USD | | | 2,682 | | | JPY | | | 276,000 | | | | 377,437 | | | | – | |
RBS | | | 01/2015 | | | USD | | | 2,576 | | | MXN | | | 34,755 | | | | 222,484 | | | | – | |
RBS | | | 01/2015 | | | USD | | | 4,428 | | | NOK | | | 27,510 | | | | 738,266 | | | | – | |
RBS | | | 01/2015 | | | ZAR | | | 6,970 | | | USD | | | 636 | | | | – | | | | 33,397 | |
TDB | | | 02/2015 | | | NOK | | | 26,600 | | | USD | | | 3,785 | | | | – | | | | 219,866 | |
TDB | | | 02/2015 | | | SEK | | | 29,150 | | | USD | | | 3,945 | | | | – | | | | 205,369 | |
TDB | | | 06/2015 - 12/2015 | | | USD | | | 179 | | | KRW | | | 201,000 | | | | – | | | | 2,095 | |
TDB | | | 02/2015 | | | USD | | | 3,908 | | | NOK | | | 26,600 | | | | 342,358 | | | | – | |
TDB | | | 02/2015 | | | USD | | | 3,875 | | | SEK | | | 29,150 | | | | 135,125 | | | | – | |
| | | | | | | | | | | | | | | | | | | | |
Total Unrealized Appreciation and Depreciation | | | | | | | | | | | | | | | | | | $ | 16,963,754 | | | $ | 10,329,295 | |
| | | | | | | | | | | | | | | | | | | | |
16 OPPENHEIMER DIVERSIFIED ALTERNATIVES FUND/VA
| | | | | | | | | | | | | | | | | | | | | | | | |
Futures Contracts as of December 31, 2014 | | | | | | | | | | | | | | | | | | | | | |
| Description | | Exchange | | | Buy/Sell | | | Expiration Date | | | Number of Contracts | | | Value | | | Unrealized Appreciation
(Depreciation) | |
90 Day Euro | | | CME | | | | Sell | | | | 12/19/16 | | | | 15 | | | $ | 3,679,875 | | | $ | (12,856 | ) |
Brent Crude Oil* | | | ICE | | | | Buy | | | | 2/12/15 | | | | 1 | | | | 58,210 | | | | 109 | |
Brent Crude Oil* | | | ICE | | | | Buy | | | | 1/15/15 | | | | 4 | | | | 229,320 | | | | (11,272 | ) |
CAC 40 10 Index | | | PAR | | | | Sell | | | | 1/16/15 | | | | 118 | | | | 6,106,953 | | | | (282,865 | ) |
CBOE Volatility Index | | | CBE | | | | Sell | | | | 2/18/15 | | | | 41 | | | | 747,225 | | | | (66,845 | ) |
Corn* | | | CBT | | | | Sell | | | | 3/13/15 | | | | 4 | | | | 79,400 | | | | (710 | ) |
Euro-BTP | | | EUX | | | | Sell | | | | 3/06/15 | | | | 2 | | | | 328,165 | | | | (3,925 | ) |
FTSE 100 Index | | | LIF | | | | Sell | | | | 3/20/15 | | | | 61 | | | | 6,201,241 | | | | (309,323 | ) |
Lead* | | | LME | | | | Buy | | | | 3/16/15 | | | | 3 | | | | 139,350 | | | | (12,264 | ) |
Live Cattle* | | | CME | | | | Sell | | | | 4/30/15 | | | | 2 | | | | 129,920 | | | | 3,181 | |
Live Cattle* | | | CME | | | | Buy | | | | 8/31/15 | | | | 1 | | | | 61,010 | | | | (135 | ) |
Natural Gas* | | | NYM | | | | Sell | | | | 3/27/15 | | | | 5 | | | | 144,050 | | | | 21,641 | |
Natural Gas* | | | NYM | | | | Buy | | | | 2/25/15 | | | | 4 | | | | 115,840 | | | | (14,028 | ) |
Natural Gas* | | | NYM | | | | Buy | | | | 1/28/15 | | | | 1 | | | | 28,890 | | | | (3,622 | ) |
New York Harbor ULSD* | | | NYM | | | | Buy | | | | 2/27/15 | | | | 2 | | | | 152,645 | | | | (10,449 | ) |
Nickel* | | | LME | | | | Buy | | | | 3/16/15 | | | | 3 | | | | 272,502 | | | | (19,211 | ) |
Palladium* | | | NYM | | | | Sell | | | | 3/27/15 | | | | 2 | | | | 159,680 | | | | (114 | ) |
Platinum* | | | NYM | | | | Buy | | | | 4/28/15 | | | | 5 | | | | 302,375 | | | | 1,620 | |
S&P 500 E-Mini Index | | | CME | | | | Buy | | | | 3/20/15 | | | | 88 | | | | 9,030,560 | | | | 268,546 | |
S&P/TSX 60 Index | | | MON | | | | Sell | | | | 3/19/15 | | | | 7 | | | | 1,026,201 | | | | (64,385 | ) |
Silver* | | | CMX | | | | Sell | | | | 3/27/15 | | | | 1 | | | | 77,995 | | | | 7,303 | |
Soybean* | | | CBT | | | | Sell | | | | 3/13/15 | | | | 3 | | | | 153,525 | | | | 2,818 | |
SPI 200 Index | | | SFE | | | | Sell | | | | 3/19/15 | | | | 21 | | | | 2,307,207 | | | | (110,613 | ) |
Sugar #11 World* | | | NYB | | | | Sell | | | | 6/30/15 | | | | 2 | | | | 34,160 | | | | 4,319 | |
Sugar #11 World* | | | NYB | | | | Sell | | | | 2/27/15 | | | | 2 | | | | 32,525 | | | | 4,923 | |
Sugar #11 World* | | | NYB | | | | Buy | | | | 4/30/15 | | | | 3 | | | | 50,131 | | | | (5,406 | ) |
United States Treasury Long Bonds | | | CBT | | | | Buy | | | | 3/20/15 | | | | 19 | | | | 2,746,688 | | | | 30,261 | |
United States Treasury Nts., 10 yr. | | | CBT | | | | Buy | | | | 3/20/15 | | | | 21 | | | | 2,662,734 | | | | 5,228 | |
WTI Crude Oil* | | | NYM | | | | Buy | | | | 11/20/15 | | | | 1 | | | | 59,450 | | | | (72 | ) |
WTI Crude Oil* | | | NYM | | | | Buy | | | | 1/20/15 | | | | 7 | | | | 372,890 | | | | (42,594 | ) |
WTI Crude Oil* | | | ICE | | | | Sell | | | | 2/19/15 | | | | 1 | | | | 53,700 | | | | 169 | |
| | | | | | | | | | | | | | | | | | | | | | | | |
| | | | | | | | | | | | | | | | | | | | | | $ | (620,571 | ) |
| | | | | | | | | | | | | | | | | | | | | | | | |
| *All | or a portion of this security is owned by the subsidiary. See Note 1 of the accompanying Consolidated Notes. |
| | | | | | | | | | | | | | | | | | | | | | | | | | | | |
Exchange-Traded Options Written at December 31, 2014 | | | | | | | | | | | | | | | | | | | | | | | | | |
| Description | | Exercise Price | | | Expiration
Date | | | | | | Number of
Contracts | | | Premiums
Received | | | Value | |
S&P 500 Index Put | | | USD | | | | 1880 .000 | | | | 3/20/15 | | | | USD | | | | (225 | ) | | $ | 584,316 | | | $ | (471,375 | ) |
| | | | | | | | | | | | | | | | | | | | | | | | | | | | | | | | |
Over-the-Counter Options Written at December 31, 2014 | | | | | | | | | | | | | | | | | |
| Description | | Counterparty | | | Exercise Price | | | Expiration
Date | | | Number of
Contracts | | | Premiums
Received | | | Value | |
CAD Currency Put | | | BOA | | | | CAD | | | | 1.260 | | | | 6/17/15 | | | | CAD | | | | (14,772,007 | )$ | | | 63,895 | | | $ | (49,073 | ) |
JPY Currency Put | | | BOA | | | | JPY | | | | 119.590 | | | | 1/7/15 | | | | JPY | | | | (106,000,000 | ) | | | 4,915 | | | | (4,876 | ) |
JPY Currency Call | | | BOA | | | | JPY | | | | 119.590 | | | | 1/7/15 | | | | JPY | | | | (106,000,000 | ) | | | 4,847 | | | | (4,876 | ) |
NOK Currency Put | | | BOA | | | | SEK | | | | 1.040 | | | | 7/2/15 | | | | NOK | | | | (39,000,000 | ) | | | 143,965 | | | | (152,149 | ) |
NOK Currency Call | | | BOA | | | | SEK | | | | 1.040 | | | | 7/2/15 | | | | NOK | | | | (39,000,000 | ) | | | 146,960 | | | | (155,262 | ) |
NOK Currency Call | | | JPM | | | | SEK | | | | 1.045 | | | | 5/17/15 | | | | NOK | | | | (39,000,000 | ) | | | 126,949 | | | | (139,309 | ) |
NOK Currency Put | | | JPM | | | | SEK | | | | 1.045 | | | | 6/17/15 | | | | NOK | | | | (39,000,000 | ) | | | 160,118 | | | | (159,655 | ) |
PLN Currency Call | | | BOA | | | | PLN | | | | 3.220 | | | | 3/17/15 | | | | PLN | | | | (37,750,685 | ) | | | 38,829 | | | | (7,663 | ) |
| | | | | | | | | | | | | | | | | | | | | | | | | | | | | | | | |
Total of Over-the-Counter Options Written | | | | | | | | | | | | | | | | | | | | | | | | | | $ | 690,478 | | | $ | (672,863 | ) |
| | | | | | | | | | | | | | | | | | | | | | | | | | | | | | | | |
| | | | | | | | | | | | | | | | | | | | | | | | | | | | |
Cleared Credit Default Swaps at December 31, 2014 | | | | | | | | | | | | | |
| Reference Asset | | Buy/Sell
Protection | | | Fixed Rate | | | Maturity Date | | | Notional Amount
(000’s) | | | Premiums
Received/(Paid) | | | Value | |
CDX.HY.22 | | | Buy | | | | 5.000 | % | | | 6/20/19 | | | | USD | | | | 1,287 | | | $ | 84,842 | | | $ | (87,870 | ) |
CDX.HY.23 | | | Buy | | | | 5.000 | | | | 12/20/19 | | | | USD | | | | 5,200 | | | | 294,441 | | | | (322,777 | ) |
CDX.IG.22 | | | Sell | | | | 1.000 | | | | 6/20/19 | | | | USD | | | | 1,650 | | | | (32,737 | ) | | | 29,997 | |
iTraxx.Main.21 | | | Buy | | | | 1.000 | | | | 6/20/19 | | | | EUR | | | | 1,250 | | | | 32,681 | | | | (30,304 | ) |
| | | | | | | | | | | | | | | | | | | | | | | | | | | | |
Total of Cleared Credit Default Swaps | | | | | | | | | | | | | | | | | | | | | | $ | 379,227 | | | $ | (410,954 | ) |
| | | | | | | | | | | | | | | | | | | | | | | | | | | | |
17 OPPENHEIMER DIVERSIFIED ALTERNATIVES FUND/VA
| | |
| |
| CONSOLIDATED STATEMENT OF INVESTMENTS Continued | | |
| | | | | | | | | | | | | | | | | | | | | | | | | | | | | | | | |
Over-the-Counter Credit Default Swaps at December 31, 2014 | |
| Reference Asset | | Counterparty | | | Buy/Sell
Protection | | | Fixed Rate | | | Maturity Date | | | | | | Notional Amount
(000’s) | | | Premiums
Received/(Paid) | | | Value | |
Amgen, Inc. | | | DEU | | | | Sell | | | | 1.000 | % | | | 12/20/19 | | | | USD | | | | 1,300 | | | $ | (38,185 | )$ | | | 41,760 | |
Avon Products, Inc. | | | BNP | | | | Buy | | | | 1.000 | | | | 12/20/19 | | | | USD | | | | 1,310 | | | | (188,750 | ) | | | 216,029 | |
Barrick Gold Corp. | | | BAC | | | | Buy | | | | 1.000 | | | | 12/20/19 | | | | USD | | | | 1,080 | | | | (28,689 | ) | | | 46,637 | |
Barrick Gold Corp. | | | BAC | | | | Buy | | | | 1.000 | | | | 12/20/19 | | | | USD | | | | 220 | | | | (9,821 | ) | | | 9,500 | |
Boston Scientific Corp. | | | GSG | | | | Buy | | | | 1.000 | | | | 12/20/19 | | | | USD | | | | 1,340 | | | | 21,767 | | | | (19,353 | ) |
Bristol-Myers Squibb Co. | | | JPM | | | | Sell | | | | 1.000 | | | | 12/20/19 | | | | USD | | | | 1,310 | | | | (54,425 | ) | | | 53,291 | |
CBS Corp. | | | BAC | | | | Buy | | | | 1.000 | | | | 12/20/19 | | | | USD | | | | 1,340 | | | | 24,517 | | | | (24,888 | ) |
CSX Corp. | | | FIB | | | | Sell | | | | 1.000 | | | | 12/20/19 | | | | USD | | | | 1,300 | | | | (48,221 | ) | | | 51,715 | |
Federative Republic of Brazil | | | BAC | | | | Buy | | | | 1.000 | | | | 3/20/20 | | | | USD | | | | 400 | | | | (16,586 | ) | | | 19,435 | |
Federative Republic of Brazil | | | GSG | | | | Buy | | | | 1.000 | | | | 12/20/19 | | | | USD | | | | 350 | | | | (22,606 | ) | | | 15,643 | |
Ford Motor Co. | | | BAC | | | | Sell | | | | 1.000 | | | | 12/20/19 | | | | USD | | | | 1,340 | | | | (12,668 | ) | | | (3,449 | ) |
Freeport-McMoran, Inc. | | | CITNA-B | | | | Buy | | | | 1.000 | | | | 12/20/19 | | | | USD | | | | 1,310 | | | | (45,855 | ) | | | 83,294 | |
Gap, Inc. (The) | | | BNP | | | | Buy | | | | 1.000 | | | | 12/20/19 | | | | USD | | | | 1,310 | | | | (4,573 | ) | | | (6,133 | ) |
General Mills, Inc. | | | BNP | | | | Buy | | | | 1.000 | | | | 12/20/19 | | | | USD | | | | 1,340 | | | | 44,980 | | | | (43,699 | ) |
International Business Machines | | | | | | | | | | | | | | | | | | | | | | | | | | | | | | | | |
Corp. | | | BNP | | | | Buy | | | | 1.000 | | | | 12/20/19 | | | | USD | | | | 1,310 | | | | 26,708 | | | | (34,935 | ) |
Lowe’s Cos., Inc. | | | JPM | | | | Sell | | | | 1.000 | | | | 12/20/19 | | | | USD | | | | 1,310 | | | | (52,606 | ) | | | 51,237 | |
Newmont Mining Corp. | | | FIB | | | | Buy | | | | 1.000 | | | | 12/20/19 | | | | USD | | | | 1,300 | | | | (53,261 | ) | | | 45,092 | |
Northrop Grumman Corp. | | | CITNA-B | | | | Sell | | | | 1.000 | | | | 12/20/19 | | | | USD | | | | 1,340 | | | | (55,816 | ) | | | 54,163 | |
Portuguese Republic | | | GSG | | | | Buy | | | | 1.000 | | | | 12/20/19 | | | | USD | | | | 660 | | | | (35,082 | ) | | | 29,157 | |
Portuguese Republic | | | JPM | | | | Buy | | | | 1.000 | | | | 3/20/20 | | | | USD | | | | 270 | | | | (13,876 | ) | | | 13,068 | |
Portuguese Republic | | | JPM | | | | Buy | | | | 1.000 | | | | 3/20/20 | | | | USD | | | | 170 | | | | (9,489 | ) | | | 8,228 | |
Republic of Austria | | | GSG | | | | Buy | | | | 1.000 | | | | 12/20/16 | | | | USD | | | | 925 | | | | 17,916 | | | | (17,042 | ) |
Republic of Austria | | | GSG | | | | Buy | | | | 1.000 | | | | 12/20/16 | | | | USD | | | | 700 | | | | 14,467 | | | | (12,896 | ) |
Republic of Italy | | | GSG | | | | Buy | | | | 1.000 | | | | 12/20/19 | | | | USD | | | | 2,950 | | | | (1,788 | ) | | | 46,614 | |
Southwest Airlines Co. | | | GSG | | | | Sell | | | | 1.000 | | | | 12/20/19 | | | | USD | | | | 1,300 | | | | (24,327 | ) | | | 26,784 | |
Starwood Hotels & Resorts | | | | | | | | | | | | | | | | | | | | | | | | | | | | | | | | |
Worlwide, Inc. | | | BAC | | | | Buy | | | | 1.000 | | | | 12/20/19 | | | | USD | | | | 1,310 | | | | 21,513 | | | | (19,751 | ) |
Target Corp. | | | BAC | | | | Sell | | | | 1.000 | | | | 12/20/19 | | | | USD | | | | 1,340 | | | | (43,635 | ) | | | 44,086 | |
Union Pacific Corp. | | | FIB | | | | Sell | | | | 1.000 | | | | 12/20/19 | | | | USD | | | | 220 | | | | (8,862 | ) | | | 8,967 | |
Union Pacific Corp. | | | FIB | | | | Sell | | | | 1.000 | | | | 12/20/19 | | | | USD | | | | 1,080 | | | | (43,953 | ) | | | 44,019 | |
Wal-Mart Stores, Inc. | | | BAC | | | | Sell | | | | 1.000 | | | | 12/20/19 | | | | USD | | | | 1,340 | | | | (57,181 | ) | | | 56,648 | |
| | | | | | | | | | | | | | | | | | | | | | | | | | | | |
Total of Over-the-Counter Credit Default Swaps | | | $ | (698,387 | ) | | $ | 783,221 | |
| | | | | | | | | | | | | | | | | | | | | | | | | | | | |
The table that follows shows the undiscounted maximum potential payment by the Fund related to selling credit protection in credit default swaps:
| | | | | | | | | | | | |
| Type of Reference Asset on which the Fund Sold Protection | | Total Maximum Potential
Payments for Selling Credit
Protection (Undiscounted) | | | Amount Recoverable* | | | Reference Asset
Rating Range** | |
Investment Grade Corporate Debt Indexes | | $ | 1,650,000 | | | $ | - | | | | BBB+ | |
Investment Grade Single Name Corporate Debt | | | 13,180,000 | | | | - | | | | BBB- to AA | |
| | | | | | | | |
Total | | $ | 14,830,000 | | | $ | - | | | | | |
| | | | | | | | |
* The Fund has no amounts recoverable from related purchased protection. In addition, the Fund has no recourse provisions under the credit derivatives and holds no collateral which can offset or reduce potential payments under a triggering event.
** The period end reference asset security ratings, as rated by any rating organization, are included in the equivalent Standard & Poor’s rating category. The reference asset rating represents the likelihood of a potential credit event on the reference asset which would result in a related payment by the Fund.
| | | | | | | | | | | | | | | | | | | | | | | | | | | | |
Cleared Interest Rate Swaps at December 31, 2014 | |
| Counterparty | | Pay/Receive
Floating Rate | | | Floating Rate | | | Fixed Rate | | | Maturity Date | | | Notional Amount (000’s) | | | Value | |
BAC | | | Pay | | |
| Six-Month CHF
BBA LIBOR |
| | | 0.663 | % | | | 12/8/24 | | | | CHF | | | | 3,870 | | | $ | (61,080 | ) |
BAC | | | Pay | | |
| Six-Month JPY
BBA LIBOR |
| | | 0.574 | | | | 12/8/24 | | | | JPY | | | | 475,000 | | | | (26,334 | ) |
BOA | | | Receive | | |
| Three-Month NZD
BBR FRA |
| | | 4.290 | | | | 12/9/24 | | | | NZD | | | | 5,095 | | | | 62,031 | |
JPM | | | Receive | | |
| Three-Month USD
BBA LIBOR |
| | | 2.387 | | | | 12/8/24 | | | | USD | | | | 4,010 | | | | 45,407 | |
| | | | | | | | | | | | | | | | | | | | | | | | | | | | |
Total of Cleared Interest Rate Swaps | | | | | | | | | | | | | | | | | | | | | | | | | | $ | 20,024 | |
| | | | | | | | | | | | | | | | | | | | | | | | | | | | |
18 OPPENHEIMER DIVERSIFIED ALTERNATIVES FUND/VA
| | | | | | | | | | | | | | | | | | | | | | | | | | | | |
Over-the-Counter Total Return Swaps at December 31, 2014 | |
| Reference Asset | | Counterparty | | | Pay/Receive
Total Return* | | | Floating Rate | | | Maturity Date | | | Notional
Amount (000’s) | | | Value | |
BCOM Index** | | | MAC | | | | Receive | | |
| Official settlement price of
BCOM Index |
| | | 2/17/15 | | | | USD | | | | (700 | ) | | $ | (27,086 | ) |
BX Index | | | GSG | | | | Receive | | |
| One-Month USD BBA
LIBOR plus 65 basis points |
| | | 3/16/15 | | | | USD | | | | 438 | | | | 22,466 | |
CGAUOPAU Custom Basket | | | CITNA-B | | | | Receive | | |
| One-Month AUD BBR
BBSW plus 50 basis points |
| | | 3/11/15 | | | | AUD | | | | 3,156 | | | | 62,635 | |
CGCNOCAD Custom Basket | | | CITNA-B | | | | Receive | | |
| One-Month CAD BA CDOR
plus 30 basis points |
| | | 4/8/15 | | | | CAD | | | | 3,044 | | | | 120,833 | |
CIBZC8DE Index** | | | CIBC | | | | Receive | | |
| Official settlement price of
CIBZC8DE Index |
| | | 2/17/15 | | | | USD | | | | (4,200 | ) | | | (162,605 | ) |
CIBZOPQR Index** | | | CIBC | | | | Receive | | |
| Official settlement price of
CIBZOPQR Index |
| | | 2/17/15 | | | | USD | | | | (2,500 | ) | | | (90,361 | ) |
DBOPSPLG Custom Basket | | | DEU | | | | Receive | | |
| One-Month USD BBA
LIBOR plus 30 basis points |
| | | 2/6/15 | | | | USD | | | | 2,815 | | | | 47,088 | |
DBOPSPST Custom Basket | | | DEU | | | | Pay | | |
| One-Month USD BBA
LIBOR minus 30 basis
points |
| | | 2/6/15 | | | | USD | | | | 2,914 | | | | (18,537 | ) |
GSEHOPHK Custom Basket | | | GSG | | | | Receive | | |
| One-Month HKD HIBOR
HKAB plus 40 basis points |
| | | 12/10/15 | | | | HKD | | | | 20,402 | | | | (3,269 | ) |
GSOPSPS3 Custom Basket | | | GSG | | | | Receive | | |
| One-Month USD BBA
LIBOR plus 35 basis points |
| | | 10/7/15 | | | | USD | | | | 9,390 | | | | 48,064 | |
HIF5 Index | | | GSG | | | | Pay | | | | No Floating Rate | | | | 2/6/15 | | | | HKD | | | | 11,705 | | | | (15,435 | ) |
iBoxx USD Leveraged Loans Index | | | JPM | | | | Receive | | |
| One-Month USD BBA
LIBOR no spread |
| | | 6/26/15 | | | | USD | | | | 36,050 | | | | 101,774 | |
MLTROPFR Custom Basket | | | BOA | | | | Receive | | |
| One-Month EUR EURIBOR
plus 29 basis points |
| | | 10/7/15 | | | | EUR | | | | 5,263 | | | | (28,869 | ) |
MLTROPUK Custom Basket | | | BOA | | | | Receive | | |
| One-Month GBP BBA
LIBOR plus 34 basis points |
| | | 10/7/15 | | | | GBP | | | | 4,179 | | | | (17,961 | ) |
OEX Index | | | GSG | | | | Pay | | |
| One-Month USD BBA
LIBOR minus 5 basis points |
| | | 7/7/15 | | | | USD | | | | 4,228 | | | | 5,265 | |
OEX Index | | | GSG | | | | Pay | | |
| One-Month USD BBA
LIBOR minus 5 basis points |
| | | 7/7/15 | | | | USD | | | | 3,462 | | | | 31,249 | |
OEX Index | | | GSG | | | | Pay | | |
| One-Month USD BBA
LIBOR minus 5 basis points |
| | | 7/7/15 | | | | USD | | | | 1,763 | | | | 8,994 | |
| | | | | | | | | | | | | | | | | | | | | | | | | | | | |
Total of Over-the-Counter Total Return Swaps | | | | | | | | | | | | | | | $ | 84,245 | |
| | | | | | | | | | | | | | | | | | | | | | | | | | | | |
* Fund will pay or receive the total return of the reference asset depending on whether the return is positive or negative. For contracts where the Fund has elected to receive the total return of the reference asset if positive, it will be responsible for paying the floating rate and the total return of the reference asset if negative. If the Fund has elected to pay the total return of the reference asset if positive, it will receive the floating rate and the total return of the reference asset if negative.
** All or a portion of this security is owned by the subsidiary. See Note 2 of the accompanying Consolidated Notes.
| | | | | | | | | | | | | | | | | | | | | | | | | | | | |
Over-the-Counter Volatility Swaps at December 31, 2014 | |
| Reference Asset | | Counterparty | | | Pay/Receive
Volatility* | | | Strike Price | | | Maturity Date | | | Notional
Amount | | | Value | |
AUD/NZD spot exchange rate | | | JPM | | | | Receive | | | $ | 7 .350 | | | | 1/15/15 | | | | AUD | | | | 2,200 | | | $ | (3,125 | ) |
AUD/NZD spot exchange rate | | | JPM | | | | Pay | | | | 10.750 | | | | 1/30/15 | | | | USD | | | | 1,800 | | | | 1,350 | |
AUD/NZD spot exchange rate | | | JPM | | | | Pay | | | | 10.630 | | | | 1/27/15 | | | | USD | | | | 1,800 | | | | 2,376 | |
AUD/NZD spot exchange rate | | | JPM | | | | Pay | | | | 11.450 | | | | 1/20/15 | | | | USD | | | | 1,800 | | | | 4,158 | |
AUD/USD spot exchange rate | | | DEU | | | | Pay | | | | 11.550 | | | | 1/16/15 | | | | USD | | | | 1,800 | | | | 5,184 | |
AUD/USD spot exchange rate | | | BOA | | | | Pay | | | | 11.200 | | | | 1/12/15 | | | | USD | | | | 1,800 | | | | 6,228 | |
AUD/USD spot exchange rate | | | BOA | | | | Pay | | | | 11.250 | | | | 1/20/15 | | | | USD | | | | 1,800 | | | | 4,122 | |
AUD/USD spot exchange rate | | | BOA | | | | Pay | | | | 10.900 | | | | 1/23/15 | | | | USD | | | | 1,800 | | | | 3,384 | |
AUD/USD spot exchange rate | | | CITNA-B | | | | Pay | | | | 10.800 | | | | 1/30/15 | | | | USD | | | | 1,800 | | | | 954 | |
AUD/USD spot exchange rate | | | BOA | | | | Pay | | | | 10.600 | | | | 1/29/15 | | | | USD | | | | 1,800 | | | | 1,566 | |
CAD/CHF spot exchange rate | | | BOA | | | | Receive | | | | 10.050 | | | | 1/22/15 | | | | CAD | | | | 2,100 | | | | (4,031 | ) |
CHF/SEK spot exchange rate | | | DEU | | | | Pay | | | | 7.975 | | | | 1/12/15 | | | | CHF | | | | 1,700 | | | | (2,103 | ) |
CHF/SEK spot exchange rate | | | BOA | | | | Pay | | | | 7.500 | | | | 1/12/15 | | | | CHF | | | | 1,800 | | | | (2,734 | ) |
EUR/CAD spot exchange rate | | | BOA | | | | Receive | | | | 7.700 | | | | 1/9/15 | | | | EUR | | | | 1,500 | | | | 2,305 | |
iShares MSCI Emerging Markets | | | GSG | | | | Pay | | | | 535.923 | | | | 4/7/15 | | | | USD | | | | 643 | | | | — | |
iShares MSCI Emerging Markets | | | GSG | | | | Pay | | | | 517.563 | | | | 4/6/15 | | | | USD | | | | 270 | | | | — | |
iShares MSCI Emerging Markets | | | GSG | | | | Receive | | | | 544.756 | | | | 4/6/15 | | | | USD | | | | 268 | | | | — | |
iShares MSCI Emerging Markets | | | GSG | | | | Receive | | | | 563.588 | | | | 4/7/15 | | | | USD | | | | 627 | | | | — | |
iShares MSCI Emerging Markets | | | GSG | | | | Receive | | | | 471.305 | | | | 1/7/15 | | | | USD | | | | 325 | | | | (54,828 | ) |
iShares MSCI Emerging Markets | | | GSG | | | | Pay | | | | 468.159 | | | | 1/6/15 | | | | USD | | | | 308 | | | | 53,038 | |
iShares MSCI Emerging Markets | | | GSG | | | | Receive | | | | 533.200 | | | | 1/7/15 | | | | USD | | | | 290 | | | | (67,425 | ) |
iShares MSCI Emerging Markets | | | GSG | | | | Pay | | | | 513.514 | | | | 1/7/15 | | | | USD | | | | 295 | | | | 80,181 | |
iShares MSCI Emerging Markets | | | GSG | | | | Receive | | | | 460.420 | | | | 1/8/15 | | | | USD | | | | 311 | | | | (48,298 | ) |
19 OPPENHEIMER DIVERSIFIED ALTERNATIVES FUND/VA
CONSOLIDATED STATEMENT OF INVESTMENTS Continued
| | | | | | | | | | | | | | | | | | | | | | | | | | | | |
Over-the-Counter Volatility Swaps (Continued) | |
| Reference Asset | | Counterparty | | | Pay/Receive
Volatility* | | | Strike Price | | | Maturity Date | | | | | | Notional Amount | | | Value | |
iShares MSCI Emerging Markets | | | GSG | | | | Receive | | | $ | 486.900 | | | | 1/6/15 | | | | USD | | | | 303 | | | $ | (59,146 | ) |
iShares MSCI Emerging Markets | | | GSG | | | | Pay | | | | 454.097 | | | | 1/7/15 | | | | USD | | | | 332 | | | | 40,305 | |
iShares MSCI Emerging Markets | | | GSG | | | | Pay | | | | 435.037 | | | | 1/8/15 | | | | USD | | | | 319 | | | | (383 | ) |
NZD/JPY spot exchange rate | | | DEU | | | | Pay | | | | 11.450 | | | | 1/8/15 | | | | NZD | | | | 2,300 | | | | 2,296 | |
USD/NOK spot exchange rate | | | JPM | | | | Pay | | | | 18.250 | | | | 1/20/15 | | | | USD | | | | 1,800 | | | | 9,306 | |
USD/NOK spot exchange rate | | | BOA | | | | Pay | | | | 15.850 | | | | 1/30/15 | | | | USD | | | | 1,800 | | | | (396 | ) |
USD/NOK spot exchange rate | | | BOA | | | | Pay | | | | 16.100 | | | | 2/2/15 | | | | USD | | | | 1,800 | | | | (630 | ) |
| | | | | | | | | | | | | | | | | | | | | | | | | | | | |
Total of Over-the-Counter Volatility Swaps | | | | | | | | | | | | | | | | | | | | | | | | | | $ | (26,346 | ) |
| | | | | | | | | | | | | | | | | | | | | | | | | | | | |
* Fund will pay or receive the volatility of the reference asset depending on whether the realized volatility of the reference asset exceeds or is less than the strike price. For contracts where the Fund has elected to receive the volatility of the reference asset, it will receive a net payment of the difference between the realized volatility and the strike price multiplied by the notional amount if the realized volatility exceeds the strike price; the Fund will make a net payment of the absolute value of the difference of the realized volatility and the strike price multiplied by the notional amount if the realized volatility is less than the strike price. For contracts where the Fund has elected to pay the volatility of the reference asset, it will make a net payment of the difference between the realized volatility and the strike price multiplied by the notional amount if the realized volatility exceeds the strike price; the Fund will receive a net payment of the absolute value of the difference of the realized and the strike price multiplied by the notional amount if the realized volatility is less than the strike price.
| | |
Glossary: |
Counterparty Abbreviations |
BAC | | Barclays Bank plc |
BNP | | BNP Paribas |
BOA | | Bank of America NA |
CIBC | | Candadian Imperial Bank of Commerce |
CITNA-B | | Citibank NA |
DEU | | Deutsche Bank AG |
FIB | | Credit Suisse International |
GSCO-OT | | Goldman Sachs Bank USA |
GSG | | Goldman Sachs Group, Inc. (The) |
JPM | | JPMorgan Chase Bank NA |
MAC | | Macquarie Bank Ltd. |
MSCO | | Morgan Stanley Capital Services, Inc. |
NOM | | Nomura Global Financial Products, Inc. |
RBS | | Royal Bank of Scotland plc (The) |
TDB | | Toronto Dominion Bank |
|
Currency abbreviations indicate amounts reporting in currencies |
AUD | | Australian Dollar |
BRL | | Brazilian Real |
CAD | | Canadian Dollar |
CHF | | Swiss Franc |
CLP | | Chilean Peso |
CZK | | Czech Koruna |
EUR | | Euro |
GBP | | British Pound Sterling |
HKD | | Hong Kong Dollar |
HUF | | Hungarian Forint |
IDR | | Indonesia Rupiah |
INR | | Indian Rupee |
JPY | | Japanese Yen |
KRW | | South Korean Won |
MXN | | Mexican Nuevo Peso |
MYR | | Malaysian Ringgit |
NOK | | Norwegian Krone |
NZD | | New Zealand Dollar |
PLN | | Polish Zloty |
SEK | | Swedish Krona |
SGD | | Singapore Dollar |
THB | | Thailand Baht |
TRY | | New Turkish Lira |
TWD | | New Taiwan Dollar |
ZAR | | South African Rand |
|
Definitions |
BA CDOR | | Canada Bankers Acceptances Deposit Offering Rate |
BBA LIBOR | | British Bankers’ Association London - Interbank Offered Rate |
BBR FRA | | Bank Bill Forward Rate Agreement |
BBR BBSW | | Bank Bill Swap Reference Rate (Australian Financial Market) |
BCOM | | Bloomberg Commodity Index |
BX | | The Blackstone Group LP Index |
CDX.HY.22 | | Markit CDX High Yield Index |
20 OPPENHEIMER DIVERSIFIED ALTERNATIVES FUND/VA
| | |
Glossary: (Continued) |
Definitions (Continued) |
CDX.HY.23 | | Markit CDX High Yield Index |
CDX.IG.22 | | Markit CDX Investment Grade Index |
CGAUOPAU | | Custom Basket of Securities |
CGCNOCAD | | Custom Basket of Securities |
CIBZC8DE | | CIBC Custom 8 Enhanced Roll Commodity Index |
CIBZOPQR | | CIBC Oppenheimer Quarterly Roll Index |
DBOPSPLG | | Custom Basket of Securities |
DBOPSPST | | Custom Basket of Securities |
EURIBOR | | Euro Interbank Offered Rate |
GSEHOPHK | | Custom Basket of Securities |
GSOPSPS3 | | Custom Basket of Securities |
HIBOR | | Hong Kong Interbank Offered Rate |
HIF5 | | The Hang Seng Index Futures |
HKAB | | Hong Kong Association of Banks |
iTraxx.Main.21 | | Credit Default Swap Trading Index for a Specific Basket of Securities |
MLTROPFR | | Custom Basket of Securities |
MLTROPUK | | Custom Basket of Securities |
MSCI | | Morgan Stanley Capital International |
OEX | | S&P 100 Index |
|
Exchange Abbreviations |
CBE | | Chicago Board Options Exchange |
CBT | | Chicago Board of Trade |
CME | | Chicago Mercantile Exchanges |
CMX | | Commodity Exchange, Inc. |
EUX | | European Stock Exchange |
ICE | | Intercontinental Exchange |
LIF | | London International Financial Futures and Options Exchange |
LME | | London Metal Exchange |
MON | | Montreal Exchange |
NYB | | New York Board of Trade |
NYM | | New York Mercantile Exchange |
PAR | | Paris Stock Exchange |
SFE | | Sydney Futures Exchange |
See accompanying Notes to Consolidated Financial Statements.
21 OPPENHEIMER DIVERSIFIED ALTERNATIVES FUND/VA
CONSOLIDATED STATEMENT OF ASSETS AND LIABILITIES December 31, 2014
| | | | |
Assets | | | | |
Investments, at value—see accompanying consolidated statement of investments: | | | | |
Unaffiliated companies (cost $217,346,401) | | $ | 210,665,900 | |
Affiliated companies (cost $40,325,799) | | | 40,325,799 | |
| | | | |
| | | | 250,991,699 | |
Cash | | | 847,306 | |
Cash—foreign currencies (cost $1,100,593) | | | 1,093,674 | |
Cash used for collateral on futures | | | 375,000 | |
Cash used for collateral on OTC derivatives | | | 630,000 | |
Cash used for collateral on centrally cleared swaps | | | 1,124,925 | |
Deposits with broker for securities sold short | | | 13,728,557 | |
Unrealized appreciation on foreign currency exchange contracts | | | 16,963,754 | |
Swaps, at value (premiums paid $853,014) | | | 1,630,488 | |
Centrally cleared swaps, at value (premiums paid $32,737) | | | 137,435 | |
Receivables and other assets: | | | | |
Investments sold | | | 1,145,100 | |
Interest and dividends | | | 1,144,370 | |
Variation margin receivable | | | 32,812 | |
Shares of beneficial interest sold | | | 11,805 | |
Other | | | 6,078 | |
| | | | |
Total assets | | | 289,863,003 | |
| | | | |
Liabilities | | | | |
Securities sold short, at value (proceeds $12,931,204) - see accompanying statement of investments | | | 12,003,730 | |
Unrealized depreciation on foreign currency exchange contracts | | | 10,329,295 | |
Options written, at value (premiums received $1,274,794) | | | 1,144,238 | |
Swaps, at value (net premiums received $154,627) | | | 789,368 | |
Centrally cleared swaps, at value (premiums received $411,964) | | | 528,365 | |
Payables and other liabilities: | | | | |
Investments purchased | | | 780,093 | |
Variation margin payable | | | 283,450 | |
Dividends | | | 13,725 | |
Shareholder communications | | | 1,671 | |
Trustees’ compensation | | | 1,215 | |
Distribution and service plan fees | | | 263 | |
Shares of beneficial interest redeemed | | | 30 | |
Other | | | 82,998 | |
| | | | |
Total liabilities | | | 25,958,441 | |
Net Assets | | $ | 263,904,562 | |
| | | | |
| | | | |
Composition of Net Assets | | | | |
Par value of shares of beneficial interest | | $ | 26,281 | |
Additional paid-in capital | | | 272,118,802 | |
Accumulated net investment loss | | | (5,239,862 | ) |
Accumulated net realized loss on investments and foreign currency transactions | | | (3,496,105 | ) |
Net unrealized depreciation on investments and translation of assets and liabilities denominated in foreign currencies | | | 495,446 | |
| | | | |
Net Assets | | $ | 263,904,562 | |
| | | | |
| | | | |
Net Asset Value Per Share | | | | |
Non-Service Shares: | | | | |
Net asset value, redemption price per share and offering price per share (based on net assets of $262,573,020 and 26,148,113 shares of beneficial interest outstanding) | | | $10.04 | |
| |
Service Shares: | | | | |
Net asset value, redemption price per share and offering price per share (based on net assets of $1,331,542 and 132,732 shares of beneficial interest outstanding) | | | $10.03 | |
See accompanying Notes to Consolidated Financial Statements.
22 OPPENHEIMER DIVERSIFIED ALTERNATIVES FUND/VA
CONSOLIDATED STATEMENT OF OPERATIONS For the Year Ended December 31, 2014
| | | | |
Allocation of Income and Expenses from master funds1 | | | | |
Net investment income allocated from Oppenheimer Master Event-Linked Bond Fund, LLC: | | | | |
Interest | | $ | 207 | |
Net expenses | | | (12 | ) |
| | | | |
Net investment income allocated from Oppenheimer Master Event-Linked Bond Fund, LLC | | | 195 | |
Net investment income allocated from Oppenheimer Master Loan Fund, LLC: | | | | |
Interest | | | 14 | |
Dividends | | | 127 | |
Net expenses | | | (4 | ) |
| | | | |
Net investment income allocated from Oppenheimer Master Loan Fund, LLC | | | 137 | |
| | | | |
Total allocation of net investment income from master funds | | | 332 | |
Investment Income | | | | |
Interest (net of foreign withholding taxes of $26,513) | | | 2,319,750 | |
Dividends: | | | | |
Unaffiliated companies (net of foreign withholding taxes of $35,499) | | | 1,021,236 | |
Affiliated companies | | | 28,243 | |
| | | | |
Total investment income | | | 3,369,229 | |
Expenses | | | | |
Management fees | | | 1,747,430 | |
Distribution and service plan fees - Service shares | | | 802 | |
Transfer and shareholder servicing agent fees: | | | | |
Non-Service shares | | | 160,525 | |
Service shares | | | 333 | |
Shareholder communications: | | | | |
Non-Service shares | | | 14,568 | |
Service shares | | | 53 | |
Dividends on short sales | | | 133,859 | |
Legal, auditing and other professional fees | | | 104,293 | |
Custodian fees and expenses | | | 66,638 | |
Financing expense from short sales | | | 28,694 | |
Trustees’ compensation | | | 23,719 | |
Other | | | 45,640 | |
| | | | |
Total expenses | | | 2,326,554 | |
Less reduction to custodian expenses | | | (89 | ) |
Less waivers and reimbursements of expenses | | | (206,441 | ) |
| | | | |
Net expenses | | | 2,120,024 | |
Net Investment Income | | | 1,249,537 | |
1. The Fund invests in certain affiliated Funds that expect to be treated as partnerships for tax purposes. See Note 4 of the accompanying Consolidated Notes.
23 OPPENHEIMER DIVERSIFIED ALTERNATIVES FUND/VA
CONSOLIDATED STATEMENT OF OPERATIONS Continued
| | | | |
Realized and Unrealized Gain (Loss) | | | | |
Net realized gain (loss) on: | | | | |
Investments from unaffiliated companies (including premiums on options exercised) | | $ | 2,432,223 | |
Closing and expiration of option contracts written | | | 873,715 | |
Closing and expiration of futures contracts | | | 755,643 | |
Foreign currency transactions | | | (8,112,979 | ) |
Short positions | | | (119,365 | ) |
Swap contracts | | | 6,094,754 | |
Net realized gain (loss) allocated from: | | | | |
Oppenheimer Master Event-Linked Bond Fund, LLC | | | (193 | ) |
Oppenheimer Master Loan Fund, LLC | | | 634 | |
| | | | |
Net realized gain | | | 1,924,432 | |
Net change in unrealized appreciation/depreciation on: | | | | |
Investments | | | (116,359 | ) |
Translation of assets and liabilities denominated in foreign currencies | | | 88,745 | |
Futures contracts | | | (640,150 | ) |
Option contracts written | | | 126,920 | |
Short positions | | | 927,474 | |
Swap contracts | | | 119,348 | |
Net change in unrealized appreciation/depreciation allocated from: | | | | |
Oppenheimer Master Event-Linked Bond Fund, LLC | | | 173 | |
Oppenheimer Master Loan Fund, LLC | | | (635 | ) |
| | | | |
Net change in unrealized appreciation/depreciation | | | 505,516 | |
Net Increase in Net Assets Resulting from Operations | | $ | 3,679,485 | |
| | | | |
See accompanying Notes to Consolidated Financial Statements.
24 OPPENHEIMER DIVERSIFIED ALTERNATIVES FUND/VA
CONSOLIDATED STATEMENTS OF CHANGES IN NET ASSETS
| | | | | | | | |
| | | Year Ended
December 31, 2014 | | | Period Ended
December 31, 20131 | |
Operations | | | | | | | | |
Net investment income (loss) | | $ | 1,249,537 | | | $ | (24,007 | ) |
Net realized gain (loss) | | | 1,924,432 | | | | (23,232 | ) |
Net change in unrealized appreciation/depreciation | | | 505,516 | | | | (10,070 | ) |
| | | | |
Net increase (decrease) in net assets resulting from operations | | | 3,679,485 | | | | (57,309 | ) |
Dividends and/or Distributions to Shareholders | | | | | | | | |
Dividends from net investment income: | | | | | | | | |
Non-Service shares | | | (6,230,727 | ) | | | (10,989 | ) |
Service shares | | | (30,926 | ) | | | (8 | ) |
| | | | |
| | | | (6,261,653 | ) | | | (10,997 | ) |
Tax return of capital: | | | | | | | | |
Non-Service shares | | | (430,129 | ) | | | — | |
Service shares | | | (2,135 | ) | | | — | |
| | | | |
| | | | (432,264 | ) | | | — | |
Distributions from net realized gain: | | | | | | | | |
Non-Service shares | | | (5,294,823 | ) | | | — | |
Service shares | | | (26,494 | ) | | | — | |
| | | | |
| | | (5,321,317 | ) | | | — | |
Beneficial Interest Transactions | | | | | | | | |
Net increase (decrease) in net assets resulting from beneficial interest transactions: | | | | | | | | |
Non-Service shares | | | 260,906,037 | | | | 10,000,989 | |
Service shares | | | 1,391,583 | | | | 10,008 | |
| | | | |
| | | 262,297,620 | | | | 10,010,997 | |
Net Assets | | | | | | | | |
Total increase | | | 253,961,871 | | | | 9,942,691 | |
Beginning of period | | | 9,942,691 | | | | — | |
| | | | |
End of period (including accumulated net investment loss of $ 5,239,862 and $ 46,804, respectively) | | $ | 263,904,562 | | | $ | 9,942,691 | |
| | | | |
1. For the period from November 14, 2013 (commencement of operations) to December 31, 2013.
See accompanying Notes to Consolidated Financial Statements.
25 OPPENHEIMER DIVERSIFIED ALTERNATIVES FUND/VA
CONSOLIDATED FINANCIAL HIGHLIGHTS
| | | | | | | | |
| | | Year Ended
December 31, | | | Period Ended
December 31, | |
| Non-Service Shares | | 2014 | | | 20131 | |
Per Share Operating Data | | | | | | | | |
Net asset value, beginning of period | | $ | 9 .92 | | | $ | 10.00 | |
Income (loss) from investment operations: | | | | | | | | |
Net investment income (loss)2 | | | 0 .08 | | | | (0 .02 | ) |
Net realized and unrealized gain (loss) | | | 0 .52 | | | | (0.05 | ) |
| | | | |
Total from investment operations | | | 0.60 | | | | (0 .07 | ) |
Dividends and/or distributions to shareholders: | | | | | | | | |
Dividends from net investment income | | | (0 .25 | ) | | | (0 .01 | ) |
Tax return of capital | | | (0 .02 | ) | | | 0 .00 | |
Distributions from net realized gain | | | (0 .21 | ) | | | 0 .00 | |
| | | | |
Total dividends and/or distributions to shareholders | | | (0 .48 | ) | | | (0 .01 | ) |
Net asset value, end of period | | $ | 10 .04 | | | $ | 9 .92 | |
| | | | |
Total Return, at Net Asset Value3 | | | 6 .02% | | | | (0.69)% | |
Ratios/Supplemental Data | | | | | | | | |
Net assets, end of period (in thousands) | | $ | 262,573 | | | $ | 9,917 | |
Average net assets (in thousands) | | $ | 161,988 | | | $ | 9,827 | |
Ratios to average net assets:4,5 | | | | | | | | |
Net investment income (loss) | | | 0 .77% | | | | (1.85)% | |
Total expenses6 | | | 1 .43% | | | | 7.16% | |
Expenses after payments, waivers and/or reimbursements and reduction to custodian expenses | | | 1 .31% | | | | 3.33% | |
Portfolio turnover rate | | | 147% | | | | 11% | |
1. For the period from November 14, 2013 (commencement of operations) to December 31, 2013.
2. Per share amounts calculated based on the average shares outstanding during the period.
3. Assumes an initial investment on the business day before the first day of the fiscal period, with all dividends and distributions reinvested in additional shares on the reinvestment date, and redemption at the net asset value calculated on the last business day of the fiscal period. Total returns are not annualized for periods less than one full year. Total return information does not reflect expenses that apply at the separate account level or to related insurance products. Inclusion of these charges would reduce the total return figures for all periods shown. Returns do not reflect the deduction of taxes that a shareholder would pay on fund distributions or the redemption of fund shares.
4. Annualized for periods less than one full year.
5. Includes the Fund’s shares of the allocated expenses and/or net investment income from the master funds.
6. Total expenses including indirect expenses from affiliated fund fees and expenses were as follows:
| | | | |
Year Ended December 31, 2014 | | | 1.45 | % |
Period Ended December 31, 2013 | | | 7.18 | % |
See accompanying Notes to Consolidated Financial Statements.
26 OPPENHEIMER DIVERSIFIED ALTERNATIVES FUND/VA
| | | | | | | | |
| | | Year Ended
December 31, | | | Period Ended
December 31, | |
| Service Shares | | 2014 | | | 20131 | |
Per Share Operating Data | | | | | | | | |
Net asset value, beginning of period | | $ | 9 .92 | | | $ | 10.00 | |
Income (loss) from investment operations: | | | | | | | | |
Net investment income (loss)2 | | | 0 .08 | | | | (0 .03) | |
Net realized and unrealized gain (loss) | | | 0 .50 | | | | (0 .04) | |
| | | | |
Total from investment operations | | | 0 .58 | | | | (0 .07) | |
Dividends and/or distributions to shareholders: | | | | | | | | |
Dividends from net investment income | | | (0 .25 | ) | | | (0.01) | |
Tax return of capital | | | (0 .01 | ) | | | 0.00 | |
Distributions from net realized gain | | | (0 .21 | ) | | | 0 .00 | |
| | | | |
Total dividends and/or distributions to shareholders | | | (0 .47 | ) | | | (0.01) | |
Net asset value, end of period | | $ | 10.03 | | | $ | 9 .92 | |
| | | | |
Total Return, at Net Asset Value3 | | | 5.90% | | | | (0.72)% | |
Ratios/Supplemental Data | | | | | | | | |
Net assets, end of period (in thousands) | | $ | 1,332 | | | $ | 10 | |
Average net assets (in thousands) | | $ | 335 | | | $ | 10 | |
Ratios to average net assets:4,5 | | | | | | | | |
Net investment income (loss) | | | 0.77% | | | | (2.12)% | |
Total expenses6 | | | 1.78% | | | | 7.43% | |
Expenses after payments, waivers and/or reimbursements and reduction to custodian expenses | | | 1.67% | | | | 3.50% | |
Portfolio turnover rate | | | 147% | | | | 11% | |
1. For the period from November 14, 2013 (inception of offering) to December 31, 2013.
2. Per share amounts calculated based on the average shares outstanding during the period.
3. Assumes an initial investment on the business day before the first day of the fiscal period, with all dividends and distributions reinvested in additional shares on the reinvestment date, and redemption at the net asset value calculated on the last business day of the fiscal period. Total returns are not annualized for periods less than one full year. Total return information does not reflect expenses that apply at the separate account level or to related insurance products. Inclusion of these charges would reduce the total return figures for all periods shown. Returns do not reflect the deduction of taxes that a shareholder would pay on fund distributions or the redemption of fund shares.
4. Annualized for periods less than one full year.
5. Includes the Fund’s shares of the allocated expenses and/or net investment income from the master funds.
6. Total expenses including indirect expenses from affiliated fund fees and expenses were as follows:
| | | | |
Year Ended December 31, 2014 | | | 1.80 | % |
Period Ended December 31, 2013 | | | 7.45 | % |
See accompanying Notes to Consolidated Financial Statements.
27 OPPENHEIMER DIVERSIFIED ALTERNATIVES FUND/VA
NOTES TO CONSOLIDATED FINANCIAL STATEMENTS December 31, 2014
1. Organization
Oppenheimer Diversified Alternatives Fund/VA (the “Fund”) is a separate series of Oppenheimer Variable Account Funds, a diversified open-end management investment company registered under the Investment Company Act of 1940, as amended. The Fund’s investment objective is to seek total return. The Fund’s investment adviser is OFI Global Asset Management, Inc. (“OFI Global” or the “Manager”), a wholly-owned subsidiary of OppenheimerFunds, Inc. (“OFI” or the “Sub-Adviser”). The Manager has entered into a sub-advisory agreement with OFI. The Sub-Adviser has entered into a sub-sub-advisory agreement with Cornerstone Real Estate Advisers LLC and OFI SteelPath, Inc. (collectively, the “Sub-Sub-Advisers”). Shares of the Fund are sold only to separate accounts of life insurance companies.
The Fund offers two classes of shares. Both classes are sold at their offering price, which is the net asset value per share, to separate investment accounts of participating insurance companies as an underlying investment for variable life insurance policies, variable annuity contracts or other investment products. The class of shares designated as Service shares is subject to a distribution and service plan. Both classes of shares have identical rights and voting privileges with respect to the Fund in general and exclusive voting rights on matters that affect that class alone. Earnings, net assets and net asset value per share may differ due to each class having its own expenses, such as transfer and shareholder servicing agent fees and shareholder communications, directly attributable to that class.
The following is a summary of significant accounting policies consistently followed by the Fund.
2. Significant Accounting Policies
Security Valuation. All investments in securities are recorded at their estimated fair value, as described in Note 3.
Basis for Consolidation. The Fund has established a Cayman Islands exempted company, Oppenheimer Diversified Alternatives Fund/VA (Cayman) Ltd., which is wholly-owned and controlled by the Fund (the “Subsidiary”). The Fund and Subsidiary are both managed by the Manager. The Fund may invest up to 25% of its total assets in the Subsidiary. The Subsidiary invests primarily in commodity-linked derivatives (including commodity futures, financial futures, options and swap contracts) and certain fixed-income securities and other investments that may serve as margin or collateral for its derivatives positions. Investments in the Subsidiary are expected to provide the Fund with exposure to commodities markets within the limitations of the federal tax requirements that apply to the Fund. The Subsidiary is subject to the same investment restrictions and guidelines, and follows the same compliance policies and procedures, as the Fund.
The financial statements have been consolidated and include accounts of the Fund and the Subsidiary. Accordingly, all inter-company transactions and balances have been eliminated. At December 31, 2014, the Fund owned 15,943 shares with net assets of $9,036,202.
Other financial information at December 31, 2014:
| | | | |
Total market value of investments | | $ | 8,363,993 | |
Net assets | | $ | 9,036,202 | |
Net income (loss) | | $ | (154,687) | |
Net realized gain (loss) | | $ | (1,718,792) | |
Net change in unrealized appreciation/depreciation | | $ | (460,749) | |
Foreign Currency Translation. The Fund’s accounting records are maintained in U.S. dollars. The values of securities denominated in foreign currencies and amounts related to the purchase and sale of foreign securities and foreign investment income are translated into U.S. dollars as of the close of the New York Stock Exchange (the “Exchange”), normally 4:00 P.M. Eastern time, on each day the Exchange is open for trading. Foreign exchange rates may be valued primarily using a reliable bank, dealer or service authorized by the Board of Trustees.
Reported net realized gains and losses from foreign currency transactions arise from sales of portfolio securities, sales and maturities of short-term securities, sales of foreign currencies, exchange rate fluctuations between the trade and settlement dates on securities transactions, and the difference between the amounts of dividends, interest, and foreign withholding taxes recorded on the Fund’s books and the U.S. dollar equivalent of the amounts actually received or paid. Net unrealized appreciation and depreciation on the translation of assets and liabilities denominated in foreign currencies arise from changes in the values of assets and liabilities, including investments in securities at fiscal period end, resulting from changes in exchange rates.
The effect of changes in foreign currency exchange rates on investments is separately identified from the fluctuations arising from changes in market values of securities held and reported with all other foreign currency gains and losses in the Fund’s Consolidated Statement of Operations.
Allocation of Income, Expenses, Gains and Losses. Income, expenses (other than those attributable to a specific class), gains and losses are allocated on a daily basis to each class of shares based upon the relative proportion of net assets represented by such class. Operating expenses directly attributable to a specific class are charged against the operations of that class.
Dividends and Distributions to Shareholders. Dividends and distributions to shareholders, which are determined in accordance with income tax regulations and may differ from U.S. generally accepted accounting principles, are recorded on the ex-dividend date. Income and capital gain distributions, if any, are declared and paid annually or at other times as deemed necessary by the Manager.
Investment Income. Dividend income is recorded on the ex-dividend date or upon ex-dividend notification in the case of certain foreign dividends where the ex-dividend date may have passed. Non-cash dividends included in dividend income, if any, are recorded at the fair market value of the securities received. Interest income is recognized on an accrual basis. Discount and premium, which are included in interest income on the Consolidated Statement of Operations, are amortized or accreted daily.
28 OPPENHEIMER DIVERSIFIED ALTERNATIVES FUND/VA
2. Significant Accounting Policies (Continued)
Custodian Fees. “Custodian fees and expenses” in the Consolidated Statement of Operations may include interest expense incurred by the Fund on any cash overdrafts of its custodian account during the period. Such cash overdrafts may result from the effects of failed trades in portfolio securities and from cash outflows resulting from unanticipated shareholder redemption activity. The Fund pays interest to its custodian on such cash overdrafts, to the extent they are not offset by positive cash balances maintained by the Fund, at a rate equal to the Federal Funds Rate plus 0.50%. The “Reduction to custodian expenses” line item, if applicable, represents earnings on cash balances maintained by the Fund during the period. Such interest expense and other custodian fees may be paid with these earnings.
Security Transactions. Security transactions are recorded on the trade date. Realized gains and losses on securities sold are determined on the basis of identified cost.
Indemnifications. The Fund’s organizational documents provide current and former Trustees and officers with a limited indemnification against liabilities arising in connection with the performance of their duties to the Fund. In the normal course of business, the Fund may also enter into contracts that provide general indemnifications. The Fund’s maximum exposure under these arrangements is unknown as this would be dependent on future claims that may be made against the Fund. The risk of material loss from such claims is considered remote.
Federal Taxes. The Fund intends to comply with provisions of the Internal Revenue Code applicable to regulated investment companies and to distribute substantially all of its investment company taxable income, including any net realized gain on investments not offset by capital loss carryforwards, if any, to shareholders. Therefore, no federal income or excise tax provision is required. The Fund files income tax returns in U.S. federal and applicable state jurisdictions. The statute of limitations on the Fund’s tax return filings generally remain open for the three preceding fiscal reporting period ends.
Subchapter M requires, among other things, that at least 90% of the Fund’s gross income be derived from securities or derived with respect to its business of investing in securities (typically referred to as “qualifying income”). Income from commodity-linked derivatives may not be treated as “qualifying income” for purposes of the 90% gross income requirement. The Internal Revenue Service (IRS) has previously issued a number of private letter rulings which conclude that income derived from commodity index-linked notes and investments in a wholly-owned subsidiary will be “qualifying income.” As a result, the Fund will gain exposure to commodities through commodity-linked notes and its wholly-owned subsidiary.
The IRS has suspended the granting of private letter rulings pending further review. As a result, there can be no assurance that the IRS will not change its position with respect to commodity-linked notes and wholly-owned subsidiaries. In addition, future legislation and guidance from Treasury and the IRS may adversely affect the fund’s ability to gain exposure to commodities through commodity-linked notes and its wholly-owned subsidiary.
The Fund is required to include in income for federal income tax purposes all of the subsidiary’s net income and gains whether or not such income is distributed by the subsidiary. Net income and gains from the subsidiary are generally treated as ordinary income by the Fund, regardless of the character of the subsidiary’s underlying income. Net losses from the subsidiary do not pass through to the Fund for federal income tax purposes.
The tax components of capital shown in the following table represent distribution requirements the Fund must satisfy under the income tax regulations, losses the Fund may be able to offset against income and gains realized in future years and unrealized appreciation or depreciation of securities and other investments for federal income tax purposes.
| | | | | | | | | | | | |
Undistributed Net Investment Income | | Undistributed
Long-Term
Gain | | | Accumulated
Loss
Carryforward1,2,3 | | | Net Unrealized Depreciation Based on cost of Securities and Other Investments for Federal Income Tax Purposes | |
$— | | | $— | | | | $122,271 | | | | $6,433,993 | |
1. The Fund had $122,271 of post-October passive foreign investment company losses which were deferred.
2. During the fiscal year ended December 31, 2014, the Fund utilized $4,521 of capital loss carryforward to offset capital gains realized in that fiscal year.
3. During the fiscal year ended December 31, 2013, the Fund did not utilize any capital loss carryforward.
Net investment income (loss) and net realized gain (loss) may differ for financial statement and tax purposes. The character of dividends and distributions made during the fiscal year from net investment income or net realized gains may differ from their ultimate characterization for federal income tax purposes. Also, due to timing of dividends and distributions, the fiscal year in which amounts are distributed may differ from the fiscal year in which the income or net realized gain was recorded by the Fund.
Accordingly, the following amounts have been reclassified for December 31, 2014. Net assets of the Fund were unaffected by the reclassifications.
| | | | | | | | |
Reduction to Paid-in Capital | | Reduction
to Accumulated Net Investment Loss | | | Increase to Accumulated Net Realized Loss on Investments | |
$163,531 | | | $251,322 | | | | $87,791 | |
29 OPPENHEIMER DIVERSIFIED ALTERNATIVES FUND/VA
NOTES TO CONSOLIDATED FINANCIAL STATEMENTS Continued
2. Significant Accounting Policies (Continued)
The tax character of distributions paid during the year ended December 31, 2014 and period ended December 31, 2013 was as follows:
| | | | | | | | |
| | | Year Ended
December 31, 2014 | | | Period Ended
December 31, 2013 | |
Distributions paid from: | | | | | | | | |
Ordinary income | | $ | 11,293,164 | | | $ | 10,997 | |
Long-term capital gain | | | 289,806 | | | | — | |
Return of capital4 | | | 432,264 | | | | — | |
| | | | |
Total | | $ | 12,015,234 | | | $ | 10,997 | |
| | | | |
4. Final return of capital numbers will be available at a later date when certain required information for partnership investments is available.
The aggregate cost of securities and other investments and the composition of unrealized appreciation and depreciation of securities and other investments for federal income tax purposes as of December 31, 2014 are noted in the following table. The primary difference between book and tax appreciation or depreciation of securities and other investments, if applicable, is attributable to the tax deferral of losses or tax realization of financial statement unrealized gain or loss.
| | | | |
Federal tax cost of securities | | $ | 259,777,972 | |
Federal tax cost of other investments | | | (12,321,523 | ) |
| | | | |
Total federal tax cost | | $ | 247,456,449 | |
| | | | |
Gross unrealized appreciation | | $ | 8,629,815 | |
Gross unrealized depreciation | | | (15,063,808 | ) |
| | | | |
Net unrealized depreciation | | $ | (6,433,993 | ) |
| | | | |
Use of Estimates. The preparation of financial statements in conformity with accounting principles generally accepted in the United States of America requires management to make estimates and assumptions that affect the reported amounts of assets and liabilities and disclosure of contingent assets and liabilities at the date of the financial statements and the reported amounts of increases and decreases in net assets from operations during the reporting period. Actual results could differ from those estimates.
3. Securities Valuation
The Fund calculates the net asset value of its shares as of the close of the New York Stock Exchange (the “Exchange”), normally 4:00 P.M. Eastern time, on each day the Exchange is open for trading.
The Fund’s Board has adopted procedures for the valuation of the Fund’s securities and has delegated the day-to-day responsibility for valuation determinations under those procedures to the Manager. The Manager has established a Valuation Committee which is responsible for determining a “fair valuation” for any security for which market quotations are not “readily available.” The Valuation Committee’s fair valuation determinations are subject to review, approval and ratification by the Fund’s Board at its next regularly scheduled meeting covering the calendar quarter in which the fair valuation was determined.
Valuation Methods and Inputs
Securities are valued using unadjusted quoted market prices, when available, as supplied primarily by third party pricing services or dealers.
The following methodologies are used to determine the market value or the fair value of the types of securities described below:
Securities traded on a registered U.S. securities exchange (including exchange-traded derivatives other than futures and futures options) are valued based on the last sale price of the security reported on the principal exchange on which it is traded, prior to the time when the Fund’s assets are valued. In the absence of a sale, the security is valued at the last sale price on the prior trading day, if it is within the spread of the current day’s closing “bid” and “asked” prices, and if not, at the current day’s closing bid price. A security of a foreign issuer traded on a foreign exchange, but not listed on a registered U.S. securities exchange, is valued based on the last sale price on the principal exchange on which the security is traded, as identified by the third party pricing service used by the Manager, prior to the time when the Fund’s assets are valued. If the last sale price is unavailable, the security is valued at the most recent official closing price on the principal exchange on which it is traded. If the last sales price or official closing price for a foreign security is not available, the security is valued at the mean between the bid and asked price per the exchange or, if not available from the exchange, obtained from two dealers. If bid and asked prices are not available from either the exchange or two dealers, the security is valued by using one of the following methodologies (listed in order of priority): (1) using a bid from the exchange, (2) the mean between the bid and asked price as provided by a single dealer, or (3) a bid from a single dealer.
Shares of a registered investment company that are not traded on an exchange are valued at that investment company’s net asset value per share.
Corporate and government debt securities (of U.S. or foreign issuers) and municipal debt securities, event-linked bonds, loans, mortgage-backed securities, collateralized mortgage obligations, and asset-backed securities are valued at the mean between the “bid” and “asked” prices utilizing evaluated prices obtained from third party pricing services or broker-dealers who may use matrix pricing methods to determine the evaluated prices.
Short-term money market type debt securities with a remaining maturity of sixty days or less are valued at cost adjusted by the amortization of discount or premium to maturity (amortized cost), which approximates market value. Short-term debt securities with a remaining maturity in excess of sixty days are valued at the mean between the “bid” and “asked” prices utilizing evaluated prices obtained from third party pricing services or broker-dealers.
30 OPPENHEIMER DIVERSIFIED ALTERNATIVES FUND/VA
3. Securities Valuation (Continued)
Structured securities, swaps, swaptions, and other over-the-counter derivatives are valued utilizing evaluated prices obtained from third party pricing services or broker-dealers.
Forward foreign currency exchange contracts are valued utilizing current and forward currency rates obtained from third party pricing services. When the settlement date of a contract is an interim date for which a quotation is not available, interpolated values are derived using the nearest dated forward currency rate.
Futures contracts and futures options traded on a commodities or futures exchange will be valued at the final settlement price or official closing price on the principal exchange as reported by such principal exchange at its trading session ending at, or most recently prior to, the time when the Fund’s assets are valued.
A description of the standard inputs that may generally be considered by the third party pricing vendors in determining their evaluated prices is provided below.
| | |
| Security Type | | Standard inputs generally considered by third-party pricing vendors |
| Corporate debt, government debt, municipal, mortgage-backed and asset-backed securities | | Reported trade data, broker-dealer price quotations, benchmark yields, issuer spreads on comparable securities, the credit quality, yield, maturity, and other appropriate factors. |
Loans | | Information obtained from market participants regarding reported trade data and broker-dealer price quotations. |
Event-linked bonds | | Information obtained from market participants regarding reported trade data and broker-dealer price quotations. |
Structured securities | | Relevant market information such as the price of underlying financial instruments, stock market indices, foreign currencies, interest rate spreads, commodities, or the occurrence of other specific events. |
Swaps | | Relevant market information, including underlying reference assets such as credit spreads, credit event probabilities, index values, individual security values, forward interest rates, variable interest rates, volatility measures, and forward currency rates. |
If a market value or price cannot be determined for a security using the methodologies described above, or if, in the “good faith” opinion of the Manager, the market value or price obtained does not constitute a “readily available market quotation,” or a significant event has occurred that would materially affect the value of the security the security is fair valued either (i) by a standardized fair valuation methodology applicable to the security type or the significant event as previously approved by the Valuation Committee and the Fund’s Board or (ii) as determined in good faith by the Manager’s Valuation Committee. The Valuation Committee considers all relevant facts that are reasonably available, through either public information or information available to the Manager, when determining the fair value of a security. Fair value determinations by the Manager are subject to review, approval and ratification by the Fund’s Board at its next regularly scheduled meeting covering the calendar quarter in which the fair valuation was determined. Those fair valuation standardized methodologies include, but are not limited to, valuing securities at the last sale price or initially at cost and subsequently adjusting the value based on: changes in company specific fundamentals, changes in an appropriate securities index, or changes in the value of similar securities which may be further adjusted for any discounts related to security-specific resale restrictions. When possible, such methodologies use observable market inputs such as unadjusted quoted prices of similar securities, observable interest rates, currency rates and yield curves. The methodologies used for valuing securities are not necessarily an indication of the risks associated with investing in those securities nor can it be assured that the Fund can obtain the fair value assigned to a security if it were to sell the security.
To assess the continuing appropriateness of security valuations, the Manager, or its third party service provider who is subject to oversight by the Manager, regularly compares prior day prices, prices on comparable securities, and sale prices to the current day prices and challenges those prices exceeding certain tolerance levels with the third party pricing service or broker source. For those securities valued by fair valuations, whether through a standardized fair valuation methodology or a fair valuation determination, the Valuation Committee reviews and affirms the reasonableness of the valuations based on such methodologies and fair valuation determinations on a regular basis after considering all relevant information that is reasonably available.
Classifications
Each investment asset or liability of the Fund is assigned a level at measurement date based on the significance and source of the inputs to its valuation. Various data inputs are used in determining the value of each of the Fund’s investments as of the reporting period end. These data inputs are categorized in the following hierarchy under applicable financial accounting standards:
1) Level 1-unadjusted quoted prices in active markets for identical assets or liabilities (including securities actively traded on a securities exchange)
2) Level 2-inputs other than unadjusted quoted prices that are observable for the asset or liability (such as unadjusted quoted prices for similar assets and market corroborated inputs such as interest rates, prepayment speeds, credit risks, etc.)
3) Level 3-significant unobservable inputs (including the Manager’s own judgments about assumptions that market participants would use in pricing the asset or liability).
The inputs used for valuing securities are not necessarily an indication of the risks associated with investing in those securities.
The table below categorizes amounts that are included in the Fund’s Consolidated Statement of Assets and Liabilities as of December 31, 2014 based on valuation input level:
31 OPPENHEIMER DIVERSIFIED ALTERNATIVES FUND/VA
NOTES TO CONSOLIDATED FINANCIAL STATEMENTS Continued
| | | | | | | | | | | | | | | | |
| 3. Securities Valuation (Continued) | | | | | | | | | | | | |
| | | | |
| | | Level 1— Unadjusted Quoted Prices | | | Level 2—
Other Significant
Observable Inputs | | | Level 3— Significant
Unobservable Inputs | | | Value | |
| |
Assets Table | | | | | | | | | | | | | | | | |
Investments, at Value: | | | | | | | | | | | | | | | | |
Common Stocks | | | | | | | | | | | | | | | | |
Consumer Discretionary | | $ | 3,977,044 | | | $ | — | | | $ | — | | | $ | 3,977,044 | |
Consumer Staples | | | 1,271,974 | | | | — | | | | — | | | | 1,271,974 | |
Energy | | | 7,679,274 | | | | — | | | | — | | | | 7,679,274 | |
Financials | | | 12,456,436 | | | | 5,904,413 | | | | — | | | | 18,360,849 | |
Health Care | | | 4,440,736 | | | | 598,999 | | | | 9,315 | | | | 5,049,050 | |
Industrials | | | 3,893,417 | | | | — | | | | — | | | | 3,893,417 | |
Information Technology | | | 4,002,990 | | | | 437,144 | | | | — | | | | 4,440,134 | |
Materials | | | 1,609,873 | | | | — | | | | — | | | | 1,609,873 | |
Telecommunication Services | | | 1,106,514 | | | | — | | | | — | | | | 1,106,514 | |
Utilities | | | 2,199,084 | | | | — | | | | — | | | | 2,199,084 | |
Preferred Stocks | | | — | | | | 1,322,144 | | | | — | | | | 1,322,144 | |
Asset-Backed Securities | | | — | | | | 6,334,474 | | | | 1,646,494 | | | | 7,980,968 | |
Foreign Government Obligations | | | — | | | | 56,002,742 | | | | — | | | | 56,002,742 | |
Non-Convertible Corporate Bonds and Notes | | | — | | | | 15,761,150 | | | | 10 | | | | 15,761,160 | |
Convertible Corporate Bond and Note | | | — | | | | 209,313 | | | | — | | | | 209,313 | |
Corporate Loans | | | — | | | | 7,214,575 | | | | — | | | | 7,214,575 | |
Event-Linked Bonds | | | — | | | | 32,033,311 | | | | — | | | | 32,033,311 | |
Exchange-Traded Options Purchased | | | 666,234 | | | | — | | | | — | | | | 666,234 | |
Over-the-Counter Options Purchased | | | — | | | | 397,763 | | | | — | | | | 397,763 | |
Over-the-Counter Interest Rate Swaptions Purchased | | | — | | | | 178,172 | | | | — | | | | 178,172 | |
Investment Companies | | | 41,695,574 | | | | — | | | | — | | | | 41,695,574 | |
Short-Term Notes | | | — | | | | 37,942,530 | | | | — | | | | 37,942,530 | |
| | | | |
Total Investments, at Value | | | 84,999,150 | | | | 164,336,730 | | | | 1,655,819 | | | | 250,991,699 | |
Other Financial Instruments: | | | | | | | | | | | | | | | | |
Swaps, at value | | | — | | | | 1,630,488 | | | | — | | | | 1,630,488 | |
Centrally cleared swaps, at value | | | — | | | | 137,435 | | | | — | | | | 137,435 | |
Futures contracts | | | 350,118 | | | | — | | | | — | | | | 350,118 | |
Foreign currency exchange contracts | | | — | | | | 16,963,754 | | | | — | | | | 16,963,754 | |
| | | | |
Total Assets | | $ | 85,349,268 | | | $ | 183,068,407 | | | $ | 1,655,819 | | | $ | 270,073,494 | |
| | | | |
| | | | |
Liabilities Table | | | | | | | | | | | | | | | | |
Other Financial Instruments: | | | | | | | | | | | | | | | | |
Common Stock Securities Sold Short | | $ | (11,728,697 | ) | | $ | (275,033 | ) | | $ | — | | | $ | (12,003,730 | ) |
Swaps, at value | | | — | | | | (789,368 | ) | | | — | | | | (789,368 | ) |
Centrally cleared swaps, at value | | | — | | | | (528,365 | ) | | | — | | | | (528,365 | ) |
Options written, at value | | | (471,375 | ) | | | (672,863 | ) | | | — | | | | (1,144,238 | ) |
Futures contracts | | | (970,689 | ) | | | — | | | | — | | | | (970,689 | ) |
Foreign currency exchange contracts | | | — | | | | (10,329,295 | ) | | | — | | | | (10,329,295 | ) |
| | | | |
Total Liabilities | | $ | (13,170,761 | ) | | $ | (12,594,924 | ) | | $ | — | | | $ | (25,765,685 | ) |
| | | | |
Forward currency exchange contracts and futures contracts, if any, are reported at their unrealized appreciation/depreciation at measurement date, which represents the change in the contract’s value from trade date. All additional assets and liabilities included in the above table are reported at their market value at measurement date.
4. Investments and Risks
Investment in Oppenheimer Institutional Money Market Fund. The Fund is permitted to invest daily available cash balances in an affiliated money market fund. The Fund may invest the available cash in Class E shares of Oppenheimer Institutional Money Market Fund (“IMMF”) to seek current income while preserving liquidity or for defensive purposes. IMMF is a registered open-end management investment company, regulated as a money market fund under the 1940 Act. The Manager is the investment adviser of IMMF, and the Sub-Adviser provides investment and related advisory services to IMMF. When applicable, the Fund’s investment in IMMF is included in the Consolidated Statement of Investments. Shares of IMMF are valued at their net asset value per share. As a shareholder, the Fund is subject to its proportional share of IMMF’s Class E expenses, including its management fee. The Manager will waive fees and/or reimburse Fund expenses in an amount equal to the indirect management fees incurred through the Fund’s investment in IMMF.
Investment in Oppenheimer Master Funds. The Fund is permitted to invest in entities sponsored and/or advised by the Manager or an affiliate. Certain of these entities in which the Fund invests are mutual funds registered under the Investment Company Act of 1940 that expect to be treated as partnerships for tax purposes, specifically Oppenheimer Master Loan Fund, LLC and Oppenheimer Master Event-Linked Bond Fund, LLC (the “Master Funds”). Each Master Fund has its own investment risks, and those risks can affect the value of the Fund’s investments and therefore the value of the Fund’s shares. To the extent that the Fund invests more of its assets in one Master Fund than in another, the Fund will have greater exposure to the risks of that Master Fund.
32 OPPENHEIMER DIVERSIFIED ALTERNATIVES FUND/VA
4. Investments and Risks (Continued)
The investment objective of Oppenheimer Master Loan Fund, LLC is to seek income. The investment objective of Oppenheimer Master Event-Linked Bond Fund, LLC is to seek total return. The Fund’s investments in the Master Funds are included in the Consolidated Statement of Investments. The Fund recognizes income and gain/(loss) on its investments in each Master Fund according to its allocated pro-rata share, based on its relative proportion of total outstanding Master Fund shares held, of the total net income earned and the net gain/(loss) realized on investments sold by the Master Funds. As a shareholder, the Fund is subject to its proportional share of the Master Funds’ expenses, including their management fee. The Manager will waive fees and/or reimburse Fund expenses in an amount equal to the indirect management fees incurred through the Fund’s investment in the Master Funds.
Event-Linked Bonds. The Fund may invest in “event-linked” bonds. Event-linked bonds, which are sometimes referred to as “catastrophe” bonds, are fixed income securities for which the return of principal and payment of interest is contingent on the non-occurrence of a specific trigger event, such as a hurricane, earthquake, or other occurrence that leads to physical or economic loss. If the trigger event occurs prior to maturity, the Fund may lose all or a portion of its principal in addition to interest otherwise due from the security. Event-linked bonds may expose the Fund to certain other risks, including issuer default, adverse regulatory or jurisdictional interpretations, liquidity risk and adverse tax consequences. The Fund records the net change in market value of event-linked bonds on the Consolidated Statement of Operations as a change in unrealized appreciation or depreciation on investments. The Fund records a realized gain or loss on the Consolidated Statement of Operations upon the sale or maturity of such securities.
Restricted Securities. As of December 31, 2014, investments in securities included issues that are restricted. A restricted security may have a contractual restriction on its resale and is valued under methods approved by the Board of Trustees as reflecting fair value. Securities that are restricted are marked with an applicable footnote on the Consolidated Statement of Investments. Restricted securities are reported on a schedule following the Consolidated Statement of Investments.
Equity Security Risk. Stocks and other equity securities fluctuate in price. The value of the Fund’s portfolio may be affected by changes in the equity markets generally. Equity markets may experience significant short-term volatility and may fall sharply at times. Different markets may behave differently from each other and U.S. equity markets may move in the opposite direction from one or more foreign stock markets.
The prices of individual equity securities generally do not all move in the same direction at the same time and a variety of factors can affect the price of a particular company’s securities. These factors may include, but are not limited to, poor earnings reports, a loss of customers, litigation against the company, general unfavorable performance of the company’s sector or industry, or changes in government regulations affecting the company or its industry.
Master Limited Partnerships (“MLPs”). MLPs issue common units that represent an equity ownership interest in a partnership and provide limited voting rights. MLP common units are registered with the Securities and Exchange Commission (“SEC”), and are freely tradable on securities exchanges such as the NYSE and the NASDAQ Stock Market (“NASDAQ”), or in the over-the-counter (“OTC”) market. An MLP consists of one or more general partners, who conduct the business, and one or more limited partners, who contribute capital. MLP common unit holders have a limited role in the partnership’s operations and management. The Fund, as a limited partner, normally would not be liable for the debts of the MLP beyond the amounts the Fund has contributed, but would not be shielded to the same extent that a shareholder of a corporation would be. In certain circumstances creditors of an MLP would have the right to seek return of capital distributed to a limited partner. This right of an MLP’s creditors would continue after the Fund sold its investment in the MLP.
Credit Risk. The Fund invests in high-yield, non-investment-grade bonds, which may be subject to a greater degree of credit risk. Credit risk relates to the ability of the issuer to meet interest or principal payments or both as they become due. The Fund may acquire securities that have missed an interest payment, and is not obligated to dispose of securities whose issuers or underlying obligors subsequently miss an interest payment. Information concerning securities not accruing interest as of December 31, 2014 is as follows:
| | | | |
Cost | | | $23,154 | |
Market Value | | | $9,510 | |
Market value as % of Net Assets | | | Less than 0.005% | |
Sovereign Debt Risk. The Fund invests in sovereign debt securities, which are subject to certain special risks. These risks include, but are not limited to, the risk that a governmental entity may delay or refuse, or otherwise be unable, to pay interest or repay the principal on its sovereign debt. There may also be no legal process for collecting sovereign debt that a government does not pay or bankruptcy proceedings through which all or part of such sovereign debt may be collected. In addition, a restructuring or default of sovereign debt may also cause additional impacts to the financial markets, such as downgrades to credit ratings, reduced liquidity and increased volatility, among others.
5. Risk Exposures and the Use of Derivative Instruments
The Fund’s investment objective not only permits the Fund to purchase investment securities, it also allows the Fund to enter into various types of derivatives contracts, including, but not limited to, futures contracts, forward currency exchange contracts, credit default swaps, interest rate swaps, total return swaps, variance swaps and purchased and written options. In doing so, the Fund will employ strategies in differing combinations to permit it to increase, decrease, or change the level or types of exposure to market risk factors. These instruments may allow the Fund to pursue its objectives more
33 OPPENHEIMER DIVERSIFIED ALTERNATIVES FUND/VA
NOTES TO CONSOLIDATED FINANCIAL STATEMENTS Continued
5. Risk Exposures and the Use of Derivative Instruments (Continued)
quickly and efficiently than if it were to make direct purchases or sales of securities capable of effecting a similar response to market factors. Such contracts may be entered into through a bilateral over-the-counter (“OTC”) transaction, or through a securities or futures exchange and cleared through a clearinghouse.
Market Risk Factors. In accordance with its investment objectives, the Fund may use derivatives to increase or decrease its exposure to one or more of the following market risk factors:
Commodity Risk. Commodity risk relates to the change in value of commodities or commodity indexes as they relate to increases or decreases in the commodities market. Commodities are physical assets that have tangible properties. Examples of these types of assets are crude oil, heating oil, metals, livestock, and agricultural products.
Credit Risk. Credit risk relates to the ability of the issuer to meet interest and principal payments, or both, as they come due. In general, lower-grade, higher-yield bonds are subject to credit risk to a greater extent than lower-yield, higher-quality bonds.
Equity Risk. Equity risk relates to the change in value of equity securities as they relate to increases or decreases in the general market.
Foreign Exchange Rate Risk. Foreign exchange rate risk relates to the change in the U.S. dollar value of a security held that is denominated in a foreign currency. The U.S. dollar value of a foreign currency denominated security will decrease as the dollar appreciates against the currency, while the U.S. dollar value will increase as the dollar depreciates against the currency.
Interest Rate Risk. Interest rate risk refers to the fluctuations in value of fixed-income securities resulting from the inverse relationship between price and yield. For example, an increase in general interest rates will tend to reduce the market value of already issued fixed-income investments, and a decline in general interest rates will tend to increase their value. In addition, debt securities with longer maturities, which tend to have higher yields, are subject to potentially greater fluctuations in value from changes in interest rates than obligations with shorter maturities.
Volatility Risk. Volatility risk refers to the magnitude of the movement, but not the direction of the movement, in a financial instrument’s price over a defined time period. Large increases or decreases in a financial instrument’s price over a relative time period typically indicate greater volatility risk, while small increases or decreases in its price typically indicate lower volatility risk.
Derivatives may have little or no initial cash investment relative to their market value exposure and therefore can produce significant gains or losses in excess of their cost due to unanticipated changes in the market risk factors and the overall market. This use of embedded leverage allows the Fund to increase its market value exposure relative to its net assets and can substantially increase the volatility of the Fund’s performance. In instances where the Fund is using derivatives to decrease, or hedge, exposures to market risk factors for securities held by the Fund, there are also risks that those derivatives may not perform as expected resulting in losses for the combined or hedged positions. Some derivatives have the potential for unlimited loss, regardless of the size of the Fund’s initial investment.
Additional associated risks from investing in derivatives also exist and potentially could have significant effects on the valuation of the derivative and the Fund. Typically, the associated risks are not the risks that the Fund is attempting to increase or decrease exposure to, per its investment objectives, but are the additional risks from investing in derivatives. Examples of these associated risks are liquidity risk, which is the risk that the Fund will not be able to sell the derivative in the open market in a timely manner, and counterparty credit risk, which is the risk that the counterparty will not fulfill its obligation to the Fund.
The Fund’s actual exposures to these market risk factors and associated risks during the period are discussed in further detail, by derivative type, below.
Forward Currency Exchange Contracts
The Fund may enter into forward currency exchange contracts (“forward contracts”) for the purchase or sale of a foreign currency at a negotiated rate at a future date. Such contracts are traded in the OTC inter-bank currency dealer market.
Forward contracts are reported on a schedule following the Consolidated Statement of Investments. The unrealized appreciation (depreciation) is reported in the Consolidated Statement of Assets and Liabilities as a receivable (or payable) and in the Consolidated Statement of Operations within the change in unrealized appreciation (depreciation). At contract close, the difference between the original cost of the contract and the value at the close date is recorded as a realized gain (loss) in the Consolidated Statement of Operations.
The Fund has entered into forward contracts with the obligation to purchase specified foreign currencies in the future at a currently negotiated forward rate in order to take a positive investment perspective on the related currency. These forward contracts seek to increase exposure to foreign exchange rate risk.
The Fund has entered into forward contracts with the obligation to purchase specified foreign currencies in the future at a currently negotiated forward rate in order to decrease exposure to foreign exchange rate risk associated with foreign currency denominated securities held by the Fund.
The Fund has entered into forward contracts with the obligation to sell specified foreign currencies in the future at a currently negotiated forward rate in order to take a negative investment perspective on the related currency. These forward contracts seek to increase exposure to foreign exchange rate risk.
The Fund has entered into forward contracts with the obligation to sell specified foreign currencies in the future at a currently negotiated forward rate in order to decrease exposure to foreign exchange rate risk associated with foreign currency denominated securities held by the Fund.
During the year ended December 31, 2014, the Fund had daily average contract amounts on forward contracts to buy and sell of $60,087,396 and $94,826,095, respectively.
Additional associated risk to the Fund includes counterparty credit risk. Counterparty credit risk arises from the possibility that the counterparty to a forward contract will default and fail to perform its obligations to the Fund.
34 OPPENHEIMER DIVERSIFIED ALTERNATIVES FUND/VA
5. Risk Exposures and the Use of Derivative Instruments (Continued)
Futures Contracts
A futures contract is a commitment to buy or sell a specific amount of a commodity, financial instrument or currency at a negotiated price on a stipulated future date. The Fund may buy and sell futures contracts and may also buy or write put or call options on these futures contracts. Futures contracts and options thereon are generally entered into on a regulated futures exchange and cleared through a clearinghouse associated with the exchange.
Upon entering into a futures contract, the Fund is required to deposit either cash or securities (initial margin) in an amount equal to a certain percentage of the contract value in an account registered in the futures commission merchant’s name. Subsequent payments (variation margin) are paid to or from the futures commission merchant each day equal to the daily changes in the contract value. Such payments are recorded as unrealized gains and losses. Should the Fund fail to make requested variation margin payments, the futures commission merchant can gain access to the initial margin to satisfy the Fund’s payment obligations.
Futures contracts are reported on a schedule following the Consolidated Statement of Investments. Securities held by a futures commission merchant to cover initial margin requirements on open futures contracts are noted in the Consolidated Statement of Investments. Cash held by a futures commission merchant to cover initial margin requirements on open futures contracts and the receivable and/or payable for the daily mark to market for the variation margin are noted in the Consolidated Statement of Assets and Liabilities. The net change in unrealized appreciation and depreciation is reported in the Consolidated Statement of Operations. Realized gains (losses) are reported in the Consolidated Statement of Operations at the closing or expiration of futures contracts.
The Fund has purchased futures contracts on various bonds and notes to increase exposure to interest rate risk.
The Fund has sold futures contracts on various bonds and notes to decrease exposure to interest rate risk.
The Fund has purchased futures contracts on various equity indexes to increase exposure to equity risk.
The Fund has sold futures contracts on various equity indexes to decrease exposure to equity risk.
The Fund has purchased futures contracts, which have values that are linked to the price movement of the related volatility indexes, in order to increase exposure to volatility risk.
The Fund has sold futures contracts, which have values that are linked to the price movement of the related volatility indexes, in order to decrease exposure to volatility risk.
The Fund has purchased futures contracts, which have values that are linked to the price movement of the related commodities, in order to increase exposure to commodity risk.
The Fund has sold futures contracts, which have values that are linked to the price movement of the related commodities, in order to decrease exposure to commodity risk.
During the year ended December 31, 2014, the Fund had an ending monthly average market value of $9,015,083 and $13,354,811 on futures contracts purchased and sold, respectively.
Additional associated risks of entering into futures contracts (and related options) include the possibility that there may be an illiquid market where the Fund is unable to liquidate the contract or enter into an offsetting position and, if used for hedging purposes, the risk that the price of the contract will correlate imperfectly with the prices of the Fund’s securities.
Option Activity
The Fund may buy and sell put and call options, or write put and call options. When an option is written, the Fund receives a premium and becomes obligated to sell or purchase the underlying security, currency or other underlying financial instrument at a fixed price, upon exercise of the option.
Options can be traded through an exchange or through a privately negotiated arrangement with a dealer in an OTC transaction. Options traded through an exchange are generally cleared through a clearinghouse (such as The Options Clearing Corporation). The difference between the premium received or paid, and market value of the option, is recorded as unrealized appreciation or depreciation. The net change in unrealized appreciation or depreciation is reported in the Consolidated Statement of Operations. When an option is exercised, the cost of the security purchased or the proceeds of the security sale are adjusted by the amount of premium received or paid. Upon the expiration or closing of the option transaction, a gain or loss is reported in the Consolidated Statement of Operations.
The Fund has purchased call options on currencies to increase exposure to foreign exchange rate risk. A purchased call option becomes more valuable as the price of the underlying financial instrument appreciates relative to the strike price.
The Fund has purchased put options on currencies to decrease exposure to foreign exchange rate risk. A purchased put option becomes more valuable as the price of the underlying financial instrument depreciates relative to the strike price.
The Fund has purchased call options on treasury and/or euro futures to increase exposure to interest rate risk. A purchased call option becomes more valuable as the price of the underlying financial instrument appreciates relative to the strike price.
The Fund has purchased call options on individual equity securities and/or equity indexes to increase exposure to equity risk. A purchased call option becomes more valuable as the price of the underlying financial instrument appreciates relative to the strike price.
The Fund has purchased put options on individual equity securities and/or equity indexes to decrease exposure to equity risk. A purchased put option becomes more valuable as the price of the underlying financial instrument depreciates relative to the strike price.
The Fund has purchased put options on individual commodities and/or commodity indexes to decrease exposure to commodity risk. A purchased put option becomes more valuable as the price of the underlying financial instrument depreciates relative to the strike price.
During the year ended December 31, 2014, the Fund had an ending monthly average market value of $235,266 and $175,110 on purchased call options and purchased put options, respectively.
35 OPPENHEIMER DIVERSIFIED ALTERNATIVES FUND/VA
NOTES TO CONSOLIDATED FINANCIAL STATEMENTS Continued
5. Risk Exposures and the Use of Derivative Instruments (Continued)
Options written, if any, are reported in a schedule following the Consolidated Statement of Investments and as a liability in the Consolidated Statement of Assets and Liabilities. Securities held in collateral accounts to cover potential obligations with respect to outstanding written options are noted in the Consolidated Statement of Investments.
The risk in writing a call option is that the market price of the security increases and if the option is exercised, the Fund must either purchase the security at a higher price for delivery or, if the Fund owns the underlying security, give up the opportunity for profit. The risk in writing a put option is that the Fund may incur a loss if the market price of the security decreases and the option is exercised. The risk in buying an option is that the Fund pays a premium whether or not the option is exercised. The Fund also has the additional risk that there may be an illiquid market where the Fund is unable to close the contract.
The Fund has written put options on currencies to increase exposure to foreign exchange rate risk. A written put option becomes more valuable as the price of the underlying financial instrument appreciates relative to the strike price.
The Fund has written call options on currencies to decrease exposure to foreign exchange rate risk. A written call option becomes more valuable as the price of the underlying financial instrument depreciates relative to the strike price.
The Fund has written put options on individual equity securities and/or equity indexes to increase exposure to equity risk. A written put option becomes more valuable as the price of the underlying financial instrument appreciates relative to the strike price.
The Fund has written call options on individual equity securities and/or equity indexes to decrease exposure to equity risk. A written call option becomes more valuable as the price of the underlying financial instrument depreciates relative to the strike price.
During the year ended December 31, 2014, the Fund had an ending monthly average market value of $67,723 and $136,701 on written call options and written put options, respectively.
Additional associated risks to the Fund include counterparty credit risk and liquidity risk.
Written option activity for the year ended December 31, 2014 was as follows:
| | | | | | | | |
| | | Number of Contracts | | | Amount of Premiums | |
| Options outstanding as of December 31, 2013 | | | 39,105,134 | | | | $ 21,023 | |
Options written | | | 10,545,728,488 | | | | 3,564,425 | |
Options closed or expired | | | (6,659,903,194) | | | | (873,716) | |
Options exercised | | | (3,504,407,511) | | | | (1,436,938) | |
| | | | |
| Options outstanding as of December 31, 2014 | | | 420,522,917 | | | | $ 1,274,794 | |
| | | | |
Swap Contracts
The Fund may enter into swap contract agreements with a counterparty to exchange a series of cash flows based on either specified reference rates, the price or volatility of asset or non-asset references, or the occurrence of a credit event, over a specified period. Swaps can be executed in a bi-lateral privately negotiated arrangement with a dealer in an OTC transaction (“OTC swaps”) or executed on a regulated market. Certain swaps, regardless of the venue of their execution, are required to be cleared through a clearinghouse (“centrally cleared swaps”). Swap contracts may include interest rate, equity, debt, index, total return, credit default, currency, and volatility swaps.
Swap contracts are reported on a schedule following the Consolidated Statement of Investments. The values of centrally cleared swap and OTC swap contracts are aggregated by positive and negative values and disclosed separately on the Consolidated Statement of Assets and Liabilities. The unrealized appreciation (depreciation) related to the change in the valuation of the notional amount of the swap is combined with the accrued interest due to (owed by) the Fund, if any, at termination or settlement. The net change in this amount during the period is included on the Consolidated Statement of Operations. The Fund also records any periodic payments received from (paid to) the counterparty, including at termination, under such contracts as realized gain (loss) on the Consolidated Statement of Operations.
Swap contract agreements are exposed to the market risk factor of the specific underlying reference rate or asset. Swap contracts are typically more attractively priced compared to similar investments in related cash securities because they isolate the risk to one market risk factor and eliminate the other market risk factors. Investments in cash securities (for instance bonds) have exposure to multiple risk factors (credit and interest rate risk). Because swaps have embedded leverage, they can expose the Fund to substantial risk in the isolated market risk factor.
Credit Default Swap Contracts. A credit default swap is a contract that enables an investor to buy or sell protection against a defined-issuer credit event, such as the issuer’s failure to make timely payments of interest or principal on a debt security, bankruptcy or restructuring. The Fund may enter into credit default swaps either by buying or selling protection on a corporate issuer, sovereign issuer, or a basket or index of issuers (the “reference asset”).
The buyer of protection pays a periodic fee to the seller of protection based on the notional amount of the swap contract. The seller of protection agrees to compensate the buyer of protection for future potential losses as a result of a credit event on the reference asset. The contract effectively transfers the credit event risk of the reference asset from the buyer of protection to the seller of protection.
The ongoing value of the contract will fluctuate throughout the term of the contract based primarily on the credit risk of the reference asset. If the credit quality of the reference asset improves relative to the credit quality at contract initiation, the buyer of protection may have an unrealized loss greater than the anticipated periodic fee owed. This unrealized loss would be the result of current credit protection being cheaper than the cost of credit protection at contract initiation. If the buyer elects to terminate the contract prior to its maturity, and there has been no credit event, this unrealized loss will become realized. If the contract is held to maturity, and there has been no credit event, the realized loss will be equal to the periodic fee paid over the life of the contract.
36 OPPENHEIMER DIVERSIFIED ALTERNATIVES FUND/VA
5. Risk Exposures and the Use of Derivative Instruments (Continued)
If there is a credit event, the buyer of protection can exercise its rights under the contract and receive a payment from the seller of protection equal to the notional amount of the swap less the market value of specified debt securities issued by the reference asset. Upon exercise of the contract the difference between such value and the notional amount is recorded as realized gain (loss) and is included on the Consolidated Statement of Operations.
The Fund has sold credit protection through credit default swaps to increase exposure to the credit risk of individual issuers and/or indexes of issuers that are either unavailable or considered to be less attractive in the bond market.
The Fund has purchased credit protection through credit default swaps to decrease exposure to the credit risk of individual issuers and/or indexes of issuers.
For the year ended December 31, 2014, the Fund had ending monthly average notional amounts of $10,271,691 and $7,054,615 on credit default swaps to buy protection and credit default swaps to sell protection, respectively.
Additional associated risks to the Fund include counterparty credit risk and liquidity risk.
Interest Rate Swap Contracts. An interest rate swap is an agreement between counterparties to exchange periodic payments based on interest rates. One cash flow stream will typically be a floating rate payment based upon a specified floating interest rate while the other is typically a fixed interest rate.
The Fund has entered into interest rate swaps in which it pays a floating interest rate and receives a fixed interest rate in order to increase exposure to interest rate risk. Typically, if relative interest rates rise, payments made by the Fund under a swap agreement will be greater than the payments received by the Fund.
The Fund has entered into interest rate swaps in which it pays a fixed interest rate and receives a floating interest rate in order to decrease exposure to interest rate risk. Typically, if relative interest rates rise, payments received by the Fund under the swap agreement will be greater than the payments made by the Fund.
For the year ended December 31, 2014, the Fund had ending monthly average notional amounts of $3,549,468 and $4,534,871 on interest rate swaps which pay a fixed rate and interest rate swaps which receive a fixed rate, respectively.
Additional associated risks to the Fund include counterparty credit risk and liquidity risk.
Total Return Swap Contracts. A total return swap is an agreement between counterparties to exchange periodic payments based on the value of asset or non-asset references. One cash flow is typically based on a non-asset reference (such as an interest rate) and the other on the total return of a reference asset (such as a security or a basket of securities or securities index). The total return of the reference asset typically includes appreciation or depreciation on the reference asset, plus any interest or dividend payments.
Total return swap contracts are exposed to the market risk factor of the specific underlying financial instrument or index. Total return swaps are less standard in structure than other types of swaps and can isolate and/or include multiple types of market risk factors including equity risk, credit risk, and interest rate risk.
The Fund has entered into total return swaps on various equity securities or indexes to increase exposure to equity risk. These equity risk related total return swaps require the Fund to pay a floating reference interest rate, and an amount equal to the negative price movement of securities or an index (expressed as a percentage) multiplied by the notional amount of the contract. The Fund will receive payments equal to the positive price movement of the same securities or index (expressed as a percentage) multiplied by the notional amount of the contract and, in some cases, dividends paid on the securities.
The Fund has entered into total return swaps on various equity securities or indexes to decrease exposure to equity risk. These equity risk related total return swaps require the Fund to pay an amount equal to the positive price movement of securities or an index (expressed as a percentage) multiplied by the notional amount of the contract and, in some cases, dividends paid on the securities. The Fund will receive payments of a floating reference interest rate and an amount equal to the negative price movement of the same securities or index (expressed as a percentage) multiplied by the notional amount of the contract.
The Fund has entered into total return swaps to increase exposure to the credit risk of various indexes or basket of securities. These credit risk related total return swaps require the Fund to pay to, or receive payments from, the counterparty based on the movement of credit spreads of the related indexes or securities.
The Fund has entered into total return swaps on various commodity indexes to increase exposure to commodity risk. These commodity risk related total return swaps require the Fund to pay a fixed or a floating reference interest rate, and an amount equal to the negative price movement of an index (expressed as a percentage) multiplied by the notional amount of the contract. The Fund will receive payments equal to the positive price movement of the same index (expressed as a percentage) multiplied by the notional amount of the contract.
The Fund has entered into total return swaps on various commodity indexes to decrease exposure to commodity risk. These commodity risk related total return swaps require the Fund to pay an amount equal to the positive price movement of an index (expressed as a percentage) multiplied by the notional amount of the contract. The Fund will receive payments of a fixed or a floating reference interest rate and an amount equal to the negative price movement of the same index (expressed as a percentage) multiplied by the notional amount of the contract.
For the year ended December 31, 2014, the Fund had ending monthly average notional amounts of $45,335,381 and $8,194,375 on total return swaps which are long the reference asset and total return swaps which are short the reference asset, respectively.
Additional associated risks to the Fund include counterparty credit risk and liquidity risk.
Volatility Swap Contracts. A volatility swap is an agreement between counterparties to exchange periodic payments based on the measured volatility of a reference security, index, currency or other reference investment over a specified time frame. One cash flow is typically based on the realized volatility of the reference investment as measured by changes in its price or level over the specified time period while the other cash flow is based on a specified rate representing expected volatility for the reference investment at the time the swap is executed, or the measured volatility of a
37 OPPENHEIMER DIVERSIFIED ALTERNATIVES FUND/VA
NOTES TO CONSOLIDATED FINANCIAL STATEMENTS Continued
5. Risk Exposures and the Use of Derivative Instruments (Continued)
different reference investment over the specified time period. The appreciation or depreciation on a volatility swap will typically depend on the magnitude of the reference investment’s volatility, or size of the movements in its price, over the specified time period, rather than general directional increases or decreases in its price.
Volatility swaps are less standard in structure than other types of swaps and provide pure, or isolated, exposure to volatility risk of the specific underlying reference investment. Volatility swaps are typically used to speculate on future volatility levels, to trade the spread between realized and expected volatility, or to decrease the volatility exposure of investments held by the Fund.
Variance swaps are a type of volatility swap where counterparties agree to exchange periodic payments based on the measured variance (or the volatility squared) of a reference security, index, or other reference investment over a specified time period. At payment date, a net cash flow will be exchanged based on the difference between the realized variance of the reference investment over the specified time period and the specified rate representing expected variance for the reference investment at the time the swap is executed multiplied by the notional amount of the contract.
The Fund has entered into volatility swaps to increase exposure to the volatility risk of various reference investments. These types of volatility swaps require the Fund to pay the measured volatility and receive a fixed rate payment. If the measured volatility of the related reference investment increases over the period, the swaps will depreciate in value. Conversely, if the measured volatility of the related reference investment decreases over the period, the swaps will appreciate in value.
The Fund has entered into volatility swaps to decrease exposure to the volatility risk of various reference investments. These types of volatility swaps require the Fund to pay a fixed rate payment and receive the measured volatility. If the measured volatility of the related reference investment increases over the period, the swaps will appreciate in value. Conversely, if the measured volatility of the related reference investment decreases over the period, the swaps will depreciate in value.
The Fund has entered into variance swaps to increase exposure to the volatility risk of various reference investments. These types of volatility swaps require the Fund to make a payment if the measured price variance of the reference investment exceeds the specified fixed rate. If the measured variance of the related reference investment increases over the period, the swaps will depreciate in value. Conversely, if the measured variance of the related reference investment decreases over the period, the swaps will appreciate in value.
The Fund has entered into variance swaps to decrease exposure to the volatility risk of various reference investments. These types of volatility swaps require the Fund to make a payment if the measured price variance of the reference asset is less than the specified fixed rate. If the measured variance of the related reference investment increases over the period, the swaps will appreciate in value. Conversely, if the measured variance of the related reference investment decreases over the period, the swaps will depreciate in value.
For the year ended December 31, 2014, the Fund had ending monthly average notional amounts of $14,179 and $6,001 on volatility swaps which pay measured volatility/variance and volatility swaps which receive measured volatility/variance, respectively.
Additional associated risks to the Fund include counterparty credit risk and liquidity risk.
Swaption Transactions
The Fund may enter into a swaption contract which grants the purchaser the right, but not the obligation, to enter into a swap transaction at preset terms detailed in the underlying agreement within a specified period of time. The purchaser pays a premium to the swaption writer who bears the risk of unfavorable changes in the preset terms on the underlying swap.
Purchased swaptions are reported as a component of investments in the Consolidated Statement of Investments and the Consolidated Statement of Assets and Liabilities. Written swaptions are reported on a schedule following the Consolidated Statement of Investments and their value is reported as a separate asset or liability line item in the Consolidated Statement of Assets and Liabilities. The net change in unrealized appreciation or depreciation on written swaptions is separately reported in the Consolidated Statement of Operations. When a swaption is exercised, the cost of the swap is adjusted by the amount of premium paid or received. Upon the expiration or closing of an unexercised swaption contract, a gain or loss is reported in the Consolidated Statement of Operations for the amount of the premium paid or received.
The Fund generally will incur a greater risk when it writes a swaption than when it purchases a swaption. When the Fund writes a swaption it will become obligated, upon exercise of the swaption, according to the terms of the underlying agreement. Swaption contracts written by the Fund do not give rise to counterparty credit risk prior to exercise as they obligate the Fund, not its counterparty, to perform. When the Fund purchases a swaption it only risks losing the amount of the premium it paid if the swaption expires unexercised. However, when the Fund exercises a purchased swaption there is a risk that the counterparty will fail to perform or otherwise default on its obligations under the swaption contract.
The Fund has purchased swaptions which gives it the option to enter into an interest rate swap in which it pays a floating interest rate and receives a fixed interest rate in order to increase exposure to interest rate risk. A purchased swaption of this type becomes more valuable as the reference interest rate decreases relative to the preset interest rate.
During the year ended December 31, 2014, the Fund had an ending monthly average market value of $85,690 on purchased swaptions.
Counterparty Credit Risk. Derivative positions are subject to the risk that the counterparty will not fulfill its obligation to the Fund. The Fund intends to enter into derivative transactions with counterparties that the Manager believes to be creditworthy at the time of the transaction.
The Fund’s risk of loss from counterparty credit risk on OTC derivatives is generally limited to the aggregate unrealized gain netted against any collateral held by the Fund. For OTC options purchased, the Fund bears the risk of loss of the amount of the premiums paid plus the positive change in market values net of any collateral held by the Fund should the counterparty fail to perform under the contracts. Options written by the Fund do not typically give rise to counterparty credit risk, as options written generally obligate the Fund and not the counterparty to perform.
To reduce counterparty risk with respect to OTC transactions, the Fund has entered into master netting arrangements, established within the Fund’s International Swap and Derivatives Association, Inc. (“ISDA”) master agreements, which allow the Fund to make (or to have an entitlement to receive) a single net payment in the event of default (close-out netting) for outstanding payables and receivables with respect to certain OTC positions in swaps,
38 OPPENHEIMER DIVERSIFIED ALTERNATIVES FUND/VA
5. Risk Exposures and the Use of Derivative Instruments (Continued)
options, swaptions, and forward currency exchange contracts for each individual counterparty. In addition, the Fund may require that certain counterparties post cash and/or securities in collateral accounts to cover their net payment obligations for those derivative contracts subject to ISDA master agreements. If the counterparty fails to perform under these contracts and agreements, the cash and/or securities will be made available to the Fund.
As of December 31, 2014, the Fund has required certain counterparties to post collateral of $7,212,970.
ISDA master agreements include credit related contingent features which allow counterparties to OTC derivatives to terminate derivative contracts prior to maturity in the event that, for example, the Fund’s net assets decline by a stated percentage or the Fund fails to meet the terms of its ISDA master agreements, which would cause the Fund to accelerate payment of any net liability owed to the counterparty.
For financial reporting purposes, the Fund does not offset derivative assets and derivative liabilities that are subject to netting arrangements in the Consolidated Statement of Assets and Liabilities. Bankruptcy or insolvency laws of a particular jurisdiction may impose restrictions on or prohibitions against the right of offset in bankruptcy, insolvency or other events.
The Fund’s risk of loss from counterparty credit risk on exchange-traded derivatives cleared through a clearinghouse and for centrally cleared swaps is generally considered lower than as compared to OTC derivatives. However, counterparty credit risk exists with respect to initial and variation margin deposited/paid by the Fund that is held in futures commission merchant, broker and/or clearinghouse accounts for such exchange-traded derivatives and for centrally cleared swaps.
With respect to centrally cleared swaps, such transactions will be submitted for clearing, and if cleared, will be held in accounts at futures commission merchants or brokers that are members of clearinghouses. While brokers, futures commission merchants and clearinghouses are required to segregate customer margin from their own assets, in the event that a broker, futures commission merchant or clearinghouse becomes insolvent or goes into bankruptcy and at that time there is a shortfall in the aggregate amount of margin held by the broker, futures commission merchant or clearinghouse for all its customers, U.S. bankruptcy laws will typically allocate that shortfall on a pro-rata basis across all the broker’s, futures commission merchant’s or clearinghouse’s customers, potentially resulting in losses to the Fund.
There is the risk that a broker, futures commission merchant or clearinghouse will decline to clear a transaction on the Fund’s behalf, and the Fund may be required to pay a termination fee to the executing broker with whom the Fund initially enters into the transaction. Clearinghouses may also be permitted to terminate centrally cleared swaps at any time. The Fund is also subject to the risk that the broker or futures commission merchant will improperly use the Fund’s assets deposited/paid as initial or variation margin to satisfy payment obligations of another customer. In the event of a default by another customer of the broker or futures commission merchant, the Fund might not receive its variation margin payments from the clearinghouse, due to the manner in which variation margin payments are aggregated for all customers of the broker/futures commission merchant.
Collateral and margin requirements differ by type of derivative. Margin requirements are established by the broker, futures commission merchant or clearinghouse for exchange-traded and cleared derivatives, including centrally cleared swaps. Brokers, futures commission merchants and clearinghouses can ask for margin in excess of the regulatory minimum, or increase the margin amount, in certain circumstances.
Collateral terms are contract specific for OTC derivatives. For derivatives traded under an ISDA master agreement, the collateral requirements are typically calculated by netting the mark to market amount for each transaction under such agreement and comparing that amount to the value of any collateral currently pledged by the Fund or the counterparty.
For financial reporting purposes, cash collateral that has been pledged to cover obligations of the Fund, if any, is reported separately on the Consolidated Statement of Assets and Liabilities as cash pledged as collateral. Non-cash collateral pledged by the Fund, if any, is noted in the Consolidated Statement of Investments. Generally, the amount of collateral due from or to a party must exceed a minimum transfer amount threshold (e.g. $250,000) before a transfer has to be made. To the extent amounts due to the Fund from its counterparties are not fully collateralized, contractually or otherwise, the Fund bears the risk of loss from counterparty nonperformance.
The following table presents by counterparty the Fund’s OTC derivative assets net of the related collateral posted for the benefit of the Fund at December 31, 2014:
| | | | | | | | | | | | | | | | | | | | |
| | | | | | Gross Amounts Not Offset in the Consolidated
Statement of Assets & Liabilities | |
| Counterparty | | Gross Amount of Assets
in the Consolidated
Statement of Assets &
Liabilities* | | | Financial Instruments
Available for Offset | | | Financial Instruments
Collateral Received** | | | Cash Collateral
Received** | | | Net Amount | |
| Bank of America NA | | $ | 5,331,908 | | | $ | (1,927,494 | ) | | $ | (3,237,978 | ) | | $ | — | | | $ | 166,436 | |
| Barclays Bank plc | | | 430,285 | | | | (430,285 | ) | | | — | | | | — | | | | — | |
| BNP Paribas | | | 238,968 | | | | (238,968 | ) | | | — | | | | — | | | | — | |
| Citibank NA | | | 3,031,325 | | | | (1,983,876 | ) | | | (987,516 | ) | | | — | | | | 59,933 | |
| Credit Suisse International | | | 220,181 | | | | (116,060 | ) | | | (104,121 | ) | | | — | | | | — | |
| Deutsche Bank AG | | | 3,136,012 | | | | (2,401,999 | ) | | | — | | | | (730,000 | ) | | | 4,013 | |
| Goldman Sachs Bank USA | | | 311,439 | | | | (192,341 | ) | | | (119,098 | ) | | | — | | | | — | |
| Goldman Sachs Group, Inc. (The) | | | 472,545 | | | | (298,075 | ) | | | (174,470 | ) | | | — | | | | — | |
| JPMorgan Chase Bank NA | | | 1,270,320 | | | | (784,923 | ) | | | (283,221 | ) | | | — | | | | 202,176 | |
| Morgan Stanley Capital Services, Inc. | | | 1,472,112 | | | | (1,402,415 | ) | | | (6,546 | ) | | | — | | | | 63,151 | |
| Nomura Global Financial Products, Inc. | | | 254,150 | | | | — | | | | — | | | | — | | | | 254,150 | |
| Royal Bank of Scotland plc (The) | | | 2,523,449 | | | | (1,150,419 | ) | | | — | | | | (1,160,000 | ) | | | 213,030 | |
| Toronto Dominion Bank | | | 477,483 | | | | (427,330 | ) | | | — | | | | — | | | | 50,153 | |
| | | | |
| | $ | 19,170,177 | | | $ | (11,354,185 | ) | | $ | (4,912,950 | ) | | $ | (1,890,000 | ) | | $ | 1,013,042 | |
| | | | |
39 OPPENHEIMER DIVERSIFIED ALTERNATIVES FUND/VA
NOTES TO CONSOLIDATED FINANCIAL STATEMENTS Continued
5. Risk Exposures and the Use of Derivative Instruments (Continued)
* OTC derivatives are reported gross on the Consolidated Statement of Assets and Liabilities. Exchange traded options and margin related to centrally cleared swaps and futures are excluded from these reported amounts.
** Reported collateral posted for the benefit of the Fund within this table is limited to the net outstanding amount due from an individual counterparty. The collateral posted for the benefit of the Fund may exceed these amounts.
The following table presents by counterparty the Fund’s OTC derivative liabilities net of the related collateral pledged by the Fund at December 31, 2014:
| | | | | | | | | | | | | | | | | | | | |
| | | | | | Gross Amounts Not Offset in the Consolidated
Statement of Assets & Liabilities | | | | |
| Counterparty | | Gross Amount of
Liabilities in the
Consolidated Statement
of Assets & Liabilities* | | | Financial Instruments
Available for Offset | | | Financial Instruments
Collateral Pledged** | | | Cash Collateral
Pledged** | | | Net Amount | |
Bank of America NA | | $ | (1,927,494 | ) | | $ | 1,927,494 | | | $ | — | | | $ | — | | | $ | — | |
Barclays Bank plc | | | (521,563 | ) | | | 430,285 | | | | — | | | | — | | | | (91,278 | ) |
BNP Paribas | | | (304,979 | ) | | | 238,968 | | | | — | | | | — | | | | (66,011 | ) |
Canadian Imperial Bank Of Commerce | | | (252,966 | ) | | | — | | | | — | | | | 252,966 | | | | — | |
Citibank NA | | | (1,983,876 | ) | | | 1,983,876 | | | | — | | | | — | | | | — | |
Credit Suisse International | | | (116,060 | ) | | | 116,060 | | | | — | | | | — | | | | — | |
Deutsche Bank AG | | | (2,401,999 | ) | | | 2,401,999 | | | | — | | | | — | | | | — | |
Goldman Sachs Bank USA | | | (192,341 | ) | | | 192,341 | | | | — | | | | — | | | | — | |
Goldman Sachs Group, Inc. (The) | | | (298,075 | ) | | | 298,075 | | | | — | | | | — | | | | — | |
JPMorgan Chase Bank NA | | | (784,923 | ) | | | 784,923 | | | | — | | | | — | | | | — | |
Macquarie Bank Ltd. | | | (27,086 | ) | | | — | | | | — | | | | 27,086 | | | | — | |
Morgan Stanley Capital Services, Inc. | | | (1,402,415 | ) | | | 1,402,415 | | | | — | | | | — | | | | — | |
Royal Bank of Scotland plc (The) | | | (1,150,419 | ) | | | 1,150,419 | | | | — | | | | — | | | | — | |
Toronto Dominion Bank | | | (427,330 | ) | | | 427,330 | | | | — | | | | — | | | | — | |
| | | | |
| | $ | (11,791,526 | ) | | $ | 11,354,185 | | | $ | — | | | $ | 280,052 | | | $ | (157,289) | |
| | | | |
* OTC derivatives are reported gross on the Consolidated Statement of Assets and Liabilities. Exchange traded options and margin related to centrally cleared swaps and futures are excluded from these reported amounts.
** Reported collateral pledged within this table is limited to the net outstanding amount due from the Fund. The securities pledged as collateral by the Fund as reported on the Consolidated Statements of Investments may exceed these amounts.
The following table presents the valuations of derivative instruments by risk exposure as reported within the Consolidated Statement of Assets and Liabilities as of December 31, 2014:
| | | | | | | | | | | | |
| | | Asset Derivatives | | | Liability Derivatives | |
Derivatives Not
Accounted for as
Hedging
Instruments | | Consolidated Statement of Assets and
Liabilities Location | | Value | | | Consolidated Statement of Assets and
Liabilities Location | | Value | |
| Commodity contracts | | | | | | | | Swaps, at value | | $ | 280,052 | |
| Credit contracts | | Swaps, at value | | $ | 1,067,141 | | | Swaps, at value | | | 182,146 | |
| Equity contracts | | Swaps, at value | | | 346,594 | | | Swaps, at value | | | 84,071 | |
| Volatility contracts | | Swaps, at value | | | 216,753 | | | Swaps, at value | | | 243,099 | |
| Credit contracts | | Centrally cleared swaps, at value | | | 29,997 | | | Centrally cleared swaps, at value | | | 440,951 | |
| Interest rate contracts | | Centrally cleared swaps, at value | | | 107,438 | | | Centrally cleared swaps, at value | | | 87,414 | |
| Commodity contracts | | Variation margin receivable | | | 19,973 | * | | Variation margin payable | | | 65,488 | * |
| Equity contracts | | Variation margin receivable | | | 2,901 | * | | Variation margin payable | | | 168,200 | * |
| Interest rate contracts | | Variation margin receivable | | | 9,938 | * | | Variation margin payable | | | 562 | * |
| Volatility contracts | | | | | | | | Variation margin payable | | | 49,200 | * |
| Foreign exchange contracts | | Unrealized appreciation on foreign currency exchange contracts | | | 16,963,754 | | | Unrealized depreciation on foreign currency exchange contracts | | | 10,329,295 | |
| Equity contracts | | | | | | | | Options written, at value | | | 471,375 | |
| Foreign exchange contracts | | | | | | | | Options written, at value | | | 672,863 | |
| Equity contracts | | Investments, at value | | | 639,000 | ** | | | | | | |
| Foreign exchange contracts | | Investments, at value | | | 397,763 | ** | | | | | | |
| Interest rate contracts | | Investments, at value | | | 205,406 | ** | | | | | | |
| | | | | | | | | | | | |
| Total | | | | $ | 20,006,658 | | | | | $ | 13,074,716 | |
| | | | | | | | | | | | |
* Includes only the current day’s variation margin. Prior variation margin movements have been reflected in cash on the Consolidated Statement of Assets and Liabilities upon receipt or payment.
** Amounts relate to purchased option contracts and purchased swaption contracts.
The effect of derivative instruments on the Consolidated Statement of Operations is as follows:
40 OPPENHEIMER DIVERSIFIED ALTERNATIVES FUND/VA
5. Risk Exposures and the Use of Derivative Instruments (Continued)
| | | | | | | | | | | | | | | | | | | | | | | | |
| | | Amount of Realized Gain or (Loss) Recognized on Derivatives | |
Derivatives Not Accounted for as Hedging Instruments | | Investment from
unaffiliated
companies (including
premiums on options
exercised)* | | | Closing and
expiration of option
contracts written | | | Closing and
expiration of futures
contracts | | | Foreign currency
transactions | | | Swap contracts | | | Total | |
| Commodity contracts | | $ | 8,280 | | | $ | — | | | $ | (208,962 | ) | | $ | — | | | $ | (1,501,277 | ) | | $ | (1,701,959 | ) |
| Credit contracts | | | — | | | | — | | | | — | | | | — | | | | (382,551 | ) | | | (382,551 | ) |
| Equity contracts | | | 747,931 | | | | 22,352 | | | | 831,323 | | | | — | | | | (799,339 | ) | | | 802,267 | |
| Foreign exchange contracts | | | 91,864 | | | | 851,363 | | | | — | | | | 1,041,494 | | | | — | | | | 1,984,721 | |
| Interest rate contracts | | | (11,944) | | | | — | | | | 315,682 | | | | — | | | | 104,124 | | | | 407,862 | |
| Volatility contracts | | | — | | | | — | | | | (182,400 | ) | | | — | | | | 8,673,797 | | | | 8,491,397 | |
| | | | |
Total | | $ | 836,131 | | | $ | 873,715 | | | $ | 755,643 | | | $ | 1,041,494 | | | $ | 6,094,754 | | | $ | 9,601,737 | |
| | | | |
* Includes purchased option contracts, purchased swaption contracts, written option contracts exercised and written swaption contracts exercised, if any.
| | | | | | | | | | | | | | | | | | | | | | | | |
| | | Amount of Change in Unrealized Gain or (Loss) Recognized on Derivatives | |
Derivatives Not Accounted for as Hedging Instruments | | Investments* | | | Option contracts
written | | | Futures contracts | | | Translation of assets
and liabilities
denominated in
foreign currencies | | | Swap contracts | | | Total | |
| Commodity contracts | | $ | — | | | $ | — | | | $ | (95,414 | ) | | $ | — | | | $ | (280,052 | ) | | $ | (375,466 | ) |
| Credit contracts | | | — | | | | — | | | | — | | | | — | | | | 154,881 | | | | 154,881 | |
| Equity contracts | | | 15,067 | | | | 111,780 | | | | (494,499 | ) | | | — | | | | 251,055 | | | | (116,597 | ) |
| Foreign exchange contracts | | | (269,396 | ) | | | 15,140 | | | | — | | | | 6,631,113 | | | | — | | | | 6,376,857 | |
| Interest rate contracts | | | (143,981 | ) | | | — | | | | 16,506 | | | | — | | | | 20,024 | | | | (107,451 | ) |
| Volatility contracts | | | — | | | | — | | | | (66,743 | ) | | | — | | | | (26,560 | ) | | | (93,303 | ) |
| | | | |
Total | | $ | (398,310 | ) | | $ | 126,920 | | | $ | (640,150 | ) | | $ | 6,631,113 | | | $ | 119,348 | | | $ | 5,838,921 | |
| | | | |
* Includes purchased option contracts and purchased swaption contracts, if any.
6. Shares of Beneficial Interest
The Fund has authorized an unlimited number of $0.001 par value shares of beneficial interest of each class. Transactions in shares of beneficial interest were as follows:
| | | | | | | | | | | | | | | | | | |
| | | Year Ended December 31, 2014 | | | | | Period Ended December 31, 20131 | |
| | | Shares | | | Amount | | | | | Shares | | | Amount | |
| Non-Service Shares | | | | | | | | | | | | | | | | | | |
| Sold | | | 24,008,256 | | | $ | 249,427,902 | | | | | | 999,000 | | | $ | 9,990,000 | |
| Dividends and/or distributions reinvested | | | 1,139,749 | | | | 11,478,135 | | | | | | 1,108 | | | | 10,989 | |
| Redeemed | | | — | | | | — | | | | | | — | | | | — | |
| | | | |
| Net increase | | | 25,148,005 | | | $ | 260,906,037 | | | | | | 1,000,108 | | | $ | 10,000,989 | |
| | | | |
| | | | | | | | | | | | | | | | | | | |
Service Shares | | | | | | | | | | | | | | | | | | |
| Sold | | | 143,042 | | | $ | 1,512,896 | | | | | | 1,000 | | | $ | 10,000 | |
| Dividends and/or distributions reinvested | | | 5,873 | | | | 59,078 | | | | | | 1 | | | | 8 | |
| Redeemed | | | (17,184 | ) | | | (180,391 | ) | | | | | — | | | | — | |
| | | | |
| Net increase | | | 131,731 | | | $ | 1,391,583 | | | | | | 1,001 | | | $ | 10,008 | |
| | | | |
1. For the period from November 14, 2013 (commencement of operations) to December 31, 2013.
7. Purchases and Sales of Securities
The aggregate cost of purchases and proceeds from sales of securities, other than short-term obligations and investments in IMMF, for the year ended December 31, 2014 were as follows:
| | | | | | | | | | |
| | | Purchases | | | | | Sales | |
Investment securities | | $ | 219,795,182 | | | | | $ | 111,581,602 | |
8. Fees and Other Transactions with Affiliates
Management Fees. Under the investment advisory agreement, the Fund pays the Manager a management fee based on the daily net assets of the Fund at an annual rate as shown in the following table:
| | | | | | | | |
| Fee Schedule | | | | | | | |
Up to $500 million | | | 1.00 | % | | | | |
Next $500 million | | | 0.95 | | | | | |
Next $4 billion | | | 0.90 | | | | | |
Over $5 billion | | | 0.88 | | | | | |
41 OPPENHEIMER DIVERSIFIED ALTERNATIVES FUND/VA
NOTES TO CONSOLIDATED FINANCIAL STATEMENTS Continued
8. Fees and Other Transactions with Affiliates (Continued)
The Manager also provides investment management related services to the Subsidiary. The Subsidiary pays the Manager a monthly management fee at an annual rate according to the above schedule. The Subsidiary also pays certain other expenses including custody and directors’ fees.
The Fund’s management fee for the fiscal year ended December 31, 2014 was 1.00% of average annual net assets before any Subsidiary management fees or any applicable waivers.
Sub-Adviser Fees. The Manager has retained the Sub-Adviser to provide the day-to-day portfolio management of the Fund and the Subsidiary. Under the Sub-Advisory Agreement, the Manager pays the Sub-Adviser an annual fee in monthly installments, equal to a percentage of the investment management fee collected by the Manager from the Fund and the Subsidiary, which shall be calculated after any investment management fee waivers. The fee paid to the Sub-Adviser is paid by the Manager, not by the Fund.
Sub-Sub-Adviser Fees. The Sub-Adviser retains the Sub-Sub-Adviser to provide the day-today portfolio management of the Fund. Under the Sub-Sub-Advisory Agreement, the Sub-Adviser pays the Sub-Sub-Adviser an annual fee in monthly installments, based on the average daily net assets of the Fund. The fee paid to the Sub-Sub-Adviser under the Sub-Sub-Advisory agreement is paid by the Sub-Adviser, not by the Fund.
Transfer Agent Fees. OFI Global (the “Transfer Agent”) serves as the transfer and shareholder servicing agent for the Fund. The Fund pays the Transfer Agent a fee based on annual net assets. Fees incurred and average net assets for each class with respect to these services are detailed in the Consolidated Statement of Operations and Consolidated Financial Highlights, respectively.
Sub-Transfer Agent Fees. The Transfer Agent has retained Shareholder Services, Inc., a wholly-owned subsidiary of OFI (the “Sub-Transfer Agent”), to provide the day-to-day transfer agent and shareholder servicing of the Fund. Under the Sub-Transfer Agency Agreement, the Transfer Agent pays the Sub-Transfer Agent an annual fee in monthly installments, equal to a percentage of the transfer agent fee collected by the Transfer Agent from the Fund, which shall be calculated after any applicable fee waivers. The fee paid to the Sub-Transfer Agent is paid by the Transfer Agent, not by the Fund.
Trustees’ Compensation. The Fund’s Board of Trustees (“Board”) has adopted a compensation deferral plan for Independent Trustees that enables Trustees to elect to defer receipt of all or a portion of the annual compensation they are entitled to receive from the Fund. For purposes of determining the amount owed to the Trustee under the plan, deferred amounts are treated as though equal dollar amounts had been invested in shares of the Fund or in other Oppenheimer funds selected by the Trustee. The Fund purchases shares of the funds selected for deferral by the Trustee in amounts equal to his or her deemed investment, resulting in a Fund asset equal to the deferred compensation liability. Such assets are included as a component of “Other” within the asset section of the Consolidated Statement of Assets and Liabilities. Deferral of Trustees’ fees under the plan will not affect the net assets of the Fund and will not materially affect the Fund’s assets, liabilities or net investment income per share. Amounts will be deferred until distributed in accordance with the compensation deferral plan.
Distribution and Service Plan for Service Shares. The Fund has adopted a Distribution and Service Plan (the “Plan”) pursuant to Rule 12b-1 under the 1940 Act for Service shares to pay OppenheimerFunds Distributor, Inc. (the “Distributor”), for distribution related services, personal service and account maintenance for the Fund’s Service shares. Under the Plan, payments are made periodically at an annual rate of 0.25% of the daily net assets of Service shares of the Fund. The Distributor currently uses all of those fees to compensate sponsors of the insurance product that offers Fund shares, for providing personal service and maintenance of accounts of their variable contract owners that hold Service shares. These fees are paid out of the Fund’s assets on an on-going basis and increase operating expenses of the Service shares, which results in lower performance compared to the Fund’s shares that are not subject to a service fee. Fees incurred by the Fund under the Plan are detailed in the Consolidated Statement of Operations.
Waivers and Reimbursements of Expenses. The Manager has contractually agreed to waive fees and/or reimburse expenses to limit the Fund’s “Expenses after payments, waivers and/or reimbursements and reduction to custodian expenses” (excluding any applicable dividend expense, taxes, interest and fees from borrowing, any subsidiary expenses, Acquired Fund Fees and Expenses, brokerage commissions, extraordinary expenses and certain other Fund expenses) so that, as percentages of average daily net assets, those expenses will not exceed the annual rate of 1.20% for Non-Service shares and 1.45% for Service shares. During the period ended December 31, 2014, the Manager waived fees and/or reimbursed the Fund $34,204 and $127 for Non-Service and Service, respectively.
The Manager has contractually agreed to waive the Fund’s management fee in an amount equal to the management fee of the Subsidiary. During the year ended December 31, 2014, this waiver reduced the Fund’s management fee by $138,626.
The Manager will waive fees and/or reimburse Fund expenses in an amount equal to the indirect management fees incurred through the Fund’s investment in IMMF and Master Funds. During the year ended December 31, 2014, the Manager waived fees and/or reimbursed the Fund $33,484 for management fees.
These undertakings may be modified or terminated as set forth according to the terms in the prospectus.
42 OPPENHEIMER DIVERSIFIED ALTERNATIVES FUND/VA
9. Borrowings and Other Financing
Securities Sold Short. The Fund sells securities that it does not own, and it will therefore be obligated to purchase such securities at a future date. Upon entering into a short position, the Fund is required to segregate cash or securities at its custodian which are pledged for the benefit of the lending broker and/or to deposit and pledge cash directly at the lending broker, with a value equal to a certain percentage, exceeding 100%, of the value of the securities that it sold short. Cash that has been segregated and pledged for this purpose will be disclosed on the Consolidated Statement of Assets and Liabilities; securities that have been segregated and pledged for this purpose are disclosed as such in the Consolidated Statement of Investments. The aggregate market value of such cash and securities at period end is $18,087,043. The value of the open short position is recorded as a liability, and the Fund records an unrealized gain or loss to the extent of the difference between the proceeds received and the change in value of the open short position. The Fund records a realized gain or loss when the short position is closed out. By entering into short sales, the Fund bears the market risk of increases in value of the security sold short in excess of the proceeds received. Until the security is replaced, the Fund is required to pay the lender any dividend or interest earned. Dividend expense on short sales is treated as an expense in the Consolidated Statement of Operations.
10. Pending Litigation
In 2009, seven class action lawsuits were filed in the U.S. District Court for the District of Colorado against OppenheimerFunds, Inc. (“OFI”), OppenheimerFunds Distributor, Inc., the Fund’s principal underwriter and distributor (the “Distributor”), and certain funds (but not including the Fund) advised by OFI Global Asset Management, Inc. and distributed by the Distributor (the “Defendant Funds”). The lawsuits also named as defendants certain officers and current and former trustees of the respective Defendant Funds. The lawsuits raised claims under federal securities laws and alleged, among other things, that the disclosure documents of the respective Defendant Funds contained misrepresentations and omissions and that the respective Defendant Funds’ investment policies were not followed. The plaintiffs in these actions sought unspecified damages, equitable relief and awards of attorneys’ fees and litigation expenses. The Defendant Funds’ Boards of Trustees also engaged counsel to represent the Funds and the present and former Independent Trustees named in those suits. In March 2014, the parties in six of these lawsuits executed stipulations and agreements of settlement resolving those actions. In July 2014, the court entered an order and final judgment approving the settlements as fair, reasonable and adequate. The settlements do not resolve a seventh outstanding lawsuit relating to Oppenheimer Rochester California Municipal Fund (the “California Fund Suit”). OFI believes the California Fund Suit is without legal merit and is defending the suit vigorously. While it is premature to render any opinion as to the outcome in the California Fund Suit, or whether any costs that OFI may bear in defending the California Fund Suit might not be reimbursed by insurance, OFI believes the California Fund Suit should not impair the ability of OFI or the Distributor to perform their respective duties to the Fund, and that the outcome of the California Fund Suit should not have any material effect on the operations of any of the Oppenheimer funds.
43 OPPENHEIMER DIVERSIFIED ALTERNATIVES FUND/VA
REPORT OF INDEPENDENT REGISTERED PUBLIC ACCOUNTING FIRM
The Board of Trustees and Shareholders of Oppenheimer Variable Account Funds:
We have audited the accompanying consolidated statement of assets and liabilities of Oppenheimer Diversified Alternatives Fund/VA (a separate series of Oppenheimer Variable Account Funds) and subsidiary, including the consolidated statement of investments, as of December 31, 2014, and the related consolidated statement of operations for the year then ended, the consolidated statements of changes in net assets and the consolidated financial highlights for each of the years or periods in the two-year period then ended. These consolidated financial statements and consolidated financial highlights are the responsibility of the Fund’s management. Our responsibility is to express an opinion on these consolidated financial statements and consolidated financial highlights based on our audits.
We conducted our audits in accordance with the standards of the Public Company Accounting Oversight Board (United States). Those standards require that we plan and perform the audit to obtain reasonable assurance about whether the financial statements and financial highlights are free of material misstatement. An audit includes examining, on a test basis, evidence supporting the amounts and disclosures in the financial statements. Our procedures included confirmation of securities owned as of December 31, 2014, by correspondence with the custodian, transfer agent and brokers, or by other appropriate auditing procedures where replies from brokers were not received. An audit also includes assessing the accounting principles used and significant estimates made by management, as well as evaluating the overall financial statement presentation. We believe that our audits provide a reasonable basis for our opinion.
In our opinion, the consolidated financial statements and consolidated financial highlights referred to above present fairly, in all material respects, the financial position of Oppenheimer Diversified Alternatives Fund/VA and subsidiary as of December 31, 2014, the results of their operations for the year then ended, the changes in their net assets and the consolidated financial highlights for each of the years or periods in the two-year period then ended, in conformity with U.S. generally accepted accounting principles.
KPMGLLP
Denver, Colorado
February 19, 2015
44 OPPENHEIMER DIVERSIFIED ALTERNATIVES FUND/VA
FEDERAL INCOME TAX INFORMATION Unaudited
In early 2015, if applicable, shareholders of record received information regarding all dividends and distributions paid to them by the Fund during calendar year 2014.
Capital gain distributions of $0.01153 per share were paid to Non-Service and Service shareholders, respectively, on December 23, 2014. Whether received in stock or in cash, the capital gain distribution should be treated by shareholders as a gain from the sale of the capital assets held for more than one year (long-term capital gains).
The Fund experienced a return of capital during the period ending December 31, 2014. Final return of capital numbers will be available at a later date when certain required information for partnership investments is available.
Dividends, if any, paid by the Fund during the fiscal year ended December 31, 2014 which are not designated as capital gain distributions should be multiplied by the maximum amount allowable but not less than 2.50% to arrive at the amount eligible for the corporate dividend-received deduction.
The foregoing information is presented to assist shareholders in reporting distributions received from the Fund to the Internal Revenue Service. Because of the complexity of the federal regulations which may affect your individual tax return and the many variations in state and local tax regulations, we recommend that you consult your tax advisor for specific guidance.
45 OPPENHEIMER DIVERSIFIED ALTERNATIVES FUND/VA
BOARD APPROVAL OF THE FUND’S INVESTMENT ADVISORY AND SUB-ADVISORY AGREEMENTS Unaudited
The Fund has entered into an investment advisory agreement with OFI Global Asset Management, Inc. (“OFI Global” or the “Adviser”), a wholly-owned subsidiary of OppenheimerFunds, Inc. (“OFI” or the “Sub-Adviser”) (“OFI Global” and “OFI”) together the “Managers”). OFI Global has entered into a sub-advisory agreement with OFI whereby OFI provides investment sub-advisory services to the Fund, and OFI has entered into sub-sub-advisory agreements with Cornerstone Real Estate Advisers LLC (“Cornerstone”) and OFI SteelPath, Inc., (“SteelPath”), (jointly, the “Sub-Sub-Advisers”), whereby Cornerstone and SteelPath provide investment sub-sub-advisory services to the Fund (collectively, the “Agreements”). Each year, the Board of Trustees (the “Board”), including a majority of the independent Trustees, is required to determine whether to renew the Agreements. The Investment Company Act of 1940, as amended, requires that the Board request and evaluate, and that the Managers provide, such information as may be reasonably necessary to evaluate the terms of the Agreements. The Board employs an independent consultant to prepare a report that provides information, including comparative information that the Board requests for that purpose. In addition to in-person meetings focused on this evaluation, the Board receives information throughout the year regarding Fund services, fees, expenses and performance.
The Managers, the Sub-Sub Advisers and the independent consultant provided information to the Board on the following factors: (i) the nature, quality and extent of the Managers’ and the Sub-Sub Advisers’ services, (ii) the investment performance of the Fund, the Managers and the Sub-Sub Advisers, (iii) the fees and expenses of the Fund, including comparative expense information, (iv) the profitability of the Managers and the Sub-Sub Advisers, including an analysis of the cost of providing services, (v) whether economies of scale are realized as the Fund grows and whether fee levels reflect these economies of scale for Fund investors and (vi) other benefits to the Managers and the Sub-Sub Advisers from their relationship with the Fund. The Board was aware that there are alternatives to retaining the Managers and the Sub-Sub Advisers.
Outlined below is a summary of the principal information considered by the Board as well as the Board’s conclusions.
Nature, Quality and Extent of Services. The Board considered information about the nature, quality and extent of the services provided to the Fund and information regarding the Managers’ and Sub-Sub Advisers’ key personnel who provide such services. OFI and the Sub-Sub-Advisers’ duties include providing the Fund with the services of the portfolio managers and the Sub-Sub-Advisers’ investment team, who provide research, analysis and other advisory services in regard to the Fund’s investments. The Managers’ duties include securities trading services; oversight of third-party service providers; monitoring compliance with applicable Fund policies and procedures and adherence to the Fund’s investment restrictions; and risk management. The Managers are responsible for providing certain administrative services to the Fund as well. Those services include providing and supervising all administrative and clerical personnel who are necessary in order to provide effective corporate administration for the Fund; compiling and maintaining records with respect to the Fund’s operations; preparing and filing reports required by the Securities and Exchange Commission; preparing periodic reports regarding the operations of the Fund for its shareholders; preparing proxy materials for shareholder meetings; and preparing the registration statements required by Federal and state securities laws for the sale of the Fund’s shares. The Managers also provide the Fund with office space, facilities and equipment.
The Board also considered the quality of the services provided and the quality of the Managers’ and Sub-Sub Advisers’ resources that are available to the Fund. The Board took account of the fact that the Sub-Adviser has had over fifty years of experience as an investment adviser and that its assets under management rank it among the top mutual fund managers in the United States. The Board evaluated the Sub-Adviser’s advisory, administrative, accounting, legal, compliance services and risk management, and information the Board has received regarding the experience and professional qualifications of the Managers’ key personnel and the size and functions of its staff. In its evaluation of the quality of the portfolio management services provided, the Board considered the experience of Mark Hamilton, Benjamin Rockmuller, Dokyoung Lee, David Wharmby, and Brian Watson, the portfolio managers for the Fund, and OFI’s and the Sub-Sub-Advisers’ investment team and analysts. The Board members also considered the totality of their experiences with the Managers as directors or trustees of the Fund and other funds advised by the Managers. The Board considered information regarding the quality of services provided by affiliates of the Managers, which its members have become knowledgeable about in connection with the renewal of the Fund’s service agreements. The Board concluded, in light of the Managers’ and the Sub-Sub Advisers’ experience, reputation, personnel, operations and resources that the Fund benefits from the services provided under the Agreements.
Investment Performance of the Fund. The Board considered that the Fund was launched on November 14, 2013 and therefore does not have a full calendar year of performance. The Board noted that the Fund’s 2014 relative performance is strong, ranking in the second percentile of its category for the year-to-date period ended April 30, 2014.
Costs of Services. The Board reviewed the fees paid to the Managers and the Sub-Sub Advisers and the other expenses borne by the Fund. The Board noted that the Manager, not the Fund, pays the Sub-Adviser’s fee under the sub-advisory agreement and the Sub-Adviser pays the Sub-Sub-Advisers’ fees under the sub-sub-advisory agreements. The independent consultant provided comparative data in regard to the fees and expenses of the Fund and other retail multialternative funds underlying variable insurance products. In reviewing the fees and expenses charged to the Fund, the Board considered the Manager’s assertion that, because there is much greater disparity in the fees and services that may be provided by a manager to a VA fund as opposed to a retail fund, when comparing the expenses of the Fund to those of retail funds, it is most appropriate to focus on total expenses (rather than on the management fees). Accordingly, while the Board reviewed and considered all expenses, it focused on total expenses. The Board noted that the Fund’s contractual management fees and total expenses were lower than their respective peer group median and category median and ranked in the first quintile of their expense group. Within the total asset range of $0 to $50 million, the Fund’s effective management fee rate was lower than its peer group median and category median. The Board further considered that the Manager has contractually agreed to limit the Fund’s total annual operating expenses so that those expenses, as percentages of daily net assets, will not exceed the annual rate of 1.20% for Non-Service Shares and 1.45% for Service Shares. This waiver and/or reimbursement may not be amended or withdrawn for one year from the date of the Fund’s prospectus, unless approved by the Board.
Economies of Scale and Profits Realized by the Managers and Sub-Sub Advisers. The Board considered information regarding the Managers’ and Sub-Sub Advisers’ costs in providing services to the Fund, including the costs associated with the personnel and systems necessary to manage the Fund. The Board reviewed whether the Managers may realize economies of scale in managing and supporting the Fund. The Board noted
46 OPPENHEIMER DIVERSIFIED ALTERNATIVES FUND/VA
that the Fund has management fee breakpoints, which are intended to share with Fund shareholders economies of scale that may exist as the Fund’s assets grow.
Other Benefits to the Managers. In addition to considering the profits realized by the Managers, the Board considered information that was provided regarding the direct and indirect benefits the Managers receive as a result of their relationship with the Fund, including compensation paid to the Managers’ affiliates and research provided to the Adviser in connection with permissible brokerage arrangements (soft dollar arrangements). The Board also considered that the Managers and Sub-Sub Advisers must be able to pay and retain experienced professional personnel at competitive rates to provide quality services to the Fund.
Conclusions. These factors were also considered by the independent Trustees meeting separately from the full Board, assisted by experienced counsel to the Fund and to the independent Trustees. Fund counsel and the independent Trustees’ counsel are independent of the Managers and Sub-Sub Advisers within the meaning and intent of the Securities and Exchange Commission Rules.
Based on its review of the information it received and its evaluations described above, the Board, including a majority of the independent Trustees, decided to continue the Agreements through August 31, 2015. In arriving at its decision, the Board did not identify any factor or factors as being more important than others, but considered all of the above information, and considered the terms and conditions of the Agreements, including the management fees, in light of all the surrounding circumstances.
47 OPPENHEIMER DIVERSIFIED ALTERNATIVES FUND/VA
PORTFOLIO PROXY VOTING POLICIES AND PROCEDURES; UPDATES TO STATEMENTS OF INVESTMENTS Unaudited
The Fund has adopted Portfolio Proxy Voting Policies and Procedures under which the Fund votes proxies relating to securities (“portfolio proxies”) held by the Fund. A description of the Fund’s Portfolio Proxy Voting Policies and Procedures is available (i) without charge, upon request, by calling the Fund toll-free at 1.800.525.7048, (ii) on the Fund’s website at www.oppenheimerfunds.com, and (iii) on the SEC’s website at www.sec.gov. In addition, the Fund is required to file Form N-PX, with its complete proxy voting record for the 12 months ended June 30th, no later than August 31st of each year. The Fund’s voting record is available (i) without charge, upon request, by calling the Fund toll-free at 1.800.525.7048, and (ii) in the Form N-PX filing on the SEC’s website at www.sec.gov.
The Fund files its complete schedule of portfolio holdings with the SEC for the first quarter and the third quarter of each fiscal year on Form N-Q. The Fund’s Form N-Q filings are available on the SEC’s website at www.sec.gov. Those forms may be reviewed and copied at the SEC’s Public Reference Room in Washington, D.C. Information on the operation of the Public Reference Room may be obtained by calling 1-800-SEC-0330.
48 OPPENHEIMER DIVERSIFIED ALTERNATIVES FUND/VA
TRUSTEES AND OFFICERS Unaudited
| | |
Name, Position(s) Held with the Fund,
Length of Service, Year of Birth | | Principal Occupation(s) During the Past 5 Years; Other Trusteeships/Directorships Held;
Number of Portfolios in the Fund Complex Currently Overseen |
| |
| INDEPENDENT TRUSTEES | | The address of each Trustee in the chart below is 6803 S. Tucson Way, Centennial, Colorado
80112-3924. Each Trustee serves for an indefinite term, or until his or her resignation, retirement,
death or removal. |
| |
Sam Freedman, Chairman of the Board of Trustees and Trustee (since 2013) Year of Birth: 1940 | | Director of Colorado UpLIFT (charitable organization) (since September 1984). Mr. Freedman held several positions with the Sub-Adviser and with subsidiary or affiliated companies of the Sub-Adviser (until October 1994). Oversees 38 portfolios in the OppenheimerFunds complex. Mr. Freedman has served on the Boards of certain Oppenheimer funds since 1996, during which time he has become familiar with the Fund’s (and other Oppenheimer funds’) financial, accounting, regulatory and investment matters and has contributed to the Boards’ deliberations. |
| |
Jon S. Fossel, Trustee (since 2013) Year of Birth: 1942 | | Chairman of the Board of Jack Creek Preserve Foundation (non-profit organization) (since 2005); Chairman of the Board (2006-December 2011) and Director (June 2002-December 2011) of UNUMProvident (insurance company); Director of Northwestern Energy Corp. (public utility corporation) (November 2004-December 2009); Director of P.R. Pharmaceuticals (October 1999-October 2003); Director of Rocky Mountain Elk Foundation (non-profit organization) (February 1998-February 2003 and February 2005-February 2007); Chairman and Director (until October 1996) and President and Chief Executive Officer (until October 1995) of the Sub-Adviser; President, Chief Executive Officer and Director of the following: Oppenheimer Acquisition Corp. (“OAC”) (parent holding company of the Sub-Adviser), Shareholder Services, Inc. and Shareholder Financial Services, Inc. (until October 1995). Oversees 38 portfolios in the OppenheimerFunds complex. Mr. Fossel has served on the Boards of certain Oppenheimer funds since 1990, during which time he has become familiar with the Fund’s (and other Oppenheimer funds’) financial, accounting, regulatory and investment matters and has contributed to the Boards’ deliberations. |
| |
Richard F. Grabish, Trustee (since 2013) Year of Birth: 1948 | | Formerly Senior Vice President and Assistant Director of Sales and Marketing (March 1997-December 2007), Director (March 1987-December 2007) and Manager of Private Client Services (June 1985-June 2005) of A.G. Edwards & Sons, Inc. (broker/dealer and investment firm); Chairman and Chief Executive Officer of A.G. Edwards Trust Company, FSB (March 2001-December 2007); President and Vice Chairman of A.G. Edwards Trust Company, FSB (investment adviser) (April 1987-March 2001); President of A.G. Edwards Trust Company, FSB (investment adviser) (June 2005-December 2007). Oversees 38 portfolios in the OppenheimerFunds complex. Mr. Grabish has served on the Boards of certain Oppenheimer funds since 2001, during which time he has become familiar with the Fund’s (and other Oppenheimer funds’) financial, accounting, regulatory and investment matters and has contributed to the Boards’ deliberations. |
| |
Beverly L. Hamilton, Trustee (since 2013) Year of Birth: 1946 | | Trustee of Monterey Institute for International Studies (educational organization) (since February 2000); Board Member of Middlebury College (educational organization) (December 2005-June 2011); Chairman (since 2010) of American Funds’ Emerging Markets Growth Fund, Inc. (mutual fund); Director of The California Endowment (philanthropic organization) (April 2002-April 2008); Director (February 2002-2005) and Chairman of Trustees (2006-2007) of the Community Hospital of Monterey Peninsula; Director (October 1991-2005); Vice Chairman (2006-2009) of American Funds’ Emerging Markets Growth Fund, Inc. (mutual fund); President of ARCO Investment Management Company (February 1991-April 2000); Member of the investment committees of The Rockefeller Foundation (2001-2006) and The University of Michigan (since 2000); Advisor at Credit Suisse First Boston’s Sprout venture capital unit (venture capital fund) (1994-January 2005); Trustee of MassMutual Institutional Funds (investment company) (1996-June 2004); Trustee of MML Series Investment Fund (investment company) (April 1989-June 2004); Member of the investment committee of Hartford Hospital (2000-2003); and Advisor to Unilever (Holland) pension fund (2000-2003). Oversees 38 portfolios in the OppenheimerFunds complex. Ms. Hamilton has served on the Boards of certain Oppenheimer funds since 2002, during which time she has become familiar with the Fund’s (and other Oppenheimer funds’) financial, accounting, regulatory and investment matters and has contributed to the Boards’ deliberations. |
| |
Victoria J. Herget, Trustee (since 2013) Year of Birth:1951 | | Board Chair (2008-Present) and Director (2004-Present), United Educators (insurance company); Trustee (since 2000) and Chair (since 2010), Newberry Library (independent research library); Trustee, Mather LifeWays (senior living organization) (since 2001); Independent Director of the First American Funds (mutual fund family) (2003-2011); former Managing Director (1993-2001), Principal (1985-1993), Vice President (1978-1985) and Assistant Vice President (1973-1978) of Zurich Scudder Investments (investment adviser) (and its predecessor firms); Trustee (1992-2007), Chair of the Board of Trustees (1999-2007), Investment Committee Chair (1994-1999) and Investment Committee member (2007-2010) of Wellesley College; Trustee, BoardSource (non-profit organization) (2006-2009) and Chicago City Day School (K-8 School) (1994-2005). Oversees 38 portfolios in the OppenheimerFunds complex. Ms. Herget has served on the Boards of certain Oppenheimer funds since 2012, during which time she has become familiar with the Fund’s (and other Oppenheimer funds’) financial, accounting, regulatory and investment matters and has contributed to the Boards’ deliberations. |
| |
Robert J. Malone, Trustee (since 2013) Year of Birth: 1944 | | Chairman of the Board (since 2012) and Director (since August 2005) of Jones International University (educational organization); Chairman, Chief Executive Officer and Director of Steele Street Bank Trust (commercial banking) (since August 2003); Trustee of the Gallagher Family Foundation (non-profit organization) (since 2000); Board of Directors of Opera Colorado Foundation (non-profit organization) (2008-2012); Director of Colorado UpLIFT (charitable organization) (1986-2010); Director of Jones Knowledge, Inc. (2006-2010); Former Chairman of U.S. Bank-Colorado (subsidiary of U.S. Bancorp and formerly Colorado National Bank) (July 1996-April 1999); Director of Commercial Assets, Inc. (real estate investment trust) (1993-2000); Director of U.S. Exploration, Inc. (oil and gas exploration) (1997-February 2004); Chairman of the Board (1991-1994) and Trustee (1985-1994) of Regis University; and Chairman of the Board (1990-1991 and Trustee (1984-1999) of Young Presidents Organization. Oversees 38 portfolios in the OppenheimerFunds complex. Mr. Malone has served on the Boards of certain Oppenheimer funds since 2002, during which time he has become familiar with the Fund’s (and other Oppenheimer funds’) financial, accounting, regulatory and investment matters and has contributed to the Boards’ deliberations. |
49 OPPENHEIMER DIVERSIFIED ALTERNATIVES FUND/VA
TRUSTEES AND OFFICERS Unaudited / Continued
| | |
F. William Marshall, Jr., Trustee (since 2013) Year of Birth: 1942 | | Trustee Emeritus of Worcester Polytech Institute (WPI) (private university) (since 2009); Trustee of MassMutual Select Funds (formerly MassMutual Institutional Funds) (investment company) (since 1996), MML Series Investment Fund (investment company) (since 1996) and Mass Mutual Premier Funds (investment company) (since January 2012); President and Treasurer of the SIS Fund (private charitable fund) (January 1999 – March 2011); Former Trustee of WPI (1985-2008); Former Chairman of the Board (2004-2006) and Former Chairman of the Investment Committee of WPI (1994-2008); Chairman of SIS & Family Bank, F.S.B. (formerly SIS Bank) (commercial bank) (January 1999-July 1999); Executive Vice President of Peoples Heritage Financial Group, Inc. (commercial bank) (January 1999-July 1999); and Former President and Chief Executive Officer of SIS Bancorp. (1993-1999). Oversees 42 portfolios in the OppenheimerFunds complex. Mr. Marshall has served on the Boards of certain Oppenheimer funds since 2000, during which time he has become familiar with the Fund’s (and other Oppenheimer funds’) financial, accounting, regulatory and investment matters and has contributed to the Boards’ deliberations. |
| |
Karen L. Stuckey, Trustee (since 2013) Year of Birth: 1953 | | Partner (1990-2012) of PricewaterhouseCoopers LLP (professional services firm) (held various positions 1975- 1990); Trustee (1992-2006) and member of Executive, Nominating and Audit Committees and Chair of Finance Committee of Lehigh University; and member, Women’s Investment Management Forum (professional organization) since inception. Oversees 38 portfolios in the OppenheimerFunds complex. Ms. Stuckey has served on the Boards of certain Oppenheimer funds since 2012, during which time she has become familiar with the Fund’s (and other Oppenheimer funds’) financial, accounting, regulatory and investment matters and has contributed to the Boards’ deliberations. |
| |
James D. Vaughn, Trustee (since 2013) Year of Birth: 1945 | | Retired; former managing partner (1994-2001) of Denver office of Deloitte & Touche LLP, (held various positions 1969-1993); Trustee and Chairman of the Audit Committee of Schroder Funds (2003-2012); Board member and Chairman of Audit Committee of AMG National Trust Bank (since 2005); Trustee and Investment Committee member, University of South Dakota Foundation (since 1996); Board member, Audit Committee Member and past Board Chair, Junior Achievement (since 1993); former Board member, Mile High United Way, Boys and Girls Clubs, Boy Scouts, Colorado Business Committee for the Arts, Economic Club of Colorado and Metro Denver Network. Oversees 38 portfolios in the OppenheimerFunds complex. Mr. Vaughn has served on the Boards of certain Oppenheimer funds since 2012, during which time he has become familiar with the Fund’s (and other Oppenheimer funds’) financial, accounting, regulatory and investment matters and has contributed to the Boards’ deliberations. |
| | |
| INTERESTED TRUSTEE | | Mr. Glavin is an “Interested Trustee” because he is affiliated with the Manager and the Sub-Adviser by virtue of his positions as director of the Sub-Adviser, and as a shareholder of the Sub-Adviser’s parent company. As a Trustee, he serves for an indefinite term, or until his resignation, retirement, death or removal. Mr. Glavin’s address is 225 Liberty Street, 11th Floor, New York, New York 10281-1008. |
| |
William F. Glavin, Jr., Trustee (since 2013) Year of Birth: 1958 | | Chairman of the Sub-Adviser (July 2014-December 2014 and December 2009-December 2012) and Director of the Sub-Adviser (since January 2009); Chairman, Director and Chief Executive Officer (January 2013-June 2014) of the Manager; President of the Manager (January 2013-May 2013); Chief Executive Officer (January 2009-December 2012); President of the Sub-Adviser (May 2009-December 2012); Management Director (June 2009-June 2014), President (December 2009-June 2014) and Chief Executive Officer (January 2011-June 2014) of Oppenheimer Acquisition Corp. (“OAC”) (the Sub-Adviser’s parent holding company); Director of Oppenheimer Real Asset Management, Inc. (March 2010-June 2014); Executive Vice President (March 2006-February 2009) and Chief Operating Officer (July 2007-February 2009) of Massachusetts Mutual Life Insurance Company (OAC’s parent company); Director (May 2004-March 2006) and Chief Operating Officer and Chief Compliance Officer (May 2004-January 2005), President (January 2005-March 2006) and Chief Executive Officer (June 2005-March 2006) of Babson Capital Management LLC; Director (March 2005-March 2006), President (May 2003-March 2006) and Chief Compliance Officer (July 2005-March 2006) of Babson Capital Securities, Inc. (a broker-dealer); President (May 2003-March 2006) of Babson Investment Company, Inc.; Director (May 2004-August 2006) of Babson Capital Europe Limited; Director (May 2004-October 2006) of Babson Capital Guernsey Limited; Director (May 2004-March 2006) of Babson Capital Management LLC; Non-Executive Director (March 2005-March 2007) of Baring Asset Management Limited; Director (February 2005-June 2006) Baring Pension Trustees Limited; Director and Treasurer (December 2003-November 2006) of Charter Oak Capital Management, Inc.; Director (May 2006-September 2006) of C.M. Benefit Insurance Company; Director (May 2008-June 2009) and Executive Vice President (June 2007-July 2009) of C.M. Life Insurance Company; President (March 2006-May 2007) of MassMutual Assignment Company; Director (January 2005-December 2006), Deputy Chairman (March 2005-December 2006) and President (February 2005-March 2005) of MassMutual Holdings (Bermuda) Limited; Director (May 2008-June 2009) and Executive Vice President (June 2007-July 2009) of MML Bay State Life Insurance Company; Chief Executive Officer and President (April 2007-January 2009) of MML Distributors, LLC; and Chairman (March 2006-December 2008) and Chief Executive Officer (May 2007-December 2008) of MML Investors Services, Inc. An officer of 91 portfolios in the OppenheimerFunds complex. Mr. Glavin has served on the Boards of certain Oppenheimer funds since December 2009, during which time he has become familiar with the Fund’s (and other Oppenheimer funds’) financial, accounting, regulatory and investment matters and has contributed to the Boards’ deliberations. |
| | |
| OTHER OFFICERS OF THE FUND | | The addresses of the Officers in the chart below are as follows: for Messrs. Hamilton, Lee, Rockmuller, Steinmetz, Gabinet, Mss. Sexton and Picciotto, 225 Liberty Street, New York, New York 10281-1008, for Mr. Wixted, 6803 S. Tucson Way, Centennial, Colorado 80112-3924. Each Officer serves for an indefinite term or until his or her resignation, retirement, death or removal. |
| |
Mark Hamilton Vice President (since 2013) Year of Birth: 1965 | | Chief Investment Officer, Asset Allocation of the Sub-Adviser (since April 2013) and a Senior Vice President of the Sub-Adviser (since April 2013). Mr. Hamilton served at AllianceBernstein L.P. (from 1994-2013), as an Investment Director of Dynamic Asset Allocation (from 2010-2013), Head of North American Blend Team (from 2009-2010), and Senior Portfolio Manager of Blend Strategies (from 2006-2010). A portfolio manager and officer of other portfolios in the OppenheimerFunds complex. |
50 OPPENHEIMER DIVERSIFIED ALTERNATIVES FUND/VA
| | |
Dokyoung Lee, Vice President (since 2014) Year of Birth: 1965 | | Director of Research, Global Multi-Asset Group (since October 2013) and a Senior Vice President of the Sub-Adviser (since October 2013). Mr. Lee served at Alliance Bernstein L.P. (1994-2013): Director of Research for Strategic Asset Allocation (2011-2013), Director of Research for Blend Strategies (2008-2011), Head of Asia Pacific Blend Strategies (2005-2008), Head of Quantitative Research and Senior Portfolio Manager for Japan Value Equities (2001-2005), Portfolio Manager for Emerging Markets Value Equities (1997-2001), and Quantitative Analyst for US Value Equities (1994-1997). A portfolio manager and officer of other portfolios in the OppenheimerFunds complex. |
| |
Benjamin H. Rockmuller, Vice President (since 2014) Year of Birth: 1979 | | Vice President of the Sub-Adviser (since September 2010); Assistant Vice President of the Sub-Adviser (January 2010-August 2010); Portfolio Manager of the Sub-Adviser (since July 2010); Senior Analyst of the Sub-Adviser for the Global Debt Team (January 2010-July 2010); Intermediate Analyst of the Sub-Adviser for the Global Debt Team (January 2007-January 2010); Junior Analyst of the Sub-Adviser for the Global Debt Team (April 2004-January 2007) and Junior Analyst of the Sub-Adviser for the High Yield Team (June 2003-April 2004). A portfolio manager and an officer in the OppenheimerFunds complex. |
| |
Arthur P. Steinmetz, President and Principal Executive Officer (since 2014) Year of Birth: 1958 | | Chairman of the Sub-Adviser (since January 2015); CEO and Chairman of the Manager (since July 2014), President of the Manager (since May 2013), a Director of the Manager (since January 2013), Director of the Sub-Adviser (since July 2014), President, Management Director and CEO of Oppenheimer Acquisition Corp. (the Sub-Adviser’s parent holding company) (since July 2014), and President and Director of OFI SteelPath, Inc. (since January 2013). Chief Investment Officer of the OppenheimerFunds advisory entities from (January 2013-December 2013); Executive Vice President of the Manager (January 2013-May 2013); Chief Investment Officer of the Sub-Adviser (October 2010-December 2012); Chief Investment Officer, Fixed-Income, of the Sub-Adviser (April 2009-October 2010); Executive Vice President of the Sub-Adviser (October 2009-December 2012); Director of Fixed Income of the Sub-Adviser (January 2009-April 2009); and a Senior Vice President of the Sub-Adviser (March 1993-September 2009). An officer of 91 portfolios in the OppenheimerFunds complex. |
| |
Arthur S. Gabinet, Secretary and Chief Legal Officer (since 2013) Year of Birth: 1958 | | Executive Vice President, Secretary and General Counsel of the Manager (since January 2013); General Counsel OFI SteelPath, Inc. (since January 2013); Executive Vice President (May 2010-December 2012) and General Counsel (since January 2011) of the Sub-Adviser; General Counsel of the Distributor (since January 2011); General Counsel of Centennial Asset Management Corporation (January 2011-December 2012); Executive Vice President (January 2011-December 2012) and General Counsel of HarbourView Asset Management Corporation (since January 2011); Assistant Secretary (since January 2011) and Director (since January 2011) of OppenheimerFunds International Ltd. and OppenheimerFunds plc; Director of Oppenheimer Real Asset Management, Inc. (January 2011-December 2012) and General Counsel (since January 2011); Executive Vice President (January 2011-December 2011) and General Counsel of Shareholder Financial Services, Inc. and Shareholder Services, Inc. (since January 2011); Executive Vice President (January 2011-December 2012) and General Counsel of OFI Private Investments Inc. (since January 2011); Vice President of OppenheimerFunds Legacy Program (January 2011-December 2011); Executive Vice President (January 2011-December 2012) and General Counsel of OFI Institutional Asset Management, Inc. (since January 2011); General Counsel, Asset Management of the Sub-Adviser (May 2010-December 2010); Principal, The Vanguard Group (November 2005-April 2010); District Administrator, U.S. Securities and Exchange Commission (January 2003-October 2005). An officer of 91 portfolios in the OppenheimerFunds complex. |
| |
Jennifer Sexton, Vice President and Chief Business Officer (since 2014) Year of Birth: 1969 | | Senior Vice President of OppenheimerFunds Distributor, Inc. (since June 2014); Vice President of OppenheimerFunds Distributor, Inc. (April 2006-June 2014); Vice President of the Sub-Adviser (January 1998-March 2006); Assistant Vice President of the Sub-Adviser (October 1991-December 1998). An officer of 91 portfolios in the OppenheimerFunds complex. |
| |
Mary Ann Picciotto, Chief Compliance Officer and Chief Anti-Money Laundering Officer (since 2014) Year of Birth: 1973 | | Senior Vice President and Chief Compliance Officer of the Manager (since March 2014); Chief Compliance Officer of the Sub-Adviser, OFI SteelPath, Inc., OFI Global Trust Company, OFI Global Institutional, Inc., Oppenheimer Real Asset Management, Inc., OFI Private Investments, Inc., Harborview Asset Management Corporation, Trinity Investment Management Corporation, and Shareholder Services, Inc. (since March 2014); Managing Director of Morgan Stanley Investment Management Inc. and certain of its various affiliated entities; Chief Compliance Officer of various Morgan Stanley Funds (May 2010-January 2014); Chief Compliance Officer of Morgan Stanley Investment Management Inc. (April 2007-January 2014). An officer of 91 portfolios in the OppenheimerFunds complex. |
| |
Brian W. Wixted, Treasurer and Principal Financial & Accounting Officer (since 2013) Year of Birth: 1959 | | Senior Vice President of the Manager (since January 2013); Treasurer of the Sub-Adviser, HarbourView Asset Management Corporation, Shareholder Financial Services, Inc., Shareholder Services, Inc., and Oppenheimer Real Asset Management, Inc. (March 1999-June 2008), OFI Private Investments, Inc. (March 2000-June 2008), OppenheimerFunds International Ltd. and OppenheimerFunds plc (since May 2000), OFI Institutional Asset Management, Inc. (November 2000-June 2008), and OppenheimerFunds Legacy Program (charitable trust program established by the Sub-Adviser) (June 2003-December 2011); Treasurer and Chief Financial Officer of OFI Trust Company (since May 2000); Assistant Treasurer of Oppenheimer Acquisition Corporation (March 1999-June 2008). An officer of 91 portfolios in the OppenheimerFunds complex. |
The Fund’s Statement of Additional Information contains additional information about the Fund’s Trustees and Officers and is available without charge, upon request, by calling 1.800.988.8287.
51 OPPENHEIMER DIVERSIFIED ALTERNATIVES FUND/VA
OPPENHEIMER DIVERSIFIED ALTERNATIVES FUND/VA
A Series of Oppenheimer Variable Account Funds
| | |
| |
| Manager | | OFI Global Asset Management, Inc. |
| |
| Sub-Adviser | | OppenheimerFunds, Inc. |
| |
| Distributor | | OppenheimerFunds Distributor, Inc. |
| |
Transfer and Shareholder Servicing Agent | | OFI Global Asset Management, Inc. |
| |
| Sub-Transfer Agent | | Shareholder Services, Inc. DBA OppenheimerFunds Services |
| |
Independent Registered Public Accounting Firm | | KPMG LLP |
| |
| Counsel | | K&L Gates LLP |
| |
| | Before investing in any of the Oppenheimer funds, investors should carefully consider a fund’s investment objectives, risks, charges and expenses. Fund prospectuses and summary prospectuses contain this and other information about the funds, and may be obtained by asking your financial advisor, or calling us at 1.800.988.8287. Read prospectuses and summary prospectuses carefully before investing. |
| |
| | © 2015 OppenheimerFunds, Inc. All rights reserved. Oppenheimer funds are distributed by OppenheimerFunds Distributor, Inc. |

PORTFOLIO MANAGERS: George R. Evans, CFA, and Robert B. Dunphy, CFA
AVERAGE ANNUAL TOTAL RETURNS FOR THE PERIODS ENDED 12/31/14
| | | | | | | | |
| | | Inception | | | | | | |
| | | Date | | 1-Year | | 5-Year | | 10-Year |
Non-Service Shares | | 5/13/92 | | -7.22% | | 8.74% | | 7.39% |
Service Shares | | 3/19/01 | | -7.15 | | 8.50 | | 7.17 |
MSCI AC World ex-U.S. Index | | | | -3.87 | | 4.43 | | 5.13 |
Performance data quoted represents past performance, which does not guarantee future results. The investment return and principal value of an investment in the Fund will fluctuate so that an investor’s shares, when redeemed, may be worth more or less than their original cost. Current performance and expense ratios may be lower or higher than the data quoted. For performance data current to the most recent month end, call us at 1.800.988.8287. The Fund’s total returns should not be expected to be the same as the returns of other funds, whether or not both funds have the same portfolio managers and/or similar names. The Fund’s total returns include changes in share price and reinvested distributions but do not include the charges associated with the separate account products that offer this Fund. Such performance would have been lower if such charges were taken into account.
| | | | |
TOP TEN COMMON STOCK HOLDINGS | | | |
Continental AG | | | 1.7% | |
Dollarama, Inc. | | | 1.6 | |
SAP SE | | | 1.5 | |
Carnival Corp. | | | 1.4 | |
Burberry Group plc | | | 1.4 | |
Wolseley plc | | | 1.4 | |
Boskalis Westminster NV | | | 1.4 | |
Syngenta AG | | | 1.4 | |
Aalberts Industries NV | | | 1.4 | |
Roche Holding AG | | | 1.4 | |
Portfolio holdings and allocations are subject to change. Percentages are as of December 31, 2014, and are based on net assets. For more current Fund holdings, please visit oppenheimerfunds.com.
REGIONAL ALLOCATION
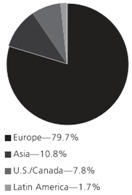
Portfolio holdings and allocations are subject to change. Percentages are as of December 31, 2014, and are based on the total market value of investments.
2 OPPENHEIMER INTERNATIONAL GROWTH FUND/VA
Fund Performance Discussion
The Fund’s Non-Service shares produced a total return of -7.22% during the reporting period. In comparison, the Fund’s benchmark, the MSCI AC World ex-U.S. Index (the “Index”), returned -3.87% during the same period. On a sector basis, the Fund underperformed the Index primarily due to weaker relative stock selection in the industrials, information technology and health care sectors. The Fund outperformed the Index in the consumer discretionary sector due to an overweight position and in the energy and materials sectors due to underweight positions.
MARKET OVERVIEW
Domestic equities were among the top performing asset classes in 2014, outperforming foreign equities, including those domiciled in Europe, Japan and emerging markets. In the U.S., the Federal Reserve (the “Fed”) began tapering its most recent quantitative easing (“QE”) program in January 2014 and completed the process at the end of October, thereby ending the program’s purchases. The Fed reduced its monthly bond purchases in steady $10 billion increments, which helped reduce market volatility and enabled investors to prepare for a post-QE market environment. Although data in the U.S. softened for the first quarter, partially attributed to cold weather effects across much of the country, it was positive in the second and third quarters of 2014, with Gross Domestic Product (“GDP”) growing at 4.6% and an estimated 5.0%, respectively.
Outside of the U.S., the positive data points that had emerged in Europe in 2013 and early 2014 largely reversed themselves later in the reporting period and the European Central Bank (the “ECB”) came under even greater pressure to provide a credible plan to boost growth and avoid deflation. In response, the ECB adopted a number of policies designed to stimulate growth. In Japan, which has been mired in economic weakness for years, the Abe administration has adopted even more aggressive economic policies with the Bank of Japan (the “BoJ”) executing a massive QE program. However, the results have not been particularly impressive, with that economy slipping back into recession in the third quarter of 2014 following the consumption tax increase. Emerging markets’ economic growth was mixed, as certain regions such as Eastern Europe and the Middle East remained burdened by geopolitical turmoil. Many commodity producing emerging market economies also struggled as prices for most commodities fell. Countries such as India and Indonesia have benefited from business-friendly new administrations.
TOP INDIVIDUAL CONTRIBUTORS
Top contributors to performance this period included ICICI Bank Ltd., Dollarama, Inc. and Domino’s Pizza Group plc. ICICI Bank is the largest private sector bank in India, a country where about half the banking sector is state-owned. In an environment where the public sector banks are inadequately capitalized for the level of non-performing loans on their books and the government’s ability to continually inject new capital is impaired as a result of its financial position, ICICI has the potential to grow faster with less competition. ICICI’s checking and savings deposits are growing, and its asset quality can improve with GDP growth as can loan growth. Additionally, the election of Narendra Modi as the new Prime Minister of India was greeted with great optimism and boosted Indian equities this reporting period. Dollarama, a dollar store operator based in Canada, posted strong results during the period. They also opened 11 new stores, and anticipate opening 75 to 80 new stores in fiscal 2015. Domino’s Pizza Group is the world’s leading pizza delivery company. It has a master franchise agreement to own, operate and franchise Domino’s Pizza stores in the United Kingdom (“U.K.”), Ireland, Germany and Switzerland. The company’s stock benefited from strong performance in its U.K. business driven in part by strength in e-commerce, food inflation falling, bundling products to drive increased spending and the opening of new stores.
TOP INDIVIDUAL DETRACTORS
Top individual detractors from performance included Yoox SpA, Rolls-Royce Holdings plc and Airbus Group NV. Yoox is an Italian-based online fashion mart offering products from high end designers worldwide. They also run the e-commerce efforts for a number of their brands. Weaker luxury goods consumption, particularly in China, negatively impacted Yoox during the period. Rolls-Royce Holdings, based in the U.K. is one of the world’s largest aircraft engine makers. The company reported disappointing results during the reporting period in part due to weakness in the defense segment. The company’s management also had issues with communication during the period which added to the weakness. We continue to focus on the long term structural growth opportunities for the company. Airbus Group along with Boeing constitutes a global duopoly in the large jet airplane market. It has a product refresh coming with the re-engining of both its single aisle A320 and dual aisle A330 products that we believe has the potential to improve profitability over the next several years. The newest Airbus product, the Airbus A350, was delivered to its first customer, Qatar Airways, just before the year end. Concerns about the near-term impact on margins of these developments led to a pullback in the shares after a strong run of performance.
3 OPPENHEIMER INTERNATIONAL GROWTH FUND/VA
STRATEGY & OUTLOOK
Our philosophy remains unchanged at period end. We take a bottom-up approach, seeking high-quality companies that are exposed to, and able to monetize durable, secular growth trends. We are long-term investors.
While some investors have reacted negatively to the decline of the euro against the U.S. dollar this reporting period, the currency’s weakness is not necessarily a negative for European companies. For European exporters, a weaker euro could be a boon, making them much more competitive in the global market and improving earnings growth.
As the markets continue to gyrate around the macro, we continue to focus on the micro. One of the benefits of the low growth environment is that as governments work to make their economies more efficient and flexible, companies have been able to restructure in ways that they not able to before. Many companies in Europe have used this as an opportunity to get lean – shedding unproductive businesses or realigning the labor force. We believe there is ample opportunity to invest in high-quality companies that can benefit from long-term global trends and that are well-positioned to benefit from a pick-up in the business cycle when it comes.
Investors should consider the Fund’s investment objective, risks, charges and expenses carefully before investing. The Fund’s prospectus and summary prospectus contain this and other information about the Fund, and may be obtained by asking your financial advisor or calling us at 1.800.988.8287. Read prospectuses and summary prospectuses carefully before investing.
Total returns include changes in share price and reinvestment of dividends and capital gains distributions in a hypothetical investment for the periods shown.
The Fund’s investment strategy and focus can change over time. The mention of specific Fund holdings does not constitute a recommendation by OppenheimerFunds, Inc. or its affiliates.
Shares of Oppenheimer funds are not deposits or obligations of any bank, are not guaranteed by any bank, are not insured by the FDIC or any other agency, and involve investment risks, including the possible loss of the principal amount invested.
Comparing the Fund’s Performance to the Market. The graphs that follow show the performance of a hypothetical $10,000 investment in each share class of the Fund held until December 31, 2014. Performance is measured over a ten-fiscal-year period for both Classes. Performance information does not reflect charges that apply to separate accounts investing in the Fund. If these charges were taken into account, performance would be lower. The graphs assume that all dividends and capital gains distributions were reinvested in additional shares.
The Fund’s performance is compared to the performance of the MSCI AC World ex-U.S. Index. The MSCI AC World ex-U.S. Index is designed to measure the equity market performance of developed and emerging markets and excludes the U.S. The Index is unmanaged and cannot be purchased directly by investors. While index comparisons may be useful to provide a benchmark for the Fund’s performance, it must be noted that the Fund’s investments are not limited to the investments comprising the Index. Index performance includes reinvestment of income, but does not reflect transaction costs, fees, expenses or taxes. Index performance is shown for illustrative purposes only as a benchmark for the Fund’s performance, and does not predict or depict performance of the Fund. The Fund’s performance reflects the effects of the Fund’s business and operating expenses.
4 OPPENHEIMER INTERNATIONAL GROWTH FUND/VA
COMPARISON OF CHANGE IN VALUE OF $10,000 HYPOTHETICAL INVESTMENTS IN:
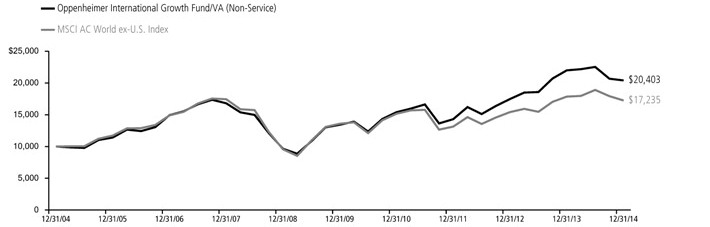
COMPARISON OF CHANGE IN VALUE OF $10,000 HYPOTHETICAL INVESTMENTS IN:
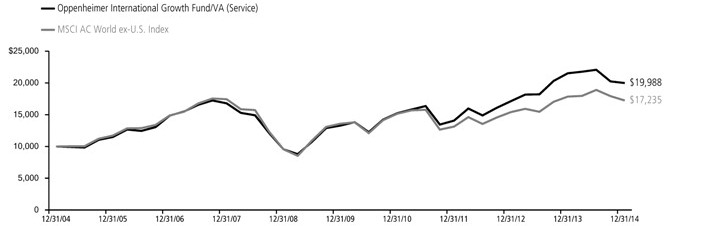
Performance data quoted represents past performance, which does not guarantee future results. The investment return and principal value of an investment in the Fund will fluctuate so that an investor’s shares, when redeemed, may be worth more or less than their original cost. Current performance may be lower or higher than the performance quoted. For performance data current to the most recent month end, call us at 1.800.988.8287. The Fund’s total returns should not be expected to be the same as the returns of other funds, whether or not both funds have the same portfolio managers and/or similar names. The Fund’s total returns include changes in share price and reinvested distributions but do not include the charges associated with the separate account products that offer this Fund. Such performance would have been lower if such charges were taken into account.
5 OPPENHEIMER INTERNATIONAL GROWTH FUND/VA
Fund Expenses
Fund Expenses. As a shareholder of the Fund, you incur two types of costs: (1) transaction costs and (2) ongoing costs, including management fees; distribution and service fees; and other Fund expenses. These examples are intended to help you understand your ongoing costs (in dollars) of investing in the Fund and to compare these costs with the ongoing costs of investing in other mutual funds.
The examples are based on an investment of $1,000.00 invested at the beginning of the period and held for the entire 6-month period ended December 31, 2014.
Actual Expenses. The first section of the table provides information about actual account values and actual expenses. You may use the information in this section for the class of shares you hold, together with the amount you invested, to estimate the expense that you paid over the period. Simply divide your account value by $1,000.00 (for example, an $8,600.00 account value divided by $1,000.00 = 8.60), then multiply the result by the number in the first section under the heading entitled “Expenses Paid During Period” to estimate the expenses you paid on your account during this period.
Hypothetical Example for Comparison Purposes.
The second section of the table provides information about hypothetical account values and hypothetical expenses based on the Fund’s actual expense ratio for each class of shares, and an assumed rate of return of 5% per year for each class before expenses, which is not the actual return. The hypothetical account values and expenses may not be used to estimate the actual ending account balance or expenses you paid for the period. You may use this information to compare the ongoing costs of investing in the Fund and other funds. To do so, compare this 5% hypothetical example for the class of shares you hold with the 5% hypothetical examples that appear in the shareholder reports of the other funds.
Please note that the expenses shown in the table are meant to highlight your ongoing costs only and do not reflect any charges associated with the separate accounts that offer this Fund. Therefore, the “hypothetical” lines of the table are useful in comparing ongoing costs only, and will not help you determine the relative total costs of owning different funds. In addition, if these separate account charges were included your costs would have been higher.
| | | | | | | | | | | | | | | | | | |
| | | Beginning | | | | | Ending | | | | | Expenses | | | |
| | | Account | | | | | Account | | | | | Paid During | | | |
| | | Value | | | | | Value | | | | | 6 Months Ended | | | |
| Actual | | July 1, 2014 | | | | | December 31, 2014 | | | | | December 31, 2014 | | | |
Non-Service shares | | $ | 1,000.00 | | | | | $ | 905.90 | | | | | $ | 4.82 | | | |
Service shares | | | 1,000.00 | | | | | | 905.70 | | | | | | 6.02 | | | |
| | | | | | |
| Hypothetical | | | | | | | | | | | | | | | |
(5% return before expenses) | | | | | | | | | | | | | | | | | | |
Non-Service shares | | | 1,000.00 | | | | | | 1,020.16 | | | | | | 5.10 | | | |
Service shares | | | 1,000.00 | | | | | | 1,018.90 | | | | | | 6.38 | | | |
Expenses are equal to the Fund’s annualized expense ratio for that class, multiplied by the average account value over the period, multiplied by 184/365 (to reflect the one-half year period). Those annualized expense ratios, excluding indirect expenses from affiliated funds, based on the 6-month period ended December 31, 2014 are as follows:
| | | | | | |
| Class | | Expense Ratios | | | |
Non-Service shares | | | 1.00% | | | |
Service shares | | | 1.25 | | | |
The expense ratios reflect voluntary and/or contractual waivers and/or reimbursements of expenses by the Fund’s Manager. Some of these undertakings may be modified or terminated at any time, as indicated in the Fund’s prospectus. The “Financial Highlights” tables in the Fund’s financial statements, included in this report, also show the gross expense ratios, without such waivers or reimbursements and reduction to custodian expenses, if applicable.
6 OPPENHEIMER INTERNATIONAL GROWTH FUND/VA
| | |
| |
| STATEMENTOFINVESTMENTS December 31, 2014 | | |
| | | | | | | | |
| | | Shares | | | Value | |
| |
Common Stocks—96.5% | |
| |
Consumer Discretionary—23.3% | |
| |
Auto Components—2.8% | |
| |
Continental AG | | | 39,395 | | | $ | 8,365,626 | |
| |
Valeo SA | | | 45,073 | | | | 5,614,168 | |
| | | | | | | | |
| | | | 13,979,794 | |
| | | | | | | | |
| |
Automobiles—1.2% | |
| |
Bayerische Motoren Werke AG | | | 55,002 | | | | 5,973,427 | |
| |
| | | | | | | | |
| |
Diversified Consumer Services—0.8% | |
| |
Dignity plc | | | 127,407 | | | | 3,789,768 | |
| | | | | | | | |
| |
Hotels, Restaurants & Leisure—3.7% | |
| |
Carnival Corp. | | | 159,690 | | | | 7,238,748 | |
| |
| Domino’s Pizza Group plc | | | 462,316 | | | | 5,060,045 | |
| |
William Hill plc | | | 1,168,450 | | | | 6,570,872 | |
| | | | | | | | |
| | | | | | | 18,869,665 | |
| | | | | | | | |
| |
Household Durables—0.7% | |
| |
SEB SA | | | 49,760 | | | | 3,703,095 | |
| | | | | | | | |
| |
Internet & Catalog Retail—0.6% | |
| |
Yoox SpA1 | | | 145,000 | | | | 3,198,941 | |
| | | | | | | | |
| |
Media—4.2% | |
| |
| Grupo Televisa SAB, Sponsored ADR1 | | | 155,750 | | | | 5,304,845 | |
| |
| ProSiebenSat.1 Media AG | | | 74,417 | | | | 3,135,102 | |
| |
SES SA | | | 151,550 | | | | 5,436,259 | |
| |
Sky plc | | | 420,873 | | | | 5,857,801 | |
| |
| Zee Entertainment Enterprises Ltd. | | | 232,693 | | | | 1,397,294 | |
| | | | | | | | |
| | | | | | | 21,131,301 | |
| | | | | | | | |
| |
Multiline Retail—2.4% | |
| |
Dollarama, Inc. | | | 160,853 | | | | 8,224,022 | |
| |
Hudson’s Bay Co. | | | 194,700 | | | | 4,115,882 | |
| | | | | | | | |
| | | | 12,339,904 | |
| | | | | | | | |
| |
Specialty Retail—1.0% | |
| |
| Inditex SA | | | 174,551 | | | | 5,001,399 | |
| | | | | | | | |
| |
Textiles, Apparel & Luxury Goods—5.9% | |
| |
Burberry Group plc | | | 285,633 | | | | 7,237,545 | |
| |
| Cie Financiere Richemont SA | | | 64,289 | | | | 5,694,548 | |
| |
Hermes International | | | 1,156 | | | | 412,199 | |
| |
Kering | | | 17,990 | | | | 3,458,714 | |
| |
| LVMH Moet Hennessy Louis Vuitton SA | | | 23,700 | | | | 3,747,777 | |
| |
Prada SpA | | | 802,000 | | | | 4,522,075 | |
| |
Swatch Group AG (The) | | | 10,517 | | | | 4,669,941 | |
| | | | | | | | |
| | | | | | | 29,742,799 | |
| | | | | | | | |
| |
Consumer Staples—10.8% | |
| |
Beverages—2.7% | |
| |
Diageo plc | | | 119,274 | | | | 3,420,913 | |
| |
Heineken NV | | | 91,325 | | | | 6,487,661 | |
| |
Pernod Ricard SA | | | 31,590 | | | | 3,502,603 | |
| | | | | | | | |
| | | | | | | 13,411,177 | |
| | | | | | | | |
| |
Food & Staples Retailing—1.2% | |
| |
CP ALL PCL | | | 4,620,800 | | | | 5,943,121 | |
| | | | | | | | |
| |
Food Products—5.2% | |
| |
Aryzta AG1 | | | 85,806 | | | | 6,593,115 | |
| |
Barry Callebaut AG1 | | | 4,016 | | | | 4,113,083 | |
| |
Danone SA | | | 64,980 | | | | 4,274,805 | |
| |
Saputo, Inc. | | | 158,929 | | | | 4,776,899 | |
| |
Unilever plc | | | 156,209 | | | | 6,345,325 | |
| | | | | | | | |
| | | | | | | 26,103,227 | |
| | | | | | | | |
| |
Household Products—1.1% | |
| |
| Reckitt Benckiser Group plc | | | 70,348 | | | | 5,675,067 | |
| | | | | | | | |
| | | Shares | | | Value | |
| |
Tobacco—0.6% | |
| |
Swedish Match AB | | | 99,315 | | | $ | 3,097,738 | |
| | | | | | | | |
| |
Energy—1.9% | |
| |
Energy Equipment & Services—0.8% | |
| |
| Schoeller-Bleckmann Oilfield Equipment AG | | | 18,912 | | | | 1,365,832 | |
| |
Technip SA | | | 42,820 | | | | 2,556,939 | |
| | | | | | | | |
| | | | 3,922,771 | |
| | | | | | | | |
| |
Oil, Gas & Consumable Fuels—1.1% | |
| |
Koninklijke Vopak NV | | | 112,227 | | | | 5,813,813 | |
| | | | | | | | |
| |
Financials—4.4% | |
| |
Capital Markets—2.4% | |
| |
ICAP plc | | | 942,597 | | | | 6,574,764 | |
| |
Tullett Prebon plc | | | 305,134 | | | | 1,340,215 | |
| |
UBS Group AG1 | | | 249,001 | | | | 4,280,253 | |
| | | | | | | | |
| | | | 12,195,232 | |
| | | | | | | | |
| |
Commercial Banks—1.0% | |
| |
| ICICI Bank Ltd., Sponsored ADR | | | 422,225 | | | | 4,876,699 | |
| | | | | | | | |
| |
Insurance—1.0% | |
| |
| Prudential plc | | | 233,636 | | | | 5,376,464 | |
| | | | | | | | |
| |
Health Care—9.4% | |
| |
Biotechnology—2.2% | |
| |
CSL Ltd. | | | 88,800 | | | | 6,252,504 | |
| |
Grifols SA | | | 117,941 | | | | 4,694,951 | |
| | | | | | | | |
| | | | 10,947,455 | |
| | | | | | | | |
| |
Health Care Equipment & Supplies—3.3% | |
| |
DiaSorin SpA | | | 92,067 | | | | 3,712,824 | |
| |
Essilor International SA | | | 36,390 | | | | 4,050,813 | |
| |
Sonova Holding AG | | | 39,165 | | | | 5,741,319 | |
| |
| William Demant Holding AS1 | | | 43,426 | | | | 3,296,119 | |
| | | | | | | | |
| | | | 16,801,075 | |
| | | | | | | | |
| |
Health Care Providers & Services—0.5% | |
| |
Sonic Healthcare Ltd. | | | 153,658 | | | | 2,307,569 | |
| | | | | | | | |
| |
Health Care Technology—0.0% | |
| |
CompuGroup Medical AG | | | 1,555 | | | | 37,442 | |
| | | | | | | | |
| |
Pharmaceuticals—3.4% | |
| |
Galenica AG | | | 4,417 | | | | 3,498,686 | |
| |
Indivior plc1 | | | 70,348 | | | | 163,809 | |
| |
Novo Nordisk AS, Cl. B | | | 159,182 | | | | 6,735,246 | |
| |
Roche Holding AG | | | 25,065 | | | | 6,793,629 | |
| | | | | | | | |
| | | | 17,191,370 | |
| | | | | | | | |
| |
Industrials—22.8% | |
| |
Aerospace & Defense—2.9% | |
| |
Airbus Group NV | | | 100,440 | | | | 4,988,574 | |
| |
Embraer SA | | | 390,426 | | | | 3,597,470 | |
| |
Rolls-Royce Holdings plc1 | | | 432,569 | | | | 5,827,162 | |
| | | | | | | | |
| | | | 14,413,206 | |
| | | | | | | | |
| |
Air Freight & Couriers—0.5% | |
| |
Royal Mail plc | | | 394,354 | | | | 2,625,958 | |
| | | | | | | | |
| |
Commercial Services & Supplies—3.0% | |
| |
Aggreko plc | | | 199,094 | | | | 4,638,571 | |
| |
Edenred | | | 177,238 | | | | 4,921,383 | |
| |
| Prosegur Cia de Seguridad SA | | | 941,364 | | | | 5,349,341 | |
| | | | | | | | |
| | | | 14,909,295 | |
| | | | | | | | |
| |
Construction & Engineering—2.4% | |
| |
| Boskalis Westminster NV | | | 128,884 | | | | 7,046,285 | |
| |
Leighton Holdings Ltd. | | | 187,380 | | | | 3,409,291 | |
| |
| Trevi Finanziaria Industriale SpA | | | 564,670 | | | | 1,927,110 | |
| | | | | | | | |
| | | | 12,382,686 | |
7 OPPENHEIMER INTERNATIONAL GROWTH FUND/VA
STATEMENTOFINVESTMENTS Continued
| | | | | | | | |
| | | Shares | | | Value | |
| |
Electrical Equipment—3.9% | |
| |
ABB Ltd.1 | | | 219,678 | | | $ | 4,646,562 | |
| |
Legrand SA | | | 93,740 | | | | 4,907,183 | |
| |
Nidec Corp. | | | 75,700 | | | | 4,910,092 | |
| |
Schneider Electric SE | | | 70,240 | | | | 5,103,768 | |
| | | | | | | | |
| | | | 19,567,605 | |
| | | | | | | | |
| |
Machinery—3.5% | |
| |
Aalberts Industries NV | | | 233,011 | | | | 6,884,110 | |
| |
Atlas Copco AB, Cl. A | | | 226,643 | | | | 6,309,090 | |
| |
Weir Group plc (The) | | | 149,708 | | | | 4,284,930 | |
| | | | | | | | |
| | | | 17,478,130 | |
| | | | | | | | |
| |
Professional Services—2.9% | |
| |
Experian plc | | | 308,445 | | | | 5,202,761 | |
| |
Intertek Group plc | | | 138,540 | | | | 5,021,914 | |
| |
SGS SA | | | 2,143 | | | | 4,369,453 | |
| | | | | | | | |
| | | | 14,594,128 | |
| | | | | | | | |
| |
Trading Companies & Distributors—3.7% | |
| |
Brenntag AG | | | 92,192 | | | | 5,187,584 | |
| |
Bunzl plc | | | 240,980 | | | | 6,569,077 | |
| |
Wolseley plc | | | 125,167 | | | | 7,125,550 | |
| | | | | | | | |
| | | | 18,882,211 | |
| | | | | | | | |
| |
Information Technology—15.6% | |
| |
Communications Equipment—1.1% | |
| |
| Telefonaktiebolaget LM Ericsson, Cl. B | | | 467,466 | | | | 5,661,452 | |
| | | | | | | | |
| |
| Electronic Equipment, Instruments, & Components—2.7% | |
| |
Hoya Corp. | | | 158,193 | | | | 5,296,455 | |
| |
Keyence Corp. | | | 9,906 | | | | 4,387,743 | |
| |
Spectris plc | | | 114,933 | | | | 3,747,429 | |
| | | | | | | | |
| | | | 13,431,627 | |
| | | | | | | | |
| |
Internet Software & Services—2.7% | |
| |
Telecity Group plc | | | 228,120 | | | | 2,858,597 | |
| |
United Internet AG | | | 142,589 | | | | 6,466,129 | |
| |
Yahoo Japan Corp. | | | 1,231,700 | | | | 4,444,472 | |
| | | | | | | | |
| | | | 13,769,198 | |
| | | | | | | | |
| |
IT Services—1.3% | |
| |
| Amadeus IT Holding SA, Cl. A | | | 171,096 | | | | 6,798,877 | |
| | | | | | | | |
| |
Semiconductors & Semiconductor Equipment—1.7% | |
| |
ARM Holdings plc | | | 169,200 | | | | 2,605,385 | |
| |
Infineon Technologies AG | | | 538,725 | | | | 5,775,695 | |
| | | | | | | | |
| | | | 8,381,080 | |
| | | | | | | | |
| |
Software—5.3% | |
| |
Aveva Group plc | | | 85,634 | | | | 1,752,960 | |
| |
Dassault Systemes | | | 79,566 | | | | 4,842,260 | |
| | | | | | | | |
| | | Shares | | | Value | |
| |
Software—5.3% | |
| |
Gemalto NV | | | 64,899 | | | $ | 5,301,314 | |
| |
Sage Group plc (The) | | | 480,743 | | | | 3,466,824 | |
| |
SAP SE | | | 109,063 | | | | 7,711,352 | |
| |
Temenos Group AG | | | 98,782 | | | | 3,503,534 | |
| | | | | | | | |
| | | | 26,578,244 | |
| | | | | | | | |
| |
Technology Hardware, Storage & Peripherals—0.8% | |
| |
| Lenovo Group Ltd. | | | 3,148,000 | | | | 4,128,215 | |
| | | | | | | | |
| |
Materials—4.1% | |
| |
Chemicals—3.3% | |
| |
Essentra plc | | | 512,432 | | | | 5,793,690 | |
| |
Sika AG | | | 1,232 | | | | 3,613,466 | |
| |
Syngenta AG | | | 21,777 | | | | 6,992,605 | |
| | | | | | | | |
| | | | 16,399,761 | |
| | | | | | | | |
| |
Construction Materials—0.8% | |
| |
| James Hardie Industries plc | | | 387,000 | | | | 4,120,702 | |
| | | | | | | | |
| |
Telecommunication Services—4.2% | |
| |
Diversified Telecommunication Services—4.0% | |
| |
BT Group plc, Cl. A | | | 1,010,199 | | | | 6,270,872 | |
| |
Iliad SA | | | 17,090 | | | | 4,105,336 | |
| |
Inmarsat plc | | | 353,060 | | | | 4,375,277 | |
| |
| Nippon Telegraph & Telephone Corp. | | | 106,700 | | | | 5,490,570 | |
| | | | | | | | |
| | | | 20,242,055 | |
| | | | | | | | |
| |
Wireless Telecommunication Services—0.2% | |
| |
Vodafone Group plc | | | 292,760 | | | | 1,003,131 | |
| | | | | | | | |
| Total Common Stocks (Cost $347,630,249) | | | | 486,797,874 | |
| | | | | | | | |
| |
| Preferred Stock—0.0% | |
| |
| Zee Entertainment Enterprises Ltd., 6% Cum. Non-Cv. (Cost $12,272) | | | 5,995,416 | | | | 82,633 | |
| | | | | | | | |
| | | Units | | | | |
| |
| Rights, Warrants and Certificates—0.0% | |
| |
| MEI Pharma, Inc. Wts., Strike Price $1.19, Exp. 5/10/171 (Cost $35,548) | | | 151,358 | | | | 38,430 | |
| | | | | | | | |
| | | Shares | | | | |
| |
| Investment Company—2.8% | |
| |
| Oppenheimer Institutional Money Market Fund, Cl. E, 0.10%2,3 (Cost $13,876,000) | | | 13,876,000 | | | | 13,876,000 | |
| | | | | | | | |
| |
| Total Investments, at Value (Cost $361,554,069) | | | 99.3% | | | | 500,794,937 | |
| |
| Net Other Assets (Liabilities) | | | 0.7 | | | | 3,476,285 | |
| | | | |
| Net Assets | | | 100.0% | | | $ | 504,271,222 | |
| | | | |
8 OPPENHEIMER INTERNATIONAL GROWTH FUND/VA
Footnotes to Statement of Investments
1. Non-income producing security.
2. Rate shown is the 7-day yield as of December 31, 2014.
3. Is or was an affiliate, as defined in the Investment Company Act of 1940, as amended, at or during the period ended December 31, 2014, by virtue of the Fund owning at least 5% of the voting securities of the issuer or as a result of the Fund and the issuer having the same investment adviser. Transactions during the period in which the issuer was an affiliate are as follows:
| | | | | | | | | | | | | | | | |
| | | Shares
December 31, 2013 | | | Gross
Additions | | | Gross
Reductions | | | Shares
December 31, 2014 | |
| |
Oppenheimer Institutional Money Market Fund, Cl. E | | | 18,850,174 | | | | 183,079,484 | | | | 188,053,658 | | | | 13,876,000 | |
| | | | | | |
| | |
| | | Value | | | Income |
|
Oppenheimer Institutional Money Market Fund, Cl. E | | $ | 13,876,000 | | | $ 10,343 |
| | | | | | | | |
| Distribution of investments representing geographic holdings, as a percentage of total investments at value, is as follows: | |
| Geographic Holdings | | Value | | | Percent | |
| |
United Kingdom | | $ | 130,582,676 | | | | 26.1% | |
Switzerland | | | 64,510,194 | | | | 12.9 | |
France | | | 60,637,302 | | | | 12.1 | |
Germany | | | 42,652,357 | | | | 8.5 | |
Netherlands | | | 36,521,757 | | | | 7.3 | |
Japan | | | 24,529,332 | | | | 4.9 | |
Spain | | | 21,844,568 | | | | 4.4 | |
United States | | | 21,153,178 | | | | 4.2 | |
Canada | | | 17,116,803 | | | | 3.4 | |
Sweden | | | 15,068,280 | | | | 3.0 | |
Italy | | | 13,360,950 | | | | 2.7 | |
Australia | | | 11,969,364 | | | | 2.4 | |
Denmark | | | 10,031,365 | | | | 2.0 | |
India | | | 6,356,626 | | | | 1.3 | |
Thailand | | | 5,943,121 | | | | 1.2 | |
Mexico | | | 5,304,845 | | | | 1.0 | |
China | | | 4,128,215 | | | | 0.8 | |
Ireland | | | 4,120,702 | | | | 0.8 | |
Brazil | | | 3,597,470 | | | | 0.7 | |
Austria | | | 1,365,832 | | | | 0.3 | |
| | | | |
Total | | $ | 500,794,937 | | | | 100.0% | |
| | | | |
See accompanying Notes to Financial Statements.
9 OPPENHEIMER INTERNATIONAL GROWTH FUND/VA
| | |
| |
| STATEMENT OF ASSETS AND LIABILITIES December 31, 2014 | | |
| | | | |
| |
Assets | | | | |
Investments, at value—see accompanying statement of investments: | | | | |
Unaffiliated companies (cost $347,678,069) | | $ | 486,918,937 | |
Affiliated companies (cost $13,876,000) | | | 13,876,000 | |
| | | | |
| | | 500,794,937 | |
| |
Cash | | | 447,171 | |
| |
Receivables and other assets: | | | | |
Shares of beneficial interest sold | | | 2,441,674 | |
Dividends | | | 823,760 | |
Investments sold | | | 783 | |
Other | | | 21,079 | |
| | | | |
Total assets | | | 504,529,404 | |
| | | | |
| |
Liabilities | | | | |
Payables and other liabilities: | | | | |
Foreign capital gains tax | | | 84,444 | |
Shares of beneficial interest redeemed | | | 72,227 | |
Distribution and service plan fees | | | 30,177 | |
Legal, auditing and other professional fees | | | 27,158 | |
Trustees’ compensation | | | 19,139 | |
Custodian fees | | | 18,731 | |
Shareholder communications | | | 5,188 | |
Investments purchased | | | 899 | |
Other | | | 219 | |
| | | | |
Total liabilities | | | 258,182 | |
| |
Net Assets | | $ | 504,271,222 | |
| | | | |
| | | | |
| |
Composition of Net Assets | | | | |
Par value of shares of beneficial interest | | $ | 215,737 | |
| |
Additional paid-in capital | | | 330,745,447 | |
| |
Accumulated net investment income | | | 5,143,744 | |
| |
Accumulated net realized gain on investments and foreign currency transactions | | | 29,060,648 | |
| |
| Net unrealized appreciation on investments and translation of assets and liabilities denominated in foreign currencies | | | 139,105,646 | |
| | | | |
Net Assets | | $ | 504,271,222 | |
| | | | |
| | | | |
| |
Net Asset Value Per Share | | | | |
Non-Service Shares: | | | | |
| Net asset value, redemption price per share and offering price per share (based on net assets of $358,756,087 and 155,096,814 shares of beneficial interest outstanding) | | | $2.31 | |
| |
Service Shares: | | | | |
| Net asset value, redemption price per share and offering price per share (based on net assets of $145,515,135 and 60,640,385 shares of beneficial interest outstanding) | | | $2.40 | |
See accompanying Notes to Financial Statements.
10 OPPENHEIMER INTERNATIONAL GROWTH FUND/VA
STATEMENT OF OPERATIONS For the Year Ended December 31, 2014
| | | | |
| |
Investment Income | | | | |
| |
Dividends: | | | | |
Unaffiliated companies (net of foreign withholding taxes of $928,310) | | $ | 11,164,620 | |
Affiliated companies | | | 10,343 | |
| |
Portfolio lending fees | | | 36,752 | |
| |
Interest | | | 235 | |
| | | | |
Total investment income | | | 11,211,950 | |
|
| |
Expenses | | | | |
Management fees | | | 4,985,935 | |
| |
Distribution and service plan fees – Service shares | | | 321,015 | |
| |
Transfer and shareholder servicing agent fees: | | | | |
Non-Service shares | | | 399,527 | |
Service shares | | | 128,439 | |
| |
Shareholder communications: | | | | |
Non-Service shares | | | 7,807 | |
Service shares | | | 2,755 | |
| |
Custodian fees and expenses | | | 54,925 | |
| |
Trustees’ compensation | | | 19,460 | |
| |
Other | | | 55,460 | |
| | | | |
Total expenses | | | 5,975,323 | |
Less reduction to custodian expenses | | | (72) | |
Less waivers and reimbursements of expenses | | | (374,501) | |
| | | | |
Net expenses | | | 5,600,750 | |
|
| |
Net Investment Income | | | 5,611,200 | |
| |
Realized and Unrealized Gain (Loss) | | | | |
Net realized gain (loss) on: | | | | |
Investments from unaffiliated companies (net of foreign capital gains tax of $33,156) | | | 40,643,000 | |
Foreign currency transactions | | | (11,092) | |
| | | | |
Net realized gain | | | 40,631,908 | |
| |
Net change in unrealized appreciation/depreciation on: | | | | |
Investments (net of foreign capital gains tax of $66,624) | | | (53,296,547) | |
Translation of assets and liabilities denominated in foreign currencies | | | (32,124,935) | |
| | | | |
Net change in unrealized appreciation/depreciation | | | (85,421,482) | |
|
| |
Net Decrease in Net Assets Resulting from Operations | | $ | (39,178,374) | |
| | | | |
See accompanying Notes to Financial Statements.
11 OPPENHEIMER INTERNATIONAL GROWTH FUND/VA
STATEMENTSOFCHANGESINNETASSETS
| | | | | | | | |
| | | Year Ended
December 31, 2014 | | | Year Ended
December 31, 2013 | |
| |
Operations | | | | | | | | |
Net investment income | | $ | 5,611,200 | | | $ | 5,818,170 | |
| |
Net realized gain | | | 40,631,908 | | | | 27,279,495 | |
| |
Net change in unrealized appreciation/depreciation | | | (85,421,482) | | | | 81,110,996 | |
| | | | |
Net increase (decrease) in net assets resulting from operations | | | (39,178,374) | | | | 114,208,661 | |
| |
Dividends and/or Distributions to Shareholders | | | | | | | | |
Dividends from net investment income: | | | | | | | | |
Non-Service shares | | | (4,718,842) | | | | (5,541,706) | |
Service shares | | | (1,168,525) | | | | (927,692) | |
| | | | |
| | | (5,887,367) | | | | (6,469,398) | |
| |
Distributions from net realized gain: | | | | | | | | |
Non-Service shares | | | (8,305,904) | | | | — | |
Service shares | | | (2,491,854) | | | | — | |
| | | | |
| | | (10,797,758) | | | | — | |
| |
Beneficial Interest Transactions | | | | | | | | |
Net increase (decrease) in net assets resulting from beneficial interest transactions: | | | | | | | | |
Non-Service shares | | | (57,258,810) | | | | 21,565,103 | |
Service shares | | | 41,295,796 | | | | 29,347,067 | |
| | | | |
| | | (15,963,014) | | | | 50,912,170 | |
| |
Net Assets | | | | | | | | |
Total increase (decrease) | | | (71,826,513) | | | | 158,651,433 | |
| |
Beginning of period | | | 576,097,735 | | | | 417,446,302 | |
| | | | |
| | |
| End of period (including accumulated net investment income of $5,143,744 and $5,258,927, respectively) | | $ | 504,271,222 | | | $ | 576,097,735 | |
| | | | |
See accompanying Notes to Financial Statements.
12 OPPENHEIMER INTERNATIONAL GROWTH FUND/VA
FINANCIALHIGHLIGHTS
| | | | | | | | | | | | | | | | | | | | |
| | | Year Ended | | | Year Ended | | | Year Ended | | | Year Ended | | | Year Ended | |
| Non-Service Shares | | December | | | December | | | December | | | December | | | December | |
| | 31, 2014 | | | 31, 2013 | | | 31, 2012 | | | 30, 20111 | | | 31, 2010 | |
| |
Per Share Operating Data | | | | | | | | | | | | | | | | | | | | |
Net asset value, beginning of period | | $ | 2.57 | | | $ | 2.07 | | | $ | 1.72 | | | $ | 1.87 | | | $ | 1.65 | |
| |
Income (loss) from investment operations: | | | | | | | | | | | | | | | | | | | | |
Net investment income2 | | | 0.03 | | | | 0.03 | | | | 0.03 | | | | 0.02 | | | | 0.02 | |
Net realized and unrealized gain (loss) | | | (0.21) | | | | 0.50 | | | | 0.35 | | | | (0.15) | | | | 0.22 | |
| | | | |
Total from investment operations | | | (0.18) | | | | 0.53 | | | | 0.38 | | | | (0.13) | | | | 0.24 | |
| |
Dividends and/or distributions to shareholders: | | | | | | | | | | | | | | | | | | | | |
Dividends from net investment income | | | (0.03) | | | | (0.03) | | | | (0.03) | | | | (0.02) | | | | (0.02) | |
Distributions from net realized gain | | | (0.05) | | | | 0.00 | | | | 0.00 | | | | 0.00 | | | | 0.00 | |
| | | | |
Total dividends and/or distributions to shareholders | | | (0.08) | | | | (0.03) | | | | (0.03) | | | | (0.02) | | | | (0.02) | |
| |
Net asset value, end of period | | $ | 2.31 | | | $ | 2.57 | | | $ | 2.07 | | | $ | 1.72 | | | $ | 1.87 | |
| | | | |
| | | | | | | | | | | | | | | | | | | | |
| |
Total Return, at Net Asset Value3 | | | (7.22)% | | | | 25.87% | | | | 22.22% | | | | (7.16)% | | | | 14.76% | |
| |
Ratios/Supplemental Data | | | | | | | | | | | | | | | | | | | | |
Net assets, end of period (in thousands) | | $ | 358,756 | | | $ | 458,038 | | | $ | 348,449 | | | $ | 364,221 | | | $ | 417,141 | |
| |
Average net assets (in thousands) | | $ | 400,556 | | | $ | 404,859 | | | $ | 332,018 | | | $ | 406,974 | | | $ | 376,612 | |
| |
Ratios to average net assets:4 | | | | | | | | | | | | | | | | | | | | |
Net investment income | | | 1.13% | | | | 1.24% | | | | 1.68% | | | | 1.21% | | | | 1.04% | |
Total expenses5 | | | 1.07% | | | | 1.09% | | | | 1.13% | | | | 1.09% | | | | 1.10% | |
| Expenses after payments, waivers and/or reimbursements and reduction to custodian expenses | | | 1.00% | | | | 1.00% | | | | 1.00% | | | | 1.00% | | | | 1.00% | |
| |
Portfolio turnover rate | | | 41% | | | | 32% | | | | 22% | | | | 25% | | | | 19% | |
1. December 30, 2011 represents the last business day of the Fund’s 2011 fiscal year.
2. Per share amounts calculated based on the average shares outstanding during the period.
3. Assumes an initial investment on the business day before the first day of the fiscal period, with all dividends and distributions reinvested in additional shares on the reinvestment date, and redemption at the net asset value calculated on the last business day of the fiscal period. Total returns are not annualized for periods less than one full year. Total return information does not reflect expenses that apply at the separate account level or to related insurance products. Inclusion of these charges would reduce the total return figures for all periods shown. Returns do not reflect the deduction of taxes that a shareholder would pay on fund distributions or the redemption of fund shares.
4. Annualized for periods less than one full year.
5. Total expenses including indirect expenses from affiliated fund fees and expenses were as follows:
| | | | | | |
| | Year Ended December 31, 2014 | | | 1.07 | % |
| | Year Ended December 31, 2013 | | | 1.09 | % |
| | Year Ended December 31, 2012 | | | 1.13 | % |
| | Year Ended December 30, 2011 | | | 1.09 | % |
| | Year Ended December 31, 2010 | | | 1.10 | % |
See accompanying Notes to Financial Statements.
13 OPPENHEIMER INTERNATIONAL GROWTH FUND/VA
FINANCIALHIGHLIGHTS Continued
| | | | | | | | | | | | | | | | | | | | |
| | | Year Ended | | | Year Ended | | | Year Ended | | | Year Ended | | | Year Ended | |
| Service Shares | | December | | | December | | | December | | | December | | | December | |
| | 31, 2014 | | | 31, 2013 | | | 31, 2012 | | | 31, 20111 | | | 31, 2010 | |
| |
Per Share Operating Data | | | | | | | | | | | | | | | | | | | | |
Net asset value, beginning of period | | $ | 2.66 | | | $ | 2.14 | | | $ | 1.78 | | | $ | 1.94 | | | $ | 1.71 | |
| |
Income (loss) from investment operations: | | | | | | | | | | | | | | | | | | | | |
Net investment income2 | | | 0.02 | | | | 0.02 | | | | 0.03 | | | | 0.02 | | | | 0.01 | |
Net realized and unrealized gain (loss) | | | (0.21) | | | | 0.53 | | | | 0.35 | | | | (0.17) | | | | 0.24 | |
| | | | |
Total from investment operations | | | (0.19) | | | | 0.55 | | | | 0.38 | | | | (0.15) | | | | 0.25 | |
| |
Dividends and/or distributions to shareholders: | | | | | | | | | | | | | | | | | | | | |
Dividends from net investment income | | | (0.02) | | | | (0.03) | | | | (0.02) | | | | (0.01) | | | | (0.02) | |
Distributions from net realized gain | | | (0.05) | | | | 0.00 | | | | 0.00 | | | | 0.00 | | | | 0.00 | |
| | | | |
Total dividends and/or distributions to shareholders | | | (0.07) | | | | (0.03) | | | | (0.02) | | | | (0.01) | | | | (0.02) | |
| |
Net asset value, end of period | | $ | 2.40 | | | $ | 2.66 | | | $ | 2.14 | | | $ | 1.78 | | | $ | 1.94 | |
| | | | |
| | | | | | | | | | | | | | | | | | | | |
| |
Total Return, at Net Asset Value3 | | | (7.15)% | | | | 25.71% | | | | 21.68% | | | | (7.61)% | | | | 14.62% | |
| |
Ratios/Supplemental Data | | | | | | | | | | | | | | | | | | | | |
Net assets, end of period (in thousands) | | $ | 145,515 | | | $ | 118,060 | | | $ | 68,997 | | | $ | 57,276 | | | $ | 61,630 | |
| |
Average net assets (in thousands) | | $ | 128,694 | | | $ | 88,647 | | | $ | 63,118 | | | $ | 62,359 | | | $ | 50,420 | |
| |
Ratios to average net assets:4 | | | | | | | | | | | | | | | | | | | | |
Net investment income | | | 0.85% | | | | 0.89% | | | | 1.43% | | | | 0.96% | | | | 1.35% | |
Total expenses5 | | | 1.32% | | | | 1.34% | | | | 1.38% | | | | 1.34% | | | | 1.35% | |
| Expenses after payments, waivers and/or reimbursements and reduction to custodian expenses | | | 1.25% | | | | 1.25% | | | | 1.25% | | | | 1.25% | | | | 1.25% | |
| |
Portfolio turnover rate | | | 41% | | | | 32% | | | | 22% | | | | 25% | | | | 19% | |
1. December 30, 2011 represents the last business day of the Fund’s 2011 fiscal year.
2. Per share amounts calculated based on the average shares outstanding during the period.
3. Assumes an initial investment on the business day before the first day of the fiscal period, with all dividends and distributions reinvested in additional shares on the reinvestment date, and redemption at the net asset value calculated on the last business day of the fiscal period. Total returns are not annualized for periods less than one full year. Total return information does not reflect expenses that apply at the separate account level or to related insurance products. Inclusion of these charges would reduce the total return figures for all periods shown. Returns do not reflect the deduction of taxes that a shareholder would pay on fund distributions or the redemption of fund shares.
4. Annualized for periods less than one full year.
5. Total expenses including indirect expenses from affiliated fund fees and expenses were as follows:
| | | | | | |
| | Year Ended December 31, 2014 | | | 1.32 | % |
| | Year Ended December 31, 2013 | | | 1.34 | % |
| | Year Ended December 31, 2012 | | | 1.38 | % |
| | Year Ended December 30, 2011 | | | 1.34 | % |
| | Year Ended December 31, 2010 | | | 1.35 | % |
See accompanying Notes to Financial Statements.
14 OPPENHEIMER INTERNATIONAL GROWTH FUND/VA
NOTES TO FINANCIAL STATEMENTS December 31, 2014
1. Organization
Oppenheimer International Growth Fund/VA (the “Fund”), formerly a series of Panorama Series, is a separate series of Oppenheimer Variable Account Funds, which is registered under the Investment Company Act of 1940 (“1940 Act”), as amended, as a diversified open-end management investment company. The Fund’s investment objective is to seek capital appreciation. The Fund’s investment adviser is OFI Global Asset Management, Inc. (“OFI Global” or the “Manager”), a wholly-owned subsidiary of OppenheimerFunds, Inc., (“OFI” or the “Sub-Adviser”). The Manager has entered into a sub-advisory agreement with OFI. Shares of the Fund are sold only to separate accounts of life insurance companies.
The Fund offers two classes of shares. Both classes are sold at their offering price, which is the net asset value per share, to separate investment accounts of participating insurance companies as an underlying investment for variable life insurance policies, variable annuity contracts or other investment products. The class of shares designated as Service shares is subject to a distribution and service plan. Both classes of shares have identical rights and voting privileges with respect to the Fund in general and exclusive voting rights on matters that affect that class alone. Earnings, net assets and net asset value per share may differ due to each class having its own expenses, such as transfer and shareholder servicing agent fees and shareholder communications, directly attributable to that class.
The following is a summary of significant accounting policies consistently followed by the Fund.
2. Significant Accounting Policies
Security Valuation. All investments in securities are recorded at their estimated fair value, as described in Note 3.
Foreign Currency Translation. The Fund’s accounting records are maintained in U.S. dollars. The values of securities denominated in foreign currencies and amounts related to the purchase and sale of foreign securities and foreign investment income are translated into U.S. dollars as of the close of the New York Stock Exchange (the “Exchange”), normally 4:00 P.M. Eastern time, on each day the Exchange is open for trading. Foreign exchange rates may be valued primarily using a reliable bank, dealer or service authorized by the Board of Trustees.
Reported net realized gains and losses from foreign currency transactions arise from sales of portfolio securities, sales and maturities of short-term securities, sales of foreign currencies, exchange rate fluctuations between the trade and settlement dates on securities transactions, and the difference between the amounts of dividends, interest, and foreign withholding taxes recorded on the Fund’s books and the U.S. dollar equivalent of the amounts actually received or paid. Net unrealized appreciation and depreciation on the translation of assets and liabilities denominated in foreign currencies arise from changes in the values of assets and liabilities, including investments in securities at fiscal period end, resulting from changes in exchange rates.
The effect of changes in foreign currency exchange rates on investments is separately identified from the fluctuations arising from changes in market values of securities held and reported with all other foreign currency gains and losses in the Fund’s Statement of Operations.
Allocation of Income, Expenses, Gains and Losses. Income, expenses (other than those attributable to a specific class), gains and losses are allocated on a daily basis to each class of shares based upon the relative proportion of net assets represented by such class. Operating expenses directly attributable to a specific class are charged against the operations of that class.
Dividends and Distributions to Shareholders. Dividends and distributions to shareholders, which are determined in accordance with income tax regulations and may differ from U.S. generally accepted accounting principles, are recorded on the ex-dividend date. Income and capital gain distributions, if any, are declared and paid annually or at other times as deemed necessary by the Manager.
Investment Income. Dividend income is recorded on the ex-dividend date or upon ex-dividend notification in the case of certain foreign dividends where the ex-dividend date may have passed. Non-cash dividends included in dividend income, if any, are recorded at the fair market value of the securities received. Interest income is recognized on an accrual basis. Discount and premium, which are included in interest income on the Statement of Operations, are amortized or accreted daily.
Custodian Fees. “Custodian fees and expenses” in the Statement of Operations may include interest expense incurred by the Fund on any cash overdrafts of its custodian account during the period. Such cash overdrafts may result from the effects of failed trades in portfolio securities and from cash outflows resulting from unanticipated shareholder redemption activity. The Fund pays interest to its custodian on such cash overdrafts, to the extent they are not offset by positive cash balances maintained by the Fund, at a rate equal to the Federal Funds Rate plus 0.50%. The “Reduction to custodian expenses” line item, if applicable, represents earnings on cash balances maintained by the Fund during the period. Such interest expense and other custodian fees may be paid with these earnings.
Security Transactions. Security transactions are recorded on the trade date. Realized gains and losses on securities sold are determined on the basis of identified cost.
Indemnifications. The Fund’s organizational documents provide current and former Trustees and officers with a limited indemnification against liabilities arising in connection with the performance of their duties to the Fund. In the normal course of business, the Fund may also enter into contracts that provide general indemnifications. The Fund’s maximum exposure under these arrangements is unknown as this would be dependent on future claims that may be made against the Fund. The risk of material loss from such claims is considered remote.
Federal Taxes. The Fund intends to comply with provisions of the Internal Revenue Code applicable to regulated investment companies and to distribute substantially all of its investment company taxable income, including any net realized gain on investments not offset by capital loss
15 OPPENHEIMER INTERNATIONAL GROWTH FUND/VA
NOTES TO FINANCIAL STATEMENTS Continued
2. Significant Accounting Policies (Continued)
carryforwards, if any, to shareholders. Therefore, no federal income or excise tax provision is required. The Fund files income tax returns in U.S. federal and applicable state jurisdictions. The statute of limitations on the Fund’s tax return filings generally remain open for the three preceding fiscal reporting period ends.
The tax components of capital shown in the following table represent distribution requirements the Fund must satisfy under the income tax regulations, losses the Fund may be able to offset against income and gains realized in future years and unrealized appreciation or depreciation of securities and other investments for federal income tax purposes.
| | | | | | | | | | | | |
| | | | | | | | | Net Unrealized | |
| | | | | | | | | Appreciation | |
| | | | | | | | | Based on cost of | |
| | | | | | | | | Securities and | |
| Undistributed | | Undistributed | | | Accumulated | | | Other Investments | |
| Net Investment | | Long-Term | | | Loss | | | for Federal Income | |
Income | | Gain | | | Carryforward1,2 | | | Tax Purposes | |
| |
$6,497,828 | | | $34,618,960 | | | | $— | | | | $132,212,389 | |
1. During the fiscal year ended December 31, 2014, the Fund did not utilize any capital loss carryforward.
2. During the fiscal year ended December 31, 2013, the Fund utilized $13,674,717 of capital loss carryforward to offset capital gains realized in that fiscal year.
Net investment income (loss) and net realized gain (loss) may differ for financial statement and tax purposes. The character of dividends and distributions made during the fiscal year from net investment income or net realized gains may differ from their ultimate characterization for federal income tax purposes. Also, due to timing of dividends and distributions, the fiscal year in which amounts are distributed may differ from the fiscal year in which the income or net realized gain was recorded by the Fund.
Accordingly, the following amounts have been reclassified for December 31, 2014. Net assets of the Fund were unaffected by the reclassifications.
| | | | | | | | |
| | | Increase | | | Reduction | |
| | | to Accumulated | | | to Accumulated Net | |
| Increase | | Net Investment | | | Realized Gain | |
to Paid-in Capital | | Income | | | on Investments3 | |
| |
$4,182,314 | | | $160,984 | | | | $4,343,298 | |
3. $4,182,314, including $4,063,145 of long-term capital gain, was distributed in connection with Fund share redemptions.
The tax character of distributions paid during the years ended December 31, 2014 and December 31, 2013 was as follows:
| | | | | | | | |
| | | Year Ended | | | Year Ended | |
| | | December 31, 2014 | | | December 31, 2013 | |
| |
Distributions paid from: | | | | | | | | |
Ordinary income | | $ | 5,887,367 | | | $ | 6,469,398 | |
Long-term capital gain | | | 10,797,758 | | | | — | |
| | | | |
Total | | $ | 16,685,125 | | | $ | 6,469,398 | |
| | | | |
The aggregate cost of securities and other investments and the composition of unrealized appreciation and depreciation of securities and other investments for federal income tax purposes as of December 31, 2014 are noted in the following table. The primary difference between book and tax appreciation or depreciation of securities and other investments, if applicable, is attributable to the tax deferral of losses or tax realization of financial statement unrealized gain or loss.
| | | | |
Federal tax cost of securities | | $ | 368,447,326 | |
| | | | |
Gross unrealized appreciation | | $ | 163,917,636 | |
Gross unrealized depreciation | | | (31,705,247) | |
| | | | |
Net unrealized appreciation | | $ | 132,212,389 | |
| | | | |
Certain foreign countries impose a tax on capital gains which is accrued by the Fund based on unrealized appreciation, if any, on affected securities. The tax is paid when the gain is realized.
Use of Estimates. The preparation of financial statements in conformity with accounting principles generally accepted in the United States of America requires management to make estimates and assumptions that affect the reported amounts of assets and liabilities and disclosure of contingent assets and liabilities at the date of the financial statements and the reported amounts of increases and decreases in net assets from operations during the reporting period. Actual results could differ from those estimates.
3. Securities Valuation
The Fund calculates the net asset value of its shares as of the close of the New York Stock Exchange (the “Exchange”), normally 4:00 P.M. Eastern time, on each day the Exchange is open for trading.
16 OPPENHEIMER INTERNATIONAL GROWTH FUND/VA
3. Securities Valuation (Continued)
The Fund’s Board has adopted procedures for the valuation of the Fund’s securities and has delegated the day-to-day responsibility for valuation determinations under those procedures to the Manager. The Manager has established a Valuation Committee which is responsible for determining a “fair valuation” for any security for which market quotations are not “readily available.” The Valuation Committee’s fair valuation determinations are subject to review, approval and ratification by the Fund’s Board at its next regularly scheduled meeting covering the calendar quarter in which the fair valuation was determined.
Valuation Methods and Inputs
Securities are valued using unadjusted quoted market prices, when available, as supplied primarily by third party pricing services or dealers.
The following methodologies are used to determine the market value or the fair value of the types of securities described below:
Securities traded on a registered U.S. securities exchange (including exchange-traded derivatives other than futures and futures options) are valued based on the last sale price of the security reported on the principal exchange on which it is traded, prior to the time when the Fund’s assets are valued. In the absence of a sale, the security is valued at the last sale price on the prior trading day, if it is within the spread of the current day’s closing “bid” and “asked” prices, and if not, at the current day’s closing bid price. A security of a foreign issuer traded on a foreign exchange, but not listed on a registered U.S. securities exchange, is valued based on the last sale price on the principal exchange on which the security is traded, as identified by the third party pricing service used by the Manager, prior to the time when the Fund’s assets are valued. If the last sale price is unavailable, the security is valued at the most recent official closing price on the principal exchange on which it is traded. If the last sales price or official closing price for a foreign security is not available, the security is valued at the mean between the bid and asked price per the exchange or, if not available from the exchange, obtained from two dealers. If bid and asked prices are not available from either the exchange or two dealers, the security is valued by using one of the following methodologies (listed in order of priority): (1) using a bid from the exchange, (2) the mean between the bid and asked price as provided by a single dealer, or (3) a bid from a single dealer.
Shares of a registered investment company that are not traded on an exchange are valued at that investment company’s net asset value per share.
Corporate and government debt securities (of U.S. or foreign issuers) and municipal debt securities, event-linked bonds, loans, mortgage-backed securities, collateralized mortgage obligations, and asset-backed securities are valued at the mean between the “bid” and “asked” prices utilizing evaluated prices obtained from third party pricing services or broker-dealers who may use matrix pricing methods to determine the evaluated prices.
Short-term money market type debt securities with a remaining maturity of sixty days or less are valued at cost adjusted by the amortization of discount or premium to maturity (amortized cost), which approximates market value. Short-term debt securities with a remaining maturity in excess of sixty days are valued at the mean between the “bid” and “asked” prices utilizing evaluated prices obtained from third party pricing services or broker-dealers.
A description of the standard inputs that may generally be considered by the third party pricing vendors in determining their evaluated prices is provided below.
| | |
| Security Type | | Standard inputs generally considered by third-party pricing vendors |
| Corporate debt, government debt, municipal, mortgage-backed and asset-backed securities | | Reported trade data, broker-dealer price quotations, benchmark yields, issuer spreads on comparable securities, the credit quality, yield, maturity, and other appropriate factors. |
| Loans | | Information obtained from market participants regarding reported trade data and broker-dealer price quotations. |
| Event-linked bonds | | Information obtained from market participants regarding reported trade data and broker-dealer price quotations. |
If a market value or price cannot be determined for a security using the methodologies described above, or if, in the “good faith” opinion of the Manager, the market value or price obtained does not constitute a “readily available market quotation,” or a significant event has occurred that would materially affect the value of the security the security is fair valued either (i) by a standardized fair valuation methodology applicable to the security type or the significant event as previously approved by the Valuation Committee and the Fund’s Board or (ii) as determined in good faith by the Manager’s Valuation Committee. The Valuation Committee considers all relevant facts that are reasonably available, through either public information or information available to the Manager, when determining the fair value of a security. Fair value determinations by the Manager are subject to review, approval and ratification by the Fund’s Board at its next regularly scheduled meeting covering the calendar quarter in which the fair valuation was determined. Those fair valuation standardized methodologies include, but are not limited to, valuing securities at the last sale price or initially at cost and subsequently adjusting the value based on: changes in company specific fundamentals, changes in an appropriate securities index, or changes in the value of similar securities which may be further adjusted for any discounts related to security-specific resale restrictions. When possible, such methodologies use observable market inputs such as unadjusted quoted prices of similar securities, observable interest rates, currency rates and yield curves. The methodologies used for valuing securities are not necessarily an indication of the risks associated with investing in those securities nor can it be assured that the Fund can obtain the fair value assigned to a security if it were to sell the security.
To assess the continuing appropriateness of security valuations, the Manager, or its third party service provider who is subject to oversight by the Manager, regularly compares prior day prices, prices on comparable securities, and sale prices to the current day prices and challenges those prices exceeding certain tolerance levels with the third party pricing service or broker source. For those securities valued by fair valuations, whether through a standardized fair valuation methodology or a fair valuation determination, the Valuation Committee reviews and affirms the reasonableness of the valuations based on such methodologies and fair valuation determinations on a regular basis after considering all relevant information that is reasonably available.
17 OPPENHEIMER INTERNATIONAL GROWTH FUND/VA
NOTES TO FINANCIAL STATEMENTS Continued
3. Securities Valuation (Continued)
Classifications
Each investment asset or liability of the Fund is assigned a level at measurement date based on the significance and source of the inputs to its valuation. Various data inputs are used in determining the value of each of the Fund’s investments as of the reporting period end. These data inputs are categorized in the following hierarchy under applicable financial accounting standards:
1) Level 1-unadjusted quoted prices in active markets for identical assets or liabilities (including securities actively traded on a securities exchange)
2) Level 2-inputs other than unadjusted quoted prices that are observable for the asset or liability (such as unadjusted quoted prices for similar assets and market corroborated inputs such as interest rates, prepayment speeds, credit risks, etc.)
3) Level 3-significant unobservable inputs (including the Manager’s own judgments about assumptions that market participants would use in pricing the asset or liability).
The inputs used for valuing securities are not necessarily an indication of the risks associated with investing in those securities.
The table below categorizes amounts that are included in the Fund’s Statement of Assets and Liabilities as of December 31, 2014 based on valuation input level:
| | | | | | | | | | | | | | | | |
| | | Level 1— Unadjusted Quoted Prices | | | Level 2— Other Significant Observable Inputs | | | Level 3— Significant Unobservable Inputs | | | Value | |
Assets Table | |
Investments, at Value: | |
Common Stocks | | | | | | | | | | | | | | | | |
Consumer Discretionary | | $ | 24,883,497 | | | $ | 92,846,596 | | | $ | — | | | $ | 117,730,093 | |
Consumer Staples | | | 4,776,899 | | | | 49,453,431 | | | | — | | | | 54,230,330 | |
Energy | | | — | | | | 9,736,584 | | | | — | | | | 9,736,584 | |
Financials | | | 9,156,952 | | | | 13,291,443 | | | | — | | | | 22,448,395 | |
Health Care | | | — | | | | 47,284,911 | | | | — | | | | 47,284,911 | |
Industrials | | | — | | | | 114,853,219 | | | | — | | | | 114,853,219 | |
Information Technology | | | — | | | | 78,748,693 | | | | — | | | | 78,748,693 | |
Materials | | | — | | | | 20,520,463 | | | | — | | | | 20,520,463 | |
Telecommunication Services | | | — | | | | 21,245,186 | | | | — | | | | 21,245,186 | |
Preferred Stock | | | 82,633 | | | | — | | | | — | | | | 82,633 | |
Rights, Warrants and Certificates | | | — | | | | 38,430 | | | | — | | | | 38,430 | |
Investment Company | | | 13,876,000 | | | | — | | | | — | | | | 13,876,000 | |
| | | | |
Total Assets | | $ | 52,775,981 | | | $ | 448,018,956 | | | $ | — | | | $ | 500,794,937 | |
| | | | |
Forward currency exchange contracts and futures contracts, if any, are reported at their unrealized appreciation/depreciation at measurement date, which represents the change in the contract’s value from trade date. All additional assets and liabilities included in the above table are reported at their market value at measurement date.
4. Investments and Risks
Investment in Oppenheimer Institutional Money Market Fund. The Fund is permitted to invest daily available cash balances in an affiliated money market fund. The Fund may invest the available cash in Class E shares of Oppenheimer Institutional Money Market Fund (“IMMF”) to seek current income while preserving liquidity or for defensive purposes. IMMF is a registered open-end management investment company, regulated as a money market fund under the 1940 Act. The Manager is the investment adviser of IMMF, and the Sub-Adviser provides investment and related advisory services to IMMF. When applicable, the Fund’s investment in IMMF is included in the Statement of Investments. Shares of IMMF are valued at their net asset value per share. As a shareholder, the Fund is subject to its proportional share of IMMF’s Class E expenses, including its management fee. The Manager will waive fees and/or reimburse Fund expenses in an amount equal to the indirect management fees incurred through the Fund’s investment in IMMF.
Equity Security Risk. Stocks and other equity securities fluctuate in price. The value of the Fund’s portfolio may be affected by changes in the equity markets generally. Equity markets may experience significant short-term volatility and may fall sharply at times. Different markets may behave differently from each other and U.S. equity markets may move in the opposite direction from one or more foreign stock markets.
The prices of individual equity securities generally do not all move in the same direction at the same time and a variety of factors can affect the price of a particular company’s securities. These factors may include, but are not limited to, poor earnings reports, a loss of customers, litigation against the company, general unfavorable performance of the company’s sector or industry, or changes in government regulations affecting the company or its industry.
5. Shares of Beneficial Interest
The Fund has authorized an unlimited number of $0.001 par value shares of beneficial interest of each class. Transactions in shares of beneficial interest were as follows:
18 OPPENHEIMER INTERNATIONAL GROWTH FUND/VA
5. Shares of Beneficial Interest (Continued)
| | | | | | | | | | | | | | | | |
| | | Year Ended December 31, 2014 | | | Year Ended December 31, 2013 | |
| | | Shares | | | Amount | | | Shares | | | Amount | |
Non-Service Shares | | | | | | | | | | | | | | | | |
Sold | | | 25,443,453 | | | $ | 62,992,150 | | | | 49,717,056 | | | $ | 113,109,114 | |
Dividends and/or distributions reinvested | | | 5,127,853 | | | | 13,024,746 | | | | 2,452,083 | | | | 5,541,707 | |
Redeemed | | | (53,834,052 | ) | | | (133,275,706 | ) | | | (42,327,625 | ) | | | (97,085,718) | |
| | | | |
Net increase (decrease) | | | (23,262,746 | ) | | $ | (57,258,810 | ) | | | 9,841,514 | | | $ | 21,565,103 | |
| | | | |
| | | | |
| | | | | | | | | | | | | | | | | |
Service Shares | | | | | | | | | | | | | | | | |
Sold | | | 19,806,037 | | | $ | 50,102,878 | | | | 16,576,608 | | | $ | 39,884,179 | |
Dividends and/or distributions reinvested | | | 1,386,507 | | | | 3,660,379 | | | | 396,450 | | | | 927,692 | |
Redeemed | | | (4,889,729 | ) | | | (12,467,461 | ) | | | (4,816,049 | ) | | | (11,464,804) | |
| | | | |
Net increase | | | 16,302,815 | | | $ | 41,295,796 | | | | 12,157,009 | | | $ | 29,347,067 | |
| | | | |
6. Purchases and Sales of Securities
The aggregate cost of purchases and proceeds from sales of securities, other than short-term obligations and investments in IMMF, for the year ended December 31, 2014 were as follows:
| | | | | | | | | | |
| | | Purchases | | | | | Sales | |
Investment securities | | $ | 211,716,827 | | | | | $ | 237,792,010 | |
7. Fees and Other Transactions with Affiliates
Management Fees. Under the investment advisory agreement, the Fund pays the Manager a management fee based on the daily net assets of the Fund at an annual rate as shown in the following table:
| | | | |
| Fee Schedule | | | |
Up to $250 million | | | 1.00% | |
Next $250 million | | | 0.90 | |
Over $500 million | | | 0.85 | |
The Fund’s management fee for the fiscal year ended December 31, 2014 was 0.94% of average annual net assets before any applicable waivers.
Sub-Adviser Fees. The Manager has retained the Sub-Adviser to provide the day-to-day portfolio management of the Fund. Under the Sub-Advisory Agreement, the Manager pays the Sub-Adviser an annual fee in monthly installments, equal to a percentage of the investment management fee collected by the Manager from the Fund, which shall be calculated after any investment management fee waivers. The fee paid to the Sub-Adviser is paid by the Manager, not by the Fund.
Transfer Agent Fees. OFI Global (the “Transfer Agent”) serves as the transfer and shareholder servicing agent for the Fund. The Fund pays the Transfer Agent a fee based on annual net assets. Fees incurred and average net assets for each class with respect to these services are detailed in the Statement of Operations and Financial Highlights, respectively.
Sub-Transfer Agent Fees. The Transfer Agent has retained Shareholder Services, Inc., a wholly-owned subsidiary of OFI (the “Sub-Transfer Agent”), to provide the day-to-day transfer agent and shareholder servicing of the Fund. Under the Sub-Transfer Agency Agreement, the Transfer Agent pays the Sub-Transfer Agent an annual fee in monthly installments, equal to a percentage of the transfer agent fee collected by the Transfer Agent from the Fund, which shall be calculated after any applicable fee waivers. The fee paid to the Sub-Transfer Agent is paid by the Transfer Agent, not by the Fund.
Trustees’ Compensation. The Fund’s Board of Trustees (“Board”) has adopted a compensation deferral plan for Independent Trustees that enables Trustees to elect to defer receipt of all or a portion of the annual compensation they are entitled to receive from the Fund. For purposes of determining the amount owed to the Trustee under the plan, deferred amounts are treated as though equal dollar amounts had been invested in shares of the Fund or in other Oppenheimer funds selected by the Trustee. The Fund purchases shares of the funds selected for deferral by the Trustee in amounts equal to his or her deemed investment, resulting in a Fund asset equal to the deferred compensation liability. Such assets are included as a component of “Other” within the asset section of the Statement of Assets and Liabilities. Deferral of Trustees’ fees under the plan will not affect the net assets of the Fund and will not materially affect the Fund’s assets, liabilities or net investment income per share. Amounts will be deferred until distributed in accordance with the compensation deferral plan.
Distribution and Service Plan for Service Shares. The Fund has adopted a Distribution and Service Plan (the “Plan”) pursuant to Rule 12b-1 under the 1940 Act for Service shares to pay OppenheimerFunds Distributor, Inc. (the “Distributor”), for distribution related services, personal service and account maintenance for the Fund’s Service shares. Under the Plan, payments are made periodically at an annual rate of 0.25% of the daily net assets of Service shares of the Fund. The Distributor currently uses all of those fees to compensate sponsors of the insurance product that offers Fund shares, for
19 OPPENHEIMER INTERNATIONAL GROWTH FUND/VA
NOTES TO FINANCIAL STATEMENTS Continued
7. Fees and Other Transactions with Affiliates (Continued)
providing personal service and maintenance of accounts of their variable contract owners that hold Service shares. These fees are paid out of the Fund’s assets on an on-going basis and increase operating expenses of the Service shares, which results in lower performance compared to the Fund’s shares that are not subject to a service fee. Fees incurred by the Fund under the Plan are detailed in the Statement of Operations.
Waivers and Reimbursements of Expenses. The Manager has contractually agreed to limit the Fund’s expenses after payments, waivers and/or reimbursements and reduction to custodian expenses, excluding expenses incurred directly or indirectly by the Fund as a result of investments in other investment companies, wholly-owned subsidiaries and pooled investment vehicles; so that those expenses, as percentages of daily net assets, will not exceed the annual rate of 1.00% for Non-Service shares and 1.25% for Service shares. During the year ended December 31, 2014, the Manager waived fees and/or reimbursed the Fund $271,654 and $90,590 for Non-Service and Service shares, respectively.
The Manager will waive fees and/or reimburse Fund expenses in an amount equal to the indirect management fees incurred through the Fund’s investment in IMMF. During the year ended December 31, 2014, the Manager waived fees and/or reimbursed the Fund $12,257 for IMMF management fees.
These undertakings may be modified or terminated as set forth according to the terms in the prospectus.
8. Borrowings and Other Financing
Securities Lending. The Fund lends portfolio securities from time to time in order to earn additional income in the form of fees, or interest on cash or securities received as collateral. The loans are secured by collateral (either securities, letters of credit, or cash) in an amount of at least 102% of the market value of the loaned U.S. securities, and at least 105% of the market value of loaned foreign securities during the period of the loan. The market value of the loaned securities is determined at the close of each business day and any additional required collateral is delivered to the Fund on the next business day. If the borrower defaults on its obligation to return the securities loaned because of insolvency or other reasons, the Fund could experience delays and cost in recovering the securities loaned or in gaining access to the collateral. The Fund continues to receive the economic benefit of interest or dividends paid on the securities loaned in the form of a substitute payment received from the borrower and recognizes the change in the fair value of the securities loaned that may occur during the term of the loan. The Fund has the right under the lending agreement to recover the securities from the borrower on demand. As of December 31, 2014, the Fund had no securities on loan.
9. Pending Litigation
In 2009, seven class action lawsuits were filed in the U.S. District Court for the District of Colorado against OppenheimerFunds, Inc. (“OFI”), OppenheimerFunds Distributor, Inc., the Fund’s principal underwriter and distributor (the “Distributor”), and certain funds (but not including the Fund) advised by OFI Global Asset Management, Inc. and distributed by the Distributor (the “Defendant Funds”). The lawsuits also named as defendants certain officers and current and former trustees of the respective Defendant Funds. The lawsuits raised claims under federal securities laws and alleged, among other things, that the disclosure documents of the respective Defendant Funds contained misrepresentations and omissions and that the respective Defendant Funds’ investment policies were not followed. The plaintiffs in these actions sought unspecified damages, equitable relief and awards of attorneys’ fees and litigation expenses. The Defendant Funds’ Boards of Trustees also engaged counsel to represent the Funds and the present and former Independent Trustees named in those suits. In March 2014, the parties in six of these lawsuits executed stipulations and agreements of settlement resolving those actions. In July 2014, the court entered an order and final judgment approving the settlements as fair, reasonable and adequate. The settlements do not resolve a seventh outstanding lawsuit relating to Oppenheimer Rochester California Municipal Fund (the “California Fund Suit”). OFI believes the California Fund Suit is without legal merit and is defending the suit vigorously. While it is premature to render any opinion as to the outcome in the California Fund Suit, or whether any costs that OFI may bear in defending the California Fund Suit might not be reimbursed by insurance, OFI believes the California Fund Suit should not impair the ability of OFI or the Distributor to perform their respective duties to the Fund, and that the outcome of the California Fund Suit should not have any material effect on the operations of any of the Oppenheimer funds.
20 OPPENHEIMER INTERNATIONAL GROWTH FUND/VA
REPORTOFINDEPENDENTREGISTEREDPUBLICACCOUNTINGFIRM
The Board of Trustees and Shareholders of Oppenheimer Variable Account Funds:
We have audited the accompanying statement of assets and liabilities of Oppenheimer International Growth Fund/VA (a separate series of Oppenheimer Variable Account Funds), including the statement of investments, as of December 31, 2014, and the related statement of operations for the year then ended, the statements of changes in net assets for each of the years in the two-year period then ended, and the financial highlights for each of the years in the five-year period then ended. These financial statements and financial highlights are the responsibility of the Fund’s management. Our responsibility is to express an opinion on these financial statements and financial highlights based on our audits.
We conducted our audits in accordance with the standards of the Public Company Accounting Oversight Board (United States). Those standards require that we plan and perform the audit to obtain reasonable assurance about whether the financial statements and financial highlights are free of material misstatement. An audit includes examining, on a test basis, evidence supporting the amounts and disclosures in the financial statements. Our procedures included confirmation of securities owned as of December 31, 2014, by correspondence with the custodian, transfer agent and brokers, or by other appropriate auditing procedures where replies from brokers were not received. An audit also includes assessing the accounting principles used and significant estimates made by management, as well as evaluating the overall financial statement presentation. We believe that our audits provide a reasonable basis for our opinion.
In our opinion, the financial statements and financial highlights referred to above present fairly, in all material respects, the financial position of Oppenheimer International Growth Fund/VA as of December 31, 2014, the results of its operations for the year then ended, the changes in its net assets for each of the years in the two-year period then ended, and the financial highlights for each of the years in the five-year period then ended, in conformity with U.S. generally accepted accounting principles.
KPMG LLP
Denver, Colorado
February 13, 2015
21 OPPENHEIMER INTERNATIONAL GROWTH FUND/VA
FEDERALINCOMETAXINFORMATION Unaudited
In early 2015, if applicable, shareholders of record received information regarding all dividends and distributions paid to them by the Fund during calendar year 2014.
Capital gain distributions of $0.05222 per share were paid to Non-Service and Service shareholders, respectively, on June 18, 2014. Whether received in stock or in cash, the capital gain distribution should be treated by shareholders as a gain from the sale of the capital assets held for more than one year (long-term capital gains).
None of the dividends paid by the Fund during the fiscal year ended December 31, 2014 are eligible for the corporate dividend-received deduction.
The Fund has elected the application of Section 853 of the Internal Revenue Code to permit shareholders to take a federal income tax credit or deduction, at their option, on a per share basis. The maximum amount allowable but not less than $908,851 of foreign income taxes were paid by the Fund during the fiscal year ended December 31, 2014. A separate notice will be mailed to each shareholder, which will reflect the proportionate share of such foreign taxes which must be treated by shareholders as gross income for federal income tax purposes.
Gross income of the maximum amount allowable but not less than $6,883,391 was derived from sources within foreign countries or possessions of the United States.
The foregoing information is presented to assist shareholders in reporting distributions received from the Fund to the Internal Revenue Service. Because of the complexity of the federal regulations which may affect your individual tax return and the many variations in state and local tax regulations, we recommend that you consult your tax advisor for specific guidance.
22 OPPENHEIMER INTERNATIONAL GROWTH FUND/VA
BOARDAPPROVALOFTHEFUND’SINVESTMENTADVISORYANDSUB-ADVISORYAGREEMENTS Unaudited
The Fund has entered into an investment advisory agreement with OFI Global Asset Management, Inc. (“OFI Global” or the “Adviser”), a wholly-owned subsidiary of OppenheimerFunds, Inc. (“OFI” or the “Sub-Adviser”) (“OFI Global” and “OFI” together the “Managers”) and OFI Global has entered into a sub-advisory agreement with OFI whereby OFI provides investment sub-advisory services to the Fund (collectively, the “Agreements”). Each year, the Board of Trustees (the “Board”), including a majority of the independent Trustees, is required to determine whether to renew the Agreements. The Investment Company Act of 1940, as amended, requires that the Board request and evaluate, and that the Managers provide, such information as may be reasonably necessary to evaluate the terms of the Agreements. The Board employs an independent consultant to prepare a report that provides information, including comparative information that the Board requests for that purpose. In addition to in-person meetings focused on this evaluation, the Board receives information throughout the year regarding Fund services, fees, expenses and performance.
The Adviser, Sub-Adviser and the independent consultant provided information to the Board on the following factors: (i) the nature, quality and extent of the Managers’ services, (ii) the investment performance of the Fund and the Managers, (iii) the fees and expenses of the Fund, including comparative expense information, (iv) the profitability of the Managers and their affiliates, including an analysis of the cost of providing services, (v) whether economies of scale are realized as the Fund grows and whether fee levels reflect these economies of scale for Fund investors and (vi) other benefits to the Managers from their relationship with the Fund. The Board was aware that there are alternatives to retaining the Managers.
Outlined below is a summary of the principal information considered by the Board as well as the Board’s conclusions.
Nature, Quality and Extent of Services. The Board considered information about the nature, quality and extent of the services provided to the Fund and information regarding the Managers’ key personnel who provide such services. The Sub-Adviser’s duties include providing the Fund with the services of the portfolio managers and the Sub-Adviser’s investment team, who provide research, analysis and other advisory services in regard to the Fund’s investments; securities trading services; oversight of third-party service providers; monitoring compliance with applicable Fund policies and procedures and adherence to the Fund’s investment restrictions; and risk management. The Managers are responsible for providing certain administrative services to the Fund as well. Those services include providing and supervising all administrative and clerical personnel who are necessary in order to provide effective corporate administration for the Fund; compiling and maintaining records with respect to the Fund’s operations; preparing and filing reports required by the Securities and Exchange Commission; preparing periodic reports regarding the operations of the Fund for its shareholders; preparing proxy materials for shareholder meetings; and preparing the registration statements required by Federal and state securities laws for the sale of the Fund’s shares. The Managers also provide the Fund with office space, facilities and equipment.
The Board also considered the quality of the services provided and the quality of the Managers’ resources that are available to the Fund. The Board took account of the fact that the Sub-Adviser has had over fifty years of experience as an investment adviser and that its assets under management rank it among the top mutual fund managers in the United States. The Board evaluated the Sub-Adviser’s advisory, administrative, accounting, legal, compliance services and risk management, and information the Board has received regarding the experience and professional qualifications of the Managers’ key personnel and the size and functions of its staff. In its evaluation of the quality of the portfolio management services provided, the Board considered the experience of George Evans and Robert Dunphy, the portfolio managers for the Fund, and the Sub-Adviser’s investment team and analysts. The Board members also considered the totality of their experiences with the Managers as directors or trustees of the Fund and other funds advised by the Managers. The Board considered information regarding the quality of services provided by affiliates of the Managers, which its members have become knowledgeable about in connection with the renewal of the Fund’s service agreements. The Board concluded, in light of the Managers’ experience, reputation, personnel, operations and resources that the Fund benefits from the services provided under the Agreements.
Investment Performance of the Manager and the Fund. Throughout the year, the Manager provided information on the investment performance of the Fund, including comparative performance information. The Board also reviewed information, prepared by the Manager and by the independent consultant, comparing the Fund’s historical performance to relevant market indices and to the performance of other foreign large growth funds underlying variable insurance products. The Board noted that the Fund outperformed its performance category median during each of the one-, three-, five- and ten-year periods. The Board also noted that the Fund performed in the first quintile of its performance category for each of the one-, three-, five- and ten-year periods.
Costs of Services by the Adviser. The Board reviewed the fees paid to the Manager and the other expenses borne by the Fund. The Board noted that the Manager, not the Fund, pays the Sub-Adviser’s fee under the sub-advisory agreement. The independent consultant provided comparative data in regard to the fees and expenses of the Fund and other foreign large growth funds underlying variable insurance products. In reviewing the fees and expenses charged to the VA funds, the Board considered the Manager’s assertion that, because there is much greater disparity in the fees and services that may be provided by a manager to a VA fund as opposed to a retail fund, when comparing the expenses of the various VA funds to those of retail funds, it is most appropriate to focus on total expenses (rather than on the management fees). Accordingly, while the Board reviewed and considered all expenses, it focused on total expenses. The Board considered that the Fund’s total expenses, after waivers, were lower than its peer group median and equal to its category median. The Board also considered that the Fund’s contractual management fee was equal to its peer group median and higher than its category median. Within the total asset range of $500 million to $1 billion, the Fund’s effective management fee rate was higher than its peer group median and category median. The Board noted that the Manager has contractually agreed to limit the Fund’s total annual operating expenses so that those expenses, as percentages of daily net assets, will not exceed the annual rate of 1.00% for Non-Service Shares and 1.25% for Service Shares. This contractual expense limitation may not be amended or withdrawn until one year from the date of the Fund’s prospectus, unless approved by the Board.
Economies of Scale and Profits Realized by the Adviser and Sub-Adviser. The Board considered information regarding the Manager’s costs in serving as the Fund’s investment adviser, including the costs associated with the personnel and systems necessary to manage the Fund, and information regarding the Manager’s profitability from its relationship with the Fund. The Board reviewed whether the Manager may realize economies of scale in managing and supporting the Fund. The Board noted that the Fund currently has management fee breakpoints, which are intended to share with Fund shareholders economies of scale that may exist as the Fund’s assets grow. The Board further noted that on November 1, 2013, an additional fee breakpoint of 0.85% for assets in excess of $500 million was added to the Fund’s breakpoint schedule.
Other Benefits to the Managers. In addition to considering the profits realized by the Managers, the Board considered information that was provided regarding the direct and indirect benefits the Managers receive as a result of their relationship with the Fund, including compensation paid to the Managers’
23 OPPENHEIMER INTERNATIONAL GROWTH FUND/VA
BOARDAPPROVALOFTHEFUND’SINVESTMENTADVISORYANDSUB-ADVISORYAGREEMENTS Unaudited / Continued
affiliates and research provided to the Adviser in connection with permissible brokerage arrangements (soft dollar arrangements). The Board also considered that the Managers must be able to pay and retain experienced professional personnel at competitive rates to provide quality services to the Fund.
Conclusions. These factors were also considered by the independent Trustees meeting separately from the full Board, assisted by experienced counsel to the Fund and to the independent Trustees. Fund counsel and the independent Trustees’ counsel are independent of the Managers within the meaning and intent of the Securities and Exchange Commission Rules.
Based on its review of the information it received and its evaluations described above, the Board, including a majority of the independent Trustees, decided to continue the Agreements through August 31, 2015. In arriving at its decision, the Board did not identify any factor or factors as being more important than others, but considered all of the above information, and considered the terms and conditions of the Agreements, including the management fees, in light of all the surrounding circumstances.
24 OPPENHEIMER INTERNATIONAL GROWTH FUND/VA
PORTFOLIOPROXYVOTINGPOLICIESANDPROCEDURES;UPDATESTOSTATEMENTSOFINVESTMENTS Unaudited
The Fund has adopted Portfolio Proxy Voting Policies and Procedures under which the Fund votes proxies relating to securities (“portfolio proxies”) held by the Fund. A description of the Fund’s Portfolio Proxy Voting Policies and Procedures is available (i) without charge, upon request, by calling the Fund toll-free at 1.800.525.7048, (ii) on the Fund’s website at www.oppenheimerfunds.com, and (iii) on the SEC’s website at www.sec.gov. In addition, the Fund is required to file Form N-PX, with its complete proxy voting record for the 12 months ended June 30th, no later than August 31st of each year. The Fund’s voting record is available (i) without charge, upon request, by calling the Fund toll-free at 1.800.525.7048, and (ii) in the Form N-PX filing on the SEC’s website at www.sec.gov.
The Fund files its complete schedule of portfolio holdings with the SEC for the first quarter and the third quarter of each fiscal year on Form N-Q. The Fund’s Form N-Q filings are available on the SEC’s website at www.sec.gov. Those forms may be reviewed and copied at the SEC’s Public Reference Room in Washington, D.C. Information on the operation of the Public Reference Room may be obtained by calling 1-800-SEC-0330.
25 OPPENHEIMER INTERNATIONAL GROWTH FUND/VA
TRUSTEESANDOFFICERS Unaudited
| | |
| | |
| Name, Position(s) Held with the Fund, Length of Service, Year of Birth | | Principal Occupation(s) During the Past 5 Years; Other Trusteeships/Directorships Held; Number of Portfolios in the Fund Complex Currently Overseen |
| |
| INDEPENDENT TRUSTEES | | The address of each Trustee in the chart below is 6803 S. Tucson Way, Centennial, Colorado 80112-3924. Each Director serves for an indefinite term, or until his or her resignation, retirement, death or removal. |
| |
Sam Freedman, Chairman of the Board of Trustees (since 2013) and Trustee (since 1996) Year of Birth: 1940 | | Director of Colorado UpLIFT (charitable organization) (since September 1984). Mr. Freedman held several positions with the Sub-Adviser and with subsidiary or affiliated companies of the Sub-Adviser (until October 1994). Oversees 38 portfolios in the OppenheimerFunds complex. Mr. Freedman has served on the Boards of certain Oppenheimer funds since 1996, during which time he has become familiar with the Fund’s (and other Oppenheimer funds’) financial, accounting, regulatory and investment matters and has contributed to the Boards’ deliberations. |
| |
Jon S. Fossel, Trustee (since 1997) Year of Birth: 1942 | | Chairman of the Board of Jack Creek Preserve Foundation (non-profit organization) (since 2005); Chairman of the Board (2006-December 2011) and Director (June 2002-December 2011) of UNUMProvident (insurance company); Director of Northwestern Energy Corp. (public utility corporation) (November 2004-December 2009); Director of P.R. Pharmaceuticals (October 1999-October 2003); Director of Rocky Mountain Elk Foundation (non-profit organization) (February 1998-February 2003 and February 2005-February 2007); Chairman and Director (until October 1996) and President and Chief Executive Officer (until October 1995) of the Sub-Adviser; President, Chief Executive Officer and Director of the following: Oppenheimer Acquisition Corp. (“OAC”) (parent holding company of the Sub-Adviser), Shareholder Services, Inc. and Shareholder Financial Services, Inc. (until October 1995). Oversees 38 portfolios in the OppenheimerFunds complex. Mr. Fossel has served on the Boards of certain Oppenheimer funds since 1990, during which time he has become familiar with the Fund’s (and other Oppenheimer funds’) financial, accounting, regulatory and investment matters and has contributed to the Boards’ deliberations. |
| |
Richard F. Grabish, Trustee (since 2008) Year of Birth: 1948 | | Formerly Senior Vice President and Assistant Director of Sales and Marketing (March 1997-December 2007), Director (March 1987-December 2007) and Manager of Private Client Services (June 1985-June 2005) of A.G. Edwards & Sons, Inc. (broker/dealer and investment firm); Chairman and Chief Executive Officer of A.G. Edwards Trust Company, FSB (March 2001-December 2007); President and Vice Chairman of A.G. Edwards Trust Company, FSB (investment adviser) (April 1987-March 2001); President of A.G. Edwards Trust Company, FSB (investment adviser) (June 2005-December 2007). Oversees 38 portfolios in the OppenheimerFunds complex. Mr. Grabish has served on the Boards of certain Oppenheimer funds since 2001, during which time he has become familiar with the Fund’s (and other Oppenheimer funds’) financial, accounting, regulatory and investment matters and has contributed to the Boards’ deliberations. |
| |
Beverly L. Hamilton, Trustee (since 2002) Year of Birth: 1946 | | Trustee of Monterey Institute for International Studies (educational organization) (since February 2000); Board Member of Middlebury College (educational organization) (December 2005-June 2011); Chairman (since 2010) of American Funds’ Emerging Markets Growth Fund, Inc. (mutual fund); Director of The California Endowment (philanthropic organization) (April 2002-April 2008); Director (February 2002-2005) and Chairman of Trustees (2006-2007) of the Community Hospital of Monterey Peninsula; Director (October 1991-2005); Vice Chairman (2006-2009) of American Funds’ Emerging Markets Growth Fund, Inc. (mutual fund); President of ARCO Investment Management Company (February 1991-April 2000); Member of the investment committees of The Rockefeller Foundation (2001-2006) and The University of Michigan (since 2000); Advisor at Credit Suisse First Boston’s Sprout venture capital unit (venture capital fund) (1994-January 2005); Trustee of MassMutual Institutional Funds (investment company) (1996-June 2004); Trustee of MML Series Investment Fund (investment company) (April 1989-June 2004); Member of the investment committee of Hartford Hospital (2000-2003); and Advisor to Unilever (Holland) pension fund (2000-2003). Oversees 38 portfolios in the OppenheimerFunds complex. Ms. Hamilton has served on the Boards of certain Oppenheimer funds since 2002, during which time she has become familiar with the Fund’s (and other Oppenheimer funds’) financial, accounting, regulatory and investment matters and has contributed to the Boards’ deliberations. |
| |
Victoria J. Herget, Trustee (since 2012) Year of Birth:1951 | | Board Chair (2008-Present) and Director (2004-Present), United Educators (insurance company); Trustee (since 2000) and Chair (since 2010), Newberry Library (independent research library); Trustee, Mather LifeWays (senior living organization) (since 2001); Independent Director of the First American Funds (mutual fund family) (2003-2011); former Managing Director (1993-2001), Principal (1985-1993), Vice President (1978-1985) and Assistant Vice President (1973-1978) of Zurich Scudder Investments (investment adviser) (and its predecessor firms); Trustee (1992-2007), Chair of the Board of Trustees (1999-2007), Investment Committee Chair (1994-1999) and Investment Committee member (2007-2010) of Wellesley College; Trustee, BoardSource (non-profit organization) (2006-2009) and Chicago City Day School (K-8 School) (1994-2005). Oversees 38 portfolios in the OppenheimerFunds complex. Ms. Herget has served on the Boards of certain Oppenheimer funds since 2012, during which time she has become familiar with the Fund’s (and other Oppenheimer funds’) financial, accounting, regulatory and investment matters and has contributed to the Boards’ deliberations. |
| |
Robert J. Malone, Trustee (since 2002) Year of Birth: 1944 | | Chairman of the Board (since 2012) and Director (since August 2005) of Jones International University (educational organization); Chairman, Chief Executive Officer and Director of Steele Street Bank Trust (commercial banking) (since August 2003); Trustee of the Gallagher Family Foundation (non-profit organization) (since 2000); Board of Directors of Opera Colorado Foundation (non-profit organization) (2008-2012); Director of Colorado UpLIFT (charitable organization) (1986-2010); Director of Jones Knowledge, Inc. (2006-2010); Former Chairman of U.S. Bank-Colorado (subsidiary of U.S. Bancorp and formerly Colorado National Bank) (July 1996-April 1999); Director of Commercial Assets, Inc. (real estate investment trust) (1993-2000); Director of U.S. Exploration, Inc. (oil and gas exploration) (1997-February 2004); Chairman of the Board (1991-1994) and Trustee (1985-1994) of Regis University; and Chairman of the Board (1990-1991 and Trustee (1984-1999) of Young Presidents Organization. Oversees 38 portfolios in the OppenheimerFunds complex. Mr. Malone has served on the Boards of certain Oppenheimer funds since 2002, during which time he has become familiar with the Fund’s (and other Oppenheimer funds’) financial, accounting, regulatory and investment matters and has contributed to the Boards’ deliberations. |
26 OPPENHEIMER INTERNATIONAL GROWTH FUND/VA
| | |
F. William Marshall, Jr., Trustee (since 2002) Year of Birth: 1942 | | Trustee Emeritus of Worcester Polytech Institute (WPI) (private university) (since 2009); Trustee of MassMutual Select Funds (formerly MassMutual Institutional Funds) (investment company) (since 1996), MML Series Investment Fund (investment company) (since 1996) and Mass Mutual Premier Funds (investment company) (since January 2012); President and Treasurer of the SIS Fund (private charitable fund) (January 1999 – March 2011); Former Trustee of WPI (1985-2008); Former Chairman of the Board (2004-2006) and Former Chairman of the Investment Committee of WPI (1994-2008); Chairman of SIS & Family Bank, F.S.B. (formerly SIS Bank) (commercial bank) (January 1999-July 1999); Executive Vice President of Peoples Heritage Financial Group, Inc. (commercial bank) (January 1999-July 1999); and Former President and Chief Executive Officer of SIS Bancorp. (1993-1999). Oversees 42 portfolios in the OppenheimerFunds complex. Mr. Marshall has served on the Boards of certain Oppenheimer funds since 2000, during which time he has become familiar with the Fund’s (and other Oppenheimer funds’) financial, accounting, regulatory and investment matters and has contributed to the Boards’ deliberations. |
| |
Karen L. Stuckey, Trustee (since 2012) Year of Birth: 1953 | | Partner (1990-2012) of PricewaterhouseCoopers LLP (professional services firm) (held various positions 1975- 1990); Trustee (1992-2006) and member of Executive, Nominating and Audit Committees and Chair of Finance Committee of Lehigh University; and member, Women’s Investment Management Forum (professional organization) since inception. Oversees 38 portfolios in the OppenheimerFunds complex. Ms. Stuckey has served on the Boards of certain Oppenheimer funds since 2012, during which time she has become familiar with the Fund’s (and other Oppenheimer funds’) financial, accounting, regulatory and investment matters and has contributed to the Boards’ deliberations. |
| |
James D. Vaughn, Trustee (since 2012) Year of Birth:1945 | | Retired; former managing partner (1994-2001) of Denver office of Deloitte & Touche LLP, (held various positions 1969-1993); Trustee and Chairman of the Audit Committee of Schroder Funds (2003-2012); Board member and Chairman of Audit Committee of AMG National Trust Bank (since 2005); Trustee and Investment Committee member, University of South Dakota Foundation (since 1996); Board member, Audit Committee Member and past Board Chair, Junior Achievement (since 1993); former Board member, Mile High United Way, Boys and Girls Clubs, Boy Scouts, Colorado Business Committee for the Arts, Economic Club of Colorado and Metro Denver Network. Oversees 38 portfolios in the OppenheimerFunds complex. Mr. Vaughn has served on the Boards of certain Oppenheimer funds since 2012, during which time he has become familiar with the Fund’s (and other Oppenheimer funds’) financial, accounting, regulatory and investment matters and has contributed to the Boards’ deliberations. |
| |
INTERESTED TRUSTEE | | Mr. Glavin is an “Interested Trustee” because he is affiliated with the Manager and the Sub-Adviser by virtue of his positions as director of the Sub-Adviser, and as a shareholder of the Sub-Adviser’s parent company. As a Trustee, he serves for an indefinite term, or until his resignation, retirement, death or removal. Mr. Glavin’s address is 225 Liberty Street, 11th Floor, New York, New York 10281-1008. |
| |
William F. Glavin, Jr., Trustee (since 2009) Year of Birth: 1958 Year | | Chairman of the Sub-Adviser (July 2014-December 2014 and December 2009-December 2012) and Director of the Sub-Adviser (since January 2009); Chairman, Director and Chief Executive Officer (January 2013-June 2014) of the Manager; President of the Manager (January 2013-May 2013); Chief Executive Officer (January 2009-December 2012); President of the Sub-Adviser (May 2009-December 2012); Management Director (June 2009-June 2014), President (December 2009-June 2014) and Chief Executive Officer (January 2011-June 2014) of Oppenheimer Acquisition Corp. (“OAC”) (the Sub-Adviser’s parent holding company); Director of Oppenheimer Real Asset Management, Inc. (March 2010-June 2014); Executive Vice President (March 2006-February 2009) and Chief Operating Officer (July 2007-February 2009) of Massachusetts Mutual Life Insurance Company (OAC’s parent company); Director (May 2004-March 2006) and Chief Operating Officer and Chief Compliance Officer (May 2004-January 2005), President (January 2005-March 2006) and Chief Executive Officer (June 2005-March 2006) of Babson Capital Management LLC; Director (March 2005-March 2006), President (May 2003-March 2006) and Chief Compliance Officer (July 2005-March 2006) of Babson Capital Securities, Inc. (a broker-dealer); President (May 2003-March 2006) of Babson Investment Company, Inc.; Director (May 2004-August 2006) of Babson Capital Europe Limited; Director (May 2004-October 2006) of Babson Capital Guernsey Limited; Director (May 2004-March 2006) of Babson Capital Management LLC; Non-Executive Director (March 2005-March 2007) of Baring Asset Management Limited; Director (February 2005-June 2006) Baring Pension Trustees Limited; Director and Treasurer (December 2003-November 2006) of Charter Oak Capital Management, Inc.; Director (May 2006-September 2006) of C.M. Benefit Insurance Company; Director (May 2008-June 2009) and Executive Vice President (June 2007-July 2009) of C.M. Life Insurance Company; President (March 2006-May 2007) of MassMutual Assignment Company; Director (January 2005-December 2006), Deputy Chairman (March 2005-December 2006) and President (February 2005-March 2005) of MassMutual Holdings (Bermuda) Limited; Director (May 2008-June 2009) and Executive Vice President (June 2007-July 2009) of MML Bay State Life Insurance Company; Chief Executive Officer and President (April 2007-January 2009) of MML Distributors, LLC; and Chairman (March 2006-December 2008) and Chief Executive Officer (May 2007-December 2008) of MML Investors Services, Inc. An officer of 91 portfolios in the OppenheimerFunds complex. Mr. Glavin has served on the Boards of certain Oppenheimer funds since December 2009, during which time he has become familiar with the Fund’s (and other Oppenheimer funds’) financial, accounting, regulatory and investment matters and has contributed to the Boards’ deliberations. |
| |
OTHER OFFICERS OF THE FUND | | The addresses of the Officers in the chart below are as follows: for Messrs. Evans, Dunphy, Steinmetz, Gabinet, Mss. Sexton and Picciotto, 225 Liberty Street, New York, New York 10281-1008, for Mr. Wixted, 6803 S. Tucson Way, Centennial, Colorado 80112-3924. Each Officer serves for an indefinite term or until his or her resignation, retirement, death or removal. |
| |
George R. Evans, Vice President (since 1999) Year of Birth: 1959 | | CIO Equities of the Sub-Adviser (since January 2013); Senior Vice President of the Sub-Adviser (since July 2004). Director of International Equities of the Sub-Adviser (since July 2004); Director of Equities of the Sub-Adviser (October 2010-December 2012); Vice President of HarbourView Asset Management Corporation (July 1994-November 2001) and Vice President of the Sub-Adviser (October 1993-July 2004). A portfolio manager and officer of other portfolios in the OppenheimerFunds complex. |
27 OPPENHEIMER INTERNATIONAL GROWTH FUND/VA
TRUSTEESANDOFFICERS Unaudited / Continued
| | |
Robert B. Dunphy, Vice President (since 2012) Year of Birth: 1979 | | Vice President of the Sub-Adviser (since January 2011); Senior Portfolio Manager (since May 2011); Senior Research Analyst and Assistant Vice President of the Sub-Adviser (May 2009-January 2011), and an Intermediate Research Analyst of the Sub-Adviser (January 2006-May 2009). A portfolio manager of other portfolios in the OppenheimerFunds complex. |
| |
Arthur P. Steinmetz, President and Principal Executive Officer (since 2014) Year of Birth: 1958 | | Chairman of the Sub-Adviser (since January 2015); CEO and Chairman of the Manager (since July 2014), President of the Manager (since May 2013), a Director of the Manager (since January 2013), Director of the Sub-Adviser (since July 2014), President, Management Director and CEO of Oppenheimer Acquisition Corp. (the Sub-Adviser’s parent holding company) (since July 2014), and President and Director of OFI SteelPath, Inc. (since January 2013). Chief Investment Officer of the OppenheimerFunds advisory entities from (January 2013-December 2013); Executive Vice President of the Manager (January 2013-May 2013); Chief Investment Officer of the Sub-Adviser (October 2010-December 2012); Chief Investment Officer, Fixed-Income, of the Sub-Adviser (April 2009-October 2010); Executive Vice President of the Sub-Adviser (October 2009-December 2012); Director of Fixed Income of the Sub-Adviser (January 2009-April 2009); and a Senior Vice President of the Sub-Adviser (March 1993-September 2009). An officer of 91 portfolios in the OppenheimerFunds complex. |
| |
Arthur S. Gabinet, Secretary and Chief Legal Officer (since 2011) Year of Birth: 1958 | | Executive Vice President, Secretary and General Counsel of the Manager (since January 2013); General Counsel OFI SteelPath, Inc. (since January 2013); Executive Vice President (May 2010-December 2012) and General Counsel (since January 2011) of the Sub-Adviser; General Counsel of the Distributor (since January 2011); General Counsel of Centennial Asset Management Corporation (January 2011-December 2012); Executive Vice President (January 2011-December 2012) and General Counsel of HarbourView Asset Management Corporation (since January 2011); Assistant Secretary (since January 2011) and Director (since January 2011) of OppenheimerFunds International Ltd. and OppenheimerFunds plc; Director of Oppenheimer Real Asset Management, Inc. (January 2011-December 2012) and General Counsel (since January 2011); Executive Vice President (January 2011-December 2011) and General Counsel of Shareholder Financial Services, Inc. and Shareholder Services, Inc. (since January 2011); Executive Vice President (January 2011-December 2012) and General Counsel of OFI Private Investments Inc. (since January 2011); Vice President of OppenheimerFunds Legacy Program (January 2011-December 2011); Executive Vice President (January 2011-December 2012) and General Counsel of OFI Institutional Asset Management, Inc. (since January 2011); General Counsel, Asset Management of the Sub-Adviser (May 2010-December 2010); Principal, The Vanguard Group (November 2005-April 2010); District Administrator, U.S. Securities and Exchange Commission (January 2003-October 2005). An officer of 91 portfolios in the OppenheimerFunds complex. |
| |
Jennifer Sexton, Vice President and Chief Business Officer (since 2014) Year of Birth: 1969 | | Senior Vice President of OppenheimerFunds Distributor, Inc. (since June 2014); Vice President of OppenheimerFunds Distributor, Inc. (April 2006-June 2014); Vice President of the Sub-Adviser (January 1998-March 2006); Assistant Vice President of the Sub-Adviser (October 1991-December 1998). An officer of 91 portfolios in the OppenheimerFunds complex. |
| |
Mary Ann Picciotto, Chief Compliance Officer and Chief Anti-Money Laundering Officer (since 2014) Year of Birth: 1973 | | Senior Vice President and Chief Compliance Officer of the Manager (since March 2014); Chief Compliance Officer of the Sub-Adviser, OFI SteelPath, Inc., OFI Global Trust Company, OFI Global Institutional, Inc., Oppenheimer Real Asset Management, Inc., OFI Private Investments, Inc., Harborview Asset Management Corporation, Trinity Investment Management Corporation, and Shareholder Services, Inc. (since March 2014); Managing Director of Morgan Stanley Investment Management Inc. and certain of its various affiliated entities; Chief Compliance Officer of various Morgan Stanley Funds (May 2010-January 2014); Chief Compliance Officer of Morgan Stanley Investment Management Inc. (April 2007-January 2014). An officer of 91 portfolios in the OppenheimerFunds complex. |
| |
Brian W. Wixted, Treasurer and Principal Financial & Accounting Officer (since 1999) Year of Birth: 1959 | | Senior Vice President of the Manager (since January 2013); Treasurer of the Sub-Adviser, HarbourView Asset Management Corporation, Shareholder Financial Services, Inc., Shareholder Services, Inc., and Oppenheimer Real Asset Management, Inc. (March 1999-June 2008), OFI Private Investments, Inc. (March 2000-June 2008), OppenheimerFunds International Ltd. and OppenheimerFunds plc (since May 2000), OFI Institutional Asset Management, Inc. (November 2000-June 2008), and OppenheimerFunds Legacy Program (charitable trust program established by the Sub-Adviser) (June 2003-December 2011); Treasurer and Chief Financial Officer of OFI Trust Company (since May 2000); Assistant Treasurer of Oppenheimer Acquisition Corporation (March 1999-June 2008). An officer of 91 portfolios in the OppenheimerFunds complex. |
The Fund’s Statement of Additional Information contains additional information about the Fund’s Directors and Officers and is available without charge, upon request, by calling 1.800.988.8287.
28 OPPENHEIMER INTERNATIONAL GROWTH FUND/VA
THIS PAGE INTENTIONALLY LEFT BLANK.
29 OPPENHEIMER INTERNATIONAL GROWTH FUND/VA
THIS PAGE INTENTIONALLY LEFT BLANK.
30 OPPENHEIMER INTERNATIONAL GROWTH FUND/VA
THIS PAGE INTENTIONALLY LEFT BLANK.
31 OPPENHEIMER INTERNATIONAL GROWTH FUND/VA
OPPENHEIMERINTERNATIONALGROWTHFUND/VA
A Series of Oppenheimer Variable Account Funds
| | |
| |
| Manager | | OFI Global Asset Management, Inc. |
| |
| Sub-Adviser | | OppenheimerFunds, Inc. |
| |
| Distributor | | OppenheimerFunds Distributor, Inc. |
| |
| Transfer and Shareholder Servicing Agent | | OFI Global Asset Management, Inc. |
| |
| Sub-Transfer Agent | | Shareholder Services, Inc. |
| | DBA OppenheimerFunds Services |
| |
| Independent | | KPMG LLP |
| Registered | | |
| Public | | |
| Accounting | | |
| Firm | | |
| |
| Counsel | | K&L Gates LLP |
| |
| | Before investing in any of the Oppenheimer funds, investors should carefully consider a fund’s investment objectives, risks, charges and expenses. Fund prospectuses and summary prospectuses contain this and other information about the funds, and may be obtained by asking your financial advisor, or calling us at 1.800.988.8287. Read prospectuses and summary prospectuses carefully before investing. |
| |
| | © 2015 OppenheimerFunds, Inc. All rights reserved. Oppenheimer funds are distributed by OppenheimerFunds Distributor, Inc. |

The registrant has adopted a code of ethics that applies to the registrant’s principal executive officer, principal financial officer, principal accounting officer or controller or persons performing similar functions.
| Item 3. | Audit Committee Financial Expert. |
The Board of Trustees of the registrant has determined that F. William Marshall, Jr., the Chairman of the Board’s Audit Committee, is the audit committee financial expert and that Mr. Marshall is “independent” for purposes of this Item 3.
| Item 4. | Principal Accountant Fees and Services. |
The principal accountant for the audit of the registrant’s annual financial statements billed $369,600 in fiscal 2014 and $333,600 in fiscal 2013.
The principal accountant for the audit of the registrant’s annual financial statements billed no such fees in fiscal 2014 and $1,500 in fiscal 2013.
The principal accountant for the audit of the registrant’s annual financial statements billed $1,012,359 in fiscal 2014 and $697,965 in fiscal 2013 to the registrant’s investment adviser or any entity controlling, controlled by, or under common control with the adviser that provides ongoing services to the registrant.
Such services include: Internal control reviews, GIPS attestation procedures, reorganization, and system conversion testing.
The principal accountant for the audit of the registrant’s annual financial statements billed $19,329 in fiscal 2014 and $24,274 in fiscal 2013.
The principal accountant for the audit of the registrant’s annual financial statements billed $477,069 in fiscal 2014 and $581,620 in fiscal 2013 to the registrant’s investment adviser or any entity controlling, controlled by, or under common control with the adviser that provides ongoing services to the registrant.
Such services include: tax compliance, tax planning and tax advice. Tax compliance generally involves preparation of original and amended tax returns, claims for a refund and tax payment-planning services. Tax planning and tax advice includes assistance with tax audits and appeals, tax advice related to mergers and acquisitions and requests for rulings or technical advice from taxing authorities.
The principal accountant for the audit of the registrant’s annual financial statements billed no such fees in fiscal 2014 and no such fees in fiscal 2013.
The principal accountant for the audit of the registrant’s annual financial statements billed no such fees in fiscal 2014 and no such fees in fiscal 2013 to the registrant’s investment adviser or any entity controlling, controlled by, or under common control with the adviser that provides ongoing services to the registrant.
Such fees would include the cost to the principal accountant of attending audit committee meetings and consultations regarding the registrant’s retirement plan with respect to its Trustees.
| (e) | (1) During its regularly scheduled periodic meetings, the registrant’s audit committee will pre-approve all audit, audit-related, tax and other services to be provided by the principal accountants of the registrant. |
The audit committee has delegated pre-approval authority to its Chairman for any subsequent new engagements that arise between regularly scheduled meeting dates provided that any fees such pre-approved are presented to the audit committee at its next regularly scheduled meeting.
Under applicable laws, pre-approval of non-audit services may be waived provided that: 1) the aggregate amount of all such services provided constitutes no more than five percent of the total amount of fees paid by the registrant to its principal accountant during the fiscal year in which services are provided 2) such services were not recognized by the registrant at the time of engagement as non-audit services and 3) such services are promptly brought to the attention of the audit committee of the registrant and approved prior to the completion of the audit.
(2) 0%
| (f) | Not applicable as less than 50%. |
| (g) | The principal accountant for the audit of the registrant’s annual financial statements billed $17,892,465 in fiscal 2014 and $15,380,794 in fiscal 2013 to the registrant and the registrant’s investment adviser or any entity controlling, controlled by, or under common control with the adviser that provides ongoing services to the registrant related to non-audit fees. Those billings did not include any prohibited non-audit services as defined by the Securities Exchange Act of 1934. |
| (h) | The registrant’s audit committee of the board of Trustees has considered whether the provision of non-audit services that were rendered to the registrant’s investment adviser, and any entity controlling, controlled by, or under common control with the investment adviser that provides ongoing services to the registrant that were not pre-approved pursuant to paragraph (c)(7)(ii) of Rule 2-01 of Regulation S-X is compatible with maintaining the principal accountant’s independence. No such services were rendered. |
| Item 5. | Audit Committee of Listed Registrants |
Not applicable.
| Item 6. | Schedule of Investments. |
a) Not applicable. The complete schedule of investments is included in Item 1 of this Form N-CSR.
b) Not applicable.
| Item 7. | Disclosure of Proxy Voting Policies and Procedures for Closed-End Management Investment Companies. |
Not applicable.
| Item 8. | Portfolio Managers of Closed-End Management Investment Companies. |
Not applicable.
| Item 9. | Purchases of Equity Securities by Closed-End Management Investment Company and Affiliated Purchasers. |
Not applicable.
| Item 10. | Submission of Matters to a Vote of Security Holders. |
The Fund’s Governance Committee Provisions with Respect to Nominations of Directors/Trustees to the Respective Boards
None
| Item 11. | Controls and Procedures. |
Based on their evaluation of the registrant’s disclosure controls and procedures (as defined in rule 30a-3(c) under the Investment Company Act of 1940 (17 CFR 270.30a-3(c)) as of 12/31/2014, the registrant’s principal executive officer and principal financial officer found the registrant’s disclosure controls and procedures to provide reasonable assurances that information required to be disclosed by the registrant in the reports that it files under the Securities Exchange Act of 1934 (a) is accumulated and communicated to registrant’s management, including its principal executive officer and principal financial officer, to allow timely decisions regarding required disclosure, and (b) is recorded, processed, summarized and reported, within the time periods specified in the rules and forms adopted by the U.S. Securities and Exchange Commission.
There have been no changes in the registrant’s internal controls over financial reporting that occurred during the registrant’s second fiscal quarter of the period covered by this report that
have materially affected, or are reasonably likely to materially affect, the registrant’s internal control over financial reporting.
| (a) | (1) Exhibit attached hereto. |
(2) Exhibits attached hereto.
(3) Not applicable.
| (b) | Exhibit attached hereto. |
SIGNATURES
Pursuant to the requirements of the Securities Exchange Act of 1934 and the Investment Company Act of 1940, the registrant has duly caused this report to be signed on its behalf by the undersigned, thereunto duly authorized.
Oppenheimer Variable Account Funds
| | |
| By: | | /s/ Arthur P. Steinmetz |
| | Arthur P. Steinmetz |
| | Principal Executive Officer |
| |
| Date: | | 2/11/2015 |
Pursuant to the requirements of the Securities Exchange Act of 1934 and the Investment Company Act of 1940, this report has been signed below by the following persons on behalf of the registrant and in the capacities and on the dates indicated.
| | |
| By: | | /s/ Arthur P. Steinmetz |
| | Arthur P. Steinmetz |
| | Principal Executive Officer |
| |
| Date: | | 2/11/2015 |
| | |
| By: | | /s/ Brian W. Wixted |
| | Brian W. Wixted |
| | Principal Financial Officer |
| |
| Date: | | 2/11/2015 |