UNITED STATES
SECURITIES AND EXCHANGE COMMISSION
WASHINGTON, D.C. 20549
FORM N-CSR
CERTIFIED SHAREHOLDER REPORT OF REGISTERED
MANAGEMENT INVESTMENT COMPANIES
Investment Company Act file number 811-4108
Oppenheimer Variable Account Funds
(Exact name of registrant as specified in charter)
6803 South Tucson Way,
Centennial, Colorado 80112-3924
(Address of principal executive offices) (Zip code)
Cynthia Lo Bessette
OFI Global Asset Management, Inc.
225 Liberty Street,
New York, New York 10281-1008
(Name and address of agent for service)
Registrant’s telephone number, including area code: (303) 768-3200
Date of fiscal year end: December 31
Date of reporting period: 6/30/2018
Item 1. Reports to Stockholders.
| ||||
June 30, 2018
| ||||
Oppenheimer | ||||
Discovery Mid Cap Growth Fund/VA | Semiannual Report | |||
A Series of Oppenheimer Variable Account Funds
| ||||
SEMIANNUAL REPORT | ||||
Listing of Top Holdings | ||||
Fund Performance Discussion | ||||
Financial Statements | ||||
PORTFOLIO MANAGERS: Ronald J. Zibelli, Jr., CFA and Justin Livengood, CFA
AVERAGE ANNUAL TOTAL RETURNS FOR THE PERIODS ENDED 6/30/18
| Inception Date | 6-Months | 1-Year | 5-Year | 10-Year | ||||||||||||||||
Non-Service Shares | 8/15/86 | 6.19% | 19.36% | 14.13% | 9.18% | |||||||||||||||
Service Shares | 10/16/00 | 6.06 | 19.05 | 13.84 | 8.91 | |||||||||||||||
Russell Midcap Growth Index | 5.40 | 18.52 | 13.37 | 10.45 | ||||||||||||||||
Performance data quoted represents past performance, which does not guarantee future results. The investment return and principal value of an investment in the Fund will fluctuate so that an investor’s shares, when redeemed, may be worth more or less than their original cost. Current performance may be lower or higher than the performance quoted. For performance data current to the most recent month end, call us at 1.800.988.8287. The Fund’s total returns should not be expected to be the same as the returns of other funds, whether or not both funds have the same portfolio managers and/or similar names. The Fund’s total returns include changes in share price and reinvested distributions but do not include the charges associated with the separate account products that offer this Fund. Such performance would have been lower if such charges were taken into account. Returns for periods of less than one year are cumulative and not annualized. See Fund prospectuses and summary prospectuses for more information on share classes and sales charges.
The Fund’s performance is compared to the performance of the Russell Midcap Growth Index. The Russell Midcap Growth Index measures the performance of the mid-cap growth segment of the U.S. equity universe. It includes those Russell Midcap Index companies with higher price-to-book ratios and higher forecasted growth values. The Index is unmanaged and cannot be purchased directly by investors. While index comparisons may be useful to provide a benchmark for the Fund’s performance, it must be noted that the Fund’s investments are not limited to the investments comprising the Index. Index performance includes reinvestment of income, but does not reflect transaction costs, fees, expenses or taxes. Index performance is shown for illustrative purposes only as a benchmark for the Fund’s performance, and does not predict or depict performance of the Fund. The Fund’s performance reflects the effects of the Fund’s business and operating expenses.
TOP HOLDINGS AND ALLOCATIONS
TOP TEN COMMON STOCK HOLDINGS
PTC, Inc. | 2.0% | |||
XPO Logistics, Inc. | 2.0 | |||
CoStar Group, Inc. | 1.9 | |||
Waste Connections, Inc. | 1.9 | |||
Total System Services, Inc. | 1.8 | |||
TransUnion | 1.8 | |||
Copart, Inc. | 1.8 | |||
IDEXX Laboratories, Inc. | 1.8 | |||
Pool Corp. | 1.8 | |||
Global Payments, Inc. | 1.8 |
Portfolio holdings and allocations are subject to change. Percentages are as of June 30, 2018, and are based on net assets. For more current Fund holdings, please visit oppenheimerfunds.com.
SECTOR ALLOCATION
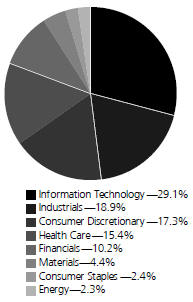
Portfolio holdings and allocations are subject to change. Percentages are as of June 30, 2018, and are based on the total market value of common stocks. For more current Fund holdings, please visit oppenheimerfunds.com
2 OPPENHEIMER DISCOVERY MID CAP GROWTH FUND/VA
Fund Performance Discussion
The Fund’s Non-Service shares produced a return of 6.19% during the reporting period, outperforming the Russell Midcap Growth Index’s (the “Index”) return of 5.40%. Our focus on seeking well-established, higher-quality growth companies is designed to provide investors with both upside participation and a degree of downside protection.
The Fund’s outperformance versus the Index was driven by stronger relative stock selection in the Health Care sector. Stock selection in the Financial, Consumer Staples, and Industrials sectors also benefited the Fund’s performance versus the Index. The Fund underperformed the Index mainly in the Energy and Information Technology sectors due to stock selection and an underweight position, respectively.
MARKET OVERVIEW
After a mixed first quarter of 2018, U.S. stock indices had a generally strong second quarter, helping to drive positive returns for both the Fund and Index this six-month reporting period. Equity markets in the U.S. continued to advance as a result of positive earnings and economic data, which more than offset concerns and possible impact of tariff wars with China. Given this backdrop, small-cap stocks experienced particularly strong performance as investors sought companies more exposed to the U.S. economy versus larger-cap multi-nationals more exposed to global trade and whose foreign revenue is negatively impacted by a rising U.S. dollar. In addition, growth investing continued to outperform value this reporting period.
TOP INDIVIDUAL CONTRIBUTORS
Top performing stocks for the Fund this reporting period included Abiomed, Inc., Align Technology, Inc., and PTC Inc.
Abiomed is a manufacturer of medical devices used to support heart function during cardiac procedures. During the reporting period, the company reported fiscal fourth quarter 2018 results that were well above consensus. Revenue grew 40% year-over-year, and the company has a variety of opportunities to continue this strong rate of growth.
Align Technology designs and manufactures a system of clear aligner therapies for treating the misalignment of teeth. The company’s first quarter 2018 results significantly exceeded expectations and positive momentum in the business led management to raise its revenue long-term growth guidance.
PTC is a global software company that reported strong first quarter earnings, with an increase in revenue that beat analysts’ expectations. This was one of the largest holdings in the Fund at the end of the period.
TOP INDIVIDUAL DETRACTORS
Detractors from performance this reporting period included Owens Corning, D.R. Horton, Inc. and Exelixis, Inc.
Owens Corning is a global producer of residential and commercial building materials, glass-fiber reinforcements and engineered materials for composite systems. The company reported softer than expected results, driven largely by higher costs that impacted operating margins. We exited our position.
D.R. Horton is a national homebuilder that engages in the construction of single-family housing. The decline in performance this reporting period was fueled by concerns surrounding increased labor and materials costs, as well as the impact of rising rates on mortgages making homes less affordable, which would decrease demand. We reduced our position during the period.
Exelixis is a biopharmaceutical company that specializes in the development of new medicines for the treatment of cancer. The company’s primary approved drug saw a slowdown in growth during the period. In addition, now clinical data about one of their drugs in development was disappointing. As a result, we exited our position.
STRATEGY & OUTLOOK
Our long-term investment process remains the same. We seek dynamic companies with above-average and sustainable revenue and earnings growth that we believe are positioned to outperform. This includes leading firms in structurally attractive industries with committed management teams that have proven records of performance.
3 OPPENHEIMER DISCOVERY MID CAP GROWTH FUND/VA
Looking forward, we expect the U.S. economy to expand at a rate of 2.7%-3.0% in 2018, faster than the trajectory of the last several years. Most important drivers of this anticipated improvement are fiscal stimulus in the form of both tax cuts and spending increases. Although interest rates remain very low in a historical context, the Federal Reserve will likely continue to normalize monetary policy by raising short term rates. Meanwhile, corporate profits are growing at a robust pace and cash flows are generally being directed to capital expenditures, dividends, buybacks, and acquisitions. Equity valuations remain high, but have moderated due to favorable earnings revisions and the recent market correction.
Market volatility has increased from unusually low levels, partly due to political and policy turmoil in Washington D.C. Technology-driven disruption remains abundant across the economy and is at the forefront of our fundamental research. Our opportunity set remains compelling and that stock selection can continue to drive our relative performance. We believe that our holdings growth trajectory remains superior to the current corporate profit environment.
The views in the Fund Performance Discussion represent the opinions of this Fund’s portfolio managers and are not intended as investment advice or to predict or depict the performance of any investment. These views are as of the close of business on June 30, 2018, and are subject to change based on subsequent developments. The Fund’s portfolio and strategies are subject to change.
Shares of Oppenheimer funds are not deposits or obligations of any bank, are not guaranteed by any bank, are not insured by the FDIC or any other agency, and involve investment risks, including the possible loss of the principal amount invested.
4 OPPENHEIMER DISCOVERY MID CAP GROWTH FUND/VA
Fund Expenses
Fund Expenses. As a shareholder of the Fund, you incur two types of costs: (1) transaction costs and (2) ongoing costs, including management fees; distribution and service fees; and other Fund expenses. These examples are intended to help you understand your ongoing costs (in dollars) of investing in the Fund and to compare these costs with the ongoing costs of investing in other mutual funds.
The examples are based on an investment of $1,000.00 invested at the beginning of the period and held for the entire 6-month period ended June 30, 2018.
Actual Expenses. The first section of the table provides information about actual account values and actual expenses. You may use the information in this section for the class of shares you hold, together with the amount you invested, to estimate the expense that you paid over the period. Simply divide your account value by $1,000.00 (for example, an $8,600.00 account value divided by $1,000.00 = 8.60), then multiply the result by the number in the first section under the heading entitled “Expenses Paid During 6 Months Ended June 30, 2018” to estimate the expenses you paid on your account during this period.
Hypothetical Example for Comparison Purposes.
The second section of the table provides information about hypothetical account values and hypothetical expenses based on the Fund’s actual expense ratio for each class of shares, and an assumed rate of return of 5% per year for each class before expenses, which is not the actual return. The hypothetical account values and expenses may not be used to estimate the actual ending account balance or expenses you paid for the period. You may use this information to compare the ongoing costs of investing in the Fund and other funds. To do so, compare this 5% hypothetical example for the class of shares you hold with the 5% hypothetical examples that appear in the shareholder reports of the other funds.
Please note that the expenses shown in the table are meant to highlight your ongoing costs only and do not reflect any charges associated with the separate accounts that offer this Fund. Therefore, the “hypothetical” lines of the table are useful in comparing ongoing costs only, and will not help you determine the relative total costs of owning different funds. In addition, if these separate account charges were included your costs would have been higher.
| Actual | Beginning Account Value January 1, 2018 | Ending Account Value June 30, 2018 | Expenses Paid During 6 Months Ended June 30, 2018 | |||||||||
Non-Service shares | $ | 1,000.00 | $ | 1,061.90 | $ | 4.10 | ||||||
Service shares | 1,000.00 | 1,060.60 | 5.38 | |||||||||
| Hypothetical | ||||||||||||
| (5% return before expenses) | ||||||||||||
Non-Service shares | 1,000.00 | 1,020.83 | 4.02 | |||||||||
Service shares | 1,000.00 | 1,019.59 | 5.27 | |||||||||
Expenses are equal to the Fund’s annualized expense ratio for that class, multiplied by the average account value over the period, multiplied by 181/365 (to reflect the one-half year period). Those annualized expense ratios, excluding indirect expenses from affiliated funds, based on the 6-month period ended June 30, 2018 are as follows:
| Class | Expense Ratios | |||||||
Non-Service shares | 0.80% | |||||||
Service shares | 1.05 | |||||||
The expense ratios reflect voluntary and/or contractual waivers and/or reimbursements of expenses by the Fund’s Manager. Some of these undertakings may be modified or terminated at any time, as indicated in the Fund’s prospectus. The “Financial Highlights” tables in the Fund’s financial statements, included in this report, also show the gross expense ratios, without such waivers or reimbursements and reduction to custodian expenses, if applicable.
5 OPPENHEIMER DISCOVERY MID CAP GROWTH FUND/VA
STATEMENT OF INVESTMENTS June 30, 2018 Unaudited
| Shares | Value | |||||||
Common Stocks—97.2% |
| |||||||
Consumer Discretionary—16.8% |
| |||||||
Auto Components—1.8% |
| |||||||
Aptiv plc | 97,370 | $ | 8,922,013 | |||||
Visteon Corp.1 | 36,600 | 4,730,184 | ||||||
|
| 13,652,197
|
| ||||||
Distributors—1.8% |
| |||||||
Pool Corp.
|
| 87,320
|
|
| 13,228,980
|
| ||
Diversified Consumer Services—1.0% |
| |||||||
Bright Horizons Family Solutions, Inc.1
|
| 69,720
|
|
| 7,147,694
|
| ||
Hotels, Restaurants & Leisure—5.8% |
| |||||||
Chipotle Mexican Grill, Inc., Cl. A1 | 8,280 | 3,571,744 | ||||||
Domino’s Pizza, Inc. | 25,860 | 7,296,916 | ||||||
Hilton Worldwide Holdings, Inc. | 162,943 | 12,898,568 | ||||||
Hyatt Hotels Corp., Cl. A | 97,680 | 7,536,012 | ||||||
Stars Group, Inc. (The)1 | 49,400 | 1,793,220 | ||||||
Vail Resorts, Inc. | 34,470 | 9,451,329 | ||||||
|
| 42,547,789
|
| ||||||
Household Durables—0.5% |
| |||||||
DR Horton, Inc.
|
| 93,790
|
|
| 3,845,390
|
| ||
Multiline Retail—0.8% |
| |||||||
Ollie’s Bargain Outlet Holdings, Inc.1
|
| 82,080
|
|
| 5,950,800
|
| ||
Specialty Retail—1.9% |
| |||||||
Burlington Stores, Inc.1 | 58,510 | 8,807,510 | ||||||
Ross Stores, Inc. | 59,480 | 5,040,930 | ||||||
|
| 13,848,440
|
| ||||||
Textiles, Apparel & Luxury Goods—3.2% |
| |||||||
lululemon athletica, Inc.1 | 72,370 | 9,035,395 | ||||||
PVH Corp. | 72,650 | 10,877,158 | ||||||
Tapestry, Inc. | 82,100 | 3,834,891 | ||||||
|
| 23,747,444
|
| ||||||
Consumer Staples—2.3% |
| |||||||
Beverages—0.8% |
| |||||||
Constellation Brands, Inc., Cl. A
|
| 25,390
|
|
| 5,557,110
|
| ||
Food Products—1.5% |
| |||||||
Lamb Weston Holdings, Inc.
|
| 166,320
|
|
| 11,394,583
|
| ||
Energy—2.2% |
| |||||||
Oil, Gas & Consumable Fuels—2.2% |
| |||||||
Cabot Oil & Gas Corp. | 148,770 | 3,540,726 | ||||||
| Centennial Resource Development, Inc., Cl. A1 | 196,300 | 3,545,178 | ||||||
Diamondback Energy, Inc. | 70,033 | 9,214,242 | ||||||
|
| 16,300,146
|
| ||||||
Financials—9.9% |
| |||||||
Capital Markets—4.1% |
| |||||||
E*TRADE Financial Corp.1 | 166,190 | 10,164,180 | ||||||
MarketAxess Holdings, Inc. | 16,150 | 3,195,439 | ||||||
MSCI, Inc., Cl. A | 61,760 | 10,216,957 | ||||||
Raymond James Financial, Inc. | 74,860 | 6,688,741 | ||||||
|
| 30,265,317
|
| ||||||
Commercial Banks—3.0% |
| |||||||
East West Bancorp, Inc. | 150,190 | 9,792,388 | ||||||
SVB Financial Group1 | 43,280 | 12,497,533 | ||||||
|
| 22,289,921
|
| ||||||
Insurance—1.6% |
| |||||||
Progressive Corp. (The)
|
| 193,700
|
|
| 11,457,355
|
| ||
Real Estate Investment Trusts (REITs)—0.6% |
| |||||||
SBA Communications Corp., Cl. A1
|
| 24,490
|
|
| 4,043,789
|
| ||
Real Estate Management & Development—0.6% |
| |||||||
CBRE Group, Inc., Cl. A1 | 99,380 | 4,744,401 | ||||||
| Shares | Value | |||||||
Health Care—15.0% |
| |||||||
Biotechnology—1.5% |
| |||||||
Neurocrine Biosciences, Inc.1 | 71,130 | $ | 6,987,811 | |||||
Sage Therapeutics, Inc.1 | 25,270 | 3,955,513 | ||||||
|
| 10,943,324
|
| ||||||
Health Care Equipment & Supplies—8.7% |
| |||||||
ABIOMED, Inc.1 | 27,180 | 11,117,979 | ||||||
Align Technology, Inc.1 | 34,150 | 11,684,081 | ||||||
Edwards Lifesciences Corp.1 | 58,090 | 8,456,161 | ||||||
ICU Medical, Inc.1 | 19,320 | 5,673,318 | ||||||
IDEXX Laboratories, Inc.1 | 60,910 | 13,274,726 | ||||||
Insulet Corp.1 | 87,120 | 7,466,184 | ||||||
Teleflex, Inc. | 24,880 | 6,673,065 | ||||||
|
| 64,345,514
|
| ||||||
Health Care Providers & Services—1.8% |
| |||||||
WellCare Health Plans, Inc.1
|
| 53,180
|
|
| 13,095,043
|
| ||
Life Sciences Tools & Services—3.0% |
| |||||||
| Agilent Technologies, Inc. | 163,200 | 10,092,288 | ||||||
| Bio-Rad Laboratories, Inc., Cl. A1 | 19,070 | 5,502,458 | ||||||
ICON plc1 | 50,860 | 6,740,476 | ||||||
|
| 22,335,222
|
| ||||||
Industrials—18.4% |
| |||||||
Aerospace & Defense—2.0% |
| |||||||
| BWX Technologies, Inc. | 124,730 | 7,773,174 | ||||||
Textron, Inc. | 107,390 | 7,078,075 | ||||||
|
| 14,851,249
|
| ||||||
Air Freight & Couriers—2.0% |
| |||||||
XPO Logistics, Inc.1
|
| 144,700
|
|
| 14,496,046
|
| ||
Building Products—1.0% |
| |||||||
A.O. Smith Corp.
|
| 125,680
|
|
| 7,433,972
|
| ||
Commercial Services & Supplies—4.9% |
| |||||||
Cintas Corp. | 51,350 | 9,503,345 | ||||||
Copart, Inc.1 | 235,870 | 13,340,807 | ||||||
Waste Connections, Inc. | 182,465 | 13,735,965 | ||||||
|
| 36,580,117
|
| ||||||
Industrial Conglomerates—1.5% |
| |||||||
Roper Technologies, Inc.
|
| 39,930
|
|
| 11,017,086
|
| ||
Machinery—2.3% |
| |||||||
IDEX Corp. | 81,720 | 11,153,145 | ||||||
Xylem, Inc. | 82,960 | 5,589,845 | ||||||
|
| 16,742,990
|
| ||||||
Professional Services—4.2% |
| |||||||
| CoStar Group, Inc.1 | 33,520 | 13,831,358 | ||||||
| IHS Markit Ltd.1 | 71,010 | 3,663,406 | ||||||
TransUnion | 186,710 | 13,375,904 | ||||||
|
| 30,870,668
|
| ||||||
Trading Companies & Distributors—0.5% |
| |||||||
United Rentals, Inc.1
|
| 25,420
|
|
| 3,752,500
|
| ||
Information Technology—28.3% |
| |||||||
Communications Equipment—1.3% |
| |||||||
Palo Alto Networks, Inc.1
|
| 45,460
|
|
| 9,340,666
|
| ||
Electronic Equipment, Instruments, & Components—3.2% |
| |||||||
| Amphenol Corp., Cl. A | 107,380 | 9,358,167 | ||||||
| CDW Corp. | 114,520 | 9,252,071 | ||||||
FLIR Systems, Inc. | 89,500 | 4,651,315 | ||||||
|
| 23,261,553
|
| ||||||
Internet Software & Services—2.5% |
| |||||||
| DocuSign, Inc.1 | 27,034 | 1,431,451 | ||||||
| GrubHub, Inc.1 | 59,590 | 6,251,587 | ||||||
| IAC/InterActiveCorp1 | 34,110 | 5,201,434 | ||||||
Nutanix, Inc., Cl. A1 | 106,890 | 5,512,317 | ||||||
| 18,396,789 | ||||||||
6 OPPENHEIMER DISCOVERY MID CAP GROWTH FUND/VA
| Shares | Value | |||||||
IT Services—7.6% |
| |||||||
Black Knight, Inc.1 | 101,980 | $ | 5,461,029 | |||||
Broadridge Financial Solutions, Inc. | 50,750 | 5,841,325 | ||||||
DXC Technology Co. | 92,350 | 7,444,334 | ||||||
Global Payments, Inc. | 118,150 | 13,172,544 | ||||||
Square, Inc., Cl. A1 | 80,280 | 4,948,459 | ||||||
Total System Services, Inc. | 160,420 | 13,558,698 | ||||||
WEX, Inc.1 | 31,080 | 5,920,118 | ||||||
|
| 56,346,507
|
| ||||||
Semiconductors & Semiconductor Equipment—2.1% |
| |||||||
Monolithic Power Systems, Inc. | 61,820 | 8,263,479 | ||||||
ON Semiconductor Corp.1 | 335,760 | 7,465,624 | ||||||
15,729,103
| ||||||||
Software—11.6% |
| |||||||
Atlassian Corp. plc, Cl. A1 | 131,310 | 8,209,501 | ||||||
Guidewire Software, Inc.1 | 83,350 | 7,399,813 | ||||||
PTC, Inc.1 | 154,760 | 14,518,035 | ||||||
RealPage, Inc.1 | 113,100 | 6,231,810 | ||||||
Red Hat, Inc.1 | 54,390 | 7,308,384 | ||||||
RingCentral, Inc., Cl. A1 | 39,720 | 2,794,302 | ||||||
ServiceNow, Inc.1 | 58,174 | 10,033,270 | ||||||
Splunk, Inc.1 | 58,670 | 5,814,784 | ||||||
Synopsys, Inc.1 | 97,680 | 8,358,478 | ||||||
| Shares | Value | |||||||
Software (Continued) |
| |||||||
Take-Two Interactive Software, Inc.1 | 94,290 | $ | 11,160,164 | |||||
Workday, Inc., Cl. A1 | 30,030 | 3,637,234 | ||||||
|
| 85,465,775
|
| ||||||
Materials—4.3% |
| |||||||
Chemicals—1.6% |
| |||||||
Celanese Corp., Cl. A | 72,070 | 8,004,094 | ||||||
Westlake Chemical Corp. | 36,720 | 3,952,174 | ||||||
|
| 11,956,268
|
| ||||||
Containers & Packaging—2.0% |
| |||||||
Avery Dennison Corp. | 66,050 | 6,743,705 | ||||||
Packaging Corp. of America | 70,650 | 7,897,963 | ||||||
|
| 14,641,668
|
| ||||||
Metals & Mining—0.7% |
| |||||||
Steel Dynamics, Inc. | 107,260 | 4,928,597 | ||||||
| Total Common Stocks (Cost $562,243,254) | 716,552,013 | |||||||
| ||||||||
Investment Company—2.9% | ||||||||
| Oppenheimer Institutional Government Money Market Fund, Cl. E, 1.85%2,3 (Cost $21,063,723) | 21,063,723 | 21,063,723 | ||||||
Total Investments, at Value (Cost $583,306,977) | 100.1% | 737,615,736 | ||||||
Net Other Assets (Liabilities) | (0.1) | (744,604 | ) | |||||
Net Assets | 100.0% | $ | 736,871,132 | |||||
Footnotes to Statement of Investments
1. Non-income producing security.
2. Rate shown is the 7-day yield at period end.
3. Is or was an affiliate, as defined in the Investment Company Act of 1940, as amended, at or during the reporting period, by virtue of the Fund owning at least 5% of the voting securities of the issuer or as a result of the Fund and the issuer having the same investment adviser. Transactions during the reporting period in which the issuer was an affiliate are as follows:
| Shares December 31, 2017 | Gross Additions | Gross Reductions | Shares June 30, 2018 | |||||||||||||
| ||||||||||||||||
| Oppenheimer Institutional Government Money Market Fund, Cl. E | 7,573,590 | 157,959,179 | 144,469,046 | 21,063,723 | ||||||||||||
| Value | Income | Realized Gain (Loss) | Change in Unrealized Gain (Loss) | |||||||||||||
| ||||||||||||||||
| Oppenheimer Institutional Government Money Market Fund, Cl. E | $ | 21,063,723 | $ | 103,548 | $ | — | $ | — | ||||||||
See accompanying Notes to Financial Statements.
7 OPPENHEIMER DISCOVERY MID CAP GROWTH FUND/VA
STATEMENT OF ASSETS AND LIABILITIES June 30, 2018 Unaudited
Assets | ||||
Investments, at value—see accompanying statement of investments: | ||||
Unaffiliated companies (cost $562,243,254) | $ | 716,552,013 | ||
Affiliated companies (cost $21,063,723) | 21,063,723 | |||
|
|
| ||
| 737,615,736 | ||||
Cash | 500,000 | |||
Receivables and other assets: | ||||
Investments sold | 13,313,954 | |||
Dividends | 302,827 | |||
Shares of beneficial interest sold | 29,704 | |||
Other | 75,769 | |||
|
|
| ||
Total assets | 751,837,990 | |||
Liabilities | ||||
Payables and other liabilities: | ||||
Investments purchased | 14,742,970 | |||
Shares of beneficial interest redeemed | 123,090 | |||
Trustees’ compensation | 65,727 | |||
Distribution and service plan fees | 8,640 | |||
Shareholder communications | 1,634 | |||
Other | 24,797 | |||
|
|
| ||
Total liabilities | 14,966,858 | |||
Net Assets | $ | 736,871,132 | ||
|
|
| ||
Composition of Net Assets | ||||
Par value of shares of beneficial interest | $ | 9,528 | ||
Additional paid-in capital | 528,027,710 | |||
Accumulated net investment loss | (877,872 | ) | ||
Accumulated net realized gain on investments | 55,403,007 | |||
Net unrealized appreciation on investments | 154,308,759 | |||
|
|
| ||
Net Assets | $ | 736,871,132 | ||
|
|
| ||
Net Asset Value Per Share | ||||
Non-Service Shares: | ||||
Net asset value, redemption price per share and offering price per share (based on net assets of $695,877,799 and 8,965,538 shares of beneficial interest outstanding) | $77.62 | |||
| Service Shares: | ||||
| Net asset value, redemption price per share and offering price per share (based on net assets of $40,993,333 and 562,229 shares of beneficial interest outstanding) | $72.91 |
See accompanying Notes to Financial Statements.
8 OPPENHEIMER DISCOVERY MID CAP GROWTH FUND/VA
STATEMENT OF OPERATIONS For the Six Months Ended June 30, 2018 Unaudited
Investment Income | ||||
Dividends: | ||||
Unaffiliated companies (net of foreign withholding taxes of $6,503) | $ | 2,096,375 | ||
Affiliated companies | 103,548 | |||
Total investment income |
| 2,199,923
|
| |
Expenses | ||||
Management fees | 2,617,136 | |||
Distribution and service plan fees - Service shares | 50,543 | |||
Transfer and shareholder servicing agent fees: | ||||
Non-Service shares | 419,124 | |||
Service shares | 24,261 | |||
Shareholder communications: | ||||
Non-Service shares | 20,321 | |||
Service shares | 1,178 | |||
Trustees’ compensation | 13,809 | |||
Borrowing fees | 13,229 | |||
Custodian fees and expenses | 2,692 | |||
Other | 31,350 | |||
Total expenses | 3,193,643 | |||
Less reduction to custodian expenses | (249 | ) | ||
Less waivers and reimbursements of expenses | (173,724 | ) | ||
Net expenses | 3,019,670 | |||
Net Investment Loss | (819,747 | ) | ||
Realized and Unrealized Gain (Loss) | ||||
Net realized gain on investment transactions in unaffiliated companies | 56,398,973 | |||
Net change in unrealized appreciation/depreciation on investment transactions in unaffiliated companies | (11,061,754 | ) | ||
Net Increase in Net Assets Resulting from Operations | $ | 44,517,472 | ||
See accompanying Notes to Financial Statements.
9 OPPENHEIMER DISCOVERY MID CAP GROWTH FUND/VA
STATEMENTS OF CHANGES IN NET ASSETS
| Six Months Ended June 30, 2018 (Unaudited) | Year Ended December 31, 2017 | |||||||
Operations | ||||||||
| Net investment loss | $ | (819,747 | ) | $ | (936,874 | ) | ||
| Net realized gain | 56,398,973 | 111,170,933 | ||||||
| Net change in unrealized appreciation/depreciation | (11,061,754 | ) | 64,493,500 | |||||
Net increase in net assets resulting from operations
|
| 44,517,472
|
|
| 174,727,559
|
| ||
Dividends and/or Distributions to Shareholders | ||||||||
| Dividends from net investment income: | ||||||||
| Non-Service shares | — | (202,565 | ) | |||||
| Service shares | — | — | ||||||
|
| —
|
|
| (202,565
| )
| |||
| Distributions from net realized gain: | ||||||||
| Non-Service shares | (95,656,703 | ) | (66,541,431 | ) | ||||
| Service shares | (5,963,052 | ) | (3,695,269 | ) | ||||
|
| (101,619,755
| )
|
| (70,236,700
| )
| |||
Beneficial Interest Transactions | ||||||||
| Net increase (decrease) in net assets resulting from beneficial interest transactions: | ||||||||
| Non-Service shares | 54,679,780 | (8,172,895 | ) | |||||
| Service shares | 5,020,050 | 2,197,994 | ||||||
|
| 59,699,830
|
|
| (5,974,901
| )
| |||
Net Assets | ||||||||
| Total increase | 2,597,547 | 98,313,393 | ||||||
| Beginning of period | 734,273,585 | 635,960,192 | ||||||
| End of period (including accumulated net investment loss of $ 877,872 and $ 58,125, respectively) | $ | 736,871,132 | $ | 734,273,585 | ||||
See accompanying Notes to Financial Statements.
10 OPPENHEIMER DISCOVERY MID CAP GROWTH FUND/VA
FINANCIAL HIGHLIGHTS
| Non-Service Shares | Six Months Ended June 30, 2018 (Unaudited) | Year Ended December 31, 2017 | Year Ended December 31, 2016 | Year Ended December 31, 2015 | Year Ended December 31, 2014 | Year Ended December 31, 2013 | ||||||||||||||||||
| ||||||||||||||||||||||||
Per Share Operating Data | ||||||||||||||||||||||||
| Net asset value, beginning of period | $84.21 | $72.65 | $76.85 | $78.82 | $74.51 | $54.80 | ||||||||||||||||||
| ||||||||||||||||||||||||
| Income (loss) from investment operations: | ||||||||||||||||||||||||
| Net investment income (loss)1 | (0.09) | (0.10) | 0.03 | (0.19) | (0.29) | (0.16) | ||||||||||||||||||
| Net realized and unrealized gain | 5.80 | 20.08 | 1.69 | 5.67 | 4.60 | 19.88 | ||||||||||||||||||
|
| |||||||||||||||||||||||
| Total from investment operations | 5.71 | 19.98 | 1.72 | 5.48 | 4.31 | 19.72 | ||||||||||||||||||
| ||||||||||||||||||||||||
| Dividends and/or distributions to shareholders: | ||||||||||||||||||||||||
| Dividends from net investment income | 0.00 | (0.03) | 0.00 | 0.00 | 0.00 | (0.01) | ||||||||||||||||||
| Distributions from net realized gain | (12.30) | (8.39) | (5.92) | (7.45) | 0.00 | 0.00 | ||||||||||||||||||
|
| |||||||||||||||||||||||
| Total dividends and/or distributions to shareholders | (12.30) | (8.42) | (5.92) | (7.45) | 0.00 | (0.01) | ||||||||||||||||||
| ||||||||||||||||||||||||
| Net asset value, end of period | $77.62 | $84.21 | $72.65 | $76.85 | $78.82 | $74.51 | ||||||||||||||||||
|
| |||||||||||||||||||||||
| ||||||||||||||||||||||||
Total Return, at Net Asset Value2 | 6.19% | 28.79% | 2.34% | 6.61% | 5.78% | 35.98% | ||||||||||||||||||
| ||||||||||||||||||||||||
Ratios/Supplemental Data | ||||||||||||||||||||||||
| Net assets, end of period (in thousands) | $695,878 | $694,675 | $603,708 | $660,450 | $682,515 | $725,406 | ||||||||||||||||||
| ||||||||||||||||||||||||
| Average net assets (in thousands) | $704,601 | $661,192 | $621,110 | $695,736 | $688,259 | $618,970 | ||||||||||||||||||
| ||||||||||||||||||||||||
| Ratios to average net assets:3 | ||||||||||||||||||||||||
| Net investment income (loss) | (0.21)% | (0.12)% | 0.04% | (0.24)% | (0.39)% | (0.24)% | ||||||||||||||||||
| Expenses excluding specific expenses listed below | 0.85% | 0.84% | 0.84% | 0.83% | 0.83% | 0.84% | ||||||||||||||||||
| Interest and fees from borrowings | 0.00%4 | 0.00%4 | 0.00%4 | 0.00%4 | 0.00% | 0.00% | ||||||||||||||||||
|
| |||||||||||||||||||||||
| Total expenses5 | 0.85% | 0.84% | 0.84% | 0.83% | 0.83% | 0.84% | ||||||||||||||||||
| Expenses after payments, waivers and/or reimbursements and reduction to custodian expenses | 0.80% | 0.80% | 0.80% | 0.80% | 0.80% | 0.80% | ||||||||||||||||||
| ||||||||||||||||||||||||
| Portfolio turnover rate | 49% | 105% | 141% | 81% | 113% | 84% | ||||||||||||||||||
1. Per share amounts calculated based on the average shares outstanding during the period.
2. Assumes an initial investment on the business day before the first day of the fiscal period, with all dividends and distributions reinvested in additional shares on the reinvestment date, and redemption at the net asset value calculated on the last business day of the fiscal period. Total returns are not annualized for periods less than one full year. Total return information does not reflect expenses that apply at the separate account level or to related insurance products. Inclusion of these charges would reduce the total return figures for all periods shown. Returns do not reflect the deduction of taxes that a shareholder would pay on fund distributions or the redemption of fund shares.
3. Annualized for periods less than one full year.
4. Less than 0.005%.
5. Total expenses including indirect expenses from affiliated fund fees and expenses were as follows:
Six Months Ended June 30, 2018 | 0.85 | % | ||||||
Year Ended December 31, 2017 | 0.84 | % | ||||||
Year Ended December 31, 2016 | 0.84 | % | ||||||
Year Ended December 31, 2015 | 0.83 | % | ||||||
Year Ended December 31, 2014 | 0.83 | % | ||||||
Year Ended December 31, 2013 | 0.84 | % | ||||||
See accompanying Notes to Financial Statements.
11 OPPENHEIMER DISCOVERY MID CAP GROWTH FUND/VA
FINANCIAL HIGHLIGHTS Continued
| Service Shares | Six Months Ended June 30, 2018 (Unaudited) | Year Ended December 31, 2017 | Year Ended December 31, 2016 | Year Ended December 31, 2015 | Year Ended December 31, 2014 | Year Ended December 31, 2013 | ||||||||||||||||||
Per Share Operating Data | ||||||||||||||||||||||||
| Net asset value, beginning of period | $79.87 | $69.43 | $73.88 | $76.21 | $72.22 | $53.25 | ||||||||||||||||||
| ||||||||||||||||||||||||
| Income (loss) from investment operations: | ||||||||||||||||||||||||
| Net investment loss1 | (0.19) | (0.28) | (0.15) | (0.38) | (0.46) | (0.30) | ||||||||||||||||||
| Net realized and unrealized gain | 5.53 | 19.11 | 1.62 | 5.50 | 4.45 | 19.27 | ||||||||||||||||||
|
| |||||||||||||||||||||||
| Total from investment operations | 5.34 | 18.83 | 1.47 | 5.12 | 3.99 | 18.97 | ||||||||||||||||||
| ||||||||||||||||||||||||
| Dividends and/or distributions to shareholders: | ||||||||||||||||||||||||
| Dividends from net investment income | 0.00 | 0.00 | 0.00 | 0.00 | 0.00 | 0.00 | ||||||||||||||||||
| Distributions from net realized gain | (12.30) | (8.39) | (5.92) | (7.45) | 0.00 | 0.00 | ||||||||||||||||||
|
| |||||||||||||||||||||||
| Total dividends and/or distributions to shareholders | (12.30) | (8.39) | (5.92) | (7.45) | 0.00 | 0.00 | ||||||||||||||||||
| ||||||||||||||||||||||||
| Net asset value, end of period | $72.91 | $79.87 | $69.43 | $73.88 | $76.21 | $72.22 | ||||||||||||||||||
|
| |||||||||||||||||||||||
Total Return, at Net Asset Value2 | 6.06% | 28.46% | 2.08% | 6.35% | 5.53% | 35.62% | ||||||||||||||||||
Ratios/Supplemental Data | �� | |||||||||||||||||||||||
| Net assets, end of period (in thousands) | $40,993 | $39,599 | $32,252 | $37,029 | $30,964 | $36,549 | ||||||||||||||||||
| ||||||||||||||||||||||||
| Average net assets (in thousands) | $40,793 | $35,753 | $33,797 | $32,812 | $32,927 | $35,905 | ||||||||||||||||||
| ||||||||||||||||||||||||
| Ratios to average net assets:3 | ||||||||||||||||||||||||
| Net investment loss | (0.46)% | (0.37)% | (0.21)% | (0.49)% | (0.64)% | (0.49)% | ||||||||||||||||||
| Expenses excluding specific expenses listed below | 1.10% | 1.09% | 1.09% | 1.08% | 1.08% | 1.09% | ||||||||||||||||||
| Interest and fees from borrowings | 0.00%4 | 0.00%4 | 0.00%4 | 0.00%4 | 0.00% | 0.00% | ||||||||||||||||||
|
| |||||||||||||||||||||||
| Total expenses5 | 1.10% | 1.09% | 1.09% | 1.08% | 1.08% | 1.09% | ||||||||||||||||||
| Expenses after payments, waivers and/or reimbursements and reduction to custodian expenses | 1.05% | 1.05% | 1.05% | 1.05% | 1.05% | 1.05% | ||||||||||||||||||
| ||||||||||||||||||||||||
| Portfolio turnover rate | 49% | 105% | 141% | 81% | 113% | 84% | ||||||||||||||||||
1. Per share amounts calculated based on the average shares outstanding during the period.
2. Assumes an initial investment on the business day before the first day of the fiscal period, with all dividends and distributions reinvested in additional shares on the reinvestment date, and redemption at the net asset value calculated on the last business day of the fiscal period. Total returns are not annualized for periods less than one full year. Total return information does not reflect expenses that apply at the separate account level or to related insurance products. Inclusion of these charges would reduce the total return figures for all periods shown. Returns do not reflect the deduction of taxes that a shareholder would pay on fund distributions or the redemption of fund shares.
3. Annualized for periods less than one full year.
4. Less than 0.005%.
5. Total expenses including indirect expenses from affiliated fund fees and expenses were as follows:
Six Months Ended June 30, 2018 | 1.10 | % | ||||||
Year Ended December 31, 2017 | 1.09 | % | ||||||
Year Ended December 31, 2016 | 1.09 | % | ||||||
Year Ended December 31, 2015 | 1.08 | % | ||||||
Year Ended December 31, 2014 | 1.08 | % | ||||||
Year Ended December 31, 2013 | 1.09 | % | ||||||
See accompanying Notes to Financial Statements.
12 OPPENHEIMER DISCOVERY MID CAP GROWTH FUND/VA
NOTES TO FINANCIAL STATEMENTS June 30, 2018 Unaudited
1. Organization
Oppenheimer Discovery Mid Cap Growth Fund/VA (the “Fund”), a separate series of Oppenheimer Variable Account Funds, is a diversified open-end management investment company registered under the Investment Company Act of 1940 (“1940 Act”), as amended. The Fund’s investment objective is to seek capital appreciation. The Fund’s investment adviser is OFI Global Asset Management, Inc. (“OFI Global” or the “Manager”), a wholly-owned subsidiary of OppenheimerFunds, Inc. (“OFI” or the “Sub-Adviser”). The Manager has entered into a sub-advisory agreement with OFI. Shares of the Fund are sold only to separate accounts of life insurance companies.
The Fund offers two classes of shares. Both classes are sold at their offering price, which is the net asset value per share, to separate investment accounts of participating insurance companies as an underlying investment for variable life insurance policies, variable annuity contracts or other investment products. The class of shares designated as Service shares is subject to a distribution and service plan. Both classes of shares have identical rights and voting privileges with respect to the Fund in general and exclusive voting rights on matters that affect that class alone. Earnings, net assets and net asset value per share may differ due to each class having its own expenses, such as transfer and shareholder servicing agent fees and shareholder communications, directly attributable to that class.
The following is a summary of significant accounting policies followed in the Fund’s preparation of financial statements in accordance with accounting principles generally accepted in the United States (“U.S. GAAP”).
2. Significant Accounting Policies
Security Valuation. All investments in securities are recorded at their estimated fair value, as described in Note 3.
Allocation of Income, Expenses, Gains and Losses. Income, expenses (other than those attributable to a specific class), gains and losses are allocated on a daily basis to each class of shares based upon the relative proportion of net assets represented by such class. Operating expenses directly attributable to a specific class are charged against the operations of that class.
Dividends and Distributions to Shareholders. Dividends and distributions to shareholders, which are determined in accordance with income tax regulations and may differ from U.S. GAAP, are recorded on the ex-dividend date. Income and capital gain distributions, if any, are declared and paid annually or at other times as determined necessary by the Manager.
The tax character of distributions is determined as of the Fund’s fiscal year end. Therefore, a portion of the Fund’s distributions made to shareholders prior to the Fund’s fiscal year end may ultimately be categorized as a tax return of capital.
Investment Income. Dividend income is recorded on the ex-dividend date or upon ex-dividend notification in the case of certain foreign dividends where the ex-dividend date may have passed. Non-cash dividends included in dividend income, if any, are recorded at the fair value of the securities received. Withholding taxes on foreign dividends, if any, and capital gains taxes on foreign investments, if any, have been provided for in accordance with the Fund’s understanding of the applicable tax rules and regulations. Interest income, if any, is recognized on an accrual basis. Discount and premium, which are included in interest income on the Statement of Operations, are amortized or accreted daily.
Return of Capital Estimates. Distributions received from the Fund’s investments in Real Estate Investments Trusts (REITs), generally are comprised of income and return of capital. The Fund records investment income and return of capital based on estimates. Such estimates are based on historical information available from each REIT and other industry sources. These estimates may subsequently be revised based on information received from REITs after their tax reporting periods are concluded.
Custodian Fees. “Custodian fees and expenses” in the Statement of Operations may include interest expense incurred by the Fund on any cash overdrafts of its custodian account during the period. Such cash overdrafts may result from the effects of failed trades in portfolio securities and from cash outflows resulting from unanticipated shareholder redemption activity. The Fund pays interest to its custodian on such cash overdrafts, to the extent they are not offset by positive cash balances maintained by the Fund, at a rate equal to the Federal Funds Rate plus 2.00%. The “Reduction to custodian expenses” line item, if applicable, represents earnings on cash balances maintained by the Fund during the period. Such interest expense and other custodian fees may be paid with these earnings.
Security Transactions. Security transactions are recorded on the trade date. Realized gains and losses on securities sold are determined on the basis of identified cost.
Indemnifications. The Fund’s organizational documents provide current and former Trustees and officers with a limited indemnification against liabilities arising in connection with the performance of their duties to the Fund. In the normal course of business, the Fund may also enter into contracts that provide general indemnifications. The Fund’s maximum exposure under these arrangements is unknown as this would be dependent on future claims that may be made against the Fund. The risk of material loss from such claims is considered remote.
Federal Taxes. The Fund intends to comply with provisions of the Internal Revenue Code applicable to regulated investment companies and to distribute substantially all of its investment company taxable income to shareholders. Therefore, no federal income or excise tax provision is required. The Fund files income tax returns in U.S. federal and applicable state jurisdictions. The statute of limitations on the Fund’s tax return filings generally remains open for the three preceding fiscal reporting period ends. The Fund has analyzed its tax positions for the fiscal year ended December 31, 2017, including
13 OPPENHEIMER DISCOVERY MID CAP GROWTH FUND/VA
NOTES TO FINANCIAL STATEMENTS Unaudited / Continued
2. Significant Accounting Policies (Continued)
open tax years, and does not believe there are any uncertain tax positions requiring recognition in the Fund’s financial statements.
During the fiscal year ended December 31, 2017, the Fund did not utilize any capital loss carryforwards to offset capital gains realized in that fiscal year. Capital losses will be carried forward to future years if not offset by gains.
At period end, it is estimated that the capital loss carryforwards would be zero. The estimated capital loss carryforward represents the carryforward as of the end of the last fiscal year, increased or decreased by capital losses or gains realized in the first six months of the current fiscal year. During the reporting period, it is estimated that the Fund will not utilize any capital loss carryforward to offset realized capital gains.
Net investment income (loss) and net realized gain (loss) may differ for financial statement and tax purposes. The character of dividends and distributions made during the fiscal year from net investment income or net realized gains are determined in accordance with federal income tax requirements, which may differ from the character of net investment income or net realized gains presented in those financial statements in accordance with U.S. GAAP. Also, due to timing of dividends and distributions, the fiscal year in which amounts are distributed may differ from the fiscal year in which the income or net realized gain was recorded by the Fund.
The aggregate cost of securities and other investments and the composition of unrealized appreciation and depreciation of securities and other investments for federal income tax purposes at period end are noted in the following table. The primary difference between book and tax appreciation or depreciation of securities and other investments, if applicable, is attributable to the tax deferral of losses or tax realization of financial statement unrealized gain or loss.
Federal tax cost of securities | $ | 583,899,551 | ||
|
|
| ||
Gross unrealized appreciation | $ | 158,645,043 | ||
Gross unrealized depreciation | (4,928,858 | ) | ||
|
|
| ||
Net unrealized appreciation | $ | 153,716,185 | ||
|
|
|
Use of Estimates. The preparation of financial statements in conformity with U.S. GAAP requires management to make estimates and assumptions that affect the reported amounts of assets and liabilities and disclosure of contingent assets and liabilities at the date of the financial statements and the reported amounts of increases and decreases in net assets from operations during the reporting period. Actual results could differ from those estimates.
3. Securities Valuation
The Fund calculates the net asset value of its shares as of 4:00 P.M. Eastern Time, on each day the New York Stock Exchange (the “Exchange”) is open for trading, except in the case of a scheduled early closing of the Exchange, in which case the Fund will calculate net asset value of the shares as of the scheduled early closing time of the Exchange.
The Fund’s Board has adopted procedures for the valuation of the Fund’s securities and has delegated the day-to-day responsibility for valuation determinations under those procedures to the Manager. The Manager has established a Valuation Committee which is responsible for determining a fair valuation for any security for which market quotations are not readily available. The Valuation Committee’s fair valuation determinations are subject to review, approval and ratification by the Fund’s Board at least quarterly or more frequently, if necessary.
Valuation Methods and Inputs
Securities are valued primarily using unadjusted quoted market prices, when available, as supplied by third party pricing services or broker-dealers.
The following methodologies are used to determine the market value or the fair value of the types of securities described below:
Equity securities traded on a securities exchange (including exchange-traded derivatives other than futures and futures options) are valued based on the official closing price on the principal exchange on which the security is traded, as identified by the Manager, prior to the time when the Fund’s assets are valued. If the official closing price is unavailable, the security is valued at the last sale price on the principal exchange on which it is traded, or if no sales occurred, the security is valued at the mean between the quoted bid and asked prices. Over-the-counter equity securities are valued at the last published sale price, or if no sales occurred, at the mean between the quoted bid and asked prices. Events occurring after the close of trading on foreign exchanges may result in adjustments to the valuation of foreign securities to more accurately reflect their fair value as of the time when the Fund’s assets are valued.
Shares of a registered investment company that are not traded on an exchange are valued at that investment company’s net asset value per share.
Securities for which market quotations are not readily available, or when a significant event has occurred that would materially affect the value of the security, are fair valued either (i) by a standardized fair valuation methodology applicable to the security type or the significant event as previously approved by the Valuation Committee and the Fund’s Board or (ii) as determined in good faith by the Manager’s Valuation Committee. The Valuation Committee considers all relevant facts that are reasonably available, through either public information or information available to the Manager, when determining the fair value of a security. Those standardized fair valuation methodologies include, but are not limited to, valuing securities at the last sale price or initially at cost and subsequently adjusting the value based on: changes in company specific fundamentals, changes in an appropriate securities index, or changes in the value of similar securities which may be further adjusted for any discounts related to security-specific resale restrictions. When possible, such methodologies use observable market inputs such as unadjusted quoted prices of similar securities, observable interest rates, currency rates and yield curves. The methodologies used for valuing securities are not necessarily an indication of the risks associated with investing in those securities nor can it be assured that the Fund can obtain the fair value assigned to a security if it were to sell the security.
14 OPPENHEIMER DISCOVERY MID CAP GROWTH FUND/VA
3. Securities Valuation (Continued)
Classifications
Each investment asset or liability of the Fund is assigned a level at measurement date based on the significance and source of the inputs to its valuation. Various data inputs may be used in determining the value of each of the Fund’s investments as of the reporting period end. These data inputs are categorized in the following hierarchy under applicable financial accounting standards:
1) Level 1-unadjusted quoted prices in active markets for identical assets or liabilities (including securities actively traded on a securities exchange)
2) Level 2-inputs other than unadjusted quoted prices that are observable for the asset or liability (such as unadjusted quoted prices for similar assets and market corroborated inputs such as interest rates, prepayment speeds, credit risks, etc.)
3) Level 3-significant unobservable inputs (including the Manager’s own judgments about assumptions that market participants would use in pricing the asset or liability).
The inputs used for valuing securities are not necessarily an indication of the risks associated with investing in those securities.
The Fund classifies each of its investments in investment companies which are publicly offered as Level 1. Investment companies that are not publicly offered, if any, are classified as Level 2 in the fair value hierarchy.
The table below categorizes amounts that are included in the Fund’s Statement of Assets and Liabilities at period end based on valuation input level:
Level 1— Unadjusted Quoted | Level 2— Other Significant Observable Inputs | Level 3— Significant Unobservable Inputs | Value | |||||||||||||
| ||||||||||||||||
Assets Table | ||||||||||||||||
Investments, at Value: | ||||||||||||||||
Common Stocks | ||||||||||||||||
Consumer Discretionary | $ | 123,968,734 | $ | — | $ | — | $ | 123,968,734 | ||||||||
Consumer Staples | 16,951,693 | — | — | 16,951,693 | ||||||||||||
Energy | 16,300,146 | — | — | 16,300,146 | ||||||||||||
Financials | 72,800,783 | — | — | 72,800,783 | ||||||||||||
Health Care | 110,719,103 | — | — | 110,719,103 | ||||||||||||
Industrials | 135,744,628 | — | — | 135,744,628 | ||||||||||||
Information Technology | 208,540,393 | — | — | 208,540,393 | ||||||||||||
Materials | 31,526,533 | — | — | 31,526,533 | ||||||||||||
Investment Company | 21,063,723 | — | — | 21,063,723 | ||||||||||||
|
| |||||||||||||||
Total Assets | $ | 737,615,736 | $ | — | $ | — | $ | 737,615,736 | ||||||||
|
| |||||||||||||||
Forward currency exchange contracts and futures contracts, if any, are reported at their unrealized appreciation/depreciation at measurement date, which represents the change in the contract’s value from trade date. All additional assets and liabilities included in the above table are reported at their market value at measurement date.
For the reporting period, there were no transfers between levels.
4. Investments and Risks
Investments in Affiliated Funds. The Fund is permitted to invest in other mutual funds advised by the Manager (“Affiliated Funds”). Affiliated Funds are open-end management investment companies registered under the 1940 Act, as amended. The Manager is the investment adviser of, and the Sub-Adviser provides investment and related advisory services to, the Affiliated Funds. When applicable, the Fund’s investments in Affiliated Funds are included in the Statement of Investments. Shares of Affiliated Funds are valued at their net asset value per share. As a shareholder, the Fund is subject to its proportional share of the Affiliated Funds’ expenses, including their management fee. The Manager will waive fees and/or reimburse Fund expenses in an amount equal to the indirect management fees incurred through the Fund’s investment in the Affiliated Funds.
Each of the Affiliated Funds in which the Fund invests has its own investment risks, and those risks can affect the value of the Fund’s investments and therefore the value of the Fund’s shares. To the extent that the Fund invests more of its assets in one Affiliated Fund than in another, the Fund will have greater exposure to the risks of that Affiliated Fund.
Investments in Money Market Instruments. The Fund is permitted to invest its free cash balances in money market instruments to provide liquidity or for defensive purposes. The Fund may invest in money market instruments by investing in Class E shares of Oppenheimer Institutional Government Money Market Fund (“IGMMF”), which is an Affiliated Fund. IGMMF is regulated as a money market fund under the 1940 Act, as amended. The Fund may also invest in money market instruments directly or in other affiliated or unaffiliated money market funds.
Equity Security Risk. Stocks and other equity securities fluctuate in price. The value of the Fund’s portfolio may be affected by changes in the equity markets generally. Equity markets may experience significant short-term volatility and may fall sharply at times. Different markets may behave differently from each other and U.S. equity markets may move in the opposite direction from one or more foreign stock markets. Adverse events in any part of the equity or fixed-income markets may have unexpected negative effects on other market segments.
The prices of individual equity securities generally do not all move in the same direction at the same time and a variety of factors can affect the price
15 OPPENHEIMER DISCOVERY MID CAP GROWTH FUND/VA
NOTES TO FINANCIAL STATEMENTS Unaudited / Continued
4. Investments and Risks (Continued)
of a particular company’s securities. These factors may include, but are not limited to, poor earnings reports, a loss of customers, litigation against the company, general unfavorable performance of the company’s sector or industry, or changes in government regulations affecting the company or its industry.
Shareholder Concentration. At period end, one shareholder owned 20% or more of the Fund’s total outstanding shares.
The shareholder is a related party of the Fund. Related parties may include, but are not limited to, the investment manager and its affiliates, affiliated broker dealers, fund of funds, and directors or employees. The related party owned 22% of the Fund’s total outstanding shares at period end.
5. Market Risk Factors
The Fund’s investments in securities and/or financial derivatives may expose the Fund to various market risk factors:
Commodity Risk. Commodity risk relates to the change in value of commodities or commodity indexes as they relate to increases or decreases in the commodities market. Commodities are physical assets that have tangible properties. Examples of these types of assets are crude oil, heating oil, metals, livestock, and agricultural products.
Credit Risk. Credit risk relates to the ability of the issuer of debt to meet interest and principal payments, or both, as they come due. In general, lower-grade, higher-yield debt securities are subject to credit risk to a greater extent than lower-yield, higher-quality securities.
Equity Risk. Equity risk relates to the change in value of equity securities as they relate to increases or decreases in the general market.
Foreign Exchange Rate Risk. Foreign exchange rate risk relates to the change in the U.S. dollar value of a security held that is denominated in a foreign currency. The U.S. dollar value of a foreign currency denominated security will decrease as the dollar appreciates against the currency, while the U.S. dollar value will increase as the dollar depreciates against the currency.
Interest Rate Risk. Interest rate risk refers to the fluctuations in value of fixed-income securities resulting from the inverse relationship between price and yield. For example, an increase in general interest rates will tend to reduce the market value of already issued fixed-income investments, and a decline in general interest rates will tend to increase their value. In addition, debt securities with longer maturities, which tend to have higher yields, are subject to potentially greater fluctuations in value from changes in interest rates than obligations with shorter maturities.
Volatility Risk. Volatility risk refers to the magnitude of the movement, but not the direction of the movement, in a financial instrument’s price over a defined time period. Large increases or decreases in a financial instrument’s price over a relative time period typically indicate greater volatility risk, while small increases or decreases in its price typically indicate lower volatility risk.
6. Shares of Beneficial Interest
The Fund has authorized an unlimited number of $0.001 par value shares of beneficial interest of each class. Transactions in shares of beneficial interest were as follows:
| Six Months Ended June 30, 2018 | Year Ended December 31, 2017 | |||||||||||||||
| Shares | Amount | Shares | Amount | |||||||||||||
| ||||||||||||||||
Non-Service Shares | ||||||||||||||||
Sold | 118,090 | $ | 10,051,074 | 235,884 | $ | 18,341,538 | ||||||||||
Dividends and/or distributions reinvested | 1,182,843 | 95,656,703 | 881,558 | 66,743,996 | ||||||||||||
Redeemed | (585,011) | (51,027,997) | (1,177,553) | (93,258,429) | ||||||||||||
|
| |||||||||||||||
Net increase (decrease) | 715,922 | $ | 54,679,780 | (60,111) | $ | (8,172,895) | ||||||||||
|
| |||||||||||||||
| ||||||||||||||||
Service Shares | ||||||||||||||||
Sold | 38,204 | $ | 3,206,275 | 69,577 | $ | 5,232,152 | ||||||||||
Dividends and/or distributions reinvested | 78,492 | 5,963,052 | 51,387 | 3,695,269 | ||||||||||||
Redeemed | (50,225) | (4,149,277) | (89,745) | (6,729,427) | ||||||||||||
|
| |||||||||||||||
Net increase | 66,471 | $ | 5,020,050 | 31,219 | $ | 2,197,994 | ||||||||||
|
| |||||||||||||||
7. Purchases and Sales of Securities
The aggregate cost of purchases and proceeds from sales of securities, other than short-term obligations and investments in IGMMF, for the reporting period were as follows:
| Purchases | Sales | |||||||||||
| ||||||||||||
Investment securities | $ | 355,548,753 | $ | 408,689,459 | ||||||||
8. Fees and Other Transactions with Affiliates
Management Fees. Under the investment advisory agreement, the Fund pays the Manager a management fee based on the daily net assets of the Fund at an annual rate as shown in the following table:
16 OPPENHEIMER DISCOVERY MID CAP GROWTH FUND/VA
8. Fees and Other Transactions with Affiliates (Continued)
| Fee Schedule | ||||||||
| ||||||||
Up to $200 million | 0.75 | % | ||||||
Next $200 million | 0.72 | |||||||
Next $200 million | 0.69 | |||||||
Next $200 million | 0.66 | |||||||
Next $700 million | 0.60 | |||||||
Over $1.5 billion | 0.58 | |||||||
The Fund’s effective management fee for the reporting period was 0.71% of average annual net assets before any applicable waivers.
Sub-Adviser Fees. The Manager has retained the Sub-Adviser to provide the day-to-day portfolio management of the Fund. Under the Sub-Advisory Agreement, the Manager pays the Sub-Adviser an annual fee in monthly installments, equal to a percentage of the investment management fee collected by the Manager from the Fund, which shall be calculated after any investment management fee waivers. The fee paid to the Sub-Adviser is paid by the Manager, not by the Fund.
Transfer Agent Fees. OFI Global (the “Transfer Agent”) serves as the transfer and shareholder servicing agent for the Fund. The Fund pays the Transfer Agent a fee based on annual net assets. Fees incurred and average net assets for each class with respect to these services are detailed in the Statement of Operations and Financial Highlights, respectively.
Sub-Transfer Agent Fees. The Transfer Agent has retained Shareholder Services, Inc., a wholly-owned subsidiary of OFI (the “Sub-Transfer Agent”), to provide the day-to-day transfer agent and shareholder servicing of the Fund. Under the Sub-Transfer Agency Agreement, the Transfer Agent pays the Sub-Transfer Agent an annual fee in monthly installments, equal to a percentage of the transfer agent fee collected by the Transfer Agent from the Fund, which shall be calculated after any applicable fee waivers. The fee paid to the Sub-Transfer Agent is paid by the Transfer Agent, not by the Fund.
Trustees’ Compensation. The Fund’s Board of Trustees (“Board”) has adopted a compensation deferral plan for Independent Trustees that enables Trustees to elect to defer receipt of all or a portion of the annual compensation they are entitled to receive from the Fund. For purposes of determining the amount owed to the Trustees under the plan, deferred amounts are treated as though equal dollar amounts had been invested in shares of the Fund or in other Oppenheimer funds selected by the Trustees. The Fund purchases shares of the funds selected for deferral by the Trustees in amounts equal to his or her deemed investment, resulting in a Fund asset equal to the deferred compensation liability. Such assets are included as a component of “Other” within the asset section of the Statement of Assets and Liabilities. Deferral of Trustees’ fees under the plan will not affect the net assets of the Fund and will not materially affect the Fund’s assets, liabilities or net investment income per share. Amounts will be deferred until distributed in accordance with the compensation deferral plan.
Distribution and Service Plan for Service Shares. The Fund has adopted a Distribution and Service Plan (the “Plan”) pursuant to Rule 12b-1 under the 1940 Act for Service shares to pay OppenheimerFunds Distributor, Inc. (the “Distributor”), for distribution related services, personal service and account maintenance for the Fund’s Service shares. Under the Plan, payments are made periodically at an annual rate of 0.25% of the daily net assets of Service shares of the Fund. The Distributor currently uses all of those fees to compensate sponsors of the insurance product that offers Fund shares, for providing personal service and maintenance of accounts of their variable contract owners that hold Service shares. These fees are paid out of the Fund’s assets on an on-going basis and increase operating expenses of the Service shares, which results in lower performance compared to the Fund’s shares that are not subject to a service fee. Fees incurred by the Fund under the Plan are detailed in the Statement of Operations.
Waivers and Reimbursements of Expenses. The Manager has contractually agreed to limit the Fund’s expenses after payments, waivers and/or reimbursements and reduction to custodian expenses, excluding any applicable dividend expense, taxes, interest and fees from borrowing, any subsidiary expenses, Acquired Fund Fees and Expenses, brokerage commissions, unusual and infrequent expenses and certain other Fund expenses; so that those expenses, as percentages of daily net assets, will not exceed the annual rate of 0.80% for Non-Service shares and 1.05% for Service shares.
During the reporting period, the Manager waived fees and/or reimbursed the Fund as follows:
Non-Service shares | $ | 158,105 | ||||||
Service shares | 9,190 |
This fee waiver and/or expense reimbursement may not be amended or withdrawn for one year from the date of the Fund’s prospectus, unless approved by the Board.
The Manager will waive fees and/or reimburse Fund expenses in an amount equal to the indirect management fees incurred through the Fund’s investment in IGMMF. During the reporting period, the Manager waived fees and/or reimbursed the Fund $6,429 for IGMMF management fees. This fee waiver and/or expense reimbursement may not be amended or withdrawn for one year from the date of the Fund’s prospectus, unless approved by the Board.
17 OPPENHEIMER DISCOVERY MID CAP GROWTH FUND/VA
NOTES TO FINANCIAL STATEMENTS Unaudited / Continued
9. Borrowings and Other Financing
Joint Credit Facility. A number of mutual funds managed by the Manager participate in a $1.875 billion revolving credit facility (the “Facility”) intended to provide short-term financing, if necessary, subject to certain restrictions in connection with atypical redemption activity. Effective July 17, 2018, the Facility was increased to $1.95 billion. Expenses and fees related to the Facility are paid by the participating funds and are disclosed separately or as other expenses on the Statement of Operations. The Fund did not utilize the Facility during the reporting period.
18 OPPENHEIMER DISCOVERY MID CAP GROWTH FUND/VA
PORTFOLIO PROXY VOTING POLICIES AND GUIDELINES; UPDATES TO STATEMENT OF
INVESTMENTS Unaudited
The Fund has adopted Portfolio Proxy Voting Policies and Guidelines under which the Fund votes proxies relating to securities (“portfolio proxies”) held by the Fund. A description of the Fund’s Portfolio Proxy Voting Policies and Guidelines is available (i) without charge, upon request, by calling the Fund toll-free at 1.800.CALL OPP (225.5677), (ii) on the Fund’s website at www.oppenheimerfunds.com, and (iii) on the SEC’s website at www.sec.gov. In addition, the Fund is required to file Form N-PX, with its complete proxy voting record for the 12 months ended June 30th, no later than August 31st of each year. The Fund’s voting record is available (i) without charge, upon request, by calling the Fund toll-free at 1.800.CALL OPP (225.5677), and (ii) in the Form N-PX filing on the SEC’s website at www.sec.gov.
The Fund files its complete schedule of portfolio holdings with the SEC for the first quarter and the third quarter of each fiscal year on Form N-Q. The Fund’s Form N-Q filings are available on the SEC’s website at www.sec.gov. Those forms may be reviewed and copied at the SEC’s Public Reference Room in Washington, D.C. Information on the operation of the Public Reference Room may be obtained by calling 1-800-SEC-0330.
19 OPPENHEIMER DISCOVERY MID CAP GROWTH FUND/VA
DISTRIBUTION SOURCES Unaudited
For any distribution that took place over the last six months of the Fund’s reporting period, the table below details on a per-share basis the percentage of the Fund’s total distribution payment amount that was derived from the following sources: net income, net profit from the sale of securities, and other capital sources. Other capital sources represent a return of capital. A return of capital may occur, for example, when some or all of the money that you invested in the Fund is paid back to you. A return of capital distribution does not necessarily reflect the Fund’s investment performance and should not be confused with “yield” or “income.” You should not draw any conclusions about the Fund’s investment performance from the amounts of these distributions. This information is based upon income and capital gains using generally accepted accounting principles as of the date of each distribution. If the Fund (or an underlying fund in which the Fund invests) invests in real estate investment trusts (REITs) and/or master limited partnerships (MLPs), the percentages attributed to each category are estimated using historical information because the character of the amounts received from the REITs and/or MLPs in which the Fund (or underlying fund) invests is unknown until after the end of the calendar year. Because the Fund is actively managed, the relative amount of the Fund’s total distributions derived from various sources over the calendar year may change. Please note that this information should not be used for tax reporting purposes as the tax character of distributable income may differ from the amounts used for this notification. You will receive communication in the first quarter of each calendar year detailing the actual amount of the taxable and non-taxable portion of distributions paid to you during the tax year.
For the most current information, please go to oppenheimerfunds.com. Select your Fund, and scroll down to the ‘Dividends’ table under ‘Analytics’. The Fund’s latest distribution information will be followed by the sources of any distribution, updated daily.
| Fund Name | Pay Date | Net Income | Net Profit from Sale | Other Capital Sources | ||||||||||||
| Oppenheimer Discovery Mid Cap Growth Fund/VA | 6/19/18 | 0.0% | 100% | 0.0% | ||||||||||||
20 OPPENHEIMER DISCOVERY MID CAP GROWTH FUND/VA
THIS PAGE INTENTIONALLY LEFT BLANK.
21 OPPENHEIMER DISCOVERY MID CAP GROWTH FUND/VA
THIS PAGE INTENTIONALLY LEFT BLANK.
22 OPPENHEIMER DISCOVERY MID CAP GROWTH FUND/VA
THIS PAGE INTENTIONALLY LEFT BLANK.
23 OPPENHEIMER DISCOVERY MID CAP GROWTH FUND/VA
OPPENHEIMER DISCOVERY MID CAP GROWTH FUND/VA
| A Series of Oppenheimer Variable Account Funds | ||
Trustees and Officers | Robert J. Malone, Chairman of the Board of Trustees and Trustee | |
| Andrew J. Donohue, Trustee | ||
| Richard F. Grabish, Trustee | ||
| Beverly L. Hamilton, Trustee | ||
| Victoria J. Herget, Trustee | ||
| Karen L. Stuckey, Trustee | ||
| James D. Vaughn, Trustee | ||
| Arthur P. Steinmetz, Trustee, President and Principal Executive Officer | ||
| Ronald J. Zibelli, Jr., Vice President | ||
| Justin Livengood, Vice President | ||
| Cynthia Lo Bessette, Secretary and Chief Legal Officer | ||
| Jennifer Foxson, Vice President and Chief Business Officer | ||
| Mary Ann Picciotto, Chief Compliance Officer and Chief Anti-Money Laundering Officer | ||
| Brian S. Petersen, Treasurer and Principal Financial & Accounting Officer | ||
Manager | OFI Global Asset Management, Inc. | |
Sub-Adviser | OppenheimerFunds, Inc. | |
Distributor | OppenheimerFunds Distributor, Inc. | |
Transfer and | OFI Global Asset Management, Inc. | |
Shareholder | ||
Servicing Agent | ||
Sub-Transfer Agent | Shareholder Services, Inc. | |
| DBA OppenheimerFunds Services | ||
Independent | KPMG LLP | |
Registered | ||
Public | ||
Accounting | ||
Firm | ||
Legal Counsel | Ropes & Gray LLP | |
| Before investing in any of the Oppenheimer funds, investors should carefully consider a fund’s investment objectives, risks, charges and expenses. Fund prospectuses and summary prospectuses contain this and other information about the funds and may be obtained by asking your financial advisor, visiting oppenheimerfunds.com or calling us at 1.800.988.8287. Read prospectuses and summary prospectuses carefully before investing. | ||
| The financial statements included herein have been taken from the records of the Fund without examination of those records by the independent registered public accounting firm | ||
| © 2018 OppenheimerFunds, Inc. All rights reserved. Oppenheimer funds are distributed by OppenheimerFunds Distributor, Inc. | ||

OppenheimerFunds® The Right Way to Invest | ||||
June 30, 2018
| ||||
Oppenheimer | ||||
| Conservative Balanced Fund/VA | Semiannual Report | |||
A Series of Oppenheimer Variable Account Funds
| ||||
SEMIANNUAL REPORT | ||||
Listing of Top Holdings | ||||
Fund Performance Discussion | ||||
Financial Statements |

PORTFOLIO MANAGERS: Krishna Memani and Magnus Krantz
AVERAGE ANNUAL TOTAL RETURNS FOR THE PERIODS ENDED 6/30/18
| Inception Date | 6-Months | 1-Year | 5-Year | 10-Year | ||||||||||||||||
Non-Service Shares | 2/9/87 | -0.99% | 2.62% | 5.88% | 2.88% | |||||||||||||||
Service Shares | 5/1/02 | -1.09 | 2.37 | 5.60 | 2.63 | |||||||||||||||
Russell 3000 Index | 3.22 | 14.78 | 13.29 | 10.23 | ||||||||||||||||
Bloomberg Barclays U.S. Aggregate Bond Index | -1.62 | -0.40 | 2.27 | 3.72 | ||||||||||||||||
Reference Index | 0.21 | 4.88 | 6.23 | 6.54 | ||||||||||||||||
Performance data quoted represents past performance, which does not guarantee future results. The investment return and principal value of an investment in the Fund will fluctuate so that an investor’s shares, when redeemed, may be worth more or less than their original cost. Current performance may be lower or higher than the performance quoted. For performance data current to the most recent month end, call us at 1.800.988.8287. The Fund’s total returns should not be expected to be the same as the returns of other funds, whether or not both funds have the same portfolio managers and/or similar names. The Fund’s total returns include changes in share price and reinvested distributions but do not include the charges associated with the separate account products that offer this Fund. Such performance would have been lower if such charges were taken into account. Returns for periods of less than one year are cumulative and not annualized. See Fund prospectuses and summary prospectuses for more information on share classes and sales charges.
The Fund’s performance is compared to the performance of the Russell 3000 Index, the Bloomberg Barclays U.S. Aggregate Bond Index and the Fund’s Reference Index. The Russell 3000 Index measures the performance of the largest 3,000 U.S. companies, representing approximately 98% of the investable U.S. equity market. The Bloomberg Barclays U.S. Aggregate Bond Index is an index of U.S dollar-denominated, investment-grade U.S. corporate government and mortgage-backed securities. The Fund’s Reference Index is a customized weighted index currently comprised of 65% of the Bloomberg Barclays U.S. Aggregate Bond Index and 35% of the Russell 3000 Index. The indices are unmanaged and cannot be purchased directly by investors. While index comparisons may be useful to provide a benchmark for the Fund’s performance, it must be noted that the Fund’s investments are not limited to the investments comprising the indices. Index performance includes reinvestment of income, but does not reflect transaction costs, fees, expenses or taxes. Index performance is shown for illustrative purposes only as a benchmark for the Fund’s performance, and does not predict or depict performance of the Fund. The Fund’s performance reflects the effects of the Fund’s business and operating expenses.
TOP HOLDINGS AND ALLOCATIONS
TOP TEN COMMON STOCK HOLDINGS
Apple, Inc. | 1.5 | % | ||||||
Microsoft Corp. | 1.2 | |||||||
Exxon Mobil Corp. | 1.1 | |||||||
JPMorgan Chase & Co. | 1.1 | |||||||
Facebook, Inc., Cl. A | 0.8 | |||||||
Mastercard, Inc., Cl. A | 0.7 | |||||||
Lowe’s Cos., Inc. | 0.7 | |||||||
Alphabet, Inc., Cl. C | 0.7 | |||||||
NIKE, Inc., Cl. B | 0.6 | |||||||
Intercontinental Exchange, Inc. | 0.6 |
Portfolio holdings and allocations are subject to change. Percentages are as of June 30, 2018, and are based on net assets. For more current Fund holdings, please visit oppenheimerfunds.com.
PORTFOLIO ALLOCATION
| ||||||||
Mortgage-Backed Obligations | ||||||||
Government Agency | 24.3 | % | ||||||
Non-Agency | 9.0 | |||||||
Common Stocks | 29.5 | |||||||
Non-Convertible Corporate Bonds and Notes | 26.8 | |||||||
Asset-Backed Securities | 8.0 | |||||||
Investment Company | ||||||||
Oppenheimer Institutional Government Money Market Fund | 2.2 | |||||||
U.S. Government Obligations | 0.2 |
Portfolio holdings and allocations are subject to change. Percentages are as of June 30, 2018, and are based on the total market value of investments. For more current Fund holdings, please visit oppenheimerfunds.com.
2 OPPENHEIMER CONSERVATIVE BALANCED FUND/VA
Fund Performance Discussion
The Fund’s Non-Service shares produced a return of -0.99% during the reporting period. On a relative basis, the Fund’s Reference Index returned 0.21%. The Fund’s Reference Index is a customized weighted index currently comprised of the following underlying broad-based security indices: 65% of the Bloomberg Barclays U.S. Aggregate Bond Index and 35% of the Russell 3000 Index. Measured separately, the Bloomberg Barclays U.S. Aggregate Bond Index returned -1.62% and the Russell 3000 Index returned 3.22%.
MARKET OVERVIEW
The U.S. economy continued to perform well during the reporting period. U.S. 2018 gross domestic product (GDP) is expected to be around 3%, significantly exceeding its 2% trend growth of this expansion. Private consumption, the driving force of the economy in recent years, is growing at a stable rate. Additionally, business fixed investment has gained momentum in recent months and is broadening across sectors. With increasingly less slack in the economy, strong profits, and the corporate tax cuts, investment should support growth and productivity improvements.
The Federal Reserve (Fed) hiked the Fed Funds target rate by 25 basis points twice – in March and June – ending the period in a range of 1.75% – 2.00%. The Fed is on track to deliver 1-2 more hikes this year, as the economy is near the Fed’s dual mandate of full employment and price stability. On the inflation front, underlying inflation is around the Fed’s 2% target. The unemployment rate is at historical lows; however, the rising labor participation rate and stable wage growth suggest that there may still be some slack in the labor market. The Federal Open Market Committee (FOMC) under new chair Jerome Powell’s leadership signaled that the Fed will remain cautious and tighten policy gradually, giving comfort to the markets. Thus far, the Fed’s hiking cycle has been orderly.
Despite the strength of the U.S. economy and the Fed’s orderly hiking cycle, international economic and geopolitical concerns were noticeable during the reporting period and caused some market turbulence. Trade tensions were on the rise and there were pockets of political issues. Such tensions, especially regarding trade, made an impact on some investment decisions, as noted in the Fed’s minutes. So far, the measures implemented are not of major economic significance, in our view. At this point, we believe there is more rhetoric than actual impactful decisions. The risk remains, however, that trade issues negatively impact confidence or that retaliations could lead to more significant measures. While these are still not the baseline, risks are elevated and worth carefully monitoring.
In this environment, markets were volatile this reporting period. Equity markets in the U.S. produced positive results and outperformed international equities, with the S&P 500 Index returning 2.65% and the MSCI All Country World Index returning -0.43%. Fixed income markets generally produced negative returns this reporting period. The 10-year U.S. Treasury rate started the reporting period at 2.41% and hit a high of 3.11% in May, before ending the reporting period at 2.86%. U.S. Treasuries (as represented by the Bloomberg Barclays U.S. Treasury Index) produced negative results, with a -1.62% return. Credit underperformed for the reporting period, with the Bloomberg Barclays U.S. Credit Index returning -2.99%.
EQUITY STRATEGY REVIEW
The equity strategy produced a muted positive absolute return during the reporting period and underperformed the Russell 3000 Index. The equity strategy’s underperformance stemmed largely from weaker relative stock selection in the Consumer Discretionary, Energy, and Consumer Staples sectors. The equity strategy outperformed the Russell 3000 Index in the Industrials sector, due to stock selection.
The equity strategy’s top contributors to performance relative to the Russell 3000 Index included Korn/Ferry International and Mastercard.
During the reporting period, recruiter and talent management consultant Korn/Ferry delivered another strong quarter in a series of strong quarterly results, with accelerating revenue growth and forward guidance that exceeded expectations. The company is effectively leveraging the intellectual property of its Hay Group organizational and leadership consulting business, acquired in 2015, to drive results in its traditional executive “headhunter” practice and its Futurestep recruitment process outsourcing division. A strengthening economy and tightening job market have been driving demand, and the company’s value-added offerings have been helping it take market share.
Mastercard’s performance was driven by strong core results reported over the second quarter of 2018, where revenues and earnings soundly beat expectations and organic revenue growth accelerated to over 20% year over year. While these results are unlikely sustainable, Mastercard has demonstrated an ability to grow at a faster pace than their largest competitor Visa driven by the strength of their services business, share gains in European processing and some market share gains internationally. Notably, this reporting period, the company won Santander’s large UK debit business. More importantly, Mastercard continues to
3 OPPENHEIMER CONSERVATIVE BALANCED FUND/VA
benefit from the long tail of revenue growth as the world transitions from cash and check to electronic forms of payment. The global ubiquity of acceptance at Visa and Mastercard make them both partners of choice for global card issuers.
Not owning Amazon for the majority of the reporting period was the biggest relative detractor from the equity strategy’s performance, as the company continued its run of impressive performance and performed well for the Russell 3000 Index. Also detracting from performance was Spectrum Brands Holdings, which is in a state of flux. The company experienced issues implementing a change to its distribution system, causing the company to lower full-year earnings guidance, leading to an approximately 25% drop in the stock over a two-day period in April. We exited the position.
FIXED-INCOME STRATEGY REVIEW
The Fund’s fixed-income strategy underperformed the Bloomberg Barclays U.S. Aggregate Bond Index during the reporting period. In a period where credit underperformed U.S. Treasuries, the Fund’s strategic underweight position to U.S. Treasuries was the largest detractor from performance versus the Index. In addition, the strategy’s position in investment grade corporate credit detracted from performance this reporting period.
Positive contributors to performance this reporting period included the strategy’s security selection in asset-backed securities (“ABS”), where we favored auto ABS given what we view as attractive fundamentals in the space. In addition, the strategy’s allocation to non-agency mortgage-backed securities (“MBS”) benefited performance.
The views in the Fund Performance Discussion represent the opinions of this Fund’s portfolio managers and are not intended as investment advice or to predict or depict the performance of any investment. These views are as of the close of business on June 30, 2018, and are subject to change based on subsequent developments. The Fund’s portfolio and strategies are subject to change.
Shares of Oppenheimer funds are not deposits or obligations of any bank, are not guaranteed by any bank, are not insured by the FDIC or any other agency, and involve investment risks, including the possible loss of the principal amount invested.
4 OPPENHEIMER CONSERVATIVE BALANCED FUND/VA
Fund Expenses
Fund Expenses. As a shareholder of the Fund, you incur two types of costs: (1) transaction costs and (2) ongoing costs, including management fees; distribution and service fees; and other Fund expenses. These examples are intended to help you understand your ongoing costs (in dollars) of investing in the Fund and to compare these costs with the ongoing costs of investing in other mutual funds.
The examples are based on an investment of $1,000.00 invested at the beginning of the period and held for the entire 6-month period ended June 30, 2018.
Actual Expenses. The first section of the table provides information about actual account values and actual expenses. You may use the information in this section for the class of shares you hold, together with the amount you invested, to estimate the expense that you paid over the period. Simply divide your account value by $1,000.00 (for example, an $8,600.00 account value divided by $1,000.00 = 8.60), then multiply the result by the number in the first section under the heading entitled “Expenses Paid During 6 Months Ended June 30, 2018” to estimate the expenses you paid on your account during this period.
Hypothetical Example for Comparison Purposes.
The second section of the table provides information about hypothetical account values and hypothetical expenses based on the Fund’s actual expense ratio for each class of shares, and an assumed rate of return of 5% per year for each class before expenses, which is not the actual return. The hypothetical account values and expenses may not be used to estimate the actual ending account balance or expenses you paid for the period. You may use this information to compare the ongoing costs of investing in the Fund and other funds. To do so, compare this 5% hypothetical example for the class of shares you hold with the 5% hypothetical examples that appear in the shareholder reports of the other funds.
Please note that the expenses shown in the table are meant to highlight your ongoing costs only and do not reflect any charges associated with the separate accounts that offer this Fund. Therefore, the “hypothetical” lines of the table are useful in comparing ongoing costs only, and will not help you determine the relative total costs of owning different funds. In addition, if these separate account charges were included your costs would have been higher.
| Actual | Beginning Value | Ending Account Value June 30, 2018 | Expenses Paid During 6 Months Ended June 30, 2018 | |||||||||||||
Non-Service shares | $ | 1,000.00 | $ | 990.10 | $ | 3.31 | ||||||||||
Service shares | 1,000.00 | 989.10 | 4.55 | |||||||||||||
| Hypothetical | ||||||||||||||||
(5% return before expenses)
| ||||||||||||||||
Non-Service shares | 1,000.00 | 1,021.47 | 3.36 | |||||||||||||
Service shares | 1,000.00 | 1,020.23 | 4.62 | |||||||||||||
Expenses are equal to the Fund’s annualized expense ratio for that class, multiplied by the average account value over the period, multiplied by 181/365 (to reflect the one-half year period). Those annualized expense ratios, excluding indirect expenses from affiliated funds, based on the 6-month period ended June 30, 2018 are as follows:
| Class | Expense Ratios | |||||||
Non-Service shares | 0.67% | |||||||
Service shares | 0.92 | |||||||
The expense ratios reflect voluntary and/or contractual waivers and/or reimbursements of expenses by the Fund’s Manager. Some of these undertakings may be modified or terminated at any time, as indicated in the Fund’s prospectus. The “Financial Highlights” tables in the Fund’s financial statements, included in this report, also show the gross expense ratios, without such waivers or reimbursements and reduction to custodian expenses, if applicable.
5 OPPENHEIMER CONSERVATIVE BALANCED FUND/VA
STATEMENT OF INVESTMENTS June 30, 2018 Unaudited
| Shares | Value | |||||||
| Common Stocks—35.7% |
| |||||||
| Consumer Discretionary—3.1% |
| |||||||
| Auto Components—0.4% |
| |||||||
Visteon Corp.1
|
| 6,210
|
| $
| 802,580
|
| ||
| Diversified Consumer Services—0.0% |
| |||||||
| Houghton Mifflin Harcourt Co.1 | 3,100 | 23,715 | ||||||
| Weight Watchers International, Inc.1 | 85 | 8,593 | ||||||
| 32,308 | ||||||||
| Hotels, Restaurants & Leisure—0.6% |
| |||||||
| Cedar Fair LP2 | 5,485 | 345,610 | ||||||
| Chipotle Mexican Grill, Inc., Cl. A1 | 24 | 10,353 | ||||||
| McDonald’s Corp. | 5,926 | 928,545 | ||||||
| 1,284,508 | ||||||||
| Household Durables—0.0% |
| |||||||
Newell Brands, Inc.
|
| 591
|
|
| 15,242
|
| ||
| Internet & Catalog Retail—0.1% |
| |||||||
| Amazon.com, Inc.1 | 36 | 61,193 | ||||||
| Booking Holdings, Inc.1 | 5 | 10,135 | ||||||
| FTD Cos., Inc.1 | 2,792 | 12,955 | ||||||
| Netflix, Inc.1 | 46 | 18,006 | ||||||
| 102,289 | ||||||||
| Leisure Products—0.0% |
| |||||||
American Outdoor Brands Corp.1
|
| 1,558
|
|
| 18,743
|
| ||
| Multiline Retail—0.0% |
| |||||||
Fred’s, Inc., Cl. A
|
| 6,982
|
|
| 15,919
|
| ||
| Specialty Retail—1.4% |
| |||||||
| Bed Bath & Beyond, Inc. | 712 | 14,186 | ||||||
| Burlington Stores, Inc.1 | 3,536 | 532,274 | ||||||
| CarMax, Inc.1 | 9,248 | 673,902 | ||||||
| GameStop Corp., Cl. A | 890 | 12,967 | ||||||
| GNC Holdings, Inc., Cl. A1 | 2,096 | 7,378 | ||||||
| Lowe’s Cos., Inc. | 15,166 | 1,449,415 | ||||||
| Office Depot, Inc. | 5,174 | 13,194 | ||||||
| Sally Beauty Holdings, Inc.1 | 1,208 | 19,364 | ||||||
| Sportsman’s Warehouse Holdings, Inc.1 | 2,168 | 11,100 | ||||||
| TravelCenters of America LLC1 | 3,146 | 11,011 | ||||||
| 2,744,791 | ||||||||
| Textiles, Apparel & Luxury Goods—0.6% |
| |||||||
NIKE, Inc., Cl. B
|
| 15,872
|
|
| 1,264,681
|
| ||
| Consumer Staples—1.2% |
| |||||||
| Beverages—0.0% |
| |||||||
| Constellation Brands, Inc., Cl. A | 35 | 7,660 | ||||||
| Molson Coors Brewing Co., Cl. B | 388 | 26,400 | ||||||
| 34,060 | ||||||||
| Food & Staples Retailing—0.2% |
| |||||||
| Kroger Co. (The) | 941 | 26,771 | ||||||
| Rite Aid Corp.1 | 174,233 | 301,423 | ||||||
| SpartanNash Co. | 630 | 16,078 | ||||||
| SUPERVALU, Inc.1 | 903 | 18,529 | ||||||
| Walgreens Boots Alliance, Inc. | 178 | 10,683 | ||||||
| 373,484 | ||||||||
| Food Products—0.6% |
| |||||||
| Campbell Soup Co. | 644 | 26,108 | ||||||
| Dean Foods Co. | 2,150 | 22,596 | ||||||
| Kellogg Co. | 355 | 24,804 | ||||||
| Kraft Heinz Co. (The) | 10,620 | 667,148 | ||||||
| Pinnacle Foods, Inc. | 6,814 | 443,319 | ||||||
| TreeHouse Foods, Inc.1 | 463 | 24,312 | ||||||
| 1,208,287 | ||||||||
| Household Products—0.0% |
| |||||||
| Church & Dwight Co., Inc. | 187 | 9,941 | ||||||
| Procter & Gamble Co. (The) | 256 | 19,983 | ||||||
| 29,924 | ||||||||
| Shares | Value | |||||||
| Personal Products—0.1% |
| |||||||
| Avon Products, Inc.1 | 7,928 | $ | 12,843 | |||||
| Coty, Inc., Cl. A | 1,336 | 18,838 | ||||||
| Edgewell Personal Care Co.1 | 358 | 18,065 | ||||||
| 49,746 | ||||||||
| Tobacco—0.3% |
| |||||||
| Altria Group, Inc. | 464 | 26,351 | ||||||
| British American Tobacco plc | 10,850 | 547,967 | ||||||
| British American Tobacco plc, | ||||||||
| Sponsored ADR | 359 | 18,112 | ||||||
| Philip Morris International, Inc. | 352 | 28,420 | ||||||
| Universal Corp. | 250 | 16,513 | ||||||
| 637,363 | ||||||||
| Energy—2.0% |
| |||||||
| Oil, Gas & Consumable Fuels—2.0% |
| |||||||
| EQT Corp. | 20,215 | 1,115,464 | ||||||
| Exxon Mobil Corp. | 27,360 | 2,263,493 | ||||||
| Matador Resources Co.1 | 192 | 5,770 | ||||||
| Noble Energy, Inc. | 177 | 6,244 | ||||||
| Range Resources Corp. | 798 | 13,350 | ||||||
| Shell Midstream Partners LP2 | 29,695 | 658,635 | ||||||
| 4,062,956 | ||||||||
| Financials—5.8% |
| |||||||
| Capital Markets—0.9% |
| |||||||
| Bank of New York Mellon Corp. (The) | 12,060 | 650,396 | ||||||
| Charles Schwab Corp. (The) | 186 | 9,505 | ||||||
| Intercontinental Exchange, Inc. | 16,906 | 1,243,436 | ||||||
| 1,903,337 | ||||||||
| Commercial Banks—2.4% |
| |||||||
| Citigroup, Inc. | 11,360 | 760,211 | ||||||
| East West Bancorp, Inc. | 10,620 | 692,424 | ||||||
| IBERIABANK Corp. | 7,010 | 531,358 | ||||||
| JPMorgan Chase & Co. | 21,510 | 2,241,342 | ||||||
| Signature Bank (New York)1 | 5,710 | 730,195 | ||||||
| 4,955,530 | ||||||||
| Consumer Finance—0.4% |
| |||||||
Synchrony Financial
|
| 25,510
|
|
| 851,524
|
| ||
| Insurance—1.2% |
| |||||||
| American International Group, Inc. | 17,710 | 938,984 | ||||||
| Arthur J. Gallagher & Co. | 10,349 | 675,582 | ||||||
| Marsh & McLennan Cos., Inc. | 101 | 8,279 | ||||||
| Progressive Corp. (The) | 12,625 | 746,769 | ||||||
| 2,369,614 | ||||||||
| Real Estate Investment Trusts (REITs)—0.8% |
| |||||||
| AGNC Investment Corp. | 1,334 | 24,799 | ||||||
| American Tower Corp. | 31 | 4,469 | ||||||
| Annaly Capital Management, Inc. | 2,374 | 24,428 | ||||||
| EPR Properties | 8,940 | 579,223 | ||||||
| Mid-America Apartment Communities, Inc. | 8,707 | 876,534 | ||||||
| Prologis, Inc. | 127 | 8,343 | ||||||
| 1,517,796 | ||||||||
| Real Estate Management & Development—0.1% |
| |||||||
Realogy Holdings Corp.
|
| 12,240
|
|
| 279,072
|
| ||
| Health Care—5.1% |
| |||||||
| Biotechnology—0.9% |
| |||||||
| BioMarin Pharmaceutical, Inc.1 | 3,030 | 285,426 | ||||||
| Exact Sciences Corp.1 | 9,130 | 545,883 | ||||||
| Sage Therapeutics, Inc.1 | 1,120 | 175,313 | ||||||
| uniQure NV1 | 6,404 | 242,071 | ||||||
| Vertex Pharmaceuticals, Inc.1 | 3,573 | 607,267 | ||||||
| 1,855,960 | ||||||||
| Health Care Equipment & Supplies—0.7% |
| |||||||
| ABIOMED, Inc.1 | 15 | 6,136 | ||||||
| Align Technology, Inc.1 | 20 | 6,843 | ||||||
6 OPPENHEIMER CONSERVATIVE BALANCED FUND/VA
| Shares | Value | |||||||
| Health Care Equipment & Supplies (Continued) |
| |||||||
| Becton Dickinson & Co. | 2,594 | $ | 621,419 | |||||
| Boston Scientific Corp.1 | 353 | 11,543 | ||||||
| CryoPort, Inc.1 | 7,880 | 124,346 | ||||||
| IDEXX Laboratories, Inc.1 | 36 | 7,846 | ||||||
| Intuitive Surgical, Inc.1 | 1,399 | 669,393 | ||||||
| 1,447,526 | ||||||||
| Health Care Providers & Services—1.6% |
| |||||||
| Aceto Corp. | 2,110 | 7,069 | ||||||
| Anthem, Inc. | 4,230 | 1,006,867 | ||||||
| Centene Corp.1 | 3,200 | 394,272 | ||||||
| CVS Health Corp. | 375 | 24,131 | ||||||
| Laboratory Corp. of America Holdings1 | 5,988 | 1,075,026 | ||||||
| LifePoint Health, Inc.1 | 299 | 14,591 | ||||||
| UnitedHealth Group, Inc. | 104 | 25,515 | ||||||
| WellCare Health Plans, Inc.1 | 3,029 | 745,861 | ||||||
| 3,293,332 | ||||||||
| Health Care Technology—0.0% | ||||||||
Teladoc, Inc.1
|
| 78
|
|
| 4,528
|
| ||
| Life Sciences Tools & Services—0.4% | ||||||||
| Agilent Technologies, Inc. | 11,791 | 729,156 | ||||||
| Illumina, Inc.1 | 29 | 8,099 | ||||||
| 737,255 | ||||||||
| Pharmaceuticals—1.5% | ||||||||
| AstraZeneca plc, Sponsored ADR | 624 | 21,909 | ||||||
| Bayer AG, Sponsored ADR | 27,990 | 771,964 | ||||||
| Johnson & Johnson | 10,160 | 1,232,814 | ||||||
| Merck & Co., Inc. | 14,611 | 886,888 | ||||||
| Nektar Therapeutics, Cl. A1 | 77 | 3,760 | ||||||
| Novartis AG, Sponsored ADR | 332 | 25,079 | ||||||
| TherapeuticsMD, Inc.1 | 30,050 | 187,512 | ||||||
| 3,129,926 | ||||||||
| Industrials—4.8% | ||||||||
| Aerospace & Defense—1.1% | ||||||||
| Boeing Co. (The) | 2,675 | 897,489 | ||||||
| Lockheed Martin Corp. | 2,482 | 733,258 | ||||||
| Spirit AeroSystems Holdings, Inc., Cl. A | 6,677 | 573,621 | ||||||
| 2,204,368 | ||||||||
| Air Freight & Couriers—0.3% | ||||||||
XPO Logistics, Inc.1
|
| 5,428
|
|
| 543,777
|
| ||
| Airlines—0.2% | ||||||||
Spirit Airlines, Inc.1
|
| 12,853
|
|
| 467,206
|
| ||
| Building Products—0.5% | ||||||||
| A.O. Smith Corp. | 105 | 6,211 | ||||||
| Lennox International, Inc. | 2,660 | 532,399 | ||||||
| Masco Corp. | 10,570 | 395,529 | ||||||
| 934,139 | ||||||||
| Commercial Services & Supplies—0.8% |
| |||||||
| ACCO Brands Corp. | 631 | 8,739 | ||||||
| KAR Auction Services, Inc. | 19,892 | 1,090,082 | ||||||
| RR Donnelley & Sons Co. | 1,701 | 9,798 | ||||||
| Waste Connections, Inc. | 7,476 | 562,793 | ||||||
| 1,671,412 | ||||||||
| Construction & Engineering—0.2% | ||||||||
Dycom Industries, Inc.1
|
| 4,740
|
|
| 447,977
|
| ||
| Industrial Conglomerates—0.0% | ||||||||
General Electric Co.
|
| 1,363
|
|
| 18,550
|
| ||
| Machinery—0.6% | ||||||||
| Illinois Tool Works, Inc. | 4,188 | 580,206 | ||||||
| Stanley Black & Decker, Inc. | 4,176 | 554,615 | ||||||
| Wabtec Corp. | 56 | 5,520 | ||||||
| 1,140,341 | ||||||||
| Professional Services—0.6% | ||||||||
| ASGN, Inc.1 | 127 | 9,930 | ||||||
| Shares | Value | |||||||
| Professional Services (Continued) | ||||||||
| Korn/Ferry International | 18,020 | $ | 1,115,979 | |||||
| 1,125,909 | ||||||||
| Road & Rail—0.3% | ||||||||
Canadian Pacific Railway Ltd.
|
| 3,860
|
|
| 706,457
|
| ||
| Trading Companies & Distributors—0.2% |
| |||||||
Fastenal Co.
|
| 8,266
|
|
| 397,843
|
| ||
| Information Technology—10.4% | ||||||||
| Communications Equipment—0.4% | ||||||||
Palo Alto Networks, Inc.1
|
| 4,393
|
|
| 902,630
|
| ||
| Internet Software & Services—2.5% | ||||||||
| Alphabet, Inc., Cl. C1 | 1,270 | 1,416,876 | ||||||
| eBay, Inc.1 | 27,313 | 990,369 | ||||||
| Envestnet, Inc.1 | 96 | 5,275 | ||||||
| Facebook, Inc., Cl. A1 | 8,433 | 1,638,701 | ||||||
| Pandora Media, Inc.1 | 988 | 7,785 | ||||||
| Q2 Holdings, Inc.1 | 8,100 | 462,105 | ||||||
| Yelp, Inc., Cl. A1 | 13,622 | 533,710 | ||||||
| 5,054,821 | ||||||||
| IT Services—2.0% | ||||||||
| CACI International, Inc., Cl. A1 | 35 | 5,899 | ||||||
| DXC Technology Co. | 9,179 | 739,919 | ||||||
| First Data Corp., Cl. A1 | 43,756 | 915,813 | ||||||
| Mastercard, Inc., Cl. A | 7,377 | 1,449,728 | ||||||
| PayPal Holdings, Inc.1 | 176 | 14,656 | ||||||
| Perspecta, Inc. | 16,764 | 344,500 | ||||||
| Teradata Corp.1 | 13,720 | 550,858 | ||||||
| Total System Services, Inc. | 105 | 8,875 | ||||||
| 4,030,248 | ||||||||
| Semiconductors & Semiconductor Equipment—0.9% |
| |||||||
| Applied Materials, Inc. | 16,699 | 771,327 | ||||||
| Broadcom, Inc. | 48 | 11,647 | ||||||
| Microchip Technology, Inc. | 10,225 | 929,964 | ||||||
| Texas Instruments, Inc. | 130 | 14,332 | ||||||
| 1,727,270 | ||||||||
| Software—2.8% | ||||||||
| Activision Blizzard, Inc. | 13,740 | 1,048,637 | ||||||
| Microsoft Corp. | 24,728 | 2,438,428 | ||||||
| MobileIron, Inc.1 | 2,738 | 12,184 | ||||||
| Pegasystems, Inc. | 14,647 | 802,656 | ||||||
| PTC, Inc.1 | 190 | 17,824 | ||||||
| Snap, Inc., Cl. A1 | 45,595 | 596,838 | ||||||
| Zynga, Inc., Cl. A1 | 185,962 | 756,865 | ||||||
| 5,673,432 | ||||||||
| Technology Hardware, Storage & Peripherals—1.8% |
| |||||||
| Apple, Inc. | 16,227 | 3,003,780 | ||||||
| Diebold Nixdorf, Inc. | 1,365 | 16,312 | ||||||
| Western Digital Corp. | 8,877 | 687,168 | ||||||
| 3,707,260 | ||||||||
| Materials—1.0% | ||||||||
| Chemicals—0.2% | ||||||||
| DowDuPont, Inc. | 172 | 11,338 | ||||||
| Valvoline, Inc. | 18,870 | 407,026 | ||||||
| 418,364 | ||||||||
| Construction Materials—0.0% | ||||||||
Vulcan Materials Co.
|
| 52
|
|
| 6,711
|
| ||
| Containers & Packaging—0.4% | ||||||||
Sealed Air Corp.
|
| 17,620
|
|
| 747,969
|
| ||
| Metals & Mining—0.4% | ||||||||
| Compass Minerals International, Inc. | 9,310 | 612,132 | ||||||
| Franco-Nevada Corp. | 125 | 9,128 | ||||||
| Kaiser Aluminum Corp. | 50 | 5,206 | ||||||
| Osisko Gold Royalties Ltd. | 33,653 | 318,701 | ||||||
| 945,167 | ||||||||
7 OPPENHEIMER CONSERVATIVE BALANCED FUND/VA
STATEMENT OF INVESTMENTS Unaudited / Continued
| Shares | Value | |||||||
| Telecommunication Services—1.0% |
| |||||||
| Diversified Telecommunication Services—0.8% |
| |||||||
| AT&T, Inc. | 740 | $ | 23,761 | |||||
| ORBCOMM, Inc.1 | 375 | 3,788 | ||||||
| Verizon Communications, Inc. | 23,060 | 1,160,149 | ||||||
| Zayo Group Holdings, Inc.1 | 10,890 | 397,267 | ||||||
| 1,584,965 | ||||||||
| Wireless Telecommunication Services—0.2% |
| |||||||
T-Mobile US, Inc.1
|
| 8,231
|
|
| 491,802
|
| ||
| Utilities—1.3% | ||||||||
| Electric Utilities—0.4% | ||||||||
| Edison International | 319 | 20,183 | ||||||
| PG&E Corp. | 20,363 | 866,649 | ||||||
| PPL Corp. | 573 | 16,359 | ||||||
| Southern Co. (The) | 356 | 16,487 | ||||||
| 919,678 | ||||||||
| Gas Utilities—0.3% | ||||||||
Suburban Propane Partners LP2
|
| 22,881
|
|
| 537,475
|
| ||
| Multi-Utilities—0.6% | ||||||||
| Centrica plc, Sponsored ADR | 2,694 | 22,697 | ||||||
| Dominion Energy, Inc. | 288 | 19,636 | ||||||
| National Grid plc | 46,590 | 515,447 | ||||||
| National Grid plc, Sponsored ADR | 385 | 21,502 | ||||||
| SCANA Corp. | 16,099 | 620,134 | ||||||
| 1,199,416 | ||||||||
| Total Common Stocks (Cost $62,490,240) | 72,627,468 | |||||||
| Principal | ||||||||
| Amount | ||||||||
Asset-Backed Securities—9.7% |
| |||||||
| American Credit Acceptance Receivables Trust: |
| |||||||
| Series 2015-3, Cl. B, 3.56%, 10/12/213 | $ | 3,187 | 3,188 | |||||
| Series 2015-3, Cl. C, 4.84%, 10/12/213 | 470,000 | 474,062 | ||||||
| Series 2015-3, Cl. D, 5.86%, 7/12/223 | 135,000 | 137,217 | ||||||
| Series 2017-3, Cl. B, 2.25%, 1/11/213 | 70,000 | 69,822 | ||||||
| Series 2017-4, Cl. B, 2.61%, 5/10/213 | 69,000 | 68,766 | ||||||
| Series 2017-4, Cl. C, 2.94%, 1/10/243 | 195,000 | 193,812 | ||||||
| Series 2017-4, Cl. D, 3.57%, 1/10/243 | 246,000 | 244,094 | ||||||
| Series 2018-2, Cl. B, 3.46%, 8/10/223 | 275,000 | 275,342 | ||||||
| Series 2018-2, Cl. C, 3.70%, 7/10/243 | 275,000 | 275,309 | ||||||
| AmeriCredit Automobile Receivables Trust: |
| |||||||
| Series 2015-2, Cl. D, 3.00%, 6/8/21 | 245,000 | 244,912 | ||||||
| Series 2017-2, Cl. D, 3.42%, 4/18/23 | 320,000 | 318,578 | ||||||
| Series 2017-4, Cl. D, 3.08%, 12/18/23 | 145,000 | 142,621 | ||||||
| Cabela’s Credit Card Master Note Trust: |
| |||||||
| Series 2015-1A, Cl. A2, 2.613% [LIBOR01M+54], 3/15/234 | 465,000 | 467,629 | ||||||
| Series 2015-2, Cl. A2, 2.743% [LIBOR01M+67], 7/17/234 | 475,000 | 478,872 | ||||||
| Series 2016-1, Cl. A1, 1.78%, 6/15/22 | 340,000 | 336,486 | ||||||
| Series 2016-1, Cl. A2, 2.923% [LIBOR01M+85], 6/15/224 | 255,000 | 256,392 | ||||||
| Capital Auto Receivables Asset Trust, | ||||||||
| Series 2017-1, Cl. D, 3.15%, 2/20/253 | 40,000 | 39,712 | ||||||
| Capital One Multi-Asset Execution | ||||||||
| Trust, Series 2016-A3, Cl. A3, 1.34%, 4/15/22 | 560,000 | 552,791 | ||||||
| CarFinance Capital Auto Trust, Series 2015-1A, Cl. A, 1.75%, 6/15/213 | 14,161 | 14,139 | ||||||
| CarMax Auto Owner Trust: | ||||||||
| Series 2015-2, Cl. D, 3.04%, 11/15/21 | 115,000 | 114,746 | ||||||
| Series 2015-3, Cl. D, 3.27%, 3/15/22 | 330,000 | 329,832 | ||||||
| Series 2016-1, Cl. D, 3.11%, 8/15/22 | 220,000 | 219,241 | ||||||
| Series 2016-3, Cl. D, 2.94%, 1/17/23 | 125,000 | 123,416 | ||||||
| Series 2016-4, Cl. D, 2.91%, 4/17/23 | 275,000 | 270,469 | ||||||
| Series 2017-1, Cl. D, 3.43%, 7/17/23 | 245,000 | 243,834 | ||||||
| Series 2017-4, Cl. D, 3.30%, 5/15/24 | 110,000 | 108,518 | ||||||
| Series 2018-1, Cl. D, 3.37%, 7/15/24 | 75,000 | 74,441 | ||||||
| Principal | ||||||||
| Amount | Value | |||||||
Asset-Backed Securities (Continued) |
| |||||||
| CCG Receivables Trust: | ||||||||
| Series 2017-1, Cl. B, 2.75%, 11/14/233 | $ | 250,000 | $ | 245,426 | ||||
| Series 2018-1, Cl. B, 3.09%, 6/16/253 | 90,000 | 89,137 | ||||||
| Series 2018-1, Cl. C, 3.42%, 6/16/253 | 25,000 | 24,717 | ||||||
| CIG Auto Receivables Trust, Series 2017-1A, Cl. A, 2.71%, 5/15/233 | 94,633 | 94,044 | ||||||
| Citibank Credit Card Issuance Trust, Series 2014-A6, Cl. A6, 2.15%, 7/15/21 | 110,000 | 109,375 | ||||||
| CNH Equipment Trust, Series 2017-C, Cl. B, 2.54%, 5/15/25 | 70,000 | 68,372 | ||||||
| CPS Auto Receivables Trust: | ||||||||
| Series 2017-C, Cl. A, 1.78%, 9/15/203 | 41,916 | 41,775 | ||||||
| Series 2017-C, Cl. B, 2.30%, 7/15/213 | 105,000 | 104,159 | ||||||
| Series 2017-D, Cl. B, 2.43%, 1/18/223 | 180,000 | 178,143 | ||||||
| Series 2018-A, Cl. B, 2.77%, 4/18/223 | 145,000 | 143,886 | ||||||
| Series 2018-B, Cl. B, 3.23%, 7/15/223 | 155,000 | 154,734 | ||||||
| CPS Auto Trust, Series 2017-A, Cl. B, 2.68%, 5/17/213 | 35,000 | 34,908 | ||||||
| Credit Acceptance Auto Loan Trust: | ||||||||
| Series 2017-3A, Cl. C, 3.48%, 10/15/263 | 220,000 | 217,133 | ||||||
| Series 2018-1A, Cl. B, 3.60%, 4/15/273 | 135,000 | 134,445 | ||||||
| Series 2018-1A, Cl. C, 3.77%, 6/15/273 | 190,000 | 188,429 | ||||||
| Series 2018-2A, Cl. C, 4.16%, 9/15/273 | 115,000 | 115,788 | ||||||
| Dell Equipment Finance Trust: | ||||||||
| Series 2017-2, Cl. B, 2.47%, 10/24/223 | 75,000 | 73,968 | ||||||
| Series 2018-1, Cl. B, 3.34%, 6/22/233 | 90,000 | 89,987 | ||||||
| Drive Auto Receivables Trust: | ||||||||
| Series 2015-BA, Cl. D, 3.84%, 7/15/213 | 20,000 | 20,119 | ||||||
| Series 2015-CA, Cl. D, 4.20%, 9/15/213 | 70,000 | 70,648 | ||||||
| Series 2016-CA, Cl. C, 3.02%, 11/15/213 | 150,000 | 150,141 | ||||||
| Series 2016-CA, Cl. D, 4.18%, 3/15/243 | 170,000 | 172,183 | ||||||
| Series 2017-1, Cl. B, 2.36%, 3/15/21 | 165,000 | 164,820 | ||||||
| Series 2017-3, Cl. C, 2.80%, 7/15/22 | 120,000 | 119,640 | ||||||
| Series 2017-AA, Cl. C, 2.98%, 1/18/223 | 195,000 | 195,057 | ||||||
| Series 2017-BA, Cl. D, 3.72%, 10/17/223 | 235,000 | 236,520 | ||||||
| Series 2018-1, Cl. D, 3.81%, 5/15/24 | 160,000 | 159,848 | ||||||
| Series 2018-2, Cl. D, 4.14%, 8/15/24 | 315,000 | 317,002 | ||||||
| DT Auto Owner Trust: | ||||||||
| Series 2016-4A, Cl. E, 6.49%, 9/15/233 | 75,000 | 77,455 | ||||||
| Series 2017-1A, Cl. C, 2.70%, 11/15/223 | 95,000 | 94,691 | ||||||
| Series 2017-1A, Cl. D, 3.55%, 11/15/223 | 150,000 | 150,022 | ||||||
| Series 2017-1A, Cl. E, 5.79%, 2/15/243 | 160,000 | 162,958 | ||||||
| Series 2017-2A, Cl. B, 2.44%, 2/15/213 | 140,000 | 139,726 | ||||||
| Series 2017-2A, Cl. D, 3.89%, 1/15/233 | 180,000 | 179,836 | ||||||
| Series 2017-3A, Cl. B, 2.40%, 5/17/213 | 200,000 | 199,216 | ||||||
| Series 2017-3A, Cl. E, 5.60%, 8/15/243 | 155,000 | 156,939 | ||||||
| Series 2017-4A, Cl. D, 3.47%, 7/17/233 | 205,000 | 203,721 | ||||||
| Series 2017-4A, Cl. E, 5.15%, | ||||||||
| 11/15/243 | 150,000 | 149,396 | ||||||
| Series 2018-1A, Cl. B, 3.04%, 1/18/223 | 155,000 | 154,512 | ||||||
| Series 2018-2A, Cl. B, 3.43%, 5/16/223 | 80,000 | 80,035 | ||||||
| Element Rail Leasing I LLC, Series | ||||||||
| 2014-1A, Cl. A1, 2.299%, 4/19/443 | 162,467 | 161,506 | ||||||
| Exeter Automobile Receivables Trust, | ||||||||
| Series 2018-1A, Cl. B, 2.75%, 4/15/223 | 155,000 | 153,740 | ||||||
| Flagship Credit Auto Trust: | ||||||||
| Series 2014-1, Cl. D, 4.83%, 6/15/203 | 20,000 | 20,122 | ||||||
| Series 2016-1, Cl. C, 6.22%, 6/15/223 | 380,000 | 395,537 | ||||||
| FRS I LLC, Series 2013-1A, Cl. A1, | ||||||||
| 1.80%, 4/15/433 | 11,093 | 11,022 | ||||||
| GLS Auto Receivables Trust, Series | ||||||||
| 2018-1A, Cl. A, 2.82%, 7/15/223 | 329,922 | 328,105 | ||||||
8 OPPENHEIMER CONSERVATIVE BALANCED FUND/VA
| Principal | ||||||||
| Amount | Value | |||||||
Asset-Backed Securities (Continued) |
| |||||||
| GM Financial Automobile Leasing Trust: | ||||||||
| Series 2017-3, Cl. C, 2.73%, 9/20/21 | $ | 120,000 | $ | 118,662 | ||||
| Series 2018-2, Cl. C, 3.50%, 4/20/22 | 145,000 | 144,996 | ||||||
| Navistar Financial Dealer Note Master Owner Trust II: |
| |||||||
| Series 2016-1, Cl. D, 5.391% | ||||||||
| [LIBOR01M+330], 9/27/213,4 | 80,000 | 80,442 | ||||||
| Series 2017-1, Cl. C, 3.641% | ||||||||
| [LIBOR01M+155], 6/27/223,4 | 60,000 | 60,271 | ||||||
| Series 2017-1, Cl. D, 4.391% | ||||||||
| [LIBOR01M+230], 6/27/223,4 | 75,000 | 75,082 | ||||||
| Santander Drive Auto Receivables Trust: | ||||||||
| Series 2016-2, Cl. D, 3.39%, 4/15/22 | 115,000 | 115,354 | ||||||
| Series 2017-1, Cl. D, 3.17%, 4/17/23 | 175,000 | 173,966 | ||||||
| Series 2017-1, Cl. E, 5.05%, 7/15/243 | 410,000 | 417,206 | ||||||
| Series 2017-3, Cl. D, 3.20%, 11/15/23 | 295,000 | 292,610 | ||||||
| Series 2018-1, Cl. D, 3.32%, 3/15/24 | 110,000 | 108,302 | ||||||
| Series 2018-2, Cl. D, 3.88%, 2/15/24 | 170,000 | 169,412 | ||||||
| Series 2018-3, Cl. C, 3.51%, 8/15/23 | 440,000 | 440,480 | ||||||
| Santander Retail Auto Lease Trust, |
| |||||||
| Series 2017-A, Cl. C, 2.96%, 11/21/223 | 195,000 | 192,344 | ||||||
| TCF Auto Receivables Owner Trust, | ||||||||
| Series 2015-1A, Cl. D, 3.53%, 3/15/223 | 190,000 | 189,001 | ||||||
| United Auto Credit Securitization Trust, |
| |||||||
| Series 2018-1, Cl. C, 3.05%, 9/10/213 | 240,000 | 239,144 | ||||||
| Verizon Owner Trust, Series 2017-3A, | ||||||||
| Cl. A1A, 2.06%, 4/20/223 | 195,000 | 191,913 | ||||||
| Veros Automobile Receivables Trust, |
| |||||||
| Series 2017-1, Cl. A, 2.84%, 4/17/233 | 93,701 | 93,334 | ||||||
| Westlake Automobile Receivables Trust: | ||||||||
| Series 2016-1A, Cl. E, 6.52%, 6/15/223 | 270,000 | 275,302 | ||||||
| Series 2017-2A, Cl. E, 4.63%, 7/15/243 | 320,000 | 321,198 | ||||||
| Series 2018-1A, Cl. C, 2.92%, 5/15/233 | 160,000 | 158,679 | ||||||
| Series 2018-1A, Cl. D, 3.41%, 5/15/233 | 315,000 | 313,267 | ||||||
| World Financial Network Credit Card Master Trust: | ||||||||
| Series 2012-D, Cl. A, 2.15%, 4/17/23 | 150,000 | 149,017 | ||||||
| Series 2016-B, Cl. A, 1.44%, 6/15/22 | 380,000 | 379,476 | ||||||
| Series 2016-C, Cl. A, 1.72%, 8/15/23 | 665,000 | 655,111 | ||||||
| Series 2017-A, Cl. A, 2.12%, 3/15/24 | 430,000 | 422,765 | ||||||
| Series 2017-B, Cl. A, 1.98%, 6/15/23 | 325,000 | 322,268 | ||||||
| Series 2017-C, Cl. A, 2.31%, 8/15/24 | 430,000 | 422,053 | ||||||
| Series 2018-A, Cl. A, 3.07%, 12/16/24 | 540,000 | 537,886 | ||||||
| Total Asset-Backed Securities (Cost $19,761,781) | 19,670,725 | |||||||
Mortgage-Backed Obligations—40.3% |
| |||||||
| Government Agency—29.4% | ||||||||
| FHLMC/FNMA/FHLB/Sponsored—25.0% | ||||||||
| Federal Home Loan Mortgage Corp. Gold Pool: |
| |||||||
| 4.50%, 10/1/18 | 1,033 | 1,041 | ||||||
| 5.00%, 12/1/34 | 2,007 | 2,141 | ||||||
| 5.50%, 9/1/39 | 248,924 | 266,507 | ||||||
| 6.50%, 7/1/28-4/1/34 | 20,315 | 22,642 | ||||||
| 7.00%, 10/1/31-10/1/37 | 67,882 | 74,032 | ||||||
| 9.00%, 8/1/22-5/1/25 | 1,197 | 1,274 | ||||||
| Federal Home Loan Mortgage Corp., Interest-Only Stripped Mtg.-Backed Security: |
| |||||||
| Series 183,Cl. IO, 74.123%, 4/1/275 | 48,160 | 9,505 | ||||||
| Series 192,Cl. IO, 99.999%, 2/1/285 | 13,839 | 2,859 | ||||||
| Series 243,Cl. 6, 5.029%, 12/15/325 | 37,564 | 6,310 | ||||||
| Federal Home Loan Mortgage Corp., | ||||||||
| Mtg.-Linked Amortizing Global Debt | ||||||||
| Securities, Series 2012-1, Cl. A10, 2.06%, 1/15/22 | 132,069 | 129,525 | ||||||
| Federal Home Loan Mortgage Corp., | ||||||||
| Principal-Only Stripped Mtg.-Backed | ||||||||
| Security, Series 176, Cl. PO, 4.198%, 6/1/266 | 14,158 | 13,002 | ||||||
| Principal | ||||||||
| Amount | Value | |||||||
| FHLMC/FNMA/FHLB/Sponsored (Continued) |
| |||||||
| Federal Home Loan Mortgage Corp., Real Estate Mtg. Investment Conduit Multiclass Pass-Through Certificates: |
| |||||||
| Series 2427,Cl. ZM, 6.50%, 3/15/32 | $ | 84,142 | $ | 92,719 | ||||
| Series 2461,Cl. PZ, 6.50%, 6/15/32 | 33,754 | 36,621 | ||||||
| Series 2626,Cl. TB, 5.00%, 6/15/33 | 52,907 | 54,743 | ||||||
| Series 2635,Cl. AG, 3.50%, 5/15/32 | 28,567 | 28,434 | ||||||
| Series 2707,Cl. QE, 4.50%, 11/15/18 | 11,643 | 11,656 | ||||||
| Series 2770,Cl. TW, 4.50%, 3/15/19 | 1,241 | 1,245 | ||||||
| Series 3010,Cl. WB, 4.50%, 7/15/20 | 6,981 | 7,064 | ||||||
| Series 3025,Cl. SJ, 17.148% [-3.667 x | ||||||||
| LIBOR01M+2,475], 8/15/354 | 12,108 | 16,251 | ||||||
| Series 3030,Cl. FL, 2.473% | ||||||||
| [LIBOR01M+40], 9/15/354 | 65,123 | 65,430 | ||||||
| Series 3741,Cl. PA, 2.15%, 2/15/35 | 24,539 | 24,512 | ||||||
| Series 3815,Cl. BD, 3.00%, 10/15/20 | 421 | 421 | ||||||
| Series 3822,Cl. JA, 5.00%, 6/15/40 | 24,136 | 24,781 | ||||||
| Series 3840,Cl. CA, 2.00%, 9/15/18 | 210 | 210 | ||||||
| Series 3848,Cl. WL, 4.00%, 4/15/40 | 62,088 | 62,728 | ||||||
| Series 3857,Cl. GL, 3.00%, 5/15/40 | 4,111 | 4,137 | ||||||
| Series 4057,Cl. QI, 4.903%, 6/15/275 | 616,887 | 52,377 | ||||||
| Series 4221,Cl. HJ, 1.50%, 7/15/23 | 406,187 | 396,575 | ||||||
| Federal Home Loan Mortgage Corp., Real Estate Mtg. Investment Conduit Multiclass Pass-Through Certificates, Interest-Only Stripped Mtg.-Backed Security: |
| |||||||
| Series 2130,Cl. SC, 60.311%, 3/15/295 | 36,609 | 4,805 | ||||||
| Series 2796,Cl. SD, 50.355%, 7/15/265 | 63,379 | 7,622 | ||||||
| Series 2920,Cl. S, 14.416%, 1/15/355 | 350,509 | 48,320 | ||||||
| Series 2922,Cl. SE, 17.785%, 2/15/355 | 20,311 | 2,615 | ||||||
| Series 2981,Cl. AS, 2.173%, 5/15/355 | 176,932 | 18,866 | ||||||
| Series 3397,Cl. GS, 0.00%, 12/15/375,7 | 21,741 | 3,475 | ||||||
| Series 3424,Cl. EI, 0.00%, 4/15/385,7 | 8,464 | 753 | ||||||
| Series 3450,Cl. BI, 10.046%, 5/15/385 | 61,545 | 8,385 | ||||||
| Series 3606,Cl. SN, 13.852%, | ||||||||
| 12/15/395 | 31,855 | 3,972 | ||||||
| Federal National Mortgage Assn.: | ||||||||
| 2.50%, 7/1/338 | 2,120,000 | 2,060,481 | ||||||
| 3.00%, 7/1/33-8/1/488 | 4,595,000 | 4,491,128 | ||||||
| 3.50%, 7/1/33-8/1/488 | 14,610,000 | 14,564,073 | ||||||
| 4.00%, 8/1/488 | 3,540,000 | 3,603,886 | ||||||
| 4.50%, 8/1/488 | 12,770,000 | 13,274,066 | ||||||
| 5.00%, 8/1/488 | 4,950,000 | 5,234,166 | ||||||
| Federal National Mortgage Assn. Pool: | ||||||||
| 5.00%, 3/1/21 | 971 | 988 | ||||||
| 5.50%, 9/1/20 | 986 | 999 | ||||||
| 6.00%, 3/1/37 | 106,489 | 117,505 | ||||||
| 6.50%, 10/1/19 | 11 | 11 | ||||||
| 7.00%, 10/1/35 | 8,222 | 8,468 | ||||||
| 7.50%, 1/1/33 | 49,138 | 56,496 | ||||||
| 8.50%, 7/1/32 | 1,527 | 1,553 | ||||||
| Federal National Mortgage Assn., Interest-Only Stripped Mtg.-Backed Security: |
| |||||||
| Series 222,Cl. 2, 99.999%, 6/25/235 | 88,568 | 10,417 | ||||||
| Series 233,Cl. 2, 63.231%, 8/25/235 | 56,484 | 7,791 | ||||||
| Series 252,Cl. 2, 99.999%, 11/25/235 | 75,950 | 10,275 | ||||||
| Series 319,Cl. 2, 12.603%, 2/25/325 | 21,147 | 4,742 | ||||||
| Series 320,Cl. 2, 49.43%, 4/25/325 | 7,873 | 1,919 | ||||||
| Series 321,Cl. 2, 19.195%, 4/25/325 | 77,114 | 18,255 | ||||||
| Series 331,Cl. 9, 20.097%, 2/25/335 | 91,077 | 18,219 | ||||||
| Series 334,Cl. 17, 23.64%, 2/25/335 | 49,462 | 12,023 | ||||||
| Series 339,Cl. 12, 0.00%, 6/25/335,7 | 66,709 | 17,040 | ||||||
| Series 339,Cl. 7, 0.00%, 11/25/335,7 | 189,064 | 41,720 | ||||||
| Series 343,Cl. 13, 0.00%, 9/25/335,7 | 71,921 | 15,027 | ||||||
| Series 345,Cl. 9, 0.00%, 1/25/345,7 | 64,235 | 14,726 | ||||||
| Series 351,Cl. 10, 0.00%, 4/25/345,7 | 8,397 | 2,045 | ||||||
| Series 351,Cl. 8, 0.00%, 4/25/345,7 | 29,961 | 5,893 | ||||||
| Series 356,Cl. 10, 0.00%, 6/25/355,7 | 20,787 | 4,516 | ||||||
| Series 356,Cl. 12, 0.00%, 2/25/355,7 | 11,119 | 2,427 | ||||||
| Series 362,Cl. 13, 0.00%, 8/25/355,7 | 80,782 | 19,724 | ||||||
| Series 364,Cl. 16, 0.00%, 9/25/355,7 | 57,486 | 14,026 | ||||||
9 OPPENHEIMER CONSERVATIVE BALANCED FUND/VA
STATEMENT OF INVESTMENTS Unaudited / Continued
| Principal | ||||||||
| Amount | Value | |||||||
| FHLMC/FNMA/FHLB/Sponsored (Continued) |
| |||||||
| Federal National Mortgage Assn., Real Estate Mtg. Investment Conduit Multiclass Pass-Through Certificates: |
| |||||||
| Series 1998-61,Cl. PL, 6.00%, 11/25/28 | $ | 33,716 | $ | 36,475 | ||||
| Series 2003-100,Cl. PA, 5.00%, 10/25/18 | 1,278 | 1,277 | ||||||
| Series 2003-130,Cl. CS, 9.918% [-2 x LIBOR01M+1,410], 12/25/334 | 3,420 | 3,524 | ||||||
| Series 2003-84,Cl. GE, 4.50%, 9/25/18 | 189 | 189 | ||||||
| Series 2004-25,Cl. PC, 5.50%, 1/25/34 | 21,624 | 21,769 | ||||||
| Series 2005-104,Cl. MC, 5.50%, 12/25/25 | 131,030 | 138,232 | ||||||
| Series 2005-31,Cl. PB, 5.50%, 4/25/35 | 250,000 | 268,672 | ||||||
| Series 2005-73,Cl. DF, 2.341% [LIBOR01M+25], 8/25/354 | 61,165 | 61,397 | ||||||
| Series 2006-11,Cl. PS, 16.899% [-3.667 x LIBOR01M+2,456.67], 3/25/364 | 49,569 | 71,443 | ||||||
| Series 2006-46,Cl. SW, 16.532% [-3.667 x LIBOR01M+2,419.92], 6/25/364 | 33,414 | 45,637 | ||||||
| Series 2006-50,Cl. KS, 16.533% [-3.667 x LIBOR01M+2,420], 6/25/364 | 6,760 | 9,540 | ||||||
| Series 2008-75,Cl. DB, 4.50%, 9/25/23 | 2,582 | 2,585 | ||||||
| Series 2009-113,Cl. DB, 3.00%, 12/25/20 | 15,028 | 15,027 | ||||||
| Series 2009-36,Cl. FA, 3.031% [LIBOR01M+94], 6/25/374 | 28,568 | 29,229 | ||||||
| Series 2009-70,Cl. TL, 4.00%, 8/25/19 | 10,565 | 10,564 | ||||||
| Series 2010-43,Cl. KG, 3.00%, 1/25/21 | 13,263 | 13,271 | ||||||
| Series 2011-15,Cl. DA, 4.00%, 3/25/41 | 15,628 | 15,570 | ||||||
| Series 2011-3,Cl. EL, 3.00%, 5/25/20 | 19,780 | 19,764 | ||||||
| Series 2011-3,Cl. KA, 5.00%, 4/25/40 | 98,258 | 102,333 | ||||||
| Series 2011-38,Cl. AH, 2.75%, 5/25/20 | 209 | 209 | ||||||
| Series 2011-82,Cl. AD, 4.00%, 8/25/26 | 41,309 | 41,411 | ||||||
| Federal National Mortgage Assn., Real Estate Mtg. Investment Conduit Multiclass Pass-Through Certificates, Interest-Only Stripped Mtg.-Backed Security: |
| |||||||
| Series 2001-65,Cl. S, 6.545%, 11/25/315 | 80,626 | 15,582 | ||||||
| Series 2001-81,Cl. S, 9.969%, 1/25/325 | 21,147 | 3,481 | ||||||
| Series 2002-47,Cl. NS, 6.007%, 4/25/325 | 58,577 | 9,798 | ||||||
| Series 2002-51,Cl. S, 6.366%, 8/25/325 | 53,788 | 8,579 | ||||||
| Series 2002-52,Cl. SD, 34.227%, 9/25/325 | 84,564 | 14,383 | ||||||
| Series 2002-77,Cl. SH, 24.894%, 12/18/325 | 31,474 | 4,959 | ||||||
| Series 2002-84,Cl. SA, 3.833%, 12/25/325 | 77,759 | 12,844 | ||||||
| Series 2002-9,Cl. MS, 9.359%, 3/25/325 | 22,152 | 3,994 | ||||||
| Series 2003-33,Cl. SP, 7.758%, 5/25/335 | 85,242 | 16,638 | ||||||
| Series 2003-4,Cl. S, 0.632%, 2/25/335 | 46,098 | 8,703 | ||||||
| Series 2003-46,Cl. IH, 0.00%, 6/25/235,7 | 134,449 | 12,480 | ||||||
| Series 2004-54,Cl. DS, 49.673%, 11/25/305 | 64,584 | 9,332 | ||||||
| Series 2004-56,Cl. SE, 5.533%, 10/25/335 | 16,375 | 2,736 | ||||||
| Series 2005-12,Cl. SC, 23.542%, 3/25/355 | 9,652 | 1,317 | ||||||
| Series 2005-14,Cl. SE, 14.597%, 3/25/355 | 32,161 | 3,524 | ||||||
| Series 2005-40,Cl. SA, 22.262%, 5/25/355 | 169,635 | 22,385 | ||||||
| Series 2005-52,Cl. JH, 23.563%, 5/25/355 | 427,228 | 51,177 | ||||||
| Principal | ||||||||
| Amount | Value | |||||||
| FHLMC/FNMA/FHLB/Sponsored (Continued) |
| |||||||
| Federal National Mortgage Assn., Real Estate Mtg. Investment Conduit Multiclass Pass-Through Certificates, Interest-Only Stripped Mtg.-Backed Security: (Continued) |
| |||||||
| Series 2005-93,Cl. SI, 0.872%, 10/25/355 | $ | 39,195 | $ | 5,170 | ||||
| Series 2007-88,Cl. XI, 0.00%, 6/25/375,7 | 82,680 | 12,314 | ||||||
| Series 2008-55,Cl. SA, 0.00%, 7/25/385,7 | 30,481 | 2,728 | ||||||
| Series 2009-8,Cl. BS, 0.00%, 2/25/245,7 | 408 | 20 | ||||||
| Series 2011-96,Cl. SA, 7.845%, 10/25/415 | 110,684 | 14,935 | ||||||
| Series 2012-134,Cl. SA, 2.276%, 12/25/425 | 403,993 | 67,526 | ||||||
| Series 2012-40,Cl. PI, 6.447%, 4/25/415 | 212,609 | 33,343 | ||||||
| Federal National Mortgage Assn., Real Estate Mtg. Investment Conduit Multiclass Pass-Through Certificates, Principal-Only Stripped Mtg.-Backed Security, Series 1993-184, Cl. M, 5.343%, 9/25/236 | 32,385 | 29,998 | ||||||
| Government National Mortgage Assn. II Pool, 3.50%, 7/1/488 | 4,465,000 | 4,481,046 | ||||||
| 50,899,270 | ||||||||
| GNMA/Guaranteed—4.4% | ||||||||
| Government National Mortgage Assn. I Pool: | ||||||||
| 7.00%, 1/15/24 | 10,872 | 10,952 | ||||||
| 7.50%, 1/15/23-6/15/24 | 17,754 | 18,343 | ||||||
| 8.00%, 4/15/23 | 5,952 | 6,249 | ||||||
| Government National Mortgage Assn. II | ||||||||
| Pool, 4.00%, 7/1/488 | 8,520,000 | 8,730,837 | ||||||
| Government National Mortgage Assn., Interest-Only Stripped Mtg.-Backed Security: |
| |||||||
| Series 2002-15,Cl. SM, 89.791%, 2/16/325 | 95,282 | 1,000 | ||||||
| Series 2002-76,Cl. SY, 0.00%, 12/16/265,7 | 166,819 | 16,782 | ||||||
| Series 2007-17,Cl. AI, 40.736%, 4/16/375 | 277,895 | 38,433 | ||||||
| Series 2011-52,Cl. HS, 20.812%, 4/16/415 | 133,660 | 15,165 | ||||||
| 8,837,761 | ||||||||
| Non-Agency—10.9% | ||||||||
| Commercial—5.2% | ||||||||
| BCAP LLC Trust, Series 2011-R11, | ||||||||
| Cl. 18A5, 3.41% [H15T1Y+210], 9/26/353,4 | 53,940 | 54,178 | ||||||
| Benchmark Mortgage Trust, Interest- | ||||||||
| Only Commercial Mtg. Pass-Through | ||||||||
| Certificates, Series 2018-B1, Cl. XA, 13.898%, 1/15/515 | 2,196,520 | 87,324 | ||||||
| CD Mortgage Trust, Interest-Only | ||||||||
| Commercial Mtg. Pass-Through | ||||||||
| Certificates, Series 2017-CD6, Cl. XA, 14.496%, 11/13/505 | 885,778 | 55,465 | ||||||
| Chase Mortgage Finance Trust, Series 2005-A2, Cl. 1A3, 3.602%, 1/25/369 | 114,436 | 108,365 | ||||||
| Citigroup Commercial Mortgage Trust: | ||||||||
| Series 2012-GC8,Cl. AAB, 2.608%, 9/10/45 | 106,480 | 105,477 | ||||||
| Series 2013-GC17,Cl. XA, 0.00%, 11/10/465,7 | 616,969 | 20,356 | ||||||
| Series 2014-GC21,Cl. AAB, 3.477%, 5/10/47 | 105,000 | 105,943 | ||||||
| Citigroup Commercial Mortgage Trust, Interest-Only Commercial Mtg. Pass- Through Certificates, Series 2017-C4, Cl. XA, 13.828%, 10/12/505 | 2,361,982 | 175,256 | ||||||
10 OPPENHEIMER CONSERVATIVE BALANCED FUND/VA
| Principal | ||||||||
| Amount | Value | |||||||
| Commercial (Continued) |
| |||||||
| COMM Mortgage Trust: | ||||||||
| Series 2012-CR3,Cl. ASB, 2.372%, 10/15/45 | $ | 21,687 | $ | 21,406 | ||||
| Series 2012-LC4,Cl. A3, 3.069%, 12/10/44 | 41,152 | 41,165 | ||||||
| Series 2013-CR13,Cl. ASB, 3.706%, 11/10/46 | 195,000 | 197,968 | ||||||
| Series 2013-CR6,Cl. AM, 3.147%, 3/10/463 | 255,000 | 250,098 | ||||||
| Series 2014-CR17,Cl. ASB, 3.598%, 5/10/47 | 255,000 | 258,164 | ||||||
| Series 2014-CR20,Cl. ASB, 3.305%, 11/10/47 | 70,000 | 70,161 | ||||||
| Series 2014-CR21,Cl. AM, 3.987%, 12/10/47 | 865,000 | 867,476 | ||||||
| Series 2014-LC15,Cl. AM, 4.198%, 4/10/47 | 140,000 | 142,848 | ||||||
| Series 2014-UBS6,Cl. AM, 4.048%, 12/10/47 | 495,000 | 498,370 | ||||||
| Series 2015-CR22,Cl. A2, 2.856%, 3/10/48 | 125,000 | 124,759 | ||||||
| COMM Mortgage Trust, Interest- | ||||||||
| Only Stripped Mtg.-Backed Security, | ||||||||
| Series 2012-CR5, Cl. XA, 23.047%, 12/10/455 | 326,148 | 18,448 | ||||||
| CSMC Mortgage-Backed Trust, Series 2006-6, Cl. 1A4, 6.00%, 7/25/36 | 132,165 | 110,671 | ||||||
| First Horizon Alternative Mortgage | ||||||||
| Securities Trust, Series 2005-FA8, | ||||||||
| Cl. 1A6, 2.741% [US0001M+65], 11/25/354 | 80,053 | 62,259 | ||||||
| FREMF Mortgage Trust: | ||||||||
| Series 2010-K6,Cl. B, 5.542%, 12/25/463,9 | 60,000 | 61,858 | ||||||
| Series 2013-K25,Cl. C, 3.744%, 11/25/453,9 | 60,000 | 58,222 | ||||||
| Series 2013-K26,Cl. C, 3.721%, 12/25/453,9 | 40,000 | 38,756 | ||||||
| Series 2013-K27,Cl. C, 3.615%, 1/25/463,9 | 110,000 | 106,007 | ||||||
| Series 2013-K28,Cl. C, 3.61%, 6/25/463,9 | 450,000 | 444,365 | ||||||
| Series 2013-K713,Cl. C, 3.262%, 4/25/463,9 | 145,000 | 144,321 | ||||||
| Series 2014-K715,Cl. C, 4.265%, 2/25/463,9 | 35,000 | 34,926 | ||||||
| GS Mortgage Securities Corp. Trust, | ||||||||
| Series 2012-SHOP, Cl. A, 2.933%, 6/5/313 | 460,000 | 460,615 | ||||||
| GS Mortgage Securities Trust: | ||||||||
| Series 2012-GC6,Cl. A3, 3.482%, 1/10/45 | 54,793 | 55,289 | ||||||
| Series 2013-GC12,Cl. AAB, 2.678%, 6/10/46 | 34,422 | 34,062 | ||||||
| Series 2013-GC16,Cl. AS, 4.649%, 11/10/46 | 65,000 | 68,158 | ||||||
| Series 2014-GC18,Cl. AAB, 3.648%, 1/10/47 | 90,000 | 91,124 | ||||||
| GSMSC Pass-Through Trust, Series 2009-3R, Cl. 1A2, 6.00%, 4/25/373,9 | 227,428 | 219,460 | ||||||
| JP Morgan Chase Commercial Mortgage Securities Trust: |
| |||||||
| Series 2012-C6,Cl. ASB, 3.144%, 5/15/45 | 143,656 | 143,829 | ||||||
| Series 2012-LC9,Cl. A4, 2.611%, 12/15/47 | 25,000 | 24,602 | ||||||
| Series 2013-C10,Cl. AS, 3.372%, 12/15/47 | 325,000 | 320,858 | ||||||
| Series 2013-C16,Cl. AS, 4.517%, 12/15/46 | 330,000 | 344,385 | ||||||
| Principal | ||||||||
| Amount | Value | |||||||
| Commercial (Continued) |
| |||||||
| JP Morgan Chase Commercial Mortgage Securities Trust: (Continued) |
| |||||||
| Series 2013-LC11,Cl. AS, 3.216%, 4/15/46 | $ | 78,000 | $ | 76,445 | ||||
| Series 2013-LC11,Cl. ASB, 2.554%, 4/15/46 | 51,606 | 50,949 | ||||||
| Series 2014-C20,Cl. AS, 4.043%, 7/15/47 | 245,000 | 248,034 | ||||||
| Series 2016-JP3,Cl. A2, 2.435%, 8/15/49 | 230,000 | 224,323 | ||||||
| JP Morgan Mortgage Trust, Series 2007-A1, Cl. 5A1, 3.692%, 7/25/359 | 93,531 | 96,236 | ||||||
| JP Morgan Resecuritization Trust, Series 2009-5, Cl. 1A2, 4.278%, 7/26/363,9 | 126,756 | 122,022 | ||||||
| JPMBB Commercial Mortgage Securities Trust: |
| |||||||
| Series 2013-C17,Cl. ASB, 3.705%, 1/15/47 | 75,000 | 76,088 | ||||||
| Series 2014-C18,Cl. A3, 3.578%, 2/15/47 | 115,000 | 115,234 | ||||||
| Series 2014-C19,Cl. ASB, 3.584%, 4/15/47 | 45,000 | 45,481 | ||||||
| Series 2014-C24,Cl. B, 4.116%, 11/15/479 | 270,000 | 271,202 | ||||||
| Series 2014-C25,Cl. AS, 4.065%, 11/15/47 | 105,000 | 106,270 | ||||||
| Series 2014-C26,Cl. AS, 3.80%, 1/15/48 | 250,000 | 249,185 | ||||||
| MASTR Adjustable Rate Mortgages | ||||||||
| Trust, Series 2004-13, Cl. 2A2, 3.809%, 4/21/349 | 32,135 | 32,987 | ||||||
| Morgan Stanley Bank of America Merrill Lynch Trust: |
| |||||||
| Series 2013-C7,Cl. AAB, 2.469%, 2/15/46 | 101,572 | 100,191 | ||||||
| Series 2013-C9,Cl. AS, 3.456%, 5/15/46 | 240,000 | 236,075 | ||||||
| Series 2014-C19,Cl. AS, 3.832%, 12/15/47 | 720,000 | 716,982 | ||||||
| Morgan Stanley Capital I Trust: | ||||||||
| Series 2011-C1,5.033%, 9/15/473,9 | 49,607 | 51,140 | ||||||
| Series 2011-C2,Cl. A4, 4.661%, 6/15/443 | 70,000 | 72,521 | ||||||
| Morgan Stanley Capital I, Inc., Interest- Only Commercial Mtg. Pass-Through Certificates, Series 2017-HR2, Cl. XA, 12.66%, 12/15/505 | 773,756 | 46,277 | ||||||
| Morgan Stanley Re-Remic Trust, Series 2012-R3, Cl. 1B, 3.059%, 11/26/363,9 | 243,550 | 219,419 | ||||||
| Morgan Stanley Resecuritization Trust, Series 2013-R9, Cl. 3A, 3.475%, 6/26/463,9 | 152,217 | 152,120 | ||||||
| RBSSP Resecuritization Trust, Series 2010-1, Cl. 2A1, 3.644%, 7/26/453,9 | 16,763 | 17,175 | ||||||
| Structured Adjustable Rate Mortgage | ||||||||
| Loan Trust, Series 2004-10, Cl. 2A, 3.731%, 8/25/349 | 163,659 | 164,748 | ||||||
| UBS Commercial Mortgage Trust, Interest-Only Commercial Mtg. Pass-Through Certificates, Series 2017-C5, Cl. XA, 13.993%, 11/15/505 | 1,524,303 | 102,004 | ||||||
| Wells Fargo Commercial Mortgage Trust, Series 2015-NXS1, Cl. ASB, 2.934%, 5/15/48 | 355,000 | 350,492 | ||||||
| Wells Fargo Commercial Mortgage Trust, Interest-Only Commercial Mtg. Pass-Through Certificates, Series 2017- C42, Cl. XA, 12.341%, 12/15/505 | 1,077,921 | 73,330 | ||||||
| WF-RBS Commercial Mortgage Trust: Series 2013-C14,Cl. AS, 3.488%, 6/15/46 | 155,000 | 153,318 | ||||||
11 OPPENHEIMER CONSERVATIVE BALANCED FUND/VA
STATEMENT OF INVESTMENTS Unaudited / Continued
| Principal Amount | Value | |||||||
| Commercial (Continued) | ||||||||
| WF-RBS Commercial Mortgage Trust: (Continued) |
| |||||||
| Series 2014-C20,Cl. AS, 4.176%, 5/15/47 | $ | 150,000 | $ | 151,305 | ||||
| Series 2014-C22,Cl. A3, 3.528%, 9/15/57 | 45,000 | 45,197 | ||||||
| Series 2014-LC14,Cl. AS, 4.351%, 3/15/479 | | 165,000 | | 169,425 | ||||
| WF-RBS Commercial Mortgage Trust, Interest-Only Commercial Mtg. Pass- Through Certificates, Series 2011-C3, Cl. XA, 30.59%, 3/15/443,5 | 2,121,503 | 65,131 | ||||||
| 10,628,300 | ||||||||
| Multi-Family—0.2% | ||||||||
| Connecticut Avenue Securities: | ||||||||
| Series 2014-C02,Cl. 1M1, 3.041% [US0001M+95], 5/25/244 | 117,668 | 118,011 | ||||||
| Series 2017-C04,Cl. 2M1, 2.941% [US0001M+85], 11/25/294 | 295,243 | 296,170 | ||||||
| 414,181 | ||||||||
| Residential—5.5% | ||||||||
| Alternative Loan Trust, Series 2005-29CB, Cl. A4, 5.00%, 7/25/35 | 216,890 | 190,348 | ||||||
| Banc of America Funding Trust: | ||||||||
| Series 2007-1,Cl. 1A3, 6.00%, 1/25/37 | 45,176 | 42,460 | ||||||
| Series 2007-C,Cl. 1A4, 3.742%, 5/20/369 | 18,471 | 17,878 | ||||||
| Series 2014-R7,Cl. 3A1, 3.822%, 3/26/363,9 | 91,653 | 92,333 | ||||||
| Banc of America Mortgage Trust, Series 2004-E, Cl. 2A6, 4.393%, 6/25/349 | 51,947 | 51,925 | ||||||
| Bear Stearns ARM Trust: | ||||||||
| Series 2005-9,Cl. A1, 3.52% [H15T1Y+230], 10/25/354 | 421,955 | 427,770 | ||||||
| Series 2006-1,Cl. A1, 3.67% [H15T1Y+225], 2/25/364 | 153,272 | 154,589 | ||||||
| CHL Mortgage Pass-Through Trust: |
| |||||||
| Series 2005-26,Cl. 1A8, 5.50%, 11/25/35 | 62,565 | 56,818 | ||||||
| Series 2006-6,Cl. A3, 6.00%, 4/25/36 | 39,234 | 33,676 | ||||||
| Citigroup Mortgage Loan Trust, Inc., Series 2006-AR1, Cl. 1A1, 4.28% [H15T1Y+240], 10/25/354 | 388,918 | 393,793 | ||||||
| Connecticut Avenue Securities: | ||||||||
| Series 2014-C03,Cl. 1M2, 5.091% [US0001M+300], 7/25/244 | 334,639 | 358,815 | ||||||
| Series 2016-C03,Cl. 1M1, 4.091% [US0001M+200], 10/25/284 | 82,053 | 83,183 | ||||||
| Series 2016-C07,Cl. 2M1, 3.391% [US0001M+130], 5/25/294 | 159,451 | 160,060 | ||||||
| Series 2017-C02,Cl. 2M1, 3.241% [US0001M+115], 9/25/294 | 442,537 | 445,079 | ||||||
| Series 2017-C03,Cl. 1M1, 3.041% [US0001M+95], 10/25/294 | 348,100 | 350,122 | ||||||
| Series 2017-C06,Cl. 1M1, 2.841% [US0001M+75], 2/25/304 | 147,572 | 147,814 | ||||||
| Series 2017-C07,Cl. 1M1, 2.741% [US0001M+65], 5/25/304 | 220,267 | 220,311 | ||||||
| Series 2017-C07,Cl. 1M2, 4.491% [US0001M+240], 5/25/304 | 225,000 | 229,891 | ||||||
| Series 2017-C07,Cl. 2M1, 2.741% [US0001M+65], 5/25/304 | 228,242 | 228,345 | ||||||
| Series 2018-C01,Cl. 1M1, 2.691% [US0001M+60], 7/25/304 | 266,266 | 265,969 | ||||||
| Series 2018-C02,Cl. 2M1, 2.741% [US0001M+65], 8/25/304 | 118,302 | 118,352 | ||||||
| Series 2018-C03,Cl. 1M1, 2.771% [US0001M+68], 10/25/304 | 271,202 | 271,174 | ||||||
| Principal Amount | Value | |||||||
| Residential (Continued) | ||||||||
| Connecticut Avenue Securities: (Continued) |
| |||||||
| Series 2018-C04,Cl. 2M1, 2.852% [US0001M+75], 12/25/304,8 | $ | 300,000 | $ | 300,772 | ||||
| GSR Mortgage Loan Trust, Series 2005- AR4, Cl. 6A1, 4.349%, 7/25/359 | 21,764 | 21,978 | ||||||
| HomeBanc Mortgage Trust, Series 2005-3, Cl. A2, 2.401% [US0001M+31], 7/25/354 | 25,137 | 25,115 | ||||||
| RALI Trust, Series 2006-QS13, Cl. 1A8, 6.00%, 9/25/36 | 8,259 | 7,394 | ||||||
| STACR Trust, Series 2018-DNA2, Cl. M1, 2.857% [US0001M+80], 12/25/303,4 | 445,000 | 445,103 | ||||||
| Structured Agency Credit Risk Debt Nts.: |
| |||||||
| Series 2013-DN2,Cl. M2, 6.341% [US0001M+425], 11/25/234 | 225,643 | 250,897 | ||||||
| Series 2014-DN1,Cl. M2, 4.291% [US0001M+220], 2/25/244 | 48,404 | 49,783 | ||||||
| Series 2014-DN1,Cl. M3, 6.591% [US0001M+450], 2/25/244 | 160,000 | 184,649 | ||||||
| Series 2014-DN2,Cl. M3, 5.691% [US0001M+360], 4/25/244 | 185,000 | 205,355 | ||||||
| Series 2014-HQ2,Cl. M3, 5.841% [US0001M+375], 9/25/244 | 335,000 | 382,589 | ||||||
| Series 2015-HQA2,Cl. M2, 4.891% [US0001M+280], 5/25/284 | 5,423 | 5,576 | ||||||
| Series 2016-DNA1,Cl. M2, 4.991% [US0001M+290], 7/25/284 | 43,136 | 44,257 | ||||||
| Series 2016-DNA4,Cl. M1, 2.891% [US0001M+80], 3/25/294 | 54,095 | 54,145 | ||||||
| Series 2016-DNA4,Cl. M3, 5.891% [US0001M+380], 3/25/294 | 355,000 | 395,538 | ||||||
| Series 2016-HQA3,Cl. M1, 2.891% [US0001M+80], 3/25/294 | 257,452 | 257,792 | ||||||
| Series 2016-HQA3,Cl. M3, 5.941% [US0001M+385], 3/25/294 | 120,000 | 133,993 | ||||||
| Series 2016-HQA4,Cl. M1, 2.891% [US0001M+80], 4/25/294 | 164,209 | 164,381 | ||||||
| Series 2016-HQA4,Cl. M3, 5.991% [US0001M+390], 4/25/294 | 350,000 | 391,391 | ||||||
| Series 2017-HQA1,Cl. M1, 3.291% [US0001M+120], 8/25/294 | 527,994 | 531,643 | ||||||
| Series 2017-HQA2,Cl. M1, 2.891% [US0001M+80], 12/25/294 | 201,783 | 202,191 | ||||||
| Series 2017-HQA3,Cl. M1, 2.641% [US0001M+55], 4/25/304 | 526,267 | 525,934 | ||||||
| Series 2018-DNA1,Cl. M1, 2.541% [US0001M+45], 7/25/304 | 624,577 | 622,129 | ||||||
| Series 2018-DNA1,Cl. M2, 3.891% [US0001M+180], 7/25/304 | 460,000 | 452,917 | ||||||
| WaMu Mortgage Pass-Through Certificates Trust: |
| |||||||
Series 2003-AR10,Cl. A7, 3.459%, 10/25/339 | 83,933 | 85,302 | ||||||
Series 2005-AR14,Cl. 1A4, 3.413%, 12/25/359 | 87,406 | 88,333 | ||||||
Series 2005-AR16,Cl. 1A1, 3.398%, 12/25/359 | 79,505 | 79,970 | ||||||
| Wells Fargo Mortgage-Backed Securities Trust: |
| |||||||
| Series 2005-AR1,Cl. 1A1, 3.839%, 2/25/359 | 14,448 | 14,822 | ||||||
| Series 2005-AR15,Cl. 1A2, 3.552%, 9/25/359 | 97,197 | 94,734 | ||||||
| Series 2005-AR15,Cl. 1A6, 3.552%, 9/25/359 | 186,273 | 180,256 | ||||||
| Series 2005-AR4,Cl. 2A2, 3.97%, 4/25/359 | 189,734 | 191,454 | ||||||
| Series 2006-AR10,Cl. 1A1, 4.12%, 7/25/369 | 39,164 | 38,432 | ||||||
12 OPPENHEIMER CONSERVATIVE BALANCED FUND/VA
| Principal Amount | Value | |||||||
| Residential (Continued) | ||||||||
| Wells Fargo Mortgage-Backed Securities Trust: (Continued) |
| |||||||
| Series 2006-AR10,Cl. 5A5, 4.278%, 7/25/369 | $ | 143,420 | $ | 145,749 | ||||
| Series 2006-AR2,Cl. 2A3, 3.822%, 3/25/369 | 18,091 | 18,332 | ||||||
| Series 2006-AR7,Cl. 2A4, 4.323%, 5/25/369 | 110,332 | 113,108 | ||||||
| Series 2006-AR8,Cl. 2A1, 3.933%, 4/25/369 | 102,530 | 104,410 | ||||||
| Series 2006-AR8,Cl. 2A4, 3.933%, 4/25/369 | 61,187 | 62,309 | ||||||
| Series 2007-16,Cl. 1A1, 6.00%, 12/28/37 | 29,041 | 29,507 | ||||||
| 11,242,945 | ||||||||
| Total Mortgage-Backed Obligations (Cost $82,259,489) | 82,022,457 | |||||||
U.S. Government Obligation—0.3% |
| |||||||
| United States Treasury Nts., 1.50%, 5/31/1910,11 (Cost $552,675) | 552,000 | 547,828 | ||||||
Non-Convertible Corporate Bonds and Notes—32.3% |
| |||||||
| Consumer Discretionary—5.1% | ||||||||
| Automobiles—1.5% | ||||||||
| Daimler Finance North America LLC: |
| |||||||
| 2.20% Sr. Unsec. Nts., 5/5/203 | 304,000 | 298,225 | ||||||
| 3.75% Sr. Unsec. Nts., 2/22/283 | 280,000 | 271,770 | ||||||
| Ford Motor Credit Co. LLC: | ||||||||
| 2.425% Sr. Unsec. Nts., 6/12/20 | 236,000 | 231,508 | ||||||
| 3.664% Sr. Unsec. Nts., 9/8/24 | 232,000 | 222,244 | ||||||
| General Motors Co., 6.25% Sr. Unsec. Nts., 10/2/43 | 82,000 | 85,194 | ||||||
| General Motors Financial Co., Inc., 3.15% Sr. Unsec. Nts., 6/30/22 | 321,000 | 312,260 | ||||||
| Harley-Davidson Financial Services, Inc., 2.40% Sr. Unsec. Nts., 6/15/203 | 337,000 | 330,617 | ||||||
| Harley-Davidson, Inc., 4.625% Sr. Unsec. Nts., 7/28/45 | 93,000 | 90,505 | ||||||
| Hyundai Capital America: | ||||||||
| 1.75% Sr. Unsec. Nts., 9/27/193 | 260,000 | 255,074 | ||||||
| 4.125% Sr. Unsec. Nts., 6/8/233 | 336,000 | 334,522 | ||||||
| Nissan Motor Acceptance Corp., 2.15% Sr. Unsec. Nts., 9/28/203 | 225,000 | 219,272 | ||||||
| Volkswagen Group of America Finance LLC, 2.45% Sr. Unsec. Nts., 11/20/193 | 351,000 | 347,222 | ||||||
| 2,998,413 | ||||||||
| Diversified Consumer Services—0.2% |
| |||||||
| Service Corp. International, 4.625% Sr. Unsec. Nts., 12/15/27 | 362,000 | 342,850 | ||||||
| Hotels, Restaurants & Leisure—0.2% |
| |||||||
| Aramark Services, Inc., 5.00% Sr. Unsec. Nts., 4/1/253 | 179,000 | 178,552 | ||||||
| Royal Caribbean Cruises Ltd., 2.65% Sr. Unsec. Nts., 11/28/20 | 305,000 | 299,960 | ||||||
| 478,512 | ||||||||
| Household Durables—0.7% | ||||||||
| DR Horton, Inc., 2.55% Sr. Unsec. Nts., 12/1/20 | 334,000 | 327,523 | ||||||
| Lennar Corp., 4.75% Sr. Unsec. Nts., 5/30/25 | 343,000 | 333,139 | ||||||
| Newell Brands, Inc., 5.00% Sr. Unsec. Nts., 11/15/23 | 194,000 | 198,382 | ||||||
| PulteGroup, Inc., 5.00% Sr. Unsec. Nts., 1/15/27 | 258,000 | 246,067 | ||||||
| Toll Brothers Finance Corp.: | ||||||||
| 4.375% Sr. Unsec. Nts., 4/15/23 | 298,000 | 293,158 | ||||||
| Principal Amount | Value | |||||||
| Household Durables (Continued) | ||||||||
| Toll Brothers Finance Corp.: (Continued) 4.875% Sr. Unsec. Nts., 3/15/27 | $ | 45,000 | $ | 42,188 | ||||
| 1,440,457 | ||||||||
| Internet & Catalog Retail—0.3% | ||||||||
| Amazon.com, Inc., 4.95% Sr. Unsec. Nts., 12/5/44 | 119,000 | 132,451 | ||||||
QVC, Inc., 4.45% Sr. Sec. Nts., 2/15/25 | 595,000 | 575,702 | ||||||
| 708,153 | ||||||||
| Media—1.0% | ||||||||
| 21st Century Fox America, Inc., 4.75% Sr. Unsec. Nts., 11/15/46 | 125,000 | 129,491 | ||||||
| Charter Communications Operating LLC/Charter Communications Operating Capital, 5.375% Sr. Sec. Nts., 5/1/47 | 148,000 | 134,769 | ||||||
| Comcast Cable Communications Holdings, Inc., 9.455% Sr. Unsec. Nts., 11/15/22 | 318,000 | 390,363 | ||||||
| Interpublic Group of Cos., Inc. (The), 4.20% Sr. Unsec. Nts., 4/15/24 | 330,000 | 332,243 | ||||||
| Sky plc, 3.75% Sr. Unsec. Nts., 9/16/243 | 161,000 | 160,222 | ||||||
| Time Warner Cable LLC, 4.50% Sr. Unsec. Unsub. Nts., 9/15/42 | 185,000 | 152,415 | ||||||
| Viacom, Inc., 4.375% Sr. Unsec. Nts., 3/15/43 | 105,000 | 87,472 | ||||||
Virgin Media Secured Finance plc, 5.25% Sr. Sec. Nts., 1/15/263 | 337,000 | 312,989 | ||||||
| WPP Finance 2010, 3.75% Sr. Unsec. Nts., 9/19/24 | 371,000 | 358,724 | ||||||
| 2,058,688 | ||||||||
| Multiline Retail—0.2% | ||||||||
| Dollar Tree, Inc., 4.00% Sr. Unsec. Nts., 5/15/25 | 338,000 | 330,757 | ||||||
| Specialty Retail—0.7% | ||||||||
| AutoZone, Inc., 1.625% Sr. Unsec. Nts., 4/21/19 | 68,000 | 67,505 | ||||||
| Best Buy Co., Inc., 5.50% Sr. Unsec. Nts., 3/15/21 | 324,000 | 339,816 | ||||||
| L Brands, Inc., 5.625% Sr. Unsec. Nts., 2/15/22 | 333,000 | 339,660 | ||||||
| Ross Stores, Inc., 3.375% Sr. Unsec. Nts., 9/15/24 | 344,000 | 339,781 | ||||||
| Sally Holdings LLC/Sally Capital, Inc., 5.625% Sr. Unsec. Nts., 12/1/25 | 134,000 | 124,285 | ||||||
| Signet UK Finance plc, 4.70% Sr. Unsec. Nts., 6/15/24 | 356,000 | 334,808 | ||||||
| 1,545,855 | ||||||||
| Textiles, Apparel & Luxury Goods—0.3% |
| |||||||
| Hanesbrands, Inc., 4.875% Sr. Unsec. Nts., 5/15/263 | 336,000 | 325,920 | ||||||
| Levi Strauss & Co., 5.00% Sr. Unsec. Nts., 5/1/25 | 252,000 | 252,000 | ||||||
| 577,920 | ||||||||
| Consumer Staples—2.9% | ||||||||
| Beverages—0.9% | ||||||||
| Anheuser-Busch InBev Finance, Inc.: |
| |||||||
| 3.65% Sr. Unsec. Nts., 2/1/26 | 57,000 | 55,874 | ||||||
| 4.90% Sr. Unsec. Nts., 2/1/46 | 127,000 | 131,069 | ||||||
| Anheuser-Busch InBev Worldwide, Inc., 8.20% Sr. Unsec. Unsub. Nts., 1/15/39 | 197,000 | 282,287 | ||||||
| Bacardi Ltd., 4.70% Sr. Unsec. Nts., 5/15/283 | 171,000 | 168,447 | ||||||
| Maple Escrow Subsidiary, Inc.: | ||||||||
| 4.057% Sr. Unsec. Nts., 5/25/233 | 345,000 | 346,664 | ||||||
| 4.597% Sr. Unsec. Nts., 5/25/283 | 172,000 | 172,904 | ||||||
| Molson Coors Brewing Co.: | ||||||||
| 1.45% Sr. Unsec. Nts., 7/15/19 | 114,000 | 112,227 | ||||||
13 OPPENHEIMER CONSERVATIVE BALANCED FUND/VA
STATEMENT OF INVESTMENTS Unaudited / Continued
| Principal Amount | Value | |||||||
| Beverages (Continued) | ||||||||
| Molson Coors Brewing Co.: (Continued) |
| |||||||
| 2.10% Sr. Unsec. Nts., 7/15/21 | $ | 299,000 | $ | 286,905 | ||||
| 4.20% Sr. Unsec. Nts., 7/15/46 | 50,000 | 45,030 | ||||||
| Pernod Ricard SA, 4.25% Sr. Unsec. |
| |||||||
| Nts., 7/15/223 | 325,000 | 332,205 | ||||||
| 1,933,612 | ||||||||
| Food & Staples Retailing—0.3% | ||||||||
| Alimentation Couche-Tard, Inc., 2.35% Sr. Unsec. Nts., 12/13/193 | 364,000 | 359,664 | ||||||
| Kroger Co. (The): | ||||||||
| 2.00% Sr. Unsec. Nts., 1/15/19 | 9,000 | 8,958 | ||||||
| 4.45% Sr. Unsec. Nts., 2/1/47 | 93,000 | 84,845 | ||||||
| 6.90% Sr. Unsec. Nts., 4/15/38 | 86,000 | 104,260 | ||||||
| 557,727 | ||||||||
| Food Products—1.0% | ||||||||
| Bunge Ltd. Finance Corp.: | ||||||||
| 3.25% Sr. Unsec. Nts., 8/15/26 | 232,000 | 212,048 | ||||||
| 8.50% Sr. Unsec. Nts., 6/15/19 | 320,000 | 336,205 | ||||||
| Campbell Soup Co., 3.30% Sr. Unsec. Nts., 3/15/21 | 338,000 | 336,795 | ||||||
| General Mills, Inc., 4.70% Sr. Unsec. Nts., 4/17/48 | 109,000 | 104,563 | ||||||
| Kraft Heinz Foods Co., 3.95% Sr. Unsec. Nts., 7/15/25 | 188,000 | 182,958 | ||||||
| Lamb Weston Holdings, Inc., 4.875% Sr. Unsec. Nts., 11/1/263 | 334,000 | 325,650 | ||||||
| Smithfield Foods, Inc.: 2.70% Sr. Unsec. Nts., 1/31/203 | 148,000 | 145,927 | ||||||
| 3.35% Sr. Unsec. Nts., 2/1/223 | 183,000 | 176,812 | ||||||
| Tyson Foods, Inc., 3.55% Sr. Unsec. Nts., 6/2/27 | 182,000 | 172,442 | ||||||
| 1,993,400 | ||||||||
| Tobacco—0.7% | ||||||||
| Altria Group, Inc., 4.00% Sr. Unsec. Nts., 1/31/24 | 238,000 | 241,069 | ||||||
| BAT Capital Corp.: | ||||||||
| 2.297% Sr. Unsec. Nts., 8/14/203 | 351,000 | 343,591 | ||||||
| 3.557% Sr. Unsec. Nts., 8/15/273 | 177,000 | 164,933 | ||||||
| Imperial Tobacco Finance plc, 2.95% Sr. Unsec. Nts., 7/21/203 | 350,000 | 346,549 | ||||||
| Philip Morris International, Inc., 2.50% Sr. Unsec. Nts., 11/2/22 | 313,000 | 300,373 | ||||||
| 1,396,515 | ||||||||
| Energy—2.4% | ||||||||
| Energy Equipment & Services—0.3% |
| |||||||
| Halliburton Co., 5.00% Sr. Unsec. Nts., 11/15/45 | 75,000 | 80,147 | ||||||
| Helmerich & Payne International Drilling Co., 4.65% Sr. Unsec. Nts., 3/15/25 | 201,000 | 207,765 | ||||||
| Schlumberger Holdings Corp., 4.00% Sr. Unsec. Nts., 12/21/253 | 196,000 | 195,596 | ||||||
| 483,508 | ||||||||
| Oil, Gas & Consumable Fuels—2.1% |
| |||||||
| Anadarko Petroleum Corp.: | ||||||||
| 4.50% Sr. Unsec. Nts., 7/15/44 | 72,000 | 67,247 | ||||||
| 6.20% Sr. Unsec. Nts., 3/15/40 | 56,000 | 63,249 | ||||||
| Andeavor, 5.125% Sr. Unsec. Nts., 12/15/26 | 299,000 | 313,190 | ||||||
| Andeavor Logistics LP/Tesoro Logistics Finance Corp.: |
| |||||||
| 4.25% Sr. Unsec. Nts., 12/1/27 | 177,000 | 170,612 | ||||||
| 5.25% Sr. Unsec. Nts., 1/15/25 | 120,000 | 123,136 | ||||||
| Apache Corp., 4.75% Sr. Unsec. Nts., 4/15/43 | 101,000 | 96,171 | ||||||
| Buckeye Partners LP, 3.95% Sr. Unsec. Nts., 12/1/26 | 89,000 | 80,864 | ||||||
| Principal Amount | Value | |||||||
| Oil, Gas & Consumable Fuels (Continued) |
| |||||||
| Columbia Pipeline Group, Inc.: | ||||||||
| 3.30% Sr. Unsec. Nts., 6/1/20 | $ | 324,000 | $ | 322,795 | ||||
| 4.50% Sr. Unsec. Nts., 6/1/25 | 168,000 | 168,386 | ||||||
| ConocoPhillips Co.: | ||||||||
| 4.95% Sr. Unsec. Nts., 3/15/26 | 37,000 | 39,928 | ||||||
| 5.95% Sr. Unsec. Nts., 3/15/46 | 75,000 | 93,594 | ||||||
| Devon Energy Corp., 4.75% Sr. Unsec. Nts., 5/15/42 | 79,000 | 77,340 | ||||||
| Energy Transfer Partners LP, 5.30% Sr. Unsec. Nts., 4/15/47 | 100,000 | 91,740 | ||||||
| Enterprise Products Operating LLC: | ||||||||
| 4.85% Sr. Unsec. Nts., 8/15/42 | 80,000 | 80,089 | ||||||
| 4.90% Sr. Unsec. Nts., 5/15/46 | 32,000 | 32,158 | ||||||
| EQT Corp., 2.50% Sr. Unsec. Nts., 10/1/20 | 353,000 | 345,079 | ||||||
| Kinder Morgan, Inc.: | ||||||||
| 5.20% Sr. Unsec. Nts., 3/1/48 | 86,000 | 83,391 | ||||||
| 5.55% Sr. Unsec. Nts., 6/1/45 | 147,000 | 148,930 | ||||||
| Noble Energy, Inc., 5.05% Sr. Unsec. Nts., 11/15/44 | 93,000 | 93,208 | ||||||
| ONEOK Partners LP, 8.625% Sr. Unsec. Nts., 3/1/19 | 203,000 | 210,147 | ||||||
| Pioneer Natural Resources Co., 3.45% Sr. Unsec. Nts., 1/15/21 | 347,000 | 347,917 | ||||||
| Sabine Pass Liquefaction LLC: | ||||||||
| 4.20% Sr. Sec. Nts., 3/15/28 | 180,000 | 173,370 | ||||||
| 5.625% Sr. Sec. Nts., 2/1/21 | 260,000 | 272,058 | ||||||
| Shell International Finance BV, 4.00% Sr. Unsec. Nts., 5/10/46 | 115,000 | 111,558 | ||||||
| Sunoco Logistics Partners Operations LP, 4.00% Sr. Unsec. Nts., 10/1/27 | 198,000 | 185,309 | ||||||
| TransCanada PipeLines Ltd., 7.625% Sr. Unsec. Nts., 1/15/39 | 76,000 | 99,898 | ||||||
| Williams Cos., Inc. (The), 3.70% Sr. Unsec. Unsub. Nts., 1/15/23 | 334,000 | 324,815 | ||||||
| Williams Partners LP, 3.75% Sr. Unsec. Nts., 6/15/27 | 140,000 | 132,389 | ||||||
| 4,348,568 | ||||||||
| Financials—9.0% | ||||||||
| Capital Markets—1.8% | ||||||||
| Apollo Management Holdings LP, 4.00% Sr. Unsec. Nts., 5/30/243 | 195,000 | 193,861 | ||||||
| Blackstone Holdings Finance Co. LLC, 3.15% Sr. Unsec. Nts., 10/2/273 | 127,000 | 119,268 | ||||||
| Brookfield Asset Management, Inc., 4.00% Sr. Unsec. Nts., 1/15/25 | 269,000 | 266,231 | ||||||
| Credit Suisse AG (New York), 3.625% Sr. Unsec. Nts., 9/9/24 | 197,000 | 194,271 | ||||||
| Credit Suisse Group Funding Guernsey Ltd., 4.55% Sr. Unsec. Nts., 4/17/26 | 154,000 | 154,188 | ||||||
| E*TRADE Financial Corp., 5.875% [US0003M+443.5] Jr. Sub. Perpetual Bonds4,12 | 327,000 | 333,540 | ||||||
| Goldman Sachs Group, Inc. (The): | ||||||||
| 3.50% Sr. Unsec. Nts., 11/16/26 | 180,000 | 169,720 | ||||||
| 3.75% Sr. Unsec. Nts., 2/25/26 | 178,000 | 172,690 | ||||||
| 3.814% [US0003M+115.8] Sr. Unsec. Nts., 4/23/294 | 286,000 | 272,027 | ||||||
| 4.017% [US0003M+137.3] Sr. Unsec. Nts., 10/31/384 | 144,000 | 131,373 | ||||||
| Morgan Stanley: | ||||||||
| 4.375% Sr. Unsec. Nts., 1/22/47 | 232,000 | 221,899 | ||||||
| 5.00% Sub. Nts., 11/24/25 | 276,000 | 286,461 | ||||||
| MSCI, Inc., 4.75% Sr. Unsec. Nts., 8/1/263 | 338,000 | 327,860 | ||||||
| Northern Trust Corp., 3.375% [US0003M+113.1] Sub. Nts., 5/8/324 | 125,000 | 117,515 | ||||||
14 OPPENHEIMER CONSERVATIVE BALANCED FUND/VA
| Principal Amount | Value | |||||
| Capital Markets (Continued) | ||||||
| Raymond James Financial, Inc., 3.625% Sr. Unsec. Nts., 9/15/26 | $ 165,000 | $ | 158,674 | |||
| TD Ameritrade Holding Corp., 3.30% Sr. Unsec. Nts., 4/1/27 | 208,000 | 198,621 | ||||
| UBS Group Funding Switzerland AG: | ||||||
| 4.125% Sr. Unsec. Nts., 4/15/263 | 160,000 | 158,453 | ||||
| 4.253% Sr. Unsec. Nts., 3/23/283 | 147,000 | 146,161 | ||||
| 3,622,813 | ||||||
| Commercial Banks—4.4% | ||||||
| ABN AMRO Bank NV, 4.40% [USSW5+219.7] Sub. Nts., 3/27/284 | 329,000 | 323,142 | ||||
| Australia & New Zealand Banking Group Ltd. (New York), 2.625% Sr. Unsec. Nts., 5/19/22 | 273,000 | 263,969 | ||||
| Banco Santander SA, 4.379% Sr. Unsec. Nts., 4/12/28 | 200,000 | 191,524 | ||||
| Bank of America Corp.: | ||||||
| 3.248% Sr. Unsec. Nts., 10/21/27 | 277,000 | 258,359 | ||||
| 3.366% [US0003M+81] Sr. Unsec. Nts., 1/23/264 | 286,000 | 275,355 | ||||
| 3.824% [US0003M+157.5] Sr. Unsec. Nts., 1/20/284 | 191,000 | 186,444 | ||||
| 7.75% Jr. Sub. Nts., 5/14/38 | 239,000 | 324,592 | ||||
| Barclays plc, 4.375% Sr. Unsec. Nts., 1/12/26 | 338,000 | 329,113 | ||||
| BB&T Corp., 2.85% Sr. Unsec. Nts., 10/26/24 | 266,000 | 252,495 | ||||
| BNP Paribas SA, 4.625% Sub. Nts., 3/13/273 | 198,000 | 194,617 | ||||
| BPCE SA, 4.50% Sub. Nts., 3/15/253 | 199,000 | 194,224 | ||||
| Citigroup, Inc.: | ||||||
| 4.075% [US0003M+119.2] Sr. Unsec. Nts., 4/23/294 | 269,000 | 264,234 | ||||
| 4.281% [US0003M+183.9] Sr. Unsec. Nts., 4/24/484 | 356,000 | 337,768 | ||||
| Citizens Bank NA (Providence RI): | ||||||
| 2.55% Sr. Unsec. Nts., 5/13/21 | 163,000 | 159,080 | ||||
| 2.65% Sr. Unsec. Nts., 5/26/22 | 68,000 | 65,799 | ||||
| Commonwealth Bank of Australia, 3.15% Sr. Unsec. Nts., 9/19/273 | 255,000 | 238,399 | ||||
| Compass Bank, 2.875% Sr. Unsec. Nts., 6/29/22 | 308,000 | 297,526 | ||||
| Credit Agricole SA, 4.375% Sub. Nts., 3/17/253 | 333,000 | 322,630 | ||||
| Fifth Third Bank (Cincinnati OH), 3.85% Sub. Nts., 3/15/26 | 176,000 | 173,331 | ||||
| First Republic Bank, 4.375% Sub. Nts., 8/1/46 | 137,000 | 131,477 | ||||
| HSBC Holdings plc: | ||||||
| 3.95% [US0003M+98.72] Sr. Unsec. Nts., 5/18/244 | 109,000 | 108,769 | ||||
| 4.041% [US0003M+154.6] Sr. Unsec. Nts., 3/13/284 | 135,000 | 131,152 | ||||
| 4.583% [US0003M+153.46] Sr. Unsec. Nts., 6/19/294 | 183,000 | 184,983 | ||||
| Huntington Bancshares, Inc.: | ||||||
| 3.15% Sr. Unsec. Nts., 3/14/21 | 162,000 | 161,185 | ||||
| 4.00% Sr. Unsec. Nts., 5/15/25 | 334,000 | 335,412 | ||||
| Intesa Sanpaolo SpA, 3.875% Sr. Unsec. Nts., 7/14/273 | 243,000 | 209,983 | ||||
| JPMorgan Chase & Co.: | ||||||
| 3.54% [US0003M+138] Sr. Unsec. Nts., 5/1/284 | 272,000 | 260,605 | ||||
| 3.782% [US0003M+133.7] Sr. Unsec. Nts., 2/1/284 | 498,000 | 485,543 | ||||
| Lloyds Banking Group plc, 6.657% [US0003M+127] Jr. Sub. Perpetual Bonds4,12,13 | 400,000 | 428,112 | ||||
| Principal Amount | Value | |||||
| Commercial Banks (Continued) | ||||||
| PNC Financial Services Group, Inc. (The), 3.15% Sr. Unsec. Nts., 5/19/27 | $ 253,000 | $ | 240,679 | |||
| Regions Bank (Birmingham AL), 2.75% Sr. Unsec. Nts., 4/1/21 | 238,000 | 234,500 | ||||
| Regions Financial Corp., 2.75% Sr. Unsec. Nts., 8/14/22 | 187,000 | 180,545 | ||||
| Royal Bank of Scotland Group plc, 3.498% [US0003M+148] Sr. Unsec. Nts., 5/15/234 | 202,000 | 195,800 | ||||
| SunTrust Bank (Atlanta GA), 3.30% Sub. Nts., 5/15/26 | 118,000 | 111,497 | ||||
| Synovus Financial Corp., 3.125% Sr. Unsec. Nts., 11/1/22 | 194,000 | 185,512 | ||||
| US Bancorp: | ||||||
| 3.10% Sub. Nts., 4/27/26 | 210,000 | 198,204 | ||||
| 3.15% Sr. Unsec. Nts., 4/27/27 | 65,000 | 62,180 | ||||
| Wells Fargo & Co.: | ||||||
| 3.584% [US0003M+131] Sr. Unsec. Nts., 5/22/284 | 277,000 | 265,599 | ||||
| 4.75% Sub. Nts., 12/7/46 | 172,000 | 166,691 | ||||
| 8,931,029 | ||||||
| Consumer Finance—0.5% | ||||||
| American Express Co., 2.50% Sr. Unsec. Nts., 8/1/22 | 111,000 | 106,514 | ||||
| American Express Credit Corp., 3.30% Sr. Unsec. Nts., 5/3/27 | 209,000 | 201,550 | ||||
| Capital One Financial Corp., 3.75% Sr. Unsec. Nts., 3/9/27 | 111,000 | 105,268 | ||||
| Discover Financial Services: | ||||||
| 3.75% Sr. Unsec. Nts., 3/4/25 | 143,000 | 136,702 | ||||
| 4.10% Sr. Unsec. Nts., 2/9/27 | 133,000 | 127,753 | ||||
| Electricite de France SA, 6.50% Sr. Unsec. Nts., 1/26/193 | 259,000 | 264,353 | ||||
| 942,140 | ||||||
| Diversified Financial Services—0.4% |
| |||||
| Berkshire Hathaway Energy Co.: | ||||||
| 2.00% Sr. Unsec. Nts., 11/15/18 | 115,000 | 114,767 | ||||
| 3.80% Sr. Unsec. Nts., 7/15/48 | 81,000 | 74,490 | ||||
| Peachtree Corners Funding Trust, 3.976% Sr. Unsec. Nts., 2/15/253 | 126,000 | 122,735 | ||||
| Precision Castparts Corp., 2.50% Sr. Unsec. Nts., 1/15/23 | 212,000 | 204,399 | ||||
| Voya Financial, Inc., 5.65% [US0003M+358] Jr. Sub. Nts., 5/15/534 | 325,000 | 327,437 | ||||
| 843,828 | ||||||
| Insurance—1.0% | ||||||
| AXA Equitable Holdings, Inc., 4.35% Sr. Unsec. Nts., 4/20/283 | 181,000 | 173,301 | ||||
| AXIS Specialty Finance plc, 5.15% Sr. Unsec. Nts., 4/1/45 | 179,000 | 176,101 | ||||
| Boardwalk Pipelines LP, 4.95% Sr. Unsec. Nts., 12/15/24 | 162,000 | 165,077 | ||||
| Brighthouse Financial, Inc., 3.70% Sr. Unsec. Nts., 6/22/27 | 68,000 | 60,629 | ||||
| CNA Financial Corp., 3.45% Sr. Unsec. Nts., 8/15/27 | 255,000 | 236,606 | ||||
| Hartford Financial Services Group, Inc. (The), 4.40% Sr. Unsec. Nts., 3/15/48 | 209,000 | 201,831 | ||||
| Lincoln National Corp., 3.80% Sr. Unsec. Nts., 3/1/28 | 207,000 | 198,109 | ||||
| Manulife Financial Corp., 4.061% [USISDA05+164.7] Sub. Nts., 2/24/324 | 208,000 | 197,667 | ||||
| Marsh & McLennan Cos., Inc., 4.35% Sr. Unsec. Nts., 1/30/47 | 113,000 | 112,766 | ||||
| Nuveen Finance LLC, 4.125% Sr. Unsec. Nts., 11/1/243 | 332,000 | 330,491 | ||||
15 OPPENHEIMER CONSERVATIVE BALANCED FUND/VA
STATEMENT OF INVESTMENTS Unaudited / Continued
| Principal Amount | Value | |||||||
| Insurance (Continued) | ||||||||
| Prudential Financial, Inc., 5.20% [US0003M+304] Jr. Sub. Nts., 3/15/444 | $ | 256,000 | $ | 255,360 | ||||
| 2,107,938 | ||||||||
| Real Estate Investment Trusts (REITs)—0.9% |
| |||||||
| American Tower Corp.: | ||||||||
| 2.80% Sr. Unsec. Nts., 6/1/20 | 281,000 | 278,706 | ||||||
| 3.00% Sr. Unsec. Nts., 6/15/23 | 274,000 | 262,940 | ||||||
| 3.60% Sr. Unsec. Nts., 1/15/28 | 181,000 | 167,974 | ||||||
| Crown Castle International Corp., 3.65% Sr. Unsec. Nts., 9/1/27 | 176,000 | 163,958 | ||||||
| Digital Realty Trust LP: | ||||||||
| 3.40% Sr. Unsec. Nts., 10/1/20 | 30,000 | 30,035 | ||||||
| 5.875% Sr. Unsec. Nts., 2/1/20 | 125,000 | 129,363 | ||||||
| HCP, Inc., 2.625% Sr. Unsec. Nts., 2/1/20 | 348,000 | 343,969 | ||||||
| Lamar Media Corp., 5.75% Sr. Unsec. Nts., 2/1/26 | 325,000 | 331,906 | ||||||
| VEREIT Operating Partnership LP, 3.00% Sr. Unsec. Nts., 2/6/19 | 134,000 | 133,956 | ||||||
| 1,842,807 | ||||||||
| Health Care—2.8% | ||||||||
| Biotechnology—0.6% | ||||||||
| AbbVie, Inc.: | ||||||||
| 3.60% Sr. Unsec. Nts., 5/14/25 | 210,000 | 203,631 | ||||||
| 4.70% Sr. Unsec. Nts., 5/14/45 | 64,000 | 63,681 | ||||||
| Amgen, Inc., 4.563% Sr. Unsec. Nts., 6/15/48 | 120,000 | 117,850 | ||||||
| Biogen, Inc., 5.20% Sr. Unsec. Nts., 9/15/45 | 82,000 | 87,106 | ||||||
| Celgene Corp.: | ||||||||
| 3.875% Sr. Unsec. Nts., 8/15/25 | 202,000 | 196,537 | ||||||
| 5.00% Sr. Unsec. Nts., 8/15/45 | 41,000 | 40,263 | ||||||
| Gilead Sciences, Inc., 4.75% Sr. Unsec. Nts., 3/1/46 | 143,000 | 147,827 | ||||||
| Shire Acquisitions Investments Ireland DAC, 1.90% Sr. Unsec. Nts., 9/23/19 | 376,000 | 370,362 | ||||||
| 1,227,257 | ||||||||
| Health Care Equipment & Supplies—0.6% |
| |||||||
| Abbott Laboratories: | ||||||||
| 2.35% Sr. Unsec. Nts., 11/22/19 | 64,000 | 63,645 | ||||||
| 3.75% Sr. Unsec. Nts., 11/30/26 | 300,000 | 295,297 | ||||||
| Becton Dickinson & Co.: | ||||||||
| 2.404% Sr. Unsec. Nts., 6/5/20 | 226,000 | 222,039 | ||||||
| 3.70% Sr. Unsec. Nts., 6/6/27 | 268,000 | 253,866 | ||||||
| Edwards Lifesciences Corp., 4.30% Sr. Unsec. Nts., 6/15/28 | 171,000 | 170,997 | ||||||
| Hologic, Inc., 4.375% Sr. Unsec. Nts., 10/15/253 | 15,000 | 14,363 | ||||||
| Medtronic, Inc., 4.625% Sr. Unsec. Nts., 3/15/45 | 145,000 | 153,942 | ||||||
| 1,174,149 | ||||||||
| Health Care Providers & Services—0.8% |
| |||||||
| Cigna Corp., 5.125% Sr. Unsec. Nts., 6/15/20 | 303,000 | 312,768 | ||||||
| CVS Health Corp.: | ||||||||
| 2.125% Sr. Unsec. Nts., 6/1/21 | 356,000 | 342,432 | ||||||
| 5.05% Sr. Unsec. Nts., 3/25/48 | 308,000 | 312,270 | ||||||
| Fresenius Medical Care US Finance II, Inc., 5.875% Sr. Unsec. Nts., 1/31/223 | 450,000 | 477,357 | ||||||
| UnitedHealth Group, Inc., 2.75% Sr. Unsec. Nts., 2/15/23 | 275,000 | 266,300 | ||||||
| 1,711,127 | ||||||||
| Life Sciences Tools & Services—0.4% |
| |||||||
| IQVIA, Inc., 5.00% Sr. Unsec. Nts., 10/15/263 | 330,000 | 322,575 | ||||||
| Principal Amount | Value | |||||||
| Life Sciences Tools & Services (Continued) |
| |||||||
| Life Technologies Corp., 6.00% Sr. Unsec. Nts., 3/1/20 | $ | 259,000 | $ | 270,065 | ||||
| Thermo Fisher Scientific, Inc., 4.15% Sr. Unsec. Nts., 2/1/24 | 132,000 | 134,089 | ||||||
| 726,729 | ||||||||
| Pharmaceuticals—0.4% | ||||||||
| Allergan Funding SCS, 3.00% Sr. Unsec. Nts., 3/12/20 | 348,000 | 346,400 | ||||||
| Bayer US Finance II LLC: | ||||||||
| 3.875% Sr. Unsec. Nts., 12/15/233 | 335,000 | 335,297 | ||||||
| 4.375% Sr. Unsec. Nts., 12/15/283 | 242,000 | 242,863 | ||||||
| 924,560 | ||||||||
| Industrials—2.2% | ||||||||
| Aerospace & Defense—0.5% | ||||||||
| BAE Systems Holdings, Inc., 3.85% Sr. Unsec. Nts., 12/15/253 | 270,000 | 267,229 | ||||||
| Huntington Ingalls Industries, Inc., 3.483% Sr. Unsec. Nts., 12/1/27 | 190,000 | 179,037 | ||||||
| L3 Technologies, Inc., 3.85% Sr. Unsec. Nts., 6/15/23 | 335,000 | 334,562 | ||||||
| Northrop Grumman Corp., 4.75% Sr. Unsec. Nts., 6/1/43 | 190,000 | 198,356 | ||||||
| 979,184 | ||||||||
| Air Freight & Couriers—0.1% | ||||||||
| CH Robinson Worldwide, Inc., 4.20% Sr. Unsec. Nts., 4/15/28 | 169,000 | 166,278 | ||||||
| FedEx Corp., 4.40% Sr. Unsec. Nts., 1/15/47 | 69,000 | 65,537 | ||||||
| 231,815 | ||||||||
| Building Products—0.1% | ||||||||
| Allegion US Holding Co., Inc., 3.55% Sec. Nts., 10/1/27 | 284,000 | 263,183 | ||||||
| Electrical Equipment—0.2% | ||||||||
| Sensata Technologies BV, 4.875% Sr. Unsec. Nts., 10/15/233 | 345,000 | 348,019 | ||||||
| Industrial Conglomerates—0.2% |
| |||||||
| GE Capital International Funding Co. Unlimited Co., 3.373% Sr. Unsec. Nts., 11/15/25 | 107,000 | 102,879 | ||||||
| Roper Technologies, Inc., 3.00% Sr. Unsec. Nts., 12/15/20 | 288,000 | 286,195 | ||||||
| 389,074 | ||||||||
| Machinery—0.5% | ||||||||
| CNH Industrial NV, 3.85% Sr. Unsec. Nts., 11/15/27 | 189,000 | 176,323 | ||||||
| Fortive Corp., 1.80% Sr. Unsec. Nts., 6/15/19 | 346,000 | 342,255 | ||||||
| John Deere Capital Corp., 2.70% Sr. Unsec. Nts., 1/6/23 | 152,000 | 148,379 | ||||||
| Nvent Finance Sarl, 4.55% Sr. Unsec. Nts., 4/15/283 | 176,000 | 172,956 | ||||||
| Wabtec Corp., 3.45% Sr. Unsec. Nts., 11/15/26 | 144,000 | 133,250 | ||||||
| 973,163 | ||||||||
| Road & Rail—0.3% | ||||||||
| Penske Truck Leasing Co. LP/PTL Finance Corp., 3.40% Sr. Unsec. Nts., 11/15/263 | 284,000 | 265,208 | ||||||
| Ryder System, Inc., 3.75% Sr. Unsec. Nts., 6/9/23 | 335,000 | 334,995 | ||||||
| 600,203 | ||||||||
| Trading Companies & Distributors—0.3% |
| |||||||
| Air Lease Corp.: | ||||||||
| 3.25% Sr. Unsec. Nts., 3/1/25 | 108,000 | 100,078 | ||||||
16 OPPENHEIMER CONSERVATIVE BALANCED FUND/VA
Principal Amount | Value | |||||||
| Trading Companies & Distributors (Continued) |
| |||||||
| Air Lease Corp.: (Continued) 3.625% Sr. Unsec. Nts., 4/1/27 | $ | 112,000 | $ | 102,838 | ||||
| GATX Corp., 3.50% Sr. Unsec. Nts., 3/15/28 | 285,000 | 263,697 | ||||||
| United Rentals North America, Inc., 4.625% Sr. Unsec. Nts., 10/15/25 | 178,000 | 169,990 | ||||||
| 636,603 | ||||||||
| Information Technology—2.2% | ||||||||
| Communications Equipment—0.1% |
| |||||||
| Motorola Solutions, Inc., 4.60% Sr. Unsec. Nts., 2/23/28 | 256,000 | 255,004 | ||||||
| Electronic Equipment, Instruments, & Components—0.3% |
| |||||||
| Arrow Electronics, Inc., 3.875% Sr. Unsec. Nts., 1/12/28 | 248,000 | 232,763 | ||||||
| CDW LLC/CDW Finance Corp., 5.50% Sr. Unsec. Nts., 12/1/24 | 58,000 | 59,450 | ||||||
| Tech Data Corp., 4.95% Sr. Unsec. Nts., 2/15/27 | 271,000 | 266,355 | ||||||
| 558,568 | ||||||||
| Internet Software & Services—0.2% |
| |||||||
| VeriSign, Inc.: | ||||||||
| 4.75% Sr. Unsec. Nts., 7/15/27 | 189,000 | 181,147 | ||||||
| 5.25% Sr. Unsec. Nts., 4/1/25 | 105,000 | 106,806 | ||||||
| 287,953 | ||||||||
| IT Services—0.3% | ||||||||
| DXC Technology Co.: | ||||||||
| 2.875% Sr. Unsec. Nts., 3/27/20 | 261,000 | 259,230 | ||||||
| 4.75% Sr. Unsec. Nts., 4/15/27 | 254,000 | 256,980 | ||||||
| Fidelity National Information Services, Inc., 4.25% Sr. Unsec. Nts., 5/15/28 | 171,000 | 171,730 | ||||||
| 687,940 | ||||||||
| Semiconductors & Semiconductor Equipment—0.2% |
| |||||||
| Intel Corp., 3.734% Sr. Unsec. Nts., 12/8/47 | 99,000 | 93,431 | ||||||
| Microchip Technology, Inc., 3.922% Sr. Sec. Nts., 6/1/213 | 335,000 | 335,760 | ||||||
| 429,191 | ||||||||
| Software—0.7% | ||||||||
| Autodesk, Inc., 4.375% Sr. Unsec. Nts., 6/15/25 | 104,000 | 104,848 | ||||||
| Dell International LLC/EMC Corp.: | ||||||||
| 4.42% Sr. Sec. Nts., 6/15/213 | 283,000 | 287,208 | ||||||
| 6.02% Sr. Sec. Nts., 6/15/263 | 213,000 | 224,266 | ||||||
| Open Text Corp., 5.625% Sr. Unsec. | ||||||||
| Nts., 1/15/233 | 174,000 | 178,790 | ||||||
| Oracle Corp.: | ||||||||
| 2.40% Sr. Unsec. Nts., 9/15/23 | 214,000 | 201,939 | ||||||
| 2.95% Sr. Unsec. Nts., 5/15/25 | 211,000 | 201,613 | ||||||
| VMware, Inc.: | ||||||||
| 2.30% Sr. Unsec. Nts., 8/21/20 | 108,000 | 105,721 | ||||||
| 3.90% Sr. Unsec. Nts., 8/21/27 | 170,000 | 157,210 | ||||||
| 1,461,595 | ||||||||
| Technology Hardware, Storage & Peripherals—0.4% |
| |||||||
| Apple, Inc., 4.375% Sr. Unsec. Nts., 5/13/45 | 207,000 | 214,510 | ||||||
| Hewlett Packard Enterprise Co., 3.60% Sr. Unsec. Nts., 10/15/20 | 342,000 | 343,817 | ||||||
| NetApp, Inc., 2.00% Sr. Unsec. Nts., 9/27/19 | 160,000 | 157,810 | ||||||
| 716,137 | ||||||||
| Materials—1.9% | ||||||||
| Chemicals—0.7% | ||||||||
| LyondellBasell Industries NV, 5.00% Sr. | ||||||||
| Unsec. Nts., 4/15/19 | 255,000 | 257,557 | ||||||
| Principal Amount | Value | |||||
| Chemicals (Continued) | ||||||
| Nutrien Ltd.: | ||||||
| 3.375% Sr. Unsec. Nts., 3/15/25 | $ | 104,000 | $ 98,005 | |||
| 4.125% Sr. Unsec. Nts., 3/15/35 | 87,000 | 80,835 | ||||
| PolyOne Corp., 5.25% Sr. Unsec. Nts., 3/15/23 | 308,000 | 314,930 | ||||
| RPM International, Inc.: 3.45% Sr. Unsec. Unsub. Nts., 11/15/22 | 304,000 | 299,686 | ||||
| 3.75% Sr. Unsec. Nts., 3/15/27 | 91,000 | 86,875 | ||||
| Yara International ASA, 4.75% Sr. Unsec. Nts., 6/1/283 | 254,000 | 255,734 | ||||
| 1,393,622 | ||||||
| Construction Materials—0.2% | ||||||
| James Hardie International Finance DAC, 4.75% Sr. Unsec. Nts., 1/15/253 | 209,000 | 204,820 | ||||
| LafargeHolcim Finance US LLC, 3.50% Sr. Unsec. Nts., 9/22/263 | 80,000 | 74,647 | ||||
| Martin Marietta Materials, Inc., 3.50% Sr. Unsec. Nts., 12/15/27 | 171,000 | 158,922 | ||||
| 438,389 | ||||||
| Containers & Packaging—0.6% | ||||||
| International Paper Co.: | ||||||
| 3.00% Sr. Unsec. Nts., 2/15/27 | 150,000 | 135,983 | ||||
| 4.80% Sr. Unsec. Nts., 6/15/44 | 142,000 | 138,047 | ||||
| Packaging Corp. of America: 3.65% Sr. Unsec. Nts., 9/15/24 | 113,000 | 111,116 | ||||
| 4.50% Sr. Unsec. Nts., 11/1/23 | 253,000 | 261,639 | ||||
| Silgan Holdings, Inc., 4.75% Sr. Unsec. Nts., 3/15/25 | 290,000 | 276,950 | ||||
| WestRock Co., 4.00% Sr. Unsec. Nts., 3/15/283 | 163,000 | 160,913 | ||||
| 1,084,648 | ||||||
| Metals & Mining—0.3% | ||||||
| Anglo American Capital plc: 3.625% Sr. Unsec. Nts., 9/11/243 | 86,000 | 81,480 | ||||
| 4.00% Sr. Unsec. Nts., 9/11/273 | 140,000 | 130,490 | ||||
| ArcelorMittal, 6.125% Sr. Unsec. Nts., 6/1/25 | 305,000 | 330,163 | ||||
| Goldcorp, Inc., 5.45% Sr. Unsec. Nts., 6/9/44 | 96,000 | 101,799 | ||||
| 643,932 | ||||||
| Paper & Forest Products—0.1% | ||||||
| Georgia-Pacific LLC, 3.734% Sr. Unsec. Nts., 7/15/233 | 65,000 | 65,312 | ||||
| Louisiana-Pacific Corp., 4.875% Sr. Unsec. Nts., 9/15/24 | 199,000 | 196,015 | ||||
| 261,327 | ||||||
| Telecommunication Services—1.7% | ||||||
| Diversified Telecommunication Services—1.4% | ||||||
| AT&T, Inc.: 4.30% Sr. Unsec. Nts., 2/15/303 | 331,000 | 313,667 | ||||
| 4.35% Sr. Unsec. Nts., 6/15/45 | 189,000 | 160,763 | ||||
| 4.50% Sr. Unsec. Nts., 3/9/48 | 142,000 | 122,348 | ||||
| British Telecommunications plc, 9.125% Sr. Unsec. Nts., 12/15/30 | 284,000 | 406,576 | ||||
| Deutsche Telekom International Finance BV: 2.225% Sr. Unsec. Nts., 1/17/203 | 355,000 | 350,086 | ||||
| 4.375% Sr. Unsec. Nts., 6/21/283 | 160,000 | 158,988 | ||||
| Telecom Italia SpA, 5.303% Sr. Unsec. Nts., 5/30/243 | 322,000 | 318,780 | ||||
| Telefonica Emisiones SAU: 4.103% Sr. Unsec. Nts., 3/8/27 | 98,000 | 94,911 | ||||
| 5.213% Sr. Unsec. Nts., 3/8/47 | 123,000 | 118,904 | ||||
| 7.045% Sr. Unsec. Unsub. Nts., 6/20/36 | 125,000 | 150,580 | ||||
| T-Mobile USA, Inc., 6.50% Sr. Unsec. Nts., 1/15/26 | 317,000 | 327,207 | ||||
17 OPPENHEIMER CONSERVATIVE BALANCED FUND/VA
STATEMENT OF INVESTMENTS Unaudited / Continued
| Principal Amount | Value | |||||||
| Diversified Telecommunication Services (Continued) |
| |||||||
| Verizon Communications, Inc.: | ||||||||
| 4.125% Sr. Unsec. Nts., 8/15/46 | $ | 140,000 | $ | 119,963 | ||||
| 4.522% Sr. Unsec. Nts., 9/15/48 | 196,000 | 179,253 | ||||||
| 5.15% Sr. Unsec. Nts., 9/15/23 | 85,000 | 90,679 | ||||||
| 2,912,705 | ||||||||
| Wireless Telecommunication Services—0.3% |
| |||||||
| Vodafone Group plc: | ||||||||
| 3.75% Sr. Unsec. Nts., 1/16/24 | 332,000 | 329,445 | ||||||
| 4.375% Sr. Unsec. Nts., 5/30/28 | 168,000 | 166,145 | ||||||
| 6.15% Sr. Unsec. Nts., 2/27/37 | 103,000 | 113,513 | ||||||
| 609,103 | ||||||||
| Utilities—2.1% | ||||||||
| Electric Utilities—1.5% | ||||||||
| AEP Texas, Inc., 3.95% Sr. Unsec. Nts., 6/1/283 | 172,000 | 171,738 | ||||||
| Duke Energy Corp.: | ||||||||
| 3.15% Sr. Unsec. Nts., 8/15/27 | 176,000 | 163,618 | ||||||
| 3.75% Sr. Unsec. Nts., 9/1/46 | 162,000 | 143,997 | ||||||
| Edison International, 2.95% Sr. Unsec. Nts., 3/15/23 | 207,000 | 199,010 | ||||||
| EDP Finance BV, 3.625% Sr. Unsec. Nts., 7/15/243 | 231,000 | 221,698 | ||||||
| Emera US Finance LP, 2.15% Sr. Unsec. Nts., 6/15/19 | 284,000 | 281,103 | ||||||
| Enel Finance International NV, 3.625% Sr. Unsec. Nts., 5/25/273 | 178,000 | 163,061 | ||||||
| Exelon Corp.: | ||||||||
| 2.45% Sr. Unsec. Nts., 4/15/21 | 165,000 | 160,450 | ||||||
| 4.45% Sr. Unsec. Nts., 4/15/46 | 87,000 | 84,787 | ||||||
| FirstEnergy Corp., 3.90% Sr. Unsec. Nts., 7/15/27 | 184,000 | 178,768 | ||||||
| Indiana Michigan Power Co., Series K, 4.55% Sr. Unsec. Nts., 3/15/46 | 88,000 | 91,461 | ||||||
| ITC Holdings Corp., 5.30% Sr. Unsec. Nts., 7/1/43 | 81,000 | 90,884 | ||||||
Principal Amount | Value | |||||||
| Electric Utilities (Continued) | ||||||||
| Mid-Atlantic Interstate Transmission LLC, 4.10% Sr. Unsec. Nts., 5/15/283 | $ | 171,000 | $ | 171,251 | ||||
| NextEra Energy Operating Partners LP, 4.25% Sr. Unsec. Nts., 9/15/243 | 29,000 | 27,985 | ||||||
| Pennsylvania Electric Co., 5.20% Sr. Unsec. Nts., 4/1/20 | 88,000 | 90,430 | ||||||
| PPL WEM Ltd./Western Power Distribution Ltd., 5.375% Sr. Unsec. Unsub. Nts., 5/1/213 | 317,000 | 329,926 | ||||||
| Southern Co. Gas Capital Corp., 4.40% Sr. Unsec. Nts., 5/30/47 | 115,000 | 114,136 | ||||||
| Southern Power Co., 1.95% Sr. Unsec. Nts., 12/15/19 | 324,000 | 318,610 | ||||||
| Trans-Allegheny Interstate Line Co., 3.85% Sr. Unsec. Nts., 6/1/253 | 187,000 | 186,616 | ||||||
| 3,189,529 | ||||||||
| Multi-Utilities—0.6% | ||||||||
| Black Hills Corp., 2.50% Sr. Unsec. Nts., 1/11/19 | 179,000 | 178,597 | ||||||
| Dominion Energy, Inc.: | ||||||||
| 2.579% Jr. Sub. Nts., 7/1/20 | 285,000 | 280,886 | ||||||
| 4.90% Sr. Unsec. Nts., 8/1/41 | 123,000 | 127,620 | ||||||
| Public Service Enterprise Group, Inc., 1.60% Sr. Unsec. Nts., 11/15/19 | 303,000 | 296,434 | ||||||
| Virginia Electric & Power Co., 2.95% Sr. Unsec. Nts., 1/15/22 | 309,000 | 305,812 | ||||||
| 1,189,349 | ||||||||
| Total Non-Convertible Corporate Bonds and Notes (Cost $67,134,792) | 65,789,548 | |||||||
| Shares | ||||||||
| Investment Company—2.6% | ||||||||
| Oppenheimer Institutional Government Money Market Fund, Cl. E, 1.85%14,15 (Cost $5,367,607) | 5,367,607 | 5,367,607 | ||||||
| Total Investments, at Value (Cost $237,566,584) | 120.9% | 246,025,633 | ||||||
| Net Other Assets (Liabilities) | (20.9) | (42,572,664 | ) | |||||
| Net Assets | 100.0% | $ | 203,452,969 | |||||
Footnotes to Statement of Investments
1. Non-income producing security.
2. Security is a Master Limited Partnership.
3. Represents securities sold under Rule 144A, which are exempt from registration under the Securities Act of 1933, as amended. These securities have been determined to be liquid under guidelines established by the Board of Trustees. These securities amount to $29,075,048 or 14.29% of the Fund’s net assets at period end.
4. Represents the current interest rate for a variable or increasing rate security, determined as [Referenced Rate + Basis-point spread].
5. Interest-Only Strips represent the right to receive the monthly interest payments on an underlying pool of mortgage loans. These securities typically decline in price as interest rates decline. Most other fixed income securities increase in price when interest rates decline. The principal amount of the underlying pool represents the notional amount on which current interest is calculated. The price of these securities is typically more sensitive to changes in prepayment rates than traditional mortgage-backed securities (for example, GNMA pass-throughs). Interest rates disclosed represent current yields based upon the current cost basis and estimated timing and amount of future cash flows. These securities amount to $1,443,568 or 0.71% of the Fund’s net assets at period end.
6. Principal-Only Strips represent the right to receive the monthly principal payments on an underlying pool of mortgage loans. The value of these securities generally increases as interest rates decline and prepayment rates rise. The price of these securities is typically more volatile than that of coupon-bearing bonds of the same maturity. Interest rates disclosed represent current yields based upon the current cost basis and estimated timing of future cash flows. These securities amount to $43,000 or 0.02% of the Fund’s net assets at period end.
7. Interest rate is less than 0.0005%.
8. All or a portion of the security position is when-issued or delayed delivery to be delivered and settled after period end. See Note 4 of the accompanying Notes.
9. This interest rate resets periodically. Interest rate shown reflects the rate in effect at period end. The rate on this variable rate security is not based on a published reference rate and spread but is determined by the issuer or agent based on current market conditions.
10. All or a portion of the security position is held in accounts at a futures clearing merchant and pledged to cover margin requirements on open futures contracts and written options on futures, if applicable. The aggregate market value of such securities is $140,927. See Note 5 of the accompanying Notes.
11. All or a portion of the security position has been pledged for collateral in association with forward roll transactions. See Note 4 of the accompanying Notes.
12. This bond has no contractual maturity date, is not redeemable and contractually pays an indefinite stream of interest.
18 OPPENHEIMER CONSERVATIVE BALANCED FUND/VA
Footnotes to Statement of Investments (Continued)
13. Restricted security. The aggregate value of restricted securities at period end was $428,112, which represents 0.21% of the Fund’s net assets. See Note 4 of the accompanying Notes. Information concerning restricted securities is as follows:
| Security | Acquisition Dates | Cost | Value | Unrealized Appreciation/ (Depreciation) | ||||||||||||
Lloyds Banking Group plc, 6.657% [US0003M+127] Jr. | ||||||||||||||||
Sub. Perpetual Bonds | 6/20/14-6/24/14 | $ | 448,440 | $ | 428,112 | $ | (20,328) | |||||||||
14. Rate shown is the 7-day yield at period end.
15. Is or was an affiliate, as defined in the Investment Company Act of 1940, as amended, at or during the reporting period, by virtue of the Fund owning at least 5% of the voting securities of the issuer or as a result of the Fund and the issuer having the same investment adviser. Transactions during the reporting period in which the issuer was an affiliate are as follows:
| Shares | Gross | Gross | Shares | |||||||||||||
| December 31, 2017 | Additions | Reductions | June 30, 2018 | |||||||||||||
| Oppenheimer Institutional Government Money Market Fund, Cl. E | 5,367,607 | — | — | 5,367,607 | ||||||||||||
| Value | Income | Realized Gain (Loss) | Change in Unrealized Gain (Loss) | |||||||||||||
| Oppenheimer Institutional Government Money Market Fund, Cl. E | $ | 5,367,607 | $ | 40,314 | $ | — | $ | — | ||||||||
Futures Contracts as of June 30, 2018 | ||||||||||||||||
| Description | Buy/Sell | Expiration Date | Number of Contracts | Notional Amount (000’s) | Value | Unrealized Appreciation/ (Depreciation) | ||||||||||
| United States Treasury Long Bonds | Sell | 9/19/18 | 8 | USD 1,157 | $ | 1,160,000 | $ (2,705) | |||||||||
| United States Treasury Nts., 10 yr. | Sell | 9/19/18 | 128 | USD 15,343 | 15,384,000 | (41,195) | ||||||||||
| United States Treasury Nts., 2 yr. | Sell | 9/28/18 | 370 | USD 78,393 | 78,376,406 | 16,649 | ||||||||||
| United States Treasury Nts., 5 yr. | Sell | 9/28/18 | 27 | USD 3,064 | 3,067,664 | (3,219) | ||||||||||
| United States Ultra Bonds | Buy | 9/19/18 | 58 | USD 9,099 | 9,254,625 | 155,941 | ||||||||||
| $ 125,471 | ||||||||||||||||
| Glossary: | ||
| Definitions | ||
| H15T1Y | US Treasury Yield Curve Rate T Note Constant Maturity 1 Year | |
| ICE LIBOR | Intercontinental Exchange London Interbank Offered Rate | |
| LIBOR01M | ICE LIBOR USD 1 Month | |
| US0001M | ICE LIBOR USD 1 Month | |
| US0003M | ICE LIBOR USD 3 Month | |
| USISDA05 | USD ICE Swap Rate 11:00am NY 5 Year | |
| USSW5 | USD Swap Semi 30/360 5 Year |
See accompanying Notes to Financial Statements.
19 OPPENHEIMER CONSERVATIVE BALANCED FUND/VA
STATEMENT OF ASSETS AND LIABILITIES June 30, 2018 Unaudited
Assets | ||||
| Investments, at value—see accompanying statement of investments: | ||||
| Unaffiliated companies (cost $232,198,977) | $ | 240,658,026 | ||
| Affiliated companies (cost $5,367,607) | 5,367,607 | |||
| 246,025,633 | ||||
| Cash | 11,567,725 | |||
| Cash used for collateral on futures | 277,000 | |||
| Receivables and other assets: | ||||
| Investments sold (including $45,501,057 sold on a when-issued or delayed delivery basis) | 47,478,941 | |||
| Interest, dividends and principal paydowns | 869,088 | |||
| Variation margin receivable | 12,534 | |||
| Shares of beneficial interest sold | 1,534 | |||
| Other | 59,325 | |||
| Total assets |
| 306,291,780
|
| |
Liabilities | ||||
| Payables and other liabilities: | ||||
| Investments purchased (including $102,034,198 purchased on a when-issued or delayed delivery basis) | 102,692,042 | |||
| Trustees’ compensation | 50,617 | |||
| Shares of beneficial interest redeemed | 48,468 | |||
| Distribution and service plan fees | 10,042 | |||
| Variation margin payable | 4,002 | |||
| Other | 33,640 | |||
| Total liabilities | 102,838,811 | |||
| Net Assets | $ | 203,452,969 | ||
Composition of Net Assets | ||||
| Par value of shares of beneficial interest | $ | 13,517 | ||
| Additional paid-in capital | 191,106,193 | |||
| Accumulated net investment income | 1,890,463 | |||
| Accumulated net realized gain on investments and foreign currency transactions | 1,858,746 | |||
| Net unrealized appreciation on investments and translation of assets and liabilities denominated in foreign currencies | 8,584,050 | |||
| Net Assets | $ | 203,452,969 | ||
Net Asset Value Per Share | ||||
| Non-Service Shares: | ||||
| Net asset value, redemption price per share and offering price per share (based on net assets of $155,347,048 and 10,291,939 shares of beneficial interest outstanding) | $15.09 | |||
| Service Shares: | ||||
| Net asset value, redemption price per share and offering price per share (based on net assets of $48,105,921 and 3,225,377 shares of beneficial interest outstanding) | $14.91 | |||
See accompanying Notes to Financial Statements.
20 OPPENHEIMER CONSERVATIVE BALANCED FUND/VA
STATEMENT OF OPERATIONS For the Six Months Ended June 30, 2018 Unaudited
Investment Income | ||||
| Interest (net of foreign withholding taxes of $1,538) | $ | 2,138,420 | ||
| Dividends: | ||||
| Unaffiliated companies (net of foreign withholding taxes of $28,293) | 549,125 | |||
| Affiliated companies | 40,314 | |||
| Total investment income | 2,727,859 | |||
Expenses | ||||
| Management fees | 777,787 | |||
| Distribution and service plan fees—service shares | 61,975 | |||
| Transfer and shareholder servicing agent fees: | ||||
| Non-Service shares | 94,925 | |||
| Service shares | 29,748 | |||
| Shareholder communications: | ||||
| Non-Service shares | 16,176 | |||
| Service shares | 5,069 | |||
| Custodian fees and expenses | 22,721 | |||
| Trustees’ compensation | 6,186 | |||
| Borrowing fees | 3,964 | |||
| Other | 38,990 | |||
| Total expenses | 1,057,541 | |||
| Less reduction to custodian expenses | (1,414) | |||
| Less waivers and reimbursements of expenses | (293,260) | |||
| Net expenses | 762,867 | |||
| Net Investment Income | 1,964,992 | |||
Realized and Unrealized Gain (Loss) | ||||
| Net realized gain (loss) on: | ||||
| Investment transactions in unaffiliated companies | 2,281,757 | |||
| Futures contracts | (190,545) | |||
| Foreign currency transactions | (1,015) | |||
| Swap contracts | (3,222) | |||
| Swaption contracts written | 9,030 | |||
| Net realized gain | 2,096,005 | |||
| Net change in unrealized appreciation/depreciation on: | ||||
| Investment transactions in unaffiliated companies | (6,162,996) | |||
| Translation of assets and liabilities denominated in foreign currencies | 1,105 | |||
| Futures contracts | (4,618) | |||
| Net change in unrealized appreciation/depreciation | (6,166,509) | |||
| Net Decrease in Net Assets Resulting from Operations | $ | (2,105,512) | ||
See accompanying Notes to Financial Statements.
21 OPPENHEIMER CONSERVATIVE BALANCED FUND/VA
STATEMENTS OF CHANGES IN NET ASSETS
| Six Months Ended June 30, 2018 (Unaudited) | Year Ended December 31, 2017 | |||||||
Operations | ||||||||
| Net investment income | $ | 1,964,992 | $ | 3,732,264 | ||||
| Net realized gain | 2,096,005 | 11,757,536 | ||||||
| Net change in unrealized appreciation/depreciation | (6,166,509) | 4,018,070 | ||||||
| Net increase (decrease) in net assets resulting from operations | (2,105,512) | 19,507,870 | ||||||
Dividends and/or Distributions to Shareholders | ||||||||
| Dividends from net investment income: | ||||||||
| Non-Service shares | (3,064,463) | (3,346,883) | ||||||
| Service shares | (836,784) | (889,490) | ||||||
| (3,901,247) | (4,236,373) | |||||||
| Distributions from net realized gain: | ||||||||
| Non-Service shares | (3,623,657) | — | ||||||
| Service shares | (1,149,810) | — | ||||||
| (4,773,467) | — | |||||||
Beneficial Interest Transactions | ||||||||
| Net decrease in net assets resulting from beneficial interest transactions: | ||||||||
| Non-Service shares | (2,426,158) | (18,304,514) | ||||||
| Service shares | (988,646) | (3,634,518) | ||||||
| (3,414,804) | (21,939,032) | |||||||
Net Assets | ||||||||
| Total decrease | (14,195,030) | (6,667,535) | ||||||
| Beginning of period | 217,647,999 | 224,315,534 | ||||||
| End of period (including accumulated net investment income of $ 1,890,463 and $ 3,826,718, respectively) | $ | 203,452,969 | $ | 217,647,999 | ||||
See accompanying Notes to Financial Statements.
22 OPPENHEIMER CONSERVATIVE BALANCED FUND/VA
FINANCIAL HIGHLIGHTS
| Non-Service Shares | Six Months Ended June 30, 2018 (Unaudited) | Year Ended December 31, 2017 | Year Ended December 31, 2016 | Year Ended December 31, 2015 | Year Ended December 31, 2014 | Year Ended December 31, 2013 | ||||||||||||||||
Per Share Operating Data | ||||||||||||||||||||||
| Net asset value, beginning of period | $15.92 | $14.86 | $14.46 | $14.67 | $13.84 | $12.52 | ||||||||||||||||
| Income (loss) from investment operations: | ||||||||||||||||||||||
| Net investment income1 | 0.15 | 0.27 | 0.26 | 0.31 | 0.29 | 0.25 | ||||||||||||||||
| Net realized and unrealized gain (loss) | (0.30) | 1.09 | 0.49 | (0.18) | 0.83 | 1.38 | ||||||||||||||||
|
| |||||||||||||||||||||
| Total from investment operations | (0.15) | 1.36 | 0.75 | 0.13 | 1.12 | 1.63 | ||||||||||||||||
| Dividends and/or distributions to shareholders: | ||||||||||||||||||||||
| Dividends from net investment income | (0.31) | (0.30) | (0.35) | (0.34) | (0.29) | (0.31) | ||||||||||||||||
| Distributions from net realized gain | (0.37) | 0.00 | 0.00 | 0.00 | 0.00 | 0.00 | ||||||||||||||||
|
| |||||||||||||||||||||
| Total dividends and/or distributions to shareholders | (0.68) | (0.30) | (0.35) | (0.34) | (0.29) | (0.31) | ||||||||||||||||
| Net asset value, end of period | $15.09 | $15.92 | $14.86 | $14.46 | $14.67 | $13.84 | ||||||||||||||||
|
| |||||||||||||||||||||
Total Return, at Net Asset Value2 | (0.99)% | 9.25% | 5.26% | 0.83% | 8.20% | 13.17% | ||||||||||||||||
Ratios/Supplemental Data | ||||||||||||||||||||||
| Net assets, end of period (in thousands) | $155,347 | $166,015 | $172,573 | $182,406 | $203,684 | $213,697 | ||||||||||||||||
| Average net assets (in thousands) | $159,459 | $170,438 | $177,368 | $194,208 | $208,556 | $218,090 | ||||||||||||||||
| Ratios to average net assets:3 | ||||||||||||||||||||||
| Net investment income | 1.95% | 1.74% | 1.78% | 2.09% | 2.03% | 1.87% | ||||||||||||||||
| Expenses excluding specific expenses listed below | 0.95% | 0.94% | 0.94% | 0.91% | 0.90% | 0.89% | ||||||||||||||||
| Interest and fees from borrowings | 0.00%4 | 0.00%4 | 0.00%4 | 0.00%4 | 0.00% | 0.00% | ||||||||||||||||
|
| |||||||||||||||||||||
| Total expenses5 | 0.95% | 0.94% | 0.94% | 0.91% | 0.90% | 0.89% | ||||||||||||||||
| Expenses after payments, waivers and/or reimbursements and reduction to custodian expenses | 0.67% | 0.67% | 0.67% | 0.67% | 0.67% | 0.66% | ||||||||||||||||
| Portfolio turnover rate6 | 32% | 76% | 68% | 68% | 98% | 187% | ||||||||||||||||
1. Per share amounts calculated based on the average shares outstanding during the period.
2. Assumes an initial investment on the business day before the first day of the fiscal period, with all dividends and distributions reinvested in additional shares on the reinvestment date, and redemption at the net asset value calculated on the last business day of the fiscal period. Total returns are not annualized for periods less than one full year. Total return information does not reflect expenses that apply at the separate account level or to related insurance products. Inclusion of these charges would reduce the total return figures for all periods shown. Returns do not reflect the deduction of taxes that a shareholder would pay on fund distributions or the redemption of fund shares.
3. Annualized for periods less than one full year.
4. Less than 0.005%.
5. Total expenses including indirect expenses from affiliated fund fees and expenses were as follows:
| Six Months Ended June 30, 2018 | 0.95 | % | ||||
| Year Ended December 31, 2017 | 0.94 | % | ||||
| Year Ended December 31, 2016 | 0.94 | % | ||||
| Year Ended December 31, 2015 | 0.91 | % | ||||
| Year Ended December 31, 2014 | 0.90 | % | ||||
| Year Ended December 31, 2013 | 0.90 | % | ||||
6. The portfolio turnover rate excludes purchase and sale transactions of To Be Announced (TBA) mortgage-related securities as follows:
| Purchase Transactions | Sale Transactions | |||||||
Six Months Ended June 30, 2018 | $400,190,001 | $398,399,976 | ||||||
Year Ended December 31, 2017 | $729,295,309 | $711,803,922 | ||||||
Year Ended December 31, 2016 | $737,550,642 | $742,753,245 | ||||||
Year Ended December 31, 2015 | $829,988,104 | $849,696,153 | ||||||
Year Ended December 31, 2014 | $697,503,637 | $678,765,376 | ||||||
Year Ended December 31, 2013 | $794,398,216 | $800,879,825 | ||||||
See accompanying Notes to Financial Statements.
23 OPPENHEIMER CONSERVATIVE BALANCED FUND/VA
FINANCIAL HIGHLIGHTS Continued
| Service Shares | Six Months Ended June 30, 2018 (Unaudited) | Year Ended December 31, 2017 | Year Ended December 31, 2016 | Year Ended December 31, 2015 | Year Ended December 31, 2014 | Year Ended December 31, 2013 | ||||||||||||||||
Per Share Operating Data | ||||||||||||||||||||||
| Net asset value, beginning of period | $15.71 | $14.67 | $14.28 | $14.49 | $13.66 | $12.37 | ||||||||||||||||
| Income (loss) from investment operations: | ||||||||||||||||||||||
| Net investment income1 | 0.13 | 0.23 | 0.22 | 0.27 | 0.25 | 0.21 | ||||||||||||||||
| Net realized and unrealized gain (loss) | (0.29) | 1.07 | 0.48 | (0.18) | 0.84 | 1.36 | ||||||||||||||||
|
| |||||||||||||||||||||
| Total from investment operations | (0.16) | 1.30 | 0.70 | 0.09 | 1.09 | 1.57 | ||||||||||||||||
| Dividends and/or distributions to shareholders: | ||||||||||||||||||||||
| Dividends from net investment income | (0.27) | (0.26) | (0.31) | (0.30) | (0.26) | (0.28) | ||||||||||||||||
| Distributions from net realized gain | (0.37) | 0.00 | 0.00 | 0.00 | 0.00 | 0.00 | ||||||||||||||||
|
| |||||||||||||||||||||
| Total dividends and/or distributions to shareholders | (0.64) | (0.26) | (0.31) | (0.30) | (0.26) | (0.28) | ||||||||||||||||
| Net asset value, end of period | $14.91 | $15.71 | $14.67 | $14.28 | $14.49 | $13.66 | ||||||||||||||||
|
| |||||||||||||||||||||
Total Return, at Net Asset Value2 | (1.09)% | 8.95% | 4.96% | 0.57% | 8.02% | 12.83% | ||||||||||||||||
Ratios/Supplemental Data | ||||||||||||||||||||||
| Net assets, end of period (in thousands) | $48,106 | $51,633 | $51,743 | $52,226 | $63,880 | $69,601 | ||||||||||||||||
| Average net assets (in thousands) | $49,967 | $51,345 | $53,914 | $59,085 | $65,450 | $72,332 | ||||||||||||||||
| Ratios to average net assets:3 | ||||||||||||||||||||||
| Net investment income | 1.70% | 1.49% | 1.53% | 1.84% | 1.78% | 1.62% | ||||||||||||||||
| Expenses excluding specific expenses listed below | 1.20% | 1.19% | 1.19% | 1.16% | 1.15% | 1.15% | ||||||||||||||||
| Interest and fees from borrowings | 0.00%4 | 0.00%4 | 0.00%4 | 0.00%4 | 0.00% | 0.00% | ||||||||||||||||
|
| |||||||||||||||||||||
| Total expenses5 | 1.20% | 1.19% | 1.19% | 1.16% | 1.15% | 1.15% | ||||||||||||||||
| Expenses after payments, waivers and/or reimbursements and reduction to custodian expenses | 0.92% | 0.92% | 0.92% | 0.92% | 0.92% | 0.92% | ||||||||||||||||
| Portfolio turnover rate6 | 32% | 76% | 68% | 68% | 98% | 187% | ||||||||||||||||
1. Per share amounts calculated based on the average shares outstanding during the period.
2. Assumes an initial investment on the business day before the first day of the fiscal period, with all dividends and distributions reinvested in additional shares on the reinvestment date, and redemption at the net asset value calculated on the last business day of the fiscal period. Total returns are not annualized for periods less than one full year. Total return information does not reflect expenses that apply at the separate account level or to related insurance products. Inclusion of these charges would reduce the total return figures for all periods shown. Returns do not reflect the deduction of taxes that a shareholder would pay on fund distributions or the redemption of fund shares.
3. Annualized for periods less than one full year.
4. Less than 0.005%.
5. Total expenses including indirect expenses from affiliated fund fees and expenses were as follows:
| Six Months Ended June 30, 2018 | 1.20 | % | ||||
| Year Ended December 31, 2017 | 1.19 | % | ||||
| Year Ended December 31, 2016 | 1.19 | % | ||||
| Year Ended December 31, 2015 | 1.16 | % | ||||
| Year Ended December 31, 2014 | 1.15 | % | ||||
| Year Ended December 31, 2013 | 1.16 | % | ||||
6. The portfolio turnover rate excludes purchase and sale transactions of To Be Announced (TBA) mortgage-related securities as follows:
| Purchase Transactions | Sale Transactions | |||||||
Six Months Ended June 30, 2018 | $400,190,001 | $398,399,976 | ||||||
Year Ended December 31, 2017 | $729,295,309 | $711,803,922 | ||||||
Year Ended December 31, 2016 | $737,550,642 | $742,753,245 | ||||||
Year Ended December 31, 2015 | $829,988,104 | $849,696,153 | ||||||
Year Ended December 31, 2014 | $697,503,637 | $678,765,376 | ||||||
Year Ended December 31, 2013 | $794,398,216 | $800,879,825 | ||||||
See accompanying Notes to Financial Statements.
24 OPPENHEIMER CONSERVATIVE BALANCED FUND/VA
NOTES TO FINANCIAL STATEMENTS June 30, 2018 Unaudited
1. Organization
Oppenheimer Conservative Balanced Fund/VA (the “Fund”), a separate series of Oppenheimer Variable Account Funds, is a diversified open-end management investment company registered under the Investment Company Act of 1940 (“1940 Act”), as amended. The Fund’s investment objective is to seek total return. The Fund’s investment adviser is OFI Global Asset Management, Inc. (“OFI Global” or the “Manager”), a wholly-owned subsidiary of OppenheimerFunds, Inc. (“OFI” or the “Sub-Adviser”). The Manager has entered into a sub-advisory agreement with OFI. Shares of the Fund are sold only to separate accounts of life insurance companies.
The Fund offers two classes of shares. Both classes are sold at their offering price, which is the net asset value per share, to separate investment accounts of participating insurance companies as an underlying investment for variable life insurance policies, variable annuity contracts or other investment products. The class of shares designated as Service shares is subject to a distribution and service plan. Both classes of shares have identical rights and voting privileges with respect to the Fund in general and exclusive voting rights on matters that affect that class alone. Earnings, net assets and net asset value per share may differ due to each class having its own expenses, such as transfer and shareholder servicing agent fees and shareholder communications, directly attributable to that class.
The following is a summary of significant accounting policies followed in the Fund’s preparation of financial statements in accordance with accounting principles generally accepted in the United States (“U.S. GAAP”).
2. Significant Accounting Policies
Security Valuation. All investments in securities are recorded at their estimated fair value, as described in Note 3.
Foreign Currency Translation. The books and records of the Fund are maintained in U.S. dollars. Any foreign currency amounts are translated into U.S. dollars on the following basis:
(1) Value of investment securities, other assets and liabilities — at the exchange rates prevailing at market close as described in Note 3.
(2) Purchases and sales of investment securities, income and expenses — at the rates of exchange prevailing on the respective dates of such transactions.
Although the net assets and the values are presented at the foreign exchange rates at market close, the Fund does not isolate the portion of the results of operations resulting from changes in foreign exchange rates on investments from the fluctuations arising from changes in prices of securities held. Such fluctuations are included with the net realized and unrealized gains or losses from investments shown in the Statement of Operations.
For securities, which are subject to foreign withholding tax upon disposition, realized and unrealized gains or losses on such securities are recorded net of foreign withholding tax.
Reported net realized foreign exchange gains or losses arise from sales of foreign currencies, currency gains or losses realized between the trade and settlement dates on securities transactions, the difference between the amounts of dividends, interest, and foreign withholding tax reclaims recorded on the Fund’s books, and the U.S. dollar equivalent of the amounts actually received or paid. Net unrealized foreign exchange gains and losses arise from changes in the value of assets and liabilities other than investments in securities, resulting from changes in the exchange rate.
Allocation of Income, Expenses, Gains and Losses. Income, expenses (other than those attributable to a specific class), gains and losses are allocated on a daily basis to each class of shares based upon the relative proportion of net assets represented by such class. Operating expenses directly attributable to a specific class are charged against the operations of that class.
Dividends and Distributions to Shareholders. Dividends and distributions to shareholders, which are determined in accordance with income tax regulations and may differ from U.S. GAAP, are recorded on the ex-dividend date. Income and capital gain distributions, if any, are declared and paid annually or at other times as determined necessary by the Manager.
The tax character of distributions is determined as of the Fund’s fiscal year end. Therefore, a portion of the Fund’s distributions made to shareholders prior to the Fund’s fiscal year end may ultimately be categorized as a tax return of capital.
Investment Income. Dividend income is recorded on the ex-dividend date or upon ex-dividend notification in the case of certain foreign dividends where the ex-dividend date may have passed. Non-cash dividends included in dividend income, if any, are recorded at the fair value of the securities received. Withholding taxes on foreign dividends, if any, and capital gains taxes on foreign investments, if any, have been provided for in accordance with the Fund’s understanding of the applicable tax rules and regulations. Interest income, if any, is recognized on an accrual basis. Discount and premium, which are included in interest income on the Statement of Operations, are amortized or accreted daily.
Return of Capital Estimates. Distributions received from the Fund’s investments in Master Limited Partnerships (MLPs) and Real Estate Investments Trusts (REITs), generally are comprised of income and return of capital. The Fund records investment income and return of capital based on estimates. Such estimates are based on historical information available from each MLP, REIT and other industry sources. These estimates may subsequently be revised based on information received from MLPs and REITs after their tax reporting periods are concluded.
Custodian Fees. “Custodian fees and expenses” in the Statement of Operations may include interest expense incurred by the Fund on any cash overdrafts of its custodian account during the period. Such cash overdrafts may result from the effects of failed trades in portfolio securities and from cash outflows resulting from unanticipated shareholder redemption activity. The Fund pays interest to its custodian on such cash overdrafts, to the extent they are not offset by positive cash balances maintained by the Fund, at a rate equal to the Federal Funds Rate plus 2.00%. The “Reduction to custodian
25 OPPENHEIMER CONSERVATIVE BALANCED FUND/VA
NOTES TO FINANCIAL STATEMENTS Unaudited / Continued
2. Significant Accounting Policies (Continued)
expenses” line item, if applicable, represents earnings on cash balances maintained by the Fund during the period. Such interest expense and other custodian fees may be paid with these earnings.
Security Transactions. Security transactions are recorded on the trade date. Realized gains and losses on securities sold are determined on the basis of identified cost.
Indemnifications. The Fund’s organizational documents provide current and former Trustees and officers with a limited indemnification against liabilities arising in connection with the performance of their duties to the Fund. In the normal course of business, the Fund may also enter into contracts that provide general indemnifications. The Fund’s maximum exposure under these arrangements is unknown as this would be dependent on future claims that may be made against the Fund. The risk of material loss from such claims is considered remote.
Federal Taxes. The Fund intends to comply with provisions of the Internal Revenue Code applicable to regulated investment companies and to distribute substantially all of its investment company taxable income to shareholders. Therefore, no federal income or excise tax provision is required. The Fund files income tax returns in U.S. federal and applicable state jurisdictions. The statute of limitations on the Fund’s tax return filings generally remains open for the three preceding fiscal reporting period ends. The Fund has analyzed its tax positions for the fiscal year ended December 31, 2017, including open tax years, and does not believe there are any uncertain tax positions requiring recognition in the Fund’s financial statements.
During the fiscal year ended December 31, 2017, the Fund utilized $5,261,675 of capital loss carryforwards to offset capital gains realized in that fiscal year. Capital losses will be carried forward to future years if not offset by gains.
At period end, it is estimated that the capital loss carryforwards would be zero. The estimated capital loss carryforward represents the carryforward as of the end of the last fiscal year, increased or decreased by capital losses or gains realized in the first six months of the current fiscal year. During the reporting period, it is estimated that the Fund will not utilize any capital loss carryforward to offset realized capital gains.
Net investment income (loss) and net realized gain (loss) may differ for financial statement and tax purposes. The character of dividends and distributions made during the fiscal year from net investment income or net realized gains are determined in accordance with federal income tax requirements, which may differ from the character of net investment income or net realized gains presented in those financial statements in accordance with U.S. GAAP. Also, due to timing of dividends and distributions, the fiscal year in which amounts are distributed may differ from the fiscal year in which the income or net realized gain was recorded by the Fund.
The aggregate cost of securities and other investments and the composition of unrealized appreciation and depreciation of securities and other investments for federal income tax purposes at period end are noted in the following table. The primary difference between book and tax appreciation or depreciation of securities and other investments, if applicable, is attributable to the tax deferral of losses or tax realization of financial statement unrealized gain or loss.
Federal tax cost of securities
| $
| 237,663,165
|
| |
Federal tax cost of other investments
|
| (88,858,916)
|
| |
|
| |||
| Total federal tax cost | $ | 148,804,249 | ||
|
| |||
Gross unrealized appreciation
| $
| 14,665,353
|
| |
Gross unrealized depreciation
|
| (6,177,884)
|
| |
|
| |||
| Net unrealized appreciation | $ | 8,487,469 | ||
|
|
Certain foreign countries impose a tax on capital gains which is accrued by the Fund based on unrealized appreciation, if any, on affected securities. The tax is paid when the gain is realized.
Use of Estimates. The preparation of financial statements in conformity with U.S. GAAP requires management to make estimates and assumptions that affect the reported amounts of assets and liabilities and disclosure of contingent assets and liabilities at the date of the financial statements and the reported amounts of increases and decreases in net assets from operations during the reporting period. Actual results could differ from those estimates.
3. Securities Valuation
The Fund calculates the net asset value of its shares as of 4:00 P.M. Eastern Time, on each day the New York Stock Exchange (the “Exchange”) is open for trading, except in the case of a scheduled early closing of the Exchange, in which case the Fund will calculate net asset value of the shares as of the scheduled early closing time of the Exchange.
The Fund’s Board has adopted procedures for the valuation of the Fund’s securities and has delegated the day-to-day responsibility for valuation determinations under those procedures to the Manager. The Manager has established a Valuation Committee which is responsible for determining a fair valuation for any security for which market quotations are not readily available. The Valuation Committee’s fair valuation determinations are subject to review, approval and ratification by the Fund’s Board at least quarterly or more frequently, if necessary.
Valuation Methods and Inputs
Securities are valued primarily using unadjusted quoted market prices, when available, as supplied by third party pricing services or broker-dealers.
The following methodologies are used to determine the market value or the fair value of the types of securities described below:
26 OPPENHEIMER CONSERVATIVE BALANCED FUND/VA
3. Securities Valuation (Continued)
Equity securities traded on a securities exchange (including exchange-traded derivatives other than futures and futures options) are valued based on the official closing price on the principal exchange on which the security is traded, as identified by the Manager, prior to the time when the Fund’s assets are valued. If the official closing price is unavailable, the security is valued at the last sale price on the principal exchange on which it is traded, or if no sales occurred, the security is valued at the mean between the quoted bid and asked prices. Over-the-counter equity securities are valued at the last published sale price, or if no sales occurred, at the mean between the quoted bid and asked prices. Events occurring after the close of trading on foreign exchanges may result in adjustments to the valuation of foreign securities to more accurately reflect their fair value as of the time when the Fund’s assets are valued.
Shares of a registered investment company that are not traded on an exchange are valued at that investment company’s net asset value per share.
Corporate and government debt securities (of U.S. or foreign issuers) and municipal debt securities, short-term notes, mortgage-backed securities, collateralized mortgage obligations, and asset-backed securities are valued at the mean between the bid and asked prices utilizing evaluated prices obtained from third party pricing services or broker-dealers who may use matrix pricing methods to determine the evaluated prices. Pricing services generally price debt securities assuming orderly transactions of an institutional “round lot” size, but some trades may occur in smaller, “odd lot” sizes, sometimes at lower prices than institutional round lot trades. Standard inputs generally considered by third-party pricing vendors include reported trade data, broker-dealer price quotations, benchmark yields, issuer spreads on comparable securities, the credit quality, yield, maturity, as well as other appropriate factors.
Futures contracts and futures options traded on a commodities or futures exchange will be valued at the final settlement price or official closing price on the principal exchange as reported by such principal exchange at its trading session ending at, or most recently prior to, the time when the Fund’s assets are valued.
Securities for which market quotations are not readily available, or when a significant event has occurred that would materially affect the value of the security, are fair valued either (i) by a standardized fair valuation methodology applicable to the security type or the significant event as previously approved by the Valuation Committee and the Fund’s Board or (ii) as determined in good faith by the Manager’s Valuation Committee. The Valuation Committee considers all relevant facts that are reasonably available, through either public information or information available to the Manager, when determining the fair value of a security. Those standardized fair valuation methodologies include, but are not limited to, valuing securities at the last sale price or initially at cost and subsequently adjusting the value based on: changes in company specific fundamentals, changes in an appropriate securities index, or changes in the value of similar securities which may be further adjusted for any discounts related to security-specific resale restrictions. When possible, such methodologies use observable market inputs such as unadjusted quoted prices of similar securities, observable interest rates, currency rates and yield curves. The methodologies used for valuing securities are not necessarily an indication of the risks associated with investing in those securities nor can it be assured that the Fund can obtain the fair value assigned to a security if it were to sell the security.
Classifications
Each investment asset or liability of the Fund is assigned a level at measurement date based on the significance and source of the inputs to its valuation. Various data inputs may be used in determining the value of each of the Fund’s investments as of the reporting period end. These data inputs are categorized in the following hierarchy under applicable financial accounting standards:
1) Level 1-unadjusted quoted prices in active markets for identical assets or liabilities (including securities actively traded on a securities exchange)
2) Level 2-inputs other than unadjusted quoted prices that are observable for the asset or liability (such as unadjusted quoted prices for similar assets and market corroborated inputs such as interest rates, prepayment speeds, credit risks, etc.)
3) Level 3-significant unobservable inputs (including the Manager’s own judgments about assumptions that market participants would use in pricing the asset or liability).
The inputs used for valuing securities are not necessarily an indication of the risks associated with investing in those securities.
The Fund classifies each of its investments in investment companies which are publicly offered as Level 1. Investment companies that are not publicly offered, if any, are classified as Level 2 in the fair value hierarchy.
The table below categorizes amounts that are included in the Fund’s Statement of Assets and Liabilities at period end based on valuation input level:
Level 1— Unadjusted | Level 2— Other Significant Observable Inputs | Level 3— Significant Unobservable Inputs | Value | |||||||||||||
| ||||||||||||||||
Assets Table | ||||||||||||||||
Investments, at Value: | ||||||||||||||||
| Common Stocks | ||||||||||||||||
Consumer Discretionary | $ | 6,281,061 | $ | — | $ | — | $ | 6,281,061 | ||||||||
Consumer Staples | 1,784,897 | 547,967 | — | 2,332,864 | ||||||||||||
Energy | 4,062,956 | — | — | 4,062,956 | ||||||||||||
Financials | 11,876,873 | — | — | 11,876,873 | ||||||||||||
Health Care | 10,468,527 | — | — | 10,468,527 | ||||||||||||
Industrials | 9,657,979 | — | — | 9,657,979 | ||||||||||||
Information Technology | 21,095,661 | — | — | 21,095,661 | ||||||||||||
Materials | 2,118,211 | — | — | 2,118,211 | ||||||||||||
Telecommunication Services | 2,076,767 | — | — | 2,076,767 | ||||||||||||
27 OPPENHEIMER CONSERVATIVE BALANCED FUND/VA
NOTES TO FINANCIAL STATEMENTS Unaudited / Continued
3. Securities Valuation (Continued)
Level 1— Unadjusted Quoted Prices | Level 2— Other Significant Observable Inputs | Level 3— Significant Unobservable Inputs | Value | |||||||||||||
| Common Stocks (Continued) | ||||||||||||||||
Utilities | $ | 2,141,122 | $ | 515,447 | $ | — | $ | 2,656,569 | ||||||||
| Asset-Backed Securities | — | 19,670,725 | — | 19,670,725 | ||||||||||||
| Mortgage-Backed Obligations | — | 82,022,457 | — | 82,022,457 | ||||||||||||
| U.S. Government Obligation | — | 547,828 | — | 547,828 | ||||||||||||
| Non-Convertible Corporate Bonds and Notes | — | 65,789,548 | — | 65,789,548 | ||||||||||||
| Investment Company | 5,367,607 | — | — | 5,367,607 | ||||||||||||
|
| |||||||||||||||
| Total Investments, at Value | 76,931,661 | 169,093,972 | — | 246,025,633 | ||||||||||||
| Other Financial Instruments: | ||||||||||||||||
| Futures contracts | 172,590 | — | — | 172,590 | ||||||||||||
|
| |||||||||||||||
| Total Assets | $ | 77,104,251 | $ | 169,093,972 | $ | — | $ | 246,198,223 | ||||||||
|
| |||||||||||||||
| Liabilities Table | ||||||||||||||||
| Other Financial Instruments: | ||||||||||||||||
| Futures contracts | $ | (47,119 | ) | $ | — | $ | — | $ | (47,119) | |||||||
|
| |||||||||||||||
| Total Liabilities | $ | (47,119 | ) | $ | — | $ | — | $ | (47,119) | |||||||
|
| |||||||||||||||
Forward currency exchange contracts and futures contracts, if any, are reported at their unrealized appreciation/depreciation at measurement date, which represents the change in the contract’s value from trade date. All additional assets and liabilities included in the above table are reported at their market value at measurement date.
The table below shows the transfers between Level 2 and Level 3. The Fund’s policy is to recognize transfers in and transfers out as of the beginning of the reporting period.
| Transfers into Level 2* | Transfers out of Level 3* | |||||||
| Assets Table | ||||||||
| Investments, at Value: | ||||||||
| Mortgage-Backed | ||||||||
| Obligations | $ | 128,201 | $ | (128,201) | ||||
|
| |||||||
| Total Assets | $ | 128,201 | $ | (128,201) | ||||
|
| |||||||
* Transferred from Level 3 to Level 2 due to the presence of a readily available unadjusted quoted market price.
4. Investments and Risks
Investments in Affiliated Funds. The Fund is permitted to invest in other mutual funds advised by the Manager (“Affiliated Funds”). Affiliated Funds are open-end management investment companies registered under the 1940 Act, as amended. The Manager is the investment adviser of, and the Sub-Adviser provides investment and related advisory services to, the Affiliated Funds. When applicable, the Fund’s investments in Affiliated Funds are included in the Statement of Investments. Shares of Affiliated Funds are valued at their net asset value per share. As a shareholder, the Fund is subject to its proportional share of the Affiliated Funds’ expenses, including their management fee. The Manager will waive fees and/or reimburse Fund expenses in an amount equal to the indirect management fees incurred through the Fund’s investment in the Affiliated Funds.
Each of the Affiliated Funds in which the Fund invests has its own investment risks, and those risks can affect the value of the Fund’s investments and therefore the value of the Fund’s shares. To the extent that the Fund invests more of its assets in one Affiliated Fund than in another, the Fund will have greater exposure to the risks of that Affiliated Fund.
Investments in Money Market Instruments. The Fund is permitted to invest its free cash balances in money market instruments to provide liquidity or for defensive purposes. The Fund may invest in money market instruments by investing in Class E shares of Oppenheimer Institutional Government Money Market Fund (“IGMMF”), which is an Affiliated Fund. IGMMF is regulated as a money market fund under the 1940 Act, as amended. The Fund may also invest in money market instruments directly or in other affiliated or unaffiliated money market funds.
Master Limited Partnerships (“MLPs”). MLPs issue common units that represent an equity ownership interest in a partnership and provide limited voting rights. MLP common units are registered with the Securities and Exchange Commission (“SEC”), and are freely tradable on securities exchanges such as the NYSE and the NASDAQ Stock Market (“NASDAQ”), or in the over-the-counter (“OTC”) market. An MLP consists of one or more general partners, who conduct the business, and one or more limited partners, who contribute capital. MLP common unit holders have a limited role in the partnership’s operations and management. The Fund, as a limited partner, normally would not be liable for the debts of the MLP beyond the amounts the Fund has contributed, but would not be shielded to the same extent that a shareholder of a corporation would be. In certain circumstances creditors of an MLP would have the right to seek return of capital distributed to a limited partner. This right of an MLP’s creditors would continue after the Fund sold its investment in the MLP.
28 OPPENHEIMER CONSERVATIVE BALANCED FUND/VA
4. Investments and Risks (Continued)
Securities on a When-Issued or Delayed Delivery Basis. The Fund may purchase securities on a “when-issued” basis, and may purchase or sell securities on a “delayed delivery” basis. “When-issued” or “delayed delivery” refers to securities whose terms and indenture are available and for which a market exists, but which are not available for immediate delivery. Delivery and payment for securities that have been purchased by the Fund on a when-issued basis normally takes place within six months and possibly as long as two years or more after the trade date. During this period, such securities do not earn interest, are subject to market fluctuation and may increase or decrease in value prior to their delivery. The purchase of securities on a when-issued basis may increase the volatility of the Fund’s net asset value to the extent the Fund executes such transactions while remaining substantially fully invested. When the Fund engages in when-issued or delayed delivery transactions, it relies on the buyer or seller, as the case may be, to complete the transaction. Their failure to do so may cause the Fund to lose the opportunity to obtain or dispose of the security at a price and yield it considers advantageous. The Fund may also sell securities that it purchased on a when-issued basis or forward commitment prior to settlement of the original purchase.
At period end, the Fund had purchased securities issued on a when-issued or delayed delivery basis and sold securities issued on a delayed delivery basis as follows:
When-Issued or Delayed Delivery Basis Transactions | ||||
| Purchased securities | $102,034,198 | |||
| Sold securities | 45,501,057 | |||
The Fund may enter into “forward roll” transactions with respect to mortgage-related securities. In this type of transaction, the Fund sells a mortgage-related security to a buyer and simultaneously agrees to repurchase a similar security (same type, coupon and maturity) at a later date at a set price. During the period between the sale and the repurchase, the Fund will not be entitled to receive interest and principal payments on the securities that have been sold. The Fund records the incremental difference between the forward purchase and sale of each forward roll as realized gain (loss) on investments or as fee income in the case of such transactions that have an associated fee in lieu of a difference in the forward purchase and sale price.
Forward roll transactions may be deemed to entail embedded leverage since the Fund purchases mortgage-related securities with extended settlement dates rather than paying for the securities under a normal settlement cycle. This embedded leverage increases the Fund’s market value of investments relative to its net assets which can incrementally increase the volatility of the Fund’s performance. Forward roll transactions can be replicated over multiple settlement periods.
Risks of entering into forward roll transactions include the potential inability of the counterparty to meet the terms of the agreement; the potential of the Fund to receive inferior securities at redelivery as compared to the securities sold to the counterparty; and counterparty credit risk.
At period end, the Fund pledged $32,751 of collateral to the counterparty for forward roll transactions.
Restricted Securities. At period end, investments in securities included issues that are restricted. A restricted security may have a contractual restriction on its resale and is valued under methods approved by the Board of Trustees as reflecting fair value. Securities that are restricted are marked with an applicable footnote on the Statement of Investments. Restricted securities are reported on a schedule following the Statement of Investments.
Equity Security Risk. Stocks and other equity securities fluctuate in price. The value of the Fund’s portfolio may be affected by changes in the equity markets generally. Equity markets may experience significant short-term volatility and may fall sharply at times. Different markets may behave differently from each other and U.S. equity markets may move in the opposite direction from one or more foreign stock markets. Adverse events in any part of the equity or fixed-income markets may have unexpected negative effects on other market segments.
The prices of individual equity securities generally do not all move in the same direction at the same time and a variety of factors can affect the price of a particular company’s securities. These factors may include, but are not limited to, poor earnings reports, a loss of customers, litigation against the company, general unfavorable performance of the company’s sector or industry, or changes in government regulations affecting the company or its industry.
Shareholder Concentration. At period end, one shareholder owned 20% or more of the Fund’s total outstanding shares.
The shareholder is a related party of the Fund. Related parties may include, but are not limited to, the investment manager and its affiliates, affiliated broker dealers, fund of funds, and directors or employees. The related party owned 30% of the Fund’s total outstanding shares at period end.
5. Market Risk Factors
The Fund’s investments in securities and/or financial derivatives may expose the Fund to various market risk factors:
Commodity Risk. Commodity risk relates to the change in value of commodities or commodity indexes as they relate to increases or decreases in the commodities market. Commodities are physical assets that have tangible properties. Examples of these types of assets are crude oil, heating oil, metals, livestock, and agricultural products.
Credit Risk. Credit risk relates to the ability of the issuer of debt to meet interest and principal payments, or both, as they come due. In general, lower-grade, higher-yield debt securities are subject to credit risk to a greater extent than lower-yield, higher-quality securities.
Equity Risk. Equity risk relates to the change in value of equity securities as they relate to increases or decreases in the general market.
29 OPPENHEIMER CONSERVATIVE BALANCED FUND/VA
NOTES TO FINANCIAL STATEMENTS Unaudited / Continued
5. Market Risk Factors (Continued)
Foreign Exchange Rate Risk. Foreign exchange rate risk relates to the change in the U.S. dollar value of a security held that is denominated in a foreign currency. The U.S. dollar value of a foreign currency denominated security will decrease as the dollar appreciates against the currency, while the U.S. dollar value will increase as the dollar depreciates against the currency.
Interest Rate Risk. Interest rate risk refers to the fluctuations in value of fixed-income securities resulting from the inverse relationship between price and yield. For example, an increase in general interest rates will tend to reduce the market value of already issued fixed-income investments, and a decline in general interest rates will tend to increase their value. In addition, debt securities with longer maturities, which tend to have higher yields, are subject to potentially greater fluctuations in value from changes in interest rates than obligations with shorter maturities.
Volatility Risk. Volatility risk refers to the magnitude of the movement, but not the direction of the movement, in a financial instrument’s price over a defined time period. Large increases or decreases in a financial instrument’s price over a relative time period typically indicate greater volatility risk, while small increases or decreases in its price typically indicate lower volatility risk.
6. Use of Derivatives
The Fund’s investment objective not only permits the Fund to purchase investment securities, it also allows the Fund to enter into various types of derivatives contracts, including, but not limited to, futures contracts, forward currency exchange contracts, credit default swaps, interest rate swaps, total return swaps, variance swaps and purchased and written options. In doing so, the Fund will employ strategies in differing combinations to permit it to increase, decrease, or change the level or types of exposure to market risk factors. These instruments may allow the Fund to pursue its objectives more quickly and efficiently than if it were to make direct purchases or sales of securities capable of effecting a similar response to market factors. Such contracts may be entered into through a bilateral over-the-counter (“OTC”) transaction, or through a securities or futures exchange and cleared through a clearinghouse.
Derivatives may have little or no initial cash investment relative to their market value exposure and therefore can produce significant gains or losses in excess of their cost due to changes in the market risk factors and the overall market. This use of embedded leverage allows the Fund to increase its market value exposure relative to its net assets and can substantially increase the volatility of the Fund’s performance. In instances where the Fund is using derivatives to decrease, or hedge, exposures to market risk factors for securities held by the Fund, there are also risks that those derivatives may not perform as expected resulting in losses for the combined or hedged positions. Some derivatives have the potential for unlimited loss, regardless of the size of the Fund’s initial investment.
Additional associated risks from investing in derivatives also exist and potentially could have significant effects on the valuation of the derivative and the Fund. Typically, the associated risks are not the risks that the Fund is attempting to increase or decrease exposure to, per its investment objectives, but are the additional risks from investing in derivatives. Examples of these associated risks are liquidity risk, which is the risk that the Fund will not be able to sell the derivative in the open market in a timely manner, and counterparty credit risk, which is the risk that the counterparty will not fulfill its obligation to the Fund.
The Fund’s actual exposures to these market risk factors and associated risks during the period are discussed in further detail, by derivative type, below.
Futures Contracts
A futures contract is a commitment to buy or sell a specific amount of a commodity, financial instrument or currency at a negotiated price on a stipulated future date. The Fund may buy and sell futures contracts and may also buy or write put or call options on these futures contracts. Futures contracts and options thereon are generally entered into on a regulated futures exchange and cleared through a clearinghouse associated with the exchange.
Upon entering into a futures contract, the Fund is required to deposit either cash or securities (initial margin) in an amount equal to a certain percentage of the contract value in an account registered in the futures commission merchant’s name. Subsequent payments (variation margin) are paid to or from the futures commission merchant each day equal to the daily changes in the contract value. Such payments are recorded as unrealized gains and losses. Should the Fund fail to make requested variation margin payments, the futures commission merchant can gain access to the initial margin to satisfy the Fund’s payment obligations.
Futures contracts are reported on a schedule following the Statement of Investments. Securities held by a futures commission merchant to cover initial margin requirements on open futures contracts are noted in the Statement of Investments. Cash held by a futures commission merchant to cover initial margin requirements on open futures contracts and the receivable and/or payable for the daily mark to market for the variation margin are noted in the Statement of Assets and Liabilities. The net change in unrealized appreciation and depreciation is reported in the Statement of Operations. Realized gains (losses) are reported in the Statement of Operations at the closing or expiration of futures contracts.
The Fund may purchase and/or sell financial futures contracts and options on futures contracts to gain exposure to, or decrease exposure to interest rate risk, equity risk, foreign exchange rate risk, volatility risk, or commodity risk.
During the reporting period, the Fund had an ending monthly average market value of $9,962,583 and $50,073,599 on futures contracts purchased and sold, respectively.
Additional associated risks of entering into futures contracts (and related options) include the possibility that there may be an illiquid market where the Fund is unable to liquidate the contract or enter into an offsetting position and, if used for hedging purposes, the risk that the price of the contract will correlate imperfectly with the prices of the Fund’s securities.
Swap Contracts
The Fund may enter into swap contract agreements with a counterparty to exchange a series of cash flows based on either specified reference rates,
30 OPPENHEIMER CONSERVATIVE BALANCED FUND/VA
6. Use of Derivatives (Continued)
the price or volatility of asset or non-asset references, or the occurrence of a credit event, over a specified period. Swaps can be executed in a bi-lateral privately negotiated arrangement with a dealer in an OTC transaction (“OTC swaps”) or executed on a regulated market. Certain swaps, regardless of the venue of their execution, are required to be cleared through a clearinghouse (“centrally cleared swaps”). Swap contracts may include interest rate, equity, debt, index, total return, credit default, currency, and volatility swaps.
Swap contracts are reported on a schedule following the Statement of Investments. The values of centrally cleared swap and OTC swap contracts are aggregated by positive and negative values and disclosed separately on the Statement of Assets and Liabilities. The unrealized appreciation (depreciation) related to the change in the valuation of the notional amount of the swap is combined with the accrued interest due to (owed by) the Fund, if any, at termination or settlement. The net change in this amount during the period is included on the Statement of Operations. The Fund also records any periodic payments received from (paid to) the counterparty, including at termination, under such contracts as realized gain (loss) on the Statement of Operations.
Swap contract agreements are exposed to the market risk factor of the specific underlying reference rate or asset. Swap contracts are typically more attractively priced compared to similar investments in related cash securities because they isolate the risk to one market risk factor and eliminate the other market risk factors. Investments in cash securities (for instance bonds) have exposure to multiple risk factors (credit and interest rate risk). Because swaps have embedded leverage, they can expose the Fund to substantial risk in the isolated market risk factor.
Credit Default Swap Contracts. A credit default swap is a contract that enables an investor to buy or sell protection against a defined-issuer credit event, such as the issuer’s failure to make timely payments of interest or principal on a debt security, bankruptcy or restructuring. The Fund may enter into credit default swaps either by buying or selling protection on a corporate issuer, sovereign issuer, or a basket or index of issuers (the “reference asset”).
The buyer of protection pays a periodic fee to the seller of protection based on the notional amount of the swap contract. The seller of protection agrees to compensate the buyer of protection for future potential losses as a result of a credit event on the reference asset. The contract effectively transfers the credit event risk of the reference asset from the buyer of protection to the seller of protection.
The ongoing value of the contract will fluctuate throughout the term of the contract based primarily on the credit risk of the reference asset. If the credit quality of the reference asset improves relative to the credit quality at contract initiation, the buyer of protection may have an unrealized loss greater than the anticipated periodic fee owed. This unrealized loss would be the result of current credit protection being cheaper than the cost of credit protection at contract initiation. If the buyer elects to terminate the contract prior to its maturity, and there has been no credit event, this unrealized loss will become realized. If the contract is held to maturity, and there has been no credit event, the realized loss will be equal to the periodic fee paid over the life of the contract.
If there is a credit event, the buyer of protection can exercise its rights under the contract and receive a payment from the seller of protection equal to the notional amount of the swap less the market value of specified debt securities issued by the reference asset. Upon exercise of the contract the difference between such value and the notional amount is recorded as realized gain (loss) and is included on the Statement of Operations.
The Fund may purchase or sell credit protection through credit default swaps to increase or decrease exposure to the credit risk of individual issuers and/or indexes of issuers that are either unavailable or considered to be less attractive in the bond market.
For the reporting period, the Fund had ending monthly average notional amounts of $89,286 on credit default swaps to sell protection.
Additional associated risks to the Fund include counterparty credit risk and liquidity risk.
At period end, the Fund had no credit default swap agreements outstanding.
Swaption Transactions
The Fund may enter into a swaption contract which grants the purchaser the right, but not the obligation, to enter into a swap transaction at preset terms detailed in the underlying agreement within a specified period of time. The purchaser pays a premium to the swaption writer who bears the risk of unfavorable changes in the preset terms on the underlying swap.
Purchased swaptions are reported as a component of investments in the Statement of Investments and the Statement of Assets and Liabilities. Written swaptions are reported on a schedule following the Statement of Investments and their value is reported as a separate asset or liability line item in the Statement of Assets and Liabilities. The net change in unrealized appreciation or depreciation on written swaptions is separately reported in the Statement of Operations. When a swaption is exercised, the cost of the swap is adjusted by the amount of premium paid or received. Upon the expiration or closing of an unexercised swaption contract, a gain or loss is reported in the Statement of Operations for the amount of the premium paid or received.
The Fund generally will incur a greater risk when it writes a swaption than when it purchases a swaption. When the Fund writes a swaption it will become obligated, upon exercise of the swaption, according to the terms of the underlying agreement. Swaption contracts written by the Fund do not give rise to counterparty credit risk prior to exercise as they obligate the Fund, not its counterparty, to perform. When the Fund purchases a swaption it only risks losing the amount of the premium it paid if the swaption expires unexercised. However, when the Fund exercises a purchased swaption there is a risk that the counterparty will fail to perform or otherwise default on its obligations under the swaption contract.
The Fund may purchase swaptions which give it the option to buy or sell credit protection through credit default swaps in order to decrease or increase exposure to the credit risk of individual issuers and/ or indexes of issuers. A swaption selling protection becomes more valuable as the likelihood of a credit event on the reference asset decreases. A swaption buying protection becomes more valuable as the likelihood of a credit event on the reference asset increases.
At period end, the Fund had no purchased swaption contracts outstanding.
The Fund may write swaptions which give it the obligation, if exercised by the purchaser, to sell or buy credit protection through credit default swaps in order to increase or decrease exposure to the credit risk of individual issuers and/or indexes of issuers. A written swaption selling protection becomes
31 OPPENHEIMER CONSERVATIVE BALANCED FUND/VA
NOTES TO FINANCIAL STATEMENTS Unaudited / Continued
6. Use of Derivatives (Continued)
more valuable as the likelihood of a credit event on the reference asset decreases. A written swaption buying protection becomes more valuable as the likelihood of a credit event on the reference asset increases.
During the reporting period, the Fund had an ending monthly average market value of $2,203 and $990 on purchased and written swaptions, respectively.
At period end, the Fund had no written swaption contracts outstanding.
Counterparty Credit Risk. Derivative positions are subject to the risk that the counterparty will not fulfill its obligation to the Fund. The Fund intends to enter into derivative transactions with counterparties that the Manager believes to be creditworthy at the time of the transaction.
The Fund’s risk of loss from counterparty credit risk on OTC derivatives is generally limited to the aggregate unrealized gain netted against any collateral held by the Fund. For OTC options purchased, the Fund bears the risk of loss of the amount of the premiums paid plus the positive change in market values net of any collateral held by the Fund should the counterparty fail to perform under the contracts. Options written by the Fund do not typically give rise to counterparty credit risk, as options written generally obligate the Fund and not the counterparty to perform.
To reduce counterparty risk with respect to OTC transactions, the Fund has entered into master netting arrangements, established within the Fund’s International Swap and Derivatives Association, Inc. (“ISDA”) master agreements, which allow the Fund to make (or to have an entitlement to receive) a single net payment in the event of default (close-out netting) for outstanding payables and receivables with respect to certain OTC positions in swaps, options, swaptions, and forward currency exchange contracts for each individual counterparty. In addition, the Fund may require that certain counterparties post cash and/or securities in collateral accounts to cover their net payment obligations for those derivative contracts subject to ISDA master agreements. If the counterparty fails to perform under these contracts and agreements, the cash and/or securities will be made available to the Fund.
ISDA master agreements include credit related contingent features which allow counterparties to OTC derivatives to terminate derivative contracts prior to maturity in the event that, for example, the Fund’s net assets decline by a stated percentage or the Fund fails to meet the terms of its ISDA master agreements, which would cause the Fund to accelerate payment of any net liability owed to the counterparty.
For financial reporting purposes, the Fund does not offset derivative assets and derivative liabilities that are subject to netting arrangements in the Statement of Assets and Liabilities. Bankruptcy or insolvency laws of a particular jurisdiction may impose restrictions on or prohibitions against the right of offset in bankruptcy, insolvency or other events.
The Fund’s risk of loss from counterparty credit risk on exchange-traded derivatives cleared through a clearinghouse and for centrally cleared swaps is generally considered lower than as compared to OTC derivatives. However, counterparty credit risk exists with respect to initial and variation margin deposited/paid by the Fund that is held in futures commission merchant, broker and/or clearinghouse accounts for such exchange-traded derivatives and for centrally cleared swaps.
With respect to centrally cleared swaps, such transactions will be submitted for clearing, and if cleared, will be held in accounts at futures commission merchants or brokers that are members of clearinghouses. While brokers, futures commission merchants and clearinghouses are required to segregate customer margin from their own assets, in the event that a broker, futures commission merchant or clearinghouse becomes insolvent or goes into bankruptcy and at that time there is a shortfall in the aggregate amount of margin held by the broker, futures commission merchant or clearinghouse for all its customers, U.S. bankruptcy laws will typically allocate that shortfall on a pro-rata basis across all the broker’s, futures commission merchant’s or clearinghouse’s customers, potentially resulting in losses to the Fund.
There is the risk that a broker, futures commission merchant or clearinghouse will decline to clear a transaction on the Fund’s behalf, and the Fund may be required to pay a termination fee to the executing broker with whom the Fund initially enters into the transaction. Clearinghouses may also be permitted to terminate centrally cleared swaps at any time. The Fund is also subject to the risk that the broker or futures commission merchant will improperly use the Fund’s assets deposited/paid as initial or variation margin to satisfy payment obligations of another customer. In the event of a default by another customer of the broker or futures commission merchant, the Fund might not receive its variation margin payments from the clearinghouse, due to the manner in which variation margin payments are aggregated for all customers of the broker/futures commission merchant.
Collateral and margin requirements differ by type of derivative. Margin requirements are established by the broker, futures commission merchant or clearinghouse for exchange-traded and cleared derivatives, including centrally cleared swaps. Brokers, futures commission merchants and clearinghouses can ask for margin in excess of the regulatory minimum, or increase the margin amount, in certain circumstances.
Collateral terms are contract specific for OTC derivatives. For derivatives traded under an ISDA master agreement, the collateral requirements are typically calculated by netting the mark to market amount for each transaction under such agreement and comparing that amount to the value of any collateral currently pledged by the Fund or the counterparty.
For financial reporting purposes, cash collateral that has been pledged to cover obligations of the Fund, if any, is reported separately on the Statement of Assets and Liabilities as cash pledged as collateral. Non-cash collateral pledged by the Fund, if any, is noted in the Statement of Investments. Generally, the amount of collateral due from or to a party must exceed a minimum transfer amount threshold (e.g. $250,000) before a transfer has to be made. To the extent amounts due to the Fund from its counterparties are not fully collateralized, contractually or otherwise, the Fund bears the risk of loss from counterparty nonperformance.
The following table presents the valuations of derivative instruments by risk exposure as reported within the Statement of Assets and Liabilities at period end:
32 OPPENHEIMER CONSERVATIVE BALANCED FUND/VA
6. Use of Derivatives (Continued)
Asset Derivatives | Liability Derivatives | |||||||||
Derivatives Not Accounted for as Hedging Instruments | Statement of Assets and Liabilities Location | Value | Statement of Assets and Liabilities Location | Value | ||||||
| ||||||||||
| Interest rate contracts Variation margin receivable | $ | 12,534* | Variation margin payable | $ 4,002* | ||||||
| * | Includes only the current day’s variation margin. Prior variation margin movements have been reflected in cash on the Statement of Assets and Liabilities upon receipt or payment. |
The effect of derivative instruments on the Statement of Operations is as follows:
| Amount of Realized Gain or (Loss) Recognized on Derivatives | ||||||||||||||||||||
| ||||||||||||||||||||
Derivatives Not Accounted for as Hedging Instruments | Investment transactions in unaffiliated companies* | Swaption | Futures contracts | Swap contracts | Total | |||||||||||||||
| ||||||||||||||||||||
| Credit contracts | $ | (19,040) | $ | 9,030 | $ | — | $ | (3,222) | $ | (13,232) | ||||||||||
| Interest rate contracts | — | — | (190,545 | ) | — | (190,545) | ||||||||||||||
|
| |||||||||||||||||||
| Total | $ | (19,040) | $ | 9,030 | $ | (190,545) | $ | (3,222) | $ | (203,777) | ||||||||||
|
| |||||||||||||||||||
| * | Includes purchased option contracts and purchased swaption contracts, if any. |
| Amount of Change in Unrealized Gain or (Loss) Recognized on Derivatives | ||||||
| ||||||
| Derivatives Not Accounted for as Hedging Instruments | Futures contracts | |||||
| ||||||
| Interest rate contracts | $ | (4,618) | ||||
7. Shares of Beneficial Interest
The Fund has authorized an unlimited number of $0.001 par value shares of beneficial interest of each class. Transactions in shares of beneficial interest were as follows:
| Six Months Ended June 30, 2018 | Year Ended December 31, 2017 | |||||||||||||||
| Shares | Amount | Shares | Amount | |||||||||||||
| Non-Service Shares | ||||||||||||||||
| Sold | 74,317 | $ | 1,170,560 | 167,674 | $ | 2,587,806 | ||||||||||
| Dividends and/or distributions reinvested | 439,719 | 6,688,120 | 217,048 | 3,346,883 | ||||||||||||
| Redeemed | (652,716 | ) | (10,284,838 | ) | (1,568,489 | ) | (24,239,203) | |||||||||
| Net decrease | (138,680 | ) | $ | (2,426,158 | ) | (1,183,767 | ) | $ | (18,304,514) | |||||||
| Service Shares | ||||||||||||||||
| Sold | 91,016 | $ | 1,418,281 | 258,277 | $ | 3,974,804 | ||||||||||
| Dividends and/or distributions reinvested | 132,175 | 1,986,594 | 58,365 | 889,490 | ||||||||||||
| Redeemed | (284,214 | ) | (4,393,521 | ) | (557,584 | ) | (8,498,812) | |||||||||
| Net decrease | (61,023 | ) | $ | (988,646 | ) | (240,942 | ) | $ | (3,634,518) | |||||||
8. Purchases and Sales of Securities
The aggregate cost of purchases and proceeds from sales of securities, other than short-term obligations and investments in IGMMF, for the reporting period were as follows:
| Purchases | Sales | |||||||
| Investment securities | $61,282,089 | $68,213,152 | ||||||
| U.S. government and government agency obligations | — | 130,820 | ||||||
| To Be Announced (TBA) mortgage-related securities | 400,190,001 | 398,399,976 | ||||||
9. Fees and Other Transactions with Affiliates
Management Fees. Under the investment advisory agreement, the Fund pays the Manager a management fee based on the daily net assets of the Fund at an annual rate as shown in the following table:
33 OPPENHEIMER CONSERVATIVE BALANCED FUND/VA
NOTES TO FINANCIAL STATEMENTS Unaudited / Continued
9. Fees and Other Transactions with Affiliates (Continued)
| Fee Schedule | ||||||||
| Up to $200 million | 0.75 | % | ||||||
| Next $200 million | 0.72 | |||||||
| Next $200 million | 0.69 | |||||||
| Next $200 million | 0.66 | |||||||
| Over $800 million | 0.60 | |||||||
The Fund’s effective management fee for the reporting period was 0.75% of average annual net assets before any applicable waivers.
Sub-Adviser Fees. The Manager has retained the Sub-Adviser to provide the day-to-day portfolio management of the Fund. Under the Sub-Advisory Agreement, the Manager pays the Sub-Adviser an annual fee in monthly installments, equal to a percentage of the investment management fee collected by the Manager from the Fund, which shall be calculated after any investment management fee waivers. The fee paid to the Sub-Adviser is paid by the Manager, not by the Fund.
Transfer Agent Fees. OFI Global (the “Transfer Agent”) serves as the transfer and shareholder servicing agent for the Fund. The Fund pays the Transfer Agent a fee based on annual net assets. Fees incurred and average net assets for each class with respect to these services are detailed in the Statement of Operations and Financial Highlights, respectively.
Sub-Transfer Agent Fees. The Transfer Agent has retained Shareholder Services, Inc., a wholly-owned subsidiary of OFI (the “Sub-Transfer Agent”), to provide the day-to-day transfer agent and shareholder servicing of the Fund. Under the Sub-Transfer Agency Agreement, the Transfer Agent pays the Sub-Transfer Agent an annual fee in monthly installments, equal to a percentage of the transfer agent fee collected by the Transfer Agent from the Fund, which shall be calculated after any applicable fee waivers. The fee paid to the Sub-Transfer Agent is paid by the Transfer Agent, not by the Fund.
Trustees’ Compensation. The Fund’s Board of Trustees (“Board”) has adopted a compensation deferral plan for Independent Trustees that enables Trustees to elect to defer receipt of all or a portion of the annual compensation they are entitled to receive from the Fund. For purposes of determining the amount owed to the Trustees under the plan, deferred amounts are treated as though equal dollar amounts had been invested in shares of the Fund or in other Oppenheimer funds selected by the Trustees. The Fund purchases shares of the funds selected for deferral by the Trustees in amounts equal to his or her deemed investment, resulting in a Fund asset equal to the deferred compensation liability. Such assets are included as a component of “Other” within the asset section of the Statement of Assets and Liabilities. Deferral of Trustees’ fees under the plan will not affect the net assets of the Fund and will not materially affect the Fund’s assets, liabilities or net investment income per share. Amounts will be deferred until distributed in accordance with the compensation deferral plan.
Distribution and Service Plan for Service Shares. The Fund has adopted a Distribution and Service Plan (the “Plan”) pursuant to Rule 12b-1 under the 1940 Act for Service shares to pay OppenheimerFunds Distributor, Inc. (the “Distributor”), for distribution related services, personal service and account maintenance for the Fund’s Service shares. Under the Plan, payments are made periodically at an annual rate of 0.25% of the daily net assets of Service shares of the Fund. The Distributor currently uses all of those fees to compensate sponsors of the insurance product that offers Fund shares, for providing personal service and maintenance of accounts of their variable contract owners that hold Service shares. These fees are paid out of the Fund’s assets on an on-going basis and increase operating expenses of the Service shares, which results in lower performance compared to the Fund’s shares that are not subject to a service fee. Fees incurred by the Fund under the Plan are detailed in the Statement of Operations.
Waivers and Reimbursements of Expenses. The Manager has contractually agreed to limit the Fund’s expenses after payments, waivers and/or reimbursements and reduction to custodian expenses, excluding any applicable dividend expense, taxes, interest and fees from borrowing, any subsidiary expenses, Acquired Fund Fees and Expenses, brokerage commissions, unusual and infrequent expenses and certain other Fund expenses; so that those expenses, as percentages of daily net assets, will not exceed the annual rate of 0.67% for Non-Service shares and 0.92% for Service shares as calculated on the daily net assets of the Fund.
During the reporting period, the waived fees and/or reimbursed the Fund as follows:
| Non-Service shares | $221,272 | |||
| Service shares | 69,325 |
This fee waiver and/or expense reimbursement may not be amended or withdrawn for one year from the date of the Fund’s prospectus, unless approved by the Board.
The Manager will waive fees and/or reimburse Fund expenses in an amount equal to the indirect management fees incurred through the Fund’s investment in IGMMF. During the reporting period, the Manager waived fees and/or reimbursed the Fund $2,663 for IGMMF management fees. This fee waiver and/or expense reimbursement may not be amended or withdrawn for one year from the date of the Fund’s prospectus, unless approved by the Board.
34 OPPENHEIMER CONSERVATIVE BALANCED FUND/VA
10. Borrowings and Other Financing
Joint Credit Facility. A number of mutual funds managed by the Manager participate in a $1.875 billion revolving credit facility (the “Facility”) intended to provide short-term financing, if necessary, subject to certain restrictions in connection with atypical redemption activity. Effective July 17, 2108, the Facility was increased to $1.95 billion. Expenses and fees related to the Facility are paid by the participating funds and are disclosed separately or as other expenses on the Statement of Operations. The Fund did not utilize the Facility during the reporting period.
35 OPPENHEIMER CONSERVATIVE BALANCED FUND/VA
PORTFOLIO PROXY VOTING POLICIES AND GUIDELINES; UPDATES TO STATEMENT OF INVESTMENTS Unaudited
The Fund has adopted Portfolio Proxy Voting Policies and Guidelines under which the Fund votes proxies relating to securities (“portfolio proxies”) held by the Fund. A description of the Fund’s Portfolio Proxy Voting Policies and Guidelines is available (i) without charge, upon request, by calling the Fund toll-free at 1.800.CALL OPP (225.5677), (ii) on the Fund’s website at www.oppenheimerfunds.com, and (iii) on the SEC’s website at www.sec.gov. In addition, the Fund is required to file Form N-PX, with its complete proxy voting record for the 12 months ended June 30th, no later than August 31st of each year. The Fund’s voting record is available (i) without charge, upon request, by calling the Fund toll-free at 1.800.CALL OPP (225.5677), and (ii) in the Form N-PX filing on the SEC’s website at www.sec.gov.
The Fund files its complete schedule of portfolio holdings with the SEC for the first quarter and the third quarter of each fiscal year on Form N-Q. The Fund’s Form N-Q filings are available on the SEC’s website at www.sec.gov. Those forms may be reviewed and copied at the SEC’s Public Reference Room in Washington, D.C. Information on the operation of the Public Reference Room may be obtained by calling 1-800-SEC-0330.
36 OPPENHEIMER CONSERVATIVE BALANCED FUND/VA
DISTRIBUTION SOURCES Unaudited
For any distribution that took place over the last six months of the Fund’s reporting period, the table below details on a per-share basis the percentage of the Fund’s total distribution payment amount that was derived from the following sources: net income, net profit from the sale of securities, and other capital sources. Other capital sources represent a return of capital. A return of capital may occur, for example, when some or all of the money that you invested in the Fund is paid back to you. A return of capital distribution does not necessarily reflect the Fund’s investment performance and should not be confused with “yield” or “income.” You should not draw any conclusions about the Fund’s investment performance from the amounts of these distributions. This information is based upon income and capital gains using generally accepted accounting principles as of the date of each distribution. If the Fund (or an underlying fund in which the Fund invests) invests in real estate investment trusts (REITs) and/or master limited partnerships (MLPs), the percentages attributed to each category are estimated using historical information because the character of the amounts received from the REITs and/or MLPs in which the Fund (or underlying fund) invests is unknown until after the end of the calendar year. Because the Fund is actively managed, the relative amount of the Fund’s total distributions derived from various sources over the calendar year may change. Please note that this information should not be used for tax reporting purposes as the tax character of distributable income may differ from the amounts used for this notification. You will receive communication in the first quarter of each calendar year detailing the actual amount of the taxable and non-taxable portion of distributions paid to you during the tax year.
For the most current information, please go to oppenheimerfunds.com. Select your Fund, and scroll down to the ‘Dividends’ table under ‘Analytics’. The Fund’s latest distribution information will be followed by the sources of any distribution, updated daily.
Fund Name |
Pay Date |
Net Income |
Net Profit from Sale |
Other Capital Sources | ||||
| Oppenheimer Conservative Balanced Fund/VA | 6/19/18 | 45.0% | 55.0% | 0.0% |
37 OPPENHEIMER CONSERVATIVE BALANCED FUND/VA
THIS PAGE INTENTIONALLY LEFT BLANK.
38 OPPENHEIMER CONSERVATIVE BALANCED FUND/VA
THIS PAGE INTENTIONALLY LEFT BLANK.
39 OPPENHEIMER CONSERVATIVE BALANCED FUND/VA
OPPENHEIMER CONSERVATIVE BALANCED FUND/VA
A Series of Oppenheimer Variable Account Funds
| ||
| Trustees and Officers | Robert J. Malone, Chairman of the Board of Trustees and Trustee | |
| Andrew J. Donohue, Trustee | ||
| Richard F. Grabish, Trustee | ||
| Beverly L. Hamilton, Trustee | ||
| Victoria J. Herget, Trustee | ||
| Karen L. Stuckey, Trustee | ||
| James D. Vaughn, Trustee | ||
| Arthur P. Steinmetz, Trustee, President and Principal Executive Officer | ||
| Magnus Krantz, Vice President | ||
| Krishna Memani, Vice President | ||
| Cynthia Lo Bessette, Secretary and Chief Legal Officer | ||
| Jennifer Foxson, Vice President and Chief Business Officer | ||
| Mary Ann Picciotto, Chief Compliance Officer and Chief Anti-Money Laundering Officer | ||
| Brian S. Petersen, Treasurer and Principal Financial & Accounting Officer | ||
| Manager | OFI Global Asset Management, Inc. | |
| Sub-Adviser | OppenheimerFunds, Inc. | |
| Distributor | OppenheimerFunds Distributor, Inc. | |
| Transfer and | OFI Global Asset Management, Inc. | |
| Shareholder | ||
| Servicing Agent | ||
| Sub-Transfer Agent | Shareholder Services, Inc. | |
| DBA OppenheimerFunds Services | ||
| Independent | KPMG LLP | |
| Registered | ||
| Public | ||
| Accounting | ||
| Firm | ||
| Legal Counsel | Ropes & Gray LLP | |
| Before investing in any of the Oppenheimer funds, investors should carefully consider a fund’s investment objectives, risks, charges and expenses. Fund prospectuses and summary prospectuses contain this and other information about the funds, and may be obtained by asking your financial advisor, visiting oppenheimerfunds.com or calling us at 1.800.988.8287. Read prospectuses and summary prospectuses carefully before investing. | ||
| The financial statements included herein have been taken from the records of the Fund without examination of those records by the independent registered public accounting firm. | ||
| © 2018 OppenheimerFunds, Inc. All rights reserved. Oppenheimer funds are distributed by OppenheimerFunds Distributor, Inc. | ||
 |
OppenheimerFunds® The Right Way to Invest | ||||
June 30, 2018 | ||||
Oppenheimer | ||||
Capital Appreciation Fund/VA | Semiannual Report | |||
A Series of Oppenheimer Variable Account Funds
| ||||
SEMIANNUAL REPORT | ||||
Listing of Top Holdings | ||||
Fund Performance Discussion | ||||
Financial Statements | ||||
PORTFOLIO MANAGER: Paul Larson
AVERAGE ANNUAL TOTAL RETURNS FOR THE PERIODS ENDED 6/30/18
| Inception Date | 6-Months | 1-Year | 5-Year | 10-Year | ||||||||||||||||
Non-Service Shares | 4/3/85 | 4.69% | 15.24% | 13.12% | 7.92% | |||||||||||||||
Service Shares | 9/18/01 | 4.56 | 14.94 | 12.83 | 7.65 | |||||||||||||||
S&P 500 Index | 2.65 | 14.37 | 13.42 | 10.17 | ||||||||||||||||
Russell 1000 Growth Index | 7.25 | 22.51 | 16.36 | 11.83 | ||||||||||||||||
Performance data quoted represents past performance, which does not guarantee future results. The investment return and principal value of an investment in the Fund will fluctuate so that an investor’s shares, when redeemed, may be worth more or less than their original cost. Current performance may be lower or higher than the performance quoted. For performance data current to the most recent month end, call us at 1.800.988.8287. The Fund’s total returns should not be expected to be the same as the returns of other funds, whether or not both funds have the same portfolio managers and/or similar names. The Fund’s total returns include changes in share price and reinvested distributions but do not include the charges associated with the separate account products that offer this Fund. Such performance would have been lower if such charges were taken into account. Returns for periods of less than one year are cumulative and not annualized. See Fund prospectuses and summary prospectuses for more information on share classes and sales charges.
The Fund’s performance is compared to the performance of the S&P 500 Index and the Russell 1000 Growth Index. The S&P 500 Index is a broad-based measure of domestic stock performance. The Russell 1000 Growth Index measures the performance of the large-cap growth segment of the U.S. equity universe. It includes those Russell 1000 companies with higher price-to-book ratios and higher forecasted growth values. The indices are unmanaged and cannot be purchased directly by investors. While index comparisons may be useful to provide a benchmark for the Fund’s performance, it must be noted that the Fund’s investments are not limited to the investments comprising the indices. Index performance includes reinvestment of income, but does not reflect transaction costs, fees, expenses or taxes. Index performance is shown for illustrative purposes only as a benchmark for the Fund’s performance, and does not predict or depict performance of the Fund. The Fund’s performance reflects the effects of the Fund’s business and operating expenses.
TOP HOLDINGS AND ALLOCATIONS
TOP TEN COMMON STOCK HOLDINGS
Facebook, Inc., Cl. A | 6.3% | |||
Microsoft Corp. | 6.2 | |||
Apple, Inc. | 6.0 | |||
Amazon.com, Inc. | 5.5 | |||
Alphabet, Inc., Cl. C | 5.0 | |||
Mastercard, Inc., Cl. A | 4.8 | |||
Lowe’s Cos., Inc. | 2.7 | |||
UnitedHealth Group, Inc. | 2.6 | |||
salesforce.com, Inc. | 2.4 | |||
Charles Schwab Corp. (The) | 1.8 |
Portfolio holdings and allocations are subject to change. Percentages are as of June 30, 2018, and are based on net assets. For more current Fund holdings, please visit oppenheimerfunds.com.
SECTOR ALLOCATION
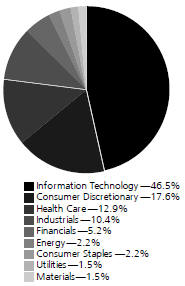
Portfolio holdings and allocations are subject to change. Percentages are as of June 30, 2018, and are based on the total market value of common stocks. For more current Fund holdings, please visit oppenheimerfunds.com.
2 OPPENHEIMER CAPITAL APPRECIATION FUND/VA
Fund Performance Discussion
During the reporting period, the Fund’s Non-Service shares generated a total return of 4.69%. In comparison, the Fund underperformed the Russell 1000 Growth Index, which returned 7.25% for the same period. The Fund’s underperformance was largely due to less favorable stock selection in the Consumer Discretionary, Information Technology and Health Care sectors. The Fund outperformed the Russell 1000 Growth Index within the Telecommunication Services, Real Estate, and Industrials sectors due to underweight positions in each of them. The Fund did not have any investments in the Telecommunication Services and Real Estate sectors at period end. The broader U.S. equity market, as measured by the S&P 500 Index, returned 2.65% this reporting period.
MARKET OVERVIEW
After starting the year with a continuation of the buoyant market environment seen for most of 2017, volatility finally returned to the U.S. equity market toward the end of January. The CBOE Volatility Index (VIX), after hitting all-time lows in 2017, spiked during the first quarter of 2018 before settling to a lower level at period end. Over the second quarter of 2018, the U.S. had good economic growth, low unemployment and low inflation, and the market showed resiliency despite increasing concerns related to tariffs and trade wars. Against this backdrop, U.S. equities generally produced positive returns for the overall six-month reporting period.
We continue to focus on the fundamentals of each business to drive our investment decisions versus getting caught up in the temporary emotions of the market, always with the long-term welfare of our shareholders in mind. Our philosophy is to seek companies with sustainable competitive advantages that have the potential to outperform in most market environments. We combine this with our valuation discipline to seek a margin of safety, with downside protection ever an important consideration.
TOP INDIVIDUAL CONTRIBUTORS
Top contributors to the Fund’s relative performance versus the Russell 1000 Growth Index this period included Mastercard, Westinghouse Air Brake Technologies (Wabtec), and Intuitive Surgical.
Mastercard’s performance was driven by strong core results reported over the second quarter of 2018, where revenues and earnings soundly beat expectations and organic revenue growth accelerated to over 20% year over year. While these results are unlikely sustainable, Mastercard has demonstrated an ability to grow at a faster pace than their largest competitor, Visa, driven by the strength of their services business, share gains in European processing and some market share gains internationally. Notably, during this reporting period, the company won Santander’s large UK debit business. More importantly, Mastercard continues to benefit from the long tail of revenue growth as the world transitions from cash and check to electronic forms of payment. The global ubiquity of acceptance at Visa and Mastercard make them both partners of choice for global card issuers.
Wabtec engages in the provision of equipment, systems, and value-added services for the rail industry. During the reporting period, it was announced that GE will merge its Transportation unit with Wabtec. Its shares rallied as a result. Not only will Wabtec be acquiring a business with essentially just one competitor in North America, but the deal will also allow the legacy Wabtec business to increase its content on GE locomotives.
Intuitive Surgical engages in the development, manufacture, and marketing of da Vinci Surgical Systems, currently the only at-scale platform for robot-assisted surgery. The platform allows for lower total costs (potential shorter hospital stays and fewer complications) as well as better patient experiences (smaller incisions versus traditional open methods). The company continues to post robust earnings results, boosted by strongly rising procedure growth on its platform.
TOP INDIVIDUAL DETRACTORS
Detractors from relative performance versus the Russell 1000 Growth Index this reporting period included Spirit Airlines, Spectrum Brands Holdings, and Celgene.
Rivalry within the domestic airline industry remains intense, with a combination of ongoing low fares and rising fuel prices stoking fears about current profitability. For Spirit Airlines, the long-term fundamental picture actually improved in the reporting period. After operational issues in mid-2017, the company signed a new five-year labor agreement with its pilots earlier this year. Despite the large bump in pay for the pilots, the company said it expects its relative cost advantage to expand further in the years ahead.
Spectrum Brands is in a state of flux. The bad news is the company experienced issues implementing a change to its distribution system, causing the company to lower full-year earnings guidance, leading to a ~25% drop in the stock over a two-day period in April. The stock has since recovered some of this ground,
3 OPPENHEIMER CAPITAL APPRECIATION FUND/VA
but it remains a major detractor. The good news is there are some positive changes happening at the company as well. Spectrum is in the process of merging with majority shareholder HRG Group, which will allow the company to greatly reduce its taxes for several years as well as eliminate a management distraction. Moreover, the sale of Spectrum’s battery business is on track, which will allow the company to reduce leverage as well as focus on the better businesses in its portfolio.
Celgene is a biotechnology company that experienced significant weakness in the fourth quarter of 2017 after lowering earnings guidance for the quarter and longer term through 2020. This was primarily due to lower expected revenues from Otezla, a drug treating certain types of arthritis, which accounts for ~10% of the company’s revenues. Secondarily, there was disappointment due to the withdrawal of a pipeline drug. These concerns are amplified in the context of the company’s blockbuster Revlimid (60+% of sales) facing patent expirations that start in 2022. The concerns appear overdone, however, as the company is on track to generate cumulative EPS of roughly three-fourths of its current stock price.
STRATEGY & OUTLOOK
In the short term, we expect the U.S. economy to continue to show modest economic growth. We believe this will likely be driven by favorable ongoing consumer confidence, tax benefits and falling regulatory hurdles. Rising home prices as well as technological innovation may also help drive the economy higher.
The risks we are focused on include trade tariffs, interest rates, disruption of traditional business models and the narrowness of the stock market rally in large-cap stocks. Regarding trade tariffs, we believe the market views it as a negotiating tactic and is implying that all will end well. A true escalation could severely hamper global growth and thereby stock prices. In addition, we are afraid companies are addicted to low interest rates. If interest rates were to rise materially, some companies’ historical decisions could look like misallocation of capital and negatively impact their stock prices. Innovation, while a positive for the overall economy over the long-term, could create short-term disruptions. Finally, there is risk around the growing disparity between stock prices of companies perceived as having “growth characteristics” irrespective of valuation versus the rest of the companies. History tells us that sooner or later, such narrow rallies result in investors crowding in a few stocks and may ultimately result in meaningful declines of those stocks.
We continue to maintain our discipline around valuation. Additionally, while innovation is alive and well and helping generate economic growth, fundamental disruptions across market segments have been elevated. We are constantly monitoring potential disruption risk to our companies.
Volatility in the markets has been unusually low by historical standards but could increase. Traditionally, during periods of heightened market volatility, investors generally favor stocks of higher quality companies—with greater consistency and stability of revenue and earnings—leading to relatively better stock performance of those companies. We think seeking companies with competitive advantages and skilled management teams positions us well, should this environment come to pass. During times of economic volatility such companies frequently widen their lead over weaker competitors. We seek to invest in companies characterized by these qualities at compelling valuations and believe this disciplined approach is essential to generating superior long-term performance.
The views in the Fund Performance Discussion represent the opinions of this Fund’s portfolio managers and are not intended as investment advice or to predict or depict the performance of any investment. These views are as of the close of business on June 30, 2018, and are subject to change based on subsequent developments. The Fund’s portfolio and strategies are subject to change.
Shares of Oppenheimer funds are not deposits or obligations of any bank, are not guaranteed by any bank, are not insured by the FDIC or any other agency, and involve investment risks, including the possible loss of the principal amount invested.
4 OPPENHEIMER CAPITAL APPRECIATION FUND/VA
Fund Expenses
Fund Expenses. As a shareholder of the Fund, you incur two types of costs: (1) transaction costs and (2) ongoing costs, including management fees; distribution and service fees; and other Fund expenses. These examples are intended to help you understand your ongoing costs (in dollars) of investing in the Fund and to compare these costs with the ongoing costs of investing in other mutual funds.
The examples are based on an investment of $1,000.00 invested at the beginning of the period and held for the entire 6-month period ended June 30, 2018.
Actual Expenses. The first section of the table provides information about actual account values and actual expenses. You may use the information in this section for the class of shares you hold, together with the amount you invested, to estimate the expense that you paid over the period. Simply divide your account value by $1,000.00 (for example, an $8,600.00 account value divided by $1,000.00 = 8.60), then multiply the result by the number in the first section under the heading entitled “Expenses Paid During 6 Months Ended June 30, 2018” to estimate the expenses you paid on your account during this period.
Hypothetical Example for Comparison Purposes.
The second section of the table provides information about hypothetical account values and hypothetical expenses based on the Fund’s actual expense ratio for each class of shares, and an assumed rate of return of 5% per year for each class before expenses, which is not the actual return. The hypothetical account values and expenses may not be used to estimate the actual ending account balance or expenses you paid for the period. You may use this information to compare the ongoing costs of investing in the Fund and other funds. To do so, compare this 5% hypothetical example for the class of shares you hold with the 5% hypothetical examples that appear in the shareholder reports of the other funds.
Please note that the expenses shown in the table are meant to highlight your ongoing costs only and do not reflect any charges associated with the separate accounts that offer this Fund. Therefore, the “hypothetical” lines of the table are useful in comparing ongoing costs only, and will not help you determine the relative total costs of owning different funds. In addition, if these separate account charges were included your costs would have been higher.
| Actual | Beginning Value | Ending Value | Expenses Paid During | |||||||||
Non-Service shares | $ | 1,000.00 | $ | 1,046.90 | $ | 4.07 | ||||||
Service shares | 1,000.00 | 1,045.60 | 5.34 | |||||||||
| Hypothetical | ||||||||||||
| (5% return before expenses) | ||||||||||||
Non-Service shares | 1,000.00 | 1,020.83 | 4.02 | |||||||||
Service shares | 1,000.00 | 1,019.59 | 5.27 | |||||||||
Expenses are equal to the Fund’s annualized expense ratio for that class, multiplied by the average account value over the period, multiplied by 181/365 (to reflect the one-half year period). Those annualized expense ratios, excluding indirect expenses from affiliated funds, based on the 6-month period ended June 30, 2018 are as follows:
| Class | Expense Ratios | |||||
Non-Service shares | 0.80% | |||||
Service shares | 1.05 | |||||
The expense ratios reflect voluntary and/or contractual waivers and/or reimbursements of expenses by the Fund’s Manager. Some of these undertakings may be modified or terminated at any time, as indicated in the Fund’s prospectus. The “Financial Highlights” tables in the Fund’s financial statements, included in this report, also show the gross expense ratios, without such waivers or reimbursements and reduction to custodian expenses, if applicable.
5 OPPENHEIMER CAPITAL APPRECIATION FUND/VA
STATEMENT OF INVESTMENTS June 30, 2018 Unaudited
| Shares | Value | |||||||
| ||||||||
Common Stocks—99.5% | ||||||||
| ||||||||
| Consumer Discretionary—17.5% | ||||||||
| ||||||||
| Hotels, Restaurants & Leisure—3.1% |
| |||||||
| ||||||||
| Cedar Fair LP1 | 194,982 | $ | 12,285,816 | |||||
| ||||||||
| Starbucks Corp. | 239,280 | 11,688,828 | ||||||
|
| |||||||
|
| 23,974,644
|
| ||||||
| ||||||||
| Internet & Catalog Retail—7.0% | ||||||||
| ||||||||
| Amazon.com, Inc.2 | 24,624 | 41,855,875 | ||||||
| ||||||||
| Booking Holdings, Inc.2 | 5,698 | 11,550,359 | ||||||
|
| |||||||
|
| 53,406,234
|
| ||||||
| ||||||||
| Media—0.9% | ||||||||
| ||||||||
Comcast Corp., Cl. A
|
| 199,107
|
|
| 6,532,701
|
| ||
| ||||||||
| Specialty Retail—6.5% | ||||||||
| ||||||||
| AutoNation, Inc.2 | 200,770 | 9,753,407 | ||||||
| ||||||||
| AutoZone, Inc.2 | 15,933 | 10,689,928 | ||||||
| ||||||||
| CarMax, Inc.2 | 112,150 | 8,172,370 | ||||||
| ||||||||
| Lowe’s Cos., Inc. | 217,690 | 20,804,633 | ||||||
|
| |||||||
|
| 49,420,338
|
| ||||||
| ||||||||
| Consumer Staples—2.1% | ||||||||
| ||||||||
| Food Products—1.2% | ||||||||
| ||||||||
| Kraft Heinz Co. (The) | 74,795 | 4,698,622 | ||||||
| ||||||||
| Mondelez International, Inc., Cl. A | 102,688 | 4,210,208 | ||||||
|
| |||||||
|
| 8,908,830
|
| ||||||
| ||||||||
| Household Products—0.9% | ||||||||
| ||||||||
| HRG Group, Inc.2 | 139,953 | 1,831,985 | ||||||
| ||||||||
| Spectrum Brands Holdings, Inc. | 67,705 | 5,526,082 | ||||||
|
| |||||||
|
| 7,358,067
|
| ||||||
| ||||||||
| Energy—2.1% | ||||||||
| ||||||||
| Oil, Gas & Consumable Fuels—2.1% | ||||||||
| ||||||||
| Husky Energy, Inc. | 336,851 | 5,250,125 | ||||||
| ||||||||
| Magellan Midstream Partners LP1 | 159,509 | 11,018,882 | ||||||
|
| |||||||
|
| 16,269,007
|
| ||||||
| ||||||||
| Financials—5.2% | ||||||||
| ||||||||
| Capital Markets—4.3% | ||||||||
| ||||||||
| Charles Schwab Corp. (The) | 268,873 | 13,739,410 | ||||||
| ||||||||
| CME Group, Inc., Cl. A | 37,185 | 6,095,365 | ||||||
| ||||||||
| Intercontinental Exchange, Inc. | 169,203 | 12,444,881 | ||||||
|
| |||||||
|
| 32,279,656
|
| ||||||
| ||||||||
| Diversified Financial Services—0.9% | ||||||||
| ||||||||
Berkshire Hathaway, Inc., Cl. B2
|
| 37,675
|
|
| 7,032,039
|
| ||
| ||||||||
| Health Care—12.9% | ||||||||
| ||||||||
| Biotechnology—5.6% | ||||||||
| ||||||||
| Biogen, Inc.2 | 35,910 | 10,422,519 | ||||||
| ||||||||
| Celgene Corp.2 | 118,674 | 9,425,089 | ||||||
| ||||||||
| Exact Sciences Corp.2 | 53,110 | 3,175,447 | ||||||
| ||||||||
| Galapagos NV2 | 39,292 | 3,604,501 | ||||||
| ||||||||
| Gilead Sciences, Inc. | 104,500 | 7,402,780 | ||||||
| ||||||||
| Vertex Pharmaceuticals, Inc.2 | 49,030 | 8,333,139 | ||||||
|
| |||||||
|
| 42,363,475
|
| ||||||
| ||||||||
| Health Care Equipment & Supplies—1.2% |
| |||||||
| ||||||||
Intuitive Surgical, Inc.2
|
| 18,363
|
|
| 8,786,328
|
| ||
| ||||||||
| Health Care Providers & Services—4.3% |
| |||||||
| ||||||||
| Laboratory Corp. of America Holdings2 | 70,635 | 12,681,102 | ||||||
| ||||||||
| UnitedHealth Group, Inc. | 82,330 | 20,198,842 | ||||||
|
| |||||||
|
| 32,879,944
|
| ||||||
| ||||||||
| Health Care Technology—0.7% | ||||||||
| ||||||||
Cerner Corp.2
|
| 87,870
|
|
| 5,253,747
|
| ||
| ||||||||
| Pharmaceuticals—1.1% | ||||||||
| ||||||||
Allergan plc
|
| 51,720
|
|
| 8,622,758
|
| ||
| ||||||||
| Industrials—10.4% | ||||||||
| ||||||||
| Aerospace & Defense—2.1% | ||||||||
| ||||||||
| Lockheed Martin Corp. | 18,410 | 5,438,866 | ||||||
| Shares | Value | |||||||
| ||||||||
| Aerospace & Defense (Continued) | ||||||||
| ||||||||
| Spirit AeroSystems Holdings, Inc., Cl. A | 121,280 | $ | 10,419,165 | |||||
|
| |||||||
|
| 15,858,031
|
| ||||||
| ||||||||
| Airlines—1.4% | ||||||||
| ||||||||
Spirit Airlines, Inc.2
|
| 300,780
|
|
| 10,933,353
|
| ||
| ||||||||
| Commercial Services & Supplies—2.1% |
| |||||||
| ||||||||
| Johnson Controls International plc | 102,908 | 3,442,273 | ||||||
| ||||||||
| KAR Auction Services, Inc. | 228,010 | 12,494,948 | ||||||
|
| |||||||
|
| 15,937,221
|
| ||||||
| ||||||||
| Machinery—2.2% | ||||||||
| ||||||||
| Deere & Co. | 37,493 | 5,241,521 | ||||||
| ||||||||
| Stanley Black & Decker, Inc. | 36,910 | 4,902,017 | ||||||
| ||||||||
| Wabtec Corp. | 69,100 | 6,811,878 | ||||||
|
| |||||||
|
| 16,955,416
|
| ||||||
| ||||||||
| Road & Rail—2.0% | ||||||||
| ||||||||
| Canadian National Railway Co. | 78,800 | 6,441,900 | ||||||
| ||||||||
| Union Pacific Corp. | 59,280 | 8,398,790 | ||||||
|
| |||||||
|
| 14,840,690
|
| ||||||
| ||||||||
| Trading Companies & Distributors—0.6% |
| |||||||
| ||||||||
Fastenal Co.
|
| 92,235
|
|
| 4,439,271
|
| ||
| ||||||||
| Information Technology—46.3% | ||||||||
| ||||||||
| Communications Equipment—0.6% | ||||||||
| ||||||||
Motorola Solutions, Inc.
|
| 42,260
|
|
| 4,917,796
|
| ||
| ||||||||
| Internet Software & Services—12.7% | ||||||||
| ||||||||
| Alphabet, Inc., Cl. C2 | 34,028 | 37,963,338 | ||||||
| ||||||||
| eBay, Inc.2 | 294,560 | 10,680,746 | ||||||
| ||||||||
| Facebook, Inc., Cl. A2 | 247,178 | 48,031,629 | ||||||
|
| |||||||
|
| 96,675,713
|
| ||||||
| ||||||||
| IT Services—7.4% | ||||||||
| ||||||||
| First Data Corp., Cl. A2 | 304,070 | 6,364,185 | ||||||
| ||||||||
| Mastercard, Inc., Cl. A | 186,668 | 36,683,995 | ||||||
| ||||||||
| PayPal Holdings, Inc.2 | 159,095 | 13,247,841 | ||||||
|
| |||||||
|
| 56,296,021
|
| ||||||
| ||||||||
| Semiconductors & Semiconductor Equipment—4.9% |
| |||||||
| ||||||||
| Applied Materials, Inc. | 129,930 | 6,001,467 | ||||||
| ||||||||
| Broadcom, Inc. | 37,530 | 9,106,279 | ||||||
| ||||||||
| NVIDIA Corp. | 40,400 | 9,570,760 | ||||||
| ||||||||
| Texas Instruments, Inc. | 111,318 | 12,272,809 | ||||||
|
| |||||||
|
| 36,951,315
|
| ||||||
| ||||||||
| Software—14.7% | ||||||||
| ||||||||
| Activision Blizzard, Inc. | 156,893 | 11,974,074 | ||||||
| ||||||||
| Microsoft Corp. | 478,313 | 47,166,445 | ||||||
| ||||||||
| Oracle Corp. | 310,790 | 13,693,407 | ||||||
| ||||||||
| Red Hat, Inc.2 | 43,670 | 5,867,938 | ||||||
| ||||||||
| salesforce.com, Inc.2 | 134,560 | 18,353,984 | ||||||
| ||||||||
| ServiceNow, Inc.2 | 72,170 | 12,447,160 | ||||||
| ||||||||
| Snap, Inc., Cl. A2 | 174,903 | 2,289,480 | ||||||
|
| |||||||
|
| 111,792,488
|
| ||||||
| ||||||||
| Technology Hardware, Storage & Peripherals—6.0% |
| |||||||
| ||||||||
Apple, Inc.
|
| 245,723
|
|
| 45,485,785
|
| ||
| ||||||||
| Materials—1.5% | ||||||||
| ||||||||
| Chemicals—0.5% | ||||||||
| ||||||||
Albemarle Corp.
|
| 40,783
|
|
| 3,847,060
|
| ||
| ||||||||
| Metals & Mining—1.0% | ||||||||
| ||||||||
Compass Minerals International, Inc.
|
| 115,368
|
|
| 7,585,446
|
| ||
| ||||||||
| Utilities—1.5% | ||||||||
| ||||||||
| Gas Utilities—1.5% | ||||||||
| ||||||||
| AmeriGas Partners LP1 | 269,940 | 11,396,867 | ||||||
|
| |||||||
| Total Common Stocks (Cost $533,732,429) | 757,000,241 | |||||||
6 OPPENHEIMER CAPITAL APPRECIATION FUND/VA
| Shares | Value | |||||||
| ||||||||
Investment Company—0.6% | ||||||||
| ||||||||
| Oppenheimer Institutional Government Money Market Fund, Cl. E, 1.85%3,4 (Cost $4,685,056) | 4,685,056 | $ | 4,685,056 | |||||
| ||||||||
| Total Investments, at Value (Cost | ||||||||
| $538,417,485) | 100.1% | 761,685,297 | ||||||
|
| |||||||
| Net Other Assets (Liabilities) | (0.1) | (986,011) | ||||||
|
| |||||||
| Net Assets | 100.0% | $ | 760,699,286 | |||||
|
| |||||||
Footnotes to Statement of Investments
1. Security is a Master Limited Partnership.
2. Non-income producing security.
3. Rate shown is the 7-day yield at period end.
4. Is or was an affiliate, as defined in the Investment Company Act of 1940, as amended, at or during the reporting period, by virtue of the Fund owning at least 5% of the voting securities of the issuer or as a result of the Fund and the issuer having the same investment adviser. Transactions during the reporting period in which the issuer was an affiliate are as follows:
| Shares December 31, 2017 | Gross Additions | Gross Reductions | Shares June 30, 2018 | |||||||||||||
| ||||||||||||||||
Oppenheimer Institutional Government Money Market Fund, Cl. E | — | 67,302,308 | 62,617,252 | 4,685,056 | ||||||||||||
Value |
Income |
Realized |
Change in Unrealized | |||||||||||||
| ||||||||||||||||
Oppenheimer Institutional Government Money Market Fund, Cl. E | $ | 4,685,056 | $ | 23,232 | $ | — | $ | — | ||||||||
See accompanying Notes to Financial Statements.
7 OPPENHEIMER CAPITAL APPRECIATION FUND/VA
STATEMENT OF ASSETS AND LIABILITIES June 30, 2018 Unaudited
| ||||
Assets | ||||
| Investments, at value—see accompanying statement of investments: | ||||
| Unaffiliated companies (cost $533,732,429) | $ | 757,000,241 | ||
| Affiliated companies (cost $4,685,056) | 4,685,056 | |||
|
| |||
| 761,685,297 | ||||
| ||||
| Cash | 1,999,564 | |||
| ||||
| Receivables and other assets: | ||||
| Dividends | 458,621 | |||
| Investments sold | 454,130 | |||
| Shares of beneficial interest sold | 20,758 | |||
| Other | 109,433 | |||
|
| |||
| Total assets | 764,727,803 | |||
| ||||
Liabilities | ||||
| Payables and other liabilities: | ||||
| Investments purchased | 3,384,580 | |||
| Shares of beneficial interest redeemed | 444,917 | |||
| Trustees’ compensation | 97,693 | |||
| Distribution and service plan fees | 44,941 | |||
| Shareholder communications | 28,784 | |||
| Other | 27,602 | |||
|
| |||
| Total liabilities | 4,028,517 | |||
| ||||
Net Assets | $ | 760,699,286 | ||
|
| |||
| ||||
Composition of Net Assets | ||||
| Par value of shares of beneficial interest | $ | 14,180 | ||
| ||||
| Additional paid-in capital | 496,251,942 | |||
| ||||
| Accumulated net investment loss | (1,049,937) | |||
| ||||
| Accumulated net realized gain on investments and foreign currency transactions | 42,232,343 | |||
| ||||
| Net unrealized appreciation on investments and translation of assets and liabilities denominated in foreign currencies | 223,250,758 | |||
|
| |||
Net Assets | $ | 760,699,286 | ||
|
| |||
| ||||
Net Asset Value Per Share | ||||
| Non-Service Shares: | ||||
| Net asset value, redemption price per share and offering price per share (based on net assets of $547,743,712 and 10,170,721 shares of beneficial interest outstanding) | $53.85 | |||
| ||||
Service Shares: | ||||
| Net asset value, redemption price per share and offering price per share (based on net assets of $212,955,574 and 4,009,029 shares of beneficial interest outstanding) | $53.12 | |||
See accompanying Notes to Financial Statements.
8 OPPENHEIMER CAPITAL APPRECIATION FUND/VA
STATEMENT OF OPERATIONS For the Six Months Ended June 30, 2018 Unaudited
| ||
Investment Income | ||||
| Dividends: | ||||
| Unaffiliated companies (net of foreign withholding taxes of $10,620) | $ | 4,000,584 | ||
| Affiliated companies | 23,232 | |||
|
| |||
| Total investment income | 4,023,816 | |||
| ||||
Expenses | ||||
| Management fees | 2,869,358 | |||
| ||||
| Distribution and service plan fees — Service shares | 335,829 | |||
| ||||
| Transfer and shareholder servicing agent fees: | ||||
| Non-Service shares | 330,342 | |||
| Service shares | 161,198 | |||
| ||||
| Shareholder communications: | ||||
| Non-Service shares | 18,644 | |||
| Service shares | 8,534 | |||
| ||||
| Borrowing fees | 15,707 | |||
| ||||
| Trustees’ compensation | 15,685 | |||
| ||||
| Custodian fees and expenses | 7,035 | |||
| ||||
| Other | 33,584 | |||
|
| |||
| Total expenses | 3,795,916 | |||
| Less reduction to custodian expenses | (641) | |||
| Less waivers and reimbursements of expenses | (166,806) | |||
|
| |||
| Net expenses | 3,628,469 | |||
| ||||
Net Investment Income | 395,347 | |||
| ||||
Realized and Unrealized Gain (Loss) | ||||
| Net realized gain on: | ||||
| Investment transactions in unaffiliated companies | 42,632,829 | |||
| Foreign currency transactions | 3,667 | |||
|
| |||
| Net realized gain | 42,636,496 | |||
| ||||
| Net change in unrealized appreciation/depreciation on: | ||||
| Investment transactions in unaffiliated companies | (9,192,803) | |||
| Translation of assets and liabilities denominated in foreign currencies | (4,023) | |||
|
| |||
| Net change in unrealized appreciation/depreciation | (9,196,826) | |||
| ||||
Net Increase in Net Assets Resulting from Operations | $ | 33,835,017 | ||
|
| |||
See accompanying Notes to Financial Statements.
9 OPPENHEIMER CAPITAL APPRECIATION FUND/VA
STATEMENTS OF CHANGES IN NET ASSETS
| Six Months Ended June 30, 2018 (Unaudited) | Year Ended December 31, 2017 | |||||||
Operations | ||||||||
| Net investment income | $ | 395,347 | $ | 1,688,841 | ||||
| ||||||||
| Net realized gain | 42,636,496 | 62,736,493 | ||||||
| ||||||||
| Net change in unrealized appreciation/depreciation | (9,196,826) | 136,373,539 | ||||||
|
| |||||||
| Net increase in net assets resulting from operations | 33,835,017 | 200,798,873 | ||||||
Dividends and/or Distributions to Shareholders | ||||||||
| Dividends from net investment income: | ||||||||
| Non-Service shares | (1,759,146) | (1,271,514) | ||||||
| Service shares | — | (28,819) | ||||||
|
| |||||||
| (1,759,146) | (1,300,333) | |||||||
| ||||||||
| Distributions from net realized gain: | ||||||||
| Non-Service shares | (41,372,587) | (48,408,998) | ||||||
| Service shares | (16,387,466) | (28,679,944) | ||||||
|
| |||||||
| (57,760,053) | (77,088,942) | |||||||
Beneficial Interest Transactions | ||||||||
| Net increase (decrease) in net assets resulting from beneficial interest transactions: | ||||||||
| Non-Service shares | 8,969,347 | (23,046,014) | ||||||
| Service shares | (95,677,355) | (23,253,888) | ||||||
|
| |||||||
| (86,708,008) | (46,299,902) | |||||||
Net Assets | ||||||||
| Total increase (decrease) | (112,392,190) | 76,109,696 | ||||||
| ||||||||
| Beginning of period | 873,091,476 | 796,981,780 | ||||||
|
| |||||||
| End of period (including accumulated net investment income (loss) of $(1,049,937) and $313,862, respectively) | $ | 760,699,286 | $ | 873,091,476 | ||||
|
| |||||||
See accompanying Notes to Financial Statements.
10 OPPENHEIMER CAPITAL APPRECIATION FUND/VA
FINANCIAL HIGHLIGHTS
| Non-Service Shares | Six Months Ended June 30, 2018 (Unaudited) | Year Ended December 31, 2017 | Year Ended December 31, 2016 | Year Ended December 31, 2015 | Year Ended December 31, 2014 | Year Ended December 31, 2013 | ||||||||||||||||||
Per Share Operating Data | ||||||||||||||||||||||||
| Net asset value, beginning of period | $55.70 | $48.36 | $55.49 | $64.87 | $57.88 | $45.06 | ||||||||||||||||||
| ||||||||||||||||||||||||
| Income (loss) from investment operations: | ||||||||||||||||||||||||
| Net investment income1 | 0.05 | 0.15 | 0.12 | 0.22 | 0.09 | 0.23 | ||||||||||||||||||
| Net realized and unrealized gain (loss) | 2.68 | 12.33 | (1.57) | 2.25 | 8.64 | 13.09 | ||||||||||||||||||
|
| |||||||||||||||||||||||
| Total from investment operations | 2.73 | 12.48 | (1.45) | 2.47 | 8.73 | 13.32 | ||||||||||||||||||
| ||||||||||||||||||||||||
| Dividends and/or distributions to shareholders: | ||||||||||||||||||||||||
| Dividends from net investment income | (0.19) | (0.13) | (0.22) | (0.06) | (0.27) | (0.50) | ||||||||||||||||||
| Distributions from net realized gain | (4.39) | (5.01) | (5.46) | (11.79) | (1.47) | 0.00 | ||||||||||||||||||
|
| |||||||||||||||||||||||
| Total dividends and/or distributions to shareholders | (4.58) | (5.14) | (5.68) | (11.85) | (1.74) | (0.50) | ||||||||||||||||||
| ||||||||||||||||||||||||
| Net asset value, end of period | $53.85 | $55.70 | $48.36 | $55.49 | $64.87 | $57.88 | ||||||||||||||||||
|
| |||||||||||||||||||||||
Total Return, at Net Asset Value2 | 4.69% | 26.83% | (2.20)% | 3.54% | 15.41% | 29.74% | ||||||||||||||||||
| ||||||||||||||||||||||||
Ratios/Supplemental Data | ||||||||||||||||||||||||
| Net assets, end of period (in thousands) | $547,744 | $556,227 | $501,756 | $564,514 | $616,862 | $626,907 | ||||||||||||||||||
| ||||||||||||||||||||||||
| Average net assets (in thousands) | $555,341 | $539,255 | $514,525 | $601,110 | $614,272 | $595,912 | ||||||||||||||||||
| ||||||||||||||||||||||||
| Ratios to average net assets:3 | ||||||||||||||||||||||||
| Net investment income | 0.18% | 0.29% | 0.25% | 0.36% | 0.15% | 0.44% | ||||||||||||||||||
| Expenses excluding specific expenses listed below | 0.84% | 0.82% | 0.83% | 0.81% | 0.80% | 0.81% | ||||||||||||||||||
| Interest and fees from borrowings | 0.00%4 | 0.00%4 | 0.00%4 | 0.00%4 | 0.00% | 0.00% | ||||||||||||||||||
|
| |||||||||||||||||||||||
| Total expenses5 | 0.84% | 0.82% | 0.83% | 0.81% | 0.80% | 0.81% | ||||||||||||||||||
| Expenses after payments, waivers and/or reimbursements and reduction to custodian expenses | 0.80% | 0.80% | 0.80% | 0.80% | 0.80%6 | 0.80% | ||||||||||||||||||
| ||||||||||||||||||||||||
| Portfolio turnover rate | 17% | 26% | 114% | 60% | 61% | 77% | ||||||||||||||||||
1. Per share amounts calculated based on the average shares outstanding during the period.
2. Assumes an initial investment on the business day before the first day of the fiscal period, with all dividends and distributions reinvested in additional shares on the reinvestment date, and redemption at the net asset value calculated on the last business day of the fiscal period. Total returns are not annualized for periods less than one full year. Total return information does not reflect expenses that apply at the separate account level or to related insurance products. Inclusion of these charges would reduce the total return figures for all periods shown. Returns do not reflect the deduction of taxes that a shareholder would pay on fund distributions or the redemption of fund shares.
3. Annualized for periods less than one full year.
4. Less than 0.005%.
5. Total expenses including indirect expenses from affiliated fund fees and expenses were as follows:
Six Months Ended June 30, 2018 | 0.84% | |||
Year Ended December 31, 2017 | 0.82% | |||
Year Ended December 31, 2016 | 0.83% | |||
Year Ended December 31, 2015 | 0.81% | |||
Year Ended December 31, 2014 | 0.80% | |||
Year Ended December 31, 2013 | 0.81% |
6. Waivers less than 0.005%.
See accompanying Notes to Financial Statements.
11 OPPENHEIMER CAPITAL APPRECIATION FUND/VA
FINANCIAL HIGHLIGHTS Continued
| Service Shares | Six Months Ended June 30, 2018 (Unaudited) | Year Ended December 31, 2017 | Year Ended December 31, 2016 | Year Ended December 31, 2015 | Year Ended December 31, 2014 | Year Ended December 31, 2013 | ||||||||||||||||||
| ||||||||||||||||||||||||
Per Share Operating Data | ||||||||||||||||||||||||
| Net asset value, beginning of period | $54.89 | $47.73 | $54.80 | $64.30 | $57.37 | $44.66 | ||||||||||||||||||
| ||||||||||||||||||||||||
| Income (loss) from investment operations: | ||||||||||||||||||||||||
| Net investment income (loss)1 | (0.02) | 0.02 | 0.002 | 0.07 | (0.06) | 0.10 | ||||||||||||||||||
| Net realized and unrealized gain (loss) | 2.64 | 12.16 | (1.55) | 2.22 | 8.57 | 12.98 | ||||||||||||||||||
|
| |||||||||||||||||||||||
| Total from investment operations | 2.62 | 12.18 | (1.55) | 2.29 | 8.51 | 13.08 | ||||||||||||||||||
| ||||||||||||||||||||||||
| Dividends and/or distributions to shareholders: | ||||||||||||||||||||||||
| Dividends from net investment income | 0.00 | (0.01) | (0.06) | 0.00 | (0.11) | (0.37) | ||||||||||||||||||
| Distributions from net realized gain | (4.39) | (5.01) | (5.46) | (11.79) | (1.47) | 0.00 | ||||||||||||||||||
|
| |||||||||||||||||||||||
| Total dividends and/or distributions to shareholders | (4.39) | (5.02) | (5.52) | (11.79) | (1.58) | (0.37) | ||||||||||||||||||
| ||||||||||||||||||||||||
| Net asset value, end of period | $53.12 | $54.89 | $47.73 | $54.80 | $64.30 | $57.37 | ||||||||||||||||||
|
| |||||||||||||||||||||||
| ||||||||||||||||||||||||
Total Return, at Net Asset Value3 | 4.56% | 26.50% | (2.43)% | 3.27% | 15.13% | 29.43% | ||||||||||||||||||
| ||||||||||||||||||||||||
Ratios/Supplemental Data | ||||||||||||||||||||||||
| Net assets, end of period (in thousands) | $212,955 | $316,864 | $295,226 | $317,737 | $337,318 | $364,214 | ||||||||||||||||||
| ||||||||||||||||||||||||
| Average net assets (in thousands) | $270,436 | $314,506 | $287,933 | $332,468 | $343,254 | $367,615 | ||||||||||||||||||
| ||||||||||||||||||||||||
| Ratios to average net assets:4 | ||||||||||||||||||||||||
| Net investment income (loss) | (0.07)% | 0.04% | 0.00%5 | 0.12% | (0.10)% | 0.20% | ||||||||||||||||||
| Expenses excluding specific expenses listed below | 1.09% | 1.07% | 1.08% | 1.06% | 1.05% | 1.06% | ||||||||||||||||||
| Interest and fees from borrowings | 0.00%5 | 0.00%5 | 0.00%5 | 0.00%5 | 0.00% | 0.00% | ||||||||||||||||||
|
| |||||||||||||||||||||||
| Total expenses6 | 1.09% | 1.07% | 1.08% | 1.06% | 1.05% | 1.06% | ||||||||||||||||||
| Expenses after payments, waivers and/or reimbursements and reduction to custodian expenses | 1.05% | 1.05% | 1.05% | 1.05% | 1.05%7 | 1.05% | ||||||||||||||||||
| ||||||||||||||||||||||||
| Portfolio turnover rate | 17% | 26% | 114% | 60% | 61% | 77% | ||||||||||||||||||
1. Per share amounts calculated based on the average shares outstanding during the period.
2. Less than $0.005 per share.
3. Assumes an initial investment on the business day before the first day of the fiscal period, with all dividends and distributions reinvested in additional shares on the reinvestment date, and redemption at the net asset value calculated on the last business day of the fiscal period. Total returns are not annualized for periods less than one full year. Total return information does not reflect expenses that apply at the separate account level or to related insurance products. Inclusion of these charges would reduce the total return figures for all periods shown. Returns do not reflect the deduction of taxes that a shareholder would pay on fund distributions or the redemption of fund shares.
4. Annualized for periods less than one full year.
5. Less than 0.005%.
6. Total expenses including indirect expenses from affiliated fund fees and expenses were as follows:
Six Months Ended June 30, 2018 | 1.09% | |||
Year Ended December 31, 2017 | 1.07% | |||
Year Ended December 31, 2016 | 1.08% | |||
Year Ended December 31, 2015 | 1.06% | |||
Year Ended December 31, 2014 | 1.05% | |||
Year Ended December 31, 2013 | 1.06% |
7. Waivers less than 0.005%.
See accompanying Notes to Financial Statements.
12 OPPENHEIMER CAPITAL APPRECIATION FUND/VA
NOTES TO FINANCIAL STATEMENTS June 30, 2018 Unaudited
1. Organization
Oppenheimer Capital Appreciation Fund/VA (the “Fund”), a separate series of Oppenheimer Variable Account Funds, is a diversified open-end management investment company registered under the Investment Company Act of 1940 (“1940 Act”), as amended. The Fund’s investment objective is to seek capital appreciation. The Fund’s investment adviser is OFI Global Asset Management, Inc. (“OFI Global” or the “Manager”), a wholly-owned subsidiary of OppenheimerFunds, Inc. (“OFI” or the “Sub-Adviser”). The Manager has entered into a sub-advisory agreement with OFI. Shares of the Fund are sold only to separate accounts of life insurance companies.
The Fund offers two classes of shares. Both classes are sold at their offering price, which is the net asset value per share, to separate investment accounts of participating insurance companies as an underlying investment for variable life insurance policies, variable annuity contracts or other investment products. The class of shares designated as Service shares is subject to a distribution and service plan. Both classes of shares have identical rights and voting privileges with respect to the Fund in general and exclusive voting rights on matters that affect that class alone. Earnings, net assets and net asset value per share may differ due to each class having its own expenses, such as transfer and shareholder servicing agent fees and shareholder communications, directly attributable to that class.
The following is a summary of significant accounting policies followed in the Fund’s preparation of financial statements in accordance with accounting principles generally accepted in the United States (“U.S. GAAP”).
2. Significant Accounting Policies
Security Valuation. All investments in securities are recorded at their estimated fair value, as described in Note 3.
Foreign Currency Translation. The books and records of the Fund are maintained in U.S. dollars. Any foreign currency amounts are translated into U.S. dollars on the following basis:
(1) Value of investment securities, other assets and liabilities — at the exchange rates prevailing at market close as described in Note 3.
(2) Purchases and sales of investment securities, income and expenses — at the rates of exchange prevailing on the respective dates of such transactions.
Although the net assets and the values are presented at the foreign exchange rates at market close, the Fund does not isolate the portion of the results of operations resulting from changes in foreign exchange rates on investments from the fluctuations arising from changes in prices of securities held. Such fluctuations are included with the net realized and unrealized gains or losses from investments shown in the Statement of Operations.
For securities, which are subject to foreign withholding tax upon disposition, realized and unrealized gains or losses on such securities are recorded net of foreign withholding tax.
Reported net realized foreign exchange gains or losses arise from sales of foreign currencies, currency gains or losses realized between the trade and settlement dates on securities transactions, the difference between the amounts of dividends, interest, and foreign withholding tax reclaims recorded on the Fund’s books, and the U.S. dollar equivalent of the amounts actually received or paid. Net unrealized foreign exchange gains and losses arise from changes in the value of assets and liabilities other than investments in securities, resulting from changes in the exchange rate.
Allocation of Income, Expenses, Gains and Losses. Income, expenses (other than those attributable to a specific class), gains and losses are allocated on a daily basis to each class of shares based upon the relative proportion of net assets represented by such class. Operating expenses directly attributable to a specific class are charged against the operations of that class.
Dividends and Distributions to Shareholders. Dividends and distributions to shareholders, which are determined in accordance with income tax regulations and may differ from U.S. GAAP, are recorded on the ex-dividend date. Income and capital gain distributions, if any, are declared and paid annually or at other times as determined necessary by the Manager.
The tax character of distributions is determined as of the Fund’s fiscal year end. Therefore, a portion of the Fund’s distributions made to shareholders prior to the Fund’s fiscal year end may ultimately be categorized as a tax return of capital.
Investment Income. Dividend income is recorded on the ex-dividend date or upon ex-dividend notification in the case of certain foreign dividends where the ex-dividend date may have passed. Non-cash dividends included in dividend income, if any, are recorded at the fair value of the securities received. Withholding taxes on foreign dividends, if any, and capital gains taxes on foreign investments, if any, have been provided for in accordance with the Fund’s understanding of the applicable tax rules and regulations. Interest income, if any, is recognized on an accrual basis. Discount and premium, which are included in interest income on the Statement of Operations, are amortized or accreted daily.
Return of Capital Estimates. Distributions received from the Fund’s investments in Master Limited Partnerships (MLPs) and Real Estate Investments Trusts (REITs), generally are comprised of income and return of capital. The Fund records investment income and return of capital based on estimates. Such estimates are based on historical information available from each MLP, REIT and other industry sources. These estimates may subsequently be revised based on information received from MLPs and REITs after their tax reporting periods are concluded.
Custodian Fees. “Custodian fees and expenses” in the Statement of Operations may include interest expense incurred by the Fund on any cash overdrafts of its custodian account during the period. Such cash overdrafts may result from the effects of failed trades in portfolio securities and from cash outflows resulting from unanticipated shareholder redemption activity. The Fund pays interest to its custodian on such cash overdrafts, to the extent they are not offset by positive cash balances maintained by the Fund, at a rate equal to the Federal Funds Rate plus 2.00%. The “Reduction to custodian
13 OPPENHEIMER CAPITAL APPRECIATION FUND/VA
NOTES TO FINANCIAL STATEMENTS Unaudited / Continued
2. Significant Accounting Policies (Continued)
expenses” line item, if applicable, represents earnings on cash balances maintained by the Fund during the period. Such interest expense and other custodian fees may be paid with these earnings.
Security Transactions. Security transactions are recorded on the trade date. Realized gains and losses on securities sold are determined on the basis of identified cost.
Indemnifications. The Fund’s organizational documents provide current and former Trustees and officers with a limited indemnification against liabilities arising in connection with the performance of their duties to the Fund. In the normal course of business, the Fund may also enter into contracts that provide general indemnifications. The Fund’s maximum exposure under these arrangements is unknown as this would be dependent on future claims that may be made against the Fund. The risk of material loss from such claims is considered remote.
Federal Taxes. The Fund intends to comply with provisions of the Internal Revenue Code applicable to regulated investment companies and to distribute substantially all of its investment company taxable income to shareholders. Therefore, no federal income or excise tax provision is required. The Fund files income tax returns in U.S. federal and applicable state jurisdictions. The statute of limitations on the Fund’s tax return filings generally remains open for the three preceding fiscal reporting period ends. The Fund has analyzed its tax positions for the fiscal year ended December 31, 2017, including open tax years, and does not believe there are any uncertain tax positions requiring recognition in the Fund’s financial statements.
During the fiscal year ended December 31, 2017, the Fund did not utilize any capital loss carryforwards to offset capital gains realized in that fiscal year. Capital losses will be carried forward to future years if not offset by gains.
At period end, it is estimated that there would be no capital loss carryforwards. The estimated capital loss carryforward represents the carryforward as of the end of the last fiscal year, increased or decreased by capital losses or gains realized in the first six months of the current fiscal year. During the reporting period, it is estimated that the Fund will not utilize any capital loss carryforward to offset realized capital gains.
Net investment income (loss) and net realized gain (loss) may differ for financial statement and tax purposes. The character of dividends and distributions made during the fiscal year from net investment income or net realized gains are determined in accordance with federal income tax requirements, which may differ from the character of net investment income or net realized gains presented in those financial statements in accordance with U.S. GAAP. Also, due to timing of dividends and distributions, the fiscal year in which amounts are distributed may differ from the fiscal year in which the income or net realized gain was recorded by the Fund.
The aggregate cost of securities and other investments and the composition of unrealized appreciation and depreciation of securities and other investments for federal income tax purposes at period end are noted in the following table. The primary difference between book and tax appreciation or depreciation of securities and other investments, if applicable, is attributable to the tax deferral of losses or tax realization of financial statement unrealized gain or loss.
Federal tax cost of securities | $ | 539,327,726 | ||
|
| |||
Gross unrealized appreciation | $ | 240,817,292 | ||
Gross unrealized depreciation | (18,476,775) | |||
|
| |||
Net unrealized appreciation | $ | 222,340,517 | ||
|
|
Use of Estimates. The preparation of financial statements in conformity with U.S. GAAP requires management to make estimates and assumptions that affect the reported amounts of assets and liabilities and disclosure of contingent assets and liabilities at the date of the financial statements and the reported amounts of increases and decreases in net assets from operations during the reporting period. Actual results could differ from those estimates.
3. Securities Valuation
The Fund calculates the net asset value of its shares as of 4:00 P.M. Eastern Time, on each day the New York Stock Exchange (the “Exchange”) is open for trading, except in the case of a scheduled early closing of the Exchange, in which case the Fund will calculate net asset value of the shares as of the scheduled early closing time of the Exchange.
The Fund’s Board has adopted procedures for the valuation of the Fund’s securities and has delegated the day-to-day responsibility for valuation determinations under those procedures to the Manager. The Manager has established a Valuation Committee which is responsible for determining a fair valuation for any security for which market quotations are not readily available. The Valuation Committee’s fair valuation determinations are subject to review, approval and ratification by the Fund’s Board at least quarterly or more frequently, if necessary.
Valuation Methods and Inputs
Securities are valued primarily using unadjusted quoted market prices, when available, as supplied by third party pricing services or broker-dealers.
The following methodologies are used to determine the market value or the fair value of the types of securities described below:
Equity securities traded on a securities exchange (including exchange-traded derivatives other than futures and futures options) are valued based on the official closing price on the principal exchange on which the security is traded, as identified by the Manager, prior to the time when the Fund’s assets are valued. If the official closing price is unavailable, the security is valued at the last sale price on the principal exchange on which it is traded, or if no sales occurred, the security is valued at the mean between the quoted bid and asked prices. Over-the-counter equity securities are valued at the last published sale price, or if no sales occurred, at the mean between the quoted bid and asked prices. Events occurring after the close of trading on foreign
14 OPPENHEIMER CAPITAL APPRECIATION FUND/VA
3. Securities Valuation (Continued)
exchanges may result in adjustments to the valuation of foreign securities to more accurately reflect their fair value as of the time when the Fund’s assets are valued.
Shares of a registered investment company that are not traded on an exchange are valued at that investment company’s net asset value per share.
Securities for which market quotations are not readily available, or when a significant event has occurred that would materially affect the value of the security, are fair valued either (i) by a standardized fair valuation methodology applicable to the security type or the significant event as previously approved by the Valuation Committee and the Fund’s Board or (ii) as determined in good faith by the Manager’s Valuation Committee. The Valuation Committee considers all relevant facts that are reasonably available, through either public information or information available to the Manager, when determining the fair value of a security. Those standardized fair valuation methodologies include, but are not limited to, valuing securities at the last sale price or initially at cost and subsequently adjusting the value based on: changes in company specific fundamentals, changes in an appropriate securities index, or changes in the value of similar securities which may be further adjusted for any discounts related to security-specific resale restrictions. When possible, such methodologies use observable market inputs such as unadjusted quoted prices of similar securities, observable interest rates, currency rates and yield curves. The methodologies used for valuing securities are not necessarily an indication of the risks associated with investing in those securities nor can it be assured that the Fund can obtain the fair value assigned to a security if it were to sell the security.
Classifications
Each investment asset or liability of the Fund is assigned a level at measurement date based on the significance and source of the inputs to its valuation. Various data inputs may be used in determining the value of each of the Fund’s investments as of the reporting period end. These data inputs are categorized in the following hierarchy under applicable financial accounting standards:
1) Level 1-unadjusted quoted prices in active markets for identical assets or liabilities (including securities actively traded on a securities exchange)
2) Level 2-inputs other than unadjusted quoted prices that are observable for the asset or liability (such as unadjusted quoted prices for similar assets and market corroborated inputs such as interest rates, prepayment speeds, credit risks, etc.)
3) Level 3-significant unobservable inputs (including the Manager’s own judgments about assumptions that market participants would use in pricing the asset or liability).
The inputs used for valuing securities are not necessarily an indication of the risks associated with investing in those securities.
The Fund classifies each of its investments in investment companies which are publicly offered as Level 1. Investment companies that are not publicly offered, if any, are classified as Level 2 in the fair value hierarchy.
The table below categorizes amounts that are included in the Fund’s Statement of Assets and Liabilities at period end based on valuation input level:
Level 1— Unadjusted Quoted Prices | Level 2— Other Significant Observable Inputs | Level 3— Significant Inputs | Value | |||||||||||||
| ||||||||||||||||
Assets Table | ||||||||||||||||
Investments, at Value: | ||||||||||||||||
Common Stocks | ||||||||||||||||
Consumer Discretionary | $ | 133,333,917 | $ | — | $ | — | $ | 133,333,917 | ||||||||
Consumer Staples | 16,266,897 | — | — | 16,266,897 | ||||||||||||
Energy | 16,269,007 | — | — | 16,269,007 | ||||||||||||
Financials | 39,311,695 | — | — | 39,311,695 | ||||||||||||
Health Care | 94,301,751 | 3,604,501 | — | 97,906,252 | ||||||||||||
Industrials | 78,963,982 | — | — | 78,963,982 | ||||||||||||
Information Technology | 352,119,118 | — | — | 352,119,118 | ||||||||||||
Materials | 11,432,506 | — | — | 11,432,506 | ||||||||||||
Utilities | 11,396,867 | — | — | 11,396,867 | ||||||||||||
Investment Company | 4,685,056 | — | — | 4,685,056 | ||||||||||||
|
| |||||||||||||||
Total Assets | $ | 758,080,796 | $ | 3,604,501 | $ | — | $ | 761,685,297 | ||||||||
|
| |||||||||||||||
Forward currency exchange contracts and futures contracts, if any, are reported at their unrealized appreciation/depreciation at measurement date, which represents the change in the contract’s value from trade date. All additional assets and liabilities included in the above table are reported at their market value at measurement date.
For the reporting period, there were no transfers between levels.
4. Investments and Risks
Investments in Affiliated Funds. The Fund is permitted to invest in other mutual funds advised by the Manager (“Affiliated Funds”). Affiliated Funds are open-end management investment companies registered under the 1940 Act, as amended. The Manager is the investment adviser of, and the Sub-Adviser provides investment and related advisory services to, the Affiliated Funds. When applicable, the Fund’s investments in Affiliated Funds are included in the Statement of Investments. Shares of Affiliated Funds are valued at their net asset value per share. As a shareholder, the Fund is subject to its proportional share of the Affiliated Funds’ expenses, including their management fee. The Manager will waive fees and/or reimburse Fund expenses in an amount equal to the indirect management fees incurred through the Fund’s investment in the Affiliated Funds.
15 OPPENHEIMER CAPITAL APPRECIATION FUND/VA
NOTES TO FINANCIAL STATEMENTS Unaudited / Continued
4. Investments and Risks (Continued)
Each of the Affiliated Funds in which the Fund invests has its own investment risks, and those risks can affect the value of the Fund’s investments and therefore the value of the Fund’s shares. To the extent that the Fund invests more of its assets in one Affiliated Fund than in another, the Fund will have greater exposure to the risks of that Affiliated Fund.
Investments in Money Market Instruments. The Fund is permitted to invest its free cash balances in money market instruments to provide liquidity or for defensive purposes. The Fund may invest in money market instruments by investing in Class E shares of Oppenheimer Institutional Government Money Market Fund (“IGMMF”), which is an Affiliated Fund. IGMMF is regulated as a money market fund under the 1940 Act, as amended. The Fund may also invest in money market instruments directly or in other affiliated or unaffiliated money market funds.
Master Limited Partnerships (“MLPs”). MLPs issue common units that represent an equity ownership interest in a partnership and provide limited voting rights. MLP common units are registered with the Securities and Exchange Commission (“SEC”), and are freely tradable on securities exchanges such as the NYSE and the NASDAQ Stock Market (“NASDAQ”), or in the over-the-counter (“OTC”) market. An MLP consists of one or more general partners, who conduct the business, and one or more limited partners, who contribute capital. MLP common unit holders have a limited role in the partnership’s operations and management. The Fund, as a limited partner, normally would not be liable for the debts of the MLP beyond the amounts the Fund has contributed, but would not be shielded to the same extent that a shareholder of a corporation would be. In certain circumstances creditors of an MLP would have the right to seek return of capital distributed to a limited partner. This right of an MLP’s creditors would continue after the Fund sold its investment in the MLP.
Equity Security Risk. Stocks and other equity securities fluctuate in price. The value of the Fund’s portfolio may be affected by changes in the equity markets generally. Equity markets may experience significant short-term volatility and may fall sharply at times. Different markets may behave differently from each other and U.S. equity markets may move in the opposite direction from one or more foreign stock markets. Adverse events in any part of the equity or fixed-income markets may have unexpected negative effects on other market segments.
The prices of individual equity securities generally do not all move in the same direction at the same time and a variety of factors can affect the price of a particular company’s securities. These factors may include, but are not limited to, poor earnings reports, a loss of customers, litigation against the company, general unfavorable performance of the company’s sector or industry, or changes in government regulations affecting the company or its industry.
Shareholder Concentration. At period end, one shareholder owned 20% or more of the Fund’s total outstanding shares.
The shareholder is a related party of the Fund. Related parties may include, but are not limited to, the investment manager and its affiliates, affiliated broker dealers, fund of funds, and directors or employees. The related party owned 23% of the Fund’s total outstanding shares at period end.
5. Market Risk Factors
The Fund’s investments in securities and/or financial derivatives may expose the Fund to various market risk factors:
Commodity Risk. Commodity risk relates to the change in value of commodities or commodity indexes as they relate to increases or decreases in the commodities market. Commodities are physical assets that have tangible properties. Examples of these types of assets are crude oil, heating oil, metals, livestock, and agricultural products.
Credit Risk. Credit risk relates to the ability of the issuer of debt to meet interest and principal payments, or both, as they come due. In general, lower-grade, higher-yield debt securities are subject to credit risk to a greater extent than lower-yield, higher-quality securities.
Equity Risk. Equity risk relates to the change in value of equity securities as they relate to increases or decreases in the general market.
Foreign Exchange Rate Risk. Foreign exchange rate risk relates to the change in the U.S. dollar value of a security held that is denominated in a foreign currency. The U.S. dollar value of a foreign currency denominated security will decrease as the dollar appreciates against the currency, while the U.S. dollar value will increase as the dollar depreciates against the currency.
Interest Rate Risk. Interest rate risk refers to the fluctuations in value of fixed-income securities resulting from the inverse relationship between price and yield. For example, an increase in general interest rates will tend to reduce the market value of already issued fixed-income investments, and a decline in general interest rates will tend to increase their value. In addition, debt securities with longer maturities, which tend to have higher yields, are subject to potentially greater fluctuations in value from changes in interest rates than obligations with shorter maturities.
Volatility Risk. Volatility risk refers to the magnitude of the movement, but not the direction of the movement, in a financial instrument’s price over a defined time period. Large increases or decreases in a financial instrument’s price over a relative time period typically indicate greater volatility risk, while small increases or decreases in its price typically indicate lower volatility risk.
6. Shares of Beneficial Interest
The Fund has authorized an unlimited number of $0.001 par value shares of beneficial interest of each class. Transactions in shares of beneficial interest were as follows:
16 OPPENHEIMER CAPITAL APPRECIATION FUND/VA
6. Shares of Beneficial Interest (Continued)
| Six Months Ended June 30, 2018 | Year Ended December 31, 2017 | |||||||||||||||
| Shares | Amount | Shares | Amount | |||||||||||||
| ||||||||||||||||
Non-Service Shares | ||||||||||||||||
Sold | 129,333 | $ | 7,321,653 | 393,813 | $ 20,493,018 | |||||||||||
Dividends and/or distributions reinvested | 779,254 | 43,131,733 | 978,541 | 49,680,512 | ||||||||||||
Redeemed | (724,127) | (41,484,039) | (1,761,563) | (93,219,544) | ||||||||||||
|
| |||||||||||||||
Net increase (decrease) | 184,460 | $ | 8,969,347 | (389,209) | $ (23,046,014) | |||||||||||
|
| |||||||||||||||
| ||||||||||||||||
Service Shares | ||||||||||||||||
Sold | 61,662 | $ | 3,426,082 | 127,462 | $ 6,431,379 | |||||||||||
Dividends and/or distributions reinvested | 300,192 | 16,387,466 | 573,029 | 28,708,763 | ||||||||||||
Redeemed | (2,125,381) | (115,490,903) | (1,113,678) | (58,394,030) | ||||||||||||
|
| |||||||||||||||
Net decrease | (1,763,527) | $(95,677,355) | (413,187) | $ (23,253,888) | ||||||||||||
|
| |||||||||||||||
7. Purchases and Sales of Securities
The aggregate cost of purchases and proceeds from sales of securities, other than short-term obligations and investments in IGMMF, for the reporting period were as follows:
| Purchases | Sales | |||||||
| ||||||||
Investment securities | $ | 137,296,275 | $ | 283,807,909 | ||||
8. Fees and Other Transactions with Affiliates
Management Fees. Under the investment advisory agreement, the Fund pays the Manager a management fee based on the daily net assets of the Fund at an annual rate as shown in the following table:
| Fee Schedule | ||||
Up to $200 million | 0.75% | |||
Next $200 million | 0.72 | |||
Next $200 million | 0.69 | |||
Next $200 million | 0.66 | |||
Next $200 million | 0.60 | |||
Over $1 billion | 0.58 | |||
The Fund’s effective management fee for the reporting period was 0.70% of average annual net assets before any applicable waivers.
Sub-Adviser Fees. The Manager has retained the Sub-Adviser to provide the day-to-day portfolio management of the Fund. Under the Sub-Advisory Agreement, the Manager pays the Sub-Adviser an annual fee in monthly installments, equal to a percentage of the investment management fee collected by the Manager from the Fund, which shall be calculated after any investment management fee waivers. The fee paid to the Sub-Adviser is paid by the Manager, not by the Fund.
Transfer Agent Fees. OFI Global (the “Transfer Agent”) serves as the transfer and shareholder servicing agent for the Fund. The Fund pays the Transfer Agent a fee based on annual net assets. Fees incurred and average net assets for each class with respect to these services are detailed in the Statement of Operations and Financial Highlights, respectively.
Sub-Transfer Agent Fees. The Transfer Agent has retained Shareholder Services, Inc., a wholly-owned subsidiary of OFI (the “Sub-Transfer Agent”), to provide the day-to-day transfer agent and shareholder servicing of the Fund. Under the Sub-Transfer Agency Agreement, the Transfer Agent pays the Sub-Transfer Agent an annual fee in monthly installments, equal to a percentage of the transfer agent fee collected by the Transfer Agent from the Fund, which shall be calculated after any applicable fee waivers. The fee paid to the Sub-Transfer Agent is paid by the Transfer Agent, not by the Fund.
Trustees’ Compensation. The Fund’s Board of Trustees (“Board”) has adopted a compensation deferral plan for Independent Trustees that enables Trustees to elect to defer receipt of all or a portion of the annual compensation they are entitled to receive from the Fund. For purposes of determining the amount owed to the Trustees under the plan, deferred amounts are treated as though equal dollar amounts had been invested in shares of the Fund or in other Oppenheimer funds selected by the Trustees. The Fund purchases shares of the funds selected for deferral by the Trustees in amounts equal to his or her deemed investment, resulting in a Fund asset equal to the deferred compensation liability. Such assets are included as a component of “Other” within the asset section of the Statement of Assets and Liabilities. Deferral of Trustees’ fees under the plan will not affect the net assets of the Fund and will not materially affect the Fund’s assets, liabilities or net investment income per share. Amounts will be deferred until distributed in accordance with the compensation deferral plan.
Distribution and Service Plan for Service Shares. The Fund has adopted a Distribution and Service Plan (the “Plan”) pursuant to Rule 12b-1 under the 1940 Act for Service shares to pay OppenheimerFunds Distributor, Inc. (the “Distributor”), for distribution related services, personal service and
17 OPPENHEIMER CAPITAL APPRECIATION FUND/VA
NOTES TO FINANCIAL STATEMENTS Unaudited / Continued
8. Fees and Other Transactions with Affiliates (Continued)
account maintenance for the Fund’s Service shares. Under the Plan, payments are made periodically at an annual rate of 0.25% of the daily net assets of Service shares of the Fund. The Distributor currently uses all of those fees to compensate sponsors of the insurance product that offers Fund shares, for providing personal service and maintenance of accounts of their variable contract owners that hold Service shares. These fees are paid out of the Fund’s assets on an on-going basis and increase operating expenses of the Service shares, which results in lower performance compared to the Fund’s shares that are not subject to a service fee. Fees incurred by the Fund under the Plan are detailed in the Statement of Operations.
Waivers and Reimbursements of Expenses. The Manager has contractually agreed to limit the Fund’s expenses after payments, waivers and/or reimbursements and reduction to custodian expenses, excluding any applicable dividend expense, taxes, interest and fees from borrowing, any subsidiary expenses, Acquired Fund Fees and Expenses, brokerage commissions, unusual and infrequent expenses and certain other Fund expenses; so that those expenses, as percentages of daily net assets, will not exceed the annual rate of 0.80% for Non-Service shares and 1.05% for Service shares.
During the reporting period, the Manager waived fees and/or reimbursed the Fund as follows:
Non-Service shares | $ | 113,811 | ||
Service shares | 51,387 |
This fee waiver and/or expense reimbursement may not be amended or withdrawn for one year from the date of the Fund’s prospectus, unless approved by the Board.
The Manager will waive fees and/or reimburse Fund expenses in an amount equal to the indirect management fees incurred through the Fund’s investment in IGMMF. During the reporting period, the Manager waived fees and/or reimbursed the Fund $1,608 for IGMMF management fees. This fee waiver and/or expense reimbursement may not be amended or withdrawn for one year from the date of the Fund’s prospectus, unless approved by the Board.
9. Borrowings and Other Financing
Joint Credit Facility. A number of mutual funds managed by the Manager participate in a $1.875 billion revolving credit facility (the “Facility”) intended to provide short-term financing, if necessary, subject to certain restrictions in connection with atypical redemption activity. Effective July 17, 2018, the Facility was increased to $1.95 billion. Expenses and fees related to the Facility are paid by the participating funds and are disclosed separately or as other expenses on the Statement of Operations. The Fund did not utilize the Facility during the reporting period.
18 OPPENHEIMER CAPITAL APPRECIATION FUND/VA
PORTFOLIO PROXY VOTING POLICIES AND GUIDELINES; UPDATES TO STATEMENT OF INVESTMENTS Unaudited
The Fund has adopted Portfolio Proxy Voting Policies and Guidelines under which the Fund votes proxies relating to securities (“portfolio proxies”) held by the Fund. A description of the Fund’s Portfolio Proxy Voting Policies and Guidelines is available (i) without charge, upon request, by calling the Fund toll-free at 1.800.CALL OPP (225.5677), (ii) on the Fund’s website at www.oppenheimerfunds.com, and (iii) on the SEC’s website at www.sec.gov. In addition, the Fund is required to file Form N-PX, with its complete proxy voting record for the 12 months ended June 30th, no later than August 31st of each year. The Fund’s voting record is available (i) without charge, upon request, by calling the Fund toll-free at 1.800.CALL OPP (225.5677), and (ii) in the Form N-PX filing on the SEC’s website at www.sec.gov.
The Fund files its complete schedule of portfolio holdings with the SEC for the first quarter and the third quarter of each fiscal year on Form N-Q. The Fund’s Form N-Q filings are available on the SEC’s website at www.sec.gov. Those forms may be reviewed and copied at the SEC’s Public Reference Room in Washington, D.C. Information on the operation of the Public Reference Room may be obtained by calling 1-800-SEC-0330.
19 OPPENHEIMER CAPITAL APPRECIATION FUND/VA
DISTRIBUTION SOURCES Unaudited
For any distribution that took place over the last six months of the Fund’s reporting period, the table below details on a per-share basis the percentage of the Fund’s total distribution payment amount that was derived from the following sources: net income, net profit from the sale of securities, and other capital sources. Other capital sources represent a return of capital. A return of capital may occur, for example, when some or all of the money that you invested in the Fund is paid back to you. A return of capital distribution does not necessarily reflect the Fund’s investment performance and should not be confused with “yield” or “income.” You should not draw any conclusions about the Fund’s investment performance from the amounts of these distributions. This information is based upon income and capital gains using generally accepted accounting principles as of the date of each distribution. If the Fund (or an underlying fund in which the Fund invests) invests in real estate investment trusts (REITs) and/or master limited partnerships (MLPs), the percentages attributed to each category are estimated using historical information because the character of the amounts received from the REITs and/or MLPs in which the Fund (or underlying fund) invests is unknown until after the end of the calendar year. Because the Fund is actively managed, the relative amount of the Fund’s total distributions derived from various sources over the calendar year may change. Please note that this information should not be used for tax reporting purposes as the tax character of distributable income may differ from the amounts used for this notification. You will receive communication in the first quarter of each calendar year detailing the actual amount of the taxable and non-taxable portion of distributions paid to you during the tax year.
For the most current information, please go to oppenheimerfunds.com. Select your Fund, and scroll down to the ‘Dividends’ table under ‘Analytics’. The Fund’s latest distribution information will be followed by the sources of any distribution, updated daily.
| Fund Name |
Pay Date |
Net Income |
Net Profit |
Other Sources | ||||||||||||
Oppenheimer Capital Appreciation Fund/VA | 6/19/18 | 3.0% | 97.0% | 0.0% | ||||||||||||
20 OPPENHEIMER CAPITAL APPRECIATION FUND/VA
THIS PAGE INTENTIONALLY LEFT BLANK.
21 OPPENHEIMER CAPITAL APPRECIATION FUND/VA
THIS PAGE INTENTIONALLY LEFT BLANK.
22 OPPENHEIMER CAPITAL APPRECIATION FUND/VA
THIS PAGE INTENTIONALLY LEFT BLANK.
23 OPPENHEIMER CAPITAL APPRECIATION FUND/VA
OPPENHEIMER CAPITAL APPRECIATION FUND/VA
A Series of Oppenheimer Variable Account Funds
| Trustees and Officers | Robert J. Malone, Chairman of the Board of Trustees and Trustee | |
| Andrew J. Donohue, Trustee | ||
| Richard F. Grabish, Trustee | ||
| Beverly L. Hamilton, Trustee | ||
| Victoria J. Herget, Trustee | ||
| Karen L. Stuckey, Trustee | ||
| James D. Vaughn, Trustee | ||
| Arthur P. Steinmetz, Trustee, President and Principal Executive Officer | ||
| Paul Larson, Vice President | ||
| Cynthia Lo Bessette, Secretary and Chief Legal Officer | ||
| Jennifer Foxson, Vice President and Chief Business Officer | ||
| Mary Ann Picciotto, Chief Compliance Officer and Chief Anti-Money Laundering Officer | ||
| Brian S. Petersen, Treasurer and Principal Financial & Accounting Officer | ||
| Manager | OFI Global Asset Management, Inc. | |
| Sub-Adviser | OppenheimerFunds, Inc. | |
| Distributor | OppenheimerFunds Distributor, Inc. | |
Transfer and Shareholder Servicing Agent | OFI Global Asset Management, Inc. | |
| Sub-Transfer Agent | Shareholder Services, Inc. | |
| DBA OppenheimerFunds Services | ||
Independent Registered Public Accounting Firm | KPMG LLP | |
| Legal Counsel | Ropes & Gray LLP | |
| Before investing in any of the Oppenheimer funds, investors should carefully consider a fund’s investment objectives, risks, charges and expenses. Fund prospectuses and summary prospectuses contain this and other information about the funds, and may be obtained by asking your financial advisor, visiting oppenheimerfunds.com or calling us at 1.800.988.8287. Read prospectuses and summary prospectuses carefully before investing. | ||
| The financial statements included herein have been taken from the records of the Fund without examination of those records by the independent registered public accounting firm. | ||
| © 2018 OppenheimerFunds, Inc. All rights reserved. Oppenheimer funds are distributed by OppenheimerFunds Distributor, Inc. | ||

OppenheimerFunds®
The Right Way
to Invest
 | ||||
June 30, 2018 | ||||
Oppenheimer | ||||
Total Return Bond Fund/VA | Semiannual Report | |||
A Series of Oppenheimer Variable Account Funds
| ||||
SEMIANNUAL REPORT | ||||
Listing of Top Holdings | ||||
Fund Performance Discussion | ||||
Financial Statements | ||||
PORTFOLIO MANAGERS: Krishna Memani and Peter A. Strzalkowski, CFA
AVERAGE ANNUAL TOTAL RETURNS FOR THE PERIODS ENDED 6/30/18
| Inception Date | 6-Months | 1-Year | 5-Year | 10-Year | ||||||||||||||||
Non-Service Shares | 4/3/85 | -2.21% | -0.69% | 3.09% | 0.29% | |||||||||||||||
Service Shares | 5/1/02 | -2.38 | -0.84 | 2.83 | 0.05 | |||||||||||||||
Bloomberg Barclays Credit Index | -2.99 | -0.65 | 3.37 | 5.15 | ||||||||||||||||
Bloomberg Barclays U.S. Aggregate Bond Index | -1.62 | -0.40 | 2.27 | 3.72 | ||||||||||||||||
FTSE US Broad Investment-Grade Bond Index | -1.65 | -0.45 | 2.26 | 3.75 | ||||||||||||||||
Performance data quoted represents past performance, which does not guarantee future results. The investment return and principal value of an investment in the Fund will fluctuate so that an investor’s shares, when redeemed, may be worth more or less than their original cost. Current performance may be lower or higher than the performance quoted. For performance data current to the most recent month end, call us at 1.800.988.8287. The Fund’s total returns should not be expected to be the same as the returns of other funds, whether or not both funds have the same portfolio managers and/or similar names. The Fund’s total returns include changes in share price and reinvested distributions but do not include the charges associated with the separate account products that offer this Fund. Such performance would have been lower if such charges were taken into account. Returns for periods of less than one year are cumulative and not annualized. See Fund prospectuses and summary prospectuses for more information on share classes and sales charges.
The Fund’s performance is compared to the performance of the Bloomberg Barclays Credit Index, an index of non-convertible U.S. investment grade corporate bonds; the Bloomberg Barclays U.S. Aggregate Bond Index, an index of U.S. corporate and government bonds and the FTSE US Broad Investment-Grade Bond Index, an index of institutionally traded U.S. Treasury Bonds, government-sponsored bonds, mortgage-backed securities and corporate securities. The indices are unmanaged and cannot be purchased directly by investors. While index comparisons may be useful to provide a benchmark for the Fund’s performance, it must be noted that the Fund’s investments are not limited to the investments comprising the indices. Index performance includes reinvestment of income, but does not reflect transaction costs, fees, expenses or taxes. Index performance is shown for illustrative purposes only as a benchmark for the Fund’s performance, and does not predict or depict performance of the Fund. The Fund’s performance reflects the effects of the Fund’s business and operating expenses.
TOP HOLDINGS AND ALLOCATIONS
PORTFOLIO ALLOCATION
| �� | |||
Mortgage-Backed Obligations | ||||
Government Agency | 32.5% | |||
Non-Agency | 11.8 | |||
Non-Convertible Corporate Bonds and Notes | 35.1 | |||
Asset-Backed Securities | 10.3 | |||
Short-Term Notes | 9.2 | |||
Investment Company | 1.0 | |||
U.S. Government Obligations | 0.1 |
Portfolio holdings and allocations are subject to change. Percentages are as of June 30, 2018 and are based on the total market value of investments. For more current Fund holdings, please visit oppenheimerfunds.com.
CORPORATE BONDS & NOTES - TOP TEN INDUSTRIES
|
| ||||
Commercial Banks | 6.5% | ||||
Oil, Gas & Consumable Fuels | 3.3 | ||||
Capital Markets | 2.6 | ||||
Electric Utilities | 2.4 | ||||
Automobiles | 2.3 | ||||
Diversified Telecommunication Services | 2.2 | ||||
Media | 1.6 | ||||
Insurance | 1.6 | ||||
Beverages | 1.5 | ||||
Food Products | 1.5 | ||||
Portfolio holdings and allocations are subject to change. Percentages are as of June 30, 2018, and are based on net assets. For more current Fund holdings, please visit oppenheimerfunds.com.
2 OPPENHEIMER TOTAL RETURN BOND FUND/VA
Fund Performance Discussion
MARKET OVERVIEW
The U.S. economy continued to perform well during the reporting period. U.S. 2018 gross domestic product (GDP) is expected to be around 3%, significantly exceeding its 2% trend growth of this expansion. Private consumption, the driving force of the economy in recent years, is growing at a stable rate. Additionally, business fixed investment has gained momentum in recent months and is broadening across sectors. With increasingly less slack in the economy, strong profits, and the corporate tax cuts, investment should support growth and productivity improvements.
The Federal Reserve (Fed) hiked the Fed Funds target rate by 25 basis points twice – in March and June – ending the period in a range of 1.75% - 2.00%. The Fed is on track to deliver 1-2 more hikes this year, as the economy is near the Fed’s dual mandate of full employment and price stability. On the inflation front, underlying inflation is around the Fed’s 2% target. The unemployment rate is at historical lows; however, the rising labor participation rate and stable wage growth suggest that there may still be some slack in the labor market. The Federal Open Market Committee (FOMC) under new chair Jerome Powell’s leadership signaled that the Fed will remain cautious and tighten policy gradually, giving comfort to the markets. Thus far, the Fed’s hiking cycle has been orderly.
Despite the strength of the U.S. economy and the Fed’s orderly hiking cycle, international economic and geopolitical concerns were noticeable during the reporting period and caused some market turbulence. Trade tensions were on the rise and there were pockets of political issues. Such tensions, especially regarding trade, made an impact on some investment decisions, as noted in the Fed’s minutes. So far, the measures implemented are not of major economic significance, in our view. At this point, we believe there is more rhetoric than actual impactful decisions. The risk remains, however, that trade issues negatively impact confidence or that retaliations could lead to more significant measures. While these are still not the baseline, risks are elevated and worth carefully monitoring.
In this environment, markets were volatile this reporting period. Equity markets in the U.S. produced positive results and outperformed international equities, with the S&P 500 Index returning 2.65% and the MSCI All Country World Index returning -0.43%. Fixed income markets generally produced negative returns this reporting period. The 10-year U.S. Treasury rate started the reporting period at 2.41% and hit a high of 3.11% in May, before ending the reporting period at 2.86%. U.S. Treasuries (as represented by the Bloomberg Barclays U.S. Treasury Index) produced negative results, with a -1.62% return. The FTSE US Broad Investment-Grade Bond Index also lost value, returning -1.65%. Credit underperformed for the reporting period, with the Bloomberg Barclays Credit Index returning -2.99%.
FUND REVIEW
Against this backdrop, the Fund’s Non-Service shares produced a return of -2.21% during the reporting period, underperforming the Bloomberg Barclays U.S. Aggregate Bond Index (“the Index”). In a period where credit underperformed U.S. Treasuries, the Fund’s strategic underweight position to U.S. Treasuries was the largest detractor from performance versus the Index. In addition, the Fund’s position in investment grade corporate credit detracted from performance this reporting period.
Positive contributors to performance this reporting period included the Fund’s security selection in asset-backed securities (“ABS”), where we favored auto ABS given what we view as attractive fundamentals in the space. In addition, the Fund’s allocation to non-agency mortgage-backed securities (“MBS”) benefitted performance.
STRATEGY & OUTLOOK
We believe macroeconomic fundamentals should remain solid with a potential increase in U.S. growth due to the stimulus package and tax reform. We believe the Fed will raise interest rates two more times this year depending on economic data after the most recent increase in June. We generally maintain a neutral duration position. However, given the Fed’s interest on continuing to raise short-term interest rates, we have sought to reduce interest rate risk with a slightly shorter effective duration of 5.09 years relative to the Index’s duration of 5.99 years.
On a sector level, we continue to maintain our strategic underweight to U.S. Treasuries. In lieu of Treasuries, we continue to maintain our overweight in agency MBS relative to the Index. We believe the sector’s high-quality and spread above Treasuries make it an attractive area to add incremental yield potential to the portfolio. Within structured credit, we continue to avoid student loans and more esoteric ABS. We continue to favor auto ABS given what we view as the sector’s attractive fundamentals, carry and solid structures. We have also maintained a smaller overweight in commercial MBS and remain up-in-structure there. Overall, we are more cautious on credit in general as we believe we currently reside in the fourth quarter of the credit cycle. We remain cautiously engaged in investment-grade corporate credit with modest exposure to typically high Sharpe Ratio BB-rated corporates. As a result, we continue to be less likely to
3 OPPENHEIMER TOTAL RETURN BOND FUND/VA
meaningfully increase credit risk, absent specific relative value opportunities. We typically avoid B-rated and below high yield corporate bonds as well as emerging market debt.
The views in the Fund Performance Discussion represent the opinions of this Fund’s portfolio managers and are not intended as investment advice or to predict or depict the performance of any investment. These views are as of the close of business on June 30, 2018, and are subject to change based on subsequent developments. The Fund’s portfolio and strategies are subject to change.
Shares of Oppenheimer funds are not deposits or obligations of any bank, are not guaranteed by any bank, are not insured by the FDIC or any other agency, and involve investment risks, including the possible loss of the principal amount invested.
4 OPPENHEIMER TOTAL RETURN BOND FUND/VA
Fund Expenses
Fund Expenses. As a shareholder of the Fund, you incur two types of costs: (1) transaction costs and (2) ongoing costs, including management fees; distribution and service fees; and other Fund expenses. These examples are intended to help you understand your ongoing costs (in dollars) of investing in the Fund and to compare these costs with the ongoing costs of investing in other mutual funds.
The examples are based on an investment of $1,000.00 invested at the beginning of the period and held for the entire 6-month period ended June 30, 2018.
Actual Expenses. The first section of the table provides information about actual account values and actual expenses. You may use the information in this section for the class of shares you hold, together with the amount you invested, to estimate the expense that you paid over the period. Simply divide your account value by $1,000.00 (for example, an $8,600.00 account value divided by $1,000.00 = 8.60), then multiply the result by the number in the first section under the heading entitled “Expenses Paid During 6 Months Ended June 30, 2018” to estimate the expenses you paid on your account during this period.
Hypothetical Example for Comparison Purposes.
The second section of the table provides information about hypothetical account values and hypothetical expenses based on the Fund’s actual expense ratio for each class of shares, and an assumed rate of return of 5% per year for each class before expenses, which is not the actual return. The hypothetical account values and expenses may not be used to estimate the actual ending account balance or expenses you paid for the period. You may use this information to compare the ongoing costs of investing in the Fund and other funds. To do so, compare this 5% hypothetical example for the class of shares you hold with the 5% hypothetical examples that appear in the shareholder reports of the other funds.
Please note that the expenses shown in the table are meant to highlight your ongoing costs only and do not reflect any charges associated with the separate accounts that offer this Fund. Therefore, the “hypothetical” lines of the table are useful in comparing ongoing costs only, and will not help you determine the relative total costs of owning different funds. In addition, if these separate account charges were included your costs would have been higher.
| Actual | Beginning Account Value January 1, 2018 | Ending Account Value June 30, 2018 | Expenses Paid During 6 Months Ended June 30, 2018 | |||||||||||||||||
Non-Service shares | $ | 1,000.00 | $ | 977.90 | $ | 3.68 | ||||||||||||||
Service shares | 1,000.00 | 976.20 | 4.91 | |||||||||||||||||
| Hypothetical | ||||||||||||||||||||
(5% return before expenses) | ||||||||||||||||||||
Non-Service shares | 1,000.00 | 1,021.08 | 3.77 | |||||||||||||||||
Service shares | 1,000.00 | 1,019.84 | 5.02 | |||||||||||||||||
Expenses are equal to the Fund’s annualized expense ratio for that class, multiplied by the average account value over the period, multiplied by 181/365 (to reflect the one-half year period). Those annualized expense ratios, excluding indirect expenses from affiliated funds, based on the 6-month period ended June 30, 2018 are as follows:
| Class | Expense Ratios | ||||
Non-Service shares | 0.75% | ||||
Service shares | 1.00 | ||||
The expense ratios reflect voluntary and/or contractual waivers and/or reimbursements of expenses by the Fund’s Manager. Some of these undertakings may be modified or terminated at any time, as indicated in the Fund’s prospectus. The “Financial Highlights” tables in the Fund’s financial statements, included in this report, also show the gross expense ratios, without such waivers or reimbursements and reduction to custodian expenses, if applicable.
5 OPPENHEIMER TOTAL RETURN BOND FUND/VA
STATEMENT OF INVESTMENTS June 30, 2018 Unaudited
| Principal Amount | Value | |||||||
| Asset-Backed Securities—14.6% |
| |||||||
| Auto Loan—10.4% | ||||||||
| American Credit Acceptance Receivables Trust: |
| |||||||
| Series 2015-3,Cl. B, 3.56%, 10/12/211 | $ | 2,942 | $ | 2,943 | ||||
| Series 2015-3,Cl. C, 4.84%, 10/12/211 | 315,000 | 317,722 | ||||||
| Series 2015-3,Cl. D, 5.86%, 7/12/221 | 125,000 | 127,053 | ||||||
| Series 2016-4,Cl. B, 2.11%, 2/12/211 | 34,723 | 34,684 | ||||||
| Series 2017-3,Cl. B, 2.25%, 1/11/211 | 65,000 | 64,835 | ||||||
| Series 2017-4,Cl. B, 2.61%, 5/10/211 | 64,000 | 63,783 | ||||||
| Series 2017-4,Cl. C, 2.94%, 1/10/241 | 183,000 | 181,885 | ||||||
| Series 2017-4,Cl. D, 3.57%, 1/10/241 | 227,000 | 225,241 | ||||||
| Series 2018-2,Cl. B, 3.46%, 8/10/221 | 255,000 | 255,317 | ||||||
| Series 2018-2,Cl. C, 3.70%, 7/10/241 | 255,000 | 255,286 | ||||||
| AmeriCredit Automobile Receivables Trust: |
| |||||||
| Series 2015-2,Cl. D, 3.00%, 6/8/21 | 200,000 | 199,928 | ||||||
| Series 2017-2,Cl. D, 3.42%, 4/18/23 | 300,000 | 298,666 | ||||||
| Series 2017-4,Cl. D, 3.08%, 12/18/23 | 130,000 | 127,868 | ||||||
| Cabela’s Credit Card Master Note Trust, Series 2015-2, Cl. A2, 2.743% [LIBOR01M+67], 7/17/232 | 520,000 | 524,239 | ||||||
| Capital Auto Receivables Asset Trust, Series 2017-1, Cl. D, 3.15%, 2/20/251 | 40,000 | 39,712 | ||||||
| CarFinance Capital Auto Trust, Series 2015-1A, Cl. A, 1.75%, 6/15/211 | 12,138 | 12,119 | ||||||
| CarMax Auto Owner Trust: |
| |||||||
| Series 2015-2,Cl. D, 3.04%, 11/15/21 | 100,000 | 99,779 | ||||||
| Series 2015-3,Cl. D, 3.27%, 3/15/22 | 295,000 | 294,850 | ||||||
| Series 2016-1,Cl. D, 3.11%, 8/15/22 | 185,000 | 184,362 | ||||||
| Series 2016-3,Cl. D, 2.94%, 1/17/23 | 115,000 | 113,543 | ||||||
| Series 2016-4,Cl. D, 2.91%, 4/17/23 | 260,000 | 255,716 | ||||||
| Series 2017-1,Cl. D, 3.43%, 7/17/23 | 230,000 | 228,906 | ||||||
| Series 2017-4,Cl. D, 3.30%, 5/15/24 | 100,000 | 98,653 | ||||||
| CIG Auto Receivables Trust, Series 2017-1A, Cl. A, 2.71%, 5/15/231 | 87,874 | 87,327 | ||||||
| CPS Auto Receivables Trust: |
| |||||||
| Series 2017-C,Cl. A, 1.78%, 9/15/201 | 39,820 | 39,687 | ||||||
| Series 2017-C,Cl. B, 2.30%, 7/15/211 | 100,000 | 99,199 | ||||||
| Series 2017-D,Cl. B, 2.43%, 1/18/221 | 170,000 | 168,246 | ||||||
| Series 2018-A,Cl. B, 2.77%, 4/18/221 | 125,000 | 124,039 | ||||||
| Series 2018-B,Cl. B, 3.23%, 7/15/221 | 150,000 | 149,742 | ||||||
| CPS Auto Trust, Series 2017-A, Cl. B, 2.68%, 5/17/211 | 30,000 | 29,921 | ||||||
| Credit Acceptance Auto Loan Trust: |
| |||||||
| Series 2017-3A,Cl. C, 3.48%, 10/15/261 | 205,000 | 202,328 | ||||||
| Series 2018-1A,Cl. B, 3.60%, 4/15/271 | 125,000 | 124,486 | ||||||
| Series 2018-1A,Cl. C, 3.77%, 6/15/271 | 180,000 | 178,512 | ||||||
| Series 2018-2A,Cl. C, 4.16%, 9/15/271 | 105,000 | 105,719 | ||||||
| Drive Auto Receivables Trust: |
| |||||||
| Series 2015-BA,Cl. D, 3.84%, 7/15/211 | 20,000 | 20,119 | ||||||
| Series 2015-CA,Cl. D, 4.20%, 9/15/211 | 60,000 | 60,556 | ||||||
| Series 2016-CA,Cl. C, 3.02%, 11/15/211 | 140,000 | 140,131 | ||||||
| Series 2016-CA,Cl. D, 4.18%, 3/15/241 | 160,000 | 162,055 | ||||||
| Series 2017-1,Cl. B, 2.36%, 3/15/21 | 155,000 | 154,831 | ||||||
| Series 2017-3,Cl. C, 2.80%, 7/15/22 | 115,000 | 114,655 | ||||||
| Series 2017-AA,Cl. C, 2.98%, 1/18/221 | 165,000 | 165,048 | ||||||
| Series 2017-BA,Cl. D, 3.72%, 10/17/221 | 215,000 | 216,391 | ||||||
| Series 2018-1,Cl. D, 3.81%, 5/15/24 | 180,000 | 179,829 | ||||||
| Series 2018-2,Cl. D, 4.14%, 8/15/24 | 295,000 | 296,875 | ||||||
| DT Auto Owner Trust: |
| |||||||
| Series 2015-2A,Cl. D, 4.25%, 2/15/221 | 39,581 | 39,826 | ||||||
| Series 2016-4A,Cl. E, 6.49%, 9/15/231 | 120,000 | 123,928 | ||||||
| Series 2017-1A,Cl. C, 2.70%, 11/15/221 | 90,000 | 89,707 | ||||||
| Series 2017-1A,Cl. D, 3.55%, 11/15/221 | 125,000 | 125,018 | ||||||
| Series 2017-1A,Cl. E, 5.79%, 2/15/241 | 150,000 | 152,773 | ||||||
| Series 2017-2A,Cl. B, 2.44%, 2/15/211 | 135,000 | 134,735 | ||||||
| Series 2017-2A,Cl. D, 3.89%, 1/15/231 | 175,000 | 174,841 | ||||||
| Series 2017-3A,Cl. B, 2.40%, 5/17/211 | 170,000 | 169,333 | ||||||
| Series 2017-3A,Cl. E, 5.60%, 8/15/241 | 155,000 | 156,939 | ||||||
| Series 2017-4A,Cl. D, 3.47%, 7/17/231 | 190,000 | 188,815 | ||||||
| Principal Amount | Value | |||||||||
| Auto Loan (Continued) |
| |||||||||
| DT Auto Owner Trust: (Continued) |
| |||||||||
| Series 2017-4A,Cl. E, 5.15%, 11/15/241 | $ | 135,000 | $ | 134,457 | ||||||
| Series 2018-1A,Cl. B, 3.04%, 1/18/221 | 145,000 | 144,543 | ||||||||
| Series 2018-2A,Cl. B, 3.43%, 5/16/221 | 80,000 | 80,035 | ||||||||
| Exeter Automobile Receivables Trust, Series 2018-1A, Cl. B, 2.75%, 4/15/221 | 140,000 | 138,862 | ||||||||
| Flagship Credit Auto Trust: |
| |||||||||
| Series 2014-1,Cl. D, 4.83%, 6/15/201 | 20,000 | 20,121 | ||||||||
| Series 2016-1,Cl. C, 6.22%, 6/15/221 | 345,000 | 359,106 | ||||||||
| GLS Auto Receivables Trust, Series 2018-1A, Cl. A, 2.82%, 7/15/221 | 306,904 | 305,214 | ||||||||
| GM Financial Automobile Leasing Trust: |
| |||||||||
| Series 2017-3,Cl. C, 2.73%, 9/20/21 | 120,000 | 118,662 | ||||||||
| Series 2018-2,Cl. C, 3.50%, 4/20/22 | 135,000 | 134,996 | ||||||||
| Navistar Financial Dealer Note Master Owner Trust II: |
| |||||||||
| Series 2016-1,Cl. D, 5.391% [LIBOR01M+330], 9/27/211,2 | 75,000 | 75,414 | ||||||||
| Series 2017-1,Cl. C, 3.641% [LIBOR01M+155], 6/27/221,2 | 60,000 | 60,271 | ||||||||
| Series 2017-1,Cl. D, 4.391% [LIBOR01M+230], 6/27/221,2 | 70,000 | 70,076 | ||||||||
| Santander Drive Auto Receivables Trust: |
| |||||||||
| Series 2016-2,Cl. D, 3.39%, 4/15/22 | 120,000 | 120,370 | ||||||||
| Series 2017-1,Cl. D, 3.17%, 4/17/23 | 160,000 | 159,055 | ||||||||
| Series 2017-1,Cl. E, 5.05%, 7/15/241 | 355,000 | 361,240 | ||||||||
| Series 2017-2,Cl. D, 3.49%, 7/17/23 | 70,000 | 69,975 | ||||||||
| Series 2017-3,Cl. D, 3.20%, 11/15/23 | 280,000 | 277,732 | ||||||||
| Series 2018-1,Cl. D, 3.32%, 3/15/24 | 100,000 | 98,456 | ||||||||
| Series 2018-2,Cl. D, 3.88%, 2/15/24 | 165,000 | 164,430 | ||||||||
| Series 2018-3,Cl. C, 3.51%, 8/15/23 | 415,000 | 415,453 | ||||||||
| Santander Retail Auto Lease Trust, Series 2017-A, Cl. C, 2.96%, 11/21/221 | 180,000 | 177,549 | ||||||||
| TCF Auto Receivables Owner Trust, Series 2015-1A, Cl. D, 3.53%, 3/15/221 | 160,000 | 159,159 | ||||||||
| United Auto Credit Securitization Trust, Series 2018-1, Cl. C, 3.05%, 9/10/211 | 215,000 | 214,233 | ||||||||
| Veros Automobile Receivables Trust, Series 2017-1, Cl. A, 2.84%, 4/17/231 | 88,189 | 87,844 | ||||||||
| Westlake Automobile Receivables Trust: |
| |||||||||
| Series 2016-1A,Cl. E, 6.52%, 6/15/221 | 260,000 | 265,106 | ||||||||
| Series 2017-2A,Cl. E, 4.63%, 7/15/241 | 305,000 | 306,142 | ||||||||
| Series 2018-1A,Cl. C, 2.92%, 5/15/231 | 145,000 | 143,803 | ||||||||
| Series 2018-1A,Cl. D, 3.41%, 5/15/231 | 160,000 | 159,120 | ||||||||
|
| 13,004,125
|
| ||||||||
| Credit Card—3.4% | ||||||||||
| Cabela’s Credit Card Master Note Trust: |
| |||||||||
| Series 2015-1A,Cl. A2, 2.613% [LIBOR01M+54], 3/15/232 | 470,000 | 472,657 | ||||||||
| Series 2016-1,Cl. A1, 1.78%, 6/15/22 | 320,000 | 316,693 | ||||||||
| Series 2016-1,Cl. A2, 2.923% [LIBOR01M+85], 6/15/222 | 235,000 | 236,282 | ||||||||
| Capital One Multi-Asset Execution Trust, Series 2016-A3, Cl. A3, 1.34%, 4/15/22 | 485,000 | 478,756 | ||||||||
| Citibank Credit Card Issuance Trust, Series 2014-A6, Cl. A6, 2.15%, 7/15/21 | 30,000 | 29,829 | ||||||||
| World Financial Network Credit Card Master Trust: |
| |||||||||
| Series 2012-D,Cl. A, 2.15%, 4/17/23 | 145,000 | 144,050 | ||||||||
| Series 2016-B,Cl. A, 1.44%, 6/15/22 | 360,000 | 359,504 | ||||||||
| Series 2016-C,Cl. A, 1.72%, 8/15/23 | 625,000 | 615,706 | ||||||||
| Series 2017-A,Cl. A, 2.12%, 3/15/24 | 405,000 | 398,186 | ||||||||
| Series 2017-B,Cl. A, 1.98%, 6/15/23 | 315,000 | 312,352 | ||||||||
| Series 2017-C,Cl. A, 2.31%, 8/15/24 | 395,000 | 387,700 | ||||||||
| Series 2018-A,Cl. A, 3.07%, 12/16/24 | 495,000 | 493,063 | ||||||||
|
| 4,244,778
|
| ||||||||
| Equipment—0.6% | ||||||||||
| CCG Receivables Trust: |
| |||||||||
| Series 2017-1,Cl. B, 2.75%, 11/14/231 | 230,000 | 225,792 | ||||||||
| Series 2018-1,Cl. B, 3.09%, 6/16/251 | 85,000 | 84,185 | ||||||||
6 OPPENHEIMER TOTAL RETURN BOND FUND/VA
| Principal Amount | Value | |||||||
| Equipment (Continued) |
| |||||||
| CCG Receivables Trust: (Continued) |
| |||||||
| Series 2018-1,Cl. C, 3.42%, 6/16/251 | $ | 20,000 | $ | 19,774 | ||||
| CNH Equipment Trust, Series 2017-C, Cl. B, 2.54%, 5/15/25 | 65,000 | 63,488 | ||||||
| Dell Equipment Finance Trust, Series 2018-1, | ||||||||
| Cl. B, 3.34%, 6/22/231 | 80,000 | 79,988 | ||||||
| FRS I LLC, Series 2013-1A, Cl. A1, 1.80%, 4/15/431 | 15,946 | 15,844 | ||||||
| Verizon Owner Trust, Series 2017-3A, Cl. A1A, 2.06%, 4/20/221 | 180,000 | 177,150 | ||||||
|
| 666,221
|
| ||||||
| Loans: Other—0.2% | ||||||||
| Dell Equipment Finance Trust, Series 2017-2, | ||||||||
| Cl. B, 2.47%, 10/24/221 | 70,000 | 69,037 | ||||||
| Element Rail Leasing I LLC, Series 2014-1A, Cl. | ||||||||
| A1, 2.299%, 4/19/441 | 178,126 | 177,072 | ||||||
| 246,109 | ||||||||
Total Asset-Backed Securities (Cost $18,242,326)
|
| 18,161,233
|
| |||||
| Mortgage-Backed Obligations—62.3% |
| |||||||
| Government Agency—45.7% |
| |||||||
| FHLMC/FNMA/FHLB/Sponsored—35.6% |
| |||||||
| Federal Home Loan Mortgage Corp. Gold Pool: |
| |||||||
| 5.00%, 12/1/34 | 3,412 | 3,639 | ||||||
| 5.50%, 9/1/39 | 242,606 | 259,743 | ||||||
| 6.00%, 10/1/22-10/1/29 | 329,858 | 362,043 | ||||||
| 6.50%, 7/1/28-4/1/34 | 108,547 | 120,978 | ||||||
| 7.00%, 10/1/31-10/1/37 | 94,175 | 102,789 | ||||||
| 9.00%, 8/1/22-5/1/25 | 5,295 | 5,637 | ||||||
| Federal Home Loan Mortgage Corp. Non Gold |
| |||||||
| Pool, 10.50%, 10/1/20 | 327 | 330 | ||||||
| Federal Home Loan Mortgage Corp., Interest-Only Stripped Mtg.-Backed Security: |
| |||||||
| Series 205,Cl. IO, 73.074%, 9/1/293 | 4,557 | 976 | ||||||
| Series 206,Cl. IO, 0.00%, 12/15/293,4 | 79,688 | 20,136 | ||||||
| Series 243,Cl. 6, 0.00%, 12/15/323,4 | 50,893 | 8,549 | ||||||
Federal Home Loan Mortgage Corp., Mtg.- Linked Amortizing Global Debt Securities, |
| |||||||
| Series 2012-1, Cl. A10, 2.06%, 1/15/22 | 248,213 | 243,430 | ||||||
| Federal Home Loan Mortgage Corp., Principal- | ||||||||
| Only Stripped Mtg.-Backed Security, Series 176, Cl. PO, 4.108%, 6/1/265 | 23,596 | 21,670 | ||||||
| Federal Home Loan Mortgage Corp., Real Estate Mtg. Investment Conduit Multiclass Pass-Through Certificates: |
| |||||||
| Series 151,Cl. F, 9.00%, 5/15/21 | 1,043 | 1,077 | ||||||
| Series 1674,Cl. Z, 6.75%, 2/15/24 | 6,870 | 7,284 | ||||||
| Series 2034,Cl. Z, 6.50%, 2/15/28 | 1,386 | 1,500 | ||||||
| Series 2042,Cl. N, 6.50%, 3/15/28 | 2,817 | 3,021 | ||||||
| Series 2043,Cl. ZP, 6.50%, 4/15/28 | 165,315 | 181,938 | ||||||
| Series 2046,Cl. G, 6.50%, 4/15/28 | 6,710 | 7,474 | ||||||
| Series 2053,Cl. Z, 6.50%, 4/15/28 | 1,531 | 1,705 | ||||||
| Series 2066,Cl. Z, 6.50%, 6/15/28 | 161,442 | 179,827 | ||||||
| Series 2195,Cl. LH, 6.50%, 10/15/29 | 125,795 | 137,178 | ||||||
| Series 2220,Cl. PD, 8.00%, 3/15/30 | 945 | 1,080 | ||||||
| Series 2326,Cl. ZP, 6.50%, 6/15/31 | 36,443 | 39,257 | ||||||
| Series 2461,Cl. PZ, 6.50%, 6/15/32 | 142,567 | 154,674 | ||||||
| Series 2470,Cl. LF, 3.073% [LIBOR01M+100], 2/15/322 | 1,169 | 1,197 | ||||||
| Series 2635,Cl. AG, 3.50%, 5/15/32 | 22,648 | 22,542 | ||||||
| Series 2707,Cl. QE, 4.50%, 11/15/18 | 669 | 670 | ||||||
| Series 2770,Cl. TW, 4.50%, 3/15/19 | 993 | 996 | ||||||
| Series 3010,Cl. WB, 4.50%, 7/15/20 | 4,654 | 4,709 | ||||||
| Series 3025,Cl. SJ, 17.148% | ||||||||
| [LIBOR01M+2,475], 8/15/352 | 12,108 | 16,251 | ||||||
| Series 3030,Cl. FL, 2.473% | ||||||||
| [LIBOR01M+40], 9/15/352 | 1,879 | 1,887 | ||||||
| Series 3645,Cl. EH, 3.00%, 12/15/20 | 12,226 | 12,234 | ||||||
| Series 3741,Cl. PA, 2.15%, 2/15/35 | 19,897 | 19,875 | ||||||
| Series 3815,Cl. BD, 3.00%, 10/15/20 | 211 | 211 | ||||||
| Principal Amount | Value | |||||||
| FHLMC/FNMA/FHLB/Sponsored (Continued) |
| |||||||
| Federal Home Loan Mortgage Corp., Real Estate Mtg. Investment Conduit Multiclass Pass-Through Certificates: (Continued) |
| |||||||
| Series 3822,Cl. JA, 5.00%, 6/15/40 | $ | 2,377 | $ | 2,441 | ||||
| Series 3840,Cl. CA, 2.00%, 9/15/18 | 105 | 105 | ||||||
| Series 3848,Cl. WL, 4.00%, 4/15/40 | 14,947 | 15,101 | ||||||
| Series 3857,Cl. GL, 3.00%, 5/15/40 | 3,524 | 3,546 | ||||||
| Series 4057,Cl. QI, 4.903%, 6/15/273 | 503,548 | 42,754 | ||||||
| Series 4221,Cl. HJ, 1.50%, 7/15/23 | 61,284 | 59,834 | ||||||
| Federal Home Loan Mortgage Corp., Real Estate Mtg. Investment Conduit Multiclass Pass-Through Certificates, Interest-Only Stripped Mtg.-Backed Security: |
| |||||||
| Series 2074,Cl. S, 99.999%, 7/17/283 | 907 | 94 | ||||||
| Series 2079,Cl. S, 99.999%, 7/17/283 | 1,665 | 207 | ||||||
| Series 2130,Cl. SC, 99.999%, 3/15/293 | 56,507 | 7,417 | ||||||
| Series 2526,Cl. SE, 67.784%, 6/15/293 | 2,121 | 314 | ||||||
| Series 2796,Cl. SD, 99.999%, 7/15/263 | 107,656 | 12,947 | ||||||
| Series 2920,Cl. S, 36.882%, 1/15/353 | 444,992 | 61,346 | ||||||
| Series 2922,Cl. SE, 19.911%, 2/15/353 | 51,776 | 6,666 | ||||||
| Series 2981,Cl. AS, 1.665%, 5/15/353 | 65,865 | 7,023 | ||||||
| Series 3004,Cl. SB, 0.00%, 7/15/353,4 | 19,354 | 1,852 | ||||||
| Series 3397,Cl. GS, 0.00%, 12/15/373,4 | 10,121 | 1,618 | ||||||
| Series 3424,Cl. EI, 0.00%, 4/15/383,4 | 7,595 | 676 | ||||||
| Series 3450,Cl. BI, 11.796%, 5/15/383 | 268,698 | 36,608 | ||||||
| Series 3606,Cl. SN, 13.009%, 12/15/393 | 69,019 | 8,606 | ||||||
| Federal National Mortgage Assn.: |
| |||||||
| 2.50%, 7/1/336 | 2,015,000 | 1,958,429 | ||||||
| 3.00%, 7/1/33-8/1/486 | 4,385,000 | 4,285,959 | ||||||
| 3.50%, 7/1/33-8/1/486 | 13,745,000 | 13,702,611 | ||||||
| 4.00%, 8/1/486 | 3,240,000 | 3,298,472 | ||||||
| 4.50%, 8/1/486 | 12,020,000 | 12,494,461 | ||||||
| 5.00%, 8/1/486 | 4,230,000 | 4,472,833 | ||||||
| Federal National Mortgage Assn. Pool: |
| |||||||
| 5.00%, 3/1/21-7/1/22 | 1,684 | 1,723 | ||||||
| 5.50%, 2/1/35-5/1/36 | 106,887 | 116,278 | ||||||
| 6.50%, 10/1/19-1/1/34 | 6,838 | 7,566 | ||||||
| 7.00%, 1/1/30-12/1/32 | 15,378 | 17,324 | ||||||
| 7.50%, 1/1/33 | 3,140 | 3,610 | ||||||
| 8.50%, 7/1/32 | 3,599 | 3,660 | ||||||
| Federal National Mortgage Assn., Interest-Only Stripped Mtg.-Backed Security: |
| |||||||
| Series 221,Cl. 2, 99.999%, 5/25/233 | 1,352 | 174 | ||||||
| Series 222,Cl. 2, 99.999%, 6/25/233 | 147,099 | 17,301 | ||||||
| Series 252,Cl. 2, 0.00%, 11/25/233,4 | 129,509 | 17,522 | ||||||
| Series 294,Cl. 2, 99.999%, 2/25/283 | 19,483 | 4,294 | ||||||
| Series 301,Cl. 2, 18.913%, 4/25/293 | 1,601 | 336 | ||||||
| Series 303,Cl. IO, 56.407%, 11/25/293 | 34,844 | 8,180 | ||||||
| Series 320,Cl. 2, 58.065%, 4/25/323 | 138,674 | 33,796 | ||||||
| Series 321,Cl. 2, 19.061%, 4/25/323 | 343,587 | 81,334 | ||||||
| Series 324,Cl. 2, 8.578%, 7/25/323 | 3,492 | 846 | ||||||
| Series 331,Cl. 5, 0.00%, 2/25/333,4 | 4,900 | 884 | ||||||
| Series 331,Cl. 9, 25.40%, 2/25/333 | 112,916 | 22,588 | ||||||
| Series 334,Cl. 12, 0.00%, 3/25/333,4 | 8,040 | 1,710 | ||||||
| Series 334,Cl. 17, 35.934%, 2/25/333 | 70,610 | 17,163 | ||||||
| Series 339,Cl. 12, 0.00%, 6/25/333,4 | 112,673 | 28,780 | ||||||
| Series 339,Cl. 7, 0.00%, 11/25/333,4 | 236,474 | 52,181 | ||||||
| Series 343,Cl. 13, 0.00%, 9/25/333,4 | 120,756 | 25,231 | ||||||
| Series 343,Cl. 18, 0.00%, 5/25/343,4 | 28,224 | 6,701 | ||||||
| Series 345,Cl. 9, 0.00%, 1/25/343,4 | 85,342 | 19,565 | ||||||
| Series 351,Cl. 10, 0.00%, 4/25/343,4 | 36,609 | 8,918 | ||||||
| Series 351,Cl. 8, 0.00%, 4/25/343,4 | 64,016 | 12,591 | ||||||
| Series 356,Cl. 10, 0.00%, 6/25/353,4 | 45,484 | 9,881 | ||||||
| Series 356,Cl. 12, 0.00%, 2/25/353,4 | 22,239 | 4,854 | ||||||
| Series 362,Cl. 13, 0.00%, 8/25/353,4 | 89,219 | 21,784 | ||||||
| Series 364,Cl. 15, 0.00%, 9/25/353,4 | 4,672 | 920 | ||||||
| Series 364,Cl. 16, 0.00%, 9/25/353,4 | 97,303 | 23,741 | ||||||
| Series 365,Cl. 16, 0.00%, 3/25/363,4 | 124,291 | 25,338 | ||||||
| Federal National Mortgage Assn., Real Estate Mtg. Investment Conduit Multiclass Pass-Through Certificates: |
| |||||||
| Series 1993-87,Cl. Z, 6.50%, 6/25/23 | 102,885 | 108,069 | ||||||
| Series 1998-58,Cl. PC, 6.50%, 10/25/28 | 87,624 | 95,160 | ||||||
7 OPPENHEIMER TOTAL RETURN BOND FUND/VA
STATEMENT OF INVESTMENTS Unaudited / Continued
| Principal Amount | Value | |||||||
| FHLMC/FNMA/FHLB/Sponsored (Continued) |
| |||||||
| Federal National Mortgage Assn., Real Estate Mtg. Investment Conduit Multiclass Pass- Through Certificates: (Continued) |
| |||||||
| Series 1998-61,Cl. PL, 6.00%, 11/25/28 | $ | 43,739 | $ | 47,318 | ||||
| Series 1999-54,Cl. LH, 6.50%, 11/25/29 | 72,400 | 78,604 | ||||||
| Series 2001-51,Cl. OD, 6.50%, 10/25/31 | 4,806 | 5,095 | ||||||
| Series 2001-74,Cl. QE, 6.00%, 12/25/31 | 107,726 | 117,585 | ||||||
| Series 2003-100,Cl. PA, 5.00%, 10/25/18 | 949 | 948 | ||||||
| Series 2003-28,Cl. KG, 5.50%, 4/25/23 | 289,177 | 300,975 | ||||||
| Series 2003-84,Cl. GE, 4.50%, 9/25/18 | 87 | 87 | ||||||
| Series 2004-25,Cl. PC, 5.50%, 1/25/34 | 865 | 871 | ||||||
| Series 2005-73,Cl. DF, 2.341% [LIBOR01M+25], 8/25/352 | 2,512 | 2,521 | ||||||
| Series 2006-11,Cl. PS, 16.899% [-3.667 x LIBOR01M+2,456.67], 3/25/362 | 66,248 | 95,483 | ||||||
| Series 2006-46,Cl. SW, 16.532% [-3.667 x LIBOR01M+2,419.92], 6/25/362 | 44,699 | 61,049 | ||||||
| Series 2006-50,Cl. KS, 16.533% [-3.667 x LIBOR01M+2,420], 6/25/362 | 58,852 | 83,053 | ||||||
| Series 2008-75,Cl. DB, 4.50%, 9/25/23 | 2,021 | 2,023 | ||||||
| Series 2009-113,Cl. DB, 3.00%, 12/25/20 | 11,060 | 11,059 | ||||||
| Series 2009-36,Cl. FA, 3.031% [LIBOR01M+94], 6/25/372 | 30,236 | 30,935 | ||||||
| Series 2009-70,Cl. TL, 4.00%, 8/25/19 | 1,140 | 1,140 | ||||||
| Series 2010-43,Cl. KG, 3.00%, 1/25/21 | 5,665 | 5,668 | ||||||
| Series 2011-3,Cl. EL, 3.00%, 5/25/20 | 14,557 | 14,545 | ||||||
| Series 2011-38,Cl. AH, 2.75%, 5/25/20 | 113 | 113 | ||||||
| Series 2011-82,Cl. AD, 4.00%, 8/25/26 | 15,957 | 15,996 | ||||||
| Federal National Mortgage Assn., Real Estate Mtg. Investment Conduit Multiclass Pass- Through Certificates, Interest-Only Stripped Mtg.-Backed Security: |
| |||||||
| Series 2001-61,Cl. SH, 18.22%, 11/18/313 | 4,282 | 738 | ||||||
| Series 2001-63,Cl. SD, 44.827%, 12/18/313 | 1,452 | 220 | ||||||
| Series 2001-65,Cl. S, 30.557%, 11/25/313 | 107,433 | 20,763 | ||||||
| Series 2001-68,Cl. SC, 43.80%, 11/25/313 | 1,028 | 167 | ||||||
| Series 2001-81,Cl. S, 30.24%, 1/25/323 | 32,078 | 5,280 | ||||||
| Series 2002-28,Cl. SA, 33.764%, 4/25/323 | 1,000 | 168 | ||||||
| Series 2002-38,Cl. SO, 78.35%, 4/25/323 | 3,078 | 441 | ||||||
| Series 2002-39,Cl. SD, 56.963%, 3/18/323 | 2,036 | 360 | ||||||
| Series 2002-47,Cl. NS, 34.366%, 4/25/323 | 99,546 | 16,651 | ||||||
| Series 2002-48,Cl. S, 38.558%, 7/25/323 | 1,602 | 285 | ||||||
| Series 2002-51,Cl. S, 33.324%, 8/25/323 | 91,383 | 14,576 | ||||||
| Series 2002-52,Cl. SD, 79.406%, 9/25/323 | 143,269 | 24,368 | ||||||
| Series 2002-52,Cl. SL, 33.322%, 9/25/323 | 1,034 | 181 | ||||||
| Series 2002-53,Cl. SK, 78.535%, 4/25/323 | 7,093 | 1,285 | ||||||
| Series 2002-56,Cl. SN, 35.487%, 7/25/323 | 2,184 | 389 | ||||||
| Series 2002-60,Cl. SM, 15.95%, 8/25/323 | 13,428 | 1,824 | ||||||
| Series 2002-7,Cl. SK, 21.808%, 1/25/323 | 6,312 | 932 | ||||||
| Series 2002-77,Cl. BS, 23.745%, 12/18/323 | 9,418 | 1,587 | ||||||
| Series 2002-77,Cl. IS, 53.752%, 12/18/323 | 5,245 | 929 | ||||||
| Series 2002-77,Cl. SH, 33.756%, 12/18/323 | 45,065 | 7,101 | ||||||
| Principal Amount | Value | |||||||
| FHLMC/FNMA/FHLB/Sponsored (Continued) |
| |||||||
| Federal National Mortgage Assn., Real Estate Mtg. Investment Conduit Multiclass Pass- Through Certificates, Interest-Only Stripped Mtg.-Backed Security: (Continued) |
| |||||||
| Series 2002-84,Cl. SA, 27.367%, 12/25/323 | $ | 103,694 | $ | 17,127 | ||||
| Series 2002-9,Cl. MS, 27.368%, 3/25/323 | 1,646 | 297 | ||||||
| Series 2002-90,Cl. SN, 16.257%, 8/25/323 | 6,908 | 938 | ||||||
| Series 2002-90,Cl. SY, 22.507%, 9/25/323 | 5,190 | 731 | ||||||
| Series 2003-26,Cl. DI, 66.862%, 4/25/333 | 5,092 | 1,311 | ||||||
| Series 2003-33,Cl. SP, 28.908%, 5/25/333 | 107,625 | 21,007 | ||||||
| Series 2003-4,Cl. S, 21.287%, 2/25/333 | 66,012 | 12,462 | ||||||
| Series 2004-54,Cl. DS, 99.999%, 11/25/303 | 94,986 | 13,725 | ||||||
| Series 2005-12,Cl. SC, 33.455%, 3/25/353 | 24,658 | 3,364 | ||||||
| Series 2005-14,Cl. SE, 39.051%, 3/25/353 | 76,710 | 8,406 | ||||||
| Series 2005-40,Cl. SA, 99.999%, 5/25/353 | 216,372 | 28,553 | ||||||
| Series 2005-40,Cl. SB, 65.684%, 5/25/353 | 9,876 | 1,137 | ||||||
| Series 2005-52,Cl. JH, 30.068%, 5/25/353 | 55,458 | 6,643 | ||||||
| Series 2005-93,Cl. SI, 5.283%, 10/25/353 | 161,227 | 21,268 | ||||||
| Series 2008-55,Cl. SA, 0.00%, 7/25/383,4 | 8,092 | 724 | ||||||
| Series 2009-8,Cl. BS, 99.999%, 2/25/243 | 1,318 | 66 | ||||||
| Series 2011-96,Cl. SA, 7.854%, 10/25/413 | 55,912 | 7,545 | ||||||
| Series 2012-134,Cl. SA, 2.641%, 12/25/423 | 144,673 | 24,182 | ||||||
| Series 2012-40,Cl. PI, 10.50%, 4/25/413 | 106,305 | 16,672 | ||||||
| Federal National Mortgage Assn., Real Estate Mtg. Investment Conduit Multiclass Pass- Through Certificates, Principal-Only Stripped Mtg.-Backed Security, Series 1993-184, Cl. M, 5.195%, 9/25/235 | 46,406 | 42,987 | ||||||
|
|
| ||||||
|
| 44,430,888
|
| ||||||
| GNMA/Guaranteed—10.1% | ||||||||
| Government National Mortgage Assn. I Pool: |
| |||||||
| 7.00%, 12/15/23-3/15/26 | 4,468 | 4,634 | ||||||
| Government National Mortgage Assn. II Pool: |
| |||||||
| 3.50%, 7/1/486 | 4,265,000 | 4,280,327 | ||||||
| 4.00%, 7/1/486 | 8,140,000 | 8,341,434 | ||||||
| Government National Mortgage Assn., Interest-Only Stripped Mtg.-Backed Security: |
| |||||||
| Series 2002-15,Cl. SM, 99.999%, 2/16/323 | 146,454 | 1,537 | ||||||
| Series 2007-17,Cl. AI, 49.388%, 4/16/373 | 58,164 | 8,044 | ||||||
| Series 2011-52,Cl. HS, 21.879%, 4/16/413 | 380,776 | 43,202 | ||||||
|
|
| ||||||
|
| 12,679,178
|
| ||||||
| Non-Agency—16.6% | ||||||||
| Commercial—7.9% | ||||||||
| Asset Securitization Corp., Interest-Only Stripped Mtg.-Backed Security, Series 1997-D4, Cl. PS1, 99.999%, 4/14/293 | 1,037,331 | 594 | ||||||
| BCAP LLC Trust, Series 2011-R11, Cl. 18A5, 3.41% [H15T1Y+210], 9/26/351,2 | 40,829 | 41,010 | ||||||
| Benchmark Mortgage Trust, Interest-Only Commercial Mtg. Pass-Through Certificates, Series 2018-B1, Cl. XA, 13.898%, 1/15/513 | 1,786,982 | 71,042 | ||||||
8 OPPENHEIMER TOTAL RETURN BOND FUND/VA
| Principal Amount | Value | |||||||
| Commercial (Continued) |
| |||||||
| Capital Lease Funding Securitization LP, Interest-Only Commercial Mtg. Pass-Through Certificates, Series 1997-CTL1, Cl. IO, 0.00%, 6/22/243,4,7,8 | $ | 209,390 | $ | 4,458 | ||||
| CD Mortgage Trust, Interest-Only Commercial Mtg. Pass-Through Certificates, Series 2017- CD6, Cl. XA, 14.496%, 11/13/503 | 751,418 | 47,052 | ||||||
| Chase Mortgage Finance Trust, Series 2005- A2, Cl. 1A3, 3.602%, 1/25/369 | 90,035 | 85,259 | ||||||
| Citigroup Commercial Mortgage Trust: |
| |||||||
| Series 2012-GC8,Cl. AAB, 2.608%, 9/10/45 | 97,961 | 97,039 | ||||||
| Series 2013-GC17,Cl. XA, 0.00%, 11/10/463,4 | 574,903 | 18,968 | ||||||
| Series 2014-GC21,Cl. AAB, 3.477%, 5/10/47 | 95,000 | 95,853 | ||||||
| Citigroup Commercial Mortgage Trust, Interest-Only Commercial Mtg. Pass-Through Certificates, Series 2017-C4, Cl. XA, 13.828%, 10/12/503 | 2,072,963 | 153,812 | ||||||
| COMM Mortgage Trust: | ||||||||
| Series 2012-CR3,Cl. ASB, 2.372%, 10/15/45 | 17,350 | 17,125 | ||||||
| Series 2012-LC4,Cl. A3, 3.069%, 12/10/44 | 38,865 | 38,878 | ||||||
| Series 2013-CR13,Cl. ASB, 3.706%, 11/10/46 | 185,000 | 187,816 | ||||||
| Series 2013-CR6,Cl. AM, 3.147%, 3/10/461 | 245,000 | 240,290 | ||||||
| Series 2014-CR17,Cl. ASB, 3.598%, 5/10/47 | 265,000 | 268,288 | ||||||
| Series 2014-CR20,Cl. ASB, 3.305%, 11/10/47 | 65,000 | 65,149 | ||||||
| Series 2014-CR21,Cl. AM, 3.987%, 12/10/47 | 715,000 | 717,047 | ||||||
| Series 2014-LC15,Cl. AM, 4.198%, 4/10/47 | 170,000 | 173,458 | ||||||
| Series 2014-UBS6,Cl. AM, 4.048%, 12/10/47 | 475,000 | 478,234 | ||||||
| Series 2015-CR22,Cl. A2, 2.856%, 3/10/48 | 120,000 | 119,769 | ||||||
| COMM Mortgage Trust, Interest-Only Stripped Mtg.-Backed Security, Series 2012-CR5, Cl. XA, 23.183%, 12/10/453 | 2,058,354 | 116,425 | ||||||
| CSMC Mortgage-Backed Trust, Series 2006-6, Cl. 1A4, 6.00%, 7/25/36 | 155,217 | 129,975 | ||||||
| First Horizon Alternative Mortgage Securities Trust, Series 2005-FA8, Cl. 1A6, 2.741% [US0001M+65], 11/25/352 | 121,292 | 94,332 | ||||||
| FREMF Mortgage Trust: |
| |||||||
| Series 2010-K6,Cl. B, 5.542%, 12/25/461,9 | 55,000 | 56,703 | ||||||
| Series 2013-K25,Cl. C, 3.744%, 11/25/451,9 | 90,000 | 87,332 | ||||||
| Series 2013-K26,Cl. C, 3.721%, 12/25/451,9 | 60,000 | 58,135 | ||||||
| Series 2013-K27,Cl. C, 3.615%, 1/25/461,9 | 95,000 | 91,551 | ||||||
| Series 2013-K28,Cl. C, 3.61%, 6/25/461,9 | 285,000 | 281,431 | ||||||
| Series 2013-K713,Cl. C, 3.262%, 4/25/461,9 | 115,000 | 114,461 | ||||||
| Series 2014-K715,Cl. C, 4.265%, 2/25/461,9 | 50,000 | 49,895 | ||||||
| GS Mortgage Securities Corp. Trust, Series 2012-SHOP, Cl. A, 2.933%, 6/5/311 | 430,000 | 430,575 | ||||||
| GS Mortgage Securities Trust: |
| |||||||
| Series 2012-GC6,Cl. A3, 3.482%, 1/10/45 | 59,774 | 60,315 | ||||||
| Principal Amount | Value | |||||||
| Commercial (Continued) |
| |||||||
| GS Mortgage Securities Trust: (Continued) |
| |||||||
| Series 2013-GC12,Cl. AAB, 2.678%, 6/10/46 | $ | 34,422 | $ | 34,062 | ||||
| Series 2013-GC16,Cl. AS, 4.649%, 11/10/46 | 45,000 | 47,186 | ||||||
| Series 2014-GC18,Cl. AAB, 3.648%, 1/10/47 | 85,000 | 86,061 | ||||||
| GSMSC Pass-Through Trust, Series 2009-3R, Cl. 1A2, 6.00%, 4/25/371,9 | 211,607 | 204,193 | ||||||
| JP Morgan Chase Commercial Mortgage Securities Trust: |
| |||||||
| Series 2012-C6,Cl. ASB, 3.144%, 5/15/45 | 132,008 | 132,167 | ||||||
| Series 2012-LC9,Cl. A4, 2.611%, 12/15/47 | 20,000 | 19,682 | ||||||
| Series 2013-C10,Cl. AS, 3.372%, 12/15/47 | 315,000 | 310,985 | ||||||
| Series 2013-C16,Cl. AS, 4.517%, 12/15/46 | 300,000 | 313,077 | ||||||
| Series 2013-LC11,Cl. AS, 3.216%, 4/15/46 | 40,000 | 39,203 | ||||||
| Series 2013-LC11,Cl. ASB, 2.554%, 4/15/46 | 46,915 | 46,317 | ||||||
| Series 2014-C20,Cl. AS, 4.043%, 7/15/47 | 220,000 | 222,725 | ||||||
| Series 2016-JP3,Cl. A2, 2.435%, 8/15/49 | 220,000 | 214,569 | ||||||
| JP Morgan Mortgage Trust, Series 2007-A1, Cl. 5A1, 3.692%, 7/25/359 | 66,289 | 68,206 | ||||||
| JP Morgan Resecuritization Trust, Series 2009-5, Cl. 1A2, 4.278%, 7/26/361,9 | 202,810 | 195,235 | ||||||
| JPMBB Commercial Mortgage Securities Trust: |
| |||||||
| Series 2013-C17,Cl. ASB, 3.705%, 1/15/47 | 75,000 | 76,088 | ||||||
| Series 2014-C18,Cl. A3, 3.578%, 2/15/47 | 105,000 | 105,214 | ||||||
| Series 2014-C19,Cl. ASB, 3.584%, 4/15/47 | 40,000 | 40,428 | ||||||
| Series 2014-C24,Cl. B, 4.116%, 11/15/479 | 245,000 | 246,091 | ||||||
| Series 2014-C25,Cl. AS, 4.065%, 11/15/47 | 200,000 | 202,419 | ||||||
| Series 2014-C26,Cl. AS, 3.80%, 1/15/48 | 255,000 | 254,169 | ||||||
| LB Commercial Conduit Mortgage Trust, Interest-Only Stripped Mtg.-Backed Security, Series 1998-C1, Cl. IO, 0.00%, 2/18/303,4 | 74,010 | 4 | ||||||
| Lehman Structured Securities Corp., Series 2002-GE1, Cl. A, 0.00%, 7/26/241,8,9 | 30,146 | 21,878 | ||||||
| Morgan Stanley Bank of America Merrill Lynch Trust: |
| |||||||
| Series 2013-C7,Cl. AAB, 2.469%, 2/15/46 | 92,338 | 91,083 | ||||||
| Series 2013-C9,Cl. AS, 3.456%, 5/15/46 | 225,000 | 221,320 | ||||||
| Series 2014-C19,Cl. AS, 3.832%, 12/15/47 | 595,000 | 592,506 | ||||||
| Morgan Stanley Capital I Trust: | ||||||||
| Series 2011-C1,5.033%, 9/15/471,9 | 64,489 | 66,482 | ||||||
| Series 2011-C2,Cl. A4, 4.661%, 6/15/441 | 75,000 | 77,701 | ||||||
| Morgan Stanley Capital I, Inc., Interest-Only Commercial Mtg. Pass-Through Certificates, Series 2017-HR2, Cl. XA, 12.66%, 12/15/503 | 683,901 | 40,903 | ||||||
| Morgan Stanley Re-Remic Trust, Series 2012- R3, Cl. 1B, 3.059%, 11/26/361,9 | 440,098 | 396,495 | ||||||
| Morgan Stanley Resecuritization Trust, Series 2013-R9, Cl. 3A, 3.475%, 6/26/461,9 | 84,263 | 84,209 | ||||||
| RBSSP Resecuritization Trust, Series 2010-1, Cl. 2A1, 3.644%, 7/26/451,9 | 13,234 | 13,560 | ||||||
| UBS Commercial Mortgage Trust, Interest-Only Commercial Mtg. Pass-Through Certificates, Series 2017-C5, Cl. XA, 13.993%, 11/15/503 | 1,255,308 | 84,003 | ||||||
9 OPPENHEIMER TOTAL RETURN BOND FUND/VA
STATEMENT OF INVESTMENTS Unaudited / Continued
| Principal Amount | Value | |||||||
| Commercial (Continued) |
| |||||||
| Wells Fargo Commercial Mortgage Trust, Series 2015-NXS1, Cl. ASB, 2.934%, 5/15/48 | $ | 305,000 | $ | 301,127 | ||||
| Wells Fargo Commercial Mortgage Trust, Interest-Only Commercial Mtg. Pass-Through Certificates, Series 2017-C42, Cl. XA, 12.341%, 12/15/503 | 898,268 | 61,108 | ||||||
| WF-RBS Commercial Mortgage Trust: |
| |||||||
| Series 2013-C14,Cl. AS, 3.488%, 6/15/46 | 150,000 | 148,372 | ||||||
| Series 2014-C20,Cl. AS, 4.176%, 5/15/47 | 130,000 | 131,131 | ||||||
| Series 2014-C22,Cl. A3, 3.528%, 9/15/57 | 45,000 | 45,197 | ||||||
| Series 2014-LC14,Cl. AS, 4.351%, 3/15/479 | 145,000 | 148,888 | ||||||
|
|
| ||||||
|
| 9,876,315
|
| ||||||
| Multi-Family—0.3% |
| |||||||
| Connecticut Avenue Securities: |
| |||||||
| Series 2014-C02,Cl. 1M1, 3.041% [US0001M+95], 5/25/242 | 109,313 | 109,632 | ||||||
| Series 2017-C04,Cl. 2M1, 2.941% [US0001M+85], 11/25/292 | 308,869 | 309,839 | ||||||
|
|
| ||||||
|
| 419,471
|
| ||||||
| Residential—8.4% |
| |||||||
| Banc of America Funding Trust: |
| |||||||
| Series 2007-1,Cl. 1A3, 6.00%, 1/25/37 | 84,329 | 79,260 | ||||||
| Series 2007-C,Cl. 1A4, 3.742%, 5/20/369 | 35,787 | 34,640 | ||||||
| Series 2014-R7,Cl. 3A1, 3.822%, 3/26/361,9 | 89,661 | 90,326 | ||||||
| Banc of America Mortgage Trust, Series 2007-1, Cl. 1A24, 6.00%, 3/25/37 | 57,497 | 54,641 | ||||||
| Bear Stearns ARM Trust: |
| |||||||
| Series 2005-9,Cl. A1, 3.52% [H15T1Y+230], 10/25/352 | 113,760 | 115,327 | ||||||
| Series 2006-1,Cl. A1, 3.67% [H15T1Y+225], 2/25/362 | 138,833 | 140,027 | ||||||
| CHL Mortgage Pass-Through Trust: |
| |||||||
| Series 2005-17,Cl. 1A8, 5.50%, 9/25/35 | 11,841 | 11,820 | ||||||
| Series 2005-26,Cl. 1A8, 5.50%, 11/25/35 | 74,090 | 67,285 | ||||||
| Series 2005-J4,Cl. A7, 5.50%, 11/25/35 | 9,837 | 9,870 | ||||||
| Citigroup Mortgage Loan Trust, Inc., Series 2006-AR1, Cl. 1A1, 4.28% [H15T1Y+240], 10/25/352 | 348,665 | 353,036 | ||||||
| Connecticut Avenue Securities: |
| |||||||
| Series 2014-C03,Cl. 1M2, 5.091% [US0001M+300], 7/25/242 | 311,400 | 333,897 | ||||||
| Series 2016-C03,Cl. 1M1, 4.091% [US0001M+200], 10/25/282 | 82,053 | 83,183 | ||||||
| Series 2016-C07,Cl. 2M1, 3.391% [US0001M+130], 5/25/292 | 155,022 | 155,613 | ||||||
| Series 2017-C02,Cl. 2M1, 3.241% [US0001M+115], 9/25/292 | 430,012 | 432,483 | ||||||
| Series 2017-C03,Cl. 1M1, 3.041% [US0001M+95], 10/25/292 | 369,857 | 372,004 | ||||||
| Series 2017-C06,Cl. 1M1, 2.841% [US0001M+75], 2/25/302 | 131,175 | 131,390 | ||||||
| Series 2017-C07,Cl. 1M1, 2.741% [US0001M+65], 5/25/302 | 196,325 | 196,364 | ||||||
| Series 2017-C07,Cl. 1M2, 4.491% [US0001M+240], 5/25/302 | 210,000 | 214,565 | ||||||
| Series 2017-C07,Cl. 2M1, 2.741% [US0001M+65], 5/25/302 | 228,242 | 228,345 | ||||||
| Series 2018-C01,Cl. 1M1, 2.691% [US0001M+60], 7/25/302 | 290,472 | 290,148 | ||||||
| Series 2018-C02,Cl. 2M1, 2.741% [US0001M+65], 8/25/302 | 100,776 | 100,818 | ||||||
| Principal Amount | Value | |||||||
| Residential (Continued) |
| |||||||
| Connecticut Avenue Securities: (Continued) |
| |||||||
| Series 2018-C03,Cl. 1M1, 2.771% [US0001M+68], 10/25/302 | $ | 285,995 | $ | 285,966 | ||||
| Series 2018-C04,Cl. 2M1, 2.852% [US0001M+75], 12/25/302,6 | 285,000 | 285,733 | ||||||
| GSR Mortgage Loan Trust, Series 2005-AR4, Cl. 6A1, 4.349%, 7/25/359 | 61,495 | 62,100 | ||||||
| HomeBanc Mortgage Trust, Series 2005-3, Cl. A2, 2.401% [US0001M+31], 7/25/352 | 26,508 | 26,485 | ||||||
| MASTR Asset Backed Securities Trust, Series 2006-WMC3, Cl. A3, 2.191% [US0001M+10], 8/25/362 | 46,411 | 24,641 | ||||||
| RALI Trust: |
| |||||||
| Series 2006-QS13,Cl. 1A8, 6.00%, 9/25/36 | 654 | 585 | ||||||
| Series 2007-QS6,Cl. A28, 5.75%, 4/25/37 | 8,316 | 7,585 | ||||||
| STACR Trust, Series 2018-DNA2, Cl. M1, 2.857% [US0001M+80], 12/25/301,2 | 380,000 | 380,088 | ||||||
| Structured Agency Credit Risk Debt Nts.: |
| |||||||
| Series 2013-DN2,Cl. M2, 6.341% [US0001M+425], 11/25/232 | 273,652 | 304,279 | ||||||
| Series 2014-DN1,Cl. M2, 4.291% [US0001M+220], 2/25/242 | 40,957 | 42,124 | ||||||
| Series 2014-DN1,Cl. M3, 6.591% [US0001M+450], 2/25/242 | 210,000 | 242,352 | ||||||
| Series 2014-DN2,Cl. M3, 5.691% [US0001M+360], 4/25/242 | 225,000 | 249,756 | ||||||
| Series 2014-HQ2,Cl. M3, 5.841% [US0001M+375], 9/25/242 | 335,000 | 382,589 | ||||||
| Series 2015-HQA2,Cl. M2, 4.891% [US0001M+280], 5/25/282 | 51,515 | 52,970 | ||||||
| Series 2016-DNA1,Cl. M2, 4.991% [US0001M+290], 7/25/282 | 95,858 | 98,348 | ||||||
| Series 2016-DNA4,Cl. M1, 2.891% [US0001M+80], 3/25/292 | 47,333 | 47,377 | ||||||
| Series 2016-DNA4,Cl. M3, 5.891% [US0001M+380], 3/25/292 | 325,000 | 362,112 | ||||||
| Series 2016-HQA3,Cl. M1, 2.891% [US0001M+80], 3/25/292 | 232,538 | 232,845 | ||||||
| Series 2016-HQA3,Cl. M3, 5.941% [US0001M+385], 3/25/292 | 110,000 | 122,827 | ||||||
| Series 2016-HQA4,Cl. M1, 2.891% [US0001M+80], 4/25/292 | 164,209 | 164,381 | ||||||
| Series 2016-HQA4,Cl. M3, 5.991% [US0001M+390], 4/25/292 | 320,000 | 357,843 | ||||||
| Series 2017-HQA1,Cl. M1, 3.291% [US0001M+120], 8/25/292 | 572,363 | 576,318 | ||||||
| Series 2017-HQA2,Cl. M1, 2.891% [US0001M+80], 12/25/292 | 192,611 | 193,000 | ||||||
| Series 2017-HQA3,Cl. M1, 2.641% [US0001M+55], 4/25/302 | 535,499 | 535,161 | ||||||
| Series 2018-DNA1,Cl. M1, 2.541% [US0001M+45], 7/25/302 | 426,068 | 424,398 | ||||||
| Series 2018-DNA1,Cl. M2, 3.891% [US0001M+180], 7/25/302 | 420,000 | 413,533 | ||||||
| WaMu Mortgage Pass-Through Certificates Trust: |
| |||||||
| Series 2003-AR10,Cl. A7, 3.459%, 10/25/339 | 74,097 | 75,306 | ||||||
| Series 2005-AR14,Cl. 1A4, 3.413%, 12/25/359 | 150,845 | 152,447 | ||||||
| Series 2005-AR16,Cl. 1A1, 3.398%, 12/25/359 | 65,284 | 65,667 | ||||||
| Wells Fargo Mortgage-Backed Securities Trust: |
| |||||||
| Series 2005-AR15,Cl. 1A2, 3.552%, 9/25/359 | 67,669 | 65,954 | ||||||
| Series 2005-AR15,Cl. 1A6, 3.552%, 9/25/359 | 26,236 | 25,388 | ||||||
10 OPPENHEIMER TOTAL RETURN BOND FUND/VA
| Principal Amount | Value | |||||||
| Residential (Continued) |
| |||||||
| Wells Fargo Mortgage-Backed Securities Trust: (Continued) |
| |||||||
| Series 2005-AR4,Cl. 2A2, 3.97%, 4/25/359 | $ | 161,328 | $ | 162,790 | ||||
| Series 2006-AR10,Cl. 1A1, 4.12%, 7/25/369 | 49,133 | 48,214 | ||||||
| Series 2006-AR10,Cl. 5A5, 4.278%, 7/25/369 | 130,034 | 132,146 | ||||||
| Series 2006-AR2,Cl. 2A3, 3.822%, 3/25/369 | 57,791 | 58,561 | ||||||
| Series 2006-AR7,Cl. 2A4, 4.323%, 5/25/369 | 13,034 | 13,362 | ||||||
| Series 2006-AR8,Cl. 2A1, 3.933%, 4/25/369 | 130,298 | 132,688 | ||||||
| Series 2006-AR8,Cl. 2A4, 3.933%, 4/25/369 | 57,035 | 58,080 | ||||||
| Series 2007-16,Cl. 1A1, 6.00%, 12/28/37 | 44,428 | 45,141 | ||||||
|
|
| ||||||
| 10,406,182 | ||||||||
|
|
| ||||||
Total Mortgage-Backed Obligations (Cost $78,860,439)
|
| 77,812,034
|
| |||||
| U.S. Government Obligation—0.2% |
| |||||||
United States Treasury Nts., 1.50%, 5/31/1910,11 (Cost $193,236)
|
| 193,000
|
|
| 191,541
|
| ||
| Corporate Bonds and Notes—49.4% |
| |||||||
| Consumer Discretionary—8.0% |
| |||||||
| Automobiles—2.3% |
| |||||||
| Daimler Finance North America LLC: | ||||||||
| 2.20% Sr. Unsec. Nts., 5/5/201 | 285,000 | 279,586 | ||||||
| 3.75% Sr. Unsec. Nts., 2/22/281 | 265,000 | 257,211 | ||||||
| Ford Motor Credit Co. LLC: | ||||||||
| 2.425% Sr. Unsec. Nts., 6/12/20 | 221,000 | 216,793 | ||||||
| 3.664% Sr. Unsec. Nts., 9/8/24 | 219,000 | 209,791 | ||||||
| General Motors Co., 6.25% Sr. Unsec. Nts., 10/2/43 | 78,000 | 81,038 | ||||||
| General Motors Financial Co., Inc., 3.15% Sr. Unsec. Nts., 6/30/22 | 301,000 | 292,804 | ||||||
| Harley-Davidson Financial Services, Inc., 2.40% Sr. Unsec. Nts., 6/15/201 | 323,000 | 316,882 | ||||||
| Harley-Davidson, Inc., 4.625% Sr. Unsec. Nts., 7/28/45 | 86,000 | 83,693 | ||||||
| Hyundai Capital America: | ||||||||
| 1.75% Sr. Unsec. Nts., 9/27/191 | 243,000 | 238,396 | ||||||
| 4.125% Sr. Unsec. Nts., 6/8/231 | 315,000 | 313,615 | ||||||
| Nissan Motor Acceptance Corp., 2.15% | ||||||||
| Sr. Unsec. Nts., 9/28/201 | 217,000 | 211,476 | ||||||
| Volkswagen Group of America Finance | ||||||||
| LLC, 2.45% Sr. Unsec. Nts., 11/20/191 | 338,000 | 334,362 | ||||||
|
|
| ||||||
|
| 2,835,647
|
| ||||||
| Diversified Consumer Services—0.3% |
| |||||||
| Service Corp. International, 4.625% Sr. Unsec. Nts., 12/15/27 | 340,000 | 322,014 | ||||||
| Hotels, Restaurants & Leisure—0.4% |
| |||||||
| Aramark Services, Inc., 5.00% Sr. Unsec. Nts., 4/1/251 | 163,000 | 162,593 | ||||||
| Royal Caribbean Cruises Ltd., 2.65% Sr. | ||||||||
| Unsec. Nts., 11/28/20 | 287,000 | 282,257 | ||||||
|
|
| ||||||
|
| 444,850
|
| ||||||
| Household Durables—1.1% |
| |||||||
| DR Horton, Inc., 2.55% Sr. Unsec. Nts., 12/1/20 | 320,000 | 313,794 | ||||||
| Lennar Corp., 4.75% Sr. Unsec. Nts., 5/30/25 | 314,000 | 304,972 | ||||||
| Newell Brands, Inc., 5.00% Sr. Unsec. Nts., 11/15/23 | 171,000 | 174,863 | ||||||
| PulteGroup, Inc., 5.00% Sr. Unsec. Nts., 1/15/27 | 251,000 | 239,391 | ||||||
| Principal Amount | Value | |||||||
| Household Durables (Continued) |
| |||||||
| Toll Brothers Finance Corp.: |
| |||||||
| 4.375% Sr. Unsec. Nts., 4/15/23 | $ | 257,000 | $ | 252,824 | ||||
| 4.875% Sr. Unsec. Nts., 3/15/27 | 75,000 | 70,313 | ||||||
|
|
| ||||||
|
| 1,356,157
|
| ||||||
| Internet & Catalog Retail—0.5% |
| |||||||
| Amazon.com, Inc., 4.95% Sr. Unsec. Nts., 12/5/44 | 113,000 | 125,773 | ||||||
| QVC, Inc., 4.45% Sr. Sec. Nts., 2/15/25 | 565,000 | 546,675 | ||||||
|
|
| ||||||
|
| 672,448
|
| ||||||
| Media—1.6% |
| |||||||
| 21st Century Fox America, Inc., 4.75% Sr. Unsec. Nts., 11/15/46 | 116,000 | 120,168 | ||||||
| Charter Communications Operating LLC/ Charter Communications Operating Capital, 5.375% Sr. Sec. Nts., 5/1/47 | 139,000 | 126,574 | ||||||
| Comcast Cable Communications | ||||||||
| Holdings, Inc., 9.455% Sr. Unsec. Nts., 11/15/22 | 306,000 | 375,632 | ||||||
| Interpublic Group of Cos., Inc. (The), 4.20% Sr. Unsec. Nts., 4/15/24 | 311,000 | 313,114 | ||||||
| Sky plc, 3.75% Sr. Unsec. Nts., 9/16/241 | 152,000 | 151,265 | ||||||
| Time Warner Cable LLC, 4.50% Sr. Unsec. Unsub. Nts., 9/15/42 | 236,000 | 194,432 | ||||||
| Viacom, Inc., 4.375% Sr. Unsec. Nts., 3/15/43 | 100,000 | 83,307 | ||||||
| Virgin Media Secured Finance plc, 5.25% Sr. Sec. Nts., 1/15/261 | 319,000 | 296,271 | ||||||
| WPP Finance 2010, 3.75% Sr. Unsec. Nts., 9/19/24 | 352,000 | 340,352 | ||||||
|
|
| ||||||
|
| 2,001,115
|
| ||||||
| Multiline Retail—0.2% |
| |||||||
| Dollar Tree, Inc., 4.00% Sr. Unsec. Nts., 5/15/25 | 323,000 | 316,079 | ||||||
| Specialty Retail—1.2% |
| |||||||
| AutoZone, Inc., 1.625% Sr. Unsec. Nts., 4/21/19 | 64,000 | 63,534 | ||||||
| Best Buy Co., Inc., 5.50% Sr. Unsec. Nts., 3/15/21 | 305,000 | 319,889 | ||||||
| L Brands, Inc., 5.625% Sr. Unsec. Nts., 2/15/22 | 322,000 | 328,440 | ||||||
| Ross Stores, Inc., 3.375% Sr. Unsec. Nts., 9/15/24 | 324,000 | 320,026 | ||||||
| Sally Holdings LLC/Sally Capital, Inc., 5.625% Sr. Unsec. Nts., 12/1/25 | 123,000 | 114,082 | ||||||
| Signet UK Finance plc, 4.70% Sr. Unsec. Nts., 6/15/24 | 342,000 | 321,641 | ||||||
|
|
| ||||||
|
| 1,467,612
|
| ||||||
| Textiles, Apparel & Luxury Goods—0.4% |
| |||||||
| Hanesbrands, Inc., 4.875% Sr. Unsec. Nts., 5/15/261 | 316,000 | 306,520 | ||||||
| Levi Strauss & Co., 5.00% Sr. Unsec. Nts., 5/1/25 | 239,000 | 239,000 | ||||||
|
|
| ||||||
|
| 545,520
|
| ||||||
| Consumer Staples—4.5% |
| |||||||
| Beverages—1.5% |
| |||||||
| Anheuser-Busch InBev Finance, Inc.: | ||||||||
| 3.65% Sr. Unsec. Nts., 2/1/26 | 85,000 | 83,321 | ||||||
| 4.90% Sr. Unsec. Nts., 2/1/46 | 121,000 | 124,877 | ||||||
| Anheuser-Busch InBev Worldwide, Inc., 8.20% Sr. Unsec. Unsub. Nts., 1/15/39 | 186,000 | 266,525 | ||||||
| Bacardi Ltd., 4.70% Sr. Unsec. Nts., 5/15/281 | 163,000 | 160,566 | ||||||
| Maple Escrow Subsidiary, Inc.: | ||||||||
| 4.057% Sr. Unsec. Nts., 5/25/231 | 327,000 | 328,577 | ||||||
| 4.597% Sr. Unsec. Nts., 5/25/281 | 162,000 | 162,851 | ||||||
11 OPPENHEIMER TOTAL RETURN BOND FUND/VA
STATEMENT OF INVESTMENTS Unaudited / Continued
| Principal Amount | Value | |||||||
| Beverages (Continued) |
| |||||||
| Molson Coors Brewing Co.: |
| |||||||
| 1.45% Sr. Unsec. Nts., 7/15/19 | $ | 109,000 | $ | 107,305 | ||||
| 2.10% Sr. Unsec. Nts., 7/15/21 | 284,000 | 272,511 | ||||||
| 4.20% Sr. Unsec. Nts., 7/15/46 | 48,000 | 43,229 | ||||||
| Pernod Ricard SA, 4.25% Sr. Unsec. Nts., 7/15/221 | 307,000 | 313,806 | ||||||
|
|
| ||||||
|
| 1,863,568
|
| ||||||
| Food & Staples Retailing—0.4% |
| |||||||
| Alimentation Couche-Tard, Inc., 2.35% Sr. Unsec. Nts., 12/13/191 | 343,000 | 338,914 | ||||||
| Kroger Co. (The): |
| |||||||
| 2.00% Sr. Unsec. Nts., 1/15/19 | 15,000 | 14,930 | ||||||
| 4.45% Sr. Unsec. Nts., 2/1/47 | 89,000 | 81,196 | ||||||
| 6.90% Sr. Unsec. Nts., 4/15/38 | 79,000 | 95,774 | ||||||
|
|
| ||||||
|
| 530,814
|
| ||||||
| Food Products—1.5% |
| |||||||
| Bunge Ltd. Finance Corp.: |
| |||||||
| 3.25% Sr. Unsec. Nts., 8/15/26 | 216,000 | 197,424 | ||||||
| 8.50% Sr. Unsec. Nts., 6/15/19 | 305,000 | 320,445 | ||||||
| Campbell Soup Co., 3.30% Sr. Unsec. Nts., 3/15/21 | 311,000 | 309,891 | ||||||
| General Mills, Inc., 4.70% Sr. Unsec. Nts., 4/17/48 | 104,000 | 99,766 | ||||||
| Kraft Heinz Foods Co., 3.95% Sr. Unsec. Nts., 7/15/25 | 177,000 | 172,253 | ||||||
| Lamb Weston Holdings, Inc., 4.875% Sr. Unsec. Nts., 11/1/261 | 308,000 | 300,300 | ||||||
| Smithfield Foods, Inc.: | ||||||||
| 2.70% Sr. Unsec. Nts., 1/31/201 | 137,000 | 135,081 | ||||||
| 3.35% Sr. Unsec. Nts., 2/1/221 | 174,000 | 168,117 | ||||||
| Tyson Foods, Inc., 3.55% Sr. Unsec. Nts., 6/2/27 | 164,000 | 155,388 | ||||||
|
|
| ||||||
|
| 1,858,665
|
| ||||||
| Tobacco—1.1% |
| |||||||
| Altria Group, Inc., 4.00% Sr. Unsec. Nts., 1/31/24 | 222,000 | 224,863 | ||||||
| BAT Capital Corp.: |
| |||||||
| 2.297% Sr. Unsec. Nts., 8/14/201 | 330,000 | 323,034 | ||||||
| 3.557% Sr. Unsec. Nts., 8/15/271 | 169,000 | 157,478 | ||||||
| Imperial Tobacco Finance plc, 2.95% Sr. Unsec. Nts., 7/21/201 | 325,000 | 321,796 | ||||||
| Philip Morris International, Inc., | ||||||||
| 2.50% Sr. Unsec. Nts., 11/2/22 | 288,000 | 276,382 | ||||||
|
|
| ||||||
|
| 1,303,553
|
| ||||||
| Energy—3.6% |
| |||||||
| Energy Equipment & Services—0.3% |
| |||||||
| Halliburton Co., 5.00% Sr. Unsec. Nts., 11/15/45 | 70,000 | 74,804 | ||||||
| Helmerich & Payne International Drilling | ||||||||
| Co., 4.65% Sr. Unsec. Nts., 3/15/25 | 194,000 | 200,530 | ||||||
| Schlumberger Holdings Corp., 4.00% Sr. | ||||||||
| Unsec. Nts., 12/21/251 | 184,000 | 183,620 | ||||||
|
|
| ||||||
|
| 458,954
|
| ||||||
| Oil, Gas & Consumable Fuels—3.3% |
| |||||||
| Anadarko Petroleum Corp.: |
| |||||||
| 4.50% Sr. Unsec. Nts., 7/15/44 | 64,000 | 59,775 | ||||||
| 6.20% Sr. Unsec. Nts., 3/15/40 | 53,000 | 59,860 | ||||||
| Andeavor, 5.125% Sr. Unsec. Nts., 12/15/26 | 283,000 | 296,431 | ||||||
| Andeavor Logistics LP/Tesoro Logistics Finance Corp.: |
| |||||||
| 4.25% Sr. Unsec. Nts., 12/1/27 | 166,000 | 160,009 | ||||||
| 5.25% Sr. Unsec. Nts., 1/15/25 | 107,000 | 109,796 | ||||||
| Apache Corp., 4.75% Sr. Unsec. Nts., 4/15/43 | 96,000 | 91,410 | ||||||
| Buckeye Partners LP, 3.95% Sr. Unsec. Nts., 12/1/26 | 85,000 | 77,229 | ||||||
| Principal Amount | Value | |||||||
| Oil, Gas & Consumable Fuels (Continued) |
| |||||||
| Columbia Pipeline Group, Inc.: |
| |||||||
| 3.30% Sr. Unsec. Nts., 6/1/20 | $ | 302,000 | $ | 300,877 | ||||
| 4.50% Sr. Unsec. Nts., 6/1/25 | 162,000 | 162,372 | ||||||
| ConocoPhillips Co.: |
| |||||||
| 4.95% Sr. Unsec. Nts., 3/15/26 | 35,000 | 37,769 | ||||||
| 5.95% Sr. Unsec. Nts., 3/15/46 | 70,000 | 87,354 | ||||||
| Devon Energy Corp., 4.75% Sr. | ||||||||
| Unsec. Nts., 5/15/42 | 74,000 | 72,445 | ||||||
| Energy Transfer Partners LP, 5.30% Sr. | ||||||||
| Unsec. Nts., 4/15/47 | 94,000 | 86,236 | ||||||
| Enterprise Products Operating LLC: |
| |||||||
| 4.85% Sr. Unsec. Nts., 8/15/42 | 79,000 | 79,088 | ||||||
| 4.90% Sr. Unsec. Nts., 5/15/46 | 27,000 | 27,134 | ||||||
| EQT Corp., 2.50% Sr. Unsec. Nts., 10/1/20 | 340,000 | 332,371 | ||||||
| Kinder Morgan, Inc.: |
| |||||||
| 5.20% Sr. Unsec. Nts., 3/1/48 | 80,000 | 77,573 | ||||||
| 5.55% Sr. Unsec. Nts., 6/1/45 | 138,000 | 139,812 | ||||||
| Noble Energy, Inc., 5.05% Sr. Unsec. Nts., 11/15/44 | 87,000 | 87,195 | ||||||
| ONEOK Partners LP, 8.625% Sr. Unsec. Nts., 3/1/19 | 192,000 | 198,760 | ||||||
| Pioneer Natural Resources Co., | ||||||||
| 3.45% Sr. Unsec. Nts., 1/15/21 | 318,000 | 318,840 | ||||||
| Sabine Pass Liquefaction LLC: |
| |||||||
| 4.20% Sr. Sec. Nts., 3/15/28 | 166,000 | 159,886 | ||||||
| 5.625% Sr. Sec. Nts., 2/1/21 | 237,000 | 247,992 | ||||||
| Shell International Finance BV, | ||||||||
| 4.00% Sr. Unsec. Nts., 5/10/46 | 110,000 | 106,707 | ||||||
| Sunoco Logistics Partners Operations LP, 4.00% Sr. Unsec. Nts., 10/1/27 | 190,000 | 177,822 | ||||||
| TransCanada PipeLines Ltd., . | ||||||||
| 7.625% Sr. Unsec. Nts., 1/15/39 | 71,000 | 93,326 | ||||||
| Williams Cos., Inc. (The), 3.70% Sr. Unsec. Unsub. Nts., 1/15/23 | 318,000 | 309,255 | ||||||
| Williams Partners LP, 3.75% Sr. Unsec. Nts., 6/15/27 | 131,000 | 123,878 | ||||||
|
|
| ||||||
|
| 4,081,202
|
| ||||||
| Financials—13.4% |
| |||||||
| Capital Markets—2.6% |
| |||||||
| Apollo Management Holdings LP, 4.00% Sr. Unsec. Nts., 5/30/241 | 184,000 | 182,925 | ||||||
| Blackstone Holdings Finance Co. LLC, 3.15% Sr. Unsec. Nts., 10/2/271 | 121,000 | 113,634 | ||||||
| Brookfield Asset Management, Inc., 4.00% Sr. Unsec. Nts., 1/15/25 | 252,000 | 249,406 | ||||||
| Credit Suisse AG (New York), 3.625% Sr. Unsec. Nts., 9/9/24 | 189,000 | 186,382 | ||||||
| Credit Suisse Group Funding | ||||||||
| Guernsey Ltd., 4.55% Sr. Unsec. Nts., 4/17/26 | 147,000 | 147,179 | ||||||
| E*TRADE Financial Corp., 5.875% [US0003M+443.5] Jr. Sub. Perpetual Bonds2,12 | 308,000 | 314,160 | ||||||
| Goldman Sachs Group, Inc. (The): |
| |||||||
| 3.50% Sr. Unsec. Nts., 11/16/26 | 172,000 | 162,176 | ||||||
| 3.75% Sr. Unsec. Nts., 2/25/26 | 170,000 | 164,929 | ||||||
| 4.017% [US0003M+137.3] Sr. Unsec. | ||||||||
| Nts., 10/31/382 | 136,000 | 124,074 | ||||||
| Morgan Stanley: |
| |||||||
| 4.375% Sr. Unsec. Nts., 1/22/47 | 219,000 | 209,465 | ||||||
| 5.00% Sub. Nts., 11/24/25 | 264,000 | 274,007 | ||||||
| MSCI, Inc., 4.75% Sr. Unsec. Nts., 8/1/261 | 317,000 | 307,490 | ||||||
| Northern Trust Corp., 3.375% | ||||||||
| [US0003M+113.1] Sub. Nts., 5/8/322 | 119,000 | 111,875 | ||||||
| Raymond James Financial, Inc., 3.625% Sr. Unsec. Nts., 9/15/26 | 157,000 | 150,980 | ||||||
12 OPPENHEIMER TOTAL RETURN BOND FUND/VA
| Principal Amount | Value | |||||||
| Capital Markets (Continued) |
| |||||||
| TD Ameritrade Holding Corp., 3.30% Sr. Unsec. Nts., 4/1/27 | $ | 197,000 | $ | 188,117 | ||||
| UBS Group Funding Switzerland AG: |
| |||||||
| 4.125% Sr. Unsec. Nts., 4/15/261 | 153,000 | 151,521 | ||||||
| 4.253% Sr. Unsec. Nts., 3/23/281 | 135,000 | 134,229 | ||||||
|
|
| ||||||
|
| 3,172,549
|
| ||||||
| Commercial Banks—6.5% |
| |||||||
| ABN AMRO Bank NV, 4.40% | ||||||||
| [USSW5+219.7] Sub. Nts., 3/27/282 | 321,000 | 315,285 | ||||||
| Australia & New Zealand Banking Group | ||||||||
| Ltd. (New York), 2.625% Sr. Unsec. Nts., 5/19/22 | 261,000 | 252,366 | ||||||
| Banco Santander SA, 4.379% | ||||||||
| Sr. Unsec. Nts., 4/12/28 | 200,000 | 191,524 | ||||||
| Bank of America Corp.: |
| |||||||
| 3.248% Sr. Unsec. Nts., 10/21/27 | 269,000 | 250,897 | ||||||
| 3.824% [US0003M+157.5] Sr. Unsec. Nts., 1/20/282 | 185,000 | 180,587 | ||||||
| 7.75% Jr. Sub. Nts., 5/14/38 | 232,000 | 315,085 | ||||||
| Barclays plc, 4.375% Sr. Unsec. Nts., 1/12/26 | 326,000 | 317,428 | ||||||
| BB&T Corp., 2.85% Sr. Unsec. Nts., 10/26/24 | 247,000 | 234,460 | ||||||
| BNP Paribas SA, 4.625% Sub. Nts., 3/13/271 | 184,000 | 180,857 | ||||||
| BPCE SA, 4.50% Sub. Nts., 3/15/251 | 185,000 | 180,560 | ||||||
| Citigroup, Inc.: |
| |||||||
| 4.075% [US0003M+119.2] Sr. | ||||||||
| Unsec. Nts., 4/23/292 | 256,000 | 251,464 | ||||||
| 4.281% [US0003M+183.9] Sr. | ||||||||
| Unsec. Nts., 4/24/482 | 334,000 | 316,894 | ||||||
| Citizens Bank NA (Providence RI): |
| |||||||
| 2.55% Sr. Unsec. Nts., 5/13/21 | 155,000 | 151,273 | ||||||
| 2.65% Sr. Unsec. Nts., 5/26/22 | 65,000 | 62,896 | ||||||
| Commonwealth Bank of Australia, 3.15% Sr. Unsec. Nts., 9/19/271 | 236,000 | 220,636 | ||||||
| Compass Bank, 2.875% Sr. Unsec. Nts., 6/29/22 | 285,000 | 275,308 | ||||||
| Credit Agricole SA, 4.375% Sub. Nts., 3/17/251 | 310,000 | 300,346 | ||||||
| Fifth Third Bank (Cincinnati OH), 3.85% Sub. Nts., 3/15/26 | 168,000 | 165,453 | ||||||
| First Republic Bank, 4.375% Sub. Nts., 8/1/46 | 127,000 | 121,880 | ||||||
| HSBC Holdings plc: |
| |||||||
| 3.95% [US0003M+98.72] Sr. | ||||||||
| Unsec. Nts., 5/18/242 | 103,000 | 102,781 | ||||||
| 4.041% [US0003M+154.6] Sr. | ||||||||
| Unsec. Nts., 3/13/282 | 125,000 | 121,437 | ||||||
| 4.583% [US0003M+153.46] Sr. Unsec. Nts., 6/19/292 | 171,000 | 172,853 | ||||||
| Huntington Bancshares, Inc.: | ||||||||
| 3.15% Sr. Unsec. Nts., 3/14/21 | 155,000 | 154,220 | ||||||
| 4.00% Sr. Unsec. Nts., 5/15/25 | 317,000 | 318,340 | ||||||
| Intesa Sanpaolo SpA, 3.875% Sr. Unsec. | ||||||||
| Nts., 7/14/271 | 225,000 | 194,428 | ||||||
| JPMorgan Chase & Co.: |
| |||||||
| 3.54% [US0003M+138] Sr. Unsec. Nts., 5/1/282 | 259,000 | 248,150 | ||||||
| 3.782% [US0003M+133.7] Sr. | ||||||||
| Unsec. Nts., 2/1/282 | 473,000 | 461,169 | ||||||
| Lloyds Banking Group plc, 6.657% [US0003M+127] Jr. Sub. Perpetual Bonds2,7,12 | 334,000 | 357,474 | ||||||
| PNC Financial Services Group, Inc. (The), 3.15% Sr. Unsec. Nts., 5/19/27 | 235,000 | 223,555 | ||||||
| Regions Bank (Birmingham AL), 2.75% Sr. Unsec. Nts., 4/1/21 | 226,000 | 222,677 | ||||||
| Principal Amount | Value | |||||||
| Commercial Banks (Continued) |
| |||||||
| Regions Financial Corp., 2.75% Sr. Unsec. Nts., 8/14/22 | $ | 177,000 | $ | 170,891 | ||||
| Royal Bank of Scotland Group plc, 3.498% [US0003M+148] Sr. Unsec. Nts., 5/15/232 | 192,000 | 186,107 | ||||||
| SunTrust Bank (Atlanta GA), 3.30% Sub. Nts., 5/15/26 | 112,000 | 105,828 | ||||||
| Synovus Financial Corp., 3.125% Sr. Unsec. Nts., 11/1/22 | 180,000 | 172,125 | ||||||
| US Bancorp: | ||||||||
| 3.10% Sub. Nts., 4/27/26 | 204,000 | 192,541 | ||||||
| 3.15% Sr. Unsec. Nts., 4/27/27 | 62,000 | 59,310 | ||||||
| Wells Fargo & Co.: | ||||||||
| 3.584% [US0003M+131] Sr. Unsec. Nts., 5/22/282 | 257,000 | 246,422 | ||||||
| 4.75% Sub. Nts., 12/7/46 | 160,000 | 155,061 | ||||||
|
|
| ||||||
|
| 8,150,568
|
| ||||||
| Consumer Finance—0.7% |
| |||||||
| American Express Co., 2.50% Sr. Unsec. Nts., 8/1/22 | 105,000 | 100,756 | ||||||
| American Express Credit Corp., 3.30% Sr. Unsec. Nts., 5/3/27 | 194,000 | 187,085 | ||||||
| Capital One Financial Corp., | ||||||||
| 3.75% Sr. Unsec. Nts., 3/9/27 | 103,000 | 97,681 | ||||||
| Discover Financial Services: | ||||||||
| 3.75% Sr. Unsec. Nts., 3/4/25 | 137,000 | 130,966 | ||||||
| 4.10% Sr. Unsec. Nts., 2/9/27 | 120,000 | 115,266 | ||||||
| Electricite de France SA, 6.50% Sr. | ||||||||
| Unsec. Nts., 1/26/191 | 246,000 | 251,085 | ||||||
|
|
| ||||||
|
| 882,839
|
| ||||||
| Diversified Financial Services—0.6% |
| |||||||
| Berkshire Hathaway Energy Co.: |
| |||||||
| 2.00% Sr. Unsec. Nts., 11/15/18 | 102,000 | 101,793 | ||||||
| 3.80% Sr. Unsec. Nts., 7/15/48 | 75,000 | 68,973 | ||||||
| Peachtree Corners Funding Trust, 3.976% Sr. Unsec. Nts., 2/15/251 | 121,000 | 117,864 | ||||||
| Precision Castparts Corp., | ||||||||
| 2.50% Sr. Unsec. Nts., 1/15/23 | 204,000 | 196,685 | ||||||
| Voya Financial, Inc., 5.65% | ||||||||
| [US0003M+358] Jr. Sub. Nts., 5/15/532 | 300,000 | 302,250 | ||||||
|
|
| ||||||
|
| 787,565
|
| ||||||
| Insurance—1.6% |
| |||||||
| AXA Equitable Holdings, Inc., | ||||||||
| 4.35% Sr. Unsec. Nts., 4/20/281 | 172,000 | 164,684 | ||||||
| AXIS Specialty Finance plc, 5.15% Sr. | ||||||||
| Unsec. Nts., 4/1/45 | 167,000 | 164,295 | ||||||
| Boardwalk Pipelines LP, | ||||||||
| 4.95% Sr. Unsec. Nts., 12/15/24 | 156,000 | 158,963 | ||||||
| Brighthouse Financial, Inc., . | ||||||||
| 3.70% Sr. Unsec. Nts., 6/22/27 | 67,000 | 59,738 | ||||||
| CNA Financial Corp., | ||||||||
| 3.45% Sr. Unsec. Nts., 8/15/27 | 239,000 | 221,760 | ||||||
| Hartford Financial Services Group, Inc. (The), 4.40% Sr. Unsec. Nts., 3/15/48 | 192,000 | 185,414 | ||||||
| Lincoln National Corp., 3.80% Sr. Unsec. Nts., 3/1/28 | 193,000 | 184,710 | ||||||
| Manulife Financial Corp., 4.061% | ||||||||
| [USISDA05+164.7] Sub. Nts., 2/24/322 | 202,000 | 191,965 | ||||||
| Marsh & McLennan Cos., Inc., 4.35% Sr. Unsec. Nts., 1/30/47 | 106,000 | 105,780 | ||||||
| Nuveen Finance LLC, 4.125% Sr. Unsec. Nts., 11/1/241 | 316,000 | 314,564 | ||||||
| Prudential Financial, Inc., 5.20% [US0003M+304] Jr. Sub. Nts., 3/15/442 | 243,000 | 242,393 | ||||||
|
|
| ||||||
| 1,994,266 | ||||||||
13 OPPENHEIMER TOTAL RETURN BOND FUND/VA
STATEMENT OF INVESTMENTS Unaudited / Continued
| Principal Amount | Value | |||||||
| Real Estate Investment Trusts (REITs)—1.4% |
| |||||||
| American Tower Corp.: | ||||||||
| 2.80% Sr. Unsec. Nts., 6/1/20 | $ | 72,000 | $ | 71,412 | ||||
| 3.00% Sr. Unsec. Nts., 6/15/23 | 262,000 | 251,424 | ||||||
| 3.60% Sr. Unsec. Nts., 1/15/28 | 174,000 | 161,478 | ||||||
| 5.05% Sr. Unsec. Unsub. Nts., 9/1/20 | 185,000 | 191,542 | ||||||
| Crown Castle International Corp., 3.65% | ||||||||
| Sr. Unsec. Nts., 9/1/27 | 170,000 | 158,368 | ||||||
| Digital Realty Trust LP: | ||||||||
| 3.40% Sr. Unsec. Nts., 10/1/20 | 29,000 | 29,034 | ||||||
| 5.875% Sr. Unsec. Nts., 2/1/20 | 118,000 | 122,119 | ||||||
| HCP, Inc., 2.625% Sr. Unsec. Nts., 2/1/20 | 326,000 | 322,223 | ||||||
| Lamar Media Corp., 5.75% Sr. Unsec. Nts., 2/1/26 | 307,000 | 313,524 | ||||||
| VEREIT Operating Partnership LP, 3.00% | ||||||||
| Sr. Unsec. Nts., 2/6/19 | 126,000 | 125,959 | ||||||
|
|
| ||||||
|
| 1,747,083
|
| ||||||
| Health Care—4.4% |
| |||||||
| Biotechnology—0.9% |
| |||||||
| AbbVie, Inc.: | ||||||||
| 3.60% Sr. Unsec. Nts., 5/14/25 | 202,000 | 195,873 | ||||||
| 4.70% Sr. Unsec. Nts., 5/14/45 | 62,000 | 61,691 | ||||||
| Amgen, Inc., 4.563% Sr. Unsec. Nts., 6/15/48 | 114,000 | 111,958 | ||||||
| Biogen, Inc., 5.20% Sr. Unsec. Nts., 9/15/45 | 77,000 | 81,795 | ||||||
| Celgene Corp.: | ||||||||
| 3.875% Sr. Unsec. Nts., 8/15/25 | 195,000 | 189,726 | ||||||
| 5.00% Sr. Unsec. Nts., 8/15/45 | 39,000 | 38,299 | ||||||
| Gilead Sciences, Inc., 4.75% Sr. Unsec. Nts., 3/1/46 | 133,000 | 137,489 | ||||||
| Shire Acquisitions Investments Ireland | ||||||||
| DAC, 1.90% Sr. Unsec. Nts., 9/23/19 | 354,000 | 348,692 | ||||||
|
|
| ||||||
|
| 1,165,523
|
| ||||||
| Health Care Equipment & Supplies—0.9% |
| |||||||
| Abbott Laboratories: | ||||||||
| 2.35% Sr. Unsec. Nts., 11/22/19 | 60,000 | 59,667 | ||||||
| 3.75% Sr. Unsec. Nts., 11/30/26 | 280,000 | 275,611 | ||||||
| Becton Dickinson & Co.: | ||||||||
| 2.404% Sr. Unsec. Nts., 6/5/20 | 213,000 | 209,266 | ||||||
| 3.70% Sr. Unsec. Nts., 6/6/27 | 252,000 | 238,710 | ||||||
| Edwards Lifesciences Corp., 4.30% Sr. Unsec. Nts., 6/15/28 | 161,000 | 160,998 | ||||||
| Hologic, Inc., 4.375% Sr. Unsec. Nts., 10/15/251 | 13,000 | 12,447 | ||||||
| Medtronic, Inc., 4.625% Sr. Unsec. Nts., 3/15/45 | 136,000 | 144,387 | ||||||
|
|
| ||||||
|
| 1,101,086
|
| ||||||
| Health Care Providers & Services—1.3% |
| |||||||
| Cigna Corp., 5.125% Sr. Unsec. Nts., 6/15/20 | 286,000 | 295,220 | ||||||
| CVS Health Corp.: | ||||||||
| 2.125% Sr. Unsec. Nts., 6/1/21 | 334,000 | 321,271 | ||||||
| 5.05% Sr. Unsec. Nts., 3/25/48 | 286,000 | 289,965 | ||||||
| Fresenius Medical Care US Finance II, | ||||||||
| Inc., 5.875% Sr. Unsec. Nts., 1/31/221 | 431,000 | 457,202 | ||||||
| UnitedHealth Group, Inc., 2.75% Sr. Unsec. Nts., 2/15/23 | 260,000 | 251,774 | ||||||
|
|
| ||||||
|
| 1,615,432
|
| ||||||
| Life Sciences Tools & Services—0.6% |
| |||||||
| IQVIA, Inc., 5.00% Sr. Unsec. Nts., 10/15/261 | 319,000 | 311,823 | ||||||
| Life Technologies Corp., 6.00% Sr. Unsec. Nts., 3/1/20 | 237,000 | 247,125 | ||||||
| Thermo Fisher Scientific, Inc., 4.15% Sr. | ||||||||
| Unsec. Nts., 2/1/24 | 121,000 | 122,915 | ||||||
|
|
| ||||||
| 681,863 | ||||||||
| Principal Amount | Value | |||||||
| Pharmaceuticals—0.7% |
| |||||||
| Allergan Funding SCS, 3.00% Sr. Unsec. Nts., 3/12/20 | $ | 329,000 | $ | 327,488 | ||||
| Bayer US Finance II LLC: | ||||||||
| 3.875% Sr. Unsec. Nts., 12/15/231 | 313,000 | 313,277 | ||||||
| 4.375% Sr. Unsec. Nts., 12/15/281 | 227,000 | 227,810 | ||||||
|
|
| ||||||
|
| 868,575
|
| ||||||
| Industrials—3.3% |
| |||||||
| Aerospace & Defense—0.7% |
| |||||||
| BAE Systems Holdings, Inc., 3.85% Sr. Unsec. Nts., 12/15/251 | 250,000 | 247,434 | ||||||
| Huntington Ingalls Industries, Inc., 3.483% Sr. Unsec. Nts., 12/1/27 | 176,000 | 165,845 | ||||||
| L3 Technologies, Inc., 3.85% Sr. Unsec. Nts., 6/15/23 | 317,000 | 316,586 | ||||||
| Northrop Grumman Corp., 4.75% Sr. Unsec. Nts., 6/1/43 | 175,000 | 182,696 | ||||||
|
|
| ||||||
|
| 912,561
|
| ||||||
| Air Freight & Couriers—0.2% |
| |||||||
| CH Robinson Worldwide, Inc., 4.20% Sr. Unsec. Nts., 4/15/28 | 163,000 | 160,375 | ||||||
| FedEx Corp., 4.40% Sr. Unsec. Nts., 1/15/47 | 65,000 | 61,737 | ||||||
|
|
| ||||||
|
| 222,112
|
| ||||||
| Building Products—0.2% |
| |||||||
| Allegion US Holding Co., Inc., 3.55% Sec. Nts., 10/1/27 | 246,000 | 227,968 | ||||||
| Electrical Equipment—0.3% |
| |||||||
| Sensata Technologies BV, 4.875% Sr. Unsec. Nts., 10/15/231 | 334,000 | 336,923 | ||||||
| Industrial Conglomerates—0.3% |
| |||||||
| GE Capital International Funding Co. Unlimited Co., 3.373% Sr. Unsec. Nts., 11/15/25 | 99,000 | 95,188 | ||||||
| Roper Technologies, Inc., 3.00% Sr. Unsec. Nts., 12/15/20 | 270,000 | 268,307 | ||||||
|
|
| ||||||
|
| 363,495
|
| ||||||
| Machinery—0.7% |
| |||||||
| CNH Industrial NV, 3.85% Sr. Unsec. Nts., 11/15/27 | 172,000 | 160,464 | ||||||
| Fortive Corp., 1.80% Sr. Unsec. Nts., 6/15/19 | 319,000 | 315,547 | ||||||
| John Deere Capital Corp., 2.70% Sr. Unsec. Nts., 1/6/23 | 142,000 | 138,617 | ||||||
| Nvent Finance Sarl, 4.55% Sr. Unsec. Nts., 4/15/281 | 162,000 | 159,198 | ||||||
| Wabtec Corp., 3.45% Sr. Unsec. Nts., 11/15/26 | 134,000 | 123,996 | ||||||
|
|
| ||||||
|
| 897,822
|
| ||||||
| Road & Rail—0.4% |
| |||||||
| Penske Truck Leasing Co. LP/PTL Finance Corp., 3.40% Sr. Unsec. Nts., 11/15/261 | 276,000 | 257,738 | ||||||
| Ryder System, Inc., 3.75% Sr. Unsec. | ||||||||
| Nts., 6/9/23 | 314,000 | 313,995 | ||||||
|
|
| ||||||
|
| 571,733
|
| ||||||
| Trading Companies & Distributors—0.5% |
| |||||||
| Air Lease Corp.: | ||||||||
| 3.25% Sr. Unsec. Nts., 3/1/25 | 99,000 | 91,738 | ||||||
| 3.625% Sr. Unsec. Nts., 4/1/27 | 106,000 | 97,329 | ||||||
| GATX Corp., 3.50% Sr. Unsec. Nts., 3/15/28 | 261,000 | 241,491 | ||||||
| United Rentals North America, Inc., 4.625% Sr. Unsec. Nts., 10/15/25 | 168,000 | 160,440 | ||||||
|
|
| ||||||
| 590,998 | ||||||||
14 OPPENHEIMER TOTAL RETURN BOND FUND/VA
| Principal Amount | Value | |||||||
| Information Technology—3.4% |
| |||||||
| Communications Equipment—0.2% |
| |||||||
| Motorola Solutions, Inc., 4.60% Sr. Unsec. Nts., 2/23/28 | $ | 241,000 | $ | 240,062 | ||||
| Electronic Equipment, Instruments, & Components—0.4% |
| |||||||
| Arrow Electronics, Inc., 3.875% Sr. |
| |||||||
| Unsec. Nts., 1/12/28 | 232,000 | 217,746 | ||||||
| CDW LLC/CDW Finance Corp., 5.50% Sr. Unsec. Nts., 12/1/24 | 54,000 | 55,350 | ||||||
| Tech Data Corp., 4.95% Sr. Unsec. Nts., 2/15/27 | 264,000 | 259,475 | ||||||
|
|
| ||||||
|
| 532,571
|
| ||||||
| Internet Software & Services—0.2% |
| |||||||
| VeriSign, Inc.: | ||||||||
| 4.75% Sr. Unsec. Nts., 7/15/27 | 190,000 | 182,105 | ||||||
| 5.25% Sr. Unsec. Nts., 4/1/25 | 99,000 | 100,703 | ||||||
|
|
| ||||||
|
| 282,808
|
| ||||||
| IT Services—0.5% |
| |||||||
| DXC Technology Co.: | ||||||||
| 2.875% Sr. Unsec. Nts., 3/27/20 | 238,000 | 236,386 | ||||||
| 4.75% Sr. Unsec. Nts., 4/15/27 | 241,000 | 243,827 | ||||||
| Fidelity National Information Services, Inc., 4.25% Sr. Unsec. Nts., 5/15/28 | 162,000 | 162,692 | ||||||
|
|
| ||||||
|
| 642,905
|
| ||||||
| Semiconductors & Semiconductor Equipment—0.3% |
| |||||||
| Intel Corp., 3.734% Sr. Unsec. Nts., 12/8/47 | 94,000 | 88,712 | ||||||
| Microchip Technology, Inc., 3.922% Sr. Sec. Nts., 6/1/211 | 316,000 | 316,717 | ||||||
|
|
| ||||||
|
| 405,429
|
| ||||||
| Software—1.2% |
| |||||||
| Autodesk, Inc., 4.375% Sr. Unsec. Nts., 6/15/25 | 98,000 | 98,799 | ||||||
| Dell International LLC/EMC Corp.: |
| |||||||
| 4.42% Sr. Sec. Nts., 6/15/211 | 251,000 | 254,733 | ||||||
| 6.02% Sr. Sec. Nts., 6/15/261 | 199,000 | 209,526 | ||||||
| Open Text Corp., 5.625% Sr. Unsec. Nts., 1/15/231 | 236,000 | 242,497 | ||||||
| Oracle Corp.: | ||||||||
| 2.40% Sr. Unsec. Nts., 9/15/23 | 200,000 | 188,728 | ||||||
| 2.95% Sr. Unsec. Nts., 5/15/25 | 194,000 | 185,369 | ||||||
| VMware, Inc.: | ||||||||
| 2.30% Sr. Unsec. Nts., 8/21/20 | 104,000 | 101,805 | ||||||
| 3.90% Sr. Unsec. Nts., 8/21/27 | 161,000 | 148,887 | ||||||
|
|
| ||||||
|
| 1,430,344
|
| ||||||
| Technology Hardware, Storage & Peripherals—0.6% |
| |||||||
| Apple, Inc., 4.375% Sr. Unsec. Nts., 5/13/45 | 198,000 | 205,183 | ||||||
| Hewlett Packard Enterprise Co., 3.60% Sr. Unsec. Nts., 10/15/20 | 323,000 | 324,716 | ||||||
| NetApp, Inc., 2.00% Sr. Unsec. Nts., 9/27/19 | 155,000 | 152,879 | ||||||
|
|
| ||||||
|
| 682,778
|
| ||||||
| Materials—2.9% |
| |||||||
| Chemicals—1.1% |
| |||||||
| LyondellBasell Industries NV, 5.00% Sr. Unsec. Nts., 4/15/19 | 236,000 | 238,366 | ||||||
| Nutrien Ltd.: | ||||||||
| 3.375% Sr. Unsec. Nts., 3/15/25 | 111,000 | 104,601 | ||||||
| 4.125% Sr. Unsec. Nts., 3/15/35 | 75,000 | 69,686 | ||||||
| PolyOne Corp., 5.25% Sr. Unsec. Nts., 3/15/23 | 299,000 | 305,728 | ||||||
| RPM International, Inc.: | ||||||||
| 3.45% Sr. Unsec. Unsub. Nts., 11/15/22 | 285,000 | 280,955 | ||||||
| 3.75% Sr. Unsec. Nts., 3/15/27 | 84,000 | 80,193 | ||||||
| Principal Amount | Value | |||||||
| Chemicals (Continued) |
| |||||||
| Yara International ASA, 4.75% Sr. Unsec. Nts., 6/1/281 | $ | 239,000 | $ | 240,631 | ||||
|
|
| ||||||
| 1,320,160 | ||||||||
| Construction Materials—0.3% |
| |||||||
| James Hardie International Finance DAC, 4.75% Sr. Unsec. Nts., 1/15/251 | 193,000 | 189,140 | ||||||
| LafargeHolcim Finance US LLC, 3.50% Sr. Unsec. Nts., 9/22/261 | 75,000 | 69,982 | ||||||
| Martin Marietta Materials, Inc., 3.50% Sr. Unsec. Nts., 12/15/27 | 161,000 | 149,628 | ||||||
|
|
| ||||||
|
| 408,750
|
| ||||||
| Containers & Packaging—0.8% |
| |||||||
| International Paper Co.: | ||||||||
| 3.00% Sr. Unsec. Nts., 2/15/27 | 157,000 | 142,329 | ||||||
| 4.80% Sr. Unsec. Nts., 6/15/44 | 131,000 | 127,353 | ||||||
| Packaging Corp. of America: | ||||||||
| 3.65% Sr. Unsec. Nts., 9/15/24 | 94,000 | 92,433 | ||||||
| 4.50% Sr. Unsec. Nts., 11/1/23 | 242,000 | 250,264 | ||||||
| Silgan Holdings, Inc., 4.75% Sr. | ||||||||
| Unsec. Nts., 3/15/25 | 270,000 | 257,850 | ||||||
| WestRock Co., 4.00% Sr. Unsec. Nts., 3/15/281 | 154,000 | 152,028 | ||||||
|
|
| ||||||
|
| 1,022,257
|
| ||||||
| Metals & Mining—0.5% |
| |||||||
| Anglo American Capital plc: | ||||||||
| 3.625% Sr. Unsec. Nts., 9/11/241 | 83,000 | 78,638 | ||||||
| 4.00% Sr. Unsec. Nts., 9/11/271 | 135,000 | 125,830 | ||||||
| ArcelorMittal, 6.125% Sr. Unsec. Nts., 6/1/25 | 285,000 | 308,512 | ||||||
| Goldcorp, Inc., 5.45% Sr. Unsec. Nts., 6/9/44 | 93,000 | 98,618 | ||||||
|
|
| ||||||
|
| 611,598
|
| ||||||
| Paper & Forest Products—0.2% |
| |||||||
| Georgia-Pacific LLC, 3.734% Sr. | ||||||||
| Unsec. Nts., 7/15/231 | 56,000 | 56,269 | ||||||
| Louisiana-Pacific Corp., 4.875% Sr. Unsec. Nts., 9/15/24 | 186,000 | 183,210 | ||||||
|
|
| ||||||
|
| 239,479
|
| ||||||
| Telecommunication Services—2.6% |
| |||||||
| Diversified Telecommunication Services—2.2% |
| |||||||
| AT&T, Inc.: | ||||||||
| 4.30% Sr. Unsec. Nts., 2/15/301 | 238,000 | 225,537 | ||||||
| 4.35% Sr. Unsec. Nts., 6/15/45 | 281,000 | 239,017 | ||||||
| 4.50% Sr. Unsec. Nts., 3/9/48 | 135,000 | 116,317 | ||||||
| British Telecommunications plc, | ||||||||
| 9.125% Sr. Unsec. Nts., 12/15/30 | 270,000 | 386,534 | ||||||
| Deutsche Telekom International Finance BV: |
| |||||||
| 2.225% Sr. Unsec. Nts., 1/17/201 | 336,000 | 331,349 | ||||||
| 4.375% Sr. Unsec. Nts., 6/21/281 | 149,000 | 148,058 | ||||||
| Telecom Italia SpA, 5.303% Sr. Unsec. | ||||||||
| Nts., 5/30/241 | 306,000 | 302,940 | ||||||
| Telefonica Emisiones SAU: | ||||||||
| 4.103% Sr. Unsec. Nts., 3/8/27 | 90,000 | 87,163 | ||||||
| 5.213% Sr. Unsec. Nts., 3/8/47 | 79,000 | 76,369 | ||||||
| 7.045% Sr. Unsec. Unsub. Nts., 6/20/36 | 115,000 | 138,534 | ||||||
| T-Mobile USA, Inc., 6.50% Sr. | ||||||||
| Unsec. Nts., 1/15/26 | 300,000 | 309,660 | ||||||
| Verizon Communications, Inc.: | ||||||||
| 4.125% Sr. Unsec. Nts., 8/15/46 | 133,000 | 113,965 | ||||||
| 4.522% Sr. Unsec. Nts., 9/15/48 | 184,000 | 168,278 | ||||||
| 5.15% Sr. Unsec. Nts., 9/15/23 | 75,000 | 80,011 | ||||||
|
|
| ||||||
|
| 2,723,732
|
| ||||||
| Wireless Telecommunication Services—0.4% |
| |||||||
| Vodafone Group plc: | ||||||||
| 3.75% Sr. Unsec. Nts., 1/16/24 | 313,000 | 310,591 | ||||||
15 OPPENHEIMER TOTAL RETURN BOND FUND/VA
STATEMENT OF INVESTMENTS Unaudited / Continued
| Principal Amount | Value | |||||||
| Wireless Telecommunication Services (Continued) |
| |||||||
| Vodafone Group plc: (Continued) |
| |||||||
| 4.375% Sr. Unsec. Nts., 5/30/28 | $ | 159,000 | $ | 157,244 | ||||
| 6.15% Sr. Unsec. Nts., 2/27/37 | 97,000 | 106,901 | ||||||
|
|
| ||||||
|
| 574,736
|
| ||||||
| Utilities—3.3% | ||||||||
| Electric Utilities—2.4% | ||||||||
| AEP Texas, Inc., 3.95% Sr. Unsec. Nts., 6/1/281 | 162,000 | 161,753 | ||||||
| Duke Energy Corp.: | ||||||||
| 3.15% Sr. Unsec. Nts., 8/15/27 | 169,000 | 157,111 | ||||||
| 3.75% Sr. Unsec. Nts., 9/1/46 | 154,000 | 136,886 | ||||||
| Edison International, 2.95% Sr. Unsec. Nts., 3/15/23 | 195,000 | 187,473 | ||||||
| EDP Finance BV, 3.625% Sr. Unsec. Nts., 7/15/241 | 219,000 | 210,181 | ||||||
| Emera US Finance LP, 2.15% Sr. Unsec. Nts., 6/15/19 | 266,000 | 263,286 | ||||||
| Enel Finance International NV, 3.625% Sr. Unsec. Nts., 5/25/271 | 172,000 | 157,565 | ||||||
| Exelon Corp.: | ||||||||
| 2.45% Sr. Unsec. Nts., 4/15/21 | 152,000 | 147,808 | ||||||
| 4.45% Sr. Unsec. Nts., 4/15/46 | 89,000 | 86,737 | ||||||
| FirstEnergy Corp., 3.90% Sr. Unsec. Nts., 7/15/27 | 175,000 | 170,024 | ||||||
| Indiana Michigan Power Co., Series K, 4.55% Sr. Unsec. Nts., 3/15/46 | 85,000 | 88,343 | ||||||
| ITC Holdings Corp., 5.30% Sr. Unsec. Nts., 7/1/43 | 78,000 | 87,517 | ||||||
| Mid-Atlantic Interstate Transmission LLC, 4.10% Sr. Unsec. Nts., 5/15/281 | 162,000 | 162,238 | ||||||
| NextEra Energy Operating Partners LP, 4.25% Sr. Unsec. Nts., 9/15/241 | 30,000 | 28,950 | ||||||
| Pennsylvania Electric Co., 5.20% Sr. Unsec. Nts., 4/1/20 | 73,000 | 75,016 | ||||||
| PPL WEM Ltd./Western Power Distribution Ltd., 5.375% Sr. Unsec. Unsub. Nts., 5/1/211 | 308,000 | 320,559 | ||||||
| Southern Co. Gas Capital Corp., 4.40% Sr. Unsec. Nts., 5/30/47 | 107,000 | 106,196 | ||||||
| Southern Power Co., 1.95% Sr. Unsec. Nts., 12/15/19 | 311,000 | 305,827 | ||||||
| Trans-Allegheny Interstate Line Co., 3.85% Sr. Unsec. Nts., 6/1/251 | 181,000 | 180,628 | ||||||
|
|
| ||||||
|
| 3,034,098
|
| ||||||
| Multi-Utilities—0.9% | ||||||||
| Black Hills Corp., 2.50% Sr. Unsec. Nts., 1/11/19 | 168,000 | 167,622 | ||||||
| Dominion Energy, Inc.: | ||||||||
| 2.579% Jr. Sub. Nts., 7/1/20 | 255,000 | 251,319 | ||||||
| 4.90% Sr. Unsec. Nts., 8/1/41 | 120,000 | 124,507 | ||||||
| Public Service Enterprise Group, Inc., 1.60% Sr. Unsec. Nts., 11/15/19 | 295,000 | 288,607 | ||||||
| Virginia Electric & Power Co., 2.95% Sr. Unsec. Nts., 1/15/22 | 294,000 | 290,967 | ||||||
|
|
| ||||||
| 1,123,022 | ||||||||
|
|
| ||||||
| Total Corporate Bonds and Notes (Cost $62,850,951) | 61,623,888 | |||||||
| Short-Term Notes—13.0% |
| |||||||
| Media—0.6% |
| |||||||
| Interpublic Group Cos., 2.323%, 7/6/181,13,14 | 250,000 | 249,891 | ||||||
| WPP CP LLC, 2.85%, 7/18/181,13,14 | 570,000 | 569,308 | ||||||
|
|
| ||||||
| 819,199 | ||||||||
| Personal Products—0.5% |
| |||||||
| Reckitt Benckiser Treasury Services plc, 2.41%, 7/2/1813,14 | 570,000 | 569,909 | ||||||
| Transportation Infrastructure—0.4% |
| |||||||
| ERAC USA Finance Co., 2.395%, 7/23/181,13,14 | 560,000 | 559,134 | ||||||
| Principal Amount | Value | |||||||
| Food Products—0.4% | ||||||||
| Campbell Soup Co., 2.276%, 7/9/181,13,14 | $ | 500,000 | $ | 499,686 | ||||
| Household Durables—0.9% |
| |||||||
| Leggett & Platt, Inc., 2.252%, 7/11/181,13,14 | 560,000 | 559,576 | ||||||
| Mohawk Industries, Inc., 2.254%, 7/6/181,13,14 | 560,000 | 559,756 | ||||||
|
|
| ||||||
|
| 1,119,332
|
| ||||||
| Water Utilities—0.5% | ||||||||
| American Water Capital Corp., 2.255%, 7/9/1813,14 | 560,000 | 559,661 | ||||||
| Electric Utilities—1.4% | ||||||||
| Commonwealth Edison Co., 2.334%, 7/10/1813,14 | 250,000 | 249,827 | ||||||
| Duke Energy Corp., 2.305%, 8/2/181,13,14 | 250,000 | 249,443 | ||||||
| NextEra Energy Capital Holdings, 2.254%, 7/9/181,13,14 | 560,000 | 559,648 | ||||||
| Puget Sound Energy, Inc., 2.301%, 7/9/1814 | 560,000 | 559,648 | ||||||
|
|
| ||||||
| 1,618,566 | ||||||||
| Commercial Services & Supplies—0.4% |
| |||||||
| Waste Management, Inc., 2.274%, 7/5/181,13,14 | 500,000 | 499,813 | ||||||
| Multi-Utilities—0.4% | ||||||||
| CenterPoint Energy Resources Corp., 2.577%, 9/10/181,13,14 | 560,000 | 557,175 | ||||||
| Chemicals—1.7% | ||||||||
| Air Liquide US LLC, 2.405%, 9/13/181,13,14 | 570,000 | 567,487 | ||||||
| Albemarle Corp., 2.294%, 7/19/181,13,14 | 560,000 | 559,255 | ||||||
| Cabot Corp., 2.292%, 7/12/181,13,14 | 560,000 | 559,538 | ||||||
| Eastman Chemical, 2.345%, 7/17/1813,14 | 250,000 | 249,713 | ||||||
| Nutrien Ltd., 2.477%, 8/7/181,13,14 | 250,000 | 249,309 | ||||||
|
|
| ||||||
| 2,185,302 | ||||||||
| Leasing & Factoring—0.8% |
| |||||||
| Harley-Davidson Financial Services, Inc., 2.516%, 9/18/1813,14 | 370,000 | 367,906 | ||||||
| Hitachi Capital America Corp., 2.445%, 7/11/1814 | 560,000 | 559,578 | ||||||
|
|
| ||||||
| 927,484 | ||||||||
| Telephone Utilities—0.4% | ||||||||
| Bell Canada Inc., 2.566%, 9/10/1813,14 | 560,000 | 557,273 | ||||||
| Textiles, Apparel & Luxury Goods—0.4% |
| |||||||
| VF Corp., 2.394%, 7/11/181,13,14 | 500,000 | 499,635 | ||||||
| Health Care Providers & Services—0.5% |
| |||||||
| McKesson Corp., 2.354%, 7/11/181,13,14 | 560,000 | 559,576 | ||||||
| Computers & Peripherals—1.1% |
| |||||||
| Hewlett Packard Enterprise Co., 2.352%, 7/10/1814 | 430,000 | 429,746 | ||||||
| HP, Inc., 2.497%, 7/23/1814 | 560,000 | 559,265 | ||||||
| NetApp, Inc., 2.254%, 7/17/181,13,14 | 500,000 | 499,426 | ||||||
|
|
| ||||||
| 1,488,437 | ||||||||
| Semiconductor Equipment & Products—0.2% |
| |||||||
| Qualcomm, Inc., 2.414%, 9/11/181,13,14 | 250,000 | 248,829 | ||||||
| Machinery—0.2% | ||||||||
| Xylem, Inc., 2.262%, 7/2/1813,14 | 250,000 | 249,954 | ||||||
| Paper, Containers & Packaging—0.5% |
| |||||||
| Avery Dennison, 2.272%, 7/5/1813,14 | 560,000 | 559,793 | ||||||
| Household Products—0.5% |
| |||||||
| Clorox Co. (The), 2.202%, 7/6/181,13,14 | 560,000 | 559,766 | ||||||
| Specialty Retail—0.4% | ||||||||
| Relx, Inc., 2.324%, 7/20/181,13,14 | 560,000 | 559,246 | ||||||
| Auto Components—0.4% | ||||||||
| Magna International, Inc., 2.385%, 7/24/181,13,14 | 560,000 | 559,092 | ||||||
16 OPPENHEIMER TOTAL RETURN BOND FUND/VA
| Principal Amount | Value | |||||||
Industrial Conglomerates—0.4% |
| |||||||
| Johnson Controls International plc, 2.24%, 7/2/181,13,14 | $ | 500,000 | $ | 499,910 | ||||
|
| |||||||
| Total Short-Term Notes (Cost $16,257,716) | 16,256,772 | |||||||
| Shares | Value | |||||||
| Investment Company—1.4% |
| |||||||
| Oppenheimer Institutional Government Money Market Fund, Cl. E, 1.85%15,16 (Cost $1,780,718) | 1,780,718 | $ | 1,780,718 | |||||
| Total Investments, at Value (Cost $178,185,386) | 140.9% | 175,826,186 | ||||||
| Net Other Assets (Liabilities) | (40.9) | (51,009,474) | ||||||
|
| |||||||
| Net Assets | 100.0% | $ | 124,816,712 | |||||
|
| |||||||
Footnotes to Statement of Investments
1. Represents securities sold under Rule 144A, which are exempt from registration under the Securities Act of 1933, as amended. These securities have been determined to be liquid under guidelines established by the Board of Trustees. These securities amount to $37,953,928 or 30.41% of the Fund’s net assets at period end.
2. Represents the current interest rate for a variable or increasing rate security, determined as [Referenced Rate + Basis-point spread].
3. Interest-Only Strips represent the right to receive the monthly interest payments on an underlying pool of mortgage loans. These securities typically decline in price as interest rates decline. Most other fixed income securities increase in price when interest rates decline. The principal amount of the underlying pool represents the notional amount on which current interest is calculated. The price of these securities is typically more sensitive to changes in prepayment rates than traditional mortgage-backed securities (for example, GNMA pass-throughs). Interest rates disclosed represent current yields based upon the current cost basis and estimated timing and amount of future cash flows. These securities amount to $1,599,957 or 1.28% of the
Fund’s net assets at period end.
4. Interest rate is less than 0.0005%.
5. Principal-Only Strips represent the right to receive the monthly principal payments on an underlying pool of mortgage loans. The value of these securities generally increases as interest rates decline and prepayment rates rise. The price of these securities is typically more volatile than that of coupon-bearing bonds of the same maturity. Interest rates disclosed represent current yields based upon the current cost basis and estimated timing of future cash flows. These securities amount to $64,657 or 0.05% of the Fund’s net assets at period end.
6. All or a portion of the security position is when-issued or delayed delivery to be delivered and settled after period end. See Note 4 of the accompanying Notes.
7. Restricted security. The aggregate value of restricted securities at period end was $361,932, which represents 0.29% of the Fund’s net assets. See Note 4 of the accompanying Notes.
Information concerning restricted securities is as follows:
| Security | Acquisition Dates | Cost | Value | Unrealized Appreciation/ (Depreciation) | ||||||||||||
| Capital Lease Funding Securitization LP, Interest-Only Commercial Mtg. Pass-Through Certificates, Series 1997-CTL1, Cl. IO, 0.00%, 6/22/24 | 4/21/97 | $ | 323,904 | $ | 4,458 | $ | (319,446) | |||||||||
| Lloyds Banking Group plc, 6.657% [US0003M+127] Jr. Sub. Perpetual Bonds | 6/20/14-6/24/14 | 374,445 | 357,474 | (16,971) | ||||||||||||
|
| |||||||||||||||
| $ | 698,349 | $ | 361,932 | $ | (336,417) | |||||||||||
|
| |||||||||||||||
8. The value of this security was determined using significant unobservable inputs. See Note 3 of the accompanying Notes.
9. This interest rate resets periodically. Interest rate shown reflects the rate in effect at period end. The rate on this variable rate security is not based on a published reference rate and spread but is determined by the issuer or agent based on current market conditions.
10. All or a portion of the security position is held in accounts at a futures clearing merchant and pledged to cover margin requirements on open futures contracts and written options on futures, if applicable. The aggregate market value of such securities is $168,715. See Note 6 of the accompanying Notes.
11. All or a portion of the security position has been pledged for collateral in association with forward roll transactions. See Note 4 of the accompanying Notes.
12. This bond has no contractual maturity date, is not redeemable and contractually pays an indefinite stream of interest.
13. Security issued in an exempt transaction without registration under the Securities Act of 1933. Such securities amount to $14,148,535 or 11.34% of the Fund’s net assets, and have been determined to be liquid pursuant to guidelines adopted by the Board of Trustees.
14. Current yield as of period end.
15. Rate shown is the 7-day yield at period end.
16. Is or was an affiliate, as defined in the Investment Company Act of 1940, as amended, at or during the reporting period, by virtue of the Fund owning at least 5% of the voting securities of the issuer or as a result of the Fund and the issuer having the same investment adviser. Transactions during the reporting period in which the issuer was an affiliate are as follows:
| Shares December 31, 2017 | Gross Additions | Gross Reductions | Shares June 30, 2018 | |||||||||||||
| Oppenheimer Institutional Government Money Market Fund, Cl. E | 2,772,340 | 36,259,758 | 37,251,380 | 1,780,718 | ||||||||||||
| Value | Income | Realized Gain (Loss) | Change in Unrealized Gain (Loss) | |||||||||||||
| Oppenheimer Institutional Government Money Market Fund, Cl. E | $ | 1,780,718 | $ | 21,316 | $ | — | $ | — | ||||||||
| Futures Contracts as of June 30, 2018 |
| |||||||||||||||||||||||||||
| Description | Buy/Sell | Expiration Date | Number of Contracts | Notional Amount (000’s) | Value | Unrealized Appreciation/ (Depreciation) | ||||||||||||||||||||||
| United States Treasury Long Bonds | Sell | 9/19/18 | 9 | USD | 1,302 | $ | 1,305,000 | $ | (2,649 | ) | ||||||||||||||||||
| United States Treasury Nts., 10 yr. | Sell | 9/19/18 | 94 | USD | 11,272 | 11,297,625 | (25,510 | ) | ||||||||||||||||||||
| United States Treasury Nts., 2 yr. | Sell | 9/28/18 | 353 | USD | 74,793 | 74,775,328 | 17,860 | |||||||||||||||||||||
| United States Treasury Nts., 5 yr. | Sell | 9/28/18 | 25 | USD | 2,837 | 2,840,430 | (3,035 | ) | ||||||||||||||||||||
| United States Ultra Bonds | Buy | 9/19/18 | 53 | USD | 8,313 | 8,456,813 | 144,206 | |||||||||||||||||||||
|
| |||||||||||||||||||||||||||
| $ | 130,872 | |||||||||||||||||||||||||||
|
| |||||||||||||||||||||||||||
17 OPPENHEIMER TOTAL RETURN BOND FUND/VA
STATEMENT OF INVESTMENTS Unaudited / Continued
| Glossary: | ||
| Definitions | ||
| H15T1Y | US Treasury Yield Curve Rate T Note Constant Maturity 1 Year | |
| ICE LIBOR | Intercontinental Exchange London Interbank Offered Rate | |
| LIBOR01M | ICE LIBOR USD 1 Month | |
| US0001M | ICE LIBOR USD 1 Month | |
| US0003M | ICE LIBOR USD 3 Month | |
| USISDA05 | USD ICE Swap Rate 11:00am NY 5 Year | |
| USSW5 | USD Swap Semi 30/360 5 Year |
See accompanying Notes to Financial Statements.
18 OPPENHEIMER TOTAL RETURN BOND FUND/VA
STATEMENT OF ASSETS AND LIABILITIES June 30, 2018 Unaudited
| ||
Assets | ||||
Investments, at value—see accompanying statement of investments: | ||||
Unaffiliated companies (cost $176,404,668) | $ | 174,045,468 | ||
Affiliated companies (cost $1,780,718) | 1,780,718 | |||
|
| |||
| 175,826,186 | ||||
| ||||
Cash | 500,000 | |||
| ||||
Cash used for collateral on futures | 220,000 | |||
| ||||
Receivables and other assets: | ||||
Investments sold (including $42,408,116 sold on a when-issued or delayed delivery basis) | 44,043,620 | |||
Interest, dividends and principal paydowns | 713,512 | |||
Variation margin receivable | 11,967 | |||
Shares of beneficial interest sold | 8,600 | |||
Other | 49,696 | |||
|
| |||
Total assets | 221,373,581 | |||
| ||||
Liabilities | ||||
Payables and other liabilities: | ||||
Investments purchased (including $95,383,666 purchased on a when-issued or delayed delivery basis) | 95,935,257 | |||
Shares of beneficial interest redeemed | 524,251 | |||
Trustees’ compensation | 41,500 | |||
Distribution and service plan fees | 9,782 | |||
Variation margin payable | 3,910 | |||
Shareholder communications | 168 | |||
Other | 42,001 | |||
|
| |||
Total liabilities | 96,556,869 | |||
| ||||
Net Assets | $ | 124,816,712 | ||
|
| |||
| ||||
Composition of Net Assets | ||||
Par value of shares of beneficial interest | $ | 16,947 | ||
| ||||
Additional paid-in capital | 130,838,312 | |||
| ||||
Accumulated net investment income | 1,974,703 | |||
| ||||
Accumulated net realized loss on investments | (5,784,922) | |||
| ||||
Net unrealized depreciation on investments | (2,228,328) | |||
|
| |||
Net Assets | $ | 124,816,712 | ||
|
| |||
| ||||
Net Asset Value Per Share | ||||
Non-Service Shares: | ||||
| Net asset value, redemption price per share and offering price per share (based on net assets of $77,769,536 and 10,509,225 shares of beneficial interest outstanding) |
| $7.40
|
| |
| ||||
Service Shares: | ||||
| Net asset value, redemption price per share and offering price per share (based on net assets of $47,047,176 and 6,437,679 shares of beneficial interest outstanding) | $7.31 | |||
See accompanying Notes to Financial Statements.
19 OPPENHEIMER TOTAL RETURN BOND FUND/VA
STATEMENT OF OPERATIONS For the Six Months Ended June 30, 2018 Unaudited
| ||||
Investment Income | ||||
Interest (net of foreign withholding taxes of $1,421) | $ | 2,187,731 | ||
| ||||
Fee income on when-issued securities | 361,241 | |||
| ||||
Dividends — affiliated companies | 21,316 | |||
|
| |||
Total investment income | 2,570,288 | |||
| ||||
Expenses | ||||
Management fees | 379,842 | |||
| ||||
Distribution and service plan fees — Service shares | 60,375 | |||
| ||||
Transfer and shareholder servicing agent fees: | ||||
Non-Service shares | 46,988 | |||
Service shares | 28,980 | |||
| ||||
Shareholder communications: | ||||
Non-Service shares | 11,531 | |||
Service shares | 7,112 | |||
| ||||
Legal, auditing and other professional fees | 37,320 | |||
| ||||
Custodian fees and expenses | 22,961 | |||
| ||||
Trustees’ compensation | 6,151 | |||
| ||||
Borrowing fees | 2,450 | |||
| ||||
Other | 4,508 | |||
|
| |||
Total expenses | 608,218 | |||
Less reduction to custodian expenses | (150) | |||
Less waivers and reimbursements of expenses | (70,441) | |||
|
| |||
Net expenses | 537,627 | |||
| ||||
Net Investment Income | 2,032,661 | |||
| ||||
Realized and Unrealized Gain (Loss) | ||||
Net realized gain (loss) on: | ||||
Investment transactions in unaffiliated companies | (1,603,198) | |||
Futures contracts | (167,670) | |||
Swap contracts | (3,068) | |||
Swaption contracts written | 8,653 | |||
|
| |||
Net realized loss | (1,765,283) | |||
| ||||
Net change in unrealized appreciation/depreciation on: | ||||
Investment transactions in unaffiliated companies | (3,289,409) | |||
Futures contracts | 11,411 | |||
|
| |||
Net change in unrealized appreciation/depreciation | (3,277,998) | |||
| ||||
Net Decrease in Net Assets Resulting from Operations | $ | (3,010,620) | ||
|
| |||
See accompanying Notes to Financial Statements.
20 OPPENHEIMER TOTAL RETURN BOND FUND/VA
STATEMENTS OF CHANGES IN NET ASSETS
| Six Months Ended June 30, 2018 (Unaudited) | Year Ended December 31, 2017 | |||||||
| ||||||||
Operations | ||||||||
Net investment income | $ | 2,032,661 | $ | 3,104,326 | ||||
| ||||||||
Net realized gain (loss) | (1,765,283) | 716,249 | ||||||
| ||||||||
Net change in unrealized appreciation/depreciation | (3,277,998) | 2,175,523 | ||||||
|
| |||||||
Net increase (decrease) in net assets resulting from operations |
| (3,010,620)
|
| 5,996,098 | ||||
| ||||||||
Dividends and/or Distributions to Shareholders | ||||||||
Dividends from net investment income: | ||||||||
Non-Service shares | (2,617,442) | (2,024,420) | ||||||
Service shares | (1,481,742) | (1,136,931) | ||||||
|
| |||||||
|
| (4,099,184)
|
| (3,161,351) | |||||
| ||||||||
Beneficial Interest Transactions | ||||||||
Net increase (decrease) in net assets resulting from beneficial interest transactions: | ||||||||
Non-Service shares | 714,315 | (3,666,983) | ||||||
Service shares | (1,299,236) | (3,411,210) | ||||||
|
| |||||||
|
| (584,921)
|
| (7,078,193) | |||||
| ||||||||
Net Assets | ||||||||
Total decrease | (7,694,725) | (4,243,446) | ||||||
| ||||||||
Beginning of period | 132,511,437 | 136,754,883 | ||||||
|
| |||||||
End of period (including accumulated net investment income of $1,974,703 and $4,041,226, respectively) | $ | 124,816,712 | $ | 132,511,437 | ||||
|
| |||||||
See accompanying Notes to Financial Statements.
21 OPPENHEIMER TOTAL RETURN BOND FUND/VA
FINANCIAL HIGHLIGHTS
| Non-Service Shares | Six Months Ended June 30, 2018 (Unaudited) | Year Ended December 31, 2017 | Year Ended December 31, 2016 | Year Ended December 31, 2015 | Year Ended December 31, 2014 | Year Ended December 31, 2013 | ||||||||||||||||||
Per Share Operating Data | ||||||||||||||||||||||||
Net asset value, beginning of period | $7.83 | $7.67 | $7.71 | $7.96 | $7.83 | $8.26 | ||||||||||||||||||
| ||||||||||||||||||||||||
Income (loss) from investment operations: | ||||||||||||||||||||||||
Net investment income1 | 0.13 | 0.19 | 0.23 | 0.27 | 0.30 | 0.36 | ||||||||||||||||||
Net realized and unrealized gain (loss) | (0.30) | 0.16 | 0.02 | (0.19) | 0.26 | (0.37) | ||||||||||||||||||
|
| |||||||||||||||||||||||
Total from investment operations | (0.17) | 0.35 | 0.25 | 0.08 | 0.56 | (0.01) | ||||||||||||||||||
| ||||||||||||||||||||||||
Dividends and/or distributions to shareholders: | ||||||||||||||||||||||||
Dividends from net investment income | (0.26) | (0.19) | (0.29) | (0.33) | (0.43) | (0.42) | ||||||||||||||||||
| ||||||||||||||||||||||||
Net asset value, end of period | $7.40 | $7.83 | $7.67 | $7.71 | $7.96 | $7.83 | ||||||||||||||||||
|
| |||||||||||||||||||||||
| ||||||||||||||||||||||||
Total Return, at Net Asset Value2 | (2.21)% | 4.59% | 3.27% | 0.96% | 7.27% | (0.10)% | ||||||||||||||||||
| ||||||||||||||||||||||||
Ratios/Supplemental Data | ||||||||||||||||||||||||
Net assets, end of period (in thousands) | $77,770 | $81,481 | $83,405 | $85,160 | $90,757 | $96,785 | ||||||||||||||||||
| ||||||||||||||||||||||||
Average net assets (in thousands) | $78,924 | $83,239 | $87,039 | $89,919 | $94,336 | $105,012 | ||||||||||||||||||
| ||||||||||||||||||||||||
Ratios to average net assets:3 | ||||||||||||||||||||||||
Net investment income | 3.31% | 2.38% | 2.96% | 3.46% | 3.72% | 4.51% | ||||||||||||||||||
Expenses excluding specific expenses listed below | 0.87% | 0.85% | 0.84% | 0.82% | 0.80% | 0.80% | ||||||||||||||||||
| Interest and fees from borrowings | 0.00%4 | 0.00%4 | 0.00%4 | 0.00%4 | 0.00% | 0.00% | ||||||||||||||||||
|
| |||||||||||||||||||||||
| Total expenses5 | 0.87% | 0.85% | 0.84% | 0.82% | 0.80% | 0.80% | ||||||||||||||||||
Expenses after payments, waivers and/or reimbursements and reduction to custodian expenses | 0.75% | 0.75% | 0.75% | 0.75% | 0.75% | 0.75% | ||||||||||||||||||
| ||||||||||||||||||||||||
Portfolio turnover rate6 | 31% | 86% | 79% | 73% | 127% | 115% | ||||||||||||||||||
1. Per share amounts calculated based on the average shares outstanding during the period.
2. Assumes an initial investment on the business day before the first day of the fiscal period, with all dividends and distributions reinvested in additional shares on the reinvestment date, and redemption at the net asset value calculated on the last business day of the fiscal period. Total returns are not annualized for periods less than one full year. Total return information does not reflect expenses that apply at the separate account level or to related insurance products. Inclusion of these charges would reduce the total return figures for all periods shown. Returns do not reflect the deduction of taxes that a shareholder would pay on fund distributions or the redemption of fund shares.
3. Annualized for periods less than one full year.
4. Less than 0.005%.
5. Total expenses including indirect expenses from affiliated fund fees and expenses were as follows:
Six Months Ended June 30, 2018 | 0.87 | % | ||||
Year Ended December 31, 2017 | 0.85 | % | ||||
Year Ended December 31, 2016 | 0.85 | % | ||||
Year Ended December 31, 2015 | 0.83 | % | ||||
Year Ended December 31, 2014 | 0.81 | % | ||||
Year Ended December 31, 2013 | 0.81 | % |
6. The portfolio turnover rate excludes purchase and sale transactions of To Be Announced (TBA) mortgage-related securities as follows:
| Purchase Transactions | Sale Transactions | |||||||
Six Months Ended June 30, 2018 | $369,648,839 | $366,986,225 | ||||||
Year Ended December 31, 2017 | $679,964,368 | $662,714,451 | ||||||
Year Ended December 31, 2016 | $672,031,328 | $673,808,454 | ||||||
Year Ended December 31, 2015 | $697,962,198 | $709,720,690 | ||||||
Year Ended December 31, 2014 | $560,409,975 | $543,669,748 | ||||||
Year Ended December 31, 2013 | $776,927,298 | $806,883,121 | ||||||
See accompanying Notes to Financial Statements.
22 OPPENHEIMER TOTAL RETURN BOND FUND/VA
| Service Shares | Six Months Ended June 30, 2018 (Unaudited) | Year Ended December 31, 2017 | Year Ended December 31, 2016 | Year Ended December 31, 2015 | Year Ended December 31, 2014 | Year Ended December 31, 2013 | ||||||||||||||||||
Per Share Operating Data | ||||||||||||||||||||||||
Net asset value, beginning of period | $7.73 | $7.57 | $7.61 | $7.86 | $7.74 | $8.17 | ||||||||||||||||||
| ||||||||||||||||||||||||
Income (loss) from investment operations: | ||||||||||||||||||||||||
Net investment income1 | 0.11 | 0.16 | 0.21 | 0.25 | 0.27 | 0.34 | ||||||||||||||||||
Net realized and unrealized gain (loss) | (0.29) | 0.17 | 0.02 | (0.19) | 0.26 | (0.37) | ||||||||||||||||||
|
| |||||||||||||||||||||||
Total from investment operations | (0.18) | 0.33 | 0.23 | 0.06 | 0.53 | (0.03) | ||||||||||||||||||
| ||||||||||||||||||||||||
Dividends and/or distributions to shareholders: | ||||||||||||||||||||||||
Dividends from net investment income | (0.24) | (0.17) | (0.27) | (0.31) | (0.41) | (0.40) | ||||||||||||||||||
| ||||||||||||||||||||||||
Net asset value, end of period | $7.31 | $7.73 | $7.57 | $7.61 | $7.86 | $7.74 | ||||||||||||||||||
|
| |||||||||||||||||||||||
| ||||||||||||||||||||||||
Total Return, at Net Asset Value2 | (2.38)% | 4.38% | 3.05% | 0.70% | 6.93% | (0.38)% | ||||||||||||||||||
| ||||||||||||||||||||||||
Ratios/Supplemental Data | ||||||||||||||||||||||||
Net assets, end of period (in thousands) | $47,047 | $51,030 | $53,350 | $52,519 | $52,675 | $54,946 | ||||||||||||||||||
| ||||||||||||||||||||||||
Average net assets (in thousands) | $48,677 | $52,525 | $52,738 | $54,016 | $55,215 | $59,523 | ||||||||||||||||||
| ||||||||||||||||||||||||
Ratios to average net assets:3 | ||||||||||||||||||||||||
Net investment income | 3.06% | 2.13% | 2.70% | 3.21% | 3.47% | 4.26% | ||||||||||||||||||
Expenses excluding specific expenses listed below | 1.12% | 1.10% | 1.09% | 1.07% | 1.04% | 1.05% | ||||||||||||||||||
Interest and fees from borrowings | 0.00%4 | 0.00%4 | 0.00%4 | 0.00%4 | 0.00% | 0.00% | ||||||||||||||||||
|
| |||||||||||||||||||||||
Total expenses5 | 1.12% | 1.10% | 1.09% | 1.07% | 1.04% | 1.05% | ||||||||||||||||||
Expenses after payments, waivers and/or reimbursements and reduction to custodian expenses | 1.00% | 1.00% | 1.00% | 1.00% | 1.00% | 1.00% | ||||||||||||||||||
| ||||||||||||||||||||||||
Portfolio turnover rate6 | 31% | 86% | 79% | 73% | 127% | 115% | ||||||||||||||||||
1. Per share amounts calculated based on the average shares outstanding during the period.
2. Assumes an initial investment on the business day before the first day of the fiscal period, with all dividends and distributions reinvested in additional shares on the reinvestment date, and redemption at the net asset value calculated on the last business day of the fiscal period. Total returns are not annualized for periods less than one full year. Total return information does not reflect expenses that apply at the separate account level or to related insurance products. Inclusion of these charges would reduce the total return figures for all periods shown. Returns do not reflect the deduction of taxes that a shareholder would pay on fund distributions or the redemption of fund shares.
3. Annualized for periods less than one full year.
4. Less than 0.005%.
5. Total expenses including indirect expenses from affiliated fund fees and expenses were as follows:
Six Months Ended June 30, 2018 | 1.12 | % | ||||
Year Ended December 31, 2017 | 1.10 | % | ||||
Year Ended December 31, 2016 | 1.10 | % | ||||
Year Ended December 31, 2015 | 1.08 | % | ||||
Year Ended December 31, 2014 | 1.05 | % | ||||
Year Ended December 31, 2013 | 1.06 | % | ||||
6. The portfolio turnover rate excludes purchase and sale transactions of To Be Announced (TBA) mortgage-related securities as follows:
| Purchase Transactions | Sale Transactions | |||||||||
| Six Months Ended June 30, 2018 | $369,648,839 | $366,986,225 | ||||||||
| Year Ended December 31, 2017 | $679,964,368 | $662,714,451 | ||||||||
| Year Ended December 31, 2016 | $672,031,328 | $673,808,454 | ||||||||
| Year Ended December 31, 2015 | $697,962,198 | $709,720,690 | ||||||||
| Year Ended December 31, 2014 | $560,409,975 | $543,669,748 | ||||||||
| Year Ended December 31, 2013 | $776,927,298 | $806,883,121 | ||||||||
See accompanying Notes to Financial Statements.
23 OPPENHEIMER TOTAL RETURN BOND FUND/VA
NOTES TO FINANCIAL STATEMENTS June 30, 2018 Unaudited
1. Organization
Oppenheimer Total Return Bond Fund/VA (the “Fund”), a separate series of Oppenheimer Variable Account Funds, is a diversified open-end management investment company registered under the Investment Company Act of 1940 (“1940 Act”), as amended. The Fund’s main investment objective is to seek total return. The Fund’s investment adviser is OFI Global Asset Management, Inc. (“OFI Global” or the “Manager”), a wholly-owned subsidiary of OppenheimerFunds, Inc. (“OFI” or the “Sub-Adviser”). The Manager has entered into a sub-advisory agreement with OFI. Shares of the Fund are sold only to separate accounts of life insurance companies.
The Fund offers two classes of shares. Both classes are sold at their offering price, which is the net asset value per share, to separate investment accounts of participating insurance companies as an underlying investment for variable life insurance policies, variable annuity contracts or other investment products. The class of shares designated as Service shares is subject to a distribution and service plan. Both classes of shares have identical rights and voting privileges with respect to the Fund in general and exclusive voting rights on matters that affect that class alone. Earnings, net assets and net asset value per share may differ due to each class having its own expenses, such as transfer and shareholder servicing agent fees and shareholder communications, directly attributable to that class.
The following is a summary of significant accounting policies followed in the Fund’s preparation of financial statements in accordance with accounting principles generally accepted in the United States (“U.S. GAAP”).
2. Significant Accounting Policies
Security Valuation. All investments in securities are recorded at their estimated fair value, as described in Note 3.
Allocation of Income, Expenses, Gains and Losses. Income, expenses (other than those attributable to a specific class), gains and losses are allocated on a daily basis to each class of shares based upon the relative proportion of net assets represented by such class. Operating expenses directly attributable to a specific class are charged against the operations of that class.
Dividends and Distributions to Shareholders. Dividends and distributions to shareholders, which are determined in accordance with income tax regulations and may differ from U.S. GAAP, are recorded on the ex-dividend date. Income and capital gain distributions, if any, are declared and paid annually or at other times as determined necessary by the Manager.
The tax character of distributions is determined as of the Fund’s fiscal year end. Therefore, a portion of the Fund’s distributions made to shareholders prior to the Fund’s fiscal year end may ultimately be categorized as a tax return of capital.
Investment Income. Dividend income is recorded on the ex-dividend date or upon ex-dividend notification in the case of certain foreign dividends where the ex-dividend date may have passed. Non-cash dividends included in dividend income, if any, are recorded at the fair value of the securities received. Withholding taxes on foreign dividends, if any, and capital gains taxes on foreign investments, if any, have been provided for in accordance with the Fund’s understanding of the applicable tax rules and regulations. Interest income, if any, is recognized on an accrual basis. Discount and premium, which are included in interest income on the Statement of Operations, are amortized or accreted daily.
Custodian Fees. “Custodian fees and expenses” in the Statement of Operations may include interest expense incurred by the Fund on any cash overdrafts of its custodian account during the period. Such cash overdrafts may result from the effects of failed trades in portfolio securities and from cash outflows resulting from unanticipated shareholder redemption activity. The Fund pays interest to its custodian on such cash overdrafts, to the extent they are not offset by positive cash balances maintained by the Fund, at a rate equal to the Federal Funds Rate plus 2.00%. The “Reduction to custodian expenses” line item, if applicable, represents earnings on cash balances maintained by the Fund during the period. Such interest expense and other custodian fees may be paid with these earnings.
Security Transactions. Security transactions are recorded on the trade date. Realized gains and losses on securities sold are determined on the basis of identified cost.
Indemnifications. The Fund’s organizational documents provide current and former Trustees and officers with a limited indemnification against liabilities arising in connection with the performance of their duties to the Fund. In the normal course of business, the Fund may also enter into contracts that provide general indemnifications. The Fund’s maximum exposure under these arrangements is unknown as this would be dependent on future claims that may be made against the Fund. The risk of material loss from such claims is considered remote.
Federal Taxes. The Fund intends to comply with provisions of the Internal Revenue Code applicable to regulated investment companies and to distribute substantially all of its investment company taxable income to shareholders. Therefore, no federal income or excise tax provision is required. The Fund files income tax returns in U.S. federal and applicable state jurisdictions. The statute of limitations on the Fund’s tax return filings generally remains open for the three preceding fiscal reporting period ends. The Fund has analyzed its tax positions for the fiscal year ended December 31, 2017, including open tax years, and does not believe there are any uncertain tax positions requiring recognition in the Fund’s financial statements.
During the fiscal year ended December 31, 2017, the Fund did not utilize any capital loss carryforwards to offset capital gains realized in that fiscal year. For the fiscal year ended December 31, 2017, the Fund had capital loss carryforwards of $3,898,917. Capital losses will be carried forward to future years if not offset by gains.
At period end, it is estimated that the capital loss carryforwards would be $5,664,200. The estimated capital loss carryforward represents the
24 OPPENHEIMER TOTAL RETURN BOND FUND/VA
2. Significant Accounting Policies (Continued)
carryforward as of the end of the last fiscal year, increased or decreased by capital losses or gains realized in the first six months of the current fiscal year. During the reporting period, it is estimated that the Fund will not utilize any capital loss carryforward to offset realized capital gains.
Net investment income (loss) and net realized gain (loss) may differ for financial statement and tax purposes. The character of dividends and distributions made during the fiscal year from net investment income or net realized gains are determined in accordance with federal income tax requirements, which may differ from the character of net investment income or net realized gains presented in those financial statements in accordance with U.S. GAAP. Also, due to timing of dividends and distributions, the fiscal year in which amounts are distributed may differ from the fiscal year in which the income or net realized gain was recorded by the Fund.
The aggregate cost of securities and other investments and the composition of unrealized appreciation and depreciation of securities and other investments for federal income tax purposes at period end are noted in the following table. The primary difference between book and tax appreciation or depreciation of securities and other investments, if applicable, is attributable to the tax deferral of losses or tax realization of financial statement unrealized gain or loss.
Federal tax cost of securities | $ | 178,197,649 | ||
Federal tax cost of other investments | (81,892,443) | |||
|
| |||
Total federal tax cost | $ | 96,305,206 | ||
|
| |||
Gross unrealized appreciation | $ | 1,634,120 | ||
Gross unrealized depreciation | (3,874,711) | |||
|
| |||
Net unrealized depreciation | $ | (2,240,591) | ||
|
|
Use of Estimates. The preparation of financial statements in conformity with U.S. GAAP requires management to make estimates and assumptions that affect the reported amounts of assets and liabilities and disclosure of contingent assets and liabilities at the date of the financial statements and the reported amounts of increases and decreases in net assets from operations during the reporting period. Actual results could differ from those estimates.
3. Securities Valuation
The Fund calculates the net asset value of its shares as of 4:00 P.M. Eastern Time, on each day the New York Stock Exchange (the “Exchange”) is open for trading, except in the case of a scheduled early closing of the Exchange, in which case the Fund will calculate net asset value of the shares as of the scheduled early closing time of the Exchange.
The Fund’s Board has adopted procedures for the valuation of the Fund’s securities and has delegated the day-to-day responsibility for valuation determinations under those procedures to the Manager. The Manager has established a Valuation Committee which is responsible for determining a fair valuation for any security for which market quotations are not readily available. The Valuation Committee’s fair valuation determinations are subject to review, approval and ratification by the Fund’s Board at least quarterly or more frequently, if necessary.
Valuation Methods and Inputs
Securities are valued primarily using unadjusted quoted market prices, when available, as supplied by third party pricing services or broker-dealers.
The following methodologies are used to determine the market value or the fair value of the types of securities described below:
Shares of a registered investment company that are not traded on an exchange are valued at that investment company’s net asset value per share.
Corporate and government debt securities (of U.S. or foreign issuers) and municipal debt securities, short-term notes, mortgage-backed securities, collateralized mortgage obligations, and asset-backed securities are valued at the mean between the bid and asked prices utilizing evaluated prices obtained from third party pricing services or broker-dealers who may use matrix pricing methods to determine the evaluated prices. Pricing services generally price debt securities assuming orderly transactions of an institutional “round lot” size, but some trades may occur in smaller, “odd lot” sizes, sometimes at lower prices than institutional round lot trades. Standard inputs generally considered by third-party pricing vendors include reported trade data, broker-dealer price quotations, benchmark yields, issuer spreads on comparable securities, the credit quality, yield, maturity, as well as other appropriate factors.
Futures contracts and futures options traded on a commodities or futures exchange will be valued at the final settlement price or official closing price on the principal exchange as reported by such principal exchange at its trading session ending at, or most recently prior to, the time when the Fund’s assets are valued.
Securities for which market quotations are not readily available, or when a significant event has occurred that would materially affect the value of the security, are fair valued either (i) by a standardized fair valuation methodology applicable to the security type or the significant event as previously approved by the Valuation Committee and the Fund’s Board or (ii) as determined in good faith by the Manager’s Valuation Committee. The Valuation Committee considers all relevant facts that are reasonably available, through either public information or information available to the Manager, when determining the fair value of a security. Those standardized fair valuation methodologies include, but are not limited to, valuing securities at the last sale price or initially at cost and subsequently adjusting the value based on: changes in company specific fundamentals, changes in an appropriate securities index, or changes in the value of similar securities which may be further adjusted for any discounts related to security-specific resale restrictions. When possible, such methodologies use observable market inputs such as unadjusted quoted prices of similar securities, observable interest rates, currency rates and yield curves. The methodologies used for valuing securities are not necessarily an indication of the risks associated with investing in those securities nor can it be assured that the Fund can obtain the fair value assigned to a security if it were to sell the security.
To assess the continuing appropriateness of security valuations, the Manager regularly compares prior day prices and sale prices to the current day
25 OPPENHEIMER TOTAL RETURN BOND FUND/VA
NOTES TO FINANCIAL STATEMENTS Unaudited / Continued
3. Securities Valuation (Continued)
prices and challenges those prices exceeding certain tolerance levels with the third party pricing service or broker source. For those securities valued by fair valuations, whether through a standardized fair valuation methodology or a fair valuation determination, the Valuation Committee reviews and affirms the reasonableness of the valuations based on such methodologies and fair valuation determinations on a regular basis after considering all relevant information that is reasonably available.
Classifications
Each investment asset or liability of the Fund is assigned a level at measurement date based on the significance and source of the inputs to its valuation. Various data inputs may be used in determining the value of each of the Fund’s investments as of the reporting period end. These data inputs are categorized in the following hierarchy under applicable financial accounting standards:
1) Level 1-unadjusted quoted prices in active markets for identical assets or liabilities (including securities actively traded on a securities exchange)
2) Level 2-inputs other than unadjusted quoted prices that are observable for the asset or liability (such as unadjusted quoted prices for similar assets and market corroborated inputs such as interest rates, prepayment speeds, credit risks, etc.)
3) Level 3-significant unobservable inputs (including the Manager’s own judgments about assumptions that market participants would use in pricing the asset or liability).
The inputs used for valuing securities are not necessarily an indication of the risks associated with investing in those securities.
The Fund classifies each of its investments in investment companies which are publicly offered as Level 1. Investment companies that are not publicly offered, if any, are classified as Level 2 in the fair value hierarchy.
The table below categorizes amounts that are included in the Fund’s Statement of Assets and Liabilities at period end based on valuation input level:
| Level 1— Unadjusted Quoted Prices | Level 2— Other Significant Observable Inputs | Level 3— Significant | Value | |||||||||||||
Assets Table | ||||||||||||||||
Investments, at Value: | ||||||||||||||||
Asset-Backed Securities | $ | — | $ | 18,161,233 | $ | — | $ | 18,161,233 | ||||||||
Mortgage-Backed Obligations | — | 77,785,698 | 26,336 | 77,812,034 | ||||||||||||
U.S. Government Obligation | — | 191,541 | — | �� | 191,541 | |||||||||||
Corporate Bonds and Notes | — | 61,623,888 | — | 61,623,888 | ||||||||||||
Short-Term Notes | — | 16,256,772 | — | 16,256,772 | ||||||||||||
Investment Company | 1,780,718 | — | — | 1,780,718 | ||||||||||||
|
| |||||||||||||||
Total Investments, at Value | 1,780,718 | 174,019,132 | 26,336 | 175,826,186 | ||||||||||||
Other Financial Instruments: | ||||||||||||||||
Futures contracts | 162,066 | — | — | 162,066 | ||||||||||||
|
| |||||||||||||||
Total Assets | $ | 1,942,784 | $ | 174,019,132 | $ | 26,336 | $ | 175,988,252 | ||||||||
|
| |||||||||||||||
Liabilities Table | ||||||||||||||||
Other Financial Instruments: | ||||||||||||||||
Futures contracts | $ | (31,194) | $ | — | $ | — | $ | (31,194) | ||||||||
|
| |||||||||||||||
Total Liabilities | $ | (31,194) | $ | — | $ | — | $ | (31,194) | ||||||||
|
| |||||||||||||||
Forward currency exchange contracts and futures contracts, if any, are reported at their unrealized appreciation/depreciation at measurement date, which represents the change in the contract’s value from trade date. All additional assets and liabilities included in the above table are reported at their market value at measurement date.
The table below shows the transfers between Level 2 and Level 3. The Fund’s policy is to recognize transfers in and transfers out as of the beginning of the reporting period.
| Transfers into Level 2* | Transfers out of Level 3* | |||||||
Assets Table | ||||||||
Investments, at Value: | ||||||||
Mortgage-Backed Obligations | $ | 125,414 | $ | (125,414) | ||||
|
| |||||||
Total Assets | $ | 125,414 | $ | (125,414) | ||||
|
| |||||||
| * | Transferred from Level 3 to Level 2 due to the availability of market data for this security. |
4. Investments and Risks
Investments in Affiliated Funds. The Fund is permitted to invest in other mutual funds advised by the Manager (“Affiliated Funds”). Affiliated Funds are open-end management investment companies registered under the 1940 Act, as amended. The Manager is the investment adviser of, and the Sub-Adviser provides investment and related advisory services to, the Affiliated Funds. When applicable, the Fund’s investments in Affiliated Funds are included in the Statement of Investments. Shares of Affiliated Funds are valued at their net asset value per share. As a shareholder, the Fund is subject to its proportional share of the Affiliated Funds’ expenses, including their management fee. The Manager will waive fees and/or reimburse Fund expenses in
26 OPPENHEIMER TOTAL RETURN BOND FUND/VA
4. Investments and Risks (Continued)
an amount equal to the indirect management fees incurred through the Fund’s investment in the Affiliated Funds.
Each of the Affiliated Funds in which the Fund invests has its own investment risks, and those risks can affect the value of the Fund’s investments and therefore the value of the Fund’s shares. To the extent that the Fund invests more of its assets in one Affiliated Fund than in another, the Fund will have greater exposure to the risks of that Affiliated Fund.
Investments in Money Market Instruments. The Fund is permitted to invest its free cash balances in money market instruments to provide liquidity or for defensive purposes. The Fund may invest in money market instruments by investing in Class E shares of Oppenheimer Institutional Government Money Market Fund (“IGMMF”), which is an Affiliated Fund. IGMMF is regulated as a money market fund under the 1940 Act, as amended. The Fund may also invest in money market instruments directly or in other affiliated or unaffiliated money market funds.
Securities on a When-Issued or Delayed Delivery Basis. The Fund may purchase securities on a “when-issued” basis, and may purchase or sell securities on a “delayed delivery” basis. “When-issued” or “delayed delivery” refers to securities whose terms and indenture are available and for which a market exists, but which are not available for immediate delivery. Delivery and payment for securities that have been purchased by the Fund on a when-issued basis normally takes place within six months and possibly as long as two years or more after the trade date. During this period, such securities do not earn interest, are subject to market fluctuation and may increase or decrease in value prior to their delivery. The purchase of securities on a when-issued basis may increase the volatility of the Fund’s net asset value to the extent the Fund executes such transactions while remaining substantially fully invested. When the Fund engages in when-issued or delayed delivery transactions, it relies on the buyer or seller, as the case may be, to complete the transaction. Their failure to do so may cause the Fund to lose the opportunity to obtain or dispose of the security at a price and yield it considers advantageous. The Fund may also sell securities that it purchased on a when-issued basis or forward commitment prior to settlement of the original purchase.
At period end, the Fund had purchased securities issued on a when-issued or delayed delivery basis and sold securities issued on a delayed delivery basis as follows:
| When-Issued or Delayed Delivery Basis Transactions | ||||
Purchased securities | $95,383,666 | |||
Sold securities | 42,408,116 | |||
The Fund may enter into “forward roll” transactions with respect to mortgage-related securities. In this type of transaction, the Fund sells a mortgage-related security to a buyer and simultaneously agrees to repurchase a similar security (same type, coupon and maturity) at a later date at a set price. During the period between the sale and the repurchase, the Fund will not be entitled to receive interest and principal payments on the securities that have been sold. The Fund records the incremental difference between the forward purchase and sale of each forward roll as realized gain (loss) on investments or as fee income in the case of such transactions that have an associated fee in lieu of a difference in the forward purchase and sale price.
Forward roll transactions may be deemed to entail embedded leverage since the Fund purchases mortgage-related securities with extended settlement dates rather than paying for the securities under a normal settlement cycle. This embedded leverage increases the Fund’s market value of investments relative to its net assets which can incrementally increase the volatility of the Fund’s performance. Forward roll transactions can be replicated over multiple settlement periods.
Risks of entering into forward roll transactions include the potential inability of the counterparty to meet the terms of the agreement; the potential of the Fund to receive inferior securities at redelivery as compared to the securities sold to the counterparty; and counterparty credit risk.
At period end, the Fund pledged $22,826 of collateral to the counterparty for forward roll transactions.
Restricted Securities. At period end, investments in securities included issues that are restricted. A restricted security may have a contractual restriction on its resale and is valued under methods approved by the Board of Trustees as reflecting fair value. Securities that are restricted are marked with an applicable footnote on the Statement of Investments. Restricted securities are reported on a schedule following the Statement of Investments.
5. Market Risk Factors
The Fund’s investments in securities and/or financial derivatives may expose the Fund to various market risk factors:
Commodity Risk. Commodity risk relates to the change in value of commodities or commodity indexes as they relate to increases or decreases in the commodities market. Commodities are physical assets that have tangible properties. Examples of these types of assets are crude oil, heating oil, metals, livestock, and agricultural products.
Credit Risk. Credit risk relates to the ability of the issuer of debt to meet interest and principal payments, or both, as they come due. In general, lower-grade, higher-yield debt securities are subject to credit risk to a greater extent than lower-yield, higher-quality securities.
Equity Risk. Equity risk relates to the change in value of equity securities as they relate to increases or decreases in the general market.
Foreign Exchange Rate Risk. Foreign exchange rate risk relates to the change in the U.S. dollar value of a security held that is denominated in a foreign currency. The U.S. dollar value of a foreign currency denominated security will decrease as the dollar appreciates against the currency, while the U.S. dollar value will increase as the dollar depreciates against the currency.
27 OPPENHEIMER TOTAL RETURN BOND FUND/VA
NOTES TO FINANCIAL STATEMENTS Unaudited / Continued
5. Market Risk Factors (Continued)
Interest Rate Risk. Interest rate risk refers to the fluctuations in value of fixed-income securities resulting from the inverse relationship between price and yield. For example, an increase in general interest rates will tend to reduce the market value of already issued fixed-income investments, and a decline in general interest rates will tend to increase their value. In addition, debt securities with longer maturities, which tend to have higher yields, are subject to potentially greater fluctuations in value from changes in interest rates than obligations with shorter maturities.
Volatility Risk. Volatility risk refers to the magnitude of the movement, but not the direction of the movement, in a financial instrument’s price over a defined time period. Large increases or decreases in a financial instrument’s price over a relative time period typically indicate greater volatility risk, while small increases or decreases in its price typically indicate lower volatility risk.
6. Use of Derivatives
The Fund’s investment objective not only permits the Fund to purchase investment securities, it also allows the Fund to enter into various types of derivatives contracts, including, but not limited to, futures contracts, forward currency exchange contracts, credit default swaps, interest rate swaps, total return swaps, variance swaps and purchased and written options. In doing so, the Fund will employ strategies in differing combinations to permit it to increase, decrease, or change the level or types of exposure to market risk factors. These instruments may allow the Fund to pursue its objectives more quickly and efficiently than if it were to make direct purchases or sales of securities capable of effecting a similar response to market factors. Such contracts may be entered into through a bilateral over-the-counter (“OTC”) transaction, or through a securities or futures exchange and cleared through a clearinghouse.
Derivatives may have little or no initial cash investment relative to their market value exposure and therefore can produce significant gains or losses in excess of their cost due to changes in the market risk factors and the overall market. This use of embedded leverage allows the Fund to increase its market value exposure relative to its net assets and can substantially increase the volatility of the Fund’s performance. In instances where the Fund is using derivatives to decrease, or hedge, exposures to market risk factors for securities held by the Fund, there are also risks that those derivatives may not perform as expected resulting in losses for the combined or hedged positions. Some derivatives have the potential for unlimited loss, regardless of the size of the Fund’s initial investment.
Additional associated risks from investing in derivatives also exist and potentially could have significant effects on the valuation of the derivative and the Fund. Typically, the associated risks are not the risks that the Fund is attempting to increase or decrease exposure to, per its investment objectives, but are the additional risks from investing in derivatives. Examples of these associated risks are liquidity risk, which is the risk that the Fund will not be able to sell the derivative in the open market in a timely manner, and counterparty credit risk, which is the risk that the counterparty will not fulfill its obligation to the Fund.
The Fund’s actual exposures to these market risk factors and associated risks during the period are discussed in further detail, by derivative type, below.
Futures Contracts
A futures contract is a commitment to buy or sell a specific amount of a commodity, financial instrument or currency at a negotiated price on a stipulated future date. The Fund may buy and sell futures contracts and may also buy or write put or call options on these futures contracts. Futures contracts and options thereon are generally entered into on a regulated futures exchange and cleared through a clearinghouse associated with the exchange.
Upon entering into a futures contract, the Fund is required to deposit either cash or securities (initial margin) in an amount equal to a certain percentage of the contract value in an account registered in the futures commission merchant’s name. Subsequent payments (variation margin) are paid to or from the futures commission merchant each day equal to the daily changes in the contract value. Such payments are recorded as unrealized gains and losses. Should the Fund fail to make requested variation margin payments, the futures commission merchant can gain access to the initial margin to satisfy the Fund’s payment obligations.
Futures contracts are reported on a schedule following the Statement of Investments. Securities held by a futures commission merchant to cover initial margin requirements on open futures contracts are noted in the Statement of Investments. Cash held by a futures commission merchant to cover initial margin requirements on open futures contracts and the receivable and/or payable for the daily mark to market for the variation margin are noted in the Statement of Assets and Liabilities. The net change in unrealized appreciation and depreciation is reported in the Statement of Operations. Realized gains (losses) are reported in the Statement of Operations at the closing or expiration of futures contracts.
The Fund may purchase and/or sell financial futures contracts and options on futures contracts to gain exposure to, or decrease exposure to interest rate risk, equity risk, foreign exchange rate risk, volatility risk, or commodity risk.
During the reporting period, the Fund had an ending monthly average market value of $8,616,763 and $47,181,818 on futures contracts purchased and sold, respectively.
Additional associated risks of entering into futures contracts (and related options) include the possibility that there may be an illiquid market where the Fund is unable to liquidate the contract or enter into an offsetting position and, if used for hedging purposes, the risk that the price of the contract will correlate imperfectly with the prices of the Fund’s securities.
Swap Contracts
The Fund may enter into swap contract agreements with a counterparty to exchange a series of cash flows based on either specified reference rates, the price or volatility of asset or non-asset references, or the occurrence of a credit event, over a specified period. Swaps can be executed in a bi-lateral privately negotiated arrangement with a dealer in an OTC transaction (“OTC swaps”) or executed on a regulated market. Certain swaps, regardless of
28 OPPENHEIMER TOTAL RETURN BOND FUND/VA
6. Use of Derivatives (Continued)
the venue of their execution, are required to be cleared through a clearinghouse (“centrally cleared swaps”). Swap contracts may include interest rate, equity, debt, index, total return, credit default, currency, and volatility swaps.
Swap contracts are reported on a schedule following the Statement of Investments. The values of centrally cleared swap and OTC swap contracts are aggregated by positive and negative values and disclosed separately on the Statement of Assets and Liabilities. The unrealized appreciation (depreciation) related to the change in the valuation of the notional amount of the swap is combined with the accrued interest due to (owed by) the Fund, if any, at termination or settlement. The net change in this amount during the period is included on the Statement of Operations. The Fund also records any periodic payments received from (paid to) the counterparty, including at termination, under such contracts as realized gain (loss) on the Statement of Operations.
Swap contract agreements are exposed to the market risk factor of the specific underlying reference rate or asset. Swap contracts are typically more attractively priced compared to similar investments in related cash securities because they isolate the risk to one market risk factor and eliminate the other market risk factors. Investments in cash securities (for instance bonds) have exposure to multiple risk factors (credit and interest rate risk). Because swaps have embedded leverage, they can expose the Fund to substantial risk in the isolated market risk factor.
Credit Default Swap Contracts. A credit default swap is a contract that enables an investor to buy or sell protection against a defined-issuer credit event, such as the issuer’s failure to make timely payments of interest or principal on a debt security, bankruptcy or restructuring. The Fund may enter into credit default swaps either by buying or selling protection on a corporate issuer, sovereign issuer, or a basket or index of issuers (the “reference asset”).
The buyer of protection pays a periodic fee to the seller of protection based on the notional amount of the swap contract. The seller of protection agrees to compensate the buyer of protection for future potential losses as a result of a credit event on the reference asset. The contract effectively transfers the credit event risk of the reference asset from the buyer of protection to the seller of protection.
The ongoing value of the contract will fluctuate throughout the term of the contract based primarily on the credit risk of the reference asset. If the credit quality of the reference asset improves relative to the credit quality at contract initiation, the buyer of protection may have an unrealized loss greater than the anticipated periodic fee owed. This unrealized loss would be the result of current credit protection being cheaper than the cost of credit protection at contract initiation. If the buyer elects to terminate the contract prior to its maturity, and there has been no credit event, this unrealized loss will become realized. If the contract is held to maturity, and there has been no credit event, the realized loss will be equal to the periodic fee paid over the life of the contract.
If there is a credit event, the buyer of protection can exercise its rights under the contract and receive a payment from the seller of protection equal to the notional amount of the swap less the market value of specified debt securities issued by the reference asset. Upon exercise of the contract the difference between such value and the notional amount is recorded as realized gain (loss) and is included on the Statement of Operations.
The Fund may purchase or sell credit protection through credit default swaps to increase or decrease exposure to the credit risk of individual issuers and/or indexes of issuers that are either unavailable or considered to be less attractive in the bond market.
For the reporting period, the Fund had ending monthly average notional amounts of $85,000 on credit default swaps to sell protection.
Additional associated risks to the Fund include counterparty credit risk and liquidity risk.
At period end, the Fund had no credit default swap agreements outstanding.
Swaption Transactions
The Fund may enter into a swaption contract which grants the purchaser the right, but not the obligation, to enter into a swap transaction at preset terms detailed in the underlying agreement within a specified period of time. The purchaser pays a premium to the swaption writer who bears the risk of unfavorable changes in the preset terms on the underlying swap.
Purchased swaptions are reported as a component of investments in the Statement of Investments and the Statement of Assets and Liabilities. Written swaptions are reported on a schedule following the Statement of Investments and their value is reported as a separate asset or liability line item in the Statement of Assets and Liabilities. The net change in unrealized appreciation or depreciation on written swaptions is separately reported in the Statement of Operations. When a swaption is exercised, the cost of the swap is adjusted by the amount of premium paid or received. Upon the expiration or closing of an unexercised swaption contract, a gain or loss is reported in the Statement of Operations for the amount of the premium paid or received.
The Fund generally will incur a greater risk when it writes a swaption than when it purchases a swaption. When the Fund writes a swaption it will become obligated, upon exercise of the swaption, according to the terms of the underlying agreement. Swaption contracts written by the Fund do not give rise to counterparty credit risk prior to exercise as they obligate the Fund, not its counterparty, to perform. When the Fund purchases a swaption it only risks losing the amount of the premium it paid if the swaption expires unexercised. However, when the Fund exercises a purchased swaption there is a risk that the counterparty will fail to perform or otherwise default on its obligations under the swaption contract.
The Fund may purchase swaptions which give it the option to buy or sell credit protection through credit default swaps in order to decrease or increase exposure to the credit risk of individual issuers and/ or indexes of issuers. A swaption selling protection becomes more valuable as the likelihood of a credit event on the reference asset decreases. A swaption buying protection becomes more valuable as the likelihood of a credit event on the reference asset increases.
At period end, the Fund had no purchased swaption contracts outstanding.
The Fund may write swaptions which give it the obligation, if exercised by the purchaser, to sell or buy credit protection through credit default swaps in order to increase or decrease exposure to the credit risk of individual issuers and/or indexes of issuers. A written swaption selling protection becomes more valuable as the likelihood of a credit event on the reference asset decreases. A written swaption buying protection becomes more valuable as the likelihood of a credit event on the reference asset increases.
29 OPPENHEIMER TOTAL RETURN BOND FUND/VA
NOTES TO FINANCIAL STATEMENTS Unaudited / Continued
6. Use of Derivatives (Continued)
During the reporting period, the Fund had an ending monthly average market value of $2,111 and $949 on purchased and written swaptions, respectively.
At period end, the Fund had no written swaption contracts outstanding.
Counterparty Credit Risk. Derivative positions are subject to the risk that the counterparty will not fulfill its obligation to the Fund. The Fund intends to enter into derivative transactions with counterparties that the Manager believes to be creditworthy at the time of the transaction.
The Fund’s risk of loss from counterparty credit risk on OTC derivatives is generally limited to the aggregate unrealized gain netted against any collateral held by the Fund. For OTC options purchased, the Fund bears the risk of loss of the amount of the premiums paid plus the positive change in market values net of any collateral held by the Fund should the counterparty fail to perform under the contracts. Options written by the Fund do not typically give rise to counterparty credit risk, as options written generally obligate the Fund and not the counterparty to perform.
To reduce counterparty risk with respect to OTC transactions, the Fund has entered into master netting arrangements, established within the Fund’s International Swap and Derivatives Association, Inc. (“ISDA”) master agreements, which allow the Fund to make (or to have an entitlement to receive) a single net payment in the event of default (close-out netting) for outstanding payables and receivables with respect to certain OTC positions in swaps, options, swaptions, and forward currency exchange contracts for each individual counterparty. In addition, the Fund may require that certain counterparties post cash and/or securities in collateral accounts to cover their net payment obligations for those derivative contracts subject to ISDA master agreements. If the counterparty fails to perform under these contracts and agreements, the cash and/or securities will be made available to the Fund.
ISDA master agreements include credit related contingent features which allow counterparties to OTC derivatives to terminate derivative contracts prior to maturity in the event that, for example, the Fund’s net assets decline by a stated percentage or the Fund fails to meet the terms of its ISDA master agreements, which would cause the Fund to accelerate payment of any net liability owed to the counterparty.
For financial reporting purposes, the Fund does not offset derivative assets and derivative liabilities that are subject to netting arrangements in the
Statement of Assets and Liabilities. Bankruptcy or insolvency laws of a particular jurisdiction may impose restrictions on or prohibitions against the right of offset in bankruptcy, insolvency or other events.
The Fund’s risk of loss from counterparty credit risk on exchange-traded derivatives cleared through a clearinghouse and for centrally cleared swaps is generally considered lower than as compared to OTC derivatives. However, counterparty credit risk exists with respect to initial and variation margin deposited/paid by the Fund that is held in futures commission merchant, broker and/or clearinghouse accounts for such exchange-traded derivatives and for centrally cleared swaps.
With respect to centrally cleared swaps, such transactions will be submitted for clearing, and if cleared, will be held in accounts at futures commission merchants or brokers that are members of clearinghouses. While brokers, futures commission merchants and clearinghouses are required to segregate customer margin from their own assets, in the event that a broker, futures commission merchant or clearinghouse becomes insolvent or goes into bankruptcy and at that time there is a shortfall in the aggregate amount of margin held by the broker, futures commission merchant or clearinghouse for all its customers, U.S. bankruptcy laws will typically allocate that shortfall on a pro-rata basis across all the broker’s, futures commission merchant’s or clearinghouse’s customers, potentially resulting in losses to the Fund.
There is the risk that a broker, futures commission merchant or clearinghouse will decline to clear a transaction on the Fund’s behalf, and the Fund may be required to pay a termination fee to the executing broker with whom the Fund initially enters into the transaction. Clearinghouses may also be permitted to terminate centrally cleared swaps at any time. The Fund is also subject to the risk that the broker or futures commission merchant will improperly use the Fund’s assets deposited/paid as initial or variation margin to satisfy payment obligations of another customer. In the event of a default by another customer of the broker or futures commission merchant, the Fund might not receive its variation margin payments from the clearinghouse, due to the manner in which variation margin payments are aggregated for all customers of the broker/futures commission merchant.
Collateral and margin requirements differ by type of derivative. Margin requirements are established by the broker, futures commission merchant or clearinghouse for exchange-traded and cleared derivatives, including centrally cleared swaps. Brokers, futures commission merchants and clearinghouses can ask for margin in excess of the regulatory minimum, or increase the margin amount, in certain circumstances.
Collateral terms are contract specific for OTC derivatives. For derivatives traded under an ISDA master agreement, the collateral requirements are typically calculated by netting the mark to market amount for each transaction under such agreement and comparing that amount to the value of any collateral currently pledged by the Fund or the counterparty.
For financial reporting purposes, cash collateral that has been pledged to cover obligations of the Fund, if any, is reported separately on the Statement of Assets and Liabilities as cash pledged as collateral. Non-cash collateral pledged by the Fund, if any, is noted in the Statement of Investments. Generally, the amount of collateral due from or to a party must exceed a minimum transfer amount threshold (e.g. $250,000) before a transfer has to be made. To the extent amounts due to the Fund from its counterparties are not fully collateralized, contractually or otherwise, the Fund bears the risk of loss from counterparty nonperformance.
The following table presents the valuations of derivative instruments by risk exposure as reported within the Statement of Assets and Liabilities at period end:
30 OPPENHEIMER TOTAL RETURN BOND FUND/VA
6. Use of Derivatives (Continued)
| Asset Derivatives | Liability Derivatives | |||||||||||||
Derivatives Not Accounted for as Hedging Instruments | Statement of Assets and Liabilities Location | Value | Statement of Assets and Liabilities Location | Value | ||||||||||
Interest rate contracts Variation margin receivable | $ | 11,967 | * | Variation margin payable | $ | 3,910 | * | |||||||
*Includes only the current day’s variation margin. Prior variation margin movements have been reflected in cash on the Statement of Assets and Liabilities upon receipt or payment.
The effect of derivative instruments on the Statement of Operations is as follows:
| Amount of Realized Gain or (Loss) Recognized on Derivatives | ||||||||||||||||||||
Derivatives Not Accounted for as Hedging Instruments | Investment transactions in unaffiliated companies | Swaption contracts written | Futures contracts | Swap contracts | Total | |||||||||||||||
Credit contracts | $ | (18,244) | $ | 8,653 | $ | — | $ | (3,068) | $ | (12,659) | ||||||||||
Interest rate contracts | — | — | (167,670) | — | (167,670) | |||||||||||||||
|
| |||||||||||||||||||
Total | $ | (18,244) | $ | 8,653 | $ | (167,670) | $ | (3,068) | $ | (180,329) | ||||||||||
|
| |||||||||||||||||||
| Amount of Change in Unrealized Gain or (Loss) Recognized on Derivatives | ||||
Derivatives Not Accounted for as Hedging Instruments | Futures contracts | |||
Interest rate contracts | $ | 11,411 | ||
7. Shares of Beneficial Interest
The Fund has authorized an unlimited number of $0.001 par value shares of beneficial interest of each class. Transactions in shares of beneficial interest were as follows:
| Six Months Ended June 30, 2018 | Year Ended December 31, 2017 | |||||||||||||||
| Shares | Amount | Shares | Amount | |||||||||||||
| ||||||||||||||||
Non-Service Shares | ||||||||||||||||
Sold | 1,569,070 | $ | 12,174,313 | 1,035,605 | $ | 8,035,937 | ||||||||||
Dividends and/or distributions reinvested | 353,708 | 2,617,442 | 261,553 | 2,024,420 | ||||||||||||
Redeemed | (1,815,148) | (14,077,440) | (1,765,201) | (13,727,340) | ||||||||||||
|
| |||||||||||||||
Net increase (decrease) | 107,630 | $ | 714,315 | (468,043) | $ | (3,666,983) | ||||||||||
|
| |||||||||||||||
| ||||||||||||||||
Service Shares | ||||||||||||||||
Sold | 455,488 | $ | 3,425,144 | 1,815,951 | $ | 13,919,373 | ||||||||||
Dividends and/or distributions reinvested | 202,701 | 1,481,742 | 148,618 | 1,136,931 | ||||||||||||
Redeemed | (823,937) | (6,206,122) | (2,406,983) | (18,467,514) | ||||||||||||
|
| |||||||||||||||
Net decrease | (165,748) | $ | (1,299,236) | (442,414) | $ | (3,411,210) | ||||||||||
|
| |||||||||||||||
8. Purchases and Sales of Securities
The aggregate cost of purchases and proceeds from sales of securities, other than short-term obligations and investments in IGMMF, for the reporting period were as follows:
| Purchases | Sales | |||||||||||
| ||||||||||||
Investment securities | $34,701,128 | $38,145,491 | ||||||||||
U.S. government and government agency obligations | — | 1,399,189 | ||||||||||
To Be Announced (TBA) mortgage-related securities | 369,648,839 | 366,986,225 | ||||||||||
9. Fees and Other Transactions with Affiliates
Management Fees. Under the investment advisory agreement, the Fund pays the Manager a management fee based on the daily net assets of the Fund at an annual rate as shown in the following table:
| Fee Schedule | ||||||||
| ||||||||
Up to $1 billion | 0.60 | % | ||||||
Over $1 billion | 0.50 | |||||||
The Fund’s effective management fee for the reporting period was 0.60% of average annual net assets before any applicable waivers.
Sub-Adviser Fees. The Manager has retained the Sub-Adviser to provide the day-to-day portfolio management of the Fund. Under the Sub-Advisory Agreement, the Manager pays the Sub-Adviser an annual fee in monthly installments, equal to a percentage of the investment management fee
31 OPPENHEIMER TOTAL RETURN BOND FUND/VA
NOTES TO FINANCIAL STATEMENTS Unaudited / Continued
9. Fees and Other Transactions with Affiliates (Continued)
collected by the Manager from the Fund, which shall be calculated after any investment management fee waivers. The fee paid to the Sub-Adviser is paid by the Manager, not by the Fund.
Transfer Agent Fees. OFI Global (the “Transfer Agent”) serves as the transfer and shareholder servicing agent for the Fund. The Fund pays the Transfer Agent a fee based on annual net assets. Fees incurred and average net assets for each class with respect to these services are detailed in the Statement of Operations and Financial Highlights, respectively.
Sub-Transfer Agent Fees. The Transfer Agent has retained Shareholder Services, Inc., a wholly-owned subsidiary of OFI (the “Sub-Transfer Agent”), to provide the day-to-day transfer agent and shareholder servicing of the Fund. Under the Sub-Transfer Agency Agreement, the Transfer Agent pays the Sub-Transfer Agent an annual fee in monthly installments, equal to a percentage of the transfer agent fee collected by the Transfer Agent from the Fund, which shall be calculated after any applicable fee waivers. The fee paid to the Sub-Transfer Agent is paid by the Transfer Agent, not by the Fund.
Trustees’ Compensation. The Fund’s Board of Trustees (“Board”) has adopted a compensation deferral plan for Independent Trustees that enables Trustees to elect to defer receipt of all or a portion of the annual compensation they are entitled to receive from the Fund. For purposes of determining the amount owed to the Trustees under the plan, deferred amounts are treated as though equal dollar amounts had been invested in shares of the Fund or in other Oppenheimer funds selected by the Trustees. The Fund purchases shares of the funds selected for deferral by the Trustees in amounts equal to his or her deemed investment, resulting in a Fund asset equal to the deferred compensation liability. Such assets are included as a component of “Other” within the asset section of the Statement of Assets and Liabilities. Deferral of Trustees’ fees under the plan will not affect the net assets of the Fund and will not materially affect the Fund’s assets, liabilities or net investment income per share. Amounts will be deferred until distributed in accordance with the compensation deferral plan.
Distribution and Service Plan for Service Shares. The Fund has adopted a Distribution and Service Plan (the “Plan”) pursuant to Rule 12b-1 under the 1940 Act for Service shares to pay OppenheimerFunds Distributor, Inc. (the “Distributor”), for distribution related services, personal service and account maintenance for the Fund’s Service shares. Under the Plan, payments are made periodically at an annual rate of 0.25% of the daily net assets of Service shares of the Fund. The Distributor currently uses all of those fees to compensate sponsors of the insurance product that offers Fund shares, for providing personal service and maintenance of accounts of their variable contract owners that hold Service shares. These fees are paid out of the Fund’s assets on an on-going basis and increase operating expenses of the Service shares, which results in lower performance compared to the Fund’s shares that are not subject to a service fee. Fees incurred by the Fund under the Plan are detailed in the Statement of Operations.
Waivers and Reimbursements of Expenses. The Manager has contractually agreed to limit the Fund’s expenses after payments, waivers and/or reimbursements and reduction to custodian expenses, excluding any applicable dividend expense, taxes, interest and fees from borrowing, any subsidiary expenses, Acquired Fund Fees and Expenses, brokerage commissions, unusual and infrequent expenses and certain other Fund expenses; so that those expenses, as percentages of daily net assets, will not exceed the annual rate of 0.75% for Non-Service shares and 1.00% for Service shares.
During the reporting period, the Manager waived fees and/or reimbursed the Fund as follows:
Non-Service shares | $ 42,690 | |||
Service shares | 26,330 |
This fee waiver and/or expense reimbursement may not be amended or withdrawn for one year from the date of the Fund’s prospectus, unless approved by the Board.
The Manager will waive fees and/or reimburse Fund expenses in an amount equal to the indirect management fees incurred through the Fund’s investment in IGMMF. During the reporting period, the Manager waived fees and/or reimbursed the Fund $1,421 for IGMMF management fees. This fee waiver and/or expense reimbursement may not be amended or withdrawn for one year from the date of the Fund’s prospectus, unless approved by the Board.
10. Borrowings and Other Financing
Joint Credit Facility. A number of mutual funds managed by the Manager participate in a $1.875 billion revolving credit facility (the ���Facility”) intended to provide short-term financing, if necessary, subject to certain restrictions in connection with atypical redemption activity. Effective July 17, 2018, the Facility was increased to $1.95 billion. Expenses and fees related to the Facility are paid by the participating funds and are disclosed separately or as other expenses on the Statement of Operations. The Fund did not utilize the Facility during the reporting period.
32 OPPENHEIMER TOTAL RETURN BOND FUND/VA
PORTFOLIO PROXY VOTING POLICIES AND GUIDELINES; UPDATES TO STATEMENT OF INVESTMENTS
The Fund has adopted Portfolio Proxy Voting Policies and Guidelines under which the Fund votes proxies relating to securities (“portfolio proxies”) held by the Fund. A description of the Fund’s Portfolio Proxy Voting Policies and Guidelines is available (i) without charge, upon request, by calling the Fund toll-free at 1.800.CALL OPP (225.5677), (ii) on the Fund’s website at www.oppenheimerfunds.com, and (iii) on the SEC’s website at www.sec.gov. In addition, the Fund is required to file Form N-PX, with its complete proxy voting record for the 12 months ended June 30th, no later than August 31st of each year. The Fund’s voting record is available (i) without charge, upon request, by calling the Fund toll-free at 1.800.CALL OPP (225.5677), and (ii) in the Form N-PX filing on the SEC’s website at www.sec.gov.
The Fund files its complete schedule of portfolio holdings with the SEC for the first quarter and the third quarter of each fiscal year on Form N-Q. The Fund’s Form N-Q filings are available on the SEC’s website at www.sec.gov. Those forms may be reviewed and copied at the SEC’s Public Reference Room in Washington, D.C. Information on the operation of the Public Reference Room may be obtained by calling 1-800-SEC-0330.
33 OPPENHEIMER TOTAL RETURN BOND FUND/VA
DISTRIBUTION SOURCES Unaudited
For any distribution that took place over the last six months of the Fund’s reporting period, the table below details on a per-share basis the percentage of the Fund’s total distribution payment amount that was derived from the following sources: net income, net profit from the sale of securities, and other capital sources. Other capital sources represent a return of capital. A return of capital may occur, for example, when some or all of the money that you invested in the Fund is paid back to you. A return of capital distribution does not necessarily reflect the Fund’s investment performance and should not be confused with “yield” or “income.” You should not draw any conclusions about the Fund’s investment performance from the amounts of these distributions. This information is based upon income and capital gains using generally accepted accounting principles as of the date of each distribution. If the Fund (or an underlying fund in which the Fund invests) invests in real estate investment trusts (REITs) and/or master limited partnerships (MLPs), the percentages attributed to each category are estimated using historical information because the character of the amounts received from the REITs and/or MLPs in which the Fund (or underlying fund) invests is unknown until after the end of the calendar year. Because the Fund is actively managed, the relative amount of the Fund’s total distributions derived from various sources over the calendar year may change. Please note that this information should not be used for tax reporting purposes as the tax character of distributable income may differ from the amounts used for this notification. You will receive communication in the first quarter of each calendar year detailing the actual amount of the taxable and non-taxable portion of distributions paid to you during the tax year.
For the most current information, please go to oppenheimerfunds.com. Select your Fund, and scroll down to the ‘Dividends’ table under ‘Analytics’. The Fund’s latest distribution information will be followed by the sources of any distribution, updated daily.
| Fund Name |
Pay | Net Income | Net Profit from Sale | Other Capital Sources | ||||||||||||
Oppenheimer Total Return Bond Fund/VA |
|
6/19/18
|
| 76.4 | % | 0.0 | % | 23.6 | % | |||||||
34 OPPENHEIMER TOTAL RETURN BOND FUND/VA
THIS PAGE INTENTIONALLY LEFT BLANK.
35 OPPENHEIMER TOTAL RETURN BOND FUND/VA
OPPENHEIMER TOTAL RETURN BOND FUND/VA
A Series of Oppenheimer Variable Account Funds
| Trustees and Officers | Robert J. Malone, Chairman of the Board of Trustees and Trustee | |
| Andrew J. Donohue, Trustee | ||
| Richard F. Grabish, Trustee | ||
| Beverly L. Hamilton, Trustee | ||
| Victoria J. Herget, Trustee | ||
| Karen L. Stuckey, Trustee | ||
| James D. Vaughn, Trustee | ||
| Arthur P. Steinmetz, Trustee, President and Principal Executive Officer | ||
| Krishna Memani, Vice President | ||
| Peter A. Strzalkowski, Vice President | ||
| Cynthia Lo Bessette, Secretary and Chief Legal Officer | ||
| Jennifer Foxson, Vice President and Chief Business Officer | ||
| Mary Ann Picciotto, Chief Compliance Officer and Chief Anti-Money Laundering Officer | ||
| Brian S. Petersen, Treasurer and Principal Financial & Accounting Officer | ||
| Manager | OFI Global Asset Management, Inc. | |
| Sub-Adviser | OppenheimerFunds, Inc. | |
| Distributor | OppenheimerFunds Distributor, Inc. | |
Transfer and Shareholder Servicing Agent | OFI Global Asset Management, Inc. | |
| Sub-Transfer Agent | Shareholder Services, Inc. | |
| DBA OppenheimerFunds Services | ||
Independent Registered Public Accounting Firm | KPMG LLP | |
| Legal Counsel | Ropes & Gray LLP | |
| Before investing in any of the Oppenheimer funds, investors should carefully consider a fund’s investment objectives, risks, charges and expenses. Fund prospectuses and summary prospectuses contain this and other information about the funds, and may be obtained by asking your financial advisor, visiting oppenheimerfunds.com or calling us at 1.800.988.8287. Read prospectuses and summary prospectuses carefully before investing. | ||
| The financial statements included herein have been taken from the records of the Fund without examination of those records by the independent registered public accounting firm. | ||
© 2018 OppenheimerFunds, Inc. All rights reserved. Oppenheimer funds are distributed by OppenheimerFunds Distributor, Inc.
| ||

| ||||
June 30, 2018
| ||||
Oppenheimer | ||||
Global Fund/VA | Semiannual Report | |||
A Series of Oppenheimer Variable Account Funds
| ||||
SEMIANNUAL REPORT | ||||
Listing of Top Holdings | ||||
Fund Performance Discussion | ||||
Financial Statements | ||||

PORTFOLIO MANAGERS: Rajeev Bhaman, CFA and John Delano, CFA1
AVERAGE ANNUAL TOTAL RETURNS FOR THE PERIODS ENDED 6/30/18
| Inception Date | 6-Months | 1-Year | 5-Year | 10-Year | ||||||||||||||||
Non-Service Shares | 11/12/90 | 1.92% | 16.13% | 11.82% | 8.91% | |||||||||||||||
Service Shares | 7/13/00 | 1.79 | 15.83 | 11.53 | 8.64 | |||||||||||||||
MSCI All Country World Index | -0.43 | 10.73 | 9.41 | 5.80 | ||||||||||||||||
Performance data quoted represents past performance, which does not guarantee future results. The investment return and principal value of an investment in the Fund will fluctuate so that an investor’s shares, when redeemed, may be worth more or less than their original cost. Current performance may be lower or higher than the performance quoted. For performance data current to the most recent month end, call us at 1.800.988.8287. The Fund’s total returns should not be expected to be the same as the returns of other funds, whether or not both funds have the same portfolio managers and/or similar names. The Fund’s total returns include changes in share price and reinvested distributions but do not include the charges associated with the separate account products that offer this Fund. Such performance would have been lower if such charges were taken into account. Returns for periods of less than one year are cumulative and not annualized. See Fund prospectuses and summary prospectuses for more information on share classes and sales charges.
The Fund’s performance is compared to the performance of the MSCI All Country World Index. The MSCI All Country World Index is a free float-adjusted market capitalization weighted index that is designed to measure the equity market performance of developed and emerging markets. The Index is unmanaged and cannot be purchased directly by investors. While index comparisons may be useful to provide a benchmark for the Fund’s performance, it must be noted that the Fund’s investments are not limited to the investments comprising the Index. Index performance includes reinvestment of income, but does not reflect transaction costs, fees, expenses or taxes. Index performance is shown for illustrative purposes only as a benchmark for the Fund’s performance, and does not predict or depict performance of the Fund. The Fund’s performance reflects the effects of the Fund’s business and operating expenses.
TOP HOLDINGS AND ALLOCATIONS
TOP TEN COMMON STOCK HOLDINGS
Alphabet, Inc., Cl. A | 6.1% | |||
Airbus SE | 3.3 | |||
LVMH Moet Hennessy Louis Vuitton SE | 3.2 | |||
Adobe Systems, Inc. | 2.9 | |||
S&P Global, Inc. | 2.8 | |||
Facebook, Inc., Cl. A | 2.6 | |||
Intuit, Inc. | 2.5 | |||
Nidec Corp. | 2.5 | |||
Aetna, Inc. | 2.4 | |||
SAP SE | 2.3 |
Portfolio holdings and allocations are subject to change. Percentages are as of June 30, 2018, and are based on net assets. For more current Fund holdings, please visit oppenheimerfunds.com.
REGIONAL ALLOCATION
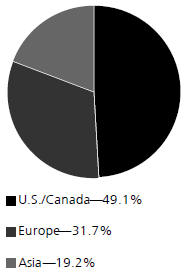
Portfolio holdings and allocations are subject to change. Percentages are as of June 30, 2018, and are based on the total market value of investments. For more current Fund holdings, please visit oppenheimerfunds.com.
1. Effective March 31, 2019, Mr. Bhaman will retire as Portfolio Manager and Vice President and Mr. Delano will be the sole Portfolio Manager of the Fund.
2 OPPENHEIMER GLOBAL FUND/VA
Fund Performance Discussion
For the six-month reporting period ended June 30, 2018, the Fund’s Non-Service shares returned 1.92% versus the MSCI All Country World Index (“the Index”), its benchmark, which returned -0.43%. The Fund outperformed the Index in seven out of eleven sectors, led by stock selection in Information Technology, Industrials, and Consumer Discretionary. Underperforming sectors included Real Estate and Health Care, due to stock selection. The Portfolio’s underweight position in the Energy sector also detracted from performance in a period where the sector produced positive results. We find little appeal in commodity or highly regulated industries, so we own little in Energy, Real Estate, or Utilities.
MARKET REVIEW
The first half of 2018 has been up and down. The near straight-up advance that characterized 2017 ran out of steam in the closing days of January. Markets very rarely perform in that fashion. So, we are likely in a period of consolidation, where the earnings have the potential to grow nicely. This is a process that is likely to continue, we believe, as markets adapt to an environment where interest rates normalize and growth picks up. We still believe that the year can yield respectable gains but nothing like the magnitude or character of 2017.
FUND REVIEW
Top performing holdings this reporting period included Adobe Systems, Inc., Kering SA, and Intuit, Inc.
Adobe Systems has seen accelerating revenues and widening margins driven by exceptional products and their transition to the cloud. Cloud based software is cheaper for the customer, and cannot be pirated. The stock has run a long way but we still like its prospects. The price has also run up as it has become more clearly understood that the company’s move to a cloud platform is a big plus for both revenues and margins.
Kering continues the resurgence in its operations, which began in mid-2016. Since then, the share price has risen by more than 250%, and more than 27% over the recently concluded quarter. Underpinning this performance have been the significant improvements in the performance of the Gucci brand, as well as a firmer economic tone around the world, particularly in Asia.
Intuit is a sponsor of tax preparation and bookkeeping software such as TurboTax and QuickBooks. The company has had considerable success in adapting these products to both mobile and the cloud. In the U.S., the company has continued to gain share and we believe it has a sizable opportunity to penetrate markets outside the U.S. as well.
Top detractors from performance included DLF Ltd., Acadia Pharmaceuticals, Inc., and Colgate-Palmolive Co.
DLF is an Indian real estate owner and developer that has been undergoing a significant financial restructuring. The balance sheet has been substantially strengthened over the last year, with net debt reduced by half. One remaining headwind is a cyclical lull in real estate markets. This will undoubtedly improve, in our view. We believe the company is strong enough to weather it.
Acadia Pharmaceuticals is a biopharmaceutical company working in the area of central nervous system disorders. A recent drug launch, Nuplazid, for the treatment of psychosis related to Parkinson’s disease was looked into by the FDA for safety concerns, sparked by a CNN report. We believe this is overblown, and the drug will see commercial success. A larger opportunity for Acadia exists if they are able to show efficacy in dementia related psychosis.
We believe Colgate-Palmolive is an exceptional company that has been a little bit slow to react to both competitive challenges and a bit too much corporate bloat. We believe both are fixable problems, and we expect that they can, and will, resolve them.
OUTLOOK AND POSITIONING
A good starting point for investing in companies that have the capacity to grow at an above average rate for a long period of time is to be thinking carefully about what economic ecosystems are expanding structurally. From this thought process, we can develop investment themes, some of which can be populated by multiple companies/beneficiaries. Among these themes today include the human desire for status and happiness. Within this broad idea we own some of the world’s best luxury goods companies. The use of technology to advance the treatment of illnesses for which there is no cure, or the deepening electronic content of automobiles and trucks, are others. None are present to capitalize on a market regime or cycle; instead they play upon trends which will unfold over the next decade or more.
3 OPPENHEIMER GLOBAL FUND/VA
We try to assemble a portfolio that is adaptable to most environments by emphasizing the quality and sustainability of purpose for each company we invest in. Businesses that have these two traits can weather an uncertain future in our opinion.
The views in the Fund Performance Discussion represent the opinions of this Fund’s portfolio managers and are not intended as investment advice or to predict or depict the performance of any investment. These views are as of the close of business on June 30, 2018, and are subject to change based on subsequent developments. The Fund’s portfolio and strategies are subject to change.
Shares of Oppenheimer funds are not deposits or obligations of any bank, are not guaranteed by any bank, are not insured by the FDIC or any other agency, and involve investment risks, including the possible loss of the principal amount invested.
4 OPPENHEIMER GLOBAL FUND/VA
Fund Expenses
Fund Expenses. As a shareholder of the Fund, you incur two types of costs: (1) transaction costs and (2) ongoing costs, including management fees; distribution and service fees; and other Fund expenses. These examples are intended to help you understand your ongoing costs (in dollars) of investing in the Fund and to compare these costs with the ongoing costs of investing in other mutual funds.
The examples are based on an investment of $1,000.00 invested at the beginning of the period and held for the entire 6-month period ended June 30, 2018.
Actual Expenses. The first section of the table provides information about actual account values and actual expenses. You may use the information in this section for the class of shares you hold, together with the amount you invested, to estimate the expense that you paid over the period. Simply divide your account value by $1,000.00 (for example, an $8,600.00 account value divided by $1,000.00 = 8.60), then multiply the result by the number in the first section under the heading entitled “Expenses Paid During 6 Months Ended June 30, 2018” to estimate the expenses you paid on your account during this period.
Hypothetical Example for Comparison Purposes.
The second section of the table provides information about hypothetical account values and hypothetical expenses based on the Fund’s actual expense ratio for each class of shares, and an assumed rate of return of 5% per year for each class before expenses, which is not the actual return. The hypothetical account values and expenses may not be used to estimate the actual ending account balance or expenses you paid for the period. You may use this information to compare the ongoing costs of investing in the Fund and other funds. To do so, compare this 5% hypothetical example for the class of shares you hold with the 5% hypothetical examples that appear in the shareholder reports of the other funds.
Please note that the expenses shown in the table are meant to highlight your ongoing costs only and do not reflect any charges associated with the separate accounts that offer this Fund. Therefore, the “hypothetical” lines of the table are useful in comparing ongoing costs only, and will not help you determine the relative total costs of owning different funds. In addition, if these separate account charges were included your costs would have been higher.
| Actual | Beginning Value | Ending Value | Expenses Paid During | |||||||||
Non-Service shares | $ | 1,000.00 | $ | 1,019.20 | $ | 3.86 | ||||||
Service shares | 1,000.00 | 1,017.90 | 5.12 | |||||||||
| Hypothetical | ||||||||||||
(5% return before expenses) | ||||||||||||
Non-Service shares | 1,000.00 | 1,020.98 | 3.87 | |||||||||
Service shares | 1,000.00 | 1,019.74 | 5.12 | |||||||||
Expenses are equal to the Fund’s annualized expense ratio for that class, multiplied by the average account value over the period, multiplied by 181/365 (to reflect the one-half year period). Those annualized expense ratios, excluding indirect expenses from affiliated funds, based on the 6-month period ended June 30, 2018 are as follows:
| Class | Expense Ratios | |||
Non-Service shares | 0.77% | |||
Service shares | 1.02 | |||
The expense ratios reflect voluntary and/or contractual waivers and/or reimbursements of expenses by the Fund’s Manager. Some of these undertakings may be modified or terminated at any time, as indicated in the Fund’s prospectus. The “Financial Highlights” tables in the Fund’s financial statements, included in this report, also show the gross expense ratios, without such waivers or reimbursements and reduction to custodian expenses, if applicable.
5 OPPENHEIMER GLOBAL FUND/VA
STATEMENT OF INVESTMENTS June 30, 2018 Unaudited
| Shares | Value | |||||||
Common Stocks—98.0% | ||||||||
Consumer Discretionary—15.2% | ||||||||
Automobiles—1.0% | ||||||||
Suzuki Motor Corp.
|
| 503,900
|
| $
| 27,789,013
|
| ||
Hotels, Restaurants & Leisure—0.7% |
| |||||||
International Game Technology plc
|
| 798,011
|
|
| 18,545,776
|
| ||
Household Durables—1.1% | ||||||||
Newell Brands, Inc.
|
| 1,114,390
|
|
| 28,740,118
|
| ||
Internet & Catalog Retail—2.0% | ||||||||
Amazon.com, Inc.1 | 4,610 | 7,836,078 | ||||||
JD.com, Inc., ADR1 | 1,165,247 | 45,386,371 | ||||||
|
| 53,222,449
|
| ||||||
Media—1.3% | ||||||||
Walt Disney Co. (The)
|
| 339,430
|
|
| 35,575,658
|
| ||
Specialty Retail—3.3% | ||||||||
Industria de Diseno Textil SA | 1,302,389 | 44,440,550 | ||||||
Tiffany & Co. | 323,290 | 42,544,964 | ||||||
|
| 86,985,514
|
| ||||||
Textiles, Apparel & Luxury Goods—5.8% |
| |||||||
Brunello Cucinelli SpA | 181,298 | 8,089,642 | ||||||
Kering SA | 100,390 | 56,625,608 | ||||||
LVMH Moet Hennessy Louis Vuitton SE | 251,320 | 83,543,481 | ||||||
Puma SE | 9,677 | 5,650,264 | ||||||
|
| 153,908,995
|
| ||||||
Consumer Staples—4.0% | ||||||||
Food Products—2.0% | ||||||||
Unilever plc
|
| 962,270
|
|
| 53,229,839
|
| ||
Household Products—2.0% | ||||||||
Colgate-Palmolive Co.
|
| 830,950
|
|
| 53,853,869
|
| ||
Energy—0.9% | ||||||||
Energy Equipment & Services—0.9% |
| |||||||
TechnipFMC plc
|
| 773,990
|
|
| 24,596,525
|
| ||
Financials—17.5% | ||||||||
Capital Markets—6.6% | ||||||||
Credit Suisse Group AG1 | 1,827,362 | 27,424,194 | ||||||
Goldman Sachs Group, Inc. (The) | 170,830 | 37,679,973 | ||||||
S&P Global, Inc. | 365,180 | 74,456,550 | ||||||
UBS Group AG1 | 2,390,538 | 36,778,605 | ||||||
|
| 176,339,322
|
| ||||||
Commercial Banks—4.4% | ||||||||
Banco Bilbao Vizcaya Argentaria SA | 1,786,888 | 12,620,738 | ||||||
Citigroup, Inc. | 876,100 | 58,628,612 | ||||||
ICICI Bank Ltd., Sponsored ADR1 | 2,425,724 | 19,478,564 | ||||||
Societe Generale SA | 594,959 | 25,052,431 | ||||||
|
| 115,780,345
|
| ||||||
Insurance—4.9% | ||||||||
Allianz SE | 213,583 | 44,134,443 | ||||||
Dai-ichi Life Holdings, Inc. | 1,242,400 | 22,098,922 | ||||||
FNF Group | 517,930 | 19,484,526 | ||||||
Prudential plc | 2,004,047 | 45,789,851 | ||||||
|
| 131,507,742
|
| ||||||
Real Estate Management & Development—1.6% |
| |||||||
DLF Ltd.
|
| 15,839,922
|
|
| 43,575,437
|
| ||
Health Care—15.6% | ||||||||
Biotechnology—7.4% | ||||||||
ACADIA Pharmaceuticals, Inc.1 | 551,120 | 8,415,602 | ||||||
AnaptysBio, Inc.1 | 135,770 | 9,645,101 | ||||||
Biogen, Inc.1 | 82,120 | 23,834,509 | ||||||
Bluebird Bio, Inc.1 | 98,120 | 15,399,934 | ||||||
Blueprint Medicines Corp.1 | 206,790 | 13,127,029 | ||||||
Circassia Pharmaceuticals plc1 | 4,471,614 | 4,961,311 | ||||||
Gilead Sciences, Inc. | 280,350 | 19,859,994 | ||||||
GlycoMimetics, Inc.1 | 364,310 | 5,876,320 | ||||||
| Shares | Value | |||||||
Biotechnology (Continued) | ||||||||
Ionis Pharmaceuticals, Inc.1 | 362,420 | $ | 15,102,041 | |||||
Loxo Oncology, Inc.1 | 132,190 | 22,932,321 | ||||||
MacroGenics, Inc.1 | 506,550 | 10,460,258 | ||||||
Mirati Therapeutics, Inc.1 | 65,522 | 3,230,235 | ||||||
Sage Therapeutics, Inc.1 | 172,300 | 26,970,119 | ||||||
Shire plc | 219,130 | 12,323,353 | ||||||
uniQure NV1 | 169,670 | 6,413,526 | ||||||
|
| 198,551,653
|
| ||||||
Health Care Equipment & Supplies—0.9% |
| |||||||
Zimmer Biomet Holdings, Inc.
|
| 217,090
|
|
| 24,192,510
|
| ||
Health Care Providers & Services—5.5% |
| |||||||
Aetna, Inc. | 353,350 | 64,839,725 | ||||||
Anthem, Inc. | 243,885 | 58,051,946 | ||||||
Centene Corp.1 | 183,180 | 22,569,608 | ||||||
|
| 145,461,279
|
| ||||||
Life Sciences Tools & Services—0.7% |
| |||||||
Agilent Technologies, Inc.
|
| 296,820
|
|
| 18,355,349
|
| ||
Pharmaceuticals—1.1% | ||||||||
Bayer AG
|
| 266,627
|
|
| 29,376,038
|
| ||
Industrials—13.9% | ||||||||
Aerospace & Defense—3.3% | ||||||||
Airbus SE
|
| 756,220
|
|
| 88,385,856
|
| ||
Air Freight & Couriers—1.0% | ||||||||
United Parcel Service, Inc., Cl. B
|
| 246,700
|
|
| 26,206,941
|
| ||
Airlines—0.9% | ||||||||
International Consolidated Airlines
|
| 2,676,600
|
|
| 23,359,136
|
| ||
Building Products—1.2% | ||||||||
Assa Abloy AB, Cl. B |
| 1,501,191
|
|
| 31,948,525
|
| ||
Construction & Engineering—0.6% |
| |||||||
FLSmidth & Co. AS |
| 269,946
|
|
| 16,143,892
|
| ||
Electrical Equipment—2.5% | ||||||||
Nidec Corp. |
| 447,800
|
|
| 67,090,229
|
| ||
Industrial Conglomerates—2.5% | ||||||||
3M Co. | 184,970 | 36,387,298 | ||||||
Siemens AG | 229,020 | 30,264,802 | ||||||
|
| 66,652,100
|
| ||||||
Machinery—1.2% | ||||||||
FANUC Corp. | 93,700 | 18,577,637 | ||||||
Minebea Mitsumi, Inc. | 881,000 | 14,844,228 | ||||||
|
| 33,421,865
|
| ||||||
Professional Services—0.7% | ||||||||
Equifax, Inc. |
| 144,840
|
|
| 18,120,932
|
| ||
Information Technology—29.8% | ||||||||
Electronic Equipment, Instruments, & Components—6.7% |
| |||||||
Keyence Corp. | 72,022 | 40,619,433 | ||||||
Kyocera Corp. | 452,800 | 25,441,730 | ||||||
Murata Manufacturing Co. Ltd. | 322,300 | 54,107,951 | ||||||
Omron Corp. | 464,700 | 21,607,692 | ||||||
TDK Corp. | 375,200 | 38,258,866 | ||||||
|
| 180,035,672
|
| ||||||
Internet Software & Services—9.6% |
| |||||||
Alphabet, Inc., Cl. A1 | 144,220 | 162,851,782 | ||||||
Baidu, Inc., Sponsored ADR1 | 98,010 | 23,816,430 | ||||||
Facebook, Inc., Cl. A1 | 351,470 | 68,297,650 | ||||||
|
| 254,965,862
|
| ||||||
IT Services—1.7% | ||||||||
Earthport plc1 | 14,765,253 | 1,995,470 | ||||||
PayPal Holdings, Inc.1 | 523,597 | 43,599,922 | ||||||
| 45,595,392 | ||||||||
6 OPPENHEIMER GLOBAL FUND/VA
| Shares | Value | |||||||
Semiconductors & Semiconductor Equipment—2.7% |
| |||||||
Maxim Integrated Products, Inc. | 989,715 | $ | 58,056,682 | |||||
Renesas Electronics Corp.1 | 1,387,900 | 13,579,725 | ||||||
|
| 71,636,407
|
| ||||||
Software—9.1% |
| |||||||
Adobe Systems, Inc.1 | 312,463 | 76,181,604 | ||||||
Capcom Co. Ltd. | 669,900 | 16,505,513 | ||||||
Intuit, Inc. | 331,600 | 67,747,538 | ||||||
Nintendo Co. Ltd. | 67,200 | 21,931,640 | ||||||
SAP SE | 520,351 | 60,114,590 | ||||||
|
| 242,480,885
|
| ||||||
Materials—1.1% |
| |||||||
Chemicals—1.1% |
| |||||||
Linde AG | 116,320 | 27,757,781 | ||||||
| Total Common Stocks (Cost $1,220,791,400) | 2,613,388,906 | |||||||
| Shares | Value | |||||||
Preferred Stocks—1.5% |
| |||||||
| Bayerische Motoren Werke (BMW) AG, Preference | 501,851 | $ | 40,009,634 | |||||
Zee Entertainment Enterprises Ltd., 6% |
| |||||||
Cum. Non-Cv. | 4,053,320 | 456,120 | ||||||
| Total Preferred Stocks (Cost $13,846,485) | 40,465,754 | |||||||
Investment Company—0.3% |
| |||||||
| Oppenheimer Institutional Government Money Market Fund, Cl. E, 1.85%2,3 (Cost $8,519,026) | 8,519,026 | 8,519,026 | ||||||
| Total Investments, at Value (Cost $1,243,156,911) | 99.8% | 2,662,373,686 | ||||||
Net Other Assets (Liabilities) | 0.2 | 6,119,729 | ||||||
Net Assets | 100.0% | $ | 2,668,493,415 | |||||
Footnotes to Statement of Investments
1. Non-income producing security.
2. Rate shown is the 7-day yield at period end.
3. Is or was an affiliate, as defined in the Investment Company Act of 1940, as amended, at or during the reporting period, by virtue of the Fund owning at least 5% of the voting securities of the issuer or as a result of the Fund and the issuer having the same investment adviser. Transactions during the reporting period in which the issuer was an affiliate are as follows:
| Shares December 31, 2017 | Gross Additions | Gross Reductions | Shares June 30, 2018 | |||||||||||||
| Oppenheimer Institutional Government Money Market Fund, Cl. E | 27,124,866 | 209,428,709 | 228,034,549 | 8,519,026 | ||||||||||||
| Value | Income | Realized Gain (Loss) | Change in Unrealized Gain (Loss) | |||||||||||||
| Oppenheimer Institutional Government Money Market Fund, Cl. E | $ | 8,519,026 | $ | 120,823 | $ | — | $ | — | ||||||||
Distribution of investments representing geographic holdings, as a percentage of total investments at value, is as follows:
| Geographic Holdings | Value | Percent | ||||||
United States | $ | 1,306,178,103 | 49.1% | |||||
Japan | 382,452,578 | 14.4 | ||||||
France | 253,607,377 | 9.5 | ||||||
Germany | 237,307,552 | 8.9 | ||||||
United Kingdom | 153,932,132 | 5.8 | ||||||
China | 69,202,801 | 2.6 | ||||||
Switzerland | 64,202,798 | 2.4 | ||||||
India | 63,510,121 | 2.4 | ||||||
Spain | 57,061,288 | 2.1 | ||||||
Sweden | 31,948,524 | 1.2 | ||||||
Denmark | 16,143,892 | 0.6 | ||||||
Ireland | 12,323,353 | 0.5 | ||||||
Italy | 8,089,641 | 0.3 | ||||||
Netherlands | 6,413,526 | 0.2 | ||||||
Total | $ | 2,662,373,686 | 100.0% | |||||
See accompanying Notes to Financial Statements.
7 OPPENHEIMER GLOBAL FUND/VA
STATEMENT OF ASSETS AND LIABILITIES June 30, 2018 Unaudited
Assets | ||||
Investments, at value—see accompanying statement of investments: | ||||
Unaffiliated companies (cost $1,234,637,885) | $ | 2,653,854,660 | ||
Affiliated companies (cost $8,519,026) | 8,519,026 | |||
|
|
| ||
| 2,662,373,686 | ||||
Cash | 50,478 | |||
Cash—foreign currencies (cost $3,823) | 9 | |||
Receivables and other assets: | ||||
Dividends | 7,620,549 | |||
Shares of beneficial interest sold | 191,627 | |||
Other | 171,472 | |||
|
|
| ||
Total assets | 2,670,407,821 | |||
Liabilities | ||||
Payables and other liabilities: | ||||
Shares of beneficial interest redeemed | 1,064,879 | |||
Distribution and service plan fees | 263,801 | |||
Investments purchased | 240,141 | |||
Trustees’ compensation | 150,379 | |||
Shareholder communications | 47,623 | |||
Foreign capital gains tax | 11,119 | |||
Other | 136,464 | |||
|
|
| ||
Total liabilities | 1,914,406 | |||
Net Assets | $ | 2,668,493,415 | ||
|
|
| ||
Composition of Net Assets | ||||
Par value of shares of beneficial interest | $ | 60,156 | ||
Additional paid-in capital | 1,043,812,802 | |||
Accumulated net investment income | 4,997,767 | |||
Accumulated net realized gain on investments and foreign currency transactions | 200,568,466 | |||
Net unrealized appreciation on investments and translation of assets and liabilities denominated in foreign currencies | 1,419,054,224 | |||
|
|
| ||
Net Assets | $ | 2,668,493,415 | ||
|
|
| ||
Net Asset Value Per Share | ||||
Non-Service Shares: | ||||
| Net asset value, redemption price per share and offering price per share (based on net assets of $1,411,596,197 and 31,653,166 shares of beneficial interest outstanding) | $44.60 | |||
Service Shares: | ||||
| Net asset value, redemption price per share and offering price per share (based on net assets of $1,256,897,218 and 28,502,619 shares of beneficial interest outstanding) | $44.10 |
See accompanying Notes to Financial Statements.
8 OPPENHEIMER GLOBAL FUND/VA
STATEMENT OF OPERATIONS For the Six Months Ended June 30, 2018 Unaudited
Investment Income | ||||
Dividends: | ||||
Unaffiliated companies (net of foreign withholding taxes of $1,241,608) | $ | 29,111,728 | ||
Affiliated companies | 120,823 | |||
Interest | 14,916 | |||
Total investment income |
| 29,247,467
|
| |
Expenses | ||||
Management fees | 8,683,658 | |||
Distribution and service plan fees - Service shares | 1,621,258 | |||
Transfer and shareholder servicing agent fees: | ||||
Non-Service shares | 875,218 | |||
Service shares | 778,204 | |||
Shareholder communications: | ||||
Non-Service shares | 32,194 | |||
Service shares | 28,622 | |||
Custodian fees and expenses | 88,180 | |||
Borrowing fees | 49,131 | |||
Trustees’ compensation | 40,274 | |||
Other | 97,747 | |||
Total expenses | 12,294,486 | |||
Less reduction to custodian expenses | (537) | |||
Less waivers and reimbursements of expenses | (8,154) | |||
Net expenses |
| 12,285,795
|
| |
Net Investment Income |
| 16,961,672
|
| |
Realized and Unrealized Gain (Loss) | ||||
Net realized gain (loss) on: | ||||
Investment transactions in unaffiliated companies (net of foreign capital gains tax of $70,875) | 215,482,286 | |||
Foreign currency transactions | (179,083) | |||
Net realized gain | 215,303,203 | |||
Net change in unrealized appreciation/depreciation on: | ||||
Investment transactions in unaffiliated companies | (178,897,680) | |||
Translation of assets and liabilities denominated in foreign currencies | (62,295) | |||
Net change in unrealized appreciation/depreciation |
| (178,959,975)
|
| |
Net Increase in Net Assets Resulting from Operations | $ | 53,304,900 | ||
See accompanying Notes to Financial Statements.
9 OPPENHEIMER GLOBAL FUND/VA
STATEMENTS OF CHANGES IN NET ASSETS
| Six Months Ended June 30, 2018 (Unaudited) | Year Ended December 31, 2017 | |||||||
Operations | ||||||||
Net investment income | $ | 16,961,672 | $ | 14,689,456 | ||||
Net realized gain | 215,303,203 | 221,558,318 | ||||||
Net change in unrealized appreciation/depreciation | (178,959,975) | 558,931,074 | ||||||
Net increase in net assets resulting from operations |
| 53,304,900
|
|
| 795,178,848
|
| ||
Dividends and/or Distributions to Shareholders | ||||||||
Dividends from net investment income: | ||||||||
Non-Service shares | (13,839,753) | (12,766,011) | ||||||
Service shares | (9,443,586) | (8,799,180) | ||||||
|
| (23,283,339)
|
|
| (21,565,191)
|
| |||
Distributions from net realized gain: | ||||||||
Non-Service shares | (97,846,445) | — | ||||||
Service shares | (88,079,353) | — | ||||||
|
| (185,925,798)
|
|
| —
|
| |||
Beneficial Interest Transactions | ||||||||
Net increase (decrease) in net assets resulting from beneficial interest transactions: | ||||||||
Non-Service shares | 14,954,533 | (179,504,173) | ||||||
Service shares | 20,819,354 | (115,703,050) | ||||||
|
| 35,773,887
|
|
| (295,207,223)
|
| |||
Net Assets | ||||||||
Total increase (decrease) | (120,130,350) | 478,406,434 | ||||||
Beginning of period | 2,788,623,765 | 2,310,217,331 | ||||||
| End of period (including accumulated net investment income of $4,997,767 and $11,319,434, respectively) | $ | 2,668,493,415 | $ | 2,788,623,765 | ||||
See accompanying Notes to Financial Statements.
10 OPPENHEIMER GLOBAL FUND/VA
FINANCIAL HIGHLIGHTS
| Non-Service Shares | Six Months Ended June 30, 2018 (Unaudited) | Year Ended December 31, 2017 | Year Ended December 31, 2016 | Year Ended December 31, 2015 | Year Ended December 31, 2014 | Year Ended December 31, 2013 | ||||||||||||||||||
| ||||||||||||||||||||||||
Per Share Operating Data | ||||||||||||||||||||||||
| Net asset value, beginning of period | $47.42 | $35.02 | $38.00 | $39.50 | $40.86 | $32.55 | ||||||||||||||||||
| ||||||||||||||||||||||||
Income (loss) from investment operations: | ||||||||||||||||||||||||
Net investment income1 | 0.32 | 0.29 | 0.26 | 0.37 | 0.52 | 0.44 | ||||||||||||||||||
Net realized and unrealized gain (loss) | 0.66 | 12.50 | (0.42) | 1.38 | 0.44 | 8.37 | ||||||||||||||||||
|
| |||||||||||||||||||||||
Total from investment operations | 0.98 | 12.79 | (0.16) | 1.75 | 0.96 | 8.81 | ||||||||||||||||||
| ||||||||||||||||||||||||
| Dividends and/or distributions to shareholders: | ||||||||||||||||||||||||
| Dividends from net investment income | (0.47) | (0.39) | (0.38) | (0.54) | (0.46) | (0.50) | ||||||||||||||||||
| Distributions from net realized gain | (3.33) | 0.00 | (2.44) | (2.71) | (1.86) | 0.00 | ||||||||||||||||||
|
| |||||||||||||||||||||||
| Total dividends and/or distributions to shareholders | (3.80) | (0.39) | (2.82) | (3.25) | (2.32) | (0.50) | ||||||||||||||||||
| ||||||||||||||||||||||||
| Net asset value, end of period | $44.60 | $47.42 | $35.02 | $38.00 | $39.50 | $40.86 | ||||||||||||||||||
|
| |||||||||||||||||||||||
| ||||||||||||||||||||||||
Total Return, at Net Asset Value2 | 1.92% | 36.66% | 0.08% | 3.94% | 2.29% | 27.31% | ||||||||||||||||||
| ||||||||||||||||||||||||
Ratios/Supplemental Data | ||||||||||||||||||||||||
| Net assets, end of period (in thousands) | $1,411,596 | $1,479,034 | $1,245,070 | $1,406,001 | $1,468,107 | $1,397,026 | ||||||||||||||||||
| ||||||||||||||||||||||||
| Average net assets (in thousands) | $1,470,820 | $1,379,895 | $1,270,049 | $1,502,338 | $1,532,383 | $1,333,848 | ||||||||||||||||||
| ||||||||||||||||||||||||
| Ratios to average net assets:3 | ||||||||||||||||||||||||
| Net investment income | 1.35% | 0.69% | 0.75% | 0.92% | 1.30% | 1.20% | ||||||||||||||||||
| Expenses excluding specific expenses listed below | 0.77% | 0.76% | 0.77% | 0.76% | 0.76% | 0.77% | ||||||||||||||||||
| Interest and fees from borrowings | 0.00%4 | 0.00%4 | 0.00%4 | 0.00%4 | 0.00% | 0.00% | ||||||||||||||||||
|
| |||||||||||||||||||||||
| Total expenses5 | 0.77% | 0.76% | 0.77% | 0.76% | 0.76% | 0.77% | ||||||||||||||||||
| Expenses after payments, waivers and/or reimbursements and reduction to custodian expenses | 0.77%6 | 0.76%6 | 0.77%6 | 0.76%6 | 0.76%6 | 0.77%6 | ||||||||||||||||||
| ||||||||||||||||||||||||
| Portfolio turnover rate | 9% | 9% | 14% | 14% | 13% | 11% | ||||||||||||||||||
1. Per share amounts calculated based on the average shares outstanding during the period.
2. Assumes an initial investment on the business day before the first day of the fiscal period, with all dividends and distributions reinvested in additional shares on the reinvestment date, and redemption at the net asset value calculated on the last business day of the fiscal period. Total returns are not annualized for periods less than one full year. Total return information does not reflect expenses that apply at the separate account level or to related insurance products. Inclusion of these charges would reduce the total return figures for all periods shown. Returns do not reflect the deduction of taxes that a shareholder would pay on fund distributions or the redemption of fund shares.
3. Annualized for periods less than one full year.
4. Less than 0.005%.
5. Total expenses including indirect expenses from affiliated fund fees and expenses were as follows:
Six Months Ended June 30, 2018 | 0.77 | % | ||||||
Year Ended December 31, 2017 | 0.76 | % | ||||||
Year Ended December 31, 2016 | 0.77 | % | ||||||
Year Ended December 31, 2015 | 0.76 | % | ||||||
Year Ended December 31, 2014 | 0.76 | % | ||||||
Year Ended December 31, 2013 | 0.77 | % | ||||||
6. Waiver was less than 0.005%.
See accompanying Notes to Financial Statements.
11 OPPENHEIMER GLOBAL FUND/VA
FINANCIAL HIGHLIGHTS Continued
| Service Shares | Six Months Ended June 30, 2018 (Unaudited) | Year Ended December 31, 2017 | Year Ended December 31, 2016 | Year Ended December 31, 2015 | Year Ended December 31, 2014 | Year Ended December 31, 2013 | ||||||||||||||||||
| ||||||||||||||||||||||||
Per Share Operating Data | ||||||||||||||||||||||||
| Net asset value, beginning of period | $46.88 | $34.64 | $37.59 | $39.10 | $40.47 | $32.25 | ||||||||||||||||||
| ||||||||||||||||||||||||
| Income (loss) from investment operations: | ||||||||||||||||||||||||
| Net investment income1 | 0.26 | 0.18 | 0.17 | 0.28 | 0.42 | 0.34 | ||||||||||||||||||
| Net realized and unrealized gain (loss) | 0.65 | 12.36 | (0.41) | 1.36 | 0.42 | 8.30 | ||||||||||||||||||
|
| |||||||||||||||||||||||
| Total from investment operations | 0.91 | 12.54 | (0.24) | 1.64 | 0.84 | 8.64 | ||||||||||||||||||
| ||||||||||||||||||||||||
| Dividends and/or distributions to shareholders: | ||||||||||||||||||||||||
| Dividends from net investment income | (0.36) | (0.30) | (0.27) | (0.44) | (0.35) | (0.42) | ||||||||||||||||||
| Distributions from net realized gain | (3.33) | 0.00 | (2.44) | (2.71) | (1.86) | 0.00 | ||||||||||||||||||
|
| |||||||||||||||||||||||
| Total dividends and/or distributions to shareholders | (3.69) | (0.30) | (2.71) | (3.15) | (2.21) | (0.42) | ||||||||||||||||||
| ||||||||||||||||||||||||
| Net asset value, end of period | $44.10 | $46.88 | $34.64 | $37.59 | $39.10 | $40.47 | ||||||||||||||||||
|
| |||||||||||||||||||||||
| ||||||||||||||||||||||||
Total Return, at Net Asset Value2 | 1.79% | 36.32% | (0.16)% | 3.67% | 2.06% | 26.99% | ||||||||||||||||||
| ||||||||||||||||||||||||
Ratios/Supplemental Data | ||||||||||||||||||||||||
| Net assets, end of period (in thousands) | $1,256,897 | $1,309,590 | $1,065,147 | $1,081,711 | $1,204,379 | $1,216,285 | ||||||||||||||||||
| ||||||||||||||||||||||||
| Average net assets (in thousands) | $1,307,979 | $1,207,002 | $1,016,772 | $1,219,501 | $1,265,528 | $1,174,119 | ||||||||||||||||||
| ||||||||||||||||||||||||
| Ratios to average net assets:3 | ||||||||||||||||||||||||
| Net investment income | 1.10% | 0.43% | 0.49% | 0.70% | 1.05% | 0.95% | ||||||||||||||||||
| Expenses excluding specific expenses listed below | 1.02% | 1.01% | 1.02% | 1.01% | 1.01% | 1.02% | ||||||||||||||||||
| Interest and fees from borrowings | 0.00%4 | 0.00%4 | 0.00%4 | 0.00%4 | 0.00% | 0.00% | ||||||||||||||||||
|
| |||||||||||||||||||||||
| Total expenses5 | 1.02% | 1.01% | 1.02% | 1.01% | 1.01% | 1.02% | ||||||||||||||||||
| Expenses after payments, waivers and/or reimbursements and reduction to custodian expenses | 1.02%6 | 1.01%6 | 1.02%6 | 1.01%6 | 1.01%6 | 1.02%6 | ||||||||||||||||||
| ||||||||||||||||||||||||
| Portfolio turnover rate | 9% | 9% | 14% | 14% | 13% | 11% | ||||||||||||||||||
1. Per share amounts calculated based on the average shares outstanding during the period.
2. Assumes an initial investment on the business day before the first day of the fiscal period, with all dividends and distributions reinvested in additional shares on the reinvestment date, and redemption at the net asset value calculated on the last business day of the fiscal period. Total returns are not annualized for periods less than one full year. Total return information does not reflect expenses that apply at the separate account level or to related insurance products. Inclusion of these charges would reduce the total return figures for all periods shown. Returns do not reflect the deduction of taxes that a shareholder would pay on fund distributions or the redemption of fund shares.
3. Annualized for periods less than one full year.
4. Less than 0.005%.
5. Total expenses including indirect expenses from affiliated fund fees and expenses were as follows:
Six Months Ended June 30, 2018 | 1.02 | % | ||||||
Year Ended December 31, 2017 | 1.01 | % | ||||||
Year Ended December 31, 2016 | 1.02 | % | ||||||
Year Ended December 31, 2015 | 1.01 | % | ||||||
Year Ended December 31, 2014 | 1.01 | % | ||||||
Year Ended December 31, 2013 | 1.03 | % | ||||||
6. Waiver was less than 0.005%.
See accompanying Notes to Financial Statements.
12 OPPENHEIMER GLOBAL FUND/VA
NOTES TO FINANCIAL STATEMENTS June 30, 2018 Unaudited
1. Organization
Oppenheimer Global Fund/VA (the “Fund”), a separate series of Oppenheimer Variable Account Funds, is a diversified open-end management investment company registered under the Investment Company Act of 1940 (“1940 Act”), as amended. The Fund’s main investment objective is to seek capital appreciation. The Fund’s investment adviser is OFI Global Asset Management, Inc. (“OFI Global” or the “Manager”), a wholly-owned subsidiary of OppenheimerFunds, Inc. (“OFI” or the “Sub-Adviser”). The Manager has entered into a sub-advisory agreement with OFI. Shares of the Fund are sold only to separate accounts of life insurance companies.
The Fund offers two classes of shares. Both classes are sold at their offering price, which is the net asset value per share, to separate investment accounts of participating insurance companies as an underlying investment for variable life insurance policies, variable annuity contracts or other investment products. The class of shares designated as Service shares is subject to a distribution and service plan. Both classes of shares have identical rights and voting privileges with respect to the Fund in general and exclusive voting rights on matters that affect that class alone. Earnings, net assets and net asset value per share may differ due to each class having its own expenses, such as transfer and shareholder servicing agent fees and shareholder communications, directly attributable to that class.
The following is a summary of significant accounting policies followed in the Fund’s preparation of financial statements in accordance with accounting principles generally accepted in the United States (“U.S. GAAP”).
2. Significant Accounting Policies
Security Valuation. All investments in securities are recorded at their estimated fair value, as described in Note 3.
Foreign Currency Translation. The books and records of the Fund are maintained in U.S. dollars. Any foreign currency amounts are translated into U.S. dollars on the following basis:
(1) Value of investment securities, other assets and liabilities — at the exchange rates prevailing at market close as described in Note 3.
(2) Purchases and sales of investment securities, income and expenses — at the rates of exchange prevailing on the respective dates of such transactions.
Although the net assets and the values are presented at the foreign exchange rates at market close, the Fund does not isolate the portion of the results of operations resulting from changes in foreign exchange rates on investments from the fluctuations arising from changes in prices of securities held. Such fluctuations are included with the net realized and unrealized gains or losses from investments shown in the Statement of Operations.
For securities, which are subject to foreign withholding tax upon disposition, realized and unrealized gains or losses on such securities are recorded net of foreign withholding tax.
Reported net realized foreign exchange gains or losses arise from sales of foreign currencies, currency gains or losses realized between the trade and settlement dates on securities transactions, the difference between the amounts of dividends, interest, and foreign withholding tax reclaims recorded on the Fund’s books, and the U.S. dollar equivalent of the amounts actually received or paid. Net unrealized foreign exchange gains and losses arise from changes in the value of assets and liabilities other than investments in securities, resulting from changes in the exchange rate.
Allocation of Income, Expenses, Gains and Losses. Income, expenses (other than those attributable to a specific class), gains and losses are allocated on a daily basis to each class of shares based upon the relative proportion of net assets represented by such class. Operating expenses directly attributable to a specific class are charged against the operations of that class.
Dividends and Distributions to Shareholders. Dividends and distributions to shareholders, which are determined in accordance with income tax regulations and may differ from U.S. GAAP, are recorded on the ex-dividend date. Income and capital gain distributions, if any, are declared and paid annually or at other times as determined necessary by the Manager.
The tax character of distributions is determined as of the Fund’s fiscal year end. Therefore, a portion of the Fund’s distributions made to shareholders prior to the Fund’s fiscal year end may ultimately be categorized as a tax return of capital.
Investment Income. Dividend income is recorded on the ex-dividend date or upon ex-dividend notification in the case of certain foreign dividends where the ex-dividend date may have passed. Non-cash dividends included in dividend income, if any, are recorded at the fair value of the securities received. Withholding taxes on foreign dividends, if any, and capital gains taxes on foreign investments, if any, have been provided for in accordance with the Fund’s understanding of the applicable tax rules and regulations. Interest income, if any, is recognized on an accrual basis. Discount and premium, which are included in interest income on the Statement of Operations, are amortized or accreted daily.
Custodian Fees. “Custodian fees and expenses” in the Statement of Operations may include interest expense incurred by the Fund on any cash overdrafts of its custodian account during the period. Such cash overdrafts may result from the effects of failed trades in portfolio securities and from cash outflows resulting from unanticipated shareholder redemption activity. The Fund pays interest to its custodian on such cash overdrafts, to the extent they are not offset by positive cash balances maintained by the Fund, at a rate equal to the Federal Funds Rate plus 2.00%. The “Reduction to custodian expenses” line item, if applicable, represents earnings on cash balances maintained by the Fund during the period. Such interest expense and other custodian fees may be paid with these earnings.
Security Transactions. Security transactions are recorded on the trade date. Realized gains and losses on securities sold are determined on the basis of identified cost.
13 OPPENHEIMER GLOBAL FUND/VA
NOTES TO FINANCIAL STATEMENTS Unaudited / Continued
2. Significant Accounting Policies (Continued)
Indemnifications. The Fund’s organizational documents provide current and former Trustees and officers with a limited indemnification against liabilities arising in connection with the performance of their duties to the Fund. In the normal course of business, the Fund may also enter into contracts that provide general indemnifications. The Fund’s maximum exposure under these arrangements is unknown as this would be dependent on future claims that may be made against the Fund. The risk of material loss from such claims is considered remote.
Federal Taxes. The Fund intends to comply with provisions of the Internal Revenue Code applicable to regulated investment companies and to distribute substantially all of its investment company taxable income to shareholders. Therefore, no federal income or excise tax provision is required. The Fund files income tax returns in U.S. federal and applicable state jurisdictions. The statute of limitations on the Fund’s tax return filings generally remains open for the three preceding fiscal reporting period ends. The Fund has analyzed its tax positions for the fiscal year ended December 31, 2017, including open tax years, and does not believe there are any uncertain tax positions requiring recognition in the Fund’s financial statements.
During the fiscal year ended December 31, 2017, the Fund utilized $17,365,953 of capital loss carryforwards to offset capital gains realized in that fiscal year. Capital losses will be carried forward to future years if not offset by gains.
At period end, it is estimated that the capital loss carryforwards would be zero. The estimated capital loss carryforward represents the carryforward as of the end of the last fiscal year, increased or decreased by capital losses or gains realized in the first six months of the current fiscal year. During the reporting period, it is estimated that the Fund will not utilize any capital loss carryforward to offset realized capital gains.
Net investment income (loss) and net realized gain (loss) may differ for financial statement and tax purposes. The character of dividends and distributions made during the fiscal year from net investment income or net realized gains are determined in accordance with federal income tax requirements, which may differ from the character of net investment income or net realized gains presented in those financial statements in accordance with U.S. GAAP. Also, due to timing of dividends and distributions, the fiscal year in which amounts are distributed may differ from the fiscal year in which the income or net realized gain was recorded by the Fund.
The aggregate cost of securities and other investments and the composition of unrealized appreciation and depreciation of securities and other investments for federal income tax purposes at period end are noted in the following table. The primary difference between book and tax appreciation or depreciation of securities and other investments, if applicable, is attributable to the tax deferral of losses or tax realization of financial statement unrealized gain or loss.
Federal tax cost of securities | $ | 1,257,612,211 | ||
|
|
| ||
Gross unrealized appreciation | $ | 1,483,325,344 | ||
Gross unrealized depreciation | (78,726,420 | ) | ||
|
|
| ||
Net unrealized appreciation | $ | 1,404,598,924 | ||
|
|
|
Certain foreign countries impose a tax on capital gains which is accrued by the Fund based on unrealized appreciation, if any, on affected securities. The tax is paid when the gain is realized.
Use of Estimates. The preparation of financial statements in conformity with U.S. GAAP requires management to make estimates and assumptions that affect the reported amounts of assets and liabilities and disclosure of contingent assets and liabilities at the date of the financial statements and the reported amounts of increases and decreases in net assets from operations during the reporting period. Actual results could differ from those estimates.
3. Securities Valuation
The Fund calculates the net asset value of its shares as of 4:00 P.M. Eastern Time, on each day the New York Stock Exchange (the “Exchange”) is open for trading, except in the case of a scheduled early closing of the Exchange, in which case the Fund will calculate net asset value of the shares as of the scheduled early closing time of the Exchange.
The Fund’s Board has adopted procedures for the valuation of the Fund’s securities and has delegated the day-to-day responsibility for valuation determinations under those procedures to the Manager. The Manager has established a Valuation Committee which is responsible for determining a fair valuation for any security for which market quotations are not readily available. The Valuation Committee’s fair valuation determinations are subject to review, approval and ratification by the Fund’s Board at least quarterly or more frequently, if necessary.
Valuation Methods and Inputs
Securities are valued primarily using unadjusted quoted market prices, when available, as supplied by third party pricing services or broker-dealers.
The following methodologies are used to determine the market value or the fair value of the types of securities described below:
Equity securities traded on a securities exchange (including exchange-traded derivatives other than futures and futures options) are valued based on the official closing price on the principal exchange on which the security is traded, as identified by the Manager, prior to the time when the Fund’s assets are valued. If the official closing price is unavailable, the security is valued at the last sale price on the principal exchange on which it is traded, or if no sales occurred, the security is valued at the mean between the quoted bid and asked prices. Over-the-counter equity securities are valued at the last published sale price, or if no sales occurred, at the mean between the quoted bid and asked prices. Events occurring after the close of trading on foreign exchanges may result in adjustments to the valuation of foreign securities to more accurately reflect their fair value as of the time when the Fund’s assets are valued.
Shares of a registered investment company that are not traded on an exchange are valued at that investment company’s net asset value per share.
14 OPPENHEIMER GLOBAL FUND/VA
3. Securities Valuation (Continued)
Securities for which market quotations are not readily available, or when a significant event has occurred that would materially affect the value of the security, are fair valued either (i) by a standardized fair valuation methodology applicable to the security type or the significant event as previously approved by the Valuation Committee and the Fund’s Board or (ii) as determined in good faith by the Manager’s Valuation Committee. The Valuation Committee considers all relevant facts that are reasonably available, through either public information or information available to the Manager, when determining the fair value of a security. Those standardized fair valuation methodologies include, but are not limited to, valuing securities at the last sale price or initially at cost and subsequently adjusting the value based on: changes in company specific fundamentals, changes in an appropriate securities index, or changes in the value of similar securities which may be further adjusted for any discounts related to security-specific resale restrictions. When possible, such methodologies use observable market inputs such as unadjusted quoted prices of similar securities, observable interest rates, currency rates and yield curves. The methodologies used for valuing securities are not necessarily an indication of the risks associated with investing in those securities nor can it be assured that the Fund can obtain the fair value assigned to a security if it were to sell the security.
Classifications
Each investment asset or liability of the Fund is assigned a level at measurement date based on the significance and source of the inputs to its valuation. Various data inputs may be used in determining the value of each of the Fund’s investments as of the reporting period end. These data inputs are categorized in the following hierarchy under applicable financial accounting standards:
1) Level 1-unadjusted quoted prices in active markets for identical assets or liabilities (including securities actively traded on a securities exchange)
2) Level 2-inputs other than unadjusted quoted prices that are observable for the asset or liability (such as unadjusted quoted prices for similar assets and market corroborated inputs such as interest rates, prepayment speeds, credit risks, etc.)
3) Level 3-significant unobservable inputs (including the Manager’s own judgments about assumptions that market participants would use in pricing the asset or liability).
The inputs used for valuing securities are not necessarily an indication of the risks associated with investing in those securities.
The Fund classifies each of its investments in investment companies which are publicly offered as Level 1. Investment companies that are not publicly offered, if any, are classified as Level 2 in the fair value hierarchy.
The table below categorizes amounts that are included in the Fund’s Statement of Assets and Liabilities at period end based on valuation input level:
Level 1— Unadjusted Quoted Prices | Level 2— Other Significant | Level 3— Significant Unobservable Inputs | Value | |||||||||||||
Assets Table | ||||||||||||||||
Investments, at Value: | ||||||||||||||||
Common Stocks | ||||||||||||||||
Consumer Discretionary | $ | 178,628,965 | $ | 226,138,558 | $ | — | $ | 404,767,523 | ||||||||
Consumer Staples | 53,853,869 | 53,229,839 | — | 107,083,708 | ||||||||||||
Energy | — | 24,596,525 | — | 24,596,525 | ||||||||||||
Financials | 209,728,225 | 257,474,621 | — | 467,202,846 | ||||||||||||
Health Care | 369,276,127 | 46,660,702 | — | 415,936,829 | ||||||||||||
Industrials | 80,715,171 | 290,614,305 | — | 371,329,476 | ||||||||||||
Information Technology | 500,551,608 | 294,162,610 | — | 794,714,218 | ||||||||||||
Materials | — | 27,757,781 | — | 27,757,781 | ||||||||||||
Preferred Stocks | 456,120 | 40,009,634 | — | 40,465,754 | ||||||||||||
Investment Company | 8,519,026 | — | — | 8,519,026 | ||||||||||||
Total Assets | $ | 1,401,729,111 | $ | 1,260,644,575 | $ | — | $ | 2,662,373,686 | ||||||||
Forward currency exchange contracts and futures contracts, if any, are reported at their unrealized appreciation/depreciation at measurement date, which represents the change in the contract’s value from trade date. All additional assets and liabilities included in the above table are reported at their market value at measurement date.
For the reporting period, there were no transfers between levels.
4. Investments and Risks
Risks of Foreign Investing. The Fund may invest in foreign securities which are subject to special risks. Securities traded in foreign markets may be less liquid and more volatile than those traded in U.S. markets. Foreign issuers are usually not subject to the same accounting and disclosure requirements that U.S. companies are subject to, which may make it difficult for the Fund to evaluate a foreign company’s operations or financial condition. A change in the value of a foreign currency against the U.S. dollar will result in a change in the U.S. dollar value of investments denominated in that foreign currency and in the value of any income or distributions the Fund may receive on those investments. The value of foreign investments may be affected by exchange control regulations, foreign taxes, higher transaction and other costs, delays in the settlement of transactions, changes in economic or monetary policy in the United States or abroad, expropriation or nationalization of a company’s assets, or other political and economic factors. In addition, due to the inter-relationship of global economies and financial markets, changes in political and economic factors in one country or region could adversely affect conditions in another country or region. Investments in foreign securities may also expose the Fund to time-zone arbitrage
15 OPPENHEIMER GLOBAL FUND/VA
NOTES TO FINANCIAL STATEMENTS Unaudited / Continued
4. Investments and Risks (Continued)
risk. Foreign securities may trade on weekends or other days when the Fund does not price its shares. At times, the Fund may emphasize investments in a particular country or region and may be subject to greater risks from adverse events that occur in that country or region. Foreign securities and foreign currencies held in foreign banks and securities depositories may be subject to limited or no regulatory oversight.
Investments in Affiliated Funds. The Fund is permitted to invest in other mutual funds advised by the Manager (“Affiliated Funds”). Affiliated Funds are open-end management investment companies registered under the 1940 Act, as amended. The Manager is the investment adviser of, and the Sub-Adviser provides investment and related advisory services to, the Affiliated Funds. When applicable, the Fund’s investments in Affiliated Funds are included in the Statement of Investments. Shares of Affiliated Funds are valued at their net asset value per share. As a shareholder, the Fund is subject to its proportional share of the Affiliated Funds’ expenses, including their management fee. The Manager will waive fees and/or reimburse Fund expenses in an amount equal to the indirect management fees incurred through the Fund’s investment in the Affiliated Funds.
Each of the Affiliated Funds in which the Fund invests has its own investment risks, and those risks can affect the value of the Fund’s investments and therefore the value of the Fund’s shares. To the extent that the Fund invests more of its assets in one Affiliated Fund than in another, the Fund will have greater exposure to the risks of that Affiliated Fund.
Investments in Money Market Instruments. The Fund is permitted to invest its free cash balances in money market instruments to provide liquidity or for defensive purposes. The Fund may invest in money market instruments by investing in Class E shares of Oppenheimer Institutional Government Money Market Fund (“IGMMF”), which is an Affiliated Fund. IGMMF is regulated as a money market fund under the 1940 Act, as amended. The Fund may also invest in money market instruments directly or in other affiliated or unaffiliated money market funds.
Equity Security Risk. Stocks and other equity securities fluctuate in price. The value of the Fund’s portfolio may be affected by changes in the equity markets generally. Equity markets may experience significant short-term volatility and may fall sharply at times. Different markets may behave differently from each other and U.S. equity markets may move in the opposite direction from one or more foreign stock markets. Adverse events in any part of the equity or fixed-income markets may have unexpected negative effects on other market segments.
The prices of individual equity securities generally do not all move in the same direction at the same time and a variety of factors can affect the price of a particular company’s securities. These factors may include, but are not limited to, poor earnings reports, a loss of customers, litigation against the company, general unfavorable performance of the company’s sector or industry, or changes in government regulations affecting the company or its industry.
5. Market Risk Factors
The Fund’s investments in securities and/or financial derivatives may expose the Fund to various market risk factors:
Commodity Risk. Commodity risk relates to the change in value of commodities or commodity indexes as they relate to increases or decreases in the commodities market. Commodities are physical assets that have tangible properties. Examples of these types of assets are crude oil, heating oil, metals, livestock, and agricultural products.
Credit Risk. Credit risk relates to the ability of the issuer of debt to meet interest and principal payments, or both, as they come due. In general, lower-grade, higher-yield debt securities are subject to credit risk to a greater extent than lower-yield, higher-quality securities.
Equity Risk. Equity risk relates to the change in value of equity securities as they relate to increases or decreases in the general market.
Foreign Exchange Rate Risk. Foreign exchange rate risk relates to the change in the U.S. dollar value of a security held that is denominated in a foreign currency. The U.S. dollar value of a foreign currency denominated security will decrease as the dollar appreciates against the currency, while the U.S. dollar value will increase as the dollar depreciates against the currency.
Interest Rate Risk. Interest rate risk refers to the fluctuations in value of fixed-income securities resulting from the inverse relationship between price and yield. For example, an increase in general interest rates will tend to reduce the market value of already issued fixed-income investments, and a decline in general interest rates will tend to increase their value. In addition, debt securities with longer maturities, which tend to have higher yields, are subject to potentially greater fluctuations in value from changes in interest rates than obligations with shorter maturities.
Volatility Risk. Volatility risk refers to the magnitude of the movement, but not the direction of the movement, in a financial instrument’s price over a defined time period. Large increases or decreases in a financial instrument’s price over a relative time period typically indicate greater volatility risk, while small increases or decreases in its price typically indicate lower volatility risk.
6. Shares of Beneficial Interest
The Fund has authorized an unlimited number of $0.001 par value shares of beneficial interest of each class. Transactions in shares of beneficial interest were as follows:
16 OPPENHEIMER GLOBAL FUND/VA
6. Shares of Beneficial Interest (Continued)
| Six Months Ended June 30, 2018 | Year Ended December 31, 2017 | |||||||||||||||||||
| Shares | Amount | Shares | Amount | |||||||||||||||||
Non-Service Shares | ||||||||||||||||||||
Sold | 622,613 | $ | 30,279,869 | 1,449,891 | $ | 60,471,325 | ||||||||||||||
Dividends and/or distributions reinvested | 2,449,259 | 111,686,198 | 305,626 | 12,766,011 | ||||||||||||||||
Redeemed | (2,610,390 | ) | (127,011,534 | ) | (6,113,341 | ) | (252,741,509) | |||||||||||||
Net increase (decrease) | 461,482 | $ | 14,954,533 | (4,357,824 | ) | $ | (179,504,173) | |||||||||||||
Service Shares | ||||||||||||||||||||
Sold | 1,194,863 | $ | 57,438,453 | 2,582,124 | $ | 107,475,911 | ||||||||||||||
Dividends and/or distributions reinvested | 2,162,851 | 97,522,939 | 212,797 | 8,799,180 | ||||||||||||||||
Redeemed | (2,791,600 | ) | (134,142,038 | ) | (5,605,593 | ) | (231,978,141) | |||||||||||||
Net increase (decrease) | 566,114 | $ | 20,819,354 | (2,810,672 | ) | $ | (115,703,050) | |||||||||||||
7. Purchases and Sales of Securities
The aggregate cost of purchases and proceeds from sales of securities, other than short-term obligations and investments in IGMMF, for the reporting period were as follows:
| Purchases | Sales | |||||||
Investment securities | $ | 251,564,976 | $ | 390,268,171 | ||||
8. Fees and Other Transactions with Affiliates
Management Fees. Under the investment advisory agreement, the Fund pays the Manager a management fee based on the daily net assets of the Fund at an annual rate as shown in the following table:
| Fee Schedule | ||||
Up to $200 million | 0.75% | |||
Next $200 million | 0.72 | |||
Next $200 million | 0.69 | |||
Next $200 million | 0.66 | |||
Next $4.2 billion | 0.60 | |||
Over $5 billion | 0.58 | |||
The Fund’s effective management fee for the reporting period was 0.63% of average annual net assets before any applicable waivers.
Sub-Adviser Fees. The Manager has retained the Sub-Adviser to provide the day-to-day portfolio management of the Fund. Under the Sub-Advisory Agreement, the Manager pays the Sub-Adviser an annual fee in monthly installments, equal to a percentage of the investment management fee collected by the Manager from the Fund, which shall be calculated after any investment management fee waivers. The fee paid to the Sub-Adviser is paid by the Manager, not by the Fund.
Transfer Agent Fees. OFI Global (the “Transfer Agent”) serves as the transfer and shareholder servicing agent for the Fund. The Fund pays the Transfer Agent a fee based on annual net assets. Fees incurred and average net assets for each class with respect to these services are detailed in the Statement of Operations and Financial Highlights, respectively.
Sub-Transfer Agent Fees. The Transfer Agent has retained Shareholder Services, Inc., a wholly-owned subsidiary of OFI (the “Sub-Transfer Agent”), to provide the day-to-day transfer agent and shareholder servicing of the Fund. Under the Sub-Transfer Agency Agreement, the Transfer Agent pays the Sub-Transfer Agent an annual fee in monthly installments, equal to a percentage of the transfer agent fee collected by the Transfer Agent from the Fund, which shall be calculated after any applicable fee waivers. The fee paid to the Sub-Transfer Agent is paid by the Transfer Agent, not by the Fund.
Trustees’ Compensation. The Fund’s Board of Trustees (“Board”) has adopted a compensation deferral plan for Independent Trustees that enables Trustees to elect to defer receipt of all or a portion of the annual compensation they are entitled to receive from the Fund. For purposes of determining the amount owed to the Trustees under the plan, deferred amounts are treated as though equal dollar amounts had been invested in shares of the Fund or in other Oppenheimer funds selected by the Trustees. The Fund purchases shares of the funds selected for deferral by the Trustees in amounts equal to his or her deemed investment, resulting in a Fund asset equal to the deferred compensation liability. Such assets are included as a component of “Other” within the asset section of the Statement of Assets and Liabilities. Deferral of Trustees’ fees under the plan will not affect the net assets of the Fund and will not materially affect the Fund’s assets, liabilities or net investment income per share. Amounts will be deferred until distributed in accordance with the compensation deferral plan.
Distribution and Service Plan for Service Shares. The Fund has adopted a Distribution and Service Plan (the “Plan”) pursuant to Rule 12b-1 under the 1940 Act for Service shares to pay OppenheimerFunds Distributor, Inc. (the “Distributor”), for distribution related services, personal service and
17 OPPENHEIMER GLOBAL FUND/VA
NOTES TO FINANCIAL STATEMENTS Unaudited / Continued
8. Fees and Other Transactions with Affiliates (Continued)
account maintenance for the Fund’s Service shares. Under the Plan, payments are made periodically at an annual rate of 0.25% of the daily net assets of Service shares of the Fund. The Distributor currently uses all of those fees to compensate sponsors of the insurance product that offers Fund shares, for providing personal service and maintenance of accounts of their variable contract owners that hold Service shares. These fees are paid out of the Fund’s assets on an on-going basis and increase operating expenses of the Service shares, which results in lower performance compared to the Fund’s shares that are not subject to a service fee. Fees incurred by the Fund under the Plan are detailed in the Statement of Operations.
Waivers and Reimbursements of Expenses. The Manager will waive fees and/or reimburse Fund expenses in an amount equal to the indirect management fees incurred through the Fund’s investment in IGMMF. During the reporting period, the Manager waived fees and/or reimbursed the Fund $8,154 for IGMMF management fees. This fee waiver and/or expense reimbursement may not be amended or withdrawn for one year from the date of the Fund’s prospectus, unless approved by the Board.
9. Borrowings and Other Financing
Joint Credit Facility. A number of mutual funds managed by the Manager participate in a $1.875 billion revolving credit facility (the “Facility”) intended to provide short-term financing, if necessary, subject to certain restrictions in connection with atypical redemption activity. Effective July 17, 2018, the Facility was increased to $1.95 billion. Expenses and fees related to the Facility are paid by the participating funds and are disclosed separately or as other expenses on the Statement of Operations. The Fund did not utilize the Facility during the reporting period.
18 OPPENHEIMER GLOBAL FUND/VA
PORTFOLIO PROXY VOTING POLICIES AND GUIDELINES; UPDATES TO STATEMENT OF INVESTMENTS Unaudited
The Fund has adopted Portfolio Proxy Voting Policies and Guidelines under which the Fund votes proxies relating to securities (“portfolio proxies”) held by the Fund. A description of the Fund’s Portfolio Proxy Voting Policies and Guidelines is available (i) without charge, upon request, by calling the Fund toll-free at 1.800.CALL OPP (225.5677), (ii) on the Fund’s website at www.oppenheimerfunds.com, and (iii) on the SEC’s website at www.sec.gov. In addition, the Fund is required to file Form N-PX, with its complete proxy voting record for the 12 months ended June 30th, no later than August 31st of each year. The Fund’s voting record is available (i) without charge, upon request, by calling the Fund toll-free at 1.800.CALL OPP (225.5677), and (ii) in the Form N-PX filing on the SEC’s website at www.sec.gov.
The Fund files its complete schedule of portfolio holdings with the SEC for the first quarter and the third quarter of each fiscal year on Form N-Q. The Fund’s Form N-Q filings are available on the SEC’s website at www.sec.gov. Those forms may be reviewed and copied at the SEC’s Public Reference Room in Washington, D.C. Information on the operation of the Public Reference Room may be obtained by calling 1-800-SEC-0330.
19 OPPENHEIMER GLOBAL FUND/VA
DISTRIBUTION SOURCES Unaudited
For any distribution that took place over the last six months of the Fund’s reporting period, the table below details on a per-share basis the percentage of the Fund’s total distribution payment amount that was derived from the following sources: net income, net profit from the sale of securities, and other capital sources. Other capital sources represent a return of capital. A return of capital may occur, for example, when some or all of the money that you invested in the Fund is paid back to you. A return of capital distribution does not necessarily reflect the Fund’s investment performance and should not be confused with “yield” or “income.” You should not draw any conclusions about the Fund’s investment performance from the amounts of these distributions. This information is based upon income and capital gains using generally accepted accounting principles as of the date of each distribution. If the Fund (or an underlying fund in which the Fund invests) invests in real estate investment trusts (REITs) and/or master limited partnerships (MLPs), the percentages attributed to each category are estimated using historical information because the character of the amounts received from the REITs and/or MLPs in which the Fund (or underlying fund) invests is unknown until after the end of the calendar year. Because the Fund is actively managed, the relative amount of the Fund’s total distributions derived from various sources over the calendar year may change. Please note that this information should not be used for tax reporting purposes as the tax character of distributable income may differ from the amounts used for this notification. You will receive communication in the first quarter of each calendar year detailing the actual amount of the taxable and non-taxable portion of distributions paid to you during the tax year.
For the most current information, please go to oppenheimerfunds.com. Select your Fund, and scroll down to the ‘Dividends’ table under ‘Analytics’. The Fund’s latest distribution information will be followed by the sources of any distribution, updated daily.
Fund Name |
Pay |
Net Income |
Net Profit |
Other | ||||||||||||
Oppenheimer Global Fund/VA
|
|
6/19/18
|
|
|
10.4%
|
|
|
88.9%
|
|
|
0.7%
|
| ||||
20 OPPENHEIMER GLOBAL FUND/VA
THIS PAGE INTENTIONALLY LEFT BLANK.
21 OPPENHEIMER GLOBAL FUND/VA
THIS PAGE INTENTIONALLY LEFT BLANK.
22 OPPENHEIMER GLOBAL FUND/VA
THIS PAGE INTENTIONALLY LEFT BLANK.
23 OPPENHEIMER GLOBAL FUND/VA
OPPENHEIMER GLOBAL FUND/VA
A Series of Oppenheimer Variable Account Funds
| Trustees and Officers | Robert J. Malone, Chairman of the Board of Trustees and Trustee | |
| Andrew J. Donohue, Trustee | ||
| Richard F. Grabish, Trustee | ||
| Beverly L. Hamilton, Trustee | ||
| Victoria J. Herget, Trustee | ||
| Karen L. Stuckey, Trustee | ||
| James D. Vaughn, Trustee | ||
| Arthur P. Steinmetz, Trustee, President and Principal Executive Officer | ||
| Rajeev Bhaman, Vice President* | ||
| John Delano, Vice President | ||
| Cynthia Lo Bessette, Secretary and Chief Legal Officer | ||
| Jennifer Foxson, Vice President and Chief Business Officer | ||
| Mary Ann Picciotto, Chief Compliance Officer and Chief Anti-Money Laundering Officer | ||
| Brian S. Petersen, Treasurer and Principal Financial & Accounting Officer | ||
| Manager | OFI Global Asset Management, Inc. | |
| Sub-Adviser | OppenheimerFunds, Inc. | |
| Distributor | OppenheimerFunds Distributor, Inc. | |
| Transfer and Shareholder Servicing Agent | OFI Global Asset Management, Inc. | |
| Sub-Transfer Agent | Shareholder Services, Inc. | |
| DBA OppenheimerFunds Services | ||
| Independent Registered Public Accounting Firm | KPMG LLP | |
| Legal Counsel | Ropes & Gray LLP | |
| *Effective March 31, 2019, Mr. Bhaman will retire as Portfolio Manager and Vice President and Mr. Delano will be the sole Portfolio Manager of the Fund. | ||
| Before investing in any of the Oppenheimer funds, investors should carefully consider a Fund’s investment objective, risks, charges and expenses. Fund prospectuses and summary prospectuses contain this and other information about the funds, and may be obtained by asking your financial advisor, visiting oppenheimerfunds.com or calling us at 1.800.988.8287. Read prospectuses and summary prospectuses carefully before investing. | ||
| The financial statements included herein have been taken from the records of the Fund without examination of those records by the independent registered public accounting firm. | ||
| © 2018 OppenheimerFunds, Inc. All rights reserved. Oppenheimer funds are distributed by OppenheimerFunds Distributor, Inc. | ||

| ||||
June 30, 2018 | ||||
Oppenheimer | ||||
| Main Street Fund®/VA | Semiannual Report
| |||
A Series of Oppenheimer Variable Account Funds
| ||||
SEMIANNUAL REPORT | ||||
Listing of Top Holdings | ||||
Fund Performance Discussion | ||||
Financial Statements | ||||

PORTFOLIO MANAGERS: Manind Govil, CFA, Benjamin Ram and Paul Larson
AVERAGE ANNUAL TOTAL RETURNS FOR THE PERIODS ENDED 6/30/18
Inception Date | 6-Months | 1-Year | 5-Year | 10-Year | ||||||||||||||||
Non-Service Shares | 7/5/95 | -0.05% | 6.66% | 12.06% | 8.82 | % | ||||||||||||||
Service Shares | 7/13/00 | -0.16 | 6.41 | 11.79 | 8.55 | |||||||||||||||
S&P 500 Index | 2.65 | 14.37 | 13.42 | 10.17 | ||||||||||||||||
Performance data quoted represents past performance, which does not guarantee future results. The investment return and principal value of an investment in the Fund will fluctuate so that an investor’s shares, when redeemed, may be worth more or less than their original cost. Current performance may be lower or higher than the performance quoted. For performance data current to the most recent month end, call us at 1.800.988.8287. The Fund’s total returns should not be expected to be the same as the returns of other funds, whether or not both funds have the same portfolio managers and/or similar names. The Fund’s total returns include changes in share price and reinvested distributions but do not include the charges associated with the separate account products that offer this Fund. Such performance would have been lower if such charges were taken into account. Returns for periods of less than one year are cumulative and not annualized. See Fund prospectuses and summary prospectuses for more information on share classes and sales charges.
The Fund’s performance is compared to the performance of the S&P 500 Index. The S&P 500 Index is a capitalization-weighted index of 500 stocks intended to be a representative sample of leading companies in leading industries within the U.S. economy. The Index is unmanaged and cannot be purchased directly by investors. While index comparisons may be useful to provide a benchmark for the Fund’s performance, it must be noted that the Fund’s investments are not limited to the investments comprising the Index. Index performance includes reinvestment of income, but does not reflect transaction costs, fees, expenses or taxes. Index performance is shown for illustrative purposes only as a benchmark for the Fund’s performance, and does not predict or depict performance of the Fund. The Fund’s performance reflects the effects of the Fund’s business and operating expenses.
TOP HOLDINGS AND ALLOCATIONS
TOP TEN COMMON STOCK HOLDINGS
Microsoft Corp. | 4.3% | |
Apple, Inc. | 4.1 | |
UnitedHealth Group, Inc. | 3.5 | |
JPMorgan Chase & Co. | 3.4 | |
Facebook, Inc., Cl. A | 3.1 | |
Amazon.com, Inc. | 3.0 | |
Merck & Co., Inc. | 2.6 | |
Suncor Energy, Inc. | 2.6 | |
Motorola Solutions, Inc. | 2.5 | |
Comcast Corp., Cl. A | 2.3 |
Portfolio holdings and allocations are subject to change. Percentages are as of June 30, 2018, and are based on net assets. For more current Fund holdings, please visit oppenheimerfunds.com.
SECTOR ALLOCATION
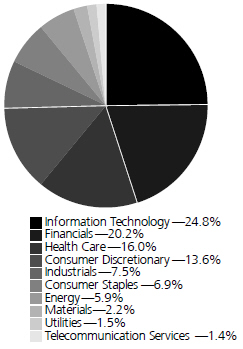
Portfolio holdings and allocations are subject to change. Percentages are as of June 30, 2018, and are based on the total market value of common stocks. For more current Fund holdings, please visit oppenheimerfunds.com.
2 OPPENHEIMER MAIN STREET FUND/VA
Fund Performance Discussion
The Fund’s Non-Service shares returned -0.05% during the reporting period. In comparison, the Fund underperformed the S&P 500 Index (the “Index”), which returned 2.65%. The Fund underperformed the Index in the Consumer Discretionary, Information Technology and Industrials sectors primarily due to less favorable stock selection. The Fund outperformed the Index mainly in the Financials and Health Care sectors due to stock selection.
MARKET OVERVIEW
During the reporting period, the U.S. had good economic growth, low unemployment, and low inflation. This was driven partly by inherent growth and partly by U.S. tax cuts. Earnings per share for the S&P 500 Index grew around 25% year-over-year over the second quarter of 2018. Even if you back out the portion of earnings growth related to tax, pre-tax earnings grew 10% and revenues grew 8%. This growth has been fairly broad-based across sectors. However, the stock price performance has not been as broad-based, even though the headline numbers for the S&P 500 Index showed strong performance. Growth stocks continued to significantly outperform value stocks led mainly by the so-called FAANG stocks (Facebook, Apple, Amazon, Netflix, and Google). The aforementioned FAANG stocks, along with five other technology-related names, have now contributed to more than 100% of the S&P 500 Index’s gain through the first half of the year. Amazon alone has driven ~40% of the Index’s gain year-to-date.
We continue to focus on the fundamentals of each business to drive our investment decisions versus getting caught up in the temporary emotions of the market, always with the long-term welfare of our shareholders in mind. Our philosophy is to focus on companies with sustainable competitive advantages that have the potential to outperform in most market environments. We combine this with our valuation discipline to seek a margin of safety, with downside protection always an important consideration.
TOP INDIVIDUAL CONTRIBUTORS
Top contributors to the Fund’s relative performance this period included Motorola Solutions, Suncor Energy, and S&P Global.
Motorola Solutions continues to display strong execution and continues to benefit from a favorable environment for public-safety spending. The company has recorded record backlogs with improved margins and return on invested capital.
Suncor’s new mega oil sands project, Fort Hills, has ramped up faster than expectations with the last of three trains commissioned in May. This project, four years in the making, is having a significant impact on production growth. Moreover, with the reduction of capital spending, free cash flow to the firm is stepping up. The stock also benefited from the general strong performance of energy stocks during the reporting period, which was partially driven by the rise in oil prices.
S&P Global, a provider of ratings, benchmarks, analytics and data, continued to deliver on revenues and margins. The stock was also a beneficiary of operating and price momentum and investors’ perception of the company as a growth company.
TOP INDIVIDUAL DETRACTORS
Not owning Amazon for the majority of the reporting period was the biggest relative detractor from performance, as the company continued its run of impressive performance and is one of the largest names in the S&P 500 Index. We re-initiated a position in the company at the end of April 2018 after previously selling the stock in early 2017. Since then, the company has continued to execute and fundamentals have strengthened.
Other detractors from performance during this reporting period included Comcast and PepsiCo.
Comcast’s stock has been under pressure since it surprised the market with its bid for Sky PLC, a European satellite-TV operator. Investors have typically viewed U.S. cable favorably as a play on residential broadband, in spite of the troubles faced in pay TV. Given the subscriber trajectories of DIRECTV and the DISH Network and the likelihood of a bidding war as Fox is currently bidding for the 60% of Sky it does not own, the market has taken a wait-and-see approach to this deal.
PepsiCo and consumer packaged-goods companies in general have faced volume and pricing headwinds. There are also concerns that increased reinvestment to try to spur revenue growth will hit margins. Additionally, there has been selling pressure in the Consumer Staples space due to the group’s interest-rate sensitivity.
3 OPPENHEIMER MAIN STREET FUND/VA
STRATEGY & OUTLOOK
In the short term, we expect the U.S. economy to continue to show decent economic growth. We believe this will be driven by favorable ongoing consumer confidence, tax benefits and falling regulatory hurdles. Rising home prices as well as technological innovation may also help drive the economy higher.
The risks we are focused on include trade tariffs, interest rates, disruption of traditional business models and the narrowness of the stock market rally in large-cap stocks. Regarding trade tariffs, we believe the market views it as a negotiating tactic and is implying that all will end well. A true escalation could severely hamper global growth and thereby stock prices. In addition, we are afraid companies are addicted to low interest rates. If interest rates were to rise materially, some companies’ historical decisions could look like misallocation of capital and negatively impact their stock prices. Innovation, while a positive for the overall economy over the long-term, could create short-term disruptions. Finally, there is risk around the growing disparity between stock prices of companies perceived as having “growth characteristics” irrespective of valuation versus the rest of the companies. History tells us that sooner or later, such narrow rallies result in investors crowding in a few stocks and ultimately result in meaningful declines of those stocks.
We continue to maintain our discipline around valuation. Additionally, while innovation is alive and well and helping generate economic growth, fundamental disruptions across market segments have been elevated. We are constantly monitoring potential disruption risk to our companies.
Volatility in the markets has been unusually low by historical standards but could increase. Traditionally, during periods of heightened market volatility, investors generally favor stocks of higher-quality companies—with greater consistency and stability of revenue and earnings—leading to relatively better stock performance of those companies. We think focusing on companies with competitive advantages and skilled management teams positions us well, should this environment come to pass. During times of economic volatility such companies frequently widen their lead over weaker competitors. We seek to invest in companies characterized by these qualities at compelling valuations and believe this disciplined approach is essential to generating superior long-term performance.
The views in the Fund Performance Discussion represent the opinions of this Fund’s portfolio managers and are not intended as investment advice or to predict or depict the performance of any investment. These views are as of the close of business on June 30, 2018, and are subject to change based on subsequent developments. The Fund’s portfolio and strategies are subject to change.
Shares of Oppenheimer funds are not deposits or obligations of any bank, are not guaranteed by any bank, are not insured by the FDIC or any other agency, and involve investment risks, including the possible loss of the principal amount invested.
4 OPPENHEIMER MAIN STREET FUND/VA
Fund Expenses
Fund Expenses. As a shareholder of the Fund, you incur two types of costs: (1) transaction costs and (2) ongoing costs, including management fees; distribution and service fees; and other Fund expenses. These examples are intended to help you understand your ongoing costs (in dollars) of investing in the Fund and to compare these costs with the ongoing costs of investing in other mutual funds.
The examples are based on an investment of $1,000.00 invested at the beginning of the period and held for the entire 6-month period ended June 30, 2018.
Actual Expenses. The first section of the table provides information about actual account values and actual expenses. You may use the information in this section for the class of shares you hold, together with the amount you invested, to estimate the expense that you paid over the period. Simply divide your account value by $1,000.00 (for example, an $8,600.00 account value divided by $1,000.00 = 8.60), then multiply the result by the number in the first section under the heading entitled “Expenses Paid During 6 Months Ended June 30, 2018” to estimate the expenses you paid on your account during this period.
Hypothetical Example for Comparison Purposes.
The second section of the table provides information about hypothetical account values and hypothetical expenses based on the Fund’s actual expense ratio for each class of shares, and an assumed rate of return of 5% per year for each class before expenses, which is not the actual return. The hypothetical account values and expenses may not be used to estimate the actual ending account balance or expenses you paid for the period. You may use this information to compare the ongoing costs of investing in the Fund and other funds. To do so, compare this 5% hypothetical example for the class of shares you hold with the 5% hypothetical examples that appear in the shareholder reports of the other funds.
Please note that the expenses shown in the table are meant to highlight your ongoing costs only and do not reflect any charges associated with the separate accounts that offer this Fund. Therefore, the “hypothetical” lines of the table are useful in comparing ongoing costs only, and will not help you determine the relative total costs of owning different funds. In addition, if these separate account charges were included your costs would have been higher.
| Actual | Beginning Account Value January 1, 2018 | Ending Account Value June 30, 2018 | Expenses Paid During 6 Months Ended June 30, 2018 | |||||||||||||
Non-Service shares | $ | 1,000.00 | $ | 999.50 | $ 3.97 | |||||||||||
Service shares | 1,000.00 | 998.40 | 5.22 | |||||||||||||
| Hypothetical | ||||||||||||||||
| (5% return before expenses) | ||||||||||||||||
Non-Service shares | 1,000.00 | 1,020.83 | 4.02 | |||||||||||||
Service shares | 1,000.00 | 1,019.59 | 5.27 | |||||||||||||
Expenses are equal to the Fund’s annualized expense ratio for that class, multiplied by the average account value over the period, multiplied by 181/365 (to reflect the one-half year period). Those annualized expense ratios, excluding indirect expenses from affiliated funds, based on the 6-month period ended June 30, 2018 are as follows:
| Class | Expense Ratios | |||||||
Non-Service shares | 0.80% | |||||||
Service shares | 1.05 | |||||||
The expense ratios reflect voluntary and/or contractual waivers and/or reimbursements of expenses by the Fund’s Manager. Some of these undertakings may be modified or terminated at any time, as indicated in the Fund’s prospectus. The “Financial Highlights” tables in the Fund’s financial statements, included in this report, also show the gross expense ratios, without such waivers or reimbursements and reduction to custodian expenses, if applicable.
5 OPPENHEIMER MAIN STREET FUND/VA
STATEMENT OF INVESTMENTS June 30, 2018 Unaudited
| Shares | Value | |||||||
Common Stocks—97.4% | ||||||||
Consumer Discretionary—13.3% | ||||||||
Auto Components—0.8% | ||||||||
Aptiv plc
|
| 112,550
|
| $
| 10,312,957
|
| ||
Hotels, Restaurants & Leisure—1.3% | ||||||||
McDonald’s Corp.
|
| 106,950
|
|
| 16,757,995
|
| ||
Internet & Catalog Retail—3.0% | ||||||||
Amazon.com, Inc.1
|
| 21,860
|
|
| 37,157,628
|
| ||
Media—2.3% | ||||||||
Comcast Corp., Cl. A
|
| 890,050
|
|
| 29,202,540
|
| ||
Specialty Retail—5.9% | ||||||||
Best Buy Co., Inc. | 300,580 | 22,417,257 | ||||||
CarMax, Inc.1 | 107,120 | 7,805,834 | ||||||
Lowe’s Cos., Inc. | 270,400 | 25,842,128 | ||||||
O’Reilly Automotive, Inc.1 | 69,996 | 19,148,806 | ||||||
|
| 75,214,025
|
| ||||||
Consumer Staples—6.7% | ||||||||
Beverages—1.6% | ||||||||
PepsiCo, Inc.
|
| 184,701
|
|
| 20,108,398
|
| ||
Food Products—1.4% | ||||||||
Kraft Heinz Co. (The)
|
| 275,385
|
|
| 17,299,686
|
| ||
Household Products—2.0% | ||||||||
Church & Dwight Co., Inc.
|
| 489,310
|
|
| 26,011,720
|
| ||
Tobacco—1.7% | ||||||||
Philip Morris International, Inc.
|
| 263,379
|
|
| 21,265,220
|
| ||
Energy—5.7% | ||||||||
Oil, Gas & Consumable Fuels—5.7% | ||||||||
Exxon Mobil Corp. | 176,800 | 14,626,664 | ||||||
Magellan Midstream Partners LP2 | 370,120 | 25,567,890 | ||||||
Suncor Energy, Inc. | 804,780 | 32,738,450 | ||||||
|
| 72,933,004
|
| ||||||
Financials—19.6% | ||||||||
Capital Markets—6.9% | ||||||||
Bank of New York Mellon Corp. (The) | 389,340 | 20,997,106 | ||||||
CME Group, Inc., Cl. A | 120,050 | 19,678,596 | ||||||
Intercontinental Exchange, Inc. | 353,890 | 26,028,610 | ||||||
S&P Global, Inc. | 101,571 | 20,709,311 | ||||||
|
| 87,413,623
|
| ||||||
Commercial Banks—5.1% | ||||||||
JPMorgan Chase & Co. | 414,630 | 43,204,446 | ||||||
SunTrust Banks, Inc. | 229,430 | 15,146,969 | ||||||
US Bancorp | 141,510 | 7,078,330 | ||||||
|
| 65,429,745
|
| ||||||
Consumer Finance—1.1% | ||||||||
Discover Financial Services
|
| 199,213
|
|
| 14,026,587
|
| ||
Diversified Financial Services—2.9% | ||||||||
AXA Equitable Holdings, Inc.1 | 724,856 | 14,939,282 | ||||||
Berkshire Hathaway, Inc., Cl. B1 | 118,080 | 22,039,632 | ||||||
|
| 36,978,914
|
| ||||||
Insurance—2.5% | ||||||||
Marsh & McLennan Cos., Inc. | 205,500 | 16,844,835 | ||||||
Progressive Corp. (The) | 251,020 | 14,847,833 | ||||||
|
| 31,692,668
|
| ||||||
Real Estate Investment Trusts (REITs)—1.1% |
| |||||||
Mid-America Apartment Communities, Inc.
|
| 141,170
|
|
| 14,211,584
|
| ||
Health Care—15.6% | ||||||||
Biotechnology—2.5% | ||||||||
Celgene Corp.1 | 79,170 | 6,287,681 | ||||||
Exact Sciences Corp.1 | 174,170 | 10,413,624 | ||||||
Gilead Sciences, Inc. | 204,790 | 14,507,324 | ||||||
| 31,208,629 | ||||||||
| Shares | Value | |||||||
Health Care Equipment & Supplies—2.0% |
| |||||||
Boston Scientific Corp.1 | 434,740 | $ | 14,215,998 | |||||
Stryker Corp. | 65,780 | 11,107,611 | ||||||
| 25,323,609 | ||||||||
Health Care Providers & Services—6.3% |
| |||||||
DaVita, Inc.1 | 322,310 | 22,381,206 | ||||||
Laboratory Corp. of America Holdings1 | 75,820 | 13,611,965 | ||||||
UnitedHealth Group, Inc. | 179,240 | 43,974,742 | ||||||
|
| 79,967,913
|
| ||||||
Health Care Technology—0.7% | ||||||||
Cerner Corp.1
|
| 142,930
|
|
| 8,545,785
|
| ||
Life Sciences Tools & Services—1.5% | ||||||||
Agilent Technologies, Inc.
|
| 309,640
|
|
| 19,148,137
|
| ||
Pharmaceuticals—2.6% | ||||||||
Merck & Co., Inc.
|
| 551,350
|
|
| 33,466,945
|
| ||
Industrials—7.3% | ||||||||
Aerospace & Defense—2.2% | ||||||||
Lockheed Martin Corp.
|
| 95,700
|
|
| 28,272,651
|
| ||
Airlines—0.4% | ||||||||
Alaska Air Group, Inc.
|
| 89,940
|
|
| 5,431,477
|
| ||
Commercial Services & Supplies—0.9% |
| |||||||
Republic Services, Inc., Cl. A
|
| 160,850
|
|
| 10,995,706
|
| ||
Machinery—1.2% | ||||||||
Illinois Tool Works, Inc.
|
| 107,910
|
|
| 14,949,851
|
| ||
Professional Services—0.6% | ||||||||
Nielsen Holdings plc
|
| 257,760
|
|
| 7,972,517
|
| ||
Road & Rail—1.1% | ||||||||
Union Pacific Corp.
|
| 99,390
|
|
| 14,081,575
|
| ||
Trading Companies & Distributors—0.9% |
| |||||||
Fastenal Co.
|
| 232,240
|
|
| 11,177,711
|
| ||
Information Technology—24.1% | ||||||||
Communications Equipment—3.4% | ||||||||
Cisco Systems, Inc. | 265,300 | 11,415,859 | ||||||
Motorola Solutions, Inc. | 270,000 | 31,419,900 | ||||||
|
| 42,835,759
|
| ||||||
Internet Software & Services—4.1% | ||||||||
eBay, Inc.1 | 333,790 | 12,103,225 | ||||||
Facebook, Inc., Cl. A1 | 204,540 | 39,746,213 | ||||||
|
| 51,849,438
|
| ||||||
IT Services—4.0% | ||||||||
Amdocs Ltd. | 261,090 | 17,281,547 | ||||||
DXC Technology Co. | 111,620 | 8,997,688 | ||||||
First Data Corp., Cl. A1 | 457,610 | 9,577,778 | ||||||
Visa, Inc., Cl. A | 114,800 | 15,205,260 | ||||||
|
| 51,062,273
|
| ||||||
Semiconductors & Semiconductor Equipment—1.8% |
| |||||||
Applied Materials, Inc. | 313,760 | 14,492,574 | ||||||
Microchip Technology, Inc. | 89,990 | 8,184,591 | ||||||
|
| 22,677,165
|
| ||||||
Software—5.9% | ||||||||
Activision Blizzard, Inc. | 188,820 | 14,410,742 | ||||||
Microsoft Corp. | 551,190 | 54,352,846 | ||||||
ServiceNow, Inc.1 | 38,100 | 6,571,107 | ||||||
|
| 75,334,695
|
| ||||||
Technology Hardware, Storage & Peripherals—4.9% |
| |||||||
Apple, Inc. | 282,676 | 52,326,154 | ||||||
Western Digital Corp. | 135,565 | 10,494,087 | ||||||
|
| 62,820,241
|
| ||||||
Materials—2.2% | ||||||||
Chemicals—1.8% | ||||||||
Ecolab, Inc. | 95,730 | 13,433,791 | ||||||
6 OPPENHEIMER MAIN STREET FUND/VA
| Shares | Value | |||||||
Chemicals (Continued) | ||||||||
PPG Industries, Inc. | 87,620 | $ | 9,088,822 | |||||
|
| 22,522,613
|
| ||||||
Construction Materials—0.4% | ||||||||
Vulcan Materials Co.
|
| 39,780
|
|
| 5,134,007
|
| ||
Telecommunication Services—1.4% | ||||||||
| Diversified Telecommunication Services—1.4% |
| |||||||
Verizon Communications, Inc. | 353,425 | 17,780,812 | ||||||
| Shares | Value | |||||||
Utilities—1.5% | ||||||||
Multi-Utilities—1.5% | ||||||||
National Grid plc | 1,677,370 | $ | 18,557,547 | |||||
Total Common Stocks (Cost $959,497,970)
|
| 1,237,133,350
|
| |||||
Investment Company—2.9% | ||||||||
| Oppenheimer Institutional Government Money Market Fund, Cl. E, 1.85%3,4 (Cost $37,269,961) | 37,269,961 | 37,269,961 | ||||||
Total Investments, at Value (Cost $996,767,931) | 100.3% | 1,274,403,311 | ||||||
Net Other Assets (Liabilities) | (0.3) | (3,559,679 | ) | |||||
|
| |||||||
Net Assets | 100.0% | $ | 1,270,843,632 | |||||
|
| |||||||
Footnotes to Statement of Investments
1. Non-income producing security.
2. Security is a Master Limited Partnership.
3. Rate shown is the 7-day yield at period end.
4. Is or was an affiliate, as defined in the Investment Company Act of 1940, as amended, at or during the reporting period, by virtue of the Fund owning at least 5% of the voting securities of the issuer or as a result of the Fund and the issuer having the same investment adviser. Transactions during the reporting period in which the issuer was an affiliate are as follows:
| Shares December 31, 2017 | Gross Additions | Gross Reductions | Shares June 30, 2018 | |||||||||||||
Oppenheimer Institutional Government Money Market Fund, Cl. E | 19,085,774 | 143,920,941 | 125,736,754 | 37,269,961 | ||||||||||||
| Value | Income | Realized Gain (Loss) | Change in Unrealized Gain (Loss) | |||||||||||||
Oppenheimer Institutional Government Money Market Fund, Cl. E | $ | 37,269,961 | $ | 127,436 | $ | — | $ | — | ||||||||
See accompanying Notes to Financial Statements.
7 OPPENHEIMER MAIN STREET FUND/VA
STATEMENT OF ASSETS AND LIABILITIES June 30, 2018 Unaudited
Assets | ||||
Investments, at value—see accompanying statement of investments: | ||||
Unaffiliated companies (cost $959,497,970) | $ | 1,237,133,350 | ||
Affiliated companies (cost $37,269,961) | 37,269,961 | |||
|
| |||
| 1,274,403,311 | ||||
Cash | 750,000 | |||
Receivables and other assets: | ||||
Investments sold | 8,791,325 | |||
Dividends | 2,065,375 | |||
Shares of beneficial interest sold | 598,039 | |||
Other | 151,113 | |||
|
| |||
Total assets
|
| 1,286,759,163
|
| |
Liabilities | ||||
Payables and other liabilities: | ||||
Investments purchased | 15,147,785 | |||
Shares of beneficial interest redeemed | 417,280 | |||
Distribution and service plan fees | 152,121 | |||
Trustees’ compensation | 138,486 | |||
Shareholder communications | 25,232 | |||
Other | 34,627 | |||
|
| |||
Total liabilities | 15,915,531 | |||
Net Assets | $ | 1,270,843,632 | ||
|
| |||
Composition of Net Assets | ||||
Par value of shares of beneficial interest | $ | 43,939 | ||
Additional paid-in capital | 852,918,793 | |||
Accumulated net investment income | 3,877,472 | |||
Accumulated net realized gain on investments and foreign currency transactions | 136,376,862 | |||
Net unrealized appreciation on investments and translation of assets and liabilities denominated in foreign currencies | 277,626,566 | |||
|
| |||
Net Assets | $ | 1,270,843,632 | ||
|
| |||
Net Asset Value Per Share | ||||
Non-Service Shares: | ||||
| Net asset value, redemption price per share and offering price per share (based on net assets of $539,986,628 and 18,561,637 shares of beneficial interest outstanding) | $29.09 | |||
Service Shares: | ||||
| Net asset value, redemption price per share and offering price per share (based on net assets of $730,857,004 and 25,377,033 shares of beneficial interest outstanding) | $28.80 | |||
See accompanying Notes to Financial Statements.
8 OPPENHEIMER MAIN STREET FUND/VA
STATEMENT OF OPERATIONS For the Six Months Ended June 30, 2018 Unaudited
Investment Income | ||||
Dividends: | ||||
Unaffiliated companies (net of foreign withholding taxes of $79,229) | $ | 11,213,623 | ||
Affiliated companies | 127,436 | |||
|
| |||
Total investment income
|
| 11,341,059
|
| |
Expenses | ||||
Management fees | 4,252,139 | |||
Distribution and service plan fees - Service shares | 932,306 | |||
Transfer and shareholder servicing agent fees: | ||||
Non-Service shares | 325,544 | |||
Service shares | 447,507 | |||
Shareholder communications: | ||||
Non-Service shares | 13,663 | |||
Service shares | 18,765 | |||
Borrowing fees | 24,144 | |||
Trustees’ compensation | 22,157 | |||
Custodian fees and expenses | 4,355 | |||
Other | 40,180 | |||
Total expenses | 6,080,760 | |||
Less reduction to custodian expenses | (192) | |||
Less waivers and reimbursements of expenses | (8,033) | |||
Net expenses
|
| 6,072,535
|
| |
Net Investment Income
|
| 5,268,524
|
| |
Realized and Unrealized Gain (Loss) | ||||
Net realized gain (loss) on: | ||||
Investment transactions in unaffiliated companies | 136,964,707 | |||
Foreign currency transactions | (3,597) | |||
|
| |||
Net realized gain | 136,961,110 | |||
Net change in unrealized appreciation/depreciation on: | ||||
Investment transactions in unaffiliated companies | (143,529,782) | |||
Translation of assets and liabilities denominated in foreign currencies | (4,444) | |||
Net change in unrealized appreciation/depreciation
|
| (143,534,226)
|
| |
Net Decrease in Net Assets Resulting from Operations | $ | (1,304,592) | ||
|
|
See accompanying Notes to Financial Statements.
9 OPPENHEIMER MAIN STREET FUND/VA
STATEMENTS OF CHANGES IN NET ASSETS
Six Months Ended June 30, 2018 | Year Ended December 31, 2017 | |||||||
Operations | ||||||||
Net investment income | $ | 5,268,524 | $ | 12,822,734 | ||||
Net realized gain | 136,961,110 | 121,840,022 | ||||||
Net change in unrealized appreciation/depreciation | (143,534,226 | ) | 68,971,875 | |||||
|
|
| ||||||
Net increase (decrease) in net assets resulting from operations |
| (1,304,592
| )
| 203,634,631 | ||||
Dividends and/or Distributions to Shareholders | ||||||||
Dividends from net investment income: | ||||||||
Non-Service shares | (6,259,485 | ) | (6,687,663) | |||||
Service shares | (6,666,702 | ) | (8,150,647) | |||||
|
|
| ||||||
|
| (12,926,187
| )
| (14,838,310) | |||||
Distributions from net realized gain: | ||||||||
Non-Service shares | (47,081,560 | ) | (8,972,517) | |||||
Service shares | (64,964,561 | ) | (13,368,399) | |||||
|
|
| ||||||
|
| (112,046,121
| )
| (22,340,916) | |||||
Beneficial Interest Transactions | ||||||||
Net increase (decrease) in net assets resulting from beneficial interest transactions: | ||||||||
Non-Service shares | 31,882,758 | 9,551,567 | ||||||
Service shares | 18,304,133 | (86,863,753) | ||||||
|
|
| ||||||
|
| 50,186,891
|
| (77,312,186) | |||||
Net Assets | ||||||||
Total increase (decrease) | (76,090,009 | ) | 89,143,219 | |||||
Beginning of period | 1,346,933,641 | 1,257,790,422 | ||||||
|
|
| ||||||
| End of period (including accumulated net investment income of $3,877,472 and $11,535,135, respectively) | $ | 1,270,843,632 | $ | 1,346,933,641 | ||||
|
|
| ||||||
See accompanying Notes to Financial Statements.
10 OPPENHEIMER MAIN STREET FUND/VA
FINANCIAL HIGHLIGHTS
| Non-Service Shares | Six Months Ended June 30, 2018 (Unaudited) | Year Ended December 31, 2017 | Year Ended December 31, 2016 | Year Ended December 31, 2015 | Year Ended December 31, 2014 | Year Ended December 31, 2013 | ||||||||||||||||||
Per Share Operating Data | ||||||||||||||||||||||||
Net asset value, beginning of period | $32.25 | $28.41 | $29.24 | $33.61 | $31.24 | $23.97 | ||||||||||||||||||
Income (loss) from investment operations: | ||||||||||||||||||||||||
Net investment income1 | 0.15 | 0.34 | 0.33 | 0.33 | 0.28 | 0.24 | ||||||||||||||||||
Net realized and unrealized gain (loss) | (0.11) | 4.41 | 2.76 | 0.80 | 3.01 | 7.33 | ||||||||||||||||||
|
| |||||||||||||||||||||||
Total from investment operations | 0.04 | 4.75 | 3.09 | 1.13 | 3.29 | 7.57 | ||||||||||||||||||
| Dividends and/or distributions to shareholders: | ||||||||||||||||||||||||
Dividends from net investment income | (0.38) | (0.39) | (0.34) | (0.32) | (0.27) | (0.30) | ||||||||||||||||||
Distributions from net realized gain | (2.82) | (0.52) | (3.58) | (5.18) | (0.65) | 0.00 | ||||||||||||||||||
|
| |||||||||||||||||||||||
| Total dividends and/or distributions to shareholders | (3.20) | (0.91) | (3.92) | (5.50) | (0.92) | (0.30) | ||||||||||||||||||
Net asset value, end of period | $29.09 | $32.25 | $28.41 | $29.24 | $33.61 | $31.24 | ||||||||||||||||||
|
| |||||||||||||||||||||||
Total Return, at Net Asset Value2 | (0.05)% | 16.91% | 11.62% | 3.33% | 10.70% | 31.77% | ||||||||||||||||||
Ratios/Supplemental Data | ||||||||||||||||||||||||
Net assets, end of period (in thousands) | $539,987 | $561,555 | $485,196 | $518,456 | $559,933 | $561,016 | ||||||||||||||||||
Average net assets (in thousands) | $547,181 | $535,770 | $502,522 | $541,020 | $554,449 | $517,750 | ||||||||||||||||||
Ratios to average net assets:3 | ||||||||||||||||||||||||
Net investment income | 0.96% | 1.12% | 1.16% | 1.05% | 0.86% | 0.87% | ||||||||||||||||||
| Expenses excluding specific expenses listed below | 0.80% | 0.78% | 0.79% | 0.78% | 0.77% | 0.78% | ||||||||||||||||||
Interest and fees from borrowings | 0.00%4 | 0.00%4 | 0.00%4 | 0.00%4 | 0.00% | 0.00% | ||||||||||||||||||
|
| |||||||||||||||||||||||
Total expenses5 | 0.80% | 0.78% | 0.79% | 0.78% | 0.77% | 0.78% | ||||||||||||||||||
| Expenses after payments, waivers and/or reimbursements and reduction to custodian expenses | 0.80%6 | 0.78%6 | 0.79%6 | 0.78%6 | 0.77%6 | 0.78%6 | ||||||||||||||||||
Portfolio turnover rate | 36% | 35% | 33% | 44% | 43% | 49% | ||||||||||||||||||
1. Per share amounts calculated based on the average shares outstanding during the period.
2. Assumes an initial investment on the business day before the first day of the fiscal period, with all dividends and distributions reinvested in additional shares on the reinvestment date, and redemption at the net asset value calculated on the last business day of the fiscal period. Total returns are not annualized for periods less than one full year. Total return information does not reflect expenses that apply at the separate account level or to related insurance products. Inclusion of these charges would reduce the total return figures for all periods shown. Returns do not reflect the deduction of taxes that a shareholder would pay on fund distributions or the redemption of fund shares.
3. Annualized for periods less than one full year.
4. Less than 0.005%.
5. Total expenses including indirect expenses from affiliated fund fees and expenses were as follows:
Six Months Ended June 30, 2018 | 0.80% | |||
Year Ended December 31, 2017 | 0.78% | |||
Year Ended December 31, 2016 | 0.79% | |||
Year Ended December 31, 2015 | 0.78% | |||
Year Ended December 31, 2014 | 0.77% | |||
Year Ended December 31, 2013 | 0.78% |
6. Waiver was less than 0.005%.
See accompanying Notes to Financial Statements.
11 OPPENHEIMER MAIN STREET FUND/VA
FINANCIAL HIGHLIGHTS Continued
| Service Shares | Six Months Ended June 30, 2018 (Unaudited) | Year Ended December 31, 2017 | Year Ended December 31, 2016 | Year Ended December 31, 2015 | Year Ended December 31, 2014 | Year Ended December 31, 2013 | ||||||||||||||||||
Per Share Operating Data | ||||||||||||||||||||||||
Net asset value, beginning of period | $31.91 | $28.12 | $28.98 | $33.33 | $30.99 | $23.78 | ||||||||||||||||||
Income (loss) from investment operations: | ||||||||||||||||||||||||
Net investment income1 | 0.11 | 0.26 | 0.26 | 0.25 | 0.19 | 0.17 | ||||||||||||||||||
Net realized and unrealized gain (loss) | (0.11) | 4.37 | 2.72 | 0.80 | 2.99 | 7.27 | ||||||||||||||||||
|
| |||||||||||||||||||||||
Total from investment operations | 0.002 | 4.63 | 2.98 | 1.05 | 3.18 | 7.44 | ||||||||||||||||||
Dividends and/or distributions to shareholders: | ||||||||||||||||||||||||
Dividends from net investment income | (0.29) | (0.32) | (0.26) | (0.22) | (0.19) | (0.23) | ||||||||||||||||||
Distributions from net realized gain | (2.82) | (0.52) | (3.58) | (5.18) | (0.65) | 0.00 | ||||||||||||||||||
|
| |||||||||||||||||||||||
| Total dividends and/or distributions to shareholders | (3.11) | (0.84) | (3.84) | (5.40) | (0.84) | (0.23) | ||||||||||||||||||
Net asset value, end of period | $28.80 | $31.91 | $28.12 | $28.98 | $33.33 | $30.99 | ||||||||||||||||||
|
| |||||||||||||||||||||||
Total Return, at Net Asset Value3 | (0.16)% | 16.63% | 11.30% | 3.11% | 10.40% | 31.44% | ||||||||||||||||||
Ratios/Supplemental Data | ||||||||||||||||||||||||
Net assets, end of period (in thousands) | $730,857 | $785,379 | $772,594 | $715,328 | $806,023 | $915,027 | ||||||||||||||||||
Average net assets (in thousands) | $751,864 | $788,342 | $725,836 | $757,218 | $856,467 | $895,073 | ||||||||||||||||||
Ratios to average net assets:4 | ||||||||||||||||||||||||
Net investment income | 0.71% | 0.87% | 0.94% | 0.80% | 0.61% | 0.62% | ||||||||||||||||||
| Expenses excluding specific expenses listed below | 1.05% | 1.03% | 1.04% | 1.03% | 1.02% | 1.04% | ||||||||||||||||||
Interest and fees from borrowings | 0.00%5 | 0.00%5 | 0.00%5 | 0.00%5 | 0.00% | 0.00% | ||||||||||||||||||
|
| |||||||||||||||||||||||
Total expenses6 | 1.05% | 1.03% | 1.04% | 1.03% | 1.02% | 1.04% | ||||||||||||||||||
| Expenses after payments, waivers and/or reimbursements and reduction to custodian expenses | 1.05%7 | 1.03%7 | 1.04%7 | 1.03%7 | 1.02%7 | 1.04%7 | ||||||||||||||||||
Portfolio turnover rate | 36% | 35% | 33% | 44% | 43% | 49% | ||||||||||||||||||
1. Per share amounts calculated based on the average shares outstanding during the period.
2. Less than $0.005 per share.
3. Assumes an initial investment on the business day before the first day of the fiscal period, with all dividends and distributions reinvested in additional shares on the reinvestment date, and redemption at the net asset value calculated on the last business day of the fiscal period. Total returns are not annualized for periods less than one full year. Total return information does not reflect expenses that apply at the separate account level or to related insurance products. Inclusion of these charges would reduce the total return figures for all periods shown. Returns do not reflect the deduction of taxes that a shareholder would pay on fund distributions or the redemption of fund shares.
4. Annualized for periods less than one full year.
5. Less than 0.005%.
6. Total expenses including indirect expenses from affiliated fund fees and expenses were as follows:
Six Months Ended June 30, 2018 | 1.05% | |||
Year Ended December 31, 2017 | 1.03% | |||
Year Ended December 31, 2016 | 1.04% | |||
Year Ended December 31, 2015 | 1.03% | |||
Year Ended December 31, 2014 | 1.02% | |||
Year Ended December 31, 2013 | 1.04% |
7. Waiver was less than 0.005%.
See accompanying Notes to Financial Statements.
12 OPPENHEIMER MAIN STREET FUND/VA
NOTES TO FINANCIAL STATEMENTS June 30, 2018 Unaudited
1. Organization
Oppenheimer Main Street Fund/VA (the “Fund”), a separate series of Oppenheimer Variable Account Funds, is a diversified open-end management investment company registered under the Investment Company Act of 1940 (“1940 Act”), as amended. The Fund’s investment objective is to seek capital appreciation. The Fund’s investment adviser is OFI Global Asset Management, Inc. (“OFI Global” or the “Manager”), a wholly-owned subsidiary of OppenheimerFunds, Inc. (“OFI” or the “Sub-Adviser”). The Manager has entered into a sub-advisory agreement with OFI. Shares of the Fund are sold only to separate accounts of life insurance companies.
The Fund offers two classes of shares. Both classes are sold at their offering price, which is the net asset value per share, to separate investment accounts of participating insurance companies as an underlying investment for variable life insurance policies, variable annuity contracts or other investment products. The class of shares designated as Service shares is subject to a distribution and service plan. Both classes of shares have identical rights and voting privileges with respect to the Fund in general and exclusive voting rights on matters that affect that class alone. Earnings, net assets and net asset value per share may differ due to each class having its own expenses, such as transfer and shareholder servicing agent fees and shareholder communications, directly attributable to that class.
The following is a summary of significant accounting policies followed in the Fund’s preparation of financial statements in accordance with accounting principles generally accepted in the United States (“U.S. GAAP”).
2. Significant Accounting Policies
Security Valuation. All investments in securities are recorded at their estimated fair value, as described in Note 3.
Foreign Currency Translation. The books and records of the Fund are maintained in U.S. dollars. Any foreign currency amounts are translated into U.S. dollars on the following basis:
(1) Value of investment securities, other assets and liabilities — at the exchange rates prevailing at market close as described in Note 3.
(2) Purchases and sales of investment securities, income and expenses — at the rates of exchange prevailing on the respective dates of such transactions.
Although the net assets and the values are presented at the foreign exchange rates at market close, the Fund does not isolate the portion of the results of operations resulting from changes in foreign exchange rates on investments from the fluctuations arising from changes in prices of securities held. Such fluctuations are included with the net realized and unrealized gains or losses from investments shown in the Statement of Operations.
For securities, which are subject to foreign withholding tax upon disposition, realized and unrealized gains or losses on such securities are recorded net of foreign withholding tax.
Reported net realized foreign exchange gains or losses arise from sales of foreign currencies, currency gains or losses realized between the trade and settlement dates on securities transactions, the difference between the amounts of dividends, interest, and foreign withholding tax reclaims recorded on the Fund’s books, and the U.S. dollar equivalent of the amounts actually received or paid. Net unrealized foreign exchange gains and losses arise from changes in the value of assets and liabilities other than investments in securities, resulting from changes in the exchange rate.
Allocation of Income, Expenses, Gains and Losses. Income, expenses (other than those attributable to a specific class), gains and losses are allocated on a daily basis to each class of shares based upon the relative proportion of net assets represented by such class. Operating expenses directly attributable to a specific class are charged against the operations of that class.
Dividends and Distributions to Shareholders. Dividends and distributions to shareholders, which are determined in accordance with income tax regulations and may differ from U.S. GAAP, are recorded on the ex-dividend date. Income and capital gain distributions, if any, are declared and paid annually or at other times as determined necessary by the Manager.
The tax character of distributions is determined as of the Fund’s fiscal year end. Therefore, a portion of the Fund’s distributions made to shareholders prior to the Fund’s fiscal year end may ultimately be categorized as a tax return of capital.
Investment Income. Dividend income is recorded on the ex-dividend date or upon ex-dividend notification in the case of certain foreign dividends where the ex-dividend date may have passed. Non-cash dividends included in dividend income, if any, are recorded at the fair value of the securities received. Withholding taxes on foreign dividends, if any, and capital gains taxes on foreign investments, if any, have been provided for in accordance with the Fund’s understanding of the applicable tax rules and regulations. Interest income, if any, is recognized on an accrual basis. Discount and premium, which are included in interest income on the Statement of Operations, are amortized or accreted daily.
Return of Capital Estimates. Distributions received from the Fund’s investments in Master Limited Partnerships (MLPs) and Real Estate Investments Trusts (REITs), generally are comprised of income and return of capital. The Fund records investment income and return of capital based on estimates. Such estimates are based on historical information available from each MLP, REIT and other industry sources. These estimates may subsequently be revised based on information received from MLPs and REITs after their tax reporting periods are concluded.
Custodian Fees. “Custodian fees and expenses” in the Statement of Operations may include interest expense incurred by the Fund on any cash overdrafts of its custodian account during the period. Such cash overdrafts may result from the effects of failed trades in portfolio securities and from cash outflows resulting from unanticipated shareholder redemption activity. The Fund pays interest to its custodian on such cash overdrafts, to the extent they are not offset by positive cash balances maintained by the Fund, at a rate equal to the Federal Funds Rate plus 2.00%. The “Reduction to custodian
13 OPPENHEIMER MAIN STREET FUND/VA
NOTES TO FINANCIAL STATEMENTS Unaudited / Continued
2. Significant Accounting Policies (Continued)
expenses” line item, if applicable, represents earnings on cash balances maintained by the Fund during the period. Such interest expense and other custodian fees may be paid with these earnings.
Security Transactions. Security transactions are recorded on the trade date. Realized gains and losses on securities sold are determined on the basis of identified cost.
Indemnifications. The Fund’s organizational documents provide current and former Trustees and officers with a limited indemnification against liabilities arising in connection with the performance of their duties to the Fund. In the normal course of business, the Fund may also enter into contracts that provide general indemnifications. The Fund’s maximum exposure under these arrangements is unknown as this would be dependent on future claims that may be made against the Fund. The risk of material loss from such claims is considered remote.
Federal Taxes. The Fund intends to comply with provisions of the Internal Revenue Code applicable to regulated investment companies and to distribute substantially all of its investment company taxable income to shareholders. Therefore, no federal income or excise tax provision is required. The Fund files income tax returns in U.S. federal and applicable state jurisdictions. The statute of limitations on the Fund’s tax return filings generally remains open for the three preceding fiscal reporting period ends. The Fund has analyzed its tax positions for the fiscal year ended December 31, 2017, including open tax years, and does not believe there are any uncertain tax positions requiring recognition in the Fund’s financial statements.
During the fiscal year ended December 31, 2017, the Fund utilized $109,852 of capital loss carryforwards to offset capital gains realized in that fiscal year. The Fund had straddle losses of $4,386 which were deferred. For the fiscal year ended December 31, 2017, the Fund had capital loss carryforwards of $16,688. Capital losses will be carried forward to future years if not offset by gains.
At period end, it is estimated that the capital loss carryforwards would be zero. The estimated capital loss carryforward represents the carryforward as of the end of the last fiscal year, increased or decreased by capital losses or gains realized in the first six months of the current fiscal year. During the reporting period, it is estimated that the Fund will utilize $16,688 of capital loss carryforward to offset realized capital gains.
Net investment income (loss) and net realized gain (loss) may differ for financial statement and tax purposes. The character of dividends and distributions made during the fiscal year from net investment income or net realized gains are determined in accordance with federal income tax requirements, which may differ from the character of net investment income or net realized gains presented in those financial statements in accordance with U.S. GAAP. Also, due to timing of dividends and distributions, the fiscal year in which amounts are distributed may differ from the fiscal year in which the income or net realized gain was recorded by the Fund.
The aggregate cost of securities and other investments and the composition of unrealized appreciation and depreciation of securities and other investments for federal income tax purposes at period end are noted in the following table. The primary difference between book and tax appreciation or depreciation of securities and other investments, if applicable, is attributable to the tax deferral of losses or tax realization of financial statement unrealized gain or loss.
Federal tax cost of securities | $ | 998,169,007 | ||
|
| |||
Gross unrealized appreciation | $ | 299,532,995 | ||
Gross unrealized depreciation | (23,307,505) | |||
|
| |||
Net unrealized appreciation | $ | 276,225,490 | ||
|
| |||
Use of Estimates. The preparation of financial statements in conformity with U.S. GAAP requires management to make estimates and assumptions that affect the reported amounts of assets and liabilities and disclosure of contingent assets and liabilities at the date of the financial statements and the reported amounts of increases and decreases in net assets from operations during the reporting period. Actual results could differ from those estimates.
3. Securities Valuation
The Fund calculates the net asset value of its shares as of 4:00 P.M. Eastern Time, on each day the New York Stock Exchange (the “Exchange”) is open for trading, except in the case of a scheduled early closing of the Exchange, in which case the Fund will calculate net asset value of the shares as of the scheduled early closing time of the Exchange.
The Fund’s Board has adopted procedures for the valuation of the Fund’s securities and has delegated the day-to-day responsibility for valuation determinations under those procedures to the Manager. The Manager has established a Valuation Committee which is responsible for determining a fair valuation for any security for which market quotations are not readily available. The Valuation Committee’s fair valuation determinations are subject to review, approval and ratification by the Fund’s Board at least quarterly or more frequently, if necessary.
Valuation Methods and Inputs
Securities are valued primarily using unadjusted quoted market prices, when available, as supplied by third party pricing services or broker-dealers.
The following methodologies are used to determine the market value or the fair value of the types of securities described below:
Equity securities traded on a securities exchange (including exchange-traded derivatives other than futures and futures options) are valued based on the official closing price on the principal exchange on which the security is traded, as identified by the Manager, prior to the time when the Fund’s assets are valued. If the official closing price is unavailable, the security is valued at the last sale price on the principal exchange on which it is traded, or if no sales occurred, the security is valued at the mean between the quoted bid and asked prices. Over-the-counter equity securities are valued at the last
14 OPPENHEIMER MAIN STREET FUND/VA
3. Securities Valuation (Continued)
published sale price, or if no sales occurred, at the mean between the quoted bid and asked prices. Events occurring after the close of trading on foreign exchanges may result in adjustments to the valuation of foreign securities to more accurately reflect their fair value as of the time when the Fund’s assets are valued.
Shares of a registered investment company that are not traded on an exchange are valued at that investment company’s net asset value per share.
Securities for which market quotations are not readily available, or when a significant event has occurred that would materially affect the value of the security, are fair valued either (i) by a standardized fair valuation methodology applicable to the security type or the significant event as previously approved by the Valuation Committee and the Fund’s Board or (ii) as determined in good faith by the Manager’s Valuation Committee. The Valuation Committee considers all relevant facts that are reasonably available, through either public information or information available to the Manager, when determining the fair value of a security. Those standardized fair valuation methodologies include, but are not limited to, valuing securities at the last sale price or initially at cost and subsequently adjusting the value based on: changes in company specific fundamentals, changes in an appropriate securities index, or changes in the value of similar securities which may be further adjusted for any discounts related to security-specific resale restrictions. When possible, such methodologies use observable market inputs such as unadjusted quoted prices of similar securities, observable interest rates, currency rates and yield curves. The methodologies used for valuing securities are not necessarily an indication of the risks associated with investing in those securities nor can it be assured that the Fund can obtain the fair value assigned to a security if it were to sell the security.
Classifications
Each investment asset or liability of the Fund is assigned a level at measurement date based on the significance and source of the inputs to its valuation. Various data inputs may be used in determining the value of each of the Fund’s investments as of the reporting period end. These data inputs are categorized in the following hierarchy under applicable financial accounting standards:
1) Level 1-unadjusted quoted prices in active markets for identical assets or liabilities (including securities actively traded on a securities exchange)
2) Level 2-inputs other than unadjusted quoted prices that are observable for the asset or liability (such as unadjusted quoted prices for similar assets and market corroborated inputs such as interest rates, prepayment speeds, credit risks, etc.)
3) Level 3-significant unobservable inputs (including the Manager’s own judgments about assumptions that market participants would use in pricing the asset or liability).
The inputs used for valuing securities are not necessarily an indication of the risks associated with investing in those securities.
The Fund classifies each of its investments in investment companies which are publicly offered as Level 1. Investment companies that are not publicly offered, if any, are classified as Level 2 in the fair value hierarchy.
The table below categorizes amounts that are included in the Fund’s Statement of Assets and Liabilities at period end based on valuation input level:
Level 1— Unadjusted Quoted Prices | Level 2— Other Significant | Level 3— Significant Unobservable Inputs | Value | |||||||||||||
Assets Table | ||||||||||||||||
Investments, at Value: | ||||||||||||||||
Common Stocks | ||||||||||||||||
Consumer Discretionary | $ | 168,645,145 | $ | — | $ | — | $ | 168,645,145 | ||||||||
Consumer Staples | 84,685,024 | — | — | 84,685,024 | ||||||||||||
Energy | 72,933,004 | — | — | 72,933,004 | ||||||||||||
Financials | 249,753,121 | — | — | 249,753,121 | ||||||||||||
Health Care | 197,661,018 | — | — | 197,661,018 | ||||||||||||
Industrials | 92,881,488 | — | — | 92,881,488 | ||||||||||||
Information Technology | 306,579,571 | — | — | 306,579,571 | ||||||||||||
Materials | 27,656,620 | — | — | 27,656,620 | ||||||||||||
Telecommunication Services | 17,780,812 | — | — | 17,780,812 | ||||||||||||
Utilities | — | 18,557,547 | — | 18,557,547 | ||||||||||||
Investment Company | 37,269,961 | — | — | 37,269,961 | ||||||||||||
|
| |||||||||||||||
Total Assets | $ | 1,255,845,764 | $ | 18,557,547 | $ | — | $ | 1,274,403,311 | ||||||||
|
| |||||||||||||||
Forward currency exchange contracts and futures contracts, if any, are reported at their unrealized appreciation/depreciation at measurement date, which represents the change in the contract’s value from trade date. All additional assets and liabilities included in the above table are reported at their market value at measurement date.
For the reporting period, there were no transfers between levels.
4. Investments and Risks
Investments in Affiliated Funds. The Fund is permitted to invest in other mutual funds advised by the Manager (“Affiliated Funds”). Affiliated Funds are open-end management investment companies registered under the 1940 Act, as amended. The Manager is the investment adviser of, and the Sub-Adviser provides investment and related advisory services to, the Affiliated Funds. When applicable, the Fund’s investments in Affiliated Funds are included in the Statement of Investments. Shares of Affiliated Funds are valued at their net asset value per share. As a shareholder, the Fund is subject to
15 OPPENHEIMER MAIN STREET FUND/VA
NOTES TO FINANCIAL STATEMENTS Unaudited / Continued
4. Investments and Risks (Continued)
its proportional share of the Affiliated Funds’ expenses, including their management fee. The Manager will waive fees and/or reimburse Fund expenses in an amount equal to the indirect management fees incurred through the Fund’s investment in the Affiliated Funds.
Each of the Affiliated Funds in which the Fund invests has its own investment risks, and those risks can affect the value of the Fund’s investments and therefore the value of the Fund’s shares. To the extent that the Fund invests more of its assets in one Affiliated Fund than in another, the Fund will have greater exposure to the risks of that Affiliated Fund.
Investments in Money Market Instruments. The Fund is permitted to invest its free cash balances in money market instruments to provide liquidity or for defensive purposes. The Fund may invest in money market instruments by investing in Class E shares of Oppenheimer Institutional Government Money Market Fund (“IGMMF”), which is an Affiliated Fund. IGMMF is regulated as a money market fund under the 1940 Act, as amended. The Fund may also invest in money market instruments directly or in other affiliated or unaffiliated money market funds.
Master Limited Partnerships (“MLPs”). MLPs issue common units that represent an equity ownership interest in a partnership and provide limited voting rights. MLP common units are registered with the Securities and Exchange Commission (“SEC”), and are freely tradable on securities exchanges such as the NYSE and the NASDAQ Stock Market (“NASDAQ”), or in the over-the-counter (“OTC”) market. An MLP consists of one or more general partners, who conduct the business, and one or more limited partners, who contribute capital. MLP common unit holders have a limited role in the partnership’s operations and management. The Fund, as a limited partner, normally would not be liable for the debts of the MLP beyond the amounts the Fund has contributed, but would not be shielded to the same extent that a shareholder of a corporation would be. In certain circumstances creditors of an MLP would have the right to seek return of capital distributed to a limited partner. This right of an MLP’s creditors would continue after the Fund sold its investment in the MLP.
Equity Security Risk. Stocks and other equity securities fluctuate in price. The value of the Fund’s portfolio may be affected by changes in the equity markets generally. Equity markets may experience significant short-term volatility and may fall sharply at times. Different markets may behave differently from each other and U.S. equity markets may move in the opposite direction from one or more foreign stock markets. Adverse events in any part of the equity or fixed-income markets may have unexpected negative effects on other market segments.
The prices of individual equity securities generally do not all move in the same direction at the same time and a variety of factors can affect the price of a particular company’s securities. These factors may include, but are not limited to, poor earnings reports, a loss of customers, litigation against the company, general unfavorable performance of the company’s sector or industry, or changes in government regulations affecting the company or its industry.
5. Market Risk Factors
The Fund’s investments in securities and/or financial derivatives may expose the Fund to various market risk factors:
Commodity Risk. Commodity risk relates to the change in value of commodities or commodity indexes as they relate to increases or decreases in the commodities market. Commodities are physical assets that have tangible properties. Examples of these types of assets are crude oil, heating oil, metals, livestock, and agricultural products.
Credit Risk. Credit risk relates to the ability of the issuer of debt to meet interest and principal payments, or both, as they come due. In general, lower-grade, higher-yield debt securities are subject to credit risk to a greater extent than lower-yield, higher-quality securities.
Equity Risk. Equity risk relates to the change in value of equity securities as they relate to increases or decreases in the general market.
Foreign Exchange Rate Risk. Foreign exchange rate risk relates to the change in the U.S. dollar value of a security held that is denominated in a foreign currency. The U.S. dollar value of a foreign currency denominated security will decrease as the dollar appreciates against the currency, while the U.S. dollar value will increase as the dollar depreciates against the currency.
Interest Rate Risk. Interest rate risk refers to the fluctuations in value of fixed-income securities resulting from the inverse relationship between price and yield. For example, an increase in general interest rates will tend to reduce the market value of already issued fixed-income investments, and a decline in general interest rates will tend to increase their value. In addition, debt securities with longer maturities, which tend to have higher yields, are subject to potentially greater fluctuations in value from changes in interest rates than obligations with shorter maturities.
Volatility Risk. Volatility risk refers to the magnitude of the movement, but not the direction of the movement, in a financial instrument’s price over a defined time period. Large increases or decreases in a financial instrument’s price over a relative time period typically indicate greater volatility risk, while small increases or decreases in its price typically indicate lower volatility risk.
6. Shares of Beneficial Interest
The Fund has authorized an unlimited number of $0.001 par value shares of beneficial interest of each class. Transactions in shares of beneficial interest were as follows:
16 OPPENHEIMER MAIN STREET FUND/VA
6. Shares of Beneficial Interest (Continued)
| Six Months Ended June 30, 2018 | Year Ended December 31, 2017 | |||||||||||||||||||||||||||
| Shares | Amount | Shares | Amount | |||||||||||||||||||||||||
Non-Service Shares | ||||||||||||||||||||||||||||
Sold | 523,122 | $ | 16,309,398 | 2,189,995 | $ | 66,648,162 | ||||||||||||||||||||||
Dividends and/or distributions reinvested | 1,802,063 | 53,341,045 | 515,816 | 15,660,180 | ||||||||||||||||||||||||
Acquisition—Note 10 | — | — | 14,913 | 454,099 | ||||||||||||||||||||||||
Redeemed | (1,176,102 | ) | (37,767,685 | ) | (2,388,470 | ) | (73,210,874 | ) | ||||||||||||||||||||
|
| |||||||||||||||||||||||||||
Net increase | 1,149,083 | $ | 31,882,758 | 332,254 | $ | 9,551,567 | ||||||||||||||||||||||
|
| |||||||||||||||||||||||||||
Service Shares | ||||||||||||||||||||||||||||
Sold | 957,385 | $ | 30,125,496 | 1,395,024 | $ | 42,024,615 | ||||||||||||||||||||||
Dividends and/or distributions reinvested | 2,444,753 | 71,631,263 | 715,394 | 21,519,046 | ||||||||||||||||||||||||
Acquisition—Note 10 | — | — | 244,900 | 7,376,390 | ||||||||||||||||||||||||
Redeemed | (2,634,296 | ) | (83,452,626 | ) | (5,216,278 | ) | (157,783,804 | ) | ||||||||||||||||||||
|
| |||||||||||||||||||||||||||
Net increase (decrease) | 767,842 | $ | 18,304,133 | (2,860,960 | ) | $ | (86,863,753 | ) | ||||||||||||||||||||
|
| |||||||||||||||||||||||||||
7. Purchases and Sales of Securities
The aggregate cost of purchases and proceeds from sales of securities, other than short-term obligations and investments in IGMMF, for the reporting period were as follows:
| Purchases | Sales | |||
Investment securities | $459,430,758 | $541,158,972 |
8. Fees and Other Transactions with Affiliates
Management Fees. Under the investment advisory agreement, the Fund pays the Manager a management fee based on the daily net assets of the Fund at an annual rate as shown in the following table:
| Fee Schedule | ||||
Up to $200 million | 0.75% | |||
Next $200 million | 0.72 | |||
Next $200 million | 0.69 | |||
Next $200 million | 0.66 | |||
Next $200 million | 0.60 | |||
Next $4 billion | 0.58 | |||
Over $5 billion | 0.56 | |||
The Fund’s effective management fee for the reporting period was 0.66% of average annual net assets before any applicable waivers.
Sub-Adviser Fees. The Manager has retained the Sub-Adviser to provide the day-to-day portfolio management of the Fund. Under the Sub-Advisory Agreement, the Manager pays the Sub-Adviser an annual fee in monthly installments, equal to a percentage of the investment management fee collected by the Manager from the Fund, which shall be calculated after any investment management fee waivers. The fee paid to the Sub-Adviser is paid by the Manager, not by the Fund.
Transfer Agent Fees. OFI Global (the “Transfer Agent”) serves as the transfer and shareholder servicing agent for the Fund. The Fund pays the Transfer Agent a fee based on annual net assets. Fees incurred and average net assets for each class with respect to these services are detailed in the Statement of Operations and Financial Highlights, respectively.
Sub-Transfer Agent Fees. The Transfer Agent has retained Shareholder Services, Inc., a wholly-owned subsidiary of OFI (the “Sub-Transfer Agent”), to provide the day-to-day transfer agent and shareholder servicing of the Fund. Under the Sub-Transfer Agency Agreement, the Transfer Agent pays the Sub-Transfer Agent an annual fee in monthly installments, equal to a percentage of the transfer agent fee collected by the Transfer Agent from the Fund, which shall be calculated after any applicable fee waivers. The fee paid to the Sub-Transfer Agent is paid by the Transfer Agent, not by the Fund.
Trustees’ Compensation. The Fund’s Board of Trustees (“Board”) has adopted a compensation deferral plan for Independent Trustees that enables Trustees to elect to defer receipt of all or a portion of the annual compensation they are entitled to receive from the Fund. For purposes of determining the amount owed to the Trustees under the plan, deferred amounts are treated as though equal dollar amounts had been invested in shares of the Fund or in other Oppenheimer funds selected by the Trustees. The Fund purchases shares of the funds selected for deferral by the Trustees in amounts equal to his or her deemed investment, resulting in a Fund asset equal to the deferred compensation liability. Such assets are included as a component of “Other” within the asset section of the Statement of Assets and Liabilities. Deferral of Trustees’ fees under the plan will not affect the net assets of the Fund and will not materially affect the Fund’s assets, liabilities or net investment income per share. Amounts will be deferred until distributed in accordance with the compensation deferral plan.
17 OPPENHEIMER MAIN STREET FUND/VA
NOTES TO FINANCIAL STATEMENTS Unaudited / Continued
8. Fees and Other Transactions with Affiliates (Continued)
Distribution and Service Plan for Service Shares. The Fund has adopted a Distribution and Service Plan (the “Plan”) pursuant to Rule 12b-1 under the 1940 Act for Service shares to pay OppenheimerFunds Distributor, Inc. (the “Distributor”), for distribution related services, personal service and account maintenance for the Fund’s Service shares. Under the Plan, payments are made periodically at an annual rate of 0.25% of the daily net assets of Service shares of the Fund. The Distributor currently uses all of those fees to compensate sponsors of the insurance product that offers Fund shares, for providing personal service and maintenance of accounts of their variable contract owners that hold Service shares. These fees are paid out of the Fund’s assets on an on-going basis and increase operating expenses of the Service shares, which results in lower performance compared to the Fund’s shares that are not subject to a service fee. Fees incurred by the Fund under the Plan are detailed in the Statement of Operations.
Waivers and Reimbursements of Expenses. The Manager will waive fees and/or reimburse Fund expenses in an amount equal to the indirect management fees incurred through the Fund’s investment in IGMMF. During the reporting period, the Manager waived fees and/or reimbursed the Fund $8,033 for IGMMF management fees. This fee waiver and/or expense reimbursement may not be amended or withdrawn for one year from the date of the Fund’s prospectus, unless approved by the Board.
9. Borrowings and Other Financing
Joint Credit Facility. A number of mutual funds managed by the Manager participate in a $1.875 billion revolving credit facility (the “Facility”) intended to provide short-term financing, if necessary, subject to certain restrictions in connection with atypical redemption activity. Effective July 17, 2018, the Facility was increased to $1.95 billion. Expenses and fees related to the Facility are paid by the participating funds and are disclosed separately or as other expenses on the Statement of Operations. The Fund did not utilize the Facility during the reporting period.
10. Acquisition of Oppenheimer Equity Income Fund/VA
On May 1, 2017, the Fund acquired all of the net assets of Oppenheimer Equity Income Fund/VA, pursuant to an Agreement and Plan of Reorganization approved by the Fund’s Board. The exchange qualified as a tax-free reorganization for federal income tax purposes. The purpose of this acquisition is to combine two funds with similar investment objectives, strategies and risks to allow shareholders to benefit from greater asset growth potential, as well as lowered total expenses.
Details of the merger are shown in the following table:
| Exchange Ratio to One Share of the Oppenheimer Equity Income Fund/VA | Shares of Beneficial Interest Issued by the Fund | Value of Issued Shares of Beneficial Interest | Combined Net Assets on May 1, 20171 | |||||||||||
Non-Service shares | 0.347188309 | 14,913 | $ 454,099 | $ 522,307,311 | ||||||||||
Service shares | 0.430279316 | 244,900 | 7,376,390 | 789,160,812 | ||||||||||
1. The net assets acquired included net unrealized appreciation of $1,182,786 and an unused capital loss carryforward of $126,540, potential utilization subject to tax limitations.
Had the merger occurred at the beginning of the reporting period, the Fund’s pro forma Statement of Operations would have been as follows (Unaudited):
Net investment income | $ | 12,883,960 | ||||
Net gain on investments | 190,984,944 | |||||
Net increase in net assets resulting from operations | 203,868,904 |
For financial reporting purposes, assets received and shares issued by the Fund were recorded at fair value; however, the tax cost basis of the investments received from Oppenheimer Equity Income Fund/VA were carried forward to align ongoing reporting of the Fund’s realized and unrealized gains and losses with amounts distributable to shareholders for tax purposes.
Because the combined investment portfolios have been managed as a single integrated portfolio since the acquisition was completed, it is not practicable to separate the amounts of revenue and earnings of Oppenheimer Equity Income Fund/VA that have been included in the Fund’s Statement of Operations since May 1, 2017.
18 OPPENHEIMER MAIN STREET FUND/VA
PORTFOLIO PROXY VOTING POLICIES AND GUIDELINES; UPDATES TO STATEMENT OF INVESTMENTS Unaudited
The Fund has adopted Portfolio Proxy Voting Policies and Guidelines under which the Fund votes proxies relating to securities (“portfolio proxies”) held by the Fund. A description of the Fund’s Portfolio Proxy Voting Policies and Guidelines is available (i) without charge, upon request, by calling the Fund toll-free at 1.800.CALL OPP (225.5677), (ii) on the Fund’s website at www.oppenheimerfunds.com, and (iii) on the SEC’s website at www.sec.gov. In addition, the Fund is required to file Form N-PX, with its complete proxy voting record for the 12 months ended June 30th, no later than August 31st of each year. The Fund’s voting record is available (i) without charge, upon request, by calling the Fund toll-free at 1.800.CALL OPP (225.5677), and (ii) in the Form N-PX filing on the SEC’s website at www.sec.gov.
The Fund files its complete schedule of portfolio holdings with the SEC for the first quarter and the third quarter of each fiscal year on Form N-Q. The Fund’s Form N-Q filings are available on the SEC’s website at www.sec.gov. Those forms may be reviewed and copied at the SEC’s Public Reference Room in Washington, D.C. Information on the operation of the Public Reference Room may be obtained by calling 1-800-SEC-0330.
19 OPPENHEIMER MAIN STREET FUND/VA
DISTRIBUTION SOURCES Unaudited
For any distribution that took place over the last six months of the Fund’s reporting period, the table below details on a per-share basis the percentage of the Fund’s total distribution payment amount that was derived from the following sources: net income, net profit from the sale of securities, and other capital sources. Other capital sources represent a return of capital. A return of capital may occur, for example, when some or all of the money that you invested in the Fund is paid back to you. A return of capital distribution does not necessarily reflect the Fund’s investment performance and should not be confused with “yield” or “income.” You should not draw any conclusions about the Fund’s investment performance from the amounts of these distributions. This information is based upon income and capital gains using generally accepted accounting principles as of the date of each distribution. If the Fund (or an underlying fund in which the Fund invests) invests in real estate investment trusts (REITs) and/or master limited partnerships (MLPs), the percentages attributed to each category are estimated using historical information because the character of the amounts received from the REITs and/or MLPs in which the Fund (or underlying fund) invests is unknown until after the end of the calendar year. Because the Fund is actively managed, the relative amount of the Fund’s total distributions derived from various sources over the calendar year may change. Please note that this information should not be used for tax reporting purposes as the tax character of distributable income may differ from the amounts used for this notification. You will receive communication in the first quarter of each calendar year detailing the actual amount of the taxable and non-taxable portion of distributions paid to you during the tax year.
For the most current information, please go to oppenheimerfunds.com. Select your Fund, and scroll down to the ‘Dividends’ table under ‘Analytics’. The Fund’s latest distribution information will be followed by the sources of any distribution, updated daily.
| Fund Name | Pay Date | Net Income | Net Profit from Sale | Other Capital Sources | ||||||||||||
Oppenheimer Main Street Fund/VA | 6/19/18 | 10.2% | 89.7% | 0.1% | ||||||||||||
20 OPPENHEIMER MAIN STREET FUND/VA
THIS PAGE INTENTIONALLY LEFT BLANK.
21 OPPENHEIMER MAIN STREET FUND/VA
THIS PAGE INTENTIONALLY LEFT BLANK.
22 OPPENHEIMER MAIN STREET FUND/VA
THIS PAGE INTENTIONALLY LEFT BLANK.
23 OPPENHEIMER MAIN STREET FUND/VA
OPPENHEIMER MAIN STREET FUND/VA
A Series of Oppenheimer Variable Account Funds
| Trustees and Officers | Robert J, Malone, Chairman of the Board of Trustees and Trustee | |
| Andrew J. Donohue, Trustee | ||
| Richard F. Grabish, Trustee | ||
| Beverly L. Hamilton, Trustee | ||
| Victoria J. Herget, Trustee | ||
| Karen L. Stuckey, Trustee | ||
| James D. Vaughn, Trustee | ||
| Arthur P. Steinmetz, Trustee, President and Principal Executive Officer | ||
| Manind Govil, Vice President | ||
| Benjamin Ram, Vice President | ||
| Paul Larson, Vice President | ||
| Cynthia Lo Bessette, Secretary and Chief Legal Officer | ||
| Jennifer Foxson, Vice President and Chief Business Officer | ||
| Mary Ann Picciotto, Chief Compliance Officer and Chief Anti-Money Laundering Officer | ||
| Brian S. Petersen, Treasurer and Principal Financial & Accounting Officer | ||
| Manager | OFI Global Asset Management, Inc. | |
| Sub-Adviser | OppenheimerFunds, Inc. | |
| Distributor | OppenheimerFunds Distributor, Inc. | |
| Transfer and | OFI Global Asset Management, Inc. | |
| Shareholder | ||
| Servicing Agent | ||
| Sub-Transfer Agent | Shareholder Services, Inc. | |
| DBA OppenheimerFunds Services | ||
| Independent | KPMG LLP | |
| Registered | ||
| Public | ||
| Accounting | ||
| Firm | ||
| Legal Counsel | Ropes & Gray LLP | |
| Before investing in any of the Oppenheimer funds, investors should carefully consider a fund’s investment objectives, risks, charges and expenses. Fund prospectuses and summary prospectuses contain this and other information about the funds and may be obtained by asking your financial advisor, visiting oppenheimerfunds.com or calling us at 1.800.988.8287. Read prospectuses and summary prospectuses carefully before investing. | ||
| The financial statements included herein have been taken from the records of the Fund without examination of those records by the independent registered public accounting firm. | ||
© 2018 OppenheimerFunds, Inc. All rights reserved. Oppenheimer funds are distributed by OppenheimerFunds Distributor, Inc.
| ||

| ||||||
June 30, 2018 | ||||||


SEMIANNUAL REPORT
Listing of Top Holdings
Fund Performance Discussion
Financial Statements
PORTFOLIO MANAGERS: Matthew P. Ziehl, CFA, Raymond Anello, CFA, Raman Vardharaj, CFA, Joy Budzinski, Kristin Ketner, Magnus Krantz and Adam Weiner.
AVERAGE ANNUAL TOTAL RETURNS FOR THE PERIODS ENDED 6/30/18
| Inception Date | 6-Months | 1-Year | 5-Year | 10-Year | ||||||||||||||||
Non-Service Shares | 5/1/98 | 8.05% | 15.29 | % | 12.60 | % | 11.19 | % | ||||||||||||
Service Shares | 7/16/01 | 7.91 | 14.96 | 12.32 | 10.91 | |||||||||||||||
Russell 2000 Index | 7.66 | 17.57 | 12.46 | 10.60 | ||||||||||||||||
Performance data quoted represents past performance, which does not guarantee future results. The investment return and principal value of an investment in the Fund will fluctuate so that an investor’s shares, when redeemed, may be worth more or less than their original cost. Current performance may be lower or higher than the performance quoted. For performance data current to the most recent month end, call us at 1.800.988.8287. The Fund’s total returns should not be expected to be the same as the returns of other funds, whether or not both funds have the same portfolio managers and/or similar names. The Fund’s total returns include changes in share price and reinvested distributions but do not include the charges associated with the separate account products that offer this Fund. Such performance would have been lower if such charges were taken into account. Returns for periods of less than one year are cumulative and not annualized. See Fund prospectuses and summary prospectuses for more information on share classes and sales charges.
The Fund’s performance is compared to the performance of the Russell 2000 Index, which measures the performance of the small-cap segment of the U.S. equity universe. The Russell 2000 Index is a subset of the Russell 3000 Index representing approximately 10% of the total market capitalization of that index. It includes approximately 2000 of the smallest securities based on a combination of their market cap and current index membership. The Index is unmanaged and cannot be purchased directly by investors. While index comparisons may be useful to provide a benchmark for the Fund’s performance, it must be noted that the Fund’s investments are not limited to the investments comprising the Index. Index performance includes reinvestment of income, but does not reflect transaction costs, fees, expenses or taxes. Index performance is shown for illustrative purposes only as a benchmark for the Fund’s performance, and does not predict or depict performance of the Fund. The Fund’s performance reflects the effects of the Fund’s business and operating expenses.
TOP HOLDINGS AND ALLOCATIONS
TOP TEN COMMON STOCK HOLDINGS
| ||||
Korn/Ferry International | 2.5% | |||
ASGN, Inc. | 2.0 | |||
CACI International, Inc., Cl. A | 2.0 | |||
Visteon Corp. | 1.9 | |||
Zynga, Inc., Cl. A | 1.7 | |||
j2 Global, Inc. | 1.7 | |||
Generac Holdings, Inc. | 1.6 | |||
Matador Resources Co. | 1.6 | |||
National Storage Affiliates Trust | 1.6 | |||
Amedisys, Inc. | 1.6 |
Portfolio holdings and allocations are subject to change. Percentages are as of June 30, 2018, and are based on net assets. For more current Fund holdings, please visit oppenheimerfunds.com.
SECTOR ALLOCATION
⬛ Financials — 22.5%
⬛ Industrials —19.2%
⬛ Information Technology —18.8%
⬛ Health Care —14.2%
⬛ Consumer Discretionary —11.0%
⬛ Utilities —4.2%
⬛ Materials—4.1%
⬛ Energy—3.7%
⬛ Consumer Staples —2.3%
Portfolio holdings and allocations are subject to change. Percentages are as of June 30, 2018, and are based on the total market value of common stocks.
2 OPPENHEIMER MAIN STREET SMALL CAP FUND/VA
Fund Performance Discussion
The Fund’s Non-Service shares returned 8.05% during the reporting period. In comparison, the Fund outperformed the Russell 2000 Index (the “Index”), which returned 7.66%. The Fund’s outperformance relative to the Index stemmed largely from stock selection in the Industrials, Information Technology, and Energy sectors. Stock selection in the Materials and Consumer Discretionary sectors and an underweight in Health Care detracted from performance.
MARKET OVERVIEW
After a mixed first quarter of 2018, U.S. stock indices had a generally strong second quarter of the year. The market showed resiliency despite increasing concerns related to tariffs and trade wars. Given this backdrop, small-cap stocks experienced particularly strong performance during the reporting period as investors sought companies more exposed to the U.S. economy versus larger-cap multi-nationals more exposed to global trade and whose foreign revenue is negatively impacted by a rising U.S. dollar.
For the first half of 2018, small-cap stocks have now outperformed large-cap stocks by almost 500 basis points, as the Russell 2000 Index has produced a total return of 7.66% versus the Russell 1000 Index’s 2.85% gain. As noted, this performance has widened as tariff and trade war concerns have intensified since April and the U.S. dollar has moved higher at the same time.
As investors, it is important to know what is and what is not within one’s circle of competence. As such, we strive to keep the portfolio in an all-weather orientation. Whether rates, commodity prices, currencies or even whole economies go up or down, our goal is to have a portfolio that has the potential to outperform no matter the environment.
We also believe we have the skills to identify company management teams that are likely to successfully execute on their plans. Lastly, we believe correctly valuing stocks and seeing what expectations the market is pricing in is also within our skillset. It is not by accident that we weight the portfolio more heavily towards companies that have structural competitive advantages and/or management teams that are executing (e.g. gaining market share, expanding profit margins), with at least reasonable stock valuations. Companies with these qualities generally have more stable earnings.
TOP INDIVIDUAL CONTRIBUTORS
Top contributors to the Fund’s relative performance this period included Korn/Ferry International, Etsy, and Amedisys.
During the reporting period, recruiter and talent management consultant Korn/Ferry delivered another strong quarter in a series of strong quarterly results, with accelerating revenue growth and forward guidance that exceeded expectations. The company is effectively leveraging the intellectual property of its Hay Group organizational and leadership consulting business, acquired in 2015, to drive results in its traditional executive “headhunter” practice and its Futurestep recruitment process outsourcing division. A strengthening economy and tightening job market have been driving demand, and the company’s value-added offerings have been helping it take market share.
Etsy’s stock moved substantially higher after instituting a significant price increase to narrow the “take rate” discount that was in place relative to other marketplaces. This was interpreted by the market as a sign of confidence that the marketplace has developed enough stickiness with sellers to support pricing power. Along with the pricing move helping top-line revenue growth and margins, the company will reinvest some of the proceeds to support more aggressive marketing to gain new buyers, enhance repeat purchase activity and improve conversion, which offers a lot of runway for continued strong growth for the foreseeable future.
In May 2018, Amedisys reported a strong quarter beating expectations driven by strength in margins. Also, the company announced it bought back 2.4 million, or 7% of its shares, from KKR, which will be 6%-7% accretive to earnings. Home health continues to be in a strong situation at period end as people increasingly try to be kept in their homes as long as possible.
TOP INDIVIDUAL DETRACTORS
Detractors from relative performance this reporting period included Prestige Brands Holdings, Spirit Airlines, and Manitowoc.
Prestige Brands markets, sells, and distributes various over-the-counter healthcare and consumer products. Organic sales trends for Prestige have slowed and cost pressures have increased, especially for transportation. Despite an attractive valuation, we exited the stock during the reporting period as we do not see a catalyst for improvement.
3 OPPENHEIMER MAIN STREET SMALL CAP FUND/VA
Rivalry within the domestic airline industry remains intense, with a combination of ongoing low fares and rising fuel prices stoking fears about current profitability. For Spirit, the long-term fundamental picture actually improved in the reporting period. After operational issues in mid-2017, the company signed a new five-year labor agreement with its pilots. Despite the large bump in pay for the pilots, the company said it expects its relative cost advantage to expand further in the years ahead.
Manitowoc is a leading global manufacturer of cranes and lifting solutions with manufacturing, distribution, and service facilities in 20 countries. After strong relative performance in the second half of 2017, the stock declined 34% in the first half of 2018 as investors grappled with the impact of higher raw material costs (i.e. steel) and a trade war possibly negating management’s hard fought multi-year restructuring efforts and a nascent cyclical recovery in Manitowoc’s core business. With an attractive valuation in our view and management execution on track, we maintained a modest position in the stock at period end.
STRATEGY & OUTLOOK
In the short term, we expect the U.S. economy to continue to show decent economic growth. We believe this will be driven by favorable consumer confidence, tax benefits and lower regulatory hurdles. Rising home prices and innovation may also help drive the economy higher.
Risks we are focused on include trade tariffs, interest rates, disruption of traditional business models and the narrowness of the stock market rally in large-cap stocks. Regarding trade tariffs, we believe the market views it as a negotiating tactic and is implying that all will end well. An escalation could severely hamper global growth and thereby stock prices. We are afraid companies are addicted to low interest rates. If interest rates were to rise materially, some companies’ historical decisions will look like misallocation of capital and negatively impact their stock prices. Innovation, while a positive for the overall economy over the long term, creates short-term disruptions. Finally, there is risk around the growing disparity between stock prices of companies perceived as having “growth characteristics” irrespective of valuation versus the rest of the companies. History tells us that sooner or later, such narrow rallies result in investors crowding in a few stocks and ultimately resulting in meaningful declines of those stocks.
We continue to maintain our discipline around valuation. Additionally, while innovation is alive and well and helping generate economic growth, fundamental disruptions across market segments have been elevated. We are focused on potential disruption risk to our companies.
Volatility in the markets has been unusually low by historical standards but could increase. Traditionally, during periods of heightened market volatility, investors favor stocks of higher quality companies—with greater consistency and stability of revenue and earnings—leading to relatively better stock performance of those companies. We think focusing on companies with competitive advantages and skilled management teams positions us well, should this environment come to pass. During times of economic volatility such companies frequently widen their lead over weaker competitors. We seek to invest in companies characterized by these qualities at compelling valuations and believe this disciplined approach is essential to generating superior long-term performance.
The views in the Fund Performance Discussion represent the opinions of this Fund’s portfolio managers and are not intended as investment advice or to predict or depict the performance of any investment. These views are as of the close of business on June 30, 2018, and are subject to change based on subsequent developments. The Fund’s portfolio and strategies are subject to change.
Shares of Oppenheimer funds are not deposits or obligations of any bank, are not guaranteed by any bank, are not insured by the FDIC or any other agency, and involve investment risks, including the possible loss of the principal amount invested.
4 OPPENHEIMER MAIN STREET SMALL CAP FUND/VA
Fund Expenses
Fund Expenses. As a shareholder of the Fund, you incur two types of costs: (1) transaction costs and (2) ongoing costs, including management fees; distribution and service fees; and other Fund expenses. These examples are intended to help you understand your ongoing costs (in dollars) of investing in the Fund and to compare these costs with the ongoing costs of investing in other mutual funds.
The examples are based on an investment of $1,000.00 invested at the beginning of the period and held for the entire 6-month period ended June 30, 2018.
Actual Expenses. The first section of the table provides information about actual account values and actual expenses. You may use the information in this section for the class of shares you hold, together with the amount you invested, to estimate the expense that you paid over the period. Simply divide your account value by $1,000.00 (for example, an $8,600.00 account value divided by $1,000.00 = 8.60), then multiply the result by the number in the first section under the heading entitled “Expenses Paid During 6 Months Ended June 30, 2018” to estimate the expenses you paid on your account during this period.
Hypothetical Example for Comparison Purposes.
The second section of the table provides information about hypothetical account values and hypothetical expenses based on the Fund’s actual expense ratio for each class of shares, and an assumed rate of return of 5% per year for each class before expenses, which is not the actual return. The hypothetical account values and expenses may not be used to estimate the actual ending account balance or expenses you paid for the period. You may use this information to compare the ongoing costs of investing in the Fund and other funds. To do so, compare this 5% hypothetical example for the class of shares you hold with the 5% hypothetical examples that appear in the shareholder reports of the other funds.
Please note that the expenses shown in the table are meant to highlight your ongoing costs only and do not reflect any charges associated with the separate accounts that offer this Fund. Therefore, the “hypothetical” lines of the table are useful in comparing ongoing costs only, and will not help you determine the relative total costs of owning different funds. In addition, if these separate account charges were included your costs would have been higher.
| Actual | Beginning Value | Ending Account Value June 30, 2018 | Expenses Paid During 6 Months Ended June 30, 2018 | |||||||||||||
Non-Service shares | $ | 1,000.00 | $ | 1,080.50 | $ | 4.13 | ||||||||||
Service shares | 1,000.00 | 1,079.10 | 5.43 | |||||||||||||
Hypothetical | ||||||||||||||||
(5% return before expenses) | ||||||||||||||||
Non-Service shares | 1,000.00 | 1,020.83 | 4.02 | |||||||||||||
Service shares | 1,000.00 | 1,019.59 | 5.27 | |||||||||||||
Expenses are equal to the Fund’s annualized expense ratio for that class, multiplied by the average account value over the period, multiplied by 181/365 (to reflect the one-half year period). Those annualized expense ratios, excluding indirect expenses from affiliated funds, based on the 6-month period ended June 30, 2018 are as follows:
| Class | Expense Ratios | |||||
Non-Service shares | 0.80% | |||||
Service shares | 1.05 | |||||
The expense ratios reflect voluntary and/or contractual waivers and/or reimbursements of expenses by the Fund’s Manager. Some of these undertakings may be modified or terminated at any time, as indicated in the Fund’s prospectus. The “Financial Highlights” tables in the Fund’s financial statements, included in this report, also show the gross expense ratios, without such waivers or reimbursements and reduction to custodian expenses, if applicable.
5 OPPENHEIMER MAIN STREET SMALL CAP FUND/VA
STATEMENT OF INVESTMENTS June 30, 2018 Unaudited
| Shares | Value | |||||||
Common Stocks—99.4% |
| |||||||
Consumer Discretionary—10.8% |
| |||||||
Auto Components—3.1% |
| |||||||
| Dorman Products, Inc.1 | 190,720 | $ | 13,028,083 | |||||
| Visteon Corp.1 | 166,700 | 21,544,308 | ||||||
|
| 34,572,391
|
| ||||||
Diversified Consumer Services—0.7% |
| |||||||
Houghton Mifflin Harcourt Co.1
|
| 1,028,020
|
|
| 7,864,353
|
| ||
Hotels, Restaurants & Leisure—3.2% |
| |||||||
| Jack in the Box, Inc. | 132,350 | 11,265,632 | ||||||
| Texas Roadhouse, Inc., Cl. A | 205,030 | 13,431,515 | ||||||
| Wendy’s Co. (The) | 617,740 | 10,612,773 | ||||||
|
| 35,309,920
|
| ||||||
Household Durables—0.6% |
| |||||||
TopBuild Corp.1
|
| 87,930
|
|
| 6,888,436
|
| ||
Specialty Retail—3.2% |
| |||||||
| Children’s Place, Inc. (The) | 108,620 | 13,121,296 | ||||||
| Group 1 Automotive, Inc. | 270,470 | 17,039,610 | ||||||
| Monro, Inc. | 97,630 | 5,672,303 | ||||||
|
| 35,833,209
|
| ||||||
Consumer Staples—2.2% |
| |||||||
Household Products—0.5% |
| |||||||
Energizer Holdings, Inc.
|
| 92,210
|
|
| 5,805,542
|
| ||
Personal Products—0.9% |
| |||||||
Nu Skin Enterprises, Inc., Cl. A
|
| 133,150
|
|
| 10,410,998
|
| ||
Tobacco—0.8% | ||||||||
Universal Corp.
|
| 139,400
|
|
| 9,207,370
|
| ||
Energy—3.7% | ||||||||
Oil, Gas & Consumable Fuels—3.7% |
| |||||||
| Matador Resources Co.1 | 580,713 | 17,450,425 | ||||||
| Noble Midstream Partners LP2 | 199,751 | 10,199,286 | ||||||
| Renewable Energy Group, Inc.1 | 722,329 | 12,893,573 | ||||||
|
| 40,543,284
|
| ||||||
Financials—22.4% | ||||||||
Capital Markets—1.1% |
| |||||||
Stifel Financial Corp.
|
| 221,280
|
|
| 11,561,880
|
| ||
Commercial Banks—9.3% |
| |||||||
| Bank of NT Butterfield & Son Ltd. (The) | 190,810 | 8,723,833 | ||||||
| BankUnited, Inc. | 398,035 | 16,259,730 | ||||||
| Berkshire Hills Bancorp, Inc. | 229,280 | 9,308,768 | ||||||
| Chemical Financial Corp. | 204,846 | 11,403,777 | ||||||
| Columbia Banking System, Inc. | 187,850 | 7,683,065 | ||||||
| Customers Bancorp, Inc.1 | 228,650 | 6,489,087 | ||||||
| FCB Financial Holdings, Inc., Cl. A1 | 178,339 | 10,486,333 | ||||||
| IBERIABANK Corp. | 140,450 | 10,646,110 | ||||||
| Sterling Bancorp | 497,960 | 11,702,060 | ||||||
| Webster Financial Corp. | 147,700 | 9,408,490 | ||||||
|
| 102,111,253
|
| ||||||
Insurance—0.5% | ||||||||
James River Group Holdings Ltd.
|
| 139,792
|
|
| 5,492,428
|
| ||
Real Estate Investment Trusts (REITs)—7.8% |
| |||||||
| Brandywine Realty Trust | 852,140 | 14,384,123 | ||||||
| CYS Investments, Inc. | 1,913,000 | 14,347,500 | ||||||
| DiamondRock Hospitality Co. | 1,388,450 | 17,050,166 | ||||||
| EPR Properties | 106,360 | 6,891,064 | ||||||
| Four Corners Property Trust, Inc. | 644,690 | 15,878,715 | ||||||
| National Storage Affiliates Trust | 556,216 | 17,142,577 | ||||||
|
| 85,694,145
|
| ||||||
Real Estate Management & Development—0.8% |
| |||||||
Realogy Holdings Corp.
|
| 398,990
|
|
| 9,096,972
|
| ||
Thrifts & Mortgage Finance—2.9% | ||||||||
| Beneficial Bancorp, Inc. | 429,960 | 6,965,352 | ||||||
| OceanFirst Financial Corp. | 331,873 | 9,942,915 | ||||||
| Shares | Value | |||||||
Thrifts & Mortgage Finance (Continued) |
| |||||||
| WSFS Financial Corp. | 289,010 | $ | 15,404,233 | |||||
|
| 32,312,500
|
| ||||||
Health Care—14.1% |
| |||||||
Biotechnology—4.4% |
| |||||||
| Emergent BioSolutions, Inc.1 | 171,360 | 8,651,967 | ||||||
| Exact Sciences Corp.1 | 82,130 | 4,910,553 | ||||||
| Galapagos NV1 | 43,228 | 3,965,575 | ||||||
| Ligand Pharmaceuticals, Inc.1 | 56,040 | 11,609,807 | ||||||
| Repligen Corp.1 | 210,310 | 9,892,982 | ||||||
| Sage Therapeutics, Inc.1 | 36,336 | 5,687,674 | ||||||
| uniQure NV1 | 94,020 | 3,553,956 | ||||||
|
| 48,272,514
|
| ||||||
Health Care Equipment & Supplies—4.1% |
| |||||||
| CryoPort, Inc.1 | 212,960 | 3,360,509 | ||||||
| Inogen, Inc.1 | 51,280 | 9,555,002 | ||||||
| NxStage Medical, Inc.1 | 203,330 | 5,672,907 | ||||||
| Quidel Corp.1 | 214,880 | 14,289,520 | ||||||
| Senseonics Holdings, Inc.1 | 982,286 | 4,037,195 | ||||||
| Wright Medical Group NV1 | 339,210 | 8,805,892 | ||||||
|
| 45,721,025
|
| ||||||
Health Care Providers & Services—3.3% |
| |||||||
| Addus HomeCare Corp.1 | 115,972 | 6,639,397 | ||||||
| Amedisys, Inc.1 | 200,010 | 17,092,855 | ||||||
| American Renal Associates Holdings, Inc.1 | 205,430 | 3,239,631 | ||||||
| Molina Healthcare, Inc.1 | 94,550 | 9,260,227 | ||||||
|
| 36,232,110
|
| ||||||
Health Care Technology—1.1% |
| |||||||
| Inspire Medical Systems, Inc.1 | 49,871 | 1,778,400 | ||||||
| Teladoc, Inc.1 | 176,440 | 10,242,342 | ||||||
|
| 12,020,742
|
| ||||||
Pharmaceuticals—1.2% |
| |||||||
| Intersect ENT, Inc.1 | 203,210 | 7,610,215 | ||||||
| TherapeuticsMD, Inc.1 | 970,780 | 6,057,667 | ||||||
|
| 13,667,882
|
| ||||||
Industrials—19.2% | ||||||||
Aerospace & Defense—0.5% |
| |||||||
Wesco Aircraft Holdings, Inc.1
|
| 520,820
|
|
| 5,859,225
|
| ||
Airlines—1.2% |
| |||||||
Spirit Airlines, Inc.1
|
| 359,270
|
|
| 13,059,465
|
| ||
Building Products—1.2% | ||||||||
Masonite International Corp.1
|
| 181,661
|
|
| 13,052,343
|
| ||
Commercial Services & Supplies—2.4% |
| |||||||
| ACCO Brands Corp. | 1,175,807 | 16,284,927 | ||||||
| Advanced Disposal Services, Inc.1 | 398,487 | 9,874,508 | ||||||
|
| 26,159,435
|
| ||||||
Construction & Engineering—2.1% |
| |||||||
| Dycom Industries, Inc.1 | 124,490 | 11,765,550 | ||||||
| KBR, Inc. | 617,611 | 11,067,589 | ||||||
|
| 22,833,139
|
| ||||||
Electrical Equipment—1.6% |
| |||||||
Generac Holdings, Inc.1
|
| 338,990
|
|
| 17,535,953
|
| ||
Machinery—4.3% |
| |||||||
| EnPro Industries, Inc. | 100,380 | 7,021,581 | ||||||
| Greenbrier Cos., Inc. (The) | 232,120 | 12,244,330 | ||||||
| Manitowoc Co., Inc. (The)1 | 239,727 | 6,199,340 | ||||||
| Navistar International Corp.1 | 230,560 | 9,388,403 | ||||||
| Rexnord Corp.1 | 434,290 | 12,620,468 | ||||||
|
| 47,474,122
|
| ||||||
Professional Services—4.5% |
| |||||||
| ASGN, Inc.1 | 282,840 | 22,115,259 | ||||||
6 OPPENHEIMER MAIN STREET SMALL CAP FUND/VA
| Shares | Value | |||||||
Professional Services (Continued) |
| |||||||
| Korn/Ferry International | 443,245 | $ | 27,450,163 | |||||
|
| 49,565,422
|
| ||||||
Road & Rail—1.4% | ||||||||
Genesee & Wyoming, Inc., Cl. A1
|
| 183,590
|
|
| 14,929,539
|
| ||
Information Technology—18.8% |
| |||||||
Internet Software & Services—7.1% |
| |||||||
| Envestnet, Inc.1 | 158,470 | 8,707,926 | ||||||
| Etsy, Inc.1 | 366,340 | 15,455,884 | ||||||
| j2 Global, Inc. | 211,493 | 18,317,409 | ||||||
| Q2 Holdings, Inc.1 | 232,960 | 13,290,368 | ||||||
| SendGrid, Inc.1 | 303,469 | 8,047,998 | ||||||
| Yelp, Inc., Cl. A1 | 368,120 | 14,422,942 | ||||||
|
| 78,242,527
|
| ||||||
IT Services—3.7% |
| |||||||
| CACI International, Inc., Cl. A1 | 128,419 | 21,645,022 | ||||||
| Perspecta, Inc. | 335,876 | 6,902,252 | ||||||
| Teradata Corp.1 | 296,240 | 11,894,036 | ||||||
|
| 40,441,310
|
| ||||||
Semiconductors & Semiconductor Equipment—3.6% |
| |||||||
| Brooks Automation, Inc. | 356,440 | 11,627,073 | ||||||
| MKS Instruments, Inc. | 149,810 | 14,336,817 | ||||||
| Semtech Corp.1 | 286,250 | 13,468,062 | ||||||
|
| 39,431,952
|
| ||||||
Software—4.4% |
| |||||||
| Blackline, Inc.1 | 206,750 | 8,979,153 | ||||||
| Paylocity Holding Corp.1 | 158,940 | 9,355,208 | ||||||
| Shares | Value | |||||||
Software (Continued) |
| |||||||
| Pegasystems, Inc. | 211,301 | $ | 11,579,295 | |||||
| Zynga, Inc., Cl. A1 | 4,539,820 | 18,477,067 | ||||||
|
| 48,390,723
|
| ||||||
Materials—4.1% |
| |||||||
Construction Materials—1.0% |
| |||||||
Summit Materials, Inc., Cl. A1
|
| 431,871
|
|
| 11,336,614
|
| ||
Metals & Mining—3.1% |
| |||||||
| Allegheny Technologies, Inc.1 | 381,188 | 9,575,443 | ||||||
| Compass Minerals International, Inc. | 160,780 | 10,571,285 | ||||||
| Kaiser Aluminum Corp. | 134,119 | 13,963,129 | ||||||
|
| 34,109,857
|
| ||||||
Utilities—4.1% |
| |||||||
Gas Utilities—1.4% |
| |||||||
Suburban Propane Partners LP2
|
| 644,475
|
|
| 15,138,718
|
| ||
Multi-Utilities—2.7% |
| |||||||
| Black Hills Corp. | 281,000 | 17,200,010 | ||||||
| NorthWestern Corp. | 226,250 | 12,952,812 | ||||||
| 30,152,822 | ||||||||
Total Common Stocks (Cost $821,691,037)
|
| 1,096,332,120
|
| |||||
Investment Company—0.4% |
| |||||||
| Oppenheimer Institutional Government Money Market Fund, Cl. E, 1.85%3,4 (Cost $4,751,836) | 4,751,836 | 4,751,836 | ||||||
| Total Investments, at Value (Cost $826,442,873) | 99.8% | 1,101,083,956 | ||||||
Net Other Assets (Liabilities) | 0.2 | 2,683,740 | ||||||
Net Assets | 100.0% | $ | 1,103,767,696 | |||||
Footnotes to Statement of Investments
1. Non-income producing security.
2. Security is a Master Limited Partnership.
3. Rate shown is the 7-day yield at period end.
4. Is or was an affiliate, as defined in the Investment Company Act of 1940, as amended, at or during the reporting period, by virtue of the Fund owning at least 5% of the voting securities of the issuer or as a result of the Fund and the issuer having the same investment adviser. Transactions during the reporting period in which the issuer was an affiliate are as follows:
Shares December 31, 2017 | Gross Additions | Gross Reductions | Shares June 30, 2018 | |||||||||||||
Oppenheimer Institutional Government Money Market Fund, Cl. E | 20,455,339 | 139,110,151 | 154,813,654 | 4,751,836 | ||||||||||||
| Value | Income |
Realized Gain (Loss) | Change in Unrealized Gain (Loss) | |||||||||||||
Oppenheimer Institutional Government Money Market Fund, Cl. E | $ | 4,751,836 | $ | 107,215 | $ | — | $ | — | ||||||||
See accompanying Notes to Financial Statements.
7 OPPENHEIMER MAIN STREET SMALL CAP FUND/VA
STATEMENT OF ASSETS AND LIABILITIES June 30, 2018 Unaudited
Assets | ||||
Investments, at value—see accompanying statement of investments: | ||||
Unaffiliated companies (cost $821,691,037) | $ | 1,096,332,120 | ||
Affiliated companies (cost $4,751,836) | 4,751,836 | |||
| 1,101,083,956 | ||||
| Cash | 1,000,000 | |||
| Receivables and other assets: | ||||
Investments sold | 2,816,569 | |||
Dividends | 1,000,827 | |||
Shares of beneficial interest sold | 241,307 | |||
Other | 77,350 | |||
Total assets | 1,106,220,009 | |||
Liabilities | ||||
Payables and other liabilities: | ||||
Investments purchased | 1,662,730 | |||
Shares of beneficial interest redeemed | 453,443 | |||
Distribution and service plan fees | 198,197 | |||
Trustees’ compensation | 67,881 | |||
Shareholder communications | 39,474 | |||
Other | 30,588 | |||
Total liabilities | 2,452,313 | |||
Net Assets | $ | 1,103,767,696 | ||
Composition of Net Assets | ||||
| Par value of shares of beneficial interest | $ | 45,596 | ||
| Additional paid-in capital | 802,215,025 | |||
| Accumulated net investment income | 238,850 | |||
| Accumulated net realized gain on investments and foreign currency transactions | 26,627,142 | |||
| Net unrealized appreciation on investments | 274,641,083 | |||
Net Assets | $ | 1,103,767,696 | ||
Net Asset Value Per Share | ||||
Non-Service Shares: | ||||
| Net asset value, redemption price per share and offering price per share (based on net assets of $153,980,914 and 6,278,206 shares of beneficial interest outstanding) | $24.53 | |||
Service Shares: | ||||
Net asset value, redemption price per share and offering price per share (based on net assets of $949,786,782 and 39,317,595 shares of beneficial interest outstanding) | $24.16 | |||
See accompanying Notes to Financial Statements.
8 OPPENHEIMER MAIN STREET SMALL CAP FUND/VA
STATEMENT OF OPERATIONS For the Six Months Ended June 30, 2018 Unaudited
Investment Income | ||||
Dividends: | ||||
Unaffiliated companies | $ | 6,041,837 | ||
Affiliated companies | 107,215 | |||
| Interest | 27 | |||
Total investment income
|
| 6,149,079
|
| |
Expenses | ||||
Management fees | 3,639,214 | |||
| Distribution and service plan fees — Service shares | 1,161,120 | |||
| Transfer and shareholder servicing agent fees: | ||||
Non-Service shares | 88,901 | |||
Service shares | 557,338 | |||
| Shareholder communications: | ||||
Non-Service shares | 5,158 | |||
Service shares | 32,205 | |||
| Borrowing fees | 19,673 | |||
| Trustees’ compensation | 18,424 | |||
| Custodian fees and expenses | 3,347 | |||
| Other | 36,763 | |||
Total expenses | 5,562,143 | |||
Less reduction to custodian expenses | (278 | ) | ||
Less waivers and reimbursements of expenses | (72,813 | ) | ||
Net expenses
|
| 5,489,052
|
| |
Net Investment Income | 660,027 | |||
Realized and Unrealized Gain | ||||
Net realized gain on: | ||||
Investment transactions in unaffiliated companies | 29,325,457 | |||
Foreign currency transactions | 28 | |||
Net realized gain | 29,325,485 | |||
| Net change in unrealized appreciation/depreciation on investment transactions in unaffiliated companies | 52,842,821 | |||
Net Increase in Net Assets Resulting from Operations | $ | 82,828,333 | ||
See accompanying Notes to Financial Statements.
9 OPPENHEIMER MAIN STREET SMALL CAP FUND/VA
STATEMENTS OF CHANGES IN NET ASSETS
Six Months Ended June 30, 2018 (Unaudited) | Year Ended December 31, 2017 | |||||||
Operations | ||||||||
Net investment income | $ | 660,027 | $ | 700,445 | ||||
| Net realized gain | 29,325,485 | 146,346,143 | ||||||
| Net change in unrealized appreciation/depreciation | 52,842,821 | (7,293,562 | ) | |||||
Net increase in net assets resulting from operations
|
| 82,828,333
|
|
| 139,753,026
|
| ||
Dividends and/or Distributions to Shareholders | ||||||||
Dividends from net investment income: | ||||||||
Non-Service shares | (451,758 | ) | (1,318,291 | ) | ||||
Service shares | (534,686 | ) | (5,916,141 | ) | ||||
|
| (986,444
| )
|
| (7,234,432
| )
| |||
| Distributions from net realized gain: | ||||||||
Non-Service shares | (18,607,843 | ) | (8,092,450 | ) | ||||
Service shares | (116,699,432 | ) | (49,338,866 | ) | ||||
|
| (135,307,275
| )
|
| (57,431,316
| )
| |||
Beneficial Interest Transactions | ||||||||
Net increase (decrease) in net assets resulting from beneficial interest transactions: | ||||||||
Non-Service shares | 8,842,029 | (3,222,317 | ) | |||||
Service shares | 59,980,995 | (50,919,555 | ) | |||||
|
| 68,823,024
|
|
| (54,141,872
| )
| |||
Net Assets | ||||||||
Total increase | 15,357,638 | 20,945,406 | ||||||
| Beginning of period | 1,088,410,058 | 1,067,464,652 | ||||||
End of period (including accumulated net investment income of $238,850 and $565,267, respectively) | $ | 1,103,767,696 | $ | 1,088,410,058 | ||||
See accompanying Notes to Financial Statements.
10 OPPENHEIMER MAIN STREET SMALL CAP FUND/VA
FINANCIAL HIGHLIGHTS
| Non-Service Shares | Six Months Ended June 30, 2018 (Unaudited) | Year Ended December 31, 2017 | Year Ended December 31, 2016 | Year Ended 2015 | Year Ended December 31, 2014 | Year Ended December 31, 2013 | ||||||||||||||||||
Per Share Operating Data | ||||||||||||||||||||||||
Net asset value, beginning of period | $25.79 | $24.08 | $21.32 | $26.56 | $27.80 | $20.14 | ||||||||||||||||||
| Income (loss) from investment operations: | ||||||||||||||||||||||||
Net investment income1 | 0.04 | 0.07 | 0.16 | 0.12 | 0.26 | 0.16 | ||||||||||||||||||
Net realized and unrealized gain (loss) | 2.13 | 3.22 | 3.55 | (1.28) | 2.74 | 8.01 | ||||||||||||||||||
Total from investment operations | 2.17 | 3.29 | 3.71 | (1.16) | 3.00 | 8.17 | ||||||||||||||||||
| Dividends and/or distributions to shareholders: | ||||||||||||||||||||||||
Dividends from net investment income | (0.08) | (0.22) | (0.11) | (0.23) | (0.25) | (0.22) | ||||||||||||||||||
Distributions from net realized gain | (3.35) | (1.36) | (0.84) | (3.85) | (3.99) | (0.29) | ||||||||||||||||||
Total dividends and/or distributions to shareholders | (3.43) | (1.58) | (0.95) | (4.08) | (4.24) | (0.51) | ||||||||||||||||||
| Net asset value, end of period | $24.53 | $25.79 | $24.08 | $21.32 | $26.56 | $27.80 | ||||||||||||||||||
Total Return, at Net Asset Value2 | 8.05% | 14.15% | 18.05% | (5.90)% | 11.93% | 41.01% | ||||||||||||||||||
Ratios/Supplemental Data | ||||||||||||||||||||||||
Net assets, end of period (in thousands) | $153,981 | $152,617 | $145,428 | $129,104 | $136,402 | $134,692 | ||||||||||||||||||
Average net assets (in thousands) | $149,408 | $150,376 | $130,889 | $134,932 | $133,864 | $113,522 | ||||||||||||||||||
Ratios to average net assets:3 | ||||||||||||||||||||||||
Net investment income | 0.34% | 0.28% | 0.74% | 0.49% | 0.99% | 0.67% | ||||||||||||||||||
Expenses excluding specific expenses listed below | 0.81% | 0.80% | 0.81% | 0.80% | 0.80% | 0.81% | ||||||||||||||||||
Interest and fees from borrowings | 0.00%4 | 0.00%4 | 0.00%4 | 0.00%4 | 0.00% | 0.00% | ||||||||||||||||||
Total expenses5 | 0.81% | 0.80% | 0.81% | 0.80% | 0.80% | 0.81% | ||||||||||||||||||
| Expenses after payments, waivers and/or reimbursements and reduction to custodian expenses | 0.80% | 0.80%6 | 0.80% | 0.80%6 | 0.79% | 0.80% | ||||||||||||||||||
Portfolio turnover rate | 23% | 42% | 65% | 43% | 65% | 60% | ||||||||||||||||||
1. Per share amounts calculated based on the average shares outstanding during the period.
2. Assumes an initial investment on the business day before the first day of the fiscal period, with all dividends and distributions reinvested in additional shares on the reinvestment date, and redemption at the net asset value calculated on the last business day of the fiscal period. Total returns are not annualized for periods less than one full year. Total return information does not reflect expenses that apply at the separate account level or to related insurance products. Inclusion of these charges would reduce the total return figures for all periods shown. Returns do not reflect the deduction of taxes that a shareholder would pay on fund distributions or the redemption of fund shares.
3. Annualized for periods less than one full year.
4. Less than 0.005%.
5. Total expenses including indirect expenses from affiliated fund fees and expenses were as follows:
| Six Months Ended June 30, 2018 | 0.81 | % | ||||||
| Year Ended December 31, 2017 | 0.80 | % | ||||||
| Year Ended December 31, 2016 | 0.81 | % | ||||||
| Year Ended December 31, 2015 | 0.80 | % | ||||||
| Year Ended December 31, 2014 | 0.80 | % | ||||||
| Year Ended December 31, 2013 | 0.81 | % |
6. Waiver was less than 0.005%.
See accompanying Notes to Financial Statements.
11 OPPENHEIMER MAIN STREET SMALL CAP FUND/VA
FINANCIAL HIGHLIGHTS Continued
| Service Shares | Six Months Ended June 30, 2018 (Unaudited) | Year Ended December 31, 2017 | Year Ended December 31, 2016 | Year Ended December 31, 2015 | Year Ended December 31, 2014 | Year Ended December 31, 2013 | ||||||||||||||||||
Per Share Operating Data | ||||||||||||||||||||||||
Net asset value, beginning of period | $25.42 | $23.75 | $21.05 | $26.26 | $27.53 | $19.96 | ||||||||||||||||||
| Income (loss) from investment operations: | ||||||||||||||||||||||||
Net investment income1 | 0.01 | 0.01 | 0.10 | 0.06 | 0.19 | 0.10 | ||||||||||||||||||
Net realized and unrealized gain (loss) | 2.10 | 3.18 | 3.49 | (1.25) | 2.71 | 7.93 | ||||||||||||||||||
Total from investment operations | 2.11 | 3.19 | 3.59 | (1.19) | 2.90 | 8.03 | ||||||||||||||||||
| Dividends and/or distributions to shareholders: | ||||||||||||||||||||||||
Dividends from net investment income | (0.02) | (0.16) | (0.05) | (0.17) | (0.18) | (0.17) | ||||||||||||||||||
Distributions from net realized gain | (3.35) | (1.36) | (0.84) | (3.85) | (3.99) | (0.29) | ||||||||||||||||||
Total dividends and/or distributions to shareholders | (3.37) | (1.52) | (0.89) | (4.02) | (4.17) | (0.46) | ||||||||||||||||||
| Net asset value, end of period | $24.16 | $25.42 | $23.75 | $21.05 | $26.26 | $27.53 | ||||||||||||||||||
Total Return, at Net Asset Value2 | 7.91% | 13.91% | 17.67% | (6.09)% | 11.66% | 40.62% | ||||||||||||||||||
Ratios/Supplemental Data | ||||||||||||||||||||||||
Net assets, end of period (in thousands) | $949,787 | $935,793 | $922,037 | $856,719 | $968,637 | $990,168 | ||||||||||||||||||
| Average net assets (in thousands) | $936,856 | $919,475 | $850,883 | $927,514 | $957,874 | $935,083 | ||||||||||||||||||
| Ratios to average net assets:3 | ||||||||||||||||||||||||
Net investment income | 0.09% | 0.03% | 0.49% | 0.24% | 0.75% | 0.43% | ||||||||||||||||||
Expenses excluding specific expenses listed below | 1.06% | 1.05% | 1.06% | 1.05% | 1.05% | 1.06% | ||||||||||||||||||
Interest and fees from borrowings | 0.00%4 | 0.00%4 | 0.00%4 | 0.00%4 | 0.00% | 0.00% | ||||||||||||||||||
Total expenses5 | 1.06% | 1.05% | 1.06% | 1.05% | 1.05% | 1.06% | ||||||||||||||||||
| Expenses after payments, waivers and/or reimbursements and reduction to custodian expenses | 1.05% | 1.05%6 | 1.05% | 1.05%6 | 1.04% | 1.05% | ||||||||||||||||||
| Portfolio turnover rate | 23% | 42% | 65% | 43% | 65% | 60% | ||||||||||||||||||
1. Per share amounts calculated based on the average shares outstanding during the period.
2. Assumes an initial investment on the business day before the first day of the fiscal period, with all dividends and distributions reinvested in additional shares on the reinvestment date, and redemption at the net asset value calculated on the last business day of the fiscal period. Total returns are not annualized for periods less than one full year. Total return information does not reflect expenses that apply at the separate account level or to related insurance products. Inclusion of these charges would reduce the total return figures for all periods shown. Returns do not reflect the deduction of taxes that a shareholder would pay on fund distributions or the redemption of fund shares.
3. Annualized for periods less than one full year.
4. Less than 0.005%.
5. Total expenses including indirect expenses from affiliated fund fees and expenses were as follows:
| Six Months Ended June 30, 2018 | 1.06 | % | ||||||
| Year Ended December 31, 2017 | 1.05 | % | ||||||
| Year Ended December 31, 2016 | 1.06 | % | ||||||
| Year Ended December 31, 2015 | 1.05 | % | ||||||
| Year Ended December 31, 2014 | 1.05 | % | ||||||
| Year Ended December 31, 2013 | 1.06 | % |
6. Waiver was less than 0.005%.
See accompanying Notes to Financial Statements.
12 OPPENHEIMER MAIN STREET SMALL CAP FUND/VA
NOTES TO FINANCIAL STATEMENTS June 30, 2018 Unaudited
1. Organization
Oppenheimer Main Street Small Cap Fund/VA (the “Fund”), a separate series of Oppenheimer Variable Account Funds, is a diversified open-end management investment company registered under the Investment Company Act of 1940 (“1940 Act”), as amended. The Fund’s investment objective is to seek capital appreciation. The Fund’s investment adviser is OFI Global Asset Management, Inc. (“OFI Global” or the “Manager”), a wholly-owned subsidiary of OppenheimerFunds, Inc. (“OFI” or the “Sub-Adviser”). The Manager has entered into a sub-advisory agreement with OFI. Shares of the Fund are sold only to separate accounts of life insurance companies.
The Fund offers two classes of shares. Both classes are sold at their offering price, which is the net asset value per share, to separate investment accounts of participating insurance companies as an underlying investment for variable life insurance policies, variable annuity contracts or other investment products. The class of shares designated as Service shares is subject to a distribution and service plan. Both classes of shares have identical rights and voting privileges with respect to the Fund in general and exclusive voting rights on matters that affect that class alone. Earnings, net assets and net asset value per share may differ due to each class having its own expenses, such as transfer and shareholder servicing agent fees and shareholder communications, directly attributable to that class.
The following is a summary of significant accounting policies followed in the Fund’s preparation of financial statements in accordance with accounting principles generally accepted in the United States (“U.S. GAAP”).
2. Significant Accounting Policies
Security Valuation. All investments in securities are recorded at their estimated fair value, as described in Note 3.
Foreign Currency Translation. The books and records of the Fund are maintained in U.S. dollars. Any foreign currency amounts are translated into U.S. dollars on the following basis:
(1) Value of investment securities, other assets and liabilities — at the exchange rates prevailing at market close as described in Note 3.
(2) Purchases and sales of investment securities, income and expenses — at the rates of exchange prevailing on the respective dates of such transactions.
Although the net assets and the values are presented at the foreign exchange rates at market close, the Fund does not isolate the portion of the results of operations resulting from changes in foreign exchange rates on investments from the fluctuations arising from changes in prices of securities held. Such fluctuations are included with the net realized and unrealized gains or losses from investments shown in the Statement of Operations.
For securities, which are subject to foreign withholding tax upon disposition, realized and unrealized gains or losses on such securities are recorded net of foreign withholding tax.
Reported net realized foreign exchange gains or losses arise from sales of foreign currencies, currency gains or losses realized between the trade and settlement dates on securities transactions, the difference between the amounts of dividends, interest, and foreign withholding tax reclaims recorded on the Fund’s books, and the U.S. dollar equivalent of the amounts actually received or paid. Net unrealized foreign exchange gains and losses arise from changes in the value of assets and liabilities other than investments in securities, resulting from changes in the exchange rate.
Allocation of Income, Expenses, Gains and Losses. Income, expenses (other than those attributable to a specific class), gains and losses are allocated on a daily basis to each class of shares based upon the relative proportion of net assets represented by such class. Operating expenses directly attributable to a specific class are charged against the operations of that class.
Dividends and Distributions to Shareholders. Dividends and distributions to shareholders, which are determined in accordance with income tax regulations and may differ from U.S. GAAP, are recorded on the ex-dividend date. Income and capital gain distributions, if any, are declared and paid annually or at other times as determined necessary by the Manager.
The tax character of distributions is determined as of the Fund’s fiscal year end. Therefore, a portion of the Fund’s distributions made to shareholders prior to the Fund’s fiscal year end may ultimately be categorized as a tax return of capital.
Investment Income. Dividend income is recorded on the ex-dividend date or upon ex-dividend notification in the case of certain foreign dividends where the ex-dividend date may have passed. Non-cash dividends included in dividend income, if any, are recorded at the fair value of the securities received. Withholding taxes on foreign dividends, if any, and capital gains taxes on foreign investments, if any, have been provided for in accordance with the Fund’s understanding of the applicable tax rules and regulations. Interest income, if any, is recognized on an accrual basis. Discount and premium, which are included in interest income on the Statement of Operations, are amortized or accreted daily.
Return of Capital Estimates. Distributions received from the Fund’s investments in Master Limited Partnerships (MLPs) and Real Estate Investments Trusts (REITs), generally are comprised of income and return of capital. The Fund records investment income and return of capital based on estimates. Such estimates are based on historical information available from each MLP, REIT and other industry sources. These estimates may subsequently be revised based on information received from MLPs and REITs after their tax reporting periods are concluded.
Custodian Fees. “Custodian fees and expenses” in the Statement of Operations may include interest expense incurred by the Fund on any cash overdrafts of its custodian account during the period. Such cash overdrafts may result from the effects of failed trades in portfolio securities and from cash outflows resulting from unanticipated shareholder redemption activity. The Fund pays interest to its custodian on such cash overdrafts, to the extent they are not offset by positive cash balances maintained by the Fund, at a rate equal to the Federal Funds Rate plus 2.00%. The “Reduction to custodian
13 OPPENHEIMER MAIN STREET SMALL CAP FUND/VA
NOTES TO FINANCIAL STATEMENTS Unaudited / Continued
2. Significant Accounting Policies (Continued)
expenses” line item, if applicable, represents earnings on cash balances maintained by the Fund during the period. Such interest expense and other custodian fees may be paid with these earnings.
Security Transactions. Security transactions are recorded on the trade date. Realized gains and losses on securities sold are determined on the basis of identified cost.
Indemnifications. The Fund’s organizational documents provide current and former Trustees and officers with a limited indemnification against liabilities arising in connection with the performance of their duties to the Fund. In the normal course of business, the Fund may also enter into contracts that provide general indemnifications. The Fund’s maximum exposure under these arrangements is unknown as this would be dependent on future claims that may be made against the Fund. The risk of material loss from such claims is considered remote.
Federal Taxes. The Fund intends to comply with provisions of the Internal Revenue Code applicable to regulated investment companies and to distribute substantially all of its investment company taxable income to shareholders. Therefore, no federal income or excise tax provision is required. The Fund files income tax returns in U.S. federal and applicable state jurisdictions. The statute of limitations on the Fund’s tax return filings generally remains open for the three preceding fiscal reporting period ends. The Fund has analyzed its tax positions for the fiscal year ended December 31, 2017, including open tax years, and does not believe there are any uncertain tax positions requiring recognition in the Fund’s financial statements.
During the fiscal year ended December 31, 2017, the Fund did not utilize any capital loss carryforwards to offset capital gains realized in that fiscal year. Capital losses will be carried forward to future years if not offset by gains.
At period end, it is estimated that the capital loss carryforwards would be zero. The estimated capital loss carryforward represents the carryforward as of the end of the last fiscal year, increased or decreased by capital losses or gains realized in the first six months of the current fiscal year. During the reporting period, it is estimated that the Fund will not utilize any capital loss carryforward to offset realized capital gains.
Net investment income (loss) and net realized gain (loss) may differ for financial statement and tax purposes. The character of dividends and distributions made during the fiscal year from net investment income or net realized gains are determined in accordance with federal income tax requirements, which may differ from the character of net investment income or net realized gains presented in those financial statements in accordance with U.S. GAAP. Also, due to timing of dividends and distributions, the fiscal year in which amounts are distributed may differ from the fiscal year in which the income or net realized gain was recorded by the Fund.
The aggregate cost of securities and other investments and the composition of unrealized appreciation and depreciation of securities and other investments for federal income tax purposes at period end are noted in the following table. The primary difference between book and tax appreciation or depreciation of securities and other investments, if applicable, is attributable to the tax deferral of losses or tax realization of financial statement unrealized gain or loss.
Federal tax cost of securities | $ | 827,791,872 | ||
|
|
| ||
Gross unrealized appreciation | $ | 290,427,062 | ||
Gross unrealized depreciation |
|
(17,134,978 |
) | |
|
|
| ||
Net unrealized appreciation | $ | 273,292,084 | ||
|
|
|
Use of Estimates. The preparation of financial statements in conformity with U.S. GAAP requires management to make estimates and assumptions that affect the reported amounts of assets and liabilities and disclosure of contingent assets and liabilities at the date of the financial statements and the reported amounts of increases and decreases in net assets from operations during the reporting period. Actual results could differ from those estimates.
3. Securities Valuation
The Fund calculates the net asset value of its shares as of 4:00 P.M. Eastern Time, on each day the New York Stock Exchange (the “Exchange”) is open for trading, except in the case of a scheduled early closing of the Exchange, in which case the Fund will calculate net asset value of the shares as of the scheduled early closing time of the Exchange.
The Fund’s Board has adopted procedures for the valuation of the Fund’s securities and has delegated the day-to-day responsibility for valuation determinations under those procedures to the Manager. The Manager has established a Valuation Committee which is responsible for determining a fair valuation for any security for which market quotations are not readily available. The Valuation Committee’s fair valuation determinations are subject to review, approval and ratification by the Fund’s Board at least quarterly or more frequently, if necessary.
Valuation Methods and Inputs
Securities are valued primarily using unadjusted quoted market prices, when available, as supplied by third party pricing services or broker-dealers.
The following methodologies are used to determine the market value or the fair value of the types of securities described below:
Equity securities traded on a securities exchange (including exchange-traded derivatives other than futures and futures options) are valued based on the official closing price on the principal exchange on which the security is traded, as identified by the Manager, prior to the time when the Fund’s assets are valued. If the official closing price is unavailable, the security is valued at the last sale price on the principal exchange on which it is traded, or if no sales occurred, the security is valued at the mean between the quoted bid and asked prices. Over-the-counter equity securities are valued at the last published sale price, or if no sales occurred, at the mean between the quoted bid and asked prices. Events occurring after the close of trading on foreign
14 OPPENHEIMER MAIN STREET SMALL CAP FUND/VA
3. Securities Valuation (Continued)
exchanges may result in adjustments to the valuation of foreign securities to more accurately reflect their fair value as of the time when the Fund’s assets are valued.
Shares of a registered investment company that are not traded on an exchange are valued at that investment company’s net asset value per share.
Securities for which market quotations are not readily available, or when a significant event has occurred that would materially affect the value of the security, are fair valued either (i) by a standardized fair valuation methodology applicable to the security type or the significant event as previously approved by the Valuation Committee and the Fund’s Board or (ii) as determined in good faith by the Manager’s Valuation Committee. The Valuation Committee considers all relevant facts that are reasonably available, through either public information or information available to the Manager, when determining the fair value of a security. Those standardized fair valuation methodologies include, but are not limited to, valuing securities at the last sale price or initially at cost and subsequently adjusting the value based on: changes in company specific fundamentals, changes in an appropriate securities index, or changes in the value of similar securities which may be further adjusted for any discounts related to security-specific resale restrictions. When possible, such methodologies use observable market inputs such as unadjusted quoted prices of similar securities, observable interest rates, currency rates and yield curves. The methodologies used for valuing securities are not necessarily an indication of the risks associated with investing in those securities nor can it be assured that the Fund can obtain the fair value assigned to a security if it were to sell the security.
Classifications
Each investment asset or liability of the Fund is assigned a level at measurement date based on the significance and source of the inputs to its valuation.
Various data inputs may be used in determining the value of each of the Fund’s investments as of the reporting period end. These data inputs are categorized in the following hierarchy under applicable financial accounting standards:
1) Level 1-unadjusted quoted prices in active markets for identical assets or liabilities (including securities actively traded on a securities exchange)
2) Level 2-inputs other than unadjusted quoted prices that are observable for the asset or liability (such as unadjusted quoted prices for similar assets and market corroborated inputs such as interest rates, prepayment speeds, credit risks, etc.)
3) Level 3-significant unobservable inputs (including the Manager’s own judgments about assumptions that market participants would use in pricing the asset or liability).
The inputs used for valuing securities are not necessarily an indication of the risks associated with investing in those securities.
The Fund classifies each of its investments in investment companies which are publicly offered as Level 1. Investment companies that are not publicly offered, if any, are classified as Level 2 in the fair value hierarchy.
The table below categorizes amounts that are included in the Fund’s Statement of Assets and Liabilities at period end based on valuation input level:
Level 1— Unadjusted Quoted Prices | Level 2— Other Significant Observable Inputs | Level 3— Significant Unobservable Inputs | Value | |||||||||||||
| ||||||||||||||||
Assets Table | ||||||||||||||||
Investments, at Value: | ||||||||||||||||
Common Stocks | ||||||||||||||||
Consumer Discretionary | $ | 120,468,309 | $ | — | $ | — | $ | 120,468,309 | ||||||||
Consumer Staples | 25,423,910 | — | — | 25,423,910 | ||||||||||||
Energy | 40,543,284 | — | — | 40,543,284 | ||||||||||||
Financials | 246,269,178 | — | — | 246,269,178 | ||||||||||||
Health Care | 151,948,698 | 3,965,575 | — | 155,914,273 | ||||||||||||
Industrials | 210,468,643 | — | — | 210,468,643 | ||||||||||||
Information Technology | 206,506,512 | — | — | 206,506,512 | ||||||||||||
Materials | 45,446,471 | — | — | 45,446,471 | ||||||||||||
Utilities | 45,291,540 | — | — | 45,291,540 | ||||||||||||
Investment Company | 4,751,836 | — | — | 4,751,836 | ||||||||||||
|
| |||||||||||||||
Total Assets | $ | 1,097,118,381 | $ | 3,965,575 | $ | — | $ | 1,101,083,956 | ||||||||
|
| |||||||||||||||
Forward currency exchange contracts and futures contracts, if any, are reported at their unrealized appreciation/depreciation at measurement date, which represents the change in the contract’s value from trade date. All additional assets and liabilities included in the above table are reported at their market value at measurement date.
For the reporting period, there were no transfers between levels.
4. Investments and Risks
Investments in Affiliated Funds. The Fund is permitted to invest in other mutual funds advised by the Manager (“Affiliated Funds”). Affiliated Funds are open-end management investment companies registered under the 1940 Act, as amended. The Manager is the investment adviser of, and the Sub-Adviser provides investment and related advisory services to, the Affiliated Funds. When applicable, the Fund’s investments in Affiliated Funds are included in the Statement of Investments. Shares of Affiliated Funds are valued at their net asset value per share. As a shareholder, the Fund is subject to its proportional share of the Affiliated Funds’ expenses, including their management fee. The Manager will waive fees and/or reimburse Fund expenses in an amount equal to the indirect management fees incurred through the Fund’s investment in the Affiliated Funds.
15 OPPENHEIMER MAIN STREET SMALL CAP FUND/VA
NOTES TO FINANCIAL STATEMENTS Unaudited / Continued
4. Investments and Risks (Continued)
Each of the Affiliated Funds in which the Fund invests has its own investment risks, and those risks can affect the value of the Fund’s investments and therefore the value of the Fund’s shares. To the extent that the Fund invests more of its assets in one Affiliated Fund than in another, the Fund will have greater exposure to the risks of that Affiliated Fund.
Investments in Money Market Instruments. The Fund is permitted to invest its free cash balances in money market instruments to provide liquidity or for defensive purposes. The Fund may invest in money market instruments by investing in Class E shares of Oppenheimer Institutional Government Money Market Fund (“IGMMF”), which is an Affiliated Fund. IGMMF is regulated as a money market fund under the 1940 Act, as amended. The Fund may also invest in money market instruments directly or in other affiliated or unaffiliated money market funds.
Master Limited Partnerships (“MLPs”). MLPs issue common units that represent an equity ownership interest in a partnership and provide limited voting rights. MLP common units are registered with the Securities and Exchange Commission (“SEC”), and are freely tradable on securities exchanges such as the NYSE and the NASDAQ Stock Market (“NASDAQ”), or in the over-the-counter (“OTC”) market. An MLP consists of one or more general partners, who conduct the business, and one or more limited partners, who contribute capital. MLP common unit holders have a limited role in the partnership’s operations and management. The Fund, as a limited partner, normally would not be liable for the debts of the MLP beyond the amounts the Fund has contributed, but would not be shielded to the same extent that a shareholder of a corporation would be. In certain circumstances creditors of an MLP would have the right to seek return of capital distributed to a limited partner. This right of an MLP’s creditors would continue after the Fund sold its investment in the MLP.
Equity Security Risk. Stocks and other equity securities fluctuate in price. The value of the Fund’s portfolio may be affected by changes in the equity markets generally. Equity markets may experience significant short-term volatility and may fall sharply at times. Different markets may behave differently from each other and U.S. equity markets may move in the opposite direction from one or more foreign stock markets. Adverse events in any part of the equity or fixed-income markets may have unexpected negative effects on other market segments.
The prices of individual equity securities generally do not all move in the same direction at the same time and a variety of factors can affect the price of a particular company’s securities. These factors may include, but are not limited to, poor earnings reports, a loss of customers, litigation against the company, general unfavorable performance of the company’s sector or industry, or changes in government regulations affecting the company or its industry.
5. Market Risk Factors
The Fund’s investments in securities and/or financial derivatives may expose the Fund to various market risk factors:
Commodity Risk. Commodity risk relates to the change in value of commodities or commodity indexes as they relate to increases or decreases in the commodities market. Commodities are physical assets that have tangible properties. Examples of these types of assets are crude oil, heating oil, metals, livestock, and agricultural products.
Credit Risk. Credit risk relates to the ability of the issuer of debt to meet interest and principal payments, or both, as they come due. In general, lower-grade, higher-yield debt securities are subject to credit risk to a greater extent than lower-yield, higher-quality securities.
Equity Risk. Equity risk relates to the change in value of equity securities as they relate to increases or decreases in the general market.
Foreign Exchange Rate Risk. Foreign exchange rate risk relates to the change in the U.S. dollar value of a security held that is denominated in a foreign currency. The U.S. dollar value of a foreign currency denominated security will decrease as the dollar appreciates against the currency, while the U.S. dollar value will increase as the dollar depreciates against the currency.
Interest Rate Risk. Interest rate risk refers to the fluctuations in value of fixed-income securities resulting from the inverse relationship between price and yield. For example, an increase in general interest rates will tend to reduce the market value of already issued fixed-income investments, and a decline in general interest rates will tend to increase their value. In addition, debt securities with longer maturities, which tend to have higher yields, are subject to potentially greater fluctuations in value from changes in interest rates than obligations with shorter maturities.
Volatility Risk. Volatility risk refers to the magnitude of the movement, but not the direction of the movement, in a financial instrument’s price over a defined time period. Large increases or decreases in a financial instrument’s price over a relative time period typically indicate greater volatility risk, while small increases or decreases in its price typically indicate lower volatility risk.
6. Shares of Beneficial Interest
The Fund has authorized an unlimited number of $0.001 par value shares of beneficial interest of each class. Transactions in shares of beneficial interest were as follows:
16 OPPENHEIMER MAIN STREET SMALL CAP FUND/VA
6. Shares of Beneficial Interest (Continued)
| Six Months Ended June 30, 2018 | Year Ended December 31, 2017 | |||||||||||||||||||||
| Shares | Amount | Shares | Amount | |||||||||||||||||||
Non-Service Shares | ||||||||||||||||||||||
Sold | 261,540 | $ | 6,888,820 | 711,775 | $ | 17,670,310 | ||||||||||||||||
Dividends and/or distributions reinvested | 754,537 | 19,059,601 | 392,769 | 9,410,741 | ||||||||||||||||||
Redeemed | (655,386 | ) | (17,106,392 | ) | (1,227,568 | ) | (30,303,368 | ) | ||||||||||||||
|
|
| ||||||||||||||||||||
Net increase (decrease) | 360,691 | $ | 8,842,029 | (123,024 | ) | $ | (3,222,317 | ) | ||||||||||||||
|
|
| ||||||||||||||||||||
Service Shares | ||||||||||||||||||||||
Sold | 844,380 | $ | 21,698,984 | 2,321,546 | $ | 56,712,198 | ||||||||||||||||
Dividends and/or distributions reinvested | 4,711,982 | 117,234,118 | 2,336,364 | 55,255,007 | ||||||||||||||||||
Redeemed | (3,050,821 | ) | (78,952,107 | ) | (6,662,764 | ) | (162,886,760 | ) | ||||||||||||||
|
|
| ||||||||||||||||||||
Net increase (decrease) | 2,505,541 | $ | 59,980,995 | (2,004,854 | ) | $ | (50,919,555 | ) | ||||||||||||||
|
|
| ||||||||||||||||||||
7. Purchases and Sales of Securities
The aggregate cost of purchases and proceeds from sales of securities, other than short-term obligations and investments in IGMMF, for the reporting period were as follows:
| Purchases | Sales | |||||||||
Investment securities | $ | 243,622,731 | $ | 294,977,042 | ||||||
8. Fees and Other Transactions with Affiliates
Management Fees. Under the investment advisory agreement, the Fund pays the Manager a management fee based on the daily net assets of the Fund at an annual rate as shown in the following table:
| Fee Schedule | ||||
Up to $200 million | 0.75 | % | ||
Next $200 million | 0.72 | |||
Next $200 million | 0.69 | |||
Next $200 million | 0.66 | |||
Next $200 million | 0.60 | |||
Next $4 billion | 0.58 | |||
Over $5 billion | 0.56 | |||
The Fund’s effective management fee for the reporting period was 0.68% of average annual net assets before any applicable waivers.
Sub-Adviser Fees. The Manager has retained the Sub-Adviser to provide the day-to-day portfolio management of the Fund. Under the Sub-Advisory Agreement, the Manager pays the Sub-Adviser an annual fee in monthly installments, equal to a percentage of the investment management fee collected by the Manager from the Fund, which shall be calculated after any investment management fee waivers. The fee paid to the Sub-Adviser is paid by the Manager, not by the Fund.
Transfer Agent Fees. OFI Global (the “Transfer Agent”) serves as the transfer and shareholder servicing agent for the Fund. The Fund pays the Transfer Agent a fee based on annual net assets. Fees incurred and average net assets for each class with respect to these services are detailed in the Statement of Operations and Financial Highlights, respectively.
Sub-Transfer Agent Fees. The Transfer Agent has retained Shareholder Services, Inc., a wholly-owned subsidiary of OFI (the “Sub-Transfer Agent”), to provide the day-to-day transfer agent and shareholder servicing of the Fund. Under the Sub-Transfer Agency Agreement, the Transfer Agent pays the Sub-Transfer Agent an annual fee in monthly installments, equal to a percentage of the transfer agent fee collected by the Transfer Agent from the Fund, which shall be calculated after any applicable fee waivers. The fee paid to the Sub-Transfer Agent is paid by the Transfer Agent, not by the Fund.
Trustees’ Compensation. The Fund’s Board of Trustees (“Board”) has adopted a compensation deferral plan for Independent Trustees that enables Trustees to elect to defer receipt of all or a portion of the annual compensation they are entitled to receive from the Fund. For purposes of determining the amount owed to the Trustees under the plan, deferred amounts are treated as though equal dollar amounts had been invested in shares of the Fund or in other Oppenheimer funds selected by the Trustees. The Fund purchases shares of the funds selected for deferral by the Trustees in amounts equal to his or her deemed investment, resulting in a Fund asset equal to the deferred compensation liability. Such assets are included as a component of “Other” within the asset section of the Statement of Assets and Liabilities. Deferral of Trustees’ fees under the plan will not affect the net assets of the Fund and will not materially affect the Fund’s assets, liabilities or net investment income per share. Amounts will be deferred until distributed in accordance with the compensation deferral plan.
Distribution and Service Plan for Service Shares. The Fund has adopted a Distribution and Service Plan (the “Plan”) pursuant to Rule 12b-1 under the 1940 Act for Service shares to pay OppenheimerFunds Distributor, Inc. (the “Distributor”), for distribution related services, personal service and
17 OPPENHEIMER MAIN STREET SMALL CAP FUND/VA
NOTES TO FINANCIAL STATEMENTS Unaudited / Continued
8. Fees and Other Transactions with Affiliates (Continued)
account maintenance for the Fund’s Service shares. Under the Plan, payments are made periodically at an annual rate of 0.25% of the daily net assets of Service shares of the Fund. The Distributor currently uses all of those fees to compensate sponsors of the insurance product that offers Fund shares, for providing personal service and maintenance of accounts of their variable contract owners that hold Service shares. These fees are paid out of the Fund’s assets on an on-going basis and increase operating expenses of the Service shares, which results in lower performance compared to the Fund’s shares that are not subject to a service fee. Fees incurred by the Fund under the Plan are detailed in the Statement of Operations.
Waivers and Reimbursements of Expenses. The Manager has contractually agreed to limit the Fund’s expenses after payments, waivers and/or reimbursements and reduction to custodian expenses, excluding any applicable dividend expense, taxes, interest and fees from borrowing, any subsidiary expenses, Acquired Fund Fees and Expenses, brokerage commissions, unusual and infrequent expenses and certain other Fund expenses; so that those expenses, as percentages of daily net assets, will not exceed the annual rate of 0.80% for Non-Service shares and 1.05% for Service shares.
During the reporting period, the Manager waived fees and/or reimbursed the Fund as follows:
Non-Service shares | $8,985 | |||
Service shares | 57,021 |
This fee waiver and/or expense reimbursement may not be amended or withdrawn for one year from the date of the Fund’s prospectus, unless approved by the Board.
The Manager will waive fees and/or reimburse Fund expenses in an amount equal to the indirect management fees incurred through the Fund’s investment in IGMMF. During the reporting period, the Manager waived fees and/or reimbursed the Fund $6,807 for IGMMF management fees. This fee waiver and/or expense reimbursement may not be amended or withdrawn for one year from the date of the Fund’s prospectus, unless approved by the Board.
9. Borrowings and Other Financing
Joint Credit Facility. A number of mutual funds managed by the Manager participate in a $1.875 billion revolving credit facility (the “Facility”) intended to provide short-term financing, if necessary, subject to certain restrictions in connection with atypical redemption activity. Effective July 17, 2018, the Facility was increased to $1.95 billion. Expenses and fees related to the Facility are paid by the participating funds and are disclosed separately or as other expenses on the Statement of Operations. The Fund did not utilize the Facility during the reporting period.
18 OPPENHEIMER MAIN STREET SMALL CAP FUND/VA
PORTFOLIO PROXY VOTING POLICIES AND GUIDELINES; UPDATES TO STATEMENT OF INVESTMENTS Unaudited
The Fund has adopted Portfolio Proxy Voting Policies and Guidelines under which the Fund votes proxies relating to securities (“portfolio proxies”) held by the Fund. A description of the Fund’s Portfolio Proxy Voting Policies and Guidelines is available (i) without charge, upon request, by calling the Fund toll-free at 1.800.CALL OPP (225.5677), (ii) on the Fund’s website at www.oppenheimerfunds.com, and (iii) on the SEC’s website at www.sec.gov. In addition, the Fund is required to file Form N-PX, with its complete proxy voting record for the 12 months ended June 30th, no later than August 31st of each year. The Fund’s voting record is available (i) without charge, upon request, by calling the Fund toll-free at 1.800.CALL OPP (225.5677), and (ii) in the Form N-PX filing on the SEC’s website at www.sec.gov.
The Fund files its complete schedule of portfolio holdings with the SEC for the first quarter and the third quarter of each fiscal year on Form N-Q. The Fund’s Form N-Q filings are available on the SEC’s website at www.sec.gov. Those forms may be reviewed and copied at the SEC’s Public Reference Room in Washington, D.C. Information on the operation of the Public Reference Room may be obtained by calling 1-800-SEC-0330.
19 OPPENHEIMER MAIN STREET SMALL CAP FUND/VA
DISTRIBUTION SOURCES Unaudited
For any distribution that took place over the last six months of the Fund’s reporting period, the table below details on a per-share basis the percentage of the Fund’s total distribution payment amount that was derived from the following sources: net income, net profit from the sale of securities, and other capital sources. Other capital sources represent a return of capital. A return of capital may occur, for example, when some or all of the money that you invested in the Fund is paid back to you. A return of capital distribution does not necessarily reflect the Fund’s investment performance and should not be confused with “yield” or “income.” You should not draw any conclusions about the Fund’s investment performance from the amounts of these distributions. This information is based upon income and capital gains using generally accepted accounting principles as of the date of each distribution. If the Fund (or an underlying fund in which the Fund invests) invests in real estate investment trusts (REITs) and/or master limited partnerships (MLPs), the percentages attributed to each category are estimated using historical information because the character of the amounts received from the REITs and/or MLPs in which the Fund (or underlying fund) invests is unknown until after the end of the calendar year. Because the Fund is actively managed, the relative amount of the Fund’s total distributions derived from various sources over the calendar year may change. Please note that this information should not be used for tax reporting purposes as the tax character of distributable income may differ from the amounts used for this notification. You will receive communication in the first quarter of each calendar year detailing the actual amount of the taxable and non-taxable portion of distributions paid to you during the tax year.
For the most current information, please go to oppenheimerfunds.com. Select your Fund, and scroll down to the ‘Dividends’ table under ‘Analytics’. The Fund’s latest distribution information will be followed by the sources of any distribution, updated daily.
| Fund Name | Pay Date | Net Income | Net Profit from Sale | Other Capital Sources | ||||||||||||
| Oppenheimer Main Street Small Cap Fund®/VA | 6/19/18 | 0.70% | 69.8% | 29.5% | ||||||||||||
20 OPPENHEIMER MAIN STREET SMALL CAP FUND/VA
THIS PAGE INTENTIONALLY LEFT BLANK.
21 OPPENHEIMER MAIN STREET SMALL CAP FUND/VA
THIS PAGE INTENTIONALLY LEFT BLANK.
22 OPPENHEIMER MAIN STREET SMALL CAP FUND/VA
THIS PAGE INTENTIONALLY LEFT BLANK.
23 OPPENHEIMER MAIN STREET SMALL CAP FUND/VA
OPPENHEIMER MAIN STREET SMALL CAP FUND/VA
A Series of Oppenheimer Variable Account Funds
| Trustees and Officers | Robert J. Malone, Chairman of the Board of Trustees and Trustee | |
| Andrew J. Donohue, Trustee | ||
| Richard F. Grabish, Trustee | ||
| Beverly L. Hamilton, Trustee | ||
| Victoria J. Herget, Trustee | ||
| Karen L. Stuckey, Trustee | ||
| James D. Vaughn, Trustee | ||
| Arthur P. Steinmetz, Trustee, President and Principal Executive Officer | ||
| Matthew P. Ziehl, Vice President | ||
| Raymond Anello, Vice President | ||
| Raman Vardharaj, Vice President | ||
| Joy Budzinski, Vice President | ||
| Kristin Ketner, Vice President | ||
| Magnus Krantz, Vice President | ||
| Adam Weiner, Vice President | ||
| Cynthia Lo Bessette, Secretary and Chief Legal Officer | ||
| Jennifer Foxson, Vice President and Chief Business Officer | ||
| Mary Ann Picciotto, Chief Compliance Officer and Chief Anti-Money Laundering Officer | ||
| Brian S. Petersen, Treasurer and Principal Financial & Accounting Officer | ||
| Manager | OFI Global Asset Management, Inc. | |
| Sub-Adviser | OppenheimerFunds, Inc. | |
| Distributor | OppenheimerFunds Distributor, Inc. | |
| Transfer and | OFI Global Asset Management, Inc. | |
| Shareholder | ||
| Servicing Agent | ||
| Sub-Transfer Agent | Shareholder Services, Inc. | |
| DBA OppenheimerFunds Services | ||
| Independent | KPMG LLP | |
| Registered | ||
| Public | ||
| Accounting | ||
| Firm | ||
| Legal Counsel | Ropes & Gray LLP | |
| Before investing in any of the Oppenheimer funds, investors should carefully consider a fund’s investment objectives, risks, charges and expenses. Fund prospectuses and summary prospectuses contain this and other information about the funds, and may be obtained by asking your financial advisor, visiting oppenheimerfunds.com or calling us at 1.800.988.8287. Read prospectuses and summary prospectuses carefully before investing. | ||
| The financial statements included herein have been taken from the records of the Fund without examination of those records by the independent registered public accounting firm. | ||
| © 2018 OppenheimerFunds, Inc. All rights reserved. Oppenheimer funds are distributed by OppenheimerFunds Distributor, Inc. | ||

 | ||||
June 30, 2018
| ||||
Oppenheimer | ||||
| Government Money Fund/VA | Semiannual Report | |||
A Series of Oppenheimer Variable Account Funds
| ||||
SEMIANNUAL REPORT | ||||
Listing of Top Holdings | ||||
Fund Performance Discussion | ||||
Financial Statements |
PORTFOLIO MANAGERS: Christopher Proctor, CFA and Adam S. Wilde, CFA
Current Yield | ||||||
For the 7-Day Period Ended 6/30/18 | ||||||
With Compounding | 1.43 | % | ||||
Without Compounding | 1.42 | % | ||||
For the 6-Month Period Ended 6/30/18 | ||||||
With Compounding | 1.09 | % | ||||
Without Compounding | 1.09 | % | ||||
Performance data quoted represents past performance, which does not guarantee future results. Yields include dividends in a hypothetical investment for the periods shown. Current performance may be lower or higher than the performance quoted. For performance data current to the most recent month end, call us at 1.800.988.8287. The yields take into account contractual and voluntary fee waivers and/or expense reimbursements, without which yields would have been lower. Some of these undertakings may be modified at any time, as indicated in the prospectus. There is no guarantee that the Fund will maintain a positive yield. The Fund’s performance should not be expected to be the same as the returns of other funds, whether or not both funds have the same portfolio managers and/or similar names. The Fund’s performance does not include the charges associated with the separate account products that offer this Fund. Such performance would have been lower if such charges were taken into account. See Fund prospectuses and summary prospectuses for more information on share classes and sales charges.
PORTFOLIO ALLOCATION | ||||
Repurchase Agreements | 49.0% | |||
U.S. Government Agencies | 47.9 | |||
Investment Companies | 2.6 | |||
U.S. Government Obligations | 0.5 |
Portfolio holdings and allocations are subject to change. Percentages are as of June 30, 2018, and are based on the total market value of investments. For more current Fund holdings, please visit oppenheimerfunds.com
2 OPPENHEIMER GOVERNMENT MONEY FUND/VA
Fund Performance Discussion
Throughout the reporting period, the Fund continued to offer very strong liquidity and a stable $1.00 net asset value (NAV). At its June meeting, the Federal Open Market Committee (FOMC) voted to lift the Federal Funds Rate, to a range of 1.75% to 2.00%, completing its seventh hike in this cycle. The Fund continued to benefit from these rate hikes, with ongoing reinvestment at higher rates. With the added expectation for further hikes this year, we believe the Fund’s yield forecast remains optimistic.
MARKET OVERVIEW
In November of 2017, it was announced that Jerome Powell would become the 16th Chair of the Federal Reserve (the “Fed”). Many market participants believe his appointment by President Trump will allow for a continuation of policy – a slow and steady rise in the Fed Funds Rate. Mr. Powell has served on the Federal Reserve Board of Governors since 2012 and during this tenure has voted in harmony with the FOMC statements under both Janet Yellen and Ben Bernanke.
Current broader market and FOMC consensus is for two more hikes in 2018. We estimate the most likely scenario includes a hike at each of the September and December meetings. Should the markets remain stable and steady, many on the street are forecasting a total of four hikes in 2018. The more conservative consensus view puts the Fed Funds Rate in the 2.00% to 2.25% range at year end. Coupled with these hikes, the Fed plans to shrink its balance sheet from $4.5 trillion, a move it started in October 2017. While the Fed has not indicated a balance sheet level it intends to hit, it has denoted the holdings will not return to pre-recession levels (less than $1 trillion).
Another area of continued interest is in Treasury bill supply. Once the debt ceiling issue was resolved, the Treasury restocked its cash balances in the first quarter of 2018 with record Treasury bill issuance. This anticipated increase in supply had a favorable impact on money market yields. In April 2018, net Treasury bill supply was negative and some are predicting issuance through year-end to be flat. We continue to keep a watchful eye on the prospects of the U.S. Treasury issuing a 2-month Treasury bill. While this has been in the works for some time now, expectations are for a September issuance.
Finally, the market witnessed a large spread difference in the 3-month London interbank offered rate and Overnight Index Swap rate in the month of April.1 The noise brought back memories of previous spikes, notably the 2008 financial crisis and the European debt crisis. However, this time around, the increase was not due to any credit concerns but rather the excess Treasury supply mentioned above and the repatriation of overseas cash. With the excess of Treasury bill supply, coupled with the Fed rate hikes, we continue to welcome higher rates and look forward to passing those on to our investors.
FUND REVIEW
The Fund’s weighted average maturity throughout the reporting period averaged 21 days with a range of 15-30 days. Supply continues to be available, notably in Federal Home Loan Bank paper. We are heavily weighted in government repurchase agreements and will occasionally add some long-dated fixed paper to the portfolio. We believe the Fund is well positioned should the Fed continue its gradual, upward trajectory on the Fed Funds Rate.
STRATEGY & OUTLOOK
Our strategy continues to incorporate select incremental investing as we seek to provide shareholders stable and steady value. We intend to remain active in the auction market, with most of that weight going to fixed-rate instruments with durations of three months or less. When pricing allows, we will continue to layer in one- and three-month floating rate securities. Our outlook is for continued rate hikes in 2018, and our investment strategy is in line with Fed’s dot plot for more hikes this year. We believe the Fund is well-positioned to take advantage of these higher rates as long as the Fed continues on a path of slow and steady hikes.
1. The London InterBank Offered Rate (LIBOR) is the average interest rate estimated by leading banks in London that they would be charged if borrowing from other banks. It is a primary benchmark for short- term interest rates around the world. The Overnight Index Swap rate is the difference between the overnight lending rates set by central banks and the three-month Libor. The Overnight Index Swap rate tracks the relationship between an expected three-month Fed Funds Rate and three-month Libor.
3 OPPENHEIMER GOVERNMENT MONEY FUND/VA
The views in the Fund Performance Discussion represent the opinions of this Fund’s portfolio managers and are not intended as investment advice or to predict or depict the performance of any investment. These views are as of the close of business on June 30, 2018, and are subject to change based on subsequent developments. The Fund’s portfolio and strategies are subject to change.
You could lose money by investing in the Fund. Although the Fund seeks to preserve the value of your investment at $1.00 per share, it cannot guarantee it will do so. An investment in the Fund is not insured or guaranteed by the Federal Deposit Insurance Corporation or any other government agency. The Fund’s sponsor has no legal obligation to provide financial support to the Fund, and you should not expect that the sponsor will provide financial support to the Fund at any time.
Shares of Oppenheimer funds are not deposits or obligations of any bank, are not guaranteed by any bank, are not insured by the FDIC or any other agency, and involve investment risks, including the possible loss of the principal amount invested.
4 OPPENHEIMER GOVERNMENT MONEY FUND/VA
Fund Expenses
Fund Expenses. As a shareholder of the Fund, you incur two types of costs: (1) transaction costs and (2) ongoing costs, including management fees; and other Fund expenses. These examples are intended to help you understand your ongoing costs (in dollars) of investing in the Fund and to compare these costs with the ongoing costs of investing in other mutual funds.
The examples are based on an investment of $1,000.00 invested at the beginning of the period and held for the entire 6-month period ended June 30, 2018.
Actual Expenses. The first section of the table provides information about actual account values and actual expenses. You may use the information in this section, together with the amount you invested, to estimate the expense that you paid over the period. Simply divide your account value by $1,000.00 (for example, an $8,600.00 account value divided by $1,000.00 = 8.60), then multiply the result by the number in the first section under the heading entitled “Expenses Paid During During 6 Months Ended June 30, 2018” to estimate the expenses you paid on your account during this period.
Hypothetical Example for Comparison Purposes.
The second section of the table provides information about hypothetical account values and hypothetical expenses based on the Fund’s actual expense ratio, and an assumed rate of return of 5% per year before expenses, which is not the actual return. The hypothetical account values and expenses may not be used to estimate the actual ending account balance or expenses you paid for the period. You may use this information to compare the ongoing costs of investing in the Fund and other funds. To do so, compare this 5% hypothetical example with the 5% hypothetical examples that appear in the shareholder reports of the other funds.
Please note that the expenses shown in the table are meant to highlight your ongoing costs only and do not reflect any charges associated with the separate accounts that offer this Fund. Therefore, the “hypothetical” lines of the table are useful in comparing ongoing costs only, and will not help you determine the relative total costs of owning different funds. In addition, if these separate account charges were included your costs would have been higher.
| Actual | Beginning Account Value | Ending Account Value | Expenses Paid During 6 Months Ended June 30, 2018 | |||||||||
| ||||||||||||
| $ | 1,000.00 | $ | 1,005.40 | $ | 2.49 | |||||||
| ||||||||||||
| Hypothetical | ||||||||||||
| (5% return before expenses) | ||||||||||||
| ||||||||||||
| 1,000.00 | 1,022.32 | 2.51 | ||||||||||
| ||||||||||||
Expenses are equal to the Fund’s annualized expense ratio, multiplied by the average account value over the period, multiplied by 181/365 (to reflect the one-half year period). This annualized expense ratio, excluding indirect expenses from affiliated funds, based on the 6-month period ended June 30, 2018 is as follows:
| Expense Ratio |
|
0.50% |
|
The expense ratio reflects voluntary and/or contractual waivers and/or reimbursements of expenses by the Fund’s Manager. Some of these undertakings may be modified or terminated at any time, as indicated in the Fund’s prospectus. The “Financial Highlights” table in the Fund’s financial statements, included in this report, also shows the gross expense ratio, without such waivers or reimbursements and reduction to custodian expenses, if applicable.
5 OPPENHEIMER GOVERNMENT MONEY FUND/VA
STATEMENT OF INVESTMENTS June 30, 2018 Unaudited
| Maturity Date* | Final Legal Maturity Date** | Principal Amount | Value | |||||||||||||
| ||||||||||||||||
U.S. Government Agencies—47.9% | ||||||||||||||||
| ||||||||||||||||
Federal Agricultural Mortgage Corp., 1.90% [FEDL01-1]1 | 7/2/18 | 7/3/18 | $ | 3,000,000 | $ | 3,000,000 | ||||||||||
| ||||||||||||||||
Federal Farm Credit Bank: | ||||||||||||||||
1.815%2 | 11/1/18 | 11/1/18 | 1,000,000 | 993,884 | ||||||||||||
1.85%2 | 12/10/18 | 12/10/18 | 500,000 | 495,905 | ||||||||||||
1.871%2 | 12/17/18 | 12/17/18 | 500,000 | 495,681 | ||||||||||||
1.88% [FCPR DLY-312]1 | 7/2/18 | 1/2/19 | 1,500,000 | 1,500,000 | ||||||||||||
1.93% [FCPR DLY-307]1 | 7/2/18 | 2/20/19 | 1,000,000 | 999,958 | ||||||||||||
1.936% [US0001M-11]1 | 7/12/18 | 3/12/19 | 1,000,000 | 999,979 | ||||||||||||
1.961% [US0001M-8.5]1 | 7/9/18 | 7/9/19 | 1,000,000 | 999,911 | ||||||||||||
1.973% [US0001M-13]1 | 7/27/18 | 3/27/19 | 1,000,000 | 999,821 | ||||||||||||
2.037% [US0001M-6.5]1 | 7/28/18 | 3/28/19 | 2,000,000 | 2,000,000 | ||||||||||||
2.186%2 | 4/3/19 | 4/3/19 | 2,000,000 | 1,967,187 | ||||||||||||
2.252%2 | 2/21/19 | 2/21/19 | 1,000,000 | 985,574 | ||||||||||||
2.265%2 | 3/11/19 | 3/11/19 | 500,000 | 492,199 | ||||||||||||
2.276%2 | 3/19/19 | 3/19/19 | 500,000 | 491,916 | ||||||||||||
| ||||||||||||||||
Federal Home Loan Bank: | ||||||||||||||||
1.25% | 7/27/18 | 7/27/18 | 1,000,000 | 999,731 | ||||||||||||
1.25% | 1/16/19 | 1/16/19 | 1,000,000 | 995,422 | ||||||||||||
1.375% | 3/18/19 | 3/18/19 | 2,000,000 | 1,988,690 | ||||||||||||
1.644%2 | 8/1/18 | 8/1/18 | 1,000,000 | 998,596 | ||||||||||||
1.654%2 | 8/3/18 | 8/3/18 | 2,000,000 | 1,996,993 | ||||||||||||
1.707%2 | 7/6/18 | 7/6/18 | 10,200,000 | 10,197,592 | ||||||||||||
1.744%2 | 8/10/18 | 8/10/18 | 1,000,000 | 998,079 | ||||||||||||
1.75% | 12/14/18 | 12/14/18 | 2,000,000 | 1,998,385 | ||||||||||||
1.753%2 | 7/5/18 | 7/5/18 | 18,200,000 | 18,196,471 | ||||||||||||
1.762%2 | 7/11/18 | 7/11/18 | 38,100,000 | 38,081,414 | ||||||||||||
1.804%2 | 7/9/18 | 7/9/18 | 11,000,000 | 10,995,600 | ||||||||||||
1.853%2 | 7/18/18 | 7/18/18 | 16,100,000 | 16,085,926 | ||||||||||||
1.858%2 | 7/27/18 | 7/27/18 | 15,000,000 | 14,979,904 | ||||||||||||
1.859%2 | 7/13/18 | 7/13/18 | 1,000,000 | 999,382 | ||||||||||||
1.865%2 | 7/12/18 | 7/12/18 | 1,000,000 | 999,432 | ||||||||||||
1.879%2 | 7/25/18 | 7/25/18 | 30,000,000 | 29,962,473 | ||||||||||||
1.883% [US0001M-13]1 | 7/6/18 | 9/6/18 | 2,000,000 | 1,999,930 | ||||||||||||
1.885%2 | 8/13/18 | 8/13/18 | 15,000,000 | 14,966,317 | ||||||||||||
1.89%2 | 8/22/18 | 8/22/18 | 750,000 | 747,958 | ||||||||||||
1.898%2 | 7/26/18 | 7/26/18 | 3,000,000 | 2,996,052 | ||||||||||||
1.913%2 | 10/10/18 | 10/10/18 | 1,000,000 | 994,684 | ||||||||||||
1.923%2 | 10/12/18 | 10/12/18 | 1,000,000 | 994,553 | ||||||||||||
1.923% [US0001M-9]1 | 7/6/18 | 4/5/19 | 2,000,000 | 2,000,000 | ||||||||||||
1.929%2 | 9/18/18 | 9/18/18 | 1,400,000 | 1,394,101 | ||||||||||||
1.93%2 | 8/31/18 | 8/31/18 | 4,000,000 | 3,986,980 | ||||||||||||
1.934% [US0003M-40.5]1 | 7/30/18 | 1/30/19 | 1,000,000 | 1,000,000 | ||||||||||||
1.935%2 | 9/25/18 | 9/25/18 | 1,000,000 | 995,401 | ||||||||||||
1.939%2 | 9/21/18 | 9/21/18 | 3,000,000 | 2,986,812 | ||||||||||||
1.949% [US0001M-13.5]1 | 7/28/18 | 2/28/19 | 3,000,000 | 3,000,000 | ||||||||||||
1.952% [US0001M-14]1 | 7/2/18 | 1/2/19 | 1,000,000 | 1,000,000 | ||||||||||||
1.954% [US0001M-13]1 | 7/20/18 | 8/20/18 | 1,000,000 | 1,000,000 | ||||||||||||
1.961% [US0001M-13]1 | 7/25/18 | 2/25/19 | 4,000,000 | 4,000,111 | ||||||||||||
1.961% [US0001M-13]1 | 7/25/18 | 1/25/19 | 2,000,000 | 2,000,000 | ||||||||||||
1.962% [US0001M-13]1 | 7/2/18 | 3/1/19 | 1,000,000 | 1,000,000 | ||||||||||||
1.962% [US0001M-13]1 | 7/2/18 | 8/30/18 | 1,000,000 | 1,000,000 | ||||||||||||
1.963% [US0001M-11]1 | 7/15/18 | 12/14/18 | 2,000,000 | 2,000,000 | ||||||||||||
1.968% [US0001M-13.5]1 | 7/27/18 | 12/27/18 | 1,000,000 | 1,000,054 | ||||||||||||
1.974% [US0001M-11]1 | 7/22/18 | 2/22/19 | 2,000,000 | 1,999,966 | ||||||||||||
1.974% [US0001M-11]1 | 7/22/18 | 4/22/19 | 2,000,000 | 1,999,713 | ||||||||||||
1.976% [US0001M-11.5]1 | 7/25/18 | 10/25/18 | 2,000,000 | 2,000,000 | ||||||||||||
1.978% [US0001M-11]1 | 7/21/18 | 12/21/18 | 1,000,000 | 1,000,000 | ||||||||||||
1.982% [US0001M-11]1 | 7/2/18 | 2/1/19 | 3,000,000 | 3,000,000 | ||||||||||||
1.99%2 | 10/17/18 | 10/17/18 | 4,000,000 | 3,976,360 | ||||||||||||
1.991% [US0003M-34]1 | 7/9/18 | 4/9/19 | 1,000,000 | 1,000,000 | ||||||||||||
1.993% [US0001M-10.5]1 | 7/26/18 | 5/24/19 | 1,000,000 | 1,000,000 | ||||||||||||
1.997% [US0001M-10.5]1 | 7/28/18 | 5/28/19 | 3,000,000 | 2,999,913 | ||||||||||||
2.00% | 9/14/18 | 9/14/18 | 1,500,000 | 1,500,835 | ||||||||||||
2.003% [US0001M-10]1 | 7/27/18 | 12/27/18 | 2,000,000 | 1,999,884 | ||||||||||||
2.02%2 | 10/22/18 | 10/22/18 | 5,000,000 | 4,968,611 | ||||||||||||
2.038% [US0001M-6]1 | 7/26/18 | 4/26/19 | 1,000,000 | 1,000,000 | ||||||||||||
6 OPPENHEIMER GOVERNMENT MONEY FUND/VA
| Maturity Date* | Final Legal Maturity Date** | Principal Amount | Value | |||||||||||||
| ||||||||||||||||
U.S. Government Agencies (Continued) | ||||||||||||||||
| ||||||||||||||||
Federal Home Loan Bank: (Continued) | ||||||||||||||||
2.076%2 | 11/28/18 | 11/28/18 | $ | 6,000,000 | $ | 5,948,750 | ||||||||||
2.094% [US0003M-24.5]1 | 9/26/18 | 9/26/18 | 5,000,000 | 5,000,000 | ||||||||||||
2.111% [US0003M-22]1 | 7/9/18 | 7/9/18 | 1,000,000 | 999,997 | ||||||||||||
2.146% [US0003M-19]1 | 9/14/18 | 9/14/18 | 1,000,000 | 1,000,000 | ||||||||||||
2.166%2 | 3/28/19 | 3/28/19 | 1,000,000 | 984,100 | ||||||||||||
| ||||||||||||||||
Federal Home Loan Mortgage Corp., 1.20% | 12/28/18 | 12/28/18 | 300,000 | 299,025 | ||||||||||||
| ||||||||||||||||
Federal National Mortgage Assn.: | ||||||||||||||||
1.125% | 12/14/18 | 12/14/18 | 1,000,000 | 996,845 | ||||||||||||
1.625% | 11/27/18 | 11/27/18 | 1,340,000 | 1,337,699 | ||||||||||||
| ||||||||||||||||
Tennessee Valley Authority, 1.882%2 | 7/10/18 | 7/10/18 | 18,100,000 | 18,091,493 | ||||||||||||
|
| |||||||||||||||
Total U.S. Government Agencies (Cost $281,062,249) |
| 281,062,249 | ||||||||||||||
| ||||||||||||||||
U.S. Government Obligation—0.5% | ||||||||||||||||
| ||||||||||||||||
United States Treasury Bills, 1.976%2 (Cost $2,982,325) | 10/18/18 | 10/18/18 | 3,000,000 | 2,982,325 | ||||||||||||
| ||||||||||||||||
Repurchase Agreements—49.0% | ||||||||||||||||
| ||||||||||||||||
Repurchase Agreements3 (Cost $287,300,000) | 287,300,000 | 287,300,000 | ||||||||||||||
| Shares | ||||||||||||||||
| ||||||||||||||||
Investment Company—2.6% | ||||||||||||||||
| ||||||||||||||||
Oppenheimer Institutional Government Money Market Fund, Cl. E, 1.85%4,5 (Cost $15,403,229) | 15,403,229 | 15,403,229 | ||||||||||||||
| ||||||||||||||||
Total Investments, at Value (Cost $586,747,803) | 100.0% | 586,747,803 | ||||||||||||||
| ||||||||||||||||
Net Other Assets (Liabilities) | 0.0 | 90,264 | ||||||||||||||
|
| |||||||||||||||
Net Assets | 100.0% | $ | 586,838,067 | |||||||||||||
|
| |||||||||||||||
Footnotes to Statement of Investments
Short-term notes and direct bank obligations are generally traded on a discount basis; the interest rate shown is the discount rate received by the Fund at the time of purchase. Other securities normally bear interest at the rates shown.
* The Maturity Date represents the date used to calculate the Fund’s weighted average maturity as determined under Rule 2a-7.
** If different from the Maturity Date, the Final Legal Maturity Date includes any maturity date extensions which may be affected at the option of the issuer or unconditional payments of principal by the issuer which may be affected at the option of the Fund, and represents the date used to calculate the Fund’s weighted average life as determined under Rule 2a-7.
1. Represents the current interest rate for a variable or increasing rate security, determined as [Referenced Rate + Basis-point spread].
2. Zero coupon bond reflects effective yield on the original acquisition date.
3. Repurchase agreements:
| Counterparty | Lending Rate | Settlement Date | Maturity Date | Principal Amount | Collateralized By | Collateral Received, at Valuea | Repurchase Agreements, at Value | Repurchase Agreement Proceeds to be Receiveda | ||||||||||||||||||||||
| ||||||||||||||||||||||||||||||
| Credit Agricole Corp. & Investment Bank | 1.94% | 6/13/18 | 7/13/18 | $ | 10,000,000 | U.S. Treasury Nts., 0.375%, 1/15/27 | $ | (10,216,508) | $10,000,000 | $10,016,185 | ||||||||||||||||||||
| Credit Agricole Corp. & Investment Bank | 2.10 | 6/29/18 | 7/2/18 | 1,000,000 | U.S. Treasury Nts., 0.375%, 1/15/27 | (1,020,269) | 1,000,000 | 1,000,263 | ||||||||||||||||||||||
| Deusche Bank Securities, Inc. | 2.11 | 6/29/18 | 7/2/18 | 5,000,000 | U.S. Government Agency, 3.00%, 1/15/56 | (5,500,968) | 5,000,000 | 5,000,880 | ||||||||||||||||||||||
| INTL FCStone Financial, Inc. | 1.90 | 6/26/18 | 7/3/18 | 5,000,000 | U.S. Government Agency, 2.00%-7.50%, 8/1/18-7/1/48 | (5,104,283) | 5,000,000 | 5,001,583 | ||||||||||||||||||||||
| INTL FCStone Financial, Inc. | 1.90 | 6/27/18 | 7/3/18 | 10,000,000 | U.S. Government Agency, 2.50%-7.50%, 12/1/19-12/1/47 | (10,223,213) | 10,000,000 | 10,002,639 | ||||||||||||||||||||||
| INTL FCStone Financial, Inc. | 1.95 | 6/19/18 | 7/19/18 | 3,000,000 | U.S. Government Agency, 2.50%-4.50%, 7/1/30-7/1/48 | (3,062,155) | 3,000,000 | 3,002,113 | ||||||||||||||||||||||
| RBC Dominion Securities, Inc. | 1.94 | 6/14/18 | 7/13/18 | 5,000,000 | U.S. Treasury Nts., 0.50%-2.25%, 11/15/27- 1/15/28; U.S. Treasury Bonds, 3.00%, 2/15/48; U.S. Treasury Bills, 0.00%, 12/27/18 and U.S. Government Agency, 3.50%, 5/20/47-11/20/47 | (5,104,996) | 5,000,000 | 5,004,898 | ||||||||||||||||||||||
RBC Dominion Securities, Inc. | 1.94 | 6/15/18 | 7/16/18 | 4,000,000 | U.S. Treasury Nts., 0.125%, 4/15/19 and U.S. Treasury Bills, 0.00%, 12/27/18 | (4,083,787) | 4,000,000 | 4,003,713 | ||||||||||||||||||||||
7 OPPENHEIMER GOVERNMENT MONEY FUND/VA
STATEMENT OF INVESTMENTS Unaudited / Continued
Footnotes to Statement of Investments (Continued)
| Counterparty | Lending Rate | Settlement Date | Maturity Date | Principal Amount | Collateralized By | Collateral Received, at Valuea | Repurchase Agreements, at Value | Repurchase Agreement Proceeds to be Receiveda | ||||||||||||||||||||||
| RBC Dominion Securities, Inc. | 2.10% | 6/29/18 | 7/2/18 | $ | 68,500,000 | U.S. Treasury Nts., 0.50%-2.875%, 10/31/20- 5/15/28; U.S. Treasury Bonds, 3.00%-5.50%, 8/15/28-2/15/47; U.S. Treasury Bills, 0.00%, 12/27/18 and U.S. Government Agency, 5.50%, 1/15/38 | $ | (69,882,227) | $68,500,000 | $68,511,988 | ||||||||||||||||||||
| Royal Bank Of Canada | 2.07 | 6/29/18 | 7/2/18 | 105,000,000 | U.S. Government Agency, 2.697%-5.00%, 6/1/35-4/20/68 | (107,118,475) | 105,000,000 | 105,018,113 | ||||||||||||||||||||||
| South Street Securities LLC | 2.02 | 6/26/18 | 7/3/18 | 25,000,000 | U.S. Government Agency, 1.853%-6.07%, 2/1/19-5/1/48 | (25,508,585) | 25,000,000 | 25,008,417 | ||||||||||||||||||||||
| South Street Securities LLC | 2.10 | 6/29/18 | 7/2/18 | 25,000,000 | U.S. Treasury Nts., 1.50%, 8/15/26 and U.S. Government Agency, 2.00%-5.00%, 11/1/20-5/1/48 | (25,504,463) | 25,000,000 | 25,004,375 | ||||||||||||||||||||||
| TD Securities (USA) LLC | 1.92 | 6/28/18 | 7/5/18 | 11,800,000 | U.S. Government Agency, 3.50%, 7/1/46 | (12,038,568) | 11,800,000 | 11,802,518 | ||||||||||||||||||||||
| TD Securities (USA) LLC | 2.11 | 6/29/18 | 7/2/18 | 9,000,000 | U.S. Government Agency, 3.50%, 7/1/46 | (9,181,615) | 9,000,000 | 9,001,583 | ||||||||||||||||||||||
|
| |||||||||||||||||||||||||||||
| $ | (293,550,112) | $287,300,000 | $287,379,268 | |||||||||||||||||||||||||||
|
| |||||||||||||||||||||||||||||
a. Includes accrued interest.
4. Rate shown is the 7-day yield at period end.
5. Is or was an affiliate, as defined in the Investment Company Act of 1940, as amended, at or during the reporting period, by virtue of the Fund owning at least 5% of the voting securities of the issuer or as a result of the Fund and the issuer having the same investment adviser. Transactions during the reporting period in which the issuer was an affiliate are as follows:
| Shares December 31, 2017 | Gross Additions | Gross Reductions | Shares June 30, 2018 | |||||||||||||
| ||||||||||||||||
Oppenheimer Institutional Government Money Market Fund, Cl. E | 15,295,885 | 107,344 | — | 15,403,229 | ||||||||||||
| Value | Income | Realized Gain (Loss) | Change in Unrealized Gain (Loss) | |||||||||||||
| ||||||||||||||||
Oppenheimer Institutional Government Money Market Fund, Cl. E | $ | 15,403,229 | $ | 115,394 | $ | — | $ | — | ||||||||
Glossary: | ||
Definitions | ||
FCPR DLY | Federal Reserve Bank Prime Loan Rate US Daily | |
FEDL01 | US Federal Funds Effective Rate (continuous series) | |
US0001M | ICE LIBOR USD 1 Month | |
US0003M | ICE LIBOR USD 3 Month |
See accompanying Notes to Financial Statements.
8 OPPENHEIMER GOVERNMENT MONEY FUND/VA
STATEMENT OF ASSETS AND LIABILITIES June 30, 2018 Unaudited
| ||
Assets | ||||
Investments, at value—see accompanying statement of investments: | ||||
Unaffiliated companies (cost $284,044,574) | $ | 284,044,574 | ||
Affiliated companies (cost $15,403,229) | 15,403,229 | |||
Repurchase agreements (cost $287,300,000) | 287,300,000 | |||
|
| |||
| 586,747,803 | ||||
| ||||
Cash | 88,488 | |||
| ||||
Receivables and other assets: | ||||
Shares of beneficial interest sold | 210,994 | |||
Interest and dividends | 177,422 | |||
Other | 67,874 | |||
|
| |||
Total assets | 587,292,581 | |||
| ||||
Liabilities | ||||
Payables and other liabilities: | ||||
Dividends | 284,898 | |||
Shares of beneficial interest redeemed | 76,912 | |||
Trustees’ compensation | 60,011 | |||
Shareholder communications | 2,549 | |||
Other | 30,144 | |||
|
| |||
Total liabilities | 454,514 | |||
| ||||
Net Assets | $ | 586,838,067 | ||
|
| |||
| ||||
Composition of Net Assets | ||||
Par value of shares of beneficial interest | $ | 586,813 | ||
| ||||
Additional paid-in capital | 586,257,994 | |||
| ||||
Accumulated net investment loss | (6,451) | |||
| ||||
Accumulated net realized loss on investments | (289) | |||
| ||||
Net Assets — applicable to 586,812,519 shares of beneficial interest outstanding | $ | 586,838,067 | ||
|
| |||
| ||||
Net Asset Value, Redemption Price Per Share and Offering Price Per Share | $1.00 | |||
See accompanying Notes to Financial Statements.
9 OPPENHEIMER GOVERNMENT MONEY FUND/VA
STATEMENT OF OPERATIONS For the Six Months Ended June 30, 2018 Unaudited
| ||||
Investment Income | ||||
Interest | $ | 4,195,776 | ||
| ||||
Dividends from affiliated companies | 115,394 | |||
|
| |||
Total investment income | 4,311,170 | |||
| ||||
Expenses | ||||
Management fees | 1,191,349 | |||
| ||||
Transfer and shareholder servicing agent fees | 319,847 | |||
| ||||
Shareholder communications | 19,658 | |||
| ||||
Trustees’ compensation | 27,469 | |||
| ||||
Custodian fees and expenses | 5,055 | |||
| ||||
Other | 41,107 | |||
|
| |||
Total expenses | 1,604,485 | |||
Less reduction to custodian expenses | (178) | |||
Less waivers and reimbursements of expenses | (271,609) | |||
|
| |||
Net expenses | 1,332,698 | |||
| ||||
Net Investment Income | 2,978,472 | |||
| ||||
Net Realized Gain on Investment Transactions in Unaffiliated Companies | 292 | |||
| ||||
Net Increase in Net Assets Resulting from Operations | $ | 2,978,764 | ||
|
| |||
See accompanying Notes to Financial Statements.
10 OPPENHEIMER GOVERNMENT MONEY FUND/VA
STATEMENTS OF CHANGES IN NET ASSETS
| Six Months Ended June 30, 2018 (Unaudited) | Year Ended December 31, 2017 | |||||||
| ||||||||
Operations | ||||||||
Net investment income | $ | 2,978,472 | $ | 1,902,800 | ||||
| ||||||||
Net realized gain (loss) | 292 | (366) | ||||||
|
| |||||||
Net increase in net assets resulting from operations | 2,978,764 | 1,902,434 | ||||||
| ||||||||
Dividends and/or Distributions to Shareholders | ||||||||
Dividends from net investment income | (2,978,680) | (1,903,588) | ||||||
| ||||||||
Beneficial Interest Transactions | ||||||||
Net increase (decrease) in net assets resulting from beneficial interest transactions | 161,233,699 | (116,364,487) | ||||||
| ||||||||
Net Assets | ||||||||
Total increase (decrease) | 161,233,783 | (116,365,641) | ||||||
| ||||||||
Beginning of period | 425,604,284 | 541,969,925 | ||||||
|
| |||||||
End of period (including accumulated net investment loss of $6,451 and $6,243, respectively) | $ | 586,838,067 | $ | 425,604,284 | ||||
|
| |||||||
See accompanying Notes to Financial Statements.
11 OPPENHEIMER GOVERNMENT MONEY FUND/VA
FINANCIAL HIGHLIGHTS
| Six Months Ended June 30, 2018 (Unaudited) | Year Ended December 31, 2017 | Year Ended December 31, 2016 | Year Ended December 31, 2015 | Year Ended December 31, 2014 | Year Ended December 31, 2013 | |||||||||||||||||||
| ||||||||||||||||||||||||
Per Share Operating Data | ||||||||||||||||||||||||
Net asset value, beginning of period | $1.00 | $1.00 | $1.00 | $1.00 | $1.00 | $1.00 | ||||||||||||||||||
| ||||||||||||||||||||||||
Income (loss) from investment operations: | ||||||||||||||||||||||||
Net investment income1 | 0.01 | 0.002 | 0.002 | 0.002 | 0.002 | 0.002 | ||||||||||||||||||
Net realized gain (loss) | 0.002 | (0.00)2 | (0.00)2 | 0.002 | 0.002 | 0.002 | ||||||||||||||||||
|
| |||||||||||||||||||||||
Total from investment operations | 0.01 | 0.002 | 0.002 | 0.002 | 0.002 | 0.002 | ||||||||||||||||||
Dividends and/or distributions to shareholders: | ||||||||||||||||||||||||
Dividends from net investment income | (0.01) | (0.00)2 | (0.00)2 | (0.00)2 | (0.00)2 | (0.00)2 | ||||||||||||||||||
| ||||||||||||||||||||||||
Net asset value, end of period | $1.00 | $1.00 | $1.00 | $1.00 | $1.00 | $1.00 | ||||||||||||||||||
|
| |||||||||||||||||||||||
| ||||||||||||||||||||||||
Total Return, at Net Asset Value3 | 0.54% | 0.39% | 0.01% | 0.01% | 0.01% | 0.01% | ||||||||||||||||||
| ||||||||||||||||||||||||
Ratios/Supplemental Data
| ||||||||||||||||||||||||
Net assets, end of period (in thousands) | $586,838 | $425,604 | $541,970 | $2,648,636 | $515,297 | $177,026 | ||||||||||||||||||
| ||||||||||||||||||||||||
Average net assets (in thousands) | $538,988 | $488,532 | $1,470,447 | $1,144,581 | $329,045 | $178,263 | ||||||||||||||||||
| ||||||||||||||||||||||||
Ratios to average net assets:4 | ||||||||||||||||||||||||
Net investment income | 1.11% | 0.39% | 0.01% | 0.01% | 0.01% | 0.01% | ||||||||||||||||||
Total expenses | 0.60%5 | 0.59%5 | 0.55%5 | 0.53%5 | 0.57%5 | 0.61% | ||||||||||||||||||
Expenses after payments, waivers and/or reimbursements and reduction to custodian expenses | 0.50% | 0.50% | 0.35% | 0.19% | 0.15% | 0.22% | ||||||||||||||||||
1. Per share amounts calculated based on the average shares outstanding during the period.
2. Less than $0.005 per share.
3. Assumes an initial investment on the business day before the first day of the fiscal period, with all dividends and distributions reinvested in additional shares on the reinvestment date, and redemption at the net asset value calculated on the last business day of the fiscal period. Total returns are not annualized for periods less than one full year. Total return information does not reflect expenses that apply at the separate account level or to related insurance products. Inclusion of these charges would reduce the total return figures for all periods shown. Returns do not reflect the deduction of taxes that a shareholder would pay on fund distributions or the redemption of fund shares.
4. Annualized for periods less than one full year.
5. Total expenses including indirect expenses from affiliated fund fees and expenses were as follows:
Six Months Ended June 30, 2018 | 0.60 | % | ||
Year Ended December 31, 2017 | 0.59 | % | ||
Year Ended December 31, 2016 | 0.55 | % | ||
Year Ended December 31, 2015 | 0.53 | % | ||
Year Ended December 31, 2014 | 0.57 | % |
See accompanying Notes to Financial Statements.
12 OPPENHEIMER GOVERNMENT MONEY FUND/VA
NOTES TO FINANCIAL STATEMENTS June 30, 2018 Unaudited
1. Organization
Oppenheimer Government Money Fund/VA (the “Fund”), a separate series of Oppenheimer Variable Account Funds, is a diversified open-end management investment company registered under the Investment Company Act of 1940 (“1940 Act”), as amended. The Fund’s investment objective is to seek income consistent with stability of principal. The Fund’s investment adviser is OFI Global Asset Management, Inc. (“OFI Global” or the “Manager”), a wholly-owned subsidiary of OppenheimerFunds, Inc. (“OFI” or the “Sub-Adviser”). The Manager has entered into a sub-advisory agreement with OFI. Shares of the Fund are sold only to separate accounts of life insurance companies.
The following is a summary of significant accounting policies followed in the Fund’s preparation of financial statements in accordance with accounting principles generally accepted in the United States (“U.S. GAAP”).
2. Significant Accounting Policies
Security Valuation. All investments in securities are recorded at their estimated fair value, as described in Note 3.
Dividends and Distributions to Shareholders. Dividends and distributions to shareholders, which are determined in accordance with income tax regulations and may differ from U.S. GAAP, are recorded on the ex-dividend date. Income distributions, if any, are declared daily and paid monthly. Capital gain distributions, if any, are declared and paid annually but may be paid at other times to maintain the net asset value per share at $1.00.
The tax character of distributions is determined as of the Fund’s fiscal year end. Therefore, a portion of the Fund’s distributions made to shareholders prior to the Fund’s fiscal year end may ultimately be categorized as a tax return of capital.
Investment Income. Dividend income is recorded on the ex-dividend date or upon ex-dividend notification in the case of certain foreign dividends where the ex-dividend date may have passed. Non-cash dividends included in dividend income, if any, are recorded at the fair value of the securities received. Withholding taxes on foreign dividends, if any, and capital gains taxes on foreign investments, if any, have been provided for in accordance with the Fund’s understanding of the applicable tax rules and regulations. Interest income, if any, is recognized on an accrual basis. Discount and premium, which are included in interest income on the Statement of Operations, are amortized or accreted daily.
Custodian Fees. “Custodian fees and expenses” in the Statement of Operations may include interest expense incurred by the Fund on any cash overdrafts of its custodian account during the period. Such cash overdrafts may result from the effects of failed trades in portfolio securities and from cash outflows resulting from unanticipated shareholder redemption activity. The Fund pays interest to its custodian on such cash overdrafts, to the extent they are not offset by positive cash balances maintained by the Fund, at a rate equal to the Federal Funds Rate plus 2.00%. The “Reduction to custodian expenses” line item, if applicable, represents earnings on cash balances maintained by the Fund during the period. Such interest expense and other custodian fees may be paid with these earnings.
Security Transactions. Security transactions are recorded on the trade date. Realized gains and losses on securities sold are determined on the basis of identified cost.
Indemnifications. The Fund’s organizational documents provide current and former Trustees and officers with a limited indemnification against liabilities arising in connection with the performance of their duties to the Fund. In the normal course of business, the Fund may also enter into contracts that provide general indemnifications. The Fund’s maximum exposure under these arrangements is unknown as this would be dependent on future claims that may be made against the Fund. The risk of material loss from such claims is considered remote.
Federal Taxes. The Fund intends to comply with provisions of the Internal Revenue Code applicable to regulated investment companies and to distribute substantially all of its investment company taxable income to shareholders. Therefore, no federal income or excise tax provision is required. The Fund files income tax returns in U.S. federal and applicable state jurisdictions. The statute of limitations on the Fund’s tax return filings generally remains open for the three preceding fiscal reporting period ends. The Fund has analyzed its tax positions for the fiscal year ended December 31, 2017, including open tax years, and does not believe there are any uncertain tax positions requiring recognition in the Fund’s financial statements.
During the fiscal year ended December 31, 2017, the Fund did not utilize any capital loss carryforward to offset capital gains realized in that fiscal year. For the fiscal year ended December 31, 2017, the Fund had capital loss carryforwards of $581. Capital losses will be carried forward to future years if not offset by gains.
At period end, it is estimated that the capital loss carryforwards would be $289. The estimated capital loss carryforward represents the carryforward as of the end of the last fiscal year, increased or decreased by capital losses or gains realized in the first six months of the current fiscal year. During the reporting period, it is estimated that the Fund will utilize $292 of capital loss carryforward to offset realized capital gains.
Use of Estimates. The preparation of financial statements in conformity with U.S. GAAP requires management to make estimates and assumptions that affect the reported amounts of assets and liabilities and disclosure of contingent assets and liabilities at the date of the financial statements and the reported amounts of increases and decreases in net assets from operations during the reporting period. Actual results could differ from those estimates.
3. Securities Valuation
The Fund calculates the net asset value of its shares as of 4:00 P.M. Eastern Time, on each day the New York Stock Exchange (the “Exchange”) is open
13 OPPENHEIMER GOVERNMENT MONEY FUND/VA
NOTES TO FINANCIAL STATEMENTS Unaudited / Continued
3. Securities Valuation (Continued)
for trading, except in the case of a scheduled early closing of the Exchange, in which case the Fund will calculate net asset value of the shares as of the scheduled early closing time of the Exchange.
The Fund’s Board has adopted procedures for the valuation of the Fund’s securities and has delegated the day-to-day responsibility for valuation determinations under those procedures to the Manager. The Manager has established a Valuation Committee which is responsible for determining a fair valuation for any security for which market quotations are not readily available. The Valuation Committee’s fair valuation determinations are subject to review, approval and ratification by the Fund’s Board at least quarterly or more frequently, if necessary.
Valuation Methods and Inputs
Securities are valued at cost adjusted by the amortization of discount or premium to maturity (amortized cost), which approximates market value. If amortized cost is determined not to approximate market value, the fair value of the portfolio securities will be determined under procedures approved by the Fund’s Board of Trustees.
Securities for which market quotations are not readily available, or when a significant event has occurred that would materially affect the value of the security, are fair valued either (i) by a standardized fair valuation methodology applicable to the security type or the significant event as previously approved by the Valuation Committee and the Fund’s Board or (ii) as determined in good faith by the Manager’s Valuation Committee. The Valuation Committee considers all relevant facts that are reasonably available, through either public information or information available to the Manager, when determining the fair value of a security. Those standardized fair valuation methodologies include, but are not limited to, valuing securities at the last sale price or initially at cost and subsequently adjusting the value based on: changes in company specific fundamentals, changes in an appropriate securities index, or changes in the value of similar securities which may be further adjusted for any discounts related to security-specific resale restrictions. When possible, such methodologies use observable market inputs such as unadjusted quoted prices of similar securities, observable interest rates, currency rates and yield curves. The methodologies used for valuing securities are not necessarily an indication of the risks associated with investing in those securities nor can it be assured that the Fund can obtain the fair value assigned to a security if it were to sell the security.
Classifications
Each investment asset or liability of the Fund is assigned a level at measurement date based on the significance and source of the inputs to its valuation. Various data inputs may be used in determining the value of each of the Fund’s investments as of the reporting period end. These data inputs are categorized in the following hierarchy under applicable financial accounting standards:
1) Level 1-unadjusted quoted prices in active markets for identical assets or liabilities (including securities actively traded on a securities exchange)
2) Level 2-inputs other than unadjusted quoted prices that are observable for the asset or liability (such as unadjusted quoted prices for similar assets and market corroborated inputs such as interest rates, prepayment speeds, credit risks, etc.)
3) Level 3-significant unobservable inputs (including the Manager’s own judgments about assumptions that market participants would use in pricing the asset or liability).
The inputs used for valuing securities are not necessarily an indication of the risks associated with investing in those securities.
The Fund classifies each of its investments in investment companies which are publicly offered as Level 1. Investment companies that are not publicly offered, if any, are measured using net asset value and are classified as Level 2 in the fair value hierarchy.
The table below categorizes amounts that are included in the Fund’s Statement of Assets and Liabilities at period end based on valuation input level:
| Level 1— Unadjusted Quoted Prices | Level 2— Other Significant Observable Inputs | Level 3— Significant Unobservable Inputs | Value | |||||||||||||
Assets Table | ||||||||||||||||
Investments, at Value: | ||||||||||||||||
U.S. Government Agencies | $ | — | $ | 281,062,249 | $ | — | $ | 281,062,249 | ||||||||
U.S. Government Obligation | — | 2,982,325 | — | 2,982,325 | ||||||||||||
Repurchase Agreements | — | 287,300,000 | — | 287,300,000 | ||||||||||||
Investment Company | 15,403,229 | — | — | 15,403,229 | ||||||||||||
|
| |||||||||||||||
Total Assets | $ | 15,403,229 | $ | 571,344,574 | $ | — | $ | 586,747,803 | ||||||||
|
| |||||||||||||||
For the reporting period, there were no transfers between levels.
4. Investments and Risks
Investments in Affiliated Funds. The Fund is permitted to invest in other mutual funds advised by the Manager (“Affiliated Funds”). Affiliated Funds are open-end management investment companies registered under the 1940 Act, as amended. The Manager is the investment adviser of, and the Sub-Adviser provides investment and related advisory services to, the Affiliated Funds. When applicable, the Fund’s investments in Affiliated Funds are included in the Statement of Investments. Shares of Affiliated Funds are valued at their net asset value per share. As a shareholder, the Fund is subject to its proportional share of the Affiliated Funds’ expenses, including their management fee. The Manager will waive fees and/or reimburse Fund expenses in an amount equal to the indirect management fees incurred through the Fund’s investment in the Affiliated Funds.
Each of the Affiliated Funds in which the Fund invests has its own investment risks, and those risks can affect the value of the Fund’s investments and therefore the value of the Fund’s shares. To the extent that the Fund invests more of its assets in one Affiliated Fund than in another, the Fund will have
14 OPPENHEIMER GOVERNMENT MONEY FUND/VA
4. Investments and Risks (Continued)
greater exposure to the risks of that Affiliated Fund.
Investments in Money Market Instruments. The Fund is permitted to invest its free cash balances in money market instruments to provide liquidity or for defensive purposes. The Fund may invest in money market instruments by investing in Class E shares of Oppenheimer Institutional Government Money Market Fund (“IGMMF”), which is an Affiliated Fund. IGMMF is regulated as a money market fund under the 1940 Act, as amended. The Fund may also invest in money market instruments directly or in other affiliated or unaffiliated money market funds
Shareholder Concentration. At period end, one shareholder owned 20% or more of the Fund’s total outstanding shares.
5. Market Risk Factors
The Fund’s investments in securities and/or financial derivatives may expose the Fund to various market risk factors:
Commodity Risk. Commodity risk relates to the change in value of commodities or commodity indexes as they relate to increases or decreases in the commodities market. Commodities are physical assets that have tangible properties. Examples of these types of assets are crude oil, heating oil, metals, livestock, and agricultural products.
Credit Risk. Credit risk relates to the ability of the issuer of debt to meet interest and principal payments, or both, as they come due. In general, lower-grade, higher-yield debt securities are subject to credit risk to a greater extent than lower-yield, higher-quality securities.
Equity Risk. Equity risk relates to the change in value of equity securities as they relate to increases or decreases in the general market.
Foreign Exchange Rate Risk. Foreign exchange rate risk relates to the change in the U.S. dollar value of a security held that is denominated in a foreign currency. The U.S. dollar value of a foreign currency denominated security will decrease as the dollar appreciates against the currency, while the U.S. dollar value will increase as the dollar depreciates against the currency.
Interest Rate Risk. Interest rate risk refers to the fluctuations in value of fixed-income securities resulting from the inverse relationship between price and yield. For example, an increase in general interest rates will tend to reduce the market value of already issued fixed-income investments, and a decline in general interest rates will tend to increase their value. In addition, debt securities with longer maturities, which tend to have higher yields, are subject to potentially greater fluctuations in value from changes in interest rates than obligations with shorter maturities.
Volatility Risk. Volatility risk refers to the magnitude of the movement, but not the direction of the movement, in a financial instrument’s price over a defined time period. Large increases or decreases in a financial instrument’s price over a relative time period typically indicate greater volatility risk, while small increases or decreases in its price typically indicate lower volatility risk.
6. Shares of Beneficial Interest
The Fund has authorized an unlimited number of $0.001 par value shares of beneficial interest. Transactions in shares of beneficial interest were as follows:
| Six Months Ended June 30, 2018 | Year Ended December 31, 2017 | |||||||||||||||
| Shares | Amount | Shares | Amount | |||||||||||||
| ||||||||||||||||
Class A | ||||||||||||||||
| Sold | 657,727,462 | $657,727,462 | 306,082,431 | $306,082,431 | ||||||||||||
| Dividends and/or distributions reinvested | 2,829,455 | 2,829,455 | 1,769,951 | 1,769,951 | ||||||||||||
| Redeemed | (499,323,218) | (499,323,218) | (424,216,869) | (424,216,869) | ||||||||||||
|
| |||||||||||||||
| Net increase (decrease) | 161,233,699 | $ 161,233,699 | (116,364,487) | $(116,364,487) | ||||||||||||
|
| |||||||||||||||
7. Fees and Other Transactions with Affiliates
Management Fees. Under the investment advisory agreement, the Fund pays the Manager a management fee based on the daily net assets of the Fund at an annual rate as shown in the following table:
| Fee Schedule | ||||||||
| ||||||||
Up to $500 million | 0.450 | % | ||||||
Next $500 million | 0.425 | |||||||
Next $500 million | 0.400 | |||||||
Over $1.5 billion | 0.375 | |||||||
The Fund’s effective management fee for the reporting period was 0.45% of average annual net assets before any applicable waivers.
Sub-Adviser Fees. The Manager has retained the Sub-Adviser to provide the day-to-day portfolio management of the Fund. Under the Sub-Advisory Agreement, the Manager pays the Sub-Adviser an annual fee in monthly installments, equal to a percentage of the investment management fee collected by the Manager from the Fund, which shall be calculated after any investment management fee waivers. The fee paid to the Sub-Adviser is paid by the Manager, not by the Fund.
Transfer Agent Fees. OFI Global (the “Transfer Agent”) serves as the transfer and shareholder servicing agent for the Fund. The Fund pays the Transfer Agent a fee based on annual net assets. Fees incurred and average net assets with respect to these services are detailed in the Statement of Operations
15 OPPENHEIMER GOVERNMENT MONEY FUND/VA
NOTES TO FINANCIAL STATEMENTS Unaudited / Continued
7. Fees and Other Transactions with Affiliates (Continued)
and Financial Highlights, respectively.
Sub-Transfer Agent Fees. The Transfer Agent has retained Shareholder Services, Inc., a wholly-owned subsidiary of OFI (the “Sub-Transfer Agent”), to provide the day-to-day transfer agent and shareholder servicing of the Fund. Under the Sub-Transfer Agency Agreement, the Transfer Agent pays the Sub-Transfer Agent an annual fee in monthly installments, equal to a percentage of the transfer agent fee collected by the Transfer Agent from the Fund, which shall be calculated after any applicable fee waivers. The fee paid to the Sub-Transfer Agent is paid by the Transfer Agent, not by the Fund.
Trustees’ Compensation. The Fund’s Board of Trustees (“Board”) has adopted a compensation deferral plan for Independent Trustees that enables Trustees to elect to defer receipt of all or a portion of the annual compensation they are entitled to receive from the Fund. For purposes of determining the amount owed to the Trustees under the plan, deferred amounts are treated as though equal dollar amounts had been invested in shares of the Fund or in other Oppenheimer funds selected by the Trustees. The Fund purchases shares of the funds selected for deferral by the Trustees in amounts equal to his or her deemed investment, resulting in a Fund asset equal to the deferred compensation liability. Such assets are included as a component of “Other” within the asset section of the Statement of Assets and Liabilities. Deferral of Trustees’ fees under the plan will not affect the net assets of the Fund and will not materially affect the Fund’s assets, liabilities or net investment income per share. Amounts will be deferred until distributed in accordance with the compensation deferral plan.
Waivers and Reimbursements of Expenses. The Manager has voluntarily undertaken to waive fees and/or reimburse expenses to the extent necessary to assist the Fund in attempting to maintain a positive yield. There is no guarantee that the Fund will maintain a positive yield.
The Manager has contractually agreed to limit the Fund’s expenses after payments, waivers and/or reimbursements and reduction to custodian expenses, excluding any applicable dividend expense, taxes, interest and fees from borrowing, any subsidiary expenses, Acquired Fund Fees and Expenses, brokerage commissions, unusual and infrequent expenses and certain other Fund expenses; so that those expenses, as percentages of daily net assets, will not exceed the annual rate of 0.50%. During the reporting period, the Manager waived and/or reimbursed the Fund $263,996.
This fee waiver and/or expense reimbursement may not be amended or withdrawn for one year from the date of the Fund’s prospectus, unless approved by the Board.
The Manager is permitted to recapture previously waived and/or reimbursed fees in any given fiscal year if the recapture would not: 1) cause the Fund to generate a negative daily yield, and 2) exceed amounts previously waived and/or reimbursed under this arrangement during the current and prior three fiscal years. The reimbursement to the Manager of such previous waivers and reimbursements would not include any portion of distribution and/or service fees. At period end, the following waived and/or reimbursed amounts are eligible for recapture:
| Expiration Date | ||||
| ||||
December 31, 2018 | $ | 3,773,037 | ||
December 31, 2019 | 2,982,813 | |||
December 31, 2020 | 427,655 | |||
December 31, 2021 | 263,996 | |||
The Manager has not recaptured any previously waived and/or reimbursed amounts during the reporting period.
The Manager will waive fees and/or reimburse Fund expenses in an amount equal to the indirect management fees incurred through the Fund’s investment in IGMMF. During the reporting period, the Manager waived fees and/or reimbursed the Fund $7,613 for IGMMF management fees. This fee waiver and/or expense reimbursement may not be amended or withdrawn for one year from the date of the Fund’s prospectus, unless approved by the Board.
8. Repurchase Agreements
In a repurchase transaction, a Fund buys a security and simultaneously sells it back to an approved institution for delivery on an agreed-upon future date. The resale price exceeds the purchase price by an amount that reflects an agreed-upon interest rate effective for the period during which the repurchase agreement is in effect. Approved institutions include U.S. commercial banks, U.S. branches of foreign banks or broker-dealers that have been designated as primary dealers in government securities. They must meet credit requirements set by the investment adviser from time to time. Repurchase agreements must be fully collateralized. However, if the seller fails to pay the repurchase price on the delivery date, a Fund may incur costs in disposing of the collateral and may experience losses if there is any delay in its ability to do so. If the default on the part of the seller is due to its bankruptcy, a Fund’s ability to liquidate the collateral may be delayed or limited.
The following is a summary by counterparty of the market value of Borrowings and Other Financing Transactions and collateral (received) as of period end:
| Repurchase Agreement | ||||||||||||
| Counterparty | Proceeds to be Received 1 | Collateral Received1 | Net Exposure2 | |||||||||
| ||||||||||||
Repurchase Agreements | ||||||||||||
Credit Agricole Corp. & Investment Bank | $10,016,185 | $(10,216,508) | $(200,323) | |||||||||
Credit Agricole Corp. & Investment Bank | 1,000,263 | (1,020,269) | (20,006) | |||||||||
Deusche Bank Securities, Inc. | 5,000,880 | (5,500,968) | (500,088) | |||||||||
INTL FCStone Financial, Inc. | 5,001,583 | (5,104,283) | (102,700) | |||||||||
16 OPPENHEIMER GOVERNMENT MONEY FUND/VA
8. Repurchase Agreements (Continued)
| Repurchase Agreement | ||||||||||||
| Counterparty | Proceeds to be Received 1 | Collateral Received1 | Net Exposure2 | |||||||||
| ||||||||||||
INTL FCStone Financial, Inc. | $10,002,639 | $(10,223,213) | $(220,574) | |||||||||
INTL FCStone Financial, Inc. | 3,002,113 | (3,062,155) | (60,042) | |||||||||
RBC Dominion Securities, Inc. | 5,004,898 | (5,104,996) | (100,098) | |||||||||
RBC Dominion Securities, Inc. | 4,003,713 | (4,083,787) | (80,074) | |||||||||
RBC Dominion Securities, Inc. | 68,511,988 | (69,882,227) | (1,370,239) | |||||||||
Royal Bank Of Canada | 105,018,113 | (107,118,475) | (2,100,362) | |||||||||
South Street Securities LLC | 25,008,417 | (25,508,585) | (500,168) | |||||||||
South Street Securities LLC | 25,004,375 | (25,504,463) | (500,088) | |||||||||
TD Securities (USA) LLC | 11,802,518 | (12,038,568) | (236,050) | |||||||||
TD Securities (USA) LLC | 9,001,583 | (9,181,615) | (180,032) | |||||||||
|
| |||||||||||
| $287,379,268 | ||||||||||||
|
| |||||||||||
1. Includes accrued interest.
2. Net exposure represents the net receivable/payable that would be due from the counterparty in the event of default.
17 OPPENHEIMER GOVERNMENT MONEY FUND/VA
PORTFOLIO PROXY VOTING POLICIES AND GUIDELINES; UPDATES TO STATEMENT OF INVESTMENTS Unaudited
The Fund has adopted Portfolio Proxy Voting Policies and Guidelines under which the Fund votes proxies relating to securities (“portfolio proxies”) held by the Fund. A description of the Fund’s Portfolio Proxy Voting Policies and Guidelines is available (i) without charge, upon request, by calling the Fund toll-free at 1.800.CALL OPP (225.5677), (ii) on the Fund’s website at www.oppenheimerfunds.com, and (iii) on the SEC’s website at www.sec.gov. In addition, the Fund is required to file Form N-PX, with its complete proxy voting record for the 12 months ended June 30th, no later than August 31st of each year. The Fund’s voting record is available (i) without charge, upon request, by calling the Fund toll-free at 1.800.CALL OPP (225.5677), and (ii) in the Form N-PX filing on the SEC’s website at www.sec.gov.
The Fund files its complete schedule of portfolio holdings with the SEC for the first quarter and the third quarter of each fiscal year on Form N-Q. The Fund’s Form N-Q filings are available on the SEC’s website at www.sec.gov. Those forms may be reviewed and copied at the SEC’s Public Reference Room in Washington, D.C. Information on the operation of the Public Reference Room may be obtained by calling 1-800-SEC-0330.
18 OPPENHEIMER GOVERNMENT MONEY FUND/VA
THIS PAGE INTENTIONALLY LEFT BLANK.
19 OPPENHEIMER GOVERNMENT MONEY FUND/VA
OPPENHEIMER GOVERNMENT MONEY FUND/VA
A Series of Oppenheimer Variable Account Funds
| Trustees and Officers | Robert J. Malone, Chairman of the Board of Trustees and Trustee | |
| Andrew J. Donohue, Trustee | ||
| Richard F. Grabish, Trustee | ||
| Beverly L. Hamilton, Trustee | ||
| Victoria J. Herget, Trustee | ||
| Karen L. Stuckey, Trustee | ||
| James D. Vaughn, Trustee | ||
| Arthur P. Steinmetz, Trustee, President and Principal Executive Officer | ||
| Christopher Proctor, Vice President | ||
| Adam S. Wilde, Vice President | ||
| Cynthia Lo Bessette Secretary and Chief Legal Officer | ||
| Jennifer Foxson, Vice President and Chief Business Officer | ||
| Mary Ann Picciotto, Chief Compliance Officer and Chief Anti-Money Laundering Officer | ||
| Brian S. Petersen, Treasurer and Principal Financial & Accounting Officer | ||
| Manager | OFI Global Asset Management, Inc. | |
| Sub-Adviser | OppenheimerFunds, Inc. | |
| Distributor | OppenheimerFunds Distributor, Inc. | |
Transfer and Shareholder Servicing Agent | OFI Global Asset Management, Inc. | |
| Sub-Transfer Agent | Shareholder Services, Inc. | |
| DBA OppenheimerFunds Services | ||
| Independent | KPMG LLP | |
| Registered | ||
| Public | ||
| Accounting | ||
| Firm | ||
| Legal Counsel | Ropes & Gray LLP | |
| Before investing in any of the Oppenheimer funds, investors should carefully consider a fund’s investment objectives, risks, charges and expenses. Fund prospectuses and summary prospectuses contain this and other information about the funds and may be obtained by asking your financial advisor, visiting oppenheimerfunds.com or calling us at 1.800.988.8287. Read prospectuses and summary prospectuses carefully before investing. | ||
| The financial statements included herein have been taken from the records of the Fund without examination of those records by the independent registered public accounting firm. | ||
| © 2018 OppenheimerFunds, Inc. All rights reserved. Oppenheimer funds are distributed by OppenheimerFunds Distributor, Inc. | ||

June 30, 2018 |


SEMIANNUAL REPORT
Listing of Top Holdings
Fund Performance Discussion
Financial Statements |
PORTFOLIO MANAGERS: Hemant Baijal, Krishna Memani, Ruta Ziverte, and Chris Kelly, CFA
AVERAGE ANNUAL TOTAL RETURNS FOR THE PERIODS ENDED 6/30/18
Inception Date | 6-Months | 1-Year | 5-Year | 10-Year | ||||||||||||||||
Non-Service Shares | 5/3/93 | -2.96 | % | -0.64 | % | 2.46 | % | 3.77 | % | |||||||||||
Service Shares | 3/19/01 | -3.15 | -1.08 | 2.20 | 3.51 | |||||||||||||||
Bloomberg Barclays U.S. Aggregate Bond Index | -1.62 | -0.40 | 2.27 | 3.72 | ||||||||||||||||
Performance data quoted represents past performance, which does not guarantee future results. The investment return and principal value of an investment in the Fund will fluctuate so that an investor’s shares, when redeemed, may be worth more or less than their original cost. Current performance may be lower or higher than the performance quoted. For performance data current to the most recent month end, call us at 1.800.988.8287. The Fund’s total returns should not be expected to be the same as the returns of other funds, whether or not both funds have the same portfolio managers and/or similar names. The Fund’s total returns include changes in share price and reinvested distributions but do not include the charges associated with the separate account products that offer this Fund. Such performance would have been lower if such charges were taken into account. Returns for periods of less than one year are cumulative and not annualized. See Fund prospectuses and summary prospectuses for more information on share classes and sales charges.
The Fund’s performance is compared to the performance of the Bloomberg Barclays U.S. Aggregate Bond Index, an index of U.S. Government and corporate bonds. The Index is unmanaged and cannot be purchased directly by investors. While index comparisons may be useful to provide a benchmark for the Fund’s performance, it must be noted that the Fund’s investments are not limited to the investments comprising the Index. Index performance includes reinvestment of income, but does not reflect transaction costs, fees, expenses or taxes. Index performance is shown for illustrative purposes only as a benchmark for the Fund’s performance, and does not predict or depict performance of the Fund. The Fund’s performance reflects the effects of the Fund’s business and operating expenses.
TOP HOLDINGS AND ALLOCATIONS
PORTFOLIO ALLOCATION
| Non-Convertible Corporate Bonds and Notes | 36.4 | % | ||
Investment Companies | ||||
Oppenheimer Institutional Government Money Market Fund | 5.5 | |||
Oppenheimer Master Event-Linked Bond Fund, LLC | 2.0 | |||
Oppenheimer Master Loan Fund, LLC | 13.8 | |||
Oppenheimer Ultra-Short Duration Fund | 3.0 | |||
Mortgage-Backed Obligations | ||||
Government Agency | 11.2 | |||
Non-Agency | 7.2 | |||
| Foreign Government Obligations | 15.8 | |||
| Asset-Backed Securities | 2.6 | |||
| Preferred Stocks | 1.3 | |||
| Short-Term Notes | 0.4 | |||
| Corporate Loans | 0.3 | |||
| Over-the-Counter Interest Rate Swaptions Purchased | 0.2 | |||
| Structured Securities | 0.2 | |||
| Over-the-Counter Options Purchased | 0.1 | |||
| Over-the-Counter Credit Default Swaptions Purchased | —* | |||
| Common Stocks | —* | |||
| Rights, Warrants and Certificates | —* |
| * | Represents a value of less than 0.05%. |
Portfolio holdings and allocations are subject to change. Percentages are as of June 30, 2018, and are based on total market value of investments. For more current Fund holdings, please visit oppenheimerfunds.com.
REGIONAL ALLOCATION
⬛ U.S./Canada—70.3%
⬛ Latin & South America—9.1%
⬛ Asia—7.2%
⬛ Europe—6.3%
⬛ Middle East/Africa—5.1%
Emerging Europe—2.0%
Portfolio holdings and allocations are subject to change. Percentages are as of June 30, 2018, and are based on the total market value of investments. For more current Fund holdings, please visit oppenheimerfunds.com.
2 OPPENHEIMER GLOBAL STRATEGIC INCOME FUND/VA
Fund Performance Discussion
The Fund’s Non-Service shares produced a return of -2.96% during the reporting period, versus the -1.62% return provided by the Bloomberg Barclays U.S. Aggregate Bond Index (the “Index”).
MARKET OVERVIEW
After rallying to close 2017, the first half of 2018 has been volatile and eventful. Central banks were in action led by the Federal Reserve (Fed), which hiked the Fed Funds target rate by 25 basis points (bps) twice – in March and June – ending the period in a range of 1.75% - 2.00%. The Fed also raised the median “dots” for this year. In addition, the European Central Bank (ECB) announced the end of its quantitative easing (QE) program. Outside of central bank actions, global markets were nervous about a Euroskeptic Italian government and trade tensions escalated during the reporting period. A stronger U.S. dollar and higher U.S. interest rates put pressure on emerging economies with imbalances. On a positive note, the Greek government and European creditors agreed on the completion of a bailout program and debt relief measures.
Global economic data stabilized in the first half of the year, but global growth remains above the historical average at period end. Growth leadership in the developed world changed hands, with U.S. growth momentum picking up thanks to the fiscal stimulus, while Eurozone growth slowed down a bit. Despite some moderation, growth in developed markets is above long-term potential, creating jobs and continuing to reduce the slack in labor markets.
The U.S. economy continued to perform well during the reporting period. U.S. 2018 gross domestic product (GDP) is expected to be around 3%, significantly exceeding its 2% trend growth of this expansion. Private consumption, the driving force of the economy in recent years, is growing at a stable rate. Additionally, business fixed investment has gained momentum in recent months and is broadening across sectors. With increasingly less slack in the economy, strong profits, and the corporate tax cuts, investment should support growth and productivity improvements.
The Fed is on track to deliver 1-2 more hikes this year, as the economy is near the Fed’s dual mandate of full employment and price stability. On the inflation front, underlying inflation is around the Fed’s 2% target. The unemployment rate is at historical lows; however, the rising labor participation rate and stable wage growth suggest that there may still be some slack in the labor market. The Federal Open Market Committee (FOMC) under new chair Jerome Powell’s leadership signaled that the Fed will remain cautious and tighten policy gradually, giving comfort to the markets. Thus far, the Fed’s hiking cycle has been orderly.
Eurozone data was weak during the reporting period, but at period end, there is some tentative evidence that growth is rebounding. The underlying forces of growth in the Eurozone, such as job creation and income growth, revival of bank lending, and high levels of confidence, are intact. We expect Eurozone growth to remain around 2%. Japan’s unemployment rate hit a 24-year low. Growth expectations remain upbeat in several other countries, including Canada, Australia, and Sweden.
Asian economies did quite well at the beginning of the year, contributing the most among all regions to world growth in the first quarter of 2018. After a stellar rebound in exports in 2017 supported by the consumer electronics cycle, we now expect Asia to settle to a slightly lower growth path. This is mainly predicated on slowing growth in China, which is a longer-term trend we expect to continue, the cooling off of the cell-phone cycle, tightening financial conditions, and the uncertainty of a full-fledged trade war. India, the second largest economy in the region, is still on a recovery path, while the rest of South Asia remains steady.
Economic growth in Latin America was significantly downgraded, owing mostly to unexpected hits in Brazil and Argentina, the two countries emerging from recession and driving the region’s return to its growth potential. In Brazil, a nationwide truckers’ strike largely reflected a weak government ahead of presidential elections this October. In Argentina, the growth outlook reversed course as the central bank was forced to tighten monetary policy and approach the International Monetary Fund (IMF) to preserve financial stability. Most central banks in the region are likely to be watchful, but remain on hold at period end as they face weak underlying inflation trends given the slack in the economies. Overall, growing back to potential has most likely been delayed to next year.
FUND REVIEW
The Fund’s underperformance this reporting period was largely the result of its allocation to emerging market credit and emerging market local debt.
Emerging market credit came under heavy pressure during the reporting period. A stronger dollar and tighter external financing conditions resulted in a re-pricing of deficit countries, including notably Argentina (which eventually went to the IMF), Turkey, Ukraine, and sub-Saharan Africa. At the same time, idiosyncratic events erupted such as in Brazil, where truckers went on strike against higher gasoline prices, though in some sense this too was connected to the weakening of the currency. The Fund’s underperformance was driven by its tilt towards higher-yielding credits, particularly in Brazil and Argentina. Overall, we
3 OPPENHEIMER GLOBAL STRATEGIC INCOME FUND/VA
still believe emerging market macroeconomic and credit fundamentals are considerably stronger than during the “taper tantrum” in 2013 and that the market reaction has been excessive, creating relative attractive valuations in global credit.
The recent sell off in emerging market currencies and rates has generated a market narrative that the cycle in emerging markets may already be over. We believe this to be premature and believe that the global growth cycle is intact and stable at fairly high levels of global growth. It remains our opinion that growth has plateaued at robust levels and the market reaction is one of reassessing the future winners and losers in this environment. With high real yields and high growth numbers in emerging markets, we believe that the current valuation of emerging market local assets is attractive over the next two to three years.
Contributing positively to performance this reporting period was our lack of exposure to high grade credit. High grade credit underperformed high yield credit this reporting period as high grade credit has more duration sensitivity than high yield credit. Our exposure to leveraged loans also benefited performance in a rising interest rate environment.
STRATEGY & OUTLOOK
International economic and geopolitical concerns were noticeable during the reporting period and caused some market turbulence. Trade tensions were on the rise, and there were pockets of political issues, such as the elections in Mexico and Turkey, the new Italian government, and issues around immigration in the Eurozone. Such tensions, and especially trade, started to make an impact in some investment decisions, as noted in the Fed’s minutes. So far, the measures implemented do not appear to be of major economic significance or hampering the global growth story. We believe there is more rhetoric than actual impactful decisions. The risk remains, however, that trade issues hit confidence, or retaliations could lead to more significant measures. While these are still not the baseline, we believe risks are elevated and worth carefully monitoring.
We still continue to believe that global growth will remain robust despite the trade tensions, though at a somewhat slower pace. We expect that growth will slow to the 3.6% – 3.7% range for this year, however, the composition will shift as European growth stabilizes. We continue to believe that the domestic European economy continues to be stable and the recent slowdown was related to a mini cycle in trade and its associated investment and inventory cycle. In addition, we do expect industrial production in emerging markets to improve as they are still barely at their long-term average, while developed market industrial production is nearly at decade highs.
From an asset valuation perspective, emerging market fixed income assets are at historically cheap levels versus developed markets assets. At period end, emerging market local bonds are offering real yields that are at or close to decade high spreads when compared to developed market real yields. The valuations of emerging market currencies are generally back to levels last seen in 2015, near the U.S. dollar high. Similarly, in credit, European financial subordinated debt offers value as does emerging market hard currency sovereign and corporate debt.
Based on these valuations, we increased our exposure to emerging market local debt and currencies over the reporting period. Given that we are in the latter stages of the credit cycle, we do not have exposure to investment-grade credit. We also reduced our exposure to mortgages. We maintained our exposure to high-yield credit despite generally tighter spreads since the sector provides healthy income. Our leveraged loan exposure was stable as well since this sector tends to benefit from a rising interest rate environment. We continue to monitor valuations and the global financial markets as we strive to generate income for our investors.
The views in the Fund Performance Discussion represent the opinions of this Fund’s portfolio managers and are not intended as investment advice or to predict or depict the performance of any investment. These views are as of the close of business on June 30, 2018, and are subject to change based on subsequent developments. The Fund’s portfolio and strategies are subject to change.
Shares of Oppenheimer funds are not deposits or obligations of any bank, are not guaranteed by any bank, are not insured by the FDIC or any other agency, and involve investment risks, including the possible loss of the principal amount invested.
4 OPPENHEIMER GLOBAL STRATEGIC INCOME FUND/VA
Fund Expenses
Fund Expenses. As a shareholder of the Fund, you incur two types of costs: (1) transaction costs and (2) ongoing costs, including management fees; distribution and service fees; and other Fund expenses. These examples are intended to help you understand your ongoing costs (in dollars) of investing in the Fund and to compare these costs with the ongoing costs of investing in other mutual funds.
The examples are based on an investment of $1,000.00 invested at the beginning of the period and held for the entire 6-month period ended June 30, 2018.
Actual Expenses. The first section of the table provides information about actual account values and actual expenses. You may use the information in this section for the class of shares you hold, together with the amount you invested, to estimate the expense that you paid over the period. Simply divide your account value by $1,000.00 (for example, an $8,600.00 account value divided by $1,000.00 = 8.60), then multiply the result by the number in the first section under the heading entitled “Expenses Paid During 6 Months Ended June 30, 2018” to estimate the expenses you paid on your account during this period.
Hypothetical Example for Comparison Purposes.
The second section of the table provides information about hypothetical account values and hypothetical expenses based on the Fund’s actual expense ratio for each class of shares, and an assumed rate of return of 5% per year for each class before expenses, which is not the actual return. The hypothetical account values and expenses may not be used to estimate the actual ending account balance or expenses you paid for the period. You may use this information to compare the ongoing costs of investing in the Fund and other funds. To do so, compare this 5% hypothetical example for the class of shares you hold with the 5% hypothetical examples that appear in the shareholder reports of the other funds.
Please note that the expenses shown in the table are meant to highlight your ongoing costs only and do not reflect any charges associated with the separate accounts that offer this Fund. Therefore, the “hypothetical” lines of the table are useful in comparing ongoing costs only, and will not help you determine the relative total costs of owning different funds. In addition, if these separate account charges were included your costs would have been higher.
| Actual | Beginning Value | Ending Value | Expenses 6 Months Ended | |||||||||||||||||||
| Non-Service shares | $ | 1,000.00 | $ | 970.40 | $ | 3.87 | ||||||||||||||||
| Service shares | 1,000.00 | 968.50 | 5.09 | |||||||||||||||||||
| Hypothetical | ||||||||||||||||||||||
| (5% return before expenses) | ||||||||||||||||||||||
| Non-Service shares | 1,000.00 | 1,020.88 | 3.97 | |||||||||||||||||||
| Service shares | 1,000.00 | 1,019.64 | 5.22 | |||||||||||||||||||
Expenses are equal to the Fund’s annualized expense ratio for that class, multiplied by the average account value over the period, multiplied by 181/365 (to reflect the one-half year period). Those annualized expense ratios, excluding indirect expenses from affiliated funds, based on the 6-month period ended June 30, 2018 are as follows:
| Class | Expense Ratios | |||
| Non-Service shares | 0.79% | |||
| Service shares | 1.04 | |||
The expense ratios reflect voluntary and/or contractual waivers and/or reimbursements of expenses by the Fund’s Manager. Some of these undertakings may be modified or terminated at any time, as indicated in the Fund’s prospectus. The “Financial Highlights” tables in the Fund’s financial statements, included in this report, also show the gross expense ratios, without such waivers or reimbursements and reduction to custodian expenses, if applicable.
5 OPPENHEIMER GLOBAL STRATEGIC INCOME FUND/VA
CONSOLIDATED STATEMENT OF INVESTMENTS June 30, 2018 Unaudited
| Principal Amount | Value | |||||||
| Asset-Backed Securities—2.8% |
| |||||||
| American Credit Acceptance Receivables Trust: |
| |||||||
| Series 2015-3, Cl. B, 3.56%, 10/12/211 | $ | 4,658 | $ | 4,659 | ||||
| Series 2015-3, Cl. C, 4.84%, 10/12/211 | 580,000 | 585,013 | ||||||
| Series 2015-3, Cl. D, 5.86%, 7/12/221 | 275,000 | 279,517 | ||||||
| Series 2016-4, Cl. B, 2.11%, 2/12/211 | 272,439 | 272,134 | ||||||
| Series 2017-3, Cl. B, 2.25%, 1/11/211 | 135,000 | 134,656 | ||||||
| Series 2017-4, Cl. B, 2.61%, 5/10/211 | 180,000 | 179,389 | ||||||
| Series 2017-4, Cl. C, 2.94%, 1/10/241 | 510,000 | 506,894 | ||||||
| Series 2017-4, Cl. D, 3.57%, 1/10/241 | 673,000 | 667,786 | ||||||
| AmeriCredit Automobile Receivables Trust: |
| |||||||
| Series 2015-2, Cl. D, 3.00%, 6/8/21 | 505,000 | 504,819 | ||||||
| Series 2017-2, Cl. D, 3.42%, 4/18/23 | 830,000 | 826,311 | ||||||
| Series 2017-4, Cl. D, 3.08%, 12/18/23 | 375,000 | 368,849 | ||||||
| Cabela’s Credit Card Master Note Trust: |
| |||||||
| Series 2016-1, Cl. A1, 1.78%, 6/15/22 | 870,000 | 861,008 | ||||||
| Series 2016-1, Cl. A2, 2.923% [LIBOR01M+85], 6/15/222 | 1,690,000 | 1,699,222 | ||||||
| Capital Auto Receivables Asset Trust, Series 2017-1, Cl. D, 3.15%, 2/20/251 | 110,000 | 109,207 | ||||||
| Capital One Multi-Asset Execution Trust, Series 2016-A3, Cl. A3, 1.34%, 4/15/22 | 805,000 | 794,636 | ||||||
| CarFinance Capital Auto Trust, Series 2015-1A, Cl. A, 1.75%, 6/15/211 | 20,988 | 20,956 | ||||||
| CarMax Auto Owner Trust: | ||||||||
| Series 2015-2, Cl. D, 3.04%, 11/15/21 | 175,000 | 174,613 | ||||||
| Series 2015-3, Cl. D, 3.27%, 3/15/22 | 610,000 | 609,690 | ||||||
| Series 2016-1, Cl. D, 3.11%, 8/15/22 | 465,000 | 463,395 | ||||||
| Series 2016-3, Cl. D, 2.94%, 1/17/23 | 315,000 | 311,009 | ||||||
| Series 2016-4, Cl. D, 2.91%, 4/17/23 | 710,000 | 698,302 | ||||||
| Series 2017-1, Cl. D, 3.43%, 7/17/23 | 630,000 | 627,002 | ||||||
| Series 2017-4, Cl. D, 3.30%, 5/15/24 | 280,000 | 276,229 | ||||||
| Series 2018-1, Cl. D, 3.37%, 7/15/24 | 195,000 | 193,547 | ||||||
| CCG Receivables Trust: | ||||||||
| Series 2017-1, Cl. B, 2.75%, 11/14/231 | 635,000 | 623,381 | ||||||
| Series 2018-1, Cl. B, 3.09%, 6/16/251 | 240,000 | 237,700 | ||||||
| Series 2018-1, Cl. C, 3.42%, 6/16/251 | 70,000 | 69,208 | ||||||
| CIG Auto Receivables Trust, Series 2017- 1A, Cl. A, 2.71%, 5/15/231 | 243,342 | 241,828 | ||||||
| Citibank Credit Card Issuance Trust, Series 2014-A6, Cl. A6, 2.15%, 7/15/21 | 575,000 | 571,731 | ||||||
| CNH Equipment Trust, Series 2017-C, Cl. B, 2.54%, 5/15/25 | 185,000 | 180,698 | ||||||
| CPS Auto Receivables Trust: | ||||||||
| Series 2017-C, Cl. A, 1.78%, 9/15/201 | 108,982 | 108,616 | ||||||
| Series 2017-C, Cl. B, 2.30%, 7/15/211 | 275,000 | 272,798 | ||||||
| Series 2017-D, Cl. B, 2.43%, 1/18/221 | 470,000 | 465,152 | ||||||
| Series 2018-A, Cl. B, 2.77%, 4/18/221 | 370,000 | 367,157 | ||||||
| CPS Auto Trust, Series 2017-A, Cl. B, 2.68%, 5/17/211 | 60,000 | 59,841 | ||||||
| Credit Acceptance Auto Loan Trust: | ||||||||
| Series 2017-3A, Cl. C, 3.48%, 10/15/261 | 565,000 | 557,636 | ||||||
| Series 2018-1A, Cl. B, 3.60%, 4/15/271 | 360,000 | 358,519 | ||||||
| Series 2018-1A, Cl. C, 3.77%, 6/15/271 | 510,000 | 505,783 | ||||||
| Dell Equipment Finance Trust, Series 2017-2, Cl. B, 2.47%, 10/24/221 | 190,000 | 187,385 | ||||||
| Discover Card Execution Note Trust, Series 2016-A4, Cl. A4, 1.39%, 3/15/22 | 1,675,000 | 1,648,063 | ||||||
| Drive Auto Receivables Trust: | ||||||||
| Series 2015-BA, Cl. D, 3.84%, 7/15/211 | 45,000 | 45,267 | ||||||
| Series 2015-CA, Cl. D, 4.20%, 9/15/211 | 135,000 | 136,250 | ||||||
| Series 2015-DA, Cl. C, 3.38%, 11/15/211 | 167,233 | 167,536 | ||||||
| Series 2016-CA, Cl. C, 3.02%, 11/15/211 | 395,000 | 395,371 | ||||||
| Series 2016-CA, Cl. D, 4.18%, 3/15/241 | 430,000 | 435,522 | ||||||
| Series 2017-1, Cl. B, 2.36%, 3/15/21 | 425,000 | 424,536 | ||||||
| Series 2017-3, Cl. C, 2.80%, 7/15/22 | 315,000 | 314,054 | ||||||
| Series 2017-AA, Cl. C, 2.98%, 1/18/221 | 355,000 | 355,104 | ||||||
| Series 2017-BA, Cl. D, 3.72%, 10/17/221 | 610,000 | 613,946 | ||||||
| Series 2018-1, Cl. D, 3.81%, 5/15/24 | 470,000 | 469,552 | ||||||
| Principal Amount | Value | |||||||
| Asset-Backed Securities (Continued) |
| |||||||
DT Auto Owner Trust: | ||||||||
| Series 2015-2A, Cl. D, 4.25%, 2/15/221 | $ | 286,963 | $ | 288,742 | ||||
| Series 2016-4A, Cl. E, 6.49%, 9/15/231 | 200,000 | 206,546 | ||||||
| Series 2017-1A, Cl. C, 2.70%, 11/15/221 | 180,000 | 179,414 | ||||||
| Series 2017-1A, Cl. D, 3.55%, 11/15/221 | 440,000 | 440,063 | ||||||
| Series 2017-1A, Cl. E, 5.79%, 2/15/241 | 415,000 | 422,672 | ||||||
| Series 2017-2A, Cl. B, 2.44%, 2/15/211 | 280,000 | 279,451 | ||||||
| Series 2017-2A, Cl. D, 3.89%, 1/15/231 | 495,000 | 494,550 | ||||||
| Series 2017-3A, Cl. B, 2.40%, 5/17/211 | 460,000 | 458,196 | ||||||
| Series 2017-3A, Cl. E, 5.60%, 8/15/241 | 380,000 | 384,755 | ||||||
| Series 2017-4A, Cl. D, 3.47%, 7/17/231 | 560,000 | 556,507 | ||||||
| Series 2017-4A, Cl. E, 5.15%, 11/15/241 | 390,000 | 388,431 | ||||||
| Series 2018-1A, Cl. B, 3.04%, 1/18/221 | 410,000 | 408,708 | ||||||
| Element Rail Leasing I LLC, Series 2014- 1A, Cl. A1, 2.299%, 4/19/441 | 162,467 | 161,506 | ||||||
| Exeter Automobile Receivables Trust, Series 2018-1A, Cl. B, 2.75%, 4/15/221 | 405,000 | 401,707 | ||||||
| Flagship Credit Auto Trust: | ||||||||
| Series 2014-1, Cl. D, 4.83%, 6/15/201 | 70,000 | 70,425 | ||||||
| Series 2016-1, Cl. C, 6.22%, 6/15/221 | 980,000 | 1,020,070 | ||||||
| GLS Auto Receivables Trust, Series 2018- 1A, Cl. A, 2.82%, 7/15/221 | 870,841 | 866,045 | ||||||
| GM Financial Automobile Leasing Trust, Series 2017-3, Cl. C, 2.73%, 9/20/21 | 320,000 | 316,432 | ||||||
| Navistar Financial Dealer Note Master Owner Trust II: |
| |||||||
| Series 2016-1, Cl. D, 5.391% | ||||||||
| [LIBOR01M+330], 9/27/211,2 | 205,000 | 206,132 | ||||||
| Series 2017-1, Cl. C, 3.641% | ||||||||
| [LIBOR01M+155], 6/27/221,2 | 160,000 | 160,722 | ||||||
| Series 2017-1, Cl. D, 4.391% | ||||||||
| [LIBOR01M+230], 6/27/221,2 | 185,000 | 185,202 | ||||||
| Santander Drive Auto Receivables Trust: |
| |||||||
| Series 2015-5, Cl. D, 3.65%, 12/15/21 | 915,000 | 920,938 | ||||||
| Series 2016-2, Cl. D, 3.39%, 4/15/22 | 300,000 | 300,924 | ||||||
| Series 2017-1, Cl. D, 3.17%, 4/17/23 | 440,000 | 437,401 | ||||||
| Series 2017-1, Cl. E, 5.05%, 7/15/241 | 1,110,000 | 1,129,510 | ||||||
| Series 2017-2, Cl. D, 3.49%, 7/17/23 | 190,000 | 189,933 | ||||||
| Series 2017-3, Cl. D, 3.20%, 11/15/23 | 760,000 | 753,844 | ||||||
| Series 2018-1, Cl. D, 3.32%, 3/15/24 | 290,000 | 285,524 | ||||||
| Series 2018-2, Cl. D, 3.88%, 2/15/24 | 145,000 | 144,499 | ||||||
| Santander Retail Auto Lease Trust, Series 2017-A, Cl. C, 2.96%, 11/21/221 | 505,000 | 498,122 | ||||||
| TCF Auto Receivables Owner Trust, Series 2015-1A, Cl. D, 3.53%, 3/15/221 | 285,000 | 283,502 | ||||||
| United Auto Credit Securitization Trust, Series 2018-1, Cl. C, 3.05%, 9/10/211 | 625,000 | 622,770 | ||||||
| Verizon Owner Trust, Series 2017-3A, Cl. A1A, 2.06%, 4/20/221 | 500,000 | 492,084 | ||||||
| Veros Automobile Receivables Trust, Series 2017-1, Cl. A, 2.84%, 4/17/231 | 242,520 | 241,571 | ||||||
| Westlake Automobile Receivables Trust: |
| |||||||
| Series 2016-1A, Cl. E, 6.52%, 6/15/221 | 670,000 | 683,158 | ||||||
| Series 2017-2A, Cl. E, 4.63%, 7/15/241 | 685,000 | 687,565 | ||||||
| Series 2018-1A, Cl. C, 2.92%, 5/15/231 | 420,000 | 416,531 | ||||||
| Series 2018-1A, Cl. D, 3.41%, 5/15/231 | 845,000 | 840,352 | ||||||
| World Financial Network Credit Card Master Trust: |
| |||||||
| Series 2012-D, Cl. A, 2.15%, 4/17/23 | 420,000 | 417,248 | ||||||
| Series 2016-B, Cl. A, 1.44%, 6/15/22 | 1,010,000 | 1,008,608 | ||||||
| Series 2017-A, Cl. A, 2.12%, 3/15/24 | 1,125,000 | 1,106,072 | ||||||
| Series 2017-B, Cl. A, 1.98%, 6/15/23 | 845,000 | 837,897 | ||||||
| Series 2017-C, Cl. A, 2.31%, 8/15/24 | 1,130,000 | 1,109,117 | ||||||
| Series 2018-A, Cl. A, 3.07%, 12/16/24 | 1,440,000 | 1,434,364 | ||||||
| Total Asset-Backed Securities (Cost $43,967,035) | 43,719,287 | |||||||
6 OPPENHEIMER GLOBAL STRATEGIC INCOME FUND/VA
| Principal Amount | Value | |||||||
| Mortgage-Backed Obligations—20.0% |
| |||||||
| Government Agency—12.2% | ||||||||
| FHLMC/FNMA/FHLB/Sponsored—10.7% |
| |||||||
| Federal Home Loan Mortgage Corp. Gold Pool: |
| |||||||
| 5.00%, 9/1/33 | $ | 222,614 | $ | 237,003 | ||||
| 5.50%, 9/1/39 | 264,087 | 282,741 | ||||||
| 6.00%, 11/1/21 | 33,394 | 36,501 | ||||||
| 6.50%, 9/1/18-8/1/32 | 198,644 | 220,584 | ||||||
| 7.00%, 10/1/31-10/1/37 | 44,922 | 49,010 | ||||||
| 7.50%, 1/1/32 | 223,164 | 259,002 | ||||||
| Federal Home Loan Mortgage Corp., Interest-Only Stripped Mtg.-Backed Security: |
| |||||||
| Series 192,Cl. IO, 99.999%, 2/1/283 | 4,953 | 1,023 | ||||||
| Series 205,Cl. IO, 56.763%, 9/1/293 | 28,153 | 6,029 | ||||||
| Series 243,Cl. 6, 1.946%, 12/15/323 | 61,799 | 10,381 | ||||||
| Federal Home Loan Mortgage Corp., Real Estate Mtg. Investment Conduit Multiclass Pass-Through Certificates: |
| |||||||
| Series 1360,Cl. PZ, 7.50%, 9/15/22 | 188,014 | 199,618 | ||||||
| Series 151,Cl. F, 9.00%, 5/15/21 | 1,564 | 1,615 | ||||||
| Series 1674,Cl. Z, 6.75%, 2/15/24 | 92,745 | 98,338 | ||||||
| Series 1897,Cl. K, 7.00%, 9/15/26 | 342,639 | 372,488 | ||||||
| Series 2043,Cl. ZP, 6.50%, 4/15/28 | 146,946 | 161,723 | ||||||
| Series 2106,Cl. FG, 2.523% [LIBOR01M+45], 12/15/282 | 253,144 | 253,828 | ||||||
| Series 2122,Cl. F, 2.523% [LIBOR01M+45], 2/15/292 | 6,696 | 6,729 | ||||||
| Series 2148,Cl. ZA, 6.00%, 4/15/29 | 144,155 | 155,778 | ||||||
| Series 2195,Cl. LH, 6.50%, 10/15/29 | 100,569 | 109,669 | ||||||
| Series 2326,Cl. ZP, 6.50%, 6/15/31 | 14,016 | 15,099 | ||||||
| Series 2344,Cl. FP, 3.023% [LIBOR01M+95], 8/15/312 | 67,071 | 68,938 | ||||||
| Series 2368,Cl. PR, 6.50%, 10/15/31 | 46,738 | 51,566 | ||||||
| Series 2412,Cl. GF, 3.023% [LIBOR01M+95], 2/15/322 | 82,419 | 84,748 | ||||||
| Series 2449,Cl. FL, 2.623% [LIBOR01M+55], 1/15/322 | 75,252 | 76,344 | ||||||
| Series 2451,Cl. FD, 3.073% [LIBOR01M+100], 3/15/322 | 35,578 | 36,641 | ||||||
| Series 2461,Cl. PZ, 6.50%, 6/15/32 | 171,731 | 186,315 | ||||||
| Series 2464,Cl. FI, 3.073% [LIBOR01M+100], 2/15/322 | 32,351 | 33,130 | ||||||
| Series 2470,Cl. AF, 3.073% [LIBOR01M+100], 3/15/322 | 61,043 | 62,867 | ||||||
| Series 2470,Cl. LF, 3.073% [LIBOR01M+100], 2/15/322 | 33,106 | 33,904 | ||||||
| Series 2477,Cl. FZ, 2.623% [LIBOR01M+55], 6/15/312 | 134,530 | 135,369 | ||||||
| Series 2517,Cl. GF, 3.073% [LIBOR01M+100], 2/15/322 | 28,784 | 29,478 | ||||||
| Series 2635,Cl. AG, 3.50%, 5/15/32 | 43,837 | 43,632 | ||||||
| Series 2668,Cl. AZ, 4.00%, 9/15/18 | 546 | 546 | ||||||
| Series 2676,Cl. KY, 5.00%, 9/15/23 | 420,309 | 436,272 | ||||||
| Series 2707,Cl. QE, 4.50%, 11/15/18 | 4,349 | 4,354 | ||||||
| Series 2770,Cl. TW, 4.50%, 3/15/19 | 1,489 | 1,494 | ||||||
| Series 3025,Cl. SJ, 17.148% [LIBOR01M+2,475], 8/15/352 | 80,931 | 108,625 | ||||||
| Series 3741,Cl. PA, 2.15%, 2/15/35 | 49,079 | 49,025 | ||||||
| Series 3815,Cl. BD, 3.00%, 10/15/20 | 658 | 658 | ||||||
| Series 3840,Cl. CA, 2.00%, 9/15/18 | 333 | 333 | ||||||
| Series 3848,Cl. WL, 4.00%, 4/15/40 | 109,803 | 110,936 | ||||||
| Series 3857,Cl. GL, 3.00%, 5/15/40 | 5,286 | 5,319 | ||||||
| Series 3917,Cl. BA, 4.00%, 6/15/38 | 55,905 | 55,529 | ||||||
| Series 4221,Cl. HJ, 1.50%, 7/15/23 | 158,199 | 154,456 | ||||||
| Federal Home Loan Mortgage Corp., Real Estate Mtg. Investment Conduit Multiclass Pass-Through Certificates, Interest-Only Stripped Mtg.-Backed Security: |
| |||||||
| Series 2074,Cl. S, 99.999%, 7/17/283 | 6,953 | 722 | ||||||
| Series 2079,Cl. S, 99.999%, 7/17/283 | 12,520 | 1,558 | ||||||
| Series 2136,Cl. SG, 33.732%, 3/15/293 | 367,065 | 45,657 | ||||||
| Series 2399,Cl. SG, 99.999%, 12/15/263 | 192,354 | 22,654 | ||||||
| Series 2437,Cl. SB, 44.531%, 4/15/323 | 622,091 | 90,145 | ||||||
| Principal Amount | Value | |||||||
| FHLMC/FNMA/FHLB/Sponsored (Continued) |
| |||||||
| Federal Home Loan Mortgage Corp., Real Estate Mtg. Investment Conduit Multiclass Pass-Through Certificates, Interest-Only Stripped Mtg.-Backed Security: (Continued) |
| |||||||
| Series 2526,Cl. SE, 52.218%, 6/15/293 | $ | 13,030 | $ | 1,926 | ||||
| Series 2682,Cl. TQ, 99.999%, 10/15/333 | 135,532 | 18,723 | ||||||
| Series 2795,Cl. SH, 69.615%, 3/15/243 | 238,348 | 18,080 | ||||||
| Series 2920,Cl. S, 49.631%, 1/15/353 | 145,019 | 19,992 | ||||||
| Series 2922,Cl. SE, 19.705%, 2/15/353 | 23,984 | 3,088 | ||||||
| Series 2981,Cl. AS, 2.173%, 5/15/353 | 218,775 | 23,327 | ||||||
| Series 2981,Cl. BS, 99.999%, 5/15/353 | 277,883 | 39,015 | ||||||
| Series 3397,Cl. GS, 0.00%, 12/15/373,4 | 94,085 | 15,038 | ||||||
| Series 3424,Cl. EI, 0.00%, 4/15/383,4 | 29,405 | 2,618 | ||||||
| Series 3450,Cl. BI, 12.998%, 5/15/383 | 159,868 | 21,781 | ||||||
| Series 3606,Cl. SN, 13.488%, 12/15/393 | 47,024 | 5,864 | ||||||
| Series 3659,Cl. IE, 0.00%, 3/15/193,4 | 16,642 | 137 | ||||||
| Series 3685,Cl. EI, 0.00%, 3/15/193,4 | 988 | 7 | ||||||
| Federal National Mortgage Assn.: |
| |||||||
| 2.50%, 7/1/335 | 5,925,000 | 5,758,655 | ||||||
| 3.00%, 7/1/33-8/1/485 | 6,990,000 | 6,883,656 | ||||||
| 3.50%, 8/1/485 | 33,595,000 | 33,387,417 | ||||||
| 4.00%, 8/1/485 | 9,725,000 | 9,900,506 | ||||||
| 4.50%, 8/1/485 | 81,220,000 | 84,425,969 | ||||||
| 5.00%, 8/1/485 | 3,320,000 | 3,510,592 | ||||||
| Federal National Mortgage Assn. Pool: |
| |||||||
| 5.00%, 7/1/19-7/1/33 | 261,572 | 278,904 | ||||||
| 5.50%, 4/1/21-5/1/36 | 146,387 | 157,426 | ||||||
| 6.50%, 12/1/29-1/1/34 | 419,873 | 464,470 | ||||||
| 7.00%, 1/1/30-6/1/34 | 530,956 | 599,300 | ||||||
| 7.50%, 2/1/27-3/1/33 | 710,419 | 811,448 | ||||||
| 8.50%, 7/1/32 | 527 | 536 | ||||||
| Federal National Mortgage Assn., Interest-Only Stripped Mtg.-Backed Security: |
| |||||||
| Series 214,Cl. 2, 99.999%, 3/25/233 | 67,565 | 7,934 | ||||||
| Series 221,Cl. 2, 99.999%, 5/25/233 | 8,098 | 1,045 | ||||||
| Series 254,Cl. 2, 99.999%, 1/25/243 | 139,633 | 19,668 | ||||||
| Series 301,Cl. 2, 17.835%, 4/25/293 | 29,319 | 6,148 | ||||||
| Series 313,Cl. 2, 99.999%, 6/25/313 | 293,775 | 63,056 | ||||||
| Series 319,Cl. 2, 0.733%, 2/25/323 | 138,374 | 31,027 | ||||||
| Series 321,Cl. 2, 21.623%, 4/25/323 | 41,798 | 9,894 | ||||||
| Series 324,Cl. 2, 0.00%, 7/25/323,4 | 42,637 | 10,333 | ||||||
| Series 328,Cl. 2, 0.00%, 12/25/323,4 | 82,104 | 18,731 | ||||||
| Series 331,Cl. 5, 0.00%, 2/25/333,4 | 160,286 | 28,905 | ||||||
| Series 332,Cl. 2, 0.00%, 3/25/333,4 | 676,912 | 157,820 | ||||||
| Series 334,Cl. 12, 0.00%, 3/25/333,4 | 129,156 | 27,472 | ||||||
| Series 339,Cl. 15, 4.107%, 10/25/333 | 378,405 | 83,748 | ||||||
| Series 345,Cl. 9, 0.00%, 1/25/343,4 | 119,488 | 27,393 | ||||||
| Series 351,Cl. 10, 0.00%, 4/25/343,4 | 71,874 | 17,509 | ||||||
| Series 351,Cl. 8, 0.00%, 4/25/343,4 | 130,451 | 25,657 | ||||||
| Series 356,Cl. 10, 0.00%, 6/25/353,4 | 93,026 | 20,209 | ||||||
| Series 356,Cl. 12, 0.00%, 2/25/353,4 | 45,589 | 9,951 | ||||||
| Series 362,Cl. 13, 0.00%, 8/25/353,4 | 61,664 | 15,056 | ||||||
| Federal National Mortgage Assn., Real Estate Mtg. Investment Conduit Multiclass Pass- Through Certificates: |
| |||||||
| Series 1999-54,Cl. LH, 6.50%, 11/25/29 | 87,175 | 94,646 | ||||||
| Series 2001-80,Cl. ZB, 6.00%, 1/25/32 | 77,164 | 83,839 | ||||||
| Series 2002-29,Cl. F, 3.091% [LIBOR01M+100], 4/25/322 | 36,998 | 37,919 | ||||||
| Series 2002-64,Cl. FJ, 3.091% [LIBOR01M+100], 4/25/322 | 11,393 | 11,676 | ||||||
| Series 2002-68,Cl. FH, 2.585% [LIBOR01M+50], 10/18/322 | 24,129 | 24,241 | ||||||
| Series 2002-84,Cl. FB, 3.091% [LIBOR01M+100], 12/25/322 | 154,593 | 158,253 | ||||||
| Series 2002-90,Cl. FH, 2.591% [LIBOR01M+50], 9/25/322 | 86,494 | 86,846 | ||||||
| Series 2003-100,Cl. PA, 5.00%, 10/25/18 | 1,055 | 1,054 | ||||||
| Series 2003-11,Cl. FA, 3.091% [LIBOR01M+100], 9/25/322 | 154,596 | 158,291 | ||||||
7 OPPENHEIMER GLOBAL STRATEGIC INCOME FUND/VA
CONSOLIDATED STATEMENT OF INVESTMENTS Unaudited / Continued
| Principal Amount | Value | |||||||
| FHLMC/FNMA/FHLB/Sponsored (Continued) |
| |||||||
| Federal National Mortgage Assn., Real Estate Mtg. Investment Conduit Multiclass Pass-Through Certificates: (Continued) |
| |||||||
| Series 2003-112,Cl. AN, 4.00%, 11/25/18 | $ | 1,262 | $ | 1,263 | ||||
| Series 2003-116,Cl. FA, 2.491% [LIBOR01M+40], 11/25/332 | 16,334 | 16,351 | ||||||
| Series 2003-84,Cl. GE, 4.50%, 9/25/18 | 291 | 290 | ||||||
| Series 2004-25,Cl. PC, 5.50%, 1/25/34 | 8,217 | 8,272 | ||||||
| Series 2005-109,Cl. AH, 5.50%, 12/25/25 | 574,185 | 597,408 | ||||||
| Series 2005-31,Cl. PB, 5.50%, 4/25/35 | 560,000 | 601,826 | ||||||
| Series 2005-71,Cl. DB, 4.50%, 8/25/25 | 82,726 | 84,432 | ||||||
| Series 2006-11,Cl. PS, 16.899% [-3.667 x LIBOR01M+2,456.67], 3/25/362 | 76,741 | 110,607 | ||||||
| Series 2006-46,Cl. SW, 16.532% [-3.667 x LIBOR01M+2,419.92], 6/25/362 | 117,828 | 160,929 | ||||||
| Series 2008-75,Cl. DB, 4.50%, 9/25/23 | 3,368 | 3,372 | ||||||
| Series 2009-113,Cl. DB, 3.00%, 12/25/20 | 16,551 | 16,550 | ||||||
| Series 2009-36,Cl. FA, 3.031% [LIBOR01M+94], 6/25/372 | 20,665 | 21,143 | ||||||
| Series 2009-70,Cl. TL, 4.00%, 8/25/19 | 4,656 | 4,655 | ||||||
| Series 2010-43,Cl. KG, 3.00%, 1/25/21 | 14,796 | 14,805 | ||||||
| Series 2011-122,Cl. EC, 1.50%, 1/25/20 | 10,644 | 10,563 | ||||||
| Series 2011-15,Cl. DA, 4.00%, 3/25/41 | 51,876 | 51,682 | ||||||
| Series 2011-3,Cl. EL, 3.00%, 5/25/20 | 21,784 | 21,767 | ||||||
| Series 2011-3,Cl. KA, 5.00%, 4/25/40 | 136,050 | 141,691 | ||||||
| Series 2011-38,Cl. AH, 2.75%, 5/25/20 | 322 | 322 | ||||||
| Series 2011-6,Cl. BA, 2.75%, 6/25/20 | 10,107 | 10,163 | ||||||
| Series 2011-82,Cl. AD, 4.00%, 8/25/26 | 42,801 | 42,906 | ||||||
| Series 2012-20,Cl. FD, 2.491% [LIBOR01M+40], 3/25/422 | 197,022 | 197,172 | ||||||
| Federal National Mortgage Assn., Real Estate Mtg. Investment Conduit Multiclass Pass-Through Certificates, Interest-Only Stripped Mtg.-Backed Security: |
| |||||||
| Series 2001-61,Cl. SH, 31.924%, 11/18/313 | 39,340 | 6,782 | ||||||
| Series 2001-63,Cl. SD, 48.844%, 12/18/313 | 10,428 | 1,580 | ||||||
| Series 2001-68,Cl. SC, 37.788%, 11/25/313 | 7,369 | 1,199 | ||||||
| Series 2001-81,Cl. S, 39.121%, 1/25/323 | 8,727 | 1,437 | ||||||
| Series 2002-28,Cl. SA, 27.846%, 4/25/323 | 6,355 | 1,069 | ||||||
| Series 2002-38,Cl. SO, 59.734%, 4/25/323 | 43,336 | 6,204 | ||||||
| Series 2002-48,Cl. S, 35.674%, 7/25/323 | 9,675 | 1,723 | ||||||
| Series 2002-52,Cl. SL, 26.236%, 9/25/323 | 6,386 | 1,117 | ||||||
| Series 2002-56,Cl. SN, 36.836%, 7/25/323 | 13,294 | 2,368 | ||||||
| Series 2002-77,Cl. IS, 50.059%, 12/18/323 | 73,832 | 13,077 | ||||||
| Series 2002-77,Cl. SH, 40.805%, 12/18/323 | 12,941 | 2,039 | ||||||
| Series 2002-9,Cl. MS, 24.646%, 3/25/323 | 11,565 | 2,086 | ||||||
| Series 2003-13,Cl. IO, 42.96%, 3/25/333 | 127,662 | 30,163 | ||||||
| Series 2003-26,Cl. DI, 46.118%, 4/25/333 | 103,276 | 26,591 | ||||||
| Series 2003-33,Cl. SP, 29.306%, 5/25/333 | 70,133 | 13,689 | ||||||
| Series 2003-4,Cl. S, 17.534%, 2/25/333 | 19,730 | 3,725 | ||||||
| Series 2004-56,Cl. SE, 3.134%, 10/25/333 | 333,689 | 55,761 | ||||||
| Series 2005-12,Cl. SC, 30.118%, 3/25/353 | 11,424 | 1,559 | ||||||
| Series 2005-14,Cl. SE, 45.459%, 3/25/353 | 415,233 | 45,499 | ||||||
| Principal Amount | Value | |||||||
| FHLMC/FNMA/FHLB/Sponsored (Continued) |
| |||||||
| Federal National Mortgage Assn., Real Estate Mtg. Investment Conduit Multiclass Pass-Through Certificates, Interest-Only Stripped Mtg.-Backed Security: (Continued) |
| |||||||
| Series 2005-40,Cl. SA, 45.736%, 5/25/353 | $ | 352,397 | $ | 46,503 | ||||
| Series 2005-40,Cl. SB, 99.999%, 5/25/353 | 564,283 | 64,940 | ||||||
| Series 2005-52,Cl. JH, 27.362%, 5/25/353 | 206,105 | 24,689 | ||||||
| Series 2005-63,Cl. SA, 34.834%, 10/25/313 | 19,294 | 2,560 | ||||||
| Series 2006-90,Cl. SX, 99.999%, 9/25/363 | 389,609 | 53,423 | ||||||
| Series 2007-88,Cl. XI, 0.00%, 6/25/373,4 | 375,938 | 55,990 | ||||||
| Series 2008-55,Cl. SA, 0.00%, 7/25/383,4 | 24,749 | 2,215 | ||||||
| Series 2009-8,Cl. BS, 0.00%, 2/25/243,4 | 1,304 | 65 | ||||||
| Series 2010-95,Cl. DI, 0.00%, 11/25/203,4 | 54,760 | 1,037 | ||||||
| Series 2011-96,Cl. SA, 7.473%, 10/25/413 | 164,314 | 22,172 | ||||||
| Series 2012-134,Cl. SA, 2.422%, 12/25/423 | 518,639 | 86,689 | ||||||
| Series 2012-40,Cl. PI, 8.814%, 4/25/413 | 850,437 | 133,373 | ||||||
| Government National Mortgage Assn. II Pool, 3.50%, 7/1/485 | 11,310,000 | 11,350,645 | ||||||
|
| 166,175,308
|
| ||||||
| GNMA/Guaranteed—1.5% | ||||||||
| Government National Mortgage Assn. I Pool: |
| |||||||
| 7.00%, 4/15/28-7/15/28 | 48,601 | 52,610 | ||||||
| 8.00%, 5/15/26 | 8,232 | 8,253 | ||||||
| Government National Mortgage Assn. II Pool: |
| |||||||
| 3.125% [H15T1Y+150], 11/20/252 | 2,146 | 2,203 | ||||||
| 4.00%, 7/1/485 | 23,015,000 | 23,584,532 | ||||||
| Government National Mortgage Assn., Interest-Only Stripped Mtg.-Backed Security: |
| |||||||
| Series 2007-17,Cl. AI, 38.94%, 4/16/373 | 207,524 | 28,701 | ||||||
| Series 2011-52,Cl. HS, 19.146%, 4/16/413 | 346,584 | 39,323 | ||||||
|
| 23,715,622
|
| ||||||
| Non-Agency—7.8% | ||||||||
Commercial—3.3% | ||||||||
| BCAP LLC Trust: | ||||||||
| Series 2011-R11,Cl. 18A5, 3.41% [H15T1Y+210], 9/26/351,2 | 44,575 | 44,772 | ||||||
| Series 2012-RR6,Cl. RR6, 2.054%, 11/26/361 | 68,179 | 67,898 | ||||||
| Benchmark Mortgage Trust, Interest-Only Commercial Mtg. Pass-Through Certificates, Series 2018-B1, Cl. XA, 13.898%, 1/15/513 | 5,745,513 | 228,416 | ||||||
| CD Mortgage Trust, Interest-Only Commercial Mtg. Pass-Through Certificates, Series 2017-CD6, Cl. XA, 14.496%, 11/13/503 | 2,318,947 | 145,205 | ||||||
| Chase Mortgage Finance Trust, Series 2005-A2, Cl. 1A3, 3.602%, 1/25/366 | 12,484 | 11,822 | ||||||
| Citigroup Commercial Mortgage Trust: | ||||||||
| Series 2012-GC8,Cl. AAB, 2.608%, 9/10/45 | 276,847 | 274,240 | ||||||
| Series 2014-GC21,Cl. AAB, 3.477%, 5/10/47 | 270,000 | 272,426 | ||||||
| Citigroup Commercial Mortgage Trust, Interest-Only Commercial Mtg. Pass-Through Certificates, Series 2017-C4, Cl. XA, 13.828%, 10/12/503 | 6,144,143 | 455,889 | ||||||
| COMM Mortgage Trust: | ||||||||
| Series 2012-CR3,Cl. ASB, 2.372%, 10/15/45 | 52,050 | 51,375 | ||||||
| Series 2012-LC4,Cl. A3, 3.069%, 12/10/44 | 109,738 | 109,772 | ||||||
8 OPPENHEIMER GLOBAL STRATEGIC INCOME FUND/VA
| Principal Amount | Value | |||||||
| Commercial (Continued) | ||||||||
| COMM Mortgage Trust: (Continued) |
| |||||||
| Series 2013-CR13,Cl. ASB, 3.706%, 11/10/46 | $ | 510,000 | $ | 517,763 | ||||
| Series 2013-CR6,Cl. AM, 3.147%, 3/10/461 | 960,000 | 941,546 | ||||||
| Series 2014-CR17,Cl. ASB, 3.598%, 5/10/47 | 870,000 | 880,795 | ||||||
| Series 2014-CR20,Cl. ASB, 3.305%, 11/10/47 | 180,000 | 180,413 | ||||||
| Series 2014-CR21,Cl. AM, 3.987%, 12/10/47 | 25,000 | 25,072 | ||||||
| Series 2014-LC15,Cl. AM, 4.198%, 4/10/47 | 455,000 | 464,256 | ||||||
| Series 2014-UBS6,Cl. AM, 4.048%, 12/10/47 | 1,600,000 | 1,610,892 | ||||||
| Series 2015-CR22,Cl. A2, 2.856%, 3/10/48 | 305,000 | 304,413 | ||||||
| COMM Mortgage Trust, Interest-Only Stripped Mtg.-Backed Security, Series 2012-CR5, Cl. XA, 22.258%, 12/10/453 | 2,594,685 | 146,762 | ||||||
| Deutsche Alt-B Securities, Inc. Mortgage Loan Trust, Series 2006-AB2, Cl. A1, 5.417%, 6/25/366 | 49,681 | 47,972 | ||||||
| Deutsche Mortgage Securities, Inc., Series 2013-RS1, Cl. 1A2, 2.304% [US0001M+22], 7/22/361,2 | 5,060,144 | 4,863,177 | ||||||
| Federal National Mortgage Assn., Stripped Mtg.-Backed Security, Series 302, Cl. 2, 6.00%, 5/1/29 | 3 | — | ||||||
| FREMF Mortgage Trust: | ||||||||
| Series 2012-K20,Cl. C, 4.005%, 5/25/451,6 | 4,165,000 | 4,081,813 | ||||||
| Series 2013-K25,Cl. C, 3.744%, 11/25/451,6 | 135,000 | 130,999 | ||||||
| Series 2013-K26,Cl. C, 3.721%, 12/25/451,6 | 95,000 | 92,047 | ||||||
| Series 2013-K27,Cl. C, 3.615%, 1/25/461,6 | 1,460,000 | 1,407,001 | ||||||
| Series 2013-K28,Cl. C, 3.61%, 6/25/461,6 | 2,330,000 | 2,300,824 | ||||||
| Series 2013-K29,Cl. C, 3.601%, 5/25/461,6 | 2,300,000 | 2,193,125 | ||||||
| Series 2013-K713,Cl. C, 3.262%, 4/25/461,6 | 535,000 | 532,494 | ||||||
| Series 2014-K714,Cl. C, 3.981%, 1/25/471,6 | 400,000 | 401,840 | ||||||
| Series 2015-K44,Cl. B, 3.81%, 1/25/481,6 | 2,310,000 | 2,274,318 | ||||||
| Series 2015-K45,Cl. B, 3.714%, 4/25/481,6 | 4,646,000 | 4,525,871 | ||||||
| Series 2017-K62,Cl. B, 4.004%, 1/25/501,6 | 280,000 | 275,957 | ||||||
| Series 2017-K724,Cl. B, 3.601%, 11/25/231,6 | 1,535,000 | 1,488,653 | ||||||
| GS Mortgage Securities Corp. Trust, Series 2012-SHOP, Cl. A, 2.933%, 6/5/311 | 1,200,000 | 1,201,604 | ||||||
| GS Mortgage Securities Trust: | ||||||||
| Series 2013-GC12,Cl. AAB, 2.678%, 6/10/46 | 93,432 | 92,453 | ||||||
| Series 2013-GC16,Cl. AS, 4.649%, 11/10/46 | 160,000 | 167,773 | ||||||
| Series 2014-GC18,Cl. AAB, 3.648%, 1/10/47 | 235,000 | 237,935 | ||||||
| JP Morgan Chase Commercial Mortgage Securities Trust: |
| |||||||
| Series 2012-C6,Cl. ASB, 3.144%, 5/15/45 | 368,845 | 369,289 | ||||||
| Series 2012-LC9,Cl. A4, 2.611%, 12/15/47 | 60,000 | 59,046 | ||||||
| Principal Amount | Value | |||||||
| Commercial (Continued) | ||||||||
| JP Morgan Chase Commercial Mortgage Securities Trust: (Continued) |
| |||||||
| Series 2013-C10,Cl. AS, 3.372%, 12/15/47 | $ | 855,000 | $ | 844,103 | ||||
| Series 2013-C16,Cl. AS, 4.517%, 12/15/46 | 820,000 | 855,744 | ||||||
| Series 2013-LC11,Cl. AS, 3.216%, 4/15/46 | 235,000 | 230,315 | ||||||
| Series 2013-LC11,Cl. ASB, 2.554%, 4/15/46 | 131,362 | 129,688 | ||||||
| Series 2014-C20,Cl. AS, 4.043%, 7/15/47 | 630,000 | 637,802 | ||||||
| Series 2016-JP3,Cl. A2, 2.435%, 8/15/49 | 600,000 | 585,189 | ||||||
| JP Morgan Mortgage Trust, Series 2007-A1, Cl. 5A1, 3.692%, 7/25/356 | 54,030 | 55,592 | ||||||
| JP Morgan Resecuritization Trust, Series 2009- 5, Cl. 1A2, 4.278%, 7/26/361,6 | 2,567,395 | 2,471,502 | ||||||
| JPMBB Commercial Mortgage Securities Trust: |
| |||||||
| Series 2013-C17,Cl. ASB, 3.705%, 1/15/47 | 200,000 | 202,902 | ||||||
| Series 2014-C18,Cl. A3, 3.578%, 2/15/47 | 295,000 | 295,601 | ||||||
| Series 2014-C19,Cl. ASB, 3.584%, 4/15/47 | 110,000 | 111,177 | ||||||
| Series 2014-C24,Cl. B, 4.116%, 11/15/476 | 680,000 | 683,027 | ||||||
| Series 2014-C25,Cl. AS, 4.065%, 11/15/47 | 1,720,000 | 1,740,802 | ||||||
| Series 2014-C26,Cl. AS, 3.80%, 1/15/48 | 1,515,000 | 1,510,060 | ||||||
| Morgan Stanley Bank of America Merrill Lynch Trust: | ||||||||
| Series 2013-C7,Cl. AAB, 2.469%, 2/15/46 | 263,163 | 259,586 | ||||||
| Series 2013-C9,Cl. AS, 3.456%, 5/15/46 | 570,000 | 560,678 | ||||||
| Series 2014-C14,Cl. B, 4.793%, 2/15/476 | 240,000 | 250,772 | ||||||
| Morgan Stanley Capital I, Inc., Interest-Only Commercial Mtg. Pass-Through Certificates, Series 2017-HR2, Cl. XA, 12.66%, 12/15/503 | 2,021,751 | 120,916 | ||||||
| Morgan Stanley Re-Remic Trust, Series 2012- R3, Cl. 1A, 3.059%, 11/26/361,6 | 7,600 | 7,597 | ||||||
| Morgan Stanley Resecuritization Trust, Series 2013-R9, Cl. 3A, 3.475%, 6/26/461,6 | 74,296 | 74,249 | ||||||
| Structured Adjustable Rate Mortgage Loan Trust, Series 2004-10, Cl. 2A, 3.731%, 8/25/346 | 2,373,051 | 2,388,843 | ||||||
| UBS Commercial Mortgage Trust, Interest-Only Commercial Mtg. Pass-Through Certificates, Series 2017-C5, Cl. XA, 13.993%, 11/15/503 | 3,825,702 | 256,011 | ||||||
| UBS-Barclays Commercial Mortgage Trust, Series 2012-C2, Cl. E, 5.05%, 5/10/631,6 | 930,000 | 773,248 | ||||||
| Wells Fargo Commercial Mortgage Trust, Series 2015-NXS1, Cl. ASB, 2.934%, 5/15/48 | 940,000 | 928,064 | ||||||
| Wells Fargo Commercial Mortgage Trust, Interest-Only Commercial Mtg. Pass-Through Certificates, Series 2017-C42, Cl. XA, 12.341%, 12/15/503 | 2,804,592 | 190,793 | ||||||
| WF-RBS Commercial Mortgage Trust: Series 2013-C14,Cl. AS, 3.488%, 6/15/46 | 640,000 | 633,056 | ||||||
| Series 2014-C20,Cl. AS, 4.176%, 5/15/47 | 490,000 | 494,263 | ||||||
| Series 2014-C22,Cl. A3, 3.528%, 9/15/57 | 120,000 | 120,527 | ||||||
| Series 2014-LC14,Cl. AS, 4.351%, 3/15/476 | 395,000 | 405,592 | ||||||
9 OPPENHEIMER GLOBAL STRATEGIC INCOME FUND/VA
CONSOLIDATED STATEMENT OF INVESTMENTS Unaudited / Continued
| Principal Amount | Value | |||||||
| Commercial (Continued) | ||||||||
| WF-RBS Commercial Mortgage Trust, Interest-Only Commercial Mtg. Pass-Through Certificates, Series 2011-C3, Cl. XA, 28.559%, 3/15/441,3 | $ | 3,127,629 | $ | 96,020 | ||||
|
| 51,391,637
|
| ||||||
| Multi-Family—0.1% | ||||||||
| Connecticut Avenue Securities: | ||||||||
| Series 2014-C02,Cl. 1M1, 3.041% [US0001M+95], 5/25/242 | 286,164 | 286,997 | ||||||
| Series 2017-C04,Cl. 2M1, 2.941% [US0001M+85], 11/25/292 | 758,547 | 760,929 | ||||||
|
| 1,047,926
|
| ||||||
| Residential—4.4% | ||||||||
| Banc of America Funding Trust, Series 2014- R7, Cl. 3A1, 3.822%, 3/26/361,6 | 36,861 | 37,134 | ||||||
| Bear Stearns ARM Trust, Series 2006-1, Cl. A1, 3.67% [H15T1Y+225], 2/25/362 | 43,316 | 43,688 | ||||||
| CHL Mortgage Pass-Through Trust: | ||||||||
| Series 2005-17,Cl. 1A8, 5.50%, 9/25/35 | 553,565 | 552,576 | ||||||
| Series 2005-J4,Cl. A7, 5.50%, 11/25/35 | 518,894 | 520,665 | ||||||
| Citigroup Mortgage Loan Trust, Inc.: | ||||||||
| Series 2005-2,Cl. 1A3, 3.964%, 5/25/356 | 627,195 | 633,273 | ||||||
| Series 2006-AR1,Cl. 1A1, 4.28% [H15T1Y+240], 10/25/352 | 188,223 | 190,582 | ||||||
| Series 2009-8,Cl. 7A2, 3.822%, 3/25/361,6 | 8,032,065 | 8,060,647 | ||||||
| Series 2012-8,Cl. 1A1, 3.901%, 10/25/351,6 | 14,787 | 14,809 | ||||||
| Series 2014-8,Cl. 1A2, 2.374% [US0001M+29], 7/20/361,2 | 3,400,000 | 3,338,332 | ||||||
| Connecticut Avenue Securities: | ||||||||
| Series 2014-C03,Cl. 1M2, 5.091% [US0001M+300], 7/25/242 | 878,428 | 941,889 | ||||||
| Series 2016-C03,Cl. 1M1, 4.091% [US0001M+200], 10/25/282 | 205,133 | 207,957 | ||||||
| Series 2016-C07,Cl. 2M1, 3.391% [US0001M+130], 5/25/292 | 422,988 | 424,602 | ||||||
| Series 2017-C01,Cl. 1M2, 5.641% [US0001M+355], 7/25/292 | 4,140,000 | 4,501,242 | ||||||
| Series 2017-C02,Cl. 2M1, 3.241% [US0001M+115], 9/25/292 | 1,214,889 | 1,221,869 | ||||||
| Series 2017-C03,Cl. 1M1, 3.041% [US0001M+95], 10/25/292 | 1,098,692 | 1,105,071 | ||||||
| Series 2017-C06,Cl. 1M1, 2.841% [US0001M+75], 2/25/302 | 259,070 | 259,496 | ||||||
| Series 2017-C07,Cl. 1M1, 2.741% [US0001M+65], 5/25/302 | 574,610 | 574,725 | ||||||
| Series 2017-C07,Cl. 1M2, 4.491% [US0001M+240], 5/25/302 | 580,000 | 592,608 | ||||||
| Series 2017-C07,Cl. 2M1, 2.741% [US0001M+65], 5/25/302 | 228,242 | 228,345 | ||||||
| Series 2018-C01,Cl. 1M1, 2.691% [US0001M+60], 7/25/302 | 784,275 | 783,401 | ||||||
| Series 2018-C02,Cl. 2M1, 2.741% [US0001M+65], 8/25/302 | 315,472 | 315,605 | ||||||
| CWHEQ Revolving Home Equity Loan Trust: | ||||||||
| Series 2005-G,Cl. 2A, 2.303% [US0001M+23], 12/15/352 | 26,662 | 26,268 | ||||||
| Series 2006-H,Cl. 2A1A, 2.223% [US0001M+15], 11/15/362 | 20,315 | 15,675 | ||||||
| GSR Mortgage Loan Trust, Series 2005-AR4, Cl. 6A1, 4.349%, 7/25/356 | 12,906 | 13,033 | ||||||
| Home Equity Mortgage Trust, Series 2005-1, Cl. M6, 5.863%, 6/25/356 | 26,115 | 26,181 | ||||||
| HomeBanc Mortgage Trust, Series 2005-3, Cl. A2, 2.401% [US0001M+31], 7/25/352 | 18,282 | 18,265 | ||||||
| Principal Amount | Value | |||||||
| Residential (Continued) | ||||||||
| MASTR Asset Backed Securities Trust, Series 2006-WMC3, Cl. A3, 2.191% [US0001M+10], 8/25/362 | $ | 868,540 | $ | 461,137 | ||||
| RALI Trust, Series 2006-QS13, Cl. 1A8, 6.00%, 9/25/36 | 13,072 | 11,703 | ||||||
| Residential Asset Securitization Trust, Series 2005-A6CB, Cl. A7, 6.00%, 6/25/35 | 1,840,168 | 1,732,597 | ||||||
| Structured Agency Credit Risk Debt Nts.: |
| |||||||
| Series 2013-DN2,Cl. M2, 6.341% [US0001M+425], 11/25/232 | 950,581 | 1,056,969 | ||||||
| Series 2014-DN1,Cl. M3, 6.591% [US0001M+450], 2/25/242 | 815,000 | 940,555 | ||||||
| Series 2014-DN2,Cl. M3, 5.691% [US0001M+360], 4/25/242 | 840,000 | 932,422 | ||||||
| Series 2014-HQ2,Cl. M3, 5.841% [US0001M+375], 9/25/242 | 915,000 | 1,044,981 | ||||||
| Series 2015-HQA2,Cl. M2, 4.891% [US0001M+280], 5/25/282 | 325,357 | 334,547 | ||||||
| Series 2016-DNA1,Cl. M2, 4.991% [US0001M+290], 7/25/282 | 388,225 | 398,311 | ||||||
| Series 2016-DNA3,Cl. M3, 7.091% [US0001M+500], 12/25/282 | 3,845,000 | 4,512,291 | ||||||
| Series 2016-DNA4,Cl. M1, 2.891% [US0001M+80], 3/25/292 | 127,124 | 127,242 | ||||||
| Series 2016-DNA4,Cl. M3, 5.891% [US0001M+380], 3/25/292 | 5,570,000 | 6,206,043 | ||||||
| Series 2016-HQA3,Cl. M1, 2.891% [US0001M+80], 3/25/292 | 627,852 | 628,681 | ||||||
| Series 2016-HQA3,Cl. M3, 5.941% [US0001M+385], 3/25/292 | 3,400,000 | 3,796,461 | ||||||
| Series 2016-HQA4,Cl. M1, 2.891% [US0001M+80], 4/25/292 | 443,578 | 444,041 | ||||||
| Series 2016-HQA4,Cl. M3, 5.991% [US0001M+390], 4/25/292 | 4,580,000 | 5,121,630 | ||||||
| Series 2017-DNA1,Cl. M2, 5.341% [US0001M+325], 7/25/292 | 4,400,000 | 4,746,443 | ||||||
| Series 2017-HQA1,Cl. M1, 3.291% [US0001M+120], 8/25/292 | 1,757,023 | 1,769,164 | ||||||
| Series 2017-HQA2,Cl. M1, 2.891% [US0001M+80], 12/25/292 | 531,974 | 533,048 | ||||||
| Series 2017-HQA3,Cl. M1, 2.641% [US0001M+55], 4/25/302 | 1,264,886 | 1,264,088 | ||||||
| Series 2018-DNA1,Cl. M1, 2.541% [US0001M+45], 7/25/302 | 1,621,964 | 1,615,606 | ||||||
| Series 2018-DNA1,Cl. M2, 3.891% [US0001M+180], 7/25/302 | 1,200,000 | 1,181,523 | ||||||
| WaMu Mortgage Pass-Through Certificates Trust: | ||||||||
| Series 2003-AR10,Cl. A7, 3.459%, 10/25/336 | 60,983 | 61,977 | ||||||
| Series 2005-AR16,Cl. 1A1, 3.398%, 12/25/356 | 8,475 | 8,524 | ||||||
| Wells Fargo Mortgage-Backed Securities Trust: | ||||||||
| Series 2005-AR1,Cl. 1A1, 3.839%, 2/25/356 | 822,501 | 843,751 | ||||||
| Series 2005-AR15,Cl. 1A2, 3.552%, 9/25/356 | 130,827 | 127,511 | ||||||
| Series 2005-AR15,Cl. 1A6, 3.552%, 9/25/356 | 1,583,756 | 1,532,599 | ||||||
| Series 2005-AR4,Cl. 2A2, 3.97%, 4/25/356 | 7,772 | 7,842 | ||||||
| Series 2006-AR10,Cl. 1A1, 4.12%, 7/25/366 | 158,792 | 155,823 | ||||||
| Series 2006-AR10,Cl. 5A5, 4.278%, 7/25/366 | 290,665 | 295,385 | ||||||
| Series 2006-AR2,Cl. 2A3, 3.822%, 3/25/366 | 1,370,893 | 1,389,181 | ||||||
| Series 2006-AR7,Cl. 2A4, 4.323%, 5/25/366 | 759,289 | 778,394 | ||||||
10 OPPENHEIMER GLOBAL STRATEGIC INCOME FUND/VA
| Principal Amount | Value | |||||||
| Residential (Continued) |
| |||||||
| Wells Fargo Mortgage-Backed Securities Trust: (Continued) |
| |||||||
| Series 2006-AR8,Cl. 2A1, 3.933%, 4/25/366 | $ | 514,357 | $ | 523,789 | ||||
| 69,232,197 | ||||||||
Total Mortgage-Backed Obligations
|
|
| 311,562,690
|
| ||||
| Foreign Government Obligations—17.1% |
| |||||||
Angola—0.3% | ||||||||
| Republic of Angola: | ||||||||
| 8.25% Sr. Unsec. Nts., 5/9/281 | 2,950,000 | 2,960,107 | ||||||
| 9.375% Sr. Unsec. Nts., 5/8/481 | 1,535,000 | 1,554,029 | ||||||
|
| 4,514,136
|
| ||||||
| Argentina—1.4% | ||||||||
| Argentine Republic: | ||||||||
| 4.625% Sr. Unsec. Nts., 1/11/23 | 1,480,000 | 1,307,780 | ||||||
| 5.875% Sr. Unsec. Nts., 1/11/28 | 4,380,000 | 3,572,437 | ||||||
| 6.875% Sr. Unsec. Nts., 1/26/27 | 1,625,000 | 1,436,094 | ||||||
| 6.875% Sr. Unsec. Nts., 1/11/48 | 1,935,000 | 1,466,749 | ||||||
| 7.50% Sr. Unsec. Nts., 4/22/26 | 695,000 | 643,744 | ||||||
| 16.00% Bonds, 10/17/23 | ARS | 9,285,000 | 289,294 | |||||
| 18.20% Unsec. Nts., 10/3/21 | ARS | 9,285,000 | 275,902 | |||||
| 21.20% Bonds, 9/19/18 | ARS | 383,950,000 | 12,739,781 | |||||
|
| 21,731,781
|
| ||||||
| Belarus—0.0% | ||||||||
Republic of Belarus, 6.875% Sr. Unsec. Nts., 2/28/231
|
| 515,000
|
|
| 534,274
|
| ||
| Brazil—0.7% | ||||||||
| Federative Republic of Brazil: | ||||||||
| 5.00% Sr. Unsec. Nts., 1/27/45 | 1,500,000 | 1,191,015 | ||||||
| 10.00% Unsec. Nts., 1/1/21 | BRL | 11,000,000 | 2,880,363 | |||||
| 10.00% Unsec. Nts., 1/1/25 | BRL | 26,900,000 | 6,540,610 | |||||
| 18.093% Unsec. Nts., 5/15/4514 | BRL | 850,000 | 680,710 | |||||
|
| 11,292,698
|
| ||||||
| Chile—0.5% | ||||||||
Republic of Chile, 4.50% Bonds, 3/1/21
| CLP
| 4,818,500,000
|
|
| 7,529,813
|
| ||
| Colombia—0.6% | ||||||||
| Republic of Colombia: | ||||||||
| 3.875% Sr. Unsec. Nts., 4/25/27 | 495,000 | 479,284 | ||||||
| 4.00% Sr. Unsec. Nts., 2/26/24 | 485,000 | 485,121 | ||||||
| 6.125% Sr. Unsec. Nts., 1/18/41 | 1,815,000 | 2,037,337 | ||||||
| Series B, 7.50% Bonds, 8/26/26 | COP | 12,830,000,000 | 4,658,537 | |||||
| Series B, 10.00% Bonds, 7/24/24 | COP | 5,146,000,000 | 2,093,853 | |||||
|
| 9,754,132
|
| ||||||
| Croatia—0.1% | ||||||||
Republic of Croatia, 3.875% Sr. Unsec. Nts., 5/30/22
| EUR
| 1,405,000
|
|
| 1,817,265
|
| ||
| Dominican Republic—0.6% | ||||||||
| Dominican Republic: | ||||||||
| 5.95% Sr. Unsec. Nts., 1/25/271 | 8,770,000 | 8,693,262 | ||||||
| 6.85% Sr. Unsec. Nts., 1/27/451 | 1,030,000 | 1,024,809 | ||||||
|
| 9,718,071
|
| ||||||
| Ecuador—0.2% | ||||||||
| Republic of Ecuador: | ||||||||
| 7.875% Sr. Unsec. Nts., 1/23/281 | 915,000 | 769,927 | ||||||
| 8.875% Sr. Unsec. Nts., 10/23/271 | 1,860,000 | 1,650,657 | ||||||
|
| 2,420,584
|
| ||||||
| Egypt—0.5% | ||||||||
| Arab Republic of Egypt: | ||||||||
| 4.75% Sr. Unsec. Nts., 4/16/261 | EUR | 2,000,000 | 2,153,229 | |||||
| 6.125% Sr. Unsec. Nts., 1/31/221 | 1,065,000 | 1,050,033 | ||||||
| 6.588% Sr. Unsec. Nts., 2/21/281 | 1,040,000 | 958,677 | ||||||
| 6.875% Sr. Unsec. Nts., 4/30/401 | 300,000 | 256,842 | ||||||
| 8.50% Sr. Unsec. Nts., 1/31/471 | 1,550,000 | 1,506,575 | ||||||
| Principal Amount | Value | |||||||
| Egypt (Continued) | ||||||||
| Arab Republic of Egypt: (Continued) |
| |||||||
| Series 3YR, 16.00% Unsec. Nts., 12/12/20 | EGP | 28,000,000 | $ | 1,524,377 | ||||
|
| 7,449,733
|
| ||||||
| Gabon—0.2% | ||||||||
Gabonese Republic, 6.375% Bonds, 12/12/241
|
| 2,665,000
|
|
| 2,394,665
|
| ||
| Ghana—0.2% | ||||||||
| Republic of Ghana: | ||||||||
| 7.625% Sr. Unsec. Nts., 5/16/291 | 2,470,000 | 2,416,747 | ||||||
| 8.627% Sr. Unsec. Nts., 6/16/491 | 1,440,000 | 1,405,630 | ||||||
|
| 3,822,377
|
| ||||||
| Greece—1.4% | ||||||||
| Hellenic Republic: | ||||||||
| Bonds, 10/15/426 | EUR | 30,230,000 | 140,646 | |||||
| 3.375% Sr. Unsec. Nts., 2/15/251 | EUR | 3,615,000 | 4,184,156 | |||||
| 3.75% Bonds, 1/30/28 | EUR | 3,790,000 | 4,356,722 | |||||
| 3.90% Bonds, 1/30/33 | EUR | 11,555,000 | 12,607,189 | |||||
| 4.00% Bonds, 1/30/37 | EUR | 930,000 | 992,655 | |||||
|
| 22,281,368
|
| ||||||
| Honduras—0.1% | ||||||||
| Republic of Honduras: | ||||||||
| 6.25% Sr. Unsec. Nts., 1/19/271 | 515,000 | 518,708 | ||||||
| 8.75% Sr. Unsec. Nts., 12/16/201 | 455,000 | 493,538 | ||||||
|
| 1,012,246
|
| ||||||
| Hungary—0.2% | ||||||||
| Hungary: | ||||||||
| 5.75% Sr. Unsec. Nts., 11/22/23 | 1,025,000 | 1,105,012 | ||||||
| Series 25/B, 5.50% Bonds, 6/24/25 | HUF | 160,840,000 | 660,972 | |||||
| Series 27/A, 3.00% Bonds, 10/27/27 | HUF | 400,000,000 | 1,354,675 | |||||
|
| 3,120,659
|
| ||||||
| India—1.4% | ||||||||
| Republic of India: | ||||||||
| 7.59% Sr. Unsec. Nts., 1/11/26 | INR | 600,000,000 | 8,492,065 | |||||
| 8.20% Sr. Unsec. Nts., 2/15/22 | INR | 600,000,000 | 8,837,764 | |||||
| 8.20% Sr. Unsec. Nts., 9/24/25 | INR | 270,600,000 | 3,965,286 | |||||
|
| 21,295,115
|
| ||||||
| Indonesia—1.4% | ||||||||
| Perusahaan Penerbit SBSN Indonesia III: | ||||||||
| 4.35% Sr. Unsec. Nts., 9/10/241 | 575,000 | 575,719 | ||||||
| 4.55% Sr. Unsec. Nts., 3/29/261 | 940,000 | 936,475 | ||||||
| Republic of Indonesia: | ||||||||
| 3.85% Sr. Unsec. Nts., 7/18/271 | 975,000 | 926,629 | ||||||
| 4.125% Sr. Unsec. Nts., 1/15/251 | 490,000 | 482,209 | ||||||
| Series FR53, 8.25% Sr. Unsec. Nts., 7/15/21 | IDR | 50,865,000,000 | 3,622,546 | |||||
| Series FR56, 8.375% Sr. Unsec. Nts., 9/15/26 | IDR | 104,095,000,000 | 7,427,669 | |||||
| Series FR74, 7.50% Sr. Unsec. Nts., 8/15/32 | IDR | 112,480,000,000 | 7,397,934 | |||||
|
| 21,369,181
|
| ||||||
| Iraq—0.1% | ||||||||
| Republic of Iraq: | ||||||||
| 5.80% Unsec. Nts., 1/15/281 | 615,000 | 553,571 | ||||||
| 6.752% Sr. Unsec. Nts., 3/9/231 | 1,000,000 | 963,370 | ||||||
|
| 1,516,941
|
| ||||||
| Ivory Coast—0.3% | ||||||||
| Republic of Cote d’Ivoire: | ||||||||
| 5.125% Sr. Unsec. Nts., 6/15/251 | EUR | 1,065,000 | 1,254,419 | |||||
| 5.25% Sr. Unsec. Nts., 3/22/301 | EUR | 1,232,000 | 1,379,760 | |||||
| 6.125% Sr. Unsec. Nts., 6/15/331 | 1,265,000 | 1,120,193 | ||||||
| 6.625% Sr. Unsec. Nts., 3/22/481 | EUR | 1,026,000 | 1,131,677 | |||||
| 4,886,049 | ||||||||
11 OPPENHEIMER GLOBAL STRATEGIC INCOME FUND/VA
CONSOLIDATED STATEMENT OF INVESTMENTS Unaudited / Continued
| Principal Amount | Value | |||||||||
| Mexico—0.8% | ||||||||||
| United Mexican States: | ||||||||||
| 3.75% Sr. Unsec. Nts., 1/11/28 | $ | 1,020,000 | $ | 965,685 | ||||||
| Series M, 5.75% Bonds, 3/5/26 | MXN | 54,445,000 | 2,450,570 | |||||||
| Series M, 8.00% Sr. Unsec. Nts., 12/7/23 | MXN | 150,000,000 | 7,666,973 | |||||||
| Series M, 8.00% Bonds, 11/7/47 | MXN | 22,265,000 | 1,161,820 | |||||||
|
| 12,245,048
|
| ||||||||
| Mongolia—0.1% | ||||||||||
| Mongolia: | ||||||||||
| 5.125% Sr. Unsec. Nts., 12/5/221 | 300,000 | 281,692 | ||||||||
| 5.625% Sr. Unsec. Nts., 5/1/231 | 700,000 | 664,289 | ||||||||
|
| 945,981
|
| ||||||||
| Nigeria—0.2% | ||||||||||
| Federal Republic of Nigeria: | ||||||||||
| 7.143% Sr. Unsec. Nts., 2/23/301 | 725,000 | 686,185 | ||||||||
| 7.696% Sr. Unsec. Nts., 2/23/381 | 1,760,000 | 1,668,146 | ||||||||
|
| 2,354,331
|
| ||||||||
| Oman—0.2% | ||||||||||
Sultanate of Oman, 6.75% Sr. Unsec. Nts., 1/17/481
| 3,325,000
|
| 3,021,427
|
| ||||||
| Peru—0.5% | ||||||||||
| Republic of Peru: | ||||||||||
| 5.70% Unsec. Nts., 8/12/241 | PEN | 5,345,000 | 1,690,791 | |||||||
| 6.15% Sr. Unsec. Nts., 8/12/321 | PEN | 4,370,000 | 1,368,334 | |||||||
| 6.35% Sr. Unsec. Nts., 8/12/281 | PEN | 5,640,000 | 1,798,025 | |||||||
| 7.84% Sr. Unsec. Nts., 8/12/201 | PEN | 9,000,000 | 3,026,949 | |||||||
|
| 7,884,099
|
| ||||||||
| Poland—0.4% | ||||||||||
| Republic of Poland: | ||||||||||
| Series 0422, 2.25% Bonds, 4/25/22 | PLN | 13,800,000 | 3,691,237 | |||||||
| Series 0725, 3.25% Bonds, 7/25/25 | PLN | 5,000,000 | 1,358,206 | |||||||
| Series 0727, 2.50% Bonds, 7/25/27 | PLN | 6,650,000 | 1,680,134 | |||||||
|
| 6,729,577
|
| ||||||||
| Portugal—0.0% | ||||||||||
Portuguese Republic, 4.10% Sr. Unsec. Nts., 2/15/451
|
| EUR
|
| 475,000
|
| 684,188
|
| |||
| Romania—0.1% | ||||||||||
| Romania: | ||||||||||
| 2.375% Sr. Unsec. Nts., 4/19/271 | EUR | 975,000 | 1,142,627 | |||||||
| 3.875% Sr. Unsec. Nts., 10/29/351 | EUR | 345,000 | 412,471 | |||||||
|
| 1,555,098
|
| ||||||||
| Russia—0.3% | ||||||||||
| Russian Federation: | ||||||||||
| 4.375% Sr. Unsec. Nts., 3/21/291 |
| 495,000 | 480,555 | |||||||
| Series 6209, 7.60% Bonds, 7/20/22 | RUB | 66,585,000 | 1,073,313 | |||||||
| Series 6211, 7.00% Bonds, 1/25/23 | RUB | 205,000,000 | 3,221,831 | |||||||
|
| 4,775,699
|
| ||||||||
| Senegal—0.1% | ||||||||||
| Republic of Senegal: | ||||||||||
| 6.25% Sr. Unsec. Nts., 7/30/241 | 590,000 | 580,071 | ||||||||
| 6.25% Unsec. Nts., 5/23/331 | 510,000 | 453,518 | ||||||||
| 6.75% Sr. Unsec. Nts., 3/13/481 | 935,000 | 802,945 | ||||||||
|
| 1,836,534
|
| ||||||||
| Serbia—0.1% | ||||||||||
Republic of Serbia, 5.875% Unsec. Nts., 12/3/181
| 1,965,000
|
| 1,986,283
|
| ||||||
| South Africa—1.6% | ||||||||||
| Republic of South Africa: | ||||||||||
| 5.875% Sr. Unsec. Nts., 6/22/30 | 1,480,000 | 1,471,392 | ||||||||
| Series 2023, 7.75% Bonds, 2/28/23 | ZAR | 22,500,000 | 1,609,439 | |||||||
| Series 2030, 8.00% Bonds, 1/31/30 | ZAR | 77,000,000 | 5,125,228 | |||||||
| Series 2037, 8.50% Bonds, 1/31/37 | ZAR | 107,000,000 | 7,075,721 | |||||||
| Series 2048, 8.75% Bonds, 2/28/48 | ZAR | 15,000,000 | 994,892 | |||||||
| Series R186, 10.50% Bonds, 12/21/26 | ZAR | 86,675,000 | 6,926,645 | |||||||
| Principal Amount | Value | |||||||||
| South Africa (Continued) | ||||||||||
| Republic of South Africa: (Continued) | ||||||||||
| Series R214, 6.50% Bonds, 2/28/41 | ZAR | 25,000,000 | $ | 1,296,293 | ||||||
|
| 24,499,610
|
| ||||||||
| Sri Lanka—0.4% | ||||||||||
| Democratic Socialist Republic of Sri Lanka: | ||||||||||
| 5.75% Sr. Unsec. Nts., 4/18/231 | 1,500,000 | 1,439,865 | ||||||||
| 5.875% Sr. Unsec. Nts., 7/25/221 | 1,475,000 | 1,451,875 | ||||||||
| 6.00% Sr. Unsec. Nts., 1/14/191 | 1,540,000 | 1,548,686 | ||||||||
| 6.25% Sr. Unsec. Nts., 10/4/201 | 465,000 | 471,952 | ||||||||
| 6.75% Sr. Unsec. Nts., 4/18/281 | 990,000 | 936,689 | ||||||||
|
| 5,849,067
|
| ||||||||
| Thailand—0.4% | ||||||||||
| Kingdom of Thailand: | ||||||||||
| 1.875% Sr. Unsec. Nts., 6/17/22 | THB | 65,400,000 | 1,966,971 | |||||||
| 2.125% Sr. Unsec. Nts., 12/17/26 | THB | 150,000,000 | 4,372,719 | |||||||
|
| 6,339,690
|
| ||||||||
| Turkey—0.9% | ||||||||||
| Republic of Turkey: | ||||||||||
| 8.80% Bonds, 11/14/18 | TRY | 10,570,000 | 2,238,778 | |||||||
| 10.60% Bonds, 2/11/26 | TRY | 5,000,000 | 829,370 | |||||||
| 10.70% Bonds, 2/17/21 | TRY | 28,445,000 | 5,294,138 | |||||||
| 11.00% Bonds, 2/24/27 | TRY | 9,570,000 | 1,591,580 | |||||||
| 12.40% Bonds, 3/8/28 | TRY | 25,000,000 | 4,500,582 | |||||||
|
| 14,454,448
|
| ||||||||
| Ukraine—0.6% | ||||||||||
| Ukraine: | ||||||||||
| 7.75% Sr. Unsec. Nts., 9/1/20 | 985,000 | 982,355 | ||||||||
| 7.75% Sr. Unsec. Nts., 9/1/23 | 2,250,000 | 2,173,005 | ||||||||
| 7.75% Sr. Unsec. Nts., 9/1/24 | 1,445,000 | 1,374,406 | ||||||||
| 7.75% Sr. Unsec. Nts., 9/1/25 | 950,000 | 894,382 | ||||||||
| 7.75% Sr. Unsec. Nts., 9/1/26 | 3,240,000 | 3,013,874 | ||||||||
| 7.75% Sr. Unsec. Nts., 9/1/27 | 1,645,000 | 1,515,808 | ||||||||
|
| 9,953,830
|
| ||||||||
| Uruguay—0.2% | ||||||||||
| Oriental Republic of Uruguay: | ||||||||||
| 5.10% Sr. Unsec. Nts., 6/18/50 | 2,860,000 | 2,822,105 | ||||||||
| 9.875% Sr. Unsec. Nts., 6/20/221 | UYU | 13,555,000 | 429,294 | |||||||
| 3,251,399 | ||||||||||
| Total Foreign Government Obligations (Cost $293,672,653) | 266,827,397 | |||||||||
| Corporate Loans—0.4% | ||||||||||
| Albertson’s LLC, Sr. Sec. Credit Facilities 1st Lien Term Loan, Tranche B4, 4.73% [LIBOR12+275], 8/25/212 |
| 274,307 | 272,063 | |||||||
| Aleris International, Inc., Sr. Sec. Credit Facilities 1st Lien Term Loan, 7.069% 4/15/235,6 |
| 550,000 | 546,045 | |||||||
| American Greetings Corp., Sr. Sec. Credit Facilities 1st Lien Term Loan, Tranche B, 6.594% [LIBOR12+450], 4/6/242 |
| 590,000 | 595,162 | |||||||
| Clear Channel Communications, Inc., Extended Sr. Sec. Credit Facilities 1st Lien Term Loan, Tranche D, 8.844% [LIBOR4+675], 1/30/192,7 |
| 800,000 | 612,300 | |||||||
| JC Penney Corp., Inc., Sr. Sec. Credit Facilities 1st Lien Term Loan, Tranche B, 6.569% [LIBOR4+425], 6/23/232 |
| 392,435 | 375,757 | |||||||
| Monitronics International, Inc., Sr. Sec. Credit Facilities 1st Lien Term Loan, Tranche B2, 7.834% [LIBOR4+550], 9/30/222 |
| 274,302 | 262,602 | |||||||
| Murray Energy Corp., Sr. Sec. Credit Facilities 1st Lien Term Loan, Tranche B2, 9.344% [LIBOR4+725], 4/16/202 |
| 1,582,981 | 1,496,827 | |||||||
12 OPPENHEIMER GLOBAL STRATEGIC INCOME FUND/VA
| Principal Amount | Value | |||||||
| Corporate Loans (Continued) | ||||||||
| Neiman Marcus Group Ltd. LLC, Sr. Sec. Credit Facilities 1st Lien Term Loan, 5.263% [LIBOR12+325], 10/25/202 | $ | 1,049,468 | $ | 932,715 | ||||
| PetSmart, Inc., Sr. Sec. Credit Facilities 1st Lien Term Loan, Tranche B, 5.01% [LIBOR12+300], 3/11/222 | 275,000 | 228,040 | ||||||
| Windstream Services LLC, Sr. Sec. Credit Facilities 1st Lien Term Loan, Tranche B6, 6.09% [LIBOR12+400], 3/29/212 | 307,652 | 293,038 | ||||||
| Total Corporate Loans (Cost $5,571,792) | 5,614,549 | |||||||
| Corporate Bonds and Notes—39.5% |
| |||||||
| Consumer Discretionary—6.0% | ||||||||
Auto Components—0.2% | ||||||||
| American Axle & Manufacturing, Inc., 6.25% Sr. Unsec. Nts., 4/1/25 | 1,100,000 | 1,095,875 | ||||||
| Cooper-Standard Automotive, Inc., 5.625% Sr. Unsec. Nts., 11/15/268 | 250,000 | 247,500 | ||||||
| Dana Financing Luxembourg Sarl, 6.50% Sr. Unsec. Nts., 6/1/261 | 705,000 | 717,337 | ||||||
| Goodyear Tire & Rubber Co. (The), 5.00% Sr. Unsec. Nts., 5/31/26 | 520,000 | 485,550 | ||||||
| Grinding Media, Inc./Moly-Cop AltaSteel Ltd., 7.375% Sr. Sec. Nts., 12/15/231 | 345,000 | 360,525 | ||||||
| Tenneco, Inc., 5.00% Sr. Unsec. Nts., 7/15/26 | 360,000 | 322,380 | ||||||
|
| 3,229,167
|
| ||||||
| Automobiles—0.1% | ||||||||
| Harley-Davidson, Inc., 4.625% Sr. Unsec. Nts., 7/28/45 | 240,000 | 233,562 | ||||||
| Jaguar Land Rover Automotive plc, 4.50% Sr. Unsec. Nts., 10/1/271 | 690,000 | 619,275 | ||||||
|
| 852,837
|
| ||||||
| Distributors—0.0% | ||||||||
LKQ Corp., 4.75% Sr. Unsec. Nts., 5/15/23
|
| 387,000
|
|
| 387,000
|
| ||
| Diversified Consumer Services—0.1% |
| |||||||
| Cengage Learning, Inc., 9.50% Sr. Unsec. Nts., 6/15/241 | 140,000 | 119,000 | ||||||
| KCA Deutag UK Finance plc, 9.625% Sr. Sec. Nts., 4/1/231 | 275,000 | 279,469 | ||||||
| Monitronics International, Inc., 9.125% Sr. Unsec. Nts., 4/1/20 | 735,000 | 475,912 | ||||||
| Service Corp. International, 4.625% Sr. Unsec. Nts., 12/15/27 | 510,000 | 483,021 | ||||||
|
| 1,357,402
|
| ||||||
| Hotels, Restaurants & Leisure—1.7% |
| |||||||
| 1011778 B.C. ULC/New Red Finance, Inc.: | ||||||||
| 4.25% Sr. Sec. Nts., 5/15/241 | 785,000 | 747,713 | ||||||
| 5.00% Sec. Nts., 10/15/251 | 1,335,000 | 1,269,852 | ||||||
| Aramark Services, Inc.: | ||||||||
| 4.75% Sr. Unsec. Nts., 6/1/26 | 745,000 | 721,719 | ||||||
| 5.00% Sr. Unsec. Nts., 2/1/281 | 815,000 | 780,362 | ||||||
| Boyd Gaming Corp.: | ||||||||
| 6.00% Sr. Unsec. Nts., 8/15/261 | 690,000 | 683,962 | ||||||
| 6.375% Sr. Unsec. Nts., 4/1/26 | 235,000 | 238,525 | ||||||
| Caesars Resort Collection LLC/CRC | ||||||||
| Finco, Inc., 5.25% Sr. Unsec. Nts., 10/15/251 | 820,000 | 777,975 | ||||||
| CEC Entertainment, Inc., 8.00% Sr. Unsec. Nts., 2/15/22 | 670,000 | 592,950 | ||||||
| Downstream Development Authority of the Quapaw Tribe of Oklahoma, 10.50% Sr. Sec. Nts., 2/15/231 | 330,000 | 338,250 | ||||||
| Eldorado Resorts, Inc., 6.00% Sr. Unsec. Nts., 4/1/25 | 540,000 | 543,375 | ||||||
| Principal Amount | Value | |||||||
| Hotels, Restaurants & Leisure (Continued) |
| |||||||
| Gateway Casinos & Entertainment Ltd., 8.25% Sec. Nts., 3/1/241 | $ | 390,000 | $ | 412,425 | ||||
| Golden Nugget, Inc.: | ||||||||
| 6.75% Sr. Unsec. Nts., 10/15/241 | 1,770,000 | 1,774,744 | ||||||
| 8.75% Sr. Sub. Nts., 10/1/251 | 1,250,000 | 1,287,137 | ||||||
| Hilton Domestic Operating Co., Inc.: | ||||||||
| 4.25% Sr. Unsec. Nts., 9/1/24 | 425,000 | 405,344 | ||||||
| 5.125% Sr. Unsec. Nts., 5/1/261 | 550,000 | 543,125 | ||||||
| Hilton Grand Vacations Borrower LLC/ | ||||||||
| Hilton Grand Vacations Borrower, Inc., 6.125% Sr. Unsec. Nts., 12/1/24 | 700,000 | 716,625 | ||||||
| International Game Technology plc, 6.25% Sr. Sec. Nts., 2/15/221 | 1,130,000 | 1,163,900 | ||||||
| IRB Holding Corp., 6.75% Sr. Unsec. Nts., 2/15/261 | 270,000 | 258,525 | ||||||
| KFC Holding Co./Pizza Hut Holdings LLC/ Taco Bell of America LLC: | ||||||||
| 4.75% Sr. Unsec. Nts., 6/1/271 | 435,000 | 412,162 | ||||||
| 5.25% Sr. Unsec. Nts., 6/1/261 | 995,000 | 982,562 | ||||||
| Melco Resorts Finance Ltd., 4.875% Sr. Unsec. Nts., 6/6/251 | 1,330,000 | 1,259,779 | ||||||
| MGM Growth Properties Operating Partnership LP/MGP Finance Co.-Issuer, Inc., 5.625% Sr. Unsec. Nts., 5/1/24 | 1,230,000 | 1,251,525 | ||||||
| MGM Resorts International: | ||||||||
| 5.75% Sr. Unsec. Nts., 6/15/25 | 780,000 | 782,925 | ||||||
| 6.00% Sr. Unsec. Nts., 3/15/23 | 855,000 | 882,788 | ||||||
| 6.625% Sr. Unsec. Nts., 12/15/21 | 405,000 | 427,275 | ||||||
| Mohegan Gaming & Entertainment, 7.875% Sr. Unsec. Nts., 10/15/241 | 780,000 | 738,075 | ||||||
| Penn National Gaming, Inc., 5.625% Sr. Unsec. Nts., 1/15/271 | 990,000 | 935,550 | ||||||
| PF Chang’s China Bistro, Inc., 10.25% Sr. Unsec. Nts., 6/30/201 | 735,000 | 665,175 | ||||||
| Premier Cruises Ltd., 11.00% Sr. Unsec. Nts., 3/15/081,7 | 250,000 | — | ||||||
| Scientific Games International, Inc.: | ||||||||
| 5.00% Sr. Sec. Nts., 10/15/251 | 1,280,000 | 1,222,400 | ||||||
| 10.00% Sr. Unsec. Nts., 12/1/22 | 1,387,000 | 1,482,356 | ||||||
| Silversea Cruise Finance Ltd., 7.25% Sr. Sec. Nts., 2/1/251 | 110,000 | 119,361 | ||||||
| Six Flags Entertainment Corp., 4.875% Sr. Unsec. Nts., 7/31/241 | 500,000 | 487,100 | ||||||
| Sugarhouse HSP Gaming Prop Mezz LP/ Sugarhouse HSP Gaming Finance Corp., 5.875% Sr. Sec. Nts., 5/15/251 | 550,000 | 518,375 | ||||||
| Viking Cruises Ltd., 5.875% Sr. Unsec. Nts., 9/15/271 | 560,000 | 530,600 | ||||||
| Wyndham Hotels & Resorts, Inc., 5.375% Sr. Unsec. Nts., 4/15/261 | 275,000 | 274,313 | ||||||
| Wynn Las Vegas LLC/Wynn Las Vegas Capital Corp.: | ||||||||
| 5.25% Sr. Unsec. Nts., 5/15/271 | 390,000 | 365,138 | ||||||
| 5.50% Sr. Unsec. Nts., 3/1/251 | 275,000 | 270,875 | ||||||
| Wynn Macau Ltd.: | ||||||||
| 4.875% Sr. Unsec. Nts., 10/1/241 | 135,000 | 129,222 | ||||||
| 5.50% Sr. Unsec. Nts., 10/1/271 | 135,000 | 129,263 | ||||||
|
| 27,123,327
|
| ||||||
| Household Durables—0.8% | ||||||||
| Arcelik AS, 5.00% Sr. Unsec. Nts., 4/3/231 | 495,000 | 468,275 | ||||||
| AV Homes, Inc., 6.625% Sr. Unsec. Nts., 5/15/22 | 1,310,000 | 1,354,212 | ||||||
| Beazer Homes USA, Inc.: | ||||||||
| 5.875% Sr. Unsec. Nts., 10/15/27 | 935,000 | 819,079 | ||||||
| 6.75% Sr. Unsec. Nts., 3/15/25 | 1,680,000 | 1,612,800 | ||||||
| 7.25% Sr. Unsec. Nts., 2/1/23 | 43,000 | 44,182 | ||||||
13 OPPENHEIMER GLOBAL STRATEGIC INCOME FUND/VA
CONSOLIDATED STATEMENT OF INVESTMENTS Unaudited / Continued
| Principal Amount | Value | |||||||
| Household Durables (Continued) | ||||||||
| KB Home, 7.625% Sr. Unsec. Nts., 5/15/23 | $ | 670,000 | $ | 721,925 | ||||
| Lennar Corp.: | ||||||||
| 4.50% Sr. Unsec. Nts., 4/30/24 | 95,000 | 91,799 | ||||||
| 4.75% Sr. Unsec. Nts., 5/30/25 | 840,000 | 815,850 | ||||||
| M/I Homes, Inc., 5.625% Sr. Unsec. Nts., 8/1/25 | 795,000 | 747,300 | ||||||
| MDC Holdings, Inc., 6.00% Sr. Unsec. Nts., 1/15/43 | 800,000 | 700,320 | ||||||
| Newell Brands, Inc., 5.00% Sr. Unsec. Nts., 11/15/23 | 311,000 | 318,025 | ||||||
| PulteGroup, Inc.: | ||||||||
| 5.00% Sr. Unsec. Nts., 1/15/27 | 525,000 | 500,719 | ||||||
| 5.50% Sr. Unsec. Nts., 3/1/26 | 740,000 | 735,375 | ||||||
| Taylor Morrison Communities, Inc./Taylor Morrison Holdings II, Inc., 5.875% Sr. Unsec. Nts., 4/15/238 | 1,160,000 | 1,160,000 | ||||||
| Toll Brothers Finance Corp.: | ||||||||
| 4.375% Sr. Unsec. Nts., 4/15/23 | 180,000 | 177,075 | ||||||
| 4.875% Sr. Unsec. Nts., 3/15/27 | 375,000 | 351,563 | ||||||
| William Lyon Homes, Inc.: | ||||||||
| 5.875% Sr. Unsec. Nts., 1/31/25 | 1,020,000 | 967,725 | ||||||
| 6.00% Sr. Unsec. Nts., 9/1/231 | 550,000 | 545,716 | ||||||
|
| 12,131,940
|
| ||||||
| Internet & Catalog Retail—0.1% | ||||||||
| Netflix, Inc., 5.875% Sr. Unsec. Nts., 11/15/281 | 275,000 | 279,042 | ||||||
| QVC, Inc., 4.45% Sr. Sec. Nts., 2/15/25 | 1,199,000 | 1,160,112 | ||||||
|
| 1,439,154
|
| ||||||
| Media—2.3% | ||||||||
| Altice Financing SA: | ||||||||
| 6.625% Sr. Sec. Nts., 2/15/231 | 205,000 | 202,540 | ||||||
| 7.50% Sr. Sec. Nts., 5/15/261 | 480,000 | 465,456 | ||||||
| Altice Finco SA, 8.125% Sec. Nts., 1/15/241 | 695,000 | 695,000 | ||||||
| Altice France SA: | ||||||||
| 6.00% Sr. Sec. Nts., 5/15/221 | 390,000 | 392,925 | ||||||
| 7.375% Sr. Sec. Nts., 5/1/261 | 580,000 | 569,241 | ||||||
| Altice Luxembourg SA, 7.75% Sr. Unsec. Nts., 5/15/221 | 205,000 | 199,106 | ||||||
| Altice US Finance I Corp., 5.50% Sr. Sec. Nts., 5/15/261 | 205,000 | 198,337 | ||||||
| AMC Entertainment Holdings, Inc.: | ||||||||
| 5.75% Sr. Sub. Nts., 6/15/25 | 705,000 | 693,544 | ||||||
| 5.875% Sr. Sub. Nts., 11/15/26 | 760,000 | 733,400 | ||||||
| 6.125% Sr. Sub. Nts., 5/15/27 | 520,000 | 507,000 | ||||||
| AMC Networks, Inc.: | ||||||||
| 4.75% Sr. Unsec. Nts., 8/1/25 | 530,000 | 510,793 | ||||||
| 5.00% Sr. Unsec. Nts., 4/1/24 | 275,000 | 271,562 | ||||||
| Belo Corp., 7.75% Sr. Unsec. Nts., 6/1/27 | 1,362,000 | 1,443,720 | ||||||
| Block Communications, Inc., 6.875% Sr. Unsec. Nts., 2/15/251 | 460,000 | 461,150 | ||||||
| CCO Holdings LLC/CCO Holdings Capital Corp.: | ||||||||
| 4.00% Sr. Unsec. Nts., 3/1/231 | 265,000 | 249,762 | ||||||
| 5.00% Sr. Unsec. Nts., 2/1/281 | 840,000 | 772,800 | ||||||
| 5.125% Sr. Unsec. Nts., 5/1/271 | 1,040,000 | 973,700 | ||||||
| 5.375% Sr. Unsec. Nts., 5/1/251 | 205,000 | 198,850 | ||||||
| 5.75% Sr. Unsec. Nts., 2/15/261 | 1,315,000 | 1,295,275 | ||||||
| 5.875% Sr. Unsec. Nts., 4/1/241 | 325,000 | 327,437 | ||||||
| 5.875% Sr. Unsec. Nts., 5/1/271 | 205,000 | 200,644 | ||||||
| Cinemark USA, Inc., 4.875% Sr. Unsec. Nts., 6/1/23 | 495,000 | 487,513 | ||||||
| Clear Channel International BV, 8.75% Sr. Unsec. Nts., 12/15/201 | 265,000 | 275,269 | ||||||
| Principal Amount | Value | |||||||
| Media (Continued) | ||||||||
| Clear Channel Worldwide Holdings, Inc.: | ||||||||
| 6.50% Sr. Unsec. Nts., Series B, 11/15/22 | $ | 1,465,000 | $ | 1,501,625 | ||||
| 7.625% Sr. Sub. Nts., Series B, 3/15/20 | 1,505,000 | 1,501,674 | ||||||
| CSC Holdings LLC: | ||||||||
| 5.25% Sr. Unsec. Nts., 6/1/24 | 715,000 | 677,462 | ||||||
| 5.50% Sr. Unsec. Nts., 4/15/271 | 750,000 | 718,125 | ||||||
| 10.875% Sr. Unsec. Nts., 10/15/251 | 722,000 | 834,127 | ||||||
| DISH DBS Corp.: | ||||||||
| 5.875% Sr. Unsec. Nts., 11/15/24 | 2,280,000 | 1,938,000 | ||||||
| 7.75% Sr. Unsec. Nts., 7/1/26 | 250,000 | 220,000 | ||||||
| Gray Television, Inc.: | ||||||||
| 5.125% Sr. Unsec. Nts., 10/15/241 | 760,000 | 727,700 | ||||||
| 5.875% Sr. Unsec. Nts., 7/15/261 | 1,770,000 | 1,688,138 | ||||||
| iHeartCommunications, Inc., 9.00% Sr. Sec. Nts., 12/15/19 | 1,455,000 | 1,109,437 | ||||||
| Lions Gate Capital Holdings LLC, 5.875% Sr. Unsec. Nts., 11/1/241 | 1,215,000 | 1,235,886 | ||||||
| Live Nation Entertainment, Inc., 5.625% Sr. Unsec. Nts., 3/15/261 | 550,000 | 547,250 | ||||||
| MDC Partners, Inc., 6.50% Sr. Unsec. Nts., 5/1/241 | 255,000 | 222,488 | ||||||
| Meredith Corp., 6.875% Sr. Unsec. Nts., 2/1/261 | 250,000 | 247,188 | ||||||
| Nexstar Broadcasting, Inc., 5.625% Sr. Unsec. Nts., 8/1/241 | 1,095,000 | 1,058,044 | ||||||
| Salem Media Group, Inc., 6.75% Sr. Sec. Nts., 6/1/241 | 775,000 | 707,188 | ||||||
| Sinclair Television Group, Inc., 5.625% Sr. Unsec. Nts., 8/1/241 | 995,000 | 990,025 | ||||||
| Sirius XM Radio, Inc., 5.375% Sr. Unsec. Nts., 7/15/261 | 665,000 | 641,725 | ||||||
| TEGNA, Inc., 5.50% Sr. Unsec. Nts., 9/15/241 | 650,000 | 652,437 | ||||||
| Time Warner Cable LLC, 4.50% Sr. Unsec. Unsub. Nts., 9/15/42 | 648,000 | 533,863 | ||||||
| Townsquare Media, Inc., 6.50% Sr. Unsec. Nts., 4/1/231 | 265,000 | 239,494 | ||||||
| Tribune Media Co., 5.875% Sr. Unsec. Nts., 7/15/22 | 725,000 | 735,331 | ||||||
| Univision Communications, Inc.: | ||||||||
| 5.125% Sr. Sec. Nts., 5/15/231 | 245,000 | 235,812 | ||||||
| 5.125% Sr. Sec. Nts., 2/15/251 | 1,730,000 | 1,602,413 | ||||||
| UPCB Finance IV Ltd., 5.375% Sr. Sec. Nts., 1/15/251 | 135,000 | 128,939 | ||||||
| Virgin Media Secured Finance plc: | ||||||||
| 5.25% Sr. Sec. Nts., 1/15/261 | 876,000 | 813,585 | ||||||
| 5.50% Sr. Sec. Nts., 8/15/261 | 705,000 | 661,713 | ||||||
| Ziggo BV, 5.50% Sr. Sec. Nts., 1/15/271 | 1,590,000 | 1,489,194 | ||||||
|
| 35,783,887
|
| ||||||
| Multiline Retail—0.1% | ||||||||
| JC Penney Corp., Inc.: | ||||||||
| 5.875% Sr. Sec. Nts., 7/1/231 | 525,000 | 494,156 | ||||||
| 7.40% Sr. Unsec. Nts., 4/1/37 | 270,000 | 157,950 | ||||||
| 8.625% Sec. Nts., 3/15/251 | 580,000 | 493,000 | ||||||
| Neiman Marcus Group Ltd. LLC, 8.00% Sr. Unsec. Nts., 10/15/211 | 140,000 | 93,275 | ||||||
|
| 1,238,381
|
| ||||||
| Specialty Retail—0.6% | ||||||||
| Claire’s Stores, Inc., 9.00% Sr. Sec. Nts., 3/15/191,7 | 405,000 | 257,175 | ||||||
| Freedom Mortgage Corp.: | ||||||||
| 8.125% Sr. Unsec. Nts., 11/15/241 | 400,000 | 389,000 | ||||||
| 8.25% Sr. Unsec. Nts., 4/15/251 | 825,000 | 814,687 | ||||||
| GameStop Corp.: | ||||||||
| 5.50% Sr. Unsec. Nts., 10/1/191 | 685,000 | 689,281 | ||||||
| 6.75% Sr. Unsec. Nts., 3/15/211 | 1,425,000 | 1,449,938 | ||||||
14 OPPENHEIMER GLOBAL STRATEGIC INCOME FUND/VA
| Principal Amount | Value | |||||||
| Specialty Retail (Continued) |
| |||||||
| L Brands, Inc.: | ||||||||
| 5.25% Sr. Unsec. Nts., 2/1/28 | $ | 270,000 | $ | 240,300 | ||||
| 5.625% Sr. Unsec. Nts., 2/15/22 | 867,000 | 884,340 | ||||||
| 6.875% Sr. Unsec. Nts., 11/1/35 | 2,060,000 | 1,843,700 | ||||||
| Lithia Motors, Inc., 5.25% Sr. Unsec. Nts., 8/1/251 | 530,000 | 518,075 | ||||||
| PetSmart, Inc., 5.875% Sr. Sec. Nts., 6/1/251 | 415,000 | 320,588 | ||||||
| Sally Holdings LLC/Sally Capital, Inc., | ||||||||
| 5.625% Sr. Unsec. Nts., 12/1/25 | 475,000 | 440,563 | ||||||
| Signet UK Finance plc, 4.70% Sr. Unsec. Nts., 6/15/24 | 927,000 | 871,816 | ||||||
| Sonic Automotive, Inc., 6.125% Sr. Sub. Nts., 3/15/27 | 650,000 | 617,500 | ||||||
|
| 9,336,963
|
| ||||||
| Textiles, Apparel & Luxury Goods—0.0% |
| |||||||
| Hanesbrands, Inc.: | ||||||||
| 4.625% Sr. Unsec. Nts., 5/15/241 | 380,000 | 372,400 | ||||||
| 4.875% Sr. Unsec. Nts., 5/15/261 | 495,000 | 480,150 | ||||||
|
| 852,550
|
| ||||||
| Consumer Staples—1.2% | ||||||||
| Beverages—0.0% | ||||||||
Coca-Cola Icecek AS, 4.215% Sr. Unsec. Nts., 9/19/241
|
| 495,000
|
|
| 463,556
|
| ||
| Food & Staples Retailing—0.5% |
| |||||||
| Albertsons Cos, Inc., 6.085% [US0003M+375] Sr. Sec. Nts., 1/15/241,2 | 825,000 | 829,125 | ||||||
| Albertsons Cos. LLC/Safeway, Inc./ New Albertson’s, Inc./Albertson’s LLC, 6.625% Sr. Unsec. Nts., 6/15/24 | 745,000 | 705,888 | ||||||
| Fresh Market, Inc. (The), 9.75% Sr. Sec. Nts., 5/1/231 | 820,000 | 524,800 | ||||||
| Ingles Markets, Inc., 5.75% Sr. Unsec. Nts., 6/15/23 | 688,000 | 681,120 | ||||||
| New Albertsons LP, 7.45% Sr. Unsec. Nts., 8/1/29 | 740,000 | 603,100 | ||||||
| Performance Food Group, Inc., 5.50% Sr. Unsec. Nts., 6/1/241 | 495,000 | 490,050 | ||||||
| Rite Aid Corp., 6.125% Sr. Unsec. Nts., 4/1/231 | 1,345,000 | 1,365,511 | ||||||
| Simmons Foods, Inc., 5.75% Sec. Nts., 11/1/241 | 1,870,000 | 1,631,575 | ||||||
| SUPERVALU, Inc., 7.75% Sr. Unsec. Nts., 11/15/22 | 630,000 | 650,475 | ||||||
|
| 7,481,644
|
| ||||||
| Food Products—0.6% | ||||||||
| Adecoagro SA, 6.00% Sr. Unsec. Nts., 9/21/271 | 210,000 | 174,268 | ||||||
| B&G Foods, Inc., 5.25% Sr. Unsec. Nts., 4/1/25 | 260,000 | 245,700 | ||||||
| BRF SA, 3.95% Sr. Unsec. Nts., 5/22/231 | 495,000 | 435,352 | ||||||
| Bunge Ltd. Finance Corp., 3.25% Sr. Unsec. Nts., 8/15/26 | 590,000 | 539,260 | ||||||
| Dean Foods Co., 6.50% Sr. Unsec. Nts., 3/15/231 | 1,250,000 | 1,210,937 | ||||||
| JBS USA LUX SA/JBS USA Finance, Inc.: | ||||||||
| 5.75% Sr. Unsec. Nts., 6/15/251 | 1,315,000 | 1,229,525 | ||||||
| 6.75% Sr. Unsec. Nts., 2/15/281 | 1,360,000 | 1,286,492 | ||||||
| MHP Lux SA, 6.95% Sr. Unsec. Nts., 4/3/261 | 535,000 | 502,079 | ||||||
| Minerva Luxembourg SA, 6.50% Sr. Unsec. Nts., 9/20/261 | 500,000 | 460,000 | ||||||
| Pilgrim’s Pride Corp.: | ||||||||
| 5.75% Sr. Unsec. Nts., 3/15/251 | 860,000 | 827,750 | ||||||
| 5.875% Sr. Unsec. Nts., 9/30/271 | 265,000 | 246,450 | ||||||
| Post Holdings, Inc.: | ||||||||
| 5.00% Sr. Unsec. Nts., 8/15/261 | 325,000 | 303,875 | ||||||
| Principal Amount | Value | |||||||
| Food Products (Continued) | ||||||||
| Post Holdings, Inc.: (Continued) | ||||||||
| 5.75% Sr. Unsec. Nts., 3/1/271 | $ | 795,000 | $ | 769,163 | ||||
| TreeHouse Foods, Inc., 6.00% Sr. Unsec. Nts., 2/15/241 | 565,000 | 579,973 | ||||||
|
| 8,810,824
|
| ||||||
| Household Products—0.0% | ||||||||
| Kronos Acquisition Holdings, Inc., 9.00% Sr. Unsec. Nts., 8/15/231 | 645,000 | 582,113 | ||||||
| Spectrum Brands, Inc., 6.125% Sr. Unsec. Nts., 12/15/24 | 280,000 | 284,200 | ||||||
|
| 866,313
|
| ||||||
| Personal Products—0.1% | ||||||||
Avon International Operations, Inc., 7.875% Sr. Sec. Nts., 8/15/221
|
| 1,045,000
|
|
| 1,041,029
|
| ||
| Energy—7.5% | ||||||||
| Energy Equipment & Services—1.0% |
| |||||||
| Bristow Group, Inc.: | ||||||||
| 6.25% Sr. Unsec. Nts., 10/15/22 | 135,000 | 105,637 | ||||||
| 8.75% Sr. Sec. Nts., 3/1/231 | 455,000 | 445,900 | ||||||
| Calfrac Holdings LP, 8.50% Sr. Unsec. Nts., 6/15/261 | 830,000 | 835,187 | ||||||
| CGG Holding US, Inc., 9.00% Sr. Sec. Nts., 5/1/231 | 140,000 | 145,075 | ||||||
| Ensco plc: | ||||||||
| 5.20% Sr. Unsec. Nts., 3/15/25 | 685,000 | 571,119 | ||||||
| 7.75% Sr. Unsec. Nts., 2/1/26 | 135,000 | 128,041 | ||||||
| Eterna Capital Pte Ltd.: | ||||||||
| 7.50% Sr. Sec. Nts., 12/11/229 | 1,025,000 | 1,017,225 | ||||||
| 8.00% Sr. Sec. Nts., 12/11/229 | 2,122,866 | 2,037,130 | ||||||
| Exterran Energy Solutions LP/EES Finance Corp., 8.125% Sr. Unsec. Nts., 5/1/25 | 260,000 | 274,950 | ||||||
| KCA Deutag UK Finance plc, 7.25% Sr. Sec. Nts., 5/15/211 | 200,000 | 194,500 | ||||||
| McDermott Technology Americas, Inc./McDermott Technology US, Inc., 10.625% Sr. Unsec. Nts., 5/1/241 | 415,000 | 433,675 | ||||||
| Nabors Industries, Inc., 5.75% Sr. Unsec. Nts., 2/1/251 | 480,000 | 454,800 | ||||||
| Noble Holding International Ltd., 7.875% Sr. Unsec. Nts., 2/1/261 | 540,000 | 556,875 | ||||||
| Parker Drilling Co.: | ||||||||
| 6.75% Sr. Unsec. Nts., 7/15/22 | 685,000 | 503,475 | ||||||
| 7.50% Sr. Unsec. Nts., 8/1/20 | 140,000 | 117,600 | ||||||
| Pioneer Energy Services Corp., 6.125% Sr. Unsec. Nts., 3/15/22 | 1,655,000 | 1,580,525 | ||||||
| Precision Drilling Corp., 7.125% Sr. Unsec. Nts., 1/15/261 | 330,000 | 339,735 | ||||||
| Rowan Cos., Inc., 7.375% Sr. Unsec. |
| |||||||
| Nts., 6/15/25 | 610,000 | 593,225 | ||||||
| SESI LLC, 7.75% Sr. Unsec. Nts., 9/15/24 | 435,000 | 448,594 | ||||||
| Shelf Drilling Holdings Ltd., 8.25% Sr. Unsec. Nts., 2/15/251 | 270,000 | 273,037 | ||||||
| Tervita Escrow Corp., 7.625% Sr. Sec. Nts., 12/1/211 | 275,000 | 281,875 | ||||||
| Transocean, Inc.: | ||||||||
| 7.50% Sr. Unsec. Nts., 1/15/261 | 265,000 | 269,803 | ||||||
| 9.00% Sr. Unsec. Nts., 7/15/231 | 1,105,000 | 1,193,400 | ||||||
| Trinidad Drilling Ltd., 6.625% Sr. Unsec. Nts., 2/15/251 | 385,000 | 372,487 | ||||||
| Unit Corp., 6.625% Sr. Sub. Nts., 5/15/21 | 135,000 | 135,338 | ||||||
Weatherford International Ltd., 9.875% Sr. Unsec. Nts., 2/15/24 | 1,382,000 | 1,402,288 | ||||||
| 14,711,496 | ||||||||
15 OPPENHEIMER GLOBAL STRATEGIC INCOME FUND/VA
CONSOLIDATED STATEMENT OF INVESTMENTS Unaudited / Continued
| Principal Amount | Value | |||||||
| Oil, Gas & Consumable Fuels—6.5% |
| |||||||
| Alta Mesa Holdings LP/Alta Mesa Finance Services Corp., 7.875% Sr. Unsec. Nts., 12/15/24 | $ | 265,000 | $ | 282,225 | ||||
| Anadarko Petroleum Corp., 4.50% Sr. Unsec. Nts., 7/15/44 | 213,000 | 198,939 | ||||||
| Andeavor Logistics LP/Tesoro Logistics Finance Corp., 5.25% Sr. Unsec. Nts., 1/15/25 | 324,000 | 332,466 | ||||||
| Ardagh Packaging Finance plc/Ardagh Holdings USA, Inc., 6.00% Sr. Unsec. Nts., 2/15/251 | 1,150,000 | 1,122,687 | ||||||
| Ascent Resources Utica Holdings LLC/ARU Finance Corp., 10.00% Sr. Unsec. Nts., 4/1/221 | 425,000 | 469,625 | ||||||
| Baytex Energy Corp., 5.625% Sr. Unsec. Nts., 6/1/241 | 875,000 | 824,687 | ||||||
| Berry Petroleum Co. LLC, 7.00% Sr. Unsec. Nts., 2/15/261 | 135,000 | 138,375 | ||||||
| Blue Racer Midstream LLC/Blue Racer Finance Corp., 6.625% Sr. Unsec. Nts., 7/15/261 | 550,000 | 545,710 | ||||||
| California Resources Corp., 8.00% Sec. Nts., 12/15/221 | 658,000 | 600,425 | ||||||
| Calumet Specialty Products Partners LP/Calumet Finance Corp.: | ||||||||
| 6.50% Sr. Unsec. Nts., 4/15/21 | 415,000 | 415,000 | ||||||
| 7.625% Sr. Unsec. Nts., 1/15/22 | 1,075,000 | 1,080,375 | ||||||
| Centennial Resource Production LLC, 5.375% Sr. Unsec. Nts., 1/15/261 | 430,000 | 419,250 | ||||||
| Cheniere Corpus Christi Holdings LLC: | ||||||||
| 5.125% Sr. Sec. Nts., 6/30/27 | 525,000 | 522,375 | ||||||
| 7.00% Sr. Sec. Nts., 6/30/24 | 940,000 | 1,028,125 | ||||||
| Chesapeake Energy Corp.: | ||||||||
| 6.125% Sr. Unsec. Nts., 2/15/21 | 493,000 | 501,627 | ||||||
| 8.00% Sec. Nts., 12/15/221 | 249,000 | 262,309 | ||||||
| 8.00% Sr. Unsec. Nts., 1/15/25 | 265,000 | 270,552 | ||||||
| 8.00% Sr. Unsec. Nts., 6/15/27 | 550,000 | 561,000 | ||||||
| Citadel LP, 5.375% Sr. Unsec. Nts., 1/17/231 | 280,000 | 278,983 | ||||||
| CITGO Petroleum Corp., 6.25% Sr. Sec. Nts., 8/15/221 | 70,000 | 70,021 | ||||||
| Cloud Peak Energy Resources LLC/Cloud Peak Energy Finance Corp., 12.00% Sec. Nts., 11/1/21 | 680,000 | 705,500 | ||||||
| CNX Resources Corp.: | ||||||||
| 5.875% Sr. Unsec. Nts., 4/15/22 | 195,000 | 196,500 | ||||||
| 8.00% Sr. Unsec. Nts., 4/1/23 | 165,000 | 175,469 | ||||||
| Crestwood Midstream Partners LP/ Crestwood Midstream Finance Corp., 5.75% Sr. Unsec. Nts., 4/1/25 | 265,000 | 265,662 | ||||||
| CrownRock LP/CrownRock Finance, Inc., 5.625% Sr. Unsec. Nts., 10/15/251 | 1,080,000 | 1,044,900 | ||||||
| CVR Refining LLC/Coffeyville Finance, Inc., 6.50% Sr. Unsec. Nts., 11/1/22 | 1,155,000 | 1,183,875 | ||||||
| DCP Midstream Operating LP, 2.70% Sr. Unsec. Nts., 4/1/19 | 345,000 | 342,412 | ||||||
| Denbury Resources, Inc.: | ||||||||
| 9.00% Sec. Nts., 5/15/211 | 555,000 | 589,521 | ||||||
| 9.25% Sec. Nts., 3/31/221 | 611,000 | 649,187 | ||||||
| Endeavor Energy Resources LP/EER Finance, Inc.: | ||||||||
| 5.50% Sr. Unsec. Nts., 1/30/261 | 340,000 | 330,650 | ||||||
| 5.75% Sr. Unsec. Nts., 1/30/281 | 275,000 | 269,156 | ||||||
| Energy Transfer Equity LP, 5.875% Sr. Sec. Nts., 1/15/24 | 565,000 | 580,537 | ||||||
| Energy Transfer Partners LP, 6.625% [US0003M+415.5] Jr. Sub. Perpetual Bonds2,10 | 684,000 | 625,432 | ||||||
| Principal Amount | Value | |||||||
| Oil, Gas & Consumable Fuels (Continued) |
| |||||||
| Enviva Partners LP/Enviva Partners Finance Corp., 8.50% Sr. Unsec. Nts., 11/1/21 | $ | 1,090,000 | $ | 1,137,687 | ||||
| EP Energy LLC/Everest Acquisition Finance, Inc.: | ||||||||
| 7.75% Sr. Sec. Nts., 5/15/261 | 415,000 | 425,375 | ||||||
| 8.00% Sr. Sec. Nts., 11/29/241 | 275,000 | 279,125 | ||||||
| 8.00% Sec. Nts., 2/15/251 | 1,692,000 | 1,319,760 | ||||||
| 9.375% Sec. Nts., 5/1/241 | 1,572,000 | 1,296,900 | ||||||
| Extraction Oil & Gas, Inc., 7.375% Sr. Unsec. Nts., 5/15/241 | 265,000 | 278,912 | ||||||
| Foresight Energy LLC/Foresight Energy Finance Corp., 11.50% Sec. Nts., 4/1/231 | 690,000 | 614,100 | ||||||
| Frontera Energy Corp., 9.70% Sr. Unsec. Nts., 6/25/231 | 470,000 | 467,650 | ||||||
| Genesis Energy LP/Genesis Energy Finance Corp.: | ||||||||
| 6.00% Sr. Unsec. Nts., 5/15/23 | 725,000 | 715,031 | ||||||
| 6.25% Sr. Unsec. Nts., 5/15/26 | 1,095,000 | 1,034,775 | ||||||
| 6.50% Sr. Unsec. Nts., 10/1/25 | 795,000 | 767,175 | ||||||
| Gulfport Energy Corp.: | ||||||||
| 6.00% Sr. Unsec. Nts., 10/15/24 | 275,000 | 266,062 | ||||||
| 6.375% Sr. Unsec. Nts., 5/15/25 | 275,000 | 268,469 | ||||||
| Halcon Resources Corp., 6.75% Sr. Unsec. Nts., 2/15/25 | 530,000 | 498,200 | ||||||
| Hess Infrastructure Partners LP/Hess Infrastructure Partners Finance Corp., 5.625% Sr. Unsec. Nts., 2/15/261 | 275,000 | 275,687 | ||||||
| HighPoint Operating Corp., 8.75% Sr. Unsec. Nts., 6/15/25 | 188,000 | 202,100 | ||||||
| Hilcorp Energy I LP/Hilcorp Finance Co., 5.75% Sr. Unsec. Nts., 10/1/251 | 165,000 | 165,412 | ||||||
| Holly Energy Partners LP/Holly Energy Finance Corp., 6.00% Sr. Unsec. Nts., 8/1/241 | 265,000 | 268,975 | ||||||
| Indigo Natural Resources LLC, 6.875% Sr. Unsec. Nts., 2/15/261 | 815,000 | 792,588 | ||||||
| Indika Energy Capital III Pte Ltd., 5.875% Sr. Sec. Nts., 11/9/241 | 760,000 | 678,243 | ||||||
| Jones Energy Holdings LLC/Jones Energy Finance Corp.: | ||||||||
| 6.75% Sr. Unsec. Nts., 4/1/22 | 818,000 | 511,250 | ||||||
| 9.25% Sr. Sec. Nts., 3/15/231 | 410,000 | 412,050 | ||||||
| KazMunayGas National Co. JSC: |
| |||||||
| 4.75% Sr. Unsec. Nts., 4/24/251 | 3,305,000 | 3,314,089 | ||||||
| 4.75% Sr. Unsec. Nts., 4/19/271 | 5,650,000 | 5,530,288 | ||||||
| 5.375% Sr. Unsec. Nts., 4/24/301 | 1,990,000 | 2,001,224 | ||||||
| 6.375% Sr. Unsec. Nts., 10/24/481 | 4,040,000 | 4,089,995 | ||||||
| KazTransGas JSC, 4.375% Sr. Unsec. Nts., 9/26/271 | 1,255,000 | 1,170,288 | ||||||
| Laredo Petroleum, Inc., 6.25% Sr. Unsec. Nts., 3/15/23 | 165,000 | 166,031 | ||||||
| LBC Tank Terminals Holding Netherlands BV, 6.875% Sr. Unsec. Nts., 5/15/238 | 475,000 | 482,125 | ||||||
| Medco Platinum Road Pte Ltd., 6.75% Sr. Sec. Nts., 1/30/251 | 2,225,000 | 1,962,225 | ||||||
| MEG Energy Corp.: | ||||||||
| 6.50% Sec. Nts., 1/15/251 | 520,000 | 520,650 | ||||||
| 7.00% Sr. Unsec. Nts., 3/31/241 | 615,000 | 577,331 | ||||||
| Moss Creek Resources Holdings, Inc., 7.50% Sr. Unsec. Nts., 1/15/261 | 575,000 | 564,023 | ||||||
| Murphy Oil Corp., 6.875% Sr. Unsec. Nts., 8/15/24 | 390,000 | 410,475 | ||||||
| Murray Energy Corp., 12.00% Sec. Nts., 4/15/24 | 2,397,000 | 2,025,465 | ||||||
| Newfield Exploration Co., 5.625% Sr. Unsec. Nts., 7/1/24 | 290,000 | 307,038 | ||||||
16 OPPENHEIMER GLOBAL STRATEGIC INCOME FUND/VA
| Principal Amount | Value | |||||||
| Oil, Gas & Consumable Fuels (Continued) |
| |||||||
| NGL Energy Partners LP/NGL Energy Finance Corp.: | ||||||||
| 6.125% Sr. Unsec. Nts., 3/1/25 | $ | 1,295,000 | $ | 1,230,250 | ||||
| 7.50% Sr. Unsec. Nts., 11/1/23 | 735,000 | 745,106 | ||||||
| NuStar Logistics LP, 5.625% Sr. Unsec. Nts., 4/28/27 | 330,000 | 320,513 | ||||||
| Oasis Petroleum, Inc.: | ||||||||
| 6.25% Sr. Unsec. Nts., 5/1/261 | 275,000 | 278,094 | ||||||
| 6.875% Sr. Unsec. Nts., 1/15/23 | 355,000 | 361,656 | ||||||
| Parkland Fuel Corp., 6.00% Sr. Unsec. Nts., 4/1/261 | 275,000 | 271,563 | ||||||
| Parsley Energy LLC/Parsley Finance Corp., 5.625% Sr. Unsec. Nts., 10/15/271 | 400,000 | 398,000 | ||||||
| PBF Holding Co. LLC/PBF Finance Corp.: |
| |||||||
| 7.00% Sr. Sec. Nts., 11/15/23 | 635,000 | 660,400 | ||||||
| 7.25% Sr. Unsec. Nts., 6/15/25 | 595,000 | 626,981 | ||||||
| PBF Logistics LP/PBF Logistics Finance Corp., 6.875% Sr. Unsec. Nts., 5/15/23 | 430,000 | 435,913 | ||||||
| PDC Energy, Inc., 5.75% Sr. Unsec. Nts., 5/15/261 | 535,000 | 535,669 | ||||||
| Peabody Energy Corp.: | ||||||||
| 6.00% Sr. Sec. Nts., 11/15/187,11,13 | 1,110,000 | 1 | ||||||
| 6.375% Sr. Sec. Nts., 3/31/251 | 275,000 | 283,594 | ||||||
| 10.00% Sr. Sec. Nts., 3/15/227,11,13 | 2,075,000 | 2 | ||||||
| Petrobras Global Finance BV: |
| |||||||
| 5.299% Sr. Unsec. Nts., 1/27/251 | 1,575,000 | 1,457,269 | ||||||
| 5.75% Sr. Unsec. Nts., 2/1/29 | 990,000 | 871,824 | ||||||
| 5.999% Sr. Unsec. Nts., 1/27/281 | 1,407,000 | 1,275,797 | ||||||
| 7.25% Sr. Unsec. Nts., 3/17/44 | 495,000 | 459,731 | ||||||
| 7.375% Sr. Unsec. Nts., 1/17/27 | 5,530,000 | 5,536,913 | ||||||
| Petroleos Mexicanos: | ||||||||
| 3.75% Sr. Unsec. Nts., 2/21/24 | EUR | 505,000 | 599,517 | |||||
| 3.75% Sr. Unsec. Nts., 4/16/26 | EUR | 1,045,000 | 1,201,417 | |||||
| 5.35% Sr. Unsec. Nts., 2/12/281 | 8,340,000 | 7,914,660 | ||||||
| 6.50% Sr. Unsec. Nts., 3/13/27 | 730,000 | 747,703 | ||||||
| 6.75% Sr. Unsec. Nts., 9/21/47 | 790,000 | 752,870 | ||||||
| Puma International Financing SA, 5.00% Sr. Unsec. Nts., 1/24/261 | 1,170,000 | 1,076,638 | ||||||
| QEP Resources, Inc., 5.625% Sr. Unsec. Nts., 3/1/26 | 665,000 | 637,569 | ||||||
| Reliance Industries Ltd., 7.00% Unsec. Nts., 8/31/22 | INR | 210,000,000 | 2,928,540 | |||||
| Repsol International Finance BV, 4.50% [EUSA10+420] Jr. Sub. Nts., 3/25/752 | EUR | 1,410,000 | 1,723,945 | |||||
| Resolute Energy Corp., 8.50% Sr. Unsec. Nts., 5/1/20 | 2,150,000 | 2,150,000 | ||||||
| Saka Energi Indonesia PT, 4.45% Sr. Unsec. Nts., 5/5/241 | 650,000 | 609,738 | ||||||
| Sanchez Energy Corp.: | ||||||||
| 6.125% Sr. Unsec. Nts., 1/15/23 | 1,600,000 | 1,092,000 | ||||||
| 7.25% Sr. Sec. Nts., 2/15/231 | 275,000 | 273,281 | ||||||
| 7.75% Sr. Unsec. Nts., 6/15/21 | 405,000 | 347,288 | ||||||
| SemGroup Corp./Rose Rock Finance Corp.: | ||||||||
| 5.625% Sr. Unsec. Nts., 7/15/22 | 165,000 | 160,875 | ||||||
| 5.625% Sr. Unsec. Nts., 11/15/23 | 545,000 | 516,388 | ||||||
| SM Energy Co., 6.75% Sr. Unsec. Nts., 9/15/26 | 170,000 | 171,275 | ||||||
| Southwestern Energy Co.: | ||||||||
| 6.70% Sr. Unsec. Nts., 1/23/25 | 205,000 | 201,413 | ||||||
| 7.50% Sr. Unsec. Nts., 4/1/26 | 265,000 | 275,600 | ||||||
| SRC Energy, Inc., 6.25% Sr. Unsec. Nts., 12/1/251 | 305,000 | 306,144 | ||||||
| Summit Midstream Holdings LLC/Summit Midstream Finance Corp., 5.75% Sr. Unsec. Nts., 4/15/25 | 780,000 | 744,900 | ||||||
| Sunoco Logistics Partners Operations LP, 4.00% Sr. Unsec. Nts., 10/1/27 | 516,000 | 482,928 | ||||||
| Principal Amount | Value | |||||||
| Oil, Gas & Consumable Fuels (Continued) |
| |||||||
| Sunoco LP/Sunoco Finance Corp.: | ||||||||
| 4.875% Sr. Unsec. Nts., 1/15/231 | $ | 335,000 | $ | 322,438 | ||||
| 5.50% Sr. Unsec. Nts., 2/15/261 | 180,000 | 171,000 | ||||||
| 5.875% Sr. Unsec. Nts., 3/15/281 | 404,000 | 381,913 | ||||||
| Tallgrass Energy Partners LP/Tallgrass Energy Finance Corp.: | ||||||||
| 5.50% Sr. Unsec. Nts., 9/15/241 | 555,000 | 568,875 | ||||||
| 5.50% Sr. Unsec. Nts., 1/15/281 | 880,000 | 871,200 | ||||||
| Targa Resources Partners LP/Targa Resources Partners Finance Corp.: | ||||||||
| 5.00% Sr. Unsec. Nts., 1/15/281 | 800,000 | 746,000 | ||||||
| 5.875% Sr. Unsec. Nts., 4/15/261 | 550,000 | 554,813 | ||||||
| Topaz Marine SA, 9.125% Sr. Unsec. Nts., 7/26/221 | 530,000 | 537,160 | ||||||
| TransMontaigne Partners LP/TLP Finance Corp., 6.125% Sr. Unsec. Nts., 2/15/26 | 135,000 | 137,025 | ||||||
| Transportadora de Gas del Sur SA, 6.75% Sr. Unsec. Nts., 5/2/251 | 475,000 | 437,000 | ||||||
| Ultra Resources, Inc.: | ||||||||
| 6.875% Sr. Unsec. Nts., 4/15/221 | 390,000 | 297,375 | ||||||
| 7.125% Sr. Unsec. Nts., 4/15/251 | 520,000 | 367,900 | ||||||
| USA Compression Partners LP/USA Compression Finance Corp., 6.875% Sr. Unsec. Nts., 4/1/261 | 415,000 | 431,081 | ||||||
| Whiting Petroleum Corp., 6.625% Sr. Unsec. Nts., 1/15/261 | 550,000 | 567,875 | ||||||
| WildHorse Resource Development Corp., 6.875% Sr. Unsec. Nts., 2/1/251 | 275,000 | 281,875 | ||||||
| WPX Energy, Inc.: | ||||||||
| 5.75% Sr. Unsec. Nts., 6/1/26 | 275,000 | 276,031 | ||||||
| 8.25% Sr. Unsec. Nts., 8/1/23 | 415,000 | 472,063 | ||||||
| YPF SA, 8.50% Sr. Unsec. Nts., 7/28/251 | 1,000,000 | 955,950 | ||||||
|
| 101,721,869
|
| ||||||
| Financials—10.0% | ||||||||
| Capital Markets—1.3% | ||||||||
| Charles Schwab Corp. (The), 5.00% [US0003M+257.5] Jr. Sub. Perpetual Bonds2,10 | 1,343,000 | 1,287,601 | ||||||
| Credit Suisse Group AG: 7.125% [USSW5+510.8] Jr. Sub. Perpetual Bonds2,10 | 1,260,000 | 1,284,570 | ||||||
| 7.50% [USSW5+459.8] Jr. Sub. Perpetual Bonds2,10 | 2,825,000 | 2,923,607 | ||||||
| Diamond Resorts International, Inc.: |
| |||||||
| 7.75% Sr. Sec. Nts., 9/1/231 | 265,000 | 276,925 | ||||||
| 10.75% Sr. Unsec. Nts., 9/1/248 | 590,000 | 635,548 | ||||||
| E*TRADE Financial Corp., 5.875% [US0003M+443.5] Jr. Sub. Perpetual Bonds2,10 | 1,258,000 | 1,283,160 | ||||||
| Flex Acquisition Co., Inc., 6.875% Sr. Unsec. Nts., 1/15/251 | 1,530,000 | 1,480,275 | ||||||
| Goldman Sachs Group, Inc. (The): |
| |||||||
| 3.814% [US0003M+115.8] Sr. Unsec. Nts., 4/23/292 | 749,000 | 712,407 | ||||||
| 5.00% [US0003M+287.4] Jr. Sub. Perpetual Bonds2,10 | 681,000 | 640,549 | ||||||
| 5.375% [US0003M+392.2] Jr. Sub. Perpetual Bonds2,10 | 645,000 | 655,481 | ||||||
| Icahn Enterprises LP/Icahn Enterprises Finance Corp., 6.375% Sr. Unsec. Nts., 12/15/25 | 545,000 | 547,044 | ||||||
| Koks OAO Via Koks Finance DAC, 7.50% Sr. Unsec. Nts., 5/4/221 | 705,000 | 704,801 | ||||||
| Macquarie Bank Ltd. (London), 6.125% [USSW5+370.3] Jr. Sub. Perpetual Bonds1,2,10 | 1,268,000 | 1,141,200 | ||||||
| MSCI, Inc., 5.375% Sr. Unsec. Nts., 5/15/271 | 275,000 | 275,687 | ||||||
17 OPPENHEIMER GLOBAL STRATEGIC INCOME FUND/VA
CONSOLIDATED STATEMENT OF INVESTMENTS Unaudited / Continued
| Principal Amount | Value | |||||||
| Capital Markets (Continued) | ||||||||
| Pisces Midco, Inc., 8.00% Sec. Nts., 4/15/261 | $ | 135,000 | $ | 130,518 | ||||
| Prime Security Services Borrower LLC/ Prime Finance, Inc., 9.25% Sec. Nts., 5/15/231 | 867,000 | 927,690 | ||||||
| Rivers Pittsburgh Borrower LP/Rivers Pittsburgh Finance Corp., 6.125% Sr. Sec. Nts., 8/15/211 | 375,000 | 372,187 | ||||||
| Staples, Inc., 8.50% Sr. Unsec. Nts., 9/15/251 | 1,860,000 | 1,739,100 | ||||||
| Tempo Acquisition LLC/Tempo Acquisition Finance Corp., 6.75% Sr. Unsec. Nts., 6/1/251 | 805,000 | 774,813 | ||||||
| TerraForm Power Operating LLC: | ||||||||
| 4.25% Sr. Unsec. Nts., 1/31/231 | 670,000 | 648,225 | ||||||
| 5.00% Sr. Unsec. Nts., 1/31/281 | 195,000 | 185,494 | ||||||
| Trident Merger Sub, Inc., 6.625% Sr. Unsec. Nts., 11/1/251 | 805,000 | 786,888 | ||||||
| UBS Group Funding Switzerland AG, 7.125% [USSW5+588.3] Jr. Sub. Perpetual Bonds2,10 | 1,220,000 | 1,259,679 | ||||||
|
| 20,673,449
|
| ||||||
| Commercial Banks—4.7% | ||||||||
| Astana Finance JSC, 9.16% Sr. Unsec. Nts., 3/14/127,13 | 315,159 | — | ||||||
| Australia & New Zealand Banking Group Ltd. (United Kingdom), 6.75% [USISDA05+516.8] Jr. Sub. Perpetual Bonds1,2,10 | 105,000 | 106,969 | ||||||
| Banca Monte dei Paschi di Siena SpA, 5.375% [EUSA5+500.5] Sub. Nts., 1/18/282 | EUR | 2,825,000 | 2,694,338 | |||||
| Banco Bilbao Vizcaya Argentaria SA: | ||||||||
| 6.125% [USSW5+387] Jr. Sub. Perpetual Bonds2,10 | 1,290,000 | 1,141,650 | ||||||
| 8.875% [EUSA5+917.7] Jr. Sub. Perpetual Bonds2,10 | EUR | 1,410,000 | 1,848,372 | |||||
| Banco do Brasil SA (Cayman): | ||||||||
| 3.875% Sr. Unsec. Nts., 10/10/22 | 4,685,000 | 4,386,331 | ||||||
| 4.875% Sr. Unsec. Nts., 4/19/231 | 2,870,000 | 2,750,895 | ||||||
| Banco Mercantil del Norte SA (Grand Cayman): | ||||||||
| 6.875% [H15T5Y+503.5] Jr. Sub. Perpetual Bonds1,2,10 | 404,000 | 400,905 | ||||||
| 7.625% [H15T10Y+535.3] Jr. Sub. Perpetual Bonds1,2,10 | 395,000 | 391,544 | ||||||
| Banco Santander SA: | ||||||||
| 6.375% [USSW5+478.8] Jr. Sub. Perpetual Bonds2,10 | 1,290,000 | 1,296,174 | ||||||
| 6.75% [EUSA5+680.3] Jr. Sub. Perpetual Bonds2,10 | EUR | 4,235,000 | 5,322,738 | |||||
| Bank of America Corp.: | ||||||||
| 3.366% [US0003M+81] Sr. Unsec. Nts., 1/23/262 | 749,000 | 721,122 | ||||||
| 6.30% [US0003M+455.3] Jr. Sub. Perpetual Bonds2,10 | 1,478,000 | 1,566,384 | ||||||
| 7.75% Jr. Sub. Nts., 5/14/38 | 623,000 | 846,113 | ||||||
| 5.989% [US0003M+363] Jr. Sub. Perpetual Bonds, Series K2,10 | 316,000 | 317,737 | ||||||
| Barclays plc: | ||||||||
| 6.50% [EUSA5+587.5] Jr. Sub. Perpetual Bonds2,10 | EUR | 2,825,000 | 3,402,575 | |||||
| 7.875% [USSW5+677.2] Jr. Sub. Perpetual Bonds2,10 | 1,225,000 | 1,268,673 | ||||||
| 8.00% [EUSA5+675] Jr. Sub. Perpetual Bonds2,10 | EUR | 2,825,000 | 3,661,912 | |||||
| BBVA Bancomer SA, 5.35% [H15T5Y+300] Sub. Nts., 11/12/291,2 | 520,000 | 484,900 | ||||||
| Principal Amount | Value | |||||||
| Commercial Banks (Continued) |
| |||||||
| BNP Paribas SA: | ||||||||
| 6.75% [USSW5+491.6] Jr. Sub. Perpetual Bonds1,2,10 | $ | 2,825,000 | $ | 2,810,875 | ||||
| 7.625% [USSW5+631.4] Jr. Sub. Perpetual Bonds1,2,10 | 1,210,000 | 1,265,963 | ||||||
| CIT Group, Inc.: | ||||||||
| 4.125% Sr. Unsec. Nts., 3/9/21 | 460,000 | 458,275 | ||||||
| 5.00% Sr. Unsec. Nts., 8/15/22 | 140,000 | 141,925 | ||||||
| 5.25% Sr. Unsec. Nts., 3/7/25 | 285,000 | 287,850 | ||||||
| 5.80% [US0003M+397.2] Jr. Sub. Perpetual Bonds2,10 | 1,308,000 | 1,294,920 | ||||||
| Citigroup, Inc., 6.125% [US0003M+447.8] Jr. Sub. Perpetual Bonds2,10 | 947,000 | 989,615 | ||||||
| Citizens Financial Group, Inc., 6.00% [US0003M+300.3] Jr. Sub. Perpetual Bonds2,10 | 635,000 | 641,350 | ||||||
| Credit Agricole SA, 8.125% [USSW5+618.5] Jr. Sub. Perpetual Bonds1,2,10 | 1,725,000 | 1,830,656 | ||||||
| Fidelity Bank plc, 10.50% Sr. Unsec. Nts., 10/16/221 | 610,000 | 602,088 | ||||||
| Fifth Third Bancorp, 5.10% [US0003M+303.33] Jr. Sub. Perpetual Bonds2,10 | 335,000 | 330,635 | ||||||
| Global Bank Corp., 4.50% Sr. Unsec. Nts., 10/20/211 | 655,000 | 639,280 | ||||||
| Globo Comunicacao e Participacoes SA, 5.125% Sr. Unsec. Nts., 3/31/271 | 545,000 | 508,213 | ||||||
| HSBC Holdings plc, 6.375% [USISDA05+370.5] Jr. Sub. Perpetual Bonds2,10 | 1,250,000 | 1,239,613 | ||||||
| Huntington Bancshares, Inc., 5.70% [US0003M+288] Jr. Sub. Perpetual Bonds2,10 | 674,000 | 666,839 | ||||||
| IDBI Bank Ltd. (GIFT-IFC), 5.00% Sr. Unsec. Nts., 9/25/19 | 430,000 | 434,499 | ||||||
| ING Groep NV, 6.875% [USSW5+512.4] Jr. Sub. Perpetual Bonds2,10 | 1,210,000 | 1,236,471 | ||||||
| JPMorgan Chase & Co.: | ||||||||
| 6.125% [US0003M+333] Jr. Sub. Perpetual Bonds2,10 | 1,231,000 | 1,266,391 | ||||||
| 5.829% [US0003M+347] Jr. Sub. Perpetual Bonds, Series 12,10 | 1,585,000 | 1,602,118 | ||||||
| Kenan Advantage Group, Inc. (The), 7.875% Sr. Unsec. Nts., 7/31/231 | 985,000 | 1,009,625 | ||||||
| Lloyds Bank plc, 7.50% Sr. Unsec. Nts., 4/2/326 | 2,825,000 | 2,438,331 | ||||||
| Lloyds Banking Group plc, 6.375% [EUSA5+529] Jr. Sub. Perpetual Bonds2,10 | EUR | 2,825,000 | 3,517,596 | |||||
| Rio Oil Finance Trust Series 2018-1, 8.20% Sr. Sec. Nts., 4/6/281 | 740,000 | 751,470 | ||||||
| Royal Bank of Scotland Group plc, 7.50% [USSW5+580] Jr. Sub. Perpetual Bonds2,10 | 1,875,000 | 1,916,250 | ||||||
| Sberbank of Russia Via SB Capital SA, 5.50% [H15T5Y+402.3] Sub. Nts., 2/26/241,2 | 1,530,000 | 1,536,633 | ||||||
| Societe Generale SA, 7.375% [USSW5+623.8] Jr. Sub. Perpetual Bonds1,2,10 | 5,460,000 | 5,569,200 | ||||||
| SunTrust Banks, Inc.: | ||||||||
| 5.05% [US0003M+310.2] Jr. Sub. Perpetual Bonds2,10 | 992,000 | 975,830 | ||||||
| 5.125% [US0003M+278.6] Jr. Sub. Perpetual Bonds2,10 | 694,000 | 660,601 | ||||||
| Swiss Insured Brazil Power Finance Sarl, 9.85% Sr. Sec. Nts., 7/16/32 | BRL | 5,250,000 | 1,259,756 | |||||
18 OPPENHEIMER GLOBAL STRATEGIC INCOME FUND/VA
| Principal Amount | Value | |||||||
| Commercial Banks (Continued) |
| |||||||
| UBS Group Funding Switzerland AG, 5.00% [USSW5+243.2] Jr. Sub. Perpetual Bonds2,10 | $ | 945,000 | $ | 831,566 | ||||
| Wachovia Capital Trust III, 5.57% [US0003M+93] Jr. Sub. Perpetual Bonds2,10 | 1,323,000 | 1,311,424 | ||||||
| Wells Fargo & Co., 6.111% [US0003M+377] Jr. Sub. Perpetual Bonds, Series K2,10 | 270,000 | 273,881 | ||||||
| Zenith Bank plc, 7.375% Sr. Unsec. Nts., 5/30/221 | 650,000 | 649,474 | ||||||
|
| 73,558,545
|
| ||||||
| Consumer Finance—0.9% | ||||||||
| Ahern Rentals, Inc., 7.375% Sec. Nts., 5/15/231 | 605,000 | 592,900 | ||||||
| Ally Financial, Inc.: | ||||||||
| 4.625% Sr. Unsec. Nts., 5/19/22 | 440,000 | 440,000 | ||||||
| 5.75% Sub. Nts., 11/20/25 | 1,325,000 | 1,354,812 | ||||||
| 8.00% Sr. Unsec. Nts., 11/1/31 | 415,000 | 495,925 | ||||||
| American Express Co., 4.90% [US0003M+328.5] Jr. Sub. Perpetual Bonds2,10 | 974,000 | 978,139 | ||||||
| Discover Financial Services, 5.50% [US0003M+307.6] Jr. Sub. Perpetual Bonds2,10 | 652,000 | 637,330 | ||||||
| Minejesa Capital BV, 4.625% Sr. Sec. Nts., 8/10/301 | 2,810,000 | 2,567,365 | ||||||
| Navient Corp.: | ||||||||
| 5.50% Sr. Unsec. Nts., 1/15/19 | 405,000 | 408,746 | ||||||
| 5.875% Sr. Unsec. Nts., 10/25/24 | 790,000 | 767,288 | ||||||
| 6.50% Sr. Unsec. Nts., 6/15/22 | 535,000 | 548,375 | ||||||
| 6.625% Sr. Unsec. Nts., 7/26/21 | 505,000 | 519,999 | ||||||
| 6.75% Sr. Unsec. Nts., 6/25/25 | 685,000 | 679,862 | ||||||
| 6.75% Sr. Unsec. Nts., 6/15/26 | 415,000 | 406,576 | ||||||
| Springleaf Finance Corp.: | ||||||||
| 5.625% Sr. Unsec. Nts., 3/15/23 | 805,000 | 802,746 | ||||||
| 6.125% Sr. Unsec. Nts., 5/15/22 | 785,000 | 804,625 | ||||||
| 6.875% Sr. Unsec. Nts., 3/15/25 | 560,000 | 557,200 | ||||||
| 8.25% Sr. Unsec. Nts., 12/15/20 | 490,000 | 530,425 | ||||||
| Terraform Global Operating LLC, 6.125% Sr. Unsec. Nts., 3/1/261 | 820,000 | 811,800 | ||||||
| TMX Finance LLC/TitleMax Finance Corp., 11.125% Sr. Sec. Nts., 4/1/231 | 555,000 | 565,406 | ||||||
|
| 14,469,519
|
| ||||||
| Diversified Financial Services—0.5% |
| |||||||
| Charming Light Investments Ltd., 4.375% Sr. Unsec. Nts., 12/21/2712 | 390,000 | 365,041 | ||||||
| Export-Import Bank of India, 7.35% Sr. Unsec. Nts., 5/18/22 | INR | 70,000,000 | 988,161 | |||||
| Fidelity & Guaranty Life Holdings, Inc., 5.50% Sr. Unsec. Nts., 5/1/251 | 385,000 | 376,337 | ||||||
| JPMorgan Hipotecaria su Casita, 6.47% Sec. Nts., 8/26/358,13 | MXN | 5,808,600 | 27,558 | |||||
| National Savings Bank, 8.875% Sr. Unsec. Nts., 9/18/181 | 1,150,000 | 1,154,773 | ||||||
| Park Aerospace Holdings Ltd.: | ||||||||
| 5.25% Sr. Unsec. Nts., 8/15/221 | 135,000 | 134,158 | ||||||
| 5.50% Sr. Unsec. Nts., 2/15/241 | 970,000 | 960,096 | ||||||
| Rural Electrification Corp. Ltd.: | ||||||||
| 7.24% Sr. Unsec. Nts., 10/21/21 | INR | 140,000,000 | 1,973,468 | |||||
| 7.60% Sr. Unsec. Nts., 4/17/21 | INR | 100,000,000 | 1,446,769 | |||||
| Voya Financial, Inc., 4.70% [US0003M+208.4] Jr. Sub. Nts., 1/23/481,2 | 686,000 | 611,398 | ||||||
|
| 8,037,759
|
| ||||||
| Insurance—0.8% | ||||||||
| AXA SA, 3.875% [EUSA11+325] Jr. Sub. Perpetual Bonds2,10 | EUR | 2,825,000 | 3,383,342 | |||||
| Principal Amount | Value | |||||||
| Insurance (Continued) | ||||||||
| Credivalores-Crediservicios SAS: | ||||||||
| 9.75% Sr. Unsec. Nts., 7/27/221 | $ | 745,000 | $ | 733,825 | ||||
| 9.75% Sr. Unsec. Nts., 7/27/2212 | 115,000 | 113,546 | ||||||
| Genworth Holdings, Inc.: | ||||||||
| 7.625% Sr. Unsec. Nts., 9/24/21 | 330,000 | 338,620 | ||||||
| 7.70% Sr. Unsec. Nts., 6/15/20 | 430,000 | 445,050 | ||||||
| Hartford Financial Services Group, Inc. (The), 4.468% [US0003M+212.5] Jr. Sub. Nts., 2/12/471,2 | 689,000 | 652,827 | ||||||
| HUB International Ltd., 7.00% Sr. Unsec. Nts., 5/1/261 | 275,000 | 272,250 | ||||||
| Liberty Mutual Group, Inc., 5.246% [US0003M+290.5] Jr. Sub. Nts., 3/15/371,2 | 323,000 | 315,732 | ||||||
| Lincoln National Corp., 4.678% [US0003M+235.75] Jr. Sub. Nts., 5/17/662 | 704,000 | 671,855 | ||||||
| MetLife, Inc., 5.25% [US0003M+357.5] Jr. Sub. Perpetual Bonds2,10 | 647,000 | 659,811 | ||||||
| Power Finance Corp. Ltd.: | ||||||||
| 7.27% Sr. Unsec. Nts., 12/22/26 | INR | 140,000,000 | 1,967,924 | |||||
| 7.50% Sr. Unsec. Nts., 8/16/21 | INR | 140,000,000 | 2,011,915 | |||||
|
| 11,566,697
|
| ||||||
| Real Estate Investment Trusts (REITs)—0.9% |
| |||||||
| AHP Health Partners, Inc., 9.75% Sr. Unsec. Nts., 7/15/261 | 550,000 | 552,750 | ||||||
| Banco Invex SA/Hipotecaria Credito y Casa SA de CV, 6.45% Sec. Nts., 3/13/347,13,14 | MXN | 4,830,531 | — | |||||
| Equinix, Inc.: | ||||||||
| 5.375% Sr. Unsec. Nts., 5/15/27 | 780,000 | 780,000 | ||||||
| 5.875% Sr. Unsec. Nts., 1/15/26 | 945,000 | 959,647 | ||||||
| FelCor Lodging LP, 6.00% Sr. Unsec. Nts., 6/1/25 | 365,000 | 375,950 | ||||||
| GLP Capital LP/GLP Financing II, Inc.: | ||||||||
| 5.375% Sr. Unsec. Nts., 11/1/23 | 410,000 | 420,250 | ||||||
| 5.75% Sr. Unsec. Nts., 6/1/28 | 265,000 | 268,312 | ||||||
| Iron Mountain US Holdings, Inc., 5.375% Sr. Unsec. Nts., 6/1/261 | 995,000 | 950,225 | ||||||
| Iron Mountain, Inc., 4.875% Sr. Unsec. Nts., 9/15/271 | 410,000 | 379,763 | ||||||
| iStar, Inc.: | ||||||||
| 5.00% Sr. Unsec. Nts., 7/1/19 | 405,000 | 404,241 | ||||||
| 5.25% Sr. Unsec. Nts., 9/15/22 | 800,000 | 780,000 | ||||||
| 6.00% Sr. Unsec. Nts., 4/1/22 | 1,165,000 | 1,167,912 | ||||||
| Lamar Media Corp., 5.75% Sr. Unsec. Nts., 2/1/26 | 620,000 | 633,175 | ||||||
| MPT Operating Partnership LP/MPT Finance Corp.: | ||||||||
| 5.00% Sr. Unsec. Nts., 10/15/27 | 795,000 | 761,213 | ||||||
| 6.375% Sr. Unsec. Nts., 3/1/24 | 250,000 | 263,125 | ||||||
| Outfront Media Capital LLC/Outfront Media Capital Corp., 5.875% Sr. Unsec. Nts., 3/15/25 | 915,000 | 925,888 | ||||||
| SBA Communications Corp., 4.00% Sr. Unsec. Nts., 10/1/221 | 690,000 | 663,263 | ||||||
| Starwood Property Trust, Inc.: | ||||||||
| 4.75% Sr. Unsec. Nts., 3/15/251 | 805,000 | 774,813 | ||||||
| 5.00% Sr. Unsec. Nts., 12/15/21 | 760,000 | 767,600 | ||||||
| Trust F/1401, 5.25% Sr. Unsec. Nts., 1/30/261 | 1,120,000 | 1,094,800 | ||||||
| Uniti Group LP/Uniti Group Finance, Inc./ CSL Capital LLC, 8.25% Sr. Unsec. Nts., 10/15/23 | 780,000 | 748,956 | ||||||
|
| 13,671,883
|
| ||||||
| Real Estate Management & Development—0.3% |
| |||||||
| Cleaver-Brooks, Inc., 7.875% Sr. Sec. Nts., 3/1/231 | 400,000 | 413,000 | ||||||
19 OPPENHEIMER GLOBAL STRATEGIC INCOME FUND/VA
CONSOLIDATED STATEMENT OF INVESTMENTS Unaudited / Continued
| Principal Amount | Value | |||||||||||
| Real Estate Management & Development (Continued) |
| |||||||||||
| Country Garden Holdings Co. Ltd., 7.50% Sr. Sec. Nts., 3/9/20 | $ | 1,065,000 | $ | 1,092,310 | ||||||||
| Greystar Real Estate Partners LLC, 5.75% Sr. Sec. Nts., 12/1/251 | 805,000 | 782,862 | ||||||||||
| Hunt Cos., Inc., 6.25% Sr. Sec. Nts., 2/15/261 | 815,000 | 762,025 | ||||||||||
| Mattamy Group Corp., 6.875% Sr. Unsec. Nts., 12/15/231 | 505,000 | 514,393 | ||||||||||
| Realogy Group LLC/Realogy Co.-Issuer Corp., 4.875% Sr. Unsec. Nts., 6/1/231 | 965,000 | 911,925 | ||||||||||
| Shea Homes LP/Shea Homes Funding Corp., 6.125% Sr. Unsec. Nts., 4/1/251 | 745,000 | 745,000 | ||||||||||
|
| 5,221,515
|
| ||||||||||
| Thrifts & Mortgage Finance—0.6% |
| |||||||||||
| Export-Import Bank of India, 8.00% Sr. Unsec. Nts., 5/27/21 | INR | 280,000,000 | 4,088,985 | |||||||||
| LIC Housing Finance Ltd., 7.45% Sr. Sec. Nts., 10/17/22 | INR | 70,000,000 | 984,277 | |||||||||
| Provident Funding Associates LP/PFG Finance Corp., 6.375% Sr. Unsec. Nts., 6/15/251 | 395,000 | 385,540 | ||||||||||
| Quicken Loans, Inc.: | ||||||||||||
| 5.25% Sr. Unsec. Nts., 1/15/281 | 1,075,000 | 995,504 | ||||||||||
| 5.75% Sr. Unsec. Nts., 5/1/251 | 1,420,000 | 1,396,967 | ||||||||||
| Radian Group, Inc., 4.50% Sr. Unsec. Nts., 10/1/24 | 545,000 | 528,650 | ||||||||||
|
| 8,379,923
|
| ||||||||||
| Health Care—2.6% | ||||||||||||
| Biotechnology—0.1% | ||||||||||||
WeWork Cos, Inc., 7.875% Sr. Unsec. Nts., 5/1/251
|
| 1,380,000
|
|
| 1,328,250
|
| ||||||
| Health Care Equipment & Supplies—0.1% |
| |||||||||||
| DJO Finance LLC/DJO Finance Corp., 8.125% Sec. Nts., 6/15/211 | 480,000 | 488,256 | ||||||||||
| Hill-Rom Holdings, Inc., 5.75% Sr. Unsec. Nts., 9/1/231 | 495,000 | 506,137 | ||||||||||
| Hologic, Inc., 4.375% Sr. Unsec. Nts., 10/15/251 | 145,000 | 138,838 | ||||||||||
|
| 1,133,231
|
| ||||||||||
| Health Care Providers & Services—1.3% |
| |||||||||||
| Acadia Healthcare Co., Inc.: |
| |||||||||||
| 5.625% Sr. Unsec. Nts., 2/15/23 | 620,000 | 627,750 | ||||||||||
| 6.50% Sr. Unsec. Nts., 3/1/24 | 250,000 | 257,500 | ||||||||||
| Centene Corp.: | ||||||||||||
| 4.75% Sr. Unsec. Nts., 5/15/22 | 655,000 | 662,369 | ||||||||||
| 6.125% Sr. Unsec. Nts., 2/15/24 | 245,000 | 258,781 | ||||||||||
| Centene Escrow I Corp., 5.375% Sr. Unsec. Nts., 6/1/261 | 825,000 | 837,895 | ||||||||||
| CHS/Community Health Systems, Inc.: |
| |||||||||||
| 6.25% Sr. Sec. Nts., 3/31/23 | 1,695,000 | 1,559,400 | ||||||||||
| 6.875% Sr. Unsec. Nts., 2/1/22 | 549,000 | 282,735 | ||||||||||
| 8.125% Sec. Nts., 6/30/241 | 60,000 | 49,875 | ||||||||||
| DaVita, Inc.: | ||||||||||||
| 5.00% Sr. Unsec. Nts., 5/1/25 | 275,000 | 259,531 | ||||||||||
| 5.125% Sr. Unsec. Nts., 7/15/24 | 1,285,000 | 1,248,859 | ||||||||||
| Encompass Health Corp., 5.75% Sr. Unsec. Nts., 11/1/24 | 1,235,000 | 1,240,347 | ||||||||||
| HCA, Inc.: | ||||||||||||
| 5.375% Sr. Unsec. Nts., 2/1/25 | 680,000 | 671,296 | ||||||||||
| 5.50% Sr. Sec. Nts., 6/15/47 | 650,000 | 598,000 | ||||||||||
| 5.875% Sr. Unsec. Nts., 2/15/26 | 275,000 | 278,094 | ||||||||||
| 7.50% Sr. Unsec. Nts., 2/15/22 | 2,405,000 | 2,621,450 | ||||||||||
| Kindred Healthcare, Inc., 6.375% Sr. Unsec. Nts., 4/15/22 | 540,000 | 558,900 | ||||||||||
| LifePoint Health, Inc., 5.375% Sr. Unsec. Nts., 5/1/24 | 535,000 | 516,944 | ||||||||||
| Principal Amount | Value | |||||||||||
| Health Care Providers & Services (Continued) |
| |||||||||||
| OCP SA, 4.50% Sr. Unsec. Nts., 10/22/251 | $ | 1,060,000 | $ | 1,011,852 | ||||||||
| Omnicare, Inc., 4.75% Sr. Unsec. Nts., 12/1/22 | 1,765,000 | 1,803,060 | ||||||||||
| Select Medical Corp., 6.375% Sr. Unsec. Nts., 6/1/21 | 770,000 | 783,379 | ||||||||||
| Tenet Healthcare Corp.: | ||||||||||||
| 4.375% Sr. Sec. Nts., 10/1/21 | 520,000 | 514,150 | ||||||||||
| 6.75% Sr. Unsec. Nts., 6/15/23 | 1,685,000 | 1,682,894 | ||||||||||
| 7.50% Sec. Nts., 1/1/221 | 505,000 | 527,094 | ||||||||||
| 8.125% Sr. Unsec. Nts., 4/1/22 | 765,000 | 801,337 | ||||||||||
| TPC Group, Inc., 8.75% Sr. Sec. Nts., 12/15/201 | 135,000 | 134,325 | ||||||||||
| Universal Hospital Services, Inc., 7.625% Sec. Nts., 8/15/20 | 755,000 | 755,944 | ||||||||||
|
| 20,543,761
|
| ||||||||||
| Health Care Technology—0.1% |
| |||||||||||
Telenet Finance Luxembourg Notes Sarl, 5.50% Sr. Sec. Nts., 3/1/281
|
| 805,000
|
|
| 735,513
|
| ||||||
| Life Sciences Tools & Services—0.0% |
| |||||||||||
West Street Merger Sub, Inc., 6.375% Sr. Unsec. Nts., 9/1/251
|
| 415,000
|
|
| 398,400
|
| ||||||
| Pharmaceuticals—1.0% |
| |||||||||||
| Concordia International Corp., 7.00% Sr. Unsec. Nts., 4/15/237,8 | 585,000 | 36,562 | ||||||||||
| Endo Dac/Endo Finance LLC/Endo Finco, Inc.: |
| |||||||||||
| 5.875% Sr. Sec. Nts., 10/15/241 | 275,000 | 269,500 | ||||||||||
| 6.00% Sr. Unsec. Nts., 7/15/231 | 1,255,000 | 1,038,512 | ||||||||||
| 6.00% Sr. Unsec. Nts., 2/1/251 | 210,000 | 164,850 | ||||||||||
| Endo Finance LLC/Endo Finco, Inc.: | ||||||||||||
| 5.375% Sr. Unsec. Nts., 1/15/231 | 1,745,000 | 1,404,725 | ||||||||||
| 7.25% Sr. Unsec. Nts., 1/15/221 | 275,000 | 254,375 | ||||||||||
| Mallinckrodt International Finance SA/ Mallinckrodt CB LLC: |
| |||||||||||
| 4.875% Sr. Unsec. Nts., 4/15/201 | 520,000 | 513,500 | ||||||||||
| 5.50% Sr. Unsec. Nts., 4/15/251 | 1,320,000 | 1,062,600 | ||||||||||
| 5.75% Sr. Unsec. Nts., 8/1/221 | 930,000 | 841,650 | ||||||||||
| Prestige Brands, Inc., 6.375% Sr. Unsec. Nts., 3/1/241 | 325,000 | 323,375 | ||||||||||
| Teva Pharmaceutical Finance Co. BV, 3.65% Sr. Unsec. Nts., 11/10/21 | 485,000 | 464,805 | ||||||||||
| Teva Pharmaceutical Finance | ||||||||||||
| Netherlands III BV: | ||||||||||||
| 1.70% Sr. Unsec. Nts., 7/19/19 | 235,000 | 229,474 | ||||||||||
| 3.15% Sr. Unsec. Nts., 10/1/26 | 275,000 | 221,333 | ||||||||||
| 6.00% Sr. Unsec. Nts., 4/15/24 | 875,000 | 874,854 | ||||||||||
| Valeant Pharmaceuticals International, Inc.: |
| |||||||||||
| 5.50% Sr. Unsec. Nts., 3/1/231 | 355,000 | 331,925 | ||||||||||
| 5.50% Sr. Sec. Nts., 11/1/251 | 935,000 | 924,949 | ||||||||||
| 5.875% Sr. Unsec. Nts., 5/15/231 | 1,025,000 | 966,703 | ||||||||||
| 6.125% Sr. Unsec. Nts., 4/15/251 | 1,480,000 | 1,369,000 | ||||||||||
| 7.00% Sr. Sec. Nts., 3/15/241 | 655,000 | 687,547 | ||||||||||
| 7.25% Sr. Unsec. Nts., 7/15/221 | 620,000 | 634,979 | ||||||||||
| 7.50% Sr. Unsec. Nts., 7/15/211 | 890,000 | 905,575 | ||||||||||
| 8.50% Sr. Unsec. Nts., 1/31/271 | 825,000 | 839,438 | ||||||||||
| 9.00% Sr. Unsec. Nts., 12/15/251 | 1,220,000 | 1,270,325 | ||||||||||
|
| 15,630,556
|
| ||||||||||
| Industrials—3.4% | ||||||||||||
| Aerospace & Defense—0.6% |
| |||||||||||
| Arconic, Inc., 5.125% Sr. Unsec. Nts., 10/1/24 | 535,000 | 533,018 | ||||||||||
| Bombardier, Inc.: | ||||||||||||
| 6.00% Sr. Unsec. Nts., 10/15/221 | 475,000 | 475,451 | ||||||||||
| 7.50% Sr. Unsec. Nts., 12/1/241 | 805,000 | 849,275 | ||||||||||
| 7.50% Sr. Unsec. Nts., 3/15/251 | 805,000 | 842,231 | ||||||||||
20 OPPENHEIMER GLOBAL STRATEGIC INCOME FUND/VA
| Principal Amount | Value | |||||||
| Aerospace & Defense (Continued) |
| |||||||
| Bombardier, Inc.: (Continued) 8.75% Sr. Unsec. Nts., 12/1/211 | $ | 1,115,000 | $ | 1,232,075 | ||||
| DAE Funding LLC: | ||||||||
| 4.50% Sr. Unsec. Nts., 8/1/221 | 590,000 | 573,775 | ||||||
| 5.00% Sr. Unsec. Nts., 8/1/241 | 265,000 | 255,195 | ||||||
| Kratos Defense & Security Solutions, Inc., 6.50% Sr. Sec. Nts., 11/30/251 | 400,000 | 415,500 | ||||||
| TransDigm UK Holdings plc, 6.875% Sr. Sub. Nts., 5/15/261 | 275,000 | 279,469 | ||||||
| TransDigm, Inc.: | ||||||||
| 6.375% Sr. Sub. Nts., 6/15/26 | 1,215,000 | 1,208,925 | ||||||
| 6.50% Sr. Sub. Nts., 7/15/24 | 535,000 | 545,700 | ||||||
| Triumph Group, Inc.: | ||||||||
| 5.25% Sr. Unsec. Nts., 6/1/22 | 785,000 | 759,487 | ||||||
| 7.75% Sr. Unsec. Nts., 8/15/25 | 965,000 | 957,763 | ||||||
|
| 8,927,864
|
| ||||||
| Airlines—0.1% | ||||||||
| American Airlines Group, Inc., 4.625% Sr. Unsec. Nts., 3/1/201 | 645,000 | 644,194 | ||||||
| United Continental Holdings, Inc., 4.25% Sr. Unsec. Nts., 10/1/22 | 800,000 | 773,000 | ||||||
|
| 1,417,194
|
| ||||||
| Building Products—0.1% | ||||||||
| Allegion US Holding Co., Inc., 3.55% Sec. Nts., 10/1/27 | 746,000 | 691,318 | ||||||
| Jeld-Wen, Inc.: | ||||||||
| 4.625% Sr. Unsec. Nts., 12/15/251 | 120,000 | 114,600 | ||||||
| 4.875% Sr. Unsec. Nts., 12/15/271 | 120,000 | 111,900 | ||||||
| Standard Industries, Inc., 5.375% Sr. Unsec. Nts., 11/15/241 | 915,000 | 908,138 | ||||||
| USG Corp., 4.875% Sr. Unsec. Nts., 6/1/271 | 370,000 | 379,250 | ||||||
|
| 2,205,206
|
| ||||||
| Commercial Services & Supplies—0.7% |
| |||||||
| ACCO Brands Corp., 5.25% Sr. Unsec. Nts., 12/15/241 | 490,000 | 490,000 | ||||||
| Affinion Group, Inc., 12.50% Sr. Unsec. Nts., 11/10/228,9 | 1,254,094 | 1,131,820 | ||||||
| ARD Finance SA, 7.125% Sr. Sec. Nts., 9/15/239 | 775,000 | 778,875 | ||||||
| Brink’s Co. (The), 4.625% Sr. Unsec. Nts., 10/15/271 | 870,000 | 806,925 | ||||||
| Clean Harbors, Inc., 5.125% Sr. Unsec. Nts., 6/1/21 | 830,000 | 835,187 | ||||||
| Covanta Holding Corp.: | ||||||||
| 5.875% Sr. Unsec. Nts., 3/1/24 | 1,485,000 | 1,466,437 | ||||||
| 5.875% Sr. Unsec. Nts., 7/1/25 | 310,000 | 299,925 | ||||||
| GFL Environmental, Inc., 5.625% Sr. Unsec. Nts., 5/1/221 | 720,000 | 696,600 | ||||||
| Hulk Finance Corp., 7.00% Sr. Unsec. Nts., 6/1/261 | 825,000 | 792,000 | ||||||
| RR Donnelley & Sons Co., 7.875% Sr. Unsec. Nts., 3/15/21 | 1,200,000 | 1,224,000 | ||||||
| TMS International Corp., 7.25% Sr. Unsec. Nts., 8/15/258 | 265,000 | 271,625 | ||||||
| Waste Pro USA, Inc., 5.50% Sr. Unsec. Nts., 2/15/261 | 125,000 | 120,469 | ||||||
| West Corp.: | ||||||||
| 5.375% Sr. Unsec. Nts., 7/15/228 | 685,000 | 690,138 | ||||||
| 8.50% Sr. Unsec. Nts., 10/15/251 | 665,000 | 610,138 | ||||||
|
| 10,214,139
|
| ||||||
| Construction & Engineering—0.1% |
| |||||||
| AECOM, 5.125% Sr. Unsec. Nts., 3/15/27 | 535,000 | 505,575 | ||||||
| Fideicomiso PA Pacifico Tres, 8.25% Sr. Sec. Nts., 1/15/358 | 510,000 | 568,650 | ||||||
| Principal Amount | Value | |||||||
| Construction & Engineering (Continued) |
| |||||||
| New Enterprise Stone & Lime Co., Inc., 6.25% Sr. Sec. Nts., 3/15/261 | $ | 275,000 | $ | 278,437 | ||||
| Tutor Perini Corp., 6.875% Sr. Unsec. Nts., 5/1/251 | 565,000 | 567,119 | ||||||
|
| 1,919,781
|
| ||||||
| Electrical Equipment—0.1% | ||||||||
| Sensata Technologies BV, 5.625% Sr. Unsec. Nts., 11/1/241 | 1,090,000 | 1,134,963 | ||||||
| Vertiv Group Corp., 9.25% Sr. Unsec. Nts., 10/15/241 | 760,000 | 748,600 | ||||||
|
| 1,883,563
|
| ||||||
| Industrial Conglomerates—0.2% |
| |||||||
| Citgo Holding, Inc., 10.75% Sr. Sec. Nts., 2/15/201 | 570,000 | 609,187 | ||||||
| General Electric Co., 5.00% Jr. Sub. Perpetual Bonds6,10 | 519,000 | 512,642 | ||||||
| Icahn Enterprises LP/Icahn Enterprises Finance Corp., 5.875% Sr. Unsec. Nts., 2/1/22 | 490,000 | 491,936 | ||||||
| Sigma Finance Netherlands BV, 4.875% Sr. Unsec. Nts., 3/27/281 | 1,015,000 | 974,400 | ||||||
| Tupras Turkiye Petrol Rafinerileri AS, 4.50% Sr. Unsec. Nts., 10/18/241 | 510,000 | 455,454 | ||||||
|
| 3,043,619
|
| ||||||
| Machinery—0.5% | ||||||||
| Allison Transmission, Inc.: | ||||||||
| 4.75% Sr. Unsec. Nts., 10/1/271 | 265,000 | 247,775 | ||||||
| 5.00% Sr. Unsec. Nts., 10/1/241 | 500,000 | 493,125 | ||||||
| Amsted Industries, Inc., 5.00% Sr. Unsec. Nts., 3/15/221 | 1,120,000 | 1,124,200 | ||||||
| BlueLine Rental Finance Corp./BlueLine Rental LLC, 9.25% Sec. Nts., 3/15/241 | 1,305,000 | 1,391,652 | ||||||
| CNH Industrial NV, 3.85% Sr. Unsec. Nts., 11/15/27 | 491,000 | 458,068 | ||||||
| Icahn Enterprises LP/Icahn Enterprises Finance Corp., 6.75% Sr. Unsec. Nts., 2/1/24 | 570,000 | 576,412 | ||||||
| JB Poindexter & Co., Inc., 7.125% Sr. Unsec. Nts., 4/15/261 | 415,000 | 427,450 | ||||||
| Meritor, Inc., 6.25% Sr. Unsec. Nts., 2/15/24 | 150,000 | 151,875 | ||||||
| Navistar International Corp., 6.625% Sr. Unsec. Nts., 11/1/251 | 915,000 | 944,737 | ||||||
| Park-Ohio Industries, Inc., 6.625% Sr. Unsec. Nts., 4/15/27 | 165,000 | 167,888 | ||||||
| Terex Corp., 5.625% Sr. Unsec. Nts., 2/1/251 | 525,000 | 523,031 | ||||||
| Titan International, Inc., 6.50% Sr. Sec. Nts., 11/30/23 | 990,000 | 990,000 | ||||||
| Wabash National Corp., 5.50% Sr. Unsec. Nts., 10/1/251 | 270,000 | 259,875 | ||||||
| Wabtec Corp., 3.45% Sr. Unsec. Nts., 11/15/26 | 374,000 | 346,080 | ||||||
|
| 8,102,168
|
| ||||||
| Marine—0.0% | ||||||||
Global Ship Lease, Inc., 9.875% Sr. Sec. Nts., 11/15/221
|
| 270,000
|
|
| 267,300
|
| ||
| Professional Services—0.1% | ||||||||
| Brand Industrial Services, Inc., 8.50% Sr. Unsec. Nts., 7/15/251 | 795,000 | 807,919 | ||||||
| FTI Consulting, Inc., 6.00% Sr. Unsec. Nts., 11/15/22 | 915,000 | 941,306 | ||||||
| IHS Markit Ltd., 4.00% Sr. Unsec. Nts., 3/1/261 | 270,000 | 258,862 | ||||||
| 2,008,087 | ||||||||
21 OPPENHEIMER GLOBAL STRATEGIC INCOME FUND/VA
CONSOLIDATED STATEMENT OF INVESTMENTS Unaudited / Continued
| Principal Amount | Value | |||||||||||
| Road & Rail—0.1% | ||||||||||||
| Algeco Global Finance plc, 8.00% Sr. Sec. Nts., 2/15/231 | $ | 270,000 | $ | 275,400 | ||||||||
| Avis Budget Car Rental LLC/Avis Budget Finance, Inc., 5.25% Sr. Unsec. Nts., 3/15/251 | 520,000 | 475,150 | ||||||||||
| DAE Funding LLC, 4.00% Sr. Unsec. Nts., 8/1/201 | 265,000 | 262,681 | ||||||||||
| Hertz Corp. (The): | ||||||||||||
| 5.875% Sr. Unsec. Nts., 10/15/20 | 250,000 | 245,625 | ||||||||||
| 7.375% Sr. Unsec. Nts., 1/15/21 | 265,000 | 261,025 | ||||||||||
| Rumo Luxembourg Sarl, 5.875% Sr. Unsec. Nts., 1/18/251 | 650,000 | 595,969 | ||||||||||
|
| 2,115,850
|
| ||||||||||
| Trading Companies & Distributors—0.5% |
| |||||||||||
| Aircastle Ltd., 5.00% Sr. Unsec. Nts., 4/1/23 | 245,000 | 247,124 | ||||||||||
| American Builders & Contractors Supply Co., Inc., 5.75% Sr. Unsec. Nts., 12/15/231 | 340,000 | 349,350 | ||||||||||
| Fly Leasing Ltd., 5.25% Sr. Unsec. Nts., 10/15/24 | 530,000 | 498,200 | ||||||||||
| H&E Equipment Services, Inc., 5.625% Sr. Unsec. Nts., 9/1/25 | 800,000 | 788,000 | ||||||||||
| Herc Rentals, Inc., 7.50% Sec. Nts., 6/1/221 | 541,000 | 574,812 | ||||||||||
| ILFC E-Capital Trust I, 4.57% [30YR CMT+155] Jr. Sub. Nts., 12/21/651,2 | 1,355,000 | 1,270,312 | ||||||||||
| Standard Industries, Inc., 6.00% Sr. Unsec. Nts., 10/15/251 | 740,000 | 745,550 | ||||||||||
| United Rentals North America, Inc.: | ||||||||||||
| 4.625% Sr. Unsec. Nts., 10/15/25 | 732,000 | 699,060 | ||||||||||
| 4.875% Sr. Unsec. Nts., 1/15/28 | 690,000 | 642,563 | ||||||||||
| 5.875% Sr. Unsec. Nts., 9/15/26 | 1,235,000 | 1,248,894 | ||||||||||
|
| 7,063,865
|
| ||||||||||
| Transportation Infrastructure—0.3% |
| |||||||||||
| Adani Abbot Point Terminal Pty Ltd., 4.45% Sr. Sec. Nts., 12/15/221 | 260,000 | 237,401 | ||||||||||
| Agile Group Holdings Ltd., 9.00% Sr. Sec. Nts., 5/21/20 | 2,125,000 | 2,202,146 | ||||||||||
| GMR Hyderabad International Airport Ltd., 4.25% Sr. Sec. Nts., 10/27/271 | 1,065,000 | 904,151 | ||||||||||
| Jasa Marga Persero Tbk PT, 7.50% Sr. Unsec. Nts., 12/11/201 | IDR | 9,160,000,000 | 600,959 | |||||||||
|
| 3,944,657
|
| ||||||||||
| Information Technology—1.6% |
| |||||||||||
| Communications Equipment—0.2% |
| |||||||||||
| CommScope Technologies LLC, 6.00% Sr. Unsec. Nts., 6/15/251 | 570,000 | 584,963 | ||||||||||
| HTA Group Ltd., 9.125% Sr. Unsec. Nts., 3/8/221 | 505,000 | 484,800 | ||||||||||
| Infor US, Inc., 6.50% Sr. Unsec. Nts., 5/15/22 | 920,000 | 928,050 | ||||||||||
| Plantronics, Inc., 5.50% Sr. Unsec. Nts., 5/31/231 | 435,000 | 436,305 | ||||||||||
| Riverbed Technology, Inc., 8.875% Sr. Unsec. Nts., 3/1/231 | 295,000 | 280,766 | ||||||||||
| ViaSat, Inc., 5.625% Sr. Unsec. Nts., 9/15/251 | 265,000 | 250,425 | ||||||||||
|
| 2,965,309
|
| ||||||||||
| Electronic Equipment, Instruments, & Components—0.1% |
| |||||||||||
| APX Group, Inc., 7.875% Sr. Sec. Nts., 12/1/22 | 275,000 | 273,969 | ||||||||||
| CDW LLC/CDW Finance Corp., 5.00% Sr. Unsec. Nts., 9/1/23 | 485,000 | 486,649 | ||||||||||
| TTM Technologies, Inc., 5.625% Sr. Unsec. Nts., 10/1/251 | 800,000 | 782,000 | ||||||||||
| 1,542,618 | ||||||||||||
| Principal Amount | Value | |||||||||||
| Internet Software & Services—0.2% |
| |||||||||||
| Gogo Intermediate Holdings LLC/Gogo Finance Co., Inc., 12.50% Sr. Sec. Nts., 7/1/221 | $ | 140,000 | $ | 149,800 | ||||||||
| GTT Communications, Inc., 7.875% Sr. Unsec. Nts., 12/31/241 | 140,000 | 139,300 | ||||||||||
| j2 Cloud Services LLC/j2 Global Co.- Obligor, Inc., 6.00% Sr. Unsec. Nts., 7/15/251 | 790,000 | 803,825 | ||||||||||
| Match Group, Inc., 5.00% Sr. Unsec. Nts., 12/15/271 | 395,000 | 368,337 | ||||||||||
| Rackspace Hosting, Inc., 8.625% Sr. Unsec. Nts., 11/15/241 | 1,395,000 | 1,405,462 | ||||||||||
| VeriSign, Inc., 4.75% Sr. Unsec. Nts., 7/15/27 | 590,000 | 565,486 | ||||||||||
|
| 3,432,210
|
| ||||||||||
| IT Services—0.6% | ||||||||||||
| Alliance Data Systems Corp., 5.375% Sr. Unsec. Nts., 8/1/221 | 275,000 | 277,716 | ||||||||||
| Booz Allen Hamilton, Inc., 5.125% Sr. Unsec. Nts., 5/1/251 | 530,000 | 519,400 | ||||||||||
| Conduent Finance, Inc./Conduent Business Services LLC, 10.50% Sr. Unsec. Nts., 12/15/241 | 1,055,000 | 1,264,681 | ||||||||||
| Everi Payments, Inc., 7.50% Sr. Unsec. Nts., 12/15/251 | 1,075,000 | 1,080,375 | ||||||||||
| Exela Intermediate LLC/Exela Finance, Inc., 10.00% Sr. Sec. Nts., 7/15/231 | 770,000 | 790,212 | ||||||||||
| First Data Corp.: | ||||||||||||
| 5.00% Sr. Sec. Nts., 1/15/241 | 455,000 | 453,294 | ||||||||||
| 5.75% Sec. Nts., 1/15/241 | 910,000 | 912,821 | ||||||||||
| 7.00% Sr. Unsec. Nts., 12/1/231 | 1,465,000 | 1,529,577 | ||||||||||
| Gartner, Inc., 5.125% Sr. Unsec. Nts., 4/1/251 | 780,000 | 778,050 | ||||||||||
| Harland Clarke Holdings Corp., 6.875% Sr. Sec. Nts., 3/1/208 | 835,000 | 828,737 | ||||||||||
| Sabre GLBL, Inc., 5.25% Sr. Sec. Nts., 11/15/231 | 825,000 | 834,265 | ||||||||||
|
| 9,269,128
|
| ||||||||||
| Semiconductors & Semiconductor Equipment—0.1% |
| |||||||||||
| NXP BV/NXP Funding LLC, 4.625% Sr. Unsec. Nts., 6/1/231 | 1,350,000 | 1,369,170 | ||||||||||
| Versum Materials, Inc., 5.50% Sr. Unsec. Nts., 9/30/241 | 250,000 | 254,100 | ||||||||||
|
| 1,623,270
|
| ||||||||||
| Software—0.3% | ||||||||||||
| BMC Software Finance, Inc., 8.125% Sr. Unsec. Nts., 7/15/211 | 1,355,000 | 1,387,181 | ||||||||||
| Dell International LLC/EMC Corp.: | ||||||||||||
| 5.875% Sr. Unsec. Nts., 6/15/211 | 215,000 | 218,455 | ||||||||||
| 7.125% Sr. Unsec. Nts., 6/15/241 | 745,000 | 789,953 | ||||||||||
| Informatica LLC, 7.125% Sr. Unsec. Nts., 7/15/231 | 595,000 | 604,056 | ||||||||||
| Symantec Corp., 5.00% Sr. Unsec. Nts., 4/15/251 | 495,000 | 480,645 | ||||||||||
| TIBCO Software, Inc., 11.375% Sr. Unsec. Nts., 12/1/211 | 625,000 | 675,781 | ||||||||||
| Veritas US, Inc./Veritas Bermuda Ltd., 7.50% Sr. Sec. Nts., 2/1/231 | 1,155,000 | 1,085,700 | ||||||||||
|
| 5,241,771
|
| ||||||||||
| Technology Hardware, Storage & Peripherals—0.1% |
| |||||||||||
| Harland Clarke Holdings Corp., 8.375% Sr. Sec. Nts., 8/15/221 | 920,000 | 906,200 | ||||||||||
| NCR Corp., 6.375% Sr. Unsec. Nts., 12/15/23 | 520,000 | 540,150 | ||||||||||
| 1,446,350 | ||||||||||||
22 OPPENHEIMER GLOBAL STRATEGIC INCOME FUND/VA
| Principal Amount | �� | Value | ||||||||||
| Materials—3.4% |
| |||||||||||
| Chemicals—1.2% |
| |||||||||||
| Ashland LLC, 6.875% Sr. Unsec. Nts., 5/15/43 | $ | 295,000 | $ | 300,900 | ||||||||
| Avantor, Inc.: | ||||||||||||
| 6.00% Sr. Sec. Nts., 10/1/241 | 415,000 | 411,555 | ||||||||||
| 9.00% Sr. Unsec. Nts., 10/1/251 | 550,000 | 555,610 | ||||||||||
| CF Industries, Inc.: | ||||||||||||
| 4.95% Sr. Unsec. Nts., 6/1/43 | 535,000 | 452,412 | ||||||||||
| 5.15% Sr. Unsec. Nts., 3/15/34 | 335,000 | 311,969 | ||||||||||
| Chemours Co. (The), 6.625% Sr. Unsec. Nts., 5/15/23 | 233,000 | 244,650 | ||||||||||
| Consolidated Energy Finance SA, 6.50% Sr. Unsec. Nts., 5/15/261 | 275,000 | 272,594 | ||||||||||
| CVR Partners LP/CVR Nitrogen Finance Corp., 9.25% Sec. Nts., 6/15/231 | 185,000 | 191,244 | ||||||||||
| Hexion, Inc.: | ||||||||||||
| 6.625% Sr. Sec. Nts., 4/15/20 | 1,850,000 | 1,736,965 | ||||||||||
| 10.375% Sr. Sec. Nts., 2/1/221 | 520,000 | 512,200 | ||||||||||
| Inkia Energy Ltd., 5.875% Sr. Unsec. Nts., 11/9/271 | 965,000 | 903,481 | ||||||||||
| Koppers, Inc., 6.00% Sr. Unsec. Nts., 2/15/251 | 510,000 | 511,275 | ||||||||||
| Kraton Polymers LLC/Kraton Polymers Capital Corp., 7.00% Sr. Unsec. Nts., 4/15/251 | 260,000 | 270,400 | ||||||||||
| LSB Industries, Inc., 9.625% Sr. Sec. Nts., 5/1/231 | 135,000 | 136,519 | ||||||||||
| NOVA Chemicals Corp.: | ||||||||||||
| 4.875% Sr. Unsec. Nts., 6/1/241 | 260,000 | 247,975 | ||||||||||
| 5.25% Sr. Unsec. Nts., 8/1/231 | 340,000 | 340,425 | ||||||||||
| Nutrien Ltd.: | ||||||||||||
| 3.375% Sr. Unsec. Nts., 3/15/25 | 378,000 | 356,209 | ||||||||||
| 4.125% Sr. Unsec. Nts., 3/15/35 | 167,000 | 155,167 | ||||||||||
| Olin Corp.: | ||||||||||||
| 5.00% Sr. Unsec. Nts., 2/1/30 | 240,000 | 227,700 | ||||||||||
| 5.125% Sr. Unsec. Nts., 9/15/27 | 3,125,000 | 3,046,875 | ||||||||||
| ONGC Videsh Ltd., 2.75% Sr. Unsec. Nts., 7/15/21 | EUR | 1,240,000 | 1,529,651 | |||||||||
| Petkim Petrokimya Holding AS, 5.875% Sr. Unsec. Nts., 1/26/231 | 880,000 | 802,801 | ||||||||||
| Platform Specialty Products Corp.: | ||||||||||||
| 5.875% Sr. Unsec. Nts., 12/1/251 | 690,000 | 675,338 | ||||||||||
| 6.50% Sr. Unsec. Nts., 2/1/221 | 195,000 | 198,900 | ||||||||||
| PolyOne Corp., 5.25% Sr. Unsec. Nts., 3/15/23 | 806,000 | 824,135 | ||||||||||
| PQ Corp., 5.75% Sr. Unsec. Nts., 12/15/251 | 270,000 | 267,975 | ||||||||||
| Rain CII Carbon LLC/CII Carbon Corp., 7.25% Sec. Nts., 4/1/251 | 980,000 | 999,600 | ||||||||||
| RPM International, Inc., 3.75% Sr. Unsec. Nts., 3/15/27 | 234,000 | 223,394 | ||||||||||
| Sherwin-Williams Co. (The), 3.45% Sr. Unsec. Nts., 6/1/27 | 110,000 | 104,020 | ||||||||||
| Tronox Finance plc, 5.75% Sr. Unsec. Nts., 10/1/251 | 535,000 | 520,956 | ||||||||||
| Tronox, Inc., 6.50% Sr. Unsec. Nts., 4/15/261 | 365,000 | 363,631 | ||||||||||
| Valvoline, Inc., 4.375% Sr. Unsec. Nts., 8/15/25 | 480,000 | 447,000 | ||||||||||
| Venator Finance Sarl/Venator Materials LLC, 5.75% Sr. Unsec. Nts., 7/15/251 | 790,000 | 758,400 | ||||||||||
|
| 18,901,926
|
| ||||||||||
| Construction Materials—0.2% |
| |||||||||||
| CIMPOR Financial Operations BV, 5.75% Sr. Unsec. Nts., 7/17/241 | 2,040,000 | 1,642,200 | ||||||||||
| James Hardie International Finance DAC: | ||||||||||||
| 4.75% Sr. Unsec. Nts., 1/15/251 | 130,000 | 127,400 | ||||||||||
| 5.00% Sr. Unsec. Nts., 1/15/281 | 125,000 | 118,750 | ||||||||||
| Principal Amount | Value | |||||||||||
| Construction Materials (Continued) |
| |||||||||||
| LafargeHolcim Finance US LLC, 3.50% Sr. Unsec. Nts., 9/22/261 | $ | 209,000 | $ | 195,015 | ||||||||
| St. Marys Cement, Inc., 5.75% Sr. Unsec. Nts., 1/28/271 | 475,000 | 459,563 | ||||||||||
| Summit Materials LLC/Summit Materials Finance Corp., 5.125% Sr. Unsec. Nts., 6/1/251 | 260,000 | 245,050 | ||||||||||
| US Concrete, Inc., 6.375% Sr. Unsec. Nts., 6/1/24 | 715,000 | 718,575 | ||||||||||
|
| 3,506,553
|
| ||||||||||
| Containers & Packaging—0.6% |
| |||||||||||
| ARD Securities Finance Sarl, 8.75% Sr. Sec. Nts., 1/31/231,9 | 815,000 | 833,338 | ||||||||||
| BWAY Holding Co., 7.25% Sr. Unsec. Nts., 4/15/251 | 270,000 | 263,925 | ||||||||||
| Crown Americas LLC/Crown Americas Capital Corp. IV, 4.50% Sr. Unsec. Nts., 1/15/23 | 880,000 | 864,600 | ||||||||||
| Crown Americas LLC/Crown Americas Capital Corp. VI, 4.75% Sr. Unsec. Nts., 2/1/261 | 270,000 | 257,175 | ||||||||||
| Flex Acquisition Co., Inc., 7.875% Sr. Unsec. Nts., 7/15/261 | 555,000 | 554,223 | ||||||||||
| Klabin Finance SA, 4.875% Sr. Unsec. Nts., 9/19/271 | 1,035,000 | 934,605 | ||||||||||
| OI European Group BV, 4.00% Sr. Unsec. Nts., 3/15/231 | 535,000 | 500,225 | ||||||||||
| Owens-Brockway Glass Container, Inc., 5.00% Sr. Unsec. Nts., 1/15/221 | 500,000 | 500,000 | ||||||||||
| Plastipak Holdings, Inc., 6.25% Sr. Unsec. Nts., 10/15/251 | 800,000 | 740,000 | ||||||||||
| Reynolds Group Issuer, Inc./Reynolds Group Issuer LLC/Reynolds Group Issuer | ||||||||||||
| Luxembourg SA: | ||||||||||||
| 5.125% Sr. Sec. Nts., 7/15/231 | 745,000 | 736,619 | ||||||||||
| 7.00% Sr. Unsec. Nts., 7/15/241 | 995,000 | 1,018,009 | ||||||||||
| Sealed Air Corp.: | ||||||||||||
| 4.875% Sr. Unsec. Nts., 12/1/221 | 585,000 | 593,044 | ||||||||||
| 6.875% Sr. Unsec. Nts., 7/15/331 | 270,000 | 297,675 | ||||||||||
| Silgan Holdings, Inc., 4.75% Sr. Unsec. Nts., 3/15/25 | 755,000 | 721,025 | ||||||||||
|
| 8,814,463
|
| ||||||||||
| Metals & Mining—1.3% |
| |||||||||||
| AK Steel Corp.: | ||||||||||||
| 6.375% Sr. Unsec. Nts., 10/15/25 | 1,210,000 | 1,131,350 | ||||||||||
| 7.00% Sr. Unsec. Nts., 3/15/27 | 405,000 | 386,775 | ||||||||||
| Alcoa Nederland Holding BV: | ||||||||||||
| 6.125% Sr. Unsec. Nts., 5/15/281 | 510,000 | 514,462 | ||||||||||
| 6.75% Sr. Unsec. Nts., 9/30/241 | 245,000 | 259,600 | ||||||||||
| 7.00% Sr. Unsec. Nts., 9/30/261 | 240,000 | 255,600 | ||||||||||
| Aleris International, Inc., 10.75% Sec. Nts., 7/15/231 | 280,000 | 282,450 | ||||||||||
| Allegheny Technologies, Inc., 7.875% Sr. Unsec. Nts., 8/15/23 | 530,000 | 572,400 | ||||||||||
| ArcelorMittal: | ||||||||||||
| 6.75% Sr. Unsec. Nts., 3/1/41 | 295,000 | 334,825 | ||||||||||
| 7.00% Sr. Unsec. Nts., 10/15/39 | 475,000 | 548,031 | ||||||||||
| Coeur Mining, Inc., 5.875% Sr. Unsec. Nts., 6/1/24 | 785,000 | 760,469 | ||||||||||
| Constellium NV, 6.625% Sr. Unsec. Nts., 3/1/251 | 510,000 | 515,095 | ||||||||||
| CSN Resources SA: | ||||||||||||
| 6.50% Sr. Unsec. Nts., 7/21/201 | 128,000 | 119,840 | ||||||||||
| 7.625% Sr. Unsec. Nts., 2/13/231 | 470,000 | 424,762 | ||||||||||
| Eldorado Gold Corp., 6.125% Sr. Unsec. Nts., 12/15/201 | 870,000 | 841,725 | ||||||||||
| Evraz Group SA, 8.25% Sr. Unsec. Nts., 1/28/21 | 690,000 | 736,713 | ||||||||||
23 OPPENHEIMER GLOBAL STRATEGIC INCOME FUND/VA
CONSOLIDATED STATEMENT OF INVESTMENTS Unaudited / Continued
| Principal Amount | Value | |||||||
| Metals & Mining (Continued) |
| |||||||
| Ferroglobe plc/Globe Specialty Metals, Inc., 9.375% Sr. Unsec. Nts., 3/1/221 | $ | 750,000 | $ | 778,125 | ||||
| First Quantum Minerals Ltd.: | ||||||||
| 6.50% Sr. Unsec. Nts., 3/1/241 | 275,000 | 266,062 | ||||||
| 6.875% Sr. Unsec. Nts., 3/1/261 | 275,000 | 264,000 | ||||||
| 7.25% Sr. Unsec. Nts., 4/1/231 | 780,000 | 781,950 | ||||||
| Freeport-McMoRan, Inc.: | ||||||||
| 3.10% Sr. Unsec. Nts., 3/15/20 | 340,000 | 334,475 | ||||||
| 4.55% Sr. Unsec. Nts., 11/14/24 | 530,000 | 506,150 | ||||||
| 5.40% Sr. Unsec. Nts., 11/14/34 | 780,000 | 711,750 | ||||||
| 5.45% Sr. Unsec. Nts., 3/15/43 | 350,000 | 308,770 | ||||||
| Goldcorp, Inc., 5.45% Sr. Unsec. Nts., 6/9/44 | 250,000 | 265,103 | ||||||
| Hudbay Minerals, Inc., 7.625% Sr. Unsec. Nts., 1/15/251 | 505,000 | 531,512 | ||||||
| JSW Steel Ltd., 4.75% Sr. Unsec. Nts., 11/12/19 | 1,025,000 | 1,023,078 | ||||||
| Kinross Gold Corp., 4.50% Sr. Unsec. Nts., 7/15/271 | 450,000 | 415,125 | ||||||
| Metinvest BV, 7.75% Sr. Unsec. Nts., 4/23/231 | 515,000 | 484,383 | ||||||
| Mountain Province Diamonds, Inc., 8.00% Sec. Nts., 12/15/221 | 335,000 | 335,000 | ||||||
| Northwest Acquisitions ULC/Dominion Finco, Inc., 7.125% Sec. Nts., 11/1/221 | 715,000 | 715,000 | ||||||
| Southern Copper Corp., 7.50% Sr. Unsec. Nts., 7/27/35 | 975,000 | 1,193,439 | ||||||
| SunCoke Energy Partners LP/SunCoke Energy Partners Finance Corp., 7.50% Sr. Unsec. Nts., 6/15/251 | 330,000 | 337,425 | ||||||
| Teck Resources Ltd.: | ||||||||
| 5.20% Sr. Unsec. Nts., 3/1/42 | 1,065,000 | 938,531 | ||||||
| 6.125% Sr. Unsec. Nts., 10/1/35 | 335,000 | 338,350 | ||||||
| United States Steel Corp.: | ||||||||
| 6.25% Sr. Unsec. Nts., 3/15/26 | 140,000 | 138,863 | ||||||
| 6.875% Sr. Unsec. Nts., 8/15/25 | 530,000 | 535,804 | ||||||
| Vedanta Resources plc, 6.375% Sr. Unsec. Nts., 7/30/221 | 535,000 | 510,925 | ||||||
| Zekelman Industries, Inc., 9.875% Sr. Sec. Nts., 6/15/238 | 275,000 | 301,813 | ||||||
|
| 19,699,730
|
| ||||||
| Paper & Forest Products—0.1% |
| |||||||
| Clearwater Paper Corp., 5.375% Sr. Unsec. Nts., 2/1/251 | 245,000 | 223,256 | ||||||
| Louisiana-Pacific Corp., 4.875% Sr. Unsec. Nts., 9/15/24 | 255,000 | 251,175 | ||||||
| Mercer International, Inc.: | ||||||||
| 5.50% Sr. Unsec. Nts., 1/15/261 | 250,000 | 243,125 | ||||||
| 6.50% Sr. Unsec. Nts., 2/1/24 | 165,000 | 167,475 | ||||||
| Suzano Austria GmbH, 5.75% Sr. Unsec. Nts., 7/14/261 | 1,120,000 | 1,135,792 | ||||||
|
| 2,020,823
|
| ||||||
| Telecommunication Services—2.2% |
| |||||||
| Diversified Telecommunication Services—1.2% |
| |||||||
| AT&T, Inc., 4.35% Sr. Unsec. Nts., 6/15/45 | 763,000 | 649,004 | ||||||
| Axtel SAB de CV, 6.375% Sr. Unsec. Nts., 11/14/241 | 1,040,000 | 989,300 | ||||||
| CB Escrow Corp., 8.00% Sr. Unsec. Nts., 10/15/251 | 265,000 | 248,437 | ||||||
| CenturyLink, Inc.: | ||||||||
| 5.625% Sr. Unsec. Nts., 4/1/25 | 785,000 | 743,787 | ||||||
| 6.15% Sr. Unsec. Nts., Series Q, 9/15/19 | 340,000 | 347,650 | ||||||
| 6.45% Sr. Unsec. Nts., Series S, 6/15/21 | 615,000 | 635,400 | ||||||
| 7.50% Sr. Unsec. Nts., Series Y, 4/1/24 | 1,065,000 | 1,096,950 | ||||||
| Cincinnati Bell Telephone Co. LLC, 6.30% Sr. Unsec. Nts., 12/1/28 | 520,000 | 501,800 | ||||||
| Principal Amount | Value | |||||||||||
| Diversified Telecommunication Services (Continued) |
| |||||||||||
| Frontier Communications Corp.: | ||||||||||||
| 8.50% Sec. Nts., 4/1/261 | $ | 1,100,000 | $ | 1,065,625 | ||||||||
| 8.75% Sr. Unsec. Nts., 4/15/22 | 590,000 | 501,500 | ||||||||||
| 10.50% Sr. Unsec. Nts., 9/15/22 | 1,315,000 | 1,199,937 | ||||||||||
| GCI LLC, 6.75% Sr. Unsec. Nts., 6/1/21 | 140,000 | 141,575 | ||||||||||
| Intelsat Jackson Holdings SA: | ||||||||||||
| 5.50% Sr. Unsec. Nts., 8/1/23 | 255,000 | 229,423 | ||||||||||
| 7.25% Sr. Unsec. Nts., 10/15/20 | 830,000 | 830,000 | ||||||||||
| Intelsat Luxembourg SA, 7.75% Sr. Unsec. Nts., 6/1/21 | 565,000 | 528,275 | ||||||||||
| Level 3 Financing, Inc.: | ||||||||||||
| 5.25% Sr. Unsec. Nts., 3/15/26 | 1,195,000 | 1,139,552 | ||||||||||
| 5.625% Sr. Unsec. Nts., 2/1/23 | 375,000 | 375,937 | ||||||||||
| Qwest Capital Funding, Inc., 7.75% Sr. Unsec. Nts., 2/15/31 | 260,000 | 233,438 | ||||||||||
| Qwest Corp., 6.875% Sr. Unsec. Nts., 9/15/33 | 785,000 | 737,684 | ||||||||||
| T-Mobile USA, Inc.: | ||||||||||||
| 4.00% Sr. Unsec. Nts., 4/15/22 | 780,000 | 773,994 | ||||||||||
| 4.50% Sr. Unsec. Nts., 2/1/26 | 245,000 | 229,075 | ||||||||||
| 4.75% Sr. Unsec. Nts., 2/1/28 | 250,000 | 231,563 | ||||||||||
| 5.125% Sr. Unsec. Nts., 4/15/25 | 780,000 | 785,850 | ||||||||||
| 5.375% Sr. Unsec. Nts., 4/15/27 | 390,000 | 380,250 | ||||||||||
| 6.00% Sr. Unsec. Nts., 4/15/24 | 985,000 | 1,021,938 | ||||||||||
| 6.50% Sr. Unsec. Nts., 1/15/26 | 825,000 | 851,565 | ||||||||||
| Windstream Services LLC/Windstream Finance Corp.: | ||||||||||||
| 8.625% Sr. Sec. Nts., 10/31/25 | 772,000 | 737,260 | ||||||||||
| 8.75% Sr. Unsec. Nts., 12/15/24 | 373,000 | 237,788 | ||||||||||
| Zayo Group LLC/Zayo Capital, Inc.: | ||||||||||||
| 5.75% Sr. Unsec. Nts., 1/15/271 | 265,000 | 261,025 | ||||||||||
| 6.00% Sr. Unsec. Nts., 4/1/23 | 1,205,000 | 1,232,113 | ||||||||||
|
| 18,937,695
|
| ||||||||||
| Wireless Telecommunication Services—1.0% |
| |||||||||||
| C&W Senior Financing DAC, 6.875% Sr. Unsec. Nts., 9/15/271 | 600,000 | 576,750 | ||||||||||
| Digicel Group Ltd., 8.25% Sr. Unsec. Nts., 9/30/201 | 425,000 | 322,469 | ||||||||||
| Sprint Capital Corp., 6.875% Sr. Unsec. Nts., 11/15/28 | 1,192,158 | 1,147,452 | ||||||||||
| Sprint Communications, Inc.: | ||||||||||||
| 6.00% Sr. Unsec. Nts., 11/15/22 | 1,979,000 | 1,966,631 | ||||||||||
| 7.00% Sr. Unsec. Nts., 3/1/201 | 850,000 | 884,000 | ||||||||||
| Sprint Corp.: | ||||||||||||
| 7.125% Sr. Unsec. Nts., 6/15/24 | 2,505,000 | 2,535,285 | ||||||||||
| 7.625% Sr. Unsec. Nts., 3/1/26 | 830,000 | 847,638 | ||||||||||
| 7.875% Sr. Unsec. Nts., 9/15/23 | 2,075,000 | 2,156,703 | ||||||||||
| Telefonica Europe BV, 5.875% [EUSA10+430.1] Jr. Sub. Perpetual Bonds2,10 | EUR | 1,410,000 | 1,797,459 | |||||||||
| Trilogy International Partners LLC/Trilogy International Finance, Inc., 8.875% Sr. Sec. Nts., 5/1/228 | 685,000 | 695,275 | ||||||||||
| Turkcell Iletisim Hizmetleri AS, 5.80% Sr. Unsec. Nts., 4/11/281 | 705,000 | 640,620 | ||||||||||
| VEON Holdings BV, 4.95% Sr. Unsec. Nts., 6/16/241 | 975,000 | 924,300 | ||||||||||
| Wand Merger Corp., 8.125% Sr. Unsec. Nts., 7/15/231,5 | 415,000 | 421,744 | ||||||||||
| Wind Tre SpA, 5.00% Sr. Sec. Nts., 1/20/26 | 805,000 | 642,157 | ||||||||||
|
| 15,558,483
|
| ||||||||||
| Utilities—1.6% |
| |||||||||||
| Electric Utilities—0.8% |
| |||||||||||
| Capex SA, 6.875% Sr. Unsec. Nts., 5/15/241 | 450,000 | 403,479 | ||||||||||
| Enel Chile SA, 4.875% Sr. Unsec. Nts., 6/12/28 | 795,000 | 802,552 | ||||||||||
24 OPPENHEIMER GLOBAL STRATEGIC INCOME FUND/VA
| Principal Amount | Value | |||||||||||
| Electric Utilities (Continued) |
| |||||||||||
| Eskom Holdings SOC Ltd.: | ||||||||||||
| 5.75% Sr. Unsec. Nts., 1/26/211 | $ | 995,000 | $ | 962,778 | ||||||||
| 6.75% Sr. Unsec. Nts., 8/6/231 | 2,535,000 | 2,427,567 | ||||||||||
| Intelsat Jackson Holdings SA: | ||||||||||||
| 7.50% Sr. Unsec. Nts., 4/1/21 | 205,000 | 204,487 | ||||||||||
| 8.00% Sr. Sec. Nts., 2/15/241 | 615,000 | 647,287 | ||||||||||
| 9.75% Sr. Unsec. Nts., 7/15/251 | 790,000 | 835,425 | ||||||||||
| Light Servicos de Eletricidade SA/Light Energia SA, 7.25% Sr. Unsec. Nts., 5/3/231 | 965,000 | 911,925 | ||||||||||
| NextEra Energy Capital Holdings, Inc., 4.80% [US0003M+240.9] Jr. Sub. Nts., 12/1/772 | 665,000 | 621,336 | ||||||||||
| NextEra Energy Operating Partners LP, 4.50% Sr. Unsec. Nts., 9/15/271 | 125,000 | 117,344 | ||||||||||
| Perusahaan Listrik Negara PT, 6.15% Sr. Unsec. Nts., 5/21/481 | 3,805,000 | 3,853,538 | ||||||||||
| PPL Capital Funding, Inc., 4.999% [US0003M+266.5] Jr. Sub. Nts., 3/30/672 | 352,000 | 353,760 | ||||||||||
| Rockpoint Gas Storage Canada Ltd., 7.00% Sr. Sec. Nts., 3/31/231 | 365,000 | 366,825 | ||||||||||
|
| 12,508,303
|
| ||||||||||
| Gas Utilities—0.2% | ||||||||||||
| AmeriGas Partners LP/AmeriGas Finance Corp., 5.50% Sr. Unsec. Nts., 5/20/25 | 550,000 | 535,562 | ||||||||||
| Ferrellgas Partners LP/Ferrellgas Partners Finance Corp., 8.625% Sr. Unsec. Nts., 6/15/20 | 85,000 | 82,238 | ||||||||||
| Gas Natural Fenosa Finance BV, 4.125% [EUSA8+335.3] Jr. Sub. Perpetual Bonds2,10 | EUR | 1,410,000 | 1,719,145 | |||||||||
| Suburban Propane Partners LP/Suburban Energy Finance Corp., 5.875% Sr. Unsec. Nts., 3/1/27 | 645,000 | 606,300 | ||||||||||
|
| 2,943,245
|
| ||||||||||
| Independent Power and Renewable Electricity Producers—0.5% |
| |||||||||||
| AES Andres BV/Dominican Power Partners/Empresa Generadora de Electricidad Itabo SA, 7.95% Sr. Unsec. Nts., 5/11/261 | 540,000 | 558,900 | ||||||||||
| AES Corp.: | ||||||||||||
| 4.00% Sr. Unsec. Nts., 3/15/21 | 275,000 | 274,312 | ||||||||||
| 6.00% Sr. Unsec. Nts., 5/15/26 | 540,000 | 561,600 | ||||||||||
| Azure Power Energy Ltd., 5.50% Sr. Sec. Nts., 11/3/221 | 420,000 | 385,350 | ||||||||||
| Calpine Corp.: | ||||||||||||
| 5.25% Sr. Sec. Nts., 6/1/261 | 1,090,000 | 1,031,412 | ||||||||||
| 5.75% Sr. Unsec. Nts., 1/15/25 | 1,325,000 | 1,214,859 | ||||||||||
| 5.875% Sr. Sec. Nts., 1/15/241 | 275,000 | 272,937 | ||||||||||
| Drax Finco plc, 6.625% Sr. Sec. Nts., 11/1/251 | 275,000 | 274,313 | ||||||||||
| NRG Energy, Inc.: | ||||||||||||
| 5.75% Sr. Unsec. Nts., 1/15/281 | 330,000 | 325,050 | ||||||||||
| 6.625% Sr. Unsec. Nts., 1/15/27 | 665,000 | 686,613 | ||||||||||
| 7.25% Sr. Unsec. Nts., 5/15/26 | 720,000 | 770,400 | ||||||||||
| Talen Energy Supply LLC, 4.60% Sr. Unsec. Nts., 12/15/21 | 535,000 | 464,113 | ||||||||||
| Vistra Energy Corp., 8.00% Sr. Unsec. Nts., 1/15/251 | 495,000 | 533,833 | ||||||||||
|
| 7,353,692
|
| ||||||||||
| Multi-Utilities—0.1% | ||||||||||||
| AssuredPartners, Inc., 7.00% Sr. Unsec. Nts., 8/15/251 | 330,000 | 318,450 | ||||||||||
| Crestwood Midstream Partners LP/ Crestwood Midstream Finance Corp., 6.25% Sr. Unsec. Nts., 4/1/23 | 265,000 | 271,625 | ||||||||||
| Principal Amount | Value | |||||||
| Multi-Utilities (Continued) |
| |||||||
| InterGen NV, 7.00% Sr. Sec. Nts., 6/30/231 | $ | 210,000 | $ | 207,375 | ||||
| NGPL PipeCo LLC: | ||||||||
| 4.875% Sr. Unsec. Nts., 8/15/271 | 395,000 | 391,544 | ||||||
| 7.768% Sr. Unsec. Nts., 12/15/371 | 650,000 | 767,000 | ||||||
| Superior Plus LP/Superior General Partner, Inc., 7.00% Sr. Unsec. Nts., 7/15/261 | 275,000 | 278,094 | ||||||
| WEC Energy Group, Inc., 4.455% [US0003M+211.25] Jr. Sub. Nts., 5/15/672 | 22,000 | 21,808 | ||||||
|
| 2,255,896
|
| ||||||
| Water Utilities—0.0% | ||||||||
| Aegea Finance Sarl, 5.75% Sr. Unsec. Nts., 10/10/241 | 625,000 | 580,938 | ||||||
| Total Corporate Bonds and Notes (Cost $634,997,990) |
|
| 615,894,036
|
| ||||
| Shares | ||||||||
| Preferred Stocks—1.4% | ||||||||
| Allstate Corp. (The), 6.625% Non-Cum., Non-Vtg. | 12,600 | 325,710 | ||||||
| American Homes 4 Rent, 6.35% Cum., Non-Vtg. | 4,200 | 105,546 | ||||||
| American Homes 4 Rent, 6.50% Cum. Cv., Series D, Non-Vtg. | 13,000 | 329,550 | ||||||
| Citigroup Capital XIII, 7.75% Cum., Non-Vtg. [US0003M+637]2 | 61,700 | 1,672,070 | ||||||
| Digital Realty Trust, Inc., 6.625% Cum., Series C, Non-Vtg. | 3,900 | 102,960 | ||||||
| Digital Realty Trust, Inc., 7.375% Cum., Non-Vtg. | 25,600 | 666,624 | ||||||
| DTE Energy Co., 5.375% Jr. Sub., Non-Vtg. | 25,000 | 631,000 | ||||||
| eBay, Inc., 6.00% Cv. | 25,700 | 675,910 | ||||||
| Fifth Third Bancorp, 6.625% Non-Cum., Non- Vtg. [US0003M+371]2 | 21,900 | 593,709 | ||||||
| First Republic Bank, 7.00% Non-Cum. | 24,200 | 622,182 | ||||||
| GMAC Capital Trust I, 7.20% Jr. Sub., Non-Vtg. [US0003M+578.5]2 | 61,325 | 1,612,847 | ||||||
| Goldman Sachs Group, Inc. (The), 6.30% Non- Cum., Series N, Non-Vtg. | 49,575 | 1,320,678 | ||||||
| Huntington Bancshares, Inc., 6.25% Non- Cum., Non-Vtg. | 24,925 | 651,041 | ||||||
| KeyCorp, 6.125% Non-Cum., Non-Vtg. [US0003M+389.2]2 | 53,125 | 1,417,375 | ||||||
| Morgan Stanley, 5.85% Non-Cum., Non-Vtg. [US0003M+349.1]2 | 35,475 | 911,353 | ||||||
| Morgan Stanley, 6.375% Non-Cum., Non-Vtg. [US0003M+370.8]2 | 49,650 | 1,333,599 | ||||||
| Northern Trust Corp., 5.85% Non-Cum., Non-Vtg. | 13,150 | 358,601 | ||||||
| PNC Financial Services Group, Inc. | ||||||||
| (The), 6.125% Non-Cum., Non-Vtg. [US0003M+406.7]2 | 49,500 | 1,358,775 | ||||||
| Prudential Financial, Inc., 5.75% Jr. Sub. | 10,125 | 259,301 | ||||||
| Public Storage, 5.20% Cum., Series X, Non- Vtg. | 25,450 | 639,050 | ||||||
| Qwest Corp., 7.00% Sr. Unsec. | 30,500 | 746,030 | ||||||
| Senior Housing Properties Trust, 5.625% Sr. Unsec. | 13,925 | 345,340 | ||||||
| Senior Housing Properties Trust, 6.25% Sr. Unsec., Non-Vtg. | 6,375 | 163,965 | ||||||
| State Street Corp., 6.00% Non-Cum., Non-Vtg. | 38,875 | 1,014,638 | ||||||
| Synovus Financial Corp., 6.30% Non-Cum., Series D, Non-Vtg. [US0003M+335.2]2,15 | 24,374 | 624,949 | ||||||
| US Bancorp, 6.50% Non-Cum., Non-Vtg. [US0003M+446.8]2 | 57,900 | 1,603,830 | ||||||
| Ventas Realty LP/Ventas Capital Corp., 5.45% Sr. Unsec. | 26,825 | 671,966 | ||||||
25 OPPENHEIMER GLOBAL STRATEGIC INCOME FUND/VA
CONSOLIDATED STATEMENT OF INVESTMENTS Unaudited / Continued
| Shares | Value | |||||||
| Preferred Stocks (Continued) |
| |||||||
| Wells Fargo & Co., 6.625% Non-Cum Non- Vtg. [US0003M+369]2 | 26,450 | $ | 727,375 | |||||
| Total Preferred Stocks (Cost $21,843,420) |
| 21,485,974
|
| |||||
| Common Stocks—0.0% | ||||||||
| Arco Capital Corp. Ltd.1,11,13,15 | 690,638 | — | ||||||
| JSC Astana Finance, GDR8,13,15 | 446,838 | — | ||||||
| Kinross Gold Corp.15 | 52,267 | 196,524 | ||||||
| Premier Holdings Ltd.13,15 | 18,514 | — | ||||||
| Quicksilver Resources, Inc.13,15 | 4,151,000 | 78,263 | ||||||
| Sabine Oil15 | 822 | 41,922 | ||||||
| Targa Resources Corp. | 2,631 | 130,208 | ||||||
| Valeant Pharmaceuticals International, Inc.15 | 8,753 | 203,420 | ||||||
| Total Common Stocks (Cost $4,941,888) |
| 650,337 | ||||||
| Units | ||||||||
| Rights, Warrants and Certificates—0.0% |
| |||||||
| Affinion Group Wts., Strike Price $1, Exp. 11/10/2213,15 | 8,584 | 128,945 | ||||||
| Sabine Oil Tranche 1 Wts., Strike Price $4.49, Exp. 8/11/2615 | 2,611 | 16,971 | ||||||
| Sabine Oil Tranche 2 Wts., Strike Price $2.72, Exp. 8/11/2615 | 465 | 2,557 | ||||||
| Total Rights, Warrants and Certificates (Cost $420,786) |
| 148,473 | ||||||
| Principal Amount | ||||||||
| Structured Securities—0.2% | ||||||||
| Deutsche Bank AG, Coriolanus Ltd. Sec. Credit Linked Bonds: |
| |||||||
| 3.003% Sr. Sec. Nts., 4/30/251,16 | $ | 949,577 | 400,946 | |||||
| Principal Amount | Value | |||||||||
| Structured Securities (Continued) |
| |||||||||
| Deutsche Bank AG, Coriolanus Ltd. Sec. Credit Linked Bonds: (Continued) |
| |||||||||
| 3.054% Sr. Sec. Nts., 4/30/251,16 | $ | 1,209,908 | $ | 510,867 | ||||||
| 3.098% Sr. Sec. Nts., 4/30/251,16 | 1,044,562 | 441,052 | ||||||||
| 3.131% Sr. Sec. Nts., 4/30/251,16 | 933,706 | 394,245 | ||||||||
| 3.179% Sr. Sec. Nts., 4/30/251,16 | 1,162,540 | 490,866 | ||||||||
| 3.231% Sr. Sec. Nts., 4/30/251,16 | 1,326,863 | 560,249 | ||||||||
| 3.265% Sr. Sec. Nts., 4/30/251,16 | 1,060,008 | 447,574 | ||||||||
| 3.346% Sr. Sec. Nts., 4/30/251,16 | 996,363 | 420,700 | ||||||||
| Morgan Stanley, Russian Federation Total Return Linked Bonds, Series 007, Cl. VR, 5.00%, 8/22/34 | RUB | 27,021,516 | 105,476 | |||||||
Total Structured Securities (Cost $8,137,822)
|
|
| 3,771,975
|
| ||||||
| Short-Term Notes—0.4% |
| |||||||||
| Arab Republic of Egypt Treasury Bills: |
| |||||||||
| 16.013%, 3/5/1916 | EGP | 50,000,000 | 2,478,743 | |||||||
| 18.370%, 8/14/1816 | EGP | 80,500,000 | 4,399,174 | |||||||
| Total Short-Term Notes (Cost $7,032,999) |
| 6,877,917 | ||||||||
| Shares | ||||||||||
| Investment Companies—26.4% |
| |||||||||
| Oppenheimer Institutional Government Money Market Fund, Cl. E, 1.85%17,18 | 92,933,810 | 92,933,810 | ||||||||
| Oppenheimer Master Event-Linked Bond Fund, LLC18 | 2,140,983 | 33,244,218 | ||||||||
| Oppenheimer Master Loan Fund, LLC18 | 13,622,237 | 234,501,609 | ||||||||
| Oppenheimer Ultra-Short Duration Fund, Cl. Y18 | 10,114,576 | 50,572,880 | ||||||||
| Total Investment Companies (Cost $414,230,496) |
| 411,252,517 | ||||||||
| Notional | ||||||||||||||||||||||||||||||||
| Expiration | Amount | |||||||||||||||||||||||||||||||
| Counterparty | Exercise Price | Date | Contracts | (000’s) | ||||||||||||||||||||||||||||
| Over-the-Counter Options Purchased—0.2% |
| |||||||||||||||||||||||||||||||
| BRL Currency Call15 | GSCO-OT | BRL | 3.150 | 5/20/19 | BRL | 424,096 | BRL 5,000 | 41,956 | ||||||||||||||||||||||||
| BRL Currency Call15 | CITNA-B | BRL | 3.608 | 8/27/18 | BRL | 25,252,500 | BRL 360,750 | 19,646 | ||||||||||||||||||||||||
| BRL Currency Call15 | JPM | BRL | 3.150 | 5/20/19 | BRL | 424,096 | BRL 5,000 | 41,956 | ||||||||||||||||||||||||
| BRL Currency Call15 | JPM | BRL | 3.000 | 5/16/19 | BRL | 550,000 | BRL 5,000 | 22,857 | ||||||||||||||||||||||||
| BRL Currency Call15 | GSCO-OT | BRL | 3.300 | 8/16/18 | BRL | 550,000 | BRL 5,500 | 5,192 | ||||||||||||||||||||||||
| BRL Currency Call15 | JPM | BRL | 3.200 | 4/25/19 | BRL | 48,000,000 | BRL 482,560 | 49,728 | ||||||||||||||||||||||||
| BRL Currency Call15 | GSCO-OT | BRL | 3.656 | 6/7/19 | BRL | 82,693,000 | BRL 731,200 | 562,809 | ||||||||||||||||||||||||
| BRL Currency Call15 | JPM | BRL | 3.514 | 8/2/18 | BRL | 99,187,204 | BRL 351,400 | 11,208 | ||||||||||||||||||||||||
| BRL Currency Call15 | CITNA-B | BRL | 3.200 | 4/25/19 | BRL | 48,000,000 | BRL 512,000 | 49,728 | ||||||||||||||||||||||||
| CAD Currency Call15 | TDB | CAD | 1.268 | 8/15/18 | CAD | 26,876,432 | CAD 190,200 | 22,657 | ||||||||||||||||||||||||
| CLP Currency Call15 | JPM | CLP | 624.550 | 8/20/18 | CLP | 10,593,027,484 | CLP 93,682,500 | 31,779 | ||||||||||||||||||||||||
| COP Currency Call15 | GSCO-OT | COP | 2851.000 | 8/21/18 | COP | 48,364,000,000 | COP 427,650,000 | 145,092 | ||||||||||||||||||||||||
| COP Currency Call15 | CITNA-B | COP | 2781.000 | 8/13/18 | COP | 39,269,131,700 | COP 278,100,000 | 39,269 | ||||||||||||||||||||||||
| COP Currency Call15 | JPM | COP | 2774.500 | 8/13/18 | COP | 39,177,348,401 | COP 277,450,000 | 39,177 | ||||||||||||||||||||||||
| EUR Currency Put15 | GSCO-OT | EUR | 316.600 | 9/4/18 | EUR | 22,620,000 | EUR 210,000 | 29,242 | ||||||||||||||||||||||||
| EUR Currency Put15 | GSCO-OT | EUR | 80.300 | 9/26/18 | EUR | 11,300,000 | EUR 100,000 | 114,147 | ||||||||||||||||||||||||
| EUR Currency Put15 | BOA | EUR | 9.250 | 4/29/20 | EUR | 2,800,000 | EUR 10,000 | 548,274 | ||||||||||||||||||||||||
| IDR Currency Call15 | GSCO-OT | IDR | 13500.000 | 2/1/19 | IDR | 351,000,000,000 | IDR 2,704,725,000 | — | ||||||||||||||||||||||||
| INR Currency Call15 | GSCO-OT | INR | 65.500 | 10/15/18 | INR | 982,500,000 | INR 6,550,000 | 10,807 | ||||||||||||||||||||||||
| INR Currency Call15 | GSCO-OT | INR | 64.800 | 7/3/18 | INR | 915,500,000 | INR 6,480,000 | — | ||||||||||||||||||||||||
| INR Currency Call15 | GSCO-OT | INR | 68.750 | 8/27/18 | INR | 770,000,000 | INR 6,875,000 | 94,710 | ||||||||||||||||||||||||
| RUB Currency Call15 | JPM | RUB | 59.500 | 6/7/19 | RUB | 1,682,200,000 | RUB 14,875,000 | 459,241 | ||||||||||||||||||||||||
| TRY Currency Put15 | JPM | TRY | 4.000 | 5/23/19 | TRY | 710,000 | TRY 10,000 | 37,943 | ||||||||||||||||||||||||
| ZAR Currency Call15 | CITNA-B | ZAR | 12.485 | 8/17/18 | ZAR | 209,750,000 | ZAR 1,872,750 | 14,053 | ||||||||||||||||||||||||
| ZAR Currency Call15 | GSCO-OT | ZAR | 12.469 | 5/27/19 | ZAR | 87,279,500 | ZAR 1,246,850 | 74,449 | ||||||||||||||||||||||||
| ZAR Currency Call15 | GSCO-OT | ZAR | 12.484 | 9/7/18 | ZAR | 88,214,600 | ZAR 936,263 | 11,203 | ||||||||||||||||||||||||
| Total Over-the-Counter Options Purchased (Cost $5,848,603) |
| 2,477,123 | ||||||||||||||||||||||||||||||
| Buy /Sell | Expiration | |||||||||||||||||||||||||||||||
| Counterparty | Protection | Reference Asset | Fixed Rate | Date | Notional Amount (000’s) | |||||||||||||||||||||||||||
| Over-the-Counter Credit Default Swaption Purchased—0.1% |
| |||||||||||||||||||||||||||||||
| Credit Default Swap maturing 6/20/23 Call15 (Cost $771,133) | JPM | Buy | CDX.NA.HY.30 | 105.000 | % | 9/19/18 | USD 56,486 | 662,581 | ||||||||||||||||||||||||
26 OPPENHEIMER GLOBAL STRATEGIC INCOME FUND/VA
| Counterparty | Pay / Receive Floating Rate | Floating Rate | Fixed Rate | Expiration Date | Notional Amount (000’s) | Value | ||||||||||||||||||||||||
| Over-the-Counter Interest Rate Swaptions Purchased—0.2% |
| |||||||||||||||||||||||||||||
| Interest Rate Swap maturing 12/24/48 Call15 | BAC | Receive | Six-Month EUR-EURIBOR-Reuters | 1.690 | % | 12/20/18 | EUR | 6,090 | $ | 67,893 | ||||||||||||||||||||
| Interest Rate Swap maturing 12/27/48 Call15 | GSCO-OT | Receive | Three-Month USD-LIBOR-BBA | 3.200 | 12/21/18 | USD | 28,300 | 426,187 | ||||||||||||||||||||||
| Interest Rate Swap maturing 4/26/49 Call15 | GSCO-OT | Receive | Six-Month EUR-EURIBOR-Reuters | 1.635 | 4/24/19 | EUR | 2,190 | 63,536 | ||||||||||||||||||||||
| Interest Rate Swap maturing 4/26/49 Call15 | BAC | Receive | Six-Month EUR-EURIBOR-Reuters | 1.637 | 4/24/19 | EUR | 3,530 | 101,670 | ||||||||||||||||||||||
| Interest Rate Swap maturing 7/26/28 Call15 | JPM | Receive | Six-Month EUR-EURIBOR-Reuters | 1.108 | 7/24/18 | EUR | 17,425 | 2,926 | ||||||||||||||||||||||
| Interest Rate Swap maturing 4/25/21 Call15 | BOA | Pay | Three-Month USD-LIBOR-BBA | 2.980 | 4/23/19 | USD | 124,305 | 524,652 | ||||||||||||||||||||||
| Interest Rate Swap maturing 5/13/21 Call15 | BAC | Pay | Three-Month USD-LIBOR-BBA | 3.045 | 5/9/19 | USD | 228,755 | 1,136,814 | ||||||||||||||||||||||
| Interest Rate Swap maturing 5/16/21 Call15 | GSCO-OT | Pay | Three-Month USD-LIBOR-BBA | 3.023 | 5/14/19 | USD | 141,275 | 675,604 | ||||||||||||||||||||||
| Total Over-the-Counter Interest Rate Swaptions Purchased (Cost $ 2,960,364) |
| 2,999,282 | ||||||||||||||||||||||||||||
| Total Investments, at Value (Cost $1,750,889,264) |
| 108.7% | 1,693,944,138 | |||||||||||||||||||||||||||
| Net Other Assets (Liabilities) |
| (8.7) | (135,438,286 | ) | ||||||||||||||||||||||||||
Net Assets | 100.0% | $ | 1,558,505,852 | |||||||||||||||||||||||||||
Consolidated Footnotes to Statement of Investments
1. Represents securities sold under Rule 144A, which are exempt from registration under the Securities Act of 1933, as amended. These securities have been determined to be liquid under guidelines established by the Board of Trustees. These securities amount to $442,043,754 or 28.36% of the Fund’s net assets at period end.
2. Represents the current interest rate for a variable or increasing rate security, determined as [Referenced Rate + Basis-point spread].
3. Interest-Only Strips represent the right to receive the monthly interest payments on an underlying pool of mortgage loans. These securities typically decline in price as interest rates decline. Most other fixed income securities increase in price when interest rates decline. The principal amount of the underlying pool represents the notional amount on which current interest is calculated. The price of these securities is typically more sensitive to changes in prepayment rates than traditional mortgage-backed securities (for example, GNMA pass-throughs). Interest rates disclosed represent current yields based upon the current cost basis and estimated timing and amount of future cash flows. These securities amount to $3,348,681 or 0.21% of the Fund’s net assets at period end.
4. Interest rate is less than 0.0005%.
5. All or a portion of the security position is when-issued or delayed delivery to be delivered and settled after period end. See Note 4 of the accompanying Consolidated Notes.
6. This interest rate resets periodically. Interest rate shown reflects the rate in effect at period end. The rate on this variable rate security is not based on a published reference rate and spread but is determined by the issuer or agent based on current market conditions.
7. This security is not accruing income because the issuer has missed an interest payment on it and/or is not anticipated to make future interest and or principal payments. The rate shown is the contractual interest rate. See Note 4 of the accompanying Consolidated Notes.
8. Restricted security. The aggregate value of restricted securities at period end was $7,077,351, which represents 0.45% of the Fund’s net assets. See Note 4 of the accompanying Consolidated Notes. Information concerning restricted securities is as follows:
| Unrealized | ||||||||||||||||
| Acquisition | Appreciation/ | |||||||||||||||
| Security | Dates | Cost | Value | (Depreciation) | ||||||||||||
| Affinion Group, Inc., 12.50% Sr. Unsec. Nts., 11/10/22 | 11/8/10-5/10/18 | $ | 1,113,679 | $ | 1,131,820 | $ | 18,141 | |||||||||
| Concordia International Corp., 7.00% Sr. Unsec. Nts., 4/15/23 | 4/13/15 | 585,000 | 36,562 | (548,438 | ) | |||||||||||
| Cooper-Standard Automotive, Inc., 5.625% Sr. Unsec. Nts., 11/15/26 | 5/2/17 | 254,609 | 247,500 | (7,109 | ) | |||||||||||
| Diamond Resorts International, Inc., 10.75% Sr. Unsec. Nts., 9/1/24 | 1/13/17 | 590,000 | 635,548 | 45,548 | ||||||||||||
| Fideicomiso PA Pacifico Tres, 8.25% Sr. Sec. Nts., 1/15/35 | 2/12/16-11/21/17 | 535,408 | 568,650 | 33,242 | ||||||||||||
| Harland Clarke Holdings Corp., 6.875% Sr. Sec. Nts., 3/1/20 | 1/27/14-3/2/17 | 838,324 | 828,737 | (9,587 | ) | |||||||||||
| JPMorgan Hipotecaria su Casita, 6.47% Sec. Nts., 8/26/35 | 3/21/07 | 528,826 | 27,558 | (501,268 | ) | |||||||||||
| JSC Astana Finance, GDR | 6/5/15 | — | — | — | ||||||||||||
| LBC Tank Terminals Holding Netherlands BV, 6.875% Sr. Unsec. Nts., 5/15/23 | 4/17/14 | 489,584 | 482,125 | (7,459 | ) | |||||||||||
| Taylor Morrison Communities, Inc./Taylor Morrison Holdings II, Inc., 5.875% Sr. Unsec. Nts., 4/15/23 | 1/22/16-3/1/17 | 1,119,437 | 1,160,000 | 40,563 | ||||||||||||
| TMS International Corp., 7.25% Sr. Unsec. Nts., 8/15/25 | 8/9/17 | 265,000 | 271,625 | 6,625 | ||||||||||||
| Trilogy International Partners LLC/Trilogy International Finance, Inc., 8.875% Sr. Sec. Nts., 5/1/22 | 4/21/17 | 681,616 | 695,275 | 13,659 | ||||||||||||
| West Corp., 5.375% Sr. Unsec. Nts., 7/15/22 | 10/30/14-11/3/14 | 674,113 | 690,138 | 16,025 | ||||||||||||
| Zekelman Industries, Inc., 9.875% Sr. Sec. Nts., 6/15/23 | 12/8/16 | 295,269 | 301,813 | 6,544 | ||||||||||||
| $ | 7,970,865 | $ | 7,077,351 | $ (893,514 | ) | |||||||||||
9. Interest or dividend is paid-in-kind, when applicable.
10. This bond has no contractual maturity date, is not redeemable and contractually pays an indefinite stream of interest.
| 11. | Security received as the result of issuer reorganization. |
27 OPPENHEIMER GLOBAL STRATEGIC INCOME FUND/VA
CONSOLIDATED STATEMENT OF INVESTMENTS Unaudited / Continued
Consolidated Footnotes to Statement of Investments (Continued)
12. All or a portion of this security is owned by the subsidiary. See Note 2 of the accompanying Consolidated Notes.
13. The value of this security was determined using significant unobservable inputs. See Note 3 of the accompanying Consolidated Notes.
14. Denotes an inflation-indexed security: coupon or principal are indexed to a consumer price index.
15. Non-income producing security.
16. Zero coupon bond reflects effective yield on the original acquisition date.
17. Rate shown is the 7-day yield at period end.
18. Is or was an affiliate, as defined in the Investment Company Act of 1940, as amended, at or during the reporting period, by virtue of the Fund owning at least 5% of the voting securities of the issuer or as a result of the Fund and the issuer having the same investment adviser. Transactions during the reporting period in which the issuer was an affiliate are as follows:
Shares December 31, 2017 | Gross Additions | Gross Reductions | Shares June 30, 2018 | |||||||||||
| Oppenheimer Institutional Government Money Market Fund, Cl. E | 41,765,253 | 389,516,705 | 338,348,148 | 92,933,810 | ||||||||||
Oppenheimer Master Event-Linked Bond Fund, LLC | 2,520,983 | — | 380,000 | 2,140,983 | ||||||||||
| Oppenheimer Master Loan Fund, LLC | 14,397,097 | — | 774,860 | 13,622,237 | ||||||||||
| Oppenheimer Ultra-Short Duration Fund, Cl. Y | 27,024,582 | 129,994 | 17,040,000 | 10,114,576 | ||||||||||
| Value | Income | Realized Gain (Loss) | Change in Unrealized Gain (Loss) | |||||||||||
Oppenheimer Institutional Government Money Market Fund, Cl. E | $ | 92,933,810 | $ | 532,241 | $ | — | $ — | |||||||
| Oppenheimer Master Event-Linked Bond Fund, LLC | 33,244,218 | 1,193,220 | a | (345,407 | )a | (133,613) a | ||||||||
| Oppenheimer Master Loan Fund, LLC | 234,501,609 | 6,385,214 | b | 527,557 | b | (1,570,565) b | ||||||||
| Oppenheimer Ultra-Short Duration Fund, Cl. Y | 50,572,880 | 657,092 | (170,400 | ) | (99,687) | |||||||||
| Total | $ | 411,252,517 | $ | 8,767,767 | $ | 11,750 | $ (1,803,865) | |||||||
| a. | Represents the amount allocated to the Fund from Oppenheimer Master Event-Linked Bond Fund, LLC. |
| b. | Represents the amount allocated to the Fund from Oppenheimer Master Loan Fund, LLC. |
Distribution of investments representing geographic holdings, as a percentage of total investments at value, is as follows:
| Geographic Holdings | Value | Percent | ||||||
| United States | $ | 1,177,330,295 | 69.3 | % | ||||
| India | 42,578,325 | 2.6 | ||||||
| Brazil | 40,638,333 | 2.5 | ||||||
| Indonesia | 32,733,379 | 1.9 | ||||||
| South Africa | 27,989,660 | 1.8 | ||||||
| Mexico | 26,850,222 | 1.7 | ||||||
| Argentina | 23,702,479 | 1.4 | ||||||
| Greece | 22,281,368 | 1.3 | ||||||
| United Kingdom | 21,973,487 | 1.3 | ||||||
| Canada | 20,633,807 | 1.0 | ||||||
| Turkey | 17,323,098 | 1.0 | ||||||
| Kazakhstan | 16,105,883 | 1.0 | ||||||
| France | 15,967,277 | 0.9 | ||||||
| Spain | 14,849,484 | 0.9 | ||||||
| Egypt | 14,327,650 | 0.8 | ||||||
| Peru | 12,744,037 | 0.8 | ||||||
| Colombia | 11,393,691 | 0.7 | ||||||
| Ukraine | 10,438,213 | 0.6 | ||||||
| Dominican Republic | 10,276,971 | 0.6 | ||||||
| Russia | 9,242,862 | 0.5 | ||||||
| Luxembourg | 8,536,116 | 0.5 | ||||||
| Chile | 8,364,145 | 0.5 | ||||||
| Netherlands | 7,055,606 | 0.4 | ||||||
| Sri Lanka | 7,003,839 | 0.4 | ||||||
| Poland | 6,729,577 | 0.4 | ||||||
| Switzerland | 6,494,437 | 0.4 | ||||||
| Thailand | 6,339,690 | 0.4 | ||||||
| Ivory Coast | 4,886,049 | 0.3 | ||||||
| Angola | 4,514,136 | 0.3 | ||||||
| Ghana | 3,822,377 | 0.2 | ||||||
| Nigeria | 3,605,892 | 0.2 | ||||||
| Ireland | 3,403,884 | 0.2 | ||||||
| Italy | 3,336,495 | 0.2 | ||||||
| Uruguay | 3,251,399 | 0.2 | ||||||
| China | 3,131,211 | 0.2 | ||||||
| Hungary | 3,120,659 | 0.2 | ||||||
| Singapore | 3,038,863 | 0.2 | ||||||
| Oman | 3,021,427 | 0.2 | ||||||
| Israel | 2,485,466 | 0.2 | ||||||
| Ecuador | 2,420,584 | 0.1 | ||||||
| Gabon | 2,394,665 | 0.1 | ||||||
| Bermuda | 2,305,769 | 0.1 | ||||||
| Serbia | 1,986,283 | 0.1 | ||||||
28 OPPENHEIMER GLOBAL STRATEGIC INCOME FUND/VA
| Geographic Holdings (Continued) | Value | Percent | ||||||
| United Arab Emirates | $ | 1,901,849 | 0.1 | % | ||||
| Senegal | 1,836,534 | 0.1 | ||||||
| Croatia | 1,817,265 | 0.1 | ||||||
| New Zealand | 1,754,628 | 0.1 | ||||||
| Romania | 1,555,098 | 0.1 | ||||||
| Iraq | 1,516,941 | 0.1 | ||||||
| Australia | 1,485,570 | 0.1 | ||||||
| Hong Kong | 1,259,779 | 0.1 | ||||||
| Cayman Islands | 1,226,467 | 0.1 | ||||||
| Belgium | 1,217,637 | 0.1 | ||||||
| Honduras | 1,012,246 | 0.1 | ||||||
| Morocco | 1,011,853 | 0.1 | ||||||
| Mongolia | 945,981 | 0.1 | ||||||
| Eurozone | 927,688 | 0.1 | ||||||
| Portugal | 684,188 | 0.0 | ||||||
| Panama | 639,280 | 0.0 | ||||||
| Belarus | 534,274 | 0.0 | ||||||
| Zambia | 530,062 | 0.0 | ||||||
| Mauritius | 484,800 | 0.0 | ||||||
| Jamaica | 322,469 | 0.0 | ||||||
| Trinidad and Tobago | 272,594 | 0.0 | ||||||
| Macau | 258,484 | 0.0 | ||||||
| Bahamas | 119,361 | 0.0 | ||||||
|
|
| ||||||
| Total | $ | 1,693,944,138 | 100.0 | % | ||||
|
|
| ||||||
Forward Currency Exchange Contracts as of June 30, 2018 |
| |||||||||||||||||||||||
| Counterparty | Settlement Month(s) | Currency Purchased (000’s) | Currency Sold (000’s) | Unrealized Appreciation | Unrealized Depreciation | |||||||||||||||||||
| BAC | 07/2018 - 08/2018 | BRL | 10,050 | USD | 2,699 | $ | — | $ | 113,937 | |||||||||||||||
| BAC | 02/2019 | IDR | 260,657,000 | USD | 18,139 | — | 507,493 | |||||||||||||||||
| BAC | 08/2018 | NOK | 147,320 | USD | 18,210 | — | 77,621 | |||||||||||||||||
| BAC | 09/2018 | PLN | 48,665 | USD | 13,468 | — | 458,567 | |||||||||||||||||
| BAC | 07/2018 | USD | 1,273 | BRL | 4,910 | 6,555 | — | |||||||||||||||||
| BAC | 08/2018 | USD | 7,049 | EUR | 5,855 | 180,554 | — | |||||||||||||||||
| BAC | 09/2018 | USD | 3,819 | KRW | 4,098,000 | 130,409 | — | |||||||||||||||||
| BAC | 09/2018 | USD | 8,101 | PEN | 26,610 | 21,025 | — | |||||||||||||||||
| BAC | 09/2018 | USD | 7,204 | PLN | 26,030 | 245,279 | — | |||||||||||||||||
| BAC | 09/2018 | USD | 29,118 | ZAR | 390,790 | 947,182 | 24,138 | |||||||||||||||||
| BAC | 09/2018 | ZAR | 9,020 | USD | 673 | — | 21,973 | |||||||||||||||||
| BOA | 09/2018 | HUF | 25,000 | USD | 89 | — | 336 | |||||||||||||||||
| BOA | 07/2018 | IDR | 188,087,000 | USD | 13,490 | — | 347,899 | |||||||||||||||||
| BOA | 09/2018 | MXN | 3,600 | USD | 171 | 7,521 | — | |||||||||||||||||
| BOA | 09/2018 | USD | 7,456 | COP | 21,345,000 | 200,066 | — | |||||||||||||||||
| BOA | 08/2018 | USD | 42,055 | EUR | 35,060 | 925,877 | — | |||||||||||||||||
| BOA | 07/2018 | USD | 23,551 | IDR | 328,372,000 | 607,380 | — | |||||||||||||||||
| BOA | 09/2018 | USD | 38,691 | INR | 2,648,000 | 435,984 | — | |||||||||||||||||
| BOA | 09/2018 | USD | 1,626 | TRY | 7,760 | — | 7,329 | |||||||||||||||||
| CITNA-B | 07/2018 - 04/2019 | BRL | 71,387 | USD | 19,792 | — | 1,667,309 | |||||||||||||||||
| CITNA-B | 07/2018 - 08/2018 | COP | 37,063,400 | USD | 12,746 | — | 127,942 | |||||||||||||||||
| CITNA-B | 09/2018 | PLN | 470 | USD | 130 | — | 3,922 | |||||||||||||||||
| CITNA-B | 09/2018 | THB | 2,400 | USD | 75 | — | 2,320 | |||||||||||||||||
| CITNA-B | 10/2018 | UAH | 87,000 | USD | 3,039 | 110,449 | — | |||||||||||||||||
| CITNA-B | 07/2018 - 04/2019 | USD | 13,046 | BRL | 48,379 | 666,772 | — | |||||||||||||||||
| CITNA-B | 09/2018 | USD | 7,798 | CLP | 4,940,000 | 238,134 | — | |||||||||||||||||
| CITNA-B | 09/2018 | USD | 5,441 | HUF | 1,475,000 | 185,607 | — | |||||||||||||||||
| CITNA-B | 09/2018 | USD | 6,721 | THB | 215,000 | 215,739 | — | |||||||||||||||||
| CITNA-B | 09/2018 | USD | 19,927 | TRY | 94,490 | 43,987 | — | |||||||||||||||||
| DEU | 08/2018 | EUR | 5,460 | USD | 6,642 | — | 236,508 | |||||||||||||||||
| DEU | 08/2018 | USD | 13,219 | EUR | 10,595 | 789,481 | — | |||||||||||||||||
| GSCO-OT | 09/2018 - 02/2019 | BRL | 16,645 | USD | 4,592 | — | 370,747 | |||||||||||||||||
| GSCO-OT | 09/2018 | COP | 496,000 | USD | 173 | — | 4,607 | |||||||||||||||||
| GSCO-OT | 08/2018 | EUR | 595 | USD | 746 | — | 47,728 | |||||||||||||||||
| GSCO-OT | 03/2019 | JPY | 1,353,000 | USD | 13,096 | — | 618,908 | |||||||||||||||||
| GSCO-OT | 08/2018 | NOK | 115,885 | USD | 14,351 | — | 87,721 | |||||||||||||||||
| GSCO-OT | 02/2019 - 06/2019 | USD | 17,406 | BRL | 67,410 | 662,282 | 152,535 | |||||||||||||||||
| GSCO-OT | 07/2018 - 08/2018 | USD | 25,842 | COP | 74,890,000 | 344,572 | — | |||||||||||||||||
| GSCO-OT | 08/2018 | USD | 14,349 | EUR | 11,960 | 318,307 | — | |||||||||||||||||
| GSCO-OT | 02/2019 | USD | 3,500 | IDR | 51,957,000 | — | 14,532 | |||||||||||||||||
| GSCO-OT | 08/2018 | USD | 4,690 | RUB | 299,500 | — | 58,971 | |||||||||||||||||
29 OPPENHEIMER GLOBAL STRATEGIC INCOME FUND/VA
CONSOLIDATED STATEMENT OF INVESTMENTS Unaudited / Continued
Forward Currency Exchange Contracts (Continued) |
| |||||||||||||||||||||||
| Counterparty | Settlement Month(s) | Currency Purchased (000’s) | Currency Sold (000’s) | Unrealized Appreciation | Unrealized Depreciation | |||||||||||||||||||
| HSBC | 08/2018 | EUR | 600 | USD | 717 | $ | — | $ | 13,016 | |||||||||||||||
| HSBC | 08/2018 - 08/2018 | USD | 7,810 | EUR | 6,415 | 290,301 | 5,363 | |||||||||||||||||
| JPM | 07/2018 - 08/2018 | BRL | 195,570 | USD | 51,653 | — | 1,235,182 | |||||||||||||||||
| JPM | 07/2018 - 08/2018 | COP | 48,422,600 | USD | 16,717 | — | 224,178 | |||||||||||||||||
| JPM | 08/2018 | EUR | 6,870 | USD | 8,261 | — | 202,120 | |||||||||||||||||
| JPM | 09/2018 | HUF | 94,000 | USD | 347 | — | 12,493 | |||||||||||||||||
| JPM | 07/2018 | IDR | 34,944,000 | USD | 2,494 | — | 52,649 | |||||||||||||||||
| JPM | 09/2018 | MXN | 250,000 | USD | 11,965 | 466,357 | — | |||||||||||||||||
| JPM | 09/2018 | RUB | 299,500 | USD | 4,763 | — | 33,566 | |||||||||||||||||
| JPM | 10/2018 | UAH | 43,450 | USD | 1,521 | 52,505 | — | |||||||||||||||||
| JPM | 07/2018 - 04/2019 | USD | 56,558 | BRL | 214,464 | 1,397,259 | — | |||||||||||||||||
| JPM | 07/2018 | USD | 3,701 | COP | 10,596,000 | 87,903 | — | |||||||||||||||||
| JPM | 08/2018 | USD | 10,513 | EUR | 8,670 | 342,696 | 1,114 | |||||||||||||||||
| JPM | 02/2019 | USD | 14,002 | IDR | 208,700,000 | — | 114,966 | |||||||||||||||||
| JPM | 09/2018 | USD | 10,874 | MXN | 227,200 | — | 423,825 | |||||||||||||||||
| JPM | 08/2018 | USD | 25,911 | NOK | 209,561 | 117,062 | — | |||||||||||||||||
| JPM | 09/2018 | USD | 4,760 | RUB | 299,300 | 33,543 | — | |||||||||||||||||
| NOM | 08/2018 | USD | 545 | EUR | 460 | 5,151 | — | |||||||||||||||||
| TDB | 08/2018 | USD | 38,169 | EUR | 31,265 | 1,550,289 | 59,037 | |||||||||||||||||
|
| |||||||||||||||||||||||
| Total Unrealized Appreciation and Depreciation |
| $ | 11,626,228 | $ | 7,330,552 | |||||||||||||||||||
|
| |||||||||||||||||||||||
Futures Contracts as of June 30, 2018 |
| |||||||||||||||||||||||||
| Description | Buy/Sell | Expiration Date | Number of Contracts | Notional Amount (000’s) | Value | Unrealized Appreciation/ (Depreciation) | ||||||||||||||||||||
| Euro-BUND | Sell | 9/06/18 | 50 | EUR | 9,445 | $ | 9,491,294 | $ (46,170) | ||||||||||||||||||
| Euro-BUXL | Sell | 9/06/18 | 48 | EUR | 9,802 | 9,960,867 | (158,861) | |||||||||||||||||||
| United States Treasury Long Bonds | Buy | 9/19/18 | 14 | USD | 2,035 | 2,030,000 | (4,852) | |||||||||||||||||||
| United States Treasury Long Bonds | Sell | 9/19/18 | 95 | USD | 13,698 | 13,775,000 | (76,878) | |||||||||||||||||||
| United States Treasury Nts., 10 yr. | Sell | 9/19/18 | 394 | USD | 47,234 | 47,353,875 | (120,239) | |||||||||||||||||||
| United States Treasury Nts., 10 yr. | Buy | 9/19/18 | 152 | USD | 18,262 | 18,268,500 | 6,227 | |||||||||||||||||||
| United States Treasury Nts., 2 yr. | Sell | 9/28/18 | 587 | USD | 124,438 | 124,343,110 | 95,314 | |||||||||||||||||||
| United States Treasury Nts., 2 yr. | Buy | 9/28/18 | 126 | USD | 26,734 | 26,690,344 | (43,474) | |||||||||||||||||||
| United States Treasury Nts., 5 yr. | Buy | 9/28/18 | 133 | USD | 15,096 | 15,111,086 | 14,929 | |||||||||||||||||||
| United States Ultra Bonds | Buy | 9/19/18 | 68 | USD | 10,666 | 10,850,250 | 183,942 | |||||||||||||||||||
| ||||||||||||||||||||||||||
| $ (150,062) | ||||||||||||||||||||||||||
| ||||||||||||||||||||||||||
Over-the-Counter Options Written at June 30, 2018 |
| |||||||||||||||||||||||||||||||||||
| Description | Counterparty | Exercise Price | Expiration Date | Number of Contracts | Notional Amount (000’s) | Premiums Received | Value | |||||||||||||||||||||||||||||
AUD Currency Put | BOA | USD | 0.747 | 8/9/18 | AUD | (37,831,542 | ) | AUD 267,917 | $ | 454,402 | $ | (458,859 | ) | |||||||||||||||||||||||
BRL Currency Put | CITNA-B | BRL | 3.817 | 8/27/18 | BRL | (26,715,500 | ) | BRL 381,650 | 92,400 | (255,668 | ) | |||||||||||||||||||||||||
BRL Currency Call | CITNA-B | BRL | 3.438 | 8/27/18 | BRL | (24,066,000 | ) | BRL 343,800 | 38,500 | (3,923 | ) | |||||||||||||||||||||||||
BRL Currency Put | GSCO-OT | BRL | 4.590 | 6/7/19 | BRL | (103,820,000 | ) | BRL 918,000 | 684,805 | (637,143 | ) | |||||||||||||||||||||||||
BRL Currency Call | JPM | BRL | 3.354 | 8/2/18 | BRL | (94,670,997 | ) | BRL 335,400 | 129,559 | (5,680 | ) | |||||||||||||||||||||||||
BRL Currency Put | JPM | BRL | 3.748 | 8/2/18 | BRL | (105,778,045 | ) | BRL 374,750 | 307,102 | (1,187,570 | ) | |||||||||||||||||||||||||
CAD Currency Put | TDB | CAD | 1.316 | 8/15/18 | CAD | (27,891,717 | ) | CAD 197,385 | 125,056 | (202,243 | ) | |||||||||||||||||||||||||
CAD Currency Call | TDB | CAD | 1.233 | 8/15/18 | CAD | (26,123,977 | ) | CAD 184,875 | 46,101 | (3,788 | ) | |||||||||||||||||||||||||
CLP Currency Call | JPM | CLP | 603.300 | 8/20/18 | CLP | (10,232,605,045 | ) | CLP 90,495,000 | 59,363 | (10,233 | ) | |||||||||||||||||||||||||
CLP Currency Put | JPM | CLP | 654.600 | 8/20/18 | CLP | (11,102,707,215 | ) | CLP 98,190,000 | 130,770 | (244,259 | ) | |||||||||||||||||||||||||
COP Currency Call | CITNA-B | COP | 2660.000 | 8/13/18 | COP | (37,560,550,278 | ) | COP 266,000,000 | 62,455 | — | ||||||||||||||||||||||||||
COP Currency Put | CITNA-B | COP | 2972.000 | 8/13/18 | COP | (41,966,148,656 | ) | COP 297,200,000 | 159,391 | (209,831 | ) | |||||||||||||||||||||||||
COP Currency Call | GSCO-OT | COP | 2719.000 | 8/21/18 | COP | (46,124,600,000 | ) | COP 407,850,000 | 83,462 | (46,125 | ) | |||||||||||||||||||||||||
COP Currency Put | GSCO-OT | COP | 3024.000 | 8/21/18 | COP | (51,298,500,000 | ) | COP 453,600,000 | 239,698 | (153,895 | ) | |||||||||||||||||||||||||
COP Currency Put | JPM | COP | 2964.750 | 8/13/18 | COP | (41,863,774,976 | ) | COP 296,475,000 | 153,208 | (209,319 | ) | |||||||||||||||||||||||||
COP Currency Call | JPM | COP | 2645.500 | 8/13/18 | COP | (37,355,802,917 | ) | COP 264,550,000 | 68,484 | — | ||||||||||||||||||||||||||
EUR Currency Call | GSCO-OT | ZAR | 15.140 | 7/3/18 | EUR | (7,070,000 | ) | EUR 75,000 | 77,535 | (456,279 | ) | |||||||||||||||||||||||||
EUR Currency Call | GSCO-OT | HUF | 323.970 | 9/4/18 | EUR | (22,620,000 | ) | EUR 210,000 | 152,951 | (569,310 | ) | |||||||||||||||||||||||||
EUR Currency Put | GSCO-OT | HUF | 310.150 | 9/4/18 | EUR | (22,620,000 | ) | EUR 210,000 | 52,809 | (16,113 | ) | |||||||||||||||||||||||||
EUR Currency Call | GSCO-OT | INR | 83.300 | 9/26/18 | EUR | (11,300,000 | ) | EUR 100,000 | 83,859 | (88,018 | ) | |||||||||||||||||||||||||
EUR Currency Put | GSCO-OT | INR | 77.800 | 9/26/18 | EUR | (11,300,000 | ) | EUR 100,000 | 40,619 | (29,995 | ) | |||||||||||||||||||||||||
IDR Currency Put | GSCO-OT | IDR | 14000.000 | 5/3/18 | IDR | (364,000,000,000 | ) | IDR 2,804,900,000 | 537,316 | (1,456,000 | ) | |||||||||||||||||||||||||
IDR Currency Call | GSCO-OT | IDR | 12700.000 | 2/1/19 | IDR | (330,200,000,000 | ) | IDR 2,544,445,000 | 126,984 | — | ||||||||||||||||||||||||||
INR Currency Call | GSCO-OT | INR | 63.500 | 10/15/18 | INR | (952,500,000 | ) | INR 6,350,000 | 28,500 | (5,715 | ) | |||||||||||||||||||||||||
INR Currency Put | GSCO-OT | INR | 67.000 | 10/15/18 | INR | (1,005,000,000 | ) | INR 6,700,000 | 187,500 | (559,785 | ) | |||||||||||||||||||||||||
INR Currency Put | GSCO-OT | INR | 70.400 | 8/27/18 | INR | (788,480,000 | ) | INR 7,040,000 | 71,680 | (46,520 | ) | |||||||||||||||||||||||||
30 OPPENHEIMER GLOBAL STRATEGIC INCOME FUND/VA
Over-the-Counter Options Written (Continued) |
| |||||||||||||||||||||||||||||||||
| Description | Counterparty | Exercise Price | Expiration Date | Number of Contracts | Notional Amount (000’s) | Premiums Received | Value | |||||||||||||||||||||||||||
| INR Currency Call | GSCO-OT | INR | 67.500 | 8/27/18 | INR | (756,000,000 | ) | INR 6,750,000 | $ | 30,240 | $ (27,216) | |||||||||||||||||||||||
| KRW Currency Put | GSCO-OT | KRW | 1065.000 | 7/3/18 | KRW | (15,975,000,000 | ) | KRW 106,500,000 | 181,500 | (654,975) | ||||||||||||||||||||||||
| KRW Currency Call | GSCO-OT | KRW | 1020.000 | 7/3/18 | KRW | (7,650,000,000 | ) | KRW 51,000,000 | 31,500 | — | ||||||||||||||||||||||||
| MXN Currency Put | GSCO-OT | MXN | 20.000 | 7/16/18 | MXN | (150,000,000 | ) | MXN 1,000,000 | 61,792 | (101,700) | ||||||||||||||||||||||||
| MXN Currency Put | JPM | MXN | 20.200 | 8/2/18 | MXN | (265,125,000 | ) | MXN 2,020,000 | 151,817 | (194,071) | ||||||||||||||||||||||||
| NOK Currency Put | GSCO-OT | NOK | 8.067 | 9/24/18 | NOK | (225,865,000 | ) | NOK 1,815,000 | 518,173 | (588,153) | ||||||||||||||||||||||||
| NOK Currency Put | JPM | NOK | 8.085 | 9/25/18 | NOK | (137,150,000 | ) | NOK 1,212,750 | 307,616 | (339,446) | ||||||||||||||||||||||||
| RUB Currency Put | JPM | RUB | 70.000 | 6/7/19 | RUB | (1,979,100,000 | ) | RUB 17,500,000 | 793,217 | (851,013) | ||||||||||||||||||||||||
| SEK Currency Put | GSCO-OT | SEK | 8.606 | 11/22/18 | SEK | (328,500,000 | ) | SEK 2,323,485 | 1,124,432 | (1,554,462) | ||||||||||||||||||||||||
| TRY Currency Put | GSCO-OT | TRY | 4.251 | 7/19/18 | TRY | (30,015,000 | ) | TRY 213,825 | 115,174 | (579,199) | ||||||||||||||||||||||||
| ZAR Currency Call | CITNA-B | ZAR | 11.870 | 8/17/18 | ZAR | (199,420,000 | ) | ZAR 1,780,500 | 88,846 | (7,578) | ||||||||||||||||||||||||
| ZAR Currency Put | CITNA-B | ZAR | 13.460 | 8/17/18 | ZAR | (226,130,000 | ) | ZAR 2,019,000 | 210,765 | (628,868) | ||||||||||||||||||||||||
| ZAR Currency Call | GSCO-OT | ZAR | 11.324 | 5/27/19 | ZAR | (79,264,500 | ) | ZAR 1,132,350 | 71,911 | (11,335) | ||||||||||||||||||||||||
| ZAR Currency Put | GSCO-OT | ZAR | 13.889 | 9/7/18 | ZAR | (98,146,500 | ) | ZAR 1,041,675 | 91,483 | (194,919) | ||||||||||||||||||||||||
| ZAR Currency Put | GSCO-OT | ZAR | 14.646 | 5/27/19 | ZAR | (102,522,000 | ) | ZAR 1,464,600 | 187,628 | (371,642) | ||||||||||||||||||||||||
| Total Over-the-Counter Options Written |
| $ | 8,160,603 | $ (12,960,848) | ||||||||||||||||||||||||||||||
| Centrally Cleared Credit Default Swaps at June 30, 2018 |
| |||||||||||||||||||||||||||||||||
| Reference Asset | Buy/Sell Protection | Fixed Rate | Maturity Date | Notional Amount (000’s) | Premiums Received/(Paid) | Value | Unrealized Appreciation/ (Depreciation) | |||||||||||||||||||||||||||
| CDX.EM 29 |
| Sell | 1.000% | 6/20/23 | USD | 1,000 | $ | 40,111 | $ | (39,833 | ) | $ 278 | ||||||||||||||||||||||
| Federative Republic of Brazil |
| Sell | 1.000 | 6/20/22 | USD | 2,500 | 154,768 | (117,295 | ) | 37,473 | ||||||||||||||||||||||||
| MALAYSIA |
| Buy | 1.000 | 6/20/23 | USD | 1,500 | 1,962 | 4,158 | 6,120 | |||||||||||||||||||||||||
| MALAYSIA |
| Buy | 1.000 | 6/20/23 | USD | 1,500 | 7,852 | 4,158 | 12,010 | |||||||||||||||||||||||||
| Mexico Government International |
| Buy | 1.000 | 6/20/23 | USD | 1,500 | (35,200 | ) | 23,217 | (11,983) | ||||||||||||||||||||||||
| Mexico Government International |
| Buy | 1.000 | 6/20/23 | USD | 1,000 | (23,480 | ) | 15,478 | (8,002) | ||||||||||||||||||||||||
| Mexico Government International |
| Buy | 1.000 | 6/20/23 | USD | 1,000 | (20,838 | ) | 15,478 | (5,360) | ||||||||||||||||||||||||
| Mexico Government International |
| Buy | 1.000 | 6/20/23 | USD | 1,000 | (16,323 | ) | 15,478 | (845) | ||||||||||||||||||||||||
| Mexico Government International |
| Buy | 1.000 | 6/20/23 | USD | 1,000 | (21,158 | ) | 15,478 | (5,680) | ||||||||||||||||||||||||
| Mexico Government International |
| Buy | 1.000 | 6/20/23 | USD | 1,000 | (22,815 | ) | 15,478 | (7,337) | ||||||||||||||||||||||||
| Mexico Government International |
| Buy | 1.000 | 6/20/23 | USD | 1,000 | (15,878 | ) | 15,478 | (400) | ||||||||||||||||||||||||
| Mexico Government International | Buy | 1.000 | 6/20/23 | USD | 1,000 | (19,036 | ) | 15,478 | (3,558) | |||||||||||||||||||||||||
| Mexico Government International |
| Buy | 1.000 | 6/20/23 | USD | 4,300 | (87,696 | ) | 66,557 | (21,139) | ||||||||||||||||||||||||
| Mexico Government International | Buy | 1.000 | 6/20/23 | USD | 1,000 | (14,059 | ) | 15,395 | 1,336 | |||||||||||||||||||||||||
| Mexico Government International |
| Buy | 1.000 | 6/20/23 | USD | 1,000 | (24,118 | ) | 15,478 | (8,640) | ||||||||||||||||||||||||
| People’s Republic of China |
| Buy | 1.000 | 6/20/23 | USD | 4,500 | 82,220 | (68,515 | ) | 13,705 | ||||||||||||||||||||||||
| Petrobras Global Finance BV |
| Sell | 1.000 | 12/20/20 | USD | 1,000 | 10,178 | (27,856 | ) | (17,678) | ||||||||||||||||||||||||
| Petrobras Global Finance BV |
| Sell | 1.000 | 12/20/20 | USD | 1,000 | 10,092 | (27,856 | ) | (17,764) | ||||||||||||||||||||||||
| Republic Of South Africa Gover |
| Buy | 1.000 | 6/20/23 | USD | 1,000 | (54,324 | ) | 50,232 | (4,092) | ||||||||||||||||||||||||
| Republic Of South Africa Gover | Buy | 1.000 | 6/20/23 | USD | 2,000 | (87,867 | ) | 100,464 | 12,597 | |||||||||||||||||||||||||
| Republic Of South Africa Gover |
| Buy | 1.000 | 6/20/23 | USD | 850 | (38,119 | ) | 42,697 | 4,578 | ||||||||||||||||||||||||
| Russian Foreign Bond - Eurobon |
| Buy | 1.000 | 6/20/23 | USD | 1,500 | (26,883 | ) | 27,151 | 268 | ||||||||||||||||||||||||
| Total Cleared Credit Default Swaps |
| $ | (200,611 | ) | $ | 176,498 | $ (24,113) | |||||||||||||||||||||||||||
| Over-the-Counter Credit Default Swaps at June 30, 2018 |
| |||||||||||||||||||||||||||||||||
| Reference Asset | Counterparty | Buy/Sell Protection | Fixed Rate | Maturity Date | Notional Amount (000’s) | Premiums Received/(Paid) | Value | Unrealized Appreciation/ (Depreciation) | ||||||||||||||||||||||||||
| Eskom Holdings Soc Ltd. | GSCOI | Sell | 1.000% | 12/20/22 | USD | 1,500 | $ | 124,911 | $ | (211,930 | ) | $ (87,019) | ||||||||||||||||||||||
| Federative Republic of Brazil | BNP | Sell | 1.000 | 12/20/18 | USD | 1,190 | 94,152 | 916 | 95,068 | |||||||||||||||||||||||||
| Idbi Bank Ltd./difc Dubai | BAC | Sell | 1.000 | 12/20/22 | USD | 1,000 | 32,421 | (28,350 | ) | 4,071 | ||||||||||||||||||||||||
| Idbi Bank Ltd./difc Dubai | BNP | Sell | 1.000 | 12/20/22 | USD | 1,000 | 30,175 | (28,350 | ) | 1,825 | ||||||||||||||||||||||||
| Oriental Republic of Uruguay | BOA | Sell | 1.000 | 12/20/21 | USD | 2,697 | 48,743 | 20,765 | 69,508 | |||||||||||||||||||||||||
| State Bank of India | BNP | Sell | 1.000 | 9/20/19 | USD | 1,740 | 71,791 | 13,954 | 85,745 | |||||||||||||||||||||||||
| Total Over-the-Counter Credit Default Swaps |
| $ | 402,193 | $ | (232,995 | ) | $ 169,198 | |||||||||||||||||||||||||||
The table that follows shows the undiscounted maximum potential payment by the Fund related to selling credit protection in credit default swaps:
31 OPPENHEIMER GLOBAL STRATEGIC INCOME FUND/VA
CONSOLIDATED STATEMENT OF INVESTMENTS Unaudited / Continued
Type of Reference Asset on which the Fund Sold Protection | Total Maximum Potential Payments for Selling Credit Protection | Amount Recoverable* | Reference Asset Rating Range**(Unaudited) | |||
| Non-Investment Grade Corporate Debt Indexes | $ 1,000,000 | $ — | BB | |||
| Investment Grade Single Name Corporate Debt | 1,740,000 | — | BBB- | |||
| Non-Investment Grade Single Name Corporate Debt | 5,500,000 | — | BB to CCC+ | |||
| Investment Grade Sovereign Debt | 2,697,000 | — | BBB | |||
| Non-Investment Grade Sovereign Debt | 3,690,000 | — | BB- | |||
|
| |||||
| Total USD | $ 14,627,000 | $ — | ||||
|
|
*The Fund has no amounts recoverable from related purchased protection. In addition, the Fund has no recourse provisions under the credit derivatives and holds no collateral which can offset or reduce potential payments under a triggering event.
**The period end reference asset security ratings, as rated by any rating organization, are included in the equivalent Standard & Poor’s rating category. The reference asset rating represents the likelihood of a potential credit event on the reference asset which would result in a related payment by the Fund.
Centrally Cleared Interest Rate Swaps at June 30, 2018 |
| |||||||||||||||||||||||||||||||
| Counterparty | Pay/Receive Floating Rate | Floating Rate | Fixed Rate | Maturity Date | Notional Amount (000’s) | Premiums Received / (Paid) | Value | Unrealized Appreciation/ (Depreciation) | ||||||||||||||||||||||||
BAC | Receive | Six-Month EUR EURIBOR | 1.123 | % | 3/8/28 | EUR | 2,475 | $ | — | $ | (86,703 | ) | $ (86,703) | |||||||||||||||||||
BAC | Receive | Six-Month JPY BBA LIBOR | 0.296 | 11/29/27 | JPY | 4,654,000 | — | (258,139 | ) | (258,139) | ||||||||||||||||||||||
BNP | Pay | BZDI | 7.515 | 1/2/19 | BRL | 108,825 | — | 106,726 | 106,726 | |||||||||||||||||||||||
BNP | Pay | BZDI | 9.130 | 1/4/21 | BRL | 27,415 | — | (8,475 | ) | (8,475) | ||||||||||||||||||||||
CITNA-B | Pay | Six-Month HUF BUBOR | 2.205 | 3/8/28 | HUF | 825,000 | — | (164,091 | ) | (164,091) | ||||||||||||||||||||||
CITNA-B | Pay | MXN TIIE BANXICO | 6.600 | 6/21/22 | MXN | 134,240 | — | (303,338 | ) | (303,338) | ||||||||||||||||||||||
CITNA-B | Pay | Six-Month PLN WIBOR WIBO | 2.990 | 11/17/27 | PLN | 5,770 | — | 38,423 | 38,423 | |||||||||||||||||||||||
DEU | Pay | JIBA3M | 8.310 | 6/29/28 | ZAR | 28,300 | 76 | 2,553 | 2,629 | |||||||||||||||||||||||
DEU | Receive | JIBA3M | 7.120 | 6/29/19 | ZAR | 202,850 | — | (1,569 | ) | (1,569) | ||||||||||||||||||||||
DEU | Pay | Three-Month ZAR JIBAR SAFEX | 7.675 | 2/21/22 | ZAR | 26,465 | — | 7,755 | 7,755 | |||||||||||||||||||||||
GSCOI | Pay | BZDI | 11.730 | 1/2/25 | BRL | 17,600 | — | 36,629 | 36,629 | |||||||||||||||||||||||
GSCOI | Pay | BZDI | 10.875 | 1/4/27 | BRL | 15,070 | — | (115,359 | ) | (115,359) | ||||||||||||||||||||||
GSCOI | Pay | EUR006M | 1.553 | 7/4/44 | EUR | 4,331 | — | 102,606 | 102,606 | |||||||||||||||||||||||
GSCOI | Pay | BZDI | 11.590 | 1/2/25 | BRL | 17,700 | — | 18,549 | 18,549 | |||||||||||||||||||||||
GSCOI | Pay | COOVIBR | 4.610 | 6/7/20 | COP | 20,710,000 | — | (33,649 | ) | (33,649) | ||||||||||||||||||||||
GSCOI | Receive | Six-Month EUR EURIBOR | 1.596 | 4/4/28 | EUR | 19,200 | — | (121,566 | ) | (121,566) | ||||||||||||||||||||||
GSCOI | Pay | Six-Month CHF BBA LIBOR | 0.884 | 4/4/28 | CHF | 21,600 | — | (34,195 | ) | (34,195) | ||||||||||||||||||||||
GSCOI | Pay | EUR006M | 0.861 | 8/15/27 | EUR | 8,030 | — | 35,444 | 35,444 | |||||||||||||||||||||||
GSCOI | Pay | EUR006M | 1.482 | 7/4/44 | EUR | 3,200 | — | 17,574 | 17,574 | |||||||||||||||||||||||
JPM | Pay | Six-Month HUF BUBOR | 1.865 | 1/24/28 | HUF | 375,735 | — | (109,196 | ) | (109,196) | ||||||||||||||||||||||
JPM | Pay | Three-Month ZAR JIBAR SAFEX | 7.930 | 11/27/22 | ZAR | 15,000 | — | 10,737 | 10,737 | |||||||||||||||||||||||
SIB | Pay | BZDI | 9.825 | 7/1/20 | BRL | 500,000 | — | (273,792 | ) | (273,792) | ||||||||||||||||||||||
SIB | Pay | BZDI | 11.605 | 1/2/25 | BRL | 35,330 | — | 40,105 | 40,105 | |||||||||||||||||||||||
Total of Centrally Cleared Interest Rate Swaps |
| $ | 76 | $ | (1,092,971 | ) | $ (1,092,895) | |||||||||||||||||||||||||
Over-the-Counter Interest Rate Swaps at June 30, 2018 |
| |||||||||||||||||||||||||||||||
| Counterparty | Pay/Receive Floating Rate | Floating Rate | Fixed Rate | Maturity Date | Notional Amount (000’s) | Premiums Received / (Paid) | Value | Unrealized Appreciation/ (Depreciation) | ||||||||||||||||||||||||
BOA | Pay | Six-Month THB THBFIX | 2.200 | % | 3/20/22 | THB | 99,500 | $ | — | $ | 36,512 | $ 36,512 | ||||||||||||||||||||
BOA | Pay | NSERO | 6.623 | 3/20/20 | INR | 2,035,500 | — | (157,383 | ) | (157,383) | ||||||||||||||||||||||
BOA | Receive | Six-Month INR FBIL MIBOR OIS Compound | 6.705 | 3/8/23 | INR | 736,875 | — | 244,873 | 244,873 | |||||||||||||||||||||||
BOA | Pay | NSERO | 6.700 | 3/8/20 | INR | 3,223,125 | — | (213,311 | ) | (213,311) | ||||||||||||||||||||||
BOA | Pay | Six-Month INR FBIL MIBOR OIS Compound | 6.330 | 1/31/22 | INR | 210,000 | — | (73,576 | ) | (73,576) | ||||||||||||||||||||||
BOA | Receive | Six-Month INR FBIL MIBOR OIS Compound | 6.620 | 3/20/23 | INR | 458,000 | — | 178,545 | 178,545 | |||||||||||||||||||||||
32 OPPENHEIMER GLOBAL STRATEGIC INCOME FUND/VA
Over-the-Counter Interest Rate Swaps (Continued) |
| |||||||||||||||||||||||||||||||||
| Counterparty | Pay/Receive Floating Rate | Floating Rate | Fixed Rate | Maturity Date | Notional Amount (000’s) | Premiums Received / (Paid) | Value | Unrealized Appreciation/ (Depreciation) | ||||||||||||||||||||||||||
CITNA-B | Receive | THFX6M | 1.605% | 6/6/20 | THB | 339,000 | $ | — | $ | (9,354 | ) | $ (9,354) | ||||||||||||||||||||||
GSCOI | Receive | CNY- CNREPOFIX=CFXS | 3.785 | 3/27/23 | CNY | 28,120 | — | (95,190 | ) | (95,190) | ||||||||||||||||||||||||
GSCOI | Receive | THFX6M | 1.500 | 4/24/20 | THB | 1,118,750 | — | 24,192 | 24,192 | |||||||||||||||||||||||||
GSCOI | Pay | THFX6M | 1.955 | 4/24/23 | THB | 459,080 | — | (73,714 | ) | (73,714) | ||||||||||||||||||||||||
GSCOI | Pay | Six-Month CLP TNA | 3.620 | 2/8/23 | CLP | 1,822,500 | — | (9,250 | ) | (9,250) | ||||||||||||||||||||||||
JPM | Pay | Six-Month THB THBFIX | 2.603 | 3/24/27 | THB | 53,200 | — | 21,440 | 21,440 | |||||||||||||||||||||||||
JPM | Receive | Three-Month MYR KLIBOR BNM | 4.005 | 2/21/22 | MYR | 13,230 | — | (13,945 | ) | (13,945) | ||||||||||||||||||||||||
SCB | Pay | Three-Month MYR KLIBOR BNM | 3.310 | 8/19/21 | MYR | 45,000 | — | (183,978 | ) | (183,978) | ||||||||||||||||||||||||
Total of Over-the-Counter Interest Rate Swaps |
| $ | — | $ | (324,139 | ) | $ (324,139) | |||||||||||||||||||||||||||
| Over-the-Counter Credit Default Swaptions Written at June 30, 2018 |
| |||||||||||||||||||||||||||||||||||||
| Description | Counterparty | Buy/Sell Protection | Reference Asset | Fixed Rate | Expiration Date | Notional Amount (000’s) | Premiums Received | Value | ||||||||||||||||||||||||||||||
| Credit Default Swap maturing 6/20/23 Call | JPM | Sell | CDX.NA.HY.30 | 5.000% | 9/19/18 | USD | 56,486 | $ | 372,808 | $ (276,838) | ||||||||||||||||||||||||||||
| Over-the-Counter Interest Rate Swaptions Written at June 30, 2018 |
| |||||||||||||||||||||||||||||||||||||
| Description | Counterparty | Pay/Receive Floating Rate | Floating Rate | Fixed Rate | Expiration Date | Notional | Amount (000’s) | Premiums Received | Value | |||||||||||||||||||||||||||||
| Interest Rate Swap maturing 5/14/29 Call | BAC | Receive | | Three-Month USD-LIBOR-BBA | | 3.103% | 5/9/19 | USD | 49,420 | $ | 1,088,935 | $ (1,324,361) | ||||||||||||||||||||||||||
| Interest Rate Swap maturing 4/26/49 Call | BAC | Receive | | Six-Month EUR- EURIBOR- Reuters | 1.452 | 4/24/19 | EUR | 3,530 | 99,169 | (117,714) | ||||||||||||||||||||||||||||
| Interest Rate Swap maturing 12/20/18 Call | BAC | Receive | | Six-Month EUR- EURIBOR- Reuters | 1.350 | 12/20/18 | EUR | 6,090 | 55,141 | (85,564) | ||||||||||||||||||||||||||||
| Interest Rate Swap maturing 4/26/49 Call | BAC | Pay | | Six-Month EUR- EURIBOR- Reuters | 1.887 | 4/24/19 | EUR | 3,530 | 81,923 | (37,421) | ||||||||||||||||||||||||||||
| Interest Rate Swap maturing 5/31/20 Call | BOA | Pay | | Three-Month USD-LIBOR-BBA | | 2.718 | 5/29/19 | USD | 282,730 | 565,460 | (980,270) | |||||||||||||||||||||||||||
| Interest Rate Swap maturing 6/12/20 Call | BOA | Pay | | Three-Month USD-LIBOR-BBA | | 2.972 | 6/10/19 | USD | 282,730 | 605,042 | (588,977) | |||||||||||||||||||||||||||
| Interest Rate Swap maturing 4/25/29 Call | BOA | Receive | | Three-Month USD-LIBOR-BBA | | 2.980 | 4/23/19 | USD | 28,250 | 526,863 | (578,636) | |||||||||||||||||||||||||||
| Interest Rate Swap maturing 12/12/19 Call | BOA | Pay | | Three-Month USD-LIBOR-BBA | | 2.820 | 12/10/18 | USD | 282,730 | 356,240 | (323,833) | |||||||||||||||||||||||||||
| Interest Rate Swap maturing 9/14/23 Call | GSCOI | Pay | | Six-Month PLN- WIBOR-WIBO | | 2.610 | 9/12/18 | PLN | 11,315 | 14,833 | (7,969) | |||||||||||||||||||||||||||
| Interest Rate Swap maturing 5/16/29 Call | GSCOI | Pay | | Three-Month USD-LIBOR-BBA | | 3.098 | 5/14/19 | USD | 31,785 | 692,913 | (848,894) | |||||||||||||||||||||||||||
| Interest Rate Swap maturing 4/26/49 Call | GSCOI | Pay | | Six-Month EUR- EURIBOR- Reuters | 1.885 | 4/24/19 | EUR | 2,190 | 50,825 | (23,416) | ||||||||||||||||||||||||||||
| Interest Rate Swap maturing 9/21/48 Call | GSCOI | Pay | | Three-Month USD-LIBOR-BBA | | 3.150 | 9/19/18 | USD | 28,300 | 198,100 | (208,992) | |||||||||||||||||||||||||||
| Interest Rate Swap maturing 4/26/49 Call | GSCOI | Receive | | Six-Month EUR- EURIBOR- Reuters | 1.450 | 4/24/19 | EUR | 2,190 | 61,524 | (72,495) | ||||||||||||||||||||||||||||
| Interest Rate Swap maturing 7/26/28 Call | JPM | Receive | | Six-Month EUR- EURIBOR- Reuters | 1.057 | 7/24/18 | EUR | 17,425 | 94,224 | (321,996) | ||||||||||||||||||||||||||||
| Interest Rate Swap maturing 7/9/28 Call | JPM | Pay | | Three-Month USD-LIBOR-BBA | | 3.000 | 7/5/18 | USD | 141,145 | 846,870 | (80,018) | |||||||||||||||||||||||||||
| Interest Rate Swap maturing 7/26/28 Call | JPM | Pay | | Six-Month EUR- EURIBOR- Reuters | 1.258 | 7/24/18 | EUR | 17,425 | 47,860 | (490) | ||||||||||||||||||||||||||||
| Total Over-the-Counter Interest Rate Swaptions Written |
| $ | 5,385,922 | $ (5,601,046) | ||||||||||||||||||||||||||||||||||
| Glossary: | ||
| Counterparty Abbreviations | ||
| BAC | Barclays Bank plc | |
| BNP | BNP Paribas | |
| BOA | Bank of America NA |
33 OPPENHEIMER GLOBAL STRATEGIC INCOME FUND/VA
CONSOLIDATED STATEMENT OF INVESTMENTS Unaudited / Continued
| Counterparty Abbreviations (Continued) | ||
| CITNA-B | Citibank NA | |
| DEU | Deutsche Bank AG | |
| GSCOI | Goldman Sachs International | |
| GSCO-OT | Goldman Sachs Bank USA | |
| HSBC | HSBC Bank USA NA | |
| JPM | JPMorgan Chase Bank NA | |
| NOM | Nomura Global Financial Products, Inc. | |
| SCB | Standard Chartered Bank | |
| SIB | Banco Santander SA | |
| TDB | Toronto Dominion Bank | |
| Currency abbreviations indicate amounts reporting in currencies | ||
| ARS | Argentine Peso | |
| AUD | Australian Dollar | |
| BRL | Brazilian Real | |
| CAD | Canadian Dollar | |
| CHF | Swiss Franc | |
| CLP | Chilean Peso | |
| CNY | Chinese Renminbi | |
| COP | Colombian Peso | |
| EGP | Egyptian Pounds | |
| EUR | Euro | |
| HUF | Hungarian Forint | |
| IDR | Indonesian Rupiah | |
| INR | Indian Rupee | |
| JPY | Japanese Yen | |
| KRW | South Korean Won | |
| MXN | Mexican Nuevo Peso | |
| MYR | Malaysian Ringgit | |
| NOK | Norwegian Krone | |
| PEN | Peruvian New Sol | |
| PLN | Polish Zloty | |
| RUB | Russian Ruble | |
| SEK | Swedish Krona | |
| THB | Thailand Baht | |
| TRY | New Turkish Lira | |
| UAH | Ukraine Hryvnia | |
| UYU | Uruguay Peso | |
| ZAR | South African Rand | |
| Definitions | ||
| 30YR CMT | 30 Year Constant Maturity Treasury | |
| BANXICO | Banco de Mexico | |
| BBA LIBOR | British Bankers’ Association London - Interbank Offered Rate | |
| BNM | Bank Negra Malaysia | |
| BUBOR | Budapest Interbank Offered Rate | |
| BUND | German Federal Obligation | |
| BUXL | German Federal Obligation | |
| BZDI | Brazil Interbank Deposit Rate | |
| CDX.EM 29 | Markit CDX Emerging Markets Index | |
| CDX.NA.HY.30 | Markit CDX North American High Yield | |
| CNREPOFIX=CFXS | Repurchase Fixing Rates | |
| COOVIBR | Columbia IBR Overnight Nominal Interbank Reference Rate | |
| EURIBOR | Euro Interbank Offered Rate | |
| EUSA10 | EUR Swap Annual 10 Year | |
| EUSA11 | EUR Swap Annual 11 Year | |
| EUSA5 | EUR Swap Annual 5 Year | |
| EUSA8 | EUR Swap Annual 8 Year | |
| FBIL | Financial Benchmarks India Private Ltd. | |
| H15T5Y | US Treasury Yield Curve Rate T Note Constant Maturity 5 Year | |
| H15T10Y | US Treasury Yield Curve Rate T Note Constant Maturity 10 Year | |
| H15T1Y | US Treasury Yield Curve Rate T Note Constant Maturity 1 Year | |
| ICE LIBOR | Intercontinental Exchange London Interbank Offered Rate | |
| JIBA3M | South Africa Johannesburg Interbank Agreed Rate 3 Month | |
| JIBAR SAFEX | South Africa Johannesburg Interbank Agreed Rate/Futures Exchange | |
| KLIBOR | Kuala Lumpur Interbank Offered Rate | |
| LIBOR | London Interbank Offered Rate | |
| LIBOR01M | ICE LIBOR USD 1 Month | |
| LIBOR4 | London Interbank Offered Rate-Yearly | |
| LIBOR4 | London Interbank Offered Rate-Quarterly | |
34 OPPENHEIMER GLOBAL STRATEGIC INCOME FUND/VA
| Definitions (Continued) | ||
| LIBOR12 | London Interbank Offered Rate-Monthly | |
| MIBOR | Mumbai Interbank Offered Rate | |
| NSERO | Indian Rupee Floating Rate | |
| OIS | Overnight Index Swap | |
| THBFIX | Thai Baht Interest Rate Fixing | |
| THFX6M | Thai 6 Month Reference Rate | |
| TIIE | Interbank Equilibrium Interest Rate | |
| TNA | Non-Deliverable CLP Camara | |
| US0001M | ICE LIBOR USD 1 Month | |
| US0003M | ICE LIBOR USD 3 Month | |
| USISDA05 | USD ICE Swap Rate 11:00am NY 5 Year | |
| USSW5 | USD Swap Semi 30/360 5 Year | |
| WIBOR WIBO | Poland Warsaw Interbank Offer Bid Rate |
See accompanying Notes to Consolidated Financial Statements.
35 OPPENHEIMER GLOBAL STRATEGIC INCOME FUND/VA
CONSOLIDATED STATEMENT OF ASSETS AND LIABILITIES June 30, 2018 Unaudited
Assets | ||||
| Investments, at value—see accompanying consolidated statement of investments: | ||||
| Unaffiliated companies (cost $1,336,658,768) | $ | 1,282,691,621 | ||
| Affiliated companies (cost $414,230,496) | 411,252,517 | |||
| 1,693,944,138 | ||||
| Cash | 25,028,493 | |||
| Cash—foreign currencies (cost $2,261,716) | 2,125,547 | |||
| Cash used for collateral on futures | 1,601,000 | |||
| Cash used for collateral on OTC derivatives | 11,164,000 | |||
| Cash used for collateral on centrally cleared swaps | 8,624,313 | |||
| Cash used for collateral on forward roll transactions | 36,000 | |||
| Unrealized appreciation on forward currency exchange contracts | 11,626,228 | |||
| Swaps, at value (premiums received $214,686) | 541,197 | |||
| Centrally cleared swaps, at value (net premiums paid $497,904) | 874,954 | |||
| Receivables and other assets: | ||||
| Investments sold (including $140,490,854 sold on a when-issued or delayed delivery basis) | 144,706,620 | |||
| Interest, dividends and principal paydowns | 17,828,203 | |||
| Shares of beneficial interest sold | 320,627 | |||
| Variation margin receivable | 14,666 | |||
| Other | 1,136,061 | |||
| Total assets | 1,919,572,047 | |||
Liabilities | ||||
| Unrealized depreciation on forward currency exchange contracts | 7,330,552 | |||
| Options written, at value (premiums received $8,160,603) | 12,960,848 | |||
| Swaps, at value (premiums received $187,507) | 1,098,331 | |||
| Centrally cleared swaps, at value (premiums received $297,369) | 1,791,427 | |||
| Swaptions written, at value (premiums received $5,758,730) | 5,877,884 | |||
| Payables and other liabilities: | ||||
| Investments purchased (including $319,708,090 purchased on a when-issued or delayed delivery basis) | 330,278,611 | |||
| Shares of beneficial interest redeemed | 1,005,925 | |||
| Distribution and service plan fees | 244,959 | |||
| Trustees’ compensation | 136,969 | |||
| Shareholder communications | 84,759 | |||
| Variation margin payable | 67,180 | |||
| Other | 188,750 | |||
| Total liabilities | 361,066,195 | |||
Net Assets | $ | 1,558,505,852 | ||
Composition of Net Assets | ||||
| Par value of shares of beneficial interest | $ | 322,397 | ||
| Additional paid-in capital | 1,756,538,906 | |||
| Accumulated net investment income | 51,755,801 | |||
| Accumulated net realized loss on investments and foreign currency transactions | (190,475,991 | ) | ||
| Net unrealized depreciation on investments and translation of assets and liabilities denominated in foreign currencies | (59,635,261 | ) | ||
Net Assets | $ | 1,558,505,852 | ||
Net Asset Value Per Share | ||||
| Non-Service Shares: | ||||
| Net asset value, redemption price per share and offering price per share (based on net assets of $376,758,570 and 79,723,270 shares of beneficial interest outstanding) | $4.73 | |||
Service Shares: | ||||
Net asset value, redemption price per share and offering price per share (based on net assets of $1,181,747,282 and 242,673,413 shares of beneficial interest outstanding) | $4.87 |
See accompanying Notes to Consolidated Financial Statements.
36 OPPENHEIMER GLOBAL STRATEGIC INCOME FUND/VA
CONSOLIDATED STATEMENT OF OPERATIONS For the Six Months Ended June 30, 2018 Unaudited
Allocation of Income and Expenses from Master Funds1 | ||||
| Net investment income allocated from Oppenheimer Master Event-Linked Bond Fund, LLC: | ||||
| Interest | $ | 1,175,823 | ||
| Dividends | 17,397 | |||
| Net expenses | (76,257 | ) | ||
| Net investment income allocated from Oppenheimer Master Event-Linked Bond Fund, LLC | 1,116,963 | |||
| Net investment income allocated from Oppenheimer Master Loan Fund, LLC | ||||
| Interest | 6,221,470 | |||
| Dividends | 163,744 | |||
| Net expenses | (410,798 | ) | ||
| Net investment income allocated from Oppenheimer Master Loan Fund, LLC | 5,974,416 | |||
| Total allocation of net investment income from master funds | 7,091,379 | |||
Investment Income | ||||
| Interest — unaffiliated companies (net of foreign withholding taxes of $377,754) | 35,344,031 | |||
| Fee income on when-issued securities | 950,925 | |||
| Dividends: | ||||
| Unaffiliated companies | 571,661 | |||
| Affiliated companies | 1,189,333 | |||
| Total investment income |
| 38,055,950
|
| |
Expenses | ||||
| Management fees | 5,008,913 | |||
| Distribution and service plan fees—Service shares | 1,540,874 | |||
| Transfer and shareholder servicing agent fees: | ||||
| Non-Service shares | 236,029 | |||
| Service shares | 739,620 | |||
| Shareholder communications: | ||||
| Non-Service shares | 25,798 | |||
| Service shares | 80,768 | |||
| Custodian fees and expenses | 68,715 | |||
| Trustees’ compensation | 31,638 | |||
| Borrowing fees | 30,772 | |||
| Other | 268,447 | |||
| Total expenses | 8,031,574 | |||
| Less reduction to custodian expenses | (3,287 | ) | ||
| Less waivers and reimbursements of expenses | (576,305 | ) | ||
| Net expenses | 7,451,982 | |||
Net Investment Income | 37,695,347 |
37 OPPENHEIMER GLOBAL STRATEGIC INCOME FUND/VA
CONSOLIDATED STATEMENT OF OPERATIONS Unaudited / Continued
| Realized and Unrealized Gain (Loss) | ||||
| Net realized gain (loss) on: | ||||
| Investment transactions in: | ||||
Unaffiliated companies (including premiums on options exercised) (net of foreign capital gains tax of $54,208) | (13,230,473 | ) | ||
Affiliated companies | (170,400 | ) | ||
| Option contracts written | (10,787,760 | ) | ||
| Futures contracts | (2,492,701 | ) | ||
| Foreign currency transactions | 98,057 | |||
| Forward currency exchange contracts | 7,992,129 | |||
| Swap contracts | 2,620,603 | |||
| Swaption contracts written | 840,324 | |||
| Net realized gain (loss) allocated from: | ||||
| Oppenheimer Master Event-Linked Bond Fund, LLC | (345,407 | ) | ||
| Oppenheimer Master Loan Fund, LLC | 527,557 | |||
| Net realized loss | (14,948,071 | ) | ||
| Net change in unrealized appreciation/depreciation on: | ||||
| Investment transactions in: | ||||
Unaffiliated companies | (69,417,537 | ) | ||
Affiliated companies | (99,687 | ) | ||
| Translation of assets and liabilities denominated in foreign currencies | (636,068 | ) | ||
| Forward currency exchange contracts | 5,480,596 | |||
| Futures contracts | (1,106,070 | ) | ||
| Option contracts written | (5,087,927 | ) | ||
| Swap contracts | (2,108,057 | ) | ||
| Swaption contracts written | (511,371 | ) | ||
| Net change in unrealized appreciation/depreciation allocated from: | ||||
| Oppenheimer Master Event-Linked Bond Fund, LLC | (133,613 | ) | ||
| Oppenheimer Master Loan Fund, LLC | (1,570,565 | ) | ||
| Net change in unrealized appreciation/depreciation | (75,190,299 | ) | ||
Net Decrease in Net Assets Resulting from Operations | $ | (52,443,023 | ) | |
1. The Fund invests in certain affiliated mutual funds that expect to be treated as partnerships for tax purposes. See Note 4 of the accompanying Consolidated Notes.
See accompanying Notes to Consolidated Financial Statements.
38 OPPENHEIMER GLOBAL STRATEGIC INCOME FUND/VA
CONSOLIDATED STATEMENTS OF CHANGES IN NET ASSETS
| Six Months Ended | ||||||||
| June 30, 2018 | Year Ended | |||||||
| (Unaudited) | December 31, 2017 | |||||||
| Operations | ||||||||
| Net investment income | $ | 37,695,347 | $ | 71,440,901 | ||||
| Net realized gain (loss) | (14,948,071 | ) | 6,249,553 | |||||
| Net change in unrealized appreciation/depreciation | (75,190,299 | ) | 22,696,681 | |||||
| Net increase (decrease) in net assets resulting from operations |
| (52,443,023
| )
|
| 100,387,135
|
| ||
| Dividends and/or Distributions to Shareholders | ||||||||
| Dividends from net investment income: | ||||||||
| Non-Service shares | (18,866,160 | ) | (9,178,475 | ) | ||||
| Service shares | (54,450,672 | ) | (25,692,448 | ) | ||||
|
| (73,316,832
| )
|
| (34,870,923
| )
| |||
| Beneficial Interest Transactions | ||||||||
| Net increase (decrease) in net assets resulting from beneficial interest transactions: | ||||||||
| Non-Service shares | 14,658,341 | (23,313,057 | ) | |||||
| Service shares | (1,418,702 | ) | (56,507,178 | ) | ||||
|
| 13,239,639
|
|
| (79,820,235
| )
| |||
| Net Assets | ||||||||
| Total decrease | (112,520,216 | ) | (14,304,023 | ) | ||||
| Beginning of period | 1,671,026,068 | 1,685,330,091 | ||||||
| End of period (including accumulated net investment income of $51,755,801 and $87,377,286, respectively) | $ | 1,558,505,852 | $ | 1,671,026,068 | ||||
See accompanying Notes to Consolidated Financial Statements.
39 OPPENHEIMER GLOBAL STRATEGIC INCOME FUND/VA
CONSOLIDATED FINANCIAL HIGHLIGHTS
| Non-Service Shares | Six Months Ended June 30, 2018 (Unaudited) | Year Ended December 31, 2017 | Year Ended December 31, 2016 | Year Ended December 31, 2015 | Year Ended December 31, 2014 | Year Ended December 31, 2013 | ||||||||||||||||||
| Per Share Operating Data | ||||||||||||||||||||||||
| Net asset value, beginning of period | $5.13 | $4.94 | $4.88 | $5.30 | $5.38 | $5.67 | ||||||||||||||||||
| Income (loss) from investment operations: | ||||||||||||||||||||||||
| Net investment income1 | 0.12 | 0.22 | 0.20 | 0.23 | 0.26 | 0.28 | ||||||||||||||||||
| Net realized and unrealized gain (loss) | (0.27) | 0.09 | 0.11 | (0.34) | (0.11) | (0.29) | ||||||||||||||||||
| Total from investment operations | (0.15) | 0.31 | 0.31 | (0.11) | 0.15 | (0.01) | ||||||||||||||||||
| Dividends and/or distributions to shareholders: | ||||||||||||||||||||||||
| Dividends from net investment income | (0.25) | (0.12) | (0.25) | (0.31) | (0.23) | (0.28) | ||||||||||||||||||
| Net asset value, end of period | $4.73 | $5.13 | $4.94 | $4.88 | $5.30 | $5.38 | ||||||||||||||||||
| Total Return, at Net Asset Value2 | (2.96)% | 6.27% | 6.53% | (2.26)% | 2.84% | (0.13)% | ||||||||||||||||||
| Ratios/Supplemental Data | ||||||||||||||||||||||||
| Net assets, end of period (in thousands) | $376,759 | $393,337 | $401,308 | $429,710 | $586,951 | $738,741 | ||||||||||||||||||
| Average net assets (in thousands) | $396,519 | $400,945 | $416,054 | $510,765 | $707,673 | $734,707 | ||||||||||||||||||
| Ratios to average net assets:3,4 | ||||||||||||||||||||||||
| Net investment income | 4.83% | 4.40% | 4.00% | 4.51% | 4.73% | 5.12% | ||||||||||||||||||
| Expenses excluding specific expenses listed below | 0.86% | 0.82% | 0.79% | 0.76% | 0.74% | 0.74% | ||||||||||||||||||
| Interest and fees from borrowings | 0.00%5 | 0.00%5 | 0.00%5 | 0.00%5 | 0.00% | 0.00% | ||||||||||||||||||
| Total expenses6 | 0.86% | 0.82% | 0.79% | 0.76% | 0.74% | 0.74% | ||||||||||||||||||
| Expenses after payments, waivers and/or reimbursements and reduction to custodian expenses | 0.79% | 0.76% | 0.74% | 0.73% | 0.71% | 0.72% | ||||||||||||||||||
| Portfolio turnover rate7 | 42% | 74% | 80% | 79% | 93% | 107% | ||||||||||||||||||
1. Per share amounts calculated based on the average shares outstanding during the period.
2. Assumes an initial investment on the business day before the first day of the fiscal period, with all dividends and distributions reinvested in additional shares on the reinvestment date, and redemption at the net asset value calculated on the last business day of the fiscal period. Total returns are not annualized for periods less than one full year. Total return information does not reflect expenses that apply at the separate account level or to related insurance products. Inclusion of these charges would reduce the total return figures for all periods shown. Returns do not reflect the deduction of taxes that a shareholder would pay on fund distributions or the redemption of fund shares.
3. Annualized for periods less than one full year.
4. Includes the Fund’s share of the allocated expenses and/or net investment income from the master funds.
5. Less than 0.005%.
6. Total expenses including indirect expenses from affiliated fund fees and expenses were as follows:
| Six Months Ended June 30, 2018 | 0.88 | % | ||||
| Year Ended December 31, 2017 | 0.83 | % | ||||
| Year Ended December 31, 2016 | 0.80 | % | ||||
| Year Ended December 31, 2015 | 0.77 | % | ||||
| Year Ended December 31, 2014 | 0.75 | % | ||||
| Year Ended December 31, 2013 | 0.74 | % |
7. The portfolio turnover rate excludes purchase and sale transactions of To Be Announced (TBA) mortgage-related securities as follows:
| Purchase Transactions | Sale Transactions | |||
| Six Months Ended June 30, 2018 | $1,343,671,924 | $1,370,524,884 | ||
| Year Ended December 31, 2017 | $2,271,944,419 | $2,153,905,799 | ||
| Year Ended December 31, 2016 | $1,798,210,272 | $1,766,445,159 | ||
| Year Ended December 31, 2015 | $1,225,140,927 | $1,266,426,777 | ||
| Year Ended December 31, 2014 | $1,348,552,640 | $1,337,346,996 | ||
| Year Ended December 31, 2013 | $4,294,357,677 | $4,679,296,373 |
See accompanying Notes to Consolidated Financial Statements.
40 OPPENHEIMER GLOBAL STRATEGIC INCOME FUND/VA
| Service Shares | Six Months Ended June 30, 2018 (Unaudited) | Year Ended December 31, 2017 | Year Ended December 31, 2016 | Year Ended December 31, 2015 | Year Ended December 31, 2014 | Year Ended December 31, 2013 | ||||||||||||||||||
| Per Share Operating Data | ||||||||||||||||||||||||
| Net asset value, beginning of period | $5.27 | $5.07 | $5.00 | $5.42 | $5.50 | $5.79 | ||||||||||||||||||
| Income (loss) from investment operations: | ||||||||||||||||||||||||
| Net investment income1 | 0.12 | 0.22 | 0.19 | 0.23 | 0.25 | 0.27 | ||||||||||||||||||
| Net realized and unrealized gain (loss) | (0.29) | 0.08 | 0.12 | (0.35) | (0.11) | (0.29) | ||||||||||||||||||
| Total from investment operations | (0.17) | 0.30 | 0.31 | (0.12) | 0.14 | (0.02) | ||||||||||||||||||
| Dividends and/or distributions to shareholders: | ||||||||||||||||||||||||
| Dividends from net investment income | (0.23) | (0.10) | (0.24) | (0.30) | (0.22) | (0.27) | ||||||||||||||||||
| Net asset value, end of period | $4.87 | $5.27 | $5.07 | $5.00 | $5.42 | $5.50 | ||||||||||||||||||
| Total Return, at Net Asset Value2 | (3.15)% | 6.04% | 6.27% | (2.49)% | 2.49% | (0.37)% | ||||||||||||||||||
| Ratios/Supplemental Data | ||||||||||||||||||||||||
| Net assets, end of period (in thousands) | $1,181,747 | $1,277,689 | $1,284,022 | $1,375,143 | $1,551,247 | $1,716,026 | ||||||||||||||||||
| Average net assets (in thousands) | $1,242,279 | $1,295,999 | $1,332,343 | $1,496,350 | $1,646,615 | $1,794,640 | ||||||||||||||||||
| Ratios to average net assets:3,4 | ||||||||||||||||||||||||
| Net investment income | 4.58% | 4.15% | 3.75% | 4.26% | 4.48% | 4.88% | ||||||||||||||||||
| Expenses excluding specific expenses listed below | 1.11% | 1.07% | 1.04% | 1.01% | 0.99% | 0.99% | ||||||||||||||||||
| Interest and fees from borrowings | 0.00%5 | 0.00%5 | 0.00%5 | 0.00%5 | 0.00% | 0.00% | ||||||||||||||||||
| Total expenses6 | 1.11% | 1.07% | 1.04% | 1.01% | 0.99% | 0.99% | ||||||||||||||||||
| Expenses after payments, waivers and/or reimbursements and reduction to custodian expenses | 1.04% | 1.01% | 0.99% | 0.98% | 0.96% | 0.97% | ||||||||||||||||||
| Portfolio turnover rate7 | 42% | 74% | 80% | 79% | 93% | 107% | ||||||||||||||||||
1. Per share amounts calculated based on the average shares outstanding during the period.
2. Assumes an initial investment on the business day before the first day of the fiscal period, with all dividends and distributions reinvested in additional shares on the reinvestment date, and redemption at the net asset value calculated on the last business day of the fiscal period. Total returns are not annualized for periods less than one full year. Total return information does not reflect expenses that apply at the separate account level or to related insurance products. Inclusion of these charges would reduce the total return figures for all periods shown. Returns do not reflect the deduction of taxes that a shareholder would pay on fund distributions or the redemption of fund shares.
3. Annualized for periods less than one full year.
4. Includes the Fund’s share of the allocated expenses and/or net investment income from the master funds.
5. Less than 0.005%.
6. Total expenses including indirect expenses from affiliated fund fees and expenses were as follows:
| Six Months Ended June 30, 2018 | 1.13 | % | ||||
| Year Ended December 31, 2017 | 1.08 | % | ||||
| Year Ended December 31, 2016 | 1.05 | % | ||||
| Year Ended December 31, 2015 | 1.02 | % | ||||
| Year Ended December 31, 2014 | 1.00 | % | ||||
| Year Ended December 31, 2013 | 0.99 | % |
7. The portfolio turnover rate excludes purchase and sale transactions of To Be Announced (TBA) mortgage-related securities as follows:
| Purchase Transactions | Sale Transactions | |||
| Six Months Ended June 30, 2018 | $1,343,671,924 | $1,370,524,884 | ||
| Year Ended December 31, 2017 | $2,271,944,419 | $2,153,905,799 | ||
| Year Ended December 31, 2016 | $1,798,210,272 | $1,766,445,159 | ||
| Year Ended December 31, 2015 | $1,225,140,927 | $1,266,426,777 | ||
| Year Ended December 31, 2014 | $1,348,552,640 | $1,337,346,996 | ||
| Year Ended December 31, 2013 | $4,294,357,677 | $4,679,296,373 |
See accompanying Notes to Consolidated Financial Statements.
41 OPPENHEIMER GLOBAL STRATEGIC INCOME FUND/VA
NOTES TO CONSOLIDATED FINANCIAL STATEMENTS June 30, 2018 Unaudited
1. Organization
Oppenheimer Global Strategic Income Fund/VA (the “Fund”), a separate series of Oppenheimer Variable Account Funds, is a diversified open-end management investment company registered under the Investment Company Act of 1940 (“1940 Act”), as amended. The Fund’s main investment objective is to seek total return. The Fund’s investment adviser is OFI Global Asset Management, Inc. (“OFI Global” or the “Manager”), a wholly-owned subsidiary of OppenheimerFunds, Inc. (“OFI” or the “Sub-Adviser”). The Manager has entered into a sub-advisory agreement with OFI. Shares of the Fund are sold only to separate accounts of life insurance companies.
The Fund offers two classes of shares. Both classes are sold at their offering price, which is the net asset value per share, to separate investment accounts of participating insurance companies as an underlying investment for variable life insurance policies, variable annuity contracts or other investment products. The class of shares designated as Service shares is subject to a distribution and service plan. Both classes of shares have identical rights and voting privileges with respect to the Fund in general and exclusive voting rights on matters that affect that class alone. Earnings, net assets and net asset value per share may differ due to each class having its own expenses, such as transfer and shareholder servicing agent fees and shareholder communications, directly attributable to that class.
The following is a summary of significant accounting policies followed in the Fund’s preparation of financial statements in accordance with accounting principles generally accepted in the United States (“U.S. GAAP”).
2. Significant Accounting Policies
Security Valuation. All investments in securities are recorded at their estimated fair value, as described in Note 3.
Basis for Consolidation. The Fund has established a Cayman Islands exempted company, Oppenheimer Global Strategic Income Fund/VA (Cayman) Ltd., which is wholly-owned and controlled by the Fund (the “Subsidiary”). The Fund and Subsidiary are both managed by the Manager. The Fund may invest up to 25% of its total assets in the Subsidiary. The Subsidiary invests primarily in Regulation S securities. The Fund applies its investment restrictions and compliance policies and procedures, on a look-through basis, to the Subsidiary.
The financial statements have been consolidated and include accounts of the Fund and the Subsidiary. Accordingly, all inter-company transactions and balances have been eliminated. At period end, the Fund owned 167,626 shares with net assets of $14,101,192 in the Subsidiary.
Other financial information at period end:
| Total market value of investments | $ | 478,587 | ||
| Net assets | $ | 14,101,192 | ||
| Net income (loss) | $ | (3,304 | ) | |
| Net realized gain (loss) | $ | (268,846 | ) | |
| Net change in unrealized appreciation/depreciation | $ | (91,955 | ) |
Foreign Currency Translation. The books and records of the Fund are maintained in U.S. dollars. Any foreign currency amounts are translated into U.S. dollars on the following basis:
(1) Value of investment securities, other assets and liabilities — at the exchange rates prevailing at market close as described in Note 3.
(2) Purchases and sales of investment securities, income and expenses — at the rates of exchange prevailing on the respective dates of such transactions.
Although the net assets and the values are presented at the foreign exchange rates at market close, the Fund does not isolate the portion of the results of operations resulting from changes in foreign exchange rates on investments from the fluctuations arising from changes in prices of securities held. Such fluctuations are included with the net realized and unrealized gains or losses from investments shown in the Consolidated Statement of Operations.
For securities, which are subject to foreign withholding tax upon disposition, realized and unrealized gains or losses on such securities are recorded net of foreign withholding tax.
Reported net realized foreign exchange gains or losses arise from sales of foreign currencies, currency gains or losses realized between the trade and settlement dates on securities transactions, the difference between the amounts of dividends, interest, and foreign withholding tax reclaims recorded on the Fund’s books, and the U.S. dollar equivalent of the amounts actually received or paid. Net unrealized foreign exchange gains and losses arise from changes in the value of assets and liabilities other than investments in securities, resulting from changes in the exchange rate.
Allocation of Income, Expenses, Gains and Losses. Income, expenses (other than those attributable to a specific class), gains and losses are allocated on a daily basis to each class of shares based upon the relative proportion of net assets represented by such class. Operating expenses directly attributable to a specific class are charged against the operations of that class.
Dividends and Distributions to Shareholders. Dividends and distributions to shareholders, which are determined in accordance with income tax regulations and may differ from U.S. GAAP, are recorded on the ex-dividend date. Income and capital gain distributions, if any, are declared and paid annually or at other times as determined necessary by the Manager.
The tax character of distributions is determined as of the Fund’s fiscal year end. Therefore, a portion of the Fund’s distributions made to shareholders prior to the Fund’s fiscal year end may ultimately be categorized as a tax return of capital.
Investment Income. Dividend income is recorded on the ex-dividend date or upon ex-dividend notification in the case of certain foreign dividends
42 OPPENHEIMER GLOBAL STRATEGIC INCOME FUND/VA
2. Significant Accounting Policies (Continued)
where the ex-dividend date may have passed. Non-cash dividends included in dividend income, if any, are recorded at the fair value of the securities received. Withholding taxes on foreign dividends, if any, and capital gains taxes on foreign investments, if any, have been provided for in accordance with the Fund’s understanding of the applicable tax rules and regulations. Interest income, if any, is recognized on an accrual basis. Discount and premium, which are included in interest income on the Consolidated Statement of Operations, are amortized or accreted daily.
Custodian Fees. “Custodian fees and expenses” in the Consolidated Statement of Operations may include interest expense incurred by the Fund on any cash overdrafts of its custodian account during the period. Such cash overdrafts may result from the effects of failed trades in portfolio securities and from cash outflows resulting from unanticipated shareholder redemption activity. The Fund pays interest to its custodian on such cash overdrafts, to the extent they are not offset by positive cash balances maintained by the Fund, at a rate equal to the Federal Funds Rate plus 2.00%. The “Reduction to custodian expenses” line item, if applicable, represents earnings on cash balances maintained by the Fund during the period. Such interest expense and other custodian fees may be paid with these earnings.
Security Transactions. Security transactions are recorded on the trade date. Realized gains and losses on securities sold are determined on the basis of identified cost.
Indemnifications. The Fund’s organizational documents provide current and former Trustees and officers with a limited indemnification against liabilities arising in connection with the performance of their duties to the Fund. In the normal course of business, the Fund may also enter into contracts that provide general indemnifications. The Fund’s maximum exposure under these arrangements is unknown as this would be dependent on future claims that may be made against the Fund. The risk of material loss from such claims is considered remote.
Federal Taxes. The Fund intends to comply with provisions of the Internal Revenue Code applicable to regulated investment companies and to distribute substantially all of its investment company taxable income to shareholders. Therefore, no federal income or excise tax provision is required. The Fund files income tax returns in U.S. federal and applicable state jurisdictions. The statute of limitations on the Fund’s tax return filings generally remains open for the three preceding fiscal reporting period ends. The Fund has analyzed its tax positions for the fiscal year ended December 31, 2017, including open tax years, and does not believe there are any uncertain tax positions requiring recognition in the Fund’s financial statements.
Subchapter M requires, among other things, that at least 90% of the Fund’s gross income be derived from securities or derived with respect to its business of investing in securities (typically referred to as “qualifying income”). Income from commodity-linked derivatives may not be treated as “qualifying income” for purposes of the 90% gross income requirement. The Internal Revenue Service (IRS) has previously issued a number of private letter rulings which conclude that income derived from commodity index-linked notes and investments in a wholly-owned subsidiary will be “qualifying income.” As a result, the Fund will gain exposure to commodities through commodity-linked notes and its wholly-owned subsidiary.
The IRS has suspended the granting of private letter rulings pending further review. As a result, there can be no assurance that the IRS will not change its position with respect to commodity-linked notes and wholly-owned subsidiaries. In addition, future legislation and guidance from the Treasury and the IRS may adversely affect the fund’s ability to gain exposure to commodities through commodity-linked notes and its wholly-owned subsidiary.
The Fund is required to include in income for federal income tax purposes all of the subsidiary’s net income and gains whether or not such income is distributed by the subsidiary. Net income and gains from the subsidiary are generally treated as ordinary income by the Fund, regardless of the character of the subsidiary’s underlying income. Net losses from the subsidiary do not pass through to the Fund for federal income tax purposes.
During the fiscal year ended December 31, 2017, the Fund utilized $3,016,001 of capital loss carryforwards to offset capital gains realized in that fiscal year. For the fiscal year ended December 31, 2017, the Fund had capital loss carryforwards of $162,638,535. Capital losses will be carried forward to future years if not offset by gains.
At period end, it is estimated that the capital loss carryforwards would be $177,586,606. The estimated capital loss carryforward represents the carryforward as of the end of the last fiscal year, increased or decreased by capital losses or gains realized in the first six months of the current fiscal year. During the reporting period, it is estimated that the Fund will not utilize any capital loss carryforward to offset realized capital gains.
Net investment income (loss) and net realized gain (loss) may differ for financial statement and tax purposes. The character of dividends and distributions made during the fiscal year from net investment income or net realized gains are determined in accordance with federal income tax requirements, which may differ from the character of net investment income or net realized gains presented in those financial statements in accordance with U.S. GAAP. Also, due to timing of dividends and distributions, the fiscal year in which amounts are distributed may differ from the fiscal year in which the income or net realized gain was recorded by the Fund.
The aggregate cost of securities and other investments and the composition of unrealized appreciation and depreciation of securities and other investments for federal income tax purposes at period end are noted in the following table. The primary difference between book and tax appreciation or depreciation of securities and other investments, if applicable, is attributable to the tax deferral of losses or tax realization of financial statement unrealized gain or loss.
| Federal tax cost of securities | $ | 1,751,316,515 | ||
| Federal tax cost of other investments | (143,683,179 | ) | ||
|
|
| ||
| Total federal tax cost | $ | 1,607,633,336 | ||
|
|
| ||
| Gross unrealized appreciation | $ | 31,928,686 | ||
| Gross unrealized depreciation | (91,991,198 | ) | ||
|
|
| ||
| Net unrealized depreciation | $ | (60,062,512 | ) | |
|
|
| ||
43 OPPENHEIMER GLOBAL STRATEGIC INCOME FUND/VA
NOTES TO CONSOLIDATED FINANCIAL STATEMENTS Unaudited / Continued
2. Significant Accounting Policies (Continued)
Use of Estimates. The preparation of financial statements in conformity with U.S. GAAP requires management to make estimates and assumptions that affect the reported amounts of assets and liabilities and disclosure of contingent assets and liabilities at the date of the financial statements and the reported amounts of increases and decreases in net assets from operations during the reporting period. Actual results could differ from those estimates.
3. Securities Valuation
The Fund calculates the net asset value of its shares as of 4:00 P.M. Eastern Time, on each day the New York Stock Exchange (the “Exchange”) is open for trading, except in the case of a scheduled early closing of the Exchange, in which case the Fund will calculate net asset value of the shares as of the scheduled early closing time of the Exchange.
The Fund’s Board has adopted procedures for the valuation of the Fund’s securities and has delegated the day-to-day responsibility for valuation determinations under those procedures to the Manager. The Manager has established a Valuation Committee which is responsible for determining a fair valuation for any security for which market quotations are not readily available. The Valuation Committee’s fair valuation determinations are subject to review, approval and ratification by the Fund’s Board at least quarterly or more frequently, if necessary.
Valuation Methods and Inputs
Securities are valued primarily using unadjusted quoted market prices, when available, as supplied by third party pricing services or broker-dealers.
The following methodologies are used to determine the market value or the fair value of the types of securities described below:
Equity securities traded on a securities exchange (including exchange-traded derivatives other than futures and futures options) are valued based on the official closing price on the principal exchange on which the security is traded, as identified by the Manager, prior to the time when the Fund’s assets are valued. If the official closing price is unavailable, the security is valued at the last sale price on the principal exchange on which it is traded, or if no sales occurred, the security is valued at the mean between the quoted bid and asked prices. Over-the-counter equity securities are valued at the last published sale price, or if no sales occurred, at the mean between the quoted bid and asked prices. Events occurring after the close of trading on foreign exchanges may result in adjustments to the valuation of foreign securities to more accurately reflect their fair value as of the time when the Fund’s assets are valued.
Shares of a registered investment company that are not traded on an exchange are valued at that investment company’s net asset value per share.
Corporate and government debt securities (of U.S. or foreign issuers) and municipal debt securities, short-term notes, mortgage-backed securities, collateralized mortgage obligations, and asset-backed securities are valued at the mean between the bid and asked prices utilizing evaluated prices obtained from third party pricing services or broker-dealers who may use matrix pricing methods to determine the evaluated prices. Pricing services generally price debt securities assuming orderly transactions of an institutional “round lot” size, but some trades may occur in smaller, “odd lot” sizes, sometimes at lower prices than institutional round lot trades. Standard inputs generally considered by third-party pricing vendors include reported trade data, broker-dealer price quotations, benchmark yields, issuer spreads on comparable securities, the credit quality, yield, maturity, as well as other appropriate factors.
Loans are valued at the mean between the bid and asked prices utilizing evaluated prices obtained from third party pricing services or broker-dealers. Standard inputs generally considered by third-party pricing vendors include information obtained from market participants regarding broker-dealer price quotations.
Structured securities, swaps, swaptions, and other over-the-counter derivatives are valued utilizing evaluated prices obtained from third party pricing services or broker-dealers. Standard inputs generally considered by third-party pricing vendors include market information relevant to the underlying reference asset such as the price of financial instruments, stock market indices, foreign currencies, interest rate spreads, commodities, credit spreads, credit event probabilities, index values, individual security values, forward interest rates, variable interest rates, volatility measures, and forward currency rates, or the occurrence of other specific events.
Forward foreign currency exchange contracts are valued utilizing current and forward currency rates obtained from third party pricing services. When the settlement date of a contract is an interim date for which a quotation is not available, interpolated values are derived using the nearest dated forward currency rate.
Futures contracts and futures options traded on a commodities or futures exchange will be valued at the final settlement price or official closing price on the principal exchange as reported by such principal exchange at its trading session ending at, or most recently prior to, the time when the Fund’s assets are valued.
Securities for which market quotations are not readily available, or when a significant event has occurred that would materially affect the value of the security, are fair valued either (i) by a standardized fair valuation methodology applicable to the security type or the significant event as previously approved by the Valuation Committee and the Fund’s Board or (ii) as determined in good faith by the Manager’s Valuation Committee. The Valuation Committee considers all relevant facts that are reasonably available, through either public information or information available to the Manager, when determining the fair value of a security. Those standardized fair valuation methodologies include, but are not limited to, valuing securities at the last sale price or initially at cost and subsequently adjusting the value based on: changes in company specific fundamentals, changes in an appropriate securities index, or changes in the value of similar securities which may be further adjusted for any discounts related to security-specific resale restrictions. When possible, such methodologies use observable market inputs such as unadjusted quoted prices of similar securities, observable interest rates, currency rates and yield curves. The methodologies used for valuing securities are not necessarily an indication of the risks associated with investing in those securities nor can it be assured that the Fund can obtain the fair value assigned to a security if it were to sell the security.
To assess the continuing appropriateness of security valuations, the Manager regularly compares prior day prices and sale prices to the current day
44 OPPENHEIMER GLOBAL STRATEGIC INCOME FUND/VA
3. Securities Valuation (Continued)
prices and challenges those prices exceeding certain tolerance levels with the third party pricing service or broker source. For those securities valued by fair valuations, whether through a standardized fair valuation methodology or a fair valuation determination, the Valuation Committee reviews and affirms the reasonableness of the valuations based on such methodologies and fair valuation determinations on a regular basis after considering all relevant information that is reasonably available.
Classifications
Each investment asset or liability of the Fund is assigned a level at measurement date based on the significance and source of the inputs to its valuation. Various data inputs may be used in determining the value of each of the Fund’s investments as of the reporting period end. These data inputs are categorized in the following hierarchy under applicable financial accounting standards:
1) Level 1-unadjusted quoted prices in active markets for identical assets or liabilities (including securities actively traded on a securities exchange)
2) Level 2-inputs other than unadjusted quoted prices that are observable for the asset or liability (such as unadjusted quoted prices for similar assets and market corroborated inputs such as interest rates, prepayment speeds, credit risks, etc.)
3) Level 3-significant unobservable inputs (including the Manager’s own judgments about assumptions that market participants would use in pricing the asset or liability).
The inputs used for valuing securities are not necessarily an indication of the risks associated with investing in those securities.
The Fund classifies each of its investments in investment companies which are publicly offered as Level 1. Investment companies that are not publicly offered, if any, are classified as Level 2 in the fair value hierarchy.
The table below categorizes amounts that are included in the Fund’s Consolidated Statement of Assets and Liabilities at period end based on valuation input level:
Level 1— Quoted Prices | Level 2— Other Significant | Level 3— Significant | Value | |||||||||||||
Assets Table | ||||||||||||||||
Investments, at Value: | ||||||||||||||||
| Asset-Backed Securities | $ | — | $ | 43,719,287 | $ | — | $ | 43,719,287 | ||||||||
| Mortgage-Backed Obligations | — | 311,562,690 | — | 311,562,690 | ||||||||||||
| Foreign Government Obligations | — | 266,827,397 | — | 266,827,397 | ||||||||||||
| Corporate Loans | — | 5,614,549 | — | 5,614,549 | ||||||||||||
| Corporate Bonds and Notes | — | 615,866,475 | 27,561 | 615,894,036 | ||||||||||||
| Preferred Stocks | 21,485,974 | — | — | 21,485,974 | ||||||||||||
| Common Stocks | 530,152 | 41,922 | 78,263 | 650,337 | ||||||||||||
| Rights, Warrants and Certificates | — | 19,528 | 128,945 | 148,473 | ||||||||||||
| Structured Securities | — | 3,771,975 | — | 3,771,975 | ||||||||||||
| Short-Term Notes | — | 6,877,917 | — | 6,877,917 | ||||||||||||
| Investment Companies | 143,506,690 | 267,745,827 | — | 411,252,517 | ||||||||||||
| Over-the-Counter Options Purchased | — | 2,477,123 | — | 2,477,123 | ||||||||||||
| Over-the-Counter Credit Default Swaption Purchased | — | 662,581 | — | 662,581 | ||||||||||||
| Over-the-Counter Interest Rate Swaptions Purchased | — | 2,999,282 | — | 2,999,282 | ||||||||||||
| Total Investments, at Value | 165,522,816 | 1,528,186,553 | 234,769 | 1,693,944,138 | ||||||||||||
Other Financial Instruments: | ||||||||||||||||
| Swaps, at value | — | 541,197 | — | 541,197 | ||||||||||||
| Centrally cleared swaps, at value | — | 874,954 | — | 874,954 | ||||||||||||
| Futures contracts | 300,412 | — | — | 300,412 | ||||||||||||
| Forward currency exchange contracts | — | 11,626,228 | — | 11,626,228 | ||||||||||||
| Total Assets | $ | 165,823,228 | $ | 1,541,228,932 | $ | 234,769 | $ | 1,707,286,929 | ||||||||
Liabilities Table | ||||||||||||||||
| Other Financial Instruments: | ||||||||||||||||
| Swaps, at value | $ | — | $ | (1,098,331 | ) | $ | — | $ | (1,098,331 | ) | ||||||
| Centrally cleared swaps, at value | — | (1,791,427 | ) | — | (1,791,427 | ) | ||||||||||
| Options written, at value | — | (12,960,848 | ) | — | (12,960,848 | ) | ||||||||||
| Futures contracts | (450,474 | ) | — | — | (450,474 | ) | ||||||||||
| Forward currency exchange contracts | — | (7,330,552 | ) | — | (7,330,552 | ) | ||||||||||
| Swaptions written, at value | — | (5,877,884 | ) | — | (5,877,884 | ) | ||||||||||
| Total Liabilities | $ | (450,474 | ) | $ | (29,059,042 | ) | $ | — | $ | (29,509,516 | ) | |||||
Forward currency exchange contracts and futures contracts, if any, are reported at their unrealized appreciation/depreciation at measurement date, which represents the change in the contract’s value from trade date. All additional assets and liabilities included in the above table are reported at their market value at measurement date.
45 OPPENHEIMER GLOBAL STRATEGIC INCOME FUND/VA
NOTES TO CONSOLIDATED FINANCIAL STATEMENTS Unaudited / Continued
3. Securities Valuation (Continued)
The table below shows the transfers between Level 2 and Level 3. The Fund’s policy is to recognize transfers in and transfers out as of the beginning of the reporting period.
| Transfers into Level 2* | Transfers out of Level 3* | |||||||
Assets Table | ||||||||
Investments, at Value: | ||||||||
| Mortgage-Backed Obligations | $ | 51,559 | $ | (51,559) | ||||
| Structured Securities | 223,349 | (223,349) | ||||||
|
|
| ||||||
| Total Assets | $ | 274,908 | $ | (274,908) | ||||
|
|
| ||||||
* Transferred from Level 3 to Level 2 due to the availability of market data for this security.
4. Investments and Risks
Risks of Foreign Investing. The Fund may invest in foreign securities which are subject to special risks. Securities traded in foreign markets may be less liquid and more volatile than those traded in U.S. markets. Foreign issuers are usually not subject to the same accounting and disclosure requirements that U.S. companies are subject to, which may make it difficult for the Fund to evaluate a foreign company’s operations or financial condition. A change in the value of a foreign currency against the U.S. dollar will result in a change in the U.S. dollar value of investments denominated in that foreign currency and in the value of any income or distributions the Fund may receive on those investments. The value of foreign investments may be affected by exchange control regulations, foreign taxes, higher transaction and other costs, delays in the settlement of transactions, changes in economic or monetary policy in the United States or abroad, expropriation or nationalization of a company’s assets, or other political and economic factors. In addition, due to the inter-relationship of global economies and financial markets, changes in political and economic factors in one country or region could adversely affect conditions in another country or region. Investments in foreign securities may also expose the Fund to time-zone arbitrage risk. Foreign securities may trade on weekends or other days when the Fund does not price its shares. At times, the Fund may emphasize investments in a particular country or region and may be subject to greater risks from adverse events that occur in that country or region. Foreign securities and foreign currencies held in foreign banks and securities depositories may be subject to limited or no regulatory oversight.
Investments in Affiliated Funds. The Fund is permitted to invest in other mutual funds advised by the Manager (“Affiliated Funds”). Affiliated Funds are open-end management investment companies registered under the 1940 Act, as amended. The Manager is the investment adviser of, and the Sub-Adviser provides investment and related advisory services to, the Affiliated Funds. When applicable, the Fund’s investments in Affiliated Funds are included in the Consolidated Statement of Investments. Shares of Affiliated Funds are valued at their net asset value per share. As a shareholder, the Fund is subject to its proportional share of the Affiliated Funds’ expenses, including their management fee. The Manager will waive fees and/or reimburse Fund expenses in an amount equal to the indirect management fees incurred through the Fund’s investment in the Affiliated Funds.
Each of the Affiliated Funds in which the Fund invests has its own investment risks, and those risks can affect the value of the Fund’s investments and therefore the value of the Fund’s shares. To the extent that the Fund invests more of its assets in one Affiliated Fund than in another, the Fund will have greater exposure to the risks of that Affiliated Fund.
Investments in Money Market Instruments. The Fund is permitted to invest its free cash balances in money market instruments to provide liquidity or for defensive purposes. The Fund may invest in money market instruments by investing in Class E shares of Oppenheimer Institutional Government Money Market Fund (“IGMMF”), which is an Affiliated Fund. IGMMF is regulated as a money market fund under the 1940 Act, as amended. The Fund may also invest in money market instruments directly or in other affiliated or unaffiliated money market funds.
Investment in Oppenheimer Master Funds. The Fund is permitted to invest in entities sponsored and/or advised by the Manager or an affiliate. Certain of these entities in which the Fund invests are mutual funds registered under the 1940 Act, as amended, that expect to be treated as partnerships for tax purposes, specifically Oppenheimer Master Loan Fund, LLC (“Master Loan”) and Oppenheimer Master Event-Linked Bond Fund, LLC (“Master Event-Linked Bond”) (the “Master Funds”). Each Master Fund has its own investment risks, and those risks can affect the value of the Fund’s investments and therefore the value of the Fund’s shares. To the extent that the Fund invests more of its assets in one Master Fund than in another, the Fund will have greater exposure to the risks of that Master Fund.
The investment objective of Master Loan is to seek income. The investment objective of Master Event-Linked Bond is to seek total return. The Fund’s investments in the Master Funds are included in the Consolidated Statement of Investments. The Fund recognizes income and gain/(loss) on its investments in each Master Fund according to its allocated pro-rata share, based on its relative proportion of total outstanding Master Fund shares held, of the total net income earned and the net gain/(loss) realized on investments sold by the Master Funds. As a shareholder, the Fund is subject to its proportional share of the Master Funds’ expenses, including their management fee. The Manager will waive fees and/or reimburse Fund expenses in an amount equal to the indirect management fees incurred through the Fund’s investment in the Master Funds. The Fund owns 16.9% of Master Loan and 8.7% of Master Event-Linked Bond at period end.
Structured Securities. The Fund invests in structured securities whose market values, interest rates and/or redemption prices are linked to the performance of underlying foreign currencies, interest rate spreads, stock market indices, prices of individual securities, commodities or other financial instruments or the occurrence of other specific events. The structured securities are often leveraged, increasing the volatility of each note’s market value
46 OPPENHEIMER GLOBAL STRATEGIC INCOME FUND/VA
4. Investments and Risks (Continued)
relative to the change in the underlying linked financial element or event. Fluctuations in value of these securities are recorded as unrealized gains and losses in the accompanying Consolidated Statement of Operations. The Fund records a realized gain or loss when a structured security is sold or matures.
Loans. The Fund invests in loans made to U.S. and foreign borrowers that are corporations, partnerships or other business entities. The Fund will do so directly as an original lender or by assignment or indirectly through participation agreements or certain derivative instruments. While many of these loans will be collateralized, the Fund can also invest in uncollateralized loans. Loans are often issued in connection with recapitalizations, acquisitions, leveraged buyouts, and refinancing of borrowers. The loans often pay interest at rates that float above (or are adjusted periodically based on) a benchmark that reflects current interest rates although the Fund can also invest in loans with fixed interest rates.
When investing in loans, the Fund generally will have a contractual relationship only with the lender, not with the relevant borrower. As a result, the Fund generally will have the right to receive payments of principal, interest, and any fees to which it is entitled only from the lender selling the participation and only upon receipt by the lender of the payments from the relevant borrower. The Fund may not directly benefit from the collateral supporting the debt obligation in which it has purchased the participation. As a result, the Fund will assume the credit risk of both the borrower and the institution selling the participation to the Fund.
Securities on a When-Issued or Delayed Delivery Basis. The Fund may purchase securities on a “when-issued” basis, and may purchase or sell securities on a “delayed delivery” basis. “When-issued” or “delayed delivery” refers to securities whose terms and indenture are available and for which a market exists, but which are not available for immediate delivery. Delivery and payment for securities that have been purchased by the Fund on a when-issued basis normally takes place within six months and possibly as long as two years or more after the trade date. During this period, such securities do not earn interest, are subject to market fluctuation and may increase or decrease in value prior to their delivery. The purchase of securities on a when-issued basis may increase the volatility of the Fund’s net asset value to the extent the Fund executes such transactions while remaining substantially fully invested. When the Fund engages in when-issued or delayed delivery transactions, it relies on the buyer or seller, as the case may be, to complete the transaction. Their failure to do so may cause the Fund to lose the opportunity to obtain or dispose of the security at a price and yield it considers advantageous. The Fund may also sell securities that it purchased on a when-issued basis or forward commitment prior to settlement of the original purchase.
At period end, the Fund had purchased securities issued on a when-issued or delayed delivery basis and sold securities issued on a delayed delivery basis as follows:
When-Issued or Delayed Delivery Basis Transactions | ||||
| Purchased securities | $319,708,090 | |||
| Sold securities | 140,490,854 | |||
The Fund may enter into “forward roll” transactions with respect to mortgage-related securities. In this type of transaction, the Fund sells a mortgage-related security to a buyer and simultaneously agrees to repurchase a similar security (same type, coupon and maturity) at a later date at a set price. During the period between the sale and the repurchase, the Fund will not be entitled to receive interest and principal payments on the securities that have been sold. The Fund records the incremental difference between the forward purchase and sale of each forward roll as realized gain (loss) on investments or as fee income in the case of such transactions that have an associated fee in lieu of a difference in the forward purchase and sale price.
Forward roll transactions may be deemed to entail embedded leverage since the Fund purchases mortgage-related securities with extended settlement dates rather than paying for the securities under a normal settlement cycle. This embedded leverage increases the Fund’s market value of investments relative to its net assets which can incrementally increase the volatility of the Fund’s performance. Forward roll transactions can be replicated over multiple settlement periods.
Risks of entering into forward roll transactions include the potential inability of the counterparty to meet the terms of the agreement; the potential of the Fund to receive inferior securities at redelivery as compared to the securities sold to the counterparty; and counterparty credit risk.
At period end, the Fund pledged $36,000 of collateral to the counterparty for forward roll transactions.
Restricted Securities. At period end, investments in securities included issues that are restricted. A restricted security may have a contractual restriction on its resale and is valued under methods approved by the Board of Trustees as reflecting fair value. Securities that are restricted are marked with an applicable footnote on the Consolidated Statement of Investments. Restricted securities are reported on a schedule following the Consolidated Statement of Investments.
Equity Security Risk. Stocks and other equity securities fluctuate in price. The value of the Fund’s portfolio may be affected by changes in the equity markets generally. Equity markets may experience significant short-term volatility and may fall sharply at times. Different markets may behave differently from each other and U.S. equity markets may move in the opposite direction from one or more foreign stock markets. Adverse events in any part of the equity or fixed-income markets may have unexpected negative effects on other market segments.
The prices of individual equity securities generally do not all move in the same direction at the same time and a variety of factors can affect the price of a particular company’s securities. These factors may include, but are not limited to, poor earnings reports, a loss of customers, litigation against the
47 OPPENHEIMER GLOBAL STRATEGIC INCOME FUND/VA
NOTES TO CONSOLIDATED FINANCIAL STATEMENTS Unaudited / Continued
4. Investments and Risks (Continued)
company, general unfavorable performance of the company’s sector or industry, or changes in government regulations affecting the company or its industry.
Credit Risk. The Fund invests in high-yield, non-investment-grade bonds, which may be subject to a greater degree of credit risk. Credit risk relates to the ability of the issuer to meet interest or principal payments or both as they become due. The Fund may acquire securities that have missed an interest payment, and is not obligated to dispose of securities whose issuers or underlying obligors subsequently miss an interest and/or principal payment.
Information concerning securities not accruing interest at period end is as follows:
| Cost | $3,557,221 | |||
| Market Value | $906,040 | |||
| Market Value as % of Net Assets | 0.06% |
Sovereign Debt Risk. The Fund invests in sovereign debt securities, which are subject to certain special risks. These risks include, but are not limited to, the risk that a governmental entity may delay or refuse, or otherwise be unable, to pay interest or repay the principal on its sovereign debt. There may also be no legal process for collecting sovereign debt that a government does not pay or bankruptcy proceedings through which all or part of such sovereign debt may be collected. In addition, a restructuring or default of sovereign debt may also cause additional impacts to the financial markets, such as downgrades to credit ratings, reduced liquidity and increased volatility, among others.
Shareholder Concentration. At period end, two shareholders each owned 20% or more of the Fund’s total outstanding shares.
5. Market Risk Factors
The Fund’s investments in securities and/or financial derivatives may expose the Fund to various market risk factors:
Commodity Risk. Commodity risk relates to the change in value of commodities or commodity indexes as they relate to increases or decreases in the commodities market. Commodities are physical assets that have tangible properties. Examples of these types of assets are crude oil, heating oil, metals, livestock, and agricultural products.
Credit Risk. Credit risk relates to the ability of the issuer of debt to meet interest and principal payments, or both, as they come due. In general, lower-grade, higher-yield debt securities are subject to credit risk to a greater extent than lower-yield, higher-quality securities.
Equity Risk. Equity risk relates to the change in value of equity securities as they relate to increases or decreases in the general market.
Foreign Exchange Rate Risk. Foreign exchange rate risk relates to the change in the U.S. dollar value of a security held that is denominated in a foreign currency. The U.S. dollar value of a foreign currency denominated security will decrease as the dollar appreciates against the currency, while the U.S. dollar value will increase as the dollar depreciates against the currency.
Interest Rate Risk. Interest rate risk refers to the fluctuations in value of fixed-income securities resulting from the inverse relationship between price and yield. For example, an increase in general interest rates will tend to reduce the market value of already issued fixed-income investments, and a decline in general interest rates will tend to increase their value. In addition, debt securities with longer maturities, which tend to have higher yields, are subject to potentially greater fluctuations in value from changes in interest rates than obligations with shorter maturities.
Volatility Risk. Volatility risk refers to the magnitude of the movement, but not the direction of the movement, in a financial instrument’s price over a defined time period. Large increases or decreases in a financial instrument’s price over a relative time period typically indicate greater volatility risk, while small increases or decreases in its price typically indicate lower volatility risk.
6. Use of Derivatives
The Fund’s investment objective not only permits the Fund to purchase investment securities, it also allows the Fund to enter into various types of derivatives contracts, including, but not limited to, futures contracts, forward currency exchange contracts, credit default swaps, interest rate swaps, total return swaps, variance swaps and purchased and written options. In doing so, the Fund will employ strategies in differing combinations to permit it to increase, decrease, or change the level or types of exposure to market risk factors. These instruments may allow the Fund to pursue its objectives more quickly and efficiently than if it were to make direct purchases or sales of securities capable of effecting a similar response to market factors. Such contracts may be entered into through a bilateral over-the-counter (“OTC”) transaction, or through a securities or futures exchange and cleared through a clearinghouse.
Derivatives may have little or no initial cash investment relative to their market value exposure and therefore can produce significant gains or losses in excess of their cost due to changes in the market risk factors and the overall market. This use of embedded leverage allows the Fund to increase its market value exposure relative to its net assets and can substantially increase the volatility of the Fund’s performance. In instances where the Fund is using derivatives to decrease, or hedge, exposures to market risk factors for securities held by the Fund, there are also risks that those derivatives may not perform as expected resulting in losses for the combined or hedged positions. Some derivatives have the potential for unlimited loss, regardless of the size of the Fund’s initial investment.
Additional associated risks from investing in derivatives also exist and potentially could have significant effects on the valuation of the derivative and the Fund. Typically, the associated risks are not the risks that the Fund is attempting to increase or decrease exposure to, per its investment objectives, but are the additional risks from investing in derivatives. Examples of these associated risks are liquidity risk, which is the risk that the Fund will not be able to sell the derivative in the open market in a timely manner, and counterparty credit risk, which is the risk that the counterparty will not fulfill its
48 OPPENHEIMER GLOBAL STRATEGIC INCOME FUND/VA
6. Use of Derivatives (Continued)
obligation to the Fund.
The Fund’s actual exposures to these market risk factors and associated risks during the period are discussed in further detail, by derivative type, below.
Forward Currency Exchange Contracts
The Fund may enter into forward currency exchange contracts (“forward contracts”) for the purchase or sale of a foreign currency at a negotiated rate at a future date. Such contracts are traded in the OTC inter-bank currency dealer market.
Forward contracts are reported on a schedule following the Consolidated Statement of Investments. The unrealized appreciation (depreciation) is reported in the Consolidated Statement of Assets and Liabilities as a receivable (or payable) and in the Consolidated Statement of Operations within the change in unrealized appreciation (depreciation). At contract close, the difference between the original cost of the contract and the value at the close date is recorded as a realized gain (loss) in the Consolidated Statement of Operations.
The Fund may enter into forward foreign currency exchange contracts in order to decrease exposure to foreign exchange rate risk associated with either specific transactions or portfolio instruments or to increase exposure to foreign exchange rate risk.
During the reporting period, the Fund had daily average contract amounts on forward contracts to buy and sell of $281,280,786 and $420,973,926, respectively.
Additional associated risk to the Fund includes counterparty credit risk. Counterparty credit risk arises from the possibility that the counterparty to a forward contract will default and fail to perform its obligations to the Fund.
Futures Contracts
A futures contract is a commitment to buy or sell a specific amount of a commodity, financial instrument or currency at a negotiated price on a stipulated future date. The Fund may buy and sell futures contracts and may also buy or write put or call options on these futures contracts. Futures contracts and options thereon are generally entered into on a regulated futures exchange and cleared through a clearinghouse associated with the exchange.
Upon entering into a futures contract, the Fund is required to deposit either cash or securities (initial margin) in an amount equal to a certain percentage of the contract value in an account registered in the futures commission merchant’s name. Subsequent payments (variation margin) are paid to or from the futures commission merchant each day equal to the daily changes in the contract value. Such payments are recorded as unrealized gains and losses. Should the Fund fail to make requested variation margin payments, the futures commission merchant can gain access to the initial margin to satisfy the Fund’s payment obligations.
Futures contracts are reported on a schedule following the Consolidated Statement of Investments. Securities held by a futures commission merchant to cover initial margin requirements on open futures contracts are noted in the Consolidated Statement of Investments. Cash held by a futures commission merchant to cover initial margin requirements on open futures contracts and the receivable and/or payable for the daily mark to market for the variation margin are noted in the Consolidated Statement of Assets and Liabilities. The net change in unrealized appreciation and depreciation is reported in the Consolidated Statement of Operations. Realized gains (losses) are reported in the Consolidated Statement of Operations at the closing or expiration of futures contracts.
The Fund may purchase and/or sell financial futures contracts and options on futures contracts to gain exposure to, or decrease exposure to interest rate risk, equity risk, foreign exchange rate risk, volatility risk, or commodity risk.
During the reporting period, the Fund had an ending monthly average market value of $114,989,095 and $204,679,087 on futures contracts purchased and sold, respectively.
Additional associated risks of entering into futures contracts (and related options) include the possibility that there may be an illiquid market where the Fund is unable to liquidate the contract or enter into an offsetting position and, if used for hedging purposes, the risk that the price of the contract will correlate imperfectly with the prices of the Fund’s securities.
Option Activity
The Fund may buy and sell put and call options, or write put and call options. When an option is written, the Fund receives a premium and becomes obligated to sell or purchase the underlying security, currency or other underlying financial instrument at a fixed price, upon exercise of the option.
Options can be traded through an exchange or through a privately negotiated arrangement with a dealer in an OTC transaction. Options traded through an exchange are generally cleared through a clearinghouse (such as The Options Clearing Corporation). The difference between the premium received or paid, and market value of the option, is recorded as unrealized appreciation or depreciation. The net change in unrealized appreciation or depreciation is reported in the Consolidated Statement of Operations. When an option is exercised, the cost of the security purchased or the proceeds of the security sale are adjusted by the amount of premium received or paid. Upon the expiration or closing of the option transaction, a gain or loss is reported in the Consolidated Statement of Operations.
Foreign Currency Options. The Fund may purchase or write call and put options on currencies to increase or decrease exposure to foreign exchange rate risk. A purchased call, or written put option becomes more valuable as the price of the underlying financial instrument appreciates relative to the strike price. A purchased put, or written call option becomes more valuable as the price of the underlying financial instrument depreciates relative to the strike price.
Index/Security Options. The Fund may purchase or write call and put options on individual equity securities and/or equity indexes to increase or decrease exposure to equity risk. A purchased call or written put option becomes more valuable as the price of the underlying financial instrument appreciates relative to the strike price. A purchased put or written call option becomes more valuable as the price of the underlying financial instrument
49 OPPENHEIMER GLOBAL STRATEGIC INCOME FUND/VA
NOTES TO CONSOLIDATED FINANCIAL STATEMENTS Unaudited / Continued
6. Use of Derivatives (Continued)
depreciates relative to the strike price.
During the reporting period, the Fund had an ending monthly average market value of $1,161,904 and $662,459 on purchased call options and purchased put options, respectively.
Options written, if any, are reported in a schedule following the Consolidated Statement of Investments and as a liability in the Consolidated Statement of Assets and Liabilities. Securities held in collateral accounts to cover potential obligations with respect to outstanding written options are noted in the Consolidated Statement of Investments.
The risk in writing a call option is the market price of the underlying security increasing above the strike price and the option being exercised. The Fund must then purchase the underlying security at the higher market price and deliver it for the strike price or, if it owns the underlying security, deliver it at the strike price and forego any benefit from the increase in the price of the underlying security above the strike price. The risk in writing a put option is the market price of the underlying security decreasing below the strike price and the option being exercised. The Fund must then purchase the underlying security at the strike price when the market price of the underlying security is below the strike price. Alternatively, the Fund could also close out a written option position, in which case the risk is that the closing transaction will require a premium to be paid by the Fund that is greater than the premium the Fund received. When writing options, the Fund has the additional risk that there may be an illiquid market where the Fund is unable to close the contact. The risk in buying an option is that the Fund pays a premium for the option, and the option may be worth less than the premium paid or expire worthless.
During the reporting period, the Fund had an ending monthly average market value of $1,079,265 and $6,936,337 on written call options and written put options, respectively.
Additional associated risks to the Fund include counterparty credit risk and liquidity risk.
Swap Contracts
The Fund may enter into swap contract agreements with a counterparty to exchange a series of cash flows based on either specified reference rates, the price or volatility of asset or non-asset references, or the occurrence of a credit event, over a specified period. Swaps can be executed in a bi-lateral privately negotiated arrangement with a dealer in an OTC transaction (“OTC swaps”) or executed on a regulated market. Certain swaps, regardless of the venue of their execution, are required to be cleared through a clearinghouse (“centrally cleared swaps”). Swap contracts may include interest rate, equity, debt, index, total return, credit default, currency, and volatility swaps.
Swap contracts are reported on a schedule following the Consolidated Statement of Investments. The values of centrally cleared swap and OTC swap contracts are aggregated by positive and negative values and disclosed separately on the Consolidated Statement of Assets and Liabilities. The unrealized appreciation (depreciation) related to the change in the valuation of the notional amount of the swap is combined with the accrued interest due to (owed by) the Fund, if any, at termination or settlement. The net change in this amount during the period is included on the Consolidated Statement of Operations. The Fund also records any periodic payments received from (paid to) the counterparty, including at termination, under such contracts as realized gain (loss) on the Consolidated Statement of Operations.
Swap contract agreements are exposed to the market risk factor of the specific underlying reference rate or asset. Swap contracts are typically more attractively priced compared to similar investments in related cash securities because they isolate the risk to one market risk factor and eliminate the other market risk factors. Investments in cash securities (for instance bonds) have exposure to multiple risk factors (credit and interest rate risk). Because swaps have embedded leverage, they can expose the Fund to substantial risk in the isolated market risk factor.
Credit Default Swap Contracts. A credit default swap is a contract that enables an investor to buy or sell protection against a defined-issuer credit event, such as the issuer’s failure to make timely payments of interest or principal on a debt security, bankruptcy or restructuring. The Fund may enter into credit default swaps either by buying or selling protection on a corporate issuer, sovereign issuer, or a basket or index of issuers (the “reference asset”).
The buyer of protection pays a periodic fee to the seller of protection based on the notional amount of the swap contract. The seller of protection agrees to compensate the buyer of protection for future potential losses as a result of a credit event on the reference asset. The contract effectively transfers the credit event risk of the reference asset from the buyer of protection to the seller of protection.
The ongoing value of the contract will fluctuate throughout the term of the contract based primarily on the credit risk of the reference asset. If the credit quality of the reference asset improves relative to the credit quality at contract initiation, the buyer of protection may have an unrealized loss greater than the anticipated periodic fee owed. This unrealized loss would be the result of current credit protection being cheaper than the cost of credit protection at contract initiation. If the buyer elects to terminate the contract prior to its maturity, and there has been no credit event, this unrealized loss will become realized. If the contract is held to maturity, and there has been no credit event, the realized loss will be equal to the periodic fee paid over the life of the contract.
If there is a credit event, the buyer of protection can exercise its rights under the contract and receive a payment from the seller of protection equal to the notional amount of the swap less the market value of specified debt securities issued by the reference asset. Upon exercise of the contract the difference between such value and the notional amount is recorded as realized gain (loss) and is included on the Consolidated Statement of Operations.
The Fund may purchase or sell credit protection through credit default swaps to increase or decrease exposure to the credit risk of individual issuers and/or indexes of issuers that are either unavailable or considered to be less attractive in the bond market.
For the reporting period, the Fund had ending monthly average notional amounts of $23,055,714 and $17,267,714 on credit default swaps to buy protection and credit default swaps to sell protection, respectively.
Additional associated risks to the Fund include counterparty credit risk and liquidity risk.
50 OPPENHEIMER GLOBAL STRATEGIC INCOME FUND/VA
6. Use of Derivatives (Continued)
Interest Rate Swap Contracts. An interest rate swap is an agreement between counterparties to exchange periodic payments based on interest rates. One cash flow stream will typically be a floating rate payment based upon a specified floating interest rate while the other is typically a fixed interest rate.
The Fund may enter into interest rate swaps in which it pays the fixed or floating interest rate in order to increase or decrease exposure to interest rate risk. Typically, if relative interest rates rise, floating payments under a swap agreement will be greater than the fixed payments.
For the reporting period, the Fund had ending monthly average notional amounts of $194,972,362 and $358,581,904 on interest rate swaps which pay a fixed rate and interest rate swaps which receive a fixed rate, respectively.
Additional associated risks to the Fund include counterparty credit risk and liquidity risk.
Total Return Swap Contracts. A total return swap is an agreement between counterparties to exchange periodic payments based on the value of asset or non-asset references. One cash flow is typically based on a non-asset reference (such as an interest rate) and the other on the total return of a reference asset (such as a security or a basket of securities or securities index). The total return of the reference asset typically includes appreciation or depreciation on the reference asset, plus any interest or dividend payments.
Total return swap contracts are exposed to the market risk factor of the specific underlying financial instrument or index. Total return swaps are less standard in structure than other types of swaps and can isolate and/or include multiple types of market risk factors including equity risk, credit risk, and interest rate risk.
The Fund may enter into total return swaps to increase or decrease exposure to the credit risk of various indexes or basket of securities. These credit risk related total return swaps require the Fund to pay to, or receive payments from, the counterparty based on the movement of credit spreads of the related indexes or securities.
For the reporting period, the Fund had ending monthly average notional amounts of $2,384,825 on total return swaps which are long the reference asset.
Additional associated risks to the Fund include counterparty credit risk and liquidity risk.
Swaption Transactions
The Fund may enter into a swaption contract which grants the purchaser the right, but not the obligation, to enter into a swap transaction at preset terms detailed in the underlying agreement within a specified period of time. The purchaser pays a premium to the swaption writer who bears the risk of unfavorable changes in the preset terms on the underlying swap.
Purchased swaptions are reported as a component of investments in the Consolidated Statement of Investments and the Consolidated Statement of Assets and Liabilities. Written swaptions are reported on a schedule following the Consolidated Statement of Investments and their value is reported as a separate asset or liability line item in the Consolidated Statement of Assets and Liabilities. The net change in unrealized appreciation or depreciation on written swaptions is separately reported in the Consolidated Statement of Operations. When a swaption is exercised, the cost of the swap is adjusted by the amount of premium paid or received. Upon the expiration or closing of an unexercised swaption contract, a gain or loss is reported in the Consolidated Statement of Operations for the amount of the premium paid or received.
The Fund generally will incur a greater risk when it writes a swaption than when it purchases a swaption. When the Fund writes a swaption it will become obligated, upon exercise of the swaption, according to the terms of the underlying agreement. Swaption contracts written by the Fund do not give rise to counterparty credit risk prior to exercise as they obligate the Fund, not its counterparty, to perform. When the Fund purchases a swaption it only risks losing the amount of the premium it paid if the swaption expires unexercised. However, when the Fund exercises a purchased swaption there is a risk that the counterparty will fail to perform or otherwise default on its obligations under the swaption contract.
The Fund may purchase swaptions which give it the option to enter into an interest rate swap in which it pays a floating or fixed interest rate and receives a fixed or floating interest rate in order to increase or decrease exposure to interest rate risk. Purchasing the fixed portion of this swaption becomes more valuable as the reference interest rate decreases relative to the preset interest rate. Purchasing the floating portion of this swaption becomes more valuable as the reference interest rate increases relative to the preset interest rate.
The Fund may purchase swaptions which give it the option to buy or sell credit protection through credit default swaps in order to decrease or increase exposure to the credit risk of individual issuers and/ or indexes of issuers. A swaption selling protection becomes more valuable as the likelihood of a credit event on the reference asset decreases. A swaption buying protection becomes more valuable as the likelihood of a credit event on the reference asset increases.
The Fund may write swaptions which give it the obligation, if exercised by the purchaser, to enter into an interest rate swap in which it pays a fixed or floating interest rate and receives a floating or fixed interest rate in order to increase or decrease exposure to interest rate risk. A written swaption paying a fixed rate becomes more valuable as the reference interest rate increases relative to the preset interest rate. A written swaption paying a floating rate becomes more valuable as the reference interest rate decreases relative to the preset interest rate.
The Fund may write swaptions which give it the obligation, if exercised by the purchaser, to sell or buy credit protection through credit default swaps in order to increase or decrease exposure to the credit risk of individual issuers and/or indexes of issuers. A written swaption selling protection becomes more valuable as the likelihood of a credit event on the reference asset decreases. A written swaption buying protection becomes more valuable as the likelihood of a credit event on the reference asset increases.
The Fund may enter into currency swaption contracts with the obligation to pay an interest rate on the US dollar notional amount or various foreign currency notional amounts and receive an interest rate on various foreign currency notional amounts or US dollar notional amounts, with an option to replace the contractual currency as disclosed in the Consolidated Statement of Investments. This is done in order to take a positive investment perspective on the related currencies for which the Fund receives a payment. The US dollar swaption contracts seek to increase exposure to foreign
51 OPPENHEIMER GLOBAL STRATEGIC INCOME FUND/VA
NOTES TO CONSOLIDATED FINANCIAL STATEMENTS Unaudited / Continued
6. Use of Derivatives (Continued)
exchange rate risk. The foreign currency swaption contracts seek to decrease exposure to foreign exchange rate risk.
During the reporting period, the Fund had an ending monthly average market value of $3,163,689 and $3,545,988 on purchased and written swaptions, respectively.
Counterparty Credit Risk. Derivative positions are subject to the risk that the counterparty will not fulfill its obligation to the Fund. The Fund intends to enter into derivative transactions with counterparties that the Manager believes to be creditworthy at the time of the transaction.
The Fund’s risk of loss from counterparty credit risk on OTC derivatives is generally limited to the aggregate unrealized gain netted against any collateral held by the Fund. For OTC options purchased, the Fund bears the risk of loss of the amount of the premiums paid plus the positive change in market values net of any collateral held by the Fund should the counterparty fail to perform under the contracts. Options written by the Fund do not typically give rise to counterparty credit risk, as options written generally obligate the Fund and not the counterparty to perform.
To reduce counterparty risk with respect to OTC transactions, the Fund has entered into master netting arrangements, established within the Fund’s International Swap and Derivatives Association, Inc. (“ISDA”) master agreements, which allow the Fund to make (or to have an entitlement to receive) a single net payment in the event of default (close-out netting) for outstanding payables and receivables with respect to certain OTC positions in swaps, options, swaptions, and forward currency exchange contracts for each individual counterparty. In addition, the Fund may require that certain counterparties post cash and/or securities in collateral accounts to cover their net payment obligations for those derivative contracts subject to ISDA master agreements. If the counterparty fails to perform under these contracts and agreements, the cash and/or securities will be made available to the Fund.
At period end, the Fund has required certain counterparties to post collateral of $2,734,269.
ISDA master agreements include credit related contingent features which allow counterparties to OTC derivatives to terminate derivative contracts prior to maturity in the event that, for example, the Fund’s net assets decline by a stated percentage or the Fund fails to meet the terms of its ISDA master agreements, which would cause the Fund to accelerate payment of any net liability owed to the counterparty.
For financial reporting purposes, the Fund does not offset derivative assets and derivative liabilities that are subject to netting arrangements in the Consolidated Statement of Assets and Liabilities. Bankruptcy or insolvency laws of a particular jurisdiction may impose restrictions on or prohibitions against the right of offset in bankruptcy, insolvency or other events.
The Fund’s risk of loss from counterparty credit risk on exchange-traded derivatives cleared through a clearinghouse and for centrally cleared swaps is generally considered lower than as compared to OTC derivatives. However, counterparty credit risk exists with respect to initial and variation margin deposited/paid by the Fund that is held in futures commission merchant, broker and/or clearinghouse accounts for such exchange-traded derivatives and for centrally cleared swaps.
With respect to centrally cleared swaps, such transactions will be submitted for clearing, and if cleared, will be held in accounts at futures commission merchants or brokers that are members of clearinghouses. While brokers, futures commission merchants and clearinghouses are required to segregate customer margin from their own assets, in the event that a broker, futures commission merchant or clearinghouse becomes insolvent or goes into bankruptcy and at that time there is a shortfall in the aggregate amount of margin held by the broker, futures commission merchant or clearinghouse for all its customers, U.S. bankruptcy laws will typically allocate that shortfall on a pro-rata basis across all the broker’s, futures commission merchant’s or clearinghouse’s customers, potentially resulting in losses to the Fund.
There is the risk that a broker, futures commission merchant or clearinghouse will decline to clear a transaction on the Fund’s behalf, and the Fund may be required to pay a termination fee to the executing broker with whom the Fund initially enters into the transaction. Clearinghouses may also be permitted to terminate centrally cleared swaps at any time. The Fund is also subject to the risk that the broker or futures commission merchant will improperly use the Fund’s assets deposited/paid as initial or variation margin to satisfy payment obligations of another customer. In the event of a default by another customer of the broker or futures commission merchant, the Fund might not receive its variation margin payments from the clearinghouse, due to the manner in which variation margin payments are aggregated for all customers of the broker/futures commission merchant.
Collateral and margin requirements differ by type of derivative. Margin requirements are established by the broker, futures commission merchant or clearinghouse for exchange-traded and cleared derivatives, including centrally cleared swaps. Brokers, futures commission merchants and clearinghouses can ask for margin in excess of the regulatory minimum, or increase the margin amount, in certain circumstances.
Collateral terms are contract specific for OTC derivatives. For derivatives traded under an ISDA master agreement, the collateral requirements are typically calculated by netting the mark to market amount for each transaction under such agreement and comparing that amount to the value of any collateral currently pledged by the Fund or the counterparty.
For financial reporting purposes, cash collateral that has been pledged to cover obligations of the Fund, if any, is reported separately on the Consolidated Statement of Assets and Liabilities as cash pledged as collateral. Non-cash collateral pledged by the Fund, if any, is noted in the Consolidated Statement of Investments. Generally, the amount of collateral due from or to a party must exceed a minimum transfer amount threshold (e.g. $250,000) before a transfer has to be made. To the extent amounts due to the Fund from its counterparties are not fully collateralized, contractually or otherwise, the Fund bears the risk of loss from counterparty nonperformance.
The following table presents by counterparty the Fund’s OTC derivative assets net of the related collateral pledged by the Fund at period end:
52 OPPENHEIMER GLOBAL STRATEGIC INCOME FUND/VA
6. Use of Derivatives (Continued)
| Gross Amounts Not Offset in the Consolidated Statement of Assets & Liabilities | ||||||||||||||||||||
| Counterparty | Gross Amounts Not Offset in the Consolidated Liabilities* | Financial Instruments Available for Offset | Financial Instruments Collateral Received** | Cash Collateral Received** | Net Amount | |||||||||||||||
| Bank of America NA | $ | 3,730,449 | $ | (3,730,409 | ) | $ | – | $ | (40 | ) | $ | – | ||||||||
| Barclays Bank plc | 2,837,381 | (2,797,139 | ) | – | – | 40,242 | ||||||||||||||
| BNP Paribas | 14,870 | (14,870 | ) | – | – | – | ||||||||||||||
| Citibank NA | 1,583,384 | (1,583,384 | ) | – | – | – | ||||||||||||||
| Deutsche Bank AG | 789,481 | (236,508 | ) | – | (380,000 | ) | 172,973 | |||||||||||||
| Goldman Sachs Bank USA | 3,580,095 | (3,580,095 | ) | – | – | – | ||||||||||||||
| Goldman Sachs International | 24,192 | (24,192 | ) | – | – | – | ||||||||||||||
| HSBC Bank USA NA | 290,301 | (18,379 | ) | – | (260,000 | ) | 11,922 | |||||||||||||
| JPMorgan Chase Bank NA | 3,878,161 | (3,878,161 | ) | – | – | – | ||||||||||||||
| Nomura Global Financial Products, Inc. | 5,151 | – | – | – | 5,151 | |||||||||||||||
| Toronto Dominion Bank | 1,572,946 | (265,068 | ) | (1,307,878 | ) | – | – | |||||||||||||
|
|
| ||||||||||||||||||
| $ | 18,306,411 | $ | (16,128,205 | ) | $ | (1,307,878 | ) | $ | (640,040 | ) | $ | 230,288 | ||||||||
|
|
| ||||||||||||||||||
*OTC derivatives are reported gross on the Consolidated Statement of Assets and Liabilities. Exchange traded options and margin related to centrally cleared swaps and futures are excluded from these reported amounts.
**Reported collateral posted for the benefit of the Fund within this table is limited to the net outstanding amount due from an individual counterparty. The collateral posted for the benefit of the Fund may exceed these amounts.
The following table presents by counterparty the Fund’s OTC derivative liabilities net of the related collateral pledged by the Fund at period end:
| Gross Amounts Not Offset in the Consolidated Statement of Assets & Liabilities | ||||||||||||||||||||
| Counterparty | Gross Amounts Not Offset in the Consolidated Statement of Assets & Liabilities* | Financial Instruments Available for Offset | Financial Instruments Collateral Pledged** | Cash Collateral Pledged** | Net Amount | |||||||||||||||
| Bank of America NA | $ | (3,730,409 | ) | $ | 3,730,409 | $ | – | $ | – | $ | – | |||||||||
| Barclays Bank plc | (2,797,139 | ) | 2,797,139 | – | – | – | ||||||||||||||
| BNP Paribas | (28,350 | ) | 14,870 | – | – | (13,480 | ) | |||||||||||||
| Citibank NA | (2,916,715 | ) | 1,583,384 | – | 1,210,000 | (123,331 | ) | |||||||||||||
| Deutsche Bank AG | (236,508 | ) | 236,508 | – | – | – | ||||||||||||||
| Goldman Sachs Bank USA | (9,504,248 | ) | 3,580,095 | – | 5,924,153 | – | ||||||||||||||
| Goldman Sachs International | (1,551,850 | ) | 24,192 | – | 310,000 | (1,217,658 | ) | |||||||||||||
| HSBC Bank USA, NA | (18,379 | ) | 18,379 | – | – | – | ||||||||||||||
| JPMorgan Chase Bank NA | (6,034,971 | ) | 3,878,161 | – | 2,156,810 | – | ||||||||||||||
| Standard Chartered Bank | (183,978 | ) | – | – | 183,978 | – | ||||||||||||||
| Toronto Dominion Bank | (265,068 | ) | 265,068 | – | – | – | ||||||||||||||
|
|
| ||||||||||||||||||
| $ | (27,267,615 | ) | $ | 16,128,205 | $ | – | $ | 9,784,941 | $ | (1,354,469 | ) | |||||||||
|
|
| ||||||||||||||||||
*OTC derivatives are reported gross on the Consolidated Statement of Assets and Liabilities. Exchange traded options and margin related to centrally cleared swaps and futures are excluded from these reported amounts.
**Reported collateral pledged within this table is limited to the net outstanding amount due from the Fund. The securities pledged as collateral by the Fund as reported on the Consolidated Statement of Investments may exceed these amounts.
The following table presents the valuations of derivative instruments by risk exposure as reported within the Consolidated Statement of Assets and Liabilities at period end:
Asset Derivatives | Liability Derivatives | |||||||||||
Derivatives Not Accounted for as Hedging Instruments | Consolidated Statement of Assets and Liabilities Location | Value | Consolidated Statement of Assets and Liabilities Location | Value | ||||||||
| Credit contracts | Swaps, at value | $ | 35,635 | Swaps, at value | $ | 268,630 | ||||||
| Interest rate contracts | Swaps, at value | 505,562 | Swaps, at value | 829,701 | ||||||||
| Credit contracts | Centrally cleared swaps, at value | 457,853 | Centrally cleared swaps, at value | 281,355 | ||||||||
| Interest rate contracts | Centrally cleared swaps, at value | 417,101 | Centrally cleared swaps, at value | 1,510,072 | ||||||||
| Interest rate contracts | Variation margin receivable | 14,666 | * | Variation margin payable | 67,180 | * | ||||||
| Forward currency exchange contracts | Unrealized appreciation on foreign currency exchange contracts | 11,626,228 | Unrealized depreciation on foreign currency exchange contracts | 7,330,552 | ||||||||
| Forward currency exchange contracts | Options written, at value | 12,960,848 | ||||||||||
53 OPPENHEIMER GLOBAL STRATEGIC INCOME FUND/VA
NOTES TO CONSOLIDATED FINANCIAL STATEMENTS Unaudited / Continued
6. Use of Derivatives (Continued)
Asset Derivatives | Liability Derivatives | |||||||||||
Derivatives Not Accounted for as Hedging Instruments | Consolidated Statement of Assets and Liabilities Location | Value | Consolidated Statement of Assets and Liabilities Location | Value | ||||||||
| Credit contracts | Swaptions written, at value | $ | 276,838 | |||||||||
| Interest rate contracts | Swaptions written, at value | 5,601,046 | ||||||||||
| Credit contracts | Investments, at value | $ | 662,581 | ** | ||||||||
| Forward currency exchange contracts | Investments, at value | 2,477,123 | ** | |||||||||
| Interest rate contracts | Investments, at value | 2,999,282 | ** | |||||||||
|
|
|
|
|
| |||||||
| Total | $ | 19,196,031 | $ | 29,126,222 | ||||||||
|
|
|
|
|
| |||||||
*Includes only the current day’s variation margin. Prior variation margin movements have been reflected in cash on the Consolidated Statement of Assets and Liabilities upon receipt or payment.
**Amounts relate to purchased option contracts and purchased swaption contracts, if any.
The effect of derivative instruments on the Consolidated Statement of Operations is as follows:
| Amount of Realized Gain or (Loss) Recognized on Derivatives | ||||||||||||||||||||||||||
Derivatives Not Accounted for as Hedging Instruments | Investment transactions in unaffiliated companies* | Swaption contracts written | Option contracts written | Futures contracts | Forward currency exchange contracts | Swap contracts | Total | |||||||||||||||||||
| Credit contracts | $ | (464,585 | ) | $ | 325,887 | $ | — | $ | — | $ | — | $ | (211,047 | ) | $ (349,745) | |||||||||||
| Equity contracts | (853,374 | ) | — | — | — | — | 44,196 | (809,178) | ||||||||||||||||||
| Forward currency exchange contracts | 405,793 | — | (10,787,760 | ) | — | 7,992,129 | — | (2,389,838) | ||||||||||||||||||
| Interest rate contracts | (1,327,394 | ) | 514,437 | — | (2,492,701 | ) | — | 2,787,454 | (518,204) | |||||||||||||||||
|
| |||||||||||||||||||||||||
| Total | $ | (2,239,560 | ) | $ | 840,324 | $ | (10,787,760 | ) | $ | (2,492,701 | ) | $ | 7,992,129 | $ | 2,620,603 | $ (4,066,965) | ||||||||||
|
| |||||||||||||||||||||||||
*Includes purchased options contracts, purchased swaption contracts, written options contracts exercised and written swaption contracts exercised, if any.
| Amount of Change in Unrealized Gain or (Loss) Recognized on Derivatives | ||||||||||||||||||||||||||
Derivatives Not Accounted for as Hedging Instruments | Investment transactions in unaffiliated companies* | Swaption contracts written | Option contracts written | Futures contracts | Forward currency exchange contracts | Swap contracts | Total | |||||||||||||||||||
| Credit contracts | $ | (108,552 | ) | $ | 95,970 | $ | — | $ | — | $ | — | $ | (41,972 | ) | $ (54,554) | |||||||||||
| Equity contracts | 412,524 | – | — | — | — | — | 412,524 | |||||||||||||||||||
| Forward currency exchange contracts | (3,067,763 | ) | – | (5,087,927 | ) | — | 5,480,596 | — | (2,675,094) | |||||||||||||||||
| Interest rate contracts | 646,999 | (607,341 | ) | — | (1,106,070 | ) | — | (2,066,085 | ) | (3,132,497) | ||||||||||||||||
|
| |||||||||||||||||||||||||
| Total | $ | (2,116,792 | ) | $ | (511,371 | ) | $ | (5,087,927 | ) | $ | (1,106,070 | ) | $ | 5,480,596 | $ | (2,108,057 | ) | $ (5,449,621) | ||||||||
|
| |||||||||||||||||||||||||
*Includes purchased option contracts and purchased swaption contracts, if any.
7. Shares of Beneficial Interest
The Fund has authorized an unlimited number of $0.001 par value shares of beneficial interest of each class. Transactions in shares of beneficial interest were as follows:
| Six Months Ended June 30, 2018 | Year Ended December 31, 2017 | |||||||||||||||
Shares | Amount | Shares | Amount | |||||||||||||
| Non-Service Shares | ||||||||||||||||
Sold | 5,484,091 | $ | 28,156,632 | 4,936,516 | $ | 24,907,153 | ||||||||||
Dividends and/or distributions reinvested | 3,988,617 | 18,866,160 | 1,828,381 | 9,178,475 | ||||||||||||
Redeemed | (6,388,953 | ) | (32,364,451 | ) | (11,338,330 | ) | (57,398,685 | ) | ||||||||
| Net increase (decrease) | 3,083,755 | $ | 14,658,341 | (4,573,433 | ) | $ | (23,313,057 | ) | ||||||||
| Service Shares | ||||||||||||||||
Sold | 4,855,858 | $ | 25,429,357 | 12,450,513 | $ | 64,464,791 | ||||||||||
Dividends and/or distributions reinvested | 11,180,836 | 54,450,672 | 4,979,157 | 25,692,448 | ||||||||||||
Redeemed | (15,656,153 | ) | (81,298,731 | ) | (28,206,027 | ) | (146,664,417 | ) | ||||||||
Net increase (decrease) | 380,541 | $ | (1,418,702 | ) | (10,776,357 | ) | $ | (56,507,178 | ) | |||||||
54 OPPENHEIMER GLOBAL STRATEGIC INCOME FUND/VA
8. Purchases and Sales of Securities
The aggregate cost of purchases and proceeds from sales of securities, other than short-term obligations and investments in IGMMF, for the reporting period were as follows:
| Purchases | Sales | |||||||
| Investment securities | $628,561,494 | $743,540,634 | ||||||
U.S. government and government agency obligations
| — | 476,833 | ||||||
| To Be Announced (TBA) mortgage-related securities | 1,343,671,924 | 1,370,524,884 | ||||||
9. Fees and Other Transactions with Affiliates
Management Fees. Under the investment advisory agreement, the Fund pays the Manager a management fee based on the daily net assets of the Fund at an annual rate as shown in the following table:
| Fee Schedule | ||||
| Up to $200 million | 0.75 | % | ||
| Next $200 million | 0.72 | |||
| Next $200 million | 0.69 | |||
| Next $200 million | 0.66 | |||
| Next $200 million | 0.60 | |||
| Next $4 billion | 0.50 | |||
| Over $5 billion | 0.48 | |||
The Manager also provides investment management related services to the Subsidiary. The Subsidiary pays the Manager a monthly management fee at an annual rate according to the above schedule. The Subsidiary also pays certain other expenses including custody and directors’ fees.
The Fund’s effective management fee for the reporting period was 0.61% of average annual net assets before any Subsidiary management fees or any applicable waivers.
Sub-Adviser Fees. The Manager has retained the Sub-Adviser to provide the day-to-day portfolio management of the Fund and the Subsidiary. Under the Sub-Advisory Agreement, the Manager pays the Sub-Adviser an annual fee in monthly installments, equal to a percentage of the investment management fee collected by the Manager from the Fund and the Subsidiary, which shall be calculated after any investment management fee waivers. The fee paid to the Sub-Adviser is paid by the Manager, not by the Fund.
Transfer Agent Fees. OFI Global (the “Transfer Agent”) serves as the transfer and shareholder servicing agent for the Fund. The Fund pays the Transfer Agent a fee based on annual net assets. Fees incurred and average net assets for each class with respect to these services are detailed in the Consolidated Statement of Operations and Consolidated Financial Highlights, respectively.
Sub-Transfer Agent Fees. The Transfer Agent has retained Shareholder Services, Inc., a wholly-owned subsidiary of OFI (the “Sub-Transfer Agent”), to provide the day-to-day transfer agent and shareholder servicing of the Fund. Under the Sub-Transfer Agency Agreement, the Transfer Agent pays the Sub-Transfer Agent an annual fee in monthly installments, equal to a percentage of the transfer agent fee collected by the Transfer Agent from the Fund, which shall be calculated after any applicable fee waivers. The fee paid to the Sub-Transfer Agent is paid by the Transfer Agent, not by the Fund.
Trustees’ Compensation. The Fund’s Board of Trustees (“Board”) has adopted a compensation deferral plan for Independent Trustees that enables Trustees to elect to defer receipt of all or a portion of the annual compensation they are entitled to receive from the Fund. For purposes of determining the amount owed to the Trustees under the plan, deferred amounts are treated as though equal dollar amounts had been invested in shares of the Fund or in other Oppenheimer funds selected by the Trustees. The Fund purchases shares of the funds selected for deferral by the Trustees in amounts equal to his or her deemed investment, resulting in a Fund asset equal to the deferred compensation liability. Such assets are included as a component of “Other” within the asset section of the Consolidated Statement of Assets and Liabilities. Deferral of Trustees’ fees under the plan will not affect the net assets of the Fund and will not materially affect the Fund’s assets, liabilities or net investment income per share. Amounts will be deferred until distributed in accordance with the compensation deferral plan.
Distribution and Service Plan for Service Shares. The Fund has adopted a Distribution and Service Plan (the “Plan”) pursuant to Rule 12b-1 under the 1940 Act for Service shares to pay OppenheimerFunds Distributor, Inc. (the “Distributor”), for distribution related services, personal service and account maintenance for the Fund’s Service shares. Under the Plan, payments are made periodically at an annual rate of 0.25% of the daily net assets of Service shares of the Fund. The Distributor currently uses all of those fees to compensate sponsors of the insurance product that offers Fund shares, for providing personal service and maintenance of accounts of their variable contract owners that hold Service shares. These fees are paid out of the Fund’s assets on an on-going basis and increase operating expenses of the Service shares, which results in lower performance compared to the Fund’s shares that are not subject to a service fee. Fees incurred by the Fund under the Plan are detailed in the Consolidated Statement of Operations.
Waivers and Reimbursements of Expenses. The Manager has contractually agreed to waive the management fee it receives from the Fund in an amount equal to the management fee it receives from the Subsidiary. During the reporting period, the Manager waived $31,073. This fee waiver and/or expense reimbursement may not be amended or withdrawn for one year from the date of the Fund’s prospectus, unless approved by the Board.
The Manager will waive fees and/or reimburse Fund expenses in an amount equal to the indirect management fees incurred through the Fund’s
55 OPPENHEIMER GLOBAL STRATEGIC INCOME FUND/VA
NOTES TO CONSOLIDATED FINANCIAL STATEMENTS Unaudited / Continued
9. Fees and Other Transactions with Affiliates (Continued)
investments in Affiliated Funds. During the reporting period, the Manager waived fees and/or reimbursed the Fund $545,232 for these management fees. This fee waiver and/or expense reimbursement may not be amended or withdrawn for one year from the date of the Fund’s prospectus, unless approved by the Board.
10. Borrowings and Other Financing
Joint Credit Facility. A number of mutual funds managed by the Manager participate in a $1.875 billion revolving credit facility (the “Facility”) intended to provide short-term financing, if necessary, subject to certain restrictions in connection with atypical redemption activity. Effective July 17, 2018, the Facility was increased to $1.95 billion. Expenses and fees related to the Facility are paid by the participating funds and are disclosed separately or as other expenses on the Consolidated Statement of Operations. The Fund did not utilize the Facility during the reporting period.
56 OPPENHEIMER GLOBAL STRATEGIC INCOME FUND/VA
PORTFOLIO PROXY VOTING POLICIES AND GUIDELINES; UPDATES TO STATEMENT OF INVESTMENTS Unaudited
The Fund has adopted Portfolio Proxy Voting Policies and Guidelines under which the Fund votes proxies relating to securities (“portfolio proxies”) held by the Fund. A description of the Fund’s Portfolio Proxy Voting Policies and Guidelines is available (i) without charge, upon request, by calling the Fund toll-free at 1.800.CALL OPP (225.5677), (ii) on the Fund’s website at www.oppenheimerfunds.com, and (iii) on the SEC’s website at www.sec.gov. In addition, the Fund is required to file Form N-PX, with its complete proxy voting record for the 12 months ended June 30th, no later than August 31st of each year. The Fund’s voting record is available (i) without charge, upon request, by calling the Fund toll-free at 1.800.CALL OPP (225.5677), and (ii) in the Form N-PX filing on the SEC’s website at www.sec.gov.
The Fund files its complete schedule of portfolio holdings with the SEC for the first quarter and the third quarter of each fiscal year on Form N-Q. The Fund’s Form N-Q filings are available on the SEC’s website at www.sec.gov. Those forms may be reviewed and copied at the SEC’s Public Reference Room in Washington, D.C. Information on the operation of the Public Reference Room may be obtained by calling 1-800-SEC-0330.
57 OPPENHEIMER GLOBAL STRATEGIC INCOME FUND/VA
THIS PAGE INTENTIONALLY LEFT BLANK.
58 OPPENHEIMER GLOBAL STRATEGIC INCOME FUND/VA
THIS PAGE INTENTIONALLY LEFT BLANK.
59 OPPENHEIMER GLOBAL STRATEGIC INCOME FUND/VA
THIS PAGE INTENTIONALLY LEFT BLANK.
60 OPPENHEIMER GLOBAL STRATEGIC INCOME FUND/VA
THIS PAGE INTENTIONALLY LEFT BLANK.
61 OPPENHEIMER GLOBAL STRATEGIC INCOME FUND/VA
THIS PAGE INTENTIONALLY LEFT BLANK.
62 OPPENHEIMER GLOBAL STRATEGIC INCOME FUND/VA
THIS PAGE INTENTIONALLY LEFT BLANK.
63 OPPENHEIMER GLOBAL STRATEGIC INCOME FUND/VA
OPPENHEIMER GLOBAL STRATEGIC INCOME FUND/VA
A Series of Oppenheimer Variable Account Funds
| Trustees and Officers | Robert J. Malone, Chairman of the Board of Trustees and Trustee | |
| Andrew J. Donohue, Trustee | ||
| Richard F. Grabish, Trustee | ||
| Beverly L. Hamilton, Trustee | ||
| Victoria J. Herget, Trustee | ||
| Karen L. Stuckey, Trustee | ||
| James D. Vaughn, Trustee | ||
| Arthur P. Steinmetz, Trustee, President and Principal Executive Officer | ||
| Hemant Baijal, Vice President | ||
| Krishna Memani, Vice President | ||
| Ruta Ziverte, Vice President | ||
| Chris Kelly, Vice President | ||
| Cynthia Lo Bessette, Secretary and Chief Legal Officer | ||
| Jennifer Foxson, Vice President and Chief Business Officer | ||
| Mary Ann Picciotto, Chief Compliance Officer and Chief Anti-Money Laundering Officer | ||
| Brian S. Petersen, Treasurer and Principal Financial & Accounting Officer | ||
| Manager | OFI Global Asset Management, Inc. | |
| Sub-Adviser | OppenheimerFunds, Inc. | |
| Distributor | OppenheimerFunds Distributor, Inc. | |
| Transfer and | OFI Global Asset Management, Inc. | |
| Shareholder | ||
| Servicing Agent | ||
| Sub-Transfer Agent | Shareholder Services, Inc. | |
| DBA OppenheimerFunds Services | ||
| Independent | KPMG LLP | |
| Registered | ||
| Public | ||
| Accounting | ||
| Firm | ||
| Legal Counsel | Ropes & Gray LLP | |
| Before investing in any of the Oppenheimer funds, investors should carefully consider a fund’s investment objectives, risks, charges and expenses. Fund prospectuses and summary prospectuses contain this and other information about the funds, and may be obtained by asking your financial advisor, visiting oppenheimerfunds.com or calling us at 1.800.988.8287. Read prospectuses and summary prospectuses carefully before investing. | ||
| The financial statements included herein have been taken from the records of the Fund without examination of those records by the independent registered public accounting firm. | ||
| © 2018 OppenheimerFunds, Inc. All rights reserved. Oppenheimer funds are distributed by OppenheimerFunds Distributor, Inc. | ||

 |
| June 30, 2018 |

SEMIANNUAL REPORT
Listing of Top Holdings
Fund Performance Discussion
Financial Statements |
PORTFOLIO MANAGERS: Ben Rockmuller, CFA and Alessio de Longis, CFA
AVERAGE ANNUAL TOTAL RETURNS FOR THE PERIODS ENDED 6/30/18
| Inception Date | 6-Months | 1-Year | Since Inception | |||||||||||||
Non-Service Shares | 11/14/13 | -0.25 | % | -0.35 | % | 1.22 | % | |||||||||
Service Shares | 11/14/13 | -0.34 | -0.65 | 0.98 | ||||||||||||
| ICE Bank of America Merrill Lynch 3-Month U.S. Treasury Bill Index | 0.81 | 1.36 | 0.45 | |||||||||||||
Performance data quoted represents past performance, which does not guarantee future results. The investment return and principal value of an investment in the Fund will fluctuate so that an investor’s shares, when redeemed, may be worth more or less than their original cost. Current performance may be lower or higher than the performance quoted. For performance data current to the most recent month end, call us at 1.800.988.8287. The Fund’s total returns should not be expected to be the same as the returns of other funds, whether or not both funds have the same portfolio managers and/or similar names. The Fund’s total returns include changes in share price and reinvested distributions but do not include the charges associated with the separate account products that offer this Fund. Such performance would have been lower if such charges were taken into account. Returns for periods of less than one year are cumulative and not annualized. See Fund prospectuses and summary prospectuses for more information on share classes and sales charges.
The Fund’s performance is compared to the performance of the ICE Bank of America Merrill Lynch 3-Month U.S. Treasury Bill Index. The ICE Bank of America Merrill Lynch 3-month U.S. Treasury Bill Index is an index of short-term U.S. Government securities with a remaining term to final maturity of less than three months. The Index is unmanaged and cannot be purchased directly by investors. While index comparisons may be useful to provide a benchmark for the Fund’s performance, it must be noted that the Fund’s investments are not limited to the investments comprising the Index. Index performance includes reinvestment of income, but does not reflect transaction costs, fees, expenses or taxes. Index performance is shown for illustrative purposes only as a benchmark for the Fund’s performance, and does not predict or depict performance of the Fund. The Fund’s performance reflects the effects of the Fund’s business and operating expenses.
2 OPPENHEIMER GLOBAL MULTI-ALTERNATIVES FUND/VA
TOP HOLDINGS AND ALLOCATIONS
TOP TEN COMMON STOCK HOLDINGS
Chubb Ltd. | 0.7 | % | ||
M&T Bank Corp. | 0.7 | |||
Enterprise Products Partners LP | 0.7 | |||
Apple, Inc. | 0.7 | |||
Energy Transfer Partners LP | 0.6 | |||
Alphabet, Inc., Cl. A | 0.6 | |||
UnitedHealth Group, Inc. | 0.6 | |||
Cisco Systems, Inc. | 0.5 | |||
Lockheed Martin Corp. | 0.5 | |||
Philip Morris International, Inc. | 0.5 |
Portfolio holdings and allocations are subject to change. Percentages are as of June 30, 2018, and are based on net assets. For more current Fund holdings, please visit oppenheimerfunds.com.
PORTFOLIO ALLOCATION
Common Stocks | 33.3 | % | ||
Short-Term Notes | 22.3 | |||
Investment Companies | ||||
Highland/iBoxx Senior Loan Exchange Traded Fund | 0.6 | |||
Oppenheimer Institutional Government Money Market Fund | 13.5 | |||
SPDR Gold Trust Exchange Traded Fund | 1.1 | |||
Event-Linked Bonds | ||||
Multiple Event | 6.4 | |||
Earthquake | 4.6 | |||
Windstorm | 2.4 | |||
Other | 0.7 | |||
Pandemic | 0.1 | |||
Longevity | 0.1 | |||
Foreign Government Obligations | 5.6 | |||
Corporate Loans | 3.5 | |||
Asset-Backed Securities | 2.5 | |||
Non-Convertible Corporate Bonds and Notes | 2.2 | |||
Mortgage-Backed Obligations Non-Agency | 0.6 | |||
Structured Securities | 0.2 | |||
Preferred Stocks | 0.2 | |||
Over-the-Counter Interest Rate Swaptions Purchased | 0.1 | |||
Rights, Warrants and Certificates | —* | |||
Exchange-Traded Options Purchased | —* | |||
Over-the-Counter Options Purchased | —* |
*Represents a value of less than 0.05%.
Portfolio holdings and allocations are subject to change. Percentages are as of June 30, 2018, and are based on the total market value of investments. For more current Fund holdings, please visit oppenheimerfunds.com.
3 OPPENHEIMER GLOBAL MULTI-ALTERNATIVES FUND/VA
Fund Performance Discussion
The Fund’s Non-Service shares returned -0.25% during the reporting period. On a relative basis, the Fund underperformed the ICE Bank of America Merrill Lynch 3-Month U.S. Treasury Bill Index (the “Index”), which returned 0.81% during the same period.
The Fund’s underperformance during the reporting period was driven by its exposure to Alpha Alternatives, which in turn are comprised of four components: Fundamental Alternatives, Systematic Alpha, Currency Alpha, and Commodity Alpha strategies.
The largest detractor during the period was Fundamental Alternatives, a diversified suite of sub-strategies that aims to capture long-term investment opportunities emerging from secular change. Within Fundamental Alternatives, the main driver of underperformance was security selection within the long equity portion of the long/short equity strategy. The long equity portfolio tends to be higher quality and more exposed to value names relative to the broader market – such styles were not favored as growth oriented companies maintained strong positive momentum. In the fixed income space, Fundamental Alternatives long/short credit strategy benefited from exposure to leveraged loans and asset-backed securities. Long/short macro strategy was a neutral contributor for the period.
Our Systematic Alpha strategy, which uses a quantitative approach to harvest risk premia across equities, fixed income, currencies, and volatility, detracted from performance as our tactical equity and fixed-income strategies underperformed. This was partially offset by positive results from a dynamic volatility strategy that trades VIX futures based on signals derived from the term structure of implied volatility. Also, our merger arbitrage strategy, which extracts merger and acquisition premium from the U.S. equity market by buying the target company’s stock right after cash deal announcements, was slightly positive during the period.
Our Currency Alpha strategy, a total return strategy focused on fundamental and systematic dislocations across currency markets, was also a detractor to performance. The strategy can be long and/or short currencies against the U.S. dollar. It has a go-anywhere mandate across currencies and seeks opportunities regardless of dollar bull or bear market cycles. The Currency Alpha strategy detracted from performance due largely to its short U.S. dollar positioning in a period where the U.S. dollar strengthened. Long exposure to higher-yielding emerging markets also detracted as these currencies were negatively impacted by trade tensions, liquidity concerns, and idiosyncratic factors. Given high levels of volatility and emerging market equity selloff, we have substantially reduced our long exposure to emerging market currencies.
Our Commodity Alpha strategy added value. In this strategy, we take opportunistic tactical long or short positions in commodities depending on supply and demand dynamics and technical factors. During the period, we had tactical long positions in oil futures due to increasing global demand and tightening supply conditions. Consistent with expectation, Brent crude rallied over 15% during the period.
Income Alternatives, which consisted of Event-Linked Bond and Leveraged Loans strategies, also contributed positively to performance this reporting period. Loans benefited from their floating rate payment and seniority structure, as short end rates moved up in line with Fed hikes and volatility increased in subordinated high yield markets. Such a backdrop allowed loans to outperform both investment grade and below investment grade credit.
Event-linked bonds transfer a specified set of catastrophe risks such as hurricanes, earthquakes and windstorms from a sponsor to investors. In addition to attractive yield and total returns prospects, event-linked bonds offer compelling portfolio diversification characteristics, as natural catastrophes generally exhibit low correlation with shocks to economic growth. Moreover, we believe floating rate event-linked bonds are particularly attractive versus more traditional high yielding asset classes given the advanced state of the credit cycle, and tightening monetary policy conditions. These characteristics were particularly evident over the reporting period, as more traditional income sources have struggled in the face of higher rates, elevated corporate balance sheet leverage, and a flatter yield curve.
4 OPPENHEIMER GLOBAL MULTI-ALTERNATIVES FUND/VA
Detracting from performance within Income Alternatives was our exposure to master limited partnerships (MLPs). Despite a move higher in energy prices, MLPs struggled particularly over the first half of the reporting period, and we witnessed a breakdown in the correlation between the two assets. Midstream equities faced additional headwinds when the U.S. Federal Energy Regulatory Commission (FERC) announced changes related to pipeline tariffs in reaction to a federal court’s previous demand that cost-of-service tariffs on interstate natural gas and oil pipelines owned by MLPs would no longer receive an income tax allowance (ITA). This shift in FERC’s long-held position caused significant market confusion and volatility across the sector. MLPs rebounded over the second half of the reporting period, but not by enough to offset the earlier losses.
The Fund’s exposure to Global Real Estate through real estate investment trusts (REITs) produced modest positive results this reporting period. Attractive absolute yields, discounted valuations, a pickup in merger and acquisition activity, and improving earnings all supported the asset class. Additionally, investors responded to rising uncertainty created by the threat of trade wars by taking more defensive positions, which benefited the REIT sector.
The Fund’s risk management overlay was also a contributor to performance. Given appropriate market conditions, the Fund periodically utilizes risk management overlays in an attempt to control and manage volatility, hedge unwanted risks, and thus maximize risk-adjusted returns. In particular, our U.S. equity positioning was constructive as U.S. markets continued to rally on strong earnings despite a marked increase in volatility. Over the latter months of the reporting period, we gradually adjusted the portfolio to a slightly more defensive stance, with a modest underweight to global equities.
STRATEGY & OUTLOOK
The Fund comprises a flexible blend of both alternative strategies and alternative asset classes. Such a strategy is designed primarily as a turnkey solution to improve the risk/reward tradeoffs associated with traditional balanced portfolios. We classify alternatives into three categories: i) Alpha Alternatives, which includes low beta Systematic Alpha, Fundamental Alternatives, Currency Alpha, and Commodity Alpha strategies. The goal of Alpha Alternatives is to reduce dependency on forecasting broad market direction to generate returns; ii) Income Alternatives (e.g., Master Limited Partnerships (“MLPs”), loans, and event-linked bonds) which provide exposure to relatively stable income producing assets with less interest rate sensitivity than traditional fixed income allocations; and iii) Real Asset alternatives, like Global Real Estate and Commodities, which could help guard against inflation over the long-term. We combine these strategies and assets to provide a core, alternative exposure that can potentially offset some risk from equity drawdowns, rising interest rates and inflationary shocks.
In our opinion, global growth has peaked and it is no longer synchronized across regions. While the U.S. remains in an expansion, Europe and emerging markets are slowing, creating a regime of potential policy divergence, repatriation of investment flows into the U.S., and large currency fluctuations. Market sentiment remains weak, particularly in non-U.S. markets. We continue to closely monitor developments in financial conditions as well as the political and policy landscape to assess risks to the macro outlook and financial markets. We are paying close attention to the policy backdrop and the inflation picture; both of which we believe are potential headwinds to derail the advanced U.S. cycle. In terms of the main risks to our view, we think growth momentum will be a key indicator to watch. We believe the slowdown in Europe and emerging markets is the underlying cause of recent market nervousness, and a more important driver of asset prices as compared to trade tariff announcements or political headlines in Italy.
We remain of the view that currency markets are currently not driven by the Federal Reserve and interest rate differentials. We believe the deterioration in non-U.S. growth, namely in Europe and emerging markets, is the primary driver of dollar outperformance. Our leading indicators suggest this is likely to continue in the short term, so we remain bullish on the U.S. dollar at period end.
Given the macro backdrop and the advanced state of the U.S. business and credit cycles, we believe that diversifying risk will be a successful approach over medium to near term time horizons. Because the Fund is constructed from a wide variety of complementary alternative assets and strategies, its diversifying properties as well as the potential to generate total returns in excess of cash should allow it to play a valuable stabilizing role in investors’ portfolios.
The views in the Fund Performance Discussion represent the opinions of this Fund’s portfolio managers and are not intended as investment advice or to predict or depict the performance of any investment. These views are as of the close of business on June 30, 2018, and are subject to change based on subsequent developments. The Fund’s portfolio and strategies are subject to change.
Shares of Oppenheimer funds are not deposits or obligations of any bank, are not guaranteed by any bank, are not insured by the FDIC or any other agency, and involve investment risks, including the possible loss of the principal amount invested.
5 OPPENHEIMER GLOBAL MULTI-ALTERNATIVES FUND/VA
Fund Expenses
Fund Expenses. As a shareholder of the Fund, you incur two types of costs: (1) transaction costs and (2) ongoing costs, including management fees; distribution and service fees; and other Fund expenses. These examples are intended to help you understand your ongoing costs (in dollars) of investing in the Fund and to compare these costs with the ongoing costs of investing in other mutual funds.
The examples are based on an investment of $1,000.00 invested at the beginning of the period and held for the entire 6-month period ended June 30, 2018.
Actual Expenses. The first section of the table provides information about actual account values and actual expenses. You may use the information in this section for the class of shares you hold, together with the amount you invested, to estimate the expense that you paid over the period. Simply divide your account value by $1,000.00 (for example, an $8,600.00 account value divided by $1,000.00 = 8.60), then multiply the result by the number in the first section under the heading entitled “Expenses Paid During 6 Months Ended June 30, 2018” to estimate the expenses you paid on your account during this period.
Hypothetical Example for Comparison Purposes.
The second section of the table provides information about hypothetical account values and hypothetical expenses based on the Fund’s actual expense ratio for each class of shares, and an assumed rate of return of 5% per year for each class before expenses, which is not the actual return. The hypothetical account values and expenses may not be used to estimate the actual ending account balance or expenses you paid for the period. You may use this information to compare the ongoing costs of investing in the Fund and other funds. To do so, compare this 5% hypothetical example for the class of shares you hold with the 5% hypothetical examples that appear in the shareholder reports of the other funds.
Please note that the expenses shown in the table are meant to highlight your ongoing costs only and do not reflect any charges associated with the separate accounts that offer this Fund. Therefore, the “hypothetical” lines of the table are useful in comparing ongoing costs only, and will not help you determine the relative total costs of owning different funds. In addition, if these separate account charges were included your costs would have been higher.
| Actual | Beginning Account Value January 1, 2018 | Ending Account Value June 30, 2018 | Expenses Paid During 6 Months Ended June 30, 2018 | |||||||||
Non-Service shares | $ | 1,000.00 | $ | 997.50 | $ | 6.81 | ||||||
Service shares | 1,000.00 | 996.60 | 8.05 | |||||||||
| Hypothetical | ||||||||||||
(5% return before expenses) | ||||||||||||
Non-Service shares | 1,000.00 | 1,018.00 | 6.88 | |||||||||
Service shares | 1,000.00 | 1,016.76 | 8.13 | |||||||||
Expenses are equal to the Fund’s annualized expense ratio for that class, multiplied by the average account value over the period, multiplied by 181/365 (to reflect the one-half year period). Those annualized expense ratios, excluding indirect expenses from affiliated funds, based on the 6-month period ended June 30, 2018 are as follows:
| Class | Expense Ratios | |||
Non-Service shares | 1.37 | % | ||
Service shares | 1.62 | |||
The expense ratios reflect voluntary and/or contractual waivers and/or reimbursements of expenses by the Fund’s Manager. Some of these undertakings may be modified or terminated at any time, as indicated in the Fund’s prospectus. The “Financial Highlights” tables in the Fund’s financial statements, included in this report, also show the gross expense ratios, without such waivers or reimbursements and reduction to custodian expenses, if applicable.
6 OPPENHEIMER GLOBAL MULTI-ALTERNATIVES FUND/VA
CONSOLIDATED STATEMENT OF INVESTMENTS June 30, 2018 Unaudited
| Shares | Value | |||||||
| Common Stocks—33.5% | ||||||||
Consumer Discretionary—1.3% | ||||||||
| Hotels, Restaurants & Leisure—0.1% | ||||||||
Hilton Worldwide Holdings, Inc.
|
| 4,703
|
| $
| 372,290
|
| ||
| Household Durables—0.1% | ||||||||
| Mohawk Industries, Inc.1 |
| 1,620
|
|
| 347,117
|
| ||
| Media—0.3% | ||||||||
| DISH Network Corp., Cl. A1 | 21,073 | 708,263 | ||||||
| Live Nation Entertainment, Inc.1 | 15,700 | 762,549 | ||||||
| Media General, Inc.1,2,3 | 1,099 | 66 | ||||||
|
| 1,470,878
|
| ||||||
| Specialty Retail—0.4% | ||||||||
| Rent-A-Center, Inc.1 |
| 110,813
|
|
| 1,631,167
|
| ||
| Textiles, Apparel & Luxury Goods—0.4% | ||||||||
| Perry Ellis International, Inc.1 |
| 60,421
|
|
| 1,641,639
|
| ||
| Consumer Staples—1.1% | ||||||||
| Beverages—0.3% | ||||||||
| Coca-Cola Co. (The) |
| 29,330
|
|
| 1,286,414
|
| ||
| Tobacco—0.8% | ||||||||
| Altria Group, Inc. | 20,702 | 1,175,667 | ||||||
| Philip Morris International, Inc. | 26,630 | 2,150,106 | ||||||
|
| 3,325,773
|
| ||||||
| Energy—7.6% | ||||||||
| Energy Equipment & Services—0.2% | ||||||||
| Halliburton Co. | 7,665 | 345,385 | ||||||
| Schlumberger Ltd. | 8,555 | 573,442 | ||||||
|
| 918,827
|
| ||||||
| Oil, Gas & Consumable Fuels—7.4% | ||||||||
| Antero Midstream GP LP | 42,307 | 797,910 | ||||||
| Buckeye Partners LP4 | 36,871 | 1,296,016 | ||||||
| Canadian Natural Resources Ltd. | 12,276 | 443,081 | ||||||
| Chevron Corp. | 6,130 | 775,016 | ||||||
| ConocoPhillips | 11,372 | 791,719 | ||||||
| Energy Transfer Equity LP4 | 123,565 | 2,131,496 | ||||||
| Energy Transfer Partners LP4,5 | 136,338 | 2,595,875 | ||||||
| Enterprise Products Partners LP4 | 95,726 | 2,648,738 | ||||||
| EOG Resources, Inc. | 5,492 | 683,369 | ||||||
| EQT Midstream Partners LP4 | 13,613 | 702,295 | ||||||
| Genesis Energy LP4 | 11,368 | 249,073 | ||||||
| Magellan Midstream Partners LP4 | 25,250 | 1,744,270 | ||||||
| MPLX LP4 | 59,204 | 2,021,224 | ||||||
| Noble Energy, Inc.5 | 14,067 | 496,284 | ||||||
| Occidental Petroleum Corp. | 11,140 | 932,195 | ||||||
| Phillips 66 Partners LP4 | 13,394 | 683,898 | ||||||
| Plains All American Pipeline LP4 | 19,177 | 453,344 | ||||||
| Plains GP Holdings LP, Cl. A | 18,948 | 453,047 | ||||||
| Rice Midstream Partners LP4 | 33,173 | 564,604 | ||||||
| Tallgrass Energy GP LP, Cl. A | 64,437 | 1,427,924 | ||||||
| Tallgrass Energy Partners LP4 | 6,400 | 277,184 | ||||||
| Targa Resources Corp.6 | 39,426 | 1,951,193 | ||||||
| TC PipeLines LP4 | 31,364 | 813,896 | ||||||
| TOTAL SA, Sponsored ADR | 16,550 | 1,002,268 | ||||||
| Valero Energy Corp. | 7,591 | 841,310 | ||||||
| Western Gas Partners LP4 | 9,881 | 478,142 | ||||||
| Williams Cos., Inc. (The) | 37,928 | 1,028,228 | ||||||
| Williams Partners LP4 | 37,735 | 1,531,664 | ||||||
|
| 29,815,263
|
| ||||||
| Financials—9.2% | ||||||||
| Capital Markets—1.0% | ||||||||
| Financial Engines, Inc. | 36,970 | 1,659,953 | ||||||
| Goldman Sachs Group, Inc. (The) | 5,940 | 1,310,186 | ||||||
| Raymond James Financial, Inc. | 5,960 | 532,526 | ||||||
| State Street Corp. | 8,460 | 787,541 | ||||||
| 4,290,206 | ||||||||
| Shares | Value | |||||||
| Commercial Banks—0.8% | ||||||||
| M&T Bank Corp.5,6 | 17,255 | $ | 2,935,938 | |||||
| PNC Financial Services Group, Inc. (The) | 3,770 | 509,327 | ||||||
|
| 3,445,265
|
| ||||||
| Diversified Financial Services—0.0% | ||||||||
NewStar Financial, Inc.1,2,3
|
| 409
|
|
| —
|
| ||
| Insurance—1.1% | ||||||||
| Allstate Corp. (The) | 10,840 | 989,367 | ||||||
| Chubb Ltd. | 23,565 | 2,993,226 | ||||||
| Travelers Cos., Inc. (The) | 2,820 | 344,999 | ||||||
|
| 4,327,592
|
| ||||||
| Real Estate Investment Trusts (REITs)—4.9% |
| |||||||
| Acadia Realty Trust | 8,360 | 228,813 | ||||||
| Agree Realty Corp. | 6,260 | 330,340 | ||||||
| Allied Properties Real Estate Investment Trust | 7,917 | 252,026 | ||||||
| American Homes 4 Rent, Cl. A | 9,800 | 217,364 | ||||||
| Ascendas Real Estate Investment Trust | 53,000 | 102,848 | ||||||
| Blackstone Mortgage Trust, Inc., Cl. A | 47,025 | 1,477,996 | ||||||
| Boston Properties, Inc. | 4,030 | 505,443 | ||||||
| Camden Property Trust | 5,070 | 462,029 | ||||||
| Chesapeake Lodging Trust | 8,690 | 274,952 | ||||||
| Cousins Properties, Inc. | 26,240 | 254,266 | ||||||
| Crown Castle International Corp. | 1,510 | 162,808 | ||||||
| Derwent London plc | 1,780 | 72,954 | ||||||
| Dexus | 25,600 | 184,594 | ||||||
| Digital Realty Trust, Inc. | 5,830 | 650,511 | ||||||
| Education Realty Trust, Inc. | 39,603 | 1,643,525 | ||||||
| Equinix, Inc. | 470 | 202,048 | ||||||
| Essex Property Trust, Inc. | 1,230 | 294,056 | ||||||
| First Industrial Realty Trust, Inc. | 11,060 | 368,740 | ||||||
| Gaming & Leisure Properties, Inc. | 4,800 | 171,840 | ||||||
| Gecina SA | 1,010 | 168,882 | ||||||
| GLP J-REIT | 137 | 145,470 | ||||||
| Goodman Group | 60,300 | 430,423 | ||||||
| Gramercy Property Trust | 59,267 | 1,619,175 | ||||||
| Green REIT plc | 93,771 | 162,050 | ||||||
| Hammerson plc | 12,870 | 88,525 | ||||||
| Healthcare Realty Trust, Inc. | 4,330 | 125,916 | ||||||
| Hispania Activos Inmobiliarios SOCIMI SA | 8,902 | 189,554 | ||||||
| Host Hotels & Resorts, Inc. | 10,970 | 231,138 | ||||||
| ICADE | 2,040 | 191,237 | ||||||
| Independence Realty Trust, Inc. | 20,370 | 210,015 | ||||||
| Inmobiliaria Colonial Socimi SA | 19,466 | 214,971 | ||||||
| Investa Office Fund | 20,700 | 80,178 | ||||||
| Invincible Investment Corp. | 231 | 104,060 | ||||||
| Invitation Homes, Inc. | 11,953 | 275,636 | ||||||
| Japan Retail Fund Investment Corp. | 54 | 97,415 | ||||||
| Keppel REIT | 293,100 | 236,920 | ||||||
| Kilroy Realty Corp. | 6,430 | 486,365 | ||||||
| Land Securities Group plc | 18,581 | 233,905 | ||||||
| Link REIT | 27,500 | 250,017 | ||||||
| LondonMetric Property plc | 40,080 | 97,615 | ||||||
| Macerich Co. (The) | 2,680 | 152,304 | ||||||
| Mapletree Logistics Trust | 91,600 | 82,624 | ||||||
| Medical Properties Trust, Inc. | 9,380 | 131,695 | ||||||
| New Residential Investment Corp. | 6,180 | 108,088 | ||||||
| NIPPON REIT Investment Corp. | 53 | 153,827 | ||||||
| Park Hotels & Resorts, Inc. | 7,790 | 238,608 | ||||||
| Physicians Realty Trust | 10,070 | 160,516 | ||||||
| Prologis, Inc. | 13,280 | 872,363 | ||||||
| Regency Centers Corp. | 7,872 | 488,694 | ||||||
| Sabra Health Care REIT, Inc. | 6,790 | 147,547 | ||||||
| Scentre Group | 99,900 | 325,465 | ||||||
| Simon Property Group, Inc. | 3,080 | 524,185 | ||||||
| Starwood Property Trust, Inc. | 31,660 | 687,339 | ||||||
| STORE Capital Corp. | 5,540 | 151,796 | ||||||
7 OPPENHEIMER GLOBAL MULTI-ALTERNATIVES FUND/VA
CONSOLIDATED STATEMENT OF INVESTMENTS Unaudited / Continued
| Shares | Value | |||||||
| Real Estate Investment Trusts (REITs) (Continued) |
| |||||||
| Sun Communities, Inc. | 3,990 | $ | 390,541 | |||||
| UDR, Inc. | 15,390 | 577,741 | ||||||
| Unibail-Rodamco-Westfield | 2,023 | 445,442 | ||||||
| Unite Group plc (The) | 23,400 | 265,838 | ||||||
| Vornado Realty Trust | 1,210 | 89,443 | ||||||
| Welltower, Inc. | 4,710 | 295,270 | ||||||
|
| 19,785,946
|
| ||||||
| Real Estate Management & Development—1.4% |
| |||||||
| Ayala Land, Inc. | 116,500 | 82,714 | ||||||
| Carmila SA | 3,850 | 107,257 | ||||||
| Castellum AB | 10,424 | 168,797 | ||||||
| China Overseas Land & Investment Ltd. | 52,000 | 170,113 | ||||||
| China Resources Land Ltd. | 86,000 | 287,853 | ||||||
| China Vanke Co. Ltd., Cl. H | 60,548 | 211,414 | ||||||
| Ciputra Development Tbk PT | 403,900 | 28,694 | ||||||
| City Developments Ltd. | 40,000 | 321,642 | ||||||
| CK Asset Holdings Ltd. | 49,000 | 387,159 | ||||||
| Country Garden Holdings Co. Ltd. | 157,000 | 273,904 | ||||||
| Deutsche Wohnen SE | 2,543 | 122,820 | ||||||
| Fabege AB | 17,852 | 212,820 | ||||||
| Hulic Co. Ltd. | 16,900 | 179,928 | ||||||
| KWG Property Holding Ltd. | 47,045 | 58,621 | ||||||
| Mitsubishi Estate Co. Ltd. | 15,100 | 263,770 | ||||||
| Mitsui Fudosan Co. Ltd. | 17,200 | 414,601 | ||||||
| Shimao Property Holdings Ltd. | 23,000 | 60,063 | ||||||
| SM Prime Holdings, Inc. | 126,000 | 84,778 | ||||||
| StorageVault Canada, Inc. | 70,058 | 131,627 | ||||||
| Sumitomo Realty & Development Co. Ltd. | 11,000 | 404,907 | ||||||
| Sun Hung Kai Properties Ltd. | 26,000 | 390,094 | ||||||
| Vonovia SE | 18,351 | 873,150 | ||||||
| Wharf Real Estate Investment Co. Ltd. | 59,000 | 418,974 | ||||||
|
| 5,655,700
|
| ||||||
| Health Care—4.9% | ||||||||
| Biotechnology—0.3% | ||||||||
| Dyax Corp.1,2,3 | 10,770 | 108 | ||||||
| Shire plc, ADR | 6,640 | 1,120,832 | ||||||
|
| 1,120,940
|
| ||||||
| Health Care Equipment & Supplies—0.9% | ||||||||
| Abaxis, Inc. | 20,002 | 1,660,366 | ||||||
| Abbott Laboratories | 9,110 | 555,619 | ||||||
| Medtronic plc | 13,962 | 1,195,287 | ||||||
|
| 3,411,272
|
| ||||||
| Health Care Providers & Services—1.8% | ||||||||
| Cigna Corp. | 8,410 | 1,429,279 | ||||||
| Envision Healthcare Corp.1 | 45,961 | 2,022,744 | ||||||
| HCA Healthcare, Inc. | 8,105 | 831,573 | ||||||
| Premier, Inc., Cl. A1 | 21,480 | 781,442 | ||||||
| UnitedHealth Group, Inc.5,6 | 9,505 | 2,331,957 | ||||||
|
| 7,396,995
|
| ||||||
| Health Care Technology—0.4% | ||||||||
Cotiviti Holdings, Inc.1
|
| 37,143
|
|
| 1,639,120
|
| ||
| Life Sciences Tools & Services—0.0% | ||||||||
CHC Group LLC1,3
|
| 697
|
|
| —
|
| ||
| Pharmaceuticals—1.5% | ||||||||
| Allergan plc5 | 3,320 | 553,510 | ||||||
| Ambit Biosciences Corp.1,2,3 | 10,347 | — | ||||||
| Bristol-Myers Squibb Co. | 7,550 | 417,817 | ||||||
| Johnson & Johnson | 6,430 | 780,216 | ||||||
| Merck & Co., Inc. | 25,915 | 1,573,041 | ||||||
| Mylan NV1 | 21,160 | 764,723 | ||||||
| Novartis AG, Sponsored ADR | 14,850 | 1,121,769 | ||||||
| Roche Holding AG | 4,665 | 1,038,033 | ||||||
| Teva Pharmaceutical Industries Ltd.1,3 | 10 | — | ||||||
| 6,249,109 | ||||||||
| Shares | Value | |||||||
| Industrials—3.4% | ||||||||
| Aerospace & Defense—1.7% | ||||||||
| L3 Technologies, Inc. | 5,660 | $ | 1,088,531 | |||||
| Lockheed Martin Corp.5 | 7,465 | 2,205,385 | ||||||
| Northrop Grumman Corp.6 | 6,060 | 1,864,662 | ||||||
| Raytheon Co.6 | 9,180 | 1,773,393 | ||||||
|
| 6,931,971
|
| ||||||
| Air Freight & Couriers—0.1% | ||||||||
FedEx Corp.
|
| 1,740
|
|
| 395,084
|
| ||
| Building Products—0.4% | ||||||||
USG Corp.1
|
| 38,342
|
|
| 1,653,307
|
| ||
| Commercial Services & Supplies—0.3% | ||||||||
| Country Garden Services Holdings Co. Ltd.1 | 18,045 | 23,138 | ||||||
| Republic Services, Inc., Cl. A | 20,250 | 1,384,290 | ||||||
|
| 1,407,428
|
| ||||||
| Construction & Engineering—0.1% | ||||||||
Granite Construction, Inc.
|
| 6,720
|
|
| 374,035
|
| ||
| Industrial Conglomerates—0.5% | ||||||||
| General Electric Co.5 | 71,250 | 969,713 | ||||||
| Honeywell International, Inc.5 | 8,580 | 1,235,949 | ||||||
|
| 2,205,662
|
| ||||||
| Machinery—0.3% | ||||||||
| Stanley Black & Decker, Inc. | 5,560 | 738,423 | ||||||
| Xerium Technologies, Inc.1 | 22,466 | 297,450 | ||||||
|
| 1,035,873
|
| ||||||
| Information Technology—3.0% | ||||||||
| Communications Equipment—0.7% | ||||||||
| Cisco Systems, Inc.6 | 53,610 | 2,306,838 | ||||||
| CommScope Holding Co., Inc.1 | 24,180 | 706,177 | ||||||
|
| 3,013,015
|
| ||||||
| Electronic Equipment, Instruments, & Components—0.4% | ||||||||
VeriFone Systems, Inc.1
|
| 71,783
|
|
| 1,638,088
|
| ||
| Internet Software & Services—0.6% | ||||||||
Alphabet, Inc., Cl. A1,5
|
| 2,126
|
|
| 2,400,658
|
| ||
| Semiconductors & Semiconductor Equipment—0.6% | ||||||||
| Hanergy Thin Film Power Group Ltd.1,3 | 161,121 | — | ||||||
| QUALCOMM, Inc.5,6 | 8,720 | 489,366 | ||||||
| Xilinx, Inc.5 | 28,975 | 1,890,909 | ||||||
|
| 2,380,275
|
| ||||||
| Technology Hardware, Storage & Peripherals—0.7% | ||||||||
Apple, Inc.6
|
| 14,100
|
|
| 2,610,051
|
| ||
| Materials—1.2% | ||||||||
| Chemicals—0.5% | ||||||||
| Celanese Corp., Cl. A5 | 13,640 | 1,514,858 | ||||||
| Westlake Chemical Partners LP4 | 23,069 | 565,191 | ||||||
|
| 2,080,049
|
| ||||||
| Containers & Packaging—0.6% | ||||||||
| Packaging Corp. of America | 8,500 | 950,215 | ||||||
| Sonoco Products Co.5 | 26,190 | 1,374,975 | ||||||
|
| 2,325,190
|
| ||||||
| Metals & Mining—0.1% | ||||||||
Steel Dynamics, Inc.
|
| 7,930
|
|
| 364,383
|
| ||
| Telecommunication Services—0.7% | ||||||||
| Diversified Telecommunication Services—0.7% |
| |||||||
| AT&T, Inc.5 | 24,750 | 794,723 | ||||||
| BCE, Inc. | 31,705 | 1,283,735 | ||||||
| Verizon Communications, Inc. | 17,790 | 895,015 | ||||||
|
| 2,973,473
|
| ||||||
| Utilities—1.1% | ||||||||
| Electric Utilities—0.5% | ||||||||
| American Electric Power Co., Inc. | 12,860 | 890,555 | ||||||
8 OPPENHEIMER GLOBAL MULTI-ALTERNATIVES FUND/VA
Shares | Value | |||||||||||
| Electric Utilities (Continued) | ||||||||||||
| Edison International | 8,485 | $ | 536,846 | |||||||||
| PG&E Corp.6 | 9,210 | 391,978 | ||||||||||
|
| 1,819,379
|
| ||||||||||
| Multi-Utilities—0.6% | ||||||||||||
| CMS Energy Corp. | 17,650 | 834,492 | ||||||||||
| Vectren Corp. | 23,025 | 1,645,136 | ||||||||||
| 2,479,628 | ||||||||||||
Total Common Stocks (Cost $119,768,285)
|
| 136,219,062
|
| |||||||||
| Preferred Stocks—0.2% | ||||||||||||
| M&T Bank Corp., 6.375% Cum., Series A, Non-Vtg. | 340 | 345,440 | ||||||||||
| M&T Bank Corp., 6.375% Cum., Series C, Non-Vtg. | 475 | 484,975 | ||||||||||
Total Preferred Stocks (Cost $845,454) | 830,415 | |||||||||||
| Units | ||||||||||||
| Rights, Warrants and Certificates—0.0% |
| |||||||||||
| Kaisa Group Holdings Ltd. Rts., Strike Price $1, Exp. 12/31/49, 0.00%1 (Cost $0) | 231 | 200 | ||||||||||
Principal Amount | ||||||||||||
| Asset-Backed Securities—2.5% |
| |||||||||||
| Bear Stearns Structured Products Trust, Series 2007-EMX1, Cl. A2, 3.391% [US0001M+130], 3/25/377,8 | $ | 1,600,000 | 1,619,222 | |||||||||
| GSAMP Trust, Series 2005-HE4, Cl. M3, 2.871% [US0001M+78], 7/25/458 | 1,400,000 | 1,396,620 | ||||||||||
| Morgan Stanley ABS Capital I, Inc. Trust, Series 2006-NC1, Cl. M1, 2.471% [US0001M+38], 12/25/358 | 1,780,000 | 1,750,242 | ||||||||||
| New Century Home Equity Loan Trust, Series 2005-1, Cl. M2, 2.811% [US0001M+72], 3/25/358 | 397,953 | 383,856 | ||||||||||
| Raspro Trust, Series 2005-1A, Cl. G, 2.725% [LIBOR03M+40], 3/23/247,8 | 607,965 | 610,885 | ||||||||||
| SG Mortgage Securities Trust, Series 2005-OPT1, Cl. M2, 2.541% [US0001M+45], 10/25/358 | 4,250,000 | 4,213,147 | ||||||||||
Total Asset-Backed Securities (Cost $8,890,852)
|
| 9,973,972
|
| |||||||||
| Mortgage-Backed Obligation—0.6% |
| |||||||||||
RAMP Trust, Series 2005-RS6, Cl. M4, 3.066% [US0001M+97.5], 6/25/358 (Cost $2,089,407)
|
| 2,300,000
|
|
| 2,308,377
|
| ||||||
| Foreign Government Obligation—5.4% |
| |||||||||||
Federative Republic of Brazil, 6.418% Unsec. Nts., 10/1/1813 (Cost $22,765,542)
|
| BRL
|
|
| 86,800,000
|
|
| 22,039,270
|
| |||
| Non-Convertible Corporate Bonds and Notes—2.1% |
| |||||||||||
| Bank of America Corp., 6.25% [US0003M+370.5] Jr. Sub. Perpetual Bonds8,9 | 1,290,000 | 1,349,663 | ||||||||||
| Citigroup, Inc., 5.875% [US0003M+405.9] Jr. Sub. Perpetual Bonds6,8,9 | 1,903,000 | 1,951,717 | ||||||||||
| Daimler Finance North America LLC, 2.913% [US0003M+55] Sr. Unsec. Nts., 5/4/217,8 | 500,000 | 501,461 | ||||||||||
| Goldman Sachs Capital II, 4.00% [US0003M+76.75] Jr. Sub. Perpetual Bonds8,9 | 8,000 | 6,745 | ||||||||||
| Goldman Sachs Group, Inc. (The): |
| |||||||||||
| 5.375% [US0003M+392.2] Jr. Sub. Perpetual Bonds8,9 | 999,000 | 1,015,234 | ||||||||||
| Principal Amount | Value | |||||||||||
| Non-Convertible Corporate Bonds and Notes (Continued) |
| |||||||||||
| Goldman Sachs Group, Inc. (The): (Continued) |
| |||||||||||
| 5.70% [US0003M+388.4] Jr. Sub. Perpetual Bonds, Series L8,9 | $ | 580,000 | $ | 588,845 | ||||||||
| Hexagon Reinsurance DAC, 6.50% [EUR003M+650] Unsec. Nts., 1/19/227,8 | 250,000 | 292,563 | ||||||||||
| JPMorgan Chase & Co., 6.10% [US0003M+333] Jr. Sub. Perpetual Bonds8,9 | 1,052,000 | 1,087,610 | ||||||||||
| Lukoil International Finance BV, 6.125% Sr. Unsec. Nts., 11/9/207 | 1,284,000 | 1,348,007 | ||||||||||
| Resolute Energy Corp., 8.50% Sr. Unsec. Nts., 5/1/20 | 600,000 | 600,000 | ||||||||||
| Samson Investment Co., 9.75% Sr. Unsec. Nts., 2/15/202,3,10 | 300,000 | — | ||||||||||
| SandRidge Energy, Inc., 7.50% Sr. Unsec. Nts., 3/15/212,3,10 | 500,000 | — | ||||||||||
Total Non-Convertible Corporate Bonds and Notes (Cost $8,758,404)
|
| 8,741,845
|
| |||||||||
| Corporate Loans—3.3% | ||||||||||||
| Axalta Coating Systems US Holdings, Inc., Sr. Sec. Credit Facilities 1st Lien Term Loan, 4.052% [LIBOR4+175], 6/1/248,11 | 2,601,797 | 2,592,248 | ||||||||||
| Delos Finance Sarl, Sr. Sec. Credit Facilities 1st Lien Term Loan, 4.052% [LIBOR4+175], 10/6/238,11 | 2,535,000 | 2,538,169 | ||||||||||
| Hilton Worldwide Finance LLC, Sr. Sec. Credit Facilities 1st Lien Term Loan, 3.328% [LIBOR12+175], 10/25/238,11 | 535,114 | 535,670 | ||||||||||
| Hilton Worldwide Finance LLC, Sr. Sec. Credit Facilities 1st Lien Term Loan, 3.841% [LIBOR12+175], 10/25/238 | 2,005,176 | 2,007,262 | ||||||||||
| Neiman Marcus Group Ltd. LLC, Sr. Sec. Credit Facilities 1st Lien Term Loan, 5.263% [LIBOR12+325], 10/25/208 | 759,143 | 674,689 | ||||||||||
| TransDigm, Inc., Sr. Sec. Credit Facilities 1st Lien Term Loan, 4.594% [LIBOR12+250], 5/30/258,11 | 2,549,360 | 2,533,235 | ||||||||||
| Vistra Operations Co. LLC, Sr. Sec. Credit Facilities 1st Lien Term Loan, 4.33% [LIBOR12+275], 12/14/238,11 | 397,980 | 396,655 | ||||||||||
| Vistra Operations Co. LLC, Sr. Sec. Credit Facilities 1st Lien Term Loan, 4.344% [LIBOR12+275], 12/14/238 | 2,287,582 | 2,279,964 | ||||||||||
Total Corporate Loans (Cost $13,683,387)
|
| 13,557,892
|
| |||||||||
| Event-Linked Bonds—13.8% | ||||||||||||
| Earthquake—4.4% | ||||||||||||
| Acorn Re Ltd. Catastrophe Linked Nts., 4.989% [US0006M+329], 7/17/187,8 | 750,000 | 752,887 | ||||||||||
| Azzurro RE I DAC Catastrophe Linked Nts., 2.15% [EUR003M+215], 1/16/197,8 | EUR | 800,000 | 937,930 | |||||||||
| Bosphorus Ltd. Catastrophe Linked Nts., 5.53% [US0006M+325], 8/17/187,8 | 750,000 | 754,912 | ||||||||||
| Buffalo Re Ltd. Catastrophe Linked Nts.: |
| |||||||||||
| 5.41% [US0006M+325], 4/7/207,8 | 500,000 | 500,325 | ||||||||||
| 8.91% [US0006M+675], 4/7/207,8 | 250,000 | 250,462 | ||||||||||
| Golden State Re II Ltd. Catastrophe Linked Nts., 4.115% [T-BILL 3MO+220], 1/8/197,8 | 1,250,000 | 1,254,062 | ||||||||||
| International Bank for Reconstruction & Development Catastrophe Linked Nts.: |
| |||||||||||
| 4.641% [US0003M+250], 2/14/20-2/15/217,8 | 1,250,000 | 1,252,388 | ||||||||||
| 5.143% [US0003M+300], 2/15/217,8 | 1,000,000 | 1,006,225 | ||||||||||
9 OPPENHEIMER GLOBAL MULTI-ALTERNATIVES FUND/VA
CONSOLIDATED STATEMENT OF INVESTMENTS Unaudited / Continued
| Principal Amount | Value | |||||
| Earthquake (Continued) | ||||||
| International Bank for Reconstruction & Development Catastrophe Linked Nts.: (Continued) |
| |||||
| 8.141% [US0003M+600], 2/15/217,8 | $ 500,000 | $ | 505,375 | |||
| 10.393% [US0003M+825], 2/14/207,8 | 500,000 | 502,488 | ||||
| Kilimanjaro Re Ltd. Catastrophe Linked Nts., 5.665% [T-BILL 3MO+375], 11/25/197,8 | 500,000 | 504,475 | ||||
| Kizuna Re II Ltd. Catastrophe Linked Nts.: | ||||||
| 3.79% [T-BILL 3MO+187.5], 4/11/237,8 | 750,000 | 754,237 | ||||
| 4.415% [T-BILL 3MO+250], 4/11/237,8 | 250,000 | 251,437 | ||||
| Merna Re Ltd. Catastrophe Linked Nts.: | ||||||
| 3.915% [T-BILL 3MO+200], 4/8/20-4/8/217,8 | 1,000,000 | 1,003,850 | ||||
| Nakama Re Ltd. Catastrophe Linked Nts.: |
| |||||
| 4.04% [T-BILL 3MO+212.5], 1/16/197,8 | 750,000 | 751,237 | ||||
| 4.177% [US0003M+200], 4/13/237,8 | 500,000 | 506,325 | ||||
| 4.321% [US0006M+220], 10/13/217,8 | 650,000 | 661,733 | ||||
| 4.79% [T-BILL 3MO+287.5], | ||||||
| 1/16/20-1/14/217,8 | 1,000,000 | 1,014,800 | ||||
| 5.165% [T-BILL 3MO+325], 1/14/218,12 | 250,000 | 255,913 | ||||
| 5.177% [US0003M+300], 4/13/237,8 | 500,000 | 508,325 | ||||
| 5.371% [US0006M+325], 10/13/217,8 | 750,000 | 768,113 | ||||
| Panda Re Ltd. Catastrophe Linked Nts., 5.965% [T-BILL 3MO+405], 7/9/187,8 | 500,000 | 501,375 | ||||
| Torrey Pines Re Ltd. Catastrophe Linked Nts.: | ||||||
| 5.092% [US0006M+300], 6/9/207,8 | 375,000 | 376,556 | ||||
| 5.842% [US0006M+375], 6/9/207,8 | 250,000 | 251,663 | ||||
| 8.342% [US0006M+625], 6/9/207,8 | 500,000 | 504,325 | ||||
| Ursa Re Ltd. Catastrophe Linked Nts.: | ||||||
| 4.00% [ZERO+400], 12/10/19-12/10/207,8 | 750,000 | 753,138 | ||||
| 5.25% [T-BILL 3MO+525], 12/10/207,8 | 500,000 | 505,375 | ||||
| 6.00% [ZERO+600], 5/27/207,8 | 500,000 | 507,425 | ||||
|
| 18,097,356
|
| ||||
| Longevity—0.1% | ||||||
Vita Capital VI Ltd. Catastrophe Linked Nts., 4.578% [US0006M+290], 1/8/217,8
| 250,000
|
| 256,413
|
| ||
| Multiple Event—6.2% | ||||||
| Alamo Re Ltd. Catastrophe Linked Nts., 5.165% [T-BILL 1MO+325], 6/7/217,8 | 250,000 | 250,612 | ||||
| Armor RE II Ltd. Catastrophe Linked Nts., 5.415% [T-BILL 3MO+350], 6/8/207,8 | 750,000 | 752,587 | ||||
| Atlas Capital UK 2018 plc Catastrophe Linked Nts., 8.336% [US0003M+600], 6/7/227,8 | 250,000 | 251,512 | ||||
| Atlas IX Capital DAC Catastrophe Linked Nts., 10.002% [US0003M+783], 1/7/197,8 | 500,000 | 461,175 | ||||
| Blue Halo Re Ltd. Catastrophe Linked Nts.: | ||||||
| 10.165% [T-BILL 3MO+825], 7/26/197,8 | 250,000 | 250,762 | ||||
| 15.915% [T-BILL 3MO+1,400], 6/21/197,8 | 500,000 | 481,025 | ||||
| Bonanza Re Ltd. Catastrophe Linked Nts.: | ||||||
| 5.911% [US0006M+375], 12/31/197,8 | 250,000 | 250,062 | ||||
| 7.161% [US0006M+500], 12/31/197,8 | 250,000 | 245,262 | ||||
| Bowline Re Ltd. Series 2018-1 Catastrophe Linked Nts., 6.417% [T-BILL 3MO+450], 5/23/227,8 | 500,000 | 500,775 | ||||
| Caelus Re IV Ltd. Catastrophe Linked Nts., 7.45% [T-BILL 3MO+553], 3/6/207,8 | 500,000 | 509,075 | ||||
| Caelus Re V Ltd. Catastrophe Linked Nts.: | ||||||
| 5.17% [T-BILL 3MO+325], 6/5/208,12 | 750,000 | 735,000 | ||||
| 5.42% [T-BILL 3MO+350], 6/7/217,8 | 250,000 | 250,412 | ||||
| Principal Amount | Value | |||||||||
| Multiple Event (Continued) | ||||||||||
| Caelus Re V Ltd. Catastrophe Linked Nts.: (Continued) | ||||||||||
| 6.42% [T-BILL 3MO+450], 6/5/207,8 | $ | 500,000 | $ | 260,450 | ||||||
| 9.42% [T-BILL 3MO+750], 6/7/217,8 | 250,000 | 251,137 | ||||||||
| 11.17% [T-BILL 3MO+925], 6/5/207,8 | 500,000 | 18,600 | ||||||||
| 12.42% [T-BILL 3MO+1,050], 6/7/217,8 | 250,000 | 252,262 | ||||||||
| Citrus Re Ltd. Catastrophe Linked Nts., 7.519% [US0006M+600], 3/18/207,8 | 250,000 | 197,500 | ||||||||
| Cranberry Re Ltd. Catastrophe Linked Nts.: |
| |||||||||
| 4.093% [US0006M+200], 7/13/207,8 | 500,000 | 506,225 | ||||||||
| 5.815% [T-BILL 3MO+390], 7/6/187,8 | 500,000 | 501,525 | ||||||||
| East Lane Re VI Ltd. Catastrophe Linked Nts., 5.305% [T-BILL 3MO+339], 3/13/207,8 | 500,000 | 504,775 | ||||||||
| Eclipse Re Ltd. Catastrophe Linked Nts., 0.00%, 7/1/197,19 | 250,000 | 240,000 | ||||||||
| Eden Re II Ltd. Catastrophe Linked Nts., 0.00%, 3/22/217,13 | 80,598 | 34,085 | ||||||||
| Fortius Re II Ltd. Catastrophe Linked | ||||||||||
| Nts., 4.803% [US0006M+375], 7/7/217,8 | 750,000 | 753,713 | ||||||||
| Galilei Re Ltd. Catastrophe Linked Nts.: | ||||||||||
| 6.178% [US0006M+466], 1/8/207,8 | 500,000 | 505,075 | ||||||||
| 6.198% [US0006M+466], 1/8/217,8 | 500,000 | 509,025 | ||||||||
| 9.948% [US0006M+841], 1/8/217,8 | 250,000 | 252,112 | ||||||||
| 15.398% [US0006M+1,388], 1/8/207,8 | 250,000 | 243,662 | ||||||||
| 15.418% [US0006M+1,388], 1/8/217,8 | 500,000 | 491,525 | ||||||||
| Galileo Re Ltd. Catastrophe Linked Nts.: 15.425% [T-BILL 3MO+1,351], 1/8/197,8 | 500,000 | 493,625 | ||||||||
| 19.683% [US0003M+1,750], 11/6/207,8 | 250,000 | 252,062 | ||||||||
| Kendall Re Ltd. Catastrophe Linked Nts., 7.452% [US0003M+525], 5/6/217,8 | 500,000 | 500,775 | ||||||||
| Kilimanjaro II Re Ltd. Catastrophe Linked Nts.: | ||||||||||
| 9.341% [US0006M+714], 4/20/217,8 | 250,000 | 252,438 | ||||||||
| 11.691% [US0006M+949], 4/20/217,8 | 500,000 | 500,925 | ||||||||
| Kilimanjaro Re Ltd. Catastrophe Linked Nts.: | ||||||||||
| 6.809% [US0003M+465], 5/6/227,8 | 500,000 | 501,175 | ||||||||
| 6.829% [US0003M+465], 5/5/237,8 | 250,000 | 250,213 | ||||||||
| 8.665% [T-BILL 3MO+675], 12/6/197,8 | 250,000 | 250,412 | ||||||||
| 11.165% [T-BILL 3MO+925], 12/6/197,8 | 250,000 | 249,037 | ||||||||
| 14.616% [US0003M+1,250], 5/6/227,8 | 250,000 | 248,862 | ||||||||
| 14.679% [US0003M+1,250], 5/5/237,8 | 250,000 | 248,938 | ||||||||
| Kinesis 2017 Sidecar, Preferred1,7,19 | 32,412 | 110,849 | ||||||||
| Lion II RE DAC Catastrophe Linked Nts., 3.17% [EUR003M+317], 7/15/217,8 | EUR | 750,000 | 876,835 | |||||||
| Loma Reinsurance Bermuda Ltd. Catastrophe Linked Nts., 2.415% [T-BILL 3MO+50], 7/9/188,12 | 500,000 | 212,500 | ||||||||
| MetroCat Re Ltd. Catastrophe Linked Nts., 5.615% [T-BILL 3MO+370], 5/8/207,8 | 500,000 | 503,425 | ||||||||
| Panthera Re Ltd. Catastrophe Linked Nts., 5.415% [T-BILL 3MO+350], 3/9/207,8 | 250,000 | 250,900 | ||||||||
| PennUnion Re Ltd. Catastrophe Linked Nts., 6.415% [T-BILL 3MO+450], 12/7/187,8 | 500,000 | 498,425 | ||||||||
| Residential Reinsurance 2013 Ltd., 4.915% [T-BILL 3MO+300], 9/6/188,12 | ||||||||||
| 250,000 | 118,750 | |||||||||
| Residential Reinsurance 2014 Ltd. Catastrophe Linked Nts., 2.415% [T-BILL 3MO+50], 9/6/187,8 | 750,000 | 52,500 | ||||||||
| Residential Reinsurance 2015 Ltd. Catastrophe Linked Nts., 12.885% [T-BILL 3MO+1097], 6/6/197,8 | 500,000 | 251,650 | ||||||||
10 OPPENHEIMER GLOBAL MULTI-ALTERNATIVES FUND/VA
| Principal Amount | Value | |||||||||||
Multiple Event (Continued) | ||||||||||||
| Residential Reinsurance 2016 Ltd. Catastrophe Linked Nts.: |
| |||||||||||
| 5.165% [T-BILL 3MO+325], 6/6/207,8 | $ | 1,000,000 | $ | 1,008,850 | ||||||||
| 5.735% [T-BILL 3MO+382], 12/6/207,8 | 250,000 | 251,963 | ||||||||||
| 13.435% [T-BILL 3MO+1,152], 6/6/207,8 | 750,000 | 264,975 | ||||||||||
| Residential Reinsurance 2017 Ltd. Catastrophe Linked Nts.: |
| |||||||||||
| 4.965% [T-BILL 3MO+305], 6/6/218,12 | 375,000 | 375,319 | ||||||||||
| 14.431%, 9/6/187,13 | 250,000 | 9,375 | ||||||||||
| 22.802%, 12/6/187,13 | 250,000 | 221,313 | ||||||||||
| Residential Reinsurance 2018 Ltd. Catastrophe Linked Nts.: |
| |||||||||||
| 5.165% [T-BILL 3MO+325], 6/6/227,8 | 500,000 | 501,275 | ||||||||||
| 12.376%, 6/6/197,13 | 500,000 | 444,775 | ||||||||||
| Resilience Re Ltd. Catastrophe Linked Nts.: |
| |||||||||||
| 9.64%, 1/8/197,13 | 250,000 | 237,388 | ||||||||||
| 10.63%, 4/8/197,13 | 250,000 | 228,313 | ||||||||||
| Riverfront Re Ltd. Catastrophe Linked Nts.: |
| |||||||||||
| 6.415% [T-BILL 3MO+450], 1/15/217,8 | 750,000 | 743,738 | ||||||||||
| 8.165% [T-BILL 3MO+625], 1/15/217,8 | 500,000 | 488,625 | ||||||||||
| Sanders Re Ltd. Catastrophe Linked Nts.: |
| |||||||||||
| 5.183% [US0006M+300], 12/6/217,8 | 750,000 | 751,538 | ||||||||||
| 5.324% [US0006M+325], 6/5/207,8 | 750,000 | 757,838 | ||||||||||
| 7.415% [T-BILL 3MO+550], 4/7/227,8 | 500,000 | 507,175 | ||||||||||
| Spectrum Capital Ltd. Catastrophe Linked Nts.: |
| |||||||||||
| 5.667% [US0006M+350], 6/8/217,8 | 250,000 | 253,263 | ||||||||||
| 7.917% [US0006M+575], 6/8/217,8 | 250,000 | 251,613 | ||||||||||
| Tailwind Re Ltd. 2017-1 Catastrophe Linked Nts.: |
| |||||||||||
| 9.165% [T-BILL 3MO+725], 1/8/227,8 | 250,000 | 256,038 | ||||||||||
| 12.915% [T-BILL 3MO+1,100], 1/8/227,8 | 250,000 | 256,888 | ||||||||||
| Tramline Re II Ltd. Catastrophe Linked |
| |||||||||||
| Nts., 10.165% [T-BILL 3MO+825], 1/4/197,8 | 400,000 | 398,260 | ||||||||||
|
| 25,292,748
|
| ||||||||||
Other—0.7% | ||||||||||||
| Benu Capital DAC Catastrophe Linked Nts.: |
| |||||||||||
| 2.55% [EUR003M+255], 1/8/207,8 | EUR | 250,000 | 294,724 | |||||||||
| 3.35% [EUR003M+335], 1/8/207,8 | EUR | 500,000 | 591,607 | |||||||||
| Horse Capital I DAC Catastrophe Linked Nts., 12.00% [EUR003M+1200], 6/15/207,8 | EUR | 750,000 | 885,528 | |||||||||
| Vitality Re V Ltd. Catastrophe Linked Nts., 4.415% [T-BILL 3MO+250], 1/7/197,8 | 250,000 | 251,362 | ||||||||||
| Vitality Re VII Ltd. Catastrophe Linked Nts., 4.565% [T-BILL 3MO+265], 1/7/207,8 | 250,000 | 253,238 | ||||||||||
| Vitality Re VIII Ltd. Catastrophe Linked Nts., 3.915% [T-BILL 3MO+200], 1/8/217,8 | 500,000 | 505,675 | ||||||||||
|
| 2,782,134
|
| ||||||||||
Pandemic—0.1% | ||||||||||||
International Bank for Reconstruction & Development Catastrophe Linked Nts., 7.957% [US0006M-40+690], 7/15/207,19
|
| 250,000
|
|
| 252,300
|
| ||||||
Windstorm—2.3% | ||||||||||||
| Akibare Re Ltd. Catastrophe Linked Nts.: |
| |||||||||||
| 4.227% [US0003M+190], 4/7/227,8 | 250,000 | 252,812 | ||||||||||
| 4.237% [US0003M+190], 4/7/227,8 | 500,000 | 505,125 | ||||||||||
| 4.681% [US0006M+234], 4/7/207,8 | 250,000 | 253,337 | ||||||||||
| Alamo Re Ltd. Catastrophe Linked Nts., |
| |||||||||||
| 6.765% [T-BILL 3MO+485], 6/8/207,8 | 500,000 | 508,325 | ||||||||||
| Aozora Re Ltd. Catastrophe Linked Nts.: |
| |||||||||||
| 4.166% [US0006M+200], 4/7/217,8 | 750,000 | 759,487 | ||||||||||
| 4.581% [US0006M+224], 4/7/207,8 | 500,000 | 506,125 | ||||||||||
| Casablanca Re Ltd. Catastrophe Linked Nts.: |
| |||||||||||
| 5.25% [US0006M+525], 6/4/208,12 | 250,000 | 250,263 | ||||||||||
| Principal Amount | Value | |||||||||||
Windstorm (Continued) | ||||||||||||
| Casablanca Re Ltd. Catastrophe Linked Nts.: (Continued) |
| |||||||||||
| 17.258% [US0006M+1,600], 6/4/203,8,12 | $ | 250,000 | $ | 122,500 | ||||||||
| Citrus Re Ltd. Catastrophe Linked Nts.: |
| |||||||||||
| 9.655% [T-BILL 3MO+774], 2/25/197,8 | 500,000 | 470,325 | ||||||||||
| 11.03% [T-BILL 1MO+1,103], 2/25/197,8 | 100,691 | 3,383 | ||||||||||
| First Coast Re 2016 Ltd. Catastrophe Linked Nts., 5.825% [T-BILL 3MO+391], 6/7/197,8 | 250,000 | 249,587 | ||||||||||
| First Coast Re 2017-1 Ltd. Catastrophe Linked Nts., 6.165% [T-BILL 3MO+425], 6/7/217,8 | 250,000 | 249,337 | ||||||||||
| Frontline Re Ltd. Catastrophe Linked Nts., 8.915% [T-BILL 3MO+700], 7/6/227,8 | 250,000 | 250,025 | ||||||||||
| Integrity Re Ltd. Catastrophe Linked Nts.: |
| |||||||||||
| 5.797% [US0003M+375], 6/10/227,8 | 750,000 | 751,088 | ||||||||||
| 6.422% [US0006M+433], 6/10/207,8 | 500,000 | 496,325 | ||||||||||
| International Bank for Reconstruction & Development Catastrophe Linked Nts.: |
| |||||||||||
| 7.626% [US0006M+590], 12/20/197,8 | 375,000 | 371,681 | ||||||||||
| 11.026% [US0006M+930], 12/20/197,8 | 250,000 | 245,869 | ||||||||||
| Long Point Re III Ltd. Catastrophe Linked Nts., 4.665% [T-BILL 3MO+275], 6/1/227,8 | 500,000 | 502,525 | ||||||||||
| Manatee Re II Ltd. Catastrophe Linked Nts.: |
| |||||||||||
| 6.165% [T-BILL 3MO+425], 6/7/217,8 | 500,000 | 501,325 | ||||||||||
| 9.665% [T-BILL 3MO+775], 6/7/217,8 | 250,000 | 250,613 | ||||||||||
| Manatee Re Ltd. Catastrophe Linked Nts., 1.899% [T-BILL 3MO+50], 3/10/198,12 | 500,000 | 13,000 | ||||||||||
| Pelican IV Re Ltd. Catastrophe Linked Nts.: |
| |||||||||||
| 4.269% [US0003M+225], 5/7/217,8 | 750,000 | 752,363 | ||||||||||
| 4.334% [US0006M+225], 5/5/207,8 | 500,000 | 500,725 | ||||||||||
| Queen Street XI Re DAC Catastrophe Linked Nts., 8.065% [T-BILL 3MO+615], 6/7/197,8 | 250,000 | 251,963 | ||||||||||
| Queen Street XII Re Designated Activity Co. Catastrophe Linked Nts., 7.587% [US0006M+525], 4/8/207,8 | 500,000 | 506,825 | ||||||||||
| 9,524,933 | ||||||||||||
Total Event-Linked Bonds (Cost $59,703,528)
|
|
| 56,205,884
|
| ||||||||
Structured Securities—0.2% | ||||||||||||
| Toronto-Dominion Bank (The): |
| |||||||||||
| Sr. Unsec. Nts., 0.00%, 6/6/1913 | 854,000 | 890,346 | ||||||||||
Total Structured Securities (Cost $854,000)
|
|
| 890,346
|
| ||||||||
Short-Term Notes—21.6% | ||||||||||||
Canada—0.3% | ||||||||||||
| Bell Canada, Inc., 2.705%, 10/15/1814,15 | USD | 500,000 | 496,170 | |||||||||
| TransCanada PipeLines Ltd., 2.627%, 9/17/187,14,15 | USD | 500,000 | 497,209 | |||||||||
|
| 993,379
|
| ||||||||||
Italy—0.1% | ||||||||||||
Eni Finance USA, Inc., 1.967%, 10/5/1814,15
|
| USD
|
|
| 500,000
|
|
| 496,584
|
| |||
Japan—3.8% | ||||||||||||
| Hitachi Capital America Corp., 2.445%, 7/11/1815 | USD | 500,000 | 499,623 | |||||||||
| Japan Treasury Bills, 0.00%, 9/10/1813 | JPY | 1,650,000,000 | 14,906,766 | |||||||||
|
| 15,406,389
|
| ||||||||||
Mexico—2.9% | ||||||||||||
| United Mexican States Treasury Bills: |
| |||||||||||
| 7.036%, 8/2/1813 | MXN | 55,000,000 | 2,751,073 | |||||||||
11 OPPENHEIMER GLOBAL MULTI-ALTERNATIVES FUND/VA
CONSOLIDATED STATEMENT OF INVESTMENTS Unaudited / Continued
| Principal Amount | Value | |||||||||||
Mexico (Continued) | ||||||||||||
| United Mexican States Treasury Bills: (Continued) |
| |||||||||||
| 7.771%, 8/30/1813 | MXN | 185,000,000 | $ | 9,190,640 | ||||||||
|
| 11,941,713
|
| ||||||||||
Portugal—3.2% | ||||||||||||
Portuguese Republic Treasury Bills, 0.00%, 7/20/1813
|
| EUR
|
|
| 11,200,000
|
|
| 13,081,374
|
| |||
Singapore—8.5% | ||||||||||||
Monetary Authority of Singapore Bills, 1.701%, 9/21/1813
|
| SGD
|
|
| 47,500,000
|
|
| 34,731,895
|
| |||
Thailand—0.5% | ||||||||||||
Bank of Thailand Treasury Bills, 1.322%, 9/6/1813
|
| THB
|
|
| 67,000,000
|
|
| 2,017,928
|
| |||
United Kingdom—0.3% | ||||||||||||
| BAT International Finance plc, 2.719%, 9/5/1814,15 | USD | 500,000 | 497,666 | |||||||||
| Reckitt Benckiser Treasury Services plc, 2.453%, 8/30/1814,15 | USD | 500,000 | 498,188 | |||||||||
|
| 995,854
|
| ||||||||||
United States—2.0% | ||||||||||||
| Albemarle Corp., 2.456%, 7/20/187,14,15 | USD | 500,000 | 499,300 | |||||||||
AT&T, Inc.: | ||||||||||||
| 2.636%, 9/6/187,14,15 | USD | 300,000 | 298,523 | |||||||||
| 3.093%, 5/30/197,14,15 | USD | 300,000 | 291,561 | |||||||||
| Principal Amount | Value | |||||||||||
United States (Continued) | ||||||||||||
| CenterPoint Energy Resources Corp., 2.577%, 9/10/187,14,15 | USD | $ | 500,000 | $ | 497,477 | |||||||
| ERAC USA Finance Co., 2.405%, 7/23/187,14,15 | USD | 500,000 | 499,226 | |||||||||
| HP, Inc., 2.497%, 7/23/1815 | USD | 500,000 | 499,344 | |||||||||
| Interpublic Group of Cos., Inc. (The), 2.302%, 7/9/187,14,15 | USD | 500,000 | 499,685 | |||||||||
| Magna International, Inc., 2.304%, 7/6/187,14,15 | USD | 500,000 | 499,782 | |||||||||
| Marriott International, Inc., 2.467%, 8/8/187,14,15 | USD | 500,000 | 498,677 | |||||||||
| McKesson Corp., 2.354%, 7/18/187,14,15 | USD | 500,000 | 499,393 | |||||||||
| Nutrien Ltd., 2.457%, 8/8/187,14,15 | USD | 500,000 | 498,581 | |||||||||
| Southern Co. (The), 2.415%, 7/26/187,14,15 | USD | 500,000 | 499,125 | |||||||||
| United States Treasury Bills, 2.003%, 10/18/1815,16 | USD | 2,160,000 | 2,147,461 | |||||||||
| WPP plc, 2.374%, 7/17/187,14,15 | USD | 500,000 | 499,426 | |||||||||
| 8,227,561 | ||||||||||||
| Total Short-Term Notes (Cost $87,947,278) |
| 87,892,677 | ||||||||||
| Shares | ||||||||||||
Investment Companies—14.7% | ||||||||||||
| Highland/iBoxx Senior Loan Exchange Traded Fund | 125,133 | 2,263,656 | ||||||||||
| Oppenheimer Institutional Government Money Market Fund, Cl. E, 1.85%16,17,18 | 53,043,378 | 53,043,378 | ||||||||||
| SPDR Gold Trust Exchange Traded Fund1,16 | 36,409 | 4,319,928 | ||||||||||
| Total Investment Companies (Cost $59,636,196) |
| 59,626,962 | ||||||||||
| Exercise Price | Expiration Date | Contracts | Notional Amount (000’s) | |||||||||||||||||||||||||||||
| Exchange-Traded Option Purchased—0.0% |
| |||||||||||||||||||||||||||||||
| S&P 500 Index Call (Cost $86,338)1 |
| USD | 2,775.000 | 8/17/18 | USD | 31 | USD 8,427 | 62,620 | ||||||||||||||||||||||||
| Counterparty | Exercise Price | Expiration Date | Contracts | Notional Amount (000’s) | ||||||||||||||||||||||||||||
| Over-the-Counter Options Purchased—0.0% |
| |||||||||||||||||||||||||||||||
| CNH Currency Put1 | GSCO-OT | CNH | 6.460 | 2/21/19 | CNH | 6,980,000 | CNH 240,000 | 41,545 | ||||||||||||||||||||||||
| JPY Currency Call1 | GSCO-OT | JPY | 106.500 | 7/27/18 | JPY | 1,172,000,000 | JPY 5,325,000 | 4,688 | ||||||||||||||||||||||||
| JPY Currency Call1 | GSCO-OT | JPY | 104.500 | 8/27/18 | JPY | 1,150,000,000 | JPY 5,227,000 | 8,050 | ||||||||||||||||||||||||
| Total Over-the-Counter Options Purchased (Cost $68,663) |
| 54,283 | ||||||||||||||||||||||||||||||
| Counterparty | Pay / Receive Floating Rate | Floating Rate | Fixed Rate | Expiration Date | Notional Amount (000’s) | |||||||||||||||||||||||||||
| Over-the-Counter Interest Rate Swaptions Purchased—0.1% |
| |||||||||||||||||||||||||||||||
| Interest Rate Swap maturing | Three-Month USD | |||||||||||||||||||||||||||||||
| 1/28/30 Call1 | GSCOI | Receive | BBA LIBOR | 2.974% | 1/24/20 | USD | 8,550 | 248,497 | ||||||||||||||||||||||||
| Interest Rate Swap maturing | Six-Month JPY BBA | |||||||||||||||||||||||||||||||
| 1/28/31 Call1 | GSCOI | Receive | LIBOR | 0.523 | 1/26/21 | JPY | 196,000 | 17,044 | ||||||||||||||||||||||||
| Interest Rate Swap maturing | Three-Month USD | |||||||||||||||||||||||||||||||
| 11/24/30 Call1 | BAC | Receive | BBA LIBOR | 2.595 | 11/20/20 | USD | 1,000 | 53,840 | ||||||||||||||||||||||||
| Interest Rate Swap maturing | Three-Month USD | |||||||||||||||||||||||||||||||
| 3/17/31 Call1 | BAC | Receive | BBA LIBOR | 2.990 | 3/15/21 | USD | 1,000 | 37,949 | ||||||||||||||||||||||||
| Interest Rate Swap maturing | Six-Month JPY BBA | |||||||||||||||||||||||||||||||
| 4/30/31 Call1 | GSCOI | Receive | LIBOR | 0.485 | 4/27/21 | JPY | 525,000 | 58,194 | ||||||||||||||||||||||||
| Interest Rate Swap maturing | Six-Month JPY BBA | |||||||||||||||||||||||||||||||
7/25/28 Call1 | GSCOI | Receive | LIBOR | 1.050 | 7/23/18 | JPY | 630,000 | — | ||||||||||||||||||||||||
Total Over-the-Counter Interest Rate Swaptions Purchased (Cost $675,742)
|
|
| 415,524
|
| ||||||||||||||||||||||||||||
Total Investments, at Value (Cost $385,773,076) |
| 98.0% | 398,819,329 | |||||||||||||||||||||||||||||
Net Other Assets (Liabilities) |
| 2.0 | 8,010,116 | |||||||||||||||||||||||||||||
Net Assets | 100.0% | $ | 406,829,445 | |||||||||||||||||||||||||||||
Footnotes to Consolidated Statement of Investments
1. Non-income producing security.
2. Security received as the result of issuer reorganization.
12 OPPENHEIMER GLOBAL MULTI-ALTERNATIVES FUND/VA
Footnotes to Consolidated Statement of Investments (Continued)
3. The value of this security was determined using significant unobservable inputs. See Note 3 of the accompanying Consolidated Notes.
4. Security is a Master Limited Partnership.
5. All or portion of the security position is held in segregated accounts and pledged to cover margin requirements with respect to securities sold short. The aggregate market value of such securities is $14,577,903. See Note 10 of the accompanying Consolidated Notes.
6. All or a portion of the security position is held in segregated accounts and pledged to cover margin requirements with respect to outstanding written options. The aggregate market value of such securities is $13,491,341. See Note 6 of the accompanying Consolidated Notes.
7. Represents securities sold under Rule 144A, which are exempt from registration under the Securities Act of 1933, as amended. These securities have been determined to be liquid under guidelines established by the Board of Trustees. These securities amount to $64,572,742 or 15.87% of the Fund’s net assets at period end.
8. Represents the current interest rate for a variable or increasing rate security, determined as [Referenced Rate + Basis-point spread].
9. This bond has no contractual maturity date, is not redeemable and contractually pays an indefinite stream of interest.
10. This security is not accruing income because the issuer has missed an interest payment on it and/or is not anticipated to make future interest and or principal payments. The rate shown is the contractual interest rate. See Note 4 of the accompanying Consolidated Notes.
11. All or a portion of the security position is when-issued or delayed delivery to be delivered and settled after period end. See Note 4 of the accompanying Consolidated Notes.
12. Restricted security. The aggregate value of restricted securities at period end was $2,083,245, which represents 0.51% of the Fund’s net assets. See Note 4 of the accompanying Consolidated Notes. Information concerning restricted securities is as follows:
| Security | Acquisition Dates | Cost | Value | Unrealized Appreciation/ (Depreciation) | ||||||||||||
Caelus Re V Ltd. Catastrophe Linked Nts., 5.17% [T-BILL 3MO+325], 6/5/20 | 4/27/17-12/4/17 | $ | 746,297 | $ | 735,000 | $ | (11,297 | ) | ||||||||
Casablanca Re Ltd. Catastrophe Linked Nts., 5.25% [US0006M+525], 6/4/20 | 5/26/17 | 250,000 | 250,263 | 263 | ||||||||||||
Casablanca Re Ltd. Catastrophe Linked Nts., 17.258% [US0006M+1600], 6/4/20 | 5/26/17 | 250,000 | 122,500 | (127,500 | ) | |||||||||||
Loma Reinsurance Bermuda Ltd. Catastrophe Linked Nts., 2.415% [T-BILL 3MO+50], 7/9/18 | 4/11/14-5/19/15 | 500,000 | 212,500 | (287,500 | ) | |||||||||||
Manatee Re Ltd. Catastrophe Linked Nts., 1.899% [T-BILL 3MO+50], 3/10/19 | 3/2/16 | 500,000 | 13,000 | (487,000 | ) | |||||||||||
Nakama Re Ltd. Catastrophe Linked Nts., 5.165% [T-BILL 3MO+325], 1/14/21 | 12/14/15 | 250,000 | 255,913 | 5,913 | ||||||||||||
Residential Reinsurance 2013 Ltd., 4.915% [T-BILL 3MO+300], 9/6/18 | 5/3/16 | 250,000 | 118,750 | (131,250 | ) | |||||||||||
Residential Reinsurance 2017 Ltd. Catastrophe Linked Nts., 4.965% [T-BILL 3MO+305], 6/6/21 | 4/19/17 | 375,000 | 375,319 | 319 | ||||||||||||
| $ | 3,121,297 | $ | 2,083,245 | $ | (1,038,052 | ) | ||||||||||
13. Zero coupon bond reflects effective yield on the original acquisition date.
14. Security issued in an exempt transaction without registration under the Securities Act of 1933. Such securities amount to $8,066,573 or 1.98% of the Fund’s net assets, and have been determined to be liquid pursuant to guidelines adopted by the Board of Trustees.
15. Current yield as of period end.
16. All or a portion of this security is owned by the subsidiary. See Note 2 of the accompanying Consolidated Notes.
17. Is or was an affiliate, as defined in the Investment Company Act of 1940, as amended, at or during the reporting period, by virtue of the Fund owning at least 5% of the voting securities of the issuer or as a result of the Fund and the issuer having the same investment adviser. Transactions during the reporting period in which the issuer was an affiliate are as follows:
Shares December 31, 2017 | Gross Additions | Gross Reductions | Shares June 30, 2018 | |||||||||||||
| Oppenheimer Institutional Government Money Market Fund, Cl. E | 17,082,111 | 270,578,921 | 234,617,654 | 53,043,378 | ||||||||||||
| Value | Income | Realized Gain (Loss) | Change in Unrealized Gain (Loss) | |||||||||||||
| Oppenheimer Institutional Government Money Market Fund, Cl. E | $ | 53,043,378 | $ | 673,741 | $ | — | $ | — | ||||||||
18. Rate shown is the 7-day yield at period end.
19. This interest rate resets periodically. Interest rate shown reflects the rate in effect at period end. The rate on this variable rate security is not based on a published reference rate and spread but is determined by the issuer or agent based on current market conditions.
Distribution of investments representing geographic holdings, as a percentage of total investments at value, is as follows:
| Geographic Holdings | Value | Percent | ||||
United States | $ | 228,102,639 | 57.2% | |||
Singapore | 35,475,929 | 8.9 | ||||
Bermuda | 25,915,337 | 6.5 | ||||
Brazil | 22,039,271 | 5.5 | ||||
Japan | 21,411,406 | 5.4 | ||||
Portugal | 13,081,374 | 3.3 | ||||
Mexico | 12,559,263 | 3.2 | ||||
Supranational | 6,889,535 | 1.7 | ||||
Cayman Islands | 5,710,456 | 1.4 | ||||
Ireland | 4,275,739 | 1.1 | ||||
Canada | 3,103,849 | 0.8 | ||||
France | 2,801,417 | 0.7 | ||||
Netherlands | 2,538,169 | 0.6 | ||||
Switzerland | 2,159,802 | 0.5 | ||||
United Kingdom | 2,064,398 | 0.5 | ||||
13 OPPENHEIMER GLOBAL MULTI-ALTERNATIVES FUND/VA
CONSOLIDATED STATEMENT OF INVESTMENTS Unaudited / Continued
| Geographic Holdings (Continued) | Value | Percent | ||||||||
| Thailand | $ 2,017,927 | 0.5 | % | |||||||
| Hong Kong | 1,506,307 | 0.4 | ||||||||
| Germany | 1,497,431 | 0.4 | ||||||||
| Russia | 1,348,007 | 0.3 | ||||||||
| China | 1,066,588 | 0.3 | ||||||||
| Australia | 1,020,660 | 0.3 | ||||||||
| Turkey | 754,912 | 0.2 | ||||||||
| Italy | 496,584 | 0.1 | ||||||||
| Spain | 404,525 | 0.1 | ||||||||
| Sweden | 381,617 | 0.1 | ||||||||
| Philippines | 167,493 | 0.0 | ||||||||
| Indonesia | 28,694 | 0.0 | ||||||||
| ||||||||||
Total | $ 398,819,329 | 100.0 | % | |||||||
| ||||||||||
| Shares Sold Short | Value | |||||||
| Securities Sold Short—(11.2)% | ||||||||
Common Stock Securities Sold Short—(11.2)% | ||||||||
| AbbVie, Inc. | (11,582) | $ | (1,073,072 | ) | ||||
| AGCO Corp. | (16,330) | (991,558 | ) | |||||
| Air Lease Corp., Cl. A | (14,595) | (612,552 | ) | |||||
| Aircastle Ltd. | (30,680) | (628,940 | ) | |||||
| Aker Solutions ASA1 | (7,123) | (49,848 | ) | |||||
| Ally Financial, Inc. | (61,480) | (1,615,080 | ) | |||||
| Apache Corp. | (19,300) | (902,275 | ) | |||||
| AvalonBay Communities, Inc. | (5,390) | (926,487 | ) | |||||
| Boeing Co. (The) | (2,392) | (802,540 | ) | |||||
| Camden Property Trust | (7,650) | (697,144 | ) | |||||
| Caterpillar, Inc. | (5,880) | (797,740 | ) | |||||
| Church & Dwight Co., Inc. | (26,620) | (1,415,119 | ) | |||||
| Cie Financiere Richemont SA | (15,136) | (1,282,274 | ) | |||||
| CNH Industrial NV | (40,210) | (423,411 | ) | |||||
| Colgate-Palmolive Co. | (24,240) | (1,570,994 | ) | |||||
| Corning, Inc. | (21,960) | (604,120 | ) | |||||
| Darden Restaurants, Inc. | (4,940) | (528,876 | ) | |||||
| Diamondback Energy, Inc. | (5,250) | (690,743 | ) | |||||
| Digital Realty Trust, Inc. | (12,130) | (1,353,465 | ) | |||||
| Dril-Quip, Inc.1 | (8,720) | (448,208 | ) | |||||
| Equity Residential | (11,390) | (725,429 | ) | |||||
| Fastenal Co. | (12,210) | (587,667 | ) | |||||
| Federal Realty Investment Trust | (5,010) | (634,015 | ) | |||||
| Franklin Resources, Inc. | (34,740) | (1,113,417 | ) | |||||
| General Mills, Inc. | (30,060) | (1,330,456 | ) | |||||
| GlaxoSmithKline plc, Sponsored ADR | (8,160) | (328,930 | ) | |||||
| HP, Inc. | (39,200) | (889,448 | ) | |||||
| Intel Corp. | (24,740) | (1,229,825 | ) | |||||
| International Business Machines Corp. | (12,380) | (1,729,486 | ) | |||||
| Jones Lang LaSalle, Inc. | (11,410) | (1,893,946 | ) | |||||
| Kirby Corp.1 | (5,810) | (485,716 | ) | |||||
| Koninklijke Ahold Delhaize NV | (50,664) | (1,212,093 | ) | |||||
| Novo Nordisk AS, Sponsored ADR | (26,130) | (1,205,116 | ) | |||||
| Oceaneering International, Inc. | (18,390) | (468,209 | ) | |||||
| Oil States International, Inc.1 | (14,952) | (479,959 | ) | |||||
| Pennsylvania Real Estate Investment Trust | (93,578) | (1,028,422 | ) | |||||
| Procter & Gamble Co. (The) | (19,030) | (1,485,482 | ) | |||||
| ResMed, Inc. | (12,500) | (1,294,750 | ) | |||||
| Rio Tinto plc, Sponsored ADR | (15,450) | (857,166 | ) | |||||
| RLJ Lodging Trust | (22,260) | (490,833 | ) | |||||
| Rowan Cos. plc, Cl. A1 | (29,790) | (483,194 | ) | |||||
| Southern Copper Corp. | (23,780) | (1,114,569 | ) | |||||
| Starbucks Corp. | (13,470) | (658,009 | ) | |||||
| Target Corp. | (18,640) | (1,418,877 | ) | |||||
| W.W. Grainger, Inc. | (2,245) | (692,358 | ) | |||||
| Wacker Chemie AG | (4,736) | (619,093 | ) | |||||
| Weingarten Realty Investors | (24,660) | (759,775 | ) | |||||
| Western Union Co. (The) | (65,410) | (1,329,785 | ) | |||||
| William Demant Holding AS1 | (32,558) | (1,309,392 | ) | |||||
|
|
| ||||||
Total Securities Sold Short (Proceeds $44,231,214) | $ | (45,269,863 | ) | |||||
|
|
| ||||||
14 OPPENHEIMER GLOBAL MULTI-ALTERNATIVES FUND/VA
| Forward Currency Exchange Contracts as of June 30, 2018 |
| |||||||||||||||||||||||||
| Counterparty | Settlement Month(s) | Currency Purchased (000’s) | Currency Sold (000’s) | Unrealized Appreciation | Unrealized Depreciation | |||||||||||||||||||||
BAC | 09/2018 | IDR | 416,000 | USD | 29 | $ | — | $ | 208 | |||||||||||||||||
BAC | 09/2018 | TWD | 92,000 | USD | 3,036 | — | 1,035 | |||||||||||||||||||
BAC | 09/2018 | USD | 4,997 | CNH | 32,620 | 96,181 | — | |||||||||||||||||||
BAC | 09/2018 | USD | 3,228 | EUR | 2,750 | — | 5,070 | |||||||||||||||||||
BAC | 09/2018 | USD | 1,096 | NOK | 8,920 | — | 3,069 | |||||||||||||||||||
BAC | 09/2018 | USD | 4,589 | PHP | 247,000 | — | 6,232 | |||||||||||||||||||
BAC | 09/2018 | USD | 1,506 | SEK | 13,430 | — | 3,053 | |||||||||||||||||||
BOA | 09/2018 | COP | 9,424,000 | USD | 3,180 | 22,393 | — | |||||||||||||||||||
BOA | 09/2018 | NOK | 32,890 | USD | 4,063 | — | 10,797 | |||||||||||||||||||
BOA | 09/2018 | SEK | 40,600 | USD | 4,604 | — | 40,437 | |||||||||||||||||||
BOA | 09/2018 | SGD | 6,000 | USD | 4,408 | 4,136 | — | |||||||||||||||||||
BOA | 09/2018 | TRY | 7,900 | USD | 1,667 | — | 9,484 | |||||||||||||||||||
BOA | 09/2018 | USD | 4,272 | SGD | 5,790 | 14,841 | — | |||||||||||||||||||
BOA | 09/2018 | USD | 1,308 | THB | 43,000 | 6,387 | — | |||||||||||||||||||
BOA | 09/2018 | USD | 3,338 | ZAR | 46,480 | — | 11,622 | |||||||||||||||||||
CITNA-B | 09/2018 | INR | 2,000 | USD | 29 | — | 254 | |||||||||||||||||||
CITNA-B | 09/2018 | MXN | 6,200 | USD | 301 | 6,756 | — | |||||||||||||||||||
CITNA-B | 09/2018 | PLN | 5,570 | USD | 1,486 | 3,367 | — | |||||||||||||||||||
CITNA-B | 09/2018 | USD | 4,049 | CLP | 2,632,000 | 21,358 | — | |||||||||||||||||||
CITNA-B | 11/2018 | USD | 1,633 | CNH | 11,040 | 4,719 | 27,367 | |||||||||||||||||||
CITNA-B | 09/2018 | USD | 172 | COP | 508,000 | — | 408 | |||||||||||||||||||
CITNA-B | 09/2018 | USD | 8,853 | EUR | 7,568 | — | 43,765 | |||||||||||||||||||
CITNA-B | 09/2018 | USD | 5,025 | ILS | 18,090 | 49,430 | — | |||||||||||||||||||
CITNA-B | 09/2018 | USD | 3,380 | PLN | 12,570 | 19,286 | — | |||||||||||||||||||
CITNA-B | 09/2018 | USD | 674 | TRY | 3,320 | — | 22,167 | |||||||||||||||||||
DEU | 09/2018 | USD | 5,692 | CAD | 7,560 | — | 67,034 | |||||||||||||||||||
GSCO-OT | 08/2018 | BRL | 790 | USD | 204 | — | 839 | |||||||||||||||||||
GSCO-OT | 07/2018 | MXN | 55,000 | USD | 2,801 | — | 32,404 | |||||||||||||||||||
GSCO-OT | 09/2018 | MYR | 165 | USD | 41 | — | 227 | |||||||||||||||||||
GSCO-OT | 09/2018 | RUB | 259,100 | USD | 4,032 | 56,897 | — | |||||||||||||||||||
GSCO-OT | 09/2018 | USD | 1,392 | AUD | 1,885 | — | 3,101 | |||||||||||||||||||
GSCO-OT | 08/2018 | USD | 2,788 | MXN | 55,000 | 32,513 | — | |||||||||||||||||||
GSCO-OT | 09/2018 | USD | 4,555 | NZD | 6,622 | 69,879 | — | |||||||||||||||||||
GSCO-OT | 09/2018 | USD | 3,102 | SEK | 27,170 | 48,571 | — | |||||||||||||||||||
GSCO-OT | 09/2018 | USD | 2,993 | ZAR | 41,510 | 1,058 | — | |||||||||||||||||||
HSBC | 09/2018 | CHF | 710 | USD | 721 | 1,668 | — | |||||||||||||||||||
HSBC | 09/2018 | CNH | 1,040 | USD | 156 | — | 164 | |||||||||||||||||||
HSBC | 09/2018 | GBP | 915 | USD | 1,208 | 3,950 | — | |||||||||||||||||||
HSBC | 09/2018 | NZD | 2,365 | USD | 1,599 | 3,064 | — | |||||||||||||||||||
HSBC | 09/2018 | THB | 68,000 | USD | 2,056 | 1,595 | — | |||||||||||||||||||
HSBC | 07/2018 | USD | 2,085 | EUR | 1,700 | 96,861 | — | |||||||||||||||||||
HSBC | 09/2018 | USD | 4,392 | KRW | 4,879,000 | — | 1,608 | |||||||||||||||||||
HSBC | 08/2018 | USD | 8,883 | MXN | 185,000 | — | 344,373 | |||||||||||||||||||
JPM | 09/2018 | AUD | 4,160 | USD | 3,071 | 8,261 | — | |||||||||||||||||||
JPM | 07/2018 | BRL | 9,700 | USD | 2,534 | — | 31,649 | |||||||||||||||||||
JPM | 09/2018 | IDR | 28,161,000 | USD | 1,943 | — | 750 | |||||||||||||||||||
JPM | 09/2018 | ILS | 10,780 | USD | 2,968 | — | 2,869 | |||||||||||||||||||
JPM | 09/2018 | JPY | 567,000 | USD | 5,191 | — | 38,565 | |||||||||||||||||||
JPM | 09/2018 | PHP | 22,000 | USD | 410 | — | 320 | |||||||||||||||||||
JPM | 09/2018 | TWD | 1,000 | USD | 33 | — | 137 | |||||||||||||||||||
JPM | 07/2018 - 10/2018 | USD | 25,658 | BRL | 96,500 | 969,192 | — | |||||||||||||||||||
JPM | 07/2018 | USD | 11,329 | EUR | 9,500 | 221,080 | — | |||||||||||||||||||
JPM | 09/2018 | USD | 1,217 | GBP | 915 | 4,953 | — | |||||||||||||||||||
JPM | 09/2018 | USD | 534 | INR | 37,000 | 18 | — | |||||||||||||||||||
JPM | 09/2018 | USD | 15,133 | JPY | 1,650,000 | 156,180 | — | |||||||||||||||||||
JPM | 09/2018 | USD | 1,084 | RUB | 68,700 | 275 | — | |||||||||||||||||||
JPM | 09/2018 | USD | 34,952 | SGD | 47,500 | 27,961 | — | |||||||||||||||||||
JPM | 09/2018 | ZAR | 101,400 | USD | 7,380 | — | 71,361 | |||||||||||||||||||
SCB | 09/2018 | USD | 2,102 | THB | 67,000 | 75,552 | — | |||||||||||||||||||
TDB | 09/2018 | USD | 1,451 | CAD | 1,915 | — | 7,350 | |||||||||||||||||||
TDB | 07/2018 | USD | 2,979 | MXN | 55,000 | 210,245 | — | |||||||||||||||||||
Total Unrealized Appreciation and Depreciation | $ | 2,238,627 | $ | 787,719 | ||||||||||||||||||||||
15 OPPENHEIMER GLOBAL MULTI-ALTERNATIVES FUND/VA
CONSOLIDATED STATEMENT OF INVESTMENTS Unaudited / Continued
| Futures Contracts as of June 30, 2018 |
| |||||||||||||||||||||||||||
| Description | Buy/Sell | Expiration Date | Number of Contracts | Notional Amount (000’s) | Value | Unrealized Appreciation/ (Depreciation) | ||||||||||||||||||||||
| Brent Crude Oil* | Buy | 7/31/18 | 55 | USD | 4,105 | $ | 4,357,650 | $ | 252,668 | |||||||||||||||||||
| Euro-BONO | Sell | 9/06/18 | 11 | EUR | 1,859 | 1,867,009 | (8,485 | ) | ||||||||||||||||||||
| Euro-BTP | Sell | 9/06/18 | 24 | EUR | 3,539 | 3,566,181 | (27,494 | ) | ||||||||||||||||||||
| Euro-BUND | Buy | 9/06/18 | 35 | EUR | 6,594 | 6,643,906 | 50,234 | |||||||||||||||||||||
| Euro-OAT | Sell | 9/06/18 | 10 | EUR | 1,787 | 1,804,718 | (17,295 | ) | ||||||||||||||||||||
| MSCI Emerging Market Index | Sell | 9/21/18 | 18 | USD | 953 | 956,970 | (4,152 | ) | ||||||||||||||||||||
| Nikkei 225 Index | Sell | 9/13/18 | 3 | JPY | 600 | 603,983 | (4,072 | ) | ||||||||||||||||||||
| Russell 2000 Mini Index | Buy | 9/21/18 | 300 | USD | 25,145 | 24,712,500 | (432,471 | ) | ||||||||||||||||||||
| S&P 500 E-Mini Index | Sell | 9/21/18 | 244 | USD | 33,780 | 33,202,300 | 577,564 | |||||||||||||||||||||
| S&P 500 E-Mini Index | Buy | 9/21/18 | 180 | USD | 24,509 | 24,493,500 | (15,372 | ) | ||||||||||||||||||||
| S&P MID 400 E-Mini Index | Buy | 9/21/18 | 17 | USD | 3,412 | 3,325,370 | (86,481 | ) | ||||||||||||||||||||
| S&P/TSX 60 Index | Sell | 9/20/18 | 2 | CAD | 292 | 293,097 | (1,212 | ) | ||||||||||||||||||||
| SPI 200 Index | Sell | 9/20/18 | 2 | AUD | 226 | 227,491 | (1,927 | ) | ||||||||||||||||||||
| Stoxx Europe 600 Index | Sell | 9/21/18 | 74 | EUR | 1,624 | 1,635,446 | (11,305 | ) | ||||||||||||||||||||
| United States Treasury Long Bonds | Buy | 9/19/18 | 114 | USD | 16,382 | 16,530,000 | 148,004 | |||||||||||||||||||||
| United States Treasury Nts., 10 yr. | Buy | 9/19/18 | 71 | USD | 8,515 | 8,533,313 | 18,741 | |||||||||||||||||||||
| United States Treasury Nts., 5 yr. | Buy | 9/28/18 | 113 | USD | 12,818 | 12,838,742 | 21,010 | |||||||||||||||||||||
| $ | 457,955 | |||||||||||||||||||||||||||
*All or a portion of this security is owned by the subsidiary. See Note 2 of the accompanying Consolidated Notes.
| Exchange-Traded Options Written at June 30, 2018 |
| |||||||||||||||||||||||||||||||||
| Description | Exercise Price | Expiration Date | Number of Contracts | Notional Amount (000’s) | Premiums Received | Value | ||||||||||||||||||||||||||||
| S&P 500 Index Put | USD | 2390.000 | 7/20/18 | USD | (29 | ) | USD 7,883 | $ | 5,712 | $ | (5,220 | ) | ||||||||||||||||||||||
| S&P 500 Index Put | USD | 2335.000 | 7/20/18 | USD | (31 | ) | USD 8,427 | 4,866 | (3,255 | ) | ||||||||||||||||||||||||
| S&P 500 Index Call | USD | 2935.000 | 7/20/18 | USD | (19 | ) | USD 5,165 | 1,215 | (238 | ) | ||||||||||||||||||||||||
| S&P 500 Index Put | USD | 2665.000 | 7/20/18 | USD | (24 | ) | USD 6,524 | 22,967 | (39,312 | ) | ||||||||||||||||||||||||
| S&P 500 Index Put | USD | 2555.000 | 7/20/18 | USD | (26 | ) | USD 7,068 | 11,101 | (15,080 | ) | ||||||||||||||||||||||||
| S&P 500 Index Call | USD | 2880.000 | 7/20/18 | USD | (19 | ) | USD 5,165 | 3,552 | (475 | ) | ||||||||||||||||||||||||
| S&P 500 Index Put | USD | 2445.000 | 7/20/18 | USD | (28 | ) | USD 7,611 | 6,915 | (7,070 | ) | ||||||||||||||||||||||||
| S&P 500 Index Put | USD | 2610.000 | 7/20/18 | USD | (25 | ) | USD 6,796 | 15,424 | (19,500 | ) | ||||||||||||||||||||||||
| S&P 500 Index Call | USD | 2990.000 | 7/20/18 | USD | (19 | ) | USD 5,165 | 550 | (190 | ) | ||||||||||||||||||||||||
| S&P 500 Index Put | USD | 2500.000 | 7/20/18 | USD | (27 | ) | USD 7,340 | 8,558 | (9,450 | ) | ||||||||||||||||||||||||
| S&P 500 Index Call | USD | 2775.000 | 7/20/18 | USD | (11 | ) | USD 2,990 | 32,637 | (8,283 | ) | ||||||||||||||||||||||||
| S&P 500 Index Put | USD | 2775.000 | 7/20/18 | USD | (11 | ) | USD 2,990 | 34,287 | (66,649 | ) | ||||||||||||||||||||||||
| S&P 500 Index Put | USD | 2720.000 | 7/20/18 | USD | (23 | ) | USD 6,252 | 37,650 | (73,140 | ) | ||||||||||||||||||||||||
| S&P 500 Index Call | USD | 2830.000 | 7/20/18 | USD | (20 | ) | USD 5,437 | 15,539 | (1,720 | ) | ||||||||||||||||||||||||
S&P 500 Index Put | USD | 2280.000 | 7/20/18 | USD | (32 | ) | USD 8,699 | 4,063 | (3,520 | ) | ||||||||||||||||||||||||
Total Exchange-Traded Options Written |
| $ | 205,036 | $ | (253,102 | ) | ||||||||||||||||||||||||||||
| Over-the-Counter Options Written at June 30, 2018 |
| |||||||||||||||||||||||||||||||||
| Description | Counterparty | Exercise Price | Expiration Date | Number of Contracts | Notional Amount (000’s) | Premiums Received | Value | |||||||||||||||||||||||||||
| EUR Currency Put | JPM | MXN | 23.687 | 7/25/18 | EUR | (2,750,000 | ) | EUR 50,000 | $ | 60,309 | $ | (86,455 | ) | |||||||||||||||||||||
| EUR Currency Call | JPM | MXN | 23.687 | 7/25/18 | EUR | (2,750,000 | ) | EUR 50,000 | 60,277 | (36,106 | ) | |||||||||||||||||||||||
| EUR Currency Put | JPM | BRL | 4.439 | 7/25/18 | EUR | (2,750,000 | ) | EUR 50,000 | 55,307 | (21,584 | ) | |||||||||||||||||||||||
| EUR Currency Call | JPM | BRL | 4.439 | 7/25/18 | EUR | (2,750,000 | ) | EUR 50,000 | 54,632 | (97,166 | ) | |||||||||||||||||||||||
| EUR Currency Put | JPM | USD | 1.159 | 7/5/18 | EUR | (4,685,000 | ) | EUR 5,105 | 27,450 | (4,559 | ) | |||||||||||||||||||||||
EUR Currency Call | JPM | USD | 1.159 | 7/5/18 | EUR | (4,685,000 | ) | EUR 5,105 | 25,660 | (48,068 | ) | |||||||||||||||||||||||
Total Over-the-Counter Options Written |
| $ | 283,635 | $ | (293,938 | ) | ||||||||||||||||||||||||||||
| Centrally Cleared Credit Default Swaps at June 30, 2018 |
| |||||||||||||||||||||||||||||||
| Reference Asset | Buy/Sell Protection | Fixed Rate | Maturity Date | Notional Amount (000’s) | Premiums Received/(Paid) | Value | Unrealized Appreciation/ (Depreciation) | |||||||||||||||||||||||||
| CDX.HY.28 | Buy | 5.000 | % | 6/20/22 | USD | 2,030 | $ | 141,749 | $ | (144,506 | ) | $ | (2,757 | ) | ||||||||||||||||||
| CDX.HY.29 | Buy | 5.000 | 12/20/22 | USD | 100 | 6,785 | (6,369 | ) | 416 | |||||||||||||||||||||||
| CDX.IG.28 | Sell | 1.000 | 6/20/22 | USD | 5,655 | (102,346 | ) | 95,243 | (7,103 | ) | ||||||||||||||||||||||
| CDX.IG.28 | Sell | 1.000 | 6/20/22 | USD | 300 | (5,377 | ) | 5,053 | (324 | ) | ||||||||||||||||||||||
| CDX.IG.29 | Sell | 1.000 | 12/20/22 | USD | 150 | (3,751 | ) | 2,627 | (1,124 | ) | ||||||||||||||||||||||
| CDX.IG.29 | Sell | 1.000 | 12/20/22 | USD | 400 | (8,143 | ) | 7,006 | (1,137 | ) | ||||||||||||||||||||||
| iTraxx.Main.27 | Buy | 1.000 | 6/20/22 | EUR | 5,040 | 107,520 | (99,623 | ) | 7,897 | |||||||||||||||||||||||
| iTraxx.Main.28 | Buy | 1.000 | 12/20/22 | EUR | 170 | 4,961 | (3,227 | ) | 1,734 | |||||||||||||||||||||||
| iTraxx.Main.29 | Buy | 1.000 | 6/20/23 | EUR | 350 | 6,671 | (5,424 | ) | 1,247 | |||||||||||||||||||||||
| Neiman Marcus Group LLC (The) | Buy | 5.000 | 12/20/20 | USD | 715 | 41,431 | 54,578 | 96,009 | ||||||||||||||||||||||||
16 OPPENHEIMER GLOBAL MULTI-ALTERNATIVES FUND/VA
| Centrally Cleared Credit Default Swaps (Continued) |
| |||||||||||||||||||||||||||||||
| Reference Asset | Buy/Sell Protection | Fixed Rate | Maturity Date | Notional Amount (000’s) | Premiums Received/(Paid) | Value | Unrealized Appreciation/ (Depreciation) | |||||||||||||||||||||||||
Penerbangan Malaysia Bhd | Buy | 1.000% | 12/20/22 | USD | 80 | $ | 1,620 | $ | (129) | $ | 1,491 | |||||||||||||||||||||
Total Cleared Credit Default Swaps | $ | 191,120 | $ | (94,771) | $ | 96,349 | ||||||||||||||||||||||||||
| Over-the-Counter Credit Default Swaps at June 30, 2018 |
| |||||||||||||||||||||||||||||||||||
| Reference Asset | Counterparty | Buy/Sell Protection | Fixed Rate | Maturity Date | Notional Amount (000’s) | Premiums Received/(Paid) | Value | Unrealized Appreciation/ (Depreciation) | ||||||||||||||||||||||||||||
| CDX.NA.HY.21 | CITNA-B | Buy | 5.000% | 12/20/18 | USD | 1,125 | $ | (34,531 | ) | $ | (28,494) | $ | (63,025) | |||||||||||||||||||||||
| CDX.NA.HY.21 | CITNA-B | Sell | 5.000 | 12/20/18 | USD | 232 | 129,187 | (2,360) | 126,827 | |||||||||||||||||||||||||||
| CDX.NA.HY.21 | GSCOI | Sell | 5.000 | 12/20/18 | USD | 68 | 37,103 | (692) | 36,411 | |||||||||||||||||||||||||||
| CDX.NA.HY.25 | GSCOI | Buy | 5.000 | 12/20/20 | USD | 1,125 | (194,688 | ) | (109,836) | (304,524) | ||||||||||||||||||||||||||
| CDX.NA.HY.25 | GSCOI | Sell | 5.000 | 12/20/20 | USD | 296 | 196,615 | (64,652) | 131,963 | |||||||||||||||||||||||||||
| Federation of Malaysia | BNP | Buy | 1.000 | 6/20/21 | USD | 775 | (22,856 | ) | (8,511) | (31,367) | ||||||||||||||||||||||||||
| Federation of Malaysia | BNP | Buy | 1.000 | 12/20/20 | USD | 1,700 | (110,691 | ) | (19,388) | (130,079) | ||||||||||||||||||||||||||
| Federation of Malaysia | MOS-A | Buy | 1.000 | 12/20/20 | USD | 1,700 | (85,394 | ) | (19,388) | (104,782) | ||||||||||||||||||||||||||
| Total Over-the-Counter Credit Default Swaps |
| $ | (85,255 | ) | $ | (253,321) | $ | (338,576) | ||||||||||||||||||||||||||||
The table that follows shows the undiscounted maximum potential payment by the Fund related to selling credit protection in credit default swaps:
Type of Reference Asset on which the Fund Sold Protection | Total Maximum Potential Payments for Selling Credit Protection (Undiscounted) | Amount Recoverable* | Reference Asset Rating Range** | |||||||||
| Investment Grade Corporate Debt Indexes | $6,505,000 | $ — | BBB to BBB- | |||||||||
| Non-Investment Grade Corporate Debt Indexes | 595,576 | 2,250,000 | BB | |||||||||
|
|
|
| |||||||||
| Total | $7,100,576 | $2,250,000 | ||||||||||
|
|
|
| |||||||||
* Amounts recoverable includes potential payments from related purchased protection for instances where the Fund is the seller of protection. In addition, the Fund has no recourse provisions under the credit derivatives and holds no collateral which can offset or reduce potential payments under a triggering event.
** The period end reference asset security ratings, as rated by any rating organization, are included in the equivalent Standard & Poor’s rating category. The reference asset rating represents the likelihood of a potential credit event on the reference asset which would result in a related payment by the Fund.
| Over-the-Counter Total Return Swaps at June 30, 2018 | ||||||||||||||||||||||||||||||
| Reference Asset | Counterparty | Pay/Receive Total Return* | Floating Rate | Maturity Date | Notional Amount (000’s) | Value | Unrealized Appreciation/ (Depreciation) | |||||||||||||||||||||||
| 0998.HK-China Citic Bank Corp. | GSCOI | Pay | One-Month HKD- HIBOR-HKAB minus 50 basis points | 5/24/19 | HKD | 4,194 | $ | 48,571 | $ | 48,571 | ||||||||||||||||||||
| 1988.HK-China Minsheng Banking Corp. Ltd. | GSCOI | Pay | One-Month HKD- HIBOR-HKAB minus 50 basis points | 5/24/19 | HKD | 4,241 | 124,999 | 124,999 | ||||||||||||||||||||||
| 3328.HK-Bank of Communications Co. Ltd. | GSCOI | Pay | One-Month HKD- HIBOR-HKAB minus 50 basis points | 5/24/19 | HKD | 4,219 | 29,831 | 29,831 | ||||||||||||||||||||||
| 3968.HK-China Merchants Bank | GSCOI | Pay | One-Month HKD- HIBOR-HKAB minus 50 basis points | 5/24/19 | HKD | 4,305 | 90,398 | 90,398 | ||||||||||||||||||||||
| 6818.HK-China Everbright Bank | GSCOI | Pay | One-Month HKD- HIBOR-HKAB minus 50 basis points | 5/24/19 | HKD | 2,115 | 29,544 | 29,544 | ||||||||||||||||||||||
| SPDR Blackston/GSO Senior Loan Exchange Traded Fund | GSCOI | Receive | One-Month USD BBA LIBOR plus 50 basis points | 11/29/18 | USD | 60,537 | 80,431 | 80,431 | ||||||||||||||||||||||
| Total Over-the-Counter Total Return Swaps | $ | 403,774 | $ | 403,774 | ||||||||||||||||||||||||||
* Fund will pay or receive the total return of the reference asset depending on whether the return is positive or negative. For contracts where the Fund has elected to receive the total return of the reference asset if positive, it will be responsible for paying the floating rate and the total return of the reference asset if negative. If the Fund has elected to pay the total return of the reference asset if positive, it will receive the floating rate and the total return of the reference asset if negative.
Glossary:
Counterparty Abbreviations
| BAC | Barclays Bank plc | |
| BNP | BNP Paribas | |
| BOA | Bank of America NA | |
| CITNA-B | Citibank NA | |
| DEU | Deutsche Bank AG |
17 OPPENHEIMER GLOBAL MULTI-ALTERNATIVES FUND/VA
CONSOLIDATED STATEMENT OF INVESTMENTS Unaudited / Continued
| Counterparty Abbreviations (Continued) | ||
GSCOI | Goldman Sachs International | |
GSCO-OT | Goldman Sachs Bank USA | |
HSBC | HSBC Bank USA NA | |
JPM | JPMorgan Chase Bank NA | |
MOS | Morgan Stanley & Co., Inc. | |
MOS-A | Morgan Stanley | |
SCB | Standard Chartered Bank | |
TDB | Toronto Dominion Bank | |
| Currency abbreviations indicate amounts reporting in currencies | ||
AUD | Australian Dollar | |
BRL | Brazilian Real | |
CAD | Canadian Dollar | |
CHF | Swiss Franc | |
CLP | Chilean Peso | |
CNH | Offshore ChineseRenminbi | |
COP | Colombian Peso | |
DKK | Danish Krone | |
EUR | Euro | |
GBP | British Pound Sterling | |
HKD | Hong Kong Dollar | |
IDR | Indonesian Rupiah | |
ILS | Israeli Shekel | |
INR | Indian Rupee | |
JPY | Japanese Yen | |
KRW | South Korean Won | |
MXN | Mexican Nuevo Peso | |
MYR | Malaysian Ringgit | |
NOK | Norwegian Krone | |
NZD | New Zealand Dollar | |
PHP | Philippine Peso | |
PLN | Polish Zloty | |
RUB | Russian Ruble | |
SEK | Swedish Krona | |
SGD | Singapore Dollar | |
THB | Thailand Baht | |
TRY | New Turkish Lira | |
TWD | New Taiwan Dollar | |
ZAR | South African Rand | |
| Definitions | ||
BBA LIBOR | British Bankers’ Association London - Interbank Offered Rate | |
BONO | Spanish Government Bonds | |
BTP | Italian Treasury Bonds | |
CDX.HY.28 | Markit CDX High Yield Index | |
CDX.HY.29 | Markit CDX High Yield Index | |
CDX.IG.28 | Markit CDX Investment Grade Index | |
CDX.IG.29 | Markit CDX Investment Grade Index | |
CDX.NA.HY.21 | Markit CDX North American High Yield | |
CDX.NA.HY.25 | Markit CDX North American High Yield | |
EUR003M | EURIBOR 3 Month ACT/360 | |
HIBOR | Hong Kong Interbank Offered Rate | |
HKAB | Hong Kong Association of Banks | |
ICE LIBOR | Intercontinental Exchange Benchmark Administration-London Interbank Offered Rate | |
iTraxx.Main.27 | Credit Default Swap Trading Index for a Specific Basket of Securities | |
iTraxx.Main.28 | Credit Default Swap Trading Index for a Specific Basket of Securities | |
iTraxx.Main.29 | Credit Default Swap Trading Index for a Specific Basket of Securities | |
LIBOR | London Interbank Offered Rate | |
LIBOR03M | ICE LIBOR USD 3 Month | |
LIBOR4 | London Interbank Offered Rate-Quarterly | |
LIBOR12 | London Interbank Offered Rate-Monthly | |
MLHKOPCB | Custom Basket of Securities | |
MSCI | Morgan Stanley Capital International | |
OAT | French Government Bonds | |
S&P | Standard & Poor’s | |
T-BILL 1MO | US Treasury Bill 1 Month | |
T-BILL 3MO | US Treasury Bill 3 Month | |
US0001M | ICE LIBOR USD 1 Month | |
18 OPPENHEIMER GLOBAL MULTI-ALTERNATIVES FUND/VA
| Definitions (Continued) | ||
US0003M | ICE LIBOR USD 3 Month | |
US0006M | ICE LIBOR USD 6 Month |
See accompanying Notes to Consolidated Financial Statements.
19 OPPENHEIMER GLOBAL MULTI-ALTERNATIVES FUND/VA
CONSOLIDATED STATEMENT OF ASSETS AND LIABILITIES June 30, 2018 Unaudited
Assets | ||||
| Investments, at value—see accompanying consolidated statement of investments: | ||||
| Unaffiliated companies (cost $332,729,698) | $ | 345,775,951 | ||
| Affiliated companies (cost $53,043,378) | 53,043,378 | |||
| 398,819,329 | ||||
| Cash | 1,069,318 | |||
| Cash used for collateral on futures | 5,488,000 | |||
| Cash used for collateral on OTC derivatives | 791,000 | |||
| Cash used for collateral on centrally cleared swaps | 284,666 | |||
| Deposits with broker for securities sold short | 39,950,397 | |||
| Deposits with broker for foreign securities sold short (cost $4,569,287) | 4,524,478 | |||
| Unrealized appreciation on forward currency exchange contracts | 2,238,627 | |||
| Swaps, at value | 403,774 | |||
| Centrally cleared swaps, at value (net premiums paid $78,186) | 164,507 | |||
| Receivables and other assets: | ||||
| Investments sold | 4,980,422 | |||
| Interest and dividends | 1,133,532 | |||
| Variation margin receivable | 100,628 | |||
| Shares of beneficial interest sold | 13 | |||
| Other | 25,194 | |||
| Total assets | 459,973,885 | |||
Liabilities | ||||
| Securities sold short, at value (proceeds $44,231,214)—see accompanying consolidated statement of investments | 45,269,863 | |||
| Unrealized depreciation on forward currency exchange contracts | 787,719 | |||
| Options written, at value (premiums received $488,671) | 547,040 | |||
| Swaps, at value (net premiums paid $85,255) | 253,321 | |||
| Centrally cleared swaps, at value (premiums received $269,306) | 259,278 | |||
| Payables and other liabilities: | ||||
| Investments purchased (including $1,715,652 purchased on a when-issued or delayed delivery basis) | 5,564,191 | |||
| Variation margin payable | 257,091 | |||
| Dividends on short sales | 51,773 | |||
| Trustees’ compensation | 12,990 | |||
| Distribution and service plan fees | 817 | |||
| Shares of beneficial interest redeemed | 100 | |||
| Other | 140,257 | |||
| Total liabilities | 53,144,440 | |||
Net Assets | $ | 406,829,445 | ||
Composition of Net Assets | ||||
| Par value of shares of beneficial interest | $ | 41,615 | ||
| Additional paid-in capital | 422,073,817 | |||
| Accumulated net investment income | 1,280,210 | |||
| Accumulated net realized loss on investments and foreign currency transactions | (30,464,745 | ) | ||
| Net unrealized appreciation on investments and translation of assets and liabilities denominated in foreign currencies | 13,898,548 | |||
Net Assets | $ | 406,829,445 | ||
Net Asset Value Per Share | ||||
| Non-Service Shares: | ||||
| Net asset value, redemption price per share and offering price per share (based on net assets of $402,805,545 and 41,202,655 shares of beneficial interest outstanding) | $9.78 | |||
| Service Shares: | ||||
| Net asset value, redemption price per share and offering price per share (based on net assets of $4,023,900 and 412,315 shares of beneficial interest outstanding) | $9.76 | |||
See accompanying Notes to Consolidated Financial Statements.
20 OPPENHEIMER GLOBAL MULTI-ALTERNATIVES FUND/VA
CONSOLIDATED STATEMENT OF OPERATIONS For the Six Months Ended June 30, 2018 Unaudited
Investment Income | ||||
| Interest (net of foreign withholding taxes of $2,094) | $ | 3,236,372 | ||
| Dividends: | ||||
| Unaffiliated companies (net of foreign withholding taxes of $32,247) | 1,501,043 | |||
| Affiliated companies | 673,741 | |||
Other income | 203,933 | |||
Total investment income
|
| 5,615,089
|
| |
Expenses | ||||
| Management fees | 2,127,896 | |||
| Distribution and service plan fees — Service shares | 4,605 | |||
| Transfer and shareholder servicing agent fees: | ||||
| Non-Service shares | 246,265 | |||
| Service shares | 2,210 | |||
| Shareholder communications: | ||||
| Non-Service shares | 11,910 | |||
| Service shares | 108 | |||
| Dividends on short sales | 354,741 | |||
| Custodian fees and expenses | 65,685 | |||
| Trustees’ compensation | 15,096 | |||
| Borrowing fees | 7,650 | |||
Other | 101,190 | |||
| Total expenses | 2,937,356 | |||
| Less reduction to custodian expenses | (579 | ) | ||
Less waivers and reimbursements of expenses | (99,908 | ) | ||
Net expenses
|
| 2,836,869
|
| |
| Net Investment Income | 2,778,220 | |||
| Realized and Unrealized Gain (Loss) | ||||
| Net realized gain (loss) on: | ||||
| Investment transactions in unaffiliated companies (net of foreign capital gains tax of $3,683) | 5,796,264 | |||
| Option contracts written | 2,367,455 | |||
| Futures contracts | 1,199,777 | |||
| Foreign currency transactions | 361,990 | |||
| Forward currency exchange contracts | (2,809,538 | ) | ||
| Short Positions | (3,501,335 | ) | ||
Swap contracts | (838,184 | ) | ||
| Net realized gain | 2,576,429 | |||
| Net change in unrealized appreciation/depreciation on: | ||||
| Investment transactions in unaffiliated companies | (13,004,705 | ) | ||
| Translation of assets and liabilities denominated in foreign currencies | (267,891 | ) | ||
| Forward currency exchange contracts | 2,471,940 | |||
| Futures contracts | (236,233 | ) | ||
| Option contracts written | (58,369 | ) | ||
| Short positions | 3,260,360 | |||
Swap contracts | 1,346,481 | |||
Net change in unrealized appreciation/depreciation
|
| (6,488,417
| )
| |
Net Decrease in Net Assets Resulting from Operations | $ | (1,133,768 | ) | |
See accompanying Notes to Consolidated Financial Statements.
21 OPPENHEIMER GLOBAL MULTI-ALTERNATIVES FUND/VA
CONSOLIDATED STATEMENTS OF CHANGES IN NET ASSETS
| Six Months Ended June 30, 2018 (Unaudited) | Year Ended December 31, 2017 | |||||||
Operations | ||||||||
| Net investment income | $ | 2,778,220 | $ | 4,888,490 | ||||
| Net realized gain (loss) | 2,576,429 | (12,625,099 | ) | |||||
Net change in unrealized appreciation/depreciation | (6,488,417 | ) | 9,719,277 | |||||
Net increase (decrease) in net assets resulting from operations
|
| (1,133,768
| )
|
| 1,982,668
|
| ||
| Dividends and/or Distributions to Shareholders | ||||||||
| Dividends from net investment income: | ||||||||
| Non-Service shares | (1,458,889 | ) | (3,921,732 | ) | ||||
Service shares | (6,755 | ) | (24,086 | ) | ||||
|
| (1,465,644
| )
|
| (3,945,818
| )
| |||
| Beneficial Interest Transactions | ||||||||
| Net increase (decrease) in net assets resulting from beneficial interest transactions: | ||||||||
| Non-Service shares | (10,429,789 | ) | 17,307,626 | |||||
Service shares | 580,879 | 940,121 | ||||||
|
| (9,848,910
| )
|
| 18,247,747
|
| |||
| Net Assets | ||||||||
| Total increase (decrease) | (12,448,322 | ) | 16,284,597 | |||||
Beginning of period | 419,277,767 | 402,993,170 | ||||||
End of period (including accumulated net investment income (loss) of $1,280,210 and $(32,366), respectively) | $ | 406,829,445 | $ | 419,277,767 | ||||
See accompanying Notes to Consolidated Financial Statements.
22 OPPENHEIMER GLOBAL MULTI-ALTERNATIVES FUND/VA
CONSOLIDATED FINANCIAL HIGHLIGHTS
| Non-Service Shares | Six Months Ended June 30, 2018 (Unaudited) | Year Ended December 31, 2017 | Year Ended December 31, 2016 | Year Ended December 31, 20151 | Year Ended December 31, 20141 | Period Ended December 31, 20132 | ||||||||||||||||||
Per Share Operating Data | ||||||||||||||||||||||||
| Net asset value, beginning of period | $9.84 | $9.88 | $9.66 | $10.04 | $9.92 | $10.00 | ||||||||||||||||||
| Income (loss) from investment operations: | ||||||||||||||||||||||||
| Net investment income (loss)3 | 0.07 | 0.12 | 0.11 | 0.11 | 0.08 | (0.02) | ||||||||||||||||||
| Net realized and unrealized gain (loss) | (0.09) | (0.06) | 0.25 | (0.46) | 0.52 | (0.05) | ||||||||||||||||||
| Total from investment operations | (0.02) | 0.06 | 0.36 | (0.35) | 0.60 | (0.07) | ||||||||||||||||||
| Dividends and/or distributions to shareholders: | ||||||||||||||||||||||||
| Dividends from net investment income | (0.04) | (0.10) | (0.14) | (0.03) | (0.25) | (0.01) | ||||||||||||||||||
| Distributions from net realized gain | 0.00 | 0.00 | 0.00 | 0.00 | (0.21) | 0.00 | ||||||||||||||||||
| Tax return of capital distribution | 0.00 | 0.00 | 0.00 | 0.00 | (0.02) | 0.00 | ||||||||||||||||||
| Total dividends and/or distributions to shareholders | (0.04) | (0.10) | (0.14) | (0.03) | (0.48) | (0.01) | ||||||||||||||||||
| Net asset value, end of period | $9.78 | $9.84 | $9.88 | $9.66 | $10.04 | $9.92 | ||||||||||||||||||
| Total Return, at Net Asset Value4 | (0.25)% | 0.56% | 3.71% | (3.45)% | 6.02% | (0.69)% | ||||||||||||||||||
| Ratios/Supplemental Data | ||||||||||||||||||||||||
| Net assets, end of period (in thousands) | $402,805 | $415,811 | $400,449 | $406,286 | $262,573 | $9,917 | ||||||||||||||||||
| Average net assets (in thousands) | $413,778 | $408,282 | $408,810 | $363,975 | $161,988 | $9,827 | ||||||||||||||||||
| Ratios to average net assets:5 | ||||||||||||||||||||||||
| Net investment income (loss) | 1.34% | 1.19% | 1.11% | 1.11% | 0.77%6 | (1.85)%6 | ||||||||||||||||||
| Expenses excluding specific expenses listed below | 1.25% | 1.24% | 1.23% | 1.24% | 1.33% | 7.16% | ||||||||||||||||||
| Dividends and/or interest expense on securities sold short | 0.17% | 0.11% | 0.22% | 0.17% | 0.08% | 0.00% | ||||||||||||||||||
| Borrowing expenses on securities sold short | 0.00% | 0.00% | 0.02% | 0.05% | 0.02% | 0.00% | ||||||||||||||||||
| Interest and fees from borrowings | 0.00%7 | 0.00%7 | 0.00%7 | 0.00%7 | 0.00% | 0.00% | ||||||||||||||||||
| Total expenses8 | 1.42% | 1.35% | 1.47% | 1.46% | 1.43%6 | 7.16%6 | ||||||||||||||||||
| Expenses after payments, waivers and/or reimbursements and reduction to custodian expenses | 1.37% | 1.32% | 1.43% | 1.41% | 1.31%6 | 3.33%6 | ||||||||||||||||||
| Portfolio turnover rate | 75% | 129% | 93% | 67% | 147% | 11% | ||||||||||||||||||
1. Net investment income per share, net realized and unrealized gain (loss) per share and the net investment income ratio include an adjustment for a prior period reclassification for the years ended December 31, 2014 and 2015. Please see Note 11 of the accompanying Notes to Financial Statements.
2. For the period from November 14, 2013 (inception of offering) to December 31, 2013.
3. Per share amounts calculated based on the average shares outstanding during the period.
4. Assumes an initial investment on the business day before the first day of the fiscal period, with all dividends and distributions reinvested in additional shares on the reinvestment date, and redemption at the net asset value calculated on the last business day of the fiscal period. Total returns are not annualized for periods less than one full year. Total return information does not reflect expenses that apply at the separate account level or to related insurance products. Inclusion of these charges would reduce the total return figures for all periods shown. Returns do not reflect the deduction of taxes that a shareholder would pay on fund distributions or the redemption of fund shares.
5. Annualized for periods less than one full year.
6. Includes the Fund’s share of the allocated expenses and/or net investment income from the master funds.
7. Less than 0.005%.
8. Total expenses including indirect expenses from affiliated fund fees and expenses were as follows:
| Six Months Ended June 30, 2018 | 1.44 | % | |||
Year Ended December 31, 2017 | 1.36 | % | ||||
Year Ended December 31, 2016 | 1.48 | % | ||||
Year Ended December 31, 2015 | 1.47 | % | ||||
Year Ended December 31, 2014 | 1.45 | % | ||||
Period Ended December 31, 2013 | 7.18 | % |
See accompanying Notes to Consolidated Financial Statements.
23 OPPENHEIMER GLOBAL MULTI-ALTERNATIVES FUND/VA
CONSOLIDATED FINANCIAL HIGHLIGHTS Continued
| Service Shares | Six Months Ended June 30, 2018 (Unaudited) | Year Ended December 31, 2017 | Year Ended December 31, 2016 | Year Ended December 31, 20151 | Year Ended December 31, 20141 | Period Ended December 31, 20132 | ||||||||||||||||||
| Per Share Operating Data | ||||||||||||||||||||||||
| Net asset value, beginning of period | $9.81 | $9.87 | $9.65 | $10.03 | $9.92 | $10.00 | ||||||||||||||||||
| Income (loss) from investment operations: | ||||||||||||||||||||||||
| Net investment income (loss)3 | 0.05 | 0.09 | 0.08 | 0.08 | 0.08 | (0.03) | ||||||||||||||||||
| Net realized and unrealized gain (loss) | (0.08) | (0.07) | 0.26 | (0.45) | 0.50 | (0.04) | ||||||||||||||||||
| Total from investment operations | (0.03) | 0.02 | 0.34 | (0.37) | 0.58 | (0.07) | ||||||||||||||||||
| Dividends and/or distributions to shareholders: | ||||||||||||||||||||||||
| Dividends from net investment income | (0.02) | (0.08) | (0.12) | (0.01) | (0.25) | (0.01) | ||||||||||||||||||
| Distributions from net realized gain | 0.00 | 0.00 | 0.00 | 0.00 | (0.21) | 0.00 | ||||||||||||||||||
| Tax return of capital distribution | 0.00 | 0.00 | 0.00 | 0.00 | (0.01) | 0.00 | ||||||||||||||||||
| Total dividends and/or distributions to shareholders | (0.02) | (0.08) | (0.12) | (0.01) | (0.47) | (0.01) | ||||||||||||||||||
| Net asset value, end of period | $9.76 | $9.81 | $9.87 | $9.65 | $10.03 | $9.92 | ||||||||||||||||||
| Total Return, at Net Asset Value4 | (0.34)% | 0.19% | 3.49% | (3.68)% | 5.90% | (0.72)% | ||||||||||||||||||
| Ratios/Supplemental Data | ||||||||||||||||||||||||
| Net assets, end of period (in thousands) | $4,024 | $3,467 | $2,544 | $1,845 | $1,332 | $10 | ||||||||||||||||||
| Average net assets (in thousands) | $3,722 | $3,063 | $2,054 | $1,695 | $335 | $10 | ||||||||||||||||||
| Ratios to average net assets:5 | ||||||||||||||||||||||||
| Net investment income (loss) | 1.09% | 0.92% | 0.85% | 0.85% | 0.78%6 | (2.12)%6 | ||||||||||||||||||
| Expenses excluding specific expenses listed below | 1.50% | 1.49% | 1.48% | 1.48% | 1.68% | 7.43% | ||||||||||||||||||
| Dividends and/or interest expense on securities sold short | 0.17% | 0.11% | 0.22% | 0.17% | 0.08% | 0.00% | ||||||||||||||||||
| Borrowing expenses on securities sold short | 0.00% | 0.00% | 0.02% | 0.05% | 0.02% | 0.00% | ||||||||||||||||||
| Interest and fees from borrowings | 0.00%7 | 0.00%7 | 0.00%7 | 0.00%7 | 0.00% | 0.00% | ||||||||||||||||||
| Total expenses8 | 1.67% | 1.60% | 1.72% | 1.70% | 1.78%6 | 7.43%6 | ||||||||||||||||||
| Expenses after payments, waivers and/or reimbursements and reduction to custodian expenses | 1.62% | 1.57% | 1.68% | 1.65% | 1.67%6 | 3.50%6 | ||||||||||||||||||
| Portfolio turnover rate | 75% | 129% | 93% | 67% | 147% | 11% | ||||||||||||||||||
1. Net investment income per share, net realized and unrealized gain (loss) per share and the net investment income ratio include an adjustment for a prior period reclassification for the years ended December 31, 2014 and 2015. Please see Note 11 of the accompanying Notes to Financial Statements.
2. For the period from November 14, 2013 (inception of offering) to December 31, 2013.
3. Per share amounts calculated based on the average shares outstanding during the period.
4. Assumes an initial investment on the business day before the first day of the fiscal period, with all dividends and distributions reinvested in additional shares on the reinvestment date, and redemption at the net asset value calculated on the last business day of the fiscal period. Total returns are not annualized for periods less than one full year. Total return information does not reflect expenses that apply at the separate account level or to related insurance products. Inclusion of these charges would reduce the total return figures for all periods shown. Returns do not reflect the deduction of taxes that a shareholder would pay on fund distributions or the redemption of fund shares.
5. Annualized for periods less than one full year.
6. Includes the Fund’s share of the allocated expenses and/or net investment income from the master funds.
7. Less than 0.005%.
8. Total expenses including indirect expenses from affiliated fund fees and expenses were as follows:
| Six Months Ended June 30, 2018 | 1.69 | % | |||
Year Ended December 31, 2017 | 1.61 | % | ||||
Year Ended December 31, 2016 | 1.73 | % | ||||
Year Ended December 31, 2015 | 1.71 | % | ||||
Year Ended December 31, 2014 | 1.80 | % | ||||
Period Ended December 31, 2013 | 7.45 | % |
See accompanying Notes to Consolidated Financial Statements.
24 OPPENHEIMER GLOBAL MULTI-ALTERNATIVES FUND/VA
NOTES TO CONSOLIDATED FINANCIAL STATEMENTS June 30, 2018 Unaudited
1. Organization
Oppenheimer Global Multi-Alternatives Fund/VA (the “Fund”) is a separate series of Oppenheimer Variable Account Funds, a diversified open-end management investment company registered under the Investment Company Act of 1940 (“1940 Act”), as amended. The Fund’s investment objective is to seek total return. The Fund’s investment adviser is OFI Global Asset Management, Inc. (“OFI Global” or the “Manager”), a wholly-owned subsidiary of OppenheimerFunds, Inc. (“OFI” or the “Sub-Adviser”). The Manager has entered into a sub-advisory agreement with OFI. The Sub-Adviser has entered into sub-sub-advisory agreements with Barings LLC and OFI SteelPath, Inc. (collectively, the “Sub-Sub-Advisers”). Shares of the Fund are sold only to separate accounts of life insurance companies.
The Fund offers two classes of shares. Both classes are sold at their offering price, which is the net asset value per share, to separate investment accounts of participating insurance companies as an underlying investment for variable life insurance policies, variable annuity contracts or other investment products. The class of shares designated as Service shares is subject to a distribution and service plan. Both classes of shares have identical rights and voting privileges with respect to the Fund in general and exclusive voting rights on matters that affect that class alone. Earnings, net assets and net asset value per share may differ due to each class having its own expenses, such as transfer and shareholder servicing agent fees and shareholder communications, directly attributable to that class.
The following is a summary of significant accounting policies followed in the Fund’s preparation of financial statements in accordance with accounting principles generally accepted in the United States (“U.S. GAAP”).
2. Significant Accounting Policies
Security Valuation. All investments in securities are recorded at their estimated fair value, as described in Note 3.
Basis for Consolidation. The Fund has established a Cayman Islands exempted company, Oppenheimer Global Multi-Alternatives Fund/VA (Cayman) Ltd., which is wholly-owned and controlled by the Fund (the “Subsidiary”). The Fund and Subsidiary are both managed by the Manager. The Fund may invest up to 25% of its total assets in the Subsidiary. The Subsidiary invests primarily in commodity-linked derivatives (including commodity futures, financial futures, options and swap contracts) and certain fixed-income securities and other investments that may serve as margin or collateral for its derivatives positions. The Fund applies its investment restrictions and compliance policies and procedures, on a look-through basis, to the Subsidiary.
The financial statements have been consolidated and include accounts of the Fund and the Subsidiary. Accordingly, all inter-company transactions and balances have been eliminated. At period end, the Fund owned 21,519 shares with net assets of $11,806,419 in the Subsidiary.
Other financial information at period end:
| Total market value of investments | $ | 9,166,494 | ||
| Net assets | $ | 11,806,419 | ||
| Net income (loss) | $ | (35,485 | ) | |
| Net realized gain (loss) | $ | 332,970 | ||
Net change in unrealized appreciation/depreciation | $ | (123,828 | ) |
Foreign Currency Translation. The books and records of the Fund are maintained in U.S. dollars. Any foreign currency amounts are translated into U.S. dollars on the following basis:
(1) Value of investment securities, other assets and liabilities — at the exchange rates prevailing at market close as described in Note 3.
(2) Purchases and sales of investment securities, income and expenses — at the rates of exchange prevailing on the respective dates of such transactions.
Although the net assets and the values are presented at the foreign exchange rates at market close, the Fund does not isolate the portion of the results of operations resulting from changes in foreign exchange rates on investments from the fluctuations arising from changes in prices of securities held. Such fluctuations are included with the net realized and unrealized gains or losses from investments shown in the Consolidated Statement of Operations.
For securities, which are subject to foreign withholding tax upon disposition, realized and unrealized gains or losses on such securities are recorded net of foreign withholding tax.
Reported net realized foreign exchange gains or losses arise from sales of foreign currencies, currency gains or losses realized between the trade and settlement dates on securities transactions, the difference between the amounts of dividends, interest, and foreign withholding tax reclaims recorded on the Fund’s books, and the U.S. dollar equivalent of the amounts actually received or paid. Net unrealized foreign exchange gains and losses arise from changes in the value of assets and liabilities other than investments in securities, resulting from changes in the exchange rate.
Allocation of Income, Expenses, Gains and Losses. Income, expenses (other than those attributable to a specific class), gains and losses are allocated on a daily basis to each class of shares based upon the relative proportion of net assets represented by such class. Operating expenses directly attributable to a specific class are charged against the operations of that class.
Dividends and Distributions to Shareholders. Dividends and distributions to shareholders, which are determined in accordance with income tax regulations and may differ from U.S. GAAP, are recorded on the ex-dividend date. Income and capital gain distributions, if any, are declared and paid annually or at other times as determined necessary by the Manager.
The tax character of distributions is determined as of the Fund’s fiscal year end. Therefore, a portion of the Fund’s distributions made to shareholders
25 OPPENHEIMER GLOBAL MULTI-ALTERNATIVES FUND/VA
NOTES TO CONSOLIDATED FINANCIAL STATEMENTS Unaudited / Continued
2. Significant Accounting Policies (Continued)
prior to the Fund’s fiscal year end may ultimately be categorized as a tax return of capital.
Investment Income. Dividend income is recorded on the ex-dividend date or upon ex-dividend notification in the case of certain foreign dividends where the ex-dividend date may have passed. Non-cash dividends included in dividend income, if any, are recorded at the fair value of the securities received. Withholding taxes on foreign dividends, if any, and capital gains taxes on foreign investments, if any, have been provided for in accordance with the Fund’s understanding of the applicable tax rules and regulations. Interest income, if any, is recognized on an accrual basis. Discount and premium, which are included in interest income on the Consolidated Statement of Operations, are amortized or accreted daily.
Return of Capital Estimates. Distributions received from the Fund’s investments in Master Limited Partnerships (MLPs) and Real Estate Investments Trusts (REITs), generally are comprised of income and return of capital. The Fund records investment income and return of capital based on estimates. Such estimates are based on historical information available from each MLP, REIT and other industry sources. These estimates may subsequently be revised based on information received from MLPs and REITs after their tax reporting periods are concluded.
Custodian Fees. “Custodian fees and expenses” in the Consolidated Statement of Operations may include interest expense incurred by the Fund on any cash overdrafts of its custodian account during the period. Such cash overdrafts may result from the effects of failed trades in portfolio securities and from cash outflows resulting from unanticipated shareholder redemption activity. The Fund pays interest to its custodian on such cash overdrafts, to the extent they are not offset by positive cash balances maintained by the Fund, at a rate equal to the Federal Funds Rate plus 2.00%. The “Reduction to custodian expenses” line item, if applicable, represents earnings on cash balances maintained by the Fund during the period. Such interest expense and other custodian fees may be paid with these earnings.
Security Transactions. Security transactions are recorded on the trade date. Realized gains and losses on securities sold are determined on the basis of identified cost.
Indemnifications. The Fund’s organizational documents provide current and former Trustees and officers with a limited indemnification against liabilities arising in connection with the performance of their duties to the Fund. In the normal course of business, the Fund may also enter into contracts that provide general indemnifications. The Fund’s maximum exposure under these arrangements is unknown as this would be dependent on future claims that may be made against the Fund. The risk of material loss from such claims is considered remote.
Federal Taxes. The Fund intends to comply with provisions of the Internal Revenue Code applicable to regulated investment companies and to distribute substantially all of its investment company taxable income to shareholders. Therefore, no federal income or excise tax provision is required. The Fund files income tax returns in U.S. federal and applicable state jurisdictions. The statute of limitations on the Fund’s tax return filings generally remains open for the three preceding fiscal reporting period ends. The Fund has analyzed its tax positions for the fiscal year ended December 31, 2017, including open tax years, and does not believe there are any uncertain tax positions requiring recognition in the Fund’s financial statements.
Subchapter M requires, among other things, that at least 90% of the Fund’s gross income be derived from securities or derived with respect to its business of investing in securities (typically referred to as “qualifying income”). Income from commodity-linked derivatives may not be treated as “qualifying income” for purposes of the 90% gross income requirement. The Internal Revenue Service (IRS) has previously issued a number of private letter rulings which conclude that income derived from commodity index-linked notes and investments in a wholly-owned subsidiary will be “qualifying income.” As a result, the Fund will gain exposure to commodities through commodity-linked notes and its wholly-owned subsidiary.
The IRS has suspended the granting of private letter rulings pending further review. As a result, there can be no assurance that the IRS will not change its position with respect to commodity-linked notes and wholly-owned subsidiaries. In addition, future legislation and guidance from the Treasury and the IRS may adversely affect the fund’s ability to gain exposure to commodities through commodity-linked notes and its wholly-owned subsidiary.
The Fund is required to include in income for federal income tax purposes all of the subsidiary’s net income and gains whether or not such income is distributed by the subsidiary. Net income and gains from the subsidiary are generally treated as ordinary income by the Fund, regardless of the character of the subsidiary’s underlying income. Net losses from the subsidiary do not pass through to the Fund for federal income tax purposes.
During the fiscal year ended December 31, 2017, the Fund did not utilize any capital loss carryforwards to offset capital gains realized in that fiscal year. The Fund had post-October foreign currency losses of 822,336 which were deferred. For the fiscal year ended December 31, 2017, the Fund had capital loss carryforwards of $20,101,917. Capital losses will be carried forward to future years if not offset by gains.
At period end, it is estimated that the capital loss carryforwards would be $17,525,488. The estimated capital loss carryforward represents the carryforward as of the end of the last fiscal year, increased or decreased by capital losses or gains realized in the first six months of the current fiscal year. During the reporting period, it is estimated that the Fund will utilize $2,576,429 of capital loss carryforward to offset realized capital gains.
Net investment income (loss) and net realized gain (loss) may differ for financial statement and tax purposes. The character of dividends and distributions made during the fiscal year from net investment income or net realized gains are determined in accordance with federal income tax requirements, which may differ from the character of net investment income or net realized gains presented in those financial statements in accordance with U.S. GAAP. Also, due to timing of dividends and distributions, the fiscal year in which amounts are distributed may differ from the fiscal year in which the income or net realized gain was recorded by the Fund.
The aggregate cost of securities and other investments and the composition of unrealized appreciation and depreciation of securities and other investments for federal income tax purposes at period end are noted in the following table. The primary difference between book and tax appreciation
26 OPPENHEIMER GLOBAL MULTI-ALTERNATIVES FUND/VA
2. Significant Accounting Policies (Continued)
or depreciation of securities and other investments, if applicable, is attributable to the tax deferral of losses or tax realization of financial statement unrealized gain or loss.
| Federal tax cost of securities | $ | 385,773,076 | ||
| Federal tax cost of other investments | 16,563,368 | |||
|
|
| ||
| Total federal tax cost | $ | 402,336,444 | ||
|
|
| ||
| Gross unrealized appreciation | $ | 32,495,874 | ||
| Gross unrealized depreciation | (18,597,326 | ) | ||
|
|
| ||
| Net unrealized appreciation | $ | 13,898,548 | ||
|
|
|
Certain foreign countries impose a tax on capital gains which is accrued by the Fund based on unrealized appreciation, if any, on affected securities. The tax is paid when the gain is realized.
Use of Estimates. The preparation of financial statements in conformity with U.S. GAAP requires management to make estimates and assumptions that affect the reported amounts of assets and liabilities and disclosure of contingent assets and liabilities at the date of the financial statements and the reported amounts of increases and decreases in net assets from operations during the reporting period. Actual results could differ from those estimates.
3. Securities Valuation
The Fund calculates the net asset value of its shares as of 4:00 P.M. Eastern Time, on each day the New York Stock Exchange (the “Exchange”) is open for trading, except in the case of a scheduled early closing of the Exchange, in which case the Fund will calculate net asset value of the shares as of the scheduled early closing time of the Exchange.
The Fund’s Board has adopted procedures for the valuation of the Fund’s securities and has delegated the day-to-day responsibility for valuation determinations under those procedures to the Manager. The Manager has established a Valuation Committee which is responsible for determining a fair valuation for any security for which market quotations are not readily available. The Valuation Committee’s fair valuation determinations are subject to review, approval and ratification by the Fund’s Board at least quarterly or more frequently, if necessary.
Valuation Methods and Inputs
Securities are valued primarily using unadjusted quoted market prices, when available, as supplied by third party pricing services or broker-dealers.
The following methodologies are used to determine the market value or the fair value of the types of securities described below:
Equity securities traded on a securities exchange (including exchange-traded derivatives other than futures and futures options) are valued based on the official closing price on the principal exchange on which the security is traded, as identified by the Manager, prior to the time when the Fund’s assets are valued. If the official closing price is unavailable, the security is valued at the last sale price on the principal exchange on which it is traded, or if no sales occurred, the security is valued at the mean between the quoted bid and asked prices. Over-the-counter equity securities are valued at the last published sale price, or if no sales occurred, at the mean between the quoted bid and asked prices. Events occurring after the close of trading on foreign exchanges may result in adjustments to the valuation of foreign securities to more accurately reflect their fair value as of the time when the Fund’s assets are valued.
Shares of a registered investment company that are not traded on an exchange are valued at that investment company’s net asset value per share.
Corporate and government debt securities (of U.S. or foreign issuers) and municipal debt securities, short-term notes, mortgage-backed securities, collateralized mortgage obligations, and asset-backed securities are valued at the mean between the bid and asked prices utilizing evaluated prices obtained from third party pricing services or broker-dealers who may use matrix pricing methods to determine the evaluated prices. Pricing services generally price debt securities assuming orderly transactions of an institutional “round lot” size, but some trades may occur in smaller, “odd lot” sizes, sometimes at lower prices than institutional round lot trades. Standard inputs generally considered by third-party pricing vendors include reported trade data, broker-dealer price quotations, benchmark yields, issuer spreads on comparable securities, the credit quality, yield, maturity, as well as other appropriate factors.
Event-linked bonds, are valued at the mean between the bid and asked prices utilizing evaluated prices obtained from third party pricing services or broker-dealers. Standard inputs generally considered by third-party pricing vendors include reported trade data and broker-dealer price quotations.
Loans are valued at the mean between the bid and asked prices utilizing evaluated prices obtained from third party pricing services or broker-dealers. Standard inputs generally considered by third-party pricing vendors include information obtained from market participants regarding broker-dealer price quotations.
Structured securities, swaps, swaptions, and other over-the-counter derivatives are valued utilizing evaluated prices obtained from third party pricing services or broker-dealers. Standard inputs generally considered by third-party pricing vendors include market information relevant to the underlying reference asset such as the price of financial instruments, stock market indices, foreign currencies, interest rate spreads, commodities, credit spreads, credit event probabilities, index values, individual security values, forward interest rates, variable interest rates, volatility measures, and forward currency rates, or the occurrence of other specific events.
Forward foreign currency exchange contracts are valued utilizing current and forward currency rates obtained from third party pricing services. When the settlement date of a contract is an interim date for which a quotation is not available, interpolated values are derived using the nearest dated forward currency rate.
27 OPPENHEIMER GLOBAL MULTI-ALTERNATIVES FUND/VA
NOTES TO CONSOLIDATED FINANCIAL STATEMENTS Unaudited / Continued
3. Securities Valuation (Continued)
Futures contracts and futures options traded on a commodities or futures exchange will be valued at the final settlement price or official closing price on the principal exchange as reported by such principal exchange at its trading session ending at, or most recently prior to, the time when the Fund’s assets are valued.
Securities for which market quotations are not readily available, or when a significant event has occurred that would materially affect the value of the security, are fair valued either (i) by a standardized fair valuation methodology applicable to the security type or the significant event as previously approved by the Valuation Committee and the Fund’s Board or (ii) as determined in good faith by the Manager’s Valuation Committee. The Valuation Committee considers all relevant facts that are reasonably available, through either public information or information available to the Manager, when determining the fair value of a security. Those standardized fair valuation methodologies include, but are not limited to, valuing securities at the last sale price or initially at cost and subsequently adjusting the value based on: changes in company specific fundamentals, changes in an appropriate securities index, or changes in the value of similar securities which may be further adjusted for any discounts related to security-specific resale restrictions. When possible, such methodologies use observable market inputs such as unadjusted quoted prices of similar securities, observable interest rates, currency rates and yield curves. The methodologies used for valuing securities are not necessarily an indication of the risks associated with investing in those securities nor can it be assured that the Fund can obtain the fair value assigned to a security if it were to sell the security.
To assess the continuing appropriateness of security valuations, the Manager regularly compares prior day prices and sale prices to the current day prices and challenges those prices exceeding certain tolerance levels with the third party pricing service or broker source. For those securities valued by fair valuations, whether through a standardized fair valuation methodology or a fair valuation determination, the Valuation Committee reviews and affirms the reasonableness of the valuations based on such methodologies and fair valuation determinations on a regular basis after considering all relevant information that is reasonably available.
Classifications
Each investment asset or liability of the Fund is assigned a level at measurement date based on the significance and source of the inputs to its valuation.
Various data inputs may be used in determining the value of each of the Fund’s investments as of the reporting period end. These data inputs are categorized in the following hierarchy under applicable financial accounting standards:
1) Level 1-unadjusted quoted prices in active markets for identical assets or liabilities (including securities actively traded on a securities exchange)
2) Level 2-inputs other than unadjusted quoted prices that are observable for the asset or liability (such as unadjusted quoted prices for similar assets and market corroborated inputs such as interest rates, prepayment speeds, credit risks, etc.)
3) Level 3-significant unobservable inputs (including the Manager’s own judgments about assumptions that market participants would use in pricing the asset or liability).
The inputs used for valuing securities are not necessarily an indication of the risks associated with investing in those securities.
The Fund classifies each of its investments in investment companies which are publicly offered as Level 1. Investment companies that are not publicly offered, if any, are classified as Level 2 in the fair value hierarchy.
The table below categorizes amounts that are included in the Fund’s Consolidated Statement of Assets and Liabilities at period end based on valuation input level:
Level 1— Unadjusted | Level 2— Other Significant Observable Inputs | Level 3— Significant Unobservable | Value | |||||||||||||
Assets Table | ||||||||||||||||
Investments, at Value: | ||||||||||||||||
| Common Stocks | ||||||||||||||||
Consumer Discretionary | $ | 5,463,025 | $ | — | $ | 66 | $ | 5,463,091 | ||||||||
Consumer Staples | 4,612,187 | — | — | 4,612,187 | ||||||||||||
Energy | 30,734,090 | — | — | 30,734,090 | ||||||||||||
Financials | 27,655,822 | 9,848,887 | — | 37,504,709 | ||||||||||||
Health Care | 18,779,295 | 1,038,033 | 108 | 19,817,436 | ||||||||||||
Industrials | 13,980,222 | 23,138 | — | 14,003,360 | ||||||||||||
Information Technology | 12,042,087 | — | — | 12,042,087 | ||||||||||||
Materials | 4,769,622 | — | — | 4,769,622 | ||||||||||||
Telecommunication Services | 2,973,473 | — | — | 2,973,473 | ||||||||||||
Utilities | 4,299,007 | — | — | 4,299,007 | ||||||||||||
| Preferred Stocks | — | 830,415 | — | 830,415 | ||||||||||||
| Rights, Warrants and Certificates | 200 | — | — | 200 | ||||||||||||
| Asset-Backed Securities | — | 9,973,972 | — | 9,973,972 | ||||||||||||
| Mortgage-Backed Obligation | — | 2,308,377 | — | 2,308,377 | ||||||||||||
| Foreign Government Obligation | — | 22,039,270 | — | 22,039,270 | ||||||||||||
| Non-Convertible Corporate Bonds and Notes | — | 8,741,845 | — | 8,741,845 | ||||||||||||
| Corporate Loans | — | 13,557,892 | — | 13,557,892 | ||||||||||||
| Event-Linked Bonds | — | 56,083,384 | 122,500 | 56,205,884 | ||||||||||||
| Structured Securities | — | 890,346 | — | 890,346 | ||||||||||||
| Short-Term Notes | — | 87,892,677 | — | 87,892,677 | ||||||||||||
28 OPPENHEIMER GLOBAL MULTI-ALTERNATIVES FUND/VA
3. Securities Valuation (Continued)
Level 1— Unadjusted | Level 2— Other Significant Observable Inputs | Level 3— Significant Unobservable | Value | |||||||||||
| Investment Companies | $ | 59,626,962 | $ | — | $ | — | $ 59,626,962 | |||||||
| Exchange-Traded Option Purchased | 62,620 | — | — | 62,620 | ||||||||||
| Over-the-Counter Options Purchased | — | 54,283 | — | 54,283 | ||||||||||
| Over-the-Counter Interest Rate Swaptions Purchased | — | 415,524 | — | 415,524 | ||||||||||
|
| |||||||||||||
| Total Investments, at Value | 184,998,612 | 213,698,043 | 122,674 | 398,819,329 | ||||||||||
Other Financial Instruments: | ||||||||||||||
| Swaps, at value | — | 403,774 | — | 403,774 | ||||||||||
| Centrally cleared swaps, at value | — | 164,507 | — | 164,507 | ||||||||||
| Futures contracts | 1,068,221 | — | — | 1,068,221 | ||||||||||
| Forward currency exchange contracts | — | 2,238,627 | — | 2,238,627 | ||||||||||
|
| |||||||||||||
| Total Assets | $ | 186,066,833 | $ | 216,504,951 | $ | 122,674 | $ 402,694,458 | |||||||
|
| |||||||||||||
Liabilities Table | ||||||||||||||
Other Financial Instruments: | ||||||||||||||
| Common Stock Securities Sold Short | $ | (40,797,163 | ) | $ | (4,472,700 | ) | $ | — | $ (45,269,863) | |||||
Other Financial Instruments: | ||||||||||||||
| Swaps, at value | — | (253,321 | ) | — | (253,321) | |||||||||
| Centrally cleared swaps, at value | — | (259,278 | ) | — | (259,278) | |||||||||
| Options written, at value | (253,102 | ) | (293,938 | ) | — | (547,040) | ||||||||
| Futures contracts | (610,266 | ) | — | — | (610,266) | |||||||||
| Forward currency exchange contracts | — | (787,719 | ) | — | (787,719) | |||||||||
|
| |||||||||||||
Total Liabilities | $ | (41,660,531 | ) | $ | (6,066,956 | ) | $ | — | $ (47,727,487) | |||||
|
| |||||||||||||
Forward currency exchange contracts and futures contracts, if any, are reported at their unrealized appreciation/depreciation at measurement date, which represents the change in the contract’s value from trade date. All additional assets and liabilities included in the above table are reported at their market value at measurement date.
For the reporting period, there were no transfers between levels.
4. Investments and Risks
Risks of Foreign Investing. The Fund may invest in foreign securities which are subject to special risks. Securities traded in foreign markets may be less liquid and more volatile than those traded in U.S. markets. Foreign issuers are usually not subject to the same accounting and disclosure requirements that U.S. companies are subject to, which may make it difficult for the Fund to evaluate a foreign company’s operations or financial condition. A change in the value of a foreign currency against the U.S. dollar will result in a change in the U.S. dollar value of investments denominated in that foreign currency and in the value of any income or distributions the Fund may receive on those investments. The value of foreign investments may be affected by exchange control regulations, foreign taxes, higher transaction and other costs, delays in the settlement of transactions, changes in economic or monetary policy in the United States or abroad, expropriation or nationalization of a company’s assets, or other political and economic factors. In addition, due to the inter-relationship of global economies and financial markets, changes in political and economic factors in one country or region could adversely affect conditions in another country or region. Investments in foreign securities may also expose the Fund to time-zone arbitrage risk. Foreign securities may trade on weekends or other days when the Fund does not price its shares. At times, the Fund may emphasize investments in a particular country or region and may be subject to greater risks from adverse events that occur in that country or region. Foreign securities and foreign currencies held in foreign banks and securities depositories may be subject to limited or no regulatory oversight.
Investments in Affiliated Funds. The Fund is permitted to invest in other mutual funds advised by the Manager (“Affiliated Funds”). Affiliated Funds are open-end management investment companies registered under the 1940 Act, as amended. The Manager is the investment adviser of, and the Sub-Adviser provides investment and related advisory services to, the Affiliated Funds. When applicable, the Fund’s investments in Affiliated Funds are included in the Consolidated Statement of Investments. Shares of Affiliated Funds are valued at their net asset value per share. As a shareholder, the Fund is subject to its proportional share of the Affiliated Funds’ expenses, including their management fee. The Manager will waive fees and/or reimburse Fund expenses in an amount equal to the indirect management fees incurred through the Fund’s investment in the Affiliated Funds.
Each of the Affiliated Funds in which the Fund invests has its own investment risks, and those risks can affect the value of the Fund’s investments and therefore the value of the Fund’s shares. To the extent that the Fund invests more of its assets in one Affiliated Fund than in another, the Fund will have greater exposure to the risks of that Affiliated Fund.
Investments in Money Market Instruments. The Fund is permitted to invest its free cash balances in money market instruments to provide liquidity or for defensive purposes. The Fund may invest in money market instruments by investing in Class E shares of Oppenheimer Institutional Government Money Market Fund (“IGMMF”), which is an Affiliated Fund. IGMMF is regulated as a money market fund under the 1940 Act, as amended. The Fund may also invest in money market instruments directly or in other affiliated or unaffiliated money market funds.
29 OPPENHEIMER GLOBAL MULTI-ALTERNATIVES FUND/VA
NOTES TO CONSOLIDATED FINANCIAL STATEMENTS Unaudited / Continued
4. Investments and Risks (Continued)
Master Limited Partnerships (“MLPs”). MLPs issue common units that represent an equity ownership interest in a partnership and provide limited voting rights. MLP common units are registered with the Securities and Exchange Commission (“SEC”), and are freely tradable on securities exchanges such as the NYSE and the NASDAQ Stock Market (“NASDAQ”), or in the over-the-counter (“OTC”) market. An MLP consists of one or more general partners, who conduct the business, and one or more limited partners, who contribute capital. MLP common unit holders have a limited role in the partnership’s operations and management. The Fund, as a limited partner, normally would not be liable for the debts of the MLP beyond the amounts the Fund has contributed, but would not be shielded to the same extent that a shareholder of a corporation would be. In certain circumstances creditors of an MLP would have the right to seek return of capital distributed to a limited partner. This right of an MLP’s creditors would continue after the Fund sold its investment in the MLP.
Structured Securities. The Fund invests in structured securities whose market values, interest rates and/or redemption prices are linked to the performance of underlying foreign currencies, interest rate spreads, stock market indices, prices of individual securities, commodities or other financial instruments or the occurrence of other specific events. The structured securities are often leveraged, increasing the volatility of each note’s market value relative to the change in the underlying linked financial element or event. Fluctuations in value of these securities are recorded as unrealized gains and losses in the accompanying Consolidated Statement of Operations. The Fund records a realized gain or loss when a structured security is sold or matures.
Event-Linked Bonds. The Fund may invest in “event-linked” bonds. Event-linked bonds, which are sometimes referred to as “catastrophe” bonds, are fixed income securities for which the return of principal and payment of interest is contingent on the non-occurrence of a specific trigger event, such as a hurricane, earthquake, or other occurrence that leads to physical or economic loss. If the trigger event occurs prior to maturity, the Fund may lose all or a portion of its principal in addition to interest otherwise due from the security. Event-linked bonds may expose the Fund to certain other risks, including issuer default, adverse regulatory or jurisdictional interpretations, liquidity risk and adverse tax consequences. The Fund records the net change in market value of event-linked bonds on the Consolidated Statement of Operations as a change in unrealized appreciation or depreciation on investments. The Fund records a realized gain or loss on the Consolidated Statement of Operations upon the sale or maturity of such securities.
Loans. The Fund invests in loans made to U.S. and foreign borrowers that are corporations, partnerships or other business entities. The Fund will do so directly as an original lender or by assignment or indirectly through participation agreements or certain derivative instruments. While many of these loans will be collateralized, the Fund can also invest in uncollateralized loans. Loans are often issued in connection with recapitalizations, acquisitions, leveraged buyouts, and refinancing of borrowers. The loans often pay interest at rates that float above (or are adjusted periodically based on) a benchmark that reflects current interest rates although the Fund can also invest in loans with fixed interest rates.
When investing in loans, the Fund generally will have a contractual relationship only with the lender, not with the relevant borrower. As a result, the Fund generally will have the right to receive payments of principal, interest, and any fees to which it is entitled only from the lender selling the participation and only upon receipt by the lender of the payments from the relevant borrower. The Fund may not directly benefit from the collateral supporting the debt obligation in which it has purchased the participation. As a result, the Fund will assume the credit risk of both the borrower and the institution selling the participation to the Fund.
Securities on a When-Issued or Delayed Delivery Basis. The Fund may purchase securities on a “when-issued” basis, and may purchase or sell securities on a “delayed delivery” basis. “When-issued” or “delayed delivery” refers to securities whose terms and indenture are available and for which a market exists, but which are not available for immediate delivery. Delivery and payment for securities that have been purchased by the Fund on a when-issued basis normally takes place within six months and possibly as long as two years or more after the trade date. During this period, such securities do not earn interest, are subject to market fluctuation and may increase or decrease in value prior to their delivery. The purchase of securities on a when-issued basis may increase the volatility of the Fund’s net asset value to the extent the Fund executes such transactions while remaining substantially fully invested. When the Fund engages in when-issued or delayed delivery transactions, it relies on the buyer or seller, as the case may be, to complete the transaction. Their failure to do so may cause the Fund to lose the opportunity to obtain or dispose of the security at a price and yield it considers advantageous. The Fund may also sell securities that it purchased on a when-issued basis or forward commitment prior to settlement of the original purchase.
At period end, the Fund had purchased securities issued on a when-issued or delayed delivery basis as follows:
When-Issued or Delayed Delivery | ||
| Purchased securities | $1,715,652 |
Restricted Securities. At period end, investments in securities included issues that are restricted. A restricted security may have a contractual restriction on its resale and is valued under methods approved by the Board of Trustees as reflecting fair value. Securities that are restricted are marked with an applicable footnote on the Consolidated Statement of Investments. Restricted securities are reported on a schedule following the Consolidated Statement of Investments.
Equity Security Risk. Stocks and other equity securities fluctuate in price. The value of the Fund’s portfolio may be affected by changes in the equity markets generally. Equity markets may experience significant short-term volatility and may fall sharply at times. Different markets may behave differently
30 OPPENHEIMER GLOBAL MULTI-ALTERNATIVES FUND/VA
4. Investments and Risks (Continued)
from each other and U.S. equity markets may move in the opposite direction from one or more foreign stock markets. Adverse events in any part of the equity or fixed-income markets may have unexpected negative effects on other market segments.
The prices of individual equity securities generally do not all move in the same direction at the same time and a variety of factors can affect the price of a particular company’s securities. These factors may include, but are not limited to, poor earnings reports, a loss of customers, litigation against the company, general unfavorable performance of the company’s sector or industry, or changes in government regulations affecting the company or its industry.
Credit Risk. The Fund invests in high-yield, non-investment-grade bonds, which may be subject to a greater degree of credit risk. Credit risk relates to the ability of the issuer to meet interest or principal payments or both as they become due. The Fund may acquire securities that have missed an interest payment, and is not obligated to dispose of securities whose issuers or underlying obligors subsequently miss an interest and/or principal payment.
Information concerning securities not accruing interest at period end is as follows:
| Cost | $5,761 | |||
| Market Value | $– | |||
Market Value as % of Net Assets | 0.00% |
Sovereign Debt Risk. The Fund invests in sovereign debt securities, which are subject to certain special risks. These risks include, but are not limited to, the risk that a governmental entity may delay or refuse, or otherwise be unable, to pay interest or repay the principal on its sovereign debt. There may also be no legal process for collecting sovereign debt that a government does not pay or bankruptcy proceedings through which all or part of such sovereign debt may be collected. In addition, a restructuring or default of sovereign debt may also cause additional impacts to the financial markets, such as downgrades to credit ratings, reduced liquidity and increased volatility, among others.
Shareholder Concentration. At period end, one shareholder owned 20% or more of the Fund’s total outstanding shares.
The shareholder is a related party of the Fund. Related parties may include, but are not limited to, the investment manager and its affiliates, affiliated broker dealers, fund of funds, and directors or employees. The related party owned 96% of the Fund’s total outstanding shares at period end.
5. Market Risk Factors
The Fund’s investments in securities and/or financial derivatives may expose the Fund to various market risk factors:
Commodity Risk. Commodity risk relates to the change in value of commodities or commodity indexes as they relate to increases or decreases in the commodities market. Commodities are physical assets that have tangible properties. Examples of these types of assets are crude oil, heating oil, metals, livestock, and agricultural products.
Credit Risk. Credit risk relates to the ability of the issuer of debt to meet interest and principal payments, or both, as they come due. In general, lower-grade, higher-yield debt securities are subject to credit risk to a greater extent than lower-yield, higher-quality securities.
Equity Risk. Equity risk relates to the change in value of equity securities as they relate to increases or decreases in the general market.
Foreign Exchange Rate Risk. Foreign exchange rate risk relates to the change in the U.S. dollar value of a security held that is denominated in a foreign currency. The U.S. dollar value of a foreign currency denominated security will decrease as the dollar appreciates against the currency, while the U.S. dollar value will increase as the dollar depreciates against the currency.
Interest Rate Risk. Interest rate risk refers to the fluctuations in value of fixed-income securities resulting from the inverse relationship between price and yield. For example, an increase in general interest rates will tend to reduce the market value of already issued fixed-income investments, and a decline in general interest rates will tend to increase their value. In addition, debt securities with longer maturities, which tend to have higher yields, are subject to potentially greater fluctuations in value from changes in interest rates than obligations with shorter maturities.
Volatility Risk. Volatility risk refers to the magnitude of the movement, but not the direction of the movement, in a financial instrument’s price over a defined time period. Large increases or decreases in a financial instrument’s price over a relative time period typically indicate greater volatility risk, while small increases or decreases in its price typically indicate lower volatility risk.
6. Use of Derivatives
The Fund’s investment objective not only permits the Fund to purchase investment securities, it also allows the Fund to enter into various types of derivatives contracts, including, but not limited to, futures contracts, forward currency exchange contracts, credit default swaps, interest rate swaps, total return swaps, variance swaps and purchased and written options. In doing so, the Fund will employ strategies in differing combinations to permit it to increase, decrease, or change the level or types of exposure to market risk factors. These instruments may allow the Fund to pursue its objectives more quickly and efficiently than if it were to make direct purchases or sales of securities capable of effecting a similar response to market factors. Such contracts may be entered into through a bilateral over-the-counter (“OTC”) transaction, or through a securities or futures exchange and cleared through a clearinghouse.
Derivatives may have little or no initial cash investment relative to their market value exposure and therefore can produce significant gains or losses in excess of their cost due to changes in the market risk factors and the overall market. This use of embedded leverage allows the Fund to increase its market value exposure relative to its net assets and can substantially increase the volatility of the Fund’s performance. In instances where the Fund is
31 OPPENHEIMER GLOBAL MULTI-ALTERNATIVES FUND/VA
NOTES TO CONSOLIDATED FINANCIAL STATEMENTS Unaudited / Continued
6. Use of Derivatives (Continued)
using derivatives to decrease, or hedge, exposures to market risk factors for securities held by the Fund, there are also risks that those derivatives may not perform as expected resulting in losses for the combined or hedged positions. Some derivatives have the potential for unlimited loss, regardless of the size of the Fund’s initial investment.
Additional associated risks from investing in derivatives also exist and potentially could have significant effects on the valuation of the derivative and the Fund. Typically, the associated risks are not the risks that the Fund is attempting to increase or decrease exposure to, per its investment objectives, but are the additional risks from investing in derivatives. Examples of these associated risks are liquidity risk, which is the risk that the Fund will not be able to sell the derivative in the open market in a timely manner, and counterparty credit risk, which is the risk that the counterparty will not fulfill its obligation to the Fund.
The Fund’s actual exposures to these market risk factors and associated risks during the period are discussed in further detail, by derivative type, below.
Forward Currency Exchange Contracts
The Fund may enter into forward currency exchange contracts (“forward contracts”) for the purchase or sale of a foreign currency at a negotiated rate at a future date. Such contracts are traded in the OTC inter-bank currency dealer market.
Forward contracts are reported on a schedule following the Consolidated Statement of Investments. The unrealized appreciation (depreciation) is reported in the Consolidated Statement of Assets and Liabilities as a receivable (or payable) and in the Consolidated Statement of Operations within the change in unrealized appreciation (depreciation). At contract close, the difference between the original cost of the contract and the value at the close date is recorded as a realized gain (loss) in the Consolidated Statement of Operations.
The Fund may enter into forward foreign currency exchange contracts in order to decrease exposure to foreign exchange rate risk associated with either specific transactions or portfolio instruments or to increase exposure to foreign exchange rate risk.
During the reporting period, the Fund had daily average contract amounts on forward contracts to buy and sell of $130,536,407 and $198,335,195, respectively.
Additional associated risk to the Fund includes counterparty credit risk. Counterparty credit risk arises from the possibility that the counterparty to a forward contract will default and fail to perform its obligations to the Fund.
Futures Contracts
A futures contract is a commitment to buy or sell a specific amount of a commodity, financial instrument or currency at a negotiated price on a stipulated future date. The Fund may buy and sell futures contracts and may also buy or write put or call options on these futures contracts. Futures contracts and options thereon are generally entered into on a regulated futures exchange and cleared through a clearinghouse associated with the exchange.
Upon entering into a futures contract, the Fund is required to deposit either cash or securities (initial margin) in an amount equal to a certain percentage of the contract value in an account registered in the futures commission merchant’s name. Subsequent payments (variation margin) are paid to or from the futures commission merchant each day equal to the daily changes in the contract value. Such payments are recorded as unrealized gains and losses. Should the Fund fail to make requested variation margin payments, the futures commission merchant can gain access to the initial margin to satisfy the Fund’s payment obligations.
Futures contracts are reported on a schedule following the Consolidated Statement of Investments. Securities held by a futures commission merchant to cover initial margin requirements on open futures contracts are noted in the Consolidated Statement of Investments. Cash held by a futures commission merchant to cover initial margin requirements on open futures contracts and the receivable and/or payable for the daily mark to market for the variation margin are noted in the Consolidated Statement of Assets and Liabilities. The net change in unrealized appreciation and depreciation is reported in the Consolidated Statement of Operations. Realized gains (losses) are reported in the Consolidated Statement of Operations at the closing or expiration of futures contracts.
The Fund may purchase and/or sell financial futures contracts and options on futures contracts to gain exposure to, or decrease exposure to interest rate risk, equity risk, foreign exchange rate risk, volatility risk, or commodity risk.
During the reporting period, the Fund had an ending monthly average market value of $88,743,321 and $55,922,671 on futures contracts purchased and sold, respectively.
Additional associated risks of entering into futures contracts (and related options) include the possibility that there may be an illiquid market where the Fund is unable to liquidate the contract or enter into an offsetting position and, if used for hedging purposes, the risk that the price of the contract will correlate imperfectly with the prices of the Fund’s securities.
Option Activity
The Fund may buy and sell put and call options, or write put and call options. When an option is written, the Fund receives a premium and becomes obligated to sell or purchase the underlying security, currency or other underlying financial instrument at a fixed price, upon exercise of the option.
Options can be traded through an exchange or through a privately negotiated arrangement with a dealer in an OTC transaction. Options traded through an exchange are generally cleared through a clearinghouse (such as The Options Clearing Corporation). The difference between the premium received or paid, and market value of the option, is recorded as unrealized appreciation or depreciation. The net change in unrealized appreciation or depreciation is reported in the Consolidated Statement of Operations. When an option is exercised, the cost of the security purchased or the proceeds of the security sale are adjusted by the amount of premium received or paid. Upon the expiration or closing of the option transaction, a gain or loss is reported in the Consolidated Statement of Operations.
32 OPPENHEIMER GLOBAL MULTI-ALTERNATIVES FUND/VA
6. Use of Derivatives (Continued)
Foreign Currency Options. The Fund may purchase or write call and put options on currencies to increase or decrease exposure to foreign exchange rate risk. A purchased call, or written put option becomes more valuable as the price of the underlying financial instrument appreciates relative to the strike price. A purchased put, or written call option becomes more valuable as the price of the underlying financial instrument depreciates relative to the strike price.
Index/Security Options. The Fund may purchase or write call and put options on individual equity securities and/or equity indexes to increase or decrease exposure to equity risk. A purchased call or written put option becomes more valuable as the price of the underlying financial instrument appreciates relative to the strike price. A purchased put or written call option becomes more valuable as the price of the underlying financial instrument depreciates relative to the strike price.
During the reporting period, the Fund had an ending monthly average market value of $116,709 and $24,181 on purchased call options and purchased put options, respectively.
Options written, if any, are reported in a schedule following the Consolidated Statement of Investments and as a liability in the Consolidated Statement of Assets and Liabilities. Securities held in collateral accounts to cover potential obligations with respect to outstanding written options are noted in the Consolidated Statement of Investments.
The risk in writing a call option is the market price of the underlying security increasing above the strike price and the option being exercised. The Fund must then purchase the underlying security at the higher market price and deliver it for the strike price or, if it owns the underlying security, deliver it at the strike price and forego any benefit from the increase in the price of the underlying security above the strike price. The risk in writing a put option is the market price of the underlying security decreasing below the strike price and the option being exercised. The Fund must then purchase the underlying security at the strike price when the market price of the underlying security is below the strike price. Alternatively, the Fund could also close out a written option position, in which case the risk is that the closing transaction will require a premium to be paid by the Fund that is greater than the premium the Fund received. When writing options, the Fund has the additional risk that there may be an illiquid market where the Fund is unable to close the contact. The risk in buying an option is that the Fund pays a premium for the option, and the option may be worth less than the premium paid or expire worthless.
During the reporting period, the Fund had an ending monthly average market value of $56,451 and $82,522 on written call options and written put options, respectively.
Additional associated risks to the Fund include counterparty credit risk and liquidity risk.
Swap Contracts
The Fund may enter into swap contract agreements with a counterparty to exchange a series of cash flows based on either specified reference rates, the price or volatility of asset or non-asset references, or the occurrence of a credit event, over a specified period. Swaps can be executed in a bi-lateral privately negotiated arrangement with a dealer in an OTC transaction (“OTC swaps”) or executed on a regulated market. Certain swaps, regardless of the venue of their execution, are required to be cleared through a clearinghouse (“centrally cleared swaps”). Swap contracts may include interest rate, equity, debt, index, total return, credit default, currency, and volatility swaps.
Swap contracts are reported on a schedule following the Consolidated Statement of Investments. The values of centrally cleared swap and OTC swap contracts are aggregated by positive and negative values and disclosed separately on the Consolidated Statement of Assets and Liabilities. The unrealized appreciation (depreciation) related to the change in the valuation of the notional amount of the swap is combined with the accrued interest due to (owed by) the Fund, if any, at termination or settlement. The net change in this amount during the period is included on the Consolidated Statement of Operations. The Fund also records any periodic payments received from (paid to) the counterparty, including at termination, under such contracts as realized gain (loss) on the Consolidated Statement of Operations.
Swap contract agreements are exposed to the market risk factor of the specific underlying reference rate or asset. Swap contracts are typically more attractively priced compared to similar investments in related cash securities because they isolate the risk to one market risk factor and eliminate the other market risk factors. Investments in cash securities (for instance bonds) have exposure to multiple risk factors (credit and interest rate risk). Because swaps have embedded leverage, they can expose the Fund to substantial risk in the isolated market risk factor.
Credit Default Swap Contracts. A credit default swap is a contract that enables an investor to buy or sell protection against a defined-issuer credit event, such as the issuer’s failure to make timely payments of interest or principal on a debt security, bankruptcy or restructuring. The Fund may enter into credit default swaps either by buying or selling protection on a corporate issuer, sovereign issuer, or a basket or index of issuers (the “reference asset”).
The buyer of protection pays a periodic fee to the seller of protection based on the notional amount of the swap contract. The seller of protection agrees to compensate the buyer of protection for future potential losses as a result of a credit event on the reference asset. The contract effectively transfers the credit event risk of the reference asset from the buyer of protection to the seller of protection.
The ongoing value of the contract will fluctuate throughout the term of the contract based primarily on the credit risk of the reference asset. If the credit quality of the reference asset improves relative to the credit quality at contract initiation, the buyer of protection may have an unrealized loss greater than the anticipated periodic fee owed. This unrealized loss would be the result of current credit protection being cheaper than the cost of credit protection at contract initiation. If the buyer elects to terminate the contract prior to its maturity, and there has been no credit event, this unrealized loss will become realized. If the contract is held to maturity, and there has been no credit event, the realized loss will be equal to the periodic fee paid over the life of the contract.
If there is a credit event, the buyer of protection can exercise its rights under the contract and receive a payment from the seller of protection equal to the notional amount of the swap less the market value of specified debt securities issued by the reference asset. Upon exercise of the contract
33 OPPENHEIMER GLOBAL MULTI-ALTERNATIVES FUND/VA
NOTES TO CONSOLIDATED FINANCIAL STATEMENTS Unaudited / Continued
6. Use of Derivatives (Continued)
the difference between such value and the notional amount is recorded as realized gain (loss) and is included on the Consolidated Statement of Operations.
The Fund may purchase or sell credit protection through credit default swaps to increase or decrease exposure to the credit risk of individual issuers and/or indexes of issuers that are either unavailable or considered to be less attractive in the bond market.
The Fund has engaged in spread curve trades by simultaneously purchasing and selling protection through credit default swaps referenced to the same reference asset but with different maturities. Spread curve trades attempt to gain exposure to credit risk on a forward basis by realizing gains on the expected differences in spreads.
For the reporting period, the Fund had ending monthly average notional amounts of $21,101,422 and $6,936,385 on credit default swaps to buy protection and credit default swaps to sell protection, respectively.
Additional associated risks to the Fund include counterparty credit risk and liquidity risk.
Interest Rate Swap Contracts. An interest rate swap is an agreement between counterparties to exchange periodic payments based on interest rates. One cash flow stream will typically be a floating rate payment based upon a specified floating interest rate while the other is typically a fixed interest rate.
The Fund may enter into interest rate swaps in which it pays the fixed or floating interest rate in order to increase or decrease exposure to interest rate risk. Typically, if relative interest rates rise, floating payments under a swap agreement will be greater than the fixed payments.
For the reporting period, the Fund had ending monthly average notional amounts of $11,446,027 and $11,470,773 on interest rate swaps which pay a fixed rate and interest rate swaps which receive a fixed rate, respectively.
Additional associated risks to the Fund include counterparty credit risk and liquidity risk.
At period end, the Fund had no interest rate swap agreements outstanding.
Total Return Swap Contracts. A total return swap is an agreement between counterparties to exchange periodic payments based on the value of asset or non-asset references. One cash flow is typically based on a non-asset reference (such as an interest rate) and the other on the total return of a reference asset (such as a security or a basket of securities or securities index). The total return of the reference asset typically includes appreciation or depreciation on the reference asset, plus any interest or dividend payments.
Total return swap contracts are exposed to the market risk factor of the specific underlying financial instrument or index. Total return swaps are less standard in structure than other types of swaps and can isolate and/or include multiple types of market risk factors including equity risk, credit risk, and interest rate risk.
The Fund may enter into total return swaps on various equity securities or indexes to increase or decrease exposure to equity risk. These equity risk related total return swaps require the Fund to pay or receive a floating reference interest rate, and an amount equal to the opposite price movement of securities or an index (expressed as a percentage) multiplied by the notional amount of the contract. Equity leg payments equal to the positive price movement of the same securities or index (expressed as a percentage) multiplied by the notional amount of the contract and, in some cases, dividends paid on the securities. Reference leg payments equal a floating reference interest rate and an amount equal to the negative price movement of the same securities or index (expressed as a percentage) multiplied by the notional amount of the contract.
The Fund may enter into total return swaps to increase or decrease exposure to the credit risk of various indexes or basket of securities. These credit risk related total return swaps require the Fund to pay to, or receive payments from, the counterparty based on the movement of credit spreads of the related indexes or securities.
For the reporting period, the Fund had ending monthly average notional amounts of $62,678,030 and $7,077,616 on total return swaps which are long the reference asset and total return swaps which are short the reference asset, respectively.
Additional associated risks to the Fund include counterparty credit risk and liquidity risk.
Volatility Swap Contracts. A volatility swap is an agreement between counterparties to exchange periodic payments based on the measured volatility of a reference security, index, currency or other reference investment over a specified time frame. One cash flow is typically based on the realized volatility of the reference investment as measured by changes in its price or level over the specified time period while the other cash flow is based on a specified rate representing expected volatility for the reference investment at the time the swap is executed, or the measured volatility of a different reference investment over the specified time period. The appreciation or depreciation on a volatility swap will typically depend on the magnitude of the reference investment’s volatility, or size of the movements in its price, over the specified time period, rather than general directional increases or decreases in its price.
Volatility swaps are less standard in structure than other types of swaps and provide pure, or isolated, exposure to volatility risk of the specific underlying reference investment. Volatility swaps are typically used to speculate on future volatility levels, to trade the spread between realized and expected volatility, or to decrease the volatility exposure of investments held by the Fund.
The Fund may enter into volatility/variance swaps to increase or decrease exposure to the volatility risk of various reference investments. These types of volatility swaps require the Fund to either pay the measured volatility, or price variance or the fixed rate payment then receive a fixed rate payment or the measured volatility or price variance. If the measured volatility of the related reference investment increases over the period, the measured volatility payment will depreciate in value. Conversely, if the measured volatility of the related reference investment decreases over the period, the fixed rate swap payment will appreciate in value.
For the reporting period, the Fund had ending monthly average notional amounts of $24,086 and $12,963 on volatility swaps which pay measured volatility/variance and volatility swaps which receive measured volatility/variance, respectively.
Additional associated risks to the Fund include counterparty credit risk and liquidity risk.
At period end, the Fund had no volatility swap agreements outstanding.
34 OPPENHEIMER GLOBAL MULTI-ALTERNATIVES FUND/VA
6. Use of Derivatives (Continued)
Swaption Transactions
The Fund may enter into a swaption contract which grants the purchaser the right, but not the obligation, to enter into a swap transaction at preset terms detailed in the underlying agreement within a specified period of time. The purchaser pays a premium to the swaption writer who bears the risk of unfavorable changes in the preset terms on the underlying swap.
Purchased swaptions are reported as a component of investments in the Consolidated Statement of Investments and the Consolidated Statement of Assets and Liabilities. Written swaptions are reported on a schedule following the Consolidated Statement of Investments and their value is reported as a separate asset or liability line item in the Consolidated Statement of Assets and Liabilities. The net change in unrealized appreciation or depreciation on written swaptions is separately reported in the Consolidated Statement of Operations. When a swaption is exercised, the cost of the swap is adjusted by the amount of premium paid or received. Upon the expiration or closing of an unexercised swaption contract, a gain or loss is reported in the Consolidated Statement of Operations for the amount of the premium paid or received.
The Fund generally will incur a greater risk when it writes a swaption than when it purchases a swaption. When the Fund writes a swaption it will become obligated, upon exercise of the swaption, according to the terms of the underlying agreement. Swaption contracts written by the Fund do not give rise to counterparty credit risk prior to exercise as they obligate the Fund, not its counterparty, to perform. When the Fund purchases a swaption it only risks losing the amount of the premium it paid if the swaption expires unexercised. However, when the Fund exercises a purchased swaption there is a risk that the counterparty will fail to perform or otherwise default on its obligations under the swaption contract.
The Fund may purchase swaptions which give it the option to enter into an interest rate swap in which it pays a floating or fixed interest rate and receives a fixed or floating interest rate in order to increase or decrease exposure to interest rate risk. Purchasing the fixed portion of this swaption becomes more valuable as the reference interest rate decreases relative to the preset interest rate. Purchasing the floating portion of this swaption becomes more valuable as the reference interest rate increases relative to the preset interest rate.
During the reporting period, the Fund had an ending monthly average market value of $368,901 on purchased swaptions.
At period end, the Fund had no written swaption contracts outstanding.
Counterparty Credit Risk. Derivative positions are subject to the risk that the counterparty will not fulfill its obligation to the Fund. The Fund intends to enter into derivative transactions with counterparties that the Manager believes to be creditworthy at the time of the transaction.
The Fund’s risk of loss from counterparty credit risk on OTC derivatives is generally limited to the aggregate unrealized gain netted against any collateral held by the Fund. For OTC options purchased, the Fund bears the risk of loss of the amount of the premiums paid plus the positive change in market values net of any collateral held by the Fund should the counterparty fail to perform under the contracts. Options written by the Fund do not typically give rise to counterparty credit risk, as options written generally obligate the Fund and not the counterparty to perform.
To reduce counterparty risk with respect to OTC transactions, the Fund has entered into master netting arrangements, established within the Fund’s International Swap and Derivatives Association, Inc. (“ISDA”) master agreements, which allow the Fund to make (or to have an entitlement to receive) a single net payment in the event of default (close-out netting) for outstanding payables and receivables with respect to certain OTC positions in swaps, options, swaptions, and forward currency exchange contracts for each individual counterparty. In addition, the Fund may require that certain counterparties post cash and/or securities in collateral accounts to cover their net payment obligations for those derivative contracts subject to ISDA master agreements. If the counterparty fails to perform under these contracts and agreements, the cash and/or securities will be made available to the Fund.
At period end, the Fund has required certain counterparties to post collateral of $1,179,634.
ISDA master agreements include credit related contingent features which allow counterparties to OTC derivatives to terminate derivative contracts prior to maturity in the event that, for example, the Fund’s net assets decline by a stated percentage or the Fund fails to meet the terms of its ISDA master agreements, which would cause the Fund to accelerate payment of any net liability owed to the counterparty.
For financial reporting purposes, the Fund does not offset derivative assets and derivative liabilities that are subject to netting arrangements in the Consolidated Statement of Assets and Liabilities. Bankruptcy or insolvency laws of a particular jurisdiction may impose restrictions on or prohibitions against the right of offset in bankruptcy, insolvency or other events.
The Fund’s risk of loss from counterparty credit risk on exchange-traded derivatives cleared through a clearinghouse and for centrally cleared swaps is generally considered lower than as compared to OTC derivatives. However, counterparty credit risk exists with respect to initial and variation margin deposited/paid by the Fund that is held in futures commission merchant, broker and/or clearinghouse accounts for such exchange-traded derivatives and for centrally cleared swaps.
With respect to centrally cleared swaps, such transactions will be submitted for clearing, and if cleared, will be held in accounts at futures commission merchants or brokers that are members of clearinghouses. While brokers, futures commission merchants and clearinghouses are required to segregate customer margin from their own assets, in the event that a broker, futures commission merchant or clearinghouse becomes insolvent or goes into bankruptcy and at that time there is a shortfall in the aggregate amount of margin held by the broker, futures commission merchant or clearinghouse for all its customers, U.S. bankruptcy laws will typically allocate that shortfall on a pro-rata basis across all the broker’s, futures commission merchant’s or clearinghouse’s customers, potentially resulting in losses to the Fund.
There is the risk that a broker, futures commission merchant or clearinghouse will decline to clear a transaction on the Fund’s behalf, and the Fund may be required to pay a termination fee to the executing broker with whom the Fund initially enters into the transaction. Clearinghouses may also be permitted to terminate centrally cleared swaps at any time. The Fund is also subject to the risk that the broker or futures commission merchant will improperly use the Fund’s assets deposited/paid as initial or variation margin to satisfy payment obligations of another customer. In the event of a default by another customer of the broker or futures commission merchant, the Fund might not receive its variation margin payments from the
35 OPPENHEIMER GLOBAL MULTI-ALTERNATIVES FUND/VA
NOTES TO CONSOLIDATED FINANCIAL STATEMENTS Unaudited / Continued
6. Use of Derivatives (Continued)
clearinghouse, due to the manner in which variation margin payments are aggregated for all customers of the broker/futures commission merchant.
Collateral and margin requirements differ by type of derivative. Margin requirements are established by the broker, futures commission merchant or clearinghouse for exchange-traded and cleared derivatives, including centrally cleared swaps. Brokers, futures commission merchants and clearinghouses can ask for margin in excess of the regulatory minimum, or increase the margin amount, in certain circumstances.
Collateral terms are contract specific for OTC derivatives. For derivatives traded under an ISDA master agreement, the collateral requirements are typically calculated by netting the mark to market amount for each transaction under such agreement and comparing that amount to the value of any collateral currently pledged by the Fund or the counterparty.
For financial reporting purposes, cash collateral that has been pledged to cover obligations of the Fund, if any, is reported separately on the Consolidated Statement of Assets and Liabilities as cash pledged as collateral. Non-cash collateral pledged by the Fund, if any, is noted in the Consolidated Statement of Investments. Generally, the amount of collateral due from or to a party must exceed a minimum transfer amount threshold (e.g. $250,000) before a transfer has to be made. To the extent amounts due to the Fund from its counterparties are not fully collateralized, contractually or otherwise, the Fund bears the risk of loss from counterparty nonperformance.
The following table presents by counterparty the Fund’s OTC derivative assets net of the related collateral pledged by the Fund at period end:
| Gross Amounts Not Offset in the Consolidated Statement of Assets & Liabilities | ||||||||||||||||||||
| Counterparty | Gross Amounts Not Offset in the Consolidated Statement of Assets & Liabilities* | Financial Instruments Available for Offset | Financial Instruments Collateral Received** | Cash Collateral Received** | Net Amount | |||||||||||||||
| Bank of America NA | $ | 47,757 | $ | (47,757 | ) | $ | – | $ | – | $ | – | |||||||||
| Barclays Bank plc | 187,970 | (18,667 | ) | – | – | 169,303 | ||||||||||||||
| Citibank NA | 104,916 | (104,916 | ) | – | – | – | ||||||||||||||
| Goldman Sachs Bank USA | 263,201 | (36,571 | ) | – | – | 226,630 | ||||||||||||||
| Goldman Sachs International | 727,509 | (175,180 | ) | – | – | 552,329 | ||||||||||||||
| HSBC Bank USA NA | 107,138 | (107,138 | ) | – | – | – | ||||||||||||||
| JPMorgan Chase Bank NA | 1,387,920 | (439,589 | ) | (918,165 | ) | – | 30,166 | |||||||||||||
| Standard Chartered Bank | 75,552 | – | – | – | 75,552 | |||||||||||||||
Toronto Dominion Bank | 210,245 | (7,350 | ) | (202,895 | ) | – | – | |||||||||||||
| $ | 3,112,208 | $ | (937,168) | $ | (1,121,060) | $ | – | $ | 1,053,980 | |||||||||||
*OTC derivatives are reported gross on the Consolidated Statement of Assets and Liabilities. Exchange traded options and margin related to centrally cleared swaps and futures are excluded from these reported amounts.
**Reported collateral posted for the benefit of the Fund within this table is limited to the net outstanding amount due from an individual counterparty. The collateral posted for the benefit of the Fund may exceed these amounts.
The following table presents by counterparty the Fund’s OTC derivative liabilities net of the related collateral pledged by the Fund at period end:
| Gross Amounts Not Offset in the Consolidated Statement of Assets & Liabilities | ||||||||||||||||||||
| Counterparty | Gross Amounts Not Offset in the Consolidated Statement of Assets & Liabilities* | Financial Instruments Available for Offset | Financial Instruments Collateral Pledged** | Cash Collateral Pledged** | Net Amount | |||||||||||||||
| Bank of America NA | $ | (72,340 | ) | $ | 47,757 | $ | – | $ | – | $ | (24,583 | ) | ||||||||
| Barclays Bank plc | (18,667 | ) | 18,667 | – | – | – | ||||||||||||||
| BNP Paribas | (27,899 | ) | – | – | 11,000 | (16,899 | ) | |||||||||||||
| Citibank NA | (124,815 | ) | 104,916 | – | 19,899 | – | ||||||||||||||
| Deutsche Bank AG | (67,034 | ) | – | – | – | (67,034 | ) | |||||||||||||
| Goldman Sachs Bank USA | (36,571 | ) | 36,571 | – | – | – | ||||||||||||||
| Goldman Sachs International | (175,180 | ) | 175,180 | – | – | – | ||||||||||||||
| HSBC Bank USA, NA | (346,145 | ) | 107,138 | – | 239,007 | – | ||||||||||||||
| JPMorgan Chase Bank NA | (439,589 | ) | 439,589 | – | – | – | ||||||||||||||
| Morgan Stanley | (19,388 | ) | – | – | – | (19,388 | ) | |||||||||||||
Toronto Dominion Bank | (7,350 | ) | 7,350 | – | – | – | ||||||||||||||
| $ | (1,334,978) | $ | 937,168 | $ | – | $ | 269,906 | $ | (127,904 | ) | ||||||||||
* OTC derivatives are reported gross on the Consolidated Statement of Assets and Liabilities. Exchange traded options and margin related to centrally cleared swaps and futures are excluded from these reported amounts.
** Reported collateral pledged within this table is limited to the net outstanding amount due from the Fund. The securities pledged as collateral by the Fund as reported on the Consolidated Statements of Investments may exceed these amounts.
The following table presents the valuations of derivative instruments by risk exposure as reported within the Consolidated Statement of Assets and Liabilities at period end:
36 OPPENHEIMER GLOBAL MULTI-ALTERNATIVES FUND/VA
6. Use of Derivatives (Continued)
Asset Derivatives | Liability Derivatives | |||||||||||
Derivatives Not Accounted for as Hedging Instruments | Consolidated Statement of Assets and Liabilities Location | Value | Consolidated Statement of Assets and Liabilities Location | Value | ||||||||
| Credit contracts | Swaps, at value | $ | 253,321 | |||||||||
| Equity contracts | Swaps, at value | $ | 403,774 | |||||||||
| Credit contracts | Centrally cleared swaps, at value | 164,507 | Centrally cleared swaps, at value | 259,278 | ||||||||
| Commodity contracts | Variation margin receivable | 89,100* | ||||||||||
| Equity contracts | Variation margin receivable | 4,287* | Variation margin payable | 212,901 | * | |||||||
| Interest rate contracts | Variation margin receivable | 7,241* | Variation margin payable | 44,190 | * | |||||||
| Forward currency exchange contracts | Unrealized appreciation on forward currency exchange contracts | 2,238,627 | Unrealized depreciation on forward currency exchange contracts | 787,719 | ||||||||
| Equity contracts | Options written, at value | 253,102 | ||||||||||
| Forward currency exchange contracts | Options written, at value | 293,938 | ||||||||||
| Equity contracts | Investments, at value | 62,620** | ||||||||||
| Forward currency exchange contracts | Investments, at value | 54,283** | ||||||||||
| Interest rate contracts | Investments, at value | 415,524** | ||||||||||
|
|
|
| |||||||||
Total | $ | 3,439,963 | $ | 2,104,449 | ||||||||
|
|
|
| |||||||||
*Includes only the current day’s variation margin. Prior variation margin movements have been reflected in cash on the Consolidated Statement of Assets and Liabilities upon receipt or payment.
**Amounts relate to purchased option contracts and purchased swaption contracts, if any.
The effect of derivative instruments on the Consolidated Statement of Operations is as follows:
| Amount of Realized Gain or (Loss) Recognized on Derivatives | ||||||||||||||||||||||||
Derivatives Not Accounted for as Hedging Instruments | Investment transactions in unaffiliated companies* | Option contracts written | Futures contracts | Forward currency exchange contracts | Swap contracts | Total | ||||||||||||||||||
| Commodity contracts | $ | — | $ | — | $ | 392,494 | $ | — | $ | — | $ | 392,494 | ||||||||||||
| Credit contracts | — | — | — | — | (240,900 | ) | (240,900 | ) | ||||||||||||||||
| Equity contracts | 736,511 | 91,063 | 422,966 | — | (613,051 | ) | 637,489 | |||||||||||||||||
| Forward currency exchange contracts | (131,575 | ) | 2,276,392 | — | (2,809,538 | ) | — | (664,721 | ) | |||||||||||||||
| Interest rate contracts | — | — | 443,841 | — | 178,014 | 621,855 | ||||||||||||||||||
| Volatility contracts | — | — | (59,524 | ) | — | (162,247 | ) | (221,771 | ) | |||||||||||||||
| Total | $ | 604,936 | $ | 2,367,455 | $ | 1,199,777 | $ | (2,809,538 | ) | $ | (838,184 | ) | $ | 524,446 | ||||||||||
*Includes purchased option contracts and purchased swaption contracts, if any.
| Amount of Change in Unrealized Gain or (Loss) Recognized on Derivatives | ||||||||||||||||||||||||
Derivatives Not Accounted for as Hedging Instruments | Investment transactions in unaffiliated companies* | Option contracts written | Futures contracts | Forward currency exchange contracts | Swap contracts | Total | ||||||||||||||||||
| Commodity contracts | $ | — | $ | — | $ | 104,569 | $ | — | $ | — | $ | 104,569 | ||||||||||||
| Credit contracts | — | — | — | — | 335,160 | 335,160 | ||||||||||||||||||
| Equity contracts | (11,288 | ) | (48,066 | ) | (311,903 | ) | — | 795,669 | 424,412 | |||||||||||||||
| Forward currency exchange contracts | 23,170 | (10,303 | ) | — | 2,471,940 | — | 2,484,807 | |||||||||||||||||
| Interest rate contracts | 87,986 | — | 15,864 | — | 135,284 | 239,134 | ||||||||||||||||||
| Volatility contracts | — | — | (44,763 | ) | — | 80,368 | 35,605 | |||||||||||||||||
| Total | $ | 99,868 | $ | (58,369 | ) | $ | (236,233 | ) | $ | 2,471,940 | $ | 1,346,481 | $ | 3,623,687 | ||||||||||
* Includes purchased option contracts and purchased swaption contracts, if any.
7. Shares of Beneficial Interest
The Fund has authorized an unlimited number of $0.001 par value shares of beneficial interest of each class. Transactions in shares of beneficial interest were as follows:
37 OPPENHEIMER GLOBAL MULTI-ALTERNATIVES FUND/VA
NOTES TO CONSOLIDATED FINANCIAL STATEMENTS Unaudited / Continued
7. Shares of Beneficial Interest (Continued)
| Six Months Ended June 30, 2018 | Year Ended December 31, 2017 | |||||||||||||||||||||||||
Shares |
Amount |
Shares |
Amount | |||||||||||||||||||||||
Non-Service Shares | ||||||||||||||||||||||||||
Sold | 294,204 | $ | 2,961,646 | 1,734,875 | $ | 17,157,352 | ||||||||||||||||||||
Dividends and/or distributions reinvested | 148,527 | 1,458,889 | 397,645 | 3,921,732 | ||||||||||||||||||||||
Redeemed | (1,507,776 | ) | (14,850,324 | ) | (380,193 | ) | (3,771,458 | ) | ||||||||||||||||||
Net increase (decrease) | (1,065,045 | ) | $ | (10,429,789 | ) | 1,752,327 | $ | 17,307,626 | ||||||||||||||||||
Service Shares | ||||||||||||||||||||||||||
Sold | 82,179 | $ | 807,895 | 151,036 | $ | 1,490,635 | ||||||||||||||||||||
Dividends and/or distributions reinvested | 688 | 6,755 | 2,437 | 24,086 | ||||||||||||||||||||||
Redeemed | (23,761 | ) | (233,771 | ) | (58,070 | ) | (574,600 | ) | ||||||||||||||||||
Net increase | 59,106 | $ | 580,879 | 95,403 | $ | 940,121 | ||||||||||||||||||||
8. Purchases and Sales of Securities
The aggregate cost of purchases and proceeds from sales of securities, other than short-term obligations and investments in IGMMF, for the reporting period were as follows:
| Purchases | Sales | |||||||
| Investment securities | $ | 150,283,315 | $ | 204,381,821 | ||||
9. Fees and Other Transactions with Affiliates
Management Fees. Under the investment advisory agreement, the Fund pays the Manager a management fee based on the daily net assets of the Fund at an annual rate as shown in the following table:
| Fee Schedule | ||||
| Up to $500 million | 1.00 | % | ||
| Next $500 million | 0.95 | |||
| Next $4 billion | 0.90 | |||
| Over $5 billion | 0.88 | |||
The Manager also provides investment management related services to the Subsidiary. The Subsidiary pays the Manager a monthly management fee at an annual rate according to the above schedule. The Subsidiary also pays certain other expenses including custody and directors’ fees.
The Fund’s effective management fee for the reporting period was 1.00% of average annual net assets before any Subsidiary management fees or any applicable waivers.
Sub-Adviser Fees. The Manager has retained the Sub-Adviser to provide the day-to-day portfolio management of the Fund and the Subsidiary. Under the Sub-Advisory Agreement, the Manager pays the Sub-Adviser an annual fee in monthly installments, equal to a percentage of the investment management fee collected by the Manager from the Fund and the Subsidiary, which shall be calculated after any investment management fee waivers. The fee paid to the Sub-Adviser is paid by the Manager, not by the Fund.
Sub-Sub-Adviser Fees. The Sub-Adviser retains the Sub-Sub-Advisers to provide the day-to-day portfolio management of the Fund. Under the Sub-Sub-Advisory Agreement, the Sub-Adviser pays the Sub-Sub-Advisers an annual fee in monthly installments, based on the average daily net assets of the Fund. The fee paid to the Sub-Sub-Advisers under the Sub-Sub-Advisory agreement is paid by the Sub-Adviser, not by the Fund.
Transfer Agent Fees. OFI Global (the “Transfer Agent”) serves as the transfer and shareholder servicing agent for the Fund. The Fund pays the Transfer Agent a fee based on annual net assets. Fees incurred and average net assets for each class with respect to these services are detailed in the Consolidated Statement of Operations and Consolidated Financial Highlights, respectively.
Sub-Transfer Agent Fees. The Transfer Agent has retained Shareholder Services, Inc., a wholly-owned subsidiary of OFI (the “Sub-Transfer Agent”), to provide the day-to-day transfer agent and shareholder servicing of the Fund. Under the Sub-Transfer Agency Agreement, the Transfer Agent pays the Sub-Transfer Agent an annual fee in monthly installments, equal to a percentage of the transfer agent fee collected by the Transfer Agent from the Fund, which shall be calculated after any applicable fee waivers. The fee paid to the Sub-Transfer Agent is paid by the Transfer Agent, not by the Fund.
Trustees’ Compensation. The Fund’s Board of Trustees (“Board”) has adopted a compensation deferral plan for Independent Trustees that enables Trustees to elect to defer receipt of all or a portion of the annual compensation they are entitled to receive from the Fund. For purposes of determining the amount owed to the Trustees under the plan, deferred amounts are treated as though equal dollar amounts had been invested in shares of the Fund or in other Oppenheimer funds selected by the Trustees. The Fund purchases shares of the funds selected for deferral by the Trustees in amounts equal to his or her deemed investment, resulting in a Fund asset equal to the deferred compensation liability. Such assets are included as a component of “Other” within the asset section of the Consolidated Statement of Assets and Liabilities. Deferral of Trustees’ fees under the plan will not affect the
38 OPPENHEIMER GLOBAL MULTI-ALTERNATIVES FUND/VA
9. Fees and Other Transactions with Affiliates (Continued)
net assets of the Fund and will not materially affect the Fund’s assets, liabilities or net investment income per share. Amounts will be deferred until distributed in accordance with the compensation deferral plan.
Distribution and Service Plan for Service Shares. The Fund has adopted a Distribution and Service Plan (the “Plan”) pursuant to Rule 12b-1 under the 1940 Act for Service shares to pay OppenheimerFunds Distributor, Inc. (the “Distributor”), for distribution related services, personal service and account maintenance for the Fund’s Service shares. Under the Plan, payments are made periodically at an annual rate of 0.25% of the daily net assets of Service shares of the Fund. The Distributor currently uses all of those fees to compensate sponsors of the insurance product that offers Fund shares, for providing personal service and maintenance of accounts of their variable contract owners that hold Service shares. These fees are paid out of the Fund’s assets on an on-going basis and increase operating expenses of the Service shares, which results in lower performance compared to the Fund’s shares that are not subject to a service fee. Fees incurred by the Fund under the Plan are detailed in the Consolidated Statement of Operations.
Waivers and Reimbursements of Expenses. The Manager has contractually agreed to waive fees and/or reimburse expenses to limit the Fund’s “Expenses after payments, waivers and/or reimbursements and reduction to custodian expenses” (excluding any applicable dividends tied to short sales expense, taxes, interest and fees from borrowing, any subsidiary expenses, Acquired Fund Fees and Expenses, brokerage commissions, unusual and infrequent expenses and certain other Fund expenses) so that, as percentages of average daily net assets, those expenses will not exceed the annual rate of 1.20% for Non-Service shares and 1.45% for Service shares as calculated on the daily net assets of the Fund.
The Manager has contractually agreed to waive the management fee it receives from the Fund in an amount equal to the management fee it receives from the Subsidiary. During the reporting period, the Manager waived $57,277. This fee waiver and/or expense reimbursement may not be amended or withdrawn for one year from the date of the Fund’s prospectus, unless approved by the Board.
The Manager will waive fees and/or reimburse Fund expenses in an amount equal to the indirect management fees incurred through the Fund’s investment in IGMMF. During the reporting period, the Manager waived fees and/or reimbursed the Fund $42,631 for IGMMF management fees. This fee waiver and/or expense reimbursement may not be amended or withdrawn for one year from the date of the Fund’s prospectus, unless approved by the Board.
10. Borrowings and Other Financing
Securities Sold Short. The Fund sells securities that it does not own, and it will therefore be obligated to purchase such securities at a future date. Upon entering into a short position, the Fund is required to segregate cash or securities at its custodian which are pledged for the benefit of the lending broker and/or to deposit and pledge cash directly at the lending broker, with a value equal to a certain percentage, exceeding 100%, of the value of the securities that it sold short. Cash that has been segregated and pledged for this purpose will be disclosed on the Consolidated Statement of Assets and Liabilities; securities that have been segregated and pledged for this purpose are disclosed as such in the Consolidated Statement of Investments. The aggregate market value of such cash and securities at period end is $59,052,777. The value of the open short position is recorded as a liability, and the Fund records an unrealized gain or loss to the extent of the difference between the proceeds received and the change in value of the open short position. The Fund records a realized gain or loss when the short position is closed out. By entering into short sales, the Fund bears the risk of an unlimited loss, since the price of the security sold short could theoretically increase without limit. Purchasing securities previously sold short to close out a short position can itself cause the price of the securities to rise further, thereby increasing the loss. Further, there is no assurance that a security the Fund needs to buy to cover a short position will be available for purchase at a reasonable price. Until the security is replaced, the Fund is required to pay the lender any dividend or interest earned. Dividend expense on short sales is treated as an expense in the Consolidated Statement of Operations.
Joint Credit Facility. A number of mutual funds managed by the Manager participate in a $1.875 billion revolving credit facility (the “Facility”) intended to provide short-term financing, if necessary, subject to certain restrictions in connection with atypical redemption activity. Effective July 17, 2018, the Facility was increased to $1.95 billion. Expenses and fees related to the Facility are paid by the participating funds and are disclosed separately or as other expenses on the Consolidated Statement of Operations. The Fund did not utilize the Facility during the reporting period.
11. Prior Period Reclassification
An adjustment to reflect a prior period reclassification between net investment income and net change in unrealized appreciation (depreciation) on investments and/or net realized gain (loss) on investments during the years ending December 31, 2014 and 2015 has been made to properly reflect income distributions received by the Fund from two of its investments.
The following adjustments are reflected in the respective fiscal years per the Consolidated Statements of Changes in Net Assets and the Consolidated Financial Highlights:
| 2014 | 2015 | |||||||
| Net investment income (loss) | $3,699 | $696,112 | ||||||
| Net realized gain (loss) | 360 | 3,812 | ||||||
| Net change in unrealized appreciation/ depreciation | (4,059 | ) | (699,924 | ) | ||||
39 OPPENHEIMER GLOBAL MULTI-ALTERNATIVES FUND/VA
NOTES TO CONSOLIDATED FINANCIAL STATEMENTS Unaudited / Continued
11. Prior Period Reclassification (Continued)
The cumulative impact of these adjustments are also reflected in the respective component of net assets on the Consolidated Statement of Assets and liabilities and had no impact on total net assets or net asset values per share of the Fund.
40 OPPENHEIMER GLOBAL MULTI-ALTERNATIVES FUND/VA
PORTFOLIO PROXY VOTING POLICIES AND GUIDELINES; UPDATES TO STATEMENT OF INVESTMENTS Unaudited
The Fund has adopted Portfolio Proxy Voting Policies and Guidelines under which the Fund votes proxies relating to securities (“portfolio proxies”) held by the Fund. A description of the Fund’s Portfolio Proxy Voting Policies and Guidelines is available (i) without charge, upon request, by calling the Fund toll-free at 1.800.CALL OPP (225.5677), (ii) on the Fund’s website at www.oppenheimerfunds.com, and (iii) on the SEC’s website at www.sec.gov. In addition, the Fund is required to file Form N-PX, with its complete proxy voting record for the 12 months ended June 30th, no later than August 31st of each year. The Fund’s voting record is available (i) without charge, upon request, by calling the Fund toll-free at 1.800.CALL OPP (225.5677), and (ii) in the Form N-PX filing on the SEC’s website at www.sec.gov.
The Fund files its complete schedule of portfolio holdings with the SEC for the first quarter and the third quarter of each fiscal year on Form N-Q. The Fund’s Form N-Q filings are available on the SEC’s website at www.sec.gov. Those forms may be reviewed and copied at the SEC’s Public Reference Room in Washington, D.C. Information on the operation of the Public Reference Room may be obtained by calling 1-800-SEC-0330.
41 OPPENHEIMER GLOBAL MULTI-ALTERNATIVES FUND/VA
THIS PAGE INTENTIONALLY LEFT BLANK.
42 OPPENHEIMER GLOBAL MULTI-ALTERNATIVES FUND/VA
THIS PAGE INTENTIONALLY LEFT BLANK.
43 OPPENHEIMER GLOBAL MULTI-ALTERNATIVES FUND/VA
OPPENHEIMER GLOBAL MULTI-ALTERNATIVES FUND/VA
A Series of Oppenheimer Variable Account Funds
| Trustees and Officers | Robert J. Malone, Chairman of the Board of Trustees and Trustee | |
| Andrew J. Donohue, Trustee | ||
| Richard F. Grabish, Trustee | ||
| Beverly L. Hamilton, Trustee | ||
| Victoria J. Herget, Trustee | ||
| Karen L. Stuckey, Trustee | ||
| James D. Vaughn, Trustee | ||
| Arthur P. Steinmetz, Trustee, President and Principal Executive Officer | ||
| Benjamin Rockmuller, Vice President | ||
| Alessio de Longis, Vice President | ||
| Cynthia Lo Bessette, Secretary and Chief Legal Officer | ||
| Jennifer Foxson, Vice President and Chief Business Officer | ||
| Mary Ann Picciotto, Chief Compliance Officer and Chief Anti-Money Laundering Officer | ||
| Brian S. Petersen, Treasurer and Principal Financial & Accounting Officer | ||
| Manager | OFI Global Asset Management, Inc. | |
| Sub-Adviser | OppenheimerFunds, Inc. | |
| Distributor | OppenheimerFunds Distributor, Inc. | |
| Transfer and | OFI Global Asset Management, Inc. | |
| Shareholder | ||
| Servicing Agent | ||
| Sub-Transfer Agent | Shareholder Services, Inc. | |
| DBA OppenheimerFunds Services | ||
| Independent | KPMG LLP | |
| Registered | ||
| Public | ||
| Accounting | ||
| Firm | ||
| Legal Counsel | Ropes & Gray LLP | |
| Before investing in any of the Oppenheimer funds, investors should carefully consider a fund’s investment objectives, risks, charges and expenses. Fund prospectuses and summary prospectuses contain this and other information about the funds and may be obtained by asking your financial advisor, visiting oppenheimerfunds.com or calling us at 1.800.988.8287. Read prospectuses and summary prospectuses carefully before investing. | ||
| The financial statements included herein have been taken from the records of the Fund without examination of those records by the independent registered public accounting firm. | ||
| © 2018 OppenheimerFunds, Inc. All rights reserved. Oppenheimer funds are distributed by OppenheimerFunds Distributor, Inc. | ||

| ||||
June 30, 2018 | ||||
Oppenheimer | ||||
International Growth Fund/VA | Semiannual Report | |||
A Series of Oppenheimer Variable Account Funds
| ||||
SEMIANNUAL REPORT | ||||
Listing of Top Holdings | ||||
Fund Performance Discussion | ||||
Financial Statements |

PORTFOLIO MANAGERS: George R. Evans, CFA, and Robert B. Dunphy, CFA
AVERAGE ANNUAL TOTAL RETURNS FOR THE PERIODS ENDED 6/30/18
| Inception Date | 6-Months | 1-Year | 5-Year | 10-Year | ||||||||||||||||
Non-Service Shares | 5/13/92 | -2.74% | 6.73% | 6.44% | 5.42% | |||||||||||||||
Service Shares | 3/19/01 | -3.23 | 5.78 | 6.14 | 5.11 | |||||||||||||||
MSCI AC World ex-U.S. Index | -3.77 | 7.28 | 5.99 | 2.54 | ||||||||||||||||
Performance data quoted represents past performance, which does not guarantee future results. The investment return and principal value of an investment in the Fund will fluctuate so that an investor’s shares, when redeemed, may be worth more or less than their original cost. Current performance may be lower or higher than the performance quoted. For performance data current to the most recent month end, call us at 1.800.988.8287. The Fund’s total returns should not be expected to be the same as the returns of other funds, whether or not both funds have the same portfolio managers and/or similar names. The Fund’s total returns include changes in share price and reinvested distributions but do not include the charges associated with the separate account products that offer this Fund. Such performance would have been lower if such charges were taken into account. Returns for periods of less than one year are cumulative and not annualized. See Fund prospectuses and summary prospectuses for more information on share classes and sales charges.
The Fund’s performance is compared to the performance of the MSCI AC World ex-U.S. Index. The MSCI AC World ex-U.S. Index is designed to measure the equity market performance of developed and emerging markets and excludes the U.S. The Index is unmanaged and cannot be purchased directly by investors. While index comparisons may be useful to provide a benchmark for the Fund’s performance, it must be noted that the Fund’s investments are not limited to the investments comprising the Index. Index performance includes reinvestment of income, but does not reflect transaction costs, fees, expenses or taxes. Index performance is shown for illustrative purposes only as a benchmark for the Fund’s performance, and does not predict or depict performance of the Fund. The Fund’s performance reflects the effects of the Fund’s business and operating expenses.
TOP HOLDINGS AND ALLOCATIONS
TOP TEN COMMON STOCK HOLDINGS
Infineon Technologies AG | 2.4% | |||
SAP SE | 2.2 | |||
Temenos AG | 2.1 | |||
Nippon Telegraph & Telephone Corp. | 1.7 | |||
STMicroelectronics NV | 1.6 | |||
Atos SE | 1.6 | |||
CSL Ltd. | 1.6 | |||
ASML Holding NV | 1.6 | |||
LVMH Moet Hennessy Louis Vuitton SE | 1.5 | |||
Continental AG | 1.5 |
Portfolio holdings and allocations are subject to change. Percentages are as of June 30, 2018, and are based on net assets. For more current Fund holdings, please visit oppenheimerfunds.com.
REGIONAL ALLOCATION
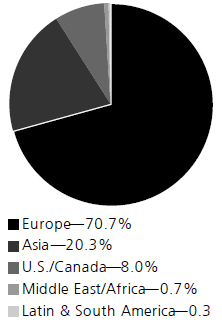
Portfolio holdings and allocations are subject to change. Percentages are as of June 30, 2018, and are based on the total market value of investments. For more current Fund holdings, please visit oppenheimerfunds.com.
2 OPPENHEIMER INTERNATIONAL GROWTH FUND/VA
Fund Performance Discussion
The Fund’s Non-Service shares returned -2.74% during the six-month reporting period ended June 30, 2018. On a relative basis, the Fund outperformed the MSCI AC World Ex-U.S. Index (the “Index”), which returned -3.77%. The Fund outperformed the Index in Information Technology and Health Care sectors due to stock selection. Stock selection in Financials along with our usual underweight position in the sector also contributed to performance. Underperformers for the Fund included stock selection in the Consumer Discretionary and Consumer Staples sectors, and our usual underweight position in the Energy sector.
With regard to countries, we remind investors that we are fundamental, bottom-up investors who view the world as one marketplace. Our geographic exposure is purely the result of our stock selection and does not reflect any views regarding the general economy of any country. During this reporting period, an overweight position in France and stock selection in Sweden and Australia were top performers relative to the Index. Detractors included stock selection in Hong Kong, India, and Canada.
MARKET OVERVIEW
World equity markets surged in the fourth quarter of 2017 to bring a close to a very strong year. 2018 started on a similar note, with equity markets rising strongly in January on the positive sentiment provoked by the U.S. tax law changes. This was followed by a sharp correction in February and volatile range trading thereafter. Given the very strong performance of equity markets last year, a correction and consolidation seemed in order and we do not find it alarming.
We believe that there are currently segments within the economy that are poised for long-term growth. For instance, we are of the opinion that the increasing digitization of the world economy is altering the shape of the semi-conductor cycle by lengthening it and reducing its amplitude. The evolution of the car to include more electronics and automation is another trend that is currently underappreciated in our view. The rates of growth for companies that benefit from these trends began to ease during the reporting period from the high levels experienced through most of the last two years. In response, investors have de-rated many of them, particularly if they are in areas that are in any way seen as sensitive to macro-economic strength or weakness. Over the second quarter of 2018, this was compounded for all things auto-related, which suffered a precipitous sell-off at the end of the reporting period on news flow of further tariff imposition by the U.S. on foreign car imports. Within this environment, many of the companies in which we have invested, especially those that we hold within our Data Deluge and Evolution of the Car investment themes, suffered profit taking.
TOP INDIVIDUAL CONTRIBUTORS
Top performing holdings for the Fund this reporting period included NEX Group plc, William Demant Holding A/S, and CSL Ltd.
NEX Group plc, a UK company, is a “broker’s broker.” It is the intermediary between professional participants in many over-the-counter financial markets such as those for foreign exchange, bonds and some derivative instruments. During the period, the Chicago Mercantile Exchange (CME) bid for NEX and the share price rose to reflect the significant premium the CME proposes to pay. We exited our position.
William Demant Holding A/S is a Danish hearing aid company whose securities we have owned for many years. During the period, the company announced earnings ahead of consensus forecasts and the stock reacted favorably. In our opinion, the demographic tailwind of an aging population will continue to support the company well into the future.
CSL is an Australian company that makes and sells medicines derived from human plasma, which it also collects. The global market for plasma is very concentrated, with only a few scale players who tightly control collection bottlenecks. The demand for plasma-based products is well-supported by the demographic trends of an aging population in the developed world and, in the emerging markets, a rising ability to pay for health care. CSL announced strong earnings during the reporting period and the share price reacted favorably.
TOP INDIVIDUAL DETRACTORS
Detractors from performance included Valeo SA, Pandora A/S, and Iliad SA.
Valeo SA is a French auto component supplier that is on the right side of the car evolution trend towards more complex componentry. Both demand for Valeo’s products and its pricing power over them are rising with this trend. During the reporting period, the company announced earnings that were shy of very
3 OPPENHEIMER INTERNATIONAL GROWTH FUND/VA
optimistic forecasts, and the stock corrected from record highs. In our opinion, the shift in the share—towards component makers and away from assemblers—of every dollar spent on a car, will continue for several years, and Valeo will continue to benefit from that shift.
Pandora, the Danish jewelry retailer, has been benefitting from the consumer trend towards brands in the very fragmented jewelry market. Furthermore, Pandora is the only company applying fast fashion techniques to the jewelry industry. They offer a good product mix at a price point that is well within reach of most middle-class consumers. Currently, the company is taking more control over its distribution, by building out its own store network. In our opinion, this is an appropriate strategy, but it is expensive in the short term. During the reporting period, the company announced results below consensus forecasts and the share price reacted unfavorably.
Iliad SA is a French telecommunications and Internet service provider. It has recently entered the Italian market as a fourth carrier and is incurring significant customer acquisition costs, which are weighing on the stock. Iliad entered the French mobile market as a fourth carrier in 2012. In the short term it lowered pricing in the market to gain share. It now has 25% of the French mobile market and makes healthy returns from it.
STRATEGY & OUTLOOK
As is often the case in market downdrafts, our portfolio outperformed the Index during the volatile reporting period.
Looking ahead, we would not be at all surprised to see continued volatility in equity markets the rest of the year. In our opinion, it is reasonable to expect this after the extremely high returns that equity markets delivered to investors last year. It is worth remembering the old adage “Markets don’t go up in a straight line.”
We will look to take advantage of the volatility to add to companies already held in our portfolio and to add new companies to the portfolio from our watch list that have heretofore been too expensive for us to buy.
We remind investors that, when we add companies to the portfolio, we are comparing their present value to the value we think they can have three to five years from now and beyond. With this long-term approach, market volatility does not change our view on the kind of companies we would like in our portfolio. It does give us the opportunity to add, or add to, such holdings.
We are bottom up, global, growth investors with a mandate to buy non-U.S. companies. We look for companies that we believe are on the winning side of long-term structural trends, that have the ability to monetize them over a long period of time and that share with us the wealth they create. Those are the companies we believe we have in the portfolio and those are the kind of companies that we will continue to seek investing in, regardless of short-term market conditions.
The views in the Fund Performance Discussion represent the opinions of this Fund’s portfolio managers and are not intended as investment advice or to predict or depict the performance of any investment. These views are as of the close of business on June 30, 2018, and are subject to change based on subsequent developments. The Fund’s portfolio and strategies are subject to change.
Shares of Oppenheimer funds are not deposits or obligations of any bank, are not guaranteed by any bank, are not insured by the FDIC or any other agency, and involve investment risks, including the possible loss of the principal amount invested.
4 OPPENHEIMER INTERNATIONAL GROWTH FUND/VA
Fund Expenses
Fund Expenses. As a shareholder of the Fund, you incur two types of costs: (1) transaction costs and (2) ongoing costs, including management fees; distribution and service fees; and other Fund expenses. These examples are intended to help you understand your ongoing costs (in dollars) of investing in the Fund and to compare these costs with the ongoing costs of investing in other mutual funds.
The examples are based on an investment of $1,000.00 invested at the beginning of the period and held for the entire 6-month period ended June 30, 2018.
Actual Expenses. The first section of the table provides information about actual account values and actual expenses. You may use the information in this section for the class of shares you hold, together with the amount you invested, to estimate the expense that you paid over the period. Simply divide your account value by $1,000.00 (for example, an $8,600.00 account value divided by $1,000.00 = 8.60), then multiply the result by the number in the first section under the heading entitled “Expenses Paid During 6 Months Ended June 30, 2018” to estimate the expenses you paid on your account during this period.
Hypothetical Example for Comparison Purposes.
The second section of the table provides information about hypothetical account values and hypothetical expenses based on the Fund’s actual expense ratio for each class of shares, and an assumed rate of return of 5% per year for each class before expenses, which is not the actual return. The hypothetical account values and expenses may not be used to estimate the actual ending account balance or expenses you paid for the period. You may use this information to compare the ongoing costs of investing in the Fund and other funds. To do so, compare this 5% hypothetical example for the class of shares you hold with the 5% hypothetical examples that appear in the shareholder reports of the other funds.
Please note that the expenses shown in the table are meant to highlight your ongoing costs only and do not reflect any charges associated with the separate accounts that offer this Fund. Therefore, the “hypothetical” lines of the table are useful in comparing ongoing costs only, and will not help you determine the relative total costs of owning different funds. In addition, if these separate account charges were included your costs would have been higher.
| Actual | Beginning Account Value January 1, 2018 | Ending Account Value June 30, 2018 | Expenses Paid During 6 Months Ended June 30, 2018 | |||||||||
Non-Service shares | $ | 1,000.00 | $ | 972.60 | $ | 4.90 | ||||||
Service shares | 1,000.00 | 967.70 | 6.12 | |||||||||
| Hypothetical | ||||||||||||
| (5% return before expenses) | ||||||||||||
Non-Service shares | 1,000.00 | 1,019.84 | 5.02 | |||||||||
Service shares | 1,000.00 | 1,018.60 | 6.28 | |||||||||
Expenses are equal to the Fund’s annualized expense ratio for that class, multiplied by the average account value over the period, multiplied by 181/365 (to reflect the one-half year period). Those annualized expense ratios, excluding indirect expenses from affiliated funds, based on the 6-month period ended June 30, 2018 are as follows:
| Class | Expense Ratios | |||||||
Non-Service shares | 1.00% | |||||||
Service shares | 1.25 | |||||||
The expense ratios reflect voluntary and/or contractual waivers and/or reimbursements of expenses by the Fund’s Manager. Some of these undertakings may be modified or terminated at any time, as indicated in the Fund’s prospectus. The “Financial Highlights” tables in the Fund’s financial statements, included in this report, also show the gross expense ratios, without such waivers or reimbursements and reduction to custodian expenses, if applicable.
5 OPPENHEIMER INTERNATIONAL GROWTH FUND/VA
STATEMENT OF INVESTMENTS June 30, 2018 Unaudited
| Shares | Value | |||||||
Common Stocks—96.9% | ||||||||
Consumer Discretionary—21.3% | ||||||||
Auto Components—4.2% | ||||||||
Continental AG | 37,159 | $ | 8,493,270 | |||||
Koito Manufacturing Co. Ltd. | 109,600 | 7,230,528 | ||||||
Valeo SA | 136,543 | 7,452,920 | ||||||
|
| 23,176,718
|
| ||||||
Automobiles—3.3% | ||||||||
Bayerische Motoren Werke AG | 53,890 | 4,887,990 | ||||||
Hero MotoCorp Ltd. | 161,717 | 8,193,701 | ||||||
Subaru Corp. | 191,200 | 5,562,551 | ||||||
|
| 18,644,242
|
| ||||||
Hotels, Restaurants & Leisure—3.0% | ||||||||
Carnival Corp. | 124,468 | 7,133,261 | ||||||
Domino’s Pizza Group plc | 1,048,054 | 4,785,945 | ||||||
Whitbread plc | 94,176 | 4,919,717 | ||||||
|
| 16,838,923
|
| ||||||
Household Durables—1.2% | ||||||||
SEB SA1
|
| 39,200
|
|
| 6,835,512
|
| ||
Internet & Catalog Retail—0.9% | ||||||||
JD.com, Inc., ADR1
|
| 131,128
|
|
| 5,107,436
|
| ||
Media—2.2% | ||||||||
ProSiebenSat.1 Media SE | 181,356 | 4,598,406 | ||||||
SES SA, Cl. A, FDR | 360,190 | 6,592,028 | ||||||
Technicolor SA1 | 694,840 | 854,138 | ||||||
|
| 12,044,572
|
| ||||||
Multiline Retail—1.0% | ||||||||
Dollarama, Inc.
|
| 139,482
|
|
| 5,406,764
|
| ||
Specialty Retail—1.1% | ||||||||
Nitori Holdings Co. Ltd.
|
| 38,800
|
|
| 6,052,155
|
| ||
Textiles, Apparel & Luxury Goods—4.4% | ||||||||
Cie Financiere Richemont SA | 53,987 | 4,573,607 | ||||||
Hermes International | 12,506 | 7,643,675 | ||||||
LVMH Moet Hennessy Louis Vuitton SE | 25,930 | 8,619,618 | ||||||
Pandora AS | 52,858 | 3,694,218 | ||||||
|
| 24,531,118
|
| ||||||
Consumer Staples—9.8% | ||||||||
Beverages—2.1% | ||||||||
Heineken NV | 54,916 | 5,505,938 | ||||||
Pernod Ricard SA | 39,110 | 6,383,336 | ||||||
|
| 11,889,274
|
| ||||||
Food & Staples Retailing—2.4% | ||||||||
Alimentation Couche-Tard, Inc., Cl. B | 111,346 | 4,837,006 | ||||||
CP ALL PCL | 2,124,700 | 4,710,875 | ||||||
SPAR Group Ltd. (The) | 296,961 | 4,010,706 | ||||||
|
| 13,558,587
|
| ||||||
Food Products—3.0% | ||||||||
Barry Callebaut AG | 2,816 | 5,056,693 | ||||||
Saputo, Inc. | 197,075 | 6,543,433 | ||||||
WH Group Ltd.2 | 6,061,500 | 4,900,713 | ||||||
|
| 16,500,839
|
| ||||||
Household Products—1.3% | ||||||||
Reckitt Benckiser Group plc
|
| 86,635
|
|
| 7,121,865
|
| ||
Tobacco—1.0% | ||||||||
Swedish Match AB
|
| 113,161
|
|
| 5,601,555
|
| ||
Energy—1.5% | ||||||||
Energy Equipment & Services—1.1% | ||||||||
TechnipFMC plc
|
| 188,522
|
|
| 5,991,015
|
| ||
Oil, Gas & Consumable Fuels—0.4% | ||||||||
Koninklijke Vopak NV | 47,812 | 2,207,017 | ||||||
| Shares | Value | |||||||
Financials—3.8% | ||||||||
Capital Markets—1.2% | ||||||||
TP ICAP plc | 639,406 | $ | 3,553,484 | |||||
UBS Group AG1 | 192,440 | 2,960,704 | ||||||
|
| 6,514,188
|
| ||||||
Commercial Banks—1.4% | ||||||||
ICICI Bank Ltd., Sponsored ADR1
|
| 969,753
|
|
| 7,787,117
|
| ||
Insurance—1.2% | ||||||||
Prudential plc
|
| 295,659
|
|
| 6,755,421
|
| ||
Health Care—12.3% | ||||||||
Biotechnology—3.0% | ||||||||
CSL Ltd. | 61,100 | 8,734,958 | ||||||
Grifols SA | 267,975 | 8,036,895 | ||||||
|
| 16,771,853
|
| ||||||
Health Care Equipment & Supplies—4.7% | ||||||||
Essilor International Cie Generale d’Optique SA | 32,763 | 4,622,602 | ||||||
Hoya Corp. | 100,893 | 5,730,069 | ||||||
Siemens Healthineers AG1,2 | 106,321 | 4,388,721 | ||||||
Sonova Holding AG | 30,268 | 5,429,923 | ||||||
William Demant Holding AS1 | 147,051 | 5,913,981 | ||||||
|
| 26,085,296
|
| ||||||
Life Sciences Tools & Services—1.2% | ||||||||
Lonza Group AG1
|
| 25,909
|
|
| 6,882,483
|
| ||
Pharmaceuticals—3.4% | ||||||||
Bayer AG | 60,798 | 6,698,513 | ||||||
Novo Nordisk AS, Cl. B | 157,447 | 7,272,353 | ||||||
Roche Holding AG | 21,083 | 4,691,288 | ||||||
|
| 18,662,154
|
| ||||||
Industrials—17.4% | ||||||||
Aerospace & Defense—1.2% | ||||||||
Airbus SE
|
| 58,170
|
|
| 6,798,822
|
| ||
Commercial Services & Supplies—2.7% | ||||||||
Edenred | 191,834 | 6,054,129 | ||||||
Prosegur Cash SA2 | 1,405,536 | 3,776,282 | ||||||
Prosegur Cia de Seguridad SA | 837,042 | 5,461,798 | ||||||
|
| 15,292,209
|
| ||||||
Construction & Engineering—1.1% | ||||||||
Boskalis Westminster
|
| 210,422
|
|
| 6,123,706
|
| ||
Electrical Equipment—2.7% | ||||||||
Legrand SA | 81,050 | 5,936,434 | ||||||
Melrose Industries plc | 767,188 | 2,152,900 | ||||||
Nidec Corp. | 47,300 | 7,086,574 | ||||||
|
| 15,175,908
|
| ||||||
Machinery—5.3% | ||||||||
Aalberts Industries NV | 139,411 | 6,670,640 | ||||||
Atlas Copco AB, Cl. A | 164,124 | 4,756,926 | ||||||
Epiroc AB, Cl. A1 | 218,967 | 2,297,788 | ||||||
Kubota Corp. | 343,800 | 5,398,798 | ||||||
VAT Group AG1,2 | 47,205 | 6,309,772 | ||||||
Weir Group plc (The) | 148,746 | 3,924,097 | ||||||
|
| 29,358,021
|
| ||||||
Professional Services—0.8% | ||||||||
Intertek Group plc
|
| 57,420
|
|
| 4,330,409
|
| ||
Trading Companies & Distributors—3.6% | ||||||||
Brenntag AG | 88,240 | 4,914,756 | ||||||
Bunzl plc | 259,579 | 7,860,789 | ||||||
Ferguson plc | 43,877 | 3,560,352 | ||||||
Travis Perkins plc | 202,332 | 3,797,477 | ||||||
|
| 20,133,374
|
| ||||||
Information Technology—24.3% | ||||||||
Communications Equipment—1.4% | ||||||||
Nokia OYJ | 1,378,137 | 7,905,951 | ||||||
6 OPPENHEIMER INTERNATIONAL GROWTH FUND/VA
| Shares | Value | |||||||
Electronic Equipment, Instruments, & Components—3.3% |
| |||||||
Hitachi Ltd. | 1,044,000 | $ | 7,353,996 | |||||
Keyence Corp. | 14,112 | 7,958,977 | ||||||
Spectris plc | 82,340 | 2,830,914 | ||||||
|
| 18,143,887
|
| ||||||
Internet Software & Services—4.2% | ||||||||
Alibaba Group Holding Ltd., Sponsored | ||||||||
ADR1 | 19,987 | 3,708,188 | ||||||
Baidu, Inc., Sponsored ADR1 | 27,660 | 6,721,380 | ||||||
Scout24 AG2 | 141,222 | 7,490,310 | ||||||
United Internet AG | 92,623 | 5,303,408 | ||||||
|
| 23,223,286
|
| ||||||
IT Services—3.1% | ||||||||
Amadeus IT Group SA | 80,526 | 6,344,756 | ||||||
Atos SE | 65,910 | 8,981,461 | ||||||
Cielo SA | 444,500 | 1,894,637 | ||||||
|
| 17,220,854
|
| ||||||
Semiconductors & Semiconductor Equipment—7.0% |
| |||||||
ams AG | 103,015 | 7,629,864 | ||||||
ASML Holding NV | 44,245 | 8,726,045 | ||||||
Infineon Technologies AG | 537,199 | 13,689,595 | ||||||
STMicroelectronics NV | 414,640 | 9,213,275 | ||||||
|
| 39,258,779
|
| ||||||
Software—5.3% | ||||||||
Dassault Systemes SE | 41,047 | 5,743,914 | ||||||
SAP SE | 104,065 | 12,022,317 | ||||||
Temenos AG1 | 79,155 | 11,969,910 | ||||||
|
| 29,736,141
|
| ||||||
| Shares | Value | |||||||
Materials—4.1% | ||||||||
Chemicals—2.3% | ||||||||
Essentra plc | 455,282 | $ | 2,885,810 | |||||
Novozymes AS, Cl. B | 86,769 | 4,393,275 | ||||||
Sika AG | 40,320 | 5,556,365 | ||||||
|
| 12,835,450
|
| ||||||
Construction Materials—0.6% | ||||||||
James Hardie Industries plc
| 191,000 | 3,214,960 | ||||||
Containers & Packaging—1.2% | ||||||||
CCL Industries, Inc., Cl. B
|
| 144,966
|
|
| 7,106,879
|
| ||
Telecommunication Services—2.4% |
| |||||||
Diversified Telecommunication Services—2.4% |
| |||||||
Iliad SA | 24,080 | 3,802,111 | ||||||
Nippon Telegraph & Telephone Corp. | 211,500 | 9,610,433 | ||||||
| 13,412,544 | ||||||||
Total Common Stocks (Cost $358,473,017)
|
|
| 540,237,284
|
| ||||
Preferred Stock—0.0% | ||||||||
Zee Entertainment Enterprises Ltd., 6% Cum. Non-Cv., 6.00% (Cost $—)
|
| 599,541
|
|
| 67,466
|
| ||
Investment Company—2.3% | ||||||||
Oppenheimer Institutional Government |
| |||||||
Money Market Fund, Cl. E, 1.85%3,4 (Cost $12,756,037) | 12,756,037 | 12,756,037 | ||||||
Total Investments, at Value (Cost $371,229,054) | 99.2% | 553,060,787 | ||||||
|
| |||||||
Net Other Assets (Liabilities) | 0.8 | 4,662,607 | ||||||
|
| |||||||
Net Assets | 100.0% | $ | 557,723,394 | |||||
|
| |||||||
Footnotes to Statement of Investments
1. Non-income producing security.
2. Represents securities sold under Rule 144A, which are exempt from registration under the Securities Act of 1933, as amended. These securities have been determined to be liquid under guidelines established by the Board of Trustees. These securities amount to $26,865,798 or 4.82% of the Fund’s net assets at period end.
3. Rate shown is the 7-day yield at period end.
4. Is or was an affiliate, as defined in the Investment Company Act of 1940, as amended, at or during the reporting period, by virtue of the Fund owning at least 5% of the voting securities of the issuer or as a result of the Fund and the issuer having the same investment adviser. Transactions during the reporting period in which the issuer was an affiliate are as follows:
Shares December 31, 2017 | Gross Additions | Gross Reductions | Shares June 30, 2018 | |||||||||||||
| ||||||||||||||||
Oppenheimer Institutional Government Money Market Fund, Cl. E | 1,843,768 | 74,320,825 | 63,408,556 | 12,756,037 | ||||||||||||
| Value | Income | Realized Gain (Loss) | Change in Unrealized Gain (Loss) | |||||||||||||
| ||||||||||||||||
| Oppenheimer Institutional Government Money Market Fund, Cl. E | $ | 12,756,037 | $ | 47,694 | $ | — | $ | — | ||||||||
Distribution of investments representing geographic holdings, as a percentage of total investments at value, is as follows:
| Geographic Holdings | Value | Percent | ||||||||||||||
| ||||||||||||||||
France | $ | 86,320,700 | 15.6 | % | ||||||||||||
Germany | 72,487,286 | 13.1 | ||||||||||||||
United Kingdom | 64,470,196 | 11.7 | ||||||||||||||
Switzerland | 62,644,018 | 11.3 | ||||||||||||||
Japan | 61,984,081 | 11.2 | ||||||||||||||
Netherlands | 29,233,346 | 5.3 | ||||||||||||||
Canada | 23,894,082 | 4.4 | ||||||||||||||
Spain | 23,619,731 | 4.2 | ||||||||||||||
Denmark | 21,273,826 | 3.8 | ||||||||||||||
United States | 19,889,298 | 3.6 | ||||||||||||||
India | 16,048,285 | 2.9 | ||||||||||||||
China | 15,537,004 | 2.8 | ||||||||||||||
Sweden | 12,656,269 | 2.3 | ||||||||||||||
Australia | 8,734,958 | 1.6 | ||||||||||||||
Finland | 7,905,951 | 1.4 | ||||||||||||||
Austria | 7,629,865 | 1.4 | ||||||||||||||
Hong Kong | 4,900,713 | 0.9 | ||||||||||||||
Thailand | 4,710,875 | 0.9 | ||||||||||||||
South Africa | 4,010,706 | 0.7 | ||||||||||||||
Ireland | 3,214,960 | 0.6 | ||||||||||||||
7 OPPENHEIMER INTERNATIONAL GROWTH FUND/VA
STATEMENT OF INVESTMENTS Unaudited / Continued
| Geographic Holdings (Continued) | Value | Percent | ||||||||||||||
| ||||||||||||||||
Brazil | $ | 1,894,637 | 0.3 | % | ||||||||||||
|
| |||||||||||||||
Total | $ | 553,060,787 | 100.0 | % | ||||||||||||
|
| |||||||||||||||
See accompanying Notes to Financial Statements.
8 OPPENHEIMER INTERNATIONAL GROWTH FUND/VA
STATEMENT OF ASSETS AND LIABILITIES June 30, 2018 Unaudited
| Assets | ||||
| Investments, at value—see accompanying statement of investments: | ||||
| Unaffiliated companies (cost $358,473,017) | $ | 540,304,750 | ||
| Affiliated companies (cost $12,756,037) | 12,756,037 | |||
|
| |||
| 553,060,787 | ||||
| Cash | 315,755 | |||
| Cash—foreign currencies (cost $109) | 109 | |||
| Receivables and other assets: | ||||
| Investments sold | 5,623,536 | |||
| Dividends | 2,071,108 | |||
| Shares of beneficial interest sold | 152,710 | |||
| Other | 46,288 | |||
|
| |||
| Total assets | 561,270,293 | |||
| Liabilities | ||||
| Payables and other liabilities: | ||||
| Investments purchased | 2,854,183 | |||
| Foreign capital gains tax | 314,609 | |||
| Shares of beneficial interest redeemed | 230,551 | |||
| Distribution and service plan fees | 49,033 | |||
| Trustees’ compensation | 35,622 | |||
| Other | 62,901 | |||
|
| |||
| Total liabilities | 3,546,899 | |||
| ||||
| Net Assets | $ | 557,723,394 | ||
|
| |||
| ||||
| Composition of Net Assets | ||||
| Par value of shares of beneficial interest | $ | 224,104 | ||
| Additional paid-in capital | 351,356,706 | |||
| Accumulated net investment income | 2,314,305 | |||
| Accumulated net realized gain on investments and foreign currency transactions | 22,329,223 | |||
| Net unrealized appreciation on investments and translation of assets and liabilities denominated in foreign currencies | 181,499,056 | |||
|
| |||
| Net Assets | $ | 557,723,394 | ||
|
| |||
| ||||
| Net Asset Value Per Share | ||||
| Non-Service Shares: | ||||
| Net asset value, redemption price per share and offering price per share (based on net assets of $326,447,534 and 133,504,698 shares of beneficial interest outstanding) | $2.45 | |||
| Service Shares: | ||||
| Net asset value, redemption price per share and offering price per share (based on net assets of $231,275,860 and 90,598,928 shares of beneficial interest outstanding) | $2.55 | |||
See accompanying Notes to Financial Statements.
9 OPPENHEIMER INTERNATIONAL GROWTH FUND/VA
STATEMENT OF OPERATIONS For the Six Months Ended June 30, 2018 Unaudited
Investment Income | ||||
Dividends: | ||||
Unaffiliated companies (net of foreign withholding taxes of $822,793) | $ | 7,856,258 | ||
Affiliated companies | 47,694 | |||
|
|
| ||
Total investment income | 7,903,952 | |||
Expenses | ||||
Management fees | 2,750,217 | |||
Distribution and service plan fees - Service shares | 301,160 | |||
Transfer and shareholder servicing agent fees: | ||||
Non-Service shares | 208,705 | |||
Service shares | 144,557 | |||
Shareholder communications: | ||||
Non-Service shares | 7,378 | |||
Service shares | 5,121 | |||
Custodian fees and expenses | 30,349 | |||
Trustees’ compensation | 11,275 | |||
Borrowing fees | 10,525 | |||
Other | 40,671 | |||
|
|
| ||
Total expenses | 3,509,958 | |||
Less reduction to custodian expenses | (127 | ) | ||
Less waivers and reimbursements of expenses | (252,811 | ) | ||
|
|
| ||
Net expenses | 3,257,020 | |||
Net Investment Income | 4,646,932 | |||
Realized and Unrealized Gain (Loss) | ||||
Net realized gain (loss) on: | ||||
Investment transactions in unaffiliated companies (net of foreign capital gains tax of $128,417) | 26,481,888 | |||
Foreign currency transactions | (11,428 | ) | ||
|
|
| ||
Net realized gain | 26,470,460 | |||
Net change in unrealized appreciation/depreciation on: | ||||
Investment transactions in unaffiliated companies | (47,904,415 | ) | ||
Translation of assets and liabilities denominated in foreign currencies | (44,499 | ) | ||
|
|
| ||
Net change in unrealized appreciation/depreciation | (47,948,914 | ) | ||
Net Decrease in Net Assets Resulting from Operations | $ | (16,831,522 | ) | |
|
|
|
See accompanying Notes to Financial Statements.
10 OPPENHEIMER INTERNATIONAL GROWTH FUND/VA
STATEMENTS OF CHANGES IN NET ASSETS
| Six Months Ended June 30, 2018 (Unaudited) | Year Ended December 31, 2017 | |||||||
Operations | ||||||||
Net investment income | $ | 4,646,932 | $ | 4,255,911 | ||||
Net realized gain | 26,470,460 | 14,279,372 | ||||||
Net change in unrealized appreciation/depreciation | (47,948,914 | ) | 108,297,137 | |||||
|
|
| ||||||
Net increase (decrease) in net assets resulting from operations | (16,831,522 | ) | 126,832,420 | |||||
Dividends and/or Distributions to Shareholders | ||||||||
Dividends from net investment income: | ||||||||
Non-Service shares | (2,799,467 | ) | (4,868,321) | |||||
Service shares | (1,364,714 | ) | (2,425,707) | |||||
|
|
| ||||||
| (4,164,181 | ) | (7,294,028) | ||||||
Distributions from net realized gain: | ||||||||
Non-Service shares | (6,335,023 | ) | — | |||||
Service shares | (4,325,570 | ) | — | |||||
|
|
| ||||||
| (10,660,593 | ) | — | ||||||
Beneficial Interest Transactions | ||||||||
Net increase (decrease) in net assets resulting from beneficial interest transactions: | ||||||||
Non-Service shares | (15,457,657 | ) | (14,779,318) | |||||
Service shares | 5,378,571 | 17,507,241 | ||||||
|
|
| ||||||
| (10,079,086 | ) | 2,727,923 | ||||||
Net Assets | ||||||||
Total increase (decrease) | (41,735,382 | ) | 122,266,315 | |||||
Beginning of period | 599,458,776 | 477,192,461 | ||||||
|
|
| ||||||
| End of period (including accumulated net investment income of $2,314,305 and $1,831,554, respectively) | $ | 557,723,394 | $ | 599,458,776 | ||||
|
|
| ||||||
See accompanying Notes to Financial Statements.
11 OPPENHEIMER INTERNATIONAL GROWTH FUND/VA
FINANCIAL HIGHLIGHTS
| Non-Service Shares | Six Months Ended June 30, 2018 (Unaudited) | Year Ended December 31, 2017 | Year Ended December 31, 2016 | Year Ended December 31, 2015 | Year Ended December 31, 2014 | Year Ended December 31, 2013 | ||||||||||||||||||
Per Share Operating Data | ||||||||||||||||||||||||
Net asset value, beginning of period | $2.59 | $2.08 | $2.20 | $2.31 | $2.57 | $2.07 | ||||||||||||||||||
Income (loss) from investment operations: | ||||||||||||||||||||||||
Net investment income1 | 0.02 | 0.02 | 0.03 | 0.03 | 0.03 | 0.03 | ||||||||||||||||||
Net realized and unrealized gain (loss) | (0.09) | 0.52 | (0.08) | 0.06 | (0.21) | 0.50 | ||||||||||||||||||
|
| |||||||||||||||||||||||
Total from investment operations | (0.07) | 0.54 | (0.05) | 0.09 | (0.18) | 0.53 | ||||||||||||||||||
| Dividends and/or distributions to shareholders: | ||||||||||||||||||||||||
Dividends from net investment income | (0.02) | (0.03) | (0.02) | (0.03) | (0.03) | (0.03) | ||||||||||||||||||
Distributions from net realized gain | (0.05) | 0.00 | (0.05) | (0.17) | (0.05) | 0.00 | ||||||||||||||||||
|
| |||||||||||||||||||||||
| Total dividends and/or distributions to shareholders | (0.07) | (0.03) | (0.07) | (0.20) | (0.08) | (0.03) | ||||||||||||||||||
Net asset value, end of period | $2.45 | $2.59 | $2.08 | $2.20 | $2.31 | $2.57 | ||||||||||||||||||
|
| |||||||||||||||||||||||
Total Return, at Net Asset Value2 | (2.74)% | 26.29% | (2.12)% | 3.43% | (7.22)% | 25.87% | ||||||||||||||||||
Ratios/Supplemental Data | ||||||||||||||||||||||||
Net assets, end of period (in thousands) | $326,447 | $360,417 | $301,559 | $317,547 | $358,756 | $458,038 | ||||||||||||||||||
Average net assets (in thousands) | $350,498 | $339,999 | $305,269 | $343,347 | $400,556 | $404,859 | ||||||||||||||||||
Ratios to average net assets:3 | ||||||||||||||||||||||||
Net investment income | 1.68% | 0.87% | 1.24% | 1.08% | 1.13% | 1.24% | ||||||||||||||||||
| Expenses excluding specific expenses listed below | 1.09% | 1.08% | 1.09% | 1.08% | 1.07% | 1.09% | ||||||||||||||||||
Interest and fees from borrowings | 0.00%4 | 0.00%4 | 0.00%4 | 0.00%4 | 0.00% | 0.00% | ||||||||||||||||||
|
| |||||||||||||||||||||||
Total expenses5 | 1.09% | 1.08% | 1.09% | 1.08% | 1.07% | 1.09% | ||||||||||||||||||
| Expenses after payments, waivers and/or reimbursements and reduction to custodian expenses | 1.00% | 1.00% | 1.00% | 1.00% | 1.00% | 1.00% | ||||||||||||||||||
Portfolio turnover rate | 11% | 27% | 15% | 24% | 41% | 32% | ||||||||||||||||||
1. Per share amounts calculated based on the average shares outstanding during the period.
2. Assumes an initial investment on the business day before the first day of the fiscal period, with all dividends and distributions reinvested in additional shares on the reinvestment date, and redemption at the net asset value calculated on the last business day of the fiscal period. Total returns are not annualized for periods less than one full year. Total return information does not reflect expenses that apply at the separate account level or to related insurance products. Inclusion of these charges would reduce the total return figures for all periods shown. Returns do not reflect the deduction of taxes that a shareholder would pay on fund distributions or the redemption of fund shares.
3. Annualized for periods less than one full year.
4. Less than 0.005%.
5. Total expenses including indirect expenses from affiliated fund fees and expenses were as follows:
Six Months Ended June 30, 2018 | 1.09% | |||
Year Ended December 31, 2017 | 1.08% | |||
Year Ended December 31, 2016 | 1.09% | |||
Year Ended December 31, 2015 | 1.08% | |||
Year Ended December 31, 2014 | 1.07% | |||
Year Ended December 31, 2013 | 1.09% |
See accompanying Notes to Financial Statements.
12 OPPENHEIMER INTERNATIONAL GROWTH FUND/VA
| Service Shares | Six Months Ended June 30, 2018 (Unaudited) | Year Ended December 31, 2017 | Year Ended December 31, 2016 | Year Ended December 31, 2015 | Year Ended December 31, 2014 | Year Ended December 31, 2013 | ||||||||||||||||||
Per Share Operating Data | ||||||||||||||||||||||||
Net asset value, beginning of period | $2.70 | $2.16 | $2.29 | $2.40 | $2.66 | $2.14 | ||||||||||||||||||
Income (loss) from investment operations: | ||||||||||||||||||||||||
Net investment income1 | 0.02 | 0.01 | 0.02 | 0.02 | 0.02 | 0.02 | ||||||||||||||||||
Net realized and unrealized gain (loss) | (0.10) | 0.56 | (0.08) | 0.06 | (0.21) | 0.53 | ||||||||||||||||||
|
| |||||||||||||||||||||||
Total from investment operations | (0.08) | 0.57 | (0.06) | 0.08 | (0.19) | 0.55 | ||||||||||||||||||
Dividends and/or distributions to shareholders: | ||||||||||||||||||||||||
Dividends from net investment income | (0.02) | (0.03) | (0.02) | (0.02) | (0.02) | (0.03) | ||||||||||||||||||
Distributions from net realized gain | (0.05) | 0.00 | (0.05) | (0.17) | (0.05) | 0.00 | ||||||||||||||||||
|
| |||||||||||||||||||||||
| Total dividends and/or distributions to shareholders | (0.07) | (0.03) | (0.07) | (0.19) | (0.07) | (0.03) | ||||||||||||||||||
Net asset value, end of period | $2.55 | $2.70 | $2.16 | $2.29 | $2.40 | $2.66 | ||||||||||||||||||
|
| |||||||||||||||||||||||
Total Return, at Net Asset Value2 | (3.23)% | 26.44% | (2.72)% | 3.11% | (7.15)% | 25.71% | ||||||||||||||||||
Ratios/Supplemental Data | ||||||||||||||||||||||||
Net assets, end of period (in thousands) | $231,276 | $239,042 | $175,633 | $169,292 | $145,515 | $118,060 | ||||||||||||||||||
Average net assets (in thousands) | $242,929 | $213,440 | $174,834 | $165,226 | $128,694 | $88,647 | ||||||||||||||||||
Ratios to average net assets:3 | ||||||||||||||||||||||||
Net investment income | 1.43% | 0.60% | 0.99% | 0.79% | 0.85% | 0.89% | ||||||||||||||||||
| Expenses excluding specific expenses listed below | 1.34% | 1.33% | 1.34% | 1.33% | 1.32% | 1.34% | ||||||||||||||||||
Interest and fees from borrowings | 0.00%4 | 0.00%4 | 0.00%4 | 0.00%4 | 0.00% | 0.00% | ||||||||||||||||||
|
| |||||||||||||||||||||||
Total expenses5 | 1.34% | 1.33% | 1.34% | 1.33% | 1.32% | 1.34% | ||||||||||||||||||
| Expenses after payments, waivers and/or reimbursements and reduction to custodian expenses | 1.25% | 1.25% | 1.25% | 1.25% | 1.25% | 1.25% | ||||||||||||||||||
Portfolio turnover rate | 11% | 27% | 15% | 24% | 41% | 32% | ||||||||||||||||||
1. Per share amounts calculated based on the average shares outstanding during the period.
2. Assumes an initial investment on the business day before the first day of the fiscal period, with all dividends and distributions reinvested in additional shares on the reinvestment date, and redemption at the net asset value calculated on the last business day of the fiscal period. Total returns are not annualized for periods less than one full year. Total return information does not reflect expenses that apply at the separate account level or to related insurance products. Inclusion of these charges would reduce the total return figures for all periods shown. Returns do not reflect the deduction of taxes that a shareholder would pay on fund distributions or the redemption of fund shares.
3. Annualized for periods less than one full year.
4. Less than 0.005%.
5. Total expenses including indirect expenses from affiliated fund fees and expenses were as follows:
Six Months Ended June 30, 2018 | 1.34% | |||
Year Ended December 31, 2017 | 1.33% | |||
Year Ended December 31, 2016 | 1.34% | |||
Year Ended December 31, 2015 | 1.33% | |||
Year Ended December 31, 2014 | 1.32% | |||
Year Ended December 31, 2013 | 1.34% |
See accompanying Notes to Financial Statements.
13 OPPENHEIMER INTERNATIONAL GROWTH FUND/VA
NOTES TO FINANCIAL STATEMENTS June 30, 2018 Unaudited
1. Organization
Oppenheimer International Growth Fund/VA (the “Fund”), is a separate series of Oppenheimer Variable Account Funds, which is registered under the Investment Company Act of 1940 (“1940 Act”), as amended, as a diversified open-end management investment company. The Fund’s investment objective is to seek capital appreciation. The Fund’s investment adviser is OFI Global Asset Management, Inc. (“OFI Global” or the “Manager”), a wholly-owned subsidiary of OppenheimerFunds, Inc. (“OFI” or the “Sub-Adviser”). The Manager has entered into a sub-advisory agreement with OFI. Shares of the Fund are sold only to separate accounts of life insurance companies.
The Fund offers two classes of shares. Both classes are sold at their offering price, which is the net asset value per share, to separate investment accounts of participating insurance companies as an underlying investment for variable life insurance policies, variable annuity contracts or other investment products. The class of shares designated as Service shares is subject to a distribution and service plan. Both classes of shares have identical rights and voting privileges with respect to the Fund in general and exclusive voting rights on matters that affect that class alone. Earnings, net assets and net asset value per share may differ due to each class having its own expenses, such as transfer and shareholder servicing agent fees and shareholder communications, directly attributable to that class.
The following is a summary of significant accounting policies followed in the Fund’s preparation of financial statements in accordance with accounting principles generally accepted in the United States (“U.S. GAAP”).
2. Significant Accounting Policies
Security Valuation. All investments in securities are recorded at their estimated fair value, as described in Note 3.
Foreign Currency Translation. The books and records of the Fund are maintained in U.S. dollars. Any foreign currency amounts are translated into U.S. dollars on the following basis:
(1) Value of investment securities, other assets and liabilities — at the exchange rates prevailing at market close as described in Note 3.
(2) Purchases and sales of investment securities, income and expenses — at the rates of exchange prevailing on the respective dates of such transactions.
Although the net assets and the values are presented at the foreign exchange rates at market close, the Fund does not isolate the portion of the results of operations resulting from changes in foreign exchange rates on investments from the fluctuations arising from changes in prices of securities held. Such fluctuations are included with the net realized and unrealized gains or losses from investments shown in the Statement of Operations.
For securities, which are subject to foreign withholding tax upon disposition, realized and unrealized gains or losses on such securities are recorded net of foreign withholding tax.
Reported net realized foreign exchange gains or losses arise from sales of foreign currencies, currency gains or losses realized between the trade and settlement dates on securities transactions, the difference between the amounts of dividends, interest, and foreign withholding tax reclaims recorded on the Fund’s books, and the U.S. dollar equivalent of the amounts actually received or paid. Net unrealized foreign exchange gains and losses arise from changes in the value of assets and liabilities other than investments in securities, resulting from changes in the exchange rate.
Allocation of Income, Expenses, Gains and Losses. Income, expenses (other than those attributable to a specific class), gains and losses are allocated on a daily basis to each class of shares based upon the relative proportion of net assets represented by such class. Operating expenses directly attributable to a specific class are charged against the operations of that class.
Dividends and Distributions to Shareholders. Dividends and distributions to shareholders, which are determined in accordance with income tax regulations and may differ from U.S. GAAP, are recorded on the ex-dividend date. Income and capital gain distributions, if any, are declared and paid annually or at other times as determined necessary by the Manager.
The tax character of distributions is determined as of the Fund’s fiscal year end. Therefore, a portion of the Fund’s distributions made to shareholders prior to the Fund’s fiscal year end may ultimately be categorized as a tax return of capital.
Investment Income. Dividend income is recorded on the ex-dividend date or upon ex-dividend notification in the case of certain foreign dividends where the ex-dividend date may have passed. Non-cash dividends included in dividend income, if any, are recorded at the fair value of the securities received. Withholding taxes on foreign dividends, if any, and capital gains taxes on foreign investments, if any, have been provided for in accordance with the Fund’s understanding of the applicable tax rules and regulations. Interest income, if any, is recognized on an accrual basis. Discount and premium, which are included in interest income on the Statement of Operations, are amortized or accreted daily.
Custodian Fees. “Custodian fees and expenses” in the Statement of Operations may include interest expense incurred by the Fund on any cash overdrafts of its custodian account during the period. Such cash overdrafts may result from the effects of failed trades in portfolio securities and from cash outflows resulting from unanticipated shareholder redemption activity. The Fund pays interest to its custodian on such cash overdrafts, to the extent they are not offset by positive cash balances maintained by the Fund, at a rate equal to the Federal Funds Rate plus 2.00%. The “Reduction to custodian expenses” line item, if applicable, represents earnings on cash balances maintained by the Fund during the period. Such interest expense and other custodian fees may be paid with these earnings.
Security Transactions. Security transactions are recorded on the trade date. Realized gains and losses on securities sold are determined on the basis of
14 OPPENHEIMER INTERNATIONAL GROWTH FUND/VA
2. Significant Accounting Policies (Continued)
identified cost.
Indemnifications. The Fund’s organizational documents provide current and former Trustees and officers with a limited indemnification against liabilities arising in connection with the performance of their duties to the Fund. In the normal course of business, the Fund may also enter into contracts that provide general indemnifications. The Fund’s maximum exposure under these arrangements is unknown as this would be dependent on future claims that may be made against the Fund. The risk of material loss from such claims is considered remote.
Federal Taxes. The Fund intends to comply with provisions of the Internal Revenue Code applicable to regulated investment companies and to distribute substantially all of its investment company taxable income to shareholders. Therefore, no federal income or excise tax provision is required. The Fund files income tax returns in U.S. federal and applicable state jurisdictions. The statute of limitations on the Fund’s tax return filings generally remains open for the three preceding fiscal reporting period ends. The Fund has analyzed its tax positions for the fiscal year ended December 31, 2017, including open tax years, and does not believe there are any uncertain tax positions requiring recognition in the Fund’s financial statements.
During the fiscal year ended December 31, 2017, the Fund utilized $417,148 of capital loss carryforwards to offset capital gains realized in that fiscal year. Capital losses will be carried forward to future years if not offset by gains.
At period end, it is estimated that the capital loss carryforwards would be zero. The estimated capital loss carryforward represents the carryforward as of the end of the last fiscal year, increased or decreased by capital losses or gains realized in the first six months of the current fiscal year. During the reporting period, it is estimated that the Fund will not utilize any capital loss carryforward to offset realized capital gains.
Net investment income (loss) and net realized gain (loss) may differ for financial statement and tax purposes. The character of dividends and distributions made during the fiscal year from net investment income or net realized gains are determined in accordance with federal income tax requirements, which may differ from the character of net investment income or net realized gains presented in those financial statements in accordance with U.S. GAAP. Also, due to timing of dividends and distributions, the fiscal year in which amounts are distributed may differ from the fiscal year in which the income or net realized gain was recorded by the Fund.
The aggregate cost of securities and other investments and the composition of unrealized appreciation and depreciation of securities and other investments for federal income tax purposes at period end are noted in the following table. The primary difference between book and tax appreciation or depreciation of securities and other investments, if applicable, is attributable to the tax deferral of losses or tax realization of financial statement unrealized gain or loss.
Federal tax cost of securities | $ | 375,089,888 | ||
Federal tax cost of other investments | 109 | |||
|
| |||
Total federal tax cost | $ | 375,089,997 | ||
|
| |||
Gross unrealized appreciation | $ | 214,430,345 | ||
Gross unrealized depreciation | (36,792,123) | |||
|
| |||
Net unrealized appreciation | $ | 177,638,222 | ||
|
|
Certain foreign countries impose a tax on capital gains which is accrued by the Fund based on unrealized appreciation, if any, on affected securities. The tax is paid when the gain is realized.
Use of Estimates. The preparation of financial statements in conformity with U.S. GAAP requires management to make estimates and assumptions that affect the reported amounts of assets and liabilities and disclosure of contingent assets and liabilities at the date of the financial statements and the reported amounts of increases and decreases in net assets from operations during the reporting period. Actual results could differ from those estimates.
3. Securities Valuation
The Fund calculates the net asset value of its shares as of 4:00 P.M. Eastern Time, on each day the New York Stock Exchange (the “Exchange”) is open for trading, except in the case of a scheduled early closing of the Exchange, in which case the Fund will calculate net asset value of the shares as of the scheduled early closing time of the Exchange.
The Fund’s Board has adopted procedures for the valuation of the Fund’s securities and has delegated the day-to-day responsibility for valuation determinations under those procedures to the Manager. The Manager has established a Valuation Committee which is responsible for determining a fair valuation for any security for which market quotations are not readily available. The Valuation Committee’s fair valuation determinations are subject to review, approval and ratification by the Fund’s Board at least quarterly or more frequently, if necessary.
Valuation Methods and Inputs
Securities are valued primarily using unadjusted quoted market prices, when available, as supplied by third party pricing services or broker-dealers.
The following methodologies are used to determine the market value or the fair value of the types of securities described below:
Equity securities traded on a securities exchange (including exchange-traded derivatives other than futures and futures options) are valued based on the official closing price on the principal exchange on which the security is traded, as identified by the Manager, prior to the time when the Fund’s assets are valued. If the official closing price is unavailable, the security is valued at the last sale price on the principal exchange on which it is traded, or if no sales occurred, the security is valued at the mean between the quoted bid and asked prices. Over-the-counter equity securities are valued at the last
15 OPPENHEIMER INTERNATIONAL GROWTH FUND/VA
NOTES TO FINANCIAL STATEMENTS Unaudited / Continued
3. Securities Valuation (Continued)
published sale price, or if no sales occurred, at the mean between the quoted bid and asked prices. Events occurring after the close of trading on foreign exchanges may result in adjustments to the valuation of foreign securities to more accurately reflect their fair value as of the time when the Fund’s assets are valued.
Shares of a registered investment company that are not traded on an exchange are valued at that investment company’s net asset value per share.
Securities for which market quotations are not readily available, or when a significant event has occurred that would materially affect the value of the security, are fair valued either (i) by a standardized fair valuation methodology applicable to the security type or the significant event as previously approved by the Valuation Committee and the Fund’s Board or (ii) as determined in good faith by the Manager’s Valuation Committee. The Valuation Committee considers all relevant facts that are reasonably available, through either public information or information available to the Manager, when determining the fair value of a security. Those standardized fair valuation methodologies include, but are not limited to, valuing securities at the last sale price or initially at cost and subsequently adjusting the value based on: changes in company specific fundamentals, changes in an appropriate securities index, or changes in the value of similar securities which may be further adjusted for any discounts related to security-specific resale restrictions. When possible, such methodologies use observable market inputs such as unadjusted quoted prices of similar securities, observable interest rates, currency rates and yield curves. The methodologies used for valuing securities are not necessarily an indication of the risks associated with investing in those securities nor can it be assured that the Fund can obtain the fair value assigned to a security if it were to sell the security.
Classifications
Each investment asset or liability of the Fund is assigned a level at measurement date based on the significance and source of the inputs to its valuation. Various data inputs may be used in determining the value of each of the Fund’s investments as of the reporting period end. These data inputs are categorized in the following hierarchy under applicable financial accounting standards:
1) Level 1-unadjusted quoted prices in active markets for identical assets or liabilities (including securities actively traded on a securities exchange)
2) Level 2-inputs other than unadjusted quoted prices that are observable for the asset or liability (such as unadjusted quoted prices for similar assets and market corroborated inputs such as interest rates, prepayment speeds, credit risks, etc.)
3) Level 3-significant unobservable inputs (including the Manager’s own judgments about assumptions that market participants would use in pricing the asset or liability).
The inputs used for valuing securities are not necessarily an indication of the risks associated with investing in those securities.
The Fund classifies each of its investments in investment companies which are publicly offered as Level 1. Investment companies that are not publicly offered, if any, are classified as Level 2 in the fair value hierarchy.
The table below categorizes amounts that are included in the Fund’s Statement of Assets and Liabilities at period end based on valuation input level:
Level 1— Unadjusted Quoted Prices | Level 2— Other Significant | Level 3— Significant Unobservable Inputs | Value | |||||||||||||
Assets Table | ||||||||||||||||
Investments, at Value: | ||||||||||||||||
Common Stocks | ||||||||||||||||
Consumer Discretionary | $ | 24,482,973 | $ | 94,154,467 | $ | — | $ | 118,637,440 | ||||||||
Consumer Staples | 11,380,439 | 43,291,681 | — | 54,672,120 | ||||||||||||
Energy | — | 8,198,032 | — | 8,198,032 | ||||||||||||
Financials | 7,787,117 | 13,269,609 | — | 21,056,726 | ||||||||||||
Health Care | — | 68,401,786 | — | 68,401,786 | ||||||||||||
Industrials | — | 97,212,449 | — | 97,212,449 | ||||||||||||
Information Technology | 10,429,568 | 125,059,330 | — | 135,488,898 | ||||||||||||
Materials | 7,106,879 | 16,050,410 | — | 23,157,289 | ||||||||||||
Telecommunication Services | — | 13,412,544 | — | 13,412,544 | ||||||||||||
Preferred Stock | 67,466 | — | — | 67,466 | ||||||||||||
Investment Company | 12,756,037 | — | — | 12,756,037 | ||||||||||||
|
| |||||||||||||||
Total Assets | $ | 74,010,479 | $ | 479,050,308 | $ | — | $ | 553,060,787 | ||||||||
|
| |||||||||||||||
Forward currency exchange contracts and futures contracts, if any, are reported at their unrealized appreciation/depreciation at measurement date, which represents the change in the contract’s value from trade date. All additional assets and liabilities included in the above table are reported at their market value at measurement date.
For the reporting period, there were no transfers between levels.
4. Investments and Risks
Risks of Foreign Investing. The Fund may invest in foreign securities which are subject to special risks. Securities traded in foreign markets may be less liquid and more volatile than those traded in U.S. markets. Foreign issuers are usually not subject to the same accounting and disclosure requirements that U.S. companies are subject to, which may make it difficult for the Fund to evaluate a foreign company’s operations or financial condition. A change in the value of a foreign currency against the U.S. dollar will result in a change in the U.S. dollar value of investments denominated
16 OPPENHEIMER INTERNATIONAL GROWTH FUND/VA
4. Investments and Risks (Continued)
in that foreign currency and in the value of any income or distributions the Fund may receive on those investments. The value of foreign investments may be affected by exchange control regulations, foreign taxes, higher transaction and other costs, delays in the settlement of transactions, changes in economic or monetary policy in the United States or abroad, expropriation or nationalization of a company’s assets, or other political and economic factors. In addition, due to the inter-relationship of global economies and financial markets, changes in political and economic factors in one country or region could adversely affect conditions in another country or region. Investments in foreign securities may also expose the Fund to time-zone arbitrage risk. Foreign securities may trade on weekends or other days when the Fund does not price its shares. At times, the Fund may emphasize investments in a particular country or region and may be subject to greater risks from adverse events that occur in that country or region. Foreign securities and foreign currencies held in foreign banks and securities depositories may be subject to limited or no regulatory oversight.
Investments in Affiliated Funds. The Fund is permitted to invest in other mutual funds advised by the Manager (“Affiliated Funds”). Affiliated Funds are open-end management investment companies registered under the 1940 Act, as amended. The Manager is the investment adviser of, and the Sub-Adviser provides investment and related advisory services to, the Affiliated Funds. When applicable, the Fund’s investments in Affiliated Funds are included in the Statement of Investments. Shares of Affiliated Funds are valued at their net asset value per share. As a shareholder, the Fund is subject to its proportional share of the Affiliated Funds’ expenses, including their management fee. The Manager will waive fees and/or reimburse Fund expenses in an amount equal to the indirect management fees incurred through the Fund’s investment in the Affiliated Funds.
Each of the Affiliated Funds in which the Fund invests has its own investment risks, and those risks can affect the value of the Fund’s investments and therefore the value of the Fund’s shares. To the extent that the Fund invests more of its assets in one Affiliated Fund than in another, the Fund will have greater exposure to the risks of that Affiliated Fund.
Investments in Money Market Instruments. The Fund is permitted to invest its free cash balances in money market instruments to provide liquidity or for defensive purposes. The Fund may invest in money market instruments by investing in Class E shares of Oppenheimer Institutional Government Money Market Fund (“IGMMF”), which is an Affiliated Fund. IGMMF is regulated as a money market fund under the 1940 Act, as amended. The Fund may also invest in money market instruments directly or in other affiliated or unaffiliated money market funds.
Equity Security Risk. Stocks and other equity securities fluctuate in price. The value of the Fund’s portfolio may be affected by changes in the equity markets generally. Equity markets may experience significant short-term volatility and may fall sharply at times. Different markets may behave differently from each other and U.S. equity markets may move in the opposite direction from one or more foreign stock markets. Adverse events in any part of the equity or fixed-income markets may have unexpected negative effects on other market segments.
The prices of individual equity securities generally do not all move in the same direction at the same time and a variety of factors can affect the price of a particular company’s securities. These factors may include, but are not limited to, poor earnings reports, a loss of customers, litigation against the company, general unfavorable performance of the company’s sector or industry, or changes in government regulations affecting the company or its industry.
5. Market Risk Factors
The Fund’s investments in securities and/or financial derivatives may expose the Fund to various market risk factors:
Commodity Risk. Commodity risk relates to the change in value of commodities or commodity indexes as they relate to increases or decreases in the commodities market. Commodities are physical assets that have tangible properties. Examples of these types of assets are crude oil, heating oil, metals, livestock, and agricultural products.
Credit Risk. Credit risk relates to the ability of the issuer of debt to meet interest and principal payments, or both, as they come due. In general, lower-grade, higher-yield debt securities are subject to credit risk to a greater extent than lower-yield, higher-quality securities.
Equity Risk. Equity risk relates to the change in value of equity securities as they relate to increases or decreases in the general market.
Foreign Exchange Rate Risk. Foreign exchange rate risk relates to the change in the U.S. dollar value of a security held that is denominated in a foreign currency. The U.S. dollar value of a foreign currency denominated security will decrease as the dollar appreciates against the currency, while the U.S. dollar value will increase as the dollar depreciates against the currency.
Interest Rate Risk. Interest rate risk refers to the fluctuations in value of fixed-income securities resulting from the inverse relationship between price and yield. For example, an increase in general interest rates will tend to reduce the market value of already issued fixed-income investments, and a decline in general interest rates will tend to increase their value. In addition, debt securities with longer maturities, which tend to have higher yields, are subject to potentially greater fluctuations in value from changes in interest rates than obligations with shorter maturities.
Volatility Risk. Volatility risk refers to the magnitude of the movement, but not the direction of the movement, in a financial instrument’s price over a defined time period. Large increases or decreases in a financial instrument’s price over a relative time period typically indicate greater volatility risk, while small increases or decreases in its price typically indicate lower volatility risk.
6. Shares of Beneficial Interest
The Fund has authorized an unlimited number of $0.001 par value shares of beneficial interest of each class. Transactions in shares of beneficial interest were as follows:
17 OPPENHEIMER INTERNATIONAL GROWTH FUND/VA
NOTES TO FINANCIAL STATEMENTS Unaudited / Continued
6. Shares of Beneficial Interest (Continued)
| Six Months Ended June 30, 2018 | Year Ended December 31, 2017 | |||||||||||||||||||||||||||
| Shares | Amount | Shares | Amount | |||||||||||||||||||||||||
Non-Service Shares | ||||||||||||||||||||||||||||
Sold | 8,790,462 | $ | 23,227,108 | 22,026,198 | $ | 51,090,812 | ||||||||||||||||||||||
Dividends and/or distributions reinvested | 3,639,212 | 9,134,490 | 2,045,409 | 4,868,321 | ||||||||||||||||||||||||
Redeemed | (18,049,453 | ) | (47,819,255 | ) | (30,252,278 | ) | (70,738,451 | ) | ||||||||||||||||||||
|
| |||||||||||||||||||||||||||
Net decrease | (5,619,779 | ) | $ | (15,457,657 | ) | (6,180,671 | ) | $ | (14,779,318 | ) | ||||||||||||||||||
|
| |||||||||||||||||||||||||||
Service Shares | ||||||||||||||||||||||||||||
Sold | 10,430,057 | $ | 28,650,172 | 23,171,844 | $ | 56,773,388 | ||||||||||||||||||||||
Dividends and/or distributions reinvested | 2,171,864 | 5,690,284 | 978,108 | 2,425,707 | ||||||||||||||||||||||||
Redeemed | (10,588,827 | ) | (28,961,885 | ) | (16,813,549 | ) | (41,691,854 | ) | ||||||||||||||||||||
|
| |||||||||||||||||||||||||||
Net increase | 2,013,094 | $ | 5,378,571 | 7,336,403 | $ | 17,507,241 | ||||||||||||||||||||||
|
| |||||||||||||||||||||||||||
7. Purchases and Sales of Securities
The aggregate cost of purchases and proceeds from sales of securities, other than short-term obligations and investments in IGMMF, for the reporting period were as follows:
| Purchases | Sales | |||
Investment securities | $60,902,800 | $88,425,838 |
8. Fees and Other Transactions with Affiliates
Management Fees. Under the investment advisory agreement, the Fund pays the Manager a management fee based on the daily net assets of the Fund at an annual rate as shown in the following table:
| Fee Schedule | ||||
Up to $250 million | 1.00% | |||
Next $250 million | 0.90 | |||
Next $500 million | 0.85 | |||
Over $1 billion | 0.82 | |||
The Fund’s effective management fee for the reporting period was 0.93% of average annual net assets before any applicable waivers.
Sub-Adviser Fees. The Manager has retained the Sub-Adviser to provide the day-to-day portfolio management of the Fund. Under the Sub-Advisory Agreement, the Manager pays the Sub-Adviser an annual fee in monthly installments, equal to a percentage of the investment management fee collected by the Manager from the Fund, which shall be calculated after any investment management fee waivers. The fee paid to the Sub-Adviser is paid by the Manager, not by the Fund.
Transfer Agent Fees. OFI Global (the “Transfer Agent”) serves as the transfer and shareholder servicing agent for the Fund. The Fund pays the Transfer Agent a fee based on annual net assets. Fees incurred and average net assets for each class with respect to these services are detailed in the Statement of Operations and Financial Highlights, respectively.
Sub-Transfer Agent Fees. The Transfer Agent has retained Shareholder Services, Inc., a wholly-owned subsidiary of OFI (the “Sub-Transfer Agent”), to provide the day-to-day transfer agent and shareholder servicing of the Fund. Under the Sub-Transfer Agency Agreement, the Transfer Agent pays the Sub-Transfer Agent an annual fee in monthly installments, equal to a percentage of the transfer agent fee collected by the Transfer Agent from the Fund, which shall be calculated after any applicable fee waivers. The fee paid to the Sub-Transfer Agent is paid by the Transfer Agent, not by the Fund.
Trustees’ Compensation. The Fund’s Board of Trustees (“Board”) has adopted a compensation deferral plan for Independent Trustees that enables Trustees to elect to defer receipt of all or a portion of the annual compensation they are entitled to receive from the Fund. For purposes of determining the amount owed to the Trustees under the plan, deferred amounts are treated as though equal dollar amounts had been invested in shares of the Fund or in other Oppenheimer funds selected by the Trustees. The Fund purchases shares of the funds selected for deferral by the Trustees in amounts equal to his or her deemed investment, resulting in a Fund asset equal to the deferred compensation liability. Such assets are included as a component of “Other” within the asset section of the Statement of Assets and Liabilities. Deferral of Trustees’ fees under the plan will not affect the net assets of the Fund and will not materially affect the Fund’s assets, liabilities or net investment income per share. Amounts will be deferred until distributed in accordance with the compensation deferral plan.
Distribution and Service Plan for Service Shares. The Fund has adopted a Distribution and Service Plan (the “Plan”) pursuant to Rule 12b-1 under the 1940 Act for Service shares to pay OppenheimerFunds Distributor, Inc. (the “Distributor”), for distribution related services, personal service and account maintenance for the Fund’s Service shares. Under the Plan, payments are made periodically at an annual rate of 0.25% of the daily net assets of Service shares of the Fund. The Distributor currently uses all of those fees to compensate sponsors of the insurance product that offers Fund shares, for
18 OPPENHEIMER INTERNATIONAL GROWTH FUND/VA
8. Fees and Other Transactions with Affiliates (Continued)
providing personal service and maintenance of accounts of their variable contract owners that hold Service shares. These fees are paid out of the Fund’s assets on an on-going basis and increase operating expenses of the Service shares, which results in lower performance compared to the Fund’s shares that are not subject to a service fee. Fees incurred by the Fund under the Plan are detailed in the Statement of Operations.
Waivers and Reimbursements of Expenses. The Manager has contractually agreed to limit the Fund’s expenses after payments, waivers and/or reimbursements and reduction to custodian expenses, excluding any applicable dividend expense, taxes, interest and fees from borrowing, any subsidiary expenses, Acquired Fund Fees and Expenses, brokerage commissions, unusual and infrequent expenses and certain other Fund expenses; so that those expenses, as percentages of daily net assets, will not exceed the annual rate of 1.00% for Non-Service shares and 1.25% for Service shares.
During the reporting period, the Manager waived fees and/or reimbursed the Fund as follows:
Non-Service shares | $ | 146,938 | ||
Service shares | 102,625 |
This fee waiver and/or expense reimbursement may not be amended or withdrawn for one year from the date of the Fund’s prospectus, unless approved by the Board.
The Manager will waive fees and/or reimburse Fund expenses in an amount equal to the indirect management fees incurred through the Fund’s investment in IGMMF. During the reporting period, the Manager waived fees and/or reimbursed the Fund $3,248 for IGMMF management fees. This fee waiver and/or expense reimbursement may not be amended or withdrawn for one year from the date of the Fund’s prospectus, unless approved by the Board.
9. Borrowings and Other Financing
Joint Credit Facility. A number of mutual funds managed by the Manager participate in a $1.875 billion revolving credit facility (the “Facility”) intended to provide short-term financing, if necessary, subject to certain restrictions in connection with atypical redemption activity. Effective July 17, 2018, the Facility was increased to $1.95 billion. Expenses and fees related to the Facility are paid by the participating funds and are disclosed separately or as other expenses on the Statement of Operations. The Fund did not utilize the Facility during the reporting period.
19 OPPENHEIMER INTERNATIONAL GROWTH FUND/VA
PORTFOLIO PROXY VOTING POLICIES AND GUIDELINES; UPDATES TO STATEMENT OF INVESTMENTS Unaudited
The Fund has adopted Portfolio Proxy Voting Policies and Guidelines under which the Fund votes proxies relating to securities (“portfolio proxies”) held by the Fund. A description of the Fund’s Portfolio Proxy Voting Policies and Guidelines is available (i) without charge, upon request, by calling the Fund toll-free at 1.800.CALL OPP (225.5677), (ii) on the Fund’s website at www.oppenheimerfunds.com, and (iii) on the SEC’s website at www.sec.gov. In addition, the Fund is required to file Form N-PX, with its complete proxy voting record for the 12 months ended June 30th, no later than August 31st of each year. The Fund’s voting record is available (i) without charge, upon request, by calling the Fund toll-free at 1.800.CALL OPP (225.5677), and (ii) in the Form N-PX filing on the SEC’s website at www.sec.gov.
The Fund files its complete schedule of portfolio holdings with the SEC for the first quarter and the third quarter of each fiscal year on Form N-Q. The Fund’s Form N-Q filings are available on the SEC’s website at www.sec.gov. Those forms may be reviewed and copied at the SEC’s Public Reference Room in Washington, D.C. Information on the operation of the Public Reference Room may be obtained by calling 1-800-SEC-0330.
20 OPPENHEIMER INTERNATIONAL GROWTH FUND/VA
DISTRIBUTION SOURCES Unaudited
For any distribution that took place over the last six months of the Fund’s reporting period, the table below details on a per-share basis the percentage of the Fund’s total distribution payment amount that was derived from the following sources: net income, net profit from the sale of securities, and other capital sources. Other capital sources represent a return of capital. A return of capital may occur, for example, when some or all of the money that you invested in the Fund is paid back to you. A return of capital distribution does not necessarily reflect the Fund’s investment performance and should not be confused with “yield” or “income.” You should not draw any conclusions about the Fund’s investment performance from the amounts of these distributions. This information is based upon income and capital gains using generally accepted accounting principles as of the date of each distribution. If the Fund (or an underlying fund in which the Fund invests) invests in real estate investment trusts (REITs) and/or master limited partnerships (MLPs), the percentages attributed to each category are estimated using historical information because the character of the amounts received from the REITs and/or MLPs in which the Fund (or underlying fund) invests is unknown until after the end of the calendar year. Because the Fund is actively managed, the relative amount of the Fund’s total distributions derived from various sources over the calendar year may change. Please note that this information should not be used for tax reporting purposes as the tax character of distributable income may differ from the amounts used for this notification. You will receive communication in the first quarter of each calendar year detailing the actual amount of the taxable and non-taxable portion of distributions paid to you during the tax year.
For the most current information, please go to oppenheimerfunds.com. Select your Fund, and scroll down to the ‘Dividends’ table under ‘Analytics’. The Fund’s latest distribution information will be followed by the sources of any distribution, updated daily.
| Fund Name | Pay Date | Net Income | Net Profit from Sale | Other Capital Sources | ||||||||||||
Oppenheimer International Growth Fund/VA | 6/19/18 | 28.1% | 71.9% | 0.0% | ||||||||||||
21 OPPENHEIMER INTERNATIONAL GROWTH FUND/VA
THIS PAGE INTENTIONALLY LEFT BLANK.
22 OPPENHEIMER INTERNATIONAL GROWTH FUND/VA
THIS PAGE INTENTIONALLY LEFT BLANK.
23 OPPENHEIMER INTERNATIONAL GROWTH FUND/VA
OPPENHEIMER INTERNATIONAL GROWTH FUND/VA
A Series of Oppenheimer Variable Account Funds
| Trustees and Officers | Robert J. Malone, Chairman of the Board of Trustees and Trustee | |
| Andrew J. Donohue, Trustee | ||
| Richard F. Grabish, Trustee | ||
| Beverly L. Hamilton, Trustee | ||
| Victoria J. Herget, Trustee | ||
| Karen L. Stuckey, Trustee | ||
| James D. Vaughn, Trustee | ||
| Arthur P. Steinmetz, Trustee, President and Principal Executive Officer | ||
| George R. Evans, Vice President | ||
| Robert B. Dunphy, Vice President | ||
| Cynthia Lo Bessette, Secretary and Chief Legal Officer | ||
| Jennifer Foxson, Vice President and Chief Business Officer | ||
| Mary Ann Picciotto, Chief Compliance Officer and Chief Anti-Money Laundering Officer | ||
| Brian S. Petersen, Treasurer and Principal Financial & Accounting Officer | ||
| Manager | OFI Global Asset Management, Inc. | |
| Sub-Adviser | OppenheimerFunds, Inc. | |
| Distributor | OppenheimerFunds Distributor, Inc. | |
| Transfer and | OFI Global Asset Management, Inc. | |
| Shareholder | ||
| Servicing Agent | ||
| Sub-Transfer Agent | Shareholder Services, Inc. | |
| DBA OppenheimerFunds Services | ||
| Independent | KPMG LLP | |
| Registered | ||
| Public | ||
| Accounting | ||
| Firm | ||
| Legal Counsel | Ropes & Gray LLP | |
| Before investing in any of the Oppenheimer funds, investors should carefully consider a fund’s investment objectives, risks, charges and expenses. Fund prospectuses and summary prospectuses contain this and other information about the funds and may be obtained by asking your financial advisor, visiting oppenheimerfunds.com or calling us at 1.800.988.8287. Read prospectuses and summary prospectuses carefully before investing. | ||
| The financial statements included herein have been taken from the records of the Fund without examination of those records by the independent registered public accounting firm. | ||
| © 2018 OppenheimerFunds, Inc. All rights reserved. Oppenheimer funds are distributed by OppenheimerFunds Distributor, Inc. | ||

Item 2. Code of Ethics.
Not applicable to semiannual reports.
Item 3. Audit Committee Financial Expert.
Not applicable to semiannual reports.
Item 4. Principal Accountant Fees and Services.
Not applicable to semiannual reports.
Item 5. Audit Committee of Listed Registrants
Not applicable.
Item 6. Schedule of Investments.
a) Not applicable. The complete schedule of investments is included in Item 1 of this Form N-CSR.
b) Not applicable.
Item 7. Disclosure of Proxy Voting Policies and Procedures for Closed-End Management Investment Companies.
Not applicable.
Item 8. Portfolio Managers of Closed-End Management Investment Companies.
Not applicable.
Item 9. Purchases of Equity Securities by Closed-End Management Investment Company and Affiliated Purchasers.
Not applicable.
Item 10. Submission of Matters to a Vote of Security Holders.
The Fund’s Governance Committee Provisions with Respect to Nominations of Directors/Trustees to the Respective Boards
None
Item 11. Controls and Procedures.
Based on their evaluation of the registrant’s disclosure controls and procedures (as defined in rule 30a-3(c) under the Investment Company Act of 1940 (17 CFR 270.30a-3(c)) as of 6/30/2018, the registrant’s principal executive officer and principal financial officer found the registrant’s disclosure controls and procedures to provide reasonable assurances that information required to be disclosed by the registrant in the reports that it files under the Securities Exchange Act of 1934 (a) is accumulated and communicated to registrant’s management, including its principal executive officer and principal financial officer, to allow timely decisions regarding required disclosure, and (b) is recorded, processed, summarized and reported, within the time periods specified in the rules and forms adopted by the U.S. Securities and Exchange Commission.
There have been no changes in the registrant’s internal controls over financial reporting that occurred during the registrant’s second fiscal quarter of the period covered by this report that have materially affected, or are reasonably likely to materially affect, the registrant’s internal control over financial reporting.
Item 12. Disclosure of Securities Lending Activities for Closed-End Management Investment Companies.
Not applicable.
Item 13. Exhibits.
| (a) | (1) Exhibit attached hereto. | |
| (2) Exhibits attached hereto. | ||
SIGNATURES
Pursuant to the requirements of the Securities Exchange Act of 1934 and the Investment Company Act of 1940, the registrant has duly caused this report to be signed on its behalf by the undersigned, thereunto duly authorized.
| Oppenheimer Variable Account Funds | ||
| By: | /s/ Arthur P. Steinmetz | |
Arthur P. Steinmetz Principal Executive Officer | ||
| Date: | 8/17/2018 | |
Pursuant to the requirements of the Securities Exchange Act of 1934 and the Investment Company Act of 1940, this report has been signed below by the following persons on behalf of the registrant and in the capacities and on the dates indicated.
| By: | /s/ Arthur P. Steinmetz | |
Arthur P. Steinmetz Principal Executive Officer | ||
| Date: | 8/17/2018 |
| By: | /s/ Brian S. Petersen | |
Brian S. Petersen Principal Financial Officer | ||
| Date: | 8/17/2018 |