UNITED STATES
SECURITIES AND EXCHANGE COMMISSION
WASHINGTON, D.C. 20549
FORM N-CSR
CERTIFIED SHAREHOLDER REPORT OF REGISTERED
MANAGEMENT INVESTMENT COMPANIES
Investment Company Act file number 811-4108
Oppenheimer Variable Account Funds
(Exact name of registrant as specified in charter)
6803 South Tucson Way, Centennial, Colorado 80112-3924
(Address of principal executive offices) (Zip code)
Arthur S. Gabinet
OFI Global Asset Management, Inc.
225 Liberty Street, New York, New York 10281-1008
(Name and address of agent for service)
Registrant’s telephone number, including area code: (303) 768-3200
Date of fiscal year end: December 31
Date of reporting period: 6/30/2015
Item 1. Reports to Stockholders.
| | | | |
| | 
| | |
| | June 30, 2015 | | |
| | | Oppenheimer | | Semiannual Report |
| | Discovery Mid Cap Growth Fund/VA | |
| | | A Series of Oppenheimer Variable Account Funds | |
| | SEMIANNUAL REPORT | | |
| | Listing of Top Holdings | | |
| | Fund Performance Discussion | | |
| | Financial Statements | | |
PORTFOLIO MANAGERS: Ronald J. Zibelli, Jr., CFA and Justin Livengood, CFA
AVERAGE ANNUAL TOTAL RETURNS FOR THE PERIODS ENDED 6/30/15
| | | | | | | | | | | | | | | | | | | | |
| | | Inception
Date | | | 6-Months | | | 1-Year | | | 5-Year | | | 10-Year | |
Non-Service Shares | | | 8/15/86 | | | | 9.80% | | | | 15.32 % | | | | 20.02 % | | | | 6.75 % | |
Service Shares | | | 10/16/00 | | | | 9.68 | | | | 15.07 | | | | 19.72 | | | | 6.48 | |
Russell Midcap Growth Index | | | | | | | 4.18 | | | | 9.45 | | | | 18.69 | | | | 9.69 | |
Performance data quoted represents past performance, which does not guarantee future results. The investment return and principal value of an investment in the Fund will fluctuate so that an investor’s shares, when redeemed, may be worth more or less than their original cost. Current performance may be lower or higher than the performance quoted. For performance data current to the most recent month end, call us at 1.800.988.8287. The Fund’s total returns should not be expected to be the same as the returns of other funds, whether or not both funds have the same portfolio managers and/or similar names. The Fund’s total returns include changes in share price and reinvested distributions but do not include the charges associated with the separate account products that offer this Fund. Such performance would have been lower if such charges were taken into account.
The Fund’s performance is compared to the performance of the Russell Midcap Growth Index. The Russell Midcap Growth Index measures the performance of the mid-cap growth segment of the U.S. equity universe. It includes those Russell Midcap companies with higher price-to-book ratios and higher forecasted growth values. The Index is unmanaged and cannot be purchased directly by investors. While index comparisons may be useful to provide a benchmark for the Fund’s performance, it must be noted that the Fund’s investments are not limited to the investments comprising the Index. Index performance includes reinvestment of income, but does not reflect transaction costs, fees, expenses or taxes. Index performance is shown for illustrative purposes only as a benchmark for the Fund’s performance, and does not predict or depict performance of the Fund. The Fund’s performance reflects the effects of the Fund’s business and operating expenses.
TOP HOLDINGS AND ALLOCATIONS
TOP TEN COMMON STOCK HOLDINGS
| | | | |
| |
O’Reilly Automotive, Inc. | | | 2.2% | |
| |
Hanesbrands, Inc. | | | 2.1 | |
| |
Dollar Tree, Inc. | | | 2.0 | |
| |
Wabtec Corp. | | | 1.9 | |
| |
Centene Corp. | | | 1.9 | |
| |
Domino’s Pizza, Inc. | | | 1.8 | |
| |
Under Armour, Inc., Cl. A | | | 1.7 | |
| |
Acuity Brands, Inc. | | | 1.7 | |
| |
Sherwin-Williams Co. (The) | | | 1.6 | |
| |
Snap-on, Inc. | | | 1.6 | |
| |
Portfolio holdings and allocations are subject to change. Percentages are as of June 30, 2015, and are based on net assets. For more current Fund holdings, please visit oppenheimerfunds.com.
| | |
| | SECTOR ALLOCATION 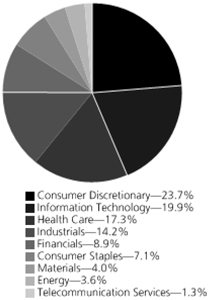 Portfolio holdings and allocations are subject to change. Percentages are as of June 30, 2015, and are based on the total market value of common stocks. |
2 OPPENHEIMER DISCOVERY MID CAP GROWTH FUND/VA
Fund Performance Discussion
The Fund’s Non-Service shares produced a return of 9.80% during the reporting period, outperforming the Russell Midcap Growth Index’s (the “Index”) return of 4.18% and the Morningstar Mid-Cap Growth peer group’s return of 5.88% over the same period. The Fund outperformed the Index in all sectors, led by stock selection in the consumer discretionary, industrials and information technology sectors.
In addition, the Fund’s Non-Service shares ranked in the 7th percentile (16 out of 104 funds) in Morningstar’s Mid-Cap Growth peer group over the 6-month period ended June 30, 2015. Over the longer-term, Fund’s Non-Service shares ranked in the 6th (6 out of 104 funds), 5th (5 out of 99 funds), and 89th (68 out of 80 funds) percentiles for the 1-, 5- and 10-year periods ended June 30, 2015, respectively.
GLOBAL MARKET AND ECONOMIC ENVIRONMENT
Markets were volatile during the six-month reporting period, but generally produced positive results with growth stocks outperforming value stocks. After U.S. equities outperformed other developed and emerging market equities in 2014, the market environment shifted over the first half of 2015. The dollar continued to strengthen, which acted as a drag on growth. Businesses, especially U.S. firms with revenues dependent on exporting goods and services, cited this as a headwind. European Central Bank (“ECB”) President Mario Draghi announced the purchase of €60 billion a month in sovereign bonds from Eurozone countries for at least 19 months, a form of quantitative easing (“QE”) that is projected to increase the ECB’s balance sheet by over €1 trillion. The announcement and implementation of these extraordinary monetary policies had a significant impact on financial markets. European markets rallied and the euro fell against the currencies of most major trading partners. This resulted in European and emerging market equities outperforming U.S. equities over the first half of the period.
Over the second half of the reporting period, fallout from the collapse of oil prices, weak overseas economies and a strong U.S. dollar weighed on U.S. Gross Domestic Product (“GDP”) and corporate profit forecasts. In a repeat of last year, first quarter GDP growth was negative (-0.2%). Meanwhile, the Federal Reserve continued to forewarn a shift in monetary policy to higher interest rates later this year. Outside of the U.S., concerns around Greece’s debt situation emerged yet again late this reporting period. The markets had hoped for an 11th hour resolution to the stand-off between Greece and its creditors, but instead got an escalation of the crisis after the Greek Prime Minister called for a referendum. In the minds of many, this increased the odds of a Greek exit from the Eurozone (“Grexit”) and impacted the markets through the end of the reporting period. Shortly after the period ended, Eurozone leaders agreed to offer Greece a third bailout, averting a Grexit for the time being.
TOP INDIVIDUAL CONTRIBUTORS
During the reporting period, top contributors to performance included Centene Corp., Palo Alto Networks, Inc. and Avago Technologies Ltd. Centene, a managed care company that serves more than four million Medicaid members across 25 states, reported strong first quarter financial results in April and raised guidance at its investor day in June. The stock also benefitted from merger and acquisition activity in the managed care sector during the reporting period. Palo Alto Networks, which provides network security software and solutions, has been benefiting from a strong security backdrop and competitive displacement of incumbent vendors. The company also reported strong financial results. Avago is a semiconductor supplier that reported strong results, due partly to accretive acquisitions, including LSI Corporation and PLX Technology. The company also announced plans to acquire Broadcom.
TOP INDIVIDUAL DETRACTORS
The most significant detractors from the Fund’s performance included Tiffany & Co., NetSuite, Inc. and Rackspace Hosting, Inc., each of which we exited by period end. Tiffany & Co., a leading retailer of high quality branded jewelry, reported disappointing holiday comps and lowered 2015 guidance, with currency headwinds pressuring the business significantly. NetSuite, a leading vendor of SaaS (Software as a Service) Enterprise Applications, guided fiscal year 2015 earnings per share (EPS) that was below the street estimates due to higher investments. Rackspace Hosting, a provider of managed hosting to small- and medium-sized businesses globally, released first quarter results and second quarter guidance that missed expections.
STRATEGY & OUTLOOK
Our long-term investment process remains the same. We seek dynamic companies with above average and sustainable revenue and earnings growth that we believe are positioned to outperform. This includes leading firms in structurally attractive industries with committed management teams that have proven records of performance.
3 OPPENHEIMER DISCOVERY MID CAP GROWTH FUND/VA
We typically have several themes across the portfolios with current examples including Affordable Care Act beneficiaries, Building Materials, Consumer Revival and Cybersecurity. Looking forward, we are constructive on the prospects for mid-cap growth stocks in the second half 2015. At period end, we are anticipating economic growth similar to the 2% trend of the last few years, modest increases in interest rates and a soft profit growth outlook. Our segment of the market offers reasonable valuations, low exposure to a strong dollar and rising merger and acquisition activity. In addition, we feel that mid-caps offer an ongoing superior opportunity to generate outperformance through effective stock selection. We remain confident that our proven investment process can further leverage benchmark returns through effective stock selection.
The Fund’s investment strategy and focus can change over time. The mention of specific fund holdings does not constitute a recommendation by OppenheimerFunds, Inc. or its affiliates.
Shares of Oppenheimer funds are not deposits or obligations of any bank, are not guaranteed by any bank, are not insured by the FDIC or any other agency, and involve investment risks, including the possible loss of the principal amount invested.
4 OPPENHEIMER DISCOVERY MID CAP GROWTH FUND/VA
Fund Expenses
Fund Expenses. As a shareholder of the Fund, you incur two types of costs: (1) transaction costs and (2) ongoing costs, including management fees; distribution and service fees; and other Fund expenses. These examples are intended to help you understand your ongoing costs (in dollars) of investing in the Fund and to compare these costs with the ongoing costs of investing in other mutual funds.
The examples are based on an investment of $1,000.00 invested at the beginning of the period and held for the entire 6-month period ended June 30, 2015.
Actual Expenses. The first section of the table provides information about actual account values and actual expenses. You may use the information in this section for the class of shares you hold, together with the amount you invested, to estimate the expense that you paid over the period. Simply divide your account value by $1,000.00 (for example, an $8,600.00 account value divided by $1,000.00 = 8.60), then multiply the result by the number in the first section under the heading entitled “Expenses Paid During the 6 Months Ended June 30, 2015” to estimate the expenses you paid on your account during this period.
Hypothetical Example for Comparison Purposes.
The second section of the table provides information about hypothetical account values and hypothetical expenses based on the Fund’s actual expense ratio for each class of shares, and an assumed rate of return of 5% per year for each class before expenses, which is not the actual return. The hypothetical account values and expenses may not be used to estimate the actual ending account balance or expenses you paid for the period. You may use this information to compare the ongoing costs of investing in the Fund and other funds. To do so, compare this 5% hypothetical example for the class of shares you hold with the 5% hypothetical examples that appear in the shareholder reports of the other funds.
Please note that the expenses shown in the table are meant to highlight your ongoing costs only and do not reflect any charges associated with the separate accounts that offer this Fund. Therefore, the “hypothetical” lines of the table are useful in comparing ongoing costs only, and will not help you determine the relative total costs of owning different funds. In addition, if these separate account charges were included your costs would have been higher.
| | | | | | | | | | | | |
| Actual | | Beginning Account Value January 1, 2015 | | | Ending Account Value June 30, 2015 | | | Expenses Paid During 6 Months Ended June 30, 2015 | |
Non-Service shares | | $ | 1,000.00 | | | $ | 1,098.00 | | | $ | 4.17 | |
Service shares | | | 1,000.00 | | | | 1,096.80 | | | | 5.47 | |
| | | |
Hypothetical (5% return before expenses) | | | | | | | | | |
Non-Service shares | | | 1,000.00 | | | | 1,020.83 | | | | 4.02 | |
Service shares | | | 1,000.00 | | | | 1,019.59 | | | | 5.27 | |
Expenses are equal to the Fund’s annualized expense ratio for that class, multiplied by the average account value over the period, multiplied by 181/365 (to reflect the one-half year period). Those annualized expense ratios, excluding indirect expenses from affiliated funds, based on the 6-month period ended June 30, 2015 are as follows:
| | |
| Class | | Expense Ratios |
Non-Service shares | | 0.80% |
Service shares | | 1.05 |
The expense ratios reflect voluntary waivers and/or reimbursements of expenses by the Fund’s Manager. Some of these undertakings may be modified or terminated at any time, as indicated in the Fund’s prospectus. The “Financial Highlights” tables in the Fund’s financial statements, included in this report, also show the gross expense ratios, without such waivers or reimbursements and reduction to custodian expenses, if applicable.
5 OPPENHEIMER DISCOVERY MID CAP GROWTH FUND/VA
STATEMENT OF INVESTMENTS June 30, 2015 Unaudited
| | | | | | | | | | |
| | | | | | | | | |
| | | Shares | | | Value | | | |
| | | |
Common Stocks—98.8% | | | | | | | | | | |
| | | |
| Consumer Discretionary—23.5% | | | | | | | | | | |
| | | |
| Auto Components—1.3% | | | | | | | | | | |
| | | |
Delphi Automotive plc | | | 114,980 | | | $ | 9,783,648 | | | |
| | | |
| Hotels, Restaurants & Leisure—4.6% | | | | | | | |
| | | |
| Domino’s Pizza, Inc. | | | 116,420 | | | | 13,202,028 | | | |
| | | |
| Jack in the Box, Inc. | | | 59,860 | | | | 5,277,258 | | | |
| | | |
| Marriott International, Inc., Cl. A | | | 128,890 | | | | 9,588,127 | | | |
| | | |
| Norwegian Cruise Line Holdings Ltd.1 | | | 112,970 | | | | 6,330,839 | | | |
| | | | | | | | | | |
| | | | | | | 34,398,252 | | | |
| | | |
| Household Durables—2.3% | | | | | | | | | | |
| | | |
| Harman International Industries, Inc. | | | 73,890 | | | | 8,788,477 | | | |
| | | |
| Mohawk Industries, Inc.1 | | | 42,520 | | | | 8,117,068 | | | |
| | | | | | | | | | |
| | | | | | | 16,905,545 | | | |
| | | |
| Multiline Retail—2.0% | | | | | | | | | | |
| | | |
Dollar Tree, Inc.1 | | | 187,890 | | | | 14,841,431 | | | |
| | | |
| Specialty Retail—8.5% | | | | | | | | | | |
| | | |
| L Brands, Inc. | | | 119,160 | | | | 10,215,587 | | | |
| | | |
| O’Reilly Automotive, Inc.1 | | | 70,990 | | | | 16,042,320 | | | |
| | | |
| Ross Stores, Inc. | | | 223,670 | | | | 10,872,599 | | | |
| | | |
| Tractor Supply Co. | | | 125,050 | | | | 11,246,997 | | | |
| | | |
| Ulta Salon, Cosmetics & Fragrance, Inc.1 | | | 71,560 | | | | 11,052,442 | | | |
| | | |
| Williams-Sonoma, Inc. | | | 46,280 | | | | 3,807,455 | | | |
| | | | | | | | | | |
| | | | | | | 63,237,400 | | | |
| | | |
| Textiles, Apparel & Luxury Goods—4.8% | | | | | | | |
| | | |
| Carter’s, Inc. | | | 69,740 | | | | 7,413,362 | | | |
| | | |
| Hanesbrands, Inc. | | | 458,954 | | | | 15,292,347 | | | |
| | | |
| Under Armour, Inc., Cl. A1 | | | 150,040 | | | | 12,519,338 | | | |
| | | | | | | | | | |
| | | | | | | 35,225,047 | | | |
| | | |
| Consumer Staples—7.0% | | | | | | | | | | |
| | | |
| Beverages—2.7% | | | | | | | | | | |
| | | |
| Constellation Brands, Inc., Cl. A | | | 87,900 | | | | 10,198,158 | | | |
| | | |
| Monster Beverage Corp.1 | | | 72,170 | | | | 9,672,223 | | | |
| | | | | | | | | | |
| | | | | | | 19,870,381 | | | |
| | | |
| Food & Staples Retailing—1.0% | | | | | | | | | | |
| | | |
Kroger Co. (The) | | | 104,880 | | | | 7,604,849 | | | |
| | | |
| Food Products—3.3% | | | | | | | | | | |
| | | |
| Hain Celestial Group, Inc. (The)1 | | | 123,880 | | | | 8,158,737 | | | |
| | | |
| Hormel Foods Corp. | | | 105,110 | | | | 5,925,051 | | | |
| | | |
| WhiteWave Foods Co. (The), Cl. A1 | | | 214,250 | | | | 10,472,540 | | | |
| | | | | | | | | | |
| | | | | | | 24,556,328 | | | |
| | | |
| Energy—3.5% | | | | | | | | | | |
| | | |
| Energy Equipment & Services—1.0% | | | | | | | |
| | | |
| Cameron International Corp.1 | | | 72,580 | | | | 3,801,014 | | | |
| | | |
| Patterson-UTI Energy, Inc. | | | 196,450 | | | | 3,696,207 | | | |
| | | | | | | | | | |
| | | | | | | 7,497,221 | | | |
| | | |
| Oil, Gas & Consumable Fuels—2.5% | | | | | | | |
| | | |
| Cimarex Energy Co. | | | 49,930 | | | | 5,507,778 | | | |
| | | |
| Concho Resources, Inc.1 | | | 95,570 | | | | 10,881,600 | | | |
| | | |
| Memorial Resource Development Corp.1 | | | 114,419 | | | | 2,170,529 | | | |
| | | | | | | | | | |
| | | | | | | 18,559,907 | | | |
| | | |
| Financials—8.8% | | | | | | | | | | |
| | | |
| Capital Markets—2.5% | | | | | | | | | | |
| | | |
| Affiliated Managers Group, Inc.1 | | | 34,590 | | | | 7,561,374 | | | |
| | | |
| Lazard Ltd., Cl. A2 | | | 126,610 | | | | 7,120,546 | | | |
| | | |
| Legg Mason, Inc. | | | 72,640 | | | | 3,743,139 | | | |
| | | | | | | | | | |
| | | | | | | 18,425,059 | | | |
| | | |
| Commercial Banks—3.8% | | | | | | | | | | |
| | | |
| First Republic Bank | | | 119,600 | | | | 7,538,388 | | | |
| | | |
| Signature Bank1 | | | 71,470 | | | | 10,462,493 | | | |
| | | | | | | | | | |
| | | | | | | | |
| | | | | | | |
| | | Shares | | | Value | |
| |
| Commercial Banks (Continued) | | | | | | | | |
| |
| SVB Financial Group1 | | | 71,530 | | | $ | 10,298,890 | |
| | | | | | | | |
| | | | | | | 28,299,771 | |
| |
| Diversified Financial Services—0.6% | | | | | | | | |
| |
Moody’s Corp. | | | 42,699 | | | | 4,609,784 | |
| |
| Real Estate Management & Development—1.9% | | | | | |
| |
| CBRE Group, Inc., Cl. A1 | | | 223,369 | | | | 8,264,653 | |
| |
| Jones Lang LaSalle, Inc. | | | 32,140 | | | | 5,495,940 | |
| | | | | | | | |
| | | | | | | 13,760,593 | |
| |
| Health Care—17.1% | | | | | | | | |
| |
| Biotechnology—3.3% | | | | | | | | |
| |
| Alnylam Pharmaceuticals, Inc.1 | | | 38,590 | | | | 4,625,783 | |
| |
| BioMarin Pharmaceutical, Inc.1 | | | 40,070 | | | | 5,480,775 | |
| |
| Incyte Corp.1 | | | 95,450 | | | | 9,946,845 | |
| |
| Medivation, Inc.1 | | | 36,770 | | | | 4,199,134 | |
| | | | | | | | |
| | | | | | | 24,252,537 | |
| |
| Health Care Equipment & Supplies—3.2% | | | | | |
| |
| Cooper Cos., Inc. (The) | | | 32,890 | | | | 5,853,433 | |
| |
| DexCom, Inc.1 | | | 104,540 | | | | 8,361,109 | |
| |
| Edwards Lifesciences Corp.1 | | | 65,680 | | | | 9,354,803 | |
| | | | | | | | |
| | | | | | | 23,569,345 | |
| |
| Health Care Providers & Services—7.3% | | | | | |
| |
| AmerisourceBergen Corp., Cl. A | | | 103,160 | | | | 10,970,034 | |
| |
| Centene Corp.1 | | | 173,170 | | | | 13,922,868 | |
| |
| Team Health Holdings, Inc.1 | | | 140,360 | | | | 9,169,719 | |
| |
| Universal Health Services, Inc., Cl. B | | | 75,420 | | | | 10,717,182 | |
| |
| VCA, Inc.1 | | | 181,590 | | | | 9,879,404 | |
| | | | | | | | |
| | | | | | | 54,659,207 | |
| |
| Health Care Technology—0.8% | | | | | | | | |
| |
Cerner Corp.1 | | | 84,770 | | | | 5,854,216 | |
| |
| Life Sciences Tools & Services—2.0% | | | | | |
| |
| Illumina, Inc.1 | | | 42,508 | | | | 9,282,047 | |
| |
| Quintiles Transnational Holdings, Inc.1 | | | 83,200 | | | | 6,041,152 | |
| | | | | | | | |
| | | | | | | 15,323,199 | |
| |
| Pharmaceuticals—0.5% | | | | | | | | |
| |
Jazz Pharmaceuticals plc1 | | | 21,570 | | | | 3,797,830 | |
| |
| Industrials—14.0% | | | | | | | | |
| |
| Aerospace & Defense—1.8% | | | | | | | | |
| |
| Hexcel Corp. | | | 76,460 | | | | 3,803,121 | |
| |
| TransDigm Group, Inc.1 | | | 43,570 | | | | 9,788,872 | |
| | | | | | | | |
| | | | | | | 13,591,993 | |
| |
| Building Products—2.4% | | | | | | | | |
| |
| A.O. Smith Corp. | | | 146,660 | | | | 10,556,587 | |
| |
| Lennox International, Inc. | | | 68,450 | | | | 7,371,380 | |
| | | | | | | | |
| | | | | | | 17,927,967 | |
| |
| Electrical Equipment—1.7% | | | | | | | | |
| |
Acuity Brands, Inc. | | | 68,340 | | | | 12,299,833 | |
| |
| Industrial Conglomerates—1.1% | | | | | | | | |
| |
Carlisle Cos., Inc. | | | 86,190 | | | | 8,629,343 | |
| |
| Machinery—4.9% | | | | | | | | |
| |
| Middleby Corp. (The)1 | | | 98,630 | | | | 11,069,245 | |
| |
| Snap-on, Inc. | | | 72,739 | | | | 11,583,686 | |
| |
| Wabtec Corp. | | | 148,640 | | | | 14,007,833 | |
| | | | | | | | |
| | | | | | | 36,660,764 | |
| |
| Professional Services—2.1% | | | | | | | | |
| |
| Equifax, Inc. | | | 39,420 | | | | 3,827,288 | |
| |
| Robert Half International, Inc. | | | 68,040 | | | | 3,776,220 | |
| |
| Verisk Analytics, Inc., Cl. A1 | | | 106,070 | | | | 7,717,653 | |
| | | | | | | | |
| | | | | | | 15,321,161 | |
6 OPPENHEIMER DISCOVERY MID CAP GROWTH FUND/VA
| | | | | | | | |
| | | Shares | | | Value | |
| |
| Information Technology—19.7% | | | | | | | | |
| |
| Communications Equipment—1.5% | | | | | | | | |
| |
| Palo Alto Networks, Inc.1 | | | 64,800 | | | $ | 11,320,560 | |
| |
| Electronic Equipment, Instruments, & Components—0.8% | |
| |
| Fitbit, Inc., Cl. A1 | | | 16,470 | | | | 629,648 | |
| |
| IPG Photonics Corp.1 | | | 62,160 | | | | 5,294,478 | |
| | | | | | | | |
| | | | | | | 5,924,126 | |
| |
| Internet Software & Services—3.3% | | | | | | | | |
| |
| Akamai Technologies, Inc.1 | | | 110,330 | | | | 7,703,240 | |
| |
| CoStar Group, Inc.1 | | | 54,210 | | | | 10,910,305 | |
| |
| LinkedIn Corp., Cl. A1 | | | 29,430 | | | | 6,081,121 | |
| | | | | | | | |
| | | | | | | 24,694,666 | |
| |
| IT Services—2.2% | | | | | | | | |
| |
| Fiserv, Inc.1 | | | 100,400 | | | | 8,316,132 | |
| |
| Global Payments, Inc. | | | 74,780 | | | | 7,735,991 | |
| | | | | | | | |
| | | | | | | 16,052,123 | |
| |
| Semiconductors & Semiconductor Equipment—5.0% | |
| |
| Avago Technologies Ltd., Cl. A | | | 83,460 | | | | 11,094,338 | |
| |
| Lam Research Corp. | | | 84,970 | | | | 6,912,309 | |
| |
| NXP Semiconductors NV1 | | | 103,900 | | | | 10,202,980 | |
| |
| Skyworks Solutions, Inc. | | | 86,060 | | | | 8,958,846 | |
| | | | | | | | |
| | | | | | | 37,168,473 | |
| |
| Software—6.9% | | | | | | | | |
| |
| Activision Blizzard, Inc. | | | 151,640 | | | | 3,671,205 | |
| |
| Electronic Arts, Inc.1 | | | 154,110 | | | | 10,248,315 | |
| |
| Fortinet, Inc.1 | | | 211,010 | | | | 8,721,043 | |
| |
| ServiceNow, Inc.1 | | | 138,400 | | | | 10,284,504 | |
| |
| Tableau Software, Inc., Cl. A1 | | | 91,700 | | | | 10,573,010 | |
| |
| Ultimate Software Group, Inc. (The)1 | | | 47,080 | | | | 7,737,127 | |
| | | | | | | | |
| | | | | | | 51,235,204 | |
| | | | | | |
| | | Shares Value | |
| |
| Materials—3.9% | | | | | | |
| |
| Chemicals—1.6% | | | | | | |
| |
| Sherwin-Williams Co. (The) | | 42,380 | | $ | 11,655,348 | |
| |
| Construction Materials—1.1% | | | | |
| |
| Vulcan Materials Co. | | 102,640 | | | 8,614,575 | |
| |
| Containers & Packaging—1.2% | | | | |
| |
| Sealed Air Corp. | | 171,970 | | | 8,835,818 | |
| |
| Telecommunication Services—1.3% | |
| |
| Wireless Telecommunication Services—1.3% | |
| |
| SBA Communications Corp., Cl. A1 | | 85,600 | | | 9,841,432 | |
| | | | | | |
Total Common Stocks (Cost $533,342,413) | | | | | 734,804,936 | |
| |
Investment Company—1.2% | | | | | | |
| |
Oppenheimer Institutional Money Market Fund, Cl. E, 0.15%3,4 (Cost $8,660,027) | | 8,660,027 | | | 8,660,027 | |
| |
| Total Investments, at Value (Cost $542,002,440) | | 100.0% | | | 743,464,963 | |
| |
| Net Other Assets (Liabilities) | | (0.0) | | | (72,466) | |
| | | |
| Net Assets | | 100.0% | | $ | 743,392,497 | |
| | | |
Footnotes to Statement of Investments
1. Non-income producing security.
2. Security is a Master Limited Partnership.
3. Is or was an affiliate, as defined in the Investment Company Act of 1940, as amended, at or during the period ended June 30, 2015, by virtue of the Fund owning at least 5% of the voting securities of the issuer or as a result of the Fund and the issuer having the same investment adviser. Transactions during the period in which the issuer was an affiliate are as follows:
| | | | | | | | | | | | | | | | |
| | | Shares
December 31, 2014 | | | Gross Additions | | | Gross Reductions | | | Shares June 30, 2015 | |
| |
Oppenheimer Institutional Money Market Fund, Cl. E | | | 11,090,218 | | | | 142,157,739 | | | | 144,587,930 | | | | 8,660,027 | |
| | | | |
| | | | | | | | | Value | | | Income | |
| |
Oppenheimer Institutional Money Market Fund, Cl. E | | | | | | | | | | $ | 8,660,027 | | | $ | 10,511 | |
4. Rate shown is the 7-day yield as of June 30, 2015.
See accompanying Notes to Financial Statements.
7 OPPENHEIMER DISCOVERY MID CAP GROWTH FUND/VA
STATEMENT OF ASSETS AND LIABILITIES June 30, 2015 Unaudited
| | | | |
| |
Assets | | | | |
| Investments, at value—see accompanying statement of investments: | | | | |
| Unaffiliated companies (cost $533,342,413) | | $ | 734,804,936 | |
| Affiliated companies (cost $8,660,027) | | | 8,660,027 | |
| | | | |
| | | 743,464,963 | |
| |
| Cash | | | 1,906,523 | |
| |
| Receivables and other assets: | | | | |
| Investments sold | | | 1,241,893 | |
| Shares of beneficial interest sold | | | 206,576 | |
| Dividends | | | 72,028 | |
| Other | | | 56,214 | |
| | | | |
| Total assets | | | 746,948,197 | |
| |
Liabilities | | | | |
| Payables and other liabilities: | | | | |
| Shares of beneficial interest redeemed | | | 1,792,532 | |
| Investments purchased | | | 1,676,498 | |
| Trustees’ compensation | | | 44,921 | |
| Shareholder communications | | | 19,513 | |
| Distribution and service plan fees | | | 6,691 | |
| Other | | | 15,545 | |
| | | | |
| Total liabilities | | | 3,555,700 | |
| |
| Net Assets | | $ | 743,392,497 | |
| | | | |
| |
Composition of Net Assets | | | | |
| Par value of shares of beneficial interest | | $ | 9,408 | |
| |
| Additional paid-in capital | | | 509,021,297 | |
| |
| Accumulated net investment loss | | | (864,916) | |
| |
| Accumulated net realized gain on investments | | | 33,764,185 | |
| |
| Net unrealized appreciation on investments | | | 201,462,523 | |
| | | | |
| Net Assets | | $ | 743,392,497 | |
| | | | |
| |
Net Asset Value Per Share | | | | |
| Non-Service Shares: | | | | |
| Net asset value, redemption price per share and offering price per share (based on net assets of $711,061,328 and 8,983,633 shares of beneficial interest outstanding) | | | $79.15 | |
| |
| Service Shares: | | | | |
| Net asset value, redemption price per share and offering price per share (based on net assets of $32,331,169 and 424,377 shares of beneficial interest outstanding) | | | $76.19 | |
See accompanying Notes to Financial Statements.
8 OPPENHEIMER DISCOVERY MID CAP GROWTH FUND/VA
STATEMENT OF OPERATIONS For the Six Months Ended June 30, 2015 Unaudited
| | | | |
| |
Investment Income | | | | |
| Dividends: | | | | |
| Unaffiliated companies | | $ | 2,090,818 | |
| Affiliated companies | | | 10,511 | |
| | | | |
Total investment income | | | 2,101,329 | |
| |
Expenses | | | | |
| Management fees | | | 2,598,071 | |
| |
| Distribution and service plan fees: | | | | |
| Service shares | | | 39,858 | |
| |
| Transfer and shareholder servicing agent fees: | | | | |
| Non-Service shares | | | 350,654 | |
| Service shares | | | 15,944 | |
| |
| Shareholder communications: | | | | |
| Non-Service shares | | | 19,076 | |
| Service shares | | | 869 | |
| |
| Trustees’ compensation | | | 14,009 | |
| |
| Custodian fees and expenses | | | 2,356 | |
| |
| Other | | | 26,184 | |
| | | | |
| Total expenses | | | 3,067,021 | |
| Less reduction to custodian expenses | | | (73) | |
| Less waivers and reimbursements of expenses | | | (94,302) | |
| | | | |
Net expenses | | | 2,972,646 | |
| |
| Net Investment Loss | | | (871,317) | |
| |
Realized and Unrealized Gain | | | | |
| Net realized gain on investments from unaffiliated companies | | | 35,054,551 | |
| |
| Net change in unrealized appreciation/depreciation on investments | | | 34,428,307 | |
| |
| Net Increase in Net Assets Resulting from Operations | | $ | 68,611,541 | |
| | | | |
See accompanying Notes to Financial Statements.
9 OPPENHEIMER DISCOVERY MID CAP GROWTH FUND/VA
STATEMENTS OF CHANGES IN NET ASSETS
| | | | | | | | |
| | | Six Months Ended
June 30, 2015
(Unaudited) | | | Year Ended
December 31, 2014 | |
| |
Operations | | | | | | | | |
| Net investment loss | | $ | (871,317) | | | $ | (2,911,214) | |
| |
| Net realized gain | | | 35,054,551 | | | | 120,740,276 | |
| |
| Net change in unrealized appreciation/depreciation | | | 34,428,307 | | | | (78,732,569) | |
| | | | | | | | |
Net increase in net assets resulting from operations | | | 68,611,541 | | | | 39,096,493 | |
| |
Dividends and/or Distributions to Shareholders | | | | | | | | |
| |
| Distributions from net realized gain: | | | | | | | | |
| Non-Service shares | | | (61,563,484) | | | | — | |
| Service shares | | | (2,875,460) | | | | — | |
| | | | | | | | |
| | | (64,438,944) | | | | — | |
| |
Beneficial Interest Transactions | | | | | | | | |
| Net increase (decrease) in net assets resulting from beneficial interest transactions: | | | | | | | | |
| Non-Service shares | | | 24,448,376 | | | | (80,362,833) | |
| Service shares | | | 1,292,690 | | | | (7,209,426) | |
| | | | | | | | |
| | | 25,741,066 | | | | (87,572,259) | |
| |
Net Assets | | | | | | | | |
| Total increase (decrease) | | | 29,913,663 | | | | (48,475,766) | |
| |
| Beginning of period | | | 713,478,834 | | | | 761,954,600 | |
| | | | | | | | |
End of period (including accumulated net investment income (loss) of ($864,916) and $6,401, respectively) | | $ | 743,392,497 | | | $ | 713,478,834 | |
| | | | |
See accompanying Notes to Financial Statements.
10 OPPENHEIMER DISCOVERY MID CAP GROWTH FUND/VA
FINANCIAL HIGHLIGHTS
| | | | | | | | | | | | | | | | | | | | | | | | | | |
| Non-Service Shares | | | | Six Months
Ended
June 30,
2015
(Unaudited) | | | Year Ended
December 31,
2014 | | | Year Ended
December 31,
2013 | | | Year Ended
December 31,
2012 | | | Year Ended
December 30,
20111 | | | Year Ended
December 31,
2010 | |
| |
Per Share Operating Data | | | | | | | | | | | | | | | | | | | | | | | | | | |
| Net asset value, beginning of period | | | | $ | 78.82 | | | $ | 74.51 | | | $ | 54.80 | | | $ | 47.06 | | | $ | 46.55 | | | $ | 36.52 | |
| |
| Income (loss) from investment operations: | | | | | | | | | | | | | | | | | | | | | | | | | | |
| Net investment income (loss)2 | | | | | (0.09) | | | | (0.29) | | | | (0.16) | | | | 0.01 | | | | (0.26) | | | | (0.11) | |
| Net realized and unrealized gain | | | | | 7.87 | | | | 4.60 | | | | 19.88 | | | | 7.73 | | | | 0.77 | | | | 10.14 | |
| | | | | | |
| Total from investment operations | | | | | 7.78 | | | | 4.31 | | | | 19.72 | | | | 7.74 | | | | 0.51 | | | | 10.03 | |
| |
| Dividends and/or distributions to shareholders: | | | | | | | | | | | | | | | | | | | | | | | | | | |
| Dividends from net investment income | | | | | 0.00 | | | | 0.00 | | | | (0.01) | | | | 0.00 | | | | 0.00 | | | | 0.00 | |
| Distributions from net realized gain | | | | | (7.45) | | | | 0.00 | | | | 0.00 | | | | 0.00 | | | | 0.00 | | | | 0.00 | |
| | | | | | |
| Total dividends and/or distributions to shareholders | | | | | (7.45) | | | | 0.00 | | | | (0.01) | | | | 0.00 | | | | 0.00 | | | | 0.00 | |
| |
| Net asset value, end of period | | | | $ | 79.15 | | | $ | 78.82 | | | $ | 74.51 | | | $ | 54.80 | | | $ | 47.06 | | | $ | 46.55 | |
| | | | | | |
| | | | | | | | | | | | | | | | | | | | | | | | | | |
| | | | | | | | | | | | | | | | | | | | | | | | | | |
| |
Total Return, at Net Asset Value3 | | | | | 9.80% | | | | 5.78% | | | | 35.98% | | | | 16.45% | | | | 1.09% | | | | 27.46% | |
| | | | | | | | | | | | | | | | | | | | | | | | | | |
| | | | | | | | | | | | | | | | | | | | | | | | | | |
| | | | | | | | | | | | | | | | | | | | | | | | | | |
| |
Ratios/Supplemental Data | | | | | | | | | | | | | | | | | | | | | | | | | | |
| Net assets, end of period (in thousands) | | | | $ | 711,061 | | | $ | 682,515 | | | $ | 725,406 | | | $ | 558,934 | | | $ | 543,020 | | | $ | 611,872 | |
| |
| Average net assets (in thousands) | | | | $ | 707,240 | | | $ | 688,259 | | | $ | 618,970 | | | $ | 575,072 | | | $ | 605,083 | | | $ | 548,739 | |
| |
| Ratios to average net assets:4 | | | | | | | | | | | | | | | | | | | | | | | | | | |
| Net investment income (loss) | | | | | (0.23)% | | | | (0.39)% | | | | (0.24)% | | | | 0.03% | | | | (0.53)% | | | | (0.29)% | |
| Total expenses5 | | | | | 0.83% | | | | 0.83% | | | | 0.84% | | | | 0.85% | | | | 0.84% | | | | 0.85% | |
| Expenses after payments, waivers and/or reimbursements and reduction to custodian expenses | | | | | 0.80% | | | | 0.80% | | | | 0.80% | | | | 0.80% | | | | 0.80% | | | | 0.76% | |
| |
| Portfolio turnover rate | | | | | 40 % | | | | 113 % | | | | 84 % | | | | 66 % | | | | 91 % | | | | 95 % | |
1. December 30, 2011 represents the last business day of the Fund’s reporting period.
2. Per share amounts calculated based on the average shares outstanding during the period.
3. Assumes an initial investment on the business day before the first day of the fiscal period, with all dividends and distributions reinvested in additional shares on the reinvestment date, and redemption at the net asset value calculated on the last business day of the fiscal period. Total returns are not annualized for periods less than one full year. Total return information does not reflect expenses that apply at the separate account level or to related insurance products. Inclusion of these charges would reduce the total return figures for all periods shown. Returns do not reflect the deduction of taxes that a shareholder would pay on fund distributions or the redemption of fund shares. The returns do not include adjustments in accordance with generally accepted accounting principles required at the period end for financial reporting purposes.
4. Annualized for periods less than one full year.
5. Total expenses including indirect expenses from affiliated fund fees and expenses were as follows:
| | | | | | |
| | | | | | |
| | Six Months Ended June 30, 2015 | | | 0.83 | % |
| | Year Ended December 31, 2014 | | | 0.83 | % |
| | Year Ended December 31, 2013 | | | 0.84 | % |
| | Year Ended December 31, 2012 | | | 0.85 | % |
| | Year Ended December 30, 2011 | | | 0.84 | % |
| | Year Ended December 31, 2010 | | | 0.85 | % |
See accompanying Notes to Financial Statements.
11 OPPENHEIMER DISCOVERY MID CAP GROWTH FUND/VA
FINANCIAL HIGHLIGHTS Continued
| | | | | | | | | | | | | | | | | | | | | | | | | | |
| Service Shares | | | | Six Months
Ended
June 30,
2015
(Unaudited) | | | Year Ended
December 31,
2014 | | | Year Ended
December 31,
2013 | | | Year Ended
December 31,
2012 | | | Year Ended
December 30,
20111 | | | Year Ended
December 31,
2010 | |
| |
Per Share Operating Data | | | | | | | | | | | | | | | | | | | | | | | | | | |
| Net asset value, beginning of period | | | | $ | 76.21 | | | $ | 72.22 | | | $ | 53.25 | | | $ | 45.84 | | | $ | 45.46 | | | $ | 35.75 | |
| |
| Income (loss) from investment operations: | | | | | | | | | | | | | | | | | | | | | | | | | | |
| Net investment loss2 | | | | | (0.19) | | | | (0.46) | | | | (0.30) | | | | (0.12) | | | | (0.37) | | | | (0.20) | |
| Net realized and unrealized gain | | | | | 7.62 | | | | 4.45 | | | | 19.27 | | | | 7.53 | | | | 0.75 | | | | 9.91 | |
| | | | | | |
| Total from investment operations | | | | | 7.43 | | | | 3.99 | | | | 18.97 | | | | 7.41 | | | | 0.38 | | | | 9.71 | |
| |
| Dividends and/or distributions to shareholders: | | | | | | | | | | | | | | | | | | | | | | | | | | |
| Dividends from net investment income | | | | | 0.00 | | | | 0.00 | | | | 0.00 | | | | 0.00 | | | | 0.00 | | | | 0.00 | |
| Distributions from net realized gain | | | | | (7.45) | | | | 0.00 | | | | 0.00 | | | | 0.00 | | | | 0.00 | | | | 0.00 | |
| | | | | | |
| Total dividends and/or distributions to shareholders | | | | | (7.45) | | | | 0.00 | | | | 0.00 | | | | 0.00 | | | | 0.00 | | | | 0.00 | |
| |
| Net asset value, end of period | | | | $ | 76.19 | | | $ | 76.21 | | | $ | 72.22 | | | $ | 53.25 | | | $ | 45.84 | | | $ | 45.46 | |
| | | | | | |
| |
Total Return, at Net Asset Value3 | | | | | 9.68% | | | | 5.53% | | | | 35.62% | | | | 16.17% | | | | 0.83% | | | | 27.16% | |
| | | | | | | | | | | | | | | | | | | | | | | | | | |
| |
Ratios/Supplemental Data | | | | | | | | | | | | | | | | | | | | | | | | | | |
| Net assets, end of period (in thousands) | | | | $ | 32,331 | | | $ | 30,964 | | | $ | 36,549 | | | $ | 35,942 | | | $ | 35,773 | | | $ | 32,669 | |
| |
| Average net assets (in thousands) | | | | $ | 32,157 | | | $ | 32,927 | | | $ | 35,905 | | | $ | 37,842 | | | $ | 37,775 | | | $ | 27,552 | |
| |
| Ratios to average net assets:4 | | | | | | | | | | | | | | | | | | | | | | | | | | |
| Net investment loss | | | | | (0.48)% | | | | (0.64)% | | | | (0.49)% | | | | (0.22)% | | | | (0.78)% | | | | (0.53)% | |
| Total expenses5 | | | | | 1.08% | | | | 1.08% | | | | 1.09% | | | | 1.10% | | | | 1.09% | | | | 1.10% | |
| Expenses after payments, waivers and/or reimbursements and reduction to custodian expenses | | | | | 1.05% | | | | 1.05% | | | | 1.05% | | | | 1.05% | | | | 1.05% | | | | 1.01% | |
| |
| Portfolio turnover rate | | | | | 40 % | | | | 113 % | | | | 84 % | | | | 66 % | | | | 91 % | | | | 95 % | |
1. December 30, 2011 represents the last business day of the Fund’s reporting period.
2. Per share amounts calculated based on the average shares outstanding during the period.
3. Assumes an initial investment on the business day before the first day of the fiscal period, with all dividends and distributions reinvested in additional shares on the reinvestment date, and redemption at the net asset value calculated on the last business day of the fiscal period. Total returns are not annualized for periods less than one full year. Total return information does not reflect expenses that apply at the separate account level or to related insurance products. Inclusion of these charges would reduce the total return figures for all periods shown. Returns do not reflect the deduction of taxes that a shareholder would pay on fund distributions or the redemption of fund shares. The returns do not include adjustments in accordance with generally accepted accounting principles required at the period end for financial reporting purposes.
4. Annualized for periods less than one full year.
5. Total expenses including indirect expenses from affiliated fund fees and expenses were as follows:
| | | | | | |
| | | | | | |
| | Six Months Ended June 30, 2015 | | | 1.08 | % |
| | Year Ended December 31, 2014 | | | 1.08 | % |
| | Year Ended December 31, 2013 | | | 1.09 | % |
| | Year Ended December 31, 2012 | | | 1.10 | % |
| | Year Ended December 30, 2011 | | | 1.09 | % |
| | Year Ended December 31, 2010 | | | 1.10 | % |
See accompanying Notes to Financial Statements.
12 OPPENHEIMER DISCOVERY MID CAP GROWTH FUND/VA
NOTES TO FINANCIAL STATEMENTS June 30, 2015 Unaudited
1. Organization
Oppenheimer Discovery Mid Cap Growth Fund/VA (the “Fund”) is a separate series of Oppenheimer Variable Account Funds, as a diversified open-end management investment company registered under the Investment Company Act of 1940 (“1940 Act”), as amended. The Fund’s investment objective is to seek capital appreciation. The Fund’s investment adviser is OFI Global Asset Management, Inc. (“OFI Global” or the “Manager”), a wholly-owned subsidiary of OppenheimerFunds Inc. (“OFI” or the “Sub-Adviser”). The Manager has entered into a sub-advisory agreement with OFI. Shares of the Fund are sold only to separate accounts of life insurance companies.
The Fund offers two classes of shares. Both classes are sold at their offering price, which is the net asset value per share, to separate investment accounts of participating insurance companies as an underlying investment for variable life insurance policies, variable annuity contracts or other investment products. The class of shares designated as Service shares is subject to a distribution and service plan. Both classes of shares have identical rights and voting privileges with respect to the Fund in general and exclusive voting rights on matters that affect that class alone. Earnings, net assets and net asset value per share may differ due to each class having its own expenses, such as transfer and shareholder servicing agent fees and shareholder communications, directly attributable to that class.
The following is a summary of significant accounting policies followed in the Fund’s preparation of financial statements in accordance with accounting principles generally accepted in the United States (“U.S. GAAP”).
2. Significant Accounting Policies
Security Valuation. All investments in securities are recorded at their estimated fair value, as described in Note 3.
Reporting Period End Date. The last day of the Fund’s reporting period is the last day the New York Stock Exchange was open for trading during the period. The Fund’s financial statements have been presented through that date to maintain consistency with the Fund’s net asset value calculations used for shareholder transactions.
Allocation of Income, Expenses, Gains and Losses. Income, expenses (other than those attributable to a specific class), gains and losses are allocated on a daily basis to each class of shares based upon the relative proportion of net assets represented by such class. Operating expenses directly attributable to a specific class are charged against the operations of that class.
Dividends and Distributions to Shareholders. Dividends and distributions to shareholders, which are determined in accordance with income tax regulations and may differ from U.S. generally accepted accounting principles, are recorded on the ex-dividend date. Income and capital gain distributions, if any, are declared and paid annually or at other times as deemed necessary by the Manager.
The tax character of distributions is determined as of the Fund’s fiscal year end. Therefore, a portion of the Fund’s distributions made to shareholders prior to the Fund’s fiscal year end may ultimately be categorized as a tax return of capital.
Investment Income. Dividend income is recorded on the ex-dividend date or upon ex-dividend notification in the case of certain foreign dividends where the ex-dividend date may have passed. Non-cash dividends included in dividend income, if any, are recorded at the fair market value of the securities received. Interest income is recognized on an accrual basis. Discount and premium, which are included in interest income on the Statement of Operations, are amortized or accreted daily.
Return of Capital Estimates. Distributions received from the Fund’s investments in MLPs generally are comprised of income and return of capital. The Fund records investment income and return of capital based on estimates made at the time such distributions are received. Such estimates are based on historical information available from each MLP and other industry sources. These estimates may subsequently be revised based on information received from MLPs after their tax reporting periods are concluded.
Custodian Fees. “Custodian fees and expenses” in the Statement of Operations may include interest expense incurred by the Fund on any cash overdrafts of its custodian account during the period. Such cash overdrafts may result from the effects of failed trades in portfolio securities and from cash outflows resulting from unanticipated shareholder redemption activity. The Fund pays interest to its custodian on such cash overdrafts, to the extent they are not offset by positive cash balances maintained by the Fund, at a rate equal to the Federal Funds Rate plus 0.50%. The “Reduction to custodian expenses” line item, if applicable, represents earnings on cash balances maintained by the Fund during the period. Such interest expense and other custodian fees may be paid with these earnings.
Security Transactions. Security transactions are recorded on the trade date. Realized gains and losses on securities sold are determined on the basis of identified cost.
Indemnifications. The Fund’s organizational documents provide current and former Trustees and officers with a limited indemnification against liabilities arising in connection with the performance of their duties to the Fund. In the normal course of business, the Fund may also enter into contracts that provide general indemnifications. The Fund’s maximum exposure under these arrangements is unknown as this would be dependent on future claims that may be made against the Fund. The risk of material loss from such claims is considered remote.
Federal Taxes. The Fund intends to comply with provisions of the Internal Revenue Code applicable to regulated investment companies and to distribute substantially all of its investment company taxable income to shareholders. Therefore, no federal income or excise tax provision is required. The
13 OPPENHEIMER DISCOVERY MID CAP GROWTH FUND/VA
NOTES TO FINANCIAL STATEMENTS Unaudited / Continued
2. Significant Accounting Policies (Continued)
Fund files income tax returns in U.S. federal and applicable state jurisdictions. The statute of limitations on the Fund’s tax return filings generally remains open for the three preceding fiscal reporting period ends.
During the fiscal year ended December 31, 2014, the Fund utilized $50,885,832 of capital loss carryforward to offset capital gains realized in that fiscal year. Capital loss carryforwards with no expiration, if any, must be utilized prior to those with expiration dates. Capital losses with no expiration will be carried forward to future years if not offset by gains.
Net investment income (loss) and net realized gain (loss) may differ for financial statement and tax purposes. The character of dividends and distributions made during the fiscal year from net investment income or net realized gains are determined in accordance with federal income tax requirements, which may differ from the character of net investment income or net realized gains presented in those financial statements in accordance with GAAP. Also, due to timing of dividends and distributions, the fiscal year in which amounts are distributed may differ from the fiscal year in which the income or net realized gain was recorded by the Fund.
The aggregate cost of securities and other investments and the composition of unrealized appreciation and depreciation of securities and other investments for federal income tax purposes as of June 30, 2015 are noted in the following table. The primary difference between book and tax appreciation or depreciation of securities and other investments, if applicable, is attributable to the tax deferral of losses or tax realization of financial statement unrealized gain or loss.
| | | | |
Federal tax cost of securities | | $ | 542,873,134 | |
| | | | |
Gross unrealized appreciation | | $ | 204,302,327 | |
Gross unrealized depreciation | | | (3,710,498) | |
| | | | |
Net unrealized appreciation | | $ | 200,591,829 | |
| | | | |
Use of Estimates. The preparation of financial statements in conformity with accounting principles generally accepted in the United States of America requires management to make estimates and assumptions that affect the reported amounts of assets and liabilities and disclosure of contingent assets and liabilities at the date of the financial statements and the reported amounts of increases and decreases in net assets from operations during the reporting period. Actual results could differ from those estimates.
3. Securities Valuation
The Fund calculates the net asset value of its shares as of the close of the New York Stock Exchange (the “Exchange”), normally 4:00 P.M. Eastern time, on each day the Exchange is open for trading.
The Fund’s Board has adopted procedures for the valuation of the Fund’s securities and has delegated the day-to-day responsibility for valuation determinations under those procedures to the Manager. The Manager has established a Valuation Committee which is responsible for determining a “fair valuation” for any security for which market quotations are not “readily available.” The Valuation Committee’s fair valuation determinations are subject to review, approval and ratification by the Fund’s Board at its next regularly scheduled meeting covering the calendar quarter in which the fair valuation was determined.
Valuation Methods and Inputs
Securities are valued using unadjusted quoted market prices, when available, as supplied primarily by third party pricing services or dealers.
The following methodologies are used to determine the market value or the fair value of the types of securities described below:
Securities traded on a registered U.S. securities exchange (including exchange-traded derivatives other than futures and futures options) are valued based on the last sale price of the security reported on the principal exchange on which it is traded, prior to the time when the Fund’s assets are valued. In the absence of a sale, the security is valued at the last sale price on the prior trading day, if it is within the spread of the current day’s closing “bid” and “asked” prices, and if not, at the current day’s closing bid price. A security of a foreign issuer traded on a foreign exchange, but not listed on a registered U.S. securities exchange, is valued based on the last sale price on the principal exchange on which the security is traded, as identified by the third party pricing service used by the Manager, prior to the time when the Fund’s assets are valued. If the last sale price is unavailable, the security is valued at the most recent official closing price on the principal exchange on which it is traded. If the last sales price or official closing price for a foreign security is not available, the security is valued at the mean between the bid and asked price per the exchange or, if not available from the exchange, obtained from two dealers. If bid and asked prices are not available from either the exchange or two dealers, the security is valued by using one of the following methodologies (listed in order of priority): (1) using a bid from the exchange, (2) the mean between the bid and asked price as provided by a single dealer, or (3) a bid from a single dealer.
Shares of a registered investment company that are not traded on an exchange are valued at that investment company’s net asset value per share.
Corporate and government debt securities (of U.S. or foreign issuers) and municipal debt securities, event-linked bonds, loans, mortgage-backed securities, collateralized mortgage obligations, and asset-backed securities are valued at the mean between the “bid” and “asked” prices utilizing evaluated prices obtained from third party pricing services or broker-dealers who may use matrix pricing methods to determine the evaluated prices.
Short-term money market type debt securities with a remaining maturity of sixty days or less are valued at cost adjusted by the amortization of discount or premium to maturity (amortized cost), which approximates market value. Short-term debt securities with a remaining maturity in excess of sixty days are valued at the mean between the “bid” and “asked” prices utilizing evaluated prices obtained from third party pricing services or broker-dealers.
A description of the standard inputs that may generally be considered by the third party pricing vendors in determining their evaluated prices is provided below.
14 OPPENHEIMER DISCOVERY MID CAP GROWTH FUND/VA
3. Securities Valuation (Continued)
| | |
| Security Type | | Standard inputs generally considered by third-party pricing vendors |
|
| Corporate debt, government debt, municipal, mortgage-backed and asset-backed securities | | Reported trade data, broker-dealer price quotations, benchmark yields, issuer spreads on comparable securities, the credit quality, yield, maturity, and other appropriate factors. |
|
| Loans | | Information obtained from market participants regarding reported trade data and broker-dealer price quotations. |
|
| Event-linked bonds | | Information obtained from market participants regarding reported trade data and broker-dealer price quotations. |
If a market value or price cannot be determined for a security using the methodologies described above, or if, in the “good faith” opinion of the Manager, the market value or price obtained does not constitute a “readily available market quotation,” or a significant event has occurred that would materially affect the value of the security, the security is fair valued either (i) by a standardized fair valuation methodology applicable to the security type or the significant event as previously approved by the Valuation Committee and the Fund’s Board or (ii) as determined in good faith by the Manager’s Valuation Committee. The Valuation Committee considers all relevant facts that are reasonably available, through either public information or information available to the Manager, when determining the fair value of a security. Fair value determinations by the Manager are subject to review, approval and ratification by the Fund’s Board at its next regularly scheduled meeting covering the calendar quarter in which the fair valuation was determined. Those fair valuation standardized methodologies include, but are not limited to, valuing securities at the last sale price or initially at cost and subsequently adjusting the value based on: changes in company specific fundamentals, changes in an appropriate securities index, or changes in the value of similar securities which may be further adjusted for any discounts related to security-specific resale restrictions. When possible, such methodologies use observable market inputs such as unadjusted quoted prices of similar securities, observable interest rates, currency rates and yield curves. The methodologies used for valuing securities are not necessarily an indication of the risks associated with investing in those securities nor can it be assured that the Fund can obtain the fair value assigned to a security if it were to sell the security.
To assess the continuing appropriateness of security valuations, the Manager, or its third party service provider who is subject to oversight by the Manager, regularly compares prior day prices, prices on comparable securities, and sale prices to the current day prices and challenges those prices exceeding certain tolerance levels with the third party pricing service or broker source. For those securities valued by fair valuations, whether through a standardized fair valuation methodology or a fair valuation determination, the Valuation Committee reviews and affirms the reasonableness of the valuations based on such methodologies and fair valuation determinations on a regular basis after considering all relevant information that is reasonably available.
Classifications
Each investment asset or liability of the Fund is assigned a level at measurement date based on the significance and source of the inputs to its valuation. Various data inputs are used in determining the value of each of the Fund’s investments as of the reporting period end. These data inputs are categorized in the following hierarchy under applicable financial accounting standards:
1) Level 1-unadjusted quoted prices in active markets for identical assets or liabilities (including securities actively traded on a securities exchange)
2) Level 2-inputs other than unadjusted quoted prices that are observable for the asset or liability (such as unadjusted quoted prices for similar assets and market corroborated inputs such as interest rates, prepayment speeds, credit risks, etc.)
3) Level 3-significant unobservable inputs (including the Manager’s own judgments about assumptions that market participants would use in pricing the asset or liability).
The inputs used for valuing securities are not necessarily an indication of the risks associated with investing in those securities.
The table below categorizes amounts that are included in the Fund’s Statement of Assets and Liabilities as of June 30, 2015 based on valuation input level:
| | | | | | | | | | | | | | | | |
| | | Level 1— Unadjusted Quoted Prices | | | Level 2—
Other Significant
Observable Inputs | | | Level 3— Significant Unobservable Inputs | | | Value | |
| |
| Assets Table | | | | | | | | | | | | | | | | |
| Investments, at Value: | | | | | | | | | | | | | | | | |
Common Stocks | | | | | | | | | | | | | | | | |
Consumer Discretionary | | $ | 174,391,323 | | | $ | — | | | $ | — | | | $ | 174,391,323 | |
Consumer Staples | | | 52,031,558 | | | | — | | | | — | | | | 52,031,558 | |
Energy | | | 26,057,128 | | | | — | | | | — | | | | 26,057,128 | |
Financials | | | 65,095,207 | | | | — | | | | — | | | | 65,095,207 | |
Health Care | | | 127,456,334 | | | | — | | | | — | | | | 127,456,334 | |
Industrials | | | 104,431,061 | | | | — | | | | — | | | | 104,431,061 | |
Information Technology | | | 146,395,152 | | | | — | | | | — | | | | 146,395,152 | |
Materials | | | 29,105,741 | | | | — | | | | — | | | | 29,105,741 | |
Telecommunication Services | | | 9,841,432 | | | | — | | | | — | | | | 9,841,432 | |
| Investment Company | | | 8,660,027 | | | | — | | | | — | | | | 8,660,027 | |
| | | | |
| Total Assets | | $ | 743,464,963 | | | $ | — | | | $ | — | | | $ | 743,464,963 | |
| | | | |
15 �� OPPENHEIMER DISCOVERY MID CAP GROWTH FUND
NOTES TO FINANCIAL STATEMENTS Unaudited / Continued
3. Securities Valuation (Continued)
Forward currency exchange contracts and futures contracts, if any, are reported at their unrealized appreciation/depreciation at measurement date, which represents the change in the contract’s value from trade date. All additional assets and liabilities included in the above table are reported at their market value at measurement date.
4. Investments and Risks
Investment in Oppenheimer Institutional Money Market Fund. The Fund is permitted to invest daily available cash balances in an affiliated money market fund. The Fund may invest the available cash in Class E shares of Oppenheimer Institutional Money Market Fund (“IMMF”) to seek current income while preserving liquidity or for defensive purposes. IMMF is a registered open-end management investment company, regulated as a money market fund under the 1940 Act. The Manager is the investment adviser of IMMF, and the Sub-Adviser provides investment and related advisory services to IMMF. When applicable, the Fund’s investment in IMMF is included in the Statement of Investments. Shares of IMMF are valued at their net asset value per share. As a shareholder, the Fund is subject to its proportional share of IMMF’s Class E expenses, including its management fee. The Manager will waive fees and/or reimburse Fund expenses in an amount equal to the indirect management fees incurred through the Fund’s investment in IMMF.
Master Limited Partnerships (“MLPs”). MLPs issue common units that represent an equity ownership interest in a partnership and provide limited voting rights. MLP common units are registered with the Securities and Exchange Commission (“SEC”), and are freely tradable on securities exchanges such as the NYSE and the NASDAQ Stock Market (“NASDAQ”), or in the over-the-counter (“OTC”) market. An MLP consists of one or more general partners, who conduct the business, and one or more limited partners, who contribute capital. MLP common unit holders have a limited role in the partnership’s operations and management. The Fund, as a limited partner, normally would not be liable for the debts of the MLP beyond the amounts the Fund has contributed, but would not be shielded to the same extent that a shareholder of a corporation would be. In certain circumstances creditors of an MLP would have the right to seek return of capital distributed to a limited partner. This right of an MLP’s creditors would continue after the Fund sold its investment in the MLP.
Equity Security Risk. Stocks and other equity securities fluctuate in price. The value of the Fund’s portfolio may be affected by changes in the equity markets generally. Equity markets may experience significant short-term volatility and may fall sharply at times. Different markets may behave differently from each other and U.S. equity markets may move in the opposite direction from one or more foreign stock markets. Adverse events in any part of the equity or fixed-income markets may have unexpected negative effects on other market segments.
The prices of individual equity securities generally do not all move in the same direction at the same time and a variety of factors can affect the price of a particular company’s securities. These factors may include, but are not limited to, poor earnings reports, a loss of customers, litigation against the company, general unfavorable performance of the company’s sector or industry, or changes in government regulations affecting the company or its industry.
5. Shares of Beneficial Interest
The Fund has authorized an unlimited number of $0.001 par value shares of beneficial interest of each class. Transactions in shares of beneficial interest were as follows:
| | | | | | | | | | | | | | | | |
| | | Six Months Ended June 30, 2015 | | | Year Ended December 31, 2014 | |
| | | Shares | | | Amount | | | Shares | | | Amount | |
| |
| Non-Service Shares | | | | | | | | | | | | | | | | |
| Sold | | | 196,585 | | | $ | 16,451,527 | | | | 416,592 | | | $ | 31,353,214 | |
| Dividends and/or distributions reinvested | | | 772,149 | | | | 61,563,484 | | | | — | | | | — | |
| Redeemed | | | (644,663) | | | | (53,566,635) | | | | (1,493,014) | | | | (111,716,047) | |
| | | | |
| Net increase (decrease) | | | 324,071 | | | $ | 24,448,376 | | | | (1,076,422) | | | $ | (80,362,833) | |
| | | | |
| | | | |
| |
| Service Shares | | | | | | | | | | | | | | | | |
| Sold | | | 33,458 | | | $ | 2,706,902 | | | | 42,402 | | | $ | 3,058,524 | |
| Dividends and/or distributions reinvested | | | 37,465 | | | | 2,875,460 | | | | — | | | | — | |
| Redeemed | | | (52,852) | | | | (4,289,672) | | | | (142,155) | | | | (10,267,950) | |
| | | | |
| Net increase (decrease) | | | 18,071 | | | $ | 1,292,690 | | | | (99,753) | | | $ | (7,209,426) | |
| | | | |
6. Purchases and Sales of Securities
The aggregate cost of purchases and proceeds from sales of securities, other than short-term obligations and investments in IMMF, for the six months ended June 30, 2015 were as follows:
| | | | | | |
| | | Purchases | | | Sales |
|
Investment securities | | $ | 288,325,167 | | | $325,472,996 |
7. Fees and Other Transactions with Affiliates
Management Fees. Under the investment advisory agreement, the Fund pays the Manager a management fee based on the daily net assets of the Fund at an annual rate as shown in the following table:
16 OPPENHEIMER DISCOVERY MID CAP GROWTH FUND/VA
7. Fees and Other Transactions with Affiliates (Continued)
| | | | |
| Fee Schedule | | | |
| |
Up to $200 million | | | 0.75% | |
Next $200 million | | | 0.72 | |
Next $200 million | | | 0.69 | |
Next $200 million | | | 0.66 | |
Next $700 million | | | 0.60 | |
Over $1.5 billion | | | 0.58 | |
The Fund’s effective management fee for the six months ended June 30, 2015 was 0.71% of average annual net assets before any applicable waivers.
Sub-Adviser Fees. The Manager has retained the Sub-Adviser to provide the day-to-day portfolio management of the Fund. Under the Sub-Advisory Agreement, the Manager pays the Sub-Adviser an annual fee in monthly installments, equal to a percentage of the investment management fee collected by the Manager from the Fund, which shall be calculated after any investment management fee waivers. The fee paid to the Sub-Adviser is paid by the Manager, not by the Fund.
Transfer Agent Fees. OFI Global (the “Transfer Agent”) serves as the transfer and shareholder servicing agent for the Fund. The Fund pays the Transfer Agent a fee based on annual net assets. Fees incurred and average net assets for each class with respect to these services are detailed in the Statement of Operations and Financial Highlights, respectively.
Sub-Transfer Agent Fees. The Transfer Agent has retained Shareholder Services, Inc., a wholly-owned subsidiary of OFI (the “Sub-Transfer Agent”), to provide the day-to-day transfer agent and shareholder servicing of the Fund. Under the Sub-Transfer Agency Agreement, the Transfer Agent pays the Sub-Transfer Agent an annual fee in monthly installments, equal to a percentage of the transfer agent fee collected by the Transfer Agent from the Fund, which shall be calculated after any applicable fee waivers. The fee paid to the Sub-Transfer Agent is paid by the Transfer Agent, not by the Fund.
Trustees’ Compensation. The Fund’s Board of Trustees (“Board”) has adopted a compensation deferral plan for Independent Trustees that enables Trustees to elect to defer receipt of all or a portion of the annual compensation they are entitled to receive from the Fund. For purposes of determining the amount owed to the Trustee under the plan, deferred amounts are treated as though equal dollar amounts had been invested in shares of the Fund or in other Oppenheimer funds selected by the Trustee. The Fund purchases shares of the funds selected for deferral by the Trustee in amounts equal to his or her deemed investment, resulting in a Fund asset equal to the deferred compensation liability. Such assets are included as a component of “Other” within the asset section of the Statement of Assets and Liabilities. Deferral of Trustees’ fees under the plan will not affect the net assets of the Fund and will not materially affect the Fund’s assets, liabilities or net investment income per share. Amounts will be deferred until distributed in accordance with the compensation deferral plan.
Distribution and Service Plan for Service Shares. The Fund has adopted a Distribution and Service Plan (the “Plan”) pursuant to Rule 12b-1 under the 1940 Act for Service shares to pay OppenheimerFunds Distributor, Inc. (the “Distributor”), for distribution related services, personal service and account maintenance for the Fund’s Service shares. Under the Plan, payments are made periodically at an annual rate of 0.25% of the daily net assets of Service shares of the Fund. The Distributor currently uses all of those fees to compensate sponsors of the insurance product that offers Fund shares, for providing personal service and maintenance of accounts of their variable contract owners that hold Service shares. These fees are paid out of the Fund’s assets on an on-going basis and increase operating expenses of the Service shares, which results in lower performance compared to the Fund’s shares that are not subject to a service fee. Fees incurred by the Fund under the Plan are detailed in the Statement of Operations.
Waivers and Reimbursements of Expenses. The Manager has contractually agreed to limit the Fund’s expenses after payments, waivers and/or reimbursements and reduction to custodian expenses, excluding expenses incurred directly or indirectly by the Fund as a result of investments in other investment companies, wholly-owned subsidiaries and pooled investment vehicles; so that those expenses, as percentages of daily net assets, will not exceed the annual rate of 0.80% for Non-Service shares and 1.05% for Service shares. During the six months ended June 30, 2015, the Manager waived fees and/or reimbursed the Fund $82,168 and $3,750 for Non-Service and Service shares, respectively.
The Manager will waive fees and/or reimburse Fund expenses in an amount equal to the indirect management fees incurred through the Fund’s investment in IMMF. During the six months ended June 30, 2015, the Manager waived fees and/or reimbursed the Fund $8,384 for IMMF management fees.
Waivers and/or reimbursements may be modified or terminated as set forth according to the terms in the prospectus.
8. Pending Litigation
In 2009, several lawsuits were filed as putative class actions and later consolidated before the U.S. District Court for the District of Colorado in connection with the investment performance of Oppenheimer Rochester California Municipal Fund (the “California Fund Suit”), a fund advised by OppenheimerFunds, Inc. (“OFI”), and distributed by its subsidiary OppenheimerFunds Distributor, Inc. ( “OFDI”). The plaintiffs asserted claims against OFI, OFDI and certain present and former trustees and officers of the Fund under the federal securities laws, alleging, among other things, that the disclosure documents of the Fund contained misrepresentations and omissions and the investment policies of the Fund were not followed. Plaintiffs in the California Fund Suit filed an amended complaint and defendants filed a motion to dismiss. In 2011, the court issued an order which granted in part
17 OPPENHEIMER DISCOVERY MID CAP GROWTH FUND
NOTES TO FINANCIAL STATEMENTS Unaudited / Continued
8. Pending Litigation (Continued)
and denied in part the defendants’ motion to dismiss. In 2012, plaintiffs filed a motion, which defendants opposed, to certify a class and appoint class representatives and class counsel. In March 2015, the court granted plaintiffs’ motion for class certification. In May 2015, the U.S. Court of Appeals for the Tenth Circuit vacated the class certification order and remanded the matter to the district court for further proceedings. In July 2015, the district court held an evidentiary hearing on plaintiffs’ motion for class certification. OFI and OFDI believe the California Fund Suit is without merit; that it is premature to render any opinion as to the likelihood of an outcome unfavorable to them in the California Fund Suit; and that no estimate can yet be made as to the amount or range of any potential loss.
18 OPPENHEIMER DISCOVERY MID CAP GROWTH FUND/VA
PORTFOLIO PROXY VOTING POLICIES AND PROCEDURES; UPDATES TO STATEMENTS OF INVESTMENTS Unaudited
The Fund has adopted Portfolio Proxy Voting Policies and Procedures under which the Fund votes proxies relating to securities (“portfolio proxies”) held by the Fund. A description of the Fund’s Portfolio Proxy Voting Policies and Procedures is available (i) without charge, upon request, by calling the Fund toll-free at 1.800.525.7048, (ii) on the Fund’s website at www.oppenheimerfunds.com, and (iii) on the SEC’s website at www.sec.gov. In addition, the Fund is required to file Form N-PX, with its complete proxy voting record for the 12 months ended June 30th, no later than August 31st of each year. The Fund’s voting record is available (i) without charge, upon request, by calling the Fund toll-free at 1.800.525.7048, and (ii) in the Form N-PX filing on the SEC’s website at www.sec.gov.
The Fund files its complete schedule of portfolio holdings with the SEC for the first quarter and the third quarter of each fiscal year on Form N-Q. The Fund’s Form N-Q filings are available on the SEC’s website at www.sec.gov. Those forms may be reviewed and copied at the SEC’s Public Reference Room in Washington, D.C. Information on the operation of the Public Reference Room may be obtained by calling 1-800-SEC-0330.
19 OPPENHEIMER DISCOVERY MID CAP GROWTH FUND
DISTRIBUTION SOURCES Unaudited
For any distribution that took place over the Fund’s reporting period, the table below details on a per-share basis the percentage of the Fund’s total distribution payment amount that was derived from the following sources: net income, net profit from the sale of securities, and other capital sources. This information is based upon income and capital gains using generally accepted accounting principles as of the date of each distribution. Because the Fund is actively managed, the relative amount of the Fund’s total distributions derived from various sources over the calendar year may change. Please note that this information should not be used for tax reporting purposes as the tax character of distributable income may differ from the amounts used for this notification. You will receive IRS tax forms in the first quarter of each calendar year detailing the actual amount of the taxable and non-taxable portion of distributions paid to you during the tax year.
For the most current information, please go to oppenheimerfunds.com. Select your Fund, then the ‘Detailed’ tab; where ‘Dividends’ are shown, the Fund’s latest pay date will be followed by the sources of any distribution, updated daily.
| | | | | | | | | | | | | | | | |
| Fund Name | | Pay Date | | | Net Income | | | Net Profit
from Sale | | | Other Capital
Sources | | |
| |
Oppenheimer Discovery Mid Cap Growth Fund/VA | | | 6/16/15 | | | | 0.0% | | | | 100.0% | | | 0.0% | |
20 OPPENHEIMER DISCOVERY MID CAP GROWTH FUND/VA
THIS PAGE INTENTIONALLY LEFT BLANK.
21 OPPENHEIMER DISCOVERY MID CAP GROWTH FUND
THIS PAGE INTENTIONALLY LEFT BLANK.
22 OPPENHEIMER DISCOVERY MID CAP GROWTH FUND/VA
THIS PAGE INTENTIONALLY LEFT BLANK.
23 OPPENHEIMER DISCOVERY MID CAP GROWTH FUND
OPPENHEIMER DISCOVERY MID CAP GROWTH FUND/VA
A Series of Oppenheimer Variable Account Funds
| | |
| Trustees and Officers | | Sam Freedman, Chairman of the Board of Trustees and Trustee |
| | Jon S. Fossel, Trustee |
| | Richard F. Grabish, Trustee |
| | Beverly L. Hamilton, Trustee |
| | Victoria J. Herget, Trustee |
| | Robert J. Malone, Trustee |
| | F. William Marshall, Jr., Trustee |
| | Karen L. Stuckey, Trustee |
| | James D. Vaughn, Trustee |
| | Arthur P. Steinmetz, Trustee, President and Principal Executive Officer |
| | Ronald J. Zibelli, Jr., Vice President |
| | Justin Livengood, Vice President |
| | Arthur S. Gabinet, Secretary and Chief Legal Officer |
| | Jennifer Sexton, Vice President and Chief Business Officer |
| | Mary Ann Picciotto, Chief Compliance Officer and Chief Anti-Money Laundering Officer |
| | Brian W. Wixted, Treasurer and Principal Financial & Accounting Officer |
| |
| Manager | | OFI Global Asset Management, Inc. |
| |
| Sub-Adviser | | OppenheimerFunds, Inc. |
| |
| Distributor | | OppenheimerFunds Distributor, Inc. |
| |
Transfer and Shareholder Servicing Agent | | OFI Global Asset Management, Inc. |
| |
| Sub-Transfer Agent | | Shareholder Services, Inc. |
| | DBA OppenheimerFunds Services |
| |
Independent Registered Public Accounting Firm | | KPMG LLP |
| |
| Legal Counsel | | Ropes & Gray LLP |
| |
| | Before investing in any of the Oppenheimer funds, investors should carefully consider a fund’s investment objectives, risks, charges and expenses. Fund prospectuses and summary prospectuses contain this and other information about the funds and may be obtained by asking your financial advisor, visiting oppenheimerfunds.com or calling us at 1.800.988.8287. Read prospectuses and summary prospectuses carefully before investing. |
| |
| | The financial statements included herein have been taken from the records of the Fund without examination of those records by the independent registered public accounting firm. |
| |
| | © 2015 OppenheimerFunds, Inc. All rights reserved. Oppenheimer funds are distributed by OppenheimerFunds Distributor, Inc. |

PORTFOLIO MANAGERS: Krishna Memani and Magnus Krantz
AVERAGE ANNUAL TOTAL RETURNS FOR THE PERIODS ENDED 6/30/015
| | | | | | | | | | | | | | | | | | | | |
| | | Inception
Date | | | 6-Months | | | 1-Year | | | 5-Year | | | 10-Year | |
Non-Service Shares | | | 2/9/87 | | | | 1.32% | | | | 3.94 | % | | | 10.26 | % | | | 2.57 | % |
Service Shares | | | 5/1/02 | | | | 1.13 | | | | 3.63 | | | | 9.99 | | | | 2.32 | |
Russell 3000 Index | | | | | | | 1.94 | | | | 7.29 | | | | 17.54 | | | | 8.15 | |
| Barclays U.S. Aggregate Bond Index | | | | | | | -0.15 | | | | 1.81 | | | | 3.34 | | | | 4.43 | |
Reference Index | | | | | | | 0.68 | | | | 3.91 | | | | 8.47 | | | | 6.32 | |
Performance data quoted represents past performance, which does not guarantee future results. The investment return and principal value of an investment in the Fund will fluctuate so that an investor’s shares, when redeemed, may be worth more or less than their original cost. Current performance may be lower or higher than the performance quoted. For performance data current to the most recent month end, call us at 1.800.988.8287. The Fund’s total returns should not be expected to be the same as the returns of other funds, whether or not both funds have the same portfolio managers and/or similar names. The Fund’s total returns include changes in share price and reinvested distributions but do not include the charges associated with the separate account products that offer this Fund. Such performance would have been lower if such charges were taken into account.
The Fund’s performance is compared to the performance of the Russell 3000 Index, the Barclays U.S. Aggregate Bond Index and the Fund’s Reference Index. The Russell 3000 Index measures the performance of the largest 3,000 U.S. companies, representing approximately 98% of the investable U.S. equity market. The Barclays U.S. Aggregate Bond Index is an index of U.S dollar-denominated, investment-grade U.S. corporate government and mortgage-backed securities. The Fund’s Reference Index is a customized weighted index currently comprised of 65% of the Barclays U.S. Aggregate Bond Index and 35% of the Russell 3000 Index. The Indices are unmanaged and cannot be purchased directly by investors. Index performance is shown for illustrative purposes only and does not predict or depict the performance of the Fund. While index comparisons may be useful to provide a benchmark for the Fund’s performance, it must be noted that the Fund’s investments are not limited to the investments comprising the indices. Index performance includes reinvestment of income, but does not reflect transaction costs, fees, expenses or taxes. Index performance is shown for illustrative purposes only as a benchmark for the Fund’s performance, and does not predict or depict performance of the Fund. The Fund’s performance reflects the effects of the Fund’s business and operating expenses.
TOP HOLDINGS AND ALLOCATIONS
| | |
TOP TEN COMMON STOCK HOLDINGS | | |
Apple, Inc. | | 1.7% |
Allergan plc | | 1.3 |
Citigroup, Inc. | | 1.0 |
Mondelez International, Inc., Cl. A | | 0.8 |
Comcast Corp., Cl. A | | 0.8 |
PG&E Corp. | | 0.7 |
United Technologies Corp. | | 0.7 |
Philip Morris International, Inc. | | 0.6 |
Simon Property Group, Inc. | | 0.6 |
Chevron Corp. | | 0.6 |
Portfolio holdings and allocations are subject to change. Percentages are as of June 30, 2015, and are based on net assets. For more current Fund holdings, please visit oppenheimerfunds.com.
PORTFOLIO ALLOCATION
| | |
Non-Convertible Corporate Bonds and Notes | | 32.1% |
Common Stocks | | 29.9 |
Mortgage-Backed Obligations | | |
Government Agency | | 18.9 |
Non-Agency | | 7.3 |
Asset-Backed Securities | | 9.6 |
Investment Company | | |
Oppenheimer Institutional Money Market Fund | | 1.9 |
U.S. Government Obligations | | 0.3 |
Portfolio holdings and allocations are subject to change. Percentages are as of June 30, 2015, and are based on the total market value of investments.
2 OPPENHEIMER CONSERVATIVE BALANCED FUND/VA
Fund Performance Discussion
The Fund’s Non-Service shares produced a return of 1.32% during the reporting period. On a relative basis, the Fund outperformed its Reference Index, which returned 0.68%. The Fund’s Reference Index is a customized weighted index currently comprised of the following underlying broad-based security indices: 65% of the Barclays U.S. Aggregate Bond Index and 35% of the Russell 3000 Index. Measured separately, the Barclays U.S. Aggregate Bond Index returned - 0.15% and the Russell 3000 Index returned 1.94%.
MARKET OVERVIEW
The opening months of 2015 were marked by cooling U.S. growth after the strong fourth quarter of 2014. The dollar continued to strengthen significantly during this time against most of the U.S.’s major trading partners, which acted as a drag on growth. Businesses, especially U.S. firms with revenues dependent on exporting goods and services, cited this as a headwind. European Central Bank (“ECB”) President Mario Draghi announced the purchase of €60 billion a month in sovereign bonds from Eurozone countries for at least 19 months, a form of quantitative easing (“QE”) that is projected to increase the ECB’s balance sheet by over €1 trillion. The announcement and implementation of these extraordinary monetary policies had a significant impact on financial markets, with European markets rallying and the euro falling against most major trading partners.
Over the second half of the reporting period, market volatility returned despite a continuation of slow and stable growth in the U.S. Deflationary pressures also appeared to have subsided during the period. Oil prices rebounded from around $48 dollars per barrel to nearly $60 dollars per barrel. It is important to note that while these levels still represent a significant discount to previous years, we believe the lower prices should continue to have a stimulative effect on developed and emerging world oil importers. Meanwhile, emerging issues in Greece highlighted downside risks to the global economy and capital markets. Greece’s ongoing negotiations with creditors and ultimate default on a $1.7 billion International Monetary Fund (“IMF”) payment on June 30, 2015, led to a more challenging environment for the Eurozone. Shortly after the period ended, Eurozone leaders agreed to offer Greece a third bailout, averting a Greek exit.
Longer-term U.S. Treasury rates continued to swing fairly wildly during the reporting period. Over the first half of the reporting period, the 10-year treasury rate fell, starting the reporting period at 2.17% and declining to 1.92% at the end of March. However, over the second half of the reporting period, longer-term U.S. Treasury rates marched higher as the 10-year treasury rate increased to 2.49% before ending the period at 2.35% due to the uncertainty around Greece. This net upward movement in rates ultimately contributed to U.S. Treasuries generating negative total returns during this time and for the overall reporting period.
EQUITY STRATEGY REVIEW
The equity strategy produced positive absolute performance during the reporting period, and outperformed the Russell 3000 Index. The equity strategy’s outperformance stemmed largely from stronger relative stock selection in the health care, information technology, financials and consumer staples sectors. The equity strategy underperformed the Russell 3000 Index in the consumer discretionary, industrials and materials sectors.
The equity strategy’s top contributors to performance included Mondelez International, Inc., JPMorgan Chase & Co. and Imperva, Inc. Mondelez manufactures and sells consumer products, primarily in the snack food and confection categories. Management reported significant margin expansion during the first quarter, surprising investors and leading to the stock’s strong performance. JPMorgan Chase performed well during the reporting period due primarily to rising interest rates. Higher rates should lead to expanding net interest margins for the company. Additionally, the Federal Reserve Board’s Comprehensive Capital Analysis and Review (CCAR) results were released late in the first quarter, which allowed the company to increase its dividends and continue to buy back stock. Imperva develops protection software and services for databases and business applications. The company reported strong results, demonstrating that the new management team’s sales and marketing overhaul is bearing fruit.
Detractors from performance included Xerox Corp., Applied Materials, Inc. and Simon Property Group, Inc. Xerox provides business process and information technology outsourcing, and document management services. Weak quarterly guidance triggered a major selloff in the stock as poor execution led to further downward revisions of earnings estimates. Applied Materials provides equipment used in the manufacture of LCD displays and solar panels, and the processing of silicon wafers to make computer chips. The company dropped its merger with Tokyo Electron as the U.S. Department of Justice would not allow the transaction to proceed on acceptable terms. The market reacted negatively. Simon Property is a real estate investment trust (REIT) that owns, develops, and manages retail real estate — primarily malls and outlets — mostly within the U.S. and Puerto Rico. Simon properties sold off along with the general REIT universe during the second quarter, driven primarily by rising long term interest rates.
3 OPPENHEIMER CONSERVATIVE BALANCED FUND/VA
FIXED-INCOME STRATEGY REVIEW
During the reporting period, the fixed-income strategy produced a modest return and outperformed the Barclays U.S. Aggregate Bond Index. The fixed-income strategy received its strongest results from its investments in mortgage-backed securities (“MBS”) and asset-backed securities (“ABS”). Among MBS, the strategy had its largest exposure to government agency MBS, with a smaller allocation to non-agency MBS. Security selection within the agency MBS sector and an allocation to non-agency MBS served the strategy well during this reporting period as agency inverse interest-only security prices were supported by a more dovish Federal Reserve (“Fed”) outlook while non-agency MBS prices benefited from solid fundamentals and a lack of supply. The strategy’s exposure to ABS is primarily concentrated in securities backed by auto loans. These investments performed well for the fixed-income strategy this reporting period.
In addition to these investments, the fixed-income strategy had its largest exposure to corporate bonds at period end. The strategy had its largest weighting in investment grade corporate bonds, which we believe still offer solid value, and also maintained an allocation to non-investment grade (BB-rated and below) corporate bonds, which have historically offered attractive yields for only incremental credit risk relative to their investment grade (BBB-rated and above) counterparts. Both investment grade and non-investment grade corporate bonds benefited the fixed-income strategy’s performance versus the Barclays U.S. Aggregate Bond Index this reporting period, although investment grade corporates produced a slight negative return.
The primary detractor from the fixed-income strategy’s performance was its minimal exposure to U.S. Treasuries. As mentioned earlier, U.S. Treasury rates rose for the overall six-month reporting period, which impacted the total returns of these securities.
The Fund’s investment strategy and focus can change over time. The mention of specific fund holdings does not constitute a recommendation by OppenheimerFunds, Inc. or its affiliates.
Shares of Oppenheimer funds are not deposits or obligations of any bank, are not guaranteed by any bank, are not insured by the FDIC or any other agency, and involve investment risks, including the possible loss of the principal amount invested.
4 OPPENHEIMER CONSERVATIVE BALANCED FUND/VA
Fund Expenses
Fund Expenses. As a shareholder of the Fund, you incur two types of costs: (1) transaction costs and (2) ongoing costs, including management fees; distribution and service fees; and other Fund expenses. These examples are intended to help you understand your ongoing costs (in dollars) of investing in the Fund and to compare these costs with the ongoing costs of investing in other mutual funds.
The examples are based on an investment of $1,000.00 invested at the beginning of the period and held for the entire 6-month period ended June 30, 2015.
Actual Expenses. The first section of the table provides information about actual account values and actual expenses. You may use the information in this section for the class of shares you hold, together with the amount you invested, to estimate the expense that you paid over the period. Simply divide your account value by $1,000.00 (for example, an $8,600.00 account value divided by $1,000.00 = 8.60), then multiply the result by the number in the first section under the heading entitled “Expenses Paid During the 6 Months Ended June 30, 2015” to estimate the expenses you paid on your account during this period.
Hypothetical Example for Comparison Purposes. The second section of the table provides information about hypothetical account values and hypothetical expenses based on the Fund’s actual expense ratio for each class of shares, and an assumed rate of return of 5% per year for each class before expenses, which is not the actual return. The hypothetical account values and expenses may not be used to estimate the actual ending account balance or expenses you paid for the period. You may use this information to compare the ongoing costs of investing in the Fund and other funds. To do so, compare this 5% hypothetical example for the class of shares you hold with the 5% hypothetical examples that appear in the shareholder reports of the other funds.
Please note that the expenses shown in the table are meant to highlight your ongoing costs only and do not reflect any charges associated with the separate accounts that offer this Fund. Therefore, the “hypothetical” lines of the table are useful in comparing ongoing costs only, and will not help you determine the relative total costs of owning different funds. In addition, if these separate account charges were included your costs would have been higher.
| | | | | | | | | | | | | | |
| Actual | | Beginning
Account Value
January 1, 2015 | | | Ending
Account Value
June 30, 2015 | | | Expenses
Paid During
6 Months Ended
June 30, 2015 | | | |
Non-Service shares | | $ | 1,000.00 | | | $ | 1,013.20 | | | $ | 3.35 | | | |
Service shares | | | 1,000.00 | | | | 1,011.30 | | | | 4.60 | | | |
| | | | |
Hypothetical (5% return before expenses) | | | | | | | | | | | |
Non-Service shares | | | 1,000.00 | | | | 1,021.47 | | | | 3.36 | | | |
Service shares | | | 1,000.00 | | | | 1,020.23 | | | | 4.62 | | | |
Expenses are equal to the Fund’s annualized expense ratio for that class, multiplied by the average account value over the period, multiplied by 181/365 (to reflect the one-half year period). Those annualized expense ratios, excluding indirect expenses from affiliated funds, based on the 6-month period ended June 30, 2015 are as follows:
| | | | | | | | |
| Class | | Expense Ratios | | | | | |
Non-Service shares | | | 0.67% | | | | | |
Service shares | | | 0.92 | | | | | |
The expense ratios reflect voluntary and/or contractual waivers and/or reimbursements of expenses by the Fund’s Manager. Some of these undertakings may be modified or terminated at any time, as indicated in the Fund’s prospectus. The “Financial Highlights” tables in the Fund’s financial statements, included in this report, also show the gross expense ratios, without such waivers or reimbursements and reduction to custodian expenses, if applicable.
5 OPPENHEIMER CONSERVATIVE BALANCED FUND/VA
STATEMENT OF INVESTMENTS June 30, 2015 Unaudited
| | | | | | | | | | |
| | | Shares | | | Value | | | |
| | | |
Common Stocks—33.6% | | | |
| | | |
Consumer Discretionary—4.4% | | | | | | | | | | |
| | | |
Auto Components—0.4% | | | | | | | | | | |
| | | |
Delphi Automotive plc | | | 10,730 | | | $ | 913,016 | | | |
| |
| | | |
Automobiles—0.4% | | | | | | | | | | |
| | | |
General Motors Co. | | | 27,900 | | | | 929,907 | | | |
| |
| | | |
Diversified Consumer Services—0.2% | | | | | | | |
| | | |
LifeLock, Inc.1 | | | 37,340 | | | | 612,376 | | | |
| |
| | | |
Hotels, Restaurants & Leisure—0.4% | | | | | | | |
| | | |
Brinker International, Inc. | | | 12,230 | | | | 705,060 | | | |
| | | |
International Speedway Corp., Cl. A | | | 7,500 | | | | 275,025 | | | |
| | | | | | | | | | |
| | | | | | | 980,085 | | | |
| | | |
Household Durables—0.3% | | | | | | | | | | |
| | | |
Toll Brothers, Inc.1 | | | 18,160 | | | | 693,530 | | | |
| |
| | | |
Media—1.1% | | | | | | | | | | |
| | | |
Comcast Corp., Cl. A | | | 31,470 | | | | 1,892,606 | | | |
| | | |
Twenty-First Century Fox, Inc., Cl. A | | | 30,380 | | | | 988,717 | | | |
| | | | | | | | | | |
| | | | | | | 2,881,323 | | | |
| | | |
Specialty Retail—1.3% | | | | | | | | | | |
| | | |
AutoZone, Inc.1 | | | 2,400 | | | | 1,600,560 | | | |
| | | |
Ross Stores, Inc. | | | 23,490 | | | | 1,141,849 | | | |
| | | |
Sally Beauty Holdings, Inc.1 | | | 17,920 | | | | 565,913 | | | |
| | | | | | | | | | |
| | | | | | | 3,308,322 | | | |
| | | |
Textiles, Apparel & Luxury Goods—0.3% | | | | | | | |
| | | |
PVH Corp. | | | 5,620 | | | | 647,424 | | | |
| |
| | | |
Consumer Staples—2.8% | | | | | | | | | | |
| | | |
Beverages—0.3% | | | | | | | | | | |
| | | |
Diageo plc | | | 26,530 | | | | 769,009 | | | |
| |
| | | |
Food Products—1.2% | | | | | | | | | | |
| | | |
Flowers Foods, Inc. | | | 46,655 | | | | 986,753 | | | |
| | | |
Mondelez International, Inc., Cl. A | | | 48,050 | | | | 1,976,777 | | | |
| | | | | | | | | | |
| | | | | | | 2,963,530 | | | |
| | | |
Household Products—0.6% | | | | | | | | | | |
| | | |
Henkel AG & Co. KGaA | | | 16,738 | | | | 1,599,641 | | | |
| |
| | | |
Tobacco—0.7% | | | | | | | | | | |
| | | |
Philip Morris International, Inc. | | | 20,260 | | | | 1,624,244 | | | |
| |
| | | |
Energy—2.3% | | | | | | | | | | |
| | | |
Oil, Gas & Consumable Fuels—2.3% | | | | | | | |
| | | |
Antero Midstream Partners LP2 | | | 24,480 | | | | 701,107 | | | |
| | | |
Chevron Corp. | | | 16,840 | | | | 1,624,555 | | | |
| | | |
HollyFrontier Corp. | | | 10,750 | | | | 458,917 | | | |
| | | |
Noble Energy, Inc. | | | 22,760 | | | | 971,397 | | | |
| | | |
Suncor Energy, Inc. | | | 46,330 | | | | 1,275,002 | | | |
| | | |
Western Refining, Inc. | | | 19,820 | | | | 864,548 | | | |
| | | | | | | | | | |
| | | | | | | 5,895,526 | | | |
| | | |
Financials—6.1% | | | | | | | | | | |
| | | |
Commercial Banks—2.9% | | | | | | | | | | |
| | | |
BancorpSouth, Inc. | | | 33,520 | | | | 863,475 | | | |
| | | |
Citigroup, Inc. | | | 44,040 | | | | 2,432,770 | | | |
| | | |
FirstMerit Corp. | | | 39,200 | | | | 816,536 | | | |
| | | |
Huntington Bancshares, Inc. | | | 92,120 | | | | 1,041,877 | | | |
| | | |
JPMorgan Chase & Co. | | | 20,230 | | | | 1,370,785 | | | |
| | | |
Webster Financial Corp. | | | 18,620 | | | | 736,421 | | | |
| | | | | | | | | | |
| | | | | | | 7,261,864 | | | |
| | | |
Consumer Finance—0.5% | | | | | | | | | | |
| | | |
Discover Financial Services | | | 21,221 | | | | 1,222,754 | | | |
| |
| | | |
Insurance—1.2% | | | | | | | | | | |
| | | |
American International Group, Inc. | | | 24,960 | | | | 1,543,027 | | | |
| | | | | | | | |
| | | Shares | | | Value | |
| |
Insurance (Continued) | | | | | | | | |
| |
FNF Group | | | 38,610 | | | $ | 1,428,184 | |
| | | | | | | | |
| | | | | | | 2,971,211 | |
| |
Real Estate Investment Trusts (REITs)—1.5% | |
| |
| Apollo Commercial Real Estate Finance, Inc. | | | 44,110 | | | | 724,727 | |
| |
Digital Realty Trust, Inc. | | | 17,060 | | | | 1,137,561 | |
| |
Simon Property Group, Inc. | | | 9,400 | | | | 1,626,388 | |
| |
STAG Industrial, Inc. | | | 19,950 | | | | 399,000 | |
| | | | | | | | |
| | | | | | | 3,887,676 | |
| |
Health Care—5.3% | | | | | | | | |
| |
Biotechnology—0.4% | | | | | | | | |
| |
BioMarin Pharmaceutical, Inc.1 | | | 6,690 | | | | 915,058 | |
| |
Celldex Therapeutics, Inc.1 | | | 9,230 | | | | 232,781 | |
| | | | | | | | |
| | | | | | | 1,147,839 | |
| |
Health Care Equipment & Supplies—0.6% | | | | | |
| |
DexCom, Inc.1 | | | 6,980 | | | | 558,260 | |
| |
Medtronic plc | | | 13,039 | | | | 966,190 | |
| | | | | | | | |
| | | | | | | 1,524,450 | |
| |
Health Care Providers & Services—1.7% | | | | | |
| |
Centene Corp.1 | | | 12,120 | | | | 974,448 | |
| |
Express Scripts Holding Co.1 | | | 10,830 | | | | 963,220 | |
| |
Team Health Holdings, Inc.1 | | | 8,420 | | | | 550,079 | |
| |
Universal Health Services, Inc., Cl. B | | | 8,870 | | | | 1,260,427 | |
| |
WellCare Health Plans, Inc.1 | | | 6,230 | | | | 528,491 | |
| | | | | | | | |
| | | | | | | 4,276,665 | |
| |
Pharmaceuticals—2.6% | | | | | | | | |
| |
Allergan plc1 | | | 10,630 | | | | 3,225,780 | |
| |
Merck & Co., Inc. | | | 25,160 | | | | 1,432,359 | |
| |
Pfizer, Inc. | | | 27,405 | | | | 918,889 | |
| |
Prestige Brands Holdings, Inc.1 | | | 19,930 | | | | 921,563 | |
| | | | | | | | |
| | | | | | | 6,498,591 | |
| |
Industrials—3.4% | | | | | | | | |
| |
Aerospace & Defense—1.1% | | | | | | | | |
| |
L-3 Communications Holdings, Inc. | | | 9,930 | | | | 1,125,863 | |
| |
United Technologies Corp. | | | 14,990 | | | | 1,662,841 | |
| | | | | | | | |
| | | | | | | 2,788,704 | |
| |
Airlines—0.3% | | | | | | | | |
| |
Spirit Airlines, Inc.1 | | | 10,390 | | | | 645,219 | |
|
| |
Commercial Services & Supplies—1.0% | | | | | |
| |
KAR Auction Services, Inc. | | | 16,260 | | | | 608,124 | |
| |
Republic Services, Inc., Cl. A | | | 19,700 | | | | 771,649 | |
| |
Tyco International plc | | | 31,220 | | | | 1,201,346 | |
| | | | | | | | |
| | | | | | | 2,581,119 | |
| |
Construction & Engineering—0.2% | | | | | |
| |
AECOM1 | | | 15,730 | | | | 520,348 | |
|
| |
Machinery—0.5% | | | | | | | | |
| |
Deere & Co. | | | 8,870 | | | | 860,834 | |
| |
Joy Global, Inc. | | | 11,550 | | | | 418,110 | |
| | | | | | | | |
| | | | | | | 1,278,944 | |
| |
Professional Services—0.3% | | | | | | | | |
| |
Robert Half International, Inc. | | | 15,450 | | | | 857,475 | |
|
| |
Information Technology—6.4% | | | | | | | | |
| |
Internet Software & Services—1.0% | | | | | |
| |
eBay, Inc.1 | | | 19,740 | | | | 1,189,138 | |
| |
Facebook, Inc., Cl. A1 | | | 15,050 | | | | 1,290,763 | |
| | | | | | | | |
| | | | | | | 2,479,901 | |
| |
IT Services—1.4% | | | | | | | | |
| |
Amdocs Ltd. | | | 22,910 | | | | 1,250,657 | |
| |
MasterCard, Inc., Cl. A | | | 12,130 | | | | 1,133,912 | |
6 OPPENHEIMER CONSERVATIVE BALANCED FUND/VA
| | | | | | | | | | |
| | | Shares | | | Value | | | |
| | | |
IT Services (Continued) | | | | | | | | | | |
| | | |
Xerox Corp. | | | 105,510 | | | $ | 1,122,626 | | | |
| | | | | | | | | | |
| | | | | | | 3,507,195 | | | |
| | | |
Semiconductors & Semiconductor Equipment—1.0% | | | |
| | | |
Applied Materials, Inc. | | | 62,160 | | | | 1,194,715 | | | |
| | | |
Cavium, Inc.1 | | | 7,390 | | | | 508,507 | | | |
| | | |
Skyworks Solutions, Inc. | | | 8,640 | | | | 899,424 | | | |
| | | | | | | | | | |
| | | | | | | 2,602,646 | | | |
| | | |
Software—1.0% | | | | | | | | | | |
| | | |
Fortinet, Inc.1 | | | 13,290 | | | | 549,276 | | | |
| | | |
Guidewire Software, Inc.1 | | | 8,570 | | | | 453,610 | | | |
| | | |
Imperva, Inc.1 | | | 7,190 | | | | 486,763 | | | |
| | | |
ServiceNow, Inc.1 | | | 7,310 | | | | 543,206 | | | |
| | | |
Splunk, Inc.1 | | | 7,950 | | | | 553,479 | | | |
| | | | | | | | | | |
| | | | | | | 2,586,334 | | | |
| | | |
Technology Hardware, Storage & Peripherals—2.0% | | | |
| | | |
Apple, Inc. | | | 34,150 | | | | 4,283,264 | | | |
| | | |
Western Digital Corp. | | | 9,050 | | | | 709,701 | | | |
| | | | | | | | | | |
| | | | | | | 4,992,965 | | | |
| | | |
Materials—1.2% | | | | | | | | | | |
| | | |
Construction Materials—0.3% | | | | | | | | | | |
| | | |
Vulcan Materials Co. | | | 10,250 | | | | 860,283 | | | |
| |
| | | |
Containers & Packaging—0.2% | | | | | | | | | | |
| | | |
Packaging Corp. of America | | | 9,650 | | | | 603,028 | | | |
| |
| | | |
Metals & Mining—0.4% | | | | | | | | | | |
| | | |
Alcoa, Inc. | | | 77,220 | | | | 861,003 | | | |
| |
| | | |
Paper & Forest Products—0.3% | | | | | | | | | | |
| | | |
PH Glatfelter Co. | | | 27,990 | | | | 615,500 | | | |
| |
| | | |
Telecommunication Services—0.6% | | | | | | | |
| | | |
Diversified Telecommunication Services—0.6% | | | |
| | | |
ORBCOMM, Inc.1 | | | 375 | | | | 2,531 | | | |
| | | |
Verizon Communications, Inc. | | | 31,450 | | | | 1,465,885 | | | |
| | | | | | | | | | |
| | | | | | | 1,468,416 | | | |
| | | |
Utilities—1.1% | | | | | | | | | | |
| | | |
Multi-Utilities—1.1% | | | | | | | | | | |
| | | |
Consolidated Edison, Inc. | | | 15,400 | | | | 891,352 | | | |
| | | |
PG&E Corp. | | | 35,360 | | | | 1,736,176 | | | |
| | | | | | | | | | |
| | | | | | | 2,627,528 | | | |
| | | | | | | | | | |
Total Common Stocks (Cost $69,680,253) | | | | 84,485,591 | | | |
| | | |
| | | Principal
Amount | | | | | | |
| | | |
Asset-Backed Securities—10.7% | | | |
| | | |
Auto Loan—9.5% | | | | | | | | | | |
| | | |
| American Credit Acceptance Receivables Trust: | | | | | | | | | | |
| Series 2013-2,Cl. B, 2.84%, 5/15/193 | | $ | 435,026 | | | | 436,851 | | | |
| Series 2014-1,Cl. B, 2.39%, 11/12/193 | | | 625,000 | | | | 626,631 | | | |
| Series 2014-2,Cl. B, 2.26%, 3/10/203 | | | 160,000 | | | | 160,129 | | | |
| Series 2014-3,Cl. B, 2.43%, 6/10/203 | | | 595,000 | | | | 595,754 | | | |
| Series 2014-4,Cl. B, 2.60%, 10/12/203 | | | 175,000 | | | | 175,081 | | | |
| Series 2015-1,Cl. B, 2.85%, 2/12/213 | | | 445,000 | | | | 445,375 | | | |
| | | |
| AmeriCredit Automobile Receivables Trust: | | | | | | | | | | |
| Series 2012-2,Cl. E, 4.85%, 8/8/193 | | | 380,000 | | | | 392,211 | | | |
| Series 2012-4,Cl. D, 2.68%, 10/9/18 | | | 115,000 | | | | 117,168 | | | |
| Series 2012-5,Cl. D, 2.35%, 12/10/18 | | | 965,000 | | | | 979,137 | | | |
| Series 2013-2,Cl. E, 3.41%, 10/8/203 | | | 415,000 | | | | 421,430 | | | |
| Series 2013-3,Cl. E, 3.74%, 12/8/203 | | | 165,000 | | | | 168,734 | | | |
Series 2013-4,Cl. D, 3.31%, 10/8/19 | | | 677,000 | | | | 694,980 | | | |
Series 2014-1,Cl. E, 3.58%, 8/9/21 | | | 110,000 | | | | 110,708 | | | |
Series 2014-2,Cl. D, 2.57%, 7/8/20 | | | 280,000 | | | | 280,394 | | | |
Series 2014-2,Cl. E, 3.37%, 11/8/21 | | | 330,000 | | | | 329,030 | | | |
Series 2014-4,Cl. D, 3.07%, 11/9/20 | | | 275,000 | | | | 276,990 | | | |
Series 2015-2,Cl. D, 3.00%, 6/8/21 | | | 80,000 | | | | 80,159 | | | |
| | | | | | | | |
| | | Principal
Amount | | | Value | |
| |
Auto Loan (Continued) | | | | | | | | |
| |
| California Republic Auto Receivables Trust: | | | | | |
| Series 2014-2,Cl. C, 3.29%, 3/15/21 | | $ | 95,000 | | | $ | 94,839 | |
| Series 2014-4,Cl. C, 3.56%, 9/15/21 | | | 125,000 | | | | 125,112 | |
| |
| Capital Auto Receivables Asset Trust: | |
| Series 2013-1,Cl. D, 2.19%, 9/20/21 | | | 125,000 | | | | 125,927 | |
| Series 2014-1,Cl. D, 3.39%, 7/22/19 | | | 140,000 | | | | 143,164 | |
| Series 2014-3,Cl. D, 3.14%, 2/20/20 | | | 195,000 | | | | 196,913 | |
| Series 2015-1,Cl. D, 3.16%, 8/20/20 | | | 195,000 | | | | 195,799 | |
| Series 2015-2,Cl. C, 2.67%, 8/20/20 | | | 180,000 | | | | 179,964 | |
| |
| CarFinance Capital Auto Trust: | | | | | | | | |
| Series 2013-1A,Cl. A, 1.65%, 7/17/173 | | | 1,934 | | | | 1,935 | |
| Series 2013-2A,Cl. B, 3.15%, 8/15/193 | | | 635,000 | | | | 645,322 | |
| Series 2014-1A,Cl. A, 1.46%, 12/17/183 | | | 81,445 | | | | 81,353 | |
| Series 2015-1A,Cl. A, 1.75%, 6/15/213 | | | 246,695 | | | | 246,991 | |
| |
| CarMax Auto Owner Trust, Series 2015-2, Cl. D, | |
| 3.04%, 11/15/21 | | | 115,000 | | | | 114,966 | |
| |
| Centre Point Funding LLC, Series 2010-1A, Cl. 1, | | | | | | | | |
| 5.43%, 7/20/163 | | | 13,336 | | | | 13,354 | |
| |
| CPS Auto Receivables Trust: | | | | | | | | |
| Series 2012-B,Cl. A, 2.52%, 9/16/193 | | | 93,916 | | | | 94,532 | |
| Series 2014-A,Cl. A, 1.21%, 8/15/183 | | | 307,562 | | | | 307,295 | |
| Series 2014-B,Cl. A, 1.11%, 11/15/183 | | | 250,677 | | | | 250,077 | |
| Series 2014-C,Cl. A, 1.31%, 2/15/193 | | | 269,326 | | | | 269,342 | |
| |
| CPS Auto Trust, Series 2012-C, Cl. A, 1.82%, | | | | | |
| 12/16/193 | | | 34,424 | | | | 34,606 | |
| |
| Credit Acceptance Auto Loan Trust: | | | | | | | | |
| Series 2013-1A,Cl. B, 1.83%, 4/15/213 | | | 165,000 | | | | 164,815 | |
| Series 2013-2A,Cl. B, 2.26%, 10/15/213 | | | 310,000 | | | | 312,288 | |
| Series 2014-1A,Cl. B, 2.29%, 4/15/223 | | | 270,000 | | | | 271,380 | |
| Series 2014-2A,Cl. B, 2.67%, 9/15/223 | | | 195,000 | | | | 195,725 | |
| Series 2015-1A,Cl. C, 3.30%, 7/17/233 | | | 265,000 | | | | 266,428 | |
| |
| Drive Auto Receivables Trust: | | | | | | | | |
| Series 2015-AA,Cl. C, 3.06%, 5/17/214 | | | 285,000 | | | | 286,876 | |
| Series 2015-BA,Cl. C, 2.76%, 7/15/213 | | | 345,000 | | | | 345,191 | |
| |
| DT Auto Owner Trust: | | | | | | | | |
| Series 2012-1A,Cl. D, 4.94%, 7/16/183 | | | 260,336 | | | | 261,395 | |
| Series 2013-1A,Cl. D, 3.74%, 5/15/203 | | | 200,000 | | | | 201,492 | |
| Series 2013-2A,Cl. D, 4.18%, 6/15/203 | | | 545,000 | | | | 552,423 | |
| Series 2014-1A,Cl. D, 3.98%, 1/15/213 | | | 435,000 | | | | 440,078 | |
| Series 2014-2A,Cl. D, 3.68%, 4/15/213 | | | 615,000 | | | | 618,490 | |
| Series 2014-3A,Cl. D, 4.47%, 11/15/213 | | | 245,000 | | | | 248,187 | |
| Series 2015-1A,Cl. C, 2.87%, 11/16/203 | | | 205,000 | | | | 205,944 | |
| |
| Exeter Automobile Receivables Trust: | | | | | | | | |
| Series 2012-2A,Cl. C, 3.06%, 7/16/183 | | | 516,000 | | | | 517,816 | |
| Series 2014-1A,Cl. B, 2.42%, 1/15/193 | | | 280,000 | | | | 281,678 | |
| Series 2014-1A,Cl. C, 3.57%, 7/15/193 | | | 280,000 | | | | 283,096 | |
| Series 2014-2A,Cl. A, 1.06%, 8/15/183 | | | 59,552 | | | | 59,472 | |
| Series 2014-2A,Cl. C, 3.26%, 12/16/193 | | | 135,000 | | | | 134,413 | |
| |
| First Investors Auto Owner Trust: | | | | | | | | |
| Series 2012-1A,Cl. D, 5.65%, 4/15/183 | | | 140,000 | | | | 142,591 | |
| Series 2013-3A,Cl. B, 2.32%, 10/15/193 | | | 465,000 | | | | 469,249 | |
| Series 2013-3A,Cl. C, 2.91%, 1/15/203 | | | 200,000 | | | | 202,306 | |
| Series 2013-3A,Cl. D, 3.67%, 5/15/203 | | | 165,000 | | | | 166,699 | |
| Series 2014-1A,Cl. D, 3.28%, 4/15/213 | | | 270,000 | | | | 269,013 | |
| Series 2014-3A,Cl. D, 3.85%, 2/15/223 | | | 175,000 | | | | 176,197 | |
| |
| Flagship Credit Auto Trust: | | | | | | | | |
| Series 2014-1,Cl. A, 1.21%, 4/15/193 | | | 140,194 | | | | 140,042 | |
| Series 2014-2,Cl. A, 1.43%, 12/16/193 | | | 277,797 | | | | 277,617 | |
| |
| GM Financial Automobile Leasing Trust: | | | | | | | | |
| Series 2014-1A,Cl. D, 2.51%, 3/20/193 | | | 470,000 | | | | 469,835 | |
| Series 2015-1,Cl. D, 3.01%, 3/20/20 | | | 280,000 | | | | 279,268 | |
| |
| GO Financial Auto Securitization Trust, Series | | | | | |
| 2015-1, Cl. A, 1.81%, 3/15/183 | | | 213,592 | | | | 213,468 | |
| |
| Navistar Financial Dealer Note Master Owner Trust | |
| II, Series 2014-1, Cl. D, 2.487%, 10/25/193,5 | | | 145,000 | | | | 145,056 | |
| |
| Santander Drive Auto Receivables Trust: | | | | | | | | |
| Series 2012-6,Cl. D, 2.52%, 9/17/18 | | | 235,000 | | | | 236,266 | |
Series 2012-AA,Cl. D, 2.46%, 12/17/183 | | | 945,000 | | | | 958,251 | |
Series 2013-1,Cl. C, 1.76%, 1/15/19 | | | 365,000 | | | | 366,133 | |
7 OPPENHEIMER CONSERVATIVE BALANCED FUND/VA
STATEMENT OF INVESTMENTS Unaudited / Continued
| | | | | | | | | | |
| | | Principal Amount | | | Value | | | |
| | | |
Auto Loan (Continued) | | | | | | | | | | |
| | | |
| Santander Drive Auto Receivables Trust: (Continued) | | | |
| Series 2013-2,Cl. D, 2.57%, 3/15/19 | | $ | 715,000 | | | $ | 725,256 | | | |
| Series 2013-3,Cl. D, 2.42%, 4/15/19 | | | 105,000 | | | | 106,212 | | | |
| Series 2013-4,Cl. D, 3.92%, 1/15/20 | | | 385,000 | | | | 398,949 | | | |
| Series 2013-A,Cl. E, 4.71%, 1/15/213 | | | 325,000 | | | | 344,240 | | | |
| Series 2014-1,Cl. D, 2.91%, 4/15/20 | | | 265,000 | | | | 268,175 | | | |
| Series 2014-4,Cl. D, 3.10%, 11/16/20 | | | 225,000 | | | | 226,726 | | | |
| Series 2015-1,Cl. D, 3.24%, 4/15/21 | | | 300,000 | | | | 301,782 | | | |
| Series 2015-2,Cl. D, 3.02%, 4/15/21 | | | 320,000 | | | | 318,573 | | | |
| | | |
| SNAAC Auto Receivables Trust: | | | | | | | | | | |
| Series 2012-1A,Cl. C, 4.38%, 6/15/173 | | | 48,668 | | | | 48,740 | | | |
| Series 2013-1A,Cl. C, 3.07%, 8/15/183 | | | 100,000 | | | | 101,161 | | | |
| Series 2014-1A,Cl. A, 1.03%, 9/17/183 | | | 77,953 | | | | 77,989 | | | |
| Series 2014-1A,Cl. D, 2.88%, 1/15/203 | | | 165,000 | | | | 165,890 | | | |
| | | |
| TCF Auto Receivables Owner Trust: | | | | | | | | | | |
| Series 2014-1A,Cl. C, 3.12%, 4/15/213 | | | 115,000 | | | | 115,129 | | | |
| Series 2015-1A,Cl. D, 3.53%, 3/15/223 | | | 190,000 | | | | 190,464 | | | |
| | | |
| United Auto Credit Securitization Trust: | | | | | | | | | | |
| Series 2013-1,Cl. C, 2.22%, 12/15/173 | | | 8,320 | | | | 8,326 | | | |
| Series 2014-1,Cl. D, 2.38%, 10/15/183 | | | 190,000 | | | | 188,864 | | | |
| Series 2015-1,Cl. D, 2.92%, 6/17/193 | | | 260,000 | | | | 260,666 | | | |
| | | |
| Westlake Automobile Receivables Trust: | | | | | | | | | | |
| Series 2014-1A,Cl. D, 2.20%, 2/15/213 | | | 180,000 | | | | 178,697 | | | |
| Series 2014-2A,Cl. D, 2.86%, 7/15/213 | | | 195,000 | | | | 194,532 | | | |
| Series 2015-2A,Cl. C, 2.45%, 1/15/213 | | | 250,000 | | | | 249,975 | | | |
| | | | | | | | | | |
| | | | | | | 24,041,777 | | | |
| | | |
| Equipment—0.7% | | | | | | | | | | |
| | | |
| CLI Funding V LLC: | | | | | | | | | | |
| Series 2014-1A,Cl. A, 3.29%, 6/18/293 | | | 546,111 | | | | 547,799 | | | |
| Series 2014-2A,Cl. A, 3.38%, 10/18/293 | | | 443,333 | | | | 445,797 | | | |
| | | |
| Cronos Containers Program I Ltd., Series 2014-2A, | | | | | | | |
| Cl. A, 3.27%, 11/18/293 | | | 500,324 | | | | 502,590 | | | |
| | | |
| FRS I LLC, Series 2013-1A, Cl. A1, 1.80%, | | | | | | | |
| 4/15/433 | | | 50,694 | | | | 50,240 | | | |
| | | |
| Trip Rail Master Funding LLC, Series 2014-1A, Cl. | | | | | | | | | | |
| A1, 2.863%, 4/15/443 | | | 145,770 | | | | 145,514 | | | |
| | | | | | | | | | |
| | | | | | | 1,691,940 | | | |
| | | |
| Home Equity Loan—0.5% | | | | | | | | | | |
| | | |
| American Credit Acceptance Receivables Trust, | | | | | | | | | | |
| Series 2015-2, Cl. B, 2.97%, 5/12/213 | | | 425,000 | | | | 426,308 | | | |
| | | |
| Element Rail Leasing I LLC, Series 2014-1A, Cl. A1, 2.299%, 4/19/443 | | | 342,493 | | | | 340,594 | | | |
| | | |
| TAL Advantage V LLC: | | | | | | | | | | |
| Series 2014-1A,Cl. A, 3.51%, 2/22/393 | | | 403,000 | | | | 405,066 | | | |
| Series 2014-2A,Cl. A1, 1.70%, 5/20/393 | | | 112,141 | | | | 111,461 | | | |
| | | | | | | | | | |
| | | | | | | 1,283,429 | | | |
| | | | | | | | | | |
| Total Asset-Backed Securities (Cost $26,894,014) | | | | 27,017,146 | | | |
| | | |
| Mortgage-Backed Obligations—29.4% | | | |
| | | |
| Government Agency—21.3% | | | | | | | | | | |
| | | |
| FHLMC/FNMA/FHLB/Sponsored—21.1% | | | | | | | |
| | | |
| Federal Home Loan Mortgage Corp. Gold Pool: | | | | | | | |
| 4.50%, 10/1/18 | | | 37,292 | | | | 38,846 | | | |
| 5.00%, 12/1/34 | | | 3,816 | | | | 4,262 | | | |
| 5.50%, 9/1/39 | | | 563,468 | | | | 631,483 | | | |
| 6.50%, 4/1/18-4/1/34 | | | 38,251 | | | | 43,109 | | | |
| 7.00%, 10/1/31-10/1/37 | | | 185,911 | | | | 212,845 | | | |
| 8.00%, 4/1/16 | | | 662 | | | | 666 | | | |
| 9.00%, 8/1/22-5/1/25 | | | 4,296 | | | | 4,748 | | | |
| | | |
| Federal Home Loan Mortgage Corp., Interest-Only Stripped Mtg.-Backed Security: | | | |
| Series 183,Cl. IO, 11.714%, 4/1/276 | | | 90,607 | | | | 22,103 | | | |
| Series 192,Cl. IO, 4.479%, 2/1/286 | | | 25,653 | | | | 4,329 | | | |
| Series 243,Cl. 6, 0.00%, 12/15/326,7 | | | 73,063 | | | | 13,823 | | | |
| | | |
| Federal Home Loan Mortgage Corp., Mtg.-Linked | | | | | | | |
Amortizing Global Debt Securities, Series 2012-1, | | | | | | | |
Cl. A10, 2.06%, 1/15/22 | | | 307,057 | | | | 312,318 | | | |
| | | | | | | | |
| | | Principal
Amount | | | Value | |
| |
| FHLMC/FNMA/FHLB/Sponsored (Continued) | |
| Federal Home Loan Mortgage Corp., Principal-Only | | | | | |
| Stripped Mtg.-Backed Security, Series 176, Cl. PO, | | | | | |
| 4.233%, 6/1/268 | | $ | 28,132 | | | $ | 26,333 | |
| |
| Federal Home Loan Mortgage Corp., Real Estate Mtg. Investment Conduit Multiclass Pass-Through Certificates: | |
| Series 2426,Cl. BG, 6.00%, 3/15/17 | | | 44,745 | | | | 46,284 | |
| Series 2427,Cl. ZM, 6.50%, 3/15/32 | | | 143,352 | | | | 165,254 | |
| Series 2461,Cl. PZ, 6.50%, 6/15/32 | | | 67,005 | | | | 77,437 | |
| Series 2564,Cl. MP, 5.00%, 2/15/18 | | | 140,871 | | | | 146,872 | |
| Series 2585,Cl. HJ, 4.50%, 3/15/18 | | | 79,645 | | | | 83,112 | |
| Series 2626,Cl. TB, 5.00%, 6/15/33 | | | 149,252 | | | | 161,406 | |
| Series 2635,Cl. AG, 3.50%, 5/15/32 | | | 54,694 | | | | 57,098 | |
| Series 2707,Cl. QE, 4.50%, 11/15/18 | | | 360,993 | | | | 377,654 | |
| Series 2770,Cl. TW, 4.50%, 3/15/19 | | | 15,396 | | | | 16,104 | |
| Series 3010,Cl. WB, 4.50%, 7/15/20 | | | 45,645 | | | | 48,062 | |
| Series 3025,Cl. SJ, 24.07%, 8/15/355 | | | 24,399 | | | | 38,547 | |
| Series 3030,Cl. FL, 0.586%, 9/15/355 | | | 122,316 | | | | 123,190 | |
| Series 3741,Cl. PA, 2.15%, 2/15/35 | | | 361,174 | | | | 367,263 | |
| Series 3815,Cl. BD, 3.00%, 10/15/20 | | | 13,831 | | | | 14,169 | |
| Series 3822,Cl. JA, 5.00%, 6/15/40 | | | 107,997 | | | | 115,898 | |
| Series 3840,Cl. CA, 2.00%, 9/15/18 | | | 10,241 | | | | 10,377 | |
| Series 3848,Cl. WL, 4.00%, 4/15/40 | | | 187,352 | | | | 193,011 | |
| Series 3857,Cl. GL, 3.00%, 5/15/40 | | | 10,606 | | | | 10,860 | |
| Series 4221,Cl. HJ, 1.50%, 7/15/23 | | | 1,001,702 | | | | 1,007,513 | |
| |
| Federal Home Loan Mortgage Corp., Real Estate Mtg. Investment Conduit Multiclass Pass-Through Certificates, Interest-Only Stripped Mtg.-Backed Security: | |
| Series 2130,Cl. SC, 50.245%, 3/15/296 | | | 89,933 | | | | 20,478 | |
| Series 2796,Cl. SD, 51.196%, 7/15/266 | | | 120,607 | | | | 26,022 | |
| Series 2920,Cl. S, 52.833%, 1/15/356 | | | 622,160 | | | | 120,480 | |
| Series 2922,Cl. SE, 5.619%, 2/15/356 | | | 37,145 | | | | 7,075 | |
| Series 2981,Cl. AS, 0.206%, 5/15/356 | | | 357,911 | | | | 71,516 | |
| Series 3201,Cl. SG, 1.768%, 8/15/366 | | | 98,407 | | | | 18,290 | |
| Series 3397,Cl. GS, 15.854%, 12/15/376 | | | 42,573 | | | | 8,834 | |
| Series 3424,Cl. EI, 15.518%, 4/15/386 | | | 23,757 | | | | 3,422 | |
| Series 3450,Cl. BI, 8.589%, 5/15/386 | | | 114,459 | | | | 19,112 | |
| Series 3606,Cl. SN, 0.698%, 12/15/396 | | | 62,835 | | | | 11,443 | |
| |
| Federal National Mortgage Assn.: | | | | | | | | |
| 3.00%, 7/1/309 | | | 2,030,000 | | | | 2,100,257 | |
| 3.50%, 7/1/419 | | | 17,055,000 | | | | 17,543,665 | |
| 4.00%, 7/1/459 | | | 15,280,000 | | | | 16,169,046 | |
| 4.50%, 7/1/309 | | | 504,000 | | | | 524,928 | |
| 5.00%, 7/1/459 | | | 4,215,000 | | | | 4,655,987 | |
| 6.00%, 7/1/459 | | | 425,000 | | | | 483,172 | |
| |
| Federal National Mortgage Assn. Pool: | | | | | | | | |
| 3.50%, 12/1/20-2/1/22 | | | 430,563 | | | | 453,881 | |
| 5.00%, 3/1/21 | | | 18,164 | | | | 19,294 | |
| 5.50%, 9/1/20 | | | 3,661 | | | | 3,916 | |
| 6.00%, 11/1/17-3/1/37 | | | 255,987 | | | | 289,084 | |
| 6.50%, 5/1/17-10/1/19 | | | 40,562 | | | | 41,899 | |
| 7.00%, 11/1/17-10/1/35 | | | 10,640 | | | | 11,012 | |
| 7.50%, 1/1/33 | | | 86,331 | | | | 104,681 | |
| 8.50%, 7/1/32 | | | 5,817 | | | | 6,705 | |
| |
| Federal National Mortgage Assn., Interest-Only Stripped Mtg.-Backed Security: | |
| Series 222,Cl. 2, 17.764%, 6/25/236 | | | 194,821 | | | | 39,976 | |
| Series 233,Cl. 2, 38.765%, 8/25/236 | | | 143,255 | | | | 31,019 | |
| Series 252,Cl. 2, 37.707%, 11/25/236 | | | 186,145 | | | | 27,845 | |
| Series 319,Cl. 2, 0.779%, 2/25/326 | | | 40,708 | | | | 9,525 | |
| Series 320,Cl. 2, 7.768%, 4/25/326 | | | 13,242 | | | | 2,576 | |
| Series 321,Cl. 2, 0.00%, 4/25/326,7 | | | 144,564 | | | | 33,958 | |
| Series 331,Cl. 9, 16.765%, 2/25/336 | | | 163,718 | | | | 37,660 | |
| Series 334,Cl. 17, 18.073%, 2/25/336 | | | 93,583 | | | | 21,417 | |
| Series 339,Cl. 12, 0.00%, 6/25/336,7 | | | 131,170 | | | | 34,145 | |
| Series 339,Cl. 7, 0.00%, 11/25/336,7 | | | 375,688 | | | | 71,869 | |
| Series 343,Cl. 13, 0.00%, 9/25/336,7 | | | 128,798 | | | | 26,359 | |
| Series 345,Cl. 9, 0.00%, 1/25/346,7 | | | 120,005 | | | | 23,669 | |
| Series 351,Cl. 10, 0.00%, 4/25/346,7 | | | 17,011 | | | | 3,493 | |
| Series 351,Cl. 8, 0.00%, 4/25/346,7 | | | 57,944 | | | | 11,915 | |
| Series 356,Cl. 10, 0.00%, 6/25/356,7 | | | 41,610 | | | | 9,147 | |
8 OPPENHEIMER CONSERVATIVE BALANCED FUND/VA
| | | | | | | | | | |
| | | Principal
Amount | | | Value | | | |
| | | |
| FHLMC/FNMA/FHLB/Sponsored (Continued) | | | | | | | |
| | | |
| Federal National Mortgage Assn., Interest-Only Stripped Mtg.-Backed Security: (Continued) | | | |
| Series 356,Cl. 12, 0.00%, 2/25/356,7 | | $ | 22,165 | | | $ | 4,890 | | | |
| Series 362,Cl. 13, 0.00%, 8/25/356,7 | | | 154,734 | | | | 33,710 | | | |
| Series 364,Cl. 16, 0.00%, 9/25/356,7 | | | 109,413 | | | | 24,254 | | | |
| | | |
| Federal National Mortgage Assn., Real Estate Mtg. Investment Conduit Multiclass Pass-Through Certificates: | | | |
| Series 1998-61,Cl. PL, 6.00%, 11/25/28 | | | 66,800 | | | | 76,117 | | | |
| Series 2003-100,Cl. PA, 5.00%, 10/25/18 | | | 283,943 | | | | 297,864 | | | |
| Series 2003-130,Cl. CS, 13.726%, 12/25/335 | | | 15,428 | | | | 18,787 | | | |
| Series 2003-84,Cl. GE, 4.50%, 9/25/18 | | | 21,637 | | | | 22,543 | | | |
| Series 2004-101,Cl. BG, 5.00%, 1/25/20 | | | 131,409 | | | | 134,761 | | | |
| Series 2004-25,Cl. PC, 5.50%, 1/25/34 | | | 189,776 | | | | 200,090 | | | |
| Series 2005-104,Cl. MC, 5.50%, 12/25/25 | | | 307,957 | | | | 338,124 | | | |
| Series 2005-31,Cl. PB, 5.50%, 4/25/35 | | | 250,000 | | | | 292,079 | | | |
| Series 2005-73,Cl. DF, 0.437%, 8/25/355 | | | 277,739 | | | | 278,969 | | | |
| Series 2006-11,Cl. PS, 23.881%, 3/25/365 | | | 92,669 | | | | 148,289 | | | |
| Series 2006-46,Cl. SW, 23.514%, 6/25/365 | | | 66,431 | | | | 89,444 | | | |
| Series 2006-50,Cl. KS, 23.514%, 6/25/365 | | | 14,246 | | | | 22,435 | | | |
| Series 2008-75,Cl. DB, 4.50%, 9/25/23 | | | 84,982 | | | | 88,428 | | | |
| Series 2009-113,Cl. DB, 3.00%, 12/25/20 | | | 299,795 | | | | 307,417 | | | |
| Series 2009-36,Cl. FA, 1.127%, 6/25/375 | | | 98,746 | | | | 101,441 | | | |
| Series 2009-37,Cl. HA, 4.00%, 4/25/19 | | | 85,801 | | | | 88,624 | | | |
| Series 2009-70,Cl. TL, 4.00%, 8/25/19 | | | 928,150 | | | | 956,715 | | | |
| Series 2010-43,Cl. KG, 3.00%, 1/25/21 | | | 142,072 | | | | 146,220 | | | |
| Series 2011-15,Cl. DA, 4.00%, 3/25/41 | | | 54,605 | | | | 57,127 | | | |
| Series 2011-3,Cl. EL, 3.00%, 5/25/20 | | | 500,158 | | | | 512,772 | | | |
| Series 2011-3,Cl. KA, 5.00%, 4/25/40 | | | 217,867 | | | | 238,999 | | | |
| Series 2011-38,Cl. AH, 2.75%, 5/25/20 | | | 11,287 | | | | 11,538 | | | |
| Series 2011-82,Cl. AD, 4.00%, 8/25/26 | | | 307,385 | | | | 318,689 | | | |
| | | |
| Federal National Mortgage Assn., Real Estate Mtg. Investment Conduit Multiclass Pass-Through Certificates, Interest-Only Stripped Mtg.-Backed Security: | | | |
| Series 2001-65,Cl. S, 28.286%, 11/25/316 | | | 154,162 | | | | 36,940 | | | |
| Series 2001-81,Cl. S, 25.165%, 1/25/326 | | | 39,720 | | | | 9,293 | | | |
| Series 2002-47,Cl. NS, 30.968%, 4/25/326 | | | 109,813 | | | | 27,016 | | | |
| Series 2002-51,Cl. S, 31.162%, 8/25/326 | | | 100,835 | | | | 24,818 | | | |
| Series 2002-52,Cl. SD, 35.368%, 9/25/326 | | | 142,230 | | | | 34,408 | | | |
| Series 2002-77,Cl. SH, 35.442%, 12/18/326 | | | 62,801 | | | | 14,869 | | | |
| Series 2002-84,Cl. SA, 34.729%, 12/25/326 | | | 151,029 | | | | 36,293 | | | |
| Series 2002-9,Cl. MS, 26.044%, 3/25/326 | | | 42,641 | | | | 9,916 | | | |
| Series 2003-33,Cl. SP, 29.22%, 5/25/336 | | | 165,152 | | | | 35,634 | | | |
| Series 2003-4,Cl. S, 30.803%, 2/25/336 | | | 91,437 | | | | 23,366 | | | |
| Series 2003-46,Cl. IH, 0.00%, 6/25/236,7 | | | 327,465 | | | | 42,891 | | | |
| Series 2004-54,Cl. DS, 39.228%, 11/25/306 | | | 119,530 | | | | 23,449 | | | |
| Series 2004-56,Cl. SE, 11.834%, 10/25/336 | | | 31,721 | | | | 6,327 | | | |
| Series 2005-12,Cl. SC, 9.333%, 3/25/356 | | | 17,587 | | | | 3,859 | | | |
| Series 2005-14,Cl. SE, 37.71%, 3/25/356 | | | 57,716 | | | | 9,568 | | | |
| Series 2005-40,Cl. SA, 48.999%, 5/25/356 | | | 308,916 | | | | 58,094 | | | |
| Series 2005-52,Cl. JH, 2.135%, 5/25/356 | | | 785,647 | | | | 147,961 | | | |
| Series 2005-93,Cl. SI, 21.353%, 10/25/356 | | | 74,792 | | | | 13,161 | | | |
| Series 2007-88,Cl. XI, 35.497%, 6/25/376 | | | 180,860 | | | | 31,854 | | | |
| Series 2008-55,Cl. SA, 14.432%, 7/25/386 | | | 82,641 | | | | 10,434 | | | |
| Series 2009-8,Cl. BS, 0.00%, 2/25/246,7 | | | 29,902 | | | | 1,710 | | | |
| Series 2012-134,Cl. SA, 12.555%, 12/25/426 | | | 609,799 | | | | 154,544 | | | |
| Series 2012-40,Cl. PI, 0.00%, 4/25/416,7 | | | 354,641 | | | | 64,292 | | | |
| | | |
| Federal National Mortgage Assn., Real Estate Mtg. | | | | | | | | | | |
| Investment Conduit Multiclass Pass-Through | | | | | | | | | | |
| Certificates, Principal-Only Stripped Mtg.-Backed | | | | | | | | | | |
| Security, Series 1993-184, Cl. M, 5.039%, 9/25/238 | | | 71,333 | | | | 68,488 | | | |
| | | | | | | | | | |
| | | | | | | 53,173,259 | | | |
| |
| | | |
| GNMA/Guaranteed—0.2% | | | | | | | | | | |
| | | |
| Government National Mortgage Assn. I Pool: | | | | | | | | | | |
| 7.00%, 1/15/24 | | | 36,190 | | | | 39,322 | | | |
| 7.50%, 1/15/23-6/15/24 | | | 35,824 | | | | 38,748 | | | |
| 8.00%, 5/15/17-4/15/23 | | | 24,980 | | | | 27,389 | | | |
| 8.50%, 8/15/17-12/15/17 | | | 4,003 | | | | 4,177 | | | |
| | | |
| Government National Mortgage Assn., Interest-Only Stripped Mtg.-Backed Security: | | | |
| Series 2002-15,Cl. SM, 58.848%, 2/16/326 | | | 193,522 | | | | 37,510 | | | |
| | | | | | | | |
| | | Principal
Amount | | | Value | |
| |
| GNMA/Guaranteed (Continued) | | | | | | | | |
| |
| Government National Mortgage Assn., Interest-Only Stripped Mtg.-Backed Security: (Continued) | |
| Series 2002-76,Cl. SY, 61.726%, 12/16/266 | | $ | 401,865 | | | $ | 81,677 | |
| Series 2007-17,Cl. AI, 19.026%, 4/16/376 | | | 438,912 | | | | 84,625 | |
| Series 2011-52,Cl. HS, 9.23%, 4/16/416 | | | 216,213 | | | | 41,787 | |
| | | | | | | | |
| | | | | | | 355,235 | |
| |
| Non-Agency—8.1% | | | | | | | | |
| |
| Commercial—7.4% | | | | | | | | |
| |
| Banc of America Commercial Mortgage Trust, | |
| Series 2006-5, Cl. AM, 5.448%, 9/10/47 | | | 215,000 | | | | 223,683 | |
| |
| Banc of America Funding Trust: | | | | | | | | |
| Series 2006-G,Cl. 2A4, 0.477%, 7/20/365 | | | 924,230 | | | | 866,376 | |
| Series 2014-R7,Cl. 3A1, 2.617%, 3/26/364,5 | | | 400,888 | | | | 409,343 | |
| |
| BCAP LLC Trust, Series 2011-R11, Cl. 18A5, 2.23%, 9/26/353,5 | | | 266,347 | | | | 270,864 | |
| |
| Bear Stearns ARM Trust: | | | | | | | | |
| Series 2005-2,Cl. A1, 2.68%, 3/25/355 | | | 325,793 | | | | 329,422 | |
| Series 2005-9,Cl. A1, 2.41%, 10/25/355 | | | 914,558 | | | | 902,522 | |
| |
| Chase Mortgage Finance Trust, Series 2005-A2, Cl. | | | | | | | | |
| 1A3, 2.435%, 1/25/365 | | | 210,492 | | | | 198,588 | |
| |
| Citigroup Commercial Mortgage Trust: | | | | | | | | |
| Series 2008-C7,Cl. AM, 6.349%, 12/10/495 | | | 105,000 | | | | 113,707 | |
| Series 2013-GC11,Cl. D, 4.604%, 4/10/463,5 | | | 185,000 | | | | 174,448 | |
| |
| Citigroup Mortgage Loan Trust, Inc., Series 2006- AR1, Cl. 1A1, 2.57%, 10/25/355 | | | 802,658 | | | | 794,235 | |
| |
| COMM Mortgage Trust: | | | | | | | | |
| Series 2012-CR4,Cl. D, 4.727%, 10/15/453,5 | | | 185,000 | | | | 180,415 | |
| Series 2012-CR5,Cl. E, 4.48%, 12/10/453,5 | | | 480,000 | | | | 458,248 | |
| Series 2013-CR7,Cl. D, 4.494%, 3/10/463,5 | | | 445,000 | | | | 409,907 | |
| Series 2014-CR21,Cl. AM, 3.987%, 12/10/47 | | | 860,000 | | | | 881,185 | |
| |
| COMM Mortgage Trust, Interest-Only Stripped | | | | | |
| Mtg.-Backed Security, Series 2012-CR5, Cl. XA, | | | | | |
| 0%, 12/10/456,7 | | | 430,856 | | | | 37,511 | |
| |
| Commercial Mortgage Trust, Series 2007-GG11, | | | | | |
| Cl. AM, 5.867%, 12/10/495 | | | 170,000 | | | | 182,539 | |
| |
| Credit Suisse First Boston Mortgage Securities Corp., Series 2005-C6, Cl. AJ, 5.23%, 12/15/405 | | | 275,000 | | | | 277,275 | |
| |
| CSMC: | | | | | | | | |
| Series 2006-6,Cl. 1A4, 6.00%, 7/25/36 | | | 212,972 | | | | 179,502 | |
| Series 2009-13R,Cl. 4A1, 2.625%, 9/26/363,5 | | | 100,428 | | | | 101,082 | |
| |
| DBUBS Mortgage Trust, Series 2011-LC1A, Cl. E, 5.735%, 11/10/463,5 | | | 50,000 | | | | 53,468 | |
| |
| First Horizon Alternative Mortgage Securities Trust: | | | | | | | | |
| Series 2004-FA2,Cl. 3A1, 6.00%, 1/25/35 | | | 135,333 | | | | 129,877 | |
| Series 2005-FA8,Cl. 1A6, 0.837%, 11/25/355 | | | 145,956 | | | | 110,290 | |
| |
| FREMF Mortgage Trust: | | | | | | | | |
| Series 2012-K501,Cl. C, 3.549%, 11/25/463,5 | | | 50,000 | | | | 51,004 | |
| Series 2013-K25,Cl. C, 3.743%, 11/25/453,5 | | | 60,000 | | | | 58,770 | |
| Series 2013-K26,Cl. C, 3.723%, 12/25/453,5 | | | 40,000 | | | | 39,408 | |
| Series 2013-K27,Cl. C, 3.616%, 1/25/463,5 | | | 110,000 | | | | 106,851 | |
| Series 2013-K28,Cl. C, 3.614%, 6/25/463,5 | | | 450,000 | | | | 436,342 | |
| Series 2013-K502,Cl. C, 3.302%, 3/25/453,5 | | | 220,000 | | | | 223,751 | |
| Series 2013-K712,Cl. C, 3.484%, 5/25/453,5 | | | 70,000 | | | | 70,182 | |
| Series 2013-K713,Cl. C, 3.274%, 4/25/463,5 | | | 145,000 | | | | 142,972 | |
| Series 2014-K715,Cl. C, 4.264%, 2/25/463,5 | | | 35,000 | | | | 35,595 | |
| Series 2015-K44,Cl. B, 3.811%, 1/25/483,5 | | | 365,000 | | | | 357,218 | |
| |
| GSMSC Pass-Through Trust, Series 2009-3R, Cl. | | | | | |
| 1A2, 6%, 4/25/373,5 | | | 477,263 | | | | 444,066 | |
| |
| GSR Mortgage Loan Trust, Series 2005-AR4, Cl. | | | | | |
| 6A1, 2.937%, 7/25/355 | | | 47,383 | | | | 46,864 | |
| |
| JP Morgan Chase Commercial Mortgage Securities | | | | | |
| Corp., Series 2012-LC9, Cl. E, 4.569%, 12/15/473,5 | | | 285,000 | | | | 277,748 | |
| |
| JP Morgan Chase Commercial Mortgage Securities Trust: | | | | | |
| Series 2006-LDP8,Cl. AJ, 5.48%, 5/15/455 | | | 690,000 | | | | 714,145 | |
| Series 2012-C6,Cl. E, 5.372%, 5/15/453,5 | | | 380,000 | | | | 384,143 | |
| |
| JP Morgan Mortgage Trust, Series 2007-A1, Cl. | | | | | |
| 5A1, 2.555%, 7/25/355 | | | 188,627 | | | | 189,195 | |
9 OPPENHEIMER CONSERVATIVE BALANCED FUND/VA
STATEMENT OF INVESTMENTS Unaudited / Continued
| | | | | | | | | | |
| | | Principal
Amount | | | Value | | | |
| | | |
| Commercial (Continued) | | | | | | | | | | |
| | | |
| JP Morgan Resecuritization Trust: | | | | | | | | | | |
| Series 2009-11,Cl. 5A1, 2.625%, 9/26/363,5 | | $ | 373,076 | | | $ | 373,780 | | | |
| Series 2009-5,Cl. 1A2, 2.721%, 7/26/363,5 | | | 253,698 | | | | 221,979 | | | |
| | | |
| JPMBB Commercial Mortgage Securities Trust: | | | | | | | | | | |
| Series 2014-C25,Cl. AS, 4.065%, 11/15/47 | | | 360,000 | | | | 375,022 | | | |
| Series 2014-C26,Cl. AS, 3.80%, 1/15/48 | | | 180,000 | | | | 182,897 | | | |
| | | |
| MASTR Adjustable Rate Mortgages Trust, Series | | | | | | | | | | |
| 2004-13, Cl. 2A2, 2.666%, 4/21/345 | | | 81,585 | | | | 83,596 | | | |
| | | |
| Morgan Stanley Bank of America Merrill Lynch Trust: | | | | | | | | | | |
| Series 2012-C6,Cl. E, 4.816%, 11/15/453,5 | | | 385,000 | | | | 380,246 | | | |
| Series 2013-C7,Cl. D, 4.437%, 2/15/463,5 | | | 115,000 | | | | 108,407 | | | |
| Series 2013-C8,Cl. D, 4.309%, 12/15/483,5 | | | 80,000 | | | | 74,524 | | | |
| Series 2014-C19,Cl. AS, 3.832%, 12/15/47 | | | 720,000 | | | | 733,627 | | | |
| | | |
| Morgan Stanley Capital I Trust, Series 2007-IQ13, Cl. AM, 5.406%, 3/15/44 | | | 470,000 | | | | 496,360 | | | |
| | | |
| Morgan Stanley Re-Remic Trust, Series 2012-R3, Cl. 1B, 1.969%, 11/26/363,5 | | | 251,018 | | | | 190,986 | | | |
| | | |
| Morgan Stanley Resecuritization Trust, Series 2013-R9, Cl. 3A, 2.379%, 6/26/463,5 | | | 614,507 | | | | 619,917 | | | |
| | | |
| RBSSP Resecuritization Trust, Series 2010-1, Cl. 2A1, 2.248%, 7/26/453,5 | | | 44,582 | | | | 44,573 | | | |
| | | |
| Structured Adjustable Rate Mortgage Loan Trust, | | | | | | | | | | |
| Series 2004-10, Cl. 2A, 2.447%, 8/25/345 | | | 355,714 | | | | 353,482 | | | |
| | | |
| UBS-Barclays Commercial Mortgage Trust, Series | | | | | | | | | | |
| 2012-C2, Cl. E, 4.889%, 5/10/633,5 | | | 45,000 | | | | 44,953 | | | |
| | | |
| WaMu Mortgage Pass-Through Certificates Trust: | | | | | | | | | | |
| Series 2005-AR14,Cl. 1A4, 2.348%, 12/25/355 | | | 163,462 | | | | 158,475 | | | |
| Series 2005-AR16,Cl. 1A1, 2.341%, 12/25/355 | | | 151,650 | | | | 144,604 | | | |
| | | |
| Wells Fargo Mortgage-Backed Securities Trust: | | | | | | | | | | |
| Series 2005-AR1,Cl. 1A1, 2.617%, 2/25/355 | | | 35,628 | | | | 35,908 | | | |
| Series 2005-AR10,Cl. 1A1, 2.658%, 6/25/355 | | | 693,595 | | | | 710,588 | | | |
| Series 2005-AR15,Cl. 1A6, 2.613%, 9/25/355 | | | 473,672 | | | | 451,926 | | | |
| Series 2006-AR7,Cl. 2A4, 2.732%, 5/25/365 | | | 248,640 | | | | 237,886 | | | |
| Series 2006-AR8,Cl. 2A4, 2.641%, 4/25/365 | | | 169,347 | | | | 165,648 | | | |
| Series 2007-16,Cl. 1A1, 6.00%, 12/28/37 | | | 105,067 | | | | 108,813 | | | |
| Series 2007-AR8,Cl. A1, 2.614%, 11/25/375 | | | 487,838 | | | | 430,973 | | | |
| | | |
| WF-RBS Commercial Mortgage Trust: | | | | | | | | | | |
| Series 2012-C10,Cl. D, 4.606%, 12/15/453,5 | | | 160,000 | | | | 154,219 | | | |
| Series 2012-C7,Cl. E, 4.999%, 6/15/453,5 | | | 80,000 | | | | 80,272 | | | |
| Series 2012-C8,Cl. E, 5.038%, 8/15/453,5 | | | 365,000 | | | | 368,646 | | | |
| Series 2013-C11,Cl. D, 4.32%, 3/15/453,5 | | | 49,000 | | | | 46,244 | | | |
| Series 2013-C15,Cl. D, 4.631%, 8/15/463,5 | | | 225,000 | | | | 213,416 | | | |
| | | |
| WF-RBS Commercial Mortgage Trust, Interest-Only | | | | | | | | | | |
| Commercial Mtg. Pass-Through Certificates, Series | | | | | | | | | | |
| 2011-C3, Cl. XA, 0%, 3/15/443,6,7 | | | 3,785,373 | | | | 181,130 | | | |
| | | | | | | | | | |
| | | | | | | 18,635,838 | | | |
| |
| | | |
| Multi-Family—0.1% | | | | | | | | | | |
| | | |
| Wells Fargo Mortgage-Backed Securities Trust: | | | | | | | |
| Series 2005-AR15,Cl. 1A2, 2.613%, 9/25/355 | | | 241,916 | | | | 236,484 | | | |
| Series 2006-AR2,Cl. 2A3, 2.621%, 3/25/365 | | | 45,608 | | | | 45,144 | | | |
| | | |
| Residential—0.6% | | | | | | | | | | |
| | | |
| Alternative Loan Trust, Series 2005-29CB, Cl. A4, | | | | | | | |
| 5%, 7/25/35 | | | 420,741 | | | | 385,364 | | | |
| | | |
| Banc of America Funding Trust: | | | | | | | | | | |
| Series 2007-1,Cl. 1A3, 6.00%, 1/25/37 | | | 103,354 | | | | 95,646 | | | |
| Series 2007-C,Cl. 1A4, 5.308%, 5/20/365 | | | 41,275 | | | | 38,746 | | | |
| | | |
| Banc of America Mortgage Trust, Series 2004-E, Cl. | | | | | | | |
| 2A6, 2.863%, 6/25/345 | | | 119,409 | | | | 119,305 | | | |
| | | |
| Bear Stearns ARM Trust, Series 2006-1, Cl. A1, | | | | | | | |
| 2.36%, 2/25/365 | | | 341,166 | | | | 339,338 | | | |
| | | |
| Carrington Mortgage Loan Trust, Series 2006- | | | | | | | | | | |
| FRE1, Cl. A2, 0.297%, 7/25/365 | | | 66,955 | | | | 65,790 | | | |
| | | |
| CHL Mortgage Pass-Through Trust: | | | | | | | |
| Series 2005-26,Cl. 1A8, 5.50%, 11/25/35 | | | 124,341 | | | | 119,181 | | | |
| Series 2006-6,Cl. A3, 6.00%, 4/25/36 | | | 64,060 | | | | 62,160 | | | |
| | | |
| HomeBanc Mortgage Trust, Series 2005-3, Cl. A2, | | | |
| 0.497%, 7/25/355 | | | 59,820 | | | | 55,613 | | | |
| | | | | | | | |
| | | Principal
Amount | | | Value | |
| |
| Residential (Continued) | | | | | | | | |
| |
| RALI Trust: | | | | | | | | |
| Series 2003-QS1,Cl. A2, 5.75%, 1/25/33 | | $ | 16,847 | | | $ | 16,936 | |
| Series 2006-QS13,Cl. 1A8, 6.00%, 9/25/36 | | | 14,824 | | | | 12,045 | |
| |
| WaMu Mortgage Pass-Through Certificates Trust, | | | | | | | | |
| Series 2003-AR10, Cl. A7, 2.418%, 10/25/335 | | | 167,136 | | | | 170,929 | |
| |
| Wells Fargo Mortgage-Backed Securities Trust, | | | | | | | | |
| Series 2006-AR14, Cl. 1A2, 5.808%, 10/25/365 | | | 89,116 | | | | 87,058 | |
| | | | | | | | |
| | | | | | | 1,568,111 | |
| | | | | | | | |
| Total Mortgage-Backed Obligations (Cost $73,482,951) | | |
|
74,014,071 |
|
|
| |
| U.S. Government Obligations—0.3% | | | | | | | | |
| |
| Federal Home Loan Mortgage Corp. Nts., 5.50%, | | | | | |
| 7/18/16 | | | 65,000 | | | | 68,433 | |
| |
| Federal National Mortgage Assn. Nts., 1%, | | | | | |
| 9/27/17 | | | 193,000 | | | | 193,765 | |
| |
| United States Treasury Nts., 1.50%, 5/31/19 | | | 552,000 | | | | 554,803 | |
| | | | | | | | |
| Total U.S. Government Obligations (Cost $814,224) | | | | 817,001 | |
|
| |
| Non-Convertible Corporate Bonds and Notes—36.0% | |
| |
| Consumer Discretionary—4.7% | | | | | | | | |
| |
| Auto Components—0.1% | | | | | | | | |
| |
| BorgWarner, Inc., 4.375% Sr. Unsec. Nts., 3/15/45 | | | 128,000 | | | | 119,779 | |
| |
| Johnson Controls, Inc., 1.40% Sr. Unsec. Nts., | | | | | |
| 11/2/17 | | | 77,000 | | | | 76,732 | |
| | | | | | | | |
| | | | | | | 196,511 | |
|
| |
| Automobiles—1.2% | | | | | | | | |
| |
| Daimler Finance North America LLC: | | | | | | | | |
| 1.30% Sr. Unsec. Nts., 7/31/153 | | | 463,000 | | | | 463,214 | |
| 8.50% Sr. Unsec. Unsub. Nts., 1/18/31 | | | 271,000 | | | | 397,940 | |
| |
| Ford Motor Credit Co. LLC, 3.664% Sr. Unsec. | |
| Nts., 9/8/24 | | | 970,000 | | | | 957,579 | |
| |
| General Motors Co., 6.25% Sr. Unsec. Nts., | |
| 10/2/43 | | | 437,000 | | | | 488,284 | |
| |
| Hyundai Capital America, 1.45% Sr. Unsec. Nts., | |
| 2/6/173 | | | 468,000 | | | | 466,631 | |
| |
| Kia Motors Corp., 3.625% Sr. Unsec. Nts., | |
| 6/14/163 | | | 341,000 | | | | 348,338 | |
| | | | | | | | |
| | | | | | | 3,121,986 | |
|
| |
| Hotels, Restaurants & Leisure—0.6% | |
| |
| Brinker International, Inc., 2.60% Sr. Unsec. Nts., | |
| 5/15/18 | | | 151,000 | | | | 151,321 | |
| |
| Carnival Corp., 1.20% Sr. Unsec. Nts., 2/5/16 | | | 465,000 | | | | 465,629 | |
| |
| Hyatt Hotels Corp., 3.875% Sr. Unsec. Unsub. Nts., | |
| 8/15/16 | | | 77,000 | | | | 79,099 | |
| |
| Marriott International, Inc., 3.25% Sr. Unsec. Nts., | |
| 9/15/22 | | | 262,000 | | | | 258,427 | |
| |
| Wyndham Worldwide Corp., 6% Sr. Unsec. Nts., | |
| 12/1/16 | | | 403,000 | | | | 425,323 | |
| | | | | | | | |
| | | | | | | 1,379,799 | |
|
| |
| Household Durables—0.4% | | | | | | | | |
| |
| Lennar Corp.: | | | | | | | | |
| 4.75% Sr. Unsec. Nts., 11/15/22 | | | 140,000 | | | | 138,250 | |
| 4.75% Sr. Unsec. Nts., 5/30/25 | | | 281,000 | | | | 273,975 | |
| |
| Toll Brothers Finance Corp., 4.375% Sr. Unsec. | |
| Nts., 4/15/23 | | | 410,000 | | | | 403,850 | |
| |
| Whirlpool Corp.: | | | | | | | | |
| 1.35% Sr. Unsec. Nts., 3/1/17 | | | 123,000 | | | | 123,396 | |
| 1.65% Sr. Unsec. Nts., 11/1/17 | | | 105,000 | | | | 105,399 | |
| | | | | | | | |
| | | | | | | 1,044,870 | |
10 OPPENHEIMER CONSERVATIVE BALANCED FUND/VA
| | | | | | | | | | |
| | | Principal
Amount | | | Value | | | |
| | | |
| Leisure Equipment & Products—0.2% | | | | | | | |
| | | |
| Mattel, Inc., 1.70% Sr. Unsec. Nts., 3/15/18 | | $ | 433,000 | | | $ | 430,927 | | | |
| |
| | | |
| Media—1.4% | | | | | | | | | | |
| | | |
| 21st Century Fox America, Inc., 6.15% Sr. Unsec. Nts., 2/15/41 | | | 183,000 | | | | 212,555 | | | |
| | | |
| Comcast Cable Communications Holdings, Inc., 9.455% Sr. Unsec. Nts., 11/15/22 | | | 211,000 | | | | 289,887 | | | |
| | | |
| Comcast Corp., 4.65% Sr. Unsec. Unsub. Nts., 7/15/42 | | | 156,000 | | | | 156,193 | | | |
| | | |
| DIRECTV Holdings LLC/DIRECTV Financing Co., Inc., 5.15% Sr. Unsec. Nts., 3/15/42 | | | 65,000 | | | | 61,165 | | | |
| | | |
| Historic TW, Inc.: | | | | | | | | | | |
| 8.05% Sr. Unsec. Nts., 1/15/16 | | | 77,000 | | | | 79,838 | | | |
| 9.15% Debs., 2/1/23 | | | 118,000 | | | | 155,936 | | | |
| | | |
| Interpublic Group of Cos., Inc. (The), 4.20% Sr. Unsec. Nts., 4/15/24 | | | 226,000 | | | | 228,882 | | | |
| | | |
| Lamar Media Corp., 5% Sr. Unsec. Sub. Nts., 5/1/23 | | | 441,000 | | | | 438,795 | | | |
| | | |
| Pearson Funding Two plc, 4% Sr. Unsec. Nts., 5/17/163 | | | 101,000 | | | | 103,394 | | | |
| | | |
| Scripps Networks Interactive, Inc., 2.70% Sr. Unsec. Nts., 12/15/16 | | | 404,000 | | | | 412,167 | | | |
| | | |
| Sky plc, 3.75% Sr. Unsec. Nts., 9/16/243 | | | 217,000 | | | | 211,946 | | | |
| | | |
| Thomson Reuters Corp., 1.65% Sr. Unsec. Nts., 9/29/17 | | | 416,000 | | | | 416,019 | | | |
| | | |
| Time Warner Cable, Inc., 4.50% Sr. Unsec. Unsub. Nts., 9/15/42 | | | 145,000 | | | | 119,238 | | | |
| | | |
| Viacom, Inc., 2.50% Sr. Unsec. Nts., 12/15/16 | | | 183,000 | | | | 185,842 | | | |
| | | |
| Virgin Media Secured Finance plc, 5.25% Sr. Sec. Nts., 1/15/263 | | | 415,000 | | | | 402,031 | | | |
| | | | | | | | | | |
| | | | | | | 3,473,888 | | | |
| |
| | | |
| Specialty Retail—0.5% | | | | | | | | | | |
| | | |
| Best Buy Co., Inc., 5.50% Sr. Unsec. Nts., 3/15/21 | | | 415,000 | | | | 432,471 | | | |
| | | |
| Home Depot, Inc. (The), 4.875% Sr. Unsec. Nts., 2/15/44 | | | 167,000 | | | | 178,401 | | | |
| | | |
| Ross Stores, Inc., 3.375% Sr. Unsec. Nts., 9/15/24 | | | 425,000 | | | | 419,348 | | | |
| | | |
| Signet UK Finance plc, 4.70% Sr. Unsec. Nts., 6/15/24 | | | 228,000 | | | | 230,349 | | | |
| | | | | | | | | | |
| | | | | | | 1,260,569 | | | |
| |
| | | |
| Textiles, Apparel & Luxury Goods—0.3% | | | | | | | |
| | | |
| Levi Strauss & Co., 5% Sr. Unsec. Nts., 5/1/253 | | | 430,000 | | | | 418,175 | | | |
| | | |
| PVH Corp., 4.50% Sr. Unsec. Unsub. Nts., 12/15/22 | | | 431,000 | | | | 428,845 | | | |
| | | | | | | | | | |
| | | | | | | 847,020 | | | |
| |
| | | |
| Consumer Staples—2.6% | | | | | | | | | | |
| | | |
| Beverages—0.7% | | | | | | | | | | |
| | | |
| Anheuser-Busch InBev Worldwide, Inc., 8.20% Sr. Unsec. Unsub. Nts., 1/15/39 | | | 386,000 | | | | 574,024 | | | |
| | | |
| Constellation Brands, Inc., 4.75% Sr. Unsec. Nts., 11/15/24 | | | 390,000 | | | | 391,950 | | | |
| | | |
| Pernod Ricard SA: | | | | | | | | | | |
| 2.95% Sr. Unsec. Nts., 1/15/173 | | | 423,000 | | | | 432,357 | | | |
| 4.25% Sr. Unsec. Nts., 7/15/223 | | | 260,000 | | | | 271,055 | | | |
| | | | | | | | | | |
| | | | | | | 1,669,386 | | | |
| |
| | | |
| Food & Staples Retailing—0.4% | | | | | | | | | | |
| CVS Health Corp., 5.30% Sr. Unsec. Nts., 12/5/43 | | | 101,000 | | | | 110,084 | | | |
| | | |
| Delhaize Group SA, 5.70% Sr. Unsec. Nts., 10/1/40 | | | 251,000 | | | | 254,793 | | | |
| | | |
| Kroger Co. (The): | | | | | | | | | | |
| 6.40% Sr. Unsec. Nts., 8/15/17 | | | 386,000 | | | | 425,129 | | | |
| 6.90% Sr. Unsec. Nts., 4/15/38 | | | 109,000 | | | | 135,209 | | | |
| | | |
| Wal-Mart Stores, Inc., 4.30% Sr. Unsec. Nts., 4/22/44 | | | 220,000 | | | | 220,283 | | | |
| | | | | | | | | | |
| | | | | | | 1,145,498 | | | |
| | | | | | | | |
| | | Principal
Amount | | | Value | |
| |
| Food Products—1.1% | | | | | | | | |
| |
| Bunge Ltd. Finance Corp.: | | | | | | | | |
| 3.20% Sr. Unsec. Nts., 6/15/17 | | $ | 350,000 | | | $ | 360,489 | |
| 8.50% Sr. Unsec. Nts., 6/15/19 | | | 320,000 | | | | 387,242 | |
| |
| HJ Heinz Co.: | | | | | | | | |
| 3.95% Sr. Unsec. Nts., 7/15/253,9 | | | 215,000 | | | | 216,647 | |
| 5.20% Sr. Unsec. Nts., 7/15/453,9 | | | 49,000 | | | | 50,332 | |
| |
| Ingredion, Inc., 1.80% Sr. Unsec. Nts., 9/25/17 | | | 424,000 | | | | 422,734 | |
| |
| JM Smucker Co., 1.75% Sr. Unsec. Nts., 3/15/183 | | | 334,000 | | | | 333,825 | |
| |
| Kraft Foods Group, Inc., 5% Sr. Unsec. Nts., 6/4/42 | | | 99,000 | | | | 98,678 | |
| |
| TreeHouse Foods, Inc., 4.875% Sr. Unsec. Nts., 3/15/22 | | | 420,000 | | | | 424,200 | |
| |
| Tyson Foods, Inc.: | | | | | | | | |
| 4.875% Sr. Unsec. Nts., 8/15/34 | | | 140,000 | | | | 140,901 | |
| 6.60% Sr. Unsec. Nts., 4/1/16 | | | 402,000 | | | | 417,416 | |
| | | | | | | | |
| | | | | | | 2,852,464 | |
|
| |
| Tobacco—0.4% | | | | | | | | |
| |
| Altria Group, Inc., 10.20% Sr. Unsec. Nts., 2/6/39 | | | 241,000 | | | | 396,934 | |
| |
| Reynolds American, Inc.: | | | | | | | | |
| 5.85% Sr. Unsec. Nts., 8/15/45 | | | 185,000 | | | | 195,208 | |
| 6.75% Sr. Unsec. Nts., 6/15/17 | | | 388,000 | | | | 424,120 | |
| | | | | | | | |
| | | | | | | 1,016,262 | |
|
| |
| Energy—3.8% | | | | | | | | |
| |
| Energy Equipment & Services—0.6% | | | | | | | | |
| |
| Ensco plc, 5.20% Sr. Unsec. Nts., 3/15/25 | | | 85,000 | | | | 84,194 | |
| |
| Halliburton Co., 4.75% Sr. Unsec. Nts., 8/1/43 | | | 99,000 | | | | 101,588 | |
| |
| Helmerich & Payne International Drilling Co., 4.65% Sr. Unsec. Nts., 3/15/253 | | | 165,000 | | | | 170,407 | |
| |
| Nabors Industries, Inc., 2.35% Sr. Unsec. Nts., 9/15/16 | | | 348,000 | | | | 349,086 | |
| |
| Rowan Cos., Inc., 4.875% Sr. Unsec. Unsub. Nts., 6/1/22 | | | 179,000 | | | | 177,850 | |
| |
| Sinopec Group Overseas Development 2014 Ltd., 1.75% Sr. Unsec. Nts., 4/10/173 | | | 431,000 | | | | 431,529 | |
| |
| Weatherford International Ltd., 5.95% Sr. Unsec. Nts., 4/15/42 | | | 118,000 | | | | 99,764 | |
| | | | | | | | |
| | | | | | | 1,414,418 | |
|
| |
| Oil, Gas & Consumable Fuels—3.2% | | | | | | | | |
| |
| Anadarko Petroleum Corp., 6.20% Sr. Unsec. Nts., 3/15/40 | | | 196,000 | | | | 220,941 | |
| |
| Boardwalk Pipelines LP, 4.95% Sr. Unsec. Nts., 12/15/24 | | | 234,000 | | | | 229,579 | |
| |
| Buckeye Partners LP, 6.05% Sr. Unsec. Nts., 1/15/18 | | | 189,000 | | | | 203,969 | |
| |
| Canadian Natural Resources Ltd.: | | | | | | | | |
| 1.75% Sr. Unsec. Nts., 1/15/18 | | | 165,000 | | | | 163,909 | |
| 5.90% Sr. Unsec. Nts., 2/1/18 | | | 186,000 | | | | 203,001 | |
| |
| Cenovus Energy, Inc., 5.20% Sr. Unsec. Nts., 9/15/43 | | | 116,000 | | | | 109,578 | |
| |
| Cimarex Energy Co., 4.375% Sr. Unsec. Nts., 6/1/24 | | | 224,000 | | | | 223,319 | |
| |
| CNOOC Nexen Finance 2014 ULC, 1.625% Sr. Unsec. Nts., 4/30/17 | | | 444,000 | | | | 444,768 | |
| |
| Columbia Pipeline Group, Inc., 4.50% Sr. Unsec. Nts., 6/1/253 | | | 224,000 | | | | 221,075 | |
| |
| DCP Midstream LLC, 5.375% Sr. Unsec. Nts., 10/15/153 | | | 342,000 | | | | 342,094 | |
| |
| Devon Energy Corp., 4.75% Sr. Unsec. Nts., 5/15/42 | | | 197,000 | | | | 188,021 | |
| |
| EnLink Midstream Partners LP: | | | | | | | | |
| 2.70% Sr. Unsec. Nts., 4/1/19 | | | 356,000 | | | | 351,541 | |
| 4.40% Sr. Unsec. Nts., 4/1/24 | | | 112,000 | | | | 112,353 | |
| |
| Husky Energy, Inc., 6.20% Sr. Unsec. Nts., 9/15/17 | | | 236,000 | | | | 256,357 | |
| |
| Kinder Morgan Energy Partners LP, 4.10% Sr. Unsec. Nts., 11/15/15 | | | 181,000 | | | | 182,898 | |
| |
| Kinder Morgan, Inc., 5% Sr. Unsec. Nts., 2/15/213 | | | 521,000 | | | | 548,934 | |
| |
11 OPPENHEIMER CONSERVATIVE BALANCED FUND/VA
STATEMENT OF INVESTMENTS Unaudited / Continued
| | | | | | | | | | |
| | | Principal Amount | | | Value | | | |
| | | |
| Oil, Gas & Consumable Fuels (Continued) | | | |
| | | |
| MarkWest Energy Partners LP/MarkWest Energy Finance Corp., 4.875% Sr. Unsec. Nts., 6/1/25 | | $ | 430,000 | | | $ | 421,400 | | | |
| | | |
| Noble Energy, Inc., 5.05% Sr. Unsec. Nts., 11/15/44 | | | 120,000 | | | | 115,002 | | | |
| | | |
| ONEOK Partners LP, 4.90% Sr. Unsec. Nts., 3/15/25 | | | 218,000 | | | | 215,744 | | | |
| | | |
| Origin Energy Finance Ltd.: | | | | | | | | | | |
| 3.50% Sr. Unsec. Nts., 10/9/183 | | | 468,000 | | | | 480,183 | | | |
| 5.45% Sr. Unsec. Nts., 10/14/213 | | | 295,000 | | | | 318,597 | | | |
| | | |
| Phillips 66 Partners LP, 3.605% Sr. Unsec. Nts., 2/15/25 | | | 86,000 | | | | 80,975 | | | |
| | | |
| Pioneer Natural Resources Co., 6.65% Sr. Unsec. Nts., 3/15/17 | | | 385,000 | | | | 416,465 | | | |
| | | |
| Plains All American Pipeline LP/PAA Finance Corp., 3.60% Sr. Unsec. Nts., 11/1/24 | | | 322,000 | | | | 310,944 | | | |
| | | |
| Southwestern Energy Co., 4.95% Sr. Unsec. Nts., 1/23/25 | | | 238,000 | | | | 240,562 | | | |
| | | |
| Spectra Energy Partners LP: | | | | | | | | | | |
| 4.50% Sr. Unsec. Nts., 3/15/45 | | | 85,000 | | | | 75,320 | | | |
| 4.60% Sr. Unsec. Nts., 6/15/21 | | | 277,000 | | | | 297,739 | | | |
| 4.75% Sr. Unsec. Nts., 3/15/24 | | | 229,000 | | | | 243,131 | | | |
| | | |
| Western Gas Partners LP, 4% Sr. Unsec. Nts., 7/1/22 | | | 273,000 | | | | 274,044 | | | |
| | | |
| Williams Partners LP, 4.50% Sr. Unsec. Nts., 11/15/23 | | | 195,000 | | | | 196,643 | | | |
| | | |
| Woodside Finance Ltd., 4.60% Sr. Unsec. Unsub. Nts., 5/10/213 | | | 372,000 | | | | 398,609 | | | |
| | | | | | | | | | |
| | | | | | | 8,087,695 | | | |
| |
| | | |
| Financials—10.5% | | | | | | | | | | |
| | | |
| Capital Markets—2.4% | | | | | | | | | | |
| | | |
| Apollo Management Holdings LP, 4% Sr. Unsec. Nts., 5/30/243 | | | 368,000 | | | | 368,388 | | | |
| | | |
| Blackstone Holdings Finance Co. LLC, 5% Sr. Unsec. Nts., 6/15/443 | | | 458,000 | | | | 458,554 | | | |
| | | |
| Credit Suisse, New York, 3.625% Sr. Unsec. Nts., 9/9/24 | | | 604,000 | | | | 600,927 | | | |
| | | |
| Deutsche Bank AG, 4.50% Sub. Nts., 4/1/25 | | | 435,000 | | | | 414,962 | | | |
| | | |
| Goldman Sachs Group, Inc. (The): | | | | | | | | | | |
| 5.15% Sub. Nts., 5/22/45 | | | 301,000 | | | | 290,450 | | | |
| 5.70% Jr. Sub. Perpetual Bonds, Series L5,10 | | | 448,000 | | | | 450,173 | | | |
| | | |
| KKR Group Finance Co. III LLC, 5.125% Sr. Unsec. Nts., 6/1/443 | | | 355,000 | | | | 339,935 | | | |
| | | |
| Lazard Group LLC: | | | | | | | | | | |
| 3.75% Sr. Unsec. Nts., 2/13/25 | | | 104,000 | | | | 99,019 | | | |
| 4.25% Sr. Unsec. Nts., 11/14/20 | | | 401,000 | | | | 421,744 | | | |
| | | |
| Morgan Stanley: | | | | | | | | | | |
| 4.30% Sr. Unsec. Nts., 1/27/45 | | | 255,000 | | | | 237,946 | | | |
| 5.00% Sub. Nts., 11/24/25 | | | 395,000 | | | | 413,713 | | | |
| 5.45% Jr. Sub. Perpetual Bonds, Series H5,10 | | | 428,000 | | | | 425,325 | | | |
| | | |
| Nomura Holdings, Inc., 2% Sr. Unsec. Nts., 9/13/16 | | | 452,000 | | | | 455,385 | | | |
| | | |
| Raymond James Financial, Inc., 5.625% Sr. Unsec. Unsub. Nts., 4/1/24 | | | 265,000 | | | | 294,912 | | | |
| | | |
| UBS Preferred Funding Trust V, 6.243% Jr. Sub. Perpetual Bonds, Series 15,10 | | | 638,000 | | | | 654,014 | | | |
| | | | | | | | | | |
| | | | | | | 5,925,447 | | | |
| |
| | | |
| Commercial Banks—3.7% | | | | | | | | | | |
| | | |
| Bank of America Corp., 7.75% Jr. Sub. Nts., 5/14/38 | | | 424,000 | | | | 564,657 | | | |
| | | |
| Barclays plc, 3.65% Sr. Unsec. Nts., 3/16/25 | | | 353,000 | | | | 334,626 | | | |
| | | |
| CIT Group, Inc., 3.875% Sr. Unsec. Nts., 2/19/19 | | | 434,000 | | | | 431,830 | | | |
| | | |
| Citigroup, Inc.: | | | | | | | | | | |
| 6.675% Sub. Nts., 9/13/43 | | | 199,000 | | | | 241,069 | | | |
| 5.95% Jr. Sub. Perpetual Bonds, Series D5,10 | | | 465,000 | | | | 458,606 | | | |
| | | |
| Citizens Financial Group, Inc., 5.50% Jr. Sub. Perpetual Bonds3,5,10 | | | 433,000 | | | | 421,905 | | | |
| | | | | | | | |
| | | Principal Amount | | | Value | |
| |
| Commercial Banks (Continued) | | | | | | | | |
| |
| Credit Agricole SA, 8.375% Jr. Sub. Perpetual Bonds4,5,10 | | $ | 370,000 | | | $ | 431,050 | |
| |
| FirstMerit Bank NA, 4.27% Sub. Nts., 11/25/26 | | | 432,000 | | | | 434,887 | |
| |
| HSBC Finance Capital Trust IX, 5.911% Unsec. Sub. Nts., 11/30/355 | | | 1,120,000 | | | | 1,129,016 | |
| |
| Intesa Sanpaolo SpA, 5.017% Sub. Nts., 6/26/243 | | | 445,000 | | | | 432,525 | |
| |
| JPMorgan Chase & Co., 6.75% Jr. Sub. Perpetual Bonds, Series S5,10 | | | 399,000 | | | | 426,802 | |
| |
| Lloyds Banking Group plc, 6.657% Jr. Sub. Perpetual Bonds3,5,10 | | | 400,000 | | | | 449,250 | |
| |
| Rabobank Capital Funding Trust III, 5.254% Jr. Sub. Perpetual Bonds4,5,10 | | | 751,000 | | | | 778,787 | |
| |
| Regions Bank, Birmingham AL, 6.45% Sub. Nts., 6/26/37 | | | 334,000 | | | | 397,285 | |
| |
Royal Bank of Scotland Group plc, 7.64% Jr. Sub. Perpetual Bonds,
Series U5,10 | | | 500,000 | | | | 536,750 | |
| |
| Societe Generale SA, 5.922% Jr. Sub. Perpetual Bonds3,5,10 | | | 440,000 | | | | 452,650 | |
| |
| SunTrust Banks, Inc.: | | | | | | | | |
| 3.60% Sr. Unsec. Nts., 4/15/16 | | | 460,000 | | | | 468,769 | |
| 5.625% Jr. Sub. Perpetual Bonds5,10 | | | 383,000 | | | | 386,351 | |
| |
| Wells Fargo & Co.: | | | | | | | | |
| 5.875% Jr. Sub. Perpetual Bonds5,10 | | | 162,000 | | | | 166,058 | |
5.90% Jr. Sub. Perpetual Bonds,
Series S5,10 | | | 318,000 | | | | 319,590 | |
| | | | | | | | |
| | | | | | | 9,262,463 | |
|
| |
| Consumer Finance—0.8% | | | | | | | | |
| |
| Ally Financial, Inc., 8% Sr. Unsec. Nts., 11/1/31 | | | 339,000 | | | | 407,224 | |
| |
| Capital One Financial Corp.: | | | | | | | | |
| 3.20% Sr. Unsec. Nts., 2/5/25 | | | 342,000 | | | | 323,128 | |
| 5.55% Jr. Sub. Perpetual Bonds5,10 | | | 419,000 | | | | 416,381 | |
| |
| Discover Financial Services: | | | | | | | | |
| 3.75% Sr. Unsec. Nts., 3/4/25 | | | 338,000 | | | | 322,889 | |
| 3.95% Sr. Unsec. Nts., 11/6/24 | | | 331,000 | | | | 321,774 | |
| |
| Synchrony Financial, 2.70% Sr. Unsec. Nts., 2/3/20 | | | 316,000 | | | | 312,221 | |
| | | | | | | | |
| | | | | | | 2,103,617 | |
|
| |
| Diversified Financial Services—0.3% | | | | | | | | |
| |
| Peachtree Corners Funding Trust, 3.976% Sr. Unsec. Nts., 2/15/253 | | | 221,000 | | | | 219,264 | |
| |
| Voya Financial, Inc., 5.65% Jr. Sub. Nts., 5/15/535 | | | 495,000 | | | | 507,375 | |
| | | | | | | | |
| | | | | | | 726,639 | |
|
| |
| Insurance—1.8% | | | | | | | | |
| |
| AXIS Specialty Finance plc, 5.15% Sr. Unsec. Nts., 4/1/45 | | | 368,000 | | | | 373,498 | |
| |
| Five Corners Funding Trust, 4.419% Unsec. Nts., 11/15/233 | | | 374,000 | | | | 386,492 | |
| |
| Liberty Mutual Group, Inc.: | | | | | | | | |
| 4.25% Sr. Unsec. Nts., 6/15/233 | | | 543,000 | | | | 558,653 | |
| 4.85% Sr. Unsec. Nts., 8/1/443 | | | 269,000 | | | | 259,967 | |
| |
| Lincoln National Corp., 6.05% Jr. Unsec. Sub. Nts., 4/20/675 | | | 401,000 | | | | 363,907 | |
| |
| MetLife, Inc., 5.25% Jr. Sub. Perpetual Bonds5,10 | | | 296,000 | | | | 294,150 | |
| |
| Prudential Financial, Inc., 5.20% Jr. Sub. Nts., 3/15/445 | | | 331,000 | | | | 328,137 | |
| |
| Swiss Re Capital I LP, 6.854% Jr. Sub. Perpetual Bonds4,5,10 | | | 780,000 | | | | 804,570 | |
| |
| TIAA Asset Management Finance Co. LLC, 4.125% Sr. Unsec. Nts., 11/1/243 | | | 437,000 | | | | 440,335 | |
| |
| XLIT Ltd., 6.50% Jr. Sub. Perpetual Bonds5,10 | | | 243,000 | | | | 208,526 | |
| |
| ZFS Finance USA Trust V, 6.50% Jr. Sub. Nts., 5/9/374,5 | | | 437,000 | | | | 455,572 | |
| | | | | | | | |
| | | | | | | 4,473,807 | |
|
| |
| Real Estate Investment Trusts (REITs)—1.3% | |
| |
| American Tower Corp.: | | | | | | | | |
| 5.05% Sr. Unsec. Unsub. Nts., 9/1/20 | | | 285,000 | | | | 309,775 | |
12 OPPENHEIMER CONSERVATIVE BALANCED FUND/VA
| | | | | | | | | | |
| | | Principal
Amount | | | Value | | | |
| | | |
| Real Estate Investment Trusts (REITs) (Continued) | | | |
| | | |
| American Tower Corp.: (Continued) | | | | | | | | | | |
| 5.90% Sr. Unsec. Nts., 11/1/21 | | $ | 233,000 | | | $ | 262,538 | | | |
| | | |
| Corrections Corp. of America, 4.625% Sr. Unsec. Nts., 5/1/23 | | | 425,000 | | | | 418,625 | | | |
| | | |
| First Industrial LP, 7.50% Sr. Unsec. Nts., 12/1/17 | | | 360,000 | | | | 400,847 | | | |
| | | |
| HCP, Inc., 5.625% Sr. Unsec. Nts., 5/1/17 | | | 125,000 | | | | 133,639 | | | |
| | | |
| Health Care REIT, Inc., 2.25% Sr. Unsec. Nts., 3/15/18 | | | 88,000 | | | | 88,665 | | | |
| | | |
| Highwoods Realty LP, 7.50% Sr. Unsec. Nts., 4/15/18 | | | 366,000 | | | | 418,034 | | | |
| | | |
| Host Hotels & Resorts LP, 3.75% Sr. Unsec. Nts., 10/15/23 | | | 244,000 | | | | 239,468 | | | |
| | | |
| Liberty Property LP, 5.50% Sr. Unsec. Nts., 12/15/16 | | | 268,000 | | | | 282,891 | | | |
| | | |
| Prologis LP, 4% Sr. Unsec. Nts., 1/15/18 | | | 219,000 | | | | 229,911 | | | |
| | | |
| Regency Centers LP, 5.875% Sr. Unsec. Nts., 6/15/17 | | | 48,000 | | | | 51,896 | | | |
| | | |
| Ventas Realty LP, 1.25% Sr. Unsec. Nts., 4/17/17 | | | 178,000 | | | | 177,616 | | | |
| | | |
| WEA Finance LLC/Westfield UK & Europe Finance plc, 1.75% Sr. Unsec. Nts., 9/15/173 | | | 369,000 | | | | 370,165 | | | |
| | | | | | | | | | |
| | | | | | | 3,384,070 | | | |
| | | |
| Real Estate Management & Development—0.2% | | | | | | | |
| | | |
Brookfield Asset Management, Inc., 4% Sr. Unsec. Nts., 1/15/25 | | | 475,000 | | | | 470,344 | | | |
| | | |
| Health Care—2.7% | | | | | | | | | | |
| | | |
| Biotechnology—0.2% | | | | | | | | | | |
| | | |
Baxalta, Inc., 5.25% Sr. Unsec. Nts., 6/23/453 | | | 125,000 | | | | 125,523 | | | |
| | | |
Gilead Sciences, Inc., 5.65% Sr. Unsec. Unsub. Nts., 12/1/41 | | | 263,000 | | | | 302,271 | | | |
| | | | | | | | | | |
| | | | | | | 427,794 | | | |
| | | |
| Health Care Equipment & Supplies—0.5% | | | | | | | |
| | | |
| Becton Dickinson & Co.: | | | | | | | | | | |
| 1.45% Sr. Unsec. Nts., 5/15/17 | | | 453,000 | | | | 452,810 | | | |
| 3.875% Sr. Unsec. Nts., 5/15/24 | | | 221,000 | | | | 221,958 | | | |
| | | |
DENTSPLY International, Inc., 2.75% Sr. Unsec. Nts., 8/15/16 | | | 425,000 | | | | 431,903 | | | |
| | | |
Zimmer Biomet Holdings, Inc., 3.55% Sr. Unsec. Nts., 4/1/25 | | | 130,000 | | | | 126,076 | | | |
| | | | | | | | | | |
| | | | | | | 1,232,747 | | | |
| | | |
| Health Care Providers & Services—1.0% | | | | | | | |
| | | |
| Cardinal Health, Inc., 3.50% Sr. Unsec. Nts., 11/15/24 | | | 214,000 | | | | 210,544 | | | |
| | | |
| CHS/Community Health Systems, Inc., 5.125% Sr. Sec. Nts., 8/1/21 | | | 420,000 | | | | 428,925 | | | |
| | | |
| Fresenius Medical Care US Finance II, Inc., 5.875% Sr. Unsec. Nts., 1/31/223 | | | 422,000 | | | | 451,540 | | | |
| | | |
| Laboratory Corp. of America Holdings, 3.60% Sr. Unsec. Nts., 2/1/25 | | | 610,000 | | | | 582,531 | | | |
| | | |
| LifePoint Health, Inc., 5.50% Sr. Unsec. Nts., 12/1/21 | | | 425,000 | | | | 439,875 | | | |
| | | |
| McKesson Corp., 4.883% Sr. Unsec. Nts., 3/15/44 | | | 180,000 | | | | 179,330 | | | |
| | | |
| Medco Health Solutions, Inc., 7.125% Sr. Unsec. Nts., 3/15/18 | | | 178,000 | | | | 202,649 | | | |
| | | | | | | | | | |
| | | | | | | 2,495,394 | | | |
| | | |
| Life Sciences Tools & Services—0.1% | | | | | | | | | | |
| | | |
| Life Technologies Corp., 3.50% Sr. Unsec. Nts., 1/15/16 | | | 28,000 | | | | 28,351 | | | |
| | | |
| Thermo Fisher Scientific, Inc.: | | | | | | | | | | |
| 4.15% Sr. Unsec. Nts., 2/1/24 | | | 144,000 | | | | 146,791 | | | |
| 5.30% Sr. Unsec. Nts., 2/1/44 | | | 165,000 | | | | 174,433 | | | |
| | | | | | | | | | |
| | | | | | | 349,575 | | | |
| | | |
| Pharmaceuticals—0.9% | | | | | | | | | | |
| | | |
| AbbVie, Inc.: | | | | | | | | | | |
| 3.60% Sr. Unsec. Nts., 5/14/25 | | | 208,000 | | | | 205,689 | | | |
| | | | | | | | | | |
| | | Principal
Amount | | | Value | | | |
| | | |
| Pharmaceuticals (Continued) | | | | | | | | | | |
| | | |
| AbbVie, Inc.: (Continued) | | | | | | | | | | |
| 4.70% Sr. Unsec. Nts., 5/14/45 | | $ | 83,000 | | | $ | 82,182 | | | |
| | | |
| Actavis Funding SCS: | | | | | | | | | | |
| 1.30% Sr. Unsec. Nts., 6/15/17 | | | 287,000 | | | | 285,155 | | | |
| 1.85% Sr. Unsec. Nts., 3/1/17 | | | 150,000 | | | | 150,774 | | | |
| 3.80% Sr. Unsec. Nts., 3/15/25 | | | 368,000 | | | | 361,671 | | | |
| 4.75% Sr. Unsec. Nts., 3/15/45 | | | 182,000 | | | | 173,181 | | | |
| | | |
| Hospira, Inc.: | | | | | | | | | | |
| 5.20% Sr. Unsec. Nts., 8/12/20 | | | 441,000 | | | | 493,073 | | | |
| 6.05% Sr. Unsec. Nts., 3/30/17 | | | 172,000 | | | | 185,118 | | | |
| | | |
| Mallinckrodt International Finance SA, 3.50% Sr. Unsec. Nts., 4/15/18 | | | 468,000 | | | | 471,510 | | | |
| | | | | | | | | | |
| | | | | | | 2,408,353 | | | |
| | | |
| Industrials—3.3% | | | | | | | | | | |
| | | |
| Aerospace & Defense—0.3% | | | | | | | | | | |
| | | |
BAE Systems Holdings, Inc., 3.80% Sr. Unsec. Nts., 10/7/243 | | | 248,000 | | | | 249,137 | | | |
| | | |
L-3 Communications Corp., 1.50% Sr. Unsec. Nts., 5/28/17 | | | 118,000 | | | | 117,227 | | | |
| | �� | |
| Northrop Grumman Corp., 4.75% Sr. Unsec. Nts., 6/1/43 | | | 115,000 | | | | 116,209 | | | |
| | | |
| Textron, Inc.: | | | | | | | | | | |
| 3.875% Sr. Unsec. Nts., 3/1/25 | | | 129,000 | | | | 127,050 | | | |
| 4.30% Sr. Unsec. Nts., 3/1/24 | | | 230,000 | | | | 238,954 | | | |
| | | | | | | | | | |
| | | | | | | 848,577 | | | |
| | | |
| Building Products—0.2% | | | | | | | | | | |
| | | |
| Owens Corning, 4.20% Sr. Unsec. Nts., 12/15/22 | | | 505,000 | | | | 512,044 | | | |
| |
| | | |
| Commercial Services & Supplies—0.6% | | | |
| | | |
| Clean Harbors, Inc., 5.25% Sr. Unsec. Unsub. Nts., 8/1/20 | | | 468,000 | | | | 477,360 | | | |
| | | |
| Pitney Bowes, Inc., 4.625% Sr. Unsec. Nts., 3/15/24 | | | 575,000 | | | | 580,178 | | | |
| | | |
| R.R. Donnelley & Sons Co., 7.625% Sr. Unsec. Nts., 6/15/20 | | | 385,000 | | | | 434,088 | | | |
| | | | | | | | | | |
| | | | | | | 1,491,626 | | | |
| | | |
| Electrical Equipment—0.1% | | | | | | | | | | |
| | | |
Sensata Technologies BV, 4.875% Sr. Unsec. Nts., 10/15/233 | | | 349,000 | | | | 345,946 | | | |
| | | |
| Industrial Conglomerates—0.4% | | | | | | | | | | |
| | | |
| General Electric Capital Corp., 6.25% Jr. Sub. Perpetual Bonds, Series B5,10 | | | 889,000 | | | | 973,455 | | | |
| | | |
| Synchrony Financial, 4.25% Sr. Unsec. Nts., 8/15/24 | | | 117,000 | | | | 117,555 | | | |
| | | | | | | | | | |
| | | | | | | 1,091,010 | | | |
| | | |
| Machinery—0.5% | | | | | | | | | | |
| | | |
| Crane Co., 4.45% Sr. Unsec. Nts., 12/15/23 | | | 234,000 | | | | 243,865 | | | |
| | | |
| Ingersoll-Rand Global Holding Co. Ltd., 4.25% Sr. Unsec. Nts., 6/15/23 | | | 410,000 | | | | 425,233 | | | |
| | | |
| Joy Global, Inc., 6% Sr. Unsec. Nts., 11/15/16 | | | 71,000 | | | | 75,310 | | | |
| | | |
| Starwood Hotels & Resorts Worldwide, Inc., 7.375% Sr. Unsec. Nts., 11/15/15 | | | 384,000 | | | | 392,620 | | | |
| | | | | | | | | | |
| | | | | | | 1,137,028 | | | |
| | | |
| Professional Services—0.2% | | | | | | | | | | |
| | | |
| Experian Finance plc, 2.375% Sr. Unsec. Nts., 6/15/173 | | | 427,000 | | | | 429,280 | | | |
| |
| | | |
| Road & Rail—0.6% | | | | | | | | | | |
| | | |
| Burlington Northern Santa Fe LLC, 3% Sr. Unsec. Nts., 3/15/23 | | | 365,000 | | | | 356,745 | | | |
| | | |
| ERAC USA Finance LLC, 4.50% Sr. Unsec. Nts., 2/15/453 | | | 126,000 | | | | 115,825 | | | |
| | | |
| Kansas City Southern de Mexico SA de CV, 3% Sr. Unsec. Nts., 5/15/23 | | | 372,000 | | | | 357,439 | | | |
|
| 13 OPPENHEIMER CONSERVATIVE BALANCED FUND/VA |
STATEMENT OF INVESTMENTS Unaudited / Continued
| | | | | | | | | | |
| | | Principal
Amount | | | Value | | | |
| | | |
| Road & Rail (Continued) | | | | | | | | | | |
| | | |
| Penske Truck Leasing Co. LP/PTL Finance Corp.: | | | | | | | | | | |
| 2.50% Sr. Unsec. Nts., 3/15/163 | | $ | 446,000 | | | $ | 449,170 | | | |
| 4.25% Sr. Unsec. Nts., 1/17/233 | | | 250,000 | | | | 253,452 | | | |
| | | | | | | | | | |
| | | | | | | 1,532,631 | | | |
| | | |
| Trading Companies & Distributors—0.4% | | | |
| | | |
| Air Lease Corp., 3.875% Sr. Unsec. Nts., 4/1/21 | | | 456,000 | | | | 461,700 | | | |
| | | |
| International Lease Finance Corp., 5.875% Sr. Unsec. Nts., 8/15/22 | | | 370,000 | | | | 400,988 | | | |
| | | | | | | | | | |
| | | | | | | 862,688 | | | |
| | | |
| Information Technology—1.9% | | | | | | | | | | |
| | | |
| Communications Equipment—0.3% | | | |
| | | |
| Motorola Solutions, Inc., 3.50% Sr. Unsec. Nts., 3/1/23 | | | 316,000 | | | | 298,161 | | | |
| | | |
| QUALCOMM, Inc., 3.45% Sr. Unsec. Nts., 5/20/25 | | | 400,000 | | | | 389,667 | | | |
| | | | | | | | | | |
| | | | | | | 687,828 | | | |
| | | |
| Electronic Equipment, Instruments, & Components—0.6% | | | |
| | | |
| Arrow Electronics, Inc., 5.125% Sr. Unsec. Unsub. Nts., 3/1/21 | | | 525,000 | | | | 570,440 | | | |
| | | |
| Avnet, Inc., 4.875% Sr. Unsec. Unsub. Nts., 12/1/22 | | | 550,000 | | | | 572,843 | | | |
| | | |
| Flextronics International Ltd., 4.75% Sr. Unsec. Nts., 6/15/253 | | | 330,000 | | | | 327,789 | | | |
| | | | | | | | | | |
| | | | | | | 1,471,072 | | | |
| | | |
| Internet Software & Services—0.2% | | | |
| | | |
VeriSign, Inc., 5.25% Sr. Unsec. Nts., 4/1/253 | | | 440,000 | | | | 440,000 | | | |
| | | |
| IT Services—0.3% | | | | | | | | | | |
| | | |
| Fidelity National Information Services, Inc.: | | | | | | | | | | |
| 1.45% Sr. Unsec. Nts., 6/5/17 | | | 351,000 | | | | 350,321 | | | |
| 3.50% Sr. Unsec. Nts., 4/15/23 | | | 244,000 | | | | 236,933 | | | |
| | | |
| Xerox Corp.: | | | | | | | | | | |
| 2.95% Sr. Unsec. Nts., 3/15/17 | | | 149,000 | | | | 152,656 | | | |
| 6.75% Sr. Unsec. Nts., 2/1/17 | | | 75,000 | | | | 80,810 | | | |
| | | | | | | | | | |
| | | | | | | 820,720 | | | |
| | | |
| Software—0.3% | | | | | | | | | | |
| | | |
| Autodesk, Inc., 4.375% Sr. Unsec. Nts., 6/15/25 | | | 125,000 | | | | 125,391 | | | |
| | | |
| Open Text Corp., 5.625% Sr. Unsec. Nts., 1/15/233 | | | 256,000 | | | | 254,080 | | | |
| | | |
| Oracle Corp., 3.40% Sr. Unsec. Nts., 7/8/24 | | | 322,000 | | | | 322,726 | | | |
| | | | | | | | | | |
| | | | | | | 702,197 | | | |
| |
| | | |
| Technology Hardware, Storage & Peripherals—0.2% | | | |
| | | |
| Apple, Inc., 4.375% Sr. Unsec. Nts., 5/13/45 | | | 227,000 | | | | 223,754 | | | |
| | | |
| Hewlett-Packard Co., 2.65% Sr. Unsec. Unsub. Nts., 6/1/16 | | | 443,000 | | | | 448,638 | | | |
| | | | | | | | | | |
| | | | | | | 672,392 | | | |
| | | |
| Materials—2.1% | | | | | | | | | | |
| | | |
| Chemicals—0.8% | | | | | | | | | | |
| | | |
| Agrium, Inc.: | | | | | | | | | | |
| 3.375% Sr. Unsec. Nts., 3/15/25 | | | 174,000 | | | | 165,522 | | | |
| 4.125% Sr. Unsec. Nts., 3/15/35 | | | 87,000 | | | | 77,809 | | | |
| | | |
| Eastman Chemical Co.: | | | | | | | | | | |
| 3.00% Sr. Unsec. Nts., 12/15/15 | | | 218,000 | | | | 219,976 | | | |
| 4.65% Sr. Unsec. Nts., 10/15/44 | | | 112,000 | | | | 106,133 | | | |
| | | |
| LYB International Finance BV, 5.25% Sr. Unsec. Nts., 7/15/43 | | | 144,000 | | | | 146,727 | | | |
| | | |
| Methanex Corp., 4.25% Sr. Unsec. Nts., 12/1/24 | | | 256,000 | | | | 253,928 | | | |
| | | |
| Rockwood Specialties Group, Inc., 4.625% Sr. Unsec. Nts., 10/15/20 | | | 450,000 | | | | 469,125 | | | |
| | | |
| RPM International, Inc., 3.45% Sr. Unsec. Unsub. Nts., 11/15/22 | | | 378,000 | | | | 364,722 | | | |
| | | |
| Valspar Corp. (The), 3.30% Sr. Unsec. Nts., 2/1/25 | | | 122,000 | | | | 117,471 | | | |
| | | | | | | | | | |
| | | | | | | 1,921,413 | | | |
| | | | | | | | |
| | | Principal
Amount | | | Value | |
| |
| Construction Materials—0.2% | | | | | | | | |
| |
| CRH America, Inc., 5.125% Sr. Unsec. Nts., 5/18/453 | | $ | 115,000 | | | $ | 113,746 | |
| |
| James Hardie International Finance Ltd., 5.875% | | | | | | | | |
| Sr. Unsec. Nts., 2/15/233 | | | 421,000 | | | | 435,735 | |
| | | | | | | | |
| | | | | | | 549,481 | |
| |
| Containers & Packaging—0.6% | | | | | | | | |
| |
| Ball Corp., 4% Sr. Unsec. Nts., 11/15/23 | | | 415,000 | | | | 386,988 | |
| |
| Packaging Corp. of America: | | | | | | | | |
| 3.65% Sr. Unsec. Nts., 9/15/24 | | | 113,000 | | | | 110,785 | |
| 4.50% Sr. Unsec. Nts., 11/1/23 | | | 358,000 | | | | 369,355 | |
| |
| Rock-Tenn Co., 3.50% Sr. Unsec. Unsub. Nts., 3/1/20 | | | 729,000 | | | | 750,906 | |
| | | | | | | | |
| | | | | | | 1,618,034 | |
| |
| Metals & Mining—0.4% | | | | | | | | |
| |
| Carpenter Technology Corp., 4.45% Sr. Unsec. Unsub. Nts., 3/1/23 | | | 159,000 | | | | 158,224 | |
| Freeport-McMoRan, Inc., 3.875% Sr. Unsec. Nts., 3/15/23 | | | 142,000 | | | | 129,048 | |
| |
| Glencore Finance Canada Ltd., 3.60% Sr. Unsec. Nts., 1/15/173 | | | 348,000 | | | | 357,286 | |
| |
| Glencore Funding LLC, 4.625% Sr. Unsec. Nts., 4/29/243 | | | 159,000 | | | | 157,967 | |
| |
| Goldcorp, Inc., 5.45% Sr. Unsec. Nts., 6/9/44 | | | 116,000 | | | | 110,460 | |
| |
| Yamana Gold, Inc., 4.95% Sr. Unsec. Nts., 7/15/24 | | | 230,000 | | | | 221,640 | |
| | | | | | | | |
| | | | | | | 1,134,625 | |
| |
| Paper & Forest Products—0.1% | | | | | | | | |
| |
| International Paper Co., 4.80% Sr. Unsec. Nts., 6/15/44 | | | 183,000 | | | | 169,737 | |
|
| |
| Telecommunication Services—1.8% | |
| |
| Diversified Telecommunication Services—1.7% | |
| |
| AT&T, Inc., 4.35% Sr. Unsec. Nts., 6/15/45 | | | 614,000 | | | | 525,938 | |
| |
| British Telecommunications plc, 9.625% Sr. Unsec. Nts., 12/15/30 | | | 288,000 | | | | 427,686 | |
| |
| CenturyLink, Inc., 6.45% Sr. Unsec. Nts., 6/15/21 | | | 397,000 | | | | 401,963 | |
| |
| Deutsche Telekom International Finance BV, 5.75% Sr. Unsec. Nts., 3/23/16 | | | 402,000 | | | | 415,910 | |
| |
| Frontier Communications Corp., 7.625% Sr. Unsec. Nts., 4/15/24 | | | 395,000 | | | | 350,563 | |
| |
| Orange SA, 2.75% Sr. Unsec. Nts., 9/14/16 | | | 111,000 | | | | 113,032 | |
| |
| Telecom Italia Capital SA, 7.721% Sr. Unsec. Unsub. Nts., 6/4/38 | | | 277,000 | | | | 313,010 | |
| |
| Telefonica Emisiones SAU, 7.045% Sr. Unsec. Unsub. Nts., 6/20/36 | | | 169,000 | | | | 207,594 | |
| |
| Verizon Communications, Inc.: | | | | | | | | |
| 3.50% Sr. Unsec. Nts., 11/1/24 | | | 189,000 | | | | 183,921 | |
| 4.50% Sr. Unsec. Nts., 9/15/20 | | | 1,050,000 | | | | 1,132,954 | |
| 4.522% Sr. Unsec. Nts., 9/15/483 | | | 288,000 | | | | 254,707 | |
| 5.012% Sr. Unsec. Nts., 8/21/54 | | | 105,000 | | | | 96,371 | |
| | | | | | | | |
| | | | | | | 4,423,649 | |
| |
| Wireless Telecommunication Services—0.1% | |
| |
| America Movil SAB de CV, 4.375% Sr. Unsec. | | | | | | | | |
| Unsub. Nts., 7/16/42 | | | 164,000 | | | | 152,710 | |
| |
| Utilities—2.6% | | | | | | | | |
| |
| Electric Utilities—1.5% | | | | | | | | |
| |
| American Transmission Systems, Inc., 5% Sr. Unsec. Nts., 9/1/443 | | | 118,000 | | | | 119,948 | |
| |
| EDP Finance BV, 5.25% Sr. Unsec. Nts., 1/14/213 | | | 325,000 | | | | 341,175 | |
| |
| Enel Finance International NV, 6.25% Sr. Unsec. Nts., 9/15/173 | | | 389,000 | | | | 426,046 | |
| |
| Exelon Corp., 3.95% Sr. Unsec. Nts., 6/15/25 | | | 411,000 | | | | 413,626 | |
| |
| ITC Holdings Corp.: | | | | | | | | |
| 3.65% Sr. Unsec. Nts., 6/15/24 | | | 390,000 | | | | 386,312 | |
| 5.30% Sr. Unsec. Nts., 7/1/43 | | | 93,000 | | | | 99,399 | |
|
| 14 OPPENHEIMER CONSERVATIVE BALANCED FUND/VA |
| | | | | | | | | | |
| | | Principal
Amount | | | Value | | | |
| | | |
| Electric Utilities (Continued) | | | | | | | | | | |
| | | |
| NextEra Energy Capital Holdings, Inc., 1.586% Sr. Unsec. Nts., 6/1/17 | | $ | 419,000 | | | $ | 419,691 | | | |
| | | |
| Pennsylvania Electric Co., 5.20% Sr. Unsec. Nts., 4/1/20 | | | 88,000 | | | | 96,361 | | | |
| | | |
| PPL Capital Funding, Inc.: | | | | | | | | | | |
| 3.50% Sr. Unsec. Unsub. Nts., 12/1/22 | | | 158,000 | | | | 159,946 | | | |
| 4.20% Sr. Sec. Nts., 6/15/22 | | | 82,000 | | | | 86,315 | | | |
| | | |
| PPL WEM Ltd./Western Power Distribution Ltd., 5.375% Sr. Unsec. Unsub. Nts., 5/1/213 | | | 590,000 | | | | 652,814 | | | |
| | | |
| Public Service Co. of New Mexico, 7.95% Sr. Unsec. Nts., 5/15/18 | | | 347,000 | | | | 403,861 | | | |
| | | |
| Trans-Allegheny Interstate Line Co., 3.85% Sr. Unsec. Nts., 6/1/253 | | | 277,000 | | | | 275,292 | | | |
| | | | | | | | | | |
| | | | | | | 3,880,786 | | | |
| | | |
| Independent Power and Renewable Electricity Producers—0.3% | | | |
| | | |
| Dayton Power & Light Co. (The), 1.875% Sec. Nts., 9/15/16 | | | 329,000 | | | | 330,847 | | | |
| | | |
| NRG Yield Operating LLC, 5.375% Sr. Unsec. Nts., 8/15/243 | | | 405,000 | | | | 410,063 | | | |
| | | | | | | | | | |
| | | | | | | 740,910 | | | |
| | | |
| Multi-Utilities—0.8% | | | | | | | | | | |
| | | |
| Berkshire Hathaway Energy Co., 4.50% Sr. Unsec. Nts., 2/1/45 | | | 224,000 | | | | 218,905 | | | |
| | | | | | | | | | |
| | | | | | | | | | |
| | | | | | | | | | |
| | | | | | | | | | |
| | | | | | | | | | |
| | | Principal
Amount | | | Value | | | |
| | | |
| Multi-Utilities (Continued) | | | | | | | | | | |
| | | |
| CenterPoint Energy, Inc., 5.95% Sr. Unsec. Nts., 2/1/17 | | $ | 386,000 | | | $ | 414,542 | | | |
| | | |
| CMS Energy Corp.: | | | | | | | | | | |
| 3.875% Sr. Unsec. Nts., 3/1/24 | | | 240,000 | | | | 244,131 | | | |
| 5.05% Sr. Unsec. Unsub. Nts., 3/15/22 | | | 349,000 | | | | 384,261 | | | |
| | | |
| Consolidated Edison Co. of New York, Inc., | | | | | | | | | | |
| 4.625% Sr. Unsec. Nts., 12/1/54 | | | 100,000 | | | | 97,225 | | | |
| | | |
| Dominion Gas Holdings LLC, 4.60% Sr. Unsec. Nts., 12/15/44 | | | 170,000 | | | | 160,025 | | | |
| | | |
| NiSource Finance Corp., 4.80% Sr. Unsec. Nts., 2/15/44 | | | 179,000 | | | | 182,561 | | | |
| | | |
| Puget Energy, Inc., 3.65% Sr. Sec. Nts., 5/15/253 | | | 206,000 | | | | 201,721 | | | |
| | | | | | | | | | |
| | | | | | | 1,903,371 | | | |
| | | | | | | | | | |
| Total Non-Convertible Corporate Bonds and Notes | | | | | | | | | | |
| (Cost $90,350,754) | | | | | | | 90,741,298 | | | |
| | | |
| | | Shares | | | | | | |
| | | |
| Investment Company—2.1% | | | |
| | | |
| Oppenheimer Institutional Money Market Fund, Cl. | | | | | | | | | | |
| E, 0.15%11,12 (Cost $5,367,607) | | | 5,367,607 | | | | 5,367,607 | | | |
| | | |
| Total Investments, at Value (Cost | | | | | | | | | | |
| $266,589,803) | | | 112.1% | | | | 282,442,714 | | | |
| | | |
| Net Other Assets (Liabilities) | | | (12.1) | | | | (30,476,685) | | | |
| | | | | | |
| Net Assets | | | 100.0% | | | $ | 251,966,029 | | | |
| | | | | | |
Footnotes to Statement of Investments
1. Non-income producing security.
2. Security is a Master Limited Partnership.
3. Represents securities sold under Rule 144A, which are exempt from registration under the Securities Act of 1933, as amended. These securities have been determined to be liquid under guidelines established by the Board of Trustees. These securities amount to $45,813,152 or 18.18% of the Fund’s net assets as of June 30, 2015.
4. Restricted security. The aggregate value of restricted securities as of June 30, 2015 was $3,166,198, which represents 1.26% of the Fund’s net assets. See Note 4 of the accompanying Notes. Information concerning restricted securities is as follows:
| | | | | | | | | | | | | | |
| Security | | Acquisition Dates | | Cost | | | Value | | | Unrealized
Appreciation/
(Depreciation) | |
| |
| Banc of America Funding Trust, Series 2014-R7, Cl. 3A1, 2.617%, 3/26/36 | | 3/6/15 - 5/13/15 | | $ | 409,474 | | | $ | 409,343 | | | $ | (131) | |
| Credit Agricole SA, 8.375% Jr. Sub. Perpetual Bonds | | 10/27/14 - 11/13/14 | | | 422,020 | | | | 431,050 | | | | 9,030 | |
| Drive Auto Receivables Trust, Series 2015-AA, Cl. C, 3.06%, 5/17/21 | | 3/12/15 | | | 284,961 | | | | 286,876 | | | | 1,915 | |
| Rabobank Capital Funding Trust III, 5.254% Jr. Sub. Perpetual Bonds | | 5/1/13 - 5/8/13 | | | 758,664 | | | | 778,787 | | | | 20,123 | |
| Swiss Re Capital I LP, 6.854% Jr. Sub. Perpetual Bonds | | 3/10/10 - 7/22/13 | | | 745,138 | | | | 804,570 | | | | 59,432 | |
| ZFS Finance USA Trust V, 6.50% Jr. Sub. Nts., 5/9/37 | | 11/20/13 | | | 452,460 | | | | 455,572 | | | | 3,112 | |
| | | | | | |
| | | | $ | 3,072,717 | | | $ | 3,166,198 | | | $ | 93,481 | |
| | | | | | |
5. Represents the current interest rate for a variable or increasing rate security.
6. Interest-Only Strips represent the right to receive the monthly interest payments on an underlying pool of mortgage loans. These securities typically decline in price as interest rates decline.
Most other fixed income securities increase in price when interest rates decline. The principal amount of the underlying pool represents the notional amount on which current interest is calculated. The price of these securities is typically more sensitive to changes in prepayment rates than traditional mortgage-backed securities (for example, GNMA pass-throughs). Interest rates disclosed represent current yields based upon the current cost basis and estimated timing and amount of future cash flows. These securities amount to $2,079,291 or 0.83% of the Fund’s net assets as of June 30, 2015.
7. Interest rate is less than 0.0005%.
8. Principal-Only Strips represent the right to receive the monthly principal payments on an underlying pool of mortgage loans. The value of these securities generally increases as interest rates decline and prepayment rates rise. The price of these securities is typically more volatile than that of coupon-bearing bonds of the same maturity. Interest rates disclosed represent current yields based upon the current cost basis and estimated timing of future cash flows. These securities amount to $94,821 or 0.04% of the Fund’s net assets as of June 30, 2015.
9. All or a portion of the security position is when-issued or delayed delivery to be delivered and settled after June 30, 2015. See Note 4 of the accompanying Notes.
10. This bond has no contractual maturity date, is not redeemable and contractually pays an indefinite stream of interest. Rate reported represents the current interest rate for this variable rate security.
11. Rate shown is the 7-day yield as of June 30, 2015.
15 OPPENHEIMER CONSERVATIVE BALANCED FUND/VA
STATEMENT OF INVESTMENTS Unaudited / Continued
Footnotes to Statement of Investments (Continued)
12. Is or was an affiliate, as defined in the Investment Company Act of 1940, as amended, at or during the period ended June 30, 2015, by virtue of the Fund owning at least 5% of the voting securities of the issuer or as a result of the Fund and the issuer having the same investment adviser. Transactions during the period in which the issuer was an affiliate are as follows:
| | | | | | | | | | | | | | | | |
| | | Shares
December 31, 2014 | | | Gross
Additions | | | Gross Reductions | | | Shares
June 30, 2015 | |
| |
Oppenheimer Institutional Money Market Fund, Cl. E | | | 5,367,607 | | | | — | | | | — | | | | 5,367,607 | |
| | | | |
| | | | | | | | | Value | | | Income | |
| |
Oppenheimer Institutional Money Market Fund, Cl. E | | | | | | | | | | $ | 5,367,607 | | | $ | 3,285 | |
| | | | | | | | | | | | | | | | | | | | | | | | |
| |
| Futures Contracts as of June 30, 2015 | | | | | | | | | | | | | | | | | | | | | | | | |
| Description | | Exchange | | | Buy/Sell | | | Expiration Date | | | Number of
Contracts | | | Value | | | Unrealized Appreciation
(Depreciation) | |
| |
| United States Treasury Long Bonds | | | CBT | | | | Sell | | | | 9/21/15 | | | | 14 | | | $ | 2,111,813 | | | $ | 36,778 | |
| United States Treasury Nts., 2 yr. | | | CBT | | | | Buy | | | | 9/30/15 | | | | 31 | | | | 6,787,063 | | | | 5,202 | |
| United States Treasury Nts., 10 yr. | | | CBT | | | | Sell | | | | 9/21/15 | | | | 107 | | | | 13,500,391 | | | | 83,513 | |
| United States Treasury Ultra Bonds | | | CBT | | | | Buy | | | | 9/21/15 | | | | 50 | | | | 7,703,125 | | | | (203,016) | |
| | | | | | | | | | | | | | | | | | | | | | | | |
| | | | | | | | | | | | | | | | | | | | | | $ | (77,523) | |
| | | | | | | | | | | | | | | | | | | | | | | | |
Glossary:
Exchange Abbreviations
| | |
CBT | | Chicago Board of Trade |
See accompanying Notes to Financial Statements.
16 OPPENHEIMER CONSERVATIVE BALANCED FUND/VA
STATEMENT OF ASSETS AND LIABILITIES June 30, 2015 Unaudited
| | | | |
|
| |
Assets | | | | |
Investments, at value—see accompanying statement of investments: | | | | |
Unaffiliated companies (cost $261,222,196) | | $ | 277,075,107 | |
Affiliated companies (cost $5,367,607) | | | 5,367,607 | |
| | | | |
| | | 282,442,714 | |
| |
Cash | | | 9,344,983 | |
| |
Cash used for collateral on futures | | | 260,000 | |
| |
Receivables and other assets: | | | | |
Investments sold (including $26,512,225 sold on a when-issued or delayed delivery basis) | | | 28,029,377 | |
Interest, dividends and principal paydowns | | | 1,228,134 | |
Shares of beneficial interest sold | | | 18,396 | |
Variation margin receivable | | | 4,940 | |
Other | | | 47,627 | |
| | | | |
Total assets | | | 321,376,171 | |
|
| |
Liabilities | | | | |
Payables and other liabilities: | | | | |
Investments purchased (including $68,396,655 purchased on a when-issued or delayed delivery basis) | | | 69,203,046 | |
Shares of beneficial interest redeemed | | | 104,129 | |
Trustees’ compensation | | | 38,354 | |
Distribution and service plan fees | | | 12,285 | |
Variation margin payable | | | 6,309 | |
Shareholder communications | | | 5,642 | |
Other | | | 40,377 | |
| | | | |
Total liabilities | | | 69,410,142 | |
|
| |
Net Assets | | $ | 251,966,029 | |
| | | | |
|
| |
Composition of Net Assets | | | | |
Par value of shares of beneficial interest | | $ | 17,392 | |
| |
Additional paid-in capital | | | 249,007,976 | |
| |
Accumulated net investment income | | | 2,655,089 | |
| |
Accumulated net realized loss on investments and foreign currency transactions | | | (15,488,481) | |
| |
Net unrealized appreciation on investments and translation of assets and liabilities denominated in foreign currencies | | | 15,774,053 | |
| | | | |
Net Assets | | $ | 251,966,029 | |
| | | | |
|
| |
| | | | |
Net Asset Value Per Share | | | | |
Non-Service Shares: | | | | |
| Net asset value, redemption price per share and offering price per share (based on net assets of $192,859,263 and 13,276,284 shares of beneficial interest outstanding) | | $ | 14.53 | |
| |
Service Shares: | | | | |
| Net asset value, redemption price per share and offering price per share (based on net assets of $59,106,766 and 4,116,207 shares of beneficial interest outstanding) | | $ | 14.36 | |
See accompanying Notes to Financial Statements.
17 OPPENHEIMER CONSERVATIVE BALANCED FUND/VA
STATEMENT OF OPERATIONS For the Six Months Ended June 30, 2015 Unaudited
| | | | |
|
| |
Investment Income | | | | |
Interest from unaffiliated companies (net of foreign withholding taxes of $497) | | $ | 2,887,137 | |
| |
Dividends: | | | | |
Unaffiliated companies (net of foreign withholding taxes of $3,723) | | | 780,670 | |
Affiliated companies | | | 3,285 | |
| | | | |
Total investment income | | | 3,671,092 | |
|
| |
Expenses | | | | |
Management fees | | | 967,106 | |
| |
Distribution and service plan fees: | | | | |
Distribution and service plan fees - Service shares | | | 76,848 | |
| |
Transfer and shareholder servicing agent fees: | | | | |
Non-Service shares | | | 99,438 | |
Service shares | | | 30,750 | |
| |
Shareholder communications: | | | | |
Non-Service shares | | | 17,925 | |
Service shares | | | 5,542 | |
| |
Custodian fees and expenses | | | 22,162 | |
| |
Trustees’ compensation | | | 7,299 | |
| |
Other | | | 31,440 | |
| | | | |
Total expenses | | | 1,258,510 | |
Less reduction to custodian expenses | | | (647) | |
Less waivers and reimbursements of expenses | | | (308,690) | |
| | | | |
Net expenses | | | 949,173 | |
|
| |
Net Investment Income | | | 2,721,919 | |
|
| |
Realized and Unrealized Gain (Loss) | | | | |
Net realized gain (loss) on: | | | | |
Investments from unaffiliated companies | | | 4,902,491 | |
Closing and expiration of futures contracts | | | (156,402) | |
Foreign currency transactions | | | (2,403) | |
| | | | |
Net realized gain | | | 4,743,686 | |
| |
Net change in unrealized appreciation/depreciation on: | | | | |
Investments | | | (3,624,102) | |
Translation of assets and liabilities denominated in foreign currencies | | | (35,848) | |
Futures contracts | | | (381,064) | |
| | | | |
Net change in unrealized appreciation/depreciation | | | (4,041,014) | |
|
| |
Net Increase in Net Assets Resulting from Operations | | $ | 3,424,591 | |
| | | | |
See accompanying Notes to Financial Statements.
18 OPPENHEIMER CONSERVATIVE BALANCED FUND/VA
STATEMENTS OF CHANGES IN NET ASSETS
| | | | | | | | |
| | | Six Months Ended
June 30, 2015
(Unaudited) | | | Year Ended
December 31, 2014 | |
| |
Operations | | | | | | | | |
Net investment income | | $ | 2,721,919 | | | $ | 5,395,256 | |
| |
Net realized gain | | | 4,743,686 | | | | 12,573,539 | |
| |
Net change in unrealized appreciation/depreciation | | | (4,041,014) | | | | 3,629,766 | |
| | | | | | | | |
Net increase in net assets resulting from operations | | | 3,424,591 | | | | 21,598,561 | |
|
| |
Dividends and/or Distributions to Shareholders | | | | | | | | |
Dividends from net investment income: | | | | | | | | |
Non-Service shares | | | (4,370,337) | | | | (4,273,013) | |
Service shares | | | (1,196,499) | | | | (1,173,553) | |
| | | | |
| | | (5,566,836) | | | | (5,446,566) | |
|
| |
Beneficial Interest Transactions | | | | | | | | |
Net decrease in net assets resulting from beneficial interest transactions: | | | | | | | | |
Non-Service shares | | | (9,118,013) | | | | (22,300,027) | |
Service shares | | | (4,337,458) | | | | (9,586,563) | |
| | | | | | | | |
| | | (13,455,471) | | | | (31,886,590) | |
|
| |
Net Assets | | | | | | | | |
Total decrease | | | (15,597,716) | | | | (15,734,595) | |
| |
Beginning of period | | | 267,563,745 | | | | 283,298,340 | |
| | | | | | | | |
| End of period (including accumulated net investment income of $ 2,655,089 and $ 5,500,006, respectively) | | $ | 251,966,029 | | | $ | 267,563,745 | |
| | | | |
See accompanying Notes to Financial Statements.
19 OPPENHEIMER CONSERVATIVE BALANCED FUND/VA
FINANCIAL HIGHLIGHTS
| | | | | | | | | | | | | | | | | | | | | | | | |
| Non-Service Shares | | Six Months
Ended
June 30,
2015
(Unaudited) | | | Year Ended
December
31, 2014 | | | Year Ended
December
31, 2013 | | | Year Ended
December
31, 2012 | | | Year Ended
December
30, 20111 | | | Year Ended
December
31, 2010 | |
| |
Per Share Operating Data | | | | | | | | | | | | | | | | | | | | | | | | |
Net asset value, beginning of period | | $ | 14.67 | | | $ | 13.84 | | | $ | 12.52 | | | $ | 11.30 | | | $ | 11.47 | | | $ | 10.30 | |
| |
Income (loss) from investment operations: | | | | | | | | | | | | | | | | | | | | | | | | |
Net investment income2 | | | 0.16 | | | | 0.29 | | | | 0.25 | | | | 0.29 | | | | 0.20 | | | | 0.23 | |
Net realized and unrealized gain (loss) | | | 0.04 | | | | 0.83 | | | | 1.38 | | | | 1.09 | | | | (0.11) | | | | 1.09 | |
| | | | |
Total from investment operations | | | 0.20 | | | | 1.12 | | | | 1.63 | | | | 1.38 | | | | 0.09 | | | | 1.32 | |
| |
Dividends and/or distributions to shareholders: | | | | | | | | | | | | | | | | | | | | | | | | |
Dividends from net investment income | | | (0.34) | | | | (0.29) | | | | (0.31) | | | | (0.16) | | | | (0.26) | | | | (0.15) | |
| |
Net asset value, end of period | | $ | 14.53 | | | $ | 14.67 | | | $ | 13.84 | | | $ | 12.52 | | | $ | 11.30 | | | $ | 11.47 | |
| | | | |
|
| |
Total Return, at Net Asset Value3 | | | 1.32% | | | | 8.20% | | | | 13.17% | | | | 12.34% | | | | 0.72% | | | | 12.91% | |
|
| |
Ratios/Supplemental Data | | | | | | | | | | | | | | | | | | | | | | | | |
Net assets, end of period (in thousands) | | $ | 192,859 | | | $ | 203,684 | | | $ | 213,697 | | | $ | 218,032 | | | $ | 128,383 | | | $ | 150,622 | |
| |
Average net assets (in thousands) | | $ | 200,439 | | | $ | 208,556 | | | $ | 218,090 | | | $ | 191,416 | | | $ | 141,848 | | | $ | 151,620 | |
| |
Ratios to average net assets:4 | | | | | | | | | | | | | | | | | | | | | | | | |
Net investment income | | | 2.15% | | | | 2.03% | | | | 1.87% | | | | 2.46% | | | | 1.70% | | | | 2.13% | |
Total expenses5 | | | 0.91% | | | | 0.90% | | | | 0.89% | | | | 0.90% | | | | 0.91% | | | | 0.91% | |
| Expenses after payments, waivers and/or reimbursements and reduction to custodian expenses | | | 0.67% | | | | 0.67% | | | | 0.66% | | | | 0.66% | | | | 0.67% | | | | 0.65% | |
| |
Portfolio turnover rate6 | | | 37% | | | | 98% | | | | 187% | | | | 110% | | | | 102% | | | | 54% | |
1. December 30, 2011 represents the last business day of the Fund’s reporting period.
2. Per share amounts calculated based on the average shares outstanding during the period.
3. Assumes an initial investment on the business day before the first day of the fiscal period, with all dividends and distributions reinvested in additional shares on the reinvestment date, and redemption at the net asset value calculated on the last business day of the fiscal period. Total returns are not annualized for periods less than one full year. Total return information does not reflect expenses that apply at the separate account level or to related insurance products. Inclusion of these charges would reduce the total return figures for all periods shown. Returns do not reflect the deduction of taxes that a shareholder would pay on fund distributions or the redemption of fund shares. The returns do not include adjustments in accordance with generally accepted accounting principles required at the period end for financial reporting purposes.
4. Annualized for periods less than one full year.
5. Total expenses including indirect expenses from affiliated fund fees and expenses were as follows:
| | | | | | |
Six Months Ended June 30, 2015 | | | 0.91 | % | |
Year Ended December 31, 2014 | | | 0.90 | % | |
Year Ended December 31, 2013 | | | 0.90 | % | |
Year Ended December 31, 2012 | | | 0.91 | % | |
Year Ended December 30, 2011 | | | 0.93 | % | |
Year Ended December 31, 2010 | | | 0.92 | % | |
6. The portfolio turnover rate excludes purchase and sale transactions of To Be Announced (TBA) mortgage-related securities as follows:
| | | | | | | | | | |
| | | Purchase Transactions | | | Sale Transactions | | | |
| | | |
Six Months Ended June 30, 2015 | | | $448,706,782 | | | | $469,025,887 | | |
Year Ended December 31, 2014 | | | $697,503,637 | | | | $678,765,376 | | |
Year Ended December 31, 2013 | | | $794,398,216 | | | | $800,879,825 | | |
Year Ended December 31, 2012 | | | $555,111,600 | | | | $549,805,766 | | |
Year Ended December 30, 2011 | | | $450,804,195 | | | | $453,759,282 | | |
Year Ended December 31, 2010 | | | $412,930,431 | | | | $414,511,903 | | |
See accompanying Notes to Financial Statements.
20 OPPENHEIMER CONSERVATIVE BALANCED FUND/VA
| | | | | | | | | | | | | | | | | | | | | | | | |
| Service Shares | | Six Months
Ended
June 30,
2015
(Unaudited) | | | Year Ended
December
31, 2014 | | | Year Ended
December
31, 2013 | | | Year Ended
December
31, 2012 | | | Year Ended
December
30, 20111 | | | Year Ended
December
31, 2010 | |
| |
Per Share Operating Data | | | | | | | | | | | | | | | | | | | | | | | | |
Net asset value, beginning of period | | $ | 14.49 | | | $ | 13.66 | | | $ | 12.37 | | | $ | 11.17 | | | $ | 11.35 | | | $ | 10.19 | |
| |
Income (loss) from investment operations: | | | | | | | | | | | | | | | | | | | | | | | | |
Net investment income2 | | | 0.14 | | | | 0.25 | | | | 0.21 | | | | 0.26 | | | | 0.16 | | | | 0.20 | |
Net realized and unrealized gain (loss) | | | 0.03 | | | | 0.84 | | | | 1.36 | | | | 1.08 | | | | (0.11) | | | | 1.08 | |
| | | | |
Total from investment operations | | | 0.17 | | | | 1.09 | | | | 1.57 | | | | 1.34 | | | | 0.05 | | | | 1.28 | |
| |
Dividends and/or distributions to shareholders: | | | | | | | | | | | | | | | | | | | | | | | | |
Dividends from net investment income | | | (0.30) | | | | (0.26) | | | | (0.28) | | | | (0.14) | | | | (0.23) | | | | (0.12) | |
| |
Net asset value, end of period | | $ | 14.36 | | | $ | 14.49 | | | $ | 13.66 | | | $ | 12.37 | | | $ | 11.17 | | | $ | 11.35 | |
| | | | |
|
| |
Total Return, at Net Asset Value3 | | | 1.13% | | | | 8.02% | | | | 12.83% | | | | 12.11% | | | | 0.38% | | | | 12.68% | |
|
| |
Ratios/Supplemental Data | | | | | | | | | | | | | | | | | | | | | | | | |
Net assets, end of period (in thousands) | | $ | 59,107 | | | $ | 63,880 | | | $ | 69,601 | | | $ | 72,872 | | | $ | 77,551 | | | $ | 89,580 | |
| |
Average net assets (in thousands) | | $ | 61,982 | | | $ | 65,450 | | | $ | 72,332 | | | $ | 76,257 | | | $ | 85,157 | | | $ | 87,280 | |
| |
Ratios to average net assets:4 | | | | | | | | | | | | | | | | | | | | | | | | |
Net investment income | | | 1.90% | | | | 1.78% | | | | 1.62% | | | | 2.18% | | | | 1.45% | | | | 1.87% | |
Total expenses5 | | | 1.16% | | | | 1.15% | | | | 1.15% | | | | 1.16% | | | | 1.16% | | | | 1.16% | |
| Expenses after payments, waivers and/or reimbursements and reduction to custodian expenses | | | 0.92% | | | | 0.92% | | | | 0.92% | | | | 0.92% | | | | 0.92% | | | | 0.90% | |
| |
Portfolio turnover rate6 | | | 37% | | | | 98% | | | | 187% | | | | 110% | | | | 102% | | | | 54% | |
1. December 30, 2011 represents the last business day of the Fund’s reporting period.
2. Per share amounts calculated based on the average shares outstanding during the period.
3. Assumes an initial investment on the business day before the first day of the fiscal period, with all dividends and distributions reinvested in additional shares on the reinvestment date, and redemption at the net asset value calculated on the last business day of the fiscal period. Total returns are not annualized for periods less than one full year. Total return information does not reflect expenses that apply at the separate account level or to related insurance products. Inclusion of these charges would reduce the total return figures for all periods shown. Returns do not reflect the deduction of taxes that a shareholder would pay on fund distributions or the redemption of fund shares. The returns do not include adjustments in accordance with generally accepted accounting principles required at the period end for financial reporting purposes.
4. Annualized for periods less than one full year.
5. Total expenses including indirect expenses from affiliated fund fees and expenses were as follows:
| | | | | | |
Six Months Ended June 30, 2015 | | | 1.16 | % | |
Year Ended December 31, 2014 | | | 1.15 | % | |
Year Ended December 31, 2013 | | | 1.16 | % | |
Year Ended December 31, 2012 | | | 1.17 | % | |
Year Ended December 30, 2011 | | | 1.18 | % | |
Year Ended December 31, 2010 | | | 1.17 | % | |
6. The portfolio turnover rate excludes purchase and sale transactions of To Be Announced (TBA) mortgage-related securities as follows:
| | | | | | | | | | |
| | | Purchase Transactions | | | Sale Transactions | | |
| | |
Six Months Ended June 30, 2015 | | | $448,706,782 | | | | $469,025,887 | | |
Year Ended December 31, 2014 | | | $697,503,637 | | | | $678,765,376 | | |
Year Ended December 31, 2013 | | | $794,398,216 | | | | $800,879,825 | | |
Year Ended December 31, 2012 | | | $555,111,600 | | | | $549,805,766 | | |
Year Ended December 31, 2011 | | | $450,804,195 | | | | $453,759,282 | | |
Year Ended December 31, 2010 | | | $412,930,431 | | | | $414,511,903 | | |
See accompanying Notes to Financial Statements.
21 OPPENHEIMER CONSERVATIVE BALANCED FUND/VA
NOTES TO FINANCIAL STATEMENTS June 30, 2015 Unaudited
1. Organization
Oppenheimer Conservative Balanced Fund/VA (the “Fund”), formerly named Oppenheimer Capital Income Fund/VA, is a separate series of Oppenheimer Variable Account Funds, a diversified open-end management investment company registered under the Investment Company Act of 1940 (“1940 Act”), as amended. The Fund’s investment objective is to seek total return. The Fund’s investment adviser is OFI Global Asset Management, Inc. (“OFI Global” or the “Manager”), a wholly-owned subsidiary of OppenheimerFunds, Inc. (“OFI” or the “Sub-Adviser”). The Manager has entered into a sub-advisory agreement with OFI. Shares of the Fund are sold only to separate accounts of life insurance companies.
The Fund offers two classes of shares. Both classes are sold at their offering price, which is the net asset value per share, to separate investment accounts of participating insurance companies as an underlying investment for variable life insurance policies, variable annuity contracts or other investment products. The class of shares designated as Service shares is subject to a distribution and service plan. Both classes of shares have identical rights and voting privileges with respect to the Fund in general and exclusive voting rights on matters that affect that class alone. Earnings, net assets and net asset value per share may differ due to each class having its own expenses, such as transfer and shareholder servicing agent fees and shareholder communications, directly attributable to that class.
The following is a summary of significant accounting policies followed in the Fund’s preparation of financial statements in accordance with accounting principles generally accepted in the United States (“U.S. GAAP”).
2. Significant Accounting Policies
Security Valuation. All investments in securities are recorded at their estimated fair value, as described in Note 3.
Reporting Period End Date. The last day of the Fund’s reporting period is the last day the New York Stock Exchange was open for trading during the period. The Fund’s financial statements have been presented through that date to maintain consistency with the Fund’s net asset value calculations used for shareholder transactions.
Foreign Currency Translation. The Fund’s accounting records are maintained in U.S. dollars. The values of securities denominated in foreign currencies and amounts related to the purchase and sale of foreign securities and foreign investment income are translated into U.S. dollars as of the close of the New York Stock Exchange (the “Exchange”), normally 4:00 P.M. Eastern time, on each day the Exchange is open for trading. Foreign exchange rates may be valued primarily using a reliable bank, dealer or service authorized by the Board of Trustees.
Reported net realized gains and losses from foreign currency transactions arise from sales of portfolio securities, sales and maturities of short-term securities, sales of foreign currencies, exchange rate fluctuations between the trade and settlement dates on securities transactions, and the difference between the amounts of dividends, interest, and foreign withholding taxes recorded on the Fund’s books and the U.S. dollar equivalent of the amounts actually received or paid. Net unrealized appreciation and depreciation on the translation of assets and liabilities denominated in foreign currencies arise from changes in the values of assets and liabilities, including investments in securities at fiscal period end, resulting from changes in exchange rates.
The effect of changes in foreign currency exchange rates on investments is separately identified from the fluctuations arising from changes in market values of securities held and reported with all other foreign currency gains and losses in the Fund’s Statement of Operations.
Allocation of Income, Expenses, Gains and Losses. Income, expenses (other than those attributable to a specific class), gains and losses are allocated on a daily basis to each class of shares based upon the relative proportion of net assets represented by such class. Operating expenses directly attributable to a specific class are charged against the operations of that class.
Dividends and Distributions to Shareholders. Dividends and distributions to shareholders, which are determined in accordance with income tax regulations and may differ from U.S. generally accepted accounting principles, are recorded on the ex-dividend date. Income and capital gain distributions, if any, are declared and paid annually or at other times as deemed necessary by the Manager.
The tax character of distributions is determined as of the Fund’s fiscal year end. Therefore, a portion of the Fund’s distributions made to shareholders prior to the Fund’s fiscal year end may ultimately be categorized as a tax return of capital.
Investment Income. Dividend income is recorded on the ex-dividend date or upon ex-dividend notification in the case of certain foreign dividends where the ex-dividend date may have passed. Non-cash dividends included in dividend income, if any, are recorded at the fair market value of the securities received. Interest income is recognized on an accrual basis. Discount and premium, which are included in interest income on the Statement of Operations, are amortized or accreted daily.
Return of Capital Estimates. Distributions received from the Fund’s investments in MLPs generally are comprised of income and return of capital. The Fund records investment income and return of capital based on estimates made at the time such distributions are received. Such estimates are based on historical information available from each MLP and other industry sources. These estimates may subsequently be revised based on information received from MLPs after their tax reporting periods are concluded.
Custodian Fees. “Custodian fees and expenses” in the Statement of Operations may include interest expense incurred by the Fund on any cash overdrafts of its custodian account during the period. Such cash overdrafts may result from the effects of failed trades in portfolio securities and from cash outflows resulting from unanticipated shareholder redemption activity. The Fund pays interest to its custodian on such cash overdrafts, to the extent they are not offset by positive cash balances maintained by the Fund, at a rate equal to the Federal Funds Rate plus 0.50% . The “Reduction to custodian
22 OPPENHEIMER CONSERVATIVE BALANCED FUND/VA
2. Significant Accounting Policies (Continued)
expenses” line item, if applicable, represents earnings on cash balances maintained by the Fund during the period. Such interest expense and other custodian fees may be paid with these earnings.
Security Transactions. Security transactions are recorded on the trade date. Realized gains and losses on securities sold are determined on the basis of identified cost.
Indemnifications. The Fund’s organizational documents provide current and former Trustees and officers with a limited indemnification against liabilities arising in connection with the performance of their duties to the Fund. In the normal course of business, the Fund may also enter into contracts that provide general indemnifications. The Fund’s maximum exposure under these arrangements is unknown as this would be dependent on future claims that may be made against the Fund. The risk of material loss from such claims is considered remote.
Federal Taxes. The Fund intends to comply with provisions of the Internal Revenue Code applicable to regulated investment companies and to distribute substantially all of its investment company taxable income to shareholders. Therefore, no federal income or excise tax provision is required. The Fund files income tax returns in U.S. federal and applicable state jurisdictions. The statute of limitations on the Fund’s tax return filings generally remains open for the three preceding fiscal reporting period ends.
During the fiscal year ended December 31, 2014, the Fund utilized $13,105,097 of capital loss carryforward to offset capital gains realized in that fiscal year. The Fund had post-October losses of $371,625 and straddle losses of $2,415. Details of the fiscal year ended December 31, 2014 capital loss carryforwards are included in the table below. Capital loss carryforwards with no expiration, if any, must be utilized prior to those with expiration dates. Capital losses with no expiration will be carried forward to future years if not offset by gains.
| | | | |
| Expiring | | | |
| |
2015 | | $ | 3,323,244 | |
2016 | | | 3,323,244 | |
2017 | | | 12,883,778 | |
| | | | |
Total | | $ | 19,530,266 | |
| | | | |
As of June 30, 2015, it is estimated that the capital loss carryforwards would be $14,786,580 expiring by 2018. The estimated capital loss carryforward represents the carryforward as of the end of the last fiscal year, increased or decreased by capital losses or gains realized in the first six months of the current fiscal year. During the six months ended June 30, 2015, it is estimated that the Fund will utilize $4,743,686 of capital loss carryforward to offset realized capital gains.
Net investment income (loss) and net realized gain (loss) may differ for financial statement and tax purposes. The character of dividends and distributions made during the fiscal year from net investment income or net realized gains are determined in accordance with federal income tax requirements, which may differ from the character of net investment income or net realized gains presented in those financial statements in accordance with GAAP. Also, due to timing of dividends and distributions, the fiscal year in which amounts are distributed may differ from the fiscal year in which the income or net realized gain was recorded by the Fund.
The aggregate cost of securities and other investments and the composition of unrealized appreciation and depreciation of securities and other investments for federal income tax purposes as of June 30, 2015 are noted in the following table. The primary difference between book and tax appreciation or depreciation of securities and other investments, if applicable, is attributable to the tax deferral of losses or tax realization of financial statement unrealized gain or loss.
| | | | |
Federal tax cost of securities | | $ | 266,665,027 | |
Federal tax cost of other investments | | | (1,044,493) | |
| | | | |
Total federal tax cost | | $ | 265,620,534 | |
| | | | |
Gross unrealized appreciation | | $ | 20,593,239 | |
Gross unrealized depreciation | | | (4,893,075) | |
| | | | |
Net unrealized appreciation | | $ | 15,700,164 | |
| | | | |
Use of Estimates. The preparation of financial statements in conformity with accounting principles generally accepted in the United States of America requires management to make estimates and assumptions that affect the reported amounts of assets and liabilities and disclosure of contingent assets and liabilities at the date of the financial statements and the reported amounts of increases and decreases in net assets from operations during the reporting period. Actual results could differ from those estimates.
3. Securities Valuation
The Fund calculates the net asset value of its shares as of the close of the New York Stock Exchange (the “Exchange”), normally 4:00 P.M. Eastern time, on each day the Exchange is open for trading.
The Fund’s Board has adopted procedures for the valuation of the Fund’s securities and has delegated the day-to-day responsibility for valuation determinations under those procedures to the Manager. The Manager has established a Valuation Committee which is responsible for determining a “fair valuation” for any security for which market quotations are not “readily available.” The Valuation Committee’s fair valuation determinations are subject to review, approval and ratification by the Fund’s Board at its next regularly scheduled meeting covering the calendar quarter in which the fair valuation was determined.
23 OPPENHEIMER CONSERVATIVE BALANCED FUND/VA
NOTES TO FINANCIAL STATEMENTS Unaudited / Continued
3. Securities Valuation (Continued)
Valuation Methods and Inputs
Securities are valued using unadjusted quoted market prices, when available, as supplied primarily by third party pricing services or dealers.
The following methodologies are used to determine the market value or the fair value of the types of securities described below:
Securities traded on a registered U.S. securities exchange (including exchange-traded derivatives other than futures and futures options) are valued based on the last sale price of the security reported on the principal exchange on which it is traded, prior to the time when the Fund’s assets are valued. In the absence of a sale, the security is valued at the last sale price on the prior trading day, if it is within the spread of the current day’s closing “bid” and “asked” prices, and if not, at the current day’s closing bid price. A security of a foreign issuer traded on a foreign exchange, but not listed on a registered U.S. securities exchange, is valued based on the last sale price on the principal exchange on which the security is traded, as identified by the third party pricing service used by the Manager, prior to the time when the Fund’s assets are valued. If the last sale price is unavailable, the security is valued at the most recent official closing price on the principal exchange on which it is traded. If the last sales price or official closing price for a foreign security is not available, the security is valued at the mean between the bid and asked price per the exchange or, if not available from the exchange, obtained from two dealers. If bid and asked prices are not available from either the exchange or two dealers, the security is valued by using one of the following methodologies (listed in order of priority): (1) using a bid from the exchange, (2) the mean between the bid and asked price as provided by a single dealer, or (3) a bid from a single dealer.
Shares of a registered investment company that are not traded on an exchange are valued at that investment company’s net asset value per share.
Corporate and government debt securities (of U.S. or foreign issuers) and municipal debt securities, event-linked bonds, loans, mortgage-backed securities, collateralized mortgage obligations, and asset-backed securities are valued at the mean between the “bid” and “asked” prices utilizing evaluated prices obtained from third party pricing services or broker-dealers who may use matrix pricing methods to determine the evaluated prices.
Short-term money market type debt securities with a remaining maturity of sixty days or less are valued at cost adjusted by the amortization of discount or premium to maturity (amortized cost), which approximates market value. Short-term debt securities with a remaining maturity in excess of sixty days are valued at the mean between the “bid” and “asked” prices utilizing evaluated prices obtained from third party pricing services or broker-dealers.
Futures contracts and futures options traded on a commodities or futures exchange will be valued at the final settlement price or official closing price on the principal exchange as reported by such principal exchange at its trading session ending at, or most recently prior to, the time when the Fund’s assets are valued.
A description of the standard inputs that may generally be considered by the third party pricing vendors in determining their evaluated prices is provided below.
| | |
| Security Type | | Standard inputs generally considered by third-party pricing vendors |
| Corporate debt, government debt, municipal, mortgage-backed and asset- backed securities | | Reported trade data, broker-dealer price quotations, benchmark yields, issuer spreads on comparable securities, the credit quality, yield, maturity, and other appropriate factors. |
| Loans | | Information obtained from market participants regarding reported trade data and broker-dealer price quotations. |
| Event-linked bonds | | Information obtained from market participants regarding reported trade data and broker-dealer price quotations. |
If a market value or price cannot be determined for a security using the methodologies described above, or if, in the “good faith” opinion of the Manager, the market value or price obtained does not constitute a “readily available market quotation,” or a significant event has occurred that would materially affect the value of the security, the security is fair valued either (i) by a standardized fair valuation methodology applicable to the security type or the significant event as previously approved by the Valuation Committee and the Fund’s Board or (ii) as determined in good faith by the Manager’s Valuation Committee. The Valuation Committee considers all relevant facts that are reasonably available, through either public information or information available to the Manager, when determining the fair value of a security. Fair value determinations by the Manager are subject to review, approval and ratification by the Fund’s Board at its next regularly scheduled meeting covering the calendar quarter in which the fair valuation was determined. Those fair valuation standardized methodologies include, but are not limited to, valuing securities at the last sale price or initially at cost and subsequently adjusting the value based on: changes in company specific fundamentals, changes in an appropriate securities index, or changes in the value of similar securities which may be further adjusted for any discounts related to security-specific resale restrictions. When possible, such methodologies use observable market inputs such as unadjusted quoted prices of similar securities, observable interest rates, currency rates and yield curves. The methodologies used for valuing securities are not necessarily an indication of the risks associated with investing in those securities nor can it be assured that the Fund can obtain the fair value assigned to a security if it were to sell the security.
To assess the continuing appropriateness of security valuations, the Manager, or its third party service provider who is subject to oversight by the Manager, regularly compares prior day prices, prices on comparable securities, and sale prices to the current day prices and challenges those prices exceeding certain tolerance levels with the third party pricing service or broker source. For those securities valued by fair valuations, whether through a standardized fair valuation methodology or a fair valuation determination, the Valuation Committee reviews and affirms the reasonableness of the valuations based on such methodologies and fair valuation determinations on a regular basis after considering all relevant information that is reasonably available.
Classifications
Each investment asset or liability of the Fund is assigned a level at measurement date based on the significance and source of the inputs to its valuation. Various data inputs are used in determining the value of each of the Fund’s investments as of the reporting period end. These data inputs are categorized in the following hierarchy under applicable financial accounting standards:
24 OPPENHEIMER CONSERVATIVE BALANCED FUND/VA
3. Securities Valuation (Continued)
1) Level 1-unadjusted quoted prices in active markets for identical assets or liabilities (including securities actively traded on a securities exchange)
2) Level 2-inputs other than unadjusted quoted prices that are observable for the asset or liability (such as unadjusted quoted prices for similar assets and market corroborated inputs such as interest rates, prepayment speeds, credit risks, etc.)
3) Level 3-significant unobservable inputs (including the Manager’s own judgments about assumptions that market participants would use in pricing the asset or liability).
The inputs used for valuing securities are not necessarily an indication of the risks associated with investing in those securities.
The table below categorizes amounts that are included in the Fund’s Statement of Assets and Liabilities as of June 30, 2015 based on valuation input level:
| | | | | | | | | | | | | | | | |
| | | Level 1— Unadjusted
Quoted Prices | | | Level 2— Other Significant
Observable Inputs | | | Level 3— Significant
Unobservable Inputs | | | Value | |
| |
Assets Table | | | | | | | | | | | | | | | | |
Investments, at Value: | | | | | | | | | | | | | | | | |
Common Stocks | | | | | | | | | | | | | | | | |
Consumer Discretionary | | $ | 10,965,983 | | | $ | — | | | $ | — | | | $ | 10,965,983 | |
Consumer Staples | | | 4,587,774 | | | | 2,368,650 | | | | — | | | | 6,956,424 | |
Energy | | | 5,895,526 | | | | — | | | | — | | | | 5,895,526 | |
Financials | | | 15,343,505 | | | | — | | | | — | | | | 15,343,505 | |
Health Care | | | 13,447,545 | | | | — | | | | — | | | | 13,447,545 | |
Industrials | | | 8,671,809 | | | | — | | | | — | | | | 8,671,809 | |
Information Technology | | | 16,169,041 | | | | — | | | | — | | | | 16,169,041 | |
Materials | | | 2,939,814 | | | | — | | | | — | | | | 2,939,814 | |
Telecommunication Services | | | 1,468,416 | | | | — | | | | — | | | | 1,468,416 | |
Utilities | | | 2,627,528 | | | | — | | | | — | | | | 2,627,528 | |
Asset-Backed Securities | | | — | | | | 27,017,146 | | | | — | | | | 27,017,146 | |
Mortgage-Backed Obligations | | | — | | | | 74,014,071 | | | | — | | | | 74,014,071 | |
U.S. Government Obligations | | | — | | | | 817,001 | | | | — | | | | 817,001 | |
Non-Convertible Corporate Bonds and Notes | | | — | | | | 90,741,298 | | | | — | | | | 90,741,298 | |
Investment Company | | | 5,367,607 | | | | — | | | | — | | | | 5,367,607 | |
| | | | |
Total Investments, at Value | | | 87,484,548 | | | | 194,958,166 | | | | — | | | | 282,442,714 | |
| | | | |
Other Financial Instruments: | | | | | | | | | | | | | | | | |
Futures contracts | | | 125,493 | | | | — | | | | — | | | | 125,493 | |
| | | | |
Total Assets | | $ | 87,610,041 | | | $ | 194,958,166 | | | $ | — | | | $ | 282,568,207 | |
| | | | |
| | | | |
Liabilities Table | | | | | | | | | | | | | | | | |
Other Financial Instruments: | | | | | | | | | | | | | | | | |
Futures contracts | | $ | (203,016 | ) | | $ | — | | | $ | — | | | $ | (203,016) | |
| | | | |
Total Liabilities | | $ | (203,016 | ) | | $ | — | | | $ | — | | | $ | (203,016) | |
| | | | |
Forward currency exchange contracts and futures contracts, if any, are reported at their unrealized appreciation/depreciation at measurement date, which represents the change in the contract’s value from trade date. All additional assets and liabilities included in the above table are reported at their market value at measurement date.
4. Investments and Risks
Investment in Oppenheimer Institutional Money Market Fund. The Fund is permitted to invest daily available cash balances in an affiliated money market fund. The Fund may invest the available cash in Class E shares of Oppenheimer Institutional Money Market Fund (“IMMF”) to seek current income while preserving liquidity or for defensive purposes. IMMF is a registered open-end management investment company, regulated as a money market fund under the 1940 Act. The Manager is the investment adviser of IMMF, and the Sub-Adviser provides investment and related advisory services to IMMF. When applicable, the Fund’s investment in IMMF is included in the Statement of Investments. Shares of IMMF are valued at their net asset value per share. As a shareholder, the Fund is subject to its proportional share of IMMF’s Class E expenses, including its management fee. The Manager will waive fees and/or reimburse Fund expenses in an amount equal to the indirect management fees incurred through the Fund’s investment in IMMF.
Master Limited Partnerships (“MLPs”). MLPs issue common units that represent an equity ownership interest in a partnership and provide limited voting rights. MLP common units are registered with the Securities and Exchange Commission (“SEC”), and are freely tradable on securities exchanges such as the NYSE and the NASDAQ Stock Market (“NASDAQ”), or in the over-the-counter (“OTC”) market. An MLP consists of one or more general partners, who conduct the business, and one or more limited partners, who contribute capital. MLP common unit holders have a limited role in the partnership’s operations and management. The Fund, as a limited partner, normally would not be liable for the debts of the MLP beyond the amounts the Fund has contributed, but would not be shielded to the same extent that a shareholder of a corporation would be. In certain circumstances creditors of an MLP would have the right to seek return of capital distributed to a limited partner. This right of an MLP’s creditors would continue after the Fund sold its investment in the MLP.
25 OPPENHEIMER CONSERVATIVE BALANCED FUND/VA
NOTES TO FINANCIAL STATEMENTS Unaudited / Continued
4. Investments and Risks (Continued)
Securities on a When-Issued or Delayed Delivery Basis. The Fund may purchase securities on a “when-issued” basis, and may purchase or sell securities on a “delayed delivery” basis. “When-issued” or “delayed delivery” refers to securities whose terms and indenture are available and for which a market exists, but which are not available for immediate delivery. Delivery and payment for securities that have been purchased by the Fund on a when-issued basis normally takes place within six months and possibly as long as two years or more after the trade date. During this period, such securities do not earn interest, are subject to market fluctuation and may increase or decrease in value prior to their delivery. The purchase of securities on a when-issued basis may increase the volatility of the Fund’s net asset value to the extent the Fund executes such transactions while remaining substantially fully invested. When the Fund engages in when-issued or delayed delivery transactions, it relies on the buyer or seller, as the case may be, to complete the transaction. Their failure to do so may cause the Fund to lose the opportunity to obtain or dispose of the security at a price and yield it considers advantageous. The Fund may also sell securities that it purchased on a when-issued basis or forward commitment prior to settlement of the original purchase.
As of June 30, 2015, the Fund had purchased securities issued on a when-issued or delayed delivery basis and sold securities issued on a delayed delivery basis as follows:
| | | | |
| | | When-Issued or
Delayed Delivery
Basis Transactions | |
| |
Purchased securities | | | $68,396,655 | |
Sold securities | | | 26,512,225 | |
The Fund may enter into “forward roll” transactions with respect to mortgage-related securities. In this type of transaction, the Fund sells a mortgage-related security to a buyer and simultaneously agrees to repurchase a similar security (same type, coupon and maturity) at a later date at a set price. During the period between the sale and the repurchase, the Fund will not be entitled to receive interest and principal payments on the securities that have been sold. The Fund records the incremental difference between the forward purchase and sale of each forward roll as realized gain (loss) on investments or as fee income in the case of such transactions that have an associated fee in lieu of a difference in the forward purchase and sale price.
Forward roll transactions may be deemed to entail embedded leverage since the Fund purchases mortgage-related securities with extended settlement dates rather than paying for the securities under a normal settlement cycle. This embedded leverage increases the Fund’s market value of investments relative to its net assets which can incrementally increase the volatility of the Fund’s performance. Forward roll transactions can be replicated over multiple settlement periods.
Risks of entering into forward roll transactions include the potential inability of the counterparty to meet the terms of the agreement; the potential of the Fund to receive inferior securities at redelivery as compared to the securities sold to the counterparty; and counterparty credit risk.
Restricted Securities. As of June 30, 2015, investments in securities included issues that are restricted. A restricted security may have a contractual restriction on its resale and is valued under methods approved by the Board of Trustees as reflecting fair value. Securities that are restricted are marked with an applicable footnote on the Statement of Investments. Restricted securities are reported on a schedule following the Statement of Investments.
Equity Security Risk. Stocks and other equity securities fluctuate in price. The value of the Fund’s portfolio may be affected by changes in the equity markets generally. Equity markets may experience significant short-term volatility and may fall sharply at times. Different markets may behave differently from each other and U.S. equity markets may move in the opposite direction from one or more foreign stock markets. Adverse events in any part of the equity or fixed-income markets may have unexpected negative effects on other market segments.
The prices of individual equity securities generally do not all move in the same direction at the same time and a variety of factors can affect the price of a particular company’s securities. These factors may include, but are not limited to, poor earnings reports, a loss of customers, litigation against the company, general unfavorable performance of the company’s sector or industry, or changes in government regulations affecting the company or its industry.
5. Risk Exposures and the Use of Derivative Instruments
The Fund’s investment objective not only permits the Fund to purchase investment securities, it also allows the Fund to enter into various types of derivatives contracts, including, but not limited to, futures contracts, forward currency exchange contracts, credit default swaps, interest rate swaps, total return swaps, variance swaps and purchased and written options. In doing so, the Fund will employ strategies in differing combinations to permit it to increase, decrease, or change the level or types of exposure to market risk factors. These instruments may allow the Fund to pursue its objectives more quickly and efficiently than if it were to make direct purchases or sales of securities capable of effecting a similar response to market factors. Such contracts may be entered into through a bilateral over-the-counter (“OTC”) transaction, or through a securities or futures exchange and cleared through a clearinghouse.
Market Risk Factors. In accordance with its investment objectives, the Fund may use derivatives to increase or decrease its exposure to one or more of the following market risk factors:
Commodity Risk. Commodity risk relates to the change in value of commodities or commodity indexes as they relate to increases or decreases in the commodities market. Commodities are physical assets that have tangible properties. Examples of these types of assets are crude oil, heating oil, metals, livestock, and agricultural products.
26 OPPENHEIMER CONSERVATIVE BALANCED FUND/VA
5. Risk Exposures and the Use of Derivative Instruments (Continued)
Credit Risk. Credit risk relates to the ability of the issuer to meet interest and principal payments, or both, as they come due. In general, lower-grade, higher-yield bonds are subject to credit risk to a greater extent than lower-yield, higher-quality bonds.
Equity Risk. Equity risk relates to the change in value of equity securities as they relate to increases or decreases in the general market.
Foreign Exchange Rate Risk. Foreign exchange rate risk relates to the change in the U.S. dollar value of a security held that is denominated in a foreign currency. The U.S. dollar value of a foreign currency denominated security will decrease as the dollar appreciates against the currency, while the U.S. dollar value will increase as the dollar depreciates against the currency.
Interest Rate Risk. Interest rate risk refers to the fluctuations in value of fixed-income securities resulting from the inverse relationship between price and yield. For example, an increase in general interest rates will tend to reduce the market value of already issued fixed-income investments, and a decline in general interest rates will tend to increase their value. In addition, debt securities with longer maturities, which tend to have higher yields, are subject to potentially greater fluctuations in value from changes in interest rates than obligations with shorter maturities.
Volatility Risk. Volatility risk refers to the magnitude of the movement, but not the direction of the movement, in a financial instrument’s price over a defined time period. Large increases or decreases in a financial instrument’s price over a relative time period typically indicate greater volatility risk, while small increases or decreases in its price typically indicate lower volatility risk.
Derivatives may have little or no initial cash investment relative to their market value exposure and therefore can produce significant gains or losses in excess of their cost due to unanticipated changes in the market risk factors and the overall market. This use of embedded leverage allows the Fund to increase its market value exposure relative to its net assets and can substantially increase the volatility of the Fund’s performance. In instances where the Fund is using derivatives to decrease, or hedge, exposures to market risk factors for securities held by the Fund, there are also risks that those derivatives may not perform as expected resulting in losses for the combined or hedged positions. Some derivatives have the potential for unlimited loss, regardless of the size of the Fund’s initial investment.
Additional associated risks from investing in derivatives also exist and potentially could have significant effects on the valuation of the derivative and the Fund. Typically, the associated risks are not the risks that the Fund is attempting to increase or decrease exposure to, per its investment objectives, but are the additional risks from investing in derivatives. Examples of these associated risks are liquidity risk, which is the risk that the Fund will not be able to sell the derivative in the open market in a timely manner, and counterparty credit risk, which is the risk that the counterparty will not fulfill its obligation to the Fund.
The Fund’s actual exposures to these market risk factors and associated risks during the period are discussed in further detail, by derivative type, below.
Futures Contracts
A futures contract is a commitment to buy or sell a specific amount of a commodity, financial instrument or currency at a negotiated price on a stipulated future date. The Fund may buy and sell futures contracts and may also buy or write put or call options on these futures contracts. Futures contracts and options thereon are generally entered into on a regulated futures exchange and cleared through a clearinghouse associated with the exchange.
Upon entering into a futures contract, the Fund is required to deposit either cash or securities (initial margin) in an amount equal to a certain percentage of the contract value in an account registered in the futures commission merchant’s name. Subsequent payments (variation margin) are paid to or from the futures commission merchant each day equal to the daily changes in the contract value. Such payments are recorded as unrealized gains and losses. Should the Fund fail to make requested variation margin payments, the futures commission merchant can gain access to the initial margin to satisfy the Fund’s payment obligations.
Futures contracts are reported on a schedule following the Statement of Investments. Securities held by a futures commission merchant to cover initial margin requirements on open futures contracts are noted in the Statement of Investments. Cash held by a futures commission merchant to cover initial margin requirements on open futures contracts and the receivable and/or payable for the daily mark to market for the variation margin are noted in the Statement of Assets and Liabilities. The net change in unrealized appreciation and depreciation is reported in the Statement of Operations. Realized gains (losses) are reported in the Statement of Operations at the closing or expiration of futures contracts.
The Fund has purchased futures contracts on various bonds and notes to increase exposure to interest rate risk.
The Fund has sold futures contracts on various bonds and notes to decrease exposure to interest rate risk.
During the six months ended June 30, 2015, the Fund had an ending monthly average market value of $9,580,201 and $24,417,020 on futures contracts purchased and sold, respectively.
Additional associated risks of entering into futures contracts (and related options) include the possibility that there may be an illiquid market where the Fund is unable to liquidate the contract or enter into an offsetting position and, if used for hedging purposes, the risk that the price of the contract will correlate imperfectly with the prices of the Fund’s securities.
Counterparty Credit Risk. Derivative positions are subject to the risk that the counterparty will not fulfill its obligation to the Fund. The Fund intends to enter into derivative transactions with counterparties that the Manager believes to be creditworthy at the time of the transaction.
For financial reporting purposes, the Fund does not offset derivative assets and derivative liabilities that are subject to netting arrangements in the Statement of Assets and Liabilities. Bankruptcy or insolvency laws of a particular jurisdiction may impose restrictions on or prohibitions against the right of offset in bankruptcy, insolvency or other events.
The Fund’s risk of loss from counterparty credit risk on exchange-traded derivatives cleared through a clearinghouse and for centrally cleared swaps is generally considered lower than as compared to OTC derivatives. However, counterparty credit risk exists with respect to initial and variation margin deposited/paid by the Fund that is held in futures commission merchant, broker and/or clearinghouse accounts for such exchange-traded derivatives and for centrally cleared swaps.
27 OPPENHEIMER CONSERVATIVE BALANCED FUND/VA
NOTES TO FINANCIAL STATEMENTS Unaudited / Continued
5. Risk Exposures and the Use of Derivative Instruments (Continued)
With respect to centrally cleared swaps, such transactions will be submitted for clearing, and if cleared, will be held in accounts at futures commission merchants or brokers that are members of clearinghouses. While brokers, futures commission merchants and clearinghouses are required to segregate customer margin from their own assets, in the event that a broker, futures commission merchant or clearinghouse becomes insolvent or goes into bankruptcy and at that time there is a shortfall in the aggregate amount of margin held by the broker, futures commission merchant or clearinghouse for all its customers, U.S. bankruptcy laws will typically allocate that shortfall on a pro-rata basis across all the broker’s, futures commission merchant’s or clearinghouse’s customers, potentially resulting in losses to the Fund.
There is the risk that a broker, futures commission merchant or clearinghouse will decline to clear a transaction on the Fund’s behalf, and the Fund may be required to pay a termination fee to the executing broker with whom the Fund initially enters into the transaction. Clearinghouses may also be permitted to terminate centrally cleared swaps at any time. The Fund is also subject to the risk that the broker or futures commission merchant will improperly use the Fund’s assets deposited/paid as initial or variation margin to satisfy payment obligations of another customer. In the event of a default by another customer of the broker or futures commission merchant, the Fund might not receive its variation margin payments from the clearinghouse, due to the manner in which variation margin payments are aggregated for all customers of the broker/futures commission merchant.
Collateral and margin requirements differ by type of derivative. Margin requirements are established by the broker, futures commission merchant or clearinghouse for exchange-traded and cleared derivatives, including centrally cleared swaps. Brokers, futures commission merchants and clearinghouses can ask for margin in excess of the regulatory minimum, or increase the margin amount, in certain circumstances.
For financial reporting purposes, cash collateral that has been pledged to cover obligations of the Fund, if any, is reported separately on the Statement of Assets and Liabilities as cash pledged as collateral. Non-cash collateral pledged by the Fund, if any, is noted in the Statement of Investments. Generally, the amount of collateral due from or to a party must exceed a minimum transfer amount threshold (e.g. $250,000) before a transfer has to be made. To the extent amounts due to the Fund from its counterparties are not fully collateralized, contractually or otherwise, the Fund bears the risk of loss from counterparty nonperformance.
The following table presents the valuations of derivative instruments by risk exposure as reported within the Statement of Assets and Liabilities as of June 30, 2015:
| | | | | | | | | | | | |
| | | Asset Derivatives | | | Liability Derivatives | |
| Derivatives Not Accounted for as | | Consolidated Statement of Assets and | | | | | Consolidated Statement of Assets and | | | |
| Hedging Instruments | | Liabilities Location | | Value | | | Liabilities Location | | Value | |
| |
Equity contracts | | Variation margin receivable | | $ | 4,940* | | | Variation margin payable | | $ | 6,309* | |
*Includes only the current day’s variation margin. Prior variation margin movements have been reflected in cash on the Statement of Assets and Liabilities upon receipt or payment.
The effect of derivative instruments on the Statement of Operations is as follows:
| | | | | | | | |
Amount of Realized Gain or (Loss) Recognized on Derivatives | |
Derivatives Not Accounted for as Hedging Instruments | | Closing and expiration
of futures contracts | | | Total | |
| |
Interest rate contracts | | $ | (156,402 | ) | | $ | (156,402) | |
|
Amount of Change in Unrealized Gain or (Loss) Recognized on Derivatives | |
Derivatives Not Accounted for as Hedging Instruments | | Futures contracts | | �� | Total | |
| |
Interest rate contracts | | $ | (381,064 | ) | | $ | (381,064) | |
6. Shares of Beneficial Interest
The Fund has authorized an unlimited number of $0.001 par value shares of beneficial interest of each class. Transactions in shares of beneficial interest were as follows:
| | | | | | | | | | | | | | | | |
| | | Six Months Ended June 30, 2015 | | | Year Ended December 31, 2014 | |
| | | Shares | | | Amount | | | Shares | | | Amount | |
| |
Non-Service Shares | | | | | | | | | | | | | | | | |
Sold | | | 73,866 | | | $ | 1,105,395 | | | | 249,594 | | | $ | 3,564,995 | |
Dividends and/or distributions reinvested | | | 299,338 | | | | 4,370,337 | | | | 300,916 | | | | 4,273,013 | |
Redeemed | | | (977,862 | ) | | | (14,593,745) | | | | (2,114,253 | ) | | | (30,138,035) | |
| | | | |
Net decrease | | | (604,658 | ) | | $ | (9,118,013) | | | | (1,563,743 | ) | | $ | (22,300,027) | |
| | | | |
| | | | | | | | | | | | | | | | |
| |
Service Shares | | | | | | | | | | | | | | | | |
Sold | | | 80,727 | | | $ | 1,189,002 | | | | 373,936 | | | $ | 5,300,928 | |
Dividends and/or distributions reinvested | | | 82,918 | | | | 1,196,499 | | | | 83,586 | | | | 1,173,553 | |
Redeemed | | | (456,742 | ) | | | (6,722,959) | | | | (1,142,911 | ) | | | (16,061,044) | |
| | | | |
Net decrease | | | (293,097 | ) | | $ | (4,337,458) | | | | (685,389 | ) | | $ | (9,586,563) | |
| | | | |
28 OPPENHEIMER CONSERVATIVE BALANCED FUND/VA
7. Purchases and Sales of Securities
The aggregate cost of purchases and proceeds from sales of securities, other than short-term obligations and investments in IMMF, for the six months ended June 30, 2015 were as follows:
| | | | | | | | |
| | | Purchases | | | Sales | |
| |
Investment securities | | | $81,897,046 | | | | $94,702,517 | |
U.S. government and government agency obligations | | | 8,820,854 | | | | 9,230,806 | |
To Be Announced (TBA) mortgage-related securities | | | 448,706,782 | | | | 469,025,887 | |
8. Fees and Other Transactions with Affiliates
Management Fees. Under the investment advisory agreement, the Fund pays the Manager a management fee based on the daily net assets of the Fund at an annual rate as shown in the following table:
| | | | |
| Fee Schedule | | | |
| |
Up to $200 million | | | 0.75% | |
Next $200 million | | | 0.72 | |
Next $200 million | | | 0.69 | |
Next $200 million | | | 0.66 | |
Over $800 million | | | 0.60 | |
The Fund’s effective management fee for the six months ended June 30, 2015 was 0.74% of average annual net assets before any applicable waivers.
Sub-Adviser Fees. The Manager has retained the Sub-Adviser to provide the day-to-day portfolio management of the Fund. Under the Sub-Advisory Agreement, the Manager pays the Sub-Adviser an annual fee in monthly installments, equal to a percentage of the investment management fee collected by the Manager from the Fund, which shall be calculated after any investment management fee waivers. The fee paid to the Sub-Adviser is paid by the Manager, not by the Fund.
Transfer Agent Fees. OFI Global (the “Transfer Agent”) serves as the transfer and shareholder servicing agent for the Fund. The Fund pays the Transfer Agent a fee based on annual net assets. Fees incurred and average net assets for each class with respect to these services are detailed in the Statement of Operations and Financial Highlights, respectively.
Sub-Transfer Agent Fees. The Transfer Agent has retained Shareholder Services, Inc., a wholly-owned subsidiary of OFI (the “Sub-Transfer Agent”), to provide the day-to-day transfer agent and shareholder servicing of the Fund. Under the Sub-Transfer Agency Agreement, the Transfer Agent pays the Sub-Transfer Agent an annual fee in monthly installments, equal to a percentage of the transfer agent fee collected by the Transfer Agent from the Fund, which shall be calculated after any applicable fee waivers. The fee paid to the Sub-Transfer Agent is paid by the Transfer Agent, not by the Fund.
Trustees’ Compensation. The Fund’s Board of Trustees (“Board”) has adopted a compensation deferral plan for Independent Trustees that enables Trustees to elect to defer receipt of all or a portion of the annual compensation they are entitled to receive from the Fund. For purposes of determining the amount owed to the Trustee under the plan, deferred amounts are treated as though equal dollar amounts had been invested in shares of the Fund or in other Oppenheimer funds selected by the Trustee. The Fund purchases shares of the funds selected for deferral by the Trustee in amounts equal to his or her deemed investment, resulting in a Fund asset equal to the deferred compensation liability. Such assets are included as a component of “Other” within the asset section of the Statement of Assets and Liabilities. Deferral of Trustees’ fees under the plan will not affect the net assets of the Fund and will not materially affect the Fund’s assets, liabilities or net investment income per share. Amounts will be deferred until distributed in accordance with the compensation deferral plan.
Distribution and Service Plan for Service Shares. The Fund has adopted a Distribution and Service Plan (the “Plan”) pursuant to Rule 12b-1 under the 1940 Act for Service shares to pay OppenheimerFunds Distributor, Inc. (the “Distributor”), for distribution related services, personal service and account maintenance for the Fund’s Service shares. Under the Plan, payments are made periodically at an annual rate of 0.25% of the daily net assets of Service shares of the Fund. The Distributor currently uses all of those fees to compensate sponsors of the insurance product that offers Fund shares, for providing personal service and maintenance of accounts of their variable contract owners that hold Service shares. These fees are paid out of the Fund’s assets on an on-going basis and increase operating expenses of the Service shares, which results in lower performance compared to the Fund’s shares that are not subject to a service fee. Fees incurred by the Fund under the Plan are detailed in the Statement of Operations.
Waivers and Reimbursements of Expenses. The Manager has contractually agreed to limit the Fund’s expenses after payments, waivers and/or reimbursements and reduction to custodian expenses, excluding expenses incurred directly or indirectly by the Fund as a result of investments in other investment companies, wholly-owned subsidiaries and pooled investment vehicles; so that those expenses, as percentages of daily net assets, will not exceed the annual rate of 0.67% for Non-Service shares and 0.92% for Service shares. During the six months ended June 30, 2015, the Manager waived fees and/or reimbursed the Fund $233,807 and $72,221 for Non-Service and Service shares, respectively.
The Manager will waive fees and/or reimburse Fund expenses in an amount equal to the indirect management fees incurred through the Fund’s investment in IMMF. During the six months ended June 30, 2015, the Manager waived fees and/or reimbursed the Fund $2,662 for IMMF management fees.
29 OPPENHEIMER CONSERVATIVE BALANCED FUND/VA
NOTES TO FINANCIAL STATEMENTS Unaudited / Continued
8. Fees and Other Transactions with Affiliates (Continued)
Waivers and/or reimbursements may be modified or terminated as set forth according to the terms in the prospectus.
9. Pending Litigation
In 2009, several lawsuits were filed as putative class actions and later consolidated before the U.S. District Court for the District of Colorado in connection with the investment performance of Oppenheimer Rochester California Municipal Fund (the “California Fund Suit”), a fund advised by OppenheimerFunds, Inc. (“OFI”), and distributed by its subsidiary OppenheimerFunds Distributor, Inc. ( “OFDI”). The plaintiffs asserted claims against OFI, OFDI and certain present and former trustees and officers of the Fund under the federal securities laws, alleging, among other things, that the disclosure documents of the Fund contained misrepresentations and omissions and the investment policies of the Fund were not followed. Plaintiffs in the California Fund Suit filed an amended complaint and defendants filed a motion to dismiss. In 2011, the court issued an order which granted in part and denied in part the defendants’ motion to dismiss. In 2012, plaintiffs filed a motion, which defendants opposed, to certify a class and appoint class representatives and class counsel. In March 2015, the court granted plaintiffs’ motion for class certification. In May 2015, the U.S. Court of Appeals for the Tenth Circuit vacated the class certification order and remanded the matter to the district court for further proceedings. In July 2015, the district court held an evidentiary hearing on plaintiffs’ motion for class certification. OFI and OFDI believe the California Fund Suit is without merit; that it is premature to render any opinion as to the likelihood of an outcome unfavorable to them in the California Fund Suit; and that no estimate can yet be made as to the amount or range of any potential loss.
30 OPPENHEIMER CONSERVATIVE BALANCED FUND/VA
PORTFOLIO PROXY VOTING POLICIES AND PROCEDURES; UPDATES TO STATEMENTS OF INVESTMENTS Unaudited
The Fund has adopted Portfolio Proxy Voting Policies and Procedures under which the Fund votes proxies relating to securities (“portfolio proxies”) held by the Fund. A description of the Fund’s Portfolio Proxy Voting Policies and Procedures is available (i) without charge, upon request, by calling the Fund toll-free at 1.800.525.7048, (ii) on the Fund’s website at www.oppenheimerfunds.com, and (iii) on the SEC’s website at www.sec.gov. In addition, the Fund is required to file Form N-PX, with its complete proxy voting record for the 12 months ended June 30th, no later than August 31st of each year. The Fund’s voting record is available (i) without charge, upon request, by calling the Fund toll-free at 1.800.525.7048, and (ii) in the Form N-PX filing on the SEC’s website at www.sec.gov.
The Fund files its complete schedule of portfolio holdings with the SEC for the first quarter and the third quarter of each fiscal year on Form N-Q. The Fund’s Form N-Q filings are available on the SEC’s website at www.sec.gov. Those forms may be reviewed and copied at the SEC’s Public Reference Room in Washington, D.C. Information on the operation of the Public Reference Room may be obtained by calling 1-800-SEC-0330.
31 OPPENHEIMER CONSERVATIVE BALANCED FUND/VA
DISTRIBUTION SOURCES Unaudited
For any distribution that took place over the Fund’s reporting period, the table below details on a per-share basis the percentage of the Fund’s total distribution payment amount that was derived from the following sources: net income, net profit from the sale of securities, and other capital sources. This information is based upon income and capital gains using generally accepted accounting principles as of the date of each distribution. Because the Fund is actively managed, the relative amount of the Fund’s total distributions derived from various sources over the calendar year may change. Please note that this information should not be used for tax reporting purposes as the tax character of distributable income may differ from the amounts used for this notification. You will receive IRS tax forms in the first quarter of each calendar year detailing the actual amount of the taxable and non-taxable portion of distributions paid to you during the tax year.
For the most current information, please go to oppenheimerfunds.com. Select your Fund, then the ‘Detailed’ tab; where ‘Dividends’ are shown, the Fund’s latest pay date will be followed by the sources of any distribution, updated daily.
| | | | | | | | | | | | | | | | |
| Fund Name | | Pay Date | | | Net Income | | | Net
Profit | | | Other Capital
Sources | |
| |
Oppenheimer Conservative Balanced Fund/VA | | | 6/16/15 | | | | 96.9% | | | | 3.1% | | | | 0.0% | |
32 OPPENHEIMER CONSERVATIVE BALANCED FUND/VA
THIS PAGE INTENTIONALLY LEFT BLANK.
33 OPPENHEIMER CONSERVATIVE BALANCED FUND/VA
THIS PAGE INTENTIONALLY LEFT BLANK.
34 OPPENHEIMER CONSERVATIVE BALANCED FUND/VA
THIS PAGE INTENTIONALLY LEFT BLANK.
35 OPPENHEIMER CONSERVATIVE BALANCED FUND/VA
OPPENHEIMER CONSERVATIVE BALANCED FUND/VA
A Series of Oppenheimer Variable Account Funds
| | |
| Trustees and Officers | | Sam Freedman, Chairman of the Board of Trustees and Trustee |
| | Jon S. Fossel, Trustee |
| | Richard F. Grabish, Trustee |
| | Beverly L. Hamilton, Trustee |
| | Victoria J. Herget, Trustee |
| | Robert J. Malone, Trustee |
| | F. William Marshall, Jr., Trustee |
| | Karen L. Stuckey, Trustee |
| | James D. Vaughn, Trustee |
| | Arthur P. Steinmetz, Trustee, President and Principal Executive Officer |
| | Magnus Krantz, Vice President |
| | Krishna Memani, Vice President |
| | Arthur S. Gabinet, Secretary and Chief Legal Officer |
| | Jennifer Sexton, Vice President and Chief Business Officer |
| | Mary Ann Picciotto, Chief Compliance Officer and Chief Anti-Money Laundering Officer |
| | Brian W. Wixted, Treasurer and Principal Financial & Accounting Officer |
| |
| Manager | | OFI Global Asset Management, Inc. |
| |
| Sub-Adviser | | OppenheimerFunds, Inc. |
| |
| Distributor | | OppenheimerFunds Distributor, Inc. |
| |
Transfer and Shareholder Servicing Agent | | OFI Global Asset Management, Inc. |
| |
| Sub-Transfer Agent | | Shareholder Services, Inc. |
| | DBA OppenheimerFunds Services |
| |
Independent Registered Public Accounting Firm | | KPMG LLP |
| |
| Legal Counsel | | Ropes & Gray LLP |
| |
| | Before investing in any of the Oppenheimer funds, investors should carefully consider a fund’s investment objectives, risks, charges and expenses. Fund prospectuses and summary prospectuses contain this and other information about the funds, and may be obtained by asking your financial advisor, visiting oppenheimerfunds.com or calling us at 1.800.988.8287. Read prospectuses and summary prospectuses carefully before investing. |
| |
| | The financial statements included herein have been taken from the records of the Fund without examination of those records by the independent registered public accounting firm. |
| |
| | © 2015 OppenheimerFunds, Inc. All rights reserved. Oppenheimer funds are distributed by OppenheimerFunds Distributor, Inc. |

| | | | |
| | 
| | |
| | June 30, 2015 | | |
| | | Oppenheimer | | |
| | Capital Appreciation Fund/VA | | Semiannual Report |
| | | A Series of Oppenheimer Variable Account Funds | | |
| | SEMIANNUAL REPORT | | |
| | Listing of Top Holdings Fund Performance Discussion Financial Statements | | |
PORTFOLIO MANAGER: Michael Kotlarz
AVERAGE ANNUAL TOTAL RETURNS FOR THE PERIODS ENDED 6/30/15
| | | | | | | | | | | | | | | | | | | | |
| | | Inception
Date | | | | | 6-Months | | | 1-Year | | | 5-Year | | | 10-Year |
Non-Service Shares | | | 4/3/85 | | | | | | 4.16% | | | | 12.97 % | | | | 16.87 % | | | 7.22 % |
|
Service Shares | | | 9/18/01 | | | | | | 4.02 | | | | 12.67 | | | | 16.58 | | | 6.95 |
|
S&P 500 Index | | | | | | | | | 1.23 | | | | 7.42 | | | | 17.34 | | | 7.89 |
|
Russell 1000 Growth Index | | | | | | | | | 3.96 | | | | 10.56 | | | | 18.59 | | | 9.10 |
|
Performance data quoted represents past performance, which does not guarantee future results. The investment return and principal value of an investment in the Fund will fluctuate so that an investor’s shares, when redeemed, may be worth more or less than their original cost. Current performance may be lower or higher than the performance quoted. For performance data current to the most recent month end, call us at 1.800.988.8287. The Fund’s total returns should not be expected to be the same as the returns of other funds, whether or not both funds have the same portfolio managers and/or similar names. The Fund’s total returns include changes in share price and reinvested distributions but do not include the charges associated with the separate account products that offer this Fund. Such performance would have been lower if such charges were taken into account.
The Fund’s performance is compared to the performance of the S&P 500 Index and the Russell 1000 Growth Index. The S&P 500 Index is a broad-based measure of domestic stock performance. The Russell 1000 Growth Index measures the performance of the large-cap growth segment of the U.S. equity universe. It includes those Russell 1000 companies with higher price-to-book ratios and higher forecasted growth values. The Indices are unmanaged and cannot be purchased directly by investors. Index performance is shown for illustrative purposes only and does not predict or depict the performance of the Fund. While index comparisons may be useful to provide a benchmark for the Fund’s performance, it must be noted that the Fund’s investments are not limited to the investments comprising the Indices. Index performance includes reinvestment of income, but does not reflect transaction costs, fees, expenses or taxes. Index performance is shown for illustrative purposes only as a benchmark for the Fund’s performance, and does not predict or depict performance of the Fund. The Fund’s performance reflects the effects of the Fund’s business and operating expenses.
TOP HOLDINGS AND ALLOCATIONS
TOP TEN COMMON STOCK HOLDINGS
| | | | |
| |
Biogen, Inc. | | | 5.0% | |
| |
Facebook, Inc., Cl. A | | | 4.9 | |
| |
eBay, Inc. | | | 4.7 | |
| |
Allergan plc | | | 4.4 | |
| |
Gilead Sciences, Inc. | | | 4.2 | |
| |
Apple, Inc. | | | 3.9 | |
| |
LinkedIn Corp., Cl. A | | | 3.4 | |
| |
MasterCard, Inc., Cl. A | | | 3.1 | |
| |
Oracle Corp. | | | 3.0 | |
| |
Visa, Inc., Cl. A | | | 3.0 | |
| |
Portfolio holdings and allocations are subject to change. Percentages are as of June 30, 2015, and are based on net assets. For more current Fund holdings, please visit oppenheimerfunds.com.
SECTOR ALLOCATION
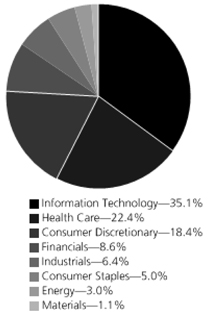
Portfolio holdings and allocations are subject to change. Percentages are as of June 30, 2015, and are based on the total market value of common stocks.
2 OPPENHEIMER CAPITAL APPRECIATION FUND/VA
Fund Performance Discussion
The Fund’s Non-Service shares produced a return of 4.16% during the reporting period, outperforming the Russell 1000 Growth Index (the “Index”), which returned 3.96%. The Fund’s outperformance relative to the Index stemmed primarily from stock selection in the health care and financials sectors, along with stock selection and an underweight position in industrials. Stock selection in the consumer discretionary and information technology detracted from relative performance. The Fund outperformed the S&P 500 Index, which returned 1.23% this reporting period.
GLOBAL MARKET AND ECONOMIC ENVIRONMENT
Equity markets were volatile during the six-month reporting period. After U.S. equities outperformed other developed and emerging market equities in 2014, the market environment shifted over the first half of 2015. The dollar continued to strengthen, which acted as a drag on growth. Businesses, especially U.S. firms with revenues dependent on exporting goods and services, cited this as a headwind. European Central Bank (“ECB”) President Mario Draghi announced the purchase of €60 billion a month in sovereign bonds from Eurozone countries for at least 19 months, a form of quantitative easing (“QE”) that is projected to increase the ECB’s balance sheet by over €1 trillion. The announcement and implementation of these extraordinary monetary policies had a significant impact on financial markets. European markets rallied and the euro fell against the currencies of most major trading partners. This resulted in European and emerging market equities outperforming U.S. equities over the first half of the period.
Over the second half of the reporting period, fallout from the collapse of oil prices, weak overseas economies and a strong U.S. dollar weighed on U.S. Gross Domestic Product (“GDP”) and corporate profit forecasts. In a repeat of last year, first quarter GDP growth was negative (-0.2%). Meanwhile, the Federal Reserve continued to forewarn a shift in monetary policy to higher interest rates later this year. Outside of the U.S., concerns around Greece’s debt situation emerged yet again late this reporting period. The markets had hoped for an 11th hour resolution to the stand-off between Greece and its creditors, but instead got an escalation of the crisis after the Greek Prime Minister called for a referendum. In the minds of many, this increased the odds of a Greek exit from the Eurozone (“Grexit”) and impacted the markets through the end of the reporting period. Shortly after the period ended, Eurozone leaders agreed to offer Greece a third bailout, averting a Grexit for the time being.
TOP INDIVIDUAL CONTRIBUTORS
During the reporting period, top contributors to performance included Biogen Inc., Gilead Sciences Inc. and Apple, Inc. Biogen is a global biotechnology company that received strong sales results from its multiple sclerosis drugs Tecfidera and Tysabri. Biogen’s experimental Alzheimer’s drug also showed promising results in an early stage trial and the company moved the drug to Phase III trials. Gilead Sciences is a biopharmaceutical company that discovers, develops and commercializes innovative medicines. The company received $3.6 billion from sales of its newest Hepatitis C pill, lifting the drug maker’s results above Wall Street expectations. The company also declared its first dividend. Apple continued to perform well as the continued success of the iPhone 6, excitement surrounding the introduction of the new iWatch, and an increased dividend and buyback program resulted in strong relative performance.
TOP INDIVIDUAL DETRACTORS
Top detractors from performance this reporting period included Western Digital Corp., Twenty-First Century Fox, Inc. and Tiffany & Co. Western Digital is a data storage solutions company that announced a decline in net revenues. Lower demand for enterprise hard drives also hurt the company this period. Twenty-First Century Fox, a diversified media company, posted strong domestic affiliate and ad revenue growth amid a weak U.S. television market, but reduced its fiscal 2015 and 2016 EBITDA (earnings before interest, taxes, depreciation and amortization) outlook due to weaker-than-expected television broadcast performance and increasing currency impediments. Tiffany, the world’s second-largest luxury jewelry retailer, declined in the first quarter of 2015. The company’s shares fell after a sluggish holiday season spurred the luxury jewelry chain to cut its annual forecast. Tiffany had been counting on the Americas to help offset weaker results overseas, especially in Japan, but that approach faltered over the holidays. We sold our position during the reporting period.
STRATEGY & OUTLOOK
Uncertainty about the Eurozone crisis, the uncertainty over when the Fed will raise interest rates, and the risk of deceleration in China, continues to weigh on the global economy. Although the U.S. economy has remained resilient, it continues to grow at a below normal expansionary pace. The U.S. economy’s resilience has been supported by strong productivity gains, low structural energy costs and a relatively attractive currency. Looking forward, we expect the U.S. economy to retain many of these tailwinds and for the markets to reward differentiated valuations to those companies demonstrating consistent quality, growth and innovation. We believe that companies with capital discipline, strong management and sustainable competitive advantages have the greatest prospects for outperformance over time.
3 OPPENHEIMER CAPITAL APPRECIATION FUND/VA
The Fund’s investment strategy and focus can change over time. The mention of specific fund holdings does not constitute a recommendation by OppenheimerFunds, Inc. or its affiliates.
Shares of Oppenheimer funds are not deposits or obligations of any bank, are not guaranteed by any bank, are not insured by the FDIC or any other agency, and involve investment risks, including the possible loss of the principal amount invested.
4 OPPENHEIMER CAPITAL APPRECIATION FUND/VA
Fund Expenses
Fund Expenses. As a shareholder of the Fund, you incur two types of costs: (1) transaction costs and (2) ongoing costs, including management fees; distribution and service fees; and other Fund expenses. These examples are intended to help you understand your ongoing costs (in dollars) of investing in the Fund and to compare these costs with the ongoing costs of investing in other mutual funds.
The examples are based on an investment of $1,000.00 invested at the beginning of the period and held for the entire 6-month period ended June 30, 2015.
Actual Expenses. The first section of the table provides information about actual account values and actual expenses. You may use the information in this section for the class of shares you hold, together with the amount you invested, to estimate the expense that you paid over the period. Simply divide your account value by $1,000.00 (for example, an $8,600.00 account value divided by $1,000.00 = 8.60), then multiply the result by the number in the first section under the heading entitled “Expenses Paid During the 6 Months Ended June 30, 2015” to estimate the expenses you paid on your account during this period.
Hypothetical Example for Comparison Purposes.
The second section of the table provides information about hypothetical account values and hypothetical expenses based on the Fund’s actual expense ratio for each class of shares, and an assumed rate of return of 5% per year for each class before expenses, which is not the actual return. The hypothetical account values and expenses may not be used to estimate the actual ending account balance or expenses you paid for the period. You may use this information to compare the ongoing costs of investing in the Fund and other funds. To do so, compare this 5% hypothetical example for the class of shares you hold with the 5% hypothetical examples that appear in the shareholder reports of the other funds.
Please note that the expenses shown in the table are meant to highlight your ongoing costs only and do not reflect any charges associated with the separate accounts that offer this Fund. Therefore, the “hypothetical” lines of the table are useful in comparing ongoing costs only, and will not help you determine the relative total costs of owning different funds. In addition, if these separate account charges were included your costs would have been higher.
| | | | | | | | | | | | | | | | |
| Actual | | Beginning
Account Value
January 1, 2015 | | | | | Ending
Account Value
June 30, 2015 | | | | | Expenses Paid During 6 Months Ended June 30, 2015 | |
Non-Service shares | | $ | 1,000.00 | | | | | $ | 1,041.60 | | | | | $ | 4.06 | |
Service shares | | | 1,000.00 | | | | | | 1,040.20 | | | | | | 5.33 | |
| | | | | |
Hypothetical (5% return before expenses) | | | | | | | | | | | | | |
Non-Service shares | | | 1,000.00 | | | | | | 1,020.83 | | | | | | 4.02 | |
Service shares | | | 1,000.00 | | | | | | 1,019.59 | | | | | | 5.27 | |
Expenses are equal to the Fund’s annualized expense ratio for that class, multiplied by the average account value over the period, multiplied by 181/365 (to reflect the one-half year period). Those annualized expense ratios, excluding indirect expenses from affiliated funds, based on the 6-month period ended June 30, 2015 are as follows:
| | | | |
| Class | | Expense Ratios | |
Non-Service shares | | | 0.80% | |
Service shares | | | 1.05 | |
The expense ratios reflect voluntary waivers and/or reimbursements of expenses by the Fund’s Manager. Some of these undertakings may be modified or terminated at any time, as indicated in the Fund’s prospectus. The “Financial Highlights” tables in the Fund’s financial statements, included in this report, also show the gross expense ratios, without such waivers or reimbursements and reduction to custodian expenses, if applicable.
5 OPPENHEIMER CAPITAL APPRECIATION FUND/VA
STATEMENT OF INVESTMENTS June 30, 2015 Unaudited
| | | | | | | | | | |
| | | | | | | | | | |
| | | Shares | | | Value | | | | |
| | | | |
| Common Stocks—99.7% | | | | | | | | | | |
| | | | |
| Consumer Discretionary—18.4% | | | | |
| | | | |
| Auto Components—0.5% | | | | | | | | | | |
| | | | |
Magna International, Inc. | | | 88,120 | | | $ 4,942,651 | | | | |
| | | | |
| Diversified Consumer Services—0.5% | | | | |
| | | | |
Service Corp. International | | | 137,420 | | | 4,044,271 | | | | |
| | | | |
| Hotels, Restaurants & Leisure—2.2% | | | | |
| | | | |
| Chipotle Mexican Grill, Inc., Cl. A1 | | | 7,350 | | | 4,446,676 | | | | |
| | | | |
| Dunkin’ Brands Group, Inc. | | | 300,720 | | | 16,539,600 | | | | |
| | | | | | | | | | |
| | | | | | 20,986,276 | | | | |
| | | | |
| Household Durables—1.0% | | | | | | | | | | |
| | | | |
Harman International Industries, Inc. | | | 81,160 | | | 9,653,170 | | | | |
| | | | |
| Internet & Catalog Retail—1.6% | | | | | | | | | | |
| | | | |
| Amazon.com, Inc.1 | | | 7,454 | | | 3,235,707 | | | | |
| | | | |
| TripAdvisor, Inc.1 | | | 136,960 | | | 11,934,694 | | | | |
| | | | | | | | | | |
| | | | | | 15,170,401 | | | | |
| | | | |
| Leisure Products—0.5% | | | | | | | | | | |
| | | | |
Hasbro, Inc. | | | 62,790 | | | 4,696,064 | | | | |
| | | | |
| Media—4.8% | | | | | | | | | | |
| | | | |
| Time Warner, Inc. | | | 234,635 | | | 20,509,445 | | | | |
| | | | |
| Twenty-First Century Fox, Inc., Cl. B | | | 343,520 | | | 11,068,215 | | | | |
| | | | |
| Walt Disney Co. (The) | | | 122,280 | | | 13,957,039 | | | | |
| | | | | | | | | | |
| | | | | | 45,534,699 | | | | |
| | | | |
| Multiline Retail—2.2% | | | | | | | | | | |
| | | | |
| Dollar Tree, Inc.1 | | | 196,830 | | | 15,547,602 | | | | |
| | | | |
| Macy’s, Inc. | | | 77,530 | | | 5,230,949 | | | | |
| | | | | | | | | | |
| | | | | | 20,778,551 | | | | |
| | | | |
| Specialty Retail—2.6% | | | | | | | | | | |
| | | | |
TJX Cos., Inc. (The) | | | 361,010 | | | 23,888,032 | | | | |
| | | | |
| Textiles, Apparel & Luxury Goods—2.5% | | | | |
| | | | |
| Coach, Inc. | | | 115,660 | | | 4,002,992 | | | | |
| | | | |
| NIKE, Inc., Cl. B | | | 98,730 | | | 10,664,815 | | | | |
| | | | |
| VF Corp. | | | 130,270 | | | 9,085,030 | | | | |
| | | | | | | | | | |
| | | | | | 23,752,837 | | | | |
| | | | |
| Consumer Staples—5.0% | | | | | | | | | | |
| | | | |
| Beverages—1.2% | | | | | | | | | | |
| | | | |
| Brown-Forman Corp., Cl. B | | | 14,725 | | | 1,475,151 | | | | |
| | | | |
| Constellation Brands, Inc., Cl. A | | | 82,010 | | | 9,514,800 | | | | |
| | | | | | | | | | |
| | | | | | 10,989,951 | | | | |
| | | | |
| Food & Staples Retailing—3.8% | | | | | | | | | | |
| | | | |
| Costco Wholesale Corp. | | | 131,950 | | | 17,821,167 | | | | |
| | | | |
| CVS Health Corp. | | | 177,000 | | | 18,563,760 | | | | |
| | | | | | | | | | |
| | | | | | 36,384,927 | | | | |
| | | | |
| Energy—2.9% | | | | | | | | | | |
| | | | |
| Energy Equipment & Services—0.4% | | | | |
| | | | |
Halliburton Co. | | | 93,530 | | | 4,028,337 | | | | |
| | | | |
| Oil, Gas & Consumable Fuels—2.5% | | | | |
| | | | |
| Antero Resources Corp.1 | | | 92,650 | | | 3,181,601 | | | | |
| | | | |
| Cimarex Energy Co. | | | 41,620 | | | 4,591,102 | | | | |
| | | | |
| EOG Resources, Inc. | | | 108,370 | | | 9,487,794 | | | | |
| | | | |
| Pioneer Natural Resources Co. | | | 47,630 | | | 6,605,805 | | | | |
| | | | | | | | | | |
| | | | | | 23,866,302 | | | | |
| | | | |
| Financials—8.6% | | | | | | | | | | |
| | | | |
| Capital Markets—3.9% | | | | | | | | | | |
| | | | |
| Charles Schwab Corp. (The) | | | 606,390 | | | 19,798,634 | | | | |
| | | | |
| Invesco Ltd. | | | 149,280 | | | 5,596,507 | | | | |
| | | | |
| State Street Corp. | | | 144,180 | | | 11,101,860 | | | | |
| | | | | | | | | | |
| | | | | | 36,497,001 | | | | |
| | | | | | | | | | |
| | | | | | | | | | |
| | | | | | | | | | |
| | | | | | | | | | |
| | | Shares | | | Value | | | | |
| | | | |
Commercial Banks—3.3% | | | | |
| | | | |
| JPMorgan Chase & Co. | | | 369,030 | | | $ 25,005,473 | | | | |
| | | | |
| SVB Financial Group1 | | | 44,750 | | | 6,443,105 | | | | |
| | | | | | | | | | |
| | | | | | 31,448,578 | | | | |
| | | | |
Insurance—1.4% | | | | |
| | | | |
Aon plc | | | 135,630 | | | 13,519,598 | | | | |
| | | | |
Health Care—22.3% | | | | |
| | | | |
Biotechnology—12.5% | | | | |
| | | | |
| Biogen, Inc.1 | | | 115,210 | | | 46,537,928 | | | | |
| | | | |
| Celgene Corp.1 | | | 238,294 | | | 27,578,956 | | | | |
| | | | |
| Gilead Sciences, Inc. | | | 339,150 | | | 39,707,682 | | | | |
| | | | |
| Vertex Pharmaceuticals, Inc.1 | | | 30,575 | | | 3,775,401 | | | | |
| | | | | | | | | | |
| | | | | | 117,599,967 | | | | |
| | | | |
Health Care Equipment & Supplies—2.1% | | | | |
| | | | |
| Abbott Laboratories | | | 272,720 | | | 13,385,098 | | | | |
| | | | |
| Hologic, Inc.1 | | | 125,540 | | | 4,778,052 | | | | |
| | | | |
| Medtronic plc | | | 25,090 | | | 1,859,169 | | | | |
| | | | | | | | | | |
| | | | | | 20,022,319 | | | | |
| | | | |
Life Sciences Tools & Services—0.3% | | | | |
| | | | |
Illumina, Inc.1 | | | 11,390 | | | 2,487,120 | | | | |
| | | | |
Pharmaceuticals—7.4% | | | | |
| | | | |
| Allergan plc1 | | | 136,260 | | | 41,349,460 | | | | |
| | | | |
| Bristol-Myers Squibb Co. | | | 90,260 | | | 6,005,900 | | | | |
| | | | |
| Perrigo Co. plc | | | 42,160 | | | 7,792,433 | | | | |
| | | | |
| Valeant Pharmaceuticals International, Inc.1 | | | 68,477 | | | 15,212,165 | | | | |
| | | | | | | | | | |
| | | | | | 70,359,958 | | | | |
| | | | |
Industrials—6.4% | | | | |
| | | | |
Aerospace & Defense—0.8% | | | | |
| | | | |
| Raytheon Co. | | | 23,770 | | | 2,274,313 | | | | |
| | | | |
| TransDigm Group, Inc.1 | | | 23,170 | | | 5,205,604 | | | | |
| | | | | | | | | | |
| | | | | | 7,479,917 | | | | |
| | | | |
Building Products—0.8% | | | | |
| | | | |
| A.O. Smith Corp. | | | 69,430 | | | 4,997,572 | | | | |
| | | | |
| Allegion plc | | | 45,330 | | | 2,726,146 | | | | |
| | | | | | | | | | |
| | | | | | 7,723,718 | | | | |
| | | | |
Commercial Services & Supplies—1.2% | | | | |
| | | | |
Cintas Corp. | | | 137,540 | | | 11,634,509 | | | | |
| | | | |
Electrical Equipment—0.6% | | | | |
| | | | |
Acuity Brands, Inc. | | | 28,150 | | | 5,066,437 | | | | |
| | | | |
Machinery—2.8% | | | | |
| | | | |
| Ingersoll-Rand plc | | | 169,380 | | | 11,419,600 | | | | |
| | | | |
| Parker-Hannifin Corp. | | | 10,250 | | | 1,192,382 | | | | |
| | | | |
| Stanley Black & Decker, Inc. | | | 36,130 | | | 3,802,321 | | | | |
| | | | |
| Wabtec Corp. | | | 107,120 | | | 10,094,989 | | | | |
| | | | | | | | | | |
| | | | | | 26,509,292 | | | | |
| | | | |
Road & Rail—0.2% | | | | |
| | | | |
Canadian Pacific Railway Ltd. | | | 12,130 | | | 1,943,590 | | | | |
| | | | |
Information Technology—35.0% | | | | |
| | | | |
Internet Software & Services—14.2% | | | | |
| | | | |
| Alibaba Group Holding Ltd., Sponsored ADR1 | | | 73,000 | | | 6,005,710 | | | | |
| | | | |
| eBay, Inc.1 | | | 742,290 | | | 44,715,549 | | | | |
| | | | |
| Facebook, Inc., Cl. A1 | | | 538,240 | | | 46,162,154 | | | | |
| | | | |
| Google, Inc., Cl. A1 | | | 10,420 | | | 5,627,217 | | | | |
| | | | |
| LinkedIn Corp., Cl. A1 | | | 153,910 | | | 31,802,423 | | | | |
| | | | | | | | | | |
| | | | | | 134,313,053 | | | | |
| | | | |
IT Services—7.6% | | | | |
| | | | |
| Computer Sciences Corp. | | | 215,360 | | | 14,136,231 | | | | |
| | | | |
| MasterCard, Inc., Cl. A | | | 312,430 | | | 29,205,956 | | | | |
| | | | |
| Visa, Inc., Cl. A | | | 416,428 | | | 27,963,140 | | | | |
| | | | | | | | | | |
| | | | | | 71,305,327 | | | | |
6 OPPENHEIMER CAPITAL APPRECIATION FUND/VA
| | | | | | | | |
| | | Shares | | | Value | |
| |
| Software—7.2% | | | | | | | | |
| |
| Microsoft Corp. | | | 438,800 | | | $ | 19,373,020 | |
| |
| Oracle Corp. | | | 705,810 | | | | 28,444,143 | |
| |
| ServiceNow, Inc.1 | | | 127,010 | | | | 9,438,113 | |
| |
| Workday, Inc., Cl. A1 | | | 143,100 | | | | 10,931,409 | |
| | | | | | | | |
| | | | | | | 68,186,685 | |
| | | | | | | | |
| |
| Technology Hardware, Storage & Peripherals—6.0% | |
| |
| Apple, Inc. | | | 294,150 | | | | 36,893,764 | |
| |
| EMC Corp. | | | 427,430 | | | | 11,279,878 | |
| |
| Western Digital Corp. | | | 102,330 | | | | 8,024,718 | |
| | | | | | | | |
| | | | | | | 56,198,360 | |
| | | | | | | | |
| |
| Materials—1.1% | | | | | | | | |
| |
| Chemicals—1.1% | | | | | | | | |
| |
| Sherwin-Williams Co. (The) | | | 37,220 | | | | 10,236,244 | |
| | | | | | | | |
| |
| Total Investments, at Value (Cost $709,397,444) | | | 99.7% | | | | 941,248,142 | |
| |
| Net Other Assets (Liabilities) | | | 0.3 | | | | 2,473,890 | |
| | | | |
| Net Assets | | | 100.0% | | | $ | 943,722,032 | |
| | | | |
Footnotes to Statement of Investments
1. Non-income producing security.
The following issuer is or was an affiliate, as defined in the Investment Company Act of 1940, as amended, at or during the period ended June 30, 2015, by virtue of the Fund owning at least 5% of the voting securities of the issuer or as a result of the Fund and the issuer having the same investment adviser. There were no affiliate securities held by the the Fund as of June 30, 2015. Transactions during the period in which the issuer was an affiliate are as follows:
| | | | | | | | | | | | | | | | |
| | | Shares
December 31, 2014 | | | Gross
Additions | | | Gross
�� Reductions | | | Shares
June 30, 2015 | |
| |
Oppenheimer Institutional Money Market Fund, Cl. E | | | 3,087,900 | | | | 83,961,048 | | | | 87,048,948 | | | | – | |
| | | | |
| | | | | | | | | | | | Income | |
| |
Oppenheimer Institutional Money Market Fund, Cl. E | | | | | | | | | | | | | | $ | 2,169 | |
See accompanying Notes to Financial Statements.
7 OPPENHEIMER CAPITAL APPRECIATION FUND/VA
STATEMENT OF ASSETS AND LIABILITIES June 30, 2015 Unaudited
| | | | |
| |
Assets | | | | |
| Investments, at value - unaffiliated companies (cost $709,397,444)—see accompanying statement of investments | | $ | 941,248,142 | |
| |
| Cash | | | 892,572 | |
| |
| Receivables and other assets: | | | | |
| Investments sold | | | 3,841,923 | |
| Dividends | | | 553,852 | |
| Shares of beneficial interest sold | | | 219,223 | |
| Other | | | 83,649 | |
| | | | |
| Total assets | | | 946,839,361 | |
|
| |
Liabilities | | | | |
| Payables and other liabilities: | | | | |
| Investments purchased | | | 1,869,935 | |
| Shares of beneficial interest redeemed | | | 1,047,182 | |
| Trustees’ compensation | | | 71,720 | |
| Distribution and service plan fees | | | 70,366 | |
| Shareholder communications | | | 36,088 | |
| Other | | | 22,038 | |
| | | | |
| Total liabilities | | | 3,117,329 | |
|
| |
Net Assets | | $ | 943,722,032 | |
| | | | |
|
| |
Composition of Net Assets | | | | |
| Par value of shares of beneficial interest | | $ | 16,975 | |
| |
| Additional paid-in capital | | | 640,573,774 | |
| |
| Accumulated net investment loss | | | (875,990) | |
| |
| Accumulated net realized gain on investments and foreign currency transactions | | | 72,159,626 | |
| |
| Net unrealized appreciation on investments and translation of assets and liabilities denominated in foreign currencies | | | 231,847,647 | |
| | | | |
| Net Assets | | $ | 943,722,032 | |
| | | | |
|
| |
Net Asset Value Per Share | | | | |
| Non-Service Shares: | | | | |
| Net asset value, redemption price per share and offering price per share (based on net assets of $605,182,873 and 10,842,321 shares of beneficial interest outstanding) | | | $55.82 | |
| |
| |
| Service Shares: | | | | |
| Net asset value, redemption price per share and offering price per share (based on net assets of $338,539,159 and 6,133,128 shares of beneficial interest outstanding) | | | $55.20 | |
See accompanying Notes to Financial Statements.
8 OPPENHEIMER CAPITAL APPRECIATION FUND/VA
STATEMENT OF OPERATIONS For the Six Months Ended June 30, 2015 Unaudited
| | | | |
| |
Investment Income | | | | |
| Dividends: | | | | |
| Unaffiliated companies (net of foreign withholding taxes of $8,907) | | $ | 4,767,120 | |
| Affiliated companies | | | 2,169 | |
| | | | |
| Total investment income | | | 4,769,289 | |
| |
Expenses | | | | |
| Management fees | | | 3,285,878 | |
| |
| Distribution and service plan fees: | | | | |
| Service shares | | | 427,416 | |
| |
| Transfer and shareholder servicing agent fees: | | | | |
| Non-Service shares | | | 307,232 | |
| Service shares | | | 170,993 | |
| |
| Shareholder communications: | | | | |
| Non-Service shares | | | 33,355 | |
| Service shares | | | 18,572 | |
| |
| Trustees’ compensation | | | 17,155 | |
| |
| Custodian fees and expenses | | | 7,690 | |
| |
| Other | | | 30,829 | |
| | | | |
| Total expenses | | | 4,299,120 | |
| Less reduction to custodian expenses | | | (406) | |
| Less waivers and reimbursements of expenses | | | (45,283) | |
| | | | |
| Net expenses | | | 4,253,431 | |
|
| |
Net Investment Income | | | 515,858 | |
|
| |
Realized and Unrealized Gain (Loss) | | | | |
| Net realized gain on: | | | | |
| Investments from unaffiliated companies | | | 73,307,842 | |
| Foreign currency transactions | | | 10,166 | |
| | | | |
| Net realized gain | | | 73,318,008 | |
| |
| Net change in unrealized appreciation/depreciation on: | | | | |
| Investments | | | (35,118,451) | |
| Translation of assets and liabilities denominated in foreign currencies | | | 290,434 | |
| | | | |
| Net change in unrealized appreciation/depreciation | | | (34,828,017) | |
|
| |
| Net Increase in Net Assets Resulting from Operations | | $ | 39,005,849 | |
| | | | |
See accompanying Notes to Financial Statements.
9 OPPENHEIMER CAPITAL APPRECIATION FUND/VA
STATEMENTS OF CHANGES IN NET ASSETS
| | | | | | | | |
| | | Six Months Ended June 30, 2015 (Unaudited) | | | Year Ended December 31, 2014 | |
| |
Operations | | | | | | | | |
| Net investment income | | $ | 515,858 | | | $ | 594,123 | |
| |
| Net realized gain | | | 73,318,008 | | | | 183,603,215 | |
| |
| Net change in unrealized appreciation/depreciation | | | (34,828,017) | | | | (48,516,600) | |
| | | | | | | | |
Net increase in net assets resulting from operations | | | 39,005,849 | | | | 135,680,738 | |
| |
Dividends and/or Distributions to Shareholders | | | | | | | | |
| Dividends from net investment income: | | | | | | | | |
| Non-Service shares | | | (554,707) | | | | (2,755,561) | |
| Service shares | | | — | | | | (632,322) | |
| | | | | | | | |
| | | (554,707) | | | | (3,387,883) | |
|
| |
| Distributions from net realized gain: | | | | | | | | |
| Non-Service shares | | | (106,184,924) | | | | (15,002,872) | |
| Service shares | | | (59,885,291) | | | | (8,466,690) | |
| | | | | | | | |
| | | (166,070,215) | | | | (23,469,562) | |
| |
Beneficial Interest Transactions | | | | | | | | |
| Net increase (decrease) in net assets resulting from beneficial interest transactions: | | | | | | | | |
| Non-Service shares | | | 69,689,721 | | | | (80,263,666) | |
| Service shares | | | 47,471,016 | | | | (65,500,468) | |
| | | | | | | | |
| | | 117,160,737 | | | | (145,764,134) | |
| |
Net Assets | | | | | | | | |
| Total decrease | | | (10,458,336) | | | | (36,940,841) | |
| |
| Beginning of period | | | 954,180,368 | | | | 991,121,209 | |
| | | | | | | | |
| | |
| End of period (including accumulated net investment loss of $ 875,990 and $ 837,141, respectively) | | $ | 943,722,032 | | | $ | 954,180,368 | |
| | | | |
See accompanying Notes to Financial Statements.
10 OPPENHEIMER CAPITAL APPRECIATION FUND/VA
FINANCIAL HIGHLIGHTS
| | | | | | | | | | | | | | | | | | | | | | | | |
| Non-Service Shares | | Six Months
Ended
June 30, 2015
(Unaudited) | | | Year Ended
December 31,
2014 | | | Year Ended
December 31,
2013 | | | Year Ended
December 31,
2012 | | | Year Ended
December 30,
20111 | | | Year Ended
December 31,
2010 | |
| |
Per Share Operating Data | | | | | | | | | | | | | | | | | | | | | | | | |
| Net asset value, beginning of period | | $ | 64.87 | | | $ | 57.88 | | | $ | 45.06 | | | | 39.75 | | | | 40.35 | | | | 36.94 | |
| |
| Income (loss) from investment operations: | | | | | | | | | | | | | | | | | | | | | | | | |
| Net investment income2 | | | 0.06 | | | | 0.09 | | | | 0.23 | | | | 0.42 | | | | 0.23 | | | | 0.11 | |
| Net realized and unrealized gain (loss) | | | 2.74 | | | | 8.64 | | | | 13.09 | | | | 5.18 | | | | (0.69) | | | | 3.36 | |
| | | | |
| Total from investment operations | | | 2.80 | | | | 8.73 | | | | 13.32 | | | | 5.60 | | | | (0.46) | | | | 3.47 | |
| |
| Dividends and/or distributions to shareholders: | | | | | | | | | | | | | | | | | | | | | | | | |
| Dividends from net investment income | | | (0.06) | | | | (0.27) | | | | (0.50) | | | | (0.29) | | | | (0.14) | | | | (0.06) | |
| Distributions from net realized gain | | | (11.79) | | | | (1.47) | | | | 0.00 | | | | 0.00 | | | | 0.00 | | | | 0.00 | |
| | | | |
| Total dividends and/or distributions to shareholders | | | (11.85) | | | | (1.74) | | | | (0.50) | | | | (0.29) | | | | (0.14) | | | | (0.06) | |
| |
| Net asset value, end of period | | $ | 55.82 | | | $ | 64.87 | | | $ | 57.88 | | | $ | 45.06 | | | $ | 39.75 | | | $ | 40.35 | |
| | | | |
|
| |
Total Return, at Net Asset Value3 | | | 4.16% | | | | 15.41% | | | | 29.74% | | | | 14.12% | | | | (1.15)% | | | | 9.42% | |
| |
| |
Ratios/Supplemental Data | | | | | | | | | | | | | | | | | | | | | | | | |
| Net assets, end of period (in thousands) | | $ | 605,183 | | | $ | 616,862 | | | $ | 626,907 | | | $ | 573,684 | | | $ | 637,868 | | | $ | 771,086 | |
| |
| Average net assets (in thousands) | | $ | 619,404 | | | $ | 614,272 | | | $ | 595,912 | | | $ | 600,121 | | | $ | 713,770 | | | $ | 976,242 | |
| |
| Ratios to average net assets:4 | | | | | | | | | | | | | | | | | | | | | | | | |
| Net investment income | | | 0.20% | | | | 0.15% | | | | 0.44% | | | | 0.95% | | | | 0.57% | | | | 0.31% | |
| Total expenses5 | | | 0.81% | | | | 0.80% | | | | 0.81% | | | | 0.81% | | | | 0.80% | | | | 0.79% | |
| Expenses after payments, waivers and/or reimbursements and reduction to custodian expenses | | | 0.80% | | | | 0.80% | | | | 0.80% | | | | 0.80% | | | | 0.80% | | | | 0.79% | |
| |
| Portfolio turnover rate | | | 33% | | | | 61% | | | | 77% | | | | 28% | | | | 27% | | | | 58% | |
1. December 30, 2011 represents the last business day of the Fund’s reporting period.
2. Per share amounts calculated based on the average shares outstanding during the period.
3. Assumes an initial investment on the business day before the first day of the fiscal period, with all dividends and distributions reinvested in additional shares on the reinvestment date, and redemption at the net asset value calculated on the last business day of the fiscal period. Total returns are not annualized for periods less than one full year. Total return information does not reflect expenses that apply at the separate account level or to related insurance products. Inclusion of these charges would reduce the total return figures for all periods shown. Returns do not reflect the deduction of taxes that a shareholder would pay on fund distributions or the redemption of fund shares. The returns do not include adjustments in accordance with generally accepted accounting principles required at the period end for financial reporting purposes.
4. Annualized for periods less than one full year.
5. Total expenses including indirect expenses from affiliated fund fees and expenses were as follows:
| | | | | | |
| | | | | | |
| | Six Months Ended June 30, 2015 | | | 0.81 | % |
| | Year Ended December 31, 2014 | | | 0.80 | % |
| | Year Ended December 31, 2013 | | | 0.81 | % |
| | Year Ended December 31, 2012 | | | 0.81 | % |
| | Year Ended December 30, 2011 | | | 0.80 | % |
| | Year Ended December 31, 2010 | | | 0.79 | % |
See accompanying Notes to Financial Statements.
11 OPPENHEIMER CAPITAL APPRECIATION FUND/VA
FINANCIAL HIGHLIGHTS Continued
| | | | | | | | | | | | | | | | | | | | | | | | |
| Service Shares | | Six Months
Ended
June 30, 2015
(Unaudited) | | | Year Ended
December 31,
2014 | | | Year Ended
December 31,
2013 | | | Year Ended
December 31,
2012 | | | Year Ended
December 30,
20111 | | | Year Ended
December 31,
2010 | |
| |
Per Share Operating Data | | | | | | | | | | | | | | | | | | | | | | | | |
| Net asset value, beginning of period | | $ | 64.30 | | | $ | 57.37 | | | $ | 44.66 | | | $ | 39.40 | | | $ | 39.99 | | | $ | 36.64 | |
| |
| Income (loss) from investment operations: | | | | | | | | | | | | | | | | | | | | | | | | |
| Net investment income (loss)2 | | | (0.02) | | | | (0.06) | | | | 0.10 | | | | 0.31 | | | | 0.13 | | | | 0.02 | |
| Net realized and unrealized gain (loss) | | | 2.71 | | | | 8.57 | | | | 12.98 | | | | 5.12 | | | | (0.68) | | | | 3.33 | |
| | | | |
| Total from investment operations | | | 2.69 | | | | 8.51 | | | | 13.08 | | | | 5.43 | | | | (0.55) | | | | 3.35 | |
| |
| Dividends and/or distributions to shareholders: | | | | | | | | | | | | | | | | | | | | | | | | |
| Dividends from net investment income | | | 0.00 | | | | (0.11) | | | | (0.37) | | | | (0.17) | | | | (0.04) | | | | 0.00 | |
| Distributions from net realized gain | | | (11.79) | | | | (1.47) | | | | 0.00 | | | | 0.00 | | | | 0.00 | | | | 0.00 | |
| | | | |
| Total dividends and/or distributions to shareholders | | | (11.79) | | | | (1.58) | | | | (0.37) | | | | (0.17) | | | | (0.04) | | | | 0.00 | |
| |
| Net asset value, end of period | | $ | 55.20 | | | $ | 64.30 | | | $ | 57.37 | | | $ | 44.66 | | | $ | 39.40 | | | $ | 39.99 | |
| | | | |
|
| |
Total Return, at Net Asset Value3 | | | 4.02% | | | | 15.13% | | | | 29.43% | | | | 13.81% | | | | (1.37)% | | | | 9.15% | |
| |
| |
Ratios/Supplemental Data | | | | | | | | | | | | | | | | | | | | | | | | |
| Net assets, end of period (in thousands) | | $ | 338,539 | | | $ | 337,318 | | | $ | 364,214 | | | $ | 366,664 | | | $ | 375,330 | | | $ | 423,989 | |
| |
| Average net assets (in thousands) | | $ | 344,728 | | | $ | 343,254 | | | $ | 367,615 | | | $ | 382,196 | | | $ | 407,413 | | | $ | 427,640 | |
| |
| Ratios to average net assets:4 | | | | | | | | | | | | | | | | | | | | | | | | |
| Net investment income (loss) | | | (0.05)% | | | | (0.10)% | | | | 0.20% | | | | 0.71% | | | | 0.32% | | | | 0.06% | |
| Total expenses5 | | | 1.06% | | | | 1.05% | | | | 1.06% | | | | 1.06% | | | | 1.05% | | | | 1.04% | |
| Expenses after payments, waivers and/or reimbursements and reduction to custodian expenses | | | 1.05% | | | | 1.05% | | | | 1.05% | | | | 1.05% | | | | 1.05% | | | | 1.04% | |
| |
| Portfolio turnover rate | | | 33% | | | | 61% | | | | 77% | | | | 28% | | | | 27% | | | | 58% | |
1. December 30, 2011 represents the last business day of the Fund’s reporting period.
2. Per share amounts calculated based on the average shares outstanding during the period.
3. Assumes an initial investment on the business day before the first day of the fiscal period, with all dividends and distributions reinvested in additional shares on the reinvestment date, and redemption at the net asset value calculated on the last business day of the fiscal period. Total returns are not annualized for periods less than one full year. Total return information does not reflect expenses that apply at the separate account level or to related insurance products. Inclusion of these charges would reduce the total return figures for all periods shown. Returns do not reflect the deduction of taxes that a shareholder would pay on fund distributions or the redemption of fund shares. The returns do not include adjustments in accordance with generally accepted accounting principles required at the period end for financial reporting purposes.
4. Annualized for periods less than one full year.
5. Total expenses including indirect expenses from affiliated fund fees and expenses were as follows:
| | | | | | |
| | | | | | |
| | Six Months Ended June 30, 2015 | | | 1.06 | % |
| | Year Ended December 31, 2014 | | | 1.05 | % |
| | Year Ended December 31, 2013 | | | 1.06 | % |
| | Year Ended December 31, 2012 | | | 1.06 | % |
| | Year Ended December 30, 2011 | | | 1.05 | % |
| | Year Ended December 31, 2010 | | | 1.04 | % |
See accompanying Notes to Financial Statements.
12 OPPENHEIMER CAPITAL APPRECIATION FUND/VA
NOTES TO FINANCIAL STATEMENTS June 30, 2015 Unaudited
1. Organization
Oppenheimer Capital Appreciation Fund/VA (the “Fund”) is a separate series of Oppenheimer Variable Account Funds, a diversified open-end management investment company registered under the Investment Company Act of 1940 (“1940 Act”), as amended. The Fund’s investment objective is to seek capital appreciation. The Fund’s investment adviser is OFI Global Asset Management, Inc. (“OFI Global” or the “Manager”), a wholly-owned subsidiary of OppenheimerFunds, Inc. (“OFI” or the “Sub-Adviser”). The Manager has entered into a sub-advisory agreement with OFI. Shares of the Fund are sold only to separate accounts of life insurance companies.
The Fund offers two classes of shares. Both classes are sold at their offering price, which is the net asset value per share, to separate investment accounts of participating insurance companies as an underlying investment for variable life insurance policies, variable annuity contracts or other investment products. The class of shares designated as Service shares is subject to a distribution and service plan. Both classes of shares have identical rights and voting privileges with respect to the Fund in general and exclusive voting rights on matters that affect that class alone. Earnings, net assets and net asset value per share may differ due to each class having its own expenses, such as transfer and shareholder servicing agent fees and shareholder communications, directly attributable to that class.
The following is a summary of significant accounting policies followed in the Fund’s preparation of financial statements in accordance with accounting principles generally accepted in the United States (“U.S. GAAP”).
2. Significant Accounting Policies
Security Valuation. All investments in securities are recorded at their estimated fair value, as described in Note 3.
Reporting Period End Date. The last day of the Fund’s reporting period is the last day the New York Stock Exchange was open for trading during the period. The Fund’s financial statements have been presented through that date to maintain consistency with the Fund’s net asset value calculations used for shareholder transactions.
Foreign Currency Translation. The Fund’s accounting records are maintained in U.S. dollars. The values of securities denominated in foreign currencies and amounts related to the purchase and sale of foreign securities and foreign investment income are translated into U.S. dollars as of the close of the New York Stock Exchange (the “Exchange”), normally 4:00 P.M. Eastern time, on each day the Exchange is open for trading. Foreign exchange rates may be valued primarily using a reliable bank, dealer or service authorized by the Board of Trustees.
Reported net realized gains and losses from foreign currency transactions arise from sales of portfolio securities, sales and maturities of short-term securities, sales of foreign currencies, exchange rate fluctuations between the trade and settlement dates on securities transactions, and the difference between the amounts of dividends, interest, and foreign withholding taxes recorded on the Fund’s books and the U.S. dollar equivalent of the amounts actually received or paid. Net unrealized appreciation and depreciation on the translation of assets and liabilities denominated in foreign currencies arise from changes in the values of assets and liabilities, including investments in securities at fiscal period end, resulting from changes in exchange rates.
The effect of changes in foreign currency exchange rates on investments is separately identified from the fluctuations arising from changes in market values of securities held and reported with all other foreign currency gains and losses in the Fund’s Statement of Operations.
Allocation of Income, Expenses, Gains and Losses. Income, expenses (other than those attributable to a specific class), gains and losses are allocated on a daily basis to each class of shares based upon the relative proportion of net assets represented by such class. Operating expenses directly attributable to a specific class are charged against the operations of that class.
Dividends and Distributions to Shareholders. Dividends and distributions to shareholders, which are determined in accordance with income tax regulations and may differ from U.S. generally accepted accounting principles, are recorded on the ex-dividend date. Income and capital gain distributions, if any, are declared and paid annually or at other times as deemed necessary by the Manager.
The tax character of distributions is determined as of the Fund’s fiscal year end. Therefore, a portion of the Fund’s distributions made to shareholders prior to the Fund’s fiscal year end may ultimately be categorized as a tax return of capital.
Investment Income. Dividend income is recorded on the ex-dividend date or upon ex-dividend notification in the case of certain foreign dividends where the ex-dividend date may have passed. Non-cash dividends included in dividend income, if any, are recorded at the fair market value of the securities received. Interest income is recognized on an accrual basis. Discount and premium, which are included in interest income on the Statement of Operations, are amortized or accreted daily.
Custodian Fees. “Custodian fees and expenses” in the Statement of Operations may include interest expense incurred by the Fund on any cash overdrafts of its custodian account during the period. Such cash overdrafts may result from the effects of failed trades in portfolio securities and from cash outflows resulting from unanticipated shareholder redemption activity. The Fund pays interest to its custodian on such cash overdrafts, to the extent they are not offset by positive cash balances maintained by the Fund, at a rate equal to the Federal Funds Rate plus 0.50%. The “Reduction to custodian expenses” line item, if applicable, represents earnings on cash balances maintained by the Fund during the period. Such interest expense and other custodian fees may be paid with these earnings.
Security Transactions. Security transactions are recorded on the trade date. Realized gains and losses on securities sold are determined on the basis of identified cost.
13 OPPENHEIMER CAPITAL APPRECIATION FUND/VA
NOTES TO FINANCIAL STATEMENTS Unaudited / Continued
2. Significant Accounting Policies (Continued)
Indemnifications. The Fund’s organizational documents provide current and former Trustees and officers with a limited indemnification against liabilities arising in connection with the performance of their duties to the Fund. In the normal course of business, the Fund may also enter into contracts that provide general indemnifications. The Fund’s maximum exposure under these arrangements is unknown as this would be dependent on future claims that may be made against the Fund. The risk of material loss from such claims is considered remote.
Federal Taxes. The Fund intends to comply with provisions of the Internal Revenue Code applicable to regulated investment companies and to distribute substantially all of its investment company taxable income to shareholders. Therefore, no federal income or excise tax provision is required. The Fund files income tax returns in U.S. federal and applicable state jurisdictions. The statute of limitations on the Fund’s tax return filings generally remains open for the three preceding fiscal reporting period ends.
During the fiscal year ended December 31, 2014, the Fund did not utilize any capital loss carryforward to offset capital gains realized in that fiscal year. Capital loss carryforwards with no expiration, if any, must be utilized prior to those with expiration dates. Capital losses with no expiration will be carried forward to future years if not offset by gains.
As of June 30, 2015, it is estimated that the capital loss carryforwards would be $73,318,008, which will not expire. The estimated capital loss carryforward represents the carryforward as of the end of the last fiscal year, increased or decreased by capital losses or gains realized in the first six months of the current fiscal year. During the six months ended June 30, 2015, it is estimated that the Fund will not utilize any capital loss carryforward to offset realized capital gains.
Net investment income (loss) and net realized gain (loss) may differ for financial statement and tax purposes. The character of dividends and distributions made during the fiscal year from net investment income or net realized gains are determined in accordance with federal income tax requirements, which may differ from the character of net investment income or net realized gains presented in those financial statements in accordance with GAAP. Also, due to timing of dividends and distributions, the fiscal year in which amounts are distributed may differ from the fiscal year in which the income or net realized gain was recorded by the Fund.
The aggregate cost of securities and other investments and the composition of unrealized appreciation and depreciation of securities and other investments for federal income tax purposes as of June 30, 2015 are noted in the following table. The primary difference between book and tax appreciation or depreciation of securities and other investments, if applicable, is attributable to the tax deferral of losses or tax realization of financial statement unrealized gain or loss.
| | | | |
Federal tax cost of securities | | $ | 709,397,444 | |
| | | | |
Gross unrealized appreciation | | $ | 242,319,936 | |
Gross unrealized depreciation | | | (10,469,238) | |
| | | | |
Net unrealized appreciation | | $ | 231,850,698 | |
| | | | |
Use of Estimates. The preparation of financial statements in conformity with accounting principles generally accepted in the United States of America requires management to make estimates and assumptions that affect the reported amounts of assets and liabilities and disclosure of contingent assets and liabilities at the date of the financial statements and the reported amounts of increases and decreases in net assets from operations during the reporting period. Actual results could differ from those estimates.
3. Securities Valuation
The Fund calculates the net asset value of its shares as of the close of the New York Stock Exchange (the “Exchange”), normally 4:00 P.M. Eastern time, on each day the Exchange is open for trading.
The Fund’s Board has adopted procedures for the valuation of the Fund’s securities and has delegated the day-to-day responsibility for valuation determinations under those procedures to the Manager. The Manager has established a Valuation Committee which is responsible for determining a “fair valuation” for any security for which market quotations are not “readily available.” The Valuation Committee’s fair valuation determinations are subject to review, approval and ratification by the Fund’s Board at its next regularly scheduled meeting covering the calendar quarter in which the fair valuation was determined.
Valuation Methods and Inputs
Securities are valued using unadjusted quoted market prices, when available, as supplied primarily by third party pricing services or dealers.
The following methodologies are used to determine the market value or the fair value of the types of securities described below:
Securities traded on a registered U.S. securities exchange (including exchange-traded derivatives other than futures and futures options) are valued based on the last sale price of the security reported on the principal exchange on which it is traded, prior to the time when the Fund’s assets are valued. In the absence of a sale, the security is valued at the last sale price on the prior trading day, if it is within the spread of the current day’s closing “bid” and “asked” prices, and if not, at the current day’s closing bid price. A security of a foreign issuer traded on a foreign exchange, but not listed on a registered U.S. securities exchange, is valued based on the last sale price on the principal exchange on which the security is traded, as identified by the third party pricing service used by the Manager, prior to the time when the Fund’s assets are valued. If the last sale price is unavailable, the security is valued at the most recent official closing price on the principal exchange on which it is traded. If the last sales price or official closing price for a foreign security is not available, the security is valued at the mean between the bid and asked price per the exchange or, if not available from the exchange, obtained from two dealers. If bid and asked prices are not available from either the exchange or two dealers, the security is valued by using one of the following methodologies (listed in order of priority): (1) using a bid from the exchange, (2) the mean between the bid and asked price as provided by a single dealer, or (3) a bid from a single dealer.
14 OPPENHEIMER CAPITAL APPRECIATION FUND/VA
3. Securities Valuation (Continued)
Shares of a registered investment company that are not traded on an exchange are valued at that investment company’s net asset value per share.
Corporate and government debt securities (of U.S. or foreign issuers) and municipal debt securities, event-linked bonds, loans, mortgage-backed securities, collateralized mortgage obligations, and asset-backed securities are valued at the mean between the “bid” and “asked” prices utilizing evaluated prices obtained from third party pricing services or broker-dealers who may use matrix pricing methods to determine the evaluated prices.
Short-term money market type debt securities with a remaining maturity of sixty days or less are valued at cost adjusted by the amortization of discount or premium to maturity (amortized cost), which approximates market value. Short-term debt securities with a remaining maturity in excess of sixty days are valued at the mean between the “bid” and “asked” prices utilizing evaluated prices obtained from third party pricing services or broker-dealers.
A description of the standard inputs that may generally be considered by the third party pricing vendors in determining their evaluated prices is provided below.
| | |
| Security Type | | Standard inputs generally considered by third-party pricing vendors |
|
| Corporate debt, government debt, municipal, mortgage-backed and asset-backed securities | | Reported trade data, broker-dealer price quotations, benchmark yields, issuer spreads on comparable securities, the credit quality, yield, maturity, and other appropriate factors. |
|
| Loans | | Information obtained from market participants regarding reported trade data and broker-dealer price quotations. |
|
| Event-linked bonds | | Information obtained from market participants regarding reported trade data and broker-dealer price quotations. |
If a market value or price cannot be determined for a security using the methodologies described above, or if, in the “good faith” opinion of the Manager, the market value or price obtained does not constitute a “readily available market quotation,” or a significant event has occurred that would materially affect the value of the security, the security is fair valued either (i) by a standardized fair valuation methodology applicable to the security type or the significant event as previously approved by the Valuation Committee and the Fund’s Board or (ii) as determined in good faith by the Manager’s Valuation Committee. The Valuation Committee considers all relevant facts that are reasonably available, through either public information or information available to the Manager, when determining the fair value of a security. Fair value determinations by the Manager are subject to review, approval and ratification by the Fund’s Board at its next regularly scheduled meeting covering the calendar quarter in which the fair valuation was determined. Those fair valuation standardized methodologies include, but are not limited to, valuing securities at the last sale price or initially at cost and subsequently adjusting the value based on: changes in company specific fundamentals, changes in an appropriate securities index, or changes in the value of similar securities which may be further adjusted for any discounts related to security-specific resale restrictions. When possible, such methodologies use observable market inputs such as unadjusted quoted prices of similar securities, observable interest rates, currency rates and yield curves. The methodologies used for valuing securities are not necessarily an indication of the risks associated with investing in those securities nor can it be assured that the Fund can obtain the fair value assigned to a security if it were to sell the security.
To assess the continuing appropriateness of security valuations, the Manager, or its third party service provider who is subject to oversight by the Manager, regularly compares prior day prices, prices on comparable securities, and sale prices to the current day prices and challenges those prices exceeding certain tolerance levels with the third party pricing service or broker source. For those securities valued by fair valuations, whether through a standardized fair valuation methodology or a fair valuation determination, the Valuation Committee reviews and affirms the reasonableness of the valuations based on such methodologies and fair valuation determinations on a regular basis after considering all relevant information that is reasonably available.
Classifications
Each investment asset or liability of the Fund is assigned a level at measurement date based on the significance and source of the inputs to its valuation. Various data inputs are used in determining the value of each of the Fund’s investments as of the reporting period end. These data inputs are categorized in the following hierarchy under applicable financial accounting standards:
1) Level 1-unadjusted quoted prices in active markets for identical assets or liabilities (including securities actively traded on a securities exchange)
2) Level 2-inputs other than unadjusted quoted prices that are observable for the asset or liability (such as unadjusted quoted prices for similar assets and market corroborated inputs such as interest rates, prepayment speeds, credit risks, etc.)
3) Level 3-significant unobservable inputs (including the Manager’s own judgments about assumptions that market participants would use in pricing the asset or liability).
The inputs used for valuing securities are not necessarily an indication of the risks associated with investing in those securities.
The table below categorizes amounts that are included in the Fund’s Statement of Assets and Liabilities as of June 30, 2015 based on valuation input level:
| | | | | | | | | | | | | | | | |
| | | Level 1— Unadjusted
Quoted Prices | | | Level 2— Other Significant
Observable Inputs | | | Level 3— Significant Unobservable Inputs | | | Value | |
| |
| Assets Table | | | | | | | | | | | | | | | | |
| Investments, at Value: | | | | | | | | | | | | | | | | |
| Common Stocks | | | | | | | | | | | | | | | | |
Consumer Discretionary | | $ | 173,446,952 | | | $ | — | | | $ | — | | | $ | 173,446,952 | |
Consumer Staples | | | 47,374,878 | | | | — | | | | — | | | | 47,374,878 | |
15 OPPENHEIMER CAPITAL APPRECIATION FUND/VA
NOTES TO FINANCIAL STATEMENTS Unaudited / Continued
3. Securities Valuation (Continued)
| | | | | | | | | | | | | | | | |
| | | Level 1— Unadjusted Quoted Prices | | | Level 2—
Other Significant
Observable Inputs | | | Level 3— Significant
Unobservable Inputs | | | Value | |
| |
| Common Stocks (Continued) | | | | | | | | | | | | | | | | |
Energy | | $ | 27,894,639 | | | $ | — | | | $ | — | | | $ | 27,894,639 | |
Financials | | | 81,465,177 | | | | — | | | | — | | | | 81,465,177 | |
Health Care | | | 210,469,364 | | | | — | | | | — | | | | 210,469,364 | |
Industrials | | | 60,357,463 | | | | — | | | | — | | | | 60,357,463 | |
Information Technology | | | 330,003,425 | | | | — | | | | — | | | | 330,003,425 | |
Materials | | | 10,236,244 | | | | — | | | | — | | | | 10,236,244 | |
| | | | |
| Total Assets | | $ | 941,248,142 | | | $ | — | | | $ | — | | | $ | 941,248,142 | |
| | | | |
Forward currency exchange contracts and futures contracts, if any, are reported at their unrealized appreciation/depreciation at measurement date, which represents the change in the contract’s value from trade date. All additional assets and liabilities included in the above table are reported at their market value at measurement date.
4. Investments and Risks
Investment in Oppenheimer Institutional Money Market Fund. The Fund is permitted to invest daily available cash balances in an affiliated money market fund. The Fund may invest the available cash in Class E shares of Oppenheimer Institutional Money Market Fund (“IMMF”) to seek current income while preserving liquidity or for defensive purposes. IMMF is a registered open-end management investment company, regulated as a money market fund under the 1940 Act. The Manager is the investment adviser of IMMF, and the Sub-Adviser provides investment and related advisory services to IMMF. When applicable, the Fund’s investment in IMMF is included in the Statement of Investments. Shares of IMMF are valued at their net asset value per share. As a shareholder, the Fund is subject to its proportional share of IMMF’s Class E expenses, including its management fee. The Manager will waive fees and/or reimburse Fund expenses in an amount equal to the indirect management fees incurred through the Fund’s investment in IMMF.
Equity Security Risk. Stocks and other equity securities fluctuate in price. The value of the Fund’s portfolio may be affected by changes in the equity markets generally. Equity markets may experience significant short-term volatility and may fall sharply at times. Different markets may behave differently from each other and U.S. equity markets may move in the opposite direction from one or more foreign stock markets. Adverse events in any part of the equity or fixed-income markets may have unexpected negative effects on other market segments.
The prices of individual equity securities generally do not all move in the same direction at the same time and a variety of factors can affect the price of a particular company’s securities. These factors may include, but are not limited to, poor earnings reports, a loss of customers, litigation against the company, general unfavorable performance of the company’s sector or industry, or changes in government regulations affecting the company or its industry.
5. Shares of Beneficial Interest
The Fund has authorized an unlimited number of $0.001 par value shares of beneficial interest of each class. Transactions in shares of beneficial interest were as follows:
| | | | | | | | | | | | | | | | |
| | | Six Months Ended June 30, 2015 | | | Year Ended December 31, 2014 | |
| | | Shares | | | Amount | | | Shares | | | Amount | |
| |
| Non-Service Shares | | | | | | | | | | | | | | | | |
| Sold | | | 90,581 | | | $ | 5,987,674 | | | | 297,082 | | | $ | 17,790,087 | |
| Dividends and/or distributions reinvested | | | 1,895,571 | | | | 106,739,631 | | | | 303,563 | | | | 17,758,433 | |
| Redeemed | | | (653,085 | ) | | | (43,037,584) | | | | (1,922,275 | ) | | | (115,812,186) | |
| | | | |
| Net increase (decrease) | | | 1,333,067 | | | $ | 69,689,721 | | | | (1,321,630 | ) | | $ | (80,263,666) | |
| | | | |
|
| |
| Service Shares | | | | | | | | | | | | | | | | |
| Sold | | | 316,654 | | | $ | 20,655,662 | | | | 259,544 | | | $ | 15,480,606 | |
| Dividends and/or distributions reinvested | | | 1,075,332 | | | | 59,885,278 | | | | 156,718 | | | | 9,099,012 | |
| Redeemed | | | (505,175 | ) | | | (33,069,924) | | | | (1,518,264 | ) | | | (90,080,086) | |
| | | | |
| Net increase (decrease) | | | 886,811 | | | $ | 47,471,016 | | | | (1,102,002 | ) | | $ | (65,500,468) | |
| | | | |
6. Purchases and Sales of Securities
The aggregate cost of purchases and proceeds from sales of securities, other than short-term obligations and investments in IMMF, for the six months ended June 30, 2015 were as follows:
| | | | | | |
| | | Purchases | | | Sales |
|
| Investment securities | | | $310,426,802 | | | $360,345,652 |
16 OPPENHEIMER CAPITAL APPRECIATION FUND/VA
7. Fees and Other Transactions with Affiliates
Management Fees. Under the investment advisory agreement, the Fund pays the Manager a management fee based on the daily net assets of the Fund at an annual rate as shown in the following table:
| | | | |
| Fee Schedule | | | |
| |
Up to $200 million | | | 0.75% | |
Next $200 million | | | 0.72 | |
Next $200 million | | | 0.69 | |
Next $200 million | | | 0.66 | |
Next $200 million | | | 0.60 | |
Over $1 billion | | | 0.58 | |
The Fund’s effective management fee for the six months ended June 30, 2015 was 0.69% of average annual net assets before any applicable waivers.
Sub-Adviser Fees. The Manager has retained the Sub-Adviser to provide the day-to-day portfolio management of the Fund. Under the Sub-Advisory Agreement, the Manager pays the Sub-Adviser an annual fee in monthly installments, equal to a percentage of the investment management fee collected by the Manager from the Fund, which shall be calculated after any investment management fee waivers. The fee paid to the Sub-Adviser is paid by the Manager, not by the Fund.
Transfer Agent Fees. OFI Global (the “Transfer Agent”) serves as the transfer and shareholder servicing agent for the Fund. The Fund pays the Transfer Agent a fee based on annual net assets. Fees incurred and average net assets for each class with respect to these services are detailed in the Statement of Operations and Financial Highlights, respectively.
Sub-Transfer Agent Fees. The Transfer Agent has retained Shareholder Services, Inc., a wholly-owned subsidiary of OFI (the “Sub-Transfer Agent”), to provide the day-to-day transfer agent and shareholder servicing of the Fund. Under the Sub-Transfer Agency Agreement, the Transfer Agent pays the Sub-Transfer Agent an annual fee in monthly installments, equal to a percentage of the transfer agent fee collected by the Transfer Agent from the Fund, which shall be calculated after any applicable fee waivers. The fee paid to the Sub-Transfer Agent is paid by the Transfer Agent, not by the Fund.
Trustees’ Compensation. The Fund’s Board of Trustees (“Board”) has adopted a compensation deferral plan for Independent Trustees that enables Trustees to elect to defer receipt of all or a portion of the annual compensation they are entitled to receive from the Fund. For purposes of determining the amount owed to the Trustee under the plan, deferred amounts are treated as though equal dollar amounts had been invested in shares of the Fund or in other Oppenheimer funds selected by the Trustee. The Fund purchases shares of the funds selected for deferral by the Trustee in amounts equal to his or her deemed investment, resulting in a Fund asset equal to the deferred compensation liability. Such assets are included as a component of “Other” within the asset section of the Statement of Assets and Liabilities. Deferral of Trustees’ fees under the plan will not affect the net assets of the Fund and will not materially affect the Fund’s assets, liabilities or net investment income per share. Amounts will be deferred until distributed in accordance with the compensation deferral plan.
Distribution and Service Plan for Service Shares. The Fund has adopted a Distribution and Service Plan (the “Plan”) pursuant to Rule 12b-1 under the 1940 Act for Service shares to pay OppenheimerFunds Distributor, Inc. (the “Distributor”), for distribution related services, personal service and account maintenance for the Fund’s Service shares. Under the Plan, payments are made periodically at an annual rate of 0.25% of the daily net assets of Service shares of the Fund. The Distributor currently uses all of those fees to compensate sponsors of the insurance product that offers Fund shares, for providing personal service and maintenance of accounts of their variable contract owners that hold Service shares. These fees are paid out of the Fund’s assets on an on-going basis and increase operating expenses of the Service shares, which results in lower performance compared to the Fund’s shares that are not subject to a service fee. Fees incurred by the Fund under the Plan are detailed in the Statement of Operations.
Waivers and Reimbursements of Expenses. The Manager has voluntarily agreed to limit the Fund’s expenses after payments, waivers and/or reimbursements and reduction to custodian expenses, excluding expenses incurred directly or indirectly by the Fund as a result of investments in other investment companies, wholly-owned subsidiaries and pooled investment vehicles; so that those expenses, as percentages of daily net assets, will not exceed the annual rate of 0.80% for Non-Service shares and 1.05% for Service shares. During the six months ended June 30, 2015, the Manager waived fees and/or reimbursed the Fund $27,594 and $15,807 for Non-Service and Service shares, respectively.
The Manager will waive fees and/or reimburse Fund expenses in an amount equal to the indirect management fees incurred through the Fund’s investment in IMMF. During the six months ended June 30, 2015, the Manager waived fees and/or reimbursed the Fund $1,882 for IMMF management fees.
Waivers and/or reimbursements may be modified or terminated as set forth according to the terms in the prospectus.
8. Pending Litigation
In 2009, several lawsuits were filed as putative class actions and later consolidated before the U.S. District Court for the District of Colorado in connection with the investment performance of Oppenheimer Rochester California Municipal Fund (the “California Fund Suit”), a fund advised by OppenheimerFunds, Inc. (“OFI”), and distributed by its subsidiary OppenheimerFunds Distributor, Inc. ( “OFDI”). The plaintiffs asserted claims against OFI, OFDI and certain present and former trustees and officers of the Fund under the federal securities laws, alleging, among other things, that the
17 OPPENHEIMER CAPITAL APPRECIATION FUND/VA
NOTES TO FINANCIAL STATEMENTS Unaudited / Continued
8. Pending Litigation (Continued)
disclosure documents of the Fund contained misrepresentations and omissions and the investment policies of the Fund were not followed. Plaintiffs in the California Fund Suit filed an amended complaint and defendants filed a motion to dismiss. In 2011, the court issued an order which granted in part and denied in part the defendants’ motion to dismiss. In 2012, plaintiffs filed a motion, which defendants opposed, to certify a class and appoint class representatives and class counsel. In March 2015, the court granted plaintiffs’ motion for class certification. In May 2015, the U.S. Court of Appeals for the Tenth Circuit vacated the class certification order and remanded the matter to the district court for further proceedings. In July 2015, the district court held an evidentiary hearing on plaintiffs’ motion for class certification. OFI and OFDI believe the California Fund Suit is without merit; that it is premature to render any opinion as to the likelihood of an outcome unfavorable to them in the California Fund Suit; and that no estimate can yet be made as to the amount or range of any potential loss.
18 OPPENHEIMER CAPITAL APPRECIATION FUND/VA
PORTFOLIO PROXY VOTING POLICIES AND PROCEDURES; UPDATES TO STATEMENTS OF INVESTMENTS Unaudited
The Fund has adopted Portfolio Proxy Voting Policies and Procedures under which the Fund votes proxies relating to securities (“portfolio proxies”) held by the Fund. A description of the Fund’s Portfolio Proxy Voting Policies and Procedures is available (i) without charge, upon request, by calling the Fund toll-free at 1.800.525.7048, (ii) on the Fund’s website at www.oppenheimerfunds.com, and (iii) on the SEC’s website at www.sec.gov. In addition, the Fund is required to file Form N-PX, with its complete proxy voting record for the 12 months ended June 30th, no later than August 31st of each year. The Fund’s voting record is available (i) without charge, upon request, by calling the Fund toll-free at 1.800.525.7048, and (ii) in the Form N-PX filing on the SEC’s website at www.sec.gov.
The Fund files its complete schedule of portfolio holdings with the SEC for the first quarter and the third quarter of each fiscal year on Form N-Q. The Fund’s Form N-Q filings are available on the SEC’s website at www.sec.gov. Those forms may be reviewed and copied at the SEC’s Public Reference Room in Washington, D.C. Information on the operation of the Public Reference Room may be obtained by calling 1-800-SEC-0330.
19 OPPENHEIMER CAPITAL APPRECIATION FUND/VA
DISTRIBUTION SOURCES Unaudited
For any distribution that took place over the Fund’s reporting period, the table below details on a per-share basis the percentage of the Fund’s total distribution payment amount that was derived from the following sources: net income, net profit from the sale of securities, and other capital sources. This information is based upon income and capital gains using generally accepted accounting principles as of the date of each distribution. Because the Fund is actively managed, the relative amount of the Fund’s total distributions derived from various sources over the calendar year may change. Please note that this information should not be used for tax reporting purposes as the tax character of distributable income may differ from the amounts used for this notification. You will receive IRS tax forms in the first quarter of each calendar year detailing the actual amount of the taxable and non-taxable portion of distributions paid to you during the tax year.
For the most current information, please go to oppenheimerfunds.com. Select your Fund, then the ‘Detailed’ tab; where ‘Dividends’ are shown, the Fund’s latest pay date will be followed by the sources of any distribution, updated daily.
| | | | | | | | | | | | | | | | |
| Fund Name | | Pay Date | | | Net Income | | | Net Profit
from Sale | | | Other Capital
Sources | |
| |
Oppenheimer Capital Appreciation Fund/VA | | | 6/16/15 | | | | 0.4% | | | | 99.6% | | | | 0.0% | |
| |
20 OPPENHEIMER CAPITAL APPRECIATION FUND/VA
THIS PAGE INTENTIONALLY LEFT BLANK.
21 OPPENHEIMER CAPITAL APPRECIATION FUND/VA
THIS PAGE INTENTIONALLY LEFT BLANK.
22 OPPENHEIMER CAPITAL APPRECIATION FUND/VA
THIS PAGE INTENTIONALLY LEFT BLANK.
23 OPPENHEIMER CAPITAL APPRECIATION FUND/VA
OPPENHEIMER CAPITAL APPRECIATION FUND/VA
A Series of Oppenheimer Variable Account Funds
| | | | |
| Trustees and Officers | | | | Sam Freedman, Chairman of the Board of Trustees and Trustee |
| | | | Jon S. Fossel, Trustee |
| | | | Richard F. Grabish, Trustee |
| | | | Beverly L. Hamilton, Trustee |
| | | | Victoria J. Herget, Trustee |
| | | | Robert J. Malone, Trustee |
| | | | F. William Marshall, Jr., Trustee |
| | | | Karen L. Stuckey, Trustee |
| | | | James D. Vaughn, Trustee |
| | | | Arthur P. Steinmetz, Trustee, President and Principal Executive Officer |
| | | | Michael Kotlarz, Vice President |
| | | | Arthur S. Gabinet, Secretary and Chief Legal Officer |
| | | | Jennifer Sexton, Vice President and Chief Business Officer |
| | | | Mary Ann Picciotto, Chief Compliance Officer and Chief Anti-Money Laundering Officer |
| | | | Brian W. Wixted, Treasurer and Principal Financial & Accounting Officer |
| | |
| Manager | | | | OFI Global Asset Management, Inc. |
| | |
| Sub-Adviser | | | | OppenheimerFunds, Inc. |
| | |
| Distributor | | | | OppenheimerFunds Distributor, Inc. |
| | |
Transfer and Shareholder Servicing Agent | | | | OFI Global Asset Management, Inc. |
| | |
| Sub-Transfer Agent | | | | Shareholder Services, Inc. |
| | | | DBA OppenheimerFunds Services |
| | |
Independent Registered Public Accounting Firm | | | | KPMG LLP |
| | |
| Legal Counsel | | | | Ropes & Gray LLP |
| | |
| | | | Before investing in any of the Oppenheimer funds, investors should carefully consider a fund’s investment objectives, risks, charges and expenses. Fund prospectuses and summary prospectuses contain this and other information about the funds and may be obtained by asking your financial advisor, visiting oppenheimerfuinds.com or calling us at 1.800.988.8287. Read prospectuses and summary prospectuses carefully before investing. |
| | |
| | | | The financial statements included herein have been taken from the records of the Fund without examination of those records by the independent registered public accounting firm. |
| | |
| | | | © 2015 OppenheimerFunds, Inc. All rights reserved. Oppenheimer funds are distributed by OppenheimerFunds Distributor, Inc. |

PORTFOLIO MANAGERS: Krishna Memani and Peter A. Strzalkowski, CFA
AVERAGE ANNUAL TOTAL RETURNS FOR THE PERIODS ENDED 6/30/15
| | | | | | | | | | | | | | | | | | | | | | | | | |
| | | Inception
Date | | 6-Months | | 1-Year | | 5-Year | | 10-Year |
Non-Service Shares | | | | 4/3/85 | | | | | 0.44 | % | | | | 2.11 | % | | | | 5.98 | % | | | | 0.52 | % |
Service Shares | | | | 5/1/02 | | | | | 0.44 | | | | | 2.00 | | | | | 5.72 | | | | | 0.28 | |
Barclays Credit Index | | | | | | | | | -0.78 | | | | | 0.93 | | | | | 4.93 | | | | | 5.12 | |
Barclays U.S. Aggregate Bond Index | | | | | | | | | -0.15 | | | | | 1.81 | | | | | 3.34 | | | | | 4.43 | |
Citigroup Broad Investment Grade Bond Index | | | | | | | | | -0.06 | | | | | 1.87 | | | | | 3.31 | | | | | 4.53 | |
Performance data quoted represents past performance, which does not guarantee future results. The investment return and principal value of an investment in the Fund will fluctuate so that an investor’s shares, when redeemed, may be worth more or less than their original cost. Current performance may be lower or higher than the performance quoted. For performance data current to the most recent month end, call us at 1.800.988.8287. The Fund’s total returns should not be expected to be the same as the returns of other funds, whether or not both funds have the same portfolio managers and/or similar names. The Fund’s total returns include changes in share price and reinvested distributions but do not include the charges associated with the separate account products that offer this Fund. Such performance would have been lower if such charges were taken into account.
The Fund’s performance is compared to the performance of the Barclays Credit Index, an index of non-convertible U.S. investment grade corporate bonds; the Barclays U.S. Aggregate Bond Index, an index of U.S. corporate and government bonds and the Citigroup Broad Investment Grade Bond Index, an index of institutionally traded U.S. Treasury Bonds, government-sponsored bonds, mortgage-backed securities and corporate securities. The indices are unmanaged and cannot be purchased directly by investors. While index comparisons may be useful to provide a benchmark for the Fund’s performance, it must be noted that the Fund’s investments are not limited to the investments comprising the indices. Index performance includes reinvestment of income, but does not reflect transaction costs, fees, expenses or taxes. Index performance is shown for illustrative purposes only as a benchmark for the Fund’s performance, and does not predict or depict performance of the Fund. The Fund’s performance reflects the effects of the Fund’s business and operating expenses.
2 OPPENHEIMER CORE BOND FUND/VA
TOP HOLDINGS AND ALLOCATIONS
| | | | | | |
CORPORATE BONDS & NOTES - TOP TEN INDUSTRIES |
Commercial Banks | | | 5.4 | % | | |
Oil, Gas & Consumable Fuels | | | 4.7 | | | |
Capital Markets | | | 3.6 | | | |
Diversified Telecommunication Services | | | 2.6 | | | |
Insurance | | | 2.5 | | | |
Electric Utilities | | | 2.3 | | | |
Media | | | 2.1 | | | |
Real Estate Investment Trusts (REITs) | | | 2.0 | | | |
Automobiles | | | 1.8 | | | |
Food Products | | | 1.7 | | | |
Portfolio holdings and allocations are subject to change. Percentages are as of June 30, 2015, and are based on net assets.
| | | | | | |
CREDIT RATING BREAKDOWN | | NRSRO ONLY TOTAL |
AAA | | | 33.4 | % | | |
AA | | | 5.7 | | | |
A | | | 15.4 | | | |
BBB | | | 34.5 | | | |
BB | | | 7.3 | | | |
B | | | 0.4 | | | |
CCC | | | 1.4 | | | |
D | | | 1.8 | | | |
Unrated | | | 0.1 | | | |
Total | | | 100.0 | % | | |
The percentages above are based on the market value of the Fund’s securities as of June 30, 2015, and are subject to change. Except for securities labeled “Unrated,” and except for certain securities issued or guaranteed by a foreign sovereign or supranational entity, all securities have been rated by at least one Nationally Recognized Statistical Rating Organization (“NRSRO”), such as Standard & Poor’s (“S&P”). For securities rated only by an NRSRO other than S&P, OppenheimerFunds, Inc. (the “Sub-Adviser”) converts that rating to the equivalent S&P rating. If two or more NRSROs have assigned a rating to a security, the highest S&P equivalent rating is used. Unrated securities issued or guaranteed by a foreign sovereign are assigned a credit rating equal to the highest NRSRO rating assigned to that foreign sovereign. For securities not rated by an NRSRO, the Sub-Adviser uses its own credit analysis to assign ratings in categories similar to those of S&P. The use of similar categories is not an indication that the sub-adviser’s credit analysis process is consistent or comparable with any NRSRO’s process were that NRSRO to rate the same security. Fund assets invested in Oppenheimer Institutional Money Market Fund are assigned that fund’s S&P rating, which is currently AAA. For the purposes of this table, “investment-grade” securities are securities rated within the NRSROs’ four highest rating categories (AAA, AA, A and BBB). Unrated securities do not necessarily indicate low credit quality, and may or may not be the equivalent of investment-grade. Please consult the Fund’s prospectus and Statement of Additional Information for further information.
3 OPPENHEIMER CORE BOND FUND/VA
Fund Performance Discussion
The Fund’s Non-Service shares produced a return of 0.44% during the reporting period. On a relative basis, the Fund outperformed its benchmarks, the Barclays U.S. Aggregate Bond Index (the “Index”), the Barclays Credit Index and the Citigroup Broad Investment Grade Bond Index, which returned -0.15%, -0.78%, -0.06%, respectively.
MARKET OVERVIEW
The opening months of 2015 were marked by cooling U.S. growth after the strong fourth quarter of 2014. The dollar continued to strengthen significantly during this time against most of the U.S.’s major trading partners, which acted as a drag on growth. Businesses, especially U.S. firms with revenues dependent on exporting goods and services, cited this as a headwind. European Central Bank (“ECB”) President Mario Draghi announced the purchase of €60 billion a month in sovereign bonds from Eurozone countries for at least 19 months, a form of quantitative easing (“QE”) that is projected to increase the ECB’s balance sheet by over €1 trillion. The announcement and implementation of these extraordinary monetary policies had a significant impact on financial markets, with European markets rallying and the euro falling against most major trading partners.
Over the second half of the reporting period, market volatility returned despite a continuation of slow and stable growth in the U.S. Deflationary pressures also appeared to have subsided during the period. Oil prices rebounded from around $48 dollars per barrel to nearly $60 dollars per barrel. It is important to note that while these levels still represent a significant discount to previous years, we believe the lower prices should continue to have a stimulative effect on developed and emerging world oil importers. Meanwhile, emerging issues in Greece highlighted downside risks to the global economy and capital markets. Greece’s ongoing negotiations with creditors and ultimate default on a $1.7 billion International Monetary Fund (“IMF”) payment on June 30, 2015, led to a more challenging environment for the Eurozone. Shortly after the period ended, Eurozone leaders agreed to offer Greece a third bailout, averting a Greek exit.
Longer-term U.S. Treasury rates continued to swing fairly wildly during the reporting period. Over the first half of the reporting period, the 10-year treasury rate fell, starting the reporting period at 2.17% and declining to 1.92% at the end of March. However, over the second half of the reporting period, longer-term U.S. Treasury rates marched higher as the 10-year treasury rate increased to 2.49% before ending the period at 2.35% due to the uncertainty around Greece. This net upward movement in rates ultimately contributed to U.S. Treasuries generating negative total returns during this time and for the overall reporting period.
FUND REVIEW
During the reporting period, the Fund received its strongest results from its investments in mortgage-backed securities (“MBS”) and asset-backed securities (“ABS”). Among MBS, the Fund had its largest exposure to government agency MBS, with a smaller allocation to non-agency MBS. Security selection within the agency MBS sector and an allocation to non-agency MBS served the Fund well during this reporting period as agency inverse interest-only security prices were supported by a more dovish Federal Reserve (“Fed”) outlook while non-agency MBS prices benefited from solid fundamentals and a lack of supply. The Fund’s exposure to ABS is primarily concentrated in securities backed by auto loans. These investments performed well for the Fund this reporting period.
In addition to these investments, the Fund had its largest exposure to corporate bonds at period end. The Fund had its largest weighting in investment grade corporate bonds, which we believe still offer solid value, and also maintained an allocation to non-investment grade (BB-rated and below) corporate bonds, which have historically offered attractive yields for only incremental credit risk relative to their investment grade (BBB-rated and above) counterparts. Both investment grade and non-investment grade corporate bonds benefited the Fund’s performance versus the Index this reporting period, although investment grade corporates produced a slight negative return.
The primary detractor from performance this reporting period was the Fund’s minimal exposure to U.S. Treasuries. As mentioned earlier, U.S. Treasury rates rose for the overall six-month reporting period, which impacted the total returns of these securities.
STRATEGY & OUTLOOK
Despite the likelihood that the Fed begins to hike rates sometime in 2015, central banks around the globe are implementing their own versions of extraordinary monetary policy in the face of global growth concerns and corresponding deflationary threats. Such policies provide the financial markets with ample liquidity and have pushed global interest rates lower. Lower global rates have made higher yielding U.S. fixed income instruments more attractive to investors and the ensuing purchasing of such securities has resulted in lower U.S. interest rates as well. This sort of continuum may potentially keep rates low for some time.
Meanwhile, the U.S. economy continues to grow at a steady pace with credit growth continuing at moderate levels far below those which preceded the financial crisis. With consumers continuing to de-lever and companies generating solid free cash flow to support investments, acquisitions, debt levels, dividends, and
|
| 4 OPPENHEIMER CORE BOND FUND/VA |
share buybacks, we believe this trend could continue. As a result and as mentioned above, we remain constructive on credit spreads which still provide good value relative to Treasuries and provide the fund with carry, or yield advantage over the index which may prove beneficial in this environment.
The Fund’s investment strategy and focus can change over time. The mention of specific fund holdings does not constitute a recommendation by OppenheimerFunds, Inc. or its affiliates.
Shares of Oppenheimer funds are not deposits or obligations of any bank, are not guaranteed by any bank, are not insured by the FDIC or any other agency, and involve investment risks, including the possible loss of the principal amount invested.
|
| 5 OPPENHEIMER CORE BOND FUND/VA |
Fund Expenses
Fund Expenses. As a shareholder of the Fund, you incur two types of costs: (1) transaction costs and (2) ongoing costs, including management fees; distribution and service fees; and other Fund expenses. These examples are intended to help you understand your ongoing costs (in dollars) of investing in the Fund and to compare these costs with the ongoing costs of investing in other mutual funds.
The examples are based on an investment of $1,000.00 invested at the beginning of the period and held for the entire 6-month period ended June 30, 2015.
Actual Expenses. The first section of the table provides information about actual account values and actual expenses. You may use the information in this section for the class of shares you hold, together with the amount you invested, to estimate the expense that you paid over the period. Simply divide your account value by $1,000.00 (for example, an $8,600.00 account value divided by $1,000.00 = 8.60), then multiply the result by the number in the first section under the heading entitled “Expenses Paid During the 6 Months Ended June 30, 2015” to estimate the expenses you paid on your account during this period.
Hypothetical Example for Comparison Purposes.
The second section of the table provides information about hypothetical account values and hypothetical expenses based on the Fund’s actual expense ratio for each class of shares, and an assumed rate of return of 5% per year for each class before expenses, which is not the actual return. The hypothetical account values and expenses may not be used to estimate the actual ending account balance or expenses you paid for the period. You may use this information to compare the ongoing costs of investing in the Fund and other funds. To do so, compare this 5% hypothetical example for the class of shares you hold with the 5% hypothetical examples that appear in the shareholder reports of the other funds.
Please note that the expenses shown in the table are meant to highlight your ongoing costs only and do not reflect any charges associated with the separate accounts that offer this Fund. Therefore, the “hypothetical” lines of the table are useful in comparing ongoing costs only, and will not help you determine the relative total costs of owning different funds. In addition, if these separate account charges were included your costs would have been higher.
| | | | | | | | | | | | | | |
| | | Beginning | | | Ending | | | Expenses | | | |
| | | Account | | | Account | | | Paid During | | | |
| | | Value | | | Value | | | 6 Months Ended | | | |
| Actual | | January 1, 2015 | | | June 30, 2015 | | | June 30, 2015 | | | |
Non-Service shares | | $ | 1,000.00 | | | $ | 1,004.40 | | | $ | 3.73 | | | |
Service shares | | | 1,000.00 | | | | 1,004.40 | | | | 4.98 | | | |
| | | | |
| Hypothetical | | | | | | | | | | | |
| (5% return before expenses) | | | | | | | | | | | |
Non-Service shares | | | 1,000.00 | | | | 1,021.08 | | | | 3.77 | | | |
Service shares | | | 1,000.00 | | | | 1,019 .84 | | | | 5.02 | | | |
Expenses are equal to the Fund’s annualized expense ratio for that class, multiplied by the average account value over the period, multiplied by 181/365 (to reflect the one-half year period). Those annualized expense ratios, excluding indirect expenses from affiliated funds, based on the 6-month period ended June 30, 2015 are as follows:
| | | | | | |
| Class | | Expense Ratios | | | |
Non-Service shares | | | 0.75% | | | |
Service shares | | | 1.00 | | | |
The expense ratios reflect voluntary waivers and/or reimbursements of expenses by the Fund’s Manager. Some of these undertakings may be modified or terminated at any time, as indicated in the Fund’s prospectus. The “Financial Highlights” tables in the Fund’s financial statements, included in this report, also show the gross expense ratios, without such waivers or reimbursements and reduction to custodian expenses, if applicable.
|
| 6 OPPENHEIMER CORE BOND FUND/VA |
STATEMENT OF INVESTMENTS June 30, 2015 Unaudited
| | | | | | | | |
| | | Principal
Amount | | | Value | |
| Asset-Backed Securities—16.5% | | | | | | | | |
| Auto Loan—14.8% | |
| American Credit Acceptance Receivables Trust: | | | | | | | | |
| Series 2013-2,Cl. B, 2.84%, 5/15/191 | | $ | 374,142 | | | $ | 375,711 | |
| Series 2014-1,Cl. B, 2.39%, 11/12/191 | | | 520,000 | | | | 521,357 | |
| Series 2014-2,Cl. B, 2.26%, 3/10/201 | | | 135,000 | | | | 135,109 | |
| Series 2014-3,Cl. B, 2.43%, 6/10/201 | | | 445,000 | | | | 445,564 | |
| Series 2014-4,Cl. B, 2.60%, 10/12/201 | | | 145,000 | | | | 145,067 | |
| Series 2015-1,Cl. B, 2.85%, 2/12/211 | | | 385,000 | | | | 385,325 | |
| AmeriCredit Automobile Receivables Trust: | | | | | | | | |
| Series 2012-2,Cl. E, 4.85%, 8/8/191 | | | 375,000 | | | | 387,051 | |
| Series 2012-4,Cl. D, 2.68%, 10/9/18 | | | 100,000 | | | | 101,885 | |
| Series 2013-2,Cl. E, 3.41%, 10/8/201 | | | 345,000 | | | | 350,345 | |
| Series 2013-3,Cl. E, 3.74%, 12/8/201 | | | 145,000 | | | | 148,282 | |
| Series 2013-4,Cl. D, 3.31%, 10/8/19 | | | 30,000 | | | | 30,797 | |
| Series 2013-5,Cl. D, 2.86%, 12/9/19 | | | 225,000 | | | | 227,518 | |
| Series 2014-1,Cl. E, 3.58%, 8/9/21 | | | 95,000 | | | | 95,612 | |
| Series 2014-2,Cl. D, 2.57%, 7/8/20 | | | 245,000 | | | | 245,345 | |
| Series 2014-2,Cl. E, 3.37%, 11/8/21 | | | 280,000 | | | | 279,177 | |
| Series 2014-4,Cl. D, 3.07%, 11/9/20 | | | 235,000 | | | | 236,700 | |
| Series 2015-2,Cl. D, 3.00%, 6/8/21 | | | 70,000 | | | | 70,139 | |
| California Republic Auto Receivables Trust: | | | | | | | | |
| Series 2013-2,Cl. C, 3.32%, 8/17/20 | | | 230,000 | | | | 231,615 | |
| Series 2014-2,Cl. C, 3.29%, 3/15/21 | | | 80,000 | | | | 79,865 | |
| Series 2014-4,Cl. C, 3.56%, 9/15/21 | | | 100,000 | | | | 100,090 | |
| Capital Auto Receivables Asset Trust: | | | | | | | | |
| Series 2013-4,Cl. D, 3.22%, 5/20/19 | | | 105,000 | | | | 106,463 | |
| Series 2014-1,Cl. D, 3.39%, 7/22/19 | | | 115,000 | | | | 117,599 | |
| Series 2014-3,Cl. D, 3.14%, 2/20/20 | | | 160,000 | | | | 161,569 | |
| Series 2015-1,Cl. D, 3.16%, 8/20/20 | | | 165,000 | | | | 165,676 | |
| Series 2015-2,Cl. C, 2.67%, 8/20/20 | | | 155,000 | | | | 154,969 | |
| CarFinance Capital Auto Trust: | | | | | | | | |
| Series 2013-1A,Cl. A, 1.65%, 7/17/171 | | | 1,686 | | | | 1,687 | |
| Series 2013-2A,Cl. B, 3.15%, 8/15/191 | | | 530,000 | | | | 538,615 | |
| Series 2014-1A,Cl. A, 1.46%, 12/17/181 | | | 70,133 | | | | 70,054 | |
| Series 2015-1A,Cl. A, 1.75%, 6/15/211 | | | 211,452 | | | | 211,706 | |
| CarMax Auto Owner Trust, Series 2015-2, Cl. D, 3.04%, 11/15/21 | | | 100,000 | | | | 99,970 | |
| Centre Point Funding LLC, Series 2010-1A, Cl. 1, 5.43%, 7/20/161 | | | 17,975 | | | | 17,999 | |
| CPS Auto Receivables Trust: | | | | | | | | |
| Series 2012-B,Cl. A, 2.52%, 9/16/191 | | | 151,995 | | | | 152,992 | |
| Series 2014-A,Cl. A, 1.21%, 8/15/181 | | | 258,231 | | | | 258,007 | |
| Series 2014-B,Cl. A, 1.11%, 11/15/181 | | | 178,608 | | | | 178,180 | |
| Series 2014-C,Cl. A, 1.31%, 2/15/191 | | | 225,652 | | | | 225,665 | |
| Credit Acceptance Auto Loan Trust: | | | | | | | | |
| Series 2013-1A,Cl. B, 1.83%, 4/15/211 | | | 235,000 | | | | 234,736 | |
| Series 2013-2A,Cl. B, 2.26%, 10/15/211 | | | 585,000 | | | | 589,318 | |
| Series 2014-1A,Cl. B, 2.29%, 4/15/221 | | | 215,000 | | | | 216,099 | |
| Series 2014-2A,Cl. B, 2.67%, 9/15/221 | | | 160,000 | | | | 160,595 | |
| Series 2015-1A,Cl. C, 3.30%, 7/17/231 | | | 225,000 | | | | 226,213 | |
| Drive Auto Receivables Trust: | | | | | | | | |
| Series 2015-AA,Cl. C, 3.06%, 5/17/212 | | | 250,000 | | | | 251,645 | |
| Series 2015-BA,Cl. C, 2.76%, 7/15/211 | | | 300,000 | | | | 300,166 | |
| DT Auto Owner Trust: | | | | | | | | |
| Series 2012-1A,Cl. D, 4.94%, 7/16/181 | | | 120,944 | | | | 121,436 | |
| Series 2013-1A,Cl. D, 3.74%, 5/15/201 | | | 175,000 | | | | 176,305 | |
| Series 2013-2A,Cl. D, 4.18%, 6/15/201 | | | 485,000 | | | | 491,606 | |
| Series 2014-1A,Cl. D, 3.98%, 1/15/211 | | | 360,000 | | | | 364,202 | |
| Series 2014-2A,Cl. D, 3.68%, 4/15/211 | | | 525,000 | | | | 527,979 | |
| Series 2014-3A,Cl. D, 4.47%, 11/15/211 | | | 205,000 | | | | 207,667 | |
| Series 2015-1A,Cl. C, 2.87%, 11/16/201 | | | 180,000 | | | | 180,829 | |
| Exeter Automobile Receivables Trust: | | | | | | | | |
| Series 2012-2A,Cl. C, 3.06%, 7/16/181 | | | 35,000 | | | | 35,123 | |
| Series 2014-1A,Cl. B, 2.42%, 1/15/191 | | | 230,000 | | | | 231,378 | |
| Series 2014-1A,Cl. C, 3.57%, 7/15/191 | | | 230,000 | | | | 232,543 | |
| Series 2014-2A,Cl. A, 1.06%, 8/15/181 | | | 48,524 | | | | 48,459 | |
| Series 2014-2A,Cl. C, 3.26%, 12/16/191 | | | 110,000 | | | | 109,522 | |
| First Investors Auto Owner Trust: | | | | | | | | |
| Series 2012-1A,Cl. C, 3.54%, 11/15/171 | | | 52,345 | | | | 52,727 | |
| Series 2012-1A,Cl. D, 5.65%, 4/15/181 | | | 155,000 | | | | 157,869 | |
| | | | | | | | |
| | | Principal
Amount | | | Value | |
| Auto Loan (Continued) | |
| First Investors Auto Owner Trust: (Continued) | | | | | | | | |
| Series 2013-3A,Cl. B, 2.32%, 10/15/191 | | $ | 385,000 | | | $ | 388,518 | |
| Series 2013-3A,Cl. C, 2.91%, 1/15/201 | | | 165,000 | | | | 166,902 | |
| Series 2013-3A,Cl. D, 3.67%, 5/15/201 | | | 125,000 | | | | 126,287 | |
| Series 2014-1A,Cl. D, 3.28%, 4/15/211 | | | 225,000 | | | | 224,177 | |
| Series 2014-3A,Cl. D, 3.85%, 2/15/221 | | | 140,000 | | | | 140,958 | |
| Flagship Credit Auto Trust: | | | | | | | | |
| Series 2014-1,Cl. A, 1.21%, 4/15/191 | | | 121,678 | | | | 121,545 | |
| Series 2014-2,Cl. A, 1.43%, 12/16/191 | | | 240,758 | | | | 240,601 | |
| GM Financial Automobile Leasing Trust: | | | | | | | | |
| Series 2014-1A,Cl. D, 2.51%, 3/20/191 | | | 545,000 | | | | 544,809 | |
| Series 2015-1,Cl. D, 3.01%, 3/20/20 | | | 240,000 | | | | 239,373 | |
| GO Financial Auto Securitization Trust, Series 2015-1, Cl. A, 1.81%, 3/15/181 | | | 185,239 | | | | 185,131 | |
| Navistar Financial Dealer Note Master Owner Trust II, Series 2014-1, Cl. D, 2.487%, 10/25/191,3 | | | 125,000 | | | | 125,049 | |
| Santander Drive Auto Receivables Trust: | | | | | | | | |
| Series 2012-5,Cl. D, 3.30%, 9/17/18 | | | 835,000 | | | | 853,188 | |
| Series 2012-6,Cl. D, 2.52%, 9/17/18 | | | 880,000 | | | | 884,741 | |
| Series 2012-AA,Cl. D, 2.46%, 12/17/181 | | | 480,000 | | | | 486,731 | |
| Series 2013-1,Cl. C, 1.76%, 1/15/19 | | | 65,000 | | | | 65,202 | |
| Series 2013-2,Cl. D, 2.57%, 3/15/19 | | | 325,000 | | | | 329,662 | |
| Series 2013-3,Cl. D, 2.42%, 4/15/19 | | | 55,000 | | | | 55,635 | |
| Series 2013-4,Cl. D, 3.92%, 1/15/20 | | | 480,000 | | | | 497,391 | |
| Series 2013-4,Cl. E, 4.67%, 1/15/201 | | | 360,000 | | | | 375,253 | |
| Series 2013-5,Cl. D, 2.73%, 10/15/19 | | | 215,000 | | | | 216,892 | |
| Series 2013-A,Cl. E, 4.71%, 1/15/211 | | | 270,000 | | | | 285,984 | |
| Series 2014-4,Cl. D, 3.10%, 11/16/20 | | | 185,000 | | | | 186,419 | |
| Series 2015-1,Cl. D, 3.24%, 4/15/21 | | | 260,000 | | | | 261,545 | |
| Series 2015-2,Cl. D, 3.02%, 4/15/21 | | | 275,000 | | | | 273,774 | |
| Series 2015-3,Cl. D, 3.49%, 5/17/21 | | | 345,000 | | | | 346,385 | |
| SNAAC Auto Receivables Trust: | | | | | | | | |
| Series 2012-1A,Cl. C, 4.38%, 6/15/171 | | | 23,410 | | | | 23,444 | |
| Series 2013-1A,Cl. C, 3.07%, 8/15/181 | | | 145,000 | | | | 146,684 | |
| Series 2014-1A,Cl. A, 1.03%, 9/17/181 | | | 66,817 | | | | 66,848 | |
| Series 2014-1A,Cl. D, 2.88%, 1/15/201 | | | 140,000 | | | | 140,755 | |
| TCF Auto Receivables Owner Trust: | | | | | | | | |
| Series 2014-1A,Cl. C, 3.12%, 4/15/211 | | | 100,000 | | | | 100,112 | |
| Series 2015-1A,Cl. D, 3.53%, 3/15/221 | | | 160,000 | | | | 160,391 | |
| United Auto Credit Securitization Trust: | | | | | | | | |
| Series 2013-1,Cl. C, 2.22%, 12/15/171 | | | 7,096 | | | | 7,102 | |
| Series 2014-1,Cl. D, 2.38%, 10/15/181 | | | 160,000 | | | | 159,044 | |
| Series 2015-1,Cl. D, 2.92%, 6/17/191 | | | 225,000 | | | | 225,576 | |
| Westlake Automobile Receivables Trust: | | | | | | | | |
| Series 2014-1A,Cl. D, 2.20%, 2/15/211 | | | 155,000 | | | | 153,878 | |
| Series 2014-2A,Cl. D, 2.86%, 7/15/211 | | | 165,000 | | | | 164,604 | |
| Series 2015-2A,Cl. C, 2.45%, 1/15/211 | | | 215,000 | | | | 214,978 | |
| | | | | | | 21,155,690 | |
| | | | | | | | | |
| Equipment—0.9% | | | | | | | | |
| CLI Funding V LLC: | | | | | | | | |
| Series 2014-1A,Cl. A, 3.29%, 6/18/291 | | | 277,532 | | | | 278,390 | |
| Series 2014-2A,Cl. A, 3.38%, 10/18/291 | | | 476,000 | | | | 478,646 | |
| Cronos Containers Program I Ltd., Series 2014-2A, Cl. A, 3.27%, 11/18/291 | | | 425,509 | | | | 427,436 | |
| FRS I LLC, Series 2013-1A, Cl. A1, 1.80%, 4/15/431 | | | 72,873 | | | | 72,220 | |
| Trip Rail Master Funding LLC, Series 2014-1A, Cl. A1, 2.863%, 4/15/441 | | | 91,106 | | | | 90,946 | |
| | | | | | | 1,347,638 | |
| | | | | | | | | |
| Home Equity Loan—0.8% | | | | | | | | |
| American Credit Acceptance Receivables Trust, Series 2015-2, Cl. B, 2.97%, 5/12/211 | | | 370,000 | | | | 371,139 | |
| Element Rail Leasing I LLC, Series 2014-1A, Cl. A1, 2.299%, 4/19/441 | | | 375,505 | | | | 373,422 | |
| TAL Advantage V LLC: | | | | | | | | |
| Series 2014-1A, Cl. A, 3.51%, 2/22/391 | | | 333,667 | | | | 335,377 | |
|
| 7 OPPENHEIMER CORE BOND FUND/VA |
STATEMENT OF INVESTMENTS Unaudited / Continued
| | | | | | | | |
| | | Principal
Amount | | | Value | |
| Home Equity Loan (Continued) | |
| TAL Advantage V LLC: (Continued) | |
| Series 2014-2A,Cl. A1, 1.70%, 5/20/391 | | $ | 94,053 | | | $ | 93,484 | |
| | | | | | | 1,173,422 | |
| Total Asset-Backed Securities (Cost $23,574,796) | | | | | | | 23,676,750 | |
| | | | | | | | | |
| Mortgage-Backed Obligations—45.6% | |
| Government Agency—32.6% | |
| FHLMC/FNMA/FHLB/Sponsored—32.4% | |
| Federal Home Loan Mortgage Corp. Gold Pool: | |
| 5.00%, 12/1/34 | | | 6,488 | | | | 7,245 | |
| 5.50%, 9/1/39 | | | 549,167 | | | | 615,455 | |
| 6.00%, 5/1/18-10/1/29 | | | 823,951 | | | | 930,637 | |
| 6.50%, 4/1/18-4/1/34 | | | 202,049 | | | | 228,224 | |
| 7.00%, 8/1/16-10/1/37 | | | 246,639 | | | | 281,091 | |
| 8.00%, 4/1/16 | | | 3,083 | | | | 3,100 | |
| 9.00%, 8/1/22-5/1/25 | | | 18,959 | | | | 20,960 | |
| Federal Home Loan Mortgage Corp. Non Gold Pool, 10.50%, 10/1/20 | | | 1,514 | | | | 1,699 | |
| Federal Home Loan Mortgage Corp., Interest-Only Stripped Mtg.-Backed Security: | |
| Series 205,Cl. IO, 11.602%, 9/1/294 | | | 8,584 | | | | 2,094 | |
| Series 206,Cl. IO, 0.00%, 12/1/294,5 | | | 135,207 | | | | 38,455 | |
| Series 243,Cl. 6, 0.00%, 12/15/324,5 | | | 98,989 | | | | 18,727 | |
| Federal Home Loan Mortgage Corp., Mtg.-Linked Amortizing Global Debt Securities, Series 2012-1, Cl. A10, 2.06%, 1/15/22 | | | 577,086 | | | | 586,974 | |
| Federal Home Loan Mortgage Corp., Principal-Only Stripped Mtg.-Backed Security, Series 176, Cl. PO, 4.256%, 6/1/266 | | | 46,887 | | | | 43,888 | |
| Federal Home Loan Mortgage Corp., Real Estate Mtg. Investment Conduit Multiclass Pass-Through Certificates: | |
| Series 151,Cl. F, 9.00%, 5/15/21 | | | 4,929 | | | | 5,479 | |
| Series 1674,Cl. Z, 6.75%, 2/15/24 | | | 16,928 | | | | 18,793 | |
| Series 2034,Cl. Z, 6.50%, 2/15/28 | | | 2,538 | | | | 2,911 | |
| Series 2042,Cl. N, 6.50%, 3/15/28 | | | 6,399 | | | | 7,117 | |
| Series 2043,Cl. ZP, 6.50%, 4/15/28 | | | 303,078 | | | | 338,323 | |
| Series 2046,Cl. G, 6.50%, 4/15/28 | | | 17,729 | | | | 20,329 | |
| Series 2053,Cl. Z, 6.50%, 4/15/28 | | | 2,716 | | | | 3,116 | |
| Series 2066,Cl. Z, 6.50%, 6/15/28 | | | 337,752 | | | | 387,300 | |
| Series 2195,Cl. LH, 6.50%, 10/15/29 | | | 233,534 | | | | 268,129 | |
| Series 2220,Cl. PD, 8.00%, 3/15/30 | | | 1,446 | | | | 1,703 | |
| Series 2326,Cl. ZP, 6.50%, 6/15/31 | | | 64,314 | | | | 71,821 | |
| Series 2461,Cl. PZ, 6.50%, 6/15/32 | | | 283,008 | | | | 327,068 | |
| Series 2470,Cl. LF, 1.186%, 2/15/323 | | | 2,240 | | | | 2,299 | |
| Series 2564,Cl. MP, 5.00%, 2/15/18 | | | 100,525 | | | | 104,806 | |
| Series 2585,Cl. HJ, 4.50%, 3/15/18 | | | 56,889 | | | | 59,366 | |
| Series 2635,Cl. AG, 3.50%, 5/15/32 | | | 43,361 | | | | 45,267 | |
| Series 2707,Cl. QE, 4.50%, 11/15/18 | | | 20,747 | | | | 21,704 | |
| Series 2770,Cl. TW, 4.50%, 3/15/19 | | | 12,317 | | | | 12,883 | |
| Series 3010,Cl. WB, 4.50%, 7/15/20 | | | 30,430 | | | | 32,042 | |
| Series 3025,Cl. SJ, 24.07%, 8/15/353 | | | 24,399 | | | | 38,547 | |
| Series 3030,Cl. FL, 0.586%, 9/15/353 | | | 3,528 | | | | 3,554 | |
| Series 3645,Cl. EH, 3.00%, 12/15/20 | | | 109,377 | | | | 112,529 | |
| Series 3741,Cl. PA, 2.15%, 2/15/35 | | | 292,843 | | | | 297,781 | |
| Series 3815,Cl. BD, 3.00%, 10/15/20 | | | 6,916 | | | | 7,085 | |
| Series 3822,Cl. JA, 5.00%, 6/15/40 | | | 10,636 | | | | 11,414 | |
| Series 3840,Cl. CA, 2.00%, 9/15/18 | | | 5,121 | | | | 5,188 | |
| Series 3848,Cl. WL, 4.00%, 4/15/40 | | | 45,103 | | | | 46,466 | |
| Series 3857,Cl. GL, 3.00%, 5/15/40 | | | 9,091 | | | | 9,309 | |
| Series 4221,Cl. HJ, 1.50%, 7/15/23 | | | 151,134 | | | | 152,011 | |
| Federal Home Loan Mortgage Corp., Real Estate Mtg. Investment Conduit Multiclass Pass-Through Certificates, Interest-Only Stripped Mtg.-Backed Security: | |
| Series 2074,Cl. S, 53.487%, 7/17/284 | | | 1,885 | | | | 413 | |
| Series 2079,Cl. S, 0.00%, 7/17/284,5 | | | 3,463 | | | | 791 | |
| Series 2130,Cl. SC, 50.364%, 3/15/294 | | | 138,814 | | | | 31,608 | |
| Series 2526,Cl. SE, 27.023%, 6/15/294 | | | 4,098 | | | | 963 | |
| Series 2796,Cl. SD, 49.915%, 7/15/264 | | | 204,862 | | | | 44,202 | |
| Series 2920,Cl. S, 53.15%, 1/15/354 | | | 789,869 | | | | 152,957 | |
| Series 2922,Cl. SE, 5.664%, 2/15/354 | | | 94,687 | | | | 18,036 | |
| Series 2981,Cl. AS, 0.206%, 5/15/354 | | | 133,237 | | | | 26,623 | |
| Series 3004,Cl. SB, 0.00%, 7/15/354,5 | | | 39,098 | | | | 6,210 | |
| Series 3201,Cl. SG, 1.899%, 8/15/364 | | | 227,628 | | | | 42,308 | |
| | | | | | | | |
| | | Principal
Amount | | | Value | |
| FHLMC/FNMA/FHLB/Sponsored (Continued) | |
| Federal Home Loan Mortgage Corp., Real Estate Mtg. Investment Conduit Multiclass Pass-Through Certificates, Interest-Only Stripped Mtg.-Backed Security: (Continued) | |
| Series 3397,Cl. GS, 15.854%, 12/15/374 | | $ | 19,819 | | | $ | 4,112 | |
| Series 3424,Cl. EI, 15.518%, 4/15/384 | | | 21,320 | | | | 3,071 | |
| Series 3450,Cl. BI, 8.89%, 5/15/384 | | | 499,713 | | | | 83,441 | |
| Series 3606,Cl. SN, 0.698%, 12/15/394 | | | 136,142 | | | | 24,794 | |
| Federal National Mortgage Assn.: | | | | | | | | |
| 3.00%, 7/1/307 | | | 1,800,000 | | | | 1,862,297 | |
| 3.50%, 7/1/417 | | | 14,840,000 | | | | 15,265,200 | |
| 4.00%, 7/1/457 | | | 13,300,000 | | | | 14,073,842 | |
| 5.00%, 7/1/457 | | | 2,815,000 | | | | 3,109,514 | |
| 6.00%, 7/1/457 | | | 160,000 | | | | 181,900 | |
| Federal National Mortgage Assn. Pool: | | | | | |
| 3.50%, 12/1/20-2/1/22 | | | 250,456 | | | | 264,020 | |
| 5.00%, 3/1/21-7/1/22 | | | 16,170 | | | | 17,196 | |
| 5.50%, 2/1/35-5/1/36 | | | 214,370 | | | | 241,662 | |
| 6.50%, 5/1/17-1/1/34 | | | 189,148 | | | | 196,897 | |
| 7.00%, 11/1/17-7/1/35 | | | 56,762 | | | | 63,715 | |
| 7.50%, 1/1/33 | | | 5,517 | | | | 6,689 | |
| 8.50%, 7/1/32 | | | 13,711 | | | | 15,805 | |
| Federal National Mortgage Assn., Interest-Only Stripped Mtg.-Backed Security: | |
| Series 221,Cl. 2, 38.797%, 5/25/234 | | | 3,050 | | | | 454 | |
| Series 222,Cl. 2, 18.28%, 6/25/234 | | | 323,571 | | | | 66,395 | |
| Series 252,Cl. 2, 37.274%, 11/25/234 | | | 317,413 | | | | 47,481 | |
| Series 294,Cl. 2, 12.133%, 2/25/284 | | | 35,277 | | | | 8,415 | |
| Series 301,Cl. 2, 0.00%, 4/25/294,5 | | | 3,194 | | | | 717 | |
| Series 303,Cl. IO, 8.553%, 11/25/294 | | | 62,214 | | | | 16,725 | |
| Series 320,Cl. 2, 7.85%, 4/25/324 | | | 233,237 | | | | 45,368 | |
| Series 321,Cl. 2, 0.00%, 4/25/324,5 | | | 644,108 | | | | 151,299 | |
| Series 324,Cl. 2, 0.00%, 7/25/324,5 | | | 6,712 | | | | 1,450 | |
| Series 331,Cl. 5, 1.854%, 2/25/334 | | | 9,506 | | | | 2,196 | |
| Series 331,Cl. 9, 16.521%, 2/25/334 | | | 202,975 | | | | 46,691 | |
| Series 334,Cl. 12, 0.00%, 3/25/334,5 | | | 15,566 | | | | 3,593 | |
| Series 334,Cl. 17, 18.144%, 2/25/334 | | | 133,594 | | | | 30,573 | |
| Series 339,Cl. 12, 0.00%, 6/25/334,5 | | | 221,550 | | | | 57,671 | |
| Series 339,Cl. 7, 0.00%, 11/25/334,5 | | | 469,896 | | | | 89,891 | |
| Series 343,Cl. 13, 0.00%, 9/25/334,5 | | | 216,254 | | | | 44,257 | |
| Series 343,Cl. 18, 0.00%, 5/25/344,5 | | | 56,044 | | | | 11,125 | |
| Series 345,Cl. 9, 0.00%, 1/25/344,5 | | | 159,437 | | | | 31,447 | |
| Series 351,Cl. 10, 0.00%, 4/25/344,5 | | | 74,168 | | | | 15,228 | |
| Series 351,Cl. 8, 0.00%, 4/25/344,5 | | | 123,806 | | | | 25,457 | |
| Series 356,Cl. 10, 0.00%, 6/25/354,5 | | | 91,047 | | | | 20,016 | |
| Series 356,Cl. 12, 0.00%, 2/25/354,5 | | | 44,330 | | | | 9,779 | |
| Series 362,Cl. 13, 0.00%, 8/25/354,5 | | | 170,895 | | | | 37,230 | |
| Series 364,Cl. 15, 0.267%, 9/25/354 | | | 9,128 | | | | 2,024 | |
| Series 364,Cl. 16, 0.00%, 9/25/354,5 | | | 185,195 | | | | 41,053 | |
| Series 365,Cl. 16, 0.00%, 3/25/364,5 | | | 267,269 | | | | 54,091 | |
| Federal National Mortgage Assn., Real Estate Mtg. Investment Conduit Multiclass Pass-Through Certificates: | |
| Series 1993-87,Cl. Z, 6.50%, 6/25/23 | | | 226,314 | | | | 251,400 | |
| Series 1998-58,Cl. PC, 6.50%, 10/25/28 | | | 173,306 | | | | 195,053 | |
| Series 1998-61,Cl. PL, 6.00%, 11/25/28 | | | 86,660 | | | | 98,746 | |
| Series 1999-54,Cl. LH, 6.50%, 11/25/29 | | | 138,954 | | | | 158,514 | |
| Series 2001-44,Cl. QC, 6.00%, 9/25/16 | | | 2,135 | | | | 2,184 | |
| Series 2001-51,Cl. OD, 6.50%, 10/25/31 | | | 10,576 | | | | 12,150 | |
| Series 2001-74,Cl. QE, 6.00%, 12/25/31 | | | 213,125 | | | | 243,470 | |
| Series 2002-12,Cl. PG, 6.00%, 3/25/17 | | | 1,465 | | | | 1,510 | |
| Series 2003-100,Cl. PA, 5.00%, 10/25/18 | | | 210,815 | | | | 221,151 | |
| Series 2003-28,Cl. KG, 5.50%, 4/25/23 | | | 731,935 | | | | 801,062 | |
| Series 2003-84,Cl. GE, 4.50%, 9/25/18 | | | 9,986 | | | | 10,404 | |
| Series 2004-101,Cl. BG, 5.00%, 1/25/20 | | | 178,742 | | | | 183,301 | |
| Series 2004-25,Cl. PC, 5.50%, 1/25/34 | | | 7,591 | | | | 8,004 | |
| Series 2005-73,Cl. DF, 0.437%, 8/25/353 | | | 11,405 | | | | 11,455 | |
| Series 2006-11,Cl. PS, 23.881%, 3/25/363 | | | 123,852 | | | | 198,187 | |
| Series 2006-46,Cl. SW, 23.514%, 6/25/363 | | | 88,867 | | | | 119,651 | |
| Series 2006-50,Cl. KS, 23.514%, 6/25/363 | | | 124,021 | | | | 195,314 | |
| Series 2008-75,Cl. DB, 4.50%, 9/25/23 | | | 66,508 | | | | 69,205 | |
| Series 2009-113,Cl. DB, 3.00%, 12/25/20 | | | 220,633 | | | | 226,242 | |
| Series 2009-36,Cl. FA, 1.127%, 6/25/373 | | | 104,510 | | | | 107,363 | |
| Series 2009-70,Cl. TL, 4.00%, 8/25/19 | | | 100,124 | | | | 103,206 | |
|
| 8 OPPENHEIMER CORE BOND FUND/VA |
| | | | | | | | |
| | | Principal
Amount | | | Value | |
| FHLMC/FNMA/FHLB/Sponsored (Continued) | |
| Federal National Mortgage Assn., Real Estate Mtg. Investment Conduit Multiclass | |
| Pass-Through Certificates: (Continued) | | | | | | | | |
| Series 2010-43,Cl. KG, 3.00%, 1/25/21 | | $ | 60,684 | | | $ | 62,456 | |
| Series 2011-3,Cl. EL, 3.00%, 5/25/20 | | | 368,089 | | | | 377,372 | |
| Series 2011-38,Cl. AH, 2.75%, 5/25/20 | | | 6,078 | | | | 6,213 | |
| Series 2011-82,Cl. AD, 4.00%, 8/25/26 | | | 118,737 | | | | 123,104 | |
| Federal National Mortgage Assn., Real Estate Mtg. Investment Conduit Multiclass Pass-Through Certificates, Interest-Only Stripped Mtg.-Backed Security: | |
| Series 2001-61,Cl. SH, 28.894%, 11/18/314 | | | 8,187 | | | | 1,985 | |
| Series 2001-63,Cl. SD, 29.728%, 12/18/314 | | | 2,949 | | | | 670 | |
| Series 2001-65,Cl. S, 28.321%, 11/25/314 | | | 205,419 | | | | 49,222 | |
| Series 2001-68,Cl. SC, 20.534%, 11/25/314 | | | 1,884 | | | | 457 | |
| Series 2001-81,Cl. S, 25.204%, 1/25/324 | | | 60,252 | | | | 14,097 | |
| Series 2002-28,Cl. SA, 34.592%, 4/25/324 | | | 1,875 | | | | 413 | |
| Series 2002-38,Cl. SO, 45.976%, 4/25/324 | | | 5,178 | | | | 1,050 | |
| Series 2002-39,Cl. SD, 37.073%, 3/18/324 | | | 3,424 | | | | 891 | |
| Series 2002-47,Cl. NS, 30.983%, 4/25/324 | | | 186,615 | | | | 45,911 | |
| Series 2002-48,Cl. S, 30.269%, 7/25/324 | | | 3,079 | | | | 751 | |
| Series 2002-51,Cl. S, 31.199%, 8/25/324 | | | 171,313 | | | | 42,164 | |
| Series 2002-52,Cl. SD, 35.114%, 9/25/324 | | | 240,966 | | | | 58,294 | |
| Series 2002-52,Cl. SL, 32.778%, 9/25/324 | | | 1,938 | | | | 477 | |
| Series 2002-53,Cl. SK, 32.28%, 4/25/324 | | | 11,929 | | | | 2,931 | |
| Series 2002-56,Cl. SN, 32.017%, 7/25/324 | | | 4,198 | | | | 1,024 | |
| Series 2002-60,Cl. SM, 30.224%, 8/25/324 | | | 27,500 | | | | 5,760 | |
| Series 2002-7,Cl. SK, 26.703%, 1/25/324 | | | 12,466 | | | | 2,591 | |
| Series 2002-77,Cl. BS, 24.887%, 12/18/324 | | | 16,881 | | | | 4,231 | |
| Series 2002-77,Cl. IS, 41.553%, 12/18/324 | | | 8,821 | | | | 2,334 | |
| Series 2002-77,Cl. SH, 32.066%, 12/18/324 | | | 89,919 | | | | 21,289 | |
| Series 2002-84,Cl. SA, 34.754%, 12/25/324 | | | 201,401 | | | | 48,398 | |
| Series 2002-9,Cl. MS, 26.29%, 3/25/324 | | | 3,168 | | | | 737 | |
| Series 2002-90,Cl. SN, 31.334%, 8/25/324 | | | 14,147 | | | | 2,963 | |
| Series 2002-90,Cl. SY, 37.014%, 9/25/324 | | | 10,080 | | | | 2,079 | |
| Series 2003-26,Cl. DI, 7.688%, 4/25/334 | | | 9,184 | | | | 2,323 | |
| Series 2003-33,Cl. SP, 29.26%, 5/25/334 | | | 208,517 | | | | 44,991 | |
| Series 2003-4,Cl. S, 30.868%, 2/25/334 | | | 130,938 | | | | 33,461 | |
| Series 2004-54,Cl. DS, 39.328%, 11/25/304 | | | 175,797 | | | | 34,487 | |
| Series 2005-12,Cl. SC, 9.333%, 3/25/354 | | | 44,930 | | | | 9,860 | |
| Series 2005-14,Cl. SE, 37.864%, 3/25/354 | | | 137,664 | | | | 22,820 | |
| Series 2005-40,Cl. SA, 49.129%, 5/25/354 | | | 394,027 | | | | 74,099 | |
| Series 2005-40,Cl. SB, 53.455%, 5/25/354 | | | 18,454 | | | | 3,309 | |
| Series 2005-52,Cl. JH, 2.135%, 5/25/354 | | | 101,984 | | | | 19,207 | |
| Series 2005-93,Cl. SI, 15.316%, 10/25/354 | | | 307,650 | | | | 54,136 | |
| Series 2008-55,Cl. SA, 13.805%, 7/25/384 | | | 21,940 | | | | 2,770 | |
| Series 2009-8,Cl. BS, 0.00%, 2/25/244,5 | | | 96,581 | | | | 5,524 | |
| Series 2012-134,Cl. SA, 12.555%, 12/25/424 | | | 211,736 | | | | 53,661 | |
| Series 2012-40,Cl. PI, 0.00%, 4/25/414,5 | | | 177,320 | | | | 32,146 | |
| Federal National Mortgage Assn., Real Estate Mtg. Investment Conduit Multiclass Pass-Through Certificates, Principal-Only Stripped Mtg.-Backed Security, Series 1993-184, Cl. M, 5.049%, 9/25/236 | | | 102,219 | | | | 98,142 | |
| | | | | | | 46,380,153 | |
| | | | | | | | | |
| GNMA/Guaranteed—0.2% | | | | | | | | |
| Government National Mortgage Assn. I Pool: | | | | | |
| 7.00%, 12/15/23-3/15/26 | | | 9,933 | | | | 10,819 | |
| 8.50%, 8/15/17-12/15/17 | | | 18,618 | | | | 19,429 | |
| Government National Mortgage Assn., Interest-Only Stripped Mtg.-Backed Security: | |
| Series 2002-15,Cl. SM, 60.151%, 2/16/324 | | | 297,457 | | | | 57,655 | |
| Series 2007-17,Cl. AI, 19.025%, 4/16/374 | | | 91,865 | | | | 17,712 | |
| Series 2011-52,Cl. HS, 9.226%, 4/16/414 | | | 615,956 | | | | 119,043 | |
| Government National Mortgage Assn., Real Estate Mtg. Investment Conduit Multiclass Pass-Through Certificates: | |
| Series 1999-32,Cl. ZB, 8.00%, 9/16/29 | | | 42,658 | | | | 50,464 | |
| Series 2000-7,Cl. Z, 8.00%, 1/16/30 | | | 15,936 | | | | 18,418 | |
| | | | | | | 293,540 | |
| | | | | | | | |
| | | Principal
Amount | | | Value | |
| Non-Agency—13.0% | |
| Commercial—11.2% | |
| Asset Securitization Corp., Interest-Only Stripped Mtg.-Backed Security, Series 1997-D4, Cl. PS1, 0%, 4/14/293,4,5 | | $ | 1,645,144 | | | $ | 43,823 | |
| Banc of America Commercial Mortgage Trust, Series 2006-5, Cl. AM, 5.448%, 9/10/47 | | | 520,000 | | | | 541,001 | |
| Banc of America Funding Trust: | | | | | | | | |
| Series 2006-G,Cl. 2A4, 0.477%, 7/20/363 | | | 773,434 | | | | 725,020 | |
| Series 2014-R7,Cl. 3A1, 2.617%, 3/26/362,3 | | | 403,472 | | | | 400,445 | |
| BCAP LLC Trust, Series 2011-R11, Cl. 18A5, 2.23%, 9/26/351,3 | | | 201,610 | | | | 205,029 | |
| Bear Stearns ARM Trust: | | | | | | | | |
| Series 2005-2,Cl. A1, 2.68%, 3/25/353 | | | 219,241 | | | | 221,683 | |
| Series 2005-9,Cl. A1, 2.41%, 10/25/353 | | | 246,566 | | | | 243,321 | |
| Capital Lease Funding Securitization LP, Interest-Only Commercial Mtg. Pass-Through Certificates, Series 1997-CTL1, Cl. IO, 0%, 6/22/241,3,4,5 | | | 1,363,458 | | | | 56,404 | |
| Chase Mortgage Finance Trust, Series 2005-A2, Cl. 1A3, 2.435%, 1/25/363 | | | 165,610 | | | | 156,245 | |
| CHL Mortgage Pass-Through Trust, Series 2005-17, Cl. 1A8, 5.50%, 9/25/35 | | | 28,596 | | | | 28,198 | |
| Citigroup Commercial Mortgage Trust: | | | | | | | | |
| Series 2008-C7,Cl. AM, 6.349%, 12/10/493 | | | 410,000 | | | | 443,998 | |
| Series 2013-GC11,Cl. D, 4.604%, 4/10/461,3 | | | 160,000 | | | | 150,874 | |
| Citigroup Mortgage Loan Trust, Inc., Series 2006- AR1, Cl. 1A1, 2.57%, 10/25/353 | | | 690,473 | | | | 683,227 | |
| COMM Mortgage Trust: | | | | | | | | |
| Series 2012-CR4,Cl. D, 4.727%, 10/15/451,3 | | | 50,000 | | | | 48,761 | |
| Series 2012-CR5,Cl. E, 4.48%, 12/10/451,3 | | | 300,000 | | | | 286,405 | |
| Series 2013-CR7,Cl. D, 4.494%, 3/10/461,3 | | | 390,000 | | | | 359,245 | |
| Series 2014-CR21,Cl. AM, 3.987%, 12/10/47 | | | 710,000 | | | | 727,490 | |
| COMM Mortgage Trust, Interest-Only Stripped Mtg.-Backed Security, Series 2012-CR5, Cl. XA, 0%, 12/10/453,4,5 | | | 2,719,181 | | | | 236,736 | |
| Commercial Mortgage Trust, Series 2007-GG11, Cl. AM, 5.867%, 12/10/493 | | | 170,000 | | | | 182,539 | |
| Credit Suisse First Boston Mortgage Securities Corp., Series 2005-C6, Cl. AJ, 5.23%, 12/15/403 | | | 410,000 | | | | 413,392 | |
| CSMC: | | | | | | | | |
| Series 2006-6,Cl. 1A4, 6.00%, 7/25/36 | | | 250,118 | | | | 210,811 | |
| Series 2009-13R,Cl. 4A1, 2.625%, 9/26/361,3 | | | 55,953 | | | | 56,317 | |
| DBUBS Mortgage Trust, Series 2011-LC1A, Cl. E, 5.735%, 11/10/461,3 | | | 75,000 | | | | 80,203 | |
| First Horizon Alternative Mortgage Securities Trust: | | | | | | | | |
| Series 2004-FA2,Cl. 3A1, 6.00%, 1/25/35 | | | 196,043 | | | | 188,140 | |
| Series 2005-FA8,Cl. 1A6, 0.837%, 11/25/353 | | | 220,804 | | | | 167,104 | |
| FREMF Mortgage Trust: | | | | | | | | |
| Series 2012-K501,Cl. C, 3.549%, 11/25/461,3 | | | 35,000 | | | | 35,703 | |
| Series 2013-K25,Cl. C, 3.743%, 11/25/451,3 | | | 90,000 | | | | 88,155 | |
| Series 2013-K26,Cl. C, 3.723%, 12/25/451,3 | | | 60,000 | | | | 59,111 | |
| Series 2013-K27,Cl. C, 3.616%, 1/25/461,3 | | | 95,000 | | | | 92,280 | |
| Series 2013-K28,Cl. C, 3.614%, 6/25/461,3 | | | 285,000 | | | | 276,350 | |
| Series 2013-K502,Cl. C, 3.302%, 3/25/451,3 | | | 175,000 | | | | 177,984 | |
| Series 2013-K712,Cl. C, 3.484%, 5/25/451,3 | | | 75,000 | | | | 75,195 | |
| Series 2013-K713,Cl. C, 3.274%, 4/25/461,3 | | | 115,000 | | | | 113,392 | |
| Series 2014-K715,Cl. C, 4.264%, 2/25/461,3 | | | 50,000 | | | | 50,850 | |
| Series 2015-K44,Cl. B, 3.811%, 1/25/481,3 | | | 315,000 | | | | 308,284 | |
| GSMSC Pass-Through Trust, Series 2009-3R, Cl. 1A2, 6%, 4/25/371,3 | | | 442,536 | | | | 413,175 | |
| GSR Mortgage Loan Trust, Series 2005-AR4, Cl. 6A1, 2.937%, 7/25/353 | | | 133,884 | | | | 132,418 | |
| JP Morgan Chase Commercial Mortgage Securities Corp., Series 2012-LC9, Cl. E, 4.569%, 12/15/471,3 | | | 245,000 | | | | 238,766 | |
| JP Morgan Chase Commercial Mortgage Securities Trust: | | | | | | | | |
| Series 2006-LDP8,Cl. AJ, 5.48%, 5/15/453 | | | 275,000 | | | | 284,623 | |
| Series 2012-C6,Cl. E, 5.372%, 5/15/451,3 | | | 325,000 | | | | 328,544 | |
| JP Morgan Mortgage Trust, Series 2007-A1, Cl. | | | | | | | | |
| 5A1, 2.555%, 7/25/353 | | | 133,687 | | | | 134,089 | |
|
| 9 OPPENHEIMER CORE BOND FUND/VA |
STATEMENT OF INVESTMENTS Unaudited / Continued
| | | | | | | | |
| | | Principal Amount | | | Value | |
| Commercial (Continued) | |
| JP Morgan Resecuritization Trust: | |
| Series 2009-11,Cl. 5A1, 2.625%, 9/26/361,3 | | $ | 213,084 | | | $ | 213,486 | |
| Series 2009-5,Cl. 1A2, 2.721%, 7/26/361,3 | | | 405,917 | | | | 355,166 | |
| JPMBB Commercial Mortgage Securities Trust: | |
| Series 2014-C25,Cl. AS, 4.065%, 11/15/47 | | | 300,000 | | | | 312,518 | |
| Series 2014-C26,Cl. AS, 3.80%, 1/15/48 | | | 145,000 | | | | 147,334 | |
| LB Commercial Conduit Mortgage Trust, Interest- Only Stripped Mtg.-Backed Security, Series 1998- C1, Cl. IO, 0%, 2/18/303,4,5 | | | 470,116 | | | | 9,069 | |
| Lehman Structured Securities Corp., Series 2002- GE1, Cl. A, 2.514%, 7/26/241,3 | | | 61,705 | | | | 52,262 | |
| Morgan Stanley Bank of America Merrill Lynch Trust: | | | | | | | | |
| Series 2012-C6,Cl. E, 4.816%, 11/15/451,3 | | | 400,000 | | | | 395,060 | |
| Series 2013-C7,Cl. D, 4.437%, 2/15/461,3 | | | 175,000 | | | | 164,968 | |
| Series 2013-C8,Cl. D, 4.309%, 12/15/481,3 | | | 130,000 | | | | 121,101 | |
| Series 2014-C19,Cl. AS, 3.832%, 12/15/47 | | | 595,000 | | | | 606,261 | |
| Morgan Stanley Capital I Trust, Series 2007-IQ13, Cl. AM, 5.406%, 3/15/44 | | | 540,000 | | | | 570,286 | |
| Morgan Stanley Re-Remic Trust, Series 2012-R3, Cl. 1B, 1.969%, 11/26/361,3 | | | 453,861 | | | | 345,115 | |
| Morgan Stanley Resecuritization Trust, Series 2013-R9, Cl. 3A, 2.379%, 6/26/461,3 | | | 340,174 | | | | 343,168 | |
| RBSSP Resecuritization Trust, Series 2010-1, Cl. 2A1, 2.248%, 7/26/451,3 | | | 35,196 | | | | 35,189 | |
| Salomon Brothers Mortgage Securities VII, Inc., Interest-Only Stripped Mtg.-Backed Security, Series 1999-C1, Cl. X, 0%, 5/18/323,4,5 | | | 3,147,474 | | | | 50 | |
| UBS-Barclays Commercial Mortgage Trust, Series 2012-C2, Cl. E, 4.889%, 5/10/631,3 | | | 65,000 | | | | 64,932 | |
| Wachovia Bank Commercial Mortgage Trust, Series 2005-C22, Cl. AM, 5.498%, 12/15/443 | | | 260,000 | | | | 262,760 | |
| WaMu Mortgage Pass-Through Certificates Trust: | |
| Series 2005-AR14,Cl. 1A4, 2.348%, 12/25/353 | | | 282,104 | | | | 273,497 | |
| Series 2005-AR16,Cl. 1A1, 2.341%, 12/25/353 | | | 124,525 | | | | 118,740 | |
| Wells Fargo Mortgage-Backed Securities Trust: | |
| Series 2005-AR10,Cl. 1A1, 2.658%, 6/25/353 | | | 585,584 | | | | 599,930 | |
| Series 2005-AR15,Cl. 1A6, 2.613%, 9/25/353 | | | 66,714 | | | | 63,652 | |
| Series 2006-AR7,Cl. 2A4, 2.732%, 5/25/363 | | | 10,329 | | | | 9,883 | |
| Series 2006-AR8,Cl. 2A4, 2.641%, 4/25/363 | | | 157,854 | | | | 154,407 | |
| Series 2007-16,Cl. 1A1, 6.00%, 12/28/37 | | | 160,737 | | | | 166,467 | |
| Series 2007-AR3,Cl. A4, 5.803%, 4/25/373 | | | 79,185 | | | | 77,578 | |
| Series 2007-AR8,Cl. A1, 2.614%, 11/25/373 | | | 201,568 | | | | 178,072 | |
| WF-RBS Commercial Mortgage Trust: | | | | | | | | |
| Series 2012-C10,Cl. D, 4.606%, 12/15/451,3 | | | 175,000 | | | | 168,677 | |
| Series 2012-C7,Cl. E, 4.999%, 6/15/451,3 | | | 120,000 | | | | 120,408 | |
| Series 2012-C8,Cl. E, 5.038%, 8/15/451,3 | | | 355,000 | | | | 358,546 | |
| Series 2013-C11,Cl. D, 4.32%, 3/15/451,3 | | | 74,000 | | | | 69,837 | |
| | | | | | | 16,023,749 | |
| | | | | | | | | |
| Multi-Family—0.2% | | | | | | | | |
| Wells Fargo Mortgage-Backed Securities Trust: | |
| Series 2005-AR15,Cl. 1A2, 2.613%, 9/25/353 | | | 168,423 | | | | 164,641 | |
| Series 2006-AR2,Cl. 2A3, 2.621%, 3/25/363 | | | 145,693 | | | | 144,210 | |
| | | | | | | 308,851 | |
| | | | | | | | | |
| Residential—1.6% | | | | | | | | |
| Banc of America Funding Trust: | | | | | | | | |
| Series 2007-1,Cl. 1A3, 6.00%, 1/25/37 | | | 192,927 | | | | 178,539 | |
| Series 2007-C,Cl. 1A4, 5.308%, 5/20/363 | | | 79,971 | | | | 75,070 | |
| Banc of America Mortgage Trust, Series 2007-1, Cl. 1A24, 6%, 3/25/37 | | | 122,121 | | | | 111,874 | |
| Bear Stearns ARM Trust, Series 2006-1, Cl. A1, 2.36%, 2/25/363 | | | 306,918 | | | | 305,273 | |
| Carrington Mortgage Loan Trust, Series 2006- FRE1, Cl. A2, 0.297%, 7/25/363 | | | 129,769 | | | | 127,512 | |
| CHL Mortgage Pass-Through Trust: | | | | | | | | |
| Series 2005-26,Cl. 1A8, 5.50%, 11/25/35 | | | 147,246 | | | | 141,135 | |
| Series 2005-J4,Cl. A7, 5.50%, 11/25/35 | | | 21,903 | | | | 22,969 | |
| HomeBanc Mortgage Trust, Series 2005-3, Cl. A2, 0.497%, 7/25/353 | | | 62,213 | | | | 57,838 | |
| | | | | | | | |
| | | Principal
Amount | | | Value | |
| Residential (Continued) | |
| MASTR Asset Backed Securities Trust, Series 2006- WMC3, Cl. A3, 0.287%, 8/25/363 | | $ | 52,997 | | | $ | 26,630 | |
| NC Finance Trust, Series 1999-I, Cl. D, 8.75%, 1/25/292,8 | | | 3,370,016 | | | | 909,904 | |
| RALI Trust: | | | | | | | | |
| Series 2003-QS1,Cl. A2, 5.75%, 1/25/33 | | | 22,885 | | | | 23,006 | |
| Series 2006-QS13,Cl. 1A8, 6.00%, 9/25/36 | | | 1,173 | | | | 953 | |
| Series 2007-QS6,Cl. A28, 5.75%, 4/25/37 | | | 14,257 | | | | 11,639 | |
| WaMu Mortgage Pass-Through Certificates Trust, Series 2003-AR10, Cl. A7, 2.418%, 10/25/333 | | | 147,550 | | | | 150,898 | |
| Wells Fargo Mortgage-Backed Securities Trust, Series 2006-AR14, Cl. 1A2, 5.808%, 10/25/363 | | | 174,288 | | | | 170,264 | |
| | | | | | | 2,313,504 | |
| Total Mortgage-Backed Obligations (Cost $68,625,684) | | | | | | | 65,319,797 | |
| | | | | | | | | |
| U.S. Government Obligations—1.2% | |
| Federal National Mortgage Assn. Nts., 1%, 9/27/17 | | | 259,000 | | | | 260,027 | |
| United States Treasury Nts., 1.50%, 5/31/19 | | | 1,438,000 | | | | 1,445,302 | |
| Total U.S. Government Obligations (Cost $1,703,450) | | | | | | | 1,705,329 | |
| | | | | | | | | |
| Corporate Bonds and Notes—54.2% | |
| Consumer Discretionary—7.2% | |
| Auto Components—0.1% | |
| BorgWarner, Inc., 4.375% Sr. Unsec. Nts., 3/15/45 | | | 109,000 | | | | 101,999 | |
| Johnson Controls, Inc., 1.40% Sr. Unsec. Nts., 11/2/17 | | | 66,000 | | | | 65,771 | |
| | | | | | | 167,770 | |
| | | | | | | | | |
| Automobiles—1.8% | |
| Daimler Finance North America LLC: | | | | | | | | |
| 1.30% Sr. Unsec. Nts., 7/31/151 | | | 316,000 | | | | 316,146 | |
| 8.50% Sr. Unsec. Unsub. Nts., 1/18/31 | | | 237,000 | | | | 348,014 | |
| Ford Motor Credit Co. LLC, 3.664% Sr. Unsec. Nts., 9/8/24 | | | 796,000 | | | | 785,807 | |
| General Motors Co., 6.25% Sr. Unsec. Nts., 10/2/43 | | | 363,000 | | | | 405,600 | |
| Hyundai Capital America, 1.45% Sr. Unsec. Nts., 2/6/171 | | | 392,000 | | | | 390,853 | |
| Kia Motors Corp., 3.625% Sr. Unsec. Nts., 6/14/161 | | | 284,000 | | | | 290,111 | |
| | | | | | | 2,536,531 | |
| | | | | | | | | |
| Hotels, Restaurants & Leisure—0.8% | |
| Brinker International, Inc., 2.60% Sr. Unsec. Nts., 5/15/18 | | | 134,000 | | | | 134,285 | |
| Carnival Corp., 1.20% Sr. Unsec. Nts., 2/5/16 | | | 386,000 | | | | 386,522 | |
| Hyatt Hotels Corp., 3.875% Sr. Unsec. Unsub. Nts., 8/15/16 | | | 65,000 | | | | 66,772 | |
| Marriott International, Inc., 3.25% Sr. Unsec. Nts., 9/15/22 | | | 228,000 | | | | 224,890 | |
| Wyndham Worldwide Corp., 6% Sr. Unsec. Nts., 12/1/16 | | | 335,000 | | | | 353,556 | |
| | | | | | | 1,166,025 | |
| | | | | | | | | |
| Household Durables—0.6% | |
| Lennar Corp.: | | | | | | | | |
| 4.75% Sr. Unsec. Nts., 11/15/22 | | | 125,000 | | | | 123,437 | |
| 4.75% Sr. Unsec. Nts., 5/30/25 | | | 245,000 | | | | 238,875 | |
| Toll Brothers Finance Corp., 4.375% Sr. Unsec. Nts., 4/15/23 | | | 352,000 | | | | 346,720 | |
| Whirlpool Corp.: | | | | | | | | |
| 1.35% Sr. Unsec. Nts., 3/1/17 | | | 104,000 | | | | 104,335 | |
|
| 10 OPPENHEIMER CORE BOND FUND/VA |
| | | | | | | | |
| | | Principal Amount | | | Value | |
| Household Durables (Continued) | |
| Whirlpool Corp.: (Continued) | | | | | | | | |
| 1.65% Sr. Unsec. Nts., 11/1/17 | | $ | 85,000 | | | $ | 85,323 | |
| | | | | | | 898,690 | |
| | | | | | | | | |
| Leisure Equipment & Products—0.3% | |
| Mattel, Inc., 1.70% Sr. Unsec. Nts., 3/15/18 | | | 371,000 | | | | 369,224 | |
| | | | | | | | | |
| Media—2.1% | | | | | | | | |
| 21st Century Fox America, Inc., 6.15% Sr. Unsec. Nts., 2/15/41 | | | 162,000 | | | | 188,164 | |
| Comcast Cable Communications Holdings, Inc., 9.455% Sr. Unsec. Nts., 11/15/22 | | | 242,000 | | | | 332,477 | |
| Comcast Corp., 4.65% Sr. Unsec. Unsub. Nts., 7/15/42 | | | 130,000 | | | | 130,161 | |
| DIRECTV Holdings LLC/DIRECTV Financing Co., Inc., 5.15% Sr. Unsec. Nts., 3/15/42 | | | 55,000 | | | | 51,755 | |
| Historic TW, Inc.: | | | | | | | | |
| 8.05% Sr. Unsec. Nts., 1/15/16 | | | 64,000 | | | | 66,359 | |
| 9.15% Debs., 2/1/23 | | | 96,000 | | | | 126,863 | |
| Interpublic Group of Cos., Inc. (The), 4.20% Sr. Unsec. Nts., 4/15/24 | | | 191,000 | | | | 193,435 | |
| Lamar Media Corp., 5% Sr. Unsec. Sub. Nts., 5/1/23 | | | 373,000 | | | | 371,135 | |
| Pearson Funding Two plc, 4% Sr. Unsec. Nts., 5/17/161 | | | 85,000 | | | | 87,015 | |
| Scripps Networks Interactive, Inc., 2.70% Sr. Unsec. Nts., 12/15/16 | | | 351,000 | | | | 358,096 | |
| Sky plc, 3.75% Sr. Unsec. Nts., 9/16/241 | | | 187,000 | | | | 182,645 | |
| Thomson Reuters Corp., 1.65% Sr. Unsec. Nts., 9/29/17 | | | 366,000 | | | | 366,017 | |
| Time Warner Cable, Inc., 4.50% Sr. Unsec. Unsub. Nts., 9/15/42 | | | 126,000 | | | | 103,613 | |
| Viacom, Inc., 2.50% Sr. Unsec. Nts., 12/15/16 | | | 155,000 | | | | 157,407 | |
| Virgin Media Secured Finance plc, 5.25% Sr. Sec. Nts., 1/15/261 | | | 360,000 | | | | 348,750 | |
| | | | | | | 3,063,892 | |
| | | | | | | | | |
| Multiline Retail—0.3% | | | | | | | | |
| Family Tree Escrow LLC, 5.75% Sr. Sec. Nts., 3/1/231 | | | 375,000 | | | | 393,750 | |
| | | | | | | | | |
| Specialty Retail—0.7% | |
| Best Buy Co., Inc., 5.50% Sr. Unsec. Nts., 3/15/21 | | | 349,000 | | | | 363,693 | |
| Home Depot, Inc. (The), 4.875% Sr. Unsec. Nts., 2/15/44 | | | 142,000 | | | | 151,694 | |
| Ross Stores, Inc., 3.375% Sr. Unsec. Nts., 9/15/24 | | | 355,000 | | | | 350,279 | |
| Signet UK Finance plc, 4.70% Sr. Unsec. Nts., 6/15/24 | | | 192,000 | | | | 193,978 | |
| | | | | | | 1,059,644 | |
| | | | | | | | | |
| Textiles, Apparel & Luxury Goods—0.5% | |
| Levi Strauss & Co., 5% Sr. Unsec. Nts., 5/1/251 | | | 370,000 | | | | 359,825 | |
| PVH Corp., 4.50% Sr. Unsec. Unsub. Nts., 12/15/22 | | | 371,000 | | | | 369,145 | |
| | | | | | | 728,970 | |
| | | | | | | | | |
| Consumer Staples—4.0% | |
| Beverages—1.0% | | | | | | | | |
| Anheuser-Busch InBev Worldwide, Inc., 8.20% Sr. Unsec. Unsub. Nts., 1/15/39 | | | 324,000 | | | | 481,823 | |
| Constellation Brands, Inc., 4.75% Sr. Unsec. Nts., 11/15/24 | | | 350,000 | | | | 351,750 | |
| Pernod Ricard SA: | | | | | | | | |
| 2.95% Sr. Unsec. Nts., 1/15/171 | | | 357,000 | | | | 364,897 | |
| 4.25% Sr. Unsec. Nts., 7/15/221 | | | 222,000 | | | | 231,440 | |
| | | | | | | 1,429,910 | |
| | | | | | | | |
| | | Principal Amount | | | Value | |
| Food & Staples Retailing—0.7% | |
| CVS Health Corp., 5.30% Sr. Unsec. Nts., 12/5/43 | | $ | 84,000 | | | $ | 91,555 | |
| Delhaize Group SA, 5.70% Sr. Unsec. Nts., 10/1/40 | | | 215,000 | | | | 218,249 | |
| Kroger Co. (The): | | | | | | | | |
| 6.40% Sr. Unsec. Nts., 8/15/17 | | | 330,000 | | | | 363,452 | |
| 6.90% Sr. Unsec. Nts., 4/15/38 | | | 90,000 | | | | 111,640 | |
| Wal-Mart Stores, Inc., 4.30% Sr. Unsec. Nts., 4/22/44 | | | 192,000 | | | | 192,247 | |
| | | | | | | 977,143 | |
| | | | | | | | | |
| Food Products—1.7% | | | | | | | | |
| Bunge Ltd. Finance Corp.: | | | | | | | | |
| 3.20% Sr. Unsec. Nts., 6/15/17 | | | 300,000 | | | | 308,990 | |
| 8.50% Sr. Unsec. Nts., 6/15/19 | | | 289,000 | | | | 349,728 | |
| HJ Heinz Co.: | | | | | | | | |
| 3.95% Sr. Unsec. Nts., 7/15/251,7 | | | 186,000 | | | | 187,425 | |
| 5.20% Sr. Unsec. Nts., 7/15/451,7 | | | 42,000 | | | | 43,142 | |
| Ingredion, Inc., 1.80% Sr. Unsec. Nts., 9/25/17 | | | 374,000 | | | | 372,883 | |
| JM Smucker Co., 1.75% Sr. Unsec. Nts., 3/15/181 | | | 288,000 | | | | 287,849 | |
| Kraft Foods Group, Inc., 5% Sr. Unsec. Nts., 6/4/42 | | | 85,000 | | | | 84,724 | |
| TreeHouse Foods, Inc., 4.875% Sr. Unsec. Nts., 3/15/22 | | | 365,000 | | | | 368,650 | |
| Tyson Foods, Inc.: | | | | | | | | |
| 4.875% Sr. Unsec. Nts., 8/15/34 | | | 118,000 | | | | 118,759 | |
| 6.60% Sr. Unsec. Nts., 4/1/16 | | | 341,000 | | | | 354,077 | |
| | | | | | | 2,476,227 | |
| | | | | | | | | |
| Tobacco—0.6% | | | | | | | | |
| Altria Group, Inc., 10.20% Sr. Unsec. Nts., 2/6/39 | | | 202,000 | | | | 332,700 | |
| Reynolds American, Inc.: | | | | | | | | |
| 5.85% Sr. Unsec. Nts., 8/15/45 | | | 162,000 | | | | 170,939 | |
| 6.75% Sr. Unsec. Nts., 6/15/17 | | | 325,000 | | | | 355,255 | |
| | | | | | | 858,894 | |
| | | | | | | | | |
| Energy—5.6% | | | | | | | | |
| Energy Equipment & Services—0.9% | |
| Ensco plc, 5.20% Sr. Unsec. Nts., 3/15/25 | | | 74,000 | | | | 73,298 | |
| Halliburton Co., 4.75% Sr. Unsec. Nts., 8/1/43 | | | 86,000 | | | | 88,248 | |
| Helmerich & Payne International Drilling Co., 4.65% Sr. Unsec. Nts., 3/15/251 | | | 146,000 | | | | 150,784 | |
| Nabors Industries, Inc., 2.35% Sr. Unsec. Nts., 9/15/16 | | | 294,000 | | | | 294,918 | |
| Rowan Cos., Inc., 4.875% Sr. Unsec. Unsub. Nts., 6/1/22 | | | 153,000 | | | | 152,017 | |
| Sinopec Group Overseas Development 2014 Ltd., 1.75% Sr. Unsec. Nts., 4/10/171 | | | 369,000 | | | | 369,453 | |
| Weatherford International Ltd., 5.95% Sr. Unsec. Nts., 4/15/42 | | | 97,000 | | | | 82,009 | |
| | | | | | | 1,210,727 | |
| | | | | | | | | |
| Oil, Gas & Consumable Fuels—4.7% | |
| Anadarko Petroleum Corp., 6.20% Sr. Unsec. Nts., 3/15/40 | | | 169,000 | | | | 190,505 | |
| Boardwalk Pipelines LP, 4.95% Sr. Unsec. Nts., 12/15/24 | | | 201,000 | | | | 197,203 | |
| Buckeye Partners LP, 6.05% Sr. Unsec. Nts., 1/15/18 | | | 164,000 | | | | 176,989 | |
| Canadian Natural Resources Ltd.: | | | | | | | | |
| 1.75% Sr. Unsec. Nts., 1/15/18 | | | 142,000 | | | | 141,061 | |
| 5.90% Sr. Unsec. Nts., 2/1/18 | | | 160,000 | | | | 174,625 | |
| Cenovus Energy, Inc., 5.20% Sr. Unsec. Nts., 9/15/43 | | | 102,000 | | | | 96,353 | |
| Cimarex Energy Co., 4.375% Sr. Unsec. Nts., 6/1/24 | | | 195,000 | | | | 194,407 | |
|
| 11 OPPENHEIMER CORE BOND FUND/VA |
STATEMENT OF INVESTMENTS Unaudited / Continued
| | | | | | | | |
| | | Principal
Amount | | | Value | |
| Oil, Gas & Consumable Fuels (Continued) | |
| CNOOC Nexen Finance 2014 ULC, 1.625% Sr. Unsec. Nts., 4/30/17 | | $ | 373,000 | | | $ | 373,646 | |
| Columbia Pipeline Group, Inc., 4.50% Sr. Unsec. Nts., 6/1/251 | | | 195,000 | | | | 192,454 | |
| DCP Midstream LLC, 5.375% Sr. Unsec. Nts., 10/15/151 | | | 290,000 | | | | 290,079 | |
| Devon Energy Corp., 4.75% Sr. Unsec. Nts., 5/15/42 | | | 162,000 | | | | 154,616 | |
| EnLink Midstream Partners LP, 2.70% Sr. Unsec. Nts., 4/1/19 | | | 299,000 | | | | 295,255 | |
| Husky Energy, Inc., 6.20% Sr. Unsec. Nts., 9/15/17 | | | 207,000 | | | | 224,856 | |
| Kinder Morgan Energy Partners LP, 4.10% Sr. Unsec. Nts., 11/15/15 | | | 152,000 | | | | 153,594 | |
| Kinder Morgan, Inc., 5% Sr. Unsec. Nts., 2/15/211 | | | 437,000 | | | | 460,430 | |
| MarkWest Energy Partners LP/MarkWest Energy Finance Corp., 4.875% Sr. Unsec. Nts., 6/1/25 | | | 374,000 | | | | 366,520 | |
| Noble Energy, Inc., 5.05% Sr. Unsec. Nts., 11/15/44 | | | 102,000 | | | | 97,752 | |
| ONEOK Partners LP, 4.90% Sr. Unsec. Nts., 3/15/25 | | | 190,000 | | | | 188,034 | |
| Origin Energy Finance Ltd.: | | | | | | | | |
| 3.50% Sr. Unsec. Nts., 10/9/181 | | | 394,000 | | | | 404,257 | |
| 5.45% Sr. Unsec. Nts., 10/14/211 | | | 245,000 | | | | 264,598 | |
| Phillips 66 Partners LP, 3.605% Sr. Unsec. Nts., 2/15/25 | | | 75,000 | | | | 70,617 | |
| Pioneer Natural Resources Co., 6.65% Sr. Unsec. Nts., 3/15/17 | | | 331,000 | | | | 358,052 | |
| Plains All American Pipeline LP/PAA Finance Corp., 3.60% Sr. Unsec. Nts., 11/1/24 | | | 279,000 | | | | 269,420 | |
| Southwestern Energy Co., 4.95% Sr. Unsec. Nts., 1/23/25 | | | 208,000 | | | | 210,239 | |
| Spectra Energy Partners LP: | | | | | | | | |
| 4.50% Sr. Unsec. Nts., 3/15/45 | | | 73,000 | | | | 64,686 | |
| 4.60% Sr. Unsec. Nts., 6/15/21 | | | 238,000 | | | | 255,819 | |
| 4.75% Sr. Unsec. Nts., 3/15/24 | | | 194,000 | | | | 205,972 | |
| Western Gas Partners LP, 4% Sr. Unsec. Nts., 7/1/22 | | | 239,000 | | | | 239,914 | |
| Williams Partners LP, 4.50% Sr. Unsec. Nts., 11/15/23 | | | 170,000 | | | | 171,432 | |
| Woodside Finance Ltd., 4.60% Sr. Unsec. Unsub. Nts., 5/10/211 | | | 284,000 | | | | 304,314 | |
| | | | | | | 6,787,699 | |
| | | | | | | | | |
| Financials—15.5% | | | | | | | | |
| Capital Markets—3.6% | | | | | | | | |
| Apollo Management Holdings LP, 4% Sr. Unsec. Nts., 5/30/241 | | | 312,000 | | | | 312,329 | |
| Blackstone Holdings Finance Co. LLC, 5% Sr. Unsec. Nts., 6/15/441 | | | 382,000 | | | | 382,462 | |
| Credit Suisse, New York, 3.625% Sr. Unsec. Nts., 9/9/24 | | | 498,000 | | | | 495,467 | |
| Deutsche Bank AG, 4.50% Sub. Nts., 4/1/25 | | | 380,000 | | | | 362,496 | |
| Goldman Sachs Group, Inc. (The): | | | | | | | | |
| 5.15% Sub. Nts., 5/22/45 | | | 262,000 | | | | 252,817 | |
| 5.70% Jr. Sub. Perpetual Bonds, Series L3,9 | | | 381,000 | | | | 382,848 | |
| KKR Group Finance Co. III LLC, 5.125% Sr. Unsec. Nts., 6/1/441 | | | 305,000 | | | | 292,057 | |
| Lazard Group LLC: | | | | | | | | |
| 3.75% Sr. Unsec. Nts., 2/13/25 | | | 90,000 | | | | 85,689 | |
| 4.25% Sr. Unsec. Nts., 11/14/20 | | | 337,000 | | | | 354,433 | |
| Morgan Stanley: | | | | | | | | |
| 4.30% Sr. Unsec. Nts., 1/27/45 | | | 217,000 | | | | 202,487 | |
| 5.00% Sub. Nts., 11/24/25 | | | 332,000 | | | | 347,728 | |
| 5.45% Jr. Sub. Perpetual Bonds, Series H3,9 | | | 366,000 | | | | 363,713 | |
| | | | | | | | |
| | | Principal
Amount | | | Value | |
| Capital Markets (Continued) | |
| Nomura Holdings, Inc., 2% Sr. Unsec. Nts., 9/13/16 | | $ | 373,000 | | | $ | 375,793 | |
| Raymond James Financial, Inc., 5.625% Sr. Unsec. Unsub. Nts., 4/1/24 | | | 417,000 | | | | 464,069 | |
| UBS Preferred Funding Trust V, 6.243% Jr. Sub. Perpetual Bonds, Series 13,9 | | | 556,000 | | | | 569,956 | |
| | | | | | | 5,244,344 | |
| | | | | | | | | |
| Commercial Banks—5.4% | | | | | | | | |
| Bank of America Corp., 7.75% Jr. Sub. Nts., 5/14/38 | | | 354,000 | | | | 471,436 | |
| Barclays plc, 3.65% Sr. Unsec. Nts., 3/16/25 | | | 303,000 | | | | 287,228 | |
| CIT Group, Inc., 3.875% Sr. Unsec. Nts., 2/19/19 | | | 373,000 | | | | 371,135 | |
| Citigroup, Inc.: | | | | | | | | |
| 6.675% Sub. Nts., 9/13/43 | | | 174,000 | | | | 210,784 | |
| 5.95% Jr. Sub. Perpetual Bonds, Series D3,9 | | | 368,000 | | | | 362,940 | |
| Citizens Financial Group, Inc., 5.50% Jr. Sub. Perpetual Bonds1,3,9 | | | 371,000 | | | | 361,493 | |
| Credit Agricole SA, 8.375% Jr. Sub. Perpetual Bonds2,3,9 | | | 320,000 | | | | 372,800 | |
| FirstMerit Bank NA, 4.27% Sub. Nts., 11/25/26 | | | 362,000 | | | | 364,419 | |
| HSBC Finance Capital Trust IX, 5.911% Unsec. Sub. Nts., 11/30/353 | | | 890,000 | | | | 897,164 | |
| Intesa Sanpaolo SpA, 5.017% Sub. Nts., 6/26/241 | | | 370,000 | | | | 359,627 | |
| JPMorgan Chase & Co., 6.75% Jr. Sub. Perpetual Bonds, Series S3,9 | | | 344,000 | | | | 367,970 | |
| Lloyds Banking Group plc, 6.657% Jr. Sub. Perpetual Bonds1,3,9 | | | 334,000 | | | | 375,124 | |
| Rabobank Capital Funding Trust III, 5.254% Jr. Sub. Perpetual Bonds2,3,9 | | | 667,000 | | | | 691,679 | |
| Regions Bank, Birmingham AL, 6.45% Sub. Nts., 6/26/37 | | | 283,000 | | | | 336,622 | |
| Royal Bank of Scotland Group plc, 7.64% Jr. Sub. Perpetual Bonds, Series U3,9 | | | 300,000 | | | | 322,050 | |
| Societe Generale SA, 5.922% Jr. Sub. Perpetual Bonds1,3,9 | | | 370,000 | | | | 380,637 | |
| SunTrust Banks, Inc.: | | | | | | | | |
| 3.60% Sr. Unsec. Nts., 4/15/16 | | | 385,000 | | | | 392,339 | |
| 5.625% Jr. Sub. Perpetual Bonds3,9 | | | 345,000 | | | | 348,019 | |
| Wells Fargo & Co.: | | | | | | | | |
| 5.875% Jr. Sub. Perpetual Bonds3,9 | | | 137,000 | | | | 140,432 | |
| 5.90% Jr. Sub. Perpetual Bonds, Series S3,9 | | | 280,000 | | | | 281,400 | |
| | | | | | | 7,695,298 | |
| | | | | | | | | |
| Consumer Finance—1.3% | | | | | | | | |
| Ally Financial, Inc., 8% Sr. Unsec. Nts., 11/1/31 | | | 283,000 | | | | 339,954 | |
| Capital One Financial Corp.: | | | | | | | | |
| 3.20% Sr. Unsec. Nts., 2/5/25 | | | 302,000 | | | | 285,335 | |
| 5.55% Jr. Sub. Perpetual Bonds3,9 | | | 369,000 | | | | 366,694 | |
| Discover Financial Services: | | | | | | | | |
| 3.75% Sr. Unsec. Nts., 3/4/25 | | | 301,000 | | | | 287,543 | |
| 3.95% Sr. Unsec. Nts., 11/6/24 | | | 280,000 | | | | 272,195 | |
| Synchrony Financial, 2.70% Sr. Unsec. Nts., 2/3/20 | | | 268,000 | | | | 264,795 | |
| | | | | | | 1,816,516 | |
| | | | | | | | | |
| Diversified Financial Services—0.4% | |
| Peachtree Corners Funding Trust, 3.976% Sr. Unsec. Nts., 2/15/251 | | | 189,000 | | | | 187,516 | |
| Voya Financial, Inc., 5.65% Jr. Sub. Nts., 5/15/533 | | | 355,000 | | | | 363,875 | |
| | | | | | | 551,391 | |
|
| 12 OPPENHEIMER CORE BOND FUND/VA |
| | | | | | | | |
| | | Principal
Amount | | | Value | |
| Insurance—2.5% | |
| AXIS Specialty Finance plc, 5.15% Sr. Unsec. Nts., 4/1/45 | | $ | 308,000 | | | $ | 312,602 | |
| Five Corners Funding Trust, 4.419% Unsec. Nts., 11/15/231 | | | 310,000 | | | | 320,354 | |
| Liberty Mutual Group, Inc.: | | | | | | | | |
| 4.25% Sr. Unsec. Nts., 6/15/231 | | | 276,000 | | | | 283,956 | |
| 4.85% Sr. Unsec. Nts., 8/1/441 | | | 224,000 | | | | 216,478 | |
| Lincoln National Corp., 6.05% Jr. Unsec. Sub. Nts., 4/20/673,7 | | | 350,000 | | | | 317,625 | |
| MetLife, Inc., 5.25% Jr. Sub. Perpetual Bonds3,9 | | | 258,000 | | | | 256,387 | |
| Prudential Financial, Inc., 5.20% Jr. Sub. Nts., 3/15/443 | | | 300,000 | | | | 297,405 | |
| Swiss Re Capital I LP, 6.854% Jr. Sub. Perpetual Bonds2,3,9 | | | 663,000 | | | | 683,885 | |
| TIAA Asset Management Finance Co. LLC, 4.125% Sr. Unsec. Nts., 11/1/241 | | | 371,000 | | | | 373,831 | |
| XLIT Ltd., 6.50% Jr. Sub. Perpetual Bonds3,9 | | | 212,000 | | | | 181,924 | |
| ZFS Finance USA Trust V, 6.50% Jr. Sub. Nts., 5/9/372,3 | | | 365,000 | | | | 380,513 | |
| | | | | | | 3,624,960 | |
| | | | | | | | | |
| Real Estate Investment Trusts (REITs)—2.0% | |
| American Tower Corp.: | | | | | | | | |
| 5.05% Sr. Unsec. Unsub. Nts., 9/1/20 | | | 149,000 | | | | 161,952 | |
| 5.90% Sr. Unsec. Nts., 11/1/21 | | | 200,000 | | | | 225,355 | |
| Corrections Corp. of America, 4.625% Sr. Unsec. Nts., 5/1/23 | | | 370,000 | | | | 364,450 | |
| First Industrial LP, 7.50% Sr. Unsec. Nts., 12/1/17 | | | 320,000 | | | | 356,309 | |
| HCP, Inc., 5.625% Sr. Unsec. Nts., 5/1/17 | | | 107,000 | | | | 114,395 | |
| Health Care REIT, Inc., 2.25% Sr. Unsec. Nts., 3/15/18 | | | 75,000 | | | | 75,567 | |
| Highwoods Realty LP, 7.50% Sr. Unsec. Nts., 4/15/18 | | | 320,000 | | | | 365,494 | |
| Host Hotels & Resorts LP, 3.75% Sr. Unsec. Nts., 10/15/23 | | | 212,000 | | | | 208,062 | |
| Liberty Property LP, 5.50% Sr. Unsec. Nts., 12/15/16 | | | 228,000 | | | | 240,669 | |
| Prologis LP, 4% Sr. Unsec. Nts., 1/15/18 | | | 189,000 | | | | 198,416 | |
| Regency Centers LP, 5.875% Sr. Unsec. Nts., 6/15/17 | | | 41,000 | | | | 44,328 | |
| Ventas Realty LP, 1.25% Sr. Unsec. Nts., 4/17/17 | | | 151,000 | | | | 150,674 | |
| WEA Finance LLC/Westfield UK & Europe Finance plc, 1.75% Sr. Unsec. Nts., 9/15/171 | | | 318,000 | | | | 319,004 | |
| | | | | | | 2,824,675 | |
| | | | | | | | | |
| Real Estate Management & Development—0.3% | |
| Brookfield Asset Management, Inc., 4% Sr. Unsec. Nts., 1/15/25 | | | 395,000 | | | | 391,128 | |
| | | | | | | | | |
| Health Care—4.1% | |
| Biotechnology—0.3% | |
| Baxalta, Inc., 5.25% Sr. Unsec. Nts., 6/23/451 | | | 110,000 | | | | 110,460 | |
| Gilead Sciences, Inc., 5.65% Sr. Unsec. Unsub. Nts., 12/1/41 | | | 232,000 | | | | 266,642 | |
| | | | | | | 377,102 | |
| | | | | | | | | |
| Health Care Equipment & Supplies—0.7% | |
| Becton Dickinson & Co.: | | | | | | | | |
| 1.45% Sr. Unsec. Nts., 5/15/17 | | | 384,000 | | | | 383,839 | |
| 3.875% Sr. Unsec. Nts., 5/15/24 | | | 188,000 | | | | 188,815 | |
| DENTSPLY International, Inc., 2.75% Sr. Unsec. Nts., 8/15/16 | | | 352,000 | | | | 357,718 | |
| Zimmer Biomet Holdings, Inc., 3.55% Sr. Unsec. Nts., 4/1/25 | | | 111,000 | | | | 107,649 | |
| | | | | | | 1,038,021 | |
| | | | | | | | |
| | | Principal
Amount | | | Value | |
| Health Care Providers & Services—1.5% | |
| Cardinal Health, Inc., 3.50% Sr. Unsec. Nts., 11/15/24 | | $ | 180,000 | | | $ | 177,093 | |
| CHS/Community Health Systems, Inc., 5.125% Sr. Sec. Nts., 8/1/21 | | | 355,000 | | | | 362,544 | |
| Fresenius Medical Care US Finance II, Inc., 5.875% Sr. Unsec. Nts., 1/31/221 | | | 350,000 | | | | 374,500 | |
| Laboratory Corp. of America Holdings, 3.60% Sr. Unsec. Nts., 2/1/25 | | | 534,000 | | | | 509,954 | |
| LifePoint Health, Inc., 5.50% Sr. Unsec. Nts., 12/1/21 | | | 350,000 | | | | 362,250 | |
| McKesson Corp., 4.883% Sr. Unsec. Nts., 3/15/44 | | | 155,000 | | | | 154,423 | |
| Medco Health Solutions, Inc., 7.125% Sr. Unsec. Nts., 3/15/187 | | | 156,000 | | | | 177,602 | |
| | | | | | | 2,118,366 | |
| | | | | | | | | |
| Life Sciences Tools & Services—0.2% | |
| Life Technologies Corp., 3.50% Sr. Unsec. Nts., 1/15/16 | | | 23,000 | | | | 23,289 | |
| Thermo Fisher Scientific, Inc.: | | | | | | | | |
| 4.15% Sr. Unsec. Nts., 2/1/24 | | | 121,000 | | | | 123,345 | |
| 5.30% Sr. Unsec. Nts., 2/1/44 | | | 140,000 | | | | 148,003 | |
| | | | | | | 294,637 | |
| | | | | | | | | |
| Pharmaceuticals—1.4% | |
| AbbVie, Inc.: | | | | | | | | |
| 3.60% Sr. Unsec. Nts., 5/14/25 | | | 184,000 | | | | 181,956 | |
| 4.70% Sr. Unsec. Nts., 5/14/45 | | | 74,000 | | | | 73,270 | |
| Actavis Funding SCS: | | | | | | | | |
| 1.30% Sr. Unsec. Nts., 6/15/17 | | | 243,000 | | | | 241,438 | |
| 1.85% Sr. Unsec. Nts., 3/1/17 | | | 136,000 | | | | 136,702 | |
| 3.80% Sr. Unsec. Nts., 3/15/25 | | | 322,000 | | | | 316,462 | |
| 4.75% Sr. Unsec. Nts., 3/15/45 | | | 158,000 | | | | 150,344 | |
| Hospira, Inc.: | | | | | | | | |
| 5.20% Sr. Unsec. Nts., 8/12/20 | | | 373,000 | | | | 417,043 | |
| 6.05% Sr. Unsec. Nts., 3/30/17 | | | 150,000 | | | | 161,440 | |
| Mallinckrodt International Finance SA, 3.50% Sr. Unsec. Nts., 4/15/18 | | | 386,000 | | | | 388,895 | |
| | | | | | | 2,067,550 | |
| | | | | | | | | |
| Industrials—4.9% | |
| Aerospace & Defense—0.5% | |
| BAE Systems Holdings, Inc., 3.80% Sr. Unsec. Nts., 10/7/241,7 | | | 215,000 | | | | 215,986 | |
| L-3 Communications Corp., 1.50% Sr. Unsec. Nts., 5/28/17 | | | 100,000 | | | | 99,345 | |
| Northrop Grumman Corp., 4.75% Sr. Unsec. Nts., 6/1/43 | | | 100,000 | | | | 101,051 | |
| Textron, Inc.: | | | | | | | | |
| 3.875% Sr. Unsec. Nts., 3/1/25 | | | 111,000 | | | | 109,322 | |
| 4.30% Sr. Unsec. Nts., 3/1/24 | | | 189,000 | | | | 196,358 | |
| | | | | | | 722,062 | |
| | | | | | | | | |
| Building Products—0.3% | |
| Owens Corning, 4.20% Sr. Unsec. Nts., 12/15/22 | | | 422,000 | | | | 427,886 | |
| | | | | | | | | |
| Commercial Services & Supplies—0.8% | |
| Clean Harbors, Inc., 5.25% Sr. Unsec. Unsub. Nts., 8/1/20 | | | 395,000 | | | | 402,900 | |
| Pitney Bowes, Inc., 4.625% Sr. Unsec. Nts., 3/15/24 | | | 431,000 | | | | 434,882 | |
| R.R. Donnelley & Sons Co., 7.625% Sr. Unsec. Nts., 6/15/20 | | | 330,000 | | | | 372,075 | |
| | | | | | | 1,209,857 | |
| | | | | | | | | |
| Electrical Equipment—0.2% | |
| Sensata Technologies BV, 4.875% Sr. Unsec. Nts., 10/15/231 | | | 294,000 | | | | 291,427 | |
|
| 13 OPPENHEIMER CORE BOND FUND/VA |
STATEMENT OF INVESTMENTS Unaudited / Continued
| | | | | | | | |
| | | Principal
Amount | | | Value | |
| Industrial Conglomerates—0.7% | |
| General Electric Capital Corp., 6.25% Jr. Sub. Perpetual Bonds, Series B3,9 | | $ | 776,000 | | | $ | 849,720 | |
| Synchrony Financial, 4.25% Sr. Unsec. Nts., 8/15/24 | | | 109,000 | | | | 109,517 | |
| | | | | | | 959,237 | |
| | | | | | | | | |
| Machinery—0.7% | |
| Crane Co., 4.45% Sr. Unsec. Nts., 12/15/23 | | | 193,000 | | | | 201,137 | |
| Ingersoll-Rand Global Holding Co. Ltd., 4.25% Sr. Unsec. Nts., 6/15/23 | | | 340,000 | | | | 352,632 | |
| Joy Global, Inc., 6% Sr. Unsec. Nts., 11/15/16 | | | 62,000 | | | | 65,763 | |
| Starwood Hotels & Resorts Worldwide, Inc., 7.375% Sr. Unsec. Nts., 11/15/15 | | | 323,000 | | | | 330,251 | |
| | | | | | | 949,783 | |
| | | | | | | | | |
| Professional Services—0.3% | |
| Experian Finance plc, 2.375% Sr. Unsec. Nts., 6/15/171 | | | 361,000 | | | | 362,928 | |
| | | | | | | | | |
| Road & Rail—0.9% | |
| Burlington Northern Santa Fe LLC, 3% Sr. Unsec. Nts., 3/15/23 | | | 309,000 | | | | 302,011 | |
| ERAC USA Finance LLC, 4.50% Sr. Unsec. Nts., 2/15/451 | | | 110,000 | | | | 101,117 | |
| Kansas City Southern de Mexico SA de CV, 3% Sr. Unsec. Nts., 5/15/23 | | | 315,000 | | | | 302,670 | |
| Penske Truck Leasing Co. LP/PTL Finance Corp.: | | | | | | | | |
| 2.50% Sr. Unsec. Nts., 3/15/161 | | | 368,000 | | | | 370,616 | |
| 4.25% Sr. Unsec. Nts., 1/17/231 | | | 230,000 | | | | 233,176 | |
| | | | | | | 1,309,590 | |
| | | | | | | | | |
| Trading Companies & Distributors—0.5% | |
| Air Lease Corp., 3.875% Sr. Unsec. Nts., 4/1/21 | | | 383,000 | | | | 387,788 | |
| International Lease Finance Corp., 5.875% Sr. Unsec. Nts., 8/15/22 | | | 323,000 | | | | 350,051 | |
| | | | | | | 737,839 | |
| | | | | | | | | |
| Information Technology—3.1% | |
| Communications Equipment—0.4% | |
| Motorola Solutions, Inc., 3.50% Sr. Unsec. Nts., 3/1/23 | | | 259,000 | | | | 244,379 | |
| QUALCOMM, Inc., 3.45% Sr. Unsec. Nts., 5/20/25 | | | 351,000 | | | | 341,933 | |
| | | | | | | 586,312 | |
| | | | | | | | | |
| Electronic Equipment, Instruments, & Components—0.8% | |
| Arrow Electronics, Inc., 5.125% Sr. Unsec. Unsub. Nts., 3/1/21 | | | 407,000 | | | | 442,227 | |
| Avnet, Inc., 4.875% Sr. Unsec. Unsub. Nts., 12/1/22 | | | 405,000 | | | | 421,821 | |
| Flextronics International Ltd., 4.75% Sr. Unsec. Nts., 6/15/251 | | | 290,000 | | | | 288,057 | |
| | | | | | | 1,152,105 | |
| | | | | | | | | |
| Internet Software & Services—0.3% | |
| VeriSign, Inc., 5.25% Sr. Unsec. Nts., 4/1/251 | | | 375,000 | | | | 375,000 | |
| | | | | | | | | |
| IT Services—0.5% | |
| Fidelity National Information Services, Inc.: | | | | | | | | |
| 1.45% Sr. Unsec. Nts., 6/5/17 | | | 297,000 | | | | 296,425 | |
| 3.50% Sr. Unsec. Nts., 4/15/23 | | | 207,000 | | | | 201,005 | |
| Xerox Corp.: | | | | | | | | |
| 2.95% Sr. Unsec. Nts., 3/15/17 | | | 130,000 | | | | 133,190 | |
| 6.75% Sr. Unsec. Nts., 2/1/17 | | | 65,000 | | | | 70,035 | |
| | | | | | | 700,655 | |
| | | | | | | | |
| | | Principal
Amount | | | Value | |
| Semiconductors & Semiconductor Equipment—0.2% | |
| Micron Technology, Inc., 5.50% Sr. Unsec. Nts., 2/1/251 | | $ | 370,000 | | | $ | 347,615 | |
| | | | | | | | | |
| Software—0.5% | |
| Autodesk, Inc., 4.375% Sr. Unsec. Nts., 6/15/25 | | | 110,000 | | | | 110,344 | |
| Open Text Corp., 5.625% Sr. Unsec. Nts., 1/15/231 | | | 349,000 | | | | 346,382 | |
| Oracle Corp., 3.40% Sr. Unsec. Nts., 7/8/24 | | | 269,000 | | | | 269,607 | |
| | | | | | | 726,333 | |
| | | | | | | | | |
| Technology Hardware, Storage & Peripherals—0.4% | |
| Apple, Inc., 4.375% Sr. Unsec. Nts., 5/13/45 | | | 198,000 | | | | 195,168 | |
| Hewlett-Packard Co., 2.65% Sr. Unsec. Unsub. Nts., 6/1/16 | | | 367,000 | | | | 371,671 | |
| | | | | | | 566,839 | |
| | | | | | | | | |
| Materials—3.2% | |
| Chemicals—1.1% | |
| Agrium, Inc.: | | | | | | | | |
| 3.375% Sr. Unsec. Nts., 3/15/25 | | | 151,000 | | | | 143,643 | |
| 4.125% Sr. Unsec. Nts., 3/15/35 | | | 75,000 | | | | 67,077 | |
| Eastman Chemical Co.: | | | | | | | | |
| 3.00% Sr. Unsec. Nts., 12/15/15 | | | 182,000 | | | | 183,650 | |
| 4.65% Sr. Unsec. Nts., 10/15/44 | | | 92,000 | | | | 87,181 | |
| LYB International Finance BV, 5.25% Sr. Unsec. Nts., 7/15/43 | | | 123,000 | | | | 125,330 | |
| Methanex Corp., 4.25% Sr. Unsec. Nts., 12/1/24 | | | 215,000 | | | | 213,259 | |
| Rockwood Specialties Group, Inc., 4.625% Sr. Unsec. Nts., 10/15/20 | | | 380,000 | | | | 396,150 | |
| RPM International, Inc., 3.45% Sr. Unsec. Unsub. Nts., 11/15/22 | | | 325,000 | | | | 313,583 | |
| Valspar Corp. (The), 3.30% Sr. Unsec. Nts., 2/1/25 | | | 103,000 | | | | 99,176 | |
| | | | | | | 1,629,049 | |
| | | | | | | | | |
| Construction Materials—0.3% | |
| CRH America, Inc., 5.125% Sr. Unsec. Nts., 5/18/451 | | | 101,000 | | | | 99,899 | |
| James Hardie International Finance Ltd., 5.875% Sr. Unsec. Nts., 2/15/231 | | | 364,000 | | | | 376,740 | |
| | | | | | | 476,639 | |
| | | | | | | | | |
| Containers & Packaging—1.0% | |
| Ball Corp., 4% Sr. Unsec. Nts., 11/15/23 | | | 370,000 | | | | 345,025 | |
| Packaging Corp. of America: | | | | | | | | |
| 3.65% Sr. Unsec. Nts., 9/15/24 | | | 94,000 | | | | 92,157 | |
| 4.50% Sr. Unsec. Nts., 11/1/23 | | | 300,000 | | | | 309,516 | |
| Rock-Tenn Co., 3.50% Sr. Unsec. Unsub. Nts., 3/1/20 | | | 617,000 | | | | 635,541 | |
| | | | | | | 1,382,239 | |
| | | | | | | | | |
| Metals & Mining—0.7% | |
| Carpenter Technology Corp., 4.45% Sr. Unsec. Unsub. Nts., 3/1/23 | | | 145,000 | | | | 144,292 | |
| Freeport-McMoRan, Inc., 3.875% Sr. Unsec. Nts., 3/15/23 | | | 122,000 | | | | 110,872 | |
| Glencore Finance Canada Ltd., 3.60% Sr. Unsec. Nts., 1/15/171 | | | 302,000 | | | | 310,059 | |
| Glencore Funding LLC, 4.625% Sr. Unsec. Nts., 4/29/241 | | | 137,000 | | | | 136,110 | |
| Goldcorp, Inc., 5.45% Sr. Unsec. Nts., 6/9/44 | | | 101,000 | | | | 96,177 | |
| Yamana Gold, Inc., 4.95% Sr. Unsec. Nts., 7/15/24 | | | 193,000 | | | | 185,984 | |
| | | | | | | 983,494 | |
|
| 14 OPPENHEIMER CORE BOND FUND/VA |
| | | | | | | | |
| | | Principal
Amount | | | Value | |
| Paper & Forest Products—0.1% | |
| International Paper Co., 4.80% Sr. Unsec. Nts., 6/15/44 | | $ | 153,000 | | | $ | 141,911 | |
| | | | | | | | | |
| Telecommunication Services—2.7% | |
| Diversified Telecommunication Services—2.6% | |
| AT&T, Inc., 4.35% Sr. Unsec. Nts., 6/15/45 | | | 543,000 | | | | 465,121 | |
| British Telecommunications plc, 9.625% Sr. Unsec. Nts., 12/15/30 | | | 247,000 | | | | 366,800 | |
| CenturyLink, Inc., 6.45% Sr. Unsec. Nts., 6/15/21 | | | 346,000 | | | | 350,325 | |
| Deutsche Telekom International Finance BV, 5.75% Sr. Unsec. Nts., 3/23/16 | | | 349,000 | | | | 361,077 | |
| Frontier Communications Corp., 7.625% Sr. Unsec. Nts., 4/15/24 | | | 345,000 | | | | 306,188 | |
| Orange SA, 2.75% Sr. Unsec. Nts., 9/14/16 | | | 97,000 | | | | 98,775 | |
| Telecom Italia Capital SA, 7.721% Sr. Unsec. Unsub. Nts., 6/4/38 | | | 230,000 | | | | 259,900 | |
| Telefonica Emisiones SAU, 7.045% Sr. Unsec. Unsub. Nts., 6/20/36 | | | 142,000 | | | | 174,428 | |
| Verizon Communications, Inc.: | | | | | | | | |
| 3.50% Sr. Unsec. Nts., 11/1/24 | | | 163,000 | | | | 158,619 | |
| 4.50% Sr. Unsec. Nts., 9/15/20 | | | 891,000 | | | | 961,393 | |
| 4.522% Sr. Unsec. Nts., 9/15/481 | | | 252,000 | | | | 222,869 | |
| 5.012% Sr. Unsec. Nts., 8/21/54 | | | 50,000 | | | | 45,891 | |
| | | | | | | 3,771,386 | |
| | | | | | | | | |
| Wireless Telecommunication Services—0.1% | |
| America Movil SAB de CV, 4.375% Sr. Unsec. Unsub. Nts., 7/16/42 | | | 138,000 | | | | 128,500 | |
| | | | | | | | | |
| Utilities—3.9% | |
| Electric Utilities—2.3% | |
| American Transmission Systems, Inc., 5% Sr. Unsec. Nts., 9/1/441 | | | 99,000 | | | | 100,634 | |
| EDP Finance BV, 5.25% Sr. Unsec. Nts., 1/14/211 | | | 275,000 | | | | 288,687 | |
| Enel Finance International NV, 6.25% Sr. Unsec. Nts., 9/15/171 | | | 333,000 | | | | 364,713 | |
| Exelon Corp., 3.95% Sr. Unsec. Nts., 6/15/25 | | | 359,000 | | | | 361,294 | |
| ITC Holdings Corp.: | | | | | | | | |
| 3.65% Sr. Unsec. Nts., 6/15/24 | | | 329,000 | | | | 325,889 | |
| 5.30% Sr. Unsec. Nts., 7/1/43 | | | 78,000 | | | | 83,367 | |
| NextEra Energy Capital Holdings, Inc., 1.586% Sr. Unsec. Nts., 6/1/17 | | | 369,000 | | | | 369,608 | |
| Pennsylvania Electric Co., 5.20% Sr. Unsec. Nts., 4/1/20 | | | 73,000 | | | | 79,936 | |
| | | | | | |
| | | Principal
Amount | | | Value |
| Electric Utilities (Continued) |
| PPL Capital Funding, Inc.: | | | | | | |
| 3.50% Sr. Unsec. Unsub. Nts., 12/1/22 | | $ | 204,000 | | | $ 206,512 |
| 4.20% Sr. Sec. Nts., 6/15/22 | | | 54,000 | | | 56,841 |
| PPL WEM Ltd./Western Power Distribution Ltd., 5.375% Sr. Unsec. Unsub. Nts., 5/1/211 | | | 429,000 | | | 474,673 |
| Public Service Co. of New Mexico, 7.95% Sr. Unsec. Nts., 5/15/18 | | | 307,000 | | | 357,307 |
| Trans-Allegheny Interstate Line Co., 3.85% Sr. Unsec. Nts., 6/1/251 | | | 231,000 | | | 229,576 |
| | | | | | 3,299,037 |
| | | | | | | |
Independent Power and Renewable Electricity
Producers—0.5% |
| Dayton Power & Light Co. (The), 1.875% Sec. Nts., 9/15/16 | | | 272,000 | | | 273,527 |
| NRG Yield Operating LLC, 5.375% Sr. Unsec. Nts., 8/15/241 | | | 349,000 | | | 353,363 |
| | | | | | 626,890 |
| | | | | | | |
| Multi-Utilities—1.1% |
| Berkshire Hathaway Energy Co., 4.50% Sr. Unsec. Nts., 2/1/45 | | | 185,000 | | | 180,792 |
| CenterPoint Energy, Inc., 5.95% Sr. Unsec. Nts., 2/1/17 | | | 327,000 | | | 351,179 |
| CMS Energy Corp.: | | | | | | |
| 3.875% Sr. Unsec. Nts., 3/1/24 | | | 202,000 | | | 205,477 |
| 5.05% Sr. Unsec. Unsub. Nts., 3/15/22 | | | 286,000 | | | 314,896 |
| Consolidated Edison Co. of New York, Inc., 4.625% Sr. Unsec. Nts., 12/1/54 | | | 84,000 | | | 81,669 |
| Dominion Gas Holdings LLC, 4.60% Sr. Unsec. Nts., 12/15/44 | | | 141,000 | | | 132,727 |
| NiSource Finance Corp., 4.80% Sr. Unsec. Nts., 2/15/44 | | | 148,000 | | | 150,944 |
| Puget Energy, Inc., 3.65% Sr. Sec. Nts., 5/15/251 | | | 183,000 | | | 179,199 |
| | | | | | 1,596,883 |
| Total Corporate Bonds and Notes (Cost $77,119,217) | | | | | | 77,630,580 |
| | |
| | | Shares | | | |
| Investment Company—5.5% |
| Oppenheimer Institutional Money Market Fund, Cl. E, 0.15%10,11 (Cost $7,925,085) | | | 7,925,085 | | | 7,925,085 |
| | | | | | | |
| Total Investments, at Value (Cost $178,948,232) | | | 123.0% | | | 176,257,541 |
| Net Other Assets (Liabilities) | | | (23.0) | | | (32,978,870) |
| | | |
Net Assets | | | 100.0% | | | $ 143,278,671 |
| | | |
Footnotes to Statement of Investments
1. Represents securities sold under Rule 144A, which are exempt from registration under the Securities Act of 1933, as amended. These securities have been determined to be liquid under guidelines established by the Board of Trustees. These securities amount to $39,657,722 or 27.68% of the Fund’s net assets as of June 30, 2015.
2. Restricted security. The aggregate value of restricted securities as of June 30, 2015 was $3,690,871, which represents 2.58% of the Fund’s net assets. See Note 4 of the accompanying Notes. Information concerning restricted securities is as follows:
| | | | | | | | | | | | | | | | |
| Security | | Acquisition Dates | | | Cost | | | Value | | | Unrealized
Appreciation/
(Depreciation) | |
| Banc of America Funding Trust, Series 2014-R7, Cl. 3A1, 2.617%, 3/26/36 | | | 3/6/15-5/13/15 | | | $ | 400,577 | | | $ | 400,445 | | | $ | (132) | |
| Credit Agricole SA, 8.375% Jr. Sub. Perpetual Bonds | | | 10/27/14-11/13/14 | | | | 364,992 | | | | 372,800 | | | | 7,808 | |
| Drive Auto Receivables Trust, Series 2015-AA, Cl. C, 3.06%, 5/17/21 | | | 3/12/15 | | | | 249,966 | | | | 251,645 | | | | 1,679 | |
| NC Finance Trust, Series 1999-I, Cl. D, 8.75%, 1/25/29 | | | 8/10/10 | | | | 3,281,116 | | | | 909,904 | | | | (2,371,212) | |
| Rabobank Capital Funding Trust III, 5.254% Jr. Sub. Perpetual Bonds | | | 5/1/13-5/8/13 | | | | 673,806 | | | | 691,679 | | | | 17,873 | |
|
| 15 OPPENHEIMER CORE BOND FUND/VA |
STATEMENT OF INVESTMENTS Unaudited / Continued
Footnotes to Statement of Investments (Continued)
| | | | | | | | | | | | | | | | |
| | | | | | | | | | | | Unrealized | |
| | | Acquisition | | | | | | | | | Appreciation/ | |
| Security | | Dates | | | Cost | | | Value | | | (Depreciation) | |
| |
Swiss Re Capital I LP, 6.854% Jr. Sub. Perpetual Bonds | | | 3/10/10-2/16/12 | | | $ | 607,833 | | | $ | 683,885 | | | $ | 76,052 | |
ZFS Finance USA Trust V, 6.50% Jr. Sub. Nts., 5/9/37 | | | 11/20/13 | | | | 377,913 | | | | 380,513 | | | | 2,600 | |
| | | | | | | | |
| | | | | | $ | 5,956,203 | | | $ | 3,690,871 | | | $ | (2,265,332) | |
| | | | | | | | |
3. Represents the current interest rate for a variable or increasing rate security.
4. Interest-Only Strips represent the right to receive the monthly interest payments on an underlying pool of mortgage loans. These securities typically decline in price as interest rates decline. Most other fixed income securities increase in price when interest rates decline. The principal amount of the underlying pool represents the notional amount on which current interest is calculated. The price of these securities is typically more sensitive to changes in prepayment rates than traditional mortgage-backed securities (for example, GNMA pass-throughs). Interest rates disclosed represent current yields based upon the current cost basis and estimated timing and amount of future cash flows. These securities amount to $2,603,436 or 1.82% of the Fund’s net assets as of June 30, 2015.
5. Interest rate is less than 0.0005%.
6. Principal-Only Strips represent the right to receive the monthly principal payments on an underlying pool of mortgage loans. The value of these securities generally increases as interest rates decline and prepayment rates rise. The price of these securities is typically more volatile than that of coupon-bearing bonds of the same maturity. Interest rates disclosed represent current yields based upon the current cost basis and estimated timing of future cash flows. These securities amount to $142,030 or 0.10% of the Fund’s net assets as of June 30, 2015.
7. All or a portion of the security position is when-issued or delayed delivery to be delivered and settled after June 30, 2015. See Note 4 of the accompanying Notes.
8. This security is not accruing income because the issuer has missed an interest payment on it and/or is not anticipated to make future interest and or principal payments. The rate shown is the original contractual interest rate. See Note 4 of the accompanying Notes.
9. This bond has no contractual maturity date, is not redeemable and contractually pays an indefinite stream of interest. Rate reported represents the current interest rate for this variable rate security.
10. Is or was an affiliate, as defined in the Investment Company Act of 1940, as amended, at or during the period ended June 30, 2015, by virtue of the Fund owning at least 5% of the voting securities of the issuer or as a result of the Fund and the issuer having the same investment adviser. Transactions during the period in which the issuer was an affiliate are as follows:
| | | | | | | | | | | | | | | | |
| | | Shares
December 31, 2014 | | | Gross
Additions | | | Gross
Reductions | | | Shares
June 30, 2015 | |
| |
Oppenheimer Institutional Money Market Fund, Cl. E | | | 6,496,088 | | | | 32,493,929 | | | | 31,064,932 | | | | 7,925,085 | |
| | | | | | | | |
| | | Value | | | Income | |
| |
Oppenheimer Institutional Money Market Fund, Cl. E | | $ | 7,925,085 | | | $ | 4,248 | |
11. Rate shown is the 7-day yield as of June 30, 2015.
| | | | | | | | | | | | | | | | | | | | | | | | |
| |
| Futures Contracts as of June 30, 2015 | |
| Description | | Exchange | | | Buy/Sell | | | Expiration Date | | | Number of Contracts | | | Value | | | Unrealized Appreciation (Depreciation) | |
| |
United States Treasury Long Bonds | | | CBT | | | | Sell | | | | 9/21/15 | | | | 33 | | | $ | 4,977,844 | | | $ | 96,950 | |
United States Treasury Nts., 2 yr. | | | CBT | | | | Sell | | | | 9/30/15 | | | | 4 | | | | 875,750 | | | | 25 �� | |
United States Treasury Nts., 10 yr. | | | CBT | | | | Sell | | | | 9/21/15 | | | | 93 | | | | 11,733,984 | | | | 73,383 | |
United States Treasury Ultra Bonds | | | CBT | | | | Buy | | | | 9/21/15 | | | | 67 | | | | 10,322,188 | | | | (272,788) | |
| | | | | | | | | | | | | | | | | | | | | | | | |
| | | | | | | | | | | | | | | | | | | | | | $ | (102,430) | |
| | | | | | | | | | | | | | | | | | | | | | | | |
| | |
| Glossary: | | |
| Exchange Abbreviations | | |
| CBT | | Chicago Board of Trade |
See accompanying Notes to Financial Statements.
|
| 16 OPPENHEIMER CORE BOND FUND/VA |
STATEMENT OF ASSETS AND LIABILITIES June 30, 2015 Unaudited
| | | | |
| |
| Assets | | | | |
| Investments, at value—see accompanying statement of investments: | | | | |
| Unaffiliated companies (cost $171,023,147) | | $ | 168,332,456 | |
| Affiliated companies (cost $7,925,085) | | | 7,925,085 | |
| | | | |
| | | 176,257,541 | |
| |
| Cash | | | 540,476 | |
| |
| Cash used for collateral on futures | | | 200,000 | |
| |
| Receivables and other assets: | | | | |
| Investments sold (including $23,226,661 sold on a when-issued or delayed delivery basis) | | | 23,996,294 | |
| Interest, dividends and principal paydowns | | | 925,229 | |
| Shares of beneficial interest sold | | | 192,146 | |
| Variation margin receivable | | | 7,167 | |
| Other | | | 37,063 | |
| | | | |
| Total assets | | | 202,155,916 | |
|
| |
| Liabilities | | | | |
| Payables and other liabilities: | | | | |
| Investments purchased (including $58,194,296 purchased on a when-issued or delayed delivery basis) | | | 58,720,363 | |
| Shares of beneficial interest redeemed | | | 63,843 | |
| Trustees’ compensation | | | 29,952 | |
| Distribution and service plan fees | | | 11,058 | |
| Shareholder communications | | | 9,439 | |
| Variation margin payable | | | 5,706 | |
| Other | | | 36,884 | |
| | | | |
| Total liabilities | | | 58,877,245 | |
|
| |
| Net Assets | | $ | 143,278,671 | |
| | | | |
|
| |
| Composition of Net Assets | | | | |
| Par value of shares of beneficial interest | | $ | 18,751 | |
| |
| Additional paid-in capital | | | 225,232,406 | |
| |
| Accumulated net investment income | | | 1,600,813 | |
| |
| Accumulated net realized loss on investments | | | (80,780,178) | |
| |
| Net unrealized depreciation on investments | | | (2,793,121) | |
| | | | |
| Net Assets | | $ | 143,278,671 | |
| | | | |
|
| |
| Net Asset Value Per Share | | | | |
| Non-Service Shares: | | | | |
| Net asset value, redemption price per share and offering price per share (based on net assets of $89,880,631 and 11,712,401 shares of beneficial interest outstanding) | | | $7.67 | |
| |
| Service Shares: | | | | |
| Net asset value, redemption price per share and offering price per share (based on net assets of $53,398,040 and 7,038,950 shares of beneficial interest outstanding) | | | $7.59 | |
See accompanying Notes to Financial Statements.
|
| 17 OPPENHEIMER CORE BOND FUND/VA |
STATEMENT OF OPERATIONS For the Six Months Ended June 30, 2015 Unaudited
| | | | |
| |
| Investment Income | | | | |
| Interest - unaffiliated companies (net of foreign withholding taxes of $ 439) | | $ | 2,668,898 | |
| |
| Fee income on when-issued securities | | | 445,513 | |
| |
| Dividends - affiliated companies | | | 4,248 | |
| | | | |
| Total investment income | | | 3,118,659 | |
|
| |
| Expenses | | | | |
| Management fees | | | 439,151 | |
| |
| Distribution and service plan fees - Service shares | | | 69,296 | |
| |
| Transfer and shareholder servicing agent fees: | | | | |
| Non-Service shares | | | 45,479 | |
| Service shares | | | 27,713 | |
| |
| Shareholder communications: | | | | |
| Non-Service shares | | | 12,667 | |
| Service shares | | | 7,716 | |
| |
| Custodian fees and expenses | | | 21,301 | |
| |
| Trustees’ compensation | | | 8,312 | |
| |
| Other | | | 31,108 | |
| | | | |
| Total expenses | | | 662,743 | |
| Less reduction to custodian expenses | | | (77) | |
| Less waivers and reimbursements of expenses | | | (44,405) | |
| | | | |
| Net expenses | | | 618,261 | |
|
| |
| Net Investment Income | | | 2,500,398 | |
|
| |
| Realized and Unrealized Gain (Loss) | | | | |
| Net realized gain (loss) on: | | | | |
| Investments from unaffiliated companies | | | 255,208 | |
| Closing and expiration of futures contracts | | | (175,172) | |
| | | | |
| Net realized gain | | | 80,036 | |
| |
| Net change in unrealized appreciation/depreciation on: | | | | |
| Investments | | | (1,426,587) | |
| Futures contracts | | | (461,305) | |
| | | | |
| Net change in unrealized appreciation/depreciation | | | (1,887,892) | |
|
| |
| Net Increase in Net Assets Resulting from Operations | | $ | 692,542 | |
| | | | |
See accompanying Notes to Financial Statements.
|
| 18 OPPENHEIMER CORE BOND FUND/VA |
STATEMENTS OF CHANGES IN NET ASSETS
| | | | | | | | |
| | | Six Months Ended
June 30, 2015
(Unaudited) | | | Year Ended
December 31, 2014 | |
| |
| Operations | | | | | | | | |
| Net investment income | | $ | 2,500,398 | | | $ | 5,421,470 | |
| |
| Net realized gain | | | 80,036 | | | | 3,158,701 | |
| |
| Net change in unrealized appreciation/depreciation | | | (1,887,892) | | | | 1,727,274 | |
| | | | | | | | |
| Net increase in net assets resulting from operations | | | 692,542 | | | | 10,307,445 | |
|
| |
| Dividends and/or Distributions to Shareholders | | | | | | | | |
| Dividends from net investment income: | | | | | | | | |
| Non-Service shares | | | (3,667,301) | | | | (4,942,642) | |
| Service shares | | | (2,079,404) | | | | (2,786,126) | |
| | | | |
| | | (5,746,705) | | | | (7,728,768) | |
|
| |
| Beneficial Interest Transactions | | | | | | | | |
| Net increase (decrease) in net assets resulting from beneficial interest transactions: | | | | | | | | |
| Non-Service shares | | | 2,307,738 | | | | (7,710,673) | |
| Service shares | | | 2,593,353 | | | | (3,167,239) | |
| | | | | | | | |
| | | 4,901,091 | | | | (10,877,912) | |
|
| |
| Net Assets | | | | | | | | |
| Total decrease | | | (153,072) | | | | (8,299,235) | |
| |
| Beginning of period | | | 143,431,743 | | | | 151,730,978 | |
| | | | | | | | |
| End of period (including accumulated net investment income of $1,600,813 and $4,847,120, respectively) | | $ | 143,278,671 | | | $ | 143,431,743 | |
| | | | |
See accompanying Notes to Financial Statements.
|
| 19 OPPENHEIMER CORE BOND FUND/VA |
FINANCIAL HIGHLIGHTS
| | | | | | | | | | | | | | | | | | | | | | | | |
| Non-Service Shares | | Six Months
Ended June 30, 2015
(Unaudited) | | | Year Ended
December
31, 2014 | | | Year Ended
December
31, 2013 | | | Year Ended
December
31, 2012 | | | Year Ended
December
30, 20111 | | | Year Ended
December
31, 2010 | |
| |
| Per Share Operating Data | | | | | | | | | | | | | | | | | | | | | | | | |
| Net asset value, beginning of period | | $ | 7.96 | | | $ | 7.83 | | | $ | 8.26 | | | $ | 7.88 | | | $ | 7.73 | | | $ | 7.07 | |
| |
| Income (loss) from investment operations: | | | | | | | | | | | | | | | | | | | | | | | | |
| Net investment income2 | | | 0.14 | | | | 0.30 | | | | 0.36 | | | | 0.35 | | | | 0.36 | | | | 0.40 | |
| Net realized and unrealized gain (loss) | | | (0.10) | | | | 0.26 | | | | (0.37) | | | | 0.44 | | | | 0.25 | | | | 0.40 | |
| | | | |
| Total from investment operations | | | 0.04 | | | | 0.56 | | | | (0.01) | | | | 0.79 | | | | 0.61 | | | | 0.80 | |
| |
| Dividends and/or distributions to shareholders: | | | | | | | | | | | | | | | | | | | | | | | | |
| Dividends from net investment income | | | (0.33) | | | | (0.43) | | | | (0.42) | | | | (0.41) | | | | (0.46) | | | | (0.14) | |
| |
| Net asset value, end of period | | $ | 7.67 | | | $ | 7.96 | | | $ | 7.83 | | | $ | 8.26 | | | $ | 7.88 | | | $ | 7.73 | |
| | | | |
| |
| Total Return, at Net Asset Value3 | | | 0.44% | | | | 7.27% | | | | (0.10)% | | | | 10.29% | | | | 8.27% | | | | 11.42% | |
|
| |
| Ratios/Supplemental Data | | | | | | | | | | | | | | | | | | | | | | | | |
| Net assets, end of period (in thousands) | | $ | 89,881 | | | $ | 90,757 | | | $ | 96,785 | | | $ | 116,989 | | | $ | 122,271 | | | $ | 132,557 | |
| |
| Average net assets (in thousands) | | $ | 91,726 | | | $ | 94,336 | | | $ | 105,012 | | | $ | 119,547 | | | $ | 127,341 | | | $ | 136,333 | |
| |
| Ratios to average net assets:4 | | | | | | | | | | | | | | | | | | | | | | | | |
| Net investment income | | | 3.51% | | | | 3.72% | | | | 4.51% | | | | 4.34% | | | | 4.71% | | | | 5.32% | |
| Total expenses5 | | | 0.81% | | | | 0.80% | | | | 0.80% | | | | 0.77% | | | | 0.77% | | | | 0.79% | |
| Expenses after payments, waivers and/or reimbursements and reduction to custodian expenses | | | 0.75% | | | | 0.75% | | | | 0.75% | | | | 0.75% | | | | 0.75% | | | | 0.70% | |
| |
| Portfolio turnover rate6 | | | 47% | | | | 127% | | | | 115% | | | | 140% | | | | 99% | | | | 98% | |
1. December 30, 2011 represents the last business day of the Fund’s reporting period.
2. Per share amounts calculated based on the average shares outstanding during the period.
3. Assumes an initial investment on the business day before the first day of the fiscal period, with all dividends and distributions reinvested in additional shares on the reinvestment date, and redemption at the net asset value calculated on the last business day of the fiscal period. Total returns are not annualized for periods less than one full year. Total return information does not reflect expenses that apply at the separate account level or to related insurance products. Inclusion of these charges would reduce the total return figures for all periods shown. Returns do not reflect the deduction of taxes that a shareholder would pay on fund distributions or the redemption of fund shares. The returns do not include adjustments in accordance with generally accepted accounting principles required at the period end for financial reporting purposes.
4. Annualized for periods less than one full year.
5. Total expenses including indirect expenses from affiliated fund fees and expenses were as follows:
| | | | | | | | |
| Six Months Ended June 30, 2015 | | | 0.81 | % | | | | |
| Year Ended December 31, 2014 | | | 0.81 | % | | | | |
| Year Ended December 31, 2013 | | | 0.81 | % | | | | |
| Year Ended December 31, 2012 | | | 0.79 | % | | | | |
| Year Ended December 30, 2011 | | | 0.79 | % | | | | |
| Year Ended December 31, 2010 | | | 0.80 | % | | | | |
6. The portfolio turnover rate excludes purchase and sale transactions of To Be Announced (TBA) mortgage-related securities as follows:
| | | | | | | | | | |
| | | Purchase Transactions | | | Sale Transactions | | | |
| | |
| Six Months Ended June 30, 2015 | | | $370,576,432 | | | | $384,401,097 | | |
| Year Ended December 31, 2014 | | | $560,409,975 | | | | $543,669,748 | | |
| Year Ended December 31, 2013 | | | $776,927,298 | | | | $806,883,121 | | |
| Year Ended December 31, 2012 | | | $930,202,858 | | | | $942,406,652 | | |
| Year Ended December 30, 2011 | | | $911,850,847 | | | | $909,531,196 | | |
| Year Ended December 31, 2010 | | | $775,240,942 | | | | $766,486,357 | | |
See accompanying Notes to Financial Statements.
|
| 20 OPPENHEIMER CORE BOND FUND/VA |
| | | | | | | | | | | | | | | | | | | | | | | | |
| Service Shares | | Six Months Ended June 30, 2015 (Unaudited) | | | Year Ended December 31, 2014 | | | Year Ended December 31, 2013 | | | Year Ended December 31, 2012 | | | Year Ended December
30, 20111 | | | Year Ended December 31, 2010 | |
| |
| Per Share Operating Data | | | | | | | | | | | | | | | | | | | | | | | | |
| Net asset value, beginning of period | | $ | 7.86 | | | $ | 7.74 | | | $ | 8.17 | | | $ | 7.79 | | | $ | 7.65 | | | $ | 6.99 | |
| |
| Income (loss) from investment operations: | | | | | | | | | | | | | | | | | | | | | | | | |
| Net investment income2 | | | 0.13 | | | | 0.27 | | | | 0.34 | | | | 0.33 | | | | 0.34 | | | | 0.37 | |
| Net realized and unrealized gain (loss) | | | (0.09) | | | | 0.26 | | | | (0.37) | | | | 0.44 | | | | 0.24 | | | | 0.41 | |
| | | | |
| Total from investment operations | | | 0.04 | | | | 0.53 | | | | (0.03) | | | | 0.77 | | | | 0.58 | | | | 0.78 | |
| |
| Dividends and/or distributions to shareholders: | | | | | | | | | | | | | | | | | | | | | | | | |
| Dividends from net investment income | | | (0.31) | | | | (0.41) | | | | (0.40) | | | | (0.39) | | | | (0.44) | | | | (0.12) | |
| |
| Net asset value, end of period | | $ | 7.59 | | | $ | 7.86 | | | $ | 7.74 | | | $ | 8.17 | | | $ | 7.79 | | | $ | 7.65 | |
| | | | |
| |
| Total Return, at Net Asset Value3 | | | 0.44% | | | | 6.93% | | | | (0.38)% | | | | 10.17% | | | | 7.93% | | | | 11.28% | |
|
| |
| Ratios/Supplemental Data | | | | | | | | | | | | | | | | | | | | | | | | |
| Net assets, end of period (in thousands) | | $ | 53,398 | | | $ | 52,675 | | | $ | 54,946 | | | $ | 64,694 | | | $ | 62,294 | | | $ | 56,562 | |
| |
| Average net assets (in thousands) | | $ | 55,895 | | | $ | 55,215 | | | $ | 59,523 | | | $ | 67,116 | | | $ | 58,629 | | | $ | 57,313 | |
| |
| Ratios to average net assets:4 | | | | | | | | | | | | | | | | | | | | | | | | |
| Net investment income | | | 3.26% | | | | 3.47% | | | | 4.26% | | | | 4.07% | | | | 4.42% | | | | 5.06% | |
| Total expenses5 | | | 1.06% | | | | 1.04% | | | | 1.05% | | | | 1.02% | | | | 1.02% | | | | 1.04% | |
| Expenses after payments, waivers and/or reimbursements and reduction to custodian expenses | | | 1.00% | | | | 1.00% | | | | 1.00% | | | | 1.00% | | | | 1.00% | | | | 0.95% | |
| |
| Portfolio turnover rate6 | | | 47% | | | | 127% | | | | 115% | | | | 140% | | | | 99% | | | | 98% | |
1. December 30, 2011 represents the last business day of the Fund’s reporting period.
2. Per share amounts calculated based on the average shares outstanding during the period.
3. Assumes an initial investment on the business day before the first day of the fiscal period, with all dividends and distributions reinvested in additional shares on the reinvestment date, and redemption at the net asset value calculated on the last business day of the fiscal period. Total returns are not annualized for periods less than one full year. Total return information does not reflect expenses that apply at the separate account level or to related insurance products. Inclusion of these charges would reduce the total return figures for all periods shown. Returns do not reflect the deduction of taxes that a shareholder would pay on fund distributions or the redemption of fund shares. The returns do not include adjustments in accordance with generally accepted accounting principles required at the period end for financial reporting purposes.
4. Annualized for periods less than one full year.
5. Total expenses including indirect expenses from affiliated fund fees and expenses were as follows:
| | | | | | | | |
| Six Months Ended June 30, 2015 | | | 1.06 | % | | | | |
| Year Ended December 31, 2014 | | | 1.05 | % | | | | |
| Year Ended December 31, 2013 | | | 1.06 | % | | | | |
| Year Ended December 31, 2012 | | | 1.04 | % | | | | |
| Year Ended December 30, 2011 | | | 1.04 | % | | | | |
| Year Ended December 31, 2010 | | | 1.05 | % | | | | |
6. The portfolio turnover rate excludes purchase and sale transactions of To Be Announced (TBA) mortgage-related securities as follows:
| | | | | | | | | | |
| | | Purchase Transactions | | | Sale Transactions | | | |
| | |
| Six Months Ended June 30, 2015 | | | $370,576,432 | | | | $384,401,097 | | |
| Year Ended December 31, 2014 | | | $560,409,975 | | | | $543,669,748 | | |
| Year Ended December 31, 2013 | | | $776,927,298 | | | | $806,883,121 | | |
| Year Ended December 31, 2012 | | | $930,202,858 | | | | $942,406,652 | | |
| Year Ended December 30, 2011 | | | $911,850,847 | | | | $909,531,196 | | |
| Year Ended December 31, 2010 | | | $775,240,942 | | | | $766,486,357 | | |
See accompanying Notes to Financial Statements.
|
| 21 OPPENHEIMER CORE BOND FUND/VA |
NOTES TO FINANCIAL STATEMENTS June 30, 2015 Unaudited
1. Organization
Oppenheimer Core Bond Fund/VA (the “Fund”) is a separate series of Oppenheimer Variable Account Funds, a diversified open-end management investment company registered under the Investment Company Act of 1940 (“1940 Act”), as amended. The Fund’s main investment objective is to seek total return. The Fund’s investment adviser is OFI Global Asset Management, Inc. (“OFI Global” or the “Manager”), a wholly-owned subsidiary of OppenheimerFunds, Inc. (“OFI” or the “Sub-Adviser”). The Manager has entered into a sub-advisory agreement with OFI. Shares of the Fund are sold only to separate accounts of life insurance companies.
The Fund offers two classes of shares. Both classes are sold at their offering price, which is the net asset value per share, to separate investment accounts of participating insurance companies as an underlying investment for variable life insurance policies, variable annuity contracts or other investment products. The class of shares designated as Service shares is subject to a distribution and service plan. Both classes of shares have identical rights and voting privileges with respect to the Fund in general and exclusive voting rights on matters that affect that class alone. Earnings, net assets and net asset value per share may differ due to each class having its own expenses, such as transfer and shareholder servicing agent fees and shareholder communications, directly attributable to that class.
The following is a summary of significant accounting policies followed in the Fund’s preparation of financial statements in accordance with accounting principles generally accepted in the United States (“U.S. GAAP”).
2. Significant Accounting Policies
Security Valuation. All investments in securities are recorded at their estimated fair value, as described in Note 3.
Reporting Period End Date. The last day of the Fund’s reporting period is the last day the New York Stock Exchange was open for trading during the period. The Fund’s financial statements have been presented through that date to maintain consistency with the Fund’s net asset value calculations used for shareholder transactions.
Allocation of Income, Expenses, Gains and Losses. Income, expenses (other than those attributable to a specific class), gains and losses are allocated on a daily basis to each class of shares based upon the relative proportion of net assets represented by such class. Operating expenses directly attributable to a specific class are charged against the operations of that class.
Dividends and Distributions to Shareholders. Dividends and distributions to shareholders, which are determined in accordance with income tax regulations and may differ from U.S. generally accepted accounting principles, are recorded on the ex-dividend date. Income and capital gain distributions, if any, are declared and paid annually or at other times as deemed necessary by the Manager.
The tax character of distributions is determined as of the Fund’s fiscal year end. Therefore, a portion of the Fund’s distributions made to shareholders prior to the Fund’s fiscal year end may ultimately be categorized as a tax return of capital.
Investment Income. Dividend income is recorded on the ex-dividend date or upon ex-dividend notification in the case of certain foreign dividends where the ex-dividend date may have passed. Non-cash dividends included in dividend income, if any, are recorded at the fair market value of the securities received. Interest income is recognized on an accrual basis. Discount and premium, which are included in interest income on the Statement of Operations, are amortized or accreted daily.
Custodian Fees. “Custodian fees and expenses” in the Statement of Operations may include interest expense incurred by the Fund on any cash overdrafts of its custodian account during the period. Such cash overdrafts may result from the effects of failed trades in portfolio securities and from cash outflows resulting from unanticipated shareholder redemption activity. The Fund pays interest to its custodian on such cash overdrafts, to the extent they are not offset by positive cash balances maintained by the Fund, at a rate equal to the Federal Funds Rate plus 0.50%. The “Reduction to custodian expenses” line item, if applicable, represents earnings on cash balances maintained by the Fund during the period. Such interest expense and other custodian fees may be paid with these earnings.
Security Transactions. Security transactions are recorded on the trade date. Realized gains and losses on securities sold are determined on the basis of identified cost.
Indemnifications. The Fund’s organizational documents provide current and former Trustees and officers with a limited indemnification against liabilities arising in connection with the performance of their duties to the Fund. In the normal course of business, the Fund may also enter into contracts that provide general indemnifications. The Fund’s maximum exposure under these arrangements is unknown as this would be dependent on future claims that may be made against the Fund. The risk of material loss from such claims is considered remote.
Federal Taxes. The Fund intends to comply with provisions of the Internal Revenue Code applicable to regulated investment companies and to distribute substantially all of its investment company taxable income to shareholders. Therefore, no federal income or excise tax provision is required. The Fund files income tax returns in U.S. federal and applicable state jurisdictions. The statute of limitations on the Fund’s tax return filings generally remains open for the three preceding fiscal reporting period ends.
|
| 22 OPPENHEIMER CORE BOND FUND/VA |
2. Significant Accounting Policies (Continued)
During the fiscal year ended December 31, 2014, the Fund utilized $3,087,162 of capital loss carryforward to offset capital gains realized in that fiscal year. The Fund had post-October losses of $104,469 and straddle losses of $6,292. Details of the fiscal year ended December 31, 2014 capital loss carryforwards are included in the table below. Capital loss carryforwards with no expiration, if any, must be utilized prior to those with expiration dates. Capital losses with no expiration will be carried forward to future years if not offset by gains.
| | | | |
| Expiring | | | |
| |
2016 | | $ | 5,271,444 | |
2017 | | | 75,069,850 | |
| | | | |
Total | | $ | 80,341,294 | |
| | | | |
As of June 30, 2015, it is estimated that the capital loss carryforwards would be $80,372,019 expiring by 2017. The estimated capital loss carryforward represents the carryforward as of the end of the last fiscal year, increased or decreased by capital losses or gains realized in the first six months of the current fiscal year. During the six months ended June 30, 2015, it is estimated that the Fund will utilize $80,036 of capital loss carryforward to offset realized capital gains.
Net investment income (loss) and net realized gain (loss) may differ for financial statement and tax purposes. The character of dividends and distributions made during the fiscal year from net investment income or net realized gains are determined in accordance with federal income tax requirements, which may differ from the character of net investment income or net realized gains presented in those financial statements in accordance with GAAP. Also, due to timing of dividends and distributions, the fiscal year in which amounts are distributed may differ from the fiscal year in which the income or net realized gain was recorded by the Fund.
The aggregate cost of securities and other investments and the composition of unrealized appreciation and depreciation of securities and other investments for federal income tax purposes as of June 30, 2015 are noted in the following table. The primary difference between book and tax appreciation or depreciation of securities and other investments, if applicable, is attributable to the tax deferral of losses or tax realization of financial statement unrealized gain or loss.
| | | | |
Federal tax cost of securities | | $ | 179,049,959 | |
Federal tax cost of other investments | | | (7,162,961) | |
| | | | |
Total federal tax cost | | $ | 171,886,998 | |
| | | | |
Gross unrealized appreciation | | $ | 3,439,466 | |
Gross unrealized depreciation | | | (6,334,314) | |
| | | | |
Net unrealized depreciation | | $ | (2,894,848) | |
| | | | |
Use of Estimates. The preparation of financial statements in conformity with accounting principles generally accepted in the United States of America requires management to make estimates and assumptions that affect the reported amounts of assets and liabilities and disclosure of contingent assets and liabilities at the date of the financial statements and the reported amounts of increases and decreases in net assets from operations during the reporting period. Actual results could differ from those estimates.
3. Securities Valuation
The Fund calculates the net asset value of its shares as of the close of the New York Stock Exchange (the “Exchange”), normally 4:00 P.M. Eastern time, on each day the Exchange is open for trading.
The Fund’s Board has adopted procedures for the valuation of the Fund’s securities and has delegated the day-to-day responsibility for valuation determinations under those procedures to the Manager. The Manager has established a Valuation Committee which is responsible for determining a “fair valuation” for any security for which market quotations are not “readily available.” The Valuation Committee’s fair valuation determinations are subject to review, approval and ratification by the Fund’s Board at its next regularly scheduled meeting covering the calendar quarter in which the fair valuation was determined.
Valuation Methods and Inputs
Securities are valued using unadjusted quoted market prices, when available, as supplied primarily by third party pricing services or dealers.
The following methodologies are used to determine the market value or the fair value of the types of securities described below:
Securities traded on a registered U.S. securities exchange (including exchange-traded derivatives other than futures and futures options) are valued based on the last sale price of the security reported on the principal exchange on which it is traded, prior to the time when the Fund’s assets are valued. In the absence of a sale, the security is valued at the last sale price on the prior trading day, if it is within the spread of the current day’s closing “bid” and “asked” prices, and if not, at the current day’s closing bid price. A security of a foreign issuer traded on a foreign exchange, but not listed on a registered U.S. securities exchange, is valued based on the last sale price on the principal exchange on which the security is traded, as identified by the third party pricing service used by the Manager, prior to the time when the Fund’s assets are valued. If the last sale price is unavailable, the security is valued at the most recent official closing price on the principal exchange on which it is traded. If the last sales price or official closing price for a foreign security is not available, the security is valued at the mean between the bid and asked price per the exchange or, if not available from the exchange, obtained from two dealers. If bid and asked prices are not available from either the exchange or two dealers, the security is valued by using one of the following methodologies (listed in order of priority): (1) using a bid from the exchange, (2) the mean between the bid and asked price as provided by a single dealer, or (3) a bid from a single dealer.
Shares of a registered investment company that are not traded on an exchange are valued at that investment company’s net asset value per share.
|
| 23 OPPENHEIMER CORE BOND FUND/VA |
NOTES TO FINANCIAL STATEMENTS Unaudited / Continued
3. Securities Valuation (Continued)
Corporate and government debt securities (of U.S. or foreign issuers) and municipal debt securities, event-linked bonds, loans, mortgage-backed securities, collateralized mortgage obligations, and asset-backed securities are valued at the mean between the “bid” and “asked” prices utilizing evaluated prices obtained from third party pricing services or broker-dealers who may use matrix pricing methods to determine the evaluated prices.
Short-term money market type debt securities with a remaining maturity of sixty days or less are valued at cost adjusted by the amortization of discount or premium to maturity (amortized cost), which approximates market value. Short-term debt securities with a remaining maturity in excess of sixty days are valued at the mean between the “bid” and “asked” prices utilizing evaluated prices obtained from third party pricing services or broker-dealers.
Futures contracts and futures options traded on a commodities or futures exchange will be valued at the final settlement price or official closing price on the principal exchange as reported by such principal exchange at its trading session ending at, or most recently prior to, the time when the Fund’s assets are valued.
A description of the standard inputs that may generally be considered by the third party pricing vendors in determining their evaluated prices is provided below.
| | |
| Security Type | | Standard inputs generally considered by third-party pricing vendors |
|
| Corporate debt, government debt, municipal, mortgage-backed and asset-backed securities | | Reported trade data, broker-dealer price quotations, benchmark yields, issuer spreads on comparable securities, the credit quality, yield, maturity, and other appropriate factors. |
|
| Loans | | Information obtained from market participants regarding reported trade data and broker-dealer price quotations. |
|
| Event-linked bonds | | Information obtained from market participants regarding reported trade data and broker-dealer price quotations. |
If a market value or price cannot be determined for a security using the methodologies described above, or if, in the “good faith” opinion of the Manager, the market value or price obtained does not constitute a “readily available market quotation,” or a significant event has occurred that would materially affect the value of the security, the security is fair valued either (i) by a standardized fair valuation methodology applicable to the security type or the significant event as previously approved by the Valuation Committee and the Fund’s Board or (ii) as determined in good faith by the Manager’s Valuation Committee. The Valuation Committee considers all relevant facts that are reasonably available, through either public information or information available to the Manager, when determining the fair value of a security. Fair value determinations by the Manager are subject to review, approval and ratification by the Fund’s Board at its next regularly scheduled meeting covering the calendar quarter in which the fair valuation was determined. Those fair valuation standardized methodologies include, but are not limited to, valuing securities at the last sale price or initially at cost and subsequently adjusting the value based on: changes in company specific fundamentals, changes in an appropriate securities index, or changes in the value of similar securities which may be further adjusted for any discounts related to security-specific resale restrictions. When possible, such methodologies use observable market inputs such as unadjusted quoted prices of similar securities, observable interest rates, currency rates and yield curves. The methodologies used for valuing securities are not necessarily an indication of the risks associated with investing in those securities nor can it be assured that the Fund can obtain the fair value assigned to a security if it were to sell the security.
To assess the continuing appropriateness of security valuations, the Manager, or its third party service provider who is subject to oversight by the Manager, regularly compares prior day prices, prices on comparable securities, and sale prices to the current day prices and challenges those prices exceeding certain tolerance levels with the third party pricing service or broker source. For those securities valued by fair valuations, whether through a standardized fair valuation methodology or a fair valuation determination, the Valuation Committee reviews and affirms the reasonableness of the valuations based on such methodologies and fair valuation determinations on a regular basis after considering all relevant information that is reasonably available.
Classifications
Each investment asset or liability of the Fund is assigned a level at measurement date based on the significance and source of the inputs to its valuation. Various data inputs are used in determining the value of each of the Fund’s investments as of the reporting period end. These data inputs are categorized in the following hierarchy under applicable financial accounting standards:
1) Level 1-unadjusted quoted prices in active markets for identical assets or liabilities (including securities actively traded on a securities exchange)
2) Level 2-inputs other than unadjusted quoted prices that are observable for the asset or liability (such as unadjusted quoted prices for similar assets and market corroborated inputs such as interest rates, prepayment speeds, credit risks, etc.)
3) Level 3-significant unobservable inputs (including the Manager’s own judgments about assumptions that market participants would use in pricing the asset or liability).
The inputs used for valuing securities are not necessarily an indication of the risks associated with investing in those securities.
The table below categorizes amounts that are included in the Fund’s Statement of Assets and Liabilities as of June 30, 2015 based on valuation input level:
|
| 24 OPPENHEIMER CORE BOND FUND/VA |
3. Securities Valuation (Continued)
| | | | | | | | | | | | | | | | |
| | | Level 1— Unadjusted Quoted Prices | | | Level 2— Other Significant Observable Inputs | | | Level 3— Significant Unobservable Inputs | | | Value | |
| |
Assets Table | | | | | | | | | | | | | | | | |
Investments, at Value: | | | | | | | | | | | | | | | | |
Asset-Backed Securities | | $ | — | | | $ | 23,676,750 | | | $ | — | | | $ | 23,676,750 | |
Mortgage-Backed Obligations | | | — | | | | 64,301,227 | | | | 1,018,570 | | | | 65,319,797 | |
U.S. Government Obligations | | | — | | | | 1,705,329 | | | | — | | | | 1,705,329 | |
Corporate Bonds and Notes | | | — | | | | 77,630,580 | | | | — | | | | 77,630,580 | |
Investment Company | | | 7,925,085 | | | | — | | | | — | | | | 7,925,085 | |
| | | | |
Total Investments, at Value | | | 7,925,085 | | | | 167,313,886 | | | | 1,018,570 | | | | 176,257,541 | |
Other Financial Instruments: | | | | | | | | | | | | | | | | |
Futures contracts | | | 170,358 | | | | — | | | | — | | | | 170,358 | |
| | | | |
Total Assets | | $ | 8,095,443 | | | $ | 167,313,886 | | | $ | 1,018,570 | | | $ | 176,427,899 | |
| | | | |
| | | | |
Liabilities Table | | | | | | | | | | | | | | | | |
Other Financial Instruments: | | | | | | | | | | | | | | | | |
Futures contracts | | $ | (272,788) | | | $ | — | | | $ | — | | | $ | (272,788) | |
| | | | |
Total Liabilities | | $ | (272,788) | | | $ | — | | | $ | — | | | $ | (272,788) | |
| | | | |
Forward currency exchange contracts and futures contracts, if any, are reported at their unrealized appreciation/depreciation at measurement date, which represents the change in the contract’s value from trade date. All additional assets and liabilities included in the above table are reported at their market value at measurement date.
4. Investments and Risks
Investment in Oppenheimer Institutional Money Market Fund. The Fund is permitted to invest daily available cash balances in an affiliated money market fund. The Fund may invest the available cash in Class E shares of Oppenheimer Institutional Money Market Fund (“IMMF”) to seek current income while preserving liquidity or for defensive purposes. IMMF is a registered open-end management investment company, regulated as a money market fund under the 1940 Act. The Manager is the investment adviser of IMMF, and the Sub-Adviser provides investment and related advisory services to IMMF. When applicable, the Fund’s investment in IMMF is included in the Statement of Investments. Shares of IMMF are valued at their net asset value per share. As a shareholder, the Fund is subject to its proportional share of IMMF’s Class E expenses, including its management fee. The Manager will waive fees and/or reimburse Fund expenses in an amount equal to the indirect management fees incurred through the Fund’s investment in IMMF.
Securities on a When-Issued or Delayed Delivery Basis. The Fund may purchase securities on a “when-issued” basis, and may purchase or sell securities on a “delayed delivery” basis. “When-issued” or “delayed delivery” refers to securities whose terms and indenture are available and for which a market exists, but which are not available for immediate delivery. Delivery and payment for securities that have been purchased by the Fund on a when-issued basis normally takes place within six months and possibly as long as two years or more after the trade date. During this period, such securities do not earn interest, are subject to market fluctuation and may increase or decrease in value prior to their delivery. The purchase of securities on a when-issued basis may increase the volatility of the Fund’s net asset value to the extent the Fund executes such transactions while remaining substantially fully invested. When the Fund engages in when-issued or delayed delivery transactions, it relies on the buyer or seller, as the case may be, to complete the transaction. Their failure to do so may cause the Fund to lose the opportunity to obtain or dispose of the security at a price and yield it considers advantageous. The Fund may also sell securities that it purchased on a when-issued basis or forward commitment prior to settlement of the original purchase.
As of June 30, 2015, the Fund had purchased securities issued on a when-issued or delayed delivery basis and sold securities issued on a delayed delivery basis as follows:
| | | | |
| | | When-Issued or
Delayed Delivery
Basis Transactions | |
| |
Purchased securities | | | $58,194,296 | |
Sold securities | | | 23,226,661 | |
The Fund may enter into “forward roll” transactions with respect to mortgage-related securities. In this type of transaction, the Fund sells a mortgage-related security to a buyer and simultaneously agrees to repurchase a similar security (same type, coupon and maturity) at a later date at a set price. During the period between the sale and the repurchase, the Fund will not be entitled to receive interest and principal payments on the securities that have been sold. The Fund records the incremental difference between the forward purchase and sale of each forward roll as realized gain (loss) on investments or as fee income in the case of such transactions that have an associated fee in lieu of a difference in the forward purchase and sale price.
Forward roll transactions may be deemed to entail embedded leverage since the Fund purchases mortgage-related securities with extended settlement dates rather than paying for the securities under a normal settlement cycle. This embedded leverage increases the Fund’s market value of investments relative to its net assets which can incrementally increase the volatility of the Fund’s performance. Forward roll transactions can be replicated over multiple settlement periods.
|
| 25 OPPENHEIMER CORE BOND FUND/VA |
NOTES TO FINANCIAL STATEMENTS Unaudited / Continued
4. Investments and Risks (Continued)
Risks of entering into forward roll transactions include the potential inability of the counterparty to meet the terms of the agreement; the potential of the Fund to receive inferior securities at redelivery as compared to the securities sold to the counterparty; and counterparty credit risk.
Restricted Securities. As of June 30, 2015, investments in securities included issues that are restricted. A restricted security may have a contractual restriction on its resale and is valued under methods approved by the Board of Trustees as reflecting fair value. Securities that are restricted are marked with an applicable footnote on the Statement of Investments. Restricted securities are reported on a schedule following the Statement of Investments.
Credit Risk. The Fund invests in high-yield, non-investment-grade bonds, which may be subject to a greater degree of credit risk. Credit risk relates to the ability of the issuer to meet interest or principal payments or both as they become due. The Fund may acquire securities that have missed an interest payment, and is not obligated to dispose of securities whose issuers or underlying obligors subsequently miss an interest payment. Information concerning securities not accruing interest as of June 30, 2015 is as follows:
| | | | |
Cost | | $ | 3,281,116 | |
Market Value | | $ | 909,904 | |
Market Value as % of Net Assets | | | 0.64% | |
5. Risk Exposures and the Use of Derivative Instruments
The Fund’s investment objective not only permits the Fund to purchase investment securities, it also allows the Fund to enter into various types of derivatives contracts, including, but not limited to, futures contracts, forward currency exchange contracts, credit default swaps, interest rate swaps, total return swaps, variance swaps and purchased and written options. In doing so, the Fund will employ strategies in differing combinations to permit it to increase, decrease, or change the level or types of exposure to market risk factors. These instruments may allow the Fund to pursue its objectives more quickly and efficiently than if it were to make direct purchases or sales of securities capable of effecting a similar response to market factors. Such contracts may be entered into through a bilateral over-the-counter (“OTC”) transaction, or through a securities or futures exchange and cleared through a clearinghouse.
Market Risk Factors. In accordance with its investment objectives, the Fund may use derivatives to increase or decrease its exposure to one or more of the following market risk factors:
Commodity Risk. Commodity risk relates to the change in value of commodities or commodity indexes as they relate to increases or decreases in the commodities market. Commodities are physical assets that have tangible properties. Examples of these types of assets are crude oil, heating oil, metals, livestock, and agricultural products.
Credit Risk. Credit risk relates to the ability of the issuer to meet interest and principal payments, or both, as they come due. In general, lower-grade, higher-yield bonds are subject to credit risk to a greater extent than lower-yield, higher-quality bonds.
Equity Risk. Equity risk relates to the change in value of equity securities as they relate to increases or decreases in the general market.
Foreign Exchange Rate Risk. Foreign exchange rate risk relates to the change in the U.S. dollar value of a security held that is denominated in a foreign currency. The U.S. dollar value of a foreign currency denominated security will decrease as the dollar appreciates against the currency, while the U.S. dollar value will increase as the dollar depreciates against the currency.
Interest Rate Risk. Interest rate risk refers to the fluctuations in value of fixed-income securities resulting from the inverse relationship between price and yield. For example, an increase in general interest rates will tend to reduce the market value of already issued fixed-income investments, and a decline in general interest rates will tend to increase their value. In addition, debt securities with longer maturities, which tend to have higher yields, are subject to potentially greater fluctuations in value from changes in interest rates than obligations with shorter maturities.
Volatility Risk. Volatility risk refers to the magnitude of the movement, but not the direction of the movement, in a financial instrument’s price over a defined time period. Large increases or decreases in a financial instrument’s price over a relative time period typically indicate greater volatility risk, while small increases or decreases in its price typically indicate lower volatility risk.
Derivatives may have little or no initial cash investment relative to their market value exposure and therefore can produce significant gains or losses in excess of their cost due to unanticipated changes in the market risk factors and the overall market. This use of embedded leverage allows the Fund to increase its market value exposure relative to its net assets and can substantially increase the volatility of the Fund’s performance. In instances where the Fund is using derivatives to decrease, or hedge, exposures to market risk factors for securities held by the Fund, there are also risks that those derivatives may not perform as expected resulting in losses for the combined or hedged positions. Some derivatives have the potential for unlimited loss, regardless of the size of the Fund’s initial investment.
Additional associated risks from investing in derivatives also exist and potentially could have significant effects on the valuation of the derivative and the Fund. Typically, the associated risks are not the risks that the Fund is attempting to increase or decrease exposure to, per its investment objectives, but are the additional risks from investing in derivatives. Examples of these associated risks are liquidity risk, which is the risk that the Fund will not be able to sell the derivative in the open market in a timely manner, and counterparty credit risk, which is the risk that the counterparty will not fulfill its obligation to the Fund.
The Fund’s actual exposures to these market risk factors and associated risks during the period are discussed in further detail, by derivative type, below.
|
| 26 OPPENHEIMER CORE BOND FUND/VA |
5. Risk Exposures and the Use of Derivative Instruments (Continued)
Futures Contracts
A futures contract is a commitment to buy or sell a specific amount of a commodity, financial instrument or currency at a negotiated price on a stipulated future date. The Fund may buy and sell futures contracts and may also buy or write put or call options on these futures contracts. Futures contracts and options thereon are generally entered into on a regulated futures exchange and cleared through a clearinghouse associated with the exchange.
Upon entering into a futures contract, the Fund is required to deposit either cash or securities (initial margin) in an amount equal to a certain percentage of the contract value in an account registered in the futures commission merchant’s name. Subsequent payments (variation margin) are paid to or from the futures commission merchant each day equal to the daily changes in the contract value. Such payments are recorded as unrealized gains and losses. Should the Fund fail to make requested variation margin payments, the futures commission merchant can gain access to the initial margin to satisfy the Fund’s payment obligations.
Futures contracts are reported on a schedule following the Statement of Investments. Securities held by a futures commission merchant to cover initial margin requirements on open futures contracts are noted in the Statement of Investments. Cash held by a futures commission merchant to cover initial margin requirements on open futures contracts and the receivable and/or payable for the daily mark to market for the variation margin are noted in the Statement of Assets and Liabilities. The net change in unrealized appreciation and depreciation is reported in the Statement of Operations. Realized gains (losses) are reported in the Statement of Operations at the closing or expiration of futures contracts.
The Fund has purchased futures contracts on various bonds and notes to increase exposure to interest rate risk.
The Fund has sold futures contracts on various bonds and notes to decrease exposure to interest rate risk.
During the six months ended June 30, 2015, the Fund had an ending monthly average market value of $11,918,456 and $31,019,571 on futures contracts purchased and sold, respectively.
Additional associated risks of entering into futures contracts (and related options) include the possibility that there may be an illiquid market where the Fund is unable to liquidate the contract or enter into an offsetting position and, if used for hedging purposes, the risk that the price of the contract will correlate imperfectly with the prices of the Fund’s securities.
Counterparty Credit Risk. Derivative positions are subject to the risk that the counterparty will not fulfill its obligation to the Fund. The Fund intends to enter into derivative transactions with counterparties that the Manager believes to be creditworthy at the time of the transaction.
For financial reporting purposes, the Fund does not offset derivative assets and derivative liabilities that are subject to netting arrangements in the Statement of Assets and Liabilities. Bankruptcy or insolvency laws of a particular jurisdiction may impose restrictions on or prohibitions against the right of offset in bankruptcy, insolvency or other events.
The Fund’s risk of loss from counterparty credit risk on exchange-traded derivatives cleared through a clearinghouse and for centrally cleared swaps is generally considered lower than as compared to OTC derivatives. However, counterparty credit risk exists with respect to initial and variation margin deposited/paid by the Fund that is held in futures commission merchant, broker and/or clearinghouse accounts for such exchange-traded derivatives and for centrally cleared swaps.
With respect to centrally cleared swaps, such transactions will be submitted for clearing, and if cleared, will be held in accounts at futures commission merchants or brokers that are members of clearinghouses. While brokers, futures commission merchants and clearinghouses are required to segregate customer margin from their own assets, in the event that a broker, futures commission merchant or clearinghouse becomes insolvent or goes into bankruptcy and at that time there is a shortfall in the aggregate amount of margin held by the broker, futures commission merchant or clearinghouse for all its customers, U.S. bankruptcy laws will typically allocate that shortfall on a pro-rata basis across all the broker’s, futures commission merchant’s or clearinghouse’s customers, potentially resulting in losses to the Fund.
There is the risk that a broker, futures commission merchant or clearinghouse will decline to clear a transaction on the Fund’s behalf, and the Fund may be required to pay a termination fee to the executing broker with whom the Fund initially enters into the transaction. Clearinghouses may also be permitted to terminate centrally cleared swaps at any time. The Fund is also subject to the risk that the broker or futures commission merchant will improperly use the Fund’s assets deposited/paid as initial or variation margin to satisfy payment obligations of another customer. In the event of a default by another customer of the broker or futures commission merchant, the Fund might not receive its variation margin payments from the clearinghouse, due to the manner in which variation margin payments are aggregated for all customers of the broker/futures commission merchant.
Collateral and margin requirements differ by type of derivative. Margin requirements are established by the broker, futures commission merchant or clearinghouse for exchange-traded and cleared derivatives, including centrally cleared swaps. Brokers, futures commission merchants and clearinghouses can ask for margin in excess of the regulatory minimum, or increase the margin amount, in certain circumstances.
For financial reporting purposes, cash collateral that has been pledged to cover obligations of the Fund, if any, is reported separately on the Statement of Assets and Liabilities as cash pledged as collateral. Non-cash collateral pledged by the Fund, if any, is noted in the Statement of Investments. Generally, the amount of collateral due from or to a party must exceed a minimum transfer amount threshold (e.g. $250,000) before a transfer has to be made. To the extent amounts due to the Fund from its counterparties are not fully collateralized, contractually or otherwise, the Fund bears the risk of loss from counterparty nonperformance.
The following table presents the valuations of derivative instruments by risk exposure as reported within the Statement of Assets and Liabilities as of June 30, 2015:
| | | | | | | | | | | | | | |
| | | Asset Derivatives | | | | | | | Liability Derivatives | | | |
| Derivatives Not Accounted for as Hedging Instruments | | Statement of Assets and Liabilities Location | | Value | | | | | Statement of Assets and Liabilities Location | | Value | |
Interest rate contracts | | Variation margin receivable | | $ | 7,167 | * | | | | Variation margin payable | | $ | 5,706 | * |
|
| 27 OPPENHEIMER CORE BOND FUND/VA |
NOTES TO FINANCIAL STATEMENTS Unaudited / Continued
5. Risk Exposures and the Use of Derivative Instruments (Continued)
*Includes only the current day’s variation margin. Prior variation margin movements have been reflected in cash on the Statement of Assets and Liabilities upon receipt or payment.
The effect of derivative instruments on the Statement of Operations is as follows:
| | |
| Amount of Realized Gain or (Loss) Recognized on Derivatives |
| Derivatives Not Accounted for as Hedging Instruments | | Closing and expiration of futures contracts |
Interest rate contracts | | $ (175,172) |
|
| Amount of Change in Unrealized Gain or (Loss) Recognized on Derivatives |
| Derivatives Not Accounted for as Hedging Instruments | | Futures contracts |
Interest rate contracts | | $ (461,305) |
6. Shares of Beneficial Interest
The Fund has authorized an unlimited number of $0.001 par value shares of beneficial interest of each class. Transactions in shares of beneficial interest were as follows:
| | | | | | | | | | | | | | | | |
| | | Six Months Ended June 30, 2015 | | | Year Ended December 31, 2014 | |
| | | Shares | | | Amount | | | Shares | | | Amount | |
| |
Non-Service Shares | | | | | | | | | | | | | | | | |
| Sold | | | 638,604 | | | $ | 5,183,249 | | | | 473,147 | | | $ | 3,766,474 | |
| Dividends and/or distributions reinvested | | | 476,892 | | | | 3,667,301 | | | | 636,119 | | | | 4,942,642 | |
| Redeemed | | | (810,958 | ) | | | (6,542,812 | ) | | | (2,061,362 | ) | | | (16,419,789 | ) |
| | | | |
| Net increase (decrease) | | | 304,538 | | | $ | 2,307,738 | | | | (952,096 | ) | | $ | (7,710,673 | ) |
| | | | |
| | | | | | | | | | | | | | | | |
| |
Service Shares | | | | | | | | | | | | | | | | |
| Sold | | | 1,396,116 | | | $ | 11,131,603 | | | | 1,990,358 | | | $ | 15,655,488 | |
| Dividends and/or distributions reinvested | | | 273,246 | | | | 2,079,404 | | | | 362,777 | | | | 2,786,126 | |
| Redeemed | | | (1,334,093 | ) | | | (10,617,654 | ) | | | (2,750,766 | ) | | | (21,608,853 | ) |
| | | | |
| Net increase (decrease) | | | 335,269 | | | $ | 2,593,353 | | | | (397,631 | ) | | $ | (3,167,239 | ) |
| | | | |
7. Purchases and Sales of Securities
The aggregate cost of purchases and proceeds from sales of securities, other than short-term obligations and investments in IMMF, for the six months ended June 30, 2015 were as follows:
| | | | | | | | | | | | |
| | | Purchases | | | | | | Sales | |
Investment securities | | $ | 56,982,172 | | | | | | | $ | 54,645,890 | |
U.S. government and government agency obligations | | | 9,125,149 | | | | | | | | 10,617,515 | |
To Be Announced (TBA) mortgage-related securities | | | 370,576,432 | | | | | | | | 384,401,097 | |
8. Fees and Other Transactions with Affiliates
Management Fees. Under the investment advisory agreement, the Fund pays the Manager a management fee based on the daily net assets of the Fund at an annual rate as shown in the following table:
| | |
| Fee Schedule | | |
Up to $1 billion | | 0.60% |
Over $1 billion | | 0.50 |
The Fund’s effective management fee for the six months ended June 30, 2015 was 0.60% of average annual net assets before any applicable waivers.
Sub-Adviser Fees. The Manager has retained the Sub-Adviser to provide the day-to-day portfolio management of the Fund. Under the Sub-Advisory Agreement, the Manager pays the Sub-Adviser an annual fee in monthly installments, equal to a percentage of the investment management fee collected by the Manager from the Fund, which shall be calculated after any investment management fee waivers. The fee paid to the Sub-Adviser is paid by the Manager, not by the Fund.
Transfer Agent Fees. OFI Global (the “Transfer Agent”) serves as the transfer and shareholder servicing agent for the Fund. The Fund pays the Transfer Agent a fee based on annual net assets. Fees incurred and average net assets for each class with respect to these services are detailed in the Statement of Operations and Financial Highlights, respectively.
Sub-Transfer Agent Fees. The Transfer Agent has retained Shareholder Services, Inc., a wholly-owned subsidiary of OFI (the “Sub-Transfer Agent”), to provide the day-to-day transfer agent and shareholder servicing of the Fund. Under the Sub-Transfer Agency Agreement, the Transfer Agent pays the Sub-Transfer Agent an annual fee in monthly installments, equal to a percentage of the transfer agent fee collected by the Transfer Agent from the Fund, which shall be calculated after any applicable fee waivers. The fee paid to the Sub-Transfer Agent is paid by the Transfer Agent, not by the Fund.
|
| 28 �� OPPENHEIMER CORE BOND FUND/VA |
8. Fees and Other Transactions with Affiliates (Continued)
Trustees’ Compensation. The Fund’s Board of Trustees (“Board”) has adopted a compensation deferral plan for Independent Trustees that enables Trustees to elect to defer receipt of all or a portion of the annual compensation they are entitled to receive from the Fund. For purposes of determining the amount owed to the Trustee under the plan, deferred amounts are treated as though equal dollar amounts had been invested in shares of the Fund or in other Oppenheimer funds selected by the Trustee. The Fund purchases shares of the funds selected for deferral by the Trustee in amounts equal to his or her deemed investment, resulting in a Fund asset equal to the deferred compensation liability. Such assets are included as a component of “Other” within the asset section of the Statement of Assets and Liabilities. Deferral of Trustees’ fees under the plan will not affect the net assets of the Fund and will not materially affect the Fund’s assets, liabilities or net investment income per share. Amounts will be deferred until distributed in accordance with the compensation deferral plan.
Distribution and Service Plan for Service Shares. The Fund has adopted a Distribution and Service Plan (the “Plan”) pursuant to Rule 12b-1 under the 1940 Act for Service shares to pay OppenheimerFunds Distributor, Inc. (the “Distributor”), for distribution related services, personal service and account maintenance for the Fund’s Service shares. Under the Plan, payments are made periodically at an annual rate of 0.25% of the daily net assets of Service shares of the Fund. The Distributor currently uses all of those fees to compensate sponsors of the insurance product that offers Fund shares, for providing personal service and maintenance of accounts of their variable contract owners that hold Service shares. These fees are paid out of the Fund’s assets on an on-going basis and increase operating expenses of the Service shares, which results in lower performance compared to the Fund’s shares that are not subject to a service fee. Fees incurred by the Fund under the Plan are detailed in the Statement of Operations.
Waivers and Reimbursements of Expenses. The Manager has contractually agreed to limit the Fund’s expenses after payments, waivers and/or reimbursements and reduction to custodian expenses, excluding expenses incurred directly or indirectly by the Fund as a result of investments in other investment companies, wholly-owned subsidiaries and pooled investment vehicles; so that those expenses, as percentages of daily net assets, will not exceed the annual rate of 0.75% for Non-Service shares and 1.00% for Service shares. During the six months ended June 30, 2015, the Manager waived fees and/or reimbursed the Fund $25,634 and $15,381 for Non-Service and Service shares, respectively.
The Manager will waive fees and/or reimburse Fund expenses in an amount equal to the indirect management fees incurred through the Fund’s investment in IMMF. During the six months ended June 30, 2015, the Manager waived fees and/or reimbursed the Fund $3,390 for IMMF management fees.
Waivers and/or reimbursements may be modified or terminated as set forth according to the terms in the prospectus.
9. Pending Litigation
In 2009, several lawsuits were filed as putative class actions and later consolidated before the U.S. District Court for the District of Colorado in connection with the investment performance of Oppenheimer Rochester California Municipal Fund (the “California Fund Suit”), a fund advised by OppenheimerFunds, Inc. (“OFI”), and distributed by its subsidiary OppenheimerFunds Distributor, Inc. ( “OFDI”). The plaintiffs asserted claims against OFI, OFDI and certain present and former trustees and officers of the Fund under the federal securities laws, alleging, among other things, that the disclosure documents of the Fund contained misrepresentations and omissions and the investment policies of the Fund were not followed. Plaintiffs in the California Fund Suit filed an amended complaint and defendants filed a motion to dismiss. In 2011, the court issued an order which granted in part and denied in part the defendants’ motion to dismiss. In 2012, plaintiffs filed a motion, which defendants opposed, to certify a class and appoint class representatives and class counsel. In March 2015, the court granted plaintiffs’ motion for class certification. In May 2015, the U.S. Court of Appeals for the Tenth Circuit vacated the class certification order and remanded the matter to the district court for further proceedings. In July 2015, the district court held an evidentiary hearing on plaintiffs’ motion for class certification. OFI and OFDI believe the California Fund Suit is without merit; that it is premature to render any opinion as to the likelihood of an outcome unfavorable to them in the California Fund Suit; and that no estimate can yet be made as to the amount or range of any potential loss.
|
| 29 OPPENHEIMER CORE BOND FUND/VA |
PORTFOLIO PROXY VOTING POLICIES AND PROCEDURES; UPDATES TO STATEMENTS OF INVESTMENTS Unaudited
The Fund has adopted Portfolio Proxy Voting Policies and Procedures under which the Fund votes proxies relating to securities (“portfolio proxies”) held by the Fund. A description of the Fund’s Portfolio Proxy Voting Policies and Procedures is available (i) without charge, upon request, by calling the Fund toll-free at 1.800.525.7048, (ii) on the Fund’s website at www.oppenheimerfunds.com, and (iii) on the SEC’s website at www.sec.gov. In addition, the Fund is required to file Form N-PX, with its complete proxy voting record for the 12 months ended June 30th, no later than August 31st of each year. The Fund’s voting record is available (i) without charge, upon request, by calling the Fund toll-free at 1.800.525.7048, and (ii) in the Form N-PX filing on the SEC’s website at www.sec.gov.
The Fund files its complete schedule of portfolio holdings with the SEC for the first quarter and the third quarter of each fiscal year on Form N-Q. The Fund’s Form N-Q filings are available on the SEC’s website at www.sec.gov. Those forms may be reviewed and copied at the SEC’s Public Reference Room in Washington, D.C. Information on the operation of the Public Reference Room may be obtained by calling 1-800-SEC-0330.
|
| 30 OPPENHEIMER CORE BOND FUND/VA |
DISTRIBUTION SOURCES Unaudited
For any distribution that took place over the Fund’s reporting period, the table below details on a per-share basis the percentage of the Fund’s total distribution payment amount that was derived from the following sources: net income, net profit from the sale of securities, and other capital sources. This information is based upon income and capital gains using generally accepted accounting principles as of the date of each distribution. Because the Fund is actively managed, the relative amount of the Fund’s total distributions derived from various sources over the calendar year may change. Please note that this information should not be used for tax reporting purposes as the tax character of distributable income may differ from the amounts used for this notification. You will receive IRS tax forms in the first quarter of each calendar year detailing the actual amount of the taxable and non-taxable portion of distributions paid to you during the tax year.
For the most current information, please go to oppenheimerfunds.com. Select your Fund, then the ’Detailed’ tab; where ‘Dividends’ are shown, the Fund’s latest pay date will be followed by the sources of any distribution, updated daily.
| | | | | | | | | | | | | | | | |
| | | | | | | | | Net Profit | | | Other Capital | |
| Fund Name | | Pay Date | | | Net Income | | | from Sale | | | Sources | |
Oppenheimer Core Bond Fund/VA | | | 6/16/15 | | | | 94.3% | | | | 5.7% | | | | 0.0% | |
|
| 31 OPPENHEIMER CORE BOND FUND/VA |
OPPENHEIMER CORE BOND FUND/VA
A Series of Oppenheimer Variable Account Funds
| | |
| Trustees and Officers | | Sam Freedman, Chairman of the Board of Trustees and Trustee |
| | Jon S. Fossel, Trustee |
| | Richard F. Grabish, Trustee |
| | Beverly L. Hamilton, Trustee |
| | Victoria J. Herget, Trustee |
| | Robert J. Malone, Trustee |
| | F. William Marshall, Jr., Trustee |
| | Karen L. Stuckey, Trustee |
| | James D. Vaughn, Trustee |
| | Arthur P. Steinmetz, Trustee, President and Principal Executive Officer |
| | Krishna Memani, Vice President |
| | Peter A. Strzalkowski, Vice President |
| | Arthur S. Gabinet, Secretary and Chief Legal Officer |
| | Jennifer Sexton, Vice President and Chief Business Officer |
| | Mary Ann Picciotto, Chief Compliance Officer and Chief Anti-Money Laundering Officer |
| | Brian W. Wixted, Treasurer and Principal Financial & Accounting Officer |
| Manager | | OFI Global Asset Management, Inc. |
| |
| Sub-Adviser | | OppenheimerFunds, Inc. |
| |
| Distributor | | OppenheimerFunds Distributor, Inc. |
| |
| Transfer and | | OFI Global Asset Management, Inc. |
| Shareholder Servicing | | |
| Agent | | |
| |
| Sub-Transfer Agent | | Shareholder Services, Inc. |
| | DBA OppenheimerFunds Services |
| |
| Independent | | KPMG LLP |
| Registered Public | | |
| Accounting Firm | | |
| |
| Legal Counsel | | Ropes & Gray LLP |
| |
| | Before investing in any of the Oppenheimer funds, investors should carefully consider a fund’s investment objectives, risks, charges and expenses. Fund prospectuses and summary prospectuses contain this and other information about the funds and may be obtained by asking your financial advisor, visiting oppenheimerfunds.com or calling us at 1.800.988.8287. Read prospectuses and summary prospectuses carefully before investing. |
| |
| | The financial statements included herein have been taken from the records of the Fund without examination of those records by the independent auditors. |
| |
| | © 2015 OppenheimerFunds, Inc. All rights reserved. Oppenheimer funds are distributed by OppenheimerFunds Distributor, Inc. |
| |
| |  |
| | | | |
| | 
| | |
| | June 30, 2015 | | |
| | | Oppenheimer | | |
| | Global Fund/VA | | Semiannual Report |
| | | A Series of Oppenheimer Variable Account Funds | | |
| | SEMIANNUAL REPORT | | |
| | Listing of Top Holdings Fund Performance Discussion Financial Statements | | |
PORTFOLIO MANAGER: Rajeev Bhaman, CFA
AVERAGE ANNUAL TOTAL RETURNS FOR THE PERIODS ENDED 6/30/15
| | | | | | | | | | | | | | | | | | | | |
| | | Inception
Date | | | 6-Months | | | 1-Year | | | 5-Year | | | 10-Year | |
Non-Service Shares | | | 11/12/90 | | | | 10.29% | | | | 7.89 | % | | | 14.94 | % | | | 8.31 % | |
Service Shares | | | 7/13/00 | | | | 10.16 | | | | 7.62 | | | | 14.66 | | | | 8.04 | |
MSCI All Country World Index | | | | | | | 2.66 | | | | 0.71 | | | | 11.93 | | | | 6.41 | |
Performance data quoted represents past performance, which does not guarantee future results. The investment return and principal value of an investment in the Fund will fluctuate so that an investor’s shares, when redeemed, may be worth more or less than their original cost. Current performance may be lower or higher than the performance quoted. For performance data current to the most recent month end, call us at 1.800.988.8287. The Fund’s total returns include changes in share price and reinvested distributions but should not be expected to be the same as the returns of other funds, whether or not both funds have the same portfolio managers and/or similar names. The Fund’s total returns do not include the charges associated with the separate account products that offer this Fund. Such performance would have been lower if such charges were taken into account.
The Fund’s performance is compared to the performance of the MSCI All Country (AC) World Index, a free float-adjusted market capitalization weighted index that is designed to measure the equity market performance of developed and emerging markets. The Index is unmanaged and cannot be purchased directly by investors. While index comparisons may be useful to provide a benchmark for the Fund’s performance, it must be noted that the Fund’s investments are not limited to the investments comprising the Index. Index performance includes reinvestment of income, but does not reflect transaction costs, fees, expenses or taxes. Index performance is shown for illustrative purposes only as a benchmark for the Fund’s performance, and does not predict or depict performance of the Fund. The Fund’s performance reflects the effects of the Fund’s business and operating expenses.
TOP HOLDINGS AND ALLOCATIONS
TOP TEN COMMON STOCK HOLDINGS
| | | | |
| |
McGraw Hill Financial, Inc. | | | 2.6% | |
| |
Murata Manufacturing Co. Ltd. | | | 2.5 | |
| |
Altera Corp. | | | 2.4 | |
| |
Aetna, Inc. | | | 2.3 | |
| |
eBay, Inc. | | | 2.2 | |
| |
Walt Disney Co. (The) | | | 2.2 | |
| |
Airbus Group SE | | | 2.1 | |
| |
Anthem, Inc. | | | 2.1 | |
| |
Citigroup, Inc. | | | 2.1 | |
| |
Telefonaktiebolaget LM Ericsson, Cl. B | | | 2.0 | |
| |
Portfolio holdings and allocations are subject to change. Percentages are as of June 30, 2015, and are based on net assets. For more current Fund holdings, please visit oppenheimerfunds.com.
REGIONAL ALLOCATION
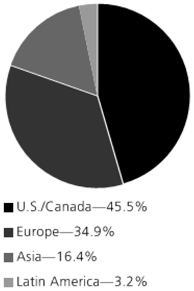
Portfolio holdings and allocations are subject to change. Percentages are as of June 30, 2015, and are based on the total market value of investments.
2 OPPENHEIMER GLOBAL FUND/VA
Fund Performance Discussion
During the six-month reporting period, the Fund’s Non-Service shares produced a return of 10.29%. By comparison, the MSCI AC World Index (the “Index”) returned 2.66%. The Fund outperformed the Index in all sectors, led by stock selection in the information technology, health care and financials sectors.
GLOBAL MARKET AND ECONOMIC ENVIRONMENT
For the six-month reporting period, global equities generally produced muted results. After U.S. equities outperformed other developed and emerging market equities in 2014, the market environment shifted in 2015. The dollar continued to strengthen, which acted as a drag on growth. Businesses, especially U.S. firms with revenues dependent on exporting goods and services, cited this as a headwind. European Central Bank (“ECB”) President Mario Draghi announced the purchase of €60 billion a month in sovereign bonds from Eurozone countries for at least 19 months, a form of quantitative easing (“QE”) that is projected to increase the ECB’s balance sheet by over €1 trillion. The announcement and implementation of these extraordinary monetary policies had a significant impact on financial markets. European markets rallied and the euro fell against the currencies of most major trading partners. This resulted in European and emerging market equities outperforming U.S. equities through May 2015. However, concerns around Greece’s debt situation emerged yet again late this reporting period. The market had hoped for an 11th hour resolution to the stand-off between Greece and its creditors, but instead got an escalation of the crisis after the Greek Prime Minister called for a referendum. In the minds of many, this increased the odds of a Greek exit from the Eurozone (“Grexit”) and impacted the markets through the end of the reporting period. Shortly after the period ended, Eurozone leaders agreed to offer Greece a third bailout, averting a Grexit for the time being.
TOP INDIVIDUAL CONTRIBUTORS
During the reporting period, top contributors to performance included Murata Manufacturing Co., Aetna Inc., and Altera Corp. Murata Manufacturing is a Japan-based smartphone ceramic capacitor manufacturer. The company has exceeded earnings expectations due to robust, global sales of high-end smartphones. As a component manufacturer with both Apple and Samsung as customers, it does not matter which company wins the next product refresh. A depreciating Japanese yen also boosted Murata, whose costs are in yen and sales are in U.S. dollars. Our investment thesis in Aetna, a health benefits company, was predicated on our belief that the company would be part of the solution to rising health care costs, and that the Affordable Care Act (Obamacare) would not supplant the entire private insurance market. Furthermore, we thought that the growth of the numbers of people entering the insured space as coverage was made broadly universal would add to both revenues and profits. So far, this proved to be correct. In a consolidating industry, we believe that Aetna’s scale and cost advantage should enable it to be one of the few survivors. Recently, Aetna bid to acquire Humana. Altera is a key player in the programmable logic device (PLD) niche of the semiconductor industry. In contrast to application-specific integrated circuits, PLDs can be reconfigured to address the unique needs of respective users. Recognizing the value of Altera’s intellectual property, Intel, the largest chip maker, announced plans to acquire Altera.
TOP INDIVIDUAL DETRACTORS
The most significant detractors from the Fund’s performance included Tiffany & Co., Telefonaktiebolaget LM Ericsson and Embraer SA. Tiffany & Co. experienced a soft holiday sales season due to some promotional missteps, and a strong U.S. dollar negatively impacted the bottom line. Despite much talk of China’s current slowdown, we believe our thesis on increasing consumption of luxury goods, particularly in the emerging markets, over the longer term remains intact. China has demonstrated a huge appetite for jewelry, with jewelry sales growing approximately 35% annually. Tiffany continues to improve its product offering, which has positive implications for margins, and continues to have a strong global brand, in our view. Ericsson, a mobile network operator, underperformed for a few reasons: slower U.S. recovery, 4G peaking in China and no resolution of a patent dispute with Apple. We view these as transient factors and remain comfortable with our position in Ericsson. Operating expenditures peaked in 2014, and we expect gross margin to improve as networks increasingly switch to software and capacity investment, which can drive LTE network quality. Ericsson is the leader in this area. Moreover, we believe that industry consolidation, which drives lower price erosion, benefits Ericsson, which has scale and a strong balance sheet with more than $5 billion in net cash. Embraer is one of the largest manufacturers of smaller sized jets, which are used in the commercial regional market and business jet market. Embraer also is well positioned with niche products in global defense markets, in our view. Although the company reported disappointing earnings earlier this year, we believed the market overreacted. We expected meaningful order flow to resume and the business jet market to pickup in activity, particularly in the emerging markets. Negative sentiment surrounding the outlook for the Brazilian economy also led the stock lower. We continue to like management’s disciplined approach to cash deployment and the company’s strong balance sheet.
STRATEGY & OUTLOOK
Headlines have very little to do with the way we invest, other than perhaps creating opportunities to buy or add to companies where we believe that near-term concerns have caused share prices to dislocate from long-term fundamentals. The Fund is a long-term, growth-oriented investment portfolio. We use a bottom-up, fundamental approach and seek to invest only in high quality companies with above average, sustainable growth characteristics. We seek to add value via our individual stock selection, and make no effort to mimic the weights assigned to the Index by sector, region or country. Valuation is a critical part of our investment criteria. Assuming we properly understand a given set of business economics, our returns are principally a function of paying an appropriate price.
3 OPPENHEIMER GLOBAL FUND/VA
The Fund’s investment strategy and focus can change over time. The mention of specific fund holdings does not constitute a recommendation by OppenheimerFunds, Inc. or its affiliates.
Shares of Oppenheimer funds are not deposits or obligations of any bank, are not guaranteed by any bank, are not insured by the FDIC or any other agency, and involve investment risks, including the possible loss of the principal amount invested.
4 OPPENHEIMER GLOBAL FUND/VA
Fund Expenses
Fund Expenses. As a shareholder of the Fund, you incur two types of costs: (1) transaction costs and (2) ongoing costs, including management fees; distribution and service fees; and other Fund expenses. These examples are intended to help you understand your ongoing costs (in dollars) of investing in the Fund and to compare these costs with the ongoing costs of investing in other mutual funds.
The examples are based on an investment of $1,000.00 invested at the beginning of the period and held for the entire 6-month period ended June 30, 2015.
Actual Expenses. The first section of the table provides information about actual account values and actual expenses. You may use the information in this section for the class of shares you hold, together with the amount you invested, to estimate the expense that you paid over the period. Simply divide your account value by $1,000.00 (for example, an $8,600.00 account value divided by $1,000.00 = 8.60), then multiply the result by the number in the first section under the heading entitled “Expenses Paid During the 6 Months Ended June 30, 2015” to estimate the expenses you paid on your account during this period.
Hypothetical Example for Comparison Purposes.
The second section of the table provides information about hypothetical account values and hypothetical expenses based on the Fund’s actual expense ratio for each class of shares, and an assumed rate of return of 5% per year for each class before expenses, which is not the actual return. The hypothetical account values and expenses may not be used to estimate the actual ending account balance or expenses you paid for the period. You may use this information to compare the ongoing costs of investing in the Fund and other funds. To do so, compare this 5% hypothetical example for the class of shares you hold with the 5% hypothetical examples that appear in the shareholder reports of the other funds.
Please note that the expenses shown in the table are meant to highlight your ongoing costs only and do not reflect any charges associated with the separate accounts that offer this Fund. Therefore, the “hypothetical” lines of the table are useful in comparing ongoing costs only, and will not help you determine the relative total costs of owning different funds. In addition, if these separate account charges were included your costs would have been higher.
| | | | | | | | | | | | | | | | |
| Actual | | Beginning
Account Value
January 1, 2015 | | | | | Ending
Account Value
June 30, 2015 | | | | | Expenses Paid During
6 Months Ended June 30, 2015 | |
Non-Service shares | | $ | 1,000.00 | | | | | $ | 1,102.90 | | | | | $ | 3.97 | |
Service shares | | | 1,000.00 | | | | | | 1,101.60 | | | | | | 5.28 | |
| | | | | |
Hypothetical (5% return before expenses) | | | | | | | | | | | | | |
Non-Service shares | | | 1,000.00 | | | | | | 1,021.03 | | | | | | 3.82 | |
Service shares | | | 1,000.00 | | | | | | 1,019.79 | | | | | | 5.07 | |
Expenses are equal to the Fund’s annualized expense ratio for that class, multiplied by the average account value over the period, multiplied by 181/365 (to reflect the one-half year period). Those annualized expense ratios, excluding indirect expenses from affiliated funds, based on the 6-month period ended June 30, 2015 are as follows:
| | | | | | |
| Class | | Expense Ratios | | | |
Non-Service shares | | | 0.76% | | | |
Service shares | | | 1.01 | | | |
The expense ratios reflect voluntary waivers and/or reimbursements of expenses by the Fund’s Manager. Some of these undertakings may be modified or terminated at any time, as indicated in the Fund’s prospectus. The “Financial Highlights” tables in the Fund’s financial statements, included in this report, also show the gross expense ratios, without such waivers or reimbursements and reduction to custodian expenses, if applicable.
5 OPPENHEIMER GLOBAL FUND/VA
STATEMENT OF INVESTMENTS June 30, 2015 Unaudited
| | | | | | | | | | | | |
| | | | | | | | | | | | |
| | | | | | | | | | | | |
| | | Shares | | | Value | | | | | |
| | | | | |
Common Stocks—97.2% | | | | | | | | | | | | |
| | | | | |
| Consumer Discretionary—11.6% | | | | | |
| | | | | |
| Hotels, Restaurants & Leisure—1.0% | | | | | |
| | | | | |
| International Game Technology plc1 | | | 808,101 | | | $ | 14,351,874 | | | | | |
| | | | | |
| McDonald’s Corp. | | | 147,660 | | | | 14,038,036 | | | | | |
| | | | | | | | | | | | |
| | | | | | | 28,389,910 | | | | | |
| | | | | |
| Internet & Catalog Retail—0.8% | | | | | |
| | | | | |
| JD.com, Inc., ADR1 | | | 706,301 | | | | 24,084,864 | | | | | |
| | | | | |
| Media—3.0% | | | | | |
| | | | | |
| Walt Disney Co. (The) | | | 547,130 | | | | 62,449,418 | | | | | |
| | | | | |
| Zee Entertainment Enterprises Ltd. | | | 4,184,363 | | | | 24,232,668 | | | | | |
| | | | | | | | | | | | |
| | | | | | | 86,682,086 | | | | | |
| | | | | |
| Specialty Retail—3.0% | | | | | |
| | | | | |
| Inditex SA | | | 1,463,755 | | | | 47,734,284 | | | | | |
| | | | | |
| Tiffany & Co. | | | 406,890 | | | | 37,352,502 | | | | | |
| | | | | | | | | | | | |
| | | | | | | 85,086,786 | | | | | |
| | | | | |
| Textiles, Apparel & Luxury Goods—3.8% | | | | | |
| | | | | |
| Brunello Cucinelli SpA | | | 394,305 | | | | 7,385,334 | | | | | |
| | | | | |
| Kering | | | 189,430 | | | | 33,790,057 | | | | | |
| | | | | |
| LVMH Moet Hennessy Louis Vuitton SE | | | 293,580 | | | | 51,392,959 | | | | | |
| | | | | |
| Tod’s SpA | | | 162,664 | | | | 15,440,385 | | | | | |
| | | | | | | | | | | | |
| | | | | | | 108,008,735 | | | | | |
| | | | | |
| Consumer Staples—5.4% | | | | | |
| | | | | |
| Beverages—1.0% | | | | | |
| | | | | |
| Ambev SA, ADR | | | 1,193,225 | | | | 7,278,672 | | | | | |
| | | | | |
| Fomento Economico Mexicano SAB de CV, ADR | | | 222,675 | | | | 19,838,116 | | | | | |
| | | | | | | | | | | | |
| | | | | | | 27,116,788 | | | | | |
| | | | | |
| Food Products—2.6% | | | | | |
| | | | | |
| Nestle SA | | | 370,589 | | | | 26,788,225 | | | | | |
| | | | | |
| Unilever plc | | | 1,128,493 | | | | 48,508,888 | | | | | |
| | | | | | | | | | | | |
| | | | | | | 75,297,113 | | | | | |
| | | | | |
| Household Products—1.8% | | | | | |
| | | | | |
| Colgate-Palmolive Co. | | | 806,580 | | | | 52,758,398 | | | | | |
| | | | | |
| Energy—1.5% | | | | | |
| | | | | |
| Energy Equipment & Services—0.9% | | | | | |
| | | | | |
Technip SA | | | 442,690 | | | | 27,420,157 | | | | | |
| | | | | |
| Oil, Gas & Consumable Fuels—0.6% | | | | | |
| | | | | |
Repsol SA | | | 922,284 | | | | 16,235,447 | | | | | |
| | | | | |
| Financials—23.5% | | | | | |
| | | | | |
| Capital Markets—6.3% | | | | | |
| | | | | |
| Credit Suisse Group AG1 | | | 1,285,391 | | | | 35,319,284 | | | | | |
| | | | | |
| Deutsche Bank AG | | | 970,715 | | | | 29,154,542 | | | | | |
| | | | | |
| Goldman Sachs Group, Inc. (The) | | | 221,910 | | | | 46,332,589 | | | | | |
| | | | | |
| Nomura Holdings, Inc. | | | 2,229,800 | | | | 15,029,226 | | | | | |
| | | | | |
| UBS Group AG1 | | | 2,655,498 | | | | 56,304,942 | | | | | |
| | | | | | | | | | | | |
| | | | | | | 182,140,583 | | | | | |
| | | | | |
| Commercial Banks—7.5% | | | | | |
| | | | | |
| Banco Bilbao Vizcaya Argentaria SA | | | 3,243,794 | | | | 31,908,975 | | | | | |
| | | | | |
| Citigroup, Inc. | | | 1,064,860 | | | | 58,822,866 | | | | | |
| | | | | |
| ICICI Bank Ltd., Sponsored ADR | | | 4,201,880 | | | | 43,783,590 | | | | | |
| | | | | |
| Itau Unibanco Holding SA, ADR | | | 2,027,744 | | | | 22,203,797 | | | | | |
| | | | | |
| Societe Generale SA | | | 542,139 | | | | 25,293,348 | | | | | |
| | | | | |
| Sumitomo Mitsui Financial Group, Inc. | | | 735,000 | | | | 32,659,310 | | | | | |
| | | | | | | | | | | | |
| | | | | | | 214,671,886 | | | | | |
| | | | | |
| Diversified Financial Services—3.1% | | | | | |
| | | | | |
| BM&FBovespa SA-Bolsa de Valores Mercadorias e Futuros | | | 3,982,700 | | | | 15,013,105 | | | | | |
| | | | | |
| McGraw Hill Financial, Inc. | | | 727,140 | | | | 73,041,213 | | | | | |
| | | | | | | | | | | | |
| | | | | | | 88,054,318 | | | | | |
| | | | | | | | | | | | |
| | | | | | | | |
| | | | | | | | |
| | | | | | | | |
| | | Shares | | | Value | |
| |
| Insurance—5.5% | |
| |
| Allianz SE | | | 276,129 | | | $ | 42,991,006 | |
| |
| Dai-ichi Life Insurance Co. Ltd. (The) | | | 2,082,800 | | | | 40,904,303 | |
| |
| FNF Group | | | 593,570 | | | | 21,956,154 | |
| |
| Prudential plc | | | 2,116,097 | | | | 51,062,687 | |
| | | | | | | | |
| | | | | | | 156,914,150 | |
| |
| Real Estate Management & Development—1.1% | |
| |
| DLF Ltd. | | | 17,080,971 | | | | 31,152,755 | |
| |
| Health Care—18.3% | |
| |
| Biotechnology—8.5% | |
| |
| ACADIA Pharmaceuticals, Inc.1 | | | 489,720 | | | | 20,509,474 | |
| |
| Biogen, Inc.1 | | | 74,940 | | | | 30,271,264 | |
| |
| BioMarin Pharmaceutical, Inc.1 | | | 209,630 | | | | 28,673,191 | |
| |
| Bluebird Bio, Inc.1 | | | 88,220 | | | | 14,853,601 | |
| |
| Celldex Therapeutics, Inc.1 | | | 1,075,550 | | | | 27,125,371 | |
| |
| Circassia Pharmaceuticals plc1 | | | 4,555,513 | | | | 20,947,919 | |
| |
| Clovis Oncology, Inc.1 | | | 216,860 | | | | 19,057,657 | |
| |
| Gilead Sciences, Inc. | | | 359,970 | | | | 42,145,288 | |
| |
| MacroGenics, Inc.1 | | | 36,540 | | | | 1,387,424 | |
| |
| Medivation, Inc.1 | | | 109,910 | | | | 12,551,722 | |
| |
| Vertex Pharmaceuticals, Inc.1 | | | 205,840 | | | | 25,417,123 | |
| | | | | | | | |
| | | | | | | 242,940,034 | |
| |
| Health Care Equipment & Supplies—1.8% | |
| |
| St. Jude Medical, Inc. | | | 268,810 | | | | 19,641,946 | |
| |
| Zimmer Biomet Holdings, Inc. | | | 281,390 | | | | 30,736,230 | |
| | | | | | | | |
| | | | | | | 50,378,176 | |
| |
| Health Care Providers & Services—4.4% | |
| |
| Aetna, Inc. | | | 526,790 | | | | 67,144,654 | |
| |
| Anthem, Inc. | | | 358,815 | | | | 58,895,894 | |
| | | | | | | | |
| | | | | | | 126,040,548 | |
| |
| Pharmaceuticals—3.6% | |
| |
| Bayer AG | | | 314,316 | | | | 43,981,560 | |
| |
| Roche Holding AG | | | 91,670 | | | | 25,736,671 | |
| |
| Shire plc | | | 251,120 | | | | 20,185,822 | |
| |
| Theravance Biopharma, Inc.1 | | | 157,022 | | | | 2,044,427 | |
| |
| Theravance, Inc. | | | 624,740 | | | | 11,289,052 | |
| | | | | | | | |
| | | | | | | 103,237,532 | |
| |
| Industrials—11.0% | |
| |
| Aerospace & Defense—2.8% | |
| |
| Airbus Group SE | | | 917,960 | | | | 59,473,013 | |
| |
| Embraer SA, Sponsored ADR | | | 724,823 | | | | 21,954,889 | |
| | | | | | | | |
| | | | | | | 81,427,902 | |
| |
| Air Freight & Couriers—1.2% | |
| |
| United Parcel Service, Inc., Cl. B | | | 342,350 | | | | 33,177,138 | |
| |
| Building Products—1.4% | |
| |
| Assa Abloy AB, Cl. B | | | 2,144,913 | | | | 40,390,110 | |
| |
| Construction & Engineering—0.4% | |
| |
| FLSmidth & Co. AS | | | 254,064 | | | | 12,257,587 | |
| |
| Electrical Equipment—2.6% | |
| |
| Emerson Electric Co. | | | 377,670 | | | | 20,934,248 | |
| |
| Nidec Corp. | | | 559,300 | | | | 41,951,148 | |
| |
| Prysmian SpA | | | 511,891 | | | | 11,048,253 | |
| | | | | | | | |
| | | | | | | 73,933,649 | |
| |
| Industrial Conglomerates—1.8% | |
| |
| 3M Co. | | | 249,760 | | | | 38,537,968 | |
| |
| Siemens AG | | | 135,121 | | | | 13,607,420 | |
| | | | | | | | |
| | | | | | | 52,145,388 | |
| |
| Machinery—0.8% | |
| |
| FANUC Corp. | | | 107,400 | | | | 21,925,269 | |
6 OPPENHEIMER GLOBAL FUND/VA
| | | | | | | | |
| | | Shares | | | Value | |
| |
| Information Technology—23.5% | |
| |
| Communications Equipment—2.0% | |
| |
| Telefonaktiebolaget LM Ericsson, Cl. B | | | 5,443,909 | | | $ | 56,352,793 | |
| |
| Electronic Equipment, Instruments, & Components—5.1% | |
| |
| Keyence Corp. | | | 80,811 | | | | 43,570,402 | |
| |
| Kyocera Corp. | | | 614,100 | | | | 31,909,819 | |
| |
| Murata Manufacturing Co. Ltd. | | | 405,900 | | | | 70,769,739 | |
| | | | | | | | |
| | | | | | | 146,249,960 | |
| |
| Internet Software & Services—6.9% | |
| |
| eBay, Inc.1 | | | 1,055,640 | | | | 63,591,754 | |
| |
| Facebook, Inc., Cl. A1 | | | 504,910 | | | | 43,303,606 | |
| |
| Google, Inc., Cl. A1 | | | 77,700 | | | | 41,961,108 | |
| |
| Google, Inc., Cl. C1 | | | 75,692 | | | | 39,398,443 | |
| |
| Qihoo 360 Technology Co. Ltd., ADR1 | | | 154,060 | | | | 10,428,321 | |
| | | | | | | | |
| | | | | | | 198,683,232 | |
| |
| IT Services—0.2% | |
| |
| Earthport plc1 | | | 6,806,563 | | | | 4,065,964 | |
| |
| Semiconductors & Semiconductor Equipment—4.1% | |
| |
| Altera Corp. | | | 1,338,100 | | | | 68,510,720 | |
| |
| Maxim Integrated Products, Inc. | | | 1,413,215 | | | | 48,861,909 | |
| | | | | | | | |
| | | | | | | 117,372,629 | |
| |
| Software—5.2% | |
| |
| Adobe Systems, Inc.1 | | | 633,933 | | | | 51,354,912 | |
| |
| Intuit, Inc. | | | 515,140 | | | | 51,910,658 | |
| |
| SAP SE | | | 669,371 | | | | 46,641,845 | |
| | | | | | | | |
| | | | | | | 149,907,415 | |
| | | | | | | | |
| | | Shares | | | Value | |
| |
| Materials—1.0% | |
| |
| Chemicals—1.0% | |
| |
| Linde AG | | | 147,441 | | | $ | 27,918,084 | |
| |
| Telecommunication Services—1.4% | |
| |
| Wireless Telecommunication Services—1.4% | |
| |
| KDDI Corp. | | | 1,619,800 | | | | 38,955,961 | |
| | | | | | | | |
Total Common Stocks (Cost $1,489,138,998) | | | | | | | 2,781,373,347 | |
| |
Preferred Stocks—1.8% | |
| |
| Bayerische Motoren Werke (BMW) AG, Preference | | | 590,367 | | | | 49,960,954 | |
| |
| Zee Entertainment Enterprises Ltd., 6% Cum. Non-Cv. | | | 79,253,601 | | | | 1,057,876 | |
| | | | | | | | |
| Total Preferred Stocks (Cost $18,576,232) | | | | | | | 51,018,830 | |
| | |
| | | Units | | | | |
| |
Rights, Warrants and Certificates—0.0% | |
| |
| Rapsol SA Rts., Strike Price 1EUR, Exp. 7/3/151 (Cost $—) | | | 922,284 | | | | 478,117 | |
| | |
| | | Shares | | | Value | |
| |
Investment Company—0.7% | | | | | | | | |
| |
Oppenheimer Institutional Money Market Fund, Cl. E, 0.15%2,3 (Cost $21,019,076) | | | 21,019,076 | | | | 21,019,076 | |
| |
| Total Investments, at Value (Cost $1,528,734,306) | | | 99.7% | | | | 2,853,889,370 | |
| |
| Net Other Assets (Liabilities) | | | 0.3 | | | | 8,987,212 | |
| | | | |
| Net Assets | | | 100.0% | | | $ | 2,862,876,582 | |
| | | | |
Footnotes to Statement of Investments
Strike price is reported in U.S. Dollars, except for those denoted in the following currency:
EUR Euro
1. Non-income producing security.
2. Is or was an affiliate, as defined in the Investment Company Act of 1940, as amended, at or during the period ended June 30, 2015, by virtue of the Fund owning at least 5% of the voting securities of the issuer or as a result of the Fund and the issuer having the same investment adviser. Transactions during the period in which the issuer was an affiliate are as follows:
| | | | | | | | | | | | | | | | | | | | | | |
| | | Shares
December 31, 2014 | | | | | Gross
Additions | | | | | Gross
Reductions | | | | | Shares
June 30, 2015 | |
| |
Oppenheimer Institutional Money Market Fund, Cl. E | | | 12,394,365 | | | | | | 215,774,981 | | | | | | 207,150,270 | | | | | | 21,019,076 | |
| | | | | | | | |
| | | Value | | | Income | |
| |
Oppenheimer Institutional Money Market Fund, Cl. E | | $ | 21,019,076 | | | $ | 17,236 | |
3. Rate shown is the 7-day yield as of June 30, 2015.
Distribution of investments representing geographic holdings, as a percentage of total investments at value, is as follows:
| | | | | | | | | | | | |
| Geographic Holdings | | Value | | | | | Percent | | | |
|
United States | | $ | 1,299,012,607 | | | | | | 45.5 | % | | |
Japan | | | 337,675,177 | | | | | | 11.8 | | | |
Germany | | | 254,255,411 | | | | | | 8.9 | | | |
Switzerland | | | 144,149,122 | | | | | | 5.1 | | | |
United Kingdom | | | 138,937,333 | | | | | | 4.9 | | | |
France | | | 137,896,521 | | | | | | 4.8 | | | |
India | | | 100,226,889 | | | | | | 3.5 | | | |
Sweden | | | 96,742,903 | | | | | | 3.4 | | | |
Spain | | | 96,356,822 | | | | | | 3.4 | | | |
Brazil | | | 66,450,463 | | | | | | 2.3 | | | |
Netherlands | | | 59,473,013 | | | | | | 2.1 | | | |
China | | | 34,513,185 | | | | | | 1.2 | | | |
Italy | | | 33,873,973 | | | | | | 1.2 | | | |
Ireland | | | 20,185,822 | | | | | | 0.7 | | | |
Mexico | | | 19,838,116 | | | | | | 0.7 | | | |
Denmark | | | 12,257,587 | | | | | | 0.4 | | | |
Cayman Islands | | | 2,044,426 | | | | | | 0.1 | | | |
| | | |
Total | | $ | 2,853,889,370 | | | | | | 100.0 | % | | |
| | | |
See accompanying Notes to Financial Statements.
7 OPPENHEIMER GLOBAL FUND/VA
STATEMENT OF ASSETS AND LIABILITIES June 30, 2015 Unaudited
| | | | | | |
|
Assets | | | | | | |
| Investments, at value—see accompanying statement of investments: | | | | | | |
| Unaffiliated companies (cost $1,507,715,230) | | $ | 2,832,870,294 | | | |
| Affiliated companies (cost $21,019,076) | | | 21,019,076 | | | |
| | | |
| | | 2,853,889,370 | | | |
|
| Cash | | | 4,984,832 | | | |
|
| Receivables and other assets: | | | | | | |
| Dividends | | | 5,620,258 | | | |
| Shares of beneficial interest sold | | | 4,024,616 | | | |
| Investments sold | | | 137,036 | | | |
| Other | | | 122,206 | | | |
| | | |
| Total assets | | | 2,868,778,318 | | | |
|
|
Liabilities | | | | | | |
| Payables and other liabilities: | | | | | | |
| Shares of beneficial interest redeemed | | | 5,207,187 | | | |
| Distribution and service plan fees | | | 270,231 | | | |
| Investments purchased | | | 136,788 | | | |
| Trustees’ compensation | | | 100,091 | | | |
| Shareholder communications | | | 71,892 | | | |
| Other | | | 115,547 | | | |
| | | |
| Total liabilities | | | 5,901,736 | | | |
|
|
| Net Assets | | $ | 2,862,876,582 | | | |
| | | |
|
|
Composition of Net Assets | | | | | | |
| Par value of shares of beneficial interest | | $ | 71,307 | | | |
|
| Additional paid-in capital | | | 1,462,600,320 | | | |
|
| Accumulated net investment income | | | 17,599,801 | | | |
|
| Accumulated net realized gain on investments and foreign currency transactions | | | 57,853,203 | | | |
|
| Net unrealized appreciation on investments and translation of assets and liabilities denominated in foreign currencies | | | 1,324,751,951 | | | |
| | | |
| Net Assets | | $ | 2,862,876,582 | | | |
| | | |
|
|
Net Asset Value Per Share | | | | | | |
| Non-Service Shares: | | | | | | |
| Net asset value, redemption price per share and offering price per share (based on net assets of $1,567,862,337 and 38,882,920 shares of beneficial interest outstanding) | | | $40.32 |
|
Service Shares: | | | | | | |
| Net asset value, redemption price per share and offering price per share (based on net assets of $1,295,014,245 and 32,424,160 shares of beneficial interest outstanding) | | | $39.94 |
See accompanying Notes to Financial Statements.
8 OPPENHEIMER GLOBAL FUND/VA
STATEMENT OF OPERATIONS For the Six Months Ended June 30, 2015 Unaudited
| | | | |
| |
Investment Income | | | | |
| Dividends: | | | | |
| Unaffiliated companies (net of foreign withholding taxes of $2,780,555) | | $ | 31,413,846 | |
| Affiliated companies | | | 17,236 | |
| |
| Interest | | | 192 | |
| |
| Portfolio lending fees | | | 6,775 | |
| | | | |
Total investment income | | | 31,438,049 | |
| |
Expenses | | | | |
| Management fees | | | 8,750,177 | |
| |
| Distribution and service plan fees - Service shares | | | 1,573,477 | |
| |
| Transfer and shareholder servicing agent fees: | | | | |
| Non-Service shares | | | 759,681 | |
| Service shares | | | 629,257 | |
| |
| Shareholder communications: | | | | |
| Non-Service shares | | | 58,095 | |
| Service shares | | | 47,945 | |
| |
| Custodian fees and expenses | | | 113,205 | |
| |
| Trustees’ compensation | | | 32,727 | |
| |
| Other | | | 116,311 | |
| | | | |
| Total expenses | | | 12,080,875 | |
| Less reduction to custodian expenses | | | (405) | |
| Less waivers and reimbursements of expenses | | | (13,755) | |
| | | | |
Net expenses | | | 12,066,715 | |
| |
Net Investment Income | | | 19,371,334 | |
| |
Realized and Unrealized Gain (Loss) | | | | |
| Net realized gain on: | | | | |
| Investments from unaffiliated companies | | | 82,531,820 | |
| Foreign currency transactions | | | 255,836 | |
| | | | |
| Net realized gain | | | 82,787,656 | |
| |
| Net change in unrealized appreciation/depreciation on: | | | | |
| Investments | | | 187,294,352 | |
| Translation of assets and liabilities denominated in foreign currencies | | | (22,019,960) | |
| | | | |
Net change in unrealized appreciation/depreciation | | | 165,274,392 | |
| |
| Net Increase in Net Assets Resulting from Operations | | $ | 267,433,382 | |
| | | | |
See accompanying Notes to Financial Statements.
9 OPPENHEIMER GLOBAL FUND/VA
STATEMENTS OF CHANGES IN NET ASSETS
| | | | | | | | |
| | | Six Months Ended June 30, 2015 (Unaudited) | | | Year Ended December 31, 2014 | |
| |
Operations | | | | | | | | |
| Net investment income | | $ | 19,371,334 | | | $ | 31,557,766 | |
| |
| Net realized gain | | | 82,787,656 | | | | 197,744,443 | |
| |
| Net change in unrealized appreciation/depreciation | | | 165,274,392 | | | | (172,610,475) | |
| | | | | | | | |
Net increase in net assets resulting from operations | | | 267,433,382 | | | | 56,691,734 | |
| |
Dividends and/or Distributions to Shareholders | | | | | | | | |
| Dividends from net investment income: | | | | | | | | |
| Non-Service shares | | | (19,562,645) | | | | (16,920,293) | |
| Service shares | | | (13,304,683) | | | | (10,958,436) | |
| | | | |
| | | (32,867,328) | | | | (27,878,729) | |
| |
| Distributions from net realized gain: | | | | | | | | |
| Non-Service shares | | | (97,527,552) | | | | (69,030,952) | |
| Service shares | | | (81,961,760) | | | | (57,658,820) | |
| | | | |
| | | (179,489,312) | | | | (126,689,772) | |
| |
Beneficial Interest Transactions | | | | | | | | |
| Net increase (decrease) in net assets resulting from beneficial interest transactions: | | | | | | | | |
| Non-Service shares | | | 69,071,496 | | | | (70,199,522) | |
| Service shares | | | 66,242,448 | | | | (60,956,871) | |
| | | | | | | | |
| | | 135,313,944 | | | | (131,156,393) | |
| |
Net Assets | | | | | | | | |
| Total increase (decrease) | | | 190,390,686 | | | | (229,033,160) | |
| |
| Beginning of period | | | 2,672,485,896 | | | | 2,901,519,056 | |
| | | | | | | | |
End of period (including accumulated net investment income of $17,599,801 and $31,095,795, respectively) | | $ | 2,862,876,582 | | | $ | 2,672,485,896 | |
| | | | |
See accompanying Notes to Financial Statements.
10 OPPENHEIMER GLOBAL FUND/VA
FINANCIAL HIGHLIGHTS
| | | | | | | | | | | | | | | | | | | | | | | | |
| Non-Service Shares | | Six Months Ended June 30, 2015 (Unaudited) | | | Year Ended December 31, 2014 | | | Year Ended December 31, 2013 | | | Year Ended December 31, 2012 | | | Year Ended December 30, 20111 | | | Year Ended December 31, 2010 | |
| |
Per Share Operating Data | | | | | | | | | | | | | | | | | | | | | | | | |
| Net asset value, beginning of period | | $ | 39.50 | | | $ | 40.86 | | | $ | 32.55 | | | $ | 27.46 | | | $ | 30.30 | | | $ | 26.50 | |
| |
| Income (loss) from investment operations: | | | | | | | | | | | | | | | | | | | | | | | | |
| Net investment income2 | | | 0.31 | | | | 0.50 | | | | 0.41 | | | | 0.44 | | | | 0.65 | | | | 0.33 | |
| Net realized and unrealized gain (loss) | | | 3.76 | | | | 0.46 | | | | 8.40 | | | | 5.29 | | | | (3.11) | | | | 3.85 | |
| | | | |
| Total from investment operations | | | 4.07 | | | | 0.96 | | | | 8.81 | | | | 5.73 | | | | (2.46) | | | | 4.18 | |
| |
| Dividends and/or distributions to shareholders: | | | | | | | | | | | | | | | | | | | | | | | | |
| Dividends from net investment income | | | (0.54) | | | | (0.46) | | | | (0.50) | | | | (0.64) | | | | (0.38) | | | | (0.38) | |
| Distributions from net realized gain | | | (2.71) | | | | (1.86) | | | | 0.00 | | | | 0.00 | | | | 0.00 | | | | 0.00 | |
| | | | |
| Total dividends and/or distributions to shareholders | | | (3.25) | | | | (2.32) | | | | (0.50) | | | | (0.64) | | | | (0.38) | | | | (0.38) | |
| |
| Net asset value, end of period | | $ | 40.32 | | | $ | 39.50 | | | $ | 40.86 | | | $ | 32.55 | | | $ | 27.46 | | | $ | 30.30 | |
| | | | |
| | | | |
| |
Total Return, at Net Asset Value3 | | | 10.29% | | | | 2.29% | | | | 27.31% | | | | 21.27% | | | | (8.29)% | | | | 15.96% | |
| | | | | | | | | | | | | | | | | | | | | | | | |
| |
Ratios/Supplemental Data | | | | | | | | | | | | | | | | | | | | | | | | |
| Net assets, end of period (in thousands) | | $ | 1,567,863 | | | $ | 1,468,107 | | | $ | 1,397,026 | | | $ | 1,252,127 | | | $ | 1,165,141 | | | $ | 1,410,764 | |
| |
| Average net assets (in thousands) | | $ | 1,532,362 | | | $ | 1,532,383 | | | $ | 1,333,848 | | | $ | 1,206,244 | | | $ | 1,335,403 | | | $ | 1,336,110 | |
| |
| Ratios to average net assets:4 | | | | | | | | | | | | | | | | | | | | | | | | |
| Net investment income | | | 1.50% | | | | 1.24% | | | | 1.13% | | | | 1.48% | | | | 2.17% | | | | 1.22% | |
| Total expenses5 | | | 0.76% | | | | 0.76% | | | | 0.77% | | | | 0.76% | | | | 0.76% | | | | 0.76% | |
| Expenses after payments, waivers and/or reimbursements and reduction to custodian expenses | | | 0.76% | | | | 0.76% | | | | 0.77% | | | | 0.76% | | | | 0.76% | | | | 0.76% | |
| |
| Portfolio turnover rate | | | 6% | | | | 13% | | | | 11% | | | | 14% | | | | 13% | | | | 15% | |
1. December 30, 2011 represents the last business day of the Fund’s reporting period.
2. Per share amounts calculated based on the average shares outstanding during the period.
3. Assumes an initial investment on the business day before the first day of the fiscal period, with all dividends and distributions reinvested in additional shares on the reinvestment date, and redemption at the net asset value calculated on the last business day of the fiscal period. Total returns are not annualized for periods less than one full year. Total return information does not reflect expenses that apply at the separate account level or to related insurance products. Inclusion of these charges would reduce the total return figures for all periods shown. Returns do not reflect the deduction of taxes that a shareholder would pay on fund distributions or the redemption of fund shares. The returns do not include adjustments in accordance with generally accepted accounting principles required at the period end for financial reporting purposes.
4. Annualized for periods less than one full year.
5. Total expenses including indirect expenses from affiliated fund fees and expenses were as follows:
| | | | | | |
| | | | | | |
| | Six Months Ended June 30, 2015 | | | 0.76 | % |
| | Year Ended December 31, 2014 | | | 0.76 | % |
| | Year Ended December 31, 2013 | | | 0.77 | % |
| | Year Ended December 31, 2012 | | | 0.76 | % |
| | Year Ended December 30, 2011 | | | 0.76 | % |
| | Year Ended December 31, 2010 | | | 0.76 | % |
See accompanying Notes to Financial Statements.
11 OPPENHEIMER GLOBAL FUND/VA
FINANCIAL HIGHLIGHTS Continued
| | | | | | | | | | | | | | | | | | | | | | | | |
| Service Shares | | Six Months Ended June 30, 2015 (Unaudited) | | | Year Ended December 31, 2014 | | | Year Ended December 31, 2013 | | | Year Ended December 31, 2012 | | | Year Ended December 30, 20111 | | | Year Ended December 31, 2010 | |
| |
Per Share Operating Data | | | | | | | | | | | | | | | | | | | | | | | | |
| Net asset value, beginning of period | | $ | 39.10 | | | $ | 40.47 | | | $ | 32.25 | | | $ | 27.21 | | | $ | 30.04 | | | $ | 26.28 | |
| |
| Income (loss) from investment operations: | | | | | | | | | | | | | | | | | | | | | | | | |
| Net investment income2 | | | 0.26 | | | | 0.40 | | | | 0.32 | | | | 0.36 | | | | 0.56 | | | | 0.26 | |
| Net realized and unrealized gain (loss) | | | 3.73 | | | | 0.44 | | | | 8.32 | | | | 5.25 | | | | (3.08) | | | | 3.82 | |
| | | | |
| Total from investment operations | | | 3.99 | | | | 0.84 | | | | 8.64 | | | | 5.61 | | | | (2.52) | | | | 4.08 | |
| |
| Dividends and/or distributions to shareholders: | | | | | | | | | | | | | | | | | | | | | | | | |
| Dividends from net investment income | | | (0.44) | | | | (0.35) | | | | (0.42) | | | | (0.57) | | | | (0.31) | | | | (0.32) | |
| Distributions from net realized gain | | | (2.71) | | | | (1.86) | | | | 0.00 | | | | 0.00 | | | | 0.00 | | | | 0.00 | |
| | | | |
| Total dividends and/or distributions to shareholders | | | (3.15) | | | | (2.21) | | | | (0.42) | | | | (0.57) | | | | (0.31) | | | | (0.32) | |
| |
| Net asset value, end of period | | $ | 39.94 | | | $ | 39.10 | | | $ | 40.47 | | | $ | 32.25 | | | $ | 27.21 | | | $ | 30.04 | |
| | | | |
| | | | |
| |
Total Return, at Net Asset Value3 | | | 10.16% | | | | 2.06% | | | | 26.99% | | | | 20.95% | | | | (8.53)% | | | | 15.70% | |
| | | | | | | | | | | | | | | | | | | | | | | | |
| |
Ratios/Supplemental Data | | | | | | | | | | | | | | | | | | | | | | | | |
| Net assets, end of period (in thousands) | | $ | 1,295,014 | | | $ | 1,204,379 | | | $ | 1,216,285 | | | $ | 1,130,388 | | | $ | 1,003,839 | | | $ | 1,101,584 | |
| |
| Average net assets (in thousands) | | $ | 1,269,279 | | | $ | 1,265,528 | | | $ | 1,174,119 | | | $ | 1,069,295 | | | $ | 1,091,128 | | | $ | 997,627 | |
| |
| Ratios to average net assets:4 | | | | | | | | | | | | | | | | | | | | | | | | |
| Net investment income | | | 1.27% | | | | 0.99% | | | | 0.89% | | | | 1.23% | | | | 1.90% | | | | 0.96% | |
| Total expenses5 | | | 1.01% | | | | 1.01% | | | | 1.02% | | | | 1.01% | | | | 1.01% | | | | 1.01% | |
| Expenses after payments, waivers and/or reimbursements and reduction to custodian expenses | | | 1.01% | | | | 1.01% | | | | 1.02% | | | | 1.01% | | | | 1.01% | | | | 1.01% | |
| |
| Portfolio turnover rate | | | 6% | | | | 13% | | | | 11% | | | | 14% | | | | 13% | | | | 15% | |
1. December 30, 2011 represents the last business day of the Fund’s reporting period.
2. Per share amounts calculated based on the average shares outstanding during the period.
3. Assumes an initial investment on the business day before the first day of the fiscal period, with all dividends and distributions reinvested in additional shares on the reinvestment date, and redemption at the net asset value calculated on the last business day of the fiscal period. Total returns are not annualized for periods less than one full year. Total return information does not reflect expenses that apply at the separate account level or to related insurance products. Inclusion of these charges would reduce the total return figures for all periods shown. Returns do not reflect the deduction of taxes that a shareholder would pay on fund distributions or the redemption of fund shares. The returns do not include adjustments in accordance with generally accepted accounting principles required at the period end for financial reporting purposes.
4. Annualized for periods less than one full year.
5. Total expenses including indirect expenses from affiliated fund fees and expenses were as follows:
| | | | | | |
| | | | | | |
| | Six Months Ended June 30, 2015 | | | 1.01 | % |
| | Year Ended December 31, 2014 | | | 1.01 | % |
| | Year Ended December 31, 2013 | | | 1.03 | % |
| | Year Ended December 31, 2012 | | | 1.01 | % |
| | Year Ended December 30, 2011 | | | 1.01 | % |
| | Year Ended December 31, 2010 | | | 1.01 | % |
See accompanying Notes to Financial Statements.
12 OPPENHEIMER GLOBAL FUND/VA
NOTES TO FINANCIAL STATEMENTS June 30, 2015 Unaudited
1. Organization
Oppenheimer Global Fund/VA (the “Fund”), a separate series of Oppenheimer Variable Account Funds, is a diversified open-end management investment company registered under the Investment Company Act of 1940 (“1940 Act”), as amended. The Fund’s investment objective is to seek capital appreciation. The Fund’s investment adviser is OFI Global Asset Management, Inc. (“OFI Global” or the “Manager”), a wholly-owned subsidiary of OppenheimerFunds, Inc. (“OFI” or the “Sub-Adviser”). The Manager has entered into a sub-advisory agreement with OFI. Shares of the Fund are sold only to separate accounts of life insurance companies.
The Fund offers two classes of shares. Both classes are sold at their offering price, which is the net asset value per share, to separate investment accounts of participating insurance companies as an underlying investment for variable life insurance policies, variable annuity contracts or other investment products. The class of shares designated as Service shares is subject to a distribution and service plan. Both classes of shares have identical rights and voting privileges with respect to the Fund in general and exclusive voting rights on matters that affect that class alone. Earnings, net assets and net asset value per share may differ due to each class having its own expenses, such as transfer and shareholder servicing agent fees and shareholder communications, directly attributable to that class.
The following is a summary of significant accounting policies followed in the Fund’s preparation of financial statements in accordance with accounting principles generally accepted in the United States (“U.S. GAAP”).
2. Significant Accounting Policies
Security Valuation. All investments in securities are recorded at their estimated fair value, as described in Note 3.
Reporting Period End Date. The last day of the Fund’s reporting period is the last day the New York Stock Exchange was open for trading during the period. The Fund’s financial statements have been presented through that date to maintain consistency with the Fund’s net asset value calculations used for shareholder transactions.
Foreign Currency Translation. The Fund’s accounting records are maintained in U.S. dollars. The values of securities denominated in foreign currencies and amounts related to the purchase and sale of foreign securities and foreign investment income are translated into U.S. dollars as of the close of the New York Stock Exchange (the “Exchange”), normally 4:00 P.M. Eastern time, on each day the Exchange is open for trading. Foreign exchange rates may be valued primarily using a reliable bank, dealer or service authorized by the Board of Trustees.
Reported net realized gains and losses from foreign currency transactions arise from sales of portfolio securities, sales and maturities of short-term securities, sales of foreign currencies, exchange rate fluctuations between the trade and settlement dates on securities transactions, and the difference between the amounts of dividends, interest, and foreign withholding taxes recorded on the Fund’s books and the U.S. dollar equivalent of the amounts actually received or paid. Net unrealized appreciation and depreciation on the translation of assets and liabilities denominated in foreign currencies arise from changes in the values of assets and liabilities, including investments in securities at fiscal period end, resulting from changes in exchange rates.
The effect of changes in foreign currency exchange rates on investments is separately identified from the fluctuations arising from changes in market values of securities held and reported with all other foreign currency gains and losses in the Fund’s Statement of Operations.
Allocation of Income, Expenses, Gains and Losses. Income, expenses (other than those attributable to a specific class), gains and losses are allocated on a daily basis to each class of shares based upon the relative proportion of net assets represented by such class. Operating expenses directly attributable to a specific class are charged against the operations of that class.
Dividends and Distributions to Shareholders. Dividends and distributions to shareholders, which are determined in accordance with income tax regulations and may differ from U.S. generally accepted accounting principles, are recorded on the ex-dividend date. Income and capital gain distributions, if any, are declared and paid annually or at other times as deemed necessary by the Manager.
The tax character of distributions is determined as of the Fund’s fiscal year end. Therefore, a portion of the Fund’s distributions made to shareholders prior to the Fund’s fiscal year end may ultimately be categorized as a tax return of capital.
Investment Income. Dividend income is recorded on the ex-dividend date or upon ex-dividend notification in the case of certain foreign dividends where the ex-dividend date may have passed. Non-cash dividends included in dividend income, if any, are recorded at the fair market value of the securities received. Interest income is recognized on an accrual basis. Discount and premium, which are included in interest income on the Statement of Operations, are amortized or accreted daily.
Custodian Fees. “Custodian fees and expenses” in the Statement of Operations may include interest expense incurred by the Fund on any cash overdrafts of its custodian account during the period. Such cash overdrafts may result from the effects of failed trades in portfolio securities and from cash outflows resulting from unanticipated shareholder redemption activity. The Fund pays interest to its custodian on such cash overdrafts, to the extent they are not offset by positive cash balances maintained by the Fund, at a rate equal to the Federal Funds Rate plus 0.50%. The “Reduction to custodian expenses” line item, if applicable, represents earnings on cash balances maintained by the Fund during the period. Such interest expense and other custodian fees may be paid with these earnings.
Security Transactions. Security transactions are recorded on the trade date. Realized gains and losses on securities sold are determined on the basis of identified cost.
13 OPPENHEIMER GLOBAL FUND/VA
NOTES TO FINANCIAL STATEMENTS Unaudited / Continued
2. Significant Accounting Policies (Continued)
Indemnifications. The Fund’s organizational documents provide current and former Trustees and officers with a limited indemnification against liabilities arising in connection with the performance of their duties to the Fund. In the normal course of business, the Fund may also enter into contracts that provide general indemnifications. The Fund’s maximum exposure under these arrangements is unknown as this would be dependent on future claims that may be made against the Fund. The risk of material loss from such claims is considered remote.
Federal Taxes. The Fund intends to comply with provisions of the Internal Revenue Code applicable to regulated investment companies and to distribute substantially all of its investment company taxable income to shareholders. Therefore, no federal income or excise tax provision is required. The Fund files income tax returns in U.S. federal and applicable state jurisdictions. The statute of limitations on the Fund’s tax return filings generally remains open for the three preceding fiscal reporting period ends.
During the fiscal year ended December 31, 2014, the Fund did not utilize any capital loss carryforward to offset capital gains realized in that fiscal year. Capital loss carryforwards with no expiration, if any, must be utilized prior to those with expiration dates. Capital losses with no expiration will be carried forward to future years if not offset by gains
Net investment income (loss) and net realized gain (loss) may differ for financial statement and tax purposes. The character of dividends and distributions made during the fiscal year from net investment income or net realized gains are determined in accordance with federal income tax requirements, which may differ from the character of net investment income or net realized gains presented in those financial statements in accordance with GAAP. Also, due to timing of dividends and distributions, the fiscal year in which amounts are distributed may differ from the fiscal year in which the income or net realized gain was recorded by the Fund.
The aggregate cost of securities and other investments and the composition of unrealized appreciation and depreciation of securities and other investments for federal income tax purposes as of June 30, 2015 are noted in the following table. The primary difference between book and tax appreciation or depreciation of securities and other investments, if applicable, is attributable to the tax deferral of losses or tax realization of financial statement unrealized gain or loss.
| | | | |
Federal tax cost of securities | | $ | 1,552,915,140 | |
| | | | |
| Gross unrealized appreciation | | $ | 1,415,601,421 | |
| Gross unrealized depreciation | | | (114,627,191) | |
| | | | |
| Net unrealized appreciation | | $ | 1,300,974,230 | |
| | | | |
Use of Estimates. The preparation of financial statements in conformity with accounting principles generally accepted in the United States of America requires management to make estimates and assumptions that affect the reported amounts of assets and liabilities and disclosure of contingent assets and liabilities at the date of the financial statements and the reported amounts of increases and decreases in net assets from operations during the reporting period. Actual results could differ from those estimates.
3. Securities Valuation
The Fund calculates the net asset value of its shares as of the close of the New York Stock Exchange (the “Exchange”), normally 4:00 P.M. Eastern time, on each day the Exchange is open for trading.
The Fund’s Board has adopted procedures for the valuation of the Fund’s securities and has delegated the day-to-day responsibility for valuation determinations under those procedures to the Manager. The Manager has established a Valuation Committee which is responsible for determining a “fair valuation” for any security for which market quotations are not “readily available.” The Valuation Committee’s fair valuation determinations are subject to review, approval and ratification by the Fund’s Board at its next regularly scheduled meeting covering the calendar quarter in which the fair valuation was determined.
Valuation Methods and Inputs
Securities are valued using unadjusted quoted market prices, when available, as supplied primarily by third party pricing services or dealers.
The following methodologies are used to determine the market value or the fair value of the types of securities described below:
Securities traded on a registered U.S. securities exchange (including exchange-traded derivatives other than futures and futures options) are valued based on the last sale price of the security reported on the principal exchange on which it is traded, prior to the time when the Fund’s assets are valued. In the absence of a sale, the security is valued at the last sale price on the prior trading day, if it is within the spread of the current day’s closing “bid” and “asked” prices, and if not, at the current day’s closing bid price. A security of a foreign issuer traded on a foreign exchange, but not listed on a registered U.S. securities exchange, is valued based on the last sale price on the principal exchange on which the security is traded, as identified by the third party pricing service used by the Manager, prior to the time when the Fund’s assets are valued. If the last sale price is unavailable, the security is valued at the most recent official closing price on the principal exchange on which it is traded. If the last sales price or official closing price for a foreign security is not available, the security is valued at the mean between the bid and asked price per the exchange or, if not available from the exchange, obtained from two dealers. If bid and asked prices are not available from either the exchange or two dealers, the security is valued by using one of the following methodologies (listed in order of priority): (1) using a bid from the exchange, (2) the mean between the bid and asked price as provided by a single dealer, or (3) a bid from a single dealer.
Shares of a registered investment company that are not traded on an exchange are valued at that investment company’s net asset value per share.
Corporate and government debt securities (of U.S. or foreign issuers) and municipal debt securities, event-linked bonds, loans, mortgage-backed securities, collateralized mortgage obligations, and asset-backed securities are valued at the mean between the “bid” and “asked” prices utilizing evaluated prices obtained from third party pricing services or broker-dealers who may use matrix pricing methods to determine the evaluated prices.
14 OPPENHEIMER GLOBAL FUND/VA
3. Securities Valuation (Continued)
Short-term money market type debt securities with a remaining maturity of sixty days or less are valued at cost adjusted by the amortization of discount or premium to maturity (amortized cost), which approximates market value. Short-term debt securities with a remaining maturity in excess of sixty days are valued at the mean between the “bid” and “asked” prices utilizing evaluated prices obtained from third party pricing services or broker-dealers.
A description of the standard inputs that may generally be considered by the third party pricing vendors in determining their evaluated prices is provided below.
| | |
| Security Type | | Standard inputs generally considered by third-party pricing vendors |
| Corporate debt, government debt, municipal, mortgage-backed and asset-backed securities | | Reported trade data, broker-dealer price quotations, benchmark yields, issuer spreads on comparable securities, the credit quality, yield, maturity, and other appropriate factors. |
| Loans | | Information obtained from market participants regarding reported trade data and broker-dealer price quotations. |
| Event-linked bonds | | Information obtained from market participants regarding reported trade data and broker-dealer price quotations. |
If a market value or price cannot be determined for a security using the methodologies described above, or if, in the “good faith” opinion of the Manager, the market value or price obtained does not constitute a “readily available market quotation,” or a significant event has occurred that would materially affect the value of the security, the security is fair valued either (i) by a standardized fair valuation methodology applicable to the security type or the significant event as previously approved by the Valuation Committee and the Fund’s Board or (ii) as determined in good faith by the Manager’s Valuation Committee. The Valuation Committee considers all relevant facts that are reasonably available, through either public information or information available to the Manager, when determining the fair value of a security. Fair value determinations by the Manager are subject to review, approval and ratification by the Fund’s Board at its next regularly scheduled meeting covering the calendar quarter in which the fair valuation was determined. Those fair valuation standardized methodologies include, but are not limited to, valuing securities at the last sale price or initially at cost and subsequently adjusting the value based on: changes in company specific fundamentals, changes in an appropriate securities index, or changes in the value of similar securities which may be further adjusted for any discounts related to security-specific resale restrictions. When possible, such methodologies use observable market inputs such as unadjusted quoted prices of similar securities, observable interest rates, currency rates and yield curves. The methodologies used for valuing securities are not necessarily an indication of the risks associated with investing in those securities nor can it be assured that the Fund can obtain the fair value assigned to a security if it were to sell the security.
To assess the continuing appropriateness of security valuations, the Manager, or its third party service provider who is subject to oversight by the Manager, regularly compares prior day prices, prices on comparable securities, and sale prices to the current day prices and challenges those prices exceeding certain tolerance levels with the third party pricing service or broker source. For those securities valued by fair valuations, whether through a standardized fair valuation methodology or a fair valuation determination, the Valuation Committee reviews and affirms the reasonableness of the valuations based on such methodologies and fair valuation determinations on a regular basis after considering all relevant information that is reasonably available.
Classifications
Each investment asset or liability of the Fund is assigned a level at measurement date based on the significance and source of the inputs to its valuation. Various data inputs are used in determining the value of each of the Fund’s investments as of the reporting period end. These data inputs are categorized in the following hierarchy under applicable financial accounting standards:
1) Level 1-unadjusted quoted prices in active markets for identical assets or liabilities (including securities actively traded on a securities exchange)
2) Level 2-inputs other than unadjusted quoted prices that are observable for the asset or liability (such as unadjusted quoted prices for similar assets and market corroborated inputs such as interest rates, prepayment speeds, credit risks, etc.)
3) Level 3-significant unobservable inputs (including the Manager’s own judgments about assumptions that market participants would use in pricing the asset or liability).
The inputs used for valuing securities are not necessarily an indication of the risks associated with investing in those securities.
The table below categorizes amounts that are included in the Fund’s Statement of Assets and Liabilities as of June 30, 2015 based on valuation input level:
| | | | | | | | | | | | | | | | |
| | | Level 1— Unadjusted Quoted Prices | | | Level 2— Other Significant Observable Inputs | | | Level 3—
Significant
Unobservable
Inputs | | | Value | |
| |
| Assets Table | | | | | | | | | | | | | | | | |
| Investments, at Value: | | | | | | | | | | | | | | | | |
| Common Stocks | | | | | | | | | | | | | | | | |
Consumer Discretionary | | $ | 152,276,694 | | | $ | 179,975,687 | | | $ | — | | | $ | 332,252,381 | |
Consumer Staples | | | 79,875,186 | | | | 75,297,113 | | | | — | | | | 155,172,299 | |
Energy | | | — | | | | 43,655,604 | | | | — | | | | 43,655,604 | |
Financials | | | 266,140,209 | | | | 406,793,483 | | | | — | | | | 672,933,692 | |
Health Care | | | 411,744,318 | | | | 110,851,972 | | | | — | | | | 522,596,290 | |
Industrials | | | 114,604,243 | | | | 200,652,800 | | | | — | | | | 315,257,043 | |
15 OPPENHEIMER GLOBAL FUND/VA
NOTES TO FINANCIAL STATEMENTS Unaudited / Continued
3. Securities Valuation (Continued)
| | | | | | | | | | | | | | | | |
| | | Level 1— Unadjusted Quoted Prices | | | Level 2— Other Significant Observable Inputs | | | Level 3— Significant Unobservable Inputs | | | Value | |
| |
| Common Stocks (Continued) | | | | | | | | | | | | | | | | |
Information Technology | | $ | 419,321,431 | | | $ | 253,310,562 | | | $ | — | | | $ | 672,631,993 | |
Materials | | | — | | | | 27,918,084 | | | | — | | | | 27,918,084 | |
Telecommunication Services | | | — | | | | 38,955,961 | | | | — | | | | 38,955,961 | |
| Preferred Stocks | | | 1,057,876 | | | | 49,960,954 | | | | — | | | | 51,018,830 | |
| Rights, Warrants and Certificates | | | — | | | | 478,117 | | | | — | | | | 478,117 | |
| Investment Company | | | 21,019,076 | | | | — | | | | — | | | | 21,019,076 | |
| | | | |
| Total Assets | | $ | 1,466,039,033 | | | $ | 1,387,850,337 | | | $ | — | | | $ | 2,853,889,370 | |
| | | | |
Forward currency exchange contracts and futures contracts, if any, are reported at their unrealized appreciation/depreciation at measurement date, which represents the change in the contract’s value from trade date. All additional assets and liabilities included in the above table are reported at their market value at measurement date.
The table below shows the transfers between Level 1 and Level 2. The Fund’s policy is to recognize transfers in and transfers out as of the beginning of the reporting period.
| | | | | | | | |
| | | Transfers out of
Level 1* | | | Transfers into Level 2* | |
| |
| Assets Table | | | | | | | | |
| Investments, at Value: | | | | | | | | |
| Common Stocks | | | | | | | | |
Financials | | $ | (47,359,051) | | | $ | 47,359,051 | |
| | | | |
| Total Assets | | $ | (47,359,051) | | | $ | 47,359,051 | |
| | | | |
*Transferred from Level 1 to Level 2 due to the absence of a readily available unadjusted quoted market price.
4. Investments and Risks
Investment in Oppenheimer Institutional Money Market Fund. The Fund is permitted to invest daily available cash balances in an affiliated money market fund. The Fund may invest the available cash in Class E shares of Oppenheimer Institutional Money Market Fund (“IMMF”) to seek current income while preserving liquidity or for defensive purposes. IMMF is a registered open-end management investment company, regulated as a money market fund under the 1940 Act. The Manager is the investment adviser of IMMF, and the Sub-Adviser provides investment and related advisory services to IMMF. When applicable, the Fund’s investment in IMMF is included in the Statement of Investments. Shares of IMMF are valued at their net asset value per share. As a shareholder, the Fund is subject to its proportional share of IMMF’s Class E expenses, including its management fee. The Manager will waive fees and/or reimburse Fund expenses in an amount equal to the indirect management fees incurred through the Fund’s investment in IMMF.
Equity Security Risk. Stocks and other equity securities fluctuate in price. The value of the Fund’s portfolio may be affected by changes in the equity markets generally. Equity markets may experience significant short-term volatility and may fall sharply at times. Different markets may behave differently from each other and U.S. equity markets may move in the opposite direction from one or more foreign stock markets. Adverse events in any part of the equity or fixed-income markets may have unexpected negative effects on other market segments.
The prices of individual equity securities generally do not all move in the same direction at the same time and a variety of factors can affect the price of a particular company’s securities. These factors may include, but are not limited to, poor earnings reports, a loss of customers, litigation against the company, general unfavorable performance of the company’s sector or industry, or changes in government regulations affecting the company or its industry.
5. Shares of Beneficial Interest
The Fund has authorized an unlimited number of $0.001 par value shares of beneficial interest of each class. Transactions in shares of beneficial interest were as follows:
| | | | | | | | | | | | | | |
| | | Six Months Ended June 30, 2015 | | | Year Ended December 31, 2014 | |
| | | Shares | | Amount | | | Shares | | | Amount | |
| |
| Non-Service Shares | | | | | | | | | | | | | | |
| Sold | | 1,775,780 | | $ | 75,019,058 | | | | 6,078,139 | | | $ | 247,743,232 | |
| Dividends and/or distributions reinvested | | 2,891,830 | | | 117,090,197 | | | | 2,154,167 | | | | 85,951,245 | |
| Redeemed | | (2,954,050) | | | (123,037,759) | | | | (9,920,341) | | | | (403,893,999)1 | |
| | | |
| Net increase (decrease) | | 1,713,560 | | $ | 69,071,496 | | | | (1,688,035) | | | $ | (70,199,522) | |
| | | |
16 OPPENHEIMER GLOBAL FUND/VA
5. Shares of Beneficial Interest (Continued)
| | | | | | | | | | | | | | | | | | |
| | | Six Months Ended June 30, 2015 | | | | | Year Ended December 31, 2014 | |
| | | Shares | | | Amount | | | | | Shares | | | Amount | |
| |
| Service Shares | | | | | | | | | | | | | | | | | | |
| Sold | | | 2,794,333 | | | $ | 114,867,766 | | | | | | 6,195,494 | | | $ | 248,008,573 | |
| Dividends and/or distributions reinvested | | | 2,375,129 | | | | 95,266,443 | | | | | | 1,734,511 | | | | 68,617,256 | |
| Redeemed | | | (3,543,953 | ) | | | (143,891,761) | | | | | | (9,552,933 | ) | | | (377,582,700)1 | |
| | | | |
| Net increase (decrease) | | | 1,625,509 | | | $ | 66,242,448 | | | | | | (1,622,928 | ) | | $ | (60,956,871) | |
| | | | |
1. Net of redemption fees of $1,517 and $1,367 for Non-Service and Service shares, respectively.
6. Purchases and Sales of Securities
The aggregate cost of purchases and proceeds from sales of securities, other than short-term obligations and investments in IMMF, for the six months ended June 30, 2015 were as follows:
| | | | | | | | | | |
| | | Purchases | | | | | Sales | |
| |
| Investment securities | | $ | 166,130,322 | | | | | $ | 239,908,839 | |
7. Fees and Other Transactions with Affiliates
Management Fees. Under the investment advisory agreement, the Fund pays the Manager a management fee based on the daily net assets of the Fund at an annual rate as shown in the following table:
| | | | |
| Fee Schedule | | | |
| |
Up to $200 million | | | 0.75% | |
Next $200 million | | | 0.72 | |
Next $200 million | | | 0.69 | |
Next $200 million | | | 0.66 | |
Next $4.2 billion | | | 0.60 | |
Over $5 billion | | | 0.58 | |
The Fund’s effective management fee for the six months ended June 30, 2015 was 0.63% of average annual net assets before any applicable waivers.
Sub-Adviser Fees. The Manager has retained the Sub-Adviser to provide the day-to-day portfolio management of the Fund. Under the Sub-Advisory Agreement, the Manager pays the Sub-Adviser an annual fee in monthly installments, equal to a percentage of the investment management fee collected by the Manager from the Fund, which shall be calculated after any investment management fee waivers. The fee paid to the Sub-Adviser is paid by the Manager, not by the Fund.
Transfer Agent Fees. OFI Global (the “Transfer Agent”) serves as the transfer and shareholder servicing agent for the Fund. The Fund pays the Transfer Agent a fee based on annual net assets. Fees incurred and average net assets for each class with respect to these services are detailed in the Statement of Operations and Financial Highlights, respectively.
Sub-Transfer Agent Fees. The Transfer Agent has retained Shareholder Services, Inc., a wholly-owned subsidiary of OFI (the “Sub-Transfer Agent”), to provide the day-to-day transfer agent and shareholder servicing of the Fund. Under the Sub-Transfer Agency Agreement, the Transfer Agent pays the Sub-Transfer Agent an annual fee in monthly installments, equal to a percentage of the transfer agent fee collected by the Transfer Agent from the Fund, which shall be calculated after any applicable fee waivers. The fee paid to the Sub-Transfer Agent is paid by the Transfer Agent, not by the Fund.
Trustees’ Compensation. The Fund’s Board of Trustees (“Board”) has adopted a compensation deferral plan for Independent Trustees that enables Trustees to elect to defer receipt of all or a portion of the annual compensation they are entitled to receive from the Fund. For purposes of determining the amount owed to the Trustee under the plan, deferred amounts are treated as though equal dollar amounts had been invested in shares of the Fund or in other Oppenheimer funds selected by the Trustee. The Fund purchases shares of the funds selected for deferral by the Trustee in amounts equal to his or her deemed investment, resulting in a Fund asset equal to the deferred compensation liability. Such assets are included as a component of “Other” within the asset section of the Statement of Assets and Liabilities. Deferral of Trustees’ fees under the plan will not affect the net assets of the Fund and will not materially affect the Fund’s assets, liabilities or net investment income per share. Amounts will be deferred until distributed in accordance with the compensation deferral plan.
Distribution and Service Plan for Service Shares. The Fund has adopted a Distribution and Service Plan (the “Plan”) pursuant to Rule 12b-1 under the 1940 Act for Service shares to pay OppenheimerFunds Distributor, Inc. (the “Distributor”), for distribution related services, personal service and account maintenance for the Fund’s Service shares. Under the Plan, payments are made periodically at an annual rate of 0.25% of the daily net assets of Service shares of the Fund. The Distributor currently uses all of those fees to compensate sponsors of the insurance product that offers Fund shares, for providing personal service and maintenance of accounts of their variable contract owners that hold Service shares. These fees are paid out of the Fund’s assets on an on-going basis and increase operating expenses of the Service shares, which results in lower performance compared to the Fund’s shares that are not subject to a service fee. Fees incurred by the Fund under the Plan are detailed in the Statement of Operations.
17 OPPENHEIMER GLOBAL FUND/VA
NOTES TO FINANCIAL STATEMENTS Unaudited / Continued
7. Fees and Other Transactions with Affiliates (Continued)
Waivers and Reimbursements of Expenses. The Manager has voluntarily agreed to limit the Fund’s expenses after payments, waivers and/or reimbursements and reduction to custodian expenses, excluding expenses incurred directly or indirectly by the Fund as a result of investments in other investment companies, wholly-owned subsidiaries and pooled investment vehicles; so that those expenses, as percentages of daily net assets, will not exceed the annual rate of 1.00% for Non-Service shares and 1.25% for Service shares.
The Manager will waive fees and/or reimburse Fund expenses in an amount equal to the indirect management fees incurred through the Fund’s investment in IMMF. During the six months ended June 30, 2015, the Manager waived fees and/or reimbursed the Fund $13,755 for IMMF management fees.
Waivers and/or reimbursements may be modified or terminated as set forth according to the terms in the prospectus.
8. Pending Litigation
In 2009, several lawsuits were filed as putative class actions and later consolidated before the U.S. District Court for the District of Colorado in connection with the investment performance of Oppenheimer Rochester California Municipal Fund (the “California Fund Suit”), a fund advised by OppenheimerFunds, Inc. (“OFI”), and distributed by its subsidiary OppenheimerFunds Distributor, Inc. ( “OFDI”). The plaintiffs asserted claims against OFI, OFDI and certain present and former trustees and officers of the Fund under the federal securities laws, alleging, among other things, that the disclosure documents of the Fund contained misrepresentations and omissions and the investment policies of the Fund were not followed. Plaintiffs in the California Fund Suit filed an amended complaint and defendants filed a motion to dismiss. In 2011, the court issued an order which granted in part and denied in part the defendants’ motion to dismiss. In 2012, plaintiffs filed a motion, which defendants opposed, to certify a class and appoint class representatives and class counsel. In March 2015, the court granted plaintiffs’ motion for class certification. In May 2015, the U.S. Court of Appeals for the Tenth Circuit vacated the class certification order and remanded the matter to the district court for further proceedings. In July 2015, the district court held an evidentiary hearing on plaintiffs’ motion for class certification. OFI and OFDI believe the California Fund Suit is without merit; that it is premature to render any opinion as to the likelihood of an outcome unfavorable to them in the California Fund Suit; and that no estimate can yet be made as to the amount or range of any potential loss.
18 OPPENHEIMER GLOBAL FUND/VA
PORTFOLIO PROXY VOTING POLICIES AND PROCEDURES; UPDATES TO STATEMENTS OF INVESTMENTS Unaudited
The Fund has adopted Portfolio Proxy Voting Policies and Procedures under which the Fund votes proxies relating to securities (“portfolio proxies”) held by the Fund. A description of the Fund’s Portfolio Proxy Voting Policies and Procedures is available (i) without charge, upon request, by calling the Fund toll-free at 1.800.525.7048, (ii) on the Fund’s website at www.oppenheimerfunds.com, and (iii) on the SEC’s website at www.sec.gov. In addition, the Fund is required to file Form N-PX, with its complete proxy voting record for the 12 months ended June 30th, no later than August 31st of each year. The Fund’s voting record is available (i) without charge, upon request, by calling the Fund toll-free at 1.800.525.7048, and (ii) in the Form N-PX filing on the SEC’s website at www.sec.gov.
The Fund files its complete schedule of portfolio holdings with the SEC for the first quarter and the third quarter of each fiscal year on Form N-Q. The Fund’s Form N-Q filings are available on the SEC’s website at www.sec.gov. Those forms may be reviewed and copied at the SEC’s Public Reference Room in Washington, D.C. Information on the operation of the Public Reference Room may be obtained by calling 1-800-SEC-0330.
19 OPPENHEIMER GLOBAL FUND/VA
DISTRIBUTION SOURCES Unaudited
For any distribution that took place over the Fund’s reporting period, the table below details on a per-share basis the percentage of the Fund’s total distribution payment amount that was derived from the following sources: net income, net profit from the sale of securities, and other capital sources. This information is based upon income and capital gains using generally accepted accounting principles as of the date of each distribution. Because the Fund is actively managed, the relative amount of the Fund’s total distributions derived from various sources over the calendar year may change. Please note that this information should not be used for tax reporting purposes as the tax character of distributable income may differ from the amounts used for this notification. You will receive IRS tax forms in the first quarter of each calendar year detailing the actual amount of the taxable and non-taxable portion of distributions paid to you during the tax year.
For the most current information, please go to oppenheimerfunds.com. Select your Fund, then the ‘Detailed’ tab; where ‘Dividends’ are shown, the Fund’s latest pay date will be followed by the sources of any distribution, updated daily.
| | | | | | | | | | | | | | | | |
| Fund Name | | Pay Date | | | Net Income | | | Net Profit
from Sale | | | Other Capital
Sources | |
| |
Oppenheimer Global Fund/VA | | | 6/16/15 | | | | 14.9% | | | | 85.1% | | | | 0.0% | |
20 OPPENHEIMER GLOBAL FUND/VA
THIS PAGE INTENTIONALLY LEFT BLANK.
21 OPPENHEIMER GLOBAL FUND/VA
THIS PAGE INTENTIONALLY LEFT BLANK.
22 OPPENHEIMER GLOBAL FUND/VA
THIS PAGE INTENTIONALLY LEFT BLANK.
23 OPPENHEIMER GLOBAL FUND/VA
OPPENHEIMER GLOBAL FUND/VA
A Series of Oppenheimer Variable Account Funds
| | |
| Trustees and Officers | | Sam Freedman, Chairman of the Board of Trustees and Trustee |
| | Jon S. Fossel, Trustee |
| | Richard F. Grabish, Trustee |
| | Beverly L. Hamilton, Trustee |
| | Victoria J. Herget, Trustee |
| | Robert J. Malone, Trustee |
| | F. William Marshall, Jr., Trustee |
| | Karen L. Stuckey, Trustee |
| | James D. Vaughn, Trustee |
| | Arthur P. Steinmetz, Trustee, President and Principal Executive Officer |
| | Rajeev Bhaman, Vice President |
| | Arthur S. Gabinet, Secretary and Chief Legal Officer |
| | Jennifer Sexton, Vice President and Chief Business Officer |
| | Mary Ann Picciotto, Chief Compliance Officer and Chief Anti-Money Laundering Officer |
| | Brian W. Wixted, Treasurer and Principal Financial & Accounting Officer |
| |
| Manager | | OFI Global Asset Management, Inc. |
| |
| Sub-Adviser | | OppenheimerFunds, Inc. |
| |
| Distributor | | OppenheimerFunds Distributor, Inc. |
| |
Transfer and Shareholder Servicing Agent | | OFI Global Asset Management, Inc. |
| |
| Sub-Transfer Agent | | Shareholder Services, Inc. |
| | DBA OppenheimerFunds Services |
| |
Independent Registered Public Accounting Firm | | KPMG LLP |
| |
| Legal Counsel | | Ropes & Gray LLP |
| | Before investing in any of the Oppenheimer funds, investors should carefully consider a Fund’s investment objective, risks, and charges and expenses. Fund prospectuses and summary prospectuses contain this and other information about the funds, and may be obtained by asking your financial advisor, visiting oppenheimerfunds.com or calling us at 1.800.988.8287. Read prospectuses and summary prospectuses carefully before investing. |
| |
| | The financial statements included herein have been taken from the records of the Fund without examination of those records by the independent registered public accounting firm. |
| |
| | © 2015 OppenheimerFunds, Inc. All rights reserved. Oppenheimer funds are distributed by OppenheimerFunds Distributor, Inc. |

PORTFOLIO MANAGERS: Manind Govil, CFA, Benjamin Ram and Paul Larson
AVERAGE ANNUAL TOTAL RETURNS FOR THE PERIODS ENDED 6/30/15
| | | | | | | | | | | | | | | | | | | | | | | | | |
| | | Inception Date | | 6-Months | | 1-Year | | 5-Year | | 10-Year |
Non-Service Shares | | | | 7/5/95 | | | | | 2.30 | % | | | | 6.65 | % | | | | 16.86 | % | | | | 7.41 | % |
Service Shares | | | | 7/13/00 | | | | | 2.22 | | | | | 6.40 | | | | | 16.57 | | | | | 7.14 | |
S&P 500 Index | | | | | | | | | 1.23 | | | | | 7.42 | | | | | 17.34 | | | | | 7.89 | |
Performance data quoted represents past performance, which does not guarantee future results. The investment return and principal value of an investment in the Fund will fluctuate so that an investor’s shares, when redeemed, may be worth more or less than their original cost. Current performance may be lower or higher than the performance quoted. For performance data current to the most recent month end, call us at 1.800.988.8287. The Fund’s total returns should not be expected to be the same as the returns of other funds, whether or not both funds have the same portfolio managers and/or similar names. The Fund’s total returns include changes in share price and reinvested distributions but do not include the charges associated with the separate account products that offer this Fund. Such performance would have been lower if such charges were taken into account.
The Fund’s performance is compared to the performance of the S&P 500 Index. The S&P 500 Index is a broad-based measure of domestic stock performance. The Index is unmanaged and cannot be purchased directly by investors. While index comparisons may be useful to provide a benchmark for the Fund’s performance, it must be noted that the Fund’s investments are not limited to the investments comprising the Index. Index performance includes reinvestment of income, but does not reflect transaction costs, fees, expenses or taxes. Index performance is shown for illustrative purposes only as a benchmark for the Fund’s performance, and does not predict or depict performance of the Fund. The Fund’s performance reflects the effects of the Fund’s business and operating expenses.
TOP HOLDINGS AND ALLOCATIONS
| | | | |
TOP TEN COMMON STOCK HOLDINGS | | | | |
Apple, Inc. | | | 5.2 | % |
Citigroup, Inc. | | | 3.6 | |
Mondelez International, Inc., Cl. A | | | 3.4 | |
Google, Inc., Cl. C | | | 2.7 | |
Philip Morris International, Inc. | | | 2.7 | |
General Electric Co. | | | 2.7 | |
Allergan plc | | | 2.5 | |
Comcast Corp., Cl. A | | | 2.3 | |
PepsiCo, Inc. | | | 2.3 | |
Chevron Corp. | | | 2.3 | |
Portfolio holdings and allocations are subject to change. Percentages are as of June 30, 2015, and are based on net assets. For more current Fund holdings, please visit oppenheimerfunds.com.
SECTOR ALLOCATION
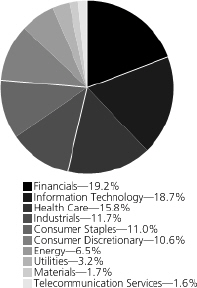
Portfolio holdings and allocations are subject to change. Percentages are as of June 30, 2015, and are based on the total market value of common stocks.
2 OPPENHEIMER MAIN STREET FUND/VA
Fund Performance Discussion
The Fund’s Non-Service shares produced a return of 2.30% during the period, outperforming the S&P 500 Index (the “Index”), which returned 1.23%. The Fund outperformed the Index in most sectors during the reporting period, led by stock selection in health care, materials and information technology. The most significant underperforming sector for the Fund relative to the Index was energy, where less favorable stock selection hurt.
GLOBAL MARKET AND ECONOMIC ENVIRONMENT
The market environment first half of 2015 was largely a continuation of the second half of 2014. Foreign exchange headwinds, declining energy prices, questions as to when the Federal Reserve (the “Fed”) would finally move to raise interest rates, and Greece’s debt crisis dominated the headlines. Energy continued to struggle as oil prices fell. Other commodity prices sputtered also — negatively impacting many materials stocks. With falling commodity prices, capital spending plans have been reined-in and this, in combination with a faltering global economic outlook, resulted in weak performance by many industrials stocks. After having been among the best performing stocks in 2014, utilities, which are very sensitive to interest rate expectations, faced pressures as investors became increasingly convinced the Fed would act this year to raise rates. Health care stocks continued to be a bright spot. In addition to high levels of mergers and acquisitions (M&A) activity, investors’ appetite for risk has increased, resulting in a speculative market concentrated largely in a narrow group of stocks, especially biotechnology companies. Despite lofty valuations, these stocks continued to perform well. However, the question becomes for how much longer. Consumer discretionary stocks have also performed well recently reflecting the increased conviction that the U.S. economic recovery will be sustained at moderate levels.
TOP INDIVIDUAL CONTRIBUTORS
Top contributing holdings this reporting period included Apple, Inc., Vulcan Materials Company and Allergan plc (previously named Actavis). Apple continued to perform well as the continued success of the iPhone 6, excitement surrounding the introduction of the new iWatch, and an increased dividend and buyback program resulted in strong relative performance. Shares of Vulcan Materials, a provider of aggregates, delivered strong results as construction demand continued to improve. Additionally, management issued an optimistic outlook for the company’s growth over the next several years, which resulted in rising investor sentiment. During the reporting period, specialty pharmaceutical company Actavis, with exposure to both generic and branded drugs, continued to augment its growth potential with the closure of its acquisition of Allergan. The company was re-named Allergan during the reporting period.
TOP INDIVIDUAL DETRACTORS
Detractors from performance this reporting period included energy stocks National Oilwell Varco, Inc. and Chevron Corp. and information technology stock Xerox Corp. National Oilwell is a worldwide supplier of equipment and components to the energy sector. Chevron is an oil company. Both stocks experienced declines—along with most energy-related stocks—due to the decline in oil prices. National Oilwell’s management revised the outlook for earnings downward. As oil prices have fallen, many of the company’s customers have decreased spending expectations, thereby negatively impacting the projected growth of National Oilwell’s products and services. We exited our position. Though Chevron’s earnings results were mostly in-line with consensus – with strong refining operations helping to offset lower oil prices – concerns about disappointing cash generation, combined with a high cash spend rate, negatively impacted sentiment. Xerox provides business process and information technology outsourcing, and document management services. Weak quarterly guidance triggered a major selloff in the stock as poor execution led to further downward revisions of earnings estimates. We believe the company needs to demonstrate more consistent execution and further restructure the business to maximize value. Xerox may be a perfect candidate for “shareholder activism” — especially given the recent uptick in technology activism. We have maintained our holdings, despite poor near-term visibility, given the stock’s low valuation. In addition we see an opportunity for value creation from a corporate restructuring — either initiated by existing management or as a result of outside actions.
STRATEGY & OUTLOOK
While financial engineering, as exemplified by the robust repurchase of shares and a step-up in M&A activities, will augment earnings per share growth in the short term, neither lead to long-term growth. These behaviors, though rational due to the supply of “cheap” money resulting from the easy monetary policies across most Central Banks globally, do not lead to sustainable fundamental economic improvements. We believe only real investments, such as capital spending and research and development, ultimately lead to viable growth over the longer run. These issues remain a concern of the Main Street team and we continue to emphasize investing in companies that are effectively allocating capital for both short-term and long-term sustainable fundamental growth.
We remain alert to disruption—both through product innovation and, increasingly, due to business model and/or process dislocations. Examples include Amazon’s dramatic impact on how goods and services are sold to customers, and how the Affordable Care Act is changing the winners and losers within health care. These disruptors pose both threats and opportunities, and our research is increasingly focused on distinguishing between the two.
3 OPPENHEIMER MAIN STREET FUND/VA
Though equity market valuations are a bit above historical averages at period end, a higher valuation level might be justified should profitability remain strong and interest rates remain low. Given our outlook that inflation will remain tame and, therefore, interest rates are unlikely to rise dramatically over the immediate future, we are not expecting a significant contraction in the market’s multiple; however, there is little margin for error.
Regardless, we remain focused on seeking to build an “all weather” portfolio by targeting companies we believe have: 1) sustainable competitive advantages; 2) skilled management with a proven track record of executing effectively; and 3) financial resources with the potential to generate improving profitability, gain market share, and/or return significant cash to shareholders. During times of volatile or slow economic growth such companies frequently widen their lead over weaker competitors. We seek to invest in companies characterized by these qualities at compelling valuations, and believe this disciplined approach is essential in seeking to generate superior long-term performance.
The Fund’s investment strategy and focus can change over time. The mention of specific fund holdings does not constitute a recommendation by OppenheimerFunds, Inc. or its affiliates.
Shares of Oppenheimer funds are not deposits or obligations of any bank, are not guaranteed by any bank, are not insured by the FDIC or any other agency, and involve investment risks, including the possible loss of the principal amount invested.
4 OPPENHEIMER MAIN STREET FUND/VA
Fund Expenses
Fund Expenses. As a shareholder of the Fund, you incur two types of costs: (1) transaction costs and (2) ongoing costs, including management fees; distribution and service fees; and other Fund expenses. These examples are intended to help you understand your ongoing costs (in dollars) of investing in the Fund and to compare these costs with the ongoing costs of investing in other mutual funds.
The examples are based on an investment of $1,000.00 invested at the beginning of the period and held for the entire 6-month period ended June 30, 2015.
Actual Expenses. The first section of the table provides information about actual account values and actual expenses. You may use the information in this section for the class of shares you hold, together with the amount you invested, to estimate the expense that you paid over the period. Simply divide your account value by $1,000.00 (for example, an $8,600.00 account value divided by $1,000.00 = 8.60), then multiply the result by the number in the first section under the heading entitled “Expenses Paid During the 6 Months Ended June 30, 2015” to estimate the expenses you paid on your account during this period.
Hypothetical Example for Comparison Purposes.
The second section of the table provides information about hypothetical account values and hypothetical expenses based on the Fund’s actual expense ratio for each class of shares, and an assumed rate of return of 5% per year for each class before expenses, which is not the actual return. The hypothetical account values and expenses may not be used to estimate the actual ending account balance or expenses you paid for the period. You may use this information to compare the ongoing costs of investing in the Fund and other funds. To do so, compare this 5% hypothetical example for the class of shares you hold with the 5% hypothetical examples that appear in the shareholder reports of the other funds.
Please note that the expenses shown in the table are meant to highlight your ongoing costs only and do not reflect any charges associated with the separate accounts that offer this Fund. Therefore, the “hypothetical” lines of the table are useful in comparing ongoing costs only, and will not help you determine the relative total costs of owning different funds. In addition, if these separate account charges were included your costs would have been higher.
| | | | | | | | |
| Actual | | Beginning
Account
Value
January 1, 2015 | | Ending
Account
Value
June 30, 2015 | | Expenses
Paid During
6 Months Ended
June 30, 2015 | | |
Non-Service shares | | $ 1,000.00 | | $ 1,023.00 | | $ 3.87 | | |
Service shares | | 1,000.00 | | 1,022.20 | | 5.13 | | |
| | | | |
| Hypothetical | | | | | | | | |
(5% return before expenses) | | | | | | | | |
Non-Service shares | | 1,000.00 | | 1,020.98 | | 3.87 | | |
Service shares | | 1,000.00 | | 1,019.74 | | 5.12 | | |
Expenses are equal to the Fund’s annualized expense ratio for that class, multiplied by the average account value over the period, multiplied by 181/365 (to reflect the one-half year period). Those annualized expense ratios, excluding indirect expenses from affiliated funds, based on the 6-month period ended June 30, 2015 are as follows:
| | | | |
| Class | | Expense Ratios | |
Non-Service shares | | | 0.77 | % |
Service shares | | | 1.02 | |
The expense ratios reflect voluntary waivers and/or reimbursements of expenses by the Fund’s Manager. Some of these undertakings may be modified or terminated at any time, as indicated in the Fund’s prospectus. The “Financial Highlights” tables in the Fund’s financial statements, included in this report, also show the gross expense ratios, without such waivers or reimbursements and reduction to custodian expenses, if applicable.
5 OPPENHEIMER MAIN STREET FUND/VA
| | |
| |
| STATEMENT OF INVESTMENTS June 30, 2015 Unaudited | | |
| | | | | | | | |
| | | Shares | | | Value | |
Common Stocks—98.6% | | | | | |
Consumer Discretionary—10.4% | |
Auto Components—1.6% | |
Delphi Automotive plc | | | 247,420 | | | $ | 21,052,968 | |
| | | | | | | | |
Automobiles—0.4% | | | | | | | | |
General Motors Co. | | | 173,152 | | | | 5,771,156 | |
| | | | | | | | |
Hotels, Restaurants & Leisure—0.7% | |
Dunkin’ Brands Group, Inc. | | | 153,920 | | | | 8,465,600 | |
| | | | | | | | |
Internet & Catalog Retail—1.2% | |
Amazon.com, Inc.1 | | | 34,540 | | | | 14,993,469 | |
| | | | | | | | |
Media—3.1% | | | | | |
Comcast Corp., Cl. A | | | 508,515 | | | | 30,582,092 | |
| Twenty-First Century Fox, Inc., Cl. A | | | 304,740 | | | | 9,917,763 | |
| | | | | | | | |
| | | | | | | 40,499,855 | |
| | | | | | | | |
Specialty Retail—3.4% | | | | | |
AutoZone, Inc.1 | | | 33,280 | | | | 22,194,432 | |
Home Depot, Inc. (The) | | | 201,367 | | | | 22,377,915 | |
| | | | | | | | |
| | | | | | | 44,572,347 | |
| | | | | | | | |
Consumer Staples—10.8% | | | | | |
Beverages—2.8% | | | | | |
Diageo plc | | | 196,630 | | | | 5,699,593 | |
PepsiCo, Inc. | | | 319,970 | | | | 29,866,000 | |
| | | | | | | | |
| | | | | | | 35,565,593 | |
| | | | | | | | |
Food Products—3.4% | | | | | |
Mondelez International, Inc., Cl. A | | | 1,081,720 | | | | 44,501,961 | |
| | | | | | | | |
Household Products—1.9% | | | | | |
Henkel AG & Co. KGaA | | | 263,008 | | | | 25,135,513 | |
| | | | | | | | |
Tobacco—2.7% | | | | | |
Philip Morris International, Inc. | | | 435,909 | | | | 34,946,824 | |
| | | | | | | | |
Energy—6.4% | | | | | |
Oil, Gas & Consumable Fuels—6.4% | | | | | |
Chevron Corp. | | | 305,310 | | | | 29,453,256 | |
HollyFrontier Corp. | | | 169,150 | | | | 7,221,013 | |
Magellan Midstream Partners LP2 | | | 81,730 | | | | 5,997,347 | |
Noble Energy, Inc. | | | 463,410 | | | | 19,778,339 | |
Suncor Energy, Inc. | | | 740,480 | | | | 20,378,010 | |
| | | | | | | | |
| | | | | | | 82,827,965 | |
| | | | | | | | |
Financials—18.9% | | | | | |
Capital Markets—1.1% | | | | | |
| Bank of New York Mellon Corp. (The) | | | 330,610 | | | | 13,875,702 | |
| | | | | | | | |
Commercial Banks—5.6% | | | | | |
Citigroup, Inc. | | | 845,278 | | | | 46,693,157 | |
JPMorgan Chase & Co. | | | 218,380 | | | | 14,797,429 | |
M&T Bank Corp. | | | 86,350 | | | | 10,787,705 | |
| | | | | | | | |
| | | | | | | 72,278,291 | |
| | | | | | | | |
Consumer Finance—1.6% | | | | | |
Discover Financial Services | | | 355,033 | | | | 20,457,001 | |
| | | | | | | | |
Diversified Financial Services—5.4% | | | | | |
Berkshire Hathaway, Inc., Cl. B1 | | | 154,290 | | | | 21,000,412 | |
CME Group, Inc., Cl. A | | | 315,000 | | | | 29,313,900 | |
McGraw Hill Financial, Inc. | | | 204,271 | | | | 20,519,022 | |
| | | | | | | | |
| | | | | | | 70,833,334 | |
| | | | | | | | |
Insurance—4.1% | | | | | |
| American International Group, Inc. | | | 465,780 | | | | 28,794,520 | |
Genworth Financial, Inc., Cl. A1 | | | 1,009,170 | | | | 7,639,417 | |
Marsh & McLennan Cos., Inc. | | | 294,440 | | | | 16,694,748 | |
| | | | | | | | |
| | | | | | | 53,128,685 | |
| | | | | | | | |
| | | Shares | | | Value | |
Real Estate Investment Trusts (REITs)—1.1% | |
Digital Realty Trust, Inc. | | | 103,580 | | | $ | 6,906,714 | |
Simon Property Group, Inc. | | | 42,940 | | | | 7,429,479 | |
| | | | | | | | |
| | | | | | | 14,336,193 | |
| | | | | | | | |
Health Care—15.6% | | | | | |
Biotechnology—1.7% | | | | | |
Gilead Sciences, Inc. | | | 190,640 | | | | 22,320,131 | |
| | | | | | | | |
Health Care Equipment & Supplies—1.1% | |
Boston Scientific Corp.1 | | | 806,770 | | | | 14,279,829 | |
| | | | | | | | |
Health Care Providers & Services—6.2% | |
Express Scripts Holding Co.1 | | | 308,347 | | | | 27,424,382 | |
HCA Holdings, Inc.1 | | | 310,200 | | | | 28,141,344 | |
UnitedHealth Group, Inc. | | | 205,990 | | | | 25,130,780 | |
| | | | | | | | |
| | | | | | | 80,696,506 | |
| | | | | | | | |
Pharmaceuticals—6.6% | |
Allergan plc1 | | | 106,400 | | | | 32,288,144 | |
Bristol-Myers Squibb Co. | | | 216,940 | | | | 14,435,188 | |
Merck & Co., Inc. | | | 440,260 | | | | 25,064,002 | |
Zoetis, Inc., Cl. A | | | 267,937 | | | | 12,919,922 | |
| | | | | | | | |
| | | | | | | 84,707,256 | |
| | | | | | | | |
Industrials—11.6% | |
Aerospace & Defense—1.0% | |
United Technologies Corp. | | | 116,340 | | | | 12,905,596 | |
| | | | | | | | |
Commercial Services & Supplies—2.3% | |
Republic Services, Inc., Cl. A | | | 286,170 | | | | 11,209,279 | |
Tyco International plc | | | 495,335 | | | | 19,060,491 | |
| | | | | | | | |
| | | | | | | 30,269,770 | |
| | | | | | | | |
Industrial Conglomerates—2.7% | |
General Electric Co. | | | 1,305,500 | | | | 34,687,135 | |
| | | | | | | | |
Machinery—2.0% | | | | | | | | |
Deere & Co. | | | 270,220 | | | | 26,224,851 | |
| | | | | | | | |
Professional Services—1.2% | | | | | | | | |
Nielsen NV | | | 341,460 | | | | 15,287,164 | |
| | | | | | | | |
Road & Rail—1.9% | | | | | | | | |
Canadian National Railway Co. | | | 329,360 | | | | 19,020,540 | |
CSX Corp. | | | 162,570 | | | | 5,307,911 | |
| | | | | | | | |
| | | | | | | 24,328,451 | |
| | | | | | | | |
Trading Companies & Distributors—0.5% | |
Fastenal Co. | | | 148,130 | | | | 6,248,123 | |
| | | | | | | | |
Information Technology—18.5% | |
Internet Software & Services—7.0% | |
eBay, Inc.1 | | | 309,705 | | | | 18,656,629 | |
Facebook, Inc., Cl. A1 | | | 248,960 | | | | 21,352,054 | |
Google, Inc., Cl. A1 | | | 27,280 | | | | 14,732,291 | |
Google, Inc., Cl. C1 | | | 67,497 | | | | 35,132,864 | |
| | | | | | | | |
| | | | | | | 89,873,838 | |
| | | | | | | | |
IT Services—4.8% | | | | | | | | |
Amdocs Ltd. | | | 493,760 | | | | 26,954,358 | |
MasterCard, Inc., Cl. A | | | 235,750 | | | | 22,037,910 | |
Xerox Corp. | | | 1,220,707 | | | | 12,988,323 | |
| | | | | | | | |
| | | | | | | 61,980,591 | |
| | | | | | | | |
Semiconductors & Semiconductor Equipment—1.0% | |
Applied Materials, Inc. | | | 689,700 | | | | 13,256,034 | |
| | | | | | | | |
Technology Hardware, Storage & Peripherals—5.7% | |
Apple, Inc. | | | 532,596 | | | | 66,800,853 | |
Western Digital Corp. | | | 89,870 | | | | 7,047,606 | |
| | | | | | | | |
| | | | | | | 73,848,459 | |
6 OPPENHEIMER MAIN STREET FUND/VA
| | | | | | | | |
| | | Shares | | | Value | |
Materials—1.7% | | | | | | | | |
Construction Materials—1.5% | | | | | | | | |
Vulcan Materials Co. | | | 230,990 | | | $ | 19,386,990 | |
| | | | | | | | |
Metals & Mining—0.2% | | | | | | | | |
Teck Resources Ltd., Cl. B | | | 211,180 | | | | 2,092,794 | |
| | | | | | | | |
Telecommunication Services—1.6% | |
Diversified Telecommunication Services—1.6% | |
Verizon Communications, Inc. | | | 451,650 | | | | 21,051,406 | |
| | | | | | | | |
Utilities—3.1% | | | | | | | | |
Electric Utilities—1.2% | | | | | | | | |
ITC Holdings Corp. | | | 208,160 | | | | 6,698,589 | |
Southern Co. (The) | | | 219,700 | | | | 9,205,430 | |
| | | | | | | | |
| | | | | | | 15,904,019 | |
| | | | | | | | |
| | | Shares | | | Value | |
Gas Utilities—0.5% | | | | | | | | |
AmeriGas Partners LP2 | | | 144,040 | | | $ | 6,584,068 | |
| | | | | | | | |
Multi-Utilities—1.4% | | | | | | | | |
PG&E Corp. | | | 372,280 | | | | 18,278,948 | |
| | | | | | | | |
Total Common Stocks (Cost $931,356,056) | | | | | | | 1,277,454,416 | |
| | | | | | | | |
Investment Company—1.1% | | | | | | | | |
Oppenheimer Institutional Money Market Fund,
Cl. E, 0.15%3,4 (Cost $13,781,735) | | | 13,781,735 | | | | 13,781,735 | |
| | | | | | | | |
Total Investments, at Value (Cost $945,137,791) | | | 99.7 | % | | | 1,291,236,151 | |
Net Other Assets (Liabilities) | | | 0.3 | | | | 3,268,277 | |
| | | | |
Net Assets | | | 100.0 | % | | $ | 1,294,504,428 | |
| | | | |
Footnotes to Statement of Investments
1. Non-income producing security.
2. Security is a Master Limited Partnership.
3. Is or was an affiliate, as defined in the Investment Company Act of 1940, as amended, at or during the period ended June 30, 2015, by virtue of the Fund owning at least 5% of the voting securities of the issuer or as a result of the Fund and the issuer having the same investment adviser. Transactions during the period in which the issuer was an affiliate are as follows:
| | | | | | | | | | | | | | | | |
| | | Shares December 31, 2014 | | | Gross Additions | | | Gross Reductions | | | Shares June 30, 2015 | |
Oppenheimer Institutional Money Market Fund, Cl. E | | | 26,546,400 | | | | 176,720,445 | | | | 189,485,110 | | | | 13,781,735 | |
| | | | |
| | | | | | | | | Value | | | Income | |
Oppenheimer Institutional Money Market Fund, Cl. E | | | | | | | | | | $ | 13,781,735 | | | $ | 8,663 | |
4. Rate shown is the 7-day yield as of June 30, 2015.
See accompanying Notes to Financial Statements.
7 OPPENHEIMER MAIN STREET FUND/VA
STATEMENT OF ASSETS AND LIABILITIES June 30, 2015 Unaudited
| | | | |
Assets | | | | |
Investments, at value—see accompanying statement of investments: | | | | |
Unaffiliated companies (cost $931,356,056) | | $ | 1,277,454,416 | |
Affiliated companies (cost $13,781,735) | | | 13,781,735 | |
| | | | |
| | | | 1,291,236,151 | |
Cash | | | 1,172,308 | |
Receivables and other assets: | | | | |
Dividends | | | 1,957,831 | |
Investments sold | | | 1,211,293 | |
Shares of beneficial interest sold | | | 752,742 | |
Other | | | 102,973 | |
| | | | |
Total assets | | | 1,296,433,298 | |
Liabilities | | | | |
Payables and other liabilities: | | | | |
Shares of beneficial interest redeemed | | | 1,620,564 | |
Distribution and service plan fees | | | 157,794 | |
Trustees’ compensation | | | 89,131 | |
Shareholder communications | | | 40,066 | |
Other | | | 21,315 | |
| | | | |
Total liabilities | | | 1,928,870 | |
Net Assets | | $ | 1,294,504,428 | |
| | | | |
| |
Composition of Net Assets | | | | |
Par value of shares of beneficial interest | | $ | 44,910 | |
Additional paid-in capital | | | 875,631,591 | |
Accumulated net investment income | | | 5,001,860 | |
Accumulated net realized gain on investments and foreign currency transactions | | | 67,738,709 | |
Net unrealized appreciation on investments and translation of assets and liabilities denominated in foreign currencies | | | 346,087,358 | |
| | | | |
Net Assets | | $ | 1,294,504,428 | |
| | | | |
| |
Net Asset Value Per Share | | | | |
Non-Service Shares: | | | | |
| Net asset value, redemption price per share and offering price per share (based on net assets of $541,566,460 and 18,704,061 shares of beneficial interest outstanding) | | | $28.95 | |
Service Shares: | | | | |
| Net asset value, redemption price per share and offering price per share (based on net assets of $752,937,968 and 26,206,411 shares of beneficial interest outstanding) | | | $28.73 | |
See accompanying Notes to Financial Statements.
8 OPPENHEIMER MAIN STREET FUND/VA
STATEMENT OF OPERATIONS For the Six Months Ended June 30, 2015 Unaudited
| | | | |
Investment Income | | | | |
Dividends: | | | | |
Unaffiliated companies (net of foreign withholding taxes of $145,675) | | $ | 11,237,264 | |
Affiliated companies | | | 8,663 | |
Interest | | | 487 | |
| | | | |
Total investment income | | | 11,246,414 | |
Expenses | | | | |
Management fees | | | 4,371,423 | |
Distribution and service plan fees —Service shares | | | 973,231 | |
Transfer and shareholder servicing agent fees: | | | | |
Non-Service shares | | | 275,256 | |
Service shares | | | 389,519 | |
Shareholder communications: | | | | |
Non-Service shares | | | 16,535 | |
Service shares | | | 23,399 | |
Trustees’ compensation | | | 22,355 | |
Custodian fees and expenses | | | 5,486 | |
Other | | | 36,600 | |
| | | | |
Total expenses | | | 6,113,804 | |
Less reduction to custodian expenses | | | (140 | ) |
Less waivers and reimbursements of expenses | | | (7,290 | ) |
| | | | |
Net expenses | | | 6,106,374 | |
Net Investment Income | | | 5,140,040 | |
Realized and Unrealized Gain (Loss) | | | | |
Net realized gain (loss) on: | | | | |
Investments from unaffiliated companies | | | 74,678,234 | |
Foreign currency transactions | | | (7,535 | ) |
| | | | |
Net realized gain | | | 74,670,699 | |
Net change in unrealized appreciation/depreciation on: | | | | |
Investments | | | (50,076,361 | ) |
Translation of assets and liabilities denominated in foreign currencies | | | 899,553 | |
| | | | |
Net change in unrealized appreciation/depreciation | | | (49,176,808 | ) |
Net Increase in Net Assets Resulting from Operations | | $ | 30,633,931 | |
| | | | |
See accompanying Notes to Financial Statements.
9 OPPENHEIMER MAIN STREET FUND/VA
STATEMENTS OF CHANGES IN NET ASSETS
| | | | | | | | |
| | | Six Months Ended
June 30, 2015
(Unaudited) | | | | | Year Ended
December 31, 2014 |
Operations | | | | | | | | |
Net investment income | | $ | 5,140,040 | | | | | $ 9,960,183 |
Net realized gain | | | 74,670,699 | | | | | 220,233,059 |
Net change in unrealized appreciation/depreciation | | | (49,176,808 | ) | | | | (89,842,290) |
| | | | | |
Net increase in net assets resulting from operations | | | 30,633,931 | | | | | 140,350,952 |
Dividends and/or Distributions to Shareholders | | | | | | | | |
Dividends from net investment income: | | | | | | | | |
Non-Service shares | | | (5,010,080 | ) | | | | (4,609,193) |
Service shares | | | (4,935,637 | ) | | | | (4,984,596) |
| | | |
| | | | (9,945,717 | ) | | | | (9,593,789) |
Distributions from net realized gain: | | | | | | | | |
Non-Service shares | | | (81,805,950 | ) | | | | (11,141,625) |
Service shares | | | (115,456,402 | ) | | | | (17,524,841) |
| | | |
| | | (197,262,352 | ) | | | | (28,666,466) |
Beneficial Interest Transactions | | | | | | | | |
Net increase (decrease) in net assets resulting from beneficial interest transactions: | | | | | | | | |
Non-Service shares | | | 55,463,937 | | | | | (41,637,582) |
Service shares | | | 49,658,983 | | | | | (170,539,977) |
| | | | | |
| | | 105,122,920 | | | | | (212,177,559)�� |
Net Assets | | | | | | | | |
Total decrease | | | (71,451,218 | ) | | | | (110,086,862) |
Beginning of period | | | 1,365,955,646 | | | | | 1,476,042,508 |
| | | | | |
End of period (including accumulated net investment income of $5,001,860 and $9,807,537, respectively) | | $ | 1,294,504,428 | | | | | $ 1,365,955,646 |
| | | |
See accompanying Notes to Financial Statements.
10 OPPENHEIMER MAIN STREET FUND/VA
FINANCIAL HIGHLIGHTS
| | | | | | | | | | | | | | | | | | | | | | | | |
| Non-Service Shares | | Six Months
Ended
June 30,
2015
(Unaudited) | | | Year Ended
December
31, 2014 | | | Year Ended
December
31, 2013 | | | Year Ended
December
31, 2012 | | | Year Ended
December
30, 20111 | | | Year Ended
December
31, 2010 | |
Per Share Operating Data | | | | | | | | | | | | | | | | | | | | | | | | |
Net asset value, beginning of period | | $ | 33.61 | | | $ | 31.24 | | | $ | 23.97 | | | $ | 20.71 | | | $ | 20.88 | | | $ | 18.18 | |
Income (loss) from investment operations: | | | | | | | | | | | | | | | | | | | | | | | | |
Net investment income2 | | | 0.15 | | | | 0.28 | | | | 0.24 | | | | 0.26 | | | | 0.16 | | | | 0.17 | |
Net realized and unrealized gain (loss) | | | 0.68 | | | | 3.01 | | | | 7.33 | | | | 3.22 | | | | (0.16 | ) | | | 2.73 | |
| | | | |
Total from investment operations | | | 0.83 | | | | 3.29 | | | | 7.57 | | | | 3.48 | | | | 0.00 | | | | 2.90 | |
Dividends and/or distributions to shareholders: | | | | | | | | | | | | | | | | | | | | | | | | |
Dividends from net investment income | | | (0.32 | ) | | | (0.27 | ) | | | (0.30 | ) | | | (0.22 | ) | | | (0.17 | ) | | | (0.20 | ) |
Distributions from net realized gain | | | (5.17 | ) | | | (0.65 | ) | | | 0.00 | | | | 0.00 | | | | 0.00 | | | | 0.00 | |
| | | | |
Total dividends and/or distributions to shareholders | | | (5.49 | ) | | | (0.92 | ) | | | (0.30 | ) | | | (0.22 | ) | | | (0.17 | ) | | | (0.20 | ) |
Net asset value, end of period | | $ | 28.95 | | | $ | 33.61 | | | $ | 31.24 | | | $ | 23.97 | | | $ | 20.71 | | | $ | 20.88 | |
| | | | |
| | | | | | | | | | | | | | | | | | | | | | | | |
Total Return, at Net Asset Value3 | | | 2.30% | | | | 10.70% | | | | 31.77% | | | | 16.87% | | | | (0.01)% | | | | 16.11% | |
| | | | | | | | | | | | | | | | | | | | | | | | |
Ratios/Supplemental Data | | | | | | | | | | | | | | | | | | | | | | | | |
Net assets, end of period (in thousands) | | $ | 541,566 | | | $ | 559,933 | | | $ | 561,016 | | | $ | 481,089 | | | $ | 392,861 | | | $ | 469,720 | |
Average net assets (in thousands) | | $ | 554,708 | | | $ | 554,449 | | | $ | 517,750 | | | $ | 466,231 | | | $ | 426,354 | | | $ | 454,937 | |
Ratios to average net assets:4 | | | | | | | | | | | | | | | | | | | | | | | | |
Net investment income | | | 0.92% | | | | 0.86% | | | | 0.87% | | | | 1.12% | | | | 0.79% | | | | 0.93% | |
Total expenses5 | | | 0.77% | | | | 0.77% | | | | 0.78% | | | | 0.78% | | | | 0.78% | | | | 0.78% | |
| Expenses after payments, waivers and/or reimbursements and reduction to custodian expenses | | | 0.77% | | | | 0.77% | | | | 0.78% | | | | 0.78% | | | | 0.78% | | | | 0.78% | |
Portfolio turnover rate | | | 23% | | | | 43% | | | | 49% | | | | 37% | | | | 38% | | | | 45% | |
1. December 30, 2011 represents the last business day of the Fund’s reporting period.
2. Per share amounts calculated based on the average shares outstanding during the period.
3. Assumes an initial investment on the business day before the first day of the fiscal period, with all dividends and distributions reinvested in additional shares on the reinvestment date, and redemption at the net asset value calculated on the last business day of the fiscal period. Total returns are not annualized for periods less than one full year. Total return information does not reflect expenses that apply at the separate account level or to related insurance products. Inclusion of these charges would reduce the total return figures for all periods shown. Returns do not reflect the deduction of taxes that a shareholder would pay on fund distributions or the redemption of fund shares. The returns do not include adjustments in accordance with generally accepted accounting principles required at the period end for financial reporting purposes.
4. Annualized for periods less than one full year.
5. Total expenses including indirect expenses from affiliated fund fees and expenses were as follows:
| | | | | | | | |
| | | | | | | | |
| | Six Months Ended June 30, 2015 | | | 0.77 | % | |
| | Year Ended December 31, 2014 | | | 0.77 | % | |
| | Year Ended December 31, 2013 | | | 0.78 | % | |
| | Year Ended December 31, 2012 | | | 0.78 | % | |
| | Year Ended December 30, 2011 | | | 0.78 | % | |
| | Year Ended December 31, 2010 | | | 0.78 | % | |
See accompanying Notes to Financial Statements.
11 OPPENHEIMER MAIN STREET FUND/VA
FINANCIAL HIGHLIGHTS Continued
| | | | | | | | | | | | | | | | | | | | | | | | |
| Service Shares | | Six Months Ended June 30, 2015 (Unaudited) | | | Year Ended December 31, 2014 | | | Year Ended December 31, 2013 | | | Year Ended December 31, 2012 | | | Year Ended December,
30, 20111 | | | Year Ended December 31, 2010 | |
Per Share Operating Data | | | | | | | | | | | | | | | | | | | | | | | | |
Net asset value, beginning of period | | $ | 33.33 | | | $ | 30.99 | | | $ | 23.78 | | | $ | 20.53 | | | $ | 20.71 | | | $ | 18.04 | |
Income (loss) from investment operations: | | | | | | | | | | | | | | | | | | | | | | | | |
Net investment income2 | | | 0.11 | | | | 0.19 | | | | 0.17 | | | | 0.20 | | | | 0.11 | | | | 0.13 | |
Net realized and unrealized gain (loss) | | | 0.68 | | | | 2.99 | | | | 7.27 | | | | 3.20 | | | | (0.17 | ) | | | 2.70 | |
| | | | |
Total from investment operations | | | 0.79 | | | | 3.18 | | | | 7.44 | | | | 3.40 | | | | (0.06 | ) | | | 2.83 | |
Dividends and/or distributions to shareholders: | | | | | | | | | | | | | | | | | | | | | | | | |
Dividends from net investment income | | | (0.22 | ) | | | (0.19 | ) | | | (0.23 | ) | | | (0.15 | ) | | | (0.12 | ) | | | (0.16 | ) |
Distributions from net realized gain | | | (5.17 | ) | | | (0.65 | ) | | | 0.00 | | | | 0.00 | | | | 0.00 | | | | 0.00 | |
| | | | |
Total dividends and/or distributions to shareholders | | | (5.39 | ) | | | (0.84 | ) | | | (0.23 | ) | | | (0.15 | ) | | | (0.12 | ) | | | (0.16 | ) |
Net asset value, end of period | | $ | 28.73 | | | $ | 33.33 | | | $ | 30.99 | | | $ | 23.78 | | | $ | 20.53 | | | $ | 20.71 | |
| | | | |
Total Return, at Net Asset Value3 | | | 2.22 | % | | | 10.40 | % | | | 31.44 | % | | | 16.61 | % | | | (0.32 | )% | | | 15.83 | % |
| | | | | | | | | | | | | | | | | | | | | | | | |
Ratios/Supplemental Data | | | | | | | | | | | | | | | | | | | | | | | | |
Net assets, end of period (in thousands) | | $ | 752,938 | | | $ | 806,023 | | | $ | 915,027 | | | $ | 869,372 | | | $ | 1,003,184 | | | $ | 1,185,456 | |
Average net assets (in thousands) | | $ | 784,973 | | | $ | 856,467 | | | $ | 895,073 | | | $ | 913,871 | | | $ | 1,094,254 | | | $ | 1,193,630 | |
Ratios to average net assets:4 | | | | | | | | | | | | | | | | | | | | | | | | |
Net investment income | | | 0.67 | % | | | 0.61 | % | | | 0.62 | % | | | 0.85 | % | | | 0.54 | % | | | 0.68 | % |
Total expenses5 | | | 1.02 | % | | | 1.02 | % | | | 1.04 | % | | | 1.03 | % | | | 1.03 | % | | | 1.03 | % |
| Expenses after payments, waivers and/or reimbursements and reduction to custodian expenses | | | 1.02 | % | | | 1.02 | % | | | 1.04 | % | | | 1.03 | % | | | 1.03 | % | | | 1.03 | % |
Portfolio turnover rate | | | 23 | % | | | 43 | % | | | 49 | % | | | 37 | % | | | 38 | % | | | 45 | % |
1. December 30, 2011 represents the last business day of the Fund’s reporting period.
2. Per share amounts calculated based on the average shares outstanding during the period.
3. Assumes an initial investment on the business day before the first day of the fiscal period, with all dividends and distributions reinvested in additional shares on the reinvestment date, and redemption at the net asset value calculated on the last business day of the fiscal period. Total returns are not annualized for periods less than one full year. Total return information does not reflect expenses that apply at the separate account level or to related insurance products. Inclusion of these charges would reduce the total return figures for all periods shown. Returns do not reflect the deduction of taxes that a shareholder would pay on fund distributions or the redemption of fund shares. The returns do not include adjustments in accordance with generally accepted accounting principles required at the period end for financial reporting purposes.
4. Annualized for periods less than one full year.
5. Total expenses including indirect expenses from affiliated fund fees and expenses were as follows:
| | | | | | | | |
| | | | | | | | |
| | Six Months Ended June 30, 2015 | | | 1.02 | % | |
| | Year Ended December 31, 2014 | | | 1.02 | % | |
| | Year Ended December 31, 2013 | | | 1.04 | % | |
| | Year Ended December 31, 2012 | | | 1.03 | % | |
| | Year Ended December 30, 2011 | | | 1.03 | % | |
| | Year Ended December 31, 2010 | | | 1.03 | % | |
See accompanying Notes to Financial Statements.
12 OPPENHEIMER MAIN STREET FUND/VA
NOTES TO FINANCIAL STATEMENTS June 30, 2015 Unaudited
1. Organization
Oppenheimer Main Street Fund/VA (the “Fund”) is a separate series of Oppenheimer Variable Account Funds, a diversified open-end management investment company registered under the Investment Company Act of 1940 (“1940 Act”), as amended. The Fund’s investment objective is to seek capital appreciation. The Fund’s investment adviser is OFI Global Asset Management, Inc. (“OFI Global” or the “Manager”), a wholly-owned subsidiary of OppenheimerFunds, Inc. (“OFI” or the “Sub-Adviser”). The Manager has entered into a sub-advisory agreement with OFI. Shares of the Fund are sold only to separate accounts of life insurance companies.
The Fund offers two classes of shares. Both classes are sold at their offering price, which is the net asset value per share, to separate investment accounts of participating insurance companies as an underlying investment for variable life insurance policies, variable annuity contracts or other investment products. The class of shares designated as Service shares is subject to a distribution and service plan. Both classes of shares have identical rights and voting privileges with respect to the Fund in general and exclusive voting rights on matters that affect that class alone. Earnings, net assets and net asset value per share may differ due to each class having its own expenses, such as transfer and shareholder servicing agent fees and shareholder communications, directly attributable to that class.
The following is a summary of significant accounting policies followed in the Fund’s preparation of financial statements in accordance with accounting principles generally accepted in the United States (“U.S. GAAP”).
2. Significant Accounting Policies
Security Valuation. All investments in securities are recorded at their estimated fair value, as described in Note 3.
Reporting Period End Date. The last day of the Fund’s reporting period is the last day the New York Stock Exchange was open for trading during the period. The Fund’s financial statements have been presented through that date to maintain consistency with the Fund’s net asset value calculations used for shareholder transactions.
Foreign Currency Translation. The Fund’s accounting records are maintained in U.S. dollars. The values of securities denominated in foreign currencies and amounts related to the purchase and sale of foreign securities and foreign investment income are translated into U.S. dollars as of the close of the New York Stock Exchange (the “Exchange”), normally 4:00 P.M. Eastern time, on each day the Exchange is open for trading. Foreign exchange rates may be valued primarily using a reliable bank, dealer or service authorized by the Board of Trustees.
Reported net realized gains and losses from foreign currency transactions arise from sales of portfolio securities, sales and maturities of short-term securities, sales of foreign currencies, exchange rate fluctuations between the trade and settlement dates on securities transactions, and the difference between the amounts of dividends, interest, and foreign withholding taxes recorded on the Fund’s books and the U.S. dollar equivalent of the amounts actually received or paid. Net unrealized appreciation and depreciation on the translation of assets and liabilities denominated in foreign currencies arise from changes in the values of assets and liabilities, including investments in securities at fiscal period end, resulting from changes in exchange rates.
The effect of changes in foreign currency exchange rates on investments is separately identified from the fluctuations arising from changes in market values of securities held and reported with all other foreign currency gains and losses in the Fund’s Statement of Operations.
Allocation of Income, Expenses, Gains and Losses. Income, expenses (other than those attributable to a specific class), gains and losses are allocated on a daily basis to each class of shares based upon the relative proportion of net assets represented by such class. Operating expenses directly attributable to a specific class are charged against the operations of that class.
Dividends and Distributions to Shareholders. Dividends and distributions to shareholders, which are determined in accordance with income tax regulations and may differ from U.S. generally accepted accounting principles, are recorded on the ex-dividend date. Income and capital gain distributions, if any, are declared and paid annually or at other times as deemed necessary by the Manager.
The tax character of distributions is determined as of the Fund’s fiscal year end. Therefore, a portion of the Fund’s distributions made to shareholders prior to the Fund’s fiscal year end may ultimately be categorized as a tax return of capital.
Investment Income. Dividend income is recorded on the ex-dividend date or upon ex-dividend notification in the case of certain foreign dividends where the ex-dividend date may have passed. Non-cash dividends included in dividend income, if any, are recorded at the fair market value of the securities received. Interest income is recognized on an accrual basis. Discount and premium, which are included in interest income on the Statement of Operations, are amortized or accreted daily.
Return of Capital Estimates. Distributions received from the Fund’s investments in MLPs generally are comprised of income and return of capital. The Fund records investment income and return of capital based on estimates made at the time such distributions are received. Such estimates are based on historical information available from each MLP and other industry sources. These estimates may subsequently be revised based on information received from MLPs after their tax reporting periods are concluded.
Custodian Fees. “Custodian fees and expenses” in the Statement of Operations may include interest expense incurred by the Fund on any cash overdrafts of its custodian account during the period. Such cash overdrafts may result from the effects of failed trades in portfolio securities and from cash outflows resulting from unanticipated shareholder redemption activity. The Fund pays interest to its custodian on such cash overdrafts, to the extent they are not offset by positive cash balances maintained by the Fund, at a rate equal to the Federal Funds Rate plus 0.50%. The “Reduction to custodian
13 OPPENHEIMER MAIN STREET FUND/VA
NOTES TO FINANCIAL STATEMENTS Unaudited / Continued
2. Significant Accounting Policies (Continued)
expenses” line item, if applicable, represents earnings on cash balances maintained by the Fund during the period. Such interest expense and other custodian fees may be paid with these earnings.
Security Transactions. Security transactions are recorded on the trade date. Realized gains and losses on securities sold are determined on the basis of identified cost.
Indemnifications. The Fund’s organizational documents provide current and former Trustees and officers with a limited indemnification against liabilities arising in connection with the performance of their duties to the Fund. In the normal course of business, the Fund may also enter into contracts that provide general indemnifications. The Fund’s maximum exposure under these arrangements is unknown as this would be dependent on future claims that may be made against the Fund. The risk of material loss from such claims is considered remote.
Federal Taxes. The Fund intends to comply with provisions of the Internal Revenue Code applicable to regulated investment companies and to distribute substantially all of its investment company taxable income to shareholders. Therefore, no federal income or excise tax provision is required. The Fund files income tax returns in U.S. federal and applicable state jurisdictions. The statute of limitations on the Fund’s tax return filings generally remains open for the three preceding fiscal reporting period ends.
During the fiscal year ended December 31, 2014, the Fund utilized $2,513,988 of capital loss carryforward to offset capital gains realized in that fiscal year. Details of the fiscal year ended December 31, 2014 capital loss carryforwards are included in the table below. Capital loss carryforwards with no expiration, if any, must be utilized prior to those with expiration dates. Capital losses with no expiration will be carried forward to future years if not offset by gains.
| | | | |
Expiring | |
2015 | | $ | 2,513,988 | |
2016 | | | 2,513,988 | |
| | | | |
Total | | $ | 5,027,976 | |
| | | | |
As of June 30, 2015, it is estimated that there will be no capital loss carryforwards. The estimated capital loss carryforward represents the carryforward as of the end of the last fiscal year, increased or decreased by capital losses or gains realized in the first six months of the current fiscal year. During the six months ended June 30, 2015, it is estimated that the Fund will utilize $5,027,976 of capital loss carryforward to offset realized capital gains.
Net investment income (loss) and net realized gain (loss) may differ for financial statement and tax purposes. The character of dividends and distributions made during the fiscal year from net investment income or net realized gains are determined in accordance with federal income tax requirements, which may differ from the character of net investment income or net realized gains presented in those financial statements in accordance with GAAP. Also, due to timing of dividends and distributions, the fiscal year in which amounts are distributed may differ from the fiscal year in which the income or net realized gain was recorded by the Fund.
The aggregate cost of securities and other investments and the composition of unrealized appreciation and depreciation of securities and other investments for federal income tax purposes as of June 30, 2015 are noted in the following table. The primary difference between book and tax appreciation or depreciation of securities and other investments, if applicable, is attributable to the tax deferral of losses or tax realization of financial statement unrealized gain or loss.
| | | | |
Federal tax cost of securities | | $ | 945,857,900 | |
| | | | |
Gross unrealized appreciation | | $ | 377,667,050 | |
Gross unrealized depreciation | | | (32,288,799 | ) |
| | | | |
Net unrealized appreciation | | $ | 345,378,251 | |
| | | | |
Use of Estimates. The preparation of financial statements in conformity with accounting principles generally accepted in the United States of America requires management to make estimates and assumptions that affect the reported amounts of assets and liabilities and disclosure of contingent assets and liabilities at the date of the financial statements and the reported amounts of increases and decreases in net assets from operations during the reporting period. Actual results could differ from those estimates.
3. Securities Valuation
The Fund calculates the net asset value of its shares as of the close of the New York Stock Exchange (the “Exchange”), normally 4:00 P.M. Eastern time, on each day the Exchange is open for trading.
The Fund’s Board has adopted procedures for the valuation of the Fund’s securities and has delegated the day-to-day responsibility for valuation determinations under those procedures to the Manager. The Manager has established a Valuation Committee which is responsible for determining a “fair valuation” for any security for which market quotations are not “readily available.” The Valuation Committee’s fair valuation determinations are subject to review, approval and ratification by the Fund’s Board at its next regularly scheduled meeting covering the calendar quarter in which the fair valuation was determined.
Valuation Methods and Inputs
Securities are valued using unadjusted quoted market prices, when available, as supplied primarily by third party pricing services or dealers.
The following methodologies are used to determine the market value or the fair value of the types of securities described below:
14 OPPENHEIMER MAIN STREET FUND/VA
3. Securities Valuation (Continued)
Securities traded on a registered U.S. securities exchange (including exchange-traded derivatives other than futures and futures options) are valued based on the last sale price of the security reported on the principal exchange on which it is traded, prior to the time when the Fund’s assets are valued. In the absence of a sale, the security is valued at the last sale price on the prior trading day, if it is within the spread of the current day’s closing “bid” and “asked” prices, and if not, at the current day’s closing bid price. A security of a foreign issuer traded on a foreign exchange, but not listed on a registered U.S. securities exchange, is valued based on the last sale price on the principal exchange on which the security is traded, as identified by the third party pricing service used by the Manager, prior to the time when the Fund’s assets are valued. If the last sale price is unavailable, the security is valued at the most recent official closing price on the principal exchange on which it is traded. If the last sales price or official closing price for a foreign security is not available, the security is valued at the mean between the bid and asked price per the exchange or, if not available from the exchange, obtained from two dealers. If bid and asked prices are not available from either the exchange or two dealers, the security is valued by using one of the following methodologies (listed in order of priority): (1) using a bid from the exchange, (2) the mean between the bid and asked price as provided by a single dealer, or (3) a bid from a single dealer.
Shares of a registered investment company that are not traded on an exchange are valued at that investment company’s net asset value per share.
Corporate and government debt securities (of U.S. or foreign issuers) and municipal debt securities, event-linked bonds, loans, mortgage-backed securities, collateralized mortgage obligations, and asset-backed securities are valued at the mean between the “bid” and “asked” prices utilizing evaluated prices obtained from third party pricing services or broker-dealers who may use matrix pricing methods to determine the evaluated prices.
Short-term money market type debt securities with a remaining maturity of sixty days or less are valued at cost adjusted by the amortization of discount or premium to maturity (amortized cost), which approximates market value. Short-term debt securities with a remaining maturity in excess of sixty days are valued at the mean between the “bid” and “asked” prices utilizing evaluated prices obtained from third party pricing services or broker-dealers.
A description of the standard inputs that may generally be considered by the third party pricing vendors in determining their evaluated prices is provided below.
| | |
| Security Type | | Standard inputs generally considered by third-party pricing vendors |
Corporate debt, government debt, municipal, mortgage-backed and asset- backed securities | | Reported trade data, broker-dealer price quotations, benchmark yields, issuer spreads on comparable securities, the credit quality, yield, maturity, and other appropriate factors. |
| Loans | | Information obtained from market participants regarding reported trade data and broker-dealer price quotations. |
| Event-linked bonds | | Information obtained from market participants regarding reported trade data and broker-dealer price quotations. |
If a market value or price cannot be determined for a security using the methodologies described above, or if, in the “good faith” opinion of the Manager, the market value or price obtained does not constitute a “readily available market quotation,” or a significant event has occurred that would materially affect the value of the security, the security is fair valued either (i) by a standardized fair valuation methodology applicable to the security type or the significant event as previously approved by the Valuation Committee and the Fund’s Board or (ii) as determined in good faith by the Manager’s Valuation Committee. The Valuation Committee considers all relevant facts that are reasonably available, through either public information or information available to the Manager, when determining the fair value of a security. Fair value determinations by the Manager are subject to review, approval and ratification by the Fund’s Board at its next regularly scheduled meeting covering the calendar quarter in which the fair valuation was determined. Those fair valuation standardized methodologies include, but are not limited to, valuing securities at the last sale price or initially at cost and subsequently adjusting the value based on: changes in company specific fundamentals, changes in an appropriate securities index, or changes in the value of similar securities which may be further adjusted for any discounts related to security-specific resale restrictions. When possible, such methodologies use observable market inputs such as unadjusted quoted prices of similar securities, observable interest rates, currency rates and yield curves. The methodologies used for valuing securities are not necessarily an indication of the risks associated with investing in those securities nor can it be assured that the Fund can obtain the fair value assigned to a security if it were to sell the security.
To assess the continuing appropriateness of security valuations, the Manager, or its third party service provider who is subject to oversight by the Manager, regularly compares prior day prices, prices on comparable securities, and sale prices to the current day prices and challenges those prices exceeding certain tolerance levels with the third party pricing service or broker source. For those securities valued by fair valuations, whether through a standardized fair valuation methodology or a fair valuation determination, the Valuation Committee reviews and affirms the reasonableness of the valuations based on such methodologies and fair valuation determinations on a regular basis after considering all relevant information that is reasonably available.
Classifications
Each investment asset or liability of the Fund is assigned a level at measurement date based on the significance and source of the inputs to its valuation. Various data inputs are used in determining the value of each of the Fund’s investments as of the reporting period end. These data inputs are categorized in the following hierarchy under applicable financial accounting standards:
1) Level 1-unadjusted quoted prices in active markets for identical assets or liabilities (including securities actively traded on a securities exchange)
2) Level 2-inputs other than unadjusted quoted prices that are observable for the asset or liability (such as unadjusted quoted prices for similar assets and market corroborated inputs such as interest rates, prepayment speeds, credit risks, etc.)
3) Level 3-significant unobservable inputs (including the Manager’s own judgments about assumptions that market participants would use in pricing the asset or liability).
15 OPPENHEIMER MAIN STREET FUND/VA
NOTES TO FINANCIAL STATEMENTS Unaudited / Continued
3. Securities Valuation (Continued)
The inputs used for valuing securities are not necessarily an indication of the risks associated with investing in those securities.
The table below categorizes amounts that are included in the Fund’s Statement of Assets and Liabilities as of June 30, 2015 based on valuation input level:
| | | | | | | | | | | | | | | | |
| | | Level 1— Unadjusted Quoted Prices | | | Level 2— Other Significant Observable Inputs | | | Level 3— Significant Unobservable Inputs | | | Value | |
Assets Table | | | | | | | | | | | | | | | | |
Investments, at Value: | | | | | | | | | | | | | | | | |
Common Stocks | | | | | | | | | | | | | | | | |
Consumer Discretionary | | $ | 135,355,395 | | | $ | — | | | $ | — | | | $ | 135,355,395 | |
Consumer Staples | | | 109,314,785 | | | | 30,835,106 | | | | — | | | | 140,149,891 | |
Energy | | | 82,827,965 | | | | — | | | | — | | | | 82,827,965 | |
Financials | | | 244,909,206 | | | | — | | | | — | | | | 244,909,206 | |
Health Care | | | 202,003,722 | | | | — | | | | — | | | | 202,003,722 | |
Industrials | | | 149,951,090 | | | | — | | | | — | | | | 149,951,090 | |
Information Technology | | | 238,958,922 | | | | — | | | | — | | | | 238,958,922 | |
Materials | | | 21,479,784 | | | | — | | | | — | | | | 21,479,784 | |
Telecommunication Services | | | 21,051,406 | | | | — | | | | — | | | | 21,051,406 | |
Utilities | | | 40,767,035 | | | | — | | | | — | | | | 40,767,035 | |
Investment Company | | | 13,781,735 | | | | — | | | | — | | | | 13,781,735 | |
Total Assets | | $ | 1,260,401,045 | | | $ | 30,835,106 | | | $ | — | | | $ | 1,291,236,151 | |
Forward currency exchange contracts and futures contracts, if any, are reported at their unrealized appreciation/depreciation at measurement date, which represents the change in the contract’s value from trade date. All additional assets and liabilities included in the above table are reported at their market value at measurement date.
4. Investments and Risks
Investment in Oppenheimer Institutional Money Market Fund. The Fund is permitted to invest daily available cash balances in an affiliated money market fund. The Fund may invest the available cash in Class E shares of Oppenheimer Institutional Money Market Fund (“IMMF”) to seek current income while preserving liquidity or for defensive purposes. IMMF is a registered open-end management investment company, regulated as a money market fund under the 1940 Act. The Manager is the investment adviser of IMMF, and the Sub-Adviser provides investment and related advisory services to IMMF. When applicable, the Fund’s investment in IMMF is included in the Statement of Investments. Shares of IMMF are valued at their net asset value per share. As a shareholder, the Fund is subject to its proportional share of IMMF’s Class E expenses, including its management fee. The Manager will waive fees and/or reimburse Fund expenses in an amount equal to the indirect management fees incurred through the Fund’s investment in IMMF.
Master Limited Partnerships (“MLPs”). MLPs issue common units that represent an equity ownership interest in a partnership and provide limited voting rights. MLP common units are registered with the Securities and Exchange Commission (“SEC”), and are freely tradable on securities exchanges such as the NYSE and the NASDAQ Stock Market (“NASDAQ”), or in the over-the-counter (“OTC”) market. An MLP consists of one or more general partners, who conduct the business, and one or more limited partners, who contribute capital. MLP common unit holders have a limited role in the partnership’s operations and management. The Fund, as a limited partner, normally would not be liable for the debts of the MLP beyond the amounts the Fund has contributed, but would not be shielded to the same extent that a shareholder of a corporation would be. In certain circumstances creditors of an MLP would have the right to seek return of capital distributed to a limited partner. This right of an MLP’s creditors would continue after the Fund sold its investment in the MLP.
Equity Security Risk. Stocks and other equity securities fluctuate in price. The value of the Fund’s portfolio may be affected by changes in the equity markets generally. Equity markets may experience significant short-term volatility and may fall sharply at times. Different markets may behave differently from each other and U.S. equity markets may move in the opposite direction from one or more foreign stock markets. Adverse events in any part of the equity or fixed-income markets may have unexpected negative effects on other market segments.
The prices of individual equity securities generally do not all move in the same direction at the same time and a variety of factors can affect the price of a particular company’s securities. These factors may include, but are not limited to, poor earnings reports, a loss of customers, litigation against the company, general unfavorable performance of the company’s sector or industry, or changes in government regulations affecting the company or its industry.
5. Shares of Beneficial Interest
The Fund has authorized an unlimited number of $0.001 par value shares of beneficial interest of each class. Transactions in shares of beneficial interest were as follows:
16 OPPENHEIMER MAIN STREET FUND/VA
5. Shares of Beneficial Interest (Continued)
| | | | | | | | | | | | | | | | | | |
| | | Six Months Ended June 30, 2015 | | | | | Year Ended December 31, 2014 | |
| | | Shares | | | Amount | | | | | Shares | | | Amount | |
| Non-Service Shares | | | | | | | | | | | | | | | | | | |
| Sold | | | 215,902 | | | $ | 7,211,138 | | | | | | 649,656 | | | $ | 20,858,404 | |
| Dividends and/or distributions reinvested | | | 2,966,041 | | | | 86,816,030 | | | | | | 493,447 | | | | 15,750,818 | |
| Redeemed | | | (1,139,864 | ) | | | (38,563,231 | ) | | | | | (2,439,387 | ) | | | (78,246,804 | ) |
| | | | |
| Net increase (decrease) | | | 2,042,079 | | | $ | 55,463,937 | | | | | | (1,296,284 | ) | | $ | (41,637,582 | ) |
| | | | |
| | | | | | | | | | | | | | | | | | | |
Service Shares | | | | | | | | | | | | | | | | | | |
| Sold | | | 367,300 | | | $ | 12,318,520 | | | | | | 485,595 | | | $ | 15,571,150 | |
| Dividends and/or distributions reinvested | | | 4,144,304 | | | | 120,392,039 | | | | | | 709,853 | | | | 22,509,437 | |
| Redeemed | | | (2,484,863 | ) | | | (83,051,576 | ) | | | | | (6,541,357 | ) | | | (208,620,564 | ) |
| | | | |
| Net increase (decrease) | | | 2,026,741 | | | $ | 49,658,983 | | | | | | (5,345,909 | ) | | $ | (170,539,977 | ) |
| | | | |
6. Purchases and Sales of Securities
The aggregate cost of purchases and proceeds from sales of securities, other than short-term obligations and investments in IMMF, for the six months ended June 30, 2015 were as follows:
| | | | | | | | | | |
| | | Purchases | | | | | Sales | |
Investment securities | | $ | 308,059,329 | | | | | $ | 395,742,439 | |
7. Fees and Other Transactions with Affiliates
Management Fees. Under the investment advisory agreement, the Fund pays the Manager a management fee based on the daily net assets of the Fund at an annual rate as shown in the following table:
| | | | | | | | | | |
| Fee Schedule | | | | |
Up to $200 million | | | | 0.75 | % | | |
Next $200 million | | | | 0.72 | | | |
Next $200 million | | | | 0.69 | | | |
Next $200 million | | | | 0.66 | | | |
Next $200 million | | | | 0.60 | | | |
Over $1 billion | | | | 0.58 | | | |
The Fund’s effective management fee for the six months ended June 30, 2015 was 0.66% of average annual net assets before any applicable waivers.
Sub-Adviser Fees. The Manager has retained the Sub-Adviser to provide the day-to-day portfolio management of the Fund. Under the Sub-Advisory Agreement, the Manager pays the Sub-Adviser an annual fee in monthly installments, equal to a percentage of the investment management fee collected by the Manager from the Fund, which shall be calculated after any investment management fee waivers. The fee paid to the Sub-Adviser is paid by the Manager, not by the Fund.
Transfer Agent Fees. OFI Global (the “Transfer Agent”) serves as the transfer and shareholder servicing agent for the Fund. The Fund pays the Transfer Agent a fee based on annual net assets. Fees incurred and average net assets for each class with respect to these services are detailed in the Statement of Operations and Financial Highlights, respectively.
Sub-Transfer Agent Fees. The Transfer Agent has retained Shareholder Services, Inc., a wholly-owned subsidiary of OFI (the “Sub-Transfer Agent”), to provide the day-to-day transfer agent and shareholder servicing of the Fund. Under the Sub-Transfer Agency Agreement, the Transfer Agent pays the Sub-Transfer Agent an annual fee in monthly installments, equal to a percentage of the transfer agent fee collected by the Transfer Agent from the Fund, which shall be calculated after any applicable fee waivers. The fee paid to the Sub-Transfer Agent is paid by the Transfer Agent, not by the Fund.
Trustees’ Compensation. The Fund’s Board of Trustees (“Board”) has adopted a compensation deferral plan for Independent Trustees that enables Trustees to elect to defer receipt of all or a portion of the annual compensation they are entitled to receive from the Fund. For purposes of determining the amount owed to the Trustee under the plan, deferred amounts are treated as though equal dollar amounts had been invested in shares of the Fund or in other Oppenheimer funds selected by the Trustee. The Fund purchases shares of the funds selected for deferral by the Trustee in amounts equal to his or her deemed investment, resulting in a Fund asset equal to the deferred compensation liability. Such assets are included as a component of “Other” within the asset section of the Statement of Assets and Liabilities. Deferral of Trustees’ fees under the plan will not affect the net assets of the Fund and will not materially affect the Fund’s assets, liabilities or net investment income per share. Amounts will be deferred until distributed in accordance with the compensation deferral plan.
Distribution and Service Plan for Service Shares. The Fund has adopted a Distribution and Service Plan (the “Plan”) pursuant to Rule 12b-1 under the 1940 Act for Service shares to pay OppenheimerFunds Distributor, Inc. (the “Distributor”), for distribution related services, personal service and
17 OPPENHEIMER MAIN STREET FUND/VA
NOTES TO FINANCIAL STATEMENTS Unaudited / Continued
7. Fees and Other Transactions with Affiliates
account maintenance for the Fund’s Service shares. Under the Plan, payments are made periodically at an annual rate of 0.25% of the daily net assets of Service shares of the Fund. The Distributor currently uses all of those fees to compensate sponsors of the insurance product that offers Fund shares, for providing personal service and maintenance of accounts of their variable contract owners that hold Service shares. These fees are paid out of the Fund’s assets on an on-going basis and increase operating expenses of the Service shares, which results in lower performance compared to the Fund’s shares that are not subject to a service fee. Fees incurred by the Fund under the Plan are detailed in the Statement of Operations.
Waivers and Reimbursements of Expenses. The Manager has voluntarily agreed to limit the Fund’s expenses after payments, waivers and/or reimbursements and reduction to custodian expenses, excluding expenses incurred directly or indirectly by the Fund as a result of investments in other investment companies, wholly-owned subsidiaries and pooled investment vehicles; so that those expenses, as percentages of daily net assets, will not exceed the annual rate of 0.80% for Non-Service shares and 1.05% for Service shares.
The Manager will waive fees and/or reimburse Fund expenses in an amount equal to the indirect management fees incurred through the Fund’s investment in IMMF. During the six months ended June 30, 2015, the Manager waived fees and/or reimbursed the Fund $7,290 for IMMF management fees.
Waivers and/or reimbursements may be modified or terminated as set forth according to the terms in the prospectus.
8. Pending Litigation
In 2009, several lawsuits were filed as putative class actions and later consolidated before the U.S. District Court for the District of Colorado in connection with the investment performance of Oppenheimer Rochester California Municipal Fund (the “California Fund Suit”), a fund advised by OppenheimerFunds, Inc. (“OFI”), and distributed by its subsidiary OppenheimerFunds Distributor, Inc. ( “OFDI”). The plaintiffs asserted claims against OFI, OFDI and certain present and former trustees and officers of the Fund under the federal securities laws, alleging, among other things, that the disclosure documents of the Fund contained misrepresentations and omissions and the investment policies of the Fund were not followed. Plaintiffs in the California Fund Suit filed an amended complaint and defendants filed a motion to dismiss. In 2011, the court issued an order which granted in part and denied in part the defendants’ motion to dismiss. In 2012, plaintiffs filed a motion, which defendants opposed, to certify a class and appoint class representatives and class counsel. In March 2015, the court granted plaintiffs’ motion for class certification. In May 2015, the U.S. Court of Appeals for the Tenth Circuit vacated the class certification order and remanded the matter to the district court for further proceedings. In July 2015, the district court held an evidentiary hearing on plaintiffs’ motion for class certification. OFI and OFDI believe the California Fund Suit is without merit; that it is premature to render any opinion as to the likelihood of an outcome unfavorable to them in the California Fund Suit; and that no estimate can yet be made as to the amount or range of any potential loss.
18 OPPENHEIMER MAIN STREET FUND/VA
PORTFOLIO PROXY VOTING POLICIES AND PROCEDURES; UPDATES TO STATEMENTS OF INVESTMENTS Unaudited
The Fund has adopted Portfolio Proxy Voting Policies and Procedures under which the Fund votes proxies relating to securities (“portfolio proxies”) held by the Fund. A description of the Fund’s Portfolio Proxy Voting Policies and Procedures is available (i) without charge, upon request, by calling the Fund toll-free at 1.800.525.7048, (ii) on the Fund’s website at www.oppenheimerfunds.com, and (iii) on the SEC’s website at www.sec.gov. In addition, the Fund is required to file Form N-PX, with its complete proxy voting record for the 12 months ended June 30th, no later than August 31st of each year. The Fund’s voting record is available (i) without charge, upon request, by calling the Fund toll-free at 1.800.525.7048, and (ii) in the Form N-PX filing on the SEC’s website at www.sec.gov.
The Fund files its complete schedule of portfolio holdings with the SEC for the first quarter and the third quarter of each fiscal year on Form N-Q. The Fund’s Form N-Q filings are available on the SEC’s website at www.sec.gov. Those forms may be reviewed and copied at the SEC’s Public Reference Room in Washington, D.C. Information on the operation of the Public Reference Room may be obtained by calling 1-800-SEC-0330.
19 OPPENHEIMER MAIN STREET FUND/VA
DISTRIBUTION SOURCES Unaudited
For any distribution that took place over the Fund’s reporting period, the table below details on a per-share basis the percentage of the Fund’s total distribution payment amount that was derived from the following sources: net income, net profit from the sale of securities, and other capital sources. This information is based upon income and capital gains using generally accepted accounting principles as of the date of each distribution. Because the Fund is actively managed, the relative amount of the Fund’s total distributions derived from various sources over the calendar year may change. Please note that this information should not be used for tax reporting purposes as the tax character of distributable income may differ from the amounts used for this notification. You will receive IRS tax forms in the first quarter of each calendar year detailing the actual amount of the taxable and non-taxable portion of distributions paid to you during the tax year.
For the most current information, please go to oppenheimerfunds.com. Select your Fund, then the ‘Detailed’ tab; where ‘Dividends’ are shown, the Fund’s latest pay date will be followed by the sources of any distribution, updated daily.
| | | | | | | | | | | | | | | | |
| Fund Name | | Pay Date | | | Net Income | | | Net Profit from Sale | | | Other Capital Sources | |
Oppenheimer Main Street Fund®/VA | | | 6/16/15 | | | | 4.8% | | | | 95.2% | | | | 0.0% | |
20 OPPENHEIMER MAIN STREET FUND/VA
THIS PAGE INTENTIONALLY LEFT BLANK.
21 OPPENHEIMER MAIN STREET FUND/VA
THIS PAGE INTENTIONALLY LEFT BLANK.
22 OPPENHEIMER MAIN STREET FUND/VA
THIS PAGE INTENTIONALLY LEFT BLANK.
23 OPPENHEIMER MAIN STREET FUND/VA
OPPENHEIMER MAIN STREET FUND/VA
A Series of Oppenheimer Variable Account Funds
| | |
| Trustees and Officers | | Sam Freedman, Chairman of the Board of Trustees and Trustee |
| | Jon S. Fossel, Trustee |
| | Richard F. Grabish, Trustee |
| | Beverly L. Hamilton, Trustee |
| | Victoria J. Herget, Trustee |
| | Robert J. Malone, Trustee |
| | F. William Marshall, Jr., Trustee |
| | Karen L. Stuckey, Trustee |
| | James D. Vaughn, Trustee |
| | Arthur P. Steinmetz, Trustee, President and Principal Executive Officer |
| | Manind Govil, Vice President |
| | Benjamin Ram, Vice President |
| | Paul Larson, Vice President |
| | Arthur S. Gabinet, Secretary and Chief Legal Officer |
| | Jennifer Sexton, Vice President and Chief Business Officer |
| | Mary Ann Picciotto, Chief Compliance Officer and Chief Anti-Money Laundering Officer |
| | Brian W. Wixted, Treasurer and Principal Financial & Accounting Officer |
| |
| Manager | | OFI Global Asset Management, Inc. |
| |
| Sub-Adviser | | OppenheimerFunds, Inc. |
| |
| Distributor | | OppenheimerFunds Distributor, Inc. |
| |
Transfer and
Shareholder Servicing
Agent | | OFI Global Asset Management, Inc. |
| |
| Sub-Transfer Agent | | Shareholder Services, Inc. DBA OppenheimerFunds Services |
| |
Independent
Registered Public
Accounting Firm | | KPMG LLP |
| |
| Legal Counsel | | Ropes & Gray LLP |
| |
| | Before investing in any of the Oppenheimer funds, investors should carefully consider a fund’s investment objectives, risks, charges and expenses. Fund prospectuses and summary prospectuses contain this and other information about the funds and may be obtained by asking your financial advisor, visiting oppenheimerfunds.com or calling us at 1.800.988.8287. Read prospectuses and summary prospectuses carefully before investing. |
| |
| | The financial statements included herein have been taken from the records of the Fund without examination of those records by the independent registered public accounting firm. |
| |
| | © 2015 OppenheimerFunds, Inc. All rights reserved. Oppenheimer funds are distributed by OppenheimerFunds Distributor, Inc. |

| | | | |
| | 
| | |
| | June 30, 2015 | | |
| | | Oppenheimer | | Semiannual Report |
| | Main Street Small Cap Fund/VA | |
| | | A Series of Oppenheimer Variable Account Funds | |
| | SEMIANNUAL REPORT | | |
| | Listing of Top Holdings Fund Performance Discussion Financial Statements | | |
PORTFOLIO MANAGERS: Matthew P. Ziehl, CFA, Raymond Anello, CFA, Raman Vardharaj, CFA, Joy Budzinski, Kristin Ketner, Magnus Krantz and Adam Weiner.
AVERAGE ANNUAL TOTAL RETURNS FOR THE PERIODS ENDED 6/30/15
| | | | | | | | | | | | | | | | | | | | |
| | | Inception
Date | | | 6-Months | | | 1-Year | | | 5-Year | | | 10-Year | |
Non-Service Shares | | | 5/1/98 | | | | 3.46 | % | | | 10.80 % | | | | 18.70 % | | | | 9.44 % | |
Service Shares | | | 7/16/01 | | | | 3.37 | | | | 10.56 | | | | 18.40 | | | | 9.17 | |
Russell 2000 Index | | | | | | | 4.75 | | | | 6.49 | | | | 17.08 | | | | 8.40 | |
Performance data quoted represents past performance, which does not guarantee future results. The investment return and principal value of an investment in the Fund will fluctuate so that an investor’s shares, when redeemed, may be worth more or less than their original cost. Current performance may be lower or higher than the performance quoted. For performance data current to the most recent month end, call us at 1.800.988.8287. The Fund’s total returns include changes in share price and reinvested distributions but should not be expected to be the same as the returns of other funds, whether or not both funds have the same portfolio managers and/or similar names. The Fund’s total returns do not include the charges associated with the separate account products that offer this Fund. Such performance would have been lower if such charges were taken into account.
The Russell 2000® Index measures the performance of the small-cap segment of the U.S. equity universe. The Russell 2000 Index is a subset of the Russell 3000 Index representing approximately 10% of the total market capitalization of that index. It includes approximately 2000 of the smallest securities based on a combination of their market cap and current index membership. The Index is unmanaged and cannot be purchased directly by investors. While index comparisons may be useful to provide a benchmark for the Fund’s performance, it must be noted that the Fund’s investments are not limited to the investments comprising the Index. Index performance includes reinvestment of income, but does not reflect transaction costs, fees, expenses or taxes. Index performance is shown for illustrative purposes only as a benchmark for the Fund’s performance, and does not predict or depict performance of the Fund. The Fund’s performance reflects the effects of the Fund’s business and operating expenses.
TOP HOLDINGS AND ALLOCATIONS
TOP TEN COMMON STOCK HOLDINGS
| | | | |
Pinnacle Foods, Inc. | | | 2.2% | |
STAG Industrial, Inc. | | | 2.0 | |
Korn/Ferry International | | | 2.0 | |
WellCare Health Plans, Inc. | | | 1.9 | |
KAR Auction Services, Inc. | | | 1.8 | |
Dana Holding Corp. | | | 1.8 | |
Mattress Firm Holding Corp. | | | 1.8 | |
HealthSouth Corp. | | | 1.8 | |
BankUnited, Inc. | | | 1.7 | |
BancorpSouth, Inc. | | | 1.7 | |
Portfolio holdings and allocations are subject to change. Percentages are as of June 30, 2015, and are based on net assets. For more current Fund holdings, please visit oppenheimerfunds.com.
SECTOR ALLOCATION
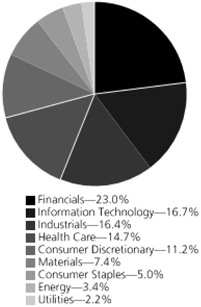
Portfolio holdings and allocations are subject to change. Percentages are as of June 30, 2015, and are based on the total market value of common stocks.
2 OPPENHEIMER MAIN STREET SMALL CAP FUND/VA
Fund Performance Discussion
The Fund’s Non-Service shares produced a return of 3.46% during the period, underperforming the Russell 2000 Index (the “Index”), which returned 4.75%. The Fund’s underperformance stemmed primarily from weaker relative stock selection in the health care, materials, consumer discretionary, and industrials sectors. The Fund outperformed the Index in the consumer staples, financials and information technology due to stock selection.
GLOBAL MARKET AND ECONOMIC ENVIRONMENT
The market environment first half of 2015 was largely a continuation of the second half of 2014. Foreign exchange headwinds, declining energy prices, questions as to when the Federal Reserve (the “Fed”) would finally move to raise interest rates, and Greece’s debt crisis dominated the headlines. Energy continued to struggle as oil prices fell. Other commodity prices sputtered also — negatively impacting many materials stocks. With falling commodity prices, capital spending plans have been reined-in and this, in combination with a faltering global economic outlook, resulted in weak performance by many industrials stocks. After having been among the best performing stocks in 2014, utilities, which are very sensitive to interest rate expectations, faced pressures as investors became increasingly convinced the Fed would act this year to raise rates. Health care stocks continued to be a bright spot. In addition to high levels of mergers and acquisitions (M&A) activity, investors’ appetite for risk has increased, resulting in a speculative market concentrated largely in a narrow group of stocks, especially biotechnology companies. Despite lofty valuations, these stocks continued to perform well. However, the question becomes for how much longer. Consumer discretionary stocks have also performed well recently reflecting the increased conviction that the U.S. economic recovery will be sustained at moderate levels.
TOP INDIVIDUAL CONTRIBUTORS
Top performing stocks for the Fund this period included Prestige Brands Holdings, Inc., Pinnacle Foods, Inc. and Imperva, Inc. Sales at Prestige Brands Holdings, a distributor of over-the-counter healthcare and household products, improved as destocking by retailers—which had hurt prior quarter results for Prestige Brands—came to an end. Consequently, revenues topped expectations, propelling the stock higher. Management also provided further “color” on its planned integration of the recently closed Insight acquisition, which added the $100 million Monistat brand—now Prestige’s largest product line. This information helped to improve visibility and boost investor sentiment. Pinnacle Foods is a packaged foods company. Large-cap giants such as General Mills, Nestlé, and Unilever have been gradually shedding mature, slow-growth brands to focus on higher growth categories that better leverage their fixed costs. Pinnacle Foods has acquired several of those divested brands over the years, most recently the Wish-Bone line of salad dressings from Unilever in 2013. With well-targeted marketing dollars and a leaner corporate fixed-cost structure, Pinnacle often is able to rejuvenate a well-known but perhaps stale brand, and more importantly, streamline product costs, leading to solid earnings growth. The stock performed well this reporting period. Imperva develops protection software and services for databases and business applications. During the reporting period, the company reported strong results, demonstrating that the new management team’s sales and marketing overhaul is bearing fruit. We see potential for further acceleration to materialize given the strong secular backdrop for IT security products.
TOP INDIVIDUAL DETRACTORS
Detractors from performance this reporting period included Century Aluminum Co., Spectranetics Corp. and Tronox Ltd. The stock of aluminum producer Century Aluminum suffered from weakening London Metals Exchange (LME) prices. Commodities, broadly, witnessed weak pricing as a result of anemic global growth during the reporting period. Consequently, earnings estimates were revised downward. Spectranetics develops single-use medical devices used in minimally-invasive cardiovascular procedures. The company had a disappointing first quarter result and guided estimates down based on lower than expected U.S. peripheral atherectomy (a procedure to remove plaque from blood vessels) growth. Additionally, management is expecting lower U.S. sales from its AngioScore (angioplasty balloon catheters) unit as a competitor launches a drug-coated balloon. Meanwhile, Spectranetics has its own drug-coated balloon under development, but it will require a step-up in investment spending to accelerate the program. Because we believe the company will be successful with its product development, we have maintained our holdings. Tronox produces and sells titanium bearing feedstocks and titanium dioxide (TiO2) pigment – used primarily in paints, coatings, plastics, and paper, globally. Disappointing results – stemming from industry over-supply of TiO2 putting added pressure on prices – hurt the stock’s performance. Additionally, Tronox’ acquisition of FMC Corp.’s soda ash business – which primarily is used in the manufacturing of glass and detergents – was not well received by investors. While this helps to diversify the company away from the more cyclical TiO2 business, the deal resulted in substantial leverage added to the balance sheet – which has made investors nervous. We exited our position in Tronox shortly after the reporting period ended.
STRATEGY & OUTLOOK
While financial engineering, as exemplified by the robust repurchase of shares and a step-up in M&A activities, will augment earnings per share growth in the short term, neither lead to long-term growth. These behaviors, though rational due to the supply of “cheap” money resulting from the easy monetary policies across most Central Banks globally, do not lead to sustainable fundamental economic improvements. We believe only real investments, such as capital spending
3 OPPENHEIMER MAIN STREET SMALL CAP FUND/VA
and research and development, ultimately lead to viable growth over the longer run. These issues remain a concern of the Main Street team and we continue to emphasize investing in companies that are effectively allocating capital for both short-term and long-term sustainable fundamental growth.
We remain alert to disruption—both through product innovation and, increasingly, due to business model and/or process dislocations. Examples include Amazon’s dramatic impact on how goods and services are sold to customers, and how the Affordable Care Act is changing the winners and losers within health care. These disruptors pose both threats and opportunities, and our research is increasingly focused on distinguishing between the two.
Though equity market valuations are a bit above historical averages at period end, a higher valuation level might be justified should profitability remain strong and interest rates remain low. Given our outlook that inflation will remain tame and, therefore, interest rates are unlikely to rise dramatically over the immediate future, we are not expecting a significant contraction in the market’s multiple; however, there is little margin for error.
Regardless, we remain focused on seeking to build an “all weather” portfolio by targeting companies we believe have: 1) sustainable competitive advantages; 2) skilled management with a proven track record of executing effectively; and 3) financial resources with the potential to generate improving profitability, gain market share, and/or return significant cash to shareholders. During times of volatile or slow economic growth such companies frequently widen their lead over weaker competitors. We seek to invest in companies characterized by these qualities at compelling valuations, and believe this disciplined approach is essential in seeking to generate superior long-term performance.
The Fund’s investment strategy and focus can change over time. The mention of specific fund holdings does not constitute a recommendation by OppenheimerFunds, Inc. or its affiliates.
Shares of Oppenheimer funds are not deposits or obligations of any bank, are not guaranteed by any bank, are not insured by the FDIC or any other agency, and involve investment risks, including the possible loss of the principal amount invested.
4 OPPENHEIMER MAIN STREET SMALL CAP FUND/VA
Fund Expenses
Fund Expenses. As a shareholder of the Fund, you incur two types of costs: (1) transaction costs and (2) ongoing costs, including management fees; distribution and service fees; and other Fund expenses. These examples are intended to help you understand your ongoing costs (in dollars) of investing in the Fund and to compare these costs with the ongoing costs of investing in other mutual funds.
The examples are based on an investment of $1,000.00 invested at the beginning of the period and held for the entire 6-month period ended June 30, 2015.
Actual Expenses. The first section of the table provides information about actual account values and actual expenses. You may use the information in this section for the class of shares you hold, together with the amount you invested, to estimate the expense that you paid over the period. Simply divide your account value by $1,000.00 (for example, an $8,600.00 account value divided by $1,000.00 = 8.60), then multiply the result by the number in the first section under the heading entitled “Expenses Paid During the 6 Months Ended June 30, 2015” to estimate the expenses you paid on your account during this period.
Hypothetical Example for Comparison Purposes.
The second section of the table provides information about hypothetical account values and hypothetical expenses based on the Fund’s actual expense ratio for each class of shares, and an assumed rate of return of 5% per year for each class before expenses, which is not the actual return. The hypothetical account values and expenses may not be used to estimate the actual ending account balance or expenses you paid for the period. You may use this information to compare the ongoing costs of investing in the Fund and other funds. To do so, compare this 5% hypothetical example for the class of shares you hold with the 5% hypothetical examples that appear in the shareholder reports of the other funds.
Please note that the expenses shown in the table are meant to highlight your ongoing costs only and do not reflect any charges associated with the separate accounts that offer this Fund. Therefore, the “hypothetical” lines of the table are useful in comparing ongoing costs only, and will not help you determine the relative total costs of owning different funds. In addition, if these separate account charges were included your costs would have been higher.
| | | | | | | | | | | | | | | | | | |
| Actual | | Beginning
Account Value January 1, 2015 | | | | | Ending Account Value June 30, 2015 | | | | | Expenses Paid During
6 Months Ended June 30, 2015 | | | |
Non-Service shares | | $ | 1,000.00 | | | | | $ | 1,034.60 | | | | | $ | 3.99 | | | |
Service shares | | | 1,000.00 | | | | | | 1,033.70 | | | | | | 5.26 | | | |
| | | | | | |
| Hypothetical | | | | | | | | | | | | | | | |
| (5% return before expenses) | | | | | | | | | | | | | | | |
Non-Service shares | | | 1,000.00 | | | | | | 1,020.88 | | | | | | 3.97 | | | |
Service shares | | | 1,000.00 | | | | | | 1,019.64 | | | | | | 5.22 | | | |
Expenses are equal to the Fund’s annualized expense ratio for that class, multiplied by the average account value over the period, multiplied by 181/365 (to reflect the one-half year period). Those annualized expense ratios, excluding indirect expenses from affiliated funds, based on the 6-month period ended June 30, 2015 are as follows:
| | | | |
| Class | | Expense Ratios | |
Non-Service shares | | | 0.79% | |
Service shares | | | 1.04 | |
The expense ratios reflect voluntary waivers and/or reimbursements of expenses by the Fund’s Manager. Some of these undertakings may be modified or terminated at any time, as indicated in the Fund’s prospectus. The “Financial Highlights” tables in the Fund’s financial statements, included in this report, also show the gross expense ratios, without such waivers or reimbursements and reduction to custodian expenses, if applicable.
5 OPPENHEIMER MAIN STREET SMALL CAP FUND/VA
STATEMENT OF INVESTMENTS June 30, 2015 Unaudited
| | | | | | | | |
| | | Shares | | Value | | | |
| | | |
Common Stocks—99.1% | | | | | | | | |
| | | |
| Consumer Discretionary—11.0% | | | |
| | | |
| Auto Components—1.8% | | | | | | | | |
| | | |
| Dana Holding Corp. | | 953,433 | | $ | 19,621,651 | | | |
| | | |
| Diversified Consumer Services—0.9% | | | |
| | | |
| LifeLock, Inc.1 | | 628,460 | | | 10,306,744 | | | |
| | | |
| Hotels, Restaurants & Leisure—5.3% | | | |
| | | |
| Brinker International, Inc. | | 232,180 | | | 13,385,177 | | | |
| | | |
| International Speedway Corp., Cl. A | | 240,847 | | | 8,831,860 | | | |
| | | |
| Krispy Kreme Doughnuts, Inc.1 | | 302,120 | | | 5,818,831 | | | |
| | | |
| Popeyes Louisiana Kitchen, Inc.1 | | 298,170 | | | 17,887,218 | | | |
| | | |
| Texas Roadhouse, Inc., Cl. A | | 338,020 | | | 12,652,089 | | | |
| | | | | | | | |
| | | | | 58,575,175 | | | |
| | | |
| Specialty Retail—2.5% | | | |
| | | |
| Mattress Firm Holding Corp.1 | | 320,513 | | | 19,535,267 | | | |
| | | |
| Party City Holdco, Inc.1 | | 409,800 | | | 8,306,646 | | | |
| | | | | | | | |
| | | | | 27,841,913 | | | |
| | | |
| Textiles, Apparel & Luxury Goods—0.5% | | | |
| | | |
| Iconix Brand Group, Inc.1 | | 232,980 | | | 5,817,511 | | | |
| | | |
| Consumer Staples—5.0% | | | |
| | | |
| Food & Staples Retailing—0.8% | | | |
| | | |
| Diplomat Pharmacy, Inc.1 | | 202,500 | | | 9,061,875 | | | |
| | | |
| Food Products—2.2% | | | | | | | | |
| | | |
| Pinnacle Foods, Inc. | | 527,380 | | | 24,016,885 | | | |
| | | |
| Personal Products—0.8% | | | | | | | | |
| | | |
| Nu Skin Enterprises, Inc., Cl. A | | 176,720 | | | 8,328,814 | | | |
| | | |
| Tobacco—1.2% | | | | | | | | |
| | | |
| Universal Corp. | | 233,910 | | | 13,407,721 | | | |
| | | |
| Energy—3.3% | | | | | | | | |
| | | |
| Energy Equipment & Services—0.5% | | | |
| | | |
| RigNet, Inc.1 | | 164,550 | | | 5,030,293 | | | |
| | | |
| Oil, Gas & Consumable Fuels—2.8% | | | |
| | | |
| Cone Midstream Partners LP2 | | 487,838 | | | 8,634,732 | | | |
| | | |
| Renewable Energy Group, Inc.1 | | 928,303 | | | 10,731,183 | | | |
| | | |
| Western Refining, Inc. | | 271,381 | | | 11,837,639 | | | |
| | | | | | | | |
| | | | | 31,203,554 | | | |
| | | |
| Financials—22.7% | | | | | | | | |
| | | |
| Commercial Banks—9.6% | | | | | | | | |
| | | |
| BancorpSouth, Inc. | | 719,780 | | | 18,541,533 | | | |
| | | |
| BankUnited, Inc. | | 519,545 | | | 18,667,252 | | | |
| | | |
| First Niagara Financial Group, Inc. | | 1,346,940 | | | 12,715,114 | | | |
| | | |
| FirstMerit Corp. | | 767,816 | | | 15,993,607 | | | |
| | | |
| MB Financial, Inc. | | 522,850 | | | 18,006,954 | | | |
| | | |
| Talmer Bancorp, Inc., Cl. A | | 480,300 | | | 8,045,025 | | | |
| | | |
| Webster Financial Corp. | | 355,760 | | | 14,070,308 | | | |
| | | | | | | | |
| | | | | 106,039,793 | | | |
| | | |
| Insurance—2.4% | | | | | | | | |
| | | |
| Endurance Specialty Holdings Ltd. | | 203,810 | | | 13,390,317 | | | |
| | | |
| James River Group Holdings Ltd. | | 257,820 | | | 6,669,803 | | | |
| | | |
| Old Republic International Corp. | | 425,380 | | | 6,648,690 | | | |
| | | | | | | | |
| | | | | 26,708,810 | | | |
| | | |
| Real Estate Investment Trusts (REITs)—9.2% | | | |
| | | |
| Apollo Commercial Real Estate Finance, Inc. | | 694,702 | | | 11,413,954 | | | |
| | | |
| Chatham Lodging Trust | | 646,700 | | | 17,118,149 | | | |
| | | |
| CYS Investments, Inc. | | 1,735,430 | | | 13,414,874 | | | |
| | | |
| DuPont Fabros Technology, Inc. | | 373,590 | | | 11,002,226 | | | |
| | | |
| LaSalle Hotel Properties | | 522,466 | | | 18,526,644 | | | |
| | | |
| National Storage Affiliates Trust | | 643,430 | | | 7,978,532 | | | |
| | | |
| STAG Industrial, Inc. | | 1,111,310 | | | 22,226,200 | | | |
| | | | | | | | |
| | | | | 101,680,579 | | | |
| | | | | | | | |
| | | Shares | | | Value | |
| |
| Thrifts & Mortgage Finance—1.5% | |
| |
| Flagstar Bancorp, Inc.1 | | | 358,207 | | | $ | 6,619,665 | |
| |
| Oritani Financial Corp. | | | 620,350 | | | | 9,956,618 | |
| | | | | | | | |
| | | | | | | 16,576,283 | |
| |
| Health Care—14.6% | | | | | | | | |
| |
| Biotechnology—2.3% | | | | | | | | |
| |
| ACADIA Pharmaceuticals, Inc.1 | | | 195,850 | | | | 8,202,198 | |
| |
| Axovant Sciences Ltd.1 | | | 118,790 | | | | 2,420,940 | |
| |
| Celldex Therapeutics, Inc.1 | | | 164,480 | | | | 4,148,186 | |
| |
| Esperion Therapeutics, Inc.1 | | | 50,720 | | | | 4,146,867 | |
| |
| Ultragenyx Pharmaceutical, Inc.1 | | | 67,270 | | | | 6,887,775 | |
| | | | | | | | |
| | | | | | | 25,805,966 | |
| |
| Health Care Equipment & Supplies—3.2% | |
| |
| DexCom, Inc.1 | | | 136,790 | | | | 10,940,464 | |
| |
| Greatbatch, Inc.1 | | | 158,631 | | | | 8,553,383 | |
| |
| NxStage Medical, Inc.1 | | | 377,280 | | | | 5,389,445 | |
| |
| Spectranetics Corp. (The)1 | | | 438,380 | | | | 10,087,124 | |
| | | | | | | | |
| | | | | | | 34,970,416 | |
| |
| Health Care Providers & Services—6.3% | |
| |
| Acadia Healthcare Co., Inc.1 | | | 187,630 | | | | 14,697,058 | |
| |
| HealthSouth Corp. | | | 416,740 | | | | 19,195,044 | |
| |
| Team Health Holdings, Inc.1 | | | 219,960 | | | | 14,369,987 | |
| |
| WellCare Health Plans, Inc.1 | | | 243,421 | | | | 20,649,403 | |
| | | | | | | | |
| | | | | | | 68,911,492 | |
| |
| Life Sciences Tools & Services—0.7% | |
| |
| VWR Corp.1 | | | 282,090 | | | | 7,540,266 | |
| |
| Pharmaceuticals—2.1% | | | | | | | | |
| |
| Aratana Therapeutics, Inc.1 | | | 295,020 | | | | 4,460,702 | |
| |
| Prestige Brands Holdings, Inc.1 | | | 391,596 | | | | 18,107,399 | |
| | | | | | | | |
| | | | | | | 22,568,101 | |
| |
| Industrials—16.3% | | | | | | | | |
| |
| Aerospace & Defense—0.7% | | | | | | | | |
| |
| AAR Corp. | | | 246,565 | | | | 7,858,027 | |
| |
| Air Freight & Couriers—0.7% | | | | | | | | |
| |
| XPO Logistics, Inc.1 | | | 174,740 | | | | 7,894,753 | |
| |
| Airlines—0.6% | | | | | | | | |
| |
| Spirit Airlines, Inc.1 | | | 99,300 | | | | 6,166,530 | |
| |
| Building Products—0.8% | | | | | | | | |
| |
| Masonite International Corp.1 | | | 130,800 | | | | 9,170,388 | |
| |
| Commercial Services & Supplies—4.7% | |
| |
| ABM Industries, Inc. | | | 372,010 | | | | 12,227,968 | |
| |
| ACCO Brands Corp.1 | | | 1,432,727 | | | | 11,132,289 | |
| |
| KAR Auction Services, Inc. | | | 534,810 | | | | 20,001,894 | |
| |
| Matthews International Corp., Cl. A | | | 158,270 | | | | 8,410,468 | |
| | | | | | | | |
| | | | | | | 51,772,619 | |
| |
| Construction & Engineering—0.7% | |
| |
| AECOM1 | | | 248,143 | | | | 8,208,570 | |
| |
| Electrical Equipment—0.9% | | | | | | | | |
| |
| Generac Holdings, Inc.1 | | | 237,990 | | | | 9,460,102 | |
| |
| Machinery—1.4% | | | | | | | | |
| |
| Greenbrier Cos., Inc. (The) | | | 150,560 | | | | 7,053,736 | |
| |
| SPX Corp. | | | 118,420 | | | | 8,572,424 | |
| | | | | | | | |
| | | | | | | 15,626,160 | |
| |
| Professional Services—3.2% | |
| |
| Korn/Ferry International | | | 622,141 | | | | 21,631,843 | |
| |
| On Assignment, Inc.1 | | | 336,590 | | | | 13,221,255 | |
| | | | | | | | |
| | | | | | | 34,853,098 | |
| |
| Road & Rail—1.3% | | | | | | | | |
| |
| Saia, Inc.1 | | | 147,300 | | | | 5,787,417 | |
6 OPPENHEIMER MAIN STREET SMALL CAP FUND/VA
| | | | | | | | |
| | | Shares | | Value | | | |
| | | |
| Road & Rail (Continued) | | | | | | | | |
| | | |
| Swift Transportation Co., Cl. A1 | | 382,074 | | $ | 8,661,618 | | | |
| | | | | | | | |
| | | | | 14,449,035 | | | |
| | | |
| Trading Companies & Distributors—0.5% | | | |
| | | |
NOW, Inc.1 | | 247,840 | | | 4,934,494 | | | |
| | | |
| Transportation Infrastructure—0.8% | | | |
| | | |
Wesco Aircraft Holdings, Inc.1 | | 545,590 | | | 8,265,688 | | | |
| | | |
| Information Technology—16.6% | | | |
| | | |
| Electronic Equipment, Instruments, & Components—1.5% | | | |
| | | |
SYNNEX Corp. | | 219,810 | | | 16,087,894 | | | |
| | | |
| Internet Software & Services—1.5% | | | |
| | | |
j2 Global, Inc. | | 244,883 | | | 16,637,351 | | | |
| | | |
| IT Services—2.5% | | | | | | | | |
| | | |
| Black Knight Financial Services, Inc., Cl. A1 | | 283,880 | | | 8,763,376 | | | |
| | | |
| Booz Allen Hamilton Holding Corp., Cl. A | | 364,830 | | | 9,208,309 | | | |
| | | |
| CACI International, Inc., Cl. A1 | | 121,310 | | | 9,812,766 | | | |
| | | | | | | | |
| | | | | 27,784,451 | | | |
| | | |
| Semiconductors & Semiconductor Equipment—3.5% | | | |
| | | |
| Cavium, Inc.1 | | 223,290 | | | 15,364,585 | | | |
| | | |
| Cypress Semiconductor Corp.1 | | 518,391 | | | 6,096,278 | | | |
| | | |
| MKS Instruments, Inc. | | 440,940 | | | 16,729,264 | | | |
| | | | | | | | |
| | | | | 38,190,127 | | | |
| | | |
| Software—7.6% | | | | | | | | |
| | | |
| FleetMatics Group plc1 | | 144,100 | | | 6,748,203 | | | |
| | | |
| Fortinet, Inc.1 | | 327,181 | | | 13,522,391 | | | |
| | | |
| Guidewire Software, Inc.1 | | 255,590 | | | 13,528,379 | | | |
| | | |
| Imperva, Inc.1 | | 253,180 | | | 17,140,286 | | | |
| | | |
| Paylocity Holding Corp.1 | | 404,380 | | | 14,497,023 | | | |
| | | |
| Proofpoint, Inc.1 | | 169,190 | | | 10,772,327 | | | |
| | | |
| Zynga, Inc., Cl. A1 | | 2,735,950 | | | 7,824,817 | | | |
| | | | | | | | |
| | | | | 84,033,426 | | | |
| | | | | | | | |
| | | Shares | | | Value | |
| |
| Materials—7.4% | | | | | | | | |
| |
| Chemicals—2.8% | | | | | | | | |
| |
| A. Schulman, Inc. | | | 161,758 | | | $ | 7,072,060 | |
| |
| Cytec Industries, Inc. | | | 165,756 | | | | 10,033,211 | |
| |
| Intrepid Potash, Inc.1 | | | 644,950 | | | | 7,700,703 | |
| |
| Tronox Ltd., Cl. A | | | 416,670 | | | | 6,095,882 | |
| | | | | | | | |
| | | | | | | 30,901,856 | |
| |
| Metals & Mining—2.4% | | | | | | | | |
| |
| Century Aluminum Co.1 | | | 494,430 | | | | 5,156,905 | |
| |
| Kaiser Aluminum Corp. | | | 190,020 | | | | 15,786,862 | |
| |
| Osisko Gold Royalties Ltd. | | | 391,941 | | | | 4,932,996 | |
| | | | | | | | |
| | | | | | | 25,876,763 | |
| |
| Paper & Forest Products—2.2% | |
| |
| Boise Cascade Co.1 | | | 253,510 | | | | 9,298,747 | |
| |
| PH Glatfelter Co. | | | 658,303 | | | | 14,476,083 | |
| | | | | | | | |
| | | | | | | 23,774,830 | |
| |
| Utilities—2.2% | | | | | | | | |
| |
| Electric Utilities—2.2% | | | | | | | | |
| |
| ALLETE, Inc. | | | 271,440 | | | | 12,592,101 | |
| |
| Portland General Electric Co. | | | 340,780 | | | | 11,300,265 | |
| | | | | | | | |
| | | | | | | 23,892,366 | |
| |
| Gas Utilities—0.0% | | | | | | | | |
| |
| Suburban Propane Partners LP2 | | | 13,105 | | | | 522,627 | |
| | | | | | | | |
Total Common Stocks (Cost $844,289,682) | | | | | | | 1,090,374,997 | |
| |
Investment Company—1.1% | | | | | | | | |
| |
| Oppenheimer Institutional Money Market Fund, | | | | | | | | |
Cl. E, 0.15%3,4 (Cost $11,827,603) | | | 11,827,603 | | | | 11,827,603 | |
| |
| Total Investments, at Value (Cost $856,117,285) | | | 100.2% | | | | 1,102,202,600 | |
| |
| Net Other Assets (Liabilities) | | | (0.2) | | | | (2,022,093) | |
| | | | |
| Net Assets | | | 100.0% | | | $ | 1,100,180,507 | |
| | | | |
Footnotes to Statement of Investments
1. Non-income producing security.
2. Security is a Master Limited Partnership.
3. Rate shown is the 7-day yield as of June 30, 2015.
4. Is or was an affiliate, as defined in the Investment Company Act of 1940, as amended, at or during the period ended June 30, 2015, by virtue of the Fund owning at least 5% of the voting securities of the issuer or as a result of the Fund and the issuer having the same investment adviser. Transactions during the period in which the issuer was an affiliate are as follows:
| | | | | | | | | | | | | | | | | | | | | | |
| | | Shares
December 31, 2014 | | | | | Gross
Additions | | | | | Gross
Reductions | | | | | Shares
June 30, 2015 | |
| |
Oppenheimer Institutional Money Market Fund, Cl. E | | | 3,962,569 | | | | | | 147,928,411 | | | | | | 140,063,377 | | | | | | 11,827,603 | |
| | | | | | | | |
| | | Value | | | Income | |
| |
Oppenheimer Institutional Money Market Fund, Cl. E | | $ | 11,827,603 | | | $ | 10,772 | |
See accompanying Notes to Financial Statements.
7 OPPENHEIMER MAIN STREET SMALL CAP FUND/VA
STATEMENT OF ASSETS AND LIABILITIES June 30, 2015 Unaudited
| | | | |
| |
Assets | | | | |
| Investments, at value—see accompanying statement of investments: | | | | |
| Unaffiliated companies (cost $844,289,682) | | $ | 1,090,374,997 | |
| Affiliated companies (cost $11,827,603) | | | 11,827,603 | |
| | | | |
| | | 1,102,202,600 | |
| |
| Cash | | | 1,091,629 | |
| |
| Receivables and other assets: | | | | |
| Investments sold | | | 6,056,558 | |
| Dividends | | | 2,293,368 | |
| Shares of beneficial interest sold | | | 320,554 | |
| Other | | | 50,785 | |
| | | | |
| Total assets | | | 1,112,015,494 | |
| |
Liabilities | | | | |
| Payables and other liabilities: | | | | |
| Investments purchased | | | 10,741,835 | |
| Shares of beneficial interest redeemed | | | 772,477 | |
| Distribution and service plan fees | | | 199,374 | |
| Shareholder communications | | | 62,291 | |
| Trustees’ compensation | | | 41,956 | |
| Other | | | 17,054 | |
| | | | |
| Total liabilities | | | 11,834,987 | |
| |
| Net Assets | | $ | 1,100,180,507 | |
| | | | |
| | | | |
| |
Composition of Net Assets | | | | |
| Par value of shares of beneficial interest | | $ | 47,420 | |
| |
| Additional paid-in capital | | | 827,073,775 | |
| |
| Accumulated net investment income | | | 1,337,926 | |
| |
| Accumulated net realized gain on investments and foreign currency transactions | | | 25,636,142 | |
| |
| Net unrealized appreciation on investments and translation of assets and liabilities denominated in foreign currencies | | | 246,085,244 | |
| | | | |
| Net Assets | | $ | 1,100,180,507 | |
| | | | |
| | | | |
| |
Net Asset Value Per Share | | | | |
| Non-Service Shares: | | | | |
| Net asset value, redemption price per share and offering price per share (based on net assets of $138,648,198 and 5,914,251 shares of beneficial interest outstanding) | | | $23.44 | |
| |
Service Shares: | | | | |
| Net asset value, redemption price per share and offering price per share (based on net assets of $961,532,309 and 41,505,705 shares of beneficial interest outstanding) | | | $23.17 | |
See accompanying Notes to Financial Statements.
8 OPPENHEIMER MAIN STREET SMALL CAP FUND/VA
STATEMENT OF OPERATIONS For the Six Months Ended June 30, 2015 Unaudited
| | | | |
| |
Investment Income | | | | |
| Dividends: | | | | |
| Unaffiliated companies (net of foreign withholding taxes of $1,425) | | $ | 7,439,243 | |
| Affiliated companies | | | 10,772 | |
| |
| Interest | | | 7 | |
| | | | |
Total investment income | | | 7,450,022 | |
| |
Expenses | | | | |
| Management fees | | | 3,681,600 | |
| |
| Distribution and service plan fees — Service shares | | | 1,192,691 | |
| |
| Transfer and shareholder servicing agent fees: | | | | |
| Non-Service shares | | | 68,701 | |
| Service shares | | | 477,144 | |
| |
| Shareholder communications: | | | | |
| Non-Service shares | | | 5,285 | |
| Service shares | | | 36,489 | |
| |
| Trustees’ compensation | | | 18,627 | |
| |
| Custodian fees and expenses | | | 2,930 | |
| |
| Other | | | 30,841 | |
| | | | |
| Total expenses | | | 5,514,308 | |
| Less reduction to custodian expenses | | | (176) | |
| Less waivers and reimbursements of expenses | | | (8,526) | |
| | | | |
Net expenses | | | 5,505,606 | |
| |
Net Investment Income | | | 1,944,416 | |
| |
Realized and Unrealized Gain | | | | |
| Net realized gain on: | | | | |
| Investments from unaffiliated companies | | | 27,364,604 | |
| Foreign currency transactions | | | 1,943 | |
| | | | |
| Net realized gain | | | 27,366,547 | |
| |
| Net change in unrealized appreciation/depreciation on: | | | | |
| Investments | | | 6,832,059 | |
| Translation of assets and liabilities denominated in foreign currencies | | | 414,248 | |
| | | | |
Net change in unrealized appreciation/depreciation | | | 7,246,307 | |
| |
Net Increase in Net Assets Resulting from Operations | | $ | 36,557,270 | |
| | | | |
See accompanying Notes to Financial Statements.
9 OPPENHEIMER MAIN STREET SMALL CAP FUND/VA
STATEMENTS OF CHANGES IN NET ASSETS
| | | | | | | | |
| | | Six Months Ended
June 30, 2015
(Unaudited) | | | Year Ended
December 31, 2014 | |
| |
Operations | | | | | | | | |
| Net investment income | | $ | 1,944,416 | | | $ | 8,483,013 | |
| |
| Net realized gain | | | 27,366,547 | | | | 178,986,366 | |
| |
| Net change in unrealized appreciation/depreciation | | | 7,246,307 | | | | (66,686,269) | |
| | | | | | | | |
Net increase in net assets resulting from operations | | | 36,557,270 | | | | 120,783,110 | |
| |
Dividends and/or Distributions to Shareholders | | | | | | | | |
| Dividends from net investment income: | | | | | | | | |
| Non-Service shares | | | (1,186,413) | | | | (1,181,678) | |
| Service shares | | | (5,919,665) | | | | (6,176,380) | |
| | | | |
| | | (7,106,078) | | | | (7,358,058) | |
| |
| Distributions from net realized gain: | | | | | | | | |
| Non-Service shares | | | (19,582,501) | | | | (18,983,832) | |
| Service shares | | | (137,100,829) | | | | (137,086,830) | |
| | | | |
| | | (156,683,330) | | | | (156,070,662) | |
| |
Beneficial Interest Transactions | | | | | | | | |
| Net increase in net assets resulting from beneficial interest transactions: | | | | | | | | |
| Non-Service shares | | | 18,258,513 | | | | 6,791,213 | |
| Service shares | | | 104,114,806 | | | | 16,033,807 | |
| | | | | | | | |
| | | 122,373,319 | | | | 22,825,020 | |
| |
Net Assets | | | | | | | | |
| Total decrease | | | (4,858,819) | | | | (19,820,590) | |
| |
| Beginning of period | | | 1,105,039,326 | | | | 1,124,859,916 | |
| | | | | | | | |
End of period (including accumulated net investment income of $1,337,926 and $6,499,588, respectively) | | $ | 1,100,180,507 | | | $ | 1,105,039,326 | |
| | | | |
See accompanying Notes to Financial Statements.
10 OPPENHEIMER MAIN STREET SMALL CAP FUND/VA
FINANCIAL HIGHLIGHTS
| | | | | | | | | | | | | | | | | | | | | | | | |
| Non-Service Shares | | Six Months
Ended
June 30, 2015
(Unaudited) | | | Year Ended
December 31,
2014 | | | Year Ended
December 31,
2013 | | | Year Ended
December 31,
2012 | | | Year Ended
December 30,
20111 | | | Year Ended
December 31,
2010 | |
| |
Per Share Operating Data | | | | | | | | | | | | | | | | | | | | | | | | |
| Net asset value, beginning of period | | $ | 26.56 | | | $ | 27.80 | | | $ | 20.14 | | | $ | 17.17 | | | $ | 17.66 | | | $ | 14.40 | |
| |
| Income (loss) from investment operations: | | | | | | | | | | | | | | | | | | | | | | | | |
| Net investment income2 | | | 0.08 | | | | 0.26 | | | | 0.16 | | | | 0.21 | | | | 0.10 | | | | 0.10 | |
| Net realized and unrealized gain (loss) | | | 0.88 | | | | 2.74 | | | | 8.01 | | | | 2.87 | | | | (0.48) | | | | 3.25 | |
| | | | |
| Total from investment operations | | | 0.96 | | | | 3.00 | | | | 8.17 | | | | 3.08 | | | | (0.38) | | | | 3.35 | |
| |
| Dividends and/or distributions to shareholders: | | | | | | | | | | | | | | | | | | | | | | | | |
| Dividends from net investment income | | | (0.23) | | | | (0.25) | | | | (0.22) | | | | (0.11) | | | | (0.11) | | | | (0.09) | |
| Distributions from net realized gain | | | (3.85) | | | | (3.99) | | | | (0.29) | | | | 0.00 | | | | 0.00 | | | | 0.00 | |
| | | | |
| Total dividends and/or distributions to shareholders | | | (4.08) | | | | (4.24) | | | | (0.51) | | | | (0.11) | | | | (0.11) | | | | (0.09) | |
| |
| Net asset value, end of period | | $ | 23.44 | | | $ | 26.56 | | | $ | 27.80 | | | $ | 20.14 | | | $ | 17.17 | | | $ | 17.66 | |
| | | | |
| | | | | | | | | |
| |
Total Return, at Net Asset Value3 | | | 3.46% | | | | 11.93% | | | | 41.01% | | | | 17.99% | | | | (2.21)% | | | | 23.41% | |
| | | | | | | | | |
| |
Ratios/Supplemental Data | | | | | | | | | | | | | | | | | | | | | | | | |
| Net assets, end of period (in thousands) | | $ | 138,648 | | | $ | 136,402 | | | $ | 134,692 | | | $ | 87,267 | | | $ | 79,722 | | | $ | 95,576 | |
| |
| Average net assets (in thousands) | | $ | 138,507 | | | $ | 133,864 | | | $ | 113,522 | | | $ | 83,790 | | | $ | 86,796 | | | $ | 88,063 | |
| |
| Ratios to average net assets:4 | | | | | | | | | | | | | | | | | | | | | | | | |
| Net investment income | | | 0.57% | | | | 0.99% | | | | 0.67% | | | | 1.09% | | | | 0.58% | | | | 0.68% | |
| Total expenses5 | | | 0.79% | | | | 0.80% | | | | 0.81% | | | | 0.83% | | | | 0.83% | | | | 0.85% | |
| Expenses after payments, waivers and/or reimbursements and reduction to custodian expenses | | | 0.79% | | | | 0.79% | | | | 0.80% | | | | 0.80% | | | | 0.80% | | | | 0.80% | |
| |
| Portfolio turnover rate | | | 21 % | | | | 65 % | | | | 60 % | | | | 92 % | | | | 108 % | | | | 73 % | |
1. December 30, 2011 represents the last business day of the Fund’s reporting period.
2. Per share amounts calculated based on the average shares outstanding during the period.
3. Assumes an initial investment on the business day before the first day of the fiscal period, with all dividends and distributions reinvested in additional shares on the reinvestment date, and redemption at the net asset value calculated on the last business day of the fiscal period. Total returns are not annualized for periods less than one full year. Total return information does not reflect expenses that apply at the separate account level or to related insurance products. Inclusion of these charges would reduce the total return figures for all periods shown. Returns do not reflect the deduction of taxes that a shareholder would pay on fund distributions or the redemption of fund shares. The returns do not include adjustments in accordance with generally accepted accounting principles required at the period end for financial reporting purposes.
4. Annualized for periods less than one full year.
5. Total expenses including indirect expenses from affiliated fund fees and expenses were as follows:
| | | | |
| | | | |
| | Six Months Ended June 30, 2015 | | 0.79% |
| | Year Ended December 31, 2014 | | 0.80% |
| | Year Ended December 31, 2013 | | 0.81% |
| | Year Ended December 31, 2012 | | 0.83% |
| | Year Ended December 30, 2011 | | 0.83% |
| | Year Ended December 31, 2010 | | 0.85% |
See accompanying Notes to Financial Statements.
11 OPPENHEIMER MAIN STREET SMALL CAP FUND/VA
FINANCIAL HIGHLIGHTS Continued
| | | | | | | | | | | | | | | | | | | | | | | | |
| Service Shares | | Six Months
Ended
June 30, 2015
(Unaudited) | | | Year Ended
December 31,
2014 | | | Year Ended
December 31,
2013 | | | Year Ended
December 31,
2012 | | | Year Ended
December 30,
20111 | | | Year Ended
December 31,
2010 | |
| |
Per Share Operating Data | | | | | | | | | | | | | | | | | | | | | | | | |
| Net asset value, beginning of period | | $ | 26.26 | | | $ | 27.53 | | | $ | 19.96 | | | $ | 17.02 | | | $ | 17.50 | | | $ | 14.28 | |
| |
| Income (loss) from investment operations: | | | | | | | | | | | | | | | | | | | | | | | | |
| Net investment income2 | | | 0.04 | | | | 0.19 | | | | 0.10 | | | | 0.15 | | | | 0.06 | | | | 0.07 | |
| Net realized and unrealized gain (loss) | | | 0.89 | | | | 2.71 | | | | 7.93 | | | | 2.85 | | | | (0.47) | | | | 3.21 | |
| | | | |
| Total from investment operations | | | 0.93 | | | | 2.90 | | | | 8.03 | | | | 3.00 | | | | (0.41) | | | | 3.28 | |
| |
| Dividends and/or distributions to shareholders: | | | | | | | | | | | | | | | | | | | | | | | | |
| Dividends from net investment income | | | (0.17) | | | | (0.18) | | | | (0.17) | | | | (0.06) | | | | (0.07) | | | | (0.06) | |
| Distributions from net realized gain | | | (3.85) | | | | (3.99) | | | | (0.29) | | | | 0.00 | | | | 0.00 | | | | 0.00 | |
| | | | |
| Total dividends and/or distributions to shareholders | | | (4.02) | | | | (4.17) | | | | (0.46) | | | | (0.06) | | | | (0.07) | | | | (0.06) | |
| |
| Net asset value, end of period | | $ | 23.17 | | | $ | 26.26 | | | $ | 27.53 | | | $ | 19.96 | | | $ | 17.02 | | | $ | 17.50 | |
| | | | |
| | | | | | | | | |
| |
Total Return, at Net Asset Value3 | | | 3.37% | | | | 11.66% | | | | 40.62% | | | | 17.67% | | | | (2.38)% | | | | 23.06% | |
| | | | | | | | | |
| |
Ratios/Supplemental Data | | | | | | | | | | | | | | | | | | | | | | | | |
| Net assets, end of period (in thousands) | | $ | 961,533 | | | $ | 968,637 | | | $ | 990,168 | | | $ | 849,920 | | | $ | 790,752 | | | $ | 859,710 | |
| |
| Average net assets (in thousands) | | $ | 961,955 | | | $ | 957,874 | | | $ | 935,083 | | | $ | 836,487 | | | $ | 823,201 | | | $ | 730,069 | |
| |
| Ratios to average net assets:4 | | | | | | | | | | | | | | | | | | | | | | | | |
| Net investment income | | | 0.33% | | | | 0.75% | | | | 0.43% | | | | 0.82% | | | | 0.34% | | | | 0.45% | |
| Total expenses5 | | | 1.04% | | | | 1.05% | | | | 1.06% | | | | 1.08% | | | | 1.08% | | | | 1.10% | |
| Expenses after payments, waivers and/or reimbursements and reduction to custodian expenses | | | 1.04% | | | | 1.04% | | | | 1.05% | | | | 1.05% | | | | 1.05% | | | | 1.05% | |
| |
| Portfolio turnover rate | | | 21 % | | | | 65 % | | | | 60 % | | | | 92 % | | | | 108 % | | | | 73 % | |
1. December 30, 2011 represents the last business day of the Fund’s reporting period.
2. Per share amounts calculated based on the average shares outstanding during the period.
3. Assumes an initial investment on the business day before the first day of the fiscal period, with all dividends and distributions reinvested in additional shares on the reinvestment date, and redemption at the net asset value calculated on the last business day of the fiscal period. Total returns are not annualized for periods less than one full year. Total return information does not reflect expenses that apply at the separate account level or to related insurance products. Inclusion of these charges would reduce the total return figures for all periods shown. Returns do not reflect the deduction of taxes that a shareholder would pay on fund distributions or the redemption of fund shares. The returns do not include adjustments in accordance with generally accepted accounting principles required at the period end for financial reporting purposes.
4. Annualized for periods less than one full year.
5. Total expenses including indirect expenses from affiliated fund fees and expenses were as follows:
| | | | |
| | | | |
| | Six Months Ended June 30, 2015 | | 1.04% |
| | Year Ended December 31, 2014 | | 1.05% |
| | Year Ended December 31, 2013 | | 1.06% |
| | Year Ended December 31, 2012 | | 1.08% |
| | Year Ended December 30, 2011 | | 1.08% |
| | Year Ended December 31, 2010 | | 1.10% |
See accompanying Notes to Financial Statements.
12 OPPENHEIMER MAIN STREET SMALL CAP FUND/VA
NOTES TO FINANCIAL STATEMENTS June 30, 2015 Unaudited
1. Organization
Oppenheimer Main Street Small Cap Fund/VA (the “Fund”), is a separate series of Oppenheimer Variable Account Funds, a diversified open-end management investment company registered under the Investment Company Act of 1940 (“1940 Act”), as amended. The Fund’s investment objective is to seek capital appreciation. The Fund’s investment adviser is OFI Global Asset Management, Inc. (“OFI Global” or the “Manager”), a wholly-owned subsidiary of OppenheimerFunds, Inc. (“OFI” or the “Sub-Adviser”). The Manager has entered into a sub-advisory agreement with OFI. Shares of the Fund are sold only to separate accounts of life insurance companies.
The Fund offers two classes of shares. Both classes are sold at their offering price, which is the net asset value per share, to separate investment accounts of participating insurance companies as an underlying investment for variable life insurance policies, variable annuity contracts or other investment products. The class of shares designated as Service shares is subject to a distribution and service plan. Both classes of shares have identical rights and voting privileges with respect to the Fund in general and exclusive voting rights on matters that affect that class alone. Earnings, net assets and net asset value per share may differ due to each class having its own expenses, such as transfer and shareholder servicing agent fees and shareholder communications, directly attributable to that class.
The following is a summary of significant accounting policies followed in the Fund’s preparation of financial statements in accordance with accounting principles generally accepted in the United States (“U.S. GAAP”).
2. Significant Accounting Policies
Security Valuation. All investments in securities are recorded at their estimated fair value, as described in Note 3.
Reporting Period End Date. The last day of the Fund’s reporting period is the last day the New York Stock Exchange was open for trading during the period. The Fund’s financial statements have been presented through that date to maintain consistency with the Fund’s net asset value calculations used for shareholder transactions.
Foreign Currency Translation. The Fund’s accounting records are maintained in U.S. dollars. The values of securities denominated in foreign currencies and amounts related to the purchase and sale of foreign securities and foreign investment income are translated into U.S. dollars as of the close of the New York Stock Exchange (the “Exchange”), normally 4:00 P.M. Eastern time, on each day the Exchange is open for trading. Foreign exchange rates may be valued primarily using a reliable bank, dealer or service authorized by the Board of Trustees.
Reported net realized gains and losses from foreign currency transactions arise from sales of portfolio securities, sales and maturities of short-term securities, sales of foreign currencies, exchange rate fluctuations between the trade and settlement dates on securities transactions, and the difference between the amounts of dividends, interest, and foreign withholding taxes recorded on the Fund’s books and the U.S. dollar equivalent of the amounts actually received or paid. Net unrealized appreciation and depreciation on the translation of assets and liabilities denominated in foreign currencies arise from changes in the values of assets and liabilities, including investments in securities at fiscal period end, resulting from changes in exchange rates.
The effect of changes in foreign currency exchange rates on investments is separately identified from the fluctuations arising from changes in market values of securities held and reported with all other foreign currency gains and losses in the Fund’s Statement of Operations.
Allocation of Income, Expenses, Gains and Losses. Income, expenses (other than those attributable to a specific class), gains and losses are allocated on a daily basis to each class of shares based upon the relative proportion of net assets represented by such class. Operating expenses directly attributable to a specific class are charged against the operations of that class.
Dividends and Distributions to Shareholders. Dividends and distributions to shareholders, which are determined in accordance with income tax regulations and may differ from U.S. generally accepted accounting principles, are recorded on the ex-dividend date. Income and capital gain distributions, if any, are declared and paid annually or at other times as deemed necessary by the Manager.
The tax character of distributions is determined as of the Fund’s fiscal year end. Therefore, a portion of the Fund’s distributions made to shareholders prior to the Fund’s fiscal year end may ultimately be categorized as a tax return of capital.
Investment Income. Dividend income is recorded on the ex-dividend date or upon ex-dividend notification in the case of certain foreign dividends where the ex-dividend date may have passed. Non-cash dividends included in dividend income, if any, are recorded at the fair market value of the securities received. Interest income is recognized on an accrual basis. Discount and premium, which are included in interest income on the Statement of Operations, are amortized or accreted daily.
Return of Capital Estimates. Distributions received from the Fund’s investments in MLPs generally are comprised of income and return of capital. The Fund records investment income and return of capital based on estimates made at the time such distributions are received. Such estimates are based on historical information available from each MLP and other industry sources. These estimates may subsequently be revised based on information received from MLPs after their tax reporting periods are concluded.
Custodian Fees. “Custodian fees and expenses” in the Statement of Operations may include interest expense incurred by the Fund on any cash overdrafts of its custodian account during the period. Such cash overdrafts may result from the effects of failed trades in portfolio securities and from cash outflows resulting from unanticipated shareholder redemption activity. The Fund pays interest to its custodian on such cash overdrafts, to the extent they are not offset by positive cash balances maintained by the Fund, at a rate equal to the Federal Funds Rate plus 0.50%. The “Reduction to custodian
13 OPPENHEIMER MAIN STREET SMALL CAP FUND/VA
NOTES TO FINANCIAL STATEMENTS Unaudited / Continued
2. Significant Accounting Policies (Continued)
expenses” line item, if applicable, represents earnings on cash balances maintained by the Fund during the period. Such interest expense and other custodian fees may be paid with these earnings.
Security Transactions. Security transactions are recorded on the trade date. Realized gains and losses on securities sold are determined on the basis of identified cost.
Indemnifications. The Fund’s organizational documents provide current and former Trustees and officers with a limited indemnification against liabilities arising in connection with the performance of their duties to the Fund. In the normal course of business, the Fund may also enter into contracts that provide general indemnifications. The Fund’s maximum exposure under these arrangements is unknown as this would be dependent on future claims that may be made against the Fund. The risk of material loss from such claims is considered remote.
Federal Taxes. The Fund intends to comply with provisions of the Internal Revenue Code applicable to regulated investment companies and to distribute substantially all of its investment company taxable income to shareholders. Therefore, no federal income or excise tax provision is required. The Fund files income tax returns in U.S. federal and applicable state jurisdictions. The statute of limitations on the Fund’s tax return filings generally remains open for the three preceding fiscal reporting period ends.
During the fiscal year ended December 31, 2014, the Fund did not utilize any capital loss carryforward to offset capital gains realized in that fiscal year. Capital loss carryforwards with no expiration, if any, must be utilized prior to those with expiration dates. Capital losses with no expiration will be carried forward to future years if not offset by gains.
Net investment income (loss) and net realized gain (loss) may differ for financial statement and tax purposes. The character of dividends and distributions made during the fiscal year from net investment income or net realized gains are determined in accordance with federal income tax requirements, which may differ from the character of net investment income or net realized gains presented in those financial statements in accordance with GAAP. Also, due to timing of dividends and distributions, the fiscal year in which amounts are distributed may differ from the fiscal year in which the income or net realized gain was recorded by the Fund.
The aggregate cost of securities and other investments and the composition of unrealized appreciation and depreciation of securities and other investments for federal income tax purposes as of June 30, 2015 are noted in the following table. The primary difference between book and tax appreciation or depreciation of securities and other investments, if applicable, is attributable to the tax deferral of losses or tax realization of financial statement unrealized gain or loss.
| | | | |
Federal tax cost of securities | | $ | 856,983,362 | |
| | | | |
Gross unrealized appreciation | | $ | 271,560,407 | |
Gross unrealized depreciation | | | (26,341,169) | |
| | | | |
Net unrealized appreciation | | $ | 245,219,238 | |
| | | | |
Use of Estimates. The preparation of financial statements in conformity with accounting principles generally accepted in the United States of America requires management to make estimates and assumptions that affect the reported amounts of assets and liabilities and disclosure of contingent assets and liabilities at the date of the financial statements and the reported amounts of increases and decreases in net assets from operations during the reporting period. Actual results could differ from those estimates.
3. Securities Valuation
The Fund calculates the net asset value of its shares as of the close of the New York Stock Exchange (the “Exchange”), normally 4:00 P.M. Eastern time, on each day the Exchange is open for trading.
The Fund’s Board has adopted procedures for the valuation of the Fund’s securities and has delegated the day-to-day responsibility for valuation determinations under those procedures to the Manager. The Manager has established a Valuation Committee which is responsible for determining a “fair valuation” for any security for which market quotations are not “readily available.” The Valuation Committee’s fair valuation determinations are subject to review, approval and ratification by the Fund’s Board at its next regularly scheduled meeting covering the calendar quarter in which the fair valuation was determined.
Valuation Methods and Inputs
Securities are valued using unadjusted quoted market prices, when available, as supplied primarily by third party pricing services or dealers.
The following methodologies are used to determine the market value or the fair value of the types of securities described below:
Securities traded on a registered U.S. securities exchange (including exchange-traded derivatives other than futures and futures options) are valued based on the last sale price of the security reported on the principal exchange on which it is traded, prior to the time when the Fund’s assets are valued. In the absence of a sale, the security is valued at the last sale price on the prior trading day, if it is within the spread of the current day’s closing “bid” and “asked” prices, and if not, at the current day’s closing bid price. A security of a foreign issuer traded on a foreign exchange, but not listed on a registered U.S. securities exchange, is valued based on the last sale price on the principal exchange on which the security is traded, as identified by the third party pricing service used by the Manager, prior to the time when the Fund’s assets are valued. If the last sale price is unavailable, the security is valued at the most recent official closing price on the principal exchange on which it is traded. If the last sales price or official closing price for a foreign security is not available, the security is valued at the mean between the bid and asked price per the exchange or, if not available from the exchange, obtained from two dealers. If bid and asked prices are not available from either the exchange or two dealers, the security is valued by using one of the
14 OPPENHEIMER MAIN STREET SMALL CAP FUND/VA
3. Securities Valuation (Continued)
following methodologies (listed in order of priority): (1) using a bid from the exchange, (2) the mean between the bid and asked price as provided by a single dealer, or (3) a bid from a single dealer.
Shares of a registered investment company that are not traded on an exchange are valued at that investment company’s net asset value per share.
Corporate and government debt securities (of U.S. or foreign issuers) and municipal debt securities, event-linked bonds, loans, mortgage-backed securities, collateralized mortgage obligations, and asset-backed securities are valued at the mean between the “bid” and “asked” prices utilizing evaluated prices obtained from third party pricing services or broker-dealers who may use matrix pricing methods to determine the evaluated prices.
Short-term money market type debt securities with a remaining maturity of sixty days or less are valued at cost adjusted by the amortization of discount or premium to maturity (amortized cost), which approximates market value. Short-term debt securities with a remaining maturity in excess of sixty days are valued at the mean between the “bid” and “asked” prices utilizing evaluated prices obtained from third party pricing services or broker-dealers.
A description of the standard inputs that may generally be considered by the third party pricing vendors in determining their evaluated prices is provided below.
| | |
| Security Type | | Standard inputs generally considered by third-party pricing vendors |
|
| Corporate debt, government debt, municipal, mortgage-backed and asset-backed securities | | Reported trade data, broker-dealer price quotations, benchmark yields, issuer spreads on comparable securities, the credit quality, yield, maturity, and other appropriate factors. |
|
| Loans | | Information obtained from market participants regarding reported trade data and broker-dealer price quotations. |
|
| Event-linked bonds | | Information obtained from market participants regarding reported trade data and broker-dealer price quotations. |
If a market value or price cannot be determined for a security using the methodologies described above, or if, in the “good faith” opinion of the Manager, the market value or price obtained does not constitute a “readily available market quotation,” or a significant event has occurred that would materially affect the value of the security, the security is fair valued either (i) by a standardized fair valuation methodology applicable to the security type or the significant event as previously approved by the Valuation Committee and the Fund’s Board or (ii) as determined in good faith by the Manager’s Valuation Committee. The Valuation Committee considers all relevant facts that are reasonably available, through either public information or information available to the Manager, when determining the fair value of a security. Fair value determinations by the Manager are subject to review, approval and ratification by the Fund’s Board at its next regularly scheduled meeting covering the calendar quarter in which the fair valuation was determined. Those fair valuation standardized methodologies include, but are not limited to, valuing securities at the last sale price or initially at cost and subsequently adjusting the value based on: changes in company specific fundamentals, changes in an appropriate securities index, or changes in the value of similar securities which may be further adjusted for any discounts related to security-specific resale restrictions. When possible, such methodologies use observable market inputs such as unadjusted quoted prices of similar securities, observable interest rates, currency rates and yield curves. The methodologies used for valuing securities are not necessarily an indication of the risks associated with investing in those securities nor can it be assured that the Fund can obtain the fair value assigned to a security if it were to sell the security.
To assess the continuing appropriateness of security valuations, the Manager, or its third party service provider who is subject to oversight by the Manager, regularly compares prior day prices, prices on comparable securities, and sale prices to the current day prices and challenges those prices exceeding certain tolerance levels with the third party pricing service or broker source. For those securities valued by fair valuations, whether through a standardized fair valuation methodology or a fair valuation determination, the Valuation Committee reviews and affirms the reasonableness of the valuations based on such methodologies and fair valuation determinations on a regular basis after considering all relevant information that is reasonably available.
Classifications
Each investment asset or liability of the Fund is assigned a level at measurement date based on the significance and source of the inputs to its valuation. Various data inputs are used in determining the value of each of the Fund’s investments as of the reporting period end. These data inputs are categorized in the following hierarchy under applicable financial accounting standards:
1) Level 1-unadjusted quoted prices in active markets for identical assets or liabilities (including securities actively traded on a securities exchange)
2) Level 2-inputs other than unadjusted quoted prices that are observable for the asset or liability (such as unadjusted quoted prices for similar assets and market corroborated inputs such as interest rates, prepayment speeds, credit risks, etc.)
3) Level 3-significant unobservable inputs (including the Manager’s own judgments about assumptions that market participants would use in pricing the asset or liability).
The inputs used for valuing securities are not necessarily an indication of the risks associated with investing in those securities.
The table below categorizes amounts that are included in the Fund’s Statement of Assets and Liabilities as of June 30, 2015 based on valuation input level:
15 OPPENHEIMER MAIN STREET SMALL CAP FUND/VA
NOTES TO FINANCIAL STATEMENTS Unaudited / Continued
3. Securities Valuation (Continued)
| | | | | | | | | | | | | | | | |
| | | Level 1— Unadjusted Quoted Prices | | | Level 2— Other Significant Observable Inputs | | | Level 3— Significant Unobservable Inputs | | | Value | |
| |
| Assets Table | | | | | | | | | | | | | | | | |
| Investments, at Value: | | | | | | | | | | | | | | | | |
| Common Stocks | | | | | | | | | | | | | | | | |
Consumer Discretionary | | $ | 122,162,994 | | | $ | — | | | $ | — | | | $ | 122,162,994 | |
Consumer Staples | | | 54,815,295 | | | | — | | | | — | | | | 54,815,295 | |
Energy | | | 36,233,847 | | | | — | | | | — | | | | 36,233,847 | |
Financials | | | 251,005,465 | | | | — | | | | — | | | | 251,005,465 | |
Health Care | | | 159,796,241 | | | | — | | | | — | | | | 159,796,241 | |
Industrials | | | 178,659,464 | | | | — | | | | — | | | | 178,659,464 | |
Information Technology | | | 182,733,249 | | | | — | | | | — | | | | 182,733,249 | |
Materials | | | 80,553,449 | | | | — | | | | — | | | | 80,553,449 | |
Utilities | | | 24,414,993 | | | | — | | | | — | | | | 24,414,993 | |
| Investment Company | | | 11,827,603 | | | | — | | | | — | | | | 11,827,603 | |
| | | | |
| Total Assets | | $ | 1,102,202,600 | | | $ | — | | | $ | — | | | $ | 1,102,202,600 | |
| | | | |
Forward currency exchange contracts and futures contracts, if any, are reported at their unrealized appreciation/depreciation at measurement date, which represents the change in the contract’s value from trade date. All additional assets and liabilities included in the above table are reported at their market value at measurement date.
4. Investments and Risks
Investment in Oppenheimer Institutional Money Market Fund. The Fund is permitted to invest daily available cash balances in an affiliated money market fund. The Fund may invest the available cash in Class E shares of Oppenheimer Institutional Money Market Fund (“IMMF”) to seek current income while preserving liquidity or for defensive purposes. IMMF is a registered open-end management investment company, regulated as a money market fund under the 1940 Act. The Manager is the investment adviser of IMMF, and the Sub-Adviser provides investment and related advisory services to IMMF. When applicable, the Fund’s investment in IMMF is included in the Statement of Investments. Shares of IMMF are valued at their net asset value per share. As a shareholder, the Fund is subject to its proportional share of IMMF’s Class E expenses, including its management fee. The Manager will waive fees and/or reimburse Fund expenses in an amount equal to the indirect management fees incurred through the Fund’s investment in IMMF.
Master Limited Partnerships (“MLPs”). MLPs issue common units that represent an equity ownership interest in a partnership and provide limited voting rights. MLP common units are registered with the Securities and Exchange Commission (“SEC”), and are freely tradable on securities exchanges such as the NYSE and the NASDAQ Stock Market (“NASDAQ”), or in the over-the-counter (“OTC”) market. An MLP consists of one or more general partners, who conduct the business, and one or more limited partners, who contribute capital. MLP common unit holders have a limited role in the partnership’s operations and management. The Fund, as a limited partner, normally would not be liable for the debts of the MLP beyond the amounts the Fund has contributed, but would not be shielded to the same extent that a shareholder of a corporation would be. In certain circumstances creditors of an MLP would have the right to seek return of capital distributed to a limited partner. This right of an MLP’s creditors would continue after the Fund sold its investment in the MLP.
Equity Security Risk. Stocks and other equity securities fluctuate in price. The value of the Fund’s portfolio may be affected by changes in the equity markets generally. Equity markets may experience significant short-term volatility and may fall sharply at times. Different markets may behave differently from each other and U.S. equity markets may move in the opposite direction from one or more foreign stock markets. Adverse events in any part of the equity or fixed-income markets may have unexpected negative effects on other market segments.
The prices of individual equity securities generally do not all move in the same direction at the same time and a variety of factors can affect the price of a particular company’s securities. These factors may include, but are not limited to, poor earnings reports, a loss of customers, litigation against the company, general unfavorable performance of the company’s sector or industry, or changes in government regulations affecting the company or its industry.
5. Shares of Beneficial Interest
The Fund has authorized an unlimited number of $0.001 par value shares of beneficial interest of each class. Transactions in shares of beneficial interest were as follows:
| | | | | | | | | | | | | | | | |
| | | Six Months Ended June 30, 2015 | | | Year Ended December 31, 2014 | |
| | | Shares | | | Amount | | | Shares | | | Amount | |
| |
| Non-Service Shares | | | | | | | | | | | | | | | | |
| Sold | | | 534,677 | | | $ | 14,171,569 | | | | 1,046,887 | | | $ | 27,673,554 | |
| Dividends and/or distributions reinvested | | | 876,695 | | | | 20,768,914 | | | | 817,408 | | | | 20,165,510 | |
| Redeemed | | | (633,442 | ) | | | (16,681,970) | | | | (1,573,636 | ) | | | (41,047,851) | |
| | | | |
| Net increase | | | 777,930 | | | $ | 18,258,513 | | | | 290,659 | | | $ | 6,791,213 | |
| | | | |
16 OPPENHEIMER MAIN STREET SMALL CAP FUND/VA
5. Shares of Beneficial Interest (Continued)
| | | | | | | | | | | | | | | | |
| | | Six Months Ended June 30, 2015 | | | Year Ended December 31, 2014 | |
| | | Shares | | | Amount | | | Shares | | | Amount | |
| |
| Service Shares | | | | | | | | | | | | | | | | |
| Sold | | | 1,634,642 | | | $ | 43,011,834 | | | | 3,683,961 | | | $ | 93,934,405 | |
| Dividends and/or distributions reinvested | | | 6,109,352 | | | | 143,020,494 | | | | 5,866,634 | | | | 143,263,210 | |
| Redeemed | | | (3,128,295) | | | | (81,917,522) | | | | (8,630,744) | | | | (221,163,808) | |
| | | | |
| Net increase | | | 4,615,699 | | | $ | 104,114,806 | | | | 919,851 | | | $ | 16,033,807 | |
| | | | |
6. Purchases and Sales of Securities
The aggregate cost of purchases and proceeds from sales of securities, other than short-term obligations and investments in IMMF, for the six months ended June 30, 2015 were as follows:
| | | | | | | | |
| | | Purchases | | | Sales | |
| |
Investment securities | | | $224,471,406 | | | | $264,984,663 | |
7. Fees and Other Transactions with Affiliates
Management Fees. Under the investment advisory agreement, the Fund pays the Manager a management fee based on the daily net assets of the Fund at an annual rate as shown in the following table:
| | | | |
| Fee Schedule | | | |
| |
Up to $200 million | | | 0.75% | |
Next $200 million | | | 0.72 | |
Next $200 million | | | 0.69 | |
Next $200 million | | | 0.66 | |
Next $200 million | | | 0.60 | |
Over $1 billion | | | 0.58 | |
The Fund’s effective management fee for the six months ended June 30, 2015 was 0.67% of average annual net assets before any applicable waivers.
Sub-Adviser Fees. The Manager has retained the Sub-Adviser to provide the day-to-day portfolio management of the Fund. Under the Sub-Advisory Agreement, the Manager pays the Sub-Adviser an annual fee in monthly installments, equal to a percentage of the investment management fee collected by the Manager from the Fund, which shall be calculated after any investment management fee waivers. The fee paid to the Sub-Adviser is paid by the Manager, not by the Fund.
Transfer Agent Fees. OFI Global (the “Transfer Agent”) serves as the transfer and shareholder servicing agent for the Fund. The Fund pays the Transfer Agent a fee based on annual net assets. Fees incurred and average net assets for each class with respect to these services are detailed in the Statement of Operations and Financial Highlights, respectively.
Sub-Transfer Agent Fees. The Transfer Agent has retained Shareholder Services, Inc., a wholly-owned subsidiary of OFI (the “Sub-Transfer Agent”), to provide the day-to-day transfer agent and shareholder servicing of the Fund. Under the Sub-Transfer Agency Agreement, the Transfer Agent pays the Sub-Transfer Agent an annual fee in monthly installments, equal to a percentage of the transfer agent fee collected by the Transfer Agent from the Fund, which shall be calculated after any applicable fee waivers. The fee paid to the Sub-Transfer Agent is paid by the Transfer Agent, not by the Fund.
Trustees’ Compensation. The Fund’s Board of Trustees (“Board”) has adopted a compensation deferral plan for Independent Trustees that enables Trustees to elect to defer receipt of all or a portion of the annual compensation they are entitled to receive from the Fund. For purposes of determining the amount owed to the Trustee under the plan, deferred amounts are treated as though equal dollar amounts had been invested in shares of the Fund or in other Oppenheimer funds selected by the Trustee. The Fund purchases shares of the funds selected for deferral by the Trustee in amounts equal to his or her deemed investment, resulting in a Fund asset equal to the deferred compensation liability. Such assets are included as a component of “Other” within the asset section of the Statement of Assets and Liabilities. Deferral of Trustees’ fees under the plan will not affect the net assets of the Fund and will not materially affect the Fund’s assets, liabilities or net investment income per share. Amounts will be deferred until distributed in accordance with the compensation deferral plan.
Distribution and Service Plan for Service Shares. The Fund has adopted a Distribution and Service Plan (the “Plan”) pursuant to Rule 12b-1 under the 1940 Act for Service shares to pay OppenheimerFunds Distributor, Inc. (the “Distributor”), for distribution related services, personal service and account maintenance for the Fund’s Service shares. Under the Plan, payments are made periodically at an annual rate of 0.25% of the daily net assets of Service shares of the Fund. The Distributor currently uses all of those fees to compensate sponsors of the insurance product that offers Fund shares, for providing personal service and maintenance of accounts of their variable contract owners that hold Service shares. These fees are paid out of the Fund’s assets on an on-going basis and increase operating expenses of the Service shares, which results in lower performance compared to the Fund’s shares that are not subject to a service fee. Fees incurred by the Fund under the Plan are detailed in the Statement of Operations.
17 OPPENHEIMER MAIN STREET SMALL CAP FUND/VA
NOTES TO FINANCIAL STATEMENTS Unaudited / Continued
7. Fees and Other Transactions with Affiliates (Continued)
Waivers and Reimbursements of Expenses. The Manager has voluntarily agreed to limit the Fund’s expenses after payments, waivers and/or reimbursements and reduction to custodian expenses, excluding expenses incurred directly or indirectly by the Fund as a result of investments in other investment companies, wholly-owned subsidiaries and pooled investment vehicles; so that those expenses, as percentages of daily net assets, will not exceed the annual rate of 0.80% for Non-Service shares and 1.05% for Service shares.
The Manager will waive fees and/or reimburse Fund expenses in an amount equal to the indirect management fees incurred through the Fund’s investment in IMMF. During the six months ended June 30, 2015, the Manager waived fees and/or reimbursed the Fund $8,526 for IMMF management fees.
Waivers and/or reimbursements may be modified or terminated as set forth according to the terms in the prospectus.
8. Pending Litigation
In 2009, several lawsuits were filed as putative class actions and later consolidated before the U.S. District Court for the District of Colorado in connection with the investment performance of Oppenheimer Rochester California Municipal Fund (the “California Fund Suit”), a fund advised by OppenheimerFunds, Inc. (“OFI”), and distributed by its subsidiary OppenheimerFunds Distributor, Inc. ( “OFDI”). The plaintiffs asserted claims against OFI, OFDI and certain present and former trustees and officers of the Fund under the federal securities laws, alleging, among other things, that the disclosure documents of the Fund contained misrepresentations and omissions and the investment policies of the Fund were not followed. Plaintiffs in the California Fund Suit filed an amended complaint and defendants filed a motion to dismiss. In 2011, the court issued an order which granted in part and denied in part the defendants’ motion to dismiss. In 2012, plaintiffs filed a motion, which defendants opposed, to certify a class and appoint class representatives and class counsel. In March 2015, the court granted plaintiffs’ motion for class certification. In May 2015, the U.S. Court of Appeals for the Tenth Circuit vacated the class certification order and remanded the matter to the district court for further proceedings. In July 2015, the district court held an evidentiary hearing on plaintiffs’ motion for class certification. OFI and OFDI believe the California Fund Suit is without merit; that it is premature to render any opinion as to the likelihood of an outcome unfavorable to them in the California Fund Suit; and that no estimate can yet be made as to the amount or range of any potential loss.
18 OPPENHEIMER MAIN STREET SMALL CAP FUND/VA
PORTFOLIO PROXY VOTING POLICIES AND PROCEDURES; UPDATES TO STATEMENTS OF INVESTMENTS Unaudited
The Fund has adopted Portfolio Proxy Voting Policies and Procedures under which the Fund votes proxies relating to securities (“portfolio proxies”) held by the Fund. A description of the Fund’s Portfolio Proxy Voting Policies and Procedures is available (i) without charge, upon request, by calling the Fund toll-free at 1.800.525.7048, (ii) on the Fund’s website at www.oppenheimerfunds.com, and (iii) on the SEC’s website at www.sec.gov. In addition, the Fund is required to file Form N-PX, with its complete proxy voting record for the 12 months ended June 30th, no later than August 31st of each year. The Fund’s voting record is available (i) without charge, upon request, by calling the Fund toll-free at 1.800.525.7048, and (ii) in the Form N-PX filing on the SEC’s website at www.sec.gov.
The Fund files its complete schedule of portfolio holdings with the SEC for the first quarter and the third quarter of each fiscal year on Form N-Q. The Fund’s Form N-Q filings are available on the SEC’s website at www.sec.gov. Those forms may be reviewed and copied at the SEC’s Public Reference Room in Washington, D.C. Information on the operation of the Public Reference Room may be obtained by calling 1-800-SEC-0330.
19 OPPENHEIMER MAIN STREET SMALL CAP FUND/VA
DISTRIBUTION SOURCES Unaudited
For any distribution that took place over the Fund’s reporting period, the table below details on a per-share basis the percentage of the Fund’s total distribution payment amount that was derived from the following sources: net income, net profit from the sale of securities, and other capital sources. This information is based upon income and capital gains using generally accepted accounting principles as of the date of each distribution. Because the Fund is actively managed, the relative amount of the Fund’s total distributions derived from various sources over the calendar year may change. Please note that this information should not be used for tax reporting purposes as the tax character of distributable income may differ from the amounts used for this notification. You will receive IRS tax forms in the first quarter of each calendar year detailing the actual amount of the taxable and non-taxable portion of distributions paid to you during the tax year.
For the most current information, please go to oppenheimerfunds.com. Select your Fund, then the ‘Detailed’ tab; where ‘Dividends’ are shown, the Fund’s latest pay date will be followed by the sources of any distribution, updated daily.
| | | | | | | | | | | | | | | | |
| Fund Name | | Pay Date | | | Net Income | | | Net Profit
from Sale | | | Other Capital
Sources | |
| |
Oppenheimer Main Street Small Cap Fund®/VA | | | 6/16/15 | | | | 5.3% | | | | 94.7% | | | | 0.0% | |
20 OPPENHEIMER MAIN STREET SMALL CAP FUND/VA
THIS PAGE INTENTIONALLY LEFT BLANK.
21 OPPENHEIMER MAIN STREET SMALL CAP FUND/VA
THIS PAGE INTENTIONALLY LEFT BLANK.
22 OPPENHEIMER MAIN STREET SMALL CAP FUND/VA
THIS PAGE INTENTIONALLY LEFT BLANK.
23 OPPENHEIMER MAIN STREET SMALL CAP FUND/VA
OPPENHEIMER MAIN STREET SMALL CAP FUND/VA
A Series of Oppenheimer Variable Account Funds
| | |
| Trustees and Officers | | Sam Freedman, Chairman of the Board of Trustees and Trustee |
| | Jon S. Fossel, Trustee |
| | Richard F. Grabish, Trustee |
| | Beverly L. Hamilton, Trustee |
| | Victoria J. Herget, Trustee |
| | Robert J. Malone, Trustee |
| | F. William Marshall, Jr., Trustee |
| | Karen L. Stuckey, Trustee |
| | James D. Vaughn, Trustee |
| | Arthur P. Steinmetz, Trustee, President and Principal Executive Officer |
| | Matthew P. Ziehl, Vice President |
| | Raymond Anello, Vice President |
| | Raman Vardharaj, Vice President |
| | Joy Budzinski, Vice President |
| | Kristin Ketner, Vice President |
| | Magnus Krantz, Vice President |
| | Adam Weiner, Vice President |
| | Arthur S. Gabinet, Secretary and Chief Legal Officer |
| | Jennifer Sexton, Vice President and Chief Business Officer |
| | Mary Ann Picciotto, Chief Compliance Officer and Chief Anti-Money Laundering Officer |
| | Brian W. Wixted, Treasurer and Principal Financial & Accounting Officer |
| |
Manager | | OFI Global Asset Management, Inc. |
| |
Sub-Adviser | | OppenheimerFunds, Inc. |
| |
Distributor | | OppenheimerFunds Distributor, Inc. |
| |
Transfer and Shareholder Servicing Agent | | OFI Global Asset Management, Inc. |
| |
Sub-Transfer Agent | | Shareholder Services, Inc. |
| | DBA OppenheimerFunds Services |
| |
Independent Registered Public Accounting Firm | | KPMG LLP |
| |
Legal Counsel | | Ropes & Gray LLP |
| |
| | Before investing in any of the Oppenheimer funds, investors should carefully consider a fund’s investment objective, risks, and charges and expenses. Fund prospectuses and summary prospectuses contain this and other information about the funds, and may be obtained by asking your financial advisor, visiting oppenheimerfunds.com, or calling us at 1.800.988.8287. Read prospectuses and summary prospectuses carefully before investing. |
| |
| | The financial statements included herein have been taken from the records of the Fund without examination of those records by the independent registered public accounting firm. |
| |
| | © 2015 OppenheimerFunds, Inc. All rights reserved. Oppenheimer funds are distributed by OppenheimerFunds Distributor, Inc. |


| | | | |
| | June 30, 2015 | | |
| | | Oppenheimer | | Semiannual Report |
| | Money Fund/VA | |
| | | A Series of Oppenheimer Variable Account Funds | |
| | SEMIANNUAL REPORT | | |
| | Listing of Top Holdings | | |
| | Fund Performance Discussion | | |
| | Financial Statements | | |
PORTFOLIO MANAGERS: Christopher Proctor, CFA and Adam S. Wilde, CFA
| | | | | | | | | | |
| | | |
CURRENT YIELD | | | | | | | |
For the 7-Day Period Ended 6/30/15 | | |
With Compounding | | | | | 0.01% | | |
Without Compounding | | | | | 0.01% | | |
| | | | | | | |
| | |
For the 6-Month Period Ended 6/30/15 | | |
With Compounding | | | | | 0.01% | | |
Without Compounding | | | | | 0.01% | | |
Performance data quoted represents past performance, which does not guarantee future results. Yields are annualized and include dividends in a hypothetical investment for the periods shown. The investment return and principal value of an investment in the Fund will fluctuate so that an investor’s shares, when redeemed, may be worth more or less than their original cost. Current performance may be lower or higher than the performance quoted. For performance data current to the most recent month end, call us at 1.800.988.8287. The Fund’s total returns should not be expected to be the same as the returns of other funds, whether or not both funds have the same portfolio managers and/or similar names. The Fund’s total returns do not include the charges associated with the separate account products that offer this Fund. Such performance would have been lower if such charges were taken into account.
| | | | |
PORTFOLIO ALLOCATION | | | | |
| |
| Short-Term Notes/Commercial Paper | | | 48.0% | |
| |
Certificates of Deposit | | | 28.9 | |
| |
Direct Bank Obligations | | | 19.4 | |
| |
Investment Company | | | 3.7 | |
| |
| | | | |
| Portfolio holdings and allocations are subject to change. Percentages are as of June 30, 2015, and are based on the total market value of investments. | | | | |
2 OPPENHEIMER MONEY FUND/VA
Fund Performance Discussion
Despite volatility among long-term interest rates stemming from changing economic expectations and a shift in U.S. monetary policy, short-term rates remained anchored by the Federal Reserve’s (the “Fed”) unchanged target of between 0% and 0.25% for the overnight federal funds rate. Although the respective target range remains in place, the overall trend in short-term interest rates and money market yields is upward sloping, albeit at a slow and gradual pace.
MARKET OVERVIEW
The start of 2015 was marked by cooling U.S. growth after the positive results in 2014. The dollar continued to strengthen significantly during this time against most of the U.S.’s major trading partners, which acted as a drag on growth. Businesses, especially U.S. firms with revenues dependent on exporting goods and services, cited this as a headwind. European Central Bank (“ECB”) President Mario Draghi announced the purchase of €60 billion a month in sovereign bonds from Eurozone countries for at least 19 months, a form of quantitative easing (“QE”) that is projected to increase the ECB’s balance sheet by over €1 trillion. The announcement and implementation of these extraordinary monetary policies had a significant impact on financial markets, with European markets rallying and the euro falling against most major trading partners. Fed Chairwoman Janet Yellen reaffirmed that the Fed plans to raise U.S. rates during 2015 despite any near-term weakness in first quarter Gross Domestic Product (“GDP”) and employment growth. The Fed has made it clear, however, that it will remain flexible on the timing and extent of rate hikes for the remainder of 2015. The reporting period ended with concerns around Greece’s debt situation and the possibility that the country would exit from the Eurozone. Shortly after the period ended, Eurozone leaders agreed to offer Greece a third bailout, averting a Greek exit for the time being. Despite numerous changes and macroeconomic concerns this reporting period, money market yields largely remained unchanged.
FUND REVIEW
In July 2014, the Securities and Exchange Commission (SEC) voted to adopt the long awaited and much anticipated rules for money market funds. The most significant changes require institutional prime money market funds to maintain a variable net asset value (VNAV) instead of the current stable NAV. Further, all prime money-market funds (retail and institutional) will now have the ability to impose liquidity fees and/or gates. In analyzing the potential impact of the rule amendments, we have engaged with our clients to understand their product needs and preferences. We continue to identify potential changes to our existing money market platforms and are assessing various options. The Fund continued to generate consistent and competitive levels of current income.
The Fund’s weighted average maturity throughout the reporting period remained in a range below market averages. During the respective period, we held higher than required amounts of liquidity in the overnight and 7-day maturities. The Fund’s exposure to floating rate securities remains relatively high when compared to historic Fund norms, with the bulk of the floating rate exposure is tied to 1-month Libor (London Interbank Offered Rate). Supply has improved but continues to ebb and flow, especially at month- and quarter-ends. With the SEC amendment noted above, market participants are anticipating the supply-demand imbalance shifting away from prime money market funds and to government money market funds. Further, we remain confident the Fund is well positioned should the Fed decide to change the target rate in 2015.
STRATEGY & OUTLOOK
There has been a favorable change to the supply-demand imbalance and the yield of the Fund has been a direct beneficiary. We remain focused on our fundamental analysis and seek to ensure only high-quality names make it into the portfolio. In closing, we continue to anticipate the Fed lift off in 2015.
An investment in the Fund is not insured or guaranteed by the Federal Deposit Insurance Corporation or any other government agency. Although the Fund seeks to preserve the value of your investment at $1.00 per share, it is possible to lose money by investing in the Fund.
Shares of Oppenheimer funds are not deposits or obligations of any bank, are not guaranteed by any bank, are not insured by the FDIC or any other agency, and involve investment risks, including the possible loss of the principal amount invested.
3 OPPENHEIMER MONEY FUND/VA
Fund Expenses
Fund Expenses. As a shareholder of the Fund, you incur two types of costs: (1) transaction costs and (2) ongoing costs, including management fees; distribution and service fees; and other Fund expenses. These examples are intended to help you understand your ongoing costs (in dollars) of investing in the Fund and to compare these costs with the ongoing costs of investing in other mutual funds.
The examples are based on an investment of $1,000.00 invested at the beginning of the period and held for the entire 6-month period ended June 30, 2015.
Actual Expenses. The first section of the table provides information about actual account values and actual expenses. You may use the information in this section for the class of shares you hold, together with the amount you invested, to estimate the expense that you paid over the period. Simply divide your account value by $1,000.00 (for example, an $8,600.00 account value divided by $1,000.00 = 8.60), then multiply the result by the number in the first section under the heading entitled “Expenses Paid During the 6 Months Ended June 30, 2015” to estimate the expenses you paid on your account during this period.
Hypothetical Example for Comparison Purposes.
The second section of the table provides information about hypothetical account values and hypothetical expenses based on the Fund’s actual expense ratio for each class of shares, and an assumed rate of return of 5% per year for each class before expenses, which is not the actual return. The hypothetical account values and expenses may not be used to estimate the actual ending account balance or expenses you paid for the period. You may use this information to compare the ongoing costs of investing in the Fund and other funds. To do so, compare this 5% hypothetical example for the class of shares you hold with the 5% hypothetical examples that appear in the shareholder reports of the other funds.
Please note that the expenses shown in the table are meant to highlight your ongoing costs only and do not reflect any charges associated with the separate accounts that offer this Fund. Therefore, the “hypothetical” lines of the table are useful in comparing ongoing costs only, and will not help you determine the relative total costs of owning different funds. In addition, if these separate account charges were included your costs would have been higher.
| | | | | | | | | | | | | | | | | | | | | | | | |
| Actual | | Beginning
Account Value
January 1, 2015 | | | | | | Ending
Account Value
June 30, 2015 | | | | | | Expenses Paid During
6 Months Ended June 30, 2015 | | | | |
| | | $ | 1,000.00 | | | | | | | $ | 1,000.10 | | | | | | | $ | 0.89 | | | | | |
| | | | | | |
| Hypothetical | | | | | | | | | | | | | | | | | | |
(5% return before expenses) | | | | | | | | | | | | | | | | | | | | | | | | |
| | | | 1,000.00 | | | | | | | | 1,023.90 | | | | | | | | 0.90 | | | | | |
Expenses are equal to the Fund’s annualized expense ratio for that class, multiplied by the average account value over the period, multiplied by 181/365 (to reflect the one-half year period). Those annualized expense ratios, excluding indirect expenses from affiliated funds, based on the 6-month period ended June 30, 2015 are as follows:
The expense ratios reflect voluntary waivers and/or reimbursements of expenses by the Fund’s Manager. Some of these undertakings may be modified or terminated at any time, as indicated in the Fund’s prospectus. The “Financial Highlights��� tables in the Fund’s financial statements, included in this report, also show the gross expense ratios, without such waivers or reimbursements and reduction to custodian expenses, if applicable.
4 OPPENHEIMER MONEY FUND/VA
STATEMENT OF INVESTMENTS June 30, 2015 Unaudited
| | | | | | | | | | | | | | | | | | | | |
| | | Maturity Date* | | | Final Legal
Maturity Date** | | | Principal Amount | | | | | | Value | |
| |
Certificates of Deposit—26.7% | | | | | | | | | | | | | | | | | | | | |
| Yankee Certificates of Deposit—26.7% | | | | | | | | | | | | | | | | | | | | |
| Bank of Montreal, Chicago, 0.288%1 | | | 7/14/15 | | | | 12/14/15 | | | | 5,000,000 | | | $ | | | | | 5,000,000 | |
| |
| Bank of Nova Scotia, Houston TX: | | | | | | | | | | | | | | | | | | | | |
| 0.34%1 | | | 7/1/15 | | | | 3/23/16 | | | | 2,000,000 | | | | | | | | 2,000,000 | |
| 0.34%1 | | | 7/1/15 | | | | 1/4/16 | | | | 3,000,000 | | | | | | | | 3,000,000 | |
| 0.407%1 | | | 7/4/15 | | | | 3/4/16 | | | | 5,000,000 | | | | | | | | 5,002,588 | |
| |
| Canadian Imperial Bank of Commerce NY: | | | | | | | | | | | | | | | | | | | | |
| 0.257%1 | | | 7/22/15 | | | | 7/22/15 | | | | 3,000,000 | | | | | | | | 3,000,000 | |
| 0.276%1 | | | 7/14/15 | | | | 9/14/15 | | | | 3,000,000 | | | | | | | | 3,000,000 | |
| |
| DZ Bank, New York, 0.24% | | | 9/10/15 | | | | 9/10/15 | | | | 5,200,000 | | | | | | | | 5,200,000 | |
| |
| HSBC Bank USA NA, 0.43% | | | 11/17/15 | | | | 11/17/15 | | | | 5,000,000 | | | | | | | | 5,000,000 | |
| |
| Mitsubishi UFJ TR & BK NY: | | | | | | | | | | | | | | | | | | | | |
| 0.28%2 | | | 9/18/15 | | | | 9/18/15 | | | | 3,000,000 | | | | | | | | 3,000,000 | |
| 0.31%2 | | | 10/14/15 | | | | 10/14/15 | | | | 2,300,000 | | | | | | | | 2,300,000 | |
| |
| Rabobank Nederland NV, New York, 0.325%1 | | | 7/17/15 | | | | 7/17/15 | | | | 1,800,000 | | | | | | | | 1,800,000 | |
| |
| Royal Bank of Canada, New York: | | | | | | | | | | | | | | | | | | | | |
| 0.276%1 | | | 7/13/15 | | | | 8/13/15 | | | | 3,300,000 | | | | | | | | 3,300,000 | |
| 0.294%1 | | | 7/6/15 | | | | 1/6/16 | | | | 5,000,000 | | | | | | | | 5,000,000 | |
| |
| Skandinaviska Enskilda Bank, New York, 0.33% | | | 10/15/15 | | | | 10/15/15 | | | | 1,500,000 | | | | | | | | 1,500,000 | |
| |
| Sumitomo Mutsui Bank NY, 0.31% | | | 10/28/15 | | | | 10/28/15 | | | | 600,000 | | | | | | | | 600,000 | |
| |
| Svenska Handelsbanken, Grand Cayman, 0.04% | | | 7/1/15 | | | | 7/1/15 | | | | 9,000,000 | | | | | | | | 9,000,000 | |
| |
| Svenska Handelsbanken, New York, 0.28% | | | 9/21/15 | | | | 9/21/15 | | | | 5,000,000 | | | | | | | | 4,999,886 | |
| |
| Toronto Dominion Bank, New York, 0.335%1 | | | 7/16/15 | | | | 3/16/16 | | | | 5,000,000 | | | | | | | | 5,000,000 | |
| |
| Wells Fargo Bank NA: | | | | | | | | | | | | | | | | | | | | |
| 0.317%1 | | | 7/2/15 | | | | 5/3/16 | | | | 2,500,000 | | | | | | | | 2,500,000 | |
| 0.32%1 | | | 7/1/15 | | | | 10/22/15 | | | | 3,500,000 | | | | | | | | 3,500,000 | |
| |
| Westpac Banking Corp., New York: | | | | | | | | | | | | | | | | | | | | |
| 0.287%1 | | | 7/3/15 | | | | 11/3/15 | | | | 4,700,000 | | | | | | | | 4,700,000 | |
| 0.316%1 | | | 7/27/15 | | | | 5/27/16 | | | | 1,000,000 | | | | | | | | 1,000,000 | |
| 0.347%1 | | | 7/1/15 | | | | 7/1/16 | | | | 5,000,000 | | | | | | | | 5,000,000 | |
| | | | | | | | | | | | | | | | |
Total Certificates of Deposit (Cost $84,402,474) | | | | | | | | | | | | | | | | | | | 84,402,474 | |
| |
Direct Bank Obligations—18.0% | | | | | | | | | | | | | | | | | | | | |
| Bank of Tokyo-Mitsubishi UFJ NY, 0.30%2 | | | 10/9/15 | | | | 10/9/15 | | | | 700,000 | | | | | | | | 699,417 | |
| |
| Commonwealth Bank of Australia: | | | | | | | | | | | | | | | | | | | | |
| 0.25%3 | | | 7/6/15 | | | | 7/6/15 | | | | 5,000,000 | | | | | | | | 4,999,827 | |
| 0.289%1,3 | | | 7/12/15 | | | | 12/7/15 | | | | 3,000,000 | | | | | | | | 3,000,000 | |
| |
| Credit Agricole Corporate & Investment Bank, New York Branch: | | | | | | | | | | | | | | | | | | | | |
| 0.08% | | | 7/6/15 | | | | 7/6/15 | | | | 6,200,000 | | | | | | | | 6,199,931 | |
| 0.12% | | | 7/7/15 | | | | 7/7/15 | | | | 5,000,000 | | | | | | | | 4,999,900 | |
| |
| DnB Bank ASA: | | | | | | | | | | | | | | | | | | | | |
| 0.17%3 | | | 7/2/15 | | | | 7/2/15 | | | | 3,195,000 | | | | | | | | 3,194,985 | |
| 0.326%3 | | | 10/1/15 | | | | 10/1/15 | | | | 5,000,000 | | | | | | | | 4,995,847 | |
| |
| ING (US) Funding LLC: | | | | | | | | | | | | | | | | | | | | |
| 0.32% | | | 10/23/15 | | | | 10/23/15 | | | | 2,000,000 | | | | | | | | 1,997,974 | |
| 0.32% | | | 10/14/15 | | | | 10/14/15 | | | | 5,000,000 | | | | | | | | 4,995,333 | |
| |
| PNC Bank NA: | | | | | | | | | | | | | | | | | | | | |
| 0.281% | | | 7/1/15 | | | | 7/1/15 | | | | 6,000,000 | | | | | | | | 6,000,000 | |
| 0.411% | | | 10/23/15 | | | | 10/23/15 | | | | 5,000,000 | | | | | | | | 4,993,508 | |
| |
| Skandinaviska Enskilda Banken AB, 0.12%3 | | | 7/7/15 | | | | 7/7/15 | | | | 10,000,000 | | | | | | | | 9,999,800 | |
| |
| Swedbank AB, 0.20% | | | 7/13/15 | | | | 7/13/15 | | | | 600,000 | | | | | | | | 599,960 | |
| | | | | | | | | | | | | | | | |
Total Direct Bank Obligations (Cost $56,676,482) | | | | | | | | | | | | | | | | | | | 56,676,482 | |
| |
Short-Term Notes/Commercial Paper—44.3% | | | | | | | | | | | | | | | | | | | | |
| Leasing & Factoring—3.2% | | | | | | | | | | | | | | | | | | | | |
| Toyota Motor Credit Corp., 0.28% | | | 8/17/15 | | | | 8/17/15 | | | | 10,000,000 | | | | | | | | 9,996,344 | |
| |
| Municipal—9.7% | | | | | | | | | | | | | | | | | | | | |
| Albany Industrial Development Agency Bonds, Albany Medical Center Hospital, Series 2007B, 0.25%1 | | | 7/7/15 | | | | 7/7/15 | | | | 1,710,000 | | | | | | | | 1,710,000 | |
| |
| Baltimore, MD General Obligation Bonds, Series 2003D, 0.12%1 | | | 7/7/15 | | | | 7/7/15 | | | | 1,850,000 | | | | | | | | 1,850,000 | |
| |
| Des Moines, IA Facilities Revenue Bonds, Elliott Aviation Project, Series 2007, 0.10%1 | | | 7/7/15 | | | | 7/7/15 | | | | 4,410,000 | | | | | | | | 4,410,000 | |
| |
| Grand River Dam Authority Revenue Bonds, Series 2014C, 0.14%1 | | | 7/7/15 | | | | 7/7/15 | | | | 5,750,000 | | | | | | | | 5,750,000 | |
| |
| IN Development Finance Authority, TTP Inc. Project, Series 2001, 0.20%1 | | | 7/7/15 | | | | 7/7/15 | | | | 1,680,000 | | | | | | | | 1,680,000 | |
| |
| NJ Health Care Facilities Financing Authority, Saint Barnabas Corp., Series 2011C, 0.12%1 | | | 7/7/15 | | | | 7/7/15 | | | | 3,070,000 | | | | | | | | 3,070,000 | |
| |
| San Antonio, TX Industrial Development Authority Revenue Bonds, Tnidall Corp., 0.23%1 | | | 7/7/15 | | | | 7/7/15 | | | | 1,500,000 | | | | | | | | 1,500,000 | |
| |
| St. Paul, MN Bonds, Rivercentre Arena Project, Series 2009A, 0.18%1 | | | 7/7/15 | | | | 7/7/15 | | | | 1,000,000 | | | | | | | | 1,000,000 | |
| |
| Tennis for Charity, Inc. Bonds, Series 2004, 0.12%1 | | | 7/7/15 | | | | 7/7/15 | | | | 1,780,000 | | | | | | | | 1,780,000 | |
5 OPPENHEIMER MONEY FUND/VA
STATEMENT OF INVESTMENTS Unaudited / Continued
| | | | | | | | | | | | | | | | | | | | |
| | | Maturity Date* | | | Final Legal
Maturity Date** | | | Principal Amount | | | | | | Value | |
| |
Municipal (Continued) | | | | | | | | | | | | | | | | | | | | |
| |
| University Hospitals Health System, Inc. Hospital Revenue Bonds, Series 2013C, 0.14%1 | | | 7/7/15 | | | | 7/7/15 | | | | 2,000,000 | | | $ | | | | | 2,000,000 | |
| |
| Valdosta-Lowndes Cnty., GA Industrial Authority Revenue Bonds, Steeda Autosports, Inc. Project, Series 08, 0.20%1 | | | 7/7/15 | | | | 7/7/15 | | | | 1,000,000 | | | | | | | | 1,000,000 | |
| |
| Westchester Cnty., Healthcare Corp. Revenue Bonds, Series 2010D, 0.11%1 | | | 7/7/15 | | | | 7/7/15 | | | | 5,000,000 | | | | | | | | 5,000,000 | |
| | | | | | | | | | | | | | | | |
| | | | | | | | | | | | | | | | | | | 30,750,000 | |
|
| |
| Receivables Finance—22.6% | | | | | | | | | | | | | | | | | | | | |
| Alpine Securitization Corp.: | | | | | | | | | | | | | | | | | | | | |
| 0.17% | | | 7/13/15 | | | | 7/13/15 | | | | 1,700,000 | | | | | | | | 1,699,903 | |
| 0.25% | | | 8/12/15 | | | | 8/12/15 | | | | 5,000,000 | | | | | | | | 4,998,542 | |
| |
| CAFCO LLC: | | | | | | | | | | | | | | | | | | | | |
| 0.32%3 | | | 11/5/15 | | | | 11/5/15 | | | | 425,000 | | | | | | | | 424,520 | |
| 0.32%3 | | | 9/1/15 | | | | 9/1/15 | | | | 5,000,000 | | | | | | | | 4,997,245 | |
| 0.321%3 | | | 9/9/15 | | | | 9/9/15 | | | | 3,000,000 | | | | | | | | 2,998,133 | |
| |
| Chariot Funding LLC: | | | | | | | | | | | | | | | | | | | | |
| 0.25%3 | | | 8/20/15 | | | | 8/20/15 | | | | 375,000 | | | | | | | | 374,870 | |
| 0.391%3 | | | 12/8/15 | | | | 12/8/15 | | | | 5,000,000 | | | | | | | | 4,991,333 | |
| 0.471%3 | | | 1/5/16 | | | | 1/5/16 | | | | 2,000,000 | | | | | | | | 1,995,091 | |
| |
| CRC Funding LLC, 0.24% | | | 9/21/15 | | | | 9/21/15 | | | | 400,000 | | | | | | | | 399,781 | |
| |
| Gotham Funding Corp., 0.18%3 | | | 7/22/15 | | | | 7/22/15 | | | | 2,000,000 | | | | | | | | 1,999,790 | |
| |
| Jupiter Securitization Co. LLC, 0.27%3 | | | 7/7/15 | | | | 7/7/15 | | | | 10,000,000 | | | | | | | | 9,999,550 | |
| |
| Manhattan Asset Funding Co.: | | | | | | | | | | | | | | | | | | | | |
| 0.18%3 | | | 7/10/15 | | | | 7/10/15 | | | | 6,200,000 | | | | | | | | 6,199,721 | |
| 0.20%3 | | | 7/20/15 | | | | 7/20/15 | | | | 4,000,000 | | | | | | | | 3,999,578 | |
| 0.209%3 | | | 7/27/15 | | | | 7/27/15 | | | | 3,300,000 | | | | | | | | 3,299,502 | |
| |
| Old Line Funding Corp., 0.26%3 | | | 7/7/15 | | | | 7/7/15 | | | | 5,200,000 | | | | | | | | 5,199,775 | |
| |
| Sheffield Receivables Corp.: | | | | | | | | | | | | | | | | | | | | |
| 0.19%3 | | | 7/7/15 | | | | 7/7/15 | | | | 1,000,000 | | | | | | | | 999,968 | |
| 0.20%3 | | | 7/8/15 | | | | 7/8/15 | | | | 4,000,000 | | | | | | | | 3,999,844 | |
| 0.30%3 | | | 8/20/15 | | | | 8/20/15 | | | | 1,250,000 | | | | | | | | 1,249,479 | |
| 0.30%3 | | | 7/15/15 | | | | 7/15/15 | | | | 2,000,000 | | | | | | | | 1,999,767 | |
| |
| Thunder Bay Funding LLC: | | | | | | | | | | | | | | | | | | | | |
| 0.25%3 | | | 9/3/15 | | | | 9/3/15 | | | | 1,250,000 | | | | | | | | 1,249,444 | |
| 0.25%3 | | | 10/15/15 | | | | 10/15/15 | | | | 2,800,000 | | | | | | | | 2,797,939 | |
| |
| Victory Receivables Corp.: | | | | | | | | | | | | | | | | | | | | |
| 0.16%3 | | | 7/9/15 | | | | 7/9/15 | | | | 5,000,000 | | | | | | | | 4,999,822 | |
| 0.19%3 | | | 7/14/15 | | | | 7/14/15 | | | | 1,000,000 | | | | | | | | 999,931 | |
| | | | | | | | | | | | | | | | |
| | | | | | | | | | | | | | | | | | | 71,873,528 | |
|
| |
| Special Purpose Financial—8.8% | | | | | | | | | | | | | | | | | | | | |
| Anglesea Funding LLC: | | | | | | | | | | | | | | | | | | | | |
| 0.15%2 | | | 7/2/15 | | | | 7/2/15 | | | | 2,500,000 | | | | | | | | 2,499,990 | |
| 0.15%2 | | | 7/1/15 | | | | 7/1/15 | | | | 4,000,000 | | | | | | | | 4,000,000 | |
| 0.16%2 | | | 7/6/15 | | | | 7/6/15 | | | | 5,100,000 | | | | | | | | 5,099,887 | |
| |
| Bedford Row Funding Corp., 0.13% | | | 7/14/15 | | | | 7/14/15 | | | | 3,000,000 | | | | | | | | 2,999,859 | |
| |
| Concord Minutemen Cap. Co. LLC: | | | | | | | | | | | | | | | | | | | | |
| 0.18% | | | 7/20/15 | | | | 7/20/15 | | | | 1,000,000 | | | | | | | | 999,905 | |
| 0.18% | | | 7/8/15 | | | | 7/8/15 | | | | 2,500,000 | | | | | | | | 2,499,913 | |
| |
| Crown Point Capital Co., 0.18% | | | 7/8/15 | | | | 7/8/15 | | | | 2,500,000 | | | | | | | | 2,499,913 | |
| |
| Lexington Parker Capital Co. LLC: | | | | | | | | | | | | | | | | | | | | |
| 0.18%3 | | | 7/8/15 | | | | 7/8/15 | | | | 2,500,000 | | | | | | | | 2,499,913 | |
| 0.27%3 | | | 9/4/15 | | | | 9/4/15 | | | | 1,600,000 | | | | | | | | 1,599,220 | |
| |
| Ridgefield Funding Co. LLC, 0.31% | | | 8/6/15 | | | | 8/6/15 | | | | 3,000,000 | | | | | | | | 2,999,070 | |
| | | | | | | | | | | | | | | | |
| | | | | | | | | | | | | | | | | | | 27,697,670 | |
| | | | | | | | | | | | | | | | |
| Total Short-Term Notes/Commercial Paper (Cost $140,317,542) | | | | | | | | | | | | | | | | | | | 140,317,542 | |
| | | | | |
| | | | | | | | | Shares | | | | | | | |
| |
Investment Company—3.4% | | | | | | | | | | | | | | | | | | | | |
| |
| Oppenheimer Institutional Money Market Fund, Cl. E, 0.15%4,5 (Cost $10,672,836) | | | | | | | | | | | 10,672,836 | | | | | | | | 10,672,836 | |
| |
| Total Investments, at Value (Cost $292,069,334) | | | | | | | | | | | 92.4% | | | | | | | | 292,069,334 | |
| |
| Net Other Assets (Liabilities) | | | | | | | | | | | 7.6 | | | | | | | | 23,968,759 | |
| | | | | | | | | | | | |
Net Assets | | | | | | | | | | | 100.0% | | | $ | | | | | 316,038,093 | |
| | | | | | | | | | | | |
6 OPPENHEIMER MONEY FUND/VA
Footnotes to Statement of Investments
Short-term notes and direct bank obligations are generally traded on a discount basis; the interest rate shown is the discount rate received by the Fund at the time of purchase. Other securities normally bear interest at the rates shown.
* The Maturity Date represents the date used to calculate the Fund’s weighted average maturity as determined under Rule 2a-7.
** If different from the Maturity Date, the Final Legal Maturity Date includes any maturity date extensions which may be affected at the option of the issuer or unconditional payments of principal by the issuer which may be affected at the option of the Fund, and represents the date used to calculate the Fund’s weighted average life as determined under Rule 2a-7.
1. Represents the current interest rate for a variable or increasing rate security.
2. Represents securities sold under Rule 144A, which are exempt from registration under the Securities Act of 1933, as amended. These securities have been determined to be liquid under guidelines established by the Board of Trustees. These securities amount to $17,599,294 or 5.57% of the Fund’s net assets as of June 30, 2015.
3. Security issued in an exempt transaction without registration under the Securities Act of 1933. Such securities amount to $95,064,894 or 30.08% of the Fund’s net assets, and have been determined to be liquid pursuant to guidelines adopted by the Board of Trustees.
4. Rate shown is the 7-day yield as of June 30, 2015.
5. Is or was an affiliate, as defined in the Investment Company Act of 1940, as amended, at or during the period ended June 30, 2015, by virtue of the Fund owning at least 5% of the voting securities of the issuer or as a result of the Fund and the issuer having the same investment adviser. Transactions during the period in which the issuer was an affiliate are as follows:
| | | | | | | | | | | | | | |
| | | Shares
December 31, 2014 | | | Gross
Additions | | | Gross Reductions | | | Shares
June 30, 2015 |
| Oppenheimer Institutional Money Market Fund, Cl. E | | | 23,255,744 | | | | 22,602,092 | | | | 35,185,000 | | | 10,672,836 |
| | | | |
| | | | | | | | | Value | | | Income |
| Oppenheimer Institutional Money Market Fund, Cl. E | | | | | | | | | | $ | 10,672,836 | | | $ 12,095 |
See accompanying Notes to Financial Statements.
7 OPPENHEIMER MONEY FUND/VA
STATEMENT OF ASSETS AND LIABILITIES June 30, 2015 Unaudited
| | | | |
| |
Assets | | | | |
Investments, at value—see accompanying statement of investments: | | | | |
Unaffiliated companies (cost $281,396,498) | | $ | 281,396,498 | |
Affiliated companies (cost $10,672,836) | | | 10,672,836 | |
| | | | |
| | | 292,069,334 | |
| |
Cash | | | 854,374 | |
| |
Receivables and other assets: | | | | |
Shares of beneficial interest sold | | | 23,468,179 | |
Interest and dividends | | | 30,587 | |
Other | | | 41,433 | |
| | | | |
Total assets | | | 316,463,907 | |
| |
Liabilities | | | | |
Payables and other liabilities: | | | | |
Investments purchased | | | 374,867 | |
Trustees’ compensation | | | 22,480 | |
Shares of beneficial interest redeemed | | | 13,940 | |
Legal, auditing and other professional fees | | | 12,982 | |
Dividends | | | 760 | |
Other | | | 785 | |
| | | | |
Total liabilities | | | 425,814 | |
| |
Net Assets | | $ | 316,038,093 | |
| | | | |
| |
| | | | |
| |
Composition of Net Assets | | | | |
Par value of shares of beneficial interest | | $ | 316,020 | |
| |
Additional paid-in capital | | | 315,709,983 | |
| |
Accumulated net investment income | | | 7,781 | |
| |
Accumulated net realized gain on investments | | | 4,309 | |
| |
| | | | |
Net Assets - applicable to 316,019,581 shares of beneficial interest outstanding | | $ | 316,038,093 | |
| | | | |
| | | | |
| |
Net Asset Value, Redemption Price Per Share and Offering Price Per Share | | | $1.00 | |
See accompanying Notes to Financial Statements.
8 OPPENHEIMER MONEY FUND/VA
STATEMENT OF OPERATIONS For the Six Months Ended June 30, 2015 Unaudited
| | | | |
| |
Investment Income | | | | |
| Interest | | $ | 357,940 | |
| |
| Dividends from affiliated companies | | | 12,095 | |
| | | | |
Total investment income | | | 370,035 | |
| |
Expenses | | | | |
| Management fees | | | 868,739 | |
| |
| Transfer and shareholder servicing agent fees | | | 194,069 | |
| |
| Shareholder communications | | | 11,829 | |
| |
| Trustees’ compensation | | | 19,638 | |
| |
| Custodian fees and expenses | | | 3,318 | |
| |
| Other | | | 33,915 | |
| | | | |
| Total expenses | | | 1,131,508 | |
| Less reduction to custodian expenses | | | (1,592) | |
| Less waivers and reimbursements of expenses | | | (779,214) | |
| | | | |
Net expenses | | | 350,702 | |
| |
Net Investment Income | | | 19,333 | |
| |
| Net realized gain | | | 4,309 | |
| |
Net Increase in Net Assets Resulting from Operations | | $ | 23,642 | |
| | | | |
See accompanying Notes to Financial Statements.
9 OPPENHEIMER MONEY FUND/VA
STATEMENTS OF CHANGES IN NET ASSETS
| | | | | | |
| | | Six Months Ended
June 30, 2015
(Unaudited) | | | Year Ended
December 31, 2014 |
Operations | | | | | | |
Net investment income | | $ | 19,333 | | | $ 32,855 |
|
Net realized gain | | | 4,309 | | | 11,471 |
| | | | | | |
Net increase in net assets resulting from operations | | | 23,642 | | | 44,326 |
Dividends and/or Distributions to Shareholders | | | | | | |
Dividends from net investment income | | | (20,159) | | | (34,163) |
Beneficial Interest Transactions | | | | | | |
Net increase (decrease) in net assets resulting from beneficial interest transactions | | | (199,262,054) | | | 338,260,098 |
Net Assets | | | | | | |
Total increase (decrease) | | | (199,258,571) | | | 338,270,261 |
|
Beginning of period | | | 515,296,664 | | | 177,026,403 |
| | | | | | |
End of period (including accumulated net investment income of $7,781 and $8,607, respectively) | | $ | 316,038,093 | | | $ 515,296,664 |
| | | |
See accompanying Notes to Financial Statements.
10 OPPENHEIMER MONEY FUND/VA
FINANCIAL HIGHLIGHTS
| | | | | | | | | | | | | | | | | | | | | | | | |
| | | Six Months
Ended
June 30, 2015
(Unaudited) | | | Year Ended
December 31,
2014 | | | Year Ended
December 31,
2013 | | | Year Ended
December 31,
2012 | | | Year Ended
December 30,
20111 | | | Year Ended
December 31,
2010 | |
| |
Per Share Operating Data | | | | | | | | | | | | | | | | | | | | | | | | |
Net asset value, beginning of period | | $ | 1.00 | | | $ | 1.00 | | | $ | 1.00 | | | $ | 1.00 | | | $ | 1.00 | | | $ | 1.00 | |
| |
| Income (loss) from investment operations-Net investment income and net realized gain2 | | | 0.003 | | | | 0.003 | | | | 0.003 | | | | 0.003 | | | | 0.003 | | | | 0.003 | |
| Dividends and/or distributions to shareholders: | | | | | | | | | | | | | | | | | | | | | | | | |
| Dividends from net investment income | | | 0.003 | | | | 0.003 | | | | 0.003 | | | | 0.003 | | | | 0.003 | | | | 0.003 | |
| |
| Net asset value, end of period | | $ | 1.00 | | | $ | 1.00 | | | $ | 1.00 | | | $ | 1.00 | | | $ | 1.00 | | | $ | 1.00 | |
| | | | |
| | | | | | | | | |
| |
Total Return, at Net Asset Value4 | | | 0.01% | | | | 0.01% | | | | 0.01% | | | | 0.01% | | | | 0.01% | | | | 0.03% | |
| | | | | | | | | |
| |
Ratios/Supplemental Data | | | | | | | | | | | | | | | | | | | | | | | | |
Net assets, end of period (in thousands) | | $ | 316,038 | | | $ | 515,297 | | | $ | 177,026 | | | $ | 174,428 | | | $ | 163,973 | | | $ | 149,697 | |
| |
Average net assets (in thousands) | | $ | 389,883 | | | $ | 329,045 | | | $ | 178,263 | | | $ | 164,276 | | | $ | 156,127 | | | $ | 164,258 | |
| |
Ratios to average net assets:5 | | | | | | | | | | | | | | | | | | | | | | | | |
Net investment income | | | 0.01% | | | | 0.01% | | | | 0.01% | | | | 0.01% | | | | 0.01% | | | | 0.01% | |
Total expenses6 | | | 0.59% | | | | 0.57% | | | | 0.61% | | | | 0.62% | | | | 0.61% | | | | 0.61% | |
| Expenses after payments, waivers and/or reimbursements and reduction to custodian expenses | | | 0.18% | | | | 0.15% | | | | 0.22% | | | | 0.30% | | | | 0.29% | | | | 0.35% | |
1. December 30, 2011 represents the last business day of the Fund’s 2011 fiscal year.
2. Per share amounts calculated based on the average shares outstanding during the period.
3. Less than $0.005 per share.
4. Assumes an initial investment on the business day before the first day of the fiscal period, with all dividends and distributions reinvested in additional shares on the reinvestment date, and redemption at the net asset value calculated on the last business day of the fiscal period. Total returns are not annualized for periods less than one full year. Total return information does not reflect expenses that apply at the separate account level or to related insurance products. Inclusion of these charges would reduce the total return figures for all periods shown. Returns do not reflect the deduction of taxes that a shareholder would pay on fund distributions or the redemption of fund shares. The returns do not include adjustments in accordance with generally accepted accounting principles required at the period end for financial reporting purposes.
5. Annualized for periods less than one full year.
6. Total expenses including indirect expenses from affiliated fund fees and expenses were as follows:
| | | | | | |
| | | | | | |
| | Six Months Ended June 30, 2015 | | | 0.60 | % |
| | Year Ended December 31, 2014 | | | 0.57 | % |
See accompanying Notes to Financial Statements.
11 OPPENHEIMER MONEY FUND/VA
NOTES TO FINANCIAL STATEMENTS June 30, 2015 Unaudited
1. Significant Accounting Policies
Oppenheimer Money Fund/VA (the “Fund”), a separate series of Oppenheimer Variable Account Funds, is a diversified open-end management investment company registered under the Investment Company Act of 1940 (“1940 Act”), as amended. The Fund’s investment objective is to seek income consistent with stability of principal. The Fund’s investment adviser is OFI Global Asset Management, Inc. (“OFI Global” or the “Manager”), a wholly-owned subsidiary of OppenheimerFunds Inc. (“OFI” or the “Sub-Adviser”). The Manager has entered into a sub-advisory agreement with OFI. Shares of the Fund are sold only to separate accounts of life insurance companies.
The following is a summary of significant accounting policies followed in the Fund’s preparation of financial statements in accordance with accounting principles generally accepted in the United States (“U.S. GAAP”).
2. Significant Accounting Policies
Security Valuation. All investments in securities are recorded at their estimated fair value, as described in Note 3.
Reporting Period End Date. The last day of the Fund’s reporting period is the last day the New York Stock Exchange was open for trading during the period. The Fund’s financial statements have been presented through that date to maintain consistency with the Fund’s net asset value calculations used for shareholder transactions.
Dividends and Distributions to Shareholders. Dividends and distributions to shareholders, which are determined in accordance with income tax regulations and may differ from U.S. generally accepted accounting principles, are recorded on the ex-dividend date. Income distributions, if any, are declared daily and paid monthly. Capital gain distributions, if any, are declared and paid annually but may be paid at other times to maintain the net asset value per share at $1.00.
The tax character of distributions is determined as of the Fund’s fiscal year end. Therefore, a portion of the Fund’s distributions made to shareholders prior to the Fund’s fiscal year end may ultimately be categorized as a tax return of capital.
Investment Income. Interest income is recognized on an accrual basis. Discount and premium, which are included in interest income on the Statement of Operations, are amortized or accreted daily.
Custodian Fees. “Custodian fees and expenses” in the Statement of Operations may include interest expense incurred by the Fund on any cash overdrafts of its custodian account during the period. Such cash overdrafts may result from the effects of failed trades in portfolio securities and from cash outflows resulting from unanticipated shareholder redemption activity. The Fund pays interest to its custodian on such cash overdrafts, to the extent they are not offset by positive cash balances maintained by the Fund, at a rate equal to the Federal Funds Rate plus 0.50%. The “Reduction to custodian expenses” line item, if applicable, represents earnings on cash balances maintained by the Fund during the period. Such interest expense and other custodian fees may be paid with these earnings.
Security Transactions. Security transactions are recorded on the trade date. Realized gains and losses on securities sold are determined on the basis of identified cost.
Indemnifications. The Fund’s organizational documents provide current and former Trustees and officers with a limited indemnification against liabilities arising in connection with the performance of their duties to the Fund. In the normal course of business, the Fund may also enter into contracts that provide general indemnifications. The Fund’s maximum exposure under these arrangements is unknown as this would be dependent on future claims that may be made against the Fund. The risk of material loss from such claims is considered remote.
Federal Taxes. The Fund intends to comply with provisions of the Internal Revenue Code applicable to regulated investment companies and to distribute substantially all of its investment company taxable income to shareholders. Therefore, no federal income or excise tax provision is required. The Fund files income tax returns in U.S. federal and applicable state jurisdictions. The statute of limitations on the Fund’s tax return filings generally remains open for the three preceding fiscal reporting period ends.
Use of Estimates. The preparation of financial statements in conformity with accounting principles generally accepted in the United States of America requires management to make estimates and assumptions that affect the reported amounts of assets and liabilities and disclosure of contingent assets and liabilities at the date of the financial statements and the reported amounts of increases and decreases in net assets from operations during the reporting period. Actual results could differ from those estimates.
3. Securities Valuation
The Fund calculates the net asset value of its shares as of the close of the New York Stock Exchange (the “Exchange”), normally 4:00 P.M. Eastern time, on each day the Exchange is open for trading.
The Fund’s Board has adopted procedures for the valuation of the Fund’s securities and has delegated the day-to-day responsibility for valuation determinations under those procedures to the Manager. The Manager has established a Valuation Committee which is responsible for determining a “fair valuation” for any security for which market quotations are not “readily available.” The Valuation Committee’s fair valuation determinations are
12 OPPENHEIMER MONEY FUND/VA
3. Securities Valuation (Continued)
subject to review, approval and ratification by the Fund’s Board at its next regularly scheduled meeting covering the calendar quarter in which the fair valuation was determined.
Valuation Methods and Inputs
Securities are valued at cost adjusted by the amortization of discount or premium to maturity (amortized cost), which approximates market value. If amortized cost is determined not to approximate market value, the fair value of the portfolio securities will be determined under procedures approved by the Fund’s Board of Trustees.
If a market value or price cannot be determined for a security using the methodologies described above, or if, in the “good faith” opinion of the Manager, the market value or price obtained does not constitute a “readily available market quotation,” or a significant event has occurred that would materially affect the value of the security, the security is fair valued either (i) by a standardized fair valuation methodology applicable to the security type or the significant event as previously approved by the Valuation Committee and the Fund’s Board or (ii) as determined in good faith by the Manager’s Valuation Committee. The Valuation Committee considers all relevant facts that are reasonably available, through either public information or information available to the Manager, when determining the fair value of a security. Fair value determinations by the Manager are subject to review, approval and ratification by the Fund’s Board at its next regularly scheduled meeting covering the calendar quarter in which the fair valuation was determined. Those fair valuation standardized methodologies include, but are not limited to, valuing securities at the last sale price or initially at cost and subsequently adjusting the value based on: changes in company specific fundamentals, changes in an appropriate securities index, or changes in the value of similar securities which may be further adjusted for any discounts related to security-specific resale restrictions. When possible, such methodologies use observable market inputs such as unadjusted quoted prices of similar securities, observable interest rates, currency rates and yield curves. The methodologies used for valuing securities are not necessarily an indication of the risks associated with investing in those securities nor can it be assured that the Fund can obtain the fair value assigned to a security if it were to sell the security.
To assess the continuing appropriateness of security valuations, the Manager, or its third party service provider who is subject to oversight by the Manager, regularly compares prior day prices, prices on comparable securities, and sale prices to the current day prices and challenges those prices exceeding certain tolerance levels with the third party pricing service or broker source. For those securities valued by fair valuations, whether through a standardized fair valuation methodology or a fair valuation determination, the Valuation Committee reviews and affirms the reasonableness of the valuations based on such methodologies and fair valuation determinations on a regular basis after considering all relevant information that is reasonably available.
Classifications
Each investment asset or liability of the Fund is assigned a level at measurement date based on the significance and source of the inputs to its valuation. Various data inputs are used in determining the value of each of the Fund’s investments as of the reporting period end. These data inputs are categorized in the following hierarchy under applicable financial accounting standards:
1) Level 1-unadjusted quoted prices in active markets for identical assets or liabilities (including securities actively traded on a securities exchange)
2) Level 2-inputs other than unadjusted quoted prices that are observable for the asset or liability (such as unadjusted quoted prices for similar assets and market corroborated inputs such as interest rates, prepayment speeds, credit risks, etc.)
3) Level 3-significant unobservable inputs (including the Manager’s own judgments about assumptions that market participants would use in pricing the asset or liability).
The inputs used for valuing securities are not necessarily an indication of the risks associated with investing in those securities.
The table below categorizes amounts that are included in the Fund’s Statement of Assets and Liabilities as of June 30, 2015 based on valuation input level:
| | | | | | | | | | | | | | | | |
| | | Level 1— Unadjusted Quoted Prices | | | Level 2— Other Significant
Observable Inputs | | | Level 3—
Significant
Unobservable
Inputs | | | Value | |
| |
| Investments, at Value: | | | | | | | | | | | | | | | | |
| Assets Table | | | | | | | | | | | | | | | | |
| Certificates of Deposit | | $ | — | | | $ | 84,402,474 | | | $ | — | | | $ | 84,402,474 | |
| Direct Bank Obligations | | | — | | | | 56,676,482 | | | | — | | | | 56,676,482 | |
| Investment Company | | | 10,672,836 | | | | — | | | | — | | | | 10,672,836 | |
| Short-Term Notes/Commercial Paper | | | — | | | | 140,317,542 | | | | — | | | | 140,317,542 | |
| | | | |
| Total Assets | | $ | 10,672,836 | | | $ | 281,396,498 | | | $ | — | | | $ | 292,069,334 | |
| | | | |
4. Investments and Risks
Investment in Oppenheimer Institutional Money Market Fund. The Fund is permitted to invest daily available cash balances in an affiliated money market fund. The Fund may invest the available cash in Class E shares of Oppenheimer Institutional Money Market Fund (“IMMF”) to seek current income while preserving liquidity or for defensive purposes. IMMF is a registered open-end management investment company, regulated as a money market fund under the 1940 Act. The Manager is the investment adviser of IMMF, and the Sub-Adviser provides investment and related advisory services to IMMF. When applicable, the Fund’s investment in IMMF is included in the Statement of Investments. Shares of IMMF are valued at their net asset
13 OPPENHEIMER MONEY FUND/VA
NOTES TO FINANCIAL STATEMENTS Unaudited / Continued
4. Investments and Risks (Continued)
value per share. As a shareholder, the Fund is subject to its proportional share of IMMF’s Class E expenses, including its management fee. The Manager will waive fees and/or reimburse Fund expenses in an amount equal to the indirect management fees incurred through the Fund’s investment in IMMF.
5. Shares of Beneficial Interest
The Fund has authorized an unlimited number of $0.001 par value shares of beneficial interest of each class. Transactions in shares of beneficial interest were as follows:
| | | | | | | | | | | | | | | | |
| | | Six Months Ended June 30, 2015 | | | Year Ended December 31, 2014 | |
| | | Shares | | | Amount | | | Shares | | | Amount | |
| |
| Sold | | | 410,058,293 | | | $ | 410,058,293 | | | | 1,568,851,985 | | | $ | 1,568,851,985 | |
| Dividends and/or distributions reinvested | | | 20,159 | | | | 20,159 | | | | 34,163 | | | | 34,163 | |
| Redeemed | | | (609,340,506 | ) | | | (609,340,506) | | | | (1,230,626,050 | ) | | | (1,230,626,050) | |
| | | | |
| Net increase (decrease) | | | (199,262,054 | ) | | $ | (199,262,054) | | | | 338,260,098 | | | $ | 338,260,098 | |
| | | | |
6. Fees and Other Transactions with Affiliates
Management Fees. Under the investment advisory agreement, the Fund pays the Manager a management fee based on the daily net assets of the Fund at an annual rate as shown in the following table:
| | | | |
Fee Schedule | | | |
| |
Up to $500 million | | | 0.450% | |
Next $500 million | | | 0.425 | |
Next $500 million | | | 0.400 | |
Over $1.5 billion | | | 0.375 | |
The Fund’s effective management fee for the six months ended June 30, 2015 was 0.45% of average annual net assets before any applicable waivers.
Sub-Adviser Fees. The Manager has retained the Sub-Adviser to provide the day-to-day portfolio management of the Fund. Under the Sub-Advisory Agreement, the Manager pays the Sub-Adviser an annual fee in monthly installments, equal to a percentage of the investment management fee collected by the Manager from the Fund, which shall be calculated after any investment management fee waivers. The fee paid to the Sub-Adviser is paid by the Manager, not by the Fund.
Transfer Agent Fees. OFI Global (the “Transfer Agent”) serves as the transfer and shareholder servicing agent for the Fund. The Fund pays the Transfer Agent a fee based on annual net assets. Fees incurred and average net assets for each class with respect to these services are detailed in the Statement of Operations and Financial Highlights, respectively.
Sub-Transfer Agent Fees. The Transfer Agent has retained Shareholder Services, Inc., a wholly-owned subsidiary of OFI (the “Sub-Transfer Agent”), to provide the day-to-day transfer agent and shareholder servicing of the Fund. Under the Sub-Transfer Agency Agreement, the Transfer Agent pays the Sub-Transfer Agent an annual fee in monthly installments, equal to a percentage of the transfer agent fee collected by the Transfer Agent from the Fund, which shall be calculated after any applicable fee waivers. The fee paid to the Sub-Transfer Agent is paid by the Transfer Agent, not by the Fund.
Trustees’ Compensation. The Fund’s Board of Trustees (“Board”) has adopted a compensation deferral plan for Independent Trustees that enables Trustees to elect to defer receipt of all or a portion of the annual compensation they are entitled to receive from the Fund. For purposes of determining the amount owed to the Trustee under the plan, deferred amounts are treated as though equal dollar amounts had been invested in shares of the Fund or in other Oppenheimer funds selected by the Trustee. The Fund purchases shares of the funds selected for deferral by the Trustee in amounts equal to his or her deemed investment, resulting in a Fund asset equal to the deferred compensation liability. Such assets are included as a component of “Other” within the asset section of the Statement of Assets and Liabilities. Deferral of Trustees’ fees under the plan will not affect the net assets of the Fund and will not materially affect the Fund’s assets, liabilities or net investment income per share. Amounts will be deferred until distributed in accordance with the compensation deferral plan.
Waivers and Reimbursements of Expenses. The Manager has voluntarily undertaken to waive fees and/or reimburse expenses to the extent necessary to assist the Fund in attempting to maintain a positive yield. There is no guarantee that the Fund will maintain a positive yield. During the six months ended June 30, 2015, the Manager waived fees and/or reimbursed the Fund $604,208.
The Manager has contractually agreed to limit the Fund’s expenses after payments, waivers and/or reimbursements and reduction to custodian expenses, excluding expenses incurred directly or indirectly by the Fund as a result of investments in other investment companies, wholly-owned subsidiaries and pooled investment vehicles; so that those expenses, as percentages of daily net assets, will not exceed the annual rate of 0.50%. As a result of this limitation, the Manager waived $164,811 for the six months ended June 30, 2015.
Effective April 30, 2013, the Manager is permitted to recapture previously waived and/or reimbursed fees in any given fiscal year if the recapture would not: 1) cause the Fund to generate a negative daily yield, and 2) exceed amounts previously waived and/or reimbursed under this arrangement during the current and prior three fiscal years. The reimbursement to the Manager of such previous waivers and reimbursements would not include any portion of distribution and/or service fees. As of June 30, 2015, the following waived and/or reimbursed amounts are eligible for recapture:
14 OPPENHEIMER MONEY FUND/VA
6. Fees and Other Transactions with Affiliates (Continued)
| | | | |
Expires | | | |
| |
December 31, 2016 | | $ | 486,156 | |
December 31, 2017 | | | 1,378,598 | |
December 31, 2018 | | | 769,019 | |
The Manager has not recaptured any previously waived and/or reimbursed amounts during the six months ended June 30, 2015.
The Manager will waive fees and/or reimburse Fund expenses in an amount equal to the indirect management fees incurred through the Fund’s investment in IMMF. During the six months ended June 30, 2015, the Manager waived fees and/or reimbursed the Fund $10,195 for IMMF management fees.
Waivers and/or reimbursements may be modified or terminated as set forth according to the terms in the prospectus.
7. Pending Litigation
In 2009, several lawsuits were filed as putative class actions and later consolidated before the U.S. District Court for the District of Colorado in connection with the investment performance of Oppenheimer Rochester California Municipal Fund (the “California Fund Suit”), a fund advised by OppenheimerFunds, Inc. (“OFI”), and distributed by its subsidiary OppenheimerFunds Distributor, Inc. (“OFDI”). The plaintiffs asserted claims against OFI, OFDI and certain present and former trustees and officers of the Fund under the federal securities laws, alleging, among other things, that the disclosure documents of the Fund contained misrepresentations and omissions and the investment policies of the Fund were not followed. Plaintiffs in the California Fund Suit filed an amended complaint and defendants filed a motion to dismiss. In 2011, the court issued an order which granted in part and denied in part the defendants’ motion to dismiss. In 2012, plaintiffs filed a motion, which defendants opposed, to certify a class and appoint class representatives and class counsel. In March 2015, the court granted plaintiffs’ motion for class certification. In May 2015, the U.S. Court of Appeals for the Tenth Circuit vacated the class certification order and remanded the matter to the district court for further proceedings. In July 2015, the district court held an evidentiary hearing on plaintiffs’ motion for class certification. OFI and OFDI believe the California Fund Suit is without merit; that it is premature to render any opinion as to the likelihood of an outcome unfavorable to them in the California Fund Suit; and that no estimate can yet be made as to the amount or range of any potential loss.
15 OPPENHEIMER MONEY FUND/VA
PORTFOLIO PROXY VOTING POLICIES AND PROCEDURES; UPDATES TO STATEMENTS OF INVESTMENTS Unaudited
The Fund has adopted Portfolio Proxy Voting Policies and Procedures under which the Fund votes proxies relating to securities (“portfolio proxies”) held by the Fund. A description of the Fund’s Portfolio Proxy Voting Policies and Procedures is available (i) without charge, upon request, by calling the Fund toll-free at 1.800.525.7048, (ii) on the Fund’s website at www.oppenheimerfunds.com, and (iii) on the SEC’s website at www.sec.gov. In addition, the Fund is required to file Form N-PX, with its complete proxy voting record for the 12 months ended June 30th, no later than August 31st of each year. The Fund’s voting record is available (i) without charge, upon request, by calling the Fund toll-free at 1.800.525.7048, and (ii) in the Form N-PX filing on the SEC’s website at www.sec.gov.
The Fund files its complete schedule of portfolio holdings with the SEC for the first quarter and the third quarter of each fiscal year on Form N-Q. The Fund’s Form N-Q filings are available on the SEC’s website at www.sec.gov. Those forms may be reviewed and copied at the SEC’s Public Reference Room in Washington, D.C. Information on the operation of the Public Reference Room may be obtained by calling 1-800-SEC-0330.
16 OPPENHEIMER MONEY FUND/VA
DISTRIBUTION SOURCES Unaudited
For any distribution that took place over the Fund’s reporting period, the table below details on a per-share basis the percentage of the Fund’s total distribution payment amount that was derived from the following sources: net income, net profit from the sale of securities, and other capital sources. This information is based upon income and capital gains using generally accepted accounting principles as of the date of each distribution. Because the Fund is actively managed, the relative amount of the Fund’s total distributions derived from various sources over the calendar year may change. Please note that this information should not be used for tax reporting purposes as the tax character of distributable income may differ from the amounts used for this notification. You will receive IRS tax forms in the first quarter of each calendar year detailing the actual amount of the taxable and non-taxable portion of distributions paid to you during the tax year.
For the most current information, please go to oppenheimerfunds.com. Select your Fund, then the ‘Detailed’ tab; where ‘Dividends’ are shown, the Fund’s latest pay date will be followed by the sources of any distribution, updated daily.
| | | | | | | | | | | | | | | | |
| Fund Name | | Pay Date | | | Net Income | | | Net Profit
from Sale | | | Other Capital Sources | |
| |
Oppenheimer Money Fund/VA | | | 1/16/15 | | | | 96.0% | | | | 0.0% | | | | 4.0% | |
| |
Oppenheimer Money Fund/VA | | | 2/20/15 | | | | 95.8% | | | | 0.0% | | | | 4.2% | |
| |
Oppenheimer Money Fund/VA | | | 3/20/15 | | | | 95.9% | | | | 4.1% | | | | 0.0% | |
| |
Oppenheimer Money Fund/VA | | | 4/17/15 | | | | 95.9% | | | | 4.1% | | | | 0.0% | |
| |
Oppenheimer Money Fund/VA | | | 5/15/15 | | | | 95.9% | | | | 4.1% | | | | 0.0% | |
| |
Oppenheimer Money Fund/VA | | | 6/19/15 | | | | 95.9% | | | | 4.1% | | | | 0.0% | |
| |
17 OPPENHEIMER MONEY FUND/VA
THIS PAGE INTENTIONALLY LEFT BLANK
18 OPPENHEIMER MONEY FUND/VA
THIS PAGE INTENTIONALLY LEFT BLANK
19 OPPENHEIMER MONEY FUND/VA
OPPENHEIMER MONEY FUND/VA
A Series of Oppenheimer Variable Account Funds
| | |
| Trustees and Officers | | Sam Freedman, Chairman of the Board of Trustees and Trustee |
| | Jon S. Fossel, Trustee |
| | Richard F. Grabish, Trustee |
| | Beverly L. Hamilton, Trustee |
| | Victoria J. Herget, Trustee |
| | Robert J. Malone, Trustee |
| | F. William Marshall, Jr., Trustee |
| | Karen L. Stuckey, Trustee |
| | James D. Vaughn, Trustee |
| | Arthur P. Steinmetz, Trustee, President and Principal Executive Officer |
| | Christopher Proctor, Vice President |
| | Adam S. Wilde, Vice President |
| | Arthur S. Gabinet, Secretary and Chief Legal Officer |
| | Jennifer Sexton, Vice President and Chief Business Officer |
| | Mary Ann Picciotto, Chief Compliance Officer and Chief Anti-Money Laundering Officer |
| | Brian W. Wixted, Treasurer and Principal Financial & Accounting Officer |
| |
| Manager | | OFI Global Asset Management, Inc. |
| |
| Sub-Adviser | | OppenheimerFunds, Inc. |
| |
| Distributor | | OppenheimerFunds Distributor, Inc. |
| |
| Transfer and | | OFI Global Asset Management, Inc. |
| Shareholder Servicing | | |
| Agent | | |
| |
| Sub-Transfer Agent | | Shareholder Services, Inc. |
| | DBA OppenheimerFunds Services |
| |
| Independent | | KPMGLLP |
| Registered Public | | |
| Accounting Firm | | |
| |
| Legal Counsel | | Ropes & Gray LLP |
| |
| | Before investing in any of the Oppenheimer funds, investors should carefully consider a fund’s investment objectives, risks, charges and expenses. Fund prospectuses and summary prospectuses contain this and other information about the funds and may be obtained by asking your financial advisor, visiting oppenheimerfunds.com or calling us at 1.800.988.8287. Read prospectuses and summary prospectuses carefully before investing. The financial statements included herein have been taken from the records of the Fund without examination of those records by the independent registered public accounting firm. © 2015 OppenheimerFunds, Inc. All rights reserved. Oppenheimer funds are distributed by OppenheimerFunds Distributor, Inc. |
| | |
| |  |
| | | | |
| | 
| | |
| | | | |
| | June 30, 2015 | | |
| | | Oppenheimer | | Semiannual Report |
| | Global Strategic Income Fund/VA | |
| | | A Series of Oppenheimer Variable Account Funds | |
| | SEMIANNUAL REPORT | | |
| | Listing of Top Holdings | | |
| | Fund Performance Discussion | | |
| | Financial Statements | | |
PORTFOLIO MANAGERS: Michael A. Mata, Krishna Memani, Hemant Baijal
AVERAGE ANNUAL TOTAL RETURNS FOR THE PERIODS ENDED 6/30/15
| | | | | | | | | | | | | | | | | | | | | | |
| | | Inception
Date | | | | | 6-Months | | | 1-Year | | | 5-Year | | | 10-Year | |
| Non-Service Shares | | | 5/3/93 | | | | | | 1.35 % | | | | -0.16 % | | | | 5.41 % | | | | 5.22 % | |
| |
| Service Shares | | | 3/19/01 | | | | | | 1.21 | | | | -0.44 | | | | 5.15 | | | | 4.96 | |
| |
| Barclays U.S. Aggregate Bond Index | | | | | | | | | -0.15 | | | | 1.81 | | | | 3.34 | | | | 4.43 | |
| |
| Citigroup World Government Bond Index | | | | | | | | | -4.02 | | | | -9.02 | | | | 1.05 | | | | 3.07 | |
| |
| Citigroup Non U.S. World Government Bond Index | | | | | | | | | -5.83 | | | | -13.49 | | | | 0.33 | | | | 2.63 | |
| |
| J.P. Morgan Domestic High Yield Index | | | | | | | | | 2.76 | | | | -0.70 | | | | 8.96 | | | | 8.07 | |
| |
| Reference Index | | | | | | | | | -1.56 | | | | -5.23 | | | | 3.84 | | | | 4.89 | |
| |
Performance data quoted represents past performance, which does not guarantee future results. The investment return and principal value of an investment in the Fund will fluctuate so that an investor’s shares, when redeemed, may be worth more or less than their original cost. Current performance may be lower or higher than the performance quoted. For performance data current to the most recent month end, call us at 1.800.988.8287. The Fund’s total returns should not be expected to be the same as the returns of other funds, whether or not both funds have the same portfolio managers and/or similar names. The Fund’s total returns include changes in share price and reinvested distributions but do not include the charges associated with the separate account products that offer this Fund. Such performance would have been lower if such charges were taken into account.
The Fund’s performance is compared to the performance of the Barclays U.S. Aggregate Bond Index, the Citigroup World Government Bond Index, the Citigroup Non-U.S. World Government Bond Index, the J.P. Morgan Domestic High Yield Index and the Fund’s Reference Index. The Barclays U.S. Aggregate Bond Index is an index of U.S. Government and corporate bonds. The Citigroup World Government Bond Index is an index of debt securities of major foreign government bond markets. The Citigroup Non-U.S. World Government Bond Index is an index of fixed rate government bonds with a maturity of one year or longer and amounts outstanding of at least U.S. $25 million. The J.P. Morgan Domestic High Yield Index is an unmanaged index of high yield fixed income securities issued by U.S. companies. The Fund’s Reference Index is a customized weighted index currently comprised of the following underlying broad-based security indices: 40% Citigroup Non-U.S. World Government Bond Index, 30% J.P. Morgan Domestic High Yield Index, and 30% Barclays U.S. Aggregate Bond Index. The indices are unmanaged and cannot be purchased directly by investors. While index comparisons may be useful to provide a benchmark for the Fund’s performance, it must be noted that the Fund’s investments are not limited to the investments comprising the indices. Index performance includes reinvestment of income, but does not reflect transaction costs, fees, expenses or taxes. Index performance is shown for illustrative purposes only as a benchmark for the Fund’s performance, and does not predict or depict performance of the Fund. The Fund’s performance reflects the effects of the Fund’s business and operating expenses.
2 OPPENHEIMER GLOBAL STRATEGIC INCOME FUND/VA
TOP HOLDINGS AND ALLOCATIONS
| | | | |
PORTFOLIO ALLOCATION | | | |
| |
| Non-Convertible Corporate Bonds and Notes | | | 61.2% | |
| |
| Foreign Government Obligations | | | 11.7 | |
| |
| Mortgage-Backed Obligations | | | | |
Government Agency | | | 5.3 | |
Non-Agency | | | 6.1 | |
| |
| Investment Companies | | | | |
Oppenheimer Master Event-Linked Bond Fund, LLC | | | 2.3 | |
Oppenheimer Master Loan Fund, LLC | | | 5.4 | |
Oppenheimer Ultra-Short Duration Fund | | | 1.0 | |
| |
| Asset-Backed Securities | | | 2.9 | |
| |
| U.S. Government Obligations | | | 1.7 | |
| |
| Corporate Loans | | | 1.4 | |
| |
| Structured Securities | | | 0.7 | |
| |
| Common Stocks | | | 0.2 | |
| |
| Over-the-Counter Options Purchased | | | 0.1 | |
| |
| Over-the-Counter Credit Default Swaptions Purchased | | | —* | |
| |
| Over-the-Counter Interest Rate Swaptions Purchased | | | —* | |
| |
| Rights, Warrants and Certificates | | | — | |
* Represents a value of less than 0.05%.
Portfolio holdings and allocations are subject to change. Percentages are as of June 30, 2015, and are based on the total market value of investments.
| | | | |
CREDIT RATING BREAKDOWN | | NRSRO ONLY TOTAL | |
| |
| AAA | | | 6.4% | |
| |
| AA | | | 1.6 | |
| |
| A | | | 5.2 | |
| |
| BBB | | | 25.9 | |
| |
| BB | | | 24.1 | |
| |
| B | | | 21.4 | |
| |
| CCC | | | 4.5 | |
| |
| CC | | | 0.5 | |
| |
| C | | | 0.0 | |
| |
| D | | | 0.6 | |
| |
| Unrated | | | 9.8 | |
| |
| Total | | | 100.0% | |
| |
The percentages above are based on the market value of the Fund’s securities as of June 30, 2015, and are subject to change. Except for securities labeled “Unrated,” and except for certain securities issued or guaranteed by a foreign sovereign, all securities have been rated by at least one Nationally Recognized Statistical Rating Organization (“NRSRO”), such as Standard & Poor’s (“S&P”). For securities rated only by an NRSRO other than S&P, OppenheimerFunds, Inc. (the “Sub-Adviser”) converts that rating to the equivalent S&P rating. If two or more NRSROs have assigned a rating to a security, the highest S&P equivalent rating is used. Unrated securities issued or guaranteed by a foreign sovereign are assigned a credit rating equal to the highest NRSRO rating assigned to that foreign sovereign. For securities not rated by an NRSRO, the Sub-Adviser uses its own credit analysis to assign ratings in categories similar to those of S&P. The use of similar categories is not an indication that the sub-adviser’s credit analysis process is consistent or comparable with any NRSRO’s process were that NRSRO to rate the same security. Fund assets invested in Oppenheimer Institutional Money Market Fund are assigned that fund’s S&P rating, which is currently AAA. For the purposes of this table, “investment-grade” securities are securities rated within the NRSROs’ four highest rating categories (AAA, AA, A and BBB). Unrated securities do not necessarily indicate low credit quality, and may or may not be the equivalent of investment-grade. Please consult the Fund’s prospectus and Statement of Additional Information for further information.
3 OPPENHEIMER GLOBAL STRATEGIC INCOME FUND/VA
Fund Performance Discussion
The Fund’s Non-Service shares produced a return of 1.35% during the reporting period, outperforming the -1.56% return provided by its Reference Index (the “Index”), which currently is composed of the following broad-based securities indices: 40% Citigroup Non-U.S. World Government Bond Index, 30% J.P. Morgan Domestic High Yield Index, and 30% Barclays U.S. Aggregate Bond Index.
MARKET OVERVIEW
The opening months of 2015 were marked by cooling U.S. growth after the strong fourth quarter of 2014. The dollar continued to strengthen significantly during this time against most of the U.S.’s major trading partners, which acted as a drag on growth. Businesses, especially U.S. firms with revenues dependent on exporting goods and services, cited this as a headwind. The period marked a continuing divergence in monetary policy with the Federal Reserve (“Fed”) preparing to raise interest rates, while the European Central Bank (“ECB”) President Mario Draghi announced the purchase of €60 billion a month in sovereign bonds from Eurozone countries for at least 19 months, a form of QE that is projected to increase the ECB’s balance sheet by over €1 trillion. The Bank of Japan (“BoJ”) continued its bold money printing experiment under the economic policies of Prime Minister Shinzō Abe, commonly referred to as “Abenomics”. The Chinese central bank also continued taking aggressive steps to stimulate its economy, including additional surprise interest rate and reserve ratio requirement cuts.
Against this backdrop, interest rates in core Europe and Japan backed up as investors anticipated positive results from accommodative monetary policies around the world. In fact, during the first half of 2015, more than 30 central banks announced interest rate cuts, with several of them doing so multiple times (e.g., Russia cut rates four times, China and India three times each, Australia twice, etc.). After rallying sharply in the first quarter of 2015, the U.S. dollar reversed course and weakened against most major currencies including the euro, British pound, Swiss franc, Canadian dollar and Australian dollar, in the second quarter of 2015.
FUND REVIEW
During the reporting period, top performing areas included high yield debt, mortgages and European credit. Our positions in high yield debt contributed to performance, and we benefited from our up-in-quality tilt in this part of the portfolio. In fact, the Fund had approximately half of the triple-C weighting of the J.P. Morgan Domestic High Yield Index. In addition, we were underweight both energy and metals/mining, which did not perform well this reporting period. We believe the current macro environment favors credit, which continues to screen as relatively attractive in our view. Mortgages continued to benefit the Fund this reporting period. This part of the portfolio is largely comprised of securitized credit that we purchased several years ago. These positions have rolled down to become fairly short in maturity, and we have been harvesting profits in them. Regarding European credit, we maintained our exposure at approximately 11% of the portfolio. These positions helped performance significantly during the past two years, and they did again this reporting period. Performance was particularly strong over the first half of the reporting period, as European growth was stabilizing and we saw early evidence of positive economic momentum in the Eurozone. Although concerns surrounding the Greek debt crisis negatively impacted this asset class over the second half of the period, performance remained positive for the Fund for the overall reporting period. We do not expect the Greek debt crisis to become an existential threat to the economic recovery in Europe. The ECB is executing an aggressive QE program in an effort to stimulate growth and push inflation higher. The Greek crisis has caused spreads to widen, which we believe could provide an attractive opportunity to increase exposure in selected European credits. More broadly, our rationale for owning European credit is simple. The U.S. economy has already stabilized. For the global economy to improve, Europe will need to improve. The ECB is easing monetary policy aggressively with a goal of stimulating economic growth. We believe the ECB’s efforts should continue to benefit European credit, just as they have so far this year.
The most significant detractor from performance this reporting period was the Fund’s exposure to high grade bonds, as these types of bonds experienced pressure during the reporting period. We also made some changes to our exposure among high grade during the period. The portfolio was previously focused more on U.S. Treasuries and agency pass-through securities. However, it is now includes more securitized credit and corporate bonds.
STRATEGY & OUTLOOK
As we enter the third quarter of 2015, the U.S. economy has regained some momentum after contracting by 0.2% in the first quarter. However, in our view the U.S. could be facing another mid-cycle slowdown, which would be its second or third in an admittedly long cycle so far. Economic growth has been slow and uneven in many parts of the world, the dollar is oscillating between periods of strength and weakness, S&P 500 earnings are being revised down, commodity prices have fallen sharply, the Greek debt crisis has flared up, geopolitical turmoil persists in the Middle East and the Chinese equity markets are under significant
4 OPPENHEIMER GLOBAL STRATEGIC INCOME FUND/VA
pressure. On the bright side, however, we do not see an existential threat to the recovery in Europe or the credit cycle, we do not see any signs of a looming recession in the U.S. and we do not expect default rates to rise above current expectations in the next 12-18 months.
We expected the U.S. market to trend sideways in the first half of 2015, and it did, with the S&P 500 Index and Barclays U.S. Aggregate Bond Index generating total returns of 1.23% and -0.15%, respectively, during the period. We continue to expect more muted returns and higher sustained volatility across a number of asset classes this year. In this regard, we have already seen negative total returns in the first half of the year for real estate investment trusts, master limited partnerships, municipal bonds, precious metals and commodities.
We also believe the market will continue to react strongly to changes in expectations about the rate of growth in the U.S. and how aggressive the Fed is when it starts to tighten. We expect that tightening to begin later this year, but we continue to believe the risks are tilted toward the Fed’s raising rates less, and doing so later than the market expects. (We expect to see a greater rise in rates in 2016.) We also anticipate the dollar will continue strengthening, although we believe it may do so in fits and starts rather than for weeks or months in a row as it did in late 2014 and the first quarter of 2015. This should be a decent environment for credit and spread products. If our views prove correct, our long position in credit, our short duration posture and our minimal exposure to foreign currencies should help performance. Our highest conviction views are in credit, and they are expressed clearly in the portfolio. We continue to believe interest rates are headed higher over time, probably over a matter of years. While we do not expect them to spike meaningfully in the near term, we can reduce duration further if needed.
Finally, we believe most key policy changes this year will likely originate elsewhere, not in the U.S. Just as the Fed tapered its asset purchases steadily in 2014, we expect it to deliver consistency in domestic monetary policy this year. We also anticipate positive changes coming from other regions. So far this year, at least 30 central banks have announced surprise interest rate cuts. Japan has gone “all in” on Abenomics as that country struggles to grow consistently and generate inflation after emerging from its fourth recession in six years in late 2014. China has announced surprise rate cuts in each of the last three quarters, and we expect more monetary and fiscal stimulus in 2015. A number of emerging market countries have ended their tightening cycles and are now easing. We believe the portfolio is positioned to benefit in each of these scenarios.
The Fund’s investment strategy and focus can change over time. The mention of specific fund holdings does not constitute a recommendation by OppenheimerFunds, Inc. or its affiliates.
Shares of Oppenheimer funds are not deposits or obligations of any bank, are not guaranteed by any bank, are not insured by the FDIC or any other agency, and involve investment risks, including the possible loss of the principal amount invested.
5 OPPENHEIMER GLOBAL STRATEGIC INCOME FUND/VA
Fund Expenses
Fund Expenses. As a shareholder of the Fund, you incur two types of costs: (1) transaction costs and (2) ongoing costs, including management fees; distribution and service fees; and other Fund expenses. These examples are intended to help you understand your ongoing costs (in dollars) of investing in the Fund and to compare these costs with the ongoing costs of investing in other mutual funds.
The examples are based on an investment of $1,000.00 invested at the beginning of the period and held for the entire 6-month period ended June 30, 2015.
Actual Expenses. The first section of the table provides information about actual account values and actual expenses. You may use the information in this section for the class of shares you hold, together with the amount you invested, to estimate the expense that you paid over the period. Simply divide your account value by $1,000.00 (for example, an $8,600.00 account value divided by $1,000.00 = 8.60), then multiply the result by the number in the first section under the heading entitled “Expenses Paid During the 6 Months Ended June 30, 2015” to estimate the expenses you paid on your account during this period.
Hypothetical Example for Comparison Purposes.
The second section of the table provides information about hypothetical account values and hypothetical expenses based on the Fund’s actual expense ratio for each class of shares, and an assumed rate of return of 5% per year for each class before expenses, which is not the actual return. The hypothetical account values and expenses may not be used to estimate the actual ending account balance or expenses you paid for the period. You may use this information to compare the ongoing costs of investing in the Fund and other funds. To do so, compare this 5% hypothetical example for the class of shares you hold with the 5% hypothetical examples that appear in the shareholder reports of the other funds.
Please note that the expenses shown in the table are meant to highlight your ongoing costs only and do not reflect any charges associated with the separate accounts that offer this Fund. Therefore, the “hypothetical” lines of the table are useful in comparing ongoing costs only, and will not help you determine the relative total costs of owning different funds. In addition, if these separate account charges were included your costs would have been higher.
| | | | | | | | | | | | | | | | | | |
| Actual | | Beginning
Account Value
January 1, 2015 | | | | | Ending
Account Value June 30, 2015 | | | | | Expenses Paid During
6 Months Ended
June 30, 2015 | | | |
Non-Service shares | | $ | 1,000.00 | | | | | $ | 1,013.50 | | | | | $ | 3.60 | | | |
Service shares | | | 1,000.00 | | | | | | 1,012.10 | | | | | | 4.85 | | | |
| | | | | | |
Hypothetical (5% return before expenses) | | | | | | | | | | | | | | | |
Non-Service shares | | | 1,000.00 | | | | | | 1,021.22 | | | | | | 3.61 | | | |
Service shares | | | 1,000.00 | | | | | | 1,019.98 | | | | | | 4.87 | | | |
Expenses are equal to the Fund’s annualized expense ratio for that class, multiplied by the average account value over the period, multiplied by 181/365 (to reflect the one-half year period). Those annualized expense ratios, excluding indirect expenses from affiliated funds, based on the 6-month period ended June 30, 2015 are as follows:
| | | | |
| Class | | Expense Ratios | |
Non-Service shares | | | 0.72% | |
Service shares | | | 0.97 | |
The expense ratios reflect voluntary waivers and/or reimbursements of expenses by the Fund’s Manager. Some of these undertakings may be modified or terminated at any time, as indicated in the Fund’s prospectus. The “Financial Highlights” tables in the Fund’s financial statements, included in this report, also show the gross expense ratios, without such waivers or reimbursements and reduction to custodian expenses, if applicable.
6 OPPENHEIMER GLOBAL STRATEGIC INCOME FUND/VA
CONSOLIDATED STATEMENT OF INVESTMENTS June 30, 2015 Unaudited
| | | | | | | | | | |
| | | | | | | | | | |
| | | Principal Amount | | | Value | | | |
| | | |
Asset-Backed Securities—3.0% | | | |
| | | |
| American Credit Acceptance Receivables Trust: | | | |
| Series 2014-2, Cl. B, 2.26%, 3/10/201 | | $ | 710,000 | | | $ | 710,572 | | | |
| Series 2014-3, Cl. B, 2.43%, 6/10/201 | | | 655,000 | | | | 655,830 | | | |
| Series 2014-4, Cl. B, 2.60%,10/12/201 | | | 205,000 | | | | 205,095 | | | |
| Series 2015-1, Cl. B, 2.85%, 2/12/211 | | | 665,000 | | | | 665,561 | | | |
| Series 2015-2, Cl. B, 2.97%, 5/12/211 | | | 625,000 | | | | 626,923 | | | |
| | | |
| AmeriCredit Automobile Receivables Trust: | | | |
| Series 2012-2, Cl. E, 4.85%, 8/8/191 | | | 470,000 | | | | 485,104 | | | |
| Series 2012-3, Cl. E, 4.46%, 11/8/191 | | | 360,000 | | | | 370,466 | | | |
| Series 2012-4, Cl. D, 2.68%, 10/9/18 | | | 315,000 | | | | 320,939 | | | |
| Series 2012-5, Cl. D, 2.35%, 12/10/18 | | | 200,000 | | | | 202,930 | | | |
| Series 2013-2, Cl. E, 3.41%, 10/8/201 | | | 560,000 | | | | 568,676 | | | |
| Series 2013-3, Cl. D, 3.00%, 7/8/19 | | | 440,000 | | | | 448,625 | | | |
| Series 2013-3, Cl. E, 3.74%, 12/8/201 | | | 250,000 | | | | 255,658 | | | |
| Series 2013-4, Cl. D, 3.31%, 10/8/19 | | | 510,000 | | | | 523,545 | | | |
| Series 2013-5, Cl. D, 2.86%, 12/9/19 | | | 860,000 | | | | 869,626 | | | |
| Series 2014-1, Cl. C, 2.15%, 3/9/20 | | | 655,000 | | | | 657,159 | | | |
| Series 2014-1, Cl. E, 3.58%, 8/9/21 | | | 165,000 | | | | 166,063 | | | |
| Series 2014-2, Cl. D, 2.57%, 7/8/20 | | | 715,000 | | | | 716,006 | | | |
| Series 2014-2, Cl. E, 3.37%, 11/8/21 | | | 390,000 | | | | 388,853 | | | |
| Series 2014-3, Cl. D, 3.13%, 10/8/20 | | | 260,000 | | | | 260,720 | | | |
| Series 2014-4, Cl. D, 3.07%, 11/9/20 | | | 305,000 | | | | 307,207 | | | |
| Series 2015-2, Cl. D, 3.00%, 6/8/21 | | | 290,000 | | | | 290,578 | | | |
| | | |
| California Republic Auto Receivables Trust: | | | |
| Series 2013-2, Cl. C, 3.32%, 8/17/20 | | | 365,000 | | | | 367,563 | | | |
| Series 2014-2, Cl. C, 3.29%, 3/15/21 | | | 130,000 | | | | 129,780 | | | |
| Series 2014-4, Cl. C, 3.56%, 9/15/21 | | | 145,000 | | | | 145,130 | | | |
| | | |
| Capital Auto Receivables Asset Trust: | | | |
| Series 2013-1, Cl. D, 2.19%, 9/20/21 | | | 275,000 | | | | 277,040 | | | |
| Series 2013-4, Cl. D, 3.22%, 5/20/19 | | | 170,000 | | | | 172,369 | | | |
| Series 2014-1, Cl. D, 3.39%, 7/22/19 | | | 185,000 | | | | 189,181 | | | |
| Series 2014-3, Cl. D, 3.14%, 2/20/20 | | | 255,000 | | | | 257,501 | | | |
| Series 2015-2, Cl. C, 2.67%, 8/20/20 | | | 270,000 | | | | 269,946 | | | |
| | | |
| CarFinance Capital Auto Trust, Series 2015-1A, Cl. A, 1.75%, 6/15/211 | | | 365,637 | | | | 366,076 | | | |
| | | |
| CarMax Auto Owner Trust: | | | |
| Series 2014-2, Cl. D, 2.58%, 11/16/20 | | | 450,000 | | | | 450,614 | | | |
| Series 2015-2, Cl. D, 3.04%, 11/15/21 | | | 175,000 | | | | 174,948 | | | |
| | | |
| CLI Funding V LLC, Series 2014-2A, Cl. A, 3.38%, 10/18/291 | | | 490,000 | | | | 492,723 | | | |
| | | |
| CPS Auto Receivables Trust: | | | |
| Series 2014-C, Cl. A, 1.31%, 2/15/191 | | | 356,676 | | | | 356,697 | | | |
| Series 2014-D, Cl. A, 1.49%, 4/15/191 | | | 722,796 | | | | 726,445 | | | |
| | | |
| CPS Auto Trust, Series 2012-C, Cl. A, 1.82%, 12/16/191 | | | 67,525 | | | | 67,881 | | | |
| | | |
| Credit Acceptance Auto Loan Trust, Series 2014-1A, Cl. B, 2.29%, 4/15/221 | | | 765,000 | | | | 768,910 | | | |
| | | |
| Cronos Containers Program I Ltd., Series 2014-2A, Cl. A, 3.27%, 11/18/291 | | | 607,870 | | | | 610,623 | | | |
| | | |
| Drive Auto Receivables Trust: | | | |
| Series 2015-AA, Cl. C, 3.06%, 5/17/212 | | | 430,000 | | | | 432,830 | | | |
| Series 2015-BA, Cl. C, 2.76%, 7/15/211 | | | 515,000 | | | | 515,285 | | | |
| | | |
| DT Auto Owner Trust: | | | |
| Series 2012-1A, Cl. D, 4.94%, 7/16/181 | | | 904,003 | | | | 907,680 | | | |
| Series 2012-2A, Cl. D, 4.35%, 3/15/191 | | | 398,655 | | | | 401,201 | | | |
| Series 2013-1A, Cl. D, 3.74%, 5/15/201 | | | 265,000 | | | | 266,977 | | | |
| Series 2013-2A, Cl. D, 4.18%, 6/15/201 | | | 675,000 | | | | 684,193 | | | |
| Series 2014-1A, Cl. D, 3.98%, 1/15/211 | | | 580,000 | | | | 586,770 | | | |
| | | | | | | | |
| | | | | | | | |
| | | Principal Amount | | | Value | |
| |
Asset-Backed Securities (Continued) | |
| |
| DT Auto Owner Trust: (Continued) | | | | | |
| Series 2014-3A, Cl. D, 4.47%, 11/15/211 | | $ | 290,000 | | | $ | 293,773 | |
| Series 2015-1A, Cl. C, 2.87%, 11/16/201 | | | 305,000 | | | | 306,404 | |
| |
| Element Rail Leasing I LLC, Series 2014-1A, Cl. A1, 2.299%, 4/19/441 | | | 342,493 | | | | 340,594 | |
| |
| Exeter Automobile Receivables Trust: | |
| Series 2012-2A, Cl. C, 3.06%, 7/16/181 | | | 65,000 | | | | 65,229 | |
| Series 2013-2A, Cl. C, 4.35%, 1/15/191 | | | 500,000 | | | | 509,913 | |
| Series 2014-1A, Cl. B, 2.42%, 1/15/191 | | | 370,000 | | | | 372,217 | |
| Series 2014-1A, Cl. C, 3.57%, 7/15/191 | | | 860,000 | | | | 869,510 | |
| Series 2014-2A, Cl. A, 1.06%, 8/15/181 | | | 79,403 | | | | 79,296 | |
| Series 2014-2A, Cl. C, 3.26%, 12/16/191 | | | 180,000 | | | | 179,217 | |
| |
| First Investors Auto Owner Trust: | |
| Series 2012-1A, Cl. D, 5.65%, 4/15/181 | | | 285,000 | | | | 290,275 | |
| Series 2013-3A, Cl. C, 2.91%, 1/15/201 | | | 265,000 | | | | 268,055 | |
| Series 2013-3A, Cl. D, 3.67%, 5/15/201 | | | 195,000 | | | | 197,008 | |
| Series 2014-3A, Cl. D, 3.85%, 2/15/221 | | | 210,000 | | | | 211,436 | |
| |
| Flagship Credit Auto Trust, Series 2014-2, Cl. A, 1.43%, 12/16/191 | | | 348,173 | | | | 347,947 | |
| |
| GM Financial Automobile Leasing Trust: | |
| Series 2014-1A, Cl. D, 2.51%, 3/20/191 | | | 305,000 | | | | 304,893 | |
| Series 2015-1, Cl. D, 3.01%, 3/20/20 | | | 415,000 | | | | 413,915 | |
| |
| GO Financial Auto Securitization Trust, Series 2015-1, Cl. A, 1.81%, 3/15/181 | | | 319,443 | | | | 319,257 | |
| |
| ICE EM CLO: | |
| Series 2007-1A, Cl. B, 2.082%, 8/15/221,3 | | | 7,870,000 | | | | 7,426,919 | |
| Series 2007-1A, Cl. C, 3.382%, 8/15/221,3 | | | 5,270,000 | | | | 4,951,165 | |
| Series 2007-1A, Cl. D, 5.382%, 8/15/221,3 | | | 4,757,343 | | | | 4,490,932 | |
| |
| Navistar Financial Dealer Note Master Owner Trust II, Series 2014-1, Cl. D, 2.487%, 10/25/191,3 | | | 180,000 | | | | 180,070 | |
| |
| Santander Drive Auto Receivables Trust: | |
| Series 2012-4, Cl. D, 3.50%, 6/15/18 | | | 970,000 | | | | 996,543 | |
| Series 2012-5, Cl. D, 3.30%, 9/17/18 | | | 540,000 | | | | 551,762 | |
| Series 2012-AA, Cl. D, 2.46%, 12/17/181 | | | 825,000 | | | | 836,568 | |
| Series 2013-1, Cl. C, 1.76%, 1/15/19 | | | 615,000 | | | | 616,909 | |
| Series 2013-1, Cl. D, 2.27%, 1/15/19 | | | 920,000 | | | | 917,207 | |
| Series 2013-2, Cl. D, 2.57%, 3/15/19 | | | 1,110,000 | | | | 1,125,921 | |
| Series 2013-3, Cl. D, 2.42%, 4/15/19 | | | 230,000 | | | | 232,656 | |
| Series 2013-4, Cl. D, 3.92%, 1/15/20 | | | 1,235,000 | | | | 1,279,746 | |
| Series 2013-4, Cl. E, 4.67%, 1/15/201 | | | 520,000 | | | | 542,033 | |
| Series 2013-5, Cl. D, 2.73%, 10/15/19 | | | 955,000 | | | | 963,404 | |
| Series 2013-A, Cl. C, 3.12%, 10/15/191 | | | 1,195,000 | | | | 1,220,245 | |
| Series 2013-A, Cl. D, 3.78%, 10/15/191 | | | 330,000 | | | | 343,318 | |
| Series 2013-A, Cl. E, 4.71%, 1/15/211 | | | 405,000 | | | | 428,976 | |
| Series 2014-2, Cl. D, 2.76%, 2/18/20 | | | 625,000 | | | | 629,668 | |
| Series 2014-3, Cl. D, 2.65%, 8/17/20 | | | 635,000 | | | | 631,006 | |
| Series 2014-4, Cl. D, 3.10%, 11/16/20 | | | 965,000 | | | | 972,404 | |
| Series 2015-1, Cl. D, 3.24%, 4/15/21 | | | 445,000 | | | | 447,644 | |
| Series 2015-2, Cl. D, 3.02%, 4/15/21 | | | 470,000 | | | | 467,904 | |
| Series 2015-3, Cl. D, 3.49%, 5/17/21 | | | 580,000 | | | | 582,328 | |
7 OPPENHEIMER GLOBAL STRATEGIC INCOME FUND/VA
CONSOLIDATED STATEMENT OF INVESTMENTS Unaudited / Continued
| | | | | | | | | | |
| | | Principal Amount | | | Value | | | |
| | | |
| Asset-Backed Securities (Continued) | | | |
| | | |
| SNAAC Auto Receivables Trust: | | | |
| Series 2012-1A, Cl. C, 4.38%, 6/15/171 | | $ | 6,161 | | | $ | 6,170 | | | |
| Series 2013-1A, Cl. C, 3.07%, 8/15/181 | | | 220,000 | | | | 222,555 | | | |
| Series 2014-1A, Cl. D, 2.88%, 1/15/201 | | | 905,000 | | | | 909,881 | | | |
| | | |
| TAL Advantage V LLC, Series 2014-2A, Cl. A1, 1.70%, 5/20/391 | | | 151,932 | | | | 151,013 | | | |
| | | |
| TCF Auto Receivables Owner Trust, Series 2015-1A, Cl. D, 3.53%, 3/15/221 | | | 285,000 | | | | 285,696 | | | |
| | | |
| Trip Rail Master Funding LLC, Series 2014-1A, Cl. A1, 2.863%, 4/15/441 | | | 141,214 | | | | 140,966 | | | |
| | | |
| United Auto Credit Securitization Trust: | | | |
| Series 2013-1, Cl. C, 2.22%, 12/15/171 | | | 11,257 | | | | 11,264 | | | |
| Series 2014-1, Cl. D, 2.38%, 10/15/181 | | | 260,000 | | | | 258,446 | | | |
| Series 2015-1, Cl. D, 2.92%, 6/17/191 | | | 385,000 | | | | 385,986 | | | |
| | | |
| Westlake Automobile Receivables Trust: | | | |
| Series 2014-1A, Cl. D, 2.20%, 2/15/211 | | | 245,000 | | | | 243,226 | | | |
| Series 2014-2A, Cl. D, 2.86%, 7/15/211 | | | 245,000 | | | | 244,413 | | | |
| Series 2015-2A, Cl. C, 2.45%, 1/15/211 | | | 365,000 | | | | 364,963 | | | |
| | | | | | | | | | |
Total Asset-Backed Securities (Cost $59,081,431) | | | | | | | 58,743,345 | | | |
| | | |
| Mortgage-Backed Obligations—11.7% | | | |
| | | |
| Government Agency—5.5% | | | |
| | | |
| FHLMC/FNMA/FHLB/Sponsored—5.4% | | | |
| | | |
| Federal Home Loan Mortgage Corp. Gold Pool: | | | |
| 5.00%, 9/1/33 | | | 454,918 | | | | 507,412 | | | |
| 5.50%, 9/1/39 | | | 597,791 | | | | 669,949 | | | |
| 6.00%, 5/1/18-11/1/21 | | | 125,999 | | | | 140,381 | | | |
| 6.50%, 3/1/18-8/1/32 | | | 515,003 | | | | 590,469 | | | |
| 7.00%, 10/1/31-10/1/37 | | | 119,635 | | | | 136,786 | | | |
| 7.50%, 1/1/32 | | | 363,992 | | | | 434,793 | | | |
| | | |
| Federal Home Loan Mortgage Corp., Interest-Only Stripped Mtg.-Backed Security: | | | |
| Series 192,Cl. IO, 4.837%, 2/1/284 | | | 9,182 | | | | 1,549 | | | |
| Series 205,Cl. IO, 10.671%, 9/1/294 | | | 53,032 | | | | 12,935 | | | |
| Series 243,Cl. 6, 0.00%, 12/15/324,5 | | | 120,201 | | | | 22,740 | | | |
| | | |
| Federal Home Loan Mortgage Corp., Multifamily Structured Pass Through Certificates: | | | |
| Series K042,Cl. A1, 2.267%, 6/25/24 | | | 941,577 | | | | 945,718 | | | |
| Series K717,Cl. A1, 2.342%, 2/25/21 | | | 930,798 | | | | 953,297 | | | |
| | | |
| Federal Home Loan Mortgage Corp., Real Estate Mtg. Investment Conduit Multiclass Pass-Through Certificates: | | | |
| Series 1360,Cl. PZ, 7.50%, 9/15/22 | | | 391,597 | | | | 436,843 | | | |
| Series 151,Cl. F, 9.00%, 5/15/21 | | | 7,394 | | | | 8,219 | | | |
| Series 1674,Cl. Z, 6.75%, 2/15/24 | | | 228,525 | | | | 253,705 | | | |
| Series 1897,Cl. K, 7.00%, 9/15/26 | | | 722,087 | | | | 813,278 | | | |
| Series 2043,Cl. ZP, 6.50%, 4/15/28 | | | 269,403 | | | | 300,732 | | | |
| Series 2106,Cl. FG, 0.636%, 12/15/283 | | | 461,957 | | | | 467,391 | | | |
| Series 2122,Cl. F, 0.636%, 2/15/293 | | | 12,147 | | | | 12,283 | | | |
| Series 2148,Cl. ZA, 6.00%, 4/15/29 | | | 296,699 | | | | 339,230 | | | |
| Series 2195,Cl. LH, 6.50%, 10/15/29 | | | 186,703 | | | | 214,360 | | | |
| Series 2326,Cl. ZP, 6.50%, 6/15/31 | | | 24,736 | | | | 27,624 | | | |
| Series 2344,Cl. FP, 1.136%, 8/15/313 | | | 120,749 | | | | 124,356 | | | |
| Series 2368,Cl. PR, 6.50%, 10/15/31 | | | 93,818 | | | | 104,857 | | | |
| Series 2412,Cl. GF, 1.136%, 2/15/323 | | | 188,818 | | | | 194,526 | | | |
| Series 2449,Cl. FL, 0.736%, 1/15/323 | | | 143,294 | | | | 145,424 | | | |
| Series 2451,Cl. FD, 1.186%, 3/15/323 | | | 72,647 | | | | 74,977 | | | |
| Series 2453,Cl. BD, 6.00%, 5/15/17 | | | 14,170 | | | | 14,697 | | | |
| Series 2461,Cl. PZ, 6.50%, 6/15/32 | | | 340,903 | | | | 393,976 | | | |
| Series 2464,Cl. FI, 1.186%, 2/15/323 | | | 61,965 | | | | 63,613 | | | |
| Series 2470,Cl. AF, 1.186%, 3/15/323 | | | 124,644 | | | | 128,652 | | | |
| Series 2470,Cl. LF, 1.186%, 2/15/323 | | | 63,413 | | | | 65,099 | | | |
| Series 2477,Cl. FZ, 0.736%, 6/15/313 | | | 260,960 | | | | 264,682 | | | |
| | | | | | | | | | |
| | | | | | | | | | |
| | | | | | | | | | |
| | | | | | | | | | |
| | | | | | | | | | |
| | | | | | | | | | |
| | | | | | | | | | |
| | | | | | | | | | |
| | | | | | | | | | |
| | | | | | | | | | |
| | | | | | | | | | |
| | | | | | | | | | |
| | | | | | | | | | |
| | | | | | | | | | |
| | | | | | | | | | |
| | | | | | | | | | |
| | | | | | | | | | |
| | | | | | | | |
| | | Principal Amount | | | Value | |
| |
| FHLMC/FNMA/FHLB/Sponsored (Continued) | |
| |
| Federal Home Loan Mortgage Corp., Real Estate Mtg. Investment Conduit Multiclass Pass-Through Certificates: (Continued) | |
| Series 2517,Cl. GF, 1.186%, 2/15/323 | | $ | 55,134 | | | $ | 56,600 | |
| Series 2635,Cl. AG, 3.50%, 5/15/32 | | | 83,930 | | | | 87,619 | |
| Series 2668,Cl. AZ, 4.00%, 9/15/18 | | | 35,949 | | | | 37,267 | |
| Series 2676,Cl. KY, 5.00%, 9/15/23 | | | 1,063,112 | | | | 1,149,224 | |
| Series 2707,Cl. QE, 4.50%, 11/15/18 | | | 134,854 | | | | 141,078 | |
| Series 2770,Cl. TW, 4.50%, 3/15/19 | | | 18,475 | | | | 19,324 | |
| Series 3025,Cl. SJ, 24.07%, 8/15/353 | | | 163,089 | | | | 257,659 | |
| Series 3465,Cl. HA, 4.00%, 7/15/17 | | | 3,022 | | | | 3,028 | |
| Series 3741,Cl. PA, 2.15%, 2/15/35 | | | 722,347 | | | | 734,526 | |
| Series 3815,Cl. BD, 3.00%, 10/15/20 | | | 21,611 | | | | 22,139 | |
| Series 3840,Cl. CA, 2.00%, 9/15/18 | | | 16,215 | | | | 16,430 | |
| Series 3848,Cl. WL, 4.00%, 4/15/40 | | | 331,336 | | | | 341,344 | |
| Series 3857,Cl. GL, 3.00%, 5/15/40 | | | 13,636 | | | | 13,963 | |
| Series 3917,Cl. BA, 4.00%, 6/15/38 | | | 178,991 | | | | 186,452 | |
| Series 4221,Cl. HJ, 1.50%, 7/15/23 | | | 390,136 | | | | 392,400 | |
| |
| Federal Home Loan Mortgage Corp., Real Estate Mtg. Investment Conduit Multiclass Pass-Through Certificates, Interest-Only Stripped Mtg.-Backed Security: | |
| Series 2074,Cl. S, 53.813%, 7/17/284 | | | 14,452 | | | | 3,168 | |
| Series 2079,Cl. S, 0.00%, 7/17/284,5 | | | 26,037 | | | | 5,945 | |
| Series 2136,Cl. SG, 64.542%, 3/15/294 | | | 645,399 | | | | 149,364 | |
| Series 2399,Cl. SG, 54.672%, 12/15/264 | | | 374,629 | | | | 84,750 | |
| Series 2437,Cl. SB, 68.924%, 4/15/324 | | | 1,327,844 | | | | 332,790 | |
| Series 2526,Cl. SE, 25.143%, 6/15/294 | | | 25,173 | | | | 5,914 | |
| Series 2682,Cl. TQ, 99.999%, 10/15/334 | | | 244,707 | | | | 58,215 | |
| Series 2795,Cl. SH, 9.08%, 3/15/244 | | | 532,339 | | | | 73,740 | |
| Series 2920,Cl. S, 47.021%, 1/15/354 | | | 257,411 | | | | 49,847 | |
| Series 2922,Cl. SE, 4.796%, 2/15/354 | | | 43,861 | | | | 8,355 | |
| Series 2981,Cl. AS, 0.206%, 5/15/354 | | | 442,556 | | | | 88,430 | |
| Series 2981,Cl. BS, 99.999%, 5/15/354 | | | 475,973 | | | | 106,069 | |
| Series 3201,Cl. SG, 2.356%, 8/15/364 | | | 230,610 | | | | 42,862 | |
| Series 3397,Cl. GS, 13.286%, 12/15/374 | | | 184,240 | | | | 38,231 | |
| Series 3424,Cl. EI, 8.812%, 4/15/384 | | | 82,540 | | | | 11,890 | |
| Series 3450,Cl. BI, 6.934%, 5/15/384 | | | 297,315 | | | | 49,645 | |
| Series 3606,Cl. SN, 0.095%, 12/15/394 | | | 92,756 | | | | 16,893 | |
| Series 3659,Cl. IE, 0.00%, 3/15/194,5 | | | 368,068 | | | | 22,637 | |
| Series 3685,Cl. EI, 0.00%, 3/15/194,5 | | | 253,710 | | | | 12,962 | |
| |
| Federal Home Loan Mortgage Corp., Structured Agency Credit Risk Debt Nts.: | |
| Series 2014-DN4,Cl. M3, 4.737%, 10/25/243 | | | 4,315,000 | | | | 4,420,720 | |
| Series 2014-HQ2,Cl. M3, 3.937%, 9/25/243 | | | 5,430,000 | | | | 5,316,070 | |
| Series 2015-DN1,Cl. M3, 4.337%, 1/25/253 | | | 1,495,000 | | | | 1,521,095 | |
| |
| Federal National Mortgage Assn.: | |
| 3.00%, 7/1/306 | | | 3,055,000 | | | | 3,160,732 | |
| 3.50%, 7/1/416 | | | 25,305,000 | | | | 26,030,047 | |
| 4.00%, 7/1/456 | | | 22,990,000 | | | | 24,327,641 | |
| 4.50%, 7/1/306 | | | 1,905,000 | | | | 1,984,102 | |
| 5.00%, 7/1/456 | | | 250,000 | | | | 276,156 | |
| 6.00%, 7/1/456 | | | 2,140,000 | | | | 2,432,913 | |
| |
| Federal National Mortgage Assn. Pool: | |
| 3.50%, 12/1/20-2/1/22 | | | 597,872 | | | | 630,252 | |
| 5.00%, 2/1/18-7/1/33 | | | 1,490,226 | | | | 1,592,249 | |
| 5.50%, 4/1/21-5/1/36 | | | 323,620 | | | | 361,597 | |
| 6.00%, 10/1/16-1/1/19 | | | 62,399 | | | | 64,105 | |
| 6.50%, 4/1/17-1/1/34 | | | 838,675 | | | | 966,909 | |
| 7.00%, 11/1/17-6/1/34 | | | 975,840 | | | | 1,149,884 | |
| 7.50%, 2/1/27-3/1/33 | | | 1,219,660 | | | | 1,483,732 | |
| 8.50%, 7/1/32 | | | 2,008 | | | | 2,315 | |
| |
| Federal National Mortgage Assn., Connecticut Avenue Securities: | |
| Series 2014-C03,Cl. 2M2, 3.087%, 7/25/243 | | | 3,110,000 | | | | 2,881,603 | |
| Series 2015-C01,Cl. 1M2, 4.487%, 2/25/253 | | | 2,500,000 | | | | 2,503,264 | |
| |
| Federal National Mortgage Assn., Interest-Only Stripped Mtg.-Backed Security: | |
| Series 214,Cl. 2, 37.106%, 3/25/234 | | | 150,103 | | | | 21,355 | |
| Series 221,Cl. 2, 40.746%, 5/25/234 | | | 18,275 | | | | 2,722 | |
| Series 254,Cl. 2, 30.647%, 1/25/244 | | | 309,565 | | | | 42,952 | |
| Series 301,Cl. 2, 0.00%, 4/25/294,5 | | | 58,499 | | | | 13,129 | |
| Series 313,Cl. 2, 3.511%, 6/25/314 | | | 551,791 | | | | 79,860 | |
| Series 319,Cl. 2, 0.00%, 2/25/324,5 | | | 266,363 | | | | 62,323 | |
| Series 321,Cl. 2, 3.244%, 4/25/324 | | | 78,357 | | | | 18,406 | |
| Series 324,Cl. 2, 0.00%, 7/25/324,5 | | | 81,944 | | | | 17,704 | |
| Series 328,Cl. 2, 0.00%, 12/25/324,5 | | | 162,857 | | | | 20,186 | |
8 OPPENHEIMER GLOBAL STRATEGIC INCOME FUND/VA
| | | | | | | | | | |
| | | Principal Amount | | | Value | | | |
| | | |
| FHLMC/FNMA/FHLB/Sponsored (Continued) | | | |
| | | |
| Federal National Mortgage Assn., Interest-Only Stripped Mtg.-Backed Security: (Continued) | | | |
| Series 331,Cl. 5, 0.00%, 2/25/334,5 | | $ | 310,942 | | | $ | 71,815 | | | |
| Series 332,Cl. 2, 0.00%, 3/25/334,5 | | | 1,276,320 | | | | 296,310 | | | |
| Series 334,Cl. 12, 0.00%, 3/25/334,5 | | | 250,062 | | | | 57,722 | | | |
| Series 339,Cl. 15, 3.152%, 10/25/334 | | | 756,567 | | | | 161,330 | | | |
| Series 345,Cl. 9, 0.00%, 1/25/344,5 | | | 223,230 | | | | 44,029 | | | |
| Series 351,Cl. 10, 0.00%, 4/25/344,5 | | | 145,614 | | | | 29,898 | | | |
| Series 351,Cl. 8, 0.00%, 4/25/344,5 | | | 252,290 | | | | 51,876 | | | |
| Series 356,Cl. 10, 0.00%, 6/25/354,5 | | | 186,214 | | | | 40,937 | | | |
| Series 356,Cl. 12, 0.00%, 2/25/354,5 | | | 90,877 | | | | 20,048 | | | |
| Series 362,Cl. 13, 0.00%, 8/25/354,5 | | | 118,114 | | | | 25,732 | | | |
| | | |
| Federal National Mortgage Assn., Real Estate Mtg. Investment Conduit Multiclass Pass-Through Certificates: | | | |
| Series 1999-54,Cl. LH, 6.50%, 11/25/29 | | | 167,312 | | | | 190,864 | | | |
| Series 2001-80,Cl. ZB, 6.00%, 1/25/32 | | | 162,259 | | | | 185,469 | | | |
| Series 2002-12,Cl. PG, 6.00%, 3/25/17 | | | 39,700 | | | | 40,932 | | | |
| Series 2002-29,Cl. F, 1.187%, 4/25/323 | | | 66,314 | | | | 68,098 | | | |
| Series 2002-64,Cl. FJ, 1.187%, 4/25/323 | | | 20,420 | | | | 20,970 | | | |
| Series 2002-68,Cl. FH, 0.685%, 10/18/323 | | | 46,135 | | | | 46,755 | | | |
| Series 2002-84,Cl. FB, 1.187%, 12/25/323 | | | 300,260 | | | | 308,389 | | | |
| Series 2002-9,Cl. PC, 6.00%, 3/25/17 | | | 37,582 | | | | 38,756 | | | |
| Series 2002-9,Cl. PR, 6.00%, 3/25/17 | | | 46,017 | | | | 47,416 | | | |
| Series 2002-90,Cl. FH, 0.687%, 9/25/323 | | | 167,996 | | | | 170,129 | | | |
| Series 2003-100,Cl. PA, 5.00%, 10/25/18 | | | 234,375 | | | | 245,866 | | | |
| Series 2003-11,Cl. FA, 1.187%, 9/25/323 | | | 300,267 | | | | 308,396 | | | |
| Series 2003-112,Cl. AN, 4.00%, 11/25/18 | | | 79,093 | | | | 81,780 | | | |
| Series 2003-116,Cl. FA, 0.587%, 11/25/333 | | | 30,125 | | | | 30,324 | | | |
| Series 2003-84,Cl. GE, 4.50%, 9/25/18 | | | 33,287 | | | | 34,681 | | | |
| Series 2004-101,Cl. BG, 5.00%, 1/25/20 | | | 165,167 | | | | 169,380 | | | |
| Series 2004-25,Cl. PC, 5.50%, 1/25/34 | | | 72,115 | | | | 76,034 | | | |
| Series 2005-109,Cl. AH, 5.50%, 12/25/25 | | | 1,360,859 | | | | 1,484,050 | | | |
| Series 2005-31,Cl. PB, 5.50%, 4/25/35 | | | 560,000 | | | | 654,256 | | | |
| Series 2005-71,Cl. DB, 4.50%, 8/25/25 | | | 196,901 | | | | 210,701 | | | |
| Series 2006-11,Cl. PS, 23.881%, 3/25/363 | | | 143,469 | | | | 229,579 | | | |
| Series 2006-46,Cl. SW, 23.514%, 6/25/363 | | | 234,258 | | | | 315,408 | | | |
| Series 2008-75,Cl. DB, 4.50%, 9/25/23 | | | 110,847 | | | | 115,341 | | | |
| Series 2009-113,Cl. DB, 3.00%, 12/25/20 | | | 330,173 | | | | 338,567 | | | |
| Series 2009-36,Cl. FA, 1.127%, 6/25/373 | | | 71,428 | | | | 73,377 | | | |
| Series 2009-70,Cl. TL, 4.00%, 8/25/19 | | | 409,007 | | | | 421,595 | | | |
| Series 2010-43,Cl. KG, 3.00%, 1/25/21 | | | 158,493 | | | | 163,120 | | | |
| Series 2011-122,Cl. EC, 1.50%, 1/25/20 | | | 202,100 | | | | 203,467 | | | |
| Series 2011-15,Cl. DA, 4.00%, 3/25/41 | | | 181,257 | | | | 189,629 | | | |
| Series 2011-3,Cl. EL, 3.00%, 5/25/20 | | | 550,839 | | | | 564,730 | | | |
| Series 2011-3,Cl. KA, 5.00%, 4/25/40 | | | 301,662 | | | | 330,922 | | | |
| Series 2011-38,Cl. AH, 2.75%, 5/25/20 | | | 17,365 | | | | 17,750 | | | |
| Series 2011-6,Cl. BA, 2.75%, 6/25/20 | | | 223,840 | | | | 229,465 | | | |
| Series 2011-69,Cl. EA, 3.00%, 11/25/29 | | | 172,135 | | | | 174,806 | | | |
| Series 2011-82,Cl. AD, 4.00%, 8/25/26 | | | 318,482 | | | | 330,194 | | | |
| Series 2012-20,Cl. FD, 0.587%, 3/25/423 | | | 495,471 | | | | 497,759 | | | |
| | | |
| Federal National Mortgage Assn., Real Estate Mtg. Investment Conduit Multiclass Pass-Through Certificates, Interest-Only Stripped Mtg.-Backed Security: | | | |
| Series 2001-61,Cl. SH, 21.848%, 11/18/314 | | | 75,222 | | | | 18,235 | | | |
| Series 2001-63,Cl. SD, 26.025%, 12/18/314 | | | 21,183 | | | | 4,811 | | | |
| Series 2001-68,Cl. SC, 17.192%, 11/25/314 | | | 13,502 | | | | 3,276 | | | |
| Series 2001-81,Cl. S, 19.465%, 1/25/324 | | | 16,392 | | | | 3,835 | | | |
| Series 2002-28,Cl. SA, 29.792%, 4/25/324 | | | 11,914 | | | | 2,622 | | | |
| Series 2002-38,Cl. SO, 42.493%, 4/25/324 | | | 72,888 | | | | 14,786 | | | |
| Series 2002-48,Cl. S, 25.454%, 7/25/324 | | | 18,594 | | | | 4,534 | | | |
| Series 2002-52,Cl. SL, 28.323%, 9/25/324 | | | 11,972 | | | | 2,947 | | | |
| Series 2002-56,Cl. SN, 27.002%, 7/25/324 | | | 25,550 | | | | 6,229 | | | |
| Series 2002-77,Cl. IS, 38.297%, 12/18/324 | | | 124,179 | | | | 32,860 | | | |
| Series 2002-77,Cl. SH, 30.082%, 12/18/324 | | | 25,821 | | | | 6,113 | | | |
| Series 2002-9,Cl. MS, 21.955%, 3/25/324 | | | 22,262 | | | | 5,177 | | | |
| Series 2003-13,Cl. IO, 7.294%, 3/25/334 | | | 229,185 | | | | 43,251 | | | |
| Series 2003-26,Cl. DI, 8.803%, 4/25/334 | | | 186,263 | | | | 47,118 | | | |
| Series 2003-33,Cl. SP, 23.79%, 5/25/334 | | | 135,880 | | | | 29,318 | | | |
| Series 2003-38,Cl. SA, 0.00%, 3/25/234,5 | | | 89,513 | | | | 4,793 | | | |
| Series 2003-4,Cl. S, 25.614%, 2/25/334 | | | 39,135 | | | | 10,001 | | | |
| Series 2004-56,Cl. SE, 9.484%, 10/25/334 | | | 646,415 | | | | 128,924 | | | |
| Series 2005-12,Cl. SC, 8.314%, 3/25/354 | | | 20,816 | | | | 4,568 | | | |
| | | | | | | | |
| | | Principal Amount | | | Value | |
| |
| FHLMC/FNMA/FHLB/Sponsored (Continued) | |
| |
| Federal National Mortgage Assn., Real Estate Mtg. Investment Conduit Multiclass Pass-Through Certificates, Interest-Only Stripped Mtg.-Backed Security: (Continued) | |
| Series 2005-14,Cl. SE, 32.555%, 3/25/354 | | $ | 745,182 | | | $ | 123,527 | |
| Series 2005-40,Cl. SA, 44.698%, 5/25/354 | | | 641,737 | | | | 120,683 | |
| Series 2005-40,Cl. SB, 59.103%, 5/25/354 | | | 1,054,338 | | | | 189,064 | |
| Series 2005-52,Cl. JH, 3.444%, 5/25/354 | | | 379,015 | | | | 71,380 | |
| Series 2005-63,Cl. SA, 43.459%, 10/25/314 | | | 36,963 | | | | 8,031 | |
| Series 2006-90,Cl. SX, 99.999%, 9/25/364 | | | 659,815 | | | | 123,754 | |
| Series 2007-88,Cl. XI, 27.947%, 6/25/374 | | | 822,350 | | | | 144,838 | |
| Series 2008-55,Cl. SA, 0.00%, 7/25/384,5 | | | 67,100 | | | | 8,472 | |
| Series 2009-8,Cl. BS, 0.00%, 2/25/244,5 | | | 95,550 | | | | 5,465 | |
| Series 2010-95,Cl. DI, 0.00%, 11/25/204,5 | | | 487,862 | | | | 30,792 | |
| Series 2012-134,Cl. SA, 12.555%, 12/25/424 | | | 753,779 | | | | 191,033 | |
| Series 2012-40,Cl. PI, 0.00%, 4/25/414,5 | | | 1,418,562 | | | | 257,167 | |
| |
| Federal National Mortgage Assn., Stripped Mtg.-Backed Security, Series 302, Cl. 2, 6%, 5/1/29 | | | 3 | | | | — | |
| | | | | | | | |
| | | | | | | 105,925,592 | |
| |
| GNMA/Guaranteed—0.1% | |
| |
| Government National Mortgage Assn. I Pool: | |
| 7.00%, 3/15/28-7/15/28 | | | 116,401 | | | | 130,384 | |
| 7.50%, 2/15/27 | | | 4,906 | | | | 5,073 | |
| 8.00%, 5/15/26 | | | 10,189 | | | | 10,343 | |
| |
| Government National Mortgage Assn. II Pool, 1.625%, 11/20/253 | | | 3,346 | | | | 3,477 | |
| |
| Government National Mortgage Assn., Interest-Only Stripped Mtg.-Backed Security: | |
| Series 2007-17,Cl. AI, 18.682%, 4/16/374 | | | 327,766 | | | | 63,195 | |
| Series 2011-52,Cl. HS, 9.352%, 4/16/414 | | | 560,645 | | | | 108,354 | |
| |
| Government National Mortgage Assn., Real Estate Mtg. Investment Conduit Multiclass Pass-Through Certificates: | |
| Series 1999-32,Cl. ZB, 8.00%, 9/16/29 | | | 538,562 | | | | 637,112 | |
| Series 2000-12,Cl. ZA, 8.00%, 2/16/30 | | | 1,147,034 | | | | 1,335,536 | |
| | | | | | | | |
| | | | | | | 2,293,474 | |
| |
| Non-Agency—6.2% | |
| |
| Commercial—5.5% | |
| |
| Banc of America Commercial Mortgage Trust, Series 2006-5, Cl. AM, 5.448%, 9/10/47 | | | 85,000 | | | | 88,433 | |
| |
| Banc of America Funding Trust: | |
| Series 2006-G,Cl. 2A4, 0.477%, 7/20/363 | | | 1,240,413 | | | | 1,162,768 | |
| Series 2014-R7,Cl. 3A1, 2.617%, 3/26/362,3 | | | 156,582 | | | | 159,887 | |
| |
| BCAP LLC Trust: | |
| Series 2011-R11,Cl. 18A5, 2.23%, 9/26/351,3 | | | 220,106 | | | | 223,839 | |
| Series 2012-RR2,Cl. 6A3, 2.687%, 9/26/351,3 | | | 375,026 | | | | 375,387 | |
| Series 2012-RR6,Cl. RR6, 2.404%, 11/26/361 | | | 310,960 | | | | 311,060 | |
| Series 2013-RR2,Cl. 5A2, 2.66%, 3/26/361,3 | | | 7,323,824 | | | | 6,252,561 | |
| |
| Bear Stearns ARM Trust, Series 2005-2, Cl. A1, 2.68%, 3/25/353 | | | 179,633 | | | | 181,634 | |
| |
| Chase Mortgage Finance Trust, Series 2005-A2, Cl. 1A3, 2.435%, 1/25/363 | | | 22,963 | | | | 21,664 | |
| |
| CHL Mortgage Pass-Through Trust, Series 2005-17, Cl. 1A8, 5.50%, 9/25/35 | | | 1,336,874 | | | | 1,318,238 | |
| |
| Citigroup Commercial Mortgage Trust: | |
| Series 2008-C7,Cl. AM, 6.349%, 12/10/493 | | | 520,000 | | | | 563,120 | |
| Series 2013-GC11,Cl. D, 4.604%, 4/10/461,3 | | | 245,000 | | | | 231,025 | |
| |
| Citigroup Mortgage Loan Trust, Inc.: | |
| Series 2009-8,Cl. 7A2, 2.621%, 3/25/361,3 | | | 10,474,197 | | | | 10,095,544 | |
| Series 2012-8,Cl. 1A1, 2.708%, 10/25/351,3 | | | 677,764 | | | | 683,319 | |
| Series 2014-8,Cl. 1A2, 0.477%, 7/20/362,3 | | | 3,400,000 | | | | 2,745,500 | |
| |
| COMM Mortgage Trust: | |
| Series 2012-CR4,Cl. D, 4.727%, 10/15/451,3 | | | 70,000 | | | | 68,265 | |
| Series 2012-CR5,Cl. E, 4.48%, 12/10/451,3 | | | 605,000 | | | | 577,584 | |
| Series 2013-CR6,Cl. D, 4.313%, 3/10/461,3 | | | 1,525,000 | | | | 1,402,446 | |
| Series 2013-CR7,Cl. D, 4.494%, 3/10/461,3 | | | 3,270,000 | | | | 3,012,129 | |
| Series 2013-CR9,Cl. D, 4.40%, 7/10/451,3 | | | 2,685,000 | | | | 2,489,273 | |
| Series 2013-LC13,Cl. D, 5.215%, 8/10/461,3 | | | 3,579,000 | | | | 3,504,587 | |
| Series 2014-UBS3,Cl. D, 4.975%, 6/10/471,3 | | | 8,895,000 | | | | 8,218,064 | |
9 OPPENHEIMER GLOBAL STRATEGIC INCOME FUND/VA
CONSOLIDATED STATEMENT OF INVESTMENTS Unaudited / Continued
| | | | | | | | | | |
| | | Principal Amount | | | Value | | | |
| | | |
Commercial (Continued) | | | |
| | | |
| COMM Mortgage Trust, Interest-Only Stripped Mtg.-Backed Security, Series 2012- CR5, Cl. XA, 0.00%, 12/10/454,5 | | $ | 3,427,700 | | | $ | 298,421 | | | |
| | | |
| Credit Suisse First Boston Mortgage Securities Corp., Series 2005-C6, Cl. AJ, 5.23%, 12/15/403 | | | 600,000 | | | | 604,964 | | | |
| | | |
| CSMC, Series 2009-13R, Cl. 4A1, 2.625%, 9/26/361,3 | | | 47,703 | | | | 48,014 | | | |
| | | |
| DBUBS Mortgage Trust, Series 2011-LC1A, Cl. E, 5.735%, 11/10/461,3 | | | 100,000 | | | | 106,937 | | | |
| | | |
| Deutsche Alt-B Securities, Inc. Mortgage Loan Trust, Series 2006-AB2, Cl. A1, 5.888%, 6/25/363 | | | 83,015 | | | | 70,277 | | | |
| | | |
| Deutsche Mortgage Securities, Inc., Series 2013-RS1, Cl. 1A2, 0.407%, 7/22/361,3 | | | 5,060,144 | | | | 4,375,709 | | | |
| | | |
| FREMF Mortgage Trust: | | | | | | | |
| Series 2012-K501,Cl. C, 3.549%, 11/25/461,3 | | | 40,000 | | | | 40,803 | | | |
| Series 2013-K25,Cl. C, 3.743%, 11/25/451,3 | | | 135,000 | | | | 132,233 | | | |
| Series 2013-K26,Cl. C, 3.723%, 12/25/451,3 | | | 95,000 | | | | 93,593 | | | |
| Series 2013-K27,Cl. C, 3.616%, 1/25/461,3 | | | 150,000 | | | | 145,706 | | | |
| Series 2013-K28,Cl. C, 3.614%, 6/25/461,3 | | | 1,605,000 | | | | 1,556,287 | | | |
| Series 2013-K502,Cl. C, 3.302%, 3/25/451,3 | | | 220,000 | | | | 223,751 | | | |
| Series 2013-K712,Cl. C, 3.484%, 5/25/451,3 | | | 265,000 | | | | 265,690 | | | |
| Series 2013-K713,Cl. C, 3.274%, 4/25/461,3 | | | 535,000 | | | | 527,517 | | | |
| Series 2015-K44,Cl. B, 3.811%, 1/25/481,3 | | | 545,000 | | | | 533,380 | | | |
| | | |
| GS Mortgage Securities Trust, Series 2014-GC22, Cl. D, 4.801%, 6/10/471,3 | | | 1,515,000 | | | | 1,375,553 | | | |
| | | |
| GSR Mortgage Loan Trust, Series 2005-AR4, Cl. 6A1, 2.937%, 7/25/353 | | | 28,099 | | | | 27,791 | | | |
| | | |
| JP Morgan Chase Commercial Mortgage Securities Corp., Series 2012-LC9, Cl. E, 4.569%, 12/15/471,3 | | | 500,000 | | | | 487,277 | | | |
| | | |
| JP Morgan Chase Commercial Mortgage Securities Trust: | | | |
| Series 2006-LDP8,Cl. AJ, 5.48%, 5/15/453 | | | 645,000 | | | | 667,570 | | | |
| Series 2013-C10,Cl. D, 4.295%, 12/15/473 | | | 2,400,000 | | | | 2,240,782 | | | |
| | | |
| JP Morgan Mortgage Trust, Series 2007-A1, Cl. 5A1, 2.555%, 7/25/353 | | | 108,964 | | | | 109,292 | | | |
| | | |
| JP Morgan Resecuritization Trust: | | | | | | | |
| Series 2009-11,Cl. 5A1, 2.625%, 9/26/361,3 | | | 180,798 | | | | 181,139 | | | |
| Series 2009-5,Cl. 1A2, 2.721%, 7/26/361,3 | | | 5,138,473 | | | | 4,496,025 | | | |
| | | |
| JPMBB Commercial Mortgage Securities Trust: | | | |
| Series 2013-C14,Cl. D, 4.714%, 8/15/461,3 | | | 2,500,000 | | | | 2,395,509 | | | |
| Series 2013-C15,Cl. D, 5.251%, 11/15/451,3 | | | 1,245,000 | | | | 1,229,461 | | | |
| Series 2014-C21,Cl. D, 4.816%, 8/15/471,3 | | | 4,953,000 | | | | 4,543,345 | | | |
| Series 2014-C25,Cl. AS, 4.065%, 11/15/47 | | | 1,215,000 | | | | 1,265,698 | | | |
| Series 2014-C26,Cl. AS, 3.80%, 1/15/48 | | | 1,225,000 | | | | 1,244,718 | | | |
| | | |
| Morgan Stanley Bank of America Merrill Lynch Trust: | | | |
| Series 2012-C6,Cl. E, 4.816%, 11/15/451,3 | | | 705,000 | | | | 696,294 | | | |
| Series 2013-C12,Cl. D, 4.926%, 10/15/461,3 | | | 2,370,000 | | | | 2,287,051 | | | |
| Series 2013-C13,Cl. D, 5.058%, 11/15/461,3 | | | 570,000 | | | | 553,600 | | | |
| Series 2013-C7,Cl. D, 4.437%, 2/15/461,3 | | | 435,000 | | | | 410,062 | | | |
| Series 2013-C8,Cl. D, 4.309%, 12/15/481,3 | | | 185,000 | | | | 172,336 | | | |
| Series 2014-C14,Cl. B, 4.804%, 2/15/473 | | | 240,000 | | | | 258,266 | | | |
| Series 2014-C14,Cl. D, 4.994%, 2/15/471,3 | | | 5,060,000 | | | | 4,807,691 | | | |
| | | |
| Morgan Stanley Capital I Trust, Series 2007-IQ13, Cl. AM, 5.406%, 3/15/44 | | | 1,265,000 | | | | 1,335,948 | | | |
| | | |
| Morgan Stanley Re-Remic Trust, Series 2012-R3, Cl. 1A, 1.969%, 11/26/361,3 | | | 30,642 | | | | 30,061 | | | |
| | | |
| Morgan Stanley Resecuritization Trust, Series 2013-R9, Cl. 3A, 2.379%, 6/26/461,3 | | | 299,938 | | | | 302,579 | | | |
| | | |
| RALI Trust, Series 2005-QA4, Cl. A32, 3.083%, 4/25/353 | | | 44,297 | | | | 6,393 | | | |
| | | |
| Structured Adjustable Rate Mortgage Loan Trust, Series 2004-10, Cl. 2A, 2.447%, 8/25/343 | | | 5,157,859 | | | | 5,125,489 | | | |
| | | |
| UBS-Barclays Commercial Mortgage Trust: | | | |
| Series 2012-C2,Cl. E, 4.889%, 5/10/631,3 | | | 3,450,000 | | | | 3,446,407 | | | |
| Series 2013-C5,Cl. D, 4.227%, 3/10/461,3 | | | 4,200,000 | | | | 3,910,408 | | | |
| | | | | | | | |
| | | Principal Amount | | | Value | |
| |
Commercial (Continued) | | | | | | | | |
| |
| Wachovia Bank Commercial Mortgage Trust, Series 2007-C33, Cl. AM, 6.15%, 2/15/513 | | $ | 1,250,000 | | | $ | 1,341,377 | |
| |
| WaMu Mortgage Pass-Through Certificates Trust, Series 2005-AR16, Cl. 1A1, 2.341%, 12/25/353 | | | 16,165 | | | | 15,414 | |
| |
| Washington Mutual Mortgage Pass-Through Certificates Trust, Series 2007-OA3, Cl. 5A, 1.937%, 4/25/473 | | | 514,737 | | | | 393,394 | |
| |
| Wells Fargo Mortgage-Backed Securities Trust: | |
| Series 2005-AR1,Cl. 1A1, 2.617%, 2/25/353 | | | 2,028,194 | | | | 2,044,154 | |
| Series 2005-AR10,Cl. 1A1, 2.658%, 6/25/353 | | | 940,862 | | | | 963,912 | |
| Series 2005-AR15,Cl. 1A6, 2.613%, 9/25/353 | | | 4,027,323 | | | | 3,842,429 | |
| Series 2006-AR7,Cl. 2A4, 2.732%, 5/25/363 | | | 1,757,449 | | | | 1,681,437 | |
| Series 2007-AR3,Cl. A4, 5.803%, 4/25/373 | | | 1,057,293 | | | | 1,035,836 | |
| |
| WF-RBS Commercial Mortgage Trust: | |
| Series 2012-C10,Cl. D, 4.606%, 12/15/451,3 | | | 115,000 | | | | 110,845 | |
| Series 2012-C7,Cl. E, 4.999%, 6/15/451,3 | | | 180,000 | | | | 180,611 | |
| Series 2012-C8,Cl. E, 5.038%, 8/15/451,3 | | | 710,000 | | | | 717,091 | |
| Series 2013-C11,Cl. D, 4.32%, 3/15/451,3 | | | 441,000 | | | | 416,193 | |
| |
| WF-RBS Commercial Mortgage Trust, Interest-Only Commercial Mtg. Pass-Through Certificates, Series 2011-C3, Cl. XA, 0.00%, 3/15/441,4,5 | | | 5,580,592 | | | | 267,031 | |
| | | | | | | | |
| | | | | | | 109,326,078 | |
| |
| Multi-Family—0.2% | |
| |
| Wells Fargo Mortgage-Backed Securities Trust: | |
| Series 2005-AR15,Cl. 1A2, 2.613%, 9/25/353 | | | 325,617 | | | | 318,305 | |
| Series 2006-AR2,Cl. 2A3, 2.621%, 3/25/363 | | | 3,456,085 | | | | 3,420,914 | |
| | | | | | | | |
| | | | | | | 3,739,219 | |
| |
| Residential—0.5% | |
| |
| Bear Stearns ARM Trust, Series 2006-1, Cl. A1, 2.36%, 2/25/363 | | | 59,276 | | | | 58,958 | |
| |
| CHL Mortgage Pass-Through Trust, Series 2005-J4, Cl. A7, 5.50%, 11/25/35 | | | 1,155,401 | | | | 1,211,607 | |
| |
| Citigroup Mortgage Loan Trust, Inc.: | | | | | |
| Series 2005-2,Cl. 1A3, 2.722%, 5/25/353 | | | 1,523,859 | | | | 1,522,236 | |
| Series 2005-3,Cl. 2A4, 2.517%, 8/25/353 | | | 2,654,987 | | | | 2,263,897 | |
| |
| CWHEQ Revolving Home Equity Loan Trust: | |
| Series 2005-G,Cl. 2A, 0.416%, 12/15/353 | | | 75,948 | | | | 65,937 | |
| Series 2006-H,Cl. 2A1A, 0.336%, 11/15/363 | | | 37,048 | | | | 27,598 | |
| |
| Home Equity Mortgage Trust, Series 2005-1, Cl. M6, 5.863%, 6/25/353 | | | 626,705 | | | | 637,760 | |
| |
| HomeBanc Mortgage Trust, Series 2005-3, Cl. A2, 0.497%, 7/25/353 | | | 13,160 | | | | 12,235 | |
| |
| MASTR Asset Backed Securities Trust, Series 2006-WMC3, Cl. A3, 0.287%, 8/25/363 | | | 991,794 | | | | 498,352 | |
| |
| NC Finance Trust, Series 1999-I, Cl. D, 8.75%, 1/25/292,7 | | | 66,744 | | | | 18,021 | |
| |
| RALI Trust, Series 2006-QS13, Cl. 1A8, 6%, 9/25/36 | | | 23,463 | | | | 19,063 | |
| |
| Residential Asset Securitization Trust, Series 2005-A6CB, Cl. A7, 6%, 6/25/35 | | | 2,949,304 | | | | 2,799,565 | |
| |
| WaMu Mortgage Pass-Through Certificates Trust, Series 2003-AR10, Cl. A7, 2.418%, 10/25/333 | | | 121,435 | | | | 124,190 | |
| |
| Wells Fargo Mortgage-Backed Securities Trust, Series 2006-AR14, Cl. 1A2, 5.808%, 10/25/363 | | | 1,585,941 | | | | 1,549,322 | |
| | | | | | | | |
| | | | | | | 10,808,741 | |
| | | | | | | | |
Total Mortgage-Backed Obligations (Cost $224,698,387) | | | | | | | 232,093,104 | |
| |
| U.S. Government Obligations—1.7% | |
| |
| Federal National Mortgage Assn. Nts., 1%, 9/27/17 | | | 848,000 | | | | 851,362 | |
10 OPPENHEIMER GLOBAL STRATEGIC INCOME FUND/VA
| | | | | | | | |
| | | Principal Amount | | | Value | |
| |
U.S. Government Obligations (Continued) | |
| |
| United States Treasury Nts.: | |
| 0.625%, 4/30/188 | | | $ 3,659,000 | | | $ | 3,623,841 | |
| 1.375%, 9/30/188,9 | | | 16,696,000 | | | | 16,823,824 | |
| 2.00%, 9/30/20 | | | 9,509,000 | | | | 9,643,467 | |
| 2.50%, 8/15/23 | | | 735,000 | | | | 750,045 | |
| |
| United States Treasury Nts. Strips, 6.16%, 2/15/16 | | | 2,116,000 | | | | 2,113,941 | |
| | | | | | | | |
| Total U.S. Government Obligations (Cost $33,439,962) | | | | | | | 33,806,480 | |
| | | | | | | | |
| |
Foreign Government Obligations—11.9% | |
| |
| Angola—0.0% | | | | | | | | |
| Republic of Angola Via Northern | | | | | |
| Lights III BV Sr. Unsec. Nts., 7%, 8/16/19 | | | 725,000 | | | | 731,457 | |
|
| |
| Argentina—0.0% | | | | | | | | |
| Provincia de Buenos Aires Sr. Unsec. Nts., 9.95%, 6/9/211 | | | 820,000 | | | | 803,600 | |
|
| |
| Brazil—2.7% | | | | | | | | |
| Brazil Minas SPE via State of Minas Gerais Sec. Bonds, 5.333%, 2/15/281 | | | 1,010,000 | | | | 959,500 | |
| |
| Federative Republic of Brazil Nota Do Tesouro Nacional Sr. Unsec. Nts.: | |
| 4.875%, 1/22/21 | | | 1,177,000 | | | | 1,232,907 | |
| 9.762%, 1/1/17 | | BRL | 85,105,000 | | | | 25,968,404 | |
| |
| Federative Republic of Brazil Nota Do Tesouro Nacional Unsec. Nts.: | |
| 9.762%, 1/1/18 | | BRL | 17,830,000 | | | | 5,358,527 | |
| 10.00%, 1/1/25 | | BRL | 29,450,000 | | | | 8,178,210 | |
| |
| Federative Republic of Brazil Unsec. Bonds, 12.959%, 10/1/1514 | | BRL | 36,000,000 | | | | 11,188,820 | |
| | | | | | | | |
| | | | | | | 52,886,368 | |
|
| |
| Cayman Islands—0.1% | | | | | | | | |
| Lima Metro Line 2 Finance Ltd. Sr. Sec. Nts., 5.875%, 7/5/341 | | | 850,000 | | | | 870,187 | |
|
| |
| China—0.1% | | | | | | | | |
| Export-Import Bank of China (The) Sr. Unsec. Nts., 3.625%, 7/31/241 | | | 2,175,000 | | | | 2,205,785 | |
|
| |
| Colombia—0.6% | | | | | | | | |
| Republic of Colombia Sr. Unsec. Nts.: | |
| 4.00%, 2/26/24 | | | 280,000 | | | | 279,300 | |
| 4.375%, 7/12/21 | | | 2,265,000 | | | | 2,374,852 | |
| 5.00%, 6/15/45 | | | 1,265,000 | | | | 1,176,450 | |
| 5.625%, 2/26/44 | | | 440,000 | | | | 447,700 | |
| 7.375%, 9/18/37 | | | 435,000 | | | | 539,400 | |
| 8.125%, 5/21/24 | | | 970,000 | | | | 1,247,905 | |
| Series B, 10.00%, 7/24/24 | | COP | 11,670,000,000 | | | | 5,297,582 | |
| | | | | | | | |
| | | | | | | 11,363,189 | |
|
| |
| Croatia—0.2% | | | | | | | | |
| Republic of Croatia Sr. Unsec. Nts.: | |
| 5.50%, 4/4/231 | | | 2,815,000 | | | | 2,908,261 | |
| 6.375%, 3/24/211 | | | 475,000 | | | | 514,781 | |
| 6.75%, 11/5/191 | | | 285,000 | | | | 315,102 | |
| | | | | | | | |
| | | | | | | 3,738,144 | |
|
| |
| Dominican Republic—0.3% | |
| Banco de Reservas de la Republica Dominicana Sub. Nts., 7%, 2/1/231 | | | 1,310,000 | | | | 1,319,294 | |
| |
| Dominican Republic Sr. Unsec. Bonds: | |
| 5.50%, 1/27/251 | | | 1,715,000 | | | | 1,727,863 | |
| 5.875%, 4/18/241 | | | 410,000 | | | | 427,425 | |
| 6.60%, 1/28/241 | | | 1,135,000 | | | | 1,228,637 | |
| 6.85%, 1/27/451 | | | 2,030,000 | | | | 2,080,750 | |
| | | | | | | | |
| | | | | | | 6,783,969 | |
| | | | | | | | | | |
| | | | | Principal Amount | | | Value | |
| | | | |
| | | Ecuador—0.0% | |
| | | Republic of Ecuador International Bonds, 10.50%, 3/24/201 | | | $ 715,000 | | | $ | 720,363 | |
| | |
| | | | |
| | | Egypt—0.1% | |
| | | Arab Republic of Egypt Bonds: | |
| | | 5.875%, 6/11/251 | | | 1,795,000 | | | | 1,757,305 | |
| | | 6.875%, 4/30/401 | | | 280,000 | | | | 275,100 | |
| | | | | | | | | | | |
| | | | | | | | | | 2,032,405 | |
| | |
| | | | |
| | | Hungary—0.5% | |
| | | Hungary Unsec. Bonds: | |
| | | Series 20/A, 7.50%, 11/12/20 | | HUF | 1,612,000,000 | | | | 6,957,810 | |
| | | Series 23/A, 6.00%, 11/24/23 | | HUF | 512,000,000 | | | | 2,095,218 | |
| | | | | | | | | | | |
| | | | | | | | | | 9,053,028 | |
| | |
| | | | |
| | | India—1.7% | |
| | | Indian Railway Finance Corp. Ltd. Sr. Unsec. Nts., 3.417%, 10/10/17 | | | 1,265,000 | | | | 1,295,661 | |
| | | | |
| | | Republic of India Bonds: | |
| | | 8.27%, 6/9/20 | | INR | 839,000,000 | | | | 13,415,173 | |
| | | 8.40%, 7/28/24 | | INR | 1,219,000,000 | | | | 19,635,892 | |
| | | | | | | | | | | |
| | | | | | | | | | 34,346,726 | |
| | |
| | | | |
| | | Indonesia—1.2% | | | | | | | | |
| | | Perusahaan Penerbit SBSN Indonesia III Sr. Unsec. Nts., 4%, 11/21/181 | | | 930,000 | | | | 971,850 | |
| | | | |
| | | Perusahaan Penerbit SBSN Indonesia III Unsec. Nts.: | |
| | | 4.35%, 9/10/241 | | | 610,000 | | | | 602,375 | |
| | | 6.125%, 3/15/191 | | | 2,045,000 | | | | 2,292,956 | |
| | | | |
| | | Republic of Indonesia International Bonds, 5.125%, 1/15/451 | | | 420,000 | | | | 401,625 | |
| | | | |
| | | Republic of Indonesia Sr. Unsec. Bonds: | |
| | | 3.375%, 4/15/231 | | | 1,040,000 | | | | 982,800 | |
| | | 4.625%, 4/15/431 | | | 540,000 | | | | 487,350 | |
| | | 4.875%, 5/5/211 | | | 2,475,000 | | | | 2,632,905 | |
| | | 5.375%, 10/17/231 | | | 880,000 | | | | 949,300 | |
| | | 5.875%, 1/15/241 | | | 1,230,000 | | | | 1,362,225 | |
| | | 6.75%, 1/15/441 | | | 345,000 | | | | 401,063 | |
| | | 11.625%, 3/4/191 | | | 560,000 | | | | 735,000 | |
| | | | |
| | | Republic of Indonesia Treasury Bonds: | |
| | | Series FR70, 8.375%, 3/15/24 | | IDR | 105,600,000,000 | | | | 7,951,702 | |
| | | Series FR71, 9.00%, 3/15/29 | | IDR | 41,160,000,000 | | | | 3,264,768 | |
| | | | | | | | | | | |
| | | | | | | | | | 23,035,919 | |
| | |
| | | | |
| | | Ivory Coast—0.2% | | | | | | | | |
| | | Republic of Cote d’Ivoire Sr. Unsec. Bonds, 5.75%, 12/31/323 | | | 3,920,000 | | | | 3,717,571 | |
| | | | |
| | | Republic of Cote d’Ivorie Bonds, 6.375%, 3/3/281 | | | 910,000 | | | | 891,800 | |
| | | | | | | | | | | |
| | | | | | | | | | 4,609,371 | |
| | |
| | | | |
| | | Kenya—0.1% | | | | | | | | |
| | | Republic of Kenya Sr. Unsec. Bonds: | |
| | | 5.875%, 6/24/191 | | | 560,000 | | | | 573,160 | |
| | | 6.875%, 6/24/241 | | | 1,165,000 | | | | 1,187,811 | |
| | | | | | | | | | | |
| | | | | | | | | | 1,760,971 | |
| | |
| | | | |
| | | Mexico—1.9% | | | | | | | | |
| | | United Mexican States Bonds: | |
| | | 3.00%, 3/6/45 | | EUR | 850,000 | | | | 824,263 | |
| | | 3.60%, 1/30/25 | | | 3,000,000 | | | | 2,965,500 | |
| | | | |
| | | United Mexican States International Bonds, 4%, 3/15/15 | | EUR | 565,000 | | | | 549,277 | |
| | | | |
| | | United Mexican States Unsec. Bonds: | |
| | | 4.60%, 1/23/46 | | | 1,690,000 | | | | 1,573,813 | |
| | | 5.625%, 1/15/17 | | | 2,690,000 | | | | 2,872,920 | |
| | | Series M, 5.00%, 12/11/19 | | MXN | 446,600,000 | | | | 28,207,247 | |
| | | Series M20, 4.75%, 3/8/44 | | | 435,000 | | | | 417,600 | |
| | | | | | | | | | | |
| | | | | | | | | | 37,410,620 | |
11 OPPENHEIMER GLOBAL STRATEGIC INCOME FUND/VA
CONSOLIDATED STATEMENT OF INVESTMENTS Unaudited / Continued
| | | | | | | | |
| | | Principal Amount | | | Value | |
| |
| Morocco—0.1% | | | | | | | | |
| Kingdom of Morocco Sr. Unsec. Bonds, 5.50%, 12/11/421 | | | $ 1,305,000 | | | $ | 1,330,774 | |
| |
| Kingdom of Morocco Sr. Unsec. Nts., 4.25%, 12/11/221 | | | 1,175,000 | | | | 1,204,375 | |
| | | | | | | | |
| | | | | | | 2,535,149 | |
|
| |
| Panama—0.4% | | | | | | | | |
| Republic of Panama Sr. Unsec. Bonds: | |
| 3.75%, 3/16/25 | | | 1,285,000 | | | | 1,272,150 | |
| 4.00%, 9/22/24 | | | 610,000 | | | | 616,100 | |
| 5.20%, 1/30/20 | | | 3,390,000 | | | | 3,744,255 | |
| 6.70%, 1/26/36 | | | 620,000 | | | | 768,800 | |
| 9.375%, 4/1/29 | | | 580,000 | | | | 861,300 | |
| | | | | | | | |
| | | | | | | 7,262,605 | |
|
| |
| Paraguay—0.0% | | | | | | | | |
| Republic of Paraguay Sr. Unsec. Bonds, 4.625%, 1/25/231 | | | 380,000 | | | | 385,700 | |
|
| |
| Peru—0.3% | | | | | | | | |
| Fondo MIVIVIENDA SA Sr. Unsec. Nts., 3.50%, 1/31/231 | | | 2,045,000 | | | | 1,949,907 | |
| |
| Republic of Peru Sr. Unsec. Bonds: | |
| 5.625%, 11/18/50 | | | 1,470,000 | | | | 1,646,400 | |
| 7.35%, 7/21/25 | | | 1,010,000 | | | | 1,320,575 | |
| | | | | | | | |
| | | | | | | 4,916,882 | |
|
| |
| Poland—0.0% | | | | | | | | |
| Republic of Poland Sr. Unsec. Bonds, 3%, 3/17/23 | | | 855,000 | | | | 841,576 | |
|
| |
| Russia—0.2% | | | | | | | | |
| Russian Federation Sr. Unsec. Bonds, 4.875%, 9/16/231 | | | 1,730,000 | | | | 1,719,620 | |
| |
| Russian Federation Sr. Unsec. Nts., 5%, 4/29/201 | | | 1,420,000 | | | | 1,462,671 | |
| | | | | | | | |
| | | | | | | 3,182,291 | |
|
| |
| Serbia—0.2% | | | | | | | | |
| Republic of Serbia Sr. Unsec. Bonds, 5.25%, 11/21/171 | | | 1,425,000 | | | | 1,479,292 | |
| |
| Republic of Serbia Unsec. Bonds, 5.875%, 12/3/181 | | | 1,510,000 | | | | 1,594,938 | |
| | | | | | | | |
| | | | | | | 3,074,230 | |
|
| |
| South Africa—0.7% | | | | | | | | |
| Republic of South Africa Sr. Unsec. Bonds: | |
| 5.875%, 9/16/25 | | | 2,170,000 | | | | 2,410,531 | |
| Series R208, 6.75%, 3/31/21 | | ZAR | 61,300,000 | | | | 4,769,746 | |
| |
| Republic of South Africa Unsec. Bonds: | |
| Series 2023, 7.75%, 2/28/23 | | ZAR | 50,000,000 | | | | 4,020,660 | |
| Series R186, 10.50%, 12/21/26 | | ZAR | 35,700,000 | | | | 3,417,109 | |
| | | | | | | | |
| | | | | | | 14,618,046 | |
|
| |
| Sri Lanka—0.1% | | | | | | | | |
| Democratic Socialist Republic of Sri Lanka Sr. Unsec. Bonds: | |
| 5.875%, 7/25/221 | | | 1,010,000 | | | | 997,375 | |
| 6.00%, 1/14/191 | | | 1,090,000 | | | | 1,115,888 | |
| 6.25%, 10/4/201 | | | 455,000 | | | | 468,104 | |
| | | | | | | | |
| | | | | | | 2,581,367 | |
|
| |
| Turkey—0.1% | | | | | | | | |
| Republic of Turkey Bonds, 4.875%, 4/16/43 | | | 1,540,000 | | | | 1,407,113 | |
| |
| Republic of Turkey Sr. Unsec. Bonds, 4.35%, 11/12/21 | | EUR | 1,040,000 | | | | 1,255,335 | |
| | | | | | | | |
| | | | | | | 2,662,448 | |
|
| |
| United Arab Emirates—0.0% | |
| Emirate of Dubai Sr. Unsec. International Bonds, 5.25%, 1/30/43 | | | 620,000 | | | | 555,862 | |
| | | | | | | | | | |
| | | | | Principal Amount | | | Value | |
| | | | |
| | | Uruguay—0.1% | | | | | | | | |
| | | Oriental Republic of Uruguay Sr. Unsec. Bonds, 5.10%, 6/18/50 | | $ | 1,430,000 | | | $ | 1,365,650 | |
| | |
| | | | |
| | | Venezuela—0.0% | | | | | | | | |
| | | Bolivarian Republic of Venezuela Sr. Unsec. Bonds, 7.75%, 10/13/19 | | | 335,000 | | | | 131,488 | |
| | |
| | | | |
| | | Vietnam—0.0% | | | | | | | | |
| | | Socialist Republic of Vietnam Bonds, 4.80%, 11/19/241 | | | 800,000 | | | | 804,000 | |
| | | | | | | | | | | |
| | | Total Foreign Government Obligations (Cost $243,084,302) | | | | | | | 237,269,396 | |
| | | | | | | | | | | |
| | | | |
| | | Corporate Loans—1.5% | | | | | | | | |
| | | | |
| | | Affinion Group, Inc., Sr. Sec. Credit Facilities 1st Lien Term Loan, 6.75%, 4/30/183 | | | 791,325 | | | | 762,639 | |
| | | | |
| | | Amaya BV, Sr. Sec. Credit Facilities 2nd Lien Term Loan, 8.00%, 7/29/223 | | | 865,000 | | | | 875,002 | |
| | | | |
| | | Asurion LLC, Sr. Sec. Credit Facilities 2nd Lien Term Loan, 8.50%, 3/3/213 | | | 5,945,247 | | | | 6,050,775 | |
| | | | |
| | | Caesars Entertainment Operating Co., Inc., Sr. Sec. Credit Facilities 1st Lien Term Loan, 9.75%, 1/29/183,7 | | | 1,084,550 | | | | 949,524 | |
| | | | |
| | | Caesars Entertainment Resort Properties LLC, Sr. Sec. Credit Facilities 1st Lien Term Loan, 7.00%, 10/11/203 | | | 4,333,691 | | | | 3,973,453 | |
| | | | |
| | | Caesars Growth Properties Holdings LLC, Sr. Sec. Credit Facilities 1st Lien Term Loan, 6.25%, 5/10/213 | | | 1,055,340 | | | | 904,954 | |
| | | | |
| | | Clear Channel Communications, Inc., Extended Sr. Sec. Credit Facilities 1st Lien Term Loan, 6.935%, 1/30/193 | | | 7,103,532 | | | | 6,576,684 | |
| | | | |
| | | Clear Channel Communications, Inc., Sr. Sec. Credit Facilities 1st Lien Term Loan, 7.685%, 7/30/193 | | | 926,326 | | | | 870,168 | |
| | | | |
| | | Deluxe Entertainment Services, Sr. Sec. Credit Facilities 1st Lien Term Loan, 6.50%, 2/26/203 | | | 271,576 | | | | 262,750 | |
| | | | |
| | | Entegra TC LLC, Sr. Sec. Credit Facilities Exit 3rd Lien Term Loan, 8.973%, 10/3/203,11 | | | 1,708,787 | | | | 1,693,835 | |
| | | | |
| | | IPC Corp., Sr. Sec. Credit Facilities 1st Lien Term Loan, 5.50%, 8/6/153,6 | | | 3,566 | | | | 3,555 | |
| | | | |
| | | iStar Financial, Inc., Sr. Sec. Credit Facilities 1st Lien Term Loan, 7.00%, 3/19/173 | | | 802,997 | | | | 824,075 | |
| | | | |
| | | NFR Energy LLC, Sr. Sec. Credit Facilities 2nd Lien Term Loan, 8.75%, 12/31/183,7 | | | 1,485,000 | | | | 551,306 | |
| | | | |
| | | NTELOS, Inc., Sr. Sec. Credit Facilities 1st Lien Term Loan, 5.75%, 11/9/193 | | | 572,281 | | | | 503,608 | |
| | | | |
| | | Orchard Acquisition Co. LLC, Sr. Sec. Credit Facilities 1st Lien Term Loan, 7.00%, 2/8/193 | | | 300,970 | | | | 292,693 | |
| | | | |
| | | Quicksilver Resources, Inc., Sr. Sec. Credit Facilities 2nd Lien Term Loan, 7.00%, 6/21/193,7 | | | 4,151,000 | | | | 2,511,355 | |
| | | | |
| | | Revel Entertainment, Inc., Sr. Sec. Credit Facilities 2nd Lien Exit Term Loan, 14.50%, 5/20/183,7,11 | | | 1,490,134 | | | | 7,452 | |
| | | | |
| | | TWCC Holding Corp., Sr. Sec. Credit Facilities 2nd Lien Term Loan, 7.00%, 6/26/203 | | | 1,950,000 | | | | 1,824,874 | |
| | | | | | | | | | | |
| | | Total Corporate Loans (Cost $33,983,476) | | | | | | | 29,438,702 | |
| | | | | | | | | | | |
12 OPPENHEIMER GLOBAL STRATEGIC INCOME FUND/VA
| | | | | | | | |
| | | Principal Amount | | | Value | |
| |
Corporate Bonds and Notes—62.7% | |
| |
| Consumer Discretionary—11.4% | |
| |
| Auto Components—1.2% | | | | | |
| |
| Affinia Group, Inc., 7.75% Sr. Unsec. Nts., 5/1/21 | | | $ 2,870,000 | | | $ | 3,013,500 | |
| |
| BorgWarner, Inc., 4.375% Sr. Unsec. Nts., 3/15/45 | | | 192,000 | | | | 179,668 | |
| |
| Gates Global LLC/Gates Global Co., 6% Sr. Unsec. Nts., 7/15/221 | | | 3,805,000 | | | | 3,462,550 | |
| |
| GKN Holdings plc: | | | | | | | | |
| 5.375% Sr. Unsec. Nts., 9/19/22 | | GBP | 970,000 | | | | 1,715,601 | |
| 6.75% Sr. Unsec. Nts., 10/28/19 | | GBP | 1,780,000 | | | | 3,239,341 | |
| |
| Goodyear Tire & Rubber Co., 8.25% Sr. Unsec. Nts., 8/15/20 | | | 1,570,000 | | | | 1,647,323 | |
| |
| Icahn Enterprises LP/Icahn Enterprises Finance Corp., 5.875% Sr. Unsec. Nts., 2/1/22 | | | 4,035,000 | | | | 4,120,744 | |
| |
| Lear Corp., 4.75% Sr. Unsec. Nts., 1/15/23 | | | 2,925,000 | | | | 2,895,750 | |
| |
| MPG Holdco I, Inc., 7.375% Sr. Unsec. Nts., 10/15/22 | | | 3,675,000 | | | | 3,932,250 | |
| | | | | | | | |
| | | | | | | 24,206,727 | |
|
| |
| Automobiles—0.8% | | | | | | | | |
| |
| Daimler Finance North America LLC, 8.50% Sr. Unsec. Unsub. Nts., 1/18/31 | | | 322,000 | | | | 472,829 | |
| |
| Ford Motor Credit Co. LLC, 3.664% Sr. Unsec. Nts., 9/8/24 | | | 1,358,000 | | | | 1,340,611 | |
| |
| General Motors Co.: | | | | | | | | |
| 5.00% Sr. Unsec. Nts., 4/1/35 | | | 2,865,000 | | | | 2,821,735 | |
| 6.25% Sr. Unsec. Nts., 10/2/43 | | | 515,000 | | | | 575,438 | |
| |
| Hyundai Capital America, 4% Sr. Unsec. Nts., 6/8/171 | | | 579,000 | | | | 603,511 | |
| |
| Jaguar Land Rover Automotive plc, 5.625% Sr. Unsec. Nts., 2/1/231 | | | 2,065,000 | | | | 2,145,019 | |
| |
| Volkswagen International Finance NV: | |
| 2.50% Jr. Sub. Perpetual Bonds3,10 | | EUR | 1,555,000 | | | | 1,662,646 | |
| 3.875% Jr. Sub. Perpetual Bonds3,10 | | EUR | 2,770,000 | | | | 3,235,111 | |
| |
| ZF North America Capital, Inc., 4.50% Sr. Unsec. Nts., 4/29/221 | | | 2,095,000 | | | | 2,066,194 | |
| | | | | | | | |
| | | | | | | 14,923,094 | |
|
| |
| Distributors—0.2% | | | | | | | | |
| |
| LKQ Corp., 4.75% Sr. Unsec. Nts., 5/15/23 | | | 3,172,000 | | | | 3,041,155 | |
|
| |
| Hotels, Restaurants & Leisure—2.1% | |
| |
| 1011778 B.C. ULC/New Red Finance, Inc., 6% Sec. Nts., 4/1/221 | | | 2,285,000 | | | | 2,353,550 | |
| |
| Boyd Gaming Corp., 6.875% Sr. Unsec. Nts., 5/15/23 | | | 1,400,000 | | | | 1,442,000 | |
| |
| Brinker International, Inc., 2.60% Sr. Unsec. Nts., 5/15/18 | | | 60,000 | | | | 60,127 | |
| |
| Caesars Entertainment Resort Properties LLC/Caesars Entertainment Resort Prope, 11% Sec. Nts., 10/1/21 | | | 1,725,000 | | | | 1,453,312 | |
| |
| Caesars Growth Properties Holdings LLC/Caesars Growth Properties Finance, Inc., 9.375% Sec. Nts., 5/1/221 | | | 830,000 | | | | 626,650 | |
| |
| Carnival Corp., 1.20% Sr. Unsec. Nts., 2/5/16 | | | 524,000 | | | | 524,709 | |
| |
| Churchill Downs, Inc., 5.375% Sr. Unsec. Nts., 12/15/21 | | | 1,650,000 | | | | 1,699,500 | |
| |
| Greektown Holdings LLC/Greektown Mothership Corp., 8.875% Sr. Sec. Nts., 3/15/191 | | | 3,150,000 | | | | 3,323,250 | |
| |
| Hilton Worldwide Finance LLC/Hilton Worldwide Finance Corp., 5.625% Sr. Unsec. Nts., 10/15/21 | | | 1,035,000 | | | | 1,080,229 | |
| | | | | | | | | | |
| | | | | Principal Amount | | | Value | |
| | | | |
| | | Hotels, Restaurants & Leisure (Continued) | |
| | | | |
| | | International Game Technology plc, 6.25% Sr. Sec. Nts., 2/15/221 | | | $ 2,100,000 | | | $ | 2,016,000 | |
| | | | |
| | | Isle of Capri Casinos, Inc., 5.875% Sr. Unsec. Nts., 3/15/21 | | | 970,000 | | | | 1,001,525 | |
| | | | |
| | | Landry’s, Inc., 9.375% Sr. Unsec. Nts., 5/1/201 | | | 4,315,000 | | | | 4,649,412 | |
| | | | |
| | | Marriott International, Inc., 3.25% Sr. Unsec. Nts., 9/15/22 | | | 388,000 | | | | 382,708 | |
| | | | |
| | | MCE Finance Ltd., 5% Sr. Unsec. Nts., 2/15/211 | | | 2,465,000 | | | | 2,354,075 | |
| | | | |
| | | Merlin Entertainments plc, 2.75% Sr. Unsec. Nts., 3/15/221 | | EUR | 2,135,000 | | | | 2,273,810 | |
| | | | |
| | | MGM Resorts International: | |
| | | 6.00% Sr. Unsec. Nts., 3/15/23 | | | 1,250,000 | | | | 1,268,750 | |
| | | 6.625% Sr. Unsec. Nts., 12/15/21 | | | 2,100,000 | | | | 2,205,000 | |
| | | 6.75% Sr. Unsec. Nts., 10/1/20 | | | 1,650,000 | | | | 1,752,795 | |
| | | | |
| | | MTR Gaming Group, Inc., 11.50% Sec. Nts., 8/1/19 | | | 2,510,825 | | | | 2,683,444 | |
| | | | |
| | | NCL Corp. Ltd., 5.25% Sr. Unsec. Nts., 11/15/191 | | | 1,830,000 | | | | 1,882,613 | |
| | | | |
| | | PF Chang’s China Bistro, Inc., 10.25% Sr. Unsec. Nts., 6/30/201 | | | 1,340,000 | | | | 1,391,925 | |
| | | | |
| | | Pinnacle Entertainment, Inc., 6.375% Sr. Unsec. Nts., 8/1/21 | | | 1,670,000 | | | | 1,780,638 | |
| | | | |
| | | Premier Cruises Ltd., 11% Sr. Unsec. Nts., 3/15/082,7 | | | 250,000 | | | | — | |
| | | | |
| | | Sugarhouse HSP Gaming Prop Mezz LP/Sugarhouse HSP Gaming Finance Corp., 6.375% Sr. Sec. Nts., 6/1/211 | | | 1,250,000 | | | | 1,193,750 | |
| | | | |
| | | Viking Cruises Ltd., 8.50% Sr. Unsec. Nts., 10/15/221 | | | 2,135,000 | | | | 2,380,525 | |
| | | | |
| | | Wyndham Worldwide Corp., 2.95% Sr. Unsec. Nts., 3/1/17 | | | 590,000 | | | | 599,064 | |
| | | | | | | | | | | |
| | | | | | | | | | 42,379,361 | |
| | |
| | | | |
| | | Household Durables—0.7% | |
| | | | |
| | | Arcelik AS, 5% Sr. Unsec. Nts., 4/3/231 | | | 555,000 | | | | 533,699 | |
| | | | |
| | | Jarden Corp., 6.125% Sr. Unsec. Nts., 11/15/22 | | | 1,080,000 | | | | 1,123,200 | |
| | | | |
| | | KB Home: | | | | | | | | |
| | | 7.00% Sr. Unsec. Nts., 12/15/21 | | | 1,965,000 | | | | 2,038,687 | |
| | | 7.625% Sr. Unsec. Nts., 5/15/23 | | | 2,805,000 | | | | 2,945,250 | |
| | | | |
| | | Lennar Corp.: | | | | | | | | |
| | | 4.75% Sr. Unsec. Nts., 11/15/22 | | | 610,000 | | | | 602,375 | |
| | | 4.75% Sr. Unsec. Nts., 5/30/25 | | | 1,954,000 | | | | 1,905,150 | |
| | | | |
| | | Meritage Homes Corp., 7.15% Sr. Unsec. Nts., 4/15/20 | | | 3,270,000 | | | | 3,547,950 | |
| | | | |
| | | Taylor Morrison Communities, Inc./Monarch Communities, Inc., 5.25% Sr. Unsec. Nts., 4/15/211 | | | 1,050,000 | | | | 1,039,500 | |
| | | | |
| | | Toll Brothers Finance Corp., 4.375% Sr. Unsec. Nts., 4/15/23 | | | 549,000 | | | | 540,765 | |
| | | | |
| | | Whirlpool Corp., 1.65% Sr. Unsec. Nts., 11/1/17 | | | 280,000 | | | | 281,064 | |
| | | | | | | | | | | |
| | | | | | | | | | 14,557,640 | |
| | |
| | | | |
| | | Leisure Equipment & Products—0.0% | |
| | | | |
| | | Mattel, Inc., 1.70% Sr. Unsec. Nts., 3/15/18 | | | 647,000 | | | | 643,902 | |
| | |
| | | | |
| | | Media—3.9% | | | | | | | | |
| | | | |
| | | 21st Century Fox America, Inc., 6.15% Sr. Unsec. Nts., 2/15/41 | | | 223,000 | | | | 259,015 | |
| | | | |
| | | Altice Financing SA, 6.50% Sec. Nts., 1/15/221 | | | 4,780,000 | | | | 4,791,950 | |
| | | | |
| | | Altice Finco SA, 8.125% Sec. Nts., 1/15/241 | | | 1,785,000 | | | | 1,807,312 | |
| | | | |
| | | Altice SA, 7.25% Sr. Sec. Nts., 5/15/221 | | EUR | 3,815,000 | | | | 4,311,102 | |
| | | | | | | | | | | |
13 OPPENHEIMER GLOBAL STRATEGIC INCOME FUND/VA
CONSOLIDATED STATEMENT OF INVESTMENTS Unaudited / Continued
| | | | | | | | |
| | | Principal Amount | | | Value | |
| |
| Media (Continued) | | | | | | | | |
| |
| Belo Corp., 7.75% Sr. Unsec. Nts., 6/1/27 | | | $ 3,132,000 | | | $ | 3,468,690 | |
| |
| CCO Holdings LLC/CCO Holdings Capital Corp.: | |
| 5.125% Sr. Unsec. Nts., 5/1/231 | | | 3,095,000 | | | | 3,021,494 | |
| 5.75% Sr. Unsec. Nts., 9/1/23 | | | 2,000,000 | | | | 2,008,750 | |
| |
| Comcast Corp., 4.65% Sr. Unsec. Unsub. Nts., 7/15/42 | | | 376,000 | | | | 376,464 | |
| |
| Cumulus Media Holdings, Inc., 7.75% Sr. Unsec. Nts., 5/1/19 | | | 820,000 | | | | 755,425 | |
| |
| DIRECTV Holdings LLC/DIRECTV | | | | | | | | |
| Financing Co., Inc., 5.15% Sr. Unsec. Nts., 3/15/42 | | | 95,000 | | | | 89,396 | |
| |
| DISH DBS Corp.: | | | | | | | | |
| 5.875% Sr. Unsec. Nts., 11/15/24 | | | 7,655,000 | | | | 7,369,169 | |
| 6.75% Sr. Unsec. Nts., 6/1/21 | | | 835,000 | | | | 872,575 | |
| |
| DreamWorks Animation SKG, Inc., 6.875% Sr. Unsec. Nts., 8/15/201 | | | 1,260,000 | | | | 1,253,700 | |
| |
| Entercom Radio LLC, 10.50% Sr. Unsec. Nts., 12/1/19 | | | 1,125,000 | | | | 1,212,188 | |
| |
| Gannett Co., Inc., 5.50% Sr. Unsec. Nts., 9/15/241 | | | 1,680,000 | | | | 1,667,400 | |
| |
| Gray Television, Inc., 7.50% Sr. Unsec. Nts., 10/1/20 | | | 4,435,000 | | | | 4,717,731 | |
| |
| iHeartCommunications, Inc., 9% Sr. Sec. Nts., 12/15/19 | | | 875,000 | | | | 837,156 | |
| |
| Interpublic Group of Cos., Inc. (The), 4.20% Sr. Unsec. Nts., 4/15/24 | | | 296,000 | | | | 299,774 | |
| |
| Lamar Media Corp., 5% Sr. Unsec. Sub. Nts., 5/1/23 | | | 628,000 | | | | 624,860 | |
| |
| LIN Television Corp., 6.375% Sr. Unsec. Nts., 1/15/21 | | | 2,245,000 | | | | 2,303,931 | |
| |
| Nexstar Broadcasting, Inc.: | |
| 6.125% Sr. Unsec. Nts., 2/15/221 | | | 1,280,000 | | | | 1,302,400 | |
| 6.875% Sr. Unsec. Nts., 11/15/20 | | | 2,305,000 | | | | 2,451,944 | |
| |
| Numericable SFR SAS, 6% Sr. Sec. Nts., 5/15/221 | | | 4,690,000 | | | | 4,634,306 | |
| |
| Scripps Networks Interactive, Inc., 2.70% Sr. Unsec. Nts., 12/15/16 | | | 591,000 | | | | 602,947 | |
| |
| Sinclair Television Group, Inc.: | |
| 5.375% Sr. Unsec. Nts., 4/1/21 | | | 700,000 | | | | 707,875 | |
| 5.625% Sr. Unsec. Nts., 8/1/241 | | | 2,330,000 | | | | 2,286,313 | |
| 6.125% Sr. Unsec. Nts., 10/1/22 | | | 2,410,000 | | | | 2,488,325 | |
| |
| Sky plc, 3.75% Sr. Unsec. Nts., 9/16/241 | | | 321,000 | | | | 313,525 | |
| |
| TEGNA, Inc., 6.375% Sr. Unsec. Nts., 10/15/23 | | | 750,000 | | | | 783,750 | |
| |
| Thomson Reuters Corp., 1.65% Sr. Unsec. Nts., 9/29/17 | | | 628,000 | | | | 628,030 | |
| |
| Time Warner Cable, Inc., 4.50% Sr. Unsec. Unsub. Nts., 9/15/42 | | | 213,000 | | | | 175,156 | |
| |
| Tribune Media Co., 5.875% Sr. Unsec. Nts., 7/15/221 | | | 965,000 | | | | 974,650 | |
| |
| Univision Communications, Inc., 8.50% Sr. Unsec. Nts., 5/15/211 | | | 1,180,000 | | | | 1,246,375 | |
| |
| UPC Holding BV, 6.75% Sr. Unsec. Nts., 3/15/231 | | EUR | 3,890,000 | | | | 4,727,136 | |
| |
| UPCB Finance VI Ltd., 6.875% Sr. Sec. Nts., 1/15/221 | | | 3,051,000 | | | | 3,264,570 | |
| |
| Viacom, Inc., 2.75% Sr. Unsec. Nts., 12/15/19 | | | 227,000 | | | | 227,032 | |
| |
| Virgin Media Finance plc, 7% Sr. Unsec. Nts., 4/15/23 | | GBP | 1,390,000 | | | | 2,335,282 | |
| |
| Virgin Media Secured Finance plc: | |
| 5.25% Sr. Sec. Nts., 1/15/261 | | | 625,000 | | | | 605,469 | |
| 6.00% Sr. Sec. Nts., 4/15/21 | | GBP | 3,609,000 | | | | 5,925,820 | |
| |
| VTR Finance BV, 6.875% Sr. Sec. Nts., 1/15/241 | | | 515,000 | | | | 527,540 | |
| | | | | | | | |
| | | | | | | 78,256,527 | |
| | | | | | | | | | |
| | | | | Principal Amount | | | Value | |
| | | | |
| | | Multiline Retail—0.5% | |
| | | | |
| | | Family Tree Escrow LLC, 5.75% Sr. Sec. Nts., 3/1/231 | | | $ 6,470,000 | | | $ | 6,793,500 | |
| | | | |
| | | Neiman Marcus Group Ltd., Inc., 8.75% Sr. Unsec. Nts., 10/15/211,11 | | | 1,325,000 | | | | 1,429,344 | |
| | | | |
| | | SACI Falabella, 4.375% Sr. Unsec. Nts., 1/27/251 | | | 700,000 | | | | 698,127 | |
| | | | | | | | | | | |
| | | | | | | | | | 8,920,971 | |
| | |
| | | | |
| | | Specialty Retail—1.3% | |
| | | | |
| | | Apex Tool Group LLC, 7% Sr. Unsec. Nts., 2/1/211 | | | 4,035,000 | | | | 3,621,412 | |
| | | | |
| | | Best Buy Co., Inc., 5.50% Sr. Unsec. Nts., 3/15/21 | | | 601,000 | | | | 626,302 | |
| | | | |
| | | CST Brands, Inc., 5% Sr. Unsec. Nts., 5/1/23 | | | 1,255,000 | | | | 1,255,000 | |
| | | | |
| | | GameStop Corp., 5.50% Sr. Unsec. Nts., 10/1/191 | | | 2,540,000 | | | | 2,622,550 | |
| | | | |
| | | Home Depot, Inc. (The), 4.875% Sr. Unsec. Nts., 2/15/44 | | | 197,000 | | | | 210,449 | |
| | | | |
| | | L Brands, Inc., 6.625% Sr. Unsec. Nts., 4/1/21 | | | 3,895,000 | | | | 4,301,560 | |
| | | | |
| | | Men’s Wearhouse, Inc. (The), 7% Sr. Unsec. Nts., 7/1/22 | | | 580,000 | | | | 623,500 | |
| | | | |
| | | Michaels Stores, Inc., 5.875% Sr. Sub. Nts., 12/15/201 | | | 5,015,000 | | | | 5,265,750 | |
| | | | |
| | | Ross Stores, Inc., 3.375% Sr. Unsec. Nts., 9/15/24 | | | 555,000 | | | | 547,619 | |
| | | | |
| | | Sally Holdings LLC/Sally Capital, Inc., 5.75% Sr. Unsec. Nts., 6/1/22 | | | 2,760,000 | | | | 2,904,900 | |
| | | | |
| | | Signet UK Finance plc, 4.70% Sr. Unsec. Nts., 6/15/24 | | | 290,000 | | | | 292,988 | |
| | | | |
| | | Stackpole International Intermediate Co., 7.75% Sr. Sec. Nts., 10/15/211 | | | 3,360,000 | | | | 3,326,400 | |
| | | | | | | | | | | |
| | | | | | | | | | 25,598,430 | |
| | |
| | | | |
| | | Textiles, Apparel & Luxury Goods—0.7% | |
| | | | |
| | | American Achievement Corp., 10.875% Sec. Nts., 4/15/161 | | | 1,290,000 | | | | 1,220,662 | |
| | | | |
| | | Levi Strauss & Co.: | | | | | | | | |
| | | 5.00% Sr. Unsec. Nts., 5/1/251 | | | 2,730,000 | | | | 2,654,925 | |
| | | 6.875% Sr. Unsec. Nts., 5/1/22 | | | 465,000 | | | | 498,713 | |
| | | | |
| | | New Look Secured Issuer plc, 6.50% Sr. Sec. Nts., 7/1/221 | | GBP | 1,525,000 | | | | 2,333,257 | |
| | | | |
| | | PVH Corp., 4.50% Sr. Unsec. Unsub. Nts., 12/15/22 | | | 2,325,000 | | | | 2,313,375 | |
| | | | |
| | | Springs Industries, Inc., 6.25% Sr. Sec. Nts., 6/1/21 | | | 3,060,000 | | | | 3,006,450 | |
| | | | |
| | | William Carter Co., 5.25% Sr. Unsec. Nts., 8/15/21 | | | 825,000 | | | | 849,750 | |
| | | | | | | | | | | |
| | | | | | | | | | 12,877,132 | |
| | |
| | | | |
| | | Consumer Staples—2.1% | |
| | | | |
| | | Beverages—0.2% | | | | | | | | |
| | | | |
| | | Anheuser-Busch InBev Worldwide, Inc., 8.20% Sr. Unsec. Unsub. Nts., 1/15/39 | | | 415,000 | | | | 617,150 | |
| | | | |
| | | Constellation Brands, Inc., 4.75% Sr. Unsec. Nts., 11/15/24 | | | 2,860,000 | | | | 2,874,300 | |
| | | | |
| | | JB y Co. SA de CV, 3.75% Sr. Unsec. Nts., 5/13/251 | | | 190,000 | | | | 184,636 | |
| | | | |
| | | Pernod Ricard SA, 4.25% Sr. Unsec. Nts., 7/15/221 | | | 387,000 | | | | 403,456 | |
| | | | | | | | | | | |
| | | | | | | | | | 4,079,542 | |
| | |
| | | | |
| | | Food & Staples Retailing—0.5% | |
| | | | |
| | | Cencosud SA, 5.15% Sr. Unsec. Nts., 2/12/251 | | | 1,265,000 | | | | 1,275,238 | |
| | | | |
| | | CVS Health Corp., 5.30% Sr. Unsec. Nts., 12/5/43 | | | 146,000 | | | | 159,131 | |
| | | | | | | | | | | |
| | | | | | | | | | | |
14 OPPENHEIMER GLOBAL STRATEGIC INCOME FUND/VA
| | | | | | | | |
| | | Principal Amount | | | Value | |
| |
| Food & Staples Retailing (Continued) | |
| |
| Delhaize Group SA, 5.70% Sr. Unsec. Nts., 10/1/40 | | $ | 228,000 | | | $ | 231,446 | |
| |
| Ingles Markets, Inc., 5.75% Sr. Unsec. Nts., 6/15/23 | | | 2,055,000 | | | | 2,098,771 | |
| |
| Kroger Co. (The): | | | | | | | | |
| 6.40% Sr. Unsec. Nts., 8/15/17 | | | 559,000 | | | | 615,666 | |
| 6.90% Sr. Unsec. Nts., 4/15/38 | | | 150,000 | | | | 186,067 | |
| |
| Rite Aid Corp.: | | | | | | | | |
| 6.125% Sr. Unsec. Nts., 4/1/231 | | | 2,100,000 | | | | 2,170,875 | |
| 6.75% Sr. Unsec. Nts., 6/15/21 | | | 1,835,000 | | | | 1,931,338 | |
| |
| Wal-Mart Stores, Inc., 4.30% Sr. Unsec. Nts., 4/22/44 | | | 327,000 | | | | 327,420 | |
| | | | | | | | |
| | | | | | | 8,995,952 | |
|
| |
| Food Products—1.0% | | | | | | | | |
| |
| ASG Consolidated LLC/ASG Finance, Inc., 15% Sr. Unsec. Nts., 5/15/172,11 | | | 3,471,883 | | | | 2,222,005 | |
| |
| BRF SA, 4.75% Sr. Unsec. Nts., 5/22/241 | | | 715,000 | | | | 705,169 | |
| |
| Bumble Bee Holdings, Inc., 9% Sr. Sec. Nts., 12/15/171 | | | 1,269,000 | | | | 1,334,036 | |
| |
| Bunge Ltd. Finance Corp.: | | | | | | | | |
| 3.20% Sr. Unsec. Nts., 6/15/17 | | | 615,000 | | | | 633,430 | |
| 8.50% Sr. Unsec. Nts., 6/15/19 | | | 400,000 | | | | 484,052 | |
| |
| Chiquita Brands International, Inc./Chiquita Brands LLC, 7.875% Sr. Sec. Nts., 2/1/21 | | | 1,029,000 | | | | 1,112,606 | |
| |
| Dean Foods Co., 6.50% Sr. Unsec. Nts., 3/15/231 | | | 1,420,000 | | | | 1,451,950 | |
| |
| HJ Heinz Co.: | | | | | | | | |
| 3.95% Sr. Unsec. Nts., 7/15/251,6 | | | 316,000 | | | | 318,421 | |
| 4.25% Sec. Nts., 10/15/20 | | | 1,615,000 | | | | 1,649,319 | |
| 4.875% Sec. Nts., 2/15/251 | | | 2,095,000 | | | | 2,286,169 | |
| 5.20% Sr. Unsec. Nts., 7/15/451,6 | | | 71,000 | | | | 72,931 | |
| |
| Ingredion, Inc., 1.80% Sr. Unsec. Nts., 9/25/17 | | | 635,000 | | | | 633,104 | |
| |
| JM Smucker Co., 1.75% Sr. Unsec. Nts., 3/15/181 | | | 498,000 | | | | 497,739 | |
| |
| Kraft Foods Group, Inc., 5% Sr. Unsec. Nts., 6/4/42 | | | 147,000 | | | | 146,522 | |
| |
| Minerva Luxembourg SA, 7.75% Sr. Unsec. Nts., 1/31/231 | | | 230,000 | | | | 232,300 | |
| |
| Pilgrim’s Pride Corp., 5.75% Sr. Unsec. Nts., 3/15/251 | | | 910,000 | | | | 921,375 | |
| |
| Post Holdings, Inc.: | | | | | | | | |
| 6.75% Sr. Unsec. Nts., 12/1/211 | | | 830,000 | | | | 832,075 | |
| 7.375% Sr. Unsec. Nts., 2/15/22 | | | 2,265,000 | | | | 2,313,131 | |
| |
| TreeHouse Foods, Inc., 4.875% Sr. Unsec. Nts., 3/15/22 | | | 447,000 | | | | 451,470 | |
| |
| Tyson Foods, Inc., 4.875% Sr. Unsec. Nts., 8/15/34 | | | 195,000 | | | | 196,254 | |
| |
| Wells Enterprises, Inc., 6.75% Sr. Sec. Nts., 2/1/201 | | | 912,000 | | | | 934,800 | |
| | | | | | | | |
| | | | | | | 19,428,858 | |
|
| |
| Household Products—0.1% | | | | | |
| |
| Spectrum Brands, Inc.: | | | | | | | | |
| 6.125% Sr. Unsec. Nts., 12/15/241 | | | 330,000 | | | | 344,025 | |
| 6.375% Sr. Unsec. Nts., 11/15/20 | | | 1,610,000 | | | | 1,710,625 | |
| | | | | | | | |
| | | | | | | 2,054,650 | |
|
| |
| Personal Products—0.1% | | | | | |
| |
| Revlon Consumer Products Corp., 5.75% Sr. Unsec. Nts., 2/15/21 | | | 2,080,000 | | | | 2,048,800 | |
|
| |
| Tobacco—0.2% | | | | | | | | |
| |
| Altria Group, Inc., 10.20% Sr. Unsec. Nts., 2/6/39 | | | 341,000 | | | | 561,638 | |
| |
| Reynolds American, Inc.: | | | | | | | | |
| 5.85% Sr. Unsec. Nts., 8/15/45 | | | 278,000 | | | | 293,339 | |
| 6.75% Sr. Unsec. Nts., 6/15/17 | | | 461,000 | | | | 503,915 | |
| | | | | | | | | | |
| | | | | Principal Amount | | | Value | |
| | | | |
| | | Tobacco (Continued) | | | | | | | | |
| | | | |
| | | Vector Group Ltd., 7.75% Sr. Sec. Nts., 2/15/21 | | $ | 2,620,000 | | | $ | 2,813,225 | |
| | | | | | | | | | | |
| | | | | | | | | | 4,172,117 | |
| | |
| | | | |
| | | Energy—7.2% | | | | | | | | |
| | | | |
| | | Energy Equipment & Services—0.8% | |
| | | | |
| | | Eletson Holdings, 9.625% Sr. Sec. Nts., 1/15/222 | | | 2,095,000 | | | | 2,053,100 | |
| | | | |
| | | Ensco plc, 5.20% Sr. Unsec. Nts., 3/15/25 | | | 128,000 | | | | 126,786 | |
| | | | |
| | | Exterran Partners LP/EXLP Finance Corp., 6% Sr. Unsec. Nts., 4/1/21 | | | 850,000 | | | | 824,500 | |
| | | | |
| | | GNL Quintero SA, 4.634% Sr. Unsec. Nts., 7/31/291 | | | 700,000 | | | | 702,397 | |
| | | | |
| | | Halliburton Co., 4.75% Sr. Unsec. Nts., 8/1/43 | | | 146,000 | | | | 149,817 | |
| | | | |
| | | Helmerich & Payne International Drilling Co., 4.65% Sr. Unsec. Nts., 3/15/251 | | | 247,000 | | | | 255,093 | |
| | | | |
| | | Hornbeck Offshore Services, Inc., 5.875% Sr. Unsec. Nts., 4/1/20 | | | 1,395,000 | | | | 1,290,375 | |
| | | | |
| | | Odebrecht Offshore Drilling Finance Ltd., 6.625% Sr. Sec. Nts., 10/1/221 | | | 1,113,783 | | | | 768,510 | |
| | | | |
| | | Pertamina Persero PT: | | | | | | | | |
| | | 5.625% Sr. Unsec. Nts., 5/20/431 | | | 4,077,000 | | | | 3,638,722 | |
| | | 6.45% Sr. Unsec. Nts., 5/30/441 | | | 850,000 | | | | 841,500 | |
| | | | |
| | | Precision Drilling Corp., 6.625% Sr. Unsec. Nts., 11/15/20 | | | 1,395,000 | | | | 1,384,538 | |
| | | | |
| | | Seadrill Ltd., 6.50% Sr. Unsec. Nts., 10/5/15 | | | 590,000 | | | | 597,375 | |
| | | | |
| | | Sinopec Group Overseas Development 2014 Ltd., 1.75% Sr. Unsec. Nts., 4/10/171 | | | 637,000 | | | | 637,782 | |
| | | | |
| | | Sinopec Group Overseas Development 2015 Ltd.: | |
| | | 2.50% Sr. Unsec. Nts., 4/28/201 | | | 1,820,000 | | | | 1,801,108 | |
| | | 3.25% Sr. Unsec. Nts., 4/28/251 | | | 905,000 | | | | 870,156 | |
| | | | |
| | | Weatherford International Ltd., 5.95% Sr. Unsec. Nts., 4/15/42 | | | 162,000 | | | | 136,964 | |
| | | | | | | | | | | |
| | | | | | | | | | 16,078,723 | |
| | |
| | | | |
| | | Oil, Gas & Consumable Fuels—6.4% | |
| | | | |
| | | Anadarko Petroleum Corp., 6.20% Sr. Unsec. Nts., 3/15/40 | | | 294,000 | | | | 331,411 | |
| | | | |
| | | Antero Resources Corp., 6% Sr. Unsec. Nts., 12/1/20 | | | 1,325,000 | | | | 1,344,875 | |
| | | | |
| | | Baytex Energy Corp., 5.125% Sr. Unsec. Nts., 6/1/211 | | | 705,000 | | | | 664,462 | |
| | | | |
| | | Bill Barrett Corp., 7.625% Sr. Unsec. Nts., 10/1/19 | | | 1,385,000 | | | | 1,329,600 | |
| | | | |
| | | Boardwalk Pipelines LP, 4.95% Sr. Unsec. Nts., 12/15/24 | | | 350,000 | | | | 343,388 | |
| | | | |
| | | Buckeye Partners LP, 6.05% Sr. Unsec. Nts., 1/15/18 | | | 280,000 | | | | 302,177 | |
| | | | |
| | | California Resources Corp.: | | | | | | | | |
| | | 5.00% Sr. Unsec. Nts., 1/15/20 | | | 2,005,000 | | | | 1,774,425 | |
| | | 5.50% Sr. Unsec. Nts., 9/15/21 | | | 2,805,000 | | | | 2,443,856 | |
| | | 6.00% Sr. Unsec. Nts., 11/15/24 | | | 230,000 | | | | 198,662 | |
| | | | |
| | | Canadian Natural Resources Ltd.: | |
| | | 1.75% Sr. Unsec. Nts., 1/15/18 | | | 247,000 | | | | 245,368 | |
| | | 5.90% Sr. Unsec. Nts., 2/1/18 | | | 277,000 | | | | 302,319 | |
| | | | |
| | | Carrizo Oil & Gas, Inc., 6.25% Sr. Unsec. Nts., 4/15/23 | | | 1,650,000 | | | | 1,662,375 | |
| | | | |
| | | Cenovus Energy, Inc., 5.20% Sr. Unsec. Nts., 9/15/43 | | | 174,000 | | | | 164,368 | |
| | | | |
| | | Chaparral Energy, Inc., 7.625% Sr. Unsec. Nts., 11/15/22 | | | 1,400,000 | | | | 1,015,000 | |
| | | | |
| | | Chesapeake Energy Corp.: | |
| | | 4.875% Sr. Unsec. Nts., 4/15/22 | | | 2,110,000 | | | | 1,846,250 | |
| | | 5.375% Sr. Unsec. Nts., 6/15/21 | | | 1,320,000 | | | | 1,201,200 | |
| | | | | | | | | | | |
15 OPPENHEIMER GLOBAL STRATEGIC INCOME FUND/VA
CONSOLIDATED STATEMENT OF INVESTMENTS Unaudited / Continued
| | | | | | | | |
| | | Principal Amount | | | Value | |
| |
| Oil, Gas & Consumable Fuels (Continued) | |
| |
| Cimarex Energy Co., 4.375% Sr. Unsec. Nts., 6/1/24 | | $ | 337,000 | | | $ | 335,976 | |
| |
| Cloud Peak Energy Resources LLC/Cloud Peak Energy Finance Corp., 8.50% Sr. Unsec. Nts., 12/15/19 | | | 2,020,000 | | | | 1,722,050 | |
| |
| CNOOC Curtis Funding No 1 Pty Ltd., 4.50% Sr. Unsec. Nts., 10/3/231 | | | 1,310,000 | | | | 1,377,103 | |
| |
| CNOOC Nexen Finance 2014 ULC, 4.25% Sr. Unsec. Nts., 4/30/24 | | | 840,000 | | | | 858,231 | |
| |
| Columbia Pipeline Group, Inc., 4.50% Sr. Unsec. Nts., 6/1/251 | | | 336,000 | | | | 331,613 | |
| |
| Concho Resources, Inc., 5.50% Sr. Unsec. Unsub. Nts., 4/1/23 | | | 2,665,000 | | | | 2,678,325 | |
| |
| CONSOL Energy, Inc., 5.875% Sr. Unsec. Nts., 4/15/22 | | | 1,440,000 | | | | 1,229,933 | |
| |
| Cosan Luxembourg SA, 5% Sr. Unsec. Nts., 3/14/231 | | | 1,010,000 | | | | 936,775 | |
| |
| Crestwood Midstream Partners LP/Crestwood Midstream Finance Corp.: | |
| 6.00% Sr. Unsec. Nts., 12/15/20 | | | 495,000 | | | | 514,800 | |
| 6.125% Sr. Unsec. Nts., 3/1/22 | | | 860,000 | | | | 882,790 | |
| |
| Delek & Avner Tamar Bond Ltd., 5.082% Sr. Sec. Nts., 12/30/231 | | | 610,000 | | | | 614,575 | |
| |
| Denbury Resources, Inc., 4.625% Sr. Sub. Nts., 7/15/23 | | | 2,250,000 | | | | 1,895,625 | |
| |
| Devon Energy Corp., 4.75% Sr. Unsec. Nts., 5/15/42 | | | 283,000 | | | | 270,101 | |
| |
| Energy Transfer Equity LP: | | | | | |
| 5.875% Sr. Sec. Nts., 1/15/24 | | | 1,175,000 | | | | 1,224,350 | |
| 7.50% Sr. Sec. Nts., 10/15/20 | | | 1,975,000 | | | | 2,236,687 | |
| |
| Energy XXI Gulf Coast, Inc., 11% Sec. Nts., 3/15/201 | | | 1,165,000 | | | | 1,028,112 | |
| |
| EnLink Midstream Partners LP, 2.70% Sr. Unsec. Nts., 4/1/19 | | | 508,000 | | | | 501,637 | |
| |
| EP Energy LLC/Everest Acquisition Finance, Inc.: | |
| 6.375% Sr. Unsec. Nts., 6/15/231 | | | 1,220,000 | | | | 1,227,625 | |
| 7.75% Sr. Unsec. Nts., 9/1/22 | | | 2,665,000 | | | | 2,811,575 | |
| |
| Gazprom OAO Via Gaz Capital SA, 4.95% Sr. Unsec. Nts., 7/19/221 | | | 2,445,000 | | | | 2,264,681 | |
| |
| Genesis Energy LP/Genesis Energy Finance Corp., 5.75% Sr. Unsec. Nts., 2/15/21 | | | 1,720,000 | | | | 1,707,100 | |
| |
| Halcon Resources Corp., 8.875% Sr. Unsec. Nts., 5/15/21 | | | 1,525,000 | | | | 1,010,312 | |
| |
| Husky Energy, Inc., 6.20% Sr. Unsec. Nts., 9/15/17 | | | 352,000 | | | | 382,363 | |
| |
| Indian Oil Corp. Ltd., 5.75% Sr. Unsec. Nts., 8/1/23 | | | 2,155,000 | | | | 2,354,842 | |
| |
| KazMunayGas National Co. JSC, 5.75% Sr. Unsec. Nts., 4/30/431 | | | 1,125,000 | | | | 944,342 | |
| |
| Kinder Morgan, Inc., 5% Sr. Unsec. Nts., 2/15/211 | | | 670,000 | | | | 705,923 | |
| |
| Kunlun Energy Co. Ltd.: | | | | | |
| 2.875% Sr. Unsec. Nts., 5/13/201 | | | 475,000 | | | | 469,528 | |
| 3.75% Sr. Unsec. Nts., 5/13/251 | | | 475,000 | | | | 460,759 | |
| |
| Laredo Petroleum, Inc., 5.625% Sr. Unsec. Nts., 1/15/22 | | | 1,765,000 | | | | 1,756,175 | |
| |
| LBC Tank Terminals Holding Netherlands BV, 6.875% Sr. Unsec. Nts., 5/15/232 | | | 1,530,000 | | | | 1,587,375 | |
| |
| Linn Energy LLC/Linn Energy Finance Corp., 7.75% Sr. Unsec. Nts., 2/1/21 | | | 3,370,000 | | | | 2,637,025 | |
| |
| MarkWest Energy Partners LP/MarkWest Energy Finance Corp.: | |
| 4.50% Sr. Unsec. Nts., 7/15/23 | | | 2,190,000 | | | | 2,157,150 | |
| 4.875% Sr. Unsec. Nts., 6/1/25 | | | 647,000 | | | | 634,060 | |
| |
| MEG Energy Corp., 6.50% Sr. Unsec. Nts., 3/15/211 | | | 3,750,000 | | | | 3,651,562 | |
| | | | | | | | | | |
| | | | | Principal Amount | | | Value | |
| | | | |
| | | Oil, Gas & Consumable Fuels (Continued) | |
| | | | |
| | | Memorial Production Partners LP/Memorial Production Finance Corp., 7.625% Sr. Unsec. Nts., 5/1/21 | | $ | 880,000 | | | $ | 842,600 | |
| | | | |
| | | Murray Energy Corp., 11.25% Sec. Nts., 4/15/211 | | | 4,660,000 | | | | 3,926,050 | |
| | | | |
| | | Navios Maritime Acquisition Corp./Navios Acquisition Finance US, Inc., 8.125% Sr. Sec. Nts., 11/15/211 | | | 1,245,000 | | | | 1,230,994 | |
| | | | |
| | | Newfield Exploration Co., 5.625% Sr. Unsec. Nts., 7/1/24 | | | 2,025,000 | | | | 2,055,375 | |
| | | | |
| | | Noble Energy, Inc., 5.05% Sr. Unsec. Nts., 11/15/44 | | | 171,000 | | | | 163,878 | |
| | | | |
| | | Novatek OAO via Novatek Finance Ltd., 4.422% Sr. Unsec. Nts., 12/13/221 | | | 915,000 | | | | 797,331 | |
| | | | |
| | | Oasis Petroleum, Inc., 6.875% Sr. Unsec. Nts., 1/15/23 | | | 2,010,000 | | | | 2,010,000 | |
| | | | |
| | | Oil India Ltd., 5.375% Sr. Unsec. Nts., 4/17/24 | | | 1,680,000 | | | | 1,795,115 | |
| | | | |
| | | ONEOK Partners LP, 4.90% Sr. Unsec. Nts., 3/15/25 | | | 328,000 | | | | 324,606 | |
| | | | |
| | | Origin Energy Finance Ltd.: | |
| | | 3.50% Sr. Unsec. Nts., 10/9/181 | | | 2,144,000 | | | | 2,199,813 | |
| | | 5.45% Sr. Unsec. Nts., 10/14/211 | | | 2,180,000 | | | | 2,354,378 | |
| | | | |
| | | Pacific Rubiales Energy Corp., 5.625% Sr. Unsec. Nts., 1/19/251 | | | 1,445,000 | | | | 1,049,431 | |
| | | | |
| | | Peabody Energy Corp., 6% Sr. Unsec. Nts., 11/15/18 | | | 2,410,000 | | | | 1,168,850 | |
| | | | |
| | | Penn Virginia Corp., 8.50% Sr. Unsec. Nts., 5/1/20 | | | 1,220,000 | | | | 1,101,050 | |
| | | | |
| | | Petrobras Global Finance BV: | |
| | | 4.375% Sr. Unsec. Nts., 5/20/23 | | | 425,000 | | | | 371,535 | |
| | | 5.375% Sr. Unsec. Nts., 1/27/21 | | | 420,000 | | | | 405,216 | |
| | | | |
| | | Petroleos de Venezuela SA, 6% Sr. Unsec. Nts., 11/15/261 | | | 2,190,000 | | | | 782,925 | |
| | | | |
| | | Petroleos Mexicanos: | |
| | | 3.50% Sr. Unsec. Nts., 7/23/201 | | | 3,365,000 | | | | 3,410,360 | |
| | | 4.50% Sr. Unsec. Nts., 1/23/261 | | | 3,375,000 | | | | 3,307,163 | |
| | | 5.50% Sr. Unsec. Nts., 6/27/441 | | | 515,000 | | | | 476,375 | |
| | | 5.625% Sr. Unsec. Nts., 1/23/461 | | | 2,945,000 | | | | 2,760,790 | |
| | | | |
| | | Phillips 66 Partners LP, 3.605% Sr. Unsec. Nts., 2/15/25 | | | 128,000 | | | | 120,521 | |
| | | | |
| | | Pioneer Natural Resources Co., 6.65% Sr. Unsec. Nts., 3/15/17 | | | 237,000 | | | | 256,369 | |
| | | | |
| | | Plains All American Pipeline LP/PAA Finance Corp., 3.60% Sr. Unsec. Nts., 11/1/24 | | | 477,000 | | | | 460,622 | |
| | | | |
| | | Range Resources Corp.: | |
| | | 5.00% Sr. Sub. Nts., 8/15/22 | | | 1,160,000 | | | | 1,142,600 | |
| | | 5.00% Sr. Sub. Nts., 3/15/23 | | | 325,000 | | | | 320,125 | |
| | | | |
| | | Reliance Holding USA, Inc., 5.40% Sr. Unsec. Nts., 2/14/221 | | | 420,000 | | | | 453,052 | |
| | | | |
| | | Reliance Industries Ltd., 4.125% Sr. Unsec. Nts., 1/28/251 | | | 1,795,000 | | | | 1,751,925 | |
| | | | |
| | | Reliance Industries Ltd., 5.875% Sr. Unsec. Perpetual Bonds1,10 | | | 85,000 | | | | 85,531 | |
| | | | |
| | | Rice Energy, Inc., 6.25% Sr. Unsec. Nts., 5/1/22 | | | 1,565,000 | | | | 1,561,088 | |
| | | | |
| | | Rosetta Resources, Inc., 5.625% Sr. Unsec. Nts., 5/1/21 | | | 1,525,000 | | | | 1,627,938 | |
| | | | |
| | | Sabine Pass Liquefaction LLC: | |
| | | 5.625% Sr. Sec. Nts., 4/15/23 | | | 1,250,000 | | | | 1,251,950 | |
| | | 5.75% Sr. Sec. Nts., 5/15/24 | | | 575,000 | | | | 575,719 | |
| | | | |
| | | Sanchez Energy Corp.: | |
| | | 6.125% Sr. Unsec. Nts., 1/15/23 | | | 825,000 | | | | 742,500 | |
| | | 7.75% Sr. Unsec. Nts., 6/15/21 | | | 1,695,000 | | | | 1,695,000 | |
| | | | | | | | | | | |
| | | | | | | | | | | |
16 OPPENHEIMER GLOBAL STRATEGIC INCOME FUND/VA
| | | | | | | | |
| | | Principal Amount | | | Value | |
| |
| Oil, Gas & Consumable Fuels (Continued) | |
| |
| SandRidge Energy, Inc., 7.51% Sr. Unsec. Nts., 3/15/21 | | $ | 1,497,000 | | | $ | 666,165 | |
| |
| SM Energy Co., 6.50% Sr. Unsec. Nts., 1/1/23 | | | 1,990,000 | | | | 2,049,700 | |
| |
| Southwestern Energy Co., 4.95% Sr. Unsec. Nts., 1/23/25 | | | 353,000 | | | | 356,800 | |
| |
| Spectra Energy Partners LP: | | | | | |
| 4.50% Sr. Unsec. Nts., 3/15/45 | | | 128,000 | | | | 113,422 | |
| 4.75% Sr. Unsec. Nts., 3/15/24 | | | 486,000 | | | | 515,991 | |
| |
| Summit Midstream Holdings LLC/Summit Midstream Finance Corp., 5.50% Sr. Unsec. Nts., 8/15/22 | | | 1,420,000 | | | | 1,363,200 | |
| |
| Targa Resources Partners LP/Targa Resources Partners Finance Corp.: | |
| 4.125% Sr. Unsec. Nts., 11/15/191 | | | 2,215,000 | | | | 2,203,925 | |
| 5.00% Sr. Unsec. Nts., 1/15/181 | | | 1,655,000 | | | | 1,700,513 | |
| |
| Tesoro Logistics LP/Tesoro Logistics Finance Corp.: | |
| 5.875% Sr. Unsec. Nts., 10/1/20 | | | 1,154,000 | | | | 1,191,505 | |
| 6.25% Sr. Unsec. Nts., 10/15/221 | | | 935,000 | | | | 972,400 | |
| |
| Thai Oil PCL, 4.875% Sr. Unsec. Nts., 1/23/431 | | | 195,000 | | | | 181,543 | |
| |
| Tullow Oil plc, 6% Sr. Unsec. Nts., 11/1/201 | | | 1,681,000 | | | | 1,531,811 | |
| |
| Western Gas Partners LP, 4% Sr. Unsec. Nts., 7/1/22 | | | 408,000 | | | | 409,560 | |
| |
| Whiting Petroleum Corp., 5.75% Sr. Unsec. Nts., 3/15/21 | | | 2,195,000 | | | | 2,170,855 | |
| |
| Williams Partners LP, 4.50% Sr. Unsec. Nts., 11/15/23 | | | 293,000 | | | | 295,468 | |
| |
| Williams Partners LP/ACMP: | | | | | | | | |
| 4.875% Sr. Unsec. Nts., 3/15/24 | | | 680,000 | | | | 669,270 | |
| 6.125% Sr. Unsec. Nts., 7/15/22 | | | 1,390,000 | | | | 1,470,459 | |
| |
| Woodside Finance Ltd., 4.60% Sr. Unsec. Unsub. Nts., 5/10/211 | | | 474,000 | | | | 507,905 | |
| |
| WPX Energy, Inc.: | | | | | |
| 5.25% Sr. Unsec. Nts., 9/15/24 | | | 945,000 | | | | 875,306 | |
| 6.00% Sr. Unsec. Nts., 1/15/22 | | | 1,375,000 | | | | 1,364,688 | |
| |
| YPF SA, 8.50% Sr. Unsec. Nts., 7/28/251 | | | 740,000 | | | | 734,450 | |
| | | | | | | | |
| | | | | | | 126,494,527 | |
|
| |
| Financials—12.4% | | | | | | | | |
| |
| Capital Markets—1.4% | | | | | |
| |
| American Capital Ltd., 6.50% Sr. Unsec. Nts., 9/15/182 | | | 875,000 | | | | 911,094 | |
| |
| Apollo Management Holdings LP, 4% Sr. Unsec. Nts., 5/30/241 | | | 494,000 | | | | 494,521 | |
| |
| Blackstone Holdings Finance Co. LLC, 4.45% Sr. Unsec. Nts., 7/15/451 | | | 632,000 | | | | 578,861 | |
| |
| Cantor Commercial Real Estate Co. LP/CCRE Finance Corp., 7.75% Sr. Unsec. Nts., 2/15/181 | | | 1,880,000 | | | | 1,974,000 | |
| |
| Credit Suisse Group AG: | | | | | | | | |
| 7.50% Jr. Sub. Perpetual Bonds1,3,10 | | | 1,775,000 | | | | 1,853,555 | |
| 7.50% Jr. Sub. Perpetual Bonds3,10 | | | 2,455,000 | | | | 2,566,712 | |
| |
| Credit Suisse, New York, 3.625% Sr. Unsec. Nts., 9/9/24 | | | 800,000 | | | | 795,930 | |
| |
| Deutsche Bank AG, 4.50% Sub. Nts., 4/1/25 | | | 655,000 | | | | 624,828 | |
| |
| Drawbridge Special Opportunities Fund LP/Drawbridge Special Opportunities Finance Corp., 5% Sr. Unsec. Nts., 8/1/212 | | | 3,145,000 | | | | 3,152,863 | |
| |
| Goldman Sachs Group, Inc. (The): | | | | | |
| 5.15% Sub. Nts., 5/22/45 | | | 452,000 | | | | 436,158 | |
| 5.70% Jr. Sub. Perpetual Bonds, Series L3,10 | | | 612,000 | | | | 614,968 | |
| |
| KCG Holdings, Inc., 6.875% Sr. Sec. Nts., 3/15/201 | | | 3,970,000 | | | | 3,840,975 | |
| | | | | | | | | | |
| | | | | Principal Amount | | | Value | |
| | | | |
| | | Capital Markets (Continued) | | | | | |
| | | | |
| | | KKR Group Finance Co. III LLC, 5.125% Sr. Unsec. Nts., 6/1/441 | | | $ 530,000 | | | $ | 507,508 | |
| | | | |
| | | Lazard Group LLC, 3.75% Sr. Unsec. Nts., 2/13/25 | | | 470,000 | | | | 447,489 | |
| | | | |
| | | Morgan Stanley: | | | | | |
| | | 4.30% Sr. Unsec. Nts., 1/27/45 | | | 375,000 | | | | 349,920 | |
| | | 5.00% Sub. Nts., 11/24/25 | | | 578,000 | | | | 605,383 | |
| | | 5.45% Jr. Sub. Perpetual Bonds, Series H3,10 | | | 628,000 | | | | 624,075 | |
| | | | |
| | | Nomura Holdings, Inc., 2% Sr. Unsec. Nts., 9/13/16 | | | 626,000 | | | | 630,688 | |
| | | | |
| | | Prospect Medical Holdings, Inc., 8.375% Sr. Sec. Nts., 5/1/191 | | | 2,160,000 | | | | 2,302,128 | |
| | | | |
| | | Schaeffler Finance BV: | |
| | | 3.25% Sr. Sec. Nts., 5/15/251 | | EUR | 670,000 | | | | 707,692 | |
| | | 4.75% Sr. Sec. Nts., 5/15/231 | | | 135,000 | | | | 132,300 | |
| | | | |
| | | Springleaf Finance Corp., 5.25% Sr. Unsec. Nts., 12/15/19 | | | 1,090,000 | | | | 1,079,100 | |
| | | | |
| | | UBS Preferred Funding Trust V, 6.243% Jr. Sub. Perpetual Bonds, Series 13,10 | | | 824,000 | | | | 844,682 | |
| | | | |
| | | Walter Investment Management Corp., 7.875% Sr. Unsec. Nts., 12/15/21 | | | 2,030,000 | | | | 1,890,438 | |
| | | | | | | | | | | |
| | | | | | | | | | 27,965,868 | |
| | |
| | | | |
| | | Commercial Banks—5.5% | | | | | |
| | | | |
| | | Akbank TAS, 4% Sr. Unsec. Nts., 1/24/201 | | | 925,000 | | | | 903,299 | |
| | | | |
| | | Altice SA, 6.25% Sr. Unsec. Nts., 2/15/251 | | EUR | 1,270,000 | | | | 1,353,165 | |
| | | | |
| | | Astana Finance JSC, 9.16% Sr. Unsec. Nts., 3/14/12 | | | 315,159 | | | | — | |
| | | | |
| | | Banco ABC Brasil SA, 7.875% Sub. Nts., 4/8/201 | | | 230,000 | | | | 239,487 | |
| | | | |
| | | Banco Bilbao Vizcaya Argentaria Colombia SA, 4.875% Sub. Nts., 4/21/251 | | | 725,000 | | | | 710,862 | |
| | | | |
| | | Banco Bilbao Vizcaya Argentaria SA, 7% Jr. Sub. Perpetual Bonds3,10 | | EUR | 4,295,000 | | | | 4,808,631 | |
| | | | |
| | | Banco Continental SA via Continental Senior Trustees Cayman Ltd., 5.50% Sr. Unsec. Nts., 11/18/201 | | | 1,010,000 | | | | 1,095,093 | |
| | | | |
| | | Banco de Credito del Peru/Panama, 5.375% Sr. Unsec. Nts., 9/16/201 | | | 420,000 | | | | 456,750 | |
| | | | |
| | | Banco del Estado de Chile, 4.125% Sr. Unsec. Nts., 10/7/201 | | | 2,060,000 | | | | 2,185,541 | |
| | | | |
| | | Bank of America Corp., 7.75% Jr. Sub. Nts., 5/14/38 | | | 455,000 | | | | 605,941 | |
| | | | |
| | | Bank of Baroda (London), 4.875% Sr. Unsec. Nts., 7/23/191 | | | 420,000 | | | | 448,042 | |
| | | | |
| | | Barclays plc: | | | | | | | | |
| | | 3.65% Sr. Unsec. Nts., 3/16/25 | | | 530,000 | | | | 502,412 | |
| | | 7.00% Jr. Sub. Perpetual Bonds3,10 | | GBP | 4,636,000 | | | | 7,125,495 | |
| | | | |
| | | BNP Paribas SA, 5.945% Jr. Sub. Perpetual Bonds3,10 | | GBP | 4,275,000 | | | | 6,769,151 | |
| | | | |
| | | Brazil Loan Trust 1, 5.477% Sec. Nts., 7/24/232 | | | 1,416,276 | | | | 1,402,113 | |
| | | | |
| | | CIT Group, Inc.: | | | | | |
| | | 3.875% Sr. Unsec. Nts., 2/19/19 | | | 647,000 | | | | 643,765 | |
| | | 4.25% Sr. Unsec. Nts., 8/15/17 | | | 575,000 | | | | 585,062 | |
| | | 5.00% Sr. Unsec. Nts., 8/15/22 | | | 3,205,000 | | | | 3,180,962 | |
| | | | |
| | | Citigroup, Inc.: | | | | | | | | |
| | | 6.675% Sub. Nts., 9/13/43 | | | 296,000 | | | | 358,575 | |
| | | 5.95% Jr. Sub. Perpetual Bonds, Series D3,10 | | | 636,000 | | | | 627,255 | |
| | | | |
| | | Citizens Financial Group, Inc., 5.50% Jr. Sub. Perpetual Bonds1,3,10 | | | 640,000 | | | | 623,600 | |
| | | | | | | | | | | |
17 OPPENHEIMER GLOBAL STRATEGIC INCOME FUND/VA
CONSOLIDATED STATEMENT OF INVESTMENTS Unaudited / Continued
| | | | | | | | |
| | | Principal Amount | | | Value | |
| |
| Commercial Banks (Continued) | |
| |
| Commerzbank AG, 8.125% Sub. Nts., 9/19/231 | | | $ 2,885,000 | | | $ | 3,375,710 | |
| |
| Constellis Holdings LLC/Constellis Finance Corp., 9.75% Sr. Sec. Nts., 5/15/201 | | | 2,095,000 | | | | 2,026,912 | |
| |
| Corp. Financiera de Desarrollo SA, 4.75% Sr. Unsec. Nts., 2/8/221 | | | 1,330,000 | | | | 1,373,890 | |
| |
| Corpbanca SA, 3.875% Sr. Unsec. Nts., 9/22/191 | | | 1,645,000 | | | | 1,672,562 | |
| |
| CorpGroup Banking SA, 6.75% Sr. Unsec. Nts., 3/15/231 | | | 950,000 | | | | 957,715 | |
| |
| Credit Agricole SA: | | | | | |
| 6.637% Jr. Sub. Perpetual Bonds2,3,10 | | | 1,065,000 | | | | 1,112,925 | |
| 8.375% Jr. Sub. Perpetual Bonds2,3,10 | | | 2,835,000 | | | | 3,302,775 | |
| 8.375% Jr. Sub. Perpetual Bonds3,10 | | | 2,730,000 | | | | 3,180,450 | |
| |
| Danske Bank, 5.684% Jr. Sub. Perpetual Bonds3,10 | | GBP | 2,965,000 | | | | 4,777,671 | |
| |
| Export-Import Bank of India: | | | | | |
| 9.50% Sr. Unsec. Nts., 10/9/18 | | INR | 42,000,000 | | | | 684,545 | |
| 9.70% Sr. Unsec. Nts., 11/21/18 | | INR | 50,000,000 | | | | 820,218 | |
| |
| Export-Import Bank of Korea, 2.875% Sr. Unsec. Nts., 1/21/25 | | | 1,685,000 | | | | 1,627,395 | |
| |
| Grupo Aval Ltd., 4.75% Sr. Unsec. Nts., 9/26/221 | | | 2,190,000 | | | | 2,116,088 | |
| |
| HBOS Capital Funding LP, 6.461% Jr. Sub. Perpetual Bonds3,10 | | GBP | 1,410,000 | | | | 2,365,731 | |
| |
| HSBC Holdings plc, 6.375% Jr. Sub. Perpetual Bonds3,10 | | | 3,380,000 | | | | 3,392,675 | |
| |
| ICICI Bank Ltd., 6.375% Jr. Sub. Nts., 4/30/221,3 | | | 925,000 | | | | 955,442 | |
| |
| ICICI Bank Ltd. (Dubai), 4.75% Sr. Unsec. Nts., 11/25/161 | | | 1,350,000 | | | | 1,403,933 | |
| |
| Intesa Sanpaolo SpA, 5.017% Sub. Nts., 6/26/241 | | | 3,345,000 | | | | 3,251,223 | |
| |
| JPMorgan Chase & Co., 6.75% Jr. Sub. Perpetual Bonds, Series S3,10 | | | 520,000 | | | | 556,234 | |
| |
| Krung Thai Bank PCL (Cayman Islands), 5.20% Sub. Nts., 12/26/243 | | | 420,000 | | | | 433,584 | |
| |
| Lloyds Banking Group plc, 6.413% Jr. Sub. Perpetual Bonds1,3,10 | | | 566,000 | | | | 631,090 | |
| |
| NABARD, 8.19% Sr. Unsec. Nts., 6/8/18 | | INR | 20,000,000 | | | | 312,828 | |
| |
| NN Group NV, 4.625% Sub. Nts., 4/8/443 | | EUR | 2,835,000 | | | | 3,267,355 | |
| |
| Rabobank Capital Funding Trust IV, 5.556% Jr. Sub. Perpetual Bonds1,3,10 | | GBP | 150,000 | | | | 251,201 | |
| |
| Royal Bank of Scotland Group plc, 7.64% Jr. Sub. Perpetual Bonds, Series U3,10 | | | 3,805,000 | | | | 4,084,668 | |
| |
| Scottish Widows plc, 5.125% Jr. Sub. Perpetual Bonds3,10 | | GBP | 565,000 | | | | 889,976 | |
| |
| Skandinaviska Enskilda Banken AB, 5.75% Jr. Sub. Perpetual Bonds3,10 | | | 3,390,000 | | | | 3,340,425 | |
| |
| Societe Generale SA: | | | | | | | | |
| 5.922% Jr. Sub. Perpetual Bonds1,3,10 | | | 4,650,000 | | | | 4,783,687 | |
| 5.922% Jr. Sub. Perpetual Bonds3,10 | | | 905,000 | | | | 931,019 | |
| |
| SPCM SA, 2.875% Sr. Unsec. Nts., 6/15/231 | | EUR | 1,645,000 | | | | 1,728,477 | |
| |
| Standard Chartered plc, 6.50% Jr. Sub. Perpetual Bonds1,3,10 | | | 2,310,000 | | | | 2,332,238 | |
| |
| SunTrust Banks, Inc., 5.625% Jr. Sub. Perpetual Bonds3,10 | | | 601,000 | | | | 606,259 | |
| |
| TC Ziraat Bankasi AS, 4.25% Sr. Unsec. Nts., 7/3/191 | | | 2,175,000 | | | | 2,182,613 | |
| |
| Turkiye Garanti Bankasi AS, 5.25% Sr. Unsec. Nts., 9/13/221 | | | 840,000 | | | | 853,608 | |
| |
| Turkiye Halk Bankasi AS: | | | | | | | | |
| 3.875% Sr. Unsec. Nts., 2/5/201 | | | 845,000 | | | | 816,329 | |
| | | | | | | | | | |
| | | | | Principal Amount | | | Value | |
| | | | |
| | | Commercial Banks (Continued) | |
| | | | |
| | | Turkiye Halk Bankasi AS: (Continued) | |
| | | 4.75% Sr. Unsec. Nts., 6/4/191 | | | $ 860,000 | | | $ | 868,376 | |
| | | | |
| | | Turkiye Sise ve Cam Fabrikalari AS, 4.25% Sr. Unsec. Nts., 5/9/201 | | | 705,000 | | | | 693,339 | |
| | | | |
| | | Turkiye Vakiflar Bankasi TAO: | |
| | | 5.00% Sr. Unsec. Nts., 10/31/181 | | | 845,000 | | | | 868,322 | |
| | | 6.875% Sub. Nts., 2/3/251,3 | | | 1,265,000 | | | | 1,249,137 | |
| | | | |
| | | Wells Fargo & Co.: | | | | | | | | |
| | | 5.875% Jr. Sub. Perpetual Bonds3,10 | | | 225,000 | | | | 230,636 | |
| | | 5.90% Jr. Sub. Perpetual Bonds, Series S3,10 | | | 485,000 | | | | 487,425 | |
| | | | |
| | | Woori Bank: | | | | | | | | |
| | | 4.75% Sub. Nts., 4/30/241 | | | 1,862,000 | | | | 1,928,321 | |
| | | 5.00% Jr. Sub. Nts., 6/10/451,3 | | | 635,000 | | | | 628,074 | |
| | | | |
| | | Yapi ve Kredi Bankasi AS, 5.125% Sr. Unsec. Nts., 10/22/191 | | | 840,000 | | | | 856,824 | |
| | | | | | | | | | | |
| | | | | | | | | | 108,835,106 | |
| | |
| | | | |
| | | Consumer Finance—1.0% | | | | | |
| | | | |
| | | Ahern Rentals, Inc., 7.375% Sec. Nts., 5/15/231 | | | 2,090,000 | | | | 2,074,325 | |
| | | | |
| | | Ally Financial, Inc.: | | | | | | | | |
| | | 4.625% Sr. Unsec. Nts., 5/19/22 | | | 2,195,000 | | | | 2,170,306 | |
| | | 5.125% Sr. Unsec. Nts., 9/30/24 | | | 2,135,000 | | | | 2,148,344 | |
| | | 8.00% Sr. Unsec. Nts., 11/1/31 | | | 497,000 | | | | 597,021 | |
| | | | |
| | | Capital One Financial Corp.: | | | | | |
| | | 3.20% Sr. Unsec. Nts., 2/5/25 | | | 514,000 | | | | 485,637 | |
| | | 5.55% Jr. Sub. Perpetual Bonds3,10 | | | 632,000 | | | | 628,050 | |
| | | | |
| | | Cash America International, Inc., 5.75% Sr. Unsec. Nts., 5/15/18 | | | 1,045,000 | | | | 1,063,287 | |
| | | | |
| | | Discover Financial Services, 3.75% Sr. Unsec. Nts., 3/4/25 | | | 980,000 | | | | 936,187 | |
| | | | |
| | | Navient Corp.: | | | | | | | | |
| | | 5.875% Sr. Unsec. Nts., 10/25/24 | | | 735,000 | | | | 692,738 | |
| | | 6.125% Sr. Unsec. Nts., 3/25/24 | | | 2,640,000 | | | | 2,534,400 | |
| | | 7.25% Sr. Unsec. Nts., 1/25/22 | | | 2,230,000 | | | | 2,358,225 | |
| | | | |
| | | Speedy Cash Intermediate Holdings Corp., 10.75% Sec. Nts., 5/15/181 | | | 1,735,000 | | | | 1,648,250 | |
| | | | |
| | | Synchrony Financial, 2.70% Sr. Unsec. Nts., 2/3/20 | | | 499,000 | | | | 493,033 | |
| | | | |
| | | TMX Finance LLC/TitleMax Finance Corp., 8.50% Sr. Sec. Nts., 9/15/181 | | | 2,285,000 | | | | 1,885,125 | |
| | | | | | | | | | | |
| | | | | | | | | | 19,714,928 | |
| | |
| | | | |
| | | Diversified Financial Services—1.5% | |
| | | | |
| | | ABN AMRO Bank NV, 4.31% Jr. Sub. Perpetual Bonds3,10 | | EUR | 6,285,000 | | | | 7,090,213 | |
| | | | |
| | | Baggot Securities Ltd., 10.24% Jr. Sub. Perpetual Bonds1,10 | | EUR | 3,020,000 | | | | 3,481,256 | |
| | | | |
| | | Banco BTG Pactual SA (Cayman Islands): | |
| | | 4.00% Sr. Unsec. Nts., 1/16/201 | | | 2,085,000 | | | | 1,965,112 | |
| | | 5.75% Sub. Nts., 9/28/221 | | | 380,000 | | | | 351,500 | |
| | | | |
| | | Capsugel SA, 7% Sr. Unsec. Nts., | | | | | | | | |
| | | 5/15/191,11 | | | 1,500,000 | | | | 1,529,235 | |
| | | | |
| | | Corp. Financiera de Desarrollo SA, | | | | | | | | |
| | | 5.25% Sub. Nts., 7/15/291,3 | | | 415,000 | | | | 419,150 | |
| | | | |
| | | Export Credit Bank of Turkey, 5.875% | | | | | | | | |
| | | Sr. Unsec. Nts., 4/24/191 | | | 3,270,000 | | | | 3,462,675 | |
| | | | |
| | | FTE Verwaltungs GmbH, 9% Sr. Sec. | | | | | | | | |
| | | Nts., 7/15/201 | | EUR | 1,545,000 | | | | 1,845,167 | |
| | | | |
| | | Global Bank Corp., 5.125% Sr. Unsec. Nts., 10/30/191 | | | 1,405,000 | | | | 1,430,290 | |
| | | | |
| | | InRetail Consumer, 5.25% Sr. Unsec. Nts., 10/10/211 | | | 310,000 | | | | 320,463 | |
| | | | |
| | | Intercorp Peru Ltd., 5.875% Sr. Unsec. Nts., 2/12/251 | | | 390,000 | | | | 392,301 | |
| | | | |
| | | Jefferies Finance LLC/JFIN Co.-Issuer Corp., 7.375% Sr. Unsec. Nts., 4/1/201 | | | 1,015,000 | | | | 1,002,313 | |
| | | | | | | | | | | |
18 OPPENHEIMER GLOBAL STRATEGIC INCOME FUND/VA
| | | | | | | | |
| | | Principal Amount | | | Value | |
| |
| Diversified Financial Services (Continued) | | | | | |
| |
| Jefferies LoanCore LLC/JLC Finance Corp., 6.875% Sr. Unsec. Nts., 6/1/201 | | | $ 1,470,000 | | | $ | 1,433,250 | |
| |
| JPMorgan Hipotecaria su Casita, 6.47% Sec. Nts., 8/26/352,15 | | MXN | 5,808,600 | | | | 37,587 | |
| |
| National Savings Bank, 8.875% Sr. Unsec. Nts., 9/18/181 | | | 1,335,000 | | | | 1,450,211 | |
| |
| Odebrecht Finance Ltd., 5.25% Sr. Unsec. Nts., 6/27/291 | | | 725,000 | | | | 547,520 | |
| |
| Peachtree Corners Funding Trust, 3.976% Sr. Unsec. Nts., 2/15/251 | | | 331,000 | | | | 328,400 | |
| |
| Power Finance Corp., 8.29% Sr. Unsec. Nts., 6/13/18 | | INR | 40,000,000 | | | | 628,438 | |
| |
| Rural Electrification Corp. Ltd., 9.04% Sr. Unsec. Nts., 10/12/19 | | INR | 60,000,000 | | | | 958,907 | |
| |
| Voya Financial, Inc., 5.65% Jr. Sub. Nts., 5/15/533 | | | 595,000 | | | | 609,875 | |
| | | | | | | | |
| | | | | | | 29,283,863 | |
|
| |
| Insurance—1.3% | | | | | | | | |
| |
| Assicurazioni Generali SpA, 7.75% Sr. Sub. Nts., 12/12/423 | | EUR | 1,650,000 | | | | 2,196,145 | |
| |
| Aviva plc: | | | | | | | | |
| 5.902% Jr. Sub. Perpetual Bonds3,10 | | GBP | 750,000 | | | | 1,233,235 | |
| 6.125% Jr. Sub. Perpetual Bonds3,10 | | GBP | 2,760,000 | | | | 4,575,686 | |
| |
| AXIS Specialty Finance plc, 5.15% Sr. Unsec. Nts., 4/1/45 | | | 480,000 | | | | 487,172 | |
| |
| CNO Financial Group, Inc., 4.50% Sr. Unsec. Nts., 5/30/20 | | | 2,195,000 | | | | 2,233,412 | |
| |
| Five Corners Funding Trust, 4.419% Unsec. Nts., 11/15/231 | | | 467,000 | | | | 482,598 | |
| |
| HUB International Ltd., 7.875% Sr. Unsec. Nts., 10/1/211 | | | 2,695,000 | | | | 2,755,637 | |
| |
| Liberty Mutual Group, Inc.: | |
| 4.25% Sr. Unsec. Nts., 6/15/231 | | | 550,000 | | | | 565,854 | |
| 4.85% Sr. Unsec. Nts., 8/1/441 | | | 359,000 | | | | 346,945 | |
| |
| Lincoln National Corp., 6.05% Jr. Unsec. Sub. Nts., 4/20/673 | | | 601,000 | | | | 545,407 | |
| |
| MetLife, Inc., 5.25% Jr. Sub. Perpetual Bonds3,10 | | | 446,000 | | | | 443,213 | |
| |
| National Financial Partners Corp., 9% Sr. Unsec. Nts., 7/15/211 | | | 2,510,000 | | | | 2,488,038 | |
| |
| Prudential Financial, Inc., 5.375% Jr. Sub. Nts., 5/15/453 | | | 505,000 | | | | 497,425 | |
| |
| Swiss Re Capital I LP, 6.854% Jr. Sub. Perpetual Bonds2,3,10 | | | 1,790,000 | | | | 1,846,385 | |
| |
| Swiss Reinsurance Co. via ELM BV, 6.302% Sub. Nts.3,10 | | GBP | 2,745,000 | | | | 4,652,736 | |
| |
| TIAA Asset Management Finance Co. LLC, 4.125% Sr. Unsec. Nts., 11/1/241 | | | 573,000 | | | | 577,373 | |
| |
| XLIT Ltd., 6.50% Jr. Sub. Perpetual Bonds3,10 | | | 360,000 | | | | 308,927 | |
| |
| ZFS Finance USA Trust V, 6.50% Jr. Sub. Nts., 5/9/372,3 | | | 600,000 | | | | 625,500 | |
| | | | | | | | |
| | | | | | | 26,861,688 | |
|
| |
| Real Estate Investment Trusts (REITs)—0.8% | |
| |
| American Tower Corp.: | |
| 2.80% Sr. Unsec. Nts., 6/1/20 | | | 275,000 | | | | 271,245 | |
| 5.90% Sr. Unsec. Nts., 11/1/21 | | | 279,000 | | | | 314,370 | |
| |
| Banco Invex SA/Hipotecaria Credito y Casa SA de CV, 6.45% Sec. Nts., 3/13/347,15 | | MXN | 4,830,531 | | | | — | |
| |
| Communications Sales & Leasing, Inc., 8.25% Sr. Unsec. Nts., 10/15/231 | | | 2,320,000 | | | | 2,288,100 | |
| |
| Corrections Corp. of America, 4.625% Sr. Unsec. Nts., 5/1/23 | | | 635,000 | | | | 625,475 | |
| |
| CTR Partnership LP/CareTrust Capital Corp., 5.875% Sr. Unsec. Nts., 6/1/21 | | | 1,645,000 | | | | 1,682,012 | |
| | | | | | | | | | |
| | | | | Principal Amount | | | Value | |
| | | | |
| | | Real Estate Investment Trusts (REITs) (Continued) | |
| | | | |
| | | DuPont Fabros Technology LP, 5.875% Sr. Unsec. Nts., 9/15/21 | | | $ 1,535,000 | | | $ | 1,561,862 | |
| | | | |
| | | First Industrial LP, 7.50% Sr. Unsec. Nts., 12/1/17 | | | 540,000 | | | | 601,271 | |
| | | | |
| | | HCP, Inc., 5.625% Sr. Unsec. Nts., 5/1/17 | | | 185,000 | | | | 197,786 | |
| | | | |
| | | Health Care REIT, Inc., 2.25% Sr. Unsec. Nts., 3/15/18 | | | 130,000 | | | | 130,983 | |
| | | | |
| | | Highwoods Realty LP, 7.50% Sr. Unsec. Nts., 4/15/18 | | | 542,000 | | | | 619,056 | |
| | | | |
| | | Host Hotels & Resorts LP, 3.75% Sr. Unsec. Nts., 10/15/23 | | | 357,000 | | | | 350,369 | |
| | | | |
| | | iStar Financial, Inc., 4.875% Sr. Unsec. Nts., 7/1/18 | | | 2,145,000 | | | | 2,118,188 | |
| | | | |
| | | Outfront Media Capital LLC/Outfront Media Capital Corp., 5.875% Sr. Unsec. Nts., 3/15/25 | | | 2,040,000 | | | | 2,119,050 | |
| | | | |
| | | Prologis LP, 4% Sr. Unsec. Nts., 1/15/18 | | | 325,000 | | | | 341,192 | |
| | | | |
| | | Regency Centers LP, 5.875% Sr. Unsec. Nts., 6/15/17 | | | 71,000 | | | | 76,762 | |
| | | | |
| | | TRUST F/1401, 5.25% Sr. Unsec. Nts., 12/15/241 | | | 1,245,000 | | | | 1,301,025 | |
| | | | |
| | | WEA Finance LLC/Westfield UK & Europe Finance plc, 1.75% Sr. Unsec. Nts., 9/15/171 | | | 434,000 | | | | 435,370 | |
| | | | | | | | | | | |
| | | | | | | | | | 15,034,116 | |
| | |
| | | | |
| | | Real Estate Management & Development—0.5% | |
| | | | |
| | | Brookfield Residential Properties, Inc., 6.50% Sr. Unsec. Nts., 12/15/201 | | | 2,025,000 | | | | 2,025,851 | |
| | | | |
| | | EMG SUKUK Ltd., 4.564% Sr. Unsec. Nts., 6/18/24 | | | 1,415,000 | | | | 1,461,641 | |
| | | | |
| | | Jafz Sukuk Ltd., 7% Sr. Unsec. Nts., 6/19/19 | | | 860,000 | | | | 979,463 | |
| | | | |
| | | Realogy Group LLC: | | | | | | | | |
| | | 7.625% Sr. Sec. Nts., 1/15/201 | | | 1,330,000 | | | | 1,415,120 | |
| | | 9.00% Sr. Sec. Nts., 1/15/202 | | | 865,000 | | | | 936,363 | |
| | | | |
| | | Realogy Group LLC/Realogy Co.-Issuer Corp., 5.25% Sr. Unsec. Nts., 12/1/211 | | | 1,605,000 | | | | 1,631,081 | |
| | | | |
| | | Sukuk Funding No. 3 Ltd., 4.348% Sr. Unsec. Nts., 12/3/18 | | | 810,000 | | | | 852,379 | |
| | | | |
| | | Techem GmbH, 6.125% Sr. Sec. Nts., 10/1/191 | | EUR | 1,025,000 | | | | 1,197,127 | |
| | | | | | | | | | | |
| | | | | | | | | | 10,499,025 | |
| | |
| | | | |
| | | Thrifts & Mortgage Finance—0.4% | |
| | | | |
| | | Housing Development Finance Corp. Ltd.: | |
| | | 8.70% Sr. Sec. Nts., 4/26/18 | | INR | 60,000,000 | | | | 943,244 | |
| | | 8.95% Sec. Nts., 10/19/20 | | INR | 31,000,000 | | | | 491,756 | |
| | | | |
| | | Jefferies Finance LLC/JFIN Co.-Issuer Corp., 6.875% Sr. Unsec. Nts., 4/15/221 | | | 500,000 | | | | 490,000 | |
| | | | |
| | | Quicken Loans, Inc., 5.75% Sr. Unsec. Nts., 5/1/251 | | | 2,135,000 | | | | 2,049,600 | |
| | | | |
| | | Radian Group, Inc., 5.25% Sr. Unsec. Nts., 6/15/20 | | | 4,115,000 | | | | 4,104,712 | |
| | | | | | | | | | | |
| | | | | | | | | | 8,079,312 | |
| | |
| | | | |
| | | Health Care—4.0% | | | | | | | | |
| | | | |
| | | Biotechnology—0.0% | |
| | | | |
| | | Baxalta, Inc., 5.25% Sr. Unsec. Nts., 6/23/451 | | | 184,000 | | | | 184,770 | |
| | | | |
| | | Universal Hospital Services, Inc., 7.625% Sec. Nts., 8/15/20 | | | 725,000 | | | | 670,625 | |
| | | | | | | | | | | |
| | | | | | | | | | 855,395 | |
| | | | | | | | | | | |
| | | | | | | | | | | |
| | | | | | | | | | | |
| | | | | | | | | | | |
19 OPPENHEIMER GLOBAL STRATEGIC INCOME FUND/VA
CONSOLIDATED STATEMENT OF INVESTMENTS Unaudited / Continued
| | | | | | | | |
| | | Principal Amount | | | Value | |
| |
| Health Care Equipment & Supplies—0.3% | |
| |
| Becton Dickinson & Co., 3.875% Sr. Unsec. Nts., 5/15/24 | | $ | 264,000 | | | $ | 265,144 | |
| |
| DJO Finco, Inc./DJO Finance LLC/DJO Finance Corp., 8.125% Sec. Nts., 6/15/211 | | | 1,400,000 | | | | 1,445,500 | |
| |
| Hologic, Inc., 5.25% Sr. Unsec. Nts., 7/15/221,6 | | | 2,405,000 | | | | 2,462,119 | |
| |
| Kinetic Concepts, Inc./KCI USA, Inc., 10.50% Sec. Nts., 11/1/18 | | | 1,840,000 | | | | 1,968,837 | |
| |
| Zimmer Biomet Holdings, Inc., 3.55% Sr. Unsec. Nts., 4/1/25 | | | 193,000 | | | | 187,174 | |
| | | | | | | | |
| | | | | | | 6,328,774 | |
|
| |
| Health Care Providers & Services—2.6% | |
| |
| Acadia Healthcare Co., Inc.: | | | | | |
| 5.625% Sr. Unsec. Nts., 2/15/231 | | | 930,000 | | | | 946,275 | |
| 6.125% Sr. Unsec. Nts., 3/15/21 | | | 440,000 | | | | 455,400 | |
| |
| Amsurg Corp.: | | | | | | | | |
| 5.625% Sr. Unsec. Nts., 11/30/20 | | | 375,000 | | | | 383,437 | |
| 5.625% Sr. Unsec. Nts., 7/15/22 | | | 945,000 | | | | 956,813 | |
| |
| Cardinal Health, Inc., 3.50% Sr. Unsec. Nts., 11/15/24 | | | 297,000 | | | | 292,204 | |
| |
| Centene Corp., 4.75% Sr. Unsec. Nts., 5/15/22 | | | 2,790,000 | | | | 2,887,650 | |
| |
| CHS/Community Health Systems, Inc.: | | | | | |
| 5.125% Sr. Sec. Nts., 8/1/21 | | | 600,000 | | | | 612,750 | |
| 6.875% Sr. Unsec. Nts., 2/1/22 | | | 4,290,000 | | | | 4,542,037 | |
| 7.125% Sr. Unsec. Nts., 7/15/20 | | | 970,000 | | | | 1,030,140 | |
| |
| DaVita HealthCare Partners, Inc.: | | | | | |
| 5.00% Sr. Unsec. Nts., 5/1/25 | | | 1,160,000 | | | | 1,119,400 | |
| 5.125% Sr. Unsec. Nts., 7/15/24 | | | 3,455,000 | | | | 3,403,175 | |
| 5.75% Sr. Unsec. Nts., 8/15/22 | | | 895,000 | | | | 952,056 | |
| |
| Envision Healthcare Corp., 5.125% Sr. Unsec. Nts., 7/1/221 | | | 3,195,000 | | | | 3,226,950 | |
| |
| FGI Operating Co. LLC/FGI Finance, Inc., 7.875% Sec. Nts., 5/1/20 | | | 3,945,000 | | | | 3,037,650 | |
| |
| Fresenius Medical Care US Finance II, Inc.: | |
| 4.75% Sr. Unsec. Nts., 10/15/241 | | | 1,290,000 | | | | 1,283,550 | |
| 5.875% Sr. Unsec. Nts., 1/31/221 | | | 405,000 | | | | 433,350 | |
| |
| HCA, Inc.: | | | | | | | | |
| 5.375% Sr. Unsec. Nts., 2/1/25 | | | 700,000 | | | | 708,750 | |
| 5.875% Sr. Unsec. Nts., 5/1/23 | | | 3,480,000 | | | | 3,706,200 | |
| 7.50% Sr. Unsec. Nts., 2/15/22 | | | 2,695,000 | | | | 3,099,250 | |
| |
| HealthSouth Corp., 5.75% Sr. Unsec. Nts., 11/1/24 | | | 1,970,000 | | | | 2,024,175 | |
| |
| Kindred Healthcare, Inc., 6.375% Sr. Unsec. Nts., 4/15/22 | | | 1,395,000 | | | | 1,398,487 | |
| |
| Laboratory Corp. of America Holdings, 3.60% Sr. Unsec. Nts., 2/1/25 | | | 907,000 | | | | 866,157 | |
| |
| LifePoint Health, Inc., 5.50% Sr. Unsec. Nts., 12/1/21 | | | 2,025,000 | | | | 2,095,875 | |
| |
| McKesson Corp., 4.883% Sr. Unsec. Nts., 3/15/44 | | | 259,000 | | | | 258,036 | |
| |
| Medco Health Solutions, Inc., 7.125% Sr. Unsec. Nts., 3/15/18 | | | 261,000 | | | | 297,142 | |
| |
| OCP SA, 4.50% Sr. Unsec. Nts., 10/22/251 | | | 905,000 | | | | 863,144 | |
| |
| Omnicare, Inc., 4.75% Sr. Unsec. Nts., 12/1/22 | | | 1,765,000 | | | | 1,879,725 | |
| |
| Select Medical Corp., 6.375% Sr. Unsec. Nts., 6/1/21 | | | 1,750,000 | | | | 1,776,250 | |
| |
| Tenet Healthcare Corp.: | | | | | | | | |
| 6.75% Sr. Unsec. Nts., 6/15/231 | | | 4,825,000 | | | | 4,930,547 | |
| 8.125% Sr. Unsec. Nts., 4/1/22 | | | 1,445,000 | | | | 1,585,888 | |
| |
| Universal Health Services, Inc., 4.75% Sr. Sec. Nts., 8/1/221 | | | 1,000,000 | | | | 1,031,875 | |
| | | | | | | | |
| | | | | | | 52,084,338 | |
| | | | | | | | | | |
| | | | | Principal Amount | | | Value | |
| | | | |
| | | Life Sciences Tools & Services—0.1% | |
| | | | |
| | | Quintiles Transnational Corp., 4.875% Sr. Unsec. Nts., 5/15/231 | | | $ 1,627,000 | | | $ | 1,639,203 | |
| | |
| | | | |
| | | Pharmaceuticals—1.0% | |
| | | | |
| | | AbbVie, Inc.: | | | | | | | | |
| | | 3.60% Sr. Unsec. Nts., 5/14/25 | | | 313,000 | | | | 309,523 | |
| | | 4.70% Sr. Unsec. Nts., 5/14/45 | | | 125,000 | | | | 123,768 | |
| | | | |
| | | Actavis Funding SCS: | |
| | | 1.85% Sr. Unsec. Nts., 3/1/17 | | | 645,000 | | | | 648,329 | |
| | | 3.80% Sr. Unsec. Nts., 3/15/25 | | | 547,000 | | | | 537,593 | |
| | | 4.75% Sr. Unsec. Nts., 3/15/45 | | | 271,000 | | | | 257,869 | |
| | | | |
| | | Almirall SA, 4.625% Sr. Unsec. Nts., 4/1/21 | | EUR | 1,445,000 | | | | 1,677,603 | |
| | | | |
| | | Concordia Healthcare Corp., 7% Sr. Unsec. Nts., 4/15/231 | | | 1,625,000 | | | | 1,629,062 | |
| | | | |
| | | Endo Finance LLC/Endo Finco, Inc., 5.375% Sr. Unsec. Nts., 1/15/231 | | | 2,500,000 | | | | 2,475,000 | |
| | | | |
| | | Endo Finance LLC/Endo Ltd./Endo Finco, Inc.: | |
| | | 6.00% Sr. Unsec. Nts., 7/15/231,6 | | | 1,205,000 | | | | 1,235,125 | |
| | | 6.00% Sr. Unsec. Nts., 2/1/251 | | | 210,000 | | | | 214,462 | |
| | | | |
| | | Hospira, Inc.: | | | | | | | | |
| | | 5.20% Sr. Unsec. Nts., 8/12/20 | | | 99,000 | | | | 110,690 | |
| | | 6.05% Sr. Unsec. Nts., 3/30/17 | | | 259,000 | | | | 278,752 | |
| | | | |
| | | Mallinckrodt International Finance SA/Mallinckrodt CB LLC: | |
| | | 4.875% Sr. Unsec. Nts., 4/15/201 | | | 1,160,000 | | | | 1,184,708 | |
| | | 5.50% Sr. Unsec. Nts., 4/15/251 | | | 1,160,000 | | | | 1,129,550 | |
| | | 5.75% Sr. Unsec. Nts., 8/1/221 | | | 1,660,000 | | | | 1,699,425 | |
| | | | |
| | | Valeant Pharmaceuticals International, Inc.: | |
| | | 5.375% Sr. Unsec. Nts., 3/15/201 | | | 935,000 | | | | 967,725 | |
| | | 5.50% Sr. Unsec. Nts., 3/1/231 | | | 2,330,000 | | | | 2,359,125 | |
| | | 5.875% Sr. Unsec. Nts., 5/15/231 | | | 555,000 | | | | 569,569 | |
| | | 7.25% Sr. Unsec. Nts., 7/15/221 | | | 1,595,000 | | | | 1,700,669 | |
| | | | | | | | | | | |
| | | | | | | | | | 19,108,547 | |
| | |
| | | | |
| | | Industrials—8.5% | | | | | | | | |
| | | | |
| | | Aerospace & Defense—1.5% | |
| | | | |
| | | Aerojet Rocketdyne Holdings, Inc., 7.125% Sec. Nts., 3/15/21 | | | 3,980,000 | | | | 4,258,600 | |
| | | | |
| | | BAE Systems Holdings, Inc., 3.80% Sr. Unsec. Nts., 10/7/241 | | | 368,000 | | | | 369,687 | |
| | | | |
| | | BOC Aviation Pte Ltd., 3% Sr. Unsec. Nts., 3/30/201 | | | 1,280,000 | | | | 1,259,881 | |
| | | | |
| | | CBC Ammo LLC/CBC FinCo, Inc., 7.25% Sr. Unsec. Nts., 11/15/211 | | | 4,450,000 | | | | 4,194,125 | |
| | | | |
| | | Embraer Netherlands Finance BV, 5.05% Sr. Unsec. Nts., 6/15/25 | | | 1,025,000 | | | | 1,027,562 | |
| | | | |
| | | Erickson, Inc., 8.25% Sec. Nts., 5/1/20 | | | 3,057,000 | | | | 2,430,315 | |
| | | | |
| | | Huntington Ingalls Industries, Inc., 7.125% Sr. Unsec. Unsub. Nts., 3/15/21 | | | 1,940,000 | | | | 2,066,100 | |
| | | | |
| | | KLX, Inc., 5.875% Sr. Unsec. Nts., 12/1/221 | | | 3,070,000 | | | | 3,115,712 | |
| | | | |
| | | Kratos Defense & Security Solutions, Inc., 7% Sr. Sec. Nts., 5/15/19 | | | 2,485,000 | | | | 2,276,881 | |
| | | | |
| | | L-3 Communications Corp., 1.50% Sr. Unsec. Nts., 5/28/17 | | | 173,000 | | | | 171,867 | |
| | | | |
| | | LMI Aerospace, Inc., 7.375% Sec. Nts., 7/15/19 | | | 2,170,000 | | | | 2,164,575 | |
| | | | |
| | | Northrop Grumman Corp., 4.75% Sr. Unsec. Nts., 6/1/43 | | | 160,000 | | | | 161,682 | |
| | | | |
| | | Sequa Corp., 7% Sr. Unsec. Nts., 12/15/172 | | | 2,365,000 | | | | 1,620,025 | |
| | | | |
| | | Spirit AeroSystems, Inc., 5.25% Sr. Unsec. Nts., 3/15/22 | | | 2,165,000 | | | | 2,246,188 | |
| | | | |
| | | TransDigm, Inc., 6% Sr. Sub. Nts., 7/15/22 | | | 780,000 | | | | 774,150 | |
| | | | |
| | | Triumph Group, Inc., 5.25% Sr. Unsec. Nts., 6/1/22 | | | 2,555,000 | | | | 2,535,838 | |
| | | | | | | | | | | |
| | | | | | | | | | 30,673,188 | |
| | | | | | | | | | | |
20 OPPENHEIMER GLOBAL STRATEGIC INCOME FUND/VA
| | | | | | | | | | |
| | | Principal Amount | | | Value | | | |
| | | |
| Air Freight & Couriers—0.7% | | | |
| | | |
| CEVA Group plc, 7% Sr. Sec. Nts., 3/1/211 | | $ | 7,950,000 | | | $ | 7,711,500 | | | |
| | | |
| Kazakhstan Temir Zholy Finance BV, 6.95% Sr. Unsec. Nts., 7/10/421 | | | 190,000 | | | | 183,924 | | | |
| | | |
| Pelabuhan Indonesia II PT, 4.25% Sr. Unsec. Nts., 5/5/251 | | | 910,000 | | | | 857,584 | | | |
| | | |
| SPL Logistics Escrow LLC/SPL Logistics Finance Corp., 8.875% Sr. Sec. Nts., 8/1/201 | | | 2,560,000 | | | | 2,726,400 | | | |
| | | |
| XPO Logistics, Inc., 7.875% Sr. Unsec. Nts., 9/1/191 | | | 1,870,000 | | | | 2,007,912 | | | |
| | | | | | | | | | |
| | | | | | | 13,487,320 | | | |
| | | |
| Airlines—0.4% | | | |
| | | |
| Air Canada, 6.75% Sr. Sec. Nts., 10/1/191 | | | 3,945,000 | | | | 4,191,563 | | | |
| | | |
| Air Medical Merger Sub Corp., 6.375% Sr. Unsec. Nts., 5/15/231 | | | 1,160,000 | | | | 1,096,200 | | | |
| | | |
| Emirates Airline, 4.50% Sr. Unsec. Nts., 2/6/251 | | | 1,157,142 | | | | 1,170,449 | | | |
| | | |
| US Airways 2011-1 Class A Pass Through Trust, 7.125% Pass-Through Certificates, 10/22/23 | | | 1,082,554 | | | | 1,255,763 | | | |
| | | | | | | | | | |
| | | | | | | 7,713,975 | | | |
| | | |
| Building Products—0.6% | | | |
| | | |
| Building Materials Corp. of America: | | | |
| 5.375% Sr. Unsec. Nts., 11/15/241 | | | 1,860,000 | | | | 1,835,541 | | | |
| 6.75% Sr. Unsec. Nts., 5/1/211 | | | 2,455,000 | | | | 2,568,544 | | | |
| | | |
| Nortek, Inc., 8.50% Sr. Unsec. Nts., 4/15/21 | | | 3,840,000 | | | | 4,118,400 | | | |
| | | |
| Owens Corning, 4.20% Sr. Unsec. Nts., 12/15/22 | | | 530,000 | | | | 537,393 | | | |
| | | |
| USG Corp., 5.50% Sr. Unsec. Nts., 3/1/251 | | | 2,000,000 | | | | 2,000,000 | | | |
| | | | | | | | | | |
| | | | | | | 11,059,878 | | | |
| | | |
| Commercial Services & Supplies—1.6% | | | |
| | | |
| ADT Corp. (The), 5.25% Sr. Unsec. Nts., 3/15/20 | | | 4,135,000 | | | | 4,352,087 | | | |
| | | |
| Affinion Group, Inc., 7.875% Sr. Unsec. Nts., 12/15/18 | | | 3,020,000 | | | | 2,023,400 | | | |
| | | |
| Cenveo Corp.: | | | |
| 6.00% Sr. Sec. Nts., 8/1/191 | | | 2,925,000 | | | | 2,764,125 | | | |
| 8.50% Sec. Nts., 9/15/221 | | | 2,550,000 | | | | 2,142,000 | | | |
| | | |
| First Data Corp., 6.75% Sr. Sec. Nts., 11/1/201 | | | 4,319,000 | | | | 4,575,462 | | | |
| | | |
| Monitronics International, Inc., 9.125% Sr. Unsec. Nts., 4/1/20 | | | 3,090,000 | | | | 2,997,300 | | | |
| | | |
| Pitney Bowes, Inc., 4.625% Sr. Unsec. Nts., 3/15/24 | | | 739,000 | | | | 745,655 | | | |
| | | |
| Quad/Graphics, Inc., 7% Sr. Unsec. Nts., 5/1/22 | | | 2,745,000 | | | | 2,683,238 | | | |
| | | |
| R.R. Donnelley & Sons Co.: | | | |
| 7.625% Sr. Unsec. Nts., 6/15/20 | | | 565,000 | | | | 637,037 | | | |
| 7.875% Sr. Unsec. Nts., 3/15/21 | | | 2,225,000 | | | | 2,519,813 | | | |
| | | |
| West Corp., 5.375% Sr. Unsec. Nts., 7/15/221 | | | 7,270,000 | | | | 6,824,713 | | | |
| | | | | | | | | | |
| | | | | | | 32,264,830 | | | |
| | | |
| Electrical Equipment—0.4% | | | |
| | | |
| EnerSys, 5% Sr. Unsec. Nts., 4/30/231 | | | 2,090,000 | | | | 2,077,585 | | | |
| | | |
| General Cable Corp., 5.75% Sr. Unsec. Nts., 10/1/22 | | | 2,615,000 | | | | 2,464,638 | | | |
| | | |
| Sensata Technologies BV: | | | |
| 4.875% Sr. Unsec. Nts., 10/15/231 | | | 329,000 | | | | 326,121 | | | |
| 5.625% Sr. Unsec. Nts., 11/1/241 | | | 2,775,000 | | | | 2,868,656 | | | |
| | | | | | | | | | |
| | | | | | | 7,737,000 | | | |
| | | | | | | | | | |
| | | | | | | | | | |
| | | | | | | | | | |
| | | | | | | | | | |
| | | | | | | | | | |
| | | | | | | | | | |
| | | | | | | | | | |
| | | | | | | | | | |
| | | | | | | | | | |
| | | | | | | | |
| | | Principal Amount | | | Value | |
| |
| Industrial Conglomerates—0.3% | |
| |
| Alfa SAB de CV, 5.25% Sr. Unsec. Nts., 3/25/241 | | | $ 835,000 | | | $ | 860,050 | |
| |
| CITIC Ltd.: | |
| 6.625% Sr. Unsec. Nts., 4/15/21 | | | 420,000 | | | | 480,690 | |
| 6.80% Sr. Unsec. Nts., 1/17/23 | | | 420,000 | | | | 486,612 | |
| 7.875% Sub. Perpetual Bonds3,10 | | | 420,000 | | | | 437,850 | |
| |
| General Electric Capital Corp., 6.25% Jr. Sub. Perpetual Bonds, Series B3,10 | | | 1,316,000 | | | | 1,441,020 | |
| |
| KOC Holding AS, 3.50% Sr. Unsec. Nts., 4/24/201 | | | 1,880,000 | | | | 1,847,251 | |
| |
| Synchrony Financial, 4.25% Sr. Unsec. Nts., 8/15/24 | | | 155,000 | | | | 155,735 | |
| | | | | | | | |
| | | | | | | 5,709,208 | |
| |
| Machinery—1.1% | | | | | | | | |
| |
| Actuant Corp., 5.625% Sr. Unsec. Nts., 6/15/22 | | | 1,645,000 | | | | 1,682,012 | |
| |
| Amsted Industries, Inc., 5% Sr. Unsec. Nts., 3/15/222 | | | 3,010,000 | | | | 3,021,287 | |
| |
| Cleaver-Brooks, Inc., 8.75% Sr. Sec. Nts., 12/15/191 | | | 2,870,000 | | | | 2,841,300 | |
| |
| EnPro Industries, Inc., 5.875% Sr. Unsec. Nts., 9/15/22 | | | 1,890,000 | | | | 1,932,525 | |
| |
| Ingersoll-Rand Global Holding Co. Ltd., 4.25% Sr. Unsec. Nts., 6/15/23 | | | 495,000 | | | | 513,391 | |
| |
| Joy Global, Inc., 6% Sr. Unsec. Nts., 11/15/16 | | | 108,000 | | | | 114,555 | |
| |
| KION Finance SA, 6.75% Sr. Sec. Nts., 2/15/201 | | EUR | 1,650,000 | | | | 1,948,949 | |
| |
| Meritor, Inc., 6.25% Sr. Unsec. Nts., 2/15/24 | | | 3,585,000 | | | | 3,558,113 | |
| |
| Navistar International Corp., 8.25% Sr. Unsec. Nts., 11/1/21 | | | 2,410,000 | | | | 2,301,550 | |
| |
| SKF AB, 2.375% Sr. Unsec. Nts., 10/29/20 | | EUR | 270,000 | | | | 319,546 | |
| |
| Terex Corp., 6% Sr. Unsec. Nts., 5/15/21 | | | 2,640,000 | | | | 2,666,400 | |
| |
| Xerium Technologies, Inc., 8.875% Sr. Unsec. Nts., 6/15/18 | | | 1,580,000 | | | | 1,638,263 | |
| | | | | | | | |
| | | | | | | 22,537,891 | |
| |
| Marine—0.1% | | | | | | | | |
| |
Navios Maritime Holdings, Inc./Navios Maritime Finance II US, Inc., 7.375% Sr. Nts., 1/15/221 | | | 1,330,000 | | | | 1,157,100 | |
| |
| Professional Services—0.1% | |
| |
FTI Consulting, Inc., 6% Sr. Unsec. Nts., 11/15/22 | | | 2,740,000 | | | | 2,866,725 | |
| |
| Road & Rail—0.5% | | | | | | | | |
| |
| Avis Budget Car Rental LLC/Avis Budget Finance, Inc., 5.25% Sr. Unsec. Nts., 3/15/251 | | | 2,100,000 | | | | 1,979,250 | |
| |
| Burlington Northern Santa Fe LLC, 3% Sr. Unsec. Nts., 3/15/23 | | | 489,000 | | | | 477,940 | |
| |
| CAR, Inc., 6.125% Sr. Unsec. Nts., 2/4/201 | | | 1,265,000 | | | | 1,296,625 | |
| |
| ERAC USA Finance LLC, 4.50% Sr. Unsec. Nts., 2/15/451 | | | 187,000 | | | | 171,899 | |
| |
| Kazakhstan Temir Zholy Finance BV, 6.375% Sr. Unsec. Nts., 10/6/201 | | | 955,000 | | | | 1,005,825 | |
| |
| Kenan Advantage Group, Inc. (The), 8.375% Sr. Unsec. Nts., 12/15/182 | | | 2,265,000 | | | | 2,364,094 | |
| |
| Penske Truck Leasing Co. LP/PTL Finance Corp., 2.50% Sr. Unsec. Nts., 3/15/161 | | | 624,000 | | | | 628,436 | |
21 OPPENHEIMER GLOBAL STRATEGIC INCOME FUND/VA
CONSOLIDATED STATEMENT OF INVESTMENTS Unaudited / Continued
| | | | | | | | | | |
| | | Principal Amount | | | Value | | | |
| | | |
| Road & Rail (Continued) | | | |
| | | |
| Transnet SOC Ltd., 4% Sr. Unsec. Nts., 7/26/221 | | $ | 2,110,000 | | | $ | 2,036,994 | | | |
| | | | | | | | | | |
| | | | | | | 9,961,063 | | | |
| | | |
| Trading Companies & Distributors—1.0% | | | |
| | | |
| Air Lease Corp., 3.875% Sr. Unsec. Nts., 4/1/21 | | | 615,000 | | | | 622,687 | | | |
| | | |
| American Builders & Contractors Supply Co., Inc., 5.625% Sr. Unsec. Nts., 4/15/211 | | | 2,000,000 | | | | 2,045,000 | | | |
| | | |
| Fly Leasing Ltd.: | | | |
| 6.375% Sr. Unsec. Nts., 10/15/21 | | | 1,845,000 | | | | 1,872,675 | | | |
| 6.75% Sr. Unsec. Nts., 12/15/20 | | | 3,035,000 | | | | 3,133,637 | | | |
| | | |
| HD Supply, Inc.: | | | |
| 5.25% Sr. Sec. Nts., 12/15/211 | | | 4,230,000 | | | | 4,304,025 | | | |
| 7.50% Sr. Unsec. Nts., 7/15/20 | | | 1,165,000 | | | | 1,237,813 | | | |
| | | |
| International Lease Finance Corp., 5.875% Sr. Unsec. Nts., 8/15/22 | | | 558,000 | | | | 604,733 | | | |
| | | |
| Jurassic Holdings III, Inc., 6.875% Sec. Nts., 2/15/211 | | | 3,780,000 | | | | 2,953,125 | | | |
| | | |
| United Rentals North America, Inc., 4.625% Sr. Sec. Nts., 7/15/23 | | | 2,100,000 | | | | 2,067,135 | | | |
| | | | | | | | | | |
| | | | | | | 18,840,830 | | | |
| | | |
| Transportation Infrastructure—0.2% | | | |
| | | |
| DP World Ltd.: | | | |
| 3.25% Sr. Unsec. Nts., 5/18/201 | | | 760,000 | | | | 756,200 | | | |
| 6.85% Sr. Unsec. Nts., 7/2/371 | | | 1,695,000 | | | | 1,859,415 | | | |
| | | |
| Empresa de Transporte de Pasajeros Metro SA, 4.75% Unsec. Nts., 2/4/241 | | | 720,000 | | | | 765,834 | | | |
| | | |
| Sydney Airport Finance Co. Pty Ltd., 3.375% Sr. Sec. Nts., 4/30/251 | | | 900,000 | | | | 866,337 | | | |
| | | | | | | | | | |
| | | | | | | 4,247,786 | | | |
| | | |
| Information Technology—4.0% | | | |
| | | |
| Communications Equipment—1.0% | | | |
| | | |
| Alcatel-Lucent USA, Inc., 6.75% Sr. Unsec. Nts., 11/15/201 | | | 4,460,000 | | | | 4,733,175 | | | |
| | | |
| Avaya, Inc., 7% Sr. Sec. Nts., 4/1/191 | | | 4,585,000 | | | | 4,504,762 | | | |
| | | |
| Blue Coat Holdings, Inc., 8.375% Sr. Unsec. Nts., 6/1/231 | | | 1,950,000 | | | | 1,989,000 | | | |
| | | |
| CommScope Technologies Finance LLC, 6% Sr. Unsec. Nts., 6/15/251 | | | 975,000 | | | | 973,781 | | | |
| | | |
| Infor US, Inc., 6.50% Sr. Unsec. Nts., 5/15/221 | | | 2,105,000 | | | | 2,152,363 | | | |
| | | |
| Motorola Solutions, Inc., 3.50% Sr. Unsec. Nts., 3/1/23 | | | 452,000 | | | | 426,484 | | | |
| | | |
| Plantronics, Inc., 5.50% Sr. Unsec. Nts., 5/31/231 | | | 730,000 | | | | 740,950 | | | |
| | | |
| Project Homestake Merger Corp., 8.875% Sr. Unsec. Nts., 3/1/231 | | | 1,630,000 | | | | 1,585,175 | | | |
| | | |
| QUALCOMM, Inc., 3.45% Sr. Unsec. Nts., 5/20/25 | | | 602,000 | | | | 586,449 | | | |
| | | |
| ViaSat, Inc., 6.875% Sr. Unsec. Nts., 6/15/20 | | | 1,511,000 | | | | 1,601,660 | | | |
| | | | | | | | | | |
| | | | | | | 19,293,799 | | | |
| | | |
| Electronic Equipment, Instruments, & Components—0.4% | | | |
| | | |
| Anixter, Inc., 5.625% Sr. Unsec. Nts., 5/1/19 | | | 2,135,000 | | | | 2,276,444 | | | |
| | | |
| Arrow Electronics, Inc., 3.50% Sr. Unsec. Nts., 4/1/22 | | | 650,000 | | | | 640,191 | | | |
| | | |
| Belden, Inc., 5.50% Sr. Sub. Nts., 9/1/221 | | | 2,090,000 | | | | 2,084,775 | | | |
| | | |
| CDW LLC/CDW Finance Corp., 5% Sr. Unsec. Nts., 9/1/23 | | | 700,000 | | | | 689,500 | | | |
| | | |
| Flextronics International Ltd., 4.75% Sr. Unsec. Nts., 6/15/251 | | | 495,000 | | | | 491,684 | | | |
| | | | | | | | | | |
| | | | | | | | | | |
| | | | | | | | | | |
| | | | | | | | | | |
| | | | | | | | | | |
| | | | | | | | | | |
| | | | | | | | | | |
| | | | | | | | | | |
| | | | | | | | | | |
| | | | | | | | | | |
| | | | | | | | | | |
| | | | | | | | | | |
| | | | | | | | |
| | | Principal Amount | | | Value | |
| |
| Electronic Equipment, Instruments, & Components (Continued) | |
| |
| Zebra Technologies Corp., 7.25% Sr. Unsec. Nts., 10/15/221 | | | $ 1,955,000 | | | $ | 2,121,175 | |
| | | | | | | | |
| | | | | | | 8,303,769 | |
| |
| Internet Software & Services—0.8% | |
| |
| Alibaba Group Holding Ltd.: | |
| 2.50% Sr. Unsec. Nts., 11/28/191 | | | 1,390,000 | | | | 1,375,133 | |
| 3.125% Sr. Unsec. Nts., 11/28/211 | | | 2,650,000 | | | | 2,619,623 | |
| 4.50% Sr. Unsec. Nts., 11/28/341 | | | 590,000 | | | | 567,002 | |
| |
| Cerved Group SpA, 6.375% Sr. Sec. Nts., 1/15/201 | | EUR | 2,290,000 | | | | 2,674,662 | |
| |
| EarthLink Holdings Corp., 7.375% Sr. Sec. Nts., 6/1/20 | | | 3,160,000 | | | | 3,302,200 | |
| |
| Equinix, Inc.: | |
| 4.875% Sr. Unsec. Nts., 4/1/20 | | | 1,220,000 | | | | 1,238,300 | |
| 5.375% Sr. Unsec. Nts., 1/1/22 | | | 2,200,000 | | | | 2,216,500 | |
| |
| IAC/InterActiveCorp, 4.75% Sr. Unsec. Nts., 12/15/22 | | | 1,255,000 | | | | 1,234,606 | |
| |
| VeriSign, Inc., 5.25% Sr. Unsec. Nts., 4/1/251 | | | 655,000 | | | | 655,000 | |
| | | | | | | | |
| | | | | | | 15,883,026 | |
| |
| IT Services—0.5% | |
| |
| Ceridian HCM Holding, Inc., 11% Sr. Unsec. Nts., 3/15/211 | | | 235,000 | | | | 249,394 | |
| |
| Fidelity National Information Services, Inc., 3.50% Sr. Unsec. Nts., 4/15/23 | | | 298,000 | | | | 289,369 | |
| |
| First Data Corp.: | |
| 8.25% Sec. Nts., 1/15/211 | | | 3,830,000 | | | | 4,050,225 | |
| 10.625% Sr. Unsec. Nts., 6/15/21 | | | 3,996,000 | | | | 4,435,560 | |
| |
| Harland Clarke Holdings Corp., 6.875% Sr. Sec. Nts., 3/1/201 | | | 1,940,000 | | | | 1,872,100 | |
| |
| Xerox Corp.: | |
| 2.95% Sr. Unsec. Nts., 3/15/17 | | | 222,000 | | | | 227,447 | |
| 6.75% Sr. Unsec. Nts., 2/1/17 | | | 111,000 | | | | 119,599 | |
| | | | | | | | |
| | | | | | | 11,243,694 | |
| |
| Semiconductors & Semiconductor Equipment—0.5% | |
| |
| Freescale Semiconductor, Inc., 6% Sr. Sec. Nts., 1/15/221 | | | 4,455,000 | | | | 4,733,437 | |
| |
| Micron Technology, Inc.: | |
| 5.25% Sr. Unsec. Nts., 8/1/231 | | | 2,635,000 | | | | 2,532,894 | |
| 5.50% Sr. Unsec. Nts., 2/1/251 | | | 1,330,000 | | | | 1,249,535 | |
| 5.875% Sr. Unsec. Nts., 2/15/22 | | | 1,385,000 | | | | 1,409,238 | |
| | | | | | | | |
| | | | | | | 9,925,104 | |
| |
| Software—0.6% | |
| |
| Activision Blizzard, Inc., 5.625% Sr. Unsec. Nts., 9/15/211 | | | 795,000 | | | | 834,750 | |
| |
| Autodesk, Inc., 4.375% Sr. Unsec. Nts., 6/15/25 | | | 185,000 | | | | 185,578 | |
| |
| Blackboard, Inc., 7.75% Sr. Unsec. Nts., 11/15/192 | | | 1,725,000 | | | | 1,630,125 | |
| |
| BMC Software Finance, Inc., 8.125% Sr. Unsec. Nts., 7/15/211 | | | 1,825,000 | | | | 1,485,094 | |
| |
| Interactive Data Corp., 5.875% Sr. Unsec. Nts., 4/15/191 | | | 3,975,000 | | | | 4,009,781 | |
| |
| Italics Merger Sub, Inc., 7.125% Sr. Unsec. Nts., 7/15/231 | | | 2,195,000 | | | | 2,173,050 | |
| |
| Open Text Corp., 5.625% Sr. Unsec. Nts., 1/15/231 | | | 592,000 | | | | 587,560 | |
| |
| Oracle Corp., 3.40% Sr. Unsec. Nts., 7/8/24 | | | 437,000 | | | | 437,986 | |
| |
| TIBCO Software, Inc., 11.375% Sr. Unsec. Nts., 12/1/211 | | | 780,000 | | | | 778,050 | |
| | | | | | | | |
| | | | | | | 12,121,974 | |
| |
| Technology Hardware, Storage & Peripherals—0.2% | |
| |
| Apple, Inc., 4.375% Sr. Unsec. Nts., 5/13/45 | | | 342,000 | | | | 337,109 | |
22 OPPENHEIMER GLOBAL STRATEGIC INCOME FUND/VA
| | | | | | | | | | |
| | | Principal Amount | | | Value | | | |
| | | |
| Technology Hardware, Storage & Peripherals (Continued) | | | |
| | | |
| Denali Borrower LLC/Denali Finance Corp., 5.625% Sr. Sec. Nts., 10/15/201 | | $ | 3,030,000 | | | $ | 3,192,862 | | | |
| | | | | | | | | | |
| | | | | | | 3,529,971 | | | |
| | | |
| Materials—5.3% | | | |
| | | |
| Chemicals—1.5% | | | |
| | | |
| ADS Waste Holdings, Inc., 8.25% Sr. Unsec. Nts., 10/1/20 | | | 1,075,000 | | | | 1,118,000 | | | |
| | | |
| Agrium, Inc.: | | | |
| 3.375% Sr. Unsec. Nts., 3/15/25 | | | 258,000 | | | | 245,429 | | | |
| 4.125% Sr. Unsec. Nts., 3/15/35 | | | 129,000 | | | | 115,372 | | | |
| | | |
| Braskem Finance Ltd.: | | | |
| 5.375% Sr. Unsec. Nts., 5/2/221 | | | 925,000 | | | | 854,237 | | | |
| 6.45% Sr. Unsec. Nts., 2/3/24 | | | 680,000 | | | | 644,300 | | | |
| | | |
| Chemours Co.: | | | |
| 6.625% Sr. Unsec. Nts., 5/15/231 | | | 1,160,000 | | | | 1,126,650 | | | |
| 7.00% Sr. Unsec. Nts., 5/15/251 | | | 2,790,000 | | | | 2,713,275 | | | |
| | | |
| Eastman Chemical Co., 3% Sr. Unsec. Nts., 12/15/15 | | | 265,000 | | | | 267,403 | | | |
| | | |
| Hexion, Inc., 6.625% Sr. Sec. Nts., 4/15/20 | | | 2,760,000 | | | | 2,546,100 | | | |
| | | |
| Huntsman International LLC, 5.125% Sr. Unsec. Nts., 11/15/221 | | | 2,245,000 | | | | 2,216,937 | | | |
| | | |
| INEOS Group Holdings SA: | | | |
| 5.875% Sec. Nts., 2/15/191 | | | 780,000 | | | | 786,825 | | | |
| 6.125% Sr. Unsec. Nts., 8/15/181 | | | 1,465,000 | | | | 1,501,625 | | | |
| | | |
| LYB International Finance BV, 5.25% Sr. Unsec. Nts., 7/15/43 | | | 175,000 | | | | 178,314 | | | |
| | | |
| Methanex Corp., 4.25% Sr. Unsec. Nts., 12/1/24 | | | 350,000 | | | | 347,167 | | | |
| | | |
| Mexichem SAB de CV: | | | |
| 4.875% Sr. Unsec. Nts., 9/19/221 | | | 1,635,000 | | | | 1,696,312 | | | |
| 5.875% Sr. Unsec. Nts., 9/17/441 | | | 1,040,000 | | | | 967,200 | | | |
| | | |
| Momentive Performance Materials, Inc., 3.88% Sr. Sec. Nts., 10/24/21 | | | 1,840,000 | | | | 1,660,600 | | | |
| | | |
| NOVA Chemicals Corp., 5% Sr. Unsec. Nts., 5/1/251 | | | 1,740,000 | | | | 1,750,875 | | | |
| | | |
| ONGC Videsh Ltd.: | | | |
| 2.75% Sr. Unsec. Nts., 7/15/21 | | EUR | 1,000,000 | | | | 1,124,605 | | | |
| 4.625% Sr. Unsec. Nts., 7/15/24 | | | 955,000 | | | | 972,649 | | | |
| | | |
| Platform Specialty Products Corp., 6.50% Sr. Unsec. Nts., 2/1/221 | | | 1,955,000 | | | | 2,028,313 | | | |
| | | |
| Rockwood Specialties Group, Inc., 4.625% Sr. Unsec. Nts., 10/15/20 | | | 605,000 | | | | 630,713 | | | |
| | | |
| Techniplas LLC, 10% Sr. Sec. Nts., 5/1/201 | | | 2,325,000 | | | | 2,354,063 | | | |
| | | |
| Tronox Finance LLC, 6.375% Sr. Unsec. Nts., 8/15/20 | | | 2,015,000 | | | | 1,878,988 | | | |
| | | | | | | | | | |
| | | | | | | 29,725,952 | | | |
| | | |
| Construction Materials—0.4% | | | |
| | | |
| Cemex SAB de CV: | | | |
| 4.375% Sr. Sec. Nts., 3/5/231 | | EUR | 455,000 | | | | 489,820 | | | |
| 4.75% Sr. Sec. Nts., 1/11/221 | | EUR | 250,000 | | | | 280,691 | | | |
| 5.70% Sr. Sec. Nts., 1/11/251 | | | 545,000 | | | | 521,129 | | | |
| | | |
| CRH America, Inc., 5.125% Sr. Unsec. Nts., 5/18/451 | | | 175,000 | | | | 173,092 | | | |
| | | |
| Elementia SAB de CV, 5.50% Sr. Unsec. Nts., 1/15/251 | | | 430,000 | | | | 437,525 | | | |
| | | |
| HeidelbergCement Finance Luxembourg SA: | | | |
| 3.25% Sr. Unsec. Nts., 10/21/21 | | EUR | 625,000 | | | | 741,745 | | | |
| 7.50% Sr. Unsec. Nts., 4/3/20 | | EUR | 570,000 | | | | 792,392 | | | |
| 8.00% Sr. Unsec. Nts., 1/31/17 | | EUR | 655,000 | | | | 806,921 | | | |
| | | |
| James Hardie International Finance Ltd., 5.875% Sr. Unsec. Nts., 2/15/231 | | | 582,000 | | | | 602,370 | | | |
| | | |
| Lafarge SA: | | | |
| 4.75% Sr. Unsec. Nts., 9/30/20 | | EUR | 930,000 | | | | 1,199,922 | | | |
| 5.375% Sr. Unsec. Nts., 6/26/17 | | EUR | 495,000 | | | | 600,099 | | | |
| | | |
| Pontis III Ltd. Sr. Sec. Nts., 6/8/251 | | | 850,000 | | | | 850,000 | | | |
| | | | | | | | | | |
| | | | | | | | | | |
| | | | | | | | | | |
| | | | | | | | | | |
| | | | | | | | | | |
| | | | | | | | | | |
| | | | | | | | |
| | | Principal Amount | | | Value | |
| |
| Construction Materials (Continued) | |
| |
| Union Andina de Cementos SAA, 5.875% Sr. Unsec. Nts., 10/30/211 | | | $ 510,000 | | | $ | 517,012 | |
| | | | | | | | |
| | | | | | | 8,012,718 | |
| |
| Containers & Packaging—1.4% | |
| |
| Ardagh Packaging Finance plc/Ardagh MP Holdings USA, Inc., 7% Sr. Unsec. Nts., 11/15/201 | | | 541,765 | | | | 555,309 | |
| |
| Ball Corp.: | |
| 4.00% Sr. Unsec. Nts., 11/15/23 | | | 625,000 | | | | 582,812 | |
| 5.00% Sr. Unsec. Nts., 3/15/22 | | | 1,225,000 | | | | 1,234,187 | |
| |
| Berry Plastics Corp.: | |
| 5.125% Sec. Nts., 7/15/23 | | | 2,200,000 | | | | 2,150,500 | |
| 5.50% Sec. Nts., 5/15/22 | | | 3,285,000 | | | | 3,305,531 | |
| |
| Coveris Holdings SA, 7.875% Sr. Unsec. Nts., 11/1/191 | | | 2,380,000 | | | | 2,380,000 | |
| |
| Crown Americas LLC/Crown Americas Capital Corp. IV, 4.50% Sr. Unsec. Nts., 1/15/23 | | | 2,120,000 | | | | 2,012,686 | |
| |
| Klabin Finance SA, 5.25% Sr. Unsec. Nts., 7/16/241 | | | 1,310,000 | | | | 1,279,870 | |
| |
| Owens-Brockway Glass Container, Inc., 5% Sr. Unsec. Nts., 1/15/221 | | | 1,245,000 | | | | 1,234,106 | |
| |
| Packaging Corp. of America, 4.50% Sr. Unsec. Nts., 11/1/23 | | | 660,000 | | | | 680,935 | |
| |
| Reynolds Group Issuer, Inc./Reynolds Group Issuer LLC/Reynolds Group Issuer Luxembourg SA, 5.75% Sr. Sec. Nts., 10/15/20 | | | 4,420,000 | | | | 4,541,550 | |
| |
| Rock-Tenn Co., 3.50% Sr. Unsec. Unsub. Nts., 3/1/20 | | | 120,000 | | | | 123,606 | |
| |
| Sealed Air Corp.: | |
| 4.875% Sr. Unsec. Nts., 12/1/221 | | | 1,150,000 | | | | 1,137,063 | |
| 5.125% Sr. Unsec. Nts., 12/1/241 | | | 1,150,000 | | | | 1,138,500 | |
| 6.50% Sr. Unsec. Nts., 12/1/201 | | | 2,260,000 | | | | 2,502,950 | |
| |
| Smurfit Kappa Acquisitions, 4.875% Sr. Sec. Nts., 9/15/181 | | | 2,095,000 | | | | 2,204,988 | |
| | | | | | | 27,064,593 | |
| |
| Metals & Mining—1.7% | |
| |
| ABJA Investment Co. Pte Ltd.: | |
| 4.95% Sr. Unsec. Nts., 5/3/23 | | SGD | 250,000 | | | | 179,980 | |
| 5.95% Sr. Unsec. Nts., 7/31/24 | | | 380,000 | | | | 381,604 | |
| |
| Aleris International, Inc.: | |
| 7.625% Sr. Unsec. Nts., 2/15/18 | | | 2,765,000 | | | | 2,847,950 | |
| 7.875% Sr. Unsec. Nts., 11/1/20 | | | 2,870,000 | | | | 2,991,975 | |
| |
| ArcelorMittal: | |
| 2.875% Sr. Unsec. Nts., 7/6/20 | | EUR | 2,000,000 | | | | 2,192,359 | |
| 5.25% Sr. Unsec. Nts., 2/25/17 | | | 2,120,000 | | | | 2,207,450 | |
| 6.125% Sr. Unsec. Nts., 6/1/25 | | | 730,000 | | | | 729,544 | |
| |
| Constellium NV, 5.75% Sr. Unsec. Nts., 5/15/241 | | | 2,420,000 | | | | 2,165,900 | |
| |
| First Quantum Minerals Ltd., 7.25% Sr. Unsec. Nts., 5/15/221 | | | 2,050,000 | | | | 1,962,875 | |
| |
| FMG Resources August 2006 Pty Ltd., 8.25% Sr. Unsec. Nts., 11/1/191 | | | 1,180,000 | | | | 1,000,050 | |
| |
| Freeport-McMoRan, Inc., 3.875% Sr. Unsec. Nts., 3/15/23 | | | 210,000 | | | | 190,845 | |
| |
| Gestamp Funding Luxembourg SA: | |
| 5.875% Sr. Sec. Nts., 5/31/201 | | EUR | 1,835,000 | | | | 2,143,295 | |
| 5.875% Sr. Sec. Nts., 5/31/20 | | EUR | 105,000 | | | | 122,658 | |
| |
| Glencore Finance Canada Ltd.: | |
| 3.60% Sr. Unsec. Nts., 1/15/171 | | | 509,000 | | | | 522,583 | |
| 4.95% Sr. Unsec. Nts., 11/15/211 | | | 1,615,000 | | | | 1,696,490 | |
| |
| Glencore Funding LLC: | |
| 4.125% Sr. Unsec. Nts., 5/30/231 | | | 2,805,000 | | | | 2,714,696 | |
| 4.625% Sr. Unsec. Nts., 4/29/241 | | | 238,000 | | | | 236,454 | |
| |
| Goldcorp, Inc., 5.45% Sr. Unsec. Nts., 6/9/44 | | | 173,000 | | | | 164,739 | |
23 OPPENHEIMER GLOBAL STRATEGIC INCOME FUND/VA
CONSOLIDATED STATEMENT OF INVESTMENTS Unaudited / Continued
| | | | | | | | | | |
| | | Principal Amount | | | Value | | | |
| | | |
| Metals & Mining (Continued) | | | |
| | | |
| JMC Steel Group, Inc., 8.25% Sr. Nts., 3/15/181 | | $ | 1,575,000 | | | $ | 1,447,031 | | | |
| | | |
| Metalloinvest Finance Ltd., 5.625% Unsec. Nts., 4/17/201 | | | 330,000 | | | | 303,560 | | | |
| | | |
| Novelis, Inc., 8.75% Sr. Unsec. Nts., 12/15/20 | | | 1,285,000 | | | | 1,362,100 | | | |
| | | |
| Southern Copper Corp., 3.875% Sr. Unsec. Nts., 4/23/25 | | | 635,000 | | | | 613,181 | | | |
| | | |
| Thompson Creek Metals Co., Inc., 7.375% Sr. Unsec. Nts., 6/1/18 | | | 1,095,000 | | | | 903,375 | | | |
| | | |
| Vedanta Resources plc, 8.25% Sr. Unsec. Nts., 6/7/211 | | | 2,385,000 | | | | 2,438,829 | | | |
| | | |
| Wise Metals Group LLC/Wise Alloys Finance Corp., 8.75% Sr. Sec. Nts., 12/15/181 | | | 1,585,000 | | | | 1,682,081 | | | |
| | | |
| Yamana Gold, Inc., 4.95% Sr. Unsec. Nts., 7/15/24 | | | 305,000 | | | | 293,914 | | | |
| | | | | | | | | | |
| | | | | | | 33,495,518 | | | |
| | | |
| Paper & Forest Products—0.3% | | | |
| | | |
| Fibria Overseas Finance Ltd., 5.25% Sr. Unsec. Nts., 5/12/24 | | | 1,095,000 | | | | 1,100,475 | | | |
| | | |
| International Paper Co., 4.80% Sr. Unsec. Nts., 6/15/44 | | | 253,000 | | | | 234,663 | | | |
| | | |
| Inversiones CMPC SA: | | | |
| 4.75% Sr. Unsec. Nts., 9/15/241 | | | 985,000 | | | | 998,096 | | | |
| 6.125% Sr. Unsec. Nts., 11/5/191 | | | 255,000 | | | | 285,017 | | | |
| | | |
| PaperWorks Industries, Inc., 9.50% Sr. Sec. Nts., 8/15/191 | | | 1,890,000 | | | | 1,887,637 | | | |
| | | |
| Sappi Papier Holding GmbH, 6.625% Sr. Sec. Nts., 4/15/211 | | | 1,730,000 | | | | 1,803,525 | | | |
| | | |
| Suzano Trading Ltd., 5.875% Sr. Unsec. Nts., 1/23/211 | | | 450,000 | | | | 465,750 | | | |
| | | | | | | | | | |
| | | | | | | 6,775,163 | | | |
| | | |
| Telecommunication Services—3.6% | | | |
| | | |
| Diversified Telecommunication Services—2.6% | | | |
| | | |
| AT&T, Inc., 4.35% Sr. Unsec. Nts., 6/15/45 | | | 925,000 | | | | 792,334 | | | |
| | | |
| British Telecommunications plc, 9.625% Sr. Unsec. Nts., 12/15/30 | | | 372,000 | | | | 552,428 | | | |
| | | |
| CenturyLink, Inc., 6.45% Sr. Unsec. Nts., 6/15/21 | | | 2,523,000 | | | | 2,554,537 | | | |
| | | |
| Cequel Communications Holdings I LLC/Cequel Capital Corp., 6.375% Sr. Unsec. Nts., 9/15/201 | | | 6,865,000 | | | | 6,844,405 | | | |
| | | |
| Colombia Telecomunicaciones SA ESP: | | | |
| 5.375% Sr. Unsec. Nts., 9/27/221 | | | 605,000 | | | | 601,219 | | | |
| 8.50% Sub. Perpetual Bonds1,3,10 | | | 365,000 | | | | 379,308 | | | |
| | | |
| Columbus International, Inc., 7.375% Sr. Unsec. Nts., 3/30/211 | | | 785,000 | | | | 846,819 | | | |
| | | |
| Deutsche Telekom International Finance BV, 5.75% Sr. Unsec. Nts., 3/23/16 | | | 599,000 | | | | 619,727 | | | |
| | | |
| Digicel Ltd., 6.75% Sr. Unsec. Nts., 3/1/231 | | | 2,885,000 | | | | 2,835,378 | | | |
| | | |
| FairPoint Communications, Inc., 8.75% Sr. Sec. Nts., 8/15/191 | | | 3,600,000 | | | | 3,757,500 | | | |
| | | |
| Frontier Communications Corp.: | | | |
| 7.125% Sr. Unsec. Nts., 1/15/23 | | | 2,190,000 | | | | 1,954,575 | | | |
| 7.625% Sr. Unsec. Nts., 4/15/24 | | | 585,000 | | | | 519,187 | | | |
| | | |
| Intelsat Luxembourg SA, 7.75% Sr. Unsec. Nts., 6/1/21 | | | 3,400,000 | | | | 2,851,750 | | | |
| | | |
| Koninklijke KPN NV, 8.375% Sr. Unsec. Nts., 10/1/30 | | | 2,870,000 | | | | 3,910,699 | | | |
| | | |
| Level 3 Financing, Inc.: | | | |
| 5.375% Sr. Unsec. Nts., 8/15/22 | | | 130,000 | | | | 131,788 | | | |
| 5.625% Sr. Unsec. Nts., 2/1/231 | | | 1,930,000 | | | | 1,956,537 | | | |
| | | | | | | | | | |
| | | | | | | | | | |
| | | | | | | | | | |
| | | | | | | | | | |
| | | | | | | | | | |
| | | | | | | | | | |
| | | | | | | | | | |
| | | | | | | | | | |
| | | | | | | | |
| | | Principal Amount | | | Value | |
| |
| Diversified Telecommunication Services (Continued) | |
| |
| Orange SA, 2.75% Sr. Unsec. Nts., 9/14/16 | | | $ 165,000 | | | $ | 168,020 | |
| |
| Telecom Italia Capital SA, 7.721% Sr. Unsec. Unsub. Nts., 6/4/38 | | | 6,117,000 | | | | 6,912,210 | |
| |
| Telefonica Emisiones SAU, 7.045% Sr. Unsec. Unsub. Nts., 6/20/36 | | | 228,000 | | | | 280,068 | |
| |
| T-Mobile USA, Inc.: | | | | | | | | |
| 6.25% Sr. Unsec. Nts., 4/1/21 | | | 2,670,000 | | | | 2,743,425 | |
| 6.625% Sr. Unsec. Nts., 11/15/20 | | | 2,020,000 | | | | 2,105,850 | |
| |
| Turk Telekomunikasyon AS, 3.75% Sr. Unsec. Nts., 6/19/191 | | | 1,010,000 | | | | 1,010,460 | |
| |
| Verizon Communications, Inc.: | |
| 3.50% Sr. Unsec. Nts., 11/1/24 | | | 250,000 | | | | 243,281 | |
| 4.50% Sr. Unsec. Nts., 9/15/20 | | | 1,268,000 | | | | 1,368,177 | |
| 4.522% Sr. Unsec. Nts., 9/15/481 | | | 350,000 | | | | 309,540 | |
| 5.012% Sr. Unsec. Nts., 8/21/54 | | | 146,000 | | | | 134,001 | |
| |
| Windstream Services LLC: | |
| 6.375% Sr. Unsec. Nts., 8/1/23 | | | 1,155,000 | | | | 953,453 | |
| 7.75% Sr. Unsec. Nts., 10/1/21 | | | 2,180,000 | | | | 2,005,600 | |
| |
| Zayo Group LLC/Zayo Capital, Inc., 6% Sr. Unsec. Nts., 4/1/231 | | | 2,095,000 | | | | 2,074,469 | |
| | | | | | | | |
| | | | | | | 51,416,745 | |
| |
| Wireless Telecommunication Services—1.0% | |
| |
| America Movil SAB de CV, 4.375% Sr. Unsec. Unsub. Nts., 7/16/42 | | | 227,000 | | | | 211,373 | |
| |
| Bharti Airtel Ltd., 4.375% Sr. Unsec. Nts., 6/10/251 | | | 1,700,000 | | | | 1,678,240 | |
| |
| Digicel Group Ltd., 7.125% Sr. Unsec. Nts., 4/1/221 | | | 915,000 | | | | 862,387 | |
| |
| Empresa Nacional de Telecomunicaciones SA, 4.75% Sr. Unsec. Nts., 8/1/261 | | | 890,000 | | | | 875,982 | |
| |
| Millicom International Cellular SA, 6% Sr. Unsec. Nts., 3/15/251 | | | 740,000 | | | | 718,203 | |
| |
| Mobile Telesystems OJSC via MTS International Funding Ltd., 5% Sr. Unsec. Nts., 5/30/231 | | | 950,000 | | | | 851,675 | |
| |
| Sprint Corp., 7.875% Sr. Unsec. Nts., 9/15/23 | | | 4,070,000 | | | | 3,978,425 | |
| |
| Telefonica Europe BV, 6.75% Jr. Sub. Perpetual Bonds3,10 | | GBP | 3,945,000 | | | | 6,532,561 | |
| |
| Telekom Austria AG, 5.625% Jr. Sub. Perpetual Bonds3,10 | | EUR | 2,100,000 | | | | 2,488,275 | |
| |
| Wind Acquisition Finance SA, 4% Sr. Sec. Nts., 7/15/201 | | EUR | 2,225,000 | | | | 2,482,325 | |
| | | | | | | | |
| | | | | | | 20,679,446 | |
| |
| Utilities—4.2% | |
| |
| Electric Utilities—2.2% | |
| |
| American Transmission Systems, Inc., 5% Sr. Unsec. Nts., 9/1/441 | | | 157,000 | | | | 159,592 | |
| |
| E.CL SA, 4.50% Sr. Unsec. Nts., 1/29/251 | | | 705,000 | | | | 708,115 | |
| |
| EDP Finance BV: | |
| 5.25% Sr. Unsec. Nts., 1/14/211 | | | 4,766,000 | | | | 5,003,204 | |
| 6.00% Sr. Unsec. Nts., 2/2/181 | | | 545,000 | | | | 585,254 | |
| |
| Electricite de France SA: | |
| 5.25% Jr. Sub. Perpetual Bonds1,3,10 | | | 2,197,000 | | | | 2,207,985 | |
| 5.625% Jr. Sub. Perpetual Bonds1,3,10 | | | 1,075,000 | | | | 1,097,306 | |
| 6.00% Jr. Sub. Perpetual Bonds3,10 | | GBP | 955,000 | | | | 1,526,002 | |
| |
| Empresas Publicas de Medellin ESP, 7.625% Sr. Unsec. Nts., 7/29/191 | | | 1,770,000 | | | | 2,066,475 | |
| |
| EnBW Energie Baden-Wuerttemberg AG, 3.625% Jr. Sub. Nts., 4/2/763 | | EUR | 3,145,000 | | | | 3,469,637 | |
| |
| Enel Finance International NV, 6.25% Sr. Unsec. Nts., 9/15/171 | | | 574,000 | | | | 628,665 | |
| |
| Enel SpA, 5% Sub. Nts., 1/15/753 | | EUR | 3,705,000 | | | | 4,334,067 | |
24 OPPENHEIMER GLOBAL STRATEGIC INCOME FUND/VA
| | | | | | | | | | |
| | | Principal Amount | | | Value | | | |
| | | |
| Electric Utilities (Continued) | | | |
| | | |
| Eskom Holdings SOC Ltd.: | | | |
| 6.75% Sr. Unsec. Nts., 8/6/231 | | | $ 1,345,000 | | | $ | 1,370,192 | | | |
| 7.125% Sr. Unsec. Nts., 2/11/251 | | | 845,000 | | | | 856,644 | | | |
| | | |
| Exelon Corp., 3.95% Sr. Unsec. Nts., 6/15/25 | | | 616,000 | | | | 619,936 | | | |
| | | |
| Iberdrola International BV, 5.75% Jr. Sub. Perpetual Bonds3,10 | | EUR | 3,560,000 | | | | 4,274,389 | | | |
| | | |
| Israel Electric Corp. Ltd.: | | | |
| 6.875% Sr. Sec. Nts., 6/21/231 | | | 1,060,000 | | | | 1,212,110 | | | |
| 7.25% Sr. Sec. Nts., 1/15/191 | | | 3,080,000 | | | | 3,488,100 | | | |
| | | |
| ITC Holdings Corp., 5.30% Sr. Unsec. Nts., 7/1/43 | | | 348,000 | | | | 371,943 | | | |
| | | |
| MMC Energy. Inc., 8.875% Sr. Unsec. Nts., 10/15/207,12 | | | 1,315,000 | | | | 1 | | | |
| | | |
| National Power Corp., 5.875% Sr. Unsec. Nts., 12/19/16 | | PHP | 109,600,000 | | | | 2,521,845 | | | |
| | | |
| NextEra Energy Capital Holdings, Inc., 1.586% Sr. Unsec. Nts., 6/1/17 | | | 629,000 | | | | 630,037 | | | |
| | | |
| Perusahaan Listrik Negara PT, 5.50% Sr. Unsec. Nts., 11/22/211 | | | 3,670,000 | | | | 3,899,375 | | | |
| | | |
| Power Grid Corp. of India Ltd., 8.70% Sec. Nts., 7/15/18 | | INR | 30,000,000 | | | | 473,567 | | | |
| | | |
| PPL Capital Funding, Inc., 4.20% Sr. Sec. Nts., 6/15/22 | | | 1,076,000 | | | | 1,132,620 | | | |
| | | |
| Public Service Co. of New Mexico, 7.95% Sr. Unsec. Nts., 5/15/18 | | | 523,000 | | | | 608,701 | | | |
| | | |
| Trans-Allegheny Interstate Line Co., 3.85% Sr. Unsec. Nts., 6/1/251 | | | 389,000 | | | | 386,602 | | | |
| | | | | | | | | | |
| | | | | | | 43,632,364 | | | |
| | | |
| Gas Utilities—0.3% | | | |
| | | |
| Empresa de Energia de Bogota SA, 6.125% Sr. Unsec. Nts., 11/10/211 | | | 1,620,000 | | | | 1,717,200 | | | |
| | | |
| Ferrellgas LP/Ferrellgas Finance Corp., 6.50% Sr. Unsec. Nts., 5/1/21 | | | 1,285,000 | | | | 1,288,212 | | | |
| | | |
| Gas Natural de Lima y Callao SA, 4.375% Sr. Unsec. Nts., 4/1/231 | | | 840,000 | | | | 827,400 | | | |
| | | |
| Perusahaan Gas Negara Persero Tbk PT, 5.125% Sr. Unsec. Nts., 5/16/241 | | | 1,545,000 | | | | 1,557,700 | | | |
| | | | | | | | | | |
| | | | | | | 5,390,512 | | | |
| | | |
| Independent Power and Renewable Electricity Producers—1.2% | | | |
| | | |
| AES Corp., 7.375% Sr. Unsec. Nts., 7/1/21 | | | 1,045,000 | | | | 1,152,112 | | | |
| | | |
| Atlantic Power Corp., 9% Sr. Unsec. Nts., 11/15/18 | | | 1,390,000 | | | | 1,457,832 | | | |
| | | |
| Calpine Corp.: | | | |
| 5.375% Sr. Unsec. Nts., 1/15/23 | | | 2,365,000 | | | | 2,335,437 | | | |
| 7.875% Sr. Sec. Nts., 1/15/231 | | | 773,000 | | | | 838,705 | | | |
| | | |
| Colbun SA, 4.50% Sr. Unsec. Nts., 7/10/241 | | | 980,000 | | | | 979,848 | | | |
| | | |
| Comision Federal de Electricidad, 4.875% Sr. Unsec. Nts., 1/15/241 | | | 1,690,000 | | | | 1,732,250 | | | |
| | | |
| Dynegy, Inc.: | | | |
| 5.875% Sr. Unsec. Nts., 6/1/23 | | | 420,000 | | | | 412,650 | | | |
| 7.375% Sr. Unsec. Nts., 11/1/221 | | | 1,580,000 | | | | 1,662,950 | | | |
| | | |
| Energy Future Intermediate Holding Co. LLC/EFIH Finance, Inc., 11.75% Sec. Nts., 3/1/221,7 | | | 1,487,674 | | | | 1,697,808 | | | |
| | | |
| GenOn Energy, Inc., 9.50% Sr. Unsec. Nts., 10/15/18 | | | 3,230,000 | | | | 3,311,073 | | | |
| | | |
| Hero Asia Investment Ltd., 2.875% Sr. Unsec. Nts., 10/3/17 | | | 420,000 | | | | 423,250 | | | |
| | | |
| Infinis plc, 7% Sr. Sec. Nts., 2/15/192 | | GBP | 1,745,000 | | | | 2,865,214 | | | |
| | | |
| Miran Mid-Atlantic Trust, 10.06% Sec. Pass-Through Certificates, Series C, 12/30/28 | | | 1,573,485 | | | | 1,728,855 | | | |
| | | |
| NRG Energy, Inc.: | | | |
| 6.25% Sr. Unsec. Nts., 5/1/24 | | | 2,220,000 | | | | 2,214,450 | | | |
| 6.625% Sr. Unsec. Nts., 3/15/23 | | | 1,455,000 | | | | 1,505,925 | | | |
| | | | | | | | | | |
| | | | | | | | | | |
| | | | | | | | | | |
| | | | | | | | |
| | | Principal Amount | | | Value | |
| |
| Independent Power and Renewable Electricity Producers (Continued) | |
| |
| NRG Yield Operating LLC, 5.375% Sr. | | | | | | | | |
| Unsec. Nts., 8/15/241 | | | $ 603,000 | | | $ | 610,538 | |
| | | | | | | | |
| | | | | | | 24,928,897 | |
| |
| Multi-Utilities—0.5% | | | | | | | | |
| |
| Berkshire Hathaway Energy Co., 4.50% Sr. Unsec. Nts., 2/1/45 | | | 81,000 | | | | 79,158 | |
| |
| CMS Energy Corp., 3.875% Sr. Unsec. Nts., 3/1/24 | | | 740,000 | | | | 752,737 | |
| |
| Dominion Gas Holdings LLC, 4.60% Sr. Unsec. Nts., 12/15/44 | | | 248,000 | | | | 233,448 | |
| |
| Empresa Electrica Guacolda SA, 4.56% Sr. Unsec. Nts., 4/30/251 | | | 635,000 | | | | 617,311 | |
| |
| InterGen NV, 7% Sr. Sec. Nts., 6/30/231 | | | 3,185,000 | | | | 2,850,575 | |
| |
| NGG Finance plc, 4.25% Sub. Nts., 6/18/763 | | EUR | 3,830,000 | | | | 4,511,508 | |
| |
| NiSource Finance Corp., 4.80% Sr. Unsec. Nts., 2/15/44 | | | 81,000 | | | | 82,611 | |
| |
| Puget Energy, Inc., 3.65% Sr. Sec. Nts., 5/15/251 | | | 312,000 | | | | 305,520 | |
| | | | | | | | |
| | | | | | | 9,432,868 | |
| | | | | | | | |
| Total Corporate Bonds and Notes (Cost $1,276,572,287) | | | | | | | 1,244,161,178 | |
| | | Shares | | | | |
| |
| Common Stocks—0.2% | |
| |
| Arco Capital Corp. Ltd.2,12,13 | | | 690,638 | | | | — | |
| |
| Entegra Etc., Series A13 | | | 5,233 | | | | 1,478,323 | |
| |
| JP Morgan International, GDR13 | | | 446,838 | | | | — | |
| |
| Kaiser Aluminum Corp. | | | 205 | | | | 17,031 | |
| |
| Nortek, Inc.13 | | | 24,095 | | | | 2,003,017 | |
| |
| Premier Holdings Ltd.13 | | | 18,514 | | | | — | |
| |
| Revel Entertainment, Inc.13 | | | 16,153 | | | | — | |
| |
| Wallace Theater Holdings, Inc.2,13 | | | 1,525 | | | | 15 | |
| | | | | | | | |
| Total Common Stocks (Cost $4,777,077) | | | | | | | 3,498,386 | |
| | | Units | | | | |
| |
| Rights, Warrants and Certificates—0.0% | |
| |
| MediaNews Group, Inc. Wts., Strike Price | | | | | | | | |
| $48.72, Exp. 3/19/1713 (Cost $6,331,150) | | | 22,685 | | | | — | |
| | | Principal Amount | | | | |
| |
| Structured Securities—0.7% | |
| |
| Credit Suisse First Boston | | | | | | | | |
| International, Moitk Total Return | | | | | | | | |
| Linked Nts., 21%, 3/30/117 | | RUB | 53,910,000 | | | | — | |
| |
| Credit Suisse First Boston, Inc. | | | | | | | | |
| (Nassau Branch), Russian Specialized | | | | | | | | |
| Construction & Installation | | | | | | | | |
| Administration Total Return Linked | | | | | | | | |
| Nts., 13%, 5/24/107 | | RUB | 97,250,000 | | | | — | |
| |
| Deutsche Bank AG, Coriolanus Ltd. Sec. Credit Linked Bonds: | |
| 3.01% Sec. Nts., 4/30/251,14 | | | 1,356,539 | | | | 828,922 | |
| 3.138% Sr. Sec. Nts., 4/30/251,14 | | | 1,333,866 | | | | 815,067 | |
| 3.191% Sec. Nts., 4/30/251,14 | | | 1,660,771 | | | | 1,014,825 | |
| 3.242% Sr. Sec. Nts., 4/30/251,14 | | | 1,895,518 | | | | 1,158,268 | |
| 3.269% Sec. Nts., 4/30/251,14 | | | 1,514,297 | | | | 925,321 | |
| 3.346% Sr. Sec. Nts., 4/30/251,14 | | | 1,423,375 | | | | 869,762 | |
| 3.905% Sr. Sec. Nts., 4/30/251,14 | | | 1,728,439 | | | | 1,056,174 | |
| 4.005% Sec. Nts., 4/30/251,14 | | | 1,492,231 | | | | 911,837 | |
| 39.866% Sr. Sec. Nts., 12/31/172,15 | | BRL | 7,710,000 | | | | 5,262,172 | |
| |
| Deutsche Bank AG, Opic Reforma I Credit Linked Nts.: | |
| Cl. 2A, 6.697%, 10/22/152,3 | | MXN | 108,415 | | | | 6,276 | |
| Cl. 2B, 6.697%, 10/22/152,3 | | MXN | 189,675 | | | | 10,979 | |
| Cl. 2C, 6.697%, 10/22/152,3 | | MXN | 2,859,845 | | | | 165,541 | |
| Cl. 2D, 6.697%, 10/22/152,3 | | MXN | 208,422 | | | | 12,064 | |
| Cl. 2E, 6.697%, 10/22/152,3 | | MXN | 151,422 | | | | 8,765 | |
25 OPPENHEIMER GLOBAL STRATEGIC INCOME FUND/VA
CONSOLIDATED STATEMENT OF INVESTMENTS Unaudited / Continued
| | | | | | | | | | | | | | |
| | | | | | Principal Amount | | | Value | | | |
| | | |
Structured Securities (Continued) | | | | | | | |
| | | |
| Deutsche Bank AG, Opic Reforma I Credit Linked Nts.: (Continued) | | | |
| Cl. 2F, 6.697%, 10/22/152,3 | | | MXN | | | | 96,706 | | | $ | 5,598 | | | |
| Cl. 2G, 6.697%, 10/22/152,3 | | | MXN | | | | 17,809 | | | | 1,031 | | | |
| | | |
| LB Peru Trust II Certificates, Series 1998-A, 3.796%, 2/28/167,14 | | | | | | | 2,994 | | | | — | | | |
| | | |
| Morgan Stanley, Russian Federation Total Return Linked Bonds, Series 007, Cl. VR, 5%, 8/22/34 | | | RUB | | | | 38,321,264 | | | | 306,399 | | | |
| | | | | | | | | | | | | | |
| Total Structured Securities (Cost $19,803,175) | | | | | | | | | | | 13,359,001 | | | |
| | | | | | | | |
| | | Shares | | | Value | |
| |
Investment Companies—8.9% | | | | | |
| |
| Oppenheimer Master Event-Linked Bond Fund, LLC16 | | | 3,158,849 | | | $ | 46,382,036 | |
| |
| Oppenheimer Master Loan Fund, LLC16 | | | 7,455,394 | | | | 109,917,667 | |
| |
| Oppenheimer Ultra-Short Duration Fund, Cl. Y16 | | | 2,071,918 | | | | 20,739,901 | |
| | | | | | | | |
| Total Investment Companies (Cost $181,616,763) | | | | | | | 177,039,604 | |
| | | | | | | | | | | | | | | | | | | | | | | | |
| | | Counterparty | | | | Exercise Price | | | | | | Expiration Date | | Contracts | | | | |
| |
Over-the-Counter Options Purchased—0.1% | | | | | | | | | | | | | | | | | |
| |
| EUR Currency Put13,17 | | CITNA-B | | USD | | | 1.000 | | | | | | | 9/16/15 | | EUR | | | 2,500,000 | | | | 120,574 | |
| |
| EUR Currency Put13 | | BAC | | USD | | | 1.084 | | | | | | | 9/10/15 | | EUR | | | 25,000,000 | | | | 321,700 | |
| |
| INR Currency Call13 | | BOA | | INR | | | 62.500 | | | | | | | 8/27/15 | | INR | | | 1,564,000,000 | | | | 26,588 | |
| |
| INR/BRL/PLN Basket Call13 | | GSG | | USD | | | 1.000 | | | | | | | 8/31/15 | | USD | | | 37,568,808 | | | | 564,622 | |
| |
| MXN Currency Call13 | | CITNA-B | | MXN | | | 14.755 | | | | | | | 3/16/16 | | MXN | | | 245,940,000 | | | | 123,708 | |
| |
| MXN Currency Call13 | | JPM | | MXN | | | 15.060 | | | | | | | 4/11/16 | | MXN | | | 187,800,000 | | | | 154,935 | |
| |
| MXN Currency Call13 | | JPM | | MXN | | | 14.723 | | | | | | | 3/16/16 | | MXN | | | 122,700,000 | | | | 58,896 | |
| |
| SX5E Index Call13 | | BOA | | EUR | | | 3,686.870 | | | | | | | 10/30/15 | | EUR | | | 7,120 | | | | 602,988 | |
| |
| SX5E Index Call13 | | GSG | | EUR | | | 3,632.250 | | | | | | | 9/9/15 | | EUR | | | 5,420 | | | | 445,439 | |
| | | | | | | | | | | | | | | | | | | | | | | | |
| Total Over-the-Counter Options Purchased (Cost $3,546,982) | | | | | | | | | | | | | | | | 2,419,450 | |
| | | | | | | |
| | | Counterparty | | Buy /Sell
Protection | | Reference Asset | | | Fixed Rate | | | Expiration Date | | Notional Amount (000’s) | | | | |
| |
Over-the-Counter Credit Default Swaption Purchased—0.0% | | | | | | | | | | | | | | | | | |
| |
| Credit Default Swap maturing 6/20/20 Put13 (Cost $87,252) | | JPM | | Sell | |
| iTraxx Europe
Crossover Series
23 Version 1 |
| | | 2.750% | | | 8/19/15 | | EUR | | | 13,200 | | | | 52,857 | |
| | | | | | | |
| | | Counterparty | | Pay / Receive
Floating Rate | | Floating Rate | | | Fixed Rate | | | Expiration Date | | Notional Amount (000’s) | | | | |
| |
Over-the-Counter Interest Rate Swaptions Purchased—0.0% | | | | | | | | | | | | | | | | | |
| |
| Interest Rate Swap maturing 4/24/18 Call13 | | DEU | | Receive | |
| If the “FRO2” is less
than 0.40% at Fixing
Date then the
Floating Rate will be
calculated as
MAX[0;(FRO 1-Strike
Swap Rate)] |
| | | 80.000% | | | 4/24/18 | | EUR | | | 52,600 | | | | 164,032 | |
| |
| Interest Rate Swap maturing 5/30/33 Call13 | | BAC | | Receive | |
| Six-Month GBP BBA
LIBOR |
| | | 3.990 | | | 5/30/23 | | GBP | | | 1,235 | | | | 76,244 | |
| |
| Interest Rate Swap maturing 7/21/25 Call13 | | GSG | | Receive | |
| Six-Month EUR
EURIBOR |
| | | 2.750 | | | 7/17/15 | | EUR | | | 43,410 | | | | — | |
| |
| Interest Rate Swap maturing 7/21/25 Call13 | | UBS | | Receive | |
| Six-Month EUR
EURIBOR |
| | | 1.821 | | | 7/17/15 | | EUR | | | 19,040 | | | | 788 | |
| |
| Interest Rate Swap maturing 9/8/35 Call13 | | GSG | | Receive | |
| Three-Month USD
BBA LIBOR |
| | | 3.220 | | | 9/3/15 | | USD | | | 23,468 | | | | 342,214 | |
| |
| Interest Rate Swap maturing 1/2/17 Call13 | | BOA | | Pay | | | BZDI | | | | 12.545 | | | 1/4/16 | | BRL | | | 31,000 | | | | 9,734 | |
| |
| Interest Rate Swap maturing 1/2/19 Call13 | | BOA | | Pay | | | BZDI | | | | 11.420 | | | 1/4/16 | | BRL | | | 31,000 | | | | 25,380 | |
| |
| Interest Rate Swap maturing 1/4/21 Call13 | | BOA | | Pay | | | BZDI | | | | 11.380 | | | 1/4/16 | | BRL | | | 28,160 | | | | 55,242 | |
| | | | | | | | | | | | | | | | | | | | | | | | |
| Total Over-the-Counter Interest Rate Swaptions Purchased (Cost $1,481,806) | | | | | | | | | | | | 673,634 | |
| |
| Total Investments, at Value (Cost $2,088,504,050) | | | | | | | | | | | | 102.4% | | | | 2,032,555,137 | |
| |
| Net Other Assets (Liabilities) | | | | | | | | | | | | | | | (2.4) | | | | (48,137,971) | |
| | | | | | | | | | | | | | | | | | | | |
| Net Assets | | | | | | | | | | | | | | | 100.0% | | | $ | 1,984,417,166 | |
| | | | | | | | | | | | | | | | | | | | |
26 OPPENHEIMER GLOBAL STRATEGIC INCOME FUND/VA
Footnotes to Consolidated Statement of Investments
1. Represents securities sold under Rule 144A, which are exempt from registration under the Securities Act of 1933, as amended. These securities have been determined to be liquid under guidelines established by the Board of Trustees. These securities amount to $750,514,053 or 37.82% of the Fund’s net assets as of June 30, 2015.
2. Restricted security. The aggregate value of restricted securities as of June 30, 2015 was $39,519,509, which represents 1.99% of the Fund’s net assets. See Note 4 of the accompanying Consolidated Notes. Information concerning restricted securities is as follows:
| | | | | | | | | | | | | | | | |
| Security | | Acquisition Dates | | | Cost | | | Value | | | Unrealized
Appreciation/
(Depreciation) | |
| |
| American Capital Ltd., 6.50% Sr. Unsec. Nts., 9/15/18 | | | 9/17/13 | | | $ | 875,000 | | | $ | 911,094 | | | $ | 36,094 | |
| Amsted Industries, Inc., 5% Sr. Unsec. Nts., 3/15/22 | | | 3/3/14 - 12/30/14 | | | | 3,007,877 | | | | 3,021,287 | | | | 13,410 | |
| Arco Capital Corp. Ltd. | | | 6/28/13 | | | | — | | | | — | | | | — | |
| ASG Consolidated LLC/ASG Finance, Inc., 15% Sr. Unsec. Nts., 5/15/17 | | | 8/19/10 - 5/15/15 | | | | 3,376,061 | | | | 2,222,005 | | | | (1,154,056) | |
| Banc of America Funding Trust, Series 2014-R7, Cl. 3A1, 2.617%, 3/26/36 | | | 3/6/15 | | | | 159,927 | | | | 159,887 | | | | (40) | |
| Blackboard, Inc., 7.75% Sr. Unsec. Nts., 11/15/19 | | | 12/2/13 - 10/16/14 | | | | 1,757,130 | | | | 1,630,125 | | | | (127,005) | |
| Brazil Loan Trust 1, 5.477% Sec. Nts., 7/24/23 | | | 7/25/13 - 7/25/14 | | | | 1,456,116 | | | | 1,402,113 | | | | (54,003) | |
| Citigroup Mortgage Loan Trust, Inc., Collateralized Mtg. Obligations, Series 2014-8, Cl. 1A2, 0.477%, 7/20/36 | | | 7/11/14 | | | | 2,867,387 | | | | 2,745,500 | | | | (121,887) | |
| Credit Agricole SA, 6.637% Jr. Sub. Perpetual Bonds | | | 12/18/13 | | | | 1,068,892 | | | | 1,112,925 | | | | 44,033 | |
| Credit Agricole SA, 8.375% Jr. Sub. Perpetual Bonds | | | 7/17/13 - 4/29/15 | | | | 3,125,635 | | | | 3,302,775 | | | | 177,140 | |
| Deutsche Bank AG, Coriolanus Ltd. Sec. Credit Linked Bonds, 39.866% Sr. Sec. Nts., 12/31/17 | | | 9/19/07 | | | | 3,749,995 | | | | 5,262,172 | | | | 1,512,177 | |
| Deutsche Bank AG, Opic Reforma I Credit Linked Nts., Cl. 2A, 6.697%, 10/22/15 | | | 5/21/08 | | | | 10,445 | | | | 6,276 | | | | (4,169) | |
| Deutsche Bank AG, Opic Reforma I Credit Linked Nts., Cl. 2B, 6.697%, 10/22/15 | | | 6/12/08 | | | | 18,272 | | | | 10,979 | | | | (7,293) | |
| Deutsche Bank AG, Opic Reforma I Credit Linked Nts., Cl. 2C, 6.697%, 10/22/15 | | | 6/18/08 | | | | 277,234 | | | | 165,541 | | | | (111,693) | |
| Deutsche Bank AG, Opic Reforma I Credit Linked Nts., Cl. 2D, 6.697%, 10/22/15 | | | 7/8/08 | | | | 20,190 | | | | 12,064 | | | | (8,126) | |
| Deutsche Bank AG, Opic Reforma I Credit Linked Nts., Cl. 2E, 6.697%, 10/22/15 | | | 7/15/08 | | | | 14,693 | | | | 8,765 | | | | (5,928) | |
| Deutsche Bank AG, Opic Reforma I Credit Linked Nts., Cl. 2F, 6.697%, 10/22/15 | | | 8/8/08 | | | | 9,512 | | | | 5,598 | | | | (3,914) | |
| Deutsche Bank AG, Opic Reforma I Credit Linked Nts., Cl. 2G, 6.697%, 10/22/15 | | | 8/22/08 | | | | 1,755 | | | | 1,031 | | | | (724) | |
| Drawbridge Special Opportunities Fund LP/Drawbridge Special Opportunities Finance Corp., 5% Sr. Unsec. Nts., 8/1/21 | | | 7/11/14 - 10/28/14 | | | | 3,111,199 | | | | 3,152,863 | | | | 41,664 | |
| Drive Auto Receivables Trust, Series 2015-AA, Cl. C, 3.06%, 5/17/21 | | | 3/12/15 | | | | 429,941 | | | | 432,830 | | | | 2,889 | |
| Eletson Holdings, 9.625% Sr. Sec. Nts., 1/15/22 | | | 12/12/13 - 5/28/15 | | | | 2,075,378 | | | | 2,053,100 | | | | (22,278) | |
| Infinis plc, 7% Sr. Sec. Nts., 2/15/19 | | | 10/2/13 - 4/28/15 | | | | 2,936,909 | | | | 2,865,214 | | | | (71,695) | |
| JPMorgan Hipotecaria su Casita, 6.47% Sec. Nts., 8/26/35 | | | 3/21/07 | | | | 528,951 | | | | 37,587 | | | | (491,364) | |
| Kenan Advantage Group, Inc. (The), 8.375% Sr. Unsec. Nts., 12/15/18 | | | 12/7/12 - 12/12/13 | | | | 2,296,557 | | | | 2,364,094 | | | | 67,537 | |
| LBC Tank Terminals Holding Netherlands BV, 6.875% Sr. Unsec. Nts., 5/15/23 | | | 5/8/13 - 4/17/14 | | | | 1,582,120 | | | | 1,587,375 | | | | 5,255 | |
| NC Finance Trust, Series 1999-I, Cl. D, 8.75%, 1/25/29 | | | 8/10/10 | | | | 66,025 | | | | 18,021 | | | | (48,004) | |
| Premier Cruises Ltd., 11% Sr. Unsec. Nts., 3/15/08 | | | 3/6/98 | | | | 242,675 | | | | — | | | | (242,675) | |
| Realogy Group LLC, 9% Sr. Sec. Nts., 1/15/20 | | | 1/25/12 - 2/1/12 | | | | 862,550 | | | | 936,363 | | | | 73,813 | |
| Sequa Corp., 7% Sr. Unsec. Nts., 12/15/17 | | | 1/8/15 - 1/30/15 | | | | 2,144,392 | | | | 1,620,025 | | | | (524,367) | |
| Swiss Re Capital I LP, 6.854% Jr. Sub. Perpetual Bonds | | | 1/13/14 - 3/13/15 | | | | 1,855,276 | | | | 1,846,385 | | | | (8,891) | |
| Wallace Theater Holdings, Inc. | | | 3/28/13 | | | | 15 | | | | 15 | | | | — | |
| ZFS Finance USA Trust V, 6.50% Jr. Sub. Nts., 5/9/37 | | | 3/11/15 | | | | 632,517 | | | | 625,500 | | | | (7,017) | |
| | | | | | | | |
| | | | | | $ | 40,560,626 | | | $ | 39,519,509 | | | $ | (1,041,117) | |
| | | | | | | | |
27 OPPENHEIMER GLOBAL STRATEGIC INCOME FUND/VA
CONSOLIDATED STATEMENT OF INVESTMENTS Unaudited / Continued
Footnotes to Consolidated Statement of Investments (Continued)
3. Represents the current interest rate for a variable or increasing rate security.
4. Interest-Only Strips represent the right to receive the monthly interest payments on an underlying pool of mortgage loans. These securities typically decline in price as interest rates decline. Most other fixed income securities increase in price when interest rates decline. The principal amount of the underlying pool represents the notional amount on which current interest is calculated. The price of these securities is typically more sensitive to changes in prepayment rates than traditional mortgage-backed securities (for example, GNMA pass-throughs). Interest rates disclosed represent current yields based upon the current cost basis and estimated timing and amount of future cash flows. These securities amount to $4,661,870 or 0.23% of the Fund’s net assets as of June 30, 2015.
5. Interest rate is less than 0.0005%.
6. All or a portion of the security position is when-issued or delayed delivery to be delivered and settled after June 30, 2015. See Note 4 of the accompanying Consolidated Notes.
7. This security is not accruing income because the issuer has missed an interest payment on it and/or is not anticipated to make future interest and or principal payments. The rate shown is the original contractual interest rate. See Note 4 of the accompanying Consolidated Notes.
8. All or a portion of the security position is held in segregated accounts and pledged to cover margin requirements under certain derivative contracts. The aggregate market value of such securities is $7,902,539. See Note 5 of the accompanying Consolidated Notes.
9. All or a portion of the security position is held in accounts at a futures clearing merchant and pledged to cover margin requirements on open futures contracts and written options on futures, if applicable. The aggregate market value of such securities is $2,015,312. See Note 5 of the accompanying Consolidated Notes.
10. This bond has no contractual maturity date, is not redeemable and contractually pays an indefinite stream of interest. Rate reported represents the current interest rate for this variable rate security.
11. Interest or dividend is paid-in-kind, when applicable.
12. Security received as the result of issuer reorganization.
13. Non-income producing security.
14. Zero coupon bond reflects effective yield on the date of purchase.
15. Denotes an inflation-indexed security: coupon or principal are indexed to a consumer price index.
16. Is or was an affiliate, as defined in the Investment Company Act of 1940, as amended, at or during the period ended June 30, 2015, by virtue of the Fund owning at least 5% of the voting securities of the issuer or as a result of the Fund and the issuer having the same investment adviser. Transactions during the period in which the issuer was an affiliate are as follows:
| | | | | | | | | | | | | | | | |
| | | Shares
December 31, 2014 | | | Gross Additions | | | Gross Reductions | | | Shares June 30, 2015 | |
| |
| Oppenheimer Institutional Money Market Fund, Cl. E | | | 55,210,591 | | | | 303,878,906 | | | | 359,089,497 | | | | — | |
| Oppenheimer Master Event-Linked Bond Fund, LLC | | | 3,158,849 | | | | — | | | | — | | | | 3,158,849 | |
| Oppenheimer Master Loan Fund, LLC | | | 8,486,824 | | | | — | | | | 1,031,430 | | | | 7,455,394 | |
| Oppenheimer Ultra-Short Duration Fund, Cl. Y | | | 4,508,180 | | | | 8,196 | | | | 2,444,458 | | | | 2,071,918 | |
| | | | |
| | | | | | Value | | | Income | | | Realized Gain (Loss) | |
| |
| Oppenheimer Institutional Money Market Fund, Cl. E | | | | | | $ | — | | | $ | 29,032 | | | $ | — | |
| Oppenheimer Master Event-Linked Bond Fund, LLC | | | | | | | 46,382,036 | | | | 1,323,728 a | | | | 650,969 a | |
| Oppenheimer Master Loan Fund, LLC | | | | | | | 109,917,667 | | | | 2,889,150 b | | | | (1,393,700) b | |
| Oppenheimer Ultra-Short Duration Fund, Cl. Y | | | | | | | 20,739,901 | | | | 82,256 | | | | (12,556) | |
| | | | | | | | |
| Total | | | | | | $ | 177,039,604 | | | $ | 4,324,166 | | | $ | (755,287) | |
| | | | | | | | |
a. Represents the amount allocated to the Fund from Oppenheimer Master Event-Linked Bond Fund, LLC.
b. Represents the amount allocated to the Fund from Oppenheimer Master Loan Fund, LLC.
17. Knock-in option expires worthless if at any time spot rates are equal to or less than 1 EUR per 1 USD.
| | | | | | | | |
| Distribution of investments representing geographic holdings, as a percentage of total investments at value, is as follows: | |
| Geographic Holdings | | Value | | | Percent | |
| |
| United States | | $ | 1,275,334,214 | | | | 62.8% | |
| Brazil | | | 72,386,329 | | | | 3.6 | |
| United Kingdom | | | 67,140,344 | | | | 3.3 | |
| Mexico | | | 57,245,881 | | | | 2.8 | |
| India | | | 57,072,705 | | | | 2.8 | |
| Indonesia | | | 33,830,800 | | | | 1.7 | |
| France | | | 33,645,580 | | | | 1.7 | |
| Netherlands | | | 32,395,472 | | | | 1.6 | |
| Canada | | | 29,186,495 | | | | 1.4 | |
| Germany | | | 24,796,148 | | | | 1.2 | |
| Italy | | | 22,479,297 | | | | 1.1 | |
| South Africa | | | 20,685,401 | | | | 1.0 | |
| Luxembourg | | | 20,135,307 | | | | 1.0 | |
| Colombia | | | 20,003,772 | | | | 1.0 | |
| Spain | | | 19,839,205 | | | | 1.0 | |
| Turkey | | | 18,808,380 | | | | 0.9 | |
| China | | | 18,721,313 | | | | 0.9 | |
| Peru | | | 17,899,117 | | | | 0.9 | |
| Supranational | | | 16,869,016 | | | | 0.8 | |
| Switzerland | | | 16,659,233 | | | | 0.8 | |
| Chile | | | 13,249,320 | | | | 0.7 | |
| Israel | | | 11,914,047 | | | | 0.6 | |
| Ireland | | | 11,174,575 | | | | 0.6 | |
| Hungary | | | 9,053,028 | | | | 0.5 | |
| Panama | | | 8,692,895 | | | | 0.4 | |
| Australia | | | 7,966,223 | | | | 0.4 | |
| Russia | | | 7,705,937 | | | | 0.4 | |
| United Arab Emirates | | | 7,635,409 | | | | 0.4 | |
28 OPPENHEIMER GLOBAL STRATEGIC INCOME FUND/VA
| | | | | | | | |
| Geographic Holdings (Continued) | | Value | | | Percent | |
| |
| Dominican Republic | | $ | 6,783,969 | | | | 0.3% | |
| Portugal | | | 5,588,458 | | | | 0.3 | |
| South Korea | | | 4,787,300 | | | | 0.2 | |
| Denmark | | | 4,777,671 | | | | 0.2 | |
| Ivory Coast | | | 4,609,371 | | | | 0.2 | |
| Sri Lanka | | | 4,031,577 | | | | 0.2 | |
| Croatia | | | 3,738,144 | | | | 0.2 | |
| Jamaica | | | 3,697,765 | | | | 0.2 | |
| Sweden | | | 3,659,970 | | | | 0.2 | |
| Morocco | | | 3,398,293 | | | | 0.2 | |
| Serbia | | | 3,074,230 | | | | 0.2 | |
| Philippines | | | 2,521,845 | | | | 0.1 | |
| Austria | | | 2,488,275 | | | | 0.1 | |
| Belgium | | | 2,435,971 | | | | 0.1 | |
| Kazakhstan | | | 2,134,091 | | | | 0.1 | |
| Greece | | | 2,053,100 | | | | 0.1 | |
| Egypt | | | 2,032,405 | | | | 0.1 | |
| Jersey, Channel Islands | | | 2,016,000 | | | | 0.1 | |
| Kenya | | | 1,760,971 | | | | 0.1 | |
| Eurozone | | | 1,708,378 | | | | 0.1 | |
| Argentina | | | 1,538,050 | | | | 0.1 | |
| Uruguay | | | 1,365,650 | | | | 0.1 | |
| Singapore | | | 1,259,881 | | | | 0.1 | |
| Venezuela | | | 914,413 | | | | 0.1 | |
| Cayman Islands | | | 870,188 | | | | 0.0 | |
| Barbados | | | 846,819 | | | | 0.0 | |
| Poland | | | 841,577 | | | | 0.0 | |
| Vietnam | | | 804,000 | | | | 0.0 | |
| Angola | | | 731,457 | | | | 0.0 | |
| Ecuador | | | 720,363 | | | | 0.0 | |
| Japan | | | 630,687 | | | | 0.0 | |
| Thailand | | | 615,127 | | | | 0.0 | |
| Bermuda | | | 610,623 | | | | 0.0 | |
| Norway | | | 597,375 | | | | 0.0 | |
| Paraguay | | | 385,700 | | | | 0.0 | |
| | | | |
| Total | | $ | 2,032,555,137 | | | | 100.0% | |
| | | | |
| | | | | | | | | | | | | | | | | | | | |
| |
Forward Currency Exchange Contracts as of June 30, 2015 | |
| Counterparty | | Settlement Month(s) | | | Currency Purchased (000’s) | | | Currency Sold (000’s) | | | Unrealized
Appreciation | | | Unrealized
Depreciation | |
| |
| BAC | | | 07/2015 | | | INR | 741,000 | | | USD | 11,558 | | | $ | 64,464 | | | $ | — | |
| BAC | | | 07/2015 | | | USD | 201 | | | RUB | 14,200 | | | | — | | | | 55,650 | |
| BOA | | | 08/2015 | | | IDR | 4,336,000 | | | USD | 319 | | | | 1,861 | | | | — | |
| BOA | | | 07/2015 - 08/2015 | | | INR | 1,315,000 | | | USD | 20,242 | | | | 272,247 | | | | — | |
| BOA | | | 07/2015 | | | KRW | 11,120,000 | | | USD | 9,992 | | | | — | | | | 27,099 | |
| BOA | | | 11/2015 | | | USD | 384 | | | GBP | 250 | | | | — | | | | 8,209 | |
| BOA | | | 08/2015 | | | USD | 8,283 | | | IDR | 112,462,000 | | | | — | | | | 48,270 | |
| BOA | | | 07/2015 - 10/2015 | | | USD | 73,093 | | | INR | 4,775,000 | | | | — | | | | 1,163,489 | |
| BOA | | | 07/2015 | | | USD | 10,047 | | | KRW | 11,120,000 | | | | 82,168 | | | | — | |
| BOA | | | 09/2015 - 12/2015 | | | USD | 54,681 | | | MXN | 855,500 | | | | 697,030 | | | | — | |
| BOA | | | 09/2015 | | | USD | 2,571 | | | PHP | 116,000 | | | | 9,083 | | | | — | |
| BOA | | | 08/2015 | | | USD | 10,030 | | | ZAR | 121,500 | | | | 141,135 | | | | — | |
| CITNA-B | | | 07/2015 | | | CAD | 13,590 | | | USD | 11,193 | | | | — | | | | 311,952 | |
| CITNA-B | | | 07/2015 - 11/2015 | | | EUR | 1,415 | | | USD | 1,595 | | | | — | | | | 16,965 | |
| CITNA-B | | | 11/2015 | | | GBP | 240 | | | USD | 377 | | | | — | | | | 392 | |
| CITNA-B | | | 08/2015 | | | TRY | 10,290 | | | USD | 3,795 | | | | — | | | | 17,476 | |
| CITNA-B | | | 10/2015 | | | USD | 22,456 | | | BRL | 71,500 | | | | 216,549 | | | | — | |
| CITNA-B | | | 07/2015 | | | USD | 11,058 | | | CAD | 13,590 | | | | 177,705 | | | | — | |
| CITNA-B | | | 11/2015 | | | USD | 515 | | | GBP | 325 | | | | 5,329 | | | | — | |
| CITNA-B | | | 11/2015 | | | USD | 186 | | | SGD | 250 | | | | 262 | | | | — | |
| CITNA-B | | | 07/2015 | | | USD | 5,751 | | | TRY | 14,180 | | | | 503,679 | | | | — | |
| CITNA-B | | | 08/2015 | | | USD | 6,246 | | | ZAR | 78,890 | | | | — | | | | 174,208 | |
| DEU | | | 07/2015 | | | BRL | 44,330 | | | USD | 14,113 | | | | 144,806 | | | | — | |
| DEU | | | 07/2015 - 08/2015 | | | USD | 27,599 | | | BRL | 86,620 | | | | 29,871 | | | | 124,266 | |
| DEU | | | 11/2015 | | | USD | 410 | | | EUR | 365 | | | | 2,138 | | | | — | |
| DEU | | | 07/2015 - 08/2015 | | | USD | 22,526 | | | ZAR | 275,610 | | | | 41,991 | | | | — | |
| DEU | | | 08/2015 | | | ZAR | 160,950 | | | USD | 13,009 | | | | 112,519 | | | | 21,899 | |
| GSCO-OT | | | 07/2015 | | | BRL | 148,790 | | | USD | 47,653 | | | | 256,819 | | | | 53,125 | |
| GSCO-OT | | | 07/2015 - 08/2015 | | | USD | 70,372 | | | BRL | 218,880 | | | | 1,335,471 | | | | 1,086,899 | |
| GSCO-OT | | | 07/2015 | | | USD | 9,891 | | | HUF | 2,746,000 | | | | 191,506 | | | | — | |
| GSCO-OT | | | 07/2015 - 08/2015 | | | USD | 25,892 | | | INR | 1,666,000 | | | | — | | | | 191,855 | |
| HSBC | | | 11/2015 | | | EUR | 2,710 | | | USD | 3,042 | | | | — | | | | 13,544 | |
29 OPPENHEIMER GLOBAL STRATEGIC INCOME FUND/VA
CONSOLIDATED STATEMENT OF INVESTMENTS Unaudited / Continued
| | | | | | | | | | | | | | | | | | | | | | | | |
| |
Forward Currency Exchange Contracts (Continued) | |
| Counterparty | | Settlement Month(s) | | | Currency Purchased
(000’s) | | | Currency Sold
(000’s) | | | Unrealized
Appreciation | | | Unrealized
Depreciation | |
| |
| HSBC | | | 07/2015 | | | HUF | | | 2,746,000 | | | USD | | | 9,828 | | | $ | — | | | $ | 128,942 | |
| HSBC | | | 07/2015 | | | INR | | | 63,000 | | | USD | | | 977 | | | | 10,801 | | | | — | |
| HSBC | | | 11/2015 | | | USD | | | 82,616 | | | EUR | | | 74,815 | | | | 6,806 | | | | 985,575 | |
| HSBC | | | 11/2015 | | | USD | | | 1,659 | | | GBP | | | 1,080 | | | | 1,908 | | | | 38,469 | |
| HSBC | | | 07/2015 | | | USD | | | 4,514 | | | INR | | | 291,000 | | | | — | | | | 49,889 | |
| JPM | | | 07/2015 | | | BRL | | | 37,220 | | | USD | | | 11,996 | | | | — | | | | 25,080 | |
| JPM | | | 01/2016 | | | CNH | | | 55,600 | | | USD | | | 9,041 | | | | — | | | | 200,625 | |
| JPM | | | 08/2015 | | | COP | | | 9,473,000 | | | USD | | | 3,667 | | | | — | | | | 52,804 | |
| JPM | | | 07/2015 - 11/2015 | | | EUR | | | 845 | | | USD | | | 955 | | | | — | | | | 11,986 | |
| JPM | | | 09/2015 | | | MXN | | | 182,900 | | | USD | | | 11,703 | | | | — | | | | 123,842 | |
| JPM | | | 07/2015 - 08/2015 | | | TRY | | | 11,870 | | | USD | | | 4,381 | | | | 51,590 | | | | 29,457 | |
| JPM | | | 07/2015 - 08/2015 | | | USD | | | 13,685 | | | BRL | | | 42,700 | | | | 11,171 | | | | 38,410 | |
| JPM | | | 01/2016 | | | USD | | | 8,825 | | | CNH | | | 55,600 | | | | — | | | | 15,363 | |
| JPM | | | 08/2015 | | | USD | | | 14,659 | | | COP | | | 36,958,000 | | | | 559,213 | | | | — | |
| JPM | | | 07/2015 - 11/2015 | | | USD | | | 14,699 | | | EUR | | | 13,095 | | | | 86,355 | | | | 1,696 | |
| JPM | | | 08/2015 | | | USD | | | 3,159 | | | IDR | | | 42,851,000 | | | | — | | | | 15,372 | |
| JPM | | | 08/2015 | | | USD | | | 207 | | | THB | | | 7,000 | | | | — | | | | 200 | |
| JPM | | | 08/2015 | | | USD | | | 6,232 | | | ZAR | | | 77,580 | | | | — | | | | 82,250 | |
| JPM | | | 08/2015 | | | ZAR | | | 78,880 | | | USD | | | 6,295 | | | | 124,840 | | | | — | |
| MSCO | | | 07/2015 - 10/2015 | | | BRL | | | 55,240 | | | USD | | | 17,611 | | | | 113,506 | | | | 332,944 | |
| MSCO | | | 11/2015 | | | EUR | | | 245 | | | USD | | | 276 | | | | — | | | | 2,261 | |
| MSCO | | | 11/2015 | | | GBP | | | 430 | | | USD | | | 676 | | | | — | | | | 530 | |
| MSCO | | | 07/2015 - 08/2015 | | | USD | | | 7,911 | | | BRL | | | 24,630 | | | | 14,884 | | | | 6,405 | |
| MSCO | | | 08/2015 | | | USD | | | 301 | | | COP | | | 776,000 | | | | 5,186 | | | | — | |
| MSCO | | | 11/2015 | | | USD | | | 746 | | | EUR | | | 680 | | | | — | | | | 13,518 | |
| MSCO | | | 11/2015 | | | USD | | | 57,338 | | | GBP | | | 37,640 | | | | — | | | | 1,746,011 | |
| MSCO | | | 07/2015 | | | USD | | | 2,974 | | | TRY | | | 8,130 | | | | — | | | | 55,463 | |
| NOM | | | 08/2015 | | | USD | | | 7,146 | | | HUF | | | 2,034,000 | | | | — | | | | 35,525 | |
| TDB | | | 07/2015 | | | BRL | | | 42,990 | | | USD | | | 13,639 | | | | 188,091 | | | | — | |
| TDB | | | 08/2015 | | | COP | | | 12,568,000 | | | USD | | | 4,860 | | | | — | | | | 64,884 | |
| TDB | | | 09/2015 | | | MXN | | | 153,700 | | | USD | | | 9,776 | | | | — | | | | 45,058 | |
| TDB | | | 07/2015 - 01/2016 | | | USD | | | 35,272 | | | BRL | | | 113,300 | | | | 28,968 | | | | 494,032 | |
| TDB | | | 11/2015 | | | USD | | | 124 | | | EUR | | | 110 | | | | 1,524 | | | | — | |
| TDB | | | 08/2015 | | | USD | | | 2,296 | | | HUF | | | 648,000 | | | | 8,385 | | | | — | |
| TDB | | | 08/2015 | | | USD | | | 6,234 | | | ZAR | | | 77,660 | | | | — | | | | 86,892 | |
| TDB | | | 08/2015 | | | ZAR | | | 77,820 | | | USD | | | 6,208 | | | | 125,194 | | | | — | |
| | | | | | | | | | | | | | | | | | | | |
| Total Unrealized Appreciation and Depreciation | | | | | | | | | $ | 5,625,055 | | | $ | 7,998,781 | |
| | | | | | | | | | | | | | | | | | | | |
| | | | | | | | | | | | | | | | | | | | | | | | | | |
| |
Futures Contracts as of June 30, 2015 | |
| Description | | Exchange | | | | | Buy/Sell | | | Expiration Date | | | Number of Contracts | | | Value | | | Unrealized Appreciation
(Depreciation) | |
| |
| United States Treasury Long Bonds | | | CBT | | | | | | Sell | | | | 9/21/15 | | | | 62 | | | $ | 9,352,312 | | | $ | (49,934) | |
| United States Treasury Long Bonds | | | CBT | | | | | | Buy | | | | 9/21/15 | | | | 7 | | | | 1,055,906 | | | | 2,958 | |
| United States Treasury Nts., 2 yr. | | | CBT | | | | | | Sell | | | | 9/30/15 | | | | 139 | | | | 30,432,313 | | | | (47,967) | |
| United States Treasury Nts., 2 yr. | | | CBT | | | | | | Buy | | | | 9/30/15 | | | | 276 | | | | 60,426,750 | | | | 81,176 | |
| United States Treasury Nts., 10 yr. | | | CBT | | | | | | Sell | | | | 9/21/15 | | | | 267 | | | | 33,687,891 | | | | (13,722) | |
| United States Treasury Ultra Bonds | | | CBT | | | | | | Buy | | | | 9/21/15 | | | | 197 | | | | 30,350,313 | | | | (803,875) | |
| | | | | | | | | | | | | | | | | | | | | | | | | | |
| | | | | | | | | | | | | | | | | | | | | | | | $ | (831,364) | |
| | | | | | | | | | | | | | | | | | | | | | | | | | |
| | | | | | | | | | | | | | | | | | | | | | | | | | | | | | | | | | |
| |
Over-the-Counter Options Written at June 30, 2015 | |
| Description | | Counterparty | | | | | Exercise Price | | | Expiration Date | | | Number of Contracts | | | Premiums Received | | | Value | |
| |
| BRL Currency Call | | | BNP | | | | | | BRL | | | | 3.080 | | | | 7/21/15 | | | | BRL | | | | (61,590,000) | | | $ | 252,800 | | | $ | (166,539) | |
| |
| BRL Currency Put1 | | | GSG | | | | | | BRL | | | | 3.230 | | | | 2/1/17 | | | | BRL | | | | (30,140,000) | | | | 538,498 | | | | (1,387,887) | |
| |
| EUR Currency Call | | | BAC | | | | | | USD | | | | 1.179 | | | | 9/10/15 | | | | EUR | | | | (25,000,000) | | | | 230,986 | | | | (98,225) | |
| |
| EUR Currency Call2 | | | CITNA-B | | | | | | BRL | | | | 3.949 | | | | 6/2/16 | | | | EUR | | | | (12,530,000) | | | | 694,412 | | | | (692,441) | |
| |
| EUR Currency Call | | | CITNA-B | | | | | | INR | | | | 69.780 | | | | 7/23/15 | | | | EUR | | | | (9,360,000) | | | | 261,854 | | | | (272,979) | |
| |
| EUR Currency Call | | | CITNA-B | | | | | | INR | | | | 73.460 | | | | 4/25/16 | | | | EUR | | | | (9,360,000) | | | | 527,753 | | | | (598,851) | |
| |
| INR Currency Put | | | BOA | | | | | | INR | | | | 66.500 | | | | 8/27/15 | | | | INR | | | | (1,664,000,000) | | | | 254,980 | | | | (59,904) | |
| |
| INR Currency Call | | | BOA | | | | | | INR | | | | 60.100 | | | | 8/27/15 | | | | INR | | | | (1,504,000,000) | | | | 96,871 | | | | — | |
| |
| MXN Currency Put | | | CITNA-B | | | | | | MXN | | | | 17.690 | | | | 3/16/16 | | | | MXN | | | | (294,860,000) | | | | 406,287 | | | | (231,760) | |
| |
| MXN Currency Put3 | | | CITNA-B | | | | | | MXN | | | | 15.690 | | | | 2/2/17 | | | | MXN | | | | (97,620,000) | | | | 227,096 | | | | (422,402) | |
| |
| MXN Currency Put | | | JPM | | | | | | MXN | | | | 17.657 | | | | 3/16/16 | | | | MXN | | | | (147,160,000) | | | | 196,029 | | | | (117,875) | |
| |
| SX5E Index Put | | | BOA | | | | | | EUR | | | | 3335.750 | | | | 10/30/15 | | | | EUR | | | | (7,120) | | | | 950,986 | | | | (1,292,742) | |
| |
| SX5E Index Put | | | GSG | | | | | | EUR | | | | 3216.440 | | | | 9/9/15 | | | | EUR | | | | (5,420) | | | | 432,711 | | | | (519,903) | |
| |
| TRY/ILS/MXN Basket Call | | | GSG | | | | | | USD | | | | 1.000 | | | | 8/31/15 | | | | USD | | | | (37,568,808) | | | | 424,527 | | | | (366,146) | |
| |
| ZAR Currency Put | | | GSG | | | | | | ZAR | | | | 14.900 | | | | 4/19/16 | | | | ZAR | | | | (186,250,000) | | | | 408,750 | | | | (250,134) | |
| | | | | | | | | | | | | | | | | | | | | | | | | | | | | | |
| Total of Over-the-Counter Options Written | | | | | | | | | | | | | | | $ | 5,904,540 | | | $ | (6,477,788) | |
| | | | | | | | | | | | | | | | | | | | | | | | | | | | | | |
30 OPPENHEIMER GLOBAL STRATEGIC INCOME FUND/VA
|
|
Over-the-Counter Options Written (Continued) |
1. Knock-out option expires worthless if at any time spot rates are less than or equal to 2.56 BRL per 1 USD.
2. Knock-out option expires worthless if at any time spot rates are equal to or less than 3.324 BRL per 1 EUR.
3. Knock-out option expires worthless if at any time spot rates are equal to or less than 14.4 MXN per 1 USD.
|
|
Centrally Cleared Credit Default Swaps at June 30, 2015 |
| | | | | | | | | | | | | | | | | | | | | | | | | | | | |
| Reference Asset | | | | | Buy/Sell
Protection | | | Fixed Rate | | | Maturity Date | | | Notional Amount (000’s) | | | Premiums Received/(Paid) | | | Value | |
| |
| CDX.EM.23 | | | | | | | Buy | | | | 1.000% | | | | 6/20/20 | | | USD | 2,340 | | | $ | (221,390) | | | $ | 224,735 | |
| |
| CDX.EM.23 | | | | | | | Buy | | | | 1.000 | | | | 6/20/20 | | | USD | 2,340 | | | | (215,982) | | | | 224,735 | |
| |
| CDX.EM.23 | | | | | | | Buy | | | | 1.000 | | | | 6/20/20 | | | USD | 2,340 | | | | (222,092) | | | | 224,735 | |
| |
| CDX.EM.23 | | | | | | | Buy | | | | 1.000 | | | | 6/20/20 | | | USD | 2,340 | | | | (224,770) | | | | 224,735 | |
| |
| CDX.EM.23 | | | | | | | Buy | | | | 1.000 | | | | 6/20/20 | | | USD | 2,340 | | | | (227,110) | | | | 224,735 | |
| |
| CDX.EM.23 | | | | | | | Buy | | | | 1.000 | | | | 6/20/20 | | | USD | 2,340 | | | | (222,560) | | | | 224,735 | |
| |
| CDX.HY.24 | | | | | | | Sell | | | | 5.000 | | | | 6/20/20 | | | USD | 12,375 | | | | (726,688) | | | | 793,694 | |
| |
| CDX.HY.24 | | | | | | | Sell | | | | 5.000 | | | | 6/20/20 | | | USD | 12,375 | | | | (862,483) | | | | 793,694 | |
| |
| CDX.HY.24 | | | | | | | Sell | | | | 5.000 | | | | 6/20/20 | | | USD | 12,375 | | | | (813,587) | | | | 793,694 | |
| |
| EUR.XOVER.23 | | | | | | | Sell | | | | 5.000 | | | | 6/20/20 | | | EUR | 8,600 | | | | (732,298) | | | | 738,023 | |
| |
| EUR.XOVER.23 | | | | | | | Sell | | | | 5.000 | | | | 6/20/20 | | | EUR | 10,000 | | | | (862,105) | | | | 859,877 | |
| |
| EUR.XOVER.23 | | | | | | | Sell | | | | 5.000 | | | | 6/20/20 | | | EUR | 18,750 | | | | (1,943,350) | | | | 1,603,560 | |
| | | | | | | | | | | | | | | | | | | | | | | | |
| Total Centrally Cleared Credit Default Swaps | | | | | | | | | | | | | | | | | | | $ | (7,274,415) | | | $ | 6,930,952 | |
| | | | | | | | | | | | | | | | | | | | | | | | |
| | | |
| | | | | | | | | | | | | |
| |
Over-the-Counter Credit Default Swaps at June 30, 2015 | |
| Reference Asset | | Counterparty | | | Buy/Sell
Protection | | | Fixed Rate | | | Maturity Date | | | Notional Amount (000’s) | | | Premiums Received/(Paid) | | | Value | |
| |
| Alpha Bank AE | | | BAC | | | | Buy | | | | 5.000% | | | | 3/20/17 | | | EUR | 1,165 | | | $ | (136,738) | | | $ | 298,201 | |
| |
| Banco Bilbao Vizcaya Argentaria Sociedad Anonima | | | UBS | | | | Sell | | | | 3.000 | | | | 12/20/17 | | | EUR | 125 | | | | (60) | | | | 7,308 | |
| |
| Banco Bilbao Vizcaya Argentaria Sociedad Anonima | | | UBS | | | | Sell | | | | 3.000 | | | | 12/20/17 | | | EUR | 125 | | | | (60) | | | | 7,308 | |
| |
| Banco Santander SA | | | UBS | | | | Sell | | | | 3.000 | | | | 9/20/17 | | | EUR | 250 | | | | (997) | | | | 13,473 | |
| |
| Federative Republic of Brazil | | | BOA | | | | Buy | | | | 1.000 | | | | 9/20/20 | | | USD | 2,124 | | | | (152,460) | | | | 173,829 | |
| |
| Hellenic Republic | | | BAC | | | | Sell | | | | 1.000 | | | | 3/20/20 | | | USD | 475 | | | | 180,526 | | | | (280,522) | |
| |
| Hellenic Republic | | | BAC | | | | Sell | | | | 1.000 | | | | 3/20/20 | | | USD | 475 | | | | 168,651 | | | | (280,522) | |
| |
| Republic of Indonesia | | | BNP | | | | Buy | | | | 1.000 | | | | 6/20/20 | | | USD | 2,135 | | | | (79,074) | | | | 76,568 | |
| |
| Republic of Turkey | | | GSG | | | | Buy | | | | 1.000 | | | | 3/20/20 | | | USD | 5,760 | | | | (277,046) | | | | 316,421 | |
| |
| Republic of Turkey | | | HSBC | | | | Buy | | | | 1.000 | | | | 3/20/20 | | | USD | 2,550 | | | | (120,373) | | | | 140,082 | |
| |
| State Bank of India | | | BNP | | | | Sell | | | | 1.000 | | | | 9/20/19 | | | USD | 1,740 | | | | 71,791 | | | | (37,744) | |
| | | | | | | | | | | | | | | | | | | | | | | | |
| Total Over-the-Counter Credit Default Swaps | | | | | | | $ | (345,840) | | | $ | 434,402 | |
| | | | | | | | | | | | | | | | | | | | | | | | |
The table that follows shows the undiscounted maximum potential payment by the Fund related to selling credit protection in credit default swaps:
| | | | | | | | | | | | | | | | | | | | |
Type of Reference Asset on which the Fund Sold Protection | | Total Maximum Potential Payments for Selling Credit Protection (Undiscounted) | | | | | | Amount Recoverable* | | | | | | Reference Asset Rating Range** | |
| |
| Investment Grade Single Name | | | | | | | | | | | | | | | | | | | | |
| Corporate Debt | | $ | 1,740,000 | | | | | | | $ | — | | | | | | | | BBB- | |
| Non-Investment Grade Corporate Debt Indexes | | | 37,350,000 | | | | EUR | | | | | | | | EUR | | | | B+ | |
| Non-Investment Grade Corporate Debt Indexes | | $ | 37,125,000 | | | | | | | $ | — | | | | | | | | B+ | |
| Investment Grade Single Name Corporate Debt | | | 500,000 | | | | EUR | | | | — | | | | EUR | | | | BBB- to BBB | |
| Non-Investment Grade Sovereign Debt | | $ | 950,000 | | | | | | | $ | — | | | | | | | | CCC- | |
| | | | | | | | | | | | | | | | | | | | |
| Total USD | | $ | 39,815,000 | | | | | | | $ | — | | | | | | | | | |
| | | | | | | | | | | | | | | | | | | | |
| Total EUR | | | 37,850,000 | | | | EUR | | | | — | | | | EUR | | | | | |
| | | | | | | | | | | | | | | | | | | | |
*The Fund has no amounts recoverable from related purchased protection. In addition, the Fund has no recourse provisions under the credit derivatives and holds no collateral which can offset or reduce potential payments under a triggering event.
**The period end reference asset security ratings, as rated by any rating organization, are included in the equivalent Standard & Poor’s rating category. The reference asset rating represents the likelihood of a potential credit event on the reference asset which would result in a related payment by the Fund.
| | | | | | | | | | | | | | | | | | | | | | | | | | | | |
| |
Over-the-Counter Currency Swap at June 30, 2015 | |
| Counterparty | | Pay/Receive Floating Rate | | | Floating Rate | | | Fixed Rate | | | Maturity Date | | | Notional Amount Currency Received (000’s) | | | Notional Amount Currency Delivered (000’s) | | | Value | |
| BOA | | | Pay | | |
| Six-Month USD
BBA LIBOR |
| | | 6.520% | | | | 4/28/18 | | | INR | 593,770 | | | USD | 9,358 | | | | $ (44,859) | |
| | | | | | | Six-Month USD | | | | | | | | | | | | | | | | | | | | | |
| BOA | | | Pay | | | | BBA LIBOR | | | | 6.330 | | | | 4/15/18 | | | INR | 288,369 | | | USD | 4,625 | | | | (117,163) | |
| | | | | | | Six-Month USD | | | | | | | | | | | | | | | | | | | | | |
| BOA | | | Pay | | | | BBA LIBOR | | | | 6.670 | | | | 5/27/18 | | | INR | 600,000 | | | USD | 9,434 | | | | (28,498) | |
| | | | | | | Six-Month USD | | | | | | | | | | | | | | | | | | | | | |
| BOA | | | Pay | | | | BBA LIBOR | | | | 6.820 | | | | 5/13/18 | | | INR | 295,306 | | | USD | 4,625 | | | | 34,045 | |
| | | | | | | Six-Month USD | | | | | | | | | | | | | | | | | | | | | |
| BOA | | | Pay | | | | BBA LIBOR | | | | 6.300 | | | | 4/13/18 | | | INR | 287,200 | | | USD | 4,614 | | | | (126,367) | |
| | | | | | | Six-Month USD | | | | | | | | | | | | | | | | | | | | | |
| BOA | | | Pay | | | | BBA LIBOR | | | | 6.250 | | | | 3/25/20 | | | INR | 145,508 | | | USD | 2,336 | | | | (73,952) | |
31 OPPENHEIMER GLOBAL STRATEGIC INCOME FUND/VA
CONSOLIDATED STATEMENT OF INVESTMENTS Unaudited / Continued
| | | | | | | | | | | | | | | | | | | | | | | | | | |
| |
Over-the-Counter Currency Swap (Continued) | | | | | | | | | |
| Counterparty | | Pay/Receive
Floating Rate | | Floating Rate | | | Fixed Rate | | | Maturity Date | | | Notional Amount Currency
Received (000’s) | | | Notional Amount Currency
Delivered (000’s) | | | Value | |
| |
| BOA | | Pay | |
| Six-Month USD
BBA LIBOR |
| | | 6.330% | | | | 3/31/20 | | | INR | 145,780 | | | USD | 2,329 | | | $ | (57,436) | |
| |
| GSG | | Pay | |
| Six-Month USD
BBA LIBOR |
| | | 6.300 | | | | 4/9/18 | | | INR | 582,000 | | | USD | 9,342 | | | | (180,944) | |
| |
| GSG | | Pay | |
| Six-Month USD
BBA LIBOR |
| | | 6.450 | | | | 3/27/18 | | | INR | 905,460 | | | USD | 14,529 | | | | (187,724) | |
| | | | | | | | | | | | | | | | | | | | | | | | | | |
| Total Over-the-Counter Currency Swap | | | | | | | | | | | | | | | $ | (782,898) | |
| | | | | | | | | | | | | | | | | | | | | | | | | | |
| | | | | | | | | | | | | | | | | | | | |
| |
Centrally Cleared Interest Rate Swaps at June 30, 2015 | | | | | |
| Counterparty | | Pay/Receive Floating
Rate | | Floating Rate | | Fixed Rate | | | Maturity Date | | | Notional Amount (000’s) | | | Value | |
| |
| BOA | | Receive | | Three-Month USD BBA LIBOR | | | 1.256% | | | | 7/6/18 | | | USD | 15,825 | | | $ | (1,725) | |
| |
| BOA | | Pay | | Three-Month AUD BBR BBSW | | | 2.315 | | | | 6/30/18 | | | AUD | 20,975 | | | | 2,576 | |
| |
| GSG | | Pay | | Six-Month PLN WIBOR WIBO | | | 2.145 | | | | 6/29/18 | | | PLN | 61,525 | | | | (13,302) | |
| |
| GSG | | Pay | | Three-Month NZD BBR FRA | | | 4.390 | | | | 5/11/25 | | | NZD | 10,000 | | | | (18,369) | |
| |
| GSG | | Receive | | Six-Month HUF BUBOR | | | 2.290 | | | | 6/4/20 | | | HUF | 1,470,000 | | | | 35,579 | |
| |
| GSG | | Pay | | Six-Month PLN WIBOR WIBO | | | 2.370 | | | | 6/5/20 | | | PLN | 19,670 | �� | | | (33,599) | |
| |
| JPM | | Pay | | Six-Month PLN WIBOR WIBO | | | 2.425 | | | | 6/8/20 | | | PLN | 19,570 | | | | (20,624) | |
| |
| JPM | | Receive | | Six-Month HUF BUBOR | | | 2.290 | | | | 6/5/20 | | | HUF | 1,430,000 | | | | 35,705 | |
| | | | | | | | | | | | | | | | | | | | |
| Total Centrally Cleared Interest Rate Swaps | | | | | | | | | | | | | | $ | (13,759) | |
| | | | | | | | | | | | | | | | | | | | |
| | | | | | | | | | | | | | | | | | | | |
| |
Over-the-Counter Interest Rate Swaps at June 30, 2015 | | | | | |
| Counterparty | | Pay/Receive Floating
Rate | | Floating Rate | | Fixed Rate | | | Maturity Date | | | Notional Amount (000’s) | | | Value | |
| |
| BAC | | Pay | | BZDI | | | 13.960% | | | | 1/2/17 | | | BRL | 34,250 | | | $ | 4,615 | |
| |
| BAC | | Receive | | BZDI | | | 12.320 | | | | 1/4/21 | | | BRL | 13,780 | | | | 46,081 | |
| |
| BAC | | Receive | | BZDI | | | 12.550 | | | | 1/4/21 | | | BRL | 14,125 | | | | 16,994 | |
| |
| BAC | | Pay | | BZDI | | | 13.440 | | | | 1/2/17 | | | BRL | 32,570 | | | | (57,053) | |
| |
| BOA | | Receive | | Six-Month INR MIBOR OIS Compound | | | 7.000 | | | | 5/12/18 | | | INR | 300,000 | | | | 36,146 | |
| |
| CITNA-B | | Pay | | Six-Month CLP TNA | | | 3.750 | | | | 5/14/18 | | | CLP | 1,250,000 | | | | 8,673 | |
| |
| GSG | | Receive | | MXN TIIE BANXICO | | | 5.440 | | | | 6/18/20 | | | MXN | 212,500 | | | | (40,056) | |
| |
| GSG | | Pay | | MXN TIIE BANXICO | | | 6.440 | | | | 6/12/25 | | | MXN | 60,000 | | | | 19,831 | |
| |
| GSG | | Pay | | Six-Month CLP TNA | | | 4.107 | | | | 5/28/20 | | | CLP | 2,500,000 | | | | 21,953 | |
| |
| GSG | | Pay | | Six-Month THB THBFIX | | | 1.975 | | | | 6/15/18 | | | THB | 559,000 | | | | 94,526 | |
| |
| GSG | | Receive | | One-Time CLP TNA | | | 3.170 | | | | 5/30/16 | | | CLP | 11,890,000 | | | | (18,910) | |
| |
| GSG | | Receive | | One-Time CLP TNA | | | 3.195 | | | | 5/27/16 | | | CLP | 3,890,000 | | | | (7,545) | |
| |
| GSG | | Pay | | Six-Month CLP TNA | | | 4.170 | | | | 5/27/20 | | | CLP | 810,000 | | | | 10,652 | |
| |
| GSG | | Pay | | MXN TIIE BANXICO | | | 4.720 | | | | 6/22/17 | | | MXN | 500,000 | | | | 22,171 | |
| |
| GSG | | Pay | | BZDI | | | 13.145 | | | | 1/2/17 | | | BRL | 38,450 | | | | (110,464) | |
| |
| GSG | | Receive | | BZDI | | | 12.340 | | | | 1/4/21 | | | BRL | 13,100 | | | | 43,310 | |
| |
| GSG | | Pay | | Three-Month MYR KLIBOR BNM | | | 4.440 | | | | 3/16/25 | | | MYR | 30,000 | | | | (129,568) | |
| |
| GSG | | Receive | | One-Time CLP TNA | | | 3.240 | | | | 4/17/16 | | | CLP | 16,250,000 | | | | (45,234) | |
| |
| GSG | | Pay | | Three-Month MYR KLIBOR BNM | | | 4.515 | | | | 3/12/25 | | | MYR | 11,900 | | | | (42,417) | |
| |
| GSG | | Pay | | Three-Month COP IBR OIS | | | 4.380 | | | | 3/5/18 | | | COP | 22,230,000 | | | | (157,205) | |
| |
| GSG | | Pay | | BZDI | | | 13.255 | | | | 1/2/17 | | | BRL | 30,200 | | | | (72,281) | |
| |
| GSG | | Pay | | Six-Month CLP TNA | | | 3.675 | | | | 5/11/18 | | | CLP | 4,000,000 | | | | 10,991 | |
| |
| JPM | | Receive | | CFXS | | | 2.630 | | | | 6/26/20 | | | CNY | 40,605 | | | | 70,850 | |
| |
| JPM | | Pay | | Three-Month COP IBR OIS | | | 4.380 | | | | 2/26/18 | | | COP | 11,250,000 | | | | (80,250) | |
| |
| JPM | | Pay | | Three-Month ILS TELEBOR01 | | | 2.920 | | | | 5/15/25 | | | ILS | 21,260 | | | | (182,664) | |
| |
| JPM | | Pay | | BZDI | | | 12.575 | | | | 1/2/19 | | | BRL | 21,615 | | | | (56,649) | |
| |
| JPM | | Pay | | BZDI | | | 13.340 | | | | 1/2/17 | | | BRL | 39,780 | | | | (86,067) | |
| |
| JPM | | Receive | | BZDI | | | 12.840 | | | | 1/2/18 | | | BRL | 54,285 | | | | 134,419 | |
| | | | | | | | | | | | | | | | | | | | |
| Total Over-the-Counter Interest Rate Swaps | | | | | | | $ | (545,151) | |
| | | | | | | | | | | | | | | | | | | | |
32 OPPENHEIMER GLOBAL STRATEGIC INCOME FUND/VA
| | | | | | | | | | | | | | | | | | | | | | | | | | | | | | | | |
| |
Over-the-Counter Credit Default Swaptions Written at June 30, 2015 | |
| Description | | Counterparty | | | Buy/Sell
Protection | | | Reference Asset | | | Fixed Rate | | | Expiration
Date | | | Notional Amount
(000’s) | | | Premiums Received | | | Value | |
| |
| Credit Default Swap maturing | | | | | | | | | |
| iTraxx Europe
Crossover Series 23 |
| | | | | | | | | | | | | | | | | | | | |
| 6/20/20 | | | JPM | | | | Sell | | | | Version 1 | | | | 3.500% | | | | 8/19/15 | | | | EUR 13,200 | | | | $ 127,869 | | | | $ (203,748) | |
| | | | | | | | | | | | | | | | | | | | | | | | | | | | | | | | | | |
| |
Over-the-Counter Interest Rate Swaptions Written at June 30, 2015 | |
| Description | | Counterparty | | | Pay/Receive
Floating Rate | | | Floating Rate | | | Fixed Rate | | | Expiration
Date | | | Notional | | Amount (000’s) | | | Premiums Received | | | Value | |
| |
| Interest Rate Swap maturing 9/8/35 Call | | | BAC | | | | Pay | | |
| Six-Month
EUR EURIBOR |
| | | 2.250% | | | | 9/4/15 | | | EUR | | | 11,746 | | | | $ 176,249 | | | | $ (112,929) | |
| |
| Interest Rate Swap maturing 1/4/21 Call | | | BOA | | | | Pay | | | | BZDI | | | | 12.580 | | | | 1/4/16 | | | BRL | | | 28,160 | | | | 54,034 | | | | (159,678) | |
| |
| Interest Rate Swap maturing 1/2/18 Call | | | BOA | | | | Pay | | | | BZDI | | | | 12.900 | | | | 1/4/16 | | | BRL | | | 36,800 | | | | 77,002 | | | | (76,935) | |
| |
| Interest Rate Swap maturing 1/2/17 Call | | | BOA | | | | Receive | | | | BZDI | | | | 13.020 | | | | 7/1/15 | | | BRL | | | 62,000 | | | | 92,380 | | | | — | |
| |
| Interest Rate Swap maturing 1/2/19 Call | | | BOA | | | | Pay | | | | BZDI | | | | 14.750 | | | | 1/4/16 | | | BRL | | | 31,000 | | | | 34,727 | | | | (27,595) | |
| |
| Interest Rate Swap maturing 1/2/17 Call | | | BOA | | | | Pay | | | | BZDI | | | | 14.320 | | | | 1/4/16 | | | BRL | | | 31,000 | | | | 21,449 | | | | (34,530) | |
| |
| Interest Rate Swap maturing 9/8/35 Call | | | GSG | | | | Pay | | |
| Three-Month
USD BBA
LIBOR |
| | | 3.620 | | | | 9/3/15 | | | USD | | | 23,468 | | | | 91,526 | | | | (72,976) | |
| |
| Interest Rate Swap maturing 11/19/20 Call | | | JPM | | | | Pay | | |
| MXN TIIE
BANXICO |
| | | 5.950 | | | | 11/25/15 | | | MXN | | | 184,600 | | | | 199,384 | | | | (73,695) | |
| |
| Interest Rate Swap maturing 1/2/18 Call | | | JPM | | | | Pay | | | | BZDI | | | | 12.900 | | | | 1/4/16 | | | BRL | | | 36,800 | | | | 77,003 | | | | (76,936) | |
| | | | | | | | | | | | | | | | | | | | | | | | | | | | | | |
| Total Over-the-Counter Interest Rate Swaptions Written | | | | | | | | | | $ 823,754 | | | | $ (635,274) | |
| | | | | | | | | | | | | | | | | | | | | | | | | | | | | | |
Glossary:
Counterparty Abbreviations
| | |
| BAC | | Barclays Bank plc |
| BNP | | BNP Paribas |
| BOA | | Bank of America NA |
| CITNA-B | | Citibank NA |
| DEU | | Deutsche Bank AG |
| GSCO-OT | | Goldman Sachs Bank USA |
| GSG | | Goldman Sachs Group, Inc. (The) |
| HSBC | | HSBC Bank USA NA |
| JPM | | JPMorgan Chase Bank NA |
| MSCO | | Morgan Stanley Capital Services, Inc. |
| NOM | | Nomura Global Financial Products, Inc. |
| TDB | | Toronto Dominion Bank |
| UBS | | UBS AG |
Currency abbreviations indicate amounts reporting in currencies
| | |
| AUD | | Australian Dollar |
| BRL | | Brazilian Real |
| CAD | | Canadian Dollar |
| CLP | | Chilean Peso |
| CNH | | Offshore Chinese Renminbi |
| CNY | | Chinese Renminbi |
| COP | | Colombian Peso |
| EUR | | Euro |
| GBP | | British Pound Sterling |
| HUF | | Hungarian Forint |
| IDR | | Indonesia Rupiah |
| ILS | | Israeli Shekel |
| INR | | Indian Rupee |
| KRW | | South Korean Won |
| MXN | | Mexican Nuevo Peso |
| MYR | | Malaysian Ringgit |
| NZD | | New Zealand Dollar |
| PHP | | Philippines Peso |
| PLN | | Polish Zloty |
| RUB | | Russian Ruble |
| SGD | | Singapore Dollar |
| THB | | Thailand Baht |
| TRY | | New Turkish Lira |
| ZAR | | South African Rand |
Definitions
| | |
| BANXICO | | Banco de Mexico |
| BBA LIBOR | | British Bankers’ Association London - Interbank Offered Rate |
| BBR FRA | | Bank Bill Forward Rate Agreement |
| BBR BBSW | | Bank Bill Swap Reference Rate (Australian Financial Market) |
| BNM | | Bank Negra Malaysia |
| BUBOR | | Budapest Interbank Offered Rate |
33 OPPENHEIMER GLOBAL STRATEGIC INCOME FUND/VA
CONSOLIDATED STATEMENT OF INVESTMENTS Unaudited / Continued
| | |
| Definitions (Continued) | | |
| BZDI | | Brazil Interbank Deposit Rate |
| CDX.EM.23 | | Merkit CDX High Yield Index |
| CDX.HY.24 | | Merkit CDX High Yield Index |
| CFXS | | Repurchase Fixing Rates |
| EUR.XOVER.23 | | Credit Default Swap Trading Index for a Specific Basket of Securities |
| EURIBOR | | Euro Interbank Offered Rate |
| FRO | | Floating Rate Option |
| IBR | | Indicador Bancario de Referencia |
| iTraxx Europe Crossover Series 23 Version 1 | | Credit Default Swap Trading Index for a Specific Basket of Securities |
| KLIBOR | | Kuala Lumpur Interbank Offered Rate |
| MIBOR | | Mumbai Interbank Offered Rate |
| OIS | | Overnight Index Swap |
| SX5E | | The EURO STOXX 50 Index |
| TELEBOR01 | | Tel Aviv Interbank Offered Rate 1 Month |
| THBFIX | | Thai Baht Interest Rate Fixing |
| TIIE | | Interbank Equilibrium Interest Rate |
| TNA | | Non-Deliverable CLP Camara |
| WIBOR WIBO | | Poland Warsaw Interbank Offer Bid Rate |
| |
| Exchange Abbreviations | | |
| CBT | | Chicago Board of Trade |
See accompanying Notes to Consolidated Financial Statements.
34 OPPENHEIMER GLOBAL STRATEGIC INCOME FUND/VA
CONSOLIDATED STATEMENT OF ASSETS AND LIABILITIES June 30, 2015 Unaudited
| | | | |
| |
Assets | | | | |
| Investments, at value—see accompanying consolidated statement of investments: | | | | |
| Unaffiliated companies (cost $1,906,887,287) | | $ | 1,855,515,533 | |
| Affiliated companies (cost $181,616,763) | | | 177,039,604 | |
| | | | |
| | | 2,032,555,137 | |
| |
| Cash—foreign currencies (cost $3,605,907) | | | 3,619,657 | |
| |
| Cash used for collateral on centrally cleared swaps | | | 1,220,645 | |
| |
| Unrealized appreciation on forward currency exchange contracts | | | 5,625,055 | |
| |
| Swaps, at value (premiums paid $766,808) | | | 1,608,447 | |
| |
| Centrally cleared swaps, at value (premiums paid $7,274,415) | | | 7,004,812 | |
| |
| Receivables and other assets: | | | | |
| Investments sold (including $44,502,985 sold on a when-issued or delayed delivery basis) | | | 48,686,410 | |
| Interest, dividends and principal paydowns | | | 25,717,086 | |
| Shares of beneficial interest sold | | | 1,443,801 | |
| Variation margin receivable | | | 91,092 | |
| Other | | | 132,072 | |
| | | | |
Total assets | | | 2,127,704,214 | |
| |
Liabilities | | | | |
| Bank overdraft | | | 8,158,934 | |
| |
| Unrealized depreciation on forward currency exchange contracts | | | 7,998,781 | |
| |
| Options written, at value (premiums received $5,904,540) | | | 6,477,788 | |
| |
| Swaps, at value (premiums received $420,968) | | | 2,502,094 | |
| |
| Centrally cleared swaps, at value | | | 87,619 | |
| |
| Swaptions written, at value (premiums received $951,623) | | | 839,022 | |
| |
| Payables and other liabilities: | | | | |
| Investments purchased (including $104,603,877 purchased on a when-issued or delayed delivery basis) | | | 115,371,594 | |
| Shares of beneficial interest redeemed | | | 1,100,967 | |
| Distribution and service plan fees | | | 312,095 | |
| Shareholder communications | | | 136,070 | |
| Trustees’ compensation | | | 98,213 | |
| Variation margin payable | | | 19,136 | |
| Other | | | 184,735 | |
| | | | |
Total liabilities | | | 143,287,048 | |
| |
| Net Assets | | $ | 1,984,417,166 | |
| | | | |
|
| |
| |
Composition of Net Assets | | | | |
| Par value of shares of beneficial interest | | $ | 384,503 | |
| |
| Additional paid-in capital | | | 2,086,731,379 | |
| |
| Accumulated net investment income | | | 40,064,358 | |
| |
| Accumulated net realized loss on investments and foreign currency transactions | | | (81,517,640) | |
| |
| Net unrealized depreciation on investments and translation of assets and liabilities denominated in foreign currencies | | | (61,245,434) | |
| | | | |
| Net Assets | | $ | 1,984,417,166 | |
| | | | |
| |
| |
Net Asset Value Per Share | | | | |
| Non-Service Shares: | | | | |
| Net asset value, redemption price per share and offering price per share (based on net assets of $477,446,207 and 94,349,713 shares of beneficial interest outstanding) | | | $5.06 | |
| |
Service Shares: | | | | |
| Net asset value, redemption price per share and offering price per share (based on net assets of $1,506,970,959 and 290,153,355 shares of beneficial interest outstanding) | | | $5.19 | |
See accompanying Notes to Consolidated Financial Statements.
35 OPPENHEIMER GLOBAL STRATEGIC INCOME FUND/VA
CONSOLIDATED STATEMENT OF OPERATIONS For the Six Months Ended June 30, 2015 Unaudited
| | | | |
| |
Allocation of Income and Expenses from Master Funds1 | | | | |
| Net investment income allocated from Oppenheimer Master Event-Linked Bond Fund, LLC: | | | | |
| Interest | | $ | 1,323,101 | |
| Dividends | | | 627 | |
| Net expenses | | | (99,131) | |
| | | | |
| Net investment income allocated from Oppenheimer Master Event-Linked Bond Fund, LLC | | | 1,224,597 | |
| |
| Net investment income allocated from Oppenheimer Master Loan Fund, LLC | | | | |
| Interest | | | 2,857,496 | |
| Dividends | | | 31,654 | |
| Net expenses | | | (183,437) | |
| | | | |
| Net investment income allocated from Oppenheimer Master Loan Fund, LLC | | | 2,705,713 | |
| | | | |
Total allocation of net investment income from master funds | | | 3,930,310 | |
| |
Investment Income | | | | |
| Interest - unaffiliated companies (net of foreign withholding taxes of $415,701) | | | 50,696,724 | |
| |
| Fee income on when-issued securities | | | 822,678 | |
| |
| Dividends: | | | | |
| Unaffiliated companies | | | 141,631 | |
| Affiliated companies | | | 111,288 | |
| | | | |
Total investment income | | | 51,772,321 | |
| |
Expenses | | | | |
| Management fees | | | 6,165,408 | |
| |
| Distribution and service plan fees - Service shares | | | 1,917,874 | |
| |
| Transfer and shareholder servicing agent fees: | | | | |
| Non-Service shares | | | 282,222 | |
| Service shares | | | 767,376 | |
| |
| Shareholder communications: | | | | |
| Non-Service shares | | | 16,532 | |
| Service shares | | | 46,015 | |
| |
| Custodian fees and expenses | | | 152,969 | |
| |
| Trustees’ compensation | | | 32,703 | |
| |
| Other | | | 133,441 | |
| | | | |
| Total expenses | | | 9,514,540 | |
| Less reduction to custodian expenses | | | (2,632) | |
| Less waivers and reimbursements of expenses | | | (348,499) | |
| | | | |
Net expenses | | | 9,163,409 | |
| |
| Net Investment Income | | | 46,539,222 | |
36 OPPENHEIMER GLOBAL STRATEGIC INCOME FUND/VA
| | | | |
| |
Realized and Unrealized Gain (Loss) | | | | |
| Net realized gain (loss) on: | | | | |
| Investments from: | | | | |
Unaffiliated companies (including premiums on options and swaptions exercised) | | $ | (20,759,171) | |
Affiliated companies | | | (12,556) | |
| Closing and expiration of option contracts written | | | 185,313 | |
| Closing and expiration of futures contracts | | | 880,509 | |
| Foreign currency transactions | | | 4,561,586 | |
| Swap contracts | | | (1,745,989) | |
| Swaption contracts | | | 416,993 | |
| |
| Net realized gain (loss) allocated from: | | | | |
| Oppenheimer Master Event-Linked Bond Fund, LLC | | | 650,969 | |
| Oppenheimer Master Loan Fund, LLC | | | (1,393,700) | |
| | | | |
| Net realized loss | | | (17,216,046) | |
| |
| Net change in unrealized appreciation/depreciation on: | | | | |
| Investments | | | 9,080,473 | |
| Translation of assets and liabilities denominated in foreign currencies | | | (4,992,643) | |
| Futures contracts | | | (1,680,984) | |
| Option contracts written | | | (591,212) | |
| Swap contracts | | | (2,255,009) | |
| Swaption contracts | | | 1,367,694 | |
| |
| Net change in unrealized appreciation/depreciation allocated from: | | | | |
| Oppenheimer Master Event-Linked Bond Fund, LLC | | | (1,457,496) | |
| Oppenheimer Master Loan Fund, LLC | | | 1,016,673 | |
| | | | |
Net change in unrealized appreciation/depreciation | | | 487,496 | |
| |
| Net Increase in Net Assets Resulting from Operations | | $ | 29,810,672 | |
| | | | |
1. The Fund invests in certain affiliated mutual funds that expect to be treated as partnerships for tax purposes. See Note 4 of the accompanying Consolidated Notes.
See accompanying Notes to Consolidated Financial Statements.
37 OPPENHEIMER GLOBAL STRATEGIC INCOME FUND/VA
CONSOLIDATED STATEMENTS OF CHANGES IN NET ASSETS
| | | | | | | | |
| | | Six Months Ended
June 30, 2015
(Unaudited) | | | Year Ended
December 31, 2014 | |
| |
Operations | | | | | | | | |
| Net investment income | | $ | 46,539,222 | | | $ | 107,224,322 | |
| |
| Net realized loss | | | (17,216,046) | | | | (5,459,632) | |
| |
| Net change in unrealized appreciation/depreciation | | | 487,496 | | | | (36,151,836) | |
| | | | | | | | |
Net increase in net assets resulting from operations | | | 29,810,672 | | | | 65,612,854 | |
| |
Dividends and/or Distributions to Shareholders | | | | | | | | |
| Dividends from net investment income: | | | | | | | | |
| Non-Service shares | | | (29,479,205) | | | | (31,299,751) | |
| Service shares | | | (81,704,570) | | | | (63,703,194) | |
| | | | | | | | |
| | | (111,183,775) | | | | (95,002,945) | |
| |
Beneficial Interest Transactions | | | | | | | | |
| Net increase (decrease) in net assets resulting from beneficial interest transactions: | | | | | | | | |
| Non-Service shares | | | (89,099,370) | | | | (142,634,078) | |
| Service shares | | | 16,691,526 | | | | (144,544,896) | |
| | | | | | | | |
| | | (72,407,844) | | | | (287,178,974) | |
| |
Net Assets | | | | | | | | |
| Total decrease | | | (153,780,947) | | | | (315,569,065) | |
| |
| Beginning of period | | | 2,138,198,113 | | | | 2,454,767,178 | |
| | | | | | | | |
| End of period (including accumulated net investment income of $40,064,358 and $104,708,911, respectively) | | $ | 1,984,417,166 | | | $ | 2,139,198,113 | |
| | | | |
See accompanying Notes to Consolidated Financial Statements.
38 OPPENHEIMER GLOBAL STRATEGIC INCOME FUND/VA
CONSOLIDATED FINANCIAL HIGHLIGHTS
| | | | | | | | | | | | | | | | | | | | | | | | |
| Non-Service Shares | | Six Months
Ended
June 30, 2015
(Unaudited) | | | Year Ended
December 31,
2014 | | | Year Ended
December 31,
2013 | | | Year Ended
December 31,
2012 | | | Year Ended
December 30,
20111 | | | Year Ended
December 31,
2010 | |
| |
Per Share Operating Data | | | | | | | | | | | | | | | | | | | | | | | | |
| Net asset value, beginning of period | | $ | 5.30 | | | $ | 5.38 | | | $ | 5.67 | | | $ | 5.38 | | | $ | 5.58 | | | $ | 5.30 | |
| |
| Income (loss) from investment operations: | | | | | | | | | | | | | | | | | | | | | | | | |
| Net investment income2 | | | 0.12 | | | | 0.26 | | | | 0.28 | | | | 0.33 | | | | 0.36 | | | | 0.34 | |
| Net realized and unrealized gain (loss) | | | (0.05) | | | | (0.11) | | | | (0.29) | | | | 0.36 | | | | (0.31) | | | | 0.40 | |
| | | | |
| Total from investment operations | | | 0.07 | | | | 0.15 | | | | (0.01) | | | | 0.69 | | | | 0.05 | | | | 0.74 | |
| |
| Dividends and/or distributions to shareholders: | | | | | | | | | | | | | | | | | | | | | | | | |
| Dividends from net investment income | | | (0.31) | | | | (0.23) | | | | (0.28) | | | | (0.34) | | | | (0.18) | | | | (0.46) | |
| Distributions from net realized gain | | | 0.00 | | | | 0.00 | | | | 0.00 | | | | (0.06) | | | | (0.07) | | | | 0.00 | |
| | | | |
| Total dividends and distributions to shareholders | | | (0.31) | | | | (0.23) | | | | (0.28) | | | | (0.40) | | | | (0.25) | | | | (0.46) | |
| |
| Net asset value, end of period | | $ | 5.06 | | | $ | 5.30 | | | $ | 5.38 | | | $ | 5.67 | | | $ | 5.38 | | | $ | 5.58 | |
| | | | |
| | | | | | | | | |
| |
Total Return, at Net Asset Value3 | | | 1.35% | | | | 2.84% | | | | (0.13)% | | | | 13.53% | | | | 0.85% | | | | 14.97% | |
| | | | | | | | | |
| |
Ratios/Supplemental Data | | | | | | | | | | | | | | | | | | | | | | | | |
| Net assets, end of period (in thousands) | | $ | 477,446 | | | $ | 586,951 | | | $ | 738,741 | | | $ | 741,996 | | | $ | 648,084 | | | $ | 771,755 | |
| |
| Average net assets (in thousands) | | $ | 568,950 | | | $ | 707,673 | | | $ | 734,707 | | | $ | 690,351 | | | $ | 694,868 | | | $ | 737,071 | |
| |
| Ratios to average net assets:4,5 | | | | | | | | | | | | | | | | | | | | | | | | |
| Net investment income | | | 4.61% | | | | 4.73% | | | | 5.12% | | | | 6.01% | | | | 6.50% | | | | 6.47% | |
| Total expenses6 | | | 0.75% | | | | 0.74% | | | | 0.74% | | | | 0.77% | | | | 0.77% | | | | 0.75% | |
| Expenses after payments, waivers and/or reimbursements and reduction to custodian expenses | | | 0.72% | | | | 0.71% | | | | 0.72% | | | | 0.71% | | | | 0.71% | | | | 0.71% | |
| |
| Portfolio turnover rate7 | | | 44 % | | | | 93 % | | | | 107 % | | | | 78 % | | | | 49 % | | | | 99 % | |
1. December 30, 2011 represents the last business day of the Fund’s reporting period.
2. Per share amounts calculated based on the average shares outstanding during the period.
3. Assumes an initial investment on the business day before the first day of the fiscal period, with all dividends and distributions reinvested in additional shares on the reinvestment date, and redemption at the net asset value calculated on the last business day of the fiscal period. Total returns are not annualized for periods less than one full year. Total return information does not reflect expenses that apply at the separate account level or to related insurance products. Inclusion of these charges would reduce the total return figures for all periods shown. Returns do not reflect the deduction of taxes that a shareholder would pay on fund distributions or the redemption of fund shares. The returns do not include adjustments in accordance with generally accepted accounting principles required at the period end for financial reporting purposes.
4. Annualized for periods less than one full year.
5. Includes the Fund’s share of the allocated expenses and/or net investment income from the master funds.
6. Total expenses including indirect expenses from affiliated fund fees and expenses were as follows:
| | | | | | |
| | | | | | |
| | Six Months Ended June 30, 2015 | | | 0.76% | |
| | Year Ended December 31, 2014 | | | 0.75% | |
| | Year Ended December 31, 2013 | | | 0.74% | |
| | Year Ended December 31, 2012 | | | 0.77% | |
| | Year Ended December 30, 2011 | | | 0.77% | |
| | Year Ended December 31, 2010 | | | 0.75% | |
7. The portfolio turnover rate excludes purchase and sale transactions of To Be Announced (TBA) mortgage-related securities as follows:
| | | | | | | | | | |
| | | | | | | | | | |
| | | | Purchase Transactions | | | Sale Transactions | |
| | | |
| | Six Months Ended June 30, 2015 | | | $669,325,753 | | | | $714,911,810 | |
| | Year Ended December 31, 2014 | | | $1,348,552,640 | | | | $1,337,346,996 | |
| | Year Ended December 31, 2013 | | | $4,294,357,677 | | | | $4,679,296,373 | |
| | Year Ended December 31, 2012 | | | $3,862,820,437 | | | | $3,466,796,233 | |
| | Year Ended December 30, 2011 | | | $1,050,654,783 | | | | $1,039,506,614 | |
| | Year Ended December 31, 2010 | | | $1,034,550,699 | | | | $1,085,289,655 | |
See accompanying Notes to Consolidated Financial Statements.
39 OPPENHEIMER GLOBAL STRATEGIC INCOME FUND/VA
CONSOLIDATED FINANCIAL HIGHLIGHTS Continued
| | | | | | | | | | | | | | | | | | | | | | | | |
| Service Shares | | Six Months Ended June 30, 2015 (Unaudited) | | | Year Ended December 31, 2014 | | | Year Ended December 31, 2013 | | | Year Ended December 31, 2012 | | | Year Ended December 30, 20111 | | | Year Ended December 31, 2010 | |
| |
Per Share Operating Data | | | | | | | | | | | | | | | | | | | | | | | | |
| Net asset value, beginning of period | | $ | 5.42 | | | $ | 5.50 | | | $ | 5.79 | | | $ | 5.49 | | | $ | 5.68 | | | $ | 5.38 | |
| |
| Income (loss) from investment operations: | | | | | | | | | | | | | | | | | | | | | | | | |
| Net investment income2 | | | 0.12 | | | | 0.25 | | | | 0.27 | | | | 0.33 | | | | 0.35 | | | | 0.33 | |
| Net realized and unrealized gain (loss) | | | (0.05) | | | | (0.11) | | | | (0.29) | | | | 0.36 | | | | (0.31) | | | | 0.42 | |
| | | | |
| Total from investment operations | | | 0.07 | | | | 0.14 | | | | (0.02) | | | | 0.69 | | | | 0.04 | | | | 0.75 | |
| |
| Dividends and/or distributions to shareholders: | | | | | | | | | | | | | | | | | | | | | | | | |
| Dividends from net investment income | | | (0.30) | | | | (0.22) | | | | (0.27) | | | | (0.33) | | | | (0.16) | | | | (0.45) | |
| Distributions from net realized gain | | | 0.00 | | | | 0.00 | | | | 0.00 | | | | (0.06) | | | | (0.07) | | | | 0.00 | |
| | | | |
| Total dividends and distributions to shareholders | | | (0.30) | | | | (0.22) | | | | (0.27) | | | | (0.39) | | | | (0.23) | | | | (0.45) | |
| |
| Net asset value, end of period | | $ | 5.19 | | | $ | 5.42 | | | $ | 5.50 | | | $ | 5.79 | | | $ | 5.49 | | | $ | 5.68 | |
| | | | |
| | | | | | | | | |
| |
Total Return, at Net Asset Value3 | | | 1.21% | | | | 2.49% | | | | (0.37)% | | | | 13.15% | | | | 0.65% | | | | 14.77% | |
| | | | | | | | | |
| |
Ratios/Supplemental Data | | | | | | | | | | | | | | | | | | | | | | | | |
| Net assets, end of period (in thousands) | | $ | 1,506,971 | | | $ | 1,551,247 | | | $ | 1,716,026 | | | $ | 1,840,721 | | | $ | 1,604,906 | | | $ | 1,670,340 | |
| |
| Average net assets (in thousands) | | $ | 1,546,971 | | | $ | 1,646,615 | | | $ | 1,794,640 | | | $ | 1,715,995 | | | $ | 1,673,715 | | | $ | 2,485,427 | |
| |
| Ratios to average net assets:4,5 | | | | | | | | | | | | | | | | | | | | | | | | |
| Net investment income | | | 4.37% | | | | 4.48% | | | | 4.88% | | | | 5.76% | | | | 6.25% | | | | 6.15% | |
| Total expenses6 | | | 1.00% | | | | 0.99% | | | | 0.99% | | | | 1.02% | | | | 1.02% | | | | 0.99% | |
| Expenses after payments, waivers and/or reimbursements and reduction to custodian expenses | | | 0.97% | | | | 0.96% | | | | 0.97% | | | | 0.96% | | | | 0.96% | | | | 0.95% | |
| |
| Portfolio turnover rate7 | | | 44 % | | | | 93 % | | | | 107 % | | | | 78 % | | | | 49 % | | | | 99 % | |
1. December 30, 2011 represents the last business day of the Fund’s reporting period.
2. Per share amounts calculated based on the average shares outstanding during the period.
3. Assumes an initial investment on the business day before the first day of the fiscal period, with all dividends and distributions reinvested in additional shares on the reinvestment date, and redemption at the net asset value calculated on the last business day of the fiscal period. Total returns are not annualized for periods less than one full year. Total return information does not reflect expenses that apply at the separate account level or to related insurance products. Inclusion of these charges would reduce the total return figures for all periods shown. Returns do not reflect the deduction of taxes that a shareholder would pay on fund distributions or the redemption of fund shares. The returns do not include adjustments in accordance with generally accepted accounting principles required at the period end for financial reporting purposes.
4. Annualized for periods less than one full year.
5. Includes the Fund’s share of the allocated expenses and/or net investment income from the master funds.
6. Total expenses including indirect expenses from affiliated fund fees and expenses were as follows:
| | | | | | |
| | | | | | |
| | Six Months Ended June 30, 2015 | | | 1.01% | |
| | Year Ended December 31, 2014 | | | 1.00% | |
| | Year Ended December 31, 2013 | | | 0.99% | |
| | Year Ended December 31, 2012 | | | 1.02% | |
| | Year Ended December 30, 2011 | | | 1.02% | |
| | Year Ended December 31, 2010 | | | 0.99% | |
7. The portfolio turnover rate excludes purchase and sale transactions of To Be Announced (TBA) mortgage-related securities as follows:
| | | | | | | | | | |
| | | | | | | | | | |
| | | | | Purchase Transactions | | | Sale Transactions | |
| | | |
| | Six Months Ended June 30, 2015 | | | $669,325,753 | | | | $714,911,810 | |
| | Year Ended December 31, 2014 | | | $1,348,552,640 | | | | $1,337,346,996 | |
| | Year Ended December 31, 2013 | | | $4,294,357,677 | | | | $4,679,296,373 | |
| | Year Ended December 31, 2012 | | | $3,862,820,437 | | | | $3,466,796,233 | |
| | Year Ended December 30, 2011 | | | $1,050,654,783 | | | | $1,039,506,614 | |
| | Year Ended December 31, 2010 | | | $1,034,550,699 | | | | $1,085,289,655 | |
See accompanying Notes to Consolidated Financial Statements.
40 OPPENHEIMER GLOBAL STRATEGIC INCOME FUND/VA
NOTES TO CONSOLIDATED FINANCIAL STATEMENTS June 30, 2015 Unaudited
1. Organization
Oppenheimer Global Strategic Income Fund/VA (the “Fund”) is a separate series of Oppenheimer Variable Account Funds, a diversified open-end management investment company registered under the Investment Company Act of 1940 (“1940 Act”), as amended. The Fund’s main investment objective is to seek total return. The Fund’s investment adviser is OFI Global Asset Management, Inc. (“OFI Global” or the “Manager”), a wholly-owned subsidiary of OppenheimerFunds, Inc. (“OFI” or the “Sub-Adviser”). The Manager has entered into a sub-advisory agreement with OFI. Shares of the Fund are sold only to separate accounts of life insurance companies.
The Fund offers two classes of shares. Both classes are sold at their offering price, which is the net asset value per share, to separate investment accounts of participating insurance companies as an underlying investment for variable life insurance policies, variable annuity contracts or other investment products. The class of shares designated as Service shares is subject to a distribution and service plan. Both classes of shares have identical rights and voting privileges with respect to the Fund in general and exclusive voting rights on matters that affect that class alone. Earnings, net assets and net asset value per share may differ due to each class having its own expenses, such as transfer and shareholder servicing agent fees and shareholder communications, directly attributable to that class.
The following is a summary of significant accounting policies followed in the Fund’s preparation of financial statements in accordance with accounting principles generally accepted in the United States (“U.S. GAAP”).
2. Significant Accounting Policies
Security Valuation. All investments in securities are recorded at their estimated fair value, as described in Note 3.
Reporting Period End Date. The last day of the Fund’s reporting period is the last day the New York Stock Exchange was open for trading during the period. The Fund’s financial statements have been presented through that date to maintain consistency with the Fund’s net asset value calculations used for shareholder transactions.
Basis for Consolidation. The Fund has established a Cayman Islands exempted company, Oppenheimer Global Strategic Income Fund (Cayman) Ltd., which is wholly-owned and controlled by the Fund (the “Subsidiary”). The Fund and Subsidiary are both managed by the Manager. The Fund may invest up to 25% of its total assets in the Subsidiary. The Subsidiary invests primarily in commodity-linked derivatives (including commodity futures, financial futures, options and swap contracts) and exchange traded funds related to gold or other special minerals (“Gold ETFs”). The Subsidiary is subject to the same investment restrictions and guidelines, and follows the same compliance policies and procedures, as the Fund.
The financial statements have been consolidated and include accounts of the Fund and the Subsidiary. Accordingly, all inter-company transactions and balances have been eliminated. At period end, the Fund owned 15,000 shares with net assets of $1,327,045.
Other financial information at period end:
| | | | |
Total market value of investments* | | $ | — | |
Net assets | | $ | 1,327,045 | |
Net income (loss) | | $ | (20,817) | |
Net realized gain (loss) | | $ | — | |
Net change in unrealized appreciation/depreciation | | $ | — | |
* At period end, the subsidiary only held cash.
Foreign Currency Translation. The Fund’s accounting records are maintained in U.S. dollars. The values of securities denominated in foreign currencies and amounts related to the purchase and sale of foreign securities and foreign investment income are translated into U.S. dollars as of the close of the New York Stock Exchange (the “Exchange”), normally 4:00 P.M. Eastern time, on each day the Exchange is open for trading. Foreign exchange rates may be valued primarily using a reliable bank, dealer or service authorized by the Board of Trustees.
Reported net realized gains and losses from foreign currency transactions arise from sales of portfolio securities, sales and maturities of short-term securities, sales of foreign currencies, exchange rate fluctuations between the trade and settlement dates on securities transactions, and the difference between the amounts of dividends, interest, and foreign withholding taxes recorded on the Fund’s books and the U.S. dollar equivalent of the amounts actually received or paid. Net unrealized appreciation and depreciation on the translation of assets and liabilities denominated in foreign currencies arise from changes in the values of assets and liabilities, including investments in securities at fiscal period end, resulting from changes in exchange rates.
The effect of changes in foreign currency exchange rates on investments is separately identified from the fluctuations arising from changes in market values of securities held and reported with all other foreign currency gains and losses in the Fund’s Consolidated Statement of Operations.
Allocation of Income, Expenses, Gains and Losses. Income, expenses (other than those attributable to a specific class), gains and losses are allocated on a daily basis to each class of shares based upon the relative proportion of net assets represented by such class. Operating expenses directly attributable to a specific class are charged against the operations of that class.
Dividends and Distributions to Shareholders. Dividends and distributions to shareholders, which are determined in accordance with income tax regulations and may differ from U.S. generally accepted accounting principles, are recorded on the ex-dividend date. Income and capital gain distributions, if any, are declared and paid annually or at other times as deemed necessary by the Manager.
The tax character of distributions is determined as of the Fund’s fiscal year end. Therefore, a portion of the Fund’s distributions made to shareholders prior to the Fund’s fiscal year end may ultimately be categorized as a tax return of capital.
41 OPPENHEIMER GLOBAL STRATEGIC INCOME FUND/VA
NOTES TO CONSOLIDATED FINANCIAL STATEMENTS Unaudited / Continued
2. Significant Accounting Policies (Continued)
Investment Income. Dividend income is recorded on the ex-dividend date or upon ex-dividend notification in the case of certain foreign dividends where the ex-dividend date may have passed. Non-cash dividends included in dividend income, if any, are recorded at the fair market value of the securities received. Interest income is recognized on an accrual basis. Discount and premium, which are included in interest income on the Consolidated Statement of Operations, are amortized or accreted daily.
Custodian Fees. “Custodian fees and expenses” in the Consolidated Statement of Operations may include interest expense incurred by the Fund on any cash overdrafts of its custodian account during the period. Such cash overdrafts may result from the effects of failed trades in portfolio securities and from cash outflows resulting from unanticipated shareholder redemption activity. The Fund pays interest to its custodian on such cash overdrafts, to the extent they are not offset by positive cash balances maintained by the Fund, at a rate equal to the Federal Funds Rate plus 0.50%. The “Reduction to custodian expenses” line item, if applicable, represents earnings on cash balances maintained by the Fund during the period. Such interest expense and other custodian fees may be paid with these earnings.
Security Transactions. Security transactions are recorded on the trade date. Realized gains and losses on securities sold (except for the investments in the Subsidiary) are determined on the basis of identified cost.
Indemnifications. The Fund’s organizational documents provide current and former Trustees and officers with a limited indemnification against liabilities arising in connection with the performance of their duties to the Fund. In the normal course of business, the Fund may also enter into contracts that provide general indemnifications. The Fund’s maximum exposure under these arrangements is unknown as this would be dependent on future claims that may be made against the Fund. The risk of material loss from such claims is considered remote.
Federal Taxes. The Fund intends to comply with provisions of the Internal Revenue Code applicable to regulated investment companies and to distribute substantially all of its investment company taxable income to shareholders. Therefore, no federal income or excise tax provision is required. The Fund files income tax returns in U.S. federal and applicable state jurisdictions. The statute of limitations on the Fund’s tax return filings generally remains open for the three preceding fiscal reporting period ends.
Subchapter M requires, among other things, that at least 90% of the Fund’s gross income be derived from securities or derived with respect to its business of investing in securities (typically referred to as “qualifying income”). Income from commodity-linked derivatives may not be treated as “qualifying income” for purposes of the 90% gross income requirement. The Internal Revenue Service (IRS) has previously issued a number of private letter rulings which conclude that income derived from commodity index-linked notes and investments in a wholly-owned subsidiary will be “qualifying income.” As a result, the Fund will gain exposure to commodities through commodity-linked notes and its wholly-owned subsidiary.
The IRS has suspended the granting of private letter rulings pending further review. As a result, there can be no assurance that the IRS will not change its position with respect to commodity-linked notes and wholly-owned subsidiaries. In addition, future legislation and guidance from Treasury and the IRS may adversely affect the fund’s ability to gain exposure to commodities through commodity-linked notes and its wholly-owned subsidiary.
The Fund is required to include in income for federal income tax purposes all of the subsidiary’s net income and gains whether or not such income is distributed by the subsidiary. Net income and gains from the subsidiary are generally treated as ordinary income by the Fund, regardless of the character of the subsidiary’s underlying income. Net losses from the subsidiary do not pass through to the Fund for federal income tax purposes.
During the fiscal year ended December 31, 2014, the Fund utilized $12,716,558 of capital loss carryforward to offset capital gains realized in that fiscal year. The Fund had straddle losses of $254,126 which were deferred. Details of the fiscal year ended December 31, 2014 capital loss carryforwards are included in the table below. Capital loss carryforwards with no expiration, if any, must be utilized prior to those with expiration dates. Capital losses with no expiration will be carried forward to future years if not offset by gains.
| | | | |
| Expiring | | | |
| |
2015 | | $ | 5,751,368 | |
2016 | | | 3,339,490 | |
No expiration | | | 41,283,570 | |
| | | | |
| Total | | $ | 50,374,428 | |
| | | | |
Of these losses, $6,678,980 are subject to Sec. 382 loss limitation rules resulting from merger activity. These limitations generally reduce the utilization of these losses to a maximum of $3,339,490 per year.
As of June 30, 2015, it is estimated that the capital loss carryforwards would be $9,090,858 expiring by 2018 and $58,753,742, which will not expire. The estimated capital loss carryforward represents the carryforward as of the end of the last fiscal year, increased or decreased by capital losses or gains realized in the first six months of the current fiscal year. During the six months ended June 30, 2015, it is estimated that the Fund will not utilize any capital loss carryforward to offset realized capital gains.
Net investment income (loss) and net realized gain (loss) may differ for financial statement and tax purposes. The character of dividends and distributions made during the fiscal year from net investment income or net realized gains are determined in accordance with federal income tax requirements, which may differ from the character of net investment income or net realized gains presented in those financial statements in accordance with GAAP. Also, due to timing of dividends and distributions, the fiscal year in which amounts are distributed may differ from the fiscal year in which the income or net realized gain was recorded by the Fund.
42 OPPENHEIMER GLOBAL STRATEGIC INCOME FUND/VA
2. Significant Accounting Policies (Continued)
The aggregate cost of securities and other investments and the composition of unrealized appreciation and depreciation of securities and other investments for federal income tax purposes as of June 30, 2015 are noted in the following table. The primary difference between book and tax appreciation or depreciation of securities and other investments, if applicable, is attributable to the tax deferral of losses or tax realization of financial statement unrealized gain or loss.
| | | | |
Federal tax cost of securities | | $ | 2,091,781,601 | |
Federal tax cost of other investments | | | 23,561,816 | |
| | | | |
| Total federal tax cost | | $ | 2,115,343,417 | |
| | | | |
Gross unrealized appreciation | | $ | 34,387,321 | |
Gross unrealized depreciation | | | (96,488,755) | |
| | | | |
| Net unrealized appreciation | | $ | (62,101,434) | |
| | | | |
Recent Accounting Pronouncement. In May 2015, Financial Accounting Standards Board (“FASB”) issued Accounting Standards Update (“ASU”), ASU 2015-07. This is an update to Fair Value Measurement Topic 820. Under the amendments in this ASU, investments for which fair value is measured at net asset value per share (or its equivalent) using the practical expedient should not be categorized in the fair value hierarchy. ASU 2015-17 is effective for financial statements issued for fiscal years beginning after December 15, 2015, and interim periods within those fiscal years. As of June 30, 2015, the Manager does not believe the adoption of the ASU will have a material effect on the financial statements or disclosures.
Use of Estimates. The preparation of financial statements in conformity with accounting principles generally accepted in the United States of America requires management to make estimates and assumptions that affect the reported amounts of assets and liabilities and disclosure of contingent assets and liabilities at the date of the financial statements and the reported amounts of increases and decreases in net assets from operations during the reporting period. Actual results could differ from those estimates.
3. Securities Valuation
The Fund calculates the net asset value of its shares as of the close of the New York Stock Exchange (the “Exchange”), normally 4:00 P.M. Eastern time, on each day the Exchange is open for trading.
The Fund’s Board has adopted procedures for the valuation of the Fund’s securities and has delegated the day-to-day responsibility for valuation determinations under those procedures to the Manager. The Manager has established a Valuation Committee which is responsible for determining a “fair valuation” for any security for which market quotations are not “readily available.” The Valuation Committee’s fair valuation determinations are subject to review, approval and ratification by the Fund’s Board at its next regularly scheduled meeting covering the calendar quarter in which the fair valuation was determined.
Valuation Methods and Inputs
Securities are valued using unadjusted quoted market prices, when available, as supplied primarily by third party pricing services or dealers.
The following methodologies are used to determine the market value or the fair value of the types of securities described below:
Securities traded on a registered U.S. securities exchange (including exchange-traded derivatives other than futures and futures options) are valued based on the last sale price of the security reported on the principal exchange on which it is traded, prior to the time when the Fund’s assets are valued. In the absence of a sale, the security is valued at the last sale price on the prior trading day, if it is within the spread of the current day’s closing “bid” and “asked” prices, and if not, at the current day’s closing bid price. A security of a foreign issuer traded on a foreign exchange, but not listed on a registered U.S. securities exchange, is valued based on the last sale price on the principal exchange on which the security is traded, as identified by the third party pricing service used by the Manager, prior to the time when the Fund’s assets are valued. If the last sale price is unavailable, the security is valued at the most recent official closing price on the principal exchange on which it is traded. If the last sales price or official closing price for a foreign security is not available, the security is valued at the mean between the bid and asked price per the exchange or, if not available from the exchange, obtained from two dealers. If bid and asked prices are not available from either the exchange or two dealers, the security is valued by using one of the following methodologies (listed in order of priority): (1) using a bid from the exchange, (2) the mean between the bid and asked price as provided by a single dealer, or (3) a bid from a single dealer.
Shares of a registered investment company that are not traded on an exchange are valued at that investment company’s net asset value per share.
Corporate and government debt securities (of U.S. or foreign issuers) and municipal debt securities, event-linked bonds, loans, mortgage-backed securities, collateralized mortgage obligations, and asset-backed securities are valued at the mean between the “bid” and “asked” prices utilizing evaluated prices obtained from third party pricing services or broker-dealers who may use matrix pricing methods to determine the evaluated prices.
Short-term money market type debt securities with a remaining maturity of sixty days or less are valued at cost adjusted by the amortization of discount or premium to maturity (amortized cost), which approximates market value. Short-term debt securities with a remaining maturity in excess of sixty days are valued at the mean between the “bid” and “asked” prices utilizing evaluated prices obtained from third party pricing services or broker-dealers.
Structured securities, swaps, swaptions, and other over-the-counter derivatives are valued utilizing evaluated prices obtained from third party pricing services or broker-dealers.
Forward foreign currency exchange contracts are valued utilizing current and forward currency rates obtained from third party pricing services. When the settlement date of a contract is an interim date for which a quotation is not available, interpolated values are derived using the nearest dated forward currency rate.
43 OPPENHEIMER GLOBAL STRATEGIC INCOME FUND/VA
NOTES TO CONSOLIDATED FINANCIAL STATEMENTS Unaudited / Continued
3. Securities Valuation (Continued)
Futures contracts and futures options traded on a commodities or futures exchange will be valued at the final settlement price or official closing price on the principal exchange as reported by such principal exchange at its trading session ending at, or most recently prior to, the time when the Fund’s assets are valued.
A description of the standard inputs that may generally be considered by the third party pricing vendors in determining their evaluated prices is provided below.
| | |
Security Type | | Standard inputs generally considered by third-party pricing vendors |
|
| Corporate debt, government debt, municipal, mortgage-backed and asset-backed securities | | Reported trade data, broker-dealer price quotations, benchmark yields, issuer spreads on comparable securities, the credit quality, yield, maturity, and other appropriate factors. |
|
| Loans | | Information obtained from market participants regarding reported trade data and broker-dealer price quotations. |
|
| Event-linked bonds | | Information obtained from market participants regarding reported trade data and broker-dealer price quotations. |
|
| Structured securities | | Relevant market information such as the price of underlying financial instruments, stock market indices, foreign currencies, interest rate spreads, commodities, or the occurrence of other specific events. |
|
| Swaps | | Relevant market information, including underlying reference assets such as credit spreads, credit event probabilities, index values, individual security values, forward interest rates, variable interest rates, volatility measures, and forward currency rates. |
If a market value or price cannot be determined for a security using the methodologies described above, or if, in the “good faith” opinion of the Manager, the market value or price obtained does not constitute a “readily available market quotation,” or a significant event has occurred that would materially affect the value of the security, the security is fair valued either (i) by a standardized fair valuation methodology applicable to the security type or the significant event as previously approved by the Valuation Committee and the Fund’s Board or (ii) as determined in good faith by the Manager’s Valuation Committee. The Valuation Committee considers all relevant facts that are reasonably available, through either public information or information available to the Manager, when determining the fair value of a security. Fair value determinations by the Manager are subject to review, approval and ratification by the Fund’s Board at its next regularly scheduled meeting covering the calendar quarter in which the fair valuation was determined. Those fair valuation standardized methodologies include, but are not limited to, valuing securities at the last sale price or initially at cost and subsequently adjusting the value based on: changes in company specific fundamentals, changes in an appropriate securities index, or changes in the value of similar securities which may be further adjusted for any discounts related to security-specific resale restrictions. When possible, such methodologies use observable market inputs such as unadjusted quoted prices of similar securities, observable interest rates, currency rates and yield curves. The methodologies used for valuing securities are not necessarily an indication of the risks associated with investing in those securities nor can it be assured that the Fund can obtain the fair value assigned to a security if it were to sell the security.
To assess the continuing appropriateness of security valuations, the Manager, or its third party service provider who is subject to oversight by the Manager, regularly compares prior day prices, prices on comparable securities, and sale prices to the current day prices and challenges those prices exceeding certain tolerance levels with the third party pricing service or broker source. For those securities valued by fair valuations, whether through a standardized fair valuation methodology or a fair valuation determination, the Valuation Committee reviews and affirms the reasonableness of the valuations based on such methodologies and fair valuation determinations on a regular basis after considering all relevant information that is reasonably available.
Classifications
Each investment asset or liability of the Fund is assigned a level at measurement date based on the significance and source of the inputs to its valuation. Various data inputs are used in determining the value of each of the Fund’s investments as of the reporting period end. These data inputs are categorized in the following hierarchy under applicable financial accounting standards:
1) Level 1-unadjusted quoted prices in active markets for identical assets or liabilities (including securities actively traded on a securities exchange)
2) Level 2-inputs other than unadjusted quoted prices that are observable for the asset or liability (such as unadjusted quoted prices for similar assets and market corroborated inputs such as interest rates, prepayment speeds, credit risks, etc.)
3) Level 3-significant unobservable inputs (including the Manager’s own judgments about assumptions that market participants would use in pricing the asset or liability).
The inputs used for valuing securities are not necessarily an indication of the risks associated with investing in those securities.
The table below categorizes amounts that are included in the Fund’s Consolidated Statement of Assets and Liabilities as of June 30, 2015 based on valuation input level:
44 OPPENHEIMER GLOBAL STRATEGIC INCOME FUND/VA
3. Securities Valuation (Continued)
| | | | | | | | | | | | | | | | |
| | | Level 1— Unadjusted
Quoted Prices | | | Level 2— Other Significant
Observable Inputs | | | Level 3— Significant
Unobservable Inputs | | | Value | |
| |
| Assets Table | | | | | | | | | | | | | | | | |
| Investments, at Value: | | | | | | | | | | | | | | | | |
| Asset-Backed Securities | | $ | — | | | $ | 41,874,329 | | | $ | 16,869,016 | | | $ | 58,743,345 | |
| Mortgage-Backed Obligations | | | — | | | | 229,329,583 | | | | 2,763,521 | | | | 232,093,104 | |
| U.S. Government Obligations | | | — | | | | 33,806,480 | | | | — | | | | 33,806,480 | |
| Foreign Government Obligations | | | — | | | | 237,269,396 | | | | — | | | | 237,269,396 | |
| Corporate Loans | | | — | | | | 29,431,250 | | | | 7,452 | | | | 29,438,702 | |
| Corporate Bonds and Notes | | | — | | | | 1,241,601,745 | | | | 2,559,433 | | | | 1,244,161,178 | |
| Common Stocks | | | 2,020,048 | | | | 1,478,323 | | | | 15 | | | | 3,498,386 | |
| Rights, Warrants and Certificates | | | — | | | | — | | | | — | | | | — | |
| Structured Securities | | | — | | | | 7,580,176 | | | | 5,778,825 | | | | 13,359,001 | |
| Investment Companies | | | 20,739,901 | | | | 156,299,703 | | | | — | | | | 177,039,604 | |
| Over-the-Counter Options Purchased | | | — | | | | 2,419,450 | | | | — | | | | 2,419,450 | |
| Over-the-Counter Credit Default Swaption Purchased | | | — | | | | 52,857 | | | | — | | | | 52,857 | |
| Over-the-Counter Interest Rate Swaptions Purchased | | | — | | | | 673,634 | | | | — | | | | 673,634 | |
| | | | |
| Total Investments, at Value | | | 22,759,949 | | | | 1,981,816,926 | | | | 27,978,262 | | | | 2,032,555,137 | |
| Other Financial Instruments: | | | | | | | | | | | | | | | | |
| Swaps, at value | | | — | | | | 1,608,447 | | | | — | | | | 1,608,447 | |
| Centrally cleared swaps, at value | | | — | | | | 7,004,812 | | | | — | | | | 7,004,812 | |
| Futures contracts | | | 84,134 | | | | — | | | | — | | | | 84,134 | |
| Forward currency exchange contracts | | | — | | | | 5,625,055 | | | | — | | | | 5,625,055 | |
| | | | |
| Total Assets | | $ | 22,844,083 | | | $ | 1,996,055,240 | | | $ | 27,978,262 | | | $ | 2,046,877,585 | |
| | | | |
| | | | |
| Liabilities Table | | | | | | | | | | | | | | | | |
| Other Financial Instruments: | | | | | | | | | | | | | | | | |
| Swaps, at value | | $ | — | | | $ | (2,502,094) | | | $ | — | | | $ | (2,502,094) | |
| Centrally cleared swaps, at value | | | — | | | | (87,619) | | | | — | | | | (87,619) | |
| Options written, at value | | | — | | | | (6,477,788) | | | | — | | | | (6,477,788) | |
| Futures contracts | | | (915,498) | | | | — | | | | — | | | | (915,498) | |
| Forward currency exchange contracts | | | — | | | | (7,998,781) | | | | — | | | | (7,998,781) | |
| Swaptions written, at value | | | — | | | | (839,022) | | | | — | | | | (839,022) | |
| | | | |
| Total Liabilities | | $ | (915,498) | | | $ | (17,905,304) | | | $ | — | | | $ | (18,820,802) | |
| | | | |
Forward currency exchange contracts and futures contracts, if any, are reported at their unrealized appreciation/depreciation at measurement date, which represents the change in the contract’s value from trade date. All additional assets and liabilities included in the above table are reported at their market value at measurement date.
The table below shows the transfers between Level 2 and Level 3. The Fund’s policy is to recognize transfers in and transfers out as of the beginning of the reporting period.
| | | | | | | | |
| | | Transfers out of Level 2* | | | Transfers into Level 3* | |
| |
| Assets Table | | | | | | | | |
| Investments, at Value: | | | | | | | | |
Non-Convertible Corporate Bonds and Notes | | $ | (39,746 | ) | | $ | 39,746 | |
| | | | |
Total Assets | | $ | (39,746 | ) | | $ | 39,746 | |
| | | | |
* Transferred from Level 2 to Level 3 because of the lack of observable market data.
The following is a reconciliation of assets in which significant unobservable inputs (level 3) were used in determining fair value:
| | | | | | | | | | | | | | | | |
| | | Value as of
December 31, 2014 | | | Realized
gain (loss) | | | Change in unrealized appreciation/ depreciation | | | Accretion/
(amortization)
of premium/ discounta | |
| |
| Assets Table | | | | | | | | | | | | | | | | |
| Investments, at Value: | | | | | | | | | | | | | | | | |
Asset-Backed Securities | | $ | 17,141,305 | | | $ | — | | | $ | (338,917) | | | $ | 66,628 | |
Mortgage-Backed Obligations | | | 2,842,770 | | | | — | | | | (99,688) | | | | 20,439 | |
Corporate Loans | | | 7,452 | | | | — | | | | — | | | | — | |
Corporate Bonds and Notes | | | 2,992,241 | | | | (5,309,043) | | | | 6,727,446 | | | | — | |
Common Stocks | | | 15 | | | | — | | | | — | | | | — | |
Structured Securities | | | 8,042,066 | | | | (1,061,081) | | | | (389,267) | | | | 49,895 | |
| | | | |
Total Assets | | $ | 31,025,849 | | | $ | (6,370,124) | | | $ | 5,899,574 | | | $ | 136,962 | |
| | | | |
a. Included in net investment income.
45 OPPENHEIMER GLOBAL STRATEGIC INCOME FUND/VA
NOTES TO CONSOLIDATED FINANCIAL STATEMENTS Unaudited / Continued
3. Securities Valuation (Continued)
| | | | | | | | | | | | |
| | | Sales | | | Transfers into Level 3 | | | Value as of
June 30, 2015 | |
| |
| Assets Table (Continued) | | | | | | | | | | | | |
| Investments, at Value: | | | | | | | | | | | | |
Asset-Backed Securities | | $ | — | | | $ | — | | | $ | 16,869,016 | |
Mortgage-Backed Obligations | | | — | | | | — | | | | 2,763,521 | |
Corporate Loans | | | — | | | | — | | | | 7,452 | |
Corporate Bonds and Notes | | | (1,890,957) | | | | 39,746 | | | | 2,559,433 | |
Common Stocks | | | — | | | | — | | | | 15 | |
Structured Securities | | | (862,788) | | | | — | | | | 5,778,825 | |
| | | | |
Total Assets | | $ | (2,753,745) | | | $ | 39,746 | | | $ | 27,978,262 | |
| | | | |
The total change in unrealized appreciation/depreciation included in the Consolidated Statement of Operations attributable to Level 3 investments still held at June 30, 2015:
| | | | |
| | | Change in
unrealized
appreciation/
depreciation | |
| |
Asset-Backed Securities | | $ | (338,917) | |
Mortgage-Backed Obligations | | | (99,688) | |
Corporate Bonds and Notes | | | (58,554) | |
Structured Securities | | | (389,267) | |
| | | | |
Total Assets | | $ | (886,426) | |
| | | | |
The following table summarizes the valuation techniques and significant unobservable inputs used in determining fair value measurements for those investments classified as Level 3 as of June 30, 2015:
| | | | | | | | | | | | | | | | | | | | |
| | | Value as of
June 30, 2015 | | | Valuation Technique | | | Unobservable input | | | Range of
Unobservable Inputs | | Unobservable
Input Used | |
| |
| Assets Table | | | | | | | | | | | | | | | | | | | | |
| Investments, at Value: | | | | | | | | | | | | | | | | | | | | |
Asset-Backed Securities | | $ | 16,869,016 | | | | Broker quotes | | | | N/A | | | N/A | | N/A | | | (a) | |
Mortgage-Backed Obligations | | | 2,763,521 | | | | Broker quotes | | | | N/A | | | N/A | | N/A | | | (a) | |
Corporate Bonds and Notes | | | 2,559,432 | | | | Broker quotes | | | | N/A | | | N/A | | N/A | | | (a) | |
Corporate Bonds and Notes | | | 1 | | |
| Estimated Recovery
proceeds |
| | | Nominal Value | | | N/A | | 1% of par | | | (b) | |
Corporate Loans | | | 7,452 | | | | Pricing service | | | | N/A | | | N/A | | N/A | | | (a) | |
Common Stock | | | 15 | | |
| Estimated Recovery
proceeds |
| | | Nominal Value | | | N/A | | $0.01/share | | | (c) | |
Structured Securities | | | 5,778,825 | | | | Broker quotes | | | | N/A | | | N/A | | N/A | | | (a) | |
| | | | | | | | | | | | | | | | | | | | |
Total | | $ | 27,978,262 | | | | | | | | | | | | | | | | | |
| | | | | | | | | | | | | | | | | | | | |
(a) Securities classified as Level 3 whose unadjusted values were provided by a pricing service or broker-dealer for which such inputs are unobservable. The Manager periodically reviews pricing vendor and broker methodologies and inputs to confirm they are determined using unobservable inputs and have been appropriately classified. Such securities’ fair valuations could change significantly based on changes in unobservable inputs used by the pricing service or broker.
(b) The Fund fair values certain corporate bonds and notes received from a bond restructuring using a nominal value to reflect the low probability of future value. The Manager monitors such investments for additional market information or the occurrence of a significant event which would warrant a re-evaluation of the security’s fair valuation.
(c) The Fund fair values certain common stocks held at a nominal value to reflect the low probability of receipt of future payments to be received as a result of a merger. The Manager monitors such investments for additional market information or the occurrence of a significant event which would warrant a re-evaluation of the security’s fair valuation. A significant increase (decrease) in the future distribution amount, or a significant increase (decrease) to the probability of payment rate, will result in a significant increase (decrease) to the fair value of the investment.
4. Investments and Risks
Investment in Oppenheimer Institutional Money Market Fund. The Fund is permitted to invest daily available cash balances in an affiliated money market fund. The Fund may invest the available cash in Class E shares of Oppenheimer Institutional Money Market Fund (“IMMF”) to seek current income while preserving liquidity or for defensive purposes. IMMF is a registered open-end management investment company, regulated as a money market fund under the 1940 Act. The Manager is the investment adviser of IMMF, and the Sub-Adviser provides investment and related advisory services to IMMF. When applicable, the Fund’s investment in IMMF is included in the Consolidated Statement of Investments. Shares of IMMF are valued at their net asset value per share. As a shareholder, the Fund is subject to its proportional share of IMMF’s Class E expenses, including its management fee. The Manager will waive fees and/or reimburse Fund expenses in an amount equal to the indirect management fees incurred through the Fund’s investment in IMMF.
Investment in Oppenheimer Master Funds. The Fund is permitted to invest in entities sponsored and/or advised by the Manager or an affiliate. Certain of these entities in which the Fund invests are mutual funds registered under the Investment Company Act of 1940 that expect to be treated as partnerships for tax purposes, specifically Oppenheimer Master Loan Fund, LLC (“Master Loan”) and Oppenheimer Master Event-Linked Bond Fund, LLC (“Master Event-Linked Bond”) (the “Master Funds”). Each Master Fund has its own investment risks, and those risks can affect the value of the Fund’s
46 OPPENHEIMER GLOBAL STRATEGIC INCOME FUND/VA
4. Investments and Risks (Continued)
investments and therefore the value of the Fund’s shares. To the extent that the Fund invests more of its assets in one Master Fund than in another, the Fund will have greater exposure to the risks of that Master Fund.
The investment objective of Master Loan is to seek income. The investment objective of Master Event-Linked Bond is to seek total return. The Fund’s investments in the Master Funds are included in the Consolidated Statement of Investments. The Fund recognizes income and gain/(loss) on its investments in each Master Fund according to its allocated pro-rata share, based on its relative proportion of total outstanding Master Fund shares held, of the total net income earned and the net gain/(loss) realized on investments sold by the Master Funds. As a shareholder, the Fund is subject to its proportional share of the Master Funds’ expenses, including their management fee. The Manager will waive fees and/or reimburse Fund expenses in an amount equal to the indirect management fees incurred through the Fund’s investment in the Master Funds. The Fund owns 8.7% of Master Loan and 15.4% of Master Event-Linked Bond at June 30, 2015.
Structured Securities. The Fund invests in structured securities whose market values, interest rates and/or redemption prices are linked to the performance of underlying foreign currencies, interest rate spreads, stock market indices, prices of individual securities, commodities or other financial instruments or the occurrence of other specific events. The structured securities are often leveraged, increasing the volatility of each note’s market value relative to the change in the underlying linked financial element or event. Fluctuations in value of these securities are recorded as unrealized gains and losses in the accompanying Consolidated Statement of Operations. The Fund records a realized gain or loss when a structured security is sold or matures.
Loans. The Fund invests in loans made to U.S. and foreign borrowers that are corporations, partnerships or other business entities. The Fund will do so directly as an original lender or by assignment or indirectly through participation agreements or certain derivative instruments. While many of these loans will be collateralized, the Fund can also invest in uncollateralized loans. Loans are often issued in connection with recapitalizations, acquisitions, leveraged buyouts, and refinancing of borrowers. The loans often pay interest at rates that float above (or are adjusted periodically based on) a benchmark that reflects current interest rates although the Fund can also invest in loans with fixed interest rates.
Securities on a When-Issued or Delayed Delivery Basis. The Fund may purchase securities on a “when-issued” basis, and may purchase or sell securities on a “delayed delivery” basis. “When-issued” or “delayed delivery” refers to securities whose terms and indenture are available and for which a market exists, but which are not available for immediate delivery. Delivery and payment for securities that have been purchased by the Fund on a when-issued basis normally takes place within six months and possibly as long as two years or more after the trade date. During this period, such securities do not earn interest, are subject to market fluctuation and may increase or decrease in value prior to their delivery. The purchase of securities on a when-issued basis may increase the volatility of the Fund’s net asset value to the extent the Fund executes such transactions while remaining substantially fully invested. When the Fund engages in when-issued or delayed delivery transactions, it relies on the buyer or seller, as the case may be, to complete the transaction. Their failure to do so may cause the Fund to lose the opportunity to obtain or dispose of the security at a price and yield it considers advantageous. The Fund may also sell securities that it purchased on a when-issued basis or forward commitment prior to settlement of the original purchase.
As of June 30, 2015, the Fund had purchased securities issued on a when-issued or delayed delivery basis and sold securities issued on a delayed delivery basis as follows:
| | | | |
| | | When-Issued or
Delayed Delivery
Basis Transactions | |
| |
Purchased securities | | | $104,603,877 | |
Sold securities | | | 44,502,985 | |
The Fund may enter into “forward roll” transactions with respect to mortgage-related securities. In this type of transaction, the Fund sells a mortgage-related security to a buyer and simultaneously agrees to repurchase a similar security (same type, coupon and maturity) at a later date at a set price. During the period between the sale and the repurchase, the Fund will not be entitled to receive interest and principal payments on the securities that have been sold. The Fund records the incremental difference between the forward purchase and sale of each forward roll as realized gain (loss) on investments or as fee income in the case of such transactions that have an associated fee in lieu of a difference in the forward purchase and sale price.
Forward roll transactions may be deemed to entail embedded leverage since the Fund purchases mortgage-related securities with extended settlement dates rather than paying for the securities under a normal settlement cycle. This embedded leverage increases the Fund’s market value of investments relative to its net assets which can incrementally increase the volatility of the Fund’s performance. Forward roll transactions can be replicated over multiple settlement periods.
Risks of entering into forward roll transactions include the potential inability of the counterparty to meet the terms of the agreement; the potential of the Fund to receive inferior securities at redelivery as compared to the securities sold to the counterparty; and counterparty credit risk.
Restricted Securities. As of June 30, 2015, investments in securities included issues that are restricted. A restricted security may have a contractual restriction on its resale and is valued under methods approved by the Board of Trustees as reflecting fair value. Securities that are restricted are marked with an applicable footnote on the Consolidated Statement of Investments. Restricted securities are reported on a schedule following the Consolidated Statement of Investments.
47 OPPENHEIMER GLOBAL STRATEGIC INCOME FUND/VA
NOTES TO CONSOLIDATED FINANCIAL STATEMENTS Unaudited / Continued
4. Investments and Risks (Continued)
Equity Security Risk. Stocks and other equity securities fluctuate in price. The value of the Fund’s portfolio may be affected by changes in the equity markets generally. Equity markets may experience significant short-term volatility and may fall sharply at times. Different markets may behave differently from each other and U.S. equity markets may move in the opposite direction from one or more foreign stock markets. Adverse events in any part of the equity or fixed-income markets may have unexpected negative effects on other market segments.
The prices of individual equity securities generally do not all move in the same direction at the same time and a variety of factors can affect the price of a particular company’s securities. These factors may include, but are not limited to, poor earnings reports, a loss of customers, litigation against the company, general unfavorable performance of the company’s sector or industry, or changes in government regulations affecting the company or its industry.
Credit Risk. The Fund invests in high-yield, non-investment-grade bonds, which may be subject to a greater degree of credit risk. Credit risk relates to the ability of the issuer to meet interest or principal payments or both as they become due. The Fund may acquire securities that have missed an interest payment, and is not obligated to dispose of securities whose issuers or underlying obligors subsequently miss an interest payment. Information concerning securities not accruing interest as of June 30, 2015 is as follows:
| | | | |
Cost | | | $16,752,298 | |
Market Value | | | $5,735,467 | |
Market value as % of Net Assets | | | 0.29% | |
Sovereign Debt Risk. The Fund invests in sovereign debt securities, which are subject to certain special risks. These risks include, but are not limited to, the risk that a governmental entity may delay or refuse, or otherwise be unable, to pay interest or repay the principal on its sovereign debt. There may also be no legal process for collecting sovereign debt that a government does not pay or bankruptcy proceedings through which all or part of such sovereign debt may be collected. In addition, a restructuring or default of sovereign debt may also cause additional impacts to the financial markets, such as downgrades to credit ratings, reduced liquidity and increased volatility, among others.
5. Risk Exposures and the Use of Derivative Instruments
The Fund’s investment objective not only permits the Fund to purchase investment securities, it also allows the Fund to enter into various types of derivatives contracts, including, but not limited to, futures contracts, forward currency exchange contracts, credit default swaps, interest rate swaps, total return swaps, variance swaps and purchased and written options. In doing so, the Fund will employ strategies in differing combinations to permit it to increase, decrease, or change the level or types of exposure to market risk factors. These instruments may allow the Fund to pursue its objectives more quickly and efficiently than if it were to make direct purchases or sales of securities capable of effecting a similar response to market factors. Such contracts may be entered into through a bilateral over-the-counter (“OTC”) transaction, or through a securities or futures exchange and cleared through a clearinghouse.
Market Risk Factors. In accordance with its investment objectives, the Fund may use derivatives to increase or decrease its exposure to one or more of the following market risk factors:
Commodity Risk. Commodity risk relates to the change in value of commodities or commodity indexes as they relate to increases or decreases in the commodities market. Commodities are physical assets that have tangible properties. Examples of these types of assets are crude oil, heating oil, metals, livestock, and agricultural products.
Credit Risk. Credit risk relates to the ability of the issuer to meet interest and principal payments, or both, as they come due. In general, lower-grade, higher-yield bonds are subject to credit risk to a greater extent than lower-yield, higher-quality bonds.
Equity Risk. Equity risk relates to the change in value of equity securities as they relate to increases or decreases in the general market.
Foreign Exchange Rate Risk. Foreign exchange rate risk relates to the change in the U.S. dollar value of a security held that is denominated in a foreign currency. The U.S. dollar value of a foreign currency denominated security will decrease as the dollar appreciates against the currency, while the U.S. dollar value will increase as the dollar depreciates against the currency.
Interest Rate Risk. Interest rate risk refers to the fluctuations in value of fixed-income securities resulting from the inverse relationship between price and yield. For example, an increase in general interest rates will tend to reduce the market value of already issued fixed-income investments, and a decline in general interest rates will tend to increase their value. In addition, debt securities with longer maturities, which tend to have higher yields, are subject to potentially greater fluctuations in value from changes in interest rates than obligations with shorter maturities.
Volatility Risk. Volatility risk refers to the magnitude of the movement, but not the direction of the movement, in a financial instrument’s price over a defined time period. Large increases or decreases in a financial instrument’s price over a relative time period typically indicate greater volatility risk, while small increases or decreases in its price typically indicate lower volatility risk.
Derivatives may have little or no initial cash investment relative to their market value exposure and therefore can produce significant gains or losses in excess of their cost due to unanticipated changes in the market risk factors and the overall market. This use of embedded leverage allows the Fund to increase its market value exposure relative to its net assets and can substantially increase the volatility of the Fund’s performance. In instances where the Fund is using derivatives to decrease, or hedge, exposures to market risk factors for securities held by the Fund, there are also risks that those derivatives may not perform as expected resulting in losses for the combined or hedged positions. Some derivatives have the potential for unlimited loss, regardless of the size of the Fund’s initial investment.
48 OPPENHEIMER GLOBAL STRATEGIC INCOME FUND/VA
5. Risk Exposures and the Use of Derivative Instruments (Continued)
Additional associated risks from investing in derivatives also exist and potentially could have significant effects on the valuation of the derivative and the Fund. Typically, the associated risks are not the risks that the Fund is attempting to increase or decrease exposure to, per its investment objectives, but are the additional risks from investing in derivatives. Examples of these associated risks are liquidity risk, which is the risk that the Fund will not be able to sell the derivative in the open market in a timely manner, and counterparty credit risk, which is the risk that the counterparty will not fulfill its obligation to the Fund.
The Fund’s actual exposures to these market risk factors and associated risks during the period are discussed in further detail, by derivative type, below.
Forward Currency Exchange Contracts
The Fund may enter into forward currency exchange contracts (“forward contracts”) for the purchase or sale of a foreign currency at a negotiated rate at a future date. Such contracts are traded in the OTC inter-bank currency dealer market.
Forward contracts are reported on a schedule following the Consolidated Statement of Investments. The unrealized appreciation (depreciation) is reported in the Consolidated Statement of Assets and Liabilities as a receivable (or payable) and in the Consolidated Statement of Operations within the change in unrealized appreciation (depreciation). At contract close, the difference between the original cost of the contract and the value at the close date is recorded as a realized gain (loss) in the Consolidated Statement of Operations.
The Fund has entered into forward contracts with the obligation to purchase specified foreign currencies in the future at a currently negotiated forward rate in order to take a positive investment perspective on the related currency. These forward contracts seek to increase exposure to foreign exchange rate risk.
The Fund has entered into forward contracts with the obligation to purchase specified foreign currencies in the future at a currently negotiated forward rate in order to decrease exposure to foreign exchange rate risk associated with foreign currency denominated securities held by the Fund.
The Fund has entered into forward contracts with the obligation to sell specified foreign currencies in the future at a currently negotiated forward rate in order to take a negative investment perspective on the related currency. These forward contracts seek to increase exposure to foreign exchange rate risk.
The Fund has entered into forward contracts with the obligation to sell specified foreign currencies in the future at a currently negotiated forward rate in order to decrease exposure to foreign exchange rate risk associated with foreign currency denominated securities held by the Fund.
During the six months ended June 30, 2015, the Fund had daily average contract amounts on forward contracts to buy and sell of $289,236,870 and $444,566,078, respectively.
Additional associated risk to the Fund includes counterparty credit risk. Counterparty credit risk arises from the possibility that the counterparty to a forward contract will default and fail to perform its obligations to the Fund.
Futures Contracts
A futures contract is a commitment to buy or sell a specific amount of a commodity, financial instrument or currency at a negotiated price on a stipulated future date. The Fund may buy and sell futures contracts and may also buy or write put or call options on these futures contracts. Futures contracts and options thereon are generally entered into on a regulated futures exchange and cleared through a clearinghouse associated with the exchange.
Upon entering into a futures contract, the Fund is required to deposit either cash or securities (initial margin) in an amount equal to a certain percentage of the contract value in an account registered in the futures commission merchant’s name. Subsequent payments (variation margin) are paid to or from the futures commission merchant each day equal to the daily changes in the contract value. Such payments are recorded as unrealized gains and losses. Should the Fund fail to make requested variation margin payments, the futures commission merchant can gain access to the initial margin to satisfy the Fund’s payment obligations.
Futures contracts are reported on a schedule following the Consolidated Statement of Investments. Securities held by a futures commission merchant to cover initial margin requirements on open futures contracts are noted in the Consolidated Statement of Investments. Cash held by a futures commission merchant to cover initial margin requirements on open futures contracts and the receivable and/or payable for the daily mark to market for the variation margin are noted in the Consolidated Statement of Assets and Liabilities. The net change in unrealized appreciation and depreciation is reported in the Consolidated Statement of Operations. Realized gains (losses) are reported in the Consolidated Statement of Operations at the closing or expiration of futures contracts.
The Fund has purchased futures contracts on various bonds and notes to increase exposure to interest rate risk.
The Fund has sold futures contracts on various bonds and notes to decrease exposure to interest rate risk.
During the six months ended June 30, 2015, the Fund had an ending monthly average market value of $141,376,951 and $108,825,987 on futures contracts purchased and sold, respectively.
Additional associated risks of entering into futures contracts (and related options) include the possibility that there may be an illiquid market where the Fund is unable to liquidate the contract or enter into an offsetting position and, if used for hedging purposes, the risk that the price of the contract will correlate imperfectly with the prices of the Fund’s securities.
Option Activity
The Fund may buy and sell put and call options, or write put and call options. When an option is written, the Fund receives a premium and becomes obligated to sell or purchase the underlying security, currency or other underlying financial instrument at a fixed price, upon exercise of the option.
Options can be traded through an exchange or through a privately negotiated arrangement with a dealer in an OTC transaction. Options traded through an exchange are generally cleared through a clearinghouse (such as The Options Clearing Corporation). The difference between the premium received or paid, and market value of the option, is recorded as unrealized appreciation or depreciation. The net change in unrealized appreciation or
49 OPPENHEIMER GLOBAL STRATEGIC INCOME FUND/VA
NOTES TO CONSOLIDATED FINANCIAL STATEMENTS Unaudited / Continued
5. Risk Exposures and the Use of Derivative Instruments (Continued)
depreciation is reported in the Consolidated Statement of Operations. When an option is exercised, the cost of the security purchased or the proceeds of the security sale are adjusted by the amount of premium received or paid. Upon the expiration or closing of the option transaction, a gain or loss is reported in the Consolidated Statement of Operations.
The Fund has purchased call options on currencies to increase exposure to foreign exchange rate risk. A purchased call option becomes more valuable as the price of the underlying financial instrument appreciates relative to the strike price.
The Fund has purchased put options on currencies to decrease exposure to foreign exchange rate risk. A purchased put option becomes more valuable as the price of the underlying financial instrument depreciates relative to the strike price.
The Fund has purchased call options on individual equity securities and/or equity indexes to increase exposure to equity risk. A purchased call option becomes more valuable as the price of the underlying financial instrument appreciates relative to the strike price.
During the six months ended June 30, 2015, the Fund had an ending monthly average market value of $1,723,829 and $1,366,864 on purchased call options and purchased put options, respectively.
Options written, if any, are reported in a schedule following the Consolidated Statement of Investments and as a liability in the Consolidated Statement of Assets and Liabilities. Securities held in collateral accounts to cover potential obligations with respect to outstanding written options are noted in the Consolidated Statement of Investments.
The risk in writing a call option is that the market price of the security increases and if the option is exercised, the Fund must either purchase the security at a higher price for delivery or, if the Fund owns the underlying security, give up the opportunity for profit. The risk in writing a put option is that the Fund may incur a loss if the market price of the security decreases and the option is exercised. The risk in buying an option is that the Fund pays a premium whether or not the option is exercised. The Fund also has the additional risk that there may be an illiquid market where the Fund is unable to close the contract.
The Fund has written put options on currencies to increase exposure to foreign exchange rate risk. A written put option becomes more valuable as the price of the underlying financial instrument appreciates relative to the strike price.
The Fund has written call options on currencies to decrease exposure to foreign exchange rate risk. A written call option becomes more valuable as the price of the underlying financial instrument depreciates relative to the strike price.
The Fund has written put options on treasury and/or euro futures to increase exposure to interest rate risk. A written put option becomes more valuable as the price of the underlying financial instrument appreciates relative to the strike price.
The Fund has written put options on individual equity securities and/or equity indexes to increase exposure to equity risk. A written put option becomes more valuable as the price of the underlying financial instrument appreciates relative to the strike price.
During the six months ended June 30, 2015, the Fund had an ending monthly average market value of $967,259 and $3,474,222 on written call options and written put options, respectively.
Additional associated risks to the Fund include counterparty credit risk and liquidity risk.
Written option activity for the six months ended June 30, 2015 was as follows:
| | | | | | | | |
| | | Number of Contracts | | | Amount of Premiums | |
| |
| Options outstanding as of December 31, 2014 | | | 108,580,000 | | | $ | 600,824 | |
Options written | | | 227,699,166,271 | | | | 17,774,447 | |
Options closed or expired | | | (77,580,000) | | | | (185,313) | |
Options exercised | | | (223,650,714,923) | | | | (12,285,418) | |
| | | | |
| Options outstanding as of June 30, 2015 | | | 4,079,451,348 | | | $ | 5,904,540 | |
| | | | |
Swap Contracts
The Fund may enter into swap contract agreements with a counterparty to exchange a series of cash flows based on either specified reference rates, the price or volatility of asset or non-asset references, or the occurrence of a credit event, over a specified period. Swaps can be executed in a bi-lateral privately negotiated arrangement with a dealer in an OTC transaction (“OTC swaps”) or executed on a regulated market. Certain swaps, regardless of the venue of their execution, are required to be cleared through a clearinghouse (“centrally cleared swaps”). Swap contracts may include interest rate, equity, debt, index, total return, credit default, currency, and volatility swaps.
Swap contracts are reported on a schedule following the Consolidated Statement of Investments. The values of centrally cleared swap and OTC swap contracts are aggregated by positive and negative values and disclosed separately on the Consolidated Statement of Assets and Liabilities. The unrealized appreciation (depreciation) related to the change in the valuation of the notional amount of the swap is combined with the accrued interest due to (owed by) the Fund, if any, at termination or settlement. The net change in this amount during the period is included on the Consolidated Statement of Operations. The Fund also records any periodic payments received from (paid to) the counterparty, including at termination, under such contracts as realized gain (loss) on the Consolidated Statement of Operations.
Swap contract agreements are exposed to the market risk factor of the specific underlying reference rate or asset. Swap contracts are typically more attractively priced compared to similar investments in related cash securities because they isolate the risk to one market risk factor and eliminate the other market risk factors. Investments in cash securities (for instance bonds) have exposure to multiple risk factors (credit and interest rate risk). Because swaps have embedded leverage, they can expose the Fund to substantial risk in the isolated market risk factor.
50 OPPENHEIMER GLOBAL STRATEGIC INCOME FUND/VA
5. Risk Exposures and the Use of Derivative Instruments (Continued)
Credit Default Swap Contracts. A credit default swap is a contract that enables an investor to buy or sell protection against a defined-issuer credit event, such as the issuer’s failure to make timely payments of interest or principal on a debt security, bankruptcy or restructuring. The Fund may enter into credit default swaps either by buying or selling protection on a corporate issuer, sovereign issuer, or a basket or index of issuers (the “reference asset”).
The buyer of protection pays a periodic fee to the seller of protection based on the notional amount of the swap contract. The seller of protection agrees to compensate the buyer of protection for future potential losses as a result of a credit event on the reference asset. The contract effectively transfers the credit event risk of the reference asset from the buyer of protection to the seller of protection.
The ongoing value of the contract will fluctuate throughout the term of the contract based primarily on the credit risk of the reference asset. If the credit quality of the reference asset improves relative to the credit quality at contract initiation, the buyer of protection may have an unrealized loss greater than the anticipated periodic fee owed. This unrealized loss would be the result of current credit protection being cheaper than the cost of credit protection at contract initiation. If the buyer elects to terminate the contract prior to its maturity, and there has been no credit event, this unrealized loss will become realized. If the contract is held to maturity, and there has been no credit event, the realized loss will be equal to the periodic fee paid over the life of the contract.
If there is a credit event, the buyer of protection can exercise its rights under the contract and receive a payment from the seller of protection equal to the notional amount of the swap less the market value of specified debt securities issued by the reference asset. Upon exercise of the contract the difference between such value and the notional amount is recorded as realized gain (loss) and is included on the Consolidated Statement of Operations.
The Fund has sold credit protection through credit default swaps to increase exposure to the credit risk of individual issuers and/or indexes of issuers that are either unavailable or considered to be less attractive in the bond market.
The Fund has purchased credit protection through credit default swaps to decrease exposure to the credit risk of individual issuers and/or indexes of issuers.
The Fund has engaged in spread curve trades by simultaneously purchasing and selling protection through credit default swaps referenced to the same reference asset but with different maturities. Spread curve trades attempt to gain exposure to credit risk on a forward basis by realizing gains on the expected differences in spreads.
For the six months ended June 30, 2015, the Fund had ending monthly average notional amounts of $13,528,564 and $24,494,975 on credit default swaps to buy protection and credit default swaps to sell protection, respectively.
Additional associated risks to the Fund include counterparty credit risk and liquidity risk.
Currency Swap Contracts. A currency swap contract is an agreement between counterparties to exchange different currencies at contract inception that are equivalent to a notional value. The exchange at contract inception is made at the current spot rate. The contract also includes an agreement to reverse the exchange of the same notional values of those currencies at contract termination. The re-exchange at contract termination may take place at the same exchange rate, a specified rate or the then current spot rate. Certain currency swap contracts provide for exchanging the currencies only at contract termination and can provide for only a net payment in the settlement currency, typically USD. A currency swap contract may also include the exchange of periodic payments, between the counterparties, that are based on interest rates available in the respective currencies at contract inception. Other currency swap contracts may not provide for exchanging the different currencies at all, and only for exchanging interest cash flows based on the notional value in the contract.
The Fund has entered into currency swap contracts with the obligation to pay an interest rate on the dollar notional amount and receive an interest rate on the various foreign currency notional amounts in order to take a positive investment perspective on the related currencies for which the Fund receives a payment. These currency swap contracts increase exposure to foreign exchange rate risk.
For the six months ended June 30, 2015, the Fund had ending monthly average notional amounts of $53,965,280 on currency swaps which receive a fixed rate.
Additional associated risks to the Fund include counterparty credit risk and liquidity risk.
Interest Rate Swap Contracts. An interest rate swap is an agreement between counterparties to exchange periodic payments based on interest rates. One cash flow stream will typically be a floating rate payment based upon a specified floating interest rate while the other is typically a fixed interest rate.
The Fund has entered into interest rate swaps in which it pays a floating interest rate and receives a fixed interest rate in order to increase exposure to interest rate risk. Typically, if relative interest rates rise, payments made by the Fund under a swap agreement will be greater than the payments received by the Fund.
The Fund has entered into interest rate swaps in which it pays a fixed interest rate and receives a floating interest rate in order to decrease exposure to interest rate risk. Typically, if relative interest rates rise, payments received by the Fund under the swap agreement will be greater than the payments made by the Fund.
For the six months ended June 30, 2015, the Fund had ending monthly average notional amounts of $72,625,881 and $97,813,525 on interest rate swaps which pay a fixed rate and interest rate swaps which receive a fixed rate, respectively.
Additional associated risks to the Fund include counterparty credit risk and liquidity risk.
Swaption Transactions
The Fund may enter into a swaption contract which grants the purchaser the right, but not the obligation, to enter into a swap transaction at preset terms detailed in the underlying agreement within a specified period of time. The purchaser pays a premium to the swaption writer who bears the risk of unfavorable changes in the preset terms on the underlying swap.
51 OPPENHEIMER GLOBAL STRATEGIC INCOME FUND/VA
NOTES TO CONSOLIDATED FINANCIAL STATEMENTS Unaudited / Continued
5. Risk Exposures and the Use of Derivative Instruments (Continued)
Purchased swaptions are reported as a component of investments in the Consolidated Statement of Investments and the Consolidated Statement of Assets and Liabilities. Written swaptions are reported on a schedule following the Consolidated Statement of Investments and their value is reported as a separate asset or liability line item in the Consolidated Statement of Assets and Liabilities. The net change in unrealized appreciation or depreciation on written swaptions is separately reported in the Consolidated Statement of Operations. When a swaption is exercised, the cost of the swap is adjusted by the amount of premium paid or received. Upon the expiration or closing of an unexercised swaption contract, a gain or loss is reported in the Consolidated Statement of Operations for the amount of the premium paid or received.
The Fund generally will incur a greater risk when it writes a swaption than when it purchases a swaption. When the Fund writes a swaption it will become obligated, upon exercise of the swaption, according to the terms of the underlying agreement. Swaption contracts written by the Fund do not give rise to counterparty credit risk prior to exercise as they obligate the Fund, not its counterparty, to perform. When the Fund purchases a swaption it only risks losing the amount of the premium it paid if the swaption expires unexercised. However, when the Fund exercises a purchased swaption there is a risk that the counterparty will fail to perform or otherwise default on its obligations under the swaption contract.
The Fund has purchased swaptions which gives it the option to enter into an interest rate swap in which it pays a floating interest rate and receives a fixed interest rate in order to increase exposure to interest rate risk. A purchased swaption of this type becomes more valuable as the reference interest rate decreases relative to the preset interest rate.
The Fund has purchased swaptions which gives it the option to enter into an interest rate swap in which it pays a fixed interest rate and receives a floating interest rate in order to decrease exposure to interest rate risk. A purchased swaption of this type becomes more valuable as the reference interest rate increases relative to the preset interest rate.
The Fund has purchased swaptions which gives it the option to sell credit protection through credit default swaps in order to increase exposure to the credit risk of individual issuers and/ or indexes of issuers. A purchased swaption of this type becomes more valuable as the likelihood of a credit event on the reference asset decreases.
The Fund has purchased swaptions which gives it the option to buy credit protection through credit default swaps in order to decrease exposure to the credit risk of individual issuers and/or indexes of issuers. A purchased swaption of this type becomes more valuable as the likelihood of a credit event on the reference asset increases.
The Fund has written swaptions which gives it the obligation, if exercised by the purchaser, to enter into an interest rate swap in which it pays a floating interest rate and receives a fixed interest rate in order to increase exposure to interest rate risk. A written swaption of this type becomes more valuable as the reference interest rate decreases relative to the preset interest rate.
The Fund has written swaptions which gives it the obligation, if exercised by the purchaser, to enter into an interest rate swap in which it pays a fixed interest rate and receives a floating interest rate in order to decrease exposure to interest rate risk. A written swaption of this type becomes more valuable as the reference interest rate increases relative to the preset interest rate.
The Fund has written swaptions which give it the obligation, if exercised by the purchaser, to sell credit protection through credit default swaps in order to increase exposure to the credit risk of individual issuers and/or indexes of issuers. A written swaption of this type becomes more valuable as the likelihood of a credit event on the reference asset decreases.
The Fund has written swaptions which give it the obligation, if exercised by the purchaser, to buy credit protection through credit default swaps in order to decrease exposure to the credit risk of individual issuers and/or, indexes of issuers. A written swaption of this type becomes more valuable as the likelihood of a credit event on the reference asset increases.
The Fund has written swaptions which gives it the obligation, if exercised by the purchaser, to enter into an currency swap contracts with the obligation to receive an interest rate on the dollar notional amount and pay an interest rate on the various foreign currency notional amounts in order to take a positive investment perspective on the related currencies for which the Fund receives a payment. These currency swap contracts increase exposure to foreign exchange rate risk.
During the six months ended June 30, 2015, the Fund had an ending monthly average market value of $2,613,317 and $3,469,226 on purchased and written swaptions, respectively.
Written swaption activity for the six months ended June 30, 2015 was as follows:
| | | | | | | | |
| | | Notional Amount | | | Amount of Premiums | |
| |
| Swaptions outstanding as of December 31, 2014 | | | $65,040,000 | | | $ | 710,481 | |
| Swaptions written | | | 2,780,935,116 | | | | 10,030,953 | |
| Swaptions closed or expired | | | (335,630,000) | | | | (416,992) | |
| Swaptions exercised | | | (1,867,571,000) | | | | (9,372,819) | |
| | | | |
| Swaptions outstanding as of June 30, 2015 | | | 642,774,116 | | | $ | 951,623 | |
| | | | |
Counterparty Credit Risk. Derivative positions are subject to the risk that the counterparty will not fulfill its obligation to the Fund. The Fund intends to enter into derivative transactions with counterparties that the Manager believes to be creditworthy at the time of the transaction.
The Fund’s risk of loss from counterparty credit risk on OTC derivatives is generally limited to the aggregate unrealized gain netted against any collateral held by the Fund. For OTC options purchased, the Fund bears the risk of loss of the amount of the premiums paid plus the positive change in market values net of any collateral held by the Fund should the counterparty fail to perform under the contracts. Options written by the Fund do not typically give rise to counterparty credit risk, as options written generally obligate the Fund and not the counterparty to perform.
To reduce counterparty risk with respect to OTC transactions, the Fund has entered into master netting arrangements, established within the Fund’s International Swap and Derivatives Association, Inc. (“ISDA”) master agreements, which allow the Fund to make (or to have an entitlement to receive) a
52 OPPENHEIMER GLOBAL STRATEGIC INCOME FUND/VA
5. Risk Exposures and the Use of Derivative Instruments (Continued)
single net payment in the event of default (close-out netting) for outstanding payables and receivables with respect to certain OTC positions in swaps, options, swaptions, and forward currency exchange contracts for each individual counterparty. In addition, the Fund may require that certain counterparties post cash and/or securities in collateral accounts to cover their net payment obligations for those derivative contracts subject to ISDA master agreements. If the counterparty fails to perform under these contracts and agreements, the cash and/or securities will be made available to the Fund.
As of June 30, 2015, the Fund has required certain counterparties to post collateral of $473,665.
ISDA master agreements include credit related contingent features which allow counterparties to OTC derivatives to terminate derivative contracts prior to maturity in the event that, for example, the Fund’s net assets decline by a stated percentage or the Fund fails to meet the terms of its ISDA master agreements, which would cause the Fund to accelerate payment of any net liability owed to the counterparty.
For financial reporting purposes, the Fund does not offset derivative assets and derivative liabilities that are subject to netting arrangements in the Consolidated Statement of Assets and Liabilities. Bankruptcy or insolvency laws of a particular jurisdiction may impose restrictions on or prohibitions against the right of offset in bankruptcy, insolvency or other events.
The Fund’s risk of loss from counterparty credit risk on exchange-traded derivatives cleared through a clearinghouse and for centrally cleared swaps is generally considered lower than as compared to OTC derivatives. However, counterparty credit risk exists with respect to initial and variation margin deposited/paid by the Fund that is held in futures commission merchant, broker and/or clearinghouse accounts for such exchange-traded derivatives and for centrally cleared swaps.
With respect to centrally cleared swaps, such transactions will be submitted for clearing, and if cleared, will be held in accounts at futures commission merchants or brokers that are members of clearinghouses. While brokers, futures commission merchants and clearinghouses are required to segregate customer margin from their own assets, in the event that a broker, futures commission merchant or clearinghouse becomes insolvent or goes into bankruptcy and at that time there is a shortfall in the aggregate amount of margin held by the broker, futures commission merchant or clearinghouse for all its customers, U.S. bankruptcy laws will typically allocate that shortfall on a pro-rata basis across all the broker’s, futures commission merchant’s or clearinghouse’s customers, potentially resulting in losses to the Fund.
There is the risk that a broker, futures commission merchant or clearinghouse will decline to clear a transaction on the Fund’s behalf, and the Fund may be required to pay a termination fee to the executing broker with whom the Fund initially enters into the transaction. Clearinghouses may also be permitted to terminate centrally cleared swaps at any time. The Fund is also subject to the risk that the broker or futures commission merchant will improperly use the Fund’s assets deposited/paid as initial or variation margin to satisfy payment obligations of another customer. In the event of a default by another customer of the broker or futures commission merchant, the Fund might not receive its variation margin payments from the clearinghouse, due to the manner in which variation margin payments are aggregated for all customers of the broker/futures commission merchant.
Collateral and margin requirements differ by type of derivative. Margin requirements are established by the broker, futures commission merchant or clearinghouse for exchange-traded and cleared derivatives, including centrally cleared swaps. Brokers, futures commission merchants and clearinghouses can ask for margin in excess of the regulatory minimum, or increase the margin amount, in certain circumstances.
Collateral terms are contract specific for OTC derivatives. For derivatives traded under an ISDA master agreement, the collateral requirements are typically calculated by netting the mark to market amount for each transaction under such agreement and comparing that amount to the value of any collateral currently pledged by the Fund or the counterparty.
For financial reporting purposes, cash collateral that has been pledged to cover obligations of the Fund, if any, is reported separately on the Consolidated Statement of Assets and Liabilities as cash pledged as collateral. Non-cash collateral pledged by the Fund, if any, is noted in the Consolidated Statement of Investments. Generally, the amount of collateral due from or to a party must exceed a minimum transfer amount threshold (e.g. $250,000) before a transfer has to be made. To the extent amounts due to the Fund from its counterparties are not fully collateralized, contractually or otherwise, the Fund bears the risk of loss from counterparty nonperformance.
The following table presents by counterparty the Fund’s OTC derivative assets net of the related collateral pledged by the Fund at June 30, 2015:
| | | | | | | | | | | | | | | | | | | | |
| | | | | | Gross Amounts Not Offset in the
Consolidated Statement of Assets & Liabilities | | | | |
| Counterparty | | Gross Amounts Not
Offset in the
Consolidated Statement
of Assets & Liabilities* | | | Financial Instruments
Available for Offset | | | Financial Instruments
Collateral Received** | | | Cash Collateral
Received** | | | Net Amount | |
| |
Bank of America NA | | $ | 2,167,476 | | | $ | (2,167,476) | | | $ | — | | | $ | — | | | $ | — | |
Barclays Bank plc | | | 828,299 | | | | (828,299) | | | | — | | | | — | | | | — | |
BNP Paribas | | | 76,568 | | | | (76,568) | | | | — | | | | — | | | | — | |
Citibank NA | | | 1,156,479 | | | | (1,156,479) | | | | — | | | | — | | | | — | |
Deutsche Bank AG | | | 495,357 | | | | (146,165) | | | | — | | | | (349,192) | | | | — | |
Goldman Sachs Bank USA | | | 1,783,796 | | | | (1,331,879) | | | | — | | | | — | | | | 451,917 | |
Goldman Sachs Group, Inc. (The) | | | 1,892,130 | | | | (1,892,130) | | | | — | | | | — | | | | — | |
HSBC Bank USA NA | | | 159,597 | | | | (159,597) | | | | — | | | | — | | | | — | |
JPMorgan Chase Bank NA | | | 1,305,126 | | | | (1,305,126) | | | | — | | | | — | | | | — | |
Morgan Stanley Capital Services, Inc. | | | 133,576 | | | | (133,576) | | | | — | | | | — | | | | — | |
Toronto Dominion Bank | | | 352,162 | | | | (352,162) | | | | — | | | | — | | | | — | |
UBS AG | | | 28,877 | | | | — | | | | (28,877) | | | | — | | | | — | |
| | | | |
| | $ | 10,379,443 | | | $ | (9,549,457) | | | $ | (28,877) | | | $ | (349,192) | | | $ | 451,917 | |
| | | | |
53 OPPENHEIMER GLOBAL STRATEGIC INCOME FUND/VA
NOTES TO CONSOLIDATED FINANCIAL STATEMENTS Unaudited / Continued
5. Risk Exposures and the Use of Derivative Instruments (Continued)
*OTC derivatives are reported gross on the Consolidated Statement of Assets and Liabilities. Exchange traded options and margin related to centrally cleared swaps and futures are excluded from these reported amounts.
**Reported collateral posted for the benefit of the Fund within this table is limited to the net outstanding amount due from an individual counterparty. The collateral posted for the benefit of the Fund may exceed these amounts.
The following table presents by counterparty the Fund’s OTC derivative liabilities net of the related collateral pledged by the Fund at June 30, 2015:
| | | | | | | | | | | | | | | | | | | | |
| | | | | | Gross Amounts Not Offset in the
Consolidated Statement of Assets & Liabilities | | | | |
| Counterparty | | Gross Amounts Not
Offset in the
Consolidated Statement
of Assets & Liabilities* | | | Financial Instruments
Available for Offset | | | Financial Instruments
Collateral Pledged** | | | Cash Collateral
Pledged** | | | Net Amount | |
| |
| Bank of America NA | | $ | (3,346,726) | | | $ | 2,167,476 | | | $ | 489,496 | | | $ | — | | | $ | (689,754) | |
| Barclays Bank plc | | | (884,901) | | | | 828,299 | | | | 56,602 | | | | — | | | | — | |
| BNP Paribas | | | (204,283) | | | | 76,568 | | | | — | | | | — | | | | (127,715) | |
| Citibank NA | | | (2,739,426) | | | | 1,156,479 | | | | 1,506,446 | | | | — | | | | (76,501) | |
| Deutsche Bank AG | | | (146,165) | | | | 146,165 | | | | — | | | | — | | | | — | |
| Goldman Sachs Bank USA | | | (1,331,879) | | | | 1,331,879 | | | | — | | | | — | | | | — | |
| Goldman Sachs Group, Inc. (The) | | | (3,589,394) | | | | 1,892,130 | | | | 59,423 | | | | — | | | | (1,637,841) | |
| HSBC Bank USA NA | | | (1,216,419) | | | | 159,597 | | | | 1,056,822 | | | | — | | | | — | |
| JPMorgan Chase Bank NA | | | (1,474,969) | | | | 1,305,126 | | | | 169,843 | | | | — | | | | — | |
| Morgan Stanley Capital Services, Inc. | | | (2,157,132) | | | | 133,576 | | | | 2,023,556 | | | | — | | | | — | |
| Nomura Global Financial Products, Inc. | | | (35,525) | | | | — | | | | 35,525 | | | | — | | | | — | |
| Toronto Dominion Bank | | | (690,866) | | | | 352,162 | | | | 244,627 | | | | — | | | | (94,077) | |
| | | | |
| | $ | (17,817,685) | | | $ | 9,549,457 | | | $ | 5,642,340 | | | $ | — | | | $ | (2,625,888) | |
| | | | |
*OTC derivatives are reported gross on the Consolidated Statement of Assets and Liabilities. Exchange traded options and margin related to centrally cleared swaps and futures are excluded from these reported amounts.
**Reported collateral pledged within this table is limited to the net outstanding amount due from the Fund. The securities pledged as collateral by the Fund as reported on the Consolidated Statements of Investments may exceed these amounts.
The following table presents the valuations of derivative instruments by risk exposure as reported within the Consolidated Statement of Assets and Liabilities as of June 30, 2015:
| | | | | | | | | | | | |
| | | Asset Derivatives | | | Liability Derivatives | |
Derivatives Not Accounted for
as Hedging Instruments | | Consolidated Statement of
Assets and Liabilities Location | | Value | | | Consolidated Statement of
Assets and Liabilities
Location | | Value | |
| |
Credit contracts | | Swaps, at value | | $ | 1,033,190 | | | Swaps, at value | | $ | 598,788 | |
| Forward currency exchange contracts | | Swaps, at value | | | 34,045 | | | Swaps, at value | | | 816,943 | |
Interest rate contracts | | Swaps, at value | | | 541,212 | | | Swaps, at value | | | 1,086,363 | |
Credit contracts | | Centrally cleared swaps, at value | | | 6,930,952 | | | | | | | |
Interest rate contracts | | Centrally cleared swaps, at value | | | 73,860 | | | Centrally cleared swaps, at value | | | 87,619 | |
Interest rate contracts | | Variation margin receivable | | | 91,092 * | | | Variation margin payable | | | 19,136 * | |
| Forward currency exchange contracts | | Unrealized appreciation on foreign currency exchange contracts | | | 5,625,055 | | | Unrealized depreciation on foreign currency exchange contracts | | | 7,998,781 | |
Equity contracts | | Investments, at value | | | 1,048,427 ** | | | Options written, at value | | | 1,812,645 | |
Foreign exchange contracts | | Investments, at value | | | 1,371,023 ** | | | Options written, at value | | | 4,665,143 | |
Credit contracts | | Investments, at value | | | 52,857 ** | | | Swaptions written, at value | | | 203,748 | |
Interest rate contracts | | Investments, at value | | | 673,634 ** | | | Swaptions written, at value | | | 635,274 | |
| | | | | | | | | | | | |
Total | | | | $ | 17,475,347 | | | | | $ | 17,924,440 | |
| | | | | | | | | | | | |
*Includes only the current day’s variation margin. Prior variation margin movements have been reflected in cash on the Consolidated Statement of Assets and Liabilities upon receipt or payment.
**Amounts relate to purchased option contracts and purchased swaption contracts.
The effect of derivative instruments on the Consolidated Statement of Operations is as follows:
| | | | | | | | | | | | | | | | | | | | | | | | | | | | |
| Amount of Realized Gain or (Loss) Recognized on Derivatives | |
| |
Derivatives Not Accounted for as Hedging
Instruments | | Investment
from
unaffiliated
companies
(including
premiums on
options and
swaptions
exercised)* | | | Closing and
expiration of
swaption
contracts
written | | | Closing and
expiration
of option
contracts
written | | | Closing and
expiration
of futures
contracts | | | Foreign
currency
transactions | | | Swap
contracts | | | Total | |
| |
Credit contracts | | $ | 65,114 | | | $ | 239,020 | | | $ | — | | | $ | — | | | $ | — | | | $ | 908,171 | | | $ | 1,212,305 | |
Equity contracts | | | 1,327,165 | | | | — | | | | — | | | | — | | | | — | | | | — | | | | 1,327,165 | |
Forward currency exchange contracts | | | 7,440,644 | | | | 59,473 | | | | 185,313 | | | | — | | | | 34,677,318 | | | | (1,345,511) | | | | 41,017,237 | |
Interest rate contracts | | | (1,787,464) | | | | 118,500 | | | | — | | | | 880,509 | | | | — | | | | (1,308,649) | | | | (2,097,104) | |
| | | | |
Total | | $ | 7,045,459 | | | $ | 416,993 | | | $ | 185,313 | | | $ | 880,509 | | | $ | 34,677,318 | | | $ | (1,745,989) | | | $ | 41,459,603 | |
| | | | |
*Includes purchased option contracts, purchased swaption contracts, written option contracts exercised and written swaption contracts exercised, if any.
54 OPPENHEIMER GLOBAL STRATEGIC INCOME FUND/VA
5. Risk Exposures and the Use of Derivative Instruments (Continued)
| | | | | | | | | | | | | | | | | | | | | | | | | | | | |
| Amount of Change in Unrealized Gain or (Loss) Recognized on Derivatives | |
| |
Derivatives Not Accounted for as
Hedging Instruments | | Investments* | | | Option
contracts
written | | | Swaption
contracts
written | | | Futures
contracts | | | Translation of
assets and
liabilities
denominated in
foreign
currencies | | | Swap
contracts | | | Total | |
| |
| Credit contracts | | $ | (34,395) | | | $ | — | | | $ | (75,879) | | | $ | — | | | $ | — | | | $ | (1,692,109) | | | $ | (1,802,383) | |
| Equity contracts | | | (331,856) | | | | (428,948) | | | | — | | | | — | | | | — | | | | — | | | | (760,804) | |
| Forward currency exchange contracts | | | (903,569) | | | | (119,381) | | | | — | | | | — | | | | (17,849,185) | | | | (782,898) | | | | (19,655,033) | |
| Interest rate contracts | | | 859,319 | | | | (42,883) | | | | 1,443,573 | | | | (1,680,984) | | | | — | | | | 219,998 | | | | 799,023 | |
| | | | |
Total | | $ | (410,501) | | | $ | (591,212) | | | $ | 1,367,694 | | | $ | (1,680,984) | | | $ | (17,849,185) | | | $ | (2,255,009) | | | $ | (21,419,197) | |
| | | | |
*Includes purchased option contracts and purchased swaption contracts, if any.
6. Shares of Beneficial Interest
The Fund has authorized an unlimited number of $0.001 par value shares of beneficial interest of each class. Transactions in shares of beneficial interest were as follows:
| | | | | | | | | | | | | | | | |
| | | Six Months Ended June 30, 2015 | | | Year Ended December 31, 2014 | |
| | | Shares | | | Amount | | | Shares | | | Amount | |
| |
Non-Service Shares | | | | | | | | | | | | | | | | |
Sold | | | 2,136,760 | | | $ | 11,454,890 | | | | 9,006,106 | | | $ | 48,748,110 | |
Dividends and/or distributions reinvested | | | 5,825,930 | | | | 29,479,205 | | | | 5,850,421 | | | | 31,299,751 | |
Redeemed | | | (24,456,276) | | | | (130,033,465) | | | | (41,379,216) | | | | (222,681,939) | |
| | | | |
Net decrease | | | (16,493,586) | | | $ | (89,099,370) | | | | (26,522,689) | | | $ | (142,634,078) | |
| | | | |
|
| |
Service Shares | | | | | | | | | | | | | | | | |
Sold | | | 5,910,152 | | | $ | 32,478,345 | | | | 11,185,648 | | | $ | 61,790,733 | |
Dividends and/or distributions reinvested | | | 15,712,417 | | | | 81,704,570 | | | | 11,624,671 | | | | 63,703,194 | |
Redeemed | | | (17,764,108) | | | | (97,491,389) | | | | (48,724,577) | | | | (270,038,823) | |
| | | | |
Net increase (decrease) | | | 3,858,461 | | | $ | 16,691,526 | | | | (25,914,258) | | | $ | (144,544,896) | |
| | | | |
7. Purchases and Sales of Securities
The aggregate cost of purchases and proceeds from sales of securities, other than short-term obligations and investments in IMMF, for the six months ended June 30, 2015 were as follows:
| | | | | | | | | | |
| | | Purchases | | | | | Sales | |
| |
Investment securities | | | $867,783,226 | | | | | | $877,650,198 | |
U.S. government and government agency obligations | | | 7,287,279 | | | | | | 9,214,322 | |
To Be Announced (TBA) mortgage-related securities | | | 669,325,753 | | | | | | 714,911,810 | |
8. Fees and Other Transactions with Affiliates
Management Fees. Under the investment advisory agreement, the Fund pays the Manager a management fee based on the daily net assets of the Fund at an annual rate as shown in the following table:
| | | | |
Fee Schedule | |
Up to $200 million | | | 0.75% | |
Next $200 million | | | 0.72 | |
Next $200 million | | | 0.69 | |
Next $200 million | | | 0.66 | |
Next $200 million | | | 0.60 | |
Next $4 billion | | | 0.50 | |
Over $5 billion | | | 0.48 | |
The Manager also provides investment management related services to the Subsidiary. The Subsidiary pays the Manager a monthly management fee at an annual rate according to the above schedule. The Subsidiary also pays certain other expenses including custody and directors’ fees.
The Fund’s effective management fee for the six months ended June 30, 2015 was 0.59% of average annual net assets before any Subsidiary management fees or any applicable waivers.
Sub-Adviser Fees. The Manager has retained the Sub-Adviser to provide the day-to-day portfolio management of the Fund. Under the Sub-Advisory Agreement, the Manager pays the Sub-Adviser an annual fee in monthly installments, equal to a percentage of the investment management fee collected by the Manager from the Fund, which shall be calculated after any investment management fee waivers. The fee paid to the Sub-Adviser is paid by the Manager, not by the Fund.
55 OPPENHEIMER GLOBAL STRATEGIC INCOME FUND/VA
NOTES TO CONSOLIDATED FINANCIAL STATEMENTS Unaudited / Continued
8. Fees and Other Transactions with Affiliates (Continued)
Transfer Agent Fees. OFI Global (the “Transfer Agent”) serves as the transfer and shareholder servicing agent for the Fund. The Fund pays the Transfer Agent a fee based on annual net assets. Fees incurred and average net assets for each class with respect to these services are detailed in the Consolidated Statement of Operations and Consolidated Financial Highlights, respectively.
Sub-Transfer Agent Fees. The Transfer Agent has retained Shareholder Services, Inc., a wholly-owned subsidiary of OFI (the “Sub-Transfer Agent”), to provide the day-to-day transfer agent and shareholder servicing of the Fund. Under the Sub-Transfer Agency Agreement, the Transfer Agent pays the Sub-Transfer Agent an annual fee in monthly installments, equal to a percentage of the transfer agent fee collected by the Transfer Agent from the Fund, which shall be calculated after any applicable fee waivers. The fee paid to the Sub-Transfer Agent is paid by the Transfer Agent, not by the Fund.
Trustees’ Compensation. The Fund’s Board of Trustees (“Board”) has adopted a compensation deferral plan for Independent Trustees that enables Trustees to elect to defer receipt of all or a portion of the annual compensation they are entitled to receive from the Fund. For purposes of determining the amount owed to the Trustee under the plan, deferred amounts are treated as though equal dollar amounts had been invested in shares of the Fund or in other Oppenheimer funds selected by the Trustee. The Fund purchases shares of the funds selected for deferral by the Trustee in amounts equal to his or her deemed investment, resulting in a Fund asset equal to the deferred compensation liability. Such assets are included as a component of “Other” within the asset section of the Consolidated Statement of Assets and Liabilities. Deferral of Trustees’ fees under the plan will not affect the net assets of the Fund and will not materially affect the Fund’s assets, liabilities or net investment income per share. Amounts will be deferred until distributed in accordance with the compensation deferral plan.
Distribution and Service Plan for Service Shares. The Fund has adopted a Distribution and Service Plan (the “Plan”) pursuant to Rule 12b-1 under the 1940 Act for Service shares to pay OppenheimerFunds Distributor, Inc. (the “Distributor”), for distribution related services, personal service and account maintenance for the Fund’s Service shares. Under the Plan, payments are made periodically at an annual rate of 0.25% of the daily net assets of Service shares of the Fund. The Distributor currently uses all of those fees to compensate sponsors of the insurance product that offers Fund shares, for providing personal service and maintenance of accounts of their variable contract owners that hold Service shares. These fees are paid out of the Fund’s assets on an on-going basis and increase operating expenses of the Service shares, which results in lower performance compared to the Fund’s shares that are not subject to a service fee. Fees incurred by the Fund under the Plan are detailed in the Consolidated Statement of Operations.
Waivers and Reimbursements of Expenses. The Manager has voluntarily agreed to waive fees and/or reimburse expenses to limit the Fund’s “Expenses after payments, waivers and/or reimbursements and reduction to custodian expenses” (excluding any applicable dividend expense, taxes, interest and fees from borrowing, any subsidiary expenses, Acquired Fund Fees and Expenses, brokerage commissions, extraordinary expenses and certain other Fund expenses) so that, as percentages of average daily net assets, those expenses will not exceed the annual rate of 0.75% for Non-Service shares and 1.00% for Service Shares.
The Manager has contractually agreed to waive the management fee it receives from the Fund in an amount equal to the management fee it receives from the Subsidiary. During the six months ended June 30, 2015, the Manager waived $4,981.
The Manager will waive fees and/or reimburse Fund expenses in an amount equal to the indirect management fees incurred through the Fund’s investments in underlying funds managed by the Manager or its affiliates. During the six months ended June 30, 2015, the Manager waived fees and/or reimbursed the Fund $343,518 for management fees.
Waivers and/or reimbursements may be modified or terminated as set forth according to the terms in the prospectus.
9. Pending Litigation
In 2009, several lawsuits were filed as putative class actions and later consolidated before the U.S. District Court for the District of Colorado in connection with the investment performance of Oppenheimer Rochester California Municipal Fund (the “California Fund Suit”), a fund advised by OppenheimerFunds, Inc. (“OFI”), and distributed by its subsidiary OppenheimerFunds Distributor, Inc. ( “OFDI”). The plaintiffs asserted claims against OFI, OFDI and certain present and former trustees and officers of the Fund under the federal securities laws, alleging, among other things, that the disclosure documents of the Fund contained misrepresentations and omissions and the investment policies of the Fund were not followed. Plaintiffs in the California Fund Suit filed an amended complaint and defendants filed a motion to dismiss. In 2011, the court issued an order which granted in part and denied in part the defendants’ motion to dismiss. In 2012, plaintiffs filed a motion, which defendants opposed, to certify a class and appoint class representatives and class counsel. In March 2015, the court granted plaintiffs’ motion for class certification. In May 2015, the U.S. Court of Appeals for the Tenth Circuit vacated the class certification order and remanded the matter to the district court for further proceedings. In July 2015, the district court held an evidentiary hearing on plaintiffs’ motion for class certification. OFI and OFDI believe the California Fund Suit is without merit; that it is premature to render any opinion as to the likelihood of an outcome unfavorable to them in the California Fund Suit; and that no estimate can yet be made as to the amount or range of any potential loss.
56 OPPENHEIMER GLOBAL STRATEGIC INCOME FUND/VA
PORTFOLIO PROXY VOTING POLICIES AND PROCEDURES; UPDATES TO STATEMENTS OF INVESTMENTS Unaudited
The Fund has adopted Portfolio Proxy Voting Policies and Procedures under which the Fund votes proxies relating to securities (“portfolio proxies”) held by the Fund. A description of the Fund’s Portfolio Proxy Voting Policies and Procedures is available (i) without charge, upon request, by calling the Fund toll-free at 1.800.525.7048, (ii) on the Fund’s website at www.oppenheimerfunds.com, and (iii) on the SEC’s website at www.sec.gov. In addition, the Fund is required to file Form N-PX, with its complete proxy voting record for the 12 months ended June 30th, no later than August 31st of each year. The Fund’s voting record is available (i) without charge, upon request, by calling the Fund toll-free at 1.800.525.7048, and (ii) in the Form N-PX filing on the SEC’s website at www.sec.gov.
The Fund files its complete schedule of portfolio holdings with the SEC for the first quarter and the third quarter of each fiscal year on Form N-Q. The Fund’s Form N-Q filings are available on the SEC’s website at www.sec.gov. Those forms may be reviewed and copied at the SEC’s Public Reference Room in Washington, D.C. Information on the operation of the Public Reference Room may be obtained by calling 1-800-SEC-0330.
57 OPPENHEIMER GLOBAL STRATEGIC INCOME FUND/VA
DISTRIBUTION SOURCES Unaudited
For any distribution that took place over the Fund’s reporting period, the table below details on a per-share basis the percentage of the Fund’s total distribution payment amount that was derived from the following sources: net income, net profit from the sale of securities, and other capital sources. This information is based upon income and capital gains using generally accepted accounting principles as of the date of each distribution. Because the Fund is actively managed, the relative amount of the Fund’s total distributions derived from various sources over the calendar year may change. Please note that this information should not be used for tax reporting purposes as the tax character of distributable income may differ from the amounts used for this notification. You will receive IRS tax forms in the first quarter of each calendar year detailing the actual amount of the taxable and non-taxable portion of distributions paid to you during the tax year.
For the most current information, please go to oppenheimerfunds.com. Select your Fund, then the ’Detailed’ tab; where ‘Dividends’ are shown, the Fund’s latest pay date will be followed by the sources of any distribution, updated daily.
| | | | | | | | | | | | | | | | |
| Fund Name | | Pay Date | | | Net Income | | | Net Profit
from Sale | | | Other Capital
Sources | |
| |
Oppenheimer Global Strategic Income Fund/VA | | | 6/16/15 | | | | 88.2% | | | | 0.0% | | | | 11.8% | |
58 OPPENHEIMER GLOBAL STRATEGIC INCOME FUND/VA
THIS PAGE INTENTIONALLY LEFT BLANK.
59 OPPENHEIMER GLOBAL STRATEGIC INCOME FUND/VA
OPPENHEIMER GLOBAL STRATEGIC INCOME FUND/VA
A Series of Oppenheimer Variable Account Funds
| | |
| Trustees and Officers | | Sam Freedman, Chairman of the Board of Trustees and Trustee |
| | Jon S. Fossel, Trustee |
| | Richard F. Grabish, Trustee |
| | Beverly L. Hamilton, Trustee |
| | Victoria J. Herget, Trustee |
| | Robert J. Malone, Trustee |
| | F. William Marshall, Jr., Trustee |
| | Karen L. Stuckey, Trustee |
| | James D. Vaughn, Trustee |
| | Arthur P. Steinmetz, Trustee, President and Principal Executive Officer |
| | Krishna Memani, Vice President |
| | Michael A. Mata, Vice President |
| | Hemant Baijal, Vice President |
| | Arthur S. Gabinet, Secretary and Chief Legal Officer |
| | Jennifer Sexton, Vice President and Chief Business Officer |
| | Mary Ann Picciotto, Chief Compliance Officer and Chief Anti-Money Laundering Officer |
| | Brian W. Wixted, Treasurer and Principal Financial & Accounting Officer |
| |
| Manager | | OFI Global Asset Management, Inc. |
| |
| Sub-Adviser | | OppenheimerFunds, Inc. |
| |
| Distributor | | OppenheimerFunds Distributor, Inc. |
| |
| Transfer and Shareholder Servicing Agent | | OFI Global Asset Management, Inc. |
| |
| Sub-Transfer Agent | | Shareholder Services, Inc. |
| | DBA OppenheimerFunds Services |
| |
| Independent Registered Public Accounting Firm | | KPMG LLP |
| |
| Legal Counsel | | Ropes & Gray LLP |
| |
| | Before investing in any of the Oppenheimer funds, investors should carefully consider a fund’s investment objectives, risks, charges and expenses. Fund prospectuses and summary prospectuses contain this and other information about the funds and may be obtained by asking your financial advisor, visiting oppenheimerfunds.com or calling us at 1.800.988.8287. Read prospectuses and summary prospectuses, carefully before investing. |
| |
| | The financial statements included herein have been taken from the records of the Fund without examination of those records by the independent auditors. |
| |
| | © 2015 OppenheimerFunds, Inc. All rights reserved. Oppenheimer funds are distributed by OppenheimerFunds Distributor, Inc. |

PORTFOLIO MANAGER: Michael Levine, CFA
AVERAGE ANNUAL TOTAL RETURNS FOR THE PERIODS ENDED 6/30/15
| | | | | | | | | | | | | | | | | | | | |
| | | Inception
Date | | | 6-Months | | | 1-Year | | | 5-Year | | | 10-Year | |
Non-Service Shares | | | 1/2/03 | | | | 0.28 | % | | | 2.75 | % | | | 15.95 | % | | | 8.11 | % |
Service Shares | | | 9/18/06 | | | | 0.18 | | | | 2.46 | | | | 14.04 | | | | 5.09 | * |
Russell 1000 Value Index | | | | | | | -0.61 | | | | 4.13 | | | | 16.50 | | | | 7.05 | |
*Shows performance since inception.
Performance data quoted represents past performance, which does not guarantee future results. The investment return and principal value of an investment in the Fund will fluctuate so that an investor’s shares, when redeemed, may be worth more or less than their original cost. Current performance may be lower or higher than the performance quoted. For performance data current to the most recent month end, call us at 1.800.988.8287. The Fund’s total returns should not be expected to be the same as the returns of other funds, whether or not both funds have the same portfolio managers and/or similar names. The Fund’s total returns include changes in share price and reinvested distributions but do not include the charges associated with the separate account products that offer this Fund. Such performance would have been lower if such charges were taken into account.
The Fund’s performance is compared to the performance of the Russell 1000 Value Index. The Russell 1000 Value Index measures the performance of the large-cap value segment of the U.S. equity universe. It includes those Russell 1000 companies with lower price-to-book ratios and lower expected growth values. The Index is unmanaged and cannot be purchased directly by investors. While index comparisons may be useful to provide a benchmark for the Fund’s performance, it must be noted that the Fund’s investments are not limited to the investments comprising the Index. Index performance includes reinvestment of income, but does not reflect transaction costs, fees, expenses or taxes. Index performance is shown for illustrative purposes only as a benchmark for the Fund’s performance, and does not predict or depict performance of the Fund. The Fund’s performance reflects the effects of the Fund’s business and operating expenses.
TOP HOLDINGS AND ALLOCATIONS
TOP TEN COMMON STOCK HOLDINGS
| | | | | | |
Citigroup, Inc. | | | 5.1 | % | | |
JPMorgan Chase & Co. | | | 4.8 | | | |
MetLife, Inc. | | | 2.6 | | | |
Ford Motor Co. | | | 2.4 | | | |
General Motors Co. | | | 2.4 | | | |
Assured Guaranty Ltd. | | | 2.3 | | | |
Kinder Morgan, Inc. | | | 2.2 | | | |
Apple, Inc. | | | 2.1 | | | |
Pfizer, Inc. | | | 2.1 | | | |
Merck & Co., Inc. | | | 2.0 | | | |
Portfolio holdings and allocations are subject to change. Percentages are as of June 30, 2015, and are based on net assets. For more current Fund holdings, please visit oppenheimerfunds.com.
SECTOR ALLOCATION
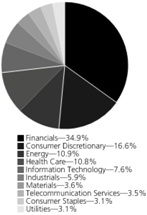
Portfolio holdings and allocations are subject to change. Percentages are as of June 30, 2015, and are based on the total market value of common stocks.
2 OPPENHEIMER EQUITY INCOME FUND/VA
Fund Performance Discussion
The Fund’s Non-Service shares produced a return of 0.28% during the reporting period, outperforming the Russell 1000 Value Index (the “Index”), which returned -0.61%. The Fund’s outperformance relative to the Index stemmed from stock selection in the consumer discretionary and consumer staples sectors, along with an underweight position in the utilities sector. The Fund underperformed in the health care sector due to less favorable stock selection and an underweight position. Weaker relative stock selection in the industrials and telecommunication services sectors also detracted from the Fund’s performance versus the Index.
GLOBAL MARKET AND ECONOMIC ENVIRONMENT
Equity markets were volatile during the six-month reporting period. After U.S. equities outperformed other developed and emerging market equities in 2014, the market environment shifted over the first half of 2015. The dollar continued to strengthen, which acted as a drag on growth. Businesses, especially U.S. firms with revenues dependent on exporting goods and services, cited this as a headwind. European Central Bank (“ECB”) President Mario Draghi announced the purchase of €60 billion a month in sovereign bonds from Eurozone countries for at least 19 months, a form of quantitative easing (“QE”) that is projected to increase the ECB’s balance sheet by over €1 trillion. The announcement and implementation of these extraordinary monetary policies had a significant impact on financial markets. European markets rallied and the euro fell against the currencies of most major trading partners. This resulted in European and emerging market equities outperforming U.S. equities over the first half of the period.
Over the second half of the reporting period, fallout from the collapse of oil prices, weak overseas economies and a strong U.S. dollar weighed on U.S. Gross Domestic Product (“GDP”) and corporate profit forecasts. In a repeat of last year, first quarter GDP growth was negative (-0.2%). Meanwhile, the Federal Reserve continued to forewarn a shift in monetary policy to higher interest rates later this year. Outside of the U.S., concerns around Greece’s debt situation emerged yet again late this reporting period. The markets had hoped for an 11th hour resolution to the stand-off between Greece and its creditors, but instead got an escalation of the crisis after the Greek Prime Minister called for a referendum. In the minds of many, this increased the odds of a Greek exit from the Eurozone (“Grexit”) and impacted the markets through the end of the reporting period. Shortly after the period ended, Eurozone leaders agreed to offer Greece a third bailout, averting a Grexit for the time being.
TOP INDIVIDUAL CONTRIBUTORS
Top contributors to the Fund’s performance this reporting period included Apple, Inc., JPMorgan Chase & Co. and Williams Cos, Inc. Apple continued to perform well with the continued success of the iPhone 6, excitement surrounding the introduction of the new iWatch, and an increased dividend and buyback program resulted in strong relative performance. While we continue to like the risk/reward profile of Apple, we did reduce our exposure to the stock during the reporting period. Nevertheless, Apple remains a top ten holding in the portfolio and we continue to like the stock as a result of its low earnings multiple, strong balance sheet, current attractive dividend yield, large share buyback and promising slate of new product opportunities. JPMorgan Chase performed well during the reporting period due primarily to rising interest rates. Higher rates should lead to expanding net interest margins for the company. Additionally, the Federal Reserve Board’s Comprehensive Capital Analysis and Review (CCAR) results were released late in the first quarter, which allowed the company to increase its dividends and continue to buy back stock. Williams is an energy infrastructure company that rallied after it launched a strategic review process to consider a restructuring that could eventually lead to a sale. Shares rallied on the news.
TOP INDIVIDUAL DETRACTORS
Top detractors from performance this reporting period included Micron Technology Inc., Navistar International Corp., and MBIA, Inc. Micron Technology is a leading manufacturer of memory (DRAM and NAND) for the technology industry. Historically, the memory business has been characterized by commodity pricing and boom/bust cycles. We believe that industry consolidation has fundamentally changed the dynamics of the memory market. In our opinion, the dominant three players should be able to limit capacity growth to better match demand and ultimately lead to better pricing. Rational capacity growth combined with steady increases in demand has resulted in better profitability in the memory market. Most of our position in Micron is in its 3% convertible bond, which we believe has an attractive risk/reward profile. Navistar is a heavy truck manufacturer that has been dealing with a relatively soft demand environment. Navistar’s new management has undertaken an extensive restructuring program that has resulted in a lower cost structure. In our opinion, the lower cost structure combined with competitive new products has the potential to ultimately lead to better results. MBIA, Inc. insures municipal bonds and other structured products. Concerns that Puerto Rico would need to restructure much of its debt caused MBIA to decline sharply towards the end of the period. While the Puerto Rico situation is complex and there are many alarming headlines, the reality is that MBIA has significant legal protections, its obligations are spread out over many
3 OPPENHEIMER EQUITY INCOME FUND/VA
years and Puerto Rico still has options to address its obligations which may result in minimal, if any, losses to MBIA. We continue to believe that MBIA will be a solid investment over time.
STRATEGY & OUTLOOK
While volatility has increased during the last few weeks of the period due to the saga surrounding Greece and a sharp downdraft in the local Chinese market, we continue to believe that the markets are positioned to appreciate during the remainder of 2015. The U.S. economy continues to gain momentum, and while interest rates have risen, they remain at historically low levels. Continued easy monetary policy across the globe, strong corporate balance sheets, an improving job market and a strengthening housing market should drive decent economic growth in the U.S. Furthermore, the decline in oil prices continues to be positive for the U.S. consumer. While the strong U.S. dollar will impact corporate earnings, outside of the commodity sectors, we continue to expect improving earnings and we believe dividends should continue to increase in-line with earnings. While interest rates have remained lower for longer than we expected, we continue to believe that interest rates will ultimately move higher, which are likely to result in flat to negative returns for most fixed income asset classes and make equities more appealing.
The Fund’s investment strategy and focus can change over time. The mention of specific fund holdings does not constitute a recommendation by OppenheimerFunds, Inc. or its affiliates.
Shares of Oppenheimer funds are not deposits or obligations of any bank, are not guaranteed by any bank, are not insured by the FDIC or any other agency, and involve investment risks, including the possible loss of the principal amount invested.
4 OPPENHEIMER EQUITY INCOME FUND/VA
Fund Expenses
Fund Expenses. As a shareholder of the Fund, you incur two types of costs: (1) transaction costs and (2) ongoing costs, including management fees; distribution and service fees; and other Fund expenses. These examples are intended to help you understand your ongoing costs (in dollars) of investing in the Fund and to compare these costs with the ongoing costs of investing in other mutual funds.
The examples are based on an investment of $1,000.00 invested at the beginning of the period and held for the entire 6-month period ended June 30, 2015.
Actual Expenses. The first section of the table provides information about actual account values and actual expenses. You may use the information in this section for the class of shares you hold, together with the amount you invested, to estimate the expense that you paid over the period. Simply divide your account value by $1,000.00 (for example, an $8,600.00 account value divided by $1,000.00 = 8.60), then multiply the result by the number in the first section under the heading entitled “Expenses Paid During the 6 Months Ended June 30, 2015” to estimate the expenses you paid on your account during this period.
Hypothetical Example for Comparison Purposes.
The second section of the table provides information about hypothetical account values and hypothetical expenses based on the Fund’s actual expense ratio for each class of shares, and an assumed rate of return of 5% per year for each class before expenses, which is not the actual return. The hypothetical account values and expenses may not be used to estimate the actual ending account balance or expenses you paid for the period. You may use this information to compare the ongoing costs of investing in the Fund and other funds. To do so, compare this 5% hypothetical example for the class of shares you hold with the 5% hypothetical examples that appear in the shareholder reports of the other funds.
Please note that the expenses shown in the table are meant to highlight your ongoing costs only and do not reflect any charges associated with the separate accounts that offer this Fund. Therefore, the “hypothetical” lines of the table are useful in comparing ongoing costs only, and will not help you determine the relative total costs of owning different funds. In addition, if these separate account charges were included your costs would have been higher.
| | | | | | | | | | | | | | | | | | |
| Actual | | Beginning
Account
Value
January 1, 2015 | | Ending
Account
Value
June 30, 2015 | | Expenses
Paid During
6 Months Ended
June 30, 2015 |
Non-Service shares | | $ | 1,000.00 | | | | | $ | 1,002.80 | | | | | $ | 3.98 | | | |
Service shares | | | 1,000.00 | | | | | | 1,001.80 | | | | | | 5.23 | | | |
| | | | | | |
| Hypothetical | | | | | | | | | | | | | | | | | | |
(5% return before expenses) | | | | | | | | | | | | | | | | | | |
Non-Service shares | | | 1,000.00 | | | | | | 1,020.83 | | | | | | 4.02 | | | |
Service shares | | | 1,000.00 | | | | | | 1,019.59 | | | | | | 5.27 | | | |
Expenses are equal to the Fund’s annualized expense ratio for that class, multiplied by the average account value over the period, multiplied by 181/365 (to reflect the one-half year period). Those annualized expense ratios, excluding indirect expenses from affiliated funds, based on the 6-month period ended June 30, 2015 are as follows:
| | | | | | |
| Class | | Expense Ratios | | | |
Non-Service shares | | | 0.80 | % | | |
Service shares | | | 1.05 | | | |
The expense ratios reflect voluntary waivers and/or reimbursements of expenses by the Fund’s Manager. Some of these undertakings may be modified or terminated at any time, as indicated in the Fund’s prospectus. The “Financial Highlights” tables in the Fund’s financial statements, included in this report, also show the gross expense ratios, without such waivers or reimbursements and reduction to custodian expenses, if applicable.
5 OPPENHEIMER EQUITY INCOME FUND/VA
| | |
| |
| STATEMENT OF INVESTMENTS June 30, 2015 Unaudited | | |
| | | | | | | | |
| | | Shares | | | Value | |
Common Stocks—81.6% | |
Consumer Discretionary—13.6% | |
Auto Components—1.7% | |
Lear Corp. | | | 1,715 | | | $ | 192,526 | |
| | |
| | | | | | | | | |
Automobiles—4.9% | |
Ford Motor Co.1 | | | 18,275 | | | | 274,308 | |
General Motors Co. | | | 8,125 | | | | 270,806 | |
| | | | | | | 545,114 | |
| | |
| | | | | | | | | |
Hotels, Restaurants & Leisure—0.1% | |
Las Vegas Sands Corp. | | | 275 | | | | 14,457 | |
| | |
| | | | | | | | | |
Household Durables—2.2% | | | | | | | | |
Beazer Homes USA, Inc.2 | | | 1,215 | | | | 24,239 | |
MDC Holdings, Inc. | | | 4,655 | | | | 139,510 | |
PulteGroup, Inc. | | | 325 | | | | 6,549 | |
Standard Pacific Corp.2 | | | 8,465 | | | | 75,423 | |
| | | | | | | 245,721 | |
| | |
| | | | | | | | | |
Media—1.6% | | | | | | | | |
DIRECTV2 | | | 1,410 | | | | 130,834 | |
Time Warner Cable, Inc. | | | 225 | | | | 40,088 | |
Viacom, Inc., Cl. B | | | 65 | | | | 4,202 | |
| | | | | | | 175,124 | |
| | |
| | | | | | | | | |
Multiline Retail—0.9% | |
Kohl’s Corp. | | | 1,635 | | | | 102,367 | |
| | |
| | | | | | | | | |
Specialty Retail—2.2% | | | | | | | | |
Best Buy Co., Inc. | | | 6,500 | | | | 211,965 | |
Foot Locker, Inc. | | | 250 | | | | 16,753 | |
Staples, Inc. | | | 875 | | | | 13,396 | |
| | | | | | | 242,114 | |
| | |
| | | | | | | | | |
Consumer Staples—2.5% | | | | | | | | |
Beverages—0.6% | | | | | | | | |
Molson Coors Brewing Co., Cl. B | | | 770 | | | | 53,753 | |
PepsiCo, Inc. | | | 170 | | | | 15,868 | |
| | | | | | | 69,621 | |
| | |
| | | | | | | | | |
Food & Staples Retailing—0.6% | |
Wal-Mart Stores, Inc. | | | 995 | | | | 70,575 | |
| | |
| | | | | | | | | |
Food Products—0.4% | |
Kraft Foods Group, Inc. | | | 110 | | | | 9,366 | |
Pinnacle Foods, Inc. | | | 745 | | | | 33,927 | |
| | | | | | | 43,293 | |
| | |
| | | | | | | | | |
Household Products—0.1% | |
Procter & Gamble Co. (The) | | | 170 | | | | 13,301 | |
| | |
| | | | | | | | | |
Tobacco—0.8% | |
Philip Morris International, Inc. | | | 1,065 | | | | 85,381 | |
| | |
| | | | | | | | | |
Energy—8.9% | | | | | | | | |
Energy Equipment & Services—0.2% | | | | | | | | |
Ensco plc, Cl. A | | | 935 | | | | 20,823 | |
| | |
| | | | | | | | | |
Oil, Gas & Consumable Fuels—8.7% | | | | | | | | |
BP plc, Sponsored ADR | | | 2,725 | | | | 108,891 | |
Chevron Corp. | | | 1,275 | | | | 122,999 | |
Exxon Mobil Corp. | | | 1,070 | | | | 89,024 | |
Kinder Morgan, Inc. | | | 6,470 | | | | 248,383 | |
Marathon Oil Corp. | | | 2,435 | | | | 64,625 | |
Royal Dutch Shell plc, Cl. A, Sponsored ADR | | | 2,910 | | | | 165,899 | |
Williams Cos., Inc. (The) | | | 3,035 | | | | 174,179 | |
| | | | | | | 974,000 | |
| | |
| | | | | | | | | |
Financials—28.5% | | | | | | | | |
Capital Markets—4.2% | | | | | | | | |
Goldman Sachs Group, Inc. (The) | | | 980 | | | | 204,614 | |
KKR & Co. LP3 | | | 5,265 | | | | 120,306 | |
| | | | | | | | | | |
| | | | | Shares | | | Value | |
| | | Capital Markets (Continued) | |
| | | Morgan Stanley | | | 3,800 | | | $ | 147,402 | |
| | | | | | | | | | 472,322 | |
| | | | | | | | | | | |
| | | Commercial Banks—12.2% | |
| | | Bank of America Corp. | | | 3,800 | | | | 64,676 | |
| | | Citigroup, Inc.1 | | | 10,300 | | | | 568,972 | |
| | | JPMorgan Chase & Co. | | | 7,875 | | | | 533,610 | |
| | | Wells Fargo & Co. | | | 3,525 | | | | 198,246 | |
| | | | | | | | | | 1,365,504 | |
| | | | | | | | | | | |
| | | Insurance—7.1% | |
| | | American International Group, Inc. | | | 905 | | | | 55,947 | |
| | | Assured Guaranty Ltd. | | | 10,600 | | | | 254,294 | |
| | | Genworth Financial, Inc., Cl. A2 | | | 5,075 | | | | 38,418 | |
| | | MBIA, Inc.2 | | | 13,925 | | | | 83,689 | |
| | | MetLife, Inc. | | | 5,235 | | | | 293,108 | |
| | | XL Group plc, Cl. A | | | 1,825 | | | | 67,890 | |
| | | | | | | | | | 793,346 | |
| | | | | | | | | | | |
| | | Real Estate Investment Trusts (REITs)—4.7% | |
| | | Apollo Commercial Real Estate Finance, Inc. | | | 4,025 | | | | 66,131 | |
| | | Ashford Hospitality Trust, Inc. | | | 2,790 | | | | 23,603 | |
| | | Blackstone Mortgage Trust, Inc., Cl. A | | | 1,765 | | | | 49,102 | |
| | | Colony Capital, Inc., Cl. A | | | 4,835 | | | | 109,513 | |
| | | Communications Sales & Leasing, Inc. | | | 2,535 | | | | 62,665 | |
| | | iStar Financial, Inc.2 | | | 1,225 | | | | 16,317 | |
| | | NorthStar Realty Finance Corp. | | | 1,795 | | | | 28,540 | |
| | | Starwood Property Trust, Inc. | | | 5,450 | | | | 117,557 | |
| | | Two Harbors Investment Corp. | | | 5,650 | | | | 55,031 | |
| | | | | | | | | | 528,459 | |
| | | | | | | | | | | |
| | | Thrifts & Mortgage Finance—0.3% | |
| | | Radian Group, Inc. | | | 1,486 | | | | 27,877 | |
| | | | | | | | | | | |
| | | Health Care—8.8% | |
| | | Health Care Equipment & Supplies—1.1% | |
| | | Medtronic plc | | | 1,580 | | | | 117,078 | |
| | | | | | | | | | | |
| | | Pharmaceuticals—7.7% | |
| | | AbbVie, Inc. | | | 1,095 | | | | 73,573 | |
| | | GlaxoSmithKline plc, Sponsored ADR | | | 1,885 | | | | 78,510 | |
| | | Johnson & Johnson | | | 715 | | | | 69,684 | |
| | | Merck & Co., Inc. | | | 3,890 | | | | 221,458 | |
| | | Mylan NV2 | | | 145 | | | | 9,840 | |
| | | Pfizer, Inc.1 | | | 6,950 | | | | 233,033 | |
| | | Roche Holding AG, Sponsored ADR | | | 2,150 | | | | 75,401 | |
| | | Teva Pharmaceutical Industries Ltd., Sponsored ADR | | | 1,780 | | | | 105,198 | |
| | | | | | | | | | 866,697 | |
| | | | | | | | | | | |
| | | Industrials—4.8% | |
| | | Aerospace & Defense—0.3% | |
| | | Textron, Inc. | | | 675 | | | | 30,125 | |
| | | | | | | | | | | |
| | | Airlines—1.3% | |
| | | Delta Air Lines, Inc. | | | 95 | | | | 3,903 | |
| | | United Continental Holdings, Inc.2 | | | 2,705 | | | | 143,392 | |
| | | | | | | | | | 147,295 | |
| | | | | | | | | | | |
| | | Commercial Services & Supplies—0.8% | |
| | | R.R. Donnelley & Sons Co. | | | 5,345 | | | | 93,163 | |
| | | | | | | | | | | |
| | | Electrical Equipment—0.4% | |
| | | Eaton Corp. plc | | | 340 | | | | 22,947 | |
| | | General Cable Corp. | | | 1,350 | | | | 26,635 | |
| | | | | | | | | | 49,582 | |
| | | | | | | | | | | |
| | | Industrial Conglomerates—0.9% | |
| | | General Electric Co.1 | | | 3,850 | | | | 102,295 | |
| | | | | | | | | | | |
| | | Machinery—0.7% | |
| | | Navistar International Corp.2 | | | 3,475 | | | | 78,639 | |
6 OPPENHEIMER EQUITY INCOME FUND/VA
| | | | | | | | |
| | | Shares | | | Value | |
Marine—0.2% | |
Costamare, Inc. | | | 1,045 | | | $ | 19,197 | |
| | |
| | | | | | | | | |
Road & Rail—0.2% | |
CSX Corp. | | | 500 | | | | 16,325 | |
| | |
| | | | | | | | | |
Information Technology—6.2% | |
Communications Equipment—1.3% | |
Cisco Systems, Inc. | | | 3,000 | | | | 82,380 | |
QUALCOMM, Inc. | | | 1,000 | | | | 62,630 | |
| | | | | | | 145,010 | |
Internet Software & Services—0.5% | |
Google, Inc., Cl. C2 | | | 105 | | | | 54,653 | |
| | |
| | | | | | | | | |
Semiconductors & Semiconductor Equipment—0.4% | |
Intel Corp. | | | 175 | | | | 5,323 | |
Micron Technology, Inc.2 | | | 1,765 | | | | 33,252 | |
| | | | | | | 38,575 | |
Software—1.2% | |
Microsoft Corp.1 | | | 3,125 | | | | 137,969 | |
| | |
| | | | | | | | | |
Technology Hardware, Storage & Peripherals—2.8% | |
Apple, Inc. | | | 1,900 | | | | 238,308 | |
EMC Corp. | | | 1,285 | | | | 33,911 | |
Hewlett-Packard Co. | | | 625 | | | | 18,756 | |
Seagate Technology plc | | | 540 | | | | 25,650 | |
| | | | | | | 316,625 | |
Materials—2.9% | |
Chemicals—0.5% | |
LyondellBasell Industries NV, Cl. A | | | 545 | | | | 56,418 | |
| | |
| | | | | | | | | |
Containers & Packaging—0.1% | |
Packaging Corp. of America | | | 245 | | | | 15,310 | |
| | |
| | | | | | | | | |
Metals & Mining—0.7% | |
Allegheny Technologies, Inc. | | | 1,425 | | | | 43,035 | |
Freeport-McMoRan, Inc. | | | 2,155 | | | | 40,126 | |
| | | | | | | 83,161 | |
Paper & Forest Products—1.6% | |
Domtar Corp. | | | 2,605 | | | | 107,847 | |
International Paper Co. | | | 1,195 | | | | 56,870 | |
Louisiana-Pacific Corp.2 | | | 625 | | | | 10,644 | |
| | | | | | | 175,361 | |
Telecommunication Services—2.9% | |
Diversified Telecommunication Services—2.9% | |
AT&T, Inc. | | | 125 | | | | 4,440 | |
CenturyLink, Inc. | | | 4,250 | | | | 124,865 | |
Frontier Communications Corp. | | | 16,100 | | | | 79,695 | |
Verizon Communications, Inc. | | | 2,215 | | | | 103,241 | |
Windstream Holdings, Inc. | | | 2,035 | | | | 12,984 | |
| | | | | | | 325,225 | |
Utilities—2.5% | |
Electric Utilities—2.0% | |
American Electric Power Co., Inc. | | | 1,325 | | | | 70,185 | |
Edison International | | | 1,150 | | | | 63,917 | |
FirstEnergy Corp. | | | 490 | | | | 15,950 | |
PPL Corp. | | | 2,745 | | | | 80,895 | |
| | | | | | | 230,947 | |
Independent Power and Renewable Electricity Producers—0.5% | |
NRG Energy, Inc. | | | 2,090 | | | | 47,819 | |
Talen Energy Corp.2 | | | 370 | | | | 6,349 | |
| | | | | | | 54,168 | |
Total Common Stocks (Cost $8,188,192) | | | | | | | 9,135,743 | |
| | | | | | | | | | |
| | | | | Shares | | | Value | |
| | | Preferred Stocks—5.1% | |
| | | Alcoa, Inc., 5.375% Cv., Non-Vtg. | | | 435 | | | $ | 17,196 | |
| | | American Homes 4 Rent, 5% Cum., Series A, Non-Vtg. | | | 1,000 | | | | 25,150 | |
| | | American Homes 4 Rent, 5% Cum., Series B, Non-Vtg. | | | 1,300 | | | | 32,760 | |
| | | Beazer Homes USA, Inc., 7.50% Cv. | | | 2,240 | | | | 63,459 | |
| | | Dominion Resources, Inc., 6.375% Cv. | | | 400 | | | | 18,680 | |
| | | Exelon Corp., 6.50% Cv. | | | 950 | | | | 43,092 | |
| | | Frontier Communications Corp., Series A, 11.125% Cv., Non-Vtg.2 | | | 570 | | | | 56,943 | |
| | | iStar Financial, Inc., 4.50% Cv., Non-Vtg. | | | 1,930 | | | | 110,473 | |
| | | Post Holdings, Inc., 2.50% Cv.4 | | | 485 | | | | 51,077 | |
| | | Post Holdings, Inc., 5.25% Cv. | | | 1,015 | | | | 106,575 | |
| | | Southwestern Energy Co., 6.25% Cv., Non-Vtg. | | | 920 | | | | 45,420 | |
| | | Total Preferred Stocks (Cost $564,185) | | | | | | | 570,825 | |
| | | | | | | | | | | |
| | | | | Units | | | | |
| | | Rights, Warrants and Certificates—0.1% | |
| | | Kinder Morgan, Inc. Wts., Strike Price $40, Exp. 5/25/172 (Cost $18,343) | | | 4,925 | | | | 13,297 | |
| | | | | | | | | | | |
| | | | | Principal
Amount | | | | |
| | | Non-Convertible Corporate Bonds and Notes—0.6% | |
| | | J.C. Penney Corp., Inc.: | | | | | | | | |
| | | 5.65% Sr. Unsec. Nts., 6/1/20 | | $ | 39,000 | | | | 35,393 | |
| | | 5.75% Sr. Unsec. Nts., 2/15/18 | | | 3,000 | | | | 2,951 | |
| | | MBIA Insurance Corp., 11.535% Sub. Nts., 1/15/334,5 | | | 65,000 | | | | 31,850 | |
| | | Total Non-Convertible Corporate Bonds and Notes (Cost $82,515) | | | | | | | 70,194 | |
| | | | | | | | | | | |
| | | Convertible Corporate Bonds and Notes—8.8% | |
| | | General Cable Corp., 4.50% Cv. Unsec. Sub. Nts., 11/15/296 | | | 146,000 | | | | 121,727 | |
| | | iStar Financial, Inc., 3% Cv. Sr. Unsec. Nts., 11/15/16 | | | 60,100 | | | | 72,571 | |
| | | MGIC Investment Corp.: | | | | | | | | |
| | | 5.00% Cv. Sr. Unsec. Nts., 5/1/17 | | | 62,000 | | | | 71,494 | |
| | | 9.00% Cv. Jr. Sub. Nts., 4/1/634 | | | 205,000 | | | | 266,628 | |
| | | Micron Technology, Inc., 3% Cv. Sr. Unsec. Nts., 11/15/43 | | | 133,000 | | | | 120,781 | |
| | | Navistar International Corp.: | | | | | | | | |
| | | 4.50% Cv. Sr. Sub. Nts., 10/15/18 | | | 102,000 | | | | 87,465 | |
| | | 4.75% Cv. Sr. Sub. Nts., 4/15/19 | | | 119,000 | | | | 102,414 | |
| | | Peabody Energy Corp., 4.75% Cv. Jr. Sub. Nts., 12/15/41 | | | 95,000 | | | | 16,506 | |
| | | Radian Group, Inc., 2.25% Cv. Sr. Unsec. Nts., 3/1/191 | | | 67,500 | | | | 120,108 | |
| | | Total Convertible Corporate Bonds and Notes (Cost $1,026,678) | | | | | | | 979,694 | |
| | | | | | | | | | | |
| | | | | Shares | | | | |
| | | Structured Securities—3.1% | |
| | | Bank of America Corp., Standard Pacific Corp. Equity Linked Nts., 10/28/152,4 | | | 2,476 | | | | 21,525 | |
| | | Bank of America Merrill Lynch, American Axle & Manufacturing Holdings, Inc. Equity Linked Nts., 10/26/154 | | | 818 | | | | 17,477 | |
| | | Bank of America Merrill Lynch, Louisiana- Pacific Corp. Equity Linked Nts., 8/12/154 | | | 1,465 | | | | 25,206 | |
| | | Bank of America Merrill Lynch, Standard Pacific Corp. Equity Linked Nts., 8/31/154 | | | 2,874 | | | | 25,614 | |
| | | Barclays Bank plc, J.C. Penney Co., Inc. Yield Enhanced Equity Linked Debt Securities, 9/11/15 | | | 3,247 | | | | 26,954 | |
| | | Citigroup, Inc., Apple, Inc. Equity Linked Nts., 8/31/154 | | | 379 | | | | 48,488 | |
7 OPPENHEIMER EQUITY INCOME FUND/VA
| | |
| |
| STATEMENT OF INVESTMENTS Unaudited / Continued | | |
| | | | | | | | |
| | | Shares | | | Value | |
Structured Securities—3.1% | |
| Citigroup, Inc., J.C. Penney Co., Inc. Equity Linked Nts., 12/7/154 | | | 2,910 | | | $ | 24,766 | |
| Citigroup, Inc., J.C. Penney Co., Inc. Equity Linked Nts., 8/12/154 | | | 1,270 | | | | 10,896 | |
| Credit Suisse AG (New York Branch), MGIC Investment Corp. Equity Linked Nts., 9/4/15 | | | 2,688 | | | | 28,401 | |
| Credit Suisse AG (New York Branch), Radian Group, Inc. Equity Linked Nts., 8/20/15 | | | 1,593 | | | | 28,445 | |
| Deutsche Bank AG (London), Standard Pacific Corp. Equity Linked Nts., 12/18/154 | | | 2,819 | | | | 24,803 | |
| Goldman Sachs Group, Inc. (The), Louisiana-Pacific Corp. Equity Linked Nts., 8/20/154 | | | 1,468 | | | | 25,065 | |
| Morgan Stanley, Louisiana-Pacific Corp. Equity Linked Nts., 8/3/154 | | | 620 | | | | 10,668 | |
| Morgan Stanley, Standard Pacific Corp. Equity Linked Nts., 9/29/154 | | | 2,921 | | | | 25,833 | |
| Total Structured Securities (Cost $334,951) | | | | | | | 344,141 | |
| | | | | | | | | | | | | | | | |
| | | | | | | | | | | Shares | | | Value | |
| | | Investment Company—1.1% | |
| | | Oppenheimer Institutional Money Market Fund, Cl. E, 0.15%7,8 (Cost $122,706) | | | 122,706 | | | $ | 122,706 | |
| | | | | | | |
| | | | | | | Exercise
Price | | Expiration
Date | | Contracts | | | | |
| | | Exchange-Traded Options Purchased—0.0% | |
| | | Medtronic plc Put2 | | USD 70.000 | | 7/17/15 | | USD | 8 | | | | 192 | |
| | | Navistar International Corp. Call2 | | USD 35.000 | | 7/17/15 | | USD | 4 | | | | 60 | |
| | | Navistar International Corp. Put2 | | USD 25.000 | | 7/17/15 | | USD | 10 | | | | 2,575 | |
| | | Total Exchange-Traded Options Purchased (Cost $1,065) | | | | | | | 2,827 | |
| | | Total Investments, at Value (Cost $10,338,635) | | | 100.4 | % | | | 11,239,427 | |
| | | Net Other Assets (Liabilities) | | | (0.4 | ) | | | (41,506 | ) |
| | | | | | | | | | | | | |
| | | Net Assets | | | | | 100.0 | % | | $ | 11,197,921 | |
| | | | | | | | | | | | | |
Footnotes to Statement of Investments
1. All or a portion of the security position is held in segregated accounts and pledged to cover margin requirements with respect to outstanding written options. The aggregate market value of such securities is $216,050. See Note 5 of the accompanying Notes.
2. Non-income producing security.
3. Security is a Master Limited Partnership.
4. Represents securities sold under Rule 144A, which are exempt from registration under the Securities Act of 1933, as amended. These securities have been determined to be liquid under guidelines established by the Board of Trustees. These securities amount to $609,896 or 5.45% of the Fund’s net assets as of June 30, 2015.
5. This security is not accruing income because the issuer has missed an interest payment on it and/or is not anticipated to make future interest and or principal payments. The rate shown is the original contractual interest rate. See Note 4 of the accompanying Notes.
6. Represents the current interest rate for a variable or increasing rate security.
7. Rate shown is the 7-day yield as of June 30, 2015.
8. Is or was an affiliate, as defined in the Investment Company Act of 1940, as amended, at or during the period ended June 30, 2015, by virtue of the Fund owning at least 5% of the voting securities of the issuer or as a result of the Fund and the issuer having the same investment adviser. Transactions during the period in which the issuer was an affiliate are as follows:
| | | | | | | | | | | | | | | | |
| | | Shares
December 31, 2014 | | | Gross
Additions | | | Gross
Reductions | | | Shares
June 30, 2015 | |
Oppenheimer Institutional Money Market Fund, Cl. E | | | 96,193 | | | | 1,378,370 | | | | 1,351,857 | | | | 122,706 | |
| | | | |
| | | | | | | | | Value | | | Income | |
Oppenheimer Institutional Money Market Fund, Cl. E | | | | | | | | | | $ | 122,706 | | | $ | 41 | |
| | | | | | | | | | | | | | | | | | | | | | | | | | | | |
Exchange-Traded Options Written at June 30, 2015 | |
| Description | | | | | Exercise Price | | | Expiration Date | | | | | | Number of Contracts | | | Premiums Received | | | Value | |
American International Group, Inc. Call | | | USD | | | | 65.000 | | | | 7/17/15 | | | | USD | | | | (5 | ) | | $ | 347 | | | $ | (80 | ) |
Applied Materials, Inc. Put | | | USD | | | | 20.000 | | | | 7/17/15 | | | | USD | | | | (8 | ) | | | 504 | | | | (752 | ) |
Bank of America Corp. Call | | | USD | | | | 18.000 | | | | 7/17/15 | | | | USD | | | | (4 | ) | | | 80 | | | | (28 | ) |
Beazer Homes USA, Inc. Put | | | USD | | | | 18.000 | | | | 7/17/15 | | | | USD | | | | (4 | ) | | | 156 | | | | (30 | ) |
Best Buy Co., Inc. Put | | | USD | | | | 35.000 | | | | 8/21/15 | | | | USD | | | | (4 | ) | | | 708 | | | | (1,060 | ) |
CSX Corp. Call | | | USD | | | | 35.000 | | | | 7/17/15 | | | | USD | | | | (5 | ) | | | 651 | | | | (100 | ) |
Edison International Put | | | USD | | | | 60.000 | | | | 7/17/15 | | | | USD | | | | (4 | ) | | | 788 | | | | (1,784 | ) |
Frontier Communications Corp. Put | | | USD | | | | 5.000 | | | | 7/17/15 | | | | USD | | | | (10 | ) | | | 200 | | | | (150 | ) |
Frontier Communications Corp. Put | | | USD | | | | 5.000 | | | | 8/21/15 | | | | USD | | | | (15 | ) | | | 324 | | | | (405 | ) |
General Electric Co. Put | | | USD | | | | 27.000 | | | | 7/17/15 | | | | USD | | | | (4 | ) | | | 156 | | | | (288 | ) |
Genworth Financial, Inc. Put | | | USD | | | | 8.000 | | | | 7/17/15 | | | | USD | | | | (14 | ) | | | 543 | | | | (700 | ) |
J.C. Penney, Inc. Put | | | USD | | | | 9.000 | | | | 7/17/15 | | | | USD | | | | (4 | ) | | | 289 | | | | (240 | ) |
JPMorgan Chase & Co. Call | | | USD | | | | 70.000 | | | | 7/17/15 | | | | USD | | | | (4 | ) | | | 171 | | | | (144 | ) |
LyondellBasell Industries NV Call | | | USD | | | | 105.000 | | | | 7/17/15 | | | | USD | | | | (4 | ) | | | 828 | | | | (620 | ) |
Medtronic plc Put | | | USD | | | | 75.000 | | | | 7/17/15 | | | | USD | | | | (4 | ) | | | 554 | | | | (632 | ) |
Micron Technology, Inc. Put | | | USD | | | | 27.000 | | | | 7/17/15 | | | | USD | | | | (5 | ) | | | 715 | | | | (4,065 | ) |
Micron Technology, Inc. Put | | | USD | | | | 30.000 | | | | 7/17/15 | | | | USD | | | | (4 | ) | | | 1,308 | | | | (4,456 | ) |
Mylan NV Put | | | USD | | | | 72.500 | | | | 7/17/15 | | | | USD | | | | (4 | ) | | | 1,148 | | | | (2,230 | ) |
Navistar International Corp. Put | | | USD | | | | 29.000 | | | | 7/17/15 | | | | USD | | | | (10 | ) | | | 1,682 | | | | (6,500 | ) |
Staples, Inc. Put | | | USD | | | | 16.000 | | | | 7/17/15 | | | | USD | | | | (4 | ) | | | 126 | | | | (320 | ) |
Teva Pharmaceutical Industries Ltd. Put | | | USD | | | | 62.500 | | | | 7/17/15 | | | | USD | | | | (4 | ) | | | 1,098 | | | | (1,480 | ) |
United Continental Holdings, Inc. Put | | | USD | | | | 67.500 | | | | 9/18/15 | | | | USD | | | | (5 | ) | | | 6,960 | | | | (7,188 | ) |
United Continental Holdings, Inc. Put | | | USD | | | | 62.500 | | | | 9/18/15 | | | | USD | | | | (8 | ) | | | 7,895 | | | | (8,040 | ) |
| | | | | | | | | | | | | | | | | | | | | | | | |
Total Exchange-Traded Options Written | | | | | | | | | | | | | | | | | | | | | | $ | 27,231 | | | $ | (41,292 | ) |
| | | | | | | | | | | | | | | | | | | | | | | | |
See accompanying Notes to Financial Statements.
8 OPPENHEIMER EQUITY INCOME FUND/VA
STATEMENT OF ASSETS AND LIABILITIES June 30, 2015 Unaudited
| | | | |
Assets | | | | |
Investments, at value—see accompanying statement of investments: | | | | |
Unaffiliated companies (cost $10,215,929) | | $ | 11,116,721 | |
Affiliated companies (cost $122,706) | | | 122,706 | |
| | | | |
| | | 11,239,427 | |
| |
Cash | | | 2,655 | |
| |
Receivables and other assets: | | | | |
Investments sold | | | 33,862 | |
Interest and dividends | | | 32,065 | |
Shares of beneficial interest sold | | | 1,051 | |
Other | | | 12,889 | |
| | | | |
Total assets | | | 11,321,949 | |
| | | | |
| |
Liabilities | | | | |
Options written, at value (premiums received $27,231) | | | 41,292 | |
| |
Payables and other liabilities: | | | | |
Investments purchased | | | 38,278 �� | |
Legal, auditing and other professional fees | | | 15,971 | |
Trustees’ compensation | | | 10,840 | |
Shares of beneficial interest redeemed | | | 8,297 | |
Shareholder communications | | | 6,568 | |
Distribution and service plan fees | | | 2,306 | |
Other | | | 476 | |
| | | | |
Total liabilities | | | 124,028 | |
|
| |
Net Assets | | $ | 11,197,921 | |
| | | | |
|
| |
Composition of Net Assets | | | | |
Par value of shares of beneficial interest | | $ | 859 | |
| |
Additional paid-in capital | | | 9,995,562 | |
| |
Accumulated net investment income | | | 92,898 | |
| |
Accumulated net realized gain on investments | | | 221,871 | |
| |
Net unrealized appreciation on investments | | | 886,731 | |
| | | | |
Net Assets | | $ | 11,197,921 | |
| | | | |
|
| |
Net Asset Value Per Share | | | | |
Non-Service Shares: | | | | |
| Net asset value, redemption price per share and offering price per share (based on net assets of $320,492 and 29,743 shares of beneficial interest outstanding) | | | $10.78 | |
| |
| |
Service Shares: | | | | |
| Net asset value, redemption price per share and offering price per share (based on net assets of $10,877,429 and 829,359 shares of beneficial interest outstanding) | | | $13.12 | |
See accompanying Notes to Financial Statements.
9 OPPENHEIMER EQUITY INCOME FUND/VA
STATEMENT OF OPERATIONS For the Six Months Ended June 30, 2015 Unaudited
| | | | |
| | |
Investment Income | | | | |
Dividends: | | | | |
Unaffiliated companies (net of foreign withholding taxes of $ 948) | | $ | 219,029 | |
Affiliated companies | | | 41 | |
| |
Interest | | | 14,828 | |
| | | | |
Total investment income | | | 233,898 | |
|
| | |
Expenses | | | | |
Management fees | | | 43,136 | |
| |
Distribution and service plan fees - Service shares | | | 13,984 | |
| |
Transfer and shareholder servicing agent fees: | | | | |
Non-Service shares | | | 157 | |
Service shares | | | 5,594 | |
| |
Shareholder communications: | | | | |
Non-Service shares | | | 123 | |
Service shares | | | 4,426 | |
| |
Legal, auditing and other professional fees | | | 18,159 | |
| |
Trustees’ compensation | | | 4,749 | |
| |
Custodian fees and expenses | | | 607 | |
| |
Other | | | 2,664 | |
| | | | |
Total expenses | | | 93,599 | |
Less reduction to custodian expenses | | | (1) | |
Less waivers and reimbursements of expenses | | | (33,528) | |
| | | | |
Net expenses | | | 60,070 | |
|
| |
Net Investment Income | | | 173,828 | |
|
| |
Realized and Unrealized Gain (Loss) | | | | |
Net realized gain on: | | | | |
Investments from unaffiliated companies (including premiums on options exercised) | | | 277,379 | |
Closing and expiration of option contracts written | | | 33,775 | |
| | | | |
Net realized gain | | | 311,154 | |
| |
Net change in unrealized appreciation/depreciation on: | | | | |
Investments | | | (441,553) | |
Option contracts written | | | (15,933) | |
| | | | |
Net change in unrealized appreciation/depreciation | | | (457,486) | |
|
| |
Net Increase in Net Assets Resulting from Operations | | $ | 27,496 | |
| | | | |
See accompanying Notes to Financial Statements.
10 OPPENHEIMER EQUITY INCOME FUND/VA
STATEMENTS OF CHANGES IN NET ASSETS
| | | | | | | | |
| | | Six Months Ended
June 30, 2015
(Unaudited) | | | Year Ended
December 31, 2014 | |
Operations | | | | | | | | |
Net investment income | | $ | 173,828 | | | $ | 206,461 | |
| |
Net realized gain | | | 311,154 | | | | 877,321 | |
| |
Net change in unrealized appreciation/depreciation | | | (457,486 | ) | | | 78,166 | |
| | | | | | | | |
Net increase in net assets resulting from operations | | | 27,496 | | | | 1,161,948 | |
| | | | | | | | |
Dividends and/or Distributions to Shareholders | | | | | | | | |
Dividends from net investment income: | | | | | | | | |
Non-Service shares | | | (10,233 | ) | | | (4,861) | |
Service shares | | | (287,911 | ) | | | (162,231) | |
| | | | |
| | | (298,144 | ) | | | (167,092) | |
| | | | | | | | |
Distributions from net realized gain: | | | | | | | | |
Non-Service shares | | | (25,987 | ) | | | (12,986) | |
Service shares | | | (746,892 | ) | | | (451,817) | |
| | | | |
| | | (772,879 | ) | | | (464,803) | |
| | | | | | | | |
Beneficial Interest Transactions | | | | | | | | |
Net increase (decrease) in net assets resulting from beneficial interest transactions: | | | | | | | | |
Non-Service shares | | | 54,638 | | | | 64,450 | |
Service shares | | | 679,215 | | | | (175,637) | |
| | | | | | | | |
| | | 733,853 | | | | (111,187) | |
| | | | | | | | |
Net Assets | | | | | | | | |
Total increase (decrease) | | | (309,674 | ) | | | 418,866 | |
| |
Beginning of period | | | 11,507,595 | | | | 11,088,729 | |
| | | | | | | | |
| | |
End of period (including accumulated net investment income of $92,898 and $217,214, respectively) | | $ | 11,197,921 | | | $ | 11,507,595 | |
| | | | |
See accompanying Notes to Financial Statements.
11 OPPENHEIMER EQUITY INCOME FUND/VA
FINANCIAL HIGHLIGHTS
| | | | | | | | | | | | | | | | | | | | | | | | |
| Non-Service Shares | | Six Months
Ended
June 30,
2015
(Unaudited) | | | Year Ended
December 31,
2014 | | | Year Ended
December 31,
2013 | | | Year Ended
December 31,
2012 | | | Year Ended
December 30,
20111 | | | Year Ended
December 31,
2010 | |
| |
Per Share Operating Data | | | | | | | | | | | | | | | | | | | | | | | | |
Net asset value, beginning of period | | $ | 12.09 | | | $ | 11.64 | | | $ | 9.15 | | | $ | 8.00 | | | $ | 8.49 | | | $ | 7.22 | |
| |
Income (loss) from investment operations: | | | | | | | | | | | | | | | | | | | | | | | | |
Net investment income2 | | | 0.20 | | | | 0.25 | | | | 0.21 | | | | 0.16 | | | | 0.15 | | | | 0.11 | |
Net realized and unrealized gain (loss) | | | (0.13 | ) | | | 1.01 | | | | 2.42 | | | | 1.11 | | | | (0.56 | ) | | | 1.24 | |
| | | | |
Total from investment operations | | | 0.07 | | | | 1.26 | | | | 2.63 | | | | 1.27 | | | | (0.41 | ) | | | 1.35 | |
| |
Dividends and/or distributions to shareholders: | | | | | | | | | | | | | | | | | | | | | | | | |
Dividends from net investment income | | | (0.39 | ) | | | (0.22 | ) | | | (0.14 | ) | | | (0.12 | ) | | | (0.08 | ) | | | (0.08) | |
Distributions from net realized gain | | | (0.99 | ) | | | (0.59 | ) | | | 0.00 | | | | 0.00 | | | | 0.00 | | | | 0.00 | |
| | | | |
Total dividends and/or distributions to shareholders | | | (1.38 | ) | | | (0.81 | ) | | | (0.14 | ) | | | (0.12 | ) | | | (0.08 | ) | | | (0.08) | |
| |
Net asset value, end of period | | $ | 10.78 | | | $ | 12.09 | | | $ | 11.64 | | | $ | 9.15 | | | $ | 8.00 | | | $ | 8.49 | |
| | | | |
| |
Total Return, at Net Asset Value3 | | | 0.28% | | | | 11.08% | | | | 28.93% | | | | 16.08% | | | | (4.93)% | | | | 18.85% | |
| |
Ratios/Supplemental Data | | | | | | | | | | | | | | | | | | | | | | | | |
Net assets, end of period (in thousands) | | $ | 321 | | | $ | 302 | | | $ | 227 | | | $ | 154 | | | $ | 104 | | | $ | 92 | |
| |
Average net assets (in thousands) | | $ | 317 | | | $ | 266 | | | $ | 195 | | | $ | 132 | | | $ | 101 | | | $ | 57 | |
| |
Ratios to average net assets:4 | | | | | | | | | | | | | | | | | | | | | | | | |
Net investment income | | | 3.24% | | | | 2.08% | | | | 2.00% | | | | 1.82% | | | | 1.78% | | | | 1.46% | |
Total expenses5 | | | 1.38% | | | | 1.42% | | | | 1.64% | | | | 1.75% | | | | 1.83% | | | | 2.05% | |
| Expenses after payments, waivers and/or reimbursements and reduction to custodian expenses | | | 0.80% | | | | 0.80% | | | | 0.80% | | | | 0.80% | | | | 0.80% | | | | 0.57% | |
| |
Portfolio turnover rate | | | 26% | | | | 40% | | | | 159% | | | | 87% | | | | 86% | | | | 109% | |
1. December 30, 2011 represents the last business day of the Fund’s reporting period.
2. Per share amounts calculated based on the average shares outstanding during the period.
3. Assumes an initial investment on the business day before the first day of the fiscal period, with all dividends and distributions reinvested in additional shares on the reinvestment date, and redemption at the net asset value calculated on the last business day of the fiscal period. Total returns are not annualized for periods less than one full year. Total return information does not reflect expenses that apply at the separate account level or to related insurance products. Inclusion of these charges would reduce the total return figures for all periods shown. Returns do not reflect the deduction of taxes that a shareholder would pay on fund distributions or the redemption of fund shares. The returns do not include adjustments in accordance with generally accepted accounting principles required at the period end for financial reporting purposes.
4. Annualized for periods less than one full year.
5. Total expenses including indirect expenses from affiliated fund fees and expenses were as follows:
| | | | | | | | |
| | Six Months Ended June 30, 2015 | | | 1.38 | % | | |
| | Year Ended December 31, 2014 | | | 1.42 | % | | |
| | Year Ended December 31, 2013 | | | 1.64 | % | | |
| | Year Ended December 31, 2012 | | | 1.75 | % | | |
| | Year Ended December 30, 2011 | | | 1.83 | % | | |
| | Year Ended December 31, 2010 | | | 2.05 | % | | |
See accompanying Notes to Financial Statements.
12 OPPENHEIMER EQUITY INCOME FUND/VA
| | | | | | | | | | | | | | | | | | | | | | | | |
| Service Shares | | Six Months
Ended
June 30,
2015
(Unaudited) | | | Year Ended
December 31,
2014 | | | Year Ended
December 31,
2013 | | | Year Ended
December 31,
2012 | | | Year Ended
December 30,
20111 | | | Year Ended
December 31,
2010 | |
| |
Per Share Operating Data | | | | | | | | | | | | | | | | | | | | | | | | |
Net asset value, beginning of period | | $ | 14.43 | | | $ | 13.78 | | | $ | 10.83 | | | $ | 9.69 | | | $ | 10.23 | | | $ | 8.99 | |
| |
Income (loss) from investment operations: | | | | | | | | | | | | | | | | | | | | | | | | |
Net investment income2 | | | 0.22 | | | | 0.26 | | | | 0.22 | | | | 0.13 | | | | 0.11 | | | | 0.08 | |
Net realized and unrealized gain (loss) | | | (0.16 | ) | | | 1.19 | | | | 2.87 | | | | 1.13 | | | | (0.56 | ) | | | 1.24 | |
| | | | |
Total from investment operations | | | 0.06 | | | | 1.45 | | | | 3.09 | | | | 1.26 | | | | (0.45 | ) | | | 1.32 | |
| |
Dividends and/or distributions to shareholders: | | | | | | | | | | | | | | | | | | | | | | | | |
Dividends from net investment income | | | (0.38 | ) | | | (0.21 | ) | | | (0.14 | ) | | | (0.12 | ) | | | (0.09 | ) | | | (0.08) | |
Distributions from net realized gain | | | (0.99 | ) | | | (0.59 | ) | | | 0.00 | | | | 0.00 | | | | 0.00 | | | | 0.00 | |
| | | | |
Total dividends and/or distributions to shareholders | | | (1.37 | ) | | | (0.80 | ) | | | (0.14 | ) | | | (0.12 | ) | | | (0.09 | ) | | | (0.08) | |
| |
Net asset value, end of period | | $ | 13.12 | | | $ | 14.43 | | | $ | 13.78 | | | $ | 10.83 | | | $ | 9.69 | | | $ | 10.23 | |
| | | | |
| |
Total Return, at Net Asset Value3 | | | 0.18% | | | | 10.73% | | | | 28.70% | | | | 13.09% | | | | (4.48)% | | | | 14.81% | |
| |
Ratios/Supplemental Data | | | | | | | | | | | | | | | | | | | | | | | | |
Net assets, end of period (in thousands) | | $ | 10,877 | | | $ | 11,206 | | | $ | 10,862 | | | $ | 6,897 | | | $ | 6,885 | | | $ | 7,311 | |
| |
Average net assets (in thousands) | | $ | 11,278 | | | $ | 11,020 | | | $ | 8,549 | | | $ | 7,095 | | | $ | 7,449 | | | $ | 7,008 | |
| |
Ratios to average net assets:4 | | | | | | | | | | | | | | | | | | | | | | | | |
Net investment income | | | 3.02% | | | | 1.82% | | | | 1.78% | | | | 1.26% | | | | 1.08% | | | | 0.85% | |
Total expenses5 | | | 1.63% | | | | 1.67% | | | | 1.89% | | | | 1.93% | | | | 1.90% | | | | 2.08% | |
| Expenses after payments, waivers and/or reimbursements and reduction to custodian expenses | | | 1.05% | | | | 1.05% | | | | 1.05% | | | | 1.04% | | | | 1.05% | | | | 0.93% | |
| |
Portfolio turnover rate | | | 26% | | | | 40% | | | | 159% | | | | 87% | | | | 86% | | | | 109% | |
1. December 30, 2011 represents the last business day of the Fund’s reporting period.
2. Per share amounts calculated based on the average shares outstanding during the period.
3. Assumes an initial investment on the business day before the first day of the fiscal period, with all dividends and distributions reinvested in additional shares on the reinvestment date, and redemption at the net asset value calculated on the last business day of the fiscal period. Total returns are not annualized for periods less than one full year. Total return information does not reflect expenses that apply at the separate account level or to related insurance products. Inclusion of these charges would reduce the total return figures for all periods shown. Returns do not reflect the deduction of taxes that a shareholder would pay on fund distributions or the redemption of fund shares. The returns do not include adjustments in accordance with generally accepted accounting principles required at the period end for financial reporting purposes.
4. Annualized for periods less than one full year.
5. Total expenses including indirect expenses from affiliated fund fees and expenses were as follows:
| | | | | | | | |
| | Six Months Ended June 30, 2015 | | | 1.63 | % | | |
| | Year Ended December 31, 2014 | | | 1.67 | % | | |
| | Year Ended December 31, 2013 | | | 1.89 | % | | |
| | Year Ended December 31, 2012 | | | 1.93 | % | | |
| | Year Ended December 30, 2011 | | | 1.90 | % | | |
| | Year Ended December 31, 2010 | | | 2.08 | % | | |
See accompanying Notes to Financial Statements.
13 OPPENHEIMER EQUITY INCOME FUND/VA
NOTES TO FINANCIAL STATEMENTS June 30, 2015 Unaudited
1. Organization
Oppenheimer Equity Income Fund/VA (the “Fund”), is a separate series of Oppenheimer Variable Account Funds, a diversified open-end management investment company registered under the Investment Company Act of 1940 (“1940 Act”), as amended. The Fund’s investment objective is to seek total return. The Fund’s investment adviser is OFI Global Asset Management, Inc. (“OFI Global” or the “Manager”), a wholly-owned subsidiary of OppenheimerFunds, Inc. (“OFI” or the “Sub-Adviser”). The Manager has entered into a sub-advisory agreement with OFI. Shares of the Fund are sold only to separate accounts of life insurance companies.
The Fund offers two classes of shares. Both classes are sold at their offering price, which is the net asset value per share, to separate investment accounts of participating insurance companies as an underlying investment for variable life insurance policies, variable annuity contracts or other investment products. The class of shares designated as Service shares is subject to a distribution and service plan. Both classes of shares have identical rights and voting privileges with respect to the Fund in general and exclusive voting rights on matters that affect that class alone. Earnings, net assets and net asset value per share may differ due to each class having its own expenses, such as transfer and shareholder servicing agent fees and shareholder communications, directly attributable to that class.
The following is a summary of significant accounting policies followed in the Fund’s preparation of financial statements in accordance with accounting principles generally accepted in the United States (“U.S. GAAP”).
2. Significant Accounting Policies
Security Valuation. All investments in securities are recorded at their estimated fair value, as described in Note 3.
Reporting Period End Date. The last day of the Fund’s reporting period is the last day the New York Stock Exchange was open for trading during the period. The Fund’s financial statements have been presented through that date to maintain consistency with the Fund’s net asset value calculations used for shareholder transactions.
Foreign Currency Translation. The Fund’s accounting records are maintained in U.S. dollars. The values of securities denominated in foreign currencies and amounts related to the purchase and sale of foreign securities and foreign investment income are translated into U.S. dollars as of the close of the New York Stock Exchange (the “Exchange”), normally 4:00 P.M. Eastern time, on each day the Exchange is open for trading. Foreign exchange rates may be valued primarily using a reliable bank, dealer or service authorized by the Board of Trustees.
Reported net realized gains and losses from foreign currency transactions arise from sales of portfolio securities, sales and maturities of short-term securities, sales of foreign currencies, exchange rate fluctuations between the trade and settlement dates on securities transactions, and the difference between the amounts of dividends, interest, and foreign withholding taxes recorded on the Fund’s books and the U.S. dollar equivalent of the amounts actually received or paid. Net unrealized appreciation and depreciation on the translation of assets and liabilities denominated in foreign currencies arise from changes in the values of assets and liabilities, including investments in securities at fiscal period end, resulting from changes in exchange rates.
The effect of changes in foreign currency exchange rates on investments is separately identified from the fluctuations arising from changes in market values of securities held and reported with all other foreign currency gains and losses in the Fund’s Statement of Operations.
Allocation of Income, Expenses, Gains and Losses. Income, expenses (other than those attributable to a specific class), gains and losses are allocated on a daily basis to each class of shares based upon the relative proportion of net assets represented by such class. Operating expenses directly attributable to a specific class are charged against the operations of that class.
Dividends and Distributions to Shareholders. Dividends and distributions to shareholders, which are determined in accordance with income tax regulations and may differ from U.S. generally accepted accounting principles, are recorded on the ex-dividend date. Income and capital gain distributions, if any, are declared and paid annually or at other times as deemed necessary by the Manager.
The tax character of distributions is determined as of the Fund’s fiscal year end. Therefore, a portion of the Fund’s distributions made to shareholders prior to the Fund’s fiscal year end may ultimately be categorized as a tax return of capital.
Investment Income. Dividend income is recorded on the ex-dividend date or upon ex-dividend notification in the case of certain foreign dividends where the ex-dividend date may have passed. Non-cash dividends included in dividend income, if any, are recorded at the fair market value of the securities received. Interest income is recognized on an accrual basis. Discount and premium, which are included in interest income on the Statement of Operations, are amortized or accreted daily.
Return of Capital Estimates. Distributions received from the Fund’s investments in MLPs generally are comprised of income and return of capital. The Fund records investment income and return of capital based on estimates made at the time such distributions are received. Such estimates are based on historical information available from each MLP and other industry sources. These estimates may subsequently be revised based on information received from MLPs after their tax reporting periods are concluded.
Custodian Fees. “Custodian fees and expenses” in the Statement of Operations may include interest expense incurred by the Fund on any cash overdrafts of its custodian account during the period. Such cash overdrafts may result from the effects of failed trades in portfolio securities and from cash outflows resulting from unanticipated shareholder redemption activity. The Fund pays interest to its custodian on such cash overdrafts, to the extent they are not offset by positive cash balances maintained by the Fund, at a rate equal to the Federal Funds Rate plus 0.50%. The “Reduction to custodian
14 OPPENHEIMER EQUITY INCOME FUND/VA
2. Significant Accounting Policies (Continued)
expenses” line item, if applicable, represents earnings on cash balances maintained by the Fund during the period. Such interest expense and other custodian fees may be paid with these earnings.
Security Transactions. Security transactions are recorded on the trade date. Realized gains and losses on securities sold are determined on the basis of identified cost.
Indemnifications. The Fund’s organizational documents provide current and former Trustees and officers with a limited indemnification against liabilities arising in connection with the performance of their duties to the Fund. In the normal course of business, the Fund may also enter into contracts that provide general indemnifications. The Fund’s maximum exposure under these arrangements is unknown as this would be dependent on future claims that may be made against the Fund. The risk of material loss from such claims is considered remote.
Federal Taxes. The Fund intends to comply with provisions of the Internal Revenue Code applicable to regulated investment companies and to distribute substantially all of its investment company taxable income to shareholders. Therefore, no federal income or excise tax provision is required. The Fund files income tax returns in U.S. federal and applicable state jurisdictions. The statute of limitations on the Fund’s tax return filings generally remains open for the three preceding fiscal reporting period ends.
During the fiscal year ended December 31, 2014, the Fund did not utilize any capital loss carryforward to offset capital gains realized in that fiscal year. Capital loss carryforwards with no expiration, if any, must be utilized prior to those with expiration dates. Capital losses with no expiration will be carried forward to future years if not offset by gains.
Net investment income (loss) and net realized gain (loss) may differ for financial statement and tax purposes. The character of dividends and distributions made during the fiscal year from net investment income or net realized gains are determined in accordance with federal income tax requirements, which may differ from the character of net investment income or net realized gains presented in those financial statements in accordance with GAAP. Also, due to timing of dividends and distributions, the fiscal year in which amounts are distributed may differ from the fiscal year in which the income or net realized gain was recorded by the Fund.
The aggregate cost of securities and other investments and the composition of unrealized appreciation and depreciation of securities and other investments for federal income tax purposes as of June 30, 2015 are noted in the following table. The primary difference between book and tax appreciation or depreciation of securities and other investments, if applicable, is attributable to the tax deferral of losses or tax realization of financial statement unrealized gain or loss.
| | | | |
Federal tax cost of securities | | $ | 10,388,447 | |
Federal tax cost of other investments | | | (27,230 | ) |
| | | | |
Total federal tax cost | | $ | 10,361,217 | |
| | | | |
Gross unrealized appreciation | | $ | 1,417,899 | |
Gross unrealized depreciation | | | (580,981 | ) |
| | | | |
Net unrealized appreciation | | $ | 836,918 | |
| | | | |
Use of Estimates. The preparation of financial statements in conformity with accounting principles generally accepted in the United States of America requires management to make estimates and assumptions that affect the reported amounts of assets and liabilities and disclosure of contingent assets and liabilities at the date of the financial statements and the reported amounts of increases and decreases in net assets from operations during the reporting period. Actual results could differ from those estimates.
3. Securities Valuation
The Fund calculates the net asset value of its shares as of the close of the New York Stock Exchange (the “Exchange”), normally 4:00 P.M. Eastern time, on each day the Exchange is open for trading.
The Fund’s Board has adopted procedures for the valuation of the Fund’s securities and has delegated the day-to-day responsibility for valuation determinations under those procedures to the Manager. The Manager has established a Valuation Committee which is responsible for determining a “fair valuation” for any security for which market quotations are not “readily available.” The Valuation Committee’s fair valuation determinations are subject to review, approval and ratification by the Fund’s Board at its next regularly scheduled meeting covering the calendar quarter in which the fair valuation was determined.
Valuation Methods and Inputs
Securities are valued using unadjusted quoted market prices, when available, as supplied primarily by third party pricing services or dealers.
The following methodologies are used to determine the market value or the fair value of the types of securities described below:
Securities traded on a registered U.S. securities exchange (including exchange-traded derivatives other than futures and futures options) are valued based on the last sale price of the security reported on the principal exchange on which it is traded, prior to the time when the Fund’s assets are valued. In the absence of a sale, the security is valued at the last sale price on the prior trading day, if it is within the spread of the current day’s closing “bid” and “asked” prices, and if not, at the current day’s closing bid price. A security of a foreign issuer traded on a foreign exchange, but not listed on a registered U.S. securities exchange, is valued based on the last sale price on the principal exchange on which the security is traded, as identified by the third party pricing service used by the Manager, prior to the time when the Fund’s assets are valued. If the last sale price is unavailable, the security is valued at the most recent official closing price on the principal exchange on which it is traded. If the last sales price or official closing price for a foreign
15 OPPENHEIMER EQUITY INCOME FUND/VA
| | |
| NOTES TO FINANCIAL STATEMENTS Unaudited / Continued | | |
| | |
3. Securities Valuation (Continued)
security is not available, the security is valued at the mean between the bid and asked price per the exchange or, if not available from the exchange, obtained from two dealers. If bid and asked prices are not available from either the exchange or two dealers, the security is valued by using one of the following methodologies (listed in order of priority): (1) using a bid from the exchange, (2) the mean between the bid and asked price as provided by a single dealer, or (3) a bid from a single dealer.
Shares of a registered investment company that are not traded on an exchange are valued at that investment company’s net asset value per share. Corporate and government debt securities (of U.S. or foreign issuers) and municipal debt securities, event-linked bonds, loans, mortgage-backed securities, collateralized mortgage obligations, and asset-backed securities are valued at the mean between the “bid” and “asked” prices utilizing evaluated prices obtained from third party pricing services or broker-dealers who may use matrix pricing methods to determine the evaluated prices. Short-term money market type debt securities with a remaining maturity of sixty days or less are valued at cost adjusted by the amortization of discount or premium to maturity (amortized cost), which approximates market value. Short-term debt securities with a remaining maturity in excess of sixty days are valued at the mean between the “bid” and “asked” prices utilizing evaluated prices obtained from third party pricing services or broker-dealers.
Structured securities, swaps, swaptions, and other over-the-counter derivatives are valued utilizing evaluated prices obtained from third party pricing services or broker-dealers.
A description of the standard inputs that may generally be considered by the third party pricing vendors in determining their evaluated prices is provided below.
| | |
| Security Type | | Standard inputs generally considered by third-party pricing vendors |
| Corporate debt, government debt, municipal, mortgage-backed and asset-backed securities | | Reported trade data, broker-dealer price quotations, benchmark yields, issuer spreads on comparable securities, the credit quality, yield, maturity, and other appropriate factors. |
| Loans | | Information obtained from market participants regarding reported trade data and broker-dealer price quotations. |
| Event-linked bonds | | Information obtained from market participants regarding reported trade data and broker-dealer price quotations. |
| Structured securities | | Relevant market information such as the price of underlying financial instruments, stock market indices, foreign currencies, interest rate spreads, commodities, or the occurrence of other specific events. |
| Swaps | | Relevant market information, including underlying reference assets such as credit spreads, credit event probabilities, index values, individual security values, forward interest rates, variable interest rates, volatility measures, and forward currency rates. |
If a market value or price cannot be determined for a security using the methodologies described above, or if, in the “good faith” opinion of the Manager, the market value or price obtained does not constitute a “readily available market quotation,” or a significant event has occurred that would materially affect the value of the security, the security is fair valued either (i) by a standardized fair valuation methodology applicable to the security type or the significant event as previously approved by the Valuation Committee and the Fund’s Board or (ii) as determined in good faith by the Manager’s Valuation Committee. The Valuation Committee considers all relevant facts that are reasonably available, through either public information or information available to the Manager, when determining the fair value of a security. Fair value determinations by the Manager are subject to review, approval and ratification by the Fund’s Board at its next regularly scheduled meeting covering the calendar quarter in which the fair valuation was determined. Those fair valuation standardized methodologies include, but are not limited to, valuing securities at the last sale price or initially at cost and subsequently adjusting the value based on: changes in company specific fundamentals, changes in an appropriate securities index, or changes in the value of similar securities which may be further adjusted for any discounts related to security-specific resale restrictions. When possible, such methodologies use observable market inputs such as unadjusted quoted prices of similar securities, observable interest rates, currency rates and yield curves. The methodologies used for valuing securities are not necessarily an indication of the risks associated with investing in those securities nor can it be assured that the Fund can obtain the fair value assigned to a security if it were to sell the security.
To assess the continuing appropriateness of security valuations, the Manager, or its third party service provider who is subject to oversight by the Manager, regularly compares prior day prices, prices on comparable securities, and sale prices to the current day prices and challenges those prices exceeding certain tolerance levels with the third party pricing service or broker source. For those securities valued by fair valuations, whether through a standardized fair valuation methodology or a fair valuation determination, the Valuation Committee reviews and affirms the reasonableness of the valuations based on such methodologies and fair valuation determinations on a regular basis after considering all relevant information that is reasonably available.
Classifications
Each investment asset or liability of the Fund is assigned a level at measurement date based on the significance and source of the inputs to its valuation. Various data inputs are used in determining the value of each of the Fund’s investments as of the reporting period end. These data inputs are categorized in the following hierarchy under applicable financial accounting standards:
1) Level 1-unadjusted quoted prices in active markets for identical assets or liabilities (including securities actively traded on a securities exchange)
2) Level 2-inputs other than unadjusted quoted prices that are observable for the asset or liability (such as unadjusted quoted prices for similar assets and market corroborated inputs such as interest rates, prepayment speeds, credit risks, etc.)
3) Level 3-significant unobservable inputs (including the Manager’s own judgments about assumptions that market participants would use in pricing the asset or liability).
The inputs used for valuing securities are not necessarily an indication of the risks associated with investing in those securities.
16 OPPENHEIMER EQUITY INCOME FUND/VA
3. Securities Valuation (Continued)
The table below categorizes amounts that are included in the Fund’s Statement of Assets and Liabilities as of June 30, 2015 based on valuation input level:
| | | | | | | | | | | | | | | | |
| | | Level 1—
Unadjusted
Quoted Prices | | | Level 2—
Other Significant
Observable Inputs | | | Level 3—
Significant
Unobservable
Inputs | | | Value | |
Assets Table | | | | | | | | | | | | | | | | |
Investments, at Value: | | | | | | | | | | | | | | | | |
Common Stocks | | | | | | | | | | | | | | | | |
Consumer Discretionary | | $ | 1,517,423 | | | $ | — | | | $ | — | | | $ | 1,517,423 | |
Consumer Staples | | | 282,171 | | | | — | | | | — | | | | 282,171 | |
Energy | | | 994,823 | | | | — | | | | — | | | | 994,823 | |
Financials | | | 3,187,508 | | | | — | | | | — | | | | 3,187,508 | |
Health Care | | | 983,775 | | | | — | | | | — | | | | 983,775 | |
Industrials | | | 536,621 | | | | — | | | | — | | | | 536,621 | |
Information Technology | | | 692,832 | | | | — | | | | — | | | | 692,832 | |
Materials | | | 330,250 | | | | — | | | | — | | | | 330,250 | |
Telecommunication Services | | | 325,225 | | | | — | | | | — | | | | 325,225 | |
Utilities | | | 285,115 | | | | — | | | | — | | | | 285,115 | |
Preferred Stocks | | | 409,275 | | | | 161,550 | | | | — | | | | 570,825 | |
Rights, Warrants and Certificates | | | 13,297 | | | | — | | | | — | | | | 13,297 | |
Non-Convertible Corporate Bonds and Notes | | | — | | | | 70,194 | | | | — | | | | 70,194 | |
Convertible Corporate Bonds and Notes | | | — | | | | 979,694 | | | | — | | | | 979,694 | |
Structured Securities | | | — | | | | 344,141 | | | | — | | | | 344,141 | |
Exchange-Traded Options Purchased | | | 2,827 | | | | — | | | | — | | | | 2,827 | |
Investment Company | | | 122,706 | | | | — | | | | — | | | | 122,706 | |
| | | | |
Total Assets | | $ | 9,683,848 | | | $ | 1,555,579 | | | $ | — | | | $ | 11,239,427 | |
| | | | |
| | | | |
Liabilities Table | | | | | | | | | | | | | | | | |
Other Financial Instruments: | | | | | | | | | | | | | | | | |
Options written, at value | | $ | — | | | $ | (41,292 | ) | | $ | — | | | $ | (41,292 | ) |
| | | | |
Total Liabilities | | $ | — | | | $ | (41,292 | ) | | $ | — | | | $ | (41,292 | ) |
| | | | |
Forward currency exchange contracts and futures contracts, if any, are reported at their unrealized appreciation/depreciation at measurement date, which represents the change in the contract’s value from trade date. All additional assets and liabilities included in the above table are reported at their market value at measurement date.
4. Investments and Risks
Investment in Oppenheimer Institutional Money Market Fund. The Fund is permitted to invest daily available cash balances in an affiliated money market fund. The Fund may invest the available cash in Class E shares of Oppenheimer Institutional Money Market Fund (“IMMF”) to seek current income while preserving liquidity or for defensive purposes. IMMF is a registered open-end management investment company, regulated as a money market fund under the 1940 Act. The Manager is the investment adviser of IMMF, and the Sub-Adviser provides investment and related advisory services to IMMF. When applicable, the Fund’s investment in IMMF is included in the Statement of Investments. Shares of IMMF are valued at their net asset value per share. As a shareholder, the Fund is subject to its proportional share of IMMF’s Class E expenses, including its management fee. The Manager will waive fees and/or reimburse Fund expenses in an amount equal to the indirect management fees incurred through the Fund’s investment in IMMF.
Master Limited Partnerships (“MLPs”). MLPs issue common units that represent an equity ownership interest in a partnership and provide limited voting rights. MLP common units are registered with the Securities and Exchange Commission (“SEC”), and are freely tradable on securities exchanges such as the NYSE and the NASDAQ Stock Market (“NASDAQ”), or in the over-the-counter (“OTC”) market. An MLP consists of one or more general partners, who conduct the business, and one or more limited partners, who contribute capital. MLP common unit holders have a limited role in the partnership’s operations and management. The Fund, as a limited partner, normally would not be liable for the debts of the MLP beyond the amounts the Fund has contributed, but would not be shielded to the same extent that a shareholder of a corporation would be. In certain circumstances creditors of an MLP would have the right to seek return of capital distributed to a limited partner. This right of an MLP’s creditors would continue after the Fund sold its investment in the MLP.
Structured Securities. The Fund invests in structured securities whose market values, interest rates and/or redemption prices are linked to the performance of underlying foreign currencies, interest rate spreads, stock market indices, prices of individual securities, commodities or other financial instruments or the occurrence of other specific events. The structured securities are often leveraged, increasing the volatility of each note’s market value relative to the change in the underlying linked financial element or event. Fluctuations in value of these securities are recorded as unrealized gains and losses in the accompanying Statement of Operations. The Fund records a realized gain or loss when a structured security is sold or matures.
Equity Security Risk. Stocks and other equity securities fluctuate in price. The value of the Fund’s portfolio may be affected by changes in the equity markets generally. Equity markets may experience significant short-term volatility and may fall sharply at times. Different markets may behave differently
17 OPPENHEIMER EQUITY INCOME FUND/VA
| | |
| NOTES TO FINANCIAL STATEMENTS Unaudited / Continued | | |
| | |
4. Investments and Risks (Continued)
from each other and U.S. equity markets may move in the opposite direction from one or more foreign stock markets. Adverse events in any part of the equity or fixed-income markets may have unexpected negative effects on other market segments.
The prices of individual equity securities generally do not all move in the same direction at the same time and a variety of factors can affect the price of a particular company’s securities. These factors may include, but are not limited to, poor earnings reports, a loss of customers, litigation against the company, general unfavorable performance of the company’s sector or industry, or changes in government regulations affecting the company or its industry.
Credit Risk. The Fund invests in high-yield, non-investment-grade bonds, which may be subject to a greater degree of credit risk. Credit risk relates to the ability of the issuer to meet interest or principal payments or both as they become due. The Fund may acquire securities that have missed an interest payment, and is not obligated to dispose of securities whose issuers or underlying obligors subsequently miss an interest payment. There were no securities not accruing interest as of June 30, 2015. Information concerning securities not accruing interest as of June 30, 2015 is as follows:
| | | | | | |
| | Cost | | $ | 48,697 | |
| | Market Value | | $ | 31,850 | |
| | Market Value as % of Net Assets | | | 0.28% | |
5. Risk Exposures and the Use of Derivative Instruments
The Fund’s investment objective not only permits the Fund to purchase investment securities, it also allows the Fund to enter into various types of derivatives contracts, including, but not limited to, futures contracts, forward currency exchange contracts, credit default swaps, interest rate swaps, total return swaps, variance swaps and purchased and written options. In doing so, the Fund will employ strategies in differing combinations to permit it to increase, decrease, or change the level or types of exposure to market risk factors. These instruments may allow the Fund to pursue its objectives more quickly and efficiently than if it were to make direct purchases or sales of securities capable of effecting a similar response to market factors. Such contracts may be entered into through a bilateral over-the-counter (“OTC”) transaction, or through a securities or futures exchange and cleared through a clearinghouse.
Market Risk Factors. In accordance with its investment objectives, the Fund may use derivatives to increase or decrease its exposure to one or more of the following market risk factors:
Commodity Risk. Commodity risk relates to the change in value of commodities or commodity indexes as they relate to increases or decreases in the commodities market. Commodities are physical assets that have tangible properties. Examples of these types of assets are crude oil, heating oil, metals, livestock, and agricultural products.
Credit Risk. Credit risk relates to the ability of the issuer to meet interest and principal payments, or both, as they come due. In general, lower-grade, higher-yield bonds are subject to credit risk to a greater extent than lower-yield, higher-quality bonds.
Equity Risk. Equity risk relates to the change in value of equity securities as they relate to increases or decreases in the general market.
Foreign Exchange Rate Risk. Foreign exchange rate risk relates to the change in the U.S. dollar value of a security held that is denominated in a foreign currency. The U.S. dollar value of a foreign currency denominated security will decrease as the dollar appreciates against the currency, while the U.S. dollar value will increase as the dollar depreciates against the currency.
Interest Rate Risk. Interest rate risk refers to the fluctuations in value of fixed-income securities resulting from the inverse relationship between price and yield. For example, an increase in general interest rates will tend to reduce the market value of already issued fixed-income investments, and a decline in general interest rates will tend to increase their value. In addition, debt securities with longer maturities, which tend to have higher yields, are subject to potentially greater fluctuations in value from changes in interest rates than obligations with shorter maturities.
Volatility Risk. Volatility risk refers to the magnitude of the movement, but not the direction of the movement, in a financial instrument’s price over a defined time period. Large increases or decreases in a financial instrument’s price over a relative time period typically indicate greater volatility risk, while small increases or decreases in its price typically indicate lower volatility risk.
Derivatives may have little or no initial cash investment relative to their market value exposure and therefore can produce significant gains or losses in excess of their cost due to unanticipated changes in the market risk factors and the overall market. This use of embedded leverage allows the Fund to increase its market value exposure relative to its net assets and can substantially increase the volatility of the Fund’s performance. In instances where the Fund is using derivatives to decrease, or hedge, exposures to market risk factors for securities held by the Fund, there are also risks that those derivatives may not perform as expected resulting in losses for the combined or hedged positions. Some derivatives have the potential for unlimited loss, regardless of the size of the Fund’s initial investment.
Additional associated risks from investing in derivatives also exist and potentially could have significant effects on the valuation of the derivative and the Fund. Typically, the associated risks are not the risks that the Fund is attempting to increase or decrease exposure to, per its investment objectives, but are the additional risks from investing in derivatives. Examples of these associated risks are liquidity risk, which is the risk that the Fund will not be able to sell the derivative in the open market in a timely manner, and counterparty credit risk, which is the risk that the counterparty will not fulfill its obligation to the Fund.
The Fund’s actual exposures to these market risk factors and associated risks during the period are discussed in further detail, by derivative type, below.
18 OPPENHEIMER EQUITY INCOME FUND/VA
5. Risk Exposures and the Use of Derivative Instruments (Continued)
Option Activity
The Fund may buy and sell put and call options, or write put and call options. When an option is written, the Fund receives a premium and becomes obligated to sell or purchase the underlying security, currency or other underlying financial instrument at a fixed price, upon exercise of the option.
Options can be traded through an exchange or through a privately negotiated arrangement with a dealer in an OTC transaction. Options traded through an exchange are generally cleared through a clearinghouse (such as The Options Clearing Corporation). The difference between the premium received or paid, and market value of the option, is recorded as unrealized appreciation or depreciation. The net change in unrealized appreciation or depreciation is reported in the Statement of Operations. When an option is exercised, the cost of the security purchased or the proceeds of the security sale are adjusted by the amount of premium received or paid. Upon the expiration or closing of the option transaction, a gain or loss is reported in the Statement of Operations.
The Fund has purchased call options on individual equity securities and/or equity indexes to increase exposure to equity risk. A purchased call option becomes more valuable as the price of the underlying financial instrument appreciates relative to the strike price.
The Fund has purchased put options on individual equity securities and/or equity indexes to decrease exposure to equity risk. A purchased put option becomes more valuable as the price of the underlying financial instrument depreciates relative to the strike price.
During the six months ended June 30, 2015, the Fund had an ending monthly average market value of $16 and $819 on purchased call options and purchased put options, respectively.
Options written, if any, are reported in a schedule following the Statement of Investments and as a liability in the Statement of Assets and Liabilities. Securities held in collateral accounts to cover potential obligations with respect to outstanding written options are noted in the Statement of Investments.
The risk in writing a call option is that the market price of the security increases and if the option is exercised, the Fund must either purchase the security at a higher price for delivery or, if the Fund owns the underlying security, give up the opportunity for profit. The risk in writing a put option is that the Fund may incur a loss if the market price of the security decreases and the option is exercised. The risk in buying an option is that the Fund pays a premium whether or not the option is exercised. The Fund also has the additional risk that there may be an illiquid market where the Fund is unable to close the contract.
The Fund has written put options on individual equity securities and/or equity indexes to increase exposure to equity risk. A written put option becomes more valuable as the price of the underlying financial instrument appreciates relative to the strike price.
The Fund has written call options on individual equity securities and/or equity indexes to decrease exposure to equity risk. A written call option becomes more valuable as the price of the underlying financial instrument depreciates relative to the strike price.
During the six months ended June 30, 2015, the Fund had an ending monthly average market value of $3,272 and $12,914 on written call options and written put options, respectively.
Additional associated risks to the Fund include counterparty credit risk and liquidity risk.
Written option activity for the six months ended June 30, 2015 was as follows:
| | | | | | | | |
| | | Number of Contracts | | | Amount of Premiums | |
| |
Options outstanding as of December 31, 2014 | | | 60 | | | | $ 7,445 | |
Options written | | | 610 | | | | 81,851 | |
Options closed or expired | | | (339 | ) | | | (33,775 | ) |
Options exercised | | | (194 | ) | | | (28,290 | ) |
| | | | |
Options outstanding as of June 30, 2015 | | | 137 | | | | $ 27,231 | |
| | | | |
Counterparty Credit Risk. Derivative positions are subject to the risk that the counterparty will not fulfill its obligation to the Fund. The Fund intends to enter into derivative transactions with counterparties that the Manager believes to be creditworthy at the time of the transaction.
For financial reporting purposes, the Fund does not offset derivative assets and derivative liabilities that are subject to netting arrangements in the Statement of Assets and Liabilities. Bankruptcy or insolvency laws of a particular jurisdiction may impose restrictions on or prohibitions against the right of offset in bankruptcy, insolvency or other events.
The Fund’s risk of loss from counterparty credit risk on exchange-traded derivatives cleared through a clearinghouse and for centrally cleared swaps is generally considered lower than as compared to OTC derivatives. However, counterparty credit risk exists with respect to initial and variation margin deposited/paid by the Fund that is held in futures commission merchant, broker and/or clearinghouse accounts for such exchange-traded derivatives and for centrally cleared swaps.
With respect to centrally cleared swaps, such transactions will be submitted for clearing, and if cleared, will be held in accounts at futures commission merchants or brokers that are members of clearinghouses. While brokers, futures commission merchants and clearinghouses are required to segregate customer margin from their own assets, in the event that a broker, futures commission merchant or clearinghouse becomes insolvent or goes into bankruptcy and at that time there is a shortfall in the aggregate amount of margin held by the broker, futures commission merchant or clearinghouse for all its customers, U.S. bankruptcy laws will typically allocate that shortfall on a pro-rata basis across all the broker’s, futures commission merchant’s or clearinghouse’s customers, potentially resulting in losses to the Fund.
There is the risk that a broker, futures commission merchant or clearinghouse will decline to clear a transaction on the Fund’s behalf, and the Fund may be required to pay a termination fee to the executing broker with whom the Fund initially enters into the transaction. Clearinghouses may also be permitted to terminate centrally cleared swaps at any time. The Fund is also subject to the risk that the broker or futures commission merchant will improperly use the Fund’s assets deposited/paid as initial or variation margin to satisfy payment obligations of another customer. In the event of a
19 OPPENHEIMER EQUITY INCOME FUND/VA
| | |
| NOTES TO FINANCIAL STATEMENTS Unaudited / Continued | | |
| | |
5. Risk Exposures and the Use of Derivative Instruments (Continued)
default by another customer of the broker or futures commission merchant, the Fund might not receive its variation margin payments from the clearinghouse, due to the manner in which variation margin payments are aggregated for all customers of the broker/futures commission merchant.
Collateral and margin requirements differ by type of derivative. Margin requirements are established by the broker, futures commission merchant or clearinghouse for exchange-traded and cleared derivatives, including centrally cleared swaps. Brokers, futures commission merchants and clearinghouses can ask for margin in excess of the regulatory minimum, or increase the margin amount, in certain circumstances.
For financial reporting purposes, cash collateral that has been pledged to cover obligations of the Fund, if any, is reported separately on the Statement of Assets and Liabilities as cash pledged as collateral. Non-cash collateral pledged by the Fund, if any, is noted in the Statement of Investments.
Generally, the amount of collateral due from or to a party must exceed a minimum transfer amount threshold (e.g. $250,000) before a transfer has to be made. To the extent amounts due to the Fund from its counterparties are not fully collateralized, contractually or otherwise, the Fund bears the risk of loss from counterparty nonperformance.
The following table presents the valuations of derivative instruments by risk exposure as reported within the Statement of Assets and Liabilities as of June 30, 2015:
| | | | | | | | | | | | |
| | | Asset Derivatives | | | Liability Derivatives | |
Derivatives Not Accounted for as
Hedging Instruments | | Statement of Assets and Liabilities Location | | Value | | | Statement of Assets and Liabilities Location | | Value | |
| |
Equity contracts | | Investments, at value | | $ | 2,827 | * | | Options written, at value | | $ | 41,292 | |
*Amounts relate to purchased options.
The effect of derivative instruments on the Statement of Operations is as follows:
| | | | | | | | | | | | |
| Amount of Realized Gain or (Loss) Recognized on Derivatives | |
| |
Derivatives Not Accounted for as Hedging
Instruments | | Investment from unaffiliated
companies* | | | Closing and expiration of option
contracts written | | | Total | |
| |
Equity contracts | | | $ (4,705) | | | | $ 33,775 | | | $ | 29,070 | |
|
| *Includes purchased option contracts and purchased swaption contracts and written option contracts exercised, if any. | |
|
| Amount of Change in Unrealized Gain or (Loss) Recognized on Derivatives | |
| |
Derivatives Not Accounted for as Hedging
Instruments | | Investments* | | | Option contracts written | | | Total | |
| |
Equity contracts | | | $ 1,799 | | | | $ (15,933) | | | $ | (14,134) | |
*Includes purchased option contracts and purchased swaption contracts, if any.
6. Shares of Beneficial Interest
The Fund has authorized an unlimited number of $0.001 par value shares of beneficial interest of each class. Transactions in shares of beneficial interest were as follows:
| | | | | | | | | | | | | | | | |
| | | Six Months Ended June 30, 2015 | | | Year Ended December 31, 2014 | |
| | | Shares | | | Amount | | | Shares | | | Amount | |
| |
Non-Service Shares | | | | | | | | | | | | | | | | |
Sold | | | 2,521 | | | $ | 30,570 | | | | 6,123 | | | $ | 72,670 | |
Dividends and/or distributions reinvested | | | 3,275 | | | | 36,220 | | | | 1,525 | | | | 17,847 | |
Redeemed | | | (992 | ) | | | (12,152 | ) | | | (2,228 | ) | | | (26,067 | ) |
| | | | |
Net increase | | | 4,804 | | | $ | 54,638 | | | | 5,420 | | | $ | 64,450 | |
| | | | |
| | | | | | | | | | | | | | | | |
| |
Service Shares | | | | | | | | | | | | | | | | |
Sold | | | 55,458 | | | $ | 801,504 | | | | 91,016 | | | $ | 1,284,880 | |
Dividends and/or distributions reinvested | | | 76,880 | | | | 1,034,803 | | | | 43,892 | | | | 614,048 | |
Redeemed | | | (79,544 | ) | | | (1,157,092 | ) | | | (146,710 | ) | | | (2,074,565 | ) |
| | | | |
Net increase (decrease) | | | 52,794 | | | $ | 679,215 | | | | (11,802 | ) | | $ | (175,637 | ) |
| | | | |
7. Purchases and Sales of Securities
The aggregate cost of purchases and proceeds from sales of securities, other than short-term obligations and investments in IMMF, for the six months ended June 30, 2015 were as follows:
| | | | | | | | |
| | | Purchases | | | Sales | |
| |
Investment securities | | $ | 2,991,268 | | | $ | 3,177,108 | |
8. Fees and Other Transactions with Affiliates
Management Fees. Under the investment advisory agreement, the Fund pays the Manager a management fee based on the daily net assets of the Fund at an annual rate as shown in the following table:
20 OPPENHEIMER EQUITY INCOME FUND/VA
8. Fees and Other Transactions with Affiliates (Continued)
| | | | | | |
| Fee Schedule | | | | | |
|
Up to $200 million | | | 0.75 | % | | |
Next $200 million | | | 0.72 | | | |
Next $200 million | | | 0.69 | | | |
Next $200 million | | | 0.66 | | | |
Over $800 million | | | 0.60 | | | |
The Fund’s effective management fee for the six months ended June 30, 2015 was 0.75% of average annual net assets before any applicable waivers.
Sub-Adviser Fees. The Manager has retained the Sub-Adviser to provide the day-to-day portfolio management of the Fund. Under the Sub-Advisory Agreement, the Manager pays the Sub-Adviser an annual fee in monthly installments, equal to a percentage of the investment management fee collected by the Manager from the Fund, which shall be calculated after any investment management fee waivers. The fee paid to the Sub-Adviser is paid by the Manager, not by the Fund.
Transfer Agent Fees. OFI Global (the “Transfer Agent”) serves as the transfer and shareholder servicing agent for the Fund. The Fund pays the Transfer Agent a fee based on annual net assets. Fees incurred and average net assets for each class with respect to these services are detailed in the Statement of Operations and Financial Highlights, respectively.
Sub-Transfer Agent Fees. The Transfer Agent has retained Shareholder Services, Inc., a wholly-owned subsidiary of OFI (the “Sub-Transfer Agent”), to provide the day-to-day transfer agent and shareholder servicing of the Fund. Under the Sub-Transfer Agency Agreement, the Transfer Agent pays the Sub-Transfer Agent an annual fee in monthly installments, equal to a percentage of the transfer agent fee collected by the Transfer Agent from the Fund, which shall be calculated after any applicable fee waivers. The fee paid to the Sub-Transfer Agent is paid by the Transfer Agent, not by the Fund.
Trustees’ Compensation. The Fund’s Board of Trustees (“Board”) has adopted a compensation deferral plan for Independent Trustees that enables Trustees to elect to defer receipt of all or a portion of the annual compensation they are entitled to receive from the Fund. For purposes of determining the amount owed to the Trustee under the plan, deferred amounts are treated as though equal dollar amounts had been invested in shares of the Fund or in other Oppenheimer funds selected by the Trustee. The Fund purchases shares of the funds selected for deferral by the Trustee in amounts equal to his or her deemed investment, resulting in a Fund asset equal to the deferred compensation liability. Such assets are included as a component of “Other” within the asset section of the Statement of Assets and Liabilities. Deferral of Trustees’ fees under the plan will not affect the net assets of the Fund and will not materially affect the Fund’s assets, liabilities or net investment income per share. Amounts will be deferred until distributed in accordance with the compensation deferral plan.
Distribution and Service Plan for Service Shares. The Fund has adopted a Distribution and Service Plan (the “Plan”) pursuant to Rule 12b-1 under the 1940 Act for Service shares to pay OppenheimerFunds Distributor, Inc. (the “Distributor”), for distribution related services, personal service and account maintenance for the Fund’s Service shares. Under the Plan, payments are made periodically at an annual rate of 0.25% of the daily net assets of Service shares of the Fund. The Distributor currently uses all of those fees to compensate sponsors of the insurance product that offers Fund shares, for providing personal service and maintenance of accounts of their variable contract owners that hold Service shares. These fees are paid out of the Fund’s assets on an on-going basis and increase operating expenses of the Service shares, which results in lower performance compared to the Fund’s shares that are not subject to a service fee. Fees incurred by the Fund under the Plan are detailed in the Statement of Operations.
Waivers and Reimbursements of Expenses. The Manager has contractually agreed to limit the Fund’s expenses after payments, waivers and/or reimbursements and reduction to custodian expenses, excluding expenses incurred directly or indirectly by the Fund as a result of investments in other investment companies, wholly-owned subsidiaries and pooled investment vehicles; so that those expenses, as percentages of daily net assets, will not exceed the annual rate of 0.80% for Non-Service shares and 1.05% for Service shares. During the six months ended June 30, 2015, the Manager waived fees and/or reimbursed the Fund $919 and $32,574 for Non-Service and Service shares, respectively.
The Manager will waive fees and/or reimburse Fund expenses in an amount equal to the indirect management fees incurred through the Fund’s investment in IMMF. During the six months ended June 30, 2015, the Manager waived fees and/or reimbursed the Fund $35 for IMMF management fees.
Waivers and/or reimbursements may be modified or terminated as set forth according to the terms in the prospectus.
9. Pending Litigation
In 2009, several lawsuits were filed as putative class actions and later consolidated before the U.S. District Court for the District of Colorado in connection with the investment performance of Oppenheimer Rochester California Municipal Fund (the “California Fund Suit”), a fund advised by OppenheimerFunds, Inc. (“OFI”), and distributed by its subsidiary OppenheimerFunds Distributor, Inc. ( “OFDI”). The plaintiffs asserted claims against OFI, OFDI and certain present and former trustees and officers of the Fund under the federal securities laws, alleging, among other things, that the disclosure documents of the Fund contained misrepresentations and omissions and the investment policies of the Fund were not followed. Plaintiffs in the California Fund Suit filed an amended complaint and defendants filed a motion to dismiss. In 2011, the court issued an order which granted in part and denied in part the defendants’ motion to dismiss. In 2012, plaintiffs filed a motion, which defendants opposed, to certify a class and appoint class
21 OPPENHEIMER EQUITY INCOME FUND/VA
| | |
NOTES TO FINANCIAL STATEMENTS Unaudited / Continued | | |
9. Pending Litigation (Continued)
representatives and class counsel. In March 2015, the court granted plaintiffs’ motion for class certification. In May 2015, the U.S. Court of Appeals for the Tenth Circuit vacated the class certification order and remanded the matter to the district court for further proceedings. In July 2015, the district court held an evidentiary hearing on plaintiffs’ motion for class certification. OFI and OFDI believe the California Fund Suit is without merit; that it is premature to render any opinion as to the likelihood of an outcome unfavorable to them in the California Fund Suit; and that no estimate can yet be made as to the amount or range of any potential loss.
22 OPPENHEIMER EQUITY INCOME FUND/VA
PORTFOLIO PROXY VOTING POLICIES AND PROCEDURES; UPDATES TO STATEMENTS OF INVESTMENTS Unaudited
The Fund has adopted Portfolio Proxy Voting Policies and Procedures under which the Fund votes proxies relating to securities (“portfolio proxies”) held by the Fund. A description of the Fund’s Portfolio Proxy Voting Policies and Procedures is available (i) without charge, upon request, by calling the Fund toll-free at 1.800.525.7048, (ii) on the Fund’s website at www.oppenheimerfunds.com, and (iii) on the SEC’s website at www.sec.gov. In addition, the Fund is required to file Form N-PX, with its complete proxy voting record for the 12 months ended June 30th, no later than August 31st of each year. The Fund’s voting record is available (i) without charge, upon request, by calling the Fund toll-free at 1.800.525.7048, and (ii) in the Form N-PX filing on the SEC’s website at www.sec.gov.
The Fund files its complete schedule of portfolio holdings with the SEC for the first quarter and the third quarter of each fiscal year on Form N-Q. The Fund’s Form N-Q filings are available on the SEC’s website at www.sec.gov. Those forms may be reviewed and copied at the SEC’s Public Reference Room in Washington, D.C. Information on the operation of the Public Reference Room may be obtained by calling 1-800-SEC-0330.
23 OPPENHEIMER EQUITY INCOME FUND/VA
| | |
DISTRIBUTION SOURCES Unaudited | | |
For any distribution that took place over the Fund’s reporting period, the table below details on a per-share basis the percentage of the Fund’s total distribution payment amount that was derived from the following sources: net income, net profit from the sale of securities, and other capital sources. This information is based upon income and capital gains using generally accepted accounting principles as of the date of each distribution. Because the Fund is actively managed, the relative amount of the Fund’s total distributions derived from various sources over the calendar year may change. Please note that this information should not be used for tax reporting purposes as the tax character of distributable income may differ from the amounts used for this notification. You will receive IRS tax forms in the first quarter of each calendar year detailing the actual amount of the taxable and non-taxable portion of distributions paid to you during the tax year.
For the most current information, please go to oppenheimerfunds.com. Select your Fund, then the ’Detailed’ tab; where ‘Dividends’ are shown, the Fund’s latest pay date will be followed by the sources of any distribution, updated daily.
| | | | | | | | | | | | | | | | |
| Fund Name | | Pay Date | | | Net Income | | | Net Profit
from Sale | | | Other Capital
Sources | |
| |
Oppenheimer Equity Income Fund/VA | | | 6/16/15 | | | | 20.2% | | | | 79.8% | | | | 0.0% | |
24 OPPENHEIMER EQUITY INCOME FUND/VA
THIS PAGE INTENTIONALLY LEFT BLANK.
25 OPPENHEIMER EQUITY INCOME FUND/VA
THIS PAGE INTENTIONALLY LEFT BLANK.
26 OPPENHEIMER EQUITY INCOME FUND/VA
THIS PAGE INTENTIONALLY LEFT BLANK.
27 OPPENHEIMER EQUITY INCOME FUND/VA
OPPENHEIMER EQUITY INCOME FUND/VA
A Series of Oppenheimer Variable Account Funds
��
| | |
| Trustees and Officers | | Sam Freedman, Chairman of the Board of Trustees and Trustee |
| | Jon S. Fossel, Trustee |
| | Richard F. Grabish, Trustee |
| | Beverly L. Hamilton, Trustee |
| | Victoria J. Herget, Trustee |
| | Robert J. Malone, Trustee |
| | F. William Marshall, Jr., Trustee |
| | Karen L. Stuckey, Trustee |
| | James D. Vaughn, Trustee |
| | Arthur P. Steinmetz, Trustee, President and Principal Executive Officer |
| | Michael S. Levine, Vice President |
| | Arthur S. Gabinet, Secretary and Chief Legal Officer |
| | Jennifer Sexton, Vice President and Chief Business Officer |
| | Mary Ann Picciotto, Chief Compliance Officer and Chief Anti-Money Laundering Officer |
| | Brian W. Wixted, Treasurer and Principal Financial & Accounting Officer |
| |
| Manager | | OFI Global Asset Management, Inc. |
| |
| Sub-Adviser | | OppenheimerFunds, Inc. |
| |
| Distributor | | OppenheimerFunds Distributor, Inc. |
| |
Transfer and Shareholder Servicing Agent | | OFI Global Asset Management, Inc. |
| |
| Sub-Transfer Agent | | Shareholder Services, Inc. DBA OppenheimerFunds Services |
| |
Independent Registered Public Accounting Firm | | KPMG LLP |
| |
| Legal Counsel | | Ropes & Gray LLP |
| |
| | Before investing in any of the Oppenheimer funds, investors should carefully consider a fund’s investment objectives, risks, charges and expenses. Fund prospectuses and summary prospectuses contain this and other information about the funds and may be obtained by asking your financial advisor, visiting oppenheimerfunds.com or calling us at 1.800.988.8287. Read prospectuses and summary prospectuses carefully before investing. |
| |
| | The financial statements included herein have been taken from the records of the Fund without examination of those records by the independent registered public accounting firm. |
| |
| | © 2015 OppenheimerFunds, Inc. All rights reserved. Oppenheimer funds are distributed by OppenheimerFunds Distributor, Inc. |

PORTFOLIO MANAGERS: Mark Hamilton; David Wharmby, CFA; Brian Watson, CFA; Benjamin Rockmuller, CFA; and Dokyoung Lee
AVERAGE ANNUAL TOTAL RETURNS FOR THE PERIODS ENDED 6/30/15
| | | | | | | | | | | | | | | | |
| | | Inception Date | | | 6-Months | | | 1-Year | | | Since Inception | |
Non-Service Shares | | | 11/14/13 | | | | -0.10% | | | | -2.64% | | | | 3.15% | |
Service Shares | | | 11/14/13 | | | | -0.20 | | | | -2.84 | | | | 2.99 | |
Bank of America Merrill Lynch 3-Month U.S. Treasury Bill Index | | | | | | | 0.01 | | | | 0.02 | | | | 0.04 | |
Performance data quoted represents past performance, which does not guarantee future results. The investment return and principal value of an investment in the Fund will fluctuate so that an investor’s shares, when redeemed, may be worth more or less than their original cost. Current performance may be lower or higher than the performance quoted. For performance data current to the most recent month end, call us at 1.800.988.8287. The Fund’s total returns should not be expected to be the same as the returns of other funds, whether or not both funds have the same portfolio managers and/or similar names. The Fund’s total returns include changes in share price and reinvested distributions but do not include the charges associated with the separate account products that offer this Fund. Such performance would have been lower if such charges were taken into account.
The Fund’s performance is compared to the performance of the Bank of America Merrill Lynch 3-Month U.S. Treasury Bill Index. The Bank of America (BofA) Merrill Lynch 3-month U.S. Treasury Bill Index is an index of short-term U.S. Government securities with a remaining term to final maturity of less than three months. The Index is unmanaged, includes the reinvestment of dividends and cannot be purchased directly by investors. While index comparisons may be useful to provide a benchmark for the Fund’s performance, it must be noted that the Fund’s investments are not limited to the investments comprising the Index. Index performance includes reinvestment of income, but does not reflect transaction costs, fees, expenses or taxes. Index performance is shown for illustrative purposes only as a benchmark for the Fund’s performance, and does not predict or depict performance of the Fund. The Fund’s performance reflects the effects of the Fund’s business and operating expenses.
TOP HOLDINGS AND ALLOCATIONS
| | | | |
TOP TEN COMMON STOCK HOLDINGS | | | |
Honeywell International, Inc. | | | 0.6 | % |
Macy’s, Inc. | | | 0.5 | |
Starwood Property Trust, Inc. | | | 0.5 | |
BCE, Inc. | | | 0.5 | |
Brinker International, Inc. | | | 0.5 | |
UnitedHealth Group, Inc. | | | 0.5 | |
Allergan plc | | | 0.4 | |
Google, Inc., Cl. A | | | 0.4 | |
Cinemark Holdings, Inc. | | | 0.4 | |
Energy Transfer Equity LP | | | 0.4 | |
Portfolio holdings and allocations are subject to change. Percentages are as of June 30, 2015, and are based on net assets. For more current Fund holdings, please visit oppenheimerfunds.com.
SECTOR ALLOCATION
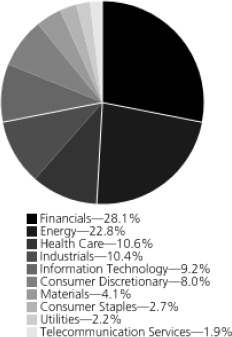
Portfolio holdings and allocations are subject to change. Percentages are as of June 30, 2015, and are based on the total market value of common stocks.
2 OPPENHEIMER GLOBAL MULTI-ALTERNATIVES FUND/VA
Fund Performance Discussion
The Fund’s Non-Service shares returned -0.10% during the reporting period. On a relative basis, the Fund underperformed the Bank of America Merrill Lynch 3-Month U.S. Treasury Bill Index, which produced a return of 0.01%.
MARKET OVERVIEW
The opening months of 2015 were marked by cooling U.S. growth after the strong fourth quarter of 2014. The dollar continued to strengthen significantly during this time against most of the U.S.’s major trading partners, which acted as a drag on growth. Businesses, especially U.S. firms with revenues dependent on exporting goods and services, cited this as a headwind. European Central Bank (“ECB”) President Mario Draghi announced the purchase of €60 billion a month in sovereign bonds from Eurozone countries for at least 19 months, a form of quantitative easing (“QE”) that is projected to increase the ECB’s balance sheet by over €1 trillion. The announcement and implementation of these extraordinary monetary policies had a significant impact on financial markets, with European markets rallying and the euro falling against most major trading partners.
Over the second half of the reporting period, market volatility returned despite a continuation of slow and stable growth in the U.S. Deflationary pressures also appeared to have subsided during the period. U.S. Treasury rates rose, although they still reside at historically low levels. Oil prices rebounded from around $48 dollars per barrel to nearly $60 dollars per barrel. It is important to note that while these levels still represent a significant discount to previous years, we believe the lower prices should continue to have a stimulative effect on developed and emerging world oil importers. Meanwhile, emerging issues in Greece highlighted downside risks to the global economy and capital markets. Greece’s ongoing negotiations with creditors and ultimate default on a $1.7 billion International Monetary Fund (“IMF”) payment on June 30, 2015, led to a more challenging environment for the Eurozone. Shortly after the period ended, Eurozone leaders agreed to offer Greece a third bailout, averting a Greek exit for the time being.
Longer-term U.S. Treasury rates continued to swing fairly wildly during the reporting period. Over the first half of the reporting period, the 10-year treasury rate fell, starting the reporting period at 2.17% and declining to 1.92% at the end of March. However, over the second half of the reporting period, longer-term U.S. Treasury rates marched higher as the 10-year treasury rate increased to 2.49% before ending the period at 2.35% due to the uncertainty around Greece. This net upward movement in rates ultimately contributed to U.S. Treasuries generating negative total returns during this time and for the overall reporting period.
FUND REVIEW
During the reporting period, top performers for the Fund included its fundamental alpha-oriented alternative strategy and its exposure to senior loans. The fundamental alpha-oriented alternative strategy offers the flexibility often associated with hedge fund-like strategies, while providing daily liquidity and transparency. The strategy seeks to provide investors with strong risk-adjusted returns that have low sensitivity to traditional market factors over the long-term. The investment process has an underlying value philosophy that combines bottom-up and top-down fundamental analysis for security selection and portfolio construction. The strategy is able to invest both long and short across three distinct alternative investment strategies including Long/Short Equity, Long/Short Credit, and Long/Short other assets (which can include currencies, rates, sovereigns, and commodities). The Long/Short Equity and Long/Short Credit strategies were the strongest performers this reporting period. In terms of senior loans, the Fund invests primarily in below-investment-grade loans issued by companies that have senior or secured claims on assets. The interest rates on the loans are floating so they provide a source of income with lower sensitivity to interest rate movements. The team employs a bottom-up fundamental approach to finding senior loans issued by companies with leading market share, innovative products, valuable assets and well regarded management. The senior loan market had a positive period mostly supported by strong technical factors. These included strong demand and an improved asset class flow environment. This income alternative proved to be a good diversifier by producing a positive return in a rising interest rate environment.
Top detractors from performance this reporting period included the Fund’s exposure to energy infrastructure master limited partnerships (“MLPs”) and its quantitative-driven alternative investment strategies. Our MLP strategy seeks to invest in U.S. midstream MLPs that the investment team believes have attractive risk and reward characteristics. MLPs had a difficult period as continued weakness in energy related commodities drove prices lower. MLPs also typically utilize fixed rate debt for a majority of their borrowing, which are typically more sensitive to shifts in interest rates. This led MLPs to suffer with the back-up in interest rates this reporting period. More importantly, we believe investment returns available to most midstream participants are robust enough that a reasonable increase in borrowing costs will not overly impact the profitability of midstream investment opportunities. Given the relatively low yield environment we are facing, over the long-term we believe investor interest in income generating asset classes will remain strong, and that MLPs are positioned to benefit. The Fund’s quantitative-driven alternative investment strategies leverages four key strategies that seek to generate attractive risk-adjusted returns that exhibit low correlation to traditional stocks and bonds. The largest detractor was the Global Macro strategy, which involves tactical positioning in broad asset and/or sector
3 OPPENHEIMER GLOBAL MULTI-ALTERNATIVES FUND/VA
classes. The strategy was hurt from mistimed tilts on interest rates and equities. The underperformance was partially offset by the Equity Market Neutral strategy, which had positive performance for the period.
STRATEGY & OUTLOOK
The Fund is comprised of a flexible blend of alternative strategies and assets and is designed to be a turnkey alternative solution that improves the risk/reward tradeoff of a traditional balanced portfolio. The alternative strategies (e.g. quantitative-driven alternative investment strategies, fundamental alpha-oriented alternative strategy, and currency alpha strategy), which are more alpha-oriented, rely less on the direction of major markets and economic factors to generate returns. Income alternatives (e.g. MLPs, senior loans, and event-linked bonds) generally provide exposure to relatively stable income producing assets with potentially less interest rate sensitivity than traditional fixed income allocations. Real asset alternatives (commodities and global real estate), have the potential to help guard against inflation over the long term. We combine these strategies and assets to provide a core, alternative exposure that can potentially offset some of the risk from equity drawdowns, rising interest rates, and inflationary shocks.
Over the second half of the reporting period, diverging central bank polices caused global equities to outperform their domestic counterparts as volatility increased and returns tapered off in U.S. equities. Going forward, we expect more measured returns to both stocks and bonds. Given we are in a world where QE is the norm internationally but not in the U.S., we expect to see greater dispersion across financial assets. In such an environment further diversifying in alternatives can improve the risk/reward profile for investors.
The Fund’s investment strategy and focus can change over time. The mention of specific fund holdings does not constitute a recommendation by OppenheimerFunds, Inc. or its affiliates.
Shares of Oppenheimer funds are not deposits or obligations of any bank, are not guaranteed by any bank, are not insured by the FDIC or any other agency, and involve investment risks, including the possible loss of the principal amount invested.
4 OPPENHEIMER GLOBAL MULTI-ALTERNATIVES FUND/VA
Fund Expenses
Fund Expenses. As a shareholder of the Fund, you incur two types of costs: (1) transaction costs and (2) ongoing costs, including management fees; distribution and service fees; and other Fund expenses. These examples are intended to help you understand your ongoing costs (in dollars) of investing in the Fund and to compare these costs with the ongoing costs of investing in other mutual funds.
The examples are based on an investment of $1,000.00 invested at the beginning of the period and held for the entire 6-month period ended June 30, 2015.
Actual Expenses. The first section of the table provides information about actual account values and actual expenses. You may use the information in this section for the class of shares you hold, together with the amount you invested, to estimate the expense that you paid over the period. Simply divide your account value by $1,000.00 (for example, an $8,600.00 account value divided by $1,000.00 = 8.60), then multiply the result by the number in the first section under the heading entitled “Expenses Paid During the 6 Months Ended June 30, 2015” to estimate the expenses you paid on your account during this period.
Hypothetical Example for Comparison Purposes.
The second section of the table provides information about hypothetical account values and hypothetical expenses based on the Fund’s actual expense ratio for each class of shares, and an assumed rate of return of 5% per year for each class before expenses, which is not the actual return. The hypothetical account values and expenses may not be used to estimate the actual ending account balance or expenses you paid for the period. You may use this information to compare the ongoing costs of investing in the Fund and other funds. To do so, compare this 5% hypothetical example for the class of shares you hold with the 5% hypothetical examples that appear in the shareholder reports of the other funds.
Please note that the expenses shown in the table are meant to highlight your ongoing costs only and do not reflect any charges associated with the separate accounts that offer this Fund. Therefore, the “hypothetical” lines of the table are useful in comparing ongoing costs only, and will not help you determine the relative total costs of owning different funds. In addition, if these separate account charges were included your costs would have been higher.
| | | | | | | | | | | | | | |
| Actual | | Beginning
Account Value January 1, 2015 | | | Ending Account
Value
June 30, 2015 | | | Expenses Paid During
6 Months Ended
June 30, 2015 | | | |
Non-Service shares | | $ | 1,000.00 | | | $ | 999.00 | | | $ | 6.86 | | | |
Service shares | | | 1,000.00 | | | | 998.00 | | | | 8.06 | | | |
| | | | |
| Hypothetical | | | | | | | | | | | |
(5% return before expenses) | | | | | | | | | | | | | | |
Non-Service shares | | | 1,000.00 | | | | 1,017.95 | | | | 6.93 | | | |
Service shares | | | 1,000.00 | | | | 1,016.76 | | | | 8.13 | | | |
Expenses are equal to the Fund’s annualized expense ratio for that class, multiplied by the average account value over the period, multiplied by 181/365 (to reflect the one-half year period). Those annualized expense ratios, excluding indirect expenses from affiliated funds, based on the 6-month period ended June 30, 2015 are as follows:
| | | | | | |
| Class | | Expense Ratios | | | |
Non-Service shares | | | 1.38% | | | |
Service shares | | | 1.62 | | | |
The expense ratios reflect voluntary waivers and/or reimbursements of expenses by the Fund’s Manager. Some of these undertakings may be modified or terminated at any time, as indicated in the Fund’s prospectus. The “Financial Highlights” tables in the Fund’s financial statements, included in this report, also show the gross expense ratios, without such waivers or reimbursements and reduction to custodian expenses, if applicable.
5 OPPENHEIMER GLOBAL MULTI-ALTERNATIVES FUND/VA
| | |
| |
| CONSOLIDATED STATEMENT OF INVESTMENTS June 30, 2015 Unaudited | | |
| | | | | | | | |
| | | Shares | | | Value | |
Common Stocks—26.2% | | | | | | | | |
Consumer Discretionary—2.1% | | | | | | | | |
Hotels, Restaurants & Leisure—0.5% | | | | | |
Brinker International, Inc.1,3 | | | 35,245 | | | $ | 2,031,874 | |
Fujita Kanko, Inc. | | | 43,000 | | | | 138,721 | |
| | | | | | | | |
| | | | | | | 2,170,595 | |
| | | | | | | | |
Internet & Catalog Retail—0.0% | | | | | | | | |
Orbitz Worldwide, Inc.2 | | | 13,965 | | | | 159,480 | |
| | | | | | | | |
Media—0.7% | | | | | | | | |
Cinemark Holdings, Inc.1,3 | | | 41,660 | | | | 1,673,482 | |
DISH Network Corp., Cl. A2 | | | 13,163 | | | | 891,267 | |
SFX Entertainment, Inc.2 | | | 62,444 | | | | 280,373 | |
| | | | | | | | |
| | | | | | | 2,845,122 | |
| | | | | | | | |
Multiline Retail—0.9% | | | | | | | | |
Macy’s, Inc.1,3 | | | 33,365 | | | | 2,251,137 | |
Target Corp.1,3 | | | 15,905 | | | | 1,298,325 | |
| | | | | | | | |
| | | | | | | 3,549,462 | |
| | | | | | | | |
Consumer Staples—0.7% | | | | | | | | |
Beverages—0.2% | | | | | | | | |
Coca-Cola Co. (The)1,3 | | | 19,460 | | | | 763,416 | |
| | | | | | | | |
Tobacco—0.5% | | | | | | | | |
Altria Group, Inc.1,3 | | | 26,642 | | | | 1,303,060 | |
Philip Morris International, Inc.1 | | | 11,110 | | | | 890,689 | |
| | | | | | | | |
| | | | | | | 2,193,749 | |
| | | | | | | | |
Energy—6.0% | | | | | | | | |
Energy Equipment & Services—0.3% | | | | | | | | |
Schlumberger Ltd. | | | 7,335 | | | | 632,203 | |
Seadrill Partners LLC4 | | | 32,241 | | | | 397,854 | |
| | | | | | | | |
| | | | | | | 1,030,057 | |
| | | | | | | | |
Oil, Gas & Consumable Fuels—5.7% | | | | | | | | |
Buckeye Partners LP1,4 | | | 13,575 | | | | 1,003,600 | |
Canadian Natural Resources Ltd. | | | 11,272 | | | | 305,941 | |
Chevron Corp. | | | 6,065 | | | | 585,091 | |
ConocoPhillips3 | | | 12,060 | | | | 740,605 | |
DCP Midstream Partners LP3,4 | | | 9,390 | | | | 288,179 | |
Energy Transfer Equity LP3,4 | | | 25,805 | | | | 1,655,907 | |
Energy Transfer Partners LP1,3,4 | | | 31,502 | | | | 1,644,404 | |
Enterprise Products Partners LP1,3,4 | | | 55,050 | | | | 1,645,444 | |
EOG Resources, Inc. | | | 7,195 | | | | 629,922 | |
EQT Midstream Partners LP1,4 | | | 9,220 | | | | 751,799 | |
Genesis Energy LP1,4 | | | 14,755 | | | | 647,597 | |
Magellan Midstream Partners LP3,4 | | | 21,585 | | | | 1,583,907 | |
MarkWest Energy Partners LP4 | | | 13,545 | | | | 763,667 | |
NGL Energy Partners LP1,3,4 | | | 20,355 | | | | 617,367 | |
Niska Gas Storage Partners LLC, Cl. U4 | | | 82,643 | | | | 304,126 | |
Noble Energy, Inc.1 | | | 9,900 | | | | 422,532 | |
NuStar Energy LP1,4 | | | 1,060 | | | | 62,911 | |
NuStar GP Holdings LLC4 | | | 10,960 | | | | 417,138 | |
ONEOK, Inc. | | | 10,585 | | | | 417,896 | |
Plains All American Pipeline LP1,4 | | | 27,735 | | | | 1,208,414 | |
Plains GP Holdings LP, Cl. A | | | 3,300 | | | | 85,272 | |
Spectra Energy Partners LP1,4 | | | 8,305 | | | | 382,860 | |
Sunoco Logistics Partners LP3,4 | | | 38,795 | | | | 1,475,374 | |
Tallgrass Energy GP LP, Cl. A2 | | | 18,078 | | | | 581,208 | |
Tallgrass Energy Partners LP4 | | | 12,200 | | | | 586,576 | |
Targa Resources Corp. | | | 2,300 | | | | 205,206 | |
Targa Resources Partners LP1,4 | | | 12,119 | | | | 467,793 | |
TC PipeLines LP4 | | | 18,920 | | | | 1,078,440 | |
Tesoro Logistics LP4 | | | 11,505 | | | | 657,166 | |
TransMontaigne Partners LP4 | | | 6,005 | | | | 228,190 | |
Valero Energy Corp.3 | | | 7,620 | | | | 477,012 | |
Western Gas Partners LP4 | | | 4,875 | | | | 308,929 | |
Williams Cos., Inc. (The)1 | | | 4,440 | | | | 254,812 | |
| | | | | | | | |
| | | Shares | | | Value | |
| Oil, Gas & Consumable Fuels (Continued) | |
| Williams Partners LP4 | | | 30,407 | | | $ | 1,472,611 | |
| | | | | | | | |
| | | | | | | 23,957,896 | |
| | | | | | | | |
| Financials—7.3% | | | | | | | | |
| Capital Markets—0.0% | | | | | | | | |
| Goldman Sachs Group, Inc. (The) | | | 668 | | | | 139,472 | |
| | | | | | | | |
| Commercial Banks—0.7% | | | | | | | | |
| Citigroup, Inc.1,3 | | | 15,280 | | | | 844,067 | |
| JPMorgan Chase & Co.3 | | | 14,815 | | | | 1,003,865 | |
| M&T Bank Corp. | | | 6,325 | | | | 790,182 | |
| Wells Fargo & Co. | | | 5,880 | | | | 330,691 | |
| | | | | | | | |
| | | | | | | 2,968,805 | |
| | | | | | | | |
| Insurance—0.8% | | | | | | | | |
| ACE Ltd.1 | | | 15,625 | | | | 1,588,750 | |
| Allstate Corp. (The) | | | 9,260 | | | | 600,696 | |
| HCC Insurance Holdings, Inc. | | | 4,438 | | | | 341,016 | |
| Meadowbrook Insurance Group, Inc. | | | 18,552 | | | | 159,547 | |
| Unum Group | | | 16,500 | | | | 589,875 | |
| | | | | | | | |
| | | | | | | 3,279,884 | |
| | | | | | | | | |
| Real Estate Investment Trusts (REITs)—4.8% | |
| Acadia Realty Trust | | | 11,210 | | | | 326,323 | |
| Alexandria Real Estate Equities, Inc. | | | 1,520 | | | | 132,939 | |
| American Assets Trust, Inc. | | | 9,815 | | | | 384,846 | |
| Associated Estates Realty Corp. | | | 7,531 | | | | 215,612 | |
| AvalonBay Communities, Inc. | | | 3,987 | | | | 637,402 | |
| Blackstone Mortgage Trust, Inc., Cl. A | | | 40,485 | | | | 1,126,293 | |
| Boston Properties, Inc. | | | 3,960 | | | | 479,318 | |
| Canadian Real Estate Investment Trust | | | 4,680 | | | | 159,060 | |
| Champion REIT | | | 183,000 | | | | 100,191 | |
| Chatham Lodging Trust | | | 5,260 | | | | 139,232 | |
| Chesapeake Lodging Trust | | | 11,210 | | | | 341,681 | |
| CubeSmart | | | 21,400 | | | | 495,624 | |
| Derwent London plc | | | 5,650 | | | | 301,693 | |
| Dexus Property Group | | | 33,300 | | | | 186,312 | |
| Equity Residential | | | 12,540 | | | | 879,932 | |
| Essex Property Trust, Inc. | | | 3,810 | | | | 809,625 | |
| Eurocommercial Properties NV | | | 3,219 | | | | 134,579 | |
| Excel Trust, Inc. | | | 12,475 | | | | 196,731 | |
| Extra Space Storage, Inc. | | | 7,190 | | | | 468,932 | |
| FelCor Lodging Trust, Inc. | | | 29,770 | | | | 294,128 | |
| Fortune Real Estate Investment Trust | | | 132,000 | | | | 133,336 | |
| Frasers Centrepoint Trust | | | 89,000 | | | | 136,050 | |
| Goodman Group | | | 46,800 | | | | 225,827 | |
| Great Portland Estates plc | | | 24,740 | | | | 302,025 | |
| Hammerson plc | | | 25,050 | | | | 242,574 | |
| Health Care REIT, Inc. | | | 8,480 | | | | 556,542 | |
| Highwoods Properties, Inc. | | | 8,310 | | | | 331,984 | |
| Home Properties, Inc. | | | 4,730 | | | | 345,526 | |
| Host Hotels & Resorts, Inc. | | | 7,262 | | | | 144,005 | |
| Invincible Investment Corp. | | | 170 | | | | 90,658 | |
| Japan Retail Fund Investment Corp. | | | 82 | | | | 163,991 | |
| Kilroy Realty Corp. | | | 5,460 | | | | 366,639 | |
| Kimco Realty Corp. | | | 9,020 | | | | 203,311 | |
| Klepierre | | | 5,910 | | | | 259,741 | |
| Land Securities Group plc | | | 19,860 | | | | 375,450 | |
| LaSalle Hotel Properties | | | 6,210 | | | | 220,207 | |
| Link REIT (The) | | | 23,500 | | | | 137,618 | |
| Macerich Co. (The) | | | 9,065 | | | | 676,249 | |
| Paramount Group, Inc. | | | 8,760 | | | | 150,322 | |
| Physicians Realty Trust | | | 9,650 | | | | 148,224 | |
| Regency Centers Corp. | | | 6,580 | | | | 388,088 | |
| Simon Property Group, Inc. | | | 7,230 | | | | 1,250,935 | |
| Sovran Self Storage, Inc. | | | 3,290 | | | | 285,934 | |
| Starwood Property Trust, Inc. | | | 102,240 | | | | 2,205,317 | |
| Tanger Factory Outlet Centers, Inc. | | | 7,230 | | | | 229,191 | |
| Taubman Centers, Inc. | | | 2,830 | | | | 196,685 | |
6 OPPENHEIMER GLOBAL MULTI-ALTERNATIVES FUND/VA
| | | | | | | | |
| | | Shares | | | Value | |
Real Estate Investment Trusts (REITs) (Continued) | |
UDR, Inc. | | | 14,430 | | | $ | 462,193 | |
Unibail-Rodamco SE | | | 2,240 | | | | 568,396 | |
Vastned Retail NV | | | 2,188 | | | | 96,310 | |
Ventas, Inc. | | | 6,190 | | | | 384,337 | |
Vornado Realty Trust | | | 3,840 | | | | 364,531 | |
Westfield Corp. | | | 101,007 | | | | 705,181 | |
| | | | | | | | |
| | | | | | | 20,157,830 | |
| | | | | | | | |
Real Estate Management & Development—1.0% | |
CapitaLand Ltd. | | | 86,000 | | | | 223,228 | |
Daiwa House Industry Co. Ltd. | | | 12,000 | | | | 279,555 | |
Deutsche Annington Immobilien SE | | | 6,653 | | | | 187,547 | |
Global Logistic Properties Ltd. | �� | | 143,000 | | | | 268,128 | |
Hang Lung Properties Ltd. | | | 71,000 | | | | 210,579 | |
Helical Bar plc | | | 25,650 | | | | 162,694 | |
Hufvudstaden AB, Cl. A | | | 9,527 | | | | 115,831 | |
Mitsubishi Estate Co. Ltd. | | | 19,100 | | | | 410,330 | |
Mitsui Fudosan Co. Ltd. | | | 29,000 | | | | 809,661 | |
St. Modwen Properties plc | | | 24,720 | | | | 176,151 | |
| Sumitomo Realty & Development Co. Ltd. | | | 11,400 | | | | 399,586 | |
Sun Hung Kai Properties Ltd. | | | 31,000 | | | | 503,195 | |
Swire Properties Ltd. | | | 66,200 | | | | 210,084 | |
Unite Group plc (The) | | | 21,820 | | | | 195,814 | |
Wharf Holdings Ltd. (The) | | | 12,000 | | | | 79,813 | |
| | | | | | | | |
| | | | | | | 4,232,196 | |
| | | | | | | | |
Health Care—2.8% | | | | | | | | |
Biotechnology—0.0% | | | | | | | | |
Chelsea Therapeutics, Inc.2,5 | | | 10,531 | | | | — | |
| | | | | | | | |
Health Care Equipment & Supplies—0.4% | |
Baxter International, Inc.1,3 | | | 17,835 | | | | 1,247,202 | |
Medtronic plc | | | 5,932 | | | | 439,561 | |
| | | | | | | | |
| | | | | | | 1,686,763 | |
| | | | | | | | |
Health Care Providers & Services—0.9% | |
Catamaran Corp.2 | | | 3,034 | | | | 185,317 | |
Express Scripts Holding Co.2 | | | 3,870 | | | | 344,198 | |
HCA Holdings, Inc.2 | | | 3,185 | | | | 288,943 | |
Omnicare, Inc. | | | 3,319 | | | | 312,816 | |
UnitedHealth Group, Inc.1,3 | | | 16,295 | | | | 1,987,990 | |
| Universal Health Services, Inc., Cl. B3 | | | 5,055 | | | | 718,315 | |
| | | | | | | | |
| | | | | | | 3,837,579 | |
| | | | | | | | |
Pharmaceuticals—1.5% | | | | | | | | |
Allergan plc2,3 | | | 5,740 | | | | 1,741,860 | |
Ambit Biosciences Corp.2,5 | | | 10,347 | | | | 6,208 | |
Durata Therapeutics2,5 | | | 6,530 | | | | — | |
Furiex Pharmaceuticals, Inc.2,5 | | | 636 | | | | 3,107 | |
Hospira, Inc.2 | | | 1,858 | | | | 164,823 | |
Merck & Co., Inc.1,3 | | | 22,865 | | | | 1,301,705 | |
Novartis AG, ADR3 | | | 14,950 | | | | 1,470,183 | |
Roche Holding AG | | | 5,148 | | | | 1,445,319 | |
Teva Pharmaceutical Industries Ltd.2 | | | 10 | | | | — | |
| | | | | | | | |
| | | | | | | 6,133,205 | |
| | | | | | | | |
Industrials—2.7% | | | | | | | | |
Aerospace & Defense—1.2% | | | | | | | | |
Honeywell International, Inc.1,3 | | | 24,010 | | | | 2,448,300 | |
Lockheed Martin Corp. | | | 6,715 | | | | 1,248,318 | |
Northrop Grumman Corp.1 | | | 8,800 | | | | 1,395,944 | |
| | | | | | | | |
| | | | | | | 5,092,562 | |
| | | | | | | | |
Airlines—0.1% | | | | | | | | |
United Continental Holdings, Inc.2 | | | 6,530 | | | | 346,155 | |
| | | | | | | | |
Commercial Services & Supplies—0.5% | |
Metalico, Inc.2 | | | 598,625 | | | | 305,299 | |
Republic Services, Inc., Cl. A | | | 31,310 | | | | 1,226,412 | |
| | | | | | | | |
| | | Shares | | | Value | |
Commercial Services & Supplies (Continued) | |
Tyco International plc3 | | | 16,985 | | | $ | 653,583 | |
| | | | | | | | |
| | | | | | | 2,185,294 | |
| | | | | | | | |
Construction & Engineering—0.2% | | | | | | | | |
Quanta Services, Inc.1,2 | | | 34,090 | | | | 982,474 | |
| | | | | | | | |
Electrical Equipment—0.1% | | | | | | | | |
Polypore International, Inc.2 | | | 2,788 | | | | 166,945 | |
| | | | | | | | |
Machinery—0.2% | |
Flowserve Corp.1 | | | 12,990 | | | | 684,054 | |
Pall Corp. | | | 2,549 | | | | 317,223 | |
| | | | | | | | |
| | | | | | | 1,001,277 | |
| | | | | | | | |
Road & Rail—0.1% | | | | | | | | |
Quality Distribution, Inc.2 | | | 20,323 | | | | 314,193 | |
Union Pacific Corp. | | | 2,180 | | | | 207,907 | |
| | | | | | | | |
| | | | | | | 522,100 | |
| | | | | | | | |
Trading Companies & Distributors—0.3% | |
AerCap Holdings NV2,3 | | | 22,720 | | | | 1,040,349 | |
| | | | | | | | |
Information Technology—2.4% | | | | | | | | |
Communications Equipment—0.9% | | | | | | | | |
Juniper Networks, Inc.1,3 | | | 55,690 | | | | 1,446,269 | |
QUALCOMM, Inc.3 | | | 22,890 | | | | 1,433,601 | |
Telefonaktiebolaget LM Ericsson, Cl. B | | | 81,454 | | | | 843,174 | |
| | | | | | | | |
| | | | | | | 3,723,044 | |
| | | | | | | | |
Internet Software & Services—0.5% | | | | | | | | |
Dealertrack Technologies, Inc.2 | | | 5,499 | | | | 345,282 | |
Google, Inc., Cl. A1,2 | | | 3,206 | | | | 1,731,369 | |
| | | | | | | | |
| | | | | | | 2,076,651 | |
| | | | | | | | |
IT Services—0.1% | | | | | | | | |
IGATE Corp.2 | | | 4,547 | | | | 216,846 | |
| | | | | | | | |
Semiconductors & Semiconductor Equipment—0.4% | |
Altera Corp. | | | 6,037 | | | | 309,095 | |
Integrated Silicon Solution, Inc. | | | 8,768 | | | | 194,124 | |
OmniVision Technologies, Inc.2 | | | 7,320 | | | | 191,747 | |
Xilinx, Inc.3 | | | 24,395 | | | | 1,077,283 | |
| | | | | | | | |
| | | | | | | 1,772,249 | |
| | | | | | | | |
Software—0.2% | | | | | | | | |
Advent Software, Inc.1 | | | 3,768 | | | | 166,583 | |
ClickSoftware Technologies Ltd.2 | | | 17,231 | | | | 216,594 | |
Informatica Corp.2 | | | 4,153 | | | | 201,296 | |
Rally Software Development Corp.2 | | | 16,792 | | | | 326,604 | |
| | | | | | | | |
| | | | | | | 911,077 | |
| | | | | | | | |
Technology Hardware, Storage & Peripherals—0.3% | |
Apple, Inc.1,3 | | | 11,210 | | | | 1,406,014 | |
| | | | | | | | |
Materials—1.1% | |
Chemicals—0.9% | | | | | | | | |
Celanese Corp., Series A, Cl. A1 | | | 12,990 | | | | 933,721 | |
LyondellBasell Industries NV, Cl. A | | | 14,536 | | | | 1,504,767 | |
Methanex Corp. | | | 19,485 | | | | 1,084,535 | |
OM Group, Inc. | | | 9,626 | | | | 323,434 | |
| | | | | | | | |
| | | | | | | 3,846,457 | |
| | | | | | | | |
Containers & Packaging—0.2% | | | | | | | | |
Sonoco Products Co.1 | | | 14,690 | | | | 629,613 | |
| | | | | | | | |
Telecommunication Services—0.5% | |
Diversified Telecommunication Services—0.5% | |
BCE, Inc.1,3 | | | 48,615 | | | | 2,066,137 | |
| | | | | | | | |
Wireless Telecommunication Services—0.0% | |
NII Holdings, Inc.2 | | | 605 | | | | 9,886 | |
7 OPPENHEIMER GLOBAL MULTI-ALTERNATIVES FUND/VA
| | |
| |
| CONSOLIDATED STATEMENT OF INVESTMENTS Unaudited / Continued | | |
| | | | | | | | | | |
| | | Shares | | | Value | |
Utilities—0.6% | | | | | | | | |
Electric Utilities—0.5% | | | | | | | | |
Edison International1,3 | | | | | 19,595 | | | $ | 1,089,090 | |
PPL Corp.1 | | | | | 31,635 | | | | 932,283 | |
| | | | | | | | | | |
| | | | | | | | | 2,021,373 | |
| | | | | | | | | | |
Independent Power and Renewable Electricity
Producers—0.0% | |
| EME Reorganization Trust | | | | | 52,072 | | | | 651 | |
NRG Energy, Inc. | | | | | 171 | | | | 3,918 | |
Talen Energy Corp.1,2 | | | | | 3,856 | | | | 66,169 | |
| | | | | | | | | | |
| | | | | | | | | 70,738 | |
| | | | | | | | | | |
Multi-Utilities—0.1% | |
CMS Energy Corp.1 | | | | | 9,270 | | | | 295,157 | |
| | | | | | | | | | |
Total Common Stocks (Cost $110,688,878) | | | | | | | | | 109,487,909 | |
| | | |
| | | | | | | | | | |
Preferred Stocks—0.5% | |
| M&T Bank Corp., 6.375% Cum., Series A, Non- Vtg. | | | | | 340 | | | | 345,100 | |
| M&T Bank Corp., 6.375% Cum., Series C, Non- Vtg. | | | | | 475 | | | | 489,250 | |
| U.S. Bancorp, 6% Non-Cum., Series G, Non-Vtg.6 | | | | | 43,700 | | | | 1,163,731 | |
| | | | | | | | | | |
Total Preferred Stocks (Cost $2,039,508) | | | | | | | 1,998,081 | |
| | |
| | | Principal Amount | | | | |
Asset-Backed Securities—3.8% | |
| Aircraft Lease Securitisation Ltd., Series 2007-1A, Cl. G3, 0.445%, 5/10/326,7 | | $ | | | 1,020,793 | | | | 1,009,360 | |
| Airspeed Ltd., Series 2007-1A, Cl. G1, 0.456%, 6/15/326,7 | | | | | 4,630,102 | | | | 3,859,626 | |
| Bear Stearns Structured Products Trust, Series 2007-EMX1, Cl. A2, 1.487%, 3/25/376,8 | | | | | 1,600,000 | | | | 1,478,145 | |
| Blade Engine Securitization Ltd., Series 2006-1AW, Cl. A1, 0.486%, 9/15/416,7 | | | | | 2,009,956 | | | | 1,477,715 | |
| JP Morgan Mortgage Acquisition Corp., Series 2005-OPT2, Cl. M2, 0.637%, 12/25/356 | | | | | 1,836,000 | | | | 1,645,221 | |
| Morgan Stanley ABS Capital I, Inc. Trust, Series 2006-NC1, Cl. M1, 0.567%, 12/25/356 | | | | | 1,780,000 | | | | 1,518,342 | |
| New Century Home Equity Loan Trust, Series 2005-1, Cl. M2, 0.907%, 3/25/356 | | | | | 1,349,704 | | | | 1,192,501 | |
| SG Mortgage Securities Trust, Series 2005-OPT1, Cl. M2, 0.637%, 10/25/35 | | | | | 4,250,000 | | | | 3,480,678 | |
| | | | | | | | | | |
| Total Asset-Backed Securities (Cost $15,851,825) | | | | | | | | | 15,661,588 | |
| | | |
| | | | | | | | | | | |
Mortgage-Backed Obligation—0.5% | |
RAMP Series 2005-RS6 Trust, Series 2005- RS6, Cl. M4, 0.837%, 6/25/356 (Cost $2,029,529) | | | | | 2,300,000 | | | | 1,998,937 | |
| | | |
| | | | | | | | | | | |
Foreign Government Obligations—7.0% | |
Brazil—2.8% | | | | | | | | | | |
| Federative Republic of Brazil Unsec. Bonds: | | | | | | | | | | |
10.794%, 7/1/15 | | BRL | | | 16,000,000 | | | | 5,144,846 | |
12.355%, 1/1/16 | | BRL | | | 8,000,000 | | | | 2,403,852 | |
13.012%, 1/7/16 | | BRL | | | 13,900,000 | | | | 4,042,145 | |
| | | | | | | | | | |
| | | | | | | | | 11,590,843 | |
| | | | | | | | | | |
Japan—2.8% | | | | | | | | | | |
Japan Sr. Unsec. Bonds: 0.10% Sr. Unsec. Nts., 9/15/15 | | JPY | | | 330,000,000 | | | | 2,696,970 | |
| 0.10% Sr. Unsec. Nts., 1/15/16 | | JPY | | | 1,109,000,000 | | | | 9,066,561 | |
| | | | | | | | | | |
| | | | | | | | | 11,763,531 | |
| | | | | | | | | | |
| | | Principal
Amount | | | Value | |
Malaysia—1.4% | | | | | | | | | | |
Federation of Malaysia Sr. Unsec. Bonds: 3.197% Sr. Unsec. Nts., 10/15/15 | | MYR | | | 9,300,000 | | | $ | 2,467,714 | |
| 4.72% Sr. Unsec. Nts., 9/30/15 | | MYR | | | 13,600,000 | | | | 3,618,087 | |
| | | | | | | | | | |
| | | | | | | | | 6,085,801 | |
| | | | | | | | | | |
| Total Foreign Government Obligations (Cost $33,169,626) | | | | | | | | | 29,440,175 | |
| | | |
| | | | | | | | | | | |
Non-Convertible Corporate Bonds and Notes—6.9% | |
| Activision Blizzard, Inc., 5.625% Sr. Unsec. Nts., 9/15/218 | | | | | 250,000 | | | | 262,500 | |
| Alcatel-Lucent USA, Inc., 6.45% Sr. Unsec. Nts., 3/15/29 | | | | | 250,000 | | | | 259,063 | |
| Alcoa, Inc., 5.40% Sr. Unsec. Nts., 4/15/21 | | | | | 250,000 | | | | 262,967 | |
| Algeco Scotsman Global Finance plc, 8.50% Sr. Sec. Nts., 10/15/188 | | | | | 200,000 | | | | 194,000 | |
| Alliance Oil Co. Ltd., 10% Sr. Unsec. Nts., 3/11/196,8 | | | | | 200,000 | | | | 144,000 | |
| Ally Financial, Inc., 8% Sr. Unsec. Nts., 11/1/31 | | | | | 250,000 | | | | 300,313 | |
| ALROSA Finance SA, 7.75% Sr. Unsec. Nts., 11/3/208 | | | | | 200,000 | | | | 211,000 | |
| AngloGold Ashanti Holdings plc, 8.50% Sr. Unsec. Nts., 7/30/20 | | | | | 200,000 | | | | 220,750 | |
| Appvion, Inc., 9% Sec. Nts., 6/1/208 | | | | | 40,000 | | | | 25,400 | |
| ArcelorMittal, 6.25% Sr. Unsec. Nts., 3/1/21 | | | | | 250,000 | | | | 262,812 | |
| Arch Coal, Inc., 7.25% Sr. Unsec. Nts., 6/15/21 | | | | | 300,000 | | | | 43,500 | |
| Audatex North America, Inc., 6% Sr. Unsec. Nts., 6/15/218 | | | | | 250,000 | | | | 257,812 | |
| Avaya, Inc., 10.50% Sec. Nts., 3/1/218 | | | | | 200,000 | | | | 166,000 | |
| Banco BMG SA, 8.875% Sub. Nts., 8/5/208 | | | | | 200,000 | | | | 199,500 | |
| Banco do Brasil SA (Cayman), 9.25% Jr. Sub. Perpetual Bonds6,8,9 | | | | | 200,000 | | | | 191,000 | |
| Banco Pan SA, 8.50% Sub. Nts., 4/23/208 | | | | | 100,000 | | | | 101,125 | |
| Bancolombia SA, 5.125% Unsec. Sub. Nts., 9/11/22 | | | | | 300,000 | | | | 300,900 | |
| BMC Software Finance, Inc., 8.125% Sr. Unsec. Nts., 7/15/218 | | | | | 250,000 | | | | 203,437 | |
| Bombardier, Inc., 6.125% Sr. Unsec. Nts., 1/15/238 | | | | | 250,000 | | | | 223,125 | |
| Caesars Entertainment Operating Co., Inc., 10% Sec. Nts., 12/15/1810 | | | | | 50,000 | | | | 13,750 | |
| Case New Holland Industrial, Inc., 7.875% Sr. Unsec. Nts., 12/1/17 | | | | | 200,000 | | | | 220,000 | |
| CCO Holdings LLC/CCO Holdings Capital Corp.: 5.125% Sr. Unsec. Nts., 5/1/238 | | | | | 200,000 | | | | 195,250 | |
| 6.50% Sr. Unsec. Nts., 4/30/21 | | | | | 250,000 | | | | 262,187 | |
| Cemex Finance LLC, 6% Sr. Sec. Nts., 4/1/248 | | | | | 350,000 | | | | 347,270 | |
| CenturyLink, Inc., 5.80% Sr. Unsec. Nts., 3/15/22 | | | | | 350,000 | | | | 335,562 | |
| Cequel Communications Holdings I LLC/Cequel Capital Corp., 6.375% Sr. Unsec. Nts., 9/15/208 | | | | | 250,000 | | | | 249,250 | |
| CHC Helicopter SA, 9.25% Sr. Sec. Nts., 10/15/20 | | | | | 90,000 | | | | 65,925 | |
| CHS/Community Health Systems, Inc., 8% Sr. Unsec. Nts., 11/15/19 | | | | | 250,000 | | | | 264,062 | |
| CIT Group, Inc., 4.25% Sr. Unsec. Nts., 8/15/17 | | | | | 250,000 | | | | 254,375 | |
| Claire’s Stores, Inc., 9% Sr. Sec. Nts., 3/15/198 | | | | | 200,000 | | | | 170,000 | |
| Clear Channel Worldwide Holdings, Inc., 6.50% Sr. Unsec. Nts., 11/15/22 | | | | | 250,000 | | | | 261,250 | |
| Columbus International, Inc., 7.375% Sr. Unsec. Nts., 3/30/218 | | | | | 400,000 | | | | 431,500 | |
8 OPPENHEIMER GLOBAL MULTI-ALTERNATIVES FUND/VA
| | | | | | | | |
| | | Principal Amount | | | Value | |
Non-Convertible Corporate Bonds and Notes (Continued) | |
| Concho Resources, Inc., 5.50% Sr. Unsec. Unsub. Nts., 4/1/23 | | $ | 300,000 | | | $ | 301,500 | |
| CONSOL Energy, Inc., 5.875% Sr. Unsec. Nts., 4/15/22 | | | 250,000 | | | | 213,530 | |
| Country Garden Holdings Co. Ltd., 7.875% Sr. Unsec. Nts., 5/27/198 | | | 200,000 | | | | 212,896 | |
| Crimson Merger Sub, Inc., 6.625% Sr. Unsec. Nts., 5/15/228 | | | 300,000 | | | | 265,500 | |
| Crown Castle International Corp., 5.25% Sr. Unsec. Nts., 1/15/23 | | | 200,000 | | | | 202,200 | |
| CSN Resources SA, 6.50% Sr. Unsec. Nts., 7/21/208 | | | 300,000 | | | | 256,410 | |
| DaVita HealthCare Partners, Inc.: | | | | | | | | |
| 5.125% Sr. Unsec. Nts., 7/15/24 | | | 400,000 | | | | 394,000 | |
| 5.75% Sr. Unsec. Nts., 8/15/22 | | | 50,000 | | | | 53,187 | |
| Denali Borrower LLC/Denali Finance Corp., 5.625% Sr. Sec. Nts., 10/15/208 | | | 200,000 | | | | 210,750 | |
| Denbury Resources, Inc.: | | | | | | | | |
| 4.625% Sr. Sub. Nts., 7/15/23 | | | 100,000 | | | | 84,250 | |
| 5.50% Sr. Sub. Nts., 5/1/22 | | | 100,000 | | | | 89,750 | |
| Digicel Group Ltd., 8.25% Sr. Unsec. Nts., 9/30/208 | | | 200,000 | | | | 201,000 | |
| DISH DBS Corp., 5.875% Sr. Unsec. Nts., 7/15/22 | | | 350,000 | | | | 343,875 | |
| Dynegy, Inc., 6.75% Sr. Unsec. Nts., 11/1/198 | | | 250,000 | | | | 261,375 | |
| Energy Transfer Equity LP, 7.50% Sr. Sec. Nts., 10/15/20 | | | 200,000 | | | | 226,500 | |
| EP Energy LLC/Everest Acquisition Finance, Inc., 9.375% Sr. Unsec. Nts., 5/1/20 | | | 200,000 | | | | 215,250 | |
| Evergrande Real Estate Group Ltd., 8.75% Sr. Unsec. Nts., 10/30/188 | | | 200,000 | | | | 188,500 | |
| FCA US LLC/CG Co.-Issuer, Inc., 8.25% Sec. Nts., 6/15/21 | | | 200,000 | | | | 218,500 | |
| Ferrexpo Finance plc, 10.375% Sr. Unsec. Nts., 4/7/198 | | | 150,000 | | | | 130,500 | |
| First Data Corp., 12.625% Sr. Unsec. Nts., 1/15/21 | | | 250,000 | | | | 289,375 | |
| First Quantum Minerals Ltd.: | | | | | | | | |
| 6.75% Sr. Unsec. Nts., 2/15/208 | | | 28,000 | | | | 27,230 | |
| 7.00% Sr. Unsec. Nts., 2/15/218 | | | 128,000 | | | | 123,040 | |
| FirstEnergy Corp., 7.375% Sr. Unsec. Nts., 11/15/31 | | | 200,000 | | | | 243,719 | |
| FMG Resources August 2006 Pty Ltd., 8.25% Sr. Unsec. Nts., 11/1/198 | | | 250,000 | | | | 211,875 | |
| Frontier Communications Corp., 8.50% Sr. Unsec. Nts., 4/15/20 | | | 250,000 | | | | 262,000 | |
| Goldman Sachs Capital II, 4% Jr. Sub. Perpetual Bonds6,9 | | | 166,000 | | | | 126,783 | |
| Halcon Resources Corp., 8.875% Sr. Unsec. Nts., 5/15/21 | | | 250,000 | | | | 165,625 | |
| HD Supply, Inc., 7.50% Sr. Unsec. Nts., 7/15/20 | | | 200,000 | | | | 212,500 | |
| Hexion, Inc., 8.875% Sr. Sec. Nts., 2/1/18 | | | 250,000 | | | | 226,875 | |
| Hilton Worldwide Finance LLC/Hilton Worldwide Finance Corp., 5.625% Sr. Unsec. Nts., 10/15/21 | | | 250,000 | | | | 260,925 | |
| HUB International Ltd., 7.875% Sr. Unsec. Nts., 10/1/218 | | | 250,000 | | | | 255,625 | |
| Icahn Enterprises LP/Icahn Enterprises Finance Corp., 5.875% Sr. Unsec. Nts., 2/1/22 | | | 200,000 | | | | 204,250 | |
| ICICI Bank Ltd., 6.375% Jr. Sub. Nts., 4/30/226,8 | | | 200,000 | | | | 206,582 | |
| iHeartCommunications, Inc., 9% Sr. Sec. Nts., 3/1/21 | | | 200,000 | | | | 183,000 | |
| | | | | | | | |
| | | Principal Amount | | | Value | |
Non-Convertible Corporate Bonds and Notes (Continued) | |
| Intelsat Jackson Holdings SA, 7.25% Sr. Unsec. Nts., 10/15/20 | | $ | 200,000 | | | $ | 198,500 | |
| International Game Technology plc, 6.25% Sr. Sec. Nts., 2/15/228 | | | 300,000 | | | | 288,000 | |
| International Lease Finance Corp., 8.75% Sr. Unsec. Nts., 3/15/17 | | | 250,000 | | | | 274,153 | |
| Intesa Sanpaolo SpA, 5.017% Sub. Nts., 6/26/248 | | | 300,000 | | | | 291,590 | |
| Kaisa Group Holdings Ltd., 8.875% Sr. Unsec. Nts., 3/19/188,10 | | | 200,000 | | | | 107,000 | |
| Kinetic Concepts, Inc./KCI USA, Inc., 10.50% Sec. Nts., 11/1/18 | | | 300,000 | | | | 321,006 | |
| Laureate Education, Inc., 10% Sr. Unsec. Nts., 9/1/198 | | | 300,000 | | | | 280,875 | |
| Linn Energy LLC/Linn Energy Finance Corp., 8.625% Sr. Unsec. Nts., 4/15/20 | �� | | 250,000 | | | | 206,303 | |
| Lukoil International Finance BV, 6.125% Sr. Unsec. Nts., 11/9/208 | | | 904,000 | | | | 924,476 | |
| Marfrig Holding Europe BV, 6.875% Sr. Unsec. Nts., 6/24/198 | | | 200,000 | | | | 191,000 | |
| MGM Resorts International, 7.75% Sr. Unsec. Nts., 3/15/22 | | | 250,000 | | | | 276,250 | |
| MHP SA, 8.25% Sr. Unsec. Nts., 4/2/208 | | | 200,000 | | | | 163,000 | |
| MMC Energy. Inc., 8.875% Sr. Unsec. Nts., 10/15/205,10 | | | 100,000 | | | | 0 | |
| Mobile Telesystems OJSC via MTS International Funding Ltd., 5% Sr. Unsec. Nts., 5/30/238 | | | 200,000 | | | | 179,300 | |
| Momentive Performance Materials, Inc., 3.88% Sr. Sec. Nts., 10/24/21 | | | 200,000 | | | | 180,500 | |
| Navient Corp., 8.45% Sr. Unsec. Nts., 6/15/18 | | | 200,000 | | | | 222,760 | |
| Navistar International Corp., 8.25% Sr. Unsec. Nts., 11/1/21 | | | 250,000 | | | | 238,750 | |
| NGPL PipeCo LLC, 7.119% Sr. Sec. Nts., 12/15/178 | | | 250,000 | | | | 257,500 | |
| Nielsen Finance LLC/Nielsen Finance Co., 5% Sr. Unsec. Nts., 4/15/228 | | | 350,000 | | | | 345,188 | |
| Novelis, Inc., 8.75% Sr. Unsec. Nts., 12/15/20 | | | 250,000 | | | | 265,000 | |
| Numericable SFR SAS, 6% Sr. Sec. Nts., 5/15/228 | | | 200,000 | | | | 197,625 | |
| OAS Financial Ltd., 8% Sr. Unsec. Nts., 7/2/218,10 | | | 200,000 | | | | 41,800 | |
| Offshore Group Investment Ltd., 7.50% Sr. Sec. Nts., 11/1/19 | | | 250,000 | | | | 155,000 | |
| Pacific Rubiales Energy Corp., 5.375% Sr. Unsec. Nts., 1/26/198 | | | 300,000 | | | | 247,200 | |
| Petroleos de Venezuela SA, 12.75% Sr. Unsec. Nts., 2/17/228 | | | 200,000 | | | | 99,700 | |
| Post Holdings, Inc., 7.375% Sr. Unsec. Nts., 2/15/22 | | | 250,000 | | | | 255,313 | |
| Reynolds Group Issuer, Inc./Reynolds Group Issuer LLC/Reynolds Group Issuer Luxembourg SA, 5.75% Sr. Sec. Nts., 10/15/20 | | | 250,000 | | | | 256,875 | |
| Rolta Americas LLC, 8.875% Sr. Unsec. Nts., 7/24/198 | | | 200,000 | | | | 168,000 | |
| Royal Bank of Scotland Group plc, 6.125% Sub. Nts., 12/15/22 | | | 200,000 | | | | 215,435 | |
| Sabine Pass Liquefaction LLC, 5.625% Sr. Sec. Nts., 2/1/21 | | | 300,000 | | | | 307,500 | |
| Samson Investment Co., 9.75% Sr. Unsec. Nts., 2/15/20 | | | 300,000 | | | | 18,750 | |
| SandRidge Energy, Inc., 7.51% Sr. Unsec. Nts., 3/15/21 | | | 500,000 | | | | 222,500 | |
9 OPPENHEIMER GLOBAL MULTI-ALTERNATIVES FUND/VA
| | |
| |
| CONSOLIDATED STATEMENT OF INVESTMENTS Unaudited / Continued | | |
| | | | | | | | |
| | | Principal Amount | | | Value | |
Non-Convertible Corporate Bonds and Notes (Continued) | |
| Scientific Games International, Inc., 10% Sr. Unsec. Nts., 12/1/22 | | $ | 250,000 | | | $ | 242,031 | |
| Sears Holdings Corp., 6.625% Sec. Nts., 10/15/18 | | | 250,000 | | | | 240,000 | |
| Sirius XM Radio, Inc., 6% Sr. Unsec. Nts., 7/15/248 | | | 350,000 | | | | 354,375 | |
| Sistema JSFC via Sistema International Funding SA, 6.95% Sr. Unsec. Nts., 5/17/198 | | | 200,000 | | | | 192,200 | |
| SoftBank Corp., 4.50% Sr. Unsec. Nts., 4/15/208 | | | 200,000 | | | | 201,250 | |
| Springleaf Finance Corp., 6.90% Sr. Unsec. Nts., 12/15/17 | | | 300,000 | | | | 318,750 | |
| Sprint Corp., 7.875% Sr. Unsec. Nts., 9/15/23 | | | 250,000 | | | | 244,375 | |
| Talen Energy Supply LLC, 5.125% Sr. Unsec. Nts., 7/15/198 | | | 250,000 | | | | 246,250 | |
| Tenet Healthcare Corp., 8.125% Sr. Unsec. Nts., 4/1/22 | | | 300,000 | | | | 329,250 | |
| T-Mobile USA, Inc., 6.625% Sr. Unsec. Nts., 4/1/23 | | | 350,000 | | | | 364,438 | |
| TransDigm, Inc., 6.50% Sr. Sub. Nts., 7/15/24 | | | 250,000 | | | | 248,125 | |
| Turk Telekomunikasyon AS, 4.875% Sr. Unsec. Nts., 6/19/248 | | | 200,000 | | | | 199,946 | |
| Turkiye Sise ve Cam Fabrikalari AS, 4.25% Sr. Unsec. Nts., 5/9/208 | | | 200,000 | | | | 196,692 | |
| United Rentals North America, Inc., 7.625% Sr. Unsec. Nts., 4/15/22 | | | 300,000 | | | | 326,250 | |
| Valeant Pharmaceuticals International, Inc., 6.375% Sr. Unsec. Nts., 10/15/208 | | | 300,000 | | | | 316,688 | |
| Vedanta Resources plc, 6% Sr. Unsec. Nts., 1/31/198 | | | 200,000 | | | | 194,500 | |
| VimpelCom Holdings BV, 7.504% Sr. Unsec. Nts., 3/1/228 | | | 350,000 | | | | 343,875 | |
| VTR Finance BV, 6.875% Sr. Sec. Nts., 1/15/248 | | | 200,000 | | | | 204,870 | |
| Wachovia Capital Trust III, 5.57% Jr. Sub. Perpetual Bonds6,9 | | | 1,667,000 | | | | 1,650,330 | |
| Williams Cos., Inc. (The), 4.55% Sr. Unsec. Nts., 6/24/24 | | | 250,000 | | | | 242,378 | |
| Williams Partners LP/ACMP Finance Corp., 4.875% Sr. Unsec. Nts., 5/15/23 | | | 250,000 | | | | 247,000 | |
| Wind Acquisition Finance SA, 7.375% Sec. Nts., 4/23/218 | | | 200,000 | | | | 202,750 | |
| Wynn Macau Ltd., 5.25% Sr. Unsec. Nts., 10/15/218 | | | 200,000 | | | | 190,000 | |
| Yapi ve Kredi Bankasi AS, 6.75% Sr. Unsec. Nts., 2/8/178 | | | 200,000 | | | | 211,266 | |
| | | | | | | | |
Total Non-Convertible Corporate Bonds and Notes
(Cost $30,421,401) | | | | | | | 28,872,900 | |
Convertible Corporate Bond and Note—0.1% | |
SEACOR Holdings, Inc., 2.50% Cv. Sr. Unsec. Nts., 12/15/27 (Cost $462,760) | | | 434,000 | | | | 446,478 | |
Corporate Loans—4.5% | |
| AZ Chem US, Inc., Sr. Sec. Credit Facilities 1st Lien Term Loan, 4.50%, 6/10/216,11 | | | 3,572,742 | | | | 3,578,326 | |
| Celanese US Holdings LLC, Sr. Sec. Credit Facilities 1st Lien Term Loan, 2.431%, 10/31/186 | | | 1,215,813 | | | | 1,222,760 | |
| Dynegy, Inc., Sr. Sec. Credit Facilities 1st Lien Term Loan, 4.00%, 4/23/206,11 | | | 3,566,621 | | | | 3,577,396 | |
| | | | | | | | | | | | |
| | | | | | Principal Amount | | | Value | |
Corporate Loans (Continued) | |
| Energy Future Intermediate Holding Co. LLC, Sr. Sec. Credit Facilities 1st Lien Term Loan, Debtor in Possession, 4.25%, 6/20/166 | | | | | | $ | 3,200,000 | | | $ | 3,208,000 | |
| Intelsat Jackson Holdings SA, Sr. Sec. Credit Facilities 1st Lien Term Loan, 3.75%, 6/30/196 | | | | | | | 3,500,000 | | | | 3,479,584 | |
| International Lease Finance Corp., Sr. Sec. Credit Facilities Term Loan, 3.50%, 2/26/216,11 | | | | | | | 3,730,000 | | | | 3,732,663 | |
| | | | | | | | | | | | |
Total Corporate Loans (Cost $18,836,503) | | | | | | | | | | | 18,798,729 | |
Event-Linked Bonds—11.6% | |
Earthquake—2.8% | | | | | | | | | | | | |
| Azzurro RE I Ltd. Catastrophe Linked Nts., 2.15%, 1/16/196,8 | | | EUR | | | | 800,000 | | | | 891,434 | |
| Bosphorus Re Ltd. Catastrophe Linked Nts., 2.50%, 5/3/166,8 | | | | | | | 650,000 | | | | 650,861 | |
| Embarcadero Reinsurance Ltd. Catastrophe Linked Nts., 5%, 8/7/156,8 | | | | | | | 250,000 | | | | 250,600 | |
| Golden State RE II Ltd. Catastrophe Linked Nts., 2.20%, 1/8/196,8 | | | | | | | 1,000,000 | | | | 995,950 | |
| Kilimanjaro Re Ltd. Catastrophe Linked Nts., 3.75%, 11/25/196,7 | | | | | | | 250,000 | | | | 247,662 | |
| Kizuna Re II Ltd. Catastrophe Linked Nts.: | | | | | | | | | | | | |
2.00%, 4/5/198 | | | JPY | | | | 60,000,000 | | | | 491,286 | |
2.25%, 4/6/186,8 | | | | | | | 950,000 | | | | 954,322 | |
| 2.50%, 4/6/186,7 | | | | | | | 750,000 | | | | 752,887 | |
| Lakeside Re III Ltd. Catastrophe Linked Nts., 8%, 1/8/166,8 | | | | | | | 750,000 | | | | 765,919 | |
| Merna Re V Ltd. Catastrophe Linked Nts., 2%, 4/7/176,8 | | | | | | | 750,000 | | | | 749,287 | |
| Merna Reinsurance IV Ltd. Catastrophe Linked Nts., 2.50%, 4/8/166,7 | | | | | | | 750,000 | | | | 753,469 | |
| Merna Reinsurance Ltd. Catastrophe Linked Nts., 2%, 4/9/186,7 | | | | | | | 500,000 | | | | 500,175 | |
| MultiCat Mexico Ltd. 2012-I Catastrophe Linked Nts., 8%, 12/4/156,8 | | | | | | | 750,000 | | | | 762,769 | |
| Nakama Re Ltd. Catastrophe Linked Nts.: | | | | | | | | | | | | |
2.125%, 1/16/196,7 | | | | | | | 250,000 | | | | 250,763 | |
2.50%, 4/13/186,8 | | | | | | | 750,000 | | | | 755,963 | |
2.75%, 9/29/166,8 | | | | | | | 500,000 | | | | 504,612 | |
| 2.875%, 1/16/206,7 | | | | | | | 250,000 | | | | 252,788 | |
| Tramline Re II Ltd. Catastrophe Linked Nts., 3.25%, 7/7/176,8 | | | | | | | 250,000 | | | | 248,038 | |
| Ursa Re Ltd. Catastrophe Linked Nts.: | | | | | | | | | | | | |
3.50%, 12/7/176,8 | | | | | | | 500,000 | | | | 497,375 | |
5.00%, 12/7/176,7 | | | | | | | 500,000 | | | | 501,625 | |
| | | | | | | | | | | | |
| | | | | | | | | | | 11,777,785 | |
Longevity—0.1% | | | | | | | | | | | | |
| Vita Capital V Ltd. Catastrophe Linked Nts., 3.458%, 1/15/176,8 | | | | | | | 500,000 | | | | 508,225 | |
| | | | | | | | | | | | |
Multiple Event—4.4% | | | | | | | | | | | | |
| Atlas IX Capital Ltd. Catastrophe Linked Nts., 7.119%, 1/7/196,8 | | | | | | | 500,000 | | | | 496,975 | |
| Atlas Reinsurance VII Ltd. Catastrophe Linked Nts., 8.154%, 1/7/166,8 | | | | | | | 250,000 | | | | 250,856 | |
| Blue Danube II Ltd. Catastrophe Linked Nts., 4.368%, 5/23/166,8 | | | | | | | 650,000 | | | | 648,326 | |
| Caelus Re 2013 Ltd. Catastrophe Linked Nts.: | | | | | | | | | | | | |
5.25%, 3/7/166,8 | | | | | | | 500,000 | | | | 491,962 | |
| 6.85%, 4/7/176,8 | | | | | | | 750,000 | | | | 755,062 | |
| Citrus Re Ltd. Catastrophe Linked Nts.: | | | | | | | | | | | | |
3.75%, 4/24/176,8 | | | | | | | 750,000 | | | | 732,937 | |
4.25%, 4/18/176,8 | | | | | | | 750,000 | | | | 731,437 | |
10 OPPENHEIMER GLOBAL MULTI-ALTERNATIVES FUND/VA
| | | | | | | | |
| | | Principal Amount | | | Value | |
Multiple Event (Continued) | |
| Cranberry Re Ltd. Catastrophe Linked Nts., | | | | | | | | |
| 3.80%, 7/6/186,8 | | $ | 500,000 | | | $ | 501,975 | |
| East Lane Re VI Ltd. Catastrophe Linked Nts.: | | | | | | | | |
| 2.75%, 3/14/186,8 | | | 500,000 | | | | 488,875 | |
| 3.75%, 3/13/206,8 | | | 250,000 | | | | 246,487 | |
| Galileo Re Ltd. Catastrophe Linked Nts.: | | | | | | | | |
| 7.40%, 1/9/176,8 | | | 250,000 | | | | 252,587 | |
| 13.50%, 1/8/186,8 | | | 250,000 | | | | 251,812 | |
| Kilimanjaro Re Ltd. Catastrophe Linked Nts.: | | | | | | | | |
| 4.50%, 4/30/186,8 | | | 500,000 | | | | 481,075 | |
4.75%, 4/30/186,8 | | | 500,000 | | | | 483,275 | |
| Loma Reinsurance Ltd. Catastrophe Linked Nts.: | | | | | | | | |
| 10.56%, 1/8/186,8 | | | 200,000 | | | | 206,690 | |
| 16.49%, 1/8/186,8 | | | 500,000 | | | | 520,975 | |
| Longpoint Re Ltd. III Catastrophe Linked Nts., | | | | | | | | |
| 3.75%, 5/23/186,8 | | | 250,000 | | | | 248,887 | |
| Mythen Re Ltd. Catastrophe Linked Nts., | | | | | | | | |
| 8.646%, 1/5/176,8 | | | 250,000 | | | | 252,037 | |
| Queen Street VII Re Ltd. Catastrophe Linked Nts., | | | | | | | | |
| 8.60%, 4/8/166,8 | | | 250,000 | | | | 252,281 | |
| Residential Reinsurance 2012 Ltd. Catastrophe Linked Nts.: | | | | | | | | |
| 4.50%, 12/6/166,8 | | | 1,499,000 | | | | 1,519,311 | |
| 5.75%, 12/6/166,8 | | | 250,000 | | | | 255,138 | |
| 12.75%, 12/6/166,8 | | | 250,000 | | | | 261,063 | |
| 19.00%, 12/6/166,8 | | | 250,000 | | | | 265,963 | |
| 22.00%, 6/6/166,8 | | | 250,000 | | | | 277,006 | |
| Residential Reinsurance 2013 Ltd. Catastrophe Linked Nts.: | | | | | | | | |
| 5.25%, 12/6/176,8 | | | 500,000 | | | | 484,325 | |
| 8.00%, 6/6/176,8 | | | 250,000 | | | | 259,638 | |
| 20.00%, 12/6/176,8 | | | 250,000 | | | | 255,438 | |
| Residential Reinsurance 2014 Ltd. Catastrophe Linked Nts.: | | | | | | | | |
| 4.80%, 12/6/186,8 | | | 500,000 | | | | 477,075 | |
| 15.00%, 6/6/186,8 | | | 500,000 | | | | 509,775 | |
Residential Reinsurance 2015 Ltd. Catastrophe Linked Nts.,
11%, 6/6/196,8 | | | 250,000 | | | | 250,613 | |
| Riverfront Re Ltd. Catastrophe Linked Nts., 4%, 1/6/176,8 | | | 500,000 | | | | 489,825 | |
| Sanders Re Ltd. Catastrophe Linked Nts.: | | | | | | | | |
| 3.00%, 5/25/186,8 | | | 250,000 | | | | 241,863 | |
| 3.24%, 5/25/186,8 | | | 500,000 | | | | 483,325 | |
| 3.86%, 5/28/196,8 | | | 500,000 | | | | 480,475 | |
| 3.90%, 6/7/176,8 | | | 500,000 | | | | 496,375 | |
| 4.00%, 5/5/176,8 | | | 500,000 | | | | 490,225 | |
| Tradewynd Re Ltd. Catastrophe Linked Nts.: | | | | | | | | |
| 5.00%, 1/8/186,8 | | | 250,000 | | | | 244,738 | |
| 5.98%, 1/9/176,8 | | | 500,000 | | | | 501,025 | |
| 6.54%, 1/9/176,8 | | | 250,000 | | | | 250,988 | |
| 7.00%, 1/8/186,8 | | | 250,000 | | | | 248,663 | |
| 8.70%, 7/9/186,8 | | | 250,000 | | | | 271,188 | |
| Tramline Re II Ltd. Catastrophe Linked Nts., | | | | | | | | |
| 9.75%, 1/4/196,8 | | | 400,000 | | | | 404,420 | |
| VenTerra Re Ltd. Catastrophe Linked Nts., | | | | | | | | |
| 3.75%, 1/9/176,8 | | | 750,000 | | | | 751,613 | |
| | | | | | | | |
| | | | | | | | 18,464,579 | |
Other—0.3% | | | | | | | | |
| Benu Capital Ltd. Catastrophe Linked Nts., | | | | | | | | |
| 3.35%, 1/8/208 | | EUR | 500,000 | | | | 558,986 | |
| Vitality Re V Ltd. Catastrophe Linked Nts., | | | | | | | | |
| 2.50%, 1/7/196,8 | | | 250,000 | | | | 253,787 | |
| Vitality Re VI Ltd. Catastrophe Linked Nts., | | | | | | | | |
| 2.10%, 1/8/186,7 | | | 250,000 | | | | 250,625 | |
| | | | | | | | |
| | | | | | | | 1,063,398 | |
Windstorm—4.0% | | | | | | | | |
| Akibare II Ltd. Catastrophe Linked Nts., 3.75%, 4/13/166,8 | | | 250,000 | | | | 251,381 | |
| | | | | | | | |
| | |
| Principal
Amount |
| | | Value | |
Windstorm (Continued) | | | | | | | | |
| Alamo Re Ltd. Catastrophe Linked Nts.: | | | | | | | | |
| 4.60%, 6/7/196,8 | | $ | 250,000 | | | $ | 250,712 | |
| 5.24%, 6/7/176,8 | | | 500,000 | | | | 499,925 | |
| 5.90%, 6/7/186,8 | | | 250,000 | | | | 249,387 | |
| Aozora Re Ltd. Catastrophe Linked Nts., | | | | | | | | |
| 2%, 4/7/176,8 | | JPY | 51,000,000 | | | | 413,717 | |
| Armor Re Ltd. Catastrophe Linked Nts., | | | | | | | | |
| 4.08%, 12/15/166,8 | | | 750,000 | | | | 743,344 | |
Atlas Reinsurance VII Ltd. Catastrophe Linked Nts.,
3.65%, 1/7/166,8 | | EUR | 250,000 | | | | 279,827 | |
| Calypso Capital II Ltd. Catastrophe Linked | | | | | | | | |
| Nts., 2.60%, 1/9/176,8 | | EUR | 500,000 | | | | 562,609 | |
| Citrus Re Ltd. Catastrophe Linked Nts.: | | | | | | | | |
| 4.75%, 4/9/186,8 | | | 250,000 | | | | 243,725 | |
| 9.00%, 4/9/186,8 | | | 250,000 | | | | 246,562 | |
| East Lane Re V Ltd. Catastrophe Linked | | | | | | | | |
| Nts., 10.75%, 3/16/166,8 | | | 250,000 | | | | 254,706 | |
Eurus Ltd. Catastrophe Linked Nts.,
3.75%, 4/7/166,8 | | EUR | 250,000 | | | | 280,218 | |
| Everglades Re II Ltd. Catastrophe Linked | | | | | | | | |
| Nts., 5.15%, 5/3/186,8 | | | 750,000 | | | | 747,037 | |
| Everglades Re Ltd. Catastrophe Linked Nts., | | | | | | | | |
| 7.45%, 4/28/176,8 | | | 750,000 | | | | 755,362 | |
| Gator Re Ltd. Catastrophe Linked Nts., | | | | | | | | |
| 6.68%, 1/9/176,8 | | | 750,000 | | | | 679,612 | |
| Green Fields II Capital Ltd. Catastrophe | | | | | | | | |
| Linked Nts., 2.75%, 1/9/176,8 | | EUR | 750,000 | | | | 845,335 | |
| Ibis Re II Ltd. Catastrophe Linked Nts., 4%, 6/28/166,8 | | | 270,000 | | | | 269,764 | |
| Lion I Re Ltd. Catastrophe Linked Nts., | | | | | | | | |
| 2.36%, 4/28/176,8 | | EUR | 750,000 | | | | 839,900 | |
| Manatee Re Ltd. Catastrophe Linked Nts., | | | | | | | | |
| 5%, 12/22/176,8 | | | 750,000 | | | | 740,100 | |
| MetroCat Re Ltd. Catastrophe Linked Nts., | | | | | | | | |
| 4.50%, 8/5/166,8 | | | 250,000 | | | | 251,606 | |
| MultiCat Mexico Ltd. 2012-I Catastrophe Linked Nts.: | | | | | | | | |
| 7.50%, 12/4/156,8 | | | 750,000 | | | | 743,644 | |
| 7.75%, 12/4/156,8 | | | 500,000 | | | | 501,463 | |
| Mythen Re Ltd. Catastrophe Linked Nts., | | | | | | | | |
| 11.876%, 11/10/166,8 | | | 250,000 | | | | 249,006 | |
| Pelican III Re Ltd. Catastrophe Linked Nts., | | | | | | | | |
| 6%, 4/16/186,8 | | | 750,000 | | | | 738,525 | |
| Pelican Re Ltd. Catastrophe Linked Nts., | | | | | | | | |
| 6%, 5/15/176,8 | | | 750,000 | | | | 756,638 | |
| Pylon II Capital Ltd. Catastrophe Linked Nts.: | | | | | | | | |
| 5.50%, 5/5/166 | | EUR | 500,000 | | | | 569,521 | |
| 9.00%, 5/5/166,8 | | EUR | 500,000 | | | | 581,325 | |
| Queen City Re Catastrophe Linked Nts., | | | | | | | | |
| 3.50%, 1/6/176,8 | | | 750,000 | | | | 731,138 | |
| Queen Street IX Re Ltd. Catastrophe Linked | | | | | | | | |
| Nts., 5.50%, 6/8/176,8 | | | 250,000 | | | | 244,888 | |
| Queen Street VIII Re Ltd. Catastrophe | | | | | | | | |
Linked Nts.,
6.50%, 6/8/166,8 | | | 500,000 | | | | 498,063 | |
| Queen Street X RE Ltd. Catastrophe Linked | | | | | | | | |
| Nts., 5.75%, 6/8/186,8 | | | 250,000 | | | | 245,263 | |
| Successor X Ltd. Catastrophe Linked Nts.: | | | | | | | | |
| 11.25%, 11/10/156,8 | | | 250,000 | | | | 248,575 | |
| 16.25%, 11/10/156,8 | | | 500,000 | | | | 478,850 | |
| Tar Heel Re Ltd. Catastrophe Linked Nts., | | | | | | | | |
| 8.50%, 5/9/166,8 | | | 750,000 | | | | 765,788 | |
| | | | | | | | |
| | | | | | | 16,757,516 | |
| | | | | | | | |
| Total Event-Linked Bonds (Cost $49,622,380) | | | | 48,571,503 | |
| | | | | | | | |
Short-Term Notes—22.0% | |
Mexico—2.8% | | | | | | | | |
| United Mexican States Treasury Bills: | | | | | | | | |
| 3.248%, 11/12/15 | | MXN | 93,000,000 | | | | 5,846,855 | |
11 OPPENHEIMER GLOBAL MULTI-ALTERNATIVES FUND/VA
CONSOLIDATED STATEMENT OF INVESTMENTS Unaudited / Continued
| | | | | | | | | | | | |
| | | | | | Principal Amount | | | Value | |
Mexico (Continued) | | | | | |
United Mexican States Treasury Bills: (Continued) | | | | | |
3.31%, 1/7/16 | | | MXN | | | | 90,300,000 | | | $ | 5,648,210 | |
| | | | | | | | | | | | |
| | | | | | | | | | | 11,495,065 | |
Sweden—2.1% | | | | | | | | | | | | |
Kingdom of Sweden Treasury Bills, (0.437)%, 12/16/1515 | | | SEK | | | | 74,000,000 | | | | 8,943,923 | |
United States—17.1% | | | | | | | | | | | | |
| United States Treasury Bills, 0.04%, 9/17/1512,13,14,15 | | | USD | | | | 67,950,000 | | | | 71,491,144 | |
| | | | | | | | | | | | |
| Total Short-Term Notes (Cost $92,692,337) | | | | | | | | | | | 91,930,132 | |
| | | | | | | | | | | | |
| | | | | | Shares | | | | |
Investment Companies—12.3% | |
| Oppenheimer Institutional Money Market Fund, Cl. E, 0.15%13,16,17 | | | | | | | 48,203,654 | | | | 48,203,654 | |
| SPDR Gold Trust Exchange Traded Fund2,13 | | | | | | | 27,881 | | | | 3,132,988 | |
| | | | | | | | | | | | |
| Total Investment Companies (Cost $51,469,085) | | | | | | | | | | | 51,336,642 | |
| | | | | | | | | | | | | | | | | | | | | | | | | | | | |
| | | | | | | | | Exercise Price | | | Expiration Date | | | | | | Contracts | | | Value | |
Exchange-Traded Option Purchased—0.0% | |
| S&P 500 Index Call2 (Cost $26,598) | | | | | | | USD | | | | 2,160.000 | | | | 7/17/15 | | | | USD | | | | 11 | | | $ | 605 | |
| | | | | | | |
| | | Counterparty | | | | | | Exercise Price | | | Expiration Date | | | | | | Contracts | | | | |
Over-the-Counter Options Purchased—0.2% | |
CAD Currency Call2,18 | | | CITNA-B | | | | MXN | | | | 12.550 | | | | 7/9/15 | | | | CAD | | | | 17,600,000 | | | | 40,874 | |
EUR Currency Put2 | | | RSBC | | | | USD | | | | 1.070 | | | | 11/30/15 | | | | EUR | | | | 14,100,000 | | | | 246,256 | |
EUR Currency Put2,19 | | | GSG | | | | USD | | | | 1.130 | | | | 7/16/15 | | | | EUR | | | | 8,825,000 | | | | 73,521 | |
EUR Currency Put2 | | | BOA | | | | PLN | | | | 4.030 | | | | 11/16/15 | | | | EUR | | | | 8,825,000 | | | | 39,177 | |
EUR Currency Put2,20 | | | BAC | | | | PLN | | | | 4.000 | | | | 8/3/15 | | | | EUR | | | | 12,500,000 | | | | 2,746 | |
EUR Currency Put2,21 | | | BAC | | | | PLN | | | | 4.000 | | | | 8/3/15 | | | | EUR | | | | 8,650,000 | | | | 1,901 | |
GBP Currency Call2 | | | GSG | | | | AUD | | | | 2.110 | | | | 12/18/15 | | | | GBP | | | | 17,800,000 | | | | 471,303 | |
SGD Currency Put2,22 | | | DEU | | | | SGD | | | | 1.350 | | | | 7/15/15 | | | | SGD | | | | 24,000,000 | | | | 74,520 | |
| | | | | | | | | | | | | | | | | | | | | | | | | | | | |
Total Over-the-Counter Options Purchased (Cost $1,372,162) | | | | 950,298 | |
| | | | | | | | | | | | | | | | | | | | | | | | | | | | | | | | |
| | | Counterparty | | | Pay / Receive Floating Rate | | | Floating Rate | | | Fixed Rate | | | Expiration Date | | | Notional Amount (000’s) | | | | |
Over-the-Counter Interest Rate Swaptions Purchased—0.2% | | | | | | | | | | | | | | | | | |
| Interest Rate Swap maturing 11/2/27 Call2 | | | GSG | | | | Receive | | |
| Six-Month JPY BBA
LIBOR |
| | | 1.070 | % | | | 11/20/17 | | | | JPY | | | | 560,000 | | | | 112,748 | |
| Interest Rate Swap maturing 11/22/27 Call2 | | | GSG | | | | Receive | | |
| Six-Month JPY BBA
LIBOR |
| | | 1.070 | | | | 11/20/17 | | | | JPY | | | | 424,000 | | | | 85,474 | |
| Interest Rate Swap maturing 3/21/28 Call2 | | | GSG | | | | Receive | | |
| Three-Month USD
BBA LIBOR |
| | | 2.580 | | | | 3/19/18 | | | | USD | | | | 1,100 | | | | 75,360 | |
| Interest Rate Swap maturing 4/18/28 Call2 | | | GSG | | | | Receive | | |
| Three-Month USD
BBA LIBOR |
| | | 2.505 | | | | 4/16/18 | | | | USD | | | | 2,200 | | | | 161,004 | |
| Interest Rate Swap maturing 4/18/28 Call2 | | | GSG | | | | Receive | | |
| Three-Month USD
BBA LIBOR |
| | | 2.505 | | | | 4/16/18 | | | | USD | | | | 3,750 | | | | 274,438 | |
| | | | | | | | | | | | | | | | | | | | | | | | | | | | | | | | |
Total Over-the-Counter Interest Rate Swaptions Purchased (Cost $603,292) | | | | | | | | | | | | | | | | 709,024 | |
| | | | | | | | | | | | | | | | | | | | | | | | | | | | | | | | | |
Total Investments, at Value (Cost $409,285,884) | | | | | | | | | | | | 95.8 | % | | | 400,203,001 | |
Net Other Assets (Liabilities) | | | | | | | | | | | | | | | | | | | | | | | | 4.2 | | | | 17,581,153 | |
| | | | | | | | | | | | | | | | | | | | | | | | | | | | |
Net Assets | | | | | | | | | | | | | | | | | | | | | | | | | | | 100.0 | % | | $ | 417,784,154 | |
| | | | | | | | | | | | | | | | | | | | | | | | | | | | |
Footnotes to Consolidated Statement of Investments
1. All or portion of the security position is held in segregated accounts and pledged to cover margin requirements with respect to securities sold short. The aggregate market value of such securities is $7,794,238. See Note 9 of accompanying Consolidated Notes.
2. Non-income producing security.
3. All or a portion of the security position is held in segregated accounts and pledged to cover margin requirements with respect to outstanding written options. The aggregate market value of such securities is $11,181,341. See Note 5 of the accompanying Consolidated Notes.
4. Security is a Master Limited Partnership.
5. Security received as the result of issuer reorganization.
6. Represents the current interest rate for a variable or increasing rate security.
12 OPPENHEIMER GLOBAL MULTI-ALTERNATIVES FUND/VA
Footnotes to Consolidated Statement of Investments (Continued)
7. Restricted security. The aggregate value of restricted securities as of June 30, 2015 was $9,856,695, which represents 2.36% of the Fund’s net assets. See Note 4 of the accompanying Consolidated Notes. Information concerning restricted securities is as follows:
| | | | | | | | | | | | | | | | |
| Security | | Acquisition
Dates | | | Cost | | | Value | | | Unrealized Appreciation/ (Depreciation) | |
| Aircraft Lease Securitisation Ltd., Series 2007-1A, Cl. G3, 0.445%, 5/10/32 | | | 1/9/15 | | | $ | 1,010,585 | | | $ | 1,009,360 | | | $ | (1,225 | ) |
| Airspeed Ltd., Series 2007-1A, Cl. G1, 0.456%, 6/15/32 | | | 7/24/14-4/15/15 | | | | 3,941,559 | | | | 3,859,626 | | | | (81,933 | ) |
| Blade Engine Securitization Ltd., Series 2006-1AW, Cl. A1, 0.486%, 9/15/41 | | | 7/25/14-8/28/14 | | | | 1,627,316 | | | | 1,477,715 | | | | (149,601 | ) |
| Kilimanjaro Re Ltd. Catastrophe Linked Nts., 3.75%, 11/25/19 | | | 4/7/15 | | | | 249,000 | | | | 247,662 | | | | (1,338 | ) |
| Kizuna Re II Ltd. Catastrophe Linked Nts., 2.50%, 4/6/18 | | | 5/2/14-5/5/15 | | | | 754,187 | | | | 752,887 | | | | (1,300 | ) |
| Merna Reinsurance IV Ltd. Catastrophe Linked Nts., 2.50%, 4/8/16 | | | 10/7/14-6/5/15 | | | | 753,059 | | | | 753,469 | | | | 410 | |
| Merna Reinsurance Ltd. Catastrophe Linked Nts., 2%, 4/9/18 | | | 3/16/15-6/24/15 | | | | 499,313 | | | | 500,175 | | | | 862 | |
| Nakama Re Ltd. Catastrophe Linked Nts., 2.125%, 1/16/19 | | | 12/12/14 | | | | 250,000 | | | | 250,763 | | | | 763 | |
| Nakama Re Ltd. Catastrophe Linked Nts., 2.875%, 1/16/20 | | | 12/12/14 | | | | 250,000 | | | | 252,788 | | | | 2,788 | |
| Ursa Re Ltd. Catastrophe Linked Nts., 5%, 12/7/17 | | | 11/14/14-4/22/15 | | | | 500,819 | | | | 501,625 | | | | 806 | |
| Vitality Re VI Ltd. Catastrophe Linked Nts., 2.10%, 1/8/18 | | | 1/21/15 | | | | 250,000 | | | | 250,625 | | | | 625 | |
| | | | | | | | |
| | | | | | $ | 10,085,838 | | | $ | 9,856,695 | | | $ | (229,143 | ) |
| | | | | | | | |
8. Represents securities sold under Rule 144A, which are exempt from registration under the Securities Act of 1933, as amended. These securities have been determined to be liquid under guidelines established by the Board of Trustees. These securities amount to $58,930,501 or 14.11% of the Fund’s net assets as of June 30, 2015.
9. This bond has no contractual maturity date, is not redeemable and contractually pays an indefinite stream of interest. Rate reported represents the current interest rate for this variable rate security.
10. This security is not accruing income because the issuer has missed an interest payment on it and/or is not anticipated to make future interest and or principal payments. The rate shown is the original contractual interest rate. See Note 4 of the accompanying Consolidated Notes.
11. All or a portion of the security position is when-issued or delayed delivery to be delivered and settled after June 30, 2015. See Note 4 of the accompanying Consolidated Notes.
12. All or a portion of the security position is held in accounts at a futures clearing merchant and pledged to cover margin requirements on open futures contracts and written options on futures, if applicable. The aggregate market value of such securities is $3,600,058. See Note 5 of the accompanying Consolidated Notes.
13. All or a portion of this security is owned by the subsidiary. See Note 2 of the accompanying Consolidated Notes.
14. All or a portion of the security position is held in segregated accounts and pledged to cover margin requirements under certain derivative contracts. The aggregate market value of such securities is $369,006. See Note 5 of the accompanying Consolidated Notes.
15. Zero coupon bond reflects effective yield on the date of purchase.
16. Is or was an affiliate, as defined in the Investment Company Act of 1940, as amended, at or during the period ended June 30, 2015, by virtue of the Fund owning at least 5% of the voting securities of the issuer or as a result of the Fund and the issuer having the same investment adviser. Transactions during the period in which the issuer was an affiliate are as follows:
| | | | | | | | | | | | | | | | |
| | | Shares December 31, 2014 | | | Gross Additions | | | Gross Reductions | | | Shares June 30, 2015 | |
Oppenheimer Institutional Money Market Fund, Cl. E | | | 40,325,799 | | | | 255,308,770 | | | | 247,430,915 | | | | 48,203,654 | |
| | | | |
| | | | | | | | | Value | | | Income | |
Oppenheimer Institutional Money Market Fund, Cl. E | | | | | | | | | | $ | 48,203,654 | | | $ | 31,281 | |
| 17. | Rate shown is the 7-day yield as of June 30, 2015. |
| 18. | Knock-out option expires worthless if at any time spot rates are equal to or less than to 11.792 MXN per 1 CAD. |
| 19. | Knock-out option expires worthless if at any time spot rates are less than or equal to 1.079 USD per 1 EUR. |
| 20. | Knock-out option expires worthless if at any time spot rates are less than or equal to 3.8245 PLN per 1 EUR. |
| 21. | Knock-out option expires worthless if at any time spot rates are less than or equal to 3.8245 PLN per 1 EUR. |
| 22. | Knock-out option expires worthless if at any time spot rates are greater than or equal to 1.415 SGD per 1 USD. |
Distribution of investments representing geographic holdings, as a percentage of total investments at value, is as follows:
| | | | | | | | |
| Geographic Holdings | | Value | | | Percent | |
United States | | $ | 286,910,009 | | | | 71.7 | % |
Japan | | | 18,327,260 | | | | 4.6 | |
Mexico | | | 13,850,210 | | | | 3.5 | |
Brazil | | | 12,571,678 | | | | 3.1 | |
Sweden | | | 9,902,928 | | | | 2.5 | |
Supranational | | | 6,570,376 | | | | 1.6 | |
Bermuda | | | 6,355,261 | | | | 1.6 | |
Malaysia | | | 6,085,801 | | | | 1.5 | |
Switzerland | | | 4,504,252 | | | | 1.1 | |
Cayman Islands | | | 4,230,203 | | | | 1.1 | |
Canada | | | 4,029,943 | | | | 1.0 | |
Luxembourg | | | 3,808,322 | | | | 1.0 | |
13 OPPENHEIMER GLOBAL MULTI-ALTERNATIVES FUND/VA
CONSOLIDATED STATEMENT OF INVESTMENTS Unaudited / Continued
| | | | | | | | | | |
| Geographic Holdings (Continued) | | Value | | | Percent | | | |
France | | $ | 3,011,408 | | | | 0.8 | % | | |
Eurozone | | | 3,507,283 | | | | 0.9 | | | |
Netherlands | | | 2,776,005 | | | | 0.7 | | | |
United Kingdom | | | 3,034,993 | | | | 0.8 | | | |
Russia | | | 1,994,851 | | | | 0.5 | | | |
Hong Kong | | | 1,374,816 | | | | 0.3 | | | |
Singapore | | | 701,925 | | | | 0.2 | | | |
Turkey | | | 607,904 | | | | 0.2 | | | |
Italy | | | 494,339 | | | | 0.1 | | | |
Colombia | | | 548,100 | | | | 0.1 | | | |
India | | | 834,082 | | | | 0.2 | | | |
China | | | 508,396 | | | | 0.1 | | | |
Barbados | | | 431,500 | | | | 0.1 | | | |
Ukraine | | | 293,500 | | | | 0.1 | | | |
Jersey, Channel Islands | | | 288,000 | | | | 0.1 | | | |
South Africa | | | 220,750 | | | | 0.1 | | | |
Israel | | | 216,594 | | | | 0.1 | | | |
Germany | | | 187,547 | | | | 0.0 | | | |
Chile | | | 204,870 | | | | 0.0 | | | |
Jamaica | | | 201,000 | | | | 0.0 | | | |
Macau | | | 190,000 | | | | 0.0 | | | |
Australia | | | 1,329,195 | | | | 0.3 | | | |
Venezuela | | | 99,700 | | | | 0.0 | | | |
| | | |
Total | | $ | 400,203,001 | | | | 100.0 | % | | |
| | | |
| | | | | | | | |
| | | Shares Sold Short | | | Value | |
Securities Sold Short—(6.9)% | | | | | | | | |
Common Stock Securities Sold Short—(6.9)% | | | | | | | | |
Aflac, Inc. | | | (22,955 | ) | | | (1,427,801 | ) |
Air Lease Corp., Cl. A | | | (29,055 | ) | | | (984,965 | ) |
Aircastle Ltd. | | | (15,595 | ) | | | (353,539 | ) |
Aker Solutions ASA | | | (56,859 | ) | | | (318,715 | ) |
Assurant, Inc. | | | (10,480 | ) | | | (702,160 | ) |
BHP Billiton Ltd., Sponsored ADR | | | (20,510 | ) | | | (834,962 | ) |
Boeing Co. (The) | | | (12,320 | ) | | | (1,709,030 | ) |
Camden Property Trust | | | (9,920 | ) | | | (736,858 | ) |
Caterpillar, Inc. | | | (14,584 | ) | | | (1,237,015 | ) |
CBL & Associates Properties, Inc. | | | (59,590 | ) | | | (965,358 | ) |
Cheniere Energy, Inc. | | | (7,800 | ) | | | (540,228 | ) |
Chesapeake Energy Corp. | | | (14,665 | ) | | | (163,808 | ) |
Cie Financiere Richemont SA | | | (13,725 | ) | | | (1,118,781 | ) |
ClubCorp Holdings, Inc. | | | (57,710 | ) | | | (1,378,115 | ) |
Comcast Corp., Cl. A | | | (4,890 | ) | | | (294,085 | ) |
Comerica, Inc. | | | (12,822 | ) | | | (658,025 | ) |
Commerce Bancshares, Inc. | | | (12,038 | ) | | | (563,017 | ) |
Ensco plc, Cl. A | | | (54,370 | ) | | | (1,210,820 | ) |
Finish Line, Inc. (The), Cl. A | | | (22,560 | ) | | | (627,619 | ) |
First Niagara Financial Group, Inc. | | | (66,045 | ) | | | (623,465 | ) |
First Quantum Minerals Ltd. | | | (51,239 | ) | | | (669,922 | ) |
FirstMerit Corp. | | | (25,610 | ) | | | (533,456 | ) |
Gulfmark Offshore, Inc., Cl. A | | | (36,140 | ) | | | (419,224 | ) |
KCG Holdings, Inc., Cl. A | | | (31,868 | ) | | | (392,932 | ) |
NASDAQ OMX Group, Inc. (The) | | | (6,625 | ) | | | (323,366 | ) |
Nationstar Mortgage Holdings, Inc. | | | (16,520 | ) | | | (277,536 | ) |
Oracle Corp. | | | (18,655 | ) | | | (751,796 | ) |
Pennsylvania Real Estate Investment Trust | | | (71,010 | ) | | | (1,515,353 | ) |
Rio Tinto plc, Sponsored ADR | | | (11,760 | ) | | | (484,630 | ) |
Rouse Properties, Inc. | | | (33,580 | ) | | | (549,033 | ) |
SanDisk Corp. | | | (20,890 | ) | | | (1,216,216 | ) |
Southern Copper Corp. | | | (32,690 | ) | | | (961,413 | ) |
Subsea 7 SA | | | (30,818 | ) | | | (301,363 | ) |
Tidewater, Inc. | | | (39,030 | ) | | | (887,152 | ) |
Tiffany & Co. | | | (6,260 | ) | | | (574,668 | ) |
Time Warner, Inc. | | | (10,430 | ) | | | (911,686 | ) |
Transocean Ltd. | | | (7,928 | ) | | | (127,799 | ) |
Weingarten Realty Investors | | | (32,530 | ) | | | (1,063,406 | ) |
Zions Bancorporation | | | (12,540 | ) | | | (397,957 | ) |
| | | | | | | | |
Total Securities Sold Short (Proceeds $30,971,521) | | | | | | $ | (28,807,274 | ) |
| | | | | | | | |
14 OPPENHEIMER GLOBAL MULTI-ALTERNATIVES FUND/VA
| | | | | | | | | | | | | | | | | | | | | | | | |
Forward Currency Exchange Contracts as of June 30, 2015 | | | | | | | | | | | | | | | | | | |
| Counterparty | | Settlement Month(s) | | | Currency Purchased (000’s) | | | Currency Sold (000’s) | | | Unrealized
Appreciation | | | Unrealized
Depreciation | |
BAC | | | 07/2015 | | | CAD | | | 420 | | | USD | | | 346 | | | $ | – | | | $ | 10,009 | |
BNP | | | 07/2015 | | | MXN | | | 67,400 | | | USD | | | 4,464 | | | | – | | | | 177,669 | |
BNP | | | 07/2015 | | | NOK | | | 13,770 | | | USD | | | 1,814 | | | | – | | | | 58,484 | |
BNP | | | 07/2015 | | | USD | | | 2,971 | | | MXN | | | 46,100 | | | | 39,340 | | | | – | |
BNP | | | 07/2015 | | | USD | | | 519 | | | SEK | | | 4,410 | | | | – | | | | 13,467 | |
BNP | | | 07/2015 | | | USD | | | 1,358 | | | TRY | | | 3,750 | | | | – | | | | 38,488 | |
BNP | | | 07/2015 | | | ZAR | | | 25,320 | | | USD | | | 2,093 | | | | – | | | | 13,825 | |
BOA | | | 07/2015 - 08/2015 | | | BRL | | | 35,725 | | | USD | | | 11,463 | | | | 38,679 | | | | 18,169 | |
BOA | | | 12/2015 | | | INR | | | 1,350,000 | | | USD | | | 20,681 | | | | 54,525 | | | | 98,159 | |
BOA | | | 07/2015 | | | KRW | | | 3,213,000 | | | USD | | | 2,933 | | | | – | | | | 53,071 | |
BOA | | | 09/2015 | | | NOK | | | 2,080 | | | USD | | | 267 | | | | – | | | | 2,765 | |
BOA | | | 07/2015 | | | NZD | | | 745 | | | USD | | | 571 | | | | – | | | | 66,425 | |
BOA | | | 07/2015 - 09/2015 | | | USD | | | 2,141 | | | AUD | | | 2,800 | | | | – | | | | 10,753 | |
BOA | | | 07/2015 | | | USD | | | 13,665 | | | BRL | | | 33,925 | | | | 2,753,300 | | | | – | |
BOA | | | 07/2015 - 11/2015 | | | USD | | | 2,314 | | | CAD | | | 2,885 | | | | 6,852 | | | | – | |
BOA | | | 09/2015 | | | USD | | | 2,070 | | | EUR | | | 1,832 | | | | 25,437 | | | | – | |
BOA | | | 07/2015 | | | USD | | | 548 | | | GBP | | | 365 | | | | – | | | | 25,167 | |
BOA | | | 07/2015 | | | USD | | | 1,060 | | | HUF | | | 300,000 | | | | – | | | | 396 | |
BOA | | | 07/2015 - 12/2015 | | | USD | | | 17,411 | | | INR | | | 1,125,000 | | | | 42,623 | | | | 40,747 | |
BOA | | | 07/2015 - 09/2015 | | | USD | | | 1,934 | | | JPY | | | 237,900 | | | | 11,322 | | | | 23,300 | |
BOA | | | 07/2015 | | | USD | | | 2,194 | | | KRW | | | 2,437,000 | | | | 11,619 | | | | 2,269 | |
BOA | | | 09/2015 - 10/2015 | | | USD | | | 6,145 | | | MYR | | | 20,155 | | | | 823,070 | | | | – | |
BOA | | | 07/2015 | | | USD | | | 1,033 | | | NZD | | | 1,355 | | | | 115,145 | | | | – | |
BOA | | | 12/2015 | | | USD | | | 9,059 | | | SEK | | | 74,000 | | | | 97,808 | | | | – | |
BOA | | | 07/2015 | | | USD | | | 1,127 | | | ZAR | | | 13,900 | | | | – | | | | 13,701 | |
BOA | | | 07/2015 | | | ZAR | | | 15,980 | | | USD | | | 1,340 | | | | 537 | | | | 28,518 | |
CITNA-B | | | 07/2015 | | | AUD | | | 1,825 | | | USD | | | 1,420 | | | | – | | | | 12,561 | |
CITNA-B | | | 07/2015 | | | BRL | | | 11,170 | | | USD | | | 3,689 | | | | – | | | | 96,468 | |
CITNA-B | | | 07/2015 | | | EUR | | | 1,610 | | | USD | | | 1,799 | | | | – | | �� | | 3,793 | |
CITNA-B | | | 07/2015 | | | HUF | | | 1,420,000 | | | USD | | | 5,223 | | | | – | | | | 204,770 | |
CITNA-B | | | 07/2015 - 12/2015 | | | INR | | | 673,000 | | | USD | | | 10,526 | | | | – | | | | 26,777 | |
CITNA-B | | | 07/2015 | | | KRW | | | 559,000 | | | USD | | | 502 | | | | – | | | | 1,256 | |
CITNA-B | | | 07/2015 | | | MXN | | | 31,700 | | | USD | | | 2,119 | | | | – | | | | 102,789 | |
CITNA-B | | | 12/2015 | | | PLN | | | 9,640 | | | USD | | | 2,615 | | | | – | | | | 62,226 | |
CITNA-B | | | 07/2015 | | | TRY | | | 5,910 | | | USD | | | 2,348 | | | | 737 | | | | 148,196 | |
CITNA-B | | | 09/2015 | | | USD | | | 107 | | | AUD | | | 140 | | | | – | | | | 363 | |
CITNA-B | | | 07/2015 - 01/2016 | | | USD | | | 6,310 | | | BRL | | | 19,170 | | | | 306,590 | | | | – | |
CITNA-B | | | 07/2015 - 11/2015 | | | USD | | | 1,959 | | | CAD | | | 2,435 | | | | 25,490 | | | | 15,251 | |
CITNA-B | | | 07/2015 - 09/2015 | | | USD | | | 1,274 | | | EUR | | | 1,145 | | | | 18 | | | | 2,722 | |
CITNA-B | | | 07/2015 | | | USD | | | 2,393 | | | HUF | | | 665,000 | | | | 45,157 | | | | 1,919 | |
CITNA-B | | | 07/2015 - 01/2016 | | | USD | | | 6,196 | | | MXN | | | 93,800 | | | | 290,195 | | | | – | |
CITNA-B | | | 07/2015 | | | USD | | | 433 | | | NOK | | | 3,310 | | | | 11,245 | | | | – | |
CITNA-B | | | 07/2015 | | | USD | | | 1,646 | | | TRY | | | 4,010 | | | | 152,598 | | | | – | |
CITNA-B | | | 07/2015 | | | USD | | | 853 | | | ZAR | | | 10,370 | | | | 1,727 | | | | – | |
CITNA-B | | | 07/2015 | | | ZAR | | | 13,730 | | | USD | | | 1,116 | | | | 10,823 | | | | – | |
DEU | | | 07/2015 | | | AUD | | | 1,350 | | | USD | | | 1,029 | | | | 12,284 | | | | – | |
DEU | | | 07/2015 | | | CHF | | | 990 | | | USD | | | 1,146 | | | | – | | | | 87,100 | |
DEU | | | 07/2015 | | | HUF | | | 19,000 | | | USD | | | 68 | | | | – | | | | 375 | |
DEU | | | 09/2015 | | | NOK | | | 140 | | | USD | | | 18 | | | | – | | | | 91 | |
DEU | | | 07/2015 | | | NZD | | | 675 | | | USD | | | 509 | | | | – | | | | 51,555 | |
DEU | | | 07/2015 | | | SEK | | | 15,140 | | | USD | | | 1,816 | | | | 10,940 | | | | – | |
DEU | | | 07/2015 | | | USD | | | 49 | | | AUD | | | 65 | | | | – | | | | 1,049 | |
DEU | | | 12/2015 | | | USD | | | 8,025 | | | CAD | | | 9,946 | | | | 76,541 | | | | – | |
DEU | | | 07/2015 | | | USD | | | 1,604 | | | CHF | | | 1,610 | | | | – | | | | 118,577 | |
DEU | | | 07/2015 | | | USD | | | 1,334 | | | EUR | | | 1,210 | | | | 2,956 | | | | 18,463 | |
DEU | | | 07/2015 | | | USD | | | 544 | | | GBP | | | 355 | | | | – | | | | 13,729 | |
DEU | | | 07/2015 | | | USD | | | 1,111 | | | HUF | | | 313,000 | | | | 4,492 | | | | – | |
DEU | | | 07/2015 - 09/2015 | | | USD | | | 5,125 | | | JPY | | | 586,000 | | | | 345,816 | | | | 12,029 | |
DEU | | | 07/2015 | | | USD | | | 366 | | | MXN | | | 5,700 | | | | 3,146 | | | | – | |
DEU | | | 07/2015 | | | USD | | | 305 | | | NOK | | | 2,440 | | | | – | | | | 6,317 | |
DEU | | | 09/2015 | | | USD | | | 1,020 | | | SEK | | | 8,430 | | | | 1,344 | | | | – | |
DEU | | | 07/2015 | | | USD | | | 470 | | | TRY | | | 1,260 | | | | 1,090 | | | | – | |
DEU | | | 07/2015 | | | USD | | | 1,393 | | | ZAR | | | 17,060 | | | | – | | | | 7,500 | |
GSCO-OT | | | 07/2015 - 01/2016 | | | BRL | | | 19,640 | | | USD | | | 6,204 | | | | 45,639 | | | | 95,074 | |
GSCO-OT | | | 07/2015 - 04/2016 | | | USD | | | 8,556 | | | BRL | | | 26,840 | | | | 365,302 | | | | 71,006 | |
GSCO-OT | | | 07/2015 | | | USD | | | 1,100 | | | CAD | | | 1,355 | | | | 14,910 | | | | – | |
GSCO-OT | | | 07/2015 | | | USD | | | 1,071 | | | TRY | | | 2,950 | | | | – | | | | 27,939 | |
HSBC | | | 07/2015 | | | MXN | | | 1,000 | | | USD | | | 65 | | | | – | | | | 1,589 | |
HSBC | | | 07/2015 | | | TRY | | | 5,590 | | | USD | | | 2,137 | | | | – | | | | 56,001 | |
15 OPPENHEIMER GLOBAL MULTI-ALTERNATIVES FUND/VA
CONSOLIDATED STATEMENT OF INVESTMENTS Unaudited / Continued
| | | | | | | | | | | | | | | | | | | | | | | | |
Forward Currency Exchange Contracts (Continued) | | | | | | | | | | | | | | | | | | |
| Counterparty | | Settlement Month(s) | | | Currency Purchased (000’s) | | | Currency Sold (000’s) | | | Unrealized Appreciation | | | Unrealized
Depreciation | |
HSBC | | | 07/2015 | | | USD | | | 840 | | | EUR | | | 750 | | | $ | 4,964 | | | $ | 1,045 | |
HSBC | | | 12/2015 | | | USD | | | 5,220 | | | INR | | | 345,000 | | | | – | | | | 54,420 | |
HSBC | | | 07/2015 | | | USD | | | 1,128 | | | MXN | | | 17,300 | | | | 28,202 | | | | – | |
HSBC | | | 07/2015 | | | USD | | | 2,080 | | | NZD | | | 2,820 | | | | 170,636 | | | | – | |
HSBC | | | 09/2015 | | | USD | | | 67 | | | SEK | | | 550 | | | | 200 | | | | – | |
HSBC | �� | | 07/2015 | | | USD | | | 379 | | | TRY | | | 1,050 | | | | – | | | | 11,486 | |
JPM | | | 07/2015 | | | CAD | | | 3,090 | | | USD | | | 2,487 | | | | 14,002 | | | | 27,286 | |
JPM | | | 07/2015 | | | CHF | | | 1,680 | | | USD | | | 1,806 | | | | – | | | | 8,640 | |
JPM | | | 07/2015 | | | JPY | | | 289,000 | | | USD | | | 2,436 | | | | – | | | | 74,114 | |
JPM | | | 07/2015 - 12/2015 | | | KRW | | | 416,000 | | | USD | | | 384 | | | | – | | | | 11,187 | |
JPM | | | 07/2015 | | | NZD | | | 1,930 | | | USD | | | 1,423 | | | | – | | | | 116,051 | |
JPM | | | 07/2015 | | | TRY | | | 3,120 | | | USD | | | 1,156 | | | | 6,212 | | | | – | |
JPM | | | 07/2015 - 09/2015 | | | USD | | | 2,025 | | | CHF | | | 1,890 | | | | 7,257 | | | | 9,244 | |
JPM | | | 07/2015 | | | USD | | | 2,303 | | | EUR | | | 2,015 | | | | 56,008 | | | | – | |
JPM | | | 07/2015 | | | USD | | | 119 | | | GBP | | | 80 | | | | – | | | | 6,882 | |
JPM | | | 12/2015 | | | USD | | | 6,211 | | | INR | | | 410,000 | | | | – | | | | 57,062 | |
JPM | | | 07/2015 | | | USD | | | 1,141 | | | JPY | | | 135,000 | | | | 37,563 | | | | – | |
JPM | | | 07/2015 | | | USD | | | 2,067 | | | KRW | | | 2,290,000 | | | | 14,023 | | | | – | |
JPM | | | 09/2015 | | | USD | | | 8,501 | | | MYR | | | 27,700 | | | | 1,178,419 | | | | – | |
JPM | | | 07/2015 | | | USD | | | 1,617 | | | NOK | | | 12,730 | | | | 3,650 | | | | 9,901 | |
JPM | | | 07/2015 | | | USD | | | 759 | | | SEK | | | 6,250 | | | | 16,492 | | | | 11,665 | |
JPM | | | 07/2015 | | | USD | | | 507 | | | ZAR | | | 6,040 | | | | 11,447 | | | | – | |
JPM | | | 07/2015 | | | ZAR | | | 12,560 | | | USD | | | 1,059 | | | | – | | | | 27,404 | |
MSCO | | | 07/2015 | | | BRL | | | 6,230 | | | USD | | | 2,058 | | | | – | | | | 54,348 | |
MSCO | | | 07/2015 | | | CAD | | | 65 | | | USD | | | 52 | | | | – | | | | 45 | |
MSCO | | | 07/2015 | | | EUR | | | 250 | | | USD | | | 265 | | | | 13,471 | | | | – | |
MSCO | | | 07/2015 | | | GBP | | | 1,865 | | | USD | | | 2,837 | | | | 93,537 | | | | – | |
MSCO | | | 12/2015 | | | INR | | | 249,000 | | | USD | | | 3,788 | | | | 20,531 | | | | 1,797 | |
MSCO | | | 07/2015 - 01/2016 | | | JPY | | | 1,381,000 | | | USD | | | 11,660 | | | | – | | | | 341,984 | |
MSCO | | | 11/2015 - 01/2016 | | | MXN | | | 128,000 | | | USD | | | 8,194 | | | | – | | | | 136,770 | |
MSCO | | | 09/2015 - 10/2015 | | | MYR | | | 24,405 | | | USD | | | 6,765 | | | | – | | | | 316,441 | |
MSCO | | | 07/2015 | | | NZD | | | 85 | | | USD | | | 64 | | | | – | | | | 6,567 | |
MSCO | | | 07/2015 | | | USD | | | 2,781 | | | AUD | | | 3,615 | | | | 17,564 | | | | 24,617 | |
MSCO | | | 07/2015 | | | USD | | | 1,985 | | | BRL | | | 6,230 | | | | – | | | | 19,087 | |
MSCO | | | 07/2015 | �� | | USD | | | 53 | | | CHF | | | 50 | | | | – | | | | 682 | |
MSCO | | | 07/2015 | | | USD | | | 2,490 | | | EUR | | | 2,215 | | | | 40,570 | | | | 20,385 | |
MSCO | | | 07/2015 | | | USD | | | 1,087 | | | GBP | | | 720 | | | | – | | | | 44,412 | |
MSCO | | | 12/2015 | | | USD | | | 5,904 | | | INR | | | 392,000 | | | | – | | | | 88,543 | |
MSCO | | | 07/2015 - 01/2016 | | | USD | | | 22,218 | | | JPY | | | 2,616,000 | | | | 788,003 | | | | 14,508 | |
MSCO | | | 11/2015 - 01/2016 | | | USD | | | 16,092 | | | MXN | | | 241,300 | | | | 900,443 | | | | – | |
NOM | | | 07/2015 | | | AUD | | | 455 | | | USD | | | 355 | | | | – | | | | 4,502 | |
NOM | | | 07/2015 | | | JPY | | | 64,000 | | | USD | | | 517 | | | | 5,915 | | | | – | |
TDB | | | 07/2015 | | | JPY | | | 43,000 | | | USD | | | 358 | | | | – | | | | 6,746 | |
TDB | | | 04/2016 | | | USD | | | 1,882 | | | BRL | | | 6,700 | | | | – | | | | 78,778 | |
TDB | | | 07/2015 | | | USD | | | 1,143 | | | CHF | | | 1,065 | | | | 3,399 | | | | – | |
TDB | | | 12/2015 | | | USD | | | 51 | | | KRW | | | 57,000 | | | | – | | | | 111 | |
TDB | | | 07/2015 | | | USD | | | 1,047 | | | MXN | | | 15,800 | | | | 42,613 | | | | – | |
TDB | | | 07/2015 | | | USD | | | 1,045 | | | ZAR | | | 12,890 | | | | – | | | | 12,898 | |
| | | | | | | | | | | | | | | | | | | | |
Total Unrealized Appreciation and Depreciation | | | | | | | | | | | | | | | | | | $ | 9,224,418 | | | $ | 3,542,475 | |
| | | | | | | | | | | | | | | | | | | | |
| | | | | | | | | | | | | | | | | | | | | | | | |
Futures Contracts as of June 30, 2015 | | | | | | | | | | | | | | | | | |
| Description | | Exchange | | | Buy/Sell | | | Expiration Date | | | Number of Contracts | | | Value | | | Unrealized Appreciation
(Depreciation) | |
Aluminum* | | | LME | | | | Buy | | | | 9/15/15 | | | | 3 | | | $ | 126,356 | | | $ | (4,656 | ) |
Brent Crude Oil* | | | ICE | | | | Buy | | | | 11/13/15 | | | | 9 | | | | 591,750 | | | | (17,222 | ) |
CAC40 10 Index | | | PAR | | | | Sell | | | | 7/17/15 | | | | 255 | | | | 13,607,385 | | | | 56,511 | |
CBOE Volatility Index | | | CBE | | | | Buy | | | | 8/19/15 | | | | 93 | | | | 1,615,875 | | | | 9,877 | |
Cocoa* | | | NYB | | | | Sell | | | | 9/15/15 | | | | 1 | | | | 32,690 | | | | (1,443 | ) |
Coffee “C”* | | | NYB | | | | Sell | | | | 9/18/15 | | | | 11 | | | | 546,150 | | | | 2,330 | |
Coffee “C”* | | | NYB | | | | Buy | | | | 7/21/15 | | | | 1 | | | | 48,994 | | | | 1,216 | |
Coffee “C”* | | | NYB | | | | Sell | | | | 7/21/15 | | | | 1 | | | | 48,994 | | | | 1,872 | |
Copper* | | | CMX | | | | Buy | | | | 9/28/15 | | | | 8 | | | | 523,000 | | | | (25,319 | ) |
Copper* | | | LME | | | | Sell | | | | 8/17/15 | | | | 1 | | | | 144,025 | | | | 16,704 | |
Corn* | | | CBT | | | | Buy | | | | 9/14/15 | | | | 30 | | | | 633,000 | | | | 100,577 | |
16 OPPENHEIMER GLOBAL MULTI-ALTERNATIVES FUND/VA
| | | | | | | | | | | | | | | | | | | | |
| Futures Contracts (Continued) | |
| | | | | | |
| Description | | Exchange | | Buy/Sell | | Expiration Date | | | Number of Contracts | | | Value | | | Unrealized Appreciation
(Depreciation) | |
Corn* | | CBT | | Buy | | | 12/14/15 | | | | 5 | | | $ | 107,875 | | | $ | 12,610 | |
Euro-BTP | | EUX | | Sell | | | 9/08/15 | | | | 7 | | | | 1,016,152 | | | | 18,117 | |
FTSE 100 Index | | LIF | | Sell | | | 9/18/15 | | | | 134 | | | | 13,672,954 | | | | 375,629 | |
Gas Oil* | | NYM | | Sell | | | 7/31/15 | | | | 7 | | | | 602,524 | | | | (8,958 | ) |
Gas Oil* | | NYM | | Sell | | | 11/30/15 | | | | 4 | | | | 291,564 | | | | (1,299 | ) |
Gold (100 oz.) * | | CMX | | Buy | | | 8/27/15 | | | | 5 | | | | 585,900 | | | | (8,072 | ) |
Gold (100 oz.) * | | CMX | | Sell | | | 8/27/15 | | | | 7 | | | | 820,260 | | | | 7,614 | |
Lead* | | LME | | Sell | | | 8/17/15 | | | | 1 | | | | 43,844 | | | | 6,373 | |
Lean Hogs* | | CME | | Sell | | | 10/14/15 | | | | 1 | | | | 26,400 | | | | 2,327 | |
Lean Hogs* | | CME | | Sell | | | 7/15/15 | | | | 18 | | | | 548,640 | | | | 50,557 | |
Live Cattle* | | CME | | Buy | | | 10/30/15 | | | | 3 | | | | 180,840 | | | | (129 | ) |
Live Cattle* | | CME | | Sell | | | 8/31/15 | | | | 4 | | | | 236,920 | | | | 3,228 | |
Natural Gas* | | NYM | | Sell | | | 7/29/15 | | | | 20 | | | | 566,400 | | | | (34,777 | ) |
New York Harbor ULSD* | | NYM | | Buy | | | 7/31/15 | | | | 7 | | | | 555,631 | | | | (18,664 | ) |
Nickel* | | LME | | Buy | | | 9/14/15 | | | | 5 | | | | 359,145 | | | | (33,871 | ) |
Platinum* | | NYM | | Buy | | | 10/28/15 | | | | 8 | | | | 431,800 | | | | 1,861 | |
S&P 500 E-Mini Index | | CME | | Buy | | | 9/18/15 | | | | 22 | | | | 2,259,840 | | | | 4,245 | |
S&P/TSX 60 Index | | MON | | Sell | | | 9/17/15 | | | | 25 | | | | 3,378,303 | | | | 44,589 | |
Silver* | | CMX | | Buy | | | 9/28/15 | | | | 7 | | | | 545,335 | | | | (48,231 | ) |
Soybean* | | CBT | | Sell | | | 8/14/15 | | | | 2 | | | | 104,950 | | | | (7,406 | ) |
SPI 200 Index | | SFE | | Sell | | | 9/17/15 | | | | 35 | | | | 3,643,548 | | | | 56,645 | |
United States Treasury Nts., 10 yr. | | CBT | | Buy | | | 9/21/15 | | | | 48 | | | | 6,056,250 | | | | (41,376 | ) |
United States Treasury Nts., 5 yr. | | CBT | | Buy | | | 9/30/15 | | | | 170 | | | | 20,273,828 | | | | (5,522 | ) |
Wheat* | | CBT | | Sell | | | 12/14/15 | | | | 5 | | | | 155,500 | | | | (21,639 | ) |
WTI Crude Oil* | | NYM | | Sell | | | 7/21/15 | | | | 47 | | | | 2,795,090 | | | | 8,934 | |
WTI Crude Oil* | | NYM | | Sell | | | 9/22/15 | | | | 4 | | | | 240,400 | | | | (1,929 | ) |
WTI Crude Oil* | | ICE | | Sell | | | 7/20/15 | | | | 11 | | | | 654,170 | | | | 5,481 | |
WTI Crude Oil* | | NYM | | Buy | | | 11/20/15 | | | | 5 | | | | 303,900 | | | | 22,616 | |
WTI Crude Oil* | | NYM | | Sell | | | 8/20/15 | | | | 6 | | | | 358,980 | | | | 7,106 | |
WTI Crude Oil* | | NYM | | Buy | | | 11/21/16 | | | | 12 | | | | 751,920 | | | | (8,318 | ) |
| | | | | | | | | | | | | | | | | | | | |
| | | | | | | | | | | | | | | | | | $ | 528,188 | |
| | | | | | | | | | | | | | | | | | | | |
*All or a portion of this security is owned by the subsidiary. See Note 2 of the accompanying Consolidated Notes.
| | | | | | | | | | | | | | | | | | | | | | | | | | | | | | | | |
| Over-the-Counter Options Written at June 30, 2015 | |
| Description | | Counterparty | | | | | | Exercise Price | | | Expiration Date | | | | | | Number of Contracts | | | Premiums Received | | | Value | |
EUR Currency Put | | | BOA | | | | USD | | | | 1.124 | | | | 7/6/15 | | | | EUR | | | | (1,800,000) | | | $ | 18,498 | | | $ | (26,840) | |
EUR Currency Call | | | BOA | | | | USD | | | | 1.124 | | | | 7/6/15 | | | | EUR | | | | (1,800,000) | | | | 18,341 | | | | (10,564) | |
EUR Currency Call | | | JPM | | | | USD | | | | 1.120 | | | | 7/3/15 | | | | EUR | | | | (1,790,000) | | | | 15,516 | | | | (8,774) | |
EUR Currency Put | | | JPM | | | | USD | | | | 1.120 | | | | 7/3/15 | | | | EUR | | | | (1,790,000) | | | | 15,415 | | | | (18,748) | |
EUR Currency Put | | | RBSC | | | | USD | | | | 1.000 | | | | 11/30/15 | | | | EUR | | | | (14,100,000) | | | | 117,312 | | | | (86,941) | |
EUR Currency Call | | | TDB | | | | USD | | | | 1.119 | | | | 7/7/15 | | | | EUR | | | | (1,780,000) | | | | 20,175 | | | | (14,776) | |
EUR Currency Put | | | TDB | | | | USD | | | | 1.119 | | | | 7/7/15 | | | | EUR | | | | (1,780,000) | | | | 20,004 | | | | (23,160) | |
GBP Currency Call | | | GSG | | | | AUD | | | | 2.250 | | | | 12/18/15 | | | | GBP | | | | (35,700,000) | | | | 289,370 | | | | (274,018) | |
INR Currency Put | | | BOA | | | | INR | | | | 64.200 | | | | 8/20/15 | | | | INR | | | | (128,400,000) | | | | 32,852 | | | | (19,132) | |
INR Currency Call | | | BOA | | | | INR | | | | 64.200 | | | | 8/20/15 | | | | INR | | | | (128,400,000) | | | | 45,180 | | | | (17,976) | |
INR Currency Put | | | BOA | | | | INR | | | | 64.200 | | | | 8/20/15 | | | | INR | | | | (514,000,000) | | | | 195,591 | | | | (76,586) | |
INR Currency Call | | | BOA | | | | INR | | | | 64.200 | | | | 8/20/15 | | | | INR | | | | (514,000,000) | | | | 195,591 | | | | (71,960) | |
INR Currency Call | | | RBSC | | | | INR | | | | 64.200 | | | | 8/20/15 | | | | INR | | | | (433,000,000) | | | | 82,270 | | | | (60,620) | |
INR Currency Put | | | RBSC | | | | INR | | | | 64.200 | | | | 8/20/15 | | | | INR | | | | (433,000,000) | | | | 147,220 | | | | (64,517) | |
| | | | | | | | | | | | | | | | | | | | | | | | | | | | |
Total of Over-the-Counter Options Written | | | | | | | | | | | $ | 1,213,335 | | | $ | (774,612) | |
| | | | | | | | | | | | | | | | | | | | | | | | | | | | |
| | | | | | | | | | | | | | | | | | | | | | | | | | | | |
| Centrally Cleared Credit Default Swaps at June 30, 2015 | |
| Reference Asset | | Buy/Sell
Protection | | | Fixed Rate | | | Maturity Date | | | | | | Notional Amount
(000’s) | | | Premiums Received/(Paid) | | | Value | |
CDX.HY.23 | | | Buy | | | | 5.000 | % | | | 12/20/19 | | | | USD | | | | 5,044 | | | $ | 285,608 | | | $ | (347,156 | ) |
CDX.HY.24 | | | Buy | | | | 5.000 | | | | 6/20/20 | | | | USD | | | | 183 | | | | 11,763 | | | | (11,747 | ) |
CDX.HY.24 | | | Buy | | | | 5.000 | | | | 6/20/20 | | | | USD | | | | 2,376 | | | | 176,999 | | | | (152,389 | ) |
CDX.HY.24 | | | Buy | | | | 5.000 | | | | 6/20/20 | | | | USD | | | | 896 | | | | 64,036 | | | | 55,224 | |
CDX.HY.24 | | | Buy | | | | 5.000 | | | | 6/20/20 | | | | USD | | | | 1,881 | | | | 145,487 | | | | (120,642 | ) |
CDX.IG.24 | | | Sell | | | | 1.000 | | | | 6/20/20 | | | | USD | | | | 2,400 | | | | (47,417 | ) | | | 36,725 | |
CDX.IG.24 | | | Sell | | | | 1.000 | | | | 6/20/20 | | | | USD | | | | 239 | | | | (3,921 | ) | | | 3,657 | |
CDX.IG.24 | | | Sell | | | | 1.000 | | | | 6/20/20 | | | | USD | | | | 1,214 | | | | (20,583 | ) | | | 18,577 | |
iTraxx.Main.23 | | | Buy | | | | 1.000 | | | | 6/20/20 | | | | EUR | | | | 2,300 | | | | 57,707 | | | | (31,780 | ) |
17 OPPENHEIMER GLOBAL MULTI-ALTERNATIVES FUND/VA
CONSOLIDATED STATEMENT OF INVESTMENTS Unaudited / Continued
| | | | | | | | | | | | | | | | | | | | | | | | | | | | | | | | |
Centrally Cleared Credit Default Swaps (Continued) | | | | | | | | | | | | | |
| Reference Asset | | | Buy/Sell
Protection | | | Fixed Rate | | | Maturity Date | | | | | | Notional Amount
(000’s) | | | Premiums Received/(Paid) | | | Value | |
iTraxx.Main.23 | | | | | | | Buy | | | | 1.000 | % | | | 6/20/20 | | | | EUR | | | | 942 | | | $ | 19,902 | | | $ | (13,016 | ) |
iTraxx.Main.23 | | | | | | | Buy | | | | 1.000 | | | | 6/20/20 | | | | EUR | | | | 153 | | | | 2,801 | | | | (2,114 | ) |
| | | | | | | | | | | | | | | | | | | | | | | | | | | | |
Total of Centrally Cleared Credit Default Swaps | | | | | | | $ | 692,382 | | | $ | (564,661 | ) |
| | | | | | | | | | | | | | | | | | | | | | | | | | | | |
Over-the-Counter Credit Default Swaps at June 30, 2015 | |
| Reference Asset | | Counterparty | | | Buy/Sell
Protection | | | Fixed Rate | | | Maturity Date | | | | | | Notional Amount
(000’s) | | | Premiums Received/(Paid) | | | Value | |
Aetna, Inc. | | | GSG | | | | Sell | | | | 1.000 | % | | | 6/20/20 | | | | USD | | | | 1,640 | | | $ | (68,081 | ) | | $ | 40,144 | |
Assured Guaranty Corp. | | | GSG | | | | Sell | | | | 5.000 | | | | 9/20/20 | | | | USD | | | | 2,650 | | | | (256,302 | ) | | | 34,335 | |
Conagra Foods, Inc. | | | JPM | | | | Sell | | | | 1.000 | | | | 9/20/20 | | | | USD | | | | 2,650 | | | | (33,843 | ) | | | 2,677 | |
Deere & Co. | | | BAC | | | | Sell | | | | 1.000 | | | | 9/20/20 | | | | USD | | | | 2,650 | | | | (86,843 | ) | | | 76,872 | |
E.I. Du Pont de Nemours & Co. | | | JPM | | | | Buy | | | | 1.000 | | | | 9/20/20 | | | | USD | | | | 2,650 | | | | 75,169 | | | | (61,905 | ) |
Expedia, Inc. | | | CITNA-B | | | | Sell | | | | 1.000 | | | | 9/20/20 | | | | USD | | | | 2,650 | | | | (11,482 | ) | | | (6,016 | ) |
Federative Republic of Brazil | | | BAC | | | | Buy | | | | 1.000 | | | | 6/20/20 | | | | USD | | | | 962 | | | | (61,114 | ) | | | 73,665 | |
Federative Republic of Brazil | | | CITNA-B | | | | Buy | | | | 1.000 | | | | 6/20/20 | | | | USD | | | | 1,930 | | | | (122,249 | ) | | | 147,789 | |
Federative Republic of Brazil | | | GSG | | | | Buy | | | | 1.000 | | | | 9/20/20 | | | | USD | | | | 190 | | | | (13,911 | ) | | | 15,071 | |
Freeport-McMoran, Inc. | | | BAC | | | | Sell | | | | 1.000 | | | | 6/20/20 | | | | USD | | | | 2,640 | | | | 149,851 | | | | (219,443 | ) |
Gap, Inc. (The) | | | CITNA-B | | | | Buy | | | | 1.000 | | | | 6/20/20 | | | | USD | | | | 2,640 | | | | 26,576 | | | | (214 | ) |
General Electric Capital Corp. | | | CITNA-B | | | | Sell | | | | 1.000 | | | | 6/20/20 | | | | USD | | | | 2,640 | | | | (81,754 | ) | | | 41,164 | |
Kingdom of Spain | | | BAC | | | | Buy | | | | 1.000 | | | | 6/20/20 | | | | USD | | | | 1,189 | | | | 5,605 | | | | 10,278 | |
Kingdom of Spain | | | BOA | | | | Buy | | | | 1.000 | | | | 6/20/20 | | | | USD | | | | 2,250 | | | | 15,265 | | | | 19,449 | |
Kingdom of Spain | | | BOA | | | | Buy | | | | 1.000 | | | | 6/20/20 | | | | USD | | | | 175 | | | | 762 | | | | 1,513 | |
Kingdom of Spain | | | GSG | | | | Buy | | | | 1.000 | | | | 9/20/20 | | | | USD | | | | 239 | | | | 796 | | | | 1,808 | |
Motorola Solutions, Inc. | | | BOA | | | | Buy | | | | 1.000 | | | | 6/20/20 | | | | USD | | | | 2,640 | | | | (17,820 | ) | | | 42,359 | |
Newmont Mining Corp. | | | CITNA-B | | | | Sell | | | | 1.000 | | | | 6/20/20 | | | | USD | | | | 2,640 | | | | 15,688 | | | | (56,305 | ) |
Nordstrom, Inc. | | | JPM | | | | Buy | | | | 1.000 | | | | 6/20/20 | | | | USD | | | | 2,640 | | | | 71,094 | | | | (51,741 | ) |
Norfolk Southern Corp. | | | JPM | | | | Buy | | | | 1.000 | | | | 9/20/20 | | | | USD | | | | 2,650 | | | | 100,826 | | | | (88,534 | ) |
Portuguese Republic | | | BAC | | | | Buy | | | | 1.000 | | | | 6/20/20 | | | | USD | | | | 719 | | | | (18,979 | ) | | | 34,104 | |
Portuguese Republic | | | GSG | | | | Buy | | | | 1.000 | | | | 6/20/20 | | | | USD | | | | 1,350 | | | | (27,368 | ) | | | 64,034 | |
Portuguese Republic | | | GSG | | | | Buy | | | | 1.000 | | | | 9/20/20 | | | | USD | | | | 143 | | | | (5,105 | ) | | | 6,927 | |
Portuguese Republic | | | GSG | | | | Buy | | | | 1.000 | | | | 6/20/20 | | | | USD | | | | 100 | | | | (2,019 | ) | | | 4,743 | |
Prudential Financial, Inc. | | | BAC | | | | Sell | | | | 1.000 | | | | 9/20/20 | | | | USD | | | | 2,650 | | | | (43,603 | ) | | | 19,225 | |
Republic of Austria | | | BAC | | | | Buy | | | | 1.000 | | | | 6/20/20 | | | | USD | | | | 414 | | | | 15,034 | | | | (13,631 | ) |
Republic of Austria | | | GSG | | | | Buy | | | | 1.000 | | | | 6/20/20 | | | | USD | | | | 50 | | | | 1,795 | | | | (1,646 | ) |
Republic of Austria | | | GSG | | | | Buy | | | | 1.000 | | | | 9/20/20 | | | | USD | | | | 81 | | | | 2,896 | | | | (2,932 | ) |
Republic of Austria | | | GSG | | | | Buy | | | | 1.000 | | | | 6/20/20 | | | | USD | | | | 765 | | | | 27,529 | | | | (25,187 | ) |
Republic of Italy | | | BAC | | | | Buy | | | | 1.000 | | | | 6/20/20 | | | | USD | | | | 1,437 | | | | (15,210 | ) | | | 30,671 | |
Republic of Italy | | | GSG | | | | Buy | | | | 1.000 | | | | 9/20/20 | | | | USD | | | | 286 | | | | (2,259 | ) | | | (6,174 | ) |
Republic of Italy | | | GSG | | | | Buy | | | | 1.000 | | | | 6/20/20 | | | | USD | | | | 2,700 | | | | (12,012 | ) | | | 57,627 | |
Republic of Italy | | | GSG | | | | Buy | | | | 1.000 | | | | 6/20/20 | | | | USD | | | | 200 | | | | (1,273 | ) | | | 4,269 | |
Southwest Airlines Co. | | | CITNA-B | | | | Buy | | | | 1.000 | | | | 6/20/20 | | | | USD | | | | 2,640 | | | | 47,368 | | | | (10,205 | ) |
Time Warner Cable, Inc. | | | BAC | | | | Sell | | | | 1.000 | | | | 9/20/20 | | | | USD | | | | 2,650 | | | | 57,828 | | | | (81,173 | ) |
Union Pacific Corp. | | | FIB | | | | Buy | | | | 1.000 | | | | 6/20/20 | | | | USD | | | | 2,640 | | | | 105,459 | | | | (96,080 | ) |
Wal-Mart Stores, Inc. | | | BAC | | | | Buy | | | | 1.000 | | | | 9/20/20 | | | | USD | | | | 2,650 | | | | 105,560 | | | | (102,089 | ) |
Whirlpool Corp. | | | BNP | | | | Buy | | | | 1.000 | | | | 6/20/20 | | | | USD | | | | 2,640 | | | | 27,222 | | | | (15,110 | ) |
Xerox Corp. | | | BOA | | | | Buy | | | | 1.000 | | | | 6/20/20 | | | | USD | | | | 2,640 | | | | (17,820 | ) | | | 29,391 | |
| | | | | | | | | | | | | | | | | | | | | | | | | | | | |
Total of Over-the-Counter Credit Default Swaps | | | $ | (46,724 | ) | | $ | (80,270 | ) |
| | | | | | | | | | | | | | | | | | | | | | | | | | | | |
The table that follows shows the undiscounted maximum potential payment by the Fund related to selling credit protection in credit default swaps:
| | | | | | | | | | | | |
| Type of Reference Asset on which the Fund Sold Protection | | Total Maximum Potential
Payments for Selling Credit
Protection (Undiscounted) | | | Amount Recoverable* | | | Reference Asset
Rating Range** | |
Investment Grade Corporate Debt Indexes | | $ | 3,853,000 | | | $ | - | | | | BBB+ | |
Investment Grade Single Name Corporate Debt | | | 25,460,000 | | | | - | | | | BBB- to AA | |
| | | | | | | | |
Total | | $ | 29,313,000 | | | $ | - | | | | | |
| | | | | | | | |
* The Fund has no amounts recoverable from related purchased protection. In addition, the Fund has no recourse provisions under the credit derivatives and holds no collateral which can offset or reduce potential payments under a triggering event.
** The period end reference asset security ratings, as rated by any rating organization, are included in the equivalent Standard & Poor’s rating category. The reference asset rating represents the likelihood of a potential credit event on the reference asset which would result in a related payment of the Fund.
| | | | | | | | | | | | | | | | | | | | | | | | | | | | |
Centrally Cleared Interest Rate Swaps at June 30, 2015 | |
| Counterparty | | Pay/Receive Floating
Rate | | | Floating Rate | | | Fixed Rate | | | Maturity Date | | | | | | Notional Amount (000’s) | | | Value | |
BAC | | | Receive | | |
| Three-Month SEK
STIBOR SIDE |
| | | 1.235% | | | | 6/3/25 | | | | SEK | | | | 2,380 | | | $ | (9,287 | ) |
BAC | | | Receive | | |
| Three-Month SEK
STIBOR SIDE |
| | | 0.946 | | | | 4/7/25 | | | | SEK | | | | 42,270 | | | | (284,773 | ) |
18 OPPENHEIMER GLOBAL MULTI-ALTERNATIVES FUND/VA
| | | | | | | | | | | | | | | | | | | | | | | | | | |
Centrally Cleared Interest Rate Swaps (Continued) | |
| Counterparty | | Pay/Receive Floating Rate | | | Floating Rate | | Fixed Rate | | | Maturity Date | | | Notional Amount (000’s) | | | Value | |
BAC | | | Pay | | | Three-Month SEK STIBOR SIDE | | | 1.600% | | | | 6/15/25 | | | | SEK | | | | 1,855 | | | $ | 251 | |
BAC | | | Receive | | | Six-Month JPY BBA LIBOR | | | 0.610 | | | | 6/3/25 | | | | JPY | | | | 38,000 | | | | 625 | |
BAC | | | Pay | | | Three-Month SEK STIBOR SIDE | | | 1.357 | | | | 5/8/25 | | | | SEK | | | | 18,780 | | | | (43,055 | ) |
BAC | | | Receive | | | Three-Month SEK STIBOR SIDE | | | 1.626 | | | | 6/29/25 | | | | SEK | | | | 4,380 | | | | 1,296 | |
BAC | | | Pay | | | Three-Month USD BBA LIBOR | | | 1.823 | | | | 2/4/25 | | | | USD | | | | 50 | | | | (2,262 | ) |
BAC | | | Pay | | | Three-Month USD BBA LIBOR | | | 2.219 | | | | 3/5/25 | | | | USD | | | | 50 | | | | (570 | ) |
BAC | | | Receive | | | Three-Month SEK STIBOR SIDE | | | 0.861 | | | | 4/16/25 | | | | SEK | | | | 4,740 | | | | (36,843 | ) |
BOA | | | Pay | | | Three-Month USD BBA LIBOR | | | 2.305 | | | | 5/8/25 | | | | USD | | | | 2,610 | | | | (24,264 | ) |
BOA | | | Receive | | | Three-Month NZD BBR FRA | | | 3.990 | | | | 5/8/25 | | | | NZD | | | | 3,300 | | | | 16,721 | |
BOA | | | Receive | | | Three-Month NZD BBR FRA | | | 4.165 | | | | 6/15/25 | | | | NZD | | | | 580 | | | | (8,835 | ) |
BOA | | | Receive | | | Three-Month NZD BBR FRA | | | 3.960 | | | | 6/29/25 | | | | NZD | | | | 1,405 | | | | (4,570 | ) |
BOA | | | Pay | | | Three-Month USD BBA LIBOR | | | 1.971 | | | | 4/7/25 | | | | USD | | | | 800 | | | | (29,701 | ) |
BOA | | | Receive | | | Three-Month NZD BBR FRA | | | 3.675 | | | | 4/16/25 | | | | NZD | | | | 555 | | | | 6,527 | |
BOA | | | Pay | | | Three-Month USD BBA LIBOR | | | 1.949 | | | | 4/16/25 | | | | USD | | | | 405 | | | | (15,909 | ) |
GSG | | | Pay | | | Three-Month USD BBA LIBOR | | | 2.489 | | | | 6/15/25 | | | | USD | | | | 530 | | | | 1,914 | |
JPM | | | Pay | | | Three-Month USD BBA LIBOR | | | 2.500 | | | | 6/29/25 | | | | USD | | | | 595 | | | | 2,526 | |
JPM | | | Receive | | | Six-Month JPY BBA LIBOR | | | 0.723 | | | | 6/15/25 | | | | JPY | | | | 50,000 | | | | (3,510 | ) |
JPM | | | Receive | | | Three-Month NZD BBR FRA | | | 3.900 | | | | 6/4/25 | | | | NZD | | | | 725 | | | | (99 | ) |
JPM | | | Pay | | | Three-Month NZD BBR FRA | | | 3.708 | | | | 4/8/25 | | | | NZD | | | | 1,135 | | | | 11,096 | |
JPM | | | Pay | | | Six-Month JPY BBA LIBOR | | | 0.541 | | | | 4/8/25 | | | | JPY | | | | 97,000 | | | | 5,629 | |
JPM | | | Pay | | | Three-Month NZD BBR FRA | | | 3.555 | | | | 2/9/25 | | | | NZD | | | | 5,460 | | | | 63,581 | |
JPM | | | Pay | | | Six-Month JPY BBA LIBOR | | | 0.550 | | | | 3/5/25 | | | | JPY | | | | 492,000 | | | | 20,497 | |
JPM | | | Receive | | | Six-Month JPY BBA LIBOR | | | 0.613 | | | | 5/13/25 | | | | JPY | | | | 310,000 | | | | 2,714 | |
JPM | | | Pay | | | Six-Month EUR EURIBOR | | | 0.888 | | | | 5/29/25 | | | | EUR | | | | 8,400 | | | | (206,286 | ) |
JPM | | | Pay | | | Six-Month JPY BBA LIBOR | | | 0.516 | | | | 4/16/25 | | | | JPY | | | | 51,000 | | | | 4,063 | |
JPM | | | Receive | | | Three-Month USD BBA LIBOR | | | 2.387 | | | | 12/8/24 | | | | USD | | | | 4,010 | | | | (1,945 | ) |
JPY | | | Pay | | | Six-Month JPY BBA LIBOR | | | 0.665 | | | | 6/29/25 | | | | JPY | | | | 83,000 | | | | (1,686 | ) |
| | | | | | | | | | | | | | | | | | | | | | | | | | |
Total of Centrally Cleared Interest Rate Swaps | | | | | | | | | | | | | | | | | | | | | $ | (536,155 | ) |
| | | | | | | | | | | | | | | | | | | | | | | | | | |
| | | | | | | | | | | | | | | | | | | | | | | | | | |
Over-the-Counter Total Return Swaps at June 30, 2015 | |
| Reference Asset | | Counterparty | | | Pay/Receive Total Return* | | | Floating Rate | | Maturity Date | | | Notional Amount (000’s) | | | Value | |
Blackstone Group LP | | | GSG | | | | Receive | | | Twelve-Month USD BBA LIBOR plus 74 basis points | | | 7/22/16 | | | | USD | | | | 1,025 | | | $ | (32,715 | ) |
CGAUOPA2 Custom Basket | | | CITNA-B | | | | Receive | | | One-Month AUD BBR BBSW plus 50 basis points | | | 3/10/16 | | | | AUD | | | | 6,886 | | | | (82,675 | ) |
CGCNCAD4 Custom Basket | | | CITNA-B | | | | Receive | | | One-Month CAD BA CDOR plus 50 basis points | | | 4/7/16 | | | | CAD | | | | 6,898 | | | | (120,243 | ) |
CIBZC8DE Index** | | | CIBC | | | | Receive | | | Official settlement price of CIBZC8DE Index | | | 7/20/15 | | | | USD | | | | (4,500 | ) | | | 96,823 | |
CIBZOPQR Index** | | | CIBC | | | | Receive | | | Official settlement price of CIBZOPQR Index | | | 7/20/15 | | | | USD | | | | (3,700 | ) | | | 80,220 | |
DBOPVALG Custom Basket | | | DEU | | | | Receive | | | One-Month USD BBA LIBOR plus 40 basis points | | | 2/5/16 | | | | USD | | | | 8,454 | | | | (37,754 | ) |
DBOPVAST Custom Basket | | | DEU | | | | Pay | | | One-Month USD BBA LIBOR minus 55 basis points | | | 2/5/16 | | | | USD | | | | 8,450 | | | | 140,700 | |
19 OPPENHEIMER GLOBAL MULTI-ALTERNATIVES FUND/VA
CONSOLIDATED STATEMENT OF INVESTMENTS Unaudited / Continued
| | | | | | | | | | | | | | | | | | | | | | | | | | |
Over-the-Counter Total Return Swaps (Continued) | |
| Reference Asset | | Counterparty | | | Pay/Receive Total Return* | | | Floating Rate | | Maturity Date | | | Notional Amount (000’s) | | | Value | |
| GSEHOPHK Custom Basket | | | GSG | | | | Receive | | | One-Month HKD HIBOR HKAB plus 40 basis points | | | 6/21/16 | | | | HKD | | | | 44,541 | | | $ | (164,150 | ) |
| GSOPSPS3 Custom Basket | | | GSG | | | | Receive | | | One-Month USD BBA LIBOR plus 35 basis points | | | 6/16/16 | | | | USD | | | | 19,594 | | | | (378,316 | ) |
| HIN5 Index | | | GSG | | | | Pay | | | No Floating Rate | | | 8/10/15 | | | | HKD | | | | 31,203 | | | | 137,867 | |
| IBOXX USD Liquid Leveraged Loans Index Series 1 Version 1 | | | JPM | | | | Receive | | | USD BBA LIBOR | | | 9/25/15 | | | | USD | | | | 54,811 | | | | (38,255 | ) |
| IBOXX USD Liquid Leveraged Loans Index Series 1 Version 1 | | | JPM | | | | Receive | | | USD BBA LIBOR | | | 9/25/15 | | | | USD | | | | 3,897 | | | | (5,224 | ) |
| MLTROPFR Custom Basket | | | BOA | | | | Receive | | | One-Month EUR EURIBOR plus 29 basis points | | | 5/9/16 | | | | EUR | | | | 11,708 | | | | (532,612 | ) |
| MLTROPFR Custom Basket | | | BOA | | | | Receive | | | One-Month EUR EURIBOR plus 29 basis points | | | 6/15/16 | | | | EUR | | | | 894 | | | | (34,083 | ) |
| MLTROPUK Custom Basket | | | BOA | | | | Receive | | | One-Month GBP BBA LIBOR plus 34 basis points | | | 6/15/16 | | | | GBP | | | | 330 | | | | (23,269 | ) |
| MLTROPUK Custom Basket | | | BOA | | | | Receive | | | One-Month GBP BBA LIBOR plus 34 basis points | | | 5/9/16 | | | | GBP | | | | 8,787 | | | | (666,372 | ) |
| MQCP169E Index** | | | MAC | | | | Receive | | | Official settlement price of MQCP169E Index | | | 7/20/15 | | | | USD | | | | (3,400 | ) | | | 73,333 | |
| MQCP169E Index** | | | MAC | | | | Receive | | | Official settlement price of MQCP169E Index | | | 7/20/15 | | | | USD | | | | (800 | ) | | | 15,636 | |
| OEX Index | | | GSG | | | | Pay | | | One-Month USD BBA LIBOR minus 35 basis points | | | 4/15/16 | | | | USD | | | | 788 | | | | 15,008 | |
| OEX Index | | | GSG | | | | Pay | | | One-Month USD BBA LIBOR minus 35 basis points | | | 4/7/16 | | | | USD | | | | 11,794 | | | | 235,706 | |
| OEX Index | | | GSG | | | | Pay | | | One-Month USD BBA LIBOR minus 35 basis points | | | 6/16/16 | | | | USD | | | | 1,022 | | | | 19,272 | |
| OEX Index | | | GSG | | | | Pay | | | One-Month USD BBA LIBOR minus 35 basis points | | | 5/6/16 | | | | USD | | | | 6,216 | | | | 124,224 | |
| | | | | | | | | | | | | | | | | | | | | | | | | | |
Total of Over-the-Counter Total Return Swaps | | | | | | | | | | | | | | | | | | | | | | | | $ | (1,176,879 | ) |
| | | | | | | | | | | | | | | | | | | | | | | | | | |
* Fund will pay or receive the total return of the reference asset depending on whether the return is positive or negative. For contracts where the Fund has elected to receive the total return of the reference asset if positive, it will be responsible for paying the floating rate and the total return of the reference asset if negative. If the Fund has elected to pay the total return of the reference asset if positive, it will receive the floating rate and the total return of the reference asset if negative.
** All or a portion of this security is owned by the subsidiary. See Note 2 of the accompanying Consolidated Notes.
| | | | | | | | | | | | | | | | | | | | | | | | | | | | |
Over-the-Counter Volatility Swaps at June 30, 2015 | |
| Reference Asset | | Counterparty | | | Pay/Receive Volatility* | | | Strike Price | | | Maturity Date | | | Notional Amount | | | Value | |
| AUD/CHF spot exchange rate | | | DEU | | | | Receive | | | $ | 11.300 | | | | 7/31/15 | | | | AUD | | | | 5,800 | | | $ | 7,965 | |
| AUD/NZD spot exchange rate | | | JPM | | | | Receive | | | | 8.150 | | | | 7/22/15 | | | | AUD | | | | 5,400 | | | | 8,083 | |
| AUD/NZD spot exchange rate | | | BOA | | | | Receive | | | | 7.850 | | | | 7/20/15 | | | | AUD | | | | 5,500 | | | | 13,028 | |
| AUD/NZD spot exchange rate | | | GSG | | | | Receive | | | | 7.725 | | | | 7/20/15 | | | | AUD | | | | 5,500 | | | | 14,555 | |
| AUD/NZD spot exchange rate | | | BOA | | | | Receive | | | | 8.350 | | | | 7/17/15 | | | | AUD | | | | 5,500 | | | | 10,142 | |
| AUD/NZD spot exchange rate | | | HSBC | | | | Receive | | | | 8.500 | | | | 7/23/15 | | | | AUD | | | | 5,500 | | | | 7,553 | |
| AUD/NZD spot exchange rate | | | BOA | | | | Receive | | | | 8.350 | | | | 7/15/15 | | | | AUD | | | | 5,500 | | | | 8,614 | |
| AUD/NZD spot exchange rate | | | BOA | | | | Receive | | | | 8.300 | | | | 7/16/15 | | | | AUD | | | | 5,500 | | | | 9,633 | |
| CAD/CHF spot exchange rate | | | BOA | | | | Pay | | | | 10.500 | | | | 7/8/15 | | | | CAD | | | | 5,200 | | | | (5,745 | ) |
| EUR/CHF spot exchange rate | | | BOA | | | | Pay | | | | 8.300 | | | | 7/3/15 | | | | EUR | | | | 3,700 | | | | 3,135 | |
| EUR/CHF spot exchange rate | | | DEU | | | | Pay | | | | 8.500 | | | | 7/29/15 | | | | EUR | | | | 4,000 | | | | (6,734 | ) |
| EUR/CHF spot exchange rate | | | DEU | | | | Pay | | | | 9.400 | | | | 8/3/15 | | | | EUR | | | | 4,000 | | | | (3,122 | ) |
| EUR/CHF spot exchange rate | | | BOA | | | | Pay | | | | 7.900 | | | | 7/27/15 | | | | EUR | | | | 4,000 | | | | (8,696 | ) |
| EUR/JPY spot exchange rate | | | JPM | | | | Pay | | | | 13.500 | | | | 8/3/15 | | | | EUR | | | | 4,000 | | | | (5,797 | ) |
| EUR/USD spot exchange rate | | | JPM | | | | Receive | | | | 11.880 | | | | 7/27/15 | | | | USD | | | | 4,300 | | | | 4,343 | |
| iShares MSCI Emerging Markets | | | GSG | | | | Receive | | | | 461.820 | | | | 7/6/15 | | | | USD | | | | 348 | | | | (77,117 | ) |
| iShares MSCI Emerging Markets | | | GSG | | | | Pay | | | | 384.160 | | | | 7/9/15 | | | | USD | | | | 250 | | | | 26,975 | |
| iShares MSCI Emerging Markets | | | GSG | | | | Receive | | | | 464.403 | | | | 10/2/15 | | | | USD | | | | 954 | | | | — | |
| iShares MSCI Emerging Markets | | | GSG | | | | Pay | | | | 447.323 | | | | 10/2/15 | | | | USD | | | | 972 | | | | — | |
| iShares MSCI Emerging Markets | | | GSG | | | | Pay | | | | 443.103 | | | | 7/9/15 | | | | USD | | | | 326 | | | | 62,005 | |
| iShares MSCI Emerging Markets | | | GSG | | | | Receive | | | | 460.103 | | | | 7/9/15 | | | | USD | | | | 320 | | | | (67,904 | ) |
| iShares MSCI Emerging Markets | | | GSG | | | | Pay | | | | 443.103 | | | | 7/9/15 | | | | USD | | | | 326 | | | | 82,413 | |
| iShares MSCI Emerging Markets | | | GSG | | | | Pay | | | | 396.010 | | | | 7/6/15 | | | | USD | | | | 251 | | | | 43,473 | |
| iShares MSCI Emerging Markets | | | GSG | | | | Receive | | | | 412.090 | | | | 7/6/15 | | | | USD | | | | 246 | | | | (44,059 | ) |
| iShares MSCI Emerging Markets | | | GSG | | | | Receive | | | | 460.103 | | | | 7/9/15 | | | | USD | | | | 320 | | | | (67,904 | ) |
| iShares MSCI Emerging Markets | | | GSG | | | | Receive | | | | 469.156 | | | | 7/7/15 | | | | USD | | | | 349 | | | | (79,851 | ) |
| iShares MSCI Emerging Markets | | | GSG | | | | Receive | | | | 444.788 | | | | 7/6/15 | | | | USD | | | | 355 | | | | 58,362 | |
| iShares MSCI Emerging Markets | | | GSG | | | | Pay | | | | 451.988 | | | | 7/7/15 | | | | USD | | | | 357 | | | | 87,858 | |
| iShares MSCI Emerging Markets | | | GSG | | | | Pay | | | | 446.477 | | | | 7/8/15 | | | | USD | | | | 355 | | | | 96,383 | |
| iShares MSCI Emerging Markets | | | GSG | | | | Receive | | | | 463.541 | | | | 7/8/15 | | | | USD | | | | 348 | | | | (78,578 | ) |
| iShares MSCI Emerging Markets | | | GSG | | | | Receive | | | | 400.000 | | | | 7/9/15 | | | | USD | | | | 247 | | | | (34,308 | ) |
| iShares MSCI Emerging Markets | | | GSG | | | | Receive | | | | 438.903 | | | | 7/9/15 | | | | USD | | | | 239 | | | | (42,662 | ) |
20 OPPENHEIMER GLOBAL MULTI-ALTERNATIVES FUND/VA
| | | | | | | | | | | | | | | | | | | | | | | | | | | | |
Over-the-Counter Volatility Swaps (Continued) | |
| Reference Asset | | Counterparty | | | Pay/Receive
Volatility* | | | Strike Price | | | Maturity Date | | | | | | Notional Amount | | | Value | |
iShares MSCI Emerging Markets | | | GSG | | | | Pay | | | $ | 422.303 | | | | 7/9/15 | | | | USD | | | | 243 | | | $ | 54,213 | |
iShares MSCI Emerging Markets | | | GSG | | | | Pay | | | | 434.723 | | | | 7/8/15 | | | | USD | | | | 240 | | | | 70,584 | |
iShares MSCI Emerging Markets | | | GSG | | | | Pay | | | | 416.160 | | | | 7/7/15 | | | | USD | | | | 245 | | | | 66,248 | |
iShares MSCI Emerging Markets | | | GSG | | | | Receive | | | | 451.563 | | | | 7/8/15 | | | | USD | | | | 235 | | | | (48,998 | ) |
iShares MSCI Emerging Markets | | | GSG | | | | Receive | | | | 432.640 | | | | 7/7/15 | | | | USD | | | | 240 | | | | (47,904 | ) |
NZD/JPY spot exchange rate | | | MOS | | | | Pay | | | | 11.250 | | | | 7/13/15 | | | | NZD | | | | 5,800 | | | | (7,114 | ) |
NZD/JPY spot exchange rate | | | BOA | | | | Pay | | | | 12.000 | | | | 7/13/15 | | | | NZD | | | | 5,900 | | | | (5,278 | ) |
USD/NOK spot exchange rate | | | JPM | | | | Receive | | | | 16.110 | | | | 7/9/15 | | | | USD | | | | 4,200 | | | | (4,200 | ) |
USD/NOK spot exchange rate | | | JPM | | | | Receive | | | | 16.310 | | | | 7/10/15 | | | | USD | | | | 4,200 | | | | (7,896 | ) |
| | | | | | | | | | | | | | | | | | | | | | | | | | | | |
Total of Over-the-Counter Volatility Swaps | | | | | | | | | | | | | | | | | | | | | | | | | | $ | 91,698 | |
| | | | | | | | | | | | | | | | | | | | | | | | | | | | |
* Fund will pay or receive the volatility of the reference asset depending on whether the realized volatility of the reference asset exceeds or is less than the strike price. For contracts where the Fund has elected to receive the volatility of the reference asset, it will receive a net payment of the difference between the realized volatility and the strike price multiplied by the notional amount if the realized volatility exceeds the strike price; the Fund will make a net payment of the absolute value of the difference of the realized volatility and the strike price multiplied by the notional amount if the realized volatility is less than the strike price. For contracts where the Fund has elected to pay the volatility of the reference asset, it will make a net payment of the difference between the realized volatility and the strike price multiplied by the notional amount if the realized volatility exceeds the strike price; the Fund will receive a net payment of the absolute value of the difference of the realized and the strike price multiplied by the notional amount if the realized volatility is less than the strike price.
| | |
Glossary: |
Counterparty Abbreviations |
BAC | | Barclays Bank plc |
BNP | | BNP Paribas |
BOA | | Bank of America NA |
CIBC | | Canadian Imperial Bank of Commerce |
CITNA-B | | Citibank NA |
DEU | | Deutsche Bank AG |
FIB | | Credit Suisse International |
GSCO-OT | | Goldman Sachs Bank USA |
GSG | | Goldman Sachs Group, Inc. (The) |
HSBC | | HSBC Bank USA NA |
JPM | | JPMorgan Chase Bank NA |
MAC | | Macquarie Bank Ltd. |
MOS | | Morgan Stanley & Co., Inc. |
MSCO | | Morgan Stanley Capital Services, Inc. |
NOM | | Nomura Global Financial Products, Inc. |
RBCS | | Royal Bank of Canada |
TDB | | Toronto Dominion Bank |
|
Currency abbreviations indicate amounts reporting in currencies |
AUD | | Australian Dollar |
BRL | | Brazilian Real |
CAD | | Canadian Dollar |
CHF | | Swiss Franc |
EUR | | Euro |
GBP | | British Pound Sterling |
HKD | | Hong Kong Dollar |
HUF | | Hungarian Forint |
INR | | Indian Rupee |
JPY | | Japanese Yen |
KRW | | South Korean Won |
MXN | | Mexican Nuevo Peso |
MYR | | Malaysian Ringgit |
NOK | | Norwegian Krone |
NZD | | New Zealand Dollar |
PLN | | Polish Zloty |
SEK | | Swedish Krona |
SGD | | Singapore Dollar |
TRY | | New Turkish Lira |
ZAR | | South African Rand |
|
Definitions |
BA CDOR | | Canada Bankers Acceptances Deposit Offering Rate |
BBA LIBOR | | British Bankers’ Association London - Interbank Offered Rate |
BBR BBSW | | Bank Bill Swap Reference Rate (Australian Financial Market) |
BBR FRA | | Bank Bill Forward Rate Agreement (Australian Financial Market) |
CDX.HY.23 | | Markit CDX High Yield Index |
CDX.HY.24 | | Markit CDX High Yield Index |
CDX.IG.24 | | Markit CDX Investment Grade Index |
CGAUOPA2 | | Custom Basket of Securities |
CGCNCAD4 | | Custom Basket of Securities |
CIBZC8DE | | CIBC Custom 8 Enhanced Roll Commodity Index |
21 OPPENHEIMER GLOBAL MULTI-ALTERNATIVES FUND/VA
CONSOLIDATED STATEMENT OF INVESTMENTS Unaudited / Continued
| | |
Definitions (Continued) |
CIBZOPQR | | CIBC Oppenheimer Quarterly Roll Index |
DBOPVAST | | Custom Basket of Securities |
DBOPALG | | Custom Basket of Securities |
EURIBOR | | Euro Interbank Offered Rate |
GSEHOPHK | | Custom Basket of Securities |
GSOPSPS3 | | Custom Basket of Securities |
H1N5 | | The Hang Seng Index Futures |
HIBOR | | Hong Kong Interbank Offered Rate |
HKAB | | Hong Kong Association of Banks |
iTraxx.Main 23 | | Credit Default Swap Trading Index for a Specific Basket of Securities |
MLTROPFR | | Custom Basket of Securities |
MLTROPUK | | Custom Basket of Securities |
MQCP169E | | Macquarie Commodity Investor Product 169 ER |
MSCI | | Morgan Stanley Capital International |
OEX | | S&P 100 Index |
STIBOR-SIDE | | Stockholm Interbank Offered Rate |
|
Exchange Abbreviations |
CBE | | Chicago Board Options Exchange |
CBT | | Chicago Board of Trade |
CME | | Chicago Mercantile Exchanges |
CMX | | Commodity Exchange, Inc. |
EUX | | European Stock Exchange |
ICE | | Intercontinental Exchange |
LIF | | London International Financial Futures and Options Exchange |
MON | | Montreal Exchange |
NAS | | NASDAQ Stock Market |
NYB | | New York Board of Trade |
NYM | | New York Mercantile Echange |
PAR | | Paris Stock Exchange |
SFE | | Sydney Futures Exchange |
See accompanying Notes to Consolidated Financial Statements.
22 OPPENHEIMER GLOBAL MULTI-ALTERNATIVES FUND/VA
CONSOLIDATED STATEMENT OF ASSETS AND LIABILITIES June 30, 2015 Unaudited
| | | | |
Assets | | | | |
| Investments, at value—see accompanying statement of investments: | | | | |
| Unaffiliated companies (cost $361,082,230) | | $ | 351,999,347 | |
| Affiliated companies (cost $48,203,654) | | | 48,203,654 | |
| | | | |
| | | 400,203,001 | |
| Cash | | | 774,603 | |
| Cash—foreign currencies (cost $2,487,823) | | | 2,477,678 | |
| Cash used for collateral on futures | | | 995,000 | |
| Cash used for collateral on centrally cleared swaps | | | 2,919,708 | |
| Deposits with broker for securities sold short | | | 29,343,353 | |
| Unrealized appreciation on forward currency exchange contracts | | | 9,224,418 | |
| Swaps, at value (net premiums paid $862,878) | | | 2,432,469 | |
| Centrally cleared swaps, at value (net premiums paid $7,885) | | | 251,623 | |
| Receivables and other assets: | | | | |
| Shares of beneficial interest sold | | | 18,337,025 | |
| Interest and dividends | | | 1,224,250 | |
| Investments sold (including $432,763 sold on a when-issued or delayed delivery basis) | | | 977,021 | |
| Variation margin receivable | | | 579,025 | |
| Other | | | 38,039 | |
| | | | |
| Total assets | | | 469,777,213 | |
| | | | |
Liabilities | | | | |
| Securities sold short, at value (proceeds $30,971,521) - see accompanying statement of investments | | | 28,807,274 | |
| Unrealized depreciation on forward currency exchange contracts | | | 3,542,475 | |
| Options written, at value (premiums received $1,213,335) | | | 774,612 | |
| Swaps, at value (net premiums received $816,154) | | | 3,597,920 | |
| Centrally cleared swaps, at value (premiums received $700,267) | | | 1,352,439 | |
| Payables and other liabilities: | | | | |
| Investments purchased (including $4,158,930 purchased on a when-issued or delayed delivery basis) | | | 13,574,113 | |
| Variation margin payable | | | 204,329 | |
| Dividends | | | 29,849 | |
| Shareholder communications | | | 5,596 | |
| Trustees’ compensation | | | 2,115 | |
| Distribution and service plan fees | | | 362 | |
| Shares of beneficial interest redeemed | | | 44 | |
| Other | | | 101,931 | |
| | | | |
| Total liabilities | | | 51,993,059 | |
| | | | |
Net Assets | | $ | 417,784,154 | |
| | | | |
| | | | |
Composition of Net Assets | | | | |
| Par value of shares of beneficial interest | | $ | 41,649 | |
| Additional paid-in capital | | | 427,903,515 | |
| Accumulated net investment loss | | | (3,845,054 | ) |
| Accumulated net realized loss on investments and foreign currency transactions | | | (4,354,785 | ) |
| Net unrealized depreciation on investments and translation of assets and liabilities denominated in foreign currencies | | | (1,961,171 | ) |
| | | | |
Net Assets | | $ | 417,784,154 | |
| | | | |
| | | | |
Net Asset Value Per Share | | | | |
| Non-Service Shares: | | | | |
| Net asset value, redemption price per share and offering price per share (based on net assets of $416,015,147 and 41,472,682 shares of beneficial interest outstanding) | | | $10.03 | |
| |
| Service Shares: | | | | |
| Net asset value, redemption price per share and offering price per share (based on net assets of $1,769,007 and 176,782 shares of beneficial interest outstanding) | | | $10.01 | |
See accompanying Notes to Consolidated Financial Statements.
23 OPPENHEIMER GLOBAL MULTI-ALTERNATIVES FUND/VA
CONSOLIDATED STATEMENT OF OPERATIONS For the Six Months Ended June 30, 2015 Unaudited
| | | | |
Investment Income | | | | |
Interest (net of foreign withholding taxes of $8,917) | | $ | 2,848,113 | |
Dividends: | | | | |
Unaffiliated companies (net of foreign withholding taxes of $21,435) | | | 686,214 | |
Affiliated companies | | | 31,281 | |
| | | | |
Total investment income | | | 3,565,608 | |
Expenses | | | | |
Management fees | | | 1,636,597 | |
Distribution and service plan fees Service shares | | | 2,033 | |
Transfer and shareholder servicing agent fees: | | | | |
Non-Service shares | | | 156,313 | |
Service shares | | | 812 | |
Shareholder communications: | | | | |
Non-Service shares | | | 6,681 | |
Service shares | | | 35 | |
Dividends on short sales | | | 235,616 | |
Financing expense from short sales | | | 66,718 | |
Custodian fees and expenses | | | 60,613 | |
Trustees’ compensation | | | 13,576 | |
Other | | | 86,917 | |
| | | | |
Total expenses | | | 2,265,911 | |
Less reduction to custodian expenses | | | (277 | ) |
Less waivers and reimbursements of expenses | | | (94,834 | ) |
| | | | |
Net expenses | | | 2,170,800 | |
Net Investment Income | | | 1,394,808 | |
Realized and Unrealized Gain (Loss) | | | | |
Net realized gain (loss) on: | | | | |
Investments from unaffiliated companies (including premiums on options exercised) | | | (56,025 | ) |
Closing and expiration of option contracts written | | | 3,030,114 | |
Closing and expiration of futures contracts | | | (2,219,091 | ) |
Foreign currency transactions | | | 14,767,151 | |
Short Positions | | | 302,476 | |
Swap contracts | | | (16,683,305 | ) |
| | | | |
Net realized loss | | | (858,680 | ) |
Net change in unrealized appreciation/depreciation on: | | | | |
Investments | | | (3,109,410 | ) |
Translation of assets and liabilities denominated in foreign currencies | | | (289,267 | ) |
Futures contracts | | | 1,148,759 | |
Option contracts written | | | 308,167 | |
Short positions | | | 1,236,773 | |
Swap contracts | | | (1,751,639 | ) |
| | | | |
Net change in unrealized appreciation/depreciation | | | (2,456,617 | ) |
| | | | |
Net Decrease in Net Assets Resulting from Operations | | $ | (1,920,489 | ) |
| | | | |
See accompanying Notes to Consolidated Financial Statements.
24 OPPENHEIMER GLOBAL MULTI-ALTERNATIVES FUND/VA
CONSOLIDATED STATEMENTS OF CHANGES IN NET ASSETS
| | | | | | | | | | |
| | | Six Months Ended
June 30, 2015
(Unaudited) | | | Year Ended
December 31, 2014 |
Operations | | | | | | | | | | |
Net investment income | | $ | 1,394,808 | | | $ | 1,249,537 | | | |
Net realized gain (loss) | | | (858,680 | ) | | | 1,924,432 | | | |
Net change in unrealized appreciation/depreciation | | | (2,456,617 | ) | | | 505,516 | | | |
| | | | | | | |
Net increase (decrease) in net assets resulting from operations | | | (1,920,489 | ) | | | 3,679,485 | | | |
Dividends and/or Distributions to Shareholders | | | | | | | | | | |
Dividends from net investment income: | | | | | | | | | | |
Non-Service shares | | | — | | | | (6,230,727 | ) | | |
Service shares | | | — | | | | (30,926 | ) | | |
| | | |
| | | | — | | | | (6,261,653 | ) | | |
Distributions from net realized gain: | | | | | | | | | | |
Non-Service shares | | | — | | | | (5,294,823 | ) | | |
Service shares | | | — | | | | (26,494 | ) | | |
| | | |
| | | | — | | | | (5,321,317 | ) | | |
Tax return of capital: | | | | | | | | | | |
Non-Service shares | | | — | | | | (430,129 | ) | | |
Service shares | | | — | | | | (2,135 | ) | | |
| | | | | | | |
| | | | — | | | | (432,264 | ) | | |
Beneficial Interest Transactions | | | | | | | | | | |
Net increase in net assets resulting from beneficial interest transactions: | | | | | | | | | | |
Non-Service shares | | | 155,353,669 | | | | 260,906,037 | | | |
Service shares | | | 446,412 | | | | 1,391,583 | | | |
| | | | | | | |
| | | 155,800,081 | | | | 262,297,620 | | | |
Net Assets | | | | | | | | | | |
Total increase | | | 153,879,592 | | | | 253,961,871 | | | |
Beginning of period | | | 263,904,562 | | | | 9,942,691 | | | |
| | | | | | | |
End of period (including accumulated net investment loss of $3,845,054 and $5,239,862, respectively) | | $ | 417,784,154 | | | $ | 263,904,562 | | | |
| | | |
See accompanying Notes to Consolidated Financial Statements.
25 OPPENHEIMER GLOBAL MULTI-ALTERNATIVES FUND/VA
CONSOLIDATED FINANCIAL HIGHLIGHTS
| | | | | | | | | | | | | | |
| Non-Service Shares | | Six Months
Ended
June 30, 2015
(Unaudited) | | | Year Ended
December 31,
2014 | | | Period Ended
December 31,
20131 |
Per Share Operating Data | | | | | | | | | | | | | | |
Net asset value, beginning of period | | $ | 10.04 | | | $ | 9.92 | | | $ | 10.00 | | | |
Income (loss) from investment operations: | | | | | | | | | | | | | | |
Net investment income (loss)2 | | | 0.04 | | | | 0.08 | | | | (0.02 | ) | | |
Net realized and unrealized gain (loss) | | | (0.05 | ) | | | 0.52 | | | | (0.05 | ) | | |
| | | |
Total from investment operations | | | (0.01 | ) | | | 0.60 | | | | (0.07 | ) | | |
Dividends and/or distributions to shareholders: | | | | | | | | | | | | | | |
Dividends from net investment income | | | 0.00 | | | | (0.25 | ) | | | (0.01 | ) | | |
Distributions from net realized gain | | | 0.00 | | | | (0.21 | ) | | | 0.00 | | | |
Tax return of capital | | | 0.00 | | | | (0.02 | ) | | | 0.00 | | | |
| | | |
Total dividends and/or distributions to shareholders | | | 0.00 | | | | (0.48 | ) | | | (0.01 | ) | | |
| | | | | | | | | | | | | | |
| | | |
Net asset value, end of period | | $ | 10.03 | | | $ | 10.04 | | | $ | 9.92 | | | |
| | | |
Total Return, at Net Asset Value3 | | | (0.10)% | | | | 6.02% | | | | (0.69)% | | | |
| | | | | | | | | | | | | | |
Ratios/Supplemental Data | | | | | | | | | | | | | | |
Net assets, end of period (in thousands) | | $ | 416,015 | | | $ | 262,573 | | | $ | 9,917 | | | |
Average net assets (in thousands) | | $ | 316,057 | | | $ | 161,988 | | | $ | 9,827 | | | |
Ratios to average net assets:4 | | | | | | | | | | | | | | |
Net investment income (loss) | | | 0.89% | | | | 0.77%5 | | | | (1.85)%5 | | | |
Total expenses6 | | | 1.44% | | | | 1.43%5 | | | | 7.16%5 | | | |
Expenses after payments, waivers and/or reimbursements and reduction to custodian expenses | | | 1.38% | | | | 1.31%5 | | | | 3.33%5 | | | |
Portfolio turnover rate | | | 39% | | | | 147% | | | | 11% | | | |
1. For the period from November 14, 2013 (commencement of operations) to December 31, 2013.
2. Per share amounts calculated based on the average shares outstanding during the period.
3. Assumes an initial investment on the business day before the first day of the fiscal period, with all dividends and distributions reinvested in additional shares on the reinvestment date, and redemption at the net asset value calculated on the last business day of the fiscal period. Total returns are not annualized for periods less than one full year. Total return information does not reflect expenses that apply at the separate account level or to related insurance products. Inclusion of these charges would reduce the total return figures for all periods shown. Returns do not reflect the deduction of taxes that a shareholder would pay on fund distributions or the redemption of fund shares. The returns do not include adjustments in accordance with generally accepted accounting principles required at the period end for financial reporting purposes.
4. Annualized for periods less than one full year.
5. Includes the Fund’s shares of the allocated expenses and/or net investment income from the master funds.
6. Total expenses including indirect expenses from affiliated fund fees and expenses were as follows:
| | | | |
Six Months Ended June 30, 2015 | | | 1.46 | % |
Year Ended December 31, 2014 | | | 1.45 | % |
Period Ended December 31, 2013 | | | 7.18 | % |
See accompanying Notes to Consolidated Financial Statements.
26 OPPENHEIMER GLOBAL MULTI-ALTERNATIVES FUND/VA
CONSOLIDATED FINANCIAL HIGHLIGHTS Continued
| | | | | | | | | | | | |
| Service Shares | | Six Months
Ended
June 30, 2015
(Unaudited) | | | Year Ended
December 31,
2014 | | | Period Ended
December 31,
20131 | |
Per Share Operating Data | | | | | | | | | | | | |
Net asset value, beginning of period | | $ | 10.03 | | | $ | 9.92 | | | $ | 10.00 | |
Income (loss) from investment operations: | | | | | | | | | | | | |
Net investment income (loss)2 | | | 0.03 | | | | 0.08 | | | | (0.03 | ) |
Net realized and unrealized gain (loss) | | | (0.05 | ) | | | 0.50 | | | | (0.04 | ) |
| | | | |
Total from investment operations | | | (0.02 | ) | | | 0.58 | | | | (0.07 | ) |
Dividends and/or distributions to shareholders: | | | | | | | | | | | | |
Dividends from net investment income | | | 0.00 | | | | (0.25 | ) | | | (0.01 | ) |
Distributions from net realized gain | | | 0.00 | | | | (0.21 | ) | | | 0.00 | |
Tax return of capital | | | 0.00 | | | | (0.01 | ) | | | 0.00 | |
| | | | |
Total dividends and/or distributions to shareholders | | | 0.00 | | | | (0.47 | ) | | | (0.01 | ) |
| | | | |
| | | | |
Net asset value, end of period | | $ | 10.01 | | | $ | 10.03 | | | $ | 9.92 | |
| | | | |
Total Return, at Net Asset Value3 | | | (0.20)% | | | | 5.90% | | | | (0.72)% | |
| | | | | | | | | | | | |
Ratios/Supplemental Data | | | | | | | | | | | | |
Net assets, end of period (in thousands) | | $ | 1,769 | | | $ | 1,332 | | | $ | 10 | |
Average net assets (in thousands) | | $ | 1,643 | | | $ | 335 | | | $ | 10 | |
Ratios to average net assets:4 | | | | | | | | | | | | |
Net investment income (loss) | | | 0.63% | | | | 0.77%5 | | | | (2.12)%5 | |
Total expenses6 | | | 1.68% | | | | 1.78%5 | | | | 7.43%5 | |
Expenses after payments, waivers and/or reimbursements and reduction to custodian expenses | | | 1.62% | | | | 1.67%5 | | | | 3.50%5 | |
Portfolio turnover rate | | | 39% | | | | 147% | | | | 11% | |
1. For the period from November 14, 2013 (commencement of operations) to December 31, 2013.
2. Per share amounts calculated based on the average shares outstanding during the period.
3. Assumes an initial investment on the business day before the first day of the fiscal period, with all dividends and distributions reinvested in additional shares on the reinvestment date, and redemption at the net asset value calculated on the last business day of the fiscal period. Total returns are not annualized for periods less than one full year. Total return information does not reflect expenses that apply at the separate account level or to related insurance products. Inclusion of these charges would reduce the total return figures for all periods shown. Returns do not reflect the deduction of taxes that a shareholder would pay on fund distributions or the redemption of fund shares. The returns do not include adjustments in accordance with generally accepted accounting principles required at the period end for financial reporting purposes.
4. Annualized for periods less than one full year.
5. Includes the Fund’s shares of the allocated expenses and/or net investment income from the master funds.
6. Total expenses including indirect expenses from affiliated fund fees and expenses were as follows:
| | | | |
Six Months Ended June 30, 2015 | | | 1.70 | % |
Year Ended December 31, 2014 | | | 1.80 | % |
Period Ended December 31, 2013 | | | 7.45 | % |
See accompanying Notes to Consolidated Financial Statements.
27 OPPENHEIMER GLOBAL MULTI-ALTERNATIVES FUND/VA
NOTES TO CONSOLIDATED FINANCIAL STATEMENTS June 30, 2015 Unaudited
1. Organization
Oppenheimer Global Multi-Alternatives Fund/VA (the “Fund”), formerly known as Oppenheimer Diversified Alternatives Fund/VA, is a separate series of Oppenheimer Variable Account Funds, a diversified open-end management investment company registered under the Investment Company Act of 1940 (“1940 Act”), as amended. The Fund’s investment objective is to seek total return. The Fund’s investment adviser is OFI Global Asset Management, Inc. (“OFI Global” or the “Manager”), a wholly-owned subsidiary of OppenheimerFunds, Inc. (“OFI” or the “Sub-Adviser”). The Manager has entered into a sub-advisory agreement with OFI. The Sub-Adviser has entered into a sub-sub-advisory agreement with Cornerstone Real Estate Advisers LLC and OFI SteelPath, Inc. (collectively, the “Sub-Sub-Advisers”). Shares of the Fund are sold only to separate accounts of life insurance companies.
The Fund offers two classes of shares. Both classes are sold at their offering price, which is the net asset value per share, to separate investment accounts of participating insurance companies as an underlying investment for variable life insurance policies, variable annuity contracts or other investment products. The class of shares designated as Service shares is subject to a distribution and service plan. Both classes of shares have identical rights and voting privileges with respect to the Fund in general and exclusive voting rights on matters that affect that class alone. Earnings, net assets and net asset value per share may differ due to each class having its own expenses, such as transfer and shareholder servicing agent fees and shareholder communications, directly attributable to that class.
The following is a summary of significant accounting policies followed in the Fund’s preparation of financial statements in accordance with accounting principles generally accepted in the United States (“U.S. GAAP”).
2. Significant Accounting Policies
Security Valuation. All investments in securities are recorded at their estimated fair value, as described in Note 3.
Reporting Period End Date. The last day of the Fund’s reporting period is the last day the New York Stock Exchange was open for trading during the period. The Fund’s financial statements have been presented through that date to maintain consistency with the Fund’s net asset value calculations used for shareholder transactions.
Basis for Consolidation. The Fund has established a Cayman Islands exempted company, Oppenheimer Global Multi-Alternatives Fund/VA (Cayman) Ltd., formerly known as Oppenheimer Diversified Alternatives Fund/VA (Cayman) Ltd., which is wholly-owned and controlled by the Fund (the “Subsidiary”). The Fund and Subsidiary are both managed by the Manager. The Fund may invest up to 25% of its total assets in the Subsidiary. The Subsidiary invests primarily in commodity-linked derivatives (including commodity futures, financial futures, options and swap contracts) and certain fixed-income securities and other investments that may serve as margin or collateral for its derivatives positions. Investments in the Subsidiary are expected to provide the Fund with exposure to commodities markets within the limitations of the federal tax requirements that apply to the Fund. The Subsidiary is subject to the same investment restrictions and guidelines, and follows the same compliance policies and procedures, as the Fund. The financial statements have been consolidated and include accounts of the Fund and the Subsidiary. Accordingly, all inter-company transactions and balances have been eliminated. At period end, the Fund owned 33,159 shares with net assets of $18,274,328.
Other financial information at period end:
| | | | |
Total market value of investments | | $ | 17,042,733 | * |
Net assets | | $ | 18,274,328 | |
Net income (loss) | | $ | (77,691 | ) |
Net realized gain (loss) | | $ | (786,152 | ) |
Net change in unrealized appreciation/depreciation | | $ | 583,942 | |
* At period end, all investments held in the subsidiary are derivatives, which are valued at net unrealized appreciation/depreciation.
Foreign Currency Translation. The Fund’s accounting records are maintained in U.S. dollars. The values of securities denominated in foreign currencies and amounts related to the purchase and sale of foreign securities and foreign investment income are translated into U.S. dollars as of the close of the New York Stock Exchange (the “Exchange”), normally 4:00 P.M. Eastern time, on each day the Exchange is open for trading. Foreign exchange rates may be valued primarily using a reliable bank, dealer or service authorized by the Board of Trustees.
Reported net realized gains and losses from foreign currency transactions arise from sales of portfolio securities, sales and maturities of short-term securities, sales of foreign currencies, exchange rate fluctuations between the trade and settlement dates on securities transactions, and the difference between the amounts of dividends, interest, and foreign withholding taxes recorded on the Fund’s books and the U.S. dollar equivalent of the amounts actually received or paid. Net unrealized appreciation and depreciation on the translation of assets and liabilities denominated in foreign currencies arise from changes in the values of assets and liabilities, including investments in securities at fiscal period end, resulting from changes in exchange rates.
The effect of changes in foreign currency exchange rates on investments is separately identified from the fluctuations arising from changes in market values of securities held and reported with all other foreign currency gains and losses in the Fund’s Consolidated Statement of Operations.
Allocation of Income, Expenses, Gains and Losses. Income, expenses (other than those attributable to a specific class), gains and losses are allocated on a daily basis to each class of shares based upon the relative proportion of net assets represented by such class. Operating expenses directly attributable to a specific class are charged against the operations of that class.
28 OPPENHEIMER GLOBAL MULTI-ALTERNATIVES FUND/VA
2. Significant Accounting Policies (Continued)
Dividends and Distributions to Shareholders. Dividends and distributions to shareholders, which are determined in accordance with income tax regulations and may differ from U.S. generally accepted accounting principles, are recorded on the ex-dividend date. Income and capital gain distributions, if any, are declared and paid annually or at other times as deemed necessary by the Manager.
The tax character of distributions is determined as of the Fund’s fiscal year end. Therefore, a portion of the Fund’s distributions made to shareholders prior to the Fund’s fiscal year end may ultimately be categorized as a tax return of capital.
Investment Income. Dividend income is recorded on the ex-dividend date or upon ex-dividend notification in the case of certain foreign dividends where the ex-dividend date may have passed. Non-cash dividends included in dividend income, if any, are recorded at the fair market value of the securities received. Interest income is recognized on an accrual basis. Discount and premium, which are included in interest income on the Consolidated Statement of Operations, are amortized or accreted daily.
Return of Capital Estimates. Distributions received from the Fund’s investments in MLPs generally are comprised of income and return of capital. The Fund records investment income and return of capital based on estimates made at the time such distributions are received. Such estimates are based on historical information available from each MLP and other industry sources. These estimates may subsequently be revised based on information received from MLPs after their tax reporting periods are concluded.
Custodian Fees. “Custodian fees and expenses” in the Consolidated Statement of Operations may include interest expense incurred by the Fund on any cash overdrafts of its custodian account during the period. Such cash overdrafts may result from the effects of failed trades in portfolio securities and from cash outflows resulting from unanticipated shareholder redemption activity. The Fund pays interest to its custodian on such cash overdrafts, to the extent they are not offset by positive cash balances maintained by the Fund, at a rate equal to the Federal Funds Rate plus 0.50%. The “Reduction to custodian expenses” line item, if applicable, represents earnings on cash balances maintained by the Fund during the period. Such interest expense and other custodian fees may be paid with these earnings.
Security Transactions. Security transactions are recorded on the trade date. Realized gains and losses on securities sold (except for the investments in the Subsidiary) are determined on the basis of identified cost.
Indemnifications. The Fund’s organizational documents provide current and former Trustees and officers with a limited indemnification against liabilities arising in connection with the performance of their duties to the Fund. In the normal course of business, the Fund may also enter into contracts that provide general indemnifications. The Fund’s maximum exposure under these arrangements is unknown as this would be dependent on future claims that may be made against the Fund. The risk of material loss from such claims is considered remote.
Federal Taxes. The Fund intends to comply with provisions of the Internal Revenue Code applicable to regulated investment companies and to distribute substantially all of its investment company taxable income to shareholders. Therefore, no federal income or excise tax provision is required. The Fund files income tax returns in U.S. federal and applicable state jurisdictions. The statute of limitations on the Fund’s tax return filings generally remains open for the three preceding fiscal reporting period ends.
Subchapter M requires, among other things, that at least 90% of the Fund’s gross income be derived from securities or derived with respect to its business of investing in securities (typically referred to as “qualifying income”). Income from commodity-linked derivatives may not be treated as “qualifying income” for purposes of the 90% gross income requirement. The Internal Revenue Service (IRS) has previously issued a number of private letter rulings which conclude that income derived from commodity index-linked notes and investments in a wholly-owned subsidiary will be “qualifying income.” As a result, the Fund will gain exposure to commodities through commodity-linked notes and its wholly-owned subsidiary.
The IRS has suspended the granting of private letter rulings pending further review. As a result, there can be no assurance that the IRS will not change its position with respect to commodity-linked notes and wholly-owned subsidiaries. In addition, future legislation and guidance from Treasury and the IRS may adversely affect the fund’s ability to gain exposure to commodities through commodity-linked notes and its wholly-owned subsidiary.
The Fund is required to include in income for federal income tax purposes all of the subsidiary’s net income and gains whether or not such income is distributed by the subsidiary. Net income and gains from the subsidiary are generally treated as ordinary income by the Fund, regardless of the character of the subsidiary’s underlying income. Net losses from the subsidiary do not pass through to the Fund for federal income tax purposes.
During the fiscal year ended December 31, 2014, the Fund utilized $4,521 of capital loss carryforward to offset capital gains realized in that fiscal year. The Fund had $122,271 of post-October passive foreign investments company losses which were deferred.
As of June 30, 2015, it is estimated that the capital loss carryforwards would be $980,951, which will not expire. During the six months ended June 30, 2015, it is estimated that the Fund will not utilize any capital loss carryforward to offset realized capital gains.
Net investment income (loss) and net realized gain (loss) may differ for financial statement and tax purposes. The character of dividends and distributions made during the fiscal year from net investment income or net realized gains are determined in accordance with federal income tax requirements, which may differ from the character of net investment income or net realized gains presented in those financial statements in accordance with GAAP. Also, due to timing of dividends and distributions, the fiscal year in which amounts are distributed may differ from the fiscal year in which the income or net realized gain was recorded by the Fund.
The aggregate cost of securities and other investments and the composition of unrealized appreciation and depreciation of securities and other investments for federal income tax purposes as of June 30, 2015 are noted in the following table. The primary difference between book and tax
29 OPPENHEIMER GLOBAL MULTI-ALTERNATIVES FUND/VA
NOTES TO CONSOLIDATED FINANCIAL STATEMENTS Unaudited / Continued
2. Significant Accounting Policies (Continued)
appreciation or depreciation of securities and other investments, if applicable, is attributable to the tax deferral of losses or tax realization of financial statement unrealized gain or loss.
| | | | |
Federal tax cost of securities | | $ | 410,270,685 | |
Federal tax cost of other investments | | | (38,455,485 | ) |
| | | | |
Total federal tax cost | | $ | 371,815,200 | |
| | | | |
Gross unrealized appreciation | | $ | 10,352,452 | |
Gross unrealized depreciation | | | (18,919,729 | ) |
| | | | |
Net unrealized depreciation | | $ | (8,567,277 | ) |
| | | | |
Certain foreign countries impose a tax on capital gains which is accrued by the Fund based on unrealized appreciation, if any, on affected securities. The tax is paid when the gain is realized.
Use of Estimates. The preparation of financial statements in conformity with accounting principles generally accepted in the United States of America requires management to make estimates and assumptions that affect the reported amounts of assets and liabilities and disclosure of contingent assets and liabilities at the date of the financial statements and the reported amounts of increases and decreases in net assets from operations during the reporting period. Actual results could differ from those estimates.
3. Securities Valuation
The Fund calculates the net asset value of its shares as of the close of the New York Stock Exchange (the “Exchange”), normally 4:00 P.M. Eastern time, on each day the Exchange is open for trading.
The Fund’s Board has adopted procedures for the valuation of the Fund’s securities and has delegated the day-to-day responsibility for valuation determinations under those procedures to the Manager. The Manager has established a Valuation Committee which is responsible for determining a “fair valuation” for any security for which market quotations are not “readily available.” The Valuation Committee’s fair valuation determinations are subject to review, approval and ratification by the Fund’s Board at its next regularly scheduled meeting covering the calendar quarter in which the fair valuation was determined.
Valuation Methods and Inputs
Securities are valued using unadjusted quoted market prices, when available, as supplied primarily by third party pricing services or dealers.
The following methodologies are used to determine the market value or the fair value of the types of securities described below:
Securities traded on a registered U.S. securities exchange (including exchange-traded derivatives other than futures and futures options) are valued based on the last sale price of the security reported on the principal exchange on which it is traded, prior to the time when the Fund’s assets are valued. In the absence of a sale, the security is valued at the last sale price on the prior trading day, if it is within the spread of the current day’s closing “bid” and “asked” prices, and if not, at the current day’s closing bid price. A security of a foreign issuer traded on a foreign exchange, but not listed on a registered U.S. securities exchange, is valued based on the last sale price on the principal exchange on which the security is traded, as identified by the third party pricing service used by the Manager, prior to the time when the Fund’s assets are valued. If the last sale price is unavailable, the security is valued at the most recent official closing price on the principal exchange on which it is traded. If the last sales price or official closing price for a foreign security is not available, the security is valued at the mean between the bid and asked price per the exchange or, if not available from the exchange, obtained from two dealers. If bid and asked prices are not available from either the exchange or two dealers, the security is valued by using one of the following methodologies (listed in order of priority): (1) using a bid from the exchange, (2) the mean between the bid and asked price as provided by a single dealer, or (3) a bid from a single dealer.
Shares of a registered investment company that are not traded on an exchange are valued at that investment company’s net asset value per share.
Corporate and government debt securities (of U.S. or foreign issuers) and municipal debt securities, event-linked bonds, loans, mortgage-backed securities, collateralized mortgage obligations, and asset-backed securities are valued at the mean between the “bid” and “asked” prices utilizing evaluated prices obtained from third party pricing services or broker-dealers who may use matrix pricing methods to determine the evaluated prices.
Short-term money market type debt securities with a remaining maturity of sixty days or less are valued at cost adjusted by the amortization of discount or premium to maturity (amortized cost), which approximates market value. Short-term debt securities with a remaining maturity in excess of sixty days are valued at the mean between the “bid” and “asked” prices utilizing evaluated prices obtained from third party pricing services or broker-dealers.
Structured securities, swaps, swaptions, and other over-the-counter derivatives are valued utilizing evaluated prices obtained from third party pricing services or broker-dealers.
Forward foreign currency exchange contracts are valued utilizing current and forward currency rates obtained from third party pricing services. When the settlement date of a contract is an interim date for which a quotation is not available, interpolated values are derived using the nearest dated forward currency rate.
Futures contracts and futures options traded on a commodities or futures exchange will be valued at the final settlement price or official closing price on the principal exchange as reported by such principal exchange at its trading session ending at, or most recently prior to, the time when the Fund’s assets are valued.
30 OPPENHEIMER GLOBAL MULTI-ALTERNATIVES FUND/VA
3. Securities Valuation (Continued)
A description of the standard inputs that may generally be considered by the third party pricing vendors in determining their evaluated prices is provided below.
| | |
| Security Type | | Standard inputs generally considered by third-party pricing vendors |
| Corporate debt, government debt, municipal, mortgage-backed and asset-backed securities | | Reported trade data, broker-dealer price quotations, benchmark yields, issuer spreads on comparable securities, the credit quality, yield, maturity, and other appropriate factors. |
Loans | | Information obtained from market participants regarding reported trade data and broker-dealer price quotations. |
Event-linked bonds | | Information obtained from market participants regarding reported trade data and broker-dealer price quotations. |
Structured securities | | Relevant market information such as the price of underlying financial instruments, stock market indices, foreign currencies, interest rate spreads, commodities, or the occurrence of other specific events. |
Swaps | | Relevant market information, including underlying reference assets such as credit spreads, credit event probabilities, index values, individual security values, forward interest rates, variable interest rates, volatility measures, and forward currency rates. |
If a market value or price cannot be determined for a security using the methodologies described above, or if, in the “good faith” opinion of the Manager, the market value or price obtained does not constitute a “readily available market quotation,” or a significant event has occurred that would materially affect the value of the security, the security is fair valued either (i) by a standardized fair valuation methodology applicable to the security type or the significant event as previously approved by the Valuation Committee and the Fund’s Board or (ii) as determined in good faith by the Manager’s Valuation Committee. The Valuation Committee considers all relevant facts that are reasonably available, through either public information or information available to the Manager, when determining the fair value of a security. Fair value determinations by the Manager are subject to review, approval and ratification by the Fund’s Board at its next regularly scheduled meeting covering the calendar quarter in which the fair valuation was determined. Those fair valuation standardized methodologies include, but are not limited to, valuing securities at the last sale price or initially at cost and subsequently adjusting the value based on: changes in company specific fundamentals, changes in an appropriate securities index, or changes in the value of similar securities which may be further adjusted for any discounts related to security-specific resale restrictions. When possible, such methodologies use observable market inputs such as unadjusted quoted prices of similar securities, observable interest rates, currency rates and yield curves. The methodologies used for valuing securities are not necessarily an indication of the risks associated with investing in those securities nor can it be assured that the Fund can obtain the fair value assigned to a security if it were to sell the security.
To assess the continuing appropriateness of security valuations, the Manager, or its third party service provider who is subject to oversight by the Manager, regularly compares prior day prices, prices on comparable securities, and sale prices to the current day prices and challenges those prices exceeding certain tolerance levels with the third party pricing service or broker source. For those securities valued by fair valuations, whether through a standardized fair valuation methodology or a fair valuation determination, the Valuation Committee reviews and affirms the reasonableness of the valuations based on such methodologies and fair valuation determinations on a regular basis after considering all relevant information that is reasonably available.
Classifications
Each investment asset or liability of the Fund is assigned a level at measurement date based on the significance and source of the inputs to its valuation. Various data inputs are used in determining the value of each of the Fund’s investments as of the reporting period end. These data inputs are categorized in the following hierarchy under applicable financial accounting standards:
1) Level 1-unadjusted quoted prices in active markets for identical assets or liabilities (including securities actively traded on a securities exchange)
2) Level 2-inputs other than unadjusted quoted prices that are observable for the asset or liability (such as unadjusted quoted prices for similar assets and market corroborated inputs such as interest rates, prepayment speeds, credit risks, etc.)
3) Level 3-significant unobservable inputs (including the Manager’s own judgments about assumptions that market participants would use in pricing the asset or liability).
The inputs used for valuing securities are not necessarily an indication of the risks associated with investing in those securities.
The table below categorizes amounts that are included in the Fund’s Consolidated Statement of Assets and Liabilities as of June 30, 2015 based on valuation input level:
| | | | | | | | | | | | | | | | |
| | | | |
| | | Level 1—
Unadjusted
Quoted Prices | | | Level 2—
Other Significant
Observable Inputs | | | Level 3—
Significant
Unobservable
Inputs | | | Value | |
| |
Assets Table | | | | | | | | | | | | | | | | |
Investments, at Value: | | | | | | | | | | | | | | | | |
Common Stocks | | | | | | | | | | | | | | | | |
Consumer Discretionary | | $ | 8,585,938 | | | $ | 138,721 | | | $ | — | | | $ | 8,724,659 | |
Consumer Staples | | | 2,957,165 | | | | — | | | | — | | | | 2,957,165 | |
Energy | | | 24,987,953 | | | | — | | | | — | | | | 24,987,953 | |
Financials | | | 22,386,059 | | | | 8,392,128 | | | | — | | | | 30,778,187 | |
Health Care | | | 10,202,913 | | | | 1,445,319 | | | | 9,315 | | | | 11,657,547 | |
Industrials | | | 11,337,156 | | | | — | | | | — | | | | 11,337,156 | |
Information Technology | | | 9,262,707 | | | | 843,174 | | | | — | | | | 10,105,881 | |
31 OPPENHEIMER GLOBAL MULTI-ALTERNATIVES FUND/VA
NOTES TO CONSOLIDATED FINANCIAL STATEMENTS Unaudited / Continued
| | | | | | | | | | | | | | | | |
| 3. Securities Valuation (Continued) | | | | | | | | | | | | |
| | | | |
| | | Level 1—
Unadjusted
Quoted Prices | | | Level 2—
Other Significant
Observable Inputs | | | Level 3— Significant
Unobservable Inputs | | | Value | |
| |
Common Stocks (Continued) | | | | | | | | | | | | | | | | |
Materials | | $ | 4,476,070 | | | $ | — | | | $ | — | | | $ | 4,476,070 | |
Telecommunication Services | | | 2,076,023 | | | | — | | | | — | | | | 2,076,023 | |
Utilities | | | 2,387,268 | | | | — | | | | — | | | | 2,387,268 | |
Preferred Stocks | | | 1,163,731 | | | | 834,350 | | | | — | | | | 1,998,081 | |
Asset-Backed Securities | | | — | | | | 14,183,873 | | | | 1,477,715 | | | | 15,661,588 | |
Mortgage-Backed Obligation | | | — | | | | 1,998,937 | | | | — | | | | 1,998,937 | |
Foreign Government Obligations | | | — | | | | 29,440,175 | | | | — | | | | 29,440,175 | |
Non-Convertible Corporate Bonds and Notes | | | — | | | | 28,872,900 | | | | — | | | | 28,872,900 | |
Convertible Corporate Bond and Note | | | — | | | | 446,478 | | | | — | | | | 446,478 | |
Corporate Loans | | | — | | | | 18,798,729 | | | | — | | | | 18,798,729 | |
Event-Linked Bonds | | | — | | | | 48,571,503 | | | | — | | | | 48,571,503 | |
Exchange-Traded Option Purchased | | | 605 | | | | — | | | | — | | | | 605 | |
Over-the-Counter Options Purchased | | | — | | | | 950,298 | | | | — | | | | 950,298 | |
Over-the-Counter Interest Rate Swaptions Purchased | | | — | | | | 709,024 | | | | — | | | | 709,024 | |
Investment Companies | | | 51,336,642 | | | | — | | | | — | | | | 51,336,642 | |
Short-Term Notes | | | — | | | | 91,930,132 | | | | — | | | | 91,930,132 | |
| | | | |
Total Investments, at Value | | | 151,160,230 | | | | 247,555,741 | | | | 1,487,030 | | | | 400,203,001 | |
Other Financial Instruments: | | | | | | | | | | | | | | | | |
Swaps, at value | | | — | | | | 2,432,469 | | | | — | | | | 2,432,469 | |
Centrally cleared swaps, at value | | | — | | | | 251,623 | | | | — | | | | 251,623 | |
Futures contracts | | | 817,019 | | | | — | | | | — | | | | 817,019 | |
Forward currency exchange contracts | | | — | | | | 9,224,418 | | | | — | | | | 9,224,418 | |
| | | | |
Total Assets | | $ | 151,977,249 | | | $ | 259,464,251 | | | $ | 1,487,030 | | | $ | 412,928,530 | |
| | | | |
| | | | |
Liabilities Table | | | | | | | | | | | | | | | | |
Other Financial Instruments: | | | | | | | | | | | | | | | | |
Common Stock Securities Sold Short | | $ | (27,068,415) | | | $ | (1,738,859 | ) | | $ | — | | | $ | (28,807,274 | ) |
Swaps, at value | | | — | | | | (3,597,920 | ) | | | — | | | | (3,597,920 | ) |
Centrally cleared swaps, at value | | | — | | | | (1,352,439 | ) | | | — | | | | (1,352,439 | ) |
Options written, at value | | | — | | | | (774,612 | ) | | | — | | | | (774,612 | ) |
Futures contracts | | | (288,831 | ) | | | — | | | | — | | | | (288,831 | ) |
Forward currency exchange contracts | | | — | | | | (3,542,475 | ) | | | — | | | | (3,542,475 | ) |
| | | | |
Total Liabilities | | $ | (27,357,246 | ) | | $ | (11,006,305 | ) | | $ | — | | | $ | (38,363,551 | ) |
| | | | |
Forward currency exchange contracts and futures contracts, if any, are reported at their unrealized appreciation/
depreciation at measurement date, which represents the change in the contract’s value from trade date. All additional assets and liabilities included in the above table are reported at their market value at measurement date.
4. Investments and Risks
Investment in Oppenheimer Institutional Money Market Fund. The Fund is permitted to invest daily available cash balances in an affiliated money market fund. The Fund may invest the available cash in Class E shares of Oppenheimer Institutional Money Market Fund (“IMMF”) to seek current income while preserving liquidity or for defensive purposes. IMMF is a registered open-end management investment company, regulated as a money market fund under the 1940 Act. The Manager is the investment adviser of IMMF, and the Sub-Adviser provides investment and related advisory services to IMMF. When applicable, the Fund’s investment in IMMF is included in the Consolidated Statement of Investments. Shares of IMMF are valued at their net asset value per share. As a shareholder, the Fund is subject to its proportional share of IMMF’s Class E expenses, including its management fee. The Manager will waive fees and/or reimburse Fund expenses in an amount equal to the indirect management fees incurred through the Fund’s investment in IMMF.
Master Limited Partnerships (“MLPs”). MLPs issue common units that represent an equity ownership interest in a partnership and provide limited voting rights. MLP common units are registered with the Securities and Exchange Commission (“SEC”), and are freely tradable on securities exchanges such as the NYSE and the NASDAQ Stock Market (“NASDAQ”), or in the over-the-counter (“OTC”) market. An MLP consists of one or more general partners, who conduct the business, and one or more limited partners, who contribute capital. MLP common unit holders have a limited role in the partnership’s operations and management. The Fund, as a limited partner, normally would not be liable for the debts of the MLP beyond the amounts the Fund has contributed, but would not be shielded to the same extent that a shareholder of a corporation would be. In certain circumstances creditors of an MLP would have the right to seek return of capital distributed to a limited partner. This right of an MLP’s creditors would continue after the Fund sold its investment in the MLP.
Event-Linked Bonds. The Fund may invest in “event-linked” bonds. Event-linked bonds, which are sometimes referred to as “catastrophe” bonds, are fixed income securities for which the return of principal and payment of interest is contingent on the non-occurrence of a specific trigger event, such as a hurricane, earthquake, or other occurrence that leads to physical or economic loss. If the trigger event occurs prior to maturity, the Fund may lose all or a portion of its principal in addition to interest otherwise due from the security. Event-linked bonds may expose the Fund to certain other risks, including
32 OPPENHEIMER GLOBAL MULTI-ALTERNATIVES FUND/VA
4. Investments and Risks (Continued)
issuer default, adverse regulatory or jurisdictional interpretations, liquidity risk and adverse tax consequences. The Fund records the net change in market value of event-linked bonds on the Consolidated Statement of Operations as a change in unrealized appreciation or depreciation on investments. The Fund records a realized gain or loss on the Consolidated Statement of Operations upon the sale or maturity of such securities.
Securities on a When-Issued or Delayed Delivery Basis. The Fund may purchase securities on a “when-issued” basis, and may purchase or sell securities on a “delayed delivery” basis. “When-issued” or “delayed delivery” refers to securities whose terms and indenture are available and for which a market exists, but which are not available for immediate delivery. Delivery and payment for securities that have been purchased by the Fund on a when-issued basis normally takes place within six months and possibly as long as two years or more after the trade date. During this period, such securities do not earn interest, are subject to market fluctuation and may increase or decrease in value prior to their delivery. The purchase of securities on a when-issued basis may increase the volatility of the Fund’s net asset value to the extent the Fund executes such transactions while remaining substantially fully invested. When the Fund engages in when-issued or delayed delivery transactions, it relies on the buyer or seller, as the case may be, to complete the transaction. Their failure to do so may cause the Fund to lose the opportunity to obtain or dispose of the security at a price and yield it considers advantageous. The Fund may also sell securities that it purchased on a when-issued basis or forward commitment prior to settlement of the original purchase.
As of June 30, 2015, the Fund had purchased securities issued on a when-issued or delayed delivery basis and sold securities issued on a delayed delivery basis as follows:
| | | | |
| | | When-Issued or
Delayed Delivery
Basis Transactions | |
Purchased securities | | $ | 4,158,930 | |
Sold securities | | | 432,763 | |
Restricted Securities. As of June 30, 2015, investments in securities included issues that are restricted. A restricted security may have a contractual restriction on its resale and is valued under methods approved by the Board of Trustees as reflecting fair value. Securities that are restricted are marked with an applicable footnote on the Consolidated Statement of Investments. Restricted securities are reported on a schedule following the Consolidated Statement of Investments.
Equity Security Risk. Stocks and other equity securities fluctuate in price. The value of the Fund’s portfolio may be affected by changes in the equity markets generally. Equity markets may experience significant short-term volatility and may fall sharply at times. Different markets may behave differently from each other and U.S. equity markets may move in the opposite direction from one or more foreign stock markets. Adverse events in any part of the equity or fixed-income markets may have unexpected negative effects on other market segments.
The prices of individual equity securities generally do not all move in the same direction at the same time and a variety of factors can affect the price of a particular company’s securities. These factors may include, but are not limited to, poor earnings reports, a loss of customers, litigation against the company, general unfavorable performance of the company’s sector or industry, or changes in government regulations affecting the company or its industry.
Credit Risk. The Fund invests in high-yield, non-investment-grade bonds, which may be subject to a greater degree of credit risk. Credit risk relates to the ability of the issuer to meet interest or principal payments or both as they become due. The Fund may acquire securities that have missed an interest payment, and is not obligated to dispose of securities whose issuers or underlying obligors subsequently miss an interest payment.
Information concerning securities not accruing interest as of June 30, 2015 is as follows:
| | | | |
Cost | | | $436,352 | |
Market Value | | | $162,550 | |
Market Value as % of Net Assets | | | 0.04% | |
Sovereign Debt Risk. The Fund invests in sovereign debt securities, which are subject to certain special risks. These risks include, but are not limited to, the risk that a governmental entity may delay or refuse, or otherwise be unable, to pay interest or repay the principal on its sovereign debt. There may also be no legal process for collecting sovereign debt that a government does not pay or bankruptcy proceedings through which all or part of such sovereign debt may be collected. In addition, a restructuring or default of sovereign debt may also cause additional impacts to the financial markets, such as downgrades to credit ratings, reduced liquidity and increased volatility, among others.
5. Risk Exposures and the Use of Derivative Instruments
The Fund’s investment objective not only permits the Fund to purchase investment securities, it also allows the Fund to enter into various types of derivatives contracts, including, but not limited to, futures contracts, forward currency exchange contracts, credit default swaps, interest rate swaps, total return swaps, variance swaps and purchased and written options. In doing so, the Fund will employ strategies in differing combinations to permit it to increase, decrease, or change the level or types of exposure to market risk factors. These instruments may allow the Fund to pursue its objectives more quickly and efficiently than if it were to make direct purchases or sales of securities capable of effecting a similar response to market factors. Such
33 OPPENHEIMER GLOBAL MULTI-ALTERNATIVES FUND/VA
NOTES TO CONSOLIDATED FINANCIAL STATEMENTS Unaudited / Continued
5. Risk Exposures and the Use of Derivative Instruments (Continued)
contracts may be entered into through a bilateral over-the-counter (“OTC”) transaction, or through a securities or futures exchange and cleared through a clearinghouse.
Market Risk Factors. In accordance with its investment objectives, the Fund may use derivatives to increase or decrease its exposure to one or more of the following market risk factors:
Commodity Risk. Commodity risk relates to the change in value of commodities or commodity indexes as they relate to increases or decreases in the commodities market. Commodities are physical assets that have tangible properties. Examples of these types of assets are crude oil, heating oil, metals, livestock, and agricultural products.
Credit Risk. Credit risk relates to the ability of the issuer to meet interest and principal payments, or both, as they come due. In general, lower-grade, higher-yield bonds are subject to credit risk to a greater extent than lower-yield, higher-quality bonds.
Equity Risk. Equity risk relates to the change in value of equity securities as they relate to increases or decreases in the general market.
Foreign Exchange Rate Risk. Foreign exchange rate risk relates to the change in the U.S. dollar value of a security held that is denominated in a foreign currency. The U.S. dollar value of a foreign currency denominated security will decrease as the dollar appreciates against the currency, while the U.S. dollar value will increase as the dollar depreciates against the currency.
Interest Rate Risk. Interest rate risk refers to the fluctuations in value of fixed-income securities resulting from the inverse relationship between price and yield. For example, an increase in general interest rates will tend to reduce the market value of already issued fixed-income investments, and a decline in general interest rates will tend to increase their value. In addition, debt securities with longer maturities, which tend to have higher yields, are subject to potentially greater fluctuations in value from changes in interest rates than obligations with shorter maturities.
Volatility Risk. Volatility risk refers to the magnitude of the movement, but not the direction of the movement, in a financial instrument’s price over a defined time period. Large increases or decreases in a financial instrument’s price over a relative time period typically indicate greater volatility risk, while small increases or decreases in its price typically indicate lower volatility risk.
Derivatives may have little or no initial cash investment relative to their market value exposure and therefore can produce significant gains or losses in excess of their cost due to unanticipated changes in the market risk factors and the overall market. This use of embedded leverage allows the Fund to increase its market value exposure relative to its net assets and can substantially increase the volatility of the Fund’s performance. In instances where the Fund is using derivatives to decrease, or hedge, exposures to market risk factors for securities held by the Fund, there are also risks that those derivatives may not perform as expected resulting in losses for the combined or hedged positions. Some derivatives have the potential for unlimited loss, regardless of the size of the Fund’s initial investment.
Additional associated risks from investing in derivatives also exist and potentially could have significant effects on the valuation of the derivative and the Fund. Typically, the associated risks are not the risks that the Fund is attempting to increase or decrease exposure to, per its investment objectives, but are the additional risks from investing in derivatives. Examples of these associated risks are liquidity risk, which is the risk that the Fund will not be able to sell the derivative in the open market in a timely manner, and counterparty credit risk, which is the risk that the counterparty will not fulfill its obligation to the Fund.
The Fund’s actual exposures to these market risk factors and associated risks during the period are discussed in further detail, by derivative type, below.
Forward Currency Exchange Contracts
The Fund may enter into forward currency exchange contracts (“forward contracts”) for the purchase or sale of a foreign currency at a negotiated rate at a future date. Such contracts are traded in the OTC inter-bank currency dealer market.
Forward contracts are reported on a schedule following the Consolidated Statement of Investments. The unrealized appreciation (depreciation) is reported in the Consolidated Statement of Assets and Liabilities as a receivable (or payable) and in the Consolidated Statement of Operations within the change in unrealized appreciation (depreciation). At contract close, the difference between the original cost of the contract and the value at the close date is recorded as a realized gain (loss) in the Consolidated Statement of Operations.
The Fund has entered into forward contracts with the obligation to purchase specified foreign currencies in the future at a currently negotiated forward rate in order to take a positive investment perspective on the related currency. These forward contracts seek to increase exposure to foreign exchange rate risk.
The Fund has entered into forward contracts with the obligation to purchase specified foreign currencies in the future at a currently negotiated forward rate in order to decrease exposure to foreign exchange rate risk associated with foreign currency denominated securities held by the Fund.
The Fund has entered into forward contracts with the obligation to sell specified foreign currencies in the future at a currently negotiated forward rate in order to take a negative investment perspective on the related currency. These forward contracts seek to increase exposure to foreign exchange rate risk.
The Fund has entered into forward contracts with the obligation to sell specified foreign currencies in the future at a currently negotiated forward rate in order to decrease exposure to foreign exchange rate risk associated with foreign currency denominated securities held by the Fund.
During the six months ended June 30, 2015, the Fund had daily average contract amounts on forward contracts to buy and sell of $140,904,125 and $159,487,802, respectively.
Additional associated risk to the Fund includes counterparty credit risk. Counterparty credit risk arises from the possibility that the counterparty to a forward contract will default and fail to perform its obligations to the Fund.
34 OPPENHEIMER GLOBAL MULTI-ALTERNATIVES FUND/VA
5. Risk Exposures and the Use of Derivative Instruments (Continued)
Futures Contracts
A futures contract is a commitment to buy or sell a specific amount of a commodity, financial instrument or currency at a negotiated price on a stipulated future date. The Fund may buy and sell futures contracts and may also buy or write put or call options on these futures contracts. Futures contracts and options thereon are generally entered into on a regulated futures exchange and cleared through a clearinghouse associated with the exchange.
Upon entering into a futures contract, the Fund is required to deposit either cash or securities (initial margin) in an amount equal to a certain percentage of the contract value in an account registered in the futures commission merchant’s name. Subsequent payments (variation margin) are paid to or from the futures commission merchant each day equal to the daily changes in the contract value. Such payments are recorded as unrealized gains and losses. Should the Fund fail to make requested variation margin payments, the futures commission merchant can gain access to the initial margin to satisfy the Fund’s payment obligations.
Futures contracts are reported on a schedule following the Consolidated Statement of Investments. Securities held by a futures commission merchant to cover initial margin requirements on open futures contracts are noted in the Consolidated Statement of Investments. Cash held by a futures commission merchant to cover initial margin requirements on open futures contracts and the receivable and/or payable for the daily mark to market for the variation margin are noted in the Consolidated Statement of Assets and Liabilities. The net change in unrealized appreciation and depreciation is reported in the Consolidated Statement of Operations. Realized gains (losses) are reported in the Consolidated Statement of Operations at the closing or expiration of futures contracts.
The Fund has purchased futures contracts on various bonds and notes to increase exposure to interest rate risk.
The Fund has sold futures contracts on various bonds and notes to decrease exposure to interest rate risk.
The Fund has purchased futures contracts on various equity indexes to increase exposure to equity risk.
The Fund has sold futures contracts on various equity indexes to decrease exposure to equity risk.
The Fund has purchased futures contracts, which have values that are linked to the price movement of the related volatility indexes, in order to increase exposure to volatility risk.
The Fund has sold futures contracts, which have values that are linked to the price movement of the related volatility indexes, in order to decrease exposure to volatility risk.
The Fund has purchased futures contracts, which have values that are linked to the price movement of the related commodities, in order to increase exposure to commodity risk.
The Fund has sold futures contracts, which have values that are linked to the price movement of the related commodities, in order to decrease exposure to commodity risk.
During the six months ended June 30, 2015, the Fund had an ending monthly average market value of $24,039,096 and $34,462,194 on futures contracts purchased and sold, respectively.
Additional associated risks of entering into futures contracts (and related options) include the possibility that there may be an illiquid market where the Fund is unable to liquidate the contract or enter into an offsetting position and, if used for hedging purposes, the risk that the price of the contract will correlate imperfectly with the prices of the Fund’s securities.
Option Activity
The Fund may buy and sell put and call options, or write put and call options. When an option is written, the Fund receives a premium and becomes obligated to sell or purchase the underlying security, currency or other underlying financial instrument at a fixed price, upon exercise of the option.
Options can be traded through an exchange or through a privately negotiated arrangement with a dealer in an OTC transaction. Options traded through an exchange are generally cleared through a clearinghouse (such as The Options Clearing Corporation). The difference between the premium received or paid, and market value of the option, is recorded as unrealized appreciation or depreciation. The net change in unrealized appreciation or depreciation is reported in the Consolidated Statement of Operations. When an option is exercised, the cost of the security purchased or the proceeds of the security sale are adjusted by the amount of premium received or paid. Upon the expiration or closing of the option transaction, a gain or loss is reported in the Consolidated Statement of Operations.
The Fund has purchased call options on currencies to increase exposure to foreign exchange rate risk. A purchased call option becomes more valuable as the price of the underlying financial instrument appreciates relative to the strike price.
The Fund has purchased put options on currencies to decrease exposure to foreign exchange rate risk. A purchased put option becomes more valuable as the price of the underlying financial instrument depreciates relative to the strike price.
The Fund has purchased call options on treasury and/or euro futures to increase exposure to interest rate risk. A purchased call option becomes more valuable as the price of the underlying financial instrument appreciates relative to the strike price.
The Fund has purchased call options on individual equity securities and/or equity indexes to increase exposure to equity risk. A purchased call option becomes more valuable as the price of the underlying financial instrument appreciates relative to the strike price.
During the six months ended June 30, 2015, the Fund had an ending monthly average market value of $600,243 and $1,071,763 on purchased call options and purchased put options, respectively.
Options written, if any, are reported in a schedule following the Consolidated Statement of Investments and as a liability in the Consolidated Statement of Assets and Liabilities. Securities held in collateral accounts to cover potential obligations with respect to outstanding written options are noted in the Consolidated Statement of Investments.
The risk in writing a call option is that the market price of the security increases and if the option is exercised, the Fund must either purchase the security at a higher price for delivery or, if the Fund owns the underlying security, give up the opportunity for profit. The risk in writing a put option is that the Fund may incur a loss if the market price of the security decreases and the option is exercised. The risk in buying an option is that the Fund pays a
35 OPPENHEIMER GLOBAL MULTI-ALTERNATIVES FUND/VA
NOTES TO CONSOLIDATED FINANCIAL STATEMENTS Unaudited / Continued
5. Risk Exposures and the Use of Derivative Instruments (Continued)
premium whether or not the option is exercised. The Fund also has the additional risk that there may be an illiquid market where the Fund is unable to close the contract.
The Fund has written put options on currencies to increase exposure to foreign exchange rate risk. A written put option becomes more valuable as the price of the underlying financial instrument appreciates relative to the strike price.
The Fund has written call options on currencies to decrease exposure to foreign exchange rate risk. A written call option becomes more valuable as the price of the underlying financial instrument depreciates relative to the strike price.
The Fund has written put options on individual equity securities and/or equity indexes to increase exposure to equity risk. A written put option becomes more valuable as the price of the underlying financial instrument appreciates relative to the strike price.
The Fund has written call options on individual equity securities and/or equity indexes to decrease exposure to equity risk. A written call option becomes more valuable as the price of the underlying financial instrument depreciates relative to the strike price.
During the six months ended June 30, 2015, the Fund had an ending monthly average market value of $586,276 and $929,503 on written call options and written put options, respectively.
Additional associated risks to the Fund include counterparty credit risk and liquidity risk.
Written option activity for the six months ended June 30, 2015 was as follows:
| | | | | | | | |
| | | Number of Contracts | | | Amount of Premiums | |
| Options outstanding as of December 31, 2014 | | | 420,522,917 | | | | $ 1,274,794 | |
Options written | | | 24,614,784,353 | | | | 10,251,876 | |
Options closed or expired | | | (5,460,733,426) | | | | (3,030,114) | |
Options exercised | | | (17,363,233,844) | | | | (7,283,221) | |
| | | | |
| Options outstanding as of June 30, 2015 | | | 2,211,340,000 | | | | $ 1,213,335 | |
| | | | |
Swap Contracts
The Fund may enter into swap contract agreements with a counterparty to exchange a series of cash flows based on either specified reference rates, the price or volatility of asset or non-asset references, or the occurrence of a credit event, over a specified period. Swaps can be executed in a bi-lateral privately negotiated arrangement with a dealer in an OTC transaction (“OTC swaps”) or executed on a regulated market. Certain swaps, regardless of the venue of their execution, are required to be cleared through a clearinghouse (“centrally cleared swaps”). Swap contracts may include interest rate, equity, debt, index, total return, credit default, currency, and volatility swaps.
Swap contracts are reported on a schedule following the Consolidated Statement of Investments. The values of centrally cleared swap and OTC swap contracts are aggregated by positive and negative values and disclosed separately on the Consolidated Statement of Assets and Liabilities. The unrealized appreciation (depreciation) related to the change in the valuation of the notional amount of the swap is combined with the accrued interest due to (owed by) the Fund, if any, at termination or settlement. The net change in this amount during the period is included on the Consolidated Statement of Operations. The Fund also records any periodic payments received from (paid to) the counterparty, including at termination, under such contracts as realized gain (loss) on the Consolidated Statement of Operations.
Swap contract agreements are exposed to the market risk factor of the specific underlying reference rate or asset. Swap contracts are typically more attractively priced compared to similar investments in related cash securities because they isolate the risk to one market risk factor and eliminate the other market risk factors. Investments in cash securities (for instance bonds) have exposure to multiple risk factors (credit and interest rate risk). Because swaps have embedded leverage, they can expose the Fund to substantial risk in the isolated market risk factor.
Credit Default Swap Contracts. A credit default swap is a contract that enables an investor to buy or sell protection against a defined-issuer credit event, such as the issuer’s failure to make timely payments of interest or principal on a debt security, bankruptcy or restructuring. The Fund may enter into credit default swaps either by buying or selling protection on a corporate issuer, sovereign issuer, or a basket or index of issuers (the “reference asset”).
The buyer of protection pays a periodic fee to the seller of protection based on the notional amount of the swap contract. The seller of protection agrees to compensate the buyer of protection for future potential losses as a result of a credit event on the reference asset. The contract effectively transfers the credit event risk of the reference asset from the buyer of protection to the seller of protection.
The ongoing value of the contract will fluctuate throughout the term of the contract based primarily on the credit risk of the reference asset. If the credit quality of the reference asset improves relative to the credit quality at contract initiation, the buyer of protection may have an unrealized loss greater than the anticipated periodic fee owed. This unrealized loss would be the result of current credit protection being cheaper than the cost of credit protection at contract initiation. If the buyer elects to terminate the contract prior to its maturity, and there has been no credit event, this unrealized loss will become realized. If the contract is held to maturity, and there has been no credit event, the realized loss will be equal to the periodic fee paid over the life of the contract.
If there is a credit event, the buyer of protection can exercise its rights under the contract and receive a payment from the seller of protection equal to the notional amount of the swap less the market value of specified debt securities issued by the reference asset. Upon exercise of the contract the difference between such value and the notional amount is recorded as realized gain (loss) and is included on the Consolidated Statement of Operations.
The Fund has sold credit protection through credit default swaps to increase exposure to the credit risk of individual issuers and/or indexes of issuers that are either unavailable or considered to be less attractive in the bond market.
The Fund has purchased credit protection through credit default swaps to decrease exposure to the credit risk of individual issuers and/or indexes of issuers.
36 OPPENHEIMER GLOBAL MULTI-ALTERNATIVES FUND/VA
5. Risk Exposures and the Use of Derivative Instruments (Continued)
For the six months ended June 30, 2015, the Fund had ending monthly average notional amounts of $37,092,457 and $19,503,857 on credit default swaps to buy protection and credit default swaps to sell protection, respectively.
Additional associated risks to the Fund include counterparty credit risk and liquidity risk.
Interest Rate Swap Contracts. An interest rate swap is an agreement between counterparties to exchange periodic payments based on interest rates. One cash flow stream will typically be a floating rate payment based upon a specified floating interest rate while the other is typically a fixed interest rate.
The Fund has entered into interest rate swaps in which it pays a floating interest rate and receives a fixed interest rate in order to increase exposure to interest rate risk. Typically, if relative interest rates rise, payments made by the Fund under a swap agreement will be greater than the payments received by the Fund.
The Fund has entered into interest rate swaps in which it pays a fixed interest rate and receives a floating interest rate in order to decrease exposure to interest rate risk. Typically, if relative interest rates rise, payments received by the Fund under the swap agreement will be greater than the payments made by the Fund.
For the six months ended June 30, 2015, the Fund had ending monthly average notional amounts of $10,880,538 and $13,582,679 on interest rate swaps which pay a fixed rate and interest rate swaps which receive a fixed rate, respectively.
Additional associated risks to the Fund include counterparty credit risk and liquidity risk.
Total Return Swap Contracts. A total return swap is an agreement between counterparties to exchange periodic payments based on the value of asset or non-asset references. One cash flow is typically based on a non-asset reference (such as an interest rate) and the other on the total return of a reference asset (such as a security or a basket of securities or securities index). The total return of the reference asset typically includes appreciation or depreciation on the reference asset, plus any interest or dividend payments.
Total return swap contracts are exposed to the market risk factor of the specific underlying financial instrument or index. Total return swaps are less standard in structure than other types of swaps and can isolate and/or include multiple types of market risk factors including equity risk, credit risk, and interest rate risk.
The Fund has entered into total return swaps on various equity securities or indexes to increase exposure to equity risk. These equity risk related total return swaps require the Fund to pay a floating reference interest rate, and an amount equal to the negative price movement of securities or an index (expressed as a percentage) multiplied by the notional amount of the contract. The Fund will receive payments equal to the positive price movement of the same securities or index (expressed as a percentage) multiplied by the notional amount of the contract and, in some cases, dividends paid on the securities.
The Fund has entered into total return swaps on various equity securities or indexes to decrease exposure to equity risk. These equity risk related total return swaps require the Fund to pay an amount equal to the positive price movement of securities or an index (expressed as a percentage) multiplied by the notional amount of the contract and, in some cases, dividends paid on the securities. The Fund will receive payments of a floating reference interest rate and an amount equal to the negative price movement of the same securities or index (expressed as a percentage) multiplied by the notional amount of the contract.
The Fund has entered into total return swaps to increase exposure to the credit risk of various indexes or basket of securities. These credit risk related total return swaps require the Fund to pay to, or receive payments from, the counterparty based on the movement of credit spreads of the related indexes or securities.
The Fund has entered into total return swaps to decrease exposure to the credit risk of various indexes or basket of securities. These credit risk related total return swaps require the fund to pay to, or receive payments from, the counterparty based on the movement of credit spreads of the related indexes or securities.
The Fund has entered into total return swaps on various commodity indexes to increase exposure to commodity risk. These commodity risk related total return swaps require the Fund to pay a fixed or a floating reference interest rate, and an amount equal to the negative price movement of an index (expressed as a percentage) multiplied by the notional amount of the contract. The Fund will receive payments equal to the positive price movement of the same index (expressed as a percentage) multiplied by the notional amount of the contract.
For the six months ended June 30, 2015, the Fund had ending monthly average notional amounts of $96,022,912 and $17,026,242 on total return swaps which are long the reference asset and total return swaps which are short the reference asset, respectively.
Additional associated risks to the Fund include counterparty credit risk and liquidity risk.
Volatility Swap Contracts. A volatility swap is an agreement between counterparties to exchange periodic payments based on the measured volatility of a reference security, index, currency or other reference investment over a specified time frame. One cash flow is typically based on the realized volatility of the reference investment as measured by changes in its price or level over the specified time period while the other cash flow is based on a specified rate representing expected volatility for the reference investment at the time the swap is executed, or the measured volatility of a different reference investment over the specified time period. The appreciation or depreciation on a volatility swap will typically depend on the magnitude of the reference investment’s volatility, or size of the movements in its price, over the specified time period, rather than general directional increases or decreases in its price.
Volatility swaps are less standard in structure than other types of swaps and provide pure, or isolated, exposure to volatility risk of the specific underlying reference investment. Volatility swaps are typically used to speculate on future volatility levels, to trade the spread between realized and expected volatility, or to decrease the volatility exposure of investments held by the Fund.
Variance swaps are a type of volatility swap where counterparties agree to exchange periodic payments based on the measured variance (or the volatility squared) of a reference security, index, or other reference investment over a specified time period. At payment date, a net cash flow will be
37 OPPENHEIMER GLOBAL MULTI-ALTERNATIVES FUND/VA
NOTES TO CONSOLIDATED FINANCIAL STATEMENTS Unaudited / Continued
5. Risk Exposures and the Use of Derivative Instruments (Continued)
exchanged based on the difference between the realized variance of the reference investment over the specified time period and the specified rate representing expected variance for the reference investment at the time the swap is executed multiplied by the notional amount of the contract.
The Fund has entered into volatility swaps to increase exposure to the volatility risk of various reference investments. These types of volatility swaps require the Fund to pay the measured volatility and receive a fixed rate payment. If the measured volatility of the related reference investment increases over the period, the swaps will depreciate in value. Conversely, if the measured volatility of the related reference investment decreases over the period, the swaps will appreciate in value.
The Fund has entered into volatility swaps to decrease exposure to the volatility risk of various reference investments. These types of volatility swaps require the Fund to pay a fixed rate payment and receive the measured volatility. If the measured volatility of the related reference investment increases over the period, the swaps will appreciate in value. Conversely, if the measured volatility of the related reference investment decreases over the period, the swaps will depreciate in value.
The Fund has entered into variance swaps to increase exposure to the volatility risk of various reference investments. These types of volatility swaps require the Fund to make a payment if the measured price variance of the reference investment exceeds the specified fixed rate. If the measured variance of the related reference investment increases over the period, the swaps will depreciate in value. Conversely, if the measured variance of the related reference investment decreases over the period, the swaps will appreciate in value.
The Fund has entered into variance swaps to decrease exposure to the volatility risk of various reference investments. These types of volatility swaps require the Fund to make a payment if the measured price variance of the reference asset is less than the specified fixed rate. If the measured variance of the related reference investment increases over the period, the swaps will appreciate in value. Conversely, if the measured variance of the related reference investment decreases over the period, the swaps will depreciate in value.
For the six months ended June 30, 2015, the Fund had ending monthly average notional amounts of $25,109 and $19,268 on volatility swaps which pay measured volatility/variance and volatility swaps which receive measured volatility/variance, respectively.
Additional associated risks to the Fund include counterparty credit risk and liquidity risk.
Swaption Transactions
The Fund may enter into a swaption contract which grants the purchaser the right, but not the obligation, to enter into a swap transaction at preset terms detailed in the underlying agreement within a specified period of time. The purchaser pays a premium to the swaption writer who bears the risk of unfavorable changes in the preset terms on the underlying swap.
Purchased swaptions are reported as a component of investments in the Consolidated Statement of Investments and the Consolidated Statement of Assets and Liabilities. Written swaptions are reported on a schedule following the Consolidated Statement of Investments and their value is reported as a separate asset or liability line item in the Consolidated Statement of Assets and Liabilities. The net change in unrealized appreciation or depreciation on written swaptions is separately reported in the Consolidated Statement of Operations. When a swaption is exercised, the cost of the swap is adjusted by the amount of premium paid or received. Upon the expiration or closing of an unexercised swaption contract, a gain or loss is reported in the Consolidated Statement of Operations for the amount of the premium paid or received.
The Fund generally will incur a greater risk when it writes a swaption than when it purchases a swaption. When the Fund writes a swaption it will become obligated, upon exercise of the swaption, according to the terms of the underlying agreement. Swaption contracts written by the Fund do not give rise to counterparty credit risk prior to exercise as they obligate the Fund, not its counterparty, to perform. When the Fund purchases a swaption it only risks losing the amount of the premium it paid if the swaption expires unexercised. However, when the Fund exercises a purchased swaption there is a risk that the counterparty will fail to perform or otherwise default on its obligations under the swaption contract.
The Fund has purchased swaptions which gives it the option to enter into an interest rate swap in which it pays a floating interest rate and receives a fixed interest rate in order to increase exposure to interest rate risk. A purchased swaption of this type becomes more valuable as the reference interest rate decreases relative to the preset interest rate.
The Fund has purchased swaptions which gives it the option to enter into an interest rate swap in which it pays a fixed interest rate and receives a floating interest rate in order to decrease exposure to interest rate risk. A purchased swaption of this type becomes more valuable as the reference interest rate increases relative to the preset interest rate.
During the six months ended June 30, 2015, the Fund had an ending monthly average market value of $314,114 on purchased swaptions.
Counterparty Credit Risk. Derivative positions are subject to the risk that the counterparty will not fulfill its obligation to the Fund. The Fund intends to enter into derivative transactions with counterparties that the Manager believes to be creditworthy at the time of the transaction.
The Fund’s risk of loss from counterparty credit risk on OTC derivatives is generally limited to the aggregate unrealized gain netted against any collateral held by the Fund. For OTC options purchased, the Fund bears the risk of loss of the amount of the premiums paid plus the positive change in market values net of any collateral held by the Fund should the counterparty fail to perform under the contracts. Options written by the Fund do not typically give rise to counterparty credit risk, as options written generally obligate the Fund and not the counterparty to perform.
To reduce counterparty risk with respect to OTC transactions, the Fund has entered into master netting arrangements, established within the Fund’s International Swap and Derivatives Association, Inc. (“ISDA”) master agreements, which allow the Fund to make (or to have an entitlement to receive) a single net payment in the event of default (close-out netting) for outstanding payables and receivables with respect to certain OTC positions in swaps, options, swaptions, and forward currency exchange contracts for each individual counterparty. In addition, the Fund may require that certain counterparties post cash and/or securities in collateral accounts to cover their net payment obligations for those derivative contracts subject to ISDA master agreements. If the counterparty fails to perform under these contracts and agreements, the cash and/or securities will be made available to the Fund.
38 OPPENHEIMER GLOBAL MULTI-ALTERNATIVES FUND/VA
5. Risk Exposures and the Use of Derivative Instruments (Continued)
As of June 30, 2015, the Fund has required certain counterparties to post collateral of $1,118,018.
ISDA master agreements include credit related contingent features which allow counterparties to OTC derivatives to terminate derivative contracts prior to maturity in the event that, for example, the Fund’s net assets decline by a stated percentage or the Fund fails to meet the terms of its ISDA master agreements, which would cause the Fund to accelerate payment of any net liability owed to the counterparty.
For financial reporting purposes, the Fund does not offset derivative assets and derivative liabilities that are subject to netting arrangements in the Consolidated Statement of Assets and Liabilities. Bankruptcy or insolvency laws of a particular jurisdiction may impose restrictions on or prohibitions against the right of offset in bankruptcy, insolvency or other events.
The Fund’s risk of loss from counterparty credit risk on exchange-traded derivatives cleared through a clearinghouse and for centrally cleared swaps is generally considered lower than as compared to OTC derivatives. However, counterparty credit risk exists with respect to initial and variation margin deposited/paid by the Fund that is held in futures commission merchant, broker and/or clearinghouse accounts for such exchange-traded derivatives and for centrally cleared swaps.
With respect to centrally cleared swaps, such transactions will be submitted for clearing, and if cleared, will be held in accounts at futures commission merchants or brokers that are members of clearinghouses. While brokers, futures commission merchants and clearinghouses are required to segregate customer margin from their own assets, in the event that a broker, futures commission merchant or clearinghouse becomes insolvent or goes into bankruptcy and at that time there is a shortfall in the aggregate amount of margin held by the broker, futures commission merchant or clearinghouse for all its customers, U.S. bankruptcy laws will typically allocate that shortfall on a pro-rata basis across all the broker’s, futures commission merchant’s or clearinghouse’s customers, potentially resulting in losses to the Fund.
There is the risk that a broker, futures commission merchant or clearinghouse will decline to clear a transaction on the Fund’s behalf, and the Fund may be required to pay a termination fee to the executing broker with whom the Fund initially enters into the transaction. Clearinghouses may also be permitted to terminate centrally cleared swaps at any time. The Fund is also subject to the risk that the broker or futures commission merchant will improperly use the Fund’s assets deposited/paid as initial or variation margin to satisfy payment obligations of another customer. In the event of a default by another customer of the broker or futures commission merchant, the Fund might not receive its variation margin payments from the clearinghouse, due to the manner in which variation margin payments are aggregated for all customers of the broker/futures commission merchant.
Collateral and margin requirements differ by type of derivative. Margin requirements are established by the broker, futures commission merchant or clearinghouse for exchange-traded and cleared derivatives, including centrally cleared swaps. Brokers, futures commission merchants and clearinghouses can ask for margin in excess of the regulatory minimum, or increase the margin amount, in certain circumstances.
Collateral terms are contract specific for OTC derivatives. For derivatives traded under an ISDA master agreement, the collateral requirements are typically calculated by netting the mark to market amount for each transaction under such agreement and comparing that amount to the value of any collateral currently pledged by the Fund or the counterparty.
For financial reporting purposes, cash collateral that has been pledged to cover obligations of the Fund, if any, is reported separately on the Consolidated Statement of Assets and Liabilities as cash pledged as collateral. Non-cash collateral pledged by the Fund, if any, is noted in the Consolidated Statement of Investments. Generally, the amount of collateral due from or to a party must exceed a minimum transfer amount threshold (e.g. $250,000) before a transfer has to be made. To the extent amounts due to the Fund from its counterparties are not fully collateralized, contractually or otherwise, the Fund bears the risk of loss from counterparty nonperformance.
The following table presents by counterparty the Fund’s OTC derivative assets net of the related collateral pledged by the Fund at June 30, 2015:
| | | | | | | | | | | | | | | | | | | | |
| | | | | | Gross Amounts Not Offset in the Consolidated Statement of Assets &
Liabilities | | | | |
| Counterparty | | Gross Amounts Not
Offset in the
Consolidated Statement
of Assets & Liabilities* | | | Financial Instruments
Available for Offset | | | Financial Instruments
Collateral Received** | | | Cash Collateral
Received** | | | Net Amount | |
| Bank of America NA | | $ | 4,157,358 | | | $ | (1,882,553 | ) | | $ | (2,274,805 | ) | | $ | — | | | $ | — | |
| Barclays Bank plc | | | 249,462 | | | | (249,462 | ) | | | — | | | | — | | | | — | |
| BNP Paribas | | | 39,340 | | | | (39,340 | ) | | | — | | | | — | | | | — | |
| Canadian Imperial Bank of Commerce | | | 177,043 | | | | — | | | | — | | | | — | | | | 177,043 | |
| Citibank NA | | | 1,074,407 | | | | (954,749 | ) | | | (119,658 | ) | | | — | | | | — | |
| Deutsche Bank Securities, Inc. | | | 681,794 | | | | (364,395 | ) | | | — | | | | (317,399 | ) | | | — | |
| Goldman Sachs Bank USA | | | 425,851 | | | | (194,019 | ) | | | (231,832 | ) | | | — | | | | — | |
| Goldman Sachs Group, Inc. (The) | | | 2,677,952 | | | | (1,474,423 | ) | | | (1,203,529 | ) | | | — | | | | — | |
| HSBC Bank USA NA | | | 211,555 | | | | (124,541 | ) | | | — | | | | — | | | | 87,014 | |
| JPMorgan Chase Bank NA | | | 1,360,176 | | | | (650,510 | ) | | | (569,488 | ) | | | — | | | | 140,178 | |
| Macquarie Bank Ltc. | | | 88,969 | | | | — | | | | — | | | | — | | | | 88,969 | |
| Morgan Stanley Capital Services, Inc. | | | 1,874,119 | | | | (1,070,186 | ) | | | — | | | | (803,933 | ) | | | — | |
| Nomura Global Financial Products, Inc. | | | 5,915 | | | | (4,502 | ) | | | — | | | | — | | | | 1,413 | |
| Toronto Dominion Bank | | | 46,012 | | | | (46,012 | ) | | | — | | | | — | | | | — | |
| | | | |
| | $ | 13,069,953 | | | $ | (7,054,692 | ) | | $ | (4,399,312 | ) | | $ | (1,121,332 | ) | | $ | 494,617 | |
| | | | |
*OTC derivatives are reported gross on the Statement of Assets and Liabilities. Exchange traded options and margin related to centrally cleared swaps and futures are excluded from these reported amounts.
**Reported collateral posted for the benefit of the Fund within this table is limited to the net outstanding amount due from an individual counterparty. The collateral posted for the benefit of the Fund may exceed these amounts.
39 OPPENHEIMER GLOBAL MULTI-ALTERNATIVES FUND/VA
NOTES TO CONSOLIDATED FINANCIAL STATEMENTS Unaudited / Continued
5. Risk Exposures and the Use of Derivative Instruments (Continued)
The following table presents by counterparty the Fund’s OTC derivative liabilities net of the related collateral pledged by the Fund at June 30, 2015:
| | | | | | | | | | | | | | | | | | | | |
| | | | | | Gross Amounts Not Offset in the Consolidated
Statement of Assets &
Liabilities | | | | |
| Counterparty | | Gross Amounts Not
Offset in the
Consolidated Statement
of Assets & Liabilities* | | | Financial Instruments
Available for Offset | | | Financial Instruments
Collateral Pledged** | | | Cash Collateral
Pledged** | | | Net Amount | |
| Bank of America NA | | $ | (1,882,553) | | | $ | 1,882,553 | | | $ | — | | | $ | — | | | $ | — | |
| Barclays Bank plc | | | (426,345) | | | | 249,462 | | | | — | | | | — | | | | (176,883) | |
| BNP Paribas | | | (317,043) | | | | 39,340 | | | | 277,703 | | | | — | | | | — | |
| Citibank NA | | | (954,749) | | | | 954,749 | | | | — | | | | — | | | | — | |
| Credit Suisse international | | | (96,080) | | | | — | | | | — | | | | — | | | | (96,080) | |
| Deutsche Bank Securities, Inc. | | | (364,395) | | | | 364,395 | | | | — | | | | — | | | | — | |
| Goldman Sachs Bank USA | | | (194,019) | | | | 194,019 | | | | — | | | | — | | | | — | |
| Goldman Sachs Group, Inc. (The) | | | (1,474,423) | | | | 1,474,423 | | | | — | | | | — | | | | — | |
| HSBC Bank USA NA | | | (124,541) | | | | 124,541 | | | | — | | | | — | | | | — | |
| JPMorgan Chase Bank NA | | | (650,510) | | | | 650,510 | | | | — | | | | — | | | | — | |
| Morgan Stanley Capital Services, Inc. | | | (1,070,186) | | | | 1,070,186 | | | | — | | | | — | | | | — | |
| Nomura Global Financial Products, Inc. | | | (4,502) | | | | 4,502 | | | | — | | | | — | | | | — | |
| Toronto Dominion Bank | | | (136,469) | | | | 46,012 | | | | — | | | | — | | | | (90,457) | |
| | | | |
| | $ | (7,695,815) | | | $ | 7,054,692 | | | $ | 277,703 | | | $ | — | | | $ | (363,420) | |
| | | | |
*OTC derivatives are reported gross on the Consolidated Statement of Assets and Liabilities. Exchange traded options and margin related to centrally cleared swaps and futures are excluded from these reported amounts.
**Reported collateral pledged within this table is limited to the net outstanding amount due from the Fund. The securities pledged as collateral by the Fund as reported on the Consolidated Statements of Investments may exceed these amounts.
The following table presents the valuations of derivative instruments by risk exposure as reported within the Consolidated Statement of Assets and Liabilities as of June 30, 2015:
| | | | | | | | | | | | |
| | | Asset Derivatives | | | Liability Derivatives | |
Derivatives Not
Accounted for as Hedging Instruments | | Consolidated Statement of Assets and
Liabilities Location | | Value | | | Consolidated Statement of Assets and
Liabilities Location | | Value | |
| Commodity contracts | | Swaps, at value | | $ | 266,012 | | | Swaps, at value | | $ | — | |
| Credit contracts | | Swaps, at value | | | 758,115 | | | Swaps, at value | | | 881,864 | |
| Equity contracts | | Swaps, at value | | | 672,777 | | | Swaps, at value | | | 2,072,189 | |
| Volatility contracts | | Swaps, at value | | | 735,565 | | | Swaps, at value | | | 643,867 | |
| Credit contracts | | Centrally cleared swaps, at value | | | 114,183 | | | Centrally cleared swaps, at value | | | 678,844 | |
| Interest rate contracts | | Centrally cleared swaps, at value | | | 137,440 | | | Centrally cleared swaps, at value | | | 673,595 | |
| Commodity contracts | | Variation margin receivable | | | 133,666 | * | | Variation margin payable | | | 155,749 | * |
| Equity contracts | | Variation margin receivable | | | 417,634 | * | | Variation margin payable | | | — | * |
| Interest rate contracts | | Variation margin receivable | | | 3,320 | * | | Variation margin payable | | | 14,454 | * |
| Volatility contracts | | Variation margin receivable | | | 24,405 | * | | Variation margin payable | | | 34,126 | * |
| Foreign exchange contracts | | Unrealized appreciation on foreign currency exchange contracts | | | 9,224,418 | | | Unrealized depreciation on foreign currency exchange contracts | | | 3,542,475 | |
| Foreign exchange contracts | | | | | | | | Options written, at value | | | 774,612 | |
| Equity contracts | | Investments, at value | | | 605 | ** | | | | | | |
| Foreign exchange contracts | | Investments, at value | | | 950,298 | ** | | | | | | |
| Interest rate contracts | | Investments, at value | | | 709,024 | ** | | | | | | |
| | | | | | | | | | | | |
| Total | | | | | $ 14,147,462 | | | | | $ | 9,471,775 | |
| | | | | | | | | | | | |
*Includes only the current day’s variation margin. Prior variation margin movements have been reflected in cash on the Consolidated Statement of Assets and Liabilities upon receipt or payment.
**Amounts relate to purchased option contracts and purchased swaption contracts.
The effect of derivative instruments on the Consolidated Statement of Operations is as follows:
| | | | | | | | | | | | | | | | | | | | | | | | |
| Amount of Realized Gain or (Loss) Recognized on Derivatives | |
Derivatives Not Accounted for as Hedging Instruments | | Investment from
unaffiliated
companies (including
premiums on
options
exercised)* | | | Closing and expiration of option contracts
written | | | Closing and
expiration of
futures contracts | | | Foreign currency
transactions | | | Swap contracts | | | Total | |
| Commodity contracts | | $ | — | | | $ | — | | | $ | (235,766 | ) | | $ | — | | | $ | (550,386 | ) | | $ | (786,152 | ) |
| Credit contracts | | | — | | | | — | | | | — | | | | — | | | | 9,000 | | | | 9,000 | |
| Equity contracts | | | 780,946 | | | | — | | | | (1,960,153 | ) | | | — | | | | 1,646,047 | | | | 466,840 | |
| Foreign exchange contracts | | | (363,959 | ) | | | 3,030,114 | | | | — | | | | 1,869,335 | | | | — | | | | 4,535,490 | |
| Interest rate contracts | | | (177,453 | ) | | | — | | | | (23,386 | ) | | | — | | | | (146,719 | ) | | | (347,558 | ) |
| Volatility contracts | | | — | | | | — | | | | 214 | | | | — | | | | (17,641,247 | ) | | | (17,641,033 | ) |
| | | | |
Total | | $ | 239,534 | | | $ | 3,030,114 | | | $ | (2,219,091 | ) | | $ | 1,869,335 | | | $ | (16,683,305 | ) | | $ | (13,763,413 | ) |
| | | | |
* Includes purchased option contracts, purchased swaption contracts, written option contracts exercised and written swaption contracts exercised, if any.
40 OPPENHEIMER GLOBAL MULTI-ALTERNATIVES FUND/VA
5. Risk Exposures and the Use of Derivative Instruments (Continued)
| | | | | | | | | | | | | | | | | | | | | | | | |
| Amount of Change in Unrealized Gain or (Loss) Recognized on Derivatives | |
Derivatives Not Accounted for as Hedging Instruments | | Investments* | | | Option contracts
written | | | Futures contracts | | | Translation of assets and
liabilities denominated
in foreign currencies | | | Swap contracts | | | Total | |
| Commodity contracts | | $ | — | | | $ | — | | | $ | 83,267 | | | $ | — | | | $ | 546,064 | | | $ | 629,331 | |
| Credit contracts | | | — | | | | — | | | | — | | | | — | | | | (197,633) | | | | (197,633) | |
| Equity contracts | | | (14,462 | ) | | | (112,941 | ) | | | 1,036,259 | | | | — | | | | (1,661,935) | | | | (753,079) | |
| Foreign exchange contracts | | | 1,217,254 | | | | 421,108 | | | | — | | | | (952,516) | | | | — | | | | 685,846 | |
| Interest rate contracts | | | 249,713 | | | | — | | | | (47,489) | | | | — | | | | (556,179) | | | | (353,955) | |
| Volatility contracts | | | — | | | | — | | | | 76,722 | | | | — | | | | 118,044 | | | | 194,766 | |
| | | | |
Total | | $ | 1,452,505 | | | $ | 308,167 | | | $ | 1,148,759 | | | $ | (952,516) | | | $ | (1,751,639) | | | $ | 205,276 | |
| | | | |
*Includes purchased option contracts and purchased swaption contracts, if any.
6. Shares of Beneficial Interest
The Fund has authorized an unlimited number of $0.001 par value shares of beneficial interest of each class. Transactions in shares of beneficial interest were as follows:
| | | | | | | | | | | | | | | | | | |
| | | Six Months Ended June 30, 2015 | | | | | Year Ended December 31, 2014 | |
| | | Shares | | | Amount | | | | | Shares | | | Amount | |
| Non-Service Shares | | | | | | | | | | | | | | | | | | |
| Sold | | | 15,324,569 | | | $ | 155,353,669 | | | | | | 24,008,256 | | | $ | 249,427,902 | |
| Dividends and/or distributions reinvested | | | — | | | | — | | | | | | 1,139,749 | | | | 11,478,135 | |
| Redeemed | | | — | | | | — | | | | | | — | | | | — | |
| | | | |
| Net increase | | | 15,324,569 | | | $ | 155,353,669 | | | | | | 25,148,005 | | | $ | 260,906,037 | |
| | | | |
| | | | | | | | | | | | | | | | | | | |
Service Shares | | | | | | | | | | | | | | | | | | |
| Sold | | | 95,975 | | | $ | 974,560 | | | | | | 143,042 | | | $ | 1,512,896 | |
| Dividends and/or distributions reinvested | | | — | | | | — | | | | | | 5,873 | | | | 59,078 | |
| Redeemed | | | (51,925 | ) | | | (528,148 | ) | | | | | (17,184 | ) | | | (180,391) | |
| | | | |
| Net increase | | | 44,050 | | | $ | 446,412 | | | | | | 131,731 | | | $ | 1,391,583 | |
| | | | |
7. Purchases and Sales of Securities
The aggregate cost of purchases and proceeds from sales of securities, other than short-term obligations and investments in IMMF, for the six months ended June 30, 2015 were as follows:
| | | | | | | | | | |
| | | Purchases | | | | | Sales | |
Investment securities | | $ | 151,121,013 | | | | | $ | 56,416,352 | |
8. Fees and Other Transactions with Affiliates
Management Fees. Under the investment advisory agreement, the Fund pays the Manager a management fee based on the daily net assets of the Fund at an annual rate as shown in the following table:
| | | | | | |
| Fee Schedule | | | | | |
Up to $500 million | | | 1.00 | % | | |
Next $500 million | | | 0.95 | | | |
Next $4 billion | | | 0.90 | | | |
Over $5 billion | | | 0.88 | | | |
The Manager also provides investment management related services to the Subsidiary. The Subsidiary pays the Manager a monthly management fee at an annual rate according to the above schedule. The Subsidiary also pays certain other expenses including custody and directors’ fees.
The Fund’s effective management fee for the six months ended June 30, 2015 was 1.04% of average annual net assets before any applicable waivers.
Sub-Adviser Fees. The Manager has retained the Sub-Adviser to provide the day-to-day portfolio management of the Fund. Under the Sub-Advisory Agreement, the Manager pays the Sub-Adviser an annual fee in monthly installments, equal to a percentage of the investment management fee collected by the Manager from the Fund, which shall be calculated after any investment management fee waivers. The fee paid to the Sub-Adviser is paid by the Manager, not by the Fund.
Sub-Sub-Adviser Fees. The Sub-Adviser retains the Sub-Sub-Adviser to provide the day-to-day portfolio management of the Fund. Under the Sub-Sub-Advisory Agreement, the Sub-Adviser pays the Sub-Sub-Adviser an annual fee in monthly installments, based on the average daily net assets of the Fund. The fee paid to the Sub-Sub-Adviser under the Sub-Sub-Advisory agreement is paid by the Sub-Adviser, not by the Fund.
41 OPPENHEIMER GLOBAL MULTI-ALTERNATIVES FUND/VA
NOTES TO CONSOLIDATED FINANCIAL STATEMENTS Unaudited / Continued
8. Fees and Other Transactions with Affiliates (Continued)
Transfer Agent Fees. OFI Global (the “Transfer Agent”) serves as the transfer and shareholder servicing agent for the Fund. The Fund pays the Transfer Agent a fee based on annual net assets. Fees incurred and average net assets for each class with respect to these services are detailed in the Consolidated Statement of Operations and Consolidated Financial Highlights, respectively.
Sub-Transfer Agent Fees. The Transfer Agent has retained Shareholder Services, Inc., a wholly-owned subsidiary of OFI (the “Sub-Transfer Agent”), to provide the day-to-day transfer agent and shareholder servicing of the Fund. Under the Sub-Transfer Agency Agreement, the Transfer Agent pays the Sub-Transfer Agent an annual fee in monthly installments, equal to a percentage of the transfer agent fee collected by the Transfer Agent from the Fund, which shall be calculated after any applicable fee waivers. The fee paid to the Sub-Transfer Agent is paid by the Transfer Agent, not by the Fund.
Trustees’ Compensation. The Fund’s Board of Trustees (“Board”) has adopted a compensation deferral plan for Independent Trustees that enables Trustees to elect to defer receipt of all or a portion of the annual compensation they are entitled to receive from the Fund. For purposes of determining the amount owed to the Trustee under the plan, deferred amounts are treated as though equal dollar amounts had been invested in shares of the Fund or in other Oppenheimer funds selected by the Trustee. The Fund purchases shares of the funds selected for deferral by the Trustee in amounts equal to his or her deemed investment, resulting in a Fund asset equal to the deferred compensation liability. Such assets are included as a component of “Other” within the asset section of the Consolidated Statement of Assets and Liabilities. Deferral of Trustees’ fees under the plan will not affect the net assets of the Fund and will not materially affect the Fund’s assets, liabilities or net investment income per share. Amounts will be deferred until distributed in accordance with the compensation deferral plan.
Distribution and Service Plan for Service Shares. The Fund has adopted a Distribution and Service Plan (the “Plan”) pursuant to Rule 12b-1 under the 1940 Act for Service shares to pay OppenheimerFunds Distributor, Inc. (the “Distributor”), for distribution related services, personal service and account maintenance for the Fund’s Service shares. Under the Plan, payments are made periodically at an annual rate of 0.25% of the daily net assets of Service shares of the Fund. The Distributor currently uses all of those fees to compensate sponsors of the insurance product that offers Fund shares, for providing personal service and maintenance of accounts of their variable contract owners that hold Service shares. These fees are paid out of the Fund’s assets on an on-going basis and increase operating expenses of the Service shares, which results in lower performance compared to the Fund’s shares that are not subject to a service fee. Fees incurred by the Fund under the Plan are detailed in the Consolidated Statement of Operations.
Waivers and Reimbursements of Expenses. The Manager has contractually agreed to waive fees and/or reimburse expenses to limit the Fund’s “Expenses after payments, waivers and/or reimbursements and reduction to custodian expenses” (excluding any applicable dividend expense, taxes, interest and fees from borrowing, any subsidiary expenses, Acquired Fund Fees and Expenses, brokerage commissions, extraordinary expenses and certain other Fund expenses) so that, as percentages of average daily net assets, those expenses will not exceed the annual rate of 1.20% for Non-Service shares and 1.45% for Service shares. During the six months ended June 30, 2015, the Manager waived fees and/or reimbursed the Fund $3,504 and $25 for Non-Service and Service shares , respectively.
The Manager has contractually agreed to waive the Fund’s management fee in an amount equal to the management fee of the Subsidiary. During the six months ended June 30, 2015, this waiver reduced the Fund’s management fee by $65,039.
The Manager will waive fees and/or reimburse Fund expenses in an amount equal to the indirect management fees incurred through the Fund’s investment in IMMF. During the six months ended June 30, 2015, the Manager waived fees and/or reimbursed the Fund $26,266 for IMMF management fees.
Waivers and/or reimbursements may be modified or terminated as set forth according to the terms in the prospectus.
9. Borrowings and Other Financing
Securities Sold Short. The Fund sells securities that it does not own, and it will therefore be obligated to purchase such securities at a future date. Upon entering into a short position, the Fund is required to segregate cash or securities at its custodian which are pledged for the benefit of the lending broker and/or to deposit and pledge cash directly at the lending broker, with a value equal to a certain percentage, exceeding 100%, of the value of the securities that it sold short. Cash that has been segregated and pledged for this purpose will be disclosed on the Consolidated Statement of Assets and Liabilities; securities that have been segregated and pledged for this purpose are disclosed as such in the Consolidated Statement of Investments. The aggregate market value of such cash and securities at period end is $37,137,591. The value of the open short position is recorded as a liability, and the Fund records an unrealized gain or loss to the extent of the difference between the proceeds received and the change in value of the open short position. The Fund records a realized gain or loss when the short position is closed out. By entering into short sales, the Fund bears the market risk of increases in value of the security sold short in excess of the proceeds received. Until the security is replaced, the Fund is required to pay the lender any dividend or interest earned. Dividend expense on short sales is treated as an expense in the Consolidated Statement of Operations.
10. Pending Litigation
In 2009, several lawsuits were filed as putative class actions and later consolidated before the U.S. District Court for the District of Colorado in connection with the investment performance of Oppenheimer Rochester California Municipal Fund (the “California Fund Suit”), a fund advised by OppenheimerFunds, Inc. (“OFI”), and distributed by its subsidiary OppenheimerFunds Distributor, Inc. ( “OFDI”). The plaintiffs asserted claims against OFI, OFDI and certain present and former trustees and officers of the Fund under the federal securities laws, alleging, among other things, that the disclosure documents of the Fund contained misrepresentations and omissions and the investment policies of the Fund were not followed. Plaintiffs in
42 OPPENHEIMER GLOBAL MULTI-ALTERNATIVES FUND/VA
10. Pending Litigation (Continued)
the California Fund Suit filed an amended complaint and defendants filed a motion to dismiss. In 2011, the court issued an order which granted in part and denied in part the defendants’ motion to dismiss. In 2012, plaintiffs filed a motion, which defendants opposed, to certify a class and appoint class representatives and class counsel. In March 2015, the court granted plaintiffs’ motion for class certification. In May 2015, the U.S. Court of Appeals for the Tenth Circuit vacated the class certification order and remanded the matter to the district court for further proceedings. In July 2015, the district court held an evidentiary hearing on plaintiffs’ motion for class certification. OFI and OFDI believe the California Fund Suit is without merit; that it is premature to render any opinion as to the likelihood of an outcome unfavorable to them in the California Fund Suit; and that no estimate can yet be made as to the amount or range of any potential loss.
43 OPPENHEIMER GLOBAL MULTI-ALTERNATIVES FUND/VA
PORTFOLIO PROXY VOTING POLICIES AND PROCEDURES; UPDATES TO STATEMENTS OF INVESTMENTS Unaudited
The Fund has adopted Portfolio Proxy Voting Policies and Procedures under which the Fund votes proxies relating to securities (“portfolio proxies”) held by the Fund. A description of the Fund’s Portfolio Proxy Voting Policies and Procedures is available (i) without charge, upon request, by calling the Fund toll-free at 1.800.525.7048, (ii) on the Fund’s website at www.oppenheimerfunds.com, and (iii) on the SEC’s website at www.sec.gov. In addition, the Fund is required to file Form N-PX, with its complete proxy voting record for the 12 months ended June 30th, no later than August 31st of each year. The Fund’s voting record is available (i) without charge, upon request, by calling the Fund toll-free at 1.800.525.7048, and (ii) in the Form N-PX filing on the SEC’s website at www.sec.gov.
The Fund files its complete schedule of portfolio holdings with the SEC for the first quarter and the third quarter of each fiscal year on Form N-Q. The Fund’s Form N-Q filings are available on the SEC’s website at www.sec.gov. Those forms may be reviewed and copied at the SEC’s Public Reference Room in Washington, D.C. Information on the operation of the Public Reference Room may be obtained by calling 1-800-SEC-0330.
44 OPPENHEIMER GLOBAL MULTI-ALTERNATIVES FUND/VA
THIS PAGE INTENTIONALLY LEFT BLANK.
45 OPPENHEIMER GLOBAL MULTI-ALTERNATIVES FUND/VA
THIS PAGE INTENTIONALLY LEFT BLANK.
46 OPPENHEIMER GLOBAL MULTI-ALTERNATIVES FUND/VA
THIS PAGE INTENTIONALLY LEFT BLANK.
47 OPPENHEIMER GLOBAL MULTI-ALTERNATIVES FUND/VA
OPPENHEIMER GLOBAL MULTI-ALTERNATIVES FUND/VA
A Series of Oppenheimer Variable Account Funds
| | |
| Trustees and Officers | | Sam Freedman, Chairman of the Board of Trustees and Trustee |
| | Jon S. Fossel, Trustee |
| | Richard F. Grabish, Trustee |
| | Beverly L. Hamilton, Trustee |
| | Victoria J. Herget, Trustee |
| | Robert J. Malone, Trustee |
| | F. William Marshall, Jr., Trustee |
| | Karen L. Stuckey, Trustee |
| | James D. Vaughn, Trustee |
| | Arthur P. Steinmetz, Trustee, President and Principal Executive Officer |
| | Mark Hamilton, Vice President |
| | Benjamin Rockmuller, Vice President |
| | Dokyoung Lee, Vice President |
| | Arthur S. Gabinet, Secretary and Chief Legal Officer |
| | Jennifer Sexton, Vice President and Chief Business Officer |
| | Mary Ann Picciotto, Chief Compliance Officer and Chief Anti-Money Laundering Officer |
| | Brian W. Wixted, Treasurer and Principal Financial & Accounting Officer |
| |
| Manager | | OFI Global Asset Management, Inc. |
| |
| Sub-Adviser | | OppenheimerFunds, Inc. |
| |
| Distributor | | OppenheimerFunds Distributor, Inc. |
| |
| Transfer and | | OFI Global Asset Management, Inc. |
| Shareholder Servicing | | |
| Agent | | |
| |
| Sub-Transfer Agent | | Shareholder Services, Inc. |
| | DBA OppenheimerFunds Services |
| |
| Independent | | KPMG LLP |
| Registered Public | | |
| Accounting Firm | | |
| |
| Legal Counsel | | Ropes & Gray LLP |
| |
| | Before investing in any of the Oppenheimer funds, investors should carefully consider a fund’s investment objectives, risks, charges and expenses. Fund prospectuses and summary prospectuses contain this and other information about the funds and may be obtained by asking your financial advisor, visiting oppenheimerfunds.com or calling us at 1.800.988.8287. Read prospectuses and summary prospectuses carefully before investing. |
| |
| | The financial statements included herein have been taken from the records of the Fund without examination of those records by the independent registered public accounting firm. |
| |
| | © 2015 OppenheimerFunds, Inc. All rights reserved. Oppenheimer funds are distributed by OppenheimerFunds Distributor, Inc. |

| | | | |
| | 
| | |
| | | | |
| | June 30, 2015 | | |
| | | Oppenheimer | | Semiannual Report |
| | International Growth Fund/VA | |
| | | A Series of Oppenheimer Variable Account Funds | |
| | SEMIANNUAL REPORT | | |
| | Listing of Top Holdings | | |
| | Fund Performance Discussion | | |
| | Financial Statements | | |
PORTFOLIO MANAGERS: George R. Evans, CFA, and Robert B. Dunphy, CFA
AVERAGE ANNUAL TOTAL RETURNS FOR THE PERIOD ENDED 6/30/15
| | | | | | | | | | | | | | | | | | | | | | |
| | | Inception Date | | | | | 6-Months | | | 1-Year | | | 5-Year | | | 10-Year | |
Non-Service Shares | | | 5/13/92 | | | | | | 6.72% | | | | -3.32 % | | | | 12.01 % | | | | 8.34 % | |
| |
Service Shares | | | 3/19/01 | | | | | | 6.71 | | | | -3.36 | | | | 11.73 | | | | 8.04 | |
| |
MSCI AC World ex-U.S. Index | | | | | | | | | 4.03 | | | | -5.26 | | | | 7.76 | | | | 5.54 | |
| |
Performance data quoted represents past performance, which does not guarantee future results. The investment return and principal value of an investment in the Fund will fluctuate so that an investor’s shares, when redeemed, may be worth more or less than their original cost. Current performance may be lower or higher than the performance quoted. For performance data current to the most recent month end, call us at 1.800.988.8287. The Fund’s total returns should not be expected to be the same as the returns of other funds, whether or not both funds have the same portfolio managers and/or similar names. The Fund’s total returns include changes in share price and reinvested distributions but do not include the charges associated with the separate account products that offer this Fund. Such performance would have been lower if such charges were taken into account.
The Fund’s performance is compared to the performance of the MSCI AC World ex-U.S. Index. The MSCI AC World ex-U.S. Index is designed to measure the equity market performance of developed and emerging markets and excludes the U.S. The Index is unmanaged and cannot be purchased directly by investors. While index comparisons may be useful to provide a benchmark for the Fund’s performance, it must be noted that the Fund’s investments are not limited to the investments comprising the Index. Index performance includes reinvestment of income, but does not reflect transaction costs, fees, expenses or taxes. Index performance is shown for illustrative purposes only as a benchmark for the Fund’s performance, and does not predict or depict performance of the Fund. The Fund’s performance reflects the effects of the Fund’s business and operating expenses.
TOP HOLDINGS AND ALLOCATIONS
TOP TEN COMMON STOCK HOLDINGS
| | | | |
| |
Dollarama, Inc. | | | 1.8% | |
| |
Continental AG | | | 1.7 | |
| |
Valeo SA | | | 1.6 | |
| |
Novo Nordisk AS, Cl. B | | | 1.6 | |
| |
Infineon Technologies AG | | | 1.6 | |
| |
Nippon Telegraph & Telephone Corp. | | | 1.5 | |
| |
Essentra plc | | | 1.5 | |
| |
Vodafone Group plc | | | 1.5 | |
| |
ICAP plc | | | 1.5 | |
| |
Carnival Corp. | | | 1.5 | |
| |
Portfolio holdings and allocations are subject to change. Percentages are as of June 30, 2015, and are based on net assets. For more current Fund holdings, please visit oppenheimerfunds.com.
REGIONAL ALLOCATION
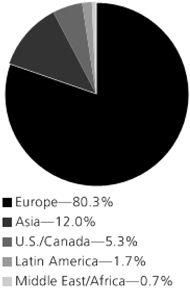
Portfolio holdings and allocations are subject to change. Percentages are as of June 30, 2015, and are based on the total market value of investments.
2 OPPENHEIMER INTERNATIONAL GROWTH FUND/VA
Fund Performance Discussion
The Fund’s Non-Service shares produced a return of 6.72% for the period, outperforming the MSCI AC World ex-U.S. Index (the “Index”), which returned 4.03%. The Fund outperformed the Index in eight of the ten sectors of the Index led, by materials, consumer discretionary and telecommunication services sectors, due primarily to stronger relative stock selection. The Fund underperformed the Index in the consumer staples and industrials sectors due to weaker relative stock selection.
GLOBAL MARKET AND ECONOMIC ENVIRONMENT
For the six-month reporting period, global equities generally produced muted results. After U.S. equities outperformed other developed and emerging market equities in 2014, the market environment shifted in 2015. The dollar continued to strengthen, which acted as a drag on growth. Businesses, especially U.S. firms with revenues dependent on exporting goods and services, cited this as a headwind. European Central Bank (“ECB”) President Mario Draghi announced the purchase of €60 billion a month in sovereign bonds from Eurozone countries for at least 19 months, a form of quantitative easing (“QE”) that is projected to increase the ECB’s balance sheet by over €1 trillion. The announcement and implementation of these extraordinary monetary policies had a significant impact on financial markets. European markets rallied and the euro fell against the currencies of most major trading partners. This resulted in European and emerging market equities outperforming U.S. equities through May 2015. However, concerns around Greece’s debt situation emerged yet again late this reporting period. The market had hoped for an 11th hour resolution to the stand-off between Greece and its creditors, but instead got an escalation of the crisis after the Greek Prime Minister called for a referendum. In the minds of many, this increased the odds of a Greek exit from the Eurozone (“Grexit”) and impacted the markets through the end of the reporting period. Shortly after the period ended, Eurozone leaders agreed to offer Greece a third bailout, averting a Grexit for the time being.
TOP INDIVIDUAL CONTRIBUTORS
Top contributors to the Fund’s performance this period included Nippon Telegraph & Telephone Corporation, Essentra plc and Syngenta AG. Nippon Telegraph & Telephone’s stock price benefited as the company continued to improve its operational performance and return more capital to shareholders. Essentra is a leading global distributor of specialty plastic, fiber and foam products, including specialty tapes, plugs, and packaging, that are used across a host of industries. They have an extensive catalog of parts that are small but critical to their clients. The industry is fragmented and Essentra has been a leading consolidator. The company reported better than expected results in part due to synergies from recent acquisitions. In our opinion, the shares continue to look attractive on the back of sustainable mid-single digit organic growth combined with opportunistic acquisitions and improving margins and returns. Syngenta is a Swiss producer of crop protection chemicals and seeds, with an attractive and defendable economic profile. During the reporting period it received a buyout offer from Monsanto, a U.S. based competitor, which it rebuffed. If no deal is made, we believe it remains a business with considerable ability to create economic value for its shareholders.
TOP INDIVIDUAL DETRACTORS
Detractors from performance this reporting period included Aryzta AG, Saputo Inc., and Boskalis Westminster NV. Aryzta is a Swiss baked goods company. At the close of the first quarter, the company announced a 49% acquisition of Picard, a French frozen food company. This was a surprise, as the company had not signaled the possibility of a large scale investment, or the possibility that they would diversify outside of baked goods. Investors reacted negatively to this news. The other near term challenge for the company has been sluggish trends in the fast food industry, where it is a supplier to some of the biggest players. We believe the Picard investment, though not an obvious fit, holds some promise. Saputo is a Canada-based dairy processor and cheese producer. The company reported weaker than expected earnings, and cautioned that cheese and milk prices could remain low throughout 2015. Boskalis Westminster, based in the Netherlands, is a dredging and marine company. The company’s offshore energy business, which includes transportation and subsea services, faces a challenging outlook given the significant fall in oil prices. However, Boskalis has a healthy order book in its dredging business and sees a good tender pipeline for capital dredging projects, expansion of ports, and land reclamation.
STRATEGY & OUTLOOK
Blaise Pascal once noted that all of humanity’s problems stem from man’s inability to sit quietly in a room alone. Nowhere perhaps is this more true than in the investment management arena. There is always an impetus to act, and to act in a fashion which responds to the controversy or perceived opportunity of the moment. However, we find no advantage in thinking or behaving this way. Our experience suggests this is a fruitless undertaking.
We produced positive results the first half of 2015. 2014 however, was a year of comparably weak performance. Yet, there were no sweeping changes made to the composition of the portfolio. With a few exceptions, the central ideas in the portfolio remain as they were in 2014, when investors didn’t seem to like them
3 OPPENHEIMER INTERNATIONAL GROWTH FUND/VA
very much. Now it appears they do. In reality, little is different about the long-run positioning of any of our key holdings from six or nine months ago. As with Pascal’s observation above, sometimes the best thing, and perhaps hardest thing to do, is to do nothing.
The Fund’s investment strategy and focus can change over time. The mention of specific fund holdings does not constitute a recommendation by OppenheimerFunds, Inc. or its affiliates.
Shares of Oppenheimer funds are not deposits or obligations of any bank, are not guaranteed by any bank, are not insured by the FDIC or any other agency, and involve investment risks, including the possible loss of the principal amount invested.
4 OPPENHEIMER INTERNATIONAL GROWTH FUND/VA
Fund Expenses
Fund Expenses. As a shareholder of the Fund, you incur two types of costs: (1) transaction costs and (2) ongoing costs, including management fees; distribution and service fees; and other Fund expenses. These examples are intended to help you understand your ongoing costs (in dollars) of investing in the Fund and to compare these costs with the ongoing costs of investing in other mutual funds.
The examples are based on an investment of $1,000.00 invested at the beginning of the period and held for the entire 6-month period ended June 30, 2015.
Actual Expenses. The first section of the table provides information about actual account values and actual expenses. You may use the information in this section for the class of shares you hold, together with the amount you invested, to estimate the expense that you paid over the period. Simply divide your account value by $1,000.00 (for example, an $8,600.00 account value divided by $1,000.00 = 8.60), then multiply the result by the number in the first section under the heading entitled “Expenses Paid During the 6 Months Ended June 30, 2015” to estimate the expenses you paid on your account during this period.
Hypothetical Example for Comparison Purposes.
The second section of the table provides information about hypothetical account values and hypothetical expenses based on the Fund’s actual expense ratio for each class of shares, and an assumed rate of return of 5% per year for each class before expenses, which is not the actual return. The hypothetical account values and expenses may not be used to estimate the actual ending account balance or expenses you paid for the period. You may use this information to compare the ongoing costs of investing in the Fund and other funds. To do so, compare this 5% hypothetical example for the class of shares you hold with the 5% hypothetical examples that appear in the shareholder reports of the other funds.
Please note that the expenses shown in the table are meant to highlight your ongoing costs only and do not reflect any charges associated with the separate accounts that offer this Fund. Therefore, the “hypothetical” lines of the table are useful in comparing ongoing costs only, and will not help you determine the relative total costs of owning different funds. In addition, if these separate account charges were included your costs would have been higher.
| | | | | | | | | | | | | | | | | | |
| Actual | | Beginning Account Value January 1, 2015 | | | | | Ending Account Value June 30, 2015 | | | | | Expenses Paid During
6 Months Ended
June 30, 2015 | | | |
Non-Service shares | | $ | 1,000.00 | | | | | $ | 1,067.20 | | | | | $ | 5.14 | | | |
Service shares | | | 1,000.00 | | | | | | 1,067.10 | | | | | | 6.43 | | | |
| | | | | | |
Hypothetical (5% return before expenses) | | | | | | | | | | | | | | | |
Non-Service shares | | | 1,000.00 | | | | | | 1,019.84 | | | | | | 5.02 | | | |
Service shares | | | 1,000.00 | | | | | | 1,018.60 | | | | | | 6.28 | | | |
Expenses are equal to the Fund’s annualized expense ratio for that class, multiplied by the average account value over the period, multiplied by 181/365 (to reflect the one-half year period). Those annualized expense ratios, excluding indirect expenses from affiliated funds, based on the 6-month period ended June 30, 2015 are as follows:
| | | | |
| Class | | Expense Ratios | |
Non-Service shares | | | 1.00% | |
Service shares | | | 1.25 | |
The expense ratios reflect voluntary and/or contractual waivers and/or reimbursements of expenses by the Fund’s Manager. Some of these undertakings may be modified or terminated at any time, as indicated in the Fund’s prospectus. The “Financial Highlights” tables in the Fund’s financial statements, included in this report, also show the gross expense ratios, without such waivers or reimbursements and reduction to custodian expenses, if applicable.
5 OPPENHEIMER INTERNATIONAL GROWTH FUND/VA
STATEMENT OF INVESTMENTS June 30, 2015 Unaudited
| | | | | | | | |
| | | |
| | | Shares | | Value | | | |
| | | |
| Common Stocks—98.5% | | | | | | | | |
| | | |
| Consumer Discretionary—24.7% | | | | | | |
| | | |
| Auto Components—3.3% | | | | | | | | |
| | | |
| Continental AG | | 37,209 | | $ | 8,801,596 | | | |
| | | |
| Valeo SA | | 52,291 | | | 8,266,258 | | | |
| | | | | | | | |
| | | | | 17,067,854 | | | |
| | | | | | | | |
| | | |
| Automobiles—1.6% | | | | | | | | |
| | | |
| Bayerische Motoren Werke AG | | 41,209 | | | 4,508,591 | | | |
| | | |
| Hero MotoCorp Ltd. | | 98,320 | | | 3,882,992 | | | |
| | | | | | | | |
| | | | | 8,391,583 | | | |
| | | | | | | | |
| | | |
| Diversified Consumer Services—0.8% | | | | | | |
| | | |
| Dignity plc | | 120,427 | | | 4,049,262 | | | |
| | | | | | | | |
| | | |
| Hotels, Restaurants & Leisure—3.8% | | | | | | |
| | | |
| Carnival Corp. | | 150,830 | | | 7,449,493 | | | |
| | | |
| Domino’s Pizza Group plc | | 416,088 | | | 5,075,250 | | | |
| | | |
| William Hill plc | | 1,121,554 | | | 7,112,959 | | | |
| | | | | | | | |
| | | | | 19,637,702 | | | |
| | | | | | | | |
| | | |
| Household Durables—1.1% | | | | | | | | |
| | | |
| SEB SA | | 57,840 | | | 5,389,452 | | | |
| | | | | | | | |
| | | |
| Internet & Catalog Retail—0.3% | | | | | | | | |
| | | |
| Yoox SpA1 | | 46,599 | | | 1,506,965 | | | |
| | | | | | | | |
| | | |
| Media—4.3% | | | | | | | | |
| | | |
| Grupo Televisa SAB, Sponsored ADR | | 147,110 | | | 5,710,810 | | | |
| | | |
| ProSiebenSat.1 Media AG | | 121,788 | | | 6,012,815 | | | |
| | | |
| SES SA | | 143,140 | | | 4,802,950 | | | |
| | | |
| Sky plc | | 343,773 | | | 5,607,462 | | | |
| | | | | | | | |
| | | | | 22,134,037 | | | |
| | | | | | | | |
| | | |
| Multiline Retail—2.9% | | | | | | | | |
| | | |
| Dollarama, Inc. | | 149,858 | | | 9,082,666 | | | |
| | | |
| Hudson’s Bay Co. | | 265,825 | | | 5,906,040 | | | |
| | | | | | | | |
| | | | | 14,988,706 | | | |
| | | | | | | | |
| | | |
| Specialty Retail—1.1% | | | | | | | | |
| | | |
| Inditex SA | | 164,867 | | | 5,376,452 | | | |
| | | | | | | | |
| | | |
| Textiles, Apparel & Luxury Goods—5.5% | | | |
| | | |
| Burberry Group plc | | 271,258 | | | 6,705,144 | | | |
| | | |
| Cie Financiere Richemont SA | | 60,723 | | | 4,949,781 | | | |
| | | |
| Hermes International | | 11,176 | | | 4,166,810 | | | |
| | | |
| Kering | | 11,690 | | | 2,085,233 | | | |
| | | |
| LVMH Moet Hennessy Louis Vuitton SE | | 26,660 | | | 4,666,995 | | | |
| | | |
| Prada SpA | | 361,200 | | | 1,735,865 | | | |
| | | |
| Swatch Group AG (The) | | 9,973 | | | 3,889,466 | | | |
| | | | | | | | |
| | | | | 28,199,294 | | | |
| | | | | | | | |
| | | |
| Consumer Staples—10.5% | | | | | | | | |
| | | |
| Beverages—2.6% | | | | | | | | |
| | | |
| Diageo plc | | 101,976 | | | 2,955,916 | | | |
| | | |
| Heineken NV | | 86,258 | | | 6,567,011 | | | |
| | | |
| Pernod Ricard SA | | 33,320 | | | 3,854,866 | | | |
| | | | | | | | |
| | | | | 13,377,793 | | | |
| | | | | | | | |
| | | |
| Food & Staples Retailing—1.8% | | | | | | | | |
| | | |
| CP ALL PCL | | 4,364,500 | | | 5,962,774 | | | |
| | | |
| Spar Group Ltd. (The) | | 217,097 | | | 3,381,361 | | | |
| | | | | | | | |
| | | | | 9,344,135 | | | |
| | | | | | | | |
| | | |
| Food Products—4.4% | | | | | | | | |
| | | |
| Aryzta AG1 | | 112,420 | | | 5,545,926 | | | |
| | | |
| Barry Callebaut AG1 | | 3,793 | | | 4,313,566 | | | |
| | | |
| Danone SA | | 56,506 | | | 3,650,528 | | | |
| | | |
| Saputo, Inc. | | 171,276 | | | 4,142,713 | | | |
| | | |
| Unilever plc | | 117,861 | | | 5,066,319 | | | |
| | | | | | | | |
| | | | | 22,719,052 | | | |
| | | | | | | | |
| | | | | | | | |
| | | | | | |
| | |
| | | Shares | | Value | |
| |
| Household Products—1.2% | | | | | | |
| |
| Reckitt Benckiser Group plc | | 67,321 | | $ | 5,813,010 | |
| | | | | | |
| |
| Tobacco—0.5% | | | | | | |
| |
| Swedish Match AB | | 95,412 | | | 2,710,411 | |
| | | | | | |
| |
| Energy—1.5% | | | | | | |
| |
| Energy Equipment & Services—0.5% | | | | | | |
| |
| Technip SA | | 39,240 | | | 2,430,520 | |
| | | | | | |
| |
| Oil, Gas & Consumable Fuels—1.0% | | | | | | |
| |
| Koninklijke Vopak NV | | 106,000 | | | 5,358,908 | |
| | | | | | |
| |
| Financials—4.7% | | | | | | |
| |
| Capital Markets—2.8% | | | | | | |
| |
| ICAP plc | | 902,737 | | | 7,504,178 | |
| |
| Tullett Prebon plc | | 313,374 | | | 1,809,256 | |
| |
| UBS Group AG1 | | 235,187 | | | 4,986,707 | |
| | | | | | |
| | | | | 14,300,141 | |
| | | | | | |
| |
| Commercial Banks—0.8% | | | | | | |
| |
| ICICI Bank Ltd., Sponsored ADR | | 398,805 | | | 4,155,548 | |
| | | | | | |
| |
| Insurance—1.1% | | | | | | |
| |
| Prudential plc | | 224,073 | | | 5,407,016 | |
| | | | | | |
| |
| Health Care—9.1% | | | | | | |
| |
| Biotechnology—1.9% | | | | | | |
| |
| CSL Ltd. | | 83,900 | | | 5,569,149 | |
| |
| Grifols SA | | 111,398 | | | 4,499,506 | |
| | | | | | |
| | | | | 10,068,655 | |
| | | | | | |
| |
| Health Care Equipment & Supplies—2.8% | | | | |
| |
| DiaSorin SpA | | 44,316 | | | 2,023,254 | |
| |
| Essilor International SA | | 34,370 | | | 4,095,759 | |
| |
| Sonova Holding AG | | 36,992 | | | 5,007,402 | |
| |
| William Demant Holding AS1 | | 41,017 | | | 3,125,266 | |
| | | | | | |
| | | | | 14,251,681 | |
| | | | | | |
| |
| Health Care Providers & Services—0.5% | | | | |
| |
| Sonic Healthcare Ltd. | | 146,958 | | | 2,421,707 | |
| | | | | | |
| |
| Pharmaceuticals—3.9% | | | | | | |
| |
| Galenica AG | | 4,172 | | | 4,356,240 | |
| |
| Novo Nordisk AS, Cl. B | | 150,350 | | | 8,245,889 | |
| |
| Roche Holding AG | | 26,482 | | | 7,434,914 | |
| | | | | | |
| | | | | 20,037,043 | |
| | | | | | |
| |
| Industrials—21.4% | | | | | | |
| |
| Aerospace & Defense—3.2% | | | | | | |
| |
| Airbus Group SE | | 111,280 | | | 7,209,636 | |
| |
| Embraer SA | | 369,226 | | | 2,809,780 | |
| |
| Rolls-Royce Holdings plc1 | | 474,537 | | | 6,495,262 | |
| | | | | | |
| | | | | 16,514,678 | |
| | | | | | |
| |
| Air Freight & Couriers—1.1% | | | | | | |
| |
| Royal Mail plc | | 701,321 | | | 5,666,417 | |
| | | | | | |
| |
| Commercial Services & Supplies—2.6% | | | | |
| |
| Aggreko plc | | 190,094 | | | 4,294,589 | |
| |
| Edenred | | 170,254 | | | 4,206,292 | |
| |
| Prosegur Cia de Seguridad SA | | 889,138 | | | 4,886,297 | |
| | | | | | |
| | | | | 13,387,178 | |
| | | | | | |
| |
| Construction & Engineering—1.5% | | | | | | |
| |
| Boskalis Westminster NV | | 85,857 | | | 4,214,784 | |
| |
| CIMIC Group Ltd. | | 157,780 | | | 2,631,660 | |
| |
| Trevi Finanziaria Industriale SpA | | 338,098 | | | 738,790 | |
| | | | | | |
| | | | | 7,585,234 | |
| | | | | | |
| |
| Electrical Equipment—3.7% | | | | | | |
| |
| ABB Ltd.1 | | 116,382 | | | 2,438,698 | |
| |
| Legrand SA | | 88,540 | | | 4,967,153 | |
| |
| Nidec Corp. | | 93,500 | | | 7,013,110 | |
6 OPPENHEIMER INTERNATIONAL GROWTH FUND/VA
| | | | | | | | |
| | | |
| | | Shares | | Value | | | |
| | | |
| Electrical Equipment (Continued) | | | |
| | | |
| Schneider Electric SE | | 66,340 | | $ | 4,575,518 | | | |
| | | | | | | | |
| | | | | 18,994,479 | | | |
| | | | | | | | |
| | | |
| Machinery—2.9% | | | |
| | | |
| Aalberts Industries NV | | 220,083 | | | 6,558,294 | | | |
| | | |
| Atlas Copco AB, Cl. A | | 214,069 | | | 5,982,213 | | | |
| | | |
| Weir Group plc (The) | | 95,143 | | | 2,534,420 | | | |
| | | | | | | | |
| | | | | 15,074,927 | | | |
| | | | | | | | |
| | | |
| Professional Services—2.8% | | | |
| | | |
| Experian plc | | 293,647 | | | 5,343,409 | | | |
| | | |
| Intertek Group plc | | 143,900 | | | 5,534,812 | | | |
| | | |
| SGS SA | | 1,809 | | | 3,304,464 | | | |
| | | | | | | | |
| | | | | 14,182,685 | | | |
| | | | | | | | |
| | | |
| Trading Companies & Distributors—3.6% | | | |
| | | |
| Brenntag AG | | 87,078 | | | 4,990,961 | | | |
| | | |
| Bunzl plc | | 252,215 | | | 6,895,297 | | | |
| | | |
| Wolseley plc | | 100,275 | | | 6,394,515 | | | |
| | | | | | | | |
| | | | | 18,280,773 | | | |
| | | | | | | | |
| | | |
| Information Technology—16.0% | | | |
| | | |
| Communications Equipment—1.8% | | | |
| | | |
| Nokia OYJ | | 642,681 | | | 4,354,475 | | | |
| | | |
| Telefonaktiebolaget LM Ericsson, Cl. B | | 490,867 | | | 5,081,225 | | | |
| | | | | | | | |
| | | | | 9,435,700 | | | |
| | | | | | | | |
| | | |
| Electronic Equipment, Instruments, & Components—3.0% | | | |
| | | |
| Hoya Corp. | | 149,493 | | | 5,986,343 | | | |
| | | |
| Keyence Corp. | | 10,406 | | | 5,610,543 | | | |
| | | |
| Spectris plc | | 107,978 | | | 3,577,036 | | | |
| | | | | | | | |
| | | | | 15,173,922 | | | |
| | | | | | | | |
| | | |
| Internet Software & Services—2.2% | | | |
| | | |
| Telecity Group plc | | 151,810 | | | 2,451,393 | | | |
| | | |
| United Internet AG | | 91,035 | | | 4,046,390 | | | |
| | | |
| Yahoo Japan Corp. | | 1,163,400 | | | 4,690,437 | | | |
| | | | | | | | |
| | | | | 11,188,220 | | | |
| | | |
| | | | | | | | |
| | | |
| IT Services—1.3% | | | |
| | | |
| Amadeus IT Holding SA, Cl. A | | 161,604 | | | 6,434,299 | | | |
| | | | | | | | |
| | | |
| Semiconductors & Semiconductor Equipment—2.3% | | | |
| | | |
| ARM Holdings plc | | 194,580 | | | 3,184,400 | | | |
| | | |
| ASML Holding NV | | 4,849 | | | 503,448 | | | |
| | | |
| Infineon Technologies AG | | 642,898 | | | 7,977,697 | | | |
| | | | | | | | |
| | | | | 11,665,545 | | | |
| | | | | | |
| | |
| | | Shares | | Value | |
| |
| Software—4.3% | |
| |
| AVEVA Group plc | | 77,764 | | $ | 2,206,919 | |
| |
| Dassault Systemes | | 75,146 | | | 5,462,713 | |
| |
| Gemalto NV | | 61,298 | | | 5,471,543 | |
| |
| SAP SE | | 72,977 | | | 5,085,045 | |
| |
| Temenos Group AG1 | | 123,511 | | | 4,079,902 | |
| | | | | | |
| | | | | 22,306,122 | |
| | | | | | |
| |
| Technology Hardware, Storage & Peripherals—1.1% | |
| |
| Lenovo Group Ltd. | | 4,148,000 | | | 5,701,607 | |
| | | | | | |
| |
| Materials—4.8% | | | | | | |
| |
| Chemicals—3.8% | | | | | | |
| |
| Essentra plc | | 489,795 | | | 7,630,875 | |
| |
| Sika AG | | 1,313 | | | 4,627,254 | |
| |
| Syngenta AG | | 18,154 | | | 7,439,127 | |
| | | | | | |
| | | | | 19,697,256 | |
| | | | | | |
| |
| Construction Materials—1.0% | |
| |
| James Hardie Industries plc | | 365,500 | | | 4,878,459 | |
| | | | | | |
| |
| Telecommunication Services—5.8% | |
| |
| Diversified Telecommunication Services—4.3% | |
| |
| BT Group plc, Cl. A | | 976,876 | | | 6,918,369 | |
| |
| Iliad SA | | 16,150 | | | 3,572,720 | |
| |
| Inmarsat plc | | 276,200 | | | 3,968,292 | |
| |
| Nippon Telegraph & Telephone Corp. | | 217,200 | | | 7,860,857 | |
| | | | | | |
| | | | | 22,320,238 | |
| | | | | | |
| |
| Wireless Telecommunication Services—1.5% | |
| |
| Vodafone Group plc | | 2,080,170 | | | 7,585,422 | |
| | | | | | |
| Total Common Stocks (Cost $344,143,621) | | | | | 505,210,088 | |
| | | | | | |
| |
| Preferred Stock—0.0% | |
| |
| Zee Entertainment Enterprises Ltd., 6% Cum. Non-Cv. (Cost $12,272) | | 5,995,416 | | | 80,027 | |
| | |
| | | Units | | | |
| |
| Rights, Warrants and Certificates—0.0% | |
| |
| MEI Pharma, Inc. Wts., Strike Price $1.19, Exp. 5/10/171 (Cost $35,548) | | 151,358 | | | 6,508 | |
| | | | | | |
| |
| Total Investments, at Value (Cost $344,191,441) | | 98.5% | | | 505,296,623 | |
| |
| |
| Net Other Assets (Liabilities) | | 1.5 | | | 7,949,478 | |
| | | |
| Net Assets | | 100.0% | | $ | 513,246,101 | |
| | | |
Footnotes to Statement of Investments
1. Non-income producing security.
The following issuer is or was an affiliate, as defined in the Investment Company Act of 1940, as amended, at or during the period ended June 30, 2015, by virtue of the Fund owning at least 5% of the voting securities of the issuer or as a result of the Fund and the issuer having the same investment adviser. There were no affiliate securities held by the Fund as of June 30, 2015. Transactions during the period in which the issuer was an affiliate are as follows:
| | | | | | | | | | | | | | |
| | | Shares
December 31, 2014 | | | Gross
Additions | | | Gross
Reductions | | Shares June 30, 2015 | |
| |
| Oppenheimer Institutional Money Market Fund, Cl. E | | | 13,876,000 | | | | 70,295,403 | | | 84,171,403 | | | — | |
| | | | |
| | | | | | | | | | | Income | |
| |
| Oppenheimer Institutional Money Market Fund, Cl. E | | $ | 6,954 | |
Distribution of investments representing geographic holdings, as a percentage of total investments at value, is as follows:
| | | | | | | | |
| Geographic Holdings | | Value | | | Percent | |
| |
United Kingdom | | $ | 137,787,201 | | | | 27.3% | |
France | | | 66,193,766 | | | | 13.1 | |
Switzerland | | | 62,373,447 | | | | 12.3 | |
Germany | | | 41,423,095 | | | | 8.2 | |
Netherlands | | | 35,883,623 | | | | 7.1 | |
Japan | | | 31,161,290 | | | | 6.1 | |
Spain | | | 21,196,554 | | | | 4.2 | |
Canada | | | 19,131,419 | | | | 3.8 | |
7 OPPENHEIMER INTERNATIONAL GROWTH FUND/VA
STATEMENT OF INVESTMENTS Unaudited / Continued
| | | | | | | | |
| Geographic Holdings (Continued) | | Value | | | Percent | |
| |
Sweden | | $ | 13,773,849 | | | | 2.7% | |
Denmark | | | 11,371,155 | | | | 2.3 | |
Australia | | | 10,622,515 | | | | 2.1 | |
India | | | 8,118,567 | | | | 1.6 | |
Italy | | | 6,004,874 | | | | 1.2 | |
United States | | | 7,456,002 | | | | 1.5 | |
Thailand | | | 5,962,774 | | | | 1.1 | |
Mexico | | | 5,710,810 | | | | 1.1 | |
China | | | 5,701,607 | | | | 1.1 | |
Ireland | | | 4,878,459 | | | | 1.0 | |
Finland | | | 4,354,475 | | | | 0.9 | |
South Africa | | | 3,381,361 | | | | 0.7 | |
Brazil | | | 2,809,780 | | | | 0.6 | |
| | | | |
Total | | $ | 505,296,623 | | | | 100.0% | |
| | | | |
See accompanying Notes to Financial Statements.
8 OPPENHEIMER INTERNATIONAL GROWTH FUND/VA
STATEMENT OF ASSETS AND LIABILITIES June 30, 2015 Unaudited
| | | | |
| |
Assets | | | | |
| Investments, at value (cost $344,191,441)—see accompanying statement of investments | | $ | 505,296,623 | |
| |
| Cash—foreign currencies (cost $1,271,717) | | | 1,271,424 | |
| |
| Receivables and other assets: | | | | |
| Investments sold | | | 7,734,038 | |
| Dividends | | | 1,689,590 | |
| Shares of beneficial interest sold | | | 315,601 | |
| Other | | | 31,483 | |
| | | | |
| Total assets | | | 516,338,759 | |
| |
Liabilities | | | | |
| Bank overdraft | | | 1,487,025 | |
| |
| Payables and other liabilities: | | | | |
| Shares of beneficial interest redeemed | | | 714,166 | |
| Investments purchased | | | 627,861 | |
| Foreign capital gains tax | | | 153,364 | |
| Distribution and service plan fees | | | 35,574 | |
| Trustees’ compensation | | | 21,069 | |
| Shareholder communications | | | 8,367 | |
| Other | | | 45,232 | |
| | | | |
| Total liabilities | | | 3,092,658 | |
| |
| Net Assets | | $ | 513,246,101 | |
| | | | |
| |
| | | | |
| |
Composition of Net Assets | | | | |
| Par value of shares of beneficial interest | | $ | 222,839 | |
| |
| Additional paid-in capital | | | 348,830,587 | |
| |
| Accumulated net investment income | | | 4,089,827 | |
| |
| Accumulated net realized loss on investments and foreign currency transactions | | | (818,966) | |
| |
| Net unrealized appreciation on investments and translation of assets and liabilities denominated in foreign currencies | | | 160,921,814 | |
| | | | |
| Net Assets | | $ | 513,246,101 | |
| | | | |
| | | | |
| |
Net Asset Value Per Share | | | | |
| Non-Service Shares: | | | | |
| Net asset value, redemption price per share and offering price per share (based on net assets of $342,500,429 and 150,703,596 shares of beneficial interest outstanding) | | | $2.27 | |
| |
Service Shares: | | | | |
| Net asset value, redemption price per share and offering price per share (based on net assets of $170,745,672 and 72,135,317 shares of beneficial interest outstanding) | | | $2.37 | |
See accompanying Notes to Financial Statements.
9 OPPENHEIMER INTERNATIONAL GROWTH FUND/VA
STATEMENT OF OPERATIONS For the Six Months Ended June 30, 2015 Unaudited
| | | | |
| |
Investment Income | | | | |
| Dividends: | | | | |
| Unaffiliated companies (net of foreign withholding taxes of $685,041) | | $ | 7,231,286 | |
| Affiliated companies | | | 6,954 | |
| |
| Portfolio lending fees | | | 808 | |
| | | | |
Total investment income | | | 7,239,048 | |
| |
Expenses | | | | |
| Management fees | | | 2,442,188 | |
| |
| Distribution and service plan fees—Service shares | | | 199,711 | |
| |
| Transfer and shareholder servicing agent fees: | | | | |
| Non-Service shares | | | 178,329 | |
| Service shares | | | 79,890 | |
| |
| Shareholder communications: | | | | |
| Non-Service shares | | | 6,252 | |
| Service shares | | | 2,768 | |
| |
| Custodian fees and expenses | | | 32,748 | |
| |
| Trustees’ compensation | | | 9,724 | |
| |
| Other | | | 29,492 | |
| | | | |
| Total expenses | | | 2,981,102 | |
| Less reduction to custodian expenses | | | (103) | |
| Less waivers and reimbursements of expenses | | | (198,474) | |
| | | | |
| Net expenses | | | 2,782,525 | |
|
| |
| Net Investment Income | | | 4,456,523 | |
|
| |
Realized and Unrealized Gain (Loss) | | | | |
| Net realized gain (loss) on: | | | | |
| Investments from unaffiliated companies (net of foreign capital gains tax of $4,573) | | | 6,010,793 | |
| Foreign currency transactions | | | (76,496) | |
| | | | |
| Net realized gain | | | 5,934,297 | |
| |
| Net change in unrealized appreciation/depreciation on: | | | | |
| Investments (net of foreign capital gains tax of $68,920) | | | 23,984,027 | |
| Translation of assets and liabilities denominated in foreign currencies | | | (2,167,859) | |
| | | | |
| Net change in unrealized appreciation/depreciation | | | 21,816,168 | |
|
| |
| Net Increase in Net Assets Resulting from Operations | | $ | 32,206,988 | |
| | | | |
See accompanying Notes to Financial Statements.
10 OPPENHEIMER INTERNATIONAL GROWTH FUND/VA
STATEMENTS OF CHANGES IN NET ASSETS
| | | | | | | | |
| | | Six Months Ended
June 30, 2015
(Unaudited) | | | Year Ended
December 31, 2014 | |
| |
Operations | | | | | | | | |
| Net investment income | | $ | 4,456,523 | | | $ | 5,611,200 | |
| |
| Net realized gain | | | 5,934,297 | | | | 40,631,908 | |
| |
| Net change in unrealized appreciation/depreciation | | | 21,816,168 | | | | (85,421,482) | |
| | | | | | | | |
Net increase (decrease) in net assets resulting from operations | | | 32,206,988 | | | | (39,178,374) | |
| |
Dividends and/or Distributions to Shareholders | | | | | | | | |
| Dividends from net investment income: | | | | | | | | |
| Non-Service shares | | | (4,005,137) | | | | (4,718,842) | |
| Service shares | | | (1,505,303) | | | | (1,168,525) | |
| | | | |
| | | (5,510,440) | | | | (5,887,367) | |
| |
| Distributions from net realized gain: | | | | | | | | |
| Non-Service shares | | | (24,445,588) | | | | (8,305,904) | |
| Service shares | | | (11,368,323) | | | | (2,491,854) | |
| | | | |
| | | (35,813,911) | | | | (10,797,758) | |
| |
Beneficial Interest Transactions | | | | | | | | |
| Net increase (decrease) in net assets resulting from beneficial interest transactions: | | | | | | | | |
| Non-Service shares | | | (10,431,676) | | | | (57,258,810) | |
| Service shares | | | 28,523,918 | | | | 41,295,796 | |
| | | | | | | | |
| | | 18,092,242 | | | | (15,963,014) | |
| |
Net Assets | | | | | | | | |
| Total increase (decrease) | | | 8,974,879 | | | | (71,826,513) | |
| |
| Beginning of period | | | 504,271,222 | | | | 576,097,735 | |
| | | | | | | | |
End of period (including accumulated net investment income of $4,089,827 and $5,143,744, respectively) | | $ | 513,246,101 | | | $ | 504,271,222 | |
| | | | |
See accompanying Notes to Financial Statements.
11 OPPENHEIMER INTERNATIONAL GROWTH FUND/VA
FINANCIAL HIGHLIGHTS
| | | | | | | | | | | | | | | | | | | | | | | | |
| Non-Service Shares | | Six Months
Ended
June 30, 2015
(Unaudited) | | | Year Ended
December 31,
2014 | | | Year Ended
December 31,
2013 | | | Year Ended
December 31,
2012 | | | Year Ended
December 30,
20111 | | | Year Ended
December 31,
2010 | |
| |
Per Share Operating Data | | | | | | | | | | | | | | | | | | | | | | | | |
| Net asset value, beginning of period | | $ | 2.31 | | | $ | 2.57 | | | $ | 2.07 | | | $ | 1.72 | | | $ | 1.87 | | | $ | 1.65 | |
| |
| Income (loss) from investment operations: | | | | | | | | | | | | | | | | | | | | | | | | |
| Net investment income2 | | | 0.02 | | | | 0.03 | | | | 0.03 | | | | 0.03 | | | | 0.02 | | | | 0.02 | |
| Net realized and unrealized gain (loss) | | | 0.14 | | | | (0.21) | | | | 0.50 | | | | 0.35 | | | | (0.15) | | | | 0.22 | |
| | | | |
| Total from investment operations | | | 0.16 | | | | (0.18) | | | | 0.53 | | | | 0.38 | | | | (0.13) | | | | 0.24 | |
| |
| Dividends and/or distributions to shareholders: | | | | | | | | | | | | | | | | | | | | | | | | |
| Dividends from net investment income | | | (0.03) | | | | (0.03) | | | | (0.03) | | | | (0.03) | | | | (0.02) | | | | (0.02) | |
| Distributions from net realized gain | | | (0.17) | | | | (0.05) | | | | 0.00 | | | | 0.00 | | | | 0.00 | | | | 0.00 | |
| | | | |
| Total dividends and/or distributions to shareholders | | | (0.20) | | | | (0.08) | | | | (0.03) | | | | (0.03) | | | | (0.02) | | | | (0.02) | |
| |
| Net asset value, end of period | | $ | 2.27 | | | $ | 2.31 | | | $ | 2.57 | | | $ | 2.07 | | | $ | 1.72 | | | $ | 1.87 | |
| | | | |
| | | | | | | | | |
| |
Total Return, at Net Asset Value3 | | | 6.72% | | | | (7.22)% | | | | 25.87% | | | | 22.22% | | | | (7.16)% | | | | 14.76% | |
| |
| |
Ratios/Supplemental Data | | | | | | | | | | | | | | | | | | | | | | | | |
| Net assets, end of period (in thousands) | | $ | 342,500 | | | $ | 358,756 | | | $ | 458,038 | | | $ | 348,449 | | | $ | 364,221 | | | $ | 417,141 | |
| |
| Average net assets (in thousands) | | $ | 359,490 | | | $ | 400,556 | | | $ | 404,859 | | | $ | 332,018 | | | $ | 406,974 | | | $ | 376,612 | |
| |
| Ratios to average net assets:4 | | | | | | | | | | | | | | | | | | | | | | | | |
| Net investment income | | | 1.80% | | | | 1.13% | | | | 1.24% | | | | 1.68% | | | | 1.21% | | | | 1.04% | |
| Total expenses5 | | | 1.08% | | | | 1.07% | | | | 1.09% | | | | 1.13% | | | | 1.09% | | | | 1.10% | |
| Expenses after payments, waivers and/or reimbursements and reduction to custodian expenses | | | 1.00% | | | | 1.00% | | | | 1.00% | | | | 1.00% | | | | 1.00% | | | | 1.00% | |
| |
| Portfolio turnover rate | | | 13 % | | | | 41 % | | | | 32 % | | | | 22 % | | | | 25 % | | | | 19 % | |
1. December 30, 2011 represents the last business day of the Fund’s reporting period.
2. Per share amounts calculated based on the average shares outstanding during the period.
3. Assumes an initial investment on the business day before the first day of the fiscal period, with all dividends and distributions reinvested in additional shares on the reinvestment date, and redemption at the net asset value calculated on the last business day of the fiscal period. Total returns are not annualized for periods less than one full year. Total return information does not reflect expenses that apply at the separate account level or to related insurance products. Inclusion of these charges would reduce the total return figures for all periods shown. Returns do not reflect the deduction of taxes that a shareholder would pay on fund distributions or the redemption of fund shares. The returns do not include adjustments in accordance with generally accepted accounting principles required at the period end for financial reporting purposes.
4. Annualized for periods less than one full year.
5. Total expenses including indirect expenses from affiliated fund fees and expenses were as follows:
| | | | | | |
| | | | | | |
| | Six Months Ended June 30, 2015 | | | 1.08 | % |
| | Year Ended December 31, 2014 | | | 1.07 | % |
| | Year Ended December 31, 2013 | | | 1.09 | % |
| | Year Ended December 31, 2012 | | | 1.13 | % |
| | Year Ended December 30, 2011 | | | 1.09 | % |
| | Year Ended December 31, 2010 | | | 1.10 | % |
See accompanying Notes to Financial Statements.
12 OPPENHEIMER INTERNATIONAL GROWTH FUND/VA
| | | | | | | | | | | | | | | | | | | | | | | | |
| Service Shares | | Six Months
Ended
June 30, 2015
(Unaudited) | | | Year Ended
December 31,
2014 | | | Year Ended
December 31,
2013 | | | Year Ended
December 31,
2012 | | | Year Ended
December 30,
20111 | | | Year Ended
December 31,
2010 | |
| |
Per Share Operating Data | | | | | | | | | | | | | | | | | | | | | | | | |
| Net asset value, beginning of period | | $ | 2.40 | | | $ | 2.66 | | | $ | 2.14 | | | $ | 1.78 | | | $ | 1.94 | | | $ | 1.71 | |
| |
| Income (loss) from investment operations: | | | | | | | | | | | | | | | | | | | | | | | | |
| Net investment income2 | | | 0.02 | | | | 0.02 | | | | 0.02 | | | | 0.03 | | | | 0.02 | | | | 0.01 | |
| Net realized and unrealized gain (loss) | | | 0.14 | | | | (0.21) | | | | 0.53 | | | | 0.35 | | | | (0.17) | | | | 0.24 | |
| | | | |
| Total from investment operations | | | 0.16 | | | | (0.19) | | | | 0.55 | | | | 0.38 | | | | (0.15) | | | | 0.25 | |
| |
| Dividends and/or distributions to shareholders: | | | | | | | | | | | | | | | | | | | | | | | | |
| Dividends from net investment income | | | (0.02) | | | | (0.02) | | | | (0.03) | | | | (0.02) | | | | (0.01) | | | | (0.02) | |
| Distributions from net realized gain | | | (0.17) | | | | (0.05) | | | | 0.00 | | | | 0.00 | | | | 0.00 | | | | 0.00 | |
| | | | |
| Total dividends and/or distributions to shareholders | | | (0.19) | | | | (0.07) | | | | (0.03) | | | | (0.02) | | | | (0.01) | | | | (0.02) | |
| |
| Net asset value, end of period | | $ | 2.37 | | | $ | 2.40 | | | $ | 2.66 | | | $ | 2.14 | | | $ | 1.78 | | | $ | 1.94 | |
| | | | |
| | | | | | | | | |
| |
Total Return, at Net Asset Value3 | | | 6.71% | | | | (7.15)% | | | | 25.71% | | | | 21.68% | | | | (7.61)% | | | | 14.62% | |
| | | | | | | | | |
| |
Ratios/Supplemental Data | | | | | | | | | | | | | | | | | | | | | | | | |
| Net assets, end of period (in thousands) | | $ | 170,746 | | | $ | 145,515 | | | $ | 118,060 | | | $ | 68,997 | | | $ | 57,276 | | | $ | 61,630 | |
| |
| Average net assets (in thousands) | | $ | 161,047 | | | $ | 128,694 | | | $ | 88,647 | | | $ | 63,118 | | | $ | 62,359 | | | $ | 50,420 | |
| |
| Ratios to average net assets:4 | | | | | | | | | | | | | | | | | | | | | | | | |
| Net investment income | | | 1.57% | | | | 0.85% | | | | 0.89% | | | | 1.43% | | | | 0.96% | | | | 0.78% | |
| Total expenses5 | | | 1.33% | | | | 1.32% | | | | 1.34% | | | | 1.38% | | | | 1.34% | | | | 1.35% | |
| Expenses after payments, waivers and/or reimbursements and reduction to custodian expenses | | | 1.25% | | | | 1.25% | | | | 1.25% | | | | 1.25% | | | | 1.25% | | | | 1.25% | |
| |
| Portfolio turnover rate | | | 13 % | | | | 41 % | | | | 32 % | | | | 22 % | | | | 25 % | | | | 19 % | |
1. December 30, 2011 represents the last business day of the Fund’s reporting period.
2. Per share amounts calculated based on the average shares outstanding during the period.
3. Assumes an initial investment on the business day before the first day of the fiscal period, with all dividends and distributions reinvested in additional shares on the reinvestment date, and redemption at the net asset value calculated on the last business day of the fiscal period. Total returns are not annualized for periods less than one full year. Total return information does not reflect expenses that apply at the separate account level or to related insurance products. Inclusion of these charges would reduce the total return figures for all periods shown. Returns do not reflect the deduction of taxes that a shareholder would pay on fund distributions or the redemption of fund shares. The returns do not include adjustments in accordance with generally accepted accounting principles required at the period end for financial reporting purposes.
4. Annualized for periods less than one full year.
5. Total expenses including indirect expenses from affiliated fund fees and expenses were as follows:
| | | | | | |
| | | | | | |
| | Six Months Ended June 30, 2015 | | | 1.33% | |
| | Year Ended December 31, 2014 | | | 1.32% | |
| | Year Ended December 31, 2013 | | | 1.34% | |
| | Year Ended December 31, 2012 | | | 1.38% | |
| | Year Ended December 30, 2011 | | | 1.34% | |
| | Year Ended December 31, 2010 | | | 1.35% | |
See accompanying Notes to Financial Statements.
13 OPPENHEIMER INTERNATIONAL GROWTH FUND/VA
NOTES TO FINANCIAL STATEMENTS June 30, 2015 Unaudited
1. Organization
Oppenheimer International Growth Fund/VA (the “Fund”) is a separate series of Oppenheimer Variable Account Funds, which is registered under the Investment Company Act of 1940 (“1940 Act”), as amended, as a diversified open-end management investment company. The Fund’s investment objective is to seek capital appreciation. The Fund’s investment adviser is OFI Global Asset Management, Inc. (“OFI Global” or the “Manager”), a wholly-owned subsidiary of OppenheimerFunds, Inc., (“OFI” or the “Sub-Adviser”). The Manager has entered into a sub-advisory agreement with OFI. Shares of the Fund are sold only to separate accounts of life insurance companies.
The Fund offers two classes of shares. Both classes are sold at their offering price, which is the net asset value per share, to separate investment accounts of participating insurance companies as an underlying investment for variable life insurance policies, variable annuity contracts or other investment products. The class of shares designated as Service shares is subject to a distribution and service plan. Both classes of shares have identical rights and voting privileges with respect to the Fund in general and exclusive voting rights on matters that affect that class alone. Earnings, net assets and net asset value per share may differ due to each class having its own expenses, such as transfer and shareholder servicing agent fees and shareholder communications, directly attributable to that class.
The following is a summary of significant accounting policies followed in the Fund’s preparation of financial statements in accordance with accounting principles generally accepted in the United States (“U.S. GAAP”).
2. Significant Accounting Policies
Security Valuation. All investments in securities are recorded at their estimated fair value, as described in Note 3.
Reporting Period End Date. The last day of the Fund’s reporting period is the last day the New York Stock Exchange was open for trading during the period. The Fund’s financial statements have been presented through that date to maintain consistency with the Fund’s net asset value calculations used for shareholder transactions.
Foreign Currency Translation. The Fund’s accounting records are maintained in U.S. dollars. The values of securities denominated in foreign currencies and amounts related to the purchase and sale of foreign securities and foreign investment income are translated into U.S. dollars as of the close of the New York Stock Exchange (the “Exchange”), normally 4:00 P.M. Eastern time, on each day the Exchange is open for trading. Foreign exchange rates may be valued primarily using a reliable bank, dealer or service authorized by the Board of Trustees.
Reported net realized gains and losses from foreign currency transactions arise from sales of portfolio securities, sales and maturities of short-term securities, sales of foreign currencies, exchange rate fluctuations between the trade and settlement dates on securities transactions, and the difference between the amounts of dividends, interest, and foreign withholding taxes recorded on the Fund’s books and the U.S. dollar equivalent of the amounts actually received or paid. Net unrealized appreciation and depreciation on the translation of assets and liabilities denominated in foreign currencies arise from changes in the values of assets and liabilities, including investments in securities at fiscal period end, resulting from changes in exchange rates.
The effect of changes in foreign currency exchange rates on investments is separately identified from the fluctuations arising from changes in market values of securities held and reported with all other foreign currency gains and losses in the Fund’s Statement of Operations.
Allocation of Income, Expenses, Gains and Losses. Income, expenses (other than those attributable to a specific class), gains and losses are allocated on a daily basis to each class of shares based upon the relative proportion of net assets represented by such class. Operating expenses directly attributable to a specific class are charged against the operations of that class.
Dividends and Distributions to Shareholders. Dividends and distributions to shareholders, which are determined in accordance with income tax regulations and may differ from U.S. generally accepted accounting principles, are recorded on the ex-dividend date. Income and capital gain distributions, if any, are declared and paid annually or at other times as deemed necessary by the Manager.
The tax character of distributions is determined as of the Fund’s fiscal year end. Therefore, a portion of the Fund’s distributions made to shareholders prior to the Fund’s fiscal year end may ultimately be categorized as a tax return of capital.
Investment Income. Dividend income is recorded on the ex-dividend date or upon ex-dividend notification in the case of certain foreign dividends where the ex-dividend date may have passed. Non-cash dividends included in dividend income, if any, are recorded at the fair market value of the securities received. Interest income is recognized on an accrual basis. Discount and premium, which are included in interest income on the Statement of Operations, are amortized or accreted daily.
Custodian Fees. “Custodian fees and expenses” in the Statement of Operations may include interest expense incurred by the Fund on any cash overdrafts of its custodian account during the period. Such cash overdrafts may result from the effects of failed trades in portfolio securities and from cash outflows resulting from unanticipated shareholder redemption activity. The Fund pays interest to its custodian on such cash overdrafts, to the extent they are not offset by positive cash balances maintained by the Fund, at a rate equal to the Federal Funds Rate plus 0.50%. The “Reduction to custodian expenses” line item, if applicable, represents earnings on cash balances maintained by the Fund during the period. Such interest expense and other custodian fees may be paid with these earnings.
Security Transactions. Security transactions are recorded on the trade date. Realized gains and losses on securities sold are determined on the basis of identified cost.
14 OPPENHEIMER INTERNATIONAL GROWTH FUND/VA
2. Significant Accounting Policies (Continued)
Indemnifications. The Fund’s organizational documents provide current and former Trustees and officers with a limited indemnification against liabilities arising in connection with the performance of their duties to the Fund. In the normal course of business, the Fund may also enter into contracts that provide general indemnifications. The Fund’s maximum exposure under these arrangements is unknown as this would be dependent on future claims that may be made against the Fund. The risk of material loss from such claims is considered remote.
Federal Taxes. The Fund intends to comply with provisions of the Internal Revenue Code applicable to regulated investment companies and to distribute substantially all of its investment company taxable income to shareholders. Therefore, no federal income or excise tax provision is required. The Fund files income tax returns in U.S. federal and applicable state jurisdictions. The statute of limitations on the Fund’s tax return filings generally remains open for the three preceding fiscal reporting period ends.
During the fiscal year ended December 31, 2014, the Fund did not utilize any capital loss carryforward to offset capital gains realized in that fiscal year. Capital loss carryforwards with no expiration, if any, must be utilized prior to those with expiration dates. Capital losses with no expiration will be carried forward to future years if not offset by gains.
Net investment income (loss) and net realized gain (loss) may differ for financial statement and tax purposes. The character of dividends and distributions made during the fiscal year from net investment income or net realized gains are determined in accordance with federal income tax requirements, which may differ from the character of net investment income or net realized gains presented in those financial statements in accordance with GAAP. Also, due to timing of dividends and distributions, the fiscal year in which amounts are distributed may differ from the fiscal year in which the income or net realized gain was recorded by the Fund.
The aggregate cost of securities and other investments and the composition of unrealized appreciation and depreciation of securities and other investments for federal income tax purposes as of June 30, 2015 are noted in the following table. The primary difference between book and tax appreciation or depreciation of securities and other investments, if applicable, is attributable to the tax deferral of losses or tax realization of financial statement unrealized gain or loss.
| | | | |
Federal tax cost of securities | | $ | 350,698,163 | |
| | | | |
Gross unrealized appreciation | | $ | 187,362,161 | |
Gross unrealized depreciation | | | (32,763,701) | |
| | | | |
Net unrealized appreciation | | $ | 154,598,460 | |
| | | | |
Certain foreign countries impose a tax on capital gains which is accrued by the Fund based on unrealized appreciation, if any, on affected securities. The tax is paid when the gain is realized.
Use of Estimates. The preparation of financial statements in conformity with accounting principles generally accepted in the United States of America requires management to make estimates and assumptions that affect the reported amounts of assets and liabilities and disclosure of contingent assets and liabilities at the date of the financial statements and the reported amounts of increases and decreases in net assets from operations during the reporting period. Actual results could differ from those estimates.
3. Securities Valuation
The Fund calculates the net asset value of its shares as of the close of the New York Stock Exchange (the “Exchange”), normally 4:00 P.M. Eastern time, on each day the Exchange is open for trading.
The Fund’s Board has adopted procedures for the valuation of the Fund’s securities and has delegated the day-to-day responsibility for valuation determinations under those procedures to the Manager. The Manager has established a Valuation Committee which is responsible for determining a “fair valuation” for any security for which market quotations are not “readily available.” The Valuation Committee’s fair valuation determinations are subject to review, approval and ratification by the Fund’s Board at its next regularly scheduled meeting covering the calendar quarter in which the fair valuation was determined.
Valuation Methods and Inputs
Securities are valued using unadjusted quoted market prices, when available, as supplied primarily by third party pricing services or dealers.
The following methodologies are used to determine the market value or the fair value of the types of securities described below:
Securities traded on a registered U.S. securities exchange (including exchange-traded derivatives other than futures and futures options) are valued based on the last sale price of the security reported on the principal exchange on which it is traded, prior to the time when the Fund’s assets are valued. In the absence of a sale, the security is valued at the last sale price on the prior trading day, if it is within the spread of the current day’s closing “bid” and “asked” prices, and if not, at the current day’s closing bid price. A security of a foreign issuer traded on a foreign exchange, but not listed on a registered U.S. securities exchange, is valued based on the last sale price on the principal exchange on which the security is traded, as identified by the third party pricing service used by the Manager, prior to the time when the Fund’s assets are valued. If the last sale price is unavailable, the security is valued at the most recent official closing price on the principal exchange on which it is traded. If the last sales price or official closing price for a foreign security is not available, the security is valued at the mean between the bid and asked price per the exchange or, if not available from the exchange, obtained from two dealers. If bid and asked prices are not available from either the exchange or two dealers, the security is valued by using one of the following methodologies (listed in order of priority): (1) using a bid from the exchange, (2) the mean between the bid and asked price as provided by a single dealer, or (3) a bid from a single dealer.
15 OPPENHEIMER INTERNATIONAL GROWTH FUND/VA
NOTES TO FINANCIAL STATEMENTS Unaudited / Continued
3. Securities Valuation (Continued)
Shares of a registered investment company that are not traded on an exchange are valued at that investment company’s net asset value per share.
Corporate and government debt securities (of U.S. or foreign issuers) and municipal debt securities, event-linked bonds, loans, mortgage-backed securities, collateralized mortgage obligations, and asset-backed securities are valued at the mean between the “bid” and “asked” prices utilizing evaluated prices obtained from third party pricing services or broker-dealers who may use matrix pricing methods to determine the evaluated prices.
Short-term money market type debt securities with a remaining maturity of sixty days or less are valued at cost adjusted by the amortization of discount or premium to maturity (amortized cost), which approximates market value. Short-term debt securities with a remaining maturity in excess of sixty days are valued at the mean between the “bid” and “asked” prices utilizing evaluated prices obtained from third party pricing services or broker-dealers.
A description of the standard inputs that may generally be considered by the third party pricing vendors in determining their evaluated prices is provided below.
| | | | |
| Security Type | | Standard inputs generally considered by third-party pricing vendors | | |
|
| Corporate debt, government debt, municipal, mortgage-backed and asset-backed securities | | Reported trade data, broker-dealer price quotations, benchmark yields, issuer spreads on comparable securities, the credit quality, yield, maturity, and other appropriate factors. | | |
|
| Loans | | Information obtained from market participants regarding reported trade data and broker-dealer price quotations. | | |
|
| Event-linked bonds | | Information obtained from market participants regarding reported trade data and broker-dealer price quotations. | | |
If a market value or price cannot be determined for a security using the methodologies described above, or if, in the “good faith” opinion of the Manager, the market value or price obtained does not constitute a “readily available market quotation,” or a significant event has occurred that would materially affect the value of the security, the security is fair valued either (i) by a standardized fair valuation methodology applicable to the security type or the significant event as previously approved by the Valuation Committee and the Fund’s Board or (ii) as determined in good faith by the Manager’s Valuation Committee. The Valuation Committee considers all relevant facts that are reasonably available, through either public information or information available to the Manager, when determining the fair value of a security. Fair value determinations by the Manager are subject to review, approval and ratification by the Fund’s Board at its next regularly scheduled meeting covering the calendar quarter in which the fair valuation was determined. Those fair valuation standardized methodologies include, but are not limited to, valuing securities at the last sale price or initially at cost and subsequently adjusting the value based on: changes in company specific fundamentals, changes in an appropriate securities index, or changes in the value of similar securities which may be further adjusted for any discounts related to security-specific resale restrictions. When possible, such methodologies use observable market inputs such as unadjusted quoted prices of similar securities, observable interest rates, currency rates and yield curves. The methodologies used for valuing securities are not necessarily an indication of the risks associated with investing in those securities nor can it be assured that the Fund can obtain the fair value assigned to a security if it were to sell the security.
To assess the continuing appropriateness of security valuations, the Manager, or its third party service provider who is subject to oversight by the Manager, regularly compares prior day prices, prices on comparable securities, and sale prices to the current day prices and challenges those prices exceeding certain tolerance levels with the third party pricing service or broker source. For those securities valued by fair valuations, whether through a standardized fair valuation methodology or a fair valuation determination, the Valuation Committee reviews and affirms the reasonableness of the valuations based on such methodologies and fair valuation determinations on a regular basis after considering all relevant information that is reasonably available.
Classifications
Each investment asset or liability of the Fund is assigned a level at measurement date based on the significance and source of the inputs to its valuation. Various data inputs are used in determining the value of each of the Fund’s investments as of the reporting period end. These data inputs are categorized in the following hierarchy under applicable financial accounting standards:
1) Level 1-unadjusted quoted prices in active markets for identical assets or liabilities (including securities actively traded on a securities exchange)
2) Level 2-inputs other than unadjusted quoted prices that are observable for the asset or liability (such as unadjusted quoted prices for similar assets and market corroborated inputs such as interest rates, prepayment speeds, credit risks, etc.)
3) Level 3-significant unobservable inputs (including the Manager’s own judgments about assumptions that market participants would use in pricing the asset or liability).
The inputs used for valuing securities are not necessarily an indication of the risks associated with investing in those securities.
The table below categorizes amounts that are included in the Fund’s Statement of Assets and Liabilities as of June 30, 2015 based on valuation input level:
16 OPPENHEIMER INTERNATIONAL GROWTH FUND/VA
3. Securities Valuation (Continued)
| | | | | | | | | | | | | | | | |
| | | Level 1— Unadjusted Quoted Prices | | | Level 2— Other Significant
Observable Inputs | | | Level 3— Significant Unobservable Inputs | | | Value | |
| |
| Assets Table | | | | | | | | | | | | | | | | |
| Investments, at Value: | | | | | | | | | | | | | | | | |
| Common Stocks | | | | | | | | | | | | | | | | |
Consumer Discretionary | | $ | 28,149,009 | | | $ | 98,592,298 | | | $ | — | | | $ | 126,741,307 | |
Consumer Staples | | | 4,142,713 | | | | 49,821,688 | | | | — | | | | 53,964,401 | |
Energy | | | — | | | | 7,789,428 | | | | — | | | | 7,789,428 | |
Financials | | | 4,155,548 | | | | 19,707,157 | | | | — | | | | 23,862,705 | |
Health Care | | | — | | | | 46,779,086 | | | | — | | | | 46,779,086 | |
Industrials | | | — | | | | 109,686,371 | | | | — | | | | 109,686,371 | |
Information Technology | | | — | | | | 81,905,415 | | | | — | | | | 81,905,415 | |
Materials | | | — | | | | 24,575,715 | | | | — | | | | 24,575,715 | |
Telecommunication Services | | | — | | | | 29,905,660 | | | | — | | | | 29,905,660 | |
| Preferred Stock | | | 80,027 | | | | — | | | | — | | | | 80,027 | |
| Rights, Warrants and Certificates | | | — | | | | 6,508 | | | | — | | | | 6,508 | |
| | | | |
| Total Assets | | $ | 36,527,297 | | | $ | 468,769,326 | | | $ | — | | | $ | 505,296,623 | |
| | | | |
Forward currency exchange contracts and futures contracts, if any, are reported at their unrealized appreciation/depreciation at measurement date, which represents the change in the contract’s value from trade date. All additional assets and liabilities included in the above table are reported at their market value at measurement date.
The table below shows the transfers between Level 1 and Level 2. The Fund’s policy is to recognize transfers in and transfers out as of the beginning of the reporting period.
| | | | | | | | |
| | | Transfers out of Level 1* | | | Transfers into Level 2* | |
| |
| Assets Table | | | | | | | | |
| Investments, at Value: | | | | | | | | |
| Common Stocks | | | | | | | | |
Financials | | $ | (4,280,253) | | | $ | 4,280,253 | |
| | | | |
| Total Assets | | $ | (4,280,253) | | | $ | 4,280,253 | |
| | | | |
*Transferred from Level 1 to Level 2 due to the absence of a readily available unadjusted quoted market price.
4. Investments and Risks
Investment in Oppenheimer Institutional Money Market Fund. The Fund is permitted to invest daily available cash balances in an affiliated money market fund. The Fund may invest the available cash in Class E shares of Oppenheimer Institutional Money Market Fund (“IMMF”) to seek current income while preserving liquidity or for defensive purposes. IMMF is a registered open-end management investment company, regulated as a money market fund under the 1940 Act. The Manager is the investment adviser of IMMF, and the Sub-Adviser provides investment and related advisory services to IMMF. When applicable, the Fund’s investment in IMMF is included in the Statement of Investments. Shares of IMMF are valued at their net asset value per share. As a shareholder, the Fund is subject to its proportional share of IMMF’s Class E expenses, including its management fee. The Manager will waive fees and/or reimburse Fund expenses in an amount equal to the indirect management fees incurred through the Fund’s investment in IMMF.
Equity Security Risk. Stocks and other equity securities fluctuate in price. The value of the Fund’s portfolio may be affected by changes in the equity markets generally. Equity markets may experience significant short-term volatility and may fall sharply at times. Different markets may behave differently from each other and U.S. equity markets may move in the opposite direction from one or more foreign stock markets. Adverse events in any part of the equity or fixed-income markets may have unexpected negative effects on other market segments.
The prices of individual equity securities generally do not all move in the same direction at the same time and a variety of factors can affect the price of a particular company’s securities. These factors may include, but are not limited to, poor earnings reports, a loss of customers, litigation against the company, general unfavorable performance of the company’s sector or industry, or changes in government regulations affecting the company or its industry.
5. Shares of Beneficial Interest
The Fund has authorized an unlimited number of $0.001 par value shares of beneficial interest of each class. Transactions in shares of beneficial interest were as follows:
17 OPPENHEIMER INTERNATIONAL GROWTH FUND/VA
NOTES TO FINANCIAL STATEMENTS Unaudited / Continued
5. Shares of Beneficial Interest (Continued)
| | | | | | | | | | | | | | | | |
| | | Six Months Ended June 30, 2015 | | | Year Ended December 31, 2014 | |
| | | Shares | | | Amount | | | Shares | | | Amount | |
| |
| Non-Service Shares | | | | | | | | | | | | | | | | |
| Sold | | | 16,820,512 | | | $ | 41,007,467 | | | | 25,443,453 | | | $ | 62,992,150 | |
| Dividends and/or distributions reinvested | | | 12,263,243 | | | | 28,450,725 | | | | 5,127,853 | | | | 13,024,746 | |
| Redeemed | | | (33,476,973 | ) | | | (79,889,868) | | | | (53,834,052 | ) | | | (133,275,706) | |
| | | | |
| Net decrease | | | (4,393,218 | ) | | $ | (10,431,676) | | | | (23,262,746 | ) | | $ | (57,258,810) | |
| | | | |
| | | | | | | | | | | | | | | | |
| |
| Service Shares | | | | | | | | | | | | | | | | |
| Sold | | | 9,859,421 | | | $ | 24,961,213 | | | | 19,806,037 | | | $ | 50,102,878 | |
| Dividends and/or distributions reinvested | | | 5,341,754 | | | | 12,873,626 | | | | 1,386,507 | | | | 3,660,379 | |
| Redeemed | | | (3,706,243 | ) | | | (9,310,921) | | | | (4,889,729 | ) | | | (12,467,461) | |
| | | | |
| Net increase | | | 11,494,932 | | | $ | 28,523,918 | | | | 16,302,815 | | | $ | 41,295,796 | |
| | | | |
6. Purchases and Sales of Securities
The aggregate cost of purchases and proceeds from sales of securities, other than short-term obligations and investments in IMMF, for the six months ended June 30, 2015 were as follows:
| | | | |
| | | Purchases | | Sales |
|
Investment securities | | $64,556,013 | | $74,058,008 |
7. Fees and Other Transactions with Affiliates
Management Fees. Under the investment advisory agreement, the Fund pays the Manager a management fee based on the daily net assets of the Fund at an annual rate as shown in the following table:
| | | | |
| Fee Schedule | | | |
| |
Up to $250 million | | | 1.00% | |
Next $250 million | | | 0.90 | |
Over $500 million | | | 0.85 | |
The Fund’s effective management fee for the six months ended June 30, 2015 was 0.95% of average annual net assets before any applicable waivers.
Sub-Adviser Fees. The Manager has retained the Sub-Adviser to provide the day-to-day portfolio management of the Fund. Under the Sub-Advisory Agreement, the Manager pays the Sub-Adviser an annual fee in monthly installments, equal to a percentage of the investment management fee collected by the Manager from the Fund, which shall be calculated after any investment management fee waivers. The fee paid to the Sub-Adviser is paid by the Manager, not by the Fund.
Transfer Agent Fees. OFI Global (the “Transfer Agent”) serves as the transfer and shareholder servicing agent for the Fund. The Fund pays the Transfer Agent a fee based on annual net assets. Fees incurred and average net assets for each class with respect to these services are detailed in the Statement of Operations and Financial Highlights, respectively.
Sub-Transfer Agent Fees. The Transfer Agent has retained Shareholder Services, Inc., a wholly-owned subsidiary of OFI (the “Sub-Transfer Agent”), to provide the day-to-day transfer agent and shareholder servicing of the Fund. Under the Sub-Transfer Agency Agreement, the Transfer Agent pays the Sub-Transfer Agent an annual fee in monthly installments, equal to a percentage of the transfer agent fee collected by the Transfer Agent from the Fund, which shall be calculated after any applicable fee waivers. The fee paid to the Sub-Transfer Agent is paid by the Transfer Agent, not by the Fund.
Trustees’ Compensation. The Fund’s Board of Trustees (“Board”) has adopted a compensation deferral plan for Independent Trustees that enables Trustees to elect to defer receipt of all or a portion of the annual compensation they are entitled to receive from the Fund. For purposes of determining the amount owed to the Trustee under the plan, deferred amounts are treated as though equal dollar amounts had been invested in shares of the Fund or in other Oppenheimer funds selected by the Trustee. The Fund purchases shares of the funds selected for deferral by the Trustee in amounts equal to his or her deemed investment, resulting in a Fund asset equal to the deferred compensation liability. Such assets are included as a component of “Other” within the asset section of the Statement of Assets and Liabilities. Deferral of Trustees’ fees under the plan will not affect the net assets of the Fund and will not materially affect the Fund’s assets, liabilities or net investment income per share. Amounts will be deferred until distributed in accordance with the compensation deferral plan.
18 OPPENHEIMER INTERNATIONAL GROWTH FUND/VA
7. Fees and Other Transactions with Affiliates (Continued)
Distribution and Service Plan for Service Shares. The Fund has adopted a Distribution and Service Plan (the “Plan”) pursuant to Rule 12b-1 under the 1940 Act for Service shares to pay OppenheimerFunds Distributor, Inc. (the “Distributor”), for distribution related services, personal service and account maintenance for the Fund’s Service shares. Under the Plan, payments are made periodically at an annual rate of 0.25% of the daily net assets of Service shares of the Fund. The Distributor currently uses all of those fees to compensate sponsors of the insurance product that offers Fund shares, for providing personal service and maintenance of accounts of their variable contract owners that hold Service shares. These fees are paid out of the Fund’s assets on an on-going basis and increase operating expenses of the Service shares, which results in lower performance compared to the Fund’s shares that are not subject to a service fee. Fees incurred by the Fund under the Plan are detailed in the Statement of Operations.
Waivers and Reimbursements of Expenses. The Manager has contractually agreed to limit the Fund’s expenses after payments, waivers and/or reimbursements and reduction to custodian expenses, excluding expenses incurred directly or indirectly by the Fund as a result of investments in other investment companies, wholly-owned subsidiaries and pooled investment vehicles; so that those expenses, as percentages of daily net assets, will not exceed the annual rate of 1.00% for Non-Service shares and 1.25% for Service shares. During the six months ended June 30, 2015, the Manager waived fees and/or reimbursed the Fund $132,251 and $60,764 for Non-Service and Service shares, respectively.
The Manager will waive fees and/or reimburse Fund expenses in an amount equal to the indirect management fees incurred through the Fund’s investment in IMMF. During the six months ended June 30, 2015, the Manager waived fees and/or reimbursed the Fund $5,459 for IMMF management fees.
Waivers and/or reimbursements may be modified or terminated as set forth according to the terms in the prospectus.
8. Borrowings and Other Financing
Securities Lending. The Fund lends portfolio securities from time to time in order to earn additional income in the form of fees, or interest on cash or securities received as collateral. The loans are secured by collateral (either securities, letters of credit, or cash) in an amount of at least 102% of the market value of the loaned U.S. securities, and at least 105% of the market value of loaned foreign securities during the period of the loan. The market value of the loaned securities is determined at the close of each business day and any additional required collateral is delivered to the Fund on the next business day. If the borrower defaults on its obligation to return the securities loaned because of insolvency or other reasons, the Fund could experience delays and cost in recovering the securities loaned or in gaining access to the collateral. The Fund continues to receive the economic benefit of interest or dividends paid on the securities loaned in the form of a substitute payment received from the borrower and recognizes the change in the fair value of the securities loaned that may occur during the term of the loan. The Fund has the right under the lending agreement to recover the securities from the borrower on demand. As of June 30, 2015, the Fund had no securities on loan.
9. Pending Litigation
In 2009, several lawsuits were filed as putative class actions and later consolidated before the U.S. District Court for the District of Colorado in connection with the investment performance of Oppenheimer Rochester California Municipal Fund (the “California Fund Suit”), a fund advised by OppenheimerFunds, Inc. (“OFI”), and distributed by its subsidiary OppenheimerFunds Distributor, Inc. ( “OFDI”). The plaintiffs asserted claims against OFI, OFDI and certain present and former trustees and officers of the Fund under the federal securities laws, alleging, among other things, that the disclosure documents of the Fund contained misrepresentations and omissions and the investment policies of the Fund were not followed. Plaintiffs in the California Fund Suit filed an amended complaint and defendants filed a motion to dismiss. In 2011, the court issued an order which granted in part and denied in part the defendants’ motion to dismiss. In 2012, plaintiffs filed a motion, which defendants opposed, to certify a class and appoint class representatives and class counsel. In March 2015, the court granted plaintiffs’ motion for class certification. In May 2015, the U.S. Court of Appeals for the Tenth Circuit vacated the class certification order and remanded the matter to the district court for further proceedings. In July 2015, the district court held an evidentiary hearing on plaintiffs’ motion for class certification. OFI and OFDI believe the California Fund Suit is without merit; that it is premature to render any opinion as to the likelihood of an outcome unfavorable to them in the California Fund Suit; and that no estimate can yet be made as to the amount or range of any potential loss.
19 OPPENHEIMER INTERNATIONAL GROWTH FUND/VA
PORTFOLIO PROXY VOTING POLICIES AND PROCEDURES; UPDATES TO STATEMENTS OF INVESTMENTS Unaudited
The Fund has adopted Portfolio Proxy Voting Policies and Procedures under which the Fund votes proxies relating to securities (“portfolio proxies”) held by the Fund. A description of the Fund’s Portfolio Proxy Voting Policies and Procedures is available (i) without charge, upon request, by calling the Fund toll-free at 1.800.525.7048, (ii) on the Fund’s website at www.oppenheimerfunds.com, and (iii) on the SEC’s website at www.sec.gov. In addition, the Fund is required to file Form N-PX, with its complete proxy voting record for the 12 months ended June 30th, no later than August 31st of each year. The Fund’s voting record is available (i) without charge, upon request, by calling the Fund toll-free at 1.800.525.7048, and (ii) in the Form N-PX filing on the SEC’s website at www.sec.gov.
The Fund files its complete schedule of portfolio holdings with the SEC for the first quarter and the third quarter of each fiscal year on Form N-Q. The Fund’s Form N-Q filings are available on the SEC’s website at www.sec.gov. Those forms may be reviewed and copied at the SEC’s Public Reference Room in Washington, D.C. Information on the operation of the Public Reference Room may be obtained by calling 1-800-SEC-0330.
20 OPPENHEIMER INTERNATIONAL GROWTH FUND/VA
DISTRIBUTION SOURCES Unaudited
For any distribution that took place over the Fund’s reporting period, the table below details on a per-share basis the percentage of the Fund’s total distribution payment amount that was derived from the following sources: net income, net profit from the sale of securities, and other capital sources. This information is based upon income and capital gains using generally accepted accounting principles as of the date of each distribution. Because the Fund is actively managed, the relative amount of the Fund’s total distributions derived from various sources over the calendar year may change. Please note that this information should not be used for tax reporting purposes as the tax character of distributable income may differ from the amounts used for this notification. You will receive IRS tax forms in the first quarter of each calendar year detailing the actual amount of the taxable and non-taxable portion of distributions paid to you during the tax year.
For the most current information, please go to oppenheimerfunds.com. Select your Fund, then the ’Detailed’ tab; where ‘Dividends’ are shown, the Fund’s latest pay date will be followed by the sources of any distribution, updated daily.
| | | | | | | | | | | | | | | | |
| Fund Name | | Pay Date | | | Net Income | | | Net Profit
from Sale | | | Other Capital Sources | |
| |
Oppenheimer International Growth Fund/VA | | | 6/16/15 | | | | 13.6% | | | | 86.4% | | | | 0.0% | |
21 OPPENHEIMER INTERNATIONAL GROWTH FUND/VA
THIS PAGE INTENTIONALLY LEFT BLANK.
22 OPPENHEIMER INTERNATIONAL GROWTH FUND/VA
THIS PAGE INTENTIONALLY LEFT BLANK.
23 OPPENHEIMER INTERNATIONAL GROWTH FUND/VA
OPPENHEIMER INTERNATIONAL GROWTH FUND/VA
A Series of Oppenheimer Variable Account Funds
| | |
| Trustees and Officers | | Sam Freedman, Chairman of the Board of Trustees and Trustee |
| | Jon S. Fossel, Trustee |
| | Richard F. Grabish, Trustee |
| | Beverly L. Hamilton, Trustee |
| | Victoria J. Herget, Trustee |
| | Robert J. Malone, Trustee |
| | F. William Marshall, Jr., Trustee |
| | Karen L. Stuckey, Trustee |
| | James D. Vaughn, Trustee |
| | Arthur P. Steinmetz, Trustee, President and Principal Executive Officer |
| | George R. Evans, Vice President |
| | Robert B. Dunphy, Vice President |
| | Arthur S. Gabinet, Secretary and Chief Legal Officer |
| | Jennifer Sexton, Vice President and Chief Business Officer |
| | Mary Ann Picciotto, Chief Compliance Officer and Chief Anti-Money Laundering Officer |
| | Brian W. Wixted, Treasurer and Principal Financial & Accounting Officer |
| |
| Manager | | OFI Global Asset Management, Inc. |
| |
| Sub-Adviser | | OppenheimerFunds, Inc. |
| |
| Distributor | | OppenheimerFunds Distributor, Inc. |
| |
| Transfer and Shareholder Servicing Agent | | OFI Global Asset Management, Inc. |
| |
| Sub-Transfer Agent | | Shareholder Services, Inc. |
| | DBA OppenheimerFunds Services |
| |
| Independent Registered Public Accounting Firm | | KPMGLLP |
| |
| Counsel | | Ropes & Gray LLP |
| |
| | Before investing in any of the Oppenheimer funds, investors should carefully consider a fund’s investment objectives, risks, charges and expenses. Fund prospectuses and summary prospectuses contain this and other information about the funds and may be obtained by asking your financial advisor, visiting oppenheimerfunds.com or calling us at 1.800.988.8287. Read prospectuses and summary prospectuses carefully before investing. |
| |
| | The financial statements included herein have been taken from the records of the Fund without examination of those records by the independent registered public accounting firm. © 2015 OppenheimerFunds, Inc. All rights reserved. Oppenheimer funds are distributed by OppenheimerFunds Distributor, Inc. |

Item 2. Code of Ethics.
Not applicable to semiannual reports.
Item 3. Audit Committee Financial Expert.
Not applicable to semiannual reports.
Item 4. Principal Accountant Fees and Services.
Not applicable to semiannual reports.
Item 5. Audit Committee of Listed Registrants
Not applicable.
Item 6. Schedule of Investments.
a) Not applicable. The complete schedule of investments is included in Item 1 of this Form N-CSR.
b) Not applicable.
Item 7. Disclosure of Proxy Voting Policies and Procedures for Closed-End Management Investment Companies.
Not applicable.
Item 8. Portfolio Managers of Closed-End Management Investment Companies.
Not applicable.
Item 9. Purchases of Equity Securities by Closed-End Management Investment Company and Affiliated Purchasers.
Not applicable.
Item 10. Submission of Matters to a Vote of Security Holders.
The Fund’s Governance Committee Provisions with Respect to Nominations of Directors/Trustees to the Respective Boards
None
Item 11. Controls and Procedures.
Based on their evaluation of the registrant’s disclosure controls and procedures (as defined in rule 30a-3(c) under the Investment Company Act of 1940 (17 CFR 270.30a-3(c)) as of 6/30/2015, the registrant’s principal executive officer and principal financial officer found the registrant’s disclosure controls and procedures to provide reasonable assurances that information required to be disclosed by the registrant in the reports that it files under the Securities Exchange Act of 1934 (a) is accumulated and communicated to registrant’s management, including its principal executive officer and principal financial officer, to allow timely decisions regarding required disclosure, and (b) is recorded, processed, summarized and reported, within the time periods specified in the rules and forms adopted by the U.S. Securities and Exchange Commission.
There have been no changes in the registrant’s internal controls over financial reporting that occurred during the registrant’s second fiscal quarter of the period covered by this report that have materially affected, or are reasonably likely to materially affect, the registrant’s internal control over financial reporting.
Item 12. Exhibits.
| (a) | (1) Not applicable to semiannual reports. |
| | (2) | Exhibits attached hereto. |
| (b) | Exhibit attached hereto. |
SIGNATURES
Pursuant to the requirements of the Securities Exchange Act of 1934 and the Investment Company Act of 1940, the registrant has duly caused this report to be signed on its behalf by the undersigned, thereunto duly authorized.
Oppenheimer Variable Account Funds
| | |
| By: | | /s/ Arthur P. Steinmetz |
| | Arthur P. Steinmetz |
| | Principal Executive Officer |
| |
| Date: | | 8/10/2015 |
Pursuant to the requirements of the Securities Exchange Act of 1934 and the Investment Company Act of 1940, this report has been signed below by the following persons on behalf of the registrant and in the capacities and on the dates indicated.
| | |
By: | | /s/ Arthur P. Steinmetz |
| | Arthur P. Steinmetz |
| | Principal Executive Officer |
| |
| Date: | | 8/10/2015 |
| |
| By: | | /s/ Brian W. Wixted |
| | Brian W. Wixted |
| | Principal Financial Officer |
| |
| Date: | | 8/10/2015 |