UNITED STATES
SECURITIES AND EXCHANGE COMMISSION
WASHINGTON, D.C. 20549
FORM N-CSR
CERTIFIED SHAREHOLDER REPORT OF REGISTERED
MANAGEMENT INVESTMENT COMPANIES
Investment Company Act file number 811-4108
Oppenheimer Variable Account Funds
(Exact name of registrant as specified in charter)
6803 South Tucson Way, Centennial, Colorado 80112-3924
(Address of principal executive offices) (Zip code)
Arthur S. Gabinet
OFI Global Asset Management, Inc.
Two World Financial Center, New York, New York 10281-1008
(Name and address of agent for service)
Registrant’s telephone number, including area code: (303) 768-3200
Date of fiscal year end: December 31
Date of reporting period: 6/30/2013
Item 1. Reports to Stockholders.
| | | | |
| June 30, 2013 | | |
| | | Oppenheimer Discovery Mid Cap Growth Fund/VA* A Series of Oppenheimer Variable Account Funds | | Semiannual Report |
| | |
| | SEMIANNUAL REPORT Listing of Top Holdings Fund Performance Discussion Financial Statements *Prior to 4/30/13, the Fund’s name was Oppenheimer Small- & Mid-Cap Growth Fund/VA | | |

Portfolio Manager: Ronald J. Zibelli, Jr., CFA
Cumulative Total Returns
For the 6-Month Period Ended 6/28/131
| | | | | | | | | | | | |
Non-Service Shares | | | 10.83 | % | | | | | | | | |
Service Shares | | | 10.68 | | | | | | | | | |
Average Annual Total Returns For the Periods Ended 6/28/131 | | | | |
| | | 1-Year | | | 5-Year | | | 10-Year | |
Non-Service Shares | | | 13.44 | % | | | 4.45% | | | | 6.21% | |
Service Shares | | | 13.17 | % | | | 4.18% | | | | 5.94% | |
The performance data quoted represents past performance, which does not guarantee future results. The investment return and principal value of an investment in the Fund will fluctuate so that an investor’s shares, when redeemed, may be worth more or less than their original cost. Current performance may be lower or higher than the performance quoted. For performance data current to the most recent month end, call us at 1.800.988.8287. The Fund’s total returns should not be expected to be the same as the returns of other funds, whether or not both funds have the same portfolio managers and/or similar names. The Fund’s total returns include changes in share price and reinvested distributions but do not include the charges associated with the separate account products that offer this Fund. Such performance would have been lower if such charges were taken into account.
1. June 28, 2013, was the last business day of the Fund’s semiannual period. See Note 1 of the accompanying Notes to Financial Statements.
| | | | |
TOP TEN COMMON STOCK HOLDINGS | | | | |
Kansas City Southern | | | 2.1 | % |
Affiliated Managers Group, Inc. | | | 2.0 | |
Tractor Supply Co. | | | 2.0 | |
SBA Communications Corp., Cl. A | | | 2.0 | |
Cooper Cos., Inc. (The) | | | 2.0 | |
LinkedIn Corp., Cl. A | | | 1.9 | |
AMETEK, Inc. | | | 1.7 | |
NetSuite, Inc. | | | 1.6 | |
Actavis, Inc. | | | 1.6 | |
Whole Foods Market, Inc. | | | 1.5 | |
Portfolio holdings and allocations are subject to change. Percentages are as of June 28, 2013, and are based on net assets. For more current Fund holdings, please visit oppenheimerfunds.com.
SECTOR ALLOCATION
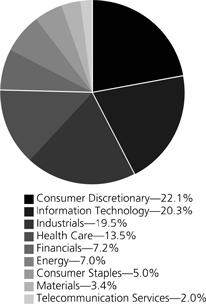
Portfolio holdings and allocations are subject to change. Percentages are as of June 28, 2013, and are based on the total market value of common stocks.
2 OPPENHEIMER DISCOVERY MID CAP GROWTH FUND/VA
| | |
Fund Performance Discussion |
The Fund’s Non-Service shares produced a return of 10.83% during the reporting period, underperforming the Russell Midcap Growth Index, (the “Index”), which returned 14.70%. The Fund’s underperformance stemmed primarily from weaker relative stock selection in the consumer discretionary sector. Weaker relative stock selection and an underweight position in the consumer staples sector also detracted to a lesser degree. The Fund outperformed the Index in the industrials and financials sectors due to stronger relative stock selection. The Fund also underperformed the Russell 2500 Growth Index and the Russell 2000 Growth Index, which returned 15.82% and 17.44%, respectively. The Fund changed its benchmarks from the Russell Midcap Growth Index, the Russell 2500 Growth Index and the Russell 2000 Growth Index to the Russell Midcap Growth Index, which it believes is a more appropriate measure of the Fund’s performance.
GLOBAL MARKET AND ECONOMIC ENVIRONMENT
Equities performed positively for the period as central banks throughout the world, including the United States, Europe and Japan, took steps to maintain highly accommodative monetary policy and stimulate their respective economies. In addition, a clear recovery in the U.S. provided further support for equity markets. However, later in the period, the Federal Reserve appeared to weigh the merits of backing away from its quantitative easing policy. As a result, the markets sold off sharply and made a quick reappraisal of interest rate risk in an array of credit markets and related currencies. Equities, particularly those in emerging markets, experienced spillover effects as a result.
TOP INDIVIDUAL CONTRIBUTORS
During the period, the top performing holdings were LinkedIn Corp., Actavis, Inc. and Tractor Supply Co. LinkedIn, the largest professional networking website, rallied strongly after announcing strong growth and profitability over its fourth quarter. Actavis is one of the largest manufacturers of generic drugs worldwide. In May, the company announced the acquisition of specialty pharmaceutical company Warner Chilcott for $8.5 billion. We believe the transaction has the potential to be beneficial for Actavis due to tax and operating expense synergies. Tractor Supply, the largest domestic operator of retail farm and ranch stores, delivered positive first quarter results despite weather challenges.
Another top performing holding this period was Kansas City Southern, which was the largest holding in the Fund at the end of the period. Kansas City Southern, an operator of a Class 1 railroad in North America, reported positive fourth quarter earnings results slightly above analysts’ expectations. The company also benefited from the potential agreement for construction of crude and chemical offloading and storage at its Port Arthur, Texas location, which could provide substantially more upside to the company’s rail business.
TOP INDIVIDUAL DETRACTORS
The most underperforming individual stocks this period were information technology companies Rackspace Hosting, Inc., Aruba Networks, Inc. and SolarWinds, Inc. Rackspace Hosting is a provider of information technology hosting services that reported fourth quarter revenue that trailed analysts’ estimates, fueling concern that growth may slow. Aruba Networks, a supplier of wireless LAN (WLAN) systems for enterprises, reported disappointing third quarter results and fourth quarter guidance due largely to delayed customer orders. SolarWinds, a provider of infrastructure management tools, reported first quarter revenue below street estimates as growth from new licenses slowed. We sold our position in these three stocks during the period. The largest underperforming sector this period was consumer discretionary, partly due to the Fund being underweight in the media and hotel sub-sectors, which performed well. In addition, Ulta Salon, Cosmetics & Fragrance, Inc. detracted from performance. Ulta, one of the largest beauty retailers in the U.S., hurt performance as investors became concerned over the surprise departure of its CEO. We have reduced our position.
STRATEGY & OUTLOOK
Our long-term investment process remains the same. We seek dynamic companies with above-average and sustainable revenue and earnings growth that we believe are positioned to outperform. This includes leading firms in structurally attractive industries with committed management teams that have proven records of performance.
The macroeconomic environment is characterized by modest economic expansion, slow corporate profit growth and low interest rates. We believe that this is an environment that favors growth companies and are optimistic regarding the Fund’s investment strategy. Our focus on well-established, higher quality growth companies has the potential to provide both upside participation and a degree of downside protection over the long term.
3 OPPENHEIMER DISCOVERY MID CAP GROWTH FUND/VA
The Fund’s investment strategy and focus can change over time. The mention of specific fund holdings does not constitute a recommendation by OppenheimerFunds, Inc. or its affiliates.
Shares of Oppenheimer funds are not deposits or obligations of any bank, are not guaranteed by any bank, are not insured by the FDIC or any other agency, and involve investment risks, including the possible loss of the principal amount invested.
4 OPPENHEIMER DISCOVERY MID CAP GROWTH FUND/VA
Fund Expenses. As a shareholder of the Fund, you incur two types of costs: (1) transaction costs and (2) ongoing costs, including management fees; distribution and service fees; and other Fund expenses. These examples are intended to help you understand your ongoing costs (in dollars) of investing in the Fund and to compare these costs with the ongoing costs of investing in other mutual funds.
The examples are based on an investment of $1,000.00 invested at the beginning of the period and held for the entire 6-month period ended June 28, 2013.
Actual Expenses. The first section of the table provides information about actual account values and actual expenses. You may use the information in this section for the class of shares you hold, together with the amount you invested, to estimate the expense that you paid over the period. Simply divide your account value by $1,000.00 (for example, an $8,600.00 account value divided by $1,000.00 = 8.60), then multiply the result by the number in the first section under the heading entitled “Expenses Paid During Period” to estimate the expenses you paid on your account during this period.
Hypothetical Example for Comparison Purposes. The second section of the table provides information about hypothetical account values and hypothetical expenses based on the Fund’s actual expense ratio for each class of shares, and an assumed rate of return of 5% per year for each class before expenses, which is not the actual return. The hypothetical account values and expenses may not be used to estimate the actual ending account balance or expenses you paid for the period. You may use this information to compare the ongoing costs of investing in the Fund and other funds. To do so, compare this 5% hypothetical example for the class of shares you hold with the 5% hypothetical examples that appear in the shareholder reports of the other funds.
Please note that the expenses shown in the table are meant to highlight your ongoing costs only and do not reflect any charges associated with the separate accounts that offer this Fund. Therefore, the “hypothetical” lines of the table are useful in comparing ongoing costs only, and will not help you determine the relative total costs of owning different funds. In addition, if these separate account charges were included your costs would have been higher.
| | | | | | | | | | | | | | |
| Actual | | Beginning
Account
Value
January 1, 2013 | | | Ending
Account
Value
June 28, 2013 | | | Expenses
Paid During
6 Months Ended
June 28, 2013 | | | |
Non-Service shares | | $ | 1,000.00 | | | $ | 1,108.30 | | | $ | 4.14 | | | |
Service shares | | | 1,000.00 | | | | 1,106.80 | | | | 5.44 | | | |
| | | | |
Hypothetical | | | | | | | | | | | | | | |
(5% return before expenses) | | | | | | | | | | | | | | |
Non-Service shares | | | 1,000.00 | | | | 1,020.60 | | | | 3.97 | | | |
Service shares | | | 1,000.00 | | | | 1,019.37 | | | | 5.21 | | | |
Expenses are equal to the Fund’s annualized expense ratio for that class, multiplied by the average account value over the period, multiplied by 179/365 (to reflect the one-half year period). Those annualized expense ratios, excluding indirect expenses from affiliated funds, based on the 6-month period ended June 28, 2013 are as follows:
| | | | | | | | | | |
| Class | | Expense Ratios | | |
Non-Service shares | | | | 0.80 | % | | |
Service shares | | | | 1.05 | | | |
The expense ratios reflect voluntary waivers and/or reimbursements of expenses by the Fund’s Manager. Some of these undertakings may be modified or terminated at any time, as indicated in the Fund’s prospectus. The “Financial Highlights” tables in the Fund’s financial statements, included in this report, also show the gross expense ratios, without such waivers or reimbursements and reduction to custodian expenses, if applicable.
5 OPPENHEIMER DISCOVERY MID CAP GROWTH FUND/VA
| | |
STATEMENT OF INVESTMENTS June 28, 2013* / Unaudited |
| | | | | | | | | | |
| | | Shares | | | Value | | | |
Common Stocks—98.6% | | | | | | | | | | |
Consumer Discretionary—22.0% | | | | | | | | | | |
Auto Components—0.7% | | | | | | | | | | |
Delphi Automotive plc | | | 90,810 | | �� | $ | 4,603,159 | | | |
Distributors—1.3% | | | | | | | | | | |
LKQ Corp.1 | | | 303,040 | | | | 7,803,280 | | | |
Hotels, Restaurants & Leisure—3.6% | | | | | | | | | | |
Domino’s Pizza, Inc. | | | 51,440 | | | | 2,991,236 | | | |
Dunkin’ Brands Group, Inc. | | | 154,250 | | | | 6,604,985 | | | |
Panera Bread Co., Cl. A1 | | | 43,990 | | | | 8,179,501 | | | |
Wynn Resorts Ltd. | | | 33,560 | | | | 4,295,680 | | | |
| | | | | | | | 22,071,402 | | | |
Household Durables—2.7% | | | | | | | | | | |
Harman International Industries, Inc. | | | 60,130 | | | | 3,259,046 | | | |
Lennar Corp., Cl. A | | | 131,840 | | | | 4,751,514 | | | |
Taylor Morrison Home Corp., Cl. A1 | | | 218,270 | | | | 5,321,423 | | | |
Whirlpool Corp. | | | 26,610 | | | | 3,043,120 | | | |
| | | | | | | | 16,375,103 | | | |
Internet & Catalog Retail—0.7% | | | | | | | | | | |
HomeAway, Inc.1 | | | 126,910 | | | | 4,104,269 | | | |
Leisure Equipment & Products—0.6% | | | | | | | | | | |
Polaris Industries, Inc. | | | 37,930 | | | | 3,603,350 | | | |
Media—2.9% | | | | | | | | | | |
AMC Networks, Inc., Cl. A1 | | | 97,450 | | | | 6,374,205 | | | |
Lions Gate Entertainment Corp.1 | | | 250,480 | | | | 6,880,686 | | | |
Sinclair Broadcast Group, Inc., Cl. A | | | 165,100 | | | | 4,850,638 | | | |
| | | | | | | | 18,105,529 | | | |
Specialty Retail—6.3% | | | | | | | | | | |
Dick’s Sporting Goods, Inc. | | | 63,200 | | | | 3,163,792 | | | |
GNC Holdings, Inc., Cl. A | | | 106,980 | | | | 4,729,586 | | | |
Lumber Liquidators Holdings, Inc.1 | | | 17,770 | | | | 1,383,750 | | | |
O’Reilly Automotive, Inc.1 | | | 42,560 | | | | 4,793,107 | | | |
Restoration Hardware Holdings, Inc.1 | | | 56,480 | | | | 4,236,000 | | | |
Tractor Supply Co. | | | 104,430 | | | | 12,282,012 | | | |
Ulta Salon, Cosmetics & Fragrance, Inc.1 | | | 36,090 | | | | 3,614,774 | | | |
Urban Outfitters, Inc.1 | | | 114,140 | | | | 4,590,711 | | | |
| | | | | | | | 38,793,732 | | | |
Textiles, Apparel & Luxury Goods—3.2% | | | |
Michael Kors Holdings Ltd.1 | | | 115,240 | | | | 7,147,185 | | | |
PVH Corp. | | | 37,940 | | | | 4,744,397 | | | |
Under Armour, Inc., Cl. A1 | | | 123,920 | | | | 7,399,263 | | | |
| | | | | | | | 19,290,845 | | | |
Consumer Staples—4.9% | | | | | | | | | | |
Beverages—0.5% | | | | | | | | | | |
Constellation Brands, Inc., Cl. A1 | | | 63,260 | | | | 3,297,111 | | | |
Food & Staples Retailing—1.5% | | | | | | | | | | |
Whole Foods Market, Inc. | | | 183,600 | | | | 9,451,728 | | | |
Food Products—1.6% | | | | | | | | | | |
Green Mountain Coffee Roasters, Inc.1 | | | 41,090 | | | | 3,084,215 | | | |
Hormel Foods Corp. | | | 74,180 | | | | 2,861,864 | | | |
Mead Johnson Nutrition Co., Cl. A | | | 48,770 | | | | 3,864,047 | | | |
| | | | | | | | 9,810,126 | | | |
Household Products—0.5% | | | | | | | | | | |
Church & Dwight Co., Inc. | | | 48,070 | | | | 2,966,400 | | | |
Personal Products—0.8% | | | | | | | | | | |
Estee Lauder Cos., Inc. (The), Cl. A | | | 77,660 | | | | 5,107,698 | | | |
Energy—6.9% | | | | | | | | | | |
Energy Equipment & Services—3.1% | | | | | | | | | | |
Atwood Oceanics, Inc.1 | | | 91,100 | | | | 4,741,755 | | | |
Dresser-Rand Group, Inc.1 | | | 57,730 | | | | 3,462,645 | | | |
Dril-Quip, Inc.1 | | | 16,950 | | | | 1,530,416 | | | |
Oceaneering International, Inc. | | | 127,030 | | | | 9,171,566 | | | |
| | | | | | | | 18,906,382 | | | |
Oil, Gas & Consumable Fuels—3.8% | | | | | | | | | | |
Cabot Oil & Gas Corp. | | | 127,060 | | | | 9,023,801 | | | |
Concho Resources, Inc.1 | | | 35,070 | | | | 2,936,060 | | | |
Gulfport Energy Corp.1 | | | 67,000 | | | | 3,153,690 | | | |
Oasis Petroleum, Inc.1 | | | 201,270 | | | | 7,823,365 | | | |
| | | | | | | 22,936,916 | | | |
| | | | | | | | |
| | | Shares | | | Value | |
Financials—7.2% | | | | | | | | |
Capital Markets—2.8% | | | | | | | | |
Affiliated Managers Group, Inc.1 | | | 75,850 | | | $ | 12,434,849 | |
Financial Engines, Inc. | | | 104,700 | | | | 4,773,273 | |
| | | | | | | | 17,208,122 | |
Commercial Banks—2.1% | | | | | | | | |
First Republic Bank | | | 82,470 | | | | 3,173,446 | |
Signature Bank1 | | | 70,820 | | | | 5,879,476 | |
SVB Financial Group1 | | | 40,750 | | | | 3,395,290 | |
| | | | | | | | 12,448,212 | |
Consumer Finance—0.5% | | | | | | | | |
Portfolio Recovery Associates, Inc.1 | | | 19,510 | | | | 2,997,321 | |
Insurance—1.3% | | | | | | | | |
ProAssurance Corp. | | | 152,880 | | | | 7,974,221 | |
Real Estate Management & Development—0.5% | | | | | |
Realogy Holdings Corp.1 | | | 64,500 | | | | 3,098,580 | |
Health Care—13.3% | | | | | | | | |
Biotechnology—2.5% | | | | | | | | |
Alexion Pharmaceuticals, Inc.1 | | | 50,540 | | | | 4,661,810 | |
BioMarin Pharmaceutical, Inc.1 | | | 58,590 | | | | 3,268,736 | |
Onyx Pharmaceuticals, Inc.1 | | | 61,970 | | | | 5,380,235 | |
Quintiles Transnational Holdings, Inc.1 | | | 43,760 | | | | 1,862,426 | |
| | | | | | | | 15,173,207 | |
Health Care Equipment & Supplies—3.0% | | | | | |
Cooper Cos., Inc. (The) | | | 102,180 | | | | 12,164,529 | |
Sirona Dental Systems, Inc.1 | | | 94,320 | | | | 6,213,802 | |
| | | | | | | | 18,378,331 | |
Health Care Providers & Services—3.8% | | | | | | | | |
Catamaran Corp.1 | | | 96,534 | | | | 4,703,136 | |
DaVita HealthCare Partners, Inc.1 | | | 43,080 | | | | 5,204,064 | |
Team Health Holdings, Inc.1 | | | 115,020 | | | | 4,723,871 | |
Universal Health Services, Inc., Cl. B | | | 91,240 | | | | 6,109,430 | |
WellCare Health Plans, Inc.1 | | | 47,460 | | | | 2,636,403 | |
| | | | | | | | 23,376,904 | |
Health Care Technology—1.4% | | | | | | | | |
Cerner Corp.1 | | | 86,850 | | | | 8,345,417 | |
Life Sciences Tools & Services—1.0% | | | | | | | | |
Covance, Inc.1 | | | 41,610 | | | | 3,168,185 | |
Illumina, Inc.1 | | | 44,160 | | | | 3,304,934 | |
| | | | | | | | 6,473,119 | |
Pharmaceuticals—1.6% | | | | | | | | |
Actavis, Inc.1 | | | 80,020 | | | | 10,100,124 | |
Industrials—18.8% | | | | | | | | |
Aerospace & Defense—4.0% | | | | | | | | |
B/E Aerospace, Inc.1 | | | 133,490 | | | | 8,420,549 | |
Hexcel Corp.1 | | | 240,680 | | | | 8,195,154 | |
TransDigm Group, Inc. | | | 52,840 | | | | 8,283,727 | |
| | | | | | | | 24,899,430 | |
Airlines—0.5% | | | | | | | | |
Copa Holdings SA, Cl. A | | | 23,480 | | | | 3,078,697 | |
Building Products—2.1% | | | | | | | | |
A.O. Smith Corp. | | | 160,400 | | | | 5,819,312 | |
Fortune Brands Home & Security, Inc. | | | 185,200 | | | | 7,174,648 | |
| | | | | | | | 12,993,960 | |
Commercial Services & Supplies—0.9% | | | | | | | | |
Stericycle, Inc.1 | | | 49,900 | | | | 5,510,457 | |
Electrical Equipment—2.9% | | | | | | | | |
AMETEK, Inc. | | | 251,992 | | | | 10,659,262 | |
Roper Industries, Inc. | | | 57,770 | | | | 7,176,189 | |
| | | | | | | | 17,835,451 | |
Machinery—3.8% | | | | | | | | |
Graco, Inc. | | | 54,210 | | | | 3,426,614 | |
Middleby Corp.1 | | | 19,210 | | | | 3,267,429 | |
Pentair Ltd. | | | 79,650 | | | | 4,595,009 | |
WABCO Holdings, Inc.1 | | | 61,400 | | | | 4,585,966 | |
Wabtec Corp. | | | 148,700 | | | | 7,945,041 | |
| | | | | | | | 23,820,059 | |
Road & Rail—3.1% | | | | | | | | |
Hertz Global Holdings, Inc.1 | | | 132,240 | | | | 3,279,552 | |
Kansas City Southern | | | 124,420 | | | | 13,183,543 | |
6 OPPENHEIMER DISCOVERY MID CAP GROWTH FUND/VA
| | | | | | | | | | |
| | | Shares | | | Value | | | |
Road & Rail (Continued) | | | |
Ryder System, Inc. | | | 51,820 | | | $ | 3,150,138 | | | |
| | | | | | | | 19,613,233 | | | |
Trading Companies & Distributors—1.5% | | | |
United Rentals, Inc.1 | | | 182,100 | | | | 9,088,611 | | | |
Information Technology—20.1% | | | |
Computers & Peripherals—0.5% | | | |
Stratasys Ltd.1 | | | 39,590 | | | | 3,315,267 | | | |
Internet Software & Services—5.9% | | | |
Cornerstone OnDemand, Inc.1 | | | 113,710 | | | | 4,922,506 | | | |
CoStar Group, Inc.1 | | | 68,060 | | | | 8,784,504 | | | |
Equinix, Inc.1 | | | 35,490 | | | | 6,555,713 | | | |
LinkedIn Corp., Cl. A1 | | | 63,910 | | | | 11,395,153 | | | |
MercadoLibre, Inc. | | | 37,930 | | | | 4,087,337 | | | |
| | | | | | | | 35,745,213 | | | |
IT Services—3.2% | | | |
Alliance Data Systems Corp.1 | | | 41,770 | | | | 7,561,623 | | | |
FleetCor Technologies, Inc.1 | | | 53,580 | | | | 4,356,054 | | | |
Gartner, Inc.1 | | | 61,260 | | | | 3,491,207 | | | |
MAXIMUS, Inc. | | | 60,990 | | | | 4,542,535 | | | |
| | | | | | | | 19,951,419 | | | |
Semiconductors & Semiconductor Equipment—1.2% | | | |
Cavium, Inc.1 | | | 116,230 | | | | 4,111,055 | | | |
Microchip Technology, Inc. | | | 84,770 | | | | 3,157,683 | | | |
| | | | | | | | 7,268,738 | | | |
Software—9.3% | | | |
Aspen Technology, Inc.1 | | | 208,080 | | | | 5,990,623 | | | |
CommVault Systems, Inc.1 | | | 102,520 | | | | 7,780,243 | | | |
Concur Technologies, Inc.1 | | | 77,078 | | | | 6,272,608 | | | |
Guidewire Software, Inc.1 | | | 77,030 | | | | 3,239,112 | | | |
Informatica Corp.1 | | | 90,680 | | | | 3,171,986 | | | |
NetSuite, Inc.1 | | | 110,432 | | | | 10,131,032 | | | |
ServiceNow, Inc.1 | | | 151,190 | | | | 6,106,564 | | | |
| | | | | | | | |
| | | Shares | | | Value | |
Software (Continued) | |
Splunk, Inc.1 | | | 125,990 | | | $ | 5,840,896 | |
Tableau Software, Inc., Cl. A1 | | | 26,230 | | | | 1,453,667 | |
Ultimate Software Group, Inc. (The)1 | | | 56,790 | | | | 6,660,899 | |
Workday, Inc., Cl. A1 | | | 14,270 | | | | 914,564 | |
| | | | | | | | 57,562,194 | |
Materials—3.4% | | | | | | | | |
Chemicals—1.6% | | | | | | | | |
Sherwin-Williams Co. | | | 24,560 | | | | 4,337,296 | |
Westlake Chemical Corp. | | | 57,530 | | | | 5,546,467 | |
| | | | | | | | 9,883,763 | |
Construction Materials—1.0% | | | | | | | | |
Eagle Materials, Inc. | | | 93,650 | | | | 6,206,186 | |
Containers & Packaging—0.8% | | | | | | | | |
Rock-Tenn Co., Cl. A | | | 48,160 | | | | 4,810,221 | |
Telecommunication Services—2.0% | |
Wireless Telecommunication Services—2.0% | |
SBA Communications Corp., Cl. A1 | | | 165,400 | | | | 12,259,448 | |
Total Common Stocks | | | | | | | | |
(Cost $429,731,548) | | | | | | | 606,642,935 | |
Investment Company—1.5% | | | | | |
Oppenheimer Institutional Money Market | | | | | |
Fund, Cl. E, 0.11%2,3 | | | | | | | | |
(Cost $9,233,637) | | | 9,233,637 | | | | 9,233,637 | |
Total Investments, at Value | | | | | | | | |
(Cost $438,965,185) | | | 100.1 | % | | | 615,876,572 | |
Liabilities in Excess of Other Assets | | | (0.1 | ) | | | (528,622 | ) |
Net Assets | | | 100.0 | % | | $ | 615,347,950 | |
Footnotes to Statement of Investments
* June 28, 2013 represents the last business day of the Fund’s semiannual period. See Note 1 of the accompanying Notes.
1. Non-income producing security.
2. Rate shown is the 7-day yield as of June 28, 2013.
3. Is or was an affiliate, as defined in the Investment Company Act of 1940, at or during the period ended June 28, 2013, by virtue of the Fund owning at least 5% of the voting securities of the issuer or as a result of the Fund and the issuer having the same investment adviser. Transactions during the period in which the issuer was an affiliate are as follows:
| | | | | | | | | | | | | | | | |
| | | Shares
December 31,
2012 | | | Gross
Additions | | | Gross
Reductions | | | Shares
June 28, 2013 | |
Oppenheimer Institutional Money Market Fund, Cl. E | | | 11,313,011 | | | | 135,060,321 | | | | 137,139,695 | | | | 9,233,637 | |
| | | | |
| | | | | | | | | Value | | | Income | |
Oppenheimer Institutional Money Market Fund, Cl. E | | | | | | | | | | $ | 9,233,637 | | | $ | 5,955 | |
See accompanying Notes to Financial Statements.
7 OPPENHEIMER DISCOVERY MID CAP GROWTH FUND/VA
| | |
STATEMENT OF ASSETS AND LIABILITIES June 28, 20131 / Unaudited |
| | | | |
Assets | | | | |
Investments, at value—see accompanying statement of investments: | | | | |
Unaffiliated companies (cost $429,731,548) | | $ | 606,642,935 | |
Affiliated companies (cost $9,233,637) | | | 9,233,637 | |
| | | | 615,876,572 | |
Cash | | | 31,333 | |
Receivables and other assets: | | | | |
Investments sold | | | 2,678,850 | |
Dividends | | | 103,426 | |
Other | | | 40,334 | |
Total assets | | | 618,730,515 | |
|
| |
Liabilities | | | | |
Payables and other liabilities: | | | | |
Investments purchased | | | 1,925,676 | |
Shares of beneficial interest redeemed | | | 1,327,606 | |
Transfer and shareholder servicing agent fees | | | 47,449 | |
Trustees’ compensation | | | 34,076 | |
Shareholder communications | | | 25,209 | |
Distribution and service plan fees | | | 6,388 | |
Other | | | 16,161 | |
Total liabilities | | | 3,382,565 | |
|
| | |
Net Assets | | $ | 615,347,950 | |
|
| |
Composition of Net Assets | | | | |
Par value of shares of beneficial interest | | $ | 10,149 | |
Additional paid-in capital | | | 560,825,339 | |
Accumulated net investment loss | | | (1,426,371 | ) |
Accumulated net realized loss on investments | | | (120,972,554 | ) |
Net unrealized appreciation on investments | | | 176,911,387 | |
Net Assets | | $ | 615,347,950 | |
|
| |
Net Asset Value Per Share | | | | |
Non-Service Shares: | | | | |
| Net asset value, redemption price per share and offering price per share (based on net assets of $581,529,626 and 9,575,491 shares of beneficial interest outstanding) | | | $60.73 | |
| |
Service Shares: | | | | |
| Net asset value, redemption price per share and offering price per share (based on net assets of $33,818,324 and 573,772 shares of beneficial interest outstanding) | | | $58.94 | |
1. June 28, 2013 represents the last business day of the Fund’s semiannual period. See Note 1 of the accompanying Notes.
See accompanying Notes to Financial Statements.
8 OPPENHEIMER DISCOVERY MID CAP GROWTH FUND/VA
| | |
STATEMENT OF OPERATIONS For the Six Months Ended June 28, 20131 / Unaudited |
| | | | |
Investment Income | | | | |
Dividends: | | | | |
Unaffiliated companies | | $ | 1,117,857 | |
Affiliated companies | | | 5,955 | |
Interest: | | | 29 | |
Total investment income | | | 1,123,841 | |
|
| | |
Expenses | | | | |
Management fees | | | 2,198,203 | |
Distribution and service plan fees - Service shares | | | 44,451 | |
Transfer and shareholder servicing agent fees: | | | | |
Non-Service shares | | | 288,357 | |
Service shares | | | 17,808 | |
Shareholder communications: | | | | |
Non-Service shares | | | 30,939 | |
Service shares | | | 1,894 | |
Trustees’ compensation | | | 21,034 | |
Custodian fees and expenses | | | 2,738 | |
Other | | | 32,671 | |
Total expenses | | | 2,638,095 | |
Less waivers and reimbursements of expenses | | | (118,254 | ) |
Net expenses | | | 2,519,841 | |
|
| | |
Net Investment Loss | | | (1,396,000 | ) |
|
| | |
Realized and Unrealized Gain | | | | |
Net realized gain on investments from unaffiliated companies | | | 53,526,707 | |
Net change in unrealized appreciation/depreciation on investments | | | 10,994,721 | |
|
| | |
Net Increase in Net Assets Resulting from Operations | | $ | 63,125,428 | |
1. June 28, 2013 represents the last business day of the Fund’s semiannual period. See Note 1 of the accompanying Notes.
See accompanying Notes to Financial Statements.
9 OPPENHEIMER DISCOVERY MID CAP GROWTH FUND/VA
| | |
STATEMENTS OF CHANGES IN NET ASSETS |
| | | | | | | | | | |
| | | Six Months Ended
June 28, 20131
(Unaudited) | | | | | Year Ended
December 31, 2012 | |
Operations | | | | | | | | | | |
Net investment income (loss) | | $ | (1,396,000) | | | | | $ | 65,784 | |
Net realized gain | | | 53,526,707 | | | | | | 50,857,244 | |
Net change in unrealized appreciation/depreciation | | | 10,994,721 | | | | | | 42,312,507 | |
Net increase in net assets resulting from operations | | | 63,125,428 | | | | | | 93,235,535 | |
|
| |
Dividends and/or Distributions to Shareholders | | | | | | | | | | |
Dividends from net investment income: | | | | | | | | | | |
Non-Service shares | | | (73,101) | | | | | | — | |
Service shares | | | — | | | | | | — | |
| | | (73,101) | | | | | | — | |
|
| |
Beneficial Interest Transactions | | | | | | | | | | |
Net decrease in net assets resulting from beneficial interest transactions: | | | | | | | | | | |
Non-Service shares | | | (36,699,691) | | | | | | (71,703,483 | ) |
Service shares | | | (5,880,354) | | | | | | (5,448,961 | ) |
| | | (42,580,045) | | | | | | (77,152,444 | ) |
|
| |
Net Assets | | | | | | | | | | |
Total increase | | | 20,472,282 | | | | | | 16,083,091 | |
Beginning of period | | | 594,875,668 | | | | | | 578,792,577 | |
| | | |
End of period (including accumulated net investment income (loss) of $(1,426,371) and $42,730, respectively) | | $ | 615,347,950 | | | | | $ | 594,875,668 | |
1. June 28, 2013 represents the last business day of the Fund’s semiannual period. See Note 1 of the accompanying Notes.
See accompanying Notes to Financial Statements.
10 OPPENHEIMER DISCOVERY MID CAP GROWTH FUND/VA
| | | | | | | | | | | | | | | | | | | | | | | | |
Non-Service Shares | |
| Six Months
Ended
June 28,
20131
(Unaudited) |
| |
| Year Ended
December
31, 2012 |
| |
| Year Ended
December
30, 2011 |
1 | |
| Year Ended
December
31, 2010 |
| |
| Year Ended
December
31, 2009 |
| |
| Year Ended
December
31, 2008 |
|
Per Share Operating Data | | | | | | | | | | | | | | | | | | | | | | | | |
Net asset value, beginning of period | | $ | 54.80 | | | $ | 47.06 | | | $ | 46.55 | | | $ | 36.52 | | | $ | 27.54 | | | $ | 54.07 | |
Income (loss) from investment operations: | | | | | | | | | | | | | | | | | | | | | | | | |
Net investment income (loss)2 | | | (0.13 | ) | | | 0.01 | | | | (0.26 | ) | | | (0.11 | ) | | | (0.05 | ) | | | (0.13 | ) |
Net realized and unrealized gain (loss) | | | 6.07 | | | | 7.73 | | | | 0.77 | | | | 10.14 | | | | 9.03 | | | | (26.40 | ) |
Total from investment operations | | | 5.94 | | | | 7.74 | | | | 0.51 | | | | 10.03 | | | | 8.98 | | | | (26.53 | ) |
Dividends and/or distributions to shareholders: | | | | | | | | | | | | | | | | | | | | | | | | |
Dividends from net investment income | | | (0.01 | ) | | | 0.00 | | | | 0.00 | | | | 0.00 | | | | 0.00 | | | | 0.00 | |
Net asset value, end of period | | $ | 60.73 | | | $ | 54.80 | | | $ | 47.06 | | | $ | 46.55 | | | $ | 36.52 | | | $ | 27.54 | |
| | | | | | |
| | | | | | | | | | | | | | | | | | | | | | | | | |
Total Return, at Net Asset Value3 | | | 10.83% | | | | 16.45% | | | | 1.09% | | | | 27.46% | | | | 32.61% | | | | (49.07)% | |
| | | | | | | | | | | | | | | | | | | | | | | | | |
Ratios/Supplemental Data | | | | | | | | | | | | | | | | | | | | | | | | |
Net assets, end of period (in thousands) | | $ | 581,530 | | | $ | 558,934 | | | $ | 543,020 | | | $ | 611,872 | | | $ | 547,683 | | | $ | 461,684 | |
Average net assets (in thousands) | | $ | 585,087 | | | $ | 575,072 | | | $ | 605,083 | | | $ | 548,739 | | | $ | 478,968 | | | $ | 754,170 | |
Ratios to average net assets:4 | | | | | | | | | | | | | | | | | | | | | | | | |
Net investment income (loss) | | | (0.44)% | | | | 0.03% | | | | (0.53)% | | | | (0.29)% | | | | (0.17)% | | | | (0.30)% | |
Total expenses5 | | | 0.84% | | | | 0.85% | | | | 0.84% | | | | 0.85% | | | | 0.86% | | | | 0.71% | |
Expenses after payments, waivers and/or reimbursements and reduction to custodian expenses | | | 0.80% | | | | 0.80% | | | | 0.80% | | | | 0.76% | | | | 0.71% | | | | 0.68% | |
Portfolio turnover rate | | | 44% | | | | 66% | | | | 91% | | | | 95% | | | | 102% | | | | 78% | |
1. June 28, 2013 and December 30, 2011 represent the last business day of the Fund’s reporting periods. See Note 1 of the accompanying Notes.
2. Per share amounts calculated based on the average shares outstanding during the period.
3. Assumes an initial investment on the business day before the first day of the fiscal period, with all dividends and distributions reinvested in additional shares on the reinvestment date, and redemption at the net asset value calculated on the last business day of the fiscal period. Total returns are not annualized for periods less than one full year. Total return information does not reflect expenses that apply at the separate account level or to related insurance products. Inclusion of these charges would reduce the total return figures for all periods shown. Returns do not reflect the deduction of taxes that a shareholder would pay on fund distributions or the redemption of fund shares.
4. Annualized for periods less than one full year.
5. Total expenses including indirect expenses from affiliated fund were as follows:
| | | | |
Six Months Ended June 28, 2013 | | | 0.84 | % |
Year Ended December 31, 2012 | | | 0.85 | % |
Year Ended December 30, 2011 | | | 0.84 | % |
Year Ended December 31, 2010 | | | 0.85 | % |
Year Ended December 31, 2009 | | | 0.86 | % |
Year Ended December 31, 2008 | | | 0.71 | % |
See accompanying Notes to Financial Statements.
11 OPPENHEIMER DISCOVERY MID CAP GROWTH FUND/VA
| | |
FINANCIAL HIGHLIGHTS Continued |
| | | | | | | | | | | | | | | | | | | | | | | | |
Service Shares | |
| Six Months
Ended
June 28,
20131
(Unaudited) |
| |
| Year Ended
December
31, 2012 |
| |
| Year Ended
December
30, 2011 |
1 | |
| Year Ended
December
31, 2010 |
| |
| Year Ended
December
31, 2009 |
| |
| Year Ended
December
31, 2008 |
|
Per Share Operating Data | | | | | | | | | | | | | | | | | | | | | | | | |
Net asset value, beginning of period | | $ | 53.25 | | | $ | 45.84 | | | $ | 45.46 | | | $ | 35.75 | | | $ | 27.03 | | | $ | 53.22 | |
Income (loss) from investment operations: | | | | | | | | | | | | | | | | | | | | | | | | |
Net investment loss2 | | | (0.20 | ) | | | (0.12 | ) | | | (0.37 | ) | | | (0.20 | ) | | | (0.13 | ) | | | (0.24 | ) |
Net realized and unrealized gain (loss) | | | 5.89 | | | | 7.53 | | | | 0.75 | | | | 9.91 | | | | 8.85 | | | | (25.95 | ) |
Total from investment operations | | | 5.69 | | | | 7.41 | | | | 0.38 | | | | 9.71 | | | | 8.72 | | | | (26.19 | ) |
Dividends and/or distributions to shareholders: | | | | | | | | | | | | | | | | | | | | | | | | |
Dividends from net investment income | | | 0.00 | | | | 0.00 | | | | 0.00 | | | | 0.00 | | | | 0.00 | | | | 0.00 | |
Net asset value, end of period | | $ | 58.94 | | | $ | 53.25 | | | $ | 45.84 | | | $ | 45.46 | | | $ | 35.75 | | | $ | 27.03 | |
| | | | | | |
| | | | | | | | | | | | | | | | | | | | | | | | | |
Total Return, at Net Asset Value3 | | | 10.68% | | | | 16.17% | | | | 0.83% | | | | 27.16% | | | | 32.26% | | | | (49.21)% | |
| | | | | | | | | | | | | | | | | | | | | | | | | |
Ratios/Supplemental Data | | | | | | | | | | | | | | | | | | | | | | | | |
Net assets, end of period (in thousands) | | $ | 33,818 | | | $ | 35,942 | | | $ | 35,773 | | | $ | 32,669 | | | $ | 26,098 | | | $ | 21,952 | |
Average net assets (in thousands) | | $ | 36,144 | | | $ | 37,842 | | | $ | 37,775 | | | $ | 27,552 | | | $ | 22,605 | | | $ | 35,815 | |
Ratios to average net assets:4 | | | | | | | | | | | | | | | | | | | | | | | | |
Net investment loss | | | (0.69)% | | | | (0.22)% | | | | (0.78)% | | | | (0.53)% | | | | (0.44)% | | | | (0.57)% | |
Total expenses5 | | | 1.09% | | | | 1.10% | | | | 1.09% | | | | 1.10% | | | | 1.12% | | | | 0.98% | |
Expenses after payments, waivers and/or reimbursements and reduction to custodian expenses | | | 1.05% | | | | 1.05% | | | | 1.05% | | | | 1.01% | | | | 0.97% | | | | 0.95% | |
Portfolio turnover rate | | | 44% | | | | 66% | | | | 91% | | | | 95% | | | | 102% | | | | 78% | |
1. June 28, 2013 and December 30, 2011 represent the last business day of the Fund’s reporting periods. See Note 1 of the accompanying Notes.
2. Per share amounts calculated based on the average shares outstanding during the period.
3. Assumes an initial investment on the business day before the first day of the fiscal period, with all dividends and distributions reinvested in additional shares on the reinvestment date, and redemption at the net asset value calculated on the last business day of the fiscal period. Total returns are not annualized for periods less than one full year. Total return information does not reflect expenses that apply at the separate account level or to related insurance products. Inclusion of these charges would reduce the total return figures for all periods shown. Returns do not reflect the deduction of taxes that a shareholder would pay on fund distributions or the redemption of fund shares.
4. Annualized for periods less than one full year.
5. Total expenses including indirect expenses from affiliated fund were as follows:
| | | | |
Six Months Ended June 28, 2013 | | | 1.09 | % |
Year Ended December 31, 2012 | | | 1.10 | % |
Year Ended December 30, 2011 | | | 1.09 | % |
Year Ended December 31, 2010 | | | 1.10 | % |
Year Ended December 31, 2009 | | | 1.12 | % |
Year Ended December 31, 2008 | | | 0.98 | % |
See accompanying Notes to Financial Statements.
12 OPPENHEIMER DISCOVERY MID CAP GROWTH FUND/VA
| | |
NOTES TO FINANCIAL STATEMENTS Unaudited |
1. Significant Accounting Policies
Oppenheimer Discovery Mid-Cap Growth Fund/VA (the “Fund”), formerly Oppenheimer Small- & Mid-Cap Growth Fund/VA, is a separate series of Oppenheimer Variable Account Funds, a diversified open-end management investment company registered under the Investment Company Act of 1940, as amended. The Fund’s investment objective is to seek capital appreciation. The Fund’s investment adviser is OFI Global Asset Management, Inc. (“OFI Global” or the “Manager”), a wholly-owned subsidiary of OppenheimerFunds, Inc. (“OFI” or the “Sub-Adviser”). The Manager has entered into a sub-advisory agreement with OFI. Shares of the Fund are sold only to separate accounts of life insurance companies.
The Fund offers two classes of shares. Both classes are sold at their offering price, which is the net asset value per share, to separate investment accounts of participating insurance companies as an underlying investment for variable life insurance policies, variable annuity contracts or other investment products. The class of shares designated as Service shares is subject to a distribution and service plan. Both classes of shares have identical rights and voting privileges with respect to the Fund in general and exclusive voting rights on matters that affect that class alone. Earnings, net assets and net asset value per share may differ due to each class having its own expenses, such as transfer and shareholder servicing agent fees and shareholder communications, directly attributable to that class.
The following is a summary of significant accounting policies consistently followed by the Fund.
Semiannual and Annual Periods. The Fund’s financial statements are presented through the last day the New York Stock Exchange was open for trading during each reporting period. The Fund’s financial statements have been presented through that date to maintain consistency with the Fund’s net asset value calculations used for shareholder transactions.
Investment in Oppenheimer Institutional Money Market Fund. The Fund is permitted to invest daily available cash balances in an affiliated money market fund. The Fund may invest the available cash in Class E shares of Oppenheimer Institutional Money Market Fund (“IMMF”) to seek current income while preserving liquidity. IMMF is a registered open-end management investment company, regulated as a money market fund under the Investment Company Act of 1940, as amended. The Manager is the investment adviser of IMMF, and the Sub-Adviser provides investment and related advisory services to IMMF. When applicable, the Fund’s investment in IMMF is included in the Statement of Investments. Shares of IMMF are valued at their net asset value per share. As a shareholder, the Fund is subject to its proportional share of IMMF’s Class E expenses, including its management fee. The Manager will waive fees and/or reimburse Fund expenses in an amount equal to the indirect management fees incurred through the Fund’s investment in IMMF.
Allocation of Income, Expenses, Gains and Losses. Income, expenses (other than those attributable to a specific class), gains and losses are allocated on a daily basis to each class of shares based upon the relative proportion of net assets represented by such class. Operating expenses directly attributable to a specific class are charged against the operations of that class.
Federal Taxes. The Fund intends to comply with provisions of the Internal Revenue Code applicable to regulated investment companies and to distribute substantially all of its investment company taxable income, including any net realized gain on investments not offset by capital loss carryforwards, if any, to shareholders. Therefore, no federal income or excise tax provision is required. The Fund files income tax returns in U.S. federal and applicable state jurisdictions. The statute of limitations on the Fund’s tax return filings generally remain open for the three preceding fiscal reporting period ends.
During the fiscal year ended December 31, 2012, the Fund utilized $44,334,654 of capital loss carryforward to offset capital gains realized in that fiscal year. The Fund had post-October losses of $1,360,650. Details of the fiscal year ended December 31, 2012 capital loss carryforwards are included in the table below. Capital loss carryforwards with no expiration, if any, must be utilized prior to those with expiration dates. Capital losses with no expiration will be carried forward to future years if not offset by gains.
| | | | |
| Expiring | | | |
2017 | | $ | 172,735,813 | |
As of June 28, 2013, it is estimated that the capital loss carryforwards would be $119,209,106 expiring by 2017. The estimated capital loss carryforward represents the carryforward as of the end of the last fiscal year, increased or decreased by capital losses or gains realized in the first six months of the current fiscal year. During the six months ended June 28, 2013, it is estimated that the Fund will utilize $53,526,707 of capital loss carryforward to offset realized capital gains.
Net investment income (loss) and net realized gain (loss) may differ for financial statement and tax purposes. The character of dividends and distributions made during the fiscal year from net investment income or net realized gains may differ from their ultimate characterization for federal income tax purposes. Also, due to timing of dividends and distributions, the fiscal year in which amounts are distributed may differ from the fiscal year in which the income or net realized gain was recorded by the Fund.
The aggregate cost of securities and other investments and the composition of unrealized appreciation and depreciation of securities and other investments for federal income tax purposes as of June 28, 2013 are noted in the following table. The primary difference between book and tax appreciation or depreciation of securities and other investments, if applicable, is attributable to the tax deferral of losses or tax realization of financial statement unrealized gain or loss.
13 OPPENHEIMER DISCOVERY MID CAP GROWTH FUND/VA
| | |
NOTES TO FINANCIAL STATEMENTS Unaudited / Continued |
1. Significant Accounting Policies (Continued)
| | | | |
Federal tax cost of securities | | $ | 439,183,198 | |
| | | | |
Gross unrealized appreciation | | $ | 180,418,996 | |
Gross unrealized depreciation | | | (3,725,622) | |
| | | | |
Net unrealized appreciation | | $ | 176,693,374 | |
| | | | |
Trustees’ Compensation. The Board of Trustees has adopted a compensation deferral plan for independent trustees that enables trustees to elect to defer receipt of all or a portion of the annual compensation they are entitled to receive from the Fund. For purposes of determining the amount owed to the Trustee under the plan, deferred amounts are treated as though equal dollar amounts had been invested in shares of the Fund or in other Oppenheimer funds selected by the Trustee. The Fund purchases shares of the funds selected for deferral by the Trustee in amounts equal to his or her deemed investment, resulting in a Fund asset equal to the deferred compensation liability. Such assets are included as a component of “Other” within the asset section of the Statement of Assets and Liabilities. Deferral of trustees’ fees under the plan will not affect the net assets of the Fund, and will not materially affect the Fund’s assets, liabilities or net investment income per share. Amounts will be deferred until distributed in accordance with the compensation deferral plan.
Dividends and Distributions to Shareholders. Dividends and distributions to shareholders, which are determined in accordance with income tax regulations and may differ from U.S. generally accepted accounting principles, are recorded on the ex-dividend date. Income and capital gain distributions, if any, are declared and paid annually or at other times as deemed necessary by the Manager. The tax character of distributions is determined as of the Fund’s fiscal year end. Therefore, a portion of the Fund’s distributions made to shareholders prior to the Fund’s fiscal year end may ultimately be categorized as a tax return of capital.
Investment Income. Dividend income is recorded on the ex-dividend date or upon ex-dividend notification in the case of certain foreign dividends where the ex-dividend date may have passed. Non-cash dividends included in dividend income, if any, are recorded at the fair market value of the securities received. Interest income is recognized on an accrual basis. Discount and premium, which are included in interest income on the Statement of Operations, are amortized or accreted daily.
Custodian Fees. “Custodian fees and expenses” in the Statement of Operations may include interest expense incurred by the Fund on any cash overdrafts of its custodian account during the period. Such cash overdrafts may result from the effects of failed trades in portfolio securities and from cash outflows resulting from unanticipated shareholder redemption activity. The Fund pays interest to its custodian on such cash overdrafts, to the extent they are not offset by positive cash balances maintained by the Fund, at a rate equal to the Federal Funds Rate plus 0.50%. The “Reduction to custodian expenses” line item, if applicable, represents earnings on cash balances maintained by the Fund during the period. Such interest expense and other custodian fees may be paid with these earnings.
Security Transactions. Security transactions are recorded on the trade date. Realized gains and losses on securities sold are determined on the basis of identified cost.
Indemnifications. The Fund’s organizational documents provide current and former trustees and officers with a limited indemnification against liabilities arising in connection with the performance of their duties to the Fund. In the normal course of business, the Fund may also enter into contracts that provide general indemnifications. The Fund’s maximum exposure under these arrangements is unknown as this would be dependent on future claims that may be made against the Fund. The risk of material loss from such claims is considered remote.
Other. The preparation of financial statements in conformity with accounting principles generally accepted in the United States of America requires management to make estimates and assumptions that affect the reported amounts of assets and liabilities and disclosure of contingent assets and liabilities at the date of the financial statements and the reported amounts of increases and decreases in net assets from operations during the reporting period. Actual results could differ from those estimates.
2. Securities Valuation
The Fund calculates the net asset value of its shares as of the close of the New York Stock Exchange (the “Exchange”), normally 4:00 P.M. Eastern time, on each day the Exchange is open for trading.
The Fund’s Board has adopted procedures for the valuation of the Fund’s securities and has delegated the day-to-day responsibility for valuation determinations under those procedures to the Manager. The Manager has established a Valuation Committee which is responsible for determining a “fair valuation” for any security for which market quotations are not “readily available.” The Valuation Committee’s fair valuation determinations are subject to review, approval and ratification by the Fund’s Board at its next regularly scheduled meeting covering the calendar quarter in which the fair valuation was determined.
Valuation Methods and Inputs
Securities are valued using unadjusted quoted market prices, when available, as supplied primarily by third party pricing services or dealers.
The following methodologies are used to determine the market value or the fair value of the types of securities described below:
14 OPPENHEIMER DISCOVERY MID CAP GROWTH FUND/VA
2. Securities Valuation (Continued)
Securities traded on a registered U.S. securities exchange (including exchange-traded derivatives other than futures and futures options) are valued based on the last sale price of the security reported on the principal exchange on which it is traded, prior to the time when the Fund’s assets are valued. In the absence of a sale, the security is valued at the last sale price on the prior trading day, if it is within the spread of the current day’s closing “bid” and “asked” prices, and if not, at the current day’s closing bid price. A security of a foreign issuer traded on a foreign exchange but not listed on a registered U.S. securities exchange is valued based on the last sale price on the principal exchange on which the security is traded, as identified by the third party pricing service used by the Manager, prior to the time when the Fund’s assets are valued. If the last sale price is unavailable, the security is valued at the most recent official closing price on the principal exchange on which it is traded. If the last sales price or official closing price for a foreign security is not available, the security is valued at the mean between the bid and asked price per the exchange or, if not available from the exchange, obtained from two dealers. If bid and asked prices are not available from either the exchange or two dealers, the security is valued by using one of the following methodologies (listed in order of priority); (1) using a bid from the exchange, (2) the mean between the bid and asked price as provided by a single dealer, or (3) a bid from a single dealer.
Shares of a registered investment company that are not traded on an exchange are valued at that investment company’s net asset value per share.
Corporate and government debt securities (of U.S. or foreign issuers) and municipal debt securities, event-linked bonds, loans, mortgage-backed securities, collateralized mortgage obligations, and asset-backed securities are valued at the mean between the “bid” and “asked” prices utilizing evaluated prices obtained from third party pricing services or broker-dealers who may use matrix pricing methods to determine the evaluated prices.
Short-term money market type debt securities with a remaining maturity of sixty days or less are valued at cost adjusted by the amortization of discount or premium to maturity (amortized cost), which approximates market value. Short-term debt securities with a remaining maturity in excess of sixty days are valued at the mean between the “bid” and “asked” prices utilizing evaluated prices obtained from third party pricing services or broker-dealers.
A description of the standard inputs that may generally be considered by the third party pricing vendors in determining their evaluated prices is provided below.
| | |
| Security Type | | Standard inputs generally considered by third-party pricing vendors |
| Corporate debt, government debt, municipal, mortgage-backed and asset-backed securities | | Reported trade data, broker-dealer price quotations, benchmark yields, issuer spreads on comparable securities, the credit quality, yield, maturity, and other appropriate factors. |
| Loans | | Information obtained from market participants regarding reported trade data and broker-dealer price quotations. |
| Event-linked bonds | | Information obtained from market participants regarding reported trade data and broker-dealer price quotations. |
If a market value or price cannot be determined for a security using the methodologies described above, or if, in the “good faith” opinion of the Manager, the market value or price obtained does not constitute a “readily available market quotation,” or a significant event has occurred that would materially affect the value of the security the security is fair valued either (i) by a standardized fair valuation methodology applicable to the security type or the significant event as previously approved by the Valuation Committee and the Fund’s Board or (ii) as determined in good faith by the Manager’s Valuation Committee. The Valuation Committee considers all relevant facts that are reasonably available, through either public information or information available to the Manager, when determining the fair value of a security. Fair value determinations by the Manager are subject to review, approval and ratification by the Fund’s Board at its next regularly scheduled meeting covering the calendar quarter in which the fair valuation was determined. Those fair valuation standardized methodologies include, but are not limited to, valuing securities at the last sale price or initially at cost and subsequently adjusting the value based on: changes in company specific fundamentals, changes in an appropriate securities index, or changes in the value of similar securities which may be further adjusted for any discounts related to security-specific resale restrictions. When possible, such methodologies use observable market inputs such as unadjusted quoted prices of similar securities, observable interest rates, currency rates and yield curves. The methodologies used for valuing securities are not necessarily an indication of the risks associated with investing in those securities nor can it be assured that the Fund can obtain the fair value assigned to a security if it were to sell the security.
To assess the continuing appropriateness of security valuations, the Manager, or its third party service provider who is subject to oversight by the Manager, regularly compares prior day prices, prices on comparable securities, and sale prices to the current day prices and challenges those prices exceeding certain tolerance levels with the third party pricing service or broker source. For those securities valued by fair valuations, whether through a standardized fair valuation methodology or a fair valuation determination, the Valuation Committee reviews and affirms the reasonableness of the valuations based on such methodologies and fair valuation determinations on a regular basis after considering all relevant information that is reasonably available.
Classifications
Each investment asset or liability of the Fund is assigned a level at measurement date based on the significance and source of the inputs to its valuation. Various data inputs are used in determining the value of each of the Fund’s investments as of the reporting period end. These data inputs are categorized in the following hierarchy under applicable financial accounting standards:
1) Level 1-unadjusted quoted prices in active markets for identical assets or liabilities (including securities actively traded on a securities exchange)
2) Level 2-inputs other than unadjusted quoted prices that are observable for the asset or liability (such as unadjusted quoted prices for similar assets and market corroborated inputs such as interest rates, prepayment speeds, credit risks, etc.)
15 OPPENHEIMER DISCOVERY MID CAP GROWTH FUND/VA
| | |
NOTES TO FINANCIAL STATEMENTS Unaudited / Continued |
2. Securities Valuation (Continued)
3) Level 3-significant unobservable inputs (including the Manager’s own judgments about assumptions that market participants would use in pricing the asset or liability).
The inputs used for valuing securities are not necessarily an indication of the risks associated with investing in those securities.
The table below categorizes amounts that are included in the Fund’s Statement of Assets and Liabilities as of June 28, 2013 based on valuation input level:
| | | | | | | | | | | | | | | | |
| | | Level 1—
Unadjusted
Quoted Prices | | | Level 2—
Other Significant
Observable Inputs | | | Level 3—
Significant
Unobservable
Inputs | | | Value | |
Assets Table | | | | | | | | | | | | | | | | |
Investments, at Value: | | | | | | | | | | | | | | | | |
Common Stocks | | | | | | | | | | | | | | | | |
Consumer Discretionary | | $ | 134,750,669 | | | $ | — | | | $ | — | | | $ | 134,750,669 | |
Consumer Staples | | | 30,633,063 | | | | — | | | | — | | | | 30,633,063 | |
Energy | | | 41,843,298 | | | | — | | | | — | | | | 41,843,298 | |
Financials | | | 43,726,456 | | | | — | | | | — | | | | 43,726,456 | |
Health Care | | | 81,847,102 | | | | — | | | | — | | | | 81,847,102 | |
Industrials | | | 116,839,898 | | | | — | | | | — | | | | 116,839,898 | |
Information Technology | | | 123,842,831 | | | | — | | | | — | | | | 123,842,831 | |
Materials | | | 20,900,170 | | | | — | | | | — | | | | 20,900,170 | |
Telecommunication Services | | | 12,259,448 | | | | — | | | | — | | | | 12,259,448 | |
Investment Company | | | 9,233,637 | | | | — | | | | — | | | | 9,233,637 | |
| | | | |
Total Assets | | $ | 615,876,572 | | | $ | — | | | $ | — | | | $ | 615,876,572 | |
| | | | |
Currency contracts and forwards, if any, are reported at their unrealized appreciation/ depreciation at measurement date, which represents the change in the contract’s value from trade date. Futures, if any, are reported at their variation margin at measurement date, which represents the amount due to/from the Fund at that date. All additional assets and liabilities included in the above table are reported at their market value at measurement date.
3. Shares of Beneficial Interest
The Fund has authorized an unlimited number of $0.001 par value shares of beneficial interest of each class. Transactions in shares of beneficial interest were as follows:
| | | | | | | | | | | | | | | | | | | | |
| | | Six Months Ended June 28, 2013 | | | | | Year Ended December 31, 2012 | | | |
| | | Shares | | | Amount | | | | | Shares | | | Amount | | | |
Non-Service Shares | | | | | | | | | | | | | | | | | | | | |
Sold | | | 271,855 | | | $ | 16,387,488 | | | | | | 424,674 | | | $ | 22,730,798 | | | |
Dividends and/or distributions reinvested | | | 1,176 | | | | 73,101 | | | | | | — | | | | — | | | |
Redeemed | | | (896,499 | ) | | | (53,160,280 | ) | | | | | (1,765,118 | ) | | | (94,434,281 | ) | | |
| | | |
Net decrease | | | (623,468 | ) | | $ | (36,699,691 | ) | | | | | (1,340,444 | ) | | $ | (71,703,483 | ) | | |
| | | |
| | | | | | | | | | | | | | | | | | | | |
Service Shares | | | | | | | | | | | | | | | | | | | | |
Sold | | | 40,915 | | | $ | 2,326,506 | | | | | | 138,098 | | | $ | 7,173,273 | | | |
Dividends and/or distributions reinvested | | | — | | | | — | | | | | | — | | | | — | | | |
Redeemed | | | (142,135 | ) | | | (8,206,860 | ) | | | | | (243,546 | ) | | | (12,622,234 | ) | | |
| | | |
Net decrease | | | (101,220 | ) | | $ | (5,880,354 | ) | | | | | (105,448 | ) | | $ | (5,448,961 | ) | | |
| | | |
4. Purchases and Sales of Securities
The aggregate cost of purchases and proceeds from sales of securities, other than short-term obligations and investments in IMMF, for the six months ended June 28, 2013, were as follows:
| | | | | | | | | | |
| | | Purchases | | | | | Sales | |
Investment securities | | $ | 267,580,528 | | | | | $ | 304,042,995 | |
5. Fees and Other Transactions with Affiliates
Management Fees. Under the investment advisory agreement, the Fund pays the Manager a management fee based on the daily net assets of the Fund at an annual rate as shown in the following table:
| | | | |
| Fee Schedule | | | |
Up to $200 million | | | 0.75% | |
Next $200 million | | | 0.72 | |
Next $200 million | | | 0.69 | |
Next $200 million | | | 0.66 | |
Next $700 million | | | 0.60 | |
Over $1.5 billion | | | 0.58 | |
16 OPPENHEIMER DISCOVERY MID CAP GROWTH FUND/VA
5. Fees and Other Transactions with Affiliates (Continued)
Sub-Adviser Fees. The Manager has retained the Sub-Adviser to provide the day-to-day portfolio management of the Fund. Under the Sub-Advisory Agreement, the Manager pays the Sub-Adviser an annual fee in monthly installments, equal to a percentage of the investment management fee collected by the Manager from the Fund, which shall be calculated after any investment management fee waivers. The fee paid to the Sub-Adviser is paid by the Manager, not by the Fund.
Transfer Agent Fees. OFI Global (the “Transfer Agent”) serves as the transfer and shareholder servicing agent for the Fund. Fees incurred by the Fund with respect to these services are detailed in the statement of operations.
Sub-Transfer Agent Fees. The Transfer Agent has retained Shareholder Services, Inc., a wholly-owned subsidiary of OFI (the “Sub-Transfer Agent”), to provide the day-to-day transfer agent and shareholder servicing of the Fund. Under the Sub-Transfer Agency Agreement, the Transfer Agent pays the Sub-Transfer Agent an annual fee in monthly installments, equal to a percentage of the transfer agent fee collected by the Transfer Agent from the Fund, which shall be calculated after any applicable fee waivers. The fee paid to the Sub-Transfer Agent is paid by the Transfer Agent, not by the Fund.
Distribution and Service Plan for Service Shares. The Fund has adopted a Distribution and Service Plan (the “Plan”) in accordance with Rule 12b-1 under the Investment Company Act of 1940 for Service shares to pay OppenheimerFunds Distributor, Inc. (the “Distributor”), for distribution related services, personal service and account maintenance for the Fund’s Service shares. Under the Plan, payments are made periodically at an annual rate of 0.25% of the daily net assets of Service shares of the Fund. The Distributor currently uses all of those fees to compensate sponsors of the insurance product that offers Fund shares, for providing personal service and maintenance of accounts of their variable contract owners that hold Service shares. These fees are paid out of the Fund’s assets on an on-going basis and increase operating expenses of the Service shares, which results in lower performance compared to the Fund’s shares that are not subject to a service fee. Fees incurred by the Fund under the Plan are detailed in the Statement of Operations.
Waivers and Reimbursements of Expenses. The Manager has voluntarily agreed to limit the Fund’s expenses after payments, waivers and/or reimbursements and reduction to custodian expenses, excluding expenses incurred directly or indirectly by the Fund as a result of investments in other investment companies, wholly-owned subsidiaries and pooled investment vehicles; so that those expenses, as percentages of daily net assets, will not exceed the annual rate of 0.80% for Non-Service shares and 1.05% for Service shares. During the six months ended June 28, 2013, the Manager waived fees and/or reimbursed the Fund $107,892 and $5,823 for Non-Service and Service shares, respectively.
The Manager will waive fees and/or reimburse Fund expenses in an amount equal to the indirect management fees incurred through the Fund’s investment in IMMF. During the six months ended June 28, 2013, the Manager waived fees and/or reimbursed the Fund $4,539 for IMMF management fees.
Some of these undertakings may be modified or terminated at any time; some may not be modified or terminated until after one year from the date of the current prospectus, as indicated therein.
6. Pending Litigation
Since 2009, a number of class action lawsuits have been pending in federal courts against OppenheimerFunds, Inc. (“OFI”), OppenheimerFunds Distributor, Inc., the Fund’s principal underwriter and distributor (the “Distributor”), and certain funds (but not including the Fund) advised by the Manager and distributed by the Distributor (the “Defendant Funds”). Several of these lawsuits also name as defendants certain officers and current and former trustees of the respective Defendant Funds. The lawsuits raise claims under federal securities law and allege, among other things, that the disclosure documents of the respective Defendant Funds contained misrepresentations and omissions and that the respective Defendant Funds’ investment policies were not followed. The plaintiffs in these actions seek unspecified damages, equitable relief and awards of attorneys’ fees and litigation expenses. The Defendant Funds’ Boards of Trustees have also engaged counsel to represent the Funds and the present and former Independent Trustees named in those suits.
Other class action and individual lawsuits have been filed since 2008 in various state and federal courts against OFI and certain of its affiliates by investors seeking to recover investments they allegedly lost as a result of the “Ponzi” scheme run by Bernard L. Madoff and his firm, Bernard L. Madoff Investment Securities, LLC (“BLMIS”). Plaintiffs in these suits allege that they suffered losses as a result of their investments in several funds managed by an affiliate of OFI and assert a variety of claims, including breach of fiduciary duty, fraud, negligent misrepresentation, unjust enrichment, and violation of federal and state securities laws and regulations, among others. They seek unspecified damages, equitable relief and awards of attorneys’ fees and litigation expenses. Neither the Distributor, nor any of the Oppenheimer mutual funds, their independent trustees or directors are named as defendants in these lawsuits. None of the Oppenheimer mutual funds invested in any funds or accounts managed by Madoff or BLMIS. On February 28, 2011, a stipulation of partial settlement of three groups of consolidated putative class action lawsuits relating to these matters was filed in the U.S. District Court for the Southern District of New York. On August 19, 2011, the court entered an order and final judgment approving the settlement as fair, reasonable and adequate. In September 2011, certain parties filed notices of appeal from the court’s order approving the settlement. The settlement does not resolve other outstanding lawsuits against OFI and its affiliates relating to BLMIS.
On April 16, 2010, a lawsuit was filed in New York state court against (i) OFI, (ii) an affiliate of OFI and (iii) AAArdvark IV Funding Limited (“AAArdvark IV”), an entity advised by OFI’s affiliate, in connection with investments made by the plaintiffs in AAArdvark IV. Plaintiffs allege breach of contract and common law fraud claims against the defendants and seek compensatory damages, costs and disbursements, including attorney fees. On April 11, 2013, the court granted defendants’ motion for summary judgment, dismissing plaintiffs’ fraud claim with prejudice and dismissing their
17 OPPENHEIMER DISCOVERY MID CAP GROWTH FUND/VA
| | |
NOTES TO FINANCIAL STATEMENTS Unaudited / Continued |
6. Pending Litigation (Continued)
contract claim without prejudice, and granted plaintiffs leave to replead their contract claim to assert a cause of action for specific performance within 30 days. On May 9, 2013, plaintiffs filed a notice of appeal from the court’s dismissal order. On July 15, 2011, a lawsuit was filed in New York state court against OFI, an affiliate of OFI and AAArdvark Funding Limited (“AAArdvark I”), an entity advised by OFI’s affiliate, in connection with investments made by the plaintiffs in AAArdvark I. The complaint alleges breach of contract and common law fraud claims against the defendants and seeks compensatory damages, costs and disbursements, including attorney fees. On November 9, 2011, a lawsuit was filed in New York state court against OFI, an affiliate of OFI and AAArdvark XS Funding Limited (“AAArdvark XS”), an entity advised by OFI’s affiliate, in connection with investments made by the plaintiffs in AAArdvark XS. The complaint alleges breach of contract against the defendants and seeks compensatory damages, costs and disbursements, including attorney fees.
OFI believes the lawsuits and appeals described above are without legal merit and, with the exception of actions it has settled, is defending against them vigorously. While it is premature to render any opinion as to the outcome in these lawsuits, or whether any costs that the Defendant Funds may bear in defending the suits might not be reimbursed by insurance, OFI believes that these suits should not impair the ability of OFI or the Distributor to perform their respective duties to the Fund, and that the outcome of all of the suits together should not have any material effect on the operations of any of the Oppenheimer mutual funds.
18 OPPENHEIMER DISCOVERY MID CAP GROWTH FUND/VA
| | |
PORTFOLIO PROXY VOTING POLICIES AND PROCEDURES; UPDATES TO STATEMENTS OF INVESTMENTS Unaudited |
The Fund has adopted Portfolio Proxy Voting Policies and Procedures under which the Fund votes proxies relating to securities (“portfolio proxies”) held by the Fund. A description of the Fund’s Portfolio Proxy Voting Policies and Procedures is available (i) without charge, upon request, by calling the Fund toll-free at 1.800.CALL OPP (225.5677), (ii) on the Fund’s website at oppenheimerfunds.com, and (iii) on the SEC’s website at www.sec.gov. In addition, the Fund is required to file Form N-PX, with its complete proxy voting record for the 12 months ended June 30th, no later than August 31st of each year. The Fund’s voting record is available (i) without charge, upon request, by calling the Fund toll-free at 1.800.CALL OPP (225.5677), and (ii) in the Form N-PX filing on the SEC’s website at www.sec.gov.
The Fund files its complete schedule of portfolio holdings with the SEC for the first quarter and the third quarter of each fiscal year on Form N-Q. The Fund’s Form N-Q filings are available on the SEC’s website at www.sec.gov. Those forms may be reviewed and copied at the SEC’s Public Reference Room in Washington, D.C. Information on the operation of the Public Reference Room may be obtained by calling 1-800-SEC-0330.
19 OPPENHEIMER DISCOVERY MID CAP GROWTH FUND/VA
| | |
OPPENHEIMER DISCOVERY MID CAP GROWTH FUND/VA |
| | |
| A Series of Oppenheimer Variable Account Funds |
| Trustees and Officers | | Sam Freedman, Chairman of the Board of Trustees and Trustee Edward L. Cameron, Trustee Jon S. Fossel, Trustee Richard F. Grabish, Trustee Beverly L. Hamilton, Trustee Victoria J. Herget, Trustee Robert J. Malone, Trustee F. William Marshall, Jr., Trustee Karen L. Stuckey, Trustee James D. Vaughn, Trustee William F. Glavin, Jr., Trustee, President and Principal Executive Officer Ronald J. Zibelli, Jr., Vice President Arthur S. Gabinet, Secretary and Chief Legal Officer Christina M. Nasta, Vice President and Chief Business Officer Mark S. Vandehey, Vice President and Chief Compliance Officer Brian W. Wixted, Treasurer and Principal Financial & Accounting Officer |
| |
| Manager | | OFI Global Asset Management, Inc. |
| |
| Sub-Adviser | | OppenheimerFunds, Inc. |
| |
| Distributor | | OppenheimerFunds Distributor, Inc. |
| |
| Transfer and Shareholder Servicing Agent | | OFI Global Asset Management, Inc. |
| |
Sub-Transfer
Agent | | Shareholder Services, Inc. DBA OppenheimerFunds Services |
| |
Independent Registered
Public
Accounting
Firm | | KPMG LLP |
| |
| Legal Counsel | | K&L Gates LLP |
| |
| | Before investing in any of the Oppenheimer funds, investors should carefully consider a fund’s investment objectives, risks, charges and expenses. Fund prospectuses and summary prospectuses contain this and other information about the funds and may be obtained by asking your financial advisor, visiting oppenheimerfunds.com, or calling us at 1.800.988.8287. Read prospectuses and summary prospectuses carefully before investing. |
| |
| | The financial statements included herein have been taken from the records of the Fund without examination of those records by the independent registered public accounting firm. |
| |
| | © 2013 OppenheimerFunds, Inc. All rights reserved. Oppenheimer funds are distributed by OppenheimerFunds Distributor, Inc. |
| | | | | | |
| | June 30, 2013 | | |
| | | | |
| | | | Oppenheimer | | Semiannual Report |
| | | | Capital Income Fund/VA* | |
| | | | A Series of Oppenheimer Variable Account Funds | |
| | | | | | |
| | | | SEMIANNUAL REPORT | | |
| | | | Listing of Top Holdings Fund Performance Discussion Financial Statements | | |
| | * Prior to 4/30/13, the Fund’s name was Oppenheimer Balanced Fund/VA | | |

| | | | | | | | |
Portfolio Managers: Magnus Krantz1 and Krishna Memani | | |
Cumulative Total Returns For the 6-Month Period Ended 6/28/132 |
Non-Service Shares | | 5.65% | | | | | | |
Service Shares | | 5.57 | | | | | | |
Average Annual Total Returns For the Periods Ended 6/28/132 | | |
| | | 1-Year | | 5-Year | | 10-Year | | |
Non-Service Shares | | 13.54% | | -0.03% | | 3.25% | | |
Service Shares | | 13.36% | | -0.26% | | 2.99% | | |
| | | | |
| | The performance data quoted represents past performance, which does not guarantee future results. The investment return and principal value of an investment in the Fund will fluctuate so that an investor’s shares, when redeemed, may be worth more or less than their original cost. Current performance may be lower or higher than the performance quoted. For performance data current to the most recent month end, call us at 1.800.988.8287. The Fund’s total returns should not be expected to be the same as the returns of other funds, whether or not both funds have the same portfolio managers and/or similar names. The Fund’s total returns include changes in share price and reinvested distributions but do not include the charges associated with the separate account products that offer this Fund. Such performance would have been lower if such charges were taken into account. | | |
TOP TEN COMMON STOCK HOLDINGS
| | | | |
| | Chevron Corp. | | 1.1% |
| | Apple, Inc. | | 1.0 |
| | National Oilwell Varco, Inc. | | 0.9 |
| | Philip Morris International, Inc. | | 0.8 |
| | Discover Financial Services | | 0.8 |
| | JPMorgan Chase & Co. | | 0.8 |
| | Google, Inc., Cl. A | | 0.8 |
| | Citigroup, Inc. | | 0.7 |
| | Pfizer, Inc. | | 0.7 |
| | QUALCOMM, Inc. | | 0.7 |
| | Portfolio holdings and allocations are subject to change. Percentages are as of June 28, 2013, and are based on net assets. For more current Fund holdings, please visit oppenheimerfunds.com. |
| | | | | |
| PORTFOLIO ALLOCATION | | | | | |
Common Stocks | | | | 35.3 | % |
Mortgage-Backed Obligations | | | | 23.9 | |
Non-Convertible Corporate Bonds and Notes | | | | 23.1 | |
Asset-Backed Securities | | | | 9.7 | |
Investment Company | | | | 7.2 | |
U.S. Government Obligations | | | | 0.8 | |
Portfolio holdings and allocations are subject to change. Percentages are as of June 28, 2013, and are based on the total market value of investments.
1. Magnus Krantz became a Portfolio Manager in April 2013.
2. June 28, 2013, was the last business day of the Fund’s semiannual period.
See Note 1 of the accompanying Notes to Financial Statements.
2 OPPENHEIMER CAPITAL INCOME FUND/VA
Fund Performance Discussion
The Fund’s Non-Service shares produced a return of 5.65% during the reporting period. On a relative basis, the Fund outperformed its Reference Index, which returned 3.14%. The Fund’s Reference Index is a customized weighted index currently comprised of the following underlying broad-based security indices: 65% of the Barclays U.S. Aggregate Bond Index and 35% of the Russell 3000 Index. Measured separately, the Barclays U.S. Aggregate Bond Index returned -2.44% and the Russell 3000 Index returned 14.06%.
GLOBAL MARKET AND ECONOMIC ENVIRONMENT
Early in the reporting period, the highly accommodative policies of central banks throughout the world and positive data surprises in the U.S. regarding housing and employment buoyed investor sentiment and resulted in a rally in risk markets. The continuation of the Bank of Japan’s massive asset purchase program “Abe-nomics” was a major driving force as Japanese investors were pushed out on the risk curve away from Japanese government bonds (JGBs) and into riskier assets. At the end of May, market volatility picked up measurably as comments from Fed Chairman Ben Bernanke at a Congressional hearing surprised the market when he indicated a possible slowdown of the central bank’s asset purchase program if the economy continued to show improvement. Additionally, fears began to creep into the market about a possible slowdown in the world’s emerging economies. As a result, risk assets sold off across the board, with Japanese stocks and emerging market debt absorbing the brunt of the selling, although investment grade credit was certainly not immune.
Simultaneously, the intermediate and long-end of the U.S. Treasury curve steepened quite dramatically as investors began to price in the likelihood of higher interest rates in the future. The volatility continued through June as the Federal Open Market Committee (FOMC) issued a statement indicating again that if the U.S. economy continued to improve the Fed would begin to slow down its $85 billion a month purchases of U.S. Treasuries and mortgage-backed securities. In this environment, equities generally outperformed fixed-income.
EQUITY STRATEGY REVIEW
The equity strategy outperformed the Russell 3000 Index this period. The outperformance was largely driven by sector allocation. Relative underweights to information technology, telecommunication services, materials and utilities, four weaker performing sectors of the Russell 3000 Index, benefited Fund performance. Favorable stock selection in both telecommunication services and materials also contributed. Stock selection in information technology, health care and consumer discretionary detracted from relative performance results.
The equity strategy’s top contributors to performance were Walgreen Co., Verizon Communications, Inc., Honeywell International, Inc., Chevron Corp. and The Goldman Sachs Group, Inc. We exited our positions in each of these stocks, except for Chevron, by period end. Drug store operator Walgreen performed particularly well for the period. In 2012, the company acquired a 45% stake in European pharmacy chain Alliance Boots. Synergies between the companies appeared strong and Alliance Boots contributed positively to Walgreen’s results this period.
Verizon Communications is a provider of communications, information and entertainment products and services. Shares of Verizon rallied as the company continued to add wireless subscribers and its FiOs TV and internet service continued to grow. Honeywell is a diversified technology and manufacturing company that released positive 2012 results during the period. The company also continued to grow despite global economic weakness. Oil company Chevron’s stock was driven partly by higher refining profitability and a rise in upstream volumes. In a favorable environment for financials, Goldman Sachs saw an increase in underwriting services and its investment banking business performed solidly. Goldman Sachs also took a number of cost-cutting measures during the period.
The most significant detractors from the equity strategy’s performance were Apple, Inc., Aruba Networks, Inc. and Philip Morris International, Inc. Apple is the maker of the iPhone, iPod and iPad. Investors were concerned about the maturation of high end smartphones markets in developed countries. There were also concerns over increased competition from other smartphone makers such as Samsung and HTC. Fundamentals of many technology companies continued to suffer from the macroeconomic headwinds impacting enterprise spending, and Aruba Networks was no exception. Networking company Aruba Networks’ earnings growth may have also been hurt due to discounting by competitor Cisco Systems. We exited our position by period end. Earnings estimates for internationally-based marketer of tobacco products Philip Morris have fallen since management reported first quarter results that missed expectations. In weaker economies the company suffered volume declines both as consumers traded-down to lower priced cigarettes and the illicit “black-market” gained share. The latter had a particularly detrimental impact in the Philippines after the government raised excise taxes by an extraordinary percentage. As is true for other multi-national companies, Philip Morris was also negatively affected by a stronger U.S. dollar. We believe Philip Morris has the opportunity to create longer-term value, despite these shorter-term setbacks.
FIXED-INCOME STRATEGY REVIEW
The Fund’s fixed-income strategy experienced a negative return this period, but outperformed the Barclays U.S. Aggregate Bond Index. The fixed-income strategy maintained a significant underweight position to government bonds, and instead sourced its exposure through corporate bonds, mortgages and structured
3 OPPENHEIMER CAPITAL INCOME FUND/VA
products. This positioning drove the fixed-income strategy’s outperformance over the first half of the period, but resulted in declines later in the period after the Fed discussed the potential eventual tapering of its quantitative easing program.
The fixed-income strategy performed positively over the first half of the period as credit markets in the U.S. rallied on the back of positive economic data, despite the Cyprus banking crisis, deteriorating conditions in the Eurozone and moderating growth in emerging markets. Our exposure to corporate bonds benefited as corporate bond performance versus Treasuries was strong. During this time, an overweight to financials drove much of the positive performance among our corporate bonds, as the sector is a perceived safe haven from leveraged buyout activity (“LBO”) activity, which picked up early in the period. Specifically, our allocations to large cap banks and multi-line insurance companies were helpful. The subordinated debt of banks was a positive as their spread relative to senior debt continued to narrow as bank profitability and capital metrics continue to improve. Investments in agency and non-agency mortgage-backed securities (“MBS”), commercial mortgage-backed securities (“CMBS”) and asset backed securities (“ABS”), also benefited performance over the first half of the period.
Beginning in May, fixed-income markets turned volatile after the Fed began to discuss tapering. The Fed’s comments resulted in spreads on the Barclays Credit Index widening out to levels last seen in October 2012. Before the Fed’s comments, we started reducing our position in MBS since we felt they were vulnerable to policy changes. While this limited the negative impact, MBS still detracted from performance, as did CMBS and ABS. Over the second half of the period, the fixed-income strategy benefited from an overweight position in junior capital instruments within the financial sector. The strategy was negatively impacted by two positions in the tobacco sector, as this sector began to underperform amid the tumultuous environment. Additionally, our sector overweight to pharmaceuticals detracted from performance, although it is worth noting that security selection within the sector was in line with the sector’s overall performance during this time.
The Fund’s investment strategy and focus can change over time. The mention of specific fund holdings does not constitute a recommendation by OppenheimerFunds, Inc. or its affiliates.
Shares of Oppenheimer funds are not deposits or obligations of any bank, are not guaranteed by any bank, are not insured by the FDIC or any other agency, and involve investment risks, including the possible loss of the principal amount invested. The performance data quoted represents past performance, which does not guarantee future results.
4 OPPENHEIMER CAPITAL INCOME FUND/VA
Fund Expenses
Fund Expenses. As a shareholder of the Fund, you incur two types of costs: (1) transaction costs and (2) ongoing costs, including management fees; distribution and service fees; and other Fund expenses. These examples are intended to help you understand your ongoing costs (in dollars) of investing in the Fund and to compare these costs with the ongoing costs of investing in other mutual funds.
The examples are based on an investment of $1,000.00 invested at the beginning of the period and held for the entire 6-month period ended June 28, 2013.
Actual Expenses. The first section of the table provides information about actual account values and actual expenses. You may use the information in this section for the class of shares you hold, together with the amount you invested, to estimate the expense that you paid over the period. Simply divide your account value by $1,000.00 (for example, an $8,600.00 account value divided by $1,000.00 = 8.60), then multiply the result by the number in the first section under the heading entitled “Expenses Paid During Period” to estimate the expenses you paid on your account during this period.
Hypothetical Example for Comparison Purposes. The second section of the table provides information about hypothetical account values and hypothetical expenses based on the Fund’s actual expense ratio for each class of shares, and an assumed rate of return of 5% per year for each class before expenses, which is not the actual return. The hypothetical account values and expenses may not be used to estimate the actual ending account balance or expenses you paid for the period. You may use this information to compare the ongoing costs of investing in the Fund and other funds. To do so, compare this 5% hypothetical example for the class of shares you hold with the 5% hypothetical examples that appear in the shareholder reports of the other funds.
Please note that the expenses shown in the table are meant to highlight your ongoing costs only and do not reflect any charges associated with the separate accounts that offer this Fund. Therefore, the “hypothetical” lines of the table are useful in comparing ongoing costs only, and will not help you determine the relative total costs of owning different funds. In addition, if these separate account charges were included your costs would have been higher.
| | | | | | | | | | | | | | | | | |
| Actual | | Beginning
Account Value
January 1, 2013 | | Ending
Account
Value
June 28, 2013 | | Expenses
Paid During
6 Months Ended
June 28, 2013 | | |
Non-Service shares | | $ 1,000.00 | | | $ | 1,056.50 | | | | $ | 3.38 | | | |
Service shares | | 1,000.00 | | | | 1,055.70 | | | | | 4.65 | | | |
| | | | |
Hypothetical (5% return before expenses) | | | | | | | | |
Non-Service shares | | 1,000.00 | | | | 1,021.23 | | | | | 3.33 | | | |
Service shares | | 1,000.00 | | | | 1,020.01 | | | | | 4.57 | | | |
Expenses are equal to the Fund’s annualized expense ratio for that class, multiplied by the average account value over the period, multiplied by 179/365 (to reflect the one-half year period). Those annualized expense ratios, excluding indirect expenses from affiliated funds, based on the 6-month period ended June 28, 2013 are as follows:
| | | | | | | | | | | | | | | |
| Class | | Expense Ratios | | | | |
Non-Service shares | | 0.67% | | | | |
Service shares | | 0.92 | | | | |
The expense ratios reflect voluntary waivers and/or reimbursements of expenses by the Fund’s Manager. Some of these undertakings may be modified or terminated at any time, as indicated in the Fund’s prospectus. The “Financial Highlights” tables in the Fund’s financial statements, included in this report, also show the gross expense ratios, without such waivers or reimbursements and reduction to custodian expenses, if applicable.
5 OPPENHEIMER CAPITAL INCOME FUND/VA
STATEMENTOF INVESTMENTS June 28, 2013* / Unaudited
| | | | | | | | | | |
| | | Shares | | | Value | | | |
| | | |
Common Stocks—34.2% | | | |
| | | |
Consumer Discretionary—4.4% | | | | | | | | | | |
| | | |
Automobiles & Components—0.7% | | | | | | | | | | |
Dana Holding Corp. | | | 45,783 | | | $ | 881,781 | | | |
| | | |
Ford Motor Co. | | | 75,470 | | | | 1,167,521 | | | |
| | | | | | | | | | |
| | | | | | | 2,049,302 | | | |
| | | |
Consumer Durables & Apparel—0.9% | | | | | | | | | | |
PVH Corp. | | | 12,800 | | | | 1,600,640 | | | |
| | | |
Toll Brothers, Inc.1 | | | 22,620 | | | | 738,091 | | | |
| | | | | | | | | | |
| | | | | | | 2,338,731 | | | |
| | | |
Media—0.6% | | | | | | | | | | |
Time Warner, Inc. | | | 30,000 | | | | 1,734,600 | | | |
| | | |
Retailing—1.7% | | | | | | | | | | |
AutoZone, Inc.1 | | | 3,830 | | | | 1,622,733 | | | |
| | | |
Pier 1 Imports, Inc. | | | 44,920 | | | | 1,055,171 | | | |
| | | |
Ross Stores, Inc. | | | 15,680 | | | | 1,016,221 | | | |
| | | |
Signet Jewelers Ltd. | | | 15,200 | | | | 1,024,936 | | | |
| | | | | | | | | | |
| | | | | | | 4,719,061 | | | |
| | | |
Services—0.5% | | | | | | | | | | |
Brinker International, Inc. | | | 13,460 | | | | 530,728 | | | |
| | | |
LifeLock, Inc.1 | | | 69,290 | | | | 811,386 | | | |
| | | | | | | | | | |
| | | | | | | 1,342,114 | | | |
| | | |
Consumer Staples—2.8% | | | | | | | | | | |
| | | |
Food, Beverage & Tobacco—2.1% | | | | | | | | | | |
Flowers Foods, Inc. | | | 87,405 | | | | 1,927,280 | | | |
| | | |
Mondelez International, Inc., Cl. A | | | 65,210 | | | | 1,860,441 | | | |
| | | |
Philip Morris International, Inc. | | | 26,860 | | | | 2,326,613 | | | |
| | | | | | | | | | |
| | | | | | | 6,114,334 | | | |
| | | |
Household & Personal Products—0.7% | | | | | | | | | | |
Henkel AG & Co. KGaA | | | 6,285 | | | | 492,595 | | | |
| | | |
Henkel AG & Co. KGaA, Preference | | | 16,995 | | | | 1,594,748 | | | |
| | | | | | | | | | |
| | | | | | | 2,087,343 | | | |
| | | |
Energy—3.8% | | | | | | | | | | |
| | | |
Energy Equipment & Services—0.9% | | | | | | | | | | |
National Oilwell Varco, Inc. | | | 39,100 | | | | 2,693,990 | | | |
| | | |
Oil, Gas & Consumable Fuels—2.9% | | | | | | | | | | |
Chevron Corp. | | | 25,490 | | | | 3,016,487 | | | |
| | | |
EPL Oil & Gas, Inc.1 | | | 15,430 | | | | 453,025 | | | |
| | | |
Noble Energy, Inc. | | | 31,920 | | | | 1,916,477 | | | |
| | | |
PAA Natural Gas Storage LP | | | 22,680 | | | | 477,187 | | | |
| | | |
QEP Resources, Inc. | | | 53,920 | | | | 1,497,898 | | | |
| | | |
Western Refining, Inc. | | | 32,960 | | | | 925,187 | | | |
| | | | | | | | | | |
| | | | | | | 8,286,261 | | | |
| | | |
Financials—6.5% | | | | | | | | | | |
| | | |
Banks—2.0% | | | | | | | | | | |
CIT Group, Inc.1 | | | 42,270 | | | | 1,971,050 | | | |
| | | |
Home Loan Servicing Solutions Ltd. | | | 34,140 | | | | 818,336 | | | |
| | | |
Huntington Bancshares, Inc. | | | 144,600 | | | | 1,139,448 | | | |
| | | |
Ocwen Financial Corp.1 | | | 20,980 | | | | 864,796 | | | |
| | | |
Webster Financial Corp. | | | 33,470 | | | | 859,510 | | | |
| | | | | | | | | | |
| | | | | | | 5,653,140 | | | |
| | | |
Diversified Financials—2.8% | | | | | | | | | | |
Citigroup, Inc. | | | 44,040 | | | | 2,112,599 | | | |
| | | |
Discover Financial Services | | | 46,880 | | | | 2,233,363 | | | |
| | | |
Financial Engines, Inc. | | | 14,180 | | | | 646,466 | | | |
| | | |
JPMorgan Chase & Co. | | | 42,150 | | | | 2,225,098 | | | |
| | | |
WisdomTree Investments, Inc.1 | | | 82,900 | | | | 959,153 | | | |
| | | | | | | | | | |
| | | | | | | 8,176,679 | | | |
| | | |
Insurance—1.1% | | | | | | | | | | |
American International Group, Inc.1 | | | 24,960 | | | | 1,115,712 | | | |
| | | |
Fidelity National Financial, Inc., Cl. A | | | 38,610 | | | | 919,304 | | | |
| | | |
Lincoln National Corp. | | | 30,640 | | | | 1,117,441 | | | |
| | | | | | | | | | |
| | | | | | | 3,152,457 | | | |
| | | |
Real Estate—0.6% | | | | | | | | | | |
Apollo Commercial Real Estate Finance, Inc. | | | 58,470 | | | | 928,504 | | | |
| | | |
Digital Realty Trust, Inc. | | | 14,740 | | | | 899,140 | | | |
| | | | | | | | | | |
| | | | | | | 1,827,644 | | | |
| | | |
Health Care—4.8% | | | | | | | | | | |
| | | |
Health Care Equipment & Services—2.1% | | | | | | | |
CareFusion Corp.1 | | | 26,460 | | | | 975,051 | | | |
| | | |
Covidien plc | | | 24,510 | | | | 1,540,208 | | | |
| | | | | | | | | | |
| | | Shares | | | Value | | | |
| | | |
Health Care Equipment & Services (Continued) | | | |
Express Scripts Holding Co.1 | | | 21,660 | | | $ | 1,336,205 | | | |
| | | |
Omnicare, Inc. | | | 11,890 | | | | 567,272 | | | |
| | | |
Team Health Holdings, Inc.1 | | | 13,650 | | | | 560,605 | | | |
| | | |
Universal Health Services, Inc., Cl. B | | | 11,300 | | | | 756,648 | | | |
| | | | | | | | | | |
| | | | | | | 5,735,989 | | | |
| | | |
Pharmaceuticals, Biotechnology & Life Sciences—2.7%% | | | |
AbbVie, Inc. | | | 22,790 | | | | 942,139 | | | |
| | | |
Actavis, Inc.1 | | | 16,180 | | | | 2,042,240 | | | |
| | | |
Bristol-Myers Squibb Co. | | | 10,100 | | | | 451,369 | | | |
| | | |
Medivation, Inc.1 | | | 9,820 | | | | 483,144 | | | |
| | �� | |
Onyx Pharmaceuticals, Inc.1 | | | 5,380 | | | | 467,092 | | | |
| | | |
Pfizer, Inc. | | | 73,565 | | | | 2,060,556 | | | |
| | | |
Santarus, Inc.1 | | | 24,860 | | | | 523,303 | | | |
| | | |
Zoetis, Inc. | | | 23,186 | | | | 716,215 | | | |
| | | | | | | | | | |
| | | | | | | 7,686,058 | | | |
| | | |
Industrials—4.3% | | | | | | | | | | |
| | | |
Capital Goods—1.3% | | | | | | | | | | |
AECOM Technology Corp.1 | | | 17,960 | | | | 570,948 | | | |
| | | |
AGCO Corp. | | | 15,090 | | | | 757,367 | | | |
| | | |
Greenbrier Cos., Inc.1 | | | 34,750 | | | | 846,857 | | | |
| | | |
Joy Global, Inc. | | | 13,520 | | | | 656,126 | | | |
| | | |
KBR, Inc. | | | 25,770 | | | | 837,525 | | | |
| | | | | | | | | | |
| | | | | | | 3,668,823 | | | |
| | | |
Commercial & Professional Services—1.8% |
ADT Corp. (The) | | | 17,720 | | | | 706,142 | | | |
| | | |
Mobile Mini, Inc.1 | | | 27,250 | | | | 903,337 | | | |
| | | |
Robert Half International, Inc. | | | 31,440 | | | | 1,044,751 | | | |
| | | |
Towers Watson & Co., Cl. A | | | 14,190 | | | | 1,162,729 | | | |
| | | |
Tyco International Ltd. | | | 48,080 | | | | 1,584,236 | | | |
| | | | | | | | | | |
| | | | | | | 5,401,195 | | | |
| | | |
Transportation—1.2% | | | | | | | | | | |
Canadian National Railway Co. | | | 20,580 | | | | 2,001,816 | | | |
| | | |
United Parcel Service, Inc., Cl. B | | | 17,920 | | | | 1,549,722 | | | |
| | | | | | | | | | |
| | | | | | | 3,551,538 | | | |
| | | |
Information Technology—6.2% | | | | | | | | | | |
| | | |
Semiconductors & Semiconductor Equipment—0.5% | | | |
Cavium, Inc.1 | | | 15,610 | | | | 552,126 | | | |
| | | |
Skyworks Solutions, Inc.1 | | | 35,070 | | | | 767,682 | | | |
| | | | | | | | | | |
| | | | | | | 1,319,808 | | | |
| | | |
Software & Service—3.3% | | | | | | | | | | |
eBay, Inc.1 | | | 39,020 | | | | 2,018,114 | | | |
| | | |
Fortinet, Inc.1 | | | 57,750 | | | | 1,010,625 | | | |
| | | |
Google, Inc., Cl. A1 | | | 2,520 | | | | 2,218,532 | | | |
| | | |
Guidewire Software, Inc.1 | | | 12,660 | | | | 532,353 | | | |
| | | |
International Business Machines Corp. | | | 8,870 | | | | 1,695,146 | | | |
| | | |
Microsoft Corp. | | | 23,710 | | | �� | 818,706 | | | |
| | | |
ServiceNow, Inc.1 | | | 12,250 | | | | 494,777 | | | |
| | | |
Splunk, Inc.1 | | | 12,350 | | | | 572,546 | | | |
| | | | | | | | | | |
| | | | | | | 9,360,799 | | | |
| | | |
Technology Hardware & Equipment—2.4% | | | | | | | | | | |
Apple, Inc. | | | 7,190 | | | | 2,847,815 | | | |
| | | |
Corning, Inc. | | | 53,650 | | | | 763,439 | | | |
| | | |
QUALCOMM, Inc. | | | 33,470 | | | | 2,044,348 | | | |
| | | |
Western Digital Corp. | | | 19,050 | | | | 1,182,814 | | | |
| | | | | | | | | | |
| | | | | | | 6,838,416 | | | |
| | | |
Materials—1.4% | | | | | | | | | | |
| | | |
Chemicals—0.3% | | | | | | | | | | |
W.R. Grace & Co.1 | | | 10,060 | | | | 845,442 | | | |
| | | |
Construction Materials—0.3% | | | | | | | | | | |
Vulcan Materials Co. | | | 15,860 | | | | 767,783 | | | |
| | | |
Containers & Materials—0.3% | | | | | | | | | | |
Packaging Corp. of America | | | 15,470 | | | | 757,411 | | | |
| | | |
Metals & Mining—0.3% | | | | | | | | | | |
Kaiser Aluminum Corp. | | | 12,270 | | | | 760,004 | | | |
| | | |
Paper & Forest Products—0.2% | | | | | | | | | | |
P.H. Glatfelter Co. | | | 21,910 | | | | 549,941 | | | |
|
| 6 OPPENHEIMER CAPITAL INCOME FUND/VA |
| | | | | | | | | | |
| | | | | | | | | | |
| | | | | | | | | | |
| | | | | | | | | | |
| | | Shares | | | Value | | | |
| | | |
Telecommunication Services—0.0% | | | |
| | | |
Diversified Telecommunication Services—0.0% | | | |
ORBCOMM, Inc.1 | | | 375 | | | | $ 1,684 | | | |
| | | | | | | | | | |
Total Common Stocks (Cost $93,925,306) | | | | | | | 97,420,547 | | | |
| | | |
| | | Principal
Amount | | | | | | |
| | | |
Asset-Backed Securities—9.3% | | | |
| | | |
Ally Auto Receivables Trust, Series 2012-A, Cl. D, 3.15%, 10/15/184 | | $ | 500,000 | | | | 507,589 | | | |
| | | |
Ally Master Owner Trust, Series 2012-2, Cl. A, 0.693%, 3/15/162 | | | 350,000 | | | | 349,220 | | | |
| | | |
American Credit Acceptance Receivables Trust: | | | | | | | | | | |
Series 2012-2, Cl. A, 1.89%, 7/15/163 | | | 189,587 | | | | 190,124 | | | |
Series 2012-3, Cl. A, 1.64%, 11/15/163 | | | 82,413 | | | | 82,318 | | | |
Series 2012-3, Cl. C, 2.78%, 9/17/183 | | | 955,000 | | | | 949,324 | | | |
| | | |
AmeriCredit Automobile Receivables Trust: | | | | | | | | | | |
Series 2010-1, Cl. D, 6.65%, 7/17/17 | | | 210,000 | | | | 220,332 | | | |
Series 2010-2, Cl. C, 4.52%, 10/8/15 | | | 290,000 | | | | 294,845 | | | |
Series 2010-2, Cl. D, 6.24%, 6/8/16 | | | 40,000 | | | | 42,310 | | | |
Series 2011-1, Cl. D, 4.26%, 2/8/17 | | | 90,000 | | | | 94,172 | | | |
Series 2011-2, Cl. D, 4.00%, 5/8/17 | | | 300,000 | | | | 311,735 | | | |
Series 2011-4, Cl. D, 4.08%, 9/8/17 | | | 500,000 | | | | 519,760 | | | |
Series 2011-5, Cl. D, 5.05%, 12/8/17 | | | 305,000 | | | | 324,696 | | | |
Series 2012-1, Cl. D, 4.72%, 3/8/18 | | | 540,000 | | | | 572,780 | | | |
Series 2012-2, Cl. D, 3.38%, 4/9/18 | | | 455,000 | | | | 464,871 | | | |
Series 2012-4, Cl. D, 2.68%, 10/9/18 | | | 70,000 | | | | 69,556 | | | |
Series 2012-5, Cl. C, 1.69%, 11/8/18 | | | 165,000 | | | | 162,475 | | | |
Series 2012-5, Cl. D, 2.35%, 12/10/18 | | | 925,000 | | | | 911,937 | | | |
Series 2013-1, Cl. C, 1.57%, 1/8/19 | | | 725,000 | | | | 706,182 | | | |
Series 2013-1, Cl. D, 2.09%, 2/8/19 | | | 195,000 | | | | 188,383 | | | |
Series 2013-2, Cl. D, 2.42%, 5/8/19 | | | 310,000 | | | | 302,402 | | | |
Series 2013-3, Cl. D, 3.00%, 7/8/19 | | | 330,000 | | | | 326,362 | | | |
| | | |
Avis Budget Rental Car Funding AESOP LLC: | | | | | | | | | | |
Series 2011-2A, Cl. A, 2.37%, 11/20/143 | | | 950,000 | | | | 965,875 | | | |
Series 2011-3A, Cl. B, 4.74%, 11/20/173 | | | 150,000 | | | | 159,782 | | | |
Series 2012-1A, Cl. A, 2.054%, 8/20/163 | | | 235,000 | | | | 238,835 | | | |
| | | |
Capital Auto Receivables Asset Trust, Series 2013-1, Cl. D, 2.19%, 9/20/21 | | | 125,000 | | | | 120,234 | | | |
| | | |
CarMax Auto Owner Trust, Series 2013-1, Cl. D, 1.99%, 8/15/19 | | | 105,000 | | | | 103,101 | | | |
| | | |
Centre Point Funding LLC, Series 2010-1A, Cl. 1, 5.43%, 7/20/163 | | | 44,501 | | | | 46,432 | | | |
| | | |
CFC 2013-1 LLC, Series 2013-1A, Cl. A, 1.65%, 7/17/173 | | | 185,670 | | | | 185,125 | | | |
| | | |
CPS Auto Receivables Trust: | | | | | | | | | | |
Series 2012-B, Cl. A, 2.52%, 9/16/193 | | | 259,759 | | | | 262,905 | | | |
Series 2012-C, Cl. A, 1.82%, 12/16/193 | | | 89,912 | | | | 90,362 | | | |
| | | |
Credit Acceptance Auto Loan Trust: | | | | | | | | | | |
Series 2012-1A, Cl. A, 2.20%, 9/16/193 | | | 175,000 | | | | 176,974 | | | |
Series 2012-2A, Cl. A, 1.52%, 3/16/203 | | | 950,000 | | | | 952,373 | | | |
Series 2012-2A, Cl. B, 2.21%, 9/15/203 | | | 50,000 | | | | 50,163 | | | |
Series 2013-1A, Cl. B, 1.83%, 4/15/213 | | | 165,000 | | | | 163,109 | | | |
| | | |
DT Auto Owner Trust: | | | | | | | | | | |
Series 2010-1A, Cl. D, 5.92%, 9/15/163 | | | 111,902 | | | | 112,011 | | | |
Series 2011-1A, Cl. C, 3.05%, 8/17/153 | | | 96,606 | | | | 96,804 | | | |
Series 2011-2A, Cl. C, 3.05%, 2/16/163 | | | 14,980 | | | | 14,990 | | | |
Series 2011-3A, Cl. C, 4.03%, 2/15/173 | | | 299,000 | | | | 301,341 | | | |
Series 2012-1A, Cl. A, 1.05%, 1/15/153 | | | 27,417 | | | | 27,426 | | | |
Series 2012-2A, Cl. C, 2.72%, 4/17/173 | | | 65,000 | | | | 65,610 | | | |
Series 2012-2A, Cl. D, 4.35%, 3/15/193 | | | 80,000 | | | | 82,174 | | | |
Series 2013-1A, Cl. D, 3.74%, 5/15/203 | | | 200,000 | | | | 199,581 | | | |
| | | |
Exeter Automobile Receivables Trust: | | | | | | | | | | |
Series 2012-1A, Cl. A, 2.02%, 8/15/163 | | | 576,699 | | | | 579,493 | | | |
Series 2012-2A, Cl. A, 1.30%, 6/15/173 | | | 107,162 | | | | 107,293 | | | |
Series 2012-2A, Cl. B, 2.22%, 12/15/173 | | | 130,000 | | | | 130,711 | | | |
Series 2012-2A, Cl. C, 3.06%, 7/16/183 | | | 516,000 | | | | 517,403 | | | |
Series 2013-1A, Cl. A, 1.29%, 10/16/173 | | | 375,003 | | | | 373,166 | | | |
| | | |
First Investors Auto Owner Trust, Series 2012-1A, Cl. D, 5.65%, 4/15/183 | | | 140,000 | | | | 147,613 | | | |
| | | | | | | | | | |
| | | Principal
Amount | | | Value | | | |
| | | |
Asset-Backed Securities (Continued) | | | |
| | | |
Ford Credit Auto Owner Trust, Series 2013-A, Cl. D, 1.86%, 8/15/19 | | $ | 195,000 | | | $ | 188,962 | | | |
| | | |
Ford Credit Floorplan Master Owner Trust A: | | | | | | | | | | |
Series 2012-1, Cl. A, 0.663%, 1/15/162 | | | 155,000 | | | | 155,165 | | | |
Series 2012-2, Cl. C, 2.86%, 1/15/19 | | | 215,000 | | | | 223,269 | | | |
Series 2013-3, Cl. D, 1.74%, 6/15/17 | | | 175,000 | | | | 175,244 | | | |
| | | |
FRS I LLC, Series 2013-1A, Cl. A1, 1.80%, 4/15/433 | | | 78,051 | | | | 77,127 | | | |
| | | |
MBNA Credit Card Master Note Trust, Series 2003-C7, Cl. C7, 1.543%, 3/15/162 | | | 975,000 | | | | 976,841 | | | |
| | | |
Prestige Auto Receivables Trust, Series 2011-1A, Cl. D, 5.18%, 7/16/183 | | | 300,000 | | | | 312,354 | | | |
| | | |
Santander Drive Auto Receivables Trust: | | | | | | | | | | |
Series 2010-3, Cl. C, 3.06%, 11/15/17 | | | 350,000 | | | | 358,496 | | | |
Series 2010-A, Cl. A3, 1.83%, 11/17/143 | | | 32,860 | | | | 32,968 | | | |
Series 2010-B, Cl. C, 3.02%, 10/17/163 | | | 284,795 | | | | 288,190 | | | |
Series 2011-1, Cl. D, 4.01%, 2/15/17 | | | 360,000 | | | | 372,816 | | | |
Series 2011-4, Cl. B, 2.90%, 5/16/16 | | | 930,000 | | | | 946,189 | | | |
Series 2011-S1A, Cl. D, 3.10%, 5/15/174 | | | 62,770 | | | | 62,924 | | | |
Series 2011-S2A, Cl. D, 3.35%, 6/15/174 | | | 139,718 | | | | 140,416 | | | |
Series 2012-1, Cl. A2, 1.25%, 4/15/15 | | | 21,220 | | | | 21,255 | | | |
Series 2012-2, Cl. C, 3.20%, 2/15/18 | | | 345,000 | | | | 355,461 | | | |
Series 2012-2, Cl. D, 3.87%, 2/15/18 | | | 375,000 | | | | 385,041 | | | |
Series 2012-4, Cl. B, 1.83%, 3/15/17 | | | 575,000 | | | | 580,874 | | | |
Series 2012-4, Cl. D, 3.50%, 6/15/18 | | | 495,000 | | | | 503,926 | | | |
Series 2012-5, Cl. C, 2.70%, 8/15/18 | | | 625,000 | | | | 629,367 | | | |
Series 2012-5, Cl. D, 3.30%, 9/17/18 | | | 540,000 | | | | 545,107 | | | |
Series 2012-6, Cl. D, 2.52%, 9/17/18 | | | 585,000 | | | | 578,115 | | | |
Series 2012-AA, Cl. D, 2.46%, 12/17/183 | | | 670,000 | | | | 656,657 | | | |
Series 2013-1, Cl. C, 1.76%, 1/15/19 | | | 295,000 | | | | 287,976 | | | |
Series 2013-1, Cl. D, 2.27%, 1/15/19 | | | 155,000 | | | | 150,318 | | | |
Series 2013-2, Cl. D, 2.57%, 3/15/19 | | | 715,000 | | | | 697,109 | | | |
Series 2013-3, Cl. D, 2.42%, 4/15/19 | | | 245,000 | | | | 237,014 | | | |
| | | |
SNAAC Auto Receivables Trust: | | | | | | | | | | |
Series 2012-1A, Cl. A, 1.78%, 6/15/163 | | | 72,415 | | | | 72,693 | | | |
Series 2012-1A, Cl. C, 4.38%, 6/15/173 | | | 125,000 | | | | 128,356 | | | |
Series 2013-1A, Cl. B, 2.09%, 7/16/183 | | | 90,000 | | | | 89,318 | | | |
Series 2013-1A, Cl. C, 3.07%, 8/15/183 | | | 100,000 | | | | 98,930 | | | |
| | | |
United Auto Credit Securitization Trust: | | | | | | | | | | |
Series 2012-1, Cl. A2, 1.10%, 3/16/153 | | | 79,464 | | | | 79,447 | | | |
Series 2012-1, Cl. B, 1.87%, 9/15/153 | | | 170,000 | | | | 169,852 | | | |
Series 2012-1, Cl. C, 2.52%, 3/15/163 | | | 120,000 | | | | 119,808 | | | |
Series 2012-1, Cl. D, 3.12%, 3/15/183 | | | 605,000 | | | | 603,961 | | | |
Series 2013-1, Cl. B, 1.74%, 4/15/163 | | | 265,000 | | | | 264,107 | | | |
Series 2013-1, Cl. C, 2.22%, 12/15/173 | | | 170,000 | | | | 169,359 | | | |
Series 2013-1, Cl. D, 2.90%, 12/15/173 | | | 30,000 | | | | 29,807 | | | |
| | | |
Westlake Automobile Receivables Trust, Series 2012-1A, Cl. A2, 1.03%, 3/15/163 | | | 85,718 | | | | 85,807 | | | |
| | | |
Wheels SPV LLC, Series 2012-1, Cl. A2, 1.19%, 3/20/213 | | | 819,025 | | | | 822,037 | | | |
| | | |
World Financial Network Credit Card Master Trust, Series 2012-B, Cl. A, 1.76%, 5/17/21 | | | 115,000 | | | | 114,494 | | | |
| | | | | | | | | | |
Total Asset-Backed Securities | | | | | | | | | | |
(Cost $26,798,174) | | | | | | | 26,649,416 | | | |
| | | | | | | | | | |
| | | |
Mortgage-Backed Obligations—23.2% | | | |
| | | |
Government Agency—16.3% | | | |
| | | |
FHLMC/FNMA/FHLB/Sponsored—16.1% | | | |
Federal Home Loan Mortgage Corp. Gold Pool: | | | | | | | | | | |
4.50%, 10/1/18 | | | 84,717 | | | | 88,961 | | | |
5.00%, 12/1/34 | | | 5,694 | | | | 6,116 | | | |
5.50%, 9/1/39 | | | 890,691 | | | | 969,497 | | | |
6.50%, 4/1/18-4/1/34 | | | 70,352 | | | | 78,403 | | | |
7.00%, 10/1/31-10/1/37 | | | 414,427 | | | | 473,203 | | | |
8.00%, 4/1/16 | | | 17,547 | | | | 18,475 | | | |
9.00%, 8/1/22-5/1/25 | | | 9,189 | | | | 10,288 | | | |
| | | |
Federal Home Loan Mortgage Corp., Interest-Only | | | | | | | | | | |
Stripped Mtg.-Backed Security: | | | | | | | | | | |
Series 183, Cl. IO, 17.594%, 4/1/275 | | | 150,473 | | | | 18,707 | | | |
Series 192, Cl. IO, 11.062%, 2/1/285 | | | 39,239 | | | | 6,336 | | | |
Series 243, Cl. 6, 0%, 12/15/325,6 | | | 127,668 | | | | 20,893 | | | |
7 OPPENHEIMER CAPITAL INCOME FUND/VA
STATEMENTOF INVESTMENTS Unaudited / Continued
| | | | | | | | | | |
| | | Principal
Amount | | | Value | | | |
| | | |
FHLMC/FNMA/FHLB/Sponsored (Continued) | | | |
Federal Home Loan Mortgage Corp., Principal-Only Stripped Mtg.-Backed Security, Series 176, Cl. PO, 3.594%, 6/1/267 | | $ | 43,164 | | | $ | 39,947 | | | |
| | | |
Federal Home Loan Mortgage Corp., Real Estate Investment Conduit Multiclass Pass-Through Certificates: | | | | | | | | | | |
Series 2426, Cl. BG, 6.00%, 3/15/17 | | | 155,784 | | | | 165,987 | | | |
Series 2427, Cl. ZM, 6.50%, 3/15/32 | | | 232,769 | | | | 262,094 | | | |
Series 2461, Cl. PZ, 6.50%, 6/15/32 | | | 119,857 | | | | 136,113 | | | |
Series 2500, Cl. FD, 0.693%, 3/15/322 | | | 17,310 | | | | 17,494 | | | |
Series 2526, Cl. FE, 0.593%, 6/15/292 | | | 21,178 | | | | 21,314 | | | |
Series 2551, Cl. FD, 0.593%, 1/15/332 | | | 13,960 | | | | 14,057 | | | |
Series 2626, Cl. TB, 5.00%, 6/15/33 | | | 297,411 | | | | 323,945 | | | |
Series 3025, Cl. SJ, 24.044%, 8/15/352 | | | 43,066 | | | | 63,996 | | | |
Series 3030, Cl. FL, 0.593%, 9/15/352 | | | 216,704 | | | | 218,256 | | | |
Series 3822, Cl. JA, 5.00%, 6/15/40 | | | 260,089 | | | | 272,929 | | | |
Series 3848, Cl. WL, 4.00%, 4/15/40 | | | 292,951 | | | | 310,485 | | | |
| | | |
Federal Home Loan Mortgage Corp., Real Estate Investment Conduit Multiclass Pass-Through Certificates, Interest-Only | | | | | | | | | | |
Stripped Mtg.-Backed Security: | | | | | | | | | | |
Series 2130, Cl. SC, 55.095%, 3/15/295 | | | 131,847 | | | | 29,023 | | | |
Series 2796, Cl. SD, 64.651%, 7/15/265 | | | 187,552 | | | | 36,920 | | | |
Series 2802, Cl. AS, 40.914%, 4/15/335 | | | 46,334 | | | | 1,652 | | | |
Series 2920, Cl. S, 63.327%, 1/15/355 | | | 957,635 | | | | 188,436 | | | |
Series 2922, Cl. SE, 11.402%, 2/15/355 | | | 57,382 | | | | 10,206 | | | |
Series 3201, Cl. SG, 9.826%, 8/15/365 | | | 149,769 | | | | 29,370 | | | |
Series 3397, Cl. GS, 33.357%, 12/15/375 | | | 66,788 | | | | 12,164 | | | |
Series 3424, Cl. EI, 41.335%, 4/15/385 | | | 64,933 | | | | 10,287 | | | |
Series 3450, Cl. BI, 16.389%, 5/15/385 | | | 178,379 | | | | 33,242 | | | |
Series 3606, Cl. SN, 9.33%, 12/15/395 | | | 95,384 | | | | 14,119 | | | |
Series 3662, Cl. SM, 28.564%, 10/15/325 | | | 170,130 | | | | 18,887 | | | |
Series 3736, Cl. SN, 10.674%, 10/15/405 | | | 631,992 | | | | 91,502 | | | |
| | | |
Federal National Mortgage Assn. Pool: | | | | | | | | | | |
2.50%, 6/18/278 | | | 2,580,000 | | | | 2,595,722 | | | |
3.00%, 7/1/27-8/1/438 | | | 5,350,000 | | | | 5,308,648 | | | |
3.50%, 7/17/27-8/1/438 | | | 5,600,000 | | | | 5,706,334 | | | |
4.00%, 7/1/418 | | | 6,975,000 | | | | 7,265,988 | | | |
4.50%, 7/1/22-7/1/398 | | | 9,659,000 | | | | 10,225,776 | | | |
5.00%, 7/1/378 | | | 2,590,000 | | | | 2,787,691 | | | |
5.50%, 9/1/20 | | | 6,757 | | | | 7,297 | | | |
6.00%, 11/1/17-3/1/37 | | | 536,157 | | | | 581,926 | | | |
6.00%, 7/1/378 | | | 425,000 | | | | 462,254 | | | |
6.50%, 5/1/17-10/1/19 | | | 128,579 | | | | 137,337 | | | |
7.00%, 11/1/17-10/1/35 | | | 59,443 | | | | 64,203 | | | |
7.50%, 1/1/33 | | | 131,883 | | | | 156,779 | | | |
8.50%, 7/1/32 | | | 6,732 | | | | 7,867 | | | |
| | | |
Federal National Mortgage Assn., Interest-Only Stripped Mtg.-Backed Security: | | | | | | | | | | |
Series 222, Cl. 2, 27.348%, 6/1/235 | | | 320,227 | | | | 48,555 | | | |
Series 233, Cl. 2, 48.013%, 8/1/235 | | | 223,241 | | | | 44,266 | | | |
Series 252, Cl. 2, 44.236%, 11/1/235 | | | 289,423 | | | | 50,439 | | | |
Series 319, Cl. 2, 3.067%, 2/1/325 | | | 68,965 | | | | 11,932 | | | |
Series 320, Cl. 2, 11.67%, 4/1/325 | | | 21,132 | | | | 3,077 | | | |
Series 321, Cl. 2, 1.579%, 4/1/325 | | | 244,492 | | | | 41,969 | | | |
Series 331, Cl. 9, 6.882%, 2/1/335 | | | 258,123 | | | | 45,191 | | | |
Series 334, Cl. 17, 13.985%, 2/1/335 | | | 155,572 | | | | 28,562 | | | |
Series 339, Cl. 12, 19.242%, 6/25/335 | | | 233,310 | | | | 40,081 | | | |
Series 339, Cl. 7, 70.367%, 8/1/335 | | | 677,515 | | | | 107,400 | | | |
Series 343, Cl. 13, 38.592%, 9/1/335 | | | 217,968 | | | | 34,105 | | | |
Series 345, Cl. 9, 99.999%, 1/1/345 | | | 195,650 | | | | 30,192 | | | |
Series 351, Cl. 10, 9.684%, 4/1/345 | | | 30,874 | | | | 4,762 | | | |
Series 351, Cl. 8, 33.498%, 4/1/345 | | | 102,661 | | | | 15,920 | | | |
Series 356, Cl. 10, 74.376%, 6/1/355 | | | 75,299 | | | | 11,552 | | | |
Series 356, Cl. 12, 84.292%, 2/1/355 | | | 40,747 | | | | 6,300 | | | |
Series 362, Cl. 13, 38.859%, 8/1/355 | | | 278,482 | | | | 44,453 | | | |
Series 364, Cl. 16, 84.362%, 9/1/355 | | | 194,787 | | | | 31,407 | | | |
| | | |
Federal National Mortgage Assn., Real Estate Investment Conduit Multiclass Pass-Through Certificates: | | | | | | | | | | |
Series 1998-61, Cl. PL, 6.00%, 11/25/28 | | | 106,128 | | | | 118,701 | | | |
Series 2003-130, Cl. CS, 13.714%, 12/25/332 | | | 28,094 | | | | 34,193 | | | |
Series 2003-28, Cl. KG, 5.50%, 4/25/23 | | | 511,405 | | | | 561,987 | | | |
Series 2004-101, Cl. BG, 5.00%, 1/25/20 | | | 502,859 | | | | 533,538 | | | |
| | | | | | | | | | |
| | | Principal
Amount | | | Value | | | |
| | | |
FHLMC/FNMA/FHLB/Sponsored (Continued) | | | |
Federal National Mortgage Assn., Real Estate Investment Conduit Multiclass Pass-Through Certificates: (Continued) | | | | | | | | | | |
Series 2005-104, Cl. MC, 5.50%, 12/25/25 | | $ | 532,957 | | | $ | 585,788 | | | |
Series 2005-31, Cl. PB, 5.50%, 4/25/35 | | | 250,000 | | | | 292,024 | | | |
Series 2005-69, Cl. LE, 5.50%, 11/25/33 | | | 38,604 | | | | 39,017 | | | |
Series 2005-73, Cl. DF, 0.443%, 8/25/352 | | | 523,624 | | | | 524,819 | | | |
Series 2006-11, Cl. PS, 23.859%, 3/25/362 | | | 154,894 | | | | 216,243 | | | |
Series 2006-46, Cl. SW, 23.492%, 6/25/362 | | | 117,477 | | | | 171,900 | | | |
Series 2006-50, Cl. KS, 23.492%, 6/25/362 | | | 26,518 | | | | 41,281 | | | |
Series 2007-109, Cl. NF, 0.743%, 12/25/372 | | | 286,946 | | | | 290,745 | | | |
Series 2007-42, Cl. A, 6.00%, 2/25/33 | | | 52,566 | | | | 52,977 | | | |
Series 2009-36, Cl. FA, 1.133%, 6/25/372 | | | 252,560 | | | | 256,250 | | | |
Series 2009-37, Cl. HA, 4.00%, 4/25/19 | | | 219,012 | | | | 232,354 | | | |
Series 2009-70, Cl. PA, 5.00%, 8/25/35 | | | 13,678 | | | | 13,685 | | | |
Series 2011-15, Cl. DA, 4.00%, 3/25/41 | | | 117,568 | | | | 124,250 | | | |
Series 2011-3, Cl. KA, 5.00%, 4/25/40 | | | 324,445 | | | | 354,641 | | | |
| | | |
Federal National Mortgage Assn., Real Estate Investment Conduit Multiclass Pass-Through Certificates, Interest-Only Stripped Mtg.-Backed Security: | | | | | | | | | | |
Series 2001-65, Cl. S, 26.136%, 11/25/315 | | | 259,936 | | | | 56,055 | | | |
Series 2001-81, Cl. S, 22.481%, 1/25/325 | | | 65,555 | | | | 13,620 | | | |
Series 2002-47, Cl. NS, 33.976%, 4/25/325 | | | 185,720 | | | | 37,480 | | | |
Series 2002-51, Cl. S, 34.173%, 8/25/325 | | | 170,535 | | | | 34,134 | | | |
Series 2002-52, Cl. SD, 40.484%, 9/25/325 | | | 226,964 | | | | 51,532 | | | |
Series 2002-77, Cl. SH, 36.841%, 12/18/325 | | | 102,365 | | | | 24,329 | | | |
Series 2002-84, Cl. SA, 32.304%, 12/25/325 | | | 262,603 | | | | 50,134 | | | |
Series 2002-9, Cl. MS, 25.952%, 3/25/325 | | | 72,240 | | | | 17,951 | | | |
Series 2003-33, Cl. SP, 25.47%, 5/25/335 | | | 284,304 | | | | 70,987 | | | |
Series 2003-4, Cl. S, 27.611%, 2/25/335 | | | 164,965 | | | | 32,264 | | | |
Series 2003-46, Cl. IH, 31.781%, 6/25/235 | | | 596,943 | | | | 78,454 | | | |
Series 2004-54, Cl. DS, 45.205%, 11/25/305 | | | 181,750 | | | | 32,062 | | | |
Series 2004-56, Cl. SE, 11.346%, 10/25/335 | | | 54,370 | | | | 9,640 | | | |
Series 2005-12, Cl. SC, 14.367%, 3/25/355 | | | 28,344 | | | | 5,525 | | | |
Series 2005-14, Cl. SE, 42.81%, 3/25/355 | | | 92,131 | | | | 15,626 | | | |
Series 2005-40, Cl. SA, 54.925%, 5/25/355 | | | 491,510 | | | | 88,862 | | | |
Series 2005-52, Cl. JH, 29.01%, 5/25/355 | | | 1,088,192 | | | | 223,639 | | | |
Series 2005-71, Cl. SA, 58.628%, 8/25/255 | | | 486,500 | | | | 68,414 | | | |
Series 2005-93, Cl. SI, 18.381%, 10/25/355 | | | 124,272 | | | | 21,901 | | | |
Series 2007-75, Cl. BI, 8.156%, 8/25/375 | | | 955,626 | | | | 174,384 | | | |
Series 2007-88, Cl. XI, 40.011%, 6/25/375 | | | 373,051 | | | | 56,458 | | | |
Series 2008-46, Cl. EI, 17.048%, 6/25/385 | | | 182,534 | | | | 27,261 | | | |
Series 2008-55, Cl. SA, 8.822%, 7/25/385 | | | 228,636 | | | | 23,680 | | | |
Series 2009-8, Cl. BS, 22.687%, 2/25/245 | | | 95,688 | | | | 8,320 | | | |
Series 2012-40, Cl. PI, 19.776%, 4/25/415 | | | 465,312 | | | | 93,124 | | | |
| | | |
Federal National Mortgage Assn., Real Estate Investment Conduit Multiclass Pass-Through Certificates, Principal-Only Stripped Mtg.-Backed Security, Series 1993-184, Cl. M, 4.112%, 9/25/237 | | | 116,762 | | | | 108,514 | | | |
| | | | | | | | | | |
| | | | | | | 45,790,032 | | | |
| | | |
GNMA/Guaranteed—0.2% | | | |
Government National Mortgage Assn. I Pool: | | | | | | | | | | |
7.00%, 1/15/24 | | | 66,420 | | | | 76,685 | | | |
7.50%, 1/15/23-6/15/24 | | | 53,920 | | | | 59,735 | | | |
8.00%, 5/15/17-4/15/23 | | | 41,878 | | | | 47,037 | | | |
8.50%, 8/15/17-12/15/17 | | | 11,970 | | | | 12,750 | | | |
| | | |
Government National Mortgage Assn., Interest-Only | | | | | | | | | | |
Stripped Mtg.-Backed Security: | | | | | | | | | | |
Series 2001-21, Cl. SB, 79.584%, 1/16/275 | | | 242,600 | | | | 48,851 | | | |
Series 2002-15, Cl. SM, 69.941%, 2/16/325 | | | 274,925 | | | | 59,384 | | | |
Series 2002-76, Cl. SY, 79.526%, 12/16/265 | | | 635,688 | | | | 142,003 | | | |
Series 2007-17, Cl. AI, 22.875%, 4/16/375 | | | 622,710 | | | | 118,895 | | | |
Series 2011-52, Cl. HS, 13.376%, 4/16/415 | | | 301,487 | | | | 71,317 | | | |
| | | | | | | | | | |
| | | | | | | 636,657 | | | |
| | | |
Non-Agency—6.9% | | | | | | | | | | |
| | | |
Commercial—4.3% | | | | | | | | | | |
Banc of America Commercial Mortgage Trust, Collateralized Mtg. Obligations, Series 2006-6, Cl. AM, 5.39%, 10/10/45 | | | 265,000 | | | | 281,946 | | | |
8 OPPENHEIMER CAPITAL INCOME FUND/VA
| | | | | | | | | | |
| | | Principal
Amount | | | Value | | | |
| | | |
Commercial (Continued) | | | | | | | | | | |
Bear Stearns ARM Trust, Collateralized Mtg. Obligations, Series 2007-4, Cl. 22A1, 5.252%, 6/25/472 | | $ | 165,761 | | | $ | 143,907 | | | |
| | | |
Citigroup Commercial Mortgage Trust: | | | | | | | | | | |
Series 2008-C7, Cl. AM, 6.339%, 12/10/492 | | | 90,000 | | | | 99,286 | | | |
Series 20113-GCJ11, 4.459%, 4/10/233 | | | 185,000 | | | | 155,568 | | | |
| | | |
Commercial Mortgage Trust: | | | | | | | | | | |
Series 2006-GG7, Cl. AM, 6.056%, 7/10/382 | | | 190,000 | | | | 208,115 | | | |
Series 2007-GG11, Cl. AM, 5.867%, 12/10/492 | | | 500,000 | | | | 537,338 | | | |
Series 2007-GG9, Cl. AM, 5.475%, 3/10/39 | | | 615,000 | | | | 648,299 | | | |
Series 2012-CR4, Cl. D, 4.731%, 10/15/452,3 | | | 185,000 | | | | 158,782 | | | |
Series 2012-CR5, Cl. E, 4.479%, 12/10/452,3 | | | 225,000 | | | | 188,968 | | | |
Series 2013-CR7, Cl. D, 4.501%, 3/10/462,3 | | | 200,000 | | | | 164,032 | | | |
| | | |
Commercial Mortgage Trust, Interest-Only Stripped Mtg.-Backed Security: | | | | | | | | | | |
Series 2010-C1, Cl. XPA, 5.01%, 7/10/462,3,5 | | | 2,894,988 | | | | 142,791 | | | |
Series 2012-CR5, Cl. XA, 3.847%, 12/10/452,5 | | | 446,648 | | | | 50,426 | | | |
| | | |
Countrywide Alternative Loan Trust, Collateralized Mtg. Obligations, Series 2006-J2, Cl. A7, 6%, 4/25/36 | | | 14,483 | | | | 13,418 | | | |
| | | |
Countrywide Home Loans, Collateralized Mtg. Obligations, Series 2007-J3, Cl. A9, 6%, 7/25/37 | | | 32,488 | | | | 26,635 | | | |
| | | |
Credit Suisse Commercial Mortgage Trust: | | | | | | | | | | |
Series 2006-6, Cl. 1A4, 6.00%, 7/25/36 | | | 278,686 | | | | 210,676 | | | |
Series 2006-C1, Cl. AJ, 5.569%, 2/15/392 | | | 175,000 | | | | 187,116 | | | |
| | | |
Credit Suisse First Boston Mortgage Securities Corp., Collateralized Mtg. Obligations, Series 2005-C6, Cl. AJ, 5.23%, 12/15/402 | | | 275,000 | | | | 291,146 | | | |
| | | |
DBUBS Mortgage Trust, Collateralized Mtg. Obligations, Series 2011-LC1A, Cl. E, 5.728%, 11/10/462,3 | | | 50,000 | | | | 48,132 | | | |
| | | |
Deutsche Alt-B Securities Mortgage Loan Trust, Collateralized Mtg. Obligations, Series 2006-AB4, Cl. A1A, 6.005%, 10/25/362 | | | 275,591 | | | | 204,382 | | | |
| | | |
EverBank Mortgage Loan Trust, Collateralized Mtg. Obligations, Series 2013-1, Cl. A1, 2.25%, 3/25/432,3 | | | 451,721 | | | | 441,813 | | | |
| | | |
First Horizon Alternative Mortgage Securities Trust: | | | | | | | | | | |
Series 2004-FA2, Cl. 3A1, 6.00%, 1/25/35 | | | 276,527 | | | | 281,572 | | | |
Series 2005-FA8, Cl. 1A6, 0.843%, 11/25/352 | | | 213,235 | | | | 155,209 | | | |
Series 2005-FA9, Cl. A4A, 5.50%, 12/25/35 | | | 19,042 | | | | 16,754 | | | |
Series 2007-FA2, Cl. 1A1, 5.50%, 4/25/37 | | | 480,107 | | | | 369,371 | | | |
Series 2007-FA4, Cl. 1A6, 6.25%, 8/25/372 | | | 241,844 | | | | 207,374 | | | |
| | | |
FREMF Mortgage Trust: | | | | | | | | | | |
Series 2013-K25, Cl. C, 3.742%, 11/25/452,3 | | | 60,000 | | | | 47,490 | | | |
Series 2013-K26, Cl. C, 3.723%, 12/25/452,3 | | | 40,000 | | | | 31,518 | | | |
Series 2013-K27, Cl. C, 3.616%, 1/25/462,3 | | | 110,000 | | | | 85,426 | | | |
Series 2013-K28, Cl. C, 3.494%, 6/25/462,3 | | | 110,000 | | | | 85,817 | | | |
Series 2013-K712, Cl. C, 3.483%, 5/25/452,3 | | | 110,000 | | | | 94,221 | | | |
| | | |
GE Capital Commercial Mortgage Corp., Collateralized Mtg. Obligations, Series 2005-C4, Cl. AJ, 5.471%, 11/10/452 | | | 430,000 | | | | 415,330 | | | |
| | | |
GS Mortgage Securities Trust: | | | | | | | | | | |
Series 2006-GG6, Cl. AM, 5.622%, 4/10/382 | | | 286,699 | | | | 307,315 | | | |
Series 2011-GC3, Cl. A1, 2.331%, 3/10/443 | | | 144,848 | | | | 147,052 | | | |
| | | |
GSR Mortgage Loan Trust, Collateralized Mtg. Obligations, Series 2005-AR4, Cl. 6A1, 5.25%, 7/25/352 | | | 91,350 | | | | 89,979 | | | |
| | | |
IndyMac Index Mortgage Loan Trust, Collateralized Mtg. Obligations, Series 2005-AR23, Cl. 6A1, 4.814%, 11/25/352 | | | 246,908 | | | | 203,187 | | | |
| | | |
JP Morgan Chase Commercial Mortgage Securities Trust: | | | | | | | | | | |
Series 2006-CB16, Cl. AJ, 5.623%, 5/12/45 | | | 470,000 | | | | 428,111 | | | |
Series 2007-LDPX, Cl. A2S2, 5.187%, 1/15/494 | | | 64,829 | | | | 65,853 | | | |
Series 2007-LDPX, Cl. A3S, 5.317%, 1/15/49 | | | 520,000 | | | | 529,364 | | | |
Series 2011-C3, Cl. A1, 1.875%, 2/15/463 | | | 156,403 | | | | 157,600 | | | |
| | | |
JP Morgan Mortgage Trust, Collateralized Mtg. Obligations, Series 2007-S3, Cl. 1A90, 7%, 8/25/37 | | | 259,867 | | | | 238,559 | | | |
| | | |
JPMorgan Resecuritization Trust, Collateralized Mtg. Obligations, Series 2009-5, Cl. 1A2, 2.613%, 7/26/362,3 | | | 258,683 | | | | 195,637 | | | |
| | | |
MASTR Adjustable Rate Mortgages Trust, Collateralized Mtg. Obligations, Series 2004-13, Cl. 2A2, 2.672%, 4/21/342 | | | 124,266 | | | | 126,485 | | | |
| | | |
Merrill Lynch Mortgage Trust, Collateralized Mtg. Obligations, Series 2006-C2, Cl. AM, 5.782%, 8/12/432 | | | 290,000 | | | | 313,416 | | | |
| | | | | | | | | | |
| | | Principal
Amount | | | Value | | | |
| | | |
Commercial (Continued) | | | | | | | | | | |
Morgan Stanley Bank of America Merrill Lynch Trust: | | | | | | | | | | |
Series 2012-C6, Cl. E, 4.82%, 11/15/452,3 | | $ | 95,000 | | | $ | 81,997 | | | |
Series 2013-C7, Cl. D, 4.444%, 2/15/462,3 | | | 115,000 | | | | 95,874 | | | |
Series 2013-C8, Cl. D, 4.312%, 12/15/482,3 | | | 80,000 | | | | 65,663 | | | |
| | | |
Morgan Stanley Capital I Trust: | | | | | | | | | | |
Series 2007-IQ13, Cl. AM, 5.406%, 3/15/44 | | | 325,000 | | | | 349,214 | | | |
Series 2007-IQ15, Cl. AM, 6.09%, 6/11/492 | | | 345,000 | | | | 372,631 | | | |
| | | |
Morgan Stanley Reremic Trust, Collateralized Mtg. Obligations, Series 2012-R3, Cl. 1B, 2.379%, 11/26/362,4 | | | 268,731 | | | | 151,198 | | | |
| | | |
Structured Adjustable Rate Mortgage Loan Trust: | | | | | | | | | | |
Series 2006-4, Cl. 6A, 5.221%, 5/25/362 | | | 163,143 | | | | 135,859 | | | |
Series 2007-6, Cl. 3A1, 4.627%, 7/25/372 | | | 255,963 | | | | 206,650 | | | |
| | | |
UBS-Barclays Commercial Mortgage Trust, Collateralized Mtg. Obligations, Series 2012-C2, Cl. E, 5.05%, 5/10/632,3 | | | 45,000 | | | | 39,927 | | | |
| | | |
WaMu Mortgage Pass-Through Certificates Trust, Collateralized Mtg. Obligations, Series 2005-AR14, Cl. 1A4, 2.514%, 12/25/352 | | | 126,652 | | | | 115,050 | | | |
| | | |
Wells Fargo Mortgage-Backed Securities Trust: | | | | | | | | | | |
Series 2005-AR1, Cl. 1A1, 2.611%, 2/25/352 | | | 53,175 | | | | 52,856 | | | |
Series 2005-AR15, Cl. 1A6, 2.613%, 9/25/352 | | | 123,863 | | | | 114,740 | | | |
Series 2007-16, Cl. 1A1, 6.00%, 12/28/37 | | | 257,213 | | | | 268,264 | | | |
Series 2007-AR8, Cl. A1, 5.98%, 11/25/372 | | | 850,723 | | | | 748,715 | | | |
| | | |
WFRBS Commercial Mortgage Trust: | | | | | | | | | | |
Series 2012-C10, Cl. D, 4.61%, 12/15/452,3 | | | 50,000 | | | | 41,471 | | | |
Series 2012-C7, Cl. E, 5.005%, 6/15/452,3 | | | 80,000 | | | | 69,767 | | | |
Series 2012-C8, Cl. E, 5.042%, 8/15/452,3 | | | 95,000 | | | | 83,014 | | | |
Series 2013-C11, Cl. D, 4.325%, 3/15/452,3 | | | 49,000 | | | | 39,735 | | | |
| | | |
WFRBS Commercial Mortgage Trust, Interest-Only, Collateralized Mtg. Obligations, Series 2011-C3, Cl. XA, 12.11%, 3/15/442,3,5 | | | 4,038,789 | | | | 296,990 | | | |
| | | | | | | | | | |
| | | | | | | 12,125,031 | | | |
| | | |
Multi-Family—0.4% | | | | | | | | | | |
Citigroup Mortgage Loan Trust, Collateralized Mtg. Obligations, Series 2006-AR3, Cl. 1A2A, 5.531%, 6/25/362 | | | 154,602 | | | | 142,216 | | | |
| | | |
Countrywide Alternative Loan Trust: | | | | | | | | | | |
Series 2005-86CB, Cl. A8, 5.50%, 2/25/36 | | | 53,056 | | | | 49,332 | | | |
Series 2005-J14, Cl. A7, 5.50%, 12/25/35 | | | 105,620 | | | | 91,169 | | | |
Series 2006-24CB, Cl. A12, 5.75%, 6/25/36 | | | 97,667 | | | | 81,327 | | | |
| | | |
Countrywide Home Loans, Collateralized Mtg. Obligations, Series 2006-20, Cl. 1A17, 5.75%, 2/25/37 | | | 298,301 | | | | 261,794 | | | |
| | | |
JP Morgan Mortgage Trust, Series 2007-A3, Cl. 3A2M, 4.925%, 5/25/372 | | | 32,326 | | | | 30,483 | | | |
| | | |
Wells Fargo Mortgage-Backed Securities Trust: | | | | | | | | | | |
Series 2006-AR2, Cl. 2A3, 2.641%, 3/25/362 | | | 66,177 | | | | 63,878 | | | |
Series 2006-AR6, Cl. 3A1, 2.77%, 3/25/362 | | | 617,827 | | | | 586,534 | | | |
| | | | | | | | | | |
| | | | | | | 1,306,733 | | | |
| | | |
Residential—2.2% | | | | | | | | | | |
Argent Securities, Inc., Series 2004-W8, Cl. A2, 1.153%, 5/25/342 | | | 132,431 | | | | 126,594 | | | |
| | | |
Banc of America Commercial Mortgage Trust, Collateralized Mtg. Obligations, Series 2007-4, Cl. AM, 6.002%, 2/10/512 | | | 820,000 | | | | 889,955 | | | |
| | | |
Banc of America Funding Trust: | | | | | | | | | | |
Series 2007-1, Cl. 1A3, 6.00%, 1/25/37 | | | 164,610 | | | | 143,893 | | | |
Series 2007-C, Cl. 1A4, 5.419%, 5/20/362 | | | 66,960 | | | | 63,997 | | | |
| | | |
Banc of America Mortgage 2004-E Trust, Collateralized Mtg. Obligations, Series 2004-E, Cl. 2A6, 2.829%, 6/25/342 | | | 179,308 | | | | 175,655 | | | |
| | | |
Carrington Mortgage Loan Trust, Series 2006-FRE1, Cl. A2, 0.303%, 7/25/362 | | | 126,398 | | | | 121,712 | | | |
| | | |
CD Commercial Mortgage Trust, Collateralized Mtg. Obligations, Series 2007-CD4, Cl. AMFX, 5.366%, 12/11/492 | | | 885,000 | | | | 895,883 | | | |
| | | |
Countrywide Alternative Loan Trust: | | | | | | | | | | |
Series 2005-29CB, Cl. A4, 5.00%, 7/25/35 | | | 634,580 | | | | 493,183 | | | |
Series 2007-19, Cl. 1A34, 6.00%, 8/25/37 | | | 326,521 | | | | 250,937 | | | |
9 OPPENHEIMER CAPITAL INCOME FUND/VA
STATEMENTOF INVESTMENTS Unaudited / Continued
| | | | | | | | | | |
| | | Principal
Amount | | | Value | | | |
| | | |
Residential (Continued) | | | | | | | | | | |
Countrywide Asset-Backed Certificates: | | | | | | | | | | |
Series 2005-16, Cl. 2AF2, 5.148%, 5/25/362 | | $ | 273,647 | | | $ | 269,519 | | | |
Series 2006-25, Cl. 2A2, 0.313%, 6/25/472 | | | 91,468 | | | | 90,846 | | | |
| | | |
Countrywide Home Loans: | | | | | | | | | | |
Series 2005-26, Cl. 1A8, 5.50%, 11/25/35 | | | 196,601 | | | | 187,219 | | | |
Series 2005-29, Cl. A1, 5.75%, 12/25/35 | | | 109,440 | | | | 100,438 | | | |
Series 2006-17, Cl. A2, 6.00%, 12/25/36 | | | 246,072 | | | | 220,993 | | | |
Series 2006-6, Cl. A3, 6.00%, 4/25/36 | | | 99,152 | | | | 92,450 | | | |
Series 2007-15, Cl. 1A29, 6.25%, 9/25/37 | | | 984,219 | | | | 922,007 | | | |
| | | |
Credit Suisse Commercial Mortgage Trust, Collateralized Mtg. Obligations, Series 2007-3, Cl. 2A10, 6%, 4/25/37 | | | 159,519 | | | | 138,063 | | | |
| | | |
GSR Mortgage Loan Trust, Collateralized Mtg. Obligations, Series 2006-5F, Cl. 2A1, 6%, 6/25/36 | | | 80,771 | | | | 78,706 | | | |
| | | |
JP Morgan Alternative Loan Trust, Series 2006-S4, Cl. A6, 5.71%, 12/25/362 | | | 103,094 | | | | 96,233 | | | |
| | | |
RALI Trust, Mtg. Pass-Through Certificates: | | | | | | | | | | |
Series 2003-QS1, Cl. A2, 5.75%, 1/25/33 | | | 82,904 | | | | 85,013 | | | |
Series 2006-QS13, Cl. 1A8, 6.00%, 9/25/36 | | | 19,267 | | | | 14,920 | | | |
| | | |
Residential Asset Securitization Trust, Series 2005-A15, Cl. 1A4, 5.75%, 2/25/36 | | | 31,305 | | | | 28,100 | | | |
| | | |
WaMu Mortgage Pass-Through Certificates Trust, Series 2006-AR18, Cl. 3A1, 4.484%, 1/25/372 | | | 78,430 | | | | 67,238 | | | |
| | | |
WaMu Mortgage-Pass Through Certificates Trust, Collateralized Mtg. Obligations, Series 2007-HY5, Cl. 3A1, 4.981%, 5/25/372 | | | 148,713 | | | | 143,413 | | | |
| | | |
Wells Fargo Alternative Loan Trust, Collateralized Mtg. Obligations, Series 2007-PA5, Cl. 1A1, 6.25%, 11/25/37 | | | 219,174 | | | | 204,897 | | | |
| | | |
Wells Fargo Mortgage-Backed Securities Trust: | | | | | | | | | | |
Series 2005-9, Cl. 2A6, 5.25%, 10/25/35 | | | 82,946 | | | | 85,333 | | | |
Series 2006-AR14, Cl. 1A2, 5.626%, 10/25/362 | | | 146,885 | | | | 138,383 | | | |
| | | | | | | | | | |
| | | | | | | 6,125,580 | | | |
| | | | | | | | | | |
Total Mortgage-Backed Obligation (Cost $65,791,019) | | | | | | | 65,984,033 | | | |
| | | | | | | | | | |
| | | |
U.S. Government Obligations—0.7% | | | |
| | | |
Federal Home Loan Mortgage Corp. Nts.: | | | | | | | | | | |
0.875%, 3/7/18 | | | 281,000 | | | | 272,228 | | | |
1.25%, 5/12/17 | | | 55,000 | | | | 55,123 | | | |
1.375%, 5/1/20 | | | 265,000 | | | | 251,372 | | | |
1.75%, 5/30/19 | | | 80,000 | | | | 78,867 | | | |
2.375%, 1/13/2210 | | | 611,000 | | | | 594,554 | | | |
5.25%, 4/18/16 | | | 300,000 | | | | 337,879 | | | |
5.50%, 7/18/16 | | | 65,000 | | | | 74,236 | | | |
| | | |
Federal National Mortgage Assn. Nts.: | | | | | | | | | | |
0.875%, 5/21/18 | | | 252,000 | | | | 243,838 | | | |
1.125%, 4/27/17 | | | 191,000 | | | | 190,490 | | | |
5.375%, 6/12/17 | | | 75,000 | | | | 86,880 | | | |
| | | | | | | | | | |
Total U.S. Government Obligation (Cost $2,201,924) | | | | | | | 2,185,467 | | | |
| | | | | | | | | | |
| | | |
Non-Convertible Corporate Bonds and Notes—22.3% | | | |
| | | |
Consumer Discretionary—2.8% | | | | | | | | | | |
| | | |
Auto Components—0.1% | | | | | | | | | | |
Dana Holding Corp., 6.75% Sr. Unsec. Nts., 2/15/21 | | | 289,000 | | | | 308,507 | | | |
| | | |
Automobiles—0.8% | | | | | | | | | | |
Daimler Finance North America LLC: | | | | | | | | | | |
1.30% Sr. Unsec. Nts., 7/31/153 | | | 463,000 | | | | 464,198 | | | |
8.50% Sr. Unsec. Unsub. Nts., 1/18/31 | | | 252,000 | | | | 357,751 | | | |
| | | |
Ford Motor Credit Co. LLC, 5.875% Sr. Unsec. Unsub. Nts., 8/2/21 | | | 973,000 | | | | 1,062,021 | | | |
| | | |
General Motors Financial Co., Inc., 4.25% Sr. Unsec. Nts., 5/15/233 | | | 396,000 | | | | 369,765 | | | |
| | | | | | | | | | |
| | | | | | | 2,253,735 | | | |
| | | |
Hotels, Restaurants & Leisure—0.1% | | | |
Brinker International, Inc.: | | | | | | | | | | |
2.60% Sr. Unsec. Nts., 5/15/18 | | | 151,000 | | | | 147,905 | | | |
3.875% Sr. Unsec. Nts., 5/15/23 | | | 151,000 | | | | 141,809 | | | |
| | | |
Starwood Hotels & Resorts Worldwide, Inc., 7.15% Sr. Unsec. Unsub. Nts., 12/1/19 | | | 164,000 | | | | 198,250 | | | |
| | | | | | | | | | |
| | | | | | | 487,964 | | | |
| | | | | | | | | | |
| | | Principal
Amount | | | Value | | | |
| | | |
Household Durables—0.3% | | | | | | | | | | |
Jarden Corp., 6.125% Sr. Unsec. Nts., 11/15/22 | | $ | 438,000 | | | $ | 461,542 | | | |
| | | |
Lennar Corp., 4.125% Sr. Unsec. Nts., 12/1/183 | | | 305,000 | | | | 290,512 | | | |
| | | | | | | | | | |
| | | | | | | 752,054 | | | |
| | | |
Media—0.7% | | | | | | | | | | |
Comcast Cable Communications Holdings, Inc., 9.455% Sr. Unsec. Nts., 11/15/22 | | | 205,000 | | | | 290,429 | | | |
| | | |
Comcast Corp., 4.65% Sr. Unsec. Unsub. Nts., 7/15/42 | | | 353,000 | | | | 340,200 | | | |
| | | |
DIRECTV Holdings LLC/DIRECTV Financing Co., Inc., 5.15% Sr. Unsec. Nts., 3/15/42 | | | 155,000 | | | | 138,900 | | | |
| | | |
Historic TW, Inc., 9.15% Debs., 2/1/23 | | | 38,000 | | | | 51,657 | | | |
| | | |
Interpublic Group of Cos., Inc. (The): | | | | | | | | | | |
6.25% Sr. Unsec. Nts., 11/15/14 | | | 155,000 | | | | 164,703 | | | |
10% Sr. Unsec. Nts., 7/15/17 | | | 324,000 | | | | 341,885 | | | |
| | | |
Lamar Media Corp., 5% Sr. Unsec. Sub. Nts., 5/1/23 | | | 296,000 | | | | 285,640 | | | |
| | | |
News America, Inc., 6.15% Sr. Unsec. Nts., 2/15/41 | | | 168,000 | | | | 187,397 | | | |
| | | |
Time Warner Entertainment Co. LP, 8.375% Sr. Unsec. Nts., 7/15/33 | | | 181,000 | | | | 214,047 | | | |
| | | |
WPP Finance 2010, 5.125% Sr. Unsec. Unsub. Nts., 9/7/42 | | | 90,000 | | | | 83,434 | | | |
| | | | | | | | | | |
| | | | | | | 2,098,292 | | | |
| | | |
Multiline Retail—0.3% | | | | | | | | | | |
Dollar General Corp., 4.125% Nts., 7/15/17 | | | 498,000 | | | | 525,607 | | | |
| | | |
Macy’s Retail Holdings, Inc., 5.75% Sr. Unsec. Nts., 7/15/14 | | | 414,000 | | | | 434,028 | | | |
| | | | | | | | | | |
| | | | | | | 959,635 | | | |
| | | |
Specialty Retail—0.1% | | | | | | | | | | |
Rent-A-Center, Inc., 4.75% Sr. Unsec. Nts., 5/1/213 | | | 300,000 | | | | 285,750 | | | |
| | | |
Textiles, Apparel & Luxury Goods—0.4% | | | |
Hanesbrands, Inc., 6.375% Sr. Unsec. Unsub. Nts., 12/15/20 | | | 422,000 | | | | 452,067 | | | |
| | | |
PVH Corp., 4.50% Sr. Unsec. Unsub. Nts., 12/15/22 | | | 481,000 | | | | 464,165 | �� | | |
| | | | | | | | | | |
| | | | | | | 916,232 | | | |
| | | |
Consumer Staples—1.6% | | | | | | | | | | |
| | | |
Beverages—0.7% | | | | | | | | | | |
Anheuser-Busch InBev Worldwide, Inc., 8.20% Sr. Unsec. Unsub. Nts., 1/15/39 | | | 366,000 | | | | 539,106 | | | |
| | | |
Coca-Cola HBC Finance BV, 5.125% Sr. Unsec. Unsub. Nts., 9/17/13 | | | 294,000 | | | | 296,649 | | | |
| | | |
Constellation Brands, Inc., 3.75% Sr. Unsec. Nts., 5/1/21 | | | 472,000 | | | | 443,090 | | | |
| | | |
Foster’s Finance Corp., 4.875% Sr. Unsec. Nts., 10/1/143 | | | 270,000 | | | | 283,340 | | | |
| | | |
SABMiller Holdings, Inc., 4.95% Sr. Unsec. Unsub. Nts., 1/15/423 | | | 235,000 | | | | 234,820 | | | |
| | | | | | | | | | |
| | | | | | | 1,797,005 | | | |
| | | |
Food & Staples Retailing—0.4% | | | | | | | | | | |
Delhaize Group SA, 5.70% Sr. Unsec. Nts., 10/1/40 | | | 245,000 | | | | 233,754 | | | |
| | | |
Safeway, Inc., 5.625% Sr. Unsec. Nts., 8/15/14 | | | 439,000 | | | | 460,763 | | | |
| | | |
Wal-Mart Stores, Inc., 4% Sr. Unsec. Unsub. Nts., 4/11/43 | | | 228,000 | | | | 208,867 | | | |
| | | | | | | | | | |
| | | | | | | 903,384 | | | |
| | | |
Food Products—0.2% | | | | | | | | | | |
Bunge Ltd. Finance Corp.: | | | | | | | | | | |
5.10% Sr. Unsec. Unsub. Nts., 7/15/15 | | | 381,000 | | | | 409,772 | | | |
5.35% Sr. Unsec. Unsub. Nts., 4/15/14 | | | 34,000 | | | | 35,054 | | | |
8.50% Sr. Unsec. Nts., 6/15/19 | | | 207,000 | | | | 255,686 | | | |
| | | | | | | | | | |
| | | | | | | 700,512 | | | |
| | | |
Personal Products—0.1% | | | | | | | | | | |
Avon Products, Inc., 4.60% Sr. Unsec. Nts., 3/15/20 | | | 402,000 | | | | 406,767 | | | |
| | | |
Tobacco—0.2% | | | | | | | | | | |
| Altria Group, Inc., 10.20% Sr. Unsec. Nts., 2/6/39 | | | 250,000 | | | | 377,680 | | | |
| | | |
| Lorillard Tobacco Co., 3.75% Sr. Unsec. Nts., 5/20/23 | | | 473,000 | | | | 437,059 | | | |
| | | | | | | | | | |
| | | | | | | 814,739 | | | |
| | | |
Energy—3.5% | | | | | | | | | | |
| | | |
Energy Equipment & Services—0.5% | | | | | | | | | | |
Ensco plc, 4.70% Sr. Unsec. Nts., 3/15/21 | | | 532,000 | | | | 565,478 | | | |
| | | |
Noble Holding International Ltd., 7.375% Sr. Unsec. Nts., 3/15/14 | | | 276,000 | | | | 288,034 | | | |
| | | |
Rowan Cos., Inc., 4.875% Sr. Unsec. Unsub. Nts., 6/1/22 | | | 329,000 | | | | 339,901 | | | |
|
| 10 OPPENHEIMER CAPITAL INCOME FUND/VA |
| | | | | | | | | | |
| | | Principal
Amount | | | Value | | | |
| | | |
Energy Equipment & Services (Continued) | | | |
Weatherford International Ltd. Bermuda, 4.50% Sr. Unsec. Unsub. Nts., 4/15/22 | | $ | 251,000 | | | $ | 248,461 | | | |
| | | | | | | | | | |
| | | | | | | 1,441,874 | | | |
| | | |
Oil, Gas & Consumable Fuels—3.0% | | | |
Anadarko Petroleum Corp.: | | | | | | | | | | |
6.20% Sr. Unsec. Nts., 3/15/40 | | | 172,000 | | | | 193,833 | | | |
7.625% Sr. Unsec. Nts., 3/15/14 | | | 206,000 | | | | 215,591 | | | |
| | | |
Apache Corp., 4.25% Sr. Unsec. Unsub. Nts., 1/15/44 | | | 125,000 | | | | 112,108 | | | |
| | | |
Buckeye Partners LP, 4.15% Sr. Unsec. Nts., 7/1/23 | | | 265,000 | | | | 258,196 | | | |
| | | |
Canadian Oil Sands Ltd.: | | | | | | | | | | |
5.80% Sr. Unsec. Nts., 8/15/133 | | | 318,000 | | | | 319,735 | | | |
6.00% Sr. Unsec. Nts., 4/1/423 | | | 206,000 | | | | 213,034 | | | |
| | | |
Cimarex Energy Co., 5.875% Sr. Unsec. Unsub. Nts., 5/1/22 | | | 272,000 | | | | 282,880 | | | |
| | | |
CNOOC Finance 2013 Ltd., 4.25% Sr. Unsec. Unsub. Nts., 5/9/43 | | | 164,000 | | | | 138,211 | | | |
| | | |
Concho Resources, Inc., 5.50% Sr. Unsec. Unsub. Nts., 4/1/23 | | | 465,000 | | | | 460,350 | | | |
| | | |
Continental Resources, Inc., 4.50% Sr. Unsec. Unsub. Nts., 4/15/233 | | | 299,000 | | | | 291,151 | | | |
| | | |
Copano Energy LLC/Copano Energy Finance Corp., | | | | | | | | | | |
7.125% Sr. Unsec. Unsub. Nts., 4/1/21 | | | 479,000 | | | | 535,282 | | | |
| | | |
DCP Midstream LLC, 5.85% Jr. Sub. Nts., 5/21/432,3 | | | 486,000 | | | | 468,990 | | | |
| | | |
DCP Midstream Operating LP: | | | | | | | | | | |
2.50% Sr. Unsec. Unsub. Nts., 12/1/17 | | | 405,000 | | | | 400,053 | | | |
3.875% Sr. Unsec. Nts., 3/15/23 | | | 237,000 | | | | 222,589 | | | |
| | | |
El Paso Pipeline Partners Operating Co. LLC, 4.70% Sr. Unsec. Unsub. Nts., 11/1/42 | | | 335,000 | | | | 298,740 | | | |
| | | |
Enbridge Energy Partners LP, 5.35% Sr. Unsec. Nts., 12/15/14 | | | 209,000 | | | | 221,357 | | | |
| | | |
EnCana Holdings Finance Corp., 5.80% Sr. Unsec. Unsub. Nts., 5/1/14 | | | 139,000 | | | | 144,510 | | | |
| | | |
Energy Transfer Partners LP: | | | | | | | | | | |
4.65% Sr. Unsec. Unsub. Nts., 6/1/21 | | | 396,000 | | | | 410,286 | | | |
5.20% Sr. Unsec. Unsub. Nts., 2/1/22 | | | 92,000 | | | | 97,477 | | | |
8.50% Sr. Unsec. Nts., 4/15/14 | | | 180,000 | | | | 190,454 | | | |
| | | |
NuStar Logistics LP, 4.75% Sr. Unsec. Unsub. Nts., 2/1/22 | | | 250,000 | | | | 233,879 | | | |
| | | |
Range Resources Corp., 5.75% Sr. Unsec. Sub. Nts., 6/1/21 | | | 285,000 | | | | 294,975 | | | |
| | | |
Ras Laffan Liquefied Natural Gas Co. Ltd. III, 5.50% Sr. Sec. Nts., 9/30/143 | | | 291,000 | | | | 305,186 | | | |
| | | |
Rockies Express Pipeline LLC, 3.90% Sr. Unsec. Unsub. Nts., 4/15/153 | | | 327,000 | | | | 325,365 | | | |
| | | |
Southwestern Energy Co., 4.10% Sr. Unsec. Nts., 3/15/22 | | | 255,000 | | | | 254,236 | | | |
| | | |
Talisman Energy, Inc.: | | | | | | | | | | |
5.125% Sr. Unsec. Nts., 5/15/15 | | | 222,000 | | | | 237,320 | | | |
6.25% Sr. Unsec. Unsub. Nts., 2/1/38 | | | 138,000 | | | | 148,826 | | | |
| | | |
Williams Cos., Inc. (The), 3.70% Sr. Unsec. Unsub. Nts., 1/15/23 | | | 253,000 | | | | 235,383 | | | |
| | | |
Woodside Finance Ltd.: | | | | | | | | | | |
4.60% Sr. Unsec. Unsub. Nts., 5/10/213 | | | 372,000 | | | | 391,750 | | | |
5.00% Sr. Unsec. Nts., 11/15/133 | | | 312,000 | | | | 316,584 | | | |
| | | | | | | | | | |
| | | | | | | 8,218,331 | | | |
| | | |
Financials—7.2% | | | | | | | | | | |
| | | |
Capital Markets—1.8% | | | |
Blackstone Holdings Finance Co. LLC, 6.625% Sr. Unsec. Nts., 8/15/193 | | | 364,000 | | | | 426,216 | | | |
| | | |
Carlyle Holdings II Finance LLC, 5.625% Sr. Sec. Nts., 3/30/433 | | | 243,000 | | | | 230,729 | | | |
| | | |
Deutsche Bank AG, 4.296% Sub. Nts., 5/24/282 | | | 484,000 | | | | 447,515 | | | |
| | | |
Goldman Sachs Capital I, 6.345% Sub. Nts., 2/15/34 | | | 469,000 | | | | 452,271 | | | |
| | | |
Goldman Sachs Group, Inc. (The), 6.25% Sr. Unsec. Nts., 2/1/41 | | | 457,000 | | | | 519,177 | | | |
| | | |
Macquarie Bank Ltd., 6.625% Unsec. Sub. Nts., 4/7/213 | | | 736,000 | | | | 779,600 | | | |
| | | |
Morgan Stanley, 6.375% Sr. Unsec. Nts., 7/24/42 | | | 312,000 | | | | 349,651 | | | |
| | | |
Nomura Holdings, Inc., 2% Sr. Unsec. Nts., 9/13/16 | | | 890,000 | | | | 880,600 | | | |
| | | |
Raymond James Financial, Inc., 5.625% Sr. Unsec. Unsub. Nts., 4/1/24 | | | 265,000 | | | | 279,504 | | | |
| | | | | | | | | | |
| | | Principal
Amount | | | Value | | | |
| | | |
Capital Markets (Continued) | | | | | | | | | | |
UBS AG (Stamford, CT), 2.25% Sr. Unsec. Nts., 8/12/13 | | $ | 139,000 | | | $ | 139,281 | | | |
| | | |
UBS Preferred Funding Trust V, 6.243% Jr. Sub. Perpetual Bonds, Series 12,9 | | | 555,000 | | | | 573,731 | | | |
| | | | | | | | | | |
| | | | | | | 5,078,275 | | | |
| | | |
Commercial Banks—1.9% | | | | | | | | | | |
Amsouth Bank NA, 5.20% Sub. Nts., 4/1/15 | | | 276,000 | | | | 286,470 | | | |
| | | |
Barclays Bank plc, 5.14% Sub. Nts., 10/14/20 | | | 460,000 | | | | 465,235 | | | |
| | | |
BPCE SA, 1.70% Sr. Unsec. Nts., 4/25/16 | | | 469,000 | | | | 465,924 | | | |
| | | |
Fifth Third Capital Trust IV, 6.50% Jr. Sub. Nts., 4/15/372 | | | 641,000 | | | | 641,000 | | | |
| | | |
HSBC Finance Capital Trust IX, 5.911% Unsec. Sub. Nts., 11/30/352 | | | 820,000 | | | | 828,610 | | | |
| | | |
LBG Capital No. 1 plc, 7.875% Unsec. Sub. Nts., 11/1/203 | | | 437,000 | | | | 455,354 | | | |
| | | |
Lloyds TSB Bank plc, 6.50% Unsec. Sub. Nts., 9/14/203 | | | 432,000 | | | | 461,028 | | | |
| | | |
PNC Financial Services Group, Inc. (The), 4.85% Jr. Sub. Perpetual Bonds2,9 | | | 496,000 | | | | 463,760 | | | |
| | | |
Royal Bank of Scotland Group plc, 7.64% Jr. Sub. Perpetual Bonds, Series U2,9 | | | 400,000 | | | | 362,000 | | | |
| | | |
Wells Fargo & Co., 7.98% Jr. Sub. Perpetual Bonds, Series K2,9 | | | 578,000 | | | | 654,224 | | | |
| | | | | | | | | | |
| | | | | | | 5,083,605 | | | |
| | | |
Consumer Finance—0.2% | | | |
Discover Financial Services, 3.85% Sr. Unsec. Unsub. Nts., 11/21/22 | | | 552,000 | | | | 519,080 | | | |
| | | |
Diversified Financial Services—1.6% | | | |
Bank of America Corp., 5.20% Jr. Sub. Perpetual Bonds2,9 | | | 484,000 | | | | 457,380 | | | |
| | | |
Citigroup, Inc.: | | | | | | | | | | |
3.375% Sr. Unsec. Unsub. Nts., 3/1/23 | | | 339,000 | | | | 324,756 | | | |
Series D, 5.95% Jr. Sub. Perpetual Bonds2,9 | | | 459,000 | | | | 457,325 | | | |
| | | |
ING Bank NV, 3.75% Sr. Unsec. Nts., 3/7/173 | | | 108,000 | | | | 113,102 | | | |
| | | |
ING US, Inc.: | | | | | | | | | | |
5.50% Sr. Unsec. Nts., 7/15/223 | | | 178,000 | | | | 189,585 | | | |
5.65% Unsec. Sub. Nts., 5/15/532,3 | | | 395,000 | | | | 372,287 | | | |
| | | |
Jefferies Group LLC, 5.125% Sr. Unsec. Nts., 1/20/23 | | | 249,000 | | | | 247,404 | | | |
| | | |
JPMorgan Chase & Co.: | | | | | | | | | | |
Series 1, 7.90% Jr. Sub. Perpetual Bonds2,9 | | | 883,000 | | | | 998,803 | | | |
Series Q, 5.15% Jr. Sub. Perpetual Bonds2,9 | | | 136,000 | | | | 130,220 | | | |
| | | |
Merrill Lynch & Co., Inc., 7.75% Jr. Sub. Nts., 5/14/38 | | | 404,000 | | | | 463,886 | | | |
| | | |
Rabobank Capital Funding Trust III, 5.254% Jr. Sub. Perpetual Bonds2,3,9 | | | 751,000 | | | | 754,755 | | | |
| | | | | | | | | | |
| | | | | | | 4,509,503 | | | |
| | | |
Insurance—1.1% | | | | | | | | | | |
CNA Financial Corp.: | | | | | | | | | | |
5.75% Sr. Unsec. Unsub. Nts., 8/15/21 | | | 290,000 | | | | 326,777 | | | |
5.875% Sr. Unsec. Unsub. Nts., 8/15/20 | | | 169,000 | | | | 191,460 | | | |
| | | |
Gulf South Pipeline Co. LP, 5.05% Sr. Unsec. Nts., 2/1/153 | | | 260,000 | | | | 273,444 | | | |
| | | |
Liberty Mutual Group, Inc., 4.25% Sr. Unsec. Nts., 6/15/233 | | | 380,000 | | | | 367,682 | | | |
| | | |
Lincoln National Corp., 6.05% Jr. Unsec. Sub. Nts., 4/20/672 | | | 864,000 | | | | 850,764 | | | |
| | | |
Marsh & McLennan Cos., Inc., 5.375% Sr. Unsec. Nts., 7/15/14 | | | 64,000 | | | | 66,848 | | | |
| | | |
Prudential Financial, Inc., 5.20% Jr. Sub. Nts., 3/15/442 | | | 206,000 | | | | 195,443 | | | |
| | | |
QBE Insurance Group Ltd., 2.40% Sr. Unsec. Nts., 5/1/183 | | | 350,000 | | | | 343,379 | | | |
| | | |
Swiss Re Capital I LP, 6.854% Jr. Sub. Perpetual Bonds2,3,9 | | | 495,000 | | | | 513,562 | | | |
| | | |
Willis Group Holdings plc, 4.125% Sr. Unsec. Unsub. Nts., 3/15/16 | | | 116,000 | | | | 121,494 | | | |
| | | | | | | | | | |
| | | | | | | 3,250,853 | | | |
| | | |
Real Estate Investment Trusts (REITs)—0.6% | | | |
American Tower Corp.: | | | | | | | | | | |
5.05% Sr. Unsec. Unsub. Nts., 9/1/20 | | | 285,000 | | | | 299,820 | | | |
7.00% Sr. Unsec. Nts., 10/15/17 | | | 294,000 | | | | 340,845 | | | |
| | | |
Corrections Corp. of America, 4.125% Sr. Unsec. Nts., 4/1/203 | | | 110,000 | | | | 107,800 | | | |
11 OPPENHEIMER CAPITAL INCOME FUND/VA
STATEMENTOF INVESTMENTS Unaudited / Continued
| | | | | | | | | | |
| | | Principal
Amount | | | Value | | | |
| | | |
Real Estate Investment Trusts (REITs) (Continued) | | | |
Hospitality Properties Trust, 5.125% Sr. Unsec. Nts., 2/15/15 | | $ | 262,000 | | | $ | 271,366 | | | |
| | | |
Host Hotels & Resorts LP, 3.75% Sr. Unsec. Nts., 10/15/23 | | | 328,000 | | | | 301,265 | | | |
| | | |
National Retail Properties, Inc., 6.25% Sr. Unsec. Nts., 6/15/14 | | | 211,000 | | | | 220,841 | | | |
| | | |
WEA Finance LLC/WT Finance Aust Pty Ltd., 7.50% Sr. Unsec. Nts., 6/2/143 | | | 283,000 | | | | 300,679 | | | |
| | | | | | | | | | |
| | | | | | | 1,842,616 | | | |
| | | |
Health Care—0.7% | | | | | | | | | | |
| | | |
Biotechnology—0.5% | | | | | | | | | | |
Amgen, Inc., 3.625% Sr. Unsec. Unsub. Nts., 5/15/22 | | | 458,000 | | | | 458,480 | | | |
| | | |
Celgene Corp., 3.25% Sr. Unsec. Nts., 8/15/22 | | | 522,000 | | | | 495,751 | | | |
| | | |
Gilead Sciences, Inc., 5.65% Sr. Unsec. Unsub. Nts., 12/1/41 | | | 232,000 | | | | 259,258 | | | |
| | | | | | | | | | |
| | | | | | | 1,213,489 | | | |
| | | |
Health Care Providers & Services—0.1% | | | |
Cardinal Health, Inc.: | | | | | | | | | | |
1.70% Sr. Unsec. Nts., 3/15/18 | | | 99,000 | | | | 96,125 | | | |
3.20% Sr. Unsec. Nts., 3/15/23 | | | 147,000 | | | | 137,381 | | | |
| | | |
McKesson Corp., 6% Sr. Unsec. Unsub. Nts., 3/1/41 | | | 183,000 | | | | 215,009 | | | |
| | | | | | | | | | |
| | | | | | | 448,515 | | | |
| | | |
Pharmaceuticals—0.1% | | | | | | | | | | |
Mallinckrodt International Finance SA, 3.50% Sr. Unsec. Unsub. Nts., 4/15/183 | | | 100,000 | | | | 98,927 | | | |
| | | |
Zoetis, Inc.: | | | | | | | | | | |
1.875% Sr. Unsec. Nts., 2/1/183 | | | 158,000 | | | | 154,787 | | | |
4.70% Sr. Unsec. Nts., 2/1/433 | | | 147,000 | | | | 137,960 | | | |
| | | | | | | | | | |
| | | | | | | 391,674 | | | |
| | | |
Industrials—1.6% | | | | | | | | | | |
| | | |
Aerospace & Defense—0.2% | | | | | | | | | | |
B/E Aerospace, Inc., 5.25% Sr. Unsec. Nts., 4/1/22 | | | 222,000 | | | | 222,000 | | | |
| | | |
Huntington Ingalls Industries, Inc., 7.125% Sr. Unsec. Unsub. Nts., 3/15/21 | | | 280,000 | | | | 302,400 | | | |
| | | | | | | | | | |
| | | | | | | 524,400 | | | |
| | | |
Building Products—0.1% | | | | | | | | | | |
Owens Corning, 4.20% Sr. Unsec. Nts., 12/15/22 | | | 368,000 | | | | 357,069 | | | |
| | | |
Commercial Services & Supplies—0.1% | | | |
Clean Harbors, Inc., 5.25% Sr. Unsec. Unsub. Nts., 8/1/20 | | | 298,000 | | | | 303,960 | | | |
| | | |
Industrial Conglomerates—0.4% | | | | | | | | | | |
General Electric Capital Corp.: | | | | | | | | | | |
5.25% Jr. Sub. Perpetual Bonds2,9 | | | 500,000 | | | | 478,750 | | | |
6.375% Unsec. Sub. Nts., 11/15/672 | | | 644,000 | | | | 671,370 | | | |
| | | | | | | | | | |
| | | | | | | 1,150,120 | | | |
| | | |
Machinery—0.3% | | | | | | | | | | |
CNH Capital LLC, 6.25% Sr. Unsec. Nts., 11/1/16 | | | 338,000 | | | | 361,660 | | | |
| | | |
Ingersoll-Rand Global Holding Co. Ltd., 4.25% Sr. Unsec. Nts., 6/15/233 | | | 388,000 | | | | 386,108 | | | |
| | | |
National Rural Utilities Cooperative Finance Corp., 4.75% Sr. Unsec. Sub. Nts., 4/30/432 | | | 251,000 | | | | 244,725 | | | |
| | | | | | | | | | |
| | | | | | | 992,493 | | | |
| | | |
Professional Services—0.2% | | | | | | | | | | |
Nielsen Finance LLC/Nielsen Finance Co., 4.50% Sr. Unsec. Nts., 10/1/203 | | | 460,000 | | | | 443,900 | | | |
| | | |
Road & Rail—0.2% | | | | | | | | | | |
Kansas City Southern Railway, 4.30% Sr. Unsec. Nts., 5/15/433 | | | 117,000 | | | | 105,955 | | | |
| | | |
Penske Truck Leasing Co. LP/PTL Finance Corp.: | | | | | | | | | | |
2.50% Sr. Unsec. Nts., 7/11/143 | | | 289,000 | | | | 293,193 | | | |
4.25% Sr. Unsec. Nts., 1/17/233 | | | 250,000 | | | | 247,471 | | | |
| | | | | | | | | | |
| | | | | | | 646,619 | | | |
| | | |
Trading Companies & Distributors—0.1% | | | |
International Lease Finance Corp., 5.875% Sr. Unsec. Unsub. Nts., 4/1/19 | | | 272,000 | | | | 276,080 | | | |
| | | |
Information Technology—1.1% | | | | | | | | | | |
| | | |
Computers & Peripherals—0.4% | | | | | | | | | | |
Apple, Inc., 3.85% Sr. Unsec. Unsub. Nts., 5/4/43 | | | 125,000 | | | | 111,632 | | | |
| | | | | | | | | | |
| | | Principal
Amount | | | Value | | | |
| | | |
Computers & Peripherals (Continued) | | | |
Hewlett-Packard Co.: | | | | | | | | | | |
2.65% Sr. Unsec. Unsub. Nts., 6/1/16 | | $ | 805,000 | | | $ | 820,987 | | | |
4.75% Sr. Unsec. Nts., 6/2/14 | | | 200,000 | | | | 206,296 | | | |
| | | | | | | | | | |
| | | | | | | 1,138,915 | | | |
| | | |
Electronic Equipment, Instruments, & Components—0.4% | | | |
Amphenol Corp., 4.75% Sr. Unsec. Nts., 11/15/14 | | | 79,000 | | | | 82,808 | | | |
| | | |
Arrow Electronics, Inc., 5.125% Sr. Unsec. Unsub. Nts., 3/1/21 | | | 525,000 | | | | 538,820 | | | |
| | | |
Avnet, Inc., 4.875% Sr. Unsec. Unsub. Nts., 12/1/22 | | | 550,000 | | | | 548,512 | | | |
| | | | | | | | | | |
| | | | | | | 1,170,140 | | | |
| | | |
IT Services—0.1% | | | | | | | | | | |
Fidelity National Information Services, Inc., 3.50% Sr. Unsec. Nts., 4/15/23 | | | 244,000 | | | | 220,686 | | | |
| | | |
Office Electronics—0.2% | | | | | | | | | | |
Xerox Corp., 4.25% Sr. Unsec. Nts., 2/15/15 | | | 449,000 | | | | 469,207 | | | |
| | | |
Materials—1.5% | | | | | | | | | | |
| | | |
Chemicals—0.5% | | | | | | | | | | |
Agrium, Inc., 6.125% Sr. Unsec. Unsub. Nts., 1/15/41 | | | 54,000 | | | | 58,880 | | | |
| | | |
CF Industries, Inc., 4.95% Sr. Unsec. Nts., 6/1/43 | | | 199,000 | | | | 189,886 | | | |
| | | |
Dow Chemical Co., 8.55% Sr. Unsec. Nts., 5/15/19 | | | 290,000 | | | | 370,300 | | | |
| | | |
Eastman Chemical Co., 4.80% Sr. Unsec. Nts., 9/1/42 | | | 181,000 | | | | 172,136 | | | |
| | | |
RPM International, Inc., 3.45% Sr. Unsec. Unsub. Nts., 11/15/22 | | | 234,000 | | | | 218,605 | | | |
| | | |
Sherwin-Williams Co., 4% Sr. Unsec. Unsub. Nts., 12/15/42 | | | 268,000 | | | | 243,204 | | | |
| | | | | | | | | | |
| | | | | | | 1,253,011 | | | |
| | | |
Containers & Packaging—0.3% | | | | | | | | | | |
Crown Americas LLC/Crown Americas Capital Corp. III, 6.25% Sr. Unsec. Nts., 2/1/21 | | | 308,000 | | | | 328,020 | | | |
| | | |
Rock Tenn Co., 3.50% Sr. Unsec. Unsub. Nts., 3/1/20 | | | 464,000 | | | | 454,503 | | | |
| | | | | | | | | | |
| | | | | | | 782,523 | | | |
| | | |
Metals & Mining—0.5% | | | | | | | | | | |
Allegheny Technologies, Inc., 5.95% Sr. Unsec. Unsub. Nts., 1/15/21 | | | 168,000 | | | | 178,664 | | | |
| | | |
Carpenter Technology Corp., 4.45% Sr. Unsec. Unsub. Nts., 3/1/23 | | | 159,000 | | | | 155,200 | | | |
| | | |
Cliffs Natural Resources, Inc., 3.95% Sr. Unsec. Unsub. Nts., 1/15/18 | | | 440,000 | | | | 420,666 | | | |
| | | |
Freeport-McMoRan Copper & Gold, Inc., 3.875% Sr. Unsec. Nts., 3/15/233 | | | 485,000 | | | | 439,578 | | | |
| | | |
Xstrata Canada Corp.: | | | | | | | | | | |
5.375% Sr. Unsec. Unsub. Nts., 6/1/15 | | | 135,000 | | | | 142,655 | | | |
6.00% Sr. Unsec. Unsub. Nts., 10/15/15 | | | 264,000 | | | | 287,611 | | | |
| | | | | | | | | | |
| | | | | | | 1,624,374 | | | |
| | | |
Paper & Forest Products—0.2% | | | | | | | | | | |
Georgia-Pacific LLC, 3.734% Sr. Unsec. Nts., 7/15/233 | | | 350,000 | | | | 340,922 | | | |
| | | |
International Paper Co., 6% Sr. Unsec. Unsub. Nts., 11/15/41 | | | 208,000 | | | | 222,262 | | | |
| | | | | | | | | | |
| | | | | | | 563,184 | | | |
| | | |
Telecommunication Services—1.2% | | | | | | | | | | |
| | | |
Diversified Telecommunication Services—1.0% | | | |
AT&T, Inc., 6.30% Sr. Unsec. Unsub. Nts., 1/15/38 | | | 596,000 | | | | 665,396 | | | |
| | | |
British Telecommunications plc, 9.625% Sr. Unsec. Nts., 12/15/30 | | | 293,000 | | | | 442,527 | | | |
| | | |
CenturyLink, Inc., 5.625% Sr. Unsec. Unsub. Nts., 4/1/20 | | | 451,000 | | | | 457,765 | | | |
| | | |
Frontier Communications Corp., 8.50% Sr. Unsec. Nts., 4/15/20 | | | 267,000 | | | | 295,702 | | | |
| | | |
MetroPCS Wireless, Inc., 6.25% Sr. Unsec. Unsub. Nts., 4/1/213 | | | 295,000 | | | | 301,269 | | | |
| | | |
Telecom Italia Capital SA, 7.721% Sr. Unsec. Unsub. Nts., 6/4/38 | | | 405,000 | | | | 413,344 | | | |
| | | |
Telefonica Emisiones SAU, 7.045% Sr. Unsec. Unsub. Nts., 6/20/36 | | | 288,000 | | | | 317,900 | | | |
| | | |
Verizon Communications, Inc., 6.40% Sr. Unsec. Nts., 2/15/38 | | | 356,000 | | | | 416,291 | | | |
| | | | | | | | | | |
| | | | | | | 3,310,194 | | | |
12 OPPENHEIMER CAPITAL INCOME FUND/VA
| | | | | | | | | | |
| | | Principal
Amount | | | Value | | | |
| | | |
Wireless Telecommunication Services—0.2% | | | |
America Movil SAB de CV, 4.375% Sr. Unsec. Unsub. Nts., 7/16/42 | | $ | 361,000 | | | $ | 309,802 | | | |
| | | |
CC Holdings GS V LLC/Crown Castle GS III Corp., 3.849% Sr. Sec. Nts., 4/15/23 | | | 255,000 | | | | 240,792 | | | |
| | | |
Vodafone Group plc, 4.375% Sr. Unsec. Unsub. Nts., 2/19/43 | | | 155,000 | | | | 139,553 | | | |
| | | | | | | | | | |
| | | | | | | 690,147 | | | |
| | | |
Utilities—1.1% | | | | | | | | | | |
| | | |
Electric Utilities—0.9% | | | | | | | | | | |
Edison International, 3.75% Sr. Unsec. Unsub. Nts., 9/15/17 | | | 491,000 | | | | 519,619 | | | |
| | | |
Electricite de France SA, 5.25% Jr. Sub. Perpetual Bonds2,3,9 | | | 390,000 | | | | 373,528 | | | |
| | | |
Exelon Generation Co. LLC, 4.25% Sr. Unsec. Unsub. Nts., 6/15/22 | | | 257,000 | | | | 257,362 | | | |
| | | |
FirstEnergy Corp., 2.75% Sr. Unsec. Nts., 3/15/18 | | | 259,000 | | | | 252,330 | | | |
| | | |
Great Plains Energy, Inc., 2.766% Sr. Unsec. Nts., 8/15/13 | | | 354,000 | | | | 354,763 | | | |
| | | |
ITC Holdings Corp., 5.30% Sr. Unsec. Nts., 7/1/43 | | | 203,000 | | | | 205,915 | | | |
| | | |
PPL Capital Funding, Inc., 3.50% Sr. Unsec. Unsub. Nts., 12/1/22 | | | 223,000 | | | | 213,633 | | | |
| | | |
PPL WEM Holdings plc, 5.375% Sr. Unsec. Unsub. Nts., 5/1/213 | | | 290,000 | | | | 318,381 | | | |
| | | | | | | | | | |
| | | | | | | 2,495,531 | | | |
| | | | | | | | | | |
| | | Principal
Amount | | | Value | | | |
| | | |
Energy Traders—0.1% | | | | | | | | | | |
TransAlta Corp., 5.75% Sr. Unsec. Nts., 12/15/13 | | $ | 316,000 | | | $ | 323,080 | | | |
| | | |
Multi-Utilities—0.1% | | | | | | | | | | |
CMS Energy Corp., 5.05% Sr. Unsec. Unsub. Nts., 3/15/22 | | | 172,000 | | | | 186,060 | | | |
| | | | | | | | | | |
Total Non-Convertible Corporate Bonds and Notes (Cost $63,940,336) | | | | | | | 63,604,084 | | | |
| | | |
| | | Shares | | | | | | |
| | | |
Investment Company—7.0% | | | |
| | | |
Oppenheimer Institutional Money Market Fund, Cl. E, | | | | | | | | | | |
0.11%11,12 (Cost $19,917,607) | | | 19,917,607 | | | | 19,917,607 | | | |
| | | |
Total Investments, at Value | | | | | | | | | | |
(Cost $272,574,366) | | | 96.7% | | | | 275,761,154 | | | |
| | | |
Assets in Excess of Other Liabilities | | | 3.3 | | | | 9,415,854 | | | |
| | | | | | |
Net Assets | | | 100.0% | | | $ | 285,177,008 | | | |
| | | | | | |
Footnotes to Statement of Investments
*June 28, 2013 represents the last business day of the Fund’s semiannual period. See Note1 of the accompanying Notes.
1. Non-income producing security.
2. Represents the current interest rate for a variable or increasing rate security.
3. Represents securities sold under Rule 144A, which are exempt from registration under the Securities Act of 1933, as amended. These securities have been determined to be liquid under guidelines established by the Board of Trustees. These securities amount to $28,220,741 or 9.90% of the Fund’s net assets as of June 28, 2013.
4. Restricted security. The aggregate value of restricted securities as of June 28, 2013 was $927,980, which represents 0.33% of the Fund’s net assets. See Note 7 of the accompanying Notes. Information concerning restricted securities is as follows:
| | | | | | | | | | | | | | | | |
| Security | | Acquisition
Dates | | | Cost | | | Value | | | Unrealized
Appreciation/
(Depreciation) | |
| |
Ally Auto Receivables Trust, Series 2012-A, Cl. D, 3.15%, 10/15/18 | | | 5/3/13 | | | $ | 516,947 | | | $ | 507,589 | | | $ | (9,358) | |
JP Morgan Chase Commercial Mortgage Securities Trust, Series 2007-LDPX, Cl. A2S2, 5.187%, 1/15/49 | | | 7/14/10 | | | | 64,018 | | | | 65,853 | | | | 1,835 | |
Morgan Stanley Reremic Trust, Collateralized Mtg. Obligations, Series 2012-R3, Cl. 1B, 2.379%, 11/26/36 | | | 10/24/12 | | | | 130,266 | | | | 151,198 | | | | 20,932 | |
Santander Drive Auto Receivables Trust, Series 2011-S1A, Cl. D, 3.10%, 5/15/17 | | | 2/4/11-2/9/12 | | | | 62,828 | | | | 62,924 | | | | 96 | |
Santander Drive Auto Receivables Trust, Series 2011-S2A, Cl. D, 3.35%, 6/15/17 | | | 5/19/11-4/9/13 | | | | 139,928 | | | | 140,416 | | | | 488 | |
| | | | | | | | |
| | | | | | $ | 913,987 | | | $ | 927,980 | | | $ | 13,993 | |
| | | | | | | | |
5. Interest-Only Strips represent the right to receive the monthly interest payments on an underlying pool of mortgage loans. These securities typically decline in price as interest rates decline. Most other fixed income securities increase in price when interest rates decline. The principal amount of the underlying pool represents the notional amount on which current interest is calculated. The price of these securities is typically more sensitive to changes in prepayment rates than traditional mortgage-backed securities (for example, GNMA pass-throughs). Interest rates disclosed represent current yields based upon the current cost basis and estimated timing and amount of future cash flows. These securities amount to $3,368,400 or 1.18% of the Fund’s net assets as of June 28, 2013.
6. The current amortization rate of the security’s cost basis exceeds the future interest payments currently estimated to be received. Both the amortization rate and interest payments are contingent on future mortgage pre-payment speeds and are therefore subject to change.
7. Principal-Only Strips represent the right to receive the monthly principal payments on an underlying pool of mortgage loans. The value of these securities generally increases as interest rates decline and prepayment rates rise. The price of these securities is typically more volatile than that of coupon-bearing bonds of the same maturity. Interest rates disclosed represent current yields based upon the current cost basis and estimated timing of future cash flows. These securities amount to $148,461 or 0.05% of the Fund’s net assets as of June 28, 2013.
8. All or a portion of the security position is when-issued or delayed delivery to be delivered and settled after June 28, 2013. See Note 1 of the accompanying Notes.
9. This bond has no contractual maturity date, is not redeemable and contractually pays an indefinite stream of interest. Rate reported represents the current interest rate for this variable rate security.
10. All or a portion of the security position is held in accounts at a futures clearing merchant and pledged to cover margin requirements on open futures contracts and written options on futures, if applicable. The aggregate market value of such securities is $594,554. See Note 6 of the accompanying Notes.
13 OPPENHEIMER CAPITAL INCOME FUND/VA
STATEMENTOF INVESTMENTS Unaudited / Continued
Footnotes to Statement of Investments (Continued)
11. Is or was an affiliate, as defined in the Investment Company Act of 1940, at or during the period ended June 28, 2013, by virtue of the Fund owning at least 5% of the voting securities of the issuer or as a result of the Fund and the issuer having the same investment adviser. Transactions during the period in which the issuer was an affiliate are as follows:
| | | | | | | | | | | | | | | | |
| | | Shares
December 31, 2012 | | | Gross
Additions | | | Gross
Reductions | | | Shares June 28, 2013 | |
| |
Oppenheimer Institutional Money Market Fund, Cl. E | | | 19,691,265 | | | | 42,627,851 | | | | 42,401,509 | | | | 19,917,607 | |
| | | | |
| | | | | | | | | Value | | | Income | |
| |
Oppenheimer Institutional Money Market Fund, Cl. E | | | | | | | | | | $ | 19,917,607 | | | $ | 14,574 | |
12. Rate shown is the 7-day yield as of June 28, 2013.
| | | | | | | | | | | | | | | | | | | | | | |
| |
Futures Contracts as of June 28, 2013: | | | | | | | | | | | | | | | | | | | | | | |
| | | | | | | |
| Contract Description | | Buy/Sell | | | | Number of
Contracts | | | | | Expiration
Date | | | Value | | | Unrealized
Appreciation
(Depreciation) | |
| |
U.S. Treasury Long Bonds | | Buy | | | | | 44 | | | | | | 9/19/13 | | | $ | 5,977,125 | | | $ | (150,081) | |
U.S. Treasury Nts., 2 yr. | | Buy | | | | | 67 | | | | | | 9/19/13 | | | | 14,740,000 | | | | (12,962) | |
U.S. Treasury Nts., 5 yr. | | Sell | | | | | 58 | | | | | | 9/19/13 | | | | 7,020,719 | | | | 135,725 | |
U.S. Treasury Nts., 10 yr. | | Buy | | | | | 73 | | | | | | 9/19/13 | | | | 9,239,062 | | | | (114,354) | |
U.S. Treasury Ultra Bonds | | Buy | | | | | 34 | | | | | | 9/19/13 | | | | 5,008,625 | | | | (298,334) | |
| | | | | | | | | | | | | | | | | | | | | | |
| | | | | | | | | | | | | | | | | | | | $ | (440,006) | |
| | | | | | | | | | | | | | | | | | | | | | |
| | | | | | | | | | | | | | | | | | | | | | | | | | | | |
| |
Over-the-Counter Credit Default Swap Contracts at June 28, 2013: | |
| | | | | | | |
Reference Entity/ Swap Counterparty | | Buy/Sell
Credit
Protection | | | Notional
Amount
(000’s) | | | Pay/
Receive
Fixed
Rate | | | Termination
Date | | | Premiums
Received/ (Paid) | | | Value | | | Unrealized
Depreciation | |
| |
CDX.NA.IG.20 | | | | | | | | | | | | | | | | | | | | | | | | | | | | |
Deutsche Bank AG | | | Buy | | | $ | 8,400 | | | | 1.00% | | | | 6/20/18 | | | $ | 29,430 | | | $ | (59,833) | | | $ | 30,403 | |
See accompanying Notes to Financial Statements.
14 OPPENHEIMER CAPITAL INCOME FUND/VA
STATEMENTOF ASSETS AND LIABILITIES June 28, 20131 Unaudited
| | | | |
| |
Assets | | | | |
Investments, at value—see accompanying statement of investments: | | | | |
Unaffiliated companies (cost $252,656,759) | | $ | 255,843,547 | |
Affiliated companies (cost $19,917,607) | | | 19,917,607 | |
| | | | |
| | | 275,761,154 | |
| |
Cash | | | 42,114,223 | |
| |
Cash used for collateral on OTC derivatives | | | 348,939 | |
| |
Receivables and other assets: | | | | |
Investments sold (including $16,874,974 sold on a when-issued or delayed delivery basis) | | | 18,996,962 | |
Interest, dividends and principal paydowns | | | 1,156,757 | |
Variation margin receivable | | | 51,682 | |
Other | | | 35,511 | |
| | | | |
Total assets | | | 338,465,228 | |
|
| |
Liabilities | | | | |
Swaps, at value (premiums received $29,430) | | | 59,833 | |
| |
Payables and other liabilities: | | | | |
Investments purchased (including $51,624,563 purchased on a when-issued or delayed delivery basis) | | | 52,928,723 | |
Shares of beneficial interest redeemed | | | 185,111 | |
Trustees’ compensation | | | 31,338 | |
Transfer and shareholder servicing agent fees | | | 22,205 | |
Shareholder communications | | | 17,737 | |
Distribution and service plan fees | | | 14,804 | |
Variation margin payable | | | 6,731 | |
Other | | | 21,738 | |
| | | | |
Total liabilities | | | 53,288,220 | |
|
| |
Net Assets | | $ | 285,177,008 | |
| | | | |
|
| |
Composition of Net Assets | | | | |
Par value of shares of beneficial interest | | $ | 22,134 | |
| |
Additional paid-in capital | | | 315,636,924 | |
| |
Accumulated net investment income | | | 2,781,077 | |
| |
Accumulated net realized loss on investments and foreign currency transactions | | | (35,978,636) | |
| |
Net unrealized appreciation on investments and translation of assets and liabilities denominated in foreign currencies | | | 2,715,509 | |
| | �� | | |
Net Assets | | $ | 285,177,008 | |
| | | | |
|
| |
| | | | |
Net Asset Value Per Share | | | | |
Non-Service Shares: | | | | |
Net asset value, redemption price per share and offering price per share (based on net assets of $214,381,112 and 16,591,512 shares of beneficial interest outstanding) | | $ | 12.92 | |
| |
Service Shares: | | | | |
Net asset value, redemption price per share and offering price per share (based on net assets of $70,795,896 and 5,542,139 shares of beneficial interest outstanding) | | $ | 12.77 | |
1. June 28, 2013 represents the last business day of the Fund’s semiannual period. See Note 1 of the accompanying Notes.
See accompanying Notes to Financial Statements.
15 OPPENHEIMER CAPITAL INCOME FUND/VA
STATEMENTOF OPERATIONS For the Six Months Ended June 28, 20131 Unaudited
| | | | |
| |
Investment Income | | | | |
Interest | | $ | 2,441,352 | |
| |
Dividends: | | | | |
Unaffiliated companies (net of foreign withholding taxes of $11,911) | | | 1,451,590 | |
Affiliated companies | | | 14,574 | |
| |
Other income | | | 11,068 | |
| | | | |
Total investment income | | | 3,918,584 | |
|
| |
Expenses | | | | |
Management fees | | | 1,086,617 | |
| |
Distribution and service plan fees: | | | | |
Distribution and service plan fees–Service shares | | | 91,611 | |
| |
Transfer and shareholder servicing agent fees: | | | | |
Non-Service shares | | | 110,121 | |
Service shares | | | 36,642 | |
| |
Shareholder communications: | | | | |
Non-Service shares | | | 14,000 | |
Service shares | | | 4,656 | |
| |
Custodian fees and expenses | | | 15,818 | |
| |
Trustees’ compensation | | | 9,217 | |
| |
Other | | | 25,471 | |
| | | | |
Total expenses | | | 1,394,153 | |
Less waivers and reimbursements of expenses | | | (318,128) | |
| | | | |
Net expenses | | | 1,076,025 | |
|
| |
Net Investment Income | | | 2,842,559 | |
|
| |
Realized and Unrealized Gain (Loss) | | | | |
Net realized gain (loss) on: | | | | |
Investments from unaffiliated companies | | | 35,168,793 | |
Closing and expiration of futures contracts | | | (922,678) | |
Foreign currency transactions | | | 4,713 | |
Swap contracts | | | (53,063) | |
| | | | |
Net realized gain | | | 34,197,765 | |
| |
Net change in unrealized appreciation/depreciation on: | | | | |
Investments | | | (20,180,382) | |
Translation of assets and liabilities denominated in foreign currencies | | | (16,909) | |
Futures contracts | | | (440,662) | |
Swap contracts | | | (30,403) | |
| | | | |
Net change in unrealized appreciation/depreciation | | | (20,668,356) | |
|
| |
Net Increase in Net Assets Resulting from Operations | | $ | 16,371,968 | |
| | | | |
1. June 28, 2013 represents the last business day of the Fund’s semiannual period. See Note 1 of the accompanying Notes.
See accompanying Notes to Financial Statements.
16 OPPENHEIMER CAPITAL INCOME FUND/VA
STATEMENTSOF CHANGES IN NET ASSETS
| | | | | | | | |
| | | Six Months Ended
June 28, 20131
(Unaudited) | | | Year Ended
December 31, 2012 | |
| |
Operations | | | | | | | | |
Net investment income | | $ | 2,842,559 | | | $ | 6,382,885 | |
| |
Net realized gain | | | 34,197,765 | | | | 10,623,927 | |
| |
Net change in unrealized appreciation/depreciation | | | (20,668,356) | | | | 11,671,534 | |
| | | | | | | | |
Net increase in net assets resulting from operations | | | 16,371,968 | | | | 28,678,346 | |
|
| |
Dividends and/or Distributions to Shareholders | | | | | | | | |
Dividends from net investment income: | | | | | | | | |
Non-Service shares | | | (5,107,178) | | | | (3,027,836) | |
Service shares | | | (1,549,783) | | | | (910,776) | |
| | | | |
| | | (6,656,961) | | | | (3,938,612) | |
|
| |
Beneficial Interest Transactions | | | | | | | | |
Net increase (decrease) in net assets resulting from beneficial interest transactions: | | | | | | | | |
Non-Service shares | | | (10,878,418) | | | | 72,773,444 | |
Service shares | | | (4,563,932) | | | | (12,542,888) | |
| | | | | | | | |
| | | (15,442,350) | | | | 60,230,556 | |
|
| |
Net Assets | | | | | | | | |
Total increase (decrease) | | | (5,727,343) | | | | 84,970,290 | |
| |
Beginning of period | | | 290,904,351 | | | | 205,934,061 | |
| | | | | | | | |
| | |
End of period (including accumulated net investment income of $2,781,077 and $6,595,479, respectively) | | $ | 285,177,008 | | | $ | 290,904,351 | |
| | | | |
1. June 28, 2013 represents the last business day of the Fund’s semiannual period. See Note 1 of the accompanying Notes.
See accompanying Notes to Financial Statements.
17 OPPENHEIMER CAPITAL INCOME FUND/VA
FINANCIAL HIGHLIGHTS
| | | | | | | | | | | | | | | | | | | | | | | | |
| Non-Service Shares | | Six Months
Ended
June 28,
20131
(Unaudited) | | | Year Ended
December 31, 2012 | | | Year Ended
December 30, 20111 | | | Year Ended
December 31, 2010 | | | Year Ended
December 31, 2009 | | | Year Ended
December 31, 2008 | |
| |
Per Share Operating Data | | | | | | | | | | | | | | | | | | | | | | | | |
Net asset value, beginning of period | | $ | 12.52 | | | $ | 11.30 | | | $ | 11.47 | | | $ | 10.30 | | | $ | 8.45 | | | $ | 16.41 | |
| |
Income (loss) from investment operations: | | | | | | | | | | | | | | | | | | | | | | | | |
Net investment income2 | | | 0.13 | | | | 0.29 | | | | 0.20 | | | | 0.23 | | | | 0.25 | | | | 0.41 | |
Net realized and unrealized gain (loss) | | | 0.58 | | | | 1.09 | | | | (0.11) | | | | 1.09 | | | | 1.60 | | | | (7.03) | |
| | | | |
Total from investment operations | | | 0.71 | | | | 1.38 | | | | 0.09 | | | | 1.32 | | | | 1.85 | | | | (6.62) | |
| |
Dividends and/or distributions to shareholders: | | | | | | | | | | | | | | | | | | | | | | | | |
Dividends from net investment income | | | (0.31) | | | | (0.16) | | | | (0.26) | | | | (0.15) | | | | 0.00 | | | | (0.39) | |
Distributions from net realized gain | | | 0.00 | | | | 0.00 | | | | 0.00 | | | | 0.00 | | | | 0.00 | | | | (0.95) | |
| | | | |
Total dividends and/or distributions to shareholders | | | (0.31) | | | | (0.16) | | | | (0.26) | | | | (0.15) | | | | 0.00 | | | | (1.34) | |
| |
Net asset value, end of period | | $ | 12.92 | | | $ | 12.52 | | | $ | 11.30 | | | $ | 11.47 | | | $ | 10.30 | | | $ | 8.45 | |
| | | | |
|
| |
Total Return, at Net Asset Value3 | | | 5.65% | | | | 12.34% | | | | 0.72% | | | | 12.91% | | | | 21.89% | | | | (43.47)% | |
|
| |
Ratios/Supplemental Data | | | | | | | | | | | | | | | | | | | | | | | | |
Net assets, end of period (in thousands) | | $ | 214,381 | | | $ | 218,032 | | | $ | 128,383 | | | $ | 150,622 | | | $ | 159,797 | | | $ | 169,621 | |
| |
Average net assets (in thousands) | | $ | 222,059 | | | $ | 191,416 | | | $ | 141,848 | | | $ | 151,620 | | | $ | 159,013 | | | $ | 295,669 | |
| |
Ratios to average net assets:4 | | | | | | | | | | | | | | | | | | | | | | | | |
Net investment income | | | 2.00% | | | | 2.46% | | | | 1.70% | | | | 2.13% | | | | 2.71% | | | | 3.14% | |
Total expenses5 | | | 0.89% | | | | 0.90% | | | | 0.91% | | | | 0.91% | | | | 0.89% | | | | 0.76% | |
Expenses after payments, waivers and/or reimbursements and reduction to custodian expenses | | | 0.67% | | | | 0.66% | | | | 0.67% | | | | 0.65% | | | | 0.60% | | | | 0.67% | |
| |
Portfolio turnover rate6 | | | 130% | | | | 110% | | | | 102% | | | | 54% | | | | 87% | | | | 67% | |
1. June 28, 2013 and December 30, 2011 represent the last business day of the Fund’s respective reporting periods. See Note 1 of the accompanying Notes.
2. Per share amounts calculated based on the average shares outstanding during the period.
3. Assumes an initial investment on the business day before the first day of the fiscal period, with all dividends and distributions reinvested in additional shares on the reinvestment date, and redemption at the net asset value calculated on the last business day of the fiscal period. Total returns are not annualized for periods less than one full year. Total return information does not reflect expenses that apply at the separate account level or to related insurance products. Inclusion of these charges would reduce the total return figures for all periods shown. Returns do not reflect the deduction of taxes that a shareholder would pay on fund distributions or the redemption of fund shares.
4. Annualized for periods less than one full year.
5. Total expenses including indirect expenses from affiliated fund were as follows:
| | | | | | |
Six Months Ended June 28, 2013 | | | 0.90 | % | |
Year Ended December 31, 2012 | | | 0.91 | % | |
Year Ended December 30, 2011 | | | 0.93 | % | |
Year Ended December 31, 2010 | | | 0.92 | % | |
Year Ended December 31, 2009 | | | 0.91 | % | |
Year Ended December 31, 2008 | | | 0.76 | % | |
6. The portfolio turnover rate excludes purchase and sale transactions of To Be Announced (TBA) mortgage-related securities as follows:
| | | | | | | | | | |
| | | Purchase Transactions | | | Sale Transactions | | |
| | |
Six Months Ended June 28, 2013 | | | $406,061,229 | | | | $411,188,547 | | |
Year Ended December 31, 2012 | | | $555,111,600 | | | | $549,805,766 | | |
Year Ended December 30, 2011 | | | $450,804,195 | | | | $453,759,282 | | |
Year Ended December 31, 2010 | | | $412,930,431 | | | | $414,511,903 | | |
Year Ended December 31, 2009 | | | $504,698,365 | | | | $520,212,670 | | |
Year Ended December 31, 2008 | | | $474,582,075 | | | | $434,587,487 | | |
See accompanying Notes to Financial Statements.
18 OPPENHEIMER CAPITAL INCOME FUND/VA
| | | | | | | | | | | | | | | | | | | | | | | | |
| Service Shares | | Six Months
Ended
June 28,
20131
(Unaudited) | | | Year Ended
December 31, 2012 | | | Year Ended
December 30, 20111 | | | Year Ended
December 31, 2010 | | | Year Ended
December 31, 2009 | | | Year Ended
December 31, 2008 | |
| |
Per Share Operating Data | | | | | | | | | | | | | | | | | | | | | | | | |
Net asset value, beginning of period | | $ | 12.37 | | | $ | 11.17 | | | $ | 11.35 | | | $ | 10.19 | | | $ | 8.38 | | | $ | 16.28 | |
| |
Income (loss) from investment operations: | | | | | | | | | | | | | | | | | | | | | | | | |
Net investment income2 | | | 0.11 | | | | 0.26 | | | | 0.16 | | | | 0.20 | | | | 0.22 | | | | 0.37 | |
Net realized and unrealized gain (loss) | | | 0.57 | | | | 1.08 | | | | (0.11) | | | | 1.08 | | | | 1.59 | | | | (6.97) | |
| | | | |
Total from investment operations | | | 0.68 | | | | 1.34 | | | | 0.05 | | | | 1.28 | | | | 1.81 | | | | (6.60) | |
| |
Dividends and/or distributions to shareholders: | | | | | | | | | | | | | | | | | | | | | | | | |
Dividends from net investment income | | | (0.28) | | | | (0.14) | | | | (0.23) | | | | (0.12) | | | | 0.00 | | | | (0.35) | |
Distributions from net realized gain | | | 0.00 | | | | 0.00 | | | | 0.00 | | | | 0.00 | | | | 0.00 | | | | (0.95) | |
| | | | |
Total dividends and/or distributions to shareholders | | | (0.28) | | | | (0.14) | | | | (0.23) | | | | (0.12) | | | | 0.00 | | | | (1.30) | |
| |
Net asset value, end of period | | $ | 12.77 | | | $ | 12.37 | | | $ | 11.17 | | | $ | 11.35 | | | $ | 10.19 | | | $ | 8.38 | |
| | | | |
|
| |
Total Return, at Net Asset Value3 | | | 5.57% | | | | 12.11% | | | | 0.38% | | | | 12.68% | | | | 21.60% | | | | (43.62)% | |
|
| |
Ratios/Supplemental Data | | | | | | | | | | | | | | | | | | | | | | | | |
Net assets, end of period (in thousands) | | $ | 70,796 | | | $ | 72,872 | | | $ | 77,551 | | | $ | 89,580 | | | $ | 88,746 | | | $ | 68,798 | |
| |
Average net assets (in thousands) | | $ | 73,889 | | | $ | 76,257 | | | $ | 85,157 | | | $ | 87,280 | | | $ | 77,101 | | | $ | 100,164 | |
| |
Ratios to average net assets:4 | | | | | | | | | | | | | | | | | | | | | | | | |
Net investment income | | | 1.75% | | | | 2.18% | | | | 1.45% | | | | 1.87% | | | | 2.42% | | | | 2.90% | |
Total expenses5 | | | 1.14% | | | | 1.16% | | | | 1.16% | | | | 1.16% | | | | 1.15% | | | | 1.01% | |
Expenses after payments, waivers and/or reimbursements and reduction to custodian expenses | | | 0.92% | | | | 0.92% | | | | 0.92% | | | | 0.90% | | | | 0.85% | | | | 0.92% | |
| |
Portfolio turnover rate6 | | | 130% | | | | 110% | | | | 102% | | | | 54% | | | | 87% | | | | 67% | |
1. June 28, 2013 and December 30, 2011 represent the last business day of the Fund’s respective reporting periods. See Note 1 of the accompanying Notes.
2. Per share amounts calculated based on the average shares outstanding during the period.
3. Assumes an initial investment on the business day before the first day of the fiscal period, with all dividends and distributions reinvested in additional shares on the reinvestment date, and redemption at the net asset value calculated on the last business day of the fiscal period. Total returns are not annualized for periods less than one full year. Total return information does not reflect expenses that apply at the separate account level or to related insurance products. Inclusion of these charges would reduce the total return figures for all periods shown. Returns do not reflect the deduction of taxes that a shareholder would pay on fund distributions or the redemption of fund shares.
4. Annualized for periods less than one full year.
5. Total expenses including indirect expenses from affiliated fund were as follows:
| | | | | | |
Six Months Ended June 28, 2013 | | | 1.15 | % | |
Year Ended December 31, 2012 | | | 1.17 | % | |
Year Ended December 30, 2011 | | | 1.18 | % | |
Year Ended December 31, 2010 | | | 1.17 | % | |
Year Ended December 31, 2009 | | | 1.17 | % | |
Year Ended December 31, 2008 | | | 1.01 | % | |
6. The portfolio turnover rate excludes purchase and sale transactions of To Be Announced (TBA) mortgage-related securities as follows:
| | | | | | | | | | |
| | | Purchase Transactions | | | Sale Transactions | | |
| | |
Six Months Ended June 28, 2013 | | | $406,061,229 | | | | $411,188,547 | | |
Year Ended December 31, 2012 | | | $555,111,600 | | | | $549,805,766 | | |
Year Ended December 30, 2011 | | | $450,804,195 | | | | $453,759,282 | | |
Year Ended December 31, 2010 | | | $412,930,431 | | | | $414,511,903 | | |
Year Ended December 31, 2009 | | | $504,698,365 | | | | $520,212,670 | | |
Year Ended December 31, 2008 | | | $474,582,075 | | | | $434,587,487 | | |
See accompanying Notes to Financial Statements.
19 OPPENHEIMER CAPITAL INCOME FUND/VA
NOTESTO FINANCIAL STATEMENTS Unaudited
1. Significant Accounting Policies
Oppenheimer Capital Income Fund/VA (the “Fund”), formerly Oppenheimer Balanced Fund/VA, is a separate series of Oppenheimer Variable Account Funds, a diversified open-end management investment company registered under the Investment Company Act of 1940, as amended. The Fund’s investment objective is to seek total return. The Fund’s investment adviser is OFI Global Asset Management, Inc. (“OFI Global” or the “Manager”), a wholly-owned subsidiary of OppenheimerFunds, Inc. (“OFI” or the “Sub-Adviser”). The Manager has entered into a sub-advisory agreement with OFI. Shares of the Fund are sold only to separate accounts of life insurance companies.
The Fund offers two classes of shares. Both classes are sold at their offering price, which is the net asset value per share, to separate investment accounts of participating insurance companies as an underlying investment for variable life insurance policies, variable annuity contracts or other investment products. The class of shares designated as Service shares is subject to a distribution and service plan. Both classes of shares have identical rights and voting privileges with respect to the Fund in general and exclusive voting rights on matters that affect that class alone. Earnings, net assets and net asset value per share may differ due to each class having its own expenses, such as transfer and shareholder servicing agent fees and shareholder communications, directly attributable to that class.
The following is a summary of significant accounting policies consistently followed by the Fund.
Semiannual and Annual Periods. The Fund’s financial statements are presented through the last day the New York Stock Exchange was open for trading during each reporting period. The Fund’s financial statements have been presented through that date to maintain consistency with the Fund’s net asset value calculations used for shareholder transactions.
Securities on a When-Issued or Delayed Delivery Basis. The Fund may purchase securities on a “when-issued” basis, and may purchase or sell securities on a “delayed delivery” basis. “When-issued” or “delayed delivery” refers to securities whose terms and indenture are available and for which a market exists, but which are not available for immediate delivery. Delivery and payment for securities that have been purchased by the Fund on a when-issued basis normally takes place within six months and possibly as long as two years or more after the trade date. During this period, such securities do not earn interest, are subject to market fluctuation and may increase or decrease in value prior to their delivery. The purchase of securities on a when-issued basis may increase the volatility of the Fund’s net asset value to the extent the Fund executes such transactions while remaining substantially fully invested. When the Fund engages in when-issued or delayed delivery transactions, it relies on the buyer or seller, as the case may be, to complete the transaction. Their failure to do so may cause the Fund to lose the opportunity to obtain or dispose of the security at a price and yield it considers advantageous. The Fund may also sell securities that it purchased on a when-issued basis or forward commitment prior to settlement of the original purchase.
As of June 28, 2013, the Fund had purchased securities issued on a when-issued or delayed delivery basis and sold securities issued on a delayed delivery basis as follows:
| | | | |
| | | When-Issued or Delayed Delivery Basis Transactions | |
| |
| |
Purchased securities | | | $51,624,563 | |
Sold securities | | | 16,874,974 | |
The Fund may enter into “forward roll” transactions with respect to mortgage-related securities. In this type of transaction, the Fund sells a mortgage-related security to a buyer and simultaneously agrees to repurchase a similar security (same type, coupon and maturity) at a later date at a set price. During the period between the sale and the repurchase, the Fund will not be entitled to receive interest and principal payments on the securities that have been sold. The Fund records the incremental difference between the forward purchase and sale of each forward roll as realized gain (loss) on investments or as fee income in the case of such transactions that have an associated fee in lieu of a difference in the forward purchase and sale price.
Forward roll transactions may be deemed to entail embedded leverage since the Fund purchases mortgage-related securities with extended settlement dates rather than paying for the securities under a normal settlement cycle. This embedded leverage increases the Fund’s market value of investments relative to its net assets which can incrementally increase the volatility of the Fund’s performance. Forward roll transactions can be replicated over multiple settlement periods.
Risks of entering into forward roll transactions include the potential inability of the counterparty to meet the terms of the agreement; the potential of the Fund to receive inferior securities at redelivery as compared to the securities sold to the counterparty; and counterparty credit risk.
Investment in Oppenheimer Institutional Money Market Fund. The Fund is permitted to invest daily available cash balances in an affiliated money market fund. The Fund may invest the available cash in Class E shares of Oppenheimer Institutional Money Market Fund (“IMMF”) to seek current income while preserving liquidity. IMMF is a registered open-end management investment company, regulated as a money market fund under the Investment Company Act of 1940, as amended. The Manager is the investment adviser of IMMF, and the Sub-Adviser provides investment and related advisory services to IMMF. When applicable, the Fund’s investment in IMMF is included in the Statement of Investments. Shares of IMMF are valued at their net asset value per share. As a shareholder, the Fund is subject to its proportional share of IMMF’s Class E expenses, including its management fee. The Manager will waive fees and/or reimburse Fund expenses in an amount equal to the indirect management fees incurred through the Fund’s investment in IMMF.
20 OPPENHEIMER CAPITAL INCOME FUND/VA
1. Significant Accounting Policies (Continued)
Foreign Currency Translation. The Fund’s accounting records are maintained in U.S. dollars. The values of securities denominated in foreign currencies and amounts related to the purchase and sale of foreign securities and foreign investment income are translated into U.S. dollars as of the close of the New York Stock Exchange (the “Exchange”), normally 4:00 P.M. Eastern time, on each day the Exchange is open for trading. Foreign exchange rates may be valued primarily using a reliable bank, dealer or service authorized by the Board of Trustees.
Reported net realized gains and losses from foreign currency transactions arise from sales of portfolio securities, sales and maturities of short-term securities, sales of foreign currencies, exchange rate fluctuations between the trade and settlement dates on securities transactions, and the difference between the amounts of dividends, interest, and foreign withholding taxes recorded on the Fund’s books and the U.S. dollar equivalent of the amounts actually received or paid. Net unrealized appreciation and depreciation on the translation of assets and liabilities denominated in foreign currencies arise from changes in the values of assets and liabilities, including investments in securities at fiscal period end, resulting from changes in exchange rates.
The effect of changes in foreign currency exchange rates on investments is separately identified from the fluctuations arising from changes in market values of securities held and reported with all other foreign currency gains and losses in the Fund’s Statement of Operations.
Allocation of Income, Expenses, Gains and Losses. Income, expenses (other than those attributable to a specific class), gains and losses are allocated on a daily basis to each class of shares based upon the relative proportion of net assets represented by such class. Operating expenses directly attributable to a specific class are charged against the operations of that class.
Federal Taxes. The Fund intends to comply with provisions of the Internal Revenue Code applicable to regulated investment companies and to distribute substantially all of its investment company taxable income, including any net realized gain on investments not offset by capital loss carryforwards, if any, to shareholders. Therefore, no federal income or excise tax provision is required. The Fund files income tax returns in U.S. federal and applicable state jurisdictions. The statute of limitations on the Fund’s tax return filings generally remain open for the three preceding fiscal reporting period ends.
During the fiscal year ended December 31, 2012, the Fund utilized $4,188,448 of capital loss carryforward to offset capital gains realized in that fiscal year. Details of the fiscal year ended December 31, 2012 capital loss carryforwards are included in the table below. Capital loss carryforwards with no expiration, if any, must be utilized prior to those with expiration dates. Capital losses with no expiration will be carried forward to future years if not offset by gains.
| | | | |
| Expiring | | | |
| |
2015 | | $ | 9,969,732 | |
2016 | | | 14,429,757 | |
2017 | | | 44,728,707 | |
| | | | |
Total | | $ | 69,128,196 | |
| | | | |
Of these losses, $13,292,976 are subject to loss limitation rules resulting from merger activity. These limitations generally reduce the utilization of these losses to a maximum of $3,323,244 per year.
As of June 28, 2013, it is estimated that the capital loss carryforwards would be $34,930,431 expiring by 2017. The estimated capital loss carryforward represents the carryforward as of the end of the last fiscal year, increased or decreased by capital losses or gains realized in the first six months of the current fiscal year. During the six months ended June 28, 2013, it is estimated that the Fund will utilize $34,197,765 of capital loss carryforward to offset realized capital gains.
Net investment income (loss) and net realized gain (loss) may differ for financial statement and tax purposes. The character of dividends and distributions made during the fiscal year from net investment income or net realized gains may differ from their ultimate characterization for federal income tax purposes. Also, due to timing of dividends and distributions, the fiscal year in which amounts are distributed may differ from the fiscal year in which the income or net realized gain was recorded by the Fund.
The aggregate cost of securities and other investments and the composition of unrealized appreciation and depreciation of securities and other investments for federal income tax purposes as of June 28, 2013 are noted in the following table. The primary difference between book and tax appreciation or depreciation of securities and other investments, if applicable, is attributable to the tax deferral of losses or tax realization of financial statement unrealized gain or loss.
| | | | |
Federal tax cost of securities | | $ | 272,592,293 | |
Federal tax cost of other investments | | | 28,354,669 | |
| | | | |
Total federal tax cost | | $ | 300,946,962 | |
| | | | |
Gross unrealized appreciation | | $ | 9,373,277 | |
Gross unrealized depreciation | | | (6,674,825) | |
| | | | |
Net unrealized appreciation | | $ | 2,698,452 | |
| | | | |
Trustees’ Compensation. The Board of Trustees has adopted a compensation deferral plan for independent trustees that enables trustees to elect to defer receipt of all or a portion of the annual compensation they are entitled to receive from the Fund. For purposes of determining the amount owed to the Trustee under the plan, deferred amounts are treated as though equal dollar amounts had been invested in shares of the Fund or in other
21 OPPENHEIMER CAPITAL INCOME FUND/VA
NOTESTO FINANCIAL STATEMENTS Unaudited / Continued
1. Significant Accounting Policies (Continued)
Oppenheimer funds selected by the Trustee. The Fund purchases shares of the funds selected for deferral by the Trustee in amounts equal to his or her deemed investment, resulting in a Fund asset equal to the deferred compensation liability. Such assets are included as a component of “Other” within the asset section of the Statement of Assets and Liabilities. Deferral of trustees’ fees under the plan will not affect the net assets of the Fund, and will not materially affect the Fund’s assets, liabilities or net investment income per share. Amounts will be deferred until distributed in accordance with the compensation deferral plan.
Dividends and Distributions to Shareholders. Dividends and distributions to shareholders, which are determined in accordance with income tax regulations and may differ from U.S. generally accepted accounting principles, are recorded on the ex-dividend date. Income and capital gain distributions, if any, are declared and paid annually or at other times as deemed necessary by the Manager. The tax character of distributions is determined as of the Fund’s fiscal year end. Therefore, a portion of the Fund’s distributions made to shareholders prior to the Fund’s fiscal year end may ultimately be categorized as a tax return of capital.
Investment Income. Dividend income is recorded on the ex-dividend date or upon ex-dividend notification in the case of certain foreign dividends where the ex-dividend date may have passed. Non-cash dividends included in dividend income, if any, are recorded at the fair market value of the securities received. Interest income is recognized on an accrual basis. Discount and premium, which are included in interest income on the Statement of Operations, are amortized or accreted daily.
Custodian Fees. “Custodian fees and expenses” in the Statement of Operations may include interest expense incurred by the Fund on any cash overdrafts of its custodian account during the period. Such cash overdrafts may result from the effects of failed trades in portfolio securities and from cash outflows resulting from unanticipated shareholder redemption activity. The Fund pays interest to its custodian on such cash overdrafts, to the extent they are not offset by positive cash balances maintained by the Fund, at a rate equal to the Federal Funds Rate plus 0.50%. The “Reduction to custodian expenses” line item, if applicable, represents earnings on cash balances maintained by the Fund during the period. Such interest expense and other custodian fees may be paid with these earnings.
Security Transactions. Security transactions are recorded on the trade date. Realized gains and losses on securities sold are determined on the basis of identified cost.
Indemnifications. The Fund’s organizational documents provide current and former trustees and officers with a limited indemnification against liabilities arising in connection with the performance of their duties to the Fund. In the normal course of business, the Fund may also enter into contracts that provide general indemnifications. The Fund’s maximum exposure under these arrangements is unknown as this would be dependent on future claims that may be made against the Fund. The risk of material loss from such claims is considered remote.
Other. The preparation of financial statements in conformity with accounting principles generally accepted in the United States of America requires management to make estimates and assumptions that affect the reported amounts of assets and liabilities and disclosure of contingent assets and liabilities at the date of the financial statements and the reported amounts of increases and decreases in net assets from operations during the reporting period. Actual results could differ from those estimates.
2. Securities Valuation
The Fund calculates the net asset value of its shares as of the close of the New York Stock Exchange (the “Exchange”), normally 4:00 P.M. Eastern time, on each day the Exchange is open for trading.
The Fund’s Board has adopted procedures for the valuation of the Fund’s securities and has delegated the day-to-day responsibility for valuation determinations under those procedures to the Manager. The Manager has established a Valuation Committee which is responsible for determining a “fair valuation” for any security for which market quotations are not “readily available.” The Valuation Committee’s fair valuation determinations are subject to review, approval and ratification by the Fund’s Board at its next regularly scheduled meeting covering the calendar quarter in which the fair valuation was determined.
Valuation Methods and Inputs
Securities are valued using unadjusted quoted market prices, when available, as supplied primarily by third party pricing services or dealers.
The following methodologies are used to determine the market value or the fair value of the types of securities described below:
Securities traded on a registered U.S. securities exchange (including exchange-traded derivatives other than futures and futures options) are valued based on the last sale price of the security reported on the principal exchange on which it is traded, prior to the time when the Fund’s assets are valued. In the absence of a sale, the security is valued at the last sale price on the prior trading day, if it is within the spread of the current day’s closing “bid” and “asked” prices, and if not, at the current day’s closing bid price. A security of a foreign issuer traded on a foreign exchange but not listed on a registered U.S. securities exchange is valued based on the last sale price on the principal exchange on which the security is traded, as identified by the third party pricing service used by the Manager, prior to the time when the Fund’s assets are valued. If the last sale price is unavailable, the security is valued at the most recent official closing price on the principal exchange on which it is traded. If the last sales price or official closing price for a foreign security is not available, the security is valued at the mean between the bid and asked price per the exchange or, if not available from the exchange, obtained from two dealers. If bid and asked prices are not available from either the exchange or two dealers, the security is valued by using one of the
22 OPPENHEIMER CAPITAL INCOME FUND/VA
2. Securities Valuation (Continued)
following methodologies (listed in order of priority); (1) using a bid from the exchange, (2) the mean between the bid and asked price as provided by a single dealer, or (3) a bid from a single dealer.
Shares of a registered investment company that are not traded on an exchange are valued at that investment company’s net asset value per share.
Corporate and government debt securities (of U.S. or foreign issuers) and municipal debt securities, event-linked bonds, loans, mortgage-backed securities, collateralized mortgage obligations, and asset-backed securities are valued at the mean between the “bid” and “asked” prices utilizing evaluated prices obtained from third party pricing services or broker-dealers who may use matrix pricing methods to determine the evaluated prices.
Short-term money market type debt securities with a remaining maturity of sixty days or less are valued at cost adjusted by the amortization of discount or premium to maturity (amortized cost), which approximates market value. Short-term debt securities with a remaining maturity in excess of sixty days are valued at the mean between the “bid” and “asked” prices utilizing evaluated prices obtained from third party pricing services or broker-dealers.
Structured securities, swaps, swaptions, and other over-the-counter derivatives are valued utilizing evaluated prices obtained from third party pricing services or broker-dealers.
Futures contracts and futures options traded on a commodities or futures exchange will be valued at the final settlement price or official closing price on the principal exchange as reported by such principal exchange at its trading session ending at, or most recently prior to, the time when the Fund’s assets are valued.
A description of the standard inputs that may generally be considered by the third party pricing vendors in determining their evaluated prices is provided below.
| | |
| Security Type | | Standard inputs generally considered by third-party pricing vendors |
| Corporate debt, government debt, municipal, mortgage-backed and asset-backed securities | | Reported trade data, broker-dealer price quotations, benchmark yields, issuer spreads on comparable securities, the credit quality, yield, maturity, and other appropriate factors. |
| Loans | | Information obtained from market participants regarding reported trade data and broker-dealer price quotations. |
| Event-linked bonds | | Information obtained from market participants regarding reported trade data and broker-dealer price quotations. |
| Structured securities | | Relevant market information such as the price of underlying financial instruments, stock market indices, foreign currencies, interest rate spreads, commodities, or the occurrence of other specific events. |
| Swaps | | Relevant market information, including underlying reference assets such as credit spreads, credit event probabilities, index values, individual security values, forward interest rates, variable interest rates, volatility measures, and forward currency rates. |
If a market value or price cannot be determined for a security using the methodologies described above, or if, in the “good faith” opinion of the Manager, the market value or price obtained does not constitute a “readily available market quotation,” or a significant event has occurred that would materially affect the value of the security the security is fair valued either (i) by a standardized fair valuation methodology applicable to the security type or the significant event as previously approved by the Valuation Committee and the Fund’s Board or (ii) as determined in good faith by the Manager’s Valuation Committee. The Valuation Committee considers all relevant facts that are reasonably available, through either public information or information available to the Manager, when determining the fair value of a security. Fair value determinations by the Manager are subject to review, approval and ratification by the Fund’s Board at its next regularly scheduled meeting covering the calendar quarter in which the fair valuation was determined. Those fair valuation standardized methodologies include, but are not limited to, valuing securities at the last sale price or initially at cost and subsequently adjusting the value based on: changes in company specific fundamentals, changes in an appropriate securities index, or changes in the value of similar securities which may be further adjusted for any discounts related to security-specific resale restrictions. When possible, such methodologies use observable market inputs such as unadjusted quoted prices of similar securities, observable interest rates, currency rates and yield curves. The methodologies used for valuing securities are not necessarily an indication of the risks associated with investing in those securities nor can it be assured that the Fund can obtain the fair value assigned to a security if it were to sell the security.
To assess the continuing appropriateness of security valuations, the Manager, or its third party service provider who is subject to oversight by the Manager, regularly compares prior day prices, prices on comparable securities, and sale prices to the current day prices and challenges those prices exceeding certain tolerance levels with the third party pricing service or broker source. For those securities valued by fair valuations, whether through a standardized fair valuation methodology or a fair valuation determination, the Valuation Committee reviews and affirms the reasonableness of the valuations based on such methodologies and fair valuation determinations on a regular basis after considering all relevant information that is reasonably available.
Classifications
Each investment asset or liability of the Fund is assigned a level at measurement date based on the significance and source of the inputs to its valuation. Various data inputs are used in determining the value of each of the Fund’s investments as of the reporting period end. These data inputs are categorized in the following hierarchy under applicable financial accounting standards:
1) Level 1-unadjusted quoted prices in active markets for identical assets or liabilities (including securities actively traded on a securities exchange)
2) Level 2-inputs other than unadjusted quoted prices that are observable for the asset or liability (such as unadjusted quoted prices for similar assets and market corroborated inputs such as interest rates, prepayment speeds, credit risks, etc.)
3) Level 3-significant unobservable inputs (including the Manager’s own judgments about assumptions that market participants would use in pricing the asset or liability).
23 OPPENHEIMER CAPITAL INCOME FUND/VA
NOTESTO FINANCIAL STATEMENTS Unaudited / Continued
2. Securities Valuation (Continued)
The inputs used for valuing securities are not necessarily an indication of the risks associated with investing in those securities.
The table below categorizes amounts that are included in the Fund’s Statement of Assets and Liabilities as of June 28, 2013 based on valuation input level:
| | | | | | | | | | | | | | | | |
| | | Level 1—
Unadjusted
Quoted Prices | | | Level 2—
Other Significant
Observable Inputs | | | Level 3—
Significant
Unobservable
Inputs | | | Value | |
| |
Assets Table | | | | | | | | | | | | | | | | |
Investments, at Value: | | | | | | | | | | | | | | | | |
Common Stocks | | | | | | | | | | | | | | | | |
Consumer Discretionary | | $ | 12,183,808 | | | $ | — | | | $ | — | | | $ | 12,183,808 | |
Consumer Staples | | | 8,201,677 | | | | — | | | | — | | | | 8,201,677 | |
Energy | | | 10,980,251 | | | | — | | | | — | | | | 10,980,251 | |
Financials | | | 18,809,920 | | | | — | | | | — | | | | 18,809,920 | |
Health Care | | | 13,422,047 | | | | — | | | | — | | | | 13,422,047 | |
Industrials | | | 12,621,556 | | | | — | | | | — | | | | 12,621,556 | |
Information Technology | | | 17,519,023 | | | | — | | | | — | | | | 17,519,023 | |
Materials | | | 3,680,581 | | | | — | | | | — | | | | 3,680,581 | |
Telecommunication Services | | | 1,684 | | | | — | | | | — | | | | 1,684 | |
Asset-Backed Securities | | | — | | | | 26,649,416 | | | | — | | | | 26,649,416 | |
Mortgage-Backed Obligations | | | — | | | | 65,984,033 | | | | — | | | | 65,984,033 | |
U.S. Government Obligations | | | — | | | | 2,185,467 | | | | — | | | | 2,185,467 | |
Non-Convertible Corporate Bonds and Notes | | | — | | | | 63,604,084 | | | | — | | | | 63,604,084 | |
Investment Company | | | 19,917,607 | | | | — | | | | — | | | | 19,917,607 | |
| | | | |
Total Investments, at Value | | | 117,338,154 | | | | 158,423,000 | | | | — | | | | 275,761,154 | |
Other Financial Instruments: | | | | | | | | | | | | | | | | |
Variation margin receivable | | | 51,682 | | | | — | | | | — | | | | 51,682 | |
| | | | |
Total Assets | | $ | 117,389,836 | | | $ | 158,423,000 | | | $ | — | | | $ | 275,812,836 | |
| | | | |
| | | | |
Liabilities Table | | | | | | | | | | | | | | | | |
Other Financial Instruments: | | | | | | | | | | | | | | | | |
Variation margin payable | | $ | (6,731 | ) | | $ | — | | | $ | — | | | $ | (6,731) | |
Swaps, at value | | | — | | | | (59,833) | | | | — | | | | (59,833) | |
| | | | |
Total Liabilities | | $ | (6,731 | ) | | $ | (59,833) | | | $ | — | | | $ | (66,564) | |
| | | | |
Currency contracts and forwards, if any, are reported at their unrealized appreciation/depreciation at measurement date, which represents the change in the contract’s value from trade date. Futures, if any, are reported at their variation margin at measurement date, which represents the amount due to/from the Fund at that date. All additional assets and liabilities included in the above table are reported at their market value at measurement date.
3. Shares of Beneficial Interest
The Fund has authorized an unlimited number of $0.001 par value shares of beneficial interest of each class. Transactions in shares of beneficial interest were as follows:
| | | | | | | | | | | | | | | | |
| | | Six Months Ended June 28, 2013 | | | Year Ended December 31, 2012 | |
| | | Shares | | | Amount | | | Shares | | | Amount | |
| |
Non-Service Shares | | | | | | | | | | | | | | | | |
Sold | | | 93,391 | | | $ | 1,237,655 | | | | 245,214 | | | $ | 2,929,071 | |
Dividends and/or distributions reinvested | | | 387,201 | | | | 5,107,178 | | | | 261,020 | | | | 3,027,836 | |
Acquisition—Note 8 | | | — | | | | — | | | | 8,473,818 | | | | 101,940,025 | |
Redeemed | | | (1,305,885 | ) | | | (17,223,251) | | | | (2,929,508 | ) | | | (35,123,488) | |
| | | | |
Net increase (decrease) | | | (825,293 | ) | | $ | (10,878,418) | | | | 6,050,544 | | | $ | 72,773,444 | |
| | | | |
|
| |
Service Shares | | | | | | | | | | | | | | | | |
Sold | | | 79,328 | | | $ | 1,039,540 | | | | 297,913 | | | $ | 3,538,468 | |
Dividends and/or distributions reinvested | | | 118,848 | | | | 1,549,783 | | | | 79,405 | | | | 910,776 | |
Redeemed | | | (548,277 | ) | | | (7,153,255) | | | | (1,428,994 | ) | | | (16,992,132) | |
| | | | |
Net decrease | | | (350,101 | ) | | $ | (4,563,932) | | | | (1,051,676 | ) | | $ | (12,542,888) | |
| | | | |
4. Purchases and Sales of Securities
The aggregate cost of purchases and proceeds from sales of securities, other than short-term obligations and investments in IMMF, for the six months ended June 28, 2013, were as follows:
| | | | | | | | |
| | | Purchases | | | Sales | |
| |
Investment securities | | $ | 327,657,309 | | | $ | 392,913,510 | |
U.S. government and government agency obligations | | | 1,966,124 | | | | 1,848,177 | |
To Be Announced (TBA) mortgage-related securities | | | 406,061,229 | | | | 411,188,547 | |
24 OPPENHEIMER CAPITAL INCOME FUND/VA
5. Fees and Other Transactions with Affiliates
Management Fees. Under the investment advisory agreement, the Fund pays the Manager a management fee based on the daily net assets of the Fund at an annual rate as shown in the following table:
| | | | |
| Fee Schedule | | | |
| |
Up to $200 million | | | 0.75% | |
Next $200 million | | | 0.72 | |
Next $200 million | | | 0.69 | |
Next $200 million | | | 0.66 | |
Over $800 million | | | 0.60 | |
Sub-Adviser Fees. The Manager has retained the Sub-Adviser to provide the day-to-day portfolio management of the Fund. Under the Sub-Advisory Agreement, the Manager pays the Sub-Adviser an annual fee in monthly installments, equal to a percentage of the investment management fee collected by the Manager from the Fund, which shall be calculated after any investment management fee waivers. The fee paid to the Sub-Adviser is paid by the Manager, not by the Fund.
Transfer Agent Fees. OppenheimerFunds Services (“OFS”), a division of OFI, acted as the transfer and shareholder servicing agent for the Fund. Fees incurred by the Fund with respect to these services are detailed in the Statement of Operations.
Sub-Transfer Agent Fees. The Transfer Agent has retained Shareholder Services, Inc., a wholly-owned subsidiary of OFI (the “Sub-Transfer Agent”), to provide the day-to-day transfer agent and shareholder servicing of the Fund. Under the Sub-Transfer Agency Agreement, the Transfer Agent pays the Sub-Transfer Agent an annual fee in monthly installments, equal to a percentage of the transfer agent fee collected by the Transfer Agent from the Fund, which shall be calculated after any applicable fee waivers. The fee paid to the Sub-Transfer Agent is paid by the Transfer Agent, not by the Fund.
Distribution and Service Plan for Service Shares. The Fund has adopted a Distribution and Service Plan (the “Plan”) in accordance with Rule 12b-1 under the Investment Company Act of 1940 for Service shares to pay OppenheimerFunds Distributor, Inc. (the “Distributor”), for distribution related services, personal service and account maintenance for the Fund’s Service shares. Under the Plan, payments are made periodically at an annual rate of 0.25% of the daily net assets of Service shares of the Fund. The Distributor currently uses all of those fees to compensate sponsors of the insurance product that offers Fund shares, for providing personal service and maintenance of accounts of their variable contract owners that hold Service shares. These fees are paid out of the Fund’s assets on an on-going basis and increase operating expenses of the Service shares, which results in lower performance compared to the Fund’s shares that are not subject to a service fee. Fees incurred by the Fund under the Plan are detailed in the Statement of Operations.
Waivers and Reimbursements of Expenses. The Manager has voluntarily agreed to limit the Fund’s expenses after payments, waivers and/or reimbursements and reduction to custodian expenses, excluding expenses incurred directly or indirectly by the Fund as a result of investments in other investment companies, wholly-owned subsidiaries and pooled investment vehicles; so that those expenses, as percentages of daily net assets, will not exceed the annual rate of 0.67% for Non-Service shares and 0.92% for Service shares. During the six months ended June 28, 2013, the Manager waived fees and/or reimbursed the Fund $230,502 and $76,673 for Non-Service and Service shares, respectively.
The Manager will waive fees and/or reimburse Fund expenses in an amount equal to the indirect management fees incurred through the Fund’s investment in IMMF. During the six months ended June 28, 2013, the Manager waived fees and/or reimbursed the Fund $10,953 for IMMF management fees.
Some of these undertakings may be modified or terminated at any time; some may not be modified or terminated until after one year from the date of the current prospectus, as indicated therein.
6. Risk Exposures and the Use of Derivative Instruments
The Fund’s investment objectives not only permit the Fund to purchase investment securities, they also allow the Fund to enter into various types of derivatives contracts, including, but not limited to, futures contracts, forward currency exchange contracts, credit default swaps, interest rate swaps, total return swaps, and purchased and written options. In doing so, the Fund will employ strategies in differing combinations to permit it to increase, decrease, or change the level or types of exposure to market risk factors. These instruments may allow the Fund to pursue its objectives more quickly and efficiently than if it were to make direct purchases or sales of securities capable of effecting a similar response to market factors. Such contracts may be entered into through a bilateral over-the-counter (“OTC”) transaction, or through a securities or futures exchange and cleared through a clearinghouse.
Market Risk Factors. In accordance with its investment objectives, the Fund may use derivatives to increase or decrease its exposure to one or more of the following market risk factors:
Commodity Risk. Commodity risk relates to the change in value of commodities or commodity indexes as they relate to increases or decreases in the commodities market. Commodities are physical assets that have tangible properties. Examples of these types of assets are crude oil, heating oil, metals, livestock, and agricultural products.
Credit Risk. Credit risk relates to the ability of the issuer to meet interest and principal payments, or both, as they come due. In general, lower-grade, higher-yield bonds are subject to credit risk to a greater extent than lower-yield, higher-quality bonds.
25 OPPENHEIMER CAPITAL INCOME FUND/VA
NOTESTO FINANCIAL STATEMENTS Unaudited / Continued
6. Risk Exposures and the Use of Derivative Instruments (Continued)
Equity Risk. Equity risk relates to the change in value of equity securities as they relate to increases or decreases in the general market.
Foreign Exchange Rate Risk. Foreign exchange rate risk relates to the change in the U.S. dollar value of a security held that is denominated in a foreign currency. The U.S. dollar value of a foreign currency denominated security will decrease as the dollar appreciates against the currency, while the U.S. dollar value will increase as the dollar depreciates against the currency.
Interest Rate Risk. Interest rate risk refers to the fluctuations in value of fixed-income securities resulting from the inverse relationship between price and yield. For example, an increase in general interest rates will tend to reduce the market value of already issued fixed-income investments, and a decline in general interest rates will tend to increase their value. In addition, debt securities with longer maturities, which tend to have higher yields, are subject to potentially greater fluctuations in value from changes in interest rates than obligations with shorter maturities.
Volatility Risk. Volatility risk refers to the magnitude of the movement, but not the direction of the movement, in a financial instrument’s price over a defined time period. Large increases or decreases in a financial instrument’s price over a relative time period typically indicate greater volatility risk, while small increases or decreases in its price typically indicate lower volatility risk.
Derivatives may have little or no initial cash investment relative to their market value exposure and therefore can produce significant gains or losses in excess of their cost due to unanticipated changes in the market risk factors and the overall market. This use of embedded leverage allows the Fund to increase its market value exposure relative to its net assets and can substantially increase the volatility of the Fund’s performance. In instances where the Fund is using derivatives to decrease, or hedge, exposures to market risk factors for securities held by the Fund, there are also risks that those derivatives may not perform as expected resulting in losses for the combined or hedged positions. Some derivatives have the potential for unlimited loss, regardless of the size of the Fund’s initial investment.
Additional associated risks from investing in derivatives also exist and potentially could have significant effects on the valuation of the derivative and the Fund. Typically, the associated risks are not the risks that the Fund is attempting to increase or decrease exposure to, per its investment objectives, but are the additional risks from investing in derivatives. Examples of these associated risks are liquidity risk, which is the risk that the Fund will not be able to sell the derivative in the open market in a timely manner, and counterparty credit risk, which is the risk that the counterparty will not fulfill its obligation to the Fund.
The Fund’s actual exposures to these market risk factors and associated risks during the period are discussed in further detail, by derivative type, below.
Futures Contracts
A futures contract is a commitment to buy or sell a specific amount of a commodity, financial instrument, or currency at a negotiated price on a stipulated future date. The Fund may buy and sell futures contracts and may also buy or write put or call options on these futures contracts. Futures contracts and options thereon are generally entered into on a regulated futures exchange and cleared through a clearinghouse associated with the exchange.
Upon entering into a futures contract, the Fund is required to deposit either cash or securities (initial margin) in an amount equal to a certain percentage of the contract value in an account registered in the futures commission merchant’s name. Subsequent payments (variation margin) are paid to or from the futures commission merchant each day equal to the daily changes in the contract value. Such payments are recorded as unrealized gains and losses. Should the Fund fail to make requested variation margin payments, the futures commission merchant can gain access to the initial margin to satisfy the Fund’s payment obligations.
Futures contracts are reported on a schedule following the Statement of Investments. Securities held by a futures commission merchant to cover initial margin requirements on open futures contracts are noted in the Statement of Investments. Cash held by a futures commission merchant to cover initial margin requirements on open futures contracts and the receivable and/or payable for the daily mark to market for the variation margin are noted in the Statement of Assets and Liabilities. The net change in unrealized appreciation and depreciation is reported in the Statement of Operations. Realized gains (losses) are reported in the Statement of Operations at the closing or expiration of futures contracts.
The Fund has purchased futures contracts on various bonds and notes to increase exposure to interest rate risk.
The Fund has sold futures contracts on various bonds and notes to decrease exposure to interest rate risk.
During the six months ended June 28, 2013, the Fund had an ending monthly average market value of $14,722,074 and $18,397,368 on futures contracts purchased and sold, respectively.
Additional associated risks of entering into futures contracts (and related options) include the possibility that there may be an illiquid market where the Fund is unable to liquidate the contract or enter into an offsetting position and, if used for hedging purposes, the risk that the price of the contract will correlate imperfectly with the prices of the Fund’s securities.
Swap Contracts
The Fund may enter into swap contract agreements with a counterparty to exchange a series of cash flows based on either specified reference rates, the price or volatility of asset or non-asset references, or the occurrence of a credit event, over a specified period. Swaps can be executed in a bi-lateral privately negotiated arrangement with a dealer in an OTC transaction (“OTC swaps”) or executed on a regulated market. Certain swaps, regardless of the venue of their execution, are required to be cleared through a clearinghouse (“cleared swaps”). Swap contracts may include interest rate, equity, debt, index, total return, credit default and currency swaps.
26 OPPENHEIMER CAPITAL INCOME FUND/VA
6. Risk Exposures and the Use of Derivative Instruments (Continued)
Swap contracts are reported on a schedule following the Statement of Investments. Daily changes in the value of cleared swaps are reported as variation margin receivable or payable on the Statement of Assets and Liabilities. The values of OTC swap contracts are aggregated by positive and negative values and disclosed separately on the Statement of Assets and Liabilities. The unrealized appreciation (depreciation) related to the change in the valuation of the notional amount of the swap is combined with the accrued interest due to (owed by) the Fund, if any, at termination or settlement. The net change in this amount during the period is included on the Statement of Operations. The Fund also records any periodic payments received from (paid to) the counterparty, including at termination, under such contracts as realized gain (loss) on the Statement of Operations.
Swap contract agreements are exposed to the market risk factor of the specific underlying reference rate or asset. Swap contracts are typically more attractively priced compared to similar investments in related cash securities because they isolate the risk to one market risk factor and eliminate the other market risk factors. Investments in cash securities (for instance bonds) have exposure to multiple risk factors (credit and interest rate risk). Because swaps have embedded leverage, they can expose the Fund to substantial risk in the isolated market risk factor.
Credit Default Swap Contracts. A credit default swap is a contract that enables an investor to buy or sell protection against a defined-issuer credit event, such as the issuer’s failure to make timely payments of interest or principal on a debt security, bankruptcy or restructuring. The Fund may enter into credit default swaps either by buying or selling protection on a corporate issuer, sovereign issuer, or a basket or index of issuers (the “reference asset”).
The buyer of protection pays a periodic fee to the seller of protection based on the notional amount of the swap contract. The seller of protection agrees to compensate the buyer of protection for future potential losses as a result of a credit event on the reference asset. The contract effectively transfers the credit event risk of the reference asset from the buyer of protection to the seller of protection.
The ongoing value of the contract will fluctuate throughout the term of the contract based primarily on the credit risk of the reference asset. If the credit quality of the reference asset improves relative to the credit quality at contract initiation, the buyer of protection may have an unrealized loss greater than the anticipated periodic fee owed. This unrealized loss would be the result of current credit protection being cheaper than the cost of credit protection at contract initiation. If the buyer elects to terminate the contract prior to its maturity, and there has been no credit event, this unrealized loss will become realized. If the contract is held to maturity, and there has been no credit event, the realized loss will be equal to the periodic fee paid over the life of the contract.
If there is a credit event, the buyer of protection can exercise its rights under the contract and receive a payment from the seller of protection equal to the notional amount of the swap less the market value of specified debt securities issued by the reference asset. Upon exercise of the contract the difference between such value and the notional amount is recorded as realized gain (loss) and is included on the Statement of Operations.
The Fund has purchased credit protection through credit default swaps to decrease exposure to the credit risk of individual issuers and/or indexes of issuers.
For the six months ended June 28, 2013, the Fund had ending monthly average notional amounts of $1,200,000 on credit default swaps to buy protection.
Additional associated risks to the Fund include counterparty credit risk and liquidity risk.
Counterparty Credit Risk. Derivative positions are subject to the risk that the counterparty will not fulfill its obligation to the Fund. The Fund intends to enter into derivative transactions with counterparties that the Manager believes to be creditworthy at the time of the transaction.
The Fund’s risk of loss from counterparty credit risk on OTC derivatives is generally limited to the aggregate unrealized gain netted against any collateral held by the Fund. For OTC options purchased, the Fund bears the risk of loss of the amount of the premiums paid plus the positive change in market values net of any collateral held by the Fund should the counterparty fail to perform under the contracts. Options written by the Fund do not typically give rise to counterparty credit risk, as options written generally obligate the Fund and not the counterparty to perform.
To reduce counterparty risk with respect to OTC transactions, the Fund has entered into master netting arrangements, established within the Fund’s International Swap and Derivatives Association, Inc. (“ISDA”) master agreements, which allow the Fund to make (or to have an entitlement to receive) a single net payment in the event of default (close-out netting) for outstanding payables and receivables with respect to certain OTC positions in swaps, options, swaptions, and forward currency exchange contracts for each individual counterparty. In addition, the Fund may require that certain counterparties post cash and/or securities in collateral accounts to cover their net payment obligations for those derivative contracts subject to ISDA master agreements. If the counterparty fails to perform under these contracts and agreements, the cash and/or securities will be made available to the Fund.
Certain ISDA master agreements include credit related contingent features which allow counterparties to OTC derivatives to terminate derivative contracts prior to maturity in the event the Fund’s net assets decline by a stated percentage or the Fund fails to meet the terms of its ISDA master agreements, which would cause the Fund to accelerate payment of any net liability owed to the counterparty. As of June 28, 2013, the aggregate fair value of derivative instruments with such credit related contingent features in a net liability position was $59,833 for which the Fund has posted collateral of $348,939.
For financial reporting purposes, the Fund does not offset derivative assets and derivative liabilities that are subject to netting arrangements in the Statement of Assets and Liabilities. Bankruptcy or insolvency laws of a particular jurisdiction may impose restrictions on or prohibitions against the right of offset in bankruptcy, insolvency or other events.
The Fund’s risk of loss from counterparty credit risk on exchange-traded derivatives cleared through a clearinghouse and for cleared swaps is generally considered lower than as compared to OTC derivatives. However, counterparty credit risk exists with respect to initial and variation margin deposited/paid by the Fund that is held in futures commission merchant, broker and/or clearinghouse accounts for such exchange-traded derivatives and for cleared swaps.
27 OPPENHEIMER CAPITAL INCOME FUND/VA
NOTESTO FINANCIAL STATEMENTS Unaudited / Continued
6. Risk Exposures and the Use of Derivative Instruments (Continued)
With respect to cleared swaps, such transactions will be submitted for clearing, and if cleared, will be held in accounts at futures commission merchants or brokers that are members of clearinghouses. While brokers, futures commission merchants and clearinghouses are required to segregate customer margin from their own assets, in the event that a broker, futures commission merchant or clearinghouse becomes insolvent or goes into bankruptcy and at that time there is a shortfall in the aggregate amount of margin held by the broker, futures commission merchant or clearinghouse for all its customers, U.S. bankruptcy laws will typically allocate that shortfall on a pro-rata basis across all the broker’s, futures commission merchant’s or clearinghouse’s customers, potentially resulting in losses to the Fund.
There is the risk that a broker, futures commission merchant or clearinghouse will decline to clear a transaction on the Fund’s behalf, and the Fund may be required to pay a termination fee to the executing broker with whom the Fund initially enters into the transaction. Clearinghouses may also be permitted to terminate cleared swaps at any time. The Fund is also subject to the risk that the broker or futures commission merchant will improperly use the Fund’s assets deposited/paid as initial or variation margin to satisfy payment obligations of another customer. In the event of a default by another customer of the broker or futures commission merchant, the Fund might not receive its variation margin payments from the clearinghouse, due to the manner in which variation margin payments are aggregated for all customers of the broker/futures commission merchant.
Collateral and margin requirements differ by type of derivative. Margin requirements are established by the broker, futures commission merchant or clearinghouse for exchange-traded and cleared derivatives, including cleared swaps. Brokers, futures commission merchants and clearinghouses can ask for margin in excess of the regulatory minimum, or increase the margin amount, in certain circumstances.
Collateral terms are contract specific for OTC derivatives. For derivatives traded under an ISDA master agreement, the collateral requirements are typically calculated by netting the mark to market amount for each transaction under such agreement and comparing that amount to the value of any collateral currently pledged by the Fund or the counterparty.
For financial reporting purposes, cash collateral that has been pledged to cover obligations of the Fund, if any, is reported separately on the Statement of Assets and Liabilities as cash pledged as collateral. Non-cash collateral pledged by the Fund, if any, is noted in the Schedule of Investments. Generally, the amount of collateral due from or to a party must exceed a minimum transfer amount threshold (e.g. $250,000) before a transfer has to be made. To the extent amounts due to the Fund from its counterparties are not fully collateralized, contractually or otherwise, the Fund bears the risk of loss from counterparty nonperformance.
The following table presents by counterparty the Fund’s OTC derivative assets net of the related collateral posted for the benefit of the Fund at June 28, 2013:
| | | | | | | | | | | | | | | | | | | | |
| | | | | | Gross Amounts Not Offset in the Statement of Assets and Liabilities | | | | |
| Counterparty | | Gross Amount of Assets in the
Statement of Assets and Liabilities* | | | Financial Instruments Available for Offset | | | Financial Instruments Collateral Received** | | | Cash Collateral Received** | | | Net Amount | |
| |
| | | | | |
Deutsche Bank AG | | $ | — | | | | $ — | | | | $ — | | | | $ — | | | | $ — | |
*OTC derivatives are reported gross on the Statement of Assets and Liabilities. Exchange traded options and margin related to cleared swaps and futures are excluded from these reported amounts. **Reported collateral posted for the benefit of the Fund within this table is limited to the net outstanding amount due from an individual counterparty. The collateral posted for the benefit of the Fund may exceed these amounts. The following table presents by counterparty the Fund’s OTC derivative liabilities net of the related collateral pledged by the Fund at June 28, 2013: | |
| | | | | | Gross Amounts Not Offset in the Statement of Assets and Liabilities | | | | |
| Counterparty | | Gross Amount of Liabilities in the
Statement of Assets and Liabilities* | | | Financial Instruments Available for Offset | | | Financial Instruments Collateral Pledged** | | | Cash Collateral Pledged** | | | Net Amount | |
| |
| | | | | |
Deutsche Bank AG | | $ | (59,833) | | | | $ — | | | | $ — | | | | $ 59,833 | | | | $ — | |
*OTC derivatives are reported gross on the Statement of Assets and Liabilities. Exchange traded options and margin related to cleared swaps and futures are excluded from these reported amounts.
**Reported collateral pledged within this table is limited to the net outstanding amount due from the Fund to an individual counterparty. The securities pledged as collateral by the Fund as reported on the Statement of Investments may exceed these amounts.
The following table presents the valuations of derivative instruments by risk exposure as reported within the Statement of Assets and Liabilities as of June 28, 2013:
| | | | | | | | | | | | | | | | | | |
| | | Asset Derivatives | | | | | Liability Derivatives | |
| | | | | | | | | | |
Derivatives Not Accounted for as Hedging Instruments | | Statement of Assets and
Liabilities Location | | | Value | | | | | Statement of Assets and
Liabilities Location | | | Value | |
| |
| | | | | |
Credit contracts | | | | | | | | | | | | | Swaps, at value | | | $ | 59,833 | |
| | | | | |
Interest rate contracts | | | Variation margin receivable | | | $ | 51,682 | * | | | | | Variation margin payable | | | | 6,731 | * |
| | | | | | | | | | | | | | | | | | |
| | | | | |
Total | | | | | | $ | 51,682 | | | | | | | | | $ | 66,564 | |
| | | | | | | | | | | | | | | | | | |
*Includes only the current day’s variation margin. Prior variation margin movements have been reflected in cash on the Statement of Assets and Liabilities upon receipt or payment.
28 OPPENHEIMER CAPITAL INCOME FUND/VA
6. Risk Exposures and the Use of Derivative Instruments (Continued)
The effect of derivative instruments on the Statement of Operations is as follows:
| | | | | | | | | | | | |
| Amount of Realized Gain or (Loss) Recognized on Derivatives | |
| |
Derivatives Not Accounted for as Hedging Instruments | | Closing and
expiration
of futures contracts | | | Swap contracts | | | Total | |
| |
Credit contracts | | $ | — | | | $ | (53,063) | | | $ | (53,063) | |
Interest rate contracts | | | (922,678) | | | | — | | | | (922,678) | |
| | | | |
Total | | $ | (922,678) | | | $ | (53,063) | | | $ | (975,741) | |
| | | | |
| | | | | | | | | | | | |
| Amount of Change in Unrealized Gain or (Loss) Recognized on Derivatives | |
| |
Derivatives Not Accounted for as Hedging Instruments | | Futures contracts | | | Swap contracts | | | Total | |
| |
Credit contracts | | $ | — | | | $ | (30,403) | | | $ | (30,403) | |
Interest rate contracts | | | (440,662) | | | | — | | | | (440,662) | |
| | | | |
Total | | $ | (440,662) | | | $ | (30,403) | | | $ | (471,065) | |
| | | | |
7. Restricted Securities
As of June 28, 2013, investments in securities included issues that are restricted. A restricted security may have a contractual restriction on its resale and is valued under methods approved by the Board of Trustees as reflecting fair value. Securities that are restricted are marked with an applicable footnote on the Statement of Investments. Restricted securities are reported on a schedule following the Statement of Investments.
8. Acquisition of Total Return Portfolio
On April 26, 2012, the Fund acquired all of the net assets of Total Return Portfolio at fair market value, pursuant to an Agreement and Plan of Reorganization approved by the Total Return Portfolio shareholders on April 20, 2012. The purpose of this acquisition is to combine two funds with similar investment objectives, strategies and risks to allow shareholders to benefit from greater asset growth potential, as well as lowered total expenses. The transaction qualified as a tax-free reorganization, (the “merger”) for federal income tax purposes allowing the Fund to use the original cost basis of the investments received to calculate subsequent gains and losses for tax reporting purposes.
Details of the merger are shown in the following table:
| | | | | | | | | | | | | | | | |
| | | Exchange Ratio to One Share of the Total Return Portfolio | | | Shares of Beneficial Interest Issued by the Fund | | | Value of Issued Shares of Beneficial Interest | | | Combined Net Assets on April 26, 20121 | |
| |
Total Return Portfolio fund shares merged into the Non-Service Shares | | | 0.1049625104 | | | | 8,473,818 | | | | $101,940,025 | | | | $230,906,772 | |
1. The net assets acquired included net unrealized appreciation of $6,091,953 and an unused capital loss carryforward of $46,084,065, potential utilization subject to tax limitations.
9. Pending Litigation
Since 2009, a number of class action lawsuits have been pending in federal courts against OppenheimerFunds, Inc. (“OFI”), OppenheimerFunds Distributor, Inc., the Fund’s principal underwriter and distributor (the “Distributor”), and certain funds (but not including the Fund) advised by the Manager and distributed by the Distributor (the “Defendant Funds”). Several of these lawsuits also name as defendants certain officers and current and former trustees of the respective Defendant Funds. The lawsuits raise claims under federal securities law and allege, among other things, that the disclosure documents of the respective Defendant Funds contained misrepresentations and omissions and that the respective Defendant Funds’ investment policies were not followed. The plaintiffs in these actions seek unspecified damages, equitable relief and awards of attorneys’ fees and litigation expenses. The Defendant Funds’ Boards of Trustees have also engaged counsel to represent the Funds and the present and former Independent Trustees named in those suits.
Other class action and individual lawsuits have been filed since 2008 in various state and federal courts against OFI and certain of its affiliates by investors seeking to recover investments they allegedly lost as a result of the “Ponzi” scheme run by Bernard L. Madoff and his firm, Bernard L. Madoff Investment Securities, LLC (“BLMIS”). Plaintiffs in these suits allege that they suffered losses as a result of their investments in several funds managed by an affiliate of OFI and assert a variety of claims, including breach of fiduciary duty, fraud, negligent misrepresentation, unjust enrichment, and violation of federal and state securities laws and regulations, among others. They seek unspecified damages, equitable relief and awards of attorneys’ fees and litigation expenses. Neither the Distributor, nor any of the Oppenheimer mutual funds, their independent trustees or directors are named as defendants in these lawsuits. None of the Oppenheimer mutual funds invested in any funds or accounts managed by Madoff or BLMIS. On February 28, 2011, a stipulation of partial settlement of three groups of consolidated putative class action lawsuits relating to these matters was filed in the U.S. District Court for the Southern District of New York. On August 19, 2011, the court entered an order and final judgment approving the settlement as fair, reasonable and adequate. In September 2011, certain parties filed notices of appeal from the court’s order approving the settlement. The settlement does not resolve other outstanding lawsuits against OFI and its affiliates relating to BLMIS.
29 OPPENHEIMER CAPITAL INCOME FUND/VA
NOTESTO FINANCIAL STATEMENTS Unaudited / Continued
9. Pending Litigation (Continued)
On April 16, 2010, a lawsuit was filed in New York state court against (i) OFI, (ii) an affiliate of OFI and (iii) AAArdvark IV Funding Limited (“AAArdvark IV”), an entity advised by OFI’s affiliate, in connection with investments made by the plaintiffs in AAArdvark IV. Plaintiffs allege breach of contract and common law fraud claims against the defendants and seek compensatory damages, costs and disbursements, including attorney fees. On April 11, 2013, the court granted defendants’ motion for summary judgment, dismissing plaintiffs’ fraud claim with prejudice and dismissing their contract claim without prejudice, and granted plaintiffs leave to replead their contract claim to assert a cause of action for specific performance within 30 days. On May 9, 2013, plaintiffs filed a notice of appeal from the court’s dismissal order. On July 15, 2011, a lawsuit was filed in New York state court against OFI, an affiliate of OFI and AAArdvark Funding Limited (“AAArdvark I”), an entity advised by OFI’s affiliate, in connection with investments made by the plaintiffs in AAArdvark I. The complaint alleges breach of contract and common law fraud claims against the defendants and seeks compensatory damages, costs and disbursements, including attorney fees. On November 9, 2011, a lawsuit was filed in New York state court against OFI, an affiliate of OFI and AAArdvark XS Funding Limited (“AAArdvark XS”), an entity advised by OFI’s affiliate, in connection with investments made by the plaintiffs in AAArdvark XS. The complaint alleges breach of contract against the defendants and seeks compensatory damages, costs and disbursements, including attorney fees.
OFI believes the lawsuits and appeals described above are without legal merit and, with the exception of actions it has settled, is defending against them vigorously. While it is premature to render any opinion as to the outcome in these lawsuits, or whether any costs that the Defendant Funds may bear in defending the suits might not be reimbursed by insurance, OFI believes that these suits should not impair the ability of OFI or the Distributor to perform their respective duties to the Fund, and that the outcome of all of the suits together should not have any material effect on the operations of any of the Oppenheimer mutual funds.
30 OPPENHEIMER CAPITAL INCOME FUND/VA
PORTFOLIO PROXY VOTING POLICIES AND PROCEDURES; UPDATES TO STATEMENTS OF INVESTMENTS UNAUDITED
The Fund has adopted Portfolio Proxy Voting Policies and Procedures under which the Fund votes proxies relating to securities (“portfolio proxies”) held by the Fund. A description of the Fund’s Portfolio Proxy Voting Policies and Procedures is available (i) without charge, upon request, by calling the Fund toll-free at 1.800.CALL OPP (225.5677), (ii) on the Fund’s website at oppenheimerfunds.com, and (iii) on the SEC’s website at www.sec.gov. In addition, the Fund is required to file Form N-PX, with its complete proxy voting record for the 12 months ended June 30th, no later than August 31st of each year. The Fund’s voting record is available (i) without charge, upon request, by calling the Fund toll-free at 1.800.CALL OPP (225.5677), and (ii) in the Form N-PX filing on the SEC’s website at www.sec.gov.
The Fund files its complete schedule of portfolio holdings with the SEC for the first quarter and the third quarter of each fiscal year on Form N-Q. The Fund’s Form N-Q filings are available on the SEC’s website at www.sec.gov. Those forms may be reviewed and copied at the SEC’s Public Reference Room in Washington, D.C. Information on the operation of the Public Reference Room may be obtained by calling 1-800-SEC-0330.
31 OPPENHEIMER CAPITAL INCOME FUND/VA
OPPENHEIMER CAPITAL INCOME FUND/VA
A Series of Oppenheimer Variable Account Funds
| | |
| Trustees and Officers | | Sam Freedman, Chairman of the Board of Trustees and Trustee |
| | Edward L. Cameron, Trustee |
| | Jon S. Fossel, Trustee |
| | Richard F. Grabish, Trustee |
| | Beverly L. Hamilton, Trustee |
| | Victoria J. Herget, Trustee |
| | Robert J. Malone, Trustee |
| | F. William Marshall, Jr., Trustee |
| | Karen L. Stuckey, Trustee |
| | James D. Vaughn, Trustee |
| | William F. Glavin, Jr., Trustee, President and Principal Executive Officer |
| | Magnus Krantz, Vice President |
| | Krishna Memani, Vice President |
| | Arthur S. Gabinet, Secretary and Chief Legal Officer |
| | Christina M. Nasta, Vice President and Chief Business Officer |
| | Mark S. Vandehey, Vice President and Chief Compliance Officer |
| | Brian W. Wixted, Treasurer and Principal Financial & Accounting Officer |
| |
| Manager | | OFI Global Asset Management, Inc. |
| |
| Sub-Adviser | | OppenheimerFunds, Inc. |
| |
| Distributor | | OppenheimerFunds Distributor, Inc. |
| |
| Transfer and | | OFI Global Asset Management, Inc. |
| Shareholder | | |
| Servicing Agent | | |
| |
| Sub-Transfer | | Shareholder Services, Inc. |
| Agent | | DBA OppenheimerFunds Services |
| |
| Independent | | KPMG LLP |
| Registered | | |
| Public | | |
| Accounting | | |
| Firm | | |
| |
| Legal Counsel | | K&L Gates LLP |
| |
| | Before investing in any of the Oppenheimer funds, investors should carefully consider a fund’s investment objectives, risks, charges And expenses. Fund prospectuses and summary prospectuses contain this and other information about the funds, and may be obtained by asking your financial advisor, visiting oppenheimerfunds.com, or calling us at 1.800.988.8287. Read prospectuses and summary prospectuses carefully before investing. |
| |
| | The financial statements included herein have been taken from the records of the Fund without examination of those records by the independent registered public accounting firm. |
© 2013 OppenheimerFunds, Inc. All rights reserved. Oppenheimer funds are distributed by OppenheimerFunds Distributor, Inc.

June 30, 2013

SEMIANNUAL REPORT
Listing of Top Holdings
Fund Performance Discussion
Financial Statements

| | |
| | _____________________________________________________ |
| | Portfolio Manager: Michael Kotlarz |
| | | | | | |
Cumulative Total Returns For the 6-Month Period Ended 6/28/131 |
Non-Service Shares | | 8.70% | | | | |
Service Shares | | 8.58 | | | | |
Average Annual Total Returns For the Periods Ended 6/28/131 |
| | | 1-Year | | 5-Year | | 10-Year |
Non-Service Shares | | 14.59% | | 2.96% | | 5.48% |
Service Shares | | 14.34% | | 2.71% | | 5.22% |
The performance data quoted represents past performance, which does not guarantee future results. The investment return and principal value of an investment in the Fund will fluctuate so that an investor’s shares, when redeemed, may be worth more or less than their original cost. Current performance may be lower or higher than the performance quoted. For performance data current to the most recent month end, call us at 1.800.988.8287. The Fund’s total returns should not be expected to be the same as the returns of other funds, whether or not both funds have the same portfolio managers and/or similar names. The Fund’s total returns include changes in share price and reinvested distributions but do not include the charges associated with the separate account products that offer this Fund. Such performance would have been lower if such charges were taken into account.
1. June 28, 2013, was the last business day of the Fund’s semiannual period. See Note 1 of the accompanying Notes to Financial Statements.
| | | | | | |
| | | | |
TOP TEN COMMON STOCK HOLDINGS | | | |
Apple, Inc. | | | 5.3 | % | | |
Google, Inc., Cl. A | | | 3.9 | | | |
QUALCOMM, Inc. | | | 3.9 | | | |
Walt Disney Co. (The) | | | 2.4 | | | |
Visa, Inc., Cl. A | | | 2.0 | | | |
O’Reilly Automotive, Inc. | | | 1.9 | | | |
eBay, Inc. | | | 1.9 | | | |
Novo Nordisk AS, Cl. B | | | 1.9 | | | |
Biogen Idec, Inc. | | | 1.8 | | | |
EMC Corp. | | | 1.8 | | | |
| |
| Portfolio holdings and allocations are subject to change. Percentages are as of June 28, 2013, and are based on net assets. For more current Fund holdings, please visit oppenheimerfunds.com. | | | |
SECTOR ALLOCATION
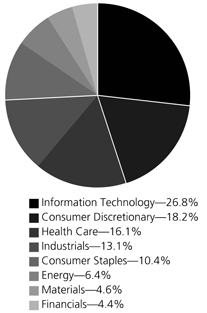
Portfolio holdings and allocations are subject to change. Percentages are as of June 28, 2013, and are based on the total market value of common stocks.
2 OPPENHEIMER CAPITAL APPRECIATION FUND/VA
Fund Performance Discussion
The Fund’s Non-Service shares produced a return of 8.70% during the reporting period, underperforming the Russell 1000 Growth Index (the “Index”), which returned 11.80%. The Fund’s underperformance relative to the Index stemmed primarily from weaker relative stock selection in the information technology sector. Weaker relative stock selection in the consumer staples and consumer discretionary sectors detracted from performance to a lesser degree. The Fund outperformed the Index in the health care and industrials sectors, where stronger stock selection benefited. The Fund also underperformed the S&P 500 Index, which returned 13.82%.
GLOBAL MARKET AND ECONOMIC ENVIRONMENT
Equities performed positively for the period as central banks throughout the world, including the United States, Europe and Japan, took steps to maintain highly accommodative monetary policy and stimulate their respective economies. In addition, a clear recovery in the U.S. provided further support for equity markets. However, later in the period, the Federal Reserve appeared to weigh the merits of backing away from its quantitative easing policy. As a result, the markets sold off sharply and made a quick reappraisal of interest rate risk in an array of credit markets and related currencies. Equities, particularly those in emerging markets and with interest rate sensitivity, experienced spillover effects as a result.
TOP INDIVIDUAL CONTRIBUTORS
During the period, three out of the top five performing holdings of the Fund were in the health care sector: Vertex Pharmaceuticals, Inc., Bristol-Myers Squibb Co. and Biogen Idec, Inc. Vertex Pharmaceuticals, a developer of small molecule pharmaceuticals for multiple diseases, released data on a compound that it was developing for Cystic Fibrosis that showed very robust benefits for patients. This positive data also boosted optimism around the entire platform of Cystic Fibrosis drugs that Vertex is developing. Bristol-Myers Squibb is a New York-based drugmaker that experienced an increase in profit due to reduced production and marketing costs. In addition, a large tax benefit offset a plunge in Plavix sales caused by generic competition. Biogen Idec is a global biotechnology company that benefited from strong sales of its new multiple-sclerosis treatment Tecfidera.
Outside of the health care sector, Google, Inc. and The Walt Disney Co. benefited performance. Google, the leading internet search engine, benefited from momentum in its continued campaign to enhance price utilization for its mobile searches. Walt Disney, an entertainment company that conducts operations in media networks, studio and theme park operations, reported strong quarterly results during the second quarter with particularly strong performance from its parks operation. The strength in park operation was a positive surprise to the market and helped boost Disney’s stock.
TOP INDIVIDUAL DETRACTORS
The most significant detractor from performance this period was information technology stock Apple, Inc. Apple is the maker of the iPhone, iPod and iPad. Investors were concerned about the maturation of high end smartphones markets in developed countries. There were also concerns over increased competition from other smartphone makers such as Samsung and HTC. Also detracting from performance were information technology stocks Teradata Corp., Salesforce.com, Inc. and Cognizant Technology Solutions Corp. Teradata, a provider of analytic data solutions through its database management service, reported disappointing quarterly results as uncertainties in the U.S. economy led to the delay of certain contracts from customers. Salesforce.com is a supplier of customer relationship management software worldwide. The market was skeptical on the strategic merits of its announced acquisition of ExactTarget, an email marketing firm. The enterprise software market has also been soft, which was also a negative for Salesforce.com. Cognizant Technology Solutions is a multinational information technology, consulting and business process outsourcing company that experienced declines in April. We exited our position during the period.
STRATEGY & OUTLOOK
Uncertainty about the Eurozone crisis, the duration of the Federal Reserve’s Quantitative Easing program, and the risk of deceleration in China continues to weigh on the global economy. Although the U.S. economy has remained resilient, it continues to grow at a below normal expansionary pace. The U.S. economy’s resilience has been supported by strong productivity gains, low structural energy costs and a relatively attractive currency. Looking forward, we expect the U.S. economy to retain many of these relative positives and for the markets to reward differentiated valuations to those companies demonstrating consistent quality, growth, and innovation. We expect that companies with capital discipline, strong management, and sustainable competitive advantages, have the greatest prospects for outperformance over time.
3 OPPENHEIMER CAPITAL APPRECIATION FUND/VA
The Fund’s investment strategy and focus can change over time. The mention of specific fund holdings does not constitute a recommendation by OppenheimerFunds, Inc. or its affiliates.
Shares of Oppenheimer funds are not deposits or obligations of any bank, are not guaranteed by any bank, are not insured by the FDIC or any other agency, and involve investment risks, including the possible loss of the principal amount invested.
4 OPPENHEIMER CAPITAL APPRECIATION FUND/VA
Fund Expenses
Fund Expenses. As a shareholder of the Fund, you incur two types of costs: (1) transaction costs and (2) ongoing costs, including management fees; distribution and service fees; and other Fund expenses. These examples are intended to help you understand your ongoing costs (in dollars) of investing in the Fund and to compare these costs with the ongoing costs of investing in other mutual funds.
The examples are based on an investment of $1,000.00 invested at the beginning of the period and held for the entire 6-month period ended June 28, 2013.
Actual Expenses. The first section of the table provides information about actual account values and actual expenses. You may use the information in this section for the class of shares you hold, together with the amount you invested, to estimate the expense that you paid over the period. Simply divide your account value by $1,000.00 (for example, an $8,600.00 account value divided by $1,000.00 = 8.60), then multiply the result by the number in the first section under the heading entitled “Expenses Paid During Period” to estimate the expenses you paid on your account during this period.
Hypothetical Example for Comparison Purposes.
The second section of the table provides information about hypothetical account values and hypothetical expenses based on the Fund’s actual expense ratio for each class of shares, and an assumed rate of return of 5% per year for each class before expenses, which is not the actual return. The hypothetical account values and expenses may not be used to estimate the actual ending account balance or expenses you paid for the period. You may use this information to compare the ongoing costs of investing in the Fund and other funds. To do so, compare this 5% hypothetical example for the class of shares you hold with the 5% hypothetical examples that appear in the shareholder reports of the other funds.
Please note that the expenses shown in the table are meant to highlight your ongoing costs only and do not reflect any charges associated with the separate accounts that offer this Fund. Therefore, the “hypothetical” lines of the table are useful in comparing ongoing costs only, and will not help you determine the relative total costs of owning different funds. In addition, if these separate account charges were included your costs would have been higher.
| | | | | | | | | | | | | | |
| Actual | | Beginning
Account Value
January 1, 2013 | | | Ending Account
Value
June 28, 2013 | | | Expenses Paid During
6 Months Ended June 28, 2013 | | | |
Non-Service shares | | $ | 1,000.00 | | | $ | 1,087.00 | | | $ | 4.10 | | | |
Service shares | | | 1,000.00 | | | | 1,085.80 | | | | 5.38 | | | |
| | | | |
| Hypothetical | | | | | | | | | | | |
(5% return before expenses) | | | | | | | | | | | | | | |
Non-Service shares | | | 1,000.00 | | | | 1,020.60 | | | | 3.97 | | | |
Service shares | | | 1,000.00 | | | | 1,019.37 | | | | 5.38 | | | |
Expenses are equal to the Fund’s annualized expense ratio for that class, multiplied by the average account value over the period, multiplied by 179/365 (to reflect the one-half year period). Those annualized expense ratios, excluding indirect expenses from affiliated funds, based on the 6-month period ended June 28, 2013 are as follows:
| | | | | | |
| Class | | Expense Ratios |
Non-Service shares | | | 0.80 | % | | |
Service shares | | | 1.05 | | | |
The expense ratios reflect voluntary waivers and/or reimbursements of expenses by the Fund’s Manager. Some of these undertakings may be modified or terminated at any time, as indicated in the Fund’s prospectus. The “Financial Highlights” tables in the Fund’s financial statements, included in this report, also show the gross expense ratios, without such waivers or reimbursements and reduction to custodian expenses, if applicable.
5 OPPENHEIMER CAPITAL APPRECIATION FUND/VA
STATEMENTOF INVESTMENTS June 28, 2013* / Unaudited
| | | | | | | | |
| | | Shares | | | Value | |
Common Stocks—98.1% | | | | | | | | |
Consumer Discretionary—18.0% | | | | | | | | |
Hotels, Restaurants & Leisure—3.1% | | | | | | | | |
McDonald’s Corp. | | | 120,870 | | | $ | 11,966,130 | |
Panera Bread Co., Cl. A1 | | | 51,150 | | | | 9,510,831 | |
Yum! Brands, Inc. | | | 107,110 | | | | 7,427,007 | |
| | | | | | | | 28,903,968 | |
Internet & Catalog Retail—1.8% | | | | | | | | |
Amazon.com, Inc.1 | | | 59,884 | | | | 16,629,188 | |
Media—3.5% | | | | | | | | |
News Corp., Cl. B | | | 310,850 | | | | 10,202,097 | |
Walt Disney Co. (The) | | | 350,460 | | | | 22,131,549 | |
| | | | | | | | 32,333,646 | |
Specialty Retail—5.9% | | | | | | | | |
Home Depot, Inc. (The) | | | 153,270 | | | | 11,873,827 | |
O’Reilly Automotive, Inc.1 | | | 160,840 | | | | 18,113,801 | |
Tiffany & Co. | | | 125,420 | | | | 9,135,593 | |
TJX Cos., Inc. (The) | | | 314,820 | | | | 15,759,889 | |
| | | | | | | | 54,883,110 | |
Textiles, Apparel & Luxury Goods—3.7% | | | | | | | | |
Nike, Inc., Cl. B | | | 256,020 | | | | 16,303,354 | |
Ralph Lauren Corp. | | | 56,460 | | | | 9,809,360 | |
VF Corp. | | | 40,890 | | | | 7,894,223 | |
| | | | | | | | 34,006,937 | |
Consumer Staples—10.4% | | | | | | | | |
Beverages—3.9% | | | | | | | | |
Brown-Forman Corp., Cl. B | | | 148,705 | | | | 10,045,023 | |
Coca-Cola Co. (The) | | | 274,190 | | | | 10,997,761 | |
SABMiller plc | | | 307,810 | | | | 14,811,428 | |
| | | | | | | | 35,854,212 | |
Food & Staples Retailing—2.6% | | | | | | | | |
Costco Wholesale Corp. | | | 133,590 | | | | 14,771,046 | |
CVS Caremark Corp. | | | 163,170 | | | | 9,330,060 | |
| | | | | | | | 24,101,106 | |
Food Products—2.6% | | | | | | | | |
Mead Johnson Nutrition Co., Cl. A | | | 130,080 | | | | 10,306,238 | |
Nestle SA | | | 210,437 | | | | 13,763,932 | |
| | | | | | | | 24,070,170 | |
Personal Products—1.3% | | | | | | | | |
Estee Lauder Cos., Inc. (The), Cl. A | | | 178,700 | | | | 11,753,099 | |
Energy—6.1% | | | | | | | | |
Energy Equipment & Services—2.4% | | | | | | | | |
Cameron International Corp.1 | | | 79,160 | | | | 4,841,426 | |
FMC Technologies, Inc.1 | | | 208,850 | | | | 11,628,768 | |
Oceaneering International, Inc. | | | 93,470 | | | | 6,748,534 | |
| | | | | | | | 23,218,728 | |
Oil, Gas & Consumable Fuels—3.7% | | | | | | | | |
Cabot Oil & Gas Corp. | | | 162,730 | | | | 11,557,085 | |
Chevron Corp. | | | 76,790 | | | | 9,087,329 | |
Noble Energy, Inc. | | | 133,700 | | | | 8,027,348 | |
Phillips 66 | | | 101,790 | | | | 5,996,449 | |
| | | | | | | | 34,668,211 | |
Financials—4.4% | | | | | | | | |
Capital Markets—3.9% | | | | | | | | |
Ameriprise Financial, Inc. | | | 86,760 | | | | 7,017,149 | |
Charles Schwab Corp. (The) | | | 403,180 | | | | 8,559,511 | |
Goldman Sachs Group, Inc. (The) | | | 62,980 | | | | 9,525,725 | |
Northern Trust Corp. | | | 194,040 | | | | 11,234,916 | |
| | | | | | | | 36,337,301 | |
Consumer Finance—0.5% | | | | | | | | |
American Express Co. | | | 64,600 | | | | 4,829,496 | |
Health Care—15.7% | | | | | | | | |
Biotechnology—6.2% | | | | | | | | |
Biogen Idec, Inc.1 | | | 79,660 | | | | 17,142,832 | |
Celgene Corp.1 | | | 87,100 | | | | 10,182,861 | |
Gilead Sciences, Inc.1 | | | 321,200 | | | | 16,448,652 | |
Vertex Pharmaceuticals, Inc.1 | | | 178,640 | | | | 14,267,977 | |
| | | | | | | | 58,042,322 | |
Health Care Equipment & Supplies—1.2% | | | | | | | | |
Baxter International, Inc. | | | 155,200 | | | | 10,750,704 | |
| | | | | | | | |
| | | Shares | | | Value | |
Health Care Providers & Services—0.8% | | | | | | | | |
UnitedHealth Group, Inc. | | | 108,720 | | | $ | 7,118,986 | |
Health Care Technology—1.5% | | | | | | | | |
Cerner Corp.1 | | | 143,980 | | | | 13,835,038 | |
Life Sciences Tools & Services—0.1% | | | | | | | | |
Mettler-Toledo International, Inc.1 | | | 3,700 | | | | 744,440 | |
Pharmaceuticals—5.9% | | | | | | | | |
Bristol-Myers Squibb Co. | | | 319,720 | | | | 14,288,287 | |
Novo Nordisk AS, Cl. B | | | 111,299 | | | | 17,327,868 | |
Perrigo Co. | | | 93,910 | | | | 11,363,110 | |
Roche Holding AG | | | 49,000 | | | | 12,141,434 | |
| | | | | | | | 55,120,699 | |
Industrials—12.7% | | | | | | | | |
Aerospace & Defense—3.9% | | | | | | | | |
Honeywell International, Inc. | | | 155,690 | | | | 12,352,445 | |
Precision Castparts Corp. | | | 55,250 | | | | 12,487,052 | |
United Technologies Corp. | | | 130,600 | | | | 12,137,964 | |
| | | | | | | | 36,977,461 | |
Building Products—0.6% | | | | | | | | |
Fortune Brands Home & Security, Inc. | | | 153,690 | | | | 5,953,951 | |
Electrical Equipment—2.1% | | | | | | | | |
AMETEK, Inc. | | | 116,830 | | | | 4,941,909 | |
Eaton Corp. plc | | | 139,330 | | | | 9,169,307 | |
Roper Industries, Inc. | | | 44,830 | | | | 5,568,783 | |
| | | | | | | | 19,679,999 | |
Machinery—1.0% | | | | | | | | |
Ingersoll-Rand plc | | | 168,200 | | | | 9,338,464 | |
Road & Rail—3.5% | | | | | | | | |
J.B. Hunt Transport Services, Inc. | | | 125,830 | | | | 9,089,959 | |
Kansas City Southern | | | 88,530 | | | | 9,380,639 | |
Union Pacific Corp. | | | 89,310 | | | | 13,778,747 | |
| | | | | | | | 32,249,345 | |
Trading Companies & Distributors—1.6% | | | | | | | | |
United Rentals, Inc.1 | | | 166,730 | | | | 8,321,494 | |
W.W. Grainger, Inc. | | | 27,070 | | | | 6,826,513 | |
| | | | | | | | 15,148,007 | |
Information Technology—26.3% | | | | | | | | |
Communications Equipment—5.3% | | | | | | | | |
Cisco Systems, Inc. | | | 551,250 | | | | 13,400,887 | |
QUALCOMM, Inc. | | | 587,490 | | | | 35,883,889 | |
| | | | | | | | 49,284,776 | |
Computers & Peripherals—7.1% | | | | | | | | |
Apple, Inc. | | | 124,910 | | | | 49,474,353 | |
EMC Corp. | | | 706,310 | | | | 16,683,042 | |
| | | | | | | | 66,157,395 | |
Internet Software & Services—5.8% | | | | | | | | |
eBay, Inc.1 | | | 341,010 | | | | 17,637,037 | |
Google, Inc., Cl. A1 | | | 41,430 | | | | 36,473,729 | |
| | | | | | | | 54,110,766 | |
IT Services—4.0% | | | | | | | | |
Mastercard, Inc., Cl. A | | | 10,070 | | | | 5,785,215 | |
Teradata Corp.1 | | | 253,110 | | | | 12,713,715 | |
Visa, Inc., Cl. A | | | 103,857 | | | | 18,979,867 | |
| | | | | | | | 37,478,797 | |
Semiconductors & Semiconductor Equipment—2.4% | | | | | | | | |
Broadcom Corp., Cl. A | | | 364,770 | | | | 12,314,635 | |
Xilinx, Inc. | | | 246,730 | | | | 9,772,975 | |
| | | | | | | | 22,087,610 | |
Software—1.7% | | | | | | | | |
Salesforce.com, Inc.1 | | | 409,260 | | | | 15,625,547 | |
Materials—4.5% | | | | | | | | |
Chemicals—3.3% | | | | | | | | |
Ecolab, Inc. | | | 141,810 | | | | 12,080,794 | |
Monsanto Co. | | | 51,130 | | | | 5,051,644 | |
PPG Industries, Inc. | | | 92,480 | | | | 13,539,997 | |
| | | | | | | | 30,672,435 | |
Containers & Packaging—1.2% | | | | | | | | |
Crown Holdings, Inc.1 | | | 272,460 | | | | 11,206,280 | |
Total Common Stocks | | | | | | | | |
(Cost $628,760,665) | | | | | | | 913,172,194 | |
6 OPPENHEIMER CAPITAL APPRECIATION FUND/VA
| | | | | | | | |
| | | Shares | | | Value | |
Investment Company—1.4% | | | | | | | | |
Oppenheimer Institutional Money Market | | | | | | | | |
Fund, Cl. E, 0.11%2,3 (Cost $13,280,401) | | | 13,280,401 | | | $ | 13,280,401 | |
| |
Total Investments,at Value (Cost $642,041,066) | | | 99.5 | % | | | 926,452,595 | |
| |
Assets in Excess of Other Liabilities | | | 0.5 | | | | 4,451,733 | |
| | | | |
Net Assets | | | 100.0 | % | | $ | 930,904,328 | |
| | | | |
Footnotes to Statement of Investments
*June 28, 2013 represents the last business day of the Fund’s semiannual period. See Note 1 of the accompanying Notes.
1. Non-income producing security.
2. Rate shown is the 7-day yield as of June 28, 2013.
3. Is or was an affiliate, as defined in the Investment Company Act of 1940, at or during the period ended June 28, 2013, by virtue of the Fund owning at least 5% of the voting securities of the issuer or as a result of the Fund and the issuer having the same investment adviser. Transactions during the period in which the issuer was an affiliate are as follows:
| | | | | | | | | | | | | | | | |
| | | Shares
December 31, 2012 | | | Gross
Additions | | | Gross
Reductions | | | Shares
June 28, 2013 | |
Oppenheimer Institutional Money Market Fund, Cl. E | | | 11,345,499 | | | | 74,002,112 | | | | 72,067,210 | | | | 13,280,401 | |
| | | | | | | | |
| | | Value | | | Income | |
Oppenheimer Institutional Money Market Fund, Cl. E | | $ | 13,280,401 | | | $ | 5,194 | |
See accompanying Notes to Financial Statements.
7 OPPENHEIMER CAPITAL APPRECIATION FUND/VA
STATEMENTOF ASSETS AND LIABILITIES June 28, 20131 Unaudited
| | | | |
Assets | | | | |
Investments, at value—see accompanying statement of investments: | | | | |
Unaffiliated companies (cost $628,760,665) | | $ | 913,172,194 | |
Affiliated companies (cost $13,280,401) | | | 13,280,401 | |
| | | | |
| | | 926,452,595 | |
| |
Cash | | | 21,123 | |
| |
Receivables and other assets: | | | | |
Investments sold | | | 15,906,728 | |
Dividends | | | 1,056,680 | |
Other | | | 64,633 | |
| | | | |
Total assets | | | 943,501,759 | |
| |
Liabilities | | | | |
Payables and other liabilities: | | | | |
Investments purchased | | | 11,335,911 | |
Shares of beneficial interest redeemed | | | 979,883 | |
Transfer and shareholder servicing agent fees | | | 72,693 | |
Distribution and service plan fees | | | 69,183 | |
Shareholder communications | | | 57,402 | |
Trustees’ compensation | | | 56,473 | |
Other | | | 25,886 | |
| | | | |
Total liabilities | | | 12,597,431 | |
| |
Net Assets | | $ | 930,904,328 | |
| | | | |
| |
Composition of Net Assets | | | | |
Par value of shares of beneficial interest | | $ | 19,252 | |
| |
Additional paid-in capital | | | 756,908,807 | |
| |
Accumulated net investment income | | | 991,824 | |
| |
Accumulated net realized loss on investments and foreign currency transactions | | | (111,435,116) | |
| |
Net unrealized appreciation on investments and translation of assets and liabilities denominated in foreign currencies | | | 284,419,561 | |
| | | | |
Net Assets | | $ | 930,904,328 | |
| | | | |
|
| |
Net Asset Value Per Share | | | | |
Non-Service Shares: | | | | |
| Net asset value, redemption price per share and offering price per share (based on net assets of $571,879,442 and 11,792,526 shares of beneficial interest outstanding) | | | $48.50 | |
| |
Service Shares: | | | | |
| Net asset value, redemption price per share and offering price per share (based on net assets of $359,024,886 and 7,459,612 shares of beneficial interest outstanding) | | | $48.13 | |
1. June 28, 2013 is the last business day of the Fund’s semiannual period. See Note 1 of the accompanying Notes.
See accompanying Notes to Financial Statements.
8 OPPENHEIMER CAPITAL APPRECIATION FUND/VA
STATEMENTOF OPERATIONS For the Six Months Ended June 28, 20131 Unaudited
| | | | |
Investment Income | | | | |
Dividends: | | | | |
Unaffiliated companies (net of foreign withholding taxes of $188,748) | | $ | 6,726,056 | |
Affiliated companies | | | 5,194 | |
| |
Interest | | | 15 | |
| | | | |
Total investment income | | | 6,731,265 | |
| |
Expenses | | | | |
Management fees | | | 3,274,712 | |
| |
Distribution and service plan fees—Service shares | | | 463,818 | |
| |
Transfer and shareholder servicing agent fees: | | | | |
Non-Service shares | | | 290,764 | |
Service shares | | | 185,980 | |
| |
Shareholder communications: | | | | |
Non-Service shares | | | 28,330 | |
Service shares | | | 18,148 | |
| |
Trustees’ compensation | | | 29,713 | |
| |
Custodian fees and expenses | | | 11,106 | |
| |
Other | | | 42,964 | |
| | | | |
Total expenses | | | 4,345,535 | |
Less waivers and reimbursements of expenses | | | (21,520) | |
| | | | |
Net expenses | | | 4,324,015 | |
| |
Net Investment Income | | | 2,407,250 | |
| |
Realized and Unrealized Gain (Loss) | | | | |
Net realized gain (loss) on: | | | | |
Investments from unaffiliated companies | | | 89,245,820 | |
Foreign currency transactions | | | (6,170) | |
| | | | |
Net realized gain | | | 89,239,650 | |
| |
Net change in unrealized appreciation/depreciation on: | | | | |
Investments | | | (9,533,901) | |
Translation of assets and liabilities denominated in foreign currencies | | | (1,592,421) | |
| | | | |
Net change in unrealized appreciation/depreciation | | | (11,126,322) | |
| |
Net Increase in Net Assets Resulting from Operations | | $ | 80,520,578 | |
| | | | |
1. June 28, 2013 is the last business day of the Fund’s semiannual period. See Note 1 of the accompanying Notes.
See accompanying Notes to Financial Statements.
9 OPPENHEIMER CAPITAL APPRECIATION FUND/VA
STATEMENTSOF CHANGES IN NET ASSETS
| | | | | | | | |
| | | Six Months Ended
June 28, 20131 (Unaudited) | | | Year Ended
December 31, 2012 | |
Operations | | | | | | | | |
Net investment income | | $ | 2,407,250 | | | $ | 8,440,486 | |
| |
Net realized gain | | | 89,239,650 | | | | 98,112,908 | |
| |
Net change in unrealized appreciation/depreciation | | | (11,126,322) | | | | 28,160,875 | |
| | | | |
Net increase in net assets resulting from operations | | | 80,520,578 | | | | 134,714,269 | |
Dividends and/or Distributions to Shareholders | | | | | | | | |
Dividends from net investment income: | | | | | | | | |
Non-Service shares | | | (5,856,634) | | | | (3,878,051) | |
Service shares | | | (2,798,285) | | | | (1,503,957) | |
| | | | |
| | | (8,654,919) | | | | (5,382,008) | |
Beneficial Interest Transactions | | | | | | | | |
Net decrease in net assets resulting from beneficial interest transactions: | | | | | | | | |
Non-Service shares | | | (45,216,718) | | | | (144,652,286) | |
Service shares | | | (36,092,630) | | | | (57,530,166) | |
| | | | |
| | | (81,309,348) | | | | (202,182,452) | |
Net Assets | | | | | | | | |
Total decrease | | | (9,443,689) | | | | (72,850,191) | |
| |
Beginning of period | | | 940,348,017 | | | | 1,013,198,208 | |
| | | | |
| | |
End of period (including accumulated net investment income of $ 991,824 and $ 7,239,493, respectively) | | $ | 930,904,328 | | | $ | 940,348,017 | |
| | | | |
1. June 28, 2013 represents the last business day of the Fund’s semiannual period. See Note 1 of the accompanying Notes
See accompanying Notes to Financial Statements.
10 OPPENHEIMER CAPITAL APPRECIATION FUND/VA
FINANCIAL HIGHLIGHTS
| | | | | | | | | | | | | | | | | | | | | | | | |
| Non-Service Shares | | Six Months Ended June 28, 20131 (Unaudited) | | | Year Ended December 31, 2012 | | | Year Ended December 30, 20111 | | | Year Ended December 31, 2010 | | | Year Ended December 31, 2009 | | | Year Ended December 31, 2008 | |
Per Share Operating Data | | | | | | | | | | | | | | | | | | | | | | | | |
Net asset value, beginning of period | | $ | 45.06 | | | $ | 39.75 | | | $ | 40.35 | | | $ | 36.94 | | | $ | 25.67 | | | $ | 47.18 | |
| |
Income (loss) from investment operations: | | | | | | | | | | | | | | | | | | | | | | | | |
Net investment income2 | | | 0.14 | | | | 0.42 | | | | 0.23 | | | | 0.11 | | | | 0.09 | | | | 0.10 | |
Net realized and unrealized gain (loss) | | | 3.80 | | | | 5.18 | | | | (0.69) | | | | 3.36 | | | | 11.27 | | | | (21.55) | |
| | | | |
Total from investment operations | | | 3.94 | | | | 5.60 | | | | (0.46) | | | | 3.47 | | | | 11.36 | | | | (21.45) | |
| |
Dividends and/or distributions to shareholders: | | | | | | | | | | | | | | | | | | | | | | | | |
Dividends from net investment income | | | (0.50) | | | | (0.29) | | | | (0.14) | | | | (0.06) | | | | (0.09) | | | | (0.06) | |
| |
Net asset value, end of period | | $ | 48.50 | | | $ | 45.06 | | | $ | 39.75 | | | $ | 40.35 | | | $ | 36.94 | | | $ | 25.67 | |
| | | | |
Total Return, at Net Asset Value3 | | | 8.70% | | | | 14.12% | | | | (1.15)% | | | | 9.42% | | | | 44.52% | | | | (45.52)% | |
Ratios/Supplemental Data | | | | | | | | | | | | | | | | | | | | | | | | |
Net assets, end of period (in thousands) | | $ | 571,879 | | | $ | 573,684 | | | $ | 637,868 | | | $ | 771,086 | | | $ | 1,074,190 | | | $ | 829,931 | |
| |
Average net assets (in thousands) | | $ | 589,853 | | | $ | 600,121 | | | $ | 713,770 | | | $ | 976,242 | | | $ | 927,670 | | | $ | 1,256,525 | |
| |
Ratios to average net assets:4 | | | | | | | | | | | | | | | | | | | | | | | | |
Net investment income | | | 0.60% | | | | 0.95% | | | | 0.57% | | | | 0.31% | | | | 0.29% | | | | 0.25% | |
Total expenses5 | | | 0.81% | | | | 0.81% | | | | 0.80% | | | | 0.79% | | | | 0.78% | | | | 0.66% | |
Expenses after payments, waivers and/or reimbursements and reduction to custodian expenses | | | 0.80% | | | | 0.80% | | | | 0.80% | | | | 0.79% | | | | 0.78% | | | | 0.66% | |
| |
Portfolio turnover rate | | | 33% | | | | 28% | | | | 27% | | | | 58% | | | | 46% | | | | 67% | |
1. June 28, 2013 and December 30, 2011 represent the last business day of the Fund’s reporting periods. See Note 1 of the accompanying Notes.
2. Per share amounts calculated based on the average shares outstanding during the period.
3. Assumes an initial investment on the business day before the first day of the fiscal period, with all dividends and distributions reinvested in additional shares on the reinvestment date, and redemption at the net asset value calculated on the last business day of the fiscal period. Total returns are not annualized for periods less than one full year. Total return information does not reflect expenses that apply at the separate account level or to related insurance products. Inclusion of these charges would reduce the total return figures for all periods shown. Returns do not reflect the deduction of taxes that a shareholder would pay on fund distributions or the redemption of fund shares.
4. Annualized for periods less than one full year.
5. Total expenses including indirect expenses from affiliated fund were as follows:
| | | | |
| | Six Months Ended June 28, 2013 | | 0.81% |
| | Year Ended December 31, 2012 | | 0.81% |
| | Year Ended December 30, 2011 | | 0.80% |
| | Year Ended December 31, 2010 | | 0.79% |
| | Year Ended December 31, 2009 | | 0.78% |
| | Year Ended December 31, 2008 | | 0.66% |
See accompanying Notes to Financial Statements.
11 OPPENHEIMER CAPITAL APPRECIATION FUND/VA
FINANCIAL HIGHLIGHTS Continued
| | | | | | | | | | | | | | | | | | | | | | | | |
| Service Shares | | Six Months Ended June 28, 20131
(Unaudited) | | | Year Ended
December 31, 2012 | | | Year Ended
December 30, 20111 | | | Year Ended
December 31, 2010 | | | Year Ended
December 31, 2009 | | | Year Ended December 31, 2008 | |
Per Share Operating Data | | | | | | | | | | | | | | | | | | | | | | | | |
Net asset value, beginning of period | | | $ 44.66 | | | | $ 39.40 | | | | $ 39.99 | | | | $ 36.64 | | | | $ 25.42 | | | | $ 46.78 | |
| |
Income (loss) from investment operations: | | | | | | | | | | | | | | | | | | | | | | | | |
Net investment income2 | | | 0.08 | | | | 0.31 | | | | 0.13 | | | | 0.02 | | | | 0.01 | | | | 0.003 | |
Net realized and unrealized gain (loss) | | | 3.76 | | | | 5.12 | | | | (0.68) | | | | 3.33 | | | | 11.21 | | | | (21.36) | |
| | | | |
Total from investment operations | | | 3.84 | | | | 5.43 | | | | (0.55) | | | | 3.35 | | | | 11.22 | | | | (21.36) | |
| |
Dividends and/or distributions to shareholders: | | | | | | | | | | | | | | | | | | | | | | | | |
Dividends from net investment income | | | (0.37) | | | | (0.17) | | | | (0.04) | | | | 0.00 | | | | 0.00 | 3 | | | 0.00 | |
| |
Net asset value, end of period | | | $ 48.13 | | | | $ 44.66 | | | | $ 39.40 | | | | $ 39.99 | | | | $ 36.64 | | | | $ 25.42 | |
| | | | |
| | | | |
Total Return, at Net Asset Value4 | | | 8.58% | | | | 13.81% | | | | (1.37)% | | | | 9.15% | | | | 44.15% | | | | (45.66)% | |
Ratios/Supplemental Data | | | | | | | | | | | | | | | | | | | | | | | | |
Net assets, end of period (in thousands) | | | $ 359,025 | | | | $ 366,664 | | | | $ 375,330 | | | | $ 423,989 | | | | $ 444,170 | | | | $ 313,931 | |
| |
Average net assets (in thousands) | | | $ 377,301 | | | | $ 382,196 | | | | $ 407,413 | | | | $ 427,640 | | | | $ 368,634 | | | | $ 454,558 | |
| |
Ratios to average net assets:5 | | | | | | | | | | | | | | | | | | | | | | | | |
Net investment income | | | 0.35% | | | | 0.71% | | | | 0.32% | | | | 0.06% | | | | 0.03% | | | | 0.00%6 | |
Total expenses7 | | | 1.06% | | | | 1.06% | | | | 1.05% | | | | 1.04% | | | | 1.04% | | | | 0.91% | |
Expenses after payments, waivers and/or reimbursements and reduction to custodian expenses | | | 1.05% | | | | 1.05% | | | | 1.05% | | | | 1.04% | | | | 1.03% | | | | 0.91% | |
| |
Portfolio turnover rate | | | 33% | | | | 28% | | | | 27% | | | | 58% | | | | 46% | | | | 67% | |
1. June 28, 2013 and December 30, 2011 represent the last business day of the Fund’s reporting periods. See Note 1 of the accompanying Notes.
2. Per share amounts calculated based on the average shares outstanding during the period.
3. Less than $0.005 per share.
4. Assumes an initial investment on the business day before the first day of the fiscal period, with all dividends and distributions reinvested in additional shares on the reinvestment date, and redemption at the net asset value calculated on the last business day of the fiscal period. Total returns are not annualized for periods less than one full year. Total return information does not reflect expenses that apply at the separate account level or to related insurance products. Inclusion of these charges would reduce the total return figures for all periods shown. Returns do not reflect the deduction of taxes that a shareholder would pay on fund distributions or the redemption of fund shares.
5. Annualized for periods less than one full year.
6. Less than 0.005%.
7. Total expenses including indirect expenses from affiliated fund were as follows:
| | | | |
| | Six Months Ended June 28, 2013 | | 1.06% |
| | Year Ended December 31, 2012 | | 1.06% |
| | Year Ended December 30, 2011 | | 1.05% |
| | Year Ended December 31, 2010 | | 1.04% |
| | Year Ended December 31, 2009 | | 1.04% |
| | Year Ended December 31, 2008 | | 0.91% |
See accompanying Notes to Financial Statements.
12 OPPENHEIMER CAPITAL APPRECIATION FUND/VA
NOTESTO FINANCIAL STATEMENTS Unaudited
1. Significant Accounting Policies
Oppenheimer Capital Appreciation Fund/VA (the “Fund”) is a separate series of Oppenheimer Variable Account Funds, a diversified open-end management investment company registered under the Investment Company Act of 1940, as amended. The Fund’s investment objective is to seek capital appreciation. The Fund’s investment adviser is OFI Global Asset Management, Inc. (“OFI Global” or the “Manager”), a wholly-owned subsidiary of OppenheimerFunds, Inc. (“OFI” or the “Sub-Adviser”). The Manager has entered into a sub-advisory agreement with OFI. Shares of the Fund are sold only to separate accounts of life insurance companies.
The Fund offers two classes of shares. Both classes are sold at their offering price, which is the net asset value per share, to separate investment accounts of participating insurance companies as an underlying investment for variable life insurance policies, variable annuity contracts or other investment products. The class of shares designated as Service shares is subject to a distribution and service plan. Both classes of shares have identical rights and voting privileges with respect to the Fund in general and exclusive voting rights on matters that affect that class alone. Earnings, net assets and net asset value per share may differ due to each class having its own expenses, such as transfer and shareholder servicing agent fees and shareholder communications, directly attributable to that class.
The following is a summary of significant accounting policies consistently followed by the Fund.
Semiannual and Annual Periods. The Fund’s financial statements are presented through the last day the New York Stock Exchange was open for trading during each reporting period. The Fund’s financial statements have been presented through that date to maintain consistency with the Fund’s net asset value calculations used for shareholder transactions.
Investment in Oppenheimer Institutional Money Market Fund. The Fund is permitted to invest daily available cash balances in an affiliated money market fund. The Fund may invest the available cash in Class E shares of Oppenheimer Institutional Money Market Fund (“IMMF”) to seek current income while preserving liquidity. IMMF is a registered open-end management investment company, regulated as a money market fund under the Investment Company Act of 1940, as amended. The Manager is the investment adviser of IMMF, and the Sub-Adviser provides investment and related advisory services to IMMF. When applicable, the Fund’s investment in IMMF is included in the Statement of Investments. Shares of IMMF are valued at their net asset value per share. As a shareholder, the Fund is subject to its proportional share of IMMF’s Class E expenses, including its management fee. The Manager will waive fees and/or reimburse Fund expenses in an amount equal to the indirect management fees incurred through the Fund’s investment in IMMF.
Foreign Currency Translation. The Fund’s accounting records are maintained in U.S. dollars. The values of securities denominated in foreign currencies and amounts related to the purchase and sale of foreign securities and foreign investment income are translated into U.S. dollars as of the close of the New York Stock Exchange (the “Exchange”), normally 4:00 P.M. Eastern time, on each day the Exchange is open for trading. Foreign exchange rates may be valued primarily using a reliable bank, dealer or service authorized by the Board of Trustees.
Reported net realized gains and losses from foreign currency transactions arise from sales of portfolio securities, sales and maturities of short-term securities, sales of foreign currencies, exchange rate fluctuations between the trade and settlement dates on securities transactions, and the difference between the amounts of dividends, interest, and foreign withholding taxes recorded on the Fund’s books and the U.S. dollar equivalent of the amounts actually received or paid. Net unrealized appreciation and depreciation on the translation of assets and liabilities denominated in foreign currencies arise from changes in the values of assets and liabilities, including investments in securities at fiscal period end, resulting from changes in exchange rates.
The effect of changes in foreign currency exchange rates on investments is separately identified from the fluctuations arising from changes in market values of securities held and reported with all other foreign currency gains and losses in the Fund’s Statement of Operations.
Allocation of Income, Expenses, Gains and Losses. Income, expenses (other than those attributable to a specific class), gains and losses are allocated on a daily basis to each class of shares based upon the relative proportion of net assets represented by such class. Operating expenses directly attributable to a specific class are charged against the operations of that class.
Federal Taxes. The Fund intends to comply with provisions of the Internal Revenue Code applicable to regulated investment companies and to distribute substantially all of its investment company taxable income, including any net realized gain on investments not offset by capital loss carryforwards, if any, to shareholders. Therefore, no federal income or excise tax provision is required. The Fund files income tax returns in U.S. federal and applicable state jurisdictions. The statute of limitations on the Fund’s tax return filings generally remain open for the three preceding fiscal reporting period ends.
During the fiscal year ended December 31, 2012, the Fund utilized $92,201,391 of capital loss carryforward to offset capital gains realized in that fiscal year. The Fund had post-October losses of $196,818. Details of the fiscal year ended December 31, 2012 capital loss carryforwards are included in the table below. Capital loss carryforwards with no expiration, if any, must be utilized prior to those with expiration dates. Capital losses with no expiration will be carried forward to future years if not offset by gains.
| | | | |
Expiring | |
2016 | | $ | 17,161,220 | |
2017 | | | 180,633,172 | |
| | | | |
Total | | $ | 197,794,392 | |
| | | | |
As of June 28, 2013, it is estimated that the capital loss carryforwards would be $108,554,742 expiring by 2017. The estimated capital loss carryforward represents the carryforward as of the end of the last fiscal year, increased or decreased by capital losses or gains realized in the first six months of the
13 OPPENHEIMER CAPITAL APPRECIATION FUND/VA
NOTESTO FINANCIAL STATEMENTS Unaudited / Continued
1. Significant Accounting Policies (Continued)
current fiscal year. During the six months ended June 28, 2013, it is estimated that the Fund will utilize $89,239,650 of capital loss carryforward to offset realized capital gains.
Net investment income (loss) and net realized gain (loss) may differ for financial statement and tax purposes. The character of dividends and distributions made during the fiscal year from net investment income or net realized gains may differ from their ultimate characterization for federal income tax purposes. Also, due to timing of dividends and distributions, the fiscal year in which amounts are distributed may differ from the fiscal year in which the income or net realized gain was recorded by the Fund.
The aggregate cost of securities and other investments and the composition of unrealized appreciation and depreciation of securities and other investments for federal income tax purposes as of June 28, 2013 are noted in the following table. The primary difference between book and tax appreciation or depreciation of securities and other investments, if applicable, is attributable to the tax deferral of losses or tax realization of financial statement unrealized gain or loss.
| | | | |
Federal tax cost of securities | | $ | 643,803,226 | |
| | | | |
Gross unrealized appreciation | | $ | 289,180,904 | |
Gross unrealized depreciation | | | (6,531,535) | |
| | | | |
Net unrealized appreciation | | $ | 282,649,369 | |
| | | | |
Trustees’ Compensation. The Board of Trustees has adopted a compensation deferral plan for independent trustees that enables trustees to elect to defer receipt of all or a portion of the annual compensation they are entitled to receive from the Fund. For purposes of determining the amount owed to the Trustee under the plan, deferred amounts are treated as though equal dollar amounts had been invested in shares of the Fund or in other Oppenheimer funds selected by the Trustee. The Fund purchases shares of the funds selected for deferral by the Trustee in amounts equal to his or her deemed investment, resulting in a Fund asset equal to the deferred compensation liability. Such assets are included as a component of “Other” within the asset section of the Statement of Assets and Liabilities. Deferral of trustees’ fees under the plan will not affect the net assets of the Fund, and will not materially affect the Fund’s assets, liabilities or net investment income per share. Amounts will be deferred until distributed in accordance with the compensation deferral plan.
Dividends and Distributions to Shareholders. Dividends and distributions to shareholders, which are determined in accordance with income tax regulations and may differ from U.S. generally accepted accounting principles, are recorded on the ex-dividend date. Income and capital gain distributions, if any, are declared and paid annually or at other times as deemed necessary by the Manager. The tax character of distributions is determined as of the Fund’s fiscal year end. Therefore, a portion of the Fund’s distributions made to shareholders prior to the Fund’s fiscal year end may ultimately be categorized as a tax return of capital.
Investment Income. Dividend income is recorded on the ex-dividend date or upon ex-dividend notification in the case of certain foreign dividends where the ex-dividend date may have passed. Non-cash dividends included in dividend income, if any, are recorded at the fair market value of the securities received. Interest income is recognized on an accrual basis. Discount and premium, which are included in interest income on the Statement of Operations, are amortized or accreted daily.
Custodian Fees. “Custodian fees and expenses” in the Statement of Operations may include interest expense incurred by the Fund on any cash overdrafts of its custodian account during the period. Such cash overdrafts may result from the effects of failed trades in portfolio securities and from cash outflows resulting from unanticipated shareholder redemption activity. The Fund pays interest to its custodian on such cash overdrafts, to the extent they are not offset by positive cash balances maintained by the Fund, at a rate equal to the Federal Funds Rate plus 0.50%. The “Reduction to custodian expenses” line item, if applicable, represents earnings on cash balances maintained by the Fund during the period. Such interest expense and other custodian fees may be paid with these earnings.
Security Transactions. Security transactions are recorded on the trade date. Realized gains and losses on securities sold are determined on the basis of identified cost.
Indemnifications. The Fund’s organizational documents provide current and former trustees and officers with a limited indemnification against liabilities arising in connection with the performance of their duties to the Fund. In the normal course of business, the Fund may also enter into contracts that provide general indemnifications. The Fund’s maximum exposure under these arrangements is unknown as this would be dependent on future claims that may be made against the Fund. The risk of material loss from such claims is considered remote.
Other. The preparation of financial statements in conformity with accounting principles generally accepted in the United States of America requires management to make estimates and assumptions that affect the reported amounts of assets and liabilities and disclosure of contingent assets and liabilities at the date of the financial statements and the reported amounts of increases and decreases in net assets from operations during the reporting period. Actual results could differ from those estimates.
14 OPPENHEIMER CAPITAL APPRECIATION FUND/VA
2. Securities Valuation
The Fund calculates the net asset value of its shares as of the close of the New York Stock Exchange (the “Exchange”), normally 4:00 P.M. Eastern time, on each day the Exchange is open for trading.
The Fund’s Board has adopted procedures for the valuation of the Fund’s securities and has delegated the day-to-day responsibility for valuation determinations under those procedures to the Manager. The Manager has established a Valuation Committee which is responsible for determining a “fair valuation” for any security for which market quotations are not “readily available.” The Valuation Committee’s fair valuation determinations are subject to review, approval and ratification by the Fund’s Board at its next regularly scheduled meeting covering the calendar quarter in which the fair valuation was determined.
Valuation Methods and Inputs
Securities are valued using unadjusted quoted market prices, when available, as supplied primarily by third party pricing services or dealers.
The following methodologies are used to determine the market value or the fair value of the types of securities described below:
Securities traded on a registered U.S. securities exchange (including exchange-traded derivatives other than futures and futures options) are valued based on the last sale price of the security reported on the principal exchange on which it is traded, prior to the time when the Fund’s assets are valued. In the absence of a sale, the security is valued at the last sale price on the prior trading day, if it is within the spread of the current day’s closing “bid” and “asked” prices, and if not, at the current day’s closing bid price. A security of a foreign issuer traded on a foreign exchange but not listed on a registered U.S. securities exchange is valued based on the last sale price on the principal exchange on which the security is traded, as identified by the third party pricing service used by the Manager, prior to the time when the Fund’s assets are valued. If the last sale price is unavailable, the security is valued at the most recent official closing price on the principal exchange on which it is traded. If the last sales price or official closing price for a foreign security is not available, the security is valued at the mean between the bid and asked price per the exchange or, if not available from the exchange, obtained from two dealers. If bid and asked prices are not available from either the exchange or two dealers, the security is valued by using one of the following methodologies (listed in order of priority); (1) using a bid from the exchange, (2) the mean between the bid and asked price as provided by a single dealer, or (3) a bid from a single dealer.
Shares of a registered investment company that are not traded on an exchange are valued at that investment company’s net asset value per share.
Corporate and government debt securities (of U.S. or foreign issuers) and municipal debt securities, event-linked bonds, loans, mortgage-backed securities, collateralized mortgage obligations, and asset-backed securities are valued at the mean between the “bid” and “asked” prices utilizing evaluated prices obtained from third party pricing services or broker-dealers who may use matrix pricing methods to determine the evaluated prices.
Short-term money market type debt securities with a remaining maturity of sixty days or less are valued at cost adjusted by the amortization of discount or premium to maturity (amortized cost), which approximates market value. Short-term debt securities with a remaining maturity in excess of sixty days are valued at the mean between the “bid” and “asked” prices utilizing evaluated prices obtained from third party pricing services or broker-dealers.
A description of the standard inputs that may generally be considered by the third party pricing vendors in determining their evaluated prices is provided below.
| | |
| Security Type | | Standard inputs generally considered by third-party pricing vendors |
|
| Corporate debt, government debt, municipal, mortgage-backed and asset-backed securities | | Reported trade data, broker-dealer price quotations, benchmark yields, issuer spreads on comparable securities, the credit quality, yield, maturity, and other appropriate factors. |
| Loans | | Information obtained from market participants regarding reported trade data and broker-dealer price quotations. |
| Event-linked bonds | | Information obtained from market participants regarding reported trade data and broker-dealer price quotations. |
If a market value or price cannot be determined for a security using the methodologies described above, or if, in the “good faith” opinion of the Manager, the market value or price obtained does not constitute a “readily available market quotation,” or a significant event has occurred that would materially affect the value of the security the security is fair valued either (i) by a standardized fair valuation methodology applicable to the security type or the significant event as previously approved by the Valuation Committee and the Fund’s Board or (ii) as determined in good faith by the Manager’s Valuation Committee. The Valuation Committee considers all relevant facts that are reasonably available, through either public information or information available to the Manager, when determining the fair value of a security. Fair value determinations by the Manager are subject to review, approval and ratification by the Fund’s Board at its next regularly scheduled meeting covering the calendar quarter in which the fair valuation was determined. Those fair valuation standardized methodologies include, but are not limited to, valuing securities at the last sale price or initially at cost and subsequently adjusting the value based on: changes in company specific fundamentals, changes in an appropriate securities index, or changes in the value of similar securities which may be further adjusted for any discounts related to security-specific resale restrictions. When possible, such methodologies use observable market inputs such as unadjusted quoted prices of similar securities, observable interest rates, currency rates and yield curves. The methodologies used for valuing securities are not necessarily an indication of the risks associated with investing in those securities nor can it be assured that the Fund can obtain the fair value assigned to a security if it were to sell the security.
To assess the continuing appropriateness of security valuations, the Manager, or its third party service provider who is subject to oversight by the Manager, regularly compares prior day prices, prices on comparable securities, and sale prices to the current day prices and challenges those prices exceeding certain tolerance levels with the third party pricing service or broker source. For those securities valued by fair valuations, whether through a standardized fair valuation methodology or a fair valuation determination, the Valuation Committee reviews and affirms the reasonableness of the
15 OPPENHEIMER CAPITAL APPRECIATION FUND/VA
NOTESTO FINANCIAL STATEMENTS Unaudited / Continued
2. Securities Valuation (Continued)
valuations based on such methodologies and fair valuation determinations on a regular basis after considering all relevant information that is reasonably available.
Classifications
Each investment asset or liability of the Fund is assigned a level at measurement date based on the significance and source of the inputs to its valuation. Various data inputs are used in determining the value of each of the Fund’s investments as of the reporting period end. These data inputs are categorized in the following hierarchy under applicable financial accounting standards:
1) Level 1-unadjusted quoted prices in active markets for identical assets or liabilities (including securities actively traded on a securities exchange)
2) Level 2-inputs other than unadjusted quoted prices that are observable for the asset or liability (such as unadjusted quoted prices for similar assets and market corroborated inputs such as interest rates, prepayment speeds, credit risks, etc.)
3) Level 3-significant unobservable inputs (including the Manager’s own judgments about assumptions that market participants would use in pricing the asset or liability).
The inputs used for valuing securities are not necessarily an indication of the risks associated with investing in those securities.
The table below categorizes amounts that are included in the Fund’s Statement of Assets and Liabilities as of June 28, 2013 based on valuation input level:
| | | | | | | | | | | | | | | | |
| | | Level 1— Unadjusted Quoted Prices | | | Level 2— Other Significant Observable Inputs | | | Level 3—
Significant Unobservable Inputs | | | Value | |
| |
Assets Table | | | | | | | | | | | | | | | | |
Investments, at Value: | | | | | | | | | | | | | | | | |
Common Stocks | | | | | | | | | | | | | | | | |
Consumer Discretionary | | $ | 166,756,849 | | | $ | — | | | $ | — | | | $ | 166,756,849 | |
Consumer Staples | | | 67,203,227 | | | | 28,575,360 | | | | — | | | | 95,778,587 | |
Energy | | | 57,886,939 | | | | — | | | | — | | | | 57,886,939 | |
Financials | | | 41,166,797 | | | | — | | | | — | | | | 41,166,797 | |
Health Care | | | 116,142,887 | | | | 29,469,302 | | | | — | | | | 145,612,189 | |
Industrials | | | 119,347,227 | | | | — | | | | — | | | | 119,347,227 | |
Information Technology | | | 244,744,891 | | | | — | | | | — | | | | 244,744,891 | |
Materials | | | 41,878,715 | | | | — | | | | — | | | | 41,878,715 | |
Investment Company | | | 13,280,401 | | | | — | | | | — | | | | 13,280,401 | |
| | | | |
Total Assets | | $ | 868,407,933 | | | $ | 58,044,662 | | | $ | — | | | $ | 926,452,595 | |
| | | | |
Currency contracts and forwards, if any, are reported at their unrealized appreciation/ depreciation at measurement date, which represents the change in the contract’s value from trade date. Futures, if any, are reported at their variation margin at measurement date, which represents the amount due to/from the Fund at that date. All additional assets and liabilities included in the above table are reported at their market value at measurement date.
The table below shows the transfers between Level 1 and Level 2. The Fund’s policy is to recognize transfers in and transfers out as of the beginning of the reporting period.
| | | | | | | | |
| | | Transfers out of Level 1* | | | Transfers into Level 2* | |
| |
Assets Table | | | | | | | | |
Investments, at Value: | | | | | | | | |
Common Stocks | | | | | | | | |
Consumer Staples | | $ | (14,421,812) | | | $ | 14,421,812 | |
| | | | |
Total Assets | | $ | (14,421,812) | | | $ | 14,421,812 | |
| | | | |
*Transferred from Level 1 to Level 2 because of the absence of a readily available unadjusted quoted market price due to a significant event occurring before the Fund’s assets were valued but after the close of the securities’ respective exchanges.
3. Shares of Beneficial Interest
The Fund has authorized an unlimited number of $0.001 par value shares of beneficial interest of each class. Transactions in shares of beneficial interest were as follows:
16 OPPENHEIMER CAPITAL APPRECIATION FUND/VA
3. Shares of Beneficial Interest (Continued)
| | | | | | | | | | | | | | | | |
| | | Six Months Ended June 28, 2013 | | | Year Ended December 31, 2012 | |
| | | Shares | | | Amount | | | Shares | | | Amount | |
| |
Non-Service Shares | | | | | | | | | | | | | | | | |
Sold | | | 157,092 | | | $ | 7,553,544 | | | | 816,576 | | | $ | 35,841,126 | |
Dividends and/or distributions reinvested | | | 117,415 | | | | 5,856,634 | | | | 89,832 | | | | 3,878,051 | |
Redeemed | | | (1,214,297) | | | | (58,626,896) | | | | (4,220,005) | | | | (184,371,463) | |
| | | | |
Net decrease | | | (939,790) | | | $ | (45,216,718) | | | | (3,313,597) | | | $ | (144,652,286) | |
| | | | |
| | | | |
| | | | | | | | | | | | | | | | | |
Service Shares | | | | | | | | | | | | | | | | |
Sold | | | 118,487 | | | $ | 5,615,620 | | | | 333,716 | | | $ | 14,458,725 | |
Dividends and/or distributions reinvested | | | 56,519 | | | | 2,798,285 | | | | 35,098 | | | | 1,503,957 | |
Redeemed | | | (925,022) | | | | (44,506,535) | | | | (1,685,918) | | | | (73,492,848) | |
| | | | |
Net decrease | | | (750,016) | | | $ | (36,092,630) | | | | (1,317,104) | | | $ | (57,530,166) | |
| | | | |
4. Purchases and Sales of Securities
The aggregate cost of purchases and proceeds from sales of securities, other than short-term obligations and investments in IMMF, for the six months ended June 28, 2013, were as follows:
| | | | | | | | |
| | | Purchases | | | Sales | |
| |
Investment securities | | $ | 312,575,534 | | | $ | 401,124,565 | |
5. Fees and Other Transactions with Affiliates
Management Fees. Under the investment advisory agreement, the Fund pays the Manager a management fee based on the daily net assets of the Fund at an annual rate as shown in the following table:
| | | | |
Fee Schedule | |
Up to $200 million | | | 0.75% | |
Next $200 million | | | 0.72 | |
Next $200 million | | | 0.69 | |
Next $200 million | | | 0.66 | |
Over $800 million | | | 0.60 | |
Sub-Adviser Fees. The Manager has retained the Sub-Adviser to provide the day-to-day portfolio management of the Fund. Under the Sub-Advisory Agreement, the Manager pays the Sub-Adviser an annual fee in monthly installments, equal to a percentage of the investment management fee collected by the Manager from the Fund, which shall be calculated after any investment management fee waivers. The fee paid to the Sub-Adviser is paid by the Manager, not by the Fund.
Transfer Agent Fees. OFI Global (the “Transfer Agent”) serves as the transfer and shareholder servicing agent for the Fund. Fees incurred by the Fund with respect to these services are detailed in the statement of operations.
Sub-Transfer Agent Fees. The Transfer Agent has retained Shareholder Services, Inc., a wholly-owned subsidiary of OFI (the “Sub-Transfer Agent”), to provide the day-to-day transfer agent and shareholder servicing of the Fund. Under the Sub-Transfer Agency Agreement, the Transfer Agent pays the Sub-Transfer Agent an annual fee in monthly installments, equal to a percentage of the transfer agent fee collected by the Transfer Agent from the Fund, which shall be calculated after any applicable fee waivers. The fee paid to the Sub-Transfer Agent is paid by the Transfer Agent, not by the Fund.
Distribution and Service Plan for Service Shares. The Fund has adopted a Distribution and Service Plan (the “Plan”) in accordance with Rule 12b-1 under the Investment Company Act of 1940 for Service shares to pay OppenheimerFunds Distributor, Inc. (the “Distributor”), for distribution related services, personal service and account maintenance for the Fund’s Service shares. Under the Plan, payments are made periodically at an annual rate of 0.25% of the daily net assets of Service shares of the Fund. The Distributor currently uses all of those fees to compensate sponsors of the insurance product that offers Fund shares, for providing personal service and maintenance of accounts of their variable contract owners that hold Service shares. These fees are paid out of the Fund’s assets on an on-going basis and increase operating expenses of the Service shares, which results in lower performance compared to the Fund’s shares that are not subject to a service fee. Fees incurred by the Fund under the Plan are detailed in the Statement of Operations.
Waivers and Reimbursements of Expenses. The Manager has voluntarily agreed to limit the Fund’s expenses after payments, waivers and/or reimbursements and reduction to custodian expenses, excluding expenses incurred directly or indirectly by the Fund as a result of investments in other investment companies, wholly-owned subsidiaries and pooled investment vehicles; so that those expenses, as percentages of daily net assets, will not exceed the annual rate of 0.80% for Non-Service shares and 1.05% for Service shares. During the six months ended June 28, 2013, the Manager waived fees and/or reimbursed the Fund $14,475 and $3,141 for Non-Service and Service shares, respectively.
The Manager will waive fees and/or reimburse Fund expenses in an amount equal to the indirect management fees incurred through the Fund’s investment in IMMF. During the six months ended June 28, 2013, the Manager waived fees and/or reimbursed the Fund $3,904 for IMMF management fees.
17 OPPENHEIMER CAPITAL APPRECIATION FUND/VA
NOTESTO FINANCIAL STATEMENTS Unaudited / Continued
5. Fees and Other Transactions with Affiliates (Continued)
Some of these undertakings may be modified or terminated at any time; some may not be modified or terminated until after one year from the date of the current prospectus, as indicated therein.
6. Pending Litigation
Since 2009, a number of class action lawsuits have been pending in federal courts against OppenheimerFunds, Inc. (“OFI”), OppenheimerFunds Distributor, Inc., the Fund’s principal underwriter and distributor (the “Distributor”), and certain funds (but not including the Fund) advised by the Manager and distributed by the Distributor (the “Defendant Funds”). Several of these lawsuits also name as defendants certain officers and current and former trustees of the respective Defendant Funds. The lawsuits raise claims under federal securities law and allege, among other things, that the disclosure documents of the respective Defendant Funds contained misrepresentations and omissions and that the respective Defendant Funds’ investment policies were not followed. The plaintiffs in these actions seek unspecified damages, equitable relief and awards of attorneys’ fees and litigation expenses. The Defendant Funds’ Boards of Trustees have also engaged counsel to represent the Funds and the present and former Independent Trustees named in those suits.
Other class action and individual lawsuits have been filed since 2008 in various state and federal courts against OFI and certain of its affiliates by investors seeking to recover investments they allegedly lost as a result of the “Ponzi” scheme run by Bernard L. Madoff and his firm, Bernard L. Madoff Investment Securities, LLC (“BLMIS”). Plaintiffs in these suits allege that they suffered losses as a result of their investments in several funds managed by an affiliate of OFI and assert a variety of claims, including breach of fiduciary duty, fraud, negligent misrepresentation, unjust enrichment, and violation of federal and state securities laws and regulations, among others. They seek unspecified damages, equitable relief and awards of attorneys’ fees and litigation expenses. Neither the Distributor, nor any of the Oppenheimer mutual funds, their independent trustees or directors are named as defendants in these lawsuits. None of the Oppenheimer mutual funds invested in any funds or accounts managed by Madoff or BLMIS. On February 28, 2011, a stipulation of partial settlement of three groups of consolidated putative class action lawsuits relating to these matters was filed in the U.S. District Court for the Southern District of New York. On August 19, 2011, the court entered an order and final judgment approving the settlement as fair, reasonable and adequate. In September 2011, certain parties filed notices of appeal from the court’s order approving the settlement. The settlement does not resolve other outstanding lawsuits against OFI and its affiliates relating to BLMIS.
On April 16, 2010, a lawsuit was filed in New York state court against (i) OFI, (ii) an affiliate of OFI and (iii) AAArdvark IV Funding Limited (“AAArdvark IV”), an entity advised by OFI’s affiliate, in connection with investments made by the plaintiffs in AAArdvark IV. Plaintiffs allege breach of contract and common law fraud claims against the defendants and seek compensatory damages, costs and disbursements, including attorney fees. On April 11, 2013, the court granted defendants’ motion for summary judgment, dismissing plaintiffs’ fraud claim with prejudice and dismissing their contract claim without prejudice, and granted plaintiffs leave to replead their contract claim to assert a cause of action for specific performance within 30 days. On May 9, 2013, plaintiffs filed a notice of appeal from the court’s dismissal order. On July 15, 2011, a lawsuit was filed in New York state court against OFI, an affiliate of OFI and AAArdvark Funding Limited (“AAArdvark I”), an entity advised by OFI’s affiliate, in connection with investments made by the plaintiffs in AAArdvark I. The complaint alleges breach of contract and common law fraud claims against the defendants and seeks compensatory damages, costs and disbursements, including attorney fees. On November 9, 2011, a lawsuit was filed in New York state court against OFI, an affiliate of OFI and AAArdvark XS Funding Limited (“AAArdvark XS”), an entity advised by OFI’s affiliate, in connection with investments made by the plaintiffs in AAArdvark XS. The complaint alleges breach of contract against the defendants and seeks compensatory damages, costs and disbursements, including attorney fees.
OFI believes the lawsuits and appeals described above are without legal merit and, with the exception of actions it has settled, is defending against them vigorously. While it is premature to render any opinion as to the outcome in these lawsuits, or whether any costs that the Defendant Funds may bear in defending the suits might not be reimbursed by insurance, OFI believes that these suits should not impair the ability of OFI or the Distributor to perform their respective duties to the Fund, and that the outcome of all of the suits together should not have any material effect on the operations of any of the Oppenheimer mutual funds.
18 OPPENHEIMER CAPITAL APPRECIATION FUND/VA
PORTFOLIO PROXY VOTING POLICIES AND PROCEDURES; UPDATES TO
STATEMENTS OF INVESTMENTS Unaudited
The Fund has adopted Portfolio Proxy Voting Policies and Procedures under which the Fund votes proxies relating to securities (“portfolio proxies”) held by the Fund. A description of the Fund’s Portfolio Proxy Voting Policies and Procedures is available (i) without charge, upon request, by calling the Fund toll-free at 1.800.CALL OPP (225.5677), (ii) on the Fund’s website at oppenheimerfunds.com, and (iii) on the SEC’s website at www.sec.gov. In addition, the Fund is required to file Form N-PX, with its complete proxy voting record for the 12 months ended June 30th, no later than August 31st of each year. The Fund’s voting record is available (i) without charge, upon request, by calling the Fund toll-free at 1.800.CALL OPP (225.5677), and (ii) in the Form N-PX filing on the SEC’s website at www.sec.gov.
The Fund files its complete schedule of portfolio holdings with the SEC for the first quarter and the third quarter of each fiscal year on Form N-Q. The Fund’s Form N-Q filings are available on the SEC’s website at www.sec.gov. Those forms may be reviewed and copied at the SEC’s Public Reference Room in Washington, D.C. Information on the operation of the Public Reference Room may be obtained by calling 1-800-SEC-0330.
19 OPPENHEIMER CAPITAL APPRECIATION FUND/VA
OPPENHEIMER CAPITAL APPRECIATION FUND/VA
A Series of Oppenheimer Variable Account Funds
| | |
| Trustees and Officers | | Sam Freedman, Chairman of the Board of Trustees and Trustee |
| | Edward L. Cameron, Trustee |
| | Jon S. Fossel, Trustee |
| | Richard F. Grabish, Trustee |
| | Beverly L. Hamilton, Trustee |
| | Victoria J. Herget, Trustee |
| | Robert J. Malone, Trustee |
| | F. William Marshall, Jr., Trustee |
| | Karen L. Stuckey, Trustee |
| | James D. Vaughn, Trustee |
| | William F. Glavin, Jr., Trustee, President and Principal Executive Officer |
| | Michael Kotlarz, Vice President |
| | Arthur S. Gabinet, Secretary and Chief Legal Officer |
| | Christina M. Nasta, Vice President and Chief Business Officer |
| | Mark S. Vandehey, Vice President and Chief Compliance Officer |
| | Brian W. Wixted, Treasurer and Principal Financial & Accounting Officer |
| |
Manager | | OFI Global Asset Management, Inc. |
| |
Sub-Adviser | | OppenheimerFunds, Inc. |
| |
Distributor | | OppenheimerFunds Distributor, Inc. |
| |
Transfer and | | OFI Global Asset Management, Inc. |
Shareholder | | |
Servicing Agent | | |
| |
Sub-Transfer | | Shareholder Services, Inc. |
Agent | | DBA OppenheimerFunds Services |
| |
Independent | | KPMG LLP |
Registered | | |
Public | | |
Accounting | | |
Firm | | |
| |
Legal Counsel | | K&L Gates LLP |
| |
| | Before investing in any of the Oppenheimer funds, investors should carefully consider a fund’s investment objectives, risks, charges and expenses. Fund prospectuses and summary prospectuses contain this and other information about the funds and may be obtained by asking your financial advisor, visiting oppenheimerfunds.com, or calling us at 1.800.988.8287. Read prospectuses and summary prospectuses carefully before investing. |
| |
| | The financial statements included herein have been taken from the records of the Fund without examination of those records by the independent registered public accounting firm. |
© 2013 OppenheimerFunds, Inc. All rights reserved. Oppenheimer funds are distributed by OppenheimerFunds Distributor, Inc.
| | | | | | |
| June 30, 2013 | | |
| | | | | | |
| | | | | | |
| | | | Oppenheimer Core Bond Fund/VA A Series of Oppenheimer Variable Account Funds | | Semiannual Report |
| | | | | | |
| | | | | | |
| | | | SEMIANNUAL REPORT Listing of Top Holdings Fund Performance Discussion Financial Statements | | |

Portfolio Managers: Krishna Memani and
Peter A. Strzalkowski, CFA
| | | | | | |
Cumulative Total Returns For the 6-Month Period Ended 6/28/131 |
Non-Service Shares | | -1.89% | | | | |
Service Shares | | -2.05 | | | | |
Average Annual Total Returns
For the Periods Ended 6/28/131
| | | | | | | | |
| | | 1-Year | | 5-Year | | 10-Year | | |
Non-Service Shares | | 3.11% | | -2.44% | | 0.52% | | |
Service Shares | | 2.99% | | -2.67% | | 0.27% | | |
The performance data quoted represents past performance, which does not guarantee future results. The investment return and principal value of an investment in the Fund will fluctuate so that an investor’s shares, when redeemed, may be worth more or less than their original cost. Current performance may be lower or higher than the performance quoted. For performance data current to the most recent month end, call us at 1.800.988.8287. The Fund’s total returns should not be expected to be the same as the returns of other funds, whether or not both funds have the same portfolio managers and/or similar names. The Fund’s total returns include changes in share price and reinvested distributions but do not include the charges associated with the separate account products that offer this Fund. Such performance would have been lower if such charges were taken into account.
CORPORATE BONDS & NOTES—TOP TEN INDUSTRIES
| | |
|
Oil, Gas & Consumable Fuels | | 6.0% |
|
Commercial Banks | | 3.7 |
|
Capital Markets | | 3.1 |
|
Insurance | | 2.6 |
|
Diversified Financial Services | | 2.5 |
|
Diversified Telecommunication Services | | 2.1 |
|
Media | | 1.8 |
|
Electric Utilities | | 1.6 |
|
Real Estate Investment Trusts (REITs) | | 1.5 |
|
Automobiles | | 1.3 |
|
Portfolio holdings and allocations are subject to change. Percentages are as of June 28, 2013, and are based on net assets. For more current Fund holdings, please visit oppenheimerfunds.com.
1. June 28, 2013, was the last business day of the Fund’s semiannual period. See Note 1 of the accompanying Notes to Financial Statements.
| | | | |
CREDIT RATING BREAKDOWN | | NRSRO ONLY
TOTAL | |
| |
AAA | | | 41.6% | |
| |
AA | | | 5.8 | |
| |
A | | | 10.5 | |
| |
BBB | | | 28.1 | |
| |
BB | | | 7.7 | |
| |
B | | | 0.8 | |
| |
CCC | | | 3.4 | |
| |
CC | | | 0.3 | |
| |
D | | | 1.8 | |
| |
Total | | | 100.0% | |
The percentages above are based on the market value of the Fund’s securities as of June 28, 2013, and are subject to change. Except for securities issued or guaranteed by a foreign sovereign or supranational entity, all securities have been rated by at least one Nationally Recognized Statistical Rating Organization (“NRSRO”), such as Standard & Poor’s (“S&P”). For securities rated only by an NRSRO other than S&P, OppenheimerFunds, Inc. converts that rating to the equivalent S&P rating. If two or more NRSROs have assigned a rating to a security, the highest S&P equivalent rating is used. Unrated securities issued or guaranteed by a foreign sovereign or supranational entity are assigned a credit rating equal to the highest NRSRO rating assigned to that foreign sovereign or supranational entity. Fund assets invested in Oppenheimer Institutional Money Market Fund are assigned that fund’s S&P rating, which is currently AAA. For the purposes of this Credit Allocation table, “investment-grade” securities are securities rated within the NRSROs’ four highest rating categories, which include AAA, AA, A and BBB. Unrated securities do not necessarily indicate low credit quality, but may or may not be the equivalent of investment-grade. Please consult the Fund’s prospectus for further information. Additional information can be found in the Fund’s Statement of Additional Information.
2 OPPENHEIMER CORE BOND FUND/VA
Fund Performance Discussion
The Fund’s Non-Service shares returned -1.89% during the period. On a relative basis, the Fund outperformed the Barclays U.S. Aggregate Bond Index, the Barclays Credit Index and the Citigroup Broad Investment Grade Bond Index, which returned -2.44%, -3.60% and -2.45%, respectively. The bulk of the Fund’s declines occurred late in the period after the Federal Reserve (the “Fed”) discussed the potential tapering of its quantitative easing program.
GLOBAL MARKET AND ECONOMIC ENVIRONMENT
Early in the reporting period, the highly accommodative policies of central banks throughout the world and positive data surprises in the U.S. regarding housing and employment buoyed investor sentiment and resulted in a rally in risk markets. The continuation of the Bank of Japan’s massive asset purchase program “Abe-nomics” was a major driving force as Japanese investors were pushed out on the risk curve away from Japanese government bonds (JGBs) and into riskier assets. At the end of May, market volatility picked up measurably as comments from Fed Chairman Ben Bernanke at a Congressional hearing surprised the market when he indicated a possible slowdown of the central bank’s asset purchase program if the economy continued to show improvement. Additionally, fears began to creep into the market about a possible slowdown in the word’s emerging economies. As a result, risk assets sold off across the board, with Japanese stocks and emerging market debt absorbing the brunt of the selling, although investment grade credit was certainly not immune. Simultaneously, the intermediate and long-end of the U.S. Treasury curve steepened quite dramatically as investors began to price in the likelihood of higher interest rates in the future. The volatility continued through June as the Federal Open Market Committee (FOMC) issued a statement indicating again that if the U.S. economy continued to improve the Fed would begin to slow down its $85 billion a month purchases of U.S. Treasuries and mortgage-backed securities.
FUND REVIEW
The Fund maintained a significant underweight position to government bonds, and instead sourced its exposure through corporate bonds, mortgages and structured products. This positioning drove the Fund’s outperformance over the first half of the period, but resulted in declines later on. The Fund performed positively over the first half of the period as credit markets in the U.S. rallied on the back of positive economic data, despite the Cyprus banking crisis, deteriorating conditions in the Eurozone and moderating growth in emerging markets. Our exposure to corporate bonds benefited as corporate bond performance versus Treasuries was strong. During this time, an overweight to financials drove much of the positive performance among our corporate bonds, as the sector is a perceived safe haven from leveraged buyout (“LBO”) activity, which picked up early in the period. Specifically, our allocations to large cap banks and multi-line insurance companies were helpful. The subordinated debt of banks was a positive as their spread relative to senior debt continued to narrow as bank profitability and capital metrics continue to improve. Investments in agency and non-agency mortgage-backed securities (“MBS”), commercial mortgage-backed securities (“CMBS”) and asset backed securities (“ABS”), also benefited performance over the first half of the period.
Beginning in May, fixed-income markets turned volatile after the Fed began to discuss tapering. The Fed’s comments resulted in spreads on the Barclays Credit Index widening out to levels last seen in October 2012. Before the Fed’s comments, we started reducing our position in MBS since we felt they were vulnerable to policy changes. While this limited the negative impact, MBS still detracted from performance, as did CMBS and ABS. Over the second half of the period, the Fund benefited from an overweight position in junior capital instruments within the financial sector. The Fund was negatively impacted by two positions in the tobacco sector, as this higher beta sector began to underperform amid the tumultuous environment. Additionally, our sector overweight to pharmaceuticals detracted from Fund performance, although it is worth noting that security selection within the sector was in line with the sector’s overall performance during this time.
STRATEGY & OUTLOOK
Although it appears that all eyes remain firmly fixated on the Fed and its eventual asset purchase unwind and the perceived growth slowdown within the emerging markets, we believe there is reason for optimism. By historical standards central banks around the globe are executing exceedingly loose monetary policy, which provides plenty of liquidity to the markets. U.S. growth appears to be a surprising bright spot and we are even beginning to see early signs that growth within Europe may be turning the corner. And while it may be clear that China’s growth trajectory is slowing, we believe policy makers have the situation in hand and the probability of a hard landing is still quite low.
In a “yield-starved” domestic fixed income market dominated by U.S. Treasuries hovering near historic lows, we continue to favor higher-yielding investments to seek a carry, or yield advantage. Given current conditions, we believe the additional carry of the Fund is positioned to help returns even in the context of spreads remaining at their current levels.
3 OPPENHEIMER CORE BOND FUND/VA
The Fund’s investment strategy and focus can change over time. The mention of specific fund holdings does not constitute a recommendation by OppenheimerFunds, Inc. or it affiliates.
Shares of Oppenheimer funds are not deposits or obligations of any bank, are not guaranteed by any bank, are not insured by the FDIC or any other agency, and involve investment risks, including the possible loss of the principal amount invested.
4 OPPENHEIMER CORE BOND FUND/VA
Fund Expenses
Fund Expenses. As a shareholder of the Fund, you incur two types of costs: (1) transaction costs and (2) ongoing costs, including management fees; distribution and service fees; and other Fund expenses. These examples are intended to help you understand your ongoing costs (in dollars) of investing in the Fund and to compare these costs with the ongoing costs of investing in other mutual funds.
The examples are based on an investment of $1,000.00 invested at the beginning of the period and held for the entire 6-month period ended June 28, 2013.
Actual Expenses. The first section of the table provides information about actual account values and actual expenses. You may use the information in this section for the class of shares you hold, together with the amount you invested, to estimate the expense that you paid over the period. Simply divide your account value by $1,000.00 (for example, an $8,600.00 account value divided by $1,000.00 = 8.60), then multiply the result by the number in the first section under the heading entitled “Expenses Paid During Period” to estimate the expenses you paid on your account during this period.
Hypothetical Example for Comparison Purposes. The second section of the table provides information about hypothetical account values and hypothetical expenses based on the Fund’s actual expense ratio for each class of shares, and an assumed rate of return of 5% per year for each class before expenses, which is not the actual return. The hypothetical account values and expenses may not be used to estimate the actual ending account balance or expenses you paid for the period. You may use this information to compare the ongoing costs of investing in the Fund and other funds. To do so, compare this 5% hypothetical example for the class of shares you hold with the 5% hypothetical examples that appear in the shareholder reports of the other funds.
Please note that the expenses shown in the table are meant to highlight your ongoing costs only and do not reflect any charges associated with the separate accounts that offer this Fund. Therefore, the “hypothetical” lines of the table are useful in comparing ongoing costs only, and will not help you determine the relative total costs of owning different funds. In addition, if these separate account charges were included your costs would have been higher.
| | | | | | | | | | | | | | |
| Actual | | Beginning
Account Value
January 1, 2013 | | | Ending
Account Value
June 28, 2013 | | | Expenses
Paid During
6 Months Ended
June 28, 2013 | | | |
Non-Service shares | | $ | 1,000.00 | | | $ | 981.10 | | | $ | 3.65 | | | |
|
Service shares | | | 1,000.00 | | | | 979.50 | | | | 4.87 | | | |
|
| | | | |
Hypothetical (5% return before expenses) | | | | | | | | | | | |
Non-Service shares | | | 1,000.00 | | | | 1,020.84 | | | | 3.72 | | | |
|
Service shares | | | 1,000.00 | | | | 1,019.62 | | | | 4.96 | | | |
|
Expenses are equal to the Fund’s annualized expense ratio for that class, multiplied by the average account value over the period, multiplied by 179/365 (to reflect the one-half year period). Those annualized expense ratios, excluding indirect expenses from affiliated funds, based on the 6-month period ended June 28, 2013 are as follows:
| | | | | |
| Class | | Expense Ratios |
Non-Service shares | | | | 0.75% | |
Service shares | | | | 1.00 | |
The expense ratios reflect voluntary waivers and/or reimbursements of expenses by the Fund’s Manager. Some of these undertakings may be modified or terminated at any time, as indicated in the Fund’s prospectus. The “Financial Highlights” tables in the Fund’s financial statements, included in this report, also show the gross expense ratios, without such waivers or reimbursements and reduction to custodian expenses, if applicable.
5 OPPENHEIMER CORE BOND FUND/VA
STATEMENTOF INVESTMENTS June 28, 2013* / Unaudited
| | | | | | |
| | | Principal
Amount | | Value | | |
Asset-Backed Securities—15.3% | | |
Auto Loan—14.9% | | | | | | |
Ally Master Owner Trust, Series 2012-2, Cl. A, 0.693%, 3/15/161 | | $ 515,000 | | $ 513,853 | | |
American Credit Acceptance Receivables Trust: | | | | | | |
Series 2012-2, Cl. A, 1.89%, 7/15/162 | | 303,340 | | 304,198 | | |
Series 2012-3, Cl. A, 1.64%, 11/15/162 | | 132,577 | | 132,425 | | |
Series 2012-3, Cl. C, 2.78%, 9/17/182 | | 90,000 | | 89,465 | | |
AmeriCredit Automobile Receivables Trust: | | | | | | |
Series 2010-2, Cl. C, 4.52%, 10/8/15 | | 430,000 | | 437,185 | | |
Series 2010-2, Cl. D, 6.24%, 6/8/16 | | 275,000 | | 290,884 | | |
Series 2011-1, Cl. D, 4.26%, 2/8/17 | | 120,000 | | 125,563 | | |
Series 2011-2, Cl. D, 4.00%, 5/8/17 | | 525,000 | | 545,536 | | |
Series 2011-4, Cl. D, 4.08%, 9/8/17 | | 650,000 | | 675,687 | | |
Series 2011-5, Cl. D, 5.05%, 12/8/17 | | 435,000 | | 463,091 | | |
Series 2012-1, Cl. D, 4.72%, 3/8/18 | | 845,000 | | 896,295 | | |
Series 2012-2, Cl. B, 1.78%, 3/8/17 | | 345,000 | | 348,574 | | |
Series 2012-2, Cl. D, 3.38%, 4/9/18 | | 695,000 | | 710,078 | | |
Series 2012-4, Cl. D, 2.68%, 10/9/18 | | 75,000 | | 74,525 | | |
Series 2012-5, Cl. C, 1.69%, 11/8/18 | | 255,000 | | 251,097 | | |
Series 2012-5, Cl. D, 2.35%, 12/10/18 | | 365,000 | | 359,845 | | |
Series 2013-1, Cl. C, 1.57%, 1/8/19 | | 420,000 | | 409,099 | | |
Series 2013-1, Cl. D, 2.09%, 2/8/19 | | 295,000 | | 284,990 | | |
Series 2013-2, Cl. D, 2.42%, 5/8/19 | | 445,000 | | 434,094 | | |
Series 2013-3, Cl. D, 3.00%, 7/8/19 | | 290,000 | | 286,803 | | |
Avis Budget Rental Car Funding AESOP LLC: | | | | | | |
Series 2011-2A, Cl. A, 2.37%, 11/20/142 | | 455,000 | | 462,603 | | |
Series 2011-3A, Cl. B, 4.74%, 11/20/172 | | 200,000 | | 213,043 | | |
Series 2012-1A, Cl. A, 2.054%, 8/20/162 | | 765,000 | | 777,484 | | |
Capital Auto Receivables Asset Trust, Series 2013-1, Cl. D, 2.19%, 9/20/21 | | 195,000 | | 187,565 | | |
CarMax Auto Owner Trust, Series 2013-1, Cl. D, 1.99%, 8/15/19 | | 145,000 | | 142,378 | | |
Centre Point Funding LLC, Series 2010-1A, Cl. 1, 5.43%, 7/20/162 | | 59,980 | | 62,582 | | |
CFC 2013-1 LLC, Series 2013-1A, Cl. A, 1.65%, 7/17/172 | | 161,866 | | 161,391 | | |
CPS Auto Receivables Trust: | | | | | | |
Series 2012-B, Cl. A, 2.52%, 9/16/192 | | 420,399 | | 425,491 | | |
Series 2012-C, Cl. A, 1.82%, 12/16/192 | | 138,327 | | 139,019 | | |
Credit Acceptance Auto Loan Trust: | | | | | | |
Series 2012-1A, Cl. A, 2.20%, 9/16/192 | | 260,000 | | 262,933 | | |
Series 2012-2A, Cl. A, 1.52%, 3/16/202 | | 155,000 | | 155,387 | | |
Series 2012-2A, Cl. B, 2.21%, 9/15/202 | | 80,000 | | 80,260 | | |
Series 2013-1A, Cl. B, 1.83%, 4/15/212 | | 235,000 | | 232,307 | | |
DT Auto Owner Trust: | | | | | | |
Series 2010-1A, Cl. D, 5.92%, 9/15/162 | | 182,578 | | 182,756 | | |
Series 2011-1A, Cl. C, 3.05%, 8/17/152 | | 128,059 | | 128,322 | | |
Series 2011-2A, Cl. C, 3.05%, 2/16/162 | | 19,117 | | 19,130 | | |
Series 2011-3A, Cl. C, 4.03%, 2/15/172 | | 435,000 | | 438,406 | | |
Series 2012-1A, Cl. A, 1.05%, 1/15/152 | | 41,366 | | 41,380 | | |
Series 2012-2A, Cl. C, 2.72%, 4/17/172 | | 100,000 | | 100,938 | | |
Series 2012-2A, Cl. D, 4.35%, 3/15/192 | | 130,000 | | 133,533 | | |
Series 2013-1A, Cl. D, 3.74%, 5/15/202 | | 175,000 | | 174,633 | | |
Exeter Automobile Receivables Trust: | | | | | | |
Series 2012-1A, Cl. A, 2.02%, 8/15/162 | | 412,427 | | 414,425 | | |
Series 2012-2A, Cl. A, 1.30%, 6/15/172 | | 167,441 | | 167,645 | | |
Series 2012-2A, Cl. B, 2.22%, 12/15/172 | | 205,000 | | 206,121 | | |
Series 2012-2A, Cl. C, 3.06%, 7/16/182 | | 35,000 | | 35,095 | | |
Series 2013-1A, Cl. A, 1.29%, 10/16/172 | | 326,926 | | 325,324 | | |
First Investors Auto Owner Trust, Series 2012-1A, Cl. D, 5.65%, 4/15/182 | | 155,000 | | 163,428 | | |
Ford Credit Auto Owner Trust, Series 2013-A, Cl. D, 1.86%, 8/15/19 | | 280,000 | | 271,331 | | |
Ford Credit Floorplan Master Owner Trust A: | | |
Series 2012-1, Cl. C, 1.693%, 1/15/161 | | 200,000 | | 201,136 | | |
Series 2012-2, Cl. C, 2.86%, 1/15/19 | | 295,000 | | 306,345 | | |
Series 2013-3, Cl. D, 1.74%, 6/15/17 | | 155,000 | | 155,216 | | |
Prestige Auto Receivables Trust, Series 2011-1A, Cl. D, 5.18%, 7/16/182 | | 180,000 | | 187,412 | | |
| | | | | | |
| | | | | | |
| | | | | | |
| | | Principal
Amount | | Value | | |
Auto Loan (Continued) | | | | | | |
Santander Drive Auto Receivables Trust: | | | | | | |
Series 2010-3, Cl. C, 3.06%, 11/15/17 | | $ 485,000 | | $ 496,773 | | |
Series 2010-B, Cl. C, 3.02%, 10/17/162 | | 461,564 | | 467,066 | | |
Series 2011-1, Cl. D, 4.01%, 2/15/17 | | 465,000 | | 481,554 | | |
Series 2011-4, Cl. B, 2.90%, 5/16/16 | | 180,000 | | 183,134 | | |
Series 2011-S1A, Cl. D, 3.10%, 5/15/173 | | 82,172 | | 82,373 | | |
Series 2011-S2A, Cl. D, 3.35%, 6/15/173 | | 127,520 | | 128,158 | | |
Series 2012-2, Cl. C, 3.20%, 2/15/18 | | 295,000 | | 303,945 | | |
Series 2012-2, Cl. D, 3.87%, 2/15/18 | | 545,000 | | 559,593 | | |
Series 2012-4, Cl. A3, 1.04%, 8/15/16 | | 330,000 | | 331,197 | | |
Series 2012-4, Cl. B, 1.83%, 3/15/17 | | 175,000 | | 176,788 | | |
Series 2012-4, Cl. D, 3.50%, 6/15/18 | | 680,000 | | 692,262 | | |
Series 2012-5, Cl. C, 2.70%, 8/15/18 | | 30,000 | | 30,210 | | |
Series 2012-5, Cl. D, 3.30%, 9/17/18 | | 835,000 | | 842,897 | | |
Series 2012-6, Cl. B, 1.33%, 5/15/17 | | 560,000 | | 562,636 | | |
Series 2012-6, Cl. D, 2.52%, 9/17/18 | | 880,000 | | 869,642 | | |
Series 2012-AA, Cl. D, 2.46%, 12/17/182 | | 75,000 | | 73,506 | | |
Series 2013-1, Cl. C, 1.76%, 1/15/19 | | 455,000 | | 444,166 | | |
Series 2013-1, Cl. D, 2.27%, 1/15/19 | | 240,000 | | 232,750 | | |
Series 2013-2, Cl. D, 2.57%, 3/15/19 | | 325,000 | | 316,868 | | |
Series 2013-3, Cl. D, 2.42%, 4/15/19 | | 215,000 | | 207,992 | | |
SNAAC Auto Receivables Trust: | | | | | | |
Series 2012-1A, Cl. A, 1.78%, 6/15/162 | | 117,886 | | 118,338 | | |
Series 2012-1A, Cl. C, 4.38%, 6/15/172 | | 165,000 | | 169,429 | | |
Series 2013-1A, Cl. B, 2.09%, 7/16/182 | | 130,000 | | 129,014 | | |
Series 2013-1A, Cl. C, 3.07%, 8/15/182 | | 145,000 | | 143,449 | | |
United Auto Credit Securitization Trust: | | | | | | |
Series 2012-1, Cl. A2, 1.10%, 3/16/152 | | 123,169 | | 123,143 | | |
Series 2012-1, Cl. B, 1.87%, 9/15/152 | | 265,000 | | 264,770 | | |
Series 2012-1, Cl. C, 2.52%, 3/15/162 | | 190,000 | | 189,697 | | |
Series 2012-1, Cl. D, 3.12%, 3/15/182 | | 135,000 | | 134,768 | | |
Series 2013-1, Cl. B, 1.74%, 4/15/162 | | 230,000 | | 229,225 | | |
Series 2013-1, Cl. C, 2.22%, 12/15/172 | | 145,000 | | 144,453 | | |
Series 2013-1, Cl. D, 2.90%, 12/15/172 | | 30,000 | | 29,808 | | |
Westlake Automobile Receivables Trust, Series 2012-1A, Cl. A2, 1.03%, 3/15/162 | | 132,863 | | 133,000 | | |
Wheels SPV LLC, Series 2012-1, Cl. A2, 1.19%, 3/20/212 | | 199,015 | | 199,747 | | |
| | | | | 24,080,657 | | |
Credit Card—0.1% | | | | | | |
World Financial Network Credit Card Master Trust, Series 2012-B, Cl. A, 1.76%, 5/17/21 | | 185,000 | | 184,186 | | |
Equipment—0.1% | | | | | | |
FRS I LLC, Series 2013-1A, Cl. A1, 1.80%, 4/15/432 | | 112,198 | | 110,870 | | |
Receivables: Other—0.2% | | | | | | |
AmeriCredit Automobile Receivables Trust, Series 2010-1, Cl. D, 6.65%, 7/17/17 | | 300,000 | | 314,759 | | |
Total Asset-Backed Securities (Cost $24,723,414) | | | | 24,690,472 | | |
| | | | | | |
Mortgage-Backed Obligations—42.8% | | | | |
Government Agency—29.4% | | | | | | |
FHLMC/FNMA/FHLB/Sponsored—29.1% | | |
Federal Home Loan Mortgage Corp. Gold Pool: | | |
5.00%, 12/1/34 | | 9,680 | | 10,398 | | |
5.50%, 9/1/39 | | 868,084 | | 944,891 | | |
6.00%, 5/1/18-10/1/29 | | 1,505,287 | | 1,637,839 | | |
6.50%, 4/1/18-4/1/34 | | 373,367 | | 417,047 | | |
7.00%, 8/1/16-10/1/37 | | 408,593 | | 470,419 | | |
8.00%, 4/1/16 | | 81,725 | | 86,050 | | |
9.00%, 8/1/22-5/1/25 | | 40,518 | | 45,369 | | |
Federal Home Loan Mortgage Corp. Non Gold Pool, 10.50%, 10/1/20 | | 2,099 | | 2,456 | | |
Federal Home Loan Mortgage Corp., Interest-Only | | |
Stripped Mtg.-Backed Security: | | | | | | |
Series 205, Cl. IO, 15.27%, 9/1/294 | | 13,977 | | 2,733 | | |
Series 206, Cl. IO, 0% , 12/1/294,5 | | 184,504 | | 28,328 | | |
Series 243, Cl. 6, 0%, 12/15/324,5 | | 172,969 | | 28,307 | | |
Federal Home Loan Mortgage Corp., Principal-Only Stripped | | | | | | |
Mtg.-Backed Security, Series 176, Cl. PO, 3.74%, 6/1/266 | | 71,940 | | 66,579 | | |
6 OPPENHEIMER CORE BOND FUND/VA
| | | | | | |
| | | Principal
Amount | | Value | | |
FHLMC/FNMA/FHLB/Sponsored (Continued) | | |
Federal Home Loan Mortgage Corp., Real Estate Investment Conduit Multiclass Pass-Through Certificates: | | | | | | |
Series 151, Cl. F, 9.00%, 5/15/21 | | $ 9,422 | | $ 10,509 | | |
Series 1674, Cl. Z, 6.75%, 2/15/24 | | 32,093 | | 36,166 | | |
Series 2034, Cl. Z, 6.50%, 2/15/28 | | 4,018 | | 4,530 | | |
Series 2042, Cl. N, 6.50%, 3/15/28 | | 9,881 | | 11,192 | | |
Series 2043, Cl. ZP, 6.50%, 4/15/28 | | 466,377 | | 530,960 | | |
Series 2046, Cl. G, 6.50%, 4/15/28 | | 29,471 | | 33,241 | | |
Series 2053, Cl. Z, 6.50%, 4/15/28 | | 5,057 | | 5,702 | | |
Series 2066, Cl. Z, 6.50%, 6/15/28 | | 507,162 | | 567,976 | | |
Series 2195, Cl. LH, 6.50%, 10/15/29 | | 391,717 | | 442,703 | | |
Series 2220, Cl. PD, 8.00%, 3/15/30 | | 2,150 | | 2,523 | | |
Series 2326, Cl. ZP, 6.50%, 6/15/31 | | 106,391 | | 120,973 | | |
Series 2461, Cl. PZ, 6.50%, 6/15/32 | | 506,236 | | 574,896 | | |
Series 2470, Cl. LF, 1.193%, 2/15/321 | | 3,945 | | 4,035 | | |
Series 2500, Cl. FD, 0.693%, 3/15/321 | | 109,346 | | 110,509 | | |
Series 2526, Cl. FE, 0.593%, 6/15/291 | | 144,292 | | 145,218 | | |
Series 2538, Cl. F, 0.793%, 12/15/321 | | 443,555 | | 448,299 | | |
Series 2551, Cl. FD, 0.593%, 1/15/331 | | 92,925 | | 93,573 | | |
Series 2936, Cl. PE, 5.00%, 2/15/35 | | 69,000 | | 75,461 | | |
Series 3025, Cl. SJ, 24.044%, 8/15/351 | | 43,066 | | 63,996 | | |
Series 3030, Cl. FL, 0.593%, 9/15/351 | | 6,251 | | 6,296 | | |
Series 3822, Cl. JA, 5.00%, 6/15/40 | | 25,615 | | 26,879 | | |
Series 3848, Cl. WL, 4.00%, 4/15/40 | | 44,580 | | 47,248 | | |
Federal Home Loan Mortgage Corp., Real Estate Investment Conduit Multiclass Pass-Through Certificates, Interest-Only Stripped Mtg.-Backed Security: | | | | | | |
Series 2074, Cl. S, 56.76%, 7/17/284 | | 2,885 | | 641 | | |
Series 2079, Cl. S, 66.46%, 7/17/284 | | 5,274 | | 1,215 | | |
Series 2130, Cl. SC, 54.32%, 3/15/294 | | 203,510 | | 44,798 | | |
Series 2526, Cl. SE, 32.95%, 6/15/294 | | 6,516 | | 1,528 | | |
Series 2796, Cl. SD, 55.09%, 7/15/264 | | 318,576 | | 62,712 | | |
Series 2802, Cl. AS, 0%, 4/15/334,7 | | 63,183 | | 2,253 | | |
Series 2819, Cl. S, 47.29%, 6/15/344 | | 65,078 | | 13,601 | | |
Series 2920, Cl. S, 56.44%, 1/15/354 | | 1,215,774 | | 239,231 | | |
Series 2922, Cl. SE, 8.62%, 2/15/354 | | 146,273 | | 26,016 | | |
Series 3004, Cl. SB, 99.999%, 7/15/354 | | 62,861 | | 10,890 | | |
Series 3201, Cl. SG, 6.31%, 8/15/364 | | 346,436 | | 67,938 | | |
Series 3397, Cl. GS, 16.715%, 12/15/374 | | 31,091 | | 5,663 | | |
Series 3424, Cl. EI, 0%, 4/15/384,5 | | 58,274 | | 9,232 | | |
Series 3450, Cl. BI, 13.26%, 5/15/384 | | 778,778 | | 145,129 | | |
Series 3606, Cl. SN, 5.38%, 12/15/394 | | 206,665 | | 30,591 | | |
Series 3662, Cl. SM, 10.08%, 10/15/324 | | 714,546 | | 79,325 | | |
Series 3736, Cl. SN, 10.267%, 10/15/404 | | 1,611,296 | | 233,290 | | |
Federal National Mortgage Assn. Pool: | | | | | | |
2.50%, 6/18/278 | | 2,250,000 | | 2,263,711 | | |
2.715%, 10/1/361 | | 138,458 | | 147,415 | | |
3.00%, 7/1/27-8/1/438 | | 4,745,000 | | 4,709,474 | | |
3.50%, 7/17/27-8/1/438 | | 5,000,000 | | 5,096,176 | | |
4.00%, 7/1/418 | | 6,095,000 | | 6,349,275 | | |
4.50%, 7/1/22-7/1/398 | | 7,675,000 | | 8,124,135 | | |
5.00%, 2/1/22-7/1/22 | | 7,563 | | 8,123 | | |
5.00%, 7/1/378 | | 685,000 | | 737,285 | | |
5.50%, 2/1/35-5/1/36 | | 391,501 | | 428,541 | | |
6.00%, 7/1/378 | | 160,000 | | 174,025 | | |
6.50%, 5/1/17-1/1/34 | | 585,250 | | 625,789 | | |
7.00%, 11/1/17-7/1/35 | | 256,562 | | 287,311 | | |
7.50%, 1/1/33 | | 8,428 | | 10,019 | | |
8.50%, 7/1/32 | | 15,868 | | 18,544 | | |
Federal National Mortgage Assn., Interest-Only Stripped Mtg.-Backed Security: | | | | | | |
Series 221, Cl. 2, 44.92%, 5/1/234 | | 5,091 | | 826 | | |
Series 222, Cl. 2, 24.28%, 6/1/234 | | 531,854 | | 80,643 | | |
Series 252, Cl. 2, 43.20%, 11/1/234 | | 493,522 | | 86,009 | | |
Series 294, Cl. 2, 14.887%, 2/1/284 | | 54,135 | | 7,219 | | |
Series 301, Cl. 2, 2.64%, 4/1/294 | | 5,206 | | 898 | | |
Series 303, Cl. IO, 10.72%, 11/1/294 | | 89,057 | | 14,103 | | |
Series 320, Cl. 2, 9.45%, 4/1/324 | | 372,189 | | 54,200 | | |
Series 321, Cl. 2, 3.01%, 4/1/324 | | 1,089,341 | | 186,993 | | |
| | | | | | |
| | | Principal
Amount | | Value | | |
FHLMC/FNMA/FHLB/Sponsored (Continued) | | |
Federal National Mortgage Assn., Interest-Only Stripped Mtg.-Backed Security: Continued | | | | | | |
Series 324, Cl. 2, 1.02%, 7/1/324 | | $ 10,918 | | $ 1,847 | | |
Series 331, Cl. 5, 0%, 2/1/334,5 | | 15,773 | | 3,183 | | |
Series 331, Cl. 9, 5.86%, 2/1/334 | | 320,016 | | 56,028 | | |
Series 334, Cl. 12, 0%, 3/1/334,5 | | 27,470 | | 5,652 | | |
Series 334, Cl. 17, 13.17%, 2/1/334 | | 222,087 | | 40,773 | | |
Series 339, Cl. 12, 0%, 6/25/334,5 | | 394,066 | | 67,698 | | |
Series 339, Cl. 7, 0%, 8/1/334,5 | | 847,410 | | 134,332 | | |
Series 343, Cl. 13, 0%, 9/1/334,5 | | 365,972 | | 57,263 | | |
Series 343, Cl. 18, 0%, 5/1/344,5 | | 99,717 | | 17,355 | | |
Series 345, Cl. 9, 0%, 1/1/344,5 | | 259,938 | | 40,112 | | |
Series 351, Cl. 10, 0%, 4/1/344,5 | | 134,609 | | 20,762 | | |
Series 351, Cl. 8, 0%, 4/1/344,5 | | 219,349 | | 34,015 | | |
Series 356, Cl. 10, 0%, 6/1/354,5 | | 164,763 | | 25,277 | | |
Series 356, Cl. 12, 0%, 2/1/354,5 | | 81,493 | | 12,599 | | |
Series 362, Cl. 13, 0%, 8/1/354,5 | | 307,568 | | 49,095 | | |
Series 364, Cl. 15, 0%, 9/1/354,5 | | 16,165 | | 2,298 | | |
Series 364, Cl. 16, 0%, 9/1/354,5 | | 329,702 | | 53,161 | | |
Series 365, Cl. 16, 0%, 3/1/364,5 | | 524,128 | | 80,124 | | |
Federal National Mortgage Assn., Real Estate Investment Conduit Multiclass Pass-Through Certificates: | | | | | | |
Series 1989-17, Cl. E, 10.40%, 4/25/19 | | 1,669 | | 1,709 | | |
Series 1993-87, Cl. Z, 6.50%, 6/25/23 | | 371,992 | | 420,234 | | |
Series 1998-58, Cl. PC, 6.50%, 10/25/28 | | 278,472 | | 315,367 | | |
Series 1998-61, Cl. PL, 6.00%, 11/25/28 | | 137,680 | | 153,990 | | |
Series 1999-54, Cl. LH, 6.50%, 11/25/29 | | 234,253 | | 262,074 | | |
Series 2001-44, Cl. QC, 6.00%, 9/25/16 | | 10,249 | | 10,830 | | |
Series 2001-51, Cl. OD, 6.50%, 10/25/31 | | 18,296 | | 20,392 | | |
Series 2001-74, Cl. QE, 6.00%, 12/25/31 | | 364,596 | | 408,621 | | |
Series 2002-12, Cl. PG, 6.00%, 3/25/17 | | 5,427 | | 5,813 | | |
Series 2003-28, Cl. KG, 5.50%, 4/25/23 | | 3,062,253 | | 3,365,128 | | |
Series 2004-101, Cl. BG, 5.00%, 1/25/20 | | 683,985 | | 725,714 | | |
Series 2005-73, Cl. DF, 0.443%, 8/25/351 | | 21,501 | | 21,551 | | |
Series 2006-11, Cl. PS, 23.859%, 3/25/361 | | 207,014 | | 289,007 | | |
Series 2006-46, Cl. SW, 23.492%, 6/25/361 | | 157,152 | | 229,954 | | |
Series 2006-50, Cl. KS, 23.492%, 6/25/361 | | 230,863 | | 359,387 | | |
Series 2007-109, Cl. NF, 0.743%, 12/25/371 | | 105,213 | | 106,606 | | |
Series 2007-42, Cl. A, 6.00%, 2/25/33 | | 72,596 | | 73,163 | | |
Series 2009-36, Cl. FA, 1.133%, 6/25/371 | | 267,304 | | 271,209 | | |
Federal National Mortgage Assn., Real Estate Investment Conduit Multiclass Pass-Through Certificates, Interest-Only Stripped Mtg.-Backed Security: | | | | | | |
Series 2001-61, Cl. SH, 28.79%, 11/18/314 | | 13,805 | | 2,683 | | |
Series 2001-63, Cl. SD, 30.14%, 12/18/314 | | 4,856 | | 1,053 | | |
Series 2001-65, Cl. S, 28.219%, 11/25/314 | | 346,360 | | 74,692 | | |
Series 2001-68, Cl. SC, 20.52%, 11/25/314 | | 3,141 | | 746 | | |
Series 2001-81, Cl. S, 28.72%, 1/25/324 | | 99,440 | | 20,660 | | |
Series 2002-28, Cl. SA, 38.04%, 4/25/324 | | 3,172 | | 615 | | |
Series 2002-38, Cl. SO, 47.557%, 4/25/324 | | 8,262 | | 1,525 | | |
Series 2002-39, Cl. SD, 38.65%, 3/18/324 | | 5,463 | | 1,238 | | |
Series 2002-47, Cl. NS, 34.398%, 4/25/324 | | 315,610 | | 63,694 | | |
Series 2002-48, Cl. S, 33.60%, 7/25/324 | | 5,009 | | 995 | | |
Series 2002-51, Cl. S, 34.616%, 8/25/324 | | 289,731 | | 57,992 | | |
Series 2002-52, Cl. SD, 36.66%, 9/25/324 | | 384,524 | | 87,305 | | |
Series 2002-52, Cl. SL, 36.21%, 9/25/324 | | 3,278 | | 656 | | |
Series 2002-53, Cl. SK, 33.82%, 4/25/324 | | 19,036 | | 4,392 | | |
Series 2002-56, Cl. SN, 35.36%, 7/25/324 | | 6,829 | | 1,357 | | |
Series 2002-60, Cl. SM, 29.90%, 8/25/324 | | 47,136 | | 8,228 | | |
Series 2002-7, Cl. SK, 26.38%, 1/25/324 | | 21,298 | | 3,807 | | |
Series 2002-77, Cl. BS, 24.59%, 12/18/324 | | 29,328 | | 6,512 | | |
Series 2002-77, Cl. IS, 43.14%, 12/18/324 | | 14,077 | | 3,313 | | |
Series 2002-77, Cl. SA, 24.15%, 12/18/324 | | 45,074 | | 8,446 | | |
Series 2002-77, Cl. SH, 36.16%, 12/18/324 | | 146,568 | | 34,835 | | |
Series 2002-84, Cl. SA, 34.38%, 12/25/324 | | 350,188 | | 66,855 | | |
Series 2002-9, Cl. MS, 29.65%, 3/25/324 | | 5,367 | | 1,334 | | |
Series 2002-90, Cl. SN, 31.00%, 8/25/324 | | 24,249 | | 4,233 | | |
Series 2002-90, Cl. SY, 36.62%, 9/25/324 | | 17,526 | | 3,264 | | |
Series 2003-26, Cl. DI, 9.04%, 4/25/334 | | 14,024 | | 2,481 | | |
7 OPPENHEIMER CORE BOND FUND/VA
STATEMENTOF INVESTMENTS Unaudited / Continued
| | | | | | |
| | | Principal
Amount | | Value | | |
FHLMC/FNMA/FHLB/Sponsored (Continued) | | |
Federal National Mortgage Assn., Real Estate Investment Conduit Multiclass Pass-Through Certificates, Interest-Only Stripped Mtg.-Backed Security: Continued | | | | | | |
Series 2003-33, Cl. SP, 28.75%, 5/25/334 | | $ 358,957 | | $ 89,627 | | |
Series 2003-4, Cl. S, 30.52%, 2/25/334 | | 236,230 | | 46,202 | | |
Series 2004-54, Cl. DS, 41.32%, 11/25/304 | | 267,307 | | 47,155 | | |
Series 2005-12, Cl. SC, 11.31%, 3/25/354 | | 72,409 | | 14,115 | | |
Series 2005-14, Cl. SE, 41.28%, 3/25/354 | | 219,750 | | 37,271 | | |
Series 2005-40, Cl. SA, 50.78%, 5/25/354 | | 626,928 | | 113,344 | | |
Series 2005-40, Cl. SB, 55.71%, 5/25/354 | | 28,185 | | 4,855 | | |
Series 2005-52, Cl. JH, 7.373%, 5/25/354 | | 141,257 | | 29,030 | | |
Series 2005-71, Cl. SA, 57.20%, 8/25/254 | | 685,041 | | 96,334 | | |
Series 2005-93, Cl. SI, 11.88%, 10/25/354 | | 511,180 | | 90,089 | | |
Series 2007-75, Cl. BI, 5.75%, 8/25/374 | | 1,286,982 | | 234,850 | | |
Series 2008-46, Cl. EI, 15.66%, 6/25/384 | | 796,915 | | 119,017 | | |
Series 2008-55, Cl. SA, 16.59%, 7/25/384 | | 60,700 | | 6,287 | | |
Series 2009-8, Cl. BS, 0%, 2/25/244,5 | | 309,061 | | 26,873 | | |
Series 2012-40, Cl. PI, 0%, 4/25/414,5 | | 232,656 | | 46,562 | | |
Federal National Mortgage Assn., Real Estate Investment Conduit Multiclass Pass-Through Certificates, Principal-Only Stripped Mtg.-Backed Security, Series 1993-184, Cl. M, 4.43%, 9/25/236 | | 167,318 | | 155,499 | | |
| | | | | 46,850,412 | | |
GNMA/Guaranteed—0.3% | | | | | | |
Government National Mortgage Assn. I Pool: | | | | | | |
7.00%, 12/15/23-3/15/26 | | 15,192 | | 17,627 | | |
8.50%, 8/15/17-12/15/17 | | 55,619 | | 59,243 | | |
Government National Mortgage Assn., Interest-Only Stripped Mtg.-Backed Security: | | | | | | |
Series 1998-19, Cl. SB, 56.68%, 7/16/284 | | 11,774 | | 2,759 | | |
Series 2001-21, Cl. SB, 69.98%, 1/16/274 | | 413,241 | | 83,212 | | |
Series 2002-15, Cl. SM, 64.76%, 2/16/324 | | 422,579 | | 91,277 | | |
Series 2007-17, Cl. AI, 18.23%, 4/16/374 | | 130,335 | | 24,885 | | |
Series 2011-52, Cl. HS, 10.50%, 4/16/414 | | 858,888 | | 203,170 | | |
Government National Mortgage Assn., Real Estate Investment Conduit Multiclass Pass-Through Certificates: | | | | | | |
Series 1999-32, Cl. ZB, 8.00%, 9/16/29 | | 58,696 | | 69,314 | | |
Series 2000-7, Cl. Z, 8.00%, 1/16/30 | | 23,055 | | 26,901 | | |
| | | | | 578,388 | | |
Non-Agency—13.4% | | | | | | |
Commercial—8.4% | | | | | | |
Asset Securitization Corp., Interest-Only Stripped Mtg.-Backed Security, Collateralized Mtg. Obligations, Series 1997-D4, Cl. PS1, 11.85%, 4/14/291,4 | | 1,869,613 | | 93,502 | | |
Banc of America Commercial Mortgage Trust, Collateralized Mtg. Obligations, Series 2006-6, Cl. AM, 5.39%, 10/10/45 | | 425,000 | | 452,177 | | |
Capital Lease Funding Securitization LP, Interest-Only Corporate-Backed Pass-Through Certificates, Series 1997- CTL1, Cl. IO, 0%, 6/22/241,3,4,5 | | 1,922,800 | | 93,446 | | |
CD Commercial Mortgage Trust, Collateralized Mtg. Obligations, Series 2007-CD4, Cl. A2B, 5.205%, 12/11/49 | | 79,365 | | 79,974 | | |
Citigroup Commercial Mortgage Trust: | | | | | | |
Series 2008-C7, Cl. AM, 6.339%, 12/10/491 | | 410,000 | | 452,301 | | |
Series 20113-GCJ11, 4.459%, 4/10/232 | | 160,000 | | 134,545 | | |
Commercial Mortgage Trust: | | | | | | |
Series 2012-CR4, Cl. D, 4.731%, 10/15/451,2 | | 50,000 | | 42,914 | | |
Series 2012-CR5, Cl. E, 4.479%, 12/10/451,2 | | 75,000 | | 62,989 | | |
Series 2013-CR7, Cl. D, 4.501%, 3/10/461,2 | | 175,000 | | 143,528 | | |
Commercial Mortgage Trust, Interest-Only Stripped Mtg.-Backed Security: | | | | | | |
Series 2010-C1, Cl. XPA, 0%, 7/10/461,2,4,5 | | 4,075,219 | | 201,004 | | |
Series 2012-CR5, Cl. XA, 2.609%, 12/10/451,4 | | 2,818,845 | | 318,243 | | |
| | | | | | |
| | | | | | |
| | | Principal
Amount | | Value | | |
Commercial (Continued) | | | | | | |
Countrywide Alternative Loan Trust, Collateralized Mtg. Obligations, Series 2006-J2, Cl. A7, 6%, 4/25/36 | | $ 10,862 | | $ 10,063 | | |
Countrywide Home Loans: | | | | | | |
Series 2005-17, Cl. 1A8, 5.50%, 9/25/35 | | 48,816 | | 48,867 | | |
Series 2007-J3, Cl. A9, 6.00%, 7/25/37 | | 202,573 | | 166,075 | | |
Credit Suisse Commercial Mortgage Trust: | | | | | | |
Series 2006-6, Cl. 1A4, 6.00%, 7/25/36 | | 327,294 | | 247,422 | | |
Series 2006-C1, Cl. AJ, 5.569%, 2/15/391 | | 275,000 | | 294,039 | | |
Credit Suisse First Boston Mortgage Securities Corp., Collateralized Mtg. Obligations, Series 2005-C6, Cl. AJ, 5.23%, 12/15/401 | | 410,000 | | 434,072 | | |
DBUBS Mortgage Trust, Collateralized Mtg. Obligations, Series 2011-LC1A, Cl. E, 5.728%, 11/10/461,2 | | 75,000 | | 72,198 | | |
First Horizon Alternative Mortgage Securities Trust: | | | | | | |
Series 2004-FA2, Cl. 3A1, 6.00%, 1/25/35 | | 400,577 | | 407,885 | | |
Series 2005-FA8, Cl. 1A6, 0.843%, 11/25/351 | | 323,083 | | 235,166 | | |
Series 2005-FA9, Cl. A4A, 5.50%, 12/25/35 | | 19,042 | | 16,754 | | |
Series 2007-FA2, Cl. 1A1, 5.50%, 4/25/37 | | 248,890 | | 191,484 | | |
Series 2007-FA4, Cl. 1A6, 6.25%, 8/25/371 | | 366,322 | | 314,110 | | |
FREMF Mortgage Trust: | | | | | | |
Series 2013-K25, Cl. C, 3.742%, 11/25/451,2 | | 90,000 | | 71,236 | | |
Series 2013-K26, Cl. C, 3.723%, 12/25/451,2 | | 60,000 | | 47,277 | | |
Series 2013-K27, Cl. C, 3.616%, 1/25/461,2 | | 95,000 | | 73,777 | | |
Series 2013-K28, Cl. C, 3.494%, 6/25/461,2 | | 95,000 | | 74,114 | | |
Series 2013-K712, Cl. C, 3.483%, 5/25/451,2 | | 160,000 | | 137,048 | | |
GE Capital Commercial Mortgage Corp., Collateralized Mtg. Obligations, Series 2005-C4, Cl. AJ, 5.471%, 11/10/451 | | 380,000 | | 367,036 | | |
GS Mortgage Securities Trust: | | | | | | |
Series 2006-GG6, Cl. AM, 5.622%, 4/10/381 | | 420,274 | | 450,495 | | |
Series 2011-GC3, Cl. A1, 2.331%, 3/10/442 | | 189,236 | | 192,116 | | |
GSR Mortgage Loan Trust, Collateralized Mtg. Obligations, Series 2005-AR4, Cl. 6A1, 5.25%, 7/25/351 | | 258,116 | | 254,244 | | |
IndyMac Index Mortgage Loan Trust, Collateralized Mtg. Obligations, Series 2005-AR23, Cl. 6A1, 4.814%, 11/25/351 | | 513,079 | | 422,226 | | |
JP Morgan Chase Commercial Mortgage Securities Trust: | | | | | | |
Series 2006-CB16, Cl. AJ, 5.623%, 5/12/45 | | 415,000 | | 378,013 | | |
Series 2007-LDPX, Cl. A2S2, 5.187%, 1/15/493 | | 463,774 | | 471,105 | | |
Series 2011-C3, Cl. A1, 1.875%, 2/15/462 | | 198,855 | | 200,377 | | |
JP Morgan Mortgage Trust, Collateralized Mtg. Obligations, Series 2007-S3, Cl. 1A90, 7%, 8/25/37 | | 505,297 | | 463,865 | | |
JPMorgan Resecuritization Trust, Collateralized Mtg. Obligations, Series 2009-5, Cl. 1A2, 2.613%, 7/26/361,2 | | 413,893 | | 313,020 | | |
LB Commercial Conduit Mortgage Trust, Interest-Only Stripped Mtg.-Backed Security, Collateralized Mtg. Obligations, Series 1998-C1, Cl. IO, 0%, 2/18/301,4,5 | | 1,365,363 | | 27,143 | | |
Lehman Structured Securities Corp., Collateralized Mtg. Obligations, Series 2002-GE1, Cl. A, 2.514%, 7/26/241,3 | | 93,460 | | 82,072 | | |
Merrill Lynch Mortgage Trust, Collateralized Mtg. Obligations, Series 2006-C2, Cl. AM, 5.782%, 8/12/431 | | 425,000 | | 459,316 | | |
Morgan Stanley Bank of America Merrill Lynch Trust: | | | | | | |
Series 2012-C6, Cl. E, 4.82%, 11/15/451,2 | | 145,000 | | 125,153 | | |
Series 2013-C7, Cl. D, 4.444%, 2/15/461,2 | | 175,000 | | 145,895 | | |
Series 2013-C8, Cl. D, 4.312%, 12/15/481,2 | | 130,000 | | 106,702 | | |
Morgan Stanley Capital I Trust: | | | | | | |
Series 2007-IQ13, Cl. AM, 5.406%, 3/15/44 | | 415,000 | | 445,919 | | |
Series 2007-IQ15, Cl. AM, 6.09%, 6/11/491 | | 490,000 | | 529,245 | | |
Morgan Stanley Reremic Trust, Collateralized Mtg. Obligations, Series 2012-R3, Cl. 1B, 2.379%, 11/26/361,3 | | 485,601 | | 273,217 | | |
8 OPPENHEIMER CORE BOND FUND/VA
| | | | | | |
| | | Principal
Amount | | Value | | |
Commercial (Continued) | | | | | | |
Salomon Brothers Mortgage Securities VII, Inc., Interest-Only Stripped Mtg.-Backed Security, Collateralized Mtg. Obligations, Series 1999-C1, Cl. X, 99.999%, 5/18/321,4 | | $ 17,331,133 | | $ 9,341 | | |
Structured Adjustable Rate Mortgage Loan Trust: | | | | | | |
Series 2006-4, Cl. 6A, 5.221%, 5/25/361 | | 305,459 | | 254,374 | | |
Series 2007-6, Cl. 3A1, 4.627%, 7/25/371 | | 496,869 | | 401,144 | | |
UBS-Barclays Commercial Mortgage Trust, Collateralized Mtg. Obligations, Series 2012-C2, Cl. E, 5.05%, 5/10/631,2 | | 65,000 | | 57,673 | | |
Wachovia Bank Commercial Mortgage Trust, Collateralized Mtg. Obligations, Series 2006-C28, Cl. AM, 5.603%, 10/15/481 | | 450,000 | | 488,354 | | |
WaMu Mortgage Pass-Through Certificates Trust, Collateralized Mtg. Obligations, Series 2005-AR14, Cl. 1A4, 2.514%, 12/25/351 | | 296,727 | | 269,545 | | |
Wells Fargo Mortgage-Backed Securities Trust: | | | | | | |
Series 2005-AR15, Cl. 1A6, 2.613%, 9/25/351 | | 91,075 | | 84,368 | | |
Series 2007-16, Cl. 1A1, 6.00%, 12/28/37 | | 393,497 | | 410,404 | | |
Series 2007-AR3, Cl. A4, 5.696%, 4/25/371 | | 124,088 | | 116,713 | | |
Series 2007-AR8, Cl. A1, 5.98%, 11/25/371 | | 351,508 | | 309,359 | | |
WFRBS Commercial Mortgage Trust: | | | | | | |
Series 2012-C10, Cl. D, 4.61%, 12/15/451,2 | | 75,000 | | 62,206 | | |
Series 2012-C7, Cl. E, 5.005%, 6/15/451,2 | | 120,000 | | 104,650 | | |
Series 2012-C8, Cl. E, 5.042%, 8/15/451,2 | | 145,000 | | 126,706 | | |
Series 2013-C11, Cl. D, 4.325%, 3/15/451,2 | | 74,000 | | 60,008 | | |
| | | | | 13,378,214 | | |
Multi-Family—1.0% | | | | | | |
Citigroup Mortgage Loan Trust, Collateralized Mtg. Obligations, Series 2006-AR3, Cl. 1A2A, 5.531%, 6/25/361 | | 316,151 | | 290,825 | | |
Countrywide Alternative Loan Trust: | | | | | | |
Series 2005-86CB, Cl. A8, 5.50%, 2/25/36 | | 84,557 | | 78,623 | | |
Series 2005-J14, Cl. A7, 5.50%, 12/25/35 | | 81,246 | | 70,130 | | |
Series 2006-24CB, Cl. A12, 5.75%, 6/25/36 | | 101,155 | | 84,231 | | |
Countrywide Home Loans, Collateralized Mtg. Obligations, Series 2006-20, Cl. 1A17, 5.75%, 2/25/37 | | 486,120 | | 426,627 | | |
JP Morgan Mortgage Trust, Series 2007-A3, Cl. 3A2M, 4.925%, 5/25/371 | | 118,530 | | 111,771 | | |
Wells Fargo Mortgage-Backed Securities Trust: | | | | | | |
Series 2006-AR2, Cl. 2A3, 2.641%, 3/25/361 | | 211,399 | | 204,054 | | |
Series 2006-AR6, Cl. 3A1, 2.77%, 3/25/361 | | 420,052 | | 398,777 | | |
| | | | | 1,665,038 | | |
Other—0.0% | | | | | | |
Salomon Brothers Mortgage Securities VI, Inc., Interest-Only Stripped Mtg.-Backed Security, Collateralized Mtg. Obligations, Series 1987-3, Cl. B, 66.76%, 10/23/174 | | 61 | | 1 | | |
Salomon Brothers Mortgage Securities VI, Inc., Principal-Only Stripped Mtg.-Backed Security, Collateralized Mtg. Obligations, Series 1987-3, Cl. A, 24.42%, 10/23/176 | | 90 | | 90 | | |
| | | | | 91 | | |
Residential—4.0% | | | | | | |
Banc of America Commercial Mortgage Trust, Collateralized Mtg. Obligations, Series 2007-4, Cl. AM, 6.002%, 2/10/511 | | 470,000 | | 510,096 | | |
Banc of America Funding Trust: | | | | | | |
Series 2007-1, Cl. 1A3, 6.00%, 1/25/37 | | 307,273 | | 268,600 | | |
Series 2007-C, Cl. 1A4, 5.419%, 5/20/361 | | 129,734 | | 123,993 | | |
Banc of America Mortgage Trust, Collateralized Mtg. Obligations, Series 2007-1, Cl. 1A24, 6%, 3/25/37 | | 236,862 | | 230,447 | | |
Carrington Mortgage Loan Trust, Series 2006-FRE1, Cl. A2, 0.303%, 7/25/361 | | 244,978 | | 235,896 | | |
CD Commercial Mortgage Trust, Collateralized Mtg. Obligations, Series 2007-CD4, Cl. AMFX, 5.366%, 12/11/491 | | 100,000 | | 101,230 | | |
| | | | | | |
| | | Principal
Amount | | Value | | |
Residential (Continued) | | | | | | |
Countrywide Home Loans: | | | | | | |
Series 2005-26, Cl. 1A8, 5.50%, 11/25/35 | | $ 232,817 | | $ 221,707 | | |
Series 2005-29, Cl. A1, 5.75%, 12/25/35 | | 261,315 | | 239,821 | | |
Series 2005-30, Cl. A5, 5.50%, 1/25/36 | | 185,089 | | 180,991 | | |
Series 2005-J4, Cl. A7, 5.50%, 11/25/35 | | 29,895 | | 30,632 | | |
Series 2006-17, Cl. A2, 6.00%, 12/25/36 | | 387,201 | | 347,740 | | |
Series 2007-15, Cl. 1A29, 6.25%, 9/25/37 | | 292,257 | | 273,784 | | |
Countrywide Alternative Loan Trust, Collateralized Mtg. Obligations, Series 2007-19, Cl. 1A34, 6%, 8/25/37 | | 498,780 | | 383,320 | | |
Countrywide Asset-Backed Certificates: | | | | | | |
Series 2005-16, Cl. 2AF2, 5.148%, 5/25/361 | | 252,043 | | 248,242 | | |
Series 2006-25, Cl. 2A2, 0.313%, 6/25/471 | | 7,622 | | 7,571 | | |
Credit Suisse Commercial Mortgage Trust, Collateralized Mtg. Obligations, Series 2007-3, Cl. 2A10, 6%, 4/25/37 | | 297,356 | | 257,359 | | |
GSR Mortgage Loan Trust, Collateralized Mtg. Obligations, Series 2006-5F, Cl. 2A1, 6%, 6/25/36 | | 181,473 | | 176,832 | | |
JP Morgan Alternative Loan Trust, Series 2006-S4, Cl. A6, 5.71%, 12/25/361 | | 450,560 | | 420,575 | | |
MASTR Asset Backed Securities Trust, Series 2006-WMC3, Cl. A3, 0.293%, 8/25/361 | | 59,052 | | 24,933 | | |
Merrill Lynch Mortgage Investors Trust, Series 2006-3, Cl. 2A1, 2.537%, 10/25/361 | | 37,331 | | 35,200 | | |
NC Finance Trust, Series 1999-I, Cl. D, 8.75%, 1/25/293,9 | | 3,370,016 | | 227,476 | | |
RALI Trust, Mtg. Pass-Through Certificates: | | | | | | |
Series 2003-QS1, Cl. A2, 5.75%, 1/25/33 | | 112,618 | | 115,482 | | |
Series 2006-QS13, Cl. 1A5, 6.00%, 9/25/36 | | 43,505 | | 33,689 | | |
Series 2006-QS13, Cl. 1A8, 6.00%, 9/25/36 | | 1,525 | | 1,181 | | |
Series 2007-QS6, Cl. A28, 5.75%, 4/25/37 | | 18,877 | | 14,897 | | |
Residential Asset Securitization Trust, Series 2005-A15, Cl. 1A4, 5.75%, 2/25/36 | | 121,741 | | 109,276 | | |
WaMu Mortgage Pass-Through Certificates Trust: | | | | | | |
Series 2006-AR18, Cl. 3A1, 4.484%, 1/25/371 | | 200,346 | | 171,757 | | |
Series 2007-HY1, Cl. 4A1, 2.553%, 2/25/371 | | 47,867 | | 39,644 | | |
WaMu Mortgage-Pass Through Certificates Trust, Collateralized Mtg. Obligations, Series 2007-HY5, Cl. 3A1, 4.981%, 5/25/371 | | 618,029 | | 596,001 | | |
Wells Fargo Alternative Loan Trust, Collateralized Mtg. Obligations, Series 2007-PA5, Cl. 1A1, 6.25%, 11/25/37 | | 369,691 | | 345,610 | | |
Wells Fargo Mortgage-Backed Securities Trust: | | | | | | |
Series 2005-9, Cl. 2A6, 5.25%, 10/25/35 | | 362,891 | | 373,332 | | |
Series 2006-AR14, Cl. 1A2, 5.626%, 10/25/361 | | 287,270 | | 270,643 | | |
| | | | 6,617,957 | | |
Total Mortgage-Backed Obligations (Cost $71,974,951) | | | | 69,090,100 | | |
| | | | | | | |
Corporate Bonds and Notes—43.0% | | | | | | |
Consumer Discretionary—5.9% | | | | | | |
Auto Components—0.3% | | | | | | |
Dana Holding Corp., 6.75% Sr. Unsec. Nts., 2/15/21 | | 420,000 | | 448,350 | | |
Automobiles—1.3% | | | | | | |
Daimler Finance North America LLC: | | | | | | |
1.30% Sr. Unsec. Nts., 7/31/152 | | 406,000 | | 407,050 | | |
8.50% Sr. Unsec. Unsub. Nts., 1/18/31 | | 237,000 | | 336,457 | | |
Ford Motor Credit Co. LLC, 5.875% Sr. Unsec. Unsub. Nts., 8/2/21 | | 936,000 | | 1,021,636 | | |
General Motors Financial Co., Inc., 4.25% Sr. Unsec. Nts., 5/15/232 | | 349,000 | | 325,879 | | |
| | | | | 2,091,022 | | |
Hotels, Restaurants & Leisure—0.4% | | | | | | |
Brinker International, Inc.: | | | | | | |
2.60% Sr. Unsec. Nts., 5/15/18 | | 134,000 | | 131,254 | | |
3.875% Sr. Unsec. Nts., 5/15/23 | | 134,000 | | 125,844 | | |
Starwood Hotels & Resorts Worldwide, Inc., 7.15% Sr. Unsec. Unsub. Nts., 12/1/19 | | 261,000 | | 315,507 | | |
| | | | 572,605 | | |
9 OPPENHEIMER CORE BOND FUND/VA
STATEMENTOF INVESTMENTS Unaudited / Continued
| | | | | | |
| | | Principal
Amount | | Value | | |
Household Durables—0.6% | | | | | | |
Jarden Corp., 6.125% Sr. Unsec. Nts., 11/15/22 | | $ 446,000 | | $ 469,972 | | |
Lennar Corp., 4.125% Sr. Unsec. Nts., 12/1/182 | | 460,000 | | 438,150 | | |
| | | | | 908,122 | | |
Media—1.8% | | | | | | |
Comcast Cable Communications Holdings, Inc., 9.455% Sr. Unsec. Nts., 11/15/22 | | 292,000 | | 413,684 | | |
Comcast Corp., 4.65% Sr. Unsec. Unsub. Nts., 7/15/42 | | 258,000 | | 248,644 | | |
DIRECTV Holdings LLC/DIRECTV Financing Co., Inc., 5.15% Sr. Unsec. Nts., 3/15/42 | | 138,000 | | 123,666 | | |
Historic TW, Inc., 9.15% Debs., 2/1/23 | | 61,000 | | 82,924 | | |
Interpublic Group of Cos., Inc. (The): | | | | | | |
6.25% Sr. Unsec. Nts., 11/15/14 | | 297,000 | | 315,592 | | |
10.00% Sr. Unsec. Nts., 7/15/17 | | 458,000 | | 483,282 | | |
Lamar Media Corp., 5% Sr. Unsec. Sub. Nts., 5/1/23 | | 473,000 | | 456,445 | | |
News America, Inc., 6.15% Sr. Unsec. Nts., 2/15/41 | | 162,000 | | 180,704 | | |
Time Warner Entertainment Co. LP, 8.375% Sr. Unsec. Nts., 7/15/33 | | 257,000 | | 303,923 | | |
WPP Finance 2010, 5.125% Sr. Unsec. Unsub. Nts., 9/7/42 | | 135,000 | | 125,151 | | |
| | | | | 2,734,015 | | |
Multiline Retail—0.7% | | | | | | |
Dollar General Corp., 4.125% Nts., 7/15/17 | | 469,000 | | 494,999 | | |
Macy’s Retail Holdings, Inc., 5.75% Sr. Unsec. Nts., 7/15/14 | | 650,000 | | 681,444 | | |
| | | | | 1,176,443 | | |
Specialty Retail—0.3% | | | | | | |
Rent-A-Center, Inc., 4.75% Sr. Unsec. Nts., 5/1/212 | | 435,000 | | 414,337 | | |
Textiles, Apparel & Luxury Goods—0.5% | | |
Hanesbrands, Inc., 6.375% Sr. Unsec. Unsub. Nts., 12/15/20 | | 371,000 | | 397,434 | | |
PVH Corp., 4.50% Sr. Unsec. Unsub. Nts., 12/15/22 | | 446,000 | | 430,390 | | |
| | | | | 827,824 | | |
Consumer Staples—2.6% | | | | | | |
Beverages—1.2% | | | | | | |
Anheuser-Busch InBev Worldwide, Inc., 8.20% Sr. Unsec. Unsub. Nts., 1/15/39 | | 324,000 | | 477,241 | | |
Coca-Cola HBC Finance BV, 5.125% Sr. Unsec. Unsub. Nts., 9/17/13 | | 469,000 | | 473,227 | | |
Constellation Brands, Inc., 3.75% Sr. Unsec. Nts., 5/1/21 | | 423,000 | | 397,091 | | |
Foster’s Finance Corp., 4.875% Sr. Unsec. Nts., 10/1/142 | | 433,000 | | 454,394 | | |
SABMiller Holdings, Inc., 4.95% Sr. Unsec. Unsub. Nts., 1/15/422 | | 206,000 | | 205,842 | | |
| | | | | 2,007,795 | | |
Food & Staples Retailing—0.4% | | | | | | |
Delhaize Group SA, 5.70% Sr. Unsec. Nts., 10/1/40 | | 215,000 | | 205,131 | | |
Safeway, Inc., 5.625% Sr. Unsec. Nts., 8/15/14 | | 385,000 | | 404,086 | | |
Wal-Mart Stores, Inc., 4% Sr. Unsec. Unsub. Nts., 4/11/43 | | 201,000 | | 184,133 | | |
| | | | | 793,350 | | |
Food Products—0.4% | | | | | | |
Bunge Ltd. Finance Corp.: | | | | | | |
5.10% Sr. Unsec. Unsub. Nts., 7/15/15 | | 332,000 | | 357,072 | | |
5.35% Sr. Unsec. Unsub. Nts., 4/15/14 | | 61,000 | | 62,892 | | |
8.50% Sr. Unsec. Nts., 6/15/19 | | 289,000 | | 356,972 | | |
| | | | | 776,936 | | |
Personal Products—0.2% | | | | | | |
Avon Products, Inc., 4.60% Sr. Unsec. Nts., 3/15/20 | | 376,000 | | 380,459 | | |
| | | | | | | |
Tobacco—0.4% | | | | | | |
Altria Group, Inc., 10.20% Sr. Unsec. Nts., 2/6/39 | | 227,000 | | 342,933 | | |
| | | | | | |
| | | Principal
Amount | | Value | | |
Tobacco (Continued) | | | | | | |
Lorillard Tobacco Co., 3.75% Sr. Unsec. Nts., 5/20/23 | | $ 413,000 | | $ 381,618 | | |
| | | | | 724,551 | | |
Energy—6.9% | | | | | | |
Energy Equipment & Services—0.9% | | | | | | |
Ensco plc, 4.70% Sr. Unsec. Nts., 3/15/21 | | 471,000 | | 500,640 | | |
Noble Holding International Ltd., 7.375% Sr. Unsec. Nts., 3/15/14 | | 403,000 | | 420,571 | | |
Rowan Cos., Inc., 4.875% Sr. Unsec. Unsub. Nts., 6/1/22 | | 318,000 | | 328,537 | | |
Weatherford International Ltd. Bermuda, 4.50% Sr. Unsec. Unsub. Nts., 4/15/22 | | 224,000 | | 221,734 | | |
| | | | | 1,471,482 | | |
Oil, Gas & Consumable Fuels—6.0% | | | | | | |
Anadarko Petroleum Corp.: | | | | | | |
6.20% Sr. Unsec. Nts., 3/15/40 | | 163,000 | | 183,691 | | |
7.625% Sr. Unsec. Nts., 3/15/14 | | 316,000 | | 330,713 | | |
Apache Corp., 4.25% Sr. Unsec. Unsub. Nts., 1/15/44 | | 110,000 | | 98,655 | | |
Buckeye Partners LP, 4.15% Sr. Unsec. Nts., 7/1/23 | | 235,000 | | 228,966 | | |
Canadian Oil Sands Ltd.: | | | | | | |
5.80% Sr. Unsec. Nts., 8/15/132 | | 457,000 | | 459,494 | | |
6.00% Sr. Unsec. Nts., 4/1/422 | | 182,000 | | 188,214 | | |
Cimarex Energy Co., 5.875% Sr. Unsec. Unsub. Nts., 5/1/22 | | 388,000 | | 403,520 | | |
CNOOC Finance 2013 Ltd., 4.25% Sr. Unsec. Unsub. Nts., 5/9/43 | | 147,000 | | 123,885 | | |
Concho Resources, Inc., 5.50% Sr. Unsec. Unsub. Nts., 4/1/23 | | 405,000 | | 400,950 | | |
Continental Resources, Inc., 4.50% Sr. Unsec. Unsub. Nts., 4/15/232 | | 428,000 | | 416,765 | | |
Copano Energy LLC/Copano Energy Finance Corp., 7.125% Sr. Unsec. Unsub. Nts., 4/1/21 | | 692,000 | | 773,310 | | |
DCP Midstream LLC, 5.85% Jr. Sub. Nts., 5/21/431,2 | | 422,000 | | 407,230 | | |
DCP Midstream Operating LP: | | | | | | |
2.50% Sr. Unsec. Unsub. Nts., 12/1/17 | | 415,000 | | 409,930 | | |
3.875% Sr. Unsec. Nts., 3/15/23 | | 214,000 | | 200,987 | | |
El Paso Pipeline Partners Operating Co. LLC, 4.70% Sr. Unsec. Unsub. Nts., 11/1/42 | | 318,000 | | 283,580 | | |
Enbridge Energy Partners LP, 5.35% Sr. Unsec. Nts., 12/15/14 | | 326,000 | | 345,274 | | |
EnCana Holdings Finance Corp., 5.80% Sr. Unsec. Unsub. Nts., 5/1/14 | | 219,000 | | 227,682 | | |
Energy Transfer Partners LP: | | | | | | |
4.65% Sr. Unsec. Unsub. Nts., 6/1/21 | | 345,000 | | 357,447 | | |
5.20% Sr. Unsec. Unsub. Nts., 2/1/22 | | 136,000 | | 144,097 | | |
8.50% Sr. Unsec. Nts., 4/15/14 | | 324,000 | | 342,817 | | |
NuStar Logistics LP, 4.75% Sr. Unsec. Unsub. Nts., 2/1/22 | | 402,000 | | 376,077 | | |
Range Resources Corp., 5.75% Sr. Unsec. Sub. Nts., 6/1/21 | | 418,000 | | 432,630 | | |
Ras Laffan Liquefied Natural Gas Co. Ltd. III, 5.50% Sr. Sec. Nts., 9/30/142 | | 420,000 | | 440,475 | | |
Rockies Express Pipeline LLC, 3.90% Sr. Unsec. Unsub. Nts., 4/15/152 | | 471,000 | | 468,645 | | |
Southwestern Energy Co., 4.10% Sr. Unsec. Nts., 3/15/22 | | 232,000 | | 231,305 | | |
Talisman Energy, Inc.: | | | | | | |
5.125% Sr. Unsec. Nts., 5/15/15 | | 315,000 | | 336,738 | | |
6.25% Sr. Unsec. Unsub. Nts., 2/1/38 | | 121,000 | | 130,493 | | |
Williams Cos., Inc. (The), 3.70% Sr. Unsec. Unsub. Nts., 1/15/23 | | 222,000 | | 206,542 | | |
Woodside Finance Ltd.: | | | | | | |
4.60% Sr. Unsec. Unsub. Nts., 5/10/212 | | 354,000 | | 372,794 | | |
5.00% Sr. Unsec. Nts., 11/15/132 | | 405,000 | | 410,951 | | |
| | | | 9,733,857 | | |
10 OPPENHEIMER CORE BOND FUND/VA
| | | | | | |
| | | Principal Amount | | Value | | |
Financials—13.7% | | | | | | |
Capital Markets—3.1% | | | | | | |
Blackstone Holdings Finance Co. LLC,
6.625% Sr. Unsec. Nts., 8/15/192 | | $ 575,000 | | $ 673,281 | | |
Carlyle Holdings II Finance LLC, 5.625% Sr. Sec. Nts., 3/30/432 | | 209,000 | | 198,446 | | |
Deutsche Bank AG, 4.296% Sub. Nts., 5/24/281 | | 423,000 | | 391,113 | | |
Goldman Sachs Capital I, 6.345% Sub. Nts., 2/15/34 | | 477,000 | | 459,985 | | |
Goldman Sachs Group, Inc. (The), 6.25% Sr. Unsec. Nts., 2/1/41 | | 443,000 | | 503,272 | | |
Macquarie Bank Ltd., 6.625% Unsec. Sub. Nts., 4/7/212 | | 672,000 | | 711,809 | | |
Morgan Stanley, 6.375% Sr. Unsec. Nts., 7/24/42 | | 271,000 | | 303,703 | | |
Nomura Holdings, Inc., 2% Sr. Unsec. Nts., 9/13/16 | | 821,000 | | 812,329 | | |
Raymond James Financial, Inc., 5.625% Sr. Unsec. Unsub. Nts., 4/1/24 | | 417,000 | | 439,823 | | |
UBS AG (Stamford, CT), 2.25% Sr. Unsec. Nts., 8/12/13 | | 188,000 | | 188,380 | | |
UBS Preferred Funding Trust V, 6.243% Jr. Sub. Perpetual Bonds, Series 11,10 | | 488,000 | | 504,470 | | |
| | | | | 5,186,611 | | |
Commercial Banks—3.7% | | | | | | |
Amsouth Bank NA, 5.20% Sub. Nts., 4/1/15 | | 419,000 | | 434,894 | | |
Barclays Bank plc, 5.14% Sub. Nts., 10/14/20 | | 399,000 | | 403,540 | | |
BPCE SA, 1.70% Sr. Unsec. Nts., 4/25/16 | | 684,000 | | 679,514 | | |
Fifth Third Capital Trust IV, 6.50% Jr. Sub. Nts., 4/15/371 | | 845,000 | | 845,000 | | |
HSBC Finance Capital Trust IX, 5.911% Unsec. Sub. Nts., 11/30/351 | | 1,090,000 | | 1,101,445 | | |
LBG Capital No. 1 plc, 7.875% Unsec. Sub. Nts., 11/1/202 | | 374,000 | | 389,708 | | |
Lloyds TSB Bank plc, 6.50% Unsec. Sub. Nts., 9/14/202 | | 377,000 | | 402,333 | | |
PNC Financial Services Group, Inc. (The), 4.85% Jr. Sub. Perpetual Bonds1,10 | | 441,000 | | 412,335 | | |
Royal Bank of Scotland Group plc, 7.64% Jr. Sub. Perpetual Bonds, Series U1,10 | | 500,000 | | 452,500 | | |
Wells Fargo & Co., 7.98% Jr. Sub. Perpetual Bonds, Series K1,10 | | 528,000 | | 597,630 | | |
| | | | | 5,718,899 | | |
Consumer Finance—0.3% | | | | | | |
Discover Financial Services, 3.85% Sr. Unsec. Unsub. Nts., 11/21/22 | | 481,000 | | 452,314 | | |
Diversified Financial Services—2.5% | | | | |
Bank of America Corp., 5.20% Jr. Sub. Perpetual Bonds1,10 | | 423,000 | | 399,735 | | |
Citigroup, Inc.: | | | | | | |
3.375% Sr. Unsec. Unsub. Nts., 3/1/23 | | 327,000 | | 313,260 | | |
Series D, 5.95% Jr. Sub. Perpetual Bonds1,10 | | 438,000 | | 436,401 | | |
ING US, Inc.: | | | | | | |
5.50% Sr. Unsec. Nts., 7/15/222 | | 260,000 | | 276,922 | | |
5.65% Unsec. Sub. Nts., 5/15/531,2 | | 350,000 | | 329,875 | | |
Jefferies Group LLC, 5.125% Sr. Unsec. Nts., 1/20/23 | | 228,000 | | 226,539 | | |
JPMorgan Chase & Co.: | | | | | | |
Series 1, 7.90% Jr. Sub. Perpetual Bonds1,10 | | 792,000 | | 895,868 | | |
Series Q, 5.15% Jr. Sub. Perpetual Bonds1,10 | | 120,000 | | 114,900 | | |
Merrill Lynch & Co., Inc., 7.75% Jr. Sub. Nts., 5/14/38 | | 354,000 | | 406,474 | | |
Rabobank Capital Funding Trust III, 5.254% Jr. Sub. Perpetual Bonds1,2,10 | | 667,000 | | 670,335 | | |
| | | | | 4,070,309 | | |
Insurance—2.6% | | | | | | |
CNA Financial Corp.: | | | | | | |
5.75% Sr. Unsec. Unsub. Nts., 8/15/21 | | 368,000 | | 414,669 | | |
5.875% Sr. Unsec. Unsub. Nts., 8/15/20 | | 260,000 | | 294,553 | | |
Gulf South Pipeline Co. LP, 5.05% Sr. Unsec. Nts., 2/1/152 | | 425,000 | | 446,976 | | |
| | | | | | |
| | | Principal Amount | | Value | | |
Insurance (Continued) | | | | | | |
Liberty Mutual Group, Inc., 4.25% Sr. Unsec. Nts., 6/15/232 | | $ 332,000 | | $ 321,238 | | |
Lincoln National Corp., 6.05% Jr. Unsec. Sub. Nts., 4/20/671 | | 748,000 | | 736,541 | | |
Marsh & McLennan Cos., Inc., 5.375% Sr. Unsec. Nts., 7/15/14 | | 101,000 | | 105,495 | | |
Prudential Financial, Inc., 5.20% Jr. Sub. Nts., 3/15/441 | | 300,000 | | 284,625 | | |
QBE Insurance Group Ltd., 2.40% Sr. Unsec. Nts., 5/1/182 | | 511,000 | | 501,333 | | |
Swiss Re Capital I LP, 6.854% Jr. Sub. Perpetual Bonds1,2,10 | | 756,000 | | 784,350 | | |
| | | | | 3,889,780 | | |
Real Estate Investment Trusts (REITs)—1.5% | | |
American Tower Corp.: | | | | | | |
5.05% Sr. Unsec. Unsub. Nts., 9/1/20 | | 149,000 | | 156,748 | | |
7.00% Sr. Unsec. Nts., 10/15/17 | | 413,000 | | 478,807 | | |
Corrections Corp. of America, 4.125% Sr. Unsec. Nts., 4/1/202 | | 165,000 | | 161,700 | | |
Hospitality Properties Trust, 5.125% Sr. Unsec. Nts., 2/15/15 | | 411,000 | | 425,692 | | |
Host Hotels & Resorts LP, 3.75% Sr. Unsec. Nts., 10/15/23 | | 297,000 | | 272,792 | | |
National Retail Properties, Inc., 6.25% Sr. Unsec. Nts., 6/15/14 | | 332,000 | | 347,485 | | |
WEA Finance LLC/WT Finance Aust Pty Ltd., 7.50% Sr. Unsec. Nts., 6/2/142 | | 408,000 | | 433,487 | | |
| | | | | 2,276,711 | | |
Health Care—1.4% | | | | | | |
Biotechnology—0.7% | | | | | | |
Amgen, Inc., 3.625% Sr. Unsec. Unsub. Nts., 5/15/22 | | 403,000 | | 403,422 | | |
Celgene Corp., 3.25% Sr. Unsec. Nts., 8/15/22 | | 504,000 | | 478,656 | | |
Gilead Sciences, Inc., 5.65% Sr. Unsec. Unsub. Nts., 12/1/41 | | 232,000 | | 259,258 | | |
| | | | | 1,141,336 | | |
Health Care Providers & Services—0.4% | | |
Cardinal Health, Inc.: | | | | | | |
1.70% Sr. Unsec. Nts., 3/15/18 | | 148,000 | | 143,702 | | |
3.20% Sr. Unsec. Nts., 3/15/23 | | 223,000 | | 208,408 | | |
McKesson Corp., 6% Sr. Unsec. Unsub. Nts., 3/1/41 | | 237,000 | | 278,454 | | |
| | | | | 630,564 | | |
Pharmaceuticals—0.3% | | | | | | |
Mallinckrodt International Finance SA, 3.50% Sr. Unsec. Unsub. Nts., 4/15/182 | | 145,000 | | 143,445 | | |
Zoetis, Inc.: | | | | | | |
1.875% Sr. Unsec. Nts., 2/1/182 | | 151,000 | | 147,929 | | |
4.70% Sr. Unsec. Nts., 2/1/432 | | 225,000 | | 211,163 | | |
| | | | | 502,537 | | |
Industrials—3.5% | | | | | | |
Aerospace & Defense—0.5% | | |
B/E Aerospace, Inc., 5.25% Sr. Unsec. Nts., 4/1/22 | | 325,000 | | 325,000 | | |
Huntington Ingalls Industries, Inc., 7.125% Sr. Unsec. Unsub. Nts., 3/15/21 | | 448,000 | | 483,840 | | |
| | | | | 808,840 | | |
Building Products—0.2% | | |
Owens Corning, 4.20% Sr. Unsec. Nts., 12/15/22 | | 333,000 | | 323,109 | | |
Commercial Services & Supplies—0.3% | | |
Clean Harbors, Inc., 5.25% Sr. Unsec. Unsub. Nts., 8/1/20 | | 475,000 | | 484,500 | | |
Industrial Conglomerates—0.9% | | |
General Electric Capital Corp.: | | | | | | |
5.25% Jr. Sub. Perpetual Bonds1,10 | | 440,000 | | 421,300 | | |
6.375% Unsec. Sub. Nts., 11/15/671 | | 934,000 | | 973,695 | | |
| | | | 1,394,995 | | |
11 OPPENHEIMER CORE BOND FUND/VA
STATEMENTOF INVESTMENTS Unaudited / Continued
| | | | | | |
| | | Principal Amount | | Value | | |
Machinery—0.6% | | | | | | |
CNH Capital LLC, 6.25% Sr. Unsec. Nts., 11/1/16 | | $ 489,000 | | $ 523,230 | | |
Ingersoll-Rand Global Holding Co. Ltd., 4.25% Sr. Unsec. Nts., 6/15/232 | | 339,000 | | 337,347 | | |
National Rural Utilities Cooperative Finance Corp., 4.75% Sr. Unsec. Sub. Nts., 4/30/431 | | 223,000 | | 217,425 | | |
| | | | | 1,078,002 | | |
Professional Services—0.2% | | | | | | |
Nielsen Finance LLC/Nielsen Finance Co., 4.50% Sr. Unsec. Nts., 10/1/202 | | 405,000 | | 390,825 | | |
Road & Rail—0.5% | | | | | | |
Kansas City Southern Railway, 4.30% Sr. Unsec. Nts., 5/15/432 | | 170,000 | | 153,951 | | |
Penske Truck Leasing Co. LP/PTL Finance Corp.: | | | | | | |
2.50% Sr. Unsec. Nts., 7/11/142 | | 442,000 | | 448,413 | | |
4.25% Sr. Unsec. Nts., 1/17/232 | | 230,000 | | 227,673 | | |
| | | | | 830,037 | | |
Trading Companies & Distributors—0.3% | | | | |
International Lease Finance Corp., 5.875% Sr. Unsec. Unsub. Nts., 4/1/19 | | 405,000 | | 411,075 | | |
Information Technology—1.8% | | | | | | |
Computers & Peripherals—0.7% | | | | | | |
Apple, Inc., 3.85% Sr. Unsec. Unsub. Nts., 5/4/43 | | 109,000 | | 97,343 | | |
Hewlett-Packard Co.: | | | | | | |
2.65% Sr. Unsec. Unsub. Nts., 6/1/16 | | 749,000 | | 763,875 | | |
4.75% Sr. Unsec. Nts., 6/2/14 | | 214,000 | | 220,737 | | |
| | | | | 1,081,955 | | |
Electronic Equipment, Instruments, & Components—0.7% | | |
Amphenol Corp., 4.75% Sr. Unsec. Nts., 11/15/14 | | 124,000 | | 129,977 | | |
Arrow Electronics, Inc., 5.125% Sr. Unsec. Unsub. Nts., 3/1/21 | | 527,000 | | 540,872 | | |
Avnet, Inc., 4.875% Sr. Unsec. Unsub. Nts., 12/1/22 | | 500,000 | | 498,647 | | |
| | | | | 1,169,496 | | |
IT Services—0.1% | | | | | | |
Fidelity National Information Services, Inc., 3.50% Sr. Unsec. Nts., 4/15/23 | | 207,000 | | 187,222 | | |
Office Electronics—0.3% | | | | | | |
Xerox Corp., 4.25% Sr. Unsec. Nts., 2/15/15 | | 391,000 | | 408,597 | | |
Materials—2.7% | | | | | | |
Chemicals—0.6% | | | | | | |
Agrium, Inc., 6.125% Sr. Unsec. Unsub. Nts., 1/15/41 | | 80,000 | | 87,229 | | |
CF Industries, Inc., 4.95% Sr. Unsec. Nts., 6/1/43 | | 172,000 | | 164,123 | | |
Dow Chemical Co., 8.55% Sr. Unsec. Nts., 5/15/19 | | 252,000 | | 321,778 | | |
Eastman Chemical Co., 4.80% Sr. Unsec. Nts., 9/1/42 | | 161,000 | | 153,116 | | |
RPM International, Inc., 3.45% Sr. Unsec. Unsub. Nts., 11/15/22 | | 227,000 | | 212,066 | | |
Sherwin-Williams Co., 4% Sr. Unsec. Unsub. Nts., 12/15/42 | | 236,000 | | 214,165 | | |
| | | | | 1,152,477 | | |
Containers & Packaging—0.6% | | | | | | |
Crown Americas LLC/Crown Americas Capital Corp. III, 6.25% Sr. Unsec. Nts., 2/1/21 | | 446,000 | | 474,990 | | |
Rock Tenn Co., 3.50% Sr. Unsec. Unsub. Nts., 3/1/20 | | 432,000 | | 423,158 | | |
| | | | | 898,148 | | |
Metals & Mining—1.2% | | | | | | |
Allegheny Technologies, Inc., 5.95% Sr. Unsec. Unsub. Nts., 1/15/21 | | 260,000 | | 276,503 | | |
Carpenter Technology Corp., 4.45% Sr. Unsec. Unsub. Nts., 3/1/23 | | 145,000 | | 141,535 | | |
Cliffs Natural Resources, Inc., 3.95% Sr. Unsec. Unsub. Nts., 1/15/18 | | 392,000 | | 374,775 | | |
Freeport-McMoRan Copper & Gold, Inc., 3.875% Sr. Unsec. | | | | | | |
Nts., 3/15/232 | | 425,000 | | 385,197 | | |
| | | | | | |
| | | Principal Amount | | Value | | |
Metals & Mining (Continued) | | | | | | |
Xstrata Canada Corp.: | | | | | | |
5.375% Sr. Unsec. Unsub. Nts., 6/1/15 | | $ 245,000 | | $ 258,892 | | |
6.00% Sr. Unsec. Unsub. Nts., 10/15/15 | | 463,000 | | 504,408 | | |
| | | | 1,941,310 | | |
| | | | | | | |
Paper & Forest Products—0.3% | | | | | | |
Georgia-Pacific LLC, 3.734% Sr. Unsec. Nts., 7/15/232 | | 306,000 | | 298,064 | | |
International Paper Co., 6% Sr. Unsec. Unsub. Nts., 11/15/41 | | 202,000 | | 215,850 | | |
| | | | | 513,914 | | |
Telecommunication Services—2.5% | | | | | | |
Diversified Telecommunication Services—2.1% | | | | |
AT&T, Inc., 6.30% Sr. Unsec. Unsub. Nts., 1/15/38 | | 522,000 | | 582,780 | | |
British Telecommunications plc, 9.625% Sr. Unsec. Nts., 12/15/30 | | 264,000 | | 398,727 | | |
CenturyLink, Inc., 5.625% Sr. Unsec. Unsub. Nts., 4/1/20 | | 437,000 | | 443,555 | | |
Frontier Communications Corp., 8.50% Sr. Unsec. Nts., 4/15/20 | | 429,000 | | 475,117 | | |
MetroPCS Wireless, Inc., 6.25% Sr. Unsec. Unsub. Nts., 4/1/212 | | 445,000 | | 454,456 | | |
Telecom Italia Capital SA, 7.721% Sr. Unsec. Unsub. Nts., 6/4/38 | | 386,000 | | 393,952 | | |
Telefonica Emisiones SAU, 7.045% Sr. Unsec. Unsub. Nts., 6/20/36 | | 283,000 | | 312,380 | | |
Verizon Communications, Inc., 6.40% Sr. Unsec. Nts., 2/15/38 | | 314,000 | | 367,178 | | |
| | | | | 3,428,145 | | |
Wireless Telecommunication Services—0.4% | | | | |
America Movil SAB de CV, 4.375% Sr. Unsec. Unsub. Nts., 7/16/42 | | 334,000 | | 286,631 | | |
CC Holdings GS V LLC/Crown Castle GS III Corp., 3.849% Sr. Sec. Nts., 4/15/23 | | 227,000 | | 214,352 | | |
Vodafone Group plc, 4.375% Sr. Unsec. Unsub. Nts., 2/19/43 | | 225,000 | | 202,576 | | |
| | | | | 703,559 | | |
Utilities—2.0% | | | | | | |
Electric Utilities—1.6% | | | | | | |
Edison International, 3.75% Sr. Unsec. Unsub. Nts., 9/15/17 | | 438,000 | | 463,530 | | |
Electricite de France SA, 5.25% Jr. Sub. Perpetual Bonds1,2,10 | | 360,000 | | 344,795 | | |
Exelon Generation Co. LLC, 4.25% Sr. Unsec. Unsub. Nts., 6/15/22 | | 230,000 | | 230,324 | | |
FirstEnergy Corp. 2.75% Sr. Unsec. Nts., 3/15/18 | | 227,000 | | 221,154 | | |
Great Plains Energy, Inc., 2.766% Sr. Unsec. Nts., 8/15/13 | | 464,000 | | 464,999 | | |
ITC Holdings Corp., 5.30% Sr. Unsec. Nts., 7/1/438 | | 179,000 | | 181,571 | | |
PPL Capital Funding, Inc., 3.50% Sr. Unsec. Unsub. Nts., 12/1/22 | | 329,000 | | 315,180 | | |
PPL WEM Holdings plc, 5.375% Sr. Unsec. Unsub. Nts., 5/1/212 | | 429,000 | | 470,985 | | |
| | | | | 2,692,538 | | |
Energy Traders—0.3% | | | | | | |
TransAlta Corp., 5.75% Sr. Unsec. Nts., 12/15/13 | | 455,000 | | 465,194 | | |
| | | | | | | |
Multi-Utilities—0.1% | | | | | | |
CMS Energy Corp., 5.05% Sr. Unsec. Unsub. Nts., 3/15/22 | | 155,000 | | 167,671 | | |
Total Corporate Bonds and Notes Cost $69,062,074) | | | | 69,461,818 | | |
| | | | | | | |
U.S. Government Obligations—2.2% | | |
Federal Home Loan Mortgage Corp. Nts.: | | | | | | |
0.875% Nts., 3/7/18 | | 735,000 | | 712,055 | | |
1.375% Nts., 5/1/20 | | 694,000 | | 658,309 | | |
12 OPPENHEIMER CORE BOND FUND/VA
| | | | | | |
| | | Principal Amount | | Value | | |
| | |
| U.S. Government Obligations (Continued) | | | | |
Federal Home Loan Mortgage Corp. Nts.: Continued | | |
2.375% Nts., 1/13/2211 | | $ 894,000 | | $ 869,937 | | |
5.25% Nts., 4/18/16 | | 515,000 | | 580,025 | | |
| | |
Federal National Mortgage Assn. Nts., 0.875%, 5/21/18 | | 652,000 | | 630,883 | | |
| | | | | | |
Total U.S. Government Obligations (Cost $3,503,518) | | | | 3,451,209 | | |
| | | | | | |
| | | Shares | | Value | | |
| | |
| Investment Company—13.3% | | | | |
Oppenheimer Institutional Money Market Fund, Cl. E, 0.11%12,13 | | | | | | |
| (Cost $21,518,986) | | 21,518,986 | | $ 21,518,986 | | |
| | |
Total Investments, at Value
(Cost $190,782,943) | | 116.6% | | 188,212,585 | | |
| | |
| Liabilities in Excess of Other Assets | | (16.6) | | (26,811,155) | | |
| | | | |
| Net Assets | | 100.0% | | $ 161,401,430 | | |
| | | | |
Footnotes to Statement of Investments
*June 28, 2013 represents the last business day of the Fund’s semiannual period. See Note 1 of the accompanying Notes.
1. Represents the current interest rate for a variable or increasing rate security.
2. Represents securities sold under Rule 144A, which are exempt from registration under the Securities Act of 1933, as amended. These securities have been determined to be liquid under guidelines established by the Board of Trustees. These securities amount to $27,158,811 or 16.83% of the Fund’s net assets as of June 28, 2013.
3. Restricted security. The aggregate value of restricted securities as of June 28, 2013 was $1,357,847, which represents 0.84% of the Fund’s net assets. See Note 7 of the accompanying Notes. Information concerning restricted securities is as follows:
| | | | | | | | | | | | | | | | |
| Security | | Acquisition Dates | | | Cost | | | Value | | | Unrealized Appreciation/ (Depreciation) | |
| |
Capital Lease Funding Securitization LP, Interest-Only Corporate-Backed Pass-Through Certificates, Series 1997-CTL1, Cl. IO, 0%, 6/22/24 | | | 4/21/97 | | | $ | 396,532 | | | $ | 93,446 | | | $ | (303,086) | |
JP Morgan Chase Commercial Mortgage Securities Trust, Series 2007-LDPX, Cl. A2S2, 5.187%, 1/15/49 | | | 7/14/10 | | | | 457,977 | | | | 471,105 | | | | 13,128 | |
Lehman Structured Securities Corp., Collateralized Mtg. Obligations, Series 2002-GE1, Cl. A, 2.514%, 7/26/24 | | | 1/28/02 | | | | 91,562 | | | | 82,072 | | | | (9,490) | |
Morgan Stanley Reremic Trust, Collateralized Mtg. Obligations, Series 2012-R3, Cl. 1B, 2.379%, 11/26/36 | | | 10/24/12 | | | | 238,602 | | | | 273,217 | | | | 34,615 | |
NC Finance Trust, Series 1999-I, Cl. D, 8.75%, 1/25/29 | | | 8/10/10 | | | | 3,281,116 | | | | 227,476 | | | | (3,053,640) | |
Santander Drive Auto Receivables Trust, Series 2011-S1A, Cl. D, 3.10%, 5/15/17 | | | 2/4/11-2/9/12 | | | | 82,241 | | | | 82,373 | | | | 132 | |
Santander Drive Auto Receivables Trust, Series 2011-S2A, Cl. D, 3.35%, 6/15/17 | | | 5/19/11-4/9/13 | | | | 127,353 | | | | 128,158 | | | | 805 | |
| | | | | | | | |
| | | | | | $ | 4,675,383 | | | $ | 1,357,847 | | | $ | (3,317,536) | |
| | | | | | | | |
4. Interest-Only Strips represent the right to receive the monthly interest payments on an underlying pool of mortgage loans. These securities typically decline in price as interest rates decline. Most other fixed income securities increase in price when interest rates decline. The principal amount of the underlying pool represents the notional amount on which current interest is calculated. The price of these securities is typically more sensitive to changes in prepayment rates than traditional mortgage-backed securities (for example, GNMA pass-throughs). Interest rates disclosed represent current yields based upon the current cost basis and estimated timing and amount of future cash flows. These securities amount to $4,778,391 or 2.96% of the Fund’s net assets as of June 28, 2013.
5. Interest rate is less than 0.0005%.
6. Principal-Only Strips represent the right to receive the monthly principal payments on an underlying pool of mortgage loans. The value of these securities generally increases as interest rates decline and prepayment rates rise. The price of these securities is typically more volatile than that of coupon-bearing bonds of the same maturity. Interest rates disclosed represent current yields based upon the current cost basis and estimated timing of future cash flows. These securities amount to $222,168 or 0.14% of the Fund’s net assets as of June 28, 2013.
7. The current amortization rate of the security’s cost basis exceeds the future interest payments currently estimated to be received. Both the amortization rate and interest payments are contingent on future mortgage pre-payment speeds and are therefore subject to change.
8. All or a portion of the security position is when-issued or delayed delivery to be delivered and settled after June 28, 2013. See Note 1 of the accompanying Notes.
9. This security is not accruing income because the issuer has missed an interest payment on it and/or is not anticipated to make future interest and/or principal payments. The rate shown is the original contractual interest rate. See Note 1 of the accompanying Notes.
10. This bond has no contractual maturity date, is not redeemable and contractually pays an indefinite stream of interest. Rate reported represents the current interest rate for this variable rate security.
11. All or a portion of the security position is held in accounts at a futures clearing merchant and pledged to cover margin requirements on open futures contracts and written options on futures, if applicable. The aggregate market value of such securities is $233,655. See Note 6 of the accompanying Notes.
12. Is or was an affiliate, as defined in the Investment Company Act of 1940, at or during the period ended June 28, 2013, by virtue of the Fund owning at least 5% of the voting securities of the issuer or as a result of the Fund and the issuer having the same investment adviser. Transactions during the period in which the issuer was an affiliate are as follows:
| | | | | | | | | | | | | | | | |
| | | Shares December 31, 2012 | | | Gross Additions | | | Gross Reductions | | | Shares June 28, 2013 | |
| |
Oppenheimer Institutional Money Market Fund, Cl. E | | | 28,238,653 | | | | 31,626,670 | | | | 38,346,337 | | | | 21,518,986 | |
| | | | |
| | | | | | | | | Value | | | Income | |
| |
Oppenheimer Institutional Money Market Fund, Cl. E | | | | | | | | | | $ | 21,581,986 | | | $ | 15,598 | |
13. Rate shown is the 7-day yield as of June 28, 2013.
13 OPPENHEIMER CORE BOND FUND/VA
STATEMENTOF INVESTMENTS Unaudited / Continued
| | | | | | | | | | | | | | | | |
| |
Futures Contracts as of June 28, 2013 is as follows: | |
| Contract Description | | Buy/Sell | | Number of Contracts | | | Expiration Date | | | Value | | Unrealized Appreciation (Depreciation) | |
| |
U.S. Long Bonds | | Sell | | | 10 | | | | 9/19/13 | | | $ 2,716,875 | | $ | 48,445 | |
U.S. Treasury Nts., 2 yr. | | Sell | | | 38 | | | | 9/30/13 | | | 8,360,000 | | | 11,488 | |
U.S. Treasury Nts., 5 yr. | | Sell | | | 81 | | | | 9/30/13 | | | 9,804,797 | | | 191,617 | |
U.S. Treasury Nts., 10 yr. | | Buy | | | 25 | | | | 9/19/13 | | | 3,164,063 | | | (23,789) | |
U.S. Treasury Ultra Bonds | | Buy | | | 54 | | | | 9/19/13 | | | 7,954,875 | | | (474,040) | |
| | | | | | | | | | | | | | | | |
| | | | | | | | | | | | | | $ | (246,279) | |
| | | | | | | | | | | | | | | | |
| | | | | | | | | | | | | | | | | | | | | | | | | | | | | | | | | | |
| |
Over-the-Counter Credit Default Swap Contracts as of June 28, 2013 are as follows: | |
Reference Entity/ Swap Counterparty | | Buy/Sell Credit Protection | | | Notional Amount (000’s) | | | Pay/ Receive Fixed Rate | | | Termination Date | | | | | Premiums Received/ (Paid) | | | | | Value | | | | | Unrealized Depreciation | |
| |
CDX.NA.IG.20 | | | | | | | | | | | | | | | | | | | | | | | | | | | | | | | | | | |
Deutsche Bank AG | | | Buy | | | $ | 7,400 | | | | 1.00% | | | | 6/20/18 | | | | | $ | 25,927 | | | | | $ | (52,710 | ) | | | | $ | 26,783 | |
See accompanying Notes to Financial Statements.
14 OPPENHEIMER CORE BOND FUND/VA
STATEMENTOF ASSETS AND LIABILITIES June 28, 20131 Unaudited
| | | | |
| |
| Assets | | | | |
| Investments, at value—see accompanying statement of investments: | | | | |
| Unaffiliated companies (cost $169,263,957) | | $ | 166,693,599 | |
| Affiliated companies (cost $21,518,986) | | | 21,518,986 | |
| | | | |
| | | 188,212,585 | |
| |
Cash used for collateral on OTC derivatives | | | 219,613 | |
| |
| Receivables and other assets: | | | | |
| Investments sold (including $14,756,408 sold on a when-issued or delayed delivery basis) | | | 23,023,856 | |
| Interest, dividends and principal paydowns | | | 1,213,619 | |
| Variation margin receivable | | | 65,412 | |
| Other | | | 26,888 | |
| | | | |
| Total assets | | | 212,761,973 | |
|
| |
Liabilities | | | | |
| Bank overdraft | | | 9,736 | |
| |
| Swaps, at value (premiums received $25,927) | | | 52,710 | |
| |
| Payables and other liabilities: | | | | |
| Investments purchased (including $42,574,071 purchased on a when-issued or delayed delivery basis) | | | 50,587,334 | |
| Shares of beneficial interest redeemed | | | 623,579 | |
| Trustees’ compensation | | | 23,355 | |
| Shareholder communications | | | 13,261 | |
| Transfer and shareholder servicing agent fees | | | 12,643 | |
| Distribution and service plan fees | | | 12,545 | |
| Variation margin payable | | | 3,383 | |
| Other | | | 21,997 | |
| | | | |
| Total liabilities | | | 51,360,543 | |
|
| |
| Net Assets | | $ | 161,401,430 | |
| | | | |
| | | | |
| |
Composition of Net Assets | | | | |
| Par value of shares of beneficial interest | | $ | 21,078 | |
| |
| Additional paid-in capital | | | 243,681,591 | |
| |
| Accumulated net investment income | | | 3,215,575 | |
| |
| Accumulated net realized loss on investments | | | (82,673,433) | |
| |
| Net unrealized depreciation on investments | | | (2,843,381) | |
| | | | |
| Net Assets | | $ | 161,401,430 | |
| | | | |
|
| |
| | | | |
Net Asset Value Per Share | | | | |
| Non-Service Shares: | | | | |
Net asset value, redemption price per share and offering price per share (based on net assets of $102,204,550 and 13,294,984 shares of beneficial interest outstanding) | | $ | 7.69 | |
| |
Service Shares: | | | | |
Net asset value, redemption price per share and offering price per share (based on net assets of $59,196,880 and 7,783,229 shares of beneficial interest outstanding) | | $ | 7.61 | |
1. June 28, 2013 represents the last business day of the Fund’s semiannual period. See Note 1 of the accompanying Notes
See accompanying Notes to Financial Statements.
15 OPPENHEIMER CORE BOND FUND/VA
STATEMENTOF OPERATIONS For the Six Months Ended June 28, 20131 Unaudited
| | | | |
| |
| Investment Income | | | | |
Interest (net of foreign withholding taxes of $821) | | $ | 3,833,871 | |
| |
Fee income on when-issued securities | | | 504,592 | |
| |
Dividends from affiliated companies | | | 15,598 | |
| |
Other income | | | 83,430 | |
| | | | |
Total investment income | | | 4,437,491 | |
|
| |
| Expenses | | | | |
Management fees | | | 515,729 | |
| |
Distribution and service plan fees—Service shares | | | 77,382 | |
| |
Transfer and shareholder servicing agent fees: | | | | |
Non-Service shares | | | 54,999 | |
Service shares | | | 30,988 | |
| |
Shareholder communications: | | | | |
Non-Service shares | | | 10,529 | |
Service shares | | | 5,891 | |
| |
Custodian fees and expenses | | | 14,998 | |
| |
Trustees’ compensation | | | 10,539 | |
| |
Other | | | 29,951 | |
| | | | |
Total expenses | | | 751,006 | |
Less waivers and reimbursements of expenses | | | (29,063) | |
| | | | |
Net expenses | | | 721,943 | |
|
| |
Net Investment Income | | | 3,715,548 | |
|
| |
| Realized and Unrealized Gain (Loss) | | | | |
Net realized gain (loss) on: | | | | |
Investments from unaffiliated companies | | | 1,156,128 | |
Closing and expiration of futures contracts | | | (25,569) | |
Swap contracts | | | (46,747) | |
| | | | |
Net realized gain | | | 1,083,812 | |
| |
Net change in unrealized appreciation/depreciation on: | | | | |
Investments | | | (7,812,493) | |
Futures contracts | | | (200,775) | |
Swap contracts | | | (26,783) | |
| | | | |
Net change in unrealized appreciation/depreciation | | | (8,040,051) | |
|
| |
Net Decrease in Net Assets Resulting from Operations | | $ | (3,240,691) | |
| | | | |
1. June 28, 2013 represents the last business day of the Fund’s semiannual period. See Note 1 of the accompanying Notes
See accompanying Notes to Financial Statements.
16 OPPENHEIMER CORE BOND FUND/VA
STATEMENTSOF CHANGES IN NET ASSETS
| | | | | | | | |
| | | Six Months Ended June 28, 20131 (Unaudited) | | | Year Ended December 31, 2012 | |
| |
Operations | | | | | | | | |
| Net investment income | | $ | 3,715,548 | | | $ | 7,917,484 | |
| |
| Net realized gain | | | 1,083,812 | | | | 6,322,735 | |
| |
| Net change in unrealized appreciation/depreciation | | | (8,040,051) | | | | 3,953,898 | |
| | | | | | | | |
| Net increase (decrease) in net assets resulting from operations | | | (3,240,691) | | | | 18,194,117 | |
|
| |
Dividends and/or Distributions to Shareholders | | | | | | | | |
Dividends from net investment income: | | | | | | | | |
| Non-Service shares | | | (5,333,237) | | | | (5,870,393) | |
| Service shares | | | (3,004,981) | | | | (3,356,788) | |
| | | | |
| | | (8,338,218) | | | | (9,227,181) | |
|
| |
Beneficial Interest Transactions | | | | | | | | |
| Net increase (decrease) in net assets resulting from beneficial interest transactions: | | | | | | | | |
| Non-Service shares | | | (7,486,135) | | | | (11,196,132) | |
| Service shares | | | (1,216,949) | | | | (652,679) | |
| | | | | | | | |
| | | (8,703,084) | | | | (11,848,811) | |
|
| |
Net Assets | | | | | | | | |
| Total decrease | | | (20,281,993) | | | | (2,881,875) | |
| |
| Beginning of period | | | 181,683,423 | | | | 184,565,298 | |
| | | | | | | | |
| End of period (including accumulated net investment income of $3,215,575 and $7,838,245, respectively) | | $ | 161,401,430 | | | $ | 181,683,423 | |
| | | | |
1. June 28, 2013 represents the last business day of the Fund’s semiannual period. See Note 1 of the accompanying Notes
See accompanying Notes to Financial Statements.
17 OPPENHEIMER CORE BOND FUND/VA
FINANCIAL HIGHLIGHTS
| | | | | | | | | | | | | | | | | | | | | | | | |
| Non-Service Shares | | Six Months
Ended
June 28,
20131
(Unaudited) | | | Year Ended
December 31,
2012 | | | Year Ended
December 30,
20111 | | | Year Ended
December 31,
2010 | | | Year Ended
December 31,
2009 | | | Year Ended
December 31,
2008 | |
| |
Per Share Operating Data | | | | | | | | | | | | | | | | | | | | | | | | |
Net asset value, beginning of period | | $ | 8.26 | | | $ | 7.88 | | | $ | 7.73 | | | $ | 7.07 | | | $ | 6.45 | | | $ | 11.06 | |
| |
Income (loss) from investment operations: | | | | | | | | | | | | | | | | | | | | | | | | |
Net investment income2 | | | 0.18 | | | | 0.35 | | | | 0.36 | | | | 0.40 | | | | 0.48 | | | | 0.66 | |
Net realized and unrealized gain (loss) | | | (0.33) | | | | 0.44 | | | | 0.25 | | | | 0.40 | | | | 0.14 | | | | (4.82) | |
| | | | |
Total from investment operations | | | (0.15) | | | | 0.79 | | | | 0.61 | | | | 0.80 | | | | 0.62 | | | | (4.16) | |
| |
Dividends and/or distributions to shareholders: | | | | | | | | | | | | | | | | | | | | | | | | |
Dividends from net investment income | | | (0.42) | | | | (0.41) | | | | (0.46) | | | | (0.14) | | | | 0.00 | | | | (0.45) | |
| |
Net asset value, end of period | | $ | 7.69 | | | $ | 8.26 | | | $ | 7.88 | | | $ | 7.73 | | | $ | 7.07 | | | $ | 6.45 | |
| | | | |
|
| |
Total Return, at Net Asset Value3 | | | (1.89)% | | | | 10.29% | | | | 8.27% | | | | 11.42% | | | | 9.61% | | | | (39.05)% | |
| |
Ratios/Supplemental Data | | | | | | | | | | | | | | | | | | | | | | | | |
Net assets, end of period (in thousands) | | $ | 102,204 | | | $ | 116,989 | | | $ | 122,271 | | | $ | 132,557 | | | $ | 137,597 | | | $ | 156,339 | |
| |
Average net assets (in thousands) | | $ | 110,784 | | | $ | 119,547 | | | $ | 127,341 | | | $ | 136,333 | | | $ | 137,631 | | | $ | 271,355 | |
| |
Ratios to average net assets:4 | | | | | | | | | | | | | | | | | | | | | | | | |
Net investment income | | | 4.42% | | | | 4.34% | | | | 4.71% | | | | 5.32% | | | | 7.40% | | | | 6.76% | |
Total expenses5 | | | 0.78% | | | | 0.77% | | | | 0.77% | | | | 0.79% | | | | 0.75% | | | | 0.63% | |
Expenses after payments, waivers and/or reimbursements and reduction to custodian expenses | | | 0.75% | | | | 0.75% | | | | 0.75% | | | | 0.70% | | | | 0.61% | | | | 0.62% | |
| |
Portfolio turnover rate6 | | | 63 % | | | | 140 % | | | | 99 % | | | | 98 % | | | | 143 % | | | | 51 % | |
1. June 28, 2013 and December 30, 2011 represent the last business day of the Fund’s reporting periods. See Note 1 of the accompanying Notes.
2. Per share amounts calculated based on the average shares outstanding during the period.
3. Assumes an initial investment on the business day before the first day of the fiscal period, with all dividends and distributions reinvested in additional shares on the reinvestment date, and redemption at the net asset value calculated on the last business day of the fiscal period. Total returns are not annualized for periods less than one full year. Total return information does not reflect expenses that apply at the separate account level or to related insurance products. Inclusion of these charges would reduce the total return figures for all periods shown. Returns do not reflect the deduction of taxes that a shareholder would pay on fund distributions or the redemption of fund shares.
4. Annualized for periods less than one full year.
5. Total expenses including indirect expenses from affiliated fund were as follows:
| | | | |
Six Months Ended June 28, 2013 | | | 0.79 | % |
Year Ended December 31, 2012 | | | 0.79 | % |
Year Ended December 30, 2011 | | | 0.79 | % |
Year Ended December 31, 2010 | | | 0.80 | % |
Year Ended December 31, 2009 | | | 0.76 | % |
Year Ended December 31, 2008 | | | 0.63 | % |
6. The portfolio turnover rate excludes purchase and sale transactions of To Be Announced (TBA) mortgage-related
securities as follows:
| | | | | | | | |
| | | Purchase Transactions | | | Sale Transactions | |
Six Months Ended June 28, 2013 | | | $453,826,271 | | | | $487,912,701 | |
Year Ended December 31, 2012 | | | $930,202,858 | | | | $942,406,652 | |
Year Ended December 30, 2011 | | | $911,850,847 | | | | $909,531,196 | |
Year Ended December 31, 2010 | | | $775,240,942 | | | | $766,486,357 | |
Year Ended December 31, 2009 | | | $977,840,247 | | | | $1,009,549,121 | |
Year Ended December 31, 2008 | | | $1,019,711,829 | | | | $963,377,934 | |
See accompanying Notes to Financial Statements.
18 OPPENHEIMER CORE BOND FUND/VA
| | | | | | | | | | | | | | | | | | | | | | | | |
| Service Shares | | Six Months
Ended
June 28,
20131
(Unaudited) | | | Year Ended
December 31,
2012 | | | Year Ended
December 30,
20111 | | | Year Ended
December 31,
2010 | | | Year Ended
December 31,
2009 | | | Year Ended
December 31,
2008 | |
| |
Per Share Operating Data | | | | | | | | | | | | | | | | | | | | | | | | |
Net asset value, beginning of period | | $ | 8.17 | | | $ | 7.79 | | | $ | 7.65 | | | $ | 6.99 | | | $ | 6.41 | | | $ | 10.98 | |
| |
Income (loss) from investment operations: | | | | | | | | | | | | | | | | | | | | | | | | |
Net investment income2 | | | 0.17 | | | | 0.33 | | | | 0.34 | | | | 0.37 | | | | 0.46 | | | | 0.63 | |
Net realized and unrealized gain (loss) | | | (0.33) | | | | 0.44 | | | | 0.24 | | | | 0.41 | | | | 0.12 | | | | (4.77) | |
| | | | |
Total from investment operations | | | (0.16) | | | | 0.77 | | | | 0.58 | | | | 0.78 | | | | 0.58 | | | | (4.14) | |
| |
Dividends and/or distributions to shareholders: | | | | | | | | | | | | | | | | | | | | | | | | |
Dividends from net investment income | | | (0.40) | | | | (0.39) | | | | (0.44) | | | | (0.12) | | | | 0.00 | | | | (0.43) | |
| |
Net asset value, end of period | | $ | 7.61 | | | $ | 8.17 | | | $ | 7.79 | | | $ | 7.65 | | | $ | 6.99 | | | $ | 6.41 | |
| | | | |
|
| |
Total Return, at Net Asset Value3 | | | (2.05)% | | | | 10.17% | | | | 7.93% | | | | 11.28% | | | | 9.05% | | | | (39.07)% | |
| |
Ratios/Supplemental Data | | | | | | | | | | | | | | | | | | | | | | | | |
Net assets, end of period (in thousands) | | $ | 59,197 | | | $ | 64,694 | | | $ | 62,294 | | | $ | 56,562 | | | $ | 56,717 | | | $ | 63,093 | |
| |
Average net assets (in thousands) | | $ | 62,420 | | | $ | 67,116 | | | $ | 58,629 | | | $ | 57,313 | | | $ | 52,648 | | | $ | 101,597 | |
| |
Ratios to average net assets:4 | | | | | | | | | | | | | | | | | | | | | | | | |
Net investment income | | | 4.16% | | | | 4.07% | | | | 4.42% | | | | 5.06% | | | | 7.16% | | | | 6.55% | |
Total expenses5 | | | 1.03% | | | | 1.02% | | | | 1.02% | | | | 1.04% | | | | 1.01% | | | | 0.88% | |
Expenses after payments, waivers and/or reimbursements and reduction to custodian expenses | | | 1.00% | | | | 1.00% | | | | 1.00% | | | | 0.95% | | | | 0.86% | | | | 0.87% | |
| |
Portfolio turnover rate6 | | | 63 % | | | | 140 % | | | | 99 % | | | | 98 % | | | | 143 % | | | | 51 % | |
1. June 28, 2013 and December 30, 2011 represent the last business day of the Fund’s reporting periods. See Note 1 of the accompanying Notes.
2. Per share amounts calculated based on the average shares outstanding during the period.
3. Assumes an initial investment on the business day before the first day of the fiscal period, with all dividends and distributions reinvested in additional shares on the reinvestment date, and redemption at the net asset value calculated on the last business day of the fiscal period. Total returns are not annualized for periods less than one full year. Total return information does not reflect expenses that apply at the separate account level or to related insurance products. Inclusion of these charges would reduce the total return figures for all periods shown. Returns do not reflect the deduction of taxes that a shareholder would pay on fund distributions or the redemption of fund shares.
4. Annualized for periods less than one full year.
5. Total expenses including indirect expenses from affiliated fund were as follows:
| | | | |
Six Months Ended June 28, 2013 | | | 1.04 | % |
Year Ended December 31, 2012 | | | 1.04 | % |
Year Ended December 30, 2011 | | | 1.04 | % |
Year Ended December 31, 2010 | | | 1.05 | % |
Year Ended December 31, 2009 | | | 1.02 | % |
Year Ended December 31, 2008 | | | 0.88 | % |
6. The portfolio turnover rate excludes purchase and sale transactions of To Be Announced (TBA) mortgage-related
securities as follows:
| | | | | | | | |
| | | Purchase Transactions | | | Sale Transactions | |
Six Months Ended June 28, 2013 | | | $453,826,271 | | | | $487,912,701 | |
Year Ended December 31, 2012 | | | $930,202,858 | | | | $942,406,652 | |
Year Ended December 30, 2011 | | | $911,850,847 | | | | $909,531,196 | |
Year Ended December 31, 2010 | | | $775,240,942 | | | | $766,486,357 | |
Year Ended December 31, 2009 | | | $977,840,247 | | | | $1,009,549,121 | |
Year Ended December 31, 2008 | | | $1,019,711,829 | | | | $963,377,934 | |
See accompanying Notes to Financial Statements.
19 OPPENHEIMER CORE BOND FUND/VA
NOTESTO FINANCIAL STATEMENTS Unaudited
1. Significant Accounting Policies
Oppenheimer Core Bond Fund/VA (the “Fund”) is a separate series of Oppenheimer Variable Account Funds, a diversified open-end management investment company registered under the Investment Company Act of 1940, as amended. The Fund’s main investment objective is to seek total return. The Fund’s investment adviser is OFI Global Asset Management, Inc. (“OFI Global” or the “Manager”), a wholly-owned subsidiary of OppenheimerFunds, Inc. (“OFI” or the “Sub-Adviser”). The Manager has entered into a sub-advisory agreement with OFI. Shares of the Fund are sold only to separate accounts of life insurance companies.
The Fund offers two classes of shares. Both classes are sold at their offering price, which is the net asset value per share, to separate investment accounts of participating insurance companies as an underlying investment for variable life insurance policies, variable annuity contracts or other investment products. The class of shares designated as Service shares is subject to a distribution and service plan. Both classes of shares have identical rights and voting privileges with respect to the Fund in general and exclusive voting rights on matters that affect that class alone. Earnings, net assets and net asset value per share may differ due to each class having its own expenses, such as transfer and shareholder servicing agent fees and shareholder communications, directly attributable to that class.
The following is a summary of significant accounting policies consistently followed by the Fund.
Semiannual and Annual Periods. The Fund’s financial statements are presented through the last day the New York Stock Exchange was open for trading during each reporting period. The Fund’s financial statements have been presented through that date to maintain consistency with the Fund’s net asset value calculations used for shareholder transactions.
Securities on a When-Issued or Delayed Delivery Basis. The Fund may purchase securities on a “when-issued” basis, and may purchase or sell securities on a “delayed delivery” basis. “When-issued” or “delayed delivery” refers to securities whose terms and indenture are available and for which a market exists, but which are not available for immediate delivery. Delivery and payment for securities that have been purchased by the Fund on a when-issued basis normally takes place within six months and possibly as long as two years or more after the trade date. During this period, such securities do not earn interest, are subject to market fluctuation and may increase or decrease in value prior to their delivery. The purchase of securities on a when-issued basis may increase the volatility of the Fund’s net asset value to the extent the Fund executes such transactions while remaining substantially fully invested. When the Fund engages in when-issued or delayed delivery transactions, it relies on the buyer or seller, as the case may be, to complete the transaction. Their failure to do so may cause the Fund to lose the opportunity to obtain or dispose of the security at a price and yield it considers advantageous. The Fund may also sell securities that it purchased on a when-issued basis or forward commitment prior to settlement of the original purchase.
As of June 28, 2013, the Fund had purchased securities issued on a when-issued or delayed delivery basis and sold securities issued on a delayed delivery basis as follows:
| | | | |
| | | When-Issued or Delayed Delivery
Basis Transactions | |
| |
Purchased securities | | | $42,574,071 | |
Sold securities | | | 14,756,408 | |
The Fund may enter into “forward roll” transactions with respect to mortgage-related securities. In this type of transaction, the Fund sells a mortgage-related security to a buyer and simultaneously agrees to repurchase a similar security (same type, coupon and maturity) at a later date at a set price. During the period between the sale and the repurchase, the Fund will not be entitled to receive interest and principal payments on the securities that have been sold. The Fund records the incremental difference between the forward purchase and sale of each forward roll as realized gain (loss) on investments or as fee income in the case of such transactions that have an associated fee in lieu of a difference in the forward purchase and sale price.
Forward roll transactions may be deemed to entail embedded leverage since the Fund purchases mortgage-related securities with extended settlement dates rather than paying for the securities under a normal settlement cycle. This embedded leverage increases the Fund’s market value of investments relative to its net assets which can incrementally increase the volatility of the Fund’s performance. Forward roll transactions can be replicated over multiple settlement periods.
Risks of entering into forward roll transactions include the potential inability of the counterparty to meet the terms of the agreement; the potential of the Fund to receive inferior securities at redelivery as compared to the securities sold to the counterparty; and counterparty credit risk.
Credit Risk. The Fund invests in high-yield, non-investment-grade bonds, which may be subject to a greater degree of credit risk. Credit risk relates to the ability of the issuer to meet interest or principal payments or both as they become due. The Fund may acquire securities that have missed an interest payment, and is not obligated to dispose of securities whose issuers or underlying obligors subsequently miss an interest payment. Information concerning securities not accruing interest as of June 28, 2013 is as follows:
| | | | |
Cost | | $ | 3,281,116 | |
Market Value | | $ | 227,476 | |
Market Value as a % of Net Assets | | | 0.14 | % |
20 OPPENHEIMER CORE BOND FUND/VA
1. Significant Accounting Policies (Continued)
Investment in Oppenheimer Institutional Money Market Fund. The Fund is permitted to invest daily available cash balances in an affiliated money market fund. The Fund may invest the available cash in Class E shares of Oppenheimer Institutional Money Market Fund (“IMMF”) to seek current income while preserving liquidity. IMMF is a registered open-end management investment company, regulated as a money market fund under the Investment Company Act of 1940, as amended. The Manager is the investment adviser of IMMF, and the Sub-Adviser provides investment and related advisory services to IMMF. When applicable, the Fund’s investment in IMMF is included in the Statement of Investments. Shares of IMMF are valued at their net asset value per share. As a shareholder, the Fund is subject to its proportional share of IMMF’s Class E expenses, including its management fee. The Manager will waive fees and/or reimburse Fund expenses in an amount equal to the indirect management fees incurred through the Fund’s investment in IMMF.
Allocation of Income, Expenses, Gains and Losses. Income, expenses (other than those attributable to a specific class), gains and losses are allocated on a daily basis to each class of shares based upon the relative proportion of net assets represented by such class. Operating expenses directly attributable to a specific class are charged against the operations of that class.
Federal Taxes. The Fund intends to comply with provisions of the Internal Revenue Code applicable to regulated investment companies and to distribute substantially all of its investment company taxable income, including any net realized gain on investments not offset by capital loss carryforwards, if any, to shareholders. Therefore, no federal income or excise tax provision is required. The Fund files income tax returns in U.S. federal and applicable state jurisdictions. The statute of limitations on the Fund’s tax return filings generally remain open for the three preceding fiscal reporting period ends.
During the fiscal year ended December 31, 2012, the Fund utilized $5,945,207 of capital loss carryforward to offset capital gains realized in that fiscal year. Details of the fiscal year ended December 31, 2012 capital loss carryforwards are included in the table below. Capital loss carryforwards with no expiration, if any, must be utilized prior to those with expiration dates. Capital losses with no expiration will be carried forward to future years if not offset by gains.
| | | | |
| Expiring | | | |
| |
2016 | | $ | 8,687,891 | |
2017 | | | 75,069,850 | |
| | | | |
Total | | $ | 83,757,741 | |
| | | | |
As of June 28, 2013, it is estimated that the capital loss carryforwards would be $82,673,929 expiring by 2017. The estimated capital loss carryforward represents the carryforward as of the end of the last fiscal year, increased or decreased by capital losses or gains realized in the first six months of the current fiscal year. During the six months ended June 28, 2013, it is estimated that the Fund will utilize $1,083,812 of capital loss carryforward to offset realized capital gains.
Net investment income (loss) and net realized gain (loss) may differ for financial statement and tax purposes. The character of dividends and distributions made during the fiscal year from net investment income or net realized gains may differ from their ultimate characterization for federal income tax purposes. Also, due to timing of dividends and distributions, the fiscal year in which amounts are distributed may differ from the fiscal year in which the income or net realized gain was recorded by the Fund.
The aggregate cost of securities and other investments and the composition of unrealized appreciation and depreciation of securities and other investments for federal income tax purposes as of June 28, 2013 are noted in the following table. The primary difference between book and tax appreciation or depreciation of securities and other investments, if applicable, is attributable to the tax deferral of losses or tax realization of financial statement unrealized gain or loss.
| | | | |
Federal tax cost of securities | | $ | 190,825,465 | |
Federal tax cost of other investments | | | (9,542,382) | |
| | | | |
Total federal tax cost | | $ | 181,283,083 | |
| | | | |
Gross unrealized appreciation | | $ | 5,241,574 | |
Gross unrealized depreciation | | | (8,127,516) | |
| | | | |
Net unrealized depreciation | | $ | (2,885,942) | |
| | | | |
Trustees’ Compensation. The Board of Trustees has adopted a compensation deferral plan for independent trustees that enables trustees to elect to defer receipt of all or a portion of the annual compensation they are entitled to receive from the Fund. For purposes of determining the amount owed to the Trustee under the plan, deferred amounts are treated as though equal dollar amounts had been invested in shares of the Fund or in other Oppenheimer funds selected by the Trustee. The Fund purchases shares of the funds selected for deferral by the Trustee in amounts equal to his or her deemed investment, resulting in a Fund asset equal to the deferred compensation liability. Such assets are included as a component of “Other” within the asset section of the Statement of Assets and Liabilities. Deferral of trustees’ fees under the plan will not affect the net assets of the Fund, and will not materially affect the Fund’s assets, liabilities or net investment income per share. Amounts will be deferred until distributed in accordance with the compensation deferral plan.
21 OPPENHEIMER CORE BOND FUND/VA
NOTESTO FINANCIAL STATEMENTS Unaudited / (Continued)
1. Significant Accounting Policies (Continued)
Dividends and Distributions to Shareholders. Dividends and distributions to shareholders, which are determined in accordance with income tax regulations and may differ from U.S. generally accepted accounting principles, are recorded on the ex-dividend date. Income and capital gain distributions, if any, are declared and paid annually or at other times as deemed necessary by the Manager. The tax character of distributions is determined as of the Fund’s fiscal year end. Therefore, a portion of the Fund’s distributions made to shareholders prior to the Fund’s fiscal year end may ultimately be categorized as a tax return of capital.
Investment Income. Dividend income is recorded on the ex-dividend date or upon ex-dividend notification in the case of certain foreign dividends where the ex-dividend date may have passed. Non-cash dividends included in dividend income, if any, are recorded at the fair market value of the securities received. Interest income is recognized on an accrual basis. Discount and premium, which are included in interest income on the Statement of Operations, are amortized or accreted daily.
Custodian Fees. “Custodian fees and expenses” in the Statement of Operations may include interest expense incurred by the Fund on any cash overdrafts of its custodian account during the period. Such cash overdrafts may result from the effects of failed trades in portfolio securities and from cash outflows resulting from unanticipated shareholder redemption activity. The Fund pays interest to its custodian on such cash overdrafts, to the extent they are not offset by positive cash balances maintained by the Fund, at a rate equal to the Federal Funds Rate plus 0.50%. The “Reduction to custodian expenses” line item, if applicable, represents earnings on cash balances maintained by the Fund during the period. Such interest expense and other custodian fees may be paid with these earnings.
Security Transactions. Security transactions are recorded on the trade date. Realized gains and losses on securities sold are determined on the basis of identified cost.
Indemnifications. The Fund’s organizational documents provide current and former trustees and officers with a limited indemnification against liabilities arising in connection with the performance of their duties to the Fund. In the normal course of business, the Fund may also enter into contracts that provide general indemnifications. The Fund’s maximum exposure under these arrangements is unknown as this would be dependent on future claims that may be made against the Fund. The risk of material loss from such claims is considered remote.
Other. The preparation of financial statements in conformity with accounting principles generally accepted in the United States of America requires management to make estimates and assumptions that affect the reported amounts of assets and liabilities and disclosure of contingent assets and liabilities at the date of the financial statements and the reported amounts of increases and decreases in net assets from operations during the reporting period. Actual results could differ from those estimates.
2. Securities Valuation
The Fund calculates the net asset value of its shares as of the close of the New York Stock Exchange (the “Exchange”), normally 4:00 P.M. Eastern time, on each day the Exchange is open for trading.
The Fund’s Board has adopted procedures for the valuation of the Fund’s securities and has delegated the day-to-day responsibility for valuation determinations under those procedures to the Manager. The Manager has established a Valuation Committee which is responsible for determining a “fair valuation” for any security for which market quotations are not “readily available.” The Valuation Committee’s fair valuation determinations are subject to review, approval and ratification by the Fund’s Board at its next regularly scheduled meeting covering the calendar quarter in which the fair valuation was determined.
Valuation Methods and Inputs
Securities are valued using unadjusted quoted market prices, when available, as supplied primarily by third party pricing services or dealers.
The following methodologies are used to determine the market value or the fair value of the types of securities described below:
Securities traded on a registered U.S. securities exchange (including exchange-traded derivatives other than futures and futures options) are valued based on the last sale price of the security reported on the principal exchange on which it is traded, prior to the time when the Fund’s assets are valued. In the absence of a sale, the security is valued at the last sale price on the prior trading day, if it is within the spread of the current day’s closing “bid” and “asked” prices, and if not, at the current day’s closing bid price. A security of a foreign issuer traded on a foreign exchange but not listed on a registered U.S. securities exchange is valued based on the last sale price on the principal exchange on which the security is traded, as identified by the third party pricing service used by the Manager, prior to the time when the Fund’s assets are valued. If the last sale price is unavailable, the security is valued at the most recent official closing price on the principal exchange on which it is traded. If the last sales price or official closing price for a foreign security is not available, the security is valued at the mean between the bid and asked price per the exchange or, if not available from the exchange, obtained from two dealers. If bid and asked prices are not available from either the exchange or two dealers, the security is valued by using one of the following methodologies (listed in order of priority); (1) using a bid from the exchange, (2) the mean between the bid and asked price as provided by a single dealer, or (3) a bid from a single dealer.
Shares of a registered investment company that are not traded on an exchange are valued at that investment company’s net asset value per share.
22 OPPENHEIMER CORE BOND FUND/VA
2. Securities Valuation (Continued)
Corporate and government debt securities (of U.S. or foreign issuers) and municipal debt securities, event-linked bonds, loans, mortgage-backed securities, collateralized mortgage obligations, and asset-backed securities are valued at the mean between the “bid” and “asked” prices utilizing evaluated prices obtained from third party pricing services or broker-dealers who may use matrix pricing methods to determine the evaluated prices.
Short-term money market type debt securities with a remaining maturity of sixty days or less are valued at cost adjusted by the amortization of discount or premium to maturity (amortized cost), which approximates market value. Short-term debt securities with a remaining maturity in excess of sixty days are valued at the mean between the “bid” and “asked” prices utilizing evaluated prices obtained from third party pricing services or broker-dealers.
Structured securities, swaps, swaptions, and other over-the-counter derivatives are valued utilizing evaluated prices obtained from third party pricing services or broker-dealers.
Futures contracts and futures options traded on a commodities or futures exchange will be valued at the final settlement price or official closing price on the principal exchange as reported by such principal exchange at its trading session ending at, or most recently prior to, the time when the Fund’s assets are valued.
A description of the standard inputs that may generally be considered by the third party pricing vendors in determining their evaluated prices is provided below.
| | |
| Security Type | | Standard inputs generally considered by third-party pricing vendors |
| Corporate debt, government debt, municipal, mortgage-backed and asset-backed securities | | Reported trade data, broker-dealer price quotations, benchmark yields, issuer spreads on comparable securities, the credit quality, yield, maturity, and other appropriate factors. |
| Loans | | Information obtained from market participants regarding reported trade data and broker-dealer price quotations. |
| Event-linked bonds | | Information obtained from market participants regarding reported trade data and broker-dealer price quotations. |
| Structured securities | | Relevant market information such as the price of underlying financial instruments, stock market indices, foreign currencies, interest rate spreads, commodities, or the occurrence of other specific events. |
| Swaps | | Relevant market information, including underlying reference assets such as credit spreads, credit event probabilities, index values, individual security values, forward interest rates, variable interest rates, volatility measures, and forward currency rates. |
If a market value or price cannot be determined for a security using the methodologies described above, or if, in the “good faith” opinion of the Manager, the market value or price obtained does not constitute a “readily available market quotation,” or a significant event has occurred that would materially affect the value of the security the security is fair valued either (i) by a standardized fair valuation methodology applicable to the security type or the significant event as previously approved by the Valuation Committee and the Fund’s Board or (ii) as determined in good faith by the Manager’s Valuation Committee. The Valuation Committee considers all relevant facts that are reasonably available, through either public information or information available to the Manager, when determining the fair value of a security. Fair value determinations by the Manager are subject to review, approval and ratification by the Fund’s Board at its next regularly scheduled meeting covering the calendar quarter in which the fair valuation was determined. Those fair valuation standardized methodologies include, but are not limited to, valuing securities at the last sale price or initially at cost and subsequently adjusting the value based on: changes in company specific fundamentals, changes in an appropriate securities index, or changes in the value of similar securities which may be further adjusted for any discounts related to security-specific resale restrictions. When possible, such methodologies use observable market inputs such as unadjusted quoted prices of similar securities, observable interest rates, currency rates and yield curves. The methodologies used for valuing securities are not necessarily an indication of the risks associated with investing in those securities nor can it be assured that the Fund can obtain the fair value assigned to a security if it were to sell the security.
To assess the continuing appropriateness of security valuations, the Manager, or its third party service provider who is subject to oversight by the Manager, regularly compares prior day prices, prices on comparable securities, and sale prices to the current day prices and challenges those prices exceeding certain tolerance levels with the third party pricing service or broker source. For those securities valued by fair valuations, whether through a standardized fair valuation methodology or a fair valuation determination, the Valuation Committee reviews and affirms the reasonableness of the valuations based on such methodologies and fair valuation determinations on a regular basis after considering all relevant information that is reasonably available.
Classifications
Each investment asset or liability of the Fund is assigned a level at measurement date based on the significance and source of the inputs to its valuation. Various data inputs are used in determining the value of each of the Fund’s investments as of the reporting period end. These data inputs are categorized in the following hierarchy under applicable financial accounting standards:
1) Level 1-unadjusted quoted prices in active markets for identical assets or liabilities (including securities actively traded on a securities exchange)
2) Level 2-inputs other than unadjusted quoted prices that are observable for the asset or liability (such as unadjusted quoted prices for similar assets and market corroborated inputs such as interest rates, prepayment speeds, credit risks, etc.)
3) Level 3-significant unobservable inputs (including the Manager’s own judgments about assumptions that market participants would use in pricing the asset or liability).
The inputs used for valuing securities are not necessarily an indication of the risks associated with investing in those securities.
23 OPPENHEIMER CORE BOND FUND/VA
NOTESTO FINANCIAL STATEMENTS Unaudited / (Continued)
2. Securities Valuation (Continued)
The table below categorizes amounts that are included in the Fund’s Statement of Assets and Liabilities as of June 28, 2013 based on valuation input level:
| | | | | | | | | | | | | | | | |
| | | Level 1—
Unadjusted
Quoted Prices | | | Level 2— Other Significant
Observable Inputs | | | Level 3— Significant Unobservable Inputs | | | Value | |
| |
Assets Table | | | | | | | | | | | | | | | | |
Investments, at Value: | | | | | | | | | | | | | | | | |
Asset-Backed Securities | | $ | — | | | $ | 24,690,472 | | | $ | — | | | $ | 24,690,472 | |
Mortgage-Backed Obligations | | | — | | | | 68,780,551 | | | | 309,549 | | | | 69,090,100 | |
Corporate Bonds and Notes | | | — | | | | 69,461,818 | | | | — | | | | 69,461,818 | |
U.S. Government Obligations | | | — | | | | 3,451,209 | | | | — | | | | 3,451,209 | |
Investment Company | | | 21,518,986 | | | | — | | | | — | | | | 21,518,986 | |
| | | | |
Total Investments, at Value | | | 21,518,986 | | | | 166,384,050 | | | $ | 309,549 | | | | 188,212,585 | |
Other Financial Instruments: | | | | | | | | | | | | | | | | |
Variation margin receivable | | | 65,412 | | | | — | | | | — | | | | 65,412 | |
| | | | |
Total Assets | | $ | 21,584,398 | | | $ | 166,384,050 | | | $ | 309,549 | | | $ | 188,277,997 | |
| | | | |
| | | | |
Liabilities Table | | | | | | | | | | | | | | | | |
Other Financial Instruments: | | | | | | | | | | | | | | | | |
Variation margin payable | | $ | (3,383 | ) | | $ | — | | | $ | — | | | $ | (3,383) | |
Swaps, at value | | | — | | | | (52,710 | ) | | | — | | | | (52,710) | |
| | | | |
Total Liabilities | | $ | (3,383 | ) | | $ | (52,710 | ) | | $ | — | | | $ | (56,093) | |
| | | | |
Currency contracts and forwards, if any, are reported at their unrealized appreciation/ depreciation at measurement date, which represents the change in the contract’s value from trade date. Futures, if any, are reported at their variation margin at measurement date, which represents the amount due to/from the Fund at that date. All additional assets and liabilities included in the above table are reported at their market value at measurement date.
3. Shares of Beneficial Interest
The Fund has authorized an unlimited number of $0.001 par value shares of beneficial interest of each class. Transactions in shares of beneficial interest were as follows:
| | | | | | | | | | | | | | | | |
| | | Six Months Ended June 28, 2013 | | | Year Ended December 31, 2012 | |
| | | Shares | | | Amount | | | Shares | | | Amount | |
| |
Non-Service Shares | | | | | | | | | | | | | | | | |
Sold | | | 284,152 | | | $ | 2,358,549 | | | | 1,396,350 | | | $ | 11,307,630 | |
Dividends and/or distributions reinvested | | | 682,873 | | | | 5,333,237 | | | | 749,731 | | | | 5,870,393 | |
Redeemed | | | (1,832,690) | | | | (15,177,921) | | | | (3,505,581) | | | | (28,374,155) | |
| | | | |
Net decrease | | | (865,665) | | | $ | (7,486,135) | | | | (1,359,500) | | | $ | (11,196,132) | |
| | | | |
| |
Service Shares | | | | | | | | | | | | | | | | |
Sold | | | 1,065,457 | | | $ | 8,781,923 | | | | 3,789,524 | | | $ | 30,414,887 | |
Dividends and/or distributions reinvested | | | 388,743 | | | | 3,004,981 | | | | 433,134 | | | | 3,356,788 | |
Redeemed | | | (1,593,831) | | | | (13,003,853) | | | | (4,293,364) | | | | (34,424,354) | |
| | | | |
Net decrease | | | (139,631) | | | $ | (1,216,949) | | | | (70,706) | | | $ | (652,679) | |
| | | | |
4. Purchases and Sales of Securities
The aggregate cost of purchases and proceeds from sales of securities, other than short-term obligations and investments in IMMF, for the six months ended June 28, 2013, were as follows:
| | | | | | | | | | |
| | | Purchases | | | | | Sales | |
| |
Investment securities | | $ | 82,714,317 | | | | | $ | 87,810,116 | |
U.S. government and government obligations | | | 4,952,730 | | | | | | 6,493,536 | |
To Be Announced (TBA) mortgage-related securities | | | 453,826,271 | | | | | | 478,912,701 | |
5. Fees and Other Transactions with Affiliates
Management Fees. Under the investment advisory agreement, the Fund pays the Manager a management fee based on the daily net assets of the Fund at an annual rate as shown in the following table:
| | | | |
| Fee Schedule | | | |
| |
Up to $1 billion | | | 0.60% | |
Over $1 billion | | | 0.50 | |
24 OPPENHEIMER CORE BOND FUND/VA
5. Fees and Other Transactions with Affiliates (Continued)
Sub-Adviser Fees. The Manager has retained the Sub-Adviser to provide the day-to-day portfolio management of the Fund. Under the Sub-Advisory Agreement, the Manager pays the Sub-Adviser an annual fee in monthly installments, equal to a percentage of the investment management fee collected by the Manager from the Fund, which shall be calculated after any investment management fee waivers. The fee paid to the Sub-Adviser is paid by the Manager, not by the Fund.
Transfer Agent Fees. OFI Global (the “Transfer Agent”) serves as the transfer and shareholder servicing agent for the Fund. Fees incurred by the Fund with respect to these services are detailed in the Statement of Operations.
Sub-Transfer Agent Fees. The Transfer Agent has retained Shareholder Services, Inc., a wholly-owned subsidiary of OFI (the “Sub-Transfer Agent”), to provide the day-to-day transfer agent and shareholder servicing of the Fund. Under the Sub-Transfer Agency Agreement, the Transfer Agent pays the Sub-Transfer Agent an annual fee in monthly installments, equal to a percentage of the transfer agent fee collected by the Transfer Agent from the Fund, which shall be calculated after any applicable fee waivers. The fee paid to the Sub-Transfer Agent is paid by the Transfer Agent, not by the Fund.
Distribution and Service Plan for Service Shares. The Fund has adopted a Distribution and Service Plan (the “Plan”) in accordance with Rule 12b-1 under the Investment Company Act of 1940 for Service shares to pay OppenheimerFunds Distributor, Inc. (the “Distributor”), for distribution related services, personal service and account maintenance for the Fund’s Service shares. Under the Plan, payments are made periodically at an annual rate of 0.25% of the daily net assets of Service shares of the Fund. The Distributor currently uses all of those fees to compensate sponsors of the insurance product that offers Fund shares, for providing personal service and maintenance of accounts of their variable contract owners that hold Service shares. These fees are paid out of the Fund’s assets on an on-going basis and increase operating expenses of the Service shares, which results in lower performance compared to the Fund’s shares that are not subject to a service fee. Fees incurred by the Fund under the Plan are detailed in the Statement of Operations.
Waivers and Reimbursements of Expenses. The Manager has voluntarily agreed to limit the Fund’s expenses after payments, waivers and/or reimbursements and reduction to custodian expenses, excluding expenses incurred directly or indirectly by the Fund as a result of investments in other investment companies, wholly-owned subsidiaries and pooled investment vehicles; so that those expenses, as percentages of daily net assets, will not exceed the annual rate of 0.75% for Non-Service shares and 1.00% for Service shares. During the six months ended June 28, 2013, the Manager waived fees and/or reimbursed the Fund $10,930 and $6,364 for Non-Service and Service shares, respectively.
The Manager will waive fees and/or reimburse Fund expenses in an amount equal to the indirect management fees incurred through the Fund’s investment in IMMF. During the six months ended June 28, 2013, the Manager waived fees and/or reimbursed the Fund $11,769 for IMMF management fees.
Some of these undertakings may be modified or terminated at any time; some may not be modified or terminated until after one year from the date of the current prospectus, as indicated therein.
6. Risk Exposures and the Use of Derivative Instruments
The Fund’s investment objectives not only permit the Fund to purchase investment securities, they also allow the Fund to enter into various types of derivatives contracts, including, but not limited to, futures contracts, forward currency exchange contracts, credit default swaps, interest rate swaps, total return swaps, and purchased and written options. In doing so, the Fund will employ strategies in differing combinations to permit it to increase, decrease, or change the level or types of exposure to market risk factors. These instruments may allow the Fund to pursue its objectives more quickly and efficiently than if it were to make direct purchases or sales of securities capable of effecting a similar response to market factors. Such contracts may be entered into through a bilateral over-the-counter (“OTC”) transaction, or through a securities or futures exchange and cleared through a clearinghouse.
Market Risk Factors. In accordance with its investment objectives, the Fund may use derivatives to increase or decrease its exposure to one or more of the following market risk factors:
Commodity Risk. Commodity risk relates to the change in value of commodities or commodity indexes as they relate to increases or decreases in the commodities market. Commodities are physical assets that have tangible properties. Examples of these types of assets are crude oil, heating oil, metals, livestock, and agricultural products.
Credit Risk. Credit risk relates to the ability of the issuer to meet interest and principal payments, or both, as they come due. In general, lower-grade, higher-yield bonds are subject to credit risk to a greater extent than lower-yield, higher-quality bonds.
Equity Risk. Equity risk relates to the change in value of equity securities as they relate to increases or decreases in the general market.
Foreign Exchange Rate Risk. Foreign exchange rate risk relates to the change in the U.S. dollar value of a security held that is denominated in a foreign currency. The U.S. dollar value of a foreign currency denominated security will decrease as the dollar appreciates against the currency, while the U.S. dollar value will increase as the dollar depreciates against the currency.
Interest Rate Risk. Interest rate risk refers to the fluctuations in value of fixed-income securities resulting from the inverse relationship between price and yield. For example, an increase in general interest rates will tend to reduce the market value of already issued fixed-income investments, and a decline in general interest rates will tend to increase their value. In addition, debt securities with longer maturities, which tend to have higher yields, are subject to potentially greater fluctuations in value from changes in interest rates than obligations with shorter maturities.
25 OPPENHEIMER CORE BOND FUND/VA
NOTESTO FINANCIAL STATEMENTS Unaudited / (Continued)
6. Risk Exposures and the Use of Derivative Instruments (Continued)
Volatility Risk. Volatility risk refers to the magnitude of the movement, but not the direction of the movement, in a financial instrument’s price over a defined time period. Large increases or decreases in a financial instrument’s price over a relative time period typically indicate greater volatility risk, while small increases or decreases in its price typically indicate lower volatility risk.
Derivatives may have little or no initial cash investment relative to their market value exposure and therefore can produce significant gains or losses in excess of their cost due to unanticipated changes in the market risk factors and the overall market. This use of embedded leverage allows the Fund to increase its market value exposure relative to its net assets and can substantially increase the volatility of the Fund’s performance. In instances where the Fund is using derivatives to decrease, or hedge, exposures to market risk factors for securities held by the Fund, there are also risks that those derivatives may not perform as expected resulting in losses for the combined or hedged positions. Some derivatives have the potential for unlimited loss, regardless of the size of the Fund’s initial investment.
Additional associated risks from investing in derivatives also exist and potentially could have significant effects on the valuation of the derivative and the Fund. Typically, the associated risks are not the risks that the Fund is attempting to increase or decrease exposure to, per its investment objectives, but are the additional risks from investing in derivatives. Examples of these associated risks are liquidity risk, which is the risk that the Fund will not be able to sell the derivative in the open market in a timely manner, and counterparty credit risk, which is the risk that the counterparty will not fulfill its obligation to the Fund.
The Fund’s actual exposures to these market risk factors and associated risks during the period are discussed in further detail, by derivative type, below.
Futures Contracts
A futures contract is a commitment to buy or sell a specific amount of a commodity, financial instrument or currency at a negotiated price on a stipulated future date. The Fund may buy and sell futures contracts and may also buy or write put or call options on these futures contracts. Futures contracts and options thereon are generally entered into on a regulated futures exchange and cleared through a clearinghouse associated with the exchange.
Upon entering into a futures contract, the Fund is required to deposit either cash or securities (initial margin) in an amount equal to a certain percentage of the contract value in an account registered in the futures commission merchant’s name. Subsequent payments (variation margin) are paid to or from the futures commission merchant each day equal to the daily changes in the contract value. Such payments are recorded as unrealized gains and losses. Should the Fund fail to make requested variation margin payments, the futures commission merchant can gain access to the initial margin to satisfy the Fund’s payment obligations.
Futures contracts are reported on a schedule following the Statement of Investments. Securities held by a futures commission merchant to cover initial margin requirements on open futures contracts are noted in the Statement of Investments. Cash held by a futures commission merchant to cover initial margin requirements on open futures contracts and the receivable and/or payable for the daily mark to market for the variation margin are noted in the Statement of Assets and Liabilities. The net change in unrealized appreciation and depreciation is reported in the Statement of Operations. Realized gains (losses) are reported in the Statement of Operations at the closing or expiration of futures contracts.
The Fund has purchased futures contracts on various bonds and notes to increase exposure to interest rate risk.
The Fund has sold futures contracts on various bonds and notes to decrease exposure to interest rate risk.
During the six months ended June 28, 2013, the Fund had an ending monthly average market value of $9,561,932 and $34,794,313 on futures contracts purchased and sold, respectively.
Additional associated risks of entering into futures contracts (and related options) include the possibility that there may be an illiquid market where the Fund is unable to liquidate the contract or enter into an offsetting position and, if used for hedging purposes, the risk that the price of the contract will correlate imperfectly with the prices of the Fund’s securities.
Swap Contracts
The Fund may enter into swap contract agreements with a counterparty to exchange a series of cash flows based on either specified reference rates, the price or volatility of asset or non-asset references, or the occurrence of a credit event, over a specified period. Swaps can be executed in a bi-lateral privately negotiated arrangement with a dealer in an OTC transaction (“OTC swaps”) or executed on a regulated market. Certain swaps, regardless of the venue of their execution, are required to be cleared through a clearinghouse (“cleared swaps”). Swap contracts may include interest rate, equity, debt, index, total return, credit default, currency and volatility swaps.
Swap contracts are reported on a schedule following the Statement of Investments. Daily changes in the value of cleared swaps are reported as variation margin receivable or payable on the Statement of Assets and Liabilities. The values of OTC swap contracts are aggregated by positive and negative values and disclosed separately on the Statement of Assets and Liabilities. The unrealized appreciation (depreciation) related to the change in the valuation of the notional amount of the swap is combined with the accrued interest due to (owed by) the Fund, if any, at termination or settlement. The net change in this amount during the period is included on the Statement of Operations. The Fund also records any periodic payments received from (paid to) the counterparty, including at termination, under such contracts as realized gain (loss) on the Statement of Operations.
Swap contract agreements are exposed to the market risk factor of the specific underlying reference rate or asset. Swap contracts are typically more attractively priced compared to similar investments in related cash securities because they isolate the risk to one market risk factor and eliminate the other market risk factors. Investments in cash securities (for instance bonds) have exposure to multiple risk factors (credit and interest rate risk). Because swaps have embedded leverage, they can expose the Fund to substantial risk in the isolated market risk factor.
26 OPPENHEIMER CORE BOND FUND/VA
6. Risk Exposures and the Use of Derivative Instruments (Continued)
Credit Default Swap Contracts. A credit default swap is a contract that enables an investor to buy or sell protection against a defined-issuer credit event, such as the issuer’s failure to make timely payments of interest or principal on a debt security, bankruptcy or restructuring. The Fund may enter into credit default swaps either by buying or selling protection on a corporate issuer, sovereign issuer, or a basket or index of issuers (the “reference asset”).
The buyer of protection pays a periodic fee to the seller of protection based on the notional amount of the swap contract. The seller of protection agrees to compensate the buyer of protection for future potential losses as a result of a credit event on the reference asset. The contract effectively transfers the credit event risk of the reference asset from the buyer of protection to the seller of protection.
The ongoing value of the contract will fluctuate throughout the term of the contract based primarily on the credit risk of the reference asset. If the credit quality of the reference asset improves relative to the credit quality at contract initiation, the buyer of protection may have an unrealized loss greater than the anticipated periodic fee owed. This unrealized loss would be the result of current credit protection being cheaper than the cost of credit protection at contract initiation. If the buyer elects to terminate the contract prior to its maturity, and there has been no credit event, this unrealized loss will become realized. If the contract is held to maturity, and there has been no credit event, the realized loss will be equal to the periodic fee paid over the life of the contract.
If there is a credit event, the buyer of protection can exercise its rights under the contract and receive a payment from the seller of protection equal to the notional amount of the swap less the market value of specified debt securities issued by the reference asset. Upon exercise of the contract the difference between such value and the notional amount is recorded as realized gain (loss) and is included on the Statement of Operations.
The Fund has purchased credit protection through credit default swaps to decrease exposure to the credit risk of individual issuers and/or indexes of issuers.
For the six months ended June 28, 2013, the Fund had ending monthly average notional amounts of $1,057,143 on credit default swaps to buy protection.
Additional associated risks to the Fund include counterparty credit risk and liquidity risk.
Counterparty Credit Risk. Derivative positions are subject to the risk that the counterparty will not fulfill its obligation to the Fund. The Fund intends to enter into derivative transactions with counterparties that the Manager believes to be creditworthy at the time of the transaction.
The Fund’s risk of loss from counterparty credit risk on OTC derivatives is generally limited to the aggregate unrealized gain netted against any collateral held by the Fund. For OTC options purchased, the Fund bears the risk of loss of the amount of the premiums paid plus the positive change in market values net of any collateral held by the Fund should the counterparty fail to perform under the contracts. Options written by the Fund do not typically give rise to counterparty credit risk, as options written generally obligate the Fund and not the counterparty to perform.
To reduce counterparty risk with respect to OTC transactions, the Fund has entered into master netting arrangements, established within the Fund’s International Swap and Derivatives Association, Inc. (“ISDA”) master agreements, which allow the Fund to make (or to have an entitlement to receive) a single net payment in the event of default (close-out netting) for outstanding payables and receivables with respect to certain OTC positions in swaps, options, swaptions, and forward currency exchange contracts for each individual counterparty. In addition, the Fund may require that certain counterparties post cash and/or securities in collateral accounts to cover their net payment obligations for those derivative contracts subject to ISDA master agreements. If the counterparty fails to perform under these contracts and agreements, the cash and/or securities will be made available to the Fund.
Certain ISDA master agreements include credit related contingent features which allow counterparties to OTC derivatives to terminate derivative contracts prior to maturity in the event the Fund’s net assets decline by a stated percentage or the Fund fails to meet the terms of its ISDA master agreements, which would cause the Fund to accelerate payment of any net liability owed to the counterparty. As of June 28, 2013, the aggregate fair value of derivative instruments with such credit related contingent features in a net liability position was $52,710 for which the Fund has posted collateral of $219,613.
For financial reporting purposes, the Fund does not offset derivative assets and derivative liabilities that are subject to netting arrangements in the Statement of Assets and Liabilities. Bankruptcy or insolvency laws of a particular jurisdiction may impose restrictions on or prohibitions against the right of offset in bankruptcy, insolvency or other events.
The Fund’s risk of loss from counterparty credit risk on exchange-traded derivatives cleared through a clearinghouse and for cleared swaps is generally considered lower than as compared to OTC derivatives. However, counterparty credit risk exists with respect to initial and variation margin deposited/paid by the Fund that is held in futures commission merchant, broker and/or clearinghouse accounts for such exchange-traded derivatives and for cleared swaps.
With respect to cleared swaps, such transactions will be submitted for clearing, and if cleared, will be held in accounts at futures commission merchants or brokers that are members of clearinghouses. While brokers, futures commission merchants and clearinghouses are required to segregate customer margin from their own assets, in the event that a broker, futures commission merchant or clearinghouse becomes insolvent or goes into bankruptcy and at that time there is a shortfall in the aggregate amount of margin held by the broker, futures commission merchant or clearinghouse for all its customers, U.S. bankruptcy laws will typically allocate that shortfall on a pro-rata basis across all the broker’s, futures commission merchant’s or clearinghouse’s customers, potentially resulting in losses to the Fund.
27 OPPENHEIMER CORE BOND FUND/VA
NOTESTO FINANCIAL STATEMENTS Unaudited / (Continued)
6. Risk Exposures and the Use of Derivative Instruments (Continued)
There is the risk that a broker, futures commission merchant or clearinghouse will decline to clear a transaction on the Fund’s behalf, and the Fund may be required to pay a termination fee to the executing broker with whom the Fund initially enters into the transaction. Clearinghouses may also be permitted to terminate cleared swaps at any time. The Fund is also subject to the risk that the broker or futures commission merchant will improperly use the Fund’s assets deposited/paid as initial or variation margin to satisfy payment obligations of another customer. In the event of a default by another customer of the broker or futures commission merchant, the Fund might not receive its variation margin payments from the clearinghouse, due to the manner in which variation margin payments are aggregated for all customers of the broker/futures commission merchant.
Collateral and margin requirements differ by type of derivative. Margin requirements are established by the broker, futures commission merchant or clearinghouse for exchange-traded and cleared derivatives, including cleared swaps. Brokers, futures commission merchants and clearinghouses can ask for margin in excess of the regulatory minimum, or increase the margin amount, in certain circumstances.
Collateral terms are contract specific for OTC derivatives. For derivatives traded under an ISDA master agreement, the collateral requirements are typically calculated by netting the mark to market amount for each transaction under such agreement and comparing that amount to the value of any collateral currently pledged by the Fund or the counterparty.
For financial reporting purposes, cash collateral that has been pledged to cover obligations of the Fund, if any, is reported separately on the Statement of Assets and Liabilities as cash pledged as collateral. Non-cash collateral pledged by the Fund, if any, is noted in the Schedule of Investments. Generally, the amount of collateral due from or to a party must exceed a minimum transfer amount threshold (e.g. $250,000) before a transfer has to be made. To the extent amounts due to the Fund from its counterparties are not fully collateralized, contractually or otherwise, the Fund bears the risk of loss from counterparty nonperformance.
The following table presents by counterparty the Fund’s OTC derivative assets net of the related collateral posted for the benefit of the Fund at June 28, 2013:
| | | | | | | | | | |
| | | | | Gross Amounts Not Offset in the Statement of Assets and Liabilities | | |
| Counterparty | | Gross Amount of
Assets in the
Statement of
Assets and Liabilities* | | Financial
Instruments
Available
for Offset | | Financial
Instruments
Collateral
Received** | | Cash Collateral
Received** | | Net Amount |
|
| | | | | |
Deutsche Bank AG | | $ — | | $ — | | $ — | | $ — | | $ — |
*OTC derivatives are reported gross on the Statement of Assets and Liabilities. Exchange traded options and margin related to cleared swaps and futures are excluded from these reported amounts.
**Reported collateral posted for the benefit of the Fund within this table is limited to the net outstanding amount due from an individual counterparty. The collateral posted for the benefit of the Fund may exceed these amounts.
The following table presents by counterparty the Fund’s OTC derivative liabilities net of the related collateral pledged by the Fund at June 28, 2013:
| | | | | | | | | | |
| | | | | Gross Amounts Not Offset in the Statement of Assets and Liabilities | | |
| Counterparty | | Gross Amount of
Liabilities in the
Statement of
Assets and Liabilities* | | Financial
Instruments
Available
for Offset | | Financial
Instruments
Collateral
Pledged** | | Cash Collateral
Pledged** | | Net Amount |
|
| | | | | |
Deutsche Bank AG | | $ (52,710) | | $ — | | $ — | | $ 52,710 | | $ — |
*OTC derivatives are reported gross on the Statement of Assets and Liabilities. Exchange traded options and margin related to cleared swaps and futures are excluded from these reported amounts.
**Reported collateral pledged within this table is limited to the net outstanding amount due from the Fund to an individual counterparty. The securities pledged as collateral by the Fund as reported on the Statement of Investments may exceed these reported amounts.
The following table presents the valuations of derivative instruments by risk exposure as reported within the Statement of Assets and Liabilities as of June 28, 2013:
| | | | | | | | | | | | |
| | | Asset Derivatives | | | Liability Derivatives | |
Derivatives Not Accounted for as Hedging
Instruments | | Statement of Assets and
Liabilities Location | | Value | | | Statement of Assets and
Liabilities Location | | Value | |
| | | | |
Credit contracts | | | | $ | — | | | Swaps, at value | | $ | 52,710 | |
| | | | |
Interest rate contracts | | Variation margin receivable | | | 65,412 | * | | Variation margin payable | | | 3,383 | * |
| | | | | | | | | | | | |
| | | | |
Total | | | | $ | 65,412 | | | | | $ | 56,093 | |
| | | | | | | | | | | | |
*Includes only the current day’s variation margin. Prior variation margin movements have been reflected in cash on the Statement of Assets and Liabilities upon receipt or payment.
28 OPPENHEIMER CORE BOND FUND/VA
6. Risk Exposures and the Use of Derivative Instruments (Continued)
The effect of derivative instruments on the Statement of Operations is as follows:
| | | | | | | | | | | | |
| Amount of Realized Gain or (Loss) Recognized on Derivatives | |
| |
| Derivatives Not Accounted for as Hedging Instruments | | Closing and
expiration of
futures
contracts | | | Swap
contracts | | | Total | |
| |
| | | |
Credit contracts | | $ | — | | | $ | (46,747) | | | $ | (46,747) | |
| | | |
Interest rate contracts | | | (25,569) | | | | — | | | | (25,569) | |
| | | | |
| | | |
Total | | $ | (25,569) | | | $ | (46,747) | | | $ | (72,316) | |
| | | | |
|
| Amount of Change in Unrealized Gain or (Loss) Recognized on Derivatives | |
| |
| Derivatives Not Accounted for as Hedging Instruments | | Futures
contracts | | | Swap
contracts | | | Total | |
| |
| | | |
Credit contracts | | $ | — | | | $ | (26,783) | | | $ | (26,783) | |
| | | |
Interest rate contracts | | | (220,775) | | | | — | | | | (220,775) | |
| | | | |
| | | |
Total | | $ | (220,775) | | | $ | (26,783) | | | $ | (247,558) | |
| | | | |
7. Restricted Securities
As of June 28, 2013, investments in securities included issues that are restricted. A restricted security may have a contractual restriction on its resale and is valued under methods approved by the Board of Trustees as reflecting fair value. Securities that are restricted are marked with an applicable footnote on the Statement of Investments. Restricted securities are reported on a schedule following the Statement of Investments.
8. Pending Litigation
Since 2009, a number of class action lawsuits have been pending in federal courts against OppenheimerFunds, Inc. (“OFI”), OppenheimerFunds Distributor, Inc., the Fund’s principal underwriter and distributor (the “Distributor”), and certain funds (but not including the Fund) advised by the Manager and distributed by the Distributor (the “Defendant Funds”). Several of these lawsuits also name as defendants certain officers and current and former trustees of the respective Defendant Funds. The lawsuits raise claims under federal securities law and allege, among other things, that the disclosure documents of the respective Defendant Funds contained misrepresentations and omissions and that the respective Defendant Funds’ investment policies were not followed. The plaintiffs in these actions seek unspecified damages, equitable relief and awards of attorneys’ fees and litigation expenses. The Defendant Funds’ Boards of Trustees have also engaged counsel to represent the Funds and the present and former Independent Trustees named in those suits.
Other class action and individual lawsuits have been filed since 2008 in various state and federal courts against OFI and certain of its affiliates by investors seeking to recover investments they allegedly lost as a result of the “Ponzi” scheme run by Bernard L. Madoff and his firm, Bernard L. Madoff Investment Securities, LLC (“BLMIS”). Plaintiffs in these suits allege that they suffered losses as a result of their investments in several funds managed by an affiliate of OFI and assert a variety of claims, including breach of fiduciary duty, fraud, negligent misrepresentation, unjust enrichment, and violation of federal and state securities laws and regulations, among others. They seek unspecified damages, equitable relief and awards of attorneys’ fees and litigation expenses. Neither the Distributor, nor any of the Oppenheimer mutual funds, their independent trustees or directors are named as defendants in these lawsuits. None of the Oppenheimer mutual funds invested in any funds or accounts managed by Madoff or BLMIS. On February 28, 2011, a stipulation of partial settlement of three groups of consolidated putative class action lawsuits relating to these matters was filed in the U.S. District Court for the Southern District of New York. On August 19, 2011, the court entered an order and final judgment approving the settlement as fair, reasonable and adequate. In September 2011, certain parties filed notices of appeal from the court’s order approving the settlement. The settlement does not resolve other outstanding lawsuits against OFI and its affiliates relating to BLMIS.
On April 16, 2010, a lawsuit was filed in New York state court against (i) OFI, (ii) an affiliate of OFI and (iii) AAArdvark IV Funding Limited (“AAArdvark IV”), an entity advised by OFI’s affiliate, in connection with investments made by the plaintiffs in AAArdvark IV. Plaintiffs allege breach of contract and common law fraud claims against the defendants and seek compensatory damages, costs and disbursements, including attorney fees. On April 11, 2013, the court granted defendants’ motion for summary judgment, dismissing plaintiffs’ fraud claim with prejudice and dismissing their contract claim without prejudice, and granted plaintiffs leave to replead their contract claim to assert a cause of action for specific performance within 30 days. On May 9, 2013, plaintiffs filed a notice of appeal from the court’s dismissal order. On July 15, 2011, a lawsuit was filed in New York state court against OFI, an affiliate of OFI and AAArdvark Funding Limited (“AAArdvark I”), an entity advised by OFI’s affiliate, in connection with investments made by the plaintiffs in AAArdvark I. The complaint alleges breach of contract and common law fraud claims against the defendants and seeks compensatory damages, costs and disbursements, including attorney fees. On November 9, 2011, a lawsuit was filed in New York state court against OFI, an affiliate of OFI and AAArdvark XS Funding Limited (“AAArdvark XS”), an entity advised by OFI’s affiliate, in connection with investments made by the plaintiffs in AAArdvark XS. The complaint alleges breach of contract against the defendants and seeks compensatory damages, costs and disbursements, including attorney fees.
29 OPPENHEIMER CORE BOND FUND/VA
NOTESTO FINANCIAL STATEMENTS Unaudited / (Continued)
8. Pending Litigation (Continued)
OFI believes the lawsuits and appeals described above are without legal merit and, with the exception of actions it has settled, is defending against them vigorously. While it is premature to render any opinion as to the outcome in these lawsuits, or whether any costs that the Defendant Funds may bear in defending the suits might not be reimbursed by insurance, OFI believes that these suits should not impair the ability of OFI or the Distributor to perform their respective duties to the Fund, and that the outcome of all of the suits together should not have any material effect on the operations of any of the Oppenheimer mutual funds.
30 OPPENHEIMER CORE BOND FUND/VA
PORTFOLIO PROXY VOTING POLICIES AND PROCEDURES; UPDATES TO STATEMENTS OF INVESTMENTS UNAUDITED
The Fund has adopted Portfolio Proxy Voting Policies and Procedures under which the Fund votes proxies relating to securities (“portfolio proxies”) held by the Fund. A description of the Fund’s Portfolio Proxy Voting Policies and Procedures is available (i) without charge, upon request, by calling the Fund toll-free at 1.800.CALL OPP (225.5677), (ii) on the Fund’s website at oppenheimerfunds.com, and (iii) on the SEC’s website at www.sec.gov. In addition, the Fund is required to file Form N-PX, with its complete proxy voting record for the 12 months ended June 30th, no later than August 31st of each year. The Fund’s voting record is available (i) without charge, upon request, by calling the Fund toll-free at 1.800.CALL OPP (225.5677), and (ii) in the Form N-PX filing on the SEC’s website at www.sec.gov.
The Fund files its complete schedule of portfolio holdings with the SEC for the first quarter and the third quarter of each fiscal year on Form N-Q. The Fund’s Form N-Q filings are available on the SEC’s website at www.sec.gov. Those forms may be reviewed and copied at the SEC’s Public Reference Room in Washington, D.C. Information on the operation of the Public Reference Room may be obtained by calling 1-800-SEC-0330.
31 OPPENHEIMER CORE BOND FUND/VA
|
OPPENHEIMER CORE BOND FUND/VA |
A Series of Oppenheimer Variable Account Funds
| | |
| Trustees and Officers | | Sam Freedman, Chairman of the Board of Trustees and Trustee |
| | Edward L. Cameron, Trustee |
| | Jon S. Fossel, Trustee |
| | Richard F. Grabish, Trustee |
| | Beverly L. Hamilton, Trustee |
| | Victoria J. Herget, Trustee |
| | Robert J. Malone, Trustee |
| | F. William Marshall, Jr., Trustee |
| | Karen L. Stuckey, Trustee |
| | James D. Vaughn, Trustee |
| | William F. Glavin, Jr., Trustee, President and Principal Executive Officer |
| | Krishna Memani, Vice President |
| | Peter A. Strzalkowski, Vice President |
| | Arthur S. Gabinet, Secretary and Chief Legal Officer |
| | Christina M. Nasta, Vice President and Chief Business Officer |
| | Mark S. Vandehey, Vice President and Chief Compliance Officer |
| | Brian W. Wixted, Treasurer and Principal Financial & Accounting Officer |
| |
| Manager | | OFI Global Asset Management, Inc. |
| |
| Sub-Adviser | | OppenheimerFunds, Inc. |
| |
| Distributor | | OppenheimerFunds Distributor, Inc. |
| |
| Transfer and Shareholder Servicing Agent | | OFI Global Asset Management, Inc. |
| |
| Sub-Transfer Agent | | Shareholder Services, Inc. DBA OppenheimerFunds Services |
| |
| Independent Registered Public Accounting Firm | | KPMG LLP |
| |
| Legal Counsel | | K&L Gates LLP |
| |
| | Before investing in any of the Oppenheimer funds, investors should carefully consider a fund’s investment objectives, risks, charges and expenses. Fund prospectuses and summary prospectuses contain this and other information about the funds and may be obtained by asking your financial advisor, visiting oppenheimerfunds.com or calling us at 1.800.988.8287. Read prospectuses and summary prospectuses carefully before investing. |
| |
| | The financial statements included herein have been taken from the records of the Fund without examination of those records by the independent auditors. |
© 2013 OppenheimerFunds, Inc. All rights reserved. Oppenheimer funds are distributed by OppenheimerFunds Distributor, Inc.

| | | | | | |
| | June 30, 2013 | | |
| | | | | | |
| | | | Oppenheimer Global Fund/VA* A Series of Oppenheimer Variable Account Funds | | Semiannual Report |
| | | | | | |
| | | | SEMIANNUAL REPORT Listing of Top Holdings Fund Performance Discussion Financial Statements * Prior to 4/30/13, the Fund’s name was Oppenheimer Global Securities Fund/VA |

Portfolio Manager: Rajeev Bhaman, CFA
| | | | | | | | | | |
Cumulative Total Returns For the 6-Month Period Ended 6/28/131 |
Non-Service Shares | | | 7.96% | | | | | | | |
Service Shares | | | 7.85 | | | | | | | |
Class 3 Shares | | | 8.00 | | | | | | | |
Class 4 Shares | | | 7.81 | | | | | | | |
Average Annual Total Returns For the Periods Ended 6/28/131 |
| | | 1-Year | | | 5-Year | | | 10-Year |
Non-Service Shares | | | 24.83% | | | | 6.09% | | | 9.77% |
Service Shares | | | 24.53% | | | | 5.83% | | | 9.51% |
Class 3 Shares | | | 24.83% | | | | 6.09% | | | 9.76% |
| | | |
| | | 1-Year | | | 5-Year | | | Since
Inception
(5/3/04) |
Class 4 Shares | | | 24.49% | | | | 5.82% | | | 7.24% |
The performance data quoted represents past performance, which does not guarantee future results. The investment return and principal value of an investment in the Fund will fluctuate so that an investor’s shares, when redeemed, may be worth more or less than their original cost. Current performance may be lower or higher than the performance quoted. For performance data current to the most recent month end, call us at 1.800.988.8287. The Fund’s total returns should not be expected to be the same as the returns of other funds, whether or not both funds have the same portfolio managers and/or similar names. The Fund’s total returns include changes in share price and reinvested distributions but do not include the charges associated with the separate account products that offer this Fund. Such performance would have been lower if such charges were taken into account.
1. June 28, 2013, was the last business day of the Fund’s semiannual period. See Note 1 of the accompanying Notes to Financial Statements
| | | | | | | |
TOP TEN COMMON STOCK HOLDINGS |
| | | | | | | |
Telefonaktiebolaget LM Ericsson, Cl. B | | | | 3.2% | | | |
European Aeronautic Defence & Space Co. | | | | 2.6 | | |
Google, Inc., Cl. A | | | | 2.5 | | |
WellPoint, Inc. | | | | 2.2 | | |
eBay, Inc. | | | | 2.1 | | |
SAP AG | | | | 2.1 | | |
Walt Disney Co. (The) | | | | 2.1 | | |
UBS AG | | | | 2.0 | | |
Bayerische Motoren Werke (BMW) AG, Preference | | | | 1.9 | | |
LVMH Moet Hennessy Louis Vuitton SA | | | | 1.8 | | |
| | | | | | | |
| Portfolio holdings and allocations are subject to change. Percentages are as of June 28, 2013, and are based on net assets. For more current Fund holdings, please visit oppenheimerfunds.com. | | |
REGIONAL ALLOCATION
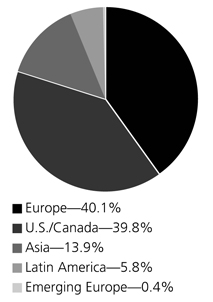
Portfolio holdings and allocations are subject to change. Percentages are as of June 28, 2013, and are based on the total market value of investments.
2 OPPENHEIMER GLOBAL FUND/VA
Fund Performance Discussion
The Fund’s Non-Service shares produced a return of 7.96% for the period, outperforming the MSCI All Country World Index (the “Index”), which returned 6.05%. The Fund received meaningful contributions from holdings in health care, information technology, industrials and consumer discretionary. Detractors were limited this period, with energy being the only sector that produced a slight negative return. The Fund underperformed the MSCI World Index, which returned 8.43% during the period. The Fund has changed its benchmark from the MSCI World Index to the MSCI All Country World Index, which it believes is a more appropriate measure of the Fund’s performance.
GLOBAL MARKET AND ECONOMIC ENVIRONMENT
Equities performed positively for the period as central banks throughout the world, including the United States, Europe and Japan, took steps to maintain highly accommodative monetary policy and stimulate their respective economies. In addition, a clear recovery in the U.S. provided further support for equity markets. However, later in the period, the Federal Reserve (the “Fed”) appeared to weigh the merits of backing away from its quantitative easing policy. As a result, the markets sold off sharply and made a quick reappraisal of interest rate risk in an array of credit markets and related currencies. Equities, particularly those in emerging markets, experienced spillover effects as a result.
TOP INDIVIDUAL CONTRIBUTORS
During the period, the Fund’s strongest performing holding was European Aeronautic Defence & Space Co. (“EADS”). EADS is the Franco-German manufacturer of Airbus airplanes. Sales and orders in the commercial aircraft business continued to grow apace as did margins. Expectations of future margin improvement also contributed to its performance. EADS has a defense business that is roughly 15% of its sales, a percentage significantly below that of its chief rival, Boeing, and has therefore been less affected by declining defense spending in the U.S. and Europe.
Also benefiting performance were WellPoint, Inc., Aetna, Inc., KDDI Corp. and Telefonaktiebolaget LM Ericsson (“Ericsson”). WellPoint is a North American health insurance company. The early concern that the Patient Protection and Affordable Care Act (also known as “Obamacare”) would supplant the private insurance market has not come to pass. Moreover, our thesis has been that WellPoint is part of the solution to rising healthcare costs. The early indications from discussions around the health exchanges, both public and private, seem less negative than most were imagining, and this has been a plus for the stock. We have a similar view for Aetna. Generally, higher interest rates are helpful in managing the liability book, and similar to WellPoint, the economics of Obamacare look better than many feared. KDDI is a Japanese telecommunications firm that offers fixed line and mobile telephony, and digital TV. The company has been gaining share with a “triple play” offering and the company began to wind down a large scale investment phase, improving business economics. Ericsson is a world-leading provider of telecommunications equipment and related services to mobile and fixed network operators. The company announced strong equipment sales growth as North American operators increased their capital expenditure spending significantly.
TOP INDIVIDUAL DETRACTORS
The most significant detractors from performance were DLF Ltd., LVMH Moet Hennessy Louis Vuitton SA, Fusion-io, Inc. and Technip SA. DLF, the largest real estate company in India, raised capital to meet the regulatory criteria for public listing. We were happy to participate in the offering and believe the market’s near-term concerns are overblown. Shares of luxury goods company LVMH Moet Hennessy Louis Vuitton fluctuated as the company experienced declines in April due to weakened demand growth in Asia. Fusion-io produces flash-enabled server accelerator cards, which allow servers to better process information in real-time. The company also has a unique software portfolio that may obviate the traditional disk array model for storage. The stock underperformed during the reporting period due to a management transition and reported revenues that fell short of aggressive projections as the company’s two biggest clients, Apple and Facebook, slowed their data center expansion. Growth in sales to other customers accelerated and the customer base of large companies continues to expand. We believe that the data storage market will increasingly move toward solid state technology and that Fusion-io’s intellectual property in the area is very good. Technip is a global oil service company that suffered from investors’ negative read-through of competitor Saipem’s poor results. Technip, by contrast, announced results in line with analyst expectations, but investors’ caution on the sector led to the sell-off.
STRATEGY & OUTLOOK
Regardless of whether we are in a fast or a slow growth world, we believe the companies in the Fund have the potential to grow at above the general rate of the economies in which they operate by virtue of the secular currents driving them and their advantages globally. We have a long-term investment horizon and build the portfolio from the bottom up, focusing on businesses advantaged by long-term trends. We invest in companies that we believe are capable of producing solid and sustainable growth through the business cycle, that have made strong returns on invested capital, and that demonstrate good cash flow generation characteristics. We are patient investors and wait for those companies to be out of favor so they are reasonably priced when we buy.
In our opinion, the volatility seen during the period was probably inevitable. Fed policy will change, though the timing remains hard to judge. Though there was some spillover to equity markets, we see the excesses as being largely in the fixed income realm. Equities still seem buoyed by a steep yield curve, valuations that are not high, and a persistent apathy on the part of investors. Until those shift, it seems to us the environment for equities will remain generally
3 OPPENHEIMER GLOBAL FUND/VA
favorable. In the current environment, we are currently focused on adding to our positions in a variety of well positioned financial companies. We believe these companies have the potential to benefit from higher interest rates and wider credit spreads.
The Fund’s investment strategy and focus can change over time. The mention of specific fund holdings does not constitute a recommendation by OppenheimerFunds, Inc. or its affiliates.
Shares of Oppenheimer funds are not deposits or obligations of any bank, are not guaranteed by any bank, are not insured by the FDIC or any other agency, and involve investment risks, including the possible loss of the principal amount invested.
4 OPPENHEIMER GLOBAL FUND/VA
Fund Expenses
Fund Expenses. As a shareholder of the Fund, you incur two types of costs: (1) transaction costs and (2) ongoing costs, including management fees; distribution and service fees; and other Fund expenses. These examples are intended to help you understand your ongoing costs (in dollars) of investing in the Fund and to compare these costs with the ongoing costs of investing in other mutual funds.
The examples are based on an investment of $1,000.00 invested at the beginning of the period and held for the entire 6-month period ended June 28, 2013.
Actual Expenses. The first section of the table provides information about actual account values and actual expenses. You may use the information in this section for the class of shares you hold, together with the amount you invested, to estimate the expense that you paid over the period. Simply divide your account value by $1,000.00 (for example, an $8,600.00 account value divided by $1,000.00 = 8.60), then multiply the result by the number in the first section under the heading entitled “Expenses Paid During Period” to estimate the expenses you paid on your account during this period.
Hypothetical Example for Comparison Purposes. The second section of the table provides information about hypothetical account values and hypothetical expenses based on the Fund’s actual expense ratio for each class of shares, and an assumed rate of return of 5% per year for each class before expenses, which is not the actual return. The hypothetical account values and expenses may not be used to estimate the actual ending account balance or expenses you paid for the period. You may use this information to compare the ongoing costs of investing in the Fund and other funds. To do so, compare this 5% hypothetical example for the class of shares you hold with the 5% hypothetical examples that appear in the shareholder reports of the other funds.
Please note that the expenses shown in the table are meant to highlight your ongoing costs only and do not reflect any charges associated with the separate accounts that offer this Fund. Therefore, the “hypothetical” lines of the table are useful in comparing ongoing costs only, and will not help you determine the relative total costs of owning different funds. In addition, if these separate account charges were included your costs would have been higher.
| | | | | | | | | | | | | | | | | | | | | | | | | |
| Actual | | Beginning
Account Value
January 1, 2013 | | | | Ending
Account Value
June 28, 2013 | | | | Expenses Paid During 6 Months Ended
June 28, 2013 |
Non-Service shares | | | $ | 1,000.00 | | | | | | $ | 1,079.60 | | | | | | $ | 3.88 | |
Service shares | | | | 1,000.00 | | | | | | | 1,078.50 | | | | | | | 5.16 | |
Class 3 shares | | | | 1,000.00 | | | | | | | 1,080.00 | | | | | | | 3.88 | |
Class 4 shares | | | | 1,000.00 | | | | | | | 1,078.10 | | | | | | | 5.16 | |
| | | | | |
Hypothetical (5% return before expenses) | | | | | | | | | | |
Non-Service shares | | | | 1,000.00 | | | | | | | 1,020.79 | | | | | | | 3.77 | |
Service shares | | | | 1,000.00 | | | | | | | 1,019.57 | | | | | | | 5.01 | |
Class 3 shares | | | | 1,000.00 | | | | | | | 1,020.79 | | | | | | | 3.77 | |
Class 4 shares | | | | 1,000.00 | | | | | | | 1,019.57 | | | | | | | 5.01 | |
Expenses are equal to the Fund’s annualized expense ratio for that class, multiplied by the average account value over the period, multiplied by 179/365 (to reflect the one-half year period). Those annualized expense ratios, excluding indirect expenses from affiliated funds, based on the 6-month period ended June 28, 2013 are as follows:
| | | | |
| Class | | Expense Ratios | |
Non-Service shares | | | 0.76% | |
Service shares | | | 1.01 | |
Class 3 shares | | | 0.76 | |
Class 4 shares | | | 1.01 | |
The expense ratios reflect voluntary waivers and/or reimbursements of expenses by the Fund’s Manager. Some of these undertakings may be modified or terminated at any time, as indicated in the Fund’s prospectus. The “Financial Highlights” tables in the Fund’s financial statements, included in this report, also show the gross expense ratios, without such waivers or reimbursements and reduction to custodian expenses, if applicable.
5 OPPENHEIMER GLOBAL FUND/VA
STATEMENTOF INVESTMENTS June 28, 2013* / Unaudited
| | | | | | | | | | |
| | | Shares | | | Value | | | |
Common Stocks—99.3% | | | | | | | | | | |
Consumer Discretionary—14.9% | | | | | | | | | | |
Automobiles—1.9% | | | | | | | | | | |
Bayerische Motoren Werke (BMW) AG, Preference | | | 742,204 | | | $ | 50,641,365 | | | |
Hotels, Restaurants & Leisure—2.0% | | | | | | | | | | |
Gtech SpA | | | 441,534 | | | | 11,051,918 | | | |
McDonald’s Corp. | | | 437,210 | | | | 43,283,790 | | | |
| | | | | | | | 54,335,708 | | | |
Media—3.4% | | | | | | | | | | |
Grupo Televisa SAB, Sponsored ADR | | | 843,085 | | | | 20,942,231 | | | |
Walt Disney Co. (The) | | | 863,910 | | | | 54,555,916 | | | |
Zee Entertainment Enterprises Ltd. | | | 4,021,146 | | | | 15,939,495 | | | |
| | | | | | | | 91,437,642 | | | |
Specialty Retail—2.9% | | | | | | | | | | |
Industria de Diseno Textil SA (Inditex) | | | 337,230 | | | | 41,598,185 | | | |
Tiffany & Co. | | | 462,310 | | | | 33,674,660 | | | |
| | | | | | | | 75,272,845 | | | |
Textiles, Apparel & Luxury Goods—4.7% | | | | | | | | | | |
Brunello Cucinelli SpA | | | 143,920 | | | | 3,554,976 | | | |
Kering | | | 239,560 | | | | 48,491,326 | | | |
LVMH Moet Hennessy Louis Vuitton SA | | | 303,290 | | | | 48,840,735 | | | |
Tod’s SpA | | | 170,264 | | | | 23,970,687 | | | |
| | | | | | | | 124,857,724 | | | |
Consumer Staples—7.3% | | | | | | | | | | |
Beverages—2.7% | | | | | | | | | | |
Carlsberg AS, Cl. B | | | 166,415 | | | | 14,853,576 | | | |
Companhia de Bebidas das Americas, Preference, ADR | | | 566,775 | | | | 21,169,046 | | | |
Fomento Economico Mexicano SAB de CV, Sponsored ADR | | | 347,725 | | | | 35,881,743 | | | |
| | | | | | | | 71,904,365 | | | |
Food Products—2.8% | | | | | | | | | | |
Nestle SA | | | 443,666 | | | | 29,018,607 | | | |
Unilever plc | | | 1,125,533 | | | | 45,709,446 | | | |
| | | | | | | | 74,728,053 | | | |
Household Products—1.8% | | | | | | | | | | |
Colgate-Palmolive Co. | | | 844,360 | | | | 48,373,384 | | | |
Energy—3.3% | | | | | | | | | | |
Energy Equipment & Services—2.6% | | | | | | | | | | |
Technip SA | | | 449,300 | | | | 45,410,501 | | | |
Transocean Ltd. | | | 491,642 | | | | 23,574,234 | | | |
| | | | | | | | 68,984,735 | | | |
Oil, Gas & Consumable Fuels—0.7% | | | | | | | | | | |
Repsol SA | | | 936,081 | | | | 19,733,671 | | | |
Financials—19.9% | | | | | | | | | | |
Capital Markets—5.2% | | | | | | | | | | |
Credit Suisse Group AG1 | | | 889,560 | | | | 23,584,627 | | | |
Deutsche Bank AG | | | 809,562 | | | | 33,866,713 | | | |
Goldman Sachs Group, Inc. (The) | | | 186,020 | | | | 28,135,525 | | | |
UBS AG1 | | | 3,066,022 | | | | 52,086,544 | | | |
| | | | | | | | 137,673,409 | | | |
Commercial Banks—5.0% | | | | | | | | | | |
Banco Bilbao Vizcaya Argentaria SA | | | 3,674,979 | | | | 30,602,306 | | | |
ICICI Bank Ltd., Sponsored ADR | | | 866,650 | | | | 33,149,363 | | | |
Itau Unibanco Holding SA, Preference, ADR | | | 1,761,359 | | | | 22,756,759 | | | |
Societe Generale | | | 408,739 | | | | 13,917,841 | | | |
Sumitomo Mitsui Financial Group, Inc. | | | 611,300 | | | | 28,048,655 | | | |
| | | | | | | | 128,474,924 | | | |
Diversified Financial Services—4.0% | | | | | | | | | | |
BM&FBovespa SA | | | 4,057,200 | | | | 22,273,825 | | | |
Citigroup, Inc. | | | 673,930 | | | | 32,328,422 | | | |
McGraw Hill Financial, Inc. | | | 800,010 | | | | 42,552,532 | | | |
Moscow Exchange (The) | | | 7,590,562 | | | | 11,385,843 | | | |
| | | | | | | | 108,540,622 | | | |
Insurance—4.8% | | | | | | | | | | |
Allianz SE | | | 293,736 | | | | 42,897,314 | | | |
Dai-ichi Life Insurance Co. Ltd. (The) | | | 21,019 | | | | 30,421,929 | | | |
Fidelity National Financial, Inc., Cl. A | | | 667,850 | | | | 15,901,508 | | | |
Prudential plc | | | 2,348,997 | | | | 38,616,685 | | | |
| | | | | | | 127,837,436 | | | |
| | | | | | | | | | |
| | | Shares | | | Value | | | |
Real Estate Management & Development—0.9% | | | | | | | | | | |
DLF Ltd. | | | 7,926,821 | | | $ | 24,017,038 | | | |
Health Care—12.9% | | | | | | | | | | |
Biotechnology—3.4% | | | | | | | | | | |
Gilead Sciences, Inc.1 | | | 531,220 | | | | 27,203,776 | | | |
Medivation, Inc.1 | | | 146,080 | | | | 7,187,136 | | | |
Theravance, Inc.1 | | | 628,750 | | | | 24,225,738 | | | |
ThromboGenics NV1 | | | 93,034 | | | | 3,566,847 | | | |
Vertex Pharmaceuticals, Inc.1 | | | 355,310 | | | | 28,378,610 | | | |
| | | | | | | | 90,562,107 | | | |
Health Care Equipment & Supplies—1.7% | | | | | | | | | | |
St. Jude Medical, Inc. | | | 290,950 | | | | 13,276,049 | | | |
Zimmer Holdings, Inc. | | | 410,310 | | | | 30,748,631 | | | |
| | | | | | | | 44,024,680 | | | |
Health Care Providers & Services—3.9% | | | | | | | | | | |
Aetna, Inc. | | | 701,370 | | | | 44,565,050 | | | |
WellPoint, Inc. | | | 723,555 | | | | 59,215,741 | | | |
| | | | | | | | 103,780,791 | | | |
Pharmaceuticals—3.9% | | | | | | | | | | |
Allergan, Inc. | | | 204,240 | | | | 17,205,178 | | | |
Bayer AG | | | 381,153 | | | | 40,633,483 | | | |
Roche Holding AG | | | 124,843 | | | | 30,934,144 | | | |
Shire plc | | | 501,510 | | | | 15,909,402 | | | |
| | | | | | | | 104,682,207 | | | |
Industrials—12.4% | | | | | | | | | | |
Aerospace & Defense—3.7% | | | | | | | | | | |
Embraer SA, ADR | | | 799,363 | | | | 29,488,501 | | | |
European Aeronautic Defence & Space Co. | | | 1,291,180 | | | | 68,658,634 | | | |
| | | | | | | | 98,147,135 | | | |
Air Freight & Couriers—1.1% | | | | | | | | | | |
United Parcel Service, Inc., Cl. B | | | 332,220 | | | | 28,730,386 | | | |
Building Products—1.5% | | | | | | | | | | |
Assa Abloy AB, Cl. B | | | 1,026,328 | | | | 40,009,679 | | | |
Construction & Engineering—0.5% | | | | | | | | | | |
FLSmidth & Co. AS | | | 320,615 | | | | 14,580,912 | | | |
Electrical Equipment—2.1% | | | | | | | | | | |
Emerson Electric Co. | | | 424,080 | | | | 23,129,323 | | | |
Nidec Corp. | | | 264,800 | | | | 18,477,674 | | | |
Prysmian SpA | | | 683,464 | | | | 12,707,491 | | | |
| | | | | | | | 54,314,488 | | | |
Industrial Conglomerates—2.9% | | | | | | | | | | |
3M Co. | | | 364,260 | | | | 39,831,831 | | | |
Siemens AG | | | 355,033 | | | | 35,873,492 | | | |
| | | | | | | | 75,705,323 | | | |
Machinery—0.6% | | | | | | | | | | |
FANUC Corp. | | | 114,600 | | | | 16,617,823 | | | |
Information Technology—25.1% | | | | | | | | | | |
Communications Equipment—4.2% | | | | | | | | | | |
Juniper Networks, Inc.1 | | | 1,401,130 | | | | 27,055,820 | | | |
Telefonaktiebolaget LM Ericsson, Cl. B | | | 7,532,599 | | | | 85,399,587 | | | |
| | | | | | | | 112,455,407 | | | |
Computers & Peripherals—0.5% | | | | | | | | | | |
Fusion-io, Inc.1 | | | 854,680 | | | | 12,170,643 | | | |
Electronic Equipment, Instruments, & Components—3.7% | | | | | | | | | | |
Keyence Corp. | | | 106,711 | | | | 34,057,014 | | | |
Kyocera Corp. | | | 213,300 | | | | 21,712,814 | | | |
Murata Manufacturing Co. Ltd. | | | 542,200 | | | | 41,279,050 | | | |
| | | | | | | | 97,048,878 | | | |
Internet Software & Services—5.2% | | | | | | | | | | |
eBay, Inc.1 | | | 1,097,000 | | | | 56,736,840 | | | |
Facebook, Inc., Cl. A1 | | | 652,520 | | | | 16,221,647 | | | |
Google, Inc., Cl. A1 | | | 74,410 | | | | 65,508,332 | | | |
| | | | | | | | 138,466,819 | | | |
IT Services—0.8% | | | | | | | | | | |
Infosys Ltd. | | | 524,853 | | | | 21,930,051 | | | |
Semiconductors & Semiconductor Equipment—4.2% | | | | | | | | | | |
Altera Corp. | | | 1,359,300 | | | | 44,843,307 | | | |
Maxim Integrated Products, Inc. | | | 1,395,465 | | | | 38,766,018 | | | |
Taiwan Semiconductor Manufacturing Co. Ltd. | | | 7,678,184 | | | | 27,787,331 | | | |
| | | | | | | 111,396,656 | | | |
6 OPPENHEIMER GLOBAL FUND/VA
| | | | | | | | | | |
| | | Shares | | | Value | | | |
| | |
Software—6.5% | | | | | | | | | |
Adobe Systems, Inc.1 | | | 899,003 | | | $ | 40,958,577 | | |
| | |
Intuit, Inc. | | | 632,320 | | | | 38,590,490 | | |
| | |
Microsoft Corp. | | | 1,129,440 | | | | 38,999,563 | | |
| | |
SAP AG | | | 772,834 | | | | 56,591,482 | | |
| | | | | | | | | |
| | | | | | | 175,140,112 | | |
| | |
Materials—1.2% | | | | | | | | | |
| | |
Chemicals—1.0% | | | | | | | | | |
Linde AG | | | 141,771 | | | | 26,398,377 | | |
| | |
Metals & Mining—0.2% | | | | | | | | | |
Iluka Resources Ltd. | | | 541,600 | | | | 4,889,815 | | | |
| | | |
Telecommunication Services—1.8% | | | | | | | | | | |
| | | |
Wireless Telecommunication Services—1.8% | | | | | | | | | | |
KDDI Corp. | | | 913,500 | | | | 47,530,593 | | | |
| | | |
Utilities—0.5% | | | | | | | | | | |
| | | |
Electric Utilities—0.5% | | | | | | | | | | |
Fortum OYJ | | | 719,111 | | | | 13,433,501 | | | |
| | | | | | | | | | |
Total Common Stocks | | | | | | | | | | |
(Cost $1,685,967,793) | | | | | | | 2,638,829,304 | | | |
| | | | | | | | | | |
| | | Units | | | Value | | | |
Rights, Warrants and Certificates—0.0% | | | | | | | | | | |
Groupe FNAC SA Rts., Strike Price 0.0001EUR, Exp. 5/15/151 | | | 160,065 | | | $ | 417,322 | | | |
| | | |
Repsol SA Rts., Strike Price 0.0001EUR, Exp. 7/4/131 | | | 941,827 | | | | 524,698 | | | |
| | | | | | | | | | |
Total Rights, Warrants and Certificates (Cost $—) | | | | | | | 942,020 | | | |
| | | |
| | | Shares | | | | | | |
Investment Company—0.2% | | | | | | | | | | |
Oppenheimer Institutional Money Market Fund, Cl. E, 0.11%2,3 | | | | | | | | | | |
(Cost $4,936,566) | | | 4,936,566 | | | | 4,936,566 | | | |
| | | |
Total Investments,at Value | | | | | | | | | | |
(Cost $1,690,904,359) | | | 99.5% | | | | 2,644,707,890 | | | |
| | | |
Assets in Excess of Other Liabilities | | | 0.5 | | | | 13,296,425 | | | |
| | | | | | |
Net Assets | | | 100.0% | | | $ | 2,658,004,315 | | | |
| | | | | | |
Footnotes to Statement of Investments
* June 28, 2013 represents the last business day of the Fund’s semiannual period. See Note 1 of the accompanying Notes.
Strike price is reported in U.S. Dollars, except for those denoted in the following currency:
EUR European Dollar
1. Non-income producing security.
2. Rate shown is the 7-day yield as of June 28, 2013.
3. Is or was an affiliate, as defined in the Investment Company Act of 1940, at or during the period ended June 28, 2013, by virtue of the Fund owning at least 5% of the voting securities of the issuer or as a result of the Fund and the issuer having the same investment adviser. Transactions during the period in which the issuer was an affiliate are as follows:
| | | | | | | | | | | | | | | | |
| | | Shares
December 31,
2012 | | | Gross
Additions | | | Gross
Reductions | | | Shares
June 28,
2013 | |
Oppenheimer Institutional Money Market Fund, Cl. E | | | 30,612,139 | | | | 139,238,123 | | | | 164,913,696 | | | | 4,936,566 | |
| | | | |
| | | | | | | | | Value | | | Income | |
Oppenheimer Institutional Money Market Fund, Cl. E | | | | | | | | | | $ | 4,936,566 | | | $ | 7,600 | |
Distribution of investments representing geographic holdings, as a percentage of total investments at value, is as follows:
| | | | | | | | | | |
| Geographic Holdings | | Value | | Percent |
United States | | | $ | 1,050,865,223 | | | | | 39.8% | |
Germany | | | | 286,902,226 | | | | | 10.9 | |
Japan | | | | 238,145,552 | | | | | 9.0 | |
France | | | | 157,077,725 | | | | | 5.9 | |
Switzerland | | | | 135,623,922 | | | | | 5.1 | |
Sweden | | | | 125,409,266 | | | | | 4.7 | |
Brazil | | | | 95,688,131 | | | | | 3.7 | |
India | | | | 95,035,947 | | | | | 3.6 | |
Spain | | | | 92,458,860 | | | | | 3.5 | |
United Kingdom | | | | 84,326,131 | | | | | 3.2 | |
Netherlands | | | | 68,658,634 | | | | | 2.6 | |
Mexico | | | | 56,823,974 | | | | | 2.1 | |
Italy | | | | 51,285,072 | | | | | 1.9 | |
Denmark | | | | 29,434,488 | | | | | 1.1 | |
Taiwan | | | | 27,787,331 | | | | | 1.1 | |
Ireland | | | | 15,909,402 | | | | | 0.6 | |
Finland | | | | 13,433,501 | | | | | 0.5 | |
Russia | | | | 11,385,843 | | | | | 0.4 | |
Australia | | | | 4,889,815 | | | | | 0.2 | |
Belgium | | | | 3,566,847 | | | | | 0.1 | |
| | | | | |
Total | | | $ | 2,644,707,890 | | | | | 100.0% | |
| | | | | |
See accompanying Notes to Financial Statements.
7 OPPENHEIMER GLOBAL FUND/VA
STATEMENTOF ASSETS AND LIABILITIES June 28, 20131 / Unaudited
| | | | |
| |
Assets | | | | |
Investments, at value—see accompanying statement of investments: | | | | |
Unaffiliated companies (cost $1,685,967,793) | | $ | 2,639,771,324 | |
Affiliated companies (cost $4,936,566) | | | 4,936,566 | |
| | | | |
| | | 2,644,707,890 | |
| |
Cash | | | 1,124,144 | |
| |
Receivables and other assets: | | | | |
Investments sold | | | 17,469,798 | |
Dividends | | | 2,445,972 | |
Other | | | 223,143 | |
| | | | |
Total assets | | | 2,665,970,947 | |
| |
Liabilities | | | | |
Payables and other liabilities: | | | | |
Shares of beneficial interest redeemed | | | 4,008,279 | |
Investments purchased | | | 3,271,705 | |
Distribution and service plan fees | | | 231,640 | |
Transfer and shareholder servicing agent fees | | | 207,120 | |
Shareholder communications | | | 91,333 | |
Trustees’ compensation | | | 76,672 | |
Other | | | 79,883 | |
| | | | |
Total liabilities | | | 7,966,632 | |
| |
Net Assets | | $ | 2,658,004,315 | |
| | | | |
| | | | |
| |
Composition of Net Assets | | | | |
Par value of shares of beneficial interest | | $ | 76,961 | |
| |
Additional paid-in capital | | | 1,640,960,343 | |
| |
Accumulated net investment income | | | 23,611,706 | |
| |
Accumulated net realized gain on investments and foreign currency transactions | | | 39,587,794 | |
| |
Net unrealized appreciation on investments and translation of assets and liabilities denominated in foreign currencies | | | 953,767,511 | |
| | | | |
Net Assets | | $ | 2,658,004,315 | |
| | | | |
| |
Net Asset Value Per Share | | | | |
Non-Service Shares: | | | | |
Net asset value, redemption price per share and offering price per share (based on net assets of $1,279,191,148 and 36,918,425 shares of beneficial interest outstanding) | | | $34.65 | |
| |
Service Shares: | | | | |
Net asset value, redemption price per share and offering price per share (based on net assets of $1,131,061,263 and 32,912,532 shares of beneficial interest outstanding) | | | $34.37 | |
| |
Class 3 Shares: | | | | |
Net asset value, redemption price per share and offering price per share (based on net assets of $169,700,603 and 4,863,088 shares of beneficial interest outstanding) | | | $34.90 | |
| |
Class 4 Shares: | | | | |
Net asset value, redemption price per share and offering price per share (based on net assets of $78,051,301 and 2,266,706 shares of beneficial interest outstanding) | | | $34.43 | |
1. June 28, 2013 represents the last business day of the Fund’s semiannual period. See Note 1 of the accompanying Notes.
See accompanying Notes to Financial Statements.
8 OPPENHEIMER GLOBAL FUND/VA
STATEMENTOF OPERATIONS For the Six Months Ended June 28, 20131 / Unaudited
| | | | | | | | | | |
| |
Investment Income | | | | | | | | | | |
Dividends: | | | |
Unaffiliated companies (net of foreign withholding taxes of $3,960,510) | | | | | | | | $ | 35,666,375 | |
Affiliated companies | | | | | | | | | 7,600 | |
| |
Interest | | | | | | | | | 632 | |
| | | | | | | | | | |
Total investment income | | | | | | | | | 35,674,607 | |
|
| |
Expenses | | | | | | | | | | |
Management fees | | | | | | | | | 8,514,248 | |
| |
Distribution and service plan fees: | | | | | | | | | | |
Service shares | | | | | | | | | 1,445,119 | |
Class 4 shares | | | | | | | | | 96,885 | |
| |
Transfer and shareholder servicing agent fees: | | | | | | | | | | |
Non-Service shares | | | | | | | | | 646,479 | |
Service shares | | | | | | | | | 579,410 | |
Class 3 shares | | | | | | | | | 85,265 | |
Class 4 shares | | | | | | | | | 38,846 | |
| |
Shareholder communications: | | | | | | | | | | |
Non-Service shares | | | | | | | | | 43,071 | |
Service shares | | | | | | | | | 38,559 | |
Class 3 shares | | | | | | | | | 5,678 | |
Class 4 shares | | | | | | | | | 2,572 | |
| |
Custodian fees and expenses | | | | | | | | | 138,464 | |
| |
Trustees’ compensation | | | | | | | | | 35,467 | |
| |
Other | | | | | | | | | 231,497 | |
| | | | | | | | | | |
Total expenses | | | | | | | | | 11,901,560 | |
Less waivers and reimbursements of expenses | | | | | | | | | (5,647) | |
| | | | | | | | | | |
Net expenses | | | | | | | | | 11,895,913 | |
| |
| | | | |
Net Investment Income | | | | | | | | | 23,778,694 | |
|
| |
Realized and Unrealized Gain (Loss) | | | | | | | | | | |
Net realized gain (loss) on: | | | | | | | | | | |
Investments from unaffiliated companies | | | | | | | | | 77,939,241 | |
Foreign currency transactions | | | | | | | | | (286,578) | |
| | | | | | | | | | |
Net realized gain | | | | | | | | | 77,652,663 | |
| |
Net change in unrealized appreciation/depreciation on: | | | | | | | | | | |
Investments | | | | | | | | | 148,432,488 | |
Translation of assets and liabilities denominated in foreign currencies | | | | | | | | | (43,281,919) | |
| | | | | | | | | | |
Net change in unrealized appreciation/depreciation | | | | | | | | | 105,150,569 | |
|
| |
Net Increase in Net Assets Resulting from Operations | | | | | | | | $ | 206,581,926 | |
| | | | | | | | | | |
1. June 28, 2013 represents the last business day of the Fund’s semiannual period. See Note 1 of the accompanying Notes.
See accompanying Notes to Financial Statements.
9 OPPENHEIMER GLOBAL FUND/VA
STATEMENTSOF CHANGES IN NET ASSETS
| | | | | | | | |
| | | Six Months Ended
June 28, 20131
(Unaudited) | | | Year Ended
December 31, 2012 | |
| |
Operations | | | | | | | | |
Net investment income | | $ | 23,778,694 | | | $ | 34,224,709 | |
| |
Net realized gain | | | 77,652,663 | | | | 20,787,143 | |
| |
Net change in unrealized appreciation/depreciation | | | 105,150,569 | | | | 427,241,919 | |
| | | | | | | | |
Net increase in net assets resulting from operations | | | 206,581,926 | | | | 482,253,771 | |
|
| |
Dividends and/or Distributions to Shareholders | | | | | | | | |
Dividends from net investment income: | | | | | | | | |
Non-Service shares | | | (18,448,869) | | | | (25,848,197) | |
Service shares | | | (13,851,659) | | | | (20,625,132) | |
Class 3 shares | | | (2,430,857) | | | | (3,444,499) | |
Class 4 shares | | | (953,729) | | | | (1,338,372) | |
| | | | |
| | | (35,685,114) | | | | (51,256,200) | |
|
| |
Beneficial Interest Transactions | | | | | | | | |
Net decrease in net assets resulting from beneficial interest transactions: | | | | | | | | |
Non-Service shares | | | (53,769,152) | | | | (120,462,188) | |
Service shares | | | (73,933,681) | | | | (57,616,385) | |
Class 3 shares | | | (5,367,353) | | | | (21,486,893) | |
Class 4 shares | | | (2,190,777) | | | | (4,855,491) | |
| | | | | | | | |
| | | (135,260,963) | | | | (204,420,957) | |
|
| |
Net Assets | | | | | | | | |
Total increase | | | 35,635,849 | | | | 226,576,614 | |
| |
Beginning of period | | | 2,622,368,466 | | | | 2,395,791,852 | |
| | | | | | | | |
| | |
End of period (including accumulated net investment income of $ 23,611,706 and $ 35,518,126, respectively) | | $ | 2,658,004,315 | | | $ | 2,622,368,466 | |
| | | | |
1. June 28, 2013 represents the last business day of the Fund’s semiannual period. See Note 1 of the accompanying Notes
See accompanying Notes to Financial Statements.
10 OPPENHEIMER GLOBAL FUND/VA
FINANCIAL HIGHLIGHTS
| | | | | | | | | | | | | | | | | | | | | | | | |
| Non-Service Shares | | Six Months
Ended June 28, 20131
(Unaudited) | | | Year Ended
December
31, 2012 | | | Year Ended
December
30, 20111 | | | Year Ended
December 31, 2010 | | | Year Ended
December
31, 2009 | | | Year Ended
December
31, 2008 | |
| |
Per Share Operating Data | | | | | | | | | | | | | | | | | | | | | | | | |
Net asset value, beginning of period | | $ | 32.55 | | | $ | 27.46 | | | $ | 30.30 | | | $ | 26.50 | | | $ | 20.21 | | | $ | 36.60 | |
| |
Income (loss) from investment operations: | | | | | | | | | | | | | | | | | | | | | | | | |
Net investment income2 | | | 0.32 | | | | 0.44 | | | | 0.65 | | | | 0.33 | | | | 0.33 | | | | 0.55 | |
Net realized and unrealized gain (loss) | | | 2.28 | | | | 5.29 | | | | (3.11) | | | | 3.85 | | | | 6.94 | | | | (14.46) | |
| | | | |
Total from investment operations | | | 2.60 | | | | 5.73 | | | | (2.46) | | | | 4.18 | | | | 7.27 | | | | (13.91) | |
| |
Dividends and/or distributions to shareholders: | | | | | | | | | | | | | | | | | | | | | | | | |
Dividends from net investment income | | | (0.50) | | | | (0.64) | | | | (0.38) | | | | (0.38) | | | | (0.50) | | | | (0.46) | |
Distributions from net realized gain | | | 0.00 | | | | 0.00 | | | | 0.00 | | | | 0.00 | | | | (0.48) | | | | (2.02) | |
| | | | |
Total dividends and/or distributions to shareholders | | | (0.50) | | | | (0.64) | | | | (0.38) | | | | (0.38) | | | | (0.98) | | | | (2.48) | |
| |
Net asset value, end of period | | $ | 34.65 | | | $ | 32.55 | | | $ | 27.46 | | | $ | 30.30 | | | $ | 26.50 | | | $ | 20.21 | |
| | | | |
| |
Total Return, at Net Asset Value3 | | | 7.96% | | | | 21.27% | | | | (8.29)% | | | | 15.96% | | | | 39.77% | | | | (40.19)% | |
| |
Ratios/Supplemental Data | | | | | | | | | | | | | | | | | | | | | | | | |
Net assets, end of period (in thousands) | | $ | 1,279,191 | | | $ | 1,252,127 | | | $ | 1,165,141 | | | $ | 1,410,764 | | | $ | 1,364,597 | | | $ | 1,150,113 | |
| |
Average net assets (in thousands) | | $ | 1,311,363 | | | $ | 1,206,244 | | | $ | 1,335,403 | | | $ | 1,336,110 | | | $ | 1,206,240 | | | $ | 1,679,720 | |
| |
Ratios to average net assets:4 | | | | | | | | | | | | | | | | | | | | | | | | |
Net investment income | | | 1.87% | | | | 1.48% | | | | 2.17% | | | | 1.22% | | | | 1.51% | | | | 1.95% | |
Total expenses5 | | | 0.76% | | | | 0.76% | | | | 0.76% | | | | 0.76% | | | | 0.75% | | | | 0.65% | |
Expenses after payments, waivers and/or reimbursements and reduction to custodian expenses | | | 0.76% | | | | 0.76% | | | | 0.76% | | | | 0.76% | | | | 0.75% | | | | 0.65% | |
| |
Portfolio turnover rate | | | 8% | | | | 14% | | | | 13% | | | | 15% | | | | 11% | | | | 19% | |
1. June 28, 2013 and December 30, 2011 represent the last business day of the Fund’s reporting periods. See Note 1 of the accompanying Notes.
2. Per share amounts calculated based on the average shares outstanding during the period.
3. Assumes an initial investment on the business day before the first day of the fiscal period, with all dividends and distributions reinvested in additional shares on the reinvestment date, and redemption at the net asset value calculated on the last business day of the fiscal period. Total returns are not annualized for periods less than one full year. Total return information does not reflect expenses that apply at the separate account level or to related insurance products. Inclusion of these charges would reduce the total return figures for all periods shown. Returns do not reflect the deduction of taxes that a shareholder would pay on fund distributions or the redemption of fund shares.
4. Annualized for periods less than one full year.
5. Total expenses including indirect expenses from affiliated fund were as follows:
| | | | | | |
Six Months Ended June 28, 2013 | | | 0.76 | % | |
Year Ended December 31, 2012 | | | 0.76 | % | |
Year Ended December 30, 2011 | | | 0.76 | % | |
Year Ended December 31, 2010 | | | 0.76 | % | |
Year Ended December 31, 2009 | | | 0.75 | % | |
Year Ended December 31, 2008 | | | 0.65 | % | |
See accompanying Notes to Financial Statements.
11 OPPENHEIMER GLOBAL FUND/VA
FINANCIAL HIGHLIGHTS Continued
| | | | | | | | | | | | | | | | | | | | | | | | |
| Service Shares | | Six Months
Ended June 28, 20131
(Unaudited) | | | Year Ended
December 31, 2012 | | | Year Ended
December 30, 20111 | | | Year Ended
December 31, 2010 | | | Year Ended
December
31, 2009 | | | Year Ended
December 31, 2008 | |
| |
Per Share Operating Data | | | | | | | | | | | | | | | | | | | | | | | | |
Net asset value, beginning of period | | $ | 32.25 | | | $ | 27.21 | | | $ | 30.04 | | | $ | 26.28 | | | $ | 20.02 | | | $ | 36.27 | |
| |
Income (loss) from investment operations: | | | | | | | | | | | | | | | | | | | | | | | | |
Net investment income2 | | | 0.28 | | | | 0.36 | | | | 0.56 | | | | 0.26 | | | | 0.27 | | | | 0.47 | |
Net realized and unrealized gain (loss) | | | 2.26 | | | | 5.25 | | | | (3.08) | | | | 3.82 | | | | 6.90 | | | | (14.32) | |
| | | | |
Total from investment operations | | | 2.54 | | | | 5.61 | | | | (2.52) | | | | 4.08 | | | | 7.17 | | | | (13.85) | |
| |
Dividends and/or distributions to shareholders: | | | | | | | | | | | | | | | | | | | | | | | | |
Dividends from net investment income | | | (0.42) | | | | (0.57) | | | | (0.31) | | | | (0.32) | | | | (0.43) | | | | (0.38) | |
Distributions from net realized gain | | | 0.00 | | | | 0.00 | | | | 0.00 | | | | 0.00 | | | | (0.48) | | | | (2.02) | |
| | | | |
Total dividends and/or distributions to shareholders | | | (0.42) | | | | (0.57) | | | | (0.31) | | | | (0.32) | | | | (0.91) | | | | (2.40) | |
| |
Net asset value, end of period | | $ | 34.37 | | | $ | 32.25 | | | $ | 27.21 | | | $ | 30.04 | | | $ | 26.28 | | | $ | 20.02 | |
| | | | |
| |
Total Return, at Net Asset Value3 | | | 7.85% | | | | 20.95% | | | | (8.53)% | | | | 15.70% | | | | 39.36% | | | | (40.33)% | |
| |
Ratios/Supplemental Data | | | | | | | | | | | | | | | | | | | | | | | | |
Net assets, end of period (in thousands) | | $ | 1,131,061 | | | $ | 1,130,388 | | | $ | 1,003,839 | | | $ | 1,101,584 | | | $ | 980,485 | | | $ | 772,107 | |
| |
Average net assets (in thousands) | | $ | 1,175,347 | | | $ | 1,069,295 | | | $ | 1,091,128 | | | $ | 997,627 | | | $ | 830,887 | | | $ | 1,051,239 | |
| |
Ratios to average net assets:4 | | | | | | | | | | | | | | | | | | | | | | | | |
Net investment income | | | 1.61% | | | | 1.23% | | | | 1.90% | | | | 0.96% | | | | 1.23% | | | | 1.70% | |
Total expenses5 | | | 1.01% | | | | 1.01% | | | | 1.01% | | | | 1.01% | | | | 1.00% | | | | 0.90% | |
Expenses after payments, waivers and/or reimbursements and reduction to custodian expenses | | | 1.01% | | | | 1.01% | | | | 1.01% | | | | 1.01% | | | | 1.00% | | | | 0.90% | |
| |
Portfolio turnover rate | | | 8% | | | | 14% | | | | 13% | | | | 15% | | | | 11% | | | | 19% | |
1. June 28, 2013 and December 30, 2011 represent the last business day of the Fund’s reporting periods. See Note 1 of the accompanying Notes.
2. Per share amounts calculated based on the average shares outstanding during the period.
3. Assumes an initial investment on the business day before the first day of the fiscal period, with all dividends and distributions reinvested in additional shares on the reinvestment date, and redemption at the net asset value calculated on the last business day of the fiscal period. Total returns are not annualized for periods less than one full year. Total return information does not reflect expenses that apply at the separate account level or to related insurance products. Inclusion of these charges would reduce the total return figures for all periods shown. Returns do not reflect the deduction of taxes that a shareholder would pay on fund distributions or the redemption of fund shares.
4. Annualized for periods less than one full year.
5. Total expenses including indirect expenses from affiliated fund were as follows:
| | | | | | |
Six Months Ended June 28, 2013 | | | 1.01 | % | |
Year Ended December 31, 2012 | | | 1.01 | % | |
Year Ended December 30, 2011 | | | 1.01 | % | |
Year Ended December 31, 2010 | | | 1.01 | % | |
Year Ended December 31, 2009 | | | 1.00 | % | |
Year Ended December 31, 2008 | | | 0.90 | % | |
See accompanying Notes to Financial Statements.
12 OPPENHEIMER GLOBAL FUND/VA
| | | | | | | | | | | | | | | | | | | | | | | | |
| Class 3 Shares | | Six Months Ended June 28, 20131 (Unaudited) | | | Year Ended December 31, 2012 | | | Year Ended December 30, 20111 | | | Year Ended
December 31, 2010 | | | Year Ended
December 31, 2009 | | | Year Ended
December 31, 2008 | |
| |
Per Share Operating Data | | | | | | | | | | | | | | | | | | | | | | | | |
Net asset value, beginning of period | | $ | 32.77 | | | $ | 27.65 | | | $ | 30.50 | | | $ | 26.67 | | | $ | 20.34 | | | $ | 36.82 | |
| |
Income (loss) from investment operations: | | | | | | | | | | | | | | | | | | | | | | | | |
Net investment income2 | | | 0.33 | | | | 0.44 | | | | 0.66 | | | | 0.33 | | | | 0.33 | | | | 0.56 | |
Net realized and unrealized gain (loss) | | | 2.30 | | | | 5.32 | | | | (3.13) | | | | 3.88 | | | | 6.98 | | | | (14.56) | |
| | | | |
Total from investment operations | | | 2.63 | | | | 5.76 | | | | (2.47) | | | | 4.21 | | | | 7.31 | | | | (14.00) | |
| |
Dividends and/or distributions to shareholders: | | | | | | | | | | | | | | | | | | | | | | | | |
Dividends from net investment income | | | (0.50) | | | | (0.64) | | | | (0.38) | | | | (0.38) | | | | (0.50) | | | | (0.46) | |
Distributions from net realized gain | | | 0.00 | | | | 0.00 | | | | 0.00 | | | | 0.00 | | | | (0.48) | | | | (2.02) | |
| | | | |
Total dividends and/or distributions to shareholders | | | (0.50) | | | | (0.64) | | | | (0.38) | | | | (0.38) | | | | (0.98) | | | | (2.48) | |
| |
Net asset value, end of period | | $ | 34.90 | | | $ | 32.77 | | | $ | 27.65 | | | $ | 30.50 | | | $ | 26.67 | | | $ | 20.34 | |
| | | | |
| |
Total Return, at Net Asset Value3 | | | 8.00% | | | | 21.23% | | | | (8.27)% | | | | 15.97% | | | | 39.70% | | | | (40.19)% | |
| |
Ratios/Supplemental Data | | | | | | | | | | | | | | | | | | | | | | | | |
Net assets, end of period (in thousands) | | $ | 169,701 | | | $ | 164,477 | | | $ | 158,343 | | | $ | 202,621 | | | $ | 206,356 | | | $ | 175,971 | |
| |
Average net assets (in thousands) | | $ | 172,951 | | | $ | 160,752 | | | $ | 187,804 | | | $ | 196,495 | | | $ | 182,553 | | | $ | 269,650 | |
| |
Ratios to average net assets:4 | | | | | | | | | | | | | | | | | | | | | | | | |
Net investment income | | | 1.87% | | | | 1.49% | | | | 2.17% | | | | 1.22% | | | | 1.49% | | | | 1.95% | |
Total expenses5 | | | 0.76% | | | | 0.76% | | | | 0.76% | | | | 0.76% | | | | 0.75% | | | | 0.65% | |
Expenses after payments, waivers and/or reimbursements and reduction to custodian expenses | | | 0.76% | | | | 0.76% | | | | 0.76% | | | | 0.76% | | | | 0.75% | | | | 0.65% | |
| |
Portfolio turnover rate | | | 8% | | | | 14% | | | | 13% | | | | 15% | | | | 11% | | | | 19% | |
1. June 28, 2013 and December 30, 2011 represent the last business day of the Fund’s reporting periods. See Note 1 of the accompanying Notes.
2. Per share amounts calculated based on the average shares outstanding during the period.
3. Assumes an initial investment on the business day before the first day of the fiscal period, with all dividends and distributions reinvested in additional shares on the reinvestment date, and redemption at the net asset value calculated on the last business day of the fiscal period. Total returns are not annualized for periods less than one full year. Total return information does not reflect expenses that apply at the separate account level or to related insurance products. Inclusion of these charges would reduce the total return figures for all periods shown. Returns do not reflect the deduction of taxes that a shareholder would pay on fund distributions or the redemption of fund shares.
4. Annualized for periods less than one full year.
5. Total expenses including indirect expenses from affiliated fund were as follows:
| | | | | | |
Six Months Ended June 28, 2013 | | | 0.76 | % | |
Year Ended December 31, 2012 | | | 0.76 | % | |
Year Ended December 30, 2011 | | | 0.76 | % | |
Year Ended December 31, 2010 | | | 0.76 | % | |
Year Ended December 31, 2009 | | | 0.75 | % | |
Year Ended December 31, 2008 | | | 0.65 | % | |
See accompanying Notes to Financial Statements.
13 OPPENHEIMER GLOBAL FUND/VA
FINANCIAL HIGHLIGHTS Continued
| | | | | | | | | | | | | | | | | | | | | | | | |
| Class 4 Shares | | Six Months Ended June 28, 20131 (Unaudited) | | | Year Ended December 31, 2012 | | | Year Ended December 30, 20111 | | | Year Ended December 31, 2010 | | | Year Ended December 31, 2009 | | | Year Ended December 31, 2008 | |
| |
Per Share Operating Data | | | | | | | | | | | | | | | | | | | | | | | | |
Net asset value, beginning of period | | $ | 32.32 | | | $ | 27.26 | | | $ | 30.08 | | | $ | 26.32 | | | $ | 20.03 | | | $ | 36.28 | |
| |
Income (loss) from investment operations: | | | | | | | | | | | | | | | | | | | | | | | | |
Net investment income2 | | | 0.28 | | | | 0.37 | | | | 0.57 | | | | 0.26 | | | | 0.27 | | | | 0.47 | |
Net realized and unrealized gain (loss) | | | 2.26 | | | | 5.25 | | | | (3.08) | | | | 3.82 | | | | 6.92 | | | | (14.34) | |
| | | | |
Total from investment operations | | | 2.54 | | | | 5.62 | | | | (2.51) | | | | 4.08 | | | | 7.19 | | | | (13.87) | |
| |
Dividends and/or distributions to shareholders: | | | | | | | | | | | | | | | | | | | | | | | | |
Dividends from net investment income | | | (0.43) | | | | (0.56) | | | | (0.31) | | | | (0.32) | | | | (0.42) | | | | (0.36) | |
Distributions from net realized gain | | | 0.00 | | | | 0.00 | | | | 0.00 | | | | 0.00 | | | | (0.48) | | | | (2.02) | |
| | | | |
Total dividends and/or distributions to shareholders | | | (0.43) | | | | (0.56) | | | | (0.31) | | | | (0.32) | | | | (0.90) | | | | (2.38) | |
| |
Net asset value, end of period | | $ | 34.43 | | | $ | 32.32 | | | $ | 27.26 | | | $ | 30.08 | | | $ | 26.32 | | | $ | 20.03 | |
| | | | |
| |
Total Return, at Net Asset Value3 | | | 7.81% | | | | 20.95% | | | | (8.49)% | | | | 15.67% | | | | 39.38% | | | | (40.35)% | |
| |
Ratios/Supplemental Data | | | | | | | | | | | | | | | | | | | | | | | | |
Net assets, end of period (in thousands) | | $ | 78,051 | | | $ | 75,376 | | | $ | 68,469 | | | $ | 81,866 | | | $ | 78,043 | | | $ | 63,099 | |
| |
Average net assets (in thousands) | | $ | 78,794 | | | $ | 69,764 | | | $ | 78,655 | | | $ | 76,519 | | | $ | 66,965 | | | $ | 93,909 | |
| |
Ratios to average net assets:4 | | | | | | | | | | | | | | | | | | | | | | | | |
Net investment income | | | 1.61% | | | | 1.25% | | | | 1.93% | | | | 0.97% | | | | 1.22% | | | | 1.69% | |
Total expenses5 | | | 1.01% | | | | 1.01% | | | | 1.01% | | | | 1.01% | | | | 1.00% | | | | 0.91% | |
Expenses after payments, waivers and/or reimbursements and reduction to custodian expenses | | | 1.01% | | | | 1.01% | | | | 1.01% | | | | 1.01% | | | | 1.00% | | | | 0.91% | |
| |
Portfolio turnover rate | | | 8% | | | | 14% | | | | 13% | | | | 15% | | | | 11% | | | | 19% | |
1. June 28, 2013 and December 30, 2011 represent the last business day of the Fund’s reporting periods. See Note 1 of the accompanying Notes.
2. Per share amounts calculated based on the average shares outstanding during the period.
3. Assumes an initial investment on the business day before the first day of the fiscal period, with all dividends and distributions reinvested in additional shares on the reinvestment date, and redemption at the net asset value calculated on the last business day of the fiscal period. Total returns are not annualized for periods less than one full year. Total return information does not reflect expenses that apply at the separate account level or to related insurance products. Inclusion of these charges would reduce the total return figures for all periods shown. Returns do not reflect the deduction of taxes that a shareholder would pay on fund distributions or the redemption of fund shares.
4. Annualized for periods less than one full year.
5. Total expenses including indirect expenses from affiliated fund were as follows:
| | | | | | |
Six Months Ended June 28, 2013 | | | 1.01 | % | |
Year Ended December 31, 2012 | | | 1.01 | % | |
Year Ended December 30, 2011 | | | 1.01 | % | |
Year Ended December 31, 2010 | | | 1.01 | % | |
Year Ended December 31, 2009 | | | 1.00 | % | |
Year Ended December 31, 2008 | | | 0.91 | % | |
See accompanying Notes to Financial Statements.
14 OPPENHEIMER GLOBAL FUND/VA
NOTESTO FINANCIAL STATEMENTS Unaudited
1. Significant Accounting Policies
Oppenheimer Global Fund/VA (the “Fund”), formerly Oppenheimer Global Securities Fund/VA, is a separate series of Oppenheimer Variable Account Funds, a diversified open-end management investment company registered under the Investment Company Act of 1940, as amended. The Fund’s investment objective is to seek capital appreciation. The Fund’s investment adviser is OFI Global Asset Management, Inc. (“OFI Global” or the “Manager”), a wholly-owned subsidiary of OppenheimerFunds, Inc. (“OFI” or the “Sub-Adviser”). The Manager has entered into a sub-advisory agreement with OFI. Shares of the Fund are sold only to separate accounts of life insurance companies.
The Fund offers Non-Service, Service, Class 3 and Class 4 shares. All classes are sold at their offering price, which is the net asset value per share, to separate investment accounts of participating insurance companies as an underlying investment for variable life insurance policies, variable annuity contracts or other investment products. The classes of shares being designated as Service shares and Class 4 shares are subject to a distribution and service plan. All classes of shares have identical rights and voting privileges with respect to the Fund in general and exclusive voting rights on matters that affect that class alone. Earnings, net assets and net asset value per share may differ due to each class having its own expenses, such as transfer and shareholder servicing agent fees and shareholder communications, directly attributable to that class. The Fund assesses a 1% fee on the proceeds of Class 3 and Class 4 shares that are redeemed (either by selling or exchanging to another Oppenheimer fund or other investment option offered through your variable life insurance or variable annuity contract) within 60 days of their purchase. The fee, which is retained by the Fund, is accounted for as an addition to paid-in capital.
The following is a summary of significant accounting policies consistently followed by the Fund.
Semiannual and Annual Periods. The Fund’s financial statements are presented through the last day the New York Stock Exchange was open for trading during each reporting period. The Fund’s financial statements have been presented through that date to maintain consistency with the Fund’s net asset value calculations used for shareholder transactions.
Investment in Oppenheimer Institutional Money Market Fund. The Fund is permitted to invest daily available cash balances in an affiliated money market fund. The Fund may invest the available cash in Class E shares of Oppenheimer Institutional Money Market Fund (“IMMF”) to seek current income while preserving liquidity. IMMF is a registered open-end management investment company, regulated as a money market fund under the Investment Company Act of 1940, as amended. The Manager is the investment adviser of IMMF, and the Sub-Adviser provides investment and related advisory services to IMMF. When applicable, the Fund’s investment in IMMF is included in the Statement of Investments. Shares of IMMF are valued at their net asset value per share. As a shareholder, the Fund is subject to its proportional share of IMMF’s Class E expenses, including its management fee. The Manager will waive fees and/or reimburse Fund expenses in an amount equal to the indirect management fees incurred through the Fund’s investment in IMMF.
Foreign Currency Translation. The Fund’s accounting records are maintained in U.S. dollars. The values of securities denominated in foreign currencies and amounts related to the purchase and sale of foreign securities and foreign investment income are translated into U.S. dollars as of the close of the New York Stock Exchange (the “Exchange”), normally 4:00 P.M. Eastern time, on each day the Exchange is open for trading. Foreign exchange rates may be valued primarily using a reliable bank, dealer or service authorized by the Board of Trustees.
Reported net realized gains and losses from foreign currency transactions arise from sales of portfolio securities, sales and maturities of short-term securities, sales of foreign currencies, exchange rate fluctuations between the trade and settlement dates on securities transactions, and the difference between the amounts of dividends, interest, and foreign withholding taxes recorded on the Fund’s books and the U.S. dollar equivalent of the amounts actually received or paid. Net unrealized appreciation and depreciation on the translation of assets and liabilities denominated in foreign currencies arise from changes in the values of assets and liabilities, including investments in securities at fiscal period end, resulting from changes in exchange rates.
The effect of changes in foreign currency exchange rates on investments is separately identified from the fluctuations arising from changes in market values of securities held and reported with all other foreign currency gains and losses in the Fund’s Statement of Operations.
Allocation of Income, Expenses, Gains and Losses. Income, expenses (other than those attributable to a specific class), gains and losses are allocated on a daily basis to each class of shares based upon the relative proportion of net assets represented by such class. Operating expenses directly attributable to a specific class are charged against the operations of that class.
Federal Taxes. The Fund intends to comply with provisions of the Internal Revenue Code applicable to regulated investment companies and to distribute substantially all of its investment company taxable income, including any net realized gain on investments not offset by capital loss carryforwards, if any, to shareholders. Therefore, no federal income or excise tax provision is required. The Fund files income tax returns in U.S. federal and applicable state jurisdictions. The statute of limitations on the Fund’s tax return filings generally remain open for the three preceding fiscal reporting period ends.
During the fiscal year ended December 31, 2012, the Fund utilized $9,221,730 of capital loss carryforward to offset capital gains realized in that fiscal year. The Fund had post-October losses of $2,236,307. Details of the fiscal year ended December 31, 2012 capital loss carryforwards are included in the table below. Capital loss carryforwards with no expiration, if any, must be utilized prior to those with expiration dates. Capital losses with no expiration will be carried forward to future years if not offset by gains.
15 OPPENHEIMER GLOBAL FUND/VA
NOTESTO FINANCIAL STATEMENTS Unaudited / Continued
1. Significant Accounting Policies (Continued)
As of June 28, 2013, it is estimated that the Fund will have no capital loss carryforwards. During the six months ended June 28, 2013, it is estimated that the Fund will utilize $12,170,660 of capital loss carryforward to offset realized capital gains.
Net investment income (loss) and net realized gain (loss) may differ for financial statement and tax purposes. The character of dividends and distributions made during the fiscal year from net investment income or net realized gains may differ from their ultimate characterization for federal income tax purposes. Also, due to timing of dividends and distributions, the fiscal year in which amounts are distributed may differ from the fiscal year in which the income or net realized gain was recorded by the Fund.
The aggregate cost of securities and other investments and the composition of unrealized appreciation and depreciation of securities and other investments for federal income tax purposes as of June 28, 2013 are noted in the following table. The primary difference between book and tax appreciation or depreciation of securities and other investments, if applicable, is attributable to the tax deferral of losses or tax realization of financial statement unrealized gain or loss.
| | | | |
Federal tax cost of securities | | $ | 1,715,329,373 | |
| | | | |
| |
Gross unrealized appreciation | | $ | 999,212,347 | |
Gross unrealized depreciation | | | (69,833,830) | |
| | | | |
Net unrealized appreciation | | $ | 929,378,517 | |
| | | | |
Trustees’ Compensation. The Board of Trustees has adopted a compensation deferral plan for independent trustees that enables trustees to elect to defer receipt of all or a portion of the annual compensation they are entitled to receive from the Fund. For purposes of determining the amount owed to the Trustee under the plan, deferred amounts are treated as though equal dollar amounts had been invested in shares of the Fund or in other Oppenheimer funds selected by the Trustee. The Fund purchases shares of the funds selected for deferral by the Trustee in amounts equal to his or her deemed investment, resulting in a Fund asset equal to the deferred compensation liability. Such assets are included as a component of “Other” within the asset section of the Statement of Assets and Liabilities. Deferral of trustees’ fees under the plan will not affect the net assets of the Fund, and will not materially affect the Fund’s assets, liabilities or net investment income per share. Amounts will be deferred until distributed in accordance with the compensation deferral plan.
Dividends and Distributions to Shareholders. Dividends and distributions to shareholders, which are determined in accordance with income tax regulations and may differ from U.S. generally accepted accounting principles, are recorded on the ex-dividend date. Income and capital gain distributions, if any, are declared and paid annually or at other times as deemed necessary by the Manager. The tax character of distributions is determined as of the Fund’s fiscal year end. Therefore, a portion of the Fund’s distributions made to shareholders prior to the Fund’s fiscal year end may ultimately be categorized as a tax return of capital.
Investment Income. Dividend income is recorded on the ex-dividend date or upon ex-dividend notification in the case of certain foreign dividends where the ex-dividend date may have passed. Non-cash dividends included in dividend income, if any, are recorded at the fair market value of the securities received. Interest income is recognized on an accrual basis. Discount and premium, which are included in interest income on the Statement of Operations, are amortized or accreted daily.
Custodian Fees. “Custodian fees and expenses” in the Statement of Operations may include interest expense incurred by the Fund on any cash overdrafts of its custodian account during the period. Such cash overdrafts may result from the effects of failed trades in portfolio securities and from cash outflows resulting from unanticipated shareholder redemption activity. The Fund pays interest to its custodian on such cash overdrafts, to the extent they are not offset by positive cash balances maintained by the Fund, at a rate equal to the Federal Funds Rate plus 0.50%. The “Reduction to custodian expenses” line item, if applicable, represents earnings on cash balances maintained by the Fund during the period. Such interest expense and other custodian fees may be paid with these earnings.
Security Transactions. Security transactions are recorded on the trade date. Realized gains and losses on securities sold are determined on the basis of identified cost.
Indemnifications. The Fund’s organizational documents provide current and former trustees and officers with a limited indemnification against liabilities arising in connection with the performance of their duties to the Fund. In the normal course of business, the Fund may also enter into contracts that provide general indemnifications. The Fund’s maximum exposure under these arrangements is unknown as this would be dependent on future claims that may be made against the Fund. The risk of material loss from such claims is considered remote.
Other. The preparation of financial statements in conformity with accounting principles generally accepted in the United States of America requires management to make estimates and assumptions that affect the reported amounts of assets and liabilities and disclosure of contingent assets and liabilities at the date of the financial statements and the reported amounts of increases and decreases in net assets from operations during the reporting period. Actual results could differ from those estimates.
16 OPPENHEIMER GLOBAL FUND/VA
2. Securities Valuation
The Fund calculates the net asset value of its shares as of the close of the New York Stock Exchange (the “Exchange”), normally 4:00 P.M. Eastern time, on each day the Exchange is open for trading.
The Fund’s Board has adopted procedures for the valuation of the Fund’s securities and has delegated the day-to-day responsibility for valuation determinations under those procedures to the Manager. The Manager has established a Valuation Committee which is responsible for determining a “fair valuation” for any security for which market quotations are not “readily available.” The Valuation Committee’s fair valuation determinations are subject to review, approval and ratification by the Fund’s Board at its next regularly scheduled meeting covering the calendar quarter in which the fair valuation was determined.
Valuation Methods and Inputs
Securities are valued using unadjusted quoted market prices, when available, as supplied primarily by third party pricing services or dealers.
The following methodologies are used to determine the market value or the fair value of the types of securities described below:
Securities traded on a registered U.S. securities exchange (including exchange-traded derivatives other than futures and futures options) are valued based on the last sale price of the security reported on the principal exchange on which it is traded, prior to the time when the Fund’s assets are valued. In the absence of a sale, the security is valued at the last sale price on the prior trading day, if it is within the spread of the current day’s closing “bid” and “asked” prices, and if not, at the current day’s closing bid price. A security of a foreign issuer traded on a foreign exchange but not listed on a registered U.S. securities exchange is valued based on the last sale price on the principal exchange on which the security is traded, as identified by the third party pricing service used by the Manager, prior to the time when the Fund’s assets are valued. If the last sale price is unavailable, the security is valued at the most recent official closing price on the principal exchange on which it is traded. If the last sales price or official closing price for a foreign security is not available, the security is valued at the mean between the bid and asked price per the exchange or, if not available from the exchange, obtained from two dealers. If bid and asked prices are not available from either the exchange or two dealers, the security is valued by using one of the following methodologies (listed in order of priority); (1) using a bid from the exchange, (2) the mean between the bid and asked price as provided by a single dealer, or (3) a bid from a single dealer.
Shares of a registered investment company that are not traded on an exchange are valued at that investment company’s net asset value per share.
Corporate and government debt securities (of U.S. or foreign issuers) and municipal debt securities, event-linked bonds, loans, mortgage-backed securities, collateralized mortgage obligations, and asset-backed securities are valued at the mean between the “bid” and “asked” prices utilizing evaluated prices obtained from third party pricing services or broker-dealers who may use matrix pricing methods to determine the evaluated prices.
Short-term money market type debt securities with a remaining maturity of sixty days or less are valued at cost adjusted by the amortization of discount or premium to maturity (amortized cost), which approximates market value. Short-term debt securities with a remaining maturity in excess of sixty days are valued at the mean between the “bid” and “asked” prices utilizing evaluated prices obtained from third party pricing services or broker-dealers.
A description of the standard inputs that may generally be considered by the third party pricing vendors in determining their evaluated prices is provided below.
| | |
| Security Type | | Standard inputs generally considered by third-party pricing vendors |
| Corporate debt, government debt, municipal, mortgage-backed and asset-backed securities | | Reported trade data, broker-dealer price quotations, benchmark yields, issuer spreads on comparable securities, the credit quality, yield, maturity, and other appropriate factors. |
| Loans | | Information obtained from market participants regarding reported trade data and broker-dealer price quotations. |
| Event-linked bonds | | Information obtained from market participants regarding reported trade data and broker-dealer price quotations. |
If a market value or price cannot be determined for a security using the methodologies described above, or if, in the “good faith” opinion of the Manager, the market value or price obtained does not constitute a “readily available market quotation,” or a significant event has occurred that would materially affect the value of the security the security is fair valued either (i) by a standardized fair valuation methodology applicable to the security type or the significant event as previously approved by the Valuation Committee and the Fund’s Board or (ii) as determined in good faith by the Manager’s Valuation Committee. The Valuation Committee considers all relevant facts that are reasonably available, through either public information or information available to the Manager, when determining the fair value of a security. Fair value determinations by the Manager are subject to review, approval and ratification by the Fund’s Board at its next regularly scheduled meeting covering the calendar quarter in which the fair valuation was determined. Those fair valuation standardized methodologies include, but are not limited to, valuing securities at the last sale price or initially at cost and subsequently adjusting the value based on: changes in company specific fundamentals, changes in an appropriate securities index, or changes in the value of similar securities which may be further adjusted for any discounts related to security-specific resale restrictions. When possible, such methodologies use observable market inputs such as unadjusted quoted prices of similar securities, observable interest rates, currency rates and yield curves. The methodologies used for valuing securities are not necessarily an indication of the risks associated with investing in those securities nor can it be assured that the Fund can obtain the fair value assigned to a security if it were to sell the security.
To assess the continuing appropriateness of security valuations, the Manager, or its third party service provider who is subject to oversight by the Manager, regularly compares prior day prices, prices on comparable securities, and sale prices to the current day prices and challenges those prices exceeding certain tolerance levels with the third party pricing service or broker source. For those securities valued by fair valuations, whether through a standardized fair valuation methodology or a fair valuation determination, the Valuation Committee reviews and affirms the reasonableness of the
17 OPPENHEIMER GLOBAL FUND/VA
NOTESTO FINANCIAL STATEMENTS Unaudited / Continued
2. Securities Valuation (Continued)
valuations based on such methodologies and fair valuation determinations on a regular basis after considering all relevant information that is reasonably available.
Classifications
Each investment asset or liability of the Fund is assigned a level at measurement date based on the significance and source of the inputs to its valuation. Various data inputs are used in determining the value of each of the Fund’s investments as of the reporting period end. These data inputs are categorized in the following hierarchy under applicable financial accounting standards:
1) Level 1-unadjusted quoted prices in active markets for identical assets or liabilities (including securities actively traded on a securities exchange)
2) Level 2-inputs other than unadjusted quoted prices that are observable for the asset or liability (such as unadjusted quoted prices for similar assets and market corroborated inputs such as interest rates, prepayment speeds, credit risks, etc.)
3) Level 3-significant unobservable inputs (including the Manager’s own judgments about assumptions that market participants would use in pricing the asset or liability).
The inputs used for valuing securities are not necessarily an indication of the risks associated with investing in those securities.
The table below categorizes amounts that are included in the Fund’s Statement of Assets and Liabilities as of June 28, 2013 based on valuation input level:
| | | | | | | | | | | | | | | | |
| | | Level 1—
Unadjusted
Quoted Prices | | | Level 2— Other Significant
Observable Inputs | | | Level 3—
Significant
Unobservable
Inputs | | | Value | |
| |
Assets Table | | | | | | | | | | | | | | | | |
Investments, at Value: | | | | | | | | | | | | | | | | |
Common Stocks | | | | | | | | | | | | | | | | |
Consumer Discretionary | | $ | 152,456,597 | | | $ | 244,088,687 | | | $ | — | | | $ | 396,545,284 | |
Consumer Staples | | | 105,424,173 | | | | 89,581,629 | | | | — | | | | 195,005,802 | |
Energy | | | 23,574,234 | | | | 65,144,172 | | | | — | | | | 88,718,406 | |
Financials | | | 174,824,109 | | | | 351,719,320 | | | | — | | | | 526,543,429 | |
Health Care | | | 252,005,909 | | | | 91,043,876 | | | | — | | | | 343,049,785 | |
Industrials | | | 121,180,041 | | | | 206,925,705 | | | | — | | | | 328,105,746 | |
Information Technology | | | 379,851,237 | | | | 288,757,329 | | | | — | | | | 668,608,566 | |
Materials | | | — | | | | 31,288,192 | | | | — | | | | 31,288,192 | |
Telecommunication Services | | | — | | | | 47,530,593 | | | | — | | | | 47,530,593 | |
Utilities | | | — | | | | 13,433,501 | | | | — | | | | 13,433,501 | |
Rights, Warrants and Certificates | | | — | | | | 942,020 | | | | — | | | | 942,020 | |
Investment Company | | | 4,936,566 | | | | — | | | | — | | | | 4,936,566 | |
| | | | |
Total Assets | | $ | 1,214,252,866 | | | $ | 1,430,455,024 | | | $ | — | | | $ | 2,644,707,890 | |
| | | | |
Currency contracts and forwards, if any, are reported at their unrealized appreciation/ depreciation at measurement date, which represents the change in the contract’s value from trade date. Futures, if any, are reported at their variation margin at measurement date, which represents the amount due to/from the Fund at that date. All additional assets and liabilities included in the above table are reported at their market value at measurement date.
The table below shows the transfers between Level 1 and Level 2. The Fund’s policy is to recognize transfers in and transfers out as of the beginning of the reporting period.
| | | | | | | | |
| | | Transfers out of
Level 1* | | | Transfers into
Level 2* | |
| |
Assets Table | | | | | | | | |
Investments, at Value: | | | | | | | | |
Commons Stocks | | | | | | | | |
Consumer Discretionary | | $ | (56,375,412) | | | $ | 56,375,412 | |
Consumer Staples | | | (29,739,726) | | | | 29,739,726 | |
Financials | | | (79,568,248) | | | | 79,568,248 | |
Health Care | | | (43,061,629) | | | | 43,061,629 | |
Industrials | | | (57,122,804) | | | | 57,122,804 | |
Information Technology | | | (121,877,094) | | | | 121,877,094 | |
Materials | | | (25,410,199) | | | | 25,410,199 | |
| | | | |
Total Assets | | $ | (413,155,112) | | | $ | 413,155,112 | |
| | | | |
*Transferred from Level 1 to Level 2 because of the absence of a readily available unadjusted quoted market price due to a significant event occurring before the Fund’s assets were valued but after the close of the securities’ respective exchanges.
3. Shares of Beneficial Interest
The Fund has authorized an unlimited number of $0.001 par value shares of beneficial interest of each class. Transactions in shares of beneficial interest were as follows:
18 OPPENHEIMER GLOBAL FUND/VA
3. Shares of Beneficial Interest (Continued)
| | | | | | | | | | | | | | | | |
| | | Six Months Ended June 28, 2013 | | | Year Ended December 31, 2012 | |
| | | Shares | | | Amount | | | Shares | | | Amount | |
| |
Non-Service Shares | | | | | | | | | | | | | | | | |
Sold | | | 1,109,563 | | | $ | 38,607,970 | | | | 2,022,136 | | | $ | 59,619,398 | |
Dividends and/or distributions reinvested | | | 517,530 | | | | 18,448,869 | | | | 923,150 | | | | 25,848,197 | |
Redeemed | | | (3,178,792 | ) | | | (110,825,991) | | | | (6,899,218 | ) | | | (205,929,783) | |
| | | | |
Net decrease | | | (1,551,699 | ) | | $ | (53,769,152) | | | | (3,953,932 | ) | | $ | (120,462,188) | |
| | | | |
| | | | | | | | | | | | | | | | |
| |
Service Shares | | | | | | | | | | | | | | | | |
Sold | | | 866,802 | | | $ | 30,019,621 | | | | 3,066,046 | | | $ | 88,602,553 | |
Dividends and/or distributions reinvested | | | 391,733 | | | | 13,851,659 | | | | 742,178 | | | | 20,625,132 | |
Redeemed | | | (3,394,221 | ) | | | (117,804,961) | | | | (5,645,732 | ) | | | (166,844,070) | |
| | | | |
Net decrease | | | (2,135,686 | ) | | $ | (73,933,681) | | | | (1,837,508 | ) | | $ | (57,616,385) | |
| | | | |
| | | | | | | | | | | | | | | | |
| |
Class 3 Shares | | | | | | | | | | | | | | | | |
Sold | | | 158,668 | | | $ | 5,562,919 | | | | 174,260 | | | $ | 5,155,447 | |
Dividends and/or distributions reinvested | | | 67,712 | | | | 2,430,857 | | | | 122,145 | | | | 3,444,499 | |
Redeemed | | | (381,744 | ) | | | (13,361,129) | 1 | | | (1,004,527 | ) | | | (30,086,839)2 | |
| | | | |
Net decrease | | | (155,364 | ) | | $ | (5,367,353) | | | | (708,122 | ) | | $ | (21,486,893) | |
| | | | |
| | | | | | | | | | | | | | | | |
| |
Class 4 Shares | | | | | | | | | | | | | | | | |
Sold | | | 117,283 | | | $ | 4,066,477 | | | | 242,463 | | | $ | 7,528,786 | |
Dividends and/or distributions reinvested | | | 26,919 | | | | 953,729 | | | | 48,074 | | | | 1,338,372 | |
Redeemed | | | (209,897 | ) | | | (7,210,983) | 1 | | | (469,722 | ) | | | (13,722,649)2 | |
| | | | |
Net decrease | | | (65,695 | ) | | $ | (2,190,777) | | | | (179,185 | ) | | $ | (4,855,491) | |
| | | | |
1. Net of redemption fees of $10,150 and $3,255 for Class 3 and Class 4, respectively.
2. Net of redemption fees of $7,643 and $1,566 for Class 3 and Class 4, respectively.
4. Purchases and Sales of Securities
The aggregate cost of purchases and proceeds from sales of securities, other than short-term obligations and investments in IMMF, for the six months ended June 28, 2013, were as follows:
| | | | | | | | | | | | |
| | | Purchases | | | | | | | Sales | |
| |
Investment securities | | | $227,160,239 | | | | | | | | $369,794,975 | |
5. Fees and Other Transactions with Affiliates
Management Fees. Under the investment advisory agreement, the Fund pays the Manager a management fee based on the daily net assets of the Fund at an annual rate as shown in the following table:
| | | | |
| Fee Schedule | | | | |
Up to $200 million | | | 0.75% | |
Next $200 million | | | 0.72 | |
Next $200 million | | | 0.69 | |
Next $200 million | | | 0.66 | |
Over $800 million | | | 0.60 | |
Sub-Adviser Fees. The Manager has retained the Sub-Adviser to provide the day-to-day portfolio management of the Fund. Under the Sub-Advisory Agreement, the Manager pays the Sub-Adviser an annual fee in monthly installments, equal to a percentage of the investment management fee collected by the Manager from the Fund, which shall be calculated after any investment management fee waivers. The fee paid to the Sub-Adviser is paid by the Manager, not by the Fund.
Transfer Agent Fees. OFI Global (the “Transfer Agent”) serves as the transfer and shareholder servicing agent for the Fund. Fees incurred by the Fund with respect to these services are detailed in the Statement of Operations.
Sub-Transfer Agent Fees. The Transfer Agent has retained Shareholder Services, Inc., a wholly-owned subsidiary of OFI (the “Sub-Transfer Agent”), to provide the day-to-day transfer agent and shareholder servicing of the Fund. Under the Sub-Transfer Agency Agreement, the Transfer Agent pays the Sub-Transfer Agent an annual fee in monthly installments, equal to a percentage of the transfer agent fee collected by the Transfer Agent from the Fund, which shall be calculated after any applicable fee waivers. The fee paid to the Sub-Transfer Agent is paid by the Transfer Agent, not by the Fund.
Distribution and Service Plan for Service Shares and Class 4 Shares. The Fund has adopted a Distribution and Service Plan (the “Plan”) in accordance with Rule 12b-1 under the Investment Company Act of 1940 for Service shares and Class 4 shares to pay OppenheimerFunds Distributor, Inc. (the “Distributor”), for distribution related services, personal service and account maintenance for the Fund’s Service shares and Class 4 shares. Under
19 OPPENHEIMER GLOBAL FUND/VA
NOTESTO FINANCIAL STATEMENTS Unaudited / Continued
5. Fees and Other Transactions with Affiliates (Continued)
the Plan, payments are made at an annual rate of 0.25% of the daily net assets of Service shares and Class 4 shares of the Fund. The Distributor currently uses all of those fees to compensate sponsors of the insurance product that offers Fund shares, for providing personal service and maintenance of accounts of their variable contract owners that hold Service shares and Class 4 shares. These fees are paid out of the Fund’s assets on an on-going basis and increase operating expenses of the Service shares and Class 4 shares, which results in lower performance compared to the Fund’s shares that are not subject to a service fee. Fees incurred by the Fund under the Plan are detailed in the Statement of Operations.
Waivers and Reimbursements of Expenses. The Manager has voluntarily agreed to limit the Fund’s expenses after payments, waivers and/or reimbursements and reduction to custodian expenses, excluding expenses incurred directly or indirectly by the Fund as a result of investments in other investment companies, wholly-owned subsidiaries and pooled investment vehicles; so that those expenses, as percentages of daily net assets, will not exceed the annual rate of 1.00% for Non-Service and Class 3 shares and 1.25% for Service and Class 4 shares
The Manager will waive fees and/or reimburse Fund expenses in an amount equal to the indirect management fees incurred through the Fund’s investment in IMMF. During the six months ended June 28, 2013, the Manager waived fees and/or reimbursed the Fund $5,647 for IMMF management fees.
Some of these undertakings may be modified or terminated at any time; some may not be modified or terminated until after one year from the date of the current prospectus, as indicated therein.
6. Pending Litigation
Since 2009, a number of class action lawsuits have been pending in federal courts against OppenheimerFunds, Inc. (“OFI”), OppenheimerFunds Distributor, Inc., the Fund’s principal underwriter and distributor (the “Distributor”), and certain funds (but not including the Fund) advised by the Manager and distributed by the Distributor (the “Defendant Funds”). Several of these lawsuits also name as defendants certain officers and current and former trustees of the respective Defendant Funds. The lawsuits raise claims under federal securities law and allege, among other things, that the disclosure documents of the respective Defendant Funds contained misrepresentations and omissions and that the respective Defendant Funds’ investment policies were not followed. The plaintiffs in these actions seek unspecified damages, equitable relief and awards of attorneys’ fees and litigation expenses. The Defendant Funds’ Boards of Trustees have also engaged counsel to represent the Funds and the present and former Independent Trustees named in those suits.
Other class action and individual lawsuits have been filed since 2008 in various state and federal courts against OFI and certain of its affiliates by investors seeking to recover investments they allegedly lost as a result of the “Ponzi” scheme run by Bernard L. Madoff and his firm, Bernard L. Madoff Investment Securities, LLC (“BLMIS”). Plaintiffs in these suits allege that they suffered losses as a result of their investments in several funds managed by an affiliate of OFI and assert a variety of claims, including breach of fiduciary duty, fraud, negligent misrepresentation, unjust enrichment, and violation of federal and state securities laws and regulations, among others. They seek unspecified damages, equitable relief and awards of attorneys’ fees and litigation expenses. Neither the Distributor, nor any of the Oppenheimer mutual funds, their independent trustees or directors are named as defendants in these lawsuits. None of the Oppenheimer mutual funds invested in any funds or accounts managed by Madoff or BLMIS. On February 28, 2011, a stipulation of partial settlement of three groups of consolidated putative class action lawsuits relating to these matters was filed in the U.S. District Court for the Southern District of New York. On August 19, 2011, the court entered an order and final judgment approving the settlement as fair, reasonable and adequate. In September 2011, certain parties filed notices of appeal from the court’s order approving the settlement. The settlement does not resolve other outstanding lawsuits against OFI and its affiliates relating to BLMIS.
On April 16, 2010, a lawsuit was filed in New York state court against (i) OFI, (ii) an affiliate of OFI and (iii) AAArdvark IV Funding Limited (“AAArdvark IV”), an entity advised by OFI’s affiliate, in connection with investments made by the plaintiffs in AAArdvark IV. Plaintiffs allege breach of contract and common law fraud claims against the defendants and seek compensatory damages, costs and disbursements, including attorney fees. On April 11, 2013, the court granted defendants’ motion for summary judgment, dismissing plaintiffs’ fraud claim with prejudice and dismissing their contract claim without prejudice, and granted plaintiffs leave to replead their contract claim to assert a cause of action for specific performance within 30 days. On May 9, 2013, plaintiffs filed a notice of appeal from the court’s dismissal order. On July 15, 2011, a lawsuit was filed in New York state court against OFI, an affiliate of OFI and AAArdvark Funding Limited (“AAArdvark I”), an entity advised by OFI’s affiliate, in connection with investments made by the plaintiffs in AAArdvark I. The complaint alleges breach of contract and common law fraud claims against the defendants and seeks compensatory damages, costs and disbursements, including attorney fees. On November 9, 2011, a lawsuit was filed in New York state court against OFI, an affiliate of OFI and AAArdvark XS Funding Limited (“AAArdvark XS”), an entity advised by OFI’s affiliate, in connection with investments made by the plaintiffs in AAArdvark XS. The complaint alleges breach of contract against the defendants and seeks compensatory damages, costs and disbursements, including attorney fees.
OFI believes the lawsuits and appeals described above are without legal merit and, with the exception of actions it has settled, is defending against them vigorously. While it is premature to render any opinion as to the outcome in these lawsuits, or whether any costs that the Defendant Funds may bear in defending the suits might not be reimbursed by insurance, OFI believes that these suits should not impair the ability of OFI or the Distributor to perform their respective duties to the Fund, and that the outcome of all of the suits together should not have any material effect on the operations of any of the Oppenheimer mutual funds.
20 OPPENHEIMER GLOBAL FUND/VA
PORTFOLIO PROXY VOTING POLICIES AND PROCEDURES; UPDATES TO STATEMENTS OF INVESTMENTS Unaudited
The Fund has adopted Portfolio Proxy Voting Policies and Procedures under which the Fund votes proxies relating to securities (“portfolio proxies”) held by the Fund. A description of the Fund’s Portfolio Proxy Voting Policies and Procedures is available (i) without charge, upon request, by calling the Fund toll-free at 1.800.CALL OPP (225.5677), (ii) on the Fund’s website at oppenheimerfunds.com, and (iii) on the SEC’s website at www.sec.gov. In addition, the Fund is required to file Form N-PX, with its complete proxy voting record for the 12 months ended June 30th, no later than August 31st of each year. The Fund’s voting record is available (i) without charge, upon request, by calling the Fund toll-free at 1.800.CALL OPP (225.5677), and (ii) in the Form N-PX filing on the SEC’s website at www.sec.gov.
The Fund files its complete schedule of portfolio holdings with the SEC for the first quarter and the third quarter of each fiscal year on Form N-Q. The Fund’s Form N-Q filings are available on the SEC’s website at www.sec.gov. Those forms may be reviewed and copied at the SEC’s Public Reference Room in Washington, D.C. Information on the operation of the Public Reference Room may be obtained by calling 1-800-SEC-0330.
21 OPPENHEIMER GLOBAL FUND/VA
OPPENHEIMER GLOBAL FUND/VA
A Series of Oppenheimer Variable Account Funds
| | |
| Trustees and Officers | | Sam Freedman, Chairman of the Board of Trustees and Trustee |
| | Edward L. Cameron, Trustee |
| | Jon S. Fossel, Trustee |
| | Richard F. Grabish, Trustee |
| | Beverly L. Hamilton, Trustee |
| | Victoria J. Herget, Trustee |
| | Robert J. Malone, Trustee |
| | F. William Marshall, Jr., Trustee |
| | Karen L. Stuckey, Trustee |
| | James D. Vaughn, Trustee |
| | William F. Glavin, Jr., Trustee, President and Principal Executive Officer |
| | Rajeev Bhaman, Vice President |
| | Arthur S. Gabinet, Secretary and Chief Legal Officer |
| | Christina M. Nasta, Vice President and Chief Business Officer |
| | Mark S. Vandehey, Vice President and Chief Compliance Officer |
| | Brian W. Wixted, Treasurer and Principal Financial & Accounting Officer |
| |
| Manager | | OFI Global Asset Management, Inc. |
| |
| Sub-Adviser | | OppenheimerFunds, Inc. |
| |
| Distributor | | OppenheimerFunds Distributor, Inc. |
| |
| Transfer and Shareholder Servicing Agent | | OFI Global Asset Management, Inc. |
| |
| Sub-Transfer Agent | | Shareholder Services, Inc. DBA OppenheimerFunds Services |
| |
| Independent Registered Public Accounting Firm | | KPMG LLP |
| |
| Legal Counsel | | K&L Gates LLP |
| |
| | Before investing in any of the Oppenheimer funds, investors should carefully consider a fund’s investment objectives, risks, charges and expenses. Fund prospectuses and summary prospectuses contain this and other information about the funds and may be obtained by asking your financial advisor, visiting oppenheimerfunds.com, or calling us at 1.800.988.8287. Read prospectuses and summary prospectuses carefully before investing. |
| |
| | The financial statements included herein have been taken from the records of the Fund without examination of those records by the independent registered public accounting firm. |
© 2013 OppenheimerFunds, Inc. All rights reserved. Oppenheimer funds are distributed by OppenheimerFunds Distributor, Inc.

| | | | |
| June 30, 2013 | | |
| | | Oppenheimer Main Street Fund®/VA A Series of Oppenheimer Variable Account Funds | | Semiannual Report |
| | |
| | SEMIANNUAL REPORT Listing of Top Holdings Fund Performance Discussion Financial Statements | | |

Portfolio Managers: Manind (“Mani”) Govil, CFA and Benjamin Ram
Cumulative Total Returns
For the 6-Month Period Ended 6/28/131
| | | | | | | | | | | | |
Non-Service Shares | | | 11.23 | % | | | | | | | | |
Service Shares | | | 11.08 | | | | | | | | | |
Average Annual Total Returns For the Periods Ended 6/28/131 | |
| | | 1-Year | | | 5-Year | | | 10-Year | |
Non-Service Shares | | | 19.24 | % | | | 5.66% | | | | 6.66% | |
Service Shares | | | 18.93 | % | | | 5.40% | | | | 6.40% | |
The performance data quoted represents past performance, which does not guarantee future results. The investment return and principal value of an investment in the Fund will fluctuate so that an investor’s shares, when redeemed, may be worth more or less than their original cost. Current performance may be lower or higher than the performance quoted. For performance data current to the most recent month end, call us at 1.800.988.8287. The Fund’s total returns should not be expected to be the same as the returns of other funds, whether or not both funds have the same portfolio managers and/or similar names. The Fund’s total returns include changes in share price and reinvested distributions but do not include the charges associated with the separate account products that offer this Fund. Such performance would have been lower if such charges were taken into account.
1. June 28, 2013, was the last business day of the Fund’s semiannual period. See Note 1 of the accompanying Notes to Financial Statements.
| | | | |
TOP TEN COMMON STOCK HOLDINGS | | | | |
JPMorgan Chase & Co. | | | 4.8 | % |
Apple, Inc. | | | 4.5 | |
Philip Morris International, Inc. | | | 4.3 | |
International Business Machines Corp. | | | 3.7 | |
Chevron Corp. | | | 3.4 | |
eBay, Inc. | | | 3.4 | |
National Oilwell Varco, Inc. | | | 3.2 | |
Covidien plc | | | 3.2 | |
Express Scripts Holding Co. | | | 3.1 | |
CIT Group, Inc. | | | 2.7 | |
Portfolio holdings and allocations are subject to change. Percentages are as of June 28, 2013, and are based on net assets. For more current Fund holdings, please visit oppenheimerfunds.com.
SECTOR ALLOCATION
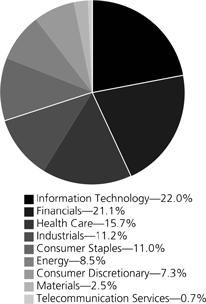
Portfolio holdings and allocations are subject to change. Percentages are as of June 28, 2013, and are based on the total market value of common stocks.
2 OPPENHEIMER MAIN STREET FUND/VA
| | |
Fund Performance Discussion |
The Fund’s Non-Service shares produced a return of 11.23% during the period, underperforming the S&P 500 Index (the “Index”), which returned 13.82%. The Fund’s underperformance relative to the Index stemmed primarily from weaker relative stock selection in the information technology sector. Weaker relative stock selection in the telecommunication services and consumer staples sectors detracted from performance to a lesser degree, as did weaker stock selection and an underweight position in consumer discretionary. The Fund outperformed the Index in the financials and health care sectors, where stronger stock selection and overweight positions benefited results.
GLOBAL MARKET AND ECONOMIC ENVIRONMENT
Equities performed positively for the period as central banks throughout the world, including the United States, Europe and Japan, took steps to maintain highly accommodative monetary policy and stimulate their respective economies. In addition, a clear recovery in the U.S. provided further support for equity markets. However, later in the period, the Federal Reserve (the “Fed”) appeared to weigh the merits of backing away from its quantitative easing policy. As a result, the markets sold off sharply and made a quick reappraisal of interest rate risk in an array of credit markets and related currencies. Equities, particularly those in emerging markets and in interest rate sensitive sectors, experienced spillover effects as a result.
TOP INDIVIDUAL CONTRIBUTORS
The top performing holding of the Fund this period was Actavis, Inc., which is a branded and generic drug company. Shares of Actavis spiked when management announced it was combining operations with Warner Chilcott – a leading specialty pharmaceutical company based in Ireland. The merged entity is expected to benefit from revenue synergies, with complementary product lines, and cost rationalization – both of which we believe have the potential to contribute to rising profits.
Following Actavis, four of the Fund’s top performing holdings were in the financials sector: JPMorgan Chase & Co., Citigroup Inc., CIT Group, Inc. and CME Group, Inc. The financials sector was the strongest performing sector for the Fund on an absolute basis. The ongoing, albeit modest improvement in the economy – largely driven by the continued health of the housing sector – has led to lower foreclosures, increased credit quality, and rising demand for mortgages. As a result, stocks of many banks have benefited, including JPMorgan and Citigroup. JPMorgan’s stock also benefited when shareholders voted against splitting Jamie Dimon’s role as Chairperson and CEO. CIT benefited from a lifting of certain restrictions previously imposed upon them by the Fed, which allowed management to announce a $200 million buyback program and signaled to the market that CIT was on better financial footing. CME Group provides a wide range of benchmark futures and options products. Increased volatility generally benefits this stock, as demand increases for investments such as futures and options to hedge positions. As volatility increased later in the period, this stock performed well.
TOP INDIVIDUAL DETRACTORS
Apple, Inc. was the most significant detractor from performance this period. Despite a boost to both its share repurchase and dividend, investors reacted negatively to management’s disappointing guidance and further delays in the launch of innovative products – which the market believes are sorely needed. Apple’s recent annual Worldwide Developers Conference also failed to inspire – leaving investors wondering further about likelihood of a “game-changing” product introduction. While we are cognizant of the market’s concern that Apple lost its “edge” with the death of Steve Jobs, we continue to believe that the team, now headed by Tim Cook, will deliver on innovation.
Also detracting from performance were America Movil SAB de CV, Vulcan Materials Co. and The ADT Corp. America Movil is a mobile carrier in Latin America. The Mexican government announced a reform proposal designed to create more competition, increase access to services, and reduce prices in the Mexican telecom sector. We believe that these potential changes could be material and this regulatory uncertainty caused us to reduce our exposure to the company. Vulcan Materials is a producer of construction aggregates, including crushed stone, sand and gravel. The stock experienced the bulk of its losses in June, which was a difficult time for materials-related stocks. Vulcan was also hurt by more harsh winter weather, which caused a shortfall in earnings when they reported during the second quarter. ADT is a provider of electronic security, interactive home and business automation and related monitoring services that experienced subscriber attrition towards the end of the period.
STRATEGY & OUTLOOK
We believe the Fed is acting appropriately by signaling that eventually it will lessen its monetary support of our expanding economy. While the market declined after the Fed’s comments, what seemed to be missing from the market’s response was the realization that when rates do rise – it should be a reflection of a strong economy. And this, in combination with the likelihood, in our view, that the Fed will be “tapering” later than currently feared, has set-up a potentially attractive investment opportunity in domestic equities. Company fundamentals are better than at prior nominal highs in the market. And, as has been well documented throughout this tepid recovery, corporations have been very cautious about spending money – largely reflecting uncertainty about the economic and
3 OPPENHEIMER MAIN STREET FUND/VA
political outlook. This cautious behavior has resulted in a massive build-up of cash on corporate balance sheets that has greatly improved the fundamental health of many companies. As the economy improves and managements’ uncertainty lifts, these cash balances have the potential to be used in a constructive manner that may support rising equity valuations.
Domestically, housing has momentum and job creation, while not robust, at least continues. We expect that company fundamentals will continue to show improvement – especially as companies tap into the large cash reserves that have been built-up. These factors have the potential to drive equity prices higher; however, rarely does the market appreciate on a straight upward trajectory. While we are not predicting a market correction, we do believe that the market may return to experiencing greater volatility.
Given this backdrop, our approach remains consistent. We aim to construct an “all weather” portfolio by targeting companies with: 1) sustainable competitive advantages; 2) skilled management with a proven track record of executing effectively; and 3) financial resources to generate improving profitability, gain market share, and/or return significant capital to shareholders. During volatile economic times such companies often widen their lead over weaker competitors. We seek to invest in companies, characterized by these qualities, at compelling valuations and believe this disciplined approach is essential.
The Fund’s investment strategy and focus can change over time. The mention of specific fund holdings does not constitute a recommendation by OppenheimerFunds, Inc. or its affiliates.
Shares of Oppenheimer funds are not deposits or obligations of any bank, are not guaranteed by any bank, are not insured by the FDIC or any other agency, and involve investment risks, including the possible loss of the principal amount invested.
4 OPPENHEIMER MAIN STREET FUND/VA
Fund Expenses. As a shareholder of the Fund, you incur two types of costs: (1) transaction costs and (2) ongoing costs, including management fees; distribution and service fees; and other Fund expenses. These examples are intended to help you understand your ongoing costs (in dollars) of investing in the Fund and to compare these costs with the ongoing costs of investing in other mutual funds.
The examples are based on an investment of $1,000.00 invested at the beginning of the period and held for the entire 6-month period ended June 28, 2013.
Actual Expenses. The first section of the table provides information about actual account values and actual expenses. You may use the information in this section for the class of shares you hold, together with the amount you invested, to estimate the expense that you paid over the period. Simply divide your account value by $1,000.00 (for example, an $8,600.00 account value divided by $1,000.00 = 8.60), then multiply the result by the number in the first section under the heading entitled “Expenses Paid During Period” to estimate the expenses you paid on your account during this period.
Hypothetical Example for Comparison Purposes. The second section of the table provides information about hypothetical account values and hypothetical expenses based on the Fund’s actual expense ratio for each class of shares, and an assumed rate of return of 5% per year for each class before expenses, which is not the actual return. The hypothetical account values and expenses may not be used to estimate the actual ending account balance or expenses you paid for the period. You may use this information to compare the ongoing costs of investing in the Fund and other funds. To do so, compare this 5% hypothetical example for the class of shares you hold with the 5% hypothetical examples that appear in the shareholder reports of the other funds.
Please note that the expenses shown in the table are meant to highlight your ongoing costs only and do not reflect any charges associated with the separate accounts that offer this Fund. Therefore, the “hypothetical” lines of the table are useful in comparing ongoing costs only, and will not help you determine the relative total costs of owning different funds. In addition, if these separate account charges were included your costs would have been higher.
| | | | | | | | | | | | | | |
| Actual | | Beginning
Account
Value
January 1, 2013 | | | Ending
Account
Value
June 28, 2013 | | | Expenses
Paid During
6 Months Ended
June 28, 2013 | | | |
Non-Service shares | | $ | 1,000.00 | | | $ | 1,112.30 | | | $ | 4.05 | | | |
Service shares | | | 1,000.00 | | | | 1,110.80 | | | | 5.34 | | | |
| | | | |
Hypothetical | | | | | | | | | | | | | | |
(5% return before expenses) | | | | | | | | | | | | | | |
Non-Service shares | | | 1,000.00 | | | | 1,020.70 | | | | 3.87 | | | |
Service shares | | | 1,000.00 | | | | 1,019.47 | | | | 5.11 | | | |
Expenses are equal to the Fund’s annualized expense ratio for that class, multiplied by the average account value over the period, multiplied by 179/365 (to reflect the one-half year period). Those annualized expense ratios, excluding indirect expenses from affiliated funds, based on the 6-month period ended June 28, 2013 are as follows:
| | | | |
| Class | | Expense Ratios | | |
Non-Service shares | | 0.78% | | |
Service shares | | 1.03 | | |
The expense ratios reflect voluntary waivers and/or reimbursements of expenses by the Fund’s Manager. Some of these undertakings may be modified or terminated at any time, as indicated in the Fund’s prospectus. The “Financial Highlights” tables in the Fund’s financial statements, included in this report, also show the gross expense ratios, without such waivers or reimbursements and reduction to custodian expenses, if applicable.
5 OPPENHEIMER MAIN STREET FUND/VA
| | |
STATEMENTOF INVESTMENTS June 28, 2013* / Unaudited |
| | | | | | | | | | |
| | | Shares | | | Value | | | |
Common Stocks—99.3% | | | | | | | | | | |
Consumer Discretionary—7.3% | | | |
Automobiles—1.1% | | | | | | | | | | |
Ford Motor Co. | | | 992,090 | | | $ | 15,347,632 | | | |
Media—1.5% | | | | | | | | | | |
Time Warner, Inc. | | | 357,180 | | | | 20,652,148 | | | |
Specialty Retail—3.9% | | | |
AutoZone, Inc.1 | | | 81,320 | | | | 34,454,471 | | | |
TJX Cos., Inc. (The) | | | 379,900 | | | | 19,017,794 | | | |
| | | | | | | | 53,472,265 | | | |
Textiles, Apparel & Luxury Goods—0.8% | | | |
PVH Corp. | | | 82,590 | | | | 10,327,879 | | | |
Consumer Staples—10.9% | | | | | | | | | | |
Beverages—1.3% | | | | | | | | | | |
Dr Pepper Snapple Group, Inc. | | | 388,070 | | | | 17,824,055 | | | |
Food Products—3.7% | | | | | | | | | | |
J.M. Smucker Co. (The) | | | 190,500 | | | | 19,650,075 | | | |
Kraft Foods Group, Inc. | | | 428,866 | | | | 23,960,743 | | | |
Mondelez International, Inc., Cl. A | | | 286,350 | | | | 8,169,565 | | | |
| | | | | | | | 51,780,383 | | | |
Household Products—1.6% | | | |
Henkel AG & Co. KGaA | | | 58,043 | | | | 4,549,198 | | | |
Henkel AG & Co. KGaA, Preference | | | 181,172 | | | | 17,000,506 | | | |
| | | | | | | | 21,549,704 | | | |
Tobacco—4.3% | | | |
Philip Morris International, Inc. | | | 673,319 | | | | 58,322,892 | | | |
Energy—8.5% | | | | | | | | | | |
Energy Equipment & Services—3.2% | | | |
National Oilwell Varco, Inc. | | | 636,460 | | | | 43,852,094 | | | |
Oil, Gas & Consumable Fuels—5.3% | | | |
Chevron Corp. | | | 395,970 | | | | 46,859,090 | | | |
Noble Energy, Inc. | | | 423,640 | | | | 25,435,346 | | | |
| | | | | | | | 72,294,436 | | | |
Financials—20.9% | | | | | | | | | | |
Commercial Banks—3.3% | | | |
CIT Group, Inc.1 | | | 806,420 | | | | 37,603,365 | | | |
M&T Bank Corp. | | | 68,240 | | | | 7,625,820 | | | |
| | | | | | | | 45,229,185 | | | |
Consumer Finance—2.1% | | | |
Discover Financial Services | | | 592,630 | | | | 28,232,893 | | | |
Diversified Financial Services—11.5% | | | |
Citigroup, Inc. | | | 709,998 | | | | 34,058,604 | | | |
CME Group, Inc., Cl. A | | | 173,680 | | | | 13,196,206 | | | |
JPMorgan Chase & Co. | | | 1,239,010 | | | | 65,407,338 | | | |
McGraw Hill Financial, Inc. | | | 551,641 | | | | 29,341,785 | | | |
Moody’s Corp. | | | 129,480 | | | | 7,889,216 | | | |
MSCI, Inc.1 | | | 220,810 | | | | 7,346,349 | | | |
| | | | | | | | 157,239,498 | | | |
Insurance—4.0% | | | |
American International Group, Inc.1 | | | 475,620 | | | | 21,260,214 | | | |
Lincoln National Corp. | | | 287,300 | | | | 10,477,831 | | | |
Marsh & McLennan Cos., Inc. | | | 553,700 | | | | 22,103,704 | | | |
| | | | | | | | 53,841,749 | | | |
Health Care—15.7% | | | | | | | | | | |
Health Care Equipment & Supplies—4.1% | | | |
Abbott Laboratories | | | 338,130 | | | | 11,793,974 | | | |
Covidien plc | | | 691,390 | | | | 43,446,948 | | | |
| | | | | | | | 55,240,922 | | | |
Health Care Providers & Services—4.8% | | | |
Express Scripts Holding Co.1 | | | 693,497 | | | | 42,781,830 | | | |
UnitedHealth Group, Inc. | | | 360,470 | | | | 23,603,576 | | | |
| | | | | | | | 66,385,406 | | | |
Pharmaceuticals—6.8% | | | |
AbbVie, Inc. | | | 426,260 | | | | 17,621,588 | | | |
Actavis, Inc.1 | | | 202,830 | | | | 25,601,203 | | | |
Pfizer, Inc. | | | 911,609 | | | | 25,534,168 | | | |
Sanofi | | | 142,010 | | | | 14,635,140 | | | |
Zoetis, Inc. | | | 287,320 | | | | 8,875,315 | | | |
| | | | | | | 92,267,414 | | | |
| | | | | | | | |
| | | Shares | | | Value | |
Industrials—11.0% | | | | | | | | |
Aerospace & Defense—0.8% | | | | | | | | |
L-3 Communications Holdings, Inc. | | | 125,220 | | | $ | 10,736,363 | |
Air Freight & Couriers—2.5% | |
United Parcel Service, Inc., Cl. B | | | 389,000 | | | | 33,640,720 | |
Commercial Services & Supplies—3.0% | |
ADT Corp. (The) | | | 291,592 | | | | 11,619,941 | |
Tyco International Ltd. | | | 919,645 | | | | 30,302,303 | |
| | | | | | | | 41,922,244 | |
Professional Services—1.6% | |
Towers Watson & Co., Cl. A | | | 275,560 | | | | 22,579,386 | |
Road & Rail—3.1% | |
Canadian National Railway Co. | | | 286,750 | | | | 27,892,172 | |
CSX Corp. | | | 642,530 | | | | 14,900,271 | |
| | | | | | | | 42,792,443 | |
Information Technology—21.9% | |
Communications Equipment—1.9% | |
QUALCOMM, Inc. | | | 422,831 | | | | 25,826,517 | |
Computers & Peripherals—5.3% | |
Apple, Inc. | | | 157,262 | | | | 62,288,333 | |
Western Digital Corp. | | | 165,760 | | | | 10,292,038 | |
| | | | | | | | 72,580,371 | |
Electronic Equipment, Instruments, & Components—1.1% | |
Corning, Inc. | | | 1,035,720 | | | | 14,738,296 | |
Internet Software & Services—6.4% | |
eBay, Inc.1 | | | 896,725 | | | | 46,378,617 | |
Facebook, Inc., Cl. A1 | | | 668,360 | | | | 16,615,430 | |
Google, Inc., Cl. A1 | | | 27,310 | | | | 24,042,905 | |
| | | | | | | | 87,036,952 | |
IT Services—4.9% | |
Amdocs Ltd. | | | 268,620 | | | | 9,963,116 | |
International Business Machines Corp. | | | 266,120 | | | | 50,858,193 | |
Mastercard, Inc., Cl. A | | | 12,230 | | | | 7,026,135 | |
| | | | | | | | 67,847,444 | |
Software—2.3% | |
Microsoft Corp. | | | 922,520 | | | | 31,854,616 | |
Materials—2.4% | |
Chemicals—0.3% | | | | | | | | |
PPG Industries, Inc. | | | 32,480 | | | | 4,755,397 | |
Construction Materials—2.1% | |
Vulcan Materials Co. | | | 607,150 | | | | 29,392,131 | |
Telecommunication Services—0.7% | |
Wireless Telecommunication Services—0.7% | |
America Movil SAB de CV, Series L, ADR | | | 461,792 | | | | 10,043,976 | |
Total Common Stocks | | | | | | | | |
(Cost $949,585,659) | | | | | | | 1,359,607,411 | |
Investment Company—1.1% | | | | | | | | |
| Oppenheimer Institutional Money Market Fund, Cl. E, 0.11%2,3 | | | | | | | | |
(Cost $15,450,330) | | | 15,450,330 | | | | 15,450,330 | |
Total Investments, at Value (Cost $965,035,989) | | | 100.4 | % | | | 1,375,057,741 | |
Liabilities in Excess of Other Assets | | | (0.4 | ) | | | (5,801,870 | ) |
Net Assets | | | 100.0 | % | | $ | 1,369,255,871 | |
6 OPPENHEIMER MAIN STREET FUND/VA
Footnotes to Statement of Investments
*June 28, 2013 represents the last business day of the Fund’s semiannual period. See Note 1 of the accompanying Notes.
1. Non-income producing security.
2. Rate shown is the 7-day yield as of June 28, 2013.
3. Is or was an affiliate, as defined in the Investment Company Act of 1940, at or during the period ended June 28, 2013, by virtue of the Fund owning at least 5% of the voting securities of the issuer or as a result of the Fund and the issuer having the same investment adviser. Transactions during the period in which the issuer was an affiliate are as follows:
| | | | | | | | | | | | | | | | |
| | | Shares
December 31,
2012 | | | Gross
Additions | | | Gross
Reductions | | | Shares
June 28, 2013 | |
Oppenheimer Institutional Money Market Fund, Cl. E | | | 24,937,150 | | | | 165,969,315 | | | | 175,456,135 | | | | 15,450,330 | |
| | | | |
| | | | | | | | | Value | | | Income | |
Oppenheimer Institutional Money Market Fund, Cl. E | | | | | | | | | | $ | 15,450,330 | | | $ | 9,269 | |
See accompanying Notes to Financial Statements.
7 OPPENHEIMER MAIN STREET FUND/VA
| | |
STATEMENT OF ASSETS AND LIABILITIES June 28, 20131 Unaudited |
| | | | |
Assets | | | | |
Investments, at value—see accompanying statement of investments: | | | | |
Unaffiliated companies (cost $949,585,659) | | $ | 1,359,607,411 | |
Affiliated companies (cost $15,450,330) | | | 15,450,330 | |
| | | | 1,375,057,741 | |
Cash | | | 28,521 | |
Receivables and other assets: | | | | |
Investments sold | | | 2,433,056 | |
Dividends | | | 1,056,307 | |
Other | | | 80,299 | |
Total assets | | | 1,378,655,924 | |
|
| |
Liabilities | | | | |
Payables and other liabilities: | | | | |
Investments purchased | | | 7,733,677 | |
Shares of beneficial interest redeemed | | | 1,235,993 | |
Distribution and service plan fees | | | 167,501 | |
Transfer and shareholder servicing agent fees | | | 107,280 | |
Trustees’ compensation | | | 69,352 | |
Shareholder communications | | | 57,539 | |
Other | | | 28,711 | |
Total liabilities | | | 9,400,053 | |
|
| | |
Net Assets | | $ | 1,369,255,871 | |
|
| |
Composition of Net Assets | | | | |
Par value of shares of beneficial interest | | $ | 52,153 | |
Additional paid-in capital | | | 1,091,758,418 | |
Accumulated net investment income | | | 5,027,085 | |
Accumulated net realized loss on investments and foreign currency transactions | | | (137,603,950 | ) |
Net unrealized appreciation on investments and translation of assets and liabilities denominated in foreign currencies | | | 410,022,165 | |
Net Assets | | $ | 1,369,255,871 | |
|
| |
Net Asset Value Per Share | | | | |
Non-Service Shares: | | | | |
| Net asset value, redemption price per share and offering price per share (based on net assets of $502,094,919 and 19,042,849 shares of beneficial interest outstanding) | | | $26.37 | |
Service Shares: | | | | |
| Net asset value, redemption price per share and offering price per share (based on net assets of $867,160,952 and 33,110,304 shares of beneficial interest outstanding) | | | $26.19 | |
1. June 28, 2013 represents the last business day of the Fund’s semiannual period. See Note 1 of the accompanying Notes.
See accompanying Notes to Financial Statements.
8 OPPENHEIMER MAIN STREET FUND/VA
| | |
STATEMENT OF OPERATIONS For the Six Months Ended June 28, 20131 Unaudited |
| | | | |
Investment Income | | | | |
Dividends: | | | | |
Unaffiliated companies (net of foreign withholding taxes of $162,272) | | $ | 12,227,758 | |
Affiliated companies | | | 9,269 | |
Total investment income | | | 12,237,027 | |
|
| | |
Expenses | | | | |
Management fees | | | 4,556,475 | |
Distribution and service plan fees—Service shares | | | 1,101,664 | |
Transfer and shareholder servicing agent fees: | | | | |
Non-Service shares | | | 248,613 | |
Service shares | | | 441,758 | |
Shareholder communications: | | | | |
Non-Service shares | | | 13,701 | |
Service shares | | | 24,482 | |
Trustees’ compensation | | | 39,951 | |
Custodian fees and expenses | | | 8,333 | |
Other | | | 120,053 | |
Total expenses | | | 6,555,030 | |
Less waivers and reimbursements of expenses | | | (7,411 | ) |
Net expenses | | | 6,547,619 | |
|
| | |
Net Investment Income | | | 5,689,408 | |
|
| | |
Realized and Unrealized Gain (Loss) | | | | |
Net realized gain on: | | | | |
Investments from unaffiliated companies | | | 72,433,553 | |
Foreign currency transactions | | | 2,102 | |
Net realized gain | | | 72,435,655 | |
Net change in unrealized appreciation/depreciation on: | | | | |
Investments | | | 69,827,118 | |
Translation of assets and liabilities denominated in foreign currencies | | | (437,392 | ) |
Net change in unrealized appreciation/depreciation | | | 69,389,726 | |
|
| | |
Net Increase in Net Assets Resulting from Operations | | $ | 147,514,789 | |
1. June 28, 2013 represents the last business day of the Fund’s semiannual period. See Note 1 of the accompanying Notes.
See accompanying Notes to Financial Statements.
9 OPPENHEIMER MAIN STREET FUND/VA
| | |
STATEMENTOF CHANGES IN NET ASSETS |
| | | | | | | | | | |
| | | Six Months Ended
June 28, 20131
(Unaudited) | | | | | Year Ended
December 31, 2012 | |
Operations | | | | | | | | | | |
Net investment income | | $ | 5,689,408 | | | | | $ | 13,024,596 | |
Net realized gain | | | 72,435,655 | | | | | | 176,687,379 | |
Net change in unrealized appreciation/depreciation | | | 69,389,726 | | | | | | 22,837,127 | |
Net increase in net assets resulting from operations | | | 147,514,789 | | | | | | 212,549,102 | |
|
| |
Dividends and/or Distributions to Shareholders | | | | | | | | | | |
Dividends from net investment income: | | | | | | | | | | |
Non-Service shares | | | (5,738,189) | | | | | | (4,702,221) | |
Service shares | | | (7,658,029) | | | | | | (5,916,709) | |
| | | (13,396,218) | | | | | | (10,618,930) | |
|
| |
Beneficial Interest Transactions | | | | | | | | | | |
Net increase (decrease) in net assets resulting from beneficial interest transactions: | | | | | | | | | | |
Non-Service shares | | | (26,396,819) | | | | | | 27,414,824 | |
Service shares | | | (88,927,089) | | | | | | (274,928,927) | |
| | | (115,323,908) | | | | | | (247,514,103) | |
|
| |
Net Assets | | | | | | | | | | |
Total increase (decrease) | | | 18,794,663 | | | | | | (45,583,931) | |
Beginning of period | | | 1,350,461,208 | | | | | | 1,396,045,139 | |
| | | |
End of period (including accumulated net investment income of $5,027,085 and $12,733,895, respectively) | | $ | 1,369,255,871 | | | | | $ | 1,350,461,208 | |
1. June 28, 2013 represents the last business day of the Fund’s semiannual period. See Note 1 of the accompanying Notes.
See accompanying Notes to Financial Statements.
10 OPPENHEIMER MAIN STREET FUND/VA
| | | | | | | | | | | | | | | | | | | | | | | | |
Non-Service Shares | |
| Six Months
Ended
June 28,
20131
(Unaudited) |
| |
| Year Ended
December 31,
2012 |
| |
| Year Ended
December 30,
20111 |
| |
| Year Ended
December 31,
2010 |
| |
| Year Ended
December 31,
2009 |
| |
| Year Ended
December 31,
2008 |
|
Per Share Operating Data | | | | | | | | | | | | | | | | | | | | | | | | |
Net asset value, beginning of period | | $ | 23.97 | | | $ | 20.71 | | | $ | 20.88 | | | $ | 18.18 | | | $ | 14.56 | | | $ | 25.61 | |
Income (loss) from investment operations: | | | | | | | | | | | | | | | | | | | | | | | | |
Net investment income2 | | | 0.13 | | | | 0.26 | | | | 0.16 | | | | 0.17 | | | | 0.21 | | | | 0.29 | |
Net realized and unrealized gain (loss) | | | 2.57 | | | | 3.22 | | | | (0.16 | ) | | | 2.73 | | | | 3.71 | | | | (9.64 | ) |
Total from investment operations | | | 2.70 | | | | 3.48 | | | | 0.00 | | | | 2.90 | | | | 3.92 | | | | (9.35 | ) |
Dividends and/or distributions to shareholders: | | | | | | | | | | | | | | | | | | | | | | | | |
Dividends from net investment income | | | (0.30 | ) | | | (0.22 | ) | | | (0.17 | ) | | | (0.20 | ) | | | (0.30 | ) | | | (0.32 | ) |
Distributions from net realized gain | | | 0.00 | | | | 0.00 | | | | 0.00 | | | | 0.00 | | | | 0.00 | | | | (1.38 | ) |
Total dividends and/or distributions to shareholders | | | (0.30 | ) | | | (0.22 | ) | | | (0.17 | ) | | | (0.20 | ) | | | (0.30 | ) | | | (1.70 | ) |
Net asset value, end of period | | $ | 26.37 | | | $ | 23.97 | | | $ | 20.71 | | | $ | 20.88 | | | $ | 18.18 | | | $ | 14.56 | |
| | | | | | | | | | | | | | | | | | | | | | | | | |
Total Return, at Net Asset Value3 | | | 11.23 | % | | | 16.87 | % | | | (0.01 | )% | | | 16.11 | % | | | 28.29 | % | | | (38.47 | )% |
| | | | | | | | | | | | | | | | | | | | | | | | | |
Ratios/Supplemental Data | | | | | | | | | | | | | | | | | | | | | | | | |
Net assets, end of period (in thousands) | | $ | 502,095 | | | $ | 481,089 | | | $ | 392,861 | | | $ | 469,720 | | | $ | 474,637 | | | $ | 432,360 | |
Average net assets (in thousands) | | $ | 504,239 | | | $ | 466,231 | | | $ | 426,354 | | | $ | 454,937 | | | $ | 430,517 | | | $ | 670,994 | |
Ratios to average net assets:4 | | | | | | | | | | | | | | | | | | | | | | | | |
Net investment income | | | 0.98 | % | | | 1.12 | % | | | 0.79 | % | | | 0.93 | % | | | 1.35 | % | | | 1.42 | % |
Total expenses5 | | | 0.78 | % | | | 0.78 | % | | | 0.78 | % | | | 0.78 | % | | | 0.78 | % | | | 0.66 | % |
Expenses after payments, waivers and/or reimbursements and reduction to custodian expenses | | | 0.78 | % | | | 0.78 | % | | | 0.78 | % | | | 0.78 | % | | | 0.78 | % | | | 0.66 | % |
Portfolio turnover rate | | | 21 | % | | | 37 | % | | | 38 | % | | | 45 | % | | | 128 | % | | | 132 | % |
1. June 28, 2013 and December 30, 2011 represent the last business day of the Fund’s reporting periods. See Note 1 of the accompanying Notes.
2. Per share amounts calculated based on the average shares outstanding during the period.
3. Assumes an initial investment on the business day before the first day of the fiscal period, with all dividends and distributions reinvested in additional shares on the reinvestment date, and redemption at the net asset value calculated on the last business day of the fiscal period. Total returns are not annualized for periods less than one full year. Total return information does not reflect expenses that apply at the separate account level or to related insurance products. Inclusion of these charges would reduce the total return figures for all periods shown. Returns do not reflect the deduction of taxes that a shareholder would pay on fund distributions or the redemption of fund shares.
4. Annualized for periods less than one full year.
5. Total expenses including indirect expenses from affiliated fund were as follows:
| | | | |
Six Months Ended June 28, 2013 | | | 0.78 | % |
Year Ended December 31, 2012 | | | 0.78 | % |
Year Ended December 30, 2011 | | | 0.78 | % |
Year Ended December 31, 2010 | | | 0.78 | % |
Year Ended December 31, 2009 | | | 0.78 | % |
Year Ended December 31, 2008 | | | 0.66 | % |
See accompanying Notes to Financial Statements.
11 OPPENHEIMER MAIN STREET FUND/VA
| | |
FINANCIAL HIGHLIGHTS Continued |
| | | | | | | | | | | | | | | | | | | | | | | | |
| Service Shares | | Six Months
Ended
June 28,
20131
(Unaudited) | | | Year Ended
December 31,
2012 | | | Year Ended
December 30,
20111 | | | Year Ended
December 31,
2010 | | | Year Ended
December 31,
2009 | | | Year Ended
December 31,
2008 | |
Per Share Operating Data | | | | | | | | | | | | | | | | | | | | | | | | |
Net asset value, beginning of period | | $ | 23.78 | | | $ | 20.53 | | | $ | 20.71 | | | $ | 18.04 | | | $ | 14.42 | | | $ | 25.38 | |
Income (loss) from investment operations: | | | | | | | | | | | | | | | | | | | | | | | | |
Net investment income2 | | | 0.09 | | | | 0.20 | | | | 0.11 | | | | 0.13 | | | | 0.17 | | | | 0.24 | |
Net realized and unrealized gain (loss) | | | 2.55 | | | | 3.20 | | | | (0.17) | | | | 2.70 | | | | 3.70 | | | | (9.56) | |
Total from investment operations | | | 2.64 | | | | 3.40 | | | | (0.06) | | | | 2.83 | | | | 3.87 | | | | (9.32) | |
Dividends and/or distributions to shareholders: | | | | | | | | | | | | | | | | | | | | | | | | |
Dividends from net investment income | | | (0.23) | | | | (0.15) | | | | (0.12) | | | | (0.16) | | | | (0.25) | | | | (0.26) | |
Distributions from net realized gain | | | 0.00 | | | | 0.00 | | | | 0.00 | | | | 0.00 | | | | 0.00 | | | | (1.38) | |
Total dividends and/or distributions to shareholders | | | (0.23) | | | | (0.15) | | | | (0.12) | | | | (0.16) | | | | (0.25) | | | | (1.64) | |
Net asset value, end of period | | $ | 26.19 | | | $ | 23.78 | | | $ | 20.53 | | | $ | 20.71 | | | $ | 18.04 | | | $ | 14.42 | |
| | | | | | | | | | | | | | | | | | | | | | | | | |
Total Return, at Net Asset Value3 | | | 11.08% | | | | 16.61% | | | | (0.32)% | | | | 15.83% | | | | 27.99% | | | | (38.63)% | |
| | | | | | | | | | | | | | | | | | | | | | | | | |
Ratios/Supplemental Data | | | | | | | | | | | | | | | | | | | | | | | | |
Net assets, end of period (in thousands) | | $ | 867,161 | | | $ | 869,372 | | | $ | 1,003,184 | | | $ | 1,185,456 | | | $ | 1,154,210 | | | $ | 1,020,103 | |
Average net assets (in thousands) | | $ | 896,075 | | | $ | 913,871 | | | $ | 1,094,254 | | | $ | 1,193,630 | | | $ | 1,029,909 | | | $ | 1,268,430 | |
Ratios to average net assets:4 | | | | | | | | | | | | | | | | | | | | | | | | |
Net investment income | | | 0.73% | | | | 0.85% | | | | 0.54% | | | | 0.68% | | | | 1.10% | | | | 1.20% | |
Total expenses5 | | | 1.03% | | | | 1.03% | | | | 1.03% | | | | 1.03% | | | | 1.03% | | | | 0.91% | |
Expenses after payments, waivers and/or reimbursements and reduction to custodian expenses | | | 1.03% | | | | 1.03% | | | | 1.03% | | | | 1.03% | | | | 1.03% | | | | 0.91% | |
Portfolio turnover rate | | | 21% | | | | 37% | | | | 38% | | | | 45% | | | | 128% | | | | 132% | |
1. June 28, 2013 and December 30, 2011 represent the last business day of the Fund’s reporting periods. See Note 1 of the accompanying Notes.
2. Per share amounts calculated based on the average shares outstanding during the period.
3. Assumes an initial investment on the business day before the first day of the fiscal period, with all dividends and distributions reinvested in additional shares on the reinvestment date, and redemption at the net asset value calculated on the last business day of the fiscal period. Total returns are not annualized for periods less than one full year. Total return information does not reflect expenses that apply at the separate account level or to related insurance products. Inclusion of these charges would reduce the total return figures for all periods shown. Returns do not reflect the deduction of taxes that a shareholder would pay on fund distributions or the redemption of fund shares.
4. Annualized for periods less than one full year.
5. Total expenses including indirect expenses from affiliated fund were as follows:
| | | | |
Six Months Ended June 28, 2013 | | | 1.03 | % |
Year Ended December 31, 2012 | | | 1.03 | % |
Year Ended December 30, 2011 | | | 1.03 | % |
Year Ended December 31, 2010 | | | 1.03 | % |
Year Ended December 31, 2009 | | | 1.03 | % |
Year Ended December 31, 2008 | | | 0.91 | % |
See accompanying Notes to Financial Statements.
12 OPPENHEIMER MAIN STREET FUND/VA
| | |
NOTES TO FINANCIAL STATEMENTS Unaudited |
1. Significant Accounting Policies
Oppenheimer Main Street Fund/VA (the “Fund”) is a separate series of Oppenheimer Variable Account Funds, a diversified open-end management investment company registered under the Investment Company Act of 1940, as amended. The Fund’s investment objective is to seek capital appreciation. The Fund’s investment adviser is OFI Global Asset Management, Inc. (“OFI Global” or the “Manager”), a wholly-owned subsidiary of OppenheimerFunds, Inc. (“OFI” or the “Sub-Adviser”) The Manager has entered into a sub-advisory agreement with OFI. Shares of the Fund are sold only to separate accounts of life insurance companies.
The Fund offers two classes of shares. Both classes are sold at their offering price, which is the net asset value per share, to separate investment accounts of participating insurance companies as an underlying investment for variable life insurance policies, variable annuity contracts or other investment products. The class of shares designated as Service shares is subject to a distribution and service plan. Both classes of shares have identical rights and voting privileges with respect to the Fund in general and exclusive voting rights on matters that affect that class alone. Earnings, net assets and net asset value per share may differ due to each class having its own expenses, such as transfer and shareholder servicing agent fees and shareholder communications, directly attributable to that class.
The following is a summary of significant accounting policies consistently followed by the Fund.
Semiannual and Annual Periods. The Fund’s financial statements are presented through the last day the New York Stock Exchange was open for trading during each reporting period. The Fund’s financial statements have been presented through that date to maintain consistency with the Fund’s net asset value calculations used for shareholder transactions.
Investment in Oppenheimer Institutional Money Market Fund. The Fund is permitted to invest daily available cash balances in an affiliated money market fund. The Fund may invest the available cash in Class E shares of Oppenheimer Institutional Money Market Fund (“IMMF”) to seek current income while preserving liquidity. IMMF is a registered open-end management investment company, regulated as a money market fund under the Investment Company Act of 1940, as amended. The Manager is the investment adviser of IMMF, and the Sub-Adviser provides investment and related advisory services to IMMF. When applicable, the Fund’s investment in IMMF is included in the Statement of Investments. Shares of IMMF are valued at their net asset value per share. As a shareholder, the Fund is subject to its proportional share of IMMF’s Class E expenses, including its management fee. The Manager will waive fees and/or reimburse Fund expenses in an amount equal to the indirect management fees incurred through the Fund’s investment in IMMF.
Foreign Currency Translation. The Fund’s accounting records are maintained in U.S. dollars. The values of securities denominated in foreign currencies and amounts related to the purchase and sale of foreign securities and foreign investment income are translated into U.S. dollars as of the close of the New York Stock Exchange (the “Exchange”), normally 4:00 P.M. Eastern time, on each day the Exchange is open for trading. Foreign exchange rates may be valued primarily using a reliable bank, dealer or service authorized by the Board of Trustees.
Reported net realized gains and losses from foreign currency transactions arise from sales of portfolio securities, sales and maturities of short-term securities, sales of foreign currencies, exchange rate fluctuations between the trade and settlement dates on securities transactions, and the difference between the amounts of dividends, interest, and foreign withholding taxes recorded on the Fund’s books and the U.S. dollar equivalent of the amounts actually received or paid. Net unrealized appreciation and depreciation on the translation of assets and liabilities denominated in foreign currencies arise from changes in the values of assets and liabilities, including investments in securities at fiscal period end, resulting from changes in exchange rates.
The effect of changes in foreign currency exchange rates on investments is separately identified from the fluctuations arising from changes in market values of securities held and reported with all other foreign currency gains and losses in the Fund’s Statement of Operations.
Allocation of Income, Expenses, Gains and Losses. Income, expenses (other than those attributable to a specific class), gains and losses are allocated on a daily basis to each class of shares based upon the relative proportion of net assets represented by such class. Operating expenses directly attributable to a specific class are charged against the operations of that class.
Federal Taxes. The Fund intends to comply with provisions of the Internal Revenue Code applicable to regulated investment companies and to distribute substantially all of its investment company taxable income, including any net realized gain on investments not offset by capital loss carryforwards, if any, to shareholders. Therefore, no federal income or excise tax provision is required. The Fund files income tax returns in U.S. federal and applicable state jurisdictions. The statute of limitations on the Fund’s tax return filings generally remain open for the three preceding fiscal reporting period ends.
During the fiscal year ended December 31, 2012, the Fund utilized $171,704,991 of capital loss carryforward to offset capital gains realized in that fiscal year. The Fund had post-October losses of $1,084,089. Details of the fiscal year ended December 31, 2012 capital loss carryforwards are included in the table below. Capital loss carryforwards with no expiration, if any, must be utilized prior to those with expiration dates. Capital losses with no expiration will be carried forward to future years if not offset by gains.
| | | | | | |
| Expiring | | | | | |
2015 | | $ | 7,541,964 | | | |
2016 | | | 2,513,988 | | | |
2017 | | | 196,457,778 | | | |
| | | | | | |
Total | | $ | 206,513,730 | | | |
| | | | | | |
Of these losses, $10,055,952 are subject to loss limitation rules resulting from merger activity. These limitations generally reduce the utilization of these losses to a maximum of $2,513,988 per year.
13 OPPENHEIMER MAIN STREET FUND/VA
| | |
NOTES TO FINANCIAL STATEMENTS Unaudited / Continued |
1. Significant Accounting Policies (Continued)
As of June 28, 2013, it is estimated that the capital loss carryforwards would be $134,078,075 expiring by 2017. The estimated capital loss carryforward represents the carryforward as of the end of the last fiscal year, increased or decreased by capital losses or gains realized in the first six months of the current fiscal year. During the six months ended June 28, 2013, it is estimated that the Fund will utilize $72,435,655 of capital loss carryforward to offset realized capital gains.
Net investment income (loss) and net realized gain (loss) may differ for financial statement and tax purposes. The character of dividends and distributions made during the fiscal year from net investment income or net realized gains may differ from their ultimate characterization for federal income tax purposes. Also, due to timing of dividends and distributions, the fiscal year in which amounts are distributed may differ from the fiscal year in which the income or net realized gain was recorded by the Fund.
The aggregate cost of securities and other investments and the composition of unrealized appreciation and depreciation of securities and other investments for federal income tax purposes as of June 28, 2013 are noted in the following table. The primary difference between book and tax appreciation or depreciation of securities and other investments, if applicable, is attributable to the tax deferral of losses or tax realization of financial statement unrealized gain or loss.
| | | | |
Federal tax cost of securities | | $ | 966,773,569 | |
| | | | |
Gross unrealized appreciation | | $ | 412,643,164 | |
Gross unrealized depreciation | | | (4,358,992) | |
| | | | |
Net unrealized appreciation | | $ | 408,284,172 | |
| | | | |
Trustees’ Compensation. The Board of Trustees has adopted a compensation deferral plan for independent trustees that enables trustees to elect to defer receipt of all or a portion of the annual compensation they are entitled to receive from the Fund. For purposes of determining the amount owed to the Trustee under the plan, deferred amounts are treated as though equal dollar amounts had been invested in shares of the Fund or in other Oppenheimer funds selected by the Trustee. The Fund purchases shares of the funds selected for deferral by the Trustee in amounts equal to his or her deemed investment, resulting in a Fund asset equal to the deferred compensation liability. Such assets are included as a component of “Other” within the asset section of the Statement of Assets and Liabilities. Deferral of trustees’ fees under the plan will not affect the net assets of the Fund, and will not materially affect the Fund’s assets, liabilities or net investment income per share. Amounts will be deferred until distributed in accordance with the compensation deferral plan.
Dividends and Distributions to Shareholders. Dividends and distributions to shareholders, which are determined in accordance with income tax regulations and may differ from U.S. generally accepted accounting principles, are recorded on the ex-dividend date. Income and capital gain distributions, if any, are declared and paid annually or at other times as deemed necessary by the Manager. The tax character of distributions is determined as of the Fund’s fiscal year end. Therefore, a portion of the Fund’s distributions made to shareholders prior to the Fund’s fiscal year end may ultimately be categorized as a tax return of capital.
Investment Income. Dividend income is recorded on the ex-dividend date or upon ex-dividend notification in the case of certain foreign dividends where the ex-dividend date may have passed. Non-cash dividends included in dividend income, if any, are recorded at the fair market value of the securities received. Interest income is recognized on an accrual basis. Discount and premium, which are included in interest income on the Statement of Operations, are amortized or accreted daily.
Custodian Fees. “Custodian fees and expenses” in the Statement of Operations may include interest expense incurred by the Fund on any cash overdrafts of its custodian account during the period. Such cash overdrafts may result from the effects of failed trades in portfolio securities and from cash outflows resulting from unanticipated shareholder redemption activity. The Fund pays interest to its custodian on such cash overdrafts, to the extent they are not offset by positive cash balances maintained by the Fund, at a rate equal to the Federal Funds Rate plus 0.50%. The “Reduction to custodian expenses” line item, if applicable, represents earnings on cash balances maintained by the Fund during the period. Such interest expense and other custodian fees may be paid with these earnings.
Security Transactions. Security transactions are recorded on the trade date. Realized gains and losses on securities sold are determined on the basis of identified cost.
Indemnifications. The Fund’s organizational documents provide current and former trustees and officers with a limited indemnification against liabilities arising in connection with the performance of their duties to the Fund. In the normal course of business, the Fund may also enter into contracts that provide general indemnifications. The Fund’s maximum exposure under these arrangements is unknown as this would be dependent on future claims that may be made against the Fund. The risk of material loss from such claims is considered remote.
Other. The preparation of financial statements in conformity with accounting principles generally accepted in the United States of America requires management to make estimates and assumptions that affect the reported amounts of assets and liabilities and disclosure of contingent assets and
14 OPPENHEIMER MAIN STREET FUND/VA
1. Significant Accounting Policies (Continued)
liabilities at the date of the financial statements and the reported amounts of increases and decreases in net assets from operations during the reporting period. Actual results could differ from those estimates.
2. Securities Valuation
The Fund calculates the net asset value of its shares as of the close of the New York Stock Exchange (the “Exchange”), normally 4:00 P.M. Eastern time, on each day the Exchange is open for trading.
The Fund’s Board has adopted procedures for the valuation of the Fund’s securities and has delegated the day-to-day responsibility for valuation determinations under those procedures to the Manager. The Manager has established a Valuation Committee which is responsible for determining a “fair valuation” for any security for which market quotations are not “readily available.” The Valuation Committee’s fair valuation determinations are subject to review, approval and ratification by the Fund’s Board at its next regularly scheduled meeting covering the calendar quarter in which the fair valuation was determined.
Valuation Methods and Inputs
Securities are valued using unadjusted quoted market prices, when available, as supplied primarily by third party pricing services or dealers.
The following methodologies are used to determine the market value or the fair value of the types of securities described below:
Securities traded on a registered U.S. securities exchange (including exchange-traded derivatives other than futures and futures options) are valued based on the last sale price of the security reported on the principal exchange on which it is traded, prior to the time when the Fund’s assets are valued. In the absence of a sale, the security is valued at the last sale price on the prior trading day, if it is within the spread of the current day’s closing “bid” and “asked” prices, and if not, at the current day’s closing bid price. A security of a foreign issuer traded on a foreign exchange but not listed on a registered U.S. securities exchange is valued based on the last sale price on the principal exchange on which the security is traded, as identified by the third party pricing service used by the Manager, prior to the time when the Fund’s assets are valued. If the last sale price is unavailable, the security is valued at the most recent official closing price on the principal exchange on which it is traded. If the last sales price or official closing price for a foreign security is not available, the security is valued at the mean between the bid and asked price per the exchange or, if not available from the exchange, obtained from two dealers. If bid and asked prices are not available from either the exchange or two dealers, the security is valued by using one of the following methodologies (listed in order of priority); (1) using a bid from the exchange, (2) the mean between the bid and asked price as provided by a single dealer, or (3) a bid from a single dealer.
Shares of a registered investment company that are not traded on an exchange are valued at that investment company’s net asset value per share.
Corporate and government debt securities (of U.S. or foreign issuers) and municipal debt securities, event-linked bonds, loans, mortgage-backed securities, collateralized mortgage obligations, and asset-backed securities are valued at the mean between the “bid” and “asked” prices utilizing evaluated prices obtained from third party pricing services or broker-dealers who may use matrix pricing methods to determine the evaluated prices.
Short-term money market type debt securities with a remaining maturity of sixty days or less are valued at cost adjusted by the amortization of discount or premium to maturity (amortized cost), which approximates market value. Short-term debt securities with a remaining maturity in excess of sixty days are valued at the mean between the “bid” and “asked” prices utilizing evaluated prices obtained from third party pricing services or broker-dealers.
A description of the standard inputs that may generally be considered by the third party pricing vendors in determining their evaluated prices is provided below.
| | |
| Security Type | | Standard inputs generally considered by third-party pricing vendors |
Corporate debt, government debt, municipal, mortgage-backed and asset-backed securities | | Reported trade data, broker-dealer price quotations, benchmark yields, issuer spreads on comparable securities, the credit quality, yield, maturity, and other appropriate factors. |
| Loans | | Information obtained from market participants regarding reported trade data and broker-dealer price quotations. |
| Event-linked bonds | | Information obtained from market participants regarding reported trade data and broker-dealer price quotations. |
If a market value or price cannot be determined for a security using the methodologies described above, or if, in the “good faith” opinion of the Manager, the market value or price obtained does not constitute a “readily available market quotation,” or a significant event has occurred that would materially affect the value of the security the security is fair valued either (i) by a standardized fair valuation methodology applicable to the security type or the significant event as previously approved by the Valuation Committee and the Fund’s Board or (ii) as determined in good faith by the Manager’s Valuation Committee. The Valuation Committee considers all relevant facts that are reasonably available, through either public information or information available to the Manager, when determining the fair value of a security. Fair value determinations by the Manager are subject to review, approval and ratification by the Fund’s Board at its next regularly scheduled meeting covering the calendar quarter in which the fair valuation was determined. Those fair valuation standardized methodologies include, but are not limited to, valuing securities at the last sale price or initially at cost and subsequently adjusting the value based on: changes in company specific fundamentals, changes in an appropriate securities index, or changes in the value of similar securities which may be further adjusted for any discounts related to security-specific resale restrictions. When possible, such methodologies use observable market inputs such as unadjusted quoted prices of similar securities, observable interest rates, currency rates and yield curves. The methodologies used for valuing securities are not necessarily an indication of the risks associated with investing in those securities nor can it be assured that the Fund can obtain the fair value assigned to a security if it were to sell the security.
15 OPPENHEIMER MAIN STREET FUND/VA
| | |
NOTES TO FINANCIAL STATEMENTS Unaudited / Continued |
2. Securities Valuation (Continued)
To assess the continuing appropriateness of security valuations, the Manager, or its third party service provider who is subject to oversight by the Manager, regularly compares prior day prices, prices on comparable securities, and sale prices to the current day prices and challenges those prices exceeding certain tolerance levels with the third party pricing service or broker source. For those securities valued by fair valuations, whether through a standardized fair valuation methodology or a fair valuation determination, the Valuation Committee reviews and affirms the reasonableness of the valuations based on such methodologies and fair valuation determinations on a regular basis after considering all relevant information that is reasonably available.
Classifications
Each investment asset or liability of the Fund is assigned a level at measurement date based on the significance and source of the inputs to its valuation. Various data inputs are used in determining the value of each of the Fund’s investments as of the reporting period end. These data inputs are categorized in the following hierarchy under applicable financial accounting standards:
1) Level 1-unadjusted quoted prices in active markets for identical assets or liabilities (including securities actively traded on a securities exchange)
2) Level 2-inputs other than unadjusted quoted prices that are observable for the asset or liability (such as unadjusted quoted prices for similar assets and market corroborated inputs such as interest rates, prepayment speeds, credit risks, etc.)
3) Level 3-significant unobservable inputs (including the Manager’s own judgments about assumptions that market participants would use in pricing the asset or liability).
The inputs used for valuing securities are not necessarily an indication of the risks associated with investing in those securities.
The table below categorizes amounts that are included in the Fund’s Statement of Assets and Liabilities as of June 28, 2013 based on valuation input level:
| | | | | | | | | | | | | | | | |
| | | Level 1—
Unadjusted
Quoted Prices | | | Level 2—
Other Significant
Observable Inputs | | | Level 3—
Significant
Unobservable
Inputs | | | Value | |
Assets Table | | | | | | | | | | | | | | | | |
Investments, at Value: | | | | | | | | | | | | | | | | |
Common Stocks | | | | | | | | | | | | | | | | |
Consumer Discretionary | | $ | 99,799,924 | | | $ | — | | | $ | — | | | $ | 99,799,924 | |
Consumer Staples | | | 127,927,330 | | | | 21,549,704 | | | | — | | | | 149,477,034 | |
Energy | | | 116,146,530 | | | | — | | | | — | | | | 116,146,530 | |
Financials | | | 284,543,325 | | | | — | | | | — | | | | 284,543,325 | |
Health Care | | | 199,258,602 | | | | 14,635,140 | | | | — | | | | 213,893,742 | |
Industrials | | | 151,671,156 | | | | — | | | | — | | | | 151,671,156 | |
Information Technology | | | 299,884,196 | | | | — | | | | — | | | | 299,884,196 | |
Materials | | | 34,147,528 | | | | — | | | | — | | | | 34,147,528 | |
Telecommunication Services | | | 10,043,976 | | | | — | | | | — | | | | 10,043,976 | |
Investment Company | | | 15,450,330 | | | | — | | | | — | | | | 15,450,330 | |
| | | | |
Total Assets | | $ | 1,338,872,897 | | | $ | 36,184,844 | | | $ | — | | | $ | 1,375,057,741 | |
| | | | |
Currency contracts and forwards, if any, are reported at their unrealized appreciation/depreciation at measurement date, which represents the change in the contract’s value from trade date. Futures, if any, are reported at their variation margin at measurement date, which represents the amount due to/from the Fund at that date. All additional assets and liabilities included in the above table are reported at their market value at measurement date.
The table below shows the transfers between Level 1 and Level 2. The Fund’s policy is to recognize transfers in and transfers out as of the beginning of the reporting period.
| | | | | | | | |
| | | Transfers out of
Level 1* | | | Transfers into
Level 2* | |
Assets Table | | | | | | | | |
Investments, at Value: | | | | | | | | |
Common Stocks | | | | | | | | |
Consumer Staples | | $ | (5,364,390) | | | $ | 5,364,390 | |
| | | | |
Total Assets | | $ | (5,364,390) | | | $ | 5,364,390 | |
| | | | |
*Transferred from Level 1 to Level 2 because of the absence of a readily available unadjusted quoted market price due to a significant event occurring before the Fund’s assets were valued but after the close of the securities’ respective exchanges.
3. Shares of Beneficial Interest
The Fund has authorized an unlimited number of $0.001 par value shares of beneficial interest of each class. Transactions in shares of beneficial interest were as follows:
16 OPPENHEIMER MAIN STREET FUND/VA
3. Shares of Beneficial Interest (Continued)
| | | | | | | | | | | | | | | | | | |
| | | | | Six Months Ended June 28, 2013 | | | Year Ended December 31, 2012 | |
| | | | | Shares | | | Amount | | | Shares | | | Amount | |
Non-Service Shares | | | | | | | | | | | | | | | | | | |
Sold | | | | | 644,164 | | | $ | 16,996,672 | | | | 1,232,469 | | | $ | 28,052,495 | |
Dividends and/or distributions reinvested | | | | | 211,118 | | | | 5,738,189 | | | | 209,174 | | | | 4,702,221 | |
Acquisition—Note 6 | | | | | — | | | | — | | | | 3,253,848 | | | | 77,116,190 | |
Redeemed | | | | | (1,886,114 | ) | | | (49,131,680 | ) | | | (3,592,251 | ) | | | (82,456,082 | ) |
| | | |
Net increase (decrease) | | | | | (1,030,832 | ) | | $ | (26,396,819 | ) | | | 1,103,240 | | | $ | 27,414,824 | |
| | | |
| | | |
Service Shares | | | | | | | | | | | | | | | | | | |
Sold | | | | | 326,859 | | | $ | 8,127,217 | | | | 1,461,740 | | | $ | 33,302,188 | |
Dividends and/or distributions reinvested | | | | | 283,631 | | | | 7,658,029 | | | | 264,967 | | | | 5,916,709 | |
Redeemed | | | | | (4,064,668 | ) | | | (104,712,335 | ) | | | (14,016,400 | ) | | | (314,147,824 | ) |
| | | |
Net decrease | | | | | (3,454,178 | ) | | $ | (88,927,089 | ) | | | (12,289,693 | ) | | $ | (274,928,927 | ) |
| | | |
4. Purchases and Sales of Securities
The aggregate cost of purchases and proceeds from sales of securities, other than short-term obligations and investments in IMMF, for the six months ended June 28, 2013, were as follows:
| | | | | | | | | | |
| | | Purchases | | | | | Sales | |
Investment securities | | $ | 288,353,820 | | | | | $ | 401,804,532 | |
5. Fees and Other Transactions with Affiliates
Management Fees. Under the investment advisory agreement, the Fund pays the Manager a management fee based on the daily net assets of the Fund at an annual rate as shown in the following table:
| | | | |
| Fee Schedule | | | |
Up to $200 million | | | 0.75% | |
Next $200 million | | | 0.72 | |
Next $200 million | | | 0.69 | |
Next $200 million | | | 0.66 | |
Over $800 million | | | 0.60 | |
Sub-Adviser Fees. The Manager has retained the Sub-Adviser to provide the day-to-day portfolio management of the Fund. Under the Sub-Advisory Agreement, the Manager pays the Sub-Adviser an annual fee in monthly installments, equal to a percentage of the investment management fee collected by the Manager from the Fund, which shall be calculated after any investment management fee waivers. The fee paid to the Sub-Adviser is paid by the Manager, not by the Fund.
Transfer Agent Fees. OFI Global (the “Transfer Agent”) serves as the transfer and shareholder servicing agent for the Fund. Fees incurred by the Fund with respect to these services are detailed in the statement of operations.
Sub-Transfer Agent Fees. The Transfer Agent has retained Shareholder Services, Inc., a wholly-owned subsidiary of OFI (the “Sub-Transfer Agent”), to provide the day-to-day transfer agent and shareholder servicing of the Fund. Under the Sub-Transfer Agency Agreement, the Transfer Agent pays the Sub-Transfer Agent an annual fee in monthly installments, equal to a percentage of the transfer agent fee collected by the Transfer Agent from the Fund, which shall be calculated after any applicable fee waivers. The fee paid to the Sub-Transfer Agent is paid by the Transfer Agent, not by the Fund.
Distribution and Service Plan for Service Shares. The Fund has adopted a Distribution and Service Plan (the “Plan”) in accordance with Rule 12b-1 under the Investment Company Act of 1940 for Service shares to pay OppenheimerFunds Distributor, Inc. (the “Distributor”), for distribution related services, personal service and account maintenance for the Fund’s Service shares. Under the Plan, payments are made periodically at an annual rate of 0.25% of the daily net assets of Service shares of the Fund. The Distributor currently uses all of those fees to compensate sponsors of the insurance product that offers Fund shares, for providing personal service and maintenance of accounts of their variable contract owners that hold Service shares. These fees are paid out of the Fund’s assets on an on-going basis and increase operating expenses of the Service shares, which results in lower performance compared to the Fund’s shares that are not subject to a service fee. Fees incurred by the Fund under the Plan are detailed in the Statement of Operations.
Waivers and Reimbursements of Expenses. The Manager has voluntarily agreed to limit the Fund’s expenses after payments, waivers and/or reimbursements and reduction to custodian expenses, excluding expenses incurred directly or indirectly by the Fund as a result of investments in other investment companies, wholly-owned subsidiaries and pooled investment vehicles; so that those expenses, as percentages of daily net assets, will not exceed the annual rate of 0.80% for Non-Service shares and 1.05% for Service shares. During the six months June 28, 2013, the Manager waived fees and/or reimbursed the Fund $197 for Non-Service shares.
17 OPPENHEIMER MAIN STREET FUND/VA
| | |
NOTES TO FINANCIAL STATEMENTS Unaudited / Continued |
5. Fees and Other Transactions with Affiliates (Continued)
The Manager will waive fees and/or reimburse Fund expenses in an amount equal to the indirect management fees incurred through the Fund’s investment in IMMF. During the six months ended June 28, 2013, the Manager waived fees and/or reimbursed the Fund $7,214 for IMMF management fees.
Some of these undertakings may be modified or terminated at any time; some may not be modified or terminated until after one year from the date of the current prospectus, as indicated therein.
6. Acquisition of Growth Portfolio
On April 26, 2012, the Fund acquired all of the net assets of Growth Portfolio, pursuant to an Agreement and Plan of Reorganization approved by the Growth Portfolio shareholders on April 20, 2012. The purpose of this acquisition is to combine two funds with similar investment objectives, strategies and risks to allow shareholders to benefit from greater asset growth potential, as well as lowered total expenses. The transaction qualified as a tax-free reorganization, (the “merger”) for federal income tax purposes allowing the Fund to use the original cost basis of the investments received to calculate subsequent gains and losses for tax reporting purposes. Details of the merger are shown in the following table:
| | | | | | | | | | | | | | | | |
| | | Exchange Ratio to One Share
of the Growth Portfolio | | | Shares of Beneficial Interest
Issued by the Fund | | | Value of Issued Shares of
Beneficial Interest | | | Combined Net Assets on April 26, 20121 | |
Non-Service Shares | | | 0.0953467932 | | | | 3,253,848 | | | $ | 77,116,190 | | | $ | 517,094,352 | |
1. The net assets acquired included net unrealized appreciation of $18,020,315 and an unused capital loss carryforward of $35,875,587, potential utilization subject to tax limitations.
Had the merger occurred at the beginning of the reporting period, the Fund’s Statement of Operations would have been adjusted to the following amounts:
| | | | |
Net investment income | | $ | 13,227,862 | |
Net loss on investments | | | 209,238,968 | |
Net increase in net assets resulting from operations | | | 222,466,830 | |
7. Pending Litigation
Since 2009, a number of class action lawsuits have been pending in federal courts against OppenheimerFunds, Inc. (“OFI”), OppenheimerFunds Distributor, Inc., the Fund’s principal underwriter and distributor (the “Distributor”), and certain funds (but not including the Fund) advised by the Manager and distributed by the Distributor (the “Defendant Funds”). Several of these lawsuits also name as defendants certain officers and current and former trustees of the respective Defendant Funds. The lawsuits raise claims under federal securities law and allege, among other things, that the disclosure documents of the respective Defendant Funds contained misrepresentations and omissions and that the respective Defendant Funds’ investment policies were not followed. The plaintiffs in these actions seek unspecified damages, equitable relief and awards of attorneys’ fees and litigation expenses. The Defendant Funds’ Boards of Trustees have also engaged counsel to represent the Funds and the present and former Independent Trustees named in those suits.
Other class action and individual lawsuits have been filed since 2008 in various state and federal courts against OFI and certain of its affiliates by investors seeking to recover investments they allegedly lost as a result of the “Ponzi” scheme run by Bernard L. Madoff and his firm, Bernard L. Madoff Investment Securities, LLC (“BLMIS”). Plaintiffs in these suits allege that they suffered losses as a result of their investments in several funds managed by an affiliate of OFI and assert a variety of claims, including breach of fiduciary duty, fraud, negligent misrepresentation, unjust enrichment, and violation of federal and state securities laws and regulations, among others. They seek unspecified damages, equitable relief and awards of attorneys’ fees and litigation expenses. Neither the Distributor, nor any of the Oppenheimer mutual funds, their independent trustees or directors are named as defendants in these lawsuits. None of the Oppenheimer mutual funds invested in any funds or accounts managed by Madoff or BLMIS. On February 28, 2011, a stipulation of partial settlement of three groups of consolidated putative class action lawsuits relating to these matters was filed in the U.S. District Court for the Southern District of New York. On August 19, 2011, the court entered an order and final judgment approving the settlement as fair, reasonable and adequate. In September 2011, certain parties filed notices of appeal from the court’s order approving the settlement. The settlement does not resolve other outstanding lawsuits against OFI and its affiliates relating to BLMIS.
On April 16, 2010, a lawsuit was filed in New York state court against (i) OFI, (ii) an affiliate of OFI and (iii) AAArdvark IV Funding Limited (“AAArdvark IV”), an entity advised by OFI’s affiliate, in connection with investments made by the plaintiffs in AAArdvark IV. Plaintiffs allege breach of contract and common law fraud claims against the defendants and seek compensatory damages, costs and disbursements, including attorney fees. On April 11, 2013, the court granted defendants’ motion for summary judgment, dismissing plaintiffs’ fraud claim with prejudice and dismissing their contract claim without prejudice, and granted plaintiffs leave to replead their contract claim to assert a cause of action for specific performance within 30 days. On May 9, 2013, plaintiffs filed a notice of appeal from the court’s dismissal order. On July 15, 2011, a lawsuit was filed in New York state court against OFI, an affiliate of OFI and AAArdvark Funding Limited (“AAArdvark I”), an entity advised by OFI’s affiliate, in connection with investments made by the plaintiffs in AAArdvark I. The complaint alleges breach of contract and common law fraud claims against the defendants and seeks compensatory damages, costs and disbursements, including attorney fees. On November 9, 2011, a lawsuit was filed in New York state court against OFI, an affiliate of OFI and AAArdvark XS Funding Limited (“AAArdvark XS”), an entity advised by OFI’s affiliate, in connection with investments made by the plaintiffs in AAArdvark XS. The complaint alleges breach of contract against the defendants and seeks compensatory damages, costs and disbursements, including attorney fees.
18 OPPENHEIMER MAIN STREET FUND/VA
7. Pending Litigation (Continued)
OFI believes the lawsuits and appeals described above are without legal merit and, with the exception of actions it has settled, is defending against them vigorously. While it is premature to render any opinion as to the outcome in these lawsuits, or whether any costs that the Defendant Funds may bear in defending the suits might not be reimbursed by insurance, OFI believes that these suits should not impair the ability of OFI or the Distributor to perform their respective duties to the Fund, and that the outcome of all of the suits together should not have any material effect on the operations of any of the Oppenheimer mutual funds.
19 OPPENHEIMER MAIN STREET FUND/VA
| | |
PORTFOLIO PROXY VOTING POLICIES AND PROCEDURES; UPDATES TO STATEMENTS OF INVESTMENTS UNAUDITED |
The Fund has adopted Portfolio Proxy Voting Policies and Procedures under which the Fund votes proxies relating to securities (“portfolio proxies”) held by the Fund. A description of the Fund’s Portfolio Proxy Voting Policies and Procedures is available (i) without charge, upon request, by calling the Fund toll-free at 1.800.CALL OPP (225.5677), (ii) on the Fund’s website at oppenheimerfunds.com, and (iii) on the SEC’s website at www.sec.gov. In addition, the Fund is required to file Form N-PX, with its complete proxy voting record for the 12 months ended June 30th, no later than August 31st of each year. The Fund’s voting record is available (i) without charge, upon request, by calling the Fund toll-free at 1.800.CALL OPP (225.5677), and (ii) in the Form N-PX filing on the SEC’s website at www.sec.gov.
The Fund files its complete schedule of portfolio holdings with the SEC for the first quarter and the third quarter of each fiscal year on Form N-Q. The Fund’s Form N-Q filings are available on the SEC’s website at www.sec.gov. Those forms may be reviewed and copied at the SEC’s Public Reference Room in Washington, D.C. Information on the operation of the Public Reference Room may be obtained by calling 1-800-SEC-0330.
20 OPPENHEIMER MAIN STREET FUND/VA
| | |
OPPENHEIMER MAIN STREET FUND/VA |
| | |
| A Series of Oppenheimer Variable Account Funds |
| Trustees and Officers | | Sam Freedman, Chairman of the Board of Trustees and Trustee |
| | Edward L. Cameron, Trustee |
| | Jon S. Fossel, Trustee |
| | Richard F. Grabish, Trustee |
| | Beverly L. Hamilton, Trustee |
| | Victoria J. Herget, Trustee |
| | Robert J. Malone, Trustee |
| | F. William Marshall, Jr., Trustee |
| | Karen L. Stuckey, Trustee |
| | James D. Vaughn, Trustee |
| | William F. Glavin, Jr., Trustee, President and Principal Executive Officer |
| | Manind Govil, Vice President |
| | Benjamin Ram, Vice President |
| | Arthur S. Gabinet, Secretary and Chief Legal Officer |
| | Christina M. Nasta, Vice President and Chief Business Officer |
| | Mark S. Vandehey, Vice President and Chief Compliance Officer |
| | Brian W. Wixted, Treasurer and Principal Financial & Accounting Officer |
| |
| Manager | | OFI Global Asset Management, Inc. |
| |
| Sub-Adviser | | OppenheimerFunds, Inc. |
| |
| Distributor | | OppenheimerFunds Distributor, Inc. |
| |
Transfer and Shareholder
Servicing Agent | | OFI Global Asset Management, Inc. |
| |
Sub-Transfer
Agent | | Shareholder Services, Inc. DBA OppenheimerFunds Services |
| |
Independent
Registered
Public
Accounting
Firm | | KPMGLLP |
| |
| Legal Counsel | | K&L Gates LLP |
| |
| | Before investing in any of the Oppenheimer funds, investors should carefully consider a fund’s investment objectives, risks, charges and expenses. Fund prospectuses and summary prospectuses contain this and other information about the funds and may be obtained by asking your financial advisor, visiting oppenheimerfunds.com, or calling us at 1.800.988.8287. Read prospectuses and summary prospectuses carefully before investing. |
| |
| | The financial statements included herein have been taken from the records of the Fund without examination of those records by the independent registered public accounting firm. |
© 2013 OppenheimerFunds, Inc. All rights reserved. Oppenheimer funds are distributed by OppenheimerFunds Distributor, Inc.
June 30, 2013
| | | | | | |
| | | | Oppenheimer Main Street Small Cap Fund®/VA* A Series of Oppenheimer Variable Account Funds | | Semiannual Report |
| | | |
| | | | SEMIANNUAL REPORT Listing of Top Holdings Fund Performance Discussion Financial Statements | | |
| | |
| | | | * Prior to 4/30/13, the Fund’s name was Oppenheimer Main Street Small- & Mid-Cap Fund®/VA |

Portfolio Managers: Matthew P. Ziehl, CFA, Raymond Anello, CFA, Raman Vardharaj, CFA, Joy Budzinski, Kristin Ketner Pak, Magnus Krantz and Adam Weiner1
| | | | | | | | | | | | | | |
Cumulative Total Returns For the 6-Month Period
Ended 6/28/132 | | | | | | | | | |
Non-Service Shares | | | 19.51% | | | | | | | | | | | |
Service Shares | | | 19.32 | | | | | | | | | | | |
Average Annual Total Returns For the Periods Ended 6/28/132 | | | |
| | | 1-Year | | | 5-Year | | | 10-Year | | | |
Non-Service Shares | | | 28.50% | | | | 9.80% | | | | 10.41% | | | |
Service Shares | | | 28.18% | | | | 9.52% | | | | 10.14% | | | |
The performance data quoted represents past performance, which does not guarantee future results. The investment return and principal value of an investment in the Fund will fluctuate so that an investor’s shares, when redeemed, may be worth more or less than their original cost. Current performance may be lower or higher than the performance quoted. For performance data current to the most recent month end, call us at 1.800.988.8287. The Fund’s total returns should not be expected to be the same as the returns of other funds, whether or not both funds have the same portfolio managers and/or similar names. The Fund’s total returns include changes in share price and reinvested distributions but do not include the charges associated with the separate account products that offer this Fund. Such performance would have been lower if such charges were taken into account.
1. Effective April 2013.
2. June 28, 2013, was the last business day of the Fund’s semiannual period. See Note 1 of the accompanying Notes to Financial Statements.
| | |
TOP TEN COMMON STOCK HOLDINGS |
Dana Holding Corp. | | 2.4% |
Home Loan Servicing Solutions Ltd. | | 2.1 |
LaSalle Hotel Properties | | 2.1 |
Financial Engines, Inc. | | 2.0 |
EPL Oil & Gas, Inc. | | 2.0 |
Robert Half International, Inc. | | 2.0 |
Hatteras Financial Corp. | | 1.9 |
Nu Skin Enterprises, Inc., Cl. A | | 1.8 |
KAR Auction Services, Inc. | | 1.7 |
Waste Connections, Inc. | | 1.7 |
Portfolio holdings and allocations are subject to change. Percentages are as of June 28, 2013, and are based on net assets. For more current Fund holdings, please visit oppenheimerfunds.com. |
SECTOR ALLOCATION
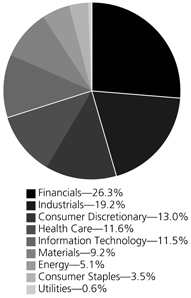
Portfolio holdings and allocations are subject to change. Percentages are as of June 28, 2013, and are based on the total market value of common stocks.
2 OPPENHEIMER MAIN STREET SMALL CAP FUND/VA
Fund Performance Discussion
The Fund’s Non-Service shares produced a return of 19.51% during the period, outperforming the Russell 2000 Index (the “Index”), which returned 15.86%. The Fund outperformed the Index in eight out of ten sectors this period, led by favorable stock selection in the health care, energy and financials sectors. The Fund underperformed the Index in the information technology sector, due to weaker relative stock selection. The Fund also outperformed the Russell 2500 Index, which returned 15.42%. The Fund changed its performance benchmark from the Russell 2500 Index to the Russell 2000 Index, which it believes is a more appropriate measure of the Fund’s performance.
GLOBAL MARKET AND ECONOMIC ENVIRONMENT
Equities performed positively for the period as central banks throughout the world, including the United States, Europe and Japan, took steps to maintain highly accommodative monetary policy and stimulate their respective economies. In addition, a clear recovery in the U.S. provided further support for equity markets. However, later in the period, the Federal Reserve (the “Fed”) appeared to weigh the merits of backing away from its quantitative easing policy. As a result, the markets sold off sharply and made a quick reappraisal of interest rate risk in an array of credit markets and related currencies. Equities, particularly those in emerging markets and interest rate sensitive sectors, experienced spillover effects as a result.
TOP INDIVIDUAL CONTRIBUTORS
The top three performing stocks for the Fund this period were Financial Engines, Inc. and energy stocks EPL Oil & Gas, Inc. and Renewable Energy Group, Inc. Financial Engines provides financial advice, portfolio management and retirement assessment services. In what was a strong period for the financials sector, Financial Engines released a solid earnings report and beat analysts’ revenue expectations. EPL Oil & Gas is an independent oil and natural gas exploration and production company. Oil production rose in its first quarter, which was the first full quarter following the company’s acquisition of Gulf of Mexico oil and gas assets from Hilcorp late last year. Renewable Energy Group is a producer of biodiesel in the U.S. It was a positive period for biofuel companies, and Renewable Energy Group reported positive earnings and record production for its first quarter.
Also benefiting performance were Santarus, Inc. and Nu Skin Enterprises, Inc. Santarus is a specialty biopharmaceutical company focused on products for the prevention and treatment of gastrointestinal diseases and disorders. Strong sales of Santarus’ Zegerid and Uceris drugs helped drive its stock price higher. Nu Skin Enterprises is a developer of anti-aging personal care products and nutritional supplements. Strong demand for the company’s products, especially in Asia, helped drive performance.
TOP INDIVIDUAL DETRACTORS
Three of the most significant detractors from performance were in the information technology sector: Aruba Networks, Inc., Fortinet, Inc. and TIBCO Software Inc. Fundamentals of many technology companies continued to suffer from the macroeconomic headwinds impacting enterprise spending. Networking company Aruba Networks’ earnings growth may have also been hurt due to discounting by competitor Cisco Systems. As of period-end we have eliminated our holdings of Aruba’s stock. Lackluster enterprise spending, particularly by service providers, resulted in a billings miss for Fortinet, a provider of network security solutions. We have maintained our position as we believe the secular outlook for network security remains favorable. Macroeconomic headwinds, resulting in sluggish business spending, negatively impacted the progression and timing of sales for many software companies during the period, including TIBCO. We have seen from similar enterprise software companies’ results that the information technology spending environment is challenged. While we believe TIBCO remains well positioned for secular growth in the big data and analytics sectors, we have lessened our exposure to this stock.
STRATEGY & OUTLOOK
We believe the Fed is acting appropriately by signaling that eventually it will lessen its monetary support of our expanding economy. While the market declined after the Fed’s comments, what seemed to be missing from the market’s response was the realization that when rates do rise – this should be a reflection of a strong economy. And this, in combination with the likelihood, in our view, that the Fed will be “tapering” later than currently feared, has set-up a potentially attractive investment opportunity in domestic equities. Company fundamentals are better than at prior nominal highs in the market. And, as has been well documented throughout this tepid recovery, corporations have been very cautious about spending money – largely reflecting uncertainty about the economic and political outlook. This cautious behavior has resulted in a massive build-up of cash on corporate balance sheets which has greatly improved the fundamental health of many companies. As the economy improves and managements’ uncertainty lifts, these cash balances have the potential to be used in a constructive manner which may support rising equity valuations.
Domestically, housing has momentum and job creation, while not robust, at least continues. We expect that company fundamentals will continue to show improvement – especially as companies tap into the large cash reserves that have been built-up. These factors have the potential to drive equity prices higher;
3 OPPENHEIMER MAIN STREET SMALL CAP FUND/VA
Fund Performance Discussion Continued
however, rarely does the market appreciate on a straight upward trajectory. While we are not predicting a market correction, we do believe that the market may return to experiencing greater volatility.
Given this backdrop, our approach remains consistent. We aim to construct an “all weather” portfolio by targeting companies that we believe have: 1) sustainable competitive advantages; 2) skilled management with a proven track record of executing effectively; and 3) financial resources to generate improving profitability, gain market share, and/or return significant capital to shareholders. During volatile economic times such companies often widen their lead over weaker competitors. We seek to invest in companies, characterized by these qualities, at compelling valuations and believe this disciplined approach is essential.
The Fund’s investment strategy and focus can change over time. The mention of specific fund holdings does not constitute a recommendation by OppenheimerFunds, Inc. or its affiliates.
Shares of Oppenheimer funds are not deposits or obligations of any bank, are not guaranteed by any bank, are not insured by the FDIC or any other agency, and involve investment risks, including the possible loss of the principal amount invested.
4 OPPENHEIMER MAIN STREET SMALL CAP FUND/VA
Fund Expenses
Fund Expenses. As a shareholder of the Fund, you incur two types of costs: (1) transaction costs and (2) ongoing costs, including management fees; distribution and service fees; and other Fund expenses. These examples are intended to help you understand your ongoing costs (in dollars) of investing in the Fund and to compare these costs with the ongoing costs of investing in other mutual funds.
The examples are based on an investment of $1,000.00 invested at the beginning of the period and held for the entire 6-month period ended June 28, 2013.
Actual Expenses. The first section of the table provides information about actual account values and actual expenses. You may use the information in this section for the class of shares you hold, together with the amount you invested, to estimate the expense that you paid over the period. Simply divide your account value by $1,000.00 (for example, an $8,600.00 account value divided by $1,000.00 = 8.60), then multiply the result by the number in the first section under the heading entitled “Expenses Paid During Period” to estimate the expenses you paid on your account during this period.
Hypothetical Example for Comparison Purposes. The second section of the table provides information about hypothetical account values and hypothetical expenses based on the Fund’s actual expense ratio for each class of shares, and an assumed rate of return of 5% per year for each class before expenses, which is not the actual return. The hypothetical account values and expenses may not be used to estimate the actual ending account balance or expenses you paid for the period. You may use this information to compare the ongoing costs of investing in the Fund and other funds. To do so, compare this 5% hypothetical example for the class of shares you hold with the 5% hypothetical examples that appear in the shareholder reports of the other funds.
Please note that the expenses shown in the table are meant to highlight your ongoing costs only and do not reflect any charges associated with the separate accounts that offer this Fund. Therefore, the “hypothetical” lines of the table are useful in comparing ongoing costs only, and will not help you determine the relative total costs of owning different funds. In addition, if these separate account charges were included your costs would have been higher.
| | | | | | | | | | | | | | |
| Actual | | Beginning
Account Value
January 1, 2013 | | | Ending
Account
Value
June 28, 2013 | | | Expenses
Paid During 6
Months Ended
June 28, 2013 | | | |
Non-Service shares | | $ | 1,000.00 | | | $ | 1,195.10 | | | $ | 4.31 | | | |
Service shares | | | 1,000.00 | | | | 1,193.20 | | | | 5.66 | | | |
| | | | |
| Hypothetical | | | | | | | | | | | |
(5% return before expenses) | | | | | | | | | | | | | | |
Non-Service shares | | | 1,000.00 | | | | 1,020.60 | | | | 3.97 | | | |
Service shares | | | 1,000.00 | | | | 1,019.37 | | | | 5.21 | | | |
Expenses are equal to the Fund’s annualized expense ratio for that class, multiplied by the average account value over the period, multiplied by 179/365 (to reflect the one-half year period). Those annualized expense ratios, excluding indirect expenses from affiliated funds, based on the 6-month period ended June 28, 2013 are as follows:
| | | | |
| Class | | Expense Ratios | | |
Non-Service shares | | 0.80% | | |
Service shares | | 1.05 | | |
The expense ratios reflect voluntary waivers and/or reimbursements of expenses by the Fund’s Manager. Some of these undertakings may be modified or terminated at any time, as indicated in the Fund’s prospectus. The “Financial Highlights” tables in the Fund’s financial statements, included in this report, also show the gross expense ratios, without such waivers or reimbursements and reduction to custodian expenses, if applicable.
5 OPPENHEIMER MAIN STREET SMALL CAP FUND/VA
STATEMENTOF INVESTMENTS June 28, 2013* / Unaudited
| | | | | | | | | | | | | | | | | | | | | | |
| | | Shares | | | Value | | | | | | | | | Shares | | | Value | |
Common Stocks—98.0% | | | | | | | | | | | | | | Biotechnology (Continued) | | | | | | | | |
| Consumer Discretionary—12.7% | | | | | | | | | | | | Medivation, Inc.1 | | 80,842 | | | $3,977,426 | |
| Auto Components—2.4% | | | | | | | | | | | | Merrimack Pharmaceuticals, Inc.1 | | 515,010 | | | 3,466,017 | |
| Dana Holding Corp. | | 1,273,855 | | | $24,534,447 | | | | | | | Sarepta Therapeutics, Inc.1 | | 113,290 | | | 4,310,685 | |
Distributors—0.5% | | | | | | | | | | | | | | | | | | | | | 25,854,054 | |
| Pool Corp. | | 102,559 | | | 5,375,117 | | | | | | | Health Care Equipment & Supplies—1.7% | | | | | | |
Diversified Consumer Services—0.8% | | | | | | | | | | | | | | DexCom, Inc.1 | | | 395,660 | | | | 8,882,567 | |
| LifeLock, Inc.1 | | 706,130 | | | 8,268,782 | | | | | | | Greatbatch, Inc.1 | | 243,391 | | | 7,980,791 | |
Hotels, Restaurants & Leisure—3.8% | | | | | | | | | | | | | | | | | | | | | 16,863,358 | |
| Brinker International, Inc. | | 343,850 | | | 13,558,005 | | | | | | | Health Care Providers & Services—5.6% | | | | | | |
| Dunkin’ Brands Group, Inc. | | 258,933 | | | 11,087,511 | | | | | | | HealthSouth Corp.1 | | 596,890 | | | 17,190,432 | |
| Texas Roadhouse, Inc., Cl. A | | 577,340 | | | 14,445,047 | | | | | | | Team Health Holdings, Inc.1 | | 310,470 | | | 12,751,003 | |
| | | | | | 39,090,563 | | | | | | | Vanguard Health Systems, Inc.1 | | 556,670 | | | 11,545,336 | |
Household Durables—0.5% | | | | | | | | | | | | | | WellCare Health Plans, Inc.1 | | | 289,131 | | | | 16,061,227 | |
| Toll Brothers, Inc.1 | | 172,360 | | | 5,624,107 | | | | | | | | | | | | 57,547,998 | |
Media—1.3% | | | | | | | | | | | | | | Pharmaceuticals—1.7% | | | | | | | | |
| Imax Corp.1 | | 554,956 | | | 13,796,206 | | | | | | | Questcor Pharmaceuticals, Inc. | | 115,180 | | | 5,236,083 | |
Specialty Retail—3.4% | | | | | | | | | | | | | | Santarus, Inc.1 | | | 599,240 | | | | 12,614,002 | |
| Monro Muffler Brake, Inc. | | 160,219 | | | 7,698,523 | | | | | | | | | | | | 17,850,085 | |
| Pier 1 Imports, Inc. | | 733,430 | | | 17,228,271 | | | | | | | Industrials—18.8% | | | | | | |
| Signet Jewelers Ltd. | | 147,670 | | | 9,957,388 | | | | | | | Aerospace & Defense—0.8% | | | | | | |
| | | | | | 34,884,182 | | | | | | | B/E Aerospace, Inc.1 | | 124,600 | | | 7,859,768 | |
| Consumer Staples—3.4% | | | | | | | | | | | | Air Freight & Couriers—0.8% | | | | | | |
| Food Products—1.6% | | | | | | | | | | | | Hub Group, Inc., Cl. A1 | | 227,978 | | | 8,302,959 | |
| Flowers Foods, Inc. | | 763,140 | | | 16,827,237 | | | | | | | Commercial Services & Supplies—5.3% | | | | | | |
| Personal Products—1.8% | | | | | | | | | | | | ACCO Brands Corp.1 | | 1,592,917 | | | 10,130,952 | |
| Nu Skin Enterprises, Inc., Cl. A | | 301,380 | | | 18,420,346 | | | | | | | KAR Auction Services, Inc. | | 789,840 | | | 18,063,641 | |
| Energy—5.2% | | | | | | | | | | | | Mobile Mini, Inc.1 | | 290,570 | | | 9,632,396 | |
Oil, Gas & Consumable Fuels—5.2% | | | | | | | | | | | | | | Waste Connections, Inc. | | | 429,690 | | | | 17,677,447 | |
| CVR Energy, Inc., Escrow Shares1,2 | | 43,316 | | | — | | | | | | | | | | | | 55,504,436 | |
| EPL Oil & Gas, Inc.1 | | 700,707 | | | 20,572,758 | | | | | | | Construction & Engineering—1.8% | | | | | | |
| PAA Natural Gas Storage LP | | 278,333 | | | 5,856,126 | | | | | | | AECOM Technology Corp.1 | | 272,543 | | | 8,664,142 | |
| Renewable Energy Group, Inc.1 | | 884,198 | | | 12,582,138 | | | | | | | KBR, Inc. | | 330,211 | | | 10,731,857 | |
| Western Refining, Inc. | | 523,881 | | | 14,705,340 | | | | | | | | | | | | 19,395,999 | |
| | | | | | 53,716,362 | | | | | | | Electrical Equipment—1.0% | | | | | | |
| Financials—25.4% | | | | | | | | | | | | General Cable Corp. | | 152,190 | | | 4,679,842 | |
| Capital Markets—2.9% | | | | | | | | | | | | Regal-Beloit Corp. | | 75,979 | | | 4,926,478 | |
| Financial Engines, Inc. | | 452,213 | | | 20,616,391 | | | | | | | | | | | | 9,606,320 | |
| WisdomTree Investments, Inc.1 | | 840,130 | | | 9,720,304 | | | | | | | Machinery—2.3% | | | | | | |
| | | | | | 30,336,695 | | | | | | | Greenbrier Cos, Inc.1 | | 528,549 | | | 12,880,739 | |
Commercial Banks—6.4% | | | | | | | | | | | | | | Wabtec Corp. | | | 217,698 | | | | 11,631,604 | |
| BankUnited, Inc. | | 414,775 | | | 10,788,298 | | | | | | | | | | | | 24,512,343 | |
| CapitalSource, Inc. | | 1,174,649 | | | 11,018,208 | | | | | | | Professional Services—3.5% | | | | | | |
| First Niagara Financial Group, Inc. | | 1,608,400 | | | 16,196,588 | | | | | | | Korn/Ferry International1 | | 817,321 | | | 15,316,596 | |
| FirstMerit Corp. | | 787,336 | | | 15,770,340 | | | | | | | Robert Half International, Inc. | | 611,815 | | | 20,330,612 | |
| Webster Financial Corp. | | 517,440 | | | 13,287,859 | | | | | | | | | | | | 35,647,208 | |
| | | | | | 67,061,293 | | | | | | | Road & Rail—2.2% | | | | | | |
Insurance—1.2% | | | | | | | | | | | | | | Old Dominion Freight Line, Inc.1 | | | 278,471 | | | | 11,589,963 | |
| AmTrust Financial Services, Inc. | | 359,586 | | | 12,837,220 | | | | | | | Swift Transportation Co., Cl. A1 | | 655,904 | | | 10,848,652 | |
| Real Estate Investment Trusts (REITs)—10.4% | | | | | | | | | | | | | | | | | 22,438,615 | |
| Apollo Commercial Real Estate Finance, Inc. | | 763,191 | | | 12,119,473 | | | | | | | Transportation Infrastructure—1.1% | | | | | | |
| Ares Commercial Real Estate Corp. | | 312,769 | | | 4,006,571 | | | | | | | Wesco Aircraft Holdings, Inc.1 | | 618,220 | | | 11,480,345 | |
| Chatham Lodging Trust | | 604,470 | | | 10,384,794 | | | | | | | Information Technology—11.3% | | | | | | |
| Hatteras Financial Corp. | | 784,030 | | | 19,318,499 | | | | | | | Communications Equipment—1.1% | | | | | | |
| LaSalle Hotel Properties | | 873,196 | | | 21,567,941 | | | | | | | Finisar Corp.1 | | 699,111 | | | 11,849,931 | |
| Mid-America Apartment Communities, Inc. | | 252,645 | | | 17,121,752 | | | | | | | Internet Software & Services—1.3% | | | | | | |
| Redwood Trust, Inc. | | 389,800 | | | 6,626,600 | | | | | | | j2 Global, Inc. | | 185,213 | | | 7,873,405 | |
| Starwood Property Trust, Inc. | | 658,372 | | | 16,294,707 | | | | | | | Liquidity Services, Inc.1 | | 153,290 | | | 5,314,564 | |
| | | | | | 107,440,337 | | | | | | | | | | | | 13,187,969 | |
Thrifts & Mortgage Finance—4.5% | | | | | | | | | | | | | | IT Services—0.9% | | | | | | | | |
| Flagstar Bancorp, Inc.1 | | 479,470 | | | 6,693,401 | | | | | | | MAXIMUS, Inc. | | 128,735 | | | 9,588,183 | |
| Home Loan Servicing Solutions Ltd. | | 916,920 | | | 21,978,572 | | | | | | | Semiconductors & Semiconductor Equipment—3.9% | |
| Ocwen Financial Corp.1 | | 240,040 | | | 9,894,449 | | | | | | | Cavium, Inc.1 | | 357,300 | | | 12,637,701 | |
| Oritani Financial Corp. | | 524,240 | | | 8,220,083 | | | | | | | Semtech Corp.1 | | 420,828 | | | 14,741,605 | |
| | | | | | 46,786,505 | | | | | | | Skyworks Solutions, Inc.1 | | 594,539 | | | 13,014,459 | |
| Health Care—11.5% | | | | | | | | | | | | | | | | | 40,393,765 | |
| Biotechnology—2.5% | | | | | | | | | | | | Software—4.1% | | | | | | |
| Achillion Pharmaceuticals, Inc.1 | | 411,829 | | | 3,368,761 | | | | | | | Fortinet, Inc.1 | | 697,521 | | | 12,206,617 | |
| Cepheid, Inc.1 | | 175,180 | | | 6,029,696 | | | | | | | Guidewire Software, Inc.1 | | 233,360 | | | 9,812,788 | |
Keryx Biopharmaceuticals, Inc.1 | | | 629,380 | | | | 4,701,469 | | | | | | | ServiceNow, Inc.1 | | | 205,330 | | | | 8,293,279 | |
| | | | | | | | | | | | | | Splunk, Inc.1 | | | 140,230 | | | | 6,501,063 | |
6 OPPENHEIMER MAIN STREET SMALL CAP FUND/VA
STATEMENTOF INVESTMENTS June 28, 2013* / Unaudited / Continued
| | | | | | | | | | | | | | | | | | | | | | |
| | | Shares | | | | Value | | | | | | | | | | Shares | | | | Value | |
| | | | | | | | |
Software (Continued) | | | | | | | | | | | | | | Utilities—0.6% | | | | | | | | |
| | | | | | | | | | | | | | | |
TIBCO Software, Inc.1 | | | 250,086 | | | $ | 5,351,840 | | | | | | | Water Utilities—0.6% | | | | | | | | |
| | | | | | | | | | | | | | | | | | | | | | |
| | | | | | | 42,165,587 | | | | | | | Aqua America, Inc. | | | 194,833 | | | $ | 6,096,326 | |
| | | | | | | | | | | | | | | |
Materials—9.1% | | | | | | | | | | | | | | Total Common Stocks | | | | | | | | |
| | | | | | | | | | | | | | | |
Chemicals—2.8% | | | | | | | | | | | | | | (Cost $796,458,439) | | | | | | | 1,013,794,694 | |
A. Schulman, Inc. | | | 348,428 | | | | 9,344,839 | | | | | | | | | | | | | | | |
| | | | | | | | |
Cytec Industries, Inc. | | | 109,478 | | | | 8,019,263 | | | | | | | Investment Company—1.9% | | | | | |
| | | | | | | | | | | | | | | |
W.R. Grace & Co.1 | | | 138,700 | | | | 11,656,348 | | | | | | | Oppenheimer Institutional Money | | | | | | | | |
| | | | | | | | | | | | | | | | | | | | | | |
| | | | | | | 29,020,450 | | | | | | | Market Fund, Cl. E, 0.11%3,4 | | | | | | | | |
| | | | | | | | | | | | | | | |
Containers & Packaging—1.4% | | | | | | | | | | | | | | (Cost $19,793,297) | | | 19,793,297 | | | | 19,793,297 | |
| | | | | | | | | | | | | | | |
Packaging Corp. of America | | | 285,220 | | | | 13,964,371 | | | | | | | Total Investments, at Value | | | | | | | | |
| | | | | | | | | | | | | | | |
Metals & Mining—2.8% | | | | | | | | | | | | | | (Cost $816,251,736) | | | 99.9% | | | | 1,033,587,991 | |
| | | | | | | | | | | | | | | |
Century Aluminum Co.1 | | | 977,090 | | | | 9,067,395 | | | | | | | Assets in Excess of Other Liabilities | | | 0.1 | | | | 743,812 | |
| | | | | | | | | | | |
Compass Minerals International, Inc. | | | 94,804 | | | | 8,013,782 | | | | | | | Net Assets | | | 100.0% | | | $ | 1,034,331,803 | |
| | | | | | | | | | | |
| | | | | | | | | | | | | | | | | | |
| Kaiser Aluminum Corp. | | | 180,050 | | | | 11,152,297 | | | | | | | | | | | | | | | |
| | | | | | | | | | | | | | | | | | | | | | |
| | | | | | | 28,233,474 | | | | | | | | | | | | | | | |
| | | | | | | | | | | | | | | |
| Paper & Forest Products—2.1% | | | | | | | | | | | | | | | | | | | | | | |
| Boise Cascade Co.1 | | | 182,470 | | | | 4,636,563 | | | | | | | | | | | | | | | |
| | | | | | | | | | | | | | | |
| P.H. Glatfelter Co. | | | 669,131 | | | | 16,795,188 | | | | | | | | | | | | | | | |
| | | | | | | | | | | | | | | | | | | | | | |
| | | | | | | 21,431,751 | | | | | | | | | | | | | | | |
Footnotes to Statement of Investments
*June 28, 2013 represents the last business day of the Fund’s semiannual period. See Note 1 of the accompanying Notes.
1. Non-income producing security.
2. Escrow shares received as a result of issuer reorganization.
3. Rate shown is the 7-day yield as of June 28, 2013.
4. Is or was an affiliate, as defined in the Investment Company Act of 1940, at or during the period ended June 28, 2013, by virtue of the Fund owning at least 5% of the voting securities of the issuer or as a result of the Fund and the issuer having the same investment adviser. Transactions during the period in which the issuer was an affiliate are as follows:
| | | | | | | | | | | | | | | | |
| | | Shares
December 31, 2012 | | | Gross
Additions | | | Gross
Reductions | | | Shares
June 28, 2013 | |
| |
Oppenheimer Institutional Money Market Fund, Cl. E | | | 13,103,742 | | | | 223,039,669 | | | | 216,350,114 | | | | 19,793,297 | |
| | | | |
| | | | | | | | | Value | | | Income | |
| |
Oppenheimer Institutional Money Market Fund, Cl. E | | | | | | | | | | $ | 19,793,297 | | | $ | 17,869 | |
See accompanying Notes to Financial Statements.
7 OPPENHEIMER MAIN STREET SMALL CAP FUND/VA
STATEMENTOF ASSETS AND LIABILITIES June 28, 20131 / Unaudited
| | | | |
Assets | | | | |
Investments, at value—see accompanying statement of investments: | | | | |
Unaffiliated companies (cost $796,458,439) | | $ | 1,013,794,694 | |
Affiliated companies (cost $19,793,297) | | | 19,793,297 | |
| | | | |
| | | 1,033,587,991 | |
| |
Cash | | | 15,957 | |
Receivables and other assets: | | | | |
Investments sold | | | 5,547,424 | |
Dividends | | | 1,961,311 | |
Other | | | 37,908 | |
| |
Total assets | | | 1,041,150,591 | |
Liabilities | | | | |
Payables and other liabilities: | | | | |
Investments purchased | | | 4,935,474 | |
Shares of beneficial interest redeemed | | | 1,453,800 | |
Distribution and service plan fees | | | 189,184 | |
Shareholder communications | | | 112,958 | |
Transfer and shareholder servicing agent fees | | | 78,627 | |
Trustees’ compensation | | | 29,168 | |
Other | | | 19,577 | |
| | | | |
Total liabilities | | | 6,818,788 | |
Net Assets | | $ | 1,034,331,803 | |
| | | | |
| | | | |
Composition of Net Assets | | | | |
Par value of shares of beneficial interest | | $ | 44,232 | |
Additional paid-in capital | | | 728,065,271 | |
Accumulated net investment income | | | 3,803,947 | |
Accumulated net realized gain on investments | | | 85,082,098 | |
Net unrealized appreciation on investments | | | 217,336,255 | |
| | | | |
Net Assets | | $ | 1,034,331,803 | |
| | | | |
| | | | |
Net Asset Value Per Share | | | | |
Non-Service Shares: | | | | |
| Net asset value, redemption price per share and offering price per share (based on net assets of $110,534,008 and 4,691,263 shares of beneficial interest outstanding) | | | $23.56 | |
| |
Service Shares: | | | | |
| Net asset value, redemption price per share and offering price per share (based on net assets of $923,797,795 and 39,540,408 shares of beneficial interest outstanding) | | | $23.36 | |
1. June 28, 2013 represents the last business day of the Fund’s semiannual period. See Note 1 of the accompanying Notes.
See accompanying Notes to Financial Statements.
8 OPPENHEIMER MAIN STREET SMALL CAP FUND/VA
STATEMENTOF OPERATIONS For the Six Months Ended June 28, 20131 / Unaudited
| | | | |
| |
Investment Income | | | | |
Dividends: | | | | |
Unaffiliated companies | | $ | 8,862,890 | |
Affiliated companies | | | 17,869 | |
| |
Interest | | | 17 | |
| | | | |
Total investment income | | | 8,880,776 | |
| |
Expenses | | | | |
Management fees | | | 3,409,512 | |
| |
Distribution and service plan fees–Service shares | | | 1,123,837 | |
| |
Transfer and shareholder servicing agent fees: | | | | |
Non-Service shares | | | 49,980 | |
Service shares | | | 449,231 | |
| |
Shareholder communications: | | | | |
Non-Service shares | | | 5,228 | |
Service shares | | | 47,120 | |
| |
Custodian fees and expenses | | | 3,701 | |
| |
Trustees’ compensation | | | 29,888 | |
| |
Other | | | 51,657 | |
| | | | |
Total expenses | | | 5,170,154 | |
Less waivers and reimbursements of expenses | | | (14,637) | |
| | | | |
Net expenses | | | 5,155,517 | |
| |
Net Investment Income | | | 3,725,259 | |
| |
Realized and Unrealized Gain | | | | |
Net realized gain on investments from unaffiliated companies | | | 87,156,705 | |
| |
Net change in unrealized appreciation/depreciation on investments | | | 85,797,617 | |
| |
Net Increase in Net Assets Resulting from Operations | | $ | 176,679,581 | |
| | | | |
1. June 28, 2013 represents the last business day of the Fund’s semiannual period. See Note 1 of the accompanying Notes.
See accompanying Notes to Financial Statements.
9 OPPENHEIMER MAIN STREET SMALL CAP FUND/VA
STATEMENTSOF CHANGES IN NET ASSETS
| | | | | | | | |
| | | Six Months Ended
June 28, 20131
(Unaudited) | | | Year Ended
December 31, 2012 | |
| |
Operations | | | | | | | | |
Net investment income | | $ | 3,725,259 | | | $ | 7,763,392 | |
| |
Net realized gain | | | 87,156,705 | | | | 96,274,108 | |
| |
Net change in unrealized appreciation/depreciation | | | 85,797,617 | | | | 44,253,351 | |
| | | | | | | | |
Net increase in net assets resulting from operations | | | 176,679,581 | | | | 148,290,851 | |
| |
Dividends and/or Distributions to Shareholders | | | | | | | | |
Dividends from net investment income: | | | | | | | | |
Non-Service shares | | | (978,471) | | | | (465,213) | |
Service shares | | | (6,606,600) | | | | (2,756,105) | |
| | | | | | | | |
| | | (7,585,071 | ) | | | (3,221,318) | |
| |
Distributions from net realized gain: | | | | | | | | |
Non-Service shares | | | (1,288,110) | | | | — | |
Service shares | | | (11,405,204) | | | | — | |
| | | | |
| | | (12,693,314) | | | | — | |
| |
Beneficial Interest Transactions | | | | | | | | |
Net increase (decrease) in net assets resulting from beneficial interest transactions: | | | | | | | | |
Non-Service shares | | | 7,885,062 | | | | (5,485,155) | |
Service shares | | | (67,141,786) | | | | (72,871,133) | |
| | | | | | | | |
| | | (59,256,724) | | | | (78,356,288) | |
| |
Net Assets | | | | | | | | |
Total increase | | | 97,144,472 | | | | 66,713,245 | |
| |
Beginning of period | | | 937,187,331 | | | | 870,474,086 | |
| | | | | | | | |
| | |
End of period (including accumulated net investment income of $3,803,947 and $7,663,759, respectively) | | $ | 1,034,331,803 | | | $ | 937,187,331 | |
| | | | |
1. June 28, 2013 represents the last business day of the Fund’s semiannual period. See Note 1 of the accompanying Notes.
See accompanying Notes to Financial Statements.
10 OPPENHEIMER MAIN STREET SMALL CAP FUND/VA
FINANCIAL HIGHLIGHTS
| | | | | | | | | | | | | | | | | | | | | | | | |
| Non-Service Shares | | Six Months
Ended
June 28,
20131
(Unaudited) | | | Year Ended
December 31, 2012 | | | Year Ended
December 30, 20111 | | | Year Ended
December 31, 2010 | | | Year Ended
December 31, 2009 | | | Year Ended
December 31, 2008 | |
| |
Per Share Operating Data | | | | | | | | | | | | | | | | | | | | | | | | |
Net asset value, beginning of period | | $ | 20.14 | | | $ | 17.17 | | | $ | 17.66 | | | $ | 14.40 | | | $ | 10.65 | | | $ | 18.20 | |
| |
Income (loss) from investment operations: | | | | | | | | | | | | | | | | | | | | | | | | |
Net investment income2 | | | 0.11 | | | | 0.21 | | | | 0.10 | | | | 0.10 | | | | 0.08 | | | | 0.12 | |
Net realized and unrealized gain (loss) | | | 3.82 | | | | 2.87 | | | | (0.48) | | | | 3.25 | | | | 3.78 | | | | (6.73) | |
| | | | |
Total from investment operations | | | 3.93 | | | | 3.08 | | | | (0.38) | | | | 3.35 | | | | 3.86 | | | | (6.61) | |
| |
Dividends and/or distributions to shareholders: | | | | | | | | | | | | | | | | | | | | | | | | |
Dividends from net investment income | | | (0.22) | | | | (0.11) | | | | (0.11) | | | | (0.09) | | | | (0.11) | | | | (0.08) | |
Distributions from net realized gain | | | (0.29) | | | | 0.00 | | | | 0.00 | | | | 0.00 | | | | 0.00 | | | | (0.86) | |
| | | | |
Total dividends and/or distributions to shareholders | | | (0.51) | | | | (0.11) | | | | (0.11) | | | | (0.09) | | | | (0.11) | | | | (0.94) | |
| |
Net asset value, end of period | | $ | 23.56 | | | $ | 20.14 | | | $ | 17.17 | | | $ | 17.66 | | | $ | 14.40 | | | $ | 10.65 | |
| | | | |
| |
| |
Total Return, at Net Asset Value3 | | | 19.51% | | | | 17.99% | | | | (2.21)% | | | | 23.41% | | | | 37.20% | | | | (37.83)% | |
| |
| |
Ratios/Supplemental Data | | | | | | | | | | | | | | | | | | | | | | | | |
Net assets, end of period (in thousands) | | $ | 110,534 | | | $ | 87,267 | | | $ | 79,722 | | | $ | 95,576 | | | $ | 81,814 | | | $ | 58,478 | |
| |
Average net assets (in thousands) | | $ | 101,385 | | | $ | 83,790 | | | $ | 86,796 | | | $ | 88,063 | | | $ | 69,585 | | | $ | 80,406 | |
| |
Ratios to average net assets:4 | | | | | | | | | | | | | | | | | | | | | | | | |
Net investment income | | | 0.97% | | | | 1.09% | | | | 0.58% | | | | 0.68% | | | | 0.71% | | | | 0.80% | |
Total expenses5 | | | 0.80% | | | | 0.83% | | | | 0.83% | | | | 0.85% | | | | 0.91% | | | | 0.75% | |
| Expenses after payments, waivers and/or reimbursements and reduction to custodian expenses | | | 0.80% | | | | 0.80% | | | | 0.80% | | | | 0.80% | | | | 0.82% | | | | 0.75% | |
| |
Portfolio turnover rate | | | 45 % | | | | 92 % | | | | 108 % | | | | 73 % | | | | 140 % | | | | 130 % | |
1. June 28, 2013 and December 30, 2011 represent the last business day of the Fund’s respective reporting periods. See Note 1 of the accompanying Notes.
2. Per share amounts calculated based on the average shares outstanding during the period.
3. Assumes an initial investment on the business day before the first day of the fiscal period, with all dividends and distributions reinvested in additional shares on the reinvestment date, and redemption at the net asset value calculated on the last business day of the fiscal period. Total returns are not annualized for periods less than one full year. Total return information does not reflect expenses that apply at the separate account level or to related insurance products. Inclusion of these charges would reduce the total return figures for all periods shown. Returns do not reflect the deduction of taxes that a shareholder would pay on fund distributions or the redemption of fund shares.
4. Annualized for periods less than one full year.
5. Total expenses including indirect expenses from affiliated fund were as follows:
| | | | |
Six Months Ended June 28, 2013 | | | 0.80 | % |
Year Ended December 31, 2012 | | | 0.83 | % |
Year Ended December 30, 2011 | | | 0.83 | % |
Year Ended December 31, 2010 | | | 0.85 | % |
Year Ended December 31, 2009 | | | 0.91 | % |
Year Ended December 31, 2008 | | | 0.75 | % |
See accompanying Notes to Financial Statements.
11 OPPENHEIMER MAIN STREET SMALL CAP FUND/VA
FINANCIAL HIGHLIGHTS
| | | | | | | | | | | | | | | | | | | | | | | | |
| Service Shares | | Six Months
Ended
June 28,
20131
(Unaudited) | | | Year Ended
December 31, 2012 | | | Year Ended
December 30, 20111 | | | Year Ended
December 31, 2010 | | | Year Ended
December 31, 2009 | | | Year Ended
December 31, 2008 | |
| |
Per Share Operating Data | | | | | | | | | | | | | | | | | | | | | | | | |
Net asset value, beginning of period | | $ | 19.96 | | | $ | 17.02 | | | $ | 17.50 | | | $ | 14.28 | | | $ | 10.54 | | | $ | 18.03 | |
| |
Income (loss) from investment operations: | | | | | | | | | | | | | | | | | | | | | | | | |
Net investment income2 | | | 0.08 | | | | 0.15 | | | | 0.06 | | | | 0.07 | | | | 0.05 | | | | 0.08 | |
Net realized and unrealized gain (loss) | | | 3.78 | | | | 2.85 | | | | (0.47) | | | | 3.21 | | | | 3.76 | | | | (6.67) | |
| | | | |
Total from investment operations | | | 3.86 | | | | 3.00 | | | | (0.41) | | | | 3.28 | | | | 3.81 | | | | (6.59) | |
| |
Dividends and/or distributions to shareholders: | | | | | | | | | | | | | | | | | | | | | | | | |
Dividends from net investment income | | | (0.17) | | | | (0.06) | | | | (0.07) | | | | (0.06) | | | | (0.07) | | | | (0.04) | |
Distributions from net realized gain | | | (0.29) | | | | 0.00 | | | | 0.00 | | | | 0.00 | | | | 0.00 | | | | (0.86) | |
| | | | |
Total dividends and/or distributions to shareholders | | | (0.46) | | | | (0.06) | | | | (0.07) | | | | (0.06) | | | | (0.07) | | | | (0.90) | |
| |
Net asset value, end of period | | $ | 23.36 | | | $ | 19.96 | | | $ | 17.02 | | | $ | 17.50 | | | $ | 14.28 | | | $ | 10.54 | |
| | | | |
| |
| |
Total Return, at Net Asset Value3 | | | 19.32% | | | | 17.67% | | | | (2.38)% | | | | 23.06% | | | | 36.88% | | | | (38.00)% | |
| |
| |
Ratios/Supplemental Data | | | | | | | | | | | | | | | | | | | | | | | | |
Net assets, end of period (in thousands) | | $ | 923,798 | | | $ | 849,920 | | | $ | 790,752 | | | $ | 859,710 | | | $ | 662,347 | | | $ | 551,644 | |
| |
Average net assets (in thousands) | | $ | 911,651 | | | $ | 836,487 | | | $ | 823,201 | | | $ | 730,069 | | | $ | 612,651 | | | $ | 769,150 | |
| |
Ratios to average net assets:4 | | | | | | | | | | | | | | | | | | | | | | | | |
Net investment income | | | 0.72% | | | | 0.82% | | | | 0.34% | | | | 0.45% | | | | 0.47% | | | | 0.52% | |
Total expenses5 | | | 1.05% | | | | 1.08% | | | | 1.08% | | | | 1.10% | | | | 1.15% | | | | 0.99% | |
| Expenses after payments, waivers and/or reimbursements and reduction to custodian expenses | | | 1.05% | | | | 1.05% | | | | 1.05% | | | | 1.05% | | | | 1.07% | | | | 0.99% | |
| |
Portfolio turnover rate | | | 45 % | | | | 92 % | | | | 108 % | | | | 73 % | | | | 140 % | | | | 130 % | |
1. June 28, 2013 and December 30, 2011 represent the last business day of the Fund’s respective reporting periods. See Note 1 of the accompanying Notes.
2. Per share amounts calculated based on the average shares outstanding during the period.
3. Assumes an initial investment on the business day before the first day of the fiscal period, with all dividends and distributions reinvested in additional shares on the reinvestment date, and redemption at the net asset value calculated on the last business day of the fiscal period. Total returns are not annualized for periods less than one full year. Total return information does not reflect expenses that apply at the separate account level or to related insurance products. Inclusion of these charges would reduce the total return figures for all periods shown. Returns do not reflect the deduction of taxes that a shareholder would pay on fund distributions or the redemption of fund shares.
4. Annualized for periods less than one full year.
5. Total expenses including indirect expenses from affiliated fund were as follows:
| | | | |
Six Months Ended June 28, 2013 | | | 1.05 | % |
Year Ended December 31, 2012 | | | 1.08 | % |
Year Ended December 30, 2011 | | | 1.08 | % |
Year Ended December 31, 2010 | | | 1.10 | % |
Year Ended December 31, 2009 | | | 1.15 | % |
Year Ended December 31, 2008 | | | 0.99 | % |
See accompanying Notes to Financial Statements.
12 OPPENHEIMER MAIN STREET SMALL CAP FUND/VA
NOTESTO FINANCIAL STATEMENTS Unaudited
1. Significant Accounting Policies
Oppenheimer Main Street Small Cap Fund/VA (the “Fund”), formerly Oppenheimer Main Street Small- & Mid-Cap Fund/VA, is a separate series of Oppenheimer Variable Account Funds, a diversified open-end management investment company registered under the Investment Company Act of 1940, as amended. The Fund’s investment objective is to seek capital appreciation. The Fund’s investment adviser is OFI Global Asset Management, Inc. (“OFI Global” or the “Manager”), a wholly-owned subsidiary of OppenheimerFunds, Inc. (“OFI” or the “Sub-Adviser”). The Manager has entered into a sub-advisory agreement with OFI. Shares of the Fund are sold only to separate accounts of life insurance companies.
The Fund offers two classes of shares. Both classes are sold at their offering price, which is the net asset value per share, to separate investment accounts of participating insurance companies as an underlying investment for variable life insurance policies, variable annuity contracts or other investment products. The class of shares designated as Service shares is subject to a distribution and service plan. Both classes of shares have identical rights and voting privileges with respect to the Fund in general and exclusive voting rights on matters that affect that class alone. Earnings, net assets and net asset value per share may differ due to each class having its own expenses, such as transfer and shareholder servicing agent fees and shareholder communications, directly attributable to that class.
The following is a summary of significant accounting policies consistently followed by the Fund.
Semiannual and Annual Periods. The Fund’s financial statements are presented through the last day the New York Stock Exchange was open for trading during each reporting period. The Fund’s financial statements have been presented through that date to maintain consistency with the Fund’s net asset value calculations used for shareholder transactions.
Investment in Oppenheimer Institutional Money Market Fund. The Fund is permitted to invest daily available cash balances in an affiliated money market fund. The Fund may invest the available cash in Class E shares of Oppenheimer Institutional Money Market Fund (“IMMF”) to seek current income while preserving liquidity. IMMF is a registered open-end management investment company, regulated as a money market fund under the Investment Company Act of 1940, as amended. The Manager is the investment adviser of IMMF, and the Sub-Adviser provides investment and related advisory services to IMMF. When applicable, the Fund’s investment in IMMF is included in the Statement of Investments. Shares of IMMF are valued at their net asset value per share. As a shareholder, the Fund is subject to its proportional share of IMMF’s Class E expenses, including its management fee. The Manager will waive fees and/or reimburse Fund expenses in an amount equal to the indirect management fees incurred through the Fund’s investment in IMMF.
Allocation of Income, Expenses, Gains and Losses. Income, expenses (other than those attributable to a specific class), gains and losses are allocated on a daily basis to each class of shares based upon the relative proportion of net assets represented by such class. Operating expenses directly attributable to a specific class are charged against the operations of that class.
Federal Taxes. The Fund intends to comply with provisions of the Internal Revenue Code applicable to regulated investment companies and to distribute substantially all of its investment company taxable income, including any net realized gain on investments not offset by capital loss carryforwards, if any, to shareholders. Therefore, no federal income or excise tax provision is required. The Fund files income tax returns in U.S. federal and applicable state jurisdictions. The statute of limitations on the Fund’s tax return filings generally remain open for the three preceding fiscal reporting period ends.
During the fiscal year ended December 31, 2012, the Fund utilized $81,263,761 of capital loss carryforward to offset capital gains realized in that fiscal year.
Net investment income (loss) and net realized gain (loss) may differ for financial statement and tax purposes. The character of dividends and distributions made during the fiscal year from net investment income or net realized gains may differ from their ultimate characterization for federal income tax purposes. Also, due to timing of dividends and distributions, the fiscal year in which amounts are distributed may differ from the fiscal year in which the income or net realized gain was recorded by the Fund.
The aggregate cost of securities and other investments and the composition of unrealized appreciation and depreciation of securities and other investments for federal income tax purposes as of June 28, 2013 are noted in the following table. The primary difference between book and tax appreciation or depreciation of securities and other investments, if applicable, is attributable to the tax deferral of losses or tax realization of financial statement unrealized gain or loss.
| | | | | | |
Federal tax cost of securities | | $ | 817,964,202 | | | |
| | | |
| | |
Gross unrealized appreciation | | $ | 226,961,830 | | | |
Gross unrealized depreciation | | | (11,338,041 | ) | | |
| | | |
Net unrealized appreciation | | $ | 215,623,789 | | | |
| | | |
Trustees’ Compensation. The Board of Trustees has adopted a compensation deferral plan for independent trustees that enables trustees to elect to defer receipt of all or a portion of the annual compensation they are entitled to receive from the Fund. For purposes of determining the amount owed to the Trustee under the plan, deferred amounts are treated as though equal dollar amounts had been invested in shares of the Fund or in other Oppenheimer funds selected by the Trustee. The Fund purchases shares of the funds selected for deferral by the Trustee in amounts equal to his or her deemed investment, resulting in a Fund asset equal to the deferred compensation liability. Such assets are included as a component of “Other” within the asset section of the Statement of Assets and Liabilities. Deferral of trustees’ fees under the plan will not affect the net assets of the Fund, and will not
13 OPPENHEIMER MAIN STREET SMALL CAP FUND/VA
NOTESTO FINANCIAL STATEMENTS Unaudited / Continued
1. Significant Accounting Policies (Continued)
materially affect the Fund’s assets, liabilities or net investment income per share. Amounts will be deferred until distributed in accordance with the compensation deferral plan.
Dividends and Distributions to Shareholders. Dividends and distributions to shareholders, which are determined in accordance with income tax regulations and may differ from U.S. generally accepted accounting principles, are recorded on the ex-dividend date. Income and capital gain distributions, if any, are declared and paid annually or at other times as deemed necessary by the Manager. The tax character of distributions is determined as of the Fund’s fiscal year end. Therefore, a portion of the Fund’s distributions made to shareholders prior to the Fund’s fiscal year end may ultimately be categorized as a tax return of capital.
Investment Income. Dividend income is recorded on the ex-dividend date or upon ex-dividend notification in the case of certain foreign dividends where the ex-dividend date may have passed. Non-cash dividends included in dividend income, if any, are recorded at the fair market value of the securities received. Interest income is recognized on an accrual basis. Discount and premium, which are included in interest income on the Statement of Operations, are amortized or accreted daily.
Custodian Fees. “Custodian fees and expenses” in the Statement of Operations may include interest expense incurred by the Fund on any cash overdrafts of its custodian account during the period. Such cash overdrafts may result from the effects of failed trades in portfolio securities and from cash outflows resulting from unanticipated shareholder redemption activity. The Fund pays interest to its custodian on such cash overdrafts, to the extent they are not offset by positive cash balances maintained by the Fund, at a rate equal to the Federal Funds Rate plus 0.50%. The “Reduction to custodian expenses” line item, if applicable, represents earnings on cash balances maintained by the Fund during the period. Such interest expense and other custodian fees may be paid with these earnings.
Security Transactions. Security transactions are recorded on the trade date. Realized gains and losses on securities sold are determined on the basis of identified cost.
Indemnifications. The Fund’s organizational documents provide current and former trustees and officers with a limited indemnification against liabilities arising in connection with the performance of their duties to the Fund. In the normal course of business, the Fund may also enter into contracts that provide general indemnifications. The Fund’s maximum exposure under these arrangements is unknown as this would be dependent on future claims that may be made against the Fund. The risk of material loss from such claims is considered remote.
Other. The preparation of financial statements in conformity with accounting principles generally accepted in the United States of America requires management to make estimates and assumptions that affect the reported amounts of assets and liabilities and disclosure of contingent assets and liabilities at the date of the financial statements and the reported amounts of increases and decreases in net assets from operations during the reporting period. Actual results could differ from those estimates.
2. Securities Valuation
The Fund calculates the net asset value of its shares as of the close of the New York Stock Exchange (the “Exchange”), normally 4:00 P.M. Eastern time, on each day the Exchange is open for trading.
The Fund’s Board has adopted procedures for the valuation of the Fund’s securities and has delegated the day-to-day responsibility for valuation determinations under those procedures to the Manager. The Manager has established a Valuation Committee which is responsible for determining a “fair valuation” for any security for which market quotations are not “readily available.” The Valuation Committee’s fair valuation determinations are subject to review, approval and ratification by the Fund’s Board at its next regularly scheduled meeting covering the calendar quarter in which the fair valuation was determined.
Valuation Methods and Inputs
Securities are valued using unadjusted quoted market prices, when available, as supplied primarily by third party pricing services or dealers.
The following methodologies are used to determine the market value or the fair value of the types of securities described below:
Securities traded on a registered U.S. securities exchange (including exchange-traded derivatives other than futures and futures options) are valued based on the last sale price of the security reported on the principal exchange on which it is traded, prior to the time when the Fund’s assets are valued. In the absence of a sale, the security is valued at the last sale price on the prior trading day, if it is within the spread of the current day’s closing “bid” and “asked” prices, and if not, at the current day’s closing bid price. A security of a foreign issuer traded on a foreign exchange but not listed on a registered U.S. securities exchange is valued based on the last sale price on the principal exchange on which the security is traded, as identified by the third party pricing service used by the Manager, prior to the time when the Fund’s assets are valued. If the last sale price is unavailable, the security is valued at the most recent official closing price on the principal exchange on which it is traded. If the last sales price or official closing price for a foreign security is not available, the security is valued at the mean between the bid and asked price per the exchange or, if not available from the exchange, obtained from two dealers. If bid and asked prices are not available from either the exchange or two dealers, the security is valued by using one of the following methodologies (listed in order of priority); (1) using a bid from the exchange, (2) the mean between the bid and asked price as provided by a single dealer, or (3) a bid from a single dealer.
14 OPPENHEIMER MAIN STREET SMALL CAP FUND/VA
NOTESTO FINANCIAL STATEMENTS Unaudited / Continued
2. Securities Valuation (Continued)
Shares of a registered investment company that are not traded on an exchange are valued at that investment company’s net asset value per share.
Corporate and government debt securities (of U.S. or foreign issuers) and municipal debt securities, event-linked bonds, loans, mortgage-backed securities, collateralized mortgage obligations, and asset-backed securities are valued at the mean between the “bid” and “asked” prices utilizing evaluated prices obtained from third party pricing services or broker-dealers who may use matrix pricing methods to determine the evaluated prices.
Short-term money market type debt securities with a remaining maturity of sixty days or less are valued at cost adjusted by the amortization of discount or premium to maturity (amortized cost), which approximates market value. Short-term debt securities with a remaining maturity in excess of sixty days are valued at the mean between the “bid” and “asked” prices utilizing evaluated prices obtained from third party pricing services or broker-dealers.
A description of the standard inputs that may generally be considered by the third party pricing vendors in determining their evaluated prices is provided below.
| | |
| Security Type | | Standard inputs generally considered by third-party pricing vendors |
| Corporate debt, government debt, municipal, mortgage-backed and asset-backed securities | | Reported trade data, broker-dealer price quotations, benchmark yields, issuer spreads on comparable securities, the credit quality, yield, maturity, and other appropriate factors. |
| Loans | | Information obtained from market participants regarding reported trade data and broker-dealer price quotations. |
| Event-linked bonds | | Information obtained from market participants regarding reported trade data and broker-dealer price quotations. |
If a market value or price cannot be determined for a security using the methodologies described above, or if, in the “good faith” opinion of the Manager, the market value or price obtained does not constitute a “readily available market quotation,” or a significant event has occurred that would materially affect the value of the security the security is fair valued either (i) by a standardized fair valuation methodology applicable to the security type or the significant event as previously approved by the Valuation Committee and the Fund’s Board or (ii) as determined in good faith by the Manager’s Valuation Committee. The Valuation Committee considers all relevant facts that are reasonably available, through either public information or information available to the Manager, when determining the fair value of a security. Fair value determinations by the Manager are subject to review, approval and ratification by the Fund’s Board at its next regularly scheduled meeting covering the calendar quarter in which the fair valuation was determined. Those fair valuation standardized methodologies include, but are not limited to, valuing securities at the last sale price or initially at cost and subsequently adjusting the value based on: changes in company specific fundamentals, changes in an appropriate securities index, or changes in the value of similar securities which may be further adjusted for any discounts related to security-specific resale restrictions. When possible, such methodologies use observable market inputs such as unadjusted quoted prices of similar securities, observable interest rates, currency rates and yield curves. The methodologies used for valuing securities are not necessarily an indication of the risks associated with investing in those securities nor can it be assured that the Fund can obtain the fair value assigned to a security if it were to sell the security.
To assess the continuing appropriateness of security valuations, the Manager, or its third party service provider who is subject to oversight by the Manager, regularly compares prior day prices, prices on comparable securities, and sale prices to the current day prices and challenges those prices exceeding certain tolerance levels with the third party pricing service or broker source. For those securities valued by fair valuations, whether through a standardized fair valuation methodology or a fair valuation determination, the Valuation Committee reviews and affirms the reasonableness of the valuations based on such methodologies and fair valuation determinations on a regular basis after considering all relevant information that is reasonably available.
Classifications
Each investment asset or liability of the Fund is assigned a level at measurement date based on the significance and source of the inputs to its valuation. Various data inputs are used in determining the value of each of the Fund’s investments as of the reporting period end. These data inputs are categorized in the following hierarchy under applicable financial accounting standards:
1) Level 1-unadjusted quoted prices in active markets for identical assets or liabilities (including securities actively traded on a securities exchange)
2) Level 2-inputs other than unadjusted quoted prices that are observable for the asset or liability (such as unadjusted quoted prices for similar assets and market corroborated inputs such as interest rates, prepayment speeds, credit risks, etc.)
3) Level 3-significant unobservable inputs (including the Manager’s own judgments about assumptions that market participants would use in pricing the asset or liability).
The inputs used for valuing securities are not necessarily an indication of the risks associated with investing in those securities.
The table below categorizes amounts that are included in the Fund’s Statement of Assets and Liabilities as of June 28, 2013 based on valuation input level:
15 OPPENHEIMER MAIN STREET SMALL CAP FUND/VA
NOTESTO FINANCIAL STATEMENTS Unaudited / Continued
2. Securities Valuation (Continued)
| | | | | | | | | | | | | | | | |
| | | Level 1— Unadjusted Quoted Prices | | | Level 2—
Other Significant
Observable Inputs | | | Level 3—
Significant
Unobservable
Inputs | | | Value | |
Assets Table | | | | | | | | | | | | | | | | |
Investments, at Value: | | | | | | | | | | | | | | | | |
Common Stocks | | | | | | | | | | | | | | | | |
Consumer Discretionary | | $ | 131,573,405 | | | $ | — | | | $ | — | | | $ | 131,573,405 | |
Consumer Staples | | | 35,247,583 | | | | — | | | | — | | | | 35,247,583 | |
Energy | | | 53,716,362 | | | | — | | | | — | | | | 53,716,362 | |
Financials | | | 264,462,050 | | | | — | | | | — | | | | 264,462,050 | |
Health Care | | | 118,115,495 | | | | — | | | | — | | | | 118,115,495 | |
Industrials | | | 194,747,993 | | | | — | | | | — | | | | 194,747,993 | |
Information Technology | | | 117,185,435 | | | | — | | | | — | | | | 117,185,435 | |
Materials | | | 92,650,046 | | | | — | | | | — | | | | 92,650,046 | |
Utilities | | | 6,096,325 | | | | — | | | | — | | | | 6,096,325 | |
Investment Company | | | 19,793,297 | | | | — | | | | — | | | | 19,793,297 | |
| | | | |
Total Assets | | $ | 1,033,587,991 | | | $ | — | | | $ | — | | | $ | 1,033,587,991 | |
| | | | |
Currency contracts and forwards, if any, are reported at their unrealized appreciation/ depreciation at measurement date, which represents the change in the contract’s value from trade date. Futures, if any, are reported at their variation margin at measurement date, which represents the amount due to/from the Fund at that date. All additional assets and liabilities included in the above table are reported at their market value at measurement date.
3. Shares of Beneficial Interest
The Fund has authorized an unlimited number of $0.001 par value shares of beneficial interest of each class. Transactions in shares of beneficial interest were as follows:
| | | | | | | | | | | | | | | | | | | | |
| | | | | Six Months Ended June 28, 2013 | | | Year Ended December 31, 2012 | | | |
| | | | | Shares | | | Amount | | | Shares | | | Amount | | | |
Non-Service Shares | | | | | | | | | | | | | | | | | | | | |
Sold | | | | | 978,295 | | | $ | 22,210,446 | | | | 1,076,459 | | | $ | 20,632,430 | | | |
Dividends and/or distributions reinvested | | | | | 95,275 | | | | 2,266,581 | | | | 25,160 | | | | 465,213 | | | |
Redeemed | | | | | (715,261 | ) | | | (16,591,965 | ) | | | (1,410,970 | ) | | | (26,582,798 | ) | | |
| | |
Net increase (decrease) | | | | | 358,309 | | | $ | 7,885,062 | | | | (309,351 | ) | | $ | (5,485,155 | ) | | |
| | |
|
Service Shares | | | | | | | | | | | | | | | | | | | | |
Sold | | | | | 1,700,035 | | | $ | 38,201,720 | | | | 4,633,662 | | | $ | 87,048,768 | | | |
Dividends and/or distributions reinvested | | | | | 763,535 | | | | 18,011,804 | | | | 150,278 | | | | 2,756,105 | | | |
Redeemed | | | | | (5,514,205 | ) | | | (123,355,310 | ) | | | (8,665,817 | ) | | | (162,676,006 | ) | | |
| | |
Net decrease | | | | | (3,050,635 | ) | | $ | (67,141,786 | ) | | | (3,881,877 | ) | | $ | (72,871,133 | ) | | |
| | |
4. Purchases and Sales of Securities
The aggregate cost of purchases and proceeds from sales of securities, other than short-term obligations and investments in IMMF, for the six months ended June 28, 2013, were as follows:
| | | | | | | | |
| | | Purchases | | | Sales | |
Investment securities | | $ | 437,637,429 | | | $ | 525,980,424 | |
5. Fees and Other Transactions with Affiliates
Management Fees. Under the investment advisory agreement, the Fund pays the Manager a management fee based on the daily net assets of the Fund at an annual rate as shown in the following table:
| | | | |
| Fee Schedule | | | |
Up to $ 200 million | | | 0.75% | |
Next $ 200 million | | | 0.72 | |
Next $ 200 million | | | 0.69 | |
Next $ 200 million | | | 0.66 | |
Over $800 million | | | 0.60 | |
Sub-Adviser Fees. The Manager has retained the Sub-Adviser to provide the day-to-day portfolio management of the Fund. Under the Sub-Advisory Agreement, the Manager pays the Sub-Adviser an annual fee in monthly installments, equal to a percentage of the investment management fee collected by the Manager from the Fund, which shall be calculated after any investment management fee waivers. The fee paid to the Sub-Adviser is paid by the Manager, not by the Fund.
16 OPPENHEIMER MAIN STREET SMALL CAP FUND/VA
NOTESTO FINANCIAL STATEMENTS Unaudited / Continued
5. Fees and Other Transactions with Affiliates (Continued)
Transfer Agent Fees. OFI Global (the “Transfer Agent”) serves as the transfer and shareholder servicing agent for the Fund. Fees incurred by the Fund with respect to these services are detailed in the statement of operations.
Sub-Transfer Agent Fees. The Transfer Agent has retained Shareholder Services, Inc., a wholly-owned subsidiary of OFI (the “Sub-Transfer Agent”), to provide the day-to-day transfer agent and shareholder servicing of the Fund. Under the Sub-Transfer Agency Agreement, the Transfer Agent pays the Sub-Transfer Agent an annual fee in monthly installments, equal to a percentage of the transfer agent fee collected by the Transfer Agent from the Fund, which shall be calculated after any applicable fee waivers. The fee paid to the Sub-Transfer Agent is paid by the Transfer Agent, not by the Fund.
Distribution and Service Plan for Service Shares. The Fund has adopted a Distribution and Service Plan (the “Plan”) in accordance with Rule 12b-1 under the Investment Company Act of 1940 for Service shares to pay OppenheimerFunds Distributor, Inc. (the “Distributor”), for distribution related services, personal service and account maintenance for the Fund’s Service shares. Under the Plan, payments are made periodically at an annual rate of 0.25% of the daily net assets of Service shares of the Fund. The Distributor currently uses all of those fees to compensate sponsors of the insurance product that offers Fund shares, for providing personal service and maintenance of accounts of their variable contract owners that hold Service shares. These fees are paid out of the Fund’s assets on an on-going basis and increase operating expenses of the Service shares, which results in lower performance compared to the Fund’s shares that are not subject to a service fee. Fees incurred by the Fund under the Plan are detailed in the Statement of Operations.
Waivers and Reimbursements of Expenses. The Manager has voluntarily agreed to limit the Fund’s expenses after payments, waivers and/or reimbursements and reduction to custodian expenses, excluding expenses incurred directly or indirectly by the Fund as a result of investments in other investment companies, wholly-owned subsidiaries and pooled investment vehicles; so that those expenses, as percentages of daily net assets, will not exceed the annual rate of 0.80% for Non-Service shares and 1.05% for Service shares. During the six months ended June 28, 2013, the Manager waived fees and/or reimbursed the Fund $1,143 for Non-Service shares.
The Manager will waive fees and/or reimburse Fund expenses in an amount equal to the indirect management fees incurred through the Fund’s investment in IMMF. During the six months ended June 28, 2013, the Manager waived fees and/or reimbursed the Fund $13,494 for IMMF management fees.
Some of these undertakings may be modified or terminated at any time; some may not be modified or terminated until after one year from the date of the current prospectus, as indicated therein.
6. Pending Litigation
Since 2009, a number of class action lawsuits have been pending in federal courts against OppenheimerFunds, Inc. (“OFI”), OppenheimerFunds Distributor, Inc., the Fund’s principal underwriter and distributor (the “Distributor”), and certain funds (but not including the Fund) advised by the Manager and distributed by the Distributor (the “Defendant Funds”). Several of these lawsuits also name as defendants certain officers and current and former trustees of the respective Defendant Funds. The lawsuits raise claims under federal securities law and allege, among other things, that the disclosure documents of the respective Defendant Funds contained misrepresentations and omissions and that the respective Defendant Funds’ investment policies were not followed. The plaintiffs in these actions seek unspecified damages, equitable relief and awards of attorneys’ fees and litigation expenses. The Defendant Funds’ Boards of Trustees have also engaged counsel to represent the Funds and the present and former Independent Trustees named in those suits.
Other class action and individual lawsuits have been filed since 2008 in various state and federal courts against OFI and certain of its affiliates by investors seeking to recover investments they allegedly lost as a result of the “Ponzi” scheme run by Bernard L. Madoff and his firm, Bernard L. Madoff Investment Securities, LLC (“BLMIS”). Plaintiffs in these suits allege that they suffered losses as a result of their investments in several funds managed by an affiliate of OFI and assert a variety of claims, including breach of fiduciary duty, fraud, negligent misrepresentation, unjust enrichment, and violation of federal and state securities laws and regulations, among others. They seek unspecified damages, equitable relief and awards of attorneys’ fees and litigation expenses. Neither the Distributor, nor any of the Oppenheimer mutual funds, their independent trustees or directors are named as defendants in these lawsuits. None of the Oppenheimer mutual funds invested in any funds or accounts managed by Madoff or BLMIS. On February 28, 2011, a stipulation of partial settlement of three groups of consolidated putative class action lawsuits relating to these matters was filed in the U.S. District Court for the Southern District of New York. On August 19, 2011, the court entered an order and final judgment approving the settlement as fair, reasonable and adequate. In September 2011, certain parties filed notices of appeal from the court’s order approving the settlement. The settlement does not resolve other outstanding lawsuits against OFI and its affiliates relating to BLMIS.
On April 16, 2010, a lawsuit was filed in New York state court against (i) OFI, (ii) an affiliate of OFI and (iii) AAArdvark IV Funding Limited (“AAArdvark IV”), an entity advised by OFI’s affiliate, in connection with investments made by the plaintiffs in AAArdvark IV. Plaintiffs allege breach of contract and common law fraud claims against the defendants and seek compensatory damages, costs and disbursements, including attorney fees. On April 11, 2013, the court granted defendants’ motion for summary judgment, dismissing plaintiffs’ fraud claim with prejudice and dismissing their contract claim without prejudice, and granted plaintiffs leave to replead their contract claim to assert a cause of action for specific performance within 30 days. On May 9, 2013, plaintiffs filed a notice of appeal from the court’s dismissal order. On July 15, 2011, a lawsuit was filed in New York state court against OFI, an affiliate of OFI and AAArdvark Funding Limited (“AAArdvark I”), an entity advised by OFI’s affiliate, in connection with investments made by the plaintiffs in AAArdvark I. The complaint alleges breach of contract and common law fraud claims against the defendants and seeks compensatory damages, costs and disbursements, including attorney fees. On November 9, 2011, a lawsuit was filed in New York state court against OFI, an affiliate of OFI and AAArdvark XS Funding Limited (“AAArdvark XS”), an entity advised by OFI’s affiliate, in connection with investments made by the plaintiffs in
17 OPPENHEIMER MAIN STREET SMALL CAP FUND/VA
NOTESTO FINANCIAL STATEMENTS Unaudited / Continued
6. Pending Litigation (Continued)
AAArdvark XS. The complaint alleges breach of contract against the defendants and seeks compensatory damages, costs and disbursements, including attorney fees.
OFI believes the lawsuits and appeals described above are without legal merit and, with the exception of actions it has settled, is defending against them vigorously. While it is premature to render any opinion as to the outcome in these lawsuits, or whether any costs that the Defendant Funds may bear in defending the suits might not be reimbursed by insurance, OFI believes that these suits should not impair the ability of OFI or the Distributor to perform their respective duties to the Fund, and that the outcome of all of the suits together should not have any material effect on the operations of any of the Oppenheimer mutual funds.
18 OPPENHEIMER MAIN STREET SMALL CAP FUND/VA
PORTFOLIO PROXY VOTING POLICIES AND PROCEDURES; UPDATES TO STATEMENTS OF INVESTMENTS Unaudited
The Fund has adopted Portfolio Proxy Voting Policies and Procedures under which the Fund votes proxies relating to securities (“portfolio proxies”) held by the Fund. A description of the Fund’s Portfolio Proxy Voting Policies and Procedures is available (i) without charge, upon request, by calling the Fund toll-free at 1.800.CALL OPP (225.5677), (ii) on the Fund’s website at oppenheimerfunds.com, and (iii) on the SEC’s website at www.sec.gov. In addition, the Fund is required to file Form N-PX, with its complete proxy voting record for the 12 months ended June 30th, no later than August 31st of each year. The Fund’s voting record is available (i) without charge, upon request, by calling the Fund toll-free at 1.800.CALL OPP (225.5677), and (ii) in the Form N-PX filing on the SEC’s website at www.sec.gov.
The Fund files its complete schedule of portfolio holdings with the SEC for the first quarter and the third quarter of each fiscal year on Form N-Q. The Fund’s Form N-Q filings are available on the SEC’s website at www.sec.gov. Those forms may be reviewed and copied at the SEC’s Public Reference Room in Washington, D.C. Information on the operation of the Public Reference Room may be obtained by calling 1-800-SEC-0330.
19 OPPENHEIMER MAIN STREET SMALL CAP FUND/VA
OPPENHEIMER MAIN STREET SMALL CAP FUND/VA
A Series of Oppenheimer Variable Account Funds
| | |
| Trustees and Officers | | Sam Freedman, Chairman of the Board of Trustees and Trustee |
| | Edward L. Cameron, Trustee |
| | Jon S. Fossel, Trustee |
| | Richard F. Grabish, Trustee |
| | Beverly L. Hamilton, Trustee |
| | Victoria J. Herget, Trustee |
| | Robert J. Malone, Trustee |
| | F. William Marshall, Jr., Trustee |
| | Karen L. Stuckey, Trustee |
| | James D. Vaughn, Trustee |
| | William F. Glavin, Jr., Trustee, President and Principal Executive Officer |
| | Matthew P. Ziehl, Vice President |
| | Raymond Anello, Vice President |
| | Raman Vardharaj, Vice President |
| | Joy Budzinski, Vice President |
| | Kristin Ketner Pak, Vice President |
| | Magnus Krantz, Vice President |
| | Adam Weiner, Vice President |
| | Arthur S. Gabinet, Secretary and Chief Legal Officer |
| | Christina M. Nasta, Vice President and Chief Business Officer |
| | Mark S. Vandehey, Vice President and Chief Compliance Officer |
| | Brian W. Wixted, Treasurer and Principal Financial & Accounting Officer |
| |
| Manager | | OFI Global Asset Management, Inc. |
| |
| Sub-Adviser | | OppenheimerFunds, Inc. |
| |
| Distributor | | OppenheimerFunds Distributor, Inc. |
| |
| Transfer and | | OFI Global Asset Management, Inc. |
| Shareholder | | |
| Servicing Agent | | |
| |
| Sub-Transfer | | Shareholder Services, Inc. |
| Agent | | DBA OppenheimerFunds Services |
| |
| Independent Registered Public Accounting Firm | | KPMGLLP |
| |
| Legal Counsel | | K&L Gates LLP |
| |
| | Before investing in any of the Oppenheimer funds, investors should carefully consider a fund’s investment objectives, risks, charges and expenses. Fund prospectuses and summary prospectuses contain this and other information about the funds and may be obtained by asking your financial advisor, visiting oppenheimerfunds.com, or calling us at 1.800.988.8287. Read prospectuses and summary prospectuses carefully before investing. |
| |
| | The financial statements included herein have been taken from the records of the Fund without examination of those records by the independent registered public accounting firm. |
© 2013 OppenheimerFunds, Inc. All rights reserved. Oppenheimer funds are distributed by OppenheimerFunds Distributor, Inc.
| | | | |
| June 30, 2013 | | |
| | | Oppenheimer Money Fund/VA A Series of Oppenheimer Variable Account Funds | | Semiannual Report |
| | |
| | SEMIANNUAL REPORT Listing of Top Holdings Fund Performance Discussion Financial Statements | | |

Portfolio Managers: Christopher Proctor, CFA and Adam S. Wilde1
Current Yield
For the 7-Day Period Ended 6/28/132
| | | | | | | | |
With Compounding | | | 0.01 | % | | | | |
Without Compounding | | | 0.01 | % | | | | |
| For the 6-Month Period Ended 6/28/132 |
With Compounding | | | 0.01 | % | | | | |
Without Compounding | | | 0.01 | % | | | | |
The performance data quoted represents past performance, which does not guarantee future results. Yields are annualized and include dividends in a hypothetical investment for the periods shown. The investment return and principal value of an investment in the Fund will fluctuate so that an investor’s shares, when redeemed, may be worth more or less than their original cost. Current performance may be lower or higher than the performance quoted. For performance data current to the most recent month end, call us at 1.800.988.8287. The Fund’s total returns should not be expected to be the same as the returns of other funds, whether or not both funds have the same portfolio managers and/or similar names. The Fund’s total returns include changes in share price and reinvested distributions but do not include the charges associated with the separate account products that offer this Fund. Such performance would have been lower if such charges were taken into account.
1. Adam S. Wilde became a Portfolio Manager in July 2013.
2. June 28, 2013, was the last business day of the Fund’s semiannual period. See Note 1 of the accompanying Notes to Financial Statements.
| | | | |
Portfolio Allocation | |
Short-Term Notes/Commercial Paper | | | 46.5 | % |
Certificates of Deposit | | | 29.5 | |
Direct Bank Obligations | | | 17.5 | |
U.S. Government Obligations | | | 6.5 | |
Portfolio holdings and allocations are subject to change. Percentages are as of June 28, 2013, and are based on the total market value of investments.
2 OPPENHEIMER MONEY FUND/VA
| | |
Fund Performance Discussion |
As they have for the past several years, short-term interest rates and money market yields remained near historical lows during the period. Nonetheless, the Fund continued to produce competitive and consistent levels of current income while maintaining liquidity and a stable net asset value.
MARKET OVERVIEW
The Federal Reserve’s (the “Fed’s”) target for short-term interest rates remained in a range between 0% and 0.25% throughout the reporting period, which effectively anchored yields of short-term debt instruments near historical lows. In addition, the Fed’s aggressively accommodative monetary policy appeared to gain a degree of traction, as a variety of U.S. economic data showed improvement during the period. Prior to the start of the period, the Fed launched a third, open-ended round of quantitative easing to buy U.S. government securities from financial institutions, providing them with cash that can be used for consumer and business loans. At the same time, the Fed stated its intention to maintain low short-term interest rates through mid-2015, an extension of its previous 2014 time frame.
Economic conditions in the rest of the world also seemed to be on the mend. While Europe continued to struggle with its sovereign debt crisis, the European Central Bank’s commitment to support the euro as the European Union’s common currency bolstered optimism. Even in Japan, which had been mired in economic weakness for years, new government leadership adopted economic policies and the central bank announced a massive quantitative easing program.
However, later in the period, the Fed appeared to weigh the merits of backing away from its quantitative easing policy. As a result, the markets sold off sharply and made a quick reappraisal of interest rate risk in an array of credit markets and related currencies. Equities, particularly those in emerging markets and with interest rate sensitivity, experienced spillover effects as a result.
PORTFOLIO STRATEGY
We continued to emphasize liquidity and safety in the reporting period, favoring U.S. Treasury securities and bank obligations in the United States and Canada, while avoiding some of the European banks that we feel still may be affected by the region’s economic downturn. We also found relatively attractive opportunities in short-dated commercial paper issued by financially stable corporations, as well as from asset-backed commercial paper and municipal variable rate demand notes. These types of short-term securities did not experience as much yield compression as other liquidity instruments, such as repurchase agreements, during the period.
As the period was characterized by declining short term interest rates, we managed the Fund’s weighted average maturity toward the longer end of its range in an effort to capture higher yields from longer dated instruments. Consequently, as of the end of the reporting period, the Fund’s weighted average maturity was slightly longer than industry averages.
STRATEGY & OUTLOOK
Although we have been encouraged by recently improved U.S. economic data and improvement in European bank funding ability, the pace of economic improvement continues to suggest that the Fed will be measured in its approach to tightening monetary policy, and that money market rates will continue to remain low by historical standards for the foreseeable future. Accordingly, we will remain focused on capital preservation and liquidity as the economic situation develops.
Additionally, we expect that U.S. regulators will propose rules soon to further strengthen money market funds during times of market stresses. We look forward to engaging in the regulatory process as it unfolds the remainder of this year and into 2014.
An investment in the Fund is not insured or guaranteed by the Federal Deposit Insurance Corporation or any other government agency. Although the Fund seeks to preserve the value of your investment at $1.00 per share, it is possible to lose money by investing in the Fund.
Shares of Oppenheimer funds are not deposits or obligations of any bank, are not guaranteed by any bank, are not insured by the FDIC or any other agency, and involve investment risks, including the possible loss of the principal amount invested.
3 OPPENHEIMER MONEY FUND/VA
Fund Expenses. As a shareholder of the Fund, you incur two types of costs: (1) transaction costs and (2) ongoing costs, including management fees; distribution and service fees; and other Fund expenses. These examples are intended to help you understand your ongoing costs (in dollars) of investing in the Fund and to compare these costs with the ongoing costs of investing in other mutual funds.
The examples are based on an investment of $1,000.00 invested at the beginning of the period and held for the entire 6-month period ended June 28, 2013.
Actual Expenses. The first section of the table provides information about actual account values and actual expenses. You may use the information in this section for the class of shares you hold, together with the amount you invested, to estimate the expense that you paid over the period. Simply divide your account value by $1,000.00 (for example, an $8,600.00 account value divided by $1,000.00 = 8.60), then multiply the result by the number in the first section under the heading entitled “Expenses Paid During Period” to estimate the expenses you paid on your account during this period.
Hypothetical Example for Comparison Purposes.
The second section of the table provides information about hypothetical account values and hypothetical expenses based on the Fund’s actual expense ratio for each class of shares, and an assumed rate of return of 5% per year for each class before expenses, which is not the actual return. The hypothetical account values and expenses may not be used to estimate the actual ending account balance or expenses you paid for the period. You may use this information to compare the ongoing costs of investing in the Fund and other funds. To do so, compare this 5% hypothetical example for the class of shares you hold with the 5% hypothetical examples that appear in the shareholder reports of the other funds.
Please note that the expenses shown in the table are meant to highlight your ongoing costs only and do not reflect any charges associated with the separate accounts that offer this Fund. Therefore, the “hypothetical” lines of the table are useful in comparing ongoing costs only, and will not help you determine the relative total costs of owning different funds. In addition, if these separate account charges were included your costs would have been higher.
| | | | | | | | | | | | | | |
| Actual | | Beginning
Account
Value
January 1, 2013 | | | Ending
Account
Value
June 28, 2013 | | | Expenses
Paid During
6 Months Ended
June 28, 2013 | | | |
| | $ | 1,000.00 | | | $ | 1,000.10 | | | $ | 1.18 | | | |
| | | | |
Hypothetical | | | | | | | | | | | | | | |
(5% return before expenses) | | | | | | | | | | | | | | |
| | | 1,000.00 | | | | 1,023.34 | | | | 1.19 | | | |
Expenses are equal to the Fund’s annualized expense ratio for that class, multiplied by the average account value over the period, multiplied by 179/365 (to reflect the one-half year period). Those annualized expense ratios, excluding indirect expenses from affiliated funds, based on the 6-month period ended June 28, 2013 are as follows:
The expense ratios reflect voluntary waivers and/or reimbursements of expenses by the Fund’s Manager. Some of these undertakings may be modified or terminated at any time, as indicated in the Fund’s prospectus. The “Financial Highlights” tables in the Fund’s financial statements, included in this report, also show the gross expense ratios, without such waivers or reimbursements and reduction to custodian expenses, if applicable.
4 OPPENHEIMER MONEY FUND/VA
| | |
STATEMENT OF INVESTMENTS June 28, 2013* / Unaudited |
| | | | | | | | | | | | | | | | |
| | | Maturity Date** | | | Final Legal Maturity
Date*** | | | Principal Amount | | | Value | |
Certificates of Deposit—29.4% | | | | | | | | | | | | | | | | |
Yankee Certificates of Deposit—29.4% | | | | | | | | | | | | | | | | |
Bank of Montreal, Chicago: | | | | | | | | | | | | | | | | |
0.12% | | | 7/1/13 | | | | 7/1/13 | | | $ | 4,600,000 | | | $ | 4,600,000 | |
0.18% | | | 9/5/13 | | | | 9/5/13 | | | | 3,900,000 | | | | 3,900,000 | |
Bank of Nova Scotia, Houston TX: | | | | | | | | | | | | | | | | |
0.20%1 | | | 7/1/13 | | | | 7/9/13 | | | | 1,200,000 | | | | 1,200,000 | |
0.22% | | | 11/13/13 | | | | 11/13/13 | | | | 1,200,000 | | | | 1,200,000 | |
0.23% | | | 10/7/13 | | | | 10/7/13 | | | | 1,000,000 | | | | 1,000,000 | |
BNP Paribas, New York, 0.74% | | | 1/15/14 | | | | 1/15/14 | | | | 2,250,000 | | | | 2,250,000 | |
Canadian Imperial Bank of Commerce NY, 0.06% | | | 7/2/13 | | | | 7/2/13 | | | | 6,500,000 | | | | 6,500,000 | |
DnB Bank ASA NY: | | | | | | | | | | | | | | | | |
0.18% | | | 9/12/13 | | | | 9/12/13 | | | | 2,000,000 | | | | 2,000,000 | |
0.185% | | | 8/14/13 | | | | 8/14/13 | | | | 2,300,000 | | | | 2,300,000 | |
0.185% | | | 8/20/13 | | | | 8/20/13 | | | | 1,000,000 | | | | 1,000,000 | |
Nordea Bank Finland plc, New York: | | | | | | | | | | | | | | | | |
0.22% | | | 11/18/13 | | | | 11/18/13 | | | | 1,000,000 | | | | 1,000,000 | |
0.23% | | | 11/15/13 | | | | 11/15/13 | | | | 6,000,000 | | | | 6,000,000 | |
Royal Bank of Canada, New York: | | | | | | | | | | | | | | | | |
0.303%1 | | | 7/24/13 | | | | 6/24/14 | | | | 3,000,000 | | | | 3,000,000 | |
0.32%1 | | | 7/1/13 | | | | 2/3/14 | | | | 2,000,000 | | | | 2,000,000 | |
Svenska Handelsbanken, New York: | | | | | | | | | | | | | | | | |
0.21% | | | 9/20/13 | | | | 9/20/13 | | | | 1,300,000 | | | | 1,300,029 | |
0.22% | | | 7/12/13 | | | | 7/12/13 | | | | 2,700,000 | | | | 2,700,000 | |
0.22% | | | 7/19/13 | | | | 7/19/13 | | | | 2,500,000 | | | | 2,500,000 | |
Toronto Dominion Bank, New York: | | | | | | | | | | | | | | | | |
0.14% | | | 7/8/13 | | | | 7/8/13 | | | | 1,750,000 | | | | 1,750,004 | |
0.24% | | | 9/27/13 | | | | 9/27/13 | | | | 4,000,000 | | | | 4,000,000 | |
0.26% | | | 1/6/14 | | | | 1/6/14 | | | | 2,000,000 | | | | 2,000,000 | |
Wells Fargo Bank NA, 0.248% | | | 7/1/13 | | | | 5/1/14 | | | | 2,500,000 | | | | 2,500,000 | |
Total Certificates of Deposit (Cost $54,700,033) | | | | | | | | | | | | | | | 54,700,033 | |
Direct Bank Obligations—17.4% | | | | | | | | | | | | | | | | |
Bank of Nova Scotia, New York, 0.07% | | | 7/3/13 | | | | 7/3/13 | | | | 5,400,000 | | | | 5,399,979 | |
National Australia Funding (Delaware), Inc., 0.25%2 | | | 7/8/13 | | | | 7/8/13 | | | | 3,000,000 | | | | 2,999,854 | |
Nordea North America, Inc., 0.20% | | | 8/13/13 | | | | 8/13/13 | | | | 1,000,000 | | | | 999,761 | |
Skandinaviska Enskilda BankenAB: | | | | | | | | | | | | | | | | |
0.20%2 | | | 9/4/13 | | | | 9/4/13 | | | | 1,500,000 | | | | 1,499,458 | |
0.20%2 | | | 9/19/13 | | | | 9/19/13 | | | | 5,800,000 | | | | 5,797,422 | |
Swedbank AB: | | | | | | | | | | | | | | | | |
0.20% | | | 8/28/13 | | | | 8/28/13 | | | | 7,000,000 | | | | 6,997,745 | |
0.20% | | | 8/27/13 | | | | 8/27/13 | | | | 1,300,000 | | | | 1,299,588 | |
Westpac Banking Corp.: | | | | | | | | | | | | | | | | |
0.329%1,2,3 | | | 7/9/13 | | | | 1/9/14 | | | | 5,400,000 | | | | 5,400,000 | |
0.34%1,2 | | | 7/1/13 | | | | 10/31/13 | | | | 2,000,000 | | | | 2,000,402 | |
Total Direct Bank Obligations (Cost $32,394,209) | | | | | | | | | | | | | | | 32,394,209 | |
Short-Term Notes/Commercial Paper—46.2% | | | | | | | | | | | | | | | | |
Capital Markets—1.9% | | | | | | | | | | | | | | | | |
BNP Paribas Finance, Inc., 0.25% | | | 9/12/13 | | | | 9/12/13 | | | | 3,500,000 | | | | 3,498,226 | |
Diversified Financial Services—3.8% | | | | | | | | | | | | | | | | |
General Electric Capital Corp.: | | | | | | | | | | | | | | | | |
0.23% | | | 11/25/13 | | | | 11/25/13 | | | | 5,000,000 | | | | 4,995,304 | |
0.23% | | | 10/28/13 | | | | 10/28/13 | | | | 2,000,000 | | | | 1,998,479 | |
| | | | | | | | | | | | | | | | 6,993,783 | |
Leasing & Factoring—6.5% | | | | | | | | | | | | | | | | |
American Honda Finance Corp.: | | | | | | | | | | | | | | | | |
0.293%1,3 | | | 9/5/13 | | | | 12/5/13 | | | | 1,000,000 | | | | 1,000,000 | |
0.305%1,3 | | | 8/8/13 | | | | 11/8/13 | | | | 1,500,000 | | | | 1,500,000 | |
0.353%1,3 | | | 8/2/13 | | | | 8/2/13 | | | | 1,500,000 | | | | 1,500,000 | |
Toyota Motor Credit Corp.: | | | | | | | | | | | | | | | | |
0.234% | | | 7/1/13 | | | | 2/25/14 | | | | 2,500,000 | | | | 2,500,000 | |
0.301% | | | 10/25/13 | | | | 10/25/13 | | | | 2,500,000 | | | | 2,497,583 | |
0.31% | | | 7/17/13 | | | | 7/17/13 | | | | 3,300,000 | | | | 3,299,546 | |
| | | | | | | | | | | | | | | | 12,297,129 | |
Municipal—1.2% | | | | | | | | | | | | | | | | |
San Antonio, TX Industrial Development Authority Revenue Bonds, | | | | | | | | | | | | | | | | |
Tindall Corp. Project, 0.25%1 | | | 7/5/13 | | | | 7/5/13 | | | | 2,300,000 | | | | 2,300,000 | |
5 OPPENHEIMER MONEY FUND/VA
| | |
STATEMENT OF INVESTMENTS Unaudited / (Continued) |
| | | | | | | | | | | | | | | | |
| | | Maturity Date** | | | Final Legal Maturity
Date*** | | | Principal Amount | | | Value | |
Oil, Gas & Consumable Fuels—3.3% | | | | | | | | | | | | | | | | |
Total Capital SA, 0.05%2 | | | 7/1/13 | | | | 7/1/13 | | | $ | 6,100,000 | | | $ | 6,100,000 | |
Receivables Finance—17.6% | | | | | | | | | | | | | | | | |
Alpine Securitization Corp.: | | | | | | | | | | | | | | | | |
0.10% | | | 7/1/13 | | | | 7/1/13 | | | | 5,800,000 | | | | 5,800,000 | |
0.10% | | | 7/3/13 | | | | 7/3/13 | | | | 3,100,000 | | | | 3,099,983 | |
Barton Capital Corp., 0.27%2 | | | 7/28/13 | | | | 11/5/13 | | | | 2,000,000 | | | | 2,000,000 | |
Gemini Securitization Corp., 0.10%2 | | | 7/1/13 | | | | 7/1/13 | | | | 9,000,000 | | | | 9,000,000 | |
Gotham Funding Corp., 0.17%2 | | | 7/11/13 | | | | 7/11/13 | | | | 1,200,000 | | | | 1,199,943 | |
Jupiter Securitization Co. LLC: | | | | | | | | | | | | | | | | |
0.26%2 | | | 9/18/13 | | | | 9/18/13 | | | | 2,500,000 | | | | 2,498,574 | |
0.26%2 | | | 10/1/13 | | | | 10/1/13 | | | | 1,000,000 | | | | 999,336 | |
Market Street Funding LLC: | | | | | | | | | | | | | | | | |
0.16%2 | | | 7/9/13 | | | | 7/9/13 | | | | 1,251,000 | | | | 1,250,955 | |
0.17%2 | | | 8/7/13 | | | | 8/7/13 | | | | 1,225,000 | | | | 1,224,786 | |
0.185%2 | | | 8/19/13 | | | | 8/19/13 | | | | 1,800,000 | | | | 1,799,547 | |
0.20%2 | | | 7/10/13 | | | | 7/10/13 | | | | 1,000,000 | | | | 999,950 | |
Old Line Funding Corp.: | | | | | | | | | | | | | | | | |
0.25%2 | | | 12/18/13 | | | | 12/18/13 | | | | 1,000,000 | | | | 998,819 | |
0.25%2 | | | 10/21/13 | | | | 10/21/13 | | | | 2,000,000 | | | | 1,998,445 | |
| | | | | | | | | | | | | | | 32,870,338 | |
Special Purpose Financial—11.9% | | | | | | | | | | | | | | | | |
Anglesea Funding LLC, 0.25%3 | | | 7/1/13 | | | | 7/1/13 | | | | 2,000,000 | | | | 2,000,000 | |
Collateralized Commercial Paper II Co. LLC, 0.401%3 | | | 7/16/13 | | | | 7/16/13 | | | | 4,500,000 | | | | 4,499,250 | |
Concord Minutemen Cap. Corp. LLC: | | | | | | | | | | | | | | | | |
0.22% | | | 8/8/13 | | | | 8/8/13 | | | | 2,000,000 | | | | 1,999,536 | |
0.22% | | | 8/12/13 | | | | 8/12/13 | | | | 2,700,000 | | | | 2,699,307 | |
0.23% | | | 7/15/13 | | | | 7/15/13 | | | | 4,100,000 | | | | 4,099,633 | |
Legacy Capital LLC, 0.23% | | | 7/2/13 | | | | 7/2/13 | | | | 1,000,000 | | | | 999,994 | |
Lexington Parker Capital Co. LLC, 0.23%2 | | | 7/8/13 | | | | 7/8/13 | | | | 5,000,000 | | | | 4,999,776 | |
Ridgefield Funding Co. LLC, 0.30% | | | 8/12/13 | | | | 8/12/13 | | | | 1,000,000 | | | | 1,000,000 | |
| | | | | | | | | | | | | | | 22,297,496 | |
Total Short-Term Notes/Commercial Paper (Cost $86,356,972) | | | | | | | | | | | | 86,356,972 | |
U.S. Government Obligations—6.4% | | | | | | | | | | | | | | | | |
U.S. Treasury Nts.: | | | | | | | | | | | | | | | | |
0.25% | | | 2/28/14 | | | | 2/28/14 | | | | 1,000,000 | | | | 1,000,408 | |
0.375% | | | 6/30/13 | | | | 6/30/13 | | | | 2,000,000 | | | | 2,000,000 | |
0.50% | | | 10/15/13 | | | | 10/15/13 | | | | 2,500,000 | | | | 2,502,161 | |
0.75% | | | 9/15/13 | | | | 9/15/13 | | | | 1,000,000 | | | | 1,001,075 | |
1.00% | | | 1/15/14 | | | | 1/15/14 | | | | 1,500,000 | | | | 1,506,559 | |
1.00% | | | 7/15/13 | | | | 7/15/13 | | | | 1,000,000 | | | | 1,000,292 | |
1.75% | | | 1/31/14 | | | | 1/31/14 | | | | 1,000,000 | | | | 1,009,055 | |
3.375% | | | 7/31/13 | | | | 7/31/13 | | | | 1,000,000 | | | | 1,002,600 | |
4.25% | | | 8/15/13 | | | | 8/15/13 | | | | 1,000,000 | | | | 1,004,974 | |
Total U.S. Government Obligations (Cost $12,027,124) | | | | | | | | | | | | | | | 12,027,124 | |
Total Investments, at Value (Cost $185,478,338) | | | | | | | | | | | 99.4% | | | | 185,478,338 | |
Assets in Excess of Other Liabilities | | | | | | | | | | | 0.6 | | | | 1,051,589 | |
Net Assets | | | | | | | | | | | 100.0 | | | $ | 186,529,927 | |
Footnotes to Statement of Investments
Short-term notes and direct bank obligations are generally traded on a discount basis; the interest rate shown is the discount rate received by the Fund at the time of purchase. Other securities normally bear interest at the rates shown.
* June 28, 2013 represents the last business day of the Fund’s semiannual period. See Note 1 of the accompanying Notes.
** The Maturity Date represents the date used to calculate the Fund’s weighted average maturity as determined under Ruler 2a-7.
*** If different from the Maturity Date, the Final Legal Maturity Date includes any maturity date extensions which may be affected at the option of the issuer or unconditional payments of principal by the issuer which may be affected at the option of the Fund, and represents the date used to calculate the Fund’s weighted average life as determined under Rule 2a-7.
1. Represents the current interest rate for a variable or increasing rate security.
2. Security issued in an exempt transaction without registration under the Securities Act of 1933. Such securities amount to $52,767,267 or 28.29% of the Fund’s net assets, and have been determined to be liquid pursuant to guidelines adopted by the Board of Trustees.
3. Represents securities sold under Rule 144A, which are exempt from registration under the Securities Act of 1933, as amended. These securities have been determined to be liquid under guidelines established by the Board of Trustees. These securities amount to $15,899,250 or 8.52% of the Fund’s net assets as of June 28, 2013.
See accompanying Notes to Financial Statements.
6 OPPENHEIMER MONEY FUND/VA
| | |
STATEMENT OF ASSETS AND LIABILITIES June 28, 20131 Unaudited |
| | | | |
Assets | | | | |
Investments, at value (cost $185,478,338)—see accompanying statement of investments | | $ | 185,478,338 | |
Cash | | | 158,434 | |
Receivables and other assets: | | | | |
Shares of beneficial interest sold | | | 1,391,733 | |
Interest | | | 87,753 | |
Other | | | 23,453 | |
Total assets | | | 187,139,711 | |
|
| |
Liabilities | | | | |
Payables and other liabilities: | | | | |
Shares of beneficial interest redeemed | | | 558,974 | |
Trustees’ compensation | | | 13,981 | |
Transfer and shareholder servicing agent fees | | | 13,751 | |
Shareholder communications | | | 10,357 | |
Dividends payable | | | 362 | |
Other | | | 12,359 | |
Total liabilities | | | 609,784 | |
|
| | |
Net Assets | | $ | 186,529,927 | |
|
| |
Composition of Net Assets | | | | |
Par value of shares of beneficial interest | | $ | 186,519 | |
Additional paid-in capital | | | 186,337,258 | |
Accumulated net investment income | | | 4,044 | |
Accumulated net realized gain on investments | | | 2,106 | |
Net Assets - applicable to 186,519,162 shares of beneficial interest outstanding | | $ | 186,529,927 | |
|
| |
Net Asset Value, Redemption Price Per Share and Offering Price Per Share | | | $1.00 | |
1. June 28, 2013 represents the last business day of the Fund’s semiannual period. See Note 1 of the accompanying Notes.
See accompanying Notes to Financial Statements.
7 OPPENHEIMER MONEY FUND/VA
| | |
STATEMENT OF OPERATIONS For the Six Months Ended June 28, 20131 / Unaudited |
| | | | |
Investment Income | | | | |
Interest | | $ | 214,112 | |
|
| | |
Expenses | | | | |
Management fees | | | 390,620 | |
Transfer and shareholder servicing agent fees | | | 86,809 | |
Trustees’ compensation | | | 14,166 | |
Shareholder communications | | | 9,049 | |
Custodian fees and expenses | | | 672 | |
Other | | | 25,051 | |
Total expenses | | | 526,367 | |
Less waivers and reimbursements of expenses | | | (321,295 | ) |
Net expenses | | | 205,072 | |
|
| | |
Net Investment Income | | | 9,040 | |
|
| | |
Net Realized Gain on Investments | | | 2,106 | |
|
| | |
Net Increase in Net Assets Resulting from Operations | | $ | 11,146 | |
1. June 28, 2013 represents the last business day of the Fund’s semiannual period. See Note 1 of the accompanying Notes.
See accompanying Notes to Financial Statements.
8 OPPENHEIMER MONEY FUND/VA
| | |
STATEMENTS OF CHANGES IN NET ASSETS |
| | | | | | | | | | |
| | | Six Months Ended
June 28, 20131
(Unaudited) | | | | | Year Ended
December 31, 2012 | |
Operations | | | | | | | | | | |
Net investment income | | $ | 9,040 | | | | | $ | 17,102 | |
Net realized gain | | | 2,106 | | | | | | 6,472 | |
Net increase in net assets resulting from operations | | | 11,146 | | | | | | 23,574 | |
|
| |
Dividends and/or Distributions to Shareholders | | | | | | | | | | |
Dividends from net investment income | | | (9,072 | ) | | | | | (17,102 | ) |
|
| |
Beneficial Interest Transactions | | | | | | | | | | |
Net increase in net assets resulting from beneficial interest transactions: | | | 12,099,528 | | | | | | 10,448,459 | |
|
| |
Net Assets | | | | | | | | | | |
Total increase | | | 12,101,602 | | | | | | 10,454,931 | |
Beginning of period | | | 174,428,325 | | | | | | 163,973,394 | |
| | | |
End of period (including accumulated net investment income of $4,044 and $4,076, respectively) | | $ | 186,529,927 | | | | | $ | 174,428,325 | |
1. June 28, 2013 represents the last business day of the Fund’s semiannual period. See Note 1 of the accompanying Notes.
See accompanying Notes to Financial Statements.
9 OPPENHEIMER MONEY FUND/VA
| | | | | | | | | | | | | | | | | | | | | | | | |
| | |
| Six Months
Ended
June 28,
20131
(Unaudited) |
| |
| Year Ended
December
31, 2012 |
| |
| Year Ended
December
30, 20111 |
| |
| Year Ended
December
31, 2010 |
| |
| Year Ended
December
31, 2009 |
| |
| Year Ended
December
31, 2008 |
|
Per Share Operating Data | | | | | | | | | | | | | | | | | | | | | | | | |
Net asset value, beginning of period | | $ | 1.00 | | | $ | 1.00 | | | $ | 1.00 | | | $ | 1.00 | | | $ | 1.00 | | | $ | 1.00 | |
Income from investment operations-net investment income and net realized gain2 | | | 0.003 | | | | 0.003 | | | | 0.003 | | | | 0.003 | | | | 0.003 | | | | 0.03 | |
Dividends and/or distributions to shareholders: | | | | | | | | | | | | | | | | | | | | | | | | |
Dividends from net investment income | | | 0.003 | | | | 0.003 | | | | 0.003 | | | | 0.003 | | | | 0.003 | | | | (0.03) | |
Net asset value, end of period | | $ | 1.00 | | | $ | 1.00 | | | $ | 1.00 | | | $ | 1.00 | | | $ | 1.00 | | | $ | 1.00 | |
| | | | |
| |
| | | | | | |
| | | | | | | | | | | | | | | | | | | | | | | | | |
Total Return, at Net Asset Value4 | | | 0.01% | | | | 0.01% | | | | 0.01% | | | | 0.03% | | | | 0.32% | | | | 2.78% | |
| | | | | | | | | | | | | | | | | | | | | | | | | |
Ratios/Supplemental Data | | | | | | | | | | | | | | | | | | | | | | | | |
Net assets, end of period (in thousands) | | $ | 186,530 | | | $ | 174,428 | | | $ | 163,973 | | | $ | 149,697 | | | $ | 180,955 | | | $ | 243,356 | |
Average net assets (in thousands) | | $ | 175,163 | | | $ | 164,276 | | | $ | 156,127 | | | $ | 164,258 | | | $ | 218,079 | | | $ | 212,564 | |
Ratios to average net assets:5 | | | | | | | | | | | | | | | | | | | | | | | | |
Net investment income | | | 0.01% | | | | 0.01% | | | | 0.01% | | | | 0.01% | | | | 0.35% | | | | 2.72% | |
Total expenses | | | 0.61% | | | | 0.62% | | | | 0.61% | | | | 0.61% | | | | 0.57% | | | | 0.50% | |
Expenses after payments, waivers and/or reimbursements and reduction to custodian expenses | | | 0.24% | | | | 0.30% | | | | 0.29% | | | | 0.35% | | | | 0.48% | | | | 0.50% | |
1. June 28, 2013 and December 30, 2011 represent the last business day of the Fund’s reporting periods. See Note 1 of the accompanying Notes.
2. Per share amounts calculated based on the average shares outstanding during the period.
3. Less than $0.005 per share.
4. Assumes an initial investment on the business day before the first day of the fiscal period, with all dividends and distributions reinvested in additional shares on the reinvestment date, and redemption at the net asset value calculated on the last business day of the fiscal period. Total returns are not annualized for periods less than one full year. Total return information does not reflect expenses that apply at the separate account level or to related insurance products. Inclusion of these charges would reduce the total return figures for all periods shown. Returns do not reflect the deduction of taxes that a shareholder would pay on fund distributions or the redemption of fund shares.
5. Annualized for periods less than one full year.
See accompanying Notes to Financial Statements.
10 OPPENHEIMER MONEY FUND/VA
| | |
NOTES TO FINANCIAL STATEMENTS Unaudited |
1. Significant Accounting Policies
Oppenheimer Money Fund/VA (the “Fund”) is a separate series of Oppenheimer Variable Account Funds, a diversified open-end management investment company registered under the Investment Company Act of 1940, as amended. The Fund’s investment objective is to seek income consistent with stability of principal. The Fund’s investment adviser is OFI Global Asset Management, Inc. (“OFI Global” or the “Manager”), a wholly-owned subsidiary of OppenheimerFunds, Inc. (“OFI” or the “Sub-Adviser”). The Manager has entered into a sub-advisory agreement with OFI. Shares of the Fund are sold only to separate accounts of life insurance companies.
The following is a summary of significant accounting policies consistently followed by the Fund.
Semiannual and Annual Periods. The Fund’s financial statements are presented through the last day the New York Stock Exchange was open for trading during each reporting period. The Fund’s financial statements have been presented through that date to maintain consistency with the Fund’s net asset value calculations used for shareholder transactions.
Federal Taxes. The Fund intends to comply with provisions of the Internal Revenue Code applicable to regulated investment companies and to distribute substantially all of its investment company taxable income to shareholders. Therefore, no federal income or excise tax provision is required. The Fund files income tax returns in U.S. federal and applicable state jurisdictions. The statute of limitations on the Fund’s tax return filings generally remain open for the three preceding fiscal reporting period ends.
Trustees’ Compensation. The Board of Trustees has adopted a compensation deferral plan for independent trustees that enables trustees to elect to defer receipt of all or a portion of the annual compensation they are entitled to receive from the Fund. For purposes of determining the amount owed to the Trustee under the plan, deferred amounts are treated as though equal dollar amounts had been invested in shares of the Fund or in other Oppenheimer funds selected by the Trustee. The Fund purchases shares of the funds selected for deferral by the Trustee in amounts equal to his or her deemed investment, resulting in a Fund asset equal to the deferred compensation liability. Such assets are included as a component of “Other” within the asset section of the Statement of Assets and Liabilities. Deferral of trustees’ fees under the plan will not affect the net assets of the Fund, and will not materially affect the Fund’s assets, liabilities or net investment income per share. Amounts will be deferred until distributed in accordance with the compensation deferral plan.
Dividends and Distributions to Shareholders. Dividends and distributions to shareholders, which are determined in accordance with income tax regulations and may differ from U.S. generally accepted accounting principles, are recorded on the ex-dividend date. Income distributions, if any, are declared daily and paid monthly. Capital gain distributions, if any, are declared and paid annually but may be paid at other times to maintain the net asset value per share at $1.00.The tax character of distributions is determined as of the Fund’s fiscal year end. Therefore, a portion of the Fund’s distributions made to shareholders prior to the Fund’s fiscal year end may ultimately be categorized as a tax return of capital.
Investment Income. Dividend income is recorded on the ex-dividend date or upon ex-dividend notification in the case of certain foreign dividends where the ex-dividend date may have passed. Non-cash dividends included in dividend income, if any, are recorded at the fair market value of the securities received. Interest income is recognized on an accrual basis. Discount and premium, which are included in interest income on the Statement of Operations, are amortized or accreted daily.
Custodian Fees. “Custodian fees and expenses” in the Statement of Operations may include interest expense incurred by the Fund on any cash overdrafts of its custodian account during the period. Such cash overdrafts may result from the effects of failed trades in portfolio securities and from cash outflows resulting from unanticipated shareholder redemption activity. The Fund pays interest to its custodian on such cash overdrafts, to the extent they are not offset by positive cash balances maintained by the Fund, at a rate equal to the Federal Funds Rate plus 0.50%. The “Reduction to custodian expenses” line item, if applicable, represents earnings on cash balances maintained by the Fund during the period. Such interest expense and other custodian fees may be paid with these earnings.
Security Transactions. Security transactions are recorded on the trade date. Realized gains and losses on securities sold are determined on the basis of identified cost.
Indemnifications. The Fund’s organizational documents provide current and former trustees and officers with a limited indemnification against liabilities arising in connection with the performance of their duties to the Fund. In the normal course of business, the Fund may also enter into contracts that provide general indemnifications. The Fund’s maximum exposure under these arrangements is unknown as this would be dependent on future claims that may be made against the Fund. The risk of material loss from such claims is considered remote.
Other. The preparation of financial statements in conformity with accounting principles generally accepted in the United States of America requires management to make estimates and assumptions that affect the reported amounts of assets and liabilities and disclosure of contingent assets and liabilities at the date of the financial statements and the reported amounts of increases and decreases in net assets from operations during the reporting period. Actual results could differ from those estimates.
11 OPPENHEIMER MONEY FUND/VA
| | |
NOTES TO FINANCIAL STATEMENTS Unaudited / Continued |
2. Securities Valuation
The Fund calculates the net asset value of its shares as of the close of the New York Stock Exchange (the “Exchange”), normally 4:00 P.M. Eastern time, on each day the Exchange is open for trading.
The Fund’s Board has adopted procedures for the valuation of the Fund’s securities and has delegated the day-to-day responsibility for valuation determinations under those procedures to the Manager. The Manager has established a Valuation Committee which is responsible for determining a “fair valuation” for any security for which market quotations are not “readily available.” The Valuation Committee’s fair valuation determinations are subject to review, approval and ratification by the Fund’s Board at its next regularly scheduled meeting covering the calendar quarter in which the fair valuation was determined.
Valuation Methods and Inputs
Securities are valued at cost adjusted by the amortization of discount or premium to maturity (amortized cost), which approximates market value. If amortized cost is determined not to approximate market value, the fair value of the portfolio securities will be determined under procedures approved by the Fund’s Board of Trustees.
If a market value or price cannot be determined for a security using the methodologies described above, or if, in the “good faith” opinion of the Manager, the market value or price obtained does not constitute a “readily available market quotation,” or a significant event has occurred that would materially affect the value of the security the security is fair valued either (i) by a standardized fair valuation methodology applicable to the security type or the significant event as previously approved by the Valuation Committee and the Fund’s Board or (ii) as determined in good faith by the Manager’s Valuation Committee. The Valuation Committee considers all relevant facts that are reasonably available, through either public information or information available to the Manager, when determining the fair value of a security. Fair value determinations by the Manager are subject to review, approval and ratification by the Fund’s Board at its next regularly scheduled meeting covering the calendar quarter in which the fair valuation was determined. Those fair valuation standardized methodologies include, but are not limited to, valuing securities at the last sale price or initially at cost and subsequently adjusting the value based on: changes in company specific fundamentals, changes in an appropriate securities index, or changes in the value of similar securities which may be further adjusted for any discounts related to security-specific resale restrictions. When possible, such methodologies use observable market inputs such as unadjusted quoted prices of similar securities, observable interest rates, currency rates and yield curves. The methodologies used for valuing securities are not necessarily an indication of the risks associated with investing in those securities nor can it be assured that the Fund can obtain the fair value assigned to a security if it were to sell the security.
To assess the continuing appropriateness of security valuations, the Manager, or its third party service provider who is subject to oversight by the Manager, regularly compares prior day prices, prices on comparable securities, and sale prices to the current day prices and challenges those prices exceeding certain tolerance levels with the third party pricing service or broker source. For those securities valued by fair valuations, whether through a standardized fair valuation methodology or a fair valuation determination, the Valuation Committee reviews and affirms the reasonableness of the valuations based on such methodologies and fair valuation determinations on a regular basis after considering all relevant information that is reasonably available.
Classifications
Each investment asset or liability of the Fund is assigned a level at measurement date based on the significance and source of the inputs to its valuation. Various data inputs are used in determining the value of each of the Fund’s investments as of the reporting period end. These data inputs are categorized in the following hierarchy under applicable financial accounting standards:
1) Level 1-unadjusted quoted prices in active markets for identical assets or liabilities (including securities actively traded on a securities exchange)
2) Level 2-inputs other than unadjusted quoted prices that are observable for the asset or liability (such as unadjusted quoted prices for similar assets and market corroborated inputs such as interest rates, prepayment speeds, credit risks, etc.)
3) Level 3-significant unobservable inputs (including the Manager’s own judgments about assumptions that market participants would use in pricing the asset or liability).
The inputs used for valuing securities are not necessarily an indication of the risks associated with investing in those securities.
The table below categorizes amounts that are included in the Fund’s Statement of Assets and Liabilities as of June 28, 2013 based on valuation input level:
| | | | | | | | | | | | | | | | |
| | | Level 1—
Unadjusted
Quoted Prices | | | Level 2—
Other Significant
Observable Inputs | | | Level 3—
Significant
Unobservable
Inputs | | | Value | |
Assets Table | | | | | | | | | | | | | | | | |
Investments, at Value: | | | | | | | | | | | | | | | | |
Certificates of Deposit | | $ | — | | | $ | 54,700,033 | | | $ | — | | | $ | 54,700,033 | |
Direct Bank Obligations | | | — | | | | 32,394,209 | | | | — | | | | 32,394,209 | |
Short-Term Notes/Commercial Paper | | | — | | | | 86,356,972 | | | | — | | | | 86,356,972 | |
U.S. Government Obligations | | | — | | | | 12,027,124 | | | | — | | | | 12,027,124 | |
| | | | |
Total Assets | | $ | — | | | $ | 185,478,338 | | | $ | — | | | $ | 185,478,338 | |
| | | | |
12 OPPENHEIMER MONEY FUND/VA
3. Shares of Beneficial Interest
The Fund has authorized an unlimited number of $0.001 par value shares of beneficial interest of each class. Transactions in shares of beneficial interest were as follows:
| | | | | | | | | | | | | | | | | | |
| | | | | Six Months Ended June 28, 2013 | | | Year Ended December 31, 2012 | |
| | | | | Shares | | | Amount | | | Shares | | | Amount | |
Sold | | | | | 42,678,555 | | | $ | 42,678,555 | | | | 75,194,128 | | | $ | 75,194,128 | |
Dividends and/or distributions reinvested | | | | | 9,072 | | | | 9,072 | | | | 17,102 | | | | 17,102 | |
Redeemed | | | | | (30,588,099 | ) | | | (30,588,099 | ) | | | (64,762,771 | ) | | | (64,762,771 | ) |
| | | |
Net increase | | | | | 12,099,528 | | | $ | 12,099,528 | | | | 10,448,459 | | | $ | 10,448,459 | |
| | | |
4. Fees and Other Transactions with Affiliates
Management Fees. Under the investment advisory agreement, the Fund pays the Manager a management fee based on the daily net assets of the Fund at an annual rate as shown in the following table:
| | | | |
| Fee Schedule | | | |
Up to $500 million | | | 0.450 | % |
Next $500 million | | | 0.425 | |
Next $500 million | | | 0.400 | |
Over $1.5 billion | | | 0.375 | |
Sub-Adviser Fees. The Manager has retained the Sub-Adviser to provide the day-to-day portfolio management of the Fund. Under the Sub-Advisory Agreement, the Manager pays the Sub-Adviser an annual fee in monthly installments, equal to a percentage of the investment management fee collected by the Manager from the Fund, which shall be calculated after any investment management fee waivers. The fee paid to the Sub-Adviser is paid by the Manager, not by the Fund.
Transfer Agent Fees. OFI Global (the “Transfer Agent”) serves as the transfer and shareholder servicing agent for the Fund. Fees incurred by the Fund with respect to these services are detailed in the statement of operations.
Sub-Transfer Agent Fees. The Transfer Agent has retained Shareholder Services, Inc., a wholly-owned subsidiary of OFI (the “Sub-Transfer Agent”), to provide the day-to-day transfer agent and shareholder servicing of the Fund. Under the Sub-Transfer Agency Agreement, the Transfer Agent pays the Sub-Transfer Agent an annual fee in monthly installments, equal to a percentage of the transfer agent fee collected by the Transfer Agent from the Fund, which shall be calculated after any applicable fee waivers. The fee paid to the Sub-Transfer Agent is paid by the Transfer Agent, not by the Fund.
Waivers and Reimbursements of Expenses. The Manager has voluntarily undertaken to waive fees and/or reimburse expenses to the extent necessary to assist the Fund in attempting to maintain a positive yield. There is no guarantee that the Fund will maintain a positive yield. During the six months ended June 28, 2013, the Manager waived fees and/or reimbursed the Fund $225,775.
The Manager has voluntarily agreed to limit the Fund’s expenses after payments, waivers and/or reimbursements and reduction to custodian expenses, excluding expenses incurred directly or indirectly by the Fund as a result of investments in other investment companies, wholly-owned subsidiaries and pooled investment vehicles; so that those expenses, as percentages of daily net assets, will not exceed the annual rate of 0.50%. As a result of this limitation, the Manager waived $95,520 for the six months ended June 28, 2013.
Effective April 30, 2013, the Manager is permitted to recapture previously waived and/or reimbursed fees in any given fiscal year if the recapture would not: 1) cause the Fund to generate a negative daily yield, and 2) exceed amounts previously waived and/or reimbursed under this arrangement during the current and prior three fiscal years. The reimbursement to the Manager of such previous waivers and reimbursements would not include any portion of distribution and/or service fees. As of June 28, 2013, the following waived and/or reimbursed amounts are eligible for recapture:
|
Expiration Date December 31, 2016 |
$113,904 |
The Manager has not recaptured any previously waived and/or reimbursed amounts during the six months ended June 28, 2013.
Some of these undertakings may be modified or terminated at any time; some may not be modified or terminated until after one year from the date of the current prospectus, as indicated therein.
5. Pending Litigation
Since 2009, a number of class action lawsuits have been pending in federal courts against OppenheimerFunds, Inc. (“OFI”), OppenheimerFunds Distributor, Inc., the Fund’s principal underwriter and distributor (the “Distributor”), and certain funds (but not including the Fund) advised by the Manager and distributed by the Distributor (the “Defendant Funds”). Several of these lawsuits also name as defendants certain officers and current and former trustees of the respective Defendant Funds. The lawsuits raise claims under federal securities law and allege, among other things, that the disclosure documents of the respective Defendant Funds contained misrepresentations and omissions and that the respective Defendant Funds’ investment policies were not followed. The plaintiffs in these actions seek unspecified damages, equitable relief and awards of attorneys’ fees and litigation expenses. The Defendant Funds’ Boards of Trustees have also engaged counsel to represent the Funds and the present and former Independent Trustees named in those suits.
13 OPPENHEIMER MONEY FUND/VA
| | |
NOTES TO FINANCIAL STATEMENTS Unaudited / (Continued) |
5. Pending Litigation (Continued)
Other class action and individual lawsuits have been filed since 2008 in various state and federal courts against OFI and certain of its affiliates by investors seeking to recover investments they allegedly lost as a result of the “Ponzi” scheme run by Bernard L. Madoff and his firm, Bernard L. Madoff Investment Securities, LLC (“BLMIS”). Plaintiffs in these suits allege that they suffered losses as a result of their investments in several funds managed by an affiliate of OFI and assert a variety of claims, including breach of fiduciary duty, fraud, negligent misrepresentation, unjust enrichment, and violation of federal and state securities laws and regulations, among others. They seek unspecified damages, equitable relief and awards of attorneys’ fees and litigation expenses. Neither the Distributor, nor any of the Oppenheimer mutual funds, their independent trustees or directors are named as defendants in these lawsuits. None of the Oppenheimer mutual funds invested in any funds or accounts managed by Madoff or BLMIS. On February 28, 2011, a stipulation of partial settlement of three groups of consolidated putative class action lawsuits relating to these matters was filed in the U.S. District Court for the Southern District of New York. On August 19, 2011, the court entered an order and final judgment approving the settlement as fair, reasonable and adequate. In September 2011, certain parties filed notices of appeal from the court’s order approving the settlement. The settlement does not resolve other outstanding lawsuits against OFI and its affiliates relating to BLMIS.
On April 16, 2010, a lawsuit was filed in New York state court against (i) OFI, (ii) an affiliate of OFI and (iii) AAArdvark IV Funding Limited (“AAArdvark IV”), an entity advised by OFI’s affiliate, in connection with investments made by the plaintiffs in AAArdvark IV. Plaintiffs allege breach of contract and common law fraud claims against the defendants and seek compensatory damages, costs and disbursements, including attorney fees. On April 11, 2013, the court granted defendants’ motion for summary judgment, dismissing plaintiffs’ fraud claim with prejudice and dismissing their contract claim without prejudice, and granted plaintiffs leave to replead their contract claim to assert a cause of action for specific performance within 30 days. On May 9, 2013, plaintiffs filed a notice of appeal from the court’s dismissal order. On July 15, 2011, a lawsuit was filed in New York state court against OFI, an affiliate of OFI and AAArdvark Funding Limited (“AAArdvark I”), an entity advised by OFI’s affiliate, in connection with investments made by the plaintiffs in AAArdvark I. The complaint alleges breach of contract and common law fraud claims against the defendants and seeks compensatory damages, costs and disbursements, including attorney fees. On November 9, 2011, a lawsuit was filed in New York state court against OFI, an affiliate of OFI and AAArdvark XS Funding Limited (“AAArdvark XS”), an entity advised by OFI’s affiliate, in connection with investments made by the plaintiffs in AAArdvark XS. The complaint alleges breach of contract against the defendants and seeks compensatory damages, costs and disbursements, including attorney fees.
OFI believes the lawsuits and appeals described above are without legal merit and, with the exception of actions it has settled, is defending against them vigorously. While it is premature to render any opinion as to the outcome in these lawsuits, or whether any costs that the Defendant Funds may bear in defending the suits might not be reimbursed by insurance, OFI believes that these suits should not impair the ability of OFI or the Distributor to perform their respective duties to the Fund, and that the outcome of all of the suits together should not have any material effect on the operations of any of the Oppenheimer mutual funds.
14 OPPENHEIMER MONEY FUND/VA
| | |
PORTFOLIO PROXY VOTING POLICIES AND PROCEDURES; UPDATES TO STATEMENTS OF INVESTMENTS Unaudited |
The Fund has adopted Portfolio Proxy Voting Policies and Procedures under which the Fund votes proxies relating to securities (“portfolio proxies”) held by the Fund. A description of the Fund’s Portfolio Proxy Voting Policies and Procedures is available (i) without charge, upon request, by calling the Fund toll-free at 1.800.CALL OPP (225.5677), (ii) on the Fund’s website at oppenheimerfunds.com, and (iii) on the SEC’s website at www.sec.gov. In addition, the Fund is required to file Form N-PX, with its complete proxy voting record for the 12 months ended June 30th, no later than August 31st of each year. The Fund’s voting record is available (i) without charge, upon request, by calling the Fund toll-free at 1.800.CALL OPP (225.5677), and (ii) in the Form N-PX filing on the SEC’s website at www.sec.gov.
The Fund files its complete schedule of portfolio holdings with the SEC for the first quarter and the third quarter of each fiscal year on Form N-Q. The Fund’s Form N-Q filings are available on the SEC’s website at www.sec.gov. Those forms may be reviewed and copied at the SEC’s Public Reference Room in Washington, D.C. Information on the operation of the Public Reference Room may be obtained by calling 1-800-SEC-0330.
15 OPPENHEIMER MONEY FUND/VA
| | |
OPPENHEIMER MONEY FUND/VA |
| | |
| A Series of Oppenheimer Variable Account Funds |
| Trustees and Officers | | Sam Freedman, Chairman of the Board of Trustees and Trustee Edward L. Cameron, Trustee Jon S. Fossel, Trustee Richard F. Grabish, Trustee Beverly L. Hamilton, Trustee Victoria J. Herget, Trustee Robert J. Malone, Trustee F. William Marshall, Jr., Trustee Karen L. Stuckey, Trustee James D. Vaughn, Trustee William F. Glavin, Jr., Trustee, President and Principal Executive Officer Christopher Proctor, Vice President Arthur S. Gabinet, Secretary and Chief Legal Officer Christina M. Nasta, Vice President and Chief Business Officer Mark S. Vandehey, Vice President and Chief Compliance Officer Brian W. Wixted, Treasurer and Principal Financial & Accounting Officer |
| |
| Manager | | OFI Global Asset Management, Inc. |
| |
| Sub-Adviser | | OppenheimerFunds, Inc. |
| |
| Distributor | | OppenheimerFunds Distributor, Inc. |
| |
Transfer and Shareholder Servicing Agent | | OFI Global Asset Management, Inc. |
| |
Sub-Transfer Agent | | Shareholder Services, Inc. DBA OppenheimerFunds Services |
| |
Independent Registered Public Accounting Firm | | KPMG LLP |
| |
| Legal Counsel | | K&L Gates LLP |
| |
| | Before investing in any of the Oppenheimer funds, investors should carefully consider a fund’s investment objectives, risks, charges and expenses. Fund prospectuses and summary prospectuses contain this and other information about the funds and may be obtained by asking your financial advisor, visiting oppenheimerfunds.com, or calling us at 1.800.988.8287. Read prospectuses and summary prospectuses carefully before investing. |
| |
| | The financial statements included herein have been taken from the records of the Fund without examination of those records by the independent registered public accounting firm. |
© 2013 OppenheimerFunds, Inc. All rights reserved. Oppenheimer funds are distributed by OppenheimerFunds Distributor, Inc.
June 30, 2013
| | | | |
| | | Oppenheimer Global Strategic Income Fund/VA A Series of Oppenheimer Variable Account Funds | | Semiannual Report |
SEMIANNUAL REPORT
Fund Performance Discussion
Listing of Top Holdings
Financial Statements

OPPENHEIMER GLOBAL STRATEGIC INCOME FUND/VA
Portfolio Managers: Arthur P. Steinmetz, Krishna Memani, Sara J. Zervos, Ph.D. and Jack Brown, CFA1.
| | | | | | |
Cumulative Total Returns For the 6-Month Period Ended 6/28/132 |
| Non-Service Shares | | –2.36% | | | | |
| Service Shares | | –2.54 | | | | |
Average Annual Total Returns For the Periods Ended 6/28/132 | | |
| | | |
| | | 1-Year | | 5-Year | | 10-Year |
| Non-Service Shares | | 4.46% | | 5.09% | | 6.36% |
| Service Shares | | 4.11% | | 4.84% | | 6.05% |
The performance data quoted represents past performance, which does not guarantee future results. The investment return and principal value of an investment in the Fund will fluctuate so that an investor’s shares, when redeemed, may be worth more or less than their original cost. Current performance may be lower or higher than the performance quoted. For performance data current to the most recent month end, call us at 1.800.988.8287. The Fund’s total returns should not be expected to be the same as the returns of other funds, whether or not both funds have the same portfolio managers and/or similar names. The Fund’s total returns include changes in share price and reinvested distributions but do not include the charges associated with the separate account products that offer this Fund. Such performance would have been lower if such charges were taken into account.
1. Jack Brown became a portfolio manager in April 2013.
2. June 28, 2013, was the last business day of the Fund’s semiannual period. See Note 1 of the accompanying Notes to Consolidated Financial Statements.
|
| Portfolio Allocation |
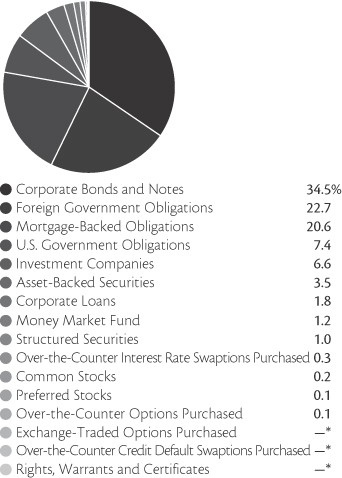
|
* Represents a value of less than 0.005%.
Portfolio holdings and allocations are subject to change. Percentages are as of June 28, 2013, and are based on the total market value of investments.
| | |
| Corporate Bonds & Notes—Top Ten Industries | | |
| Oil, Gas & Consumable Fuels | | 5.5% |
| Commercial Banks | | 3.8 |
| Media | | 1.7 |
| Diversified Telecommunication Services | | 1.7 |
| Wireless Telecommunication Services | | 1.7 |
| Hotels, Restaurants & Leisure | | 1.2 |
| Metals & Mining | | 1.2 |
| Aerospace & Defense | | 1.1 |
| Electric Utilities | | 1.1 |
| Capital Markets | | 1.0 |
Portfolio holdings and allocations are subject to change. Percentages are as of June 28, 2013, and are based on net assets.
| | | | |
| 2 | | | | OPPENHEIMER GLOBAL STRATEGIC INCOME FUND/VA |
FUND PERFORMANCE DISCUSSION
The Fund’s Non-Service shares returned -2.36% during the period, outperforming its Reference Index, which returned -3.08%. The Fund’s Reference Index is a customized weighted index currently comprised of 40% of the Citigroup Non-U.S. World Government Bond Index, 30% of the JPMorgan Domestic High Yield Index and 30% of the Barclays U.S. Aggregate Bond Index. The Fund produced a negative return in what was a difficult period for fixed-income markets, particularly over the second half of the period after the Federal Reserve (the “Fed”) discussed the eventual tapering of its quantitative easing program.
Global Market and Economic Environment
Early in the reporting period, the highly accommodative policies of central banks throughout the world and positive data surprises in the U.S. regarding housing and employment buoyed investor sentiment and helped send the equity markets to new highs, pressuring yields until European turmoil began to recapture the headlines. The situation in Europe began to worsen as the Cyprus banking crisis and election results in Italy hurt investor sentiment. The expectation of aggressive quantitative easing in Japan continued to push the yen lower, along with yields on the longer-term debt of that nation.
Over the second half of the period, positive economic data in the U.S. prompted the Fed to start talking about tapering its quantitative easing program, and both foreign and domestic fixed income markets reacted strongly. While interest rates increased in most developed markets, the magnitude of the reaction in emerging markets surprised many as rates in Mexico, Brazil, Russia and elsewhere rose faster than those in the U.S. While the rapid increase in rates in emerging markets was impacted by potential Fed tapering, we believe it was more so the result of a series of “liquidation events,” as investors such as hedge funds and commodity trading advisors (CTAs)1 unwound their momentum trades. While spikes in market volatility are seldom pleasant, the impact on international bonds this period was especially acute given the double whammy of rising rates and a rising U.S. dollar.
Fund Review
In this environment, very few fixed-income sectors performed positively. For the Fund, the largest positive contributors were high yield bonds and senior bank loans. The Fund benefited from overweight exposure to U.S. corporate bonds with below-investment-grade credit ratings. Returns were robust among credits rated B, B- and CCC+, which were areas of emphasis for the Fund. While senior bank loans performed positively for the Fund, they generally trailed their high yield fixed-income counterparts, leading us to reduce our exposure and reallocate the capital into high yield bonds and agency mortgages. We are looking to add exposure opportunistically in European credit and structured products, which became much more attractive as credit spreads widened when rates backed up. Also contributing positively for the Fund were an underweight position in developed markets bonds and our zero weight in the yen. If Japanese Prime Minister Shinzo Abe’s policies gain meaningful traction, it will most likely be through a falling yen, and we view the prospects for that currency as poor.
The most significant detractor from performance was our allocation to emerging markets, and particularly our exposure to emerging market debt denominated in local currencies. The rapid increase in rates in emerging markets coupled with the U.S. dollar appreciating against a host of foreign currencies resulted in declines. However, we believe many emerging markets have more policy flexibility than many investors realize, and after the recent selloff, valuations are much more attractive. We maintained our position at period end. Also detracting from performance were mortgage-backed securities (“MBS”), which suffered declines during the period. However, before the Fed began discussing tapering, we started reducing our position in MBS since we felt they were vulnerable to policy changes. Accordingly, we reduced the allocation to MBS by over 50% before the market rout, which limited the negative impact on performance. At period end, we remain comfortable with our remaining exposure in collateralized MBS, subprime
1. A CTA is an individual or organization who is retained by a fund or individual client to provide advice and services related to trading in futures contracts, commodity options and/or swaps.
| | | | |
| 3 | | | | OPPENHEIMER GLOBAL STRATEGIC INCOME FUND/VA |
FUND PERFORMANCE DISCUSSION
auto and non-agency MBS. We believe consumer leverage is under control, debt service coverage and employment are both improving, and the economy is slowly recovering. Although these sectors were hurt during the recent selloff, we believe they have the potential to rebound as fundamentals reassert themselves.
Separately, we maintained the Fund’s duration in line with the Barclays U.S. Aggregate Bond Index at just over five years.
Strategy & Outlook
Regarding the macro outlook, we became more constructive on the U.S. economy in late 2012 as incoming data improved, causing us to raise our expectations for economic growth this year. In light of the ongoing recession in Europe and the money printing experiment in Japan, we believe this is a good environment for the U.S. dollar as well as U.S. credit. With Japan’s aggressive monetary easing, we believe the outlook for the yen is poor, and we also believe that Japanese Government bonds have approached full value. Our outlook for emerging markets credit was mixed coming into the second half of the period, but after the selloff of the last two months, valuations look much more attractive. Where global growth expectations remain strong, we have exposure to emerging markets corporates. We expect rates to move modestly higher over time, and we believe the portfolio is positioned to perform relatively well if this should occur.
Against this backdrop, we continue to like credit as well as the high real yields available in emerging markets. We entered 2012 believing that some level of risk premium would get taken out of the market, and that view proved correct. We believe the Fund is positioned to benefit if this trend continues in 2013. We have sought to construct the portfolio to allow significant flexibility if conditions change meaningfully in Europe, the emerging markets or elsewhere, or within particular asset classes.
The Fund’s investment strategy and focus can change over time. The mention of specific fund holdings does not constitute a recommendation by OppenheimerFunds, Inc. or its affiliates.
Shares of Oppenheimer funds are not deposits or obligations of any bank, are not guaranteed by any bank, are not insured by the FDIC or any other agency, and involve investment risks, including the possible loss of the principal amount invested.
| | | | |
| 4 | | | | OPPENHEIMER GLOBAL STRATEGIC INCOME FUND/VA |
FUND EXPENSES
Fund Expenses. As a shareholder of the Fund, you incur two types of costs: (1) transaction costs and (2) ongoing costs, including management fees; distribution and service fees; and other Fund expenses. These examples are intended to help you understand your ongoing costs (in dollars) of investing in the Fund and to compare these costs with the ongoing costs of investing in other mutual funds.
The examples are based on an investment of $1,000.00 invested at the beginning of the period and held for the entire 6-month period ended June 28, 2013.
Actual Expenses. The first section of the table provides information about actual account values and actual expenses. You may use the information in this section for the class of shares you hold, together with the amount you invested, to estimate the expense that you paid over the period. Simply divide your account value by $1,000.00 (for example, an $8,600.00 account value divided by $1,000.00 = 8.60), then multiply the result by the number in the first section under the heading entitled “Expenses Paid During Period” to estimate the expenses you paid on your account during this period.
Hypothetical Example for Comparison Purposes. The second section of the table provides information about hypothetical account values and hypothetical expenses based on the Fund’s actual expense ratio for each class of shares, and an assumed rate of return of 5% per year for each class before expenses, which is not the actual return. The hypothetical account values and expenses may not be used to estimate the actual ending account balance or expenses you paid for the period. You may use this information to compare the ongoing costs of investing in the Fund and other funds. To do so, compare this 5% hypothetical example for the class of shares you hold with the 5% hypothetical examples that appear in the shareholder reports of the other funds.
Please note that the expenses shown in the table are meant to highlight your ongoing costs only and do not reflect any charges associated with the separate accounts that offer this Fund. Therefore, the “hypothetical” lines of the table are useful in comparing ongoing costs only, and will not help you determine the relative total costs of owning different funds. In addition, if these separate account charges were included your costs would have been higher.
| | | | | | | | | | | | |
| Actual | | Beginning
Account
Value
January 1, 2013 | | | Ending
Account
Value
June 28, 2013 | | | Expenses
Paid During
6 Months Ended
June 28, 2013 | |
| Non-Service Shares | | $ | 1,000.00 | | | $ | 976.40 | | | $ | 3.45 | |
| Service Shares | | | 1,000.00 | | | | 974.60 | | | | 4.66 | |
| | | |
Hypothetical
(5% return before expenses) | | | | | | | | | |
| Non-Service Shares | | | 1,000.00 | | | | 1,021.04 | | | | 3.52 | |
| Service Shares | | | 1,000.00 | | | | 1,019.81 | | | | 4.77 | |
Expenses are equal to the Fund’s annualized expense ratio for that class, multiplied by the average account value over the period, multiplied by 179/365 (to reflect the one-half year period). Those annualized expense ratios, excluding indirect expenses from affiliated funds, based on the 6-month period ended June 28, 2013 are as follows:
| | | | |
| Class | | Expense Ratios | |
| Non-Service Shares | | | 0.71 | % |
| Service Shares | | | 0.96 | |
The expense ratios reflect voluntary waivers and/or reimbursements of expenses by the Fund’s Manager. Some of these undertakings may be modified or terminated at any time, as indicated in the Fund’s prospectus. The “Consolidated Financial Highlights” tables in the Fund’s consolidated financial statements, included in this report, also show the gross expense ratios, without such waivers or reimbursements and reduction to custodian expenses, if applicable.
| | | | |
| 5 | | | | OPPENHEIMER GLOBAL STRATEGIC INCOME FUND/VA |
CONSOLIDATED STATEMENT OF INVESTMENTS June 28, 2013* / Unaudited
| | | | | | | | |
| | | Principal
Amount | | | Value | |
| Asset-Backed Securities—3.6% | |
Ally Auto Receivables Trust,
Automobile Receivables Nts.,
Series 2012-A, Cl. D, 3.15%, 10/15/181 | | $ | 2,125,000 | | | $ | 2,157,255 | |
Ally Master Owner Trust,
Automobile Receivable Nts.,
Series 2012-3, Cl. D, 2.543%, 7/15/172 | | | 1,200,000 | | | | 1,204,171 | |
American Credit Acceptance
Receivables Trust 2012-2,
Automobile Receivable Nts.,
Series 2012-2, Cl. D, 5.91%, 7/15/193 | | | 2,100,000 | | | | 2,150,955 | |
American Credit Acceptance
Receivables Trust 2012-3,
Automobile Receivable Nts.,
Series 2012-3, Cl. C, 2.78%, 9/17/183 | | | 230,000 | | | | 228,633 | |
AmeriCredit Automobile Receivables Trust 2012-1,
Automobile Receivables-Backed Nts., Series 2012-1, Cl. D, 4.72%, 3/8/18 | | | 8,055,000 | | | | 8,543,913 | |
AmeriCredit Automobile
Receivables Trust 2012-3,
Automobile Receivables-Backed Nts.:
Series 2012-3, Cl. D, 3.03%, 7/9/18 | | | 2,625,000 | | | | 2,655,735 | |
| Series 2012-3, Cl. E, 4.46%, 11/8/193 | | | 360,000 | | | | 379,497 | |
AmeriCredit Automobile
Receivables Trust 2012-4,
Automobile Receivables-Backed Nts., Series 2012-4, Cl. D, 2.68%, 10/9/18 | | | 1,190,000 | | | | 1,182,456 | |
AmeriCredit Automobile
Receivables Trust 2013-1,
Automobile Receivables-Backed Nts.:
Series 2013-1, Cl. D, 2.09%, 2/8/19 | | | 425,000 | | | | 410,579 | |
| Series 2013-1, Cl. E, 3.92%, 7/8/203 | | | 2,385,000 | | | | 2,286,412 | |
AmeriCredit Automobile
Receivables Trust 2013-2,
Automobile Receivables-Backed Nts.:
Series 2013-2, Cl. D, 2.42%, 5/8/19 | | | 675,000 | | | | 658,456 | |
| Series 2013-2, Cl. E, 3.41%, 10/8/203 | | | 1,055,000 | | | | 1,036,928 | |
AmeriCredit Automobile
Receivables Trust 2013-3,
Automobile Receivables-Backed Nts.:
Series 2013-3, Cl. D, 3%, 7/8/19 | | | 440,000 | | | | 435,150 | |
| Series 2013-3, Cl. E, 3.74%, 12/8/203 | | | 1,995,000 | | | | 1,973,637 | |
| | | | | | | | |
| | | Principal
Amount | | | Value | |
| Asset-Backed Securities Continued | |
Avis Budget Rental
Car Funding AESOP LLC,
Automobile Receivable Nts.,
Series 2011-3A, Cl. B, 4.74%, 11/20/173 | | $ | 335,000 | | | $ | 356,847 | |
Axius European CLO SA,
Collateralized Debt Obligations,
Series 2007-1X, Cl. E, 4.803%, 11/15/232 | | | 212,712 | EUR | | | 243,416 | |
Capital Auto Receivables
Asset Trust 2013-1,
Automobile Receivables Nts.,
Series 2013-1, Cl. D, 2.19%, 9/20/21 | | | 275,000 | | | | 264,514 | |
CarMax Auto Owner
Trust 2012-2, Automobile
Receivables Nts.,
Series 2012-2, Cl. D, 3.02%, 11/15/18 | | | 1,200,000 | | | | 1,212,179 | |
CarMax Auto Owner
Trust 2013-1, Automobile Receivables Nts., Series 2013-1, Cl. D, 1.99%, 8/15/19 | | | 250,000 | | | | 245,480 | |
CPS Auto Trust, Automobile Receivable Nts.,
Series 2012-C, Cl. A, 1.82%, 12/16/193 | | | 176,367 | | | | 177,249 | |
Credit Acceptance Auto Loan
Trust, Automobile Receivable Nts., Series 2012-2A, Cl. B, 2.21%, 9/15/203 | | | 100,000 | | | | 100,325 | |
DT Auto Owner Trust
2012-2, Automobile Receivable Nts.:
Series 2012-2, Cl. C, 2.72%, 4/17/173 | | | 690,000 | | | | 696,474 | |
| Series 2012-2, Cl. D, 4.35%, 3/15/193 | | | 2,245,000 | | | | 2,306,013 | |
DT Auto Owner Trust
2013-1A, Automobile Receivable Nts., Series 2013-1A, Cl. D, 3.72%, 5/15/203 | | | 2,920,000 | | | | 2,913,882 | |
Exeter Automobile Receivables Trust, Automobile Receivable Nts.:
Series 2012-2A, Cl. B, 2.22%, 12/15/173 | | | 875,000 | | | | 879,783 | |
| Series 2012-2A, Cl. C, 3.06%, 7/16/183 | | | 1,100,000 | | | | 1,102,991 | |
| First Investors Auto Owner Trust 2012-1A, Automobile Receivables Nts., Series 2012-1A, Cl. D, 5.65%, 4/15/183 | | | 285,000 | | | | 300,497 | |
| | | | |
| 6 | | | | OPPENHEIMER GLOBAL STRATEGIC INCOME FUND/VA |
| | | | | | | | |
| | | Principal
Amount | | | Value | |
| Asset-Backed Securities Continued | |
| Ford Credit Floorplan Master Owner Trust A, Automobile Receivable Nts., Series 2013-3, Cl. D, 2.01%, 6/15/17 | | $ | 240,000 | | | $ | 240,335 | |
| Ice 1 Em CLO Ltd./Ice 1 Em CLO Corp., Sr. Sec. Sub. Term Nts.: | | | | | | | | |
| Series 2007-1A, Cl. B, 2.165%, 8/15/221,2 | | | 7,870,000 | | | | 7,181,375 | |
| Series 2007-1A, Cl. C, 3.465%, 8/15/221,2 | | | 5,270,000 | | | | 4,679,760 | |
| Series 2007-1A, Cl. D, 5.465%, 8/15/221,2 | | | 5,270,000 | | | | 4,637,600 | |
Santander Drive Auto Receivables Trust 2011-S1A, Automobile Receivables Nts.,
Series 2011-S1A, Cl. D, 3.10%, 5/15/171 | | | 37,662 | | | | 37,754 | |
Santander Drive Auto Receivables Trust 2012-2, Automobile Receivables Nts.,
Series 2012-2, Cl. D, 3.87%, 2/15/18 | | | 545,000 | | | | 559,593 | |
| Santander Drive Auto Receivables Trust 2012-3, Automobile Receivables Nts.: | | | | | | | | |
| Series 2012-3, Cl. C, 3.01%, 4/16/18 | | | 5,830,000 | | | | 5,990,649 | |
| Series 2012-3, Cl. D, 3.64%, 5/15/18 | | | 7,770,000 | | | | 7,943,384 | |
| Santander Drive Auto Receivables Trust 2012-4, Automobile Receivables Nts., Series 2012-4, Cl. D, 3.50%, 6/15/18 | | | 3,510,000 | | | | 3,573,296 | |
| Santander Drive Auto Receivables Trust 2012-5, Automobile Receivables Nts.: | | | | | | | | |
| Series 2012-5, Cl. C, 2.70%, 8/15/18 | | | 2,180,000 | | | | 2,195,233 | |
| Series 2012-5, Cl. D, 3.30%, 9/17/18 | | | 3,160,000 | | | | 3,189,887 | |
Santander Drive Auto Receivables Trust 2012-AA, Automobile Receivables Nts.,
Series 2012-AA, Cl. D, 2.46%, 12/17/183 | | | 825,000 | | | | 808,571 | |
| Santander Drive Auto Receivables Trust 2013-1, Automobile Receivables Nts., Series 2013-1, Cl. D, 2.80%, 1/15/19 | | | 920,000 | | | | 892,210 | |
| Santander Drive Auto Receivables Trust 2013-2, Automobile Receivables Nts., Series 2013-2, Cl. D, 2.70%, 3/15/19 | | | 1,110,000 | | | | 1,082,224 | |
| Santander Drive Auto Receivables Trust 2013-3, Automobile Receivables Nts., Series 2013-3, Cl. D, 2.42%, 4/15/19 | | | 950,000 | | | | 919,034 | |
| | | | | | | | |
| | | Principal
Amount | | | Value | |
| Asset-Backed Securities Continued | |
| SLM Student Loan Trust, Student Loan Receivables, Series 2005-B, Cl. B, 0.673%, 6/15/392 | | $ | 2,203,812 | | | $ | 1,422,309 | |
| SNAAC Auto Receivables Trust, Automobile Receivable Nts.: | | | | | | | | |
| Series 2012-1A, Cl. B, 3.11%, 6/15/173 | | | 525,000 | | | | 530,606 | |
| Series 2012-1A, Cl. C, 4.38%, 6/15/173 | | | 595,000 | | | | 610,973 | |
| SNAAC Auto Receivables Trust, Automobile Receivables Nts.: | | | | | | | | |
| Series 2013-1A, Cl. B, 2.09%, 7/16/18 | | | 200,000 | | | | 198,484 | |
| Series 2013-1A, Cl. C, 3.07%, 8/15/18 | | | 220,000 | | | | 217,646 | |
| United Auto Credit Securitization Trust 2012-1, Automobile Receivables Nts.: | | | | | | | | |
| Series 2012-1, Cl. B, 1.87%, 9/15/15 | | | 335,000 | | | | 334,709 | |
| Series 2012-1, Cl. C, 2.52%, 3/15/16 | | | 2,665,000 | | | | 2,660,743 | |
| Series 2012-1, Cl. D, 3.12%, 3/15/18 | | | 1,690,000 | | | | 1,687,097 | |
| Series 2013-1, Cl. D, 2.90%, 12/15/173 | | | 440,000 | | | | 437,176 | |
| United Auto Credit Securitization Trust 2013-1, Automobile Receivables Nts.: | | | | | | | | |
| Series 2013-1, Cl. B, 1.74%, 4/15/163 | | | 360,000 | | | | 358,787 | |
| Series 2013-1, Cl. C, 2.22%, 12/15/173 | | | 230,000 | | |
| 229,132
|
|
Total Asset-Backed Securities
(Cost $89,281,066) | | | | | | | 88,721,994 | |
| Corporate Loans—1.9% | | | | | | | | |
| Affinion Group, Inc., Sr. Sec. Credit Facilities 1st Lien Term Loan, Tranche B, 6.50%, 10/9/162 | | | 1,993,918 | | | | 1,899,320 | |
| ATP Oil & Gas Corp., Sr. Sec. Credit Facilities 1st Lien Term Loan, Debtor in Possession: | | | | | | | | |
| 13.116%, 3/1/142 | | | 203,038 | | | | 121,315 | |
| 13.449%, 3/1/142 | | | 18,723 | | | | 11,187 | |
| Tranche NM, 13.116%, 3/1/142 | | | 50,751 | | | | 30,324 | |
| ATP Oil & Gas Corp., Sr. Sec. Credit Facilities 1st Lien Term Loan, Debtor in Possession, Delayed Draw, 13.116%, 3/3/142 | | | 768,573 | | | | 459,222 | |
| ATP Oil & Gas Corp., Sr. Sec. Credit Facilities 1st Lien Term Loan, Debtor in Possession, 13.116%, 3/1/142 | | | 359,943 | | | | 215,066 | |
| Autoparts Holdings Ltd., Sr. Sec. Credit Facilities 1st Lien Term Loan, 6.50%, 7/29/172 | | | 1,022,935 | | | | 1,010,149 | |
| | | | |
| 7 | | | | OPPENHEIMER GLOBAL STRATEGIC INCOME FUND/VA |
CONSOLIDATED STATEMENT OF INVESTMENTS Unaudited / Continued
| | | | | | | | |
| | | Principal
Amount | | | Value | |
| Corporate Loans Continued | | | | | | | �� | |
| BJ’S Wholesale Club, Inc., Sr. Sec. Credit Facilities 2nd Lien Term Loan, 9.75%, 3/26/202 | | $ | 1,030,000 | | | $ | 1,048,347 | |
| Blue Coat Systems, Inc., Sr. Sec. Credit Facilities 2nd Lien Term Loan, 9.50%, 6/5/202,4 | | | 895,000 | | | | 895,000 | |
| BMC Software, Inc., Sr. Sec. Credit Facilities Bridge Term Loan, 0.50%, 5/24/142 | | | 3,160,000 | | | | — | |
| Brock Holdings III, Inc., Sr. Sec. Credit Facilities 2nd Lien Term Loan, 8.25%, 3/16/182 | | | 775,000 | | | | 788,563 | |
| Caesars Entertainment Operating Co., Inc., Sr. Sec. Credit Facilities 1st Lien Term Loan, Tranche B6, 5.443%, 1/28/182 | | | 2,838,271 | | | | 2,514,353 | |
| Catalent Pharma Solutions, Inc., Sr. Sec. Credit Facilities Term Loan, 6.50%, 12/31/172 | | | 1,265,000 | | | | 1,260,256 | |
| Chesapeake Energy Corp., Sr. Sec. Credit Facilities Term Loan, Tranche B, 5.75%, 12/2/172 | | | 1,420,000 | | | | 1,438,735 | |
| Clear Channel Capital I LLC, Extended Sr. Sec. Credit Facilities, Tranche D, 6.945%, 1/30/192 | | | 4,148,532 | | | | 3,792,019 | |
| Clear Channel Communications, Inc., Sr. Sec. Credit Facilities 1st Lien Term Loan, Tranche B, 3.845%, 1/29/162 | | | 1,406,487 | | | | 1,289,748 | |
| Deltek, Inc., Sr. Sec. Credit Facilities 2nd Lien Term Loan, 10%, 10/10/192,4 | | | 2,050,000 | | | | 2,057,688 | |
| Entegra Holdings LLC, Sr. Sec. Credit Facilities 3rd Lien Term Loan, Tranche B, 3.539%, 10/19/152,5 | | | 7,165,008 | | | | 4,034,795 | |
| Hallertau SPC, Sr. Sec. Credit Facilities Term Loan, 7.94%, 8/15/136 | | | 12,143,750 | | | | 4,212,575 | |
| Ion Trading Technologies Ltd., Sr. Sec. Credit Facilities 2nd Lien Term Loan, 8.25%, 5/22/212 | | | 140,000 | | | | 139,650 | |
| iStar Financial, Inc., Sr. Sec. Credit Facilities 1st Lien Term Loan, Tranche A2, 7%, 3/19/172,4 | | | 1,815,000 | | | | 1,911,800 | |
| JG Wentworth, Sr. Sec. Credit Facilities 1st Lien Term Loan, Tranche B, 9%, 2/8/192 | | | 366,693 | | | | 363,026 | |
| Lonestar Intermediate Super Holdings LLC, Sr. Sec. Credit Facilities Term Loan, 11%, 9/2/192 | | | 1,555,000 | | | | 1,632,750 | |
| | | | | | | | |
| | | Principal
Amount | | | Value | |
| Corporate Loans Continued | | | | | | | | |
| NFR Energy LLC, Sr. Sec. Credit Facilities 2nd Lien Term Loan, 8.75%, 12/31/182 | | $ | 1,705,000 | | | $ | 1,705,000 | |
| NTELOS, Inc., Sr. Sec. Credit Facilities 1st Lien Term Loan, Tranche B, 5.75%, 11/9/192 | | | 1,215,813 | | | | 1,207,180 | |
| Nuveen Investments, Inc., Sr. Sec. Credit Facilities 2nd Lien Term Loan, 6.50%, 2/28/192 | | | 3,755,000 | | | | 3,729,184 | |
| OneLink Communications/San Juan Cable LLC, Sr. Sec. Credit Facilities 2nd Lien Term Loan, 10%, 6/11/182 | | | 1,885,000 | | | | 1,896,781 | |
| Quicksilver Resources, Inc., Sr. Sec. Credit Facilities 2nd Lien Term Loan, 7%, 6/12/192,4 | | | 3,040,000 | | | | 2,948,800 | |
Revel Entertainment LLC, Sr. Sec. Credit Facilities 1st Lien Term Loan:
9.125%, 2/17/176 | | | 2,186,396 | | | | 1,078,621 | |
| 9.15%, 2/17/174,6 | | | 101,693 | | | | 50,168 | |
| Revel Entertainment, Inc., Sr. Sec. Credit Facilities 1st Lien Exit Term Loan, 14.50%, 5/20/182,4,5 | | | 1,325,000 | | | | 1,331,625 | |
| TWCC Holding Corp., Sr. Sec. Credit Facilities 2nd Lien Term Loan, 7%, 12/11/202,4 | | | 860,000 | | | | 870,750 | |
| | | | | | |
|
|
|
| Total Corporate Loans (Cost $47,867,915) | | | | | | | 45,943,997 | |
| Mortgage-Backed Obligations—21.1% | |
| Government Agency—5.8% | |
| FHLMC/FNMA/FHLB/Sponsored—5.7% | |
Federal Home Loan Mortgage Corp.:
5%, 9/15/33 | | | 810,134 | | | | 870,261 | |
| 5.50%, 9/1/39 | | | 944,946 | | | | 1,028,553 | |
| 6%, 5/15/18-11/15/21 | | | 264,651 | | | | 285,482 | |
| 6.50%, 3/15/18-8/15/32 | | | 1,063,961 | | | | 1,173,730 | |
| 7%, 10/1/31-10/1/37 | | | 232,022 | | | | 266,238 | |
| 7.50%, 1/1/32 | | | 538,993 | | | | 643,441 | |
| Federal Home Loan Mortgage Corp., Gtd. Real Estate Mtg. Investment Conduit Multiclass Pass-Through Certificates: Series 1360, Cl. PZ, 7.50%, 9/15/22 | | | 574,974 | | | | 651,679 | |
| Series 151, Cl. F, 9%, 5/15/21 | | | 14,331 | | | | 15,985 | |
| Series 1674, Cl. Z, 6.75%, 2/15/24 | | | 433,252 | | | | 488,243 | |
| Series 1897, Cl. K, 7%, 9/15/26 | | | 1,031,538 | | | | 1,173,751 | |
| Series 2043, Cl. ZP, 6.50%, 4/15/28 | | | 414,557 | | | | 471,964 | |
| Series 2106, Cl. FG, 0.643%, 12/15/282 | | | 715,436 | | | | 721,543 | |
| Series 2122, Cl. F, 0.643%, 2/15/292 | | | 19,695 | | | | 19,866 | |
| Series 2148, Cl. ZA, 6%, 4/15/29 | | | 519,612 | | | | 581,723 | |
| Series 2195, Cl. LH, 6.50%, 10/15/29 | | | 313,165 | | | | 353,927 | |
| | | | |
| 8 | | | | OPPENHEIMER GLOBAL STRATEGIC INCOME FUND/VA |
| | | | | | | | |
| | | Principal
Amount | | | Value | |
| FHLMC/FNMA/FHLB/Sponsored Continued | | | | | |
Federal Home Loan Mortgage Corp., Gtd. Real Estate Mtg. Investment Conduit Multiclass Pass-Through Certificates: Continued Series 2326, Cl. ZP, 6.50%, 6/15/31 | | $ | 40,920 | | | $ | 46,528 | |
| Series 2344, Cl. FP, 1.143%, 8/15/312 | | | 206,001 | | | | 211,085 | |
| Series 2368, Cl. PR, 6.50%, 10/15/31 | | | 159,570 | | | | 181,527 | |
| Series 2412, Cl. GF, 1.143%, 2/15/322 | | | 343,283 | | | | 351,753 | |
| Series 2449, Cl. FL, 0.743%, 1/15/322 | | | 237,457 | | | | 240,528 | |
| Series 2451, Cl. FD, 1.193%, 3/15/322 | | | 129,185 | | | | 132,582 | |
| Series 2453, Cl. BD, 6%, 5/15/17 | | | 46,610 | | | | 49,759 | |
| Series 2461, Cl. PZ, 6.50%, 6/1/32 | | | 609,796 | | | | 692,502 | |
| Series 2464, Cl. FI, 1.193%, 2/15/322 | | | 109,139 | | | | 111,626 | |
| Series 2470, Cl. AF, 1.193%, 3/15/322 | | | 221,651 | | | | 227,478 | |
| Series 2470, Cl. LF, 1.193%, 2/15/322 | | | 111,688 | | | | 114,233 | |
| Series 2471, Cl. FD, 1.193%, 3/15/322 | | | 163,601 | | | | 167,371 | |
| Series 2477, Cl. FZ, 0.743%, 6/15/312 | | | 454,319 | | | | 459,761 | |
| Series 2500, Cl. FD, 0.693%, 3/15/322 | | | 18,365 | | | | 18,560 | |
| Series 2517, Cl. GF, 1.193%, 2/15/322 | | | 97,107 | | | | 99,319 | |
| Series 2526, Cl. FE, 0.593%, 6/15/292 | | | 31,884 | | | | 32,089 | |
| Series 2551, Cl. FD, 0.593%, 1/15/332 | | | 14,376 | | | | 14,477 | |
| Series 2668, Cl. AZ, 4%, 9/1/18 | | | 88,573 | | | | 93,580 | |
| Series 2676, Cl. KY, 5%, 9/15/23 | | | 1,908,101 | | | | 2,095,144 | |
| Series 3025, Cl. SJ, 24.044%, 8/15/352 | | | 287,865 | | | | 427,765 | |
| Series 3465, Cl. HA, 4%, 7/1/17 | | | 48,619 | | | | 49,992 | |
| Series 3617, Cl. DC, 4%, 7/1/27 | | | 155,534 | | | | 158,647 | |
| Series 3822, Cl. JA, 5%, 6/1/40 | | | 74,874 | | | | 78,570 | |
| Series 3848, Cl. WL, 4%, 4/1/40 | | | 525,402 | | | | 556,848 | |
| Series 3917, Cl. BA, 4%, 6/1/38 | | | 476,551 | | | | 497,209 | |
Federal Home Loan Mortgage Corp., Interest-Only Stripped Mtg.-Backed Security:
Series 192, Cl. IO, 11.746%, 2/1/287 | | | 14,045 | | | | 2,268 | |
| Series 205, Cl. IO, 16.015%, 9/1/297 | | | 86,349 | | | | 16,884 | |
| Series 2074, Cl. S, 57.025%, 7/17/287 | | | 22,119 | | | | 4,915 | |
| Series 2079, Cl. S, 71.767%, 7/17/287 | | | 39,654 | | | | 9,135 | |
| Series 2136, Cl. SG, 69.689%, 3/15/297 | | | 1,043,298 | | | | 207,813 | |
| Series 2399, Cl. SG, 63.624%, 12/15/267 | | | 577,398 | | | | 124,607 | |
| | | | | | | | |
| | | Principal
Amount | | | Value | |
| FHLMC/FNMA/FHLB/Sponsored Continued | | | | | |
Federal Home Loan Mortgage Corp., Interest-Only Stripped Mtg.-Backed Security: Continued Series 243, Cl. 6, 0%, 12/15/327,8 | | $ | 210,034 | | | $ | 34,373 | |
| Series 2437, Cl. SB, 74.493%, 4/15/327 | | | 1,846,485 | | | | 401,657 | |
| Series 2526, Cl. SE, 31.624%, 6/15/297 | | | 40,029 | | | | 9,389 | |
| Series 2795, Cl. SH, 15.578%, 3/15/247 | | | 872,812 | | | | 123,971 | |
| Series 2802, Cl. AS, 0%, 4/15/337,8 | | | 82,739 | | | | 2,951 | |
| Series 2920, Cl. S, 54.575%, 1/15/357 | | | 396,210 | | | | 77,963 | |
| Series 2922, Cl. SE, 8.876%, 2/15/357 | | | 67,757 | | | | 12,051 | |
| Series 3201, Cl. SG, 6.617%, 8/15/367 | | | 350,975 | | | | 68,828 | |
| Series 3397, Cl. GS, 13.322%, 12/15/377 | | | 289,029 | | | | 52,640 | |
| Series 3424, Cl. EI, 0.642%, 4/15/387 | | | 225,602 | | | | 35,742 | |
| Series 3450, Cl. BI, 15.996%, 5/15/387 | | | 463,351 | | | | 86,348 | |
| Series 3606, Cl. SN, 9.875%, 12/15/397 | | | 140,805 | | | | 20,842 | |
| Series 3659, Cl. IE, 11.012%, 3/1/197 | | | 826,542 | | | | 61,913 | |
| Series 3662, Cl. SM, 27.706%, 10/15/327 | | | 369,425 | | | | 41,012 | |
| Series 3685, Cl. EI, 13.478%, 3/1/197 | | | 693,873 | | | | 45,653 | |
| Series 3736, Cl. SN, 10.521%, 10/15/407 | | | 745,865 | | | | 107,989 | |
| Federal Home Loan Mortgage Corp., Mtg.-Linked Global Debt Securities, 2.06%, 1/15/22 | | | 1,056,629 | | | | 1,074,153 | |
| Federal National Mortgage Assn.: 2.50%, 7/1/284 | | | 5,915,000 | | | | 5,951,044 | |
| 2.715%, 10/1/362 | | | 3,205,625 | | | | 3,413,007 | |
| 3%, 8/1/434 | | | 11,865,000 | | | | 11,564,667 | |
| 3.50%, 7/1/43-8/1/434 | | | 29,480,000 | | | | 29,893,768 | |
| 4%, 7/1/284 | | | 1,120,000 | | | | 1,180,856 | |
| 4.50%, 7/1/28-7/1/434 | | | 16,195,000 | | | | 17,146,745 | |
| 5%, 2/25/18-7/25/33 | | | 3,421,497 | | | | 3,670,409 | |
| 5%, 7/1/434 | | | 2,465,000 | | | | 2,653,150 | |
| 5.50%, 4/25/21-5/1/36 | | | 597,048 | | | | 651,848 | |
| 6%, 10/25/16-1/25/19 | | | 214,714 | | | | 227,213 | |
| 6%, 7/1/434 | | | 4,305,000 | | | | 4,682,361 | |
| 6.50%, 4/25/17-1/1/34 | | | 1,397,589 | | | | 1,573,021 | |
| 7%, 11/1/17-6/25/34 | | | 1,591,910 | | | | 1,846,539 | |
| 7.50%, 2/1/27-3/25/33 | | | 1,852,106 | | | | 2,203,218 | |
| 8.50%, 7/1/32 | | | 2,324 | | | | 2,716 | |
Federal National Mortgage Assn., 15 yr.:
3%, 7/1/284 | | | 2,245,000 | | | | 2,309,895 | |
| 3.50%, 7/1/284 | | | 1,645,000 | | | | 1,713,884 | |
| Federal National Mortgage Assn., 30 yr., 4%, 7/1/434 | | | 9,955,000 | | | | 10,373,810 | |
| | | | |
| 9 | | | | OPPENHEIMER GLOBAL STRATEGIC INCOME FUND/VA |
CONSOLIDATED STATEMENT OF INVESTMENTS Unaudited / Continued
| | | | | | | | |
| | | Principal
Amount | | | Value | |
| FHLMC/FNMA/FHLB/Sponsored Continued | | | | | |
Federal National Mortgage Assn., Gtd. Real Estate Mtg. Investment Conduit Multiclass Pass-Through Certificates: Continued
Trust 1999-54, Cl. LH, 6.50%, 11/25/29 | | $ | 282,060 | | | $ | 315,559 | |
| Trust 2001-51, Cl. OD, 6.50%, 10/25/31 | | | 155,513 | | | | 173,330 | |
Trust 2001-69, Cl. PF,
1.193%, 12/25/312 | | | 245,350 | | | | 251,014 | |
| Trust 2001-80, Cl. ZB, 6%, 1/25/32 | | | 301,792 | | | | 337,735 | |
| Trust 2002-12, Cl. PG, 6%, 3/25/17 | | | 147,084 | | | | 157,541 | |
| Trust 2002-29, Cl. F, 1.193%, 4/25/322 | | | 115,210 | | | | 117,875 | |
| Trust 2002-60, Cl. FH, 1.193%, 8/25/322 | | | 230,992 | | | | 236,354 | |
| Trust 2002-64, Cl. FJ, 1.193%, 4/25/322 | | | 35,477 | | | | 36,297 | |
| Trust 2002-68, Cl. FH, 0.693%, 10/18/322 | | | 77,789 | | | | 78,587 | |
| Trust 2002-84, Cl. FB, 1.193%, 12/25/322 | | | 522,080 | | | | 534,227 | |
| Trust 2002-9, Cl. PC, 6%, 3/25/17 | | | 147,073 | | | | 156,516 | |
| Trust 2002-9, Cl. PR, 6%, 3/25/17 | | | 180,083 | | | | 191,313 | |
| Trust 2002-90, Cl. FH, 0.693%, 9/25/322 | | | 292,105 | | | | 295,123 | |
| Trust 2003-11, Cl. FA, 1.193%, 9/25/322 | | | 522,092 | | | | 534,239 | |
| Trust 2003-112, Cl. AN, 4%, 11/1/18 | | | 188,467 | | | | 199,342 | |
| Trust 2003-116, Cl. FA, 0.593%, 11/25/332 | | | 48,218 | | | | 48,507 | |
| Trust 2003-119, Cl. FK, 0.693%, 5/25/182 | | | 1,118,117 | | | | 1,124,457 | |
| Trust 2004-101, Cl. BG, 5%, 1/25/20 | | | 632,037 | | | | 670,597 | |
| Trust 2005-109, Cl. AH, 5.50%, 12/25/25 | | | 2,160,000 | | | | 2,396,670 | |
| Trust 2005-25, Cl. PS, 27.311%, 4/25/352 | | | 382,761 | | | | 608,570 | |
| Trust 2005-31, Cl. PB, 5.50%, 4/25/35 | | | 560,000 | | | | 654,134 | |
| Trust 2005-71, Cl. DB, 4.50%, 8/25/25 | | | 349,189 | | | | 379,894 | |
| Trust 2006-11, Cl. PS, 23.859%, 3/25/362 | | | 239,804 | | | | 334,784 | |
| Trust 2006-46, Cl. SW, 23.492%, 6/25/362 | | | 414,262 | | | | 606,174 | |
| Trust 2007-109, Cl. NF, 0.743%, 12/25/372 | | | 524,154 | | | | 531,094 | |
| Trust 2007-42, Cl. A, 6%, 2/1/33 | | | 92,908 | | | | 93,633 | |
| Trust 2008-14, Cl. BA, 4.25%, 3/1/23 | | | 89,771 | | | | 95,355 | |
| Trust 2009-114, Cl. AC, 2.50%, 12/1/23 | | | 163,673 | | | | 167,667 | |
| Trust 2009-36, Cl. FA, 1.133%, 6/25/372 | | | 182,690 | | | | 185,358 | |
| Trust 2011-122, Cl. EA, 3%, 11/1/29 | | | 417,737 | | | | 428,370 | |
| | | | | | | | |
| | | Principal
Amount | | | Value | |
| FHLMC/FNMA/FHLB/Sponsored Continued | | | | | |
Federal National Mortgage Assn., Gtd. Real Estate Mtg. Investment Conduit Multiclass Pass-Through Certificates: Continued
Trust 2011-122, Cl. EC, 1.50%, 1/1/20 | | $ | 466,586 | | | $ | 471,787 | |
| Trust 2011-15, Cl. DA, 4%, 3/1/41 | | | 390,261 | | | | 412,442 | |
| Trust 2011-3, Cl. KA, 5%, 4/1/40 | | | 449,231 | | | | 491,042 | |
| Trust 2011-6, Cl. BA, 2.75%, 6/1/20 | | | 499,289 | | | | 518,311 | |
| Trust 2012-20, Cl. FD, 0.593%, 3/25/422 | | | 1,229,878 | | | | 1,236,814 | |
Federal National Mortgage Assn., Interest-Only Stripped Mtg.-Backed Security:
Trust 2001-61, Cl. SH, 24.214%, 11/18/317 | | | 126,833 | | | | 24,650 | |
| Trust 2001-63, Cl. SD, 28.213%, 12/18/317 | | | 34,878 | | | | 7,560 | |
| Trust 2001-68, Cl. SC, 19.442%, 11/25/317 | | | 22,508 | | | | 5,344 | |
| Trust 2001-81, Cl. S, 25.06%, 1/25/327 | | | 27,053 | | | | 5,621 | |
| Trust 2002-28, Cl. SA, 35.658%, 4/25/327 | | | 20,150 | | | | 3,911 | |
| Trust 2002-38, Cl. SO, 44.968%, 4/25/327 | | | 116,311 | | | | 21,474 | |
| Trust 2002-48, Cl. S, 30.827%, 7/25/327 | | | 30,245 | | | | 6,006 | |
| Trust 2002-52, Cl. SL, 34.072%, 9/25/327 | | | 20,247 | | | | 4,055 | |
| Trust 2002-56, Cl. SN, 32.489%, 7/25/327 | | | 41,561 | | | | 8,256 | |
| Trust 2002-77, Cl. IS, 40.933%, 12/18/327 | | | 198,160 | | | | 46,641 | |
| Trust 2002-77, Cl. SH, 36.238%, 12/18/327 | | | 42,088 | | | | 10,003 | |
| Trust 2002-9, Cl. MS, 27.486%, 3/25/327 | | | 37,716 | | | | 9,372 | |
| Trust 2003-13, Cl. IO, 10.128%, 3/25/337 | | | 362,460 | | | | 88,492 | |
| Trust 2003-26, Cl. DI, 11.25%, 4/25/337 | | | 284,415 | | | | 50,307 | |
| Trust 2003-33, Cl. SP, 26.786%, 5/25/337 | | | 233,913 | | | | 58,405 | |
| Trust 2003-38, Cl. SA, 5.042%, 3/25/237 | | | 271,829 | | | | 25,998 | |
| Trust 2003-4, Cl. S, 27.924%, 2/25/337 | | | 70,605 | | | | 13,809 | |
| Trust 2004-56, Cl. SE, 9.979%, 10/25/337 | | | 1,107,975 | | | | 196,440 | |
| Trust 2005-12, Cl. SC, 10.588%, 3/25/357 | | | 33,547 | | | | 6,540 | |
| Trust 2005-14, Cl. SE, 39.20%, 3/25/357 | | | 1,189,517 | | | | 201,748 | |
| Trust 2005-40, Cl. SA, 47.027%, 5/25/357 | | | 1,021,055 | | | | 184,599 | |
| | | | |
| 10 | | | | OPPENHEIMER GLOBAL STRATEGIC INCOME FUND/VA |
| | | | | | | | |
| | | Principal
Amount | | | Value | |
| FHLMC/FNMA/FHLB/Sponsored Continued | | | | | |
Federal National Mortgage Assn., Interest-Only Stripped Mtg.-Backed Security: Continued
Trust 2005-40, Cl. SB, 65.34%, 5/25/357 | | $ | 1,610,323 | | | $ | 277,396 | |
| Trust 2005-52, Cl. JH, 7.678%, 5/25/357 | | | 524,970 | | | | 107,889 | |
| Trust 2005-63, Cl. SA, 51.238%, 10/25/317 | | | 61,754 | | | | 12,835 | |
| Trust 2005-71, Cl. SA, 52.786%, 8/25/257 | | | 218,243 | | | | 30,690 | |
| Trust 2006-51, Cl. SA, 10.523%, 6/25/367 | | | 4,493,466 | | | | 814,578 | |
| Trust 2006-90, Cl. SX, 99.999%, 9/25/367 | | | 1,142,207 | | | | 243,659 | |
| Trust 2007-75, Cl. BI, 5.55%, 8/25/377 | | | 1,706,213 | | | | 311,352 | |
| Trust 2007-88, Cl. XI, 33.574%, 6/25/377 | | | 1,696,215 | | | | 256,709 | |
| Trust 2008-46, Cl. EI, 15.193%, 6/25/387 | | | 474,142 | | | | 70,812 | |
| Trust 2008-55, Cl. SA, 4.041%, 7/25/387 | | | 185,640 | | | | 19,227 | |
| Trust 2009-8, Cl. BS, 1.11%, 2/25/247 | | | 305,761 | | | | 26,586 | |
| Trust 2010-95, Cl. DI, 9.419%, 11/1/207 | | | 1,069,829 | | | | 76,024 | |
| Trust 2011-84, Cl. IG, 0%, 8/1/137,8 | | | 3,918,196 | | | | 6,988 | |
| Trust 2012-40, Cl. PI, 0%, 4/1/417,8 | | | 1,861,247 | | | | 372,495 | |
| Trust 214, Cl. 2, 45.246%, 3/1/237 | | | 247,946 | | | | 41,988 | |
| Trust 221, Cl. 2, 47.866%, 5/1/237 | | | 30,505 | | | | 4,949 | |
| Trust 254, Cl. 2, 37.521%, 1/1/247 | | | 486,998 | | | | 79,996 | |
| Trust 2682, Cl. TQ, 99.999%, 10/15/337 | | | 410,381 | | | | 81,598 | |
| Trust 2981, Cl. BS, 99.999%, 5/15/357 | | | 719,366 | | | | 135,068 | |
| Trust 301, Cl. 2, 2.243%, 4/1/297 | | | 95,353 | | | | 16,449 | |
| Trust 313, Cl. 2, 19.329%, 6/1/317 | | | 910,687 | | | | 120,204 | |
| Trust 319, Cl. 2, 1.574%, 2/1/327 | | | 451,259 | | | | 78,072 | |
| Trust 321, Cl. 2, 8.178%, 4/1/327 | | | 132,521 | | | | 22,748 | |
| Trust 324, Cl. 2, 0%, 7/1/327,8 | | | 133,294 | | | | 22,549 | |
| Trust 328, Cl. 2, 0%, 12/1/327,8 | | | 293,816 | | | | 51,605 | |
| Trust 331, Cl. 5, 0%, 2/1/337,8 | | | 515,943 | | | | 104,101 | |
| Trust 332, Cl. 2, 0%, 3/1/337,8 | | | 2,342,403 | | | | 331,626 | |
| Trust 334, Cl. 12, 0%, 3/1/337,8 | | | 441,289 | | | | 90,789 | |
| Trust 339, Cl. 15, 0%, 8/1/337,8 | | | 1,368,470 | | | | 257,008 | |
| Trust 345, Cl. 9, 0%, 1/1/347,8 | | | 363,943 | | | | 56,162 | |
| Trust 351, Cl. 10, 0%, 4/1/347,8 | | | 264,278 | | | | 40,763 | |
| Trust 351, Cl. 8, 0%, 4/1/347,8 | | | 446,988 | | | | 69,316 | |
| Trust 356, Cl. 10, 0%, 6/1/357,8 | | | 336,981 | | | | 51,698 | |
| Trust 356, Cl. 12, 0%, 2/1/357,8 | | | 167,061 | | | | 25,829 | |
| Trust 362, Cl. 13, 0%, 8/1/357,8 | | | 212,575 | | | | 33,932 | |
| | | | | | |
|
|
|
| | | | | | | | 139,930,200 | |
| | | | | | | | |
| | | Principal
Amount | | | Value | |
| GNMA/Guaranteed—0.1% | | | | | |
Government National Mortgage Assn.:
1.625%, 12/9/252 | | $ | 4,371 | | | $ | 4,562 | |
| 7%, 3/29/28-7/29/28 | | | 184,211 | | | | 210,799 | |
| 7.50%, 3/1/27 | | | 10,690 | | | | 11,599 | |
| 8%, 11/29/25-5/29/26 | | | 35,319 | | | | 35,715 | |
Government National Mortgage Assn., Gtd. Real Estate Mtg. Investment Conduit Pass-Through Certificates:
Series 1999-32, Cl. ZB, 8%, 9/1/29 | | | 741,034 | | | | 875,091 | |
| Series 2000-12, Cl. ZA, 8%, 2/16/30 | | | 1,669,220 | | | | 1,961,002 | |
| Government National Mortgage Assn., Interest-Only Stripped Mtg.-Backed Security: Series 1998-19, Cl. SB, 67.437%, 7/16/287 | | | 88,406 | | | | 20,713 | |
| Series 1998-6, Cl. SA, 76.117%, 3/16/287 | | | 52,861 | | | | 12,644 | |
| Series 2001-21, Cl. SB, 78.169%, 1/16/277 | | | 386,874 | | | | 77,902 | |
| Series 2007-17, Cl. AI, 22.611%, 4/16/377 | | | 465,021 | | | | 88,788 | |
| Series 2010-111, Cl. GI, 48.774%, 9/1/137 | | | 7,963,169 | | | | 26,746 | |
| Series 2011-52, Cl. HS, 13.451%, 4/16/417 | | | 781,764 | | | | 184,926 | |
| | | | | | |
|
|
|
| | | | | | | | 3,510,487 | |
| Non-Agency—15.3% | | | | | | | | |
| Commercial—10.9% | | | | | | | | |
| Banc of America Commercial Mortgage Trust 2006-1, Commercial Mtg. Pass-Through Certificates, Series 2006-1, Cl. AJ, 5.46%, 9/1/45 | | | 2,200,000 | | | | 2,349,932 | |
| Banc of America Commercial Mortgage Trust 2006-3, Commercial Mtg. Pass-Through Certificates, Series 2006-3, Cl. AM, 6.055%, 7/10/442 | | | 4,242,000 | | | | 4,399,505 | |
| Banc of America Commercial Mortgage Trust 2006-5, Commercial Mtg. Pass-Through Certificates, Series 2006-5, Cl. AM, 5.448%, 9/1/47 | | | 6,055,000 | | | | 6,370,414 | |
| Banc of America Commercial Mortgage Trust 2007-5, Commercial Mtg. Pass-Through Certificates, Series 2007-5, Cl. AM, 5.772%, 2/1/51 | | | 8,090,000 | | | | 8,750,136 | |
| Banc of America Commercial Mortgage, Inc., Commercial Mtg. Pass-Through Certificates, Series 2008-1, Cl. AM, 6.438%, 2/10/512 | | | 3,415,000 | | | | 3,729,574 | |
| | | | |
| 11 | | | | OPPENHEIMER GLOBAL STRATEGIC INCOME FUND/VA |
CONSOLIDATED STATEMENT OF INVESTMENTS Unaudited / Continued
| | | | | | | | |
| | | Principal
Amount | | | Value | |
| Commercial Continued | | | | | |
BCAP LLC Trust, Mtg. Pass-Through Certificates:
Series 2012-RR2, Cl. 6A3, 3.11%, 9/1/352,3 | | $ | 726,121 | | | $ | 742,560 | |
| Series 2012-RR6, Cl. 1A5, 2.379%, 11/1/361,2 | | | 466,419 | | | | 473,497 | |
| Bear Stearns ARM Trust 2007-4, Mtg. Pass-Through Certificates, Series 2007-4, Cl. 22A1, 5.252%, 6/1/472 | | | 743,744 | | | | 645,689 | |
| Bear Stearns Commercial Mortgage Securities Trust 2006-PWR13, Commercial Mtg. Pass-Through Certificates, Series 2006-PWR13, Cl. AJ, 5.611%, 9/1/41 | | | 8,145,000 | | | | 7,954,717 | |
| Bear Stearns Commercial Mortgage Securities Trust 2007-PWR17, Commercial Mtg. Pass-Through Certificates, Series 2007-PWR17, Cl. AJ, 5.888%, 6/1/502 | | | 7,400,000 | | | | 6,908,359 | |
| Bear Stearns Commercial Mortgage Securities Trust 2007-T26, Commercial Mtg. Pass-Through Certificates, Series 2007-T26, Cl. AJ, 5.566%, 1/1/452 | | | 6,183,000 | | | | 5,993,445 | |
| CHL Mortgage Pass-Through Trust 2005-17, Mtg. Pass-Through Certificates, Series 2005-17, Cl. 1A8, 5.50%, 9/1/35 | | | 2,282,141 | | | | 2,284,527 | |
| CHL Mortgage Pass-Through Trust 2005-HYB8, Mtg. Pass-Through Certificates, Series 2005-HYB8, Cl. 4A1, 4.553%, 12/20/352 | | | 133,696 | | | | 110,060 | |
| CHL Mortgage Pass-Through Trust 2007-J3, Mtg. Pass-Through Certificates, Series 2007-J3, Cl. A9, 6%, 7/1/37 | | | 5,750,398 | | | | 4,714,337 | |
| Citigroup Commercial Mortgage Trust 2008-C7, Commercial Mtg. Pass-Through Certificates, Series 2008-C7, Cl. AM, 6.135%, 12/1/492 | | | 4,270,000 | | | | 4,710,551 | |
| Citigroup Commercial Mortgage Trust 2013-GC11, Commercial Mtg. Pass-Through Certificates, Series 2013-GC11, Cl. D, 4.607%, 4/1/232,3 | | | 3,125,000 | | | | 2,627,839 | |
| Citigroup Mortgage Loan Trust, Inc. 2012-8, Mtg. Pass-Through Certificates, Series 2012-8, Cl. 1A1, 2.674%, 10/1/351,2 | | | 1,048,789 | | | | 1,085,305 | |
| | | | | | | | |
| | | Principal
Amount | | | Value | |
| Commercial Continued | | | | | |
Commercial Mortgage Trust, Commercial Mtg. Pass-Through Certificates:
Series 2012-CR4, Cl. D, 4.731%, 10/1/452,3 | | $ | 1,530,000 | | | $ | 1,313,167 | |
| Series 2012-CR5, Cl. E, 4.335%, 12/1/452 | | | 1,165,000 | | | | 978,436 | |
| Series 2013-CR6, Cl. D, 4.177%, 3/1/462 | | | 1,525,000 | | | | 1,254,383 | |
| Series 2013-CR7, Cl. D, 4.501%, 3/1/462,3 | | | 1,420,000 | | | | 1,164,624 | |
| Countrywide Alternative Loan Trust 2006-J2, Mtg. Pass-Through Certificates, Series 2006-J2, Cl. A7, 6%, 4/1/36 | | | 553,959 | | | | 513,229 | |
| Credit Suisse First Boston Mortgage Securities Corp., Commercial Mtg. Pass-Through Certificates, Series 2005-C6, Cl. AJ, 5.23%, 12/1/40 | | | 600,000 | | | | 635,227 | |
| CSMC Mortgage-Backed Trust 2006-C1, Mtg. Pass-Through Certificates, Series 2006-C1, Cl. AJ, 5.569%, 2/1/392 | | | 9,720,000 | | | | 10,392,954 | |
DBUBS Mortgage Trust, Commercial Mtg. Pass-Through Certificates: Series 2011-LC1, Cl. E, 5.557%, 11/1/462,3 | | | 3,620,000 | | | | 3,484,759 | |
| Series 2011-LC2A, Cl. D, 5.445%, 7/1/442,3 | | | 3,845,000 | | | | 3,645,746 | |
| Deutsche Alt-B Securities, Inc., Mtg. Pass-Through Certificates: Series 2006-AB2, Cl. A1, 5.885%, 6/25/36 | | | 108,716 | | | | 81,383 | |
| Series 2006-AB4, Cl. A1A, 6.005%, 10/25/36 | | | 528,922 | | | | 392,257 | |
Deutsche Mortgage & Asset Receiving, Commercial Mtg. Pass-Through Certificates, Interest-Only Stripped Mtg.-Backed Security:
Series 2010-C1, Cl. XPA, 5.012%, 7/1/463,7 | | | 4,981,774 | | | | 245,719 | |
| Series 2012-CR5, Cl. XA, 3.841%, 12/1/457 | | | 3,553,332 | | | | 401,166 | |
| EverBank Mortgage Loan Trust, Commercial Mtg. Pass-Through Certificates, Series 2013-1, Cl. A1, 2.25%, 4/1/43 | | | 1,249,442 | | | | 1,222,037 | |
| First Horizon Alternative Mortgage Securities Trust 2005-FA8, Mtg. Pass-Through Certificates, Series 2005-FA8, Cl. 1A6, 0.843%, 11/25/352 | | | 4,642,701 | | | | 3,379,334 | |
| | | | |
| 12 | | | | OPPENHEIMER GLOBAL STRATEGIC INCOME FUND/VA |
| | | | | | | | |
| | | Principal
Amount | | | Value | |
| Commercial Continued | | | | | |
| First Horizon Alternative Mortgage Securities Trust 2005-FA9, Mtg. Pass-Through Certificates, Series 2005-FA9, Cl. A4A, 5.50%, 12/1/35 | | $ | 1,755,700 | | | $ | 1,544,704 | |
| First Horizon Alternative Mortgage Securities Trust 2007-FA2, Mtg. Pass-Through Certificates, Series 2007-FA2, Cl. 1A1, 5.50%, 4/1/37 | | | 1,335,758 | | | | 1,027,667 | |
| First Horizon Alternative Mortgage Securities Trust 2007-FA4, Mtg. Pass-Through Certificates, Series 2007-FA4, Cl. 1A6, 6.25%, 8/1/372 | | | 5,263,656 | | | | 4,513,427 | |
| FREMF Mortgage Trust 2013-K25, Commerical Mtg. Pass-Through Certificates, Series 2013-K25, Cl. C, 3.742%, 11/1/452 | | | 2,850,000 | | | | 2,255,791 | |
| FREMF Mortgage Trust 2013-K26, Commerical Mtg. Pass-Through Certificates, Series 2013-K26, Cl. C, 3.723%, 12/1/402,3 | | | 1,040,000 | | | | 819,476 | |
| FREMF Mortgage Trust 2013-K27, Commerical Mtg. Pass-Through Certificates, Series 2013-K27, Cl. C, 3.616%, 1/1/462,3 | | | 1,630,000 | | | | 1,265,865 | |
| FREMF Mortgage Trust 2013-K28, Commerical Mtg. Pass-Through Certificates, Series 2013-K28, Cl. C, 3.494%, 3/1/232,3 | | | 1,605,000 | | | | 1,252,143 | |
| FREMF Mortgage Trust 2013-K712, Commerical Mtg. Pass-Through Certificates, Series 2013-K712, Cl. C, 3.483%, 5/1/452,3 | | | 2,655,000 | | | | 2,274,142 | |
| FREMF Mortgage Trust 2013-K713, Commerical Mtg. Pass-Through Certificates, Series 2013-K713, Cl. C, 3.165%, 4/25/202,3 | | | 740,000 | | | | 617,143 | |
| GE Commercial Mortgage Corp., Commercial Mtg. Pass-Through Certificates, Series 2005-C4, Cl. AJ, 5.471%, 11/1/452 | | | 6,510,000 | | | | 6,287,908 | |
| Greenwich Capital Commercial Funding Corp./Commercial Mortgage Trust 2006-GG7, Commercial Mtg. Pass-Through Certificates, Series 2006-GG7, Cl. AJ, 5.86%, 7/10/382 | | | 8,205,000 | | | | 7,957,065 | |
| Greenwich Capital Commercial Funding Corp./Commercial Mortgage Trust 2007-GG11, Commercial Mtg. Pass-Through Certificates, Series 2007-GG11, Cl. AM, 5.867%, 12/1/49 | | | 5,550,000 | | | | 5,964,452 | |
| | | | | | | | |
| | | Principal
Amount | | | Value | |
| Commercial Continued | | | | | |
| Greenwich Capital Commercial Funding Corp./Commercial Mortgage Trust 2007-GG9, Commercial Mtg. Pass-Through Certificates, Series 2007-GG9, Cl. AM, 5.475%, 3/1/39 | | $ | 5,035,000 | | | $ | 5,307,618 | |
| GS Mortgage Securities Corp. II, Commercial Mtg. Obligations, Series 2011-GC3, Cl. D, 5.543%, 3/1/442,3 | | | 4,085,000 | | | | 3,913,810 | |
| GSR Mortgage Loan Trust 2005-AR4, Mtg. Pass-Through Certificates, Series 2005-AR4, Cl. 6A1, 5.25%, 7/1/35 | | | 54,173 | | | | 53,360 | |
| IndyMac Index Mortgage Loan Trust 2005-AR23, Mtg. Pass-Through Certificates, Series 2005-AR23, Cl. 6 A1, 4.814%, 11/1/352 | | | 1,257,306 | | | | 1,034,669 | |
JPMorgan Chase Commercial Mortgage Securities Corp., Commercial Mtg. Pass-Through Certificates:
Series 2006-LDP7, Cl. AJ, 5.861%, 4/1/452 | | | 3,495,000 | | | | 3,508,985 | |
| Series 2006-LDP8, Cl. AJ, 5.48%, 5/1/452 | | | 4,175,000 | | | | 4,218,622 | |
| Series 2007-CB15, Cl. AJ, 5.502%, 6/1/47 | | | 8,281,000 | | | | 6,899,924 | |
| JPMorgan Chase Commercial Mortgage Securities Trust 2006-CIBC16, Commercial Mtg. Pass-Through Certificates, Series 2006-CIBC16, Cl. AJ, 5.623%, 5/1/45 | | | 2,695,000 | | | | 2,454,805 | |
| JPMorgan Chase Commercial Mortgage Securities Trust 2007-CB19, Commercial Mtg. Pass-Through Certificates, Series 2007-CB19, Cl. AM, 5.714%, 2/1/492 | | | 5,850,000 | | | | 6,358,333 | |
| JPMorgan Chase Commercial Mortgage Securities Trust 2013-C10, Commercial Mtg. Pass-Through Certificates, Series 2013-C10, Cl. D, 4.30%, 12/15/472 | | | 3,420,000 | | | | 2,760,523 | |
| JPMorgan Mortgage Trust 2006-A7, Mtg. Pass-Through Certificates, Series 2006-A7, Cl. 2A2, 2.867%, 1/1/372 | | | 249,028 | | | | 201,199 | |
| JPMorgan, Re-Securitized Real Estate Mtg. Investment Conduit Multiclass Pass-Through Certificates, Series 2009-5, Cl. 1A2, 2.613%, 7/1/362,3 | | | 5,239,509 | | | | 3,962,549 | |
| | | | |
| 13 | | | | OPPENHEIMER GLOBAL STRATEGIC INCOME FUND/VA |
CONSOLIDATED STATEMENT OF INVESTMENTS Unaudited / Continued
| | | | | | | | |
| | | Principal
Amount | | | Value | |
| Commercial Continued | | | | | |
| LB-UBS Commercial Mortgage Trust 2006-C3, Commercial Mtg. Pass-Through Certificates, Series 2006-C3, Cl. AJ, 5.72%, 3/11/39 | | $ | 1,325,000 | | | $ | 1,267,426 | |
| LB-UBS Commercial Mortgage Trust 2007-C6, Commercial Mtg. Pass-Through Certificates, Series 2007-C6, Cl. AM, 6.114%, 7/11/40 | | | 5,855,000 | | | | 6,383,944 | |
| LB-UBS Commercial Mortgage Trust 2008-C1, Commercial Mtg. Pass-Through Certificates, Series 2008-C1, Cl. AM, 6.32%, 4/11/412 | | | 2,610,000 | | | | 2,927,276 | |
| Lehman Structured Securities Corp., Mtg.-Backed Security, 6%, 5/1/29 | | | 5,172 | | | | 1,021 | |
| Merrill Lynch Mortgage Trust 2006-C1, Commercial Mtg. Pass-Through Certificates, Series 2006-C1, Cl. AJ, 5.683%, 5/1/392 | | | 6,860,000 | | | | 6,817,183 | |
| ML-CFC Commercial Mortgage Trust 2006-3, Commercial Mtg. Pass-Through Certificates, Series 2006-3, Cl. AJ, 5.485%, 7/1/46 | | | 5,820,000 | | | | 5,452,950 | |
| Morgan Stanley Bank of America Merrill Lynch Trust 2012-C6, Commerical Mtg. Pass-Through Certificates, Series 2012-C6, Cl. E, 4.82%, 11/1/452,3 | | | 2,290,000 | | | | 1,976,548 | |
| Morgan Stanley Bank of America Merrill Lynch Trust 2013-C7, Commerical Mtg. Pass-Through Certificates, Series 2013-C7, Cl. D, 4.444%, 2/1/462 | | | 4,250,000 | | | | 3,543,168 | |
| Morgan Stanley Bank of America Merrill Lynch Trust 2013-C8, Commerical Mtg. Pass-Through Certificates, Series 2013-C8, Cl. D, 4.312%, 12/1/482 | | | 2,020,000 | | | | 1,657,984 | |
| Morgan Stanley Capital I Trust 2006-HQ10, Commercial Mtg. Pass-Through Certificates, Series 2006-HQ10, Cl. AJ, 5.39%, 11/1/41 | | | 3,975,000 | | | | 3,867,768 | |
| Morgan Stanley Capital I Trust 2007-HQ11, Commercial Mtg. Pass-Through Certificates, Series 2007-HQ11, Cl. AJ, 5.51%, 2/1/44 | | | 2,115,000 | | | | 2,163,132 | |
| | | | | | | | |
| | | Principal
Amount | | | Value | |
| Commercial Continued | | | | | |
| Morgan Stanley Capital I Trust 2007-IQ13, Commercial Mtg. Pass-Through Certificates, Series 2007-IQ13, Cl. AM, 5.406%, 3/1/44 | | $ | 765,000 | | | $ | 821,996 | |
| Morgan Stanley Capital I Trust 2007-IQ15, Commercial Mtg. Pass-Through Certificates, Series 2007-IQ15, Cl. AM, 5.894%, 6/1/492 | | | 5,875,000 | | | | 6,345,535 | |
| Morgan Stanley Capital I Trust, Commercial Mtg. Pass-Through Certificates, Series 2006-HQ10, Cl. AM, 5.36%, 11/1/41 | | | 8,500,000 | | | | 9,264,218 | |
| Morgan Stanley, Re-Securitized Real Estate Mtg. Investment Conduit Multiclass Pass-Through Certificates, Series 2012-R3, Cl. 1A, 2.379%, 11/1/362,3 | | | 45,396 | | | | 45,002 | |
| RALI Series 2005-QA4 Trust, Mtg. Asset-Backed Pass-Through Certificates, Series 2005-QA4, Cl. A32, 3.245%, 4/25/352 | | | 99,855 | | | | 14,383 | |
| Residential Asset Securitization Trust 2006-A12, Mtg. Pass-Through Certificates, Series 2006-A12, Cl. 1A, 6.25%, 11/1/36 | | | 591,977 | | | | 457,322 | |
| Sequoia Mortgage Trust, Mtg. Pass-Through Certificates, Series 2012-2, Cl. A2, 3.50%, 4/1/42 | | | 261,782 | | | | 258,194 | |
| STARM Mortgage Loan Trust 2007-1, Mtg. Pass-Through Certificates, Series 2007-1, Cl. 2A1, 5.811%, 2/1/372 | | | 6,924,790 | | | | 5,713,928 | |
| Structured Adjustable Rate Mortgage Loan Trust 2006-4, Commercial Mtg. Pass-Through Certificates, Series 2006-4, Cl. 6A, 5.28%, 5/1/362 | | | 2,049,701 | | | | 1,706,907 | |
| Structured Adjustable Rate Mortgage Loan Trust 2007-6, Mtg. Pass-Through Certificates, Series 2007-6, Cl. 3A1, 4.627%, 7/1/372 | | | 5,872,090 | | | | 4,740,797 | |
| UBS-Barclays Commercial Mortgage Trust 2012-C2, Commerical Mtg. Pass-Through Certificates, Series 2012-C2, Cl. E, 4.892%, 5/1/632,3 | | | 1,415,000 | | | | 1,255,491 | |
| UBS-Barclays Commercial Mortgage Trust 2013-C5, Commerical Mtg. Pass-Through Certificates, Series 2013-C5, Cl. D, 4.233%, 3/1/462 | | | 2,860,000 | | | | 2,342,532 | |
| | | | |
| 14 | | | | OPPENHEIMER GLOBAL STRATEGIC INCOME FUND/VA |
| | | | | | | | |
| | | Principal
Amount | | | Value | |
| Commercial Continued | | | | | |
| Wachovia Bank Commercial Mortgage Trust 2006-C23, Commercial Mtg. Pass-Through Certificates, Series 2006-C23, Cl. AJ, 5.515%, 1/1/45 | | $ | 4,510,000 | | | $ | 4,749,702 | |
| Wachovia Bank Commercial Mortgage Trust 2006-C25, Commercial Mtg. Pass-Through Certificates, Series 2006-C25, Cl. AJ, 5.919%, 5/1/432 | | | 5,315,000 | | | | 5,328,200 | |
| WaMu Mortgage Pass-Through Certificates 2007-OA3 Trust, Mtg. Pass-Through Certificates, Series 2007-OA3, Cl. 5A, 2.22%, 4/1/472 | | | 635,792 | | | | 424,944 | |
| Wells Fargo Mortgage-Backed Securities 2004-W Trust, Mtg. Pass-Through Certificates, Series 2004-W, Cl. B2, 2.696%, 11/1/342 | | | 163,378 | | | | 5,894 | |
| Wells Fargo Mortgage-Backed Securities 2005-AR1 Trust, Mtg. Pass-Through Certificates, Series 2005-AR1, Cl. 1A1, 2.611%, 2/1/352 | | | 3,027,112 | | | | 3,008,928 | |
| Wells Fargo Mortgage-Backed Securities 2005-AR15 Trust, Mtg. Pass-Through Certificates, Series 2005-AR15, Cl. 1A6, 2.613%, 9/1/352 | | | 6,597,506 | | | | 6,111,613 | |
| Wells Fargo Mortgage-Backed Securities 2006-8 Trust, Mtg. Pass-Through Certificates, Series 2006-8, Cl. A15, 6%, 7/1/36 | | | 3,558,561 | | | | 3,477,927 | |
| Wells Fargo Mortgage-Backed Securities 2007-AR3 Trust, Mtg. Pass-Through Certificates, Series 2007-AR3, Cl. A4, 5.702%, 4/1/372 | | | 1,656,839 | | | | 1,558,361 | |
| WFRBS Commercial Mortgage Trust 2011-C3, Interest-Only Commercial Mtg. Pass-Through Certificates, Series 2011-C3, Cl. XA, 13.006%, 3/1/447 | | | 5,954,191 | | | | 437,838 | |
| WFRBS Commercial Mortgage Trust 2012-C10, Commercial Mtg. Pass-Through Certificates, Series 2012-C10, Cl. D, 4.61%, 12/1/452,3 | | | 1,165,000 | | | | 966,266 | |
| WFRBS Commercial Mortgage Trust 2012-C7, Commercial Mtg. Pass-Through Certificates, Series 2012-C7, Cl. E, 5.005%, 6/1/452,3 | | | 2,040,000 | | | | 1,779,046 | |
| | | | | | | | |
| | | Principal
Amount | | | Value | |
| Commercial Continued | | | | | |
| WFRBS Commercial Mortgage Trust 2012-C8, Commercial Mtg. Pass-Through Certificates, Series 2012-C8, Cl. D, 5.402%, 8/1/452,3 | | $ | 2,275,000 | | | $ | 1,987,975 | |
| WFRBS Commercial Mortgage Trust 2013-C11, Commercial Mtg. Pass-Through Certificates, Series 2013-C11, Cl. D, 4.325%, 3/1/452,3 | | | 1,168,000 | | | | 947,160 | |
| | | | | | |
|
|
|
| | | | | | | | 269,217,607 | |
| Multifamily—1.0% | | | | | | | | |
| Banc of America Commercial Mortgage, Inc., Commercial Mtg. Pass-Through Certificates, Series 2006-2, Cl. AJ, 5.954%, 5/1/452 | | | 4,295,000 | | | | 4,492,499 | |
| CHL Mortgage Pass-Through Trust 2006-20, Mtg. Pass-Through Certificates, Series 2006-20, Cl. 1A17, 5.75%, 2/1/37 | | | 2,088,108 | | | | 1,832,558 | |
| Citigroup Mortgage Loan Trust, Inc. 2006-AR3, Mtg. Pass-Through Certificates, Series 2006-AR3, Cl. 1 A2A, 5.531%, 6/1/362 | | | 4,641,519 | | | | 4,269,689 | |
| Countrywide Alternative Loan Trust 2006-24CB, Mtg. Pass-Through Certificates, Series 2006-24CB, Cl. A12, 5.75%, 6/1/36 | | | 1,723,127 | | | | 1,434,839 | |
| JPMorgan Mortgage Trust 2007-A3, Mtg. Pass-Through Certificates, Series 2007-A3, Cl. 3A2M, 4.925%, 5/1/372 | | | 3,588,219 | | | | 3,383,601 | |
| Wells Fargo Mortgage-Backed Securities 2005-AR15 Trust, Mtg. Pass-Through Certificates, Series 2005-AR15, Cl. 1A2, 2.613%, 9/1/352 | | | 329,053 | | | | 316,376 | |
| Wells Fargo Mortgage-Backed Securities 2006-AR2 Trust, Mtg. Pass-Through Certificates, Series 2006-AR2, Cl. 2A3, 2.641%, 3/1/362 | | | 5,014,748 | | | | 4,840,515 | |
| Wells Fargo Mortgage-Backed Securities 2006-AR6 Trust, Mtg. Pass-Through Certificates, Series 2006-AR6, Cl. 3A1, 2.77%, 3/25/362 | | | 2,740,841 | | | | 2,602,017 | |
| | | | | | |
|
|
|
| | | | | | | | 23,172,094 | |
| | | | |
| 15 | | | | OPPENHEIMER GLOBAL STRATEGIC INCOME FUND/VA |
CONSOLIDATED STATEMENT OF INVESTMENTS Unaudited / Continued
| | | | | | | | |
| | | Principal
Amount | | | Value | |
| Residential—3.4% | | | | | | | | |
| Argent Securities Trust 2004-W8, Asset-Backed Pass-Through Certificates, Series 2004-W8, Cl. A2, 1.153%, 5/25/342 | | $ | 865,219 | | | $ | 827,084 | |
| Banc of America Commercial Mortgage, Inc., Commercial Mtg. Pass-Through Certificates: Series 2007-1, Cl. 1A3, 6%, 1/1/37 | | | 1,861,925 | | | | 1,627,590 | |
| Series 2007-4, Cl. AM, 5.811%, 2/1/512 | | | 4,760,000 | | | | 5,166,080 | |
| Banc of America Funding 2007-C Trust, Mtg. Pass-Through Certificates, Series 2007-C, Cl. 1A4, 5.419%, 5/1/362 | | | 1,694,916 | | | | 1,619,912 | |
| Bear Stearns ARM Trust 2004-2, Mtg. Pass-Through Certificates, Series 2004-2, Cl. 12A2, 2.763%, 5/1/342 | | | 2,239,070 | | | | 2,185,274 | |
| CHL Mortgage Pass-Through Trust 2005-29, Mtg. Pass-Through Certificates, Series 2005-29, Cl. A1, 5.75%, 12/1/35 | | | 4,536,163 | | | | 4,163,050 | |
| CHL Mortgage Pass-Through Trust 2005-J4, Mtg. Pass-Through Certificates, Series 2005-J4, Cl. A7, 5.50%, 11/1/35 | | | 1,576,984 | | | | 1,615,840 | |
| CHL Mortgage Pass-Through Trust 2006-6, Mtg. Pass-Through Certificates, Series 2006-6, Cl. A3, 6%, 4/1/36 | | | 387,709 | | | | 361,505 | |
| CHL Mortgage Pass-Through Trust 2007-15, Mtg. Pass-Through Certificates, Series 2007-15, Cl. 1A29, 6.25%, 9/1/37 | | | 3,482,172 | | | | 3,262,066 | |
| CHL Mortgage Pass-Through Trust 2007-HY3, Mtg. Pass-Through Certificates, Series 2007-HY3, Cl. 1A1, 2.76%, 6/1/472 | | | 1,921,208 | | | | 1,667,119 | |
| Citigroup Mortgage Loan Trust, Inc. 2005-2, Mtg. Pass-Through Certificates, Series 2005-2, Cl. 1A3, 2.688%, 5/1/352 | | | 2,051,564 | | | | 2,015,751 | |
| Citigroup Mortgage Loan Trust, Inc. 2005-3, Mtg. Pass-Through Certificates, Series 2005-3, Cl. 2A4, 2.891%, 8/1/352 | | | 3,831,750 | | | | 3,217,735 | |
| Citigroup, Inc./Deutsche Bank 2007-CD4 Commercial Mortgage Trust, Commercial Mtg. Pass-Through Certificates, Series 2007-CD4, Cl. AMFX, 5.366%, 12/1/49 | | | 8,565,000 | | | | 8,670,328 | |
| | | | | | | | |
| | | Principal
Amount | | | Value | |
| Residential Continued | | | | | |
| Countrywide Alternative Loan Trust 2006-43CB, Mtg. Pass-Through Certificates, Series 2006-43CB, Cl. 1A10, 6%, 2/1/37 | | $ | 7,864,747 | | | $ | 6,390,335 | |
| Countrywide Alternative Loan Trust 2007-19, Mtg. Pass-Through Certificates, Series 2007-19, Cl. 1A4, 6%, 8/1/37 | | | 2,097,335 | | | | 1,609,186 | |
Countrywide Home Loans, Asset-Backed Certificates,
Series 2005-16, Cl. 2AF2, 5.148%, 5/1/362 | | | 550,894 | | | | 542,585 | |
| CSMC Mortgage-Backed Trust 2007-3, Mtg. Pass-Through Certificates, Series 2007-3, Cl. 2A10, 6%, 4/1/37 | | | 2,031,936 | | | | 1,758,623 | |
| CWABS Asset-Backed Certificates Trust 2006-25, Asset-Backed Certificates, Series 2006-25, Cl. 2A2, 0.313%, 6/25/472 | | | 1,013,768 | | | | 1,006,874 | |
CWHEQ Revolving Home Equity Loan Trust, Asset-Backed Certificates:
Series 2005-G, Cl. 2A, 0.423%, 12/15/352 | | | 136,275 | | | | 80,062 | |
| Series 2006-H, Cl. 2A1A, 0.343%, 11/15/362 | | | 60,097 | | | | 26,303 | |
| GSR Mortgage Loan Trust 2006-5F, Mtg. Pass-Through Certificates, Series 2006-5F, Cl. 2A1, 6%, 6/1/36 | | | 504,559 | | | | 491,654 | |
| Home Equity Mortgage Trust 2005-1, Mtg. Pass-Through Certificates, Series 2005-1, Cl. M6, 5.863%, 6/1/35 | | | 1,046,000 | | | | 1,072,906 | |
| JPMorgan Alternative Loan Trust 2006-S4, Mtg. Pass-Through Certificates, Series 2006-S4, Cl. A6, 5.71%, 12/1/36 | | | 263,463 | | | | 245,929 | |
| Mastr Asset-Backed Securities Trust 2006-WMC3, Mtg. Pass-Through Certificates, Series 2006-WMC3, Cl. A3, 0.293%, 8/25/362 | | | 1,105,111 | | | | 466,609 | |
| Merrill Lynch Mortgage Investors Trust 2006-3, Mtg. Pass-Through Certificates, Series MLCC 2006-3, Cl. 2A1, 2.537%, 10/25/362 | | | 1,397,067 | | | | 1,317,339 | |
| NC Finance Trust, Series 1999-I, Cl. D, 3.405%, 1/25/291,6 | | | 66,744 | | | | 4,505 | |
| | | | |
| 16 | | | | OPPENHEIMER GLOBAL STRATEGIC INCOME FUND/VA |
| | | | | | | | |
| | | Principal
Amount | | | Value | |
| Residential Continued | | | | | |
RALI Series 2006-QS13 Trust, Mtg. Asset-Backed Pass-Through Certificates:
Series 2006-QS13, Cl. 1A5, 6%, 9/25/36 | | $ | 1,525,562 | | | $ | 1,181,366 | |
| Series 2006-QS13, Cl. 1A8, 6%, 9/1/36 | | | 30,494 | | | | 23,614 | |
| RALI Series 2007-QS6 Trust, Mtg. Asset-Backed Pass-Through Certificates, Series 2007-QS6, Cl. A28, 5.75%, 4/25/37 | | | 736,191 | | | | 580,998 | |
| Residential Asset Securitization Trust 2005-A14, Mtg. Pass-Through Certificates, Series 2005-A14, Cl. A1, 5.50%, 12/1/35 | | | 3,014,673 | | | | 2,687,631 | |
| Residential Asset Securitization Trust 2005-A15, Mtg. Pass-Through Certificates, Series 2005-A15, Cl. 1A4, 5.75%, 2/1/36 | | | 3,231,341 | | | | 2,900,498 | |
| Residential Asset Securitization Trust 2005-A6CB, Mtg. Pass-Through Certificates, Series 2005-A6CB, Cl. A7, 6%, 6/1/35 | | | 3,871,076 | | | | 3,730,658 | |
| Terwin Mortgage Trust, Home Equity Asset-Backed Securities, Series 2006-4SL, Cl. A1, 2.367%, 5/1/372,3,9 | | | 155,504 | | | | 74,057 | |
| WaMu Mortgage Pass-Through Certificates 2005-AR12 Trust, Mtg. Pass-Through Certificates, Series 2007-AR12, Cl. 1A8, 2.444%, 10/1/352 | | | 2,106,179 | | | | 1,985,269 | |
| WaMu Mortgage Pass-Through Certificates 2006-AR10 Trust, Mtg. Pass-Through Certificates, Series 2006-AR10, Cl. 1A2, 2.658%, 9/1/362 | | | 791,184 | | | | 645,197 | |
| WaMu Mortgage Pass-Through Certificates 2007-HY1 Trust, Mtg. Pass-Through Certificates: Series 2007-HY1, Cl. 4A1, 2.553%, 2/1/372 | | | 11,162,484 | | | | 9,245,081 | |
| Series 2007-HY1, Cl. 5A1, 2.546%, 2/1/372 | | | 6,867,879 | | | | 5,548,171 | |
| WaMu Mortgage Pass-Through Certificates 2007-HY5 Trust, Mtg. Pass-Through Certificates, Series 2007-HY5, Cl. 3A1, 4.981%, 5/1/372 | | | 801,506 | | | | 772,939 | |
| | | | | | | | |
| | | Principal
Amount | | | Value | |
| Residential Continued | | | | | |
| Wells Fargo Mortgage-Backed Securities 2005-9 Trust, Mtg. Pass-Through Certificates, Series 2005-9, Cl. 2A6, 5.25%, 10/25/35 | | $ | 321,418 | | | $ | 330,666 | |
Wells Fargo Mortgage-Backed
Securities 2006-AR14 Trust, Mtg. Pass-Through Certificates,
Series 2006-AR14, Cl. 1A2,
5.626%, 10/1/362 | | | 2,614,030 | | | | 2,462,728 | |
| | | | | | |
|
|
|
| | | | | | | | 83,581,117 | |
| | | | | | |
|
|
|
Total Mortgage-Backed Obligations
(Cost $511,016,943) | | | | 519,411,505 | |
| U.S. Government Obligations—7.6% | |
Federal Home Loan
Mortgage Corp. Nts.:
0.875%, 3/7/18 | | | 8,718,000 | | | | 8,445,841 | |
| 1.375%, 5/1/20 | | | 11,644,000 | | | | 11,045,172 | |
| 2.375%, 1/13/22 | | | 1,113,000 | | | | 1,083,042 | |
Federal National Mortgage
Assn. Nts.:
0.375%, 7/5/16 | | | 4,500,000 | | | | 4,447,814 | |
| 0.875%, 5/21/18 | | | 8,973,000 | | | | 8,682,382 | |
U.S. Treasury Bills:
0.035%, 8/22/13 | | | 11,510,000 | | | | 11,509,418 | |
| 0.063%, 11/7/13 | | | 11,745,000 | | | | 11,742,945 | |
| 0.065%, 10/31/1310,11 | | | 21,980,000 | | | | 21,976,088 | |
| 0.102%, 7/18/13 | | | 7,660,000 | | | | 7,659,891 | |
U.S. Treasury Bonds, STRIPS,
4.833%, 2/15/1612 | | | 2,116,000 | | | | 2,083,998 | |
U.S. Treasury Nts,
1.75%, 5/15/23 | | | 64,400,000 | | | | 60,279,430 | |
U.S. Treasury Nts.,
2%, 2/15/23 | | | 40,630,000 | | | | 39,076,228 | |
| | | | | | |
|
|
|
Total U.S. Government Obligations
(Cost $192,614,830) | | | | 188,032,249 | |
| Foreign Government Obligations—23.2% | | | | | |
| Angola—0.2% | | | | | | | | |
Angola (Republic of)
Sr. Unsec. Nts.,
7%, 8/16/19 | | | 3,970,000 | | | | 4,094,063 | |
| Australia—0.3% | | | | | | | | |
New South Wales Treasury Corp. Sr. Unsec. Nts.:
Series 19, 6%, 4/1/19 | | | 460,000 | AUD | | | 470,401 | |
| Series 20, 6%, 6/1/20 | | | 635,000 | AUD | | | 657,008 | |
Queensland Treasury Corp. Nts.:
Series 17, 6%, 9/14/17 | | | 1,090,000 | AUD | | | 1,099,266 | |
| Series 21, 6%, 6/14/21 | | | 1,340,000 | AUD | | | 1,372,381 | |
| Series 33, 6.50%, 3/14/33 | | | 1,325,000 | AUD | | | 1,387,231 | |
| | | | |
| 17 | | | | OPPENHEIMER GLOBAL STRATEGIC INCOME FUND/VA |
CONSOLIDATED STATEMENT OF INVESTMENTS Unaudited / Continued
| | | | | | | | |
| | | Principal
Amount | | | Value | |
| Australia Continued | | | | | |
Queensland Treasury Corp.
Sr. Unsec. Nts.:
Series 19, 6.25%, 6/14/19 | | | 585,000 | AUD | | $ | 604,501 | |
| Series 23, 4.25%, 7/21/23 | | | 645,000 | AUD | | | 564,442 | |
Victoria Treasury Corp. Nts.,
5.50%, 11/17/26 | | | 1,705,000 | AUD | | | 1,680,509 | |
| Western Australia Treasury Corp. Unsec. Nts., 7%, 10/15/19 | | | 225,000 | AUD | | | 240,561 | |
| | | | | | |
|
|
|
| | | | | | | | 8,076,300 | |
| Belgium—0.2% | | | | | | | | |
Belgium (Kingdom of) Bonds:
Series 58, 3.75%, 9/28/20 | | | 2,740,000 | EUR | | | 3,991,093 | |
| Series 60, 4.25%, 3/28/41 | | | 135,000 | EUR | | | 199,833 | |
| | | | | | |
|
|
|
| | | | | | | | 4,190,926 | |
| Bolivia—0.0% | | | | | | | | |
Bolivia (Plurinational State of)
Unsec. Bonds,
4.875%, 10/29/22 | | | 1,195,000 | | | | 1,126,288 | |
| Brazil—3.0% | | | | | | | | |
Brazil (Federative Republic of)
Letra Tesouro Nacional Nts.:
8.897%, 7/1/1412 | | | 14,575,000 | BRR | | | 5,967,027 | |
| 9.029%, 1/1/1412 | | | 29,110,000 | BRR | | | 12,479,212 | |
Brazil (Federative Republic of)
Nota Do Tesouro Nacional Nts.:
9.762%, 1/1/14 | | | 7,810,000 | BRR | | | 3,510,882 | |
| 9.762%, 1/1/17 | | | 23,545,000 | BRR | | | 10,356,754 | |
| 9.762%, 1/1/21 | | | 58,163,000 | BRR | | | 25,057,350 | |
| 13.505%, 5/15/4513 | | | 4,105,000 | BRR | | | 4,727,283 | |
| Series NTNB, 13.288%, 8/15/5013 | | | 3,810,000 | BRR | | | 4,431,878 | |
Brazil (Federative Republic of) Nota Do Tesouro Nacional
Unsec. Bonds, 9.762%, 1/1/18 | | | 15,355,000 | BRR | | | 6,710,320 | |
| | | | | | |
|
|
|
| | | | | | | | 73,240,706 | |
| Canada—0.1% | | | | | | | | |
Canada (Government of) Nts.,
3.75%, 6/1/19 | | | 2,010,000 | CAD | | | 2,098,163 | |
Canada (Government of)
Treasury Bills,
1.044%, 12/5/1312 | | | 915,000 | CAD | | | 866,192 | |
| | | | | | |
|
|
|
| | | | | | | | 2,964,355 | |
| Croatia—0.3% | | | | | | | | |
Croatia (Republic of)
Unsec. Nts.:
5.50%, 4/4/233 | | | 3,095,000 | | | | 3,017,625 | |
| 6.25%, 4/27/173 | | | 1,570,000 | | | | 1,649,929 | |
| 6.375%, 3/24/213 | | | 740,000 | | | | 777,925 | |
| 6.75%, 11/5/193 | | | 695,000 | | | | 745,332 | |
| | | | | | |
|
|
|
| | | | | | | | 6,190,811 | |
| | | | | | | | |
| | | Principal
Amount | | | Value | |
| Denmark—0.1% | | | | | | | | |
Denmark (Kingdom of) Bonds,
4%, 11/15/19 | | | 6,050,000 | DKK | | $ | 1,244,821 | |
| Dominican Republic—0.1% | | | | | | | | |
Banco De Reservas De La Republica Dominicana Bonds,
7%, 2/1/233 | | | 1,195,000 | | | | 1,200,975 | |
Dominican Republic
Sr. Unsec. Bonds,
5.875%, 4/18/243 | | | 1,325,000 | | | | 1,281,938 | |
| | | | | | |
|
|
|
| | | | | | | | 2,482,913 | |
| Finland—0.0% | | | | | | | | |
Finland (Repulic of)
Unsec. Bonds,
1.625%, 9/15/22 | | | 555,000 | EUR | | | 706,591 | |
| France—0.3% | | | | | | | | |
France (Republic of) Bonds:
3.75% 10/25/19 | | | 1,220,000 | EUR | | | 1,803,133 | |
| 4%, 4/25/60 | | | 565,000 | EUR | | | 820,407 | |
| 4.50%, 4/25/41 | | | 870,000 | EUR | | | 1,381,450 | |
France (Republic of) Unsec. Nts.,
2.25%, 10/25/22 | | | 2,785,000 | EUR | | | 3,624,002 | |
| | | | | | |
|
|
|
| | | | | | | | 7,628,992 | |
| Germany—0.8% | | | | | | | | |
Germany (Federal Republic of)
Bonds, 2.50%, 7/4/44 | | | 1,210,000 | EUR | | | 1,585,523 | |
Germany (Federal Republic of)
Unsec. Bonds:
0.25%, 4/13/18 | | | 3,975,000 | EUR | | | 5,053,423 | |
| 1.50%, 5/15/23 | | | 1,740,000 | EUR | | | 2,215,530 | |
| 3.50%, 1/4/16 | | | 1,350,000 | EUR | | | 1,899,840 | |
Series 153, 4%, 10/11/13 | | | 7,080,000 | EUR | | | 9,316,514 | |
| | | | | | |
|
|
|
| | | | | | | | 20,070,830 | |
| Guatemala—0.0% | | | | | | | | |
Guatemala (Republic of)
Sr. Unsec. Bonds,
4.875%, 2/13/283 | | | 1,220,000 | | | | 1,116,300 | |
| Hungary—1.4% | | | | | | | | |
Hungary (Republic of) Bonds:
6.75%, 11/24/17 | | | 695,000,000 | HUF | | | 3,237,567 | |
| Series 19/A, 6.50%, 6/24/19 | | | 1,415,000,000 | HUF | | | 6,571,455 | |
| Series 20/A, 7.50%, 11/12/20 | | | 491,000,000 | HUF | | | 2,387,032 | |
| Series 23A, 6%, 11/24/23 | | | 1,581,200,000 | HUF | | | 6,988,451 | |
Hungary (Republic of)
Sr. Unsec. Bonds,
7.625%, 3/29/41 | | | 135,000 | | | | 141,615 | |
Hungary (Republic of)
Sr. Unsec. Nts.,
5.75%, 6/11/18 | | | 365,000 | EUR | | | 491,719 | |
| | | | |
| 18 | | | | OPPENHEIMER GLOBAL STRATEGIC INCOME FUND/VA |
| | | | | | | | |
| | | Principal
Amount | | | Value | |
| Hungary Continued | | | | | |
Hungary (Republic of)
Sr. Unsec. Unsub. Nts.,
6.375%, 3/29/21 | | $ | 3,500,000 | | | $ | 3,657,500 | |
Hungary (Republic of)
Unsec. Bonds:
5.375%, 2/21/23 | | | 2,555,000 | | | | 2,471,963 | |
| 5.50%, 12/20/18 | | | 1,747,000,000 | HUF | | | 7,753,505 | |
| | | | | | |
|
|
|
| | | | | | | | 33,700,807 | |
| Ireland—0.0% | | | | | | | | |
| Ireland (Republic of) Treasury Bonds, 4.40%, 6/18/19 | | | 720,000 | EUR | | | 984,014 | |
| Italy—0.5% | | | | | | | | |
Italy (Republic of) Bonds:
4%, 9/1/20 | | | 1,015,000 | EUR | | | 1,332,080 | |
| 4.50%, 3/1/19 | | | 3,480,000 | EUR | | | 4,718,153 | |
| 5%, 3/1/22 | | | 535,000 | EUR | | | 733,607 | |
| 5%, 9/1/40 | | | 1,110,000 | EUR | | | 1,443,191 | |
| Series EU, 1.129%, 10/15/172 | | | 680,000 | EUR | | | 835,447 | |
| Italy (Republic of) Sr. Unsec. Nts., 4.50%, 6/8/15 | | | 132,000,000 | JPY | | | 1,403,878 | |
| Italy (Republic of) Treasury Bonds: | | | | | | | | |
| 3.50%, 11/1/17 | | | 570,000 | EUR | | | 748,591 | |
| 4.75%, 5/1/17 | | | 740,000 | EUR | | | 1,018,273 | |
| 4.75%, 9/1/44 | | | 535,000 | EUR | |
| 664,032
|
|
| | | | | | | | 12,897,252 | |
| Ivory Coast—0.2% | | | | | | | | |
Ivory Coast Bonds,
5.75%, 12/31/32 | | | 6,055,000 | | | | 5,010,513 | |
| Japan—1.2% | | | | | | | | |
| Japan Bonds: | | | | | | | | |
| 5 yr., 0.30%, 3/20/17 | | | 606,000,000 | JPY | | | 6,131,568 | |
| 10 yr., 1.10%, 3/20/21 | | | 427,000,000 | JPY | | | 4,441,299 | |
| 10 yr., Series 329, 0.80%, 6/20/23 | | | 81,000,000 | JPY | | | 813,124 | |
| 20 yr., Series 112, 2.10%, 6/20/29 | | | 375,000,000 | JPY | | | 4,155,777 | |
| 20 yr., Series 134, 1.80%, 3/20/32 | | | 236,000,000 | JPY | | | 2,440,508 | |
| 30 yr., 2%, 3/20/42 | | | 463,000,000 | JPY | | | 4,856,538 | |
| 30 yr., Series 39, 1.90%, 6/20/43 | | | 27,000,000 | JPY | | | 276,190 | |
| Japan Sr. Unsec. Bonds: | | | | | | | | |
| Series 38, 1.80%, 3/20/43 | | | 81,000,000 | JPY | | | 810,509 | |
| Series 143, 1.60%, 3/20/33 | | | 364,000,000 | JPY | | | 3,617,223 | |
| Series 328, 0.60%, 3/20/23 | | | 267,000,000 | JPY | | | 2,633,703 | |
Japan Sr. Unsec. Nts.,
2.30%, 3/19/18 | | | 395,000 | CAD | | | 371,864 | |
| | | | | | |
|
|
|
| | | | | | | | 30,548,303 | |
| Kazakhstan—0.0% | | | | | | | | |
| Development Bank of Kazakhstan Sr. Unsec. Bonds, 4.125%, 12/10/223 | | | 295,000 | | | | 264,025 | |
| | | | | | | | |
| | | Principal
Amount | | | Value | |
| Korea, Republic of South—0.1% | | | | | |
| Korea Housing Finance Corp., 1.625% Sec. Nts., 9/15/183 | | $ | 1,325,000 | | | $ | 1,221,776 | |
| Malaysia—0.4% | | | | | |
| Central Bank of Malaysia Treasury Bills: | | | | | | | | |
| Series 0213, 2.975%, 1/9/1412 | | | 7,790,000 | MYR | | | 2,426,597 | |
| Series 0413, 2.974%, 1/16/1412 | | | 15,580,000 | MYR | | | 4,850,333 | |
| Series 2513, 2.953%, 12/5/1312 | | | 3,895,000 | MYR | | | 1,217,115 | |
| Malaysia (Government of) Sr. Unsec. Bonds: | | | | | | | | |
| Series 1/06, 4.262%, 9/15/16 | | | 2,400,000 | MYR | | | 779,381 | |
| Series 0210, 4.012%, 9/15/17 | | | 1,910,000 | MYR | |
| 616,967
|
|
| | | | | | | | 9,890,393 | |
| Mexico—3.8% | | | | | | | | |
| United Mexican States Bonds: | | | | | | | | |
| Series M, 5%, 6/15/172 | | | 58,500,000 | MXN | | | 4,532,367 | |
| Series M, 6.50%, 6/9/222 | | | 121,200,000 | MXN | | | 9,878,350 | |
| Series M20, 7.50%, 6/3/272 | | | 74,800,000 | MXN | | | 6,479,838 | |
| Series M10, 7.75%, 12/14/17 | | | 23,655,000 | MXN | | | 2,017,581 | |
| Series MI10, 8%, 12/19/13 | | | 237,800,000 | MXN | | | 18,717,020 | |
| Series M20, 8.50%, 5/31/292 | | | 56,440,000 | MXN | | | 5,202,880 | |
| United Mexican States Treasury Bills: | | | | | | | | |
| 3.801%, 11/14/1312 | | | 57,200,000 | MXN | | | 4,348,409 | |
| 3.814%, 9/19/1312 | | | 64,800,000 | MXN | | | 4,956,875 | |
| 3.823%, 9/5/1312 | | | 76,400,000 | MXN | | | 5,853,179 | |
| 3.826%, 10/3/1312 | | | 156,600,000 | MXN | | | 11,961,108 | |
| 4.244%, 7/11/1312 | | | 109,900,000 | MXN | | | 8,469,987 | |
| United Mexican States Unsec. Nts., Series BI, 3.809%, 10/31/1312 | | | 143,500,000 | MXN | | | 10,928,967 | |
| | | | | | |
|
|
|
| | | | | | | | 93,346,561 | |
| Nigeria—0.4% | | | | | | | | |
| Nigeria (Federal Republic of) Treasury Bills: | | | | | | | | |
| 10.635%, 7/4/1312 | | | 45,000,000 | NGN | | | 275,510 | |
| 11.235%, 1/23/1412 | | | 166,000,000 | NGN | | | 948,859 | |
| 11.835%, 10/24/1312 | | | 42,000,000 | NGN | | | 250,219 | |
| 11.851%, 10/10/1312 | | | 32,000,000 | NGN | | | 189,441 | |
| 12.226%, 8/1/1312 | | | 45,555,000 | NGN | | | 276,537 | |
| 13.662%, 9/5/1312 | | | 329,000,000 | NGN | | | 1,975,312 | |
| 13.779%, 9/26/1312 | | | 164,000,000 | NGN | | | 978,029 | |
| Nigeria (Federal Republic of) Treasury Bonds: | | | | | | | | |
| 7%, 10/23/19 | | | 302,000,000 | NGN | | | 1,326,752 | |
| 16%, 6/29/19 | | | 314,000,000 | NGN | | | 2,082,991 | |
| 16.39%, 1/27/22 | | | 328,000,000 | NGN | |
| 2,264,054
|
|
| | | | | | | | 10,567,704 | |
| Paraguay—0.0% | | | | | | | | |
| Paraguay (Republic of) Sr. Unsec. Bonds, 4.625%, 1/25/233 | | | 800,000 | | | | 780,000 | |
| | | | |
| 19 | | | | OPPENHEIMER GLOBAL STRATEGIC INCOME FUND/VA |
CONSOLIDATED STATEMENT OF INVESTMENTS Unaudited / Continued
| | | | | | | | |
| | | Principal
Amount | | | Value | |
| Peru—0.2% | | | | | | | | |
| Peru (Republic of) Sr. Unsec. Bonds, 8.20%, 8/12/263 | | | 9,765,000 | PEN | | $ | 4,300,356 | |
| Peru (Republic of) Sr. Unsec. Nts., 7.84%, 8/12/203 | | | 4,400,000 | PEN | | | 1,824,213 | |
| | | | | | |
|
|
|
| | | | | | | | 6,124,569 | |
| Poland—0.4% | | | | | | | | |
| Poland (Republic of) Bonds: | | | | | | | | |
| Series 0415, 5.50%, 4/25/15 | | | 2,355,000 | PLZ | | | 739,358 | |
| Series 1017, 5.25%, 10/25/17 | | | 3,260,000 | PLZ | | | 1,043,789 | |
| Poland (Republic of) Unsec. Bonds, Series 429, 5.75%, 4/25/29 | | | 26,340,000 | PLZ | | | 9,086,892 | |
| | | | | | |
|
|
|
| | | | | | | | 10,870,039 | |
| Portugal—0.2% | | | | | | | | |
| Portugal (Republic of) Sr. Unsec. Bonds: | | | | | | | | |
| 4.10%, 4/15/37 | | | 605,000 | EUR | | | 553,135 | |
| 5.65% 2/15/243 | | | 930,000 | EUR | | | 1,127,734 | |
| Portugal (Republic of) Sr. Unsec. Nts., 4.75%, 6/14/19 | | | 270,000 | EUR | | | 332,353 | |
| Portugal (Republic of) Sr. Unsec. Unsub. Bonds, 4.35%, 10/16/17 | | | 1,660,000 | EUR | | | 2,103,143 | |
| | | | | | |
|
|
|
| | | | | | | | 4,116,365 | |
| Russia—1.9% | | | | | | | | |
| AHML Finance Ltd. Unsec. Nts., 7.75%, 2/13/183 | | | 62,400,000 | RUR | | | 1,863,098 | |
| Russian Federation Bonds: | | | | | | | | |
| 7.50%, 3/15/182 | | | 198,300,000 | RUR | | | 6,239,184 | |
| 7.50%, 2/27/192 | | | 250,700,000 | RUR | | | 7,756,106 | |
| 7.60%, 4/14/212 | | | 271,700,000 | RUR | | | 8,439,108 | |
| Russian Federation Sr. Unsec. Bonds, Series 6211, 7%, 1/25/232 | | | 465,800,000 | RUR | | | 13,723,700 | |
| Russian Federation Unsec. Bonds: | | | | | | | | |
| Series 9, 7.90%, 3/18/212 | | | 43,800,000 | RUR | | | 1,328,547 | |
| Series 6209, 7.60%, 7/20/222 | | | 197,600,000 | RUR | | | 6,074,217 | |
| Vnesheconombank Sr. Unsec. Bonds, Series 18, 8.55%, 9/17/322 | | | 49,000,000 | RUR | | | 1,506,258 | |
| | | | | | |
|
|
|
| | | | | | | | 46,930,218 | |
| Rwanda—0.1% | | | | | | | | |
| Rwanda (Republic of) Sr. Unsec. Bonds, 6.625%, 5/2/233 | | | 1,780,000 | | | | 1,553,050 | |
| Serbia—0.1% | | | | | | | | |
| Serbia (Republic of) Sr. Unsec. Nts., 5.25%, 11/21/173 | | | 1,165,000 | | | | 1,141,700 | |
Serbia (Republic of) Treasury Bills:
9.824%, 1/30/1412 | | | 38,000,000 | RSD | | | 413,677 | |
| 10.004%, 6/12/1412 | | | 151,000,000 | RSD | | | 1,584,371 | |
| | | | | | |
|
|
|
| | | | | | | | 3,139,748 | |
| | | | | | | | |
| | | Principal
Amount | | | Value | |
| South Africa—1.4% | | | | | | | | |
South Africa (Republic of) Bonds:
Series R208, 6.75%, 3/31/21 | | | 147,470,000 | ZAR | | $ | 14,322,047 | |
| Series R213, 7%, 2/28/31 | | | 43,338,000 | ZAR | | | 3,815,592 | |
| Series R207, 7.25%, 1/15/20 | | | 130,730,000 | ZAR | | | 13,167,228 | |
South Africa (Republic of)
Unsec. Bonds, Series 2023, 7.75%, 2/28/23 | | | 34,900,000 | ZAR | | | 3,565,039 | |
| | | | | | |
|
|
|
| | | | | | | | 34,869,906 | |
| Spain—0.2% | | | | | | | | |
Comunidad De Madrid
Sr. Unsec. Nts., 4.30%, 9/15/26 | | | 1,900,000 | EUR | | | 2,023,438 | |
Instituto de Credito Oficial
Sr. Unsec. Nts., 5%, 5/15/15 | | | 2,200,000 | NOK | | | 360,359 | |
Spain (Kingdom of) Bonds:
4.25%, 10/31/16 | | | 425,000 | EUR | | | 574,236 | |
| 5.50%, 7/30/17 | | | 775,000 | EUR | | | 1,089,203 | |
| | | | | | |
|
|
|
| | | | | | | | 4,047,236 | |
| Sri Lanka—0.2% | | | | | | | | |
Sri Lanka (Democratic Socialist Republic of) Sr. Unsec. Bonds,
5.875%, 7/25/223 | | | 985,000 | | | | 940,675 | |
Sri Lanka (Democratic Socialist Republic of) Sr. Unsec. Nts.:
6.25%, 10/4/203 | | | 1,775,000 | | | | 1,775,000 | |
| 6.25% 7/27/213 | | | 2,015,000 | | | | 2,004,925 | |
| | | | | | |
|
|
|
| | | | | | | | 4,720,600 | |
| Tanzania—0.1% | | | | | | | | |
Tanzania (United Republic of)
Sr. Unsec. Nts., 6.45%, 3/8/202 | | | 1,610,000 | | | | 1,618,050 | |
| Thailand—0.7% | | | | | | | | |
Thailand (Kingdom of)
Sr. Unsec. Bonds:
3.58%, 12/17/27 | | | 204,000,000 | THB | | | 6,212,098 | |
| 3.625%, 6/16/23 | | | 200,400,000 | THB | | | 6,387,814 | |
| 3.65%, 12/17/21 | | | 128,400,000 | THB | | | 4,131,346 | |
| | | | | | |
|
|
|
| | | | | | | | 16,731,258 | |
| The Netherlands—0.1% | | | | | |
Netherlands (Kingdom of the) Bonds:
4%, 7/15/19 | | | 1,060,000 | EUR | | | 1,592,264 | |
| 4%, 1/15/37 | | | 360,000 | EUR | | | 581,930 | |
Netherlands (Kingdom of the)
Unsec. Nts., 1.75%, 7/15/233 | | | 810,000 | EUR | | | 1,018,258 | |
| | | | | | |
|
|
|
| | | | | | | | 3,192,452 | |
| Turkey—2.8% | | | | | | | | |
Turkey (Republic of) Bonds:
6.875%, 3/17/36 | | | 2,270,000 | | | | 2,539,563 | |
| 7%, 3/11/19 | | | 1,390,000 | | | | 1,596,763 | |
| 9%, 3/5/14 | | | 16,685,000 | TRY | | | 8,780,582 | |
| 9%, 3/8/17 | | | 20,535,000 | TRY | | | 11,019,715 | |
| | | | |
| 20 | | | | OPPENHEIMER GLOBAL STRATEGIC INCOME FUND/VA |
| | | | | | | | |
| | | Principal
Amount | | | Value | |
| Turkey Continued | | | | | | | | |
Turkey (Republic of) Bonds: Continued 9.50%, 1/12/222 | | | 8,905,000 | TRY | | $ | 4,905,668 | |
| 16.519%, 8/14/1313 | | | 2,310,000 | TRY | | | 1,722,288 | |
Turkey (Republic of) Nts.,
7.50%, 7/14/17 | | | 2,110,000 | | | | 2,429,138 | |
Turkey (Republic of) Unsec. Bonds:
5.621%, 2/11/1513 | | | 2,305,000 | TRY | | | 1,600,164 | |
| 6.25%, 9/26/22 | | | 5,395,000 | | | | 5,988,450 | |
| 8.50%, 9/14/222 | | | 8,590,000 | TRY | | | 4,509,449 | |
| Series 5Y, 6.30%, 2/14/182 | | | 12,365,000 | TRY | | | 6,002,285 | |
Turkey (Republic of) Unsec. Nts.:
4.097%, 9/11/1312 | | | 22,100,000 | TRY | | | 11,333,827 | |
| 5.125%, 3/25/22 | | | 2,990,000 | | | | 3,072,225 | |
| 6%, 1/14/41 | | | 2,650,000 | | | | 2,653,313 | |
| | | | | | |
|
|
|
| | | | | | | | 68,153,430 | |
| Ukraine—0.2% | | | | | | | | |
Ukraine (Republic of) Bonds,
7.75%, 9/23/203 | | | 1,670,000 | | | | 1,532,225 | |
| Ukraine (Republic of) Sr. Unsec. Bonds, 7.50%, 4/17/233 | | | 1,780,000 | | | | 1,570,850 | |
| Ukraine (Republic of) Sr. Unsec. Nts., 7.95%, 2/23/213 | | | 2,330,000 | | | | 2,155,250 | |
| | | | | | |
|
|
|
| | | | | | | | 5,258,325 | |
| United Arab Emirates—0.0% | | | | | |
Emirates of Dubai Sr. Unsec.
International Bonds,
Series EMTN, 5.25%, 1/30/43 | | | 425,000 | | | | 361,250 | |
| United Kingdom—0.4% | | | | | |
United Kingdom Treasury Bonds:
3.75%, 9/7/21 | | | 1,530,000 | GBP | | | 2,596,157 | |
| 4%, 9/7/16 | | | 1,080,000 | GBP | | | 1,810,736 | |
| 4.25%, 12/7/55 | | | 395,000 | GBP | | | 691,859 | |
| 4.75%, 12/7/38 | | | 1,980,000 | GBP | | | 3,693,022 | |
| | | | | | |
|
|
|
| | | | | | | | 8,791,774 | |
| Venezuela—0.8% | | | | | | | | |
Venezuela (Republic of) Bonds:
9%, 5/7/23 | | | 4,710,000 | | | | 3,944,625 | |
| 11.95%, 8/5/31 | | | 2,080,000 | | | | 1,996,800 | |
Venezuela (Republic of) Nts.,
8.25%, 10/13/24 | | | 3,380,000 | | | | 2,636,400 | |
Venezuela (Republic of)
Sr. Unsec. Bonds,
11.75%, 10/21/26 | | | 800,000 | | | | 764,000 | |
Venezuela (Republic of)
Sr. Unsec. Unsub. Nts.,
12.75%, 8/23/22 | | | 2,615,000 | | | | 2,693,450 | |
Venezuela (Republic of) Unsec. Bonds:
7%, 3/31/38 | | | 2,410,000 | | | | 1,654,465 | |
| 7.65%, 4/21/25 | | | 3,300,000 | | | | 2,475,000 | |
| | | | | | | | |
| | | Principal
Amount | | | Value | |
| Venezuela Continued | | | | | |
| Venezuela (Republic of) Unsec. Nts., 13.625%, 8/15/183 | | $ | 3,830,000 | | | $ | 3,935,325 | |
| | | | | | |
|
|
|
| | | | | | | | 20,100,065 | |
| | | | | | |
|
|
|
| Total Foreign Government Obligations (Cost $613,873,443) | | | | | | | 572,923,579 | |
| Corporate Bonds and Notes—35.4% | |
| Consumer Discretionary—5.0% | | | | | |
| Auto Components—0.6% | | | | | | | | |
Affinia Group, Inc.,
7.75% Sr. Unsec. Nts., 5/1/213 | | | 1,640,000 | | | | 1,660,500 | |
| Continental Rubber of America Corp., 4.50% Sr. Sec. Nts., 9/15/193 | | | 510,000 | | | | 527,684 | |
Goodyear Tire & Rubber Co. (The), 8.25% Sr. Unsec. Unsub.
Nts., 8/15/20 | | | 3,385,000 | | | | 3,723,500 | |
Lear Corp.,
4.75% Sr. Unsec. Nts., 1/15/233 | | | 3,235,000 | | | | 3,089,425 | |
| Tower Automotive Holdings USA LLC/TA Holdings Finance, Inc., 10.625% Sr. Sec. Nts., 9/1/173 | | | 711,000 | | | | 757,215 | |
Visteon Corp.,
6.75% Sr. Unsec. Nts., 4/15/19 | | | 3,559,000 | | | | 3,763,643 | |
| | | | | | |
|
|
|
| | | | | | | | 13,521,967 | |
| Automobiles—0.1% | | | | | | | | |
Ford Motor Co.,
7.45% Bonds, 7/16/31 | | | 1,025,000 | | | | 1,233,196 | |
Jaguar Land Rover plc:
5.625% Sr. Unsec. Nts., 2/1/233 | | | 1,295,000 | | | | 1,262,625 | |
| 7.75% Sr. Unsec. Bonds, 5/15/183 | | | 500,000 | | | | 542,500 | |
| 8.25% Sr. Nts., 3/15/203 | | | 245,000 | GBP | | | 406,172 | |
| | | | | | |
|
|
|
| | | | | | | | 3,444,493 | |
| Distributors—0.0% | | | | | | | | |
LKQ Corp., 4.75% Sr. Unsec.
Nts., 5/15/233 | | | 630,000 | | | | 603,225 | |
| Diversified Consumer Services—0.2% | | | | | |
Monitronics International, Inc.,
9.125% Sr. Unsec. Nts., 4/1/20 | | | 1,285,000 | | | | 1,336,400 | |
ServiceMaster Co.:
7% Sr. Unsec. Unsub.
Nts., 8/15/20 | | | 2,265,000 | | | | 2,160,244 | |
| 8% Sr. Unsec. Unsub. Nts., 2/15/20 | | | 1,565,000 | | | | 1,568,913 | |
| | | | | | |
|
|
|
| | | | | | | | 5,065,557 | |
| Hotels, Restaurants & Leisure—1.2% | | | | | |
Boyd Gaming Corp.,
9.125% Sr. Unsec. Nts., 12/1/18 | | | 3,105,000 | | | | 3,252,488 | |
| | | | |
| 21 | | | | OPPENHEIMER GLOBAL STRATEGIC INCOME FUND/VA |
CONSOLIDATED STATEMENT OF INVESTMENTS Unaudited / Continued
| | | | | | | | |
| | | Principal
Amount | | | Value | |
| Hotels, Restaurants & Leisure Continued | | | | | |
Burger King Corp.,
9.875% Sr. Unsec. Unsub.
Nts., 10/15/18 | | $ | 1,105,000 | | | $ | 1,237,600 | |
Caesars Entertainment Operating Co., Inc., 10% Sr. Sec.
Nts., 12/15/18 | | | 6,965,000 | | | | 4,213,825 | |
| CKE Restaurants, Inc., 11.375% Sec. Nts., 7/15/18 | | | 115,000 | | | | 119,170 | |
| HOA Restaurants Group LLC/HOA Finance Corp., 11.25% Sr. Sec. Nts., 4/1/173 | | | 2,075,000 | | | | 2,085,375 | |
| Isle of Capri Casinos, Inc., 7.75% Sr. Unsec. Unsub. Nts., 3/15/19 | | | 2,615,000 | | | | 2,765,363 | |
| Landry’s, Inc., 9.375% Sr. Unsec. Nts., 5/1/203 | | | 2,985,000 | | | | 3,164,100 | |
| MCE Finance Ltd., 5% Sr. Unsec. Nts., 2/15/213 | | | 1,625,000 | | | | 1,527,500 | |
| MGM Resorts International: 6.625% Sr. Unsec. Unsub. Nts., 12/15/21 | | | 1,595,000 | | | | 1,646,838 | |
| 6.75% Sr. Unsec. Nts., 10/1/20 | | | 1,515,000 | | | | 1,571,813 | |
| MTR Gaming Group, Inc., 11.50% Sec. Nts., 8/1/19 | | | 1,170,825 | | | | 1,229,366 | |
| NCL Corp. Ltd., 5% Sr. Unsec. Nts., 2/15/183 | | | 1,625,000 | | | | 1,600,625 | |
| Penn National Gaming, Inc., 8.75% Sr. Unsec. Sub. Nts., 8/15/19 | | | 1,985,000 | | | | 2,183,500 | |
| Premier Cruise Ltd., 11% Sr. Nts., 3/15/081,6 | | | 250,000 | | | | — | |
| Sugarhouse HSP Gaming Prop Mezz LP/Sugarhouse HSP Gaming Finance Corp., 6.375% Sr. Sec. Nts., 6/1/213 | | | 1,645,000 | | | | 1,599,763 | |
| Viking Cruises Ltd., 8.50% Sr. Nts., 10/15/223 | | | 930,000 | | | | 1,023,000 | |
| | | | | | |
|
|
|
| | | | | | | | 29,220,326 | |
| Household Durables—0.3% | | | | | | | | |
Arcelik AS, 5% Sr. Unsec.
Nts., 4/3/233 | | | 690,000 | | | | 621,000 | |
Beazer Homes USA, Inc.,
9.125% Sr. Unsec. Nts., 5/15/19 | | | 3,805,000 | | | | 4,004,763 | |
| K Hovnanian Enterprises, Inc., 9.125% Sec. Nts., 11/15/203 | | | 1,465,000 | | | | 1,611,500 | |
| Taylor Morrison Communities, Inc./Monarch Communities, Inc., 5.25% Sr. Unsec. Nts., 4/15/213 | | | 1,050,000 | | | | 1,000,125 | |
| | | | | | |
|
|
|
| | | | | | | | 7,237,388 | |
| | | | | | | | |
| | | Principal
Amount | | | Value | |
| Media—1.7% | | | | | | | | |
Belo (A.H.) Corp., 7.75%
Sr. Unsec. Unsub. Debs., 6/1/27 | | $ | 3,702,000 | | | $ | 3,979,650 | |
CCO Holdings LLC/CCO Holdings Capital Corp., 5.75%
Sr. Unsec. Nts., 9/1/233 | | | 1,615,000 | | | | 1,570,588 | |
Cinemark USA, Inc., 5.125%
Sr. Unsec. Nts., 12/15/22 | | | 615,000 | | | | 596,550 | |
Cogeco Cable, Inc., 4.875%
Sr. Unsec. Nts., 5/1/203 | | | 420,000 | | | | 409,500 | |
Cumulus Media Holdings, Inc., 7.75% Sr. Unsec. Unsub.
Nts., 5/1/19 | | | 1,580,000 | | | | 1,552,350 | |
DISH DBS Corp.:
5.875% Sr. Unsec. Nts., 7/15/22 | | | 1,675,000 | | | | 1,708,500 | |
| 6.75% Sr. Unsec. Nts., 6/1/21 | | | 835,000 | | | | 891,363 | |
| 7.875% Sr. Unsec. Nts., 9/1/19 | | | 2,820,000 | | | | 3,172,500 | |
| Entravision Communications Corp., 8.75% Sr. Sec. Nts., 8/1/17 | | | 2,059,000 | | | | 2,200,556 | |
Getty Images, Inc., 7% Sr.
Nts., 10/15/203,4 | | | 1,525,000 | | | | 1,479,250 | |
Gray Television, Inc., 7.50%
Sr. Unsec. Nts., 10/1/20 | | | 3,100,000 | | | | 3,177,500 | |
Igloo Holdings Corp., 8.25%
Sr. Unsec. Nts., 12/15/171,5 | | | 2,879,000 | | | | 2,916,787 | |
LIN Television Corp., 6.375%
Sr. Unsec. Nts., 1/15/21 | | | 1,510,000 | | | | 1,534,538 | |
Lynx I Corp., 5.375% Sr. Sec.
Nts., 4/15/213 | | | 880,000 | | | | 888,800 | |
| Nexstar Broadcasting, Inc., 6.875% Sr. Unsec. Nts., 11/15/203 | | | 1,545,000 | | | | 1,599,075 | |
| Sinclair Television Group, Inc.: 5.375% Sr. Unsec. Nts., 4/1/213 | | | 1,680,000 | | | | 1,621,200 | |
| 6.125% Sr. Nts., 10/1/223 | | | 2,980,000 | | | | 2,994,900 | |
| Unitymedia Hessen GmbH & Co KG/Unitymedia NRW GmbH, 5.50% Sr. Sec. Nts., 1/15/233 | | | 850,000 | | | | 807,500 | |
Unitymedia Hessen GmbH & Co. KG/Unitymedia NRW
GmbH, 7.50% Sr. Sec. Nts., 3/15/19 | | | 830,000 | | | | 877,725 | |
| Univision Communications, Inc., 7.875% Sr. Sec. Nts., 11/1/203 | | | 2,935,000 | | | | 3,191,813 | |
UPCB Finance V Ltd., 7.25%
Sr. Sec. Nts., 11/15/213 | | | 2,040,000 | | | | 2,167,500 | |
UPCB Finance VI Ltd., 6.875%
Sr. Sec. Nts., 1/15/223 | | | 2,855,000 | | | | 2,969,200 | |
| | | | | | |
|
|
|
| | | | | | | | 42,307,345 | |
| | | | |
| 22 | | | | OPPENHEIMER GLOBAL STRATEGIC INCOME FUND/VA |
| | | | | | | | |
| | | Principal
Amount | | | Value | |
| Multiline Retail—0.1% | | | | | | | | |
J.C. Penney Corp, Inc.,
6.375% Sr. Unsec. Unsub.
Nts., 10/15/36 | | $ | 2,130,000 | | | $ | 1,672,050 | |
| Specialty Retail—0.5% | | | | | | | | |
| BC Mountain LLC/BC Mountain Finance, Inc., 7% Sr. Unsec. Nts., 2/1/213 | | | 3,240,000 | | | | 3,312,900 | |
| Burlington Coat Factory Warehouse Corp., 10% Sr. Unsec. Nts., 2/15/19 | | | 1,420,000 | | | | 1,576,200 | |
Claire’s Stores, Inc.:
7.75% Sr. Unsec. Nts., 6/1/203 | | | 1,605,000 | | | | 1,560,863 | |
| 8.875% Sr. Sec. Nts., 3/15/19 | | | 1,610,000 | | | | 1,698,550 | |
CST Brands, Inc., 5% Sr. Unsec.
Nts., 5/1/233 | | | 840,000 | | | | 823,200 | |
Hot Topic, Inc., 9.25% Sr. Sec.
Nts., 6/15/213 | | | 1,475,000 | | | | 1,500,813 | |
Limited Brands, Inc., 5.625%
Sr. Nts., 2/15/22 | | | 1,075,000 | | | | 1,096,500 | |
| Party City Holdings, Inc., 8.875% Sr. Unsec. Nts, 8/1/203 | | | 1,420,000 | | | | 1,530,050 | |
| | | | | | |
|
|
|
| | | | | | | | 13,099,076 | |
| Textiles, Apparel & Luxury Goods—0.3% | | | | | |
| Burlington Holdings LLC/Burlington Holding Finance, Inc., 9% Sr. Unsec. Nts., 2/15/183,5 | | | 3,100,000 | | | | 3,193,000 | |
Quiksilver, Inc., 6.875% Sr. Unsec.
Nts., 4/15/15 | | | 1,590,000 | | | | 1,566,150 | |
SIWF Merger Sub, Inc./Springs Industries, Inc., 6.25%
Sr. Sec. Nts., 6/1/213 | | | 1,650,000 | | | | 1,621,125 | |
| | | | | | |
|
|
|
| | | | | | | | 6,380,275 | |
| Consumer Staples—1.2% | | | | | |
| Food & Staples Retailing—0.1% | |
Rite Aid Corp., 9.25%
Sr. Unsec. Unsub. Nts., 3/15/20 | | | 505,000 | | | | 559,919 | |
US Foods, Inc., 8.50%
Sr. Sec. Nts., 6/30/19 | | | 1,585,000 | | | | 1,664,250 | |
| | | | | | |
|
|
|
| | | | | | | | 2,224,169 | |
| Food Products—0.8% | | | | | | | | |
Alicorp SA, 3.875%
Sr. Unsec. Nts., 3/20/233 | | | 620,000 | | | | 575,050 | |
American Seafoods Group LLC,
10.75% Sr. Sub. Nts., 5/15/163 | | | 2,770,000 | | | | 2,894,650 | |
ARAMARK Corp., 5.75%
Sr. Unsec. Nts., 3/15/203 | | | 1,615,000 | | | | 1,659,413 | |
ASG Consolidated LLC, 15%
Sr. Nts., 5/15/173,5 | | | 2,599,749 | | | | 2,781,731 | |
| | | | | | | | |
| | | Principal
Amount | | | Value | |
| Food Products Continued | | | | | | | | |
| BRF SA, 3.95% Sr. Unsec. Nts., 5/22/233 | | $ | 885,000 | | | $ | 781,013 | |
| Bumble Bee Acquisition Corp., 9% Sr. Sec. Nts., 12/15/173 | | | 2,942,000 | | | | 3,140,585 | |
| Chiquita Brands International, Inc., 7.875% Sr. Sec. Nts., 2/1/213 | | | 1,460,000 | | | | 1,533,000 | |
| KazAgro National Management Holding JSC, 4.625% Sr. Unsec. Nts., 5/24/233 | | | 535,000 | | | | 494,875 | |
MHP SA, 8.25% Sr. Unsec.
Nts., 4/2/203 | | | 1,660,000 | | | | 1,480,513 | |
| Southern States Cooperative, Inc., 11.25% Sr. Nts., 5/15/153 | | | 3,155,000 | | | | 3,281,200 | |
| Wells Enterprises, Inc., 6.75% Sr. Sec. Nts., 2/1/203 | | | 1,630,000 | | | | 1,711,500 | |
| | | | | | |
|
|
|
| | | | | | | | 20,333,530 | |
| Household Products—0.1% | |
Reynolds Group Issuer, Inc./Reynolds Group Issuer LLC/Reynolds Group Issuer Luxembourg SA:
5.75% Sr. Sec. Nts., 10/15/20 | | | 1,540,000 | | | | 1,555,400 | |
| 9% Sr. Unsec. Unsub. Nts., 4/15/19 | | | 1,285,000 | | | | 1,333,188 | |
| | | | | | |
|
|
|
| | | | | | | | 2,888,588 | |
| Personal Products—0.1% | |
| Revlon Consumer Products Corp., 5.75% Sr. Unsec. Nts., 2/15/213 | | | 2,510,000 | | | | 2,456,663 | |
| Tobacco—0.1% | | | | | | | | |
Alliance One International, Inc.,
10% Sr. Unsec. Nts., 7/15/16 | | | 1,525,000 | | | | 1,566,938 | |
Vector Group Ltd., 7.75% Sr. Sec.
Nts., 2/15/21 | | | 1,615,000 | | | | 1,675,563 | |
| | | | | | |
|
|
|
| | | | | | | | 3,242,501 | |
| Energy—6.2% | | | | | | | | |
| Energy Equipment & Services—0.7% | | | | | |
Drill Rigs Holdings, Inc.,
6.50% Sr. Sec. Nts., 10/1/173 | | | 1,595,000 | | | | 1,598,988 | |
| Exterran Partners LP/EXLP Finance Corp., 6% Sr. Unsec. Nts., 4/1/213 | | | 835,000 | | | | 826,650 | |
Forbes Energy Services Ltd.,
9% Sr. Unsec. Nts., 6/15/19 | | | 1,020,000 | | | | 1,009,800 | |
Hornbeck Offshore Services, Inc.,
5.875% Sr. Unsec. Nts., 4/1/20 | | | 2,575,000 | | | | 2,600,750 | |
ION Geophysical Corp.,
8.125% Sr. Sec. Nts., 5/15/183 | | | 425,000 | | | | 412,250 | |
| | | | |
| 23 | | | | OPPENHEIMER GLOBAL STRATEGIC INCOME FUND/VA |
CONSOLIDATED STATEMENT OF INVESTMENTS Unaudited / Continued
| | | | | | | | |
| | | Principal
Amount | | | Value | |
| Energy Equipment & Services Continued | |
Offshore Group Investment Ltd.:
7.125% Sr. Sec. Nts., 4/1/233 | | $ | 1,680,000 | | | $ | 1,659,000 | |
| 7.50% Sr. Sec. Nts., 11/1/19 | | | 2,990,000 | | | | 3,132,025 | |
Pacific Drilling SA, 5.375% Sr. Sec.
Nts., 6/1/203 | | | 1,690,000 | | | | 1,584,375 | |
Precision Drilling Corp.,
6.625% Sr. Unsec. Nts., 11/15/20 | | | 3,100,000 | | | | 3,162,000 | |
QGOG Constellation SA,
6.25% Sr. Unsec. Nts., 11/9/193 | | | 1,430,000 | | | | 1,404,975 | |
| | | | | | |
|
|
|
| | | | | | | | 17,390,813 | |
| Oil, Gas & Consumable Fuels—5.5% | | | | | |
Access Midstream Partners LP/ACMP Finance Corp.,
4.875% Sr. Unsec. Unsub.
Nts., 5/15/23 | | | 1,030,000 | | | | 960,475 | |
Alliance Oil Co. Ltd.,
9.875% Sr. Unsec. Nts., 3/11/153 | | | 2,800,000 | | | | 2,989,000 | |
Alpha Natural Resources, Inc.,
6% Sr. Unsec. Unsub. Nts., 6/1/19 | | | 1,055,000 | | | | 862,463 | |
| Antero Resources Finance Corp., 6% Sr. Unsec. Nts., 12/1/20 | | | 1,025,000 | | | | 1,014,750 | |
Arch Coal, Inc., 7.25% Sr. Unsec.
Unsub. Nts., 6/15/21 | | | 1,065,000 | | | | 883,950 | |
Atlas Pipeline Partners LP/Atlas Pipeline Finance Corp.:
5.875% Sr. Unsec. Nts., 8/1/233 | | | 1,435,000 | | | | 1,370,425 | |
| 6.625% Sr. Nts., 10/1/203 | | | 1,025,000 | | | | 1,032,688 | |
Bill Barrett Corp., 7.625%
Sr. Unsec. Unsub. Nts., 10/1/19 | | | 1,275,000 | | | | 1,326,000 | |
BreitBurn Energy Partners LP/BreitBurn Finance Corp.:
7.875% Sr. Unsec. Nts., 4/15/22 | | | 700,000 | | | | 717,500 | |
| 8.625% Sr. Unsec. Nts., 10/15/20 | | | 3,735,000 | | | | 3,977,775 | |
Chaparral Energy, Inc.,
9.875% Sr. Unsec. Nts., 10/1/20 | | | 900,000 | | | | 1,003,500 | |
Chesapeake Energy Corp., 5.75%
Sr. Unsec. Nts., 3/15/23 | | | 1,615,000 | | | | 1,639,225 | |
| Chesapeake Midstream Partners LP/CHKM Finance Corp., 6.125% Sr. Unsec. Unsub. Nts., 7/15/22 | | | 1,860,000 | | | | 1,892,550 | |
| Cimarex Energy Co., 5.875% Sr. Unsec. Unsub. Nts., 5/1/22 | | | 2,375,000 | | | | 2,470,000 | |
Cloud Peak Energy Resources LLC/Cloud Peak Energy Finance Corp., 8.50% Sr. Unsec.
Unsub. Nts., 12/15/19 | | | 485,000 | | | | 518,950 | |
CNOOC Finance 2013 Ltd, 3%
Sr. Unsec. Unsub. Nts., 5/9/23 | | | 220,000 | | | | 199,030 | |
| | | | | | | | |
| | | Principal
Amount | | | Value | |
| Oil, Gas & Consumable Fuels Continued | | | | | |
| Continental Resources, Inc., 4.50% Sr. Unsec. Unsub. Nts., 4/15/233 | | $ | 1,385,000 | | | $ | 1,348,644 | |
Cosan Luxembourg SA, 5%
Sr. Unsec. Nts., 3/14/233 | | | 685,000 | | | | 652,463 | |
| Denbury Resources, Inc., 4.625% Sr. Unsec. Sub. Nts., 7/15/23 | | | 1,475,000 | | | | 1,362,531 | |
Empresa Nacional del Petroleo, 4.75% Sr. Unsec. Unsub.
Nts., 12/6/213 | | | 355,000 | | | | 347,966 | |
| EP Energy LLC/Everest Acquisition Finance, Inc., 7.75% Sr. Unsec. Nts., 9/1/22 | | | 2,900,000 | | | | 3,117,500 | |
Gaz Capital SA:
7.288% Sr. Sec. Nts., 8/16/373 | | | 4,320,000 | | | | 4,644,000 | |
| 8.146% Sr. Sec. Nts., 4/11/183 | | | 5,520,000 | | | | 6,348,000 | |
| 8.625% Sr. Sec. Nts., 4/28/343 | | | 3,880,000 | | | | 4,617,200 | |
| 9.25% Sr. Unsec. Unsub. Nts., 4/23/193 | | | 6,550,000 | | | | 7,925,500 | |
Gazprom OAO Via Gaz Capital SA:
4.95% Sr. Unsec. Nts., 2/6/283 | | | 3,080,000 | | | | 2,664,200 | |
| 4.95% Sr. Unsec. Nts., 7/19/223 | | | 8,145,000 | | | | 7,819,200 | |
| Genesis Energy LP/Genesis Energy Finance Corp., 5.75% Sr. Unsec. Nts., 2/15/213 | | | 945,000 | | | | 926,100 | |
| Halcon Resources Corp., 8.875% Sr. Unsec. Unsub. Nts., 5/15/21 | | | 3,105,000 | | | | 3,027,375 | |
| Harvest Operations Corp., 2.125% Sr. Unsec. Nts., 5/14/183 | | | 530,000 | | | | 503,918 | |
Hiland Partners LP/Hiland Partners Finance Corp., 7.25%
Sr. Nts., 10/1/203 | | | 785,000 | | | | 812,475 | |
Inergy Midstream LP/Finance Corp., 6% Sr. Unsec.
Nts., 12/15/203 | | | 695,000 | | | | 674,150 | |
| KazMunayGas National Co., 5.75% Sr. Unsec. Nts., 4/30/433 | | | 330,000 | | | | 293,288 | |
| Kodiak Oil & Gas Corp., 5.50% Sr. Unsec. Nts., 1/15/213 | | | 2,555,000 | | | | 2,494,319 | |
LBC Tank Terminals Holding Netherlands BV, 6.875%
Sr. Unsec. Nts., 5/15/233 | | | 630,000 | | | | 634,725 | |
| Linn Energy LLC/Linn Energy Finance Corp., 8.625% Sr. Unsec. Nts., 4/15/20 | | | 4,075,000 | | | | 4,299,125 | |
Lukoil International Finance BV:
4.563% Sr. Unsec. Nts., 4/24/233 | | | 2,655,000 | | | | 2,475,788 | |
| 6.125% Sr. Unsec. Nts., 11/9/203 | | | 2,760,000 | | | | 2,918,700 | |
7.25% Sr. Unsec. Unsub.
Nts., 11/5/193 | | | 1,505,000 | | | | 1,695,383 | |
| | | | |
| 24 | | | | OPPENHEIMER GLOBAL STRATEGIC INCOME FUND/VA |
| | | | | | | | |
| | | Principal
Amount | | | Value | |
| Oil, Gas & Consumable Fuels Continued | | | | | |
MarkWest Energy Partners LP/MarkWest Energy Finance Corp., 4.50% Sr. Unsec. Unsub.
Nts., 7/15/23 | | $ | 2,815,000 | | | $ | 2,589,800 | |
| MEG Energy Corp., 6.50% Sr. Unsec. Nts., 3/15/213 | | | 4,845,000 | | | | 4,826,831 | |
| Memorial Production Partners LP/Memorial Finance Corp., 7.625% Sr. Unsec. Nts., 5/1/213 | | | 1,050,000 | | | | 1,039,500 | |
| Midstates Petroleum Co., Inc./Midstates Petroleum Co., LLC, 9.25% Sr. Unsec. Nts., 6/1/213 | | | 1,645,000 | | | | 1,548,356 | |
Murray Energy Corp., 8.625%
Sr. Sec. Nts., 6/15/213 | | | 635,000 | | | | 638,175 | |
Navios Maritime Acquisition Corp., 8.625% Sr. Sec.
Nts., 11/1/17 | | | 890,000 | | | | 914,475 | |
Novatek OAO via Novatek Finance Ltd.:
4.422% Sr. Unsec. Nts., 12/13/223 | | | 4,195,000 | | | | 3,859,400 | |
| 7.75% Unsec. Nts., 2/21/173 | | | 26,360,000 | RUR | | | 792,655 | |
| Oasis Petroleum, Inc., 6.875% Sr. Unsec. Nts., 1/15/23 | | | 1,110,000 | | | | 1,148,850 | |
| Odebrecht Drilling Norbe VIII/IX Ltd., 6.35% Sr. Sec. Nts., 6/30/213 | | | 1,021,200 | | | | 1,036,518 | |
| Pacific Rubiales Energy Corp., 5.125% Sr. Unsec. Nts., 3/28/233 | | | 1,375,000 | | | | 1,306,250 | |
| Pemex Project Funding Master Trust, 6.625% Unsec. Unsub. Bonds, 6/15/35 | | | 610,000 | | | | 643,550 | |
Pertamina Persero PT, 6.50%
Sr. Unsec. Nts., 5/27/413 | | | 80,000 | | | | 77,600 | |
Petroleos de Venezuela SA:
5.125% Sr. Unsec. Nts., 10/28/16 | | | 1,145,000 | | | | 950,350 | |
| 8.50% Sr. Nts., 11/2/173 | | | 4,805,000 | | | | 4,414,594 | |
| 12.75% Sr. Unsec. Nts., 2/17/223 | | | 2,755,000 | | | | 2,775,663 | |
Petroleos Mexicanos:
1.95% Sr. Unsec. Nts., 12/20/22 | | | 175,000 | | | | 173,695 | |
| 2% Sr. Unsec. Nts., 12/20/22 | | | 870,000 | | | | 865,554 | |
5.50% Sr. Unsec. Unsub.
Nts., 6/27/44 | | | 185,000 | | | | 166,963 | |
Range Resources Corp., 5%
Sr. Unsec. Sub. Nts., 8/15/22 | | | 1,260,000 | | | | 1,237,950 | |
Reliance Industries Ltd., 5.875%
Sr. Unsec. Perpetual Bonds3,14 | | | 2,200,000 | | | | 1,930,500 | |
| Rentech Nitrogen Partners LP/Rentech Nitrogen Finance Corp., 6.50% Sec. Nts., 4/15/213 | | | 1,050,000 | | | | 1,043,438 | |
| Rosetta Resources, Inc., 5.625% Sr. Unsec. Unsub. Nts., 5/1/21 | | | 1,055,000 | | | | 1,031,263 | |
| | | | | | | | |
| | | Principal
Amount | | | Value | |
| Oil, Gas & Consumable Fuels Continued | | | | | |
Sabine Pass Liquefaction LLC:
5.625% Sr. Sec. Nts., 2/1/213 | | $ | 1,630,000 | | | $ | 1,585,175 | |
| 5.625% Sr. Sec. Nts., 4/15/233 | | | 1,265,000 | | | | 1,198,588 | |
| Samson Investment Co., 9.75% Sr. Unsec. Nts., 2/15/203 | | | 1,675,000 | | | | 1,773,406 | |
| Sanchez Energy Corp., 7.75% Sr. Unsec. Nts., 6/15/213 | | | 1,055,000 | | | | 1,031,263 | |
| SandRidge Energy, Inc.: 7.50% Sr. Unsec. Unsub. Nts., 2/15/23 | | | 1,480,000 | | | | 1,413,400 | |
| 7.50% Sr. Unsec. Unsub. Nts., 3/15/21 | | | 640,000 | | | | 614,400 | |
Schahin II Finance Co. SPV Ltd., 5.875% Sr. Sec. Unsub.
Nts., 9/25/223 | | | 3,243,307 | | | | 3,218,982 | |
Sibur Securities Ltd., 3.914%
Sr. Unsec. Nts., 1/31/183 | | | 1,765,000 | | | | 1,641,450 | |
| SM Energy Co., 6.50% Sr. Unsec. Unsub. Nts., 1/1/23 | | | 1,285,000 | | | | 1,355,675 | |
| Tengizchevroil LLP, 6.124% Nts., 11/15/143 | | | 422,045 | | | | 434,094 | |
Tesoro Logistics LP/Tesoro Logistics Finance Corp., 5.875%
Sr. Nts., 10/1/203 | | | 735,000 | | | | 727,650 | |
| Western Refining, Inc., 6.25% Sr. Unsec. Nts., 4/1/213 | | | 1,615,000 | | | | 1,582,700 | |
| | | | | | |
|
|
|
| | | | | | | | 136,049,544 | |
| Financials—7.0% | | | | | | | | |
| Capital Markets—1.0% | | | | | | | | |
Cantor Commercial Real Estate Co. LP/CCRE Finance, 7.75%
Sr. Unsec. Nts., 2/15/183,4 | | | 2,090,000 | | | | 2,110,900 | |
| Deutsche Bank AG, 4.296% Unsec. Sub. Nts., 5/24/28 | | | 670,000 | | | | 619,493 | |
| Deutsche Bank Capital Trust, 4.901% Unsec. Sub. Perpetual Bonds2,3,14 | | | 610,000 | | | | 527,650 | |
Nationstar Mortgage LLC/Nationstar Capital Corp.:
6.50% Sr. Unsec. Unsub.
Nts., 7/1/21 | | | 3,225,000 | | | | 3,112,125 | |
| 7.875% Sr. Unsec. Nts., 10/1/20 | | | 1,655,000 | | | | 1,762,575 | |
| 10.875% Sr. Unsec. Nts., 4/1/15 | | | 1,725,000 | | | | 1,811,250 | |
| Nuveen Investments, Inc., 9.50% Sr. Unsec. Nts., 10/15/203 | | | 1,545,000 | | | | 1,545,000 | |
| Pinafore LLC/Pinafore, Inc., 9% Sec. Nts., 10/1/18 | | | 2,872,000 | | | | 3,144,840 | |
| Prospect Medical Holdings, Inc., 8.375% Sr. Sec. Nts., 5/1/193 | | | 1,100,000 | | | | 1,155,000 | |
| | | | |
| 25 | | | | OPPENHEIMER GLOBAL STRATEGIC INCOME FUND/VA |
CONSOLIDATED STATEMENT OF INVESTMENTS Unaudited / Continued
| | | | | | | | |
| | | Principal
Amount | | | Value | |
| Capital Markets Continued | | | | | | | | |
Red de Carreteras de Occidente SAPIB de CV, 9% Sr. Sec.
Nts., 6/10/283 | | | 23,700,000 | MXN | | $ | 1,729,811 | |
| Springleaf Finance Corp., 6.90% Nts., Series J, 12/15/17 | | | 2,460,000 | | | | 2,426,175 | |
UBS AG (Jersey Branch):
4.28% Jr. Sub. Perpetual Nts.14 | | | 185,000 | EUR | | | 238,281 | |
| 7.152% Jr. Sub. Perpetual Bonds14 | | | 125,000 | EUR | | | 175,697 | |
US Coatings Acquisition, Inc./Flash Dutch 2 BV, 7.375%
Sr. Unsec. Nts., 5/1/213 | | | 1,045,000 | | | | 1,069,819 | |
Verso Paper Holdings LLC/Verso Paper, Inc., 11.75% Sr. Sec.
Nts., 1/15/19 | | | 3,719,000 | | | | 2,584,705 | |
| | | | | | |
|
|
|
| | | | | | | | 24,013,321 | |
| Commercial Banks—3.8% | |
| Akbank TAS, 7.50% Sr. Unsec. Nts., 2/5/183 | | | 5,970,000 | TRY | | | 2,857,626 | |
| Alfa Bank/Alfa Bond Issuance plc, 7.875% Nts., 9/25/173 | | | 2,125,000 | | | | 2,265,675 | |
Banco ABC Brasil SA, 8.50%
Sr. Unsec. Nts., 3/28/163 | | | 1,510,000 | BRR | | | 629,350 | |
Banco BMG SA:
8.875% Unsec. Sub. Nts., 8/5/203 | | | 445,000 | | | | 400,500 | |
| 9.15% Nts., 1/15/163 | | | 978,000 | | | | 1,002,450 | |
9.95% Unsec. Unsub.
Nts., 11/5/193 | | | 1,480,000 | | | | 1,420,800 | |
Banco do Brasil SA (Cayman):
6.25% Jr. Sub. Perpetual Bonds14 | | | 1,880,000 | | | | 1,659,100 | |
| 9.25% Jr. Sub. Perpetual Bonds3,14 | | | 7,190,000 | | | | 7,855,075 | |
Banco do Estado do Rio Grande do Sul SA, 7.375% Sub
Nts., 2/2/223 | | | 5,365,000 | | | | 5,552,775 | |
| Banco Santander Brasil SA (Cayman Islands), 8% Sr. Unsec. Unsub. Nts., 3/18/163 | | | 2,620,000 | BRR | | | 1,086,114 | |
| Banco Santander Mexico SA, 4.125% Sr. Unsec. Nts., 11/9/223 | | | 1,995,000 | | | | 1,875,300 | |
| Bancolombia SA, 5.125% Unsec. Sub. Nts., 9/11/22 | | | 3,315,000 | | | | 3,174,113 | |
Bank of Scotland plc:
4.875% Sr. Sec. Nts., 12/20/24 | | | 230,000 | GBP | | | 387,989 | |
4.875% Sr. Sec. Unsub.
Nts., 11/8/16 | | | 140,000 | GBP | | | 236,651 | |
Barclays Bank plc:
4.75% Jr. Sub. Perpetual Bonds14 | | | 370,000 | EUR | | | 348,891 | |
| 14% Jr. Sub. Perpetual Bonds14 | | | 565,000 | GBP | | | 1,125,635 | |
| BBVA Banco Continental SA, 5% Sr. Unsec. Nts., 8/26/223 | | | 1,850,000 | | | | 1,808,375 | |
| | | | | | | | |
| | | Principal
Amount | | | Value | |
| Commercial Banks Continued | |
BBVA US Senior SAU, 4.664%
Sr. Unsec. Nts., 10/9/15 | | $ | 630,000 | | | $ | 649,240 | |
BNP Paribas SA, 7.195%
Jr. Sub. Perpetual Bonds3,14 | | | 400,000 | | | | 389,000 | |
| BPCE SA, 9% Jr. Sub. Perpetual Bonds14 | | | 505,000 | EUR | | | 685,266 | |
CIT Group, Inc.:
4.25% Sr. Unsec. Nts., 8/15/17 | | | 405,000 | | | | 408,544 | |
| 5% Sr. Unsec. Nts., 8/15/22 | | | 2,720,000 | | | | 2,711,699 | |
| Corp Group Banking SA, 6.75% Sr. Unsec. Nts., 3/15/233 | | | 1,810,000 | | | | 1,830,954 | |
Credit Agricole SA, 8.375%
Jr. Sub. Perpetual Bonds3,14 | | | 795,000 | | | | 845,681 | |
DTEK Finance plc, 7.875%
Sr. Unsec. Nts., 4/4/183 | | | 1,375,000 | | | | 1,285,625 | |
EUROFIMA, 6.25%
Bonds, 12/28/18 | | | 935,000 | AUD | | | 922,819 | |
European Investment Bank:
5% Sr. Unsec. Nts., 8/22/22 | | | 680,000 | AUD | | | 612,098 | |
| 6% Sr. Unsec. Nts., 8/6/20 | | | 550,000 | AUD | | | 534,341 | |
| 6.50% Sr. Unsec. Nts., 8/7/19 | | | 550,000 | AUD | | | 548,627 | |
Grupo Aval Ltd., 4.75%
Sr. Unsec. Nts., 9/26/223 | | | 2,515,000 | | | | 2,370,388 | |
| Hana Bank, 1.375% Sr. Unsec. Nts., 2/5/163 | | | 526,671 | | | | 516,472 | |
ICICI Bank Ltd., 6.375%
Bonds, 4/30/222,3 | | | 1,130,000 | | | | 1,084,800 | |
Intesa Sanpaolo SpA:
3.125% Unsec. Nts., 1/15/16 | | | 530,000 | | | | 521,374 | |
| 3.875% Unsec. Nts., 1/16/18 | | | 265,000 | | | | 254,630 | |
| LBG Capital No. 1 plc, 11.04% Unsec. Sub. Nts., 3/19/20 | | | 536,000 | GBP | | | 912,737 | |
| LBG Capital No.1 plc, 7.869% Sec. Sub. Nts., 8/25/20 | | | 265,000 | GBP | | | 411,115 | |
Lloyds TSB Bank plc:
6% Sr. Sec. Nts., 2/8/29 | | | 385,000 | GBP | | | 716,946 | |
| 11.875% Unsec. Sub. Nts., 12/16/21 | | | 665,000 | EUR | | | 1,051,110 | |
Royal Bank of Scotland NV:
3.57% Unsec. Sub. Nts., 5/17/182 | | | 265,000 | AUD | | | 216,444 | |
| 3.57% Unsec. Sub. Nts., 5/17/182 | | | 290,000 | AUD | | | 236,863 | |
Royal Bank of Scotland plc (The):
2.375% Sr. Unsec. Sub.
Nts., 11/2/15 | | | 80,000 | CHF | | | 84,113 | |
| 13.125% Unsec. Sub. Nts., 3/19/22 | | | 345,000 | AUD | | | 370,794 | |
Sberbank of Russia Via SB Capital SA:
5.125% Sub. Nts., 10/29/223 | | | 4,035,000 | | | | 3,802,988 | |
| 5.40% Sr. Unsec. Nts., 3/24/17 | | | 1,350,000 | | | | 1,417,500 | |
| 6.125% Sr. Nts., 2/7/223 | | | 4,620,000 | | | | 4,833,444 | |
| | | | |
| 26 | | | | OPPENHEIMER GLOBAL STRATEGIC INCOME FUND/VA |
| | | | | | | | |
| | | Principal
Amount | | | Value | |
| Commercial Banks Continued | |
| Stadshypotek AB, 6% Sec. Unsub. Bonds, 6/21/17 | | | 5,385,000 | SEK | | $ | 918,497 | |
| Turkiye Halk Bankasi AS, 4.875% Sr. Unsec. Nts., 7/19/173 | | | 2,550,000 | | | | 2,562,750 | |
Turkiye Is Bankasi AS:
3.875% Sr. Unsec. Nts., 11/7/173 | | | 1,050,000 | | | | 1,029,000 | |
| 4.916% Unsec. Nts., 8/12/1312 | | | 6,500,000 | TRY | | | 3,343,892 | |
| 5.097% Unsec. Nts., 11/6/1312 | | | 13,100,000 | TRY | | | 6,614,729 | |
| 6% Sub. Nts., 10/24/223 | | | 1,790,000 | | | | 1,758,675 | |
| 7.293% Unsec. Nts., 10/9/1312 | | | 3,895,000 | TRY | | | 1,981,862 | |
| Turkiye Sise ve Cam Fabrikalari AS, 4.25% Sr. Unsec. Nts., 5/9/203 | | | 740,000 | | | | 677,100 | |
| Turkiye Vakiflar Bankasi Tao, 3.75% Sr. Unsec. Nts., 4/15/183 | | | 2,370,000 | | | | 2,239,650 | |
| VTB Bank OJSC Via VTB Capital SA, 6% Sr. Unsec. Nts., 4/12/173 | | | 575,000 | | | | 599,438 | |
VTB Capital SA:
6.315% Nts., 2/22/183 | | | 1,135,000 | | | | 1,186,075 | |
6.465% Sr. Sec. Unsub.
Nts., 3/4/153 | | | 1,100,000 | | | | 1,159,620 | |
| 6.875% Sr. Sec. Nts., 5/29/183 | | | 1,860,000 | | | | 1,976,250 | |
Yapi ve Kredi Bankasi AS:
5.50% Unsec. Sub. Nts., 12/6/223 | | | 2,585,000 | | | | 2,365,275 | |
| 6.75% Sr. Unsec. Nts., 2/8/173 | | | 2,045,000 | | | | 2,149,806 | |
| | | | | | |
|
|
|
| | | | | | | | 94,474,650 | |
| Consumer Finance—0.6% | |
Ahern Rentals, Inc., 9.50%
Sr. Sec. Nts., 6/15/183 | | | 1,475,000 | | | | 1,476,844 | |
Ally Financial, Inc., 7.50%
Sr. Unsec. Unsub. Nts., 9/15/20 | | | 1,405,000 | | | | 1,624,531 | |
| Cash America International, Inc., 5.75% Sr. Unsec. Nts., 5/15/183 | | | 3,160,000 | | | | 3,033,600 | |
| Community Choice Financial, Inc., 10.75% Sr. Sec. Nts., 5/1/19 | | | 1,315,000 | | | | 1,265,688 | |
| JSC Astana Finance, 9.16% Nts., 3/14/126 | | | 7,200,000 | | | | 468,000 | |
| Milestone Aviation Group LLC, 8.625% Sr. Unsec. Nts., 12/15/173 | | | 1,645,000 | | | | 1,714,913 | |
| SLM Corp., 7.25% Sr. Unsec. Unsub. Nts., 1/25/22 | | | 1,615,000 | | | | 1,703,825 | |
| Speedy Cash, Inc., 10.75% Sr. Sec. Nts., 5/15/183 | | | 1,930,000 | | | | 2,026,500 | |
| TMX Finance LLC/TitleMax Finance Corp., 13.25% Sr. Sec. Nts., 7/15/15 | | | 1,155,000 | | | | 1,244,513 | |
| | | | | | |
|
|
|
| | | | | | | | 14,558,414 | |
| Diversified Financial Services—0.9% | |
| Autopistas del Nordeste Cayman Ltd., 9.39% Nts., 4/15/243 | | | 2,472,556 | | | | 2,401,593 | |
| | | | | | | | |
| | | Principal
Amount | | | Value | |
| Diversified Financial Services Continued | |
Banco BTG Pactual SA (Cayman):
4% Sr. Unsec. Nts., 1/16/203 | | $ | 2,985,000 | | | $ | 2,574,563 | |
| 5.75% Unsec. Sub. Nts., 9/28/223 | | | 2,500,000 | | | | 2,168,750 | |
| Banco Invex SA, 31.938% Mtg.-Backed Certificates, Series 062U, 3/13/346,13 | | | 4,830,531 | MXN | | | 246,733 | |
| Citigroup, Inc., 5.35% Jr. Sub. Perpetual Bonds, Series D14 | | | 1,645,000 | | | | 1,549,100 | |
| Export Credit Bank of Turkey, 5.875% Sr. Unsec. Nts., 4/24/193 | | | 5,685,000 | | | | 5,869,763 | |
| Jefferies Finance LLC/JFIN Co-Issuer Corp., 7.375% Sr. Unsec. Nts., 4/1/203 | | | 1,880,000 | | | | 1,833,000 | |
| Jefferies LoanCore LLC/JLC Finance Corp., 6.875% Sr. Unsec. Nts., 6/1/203 | | | 1,685,000 | | | | 1,642,875 | |
JPMorgan Hipotecaria su Casita:
8.432% Sec. Nts., 8/26/351,13 | | | 5,808,600 | MXN | | | 36,759 | |
| 30.21% Mtg.-Backed Certificates, Series 06U, 9/25/3513 | | | 1,322,889 | MXN | | | 166,786 | |
| Korea Development Bank (The), 1.50% Sr. Unsec. Nts., 1/22/18 | | | 580,000 | | | | 541,832 | |
| Magyar Export-Import Bank RT, 5.50% Sr. Unsec. Nts., 2/12/183 | | | 1,315,000 | | | | 1,321,575 | |
| Rabobank Capital Funding Trust IV, 5.556% Perpetual Bonds3,14 | | | 205,000 | GBP | | | 297,136 | |
| Stanbic IBTC Holding Co., 12.468% Nts., 9/24/1312 | | | 151,000,000 | NGN | | | 896,542 | |
| | | | | | |
|
|
|
| | | | | | | | 21,547,007 | |
| Insurance—0.1% | | | | | | | | |
| Assicurazioni Generali SpA, 7.75% Unsec. Sub. Nts., 12/12/42 | | | 55,000 | EUR | | | 76,244 | |
| AXA SA, 6.379% Sub. Perpetual Bonds3,14 | | | 530,000 | | | | 518,075 | |
| Patriot Merger Corp., 9% Sr. Unsec. Nts., 7/15/213,4 | | | 850,000 | | | | 835,125 | |
Swiss Reinsurance Co. via ELM BV:
3.96% Jr. Sub. Perpetual Bonds2,14 | | | 125,000 | AUD | | | 105,680 | |
| 7.635% Jr. Sub. Perpetual Bonds14 | | | 55,000 | AUD | | | 51,700 | |
| | | | | | |
|
|
|
| | | | | | | | 1,586,824 | |
| Real Estate Investment Trusts (REITs)—0.4% | |
| FelCor Escrow Holdings LLC, 6.75% Sr. Sec. Nts., 6/1/19 | | | 1,585,000 | | | | 1,664,250 | |
| Felcor Lodging LP, 5.625% Sr. Sec. Nts., 3/1/23 | | | 1,605,000 | | | | 1,564,875 | |
| Geo Group, Inc. (The), 5.125% Sr. Unsec. Nts., 4/1/233 | | | 1,615,000 | | | | 1,546,363 | |
| | | | |
| 27 | | | | OPPENHEIMER GLOBAL STRATEGIC INCOME FUND/VA |
CONSOLIDATED STATEMENT OF INVESTMENTS Unaudited / Continued
| | | | | | | | |
| | | Principal
Amount | | | Value | |
| Real Estate Investment Trusts (REITs) Continued | |
| iStar Financial, Inc., 4.875% Sr. Unsec. Unsub. Nts., 7/1/18 | | $ | 1,055,000 | | | $ | 994,338 | |
| OMEGA Healthcare Investors, Inc., 6.75% Sr. Unsec. Nts., 10/15/22 | | | 2,070,000 | | | | 2,214,900 | |
| RHP Hotel Properties LP/RHP Finance Corp., 5% Sr. Unsec. Nts., 4/15/213 | | | 1,615,000 | | | | 1,574,625 | |
| | | | | | |
|
|
|
| | | | | | | | 9,559,351 | |
| Real Estate Management & Development—0.2% | |
| BR Malls International Finance Ltd., 8.50% Perpetual Bonds3,14 | | | 1,190,000 | | | | 1,194,463 | |
| Country Garden Holdings Co. Ltd., 7.50% Sr. Unsec. Unsub. Nts., 12/31/233 | | | 1,160,000 | | | | 1,067,200 | |
Realogy Corp.:
7.625% Sr. Sec. Nts., 1/15/203 | | | 2,535,000 | | | | 2,756,813 | |
| 9% Sr. Sec. Nts., 1/15/203 | | | 1,295,000 | | | | 1,450,400 | |
| | | | | | |
|
|
|
| | | | | | | | 6,468,876 | |
| Health Care—1.4% | | | | | | | | |
| Biotechnology—0.1% | | | | | | | | |
| Grifols SA, 8.25% Sr. Sec. Nts., 2/1/18 | | | 995,000 | | | | 1,074,600 | |
| Universal Hospital Services, Inc., 7.625% Sr. Sec. Nts, 8/15/20 | | | 1,750,000 | | | | 1,837,500 | |
| | | | | | |
|
|
|
| | | | | | | | 2,912,100 | |
| Health Care Equipment & Supplies—0.3% | |
| Accellent, Inc., 10% Sr. Unsec. Sub. Nts., 11/1/17 | | | 840,000 | | | | 777,000 | |
Alere, Inc.:
7.25% Sr. Unsec. Nts., 7/1/183 | | | 1,270,000 | | | | 1,352,550 | |
| 8.625% Sr. Unsec. Sub. Nts., 10/1/18 | | | 152,298 | | | | 161,436 | |
Biomet, Inc.:
6.50% Sr. Unsec. Sub. Nts., 10/1/203 | | | 630,000 | | | | 618,975 | |
| 6.50% Sr. Unsec. Unsub. Nts., 8/1/20 | | | 2,090,000 | | | | 2,164,456 | |
| Hologic, Inc., 6.25% Sr. Unsec. Unsub. Nts., 8/1/20 | | | 185,000 | | | | 192,747 | |
| Kinetic Concepts, Inc./KCI USA, Inc., 10.50% Sec. Nts., 11/1/18 | | | 1,840,000 | | | | 1,987,200 | |
| | | | | | |
|
|
|
| | | | | | | | 7,254,364 | |
| Health Care Providers & Services—0.8% | |
| Acadia Healthcare Co., Inc., 6.125% Sr. Unsec. Nts., 3/15/213 | | | 440,000 | | | | 442,200 | |
| CDRT Holding Corp., 9.25% Sr. Unsec. Nts., 10/1/173,5 | | | 875,000 | | | | 890,313 | |
| | | | | | | | |
| | | Principal
Amount | | | Value | |
| Health Care Providers & Services Continued | |
| CHS/Community Health Systems, Inc., 7.125% Sr. Unsec. Unsub. Nts., 7/15/20 | | $ | 2,170,000 | | | $ | 2,240,525 | |
| DaVita HealthCare Partners, Inc., 5.75% Sr. Unsec. Unsub. Nts., 8/15/22 | | | 895,000 | | | | 897,238 | |
Fresenius Medical Care US Finance II, Inc.:
5.625% Sr. Unsec. Nts., 7/31/193 | | | 805,000 | | | | 841,225 | |
| 5.875% Sr. Unsec. Nts., 1/31/223 | | | 405,000 | | | | 428,288 | |
| Gentiva Health Services, Inc., 11.50% Sr. Unsec. Unsub. Nts., 9/1/18 | | | 1,510,000 | | | | 1,562,850 | |
| HCA, Inc., 7.50% Sr. Unsec. Unsub. Nts., 2/15/22 | | | 2,495,000 | | | | 2,769,450 | |
| Health Management Associates, Inc., 7.375% Sr. Unsec. Nts., 1/15/20 | | | 855,000 | | | | 941,569 | |
HealthSouth Corp.:
7.75% Sr. Unsec. Nts., 9/15/22 | | | 845,000 | | | | 904,150 | |
| 8.125% Sr. Unsec. Unsub. Nts., 2/15/20 | | | 549,000 | | | | 597,038 | |
| Kindred Healthcare, Inc., 8.25% Sr. Unsec. Nts., 6/1/19 | | | 2,765,000 | | | | 2,847,950 | |
| Multiplan, Inc., 9.875% Sr. Nts., 9/1/183 | | | 1,390,000 | | | | 1,518,575 | |
| Select Medical Corp., 6.375% Sr. Unsec. Nts., 6/1/213 | | | 1,055,000 | | | | 1,007,525 | |
| Tenet Healthcare Corp., 4.75% Sr. Sec. Nts., 6/1/203 | | | 440,000 | | | | 425,150 | |
| US Oncology, Inc., Escrow Shares (related to 9.125% Sr. Sec. Nts., 8/15/17)6 | | | 2,165,000 | | | | 86,600 | |
| Vanguard Health Holding Co. II LLC/Vanguard Holding Co. II, Inc., 8% Sr. Nts., 2/1/18 | | | 1,970,000 | | | | 2,098,050 | |
| | | | | | |
|
|
|
| | | | | | | | 20,498,696 | |
| Health Care Technology—0.0% | |
| MedAssets, Inc., 8% Sr. Unsec. Nts., 11/15/18 | | | 380,000 | | | | 404,700 | |
| Life Sciences Tools & Services—0.1% | |
| Jaguar Holding Co./Jaguar Merger Sub, Inc., 9.50% Sr. Unsec. Nts., 12/1/193 | | | 990,000 | | | | 1,098,900 | |
| Pharmaceuticals—0.1% | | | | | | | | |
| Valeant Pharmaceuticals International, Inc., 6.875% Sr. Unsec. Nts., 12/1/183 | | | 955,000 | | | | 983,650 | |
| Warner Chilcott Co. LLC/Warner Chilcott Finance LLC, 7.75% Sr. Unsec. Nts., 9/15/18 | | | 1,005,000 | | | | 1,090,425 | |
| | | | | | |
|
|
|
| | | | | | | | 2,074,075 | |
| | | | |
| 28 | | | | OPPENHEIMER GLOBAL STRATEGIC INCOME FUND/VA |
| | | | | | | | |
| | | Principal
Amount | | | Value | |
| Industrials—4.6% | | | | | | | | |
| Aerospace & Defense—1.1% | |
| BE Aerospace, Inc., 6.875% Sr. Nts., 10/1/20 | | $ | 1,080,000 | | | $ | 1,171,800 | |
| DigitalGlobe, Inc., 5.25% Sr. Unsec. Unsub. Nts., 2/1/213 | | | 835,000 | | | | 805,775 | |
| DynCorp International, Inc., 10.375% Sr. Unsec. Nts., 7/1/17 | | | 4,770,000 | | | | 4,817,700 | |
| Embraer SA, 5.15% Sr. Unsec. Unsub. Nts., 6/15/22 | | | 1,810,000 | | | | 1,819,050 | |
| Erickson Air-Crane, Inc., 8.25% Sr. Sec. Nts., 5/1/203 | | | 3,270,000 | | | | 3,192,338 | |
| FGI Operating Co. LLC/FGI Finance, Inc., 7.875% Sr. Sec. Nts., 5/1/203 | | | 2,560,000 | | | | 2,662,400 | |
| GenCorp, Inc., 7.125% Sec. Nts., 3/15/213 | | | 3,235,000 | | | | 3,364,400 | |
| Huntington Ingalls Industries, Inc., 7.125% Sr. Unsec. Unsub. Nts., 3/15/21 | | | 2,215,000 | | | | 2,392,200 | |
| Kratos Defense & Security Solutions, Inc., 10% Sr. Sec. Nts., 6/1/17 | | | 1,307,000 | | | | 1,405,025 | |
| Schaeffler Finance BV, 8.50% Sr. Sec. Nts., 2/15/193 | | | 1,940,000 | | | | 2,172,800 | |
| TransDigm, Inc., 7.75% Sr. Unsec. Sub. Nts., 12/15/18 | | | 3,140,000 | | | | 3,320,550 | |
| Triumph Group, Inc., 8.625% Sr. Unsec. Nts., 7/15/18 | | | 650,000 | | | | 705,250 | |
| | | | | | |
|
|
|
| | | | | | | | 27,829,288 | |
| Air Freight & Logistics—0.2% | |
| Air Medical Group Holdings, Inc., 9.25% Sr. Sec. Nts., 11/1/18 | | | 1,337,000 | | | | 1,450,645 | |
| SPL Logistics Escrow LLC/SPL Logistics Finance Corp., 8.875% Sr. Sec. Nts., 8/1/203 | | | 2,560,000 | | | | 2,675,200 | |
| | | | | | |
|
|
|
| | | | | | | | 4,125,845 | |
| Airlines—0.1% | | | | | | | | |
| American Airlines 2011-2 Class A Pass-Through Trust, 8.625% Sec. Certificates, 4/15/23 | | | 1,310,380 | | | | 1,392,279 | |
| Emirates Airline, 4.50% Sr. Unsec. Nts., 2/28/253 | | | 330,000 | | | | 303,666 | |
| US Airways 2011-1 Class A Pass-Through Trust, 7.125% Sec. Certificates, 10/22/23 | | | 1,256,516 | | | | 1,419,863 | |
| | | | | | |
|
|
|
| | | | | | | | 3,115,808 | |
| Building Products—0.3% | | | | | | | | |
Nortek, Inc.:
8.50% Sr. Unsec. Nts., 4/15/213 | | | 2,315,000 | | | | 2,465,475 | |
| 8.50% Sr. Unsec. Nts., 4/15/21 | | | 370,000 | | | | 397,750 | |
| | | | | | | | |
| | | Principal
Amount | | | Value | |
| Building Products Continued | |
Ply Gem Industries, Inc.:
8.25% Sr. Sec. Nts., 2/15/18 | | $ | 1,508,000 | | | $ | 1,620,640 | |
| 9.375% Sr. Unsec. Nts., 4/15/17 | | | 1,755,000 | | | | 1,864,688 | |
| | | | | | |
|
|
|
| | | | | | | | 6,348,553 | |
| Commercial Services & Supplies—0.7% | |
| Affinion Group Holdings, Inc., 11.625% Sr. Unsec. Nts., 11/15/15 | | | 1,465,000 | | | | 739,825 | |
| Affinion Group, Inc., 7.875% Sr. Unsec. Nts., 12/15/18 | | | 4,690,000 | | | | 3,564,400 | |
| Cenveo Corp., 8.875% Sec. Nts., 2/1/18 | | | 1,295,000 | | | | 1,256,150 | |
| First Data Corp., 6.75% Sr. Sec. Nts., 11/1/203 | | | 3,075,000 | | | | 3,144,188 | |
| R.R. Donnelley & Sons Co., 7.875% Sr. Unsec. Unsub. Nts., 3/15/21 | | | 2,405,000 | | | | 2,465,125 | |
| STHI Holding Corp., 8% Sec. Nts., 3/15/183 | | | 995,000 | | | | 1,079,575 | |
| Tervita Corp., 8% Sr. Sec. Nts., 11/15/183 | | | 1,250,000 | | | | 1,258,594 | |
| West Corp., 8.625% Sr. Unsec. Nts., 10/1/18 | | | 2,285,000 | | | | 2,453,519 | |
| | | | | | |
|
|
|
| | | | | | | | 15,961,376 | |
| Construction & Engineering—0.3% | |
| Andrade Gutierrez International SA, 4% Sr. Unsec. Nts., 4/30/183 | | | 925,000 | | | | 871,813 | |
| IIRSA Norte Finance Ltd., 8.75% Sr. Nts., 5/30/241 | | | 3,410,502 | | | | 4,024,392 | |
| OAS Investments GmbH, 8.25% Sr. Nts., 10/19/193 | | | 1,015,000 | | | | 1,002,313 | |
Odebrecht Finance Ltd.:
4.375% Sr. Unsec. Nts., 4/25/253 | | | 315,000 | | | | 282,713 | |
| 8.25% Sr. Unsec. Nts., 4/25/183 | | | 1,290,000 | BRR | | | 508,779 | |
| | | | | | |
|
|
|
| | | | | | | | 6,690,010 | |
| Electrical Equipment—0.1% | |
| Belden, Inc., 5.50% Sr. Unsec. Sub. Nts., 9/1/223 | | | 1,485,000 | | | | 1,466,438 | |
| General Cable Corp., 5.75% Sr. Unsec. Unsub. Nts., 10/1/223 | | | 1,530,000 | | | | 1,522,350 | |
| | | | | | |
|
|
|
| | | | | | | | 2,988,788 | |
| Industrial Conglomerates—0.1% | �� |
| GE Capital Australia Funding Pty Ltd., 7% Bonds, 10/8/15 | | | 625,000 | AUD | | | 610,121 | |
| KOC Holding AS, 3.50% Sr. Unsec. Nts., 4/24/203 | | | 2,215,000 | | | | 1,938,125 | |
| | | | | | |
|
|
|
| | | | | | | | 2,548,246 | |
| | | | |
| 29 | | | | OPPENHEIMER GLOBAL STRATEGIC INCOME FUND/VA |
CONSOLIDATED STATEMENT OF INVESTMENTS Unaudited / Continued
| | | | | | | | |
| | | Principal
Amount | | | Value | |
| Machinery—0.7% | | | | | | | | |
| Actuant Corp., 5.625% Sr. Unsec. Unsub. Nts., 6/15/22 | | $ | 1,560,000 | | | $ | 1,587,300 | |
| ArvinMeritor, Inc., 10.625% Sr. Unsec. Nts., 3/15/18 | | | 1,115,000 | | | | 1,212,563 | |
| Cleaver-Brooks, Inc., 8.75% Sr. Sec. Nts., 12/15/193 | | | 2,175,000 | | | | 2,289,188 | |
| CNH Capital LLC, 6.25% Sr. Unsec. Nts., 11/1/16 | | | 670,000 | | | | 716,900 | |
| Manitowoc Co., Inc. (The), 8.50% Sr. Unsec. Nts., 11/1/20 | | | 3,410,000 | | | | 3,733,950 | |
| Navistar International Corp., 8.25% Sr. Unsec. Nts., 11/1/21 | | | 965,000 | | | | 952,938 | |
| Terex Corp., 6% Sr. Unsec. Nts., 5/15/21 | | | 3,100,000 | | | | 3,107,750 | |
| Thermadyne Holdings Corp., 9% Sr. Sec. Nts., 12/15/17 | | | 2,435,000 | | | | 2,635,888 | |
| Xerium Technologies, Inc., 8.875% Sr. Unsec. Nts., 6/15/18 | | | 1,580,000 | | | | 1,595,800 | |
| | | | | | |
|
|
|
| | | | | | | | 17,832,277 | |
| Marine—0.0% | | | | | | | | |
| Navios Maritime Holdings, Inc./Navios Maritime Finance U.S., Inc., 8.875% Sr. Sec. Nts., 11/1/17 | | | 725,000 | | | | 754,000 | |
| Professional Services—0.2% | | | | | | | | |
| Altegrity, Inc., 10.50% Sr. Unsec. Sub. Nts., 11/1/153 | | | 1,275,000 | | | | 1,153,875 | |
| FTI Consulting, Inc., 6% Sr. Unsec. Unsub. Nts., 11/15/223 | | | 2,565,000 | | | | 2,609,888 | |
| Spencer Spirit Holdings, Inc., 9% Sr. Unsec. Nts., 5/1/183,5 | | | 1,685,000 | | | | 1,651,300 | |
| | | | | | |
|
|
|
| | | | | | | | 5,415,063 | |
| Road & Rail—0.3% | | | | | | | | |
| Avis Budget Car Rental LLC/Avis Budget Finance, Inc., 5.50% Sr. Unsec. Nts., 4/1/233 | | | 1,680,000 | | | | 1,629,600 | |
| Kenan Advantage Group, Inc. (The), 8.375% Sr. Unsec. Nts., 12/15/183 | | | 1,510,000 | | | | 1,577,950 | |
| Rede Ferroviaria Nacional REFER EPE, 4% Sr. Unsec. Unsub. Nts., 3/16/15 | | | 540,000 | EUR | | | 685,315 | |
| Ukraine Railways via Shortline plc, 9.50% Unsec. Nts., 5/21/183 | | | 1,335,000 | | | | 1,211,513 | |
| Western Express, Inc., 12.50% Sr. Sec. Nts., 4/15/153 | | | 4,775,000 | | | | 3,175,375 | |
| | | | | | |
|
|
|
| | | | | | | | 8,279,753 | |
| Trading Companies & Distributors—0.5% | |
| Air Lease Corp., 4.75% Sr. Unsec. Unsub. Nts., 3/1/20 | | | 2,180,000 | | | | 2,114,600 | |
| | | | | | | | |
| | | Principal
Amount | | | Value | |
| Trading Companies & Distributors Continued | |
| HD Supply, Inc., 7.50% Sr. Unsec. Nts., 7/15/203 | | $ | 3,255,000 | | | $ | 3,303,825 | |
International Lease Finance Corp.:
3.875% Sr. Unsec. Unsub. Nts., 4/15/18 | | | 1,255,000 | | | | 1,182,053 | |
| 4.625% Sr. Unsec. Unsub. Nts., 4/15/21 | | | 835,000 | | | | 769,766 | |
| 8.75% Sr. Unsec. Unsub. Nts., 3/15/17 | | | 1,847,000 | | | | 2,066,331 | |
| United Rentals North America, Inc., 7.375% Sr. Unsec. Nts., 5/15/20 | | | 1,645,000 | | | | 1,764,263 | |
| | | | | | |
|
|
|
| | | | | | | | 11,200,838 | |
| Information Technology—1.3% | |
| Communications Equipment—0.1% | |
| Avaya, Inc., 7% Sr. Sec. Nts., 4/1/193 | | | 1,400,000 | | | | 1,270,500 | |
| ViaSat, Inc., 6.875% Sr. Unsec. Unsub. Nts., 6/15/20 | | | 1,166,000 | | |
| 1,235,960
|
|
| | | | | | | | 2,506,460 | |
| Computers & Peripherals—0.1% | |
Seagate HDD (Cayman), 7%
Sr. Unsec. Nts., 11/1/21 | | | 1,665,000 | | | | 1,789,875 | |
| Electronic Equipment, Instruments & Components—0.0% | |
| Anixter, Inc., 5.625% Sr. Unsec. Nts., 5/1/19 | | | 980,000 | | | | 1,019,200 | |
| Internet Software & Services—0.3% | |
| EarthLink, Inc., 7.375% Sr. Sec. Nts., 6/1/203 | | | 3,160,000 | | | | 3,049,400 | |
| Equinix, Inc., 4.875% Sr. Unsec. Nts., 4/1/20 | | | 1,615,000 | | | | 1,590,775 | |
IAC/InterActiveCorp, 4.75%
Sr. Unsec. Nts., 12/15/223 | | | 1,610,000 | | | | 1,529,500 | |
| VeriSign, Inc., 4.625% Sr. Unsec. Nts., 5/1/233 | | | 840,000 | | | | 819,000 | |
| | | | | | |
|
|
|
| | | | | | | | 6,988,675 | |
| IT Services—0.5% | | | | | | | | |
| Ceridian Corp., 11.25% Sr. Unsec. Nts., 11/15/15 | | | 1,260,000 | | | | 1,283,625 | |
First Data Corp.:
8.25% Sec. Nts., 1/15/213 | | | 1,565,000 | | | | 1,604,125 | |
| 10.625% Sr. Unsec. Nts., 6/15/213 | | | 2,090,000 | | | | 2,074,325 | |
| 12.625% Sr. Unsec. Nts., 1/15/21 | | | 1,411,000 | | | | 1,499,188 | |
| iPayment, Inc., 10.25% Sr. Unsec. Nts., 5/15/18 | | | 4,845,000 | | | | 3,997,125 | |
| WEX, Inc., 4.75% Sr. Unsec. Nts., 2/1/233 | | | 2,085,000 | | |
| 1,980,750
|
|
| | | | | | | | 12,439,138 | |
| | | | |
| 30 | | | | OPPENHEIMER GLOBAL STRATEGIC INCOME FUND/VA |
| | | | | | | | |
| | | Principal
Amount | | | Value | |
| Semiconductors & Semiconductor Equipment—0.2% | |
Freescale Semiconductor, Inc.:
9.25% Sr. Sec. Nts., 4/15/183 | | $ | 2,480,000 | | | $ | 2,684,600 | |
| 10.75% Sr. Unsec. Nts., 8/1/20 | | | 1,988,000 | | | | 2,196,740 | |
| | | | | | |
|
|
|
| | | | | | | | 4,881,340 | |
| Software—0.1% | | | | | | | | |
| Infor US, Inc., 9.375% Sr. Unsec. Nts., 4/1/19 | | | 485,000 | | | | 528,044 | |
| SunGard Data Systems, Inc., 7.625% Sr. Unsec. Nts., 11/15/20 | | | 1,125,000 | | | | 1,198,125 | |
| | | | | | |
|
|
|
| | | | | | | | 1,726,169 | |
| Materials—3.1% | | | | | | | | |
| Chemicals—0.8% | | | | | | | | |
ADS Waste Holdings, Inc., 8.25%
Sr. Nts., 10/1/203 | | | 465,000 | | | | 476,625 | |
Alphabet Holding Co., Inc., 7.75%
Sr. Unsec. Unsub. Nts., 11/1/175 | | | 640,000 | | | | 659,200 | |
Braskem Finance Ltd.:
5.375% Sr. Unsec. Nts., 5/2/223 | | | 1,395,000 | | | | 1,332,225 | |
| 5.75% Sr. Unsec. Nts., 4/15/213 | | | 915,000 | | | | 896,700 | |
Eagle Spinco, Inc., 4.625%
Sr. Unsec. Nts., 2/15/213 | | | 1,250,000 | | | | 1,204,688 | |
Hexion U.S. Finance Corp./Hexion Nova Scotia Finance ULC, 8.875%
Sr. Sec. Nts., 2/1/18 | | | 1,260,000 | | | | 1,291,500 | |
Hexion US Finance Corp., 6.625%
Sr. Sec. Nts., 4/15/203 | | | 875,000 | | | | 877,188 | |
| Huntsman International LLC, 4.875% Sr. Unsec. Unsub. Nts., 11/15/20 | | | 1,290,000 | | | | 1,280,325 | |
Ineos Finance plc, 8.375%
Sr. Sec. Bonds, 2/15/193 | | | 1,920,000 | | | | 2,104,800 | |
| INEOS Group Holdings SA, 6.125% Sr. Unsec. Nts., 8/15/183 | | | 1,050,000 | | | | 1,005,375 | |
Mexichem SAB de CV, 4.875%
Sr. Unsec. Nts., 9/19/223 | | | 2,245,000 | | | | 2,261,838 | |
| Momentive Performance Materials, Inc., 8.875% Sr. Sec. Nts., 10/15/20 | | | 1,645,000 | | | | 1,727,250 | |
| PetroLogistics LP/PetroLogistics Finance Corp., 6.25% Sr. Unsec. Nts., 4/1/203 | | | 420,000 | | | | 413,700 | |
| PolyOne Corp., 5.25% Sr. Unsec. Nts., 3/15/233 | | | 420,000 | | | | 415,800 | |
| PQ Corp., 8.75% Sr. Sec. Nts., 5/1/183 | | | 1,595,000 | | | | 1,642,850 | |
Sun Products Corp. (The), 7.75%
Sr. Unsec. Nts., 3/15/213 | | | 1,615,000 | | | | 1,610,963 | |
| Trinseo Materials Operating SCA/Trinseo Materials Finance, Inc., 8.75% Sr. Sec. Nts., 2/1/193 | | | 1,620,000 | | | | 1,555,200 | |
| | | | | | |
|
|
|
| | | | | | | | 20,756,227 | |
| | | | | | | | |
| | | Principal
Amount | | | Value | |
| Construction Materials—0.4% | |
| Building Materials Corp. of America, 6.75% Sr. Nts., 5/1/213 | | $ | 1,975,000 | | | $ | 2,103,375 | |
| CEMEX Espana Luxembourg, 9.875% Sr. Sec. Nts., 4/30/193 | | | 2,820,000 | | | | 3,059,700 | |
CEMEX Espana SA, 9.25%
Sr. Sec. Nts., 5/12/203 | | | 1,930,000 | | | | 2,045,800 | |
CEMEX Finance LLC, 9.375%
Sr. Sec. Nts., 10/12/223 | | | 2,475,000 | | | | 2,710,125 | |
| | | | | | |
|
|
|
| | | | | | | | 9,919,000 | |
| Containers & Packaging—0.5% | |
| Ardagh Packaging Finance plc/Ardagh MP Holdings USA, Inc., 7% Sr. Unsec. Nts., 11/15/203 | | | 2,205,000 | | | | 2,130,581 | |
| Berry Plastics Corp., 9.75% Sec. Nts., 1/15/21 | | | 1,580,000 | | | | 1,793,300 | |
| Consolidated Container Co. LLC/Consolidated Container Capital, Inc., 10.125% Sr. Unsec. Nts., 7/15/201 | | | 590,000 | | | | 622,450 | |
Crown Americas LLC/Crown Americas Capital Corp. IV, 4.50%
Sr. Unsec. Nts., 1/15/233 | | | 2,815,000 | | | | 2,667,213 | |
Polymer Group, Inc., 7.75%
Sr. Sec. Nts., 2/1/19 | | | 1,540,000 | | | | 1,609,300 | |
Sealed Air Corp.:
5.25% Sr. Unsec. Nts., 4/1/233 | | | 1,620,000 | | | | 1,579,500 | |
| 6.50% Sr. Unsec. Nts., 12/1/203 | | | 1,445,000 | | | | 1,531,700 | |
| | | | | | |
|
|
|
| | | | | | | | 11,934,044 | |
| Metals & Mining—1.2% | | | | | | | | |
Aleris International, Inc.:
7.625% Sr. Unsec. Nts., 2/15/18 | | | 2,655,000 | | | | 2,777,794 | |
| 7.875% Sr. Unsec. Unsub. Nts., 11/1/20 | | | 2,550,000 | | | | 2,626,500 | |
| Alrosa Finance SA, 7.75% Nts., 11/3/203 | | | 4,440,000 | | | | 4,773,000 | |
| Consolidated Minerals Ltd., 8.875% Sr. Sec. Nts., 5/1/163 | | | 1,245,000 | | | | 1,213,875 | |
CSN Islands XI Corp., 6.875%
Sr. Unsec. Nts., 9/21/193 | | | 1,445,000 | | | | 1,466,675 | |
CSN Resources SA, 6.50%
Sr. Unsec. Unsub. Nts., 7/21/203 | | | 1,305,000 | | | | 1,277,269 | |
Evraz Group SA, 6.50%
Sr. Unsec. Nts., 4/22/203 | | | 1,840,000 | | | | 1,660,600 | |
Ferrexpo Finance plc, 7.875%
Sr. Unsec. Bonds, 4/7/163 | | | 2,120,000 | | | | 1,967,084 | |
Gerdau Trade, Inc., 4.75%
Sr. Unsec. Nts., 4/15/233 | | | 2,205,000 | | | | 2,039,625 | |
| JMC Steel Group, Inc., 8.25% Sr. Unsec. Nts., 3/15/183 | | | 205,000 | | | | 201,413 | |
| | | | |
| 31 | | | | OPPENHEIMER GLOBAL STRATEGIC INCOME FUND/VA |
CONSOLIDATED STATEMENT OF INVESTMENTS Unaudited / Continued
| | | | | | | | |
| | | Principal
Amount | | | Value | |
| Metals & Mining Continued | | | | | | | | |
| Korea Resources Corp., 2.125% Sr. Unsec. Nts., 5/2/183 | | $ | 665,000 | | | $ | 628,575 | |
| Metalloinvest Finance Ltd., 5.625% Unsec. Nts., 4/17/203 | | | 1,375,000 | | | | 1,265,000 | |
| Mexico Generadora de Energia S de RL, 5.50% Sr. Sec. Nts., 12/6/323 | | | 1,450,000 | | | | 1,366,625 | |
| Novelis, Inc., 8.75% Sr. Unsec. Nts., 12/15/20 | | | 600,000 | | | | 646,500 | |
| OJSC Novolipetsk Steel via Steel Funding Ltd., 4.45% Unsec. Nts., 2/19/183 | | | 1,325,000 | | | | 1,238,875 | |
| Samarco Mineracao SA, 4.125% Sr. Unsec. Nts., 11/1/223 | | | 1,360,000 | | | | 1,220,600 | |
| Severstal OAO Via Steel Capital SA, 4.45% Sr. Unsec. Nts., 3/19/183 | | | 920,000 | | | | 874,000 | |
| Walter Energy, Inc., 9.875% Sr. Unsec. Unsub. Nts., 12/15/203 | | | 1,420,000 | | | | 1,242,500 | |
| | | | | | |
|
|
|
| | | | | | | | 28,486,510 | |
| Paper & Forest Products—0.2% | | | | | |
| Catalyst Paper Corp., 11% Sr. Sec. Nts., 10/30/175 | | | 3,308,571 | | | | 2,382,171 | |
NewPage Corp., 11.375% Sr. Sec.
Nts., 12/31/146 | | | 3,620,097 | | | | 1,270,111 | |
| Norske Skogindustrier ASA, 6.125% Unsec. Bonds, 10/15/153 | | | 1,235,000 | | | | 867,588 | |
| | | | | | |
|
|
|
| | | | | | | | 4,519,870 | |
| Telecommunication Services—3.4% | |
| Diversified Telecommunication Services—1.7% | |
| Brasil Telecom SA, 9.75% Sr. Unsec. Nts., 9/15/163 | | | 2,990,000 | BRR | | | 1,246,196 | |
| Cequel Communications Escrow 1 LLC/Cequel Escrow Capital Corp., 6.375% Sr. Nts., 9/15/203 | | | 6,080,000 | | | | 6,216,800 | |
| Cincinnati Bell, Inc.: | | | | | | | | |
| 8.375% Sr. Unsec. Unsub. Nts., 10/15/20 | | | 625,000 | | | | 646,875 | |
| 8.75% Sr. Unsec. Sub. Nts., 3/15/18 | | | 720,000 | | | | 724,500 | |
| Colombia Telecomunicaciones SA ESP, 5.375% Sr. Unsec. Nts., 9/27/223 | | | 615,000 | | | | 582,713 | |
| Fairpoint Communications, Inc., 8.75% Sr. Sec. Nts., 8/15/193 | | | 5,225,000 | | | | 5,198,875 | |
| Frontier Communications Corp., 7.625% Sr. Unsec. Unsub. Nts., 4/15/24 | | | 1,615,000 | | | | 1,627,113 | |
| Intelsat Jackson Holdings SA: | | | | | | | | |
| 5.50% Sr. Unsec. Nts., 8/1/233 | | | 1,055,000 | | | | 996,975 | |
| 7.25% Sr. Unsec. Nts., 10/15/20 | | | 1,460,000 | | | | 1,540,300 | |
| | | | | | | | |
| | | Principal
Amount | | | Value | |
| Diversified Telecommunication Services Continued | |
| Intelsat Luxembourg SA, 7.75% Sr. Unsec. Nts., 6/1/213 | | $ | 2,095,000 | | | $ | 2,170,944 | |
| Level 3 Communications, Inc., 8.875% Sr. Unsec. Unsub. Nts., 6/1/19 | | | 2,125,000 | | | | 2,217,969 | |
| Level 3 Financing, Inc., 9.375% Sr. Unsec. Unsub. Nts., 4/1/19 | | | 765,000 | | | | 830,025 | |
| MetroPCS Wireless, Inc.: | | | | | | | | |
| 6.25% Sr. Unsec. Unsub. Nts., 4/1/213 | | | 1,610,000 | | | | 1,644,213 | |
| 6.625% Sr. Unsec. Nts., 11/15/20 | | | 2,490,000 | | | | 2,592,713 | |
| 6.625% Sr. Unsec. Nts., 4/1/233 | | | 1,610,000 | | | | 1,644,213 | |
| Qtel International Finance Ltd., 3.875% Sr. Unsec. Nts., 1/31/283 | | | 745,000 | | | | 655,600 | |
| Telecom Italia SpA, 7.75% Unsec. Sub. Nts., 3/20/73 | | | 135,000 | EUR | | | 173,594 | |
| Telefonica Chile SA, 3.875% Sr. Unsec. Nts., 10/12/223 | | | 2,125,000 | | | | 1,950,079 | |
Telemar Norte Leste SA, 5.50%
Sr. Unsec. Nts., 10/23/203 | | | 5,955,000 | | | | 5,567,925 | |
| Wind Acquisition Finance SA, 7.25% Sr. Sec. Nts., 2/15/183 | | | 2,535,000 | | | | 2,566,688 | |
| Windstream Corp., 6.375% Sr. Unsec. Nts., 8/1/23 | | | 1,045,000 | | | | 982,300 | |
| | | | | | |
|
|
|
| | | | | | | | 41,776,610 | |
| Wireless Telecommunication Services—1.7% | |
| America Movil SAB de CV: | | | | | | | | |
| 6.45% Sr. Unsec. Nts., 12/5/22 | | | 40,450,000 | MXN | | | 3,038,867 | |
| 8.46% Sr. Unsec. Unsub. Bonds, 12/18/36 | | | 14,700,000 | MXN | | | 1,129,835 | |
| Cricket Communications, Inc., 7.75% Sr. Unsec. Nts., 10/15/20 | | | 1,960,000 | | | | 1,891,400 | |
| Digicel Group Ltd., 8.25% Sr. Unsec. Nts., 9/30/203 | | | 730,000 | | | | 759,200 | |
| Digicel Ltd., 6% Sr. Unsec. Nts., 4/15/213 | | | 1,445,000 | | | | 1,369,138 | |
| Leap Wireless International, Inc., 4.50% Cv. Sr. Unsec. Nts., 7/15/14 | | | 1,540,000 | | | | 1,552,513 | |
| Millicom International Cellular SA, 4.75% Sr. Unsec. Nts., 5/22/203 | | | 925,000 | | | | 881,303 | |
| MTS International Funding Ltd.: | | | | | | | | |
| 5% Sr. Unsec. Nts., 5/30/233 | | | 1,390,000 | | | | 1,337,875 | |
| 8.625% Sr. Unsec. Nts., 6/22/203 | | | 2,295,000 | | | | 2,708,100 | |
| SBA Telecommunications, Inc., 5.75% Sr. Unsec. Unsub. Nts., 7/15/203 | | | 785,000 | | | | 789,906 | |
Sprint Capital Corp., 6.875%
Sr. Unsec. Nts., 11/15/28 | | | 3,075,000 | | | | 2,967,375 | |
| | | | |
| 32 | | | | OPPENHEIMER GLOBAL STRATEGIC INCOME FUND/VA |
| | | | | | | | |
| | | Principal
Amount | | | Value | |
| Wireless Telecommunication Services Continued | |
Sprint Nextel Corp., 9%
Sr. Unsec. Nts., 11/15/183 | | $ | 1,400,000 | | | $ | 1,641,500 | |
Vimpel Communications, 8.85%
Sr. Unsec. Nts., 3/8/222 | | | 21,900,000 | RUR | | | 676,739 | |
| Vimpel Communications, Inc., 8.85% Sr. Unsec. Nts., 3/8/222 | | | 21,900,000 | RUR | | | 676,739 | |
| Vimpel Communications/VIP Finance Ireland Ltd. OJSC: | | | | | | | | |
| 7.748% Sec. Nts., 2/2/213 | | | 2,265,000 | | | | 2,420,719 | |
| 9.125% Sr. Unsec. Nts., 4/30/183 | | | 4,795,000 | | | | 5,478,288 | |
| VimpelCom, 7.504% Sr. Unsec. Unsub. Nts., 3/1/223 | | | 5,290,000 | | | | 5,488,375 | |
| VimpelCom Holdings BV: | | | | | | | | |
| 5.95% Sr. Unsec. Unsub. Nts., 2/13/233 | | | 4,225,000 | | | | 3,971,500 | |
| 9% Sr. Unsec. Nts., 2/13/18 | | | 64,100,000 | RUR | | | 1,931,579 | |
| Wind Acquisition Finance SA, 11.75% Sr. Sec. Nts., 7/15/173 | | | 905,000 | | | | 945,725 | |
| | | | | | |
|
|
|
| | | | | | | | 41,656,676 | |
| Utilities—2.2% | | | | | | | | |
| Electric Utilities—1.1% | |
| Dubai Electricity & Water Authority, 7.375% Sr. Unsec. Unsub. Nts., 10/21/203 | | | 1,975,000 | | | | 2,221,875 | |
| Electricite de France SA, 5.25% Jr. Sub. Perpetual Bonds2,3,14 | | | 930,000 | | | | 890,721 | |
| Empresas Publicas de Medellin ESP, 8.375% Sr. Unsec. Unsub. Nts., 2/1/213 | | | 2,605,000,000 | COP | | | 1,453,861 | |
| Eskom Holdings Ltd.: | | | | | | | | |
7.85% Sr. Unsec. Unsub. Nts.,
Series ES26, 4/2/26 | | | 37,000,000 | ZAR | | | 3,575,979 | |
| 10% Nts., Series ES23, 1/25/23 | | | 46,000,000 | ZAR | | | 5,292,095 | |
| Israel Electric Corp. Ltd.: | | | | | | | | |
| 6.70% Sr. Unsec. Nts., 2/10/173 | | | 1,960,000 | | | | 2,068,902 | |
| 7.25% Nts., 1/15/193 | | | 7,780,000 | | | | 8,291,994 | |
| 9.375% Sr. Sec. Nts., 1/28/203 | | | 670,000 | | | | 791,299 | |
| National Power Corp., 5.875% Unsec. Unsub. Bonds, 12/19/16 | | | 109,600,000 | PHP | | | 2,801,719 | |
| | | | | | |
|
|
|
| | | | | | | | 27,388,445 | |
| Energy Traders—0.7% | |
| AES Corp. (The): | | | | | | | | |
| 7.375% Sr. Unsec. Unsub. Nts., 7/1/21 | | | 1,045,000 | | | | 1,152,113 | |
| 8% Sr. Unsec. Unsub. Nts., 10/15/17 | | | 1,100,000 | | | | 1,243,000 | |
| Calpine Corp.: | | | | | | | | |
| 7.50% Sr. Sec. Nts., 2/15/213 | | | 1,026,000 | | | | 1,100,385 | |
| 7.875% Sr. Sec. Nts., 1/15/233 | | | 995,000 | | | | 1,074,600 | |
Colbun SA, 6% Sr. Unsec.
Nts., 1/21/203 | | | 2,965,000 | | | | 3,171,575 | |
| | | | | | | | |
| | | Principal
Amount | | | Value | |
| Energy Traders Continued | |
Dynegy, Inc., 5.875% Sr. Unsec.
Nts., 6/1/233 | | $ | 420,000 | | | $ | 383,250 | |
Energy Future Intermediate Holding Co. LLC/EFIH Finance, Inc.:
10% Sr. Sec. Nts., 12/1/203 | | | 2,370,000 | | | | 2,601,075 | |
| 11.75% Sec. Nts., 3/1/223 | | | 2,605,000 | | | | 2,891,550 | |
| Foresight Energy LLC, 9.625% Sr. Unsec. Nts., 8/15/173 | | | 1,845,000 | | | | 1,946,475 | |
| NRG Energy, Inc., 6.625% Sr. Unsec. Nts., 3/15/233 | | | 1,455,000 | | | | 1,462,275 | |
Perusahaan Listrik Negara PT,
5.25% Sr. Unsec. Nts., 10/24/423 | | | 315,000 | | | | 263,025 | |
| | | | | | |
|
|
|
| | | | | | | | 17,289,323 | |
| Gas Utilities—0.3% | | | | | | | | |
| AmeriGas Finance LLC/AmeriGas Finance Corp., 6.75% Sr. Unsec. Nts., 5/20/20 | | | 3,050,000 | | | | 3,172,000 | |
Empresa de Energia de Bogota SA ESP, 6.125% Sr. Unsec. Unsub.
Nts., 11/10/213 | | | 1,850,000 | | | | 1,924,000 | |
Gas Natural de Lima y Callao SA,
4.375% Sr. Unsec. Nts., 4/1/233 | | | 1,320,000 | | | | 1,194,600 | |
| Transportadora de Gas Internacional SA ESP, 5.70% Sr. Unsec. Nts., 3/20/223 | | | 1,005,000 | | | | 1,042,688 | |
| | | | | | |
|
|
|
| | | | | | | | 7,333,288 | |
| Multi-Utilities—0.1% | | | | | | | | |
Abu Dhabi National Energy Co.,
3.625% Sr. Unsec. Unsub. Nts., 1/12/233 | | | 1,790,000 | | | | 1,664,700 | |
Veolia Environnement SA,
4.44% Unsec. Perpetual Bonds2,14 | | | 850,000 | EUR | | | 1,069,055 | |
| | | | | | |
|
|
|
| | | | | | | | 2,733,755 | |
| | | | | | |
|
|
|
| Total Corporate Bonds and Notes (Cost $900,483,626) | | | | | | | 871,823,238 | |
| | | Shares | | | | |
| Preferred Stocks—0.1% | |
Ally Financial, Inc., 7% Cum.,
Series G, Non-Vtg.
(Cost $3,049,853) | | | 3,287 | | | | 3,124,396 | |
| Common Stocks—0.2% | |
| American Media Operations, Inc.15 | | | 219,796 | | | | 2,527,654 | |
| Arco Capital Corp. Ltd.1,15 | | | 690,638 | | | | — | |
| Catalyst Paper Corp.15 | | | 190,901 | | | | 199,668 | |
| Global Aviation Holdings, Inc.15 | | | 400 | | | | — | |
| Goldman Sachs Group, Inc. (The) | | | 1,190 | | | | 179,988 | |
| | | | |
| 33 | | | | OPPENHEIMER GLOBAL STRATEGIC INCOME FUND/VA |
CONSOLIDATED STATEMENT OF INVESTMENTS Unaudited / Continued
| | | | | | | | |
| | | Shares | | | Value | |
| Common Stocks Continued | |
| Nortek, Inc.15 | | | 24,095 | | | $ | 1,552,441 | |
| Premier Holdings Ltd.15 | | | 18,514 | | | | — | |
| Wallace Theater Holdings, Inc.1,15 | | | 1,525 | | | | 15,296 | |
| | | | | | |
|
|
|
Total Common Stocks
(Cost $8,367,774) | | | | | | | 4,475,047 | |
| | |
| | | Units | | | | |
| Rights, Warrants and Certificates—0.0% | |
MediaNews Group, Inc. Wts., Strike Price $48.72, Exp. 3/19/1715
(Cost $6,331,150) | | | 22,685 | | | | — | |
| | |
| | | Principal
Amount | | | | |
| Structured Securities—1.0% | |
Citigroup Funding, Inc., Ghana (Republic of) Credit Linked Nts.,
13.45%, 2/19/142,3 | | | 690,000 | GHS | | | 331,683 | |
| Citigroup Global Markets Holdings, Inc., Colombia (Republic of) Credit Linked Nts., Series 2, 10%, 7/25/24 | | | 1,549,000,000 | COP | | | 1,012,899 | |
| Credit Suisse First Boston International, Moitk Total Return Linked Nts., 21%, 3/30/116 | | | 53,910,000 | RUR | | | — | |
| Credit Suisse First Boston, Inc. (Nassau Branch), Russian Specialized Construction & Installation Administration Total Return Linked Nts., 13%, 5/24/106 | | | 97,250,000 | RUR | | | — | |
Deutsche Bank AG:
Coriolanus Ltd. Sec. Credit Linked Bonds, Series 128, 3.006%, 5/6/253,12 | | | 1,627,846 | | | | 1,044,853 | |
| Coriolanus Ltd. Sec. Credit Linked Bonds, 3.061%, 5/6/253,12 | | | 2,074,127 | | | | 1,331,304 | |
| Coriolanus Ltd. Sec. Credit Linked Bonds, 3.10%, 5/6/253,12 | | | 1,790,677 | | | | 1,149,368 | |
| Coriolanus Ltd. Sec. Credit Linked Bonds, 3.134%, 5/6/253,12 | | | 1,600,639 | | | | 1,027,390 | |
| | | | | | | | |
| | | Principal
Amount | | | Value | |
| Structured Securities Continued | |
| Coriolanus Ltd. Sec. Credit Linked Bonds, 3.187%, 5/6/253,12 | | $ | 1,992,926 | | | $ | 1,279,183 | |
| Coriolanus Ltd. Sec. Credit Linked Bonds, 3.239%, 5/6/253,12 | | | 2,274,622 | | | | 1,459,993 | |
| Coriolanus Ltd. Sec. Credit Linked Bonds, 3.266%, 5/6/253,12 | | | 1,817,157 | | | | 1,166,364 | |
| Coriolanus Ltd. Sec. Credit Linked Bonds, 3.343%, 5/6/253,12 | | | 1,708,050 | | | | 1,096,333 | |
| Coriolanus Ltd. Sec. Credit Linked Nts., 17.759%, 12/31/171,13 | | | 12,850,000 | BRR | | | 7,567,123 | |
Opic Reforma I Credit Linked
Nts., Cl. 2A, 7.719%, 5/22/151,2 | | | 697,693 | MXN | | | 50,641 | |
Opic Reforma I Credit Linked
Nts., Cl. 2B, 7.719%, 5/22/151,2 | | | 1,220,632 | MXN | | | 88,598 | |
Opic Reforma I Credit Linked
Nts., Cl. 2C, 7.719%, 5/22/151,2 | | | 18,404,162 | MXN | | | 1,335,843 | |
Opic Reforma I Credit Linked
Nts., Cl. 2D, 7.719%, 5/22/151,2 | | | 1,341,270 | MXN | | | 97,354 | |
Opic Reforma I Credit Linked
Nts., Cl. 2E, 7.719%, 5/22/151,2 | | | 974,458 | MXN | | | 70,730 | |
Opic Reforma I Credit Linked
Nts., Cl. 2F, 7.719%, 5/22/151,2 | | | 622,337 | MXN | | | 45,172 | |
Opic Reforma I Credit Linked
Nts., Cl. 2G, 7.719%, 5/22/151,2 | | | 114,609 | MXN | | | 8,319 | |
| Goldman Sachs Capital Markets LP, Colombia (Republic of) Credit Linked Nts., Cl. B, 10%, 7/30/241 | | | 4,250,000,000 | COP | | | 2,788,829 | |
| Goldman Sachs Group, Inc. (The), United Mexican States Credit Linked Nts., 9.05%, 2/8/371,12 | | | 315,000,000 | MXN | | | 2,080,965 | |
LB Peru Trust II Certificates,
Series 1998-A, 3.796%, 2/28/166,12 | | | 262,158 | | | | 277,058 | |
| Morgan Stanley, Russian Federation Total Return Linked Bonds, Series 007, Cl. VR, 5%, 8/22/34 | | | 49,299,985 | RUR | | | 742,741 | |
| | | | | | |
|
|
|
Total Structured Securities
(Cost $33,459,355) | | | | | | | 26,052,743 | |
| | | | | | | | | | | | | | | | |
| | | Expiration
Date | | | Strike
Price | | | Contracts | | | | |
| Exchange-Traded Options Purchased—0.0% | |
| U.S. Treasury Nts., 10 yr. Futures, 9/19/13 Call15 | | | 8/26/13 | | | | $130.500 | | | | 886 | | | | 110,750 | |
| U.S. Treasury Nts., 10 yr. Futures, 9/19/13 Call15 | | | 8/26/13 | | | | 132.500 | | | | 886 | | | | 41,531 | |
| U.S. Treasury Nts., 10 yr. Futures, 9/19/13 Call15 | | | 8/26/13 | | | | 132.000 | | | | 886 | | | | 55,375 | |
| | | | | | | | | | | | | | |
|
|
|
| Total Exchange-Traded Options Purchased (Cost $972,509) | | | | | | | | | | | | | | | 207,656 | |
| | | | |
| 34 | | | | OPPENHEIMER GLOBAL STRATEGIC INCOME FUND/VA |
| | | | | | | | | | | | | | | | |
| | | Expiration
Date | | | Strike
Price | | | Contracts | | | Value | |
| Over-the-Counter Options Purchased—0.1% | | | | | | | | | | | | | | | | |
| Dual digital option with $105,000 payout contingent on: British pound (GBP)/United States Dollar (USD) spot rates, and; United States Dollar (USD)/Indian Rupee (INR) Spot rates at expire date15 | | | 8/28/13 | | |
| Spot trades at or below:
1 GBP per 1.498 USD
Spot trades at or below:
1 USD per 54.06 INR |
| | | 1 | | | $ | 260 | |
| Euro (EUR) Call15 | | | 9/18/13 | | | | 1 EUR per 1.356 USD | | | | 2,030,000 | | | | 7,772 | |
| Euro (EUR) Put15 | | | 9/27/13 | | | | 1 EUR per 7.766 NOK | | | | 1,375,000 | | | | 127 | |
| Indian Rupee (INR) Call15 | | | 4/16/14 | | | | 1 USD per 57.500 INR | | | | 130,200,000 | | | | 14,140 | |
| Indian Rupee (INR) Call15 | | | 4/29/14 | | | | 1 USD per 57.500 INR | | | | 109,000,000 | | | | 12,776 | |
| Indian Rupee (INR) Call15 | | | 5/12/14 | | | | 1 USD per 58.000 INR | | | | 110,000,000 | | | | 16,391 | |
| iShares iBoxx High Yield Corporate Bond Exchange Traded Fund Call15 | | | 12/20/13 | | | | 93.000 | | | | 6,663 | | | | 550,353 | |
| iShares iBoxx High Yield Corporate Bond Exchange Traded Fund Call15 | | | 12/20/13 | | | | 92.000 | | | | 2,218 | | | | 246,198 | |
| iShares iBoxx High Yield Corporate Bond Exchange Traded Fund Call15 | | | 12/20/13 | | | | 94.000 | | | | 4,460 | | | | 568,650 | |
| iShares iBoxx High Yield Corporate Bond Exchange Traded Fund Call15 | | | 12/20/13 | | | | 94.000 | | | | 4,465 | | | | 248,162 | |
| Japanese Yen (JPY) Put15 | | | 5/22/15 | | | | 1 USD per 108.000 JPY | | | | 650,000,000 | | | | 229,112 | |
| Mexican Nuevo Peso (MXN) Call15 | | | 9/18/13 | | | | 1 USD per 12.770 MXN | | | | 148,900,000 | | | | 198,585 | |
| Mexican Nuevo Peso (MXN) Call15 | | | 9/18/13 | | | | 1 USD per 12.770 MXN | | | | 148,900,000 | | | | 198,585 | |
| Mexican Nuevo Peso (MXN) Call15 | | | 9/23/13 | | | | 1 USD per 13.310 MXN | | | | 103,400,000 | | | | 319,068 | |
| Mexican Nuevo Peso (MXN) Call15 | | | 9/23/13 | | | | 1 USD per 13.149 MXN | | | | 102,200,000 | | | | 256,064 | |
| | | | | | | | | | | | | | |
|
|
|
| Total Over-the-Counter Options Purchased (Cost $3,640,281) | | | | | | | | | | | | | | | 2,866,243 | |
| | | | | | | | | | | | |
| | | |
| | | Swaption
Expiration
Date | | | Notional
Amount | | | | |
| Over-the-Counter Credit Default Swaptions Purchased—0.0% | | | | | | | | | | | | |
| JPMorgan Chase Bank NA, Index Credit Default Swaption (European); Swap Terms: Paid: 1%; Received: Protection on iTraxx Europe Series 19 Version 1; Termination Date: 6/20/1815 | | | 7/18/13 | | | | 3,405,000 | EUR | | | 16,308 | |
| JPMorgan Chase Bank NA, Index Credit Default Swaption (European); Swap Terms: Paid: 1%; Received: Protection on iTraxx Europe Series 19 Version 1; Termination Date: 6/20/1815 | | | 7/18/13 | | | | 6,800,000 | EUR | | | 32,568 | |
| JPMorgan Chase Bank NA, Index Credit Default Swaption (European); Swap Terms: Paid: 5%; Received: Protection on CDX.NA.HY.20; Termination Date: 6/20/1815 | | | 12/19/13 | | | | 685,000 | | | | 21,064 | |
| JPMorgan Chase Bank NA, Index Credit Default Swaption (European); Swap Terms: Paid: 5%; Received: Protection on CDX.NA.HY.20; Termination Date: 6/20/1815 | | | 9/19/13 | | | | 685,000 | | | | 14,385 | |
| | | | | | | | | | |
|
|
|
| Total Over-the-Counter Credit Default Swaptions Purchased (Cost $69,700) | | | | | | | | | | | 84,325 | |
| Over-the-Counter Interest Rate Swaptions Purchased—0.3% | | | | | | | | | | | | |
| Bank of America NA; Interest Rate Swaption (European); Swap Terms: Paid: 2.795%; Received: Three-Month USD BBA LIBOR; Termination Date: 7/30/2315 | | | 7/29/13 | | | | 20,500,000 | | | | 158,683 | |
| Bank of America NA; Interest Rate Swaption (European); Swap Terms: Paid: 2.9125%; Received: Three-Month USD BBA LIBOR; Termination Date: 8/29/2315 | | | 8/28/13 | | | | 59,550,000 | | | | 609,815 | |
Bank of America NA; Interest Rate Swaption (European); Swap Terms: Paid:
Three-Month CAD BA CDOR; Received: 2.0825%; Termination Date: 10/8/2315 | | | 10/9/13 | | | | 15,740,000 | CAD | | | 12 | |
Bank of America NA; Interest Rate Swaption (European); Swap Terms: Paid:
Three-Month USD BBA LIBOR; Received: 3.20%; Termination Date: 11/13/2315 | | | 11/8/13 | | | | 2,655,000 | | | | 1,927 | |
| Barclays Bank plc; Interest Rate Swaption (European); Swap Terms: Paid: 2.1825%; Received: Three-Month USD BBA LIBOR; Termination Date: 11/20/2315 | | | 11/19/13 | | | | 2,850,000 | | | | 178,634 | |
| | | | |
| 35 | | | | OPPENHEIMER GLOBAL STRATEGIC INCOME FUND/VA |
CONSOLIDATED STATEMENT OF INVESTMENTS Unaudited / Continued
| | | | | | | | | | | | |
| | | |
| | | Swaption
Expiration
Date | | | Notional
Amount | | | Value | |
| Over-the-Counter Interest Rate Swaptions Purchased Continued | | | | | | | | | | | | |
| Barclays Bank plc; Interest Rate Swaption (European); Swap Terms: Paid: 2.6725%; Received: Three-Month USD BBA LIBOR; Termination Date: 10/10/2315 | | | 10/9/13 | | | | 15,740,000 | CAD | | $ | 412,775 | |
| Barclays Bank plc; Interest Rate Swaption (European); Swap Terms: Paid: 3.40%; Received: Three-Month USD BBA LIBOR; Termination Date: 5/28/2515 | | | 5/27/15 | | | | 5,350,000 | | | | 266,641 | |
| Barclays Bank plc; Interest Rate Swaption (European); Swap Terms: Paid: 3.48%; Received: Three-Month USD BBA LIBOR; Termination Date: 4/27/4715 | | | 4/26/17 | | | | 5,040,000 | | | | 770,956 | |
| Barclays Bank plc; Interest Rate Swaption (European); Swap Terms: Paid: 3.537%; Received: Six-Month GBP BBA LIBOR; Termination Date: 1/25/4615 | | | 1/26/16 | | | | 1,325,000 | GBP | | | 189,912 | |
| Barclays Bank plc; Interest Rate Swaption (European); Swap Terms: Paid: 3.57%; Received: Three-Month USD BBA LIBOR; Termination Date: 9/3/4315 | | | 9/3/13 | | | | 2,015,000 | | | | 43,609 | |
| Barclays Bank plc; Interest Rate Swaption (European); Swap Terms: Paid: 3.99%; Received: Six-Month GBP BBA LIBOR; Termination Date: 5/30/3315 | | | 5/31/23 | | | | 1,235,000 | GBP | | | 110,608 | |
| Barclays Bank plc; Interest Rate Swaption (European); Swap Terms: Paid: Six-Month GBP BBA LIBOR; Received: 2.6175%; Termination Date: 6/20/2115 | | | 6/21/16 | | | | 5,420,000 | GBP | | | 140,748 | |
| Barclays Bank plc; Interest Rate Swaption (European); Swap Terms: Paid: Three-Month USD BBA LIBOR; Received: 3.20%; Termination Date: 11/9/2315 | | | 11/8/13 | | | | 10,525,000 | | | | 7,699 | |
| Goldman Sachs Bank USA; Interest Rate Swaption (European); Swap Terms: Paid: 3.275%; Received: Six-Month GBP BBA LIBOR; Termination Date: 12/4/4515 | | | 12/7/15 | | | | 1,320,000 | GBP | | | 239,549 | |
| Goldman Sachs International; Interest Rate Swaption (European); Swap Terms: Paid: 2.88375%; Received: Three-Month USD BBA LIBOR; Termination Date: 9/30/2315 | | | 9/27/13 | | | | 34,610,000 | | | | 547,261 | |
| Goldman Sachs International; Interest Rate Swaption (European); Swap Terms: Paid: 2.9375%; Received: Three-Month USD BBA LIBOR; Termination Date: 9/24/2315 | | | 9/23/13 | | | | 42,970,000 | | | | 569,186 | |
| Goldman Sachs International; Interest Rate Swaption (European); Swap Terms: Paid: 3.32%; Received: Three-Month KRW CD KSDA; Termination Date: 1/5/2315 | | | 1/5/18 | | | | 2,660,000,000 | KRW | | | 53,577 | |
| Goldman Sachs International; Interest Rate Swaption (European); Swap Terms: Paid: 3.70%; Received: Three-Month USD BBA LIBOR; Termination Date: 2/21/4415 | | | 2/20/14 | | | | 20,940,000 | | | | 850,675 | |
| JPMorgan Chase Bank NA; Interest Rate Swaption (European); Swap Terms: Paid: 1.745%: Received: Three-Month USD BBA LIBOR; Termination Date: 8/29/1815 | | | 8/28/13 | | | | 13,565,000 | | | | 82,636 | |
| JPMorgan Chase Bank NA; Interest Rate Swaption (European); Swap Terms: Paid: 2.256%: Received: Three-Month USD BBA LIBOR; Termination Date: 11/19/2315 | | | 11/18/13 | | | | 2,640,000 | | | | 150,476 | |
| JPMorgan Chase Bank NA; Interest Rate Swaption (European); Swap Terms: Paid: 2.8825%: Received: Three-Month USD BBA LIBOR; Termination Date: 9/23/2315 | | | 9/20/13 | | | | 12,325,000 | | | | 183,420 | |
| JPMorgan Chase Bank NA; Interest Rate Swaption (European); Swap Terms: Paid: 2.885%: Received: Three-Month USD BBA LIBOR; Termination Date: 9/23/2315 | | | 9/20/13 | | | | 10,270,000 | | | | 151,967 | |
| JPMorgan Chase Bank NA; Interest Rate Swaption (European); Swap Terms: Paid: 3.5175%: Received: Three-Month USD BBA LIBOR; Termination Date: 9/16/4315 | | | 9/13/13 | | | | 15,915,000 | | | | 467,138 | |
UBS AG, Interest Rate Swaption (European); Swap Terms: Paid: 3.27%; Received:
Three-Month USD BBA LIBOR; Termination Date: 9/3/4315 | | | 9/3/13 | | | | 5,085,000 | | | | 268,292 | |
UBS AG; Interest Rate Swaption (European); Swap Terms: Paid: 3.2575%; Received:
Three-Month USD BBA LIBOR; Termination Date: 9/3/4315 | | | 9/3/13 | | | | 1,340,000 | | | | 72,927 | |
| UBS AG; Interest Rate Swaption (European); Swap Terms: Paid: Six-Month EUR EURIBOR; Received: 1.545%; Termination Date: 1/26/1915 | | | 1/25/17 | | | | 11,220,000 | EUR | | | 68,274 | |
| | | | | | | | | | |
|
|
|
| Total Over-the-Counter Interest Rate Swaptions Purchased (Cost $6,257,847) | | | | | | | | | | | 6,597,397 | |
| | | | | | Shares | | | | |
| Investment Companies—8.0% | | | | | | | | | | | | |
| Oppenheimer Institutional Money Market Fund, Cl. E, 0.11%16,17 | | | | | | | 30,345,261 | | | | 30,345,261 | |
| Oppenheimer Master Event-Linked Bond Fund, LLC16 | | | | | | | 4,827,322 | | | | 62,946,128 | |
| | | | |
| 36 | | | | OPPENHEIMER GLOBAL STRATEGIC INCOME FUND/VA |
| | | | | | | | | | |
| | | | | Shares | | | Value | |
| | | | | | | | | | | |
| Investment Companies Continued | | | | | | | | | | |
| Oppenheimer Master Loan Fund, LLC16 | | | | | 6,251,605 | | | $ | 85,550,125 | |
| Oppenheimer Short Duration Fund, Cl. Y16 | | | | | 1,787,070 | | |
| 17,906,445
|
|
| Total Investment Companies (Cost $195,028,725) | | | | | | | | | 196,747,959 | |
| Total Investments, at Value (Cost $2,612,315,017) | | | | | 102.5 | % | | | 2,527,012,328 | |
| Liabilities in Excess of Other Assets | |
| |
| (2.5
| )
| |
| (61,625,676
| )
|
| Net Assets | |
| |
| 100.0
| %
| | $
| 2,465,386,652
|
|
Footnotes to Consolidated Statement of Investments
* June 28, 2013 represents the last business day of the Fund’s semiannual period. See Note 1 of the accompanying Notes.
Principal amount, strike price and notional amount are reported in U.S. Dollars, except for those denoted in the following currencies:
| | |
| AUD | | Australian Dollar |
| BRR | | Brazilian Real |
| CAD | | Canadian Dollar |
| CHF | | Swiss Franc |
| COP | | Colombian Peso |
| DKK | | Danish Krone |
| EUR | | Euro |
| GBP | | British Pound Sterling |
| GHS | | Ghana Cedi |
| HUF | | Hungarian Forint |
| JPY | | Japanese Yen |
| KRW | | South Korean Won |
| MXN | | Mexican Nuevo Peso |
| MYR | | Malaysian Ringgit |
| NGN | | Nigeria Naira |
| NOK | | Norwegian Krone |
| PEN | | Peruvian New Sol |
| PHP | | Philippines Peso |
| PLZ | | Polish Zloty |
| RSD | | Serbian Dinar |
| RUR | | Russian Ruble |
| SEK | | Swedish Krona |
| THB | | Thai Bhat |
| TRY | | New Turkish Lira |
| ZAR | | South African Rand |
1. Restricted security. The aggregate value of restricted securities as of June 28, 2013 was $42,006,309, which represents 1.70% of the Fund’s net assets. See Note 7 of the accompanying Notes. Information concerning restricted securities is as follows:
| | | | | | | | | | | | | | | | |
| Security | | Acquisition
Dates | | | Cost | | | Value | | | Unrealized
Appreciation
(Depreciation) | |
| Ally Auto Receivables Trust, Automobile Receivables Nts., Series 2012-A, Cl. D, 3.15%, 10/15/18 | | | 6/8/12 | | | $ | 2,110,379 | | | $ | 2,157,255 | | | $ | 46,876 | |
| Arco Capital Corp. Ltd. | | | 6/28/13 | | | | — | | | | — | | | | — | |
| BCAP LLC Trust, Mtg. Pass-Through Certificates, Series 2012-RR6, Cl. 1A5, 2.379%, 11/1/36 | | | 6/14/12 | | | | 460,006 | | | | 473,497 | | | | 13,491 | |
| Citigroup Mortgage Loan Trust, Inc. 2012-8, Mtg. Pass-Through Certificates, Series 2012-8, Cl. 1A1, 2.674%, 10/1/35 | | | 8/1/12 | | | | 1,044,856 | | | | 1,085,305 | | | | 40,449 | |
Consolidated Container Co. LLC/Consolidated Container Capital, Inc., 10.125%
Sr. Unsec. Nts., 7/15/20 | | | 6/28/12 | | | | 590,000 | | | | 622,450 | | | | 32,450 | |
| | | | |
| 37 | | | | OPPENHEIMER GLOBAL STRATEGIC INCOME FUND/VA |
CONSOLIDATED STATEMENT OF INVESTMENTS Unaudited / Continued
Footnotes to Consolidated Statement of Investments Continued
| | | | | | | | | | | | | | | | |
| Security | | Acquisition
Dates | | | Cost | | | Value | | | Unrealized
Appreciation
(Depreciation) | |
| Deutsche Bank AG, Coriolanus Ltd. Sec. Credit Linked Nts., 17.759%, 12/31/17 | | | 9/19/07 | | | $ | 5,928,360 | | | $ | 7,567,123 | | | $ | 1,638,763 | |
| Deutsche Bank AG, Opic Reforma I Credit Linked Nts., Cl. 2A, 7.719%, 5/22/15 | | | 5/21/08 | | | | 67,269 | | | | 50,641 | | | | (16,628 | ) |
| Deutsche Bank AG, Opic Reforma I Credit Linked Nts., Cl. 2B, 7.719%, 5/22/15 | | | 6/12/08 | | | | 117,680 | | | | 88,598 | | | | (29,082 | ) |
| Deutsche Bank AG, Opic Reforma I Credit Linked Nts., Cl. 2C, 7.719%, 5/22/15 | | | 6/18/08 | | | | 1,785,486 | | | | 1,335,843 | | | | (449,643 | ) |
| Deutsche Bank AG, Opic Reforma I Credit Linked Nts., Cl. 2D, 7.719%, 5/22/15 | | | 7/8/08 | | | | 130,028 | | | | 97,354 | | | | (32,674 | ) |
| Deutsche Bank AG, Opic Reforma I Credit Linked Nts., Cl. 2E, 7.719%, 5/22/15 | | | 7/15/08 | | | | 94,626 | | | | 70,730 | | | | (23,896 | ) |
| Deutsche Bank AG, Opic Reforma I Credit Linked Nts., Cl. 2F, 7.719%, 5/22/15 | | | 8/8/08 | | | | 61,263 | | | | 45,172 | | | | (16,091 | ) |
| Deutsche Bank AG, Opic Reforma I Credit Linked Nts., Cl. 2G, 7.719%, 5/22/15 | | | 8/22/08 | | | | 11,304 | | | | 8,319 | | | | (2,985 | ) |
| Goldman Sachs Capital Markets LP, Colombia (Republic of) Credit Linked Nts., Cl. B, 10%, 7/30/24 | | | 9/12/12 | | | | 2,990,444 | | | | 2,788,829 | | | | (201,615 | ) |
| Goldman Sachs Group, Inc. (The), United Mexican States Credit Linked Nts., 9.05%, 2/8/37 | | | 9/12/12 | | | | 3,471,593 | | | | 2,080,965 | | | | (1,390,628 | ) |
| Ice 1 Em CLO Ltd./Ice 1 Em CLO Corp., Sr. Sec. Sub. Term Nts., Series 2007-1A, Cl. B, 2.165%, 8/15/22 | | | 11/6/07 | | | | 7,081,417 | | | | 7,181,375 | | | | 99,958 | |
| Ice 1 Em CLO Ltd./Ice 1 Em CLO Corp., Sr. Sec. Sub. Term Nts., Series 2007-1A, Cl. C, 3.465%, 8/15/22 | | | 6/8/07 | | | | 5,270,000 | | | | 4,679,760 | | | | (590,240 | ) |
| Ice 1 Em CLO Ltd./Ice 1 Em CLO Corp., Sr. Sec. Sub. Term Nts., Series 2007-1A, Cl. D, 5.465%, 8/15/22 | | | 6/8/07 | | | | 5,270,000 | | | | 4,637,600 | | | | (632,400 | ) |
| Igloo Holdings Corp., 8.25% Sr. Unsec. Nts., 12/15/17 | | | 12/13/12-12/14/12 | | | | 2,870,788 | | | | 2,916,787 | | | | 45,999 | |
| IIRSA Norte Finance Ltd., 8.75% Sr. Nts., 5/30/24 | | | 8/3/06-7/24/07 | | | | 3,625,759 | | | | 4,024,392 | | | | 398,633 | |
JPMorgan Hipotecaria su Casita,
8.432% Sec. Nts., 8/26/35 | | | 3/21/07 | | | | 526,714 | | | | 36,759 | | | | (489,955 | ) |
NC Finance Trust, Collateralized Mtg. Obligation Pass-Through Certificates,
Series 1999-I, Cl. ECFD, 3.405%, 1/25/29 | | | 8/10/10 | | | | 66,025 | | | | 4,505 | | | | (61,520 | ) |
| Premier Cruise Ltd., 11% Sr. Nts., 3/15/08 | | | 3/6/98 | | | | 242,675 | | | | — | | | | (242,675 | ) |
| Santander Drive Auto Receivables Trust 2011-S1A, Automobile Receivables Nts., Series 2011-S1A, Cl. D, 3.10%, 5/15/17 | | | 2/4/11-4/14/11 | | | | 37,700 | | | | 37,754 | | | | 54 | |
| Wallace Theater Holdings, Inc. | | | 3/28/13 | | | | 15 | | | | 15,296 | | | | 15,281 | |
| | | | | | |
|
|
| |
|
|
| |
|
|
|
| | | | | | | $ | 43,854,387 | | | $ | 42,006,309 | | | $ | (1,848,078 | ) |
| | | | | | |
|
|
| |
|
|
| |
|
|
|
2. Represents the current interest rate for a variable or increasing rate security.
3. Represents securities sold under Rule 144A, which are exempt from registration under the Securities Act of 1933, as amended. These securities have been determined to be liquid under guidelines established by the Board of Trustees. These securities amount to $617,581,716 or 25.05% of the Fund’s net assets as of June 28, 2013.
| | | | |
| 38 | | | | OPPENHEIMER GLOBAL STRATEGIC INCOME FUND/VA |
4. All or a portion of the security position is when-issued or delayed delivery to be delivered and settled after June 28, 2013. See Note 1 of the accompanying Notes.
5. Interest or dividend is paid-in-kind, when applicable.
6. This security is not accruing income because the issuer has missed an interest payment on it and/or is not anticipated to make future interest and/or principal payments. The rate shown is the original contractual interest rate. See Note 1 of the accompanying Notes.
7. Interest-Only Strips represent the right to receive the monthly interest payments on an underlying pool of mortgage loans or other receivables. These securities typically decline in price as interest rates decline. Most other fixed income securities increase in price when interest rates decline. The principal amount of the underlying pool represents the notional amount on which current interest is calculated. The price of these securities is typically more sensitive to changes in prepayment rates than traditional mortgage or asset-backed securities (for example, GNMA pass-throughs). Interest rates disclosed represent current yields based upon the current cost basis and estimated timing and amount of future cash flows. These securities amount to $8,368,307 or 0.34% of the Fund’s net assets as of June 28, 2013.
8. The current amortization rate of the security’s cost basis exceeds the future interest payments currently estimated to be received. Both the amortization rate and interest payments are contingent on future mortgage pre-payment speeds and are therefore subject to change.
9. This security is accruing partial income at an anticipated effective rate based on expected interest and/or principal payments. The rate shown is the original contractual interest rate.
10. All or a portion of the security position is held in accounts at a futures clearing merchant and pledged to cover margin requirements on open futures contracts and written options on futures, if applicable. The aggregate market value of such securities is $3,099,448. See Note 6 of the accompanying Notes.
11. All or a portion of the security position is held in segregated accounts and pledged to cover margin requirements under certain derivative contracts. The aggregate market value of such securities is $3,504,376. See Note 6 of the accompanying Notes.
12. Zero coupon bond reflects effective yield on the date of purchase.
13. Denotes an inflation-indexed security: coupon or principal are indexed to a consumer price index.
14. This bond has no contractual maturity date, is not redeemable and contractually pays an indefinite stream of interest. Rate reported represents the current interest rate for this variable rate security.
15. Non-income producing security.
16. Is or was an affiliate, as defined in the Investment Company Act of 1940, at or during the period ended June 28, 2013, by virtue of the Fund owning at least 5% of the voting securities of the issuer or as a result of the Fund and the issuer having the same investment adviser. Transactions during the period in which the issuer was an affiliate are as follows:
| | | | | | | | | | | | | | | | |
| | | Shares
December 31, 2012 | | | Gross
Additions | | | Gross
Reductions | | | Shares
June 28, 2013 | |
| Oppenheimer Institutional Money Market Fund, Cl. E | | | 34,093,630 | | | | 451,041,703 | | | | 454,790,072 | | | | 30,345,261 | |
| Oppenheimer Master Event-Linked Bond Fund, LLC | | | 4,827,322 | | | | — | | | | — | | | | 4,827,322 | |
| Oppenheimer Master Loan Fund, LLC | | | 25,357,850 | | | | — | | | | 19,106,245 | | | | 6,251,605 | |
| Oppenheimer Short Duration Fund, Cl. Y | | | 1,010,027 | | | | 777,043 | | | | — | | | | 1,787,070 | |
| | | | |
| | | | | | Value | | | Income | | | Realized
Gain (Loss) | |
| Oppenheimer Institutional Money Market Fund, Cl. E | | | | | | $ | 30,345,261 | | | $ | 20,486 | | | $ | — | |
| Oppenheimer Master Event-Linked Bond Fund, LLC | | | | | | | 62,946,128 | | | | 2,614,449 | a | | | (33,682 | )a |
| Oppenheimer Master Loan Fund, LLC | | | | | | | 85,550,125 | | | | 5,979,749 | b | | | 4,563,554 | b |
| Oppenheimer Short Duration Fund, Cl. Y | | | | | | | 17,906,445 | | | | 26,633 | | | | — | |
| | | | | | |
|
|
| |
|
|
| |
|
|
|
| | | | | | | $ | 196,747,959 | | | $ | 8,641,317 | | | $ | 4,529,872 | |
| | | | | | |
|
|
| |
|
|
| |
|
|
|
a. Represents the amount allocated to the Fund from Oppenheimer Master Event-Linked Bond Fund, LLC.
b. Represents the amount allocated to the Fund from Oppenheimer Master Loan Fund, LLC.
17. Rate shown is the 7-day yield as of June 28, 2013.
Distribution of investments representing geographic holdings, as a percentage of total investments at value, is as follows:
| | | | | | | | |
| Geographic Holdings | | Value | | | Percent | |
| United States | | $ | 1,543,119,511 | | | | 61.1 | % |
| Russia | | | 149,805,814 | | | | 5.9 | |
| Brazil | | | 137,190,178 | | | | 5.4 | |
| Mexico | | | 119,614,426 | | | | 4.7 | |
| Turkey | | | 104,162,683 | | | | 4.1 | |
| South Africa | | | 43,737,980 | | | | 1.7 | |
| | | | |
| 39 | | | | OPPENHEIMER GLOBAL STRATEGIC INCOME FUND/VA |
CONSOLIDATED STATEMENT OF INVESTMENTS Unaudited / Continued
Footnotes to Consolidated Statement of Investments Continued
| | | | | | | | |
| Geographic Holdings | | Value | | | Percent | |
| Hungary | | $ | 35,022,382 | | | | 1.4 | % |
| Japan | | | 30,777,415 | | | | 1.2 | |
| Venezuela | | | 28,240,672 | | | | 1.1 | |
| Germany | | | 26,873,195 | | | | 1.1 | |
| Peru | | | 23,558,832 | | | | 0.9 | |
| United Kingdom | | | 21,328,844 | | | | 0.8 | |
| Supranational | | | 19,116,880 | | | | 0.8 | |
| Italy | | | 17,435,507 | | | | 0.7 | |
| Thailand | | | 16,731,258 | | | | 0.7 | |
| Canada | | | 16,690,699 | | | | 0.7 | |
| Colombia | | | 16,537,044 | | | | 0.7 | |
| France | | | 12,026,790 | | | | 0.5 | |
| Nigeria | | | 11,464,246 | | | | 0.5 | |
| Ukraine | | | 11,203,060 | | | | 0.4 | |
| Israel | | | 11,152,195 | | | | 0.4 | |
| Poland | | | 10,870,039 | | | | 0.4 | |
| Malaysia | | | 9,890,393 | | | | 0.4 | |
| The Netherlands | | | 9,499,359 | | | | 0.4 | |
| Australia | | | 9,290,175 | | | | 0.4 | |
| Chile | | | 7,300,574 | | | | 0.3 | |
| Luxembourg | | | 7,097,116 | | | | 0.3 | |
| Croatia | | | 6,190,811 | | | | 0.3 | |
| Spain | | | 5,771,076 | | | | 0.2 | |
| Ivory Coast | | | 5,010,513 | | | | 0.2 | |
| Dominican Republic | | | 4,884,506 | | | | 0.2 | |
| Belgium | | | 4,825,651 | | | | 0.2 | |
| Portugal | | | 4,801,680 | | | | 0.2 | |
| Sri Lanka | | | 4,720,600 | | | | 0.2 | |
| United Arab Emirates | | | 4,551,491 | | | | 0.2 | |
| Angola | | | 4,094,063 | | | | 0.2 | |
| India | | | 3,705,107 | | | | 0.2 | |
| Serbia | | | 3,139,748 | | | | 0.1 | |
| Korea, Republic of South | | | 2,962,232 | | | | 0.1 | |
| Philippines | | | 2,801,719 | | | | 0.1 | |
| China | | | 2,793,730 | | | | 0.1 | |
| Jamaica | | | 2,128,338 | | | | 0.1 | |
| Kazakhstan | | | 1,954,282 | | | | 0.1 | |
| Tanzania | | | 1,618,050 | | | | 0.1 | |
| Rwanda | | | 1,553,050 | | | | 0.1 | |
| Denmark | | | 1,244,821 | | | | 0.1 | |
| Bolivia | | | 1,126,288 | | | | — | |
| Guatemala | | | 1,116,300 | | | | — | |
| Ireland | | | 984,014 | | | | — | |
| Sweden | | | 918,497 | | | | — | |
| Norway | | | 867,588 | | | | — | |
| Paraguay | | | 780,000 | | | | — | |
| Finland | | | 706,591 | | | | — | |
| Qatar | | | 655,600 | | | | — | |
| Switzerland | | | 571,358 | | | | — | |
| Indonesia | | | 340,625 | | | | — | |
| Ghana | | | 331,683 | | | | — | |
| European Union | | | 125,049 | | | | — | |
| | |
|
|
| |
|
|
|
| Total | | $ | 2,527,012,328 | | | | 100.0 | % |
| | |
|
|
| |
|
|
|
| | | | |
| 40 | | | | OPPENHEIMER GLOBAL STRATEGIC INCOME FUND/VA |
| | | | | | | | | | | | | | | | | | | | | | | | |
| Forward Currency Exchange Contracts as of June 28, 2013 are as follows: | |
Counterparty/
Contract Description | | Buy/Sell | | | Contract Amount
(000’s) | | | Expiration
Dates | | | Value | | | Unrealized
Appreciation | | | Unrealized
Depreciation | |
| Bank of America NA: | | | | | | | | | | | | | | | | | | | | | | | | |
| Brazilian Real (BRR) | | | Sell | | | | 8,640 | BRR | | | 1/3/14 | | | $ | 3,725,879 | | | $ | 23,307 | | | $ | — | |
| Colombian Peso (COP) | | | Buy | | | | 1,530,000 | COP | | | 9/26/13 | | | | 789,053 | | | | 8,839 | | | | — | |
| Colombian Peso (COP) | | | Sell | | | | 3,532,000 | COP | | | 7/19/13 | | | | 1,834,199 | | | | 63,195 | | | | — | |
| Hungarian Forint (HUF) | | | Buy | | | | 809,000 | HUF | | | 9/16/13 | | | | 3,542,175 | | | | 40,854 | | | | — | |
| Japanese Yen (JPY) | | | Buy | | | | 1,557,000 | JPY | | | 11/29/13 | | | | 15,715,102 | | | | 258,476 | | | | — | |
| Mexican Nuevo Peso (MXN) | | | Buy | | | | 80,100 | MXN | | | 8/16/13 | | | | 6,154,910 | | | | 163,213 | | | | — | |
| Mexican Nuevo Peso (MXN) | | | Sell | | | | 279,600 | MXN | | | 9/19/13-12/19/13 | | | | 21,323,615 | | | | 540,219 | | | | — | |
| New Turkish Lira (TRY) | | | Sell | | | | 1,710 | TRY | | | 9/3/13 | | | | 877,342 | | | | 24,143 | | | | — | |
| Peruvian New Sol (PEN) | | | Buy | | | | 2,240 | PEN | | | 9/30/13 | | | | 798,687 | | | | — | | | | 1,599 | |
| Peruvian New Sol (PEN) | | | Sell | | | | 15,820 | PEN | | | 10/29/13 | | | | 5,628,939 | | | | 342,884 | | | | — | |
| Philippines Peso (PHP) | | | Sell | | | | 123,000 | PHP | | | 10/7/13 | | | | 2,852,075 | | | | 202,308 | | | | — | |
| South African Rand (ZAR) | | | Buy | | | | 36,840 | ZAR | | | 7/5/13 | | | | 3,724,047 | | | | 116,623 | | | | — | |
| South Korean Won (KRW) | | | Buy | | | | 1,135,000 | KRW | | | 7/5/13 | | | | 993,508 | | | | 2,198 | | | | — | |
| South Korean Won (KRW) | | | Sell | | | | 2,652,000 | KRW | | | 7/5/13 | | | | 2,321,394 | | | | — | | | | 5,135 | |
| | | | | | | | | | | | | | | | | | |
|
|
| |
|
|
|
| | | | | | | | | | | | | | | | | | | | 1,786,259 | | | | 6,734 | |
| Barclays Bank plc: | | | | | | | | | | | | | | | | | | | | | | | | |
| Brazilian Real (BRR) | | | Sell | | | | 14,880 | BRR | | | 1/3/14 | | | | 6,416,792 | | | | 144,055 | | | | — | |
| Chilean Peso (CLP) | | | Buy | | | | 423,000 | CLP | | | 8/2/13 | | | | 827,667 | | | | — | | | | 59,032 | |
| Euro (EUR) | | | Buy | | | | 3,905 | EUR | | | 11/29/13 | | | | 5,086,721 | | | | 15,488 | | | | 22,996 | |
| Euro (EUR) | | | Sell | | | | 3,200 | EUR | | | 9/16/13-11/29/13 | | | | 4,167,418 | | | | — | | | | 13,080 | |
| Hungarian Forint (HUF) | | | Buy | | | | 1,077,000 | HUF | | | 9/16/13 | | | | 4,715,603 | | | | 14,697 | | | | 18,413 | |
| Japanese Yen (JPY) | | | Sell | | | | 5,473,000 | JPY | | | 8/30/13-11/29/13 | | | | 55,197,843 | | | | 14,594 | | | | 1,004,109 | |
| New Turkish Lira (TRY) | | | Sell | | | | 3,630 | TRY | | | 7/29/13 | | | | 1,873,460 | | | | 39,584 | | | | — | |
| South African Rand (ZAR) | | | Buy | | | | 39,430 | ZAR | | | 7/5/13 | | | | 3,985,862 | | | | 90,173 | | | | — | |
| South African Rand (ZAR) | | | Sell | | | | 203,620 | ZAR | | | 10/7/13-11/15/13 | | | | 20,198,031 | | | | 1,462,994 | | | | 52,203 | |
| | | | | | | | | | | | | | | | | | |
|
|
| |
|
|
|
| | | | | | | | | | | | | | | | | | | | 1,781,585 | | | | 1,169,833 | |
| BNP Paribas | | | | | | | | | | | | | | | | | | | | | | | | |
| British Pound Sterling (GBP) | | | Sell | | | | 1,120 | GBP | | | 11/29/13 | | | | 1,701,832 | | | | — | | | | 10,263 | |
| Citibank NA: | | | | | | | | | | | | | | | | | | | | | | | | |
| Australian Dollar (AUD) | | | Sell | | | | 9,945 | AUD | | | 11/29/13 | | | | 8,997,176 | | | | 462,757 | | | | — | |
| British Pound Sterling (GBP) | | | Sell | | | | 100 | GBP | | | 11/29/13 | | | | 151,949 | | | | 1,941 | | | | — | |
| Canadian Dollar (CAD) | | | Buy | | | | 700 | CAD | | | 11/29/13 | | | | 663,111 | | | | — | | | | 20,341 | |
| Colombian Peso (COP) | | | Buy | | | | 12,260,000 | COP | | | 7/19/13-10/7/13 | | | | 6,354,179 | | | | — | | | | 104,165 | |
| Colombian Peso (COP) | | | Sell | | | | 12,473,000 | COP | | | 7/19/13-9/26/13 | | | | 6,445,268 | | | | 284,583 | | | | — | |
| Hungarian Forint (HUF) | | | Sell | | | | 294,000 | HUF | | | 9/16/13 | | | | 1,287,268 | | | | — | | | | 13,184 | |
| Malaysian Ringgit (MYR) | | | Buy | | | | 62,480 | MYR | | | 7/25/13 | | | | 19,656,184 | | | | — | | | | 826,712 | |
| Mexican Nuevo Peso (MXN) | | | Sell | | | | 308,900 | MXN | | | 7/11/13-12/19/13 | | | | 23,650,485 | | | | 94,290 | | | | 232,145 | |
| New Turkish Lira (TRY) | | | Sell | | | | 1,740 | TRY | | | 9/3/13 | | | | 892,734 | | | | 31,105 | | | | — | |
| | | | | | | | | | | | | | | | | | |
|
|
| |
|
|
|
| | | | | | | | | | | | | | | | | | | | 874,676 | | | | 1,196,547 | |
| Credit Suisse International: | | | | | | | | | | | | | | | | | | | | | | | | |
| British Pound Sterling (GBP) | | | Sell | | | | 1,210 | GBP | | | 8/30/13 | | | | 1,839,566 | | | | — | | | | 13,501 | |
| New Turkish Lira (TRY) | | | Sell | | | | 3,240 | TRY | | | 7/17/13 | | | | 1,675,369 | | | | — | | | | 105,546 | |
| South Korean Won (KRW) | | | Buy | | | | 1,134,000 | KRW | | | 7/5/13 | | | | 992,632 | | | | 2,239 | | | | — | |
| South Korean Won (KRW) | | | Sell | | | | 2,650,000 | KRW | | | 7/5/13 | | | | 2,319,643 | | | | — | | | | 5,233 | |
| | | | | | | | | | | | | | | | | | |
|
|
| |
|
|
|
| | | | | | | | | | | | | | | | | | | | 2,239 | | | | 124,280 | |
| Deutsche Bank AG: | | | | | | | | | | | | | | | | | | | | | | | | |
| Colombian Peso (COP) | | | Buy | | | | 14,476,000 | COP | | | 7/19/13 | | | | 7,517,517 | | | | — | | | | 269,465 | |
| Euro (EUR) | | | Sell | | | | 21,780 | EUR | | | 8/30/13 | | | | 28,357,664 | | | | — | | | | 123,684 | |
| Hungarian Forint (HUF) | | | Sell | | | | 284,000 | HUF | | | 9/16/13 | | | | 1,243,483 | | | | — | | | | 55,146 | |
| | | | |
| 41 | | | | OPPENHEIMER GLOBAL STRATEGIC INCOME FUND/VA |
CONSOLIDATED STATEMENT OF INVESTMENTS Unaudited / Continued
Footnotes to Consolidated Statement of Investments Continued
| | | | | | | | | | | | | | | | | | | | | | | | |
| Forward Currency Exchange Contracts Continued | |
Counterparty/
Contract Description | | Buy/Sell | | | Contract Amount
(000’s) | | | Expiration
Dates | | | Value | | | Unrealized
Appreciation | | | Unrealized
Depreciation | |
| Deutsche Bank AG: Continued | | | | | | | | | | | | | | | | | | | | | | | | |
| New Turkish Lira (TRY) | | | Sell | | | | 5,530 | TRY | | | 9/3/13 | | | $ | 2,837,251 | | | $ | 72,326 | | | $ | — | |
| Peruvian New Sol (PEN) | | | Sell | | | | 1,110 | PEN | | | 9/30/13 | | | | 395,778 | | | | 6,834 | | | | — | |
| Polish Zloty (PLZ) | | | Sell | | | | 2,400 | PLZ | | | 11/29/13 | | | | 715,565 | | | | 13,754 | | | | — | |
| South African Rand (ZAR) | | | Buy | | | | 9,710 | ZAR | | | 7/5/13-11/29/13 | | | | 977,697 | | | | 15,781 | | | | 890 | |
| | | | | | | | | | | | | | | | | | |
|
|
| |
|
|
|
| | | | | | | | | | | | | | | | | | | | 108,695 | | | | 449,185 | |
| Goldman Sachs Bank USA: | | | | | | | | | | | | | | | | | | | | | | | | |
| Australian Dollar (AUD) | | | Sell | | | | 1,205 | AUD | | | 11/29/13 | | | | 1,090,156 | | | | 17,649 | | | | — | |
| Brazilian Real (BRR) | | | Sell | | | | 12,910 | BRR | | | 1/3/14 | | | | 5,567,257 | | | | 147,661 | | | | — | |
| Colombian Peso (COP) | | | Buy | | | | 10,170,000 | COP | | | 9/26/13 | | | | 5,244,883 | | | | 13,414 | | | | 40,973 | |
| Euro (EUR) | | | Sell | | | | 25,775 | EUR | | | 8/26/13 | | | | 33,558,533 | | | | 198,469 | | | | — | |
| Japanese Yen (JPY) | | | Sell | | | | 246,000 | JPY | | | 11/29/13 | | | | 2,482,925 | | | | 60,279 | | | | 555 | |
| New Turkish Lira (TRY) | | | Sell | | | | 6,500 | TRY | | | 8/12/13 | | | | 3,346,870 | | | | 229,487 | | | | — | |
| South African Rand (ZAR) | | | Buy | | | | 11,660 | ZAR | | | 7/5/13 | | | | 1,178,675 | | | | 41,643 | | | | — | |
| | | | | | | | | | | | | | | | | | |
|
|
| |
|
|
|
| | | | | | | | | | | | | | | | | | | | 708,602 | | | | 41,528 | |
| HSBC Bank USA NA: | | | | | | | | | | | | | | | | | | | | | | | | |
| Malaysian Ringgit (MYR) | | | Buy | | | | 40,070 | MYR | | | 9/25/13 | | | | 12,549,565 | | | | 129,990 | | | | 1,023 | |
| Malaysian Ringgit (MYR) | | | Sell | | | | 25,335 | MYR | | | 7/5/13-9/25/13 | | | | 7,938,538 | | | | — | | | | 81,447 | |
| New Turkish Lira (TRY) | | | Buy | | | | 3,240 | TRY | | | 7/17/13 | | | | 1,675,369 | | | | 11,697 | | | | — | |
| | | | | | | | | | | | | | | | | | |
|
|
| |
|
|
|
| | | | | | | | | | | | | | | | | | | | 141,687 | | | | 82,470 | |
| JPMorgan Chase Bank NA: | | | | | | | | | | | | | | | | | | | | | | | | |
| Brazilian Real (BRR) | | | Sell | | | | 78,625 | BRR | | | 8/2/13-9/4/13 | | | | 34,892,346 | | | | 226,354 | | | | — | |
| Colombian Peso (COP) | | | Sell | | | | 22,182,000 | COP | | | 10/7/13 | | | | 11,427,412 | | | | 592,094 | | | | — | |
| Hungarian Forint (HUF) | | | Sell | | | | 280,000 | HUF | | | 9/16/13 | | | | 1,225,969 | | | | — | | | | 13,027 | |
| Japanese Yen (JPY) | | | Sell | | | | 97,000 | JPY | | | 11/29/13 | | | | 979,040 | | | | 5,220 | | | | 1,216 | |
| Malaysian Ringgit (MYR) | | | Buy | | | | 24,310 | MYR | | | 7/5/13 | | | | 7,684,988 | | | | — | | | | 158,213 | |
| Mexican Nuevo Peso (MXN) | | | Buy | | | | 46,400 | MXN | | | 8/16/13 | | | | 3,565,391 | | | | — | | | | 232,906 | |
| Mexican Nuevo Peso (MXN) | | | Sell | | | | 132,000 | MXN | | | 10/31/13 | | | | 10,076,295 | | | | 612,331 | | | | — | |
| New Turkish Lira (TRY) | | | Sell | | | | 72,380 | TRY | | | 7/29/13-11/6/13 | | | | 37,141,508 | | | | 2,364,452 | | | | 8,750 | |
| Russian Ruble (RUR) | | | Sell | | | | 356,620 | RUR | | | 9/10/13 | | | | 10,727,856 | | | | 177,954 | | | | — | |
| South African Rand (ZAR) | | | Sell | | | | 97,700 | ZAR | | | 7/5/13 | | | | 9,876,205 | | | | 597,637 | | | | — | |
| South Korean Won (KRW) | | | Buy | | | | 5,302,000 | KRW | | | 7/5/13 | | | | 4,641,037 | | | | — | | | | 75,625 | |
| South Korean Won (KRW) | | | Sell | | | | 2,269,000 | KRW | | | 7/5/13 | | | | 1,986,140 | | | | 32,364 | | | | — | |
| Thailand Baht (THB) | | | Sell | | | | 278,400 | THB | | | 7/12/13-5/8/14 | | | | 8,919,132 | | | | 432,718 | | | | — | |
| | | | | | | | | | | | | | | | | | |
|
|
| |
|
|
|
| | | | | | | | | | | | | | | | | | | | 5,041,124 | | | | 489,737 | |
| Morgan Stanley & Co. International plc | | | | | | | | | | | | | | | | | | | | | | | | |
| Peruvian New Sol (PEN) | | | Buy | | | | 4,970 | PEN | | | 9/30/13 | | | | 1,772,086 | | | | — | | | | 56,464 | |
| Morgan Stanley Capital Services, Inc.: | | | | | | | | | | | | | | | | | | | | | | | | |
| Brazilian Real (BRR) | | | Sell | | | | 13,300 | BRR | | | 7/2/14 | | | | 5,530,336 | | | | 224,749 | | | | — | |
| British Pound Sterling (GBP) | | | Sell | | | | 360 | GBP | | | 11/29/13 | | | | 547,018 | | | | 17,280 | | | | — | |
| Euro (EUR) | | | Sell | | | | 2,315 | EUR | | | 11/29/13 | | | | 3,015,559 | | | | 61,330 | | | | — | |
| Mexican Nuevo Peso (MXN) | | | Sell | | | | 374,880 | MXN | | | 8/16/13-11/6/13 | | | | 28,680,287 | | | | 793,829 | | | | — | |
| Peruvian New Sol (PEN) | | | Buy | | | | 5,350 | PEN | | | 10/29/13 | | | | 1,903,592 | | | | — | | | | 31,309 | |
| Polish Zloty (PLZ) | | | Buy | | | | 46,390 | PLZ | | | 8/26/13 | | | | 13,909,987 | | | | — | | | | 30,531 | |
| Polish Zloty (PLZ) | | | Sell | | | | 19,220 | PLZ | | | 8/26/13 | | | | 5,763,094 | | | | 12,649 | | | | — | |
| Russian Ruble (RUR) | | | Sell | | | | 111,700 | RUR | | | 9/10/13 | | | | 3,360,164 | | | | — | | | | 11,842 | |
| South African Rand (ZAR) | | | Buy | | | | 2,980 | ZAR | | | 7/5/13 | | | | 301,239 | | | | 5,463 | | | | — | |
| Swedish Krona (SEK) | | | Sell | | | | 1,040 | SEK | | | 11/29/13 | | | | 154,566 | | | | 6,207 | | | | — | |
| | | | | | | | | | | | | | | | | | |
|
|
| |
|
|
|
| | | | | | | | | | | | | | | | | | | | 1,121,507 | | | | 73,682 | |
| | | | |
| 42 | | | | OPPENHEIMER GLOBAL STRATEGIC INCOME FUND/VA |
| | | | | | | | | | | | | | | | | | | | | | | | |
| Forward Currency Exchange Contracts Continued | |
Counterparty/
Contract Description | | Buy/Sell | | | Contract Amount
(000’s) | | | Expiration
Date | | | Value | | | Unrealized
Appreciation | | | Unrealized
Depreciation | |
| Nomura Global Financial Products, Inc.: | | | | | | | | | | | | | | | | | | | | | | | | |
| Canadian Dollar (CAD) | | | Sell | | | | 800 | CAD | | | 8/30/13 | | | $ | 759,521 | | | $ | 10,167 | | | $ | — | |
| Japanese Yen (JPY) | | | Buy | | | | 1,430,000 | JPY | | | 11/29/13 | | | | 14,433,266 | | | | 246,758 | | | | — | |
| Thailand Baht (THB) | | | Buy | | | | 87,800 | THB | | | 11/20/13 | | | | 2,810,871 | | | | 11,365 | | | | 43,581 | |
| | | | | | | | | | | | | | | | | | |
|
|
| |
|
|
|
| | | | | | | | | | | | | | | | | | | | 268,290 | | | | 43,581 | |
| Standard Chartered Bank | | | | | | | | | | | | | | | | | | | | | | | | |
| Malaysian Ringgit (MYR) | | | Sell | | | | 23,000 | MYR | | | 7/5/13 | | | | 7,270,865 | | | | — | | | | 97,935 | |
| The Royal Bank of Scotland plc: | | | | | | | | | | | | | | | | | | | | | | | | |
| Hungarian Forint (HUF) | | | Sell | | | | 716,000 | HUF | | | 9/16/13 | | | | 3,134,978 | | | | — | | | | 35,804 | |
| Norwegian Krone (NOK) | | | Buy | | | | 680 | NOK | | | 11/29/13 | | | | 111,346 | | | | — | | | | 3,607 | |
| South African Rand (ZAR) | | | Buy | | | | 11,870 | ZAR | | | 7/5/13 | | | | 1,199,903 | | | | 26,555 | | | | — | |
| South African Rand (ZAR) | | | Sell | | | | 128,970 | ZAR | | | 10/7/13 | | | | 12,859,006 | | | | 782,983 | | | | — | |
| Swiss Franc (CHF) | | | Buy | | | | 520 | CHF | | | 11/29/13 | | | | 551,403 | | | | 10,366 | | | | — | |
| | | | | | | | | | | | | | | | | | |
|
|
| |
|
|
|
| | | | | | | | | | | | | | | | | | | | 819,904 | | | | 39,411 | |
| | | | | | | | | | | | | | | | | | |
|
|
| |
|
|
|
| Total unrealized appreciation and depreciation | | | | | | | | | | | | | | | $ | 12,654,568 | | | $ | 3,881,650 | |
| | | | | | | | | | | | | | | | | | |
|
|
| |
|
|
|
| | | | | | | | | | | | | | | | | | | | |
| Futures Contracts as of June 28, 2013 are as follows: | | | | | | | |
| Contract Description | | Buy/Sell | | | Number
of
Contracts | | | Expiration
Date | | | Value | | | Unrealized
Appreciation
(Depreciation) | |
| 90-Day Sterling | | | Buy | | | | 14 | | | | 12/16/15 | | | $ | 2,625,346 | | | $ | 10,367 | |
| 90-Day Sterling | | | Buy | | | | 34 | | | | 12/21/16 | | | | 6,329,299 | | | | 1,349 | |
| Australian Treasury Bonds, 10 yr. | | | Sell | | | | 58 | | | | 9/16/13 | | | | 6,279,890 | | | | 135,478 | |
| Euro OAT | | | Sell | | | | 6 | | | | 9/6/13 | | | | 1,034,572 | | | | 17,923 | |
| Euro-Bundesobligation | | | Sell | | | | 23 | | | | 9/6/13 | | | | 3,748,210 | | | | (17,865 | ) |
| Euro-Bundesobligation | | | Sell | | | | 11 | | | | 9/6/13 | | | | 2,026,293 | | | | (14,765 | ) |
| Three-Month Euro Euribor Interest Rate | | | Buy | | | | 8 | | | | 9/19/16 | | | | 2,566,449 | | | | 7,091 | |
| U.S. Treasury Long Bonds | | | Sell | | | | 93 | | | | 9/19/13 | | | | 12,633,469 | | | | 189,567 | |
| U.S. Treasury Long Bonds | | | Buy | | | | 590 | | | | 9/19/13 | | | | 80,147,813 | | | | (3,372,514 | ) |
| U.S. Treasury Nts., 2 yr. | | | Sell | | | | 191 | | | | 9/30/13 | | | | 42,020,000 | | | | 28,574 | |
| U.S. Treasury Nts., 2 yr. | | | Buy | | | | 5 | | | | 9/30/13 | | | | 1,100,000 | | | | 166 | |
| U.S. Treasury Nts., 5 yr. | | | Sell | | | | 94 | | | | 9/30/13 | | | | 11,378,406 | | | | 215,078 | |
| U.S. Treasury Nts., 5 yr. | | | Buy | | | | 521 | | | | 9/30/13 | | | | 63,065,422 | | | | (547,360 | ) |
| U.S. Treasury Nts., 10 yr. | | | Sell | | | | 265 | | | | 9/19/13 | | | | 33,539,063 | | | | 708,551 | |
| U.S. Treasury Nts., 10 yr. | | | Buy | | | | 518 | | | | 9/19/13 | | | | 65,559,375 | | | | (1,239,567 | ) |
| U.S. Treasury Ultra Bonds | | | Buy | | | | 197 | | | | 9/19/13 | | | | 29,020,563 | | | | (1,729,131 | ) |
| | | | | | | | | | | | | | | | | | |
|
|
|
| | | | | | | | | | | | | | | | | | | $ | (5,607,058 | ) |
| | | | | | | | | | | | | | | | | | |
|
|
|
| | | | | | | | | | | | | | | | | | | | | | | | | | | | |
| Over-the-Counter Written Options as of June 28, 2013 are as follows: | |
| Description | | Type | | | Number of
Contracts | | | Exercise Price | | | Expiration
Date | | | Premiums
Received | | | Value | | | Unrealized
Appreciation/
(Depreciation) | |
| France (Republic of) Bonds, 2.75%, 10/25/27 | | | Put | | | | 1,325,000 | | | | 98.875 | EUR | | | 10/22/13 | | | $ | 49,408 | | | $ | (40,283 | ) | | $ | 9,125 | |
| Indian Rupee (INR) | | | Put | | | | 113,000,000 | | | | 1USD per 59.450 INR | | | | 4/29/14 | | | | 50,132 | | | | (144,024 | ) | | | (93,892 | ) |
| iShares iBoxx High Yield Corporate Bond Exchange Traded Fund | | | Put | | | | 1,336 | | | | 90.000 | | | | 12/20/13 | | | | 402,995 | | | | (587,840 | ) | | | (184,845 | ) |
| iShares iBoxx High Yield Corporate Bond Exchange Traded Fund | | | Put | | | | 889 | | | | 89.000 | | | | 12/20/13 | | | | 264,470 | | | | (347,852 | ) | | | (83,382 | ) |
| | | | |
| 43 | | | | OPPENHEIMER GLOBAL STRATEGIC INCOME FUND/VA |
CONSOLIDATED STATEMENT OF INVESTMENTS Unaudited / Continued
Footnotes to Consolidated Statement of Investments Continued
| | | | | | | | | | | | | | | | | | | | | | | | | | | | |
| Over-the-Counter Written Options Continued | |
| Description | | Type | | | Number of
Contracts | | | Exercise Price | | | Expiration
Date | | | Premiums
Received | | | Value | | | Unrealized
Appreciation/
(Depreciation) | |
| iShares iBoxx High Yield Corporate Bond Exchange Traded Fund | | | Put | | | | 446 | | | | $90.000 | | | | 12/20/13 | | | $ | 139,375 | | | $ | (196,240 | ) | | $ | (56,865 | ) |
| iShares iBoxx High Yield Corporate Bond Exchange Traded Fund | | | Put | | | | 446 | | | | 91.000 | | | | 12/20/13 | | | | 149,410 | | | | (223,000 | ) | | | (73,590 | ) |
| iShares iBoxx High Yield Corporate Bond Exchange Traded Fund | | | Put | | | | 444 | | | | 89.000 | | | | 12/20/13 | | | | 135,420 | | | | (161,616 | ) | | | (26,196 | ) |
| Japanese Yen (JPY) | | | Put | | | | 273,000,000 | | | | 1USD per 100.250 JPY | | | | 7/5/13 | | | | 13,398 | | | | (10,775 | ) | | | 2,623 | |
| Japanese Yen (JPY) | | | Put | | | | 722,000,000 | | | | 1USD per 120.000 JPY | | | | 5/22/15 | | | | 122,138 | | | | (109,917 | ) | | | 12,221 | |
| Japanese Yen (JPY)1 | | | Call | | | | 542,000,000 | | | | 1USD per 90.000 JPY | | | | 5/22/15 | | | | 102,378 | | | | (232,572 | ) | | | (130,194 | ) |
| Mexican Nuevo Peso (MXN) | | | Call | | | | 144,000,000 | | | | 1USD per 12.350 MXN | | | | 9/18/13 | | | | 73,749 | | | | (72,153 | ) | | | 1,596 | |
| Mexican Nuevo Peso (MXN) | | | Call | | | | 144,000,000 | | | | 1USD per 12.350 MXN | | | | 9/18/13 | | | | 74,390 | | | | (72,153 | ) | | | 2,237 | |
| Mexican Nuevo Peso (MXN) | | | Call | | | | 99,200,000 | | | | 1USD per 12.765 MXN | | | | 9/23/13 | | | | 66,833 | | | | (135,055 | ) | | | (68,222 | ) |
| Mexican Nuevo Peso (MXN) | | | Call | | | | 98,200,000 | | | | 1USD per 12.632 MXN | | | | 9/23/13 | | | | 59,159 | | | | (103,061 | ) | | | (43,902 | ) |
| Mexican Nuevo Peso (MXN) | | | Put | | | | 160,350,000 | | | | 1USD per 13.755 MXN | | | | 9/18/13 | | | | 136,394 | | | | (148,056 | ) | | | (11,662 | ) |
| Mexican Nuevo Peso (MXN) | | | Put | | | | 160,350,000 | | | | 1USD per 13.755 MXN | | | | 9/18/13 | | | | 136,860 | | | | (148,056 | ) | | | (11,196 | ) |
| Mexican Nuevo Peso (MXN) | | | Put | | | | 111,300,000 | | | | 1USD per 14.319 MXN | | | | 9/23/13 | | | | 114,184 | | | | (62,555 | ) | | | 51,629 | |
| Mexican Nuevo Peso (MXN) | | | Put | | | | 111,100,000 | | | | 1USD per 14.300 MXN | | | | 9/23/13 | | | | 130,678 | | | | (63,561 | ) | | | 67,117 | |
| | | | | | | | | | | | | | | | | | |
|
|
| |
|
|
| |
|
|
|
| | | | | | | | | | | | | | | | | | | $ | 2,221,371 | | | $ | (2,858,769 | ) | | $ | (637,398 | ) |
| | | | | | | | | | | | | | | | | | |
|
|
| |
|
|
| |
|
|
|
1. Knock-in option becomes eligible for exercise if at any time spot rates are less than or equal to 79.50 JPY per 1 USD.
| | | | | | | | | | | | | | | | | | | | | | | | | | | | |
| Over-the-Counter Credit Default Swap Contracts as of June 28, 2013 are as follows: | |
Reference Entity/
Swap Counterparty | | Buy/Sell
Credit
Protection | | | Notional
Amount
(000’s) | | | Pay/
Receive
Fixed
Rate | | | Termination
Date | | | Premium
Received/
(Paid) | | | Value | | | Unrealized
Appreciation
(Depreciation) | |
| Banco Bilbao Vizcaya Argentaria Senior Finance SAU: | | | | | | | | | | | | | | | | | | | | | | | | | | | | |
| UBS AG | | | Sell | | | | 125 | EUR | | | 3 | % | | | 12/20/17 | | | $ | 4,874 | | | $ | 314 | | | $ | 5,188 | |
| UBS AG | | | Sell | | | | 125 | EUR | | | 3 | | | | 12/20/17 | | | | 5,012 | | | | 314 | | | | 5,326 | |
| | | | | | |
|
|
| | | | | | | | | |
|
|
|
| | | | Total | | | | 250 | EUR | | | | | | | | | | | 9,886 | | | | 628 | | | | 10,514 | |
| Banco Santander SA | | | | | | | | | | | | | | | | | | | | | | | | | | | | |
| UBS AG | | | Sell | | | | 250 | EUR | | | 3 | | | | 9/20/17 | | | | (901 | ) | | | 3,170 | | | | 2,269 | |
| | | | | | |
|
|
| | | | | | | | | |
|
|
|
| | | | Total | | | | 250 | EUR | | | | | | | | | | | (901 | ) | | | 3,170 | | | | 2,269 | |
| Ireland (Republic of): | | | | | | | | | | | | | | | | | | | | | | | | | | | | |
| Goldman Sachs International | | | Buy | | | | 660 | | | | 1 | | | | 3/20/18 | | | | (27,725 | ) | | | 17,890 | | | | (9,835 | ) |
| Goldman Sachs International | | | Buy | | | | 585 | EUR | | | 1 | | | | 3/20/18 | | | | (21,644 | ) | | | 9,844 | | | | (11,800 | ) |
| | | | | | |
|
|
| | | | | | | | | |
|
|
|
| | | | Total | | | | 660 | | | | | | | | | | | | (49,369 | ) | | | 27,734 | | | | (21,635 | ) |
| | | | | | |
|
|
| | | | | | | | | |
|
|
|
| | | | Total | | | | 585 | EUR | | | | | | | | | | | | | | | | | | | | |
| Italy (Republic of) | | | | | | | | | | | | | | | | | | | | | | | | | | | | |
| Goldman Sachs International | | | Sell | | | | 660 | | | | 1 | | | | 3/20/23 | | | | 105,519 | | | | (102,930 | ) | | | 2,589 | |
| | | | | | |
|
|
| | | | | | | | | |
|
|
|
| | | | Total | | | | 660 | | | | | | | | | | | | 105,519 | | | | (102,930 | ) | | | 2,589 | |
| | | | |
| 44 | | | | OPPENHEIMER GLOBAL STRATEGIC INCOME FUND/VA |
| | | | | | | | | | | | | | | | | | | | | | | | | | | | |
| Over-the-Counter Credit Default Swap Contracts Continued | |
Reference Entity/
Swap Counterparty | | Buy/Sell
Credit
Protection | | | Notional
Amount
(000’s) | | | Pay/
Receive
Fixed
Rate | | | Termination
Date | | | Premium
Received/
(Paid) | | | Value | | | Unrealized
Appreciation
(Depreciation) | |
| Peru (Republic of) | | | | | | | | | | | | | | | | | | | | | | | | | | | | |
| Deutsche Bank AG | | | Buy | | | $ | 3,605 | | | | 1 | % | | | 6/20/18 | | | $ | 11,126 | | | $ | 76,919 | | | $ | 88,045 | |
| | | | | | |
|
|
| | | | | | | | | |
|
|
|
| | | | Total | | | | 3,605 | | | | | | | | | | | | 11,126 | | | | 76,919 | | | | 88,045 | |
| | | | | | | | | | | | | | | | | | |
|
|
|
| | | | | | | | Grand Total Buys | | | | (38,243 | ) | | | 104,653 | | | | 66,410 | |
| | | | | | | | Grand Total Sells | | | | 114,504 | | | | (99,132 | ) | | | 15,372 | |
| | | | | | | | | | | | | | | | | | |
|
|
|
| | | | Total Over-the-Counter Credit Default Swaps | | | $ | 76,261 | | | $ | 5,521 | | | $ | 81,782 | |
| | | | | | | | | | | | | | | | | | |
|
|
|
The table that follows shows the undiscounted maximum potential payment by the Fund related to selling credit protection in credit default swaps:
| | | | | | | | | | | | |
| Type of Reference Asset on which the Fund Sold Protection | | Total Maximum Potential
Payments for Selling
Credit Protection
(Undiscounted) | | | Amount Recoverable* | | | Reference
Asset Rating
Range** | |
| Investment Grade Single Name Corporate Debt (EUR) | | | 500,000 | EUR | | $ | — | | | | BBB to BBB- | |
| Investment Grade Sovereign Debt | | $ | 660,000 | USD | | | — | | | | BBB+ | |
| | |
|
|
| | | | |
| Total USD | | $ | 660,000 | | | $ | — | | | | | |
| | |
|
|
| | | | |
| Total EUR | | | 500,000 | EUR | | | — | | | | | |
| | |
|
|
| | | | |
* The Fund has no amounts recoverable from related purchased protection. In addition, the Fund has no recourse provisions under the credit derivatives and holds no collateral which can offset or reduce potential payments under a triggering event.
** The period end reference asset security ratings, as rated by any rating organization, are included in the equivalent Standard & Poor’s rating category. The reference asset rating represents the likelihood of a potential credit event on the reference asset which would result in a related payment by the Fund.
| | | | | | | | | | | | | | | | | | | | |
| Over-the-Counter Interest Rate Swap Contracts as of June 28, 2013 are as follows: | | | | | | | | | | |
Interest Rate/
Swap Counterparty | | Notional
Amount
(000’s) | | | Paid by
the Fund | | | Received by
the Fund | | | Termination
Date | | | Value | |
| BZDI: | | | | | | | | | | | | | | | | | | | | |
| Deutsche Bank AG | | | 10,430 | BRR | | | BZDI | | | | 10.410 | % | | | 1/2/17 | | | $ | (59,710 | ) |
| Deutsche Bank AG | | | 6,930 | BRR | | | BZDI | | | | 10.540 | | | | 1/2/17 | | | | (30,078 | ) |
| Goldman Sachs International | | | 30,465 | BRR | | | BZDI | | | | 9.950 | | | | 1/2/15 | | | | 15,994 | |
| | |
|
|
| | | | | | | | | | | | | |
|
|
|
| Total | | | 47,825 | BRR | | | | | | | | | | | | | | | (73,794 | ) |
| MXN TIIE BANXICO: | | | | | | | | | | | | | | | | | | | | |
| Credit Suisse International | | | 12,200 | MXN | | | 5.780 | % | | | MXN TIIE BANXICO | | | | 1/6/23 | | | | 58,658 | |
| Goldman Sachs International | | | 17,500 | MXN | | | 5.780 | | | | MXN TIIE BANXICO | | | | 1/6/23 | | | | 84,140 | |
| JPMorgan Chase Bank NA | | | 28,500 | MXN | | | 5.750 | | | | MXN TIIE BANXICO | | | | 1/9/23 | | | | 142,410 | |
| | |
|
|
| | | | | | | | | | | | | |
|
|
|
| Total where Fund pays a fixed rate | | | 58,200 | MXN | | | | | | | | | | | | | | | 285,208 | |
| | |
|
|
| | | | | | | | | | | | | |
|
|
|
| Bank of America NA | | | 2,700 | MXN | | | MXN TIIE BANXICO | | | | 7.530 | | | | 5/18/33 | | | | 1,523 | |
| Barclays Bank plc | | | 22,600 | MXN | | | MXN TIIE BANXICO | | | | 7.040 | | | | 6/13/23 | | | | 46,713 | |
| Barclays Bank plc | | | 26,000 | MXN | | | MXN TIIE BANXICO | | | | 6.995 | | | | 6/12/23 | | | | 41,067 | |
| Credit Suisse International | | | 8,400 | MXN | | | MXN TIIE BANXICO | | | | 6.645 | | | | 12/24/32 | | | | (56,816 | ) |
| Goldman Sachs International | | | 11,000 | MXN | | | MXN TIIE BANXICO | | | | 6.640 | | | | 12/24/32 | | | | (91,341 | ) |
| Goldman Sachs International | | | 2,200 | MXN | | | MXN TIIE BANXICO | | | | 7.800 | | | | 5/27/33 | | | | 4,665 | |
| HSBC Bank USA NA | | | 22,300 | MXN | | | MXN TIIE BANXICO | | | | 6.995 | | | | 6/12/23 | | | | 40,412 | |
| HSBC Bank USA NA | | | 3,000 | MXN | | | MXN TIIE BANXICO | | | | 7.370 | | | | 5/17/33 | | | | (2,300 | ) |
| JPMorgan Chase Bank NA | | | 2,700 | MXN | | | MXN TIIE BANXICO | | | | 7.340 | | | | 5/17/33 | | | | (2,748 | ) |
| JPMorgan Chase Bank NA | | | 28,215 | MXN | | | MXN TIIE BANXICO | | | | 7.100 | | | | 6/12/23 | | | | 68,367 | |
| | | | |
| 45 | | | | OPPENHEIMER GLOBAL STRATEGIC INCOME FUND/VA |
CONSOLIDATED STATEMENT OF INVESTMENTS Unaudited / Continued
Footnotes to Consolidated Statement of Investments Continued
| | | | | | | | | | | | | | | | | | | | |
| Over-the-Counter Interest Rate Swap Contracts Continued | | | | | | | | | | |
Interest Rate/
Swap Counterparty | | Notional
Amount
(000’s) | | | Paid by
the Fund | | | Received by
the Fund | | | Termination
Date | | | Value | |
| MXN TIIE BANXICO: Continued | | | | | | | | | | | | | | | | | | | | |
| JPMorgan Chase Bank NA | | | 18,300 | MXN | | | MXN TIIE BANXICO | | | | 6.590 | % | | | 12/27/32 | | | $ | (131,682 | ) |
| Morgan Stanley Capital Services, Inc. | | | 24,600 | MXN | | | MXN TIIE BANXICO | | | | 7.370 | | | | 5/17/33 | | | | (29,313 | ) |
| | |
|
|
| | | | | | | | | | | | | |
|
|
|
| Total where Fund pays a variable rate | | | 172,015 | MXN | | | | | | | | | | | | | | | (111,453 | ) |
| | |
|
|
| | | | | | | | | | | | | |
|
|
|
| Total | | | 230,215 | MXN | | | | | | | | | | | | | | | 173,755 | |
| Six-Month HUF BUBOR: | | | | | | | | | | | | | | | | | | | | |
| Bank of America NA | | | 379,000 | HUF | | | Six-Month HUF BUBOR | | | | 4.800 | | | | 6/17/18 | | | | (22,971 | ) |
| Deutsche Bank AG | | | 580,000 | HUF | | | Six-Month HUF BUBOR | | | | 4.800 | | | | 6/17/18 | | | | (35,153 | ) |
| | |
|
|
| | | | | | | | | | | | | |
|
|
|
| Total | | | 959,000 | HUF | | | | | | | | | | | | | | | (58,124 | ) |
| Six-Month JPY BBA LIBOR | | | | | | | | | | | | | | | | | | | | |
| Goldman Sachs International | | | 79,000 | JPY | | | Six-Month JPY BBA LIBOR | | | | 0.820 | | | | 4/15/23 | | | | (12,435 | ) |
| Three-Month CAD BA CDOR | | | | | | | | | | | | | | | | | | | | |
| Bank of America NA | | | 6,635 | CAD | | | Three-Month CAD BA CDOR | | | | 1.660 | | | | 5/9/16 | | | | (31,187 | ) |
| Three-Month SEK STIBOR SIDE: | | | | | | | | | | | | | | | | | | | | |
| Barclays Bank plc | | | 5,000 | SEK | | | Three-Month SEK STIBOR SIDE | | | | 2.175 | | | | 5/10/23 | | | | (34,435 | ) |
| Barclays Bank plc | | | 5,000 | SEK | | | Three-Month SEK STIBOR SIDE | | | | 2.055 | | | | 4/29/23 | | | | (41,923 | ) |
| Goldman Sachs International | | | 10,000 | SEK | | | Three-Month SEK STIBOR SIDE | | | | 1.555 | | | | 4/29/18 | | | | (40,645 | ) |
| Goldman Sachs International | | | 19,000 | SEK | | | Three-Month SEK STIBOR SIDE | | | | 1.565 | | | | 5/3/18 | | | | (76,360 | ) |
| | |
|
|
| | | | | | | | | | | | | |
|
|
|
| Total | | | 39,000 | SEK | | | | | | | | | | | | | | | (193,363 | ) |
| Three-Month ZAR JIBAR SAFEX: | | | | | | | | | | | | | | | | | | | | |
| Barclays Bank plc | | | 81,000 | ZAR | | | Three-Month ZAR JIBAR SAFEX | | | | 5.990 | | | | 6/19/15 | | | | 10,382 | |
| Barclays Bank plc | | | 85,000 | ZAR | | | Three-Month ZAR JIBAR SAFEX | | | | 6.980 | | | | 6/20/15 | | | | 37,652 | |
| Goldman Sachs Bank USA | | | 96,000 | ZAR | | | Three-Month ZAR JIBAR SAFEX | | | | 7.850 | | | | 6/25/16 | | | | 30,595 | |
| Goldman Sachs International | | | 132,000 | ZAR | | | Three-Month ZAR JIBAR SAFEX | | | | 7.000 | | | | 6/20/15 | | | | 60,912 | |
| Goldman Sachs International | | | 93,000 | ZAR | | | Three-Month ZAR JIBAR SAFEX | | | | 7.950 | | | | 6/22/16 | | | | 36,962 | |
| JPMorgan Chase Bank NA | | | 294,000 | ZAR | | | Three-Month ZAR JIBAR SAFEX | | | | 8.070 | | | | 6/19/17 | | | | 519 | |
| JPMorgan Chase Bank NA | | | 179,000 | ZAR | | | Three-Month ZAR JIBAR SAFEX | | | | 7.460 | | | | 6/19/16 | | | | (1,057 | ) |
| JPMorgan Chase Bank NA | | | 142,000 | ZAR | | | Three-Month ZAR JIBAR SAFEX | | | | 7.920 | | | | 6/20/16 | | | | 56,710 | |
| | |
|
|
| | | | | | | | | | | | | |
|
|
|
| Total | | | 1,102,000 | ZAR | | | | | | | | | | | | | | | 232,675 | |
| | | | | | | | | | | | | | | | | | |
|
|
|
| | | | | | | | Total Over-the-Counter Interest Rate Swaps | | | $ | 37,527 | |
| | | | | | | | | | | | | | | | | | |
|
|
|
Notional amount is reported in U.S. Dollars (USD), except for those denoted in the following currencies:
| | |
| BRR | | Brazilian Real |
| CAD | | Canadian Dollar |
| HUF | | Hungarian Forint |
| JPY | | Japanese Yen |
| MXN | | Mexican Nuevo Peso |
| SEK | | Swedish Krona |
| ZAR | | South African Rand |
Abbreviations/Definitions are as follows:
| | |
| BA CDOR | | Canada Bankers Acceptances Deposit Offering Rate |
| BANXICO | | Banco de Mexico |
| BBA LIBOR | | British Bankers’ Association London-Interbank Offered Rate |
| BUBOR | | Budapest Interbank Offered Rate |
| | | | |
| 46 | | | | OPPENHEIMER GLOBAL STRATEGIC INCOME FUND/VA |
Abbreviations/Definitions are as follows: Continued
| | |
| BZDI | | Brazil Interbank Deposit Rate |
| JIBAR SAFEX | | Johannesburg Interbank Agreed Rate South African Futures Exchange |
| STIBOR SIDE | | Stockholm Interbank Offered Rate |
| TIIE | | Interbank Equilibrium Interest Rate |
| | | | | | | | | | | | | | | | | | | | | | | | | | |
| Over-the-Counter Credit Default Written Swaption Contracts as of June 28, 2013 are as follows: | |
Reference Entity /
Swaption Counterparty | | Swaption Description | | Underlying
Swap Type
from Fund
Perspective | | | Notional
Amount
(000’s) | | | Expiration
Date | | | Premium
Received | | | Value | | | Unrealized
Appreciation
(Depreciation) | |
| CDX.NA.HY.20: | | | | | | | | | | | | | | | | | | | | | | | | | | |
| JPMorgan Chase Bank NA | | Index Credit Default Swaption (European); Swap Terms: Paid: CDX.NA.HY.20; Received: 5%; Termination Date: 6/20/18 | |
| Index Credit
Default Swap;
Pay Floating |
| | $ | 685 | | | | 12/19/13 | | | $ | 10,446 | | | $ | (10,446 | ) | | $ | — | |
| JPMorgan Chase Bank NA | | Index Credit Default Swaption (European); Swap Terms: Paid: CDX.NA.HY.20; Received: 5%; Termination Date: 6/20/18 | |
| Index Credit
Default Swap;
Pay Floating |
| | | 685 | | | | 9/19/13 | | | | 8,220 | | | | (8,220 | ) | | | — | |
| JPMorgan Chase Bank NA | | Index Credit Default Swaption (European); Swap Terms: Paid: CDX.NA.HY.20; Received: 5%; Termination Date: 6/20/18 | |
| Index Credit
Default Swap;
Pay Floating |
| | | 685 | | | | 12/19/13 | | | | 10,960 | | | | (10,960 | ) | | | — | |
| JPMorgan Chase Bank NA | | Index Credit Default Swaption (European); Swap Terms: Paid: CDX.NA.HY.20; Received: 5%; Termination Date: 6/20/18 | |
| Index Credit
Default Swap;
Pay Floating |
| | | 685 | | | | 9/19/13 | | | | 4,042 | | | | (4,042 | ) | | | — | |
| | | | | | | | | | | | | | | | |
|
|
|
| | | | | | | | | | | | | | | | | | 33,668 | | | | (33,668 | ) | | | — | |
| iTraxx Europe Crossover Series 19 Version 1: | | | | | | | | | | | | | | | | | | | | | | | | |
| JPMorgan Chase Bank NA | | Index Credit Default Swaption (European); Swap Terms: Paid: Protection on iTraxx Europe Crossover Series 19 Version 1; Received: 5%; Termination Date: 6/20/18 | |
| Index Credit
Default Swap;
Pay Floating |
| | | 1,375 | EUR | | | 7/18/13 | | | | 10,310 | | | | (10,291 | ) | | | 19 | |
| JPMorgan Chase Bank NA | | Index Credit Default Swaption (European); Swap Terms: Paid: Protection on iTraxx Europe Crossover Series 19 Version 1; Received: 5%; Termination Date: 6/20/18 | |
| Index Credit
Default Swap;
Pay Floating |
| | | 1,375 | EUR | | | 7/18/13 | | | | 10,758 | | | | (10,739 | ) | | | 19 | |
| JPMorgan Chase Bank NA | | Index Credit Default Swaption (European); Swap Terms: Paid: Protection on iTraxx Europe Crossover Series 19 Version 1; Received: 5%; Termination Date: 6/20/18 | |
| Index Credit
Default Swap;
Pay Floating |
| | | 1,355 | EUR | | | 7/18/13 | | | | 5,173 | | | | (6,559 | ) | | | (1,386 | ) |
| JPMorgan Chase Bank NA | | Index Credit Default Swaption (European); Swap Terms: Paid: Protection on iTraxx Europe Crossover Series 19 Version 1; Received: 5%; Termination Date: 6/20/18 | |
| Index Credit
Default Swap;
Pay Floating |
| | | 675 | EUR | | | 7/18/13 | | | | 2,577 | | | | (3,267 | ) | | | (690 | ) |
| | | | | | | | | | | | | | | | |
|
|
|
| | | | | | | | | | | | | | | | | | 28,818 | | | | (30,856 | ) | | | (2,038 | ) |
| | | | |
| 47 | | | | OPPENHEIMER GLOBAL STRATEGIC INCOME FUND/VA |
CONSOLIDATED STATEMENT OF INVESTMENTS Unaudited / Continued
Footnotes to Consolidated Statement of Investments Continued
| | | | | | | | | | | | | | | | | | | | | | | | |
| Over-the-Counter Credit Default Written Swaption Contracts: Continued | |
Reference Entity /
Swaption Counterparty | | Swaption Description | | Underlying
Swap Type
from Fund
Perspective | | Notional
Amount
(000’s) | | | Expiration
Date | | | Premium
Received | | | Value | | | Unrealized
Appreciation
(Depreciation) | |
| iTraxx Europe Series 19 Version 1: | | | | | | | | | | | | | | | | | | | | | | |
| JPMorgan Chase Bank NA | | Index Credit Default Swaption (European); Swap Terms: Paid: Protection on iTraxx Europe Series 19 Version 1; Received: 1%; Termination Date: 6/20/18 | | Index Credit
Default Swap;
Pay Floating | | | 3,405 | EUR | | | 7/18/13 | | | $ | 10,350 | | | $ | (9,241 | ) | | $ | 1,109 | |
| JPMorgan Chase Bank NA | | Index Credit Default Swaption (European); Swap Terms: Paid: Protection on iTraxx Europe Series 19 Version 1; Received: 1%; Termination Date: 6/20/18 | | Index Credit
Default Swap;
Pay Floating | | | 3,405 | EUR | | | 7/18/13 | | | | 5,850 | | | | (5,250 | ) | | | 600 | |
| JPMorgan Chase Bank NA | | Index Credit Default Swaption (European); Swap Terms: Paid: Protection on iTraxx Europe Series 19 Version 1; Received: 1%; Termination Date: 6/20/18 | | Index Credit
Default Swap;
Pay Floating | | | 6,800 | EUR | | | 7/18/13 | | | | 8,126 | | | | (18,455 | ) | | | (10,329 | ) |
| JPMorgan Chase Bank NA | | Index Credit Default Swaption (European); Swap Terms: Paid: Protection on iTraxx Europe Series 19 Version 1; Received: 1%; Termination Date: 6/20/18 | | Index Credit
Default Swap;
Pay Floating | | | 6,800 | EUR | | | 7/18/13 | | | | 4,514 | | | | (10,484 | ) | | | (5,970 | ) |
| | | | | | | | | | | | | | |
|
|
|
| | | | | | | | | | | | | | | | 28,840 | | | | (43,430 | ) | | | (14,590 | ) |
| | | | | | | | | | | | | | |
|
|
|
| | | Total Over-the-Counter Credit Default Written Swaption Contracts | | | $ | 91,326 | | | $ | (107,954 | ) | | | $(16,628) | |
| | | | | | | | | | | | | | |
|
|
|
Notional amount is reported in U.S. Dollars (USD), except for those denoted in the following currencies:
Abbreviations/Definitions are as follows:
| | |
| CDX.NA.HY.20 | | Markit CDX North American High Yield |
| iTraxx Europe Crossover Series 19 Version 1: | | Credit Default Swap Trading Index for a Specific Basket of Securities |
| iTraxx Europe Series 19 Version 1 | | Credit Default Swap Trading Index for a Specific Basket of Securities |
| | | | | | | | | | | | | | | | | | | | | | | | | | |
| Over-the-Counter Interest Rate Written Swaption Contracts as of June 28, 2013 are as follows: | |
Reference Entity/
Swaption Counterparty | | Swaption Description | | Underlying
Swap Type
from Fund
Perspective | | | Notional
Amount
(000’s) | | | Expiration
Date | | | Premium
Received | | | Value | | | Unrealized
Appreciation
(Depreciation) | |
| MXN TIIE BANXICO: | | | | | | | | | | | | | | | | | | | | | | | | | | |
| Bank of America NA | | Interest Rate Swaption (European); Swap Terms: Paid: MXN TIIE BANXICO; Received: 6.06%; Termination Date: 1/2/24 | |
| Interest Rate
Swap; Pay Floating |
| | | 6,630 | MXN | | | 1/14/14 | | | $ | 19,218 | | | $ | (43,931 | ) | | $ | (24,713 | ) |
| Barclays Bank plc | | Interest Rate Swaption (European); Swap Terms: Paid: MXN TIIE BANXICO; Received: 5.39%; Termination Date: 10/20/23 | |
| Interest Rate
Swap; Pay Floating |
| | | 39,100 | MXN | | | 11/1/13 | | | | 65,279 | | | | (349,868 | ) | | | (284,589 | ) |
| | | | |
| 48 | | | | OPPENHEIMER GLOBAL STRATEGIC INCOME FUND/VA |
| | | | | | | | | | | | | | | | | | | | | | | | | | |
| Over-the-Counter Interest Rate Written Swaption Contracts: Continued | |
Reference Entity/
Swaption Counterparty | | Swaption Description | | Underlying
Swap Type
from Fund
Perspective | | | Notional
Amount
(000’s) | | | Expiration
Date | | | Premium
Received | | | Value | | | Unrealized
Appreciation
(Depreciation) | |
| MXN TIIE BANXICO: Continued | | | | | | | | | | | | | | | | | | | | | | | | |
| JPMorgan Chase Bank NA | | Interest Rate Swaption (European); Swap Terms: Paid: MXN TIIE BANXICO; Received: 5.44%; Termination Date: 10/19/23 | |
| Interest Rate
Swap; Pay Floating |
| | | 39,600 | MXN | | | 10/31/13 | | | $ | 67,479 | | | $ | (344,435 | ) | | $ | (276,956 | ) |
| | | | | | | | | | | | | | | | |
|
|
|
| | | | | | | | | | | | | | | | | | 151,976 | | | | (738,234 | ) | | | (586,258 | ) |
| Six-Month AUD BBR BBSW | | | | | | | | | | | | | | | | | | | | | | | | |
| JPMorgan Chase Bank NA | | Interest Rate Swaption (European); Swap Terms: Paid: Six-Month AUD BBR BBSW; Received: 4.057%; Termination Date: 5/13/24 | |
| Interest Rate
Swap; Pay Floating |
| | | 1,330 | AUD | | | 5/13/14 | | | | 34,620 | | | | (60,355 | ) | | | (25,735 | ) |
| Six-Month EUR EURIBOR: | | | | | | | | | | | | | | | | | | | | | | | | |
| UBS AG | | Interest Rate Swaption (European); Swap Terms: Paid: 2.71%; Received: Six-Month EUR EURIBOR; Termination Date: 2/5/23 | |
| Interest Rate
Swap; Pay Fixed |
| | | 3,545 | EUR | | | 1/30/18 | | | | 144,495 | | | | (124,582 | ) | | | 19,913 | |
| UBS AG | | Interest Rate Swaption (European); Swap Terms: Paid: 2.545%; Received: Six-Month EUR EURIBOR; Termination Date: 1/26/27 | |
| Interest Rate
Swap; Pay Fixed |
| | | 2,670 | EUR | | | 1/25/17 | | | | 163,464 | | | | (110,793 | ) | | | 52,671 | |
| | | | | | | | | | | | | | | | |
|
|
|
| | | | | | Total where Fund pays fixed rate | | | | 307,959 | | | | (235,375 | ) | | | 72,584 | |
| Barclays Bank plc | | Interest Rate Swaption (European); Swap Terms: Paid: Six-Month EUR EURIBOR; Received: 3.117%; Termination Date: 6/1/33 | |
| Interest Rate
Swap; Pay Floating |
| | | 1,345 | EUR | | | 5/31/23 | | | | 118,392 | | | | (110,465 | ) | | | 7,927 | |
| Goldman Sachs International | | Interest Rate Swaption (European); Swap Terms: Paid: Six-Month EUR EURIBOR; Received: 2.055%; Termination Date: 12/27/18 | |
| Interest Rate
Swap; Pay Floating |
| | | 6,810 | EUR | | | 12/23/13 | | | | 53,548 | | | | (40,948 | ) | | | 12,600 | |
| UBS AG | | Interest Rate Swaption (European); Swap Terms: Paid: Six-Month EUR EURIBOR; Received: 1.82%; Termination Date: 6/29/17 | |
| Interest Rate
Swap; Pay Floating |
| | | 5,510 | EUR | | | 6/26/15 | | | | 48,355 | | | | (42,351 | ) | | | 6,004 | |
| UBS AG | | Interest Rate Swaption (European); Swap Terms: Paid: Six-Month EUR EURIBOR; Received: 1.7625%; Termination Date: 6/24/17 | |
| Interest Rate
Swap; Pay Floating |
| | | 5,480 | EUR | | | 6/23/15 | | | | 45,671 | | | | (43,706 | ) | | | 1,965 | |
| | | | | | | | | | | | | | | | |
|
|
|
| | | | | | Total where Fund pays floating rate | | | | 265,966 | | | | (237,470 | ) | | | 28,496 | |
| | | | | | | | | | | | | | | | |
|
|
|
| | | | | | | | | | | | | | Total | | | | 573,925 | | | | (472,845 | ) | | | 101,080 | |
| Six-Month GBP BBA LIBOR: | | | | | | | | | | | | | | | | | | | | | | | | |
| Barclays Bank plc | | Interest Rate Swaption (European); Swap Terms: Paid: 2.1175%; Received: Six-Month GBP BBA LIBOR; Termination Date: 6/20/21 | |
| Interest Rate
Swap; Pay Fixed |
| | | 5,420 | GBP | | | 6/21/16 | | | | 143,319 | | | | (65,264 | ) | | | 78,055 | |
| | | | |
| 49 | | | | OPPENHEIMER GLOBAL STRATEGIC INCOME FUND/VA |
CONSOLIDATED STATEMENT OF INVESTMENTS Unaudited / Continued
Footnotes to Consolidated Statement of Investments Continued
| | | | | | | | | | | | | | | | | | | | | | | | | | |
| Over-the-Counter Interest Rate Written Swaption Contracts: Continued | |
Reference Entity/
Swaption Counterparty | | Swaption Description | | Underlying
Swap Type
from Fund
Perspective | | | Notional
Amount
(000’s) | | | Expiration
Date | | | Premium
Received | | | Value | | | Unrealized
Appreciation
(Depreciation) | |
| Six-Month GBP BBA LIBOR: Continued | | | | | | | | | | | | | | | | | | | | | | | | |
| Barclays Bank plc | | Interest Rate Swaption (European); Swap Terms: Paid: 2.75%; Received: Six-Month GBP BBA LIBOR; Termination Date: 1/14/44 | |
| Interest Rate
Swap; Pay Fixed |
| | | 1,990 | GBP | | | 1/15/14 | | | $ | 52,369 | | | $ | (10,692 | ) | | $ | 41,677 | |
| | | | | | | | | | | | | | | | |
|
|
|
| | | | | | Total where Fund pays a fixed rate | | | | 195,688 | | | | (75,956 | ) | | | 119,732 | |
| Barclays Bank plc | | Interest Rate Swaption (European); Swap Terms: Paid: Six-Month GBP BBA LIBOR; Received: 3.1175%; Termination Date: 6/20/21 | |
| Interest Rate
Swap; Pay Floating |
| | | 5,420 | GBP | | | 6/21/16 | | | | 114,486 | | | | (209,563 | ) | | | (95,077 | ) |
| Barclays Bank plc | | Interest Rate Swaption (European); Swap Terms: Paid: Six-Month GBP BBA LIBOR; Received: 2.295%; Termination Date: 1/25/21 | |
| Interest Rate
Swap; Pay Floating |
| | | 4,765 | GBP | | | 1/26/16 | | | | 178,161 | | | | (262,132 | ) | | | (83,971 | ) |
| Barclays Bank plc | | Interest Rate Swaption (European); Swap Terms: Paid: Six-Month GBP BBA LIBOR; Received: 1.955%; Termination Date: 6/11/17 | |
| Interest Rate
Swap; Pay Floating |
| | | 4,060 | GBP | | | 6/12/15 | | | | 33,034 | | | | (44,970 | ) | | | (11,936 | ) |
| Barclays Bank plc | | Interest Rate Swaption (European); Swap Terms: Paid: Six-Month GBP BBA LIBOR; Received: 3.50%; Termination Date: 1/14/44 | |
| Interest Rate
Swap; Pay Floating |
| | | 1,990 | GBP | | | 1/15/14 | | | | 44,360 | | | | (99,105 | ) | | | (54,745 | ) |
| Barclays Bank plc | | Interest Rate Swaption (European); Swap Terms: Paid: Six-Month GBP BBA LIBOR; Received: 1.525%; Termination Date: 5/23/18 | |
| Interest Rate
Swap; Pay Floating |
| | | 21,170 | GBP | | | 5/24/16 | | | | 281,004 | | | | (607,666 | ) | | | (326,662 | ) |
| Goldman Sachs Bank USA | | Interest Rate Swaption (European); Swap Terms: Paid: Six-Month GBP BBA LIBOR; Received: 2.055%; Termination Date: 12/4/20 | |
| Interest Rate
Swap; Pay Floating |
| | | 5,020 | GBP | | | 12/7/15 | | | | 189,330 | | | | (331,850 | ) | | | (142,520 | ) |
| UBS AG | | Interest Rate Swaption (European); Swap Terms: Paid: Six-Month GBP BBA LIBOR; Received: 1.545%; Termination Date: 5/23/18 | |
| Interest Rate
Swap; Pay Floating |
| | | 2,675 | GBP | | | 5/24/16 | | | | 35,371 | | | | (75,817 | ) | | | (40,446 | ) |
| UBS AG | | Interest Rate Swaption (European); Swap Terms: Paid: Six-Month GBP BBA LIBOR; Received: 1.765%; Termination Date: 6/10/17 | |
| Interest Rate
Swap; Pay Floating |
| | | 8,090 | GBP | | | 6/11/15 | | | | 65,112 | | | | (104,634 | ) | | | (39,522 | ) |
| | | | | | | | | | | | | | | | |
|
|
|
| | | | | | Total where Fund pays a floating rate | | | | 940,858 | | | | (1,735,737 | ) | | | (794,879 | ) |
| | | | | | | | | | | | | | | | |
|
|
|
| | | | | | | | | | | | | | Total | | | | 1,136,546 | | | | (1,811,693 | ) | | | (675,147 | ) |
| | | | |
| 50 | | | | OPPENHEIMER GLOBAL STRATEGIC INCOME FUND/VA |
| | | | | | | | | | | | | | | | | | | | | | | | | | |
| Over-the-Counter Interest Rate Written Swaption Contracts: Continued | |
Reference Entity/
Swaption Counterparty | | Swaption Description | | Underlying
Swap Type
from Fund
Perspective | | | Notional
Amount
(000’s) | | | Expiration
Date | | | Premium
Received | | | Value | | | Unrealized
Appreciation
(Depreciation) | |
| Three-Month CAD BA CDOR | |
| Bank of America NA | | Interest Rate Swaption (European); Swap Terms: Paid: Three-Month CAD BA CDOR; Received: 2.5825%; Termination Date: 10/8/23 | |
| Interest Rate
Swap; Pay Floating |
| | | 15,740 | CAD | | | 10/9/13 | | | $ | 136,665 | | | $ | (563,836 | ) | | $ | (427,171 | ) |
| Three-Month USD BBA LIBOR: | |
| Bank of America NA | | Interest Rate Swaption (European); Swap Terms: Paid: 3%; Received: Three-Month USD BBA LIBOR; Termination Date: 11/13/23 | |
| Interest Rate
Swap; Pay Fixed |
| | | 2,655 | | | | 11/8/13 | | | | 18,054 | | | | (852 | ) | | | 17,202 | |
| Bank of America NA | | Interest Rate Swaption (European); Swap Terms: Paid: 2.80%; Received: Three-Month USD BBA LIBOR; Termination Date: 11/13/23 | |
| Interest Rate
Swap; Pay Fixed |
| | | 2,655 | | | | 11/8/13 | | | | 10,886 | | | | (352 | ) | | | 10,534 | |
| Barclays Bank plc | | Interest Rate Swaption (European); Swap Terms: Paid: 3.07%; Received: Three-Month USD BBA LIBOR; Termination Date: 9/3/43 | |
| Interest Rate
Swap; Pay Fixed |
| | | 2,015 | | | | 9/3/13 | | | | 28,311 | | | | (11,297 | ) | | | 17,014 | |
| Barclays Bank plc | | Interest Rate Swaption (European); Swap Terms: Paid: 2.80%; Received: Three-Month USD BBA LIBOR; Termination Date: 11/9/23 | |
| Interest Rate
Swap; Pay Fixed |
| | | 10,525 | | | | 11/8/13 | | | | 44,205 | | | | (1,408 | ) | | | 42,797 | |
| Barclays Bank plc | | Interest Rate Swaption (European); Swap Terms: Paid: 3%; Received: Three-Month USD BBA LIBOR; Termination Date: 11/9/23 | |
| Interest Rate
Swap; Pay Fixed |
| | | 10,525 | | | | 11/8/13 | | | | 74,201 | | | | (3,405 | ) | | | 70,796 | |
| Barclays Bank plc | | Interest Rate Swaption (European); Swap Terms: Paid: 2.1725%; Received: Three-Month USD BBA LIBOR; Termination Date: 10/10/23 | |
| Interest Rate
Swap; Pay Fixed |
| | | 15,740 | | | | 10/9/13 | | | | 116,870 | | | | (26,749 | ) | | | 90,121 | |
| | | | | | | | | | | | | | | | |
|
|
|
| | | | | | Total where Fund pays a fixed rate | | | | 292,527 | | | | (44,063 | ) | | | 248,464 | |
| Bank of America NA | | Interest Rate Swaption (European); Swap Terms: Paid: Three-Month USD BBA LIBOR; Received: 2.4025%; Termination Date: 12/18/18 | |
| Interest Rate
Swap; Pay Floating |
| | | 33,000 | | | | 12/17/13 | | | | 221,100 | | | | (435,570 | ) | | | (214,470 | ) |
| Bank of America NA | | Interest Rate Swaption (European); Swap Terms: Paid: Three-Month USD BBA LIBOR; Received: 3.045%; Termination Date: 7/30/23 | |
| Interest Rate
Swap; Pay Floating |
| | | 20,500 | | | | 7/29/13 | | | | 102,500 | | | | (46,549 | ) | | | 55,951 | |
| Bank of America NA | | Interest Rate Swaption (European); Swap Terms: Paid: Three-Month USD BBA LIBOR; Received: 3.2625%; Termination Date: 8/29/23 | |
| Interest Rate
Swap; Pay Floating |
| | | 59,550 | | | | 8/28/13 | | | | 433,091 | | | | (206,811 | ) | | | 226,280 | |
| | | | |
| 51 | | | | OPPENHEIMER GLOBAL STRATEGIC INCOME FUND/VA |
CONSOLIDATED STATEMENT OF INVESTMENTS Unaudited / Continued
Footnotes to Consolidated Statement of Investments Continued
| | | | | | | | | | | | | | | | | | | | | | | | | | |
| Over-the-Counter Interest Rate Written Swaption Contracts: Continued | |
Reference Entity/
Swaption Counterparty | | Swaption Description | | Underlying
Swap Type
from Fund
Perspective | | | Notional
Amount
(000’s) | | | Expiration
Date | | | Premium
Received | | | Value | | | Unrealized
Appreciation
(Depreciation) | |
| Three-Month USD BBA LIBOR: Continued | |
| Barclays Bank plc | | Interest Rate Swaption (European); Swap Terms: Paid: Three-Month USD BBA LIBOR; Received: 2.6775%; Termination Date: 12/16/25 | |
| Interest Rate
Swap; Pay Floating |
| | $ | 10,450 | | | | 12/15/15 | | | $ | 536,608 | | | $ | (1,037,043 | ) | | $ | (500,435 | ) |
| Barclays Bank plc | | Interest Rate Swaption (European); Swap Terms: Paid: Three Month USD BBA LIBOR; Received: 3.10%; Termination Date: 4/27/22 | |
| Interest Rate
Swap; Pay Floating |
| | | 20,415 | | | | 4/26/17 | | | | 528,749 | | | | (966,225 | ) | | | (437,476 | ) |
| Barclays Bank plc | | Interest Rate Swaption (European); Swap Terms: Paid: Three-Month USD BBA LIBOR; Received: 3.80%; Termination Date: 5/28/25 | |
| Interest Rate
Swap; Pay Floating |
| | | 5,350 | | | | 5/27/15 | | | | 89,773 | | | | (193,783 | ) | | | (104,010 | ) |
| Barclays Bank plc | | Interest Rate Swaption (European); Swap Terms: Paid: Three-Month USD BBA LIBOR; Received: 4.30%; Termination Date: 5/28/25 | |
| Interest Rate
Swap; Pay Floating |
| | | 5,350 | | | | 5/27/15 | | | | 54,035 | | | | (128,615 | ) | | | (74,580 | ) |
| Goldman Sachs International | | Interest Rate Swaption (European); Swap Terms: Paid: Three-Month USD BBA LIBOR; Received: 2.95%; Termination Date: 2/21/24 | |
| Interest Rate
Swap; Pay Floating |
| | | 41,885 | | | | 2/20/14 | | | | 586,390 | | | | (1,240,522 | ) | | | (654,132 | ) |
| Goldman Sachs International | | Interest Rate Swaption (European); Swap Terms: Paid: Three-Month USD BBA LIBOR; Received: 3.13375%; Termination Date: 9/30/23 | |
| Interest Rate
Swap; Pay Floating |
| | | 34,610 | | | | 9/27/13 | | | | 410,994 | | | | (311,354 | ) | | | 99,640 | |
| JPMorgan Chase Bank NA | | Interest Rate Swaption (European); Swap Terms: Paid: Three-Month USD BBA LIBOR; Received: 1.995%; Termination Date: 8/29/18 | |
| Interest Rate
Swap; Pay Floating |
| | | 13,565 | | | | 8/28/13 | | | | 64,434 | | | | (40,294 | ) | | | 24,140 | |
| UBS AG | | Interest Rate Swaption (European); Swap Terms: Paid: Three-Month USD BBA LIBOR; Received: 3.5075%; Termination Date: 9/3/43 | |
| Interest Rate
Swap; Pay Floating |
| | | 1,340 | | | | 9/3/13 | | | | 20,033 | | | | (35,773 | ) | | | (15,740 | ) |
| | | | |
| 52 | | | | OPPENHEIMER GLOBAL STRATEGIC INCOME FUND/VA |
| | | | | | | | | | | | | | | | | | | | | | | | | | |
| Over-the-Counter Interest Rate Written Swaption Contracts: Continued | |
Reference Entity/
Swaption Counterparty | | Swaption Description | | Underlying
Swap Type
from Fund
Perspective | | | Notional
Amount
(000’s) | | | Expiration
Date | | | Premium
Received | | | Value | | | Unrealized
Appreciation
(Depreciation) | |
| Three-Month USD BBA LIBOR: Continued | |
| UBS AG | | Interest Rate Swaption (European); Swap Terms: Paid: Three-Month USD BBA LIBOR; Received: 3.52%; Termination Date: 9/3/43 | |
| Interest Rate
Swap; Pay Floating |
| | $ | 5,085 | | | | 9/3/13 | | | $ | 76,021 | | | $ | (130,312 | ) | | $ | (54,291 | ) |
| | | | | | | | | | | | | | | | |
|
|
|
| | | | | | Total where Fund pays a floating rate | | | | 3,123,728 | | | | (4,772,851 | ) | | | (1,649,123 | ) |
| | | | | | | | | | | | | | | | |
|
|
|
| | | | | | | | | | | | | | Total | | | | 3,416,255 | | | | (4,816,914 | ) | | | (1,400,659 | ) |
| | | | | | | | | | | | | | | | |
|
|
|
| | | Total Over-the-Counter Interest Rate Written Swaption Contracts | | | $ | 5,449,987 | | | $ | (8,463,877 | ) | | $ | (3,013,890 | ) |
| | | | | | | | | | | | | | | | |
|
|
|
Notional amount is reported in U.S. Dollars (USD), except for those denoted in the following currencies:
| | |
| AUD | | Australian Dollar |
| CAD | | Canadian Dollar |
| EUR | | Euro |
| GBP | | British Pound Sterling |
| MXN | | Mexican Peso |
Abbreviations/Definitions are as follows:
| | |
| BA CDOR | | Canada Bankers Acceptances Deposit Offering Rate |
| BANXICO | | Banco de Mexico |
| BBA LIBOR | | British Bankers’ Association London-Interbank Offered Rate |
| BBR BBSW | | Bank Bill Swap Reference Rate (Australian Financial Market) |
| EURIBOR | | Euro Interbank Offered Rate |
| TIIE | | Interbank Equilibrium Interest Rate |
See accompanying Notes to Consolidated Financial Statements.
| | | | |
| 53 | | | | OPPENHEIMER GLOBAL STRATEGIC INCOME FUND/VA |
CONSOLIDATED STATEMENT OF ASSETS AND LIABILITIES Unaudited
| | | | |
| June 28, 20131 | | | |
| Assets | | | |
| Investments, at value—see accompanying consolidated statement of investments: | | | | |
| Unaffiliated companies (cost $2,417,286,292) | | $ | 2,330,264,369 | |
| Affiliated companies (cost $195,028,725) | |
| 196,747,959
|
|
| | | | 2,527,012,328 | |
| Cash | | | 7,485,264 | |
| Unrealized appreciation on foreign currency exchange contracts | | | 12,654,568 | |
| Swaps, at value (net premiums paid $29,258) | | | 846,132 | |
| Receivables and other assets: | | | | |
| Investments sold (including $24,335,298 sold on a when-issued or delayed delivery basis) | | | 33,883,872 | |
| Interest, dividends and principal paydowns | | | 29,598,608 | |
| Closed foreign currency contracts | | | 2,864,405 | |
| Shares of beneficial interest sold | | | 865,288 | |
| Variation margin receivable | | | 435,506 | |
| Other | |
| 99,314
|
|
| Total assets | | | 2,615,745,285 | |
| Liabilities | | | |
| Bank overdraft-foreign currencies | | | 6,667 | |
| Options written, at value (premiums received $2,221,371) | | | 2,858,769 | |
| Swaptions written, at value (premiums received $5,541,313) | | | 8,571,831 | |
| Unrealized depreciation on foreign currency exchange contracts | | | 3,881,650 | |
| Swaps, at value (premiums received $105,519) | | | 803,084 | |
| Payables and other liabilities: | | | | |
| Investments purchased (including $114,903,454 purchased on a when-issued or delayed delivery basis) | | | 128,352,910 | |
| Closed foreign currency contracts | | | 2,736,562 | |
| Shares of beneficial interest redeemed | | | 2,122,526 | |
| Distribution and service plan fees | | | 368,019 | |
| Transfer and shareholder servicing agent fees | | | 206,605 | |
| Variation margin payable | | | 108,220 | |
| Trustees’ compensation | | | 82,889 | |
| Shareholder communications | | | 46,068 | |
| Other | |
| 212,833
|
|
| Total liabilities | | | 150,358,633 | |
| Net Assets | | $
| 2,465,386,652
|
|
| Composition of Net Assets | | | |
| Par value of shares of beneficial interest | | $ | 461,001 | |
| Additional paid-in capital | | | 2,506,295,847 | |
| Accumulated net investment income | | | 82,701,059 | |
| Accumulated net realized loss on investments and foreign currency transactions | | | (37,718,106 | ) |
| Net unrealized depreciation on investments and translation of assets and liabilities denominated in foreign currencies | |
| (86,353,149
| )
|
| Net Assets | | $
| 2,465,386,652
|
|
| | | | |
| 54 | | | | OPPENHEIMER GLOBAL STRATEGIC INCOME FUND/VA |
| | | | |
| Net Asset Value Per Share | | | |
| Non-Service Shares: | | | | |
Net asset value, redemption price per share and offering price per share (based on net assets of $709,562,002
and 134,872,758 shares of beneficial interest outstanding) | | | $5.26 | |
| Service Shares: | | | | |
Net asset value, redemption price per share and offering price per share (based on net assets of $1,755,824,650
and 326,127,796 shares of beneficial interest outstanding) | | | $5.38 | |
1. June 28, 2013 represents the last business day of the Fund’s semiannual period. See Note 1 of the accompanying Notes.
See accompanying Notes to Consolidated Financial Statements.
| | | | |
| 55 | | | | OPPENHEIMER GLOBAL STRATEGIC INCOME FUND/VA |
CONSOLIDATED STATEMENT OF OPERATIONS Unaudited
| | | | |
| For the Six Months Ended June 28, 20131 | | | |
| Allocation of Income and Expenses from Master Funds2 | | | |
| Net investment income allocated from Oppenheimer Master Event-Linked Bond Fund, LLC: | | | | |
| Interest | | $ | 2,612,725 | |
| Dividends | | | 1,724 | |
| Net expenses | |
| (129,105
| )
|
| Net investment income allocated from Oppenheimer Master Event-Linked Bond Fund, LLC | | | 2,485,344 | |
| Net investment income allocated from Oppenheimer Master Loan Fund, LLC: | | | | |
| Interest | | | 5,976,837 | |
| Dividends | | | 2,912 | |
| Net expenses | |
| (291,950
| )
|
| Net investment income allocated from Oppenheimer Master Loan Fund, LLC | |
| 5,687,799
|
|
| Total allocation of net investment income from master funds | | | 8,173,143 | |
| Investment Income | | | | |
| Interest (net of foreign withholding taxes of $44,557) | | | 67,707,786 | |
| Dividends: | | | | |
| Unaffiliated companies | | | 116,235 | |
| Affiliated companies | | | 47,119 | |
| Fee income on when-issued securities | |
| 5,525,609
|
|
| Total investment income | | | 73,396,749 | |
| Expenses | | | |
| Management fees | | | 7,340,495 | |
| Distribution and service plan fees—Service shares | | | 2,291,858 | |
| Transfer and shareholder servicing agent fees: | | | | |
| Non-Service shares | | | 367,777 | |
| Service shares | | | 916,765 | |
| Shareholder communications: | | | | |
| Non-Service shares | | | 33,718 | |
| Service shares | | | 84,014 | |
| Custodian fees and expenses | | | 191,435 | |
| Trustees’ compensation | | | 41,009 | |
| Other | |
| 107,964
|
|
| Total expenses | | | 11,375,035 | |
| Less waivers and reimbursements of expenses | |
| (406,348
| )
|
| Net expenses | | | 10,968,687 | |
| Net Investment Income | | | 70,601,205 | |
| | | | |
| 56 | | | | OPPENHEIMER GLOBAL STRATEGIC INCOME FUND/VA |
| | | | |
| Realized and Unrealized Gain (Loss) | | | |
| Net realized gain (loss) on: | | | | |
| Investments from unaffiliated companies (including premiums on options and swaptions exercised) | | $ | 18,120,998 | |
| Closing and expiration of option contracts written | | | 7,071,960 | |
| Closing and expiration of swaption contracts written | | | (1,994,606 | ) |
| Closing and expiration of futures contracts | | | (7,032,578 | ) |
| Foreign currency transactions | | | (14,143,544 | ) |
| Swap contracts | | | (3,534,801 | ) |
| Net realized gain (loss) allocated from: | | | | |
| Oppenheimer Master Event-Linked Bond Fund, LLC | | | (33,682 | ) |
| Oppenheimer Master Loan Fund, LLC | |
| 4,563,554
|
|
| Net realized gain | | | 3,017,301 | |
| Net change in unrealized appreciation/depreciation on: | | | | |
| Investments | | | (99,965,034 | ) |
| Translation of assets and liabilities denominated in foreign currencies | | | (24,260,007 | ) |
| Futures contracts | | | (4,254,644 | ) |
| Option contracts written | | | (1,195,923 | ) |
| Swaption contracts written | | | (2,882,894 | ) |
| Swap contracts | | | 128,355 | |
| Net change in unrealized appreciation/deprecation allocated from: | | | | |
| Oppenheimer Master Event-Linked Bond Fund, LLC | | | 920,950 | |
| Oppenheimer Master Loan Fund, LLC | |
| (2,813,102
| )
|
| Net change in unrealized appreciation/depreciation | | | (134,322,299 | ) |
| Net Decrease in Net Assets Resulting from Operations | | $
| (60,703,793
| )
|
1. June 28, 2013 represents the last business day of the Fund’s semiannual period. See Note 1 of the accompanying Notes.
2. The Fund invests in certain affiliated funds that expected to be treated as partnerships for tax purposes.
See accompanying Notes to Consolidated Financial Statements.
| | | | |
| 57 | | | | OPPENHEIMER GLOBAL STRATEGIC INCOME FUND/VA |
CONSOLIDATED STATEMENTS OF CHANGES IN NET ASSETS
| | | | | | | | |
| | | Six Months
Ended
June 28, 20131
(Unaudited) | | | Year
Ended
December 31,
20122 | |
| Operations | | | | | | |
| Net investment income | | $ | 70,601,205 | | | $ | 140,214,643 | |
| Net realized gain (loss) | | | 3,017,301 | | | | (35,412,937 | ) |
| Net change in unrealized appreciation/depreciation | |
| (134,322,299
| )
| |
| 192,342,982
|
|
| Net increase (decrease) in net assets resulting from operations | | | (60,703,793 | ) | | | 297,144,688 | |
| Dividends and/or Distributions to Shareholders | | | | | | |
| Dividends from net investment income: | | | | | | | | |
| Non-Service shares | | | (36,272,242 | ) | | | (41,097,829 | ) |
| Service shares | |
| (83,922,335
| )
| |
| (95,632,597
| )
|
| | | | (120,194,577 | ) | | | (136,730,426 | ) |
| Distributions from net realized gain: | | | | | | | | |
| Non-Service shares | | | — | | | | (7,582,316 | ) |
| Service shares | |
| —
|
| |
| (18,415,501
| )
|
| | | | — | | | | (25,997,817 | ) |
| Beneficial Interest Transactions | | | | | | |
| Net increase in net assets resulting from beneficial interest transactions: | | | | | | | | |
| Non-Service shares | | | 20,668,535 | | | | 56,198,952 | |
| Service shares | |
| 42,899,331
|
| |
| 139,111,661
|
|
| | | | 63,567,866 | | | | 195,310,613 | |
| Net Assets | | | | | | |
| Total increase (decrease) | | | (117,330,504 | ) | | | 329,727,058 | |
| Beginning of period | |
| 2,582,717,156
|
| |
| 2,252,990,098
|
|
| End of period (including accumulated net investment income of $82,701,059 and $132,294,431, respectively) | | $
| 2,465,386,652
|
| | $
| 2,582,717,156
|
|
1. June 28, 2013 represents the last business day of the Fund’s semiannual period. See Note 1 of the accompanying Notes.
2. Certain amounts have been restated to reflect a change in method of accounting. See Note 1 of the accompanying Notes.
See accompanying Notes to Consolidated Financial Statements.
| | | | |
| 58 | | | | OPPENHEIMER GLOBAL STRATEGIC INCOME FUND/VA |
CONSOLIDATED FINANCIAL HIGHLIGHTS
| | | | | | | | | | | | | | | | | | | | | | | | |
| | | Six Months
Ended
June 28, 20131 | | | Year Ended
December 31, | | | Year Ended
December 30, | | | Year Ended
December 31, | | | Year Ended
December 31, | | | Year Ended
December 31, | |
| Non-Service Shares | | (Unaudited) | | | 20122 | | | 20111,2 | | | 2010 | | | 2009 | | | 2008 | |
| Per Share Operating Data | | | | | | | | | | | | | | | | | | |
| Net asset value, beginning of period | | $ | 5.67 | | | $ | 5.38 | | | $ | 5.58 | | | $ | 5.30 | | | $ | 4.49 | | | $ | 5.56 | |
| Income (loss) from investment operations: | | | | | | | | | | | | | | | | | | | | | | | | |
| Net investment income3 | | | .16 | | | | .33 | | | | .36 | | | | .34 | | | | .30 | | | | .30 | |
| Net realized and unrealized gain (loss) | |
| (.29
| )
| |
| .36
|
| |
| (.31
| )
| |
| .40
|
| |
| .53
|
| |
| (1.04
| )
|
| Total from investment operations | | | (.13 | ) | | | .69 | | | | .05 | | | | .74 | | | | .83 | | | | (.74 | ) |
| Dividends and/or distributions to shareholders: | | | | | | | | | | | | | | | | | | | | | | | | |
| Dividends from net investment income | | | (.28 | ) | | | (.34 | ) | | | (.18 | ) | | | (.46 | ) | | | (.02 | ) | | | (.27 | ) |
| Distributions from net realized gain | |
| —
|
| |
| (.06
| )
| |
| (.07
| )
| |
| —
|
| |
| —
| 4
| |
| (.06
| )
|
| Total dividends and distributions to shareholders | | | (.28 | ) | | | (.40 | ) | | | (.25 | ) | | | (.46 | ) | | | (.02 | ) | | | (.33 | ) |
| Net asset value, end of period | | $
| 5.26
|
| | $
| 5.67
|
| | $
| 5.38
|
| | $
| 5.58
|
| | $
| 5.30
|
| | $
| 4.49
|
|
| Total Return, at Net Asset Value5 | | | (2.36 | )% | | | 13.53 | % | | | 0.85 | % | | | 14.97 | % | | | 18.83 | % | | | (14.21 | )% |
| | | | | | | | | | | | | | | | | | | | | | | | | |
| Ratios/Supplemental Data | | | | | | | | | | | | | | | | | | |
| Net assets, end of period (in thousands) | | $ | 709,562 | | | $ | 741,996 | | | $ | 648,084 | | | $ | 711,755 | | | $ | 757,772 | | | $ | 648,570 | |
| Average net assets (in thousands) | | $ | 741,455 | | | $ | 690,351 | | | $ | 694,868 | | | $ | 737,071 | | | $ | 681,926 | | | $ | 753,062 | |
| Ratios to average net assets:6,7 | | | | | | | | | | | | | | | | | | | | | | | | |
| Net investment income | | | 5.68 | % | | | 6.01 | % | | | 6.50 | % | | | 6.47 | % | | | 6.20 | % | | | 5.78 | % |
| Total expenses8 | | | 0.74 | % | | | 0.77 | % | | | 0.77 | % | | | 0.75 | % | | | 0.67 | % | | | 0.59 | % |
| Expenses after payments, waivers and/or reimbursements and reduction to custodian expenses | | | 0.71 | % | | | 0.71 | % | | | 0.71 | % | | | 0.71 | % | | | 0.64 | % | | | 0.57 | % |
| Portfolio turnover rate9 | | | 52 | % | | | 78 | % | | | 49 | % | | | 99 | % | | | 110 | % | | | 86 | % |
1. June 28, 2013 and December 30, 2011 represent the last business day of the Fund’s reporting periods. See Note 1 of the accompanying Notes.
2. Certain amounts have been restated to reflect a change in method of accounting. See Note 1 of the accompanying Notes.
3. Per share amounts calculated based on the average shares outstanding during the period.
4. Less than $0.005 per share.
5. Assumes an initial investment on the business day before the first day of the fiscal period, with all dividends and distributions reinvested in additional shares on the reinvestment date, and redemption at the net asset value calculated on the last business day of the fiscal period. Total returns are not annualized for periods less than one full year. Total return information does not reflect expenses that apply at the separate account level or to related insurance products. Inclusion of these charges would reduce the total return figures for all periods shown. Returns do not reflect the deduction of taxes that a shareholder would pay on fund distributions or the redemption of fund shares.
6. Annualized for periods less than one full year.
7. Includes the Fund’s share of the allocated expenses and/or net investment income from the master funds.
8. Total expenses including all affiliated fund expenses were as follows:
| | | | |
| Six Months Ended June 28, 2013 | | | 0.74 | % |
| Year Ended December 31, 2012 | | | 0.77 | % |
| Year Ended December 30, 2011 | | | 0.77 | % |
| Year Ended December 31, 2010 | | | 0.75 | % |
| Year Ended December 31, 2009 | | | 0.68 | % |
| Year Ended December 31, 2008 | | | 0.60 | % |
9. The portfolio turnover rate excludes purchase and sale transactions of To Be Announced (TBA) mortgage-related securities as follows:
| | | | | | | | |
| | | Purchase Transactions | | | Sale Transactions | |
| Six Months Ended June 28, 2013 | | $ | 3,507,512,135 | | | $ | 3,896,975,119 | |
| Year Ended December 31, 2012 | | $ | 3,862,820,437 | | | $ | 3,466,796,223 | |
| Year Ended December 30, 2011 | | $ | 1,050,654,783 | | | $ | 1,039,506,614 | |
| Year Ended December 31, 2010 | | $ | 1,034,550,699 | | | $ | 1,085,289,655 | |
| Year Ended December 31, 2009 | | $ | 1,909,574,925 | | | $ | 1,836,038,328 | |
| Year Ended December 31, 2008 | | $ | 634,319,548 | | | $ | 594,845,589 | |
See accompanying Notes to Consolidated Financial Statements.
| | | | |
| 59 | | | | OPPENHEIMER GLOBAL STRATEGIC INCOME FUND/VA |
CONSOLIDATED FINANCIAL HIGHLIGHTS Continued
| | | | | | | | | | | | | | | | | | | | | | | | |
| | | Six Months
Ended
June 28, 20131 | | | Year Ended
December 31, | | | Year Ended
December 30, | | | Year Ended
December 31, | | | Year Ended
December 31, | | | Year Ended
December 31, | |
| Service Shares | | (Unaudited) | | | 20122 | | | 20111,2 | | | 2010 | | | 2009 | | | 2008 | |
| Per Share Operating Data | | | | | | | | | | | | | | | | | | |
| Net asset value, beginning of period | | $ | 5.79 | | | $ | 5.49 | | | $ | 5.68 | | | $ | 5.38 | | | $ | 4.56 | | | $ | 5.65 | |
| Income (loss) from investment operations: | | | | | | | | | | | | | | | | | | | | | | | | |
| Net investment income3 | | | .16 | | | | .33 | | | | .35 | | | | .33 | | | | .29 | | | | .29 | |
| Net realized and unrealized gain (loss) | |
| (.30
| )
| |
| .36
|
| |
| (.31
| )
| |
| .42
|
| |
| .54
|
| |
| (1.06
| )
|
| Total from investment operations | | | (.14 | ) | | | .69 | | | | .04 | | | | .75 | | | | .83 | | | | (.77 | ) |
| Dividends and/or distributions to shareholders: | | | | | | | | | | | | | | | | | | | | | | | | |
| Dividends from net investment income | | | (.27 | ) | | | (.33 | ) | | | (.16 | ) | | | (.45 | ) | | | (.01 | ) | | | (.26 | ) |
| Distributions from net realized gain | |
| —
|
| |
| (.06
| )
| |
| (.07
| )
| |
| —
|
| |
| —
| 4
| |
| (.06
| )
|
| Total dividends and distributions to shareholders | | | (.27 | ) | | | (.39 | ) | | | (.23 | ) | | | (.45 | ) | | | (.01 | ) | | | (.32 | ) |
| Net asset value, end of period | | $
| 5.38
|
| | $
| 5.79
|
| | $
| 5.49
|
| | $
| 5.68
|
| | $
| 5.38
|
| | $
| 4.56
|
|
| Total Return, at Net Asset Value5 | | | (2.54 | )% | | | 13.15 | % | | | 0.65 | % | | | 14.77 | % | | | 18.41 | % | | | (14.49 | )% |
| | | | | | | | | | | | | | | | | | | | | | | | | |
| Ratios/Supplemental Data | | | | | | | | | | | | | | | | | | |
| Net assets, end of period (in thousands) | | $ | 1,755,825 | | | $ | 1,840,721 | | | $ | 1,604,906 | | | $ | 1,670,340 | | | $ | 3,656,726 | | | $ | 2,810,315 | |
| Average net assets (in thousands) | | $ | 1,848,292 | | | $ | 1,715,995 | | | $ | 1,673,715 | | | $ | 2,485,427 | | | $ | 3,143,836 | | | $ | 3,152,967 | |
| Ratios to average net assets:6,7 | | | | | | | | | | | | | | | | | | | | | | | | |
| Net investment income | | | 5.43 | % | | | 5.76 | % | | | 6.25 | % | | | 6.15 | % | | | 5.95 | % | | | 5.54 | % |
| Total expenses8 | | | 0.99 | % | | | 1.02 | % | | | 1.02 | % | | | 0.99 | % | | | 0.92 | % | | | 0.84 | % |
| Expenses after payments, waivers and/or reimbursements and reduction to custodian expenses | | | 0.96 | % | | | 0.96 | % | | | 0.96 | % | | | 0.95 | % | | | 0.89 | % | | | 0.82 | % |
| Portfolio turnover rate9 | | | 52 | % | | | 78 | % | | | 49 | % | | | 99 | % | | | 110 | % | | | 86 | % |
1. June 28, 2013 and December 30, 2011 represent the last business day of the Fund’s reporting periods. See Note 1 of the accompanying Notes.
2. Certain amounts have been restated to reflect a change in method of accounting. See Note 1 of the accompanying Notes.
3. Per share amounts calculated based on the average shares outstanding during the period.
4. Less than $0.005 per share.
5. Assumes an initial investment on the business day before the first day of the fiscal period, with all dividends and distributions reinvested in additional shares on the reinvestment date, and redemption at the net asset value calculated on the last business day of the fiscal period. Total returns are not annualized for periods less than one full year. Total return information does not reflect expenses that apply at the separate account level or to related insurance products. Inclusion of these charges would reduce the total return figures for all periods shown. Returns do not reflect the deduction of taxes that a shareholder would pay on fund distributions or the redemption of fund shares.
6. Annualized for periods less than one full year.
7. Includes the Fund’s share of the allocated expenses and/or net investment income from the master funds.
8. Total expenses including all affiliated fund expenses were as follows:
| | | | |
| Six Months Ended June 28, 2013 | | | 0.99 | % |
| Year Ended December 31, 2012 | | | 1.02 | % |
| Year Ended December 30, 2011 | | | 1.02 | % |
| Year Ended December 31, 2010 | | | 0.99 | % |
| Year Ended December 31, 2009 | | | 0.93 | % |
| Year Ended December 31, 2008 | | | 0.85 | % |
9. The portfolio turnover rate excludes purchase and sale transactions of To Be Announced (TBA) mortgage-related securities as follows:
| | | | | | | | |
| | | Purchase Transactions | | | Sale Transactions | |
| Six Months Ended June 28, 2013 | | $ | 3,507,512,135 | | | $ | 3,896,975,119 | |
| Year Ended December 31, 2012 | | $ | 3,862,820,437 | | | $ | 3,466,796,223 | |
| Year Ended December 30, 2011 | | $ | 1,050,654,783 | | | $ | 1,039,506,614 | |
| Year Ended December 31, 2010 | | $ | 1,034,550,699 | | | $ | 1,085,289,655 | |
| Year Ended December 31, 2009 | | $ | 1,909,574,925 | | | $ | 1,836,038,328 | |
| Year Ended December 31, 2008 | | $ | 634,319,548 | | | $ | 594,845,589 | |
See accompanying Notes to Consolidated Financial Statements.
| | | | |
| 60 | | | | OPPENHEIMER GLOBAL STRATEGIC INCOME FUND/VA |
NOTES TO CONSOLIDATED FINANCIAL STATEMENTS Unaudited
1. Significant Accounting Policies
Oppenheimer Global Strategic Income Fund/VA (the “Fund”) is a separate series of Oppenheimer Variable Account Funds, a diversified open-end management investment company registered under the Investment Company Act of 1940, as amended. The Fund’s investment objective is to seek total return. The Fund’s investment adviser is OFI Global Asset Management, Inc. (“OFI Global” or the “Manager”), a wholly-owned subsidiary of OppenheimerFunds, Inc. (“OFI” or the “Sub-Adviser”). The Manager has entered into a sub-advisory agreement with OFI.
The Fund offers two classes of shares. Both classes are sold at their offering price, which is the net asset value per share, to separate investment accounts of participating insurance companies as an underlying investment for variable life insurance policies, variable annuity contracts or other investment products. The class of shares designated as Service shares is subject to a distribution and service plan. Both classes of shares have identical rights and voting privileges with respect to the Fund in general and exclusive voting rights on matters that affect that class alone. Earnings, net assets and net asset value per share may differ due to each class having its own expenses, such as transfer and shareholder servicing agent fees and shareholder communications, directly attributable to that class.
The following is a summary of significant accounting policies consistently followed by the Fund.
Change in Method of Accounting. The accompanying financial statements reflect the financial position of the Fund and its Subsidiary and the results of operations on a consolidated basis. Prior to June 28, 2013, the Subsidiary was shown as an investment of the Fund on the Statement of Investments and the financial statements of the Subsidiary were presented along with the Fund. The staff of the Securities and Exchange Commission has recently commented on their preference to have wholly-owned Cayman investment funds consolidated into the parent fund’s financial statements. Management of the Fund implemented the change in policy because it is a more effective method of providing transparency into the Fund’s holdings and operations. Accordingly, as a result of the change in method of accounting, the Fund consolidates the assets and liabilities as well as the operations of the Subsidiary within its financial statements.
The result of the policy change did not have an impact on total net assets of the Fund, however it resulted in the following changes to the financial statements. As of the beginning of the Fund’s fiscal period, the financial statement line items on the Consolidated Statement of Assets and Liabilities were affected by the change as follows: cash increased $1,455,203; payables and other liabilities increased $20,236 and investments at value, wholly-owned subsidiary decreased $1,434,967. For the six months ended June 28, 2013, the financial statement line items on the Consolidated Statements of Operations and Changes in Net Assets were affected by the change as follows: net investment income includes a net investment loss from the Subsidiary of $22,208. For the year ended December 31, 2012, the following changes were made to the Consolidated Statement of Changes in Net Assets: net investment income decreased $47,552 and net change in unrealized appreciation increased by $47,552. The changes to the Consolidated Financial Highlights were immaterial.
Semiannual and Annual Periods. The Fund’s financial statements are presented through the last day the New York Stock Exchange was open for trading during each reporting period. The Fund’s financial statements have been presented through that date to maintain consistency with the Fund’s net asset value calculations used for shareholder transactions.
Structured Securities. The Fund invests in structured securities whose market values, interest rates and/or redemption prices are linked to the performance of underlying foreign currencies, interest rate spreads, stock market indices, prices of individual securities, commodities or other financial instruments or the occurrence of other specific events. The structured securities are often leveraged, increasing the volatility of each note’s market value relative to the change in the underlying linked financial element or event. Fluctuations in value of these securities are recorded as unrealized gains and losses in the accompanying Consolidated Statement of Operations. The Fund records a realized gain or loss when a structured security is sold or matures.
Securities on a When-Issued or Delayed Delivery Basis. The Fund may purchase securities on a “when-issued” basis, and may purchase or sell securities on a “delayed delivery” basis. “When-issued” or “delayed delivery” refers to securities
| | | | |
| 61 | | | | OPPENHEIMER GLOBAL STRATEGIC INCOME FUND/VA |
NOTES TO CONSOLIDATED FINANCIAL STATEMENTS Unaudited / Continued
1. Significant Accounting Policies Continued
whose terms and indenture are available and for which a market exists, but which are not available for immediate delivery. Delivery and payment for securities that have been purchased by the Fund on a when-issued basis normally takes place within six months and possibly as long as two years or more after the trade date. During this period, such securities do not earn interest, are subject to market fluctuation and may increase or decrease in value prior to their delivery. The purchase of securities on a when-issued basis may increase the volatility of the Fund’s net asset value to the extent the Fund executes such transactions while remaining substantially fully invested. When the Fund engages in when-issued or delayed delivery transactions, it relies on the buyer or seller, as the case may be, to complete the transaction. Their failure to do so may cause the Fund to lose the opportunity to obtain or dispose of the security at a price and yield it considers advantageous. The Fund may also sell securities that it purchased on a when-issued basis or forward commitment prior to settlement of the original purchase.
As of June 28, 2013, the Fund had purchased securities issued on a when-issued or delayed delivery basis and sold securities issued on a delayed delivery basis as follows:
| | | | |
| | | When-Issued or Delayed Delivery
Basis Transactions | |
| Purchased securities | | $ | 114,903,454 | |
| Sold securities | | | 24,335,298 | |
The Fund may enter into “forward roll” transactions with respect to mortgage-related securities. In this type of transaction, the Fund sells a mortgage-related security to a buyer and simultaneously agrees to repurchase a similar security (same type, coupon and maturity) at a later date at a set price. During the period between the sale and the repurchase, the Fund will not be entitled to receive interest and principal payments on the securities that have been sold. The Fund records the incremental difference between the forward purchase and sale of each forward roll as realized gain (loss) on investments or as fee income in the case of such transactions that have an associated fee in lieu of a difference in the forward purchase and sale price.
Forward roll transactions may be deemed to entail embedded leverage since the Fund purchases mortgage-related securities with extended settlement dates rather than paying for the securities under a normal settlement cycle. This embedded leverage increases the Fund’s market value of investments relative to its net assets which can incrementally increase the volatility of the Fund’s performance. Forward roll transactions can be replicated over multiple settlement periods.
Risks of entering into forward roll transactions include the potential inability of the counterparty to meet the terms of the agreement; the potential of the Fund to receive inferior securities at redelivery as compared to the securities sold to the counterparty; and counterparty credit risk.
Credit Risk. The Fund invests in high-yield, non-investment-grade bonds, which may be subject to a greater degree of credit risk. Credit risk relates to the ability of the issuer to meet interest or principal payments or both as they become due. The Fund may acquire securities that have missed an interest payment, and is not obligated to dispose of securities whose issuers or underlying obligors subsequently miss an interest payment. Information concerning securities not accruing interest as of June 28, 2013 is as follows:
| | | | |
| Cost | | $ | 24,398,289 | |
| Market Value | | $ | 7,694,371 | |
| Market Value as a % of Net Assets | | | 0.31 | % |
Investment in Oppenheimer Global Strategic Income Fund (Cayman) Ltd. The Fund may invest up to 25% of its total assets in Oppenheimer Global Strategic Income Fund (Cayman) Ltd., a wholly-owned and controlled Cayman Islands subsidiary (the “Subsidiary”). The Subsidiary invests primarily in commodity-linked derivatives (including commodity related futures, options and swap contracts), exchange traded funds and certain fixed-income securities and other investments that may serve as margin or collateral for its derivatives positions. Investments in the Subsidiary are
| | | | |
| 62 | | | | OPPENHEIMER GLOBAL STRATEGIC INCOME FUND/VA |
expected to provide the Fund with exposure to commodities markets within the limitations of the federal tax requirements that apply to the Fund. The Subsidiary is subject to the same investment restrictions and guidelines, and follows the same compliance policies and procedures, as the Fund. The Fund wholly owns and controls the Subsidiary, and the Fund and Subsidiary are both managed by the Manager. The financial statements have been consolidated and include accounts of the Fund and the Subsidiary. Accordingly, all inter-company transactions and balances have been eliminated.
For tax purposes, the Subsidiary is an exempted Cayman investment company. The Subsidiary has received an undertaking from the Government of the Cayman Islands exempting it from all local income, profits and capital gains taxes through September of 2030. No such taxes are levied in the Cayman Islands at the present time. For U.S. income tax purposes, the Subsidiary is a Controlled Foreign Corporation and as such is not subject to U.S. income tax. However, as a wholly-owned Controlled Foreign Corporation, the Subsidiary’s net income and capital gain, to the extent of its earnings and profits, will be included each year in the Fund’s investment company taxable income. For the six months ended June 28, 2013, the Subsidiary has a deficit of $22,208 in its taxable earnings and profits. In addition, any in-kind capital contributions made by the Fund to the Subsidiary will result in the Fund recognizing taxable gain to the extent of unrealized gain, if any, on securities transferred to the Subsidiary while any unrealized losses on securities so transferred will not be recognized at the time of transfer.
The financial statements have been consolidated and include accounts of the Fund and the Subsidiary. Accordingly, all inter-company transactions and balances have been eliminated. At June 28, 2013, the Fund owned 15,000 shares with a market value of $1,412,759.
Investment in Oppenheimer Institutional Money Market Fund. The Fund is permitted to invest daily available cash balances in an affiliated money market fund. The Fund may invest the available cash in Class E shares of Oppenheimer Institutional Money Market Fund (“IMMF”) to seek current income while preserving liquidity. IMMF is a registered open-end management investment company, regulated as a money market fund under the Investment Company Act of 1940, as amended. The Manager is the investment adviser of IMMF, and the Sub-Adviser provides investment and related advisory services to IMMF. When applicable, the Fund’s investment in IMMF is included in the Consolidated Statement of Investments. Shares of IMMF are valued at their net asset value per share. As a shareholder, the Fund is subject to its proportional share of IMMF’s Class E expenses, including its management fee. The Manager will waive fees and/or reimburse Fund expenses in an amount equal to the indirect management fees incurred through the Fund’s investment in IMMF.
Investment in Oppenheimer Master Funds. The Fund is permitted to invest in entities sponsored and/or advised by the Manager or an affiliate. Certain of these entities in which the Fund invests are mutual funds registered under the Investment Company Act of 1940 that expect to be treated as partnerships for tax purposes, specifically Oppenheimer Master Loan Fund, LLC and Oppenheimer Master Event-Linked Bond Fund, LLC (the “Master Funds”). Each Master Fund has its own investment risks, and those risks can affect the value of the Fund’s investments and therefore the value of the Fund’s shares. To the extent that the Fund invests more of its assets in one Master Fund than in another, the Fund will have greater exposure to the risks of that Master Fund.
The investment objective of Oppenheimer Master Loan Fund, LLC is to seek as high a level of current income and preservation of capital as is consistent with investing primarily in loans and other debt securities. The investment objective of Oppenheimer Master Event-Linked Bond Fund, LLC is to seek a high level of current income principally derived from interest on debt securities. The Fund’s investments in the Master Funds are included in the Consolidated Statement of Investments. The Fund recognizes income and gain/(loss) on its investments in each Master Fund according to its allocated pro-rata share, based on its relative proportion of total outstanding Master Fund shares held, of the total net income earned and the net gain/(loss) realized on investments sold by the Master Funds. As a shareholder, the Fund is subject to its proportional share of the Master Funds’ expenses, including their management fee.
| | | | |
| 63 | | | | OPPENHEIMER GLOBAL STRATEGIC INCOME FUND/VA |
NOTES TO CONSOLIDATED FINANCIAL STATEMENTS Unaudited / Continued
1. Significant Accounting Policies Continued
The Manager will waive fees and/or reimburse Fund expenses in an amount equal to the indirect management fees incurred through the Fund’s investment in the Master Funds.
Foreign Currency Translation. The Fund’s accounting records are maintained in U.S. dollars. The values of securities denominated in foreign currencies and amounts related to the purchase and sale of foreign securities and foreign investment income are translated into U.S. dollars as of the close of the New York Stock Exchange (the “Exchange”), normally 4:00 P.M. Eastern time, on each day the Exchange is open for trading. Foreign exchange rates may be valued primarily using a reliable bank, dealer or service authorized by the Board of Trustees.
Reported net realized gains and losses from foreign currency transactions arise from sales of portfolio securities, sales and maturities of short-term securities, sales of foreign currencies, exchange rate fluctuations between the trade and settlement dates on securities transactions, and the difference between the amounts of dividends, interest, and foreign withholding taxes recorded on the Fund’s books and the U.S. dollar equivalent of the amounts actually received or paid. Net unrealized appreciation and depreciation on the translation of assets and liabilities denominated in foreign currencies arise from changes in the values of assets and liabilities, including investments in securities at fiscal period end, resulting from changes in exchange rates.
The effect of changes in foreign currency exchange rates on investments is separately identified from the fluctuations arising from changes in market values of securities held and reported with all other foreign currency gains and losses in the Fund’s Consolidated Statement of Operations.
Allocation of Income, Expenses, Gains and Losses. Income, expenses (other than those attributable to a specific class), gains and losses are allocated on a daily basis to each class of shares based upon the relative proportion of net assets represented by such class. Operating expenses directly attributable to a specific class are charged against the operations of that class.
Federal Taxes. The Fund intends to comply with provisions of the Internal Revenue Code applicable to regulated investment companies and to distribute substantially all of its investment company taxable income, including any net realized gain on investments not offset by capital loss carryforwards, if any, to shareholders. Therefore, no federal income or excise tax provision is required. The Fund files income tax returns in U.S. federal and applicable state jurisdictions. The statute of limitations on the Fund’s tax return filings generally remain open for the three preceding fiscal reporting period ends.
During the fiscal year ended December 31, 2012, the Fund did not utilize any capital loss carryforward to offset capital gains realized in that fiscal year. Details of the fiscal year ended December 31, 2012 capital loss carryforwards are included in the table below. Capital loss carryforwards with no expiration, if any, must be utilized prior to those with expiration dates. Capital losses with no expiration will be carried forward to future years if not offset by gains.
| | | | |
| Expiring | | | |
| 2015 | | $ | 5,751,368 | |
| 2016 | | | 3,339,490 | |
| No expiration | | | 21,172,357 | |
| | |
|
|
|
| Total | | $ | 30,263,215 | |
| | |
|
|
|
Of these losses, $13,943,514 are subject to Sec. 382 loss limitation rules resulting from merger activity. These limitations generally reduce the utilization of these losses to a maximum of $3,339,490 per year.
As of June 28, 2013, it is estimated that the capital loss carryforwards would be $9,090,858 expiring by 2016 and $18,155,056 which will not expire. The estimated capital loss carryforward represents the carryforward as of the end of the last fiscal year, increased or decreased by capital losses or gains realized in the first six months of the current fiscal
| | | | |
| 64 | | | | OPPENHEIMER GLOBAL STRATEGIC INCOME FUND/VA |
year. During the six months ended June 28, 2013, it is estimated that the Fund will utilize $3,017,301 of capital loss carryforward to offset realized capital gains.
Net investment income (loss) and net realized gain (loss) may differ for financial statement and tax purposes. The character of dividends and distributions made during the fiscal year from net investment income or net realized gains may differ from their ultimate characterization for federal income tax purposes. Also, due to timing of dividends and distributions, the fiscal year in which amounts are distributed may differ from the fiscal year in which the income or net realized gain was recorded by the Fund.
The aggregate cost of securities and other investments and the composition of unrealized appreciation and depreciation of securities and other investments for federal income tax purposes as of June 28, 2013 are noted in the following table. The primary difference between book and tax appreciation or depreciation of securities and other investments, if applicable, is attributable to the tax deferral of losses or tax realization of financial statement unrealized gain or loss.
| | | | |
| Federal tax cost of securities | | $ | 2,612,529,821 | |
| Federal tax cost of other investments | | | 135,515,810 | |
| | |
|
|
|
| Total federal tax cost | | $ | 2,748,045,631 | |
| | |
|
|
|
| |
| Gross unrealized appreciation | | $ | 53,967,954 | |
| Gross unrealized depreciation | | | (148,641,112) | |
| | |
|
|
|
| Net unrealized depreciation | | $ | (94,673,158) | |
| | |
|
|
|
Certain foreign countries impose a tax on capital gains which is accrued by the Fund based on unrealized appreciation, if any, on affected securities. The tax is paid when the gain is realized.
Trustees’ Compensation. The Board of Trustees has adopted a compensation deferral plan for independent trustees that enables trustees to elect to defer receipt of all or a portion of the annual compensation they are entitled to receive from the Fund. For purposes of determining the amount owed to the Trustee under the plan, deferred amounts are treated as though equal dollar amounts had been invested in shares of the Fund or in other Oppenheimer funds selected by the Trustee. The Fund purchases shares of the funds selected for deferral by the Trustee in amounts equal to his or her deemed investment, resulting in a Fund asset equal to the deferred compensation liability. Such assets are included as a component of “Other” within the asset section of the Consolidated Statement of Assets and Liabilities. Deferral of trustees’ fees under the plan will not affect the net assets of the Fund, and will not materially affect the Fund’s assets, liabilities or net investment income per share. Amounts will be deferred until distributed in accordance with the compensation deferral plan.
Dividends and Distributions to Shareholders. Dividends and distributions to shareholders, which are determined in accordance with income tax regulations and may differ from U.S. generally accepted accounting principles, are recorded on the ex-dividend date. Income and capital gain distributions, if any, are declared and paid annually or at other times as deemed necessary by the Manager. The tax character of distributions is determined as of the Fund’s fiscal year end. Therefore, a portion of the Fund’s distributions made to shareholders prior to the Fund’s fiscal year end may ultimately be categorized as a tax return of capital.
Investment Income. Dividend income is recorded on the ex-dividend date or upon ex-dividend notification in the case of certain foreign dividends where the ex-dividend date may have passed. Non-cash dividends included in dividend income, if any, are recorded at the fair market value of the securities received. Interest income is recognized on an accrual basis. Discount and premium, which are included in interest income on the Consolidated Statement of Operations, are amortized or accreted daily.
| | | | |
| 65 | | | | OPPENHEIMER GLOBAL STRATEGIC INCOME FUND/VA |
NOTES TO CONSOLIDATED FINANCIAL STATEMENTS Unaudited / Continued
1. Significant Accounting Policies Continued
Custodian Fees. “Custodian fees and expenses” in the Consolidated Statement of Operations may include interest expense incurred by the Fund on any cash overdrafts of its custodian account during the period. Such cash overdrafts may result from the effects of failed trades in portfolio securities and from cash outflows resulting from unanticipated shareholder redemption activity. The Fund pays interest to its custodian on such cash overdrafts, to the extent they are not offset by positive cash balances maintained by the Fund, at a rate equal to the Federal Funds Rate plus 0.50%. The “Reduction to custodian expenses” line item, if applicable, represents earnings on cash balances maintained by the Fund during the period. Such interest expense and other custodian fees may be paid with these earnings.
Security Transactions. Security transactions are recorded on the trade date. Realized gains and losses on securities sold (except for the investments in the Subsidiary) are determined on the basis of identified cost.
Indemnifications. The Fund’s organizational documents provide current and former trustees and officers with a limited indemnification against liabilities arising in connection with the performance of their duties to the Fund. In the normal course of business, the Fund may also enter into contracts that provide general indemnifications. The Fund’s maximum exposure under these arrangements is unknown as this would be dependent on future claims that may be made against the Fund. The risk of material loss from such claims is considered remote.
Other. The preparation of financial statements in conformity with accounting principles generally accepted in the United States of America requires management to make estimates and assumptions that affect the reported amounts of assets and liabilities and disclosure of contingent assets and liabilities at the date of the financial statements and the reported amounts of increases and decreases in net assets from operations during the reporting period. Actual results could differ from those estimates.
2. Securities Valuation
The Fund calculates the net asset value of its shares as of the close of the New York Stock Exchange (the “Exchange”), normally 4:00 P.M. Eastern time, on each day the Exchange is open for trading.
The Fund’s Board has adopted procedures for the valuation of the Fund’s securities and has delegated the day-to-day responsibility for valuation determinations under those procedures to the Manager. The Manager has established a Valuation Committee which is responsible for determining a “fair valuation” for any security for which market quotations are not “readily available.” The Valuation Committee’s fair valuation determinations are subject to review, approval and ratification by the Fund’s Board at its next regularly scheduled meeting covering the calendar quarter in which the fair valuation was determined.
Valuation Methods and Inputs
Securities are valued using unadjusted quoted market prices, when available, as supplied primarily by third party pricing services or dealers.
The following methodologies are used to determine the market value or the fair value of the types of securities described below:
Securities traded on a registered U.S. securities exchange (including exchange-traded derivatives other than futures and futures options) are valued based on the last sale price of the security reported on the principal exchange on which it is traded, prior to the time when the Fund’s assets are valued. In the absence of a sale, the security is valued at the last sale price on the prior trading day, if it is within the spread of the current day’s closing “bid” and “asked” prices, and if not, at the current day’s closing bid price. A security of a foreign issuer traded on a foreign exchange but not listed on a registered U.S. securities exchange is valued based on the last sale price on the principal exchange on which the security is traded, as identified by the third party pricing service used by the Manager, prior to the time when the Fund’s assets are valued. If the last sale price is unavailable, the security is valued at the most recent official closing price on the
| | | | |
| 66 | | | | OPPENHEIMER GLOBAL STRATEGIC INCOME FUND/VA |
principal exchange on which it is traded. If the last sales price or official closing price for a foreign security is not available, the security is valued at the mean between the bid and asked price per the exchange or, if not available from the exchange, obtained from two dealers. If bid and asked prices are not available from either the exchange or two dealers, the security is valued by using one of the following methodologies (listed in order of priority); (1) using a bid from the exchange, (2) the mean between the bid and asked price as provided by a single dealer, or (3) a bid from a single dealer.
Shares of a registered investment company that are not traded on an exchange are valued at that investment company’s net asset value per share.
Corporate and government debt securities (of U.S. or foreign issuers) and municipal debt securities, event-linked bonds, loans, mortgage-backed securities, collateralized mortgage obligations, and asset-backed securities are valued at the mean between the “bid” and “asked” prices utilizing evaluated prices obtained from third party pricing services or broker-dealers who may use matrix pricing methods to determine the evaluated prices.
Short-term money market type debt securities with a remaining maturity of sixty days or less are valued at cost adjusted by the amortization of discount or premium to maturity (amortized cost), which approximates market value. Short-term debt securities with a remaining maturity in excess of sixty days are valued at the mean between the “bid” and “asked” prices utilizing evaluated prices obtained from third party pricing services or broker-dealers.
Structured securities, swaps, swaptions, and other over-the-counter derivatives are valued utilizing evaluated prices obtained from third party pricing services or broker-dealers.
Forward foreign currency exchange contracts are valued utilizing current and forward currency rates obtained from third party pricing services. When the settlement date of a contract is an interim date for which a quotation is not available, interpolated values are derived using the nearest dated forward currency rate.
Futures contracts and futures options traded on a commodities or futures exchange will be valued at the final settlement price or official closing price on the principal exchange as reported by such principal exchange at its trading session ending at, or most recently prior to, the time when the Fund’s assets are valued.
A description of the standard inputs that may generally be considered by the third party pricing vendors in determining their evaluated prices is provided below.
| | |
| Security Type | | Standard inputs generally considered by third-party pricing vendors |
| Corporate debt, government debt, municipal, mortgage-backed and asset-backed securities | | Reported trade data, broker-dealer price quotations, benchmark yields, issuer spreads on comparable securities, the credit quality, yield, maturity, and other appropriate factors. |
| Loans | | Information obtained from market participants regarding reported trade data and broker-dealer price quotations. |
| Event-linked bonds | | Information obtained from market participants regarding reported trade data and broker-dealer price quotations. |
| Structured securities | | Relevant market information such as the price of underlying financial instruments, stock market indices, foreign currencies, interest rate spreads, commodities, or the occurrence of other specific events. |
| Swaps | | Relevant market information, including underlying reference assets such as credit spreads, credit event probabilities, index values, individual security values, forward interest rates, variable interest rates, volatility measures, and forward currency rates. |
If a market value or price cannot be determined for a security using the methodologies described above, or if, in the “good faith” opinion of the Manager, the market value or price obtained does not constitute a “readily available market quotation,” or a significant event has occurred that would materially affect the value of the security the security is fair valued either (i) by a standardized fair valuation methodology applicable to the security type or the significant event as previously approved by the Valuation Committee and the Fund’s Board or (ii) as determined in good faith by the Manager’s Valuation Committee. The Valuation Committee considers all relevant facts that are reasonably available, through either public information or information available to the Manager, when determining the fair value of a security.
| | | | |
| 67 | | | | OPPENHEIMER GLOBAL STRATEGIC INCOME FUND/VA |
NOTES TO CONSOLIDATED FINANCIAL STATEMENTS Unaudited / Continued
2. Securities Valuation Continued
Fair value determinations by the Manager are subject to review, approval and ratification by the Fund’s Board at its next regularly scheduled meeting covering the calendar quarter in which the fair valuation was determined. Those fair valuation standardized methodologies include, but are not limited to, valuing securities at the last sale price or initially at cost and subsequently adjusting the value based on: changes in company specific fundamentals, changes in an appropriate securities index, or changes in the value of similar securities which may be further adjusted for any discounts related to security-specific resale restrictions. When possible, such methodologies use observable market inputs such as unadjusted quoted prices of similar securities, observable interest rates, currency rates and yield curves. The methodologies used for valuing securities are not necessarily an indication of the risks associated with investing in those securities nor can it be assured that the Fund can obtain the fair value assigned to a security if it were to sell the security.
To assess the continuing appropriateness of security valuations, the Manager, or its third party service provider who is subject to oversight by the Manager, regularly compares prior day prices, prices on comparable securities, and sale prices to the current day prices and challenges those prices exceeding certain tolerance levels with the third party pricing service or broker source. For those securities valued by fair valuations, whether through a standardized fair valuation methodology or a fair valuation determination, the Valuation Committee reviews and affirms the reasonableness of the valuations based on such methodologies and fair valuation determinations on a regular basis after considering all relevant information that is reasonably available.
Classifications
Each investment asset or liability of the Fund is assigned a level at measurement date based on the significance and source of the inputs to its valuation. Various data inputs are used in determining the value of each of the Fund’s investments as of the reporting period end. These data inputs are categorized in the following hierarchy under applicable financial accounting standards:
| | 1) | Level 1—unadjusted quoted prices in active markets for identical assets or liabilities (including securities actively traded on a securities exchange) |
| | 2) | Level 2—inputs other than unadjusted quoted prices that are observable for the asset or liability (such as unadjusted quoted prices for similar assets and market corroborated inputs such as interest rates, prepayment speeds, credit risks, etc.) |
| | 3) | Level 3—significant unobservable inputs (including the Manager’s own judgments about assumptions that market participants would use in pricing the asset or liability). |
The inputs used for valuing securities are not necessarily an indication of the risks associated with investing in those securities.
The table below categorizes amounts that are included in the Fund’s Consolidated Statement of Assets and Liabilities as of June 28, 2013 based on valuation input level:
| | | | | | | | | | | | | | | | |
| | | Level 1—
Unadjusted
Quoted
Prices | | | Level 2—
Other Significant
Observable Inputs | | | Level 3—
Significant
Unobservable
Inputs | | | Value | |
| Assets Table | | | | | | | | | | | | | | | | |
| Investments, at Value: | | | | | | | | | | | | | | | | |
| Asset-Backed Securities | | $ | — | | | $ | 72,223,259 | | | $ | 16,498,735 | | | $ | 88,721,994 | |
| Corporate Loans | | | — | | | | 41,731,422 | | | | 4,212,575 | | | | 45,943,997 | |
| Mortgage-Backed Obligations | | | — | | | | 518,933,503 | | | | 478,002 | | | | 519,411,505 | |
| U.S. Government Obligations | | | — | | | | 188,032,249 | | | | — | | | | 188,032,249 | |
| Foreign Government Obligations | | | — | | | | 572,923,579 | | | | — | | | | 572,923,579 | |
| Corporate Bonds and Notes | | | — | | | | 871,823,238 | | | | — | | | | 871,823,238 | |
| Preferred Stocks | | | — | | | | 3,124,396 | | | | — | | | | 3,124,396 | |
| | | | |
| 68 | | | | OPPENHEIMER GLOBAL STRATEGIC INCOME FUND/VA |
| | | | | | | | | | | | | | | | |
| | | Level 1—
Unadjusted
Quoted
Prices | | | Level 2—
Other Significant
Observable Inputs | | | Level 3—
Significant
Unobservable
Inputs | | | Value | |
| Assets Table: continued | | | | | | | | | | | | | | | | |
| Common Stocks | | $ | 1,932,097 | | | $ | — | | | $ | 2,542,950 | | | $ | 4,475,047 | |
| Rights, Warrants and Certificates | | | — | | | | — | | | | — | | | | — | |
| Structured Securities | | | — | | | | 13,688,199 | | | | 12,364,544 | | | | 26,052,743 | |
| Exchange-Traded Options Purchased | | | 207,656 | | | | — | | | | — | | | | 207,656 | |
| Over-the-Counter Options Purchased | | | — | | | | 2,866,243 | | | | — | | | | 2,866,243 | |
| Over-the-Counter Credit Default Swaptions Purchased | | | — | | | | 84,325 | | | | — | | | | 84,325 | |
| Over-the-Counter Interest Rate Swaptions Purchased | | | — | | | | 6,597,397 | | | | — | | | | 6,597,397 | |
| Investment Companies | | | 48,251,706 | | | | 148,496,253 | | | | — | | | | 196,747,959 | |
| | |
|
|
| |
|
|
| |
|
|
| |
|
|
|
| Total Investments, at Value | | | 50,391,459 | | | | 2,440,524,063 | | | | 36,096,806 | | | | 2,527,012,328 | |
| Other Financial Instruments: | | | | | | | | | | | | | | | | |
| Swaps, at value | | | — | | | | 846,132 | | | | — | | | | 846,132 | |
| Variation margin receivable | | | 435,506 | | | | — | | | | — | | | | 435,506 | |
| Foreign currency exchange contracts | | | — | | | | 12,654,568 | | | | — | | | | 12,654,568 | |
| | |
|
|
| |
|
|
| |
|
|
| |
|
|
|
| Total Assets | | $ | 50,826,965 | | | $ | 2,454,024,763 | | | $ | 36,096,806 | | | $ | 2,540,948,534 | |
| | |
|
|
| |
|
|
| |
|
|
| |
|
|
|
| Liabilities Table | | | | | | | | | | | | | | | | |
| Other Financial Instruments: | | | | | | | | | | | | | | | | |
| Swaps, at value | | $ | — | | | $ | (803,084 | ) | | $ | — | | | $ | (803,084 | ) |
| Options written, at value | | | — | | | | (2,858,769 | ) | | | — | | | | (2,858,769 | ) |
| Variation margin payable | | | (108,220 | ) | | | — | | | | — | | | | (108,220 | ) |
| Foreign currency exchange contracts | | | — | | | | (3,881,650 | ) | | | — | | | | (3,881,650 | ) |
| Swaptions written, at value | | | — | | | | (8,571,831 | ) | | | — | | | | (8,571,831 | ) |
| | |
|
|
| |
|
|
| |
|
|
| |
|
|
|
| Total Liabilities | | $ | (108,220 | ) | | $ | (16,115,334 | ) | | $ | — | | | $ | (16,223,554 | ) |
| | |
|
|
| |
|
|
| |
|
|
| |
|
|
|
Currency contracts and forwards, if any, are reported at their unrealized appreciation/depreciation at measurement date, which represents the change in the contract’s value from trade date. Futures, if any, are reported at their variation margin at measurement date, which represents the amount due to/from the Fund at that date. All additional assets and liabilities included in the above table are reported at their market value at measurement date.
The table below shows the transfers between Level 1 and Level 2. The Fund’s policy is to recognize transfers in and transfers out as of the beginning of the reporting period.
| | | | | | | | | | | | | | | | | | | | |
| | | Transfers into
Level 1 | | | Transfers into
Level 2 | | | Transfers out of
Level 2 | | | Transfers into
Level 3 | | | Transfers out of
Level 3 | |
| Assets Table | | | | | | | | | | | | | | | | | | | | |
| Investments, at Value: | | | | | | | | | | | | | | | | | | | | |
| Common Stocks | | $ | 143,954 | a | | $ | — | | | $ | — | | | $ | — | | | $ | (143,954 | )a |
| Corporate Bonds and Notes | | | — | | | | 540,000 | b | | | — | | | | — | | | | (540,000 | )b |
| Structured Securities | | | — | | | | 11,214,573 | b | | | (10,550,289 | )c | | | 10,550,289 | c | | | (11,214,573 | )b |
| | |
|
|
| |
|
|
| |
|
|
| |
|
|
| |
|
|
|
| Total Assets | | $ | 143,954 | | | $ | 11,754,573 | | | $ | (10,550,289 | ) | | $ | 10,550,289 | | | $ | (11,898,527 | )�� |
| | |
|
|
| |
|
|
| |
|
|
| |
|
|
| |
|
|
|
a. Transferred from Level 3 to Level 1 due to the presence of a readily available unadjusted quoted market price.
b. Transferred from Level 3 to Level 2 due to the availability of market data for this security.
c. Transferred from Level 2 to Level 3 because of the lack of observable market data.
| | | | |
| 69 | | | | OPPENHEIMER GLOBAL STRATEGIC INCOME FUND/VA |
NOTES TO CONSOLIDATED FINANCIAL STATEMENTS Unaudited / Continued
2. Securities Valuation Continued
The following is a reconciliation of assets in which significant unobservable inputs (level 3) were used in determining fair value:
| | | | | | | | | | | | | | | | |
| | | Value as of
December 31, 2012 | | | Realized gain (loss) | | | Change in
unrealized
appreciation/
depreciation | | | Accretion/
(amortization) of
premium/discounta | |
| Assets Table | | | | | | | | | | | | | | | | |
| Investments, at Value: | | | | | | | | | | | | | | | | |
| Asset-Backed Securities | | $ | 13,833,500 | | | $ | — | | | $ | 2,637,390 | | | $ | 27,845 | |
| Corporate Loans | | | 4,212,575 | | | | — | | | | — | | | | — | |
| Mortgage-Backed Obligations | | | 4,785,844 | | | | 111,377 | | | | (236,633 | ) | | | 8,834 | |
| Corporate Bonds and Notes | | | 1,357,068 | | | | 71,658 | | | | (53,019 | ) | | | (6,131 | ) |
| Preferred Stocks | | | 2,778,825 | | | | (316,640 | ) | | | 926,275 | | | | — | |
| Common Stocks | | | 2,939,696 | | | | (2,582,067 | ) | | | 2,724,706 | | | | — | |
| Rights, Warrants, and Certificates | | | 816 | | | | — | | | | (816 | ) | | | — | |
| Structured Securities | | | 19,537,403 | | | | 1,875 | | | | (799,380 | ) | | | 540,805 | |
| | |
|
|
| |
|
|
| |
|
|
| |
|
|
|
| Total Assets | | $ | 49,445,727 | | | $ | (2,713,797 | ) | | $ | 5,198,523 | | | $ | 571,353 | |
| | |
|
|
| |
|
|
| |
|
|
| |
|
|
|
a. Included in net investment income.
| | | | | | | | | | | | | | | | | | | | |
| | | Purchases | | | Sales | | | Transfers into
Level 3 | | | Transfers out of
Level 3 | | | Value as of June 28,
2013 | |
| Assets Table | | | | | | | | | | | | | | | | | | | | |
| Investments, at Value: | | | | | | | | | | | | | | | | | | | | |
| Asset-Backed Securities | | $ | — | | | $ | — | | | $ | — | | | $ | — | | | $ | 16,498,735 | |
| Corporate Loans | | | — | | | | — | | | | — | | | | — | | | | 4,212,575 | |
| Mortgage-Backed Obligations | | | — | | | | (4,191,420 | ) | | | — | | | | — | | | | 478,002 | |
| Corporate Bonds and Notes | | | — | | | | (829,576 | ) | | | — | | | | (540,000 | ) | | | — | |
| Preferred Stocks | | | — | | | | (3,388,460 | ) | | | — | | | | — | | | | — | |
| Common Stocks | | | 15 | | | | (395,446 | ) | | | — | | | | (143,954 | ) | | | 2,542,950 | |
| Rights, Warrants, and Certificates | | | — | | | | — | | | | — | | | | — | | | | — | |
| Structured Securities | | | — | | | | (6,251,875 | ) | | | 10,550,289 | | | | (11,214,573 | ) | | | 12,364,544 | |
| | |
|
|
| |
|
|
| |
|
|
| |
|
|
| |
|
|
|
| Total Assets | | $ | 15 | | | $ | (15,056,777 | ) | | $ | 10,550,289 | | | $ | (11,898,527 | ) | | $ | 36,096,806 | |
| | |
|
|
| |
|
|
| |
|
|
| |
|
|
| |
|
|
|
The total change in unrealized appreciation/depreciation included in the Consolidated Statement of Operations attributable to level 3 investments still held at June 28, 2013 includes:
| | | | |
| | | Change in unrealized
appreciation/depreciation | |
| Asset-Backed Securities | | $ | 2,637,390 | |
| Mortgaged-Backed Obligations | | | 7,804 | |
| Common Stocks | | | 15,281 | |
| Rights, Warrants and Certificates | | | (816 | ) |
| Structured Securities | | | (993,684 | ) |
| | |
|
|
|
| Total | | $ | 1,665,975 | |
| | |
|
|
|
| | | | |
| 70 | | | | OPPENHEIMER GLOBAL STRATEGIC INCOME FUND/VA |
The following table summarizes the valuation techniques and significant unobservable inputs used in determining fair value measurements for those investments classified as Level 3 as of June 28, 2013:
| | | | | | | | | | | | | | | | | | |
| | | Value as of
June 28, 2013 | | | Valuation Technique | | | Unobservable Input | | | Range of
Unobservable Inputs | | Unobservable
Input Used | |
| Assets Table | | | | | | | | | | | | | | | | | | |
| Investments, at Value: | | | | | | | | | | | | | | | | | | |
| Asset-Backed Securities | | | $16,498,735 | | | | Broker quotes | | | | Broker Bid | | | N/A | | | N/A | a |
| Corporate Loans | | | 4,212,575 | | |
| Discount
to appraised value |
| | | Discount rate Appraisal of Collateral | | | N/A $30—35 million | |
| 35%b
$32.5 million |
|
| Mortgage-Backed Obligations | | | 4,505 | | | | Broker quotes | | | | Broker Bid and Ask | | | N/A | | | N/A | c |
| Mortgage-Backed Obligations | | | 473,497 | | |
| Broker quotes through
Pricing Service |
| | | Broker Bid and Ask | | | N/A | | | N/A | c |
| Common Stock | | | 2,527,654 | | | | Broker quotes | | | | Proprietary model | | | N/A | | | N/A | c |
| | | | | | | | Discounted cash flow | | | | Future distributions | | | August 2013 distribution ($0—1.91 / share) | |
| $0.955 / shared
|
|
| | | | | |
| Common Stock | | | 15,296 | | | | | | | | Probability of payment | | | August 2013 distribution ($0—12.10 / share) | | | $9.075 / share | |
| Structured Securities | | | 12,087,485 | | | | Broker quotes | | | | Proprietary model | | | N/A | | | N/A | c |
| Structured Securities | | | 277,059 | | |
| Estimated recovery
proceeds |
| |
| Court awarded
settlement terms |
| | N/A | | | N/A | e |
| | |
|
|
| | | | | | | | | | | | | | |
| Total | | | $36,096,806 | | | | | | | | | | | | | | | |
| | |
|
|
| | | | | | | | | | | | | | |
a. The Fund fair values certain asset-backed securities using broker-dealer price quotations provided on a monthly basis. The Manager periodically reviews broker methodologies and inputs to confirm they are determined using unobservable inputs and have been appropriately classified. Such securities’ fair valuations could change significantly based on changes in unobservable inputs used by the broker.
b. The Fund fair values its proportionate ownership of certain loans at a discount to an appraised value of underlying collateral to reflect the age of the appraisal, uncertainty of the sales price as compared to the appraised value, and illiquidity. A significant decrease (increase) to the discount rate, or a significant increase (decrease) to the underlying collateral’s appraised value, will result in a significant increase (decrease) to the fair value of the investment.
c. Securities classified as Level 3 whose unadjusted values were provided by a pricing service or broker-dealer for which such inputs are unobservable. The Manager periodically reviews pricing vendor and broker methodologies and inputs to confirm they are determined using unobservable inputs and have been appropriately classified. Such securities’ fair valuations could change significantly based on changes in unobservable inputs used by the pricing service or broker.
d. The Fund fair values certain cash distributions to be received as a result of a merger on common stock held using discounts to reflect the uncertainty of the future anticipated distributions. The Manager monitors such investments for additional market information or the occurence of a significant event which would warrant a re-evaluation of the security’s fair valuation.
e. The Fund fair values certain structured securities using projected settlement proceeds of principal and penalty interest estimated using the information provided within the court order. A significant increase (decrease) to the estimated settlement proceeds will result in a significant increase (decrease) to the value of the investment.
3. Shares of Beneficial Interest
The Fund has authorized an unlimited number of $0.001 par value shares of beneficial interest of each class. Transactions in shares of beneficial interest were as follows:
| | | | | | | | | | | | | | | | |
| | | Six Months Ended June 28, 2013 | | | Year Ended December 31, 2012 | |
| | | Shares | | | Amount | | | Shares | | | Amount | |
| Non-Service Shares | | | | | | | | | | | | | | | | |
| Sold | | | 8,049,402 | | | $ | 46,244,670 | | | | 11,893,556 | | | $ | 65,980,860 | |
| Dividends and/or distributions reinvested | | | 6,754,608 | | | | 36,272,242 | | | | 9,254,780 | | | | 48,680,145 | |
| Acquisition—Note 9 | | | — | | | | — | | | | 9,127,251 | | | | 50,838,789 | |
| Redeemed | | | (10,824,832 | ) | | | (61,848,377 | ) | | | (19,793,962 | ) | | | (109,300,842 | ) |
| | |
|
|
| |
|
|
| |
|
|
| |
|
|
|
| Net increase | | | 3,979,178 | | | $ | 20,668,535 | | | | 10,481,625 | | | $ | 56,198,952 | |
| | |
|
|
| |
|
|
| |
|
|
| |
|
|
|
| | | | |
| 71 | | | | OPPENHEIMER GLOBAL STRATEGIC INCOME FUND/VA |
NOTES TO CONSOLIDATED FINANCIAL STATEMENTS Unaudited / Continued
3. Shares of Beneficial Interest Continued
| | | | | | | | | | | | | | | | |
| | | Six Months Ended June 28, 2013 | | | Year Ended December 31, 2012 | |
| | | Shares | | | Amount | | | Shares | | | Amount | |
| Service Shares | | | | | | | | | | | | | | | | |
| Sold | | | 13,878,771 | | | $ | 81,172,979 | | | | 29,727,051 | | | $ | 168,387,762 | |
| Dividends and/or distributions reinvested | | | 15,286,400 | | | | 83,922,335 | | | | 21,198,531 | | | | 114,048,098 | |
| Acquisition—Note 9 | | | — | | | | — | | | | 10,563,745 | | | | 60,107,709 | |
| Redeemed | | | (21,051,546 | ) | | | (122,195,983 | ) | | | (35,968,087 | ) | | | (203,431,908 | ) |
| | |
|
|
| |
|
|
| |
|
|
| |
|
|
|
| Net increase | | | 8,113,625 | | | $ | 42,899,331 | | | | 25,521,240 | | | $ | 139,111,661 | |
| | |
|
|
| |
|
|
| |
|
|
| |
|
|
|
4. Purchases and Sales of Securities
The aggregate cost of purchases and proceeds from sales of securities, other than short-term obligations and investments in IMMF, for the six months ended June 28, 2013, were as follows:
| | | | | | | | |
| | | Purchases | | | Sales | |
| Investment securities | | $ | 825,802,027 | | | $ | 1,038,070,764 | |
| U.S. government and government agency obligations | | | 216,851,702 | | | | 180,704,172 | |
| To Be Announced (TBA) mortgage-related securities | | | 3,507,512,135 | | | | 3,896,975,119 | |
5. Fees and Other Transactions with Affiliates
Management Fees. Under the investment advisory agreement, the Fund pays the Manager a management fee based on the daily net assets of the Fund at an annual rate as shown in the following table:
| | | | |
| Fee Schedule | | | |
| Up to $200 million | | | 0.75 | % |
| Next $200 million | | | 0.72 | |
| Next $200 million | | | 0.69 | |
| Next $200 million | | | 0.66 | |
| Next $200 million | | | 0.60 | |
| Over $1 billion | | | 0.50 | |
The Manager also provides investment management related services to the Subsidiary. The Subsidiary pays the Manager a monthly management fee at an annual rate according to the above schedule. The Subsidiary also pays certain other expenses including custody and directors’ fees.
Sub-Adviser Fees. The Manager has retained the Sub-Adviser to provide the day-to-day portfolio management of the Fund and the Subsidiary. Under the Sub-Advisory Agreements, the Manager pays the Sub-Adviser an annual fee in monthly installments, equal to a percentage of the investment management fee collected by the Manager from the Fund and the subsidiary, which shall be calculated after any investment management fee waivers. The fees paid to the Sub-Adviser are paid by the Manager, not by the Fund.
Transfer Agent Fees. OFI Global (the “Transfer Agent”) serves as the transfer and shareholder servicing agent for the Fund. Fees incurred by the Fund with respect to these services are detailed in the Statement of Operations.
Sub-Transfer Agent Fees. The Transfer Agent has retained Shareholder Services, Inc., a wholly-owned subsidiary of OFI (the “Sub-Transfer Agent”), to provide the day-to-day transfer agent and shareholder servicing of the Fund. Under the Sub-Transfer Agency Agreement, the Transfer Agent pays the Sub-Transfer Agent an annual fee in monthly installments, equal to a percentage of the transfer agent fee collected by the Transfer Agent from the Fund, which shall be calculated after any applicable fee waivers. The fee paid to the Sub-Transfer Agent is paid by the Transfer Agent, not by the Fund.
| | | | |
| 72 | | | | OPPENHEIMER GLOBAL STRATEGIC INCOME FUND/VA |
Distribution and Service Plan for Service Shares. The Fund has adopted a Distribution and Service Plan (the “Plan”) in accordance with Rule 12b-1 under the Investment Company Act of 1940 for Service shares to pay OppenheimerFunds Distributor, Inc. (the “Distributor”), for distribution related services, personal service and account maintenance for the Fund’s Service shares. Under the Plan, payments are made periodically at an annual rate of 0.25% of the daily net assets of Service shares of the Fund. The Distributor currently uses all of those fees to compensate sponsors of the insurance product that offers Fund shares, for providing personal service and maintenance of accounts of their variable contract owners that hold Service shares. These fees are paid out of the Fund’s assets on an on-going basis and increase operating expenses of the Service shares, which results in lower performance compared to the Fund’s shares that are not subject to a service fee. Fees incurred by the Fund under the Plan are detailed in the Consolidated Statement of Operations.
Waivers and Reimbursements of Expenses. The Manager has voluntarily agreed to limit the Fund’s expenses after payments, waivers and/or reimbursements and reduction to custodian expenses, excluding expenses incurred directly or indirectly by the Fund as a result of investments in wholly-owned subsidiaries and pooled investment vehicles; so that those expenses, as percentages of daily net assets, will not exceed the annual rate of 0.75% for Non-Service shares and 1.00% for Service shares.
The Manager has contractually agreed to waive the management fee it receives from the Fund in an amount equal to the management fee it receives from the Subsidiary. This undertaking will continue in effect for so long as the Fund invests in the Subsidiary and may not be terminated unless approved by the Fund’s Board of Trustees. During the six months ended June 28, 2013, the Manager waived $5,296.
The Manager will waive fees and/or reimburse Fund expenses in an amount equal to the indirect management fees incurred through the Fund’s investments in IMMF, Oppenheimer Short Duration Fund and the Master Funds. During the six months ended June 28, 2013, the Manager waived fees and/or reimbursed the Fund $401,052 for management fees.
Some of these undertakings may be modified or terminated at any time; some may not be modified or terminated until after one year from the date of the current prospectus, as indicated therein.
6. Risk Exposures and the Use of Derivative Instruments
The Fund’s investment objectives not only permit the Fund to purchase investment securities, they also allow the Fund to enter into various types of derivatives contracts, including, but not limited to, futures contracts, forward currency exchange contracts, credit default swaps, interest rate swaps, total return swaps, and purchased and written options. In doing so, the Fund will employ strategies in differing combinations to permit it to increase, decrease, or change the level or types of exposure to market risk factors. These instruments may allow the Fund to pursue its objectives more quickly and efficiently than if it were to make direct purchases or sales of securities capable of effecting a similar response to market factors. Such contracts may be entered into through a bilateral over-the-counter (“OTC”) transaction, or through a securities or futures exchange and cleared through a clearinghouse.
Market Risk Factors. In accordance with its investment objectives, the Fund may use derivatives to increase or decrease its exposure to one or more of the following market risk factors:
Commodity Risk. Commodity risk relates to the change in value of commodities or commodity indexes as they relate to increases or decreases in the commodities market. Commodities are physical assets that have tangible properties. Examples of these types of assets are crude oil, heating oil, metals, livestock, and agricultural products.
Credit Risk. Credit risk relates to the ability of the issuer to meet interest and principal payments, or both, as they come due. In general, lower-grade, higher-yield bonds are subject to credit risk to a greater extent than lower-yield, higher-quality bonds.
Equity Risk. Equity risk relates to the change in value of equity securities as they relate to increases or decreases in the general market.
| | | | |
| 73 | | | | OPPENHEIMER GLOBAL STRATEGIC INCOME FUND/VA |
NOTES TO CONSOLIDATED FINANCIAL STATEMENTS Unaudited / Continued
6. Risk Exposures and the Use of Derivative Instruments Continued
Foreign Exchange Rate Risk. Foreign exchange rate risk relates to the change in the U.S. dollar value of a security held that is denominated in a foreign currency. The U.S. dollar value of a foreign currency denominated security will decrease as the dollar appreciates against the currency, while the U.S. dollar value will increase as the dollar depreciates against the currency.
Interest Rate Risk. Interest rate risk refers to the fluctuations in value of fixed-income securities resulting from the inverse relationship between price and yield. For example, an increase in general interest rates will tend to reduce the market value of already issued fixed-income investments, and a decline in general interest rates will tend to increase their value. In addition, debt securities with longer maturities, which tend to have higher yields, are subject to potentially greater fluctuations in value from changes in interest rates than obligations with shorter maturities.
Volatility Risk. Volatility risk refers to the magnitude of the movement, but not the direction of the movement, in a financial instrument’s price over a defined time period. Large increases or decreases in a financial instrument’s price over a relative time period typically indicate greater volatility risk, while small increases or decreases in its price typically indicate lower volatility risk.
Derivatives may have little or no initial cash investment relative to their market value exposure and therefore can produce significant gains or losses in excess of their cost due to unanticipated changes in the market risk factors and the overall market. This use of embedded leverage allows the Fund to increase its market value exposure relative to its net assets and can substantially increase the volatility of the Fund’s performance. In instances where the Fund is using derivatives to decrease, or hedge, exposures to market risk factors for securities held by the Fund, there are also risks that those derivatives may not perform as expected resulting in losses for the combined or hedged positions. Some derivatives have the potential for unlimited loss, regardless of the size of the Fund’s initial investment.
Additional associated risks from investing in derivatives also exist and potentially could have significant effects on the valuation of the derivative and the Fund. Typically, the associated risks are not the risks that the Fund is attempting to increase or decrease exposure to, per its investment objectives, but are the additional risks from investing in derivatives. Examples of these associated risks are liquidity risk, which is the risk that the Fund will not be able to sell the derivative in the open market in a timely manner, and counterparty credit risk, which is the risk that the counterparty will not fulfill its obligation to the Fund.
The Fund’s actual exposures to these market risk factors and associated risks during the period are discussed in further detail, by derivative type, below.
Forward Currency Exchange Contracts
The Fund may enter into forward currency exchange contracts (“forward contracts”) for the purchase or sale of a foreign currency at a negotiated rate at a future date. Such contracts are traded in the OTC inter-bank currency dealer market.
Forward contracts are reported on a schedule following the Consolidated Statement of Investments. The unrealized appreciation (depreciation) is reported in the Consolidated Statement of Assets and Liabilities as a receivable (or payable) and in the Consolidated Statement of Operations within the change in unrealized appreciation (depreciation). At contract close, the difference between the original cost of the contract and the value at the close date is recorded as a realized gain (loss) in the Consolidated Statement of Operations.
The Fund has entered into forward contracts with the obligation to purchase specified foreign currencies in the future at a currently negotiated forward rate in order to take a positive investment perspective on the related currency. These forward contracts seek to increase exposure to foreign exchange rate risk.
The Fund has entered into forward contracts with the obligation to purchase specified foreign currencies in the future at a currently negotiated forward rate in order to decrease exposure to foreign exchange rate risk associated with foreign currency denominated securities held by the Fund.
| | | | |
| 74 | | | | OPPENHEIMER GLOBAL STRATEGIC INCOME FUND/VA |
The Fund has entered into forward contracts with the obligation to sell specified foreign currencies in the future at a currently negotiated forward rate in order to take a negative investment perspective on the related currency. These forward contracts seek to increase exposure to foreign exchange rate risk.
The Fund has entered into forward contracts with the obligation to sell specified foreign currencies in the future at a currently negotiated forward rate in order to decrease exposure to foreign exchange rate risk associated with foreign currency denominated securities held by the Fund.
During the six months ended June 28, 2013, the Fund had daily average contract amounts on forward contracts to buy and sell of $323,830,761 and $767,738,320, respectively.
Additional associated risk to the Fund includes counterparty credit risk. Counterparty credit risk arises from the possibility that the counterparty to a forward contract will default and fail to perform its obligations to the Fund.
Futures Contracts
A futures contract is a commitment to buy or sell a specific amount of a commodity, financial instrument or currency at a negotiated price on a stipulated future date. The Fund may buy and sell futures contracts and may also buy or write put or call options on these futures contracts. Futures contracts and options thereon are generally entered into on a regulated futures exchange and cleared through a clearinghouse associated with the exchange.
Upon entering into a futures contract, the Fund is required to deposit either cash or securities (initial margin) in an amount equal to a certain percentage of the contract value in an account registered in the futures commission merchant’s name. Subsequent payments (variation margin) are paid to or from the futures commission merchant each day equal to the daily changes in the contract value. Such payments are recorded as unrealized gains and losses. Should the Fund fail to make requested variation margin payments, the futures commission merchant can gain access to the initial margin to satisfy the Fund’s payment obligations.
Futures contracts are reported on a schedule following the Consolidated Statement of Investments. Securities held by a futures commission merchant to cover initial margin requirements on open futures contracts are noted in the Consolidated Statement of Investments. Cash held by a futures commission merchant to cover initial margin requirements on open futures contracts and the receivable and/or payable for the daily mark to market for the variation margin are noted in the Consolidated Statement of Assets and Liabilities. The net change in unrealized appreciation and depreciation is reported in the Consolidated Statement of Operations. Realized gains (losses) are reported in the Consolidated Statement of Operations at the closing or expiration of futures contracts.
The Fund has purchased futures contracts on various bonds and notes to increase exposure to interest rate risk.
The Fund has sold futures contracts on various bonds and notes to decrease exposure to interest rate risk.
The Fund has purchased futures contracts on various equity indexes to increase exposure to equity risk.
The Fund has sold futures contracts on various equity indexes to decrease exposure to equity risk.
The Fund has purchased futures contracts on various currencies to increase exposure to foreign exchange rate risk.
The Fund has sold futures contracts on various currencies to decrease exposure to foreign exchange rate risk.
The Fund has sold futures contracts, which have values that are linked to the price movement of the related volatility indexes, in order to decrease exposure to volatility risk.
During the six months ended June 28, 2013, the Fund had an ending monthly average market value of $171,156,289 and $426,246,456 on futures contracts purchased and sold, respectively.
Additional associated risks of entering into futures contracts (and related options) include the possibility that there may be an illiquid market where the Fund is unable to liquidate the contract or enter into an offsetting position and, if used for hedging purposes, the risk that the price of the contract will correlate imperfectly with the prices of the Fund’s securities.
| | | | |
| 75 | | | | OPPENHEIMER GLOBAL STRATEGIC INCOME FUND/VA |
NOTES TO CONSOLIDATED FINANCIAL STATEMENTS Unaudited / Continued
6. Risk Exposures and the Use of Derivative Instruments Continued
Option Activity
The Fund may buy and sell put and call options, or write put and call options. When an option is written, the Fund receives a premium and becomes obligated to sell or purchase the underlying security, currency or other underlying financial instrument at a fixed price, upon exercise of the option.
Options can be traded through an exchange or through a privately negotiated arrangement with a dealer in an OTC transaction. Options traded through an exchange are generally cleared through a clearinghouse (such as The Options Clearing Corporation). The difference between the premium received or paid, and market value of the option, is recorded as unrealized appreciation or depreciation. The net change in unrealized appreciation or depreciation is reported in the Consolidated Statement of Operations. When an option is exercised, the cost of the security purchased or the proceeds of the security sale are adjusted by the amount of premium received or paid. Upon the expiration or closing of the option transaction, a gain or loss is reported in the Consolidated Statement of Operations.
The Fund has purchased call options on currencies to increase exposure to foreign exchange rate risk. A purchased call option becomes more valuable as the price of the underlying financial instrument appreciates relative to the strike price.
The Fund has purchased put options on currencies to decrease exposure to foreign exchange rate risk. A purchased put option becomes more valuable as the price of the underlying financial instrument depreciates relative to the strike price.
The Fund has purchased call options on treasury and/or euro futures to increase exposure to interest rate risk. A purchased call option becomes more valuable as the price of the underlying financial instrument appreciates relative to the strike price.
The Fund has purchased put options on treasury and/or euro futures to decrease exposure to interest rate risk. A purchased put option becomes more valuable as the price of the underlying financial instrument depreciates relative to the strike price.
During the six months ended June 28, 2013, the Fund had an ending monthly average market value of $698,507 and $396,000 on purchased call options and purchased put options, respectively.
Options written, if any, are reported in a schedule following the Consolidated Statement of Investments and as a liability in the Consolidated Statement of Assets and Liabilities. Securities held in collateral accounts to cover potential obligations with respect to outstanding written options are noted in the Consolidated Statement of Investments.
The risk in writing a call option is that the market price of the security increases and if the option is exercised, the Fund must either purchase the security at a higher price for delivery or, if the Fund owns the underlying security, give up the opportunity for profit. The risk in writing a put option is that the Fund may incur a loss if the market price of the security decreases and the option is exercised. The risk in buying an option is that the Fund pays a premium whether or not the option is exercised. The Fund also has the additional risk that there may be an illiquid market where the Fund is unable to close the contract.
The Fund has written put options on currencies to increase exposure to foreign exchange rate risk. A written put option becomes more valuable as the price of the underlying financial instrument appreciates relative to the strike price.
The Fund has written call options on currencies to decrease exposure to foreign exchange rate risk. A written call option becomes more valuable as the price of the underlying financial instrument depreciates relative to the strike price.
The Fund has written call options on treasury and/or euro futures to decrease exposure to interest rate risk. A written call option becomes more valuable as the price of the underlying financial instrument depreciates relative to the strike price.
The Fund has written put options on treasury and/or euro futures to increase exposure to interest rate risk. A written put option becomes more valuable as the price of the underlying financial instrument appreciates relative to the strike price.
| | | | |
| 76 | | | | OPPENHEIMER GLOBAL STRATEGIC INCOME FUND/VA |
During the six months ended June 28, 2013, the Fund had an ending monthly average market value of $401,844 and $721,855 on written call options and written put options, respectively.
Additional associated risks to the Fund include counterparty credit risk and liquidity risk.
Written option activity for the six months ended June 28, 2013 was as follows:
| | | | | | | | | | | | | | | | |
| | | Call Options
| | | Put Options
| |
| | | Number of
Contracts | | | Amount of
Premiums | | | Number of
Contracts | | | Amount of
Premiums | |
| Options outstanding as of December 31, 2012 | | | 1,635,535,942 | | | $ | 745,170 | | | | 2,145,319,399 | | | $ | 979,485 | |
| Options written | | | 64,999,785,439 | | | | 6,846,564 | | | | 64,087,777,737 | | | | 9,141,161 | |
| Options closed or expired | | | (45,758,891,381 | ) | | | (5,127,122 | ) | | | (26,504,513,575 | ) | | | (4,411,982 | ) |
| Options exercised | | | (19,849,030,000 | ) | | | (2,088,103 | ) | | | (38,076,155,000 | ) | | | (3,863,802 | ) |
| | |
|
|
| |
|
|
| |
|
|
| |
|
|
|
| Options outstanding as of June 28, 2013 | | | 1,027,400,000 | | | $ | 376,509 | | | | 1,652,428,561 | | | $ | 1,844,862 | |
| | |
|
|
| |
|
|
| |
|
|
| |
|
|
|
Swap Contracts
The Fund may enter into swap contract agreements with a counterparty to exchange a series of cash flows based on either specified reference rates, the price or volatility of asset or non-asset references, or the occurrence of a credit event, over a specified period. Swaps can be executed in a bi-lateral privately negotiated arrangement with a dealer in an OTC transaction (“OTC swaps”) or executed on a regulated market. Certain swaps, regardless of the venue of their execution, are required to be cleared through a clearinghouse (“cleared swaps”). Swap contracts may include interest rate, equity, debt, index, total return, credit default, currency and volatility swaps.
Swap contracts are reported on a schedule following the Consolidated Statement of Investments. Daily changes in the value of cleared swaps are reported as variation margin receivable or payable on the Consolidated Statements of Assets and Liabilities. The values of OTC swap contracts are aggregated by positive and negative values and disclosed separately on the Consolidated Statement of Assets and Liabilities. The unrealized appreciation (depreciation) related to the change in the valuation of the notional amount of the swap is combined with the accrued interest due to (owed by) the Fund, if any, at termination or settlement. The net change in this amount during the period is included on the Consolidated Statement of Operations. The Fund also records any periodic payments received from (paid to) the counterparty, including at termination, under such contracts as realized gain (loss) on the Consolidated Statement of Operations.
Swap contract agreements are exposed to the market risk factor of the specific underlying reference rate or asset. Swap contracts are typically more attractively priced compared to similar investments in related cash securities because they isolate the risk to one market risk factor and eliminate the other market risk factors. Investments in cash securities (for instance bonds) have exposure to multiple risk factors (credit and interest rate risk). Because swaps have embedded leverage, they can expose the Fund to substantial risk in the isolated market risk factor.
Credit Default Swap Contracts. A credit default swap is a contract that enables an investor to buy or sell protection against a defined-issuer credit event, such as the issuer’s failure to make timely payments of interest or principal on a debt security, bankruptcy or restructuring. The Fund may enter into credit default swaps either by buying or selling protection on a corporate issuer, sovereign issuer, or a basket or index of issuers (the “reference asset”).
The buyer of protection pays a periodic fee to the seller of protection based on the notional amount of the swap contract. The seller of protection agrees to compensate the buyer of protection for future potential losses as a result of a credit event on the reference asset. The contract effectively transfers the credit event risk of the reference asset from the buyer of protection to the seller of protection.
The ongoing value of the contract will fluctuate throughout the term of the contract based primarily on the credit risk of the reference asset. If the credit quality of the reference asset improves relative to the credit quality at contract initiation, the buyer of protection may have an unrealized loss greater than the anticipated periodic fee owed. This
| | | | |
| 77 | | | | OPPENHEIMER GLOBAL STRATEGIC INCOME FUND/VA |
NOTES TO CONSOLIDATED FINANCIAL STATEMENTS Unaudited / Continued
6. Risk Exposures and the Use of Derivative Instruments Continued
unrealized loss would be the result of current credit protection being cheaper than the cost of credit protection at contract initiation. If the buyer elects to terminate the contract prior to its maturity, and there has been no credit event, this unrealized loss will become realized. If the contract is held to maturity, and there has been no credit event, the realized loss will be equal to the periodic fee paid over the life of the contract.
If there is a credit event, the buyer of protection can exercise its rights under the contract and receive a payment from the seller of protection equal to the notional amount of the swap less the market value of specified debt securities issued by the reference asset. Upon exercise of the contract the difference between such value and the notional amount is recorded as realized gain (loss) and is included on the Consolidated Statement of Operations.
The Fund has sold credit protection through credit default swaps to increase exposure to the credit risk of individual issuers and/or indexes of issuers that are either unavailable or considered to be less attractive in the bond market.
The Fund has purchased credit protection through credit default swaps to decrease exposure to the credit risk of individual issuers and/or indexes of issuers.
The Fund has engaged in spread curve trades by simultaneously purchasing and selling protection through credit default swaps referenced to the same reference asset but with different maturities. Spread curve trades attempt to gain exposure to credit risk on a forward basis by realizing gains on the expected differences in spreads.
For the six months ended June 28, 2013, the Fund had ending monthly average notional amounts of $30,318,108 and $21,310,250 on credit default swaps to buy protection and credit default swaps to sell protection, respectively.
Additional associated risks to the Fund include counterparty credit risk and liquidity risk.
Interest Rate Swap Contracts. An interest rate swap is an agreement between counterparties to exchange periodic payments based on interest rates. One cash flow stream will typically be a floating rate payment based upon a specified floating interest rate while the other is typically a fixed interest rate.
The Fund has entered into interest rate swaps in which it pays a floating interest rate and receives a fixed interest rate in order to increase exposure to interest rate risk. Typically, if relative interest rates rise, payments made by the Fund under a swap agreement will be greater than the payments received by the Fund.
The Fund has entered into interest rate swaps in which it pays a fixed interest rate and receives a floating interest rate in order to decrease exposure to interest rate risk. Typically, if relative interest rates rise, payments received by the Fund under the swap agreement will be greater than the payments made by the Fund.
For the six months ended June 28, 2013, the Fund had ending monthly average notional amounts of $28,134,749 and $70,948,743 on interest rate swaps which pay a fixed rate and interest rate swaps which receive a fixed rate, respectively.
Additional associated risks to the Fund include counterparty credit risk and liquidity risk.
Total Return Swap Contracts. A total return swap is an agreement between counterparties to exchange periodic payments based on the value of asset or non-asset references. One cash flow is typically based on a non-asset reference (such as an interest rate) and the other on the total return of a reference asset (such as a security or a basket of securities or securities index). The total return of the reference asset typically includes appreciation or depreciation on the reference asset, plus any interest or dividend payments.
Total return swap contracts are exposed to the market risk factor of the specific underlying financial instrument or index. Total return swaps are less standard in structure than other types of swaps and can isolate and/or include multiple types of market risk factors including equity risk, credit risk, and interest rate risk.
The Fund has entered into total return swaps on various equity securities or indexes to increase exposure to equity risk. These equity risk related total return swaps require the Fund to pay a floating reference interest rate, and an amount equal to the negative price movement of securities or an index (expressed as a percentage) multiplied by the notional amount of the contract. The Fund will receive payments equal to the positive price movement of the same securities or index (expressed as a percentage) multiplied by the notional amount of the contract and, in some cases, dividends paid on the securities.
| | | | |
| 78 | | | | OPPENHEIMER GLOBAL STRATEGIC INCOME FUND/VA |
The Fund has entered into total return swaps on various equity securities or indexes to decrease exposure to equity risk. These equity risk related total return swaps require the Fund to pay an amount equal to the positive price movement of securities or an index (expressed as a percentage) multiplied by the notional amount of the contract and, in some cases, dividends paid on the securities. The Fund will receive payments of a floating reference interest rate and an amount equal to the negative price movement of the same securities or index (expressed as a percentage) multiplied by the notional amount of the contract.
For the six months ended June 28, 2013, the Fund had ending monthly average notional amounts of $37,679,084 and $24,848,040 on total return swaps which are long the reference asset and total return swaps which are short the reference asset, respectively.
Additional associated risks to the Fund include counterparty credit risk and liquidity risk.
As of June 28, 2013, the Fund had no such total return swap agreements outstanding.
Volatility Swap Contracts. A volatility swap is an agreement between counterparties to exchange periodic payments based on the measured volatility of a reference security, index, currency or other reference investment over a specified time frame. One cash flow is typically based on the realized volatility of the reference investment as measured by changes in its price or level over the specified time period while the other cash flow is based on a specified rate representing expected volatility for the reference investment at the time the swap is executed, or the measured volatility of a different reference investment over the specified time period. The appreciation or depreciation on a volatility swap will typically depend on the magnitude of the reference investment’s volatility, or size of the movements in its price, over the specified time period, rather than general directional increases or decreases in its price.
Volatility swaps are less standard in structure than other types of swaps and provide pure, or isolated, exposure to volatility risk of the specific underlying reference investment. Volatility swaps are typically used to speculate on future volatility levels, to trade the spread between realized and expected volatility, or to decrease the volatility exposure of investments held by the Fund.
Variance swaps are a type of volatility swap where counterparties agree to exchange periodic payments based on the measured variance (or the volatility squared) of a reference security, index, or other reference investment over a specified time period. At payment date, a net cash flow will be exchanged based on the difference between the realized variance of the reference investment over the specified time period and the specified rate representing expected variance for the reference investment at the time the swap is executed multiplied by the notional amount of the contract.
The Fund has entered into volatility swaps to increase exposure to the volatility risk of various reference investments. These types of volatility swaps require the Fund to pay the measured volatility and receive a fixed rate payment. If the measured volatility of the related reference investment increases over the period, the swaps will depreciate in value. Conversely, if the measured volatility of the related reference investment decreases over the period, the swaps will appreciate in value.
The Fund has entered into volatility swaps to decrease exposure to the volatility risk of various reference investments. These types of volatility swaps require the Fund to pay a fixed rate payment and receive the measured volatility. If the measured volatility of the related reference investment increases over the period, the swaps will appreciate in value. Conversely, if the measured volatility of the related reference investment decreases over the period, the swaps will depreciate in value.
For the six months ended June 28, 2013, the Fund had ending monthly average notional amounts of $308,694 and $329,354 on volatility swaps which pay measured volatility/variance and volatility swaps which receive measured volatility/variance, respectively.
Additional associated risks to the Fund include counterparty credit risk and liquidity risk.
As of June 28, 2013, the Fund had no such volatility swap agreements outstanding.
| | | | |
| 79 | | | | OPPENHEIMER GLOBAL STRATEGIC INCOME FUND/VA |
NOTES TO CONSOLIDATED FINANCIAL STATEMENTS Unaudited / Continued
6. Risk Exposures and the Use of Derivative Instruments Continued
Swaption Transactions
The Fund may enter into a swaption contract which grants the purchaser the right, but not the obligation, to enter into a swap transaction at preset terms detailed in the underlying agreement within a specified period of time. The purchaser pays a premium to the swaption writer who bears the risk of unfavorable changes in the preset terms on the underlying swap.
Purchased swaptions are reported as a component of investments in the Consolidated Statement of Investments and the Consolidated Statement of Assets and Liabilities. Written swaptions are reported on a schedule following the Consolidated Statement of Investments and their value is reported as a separate asset or liability line item in the Consolidated Statement of Assets and Liabilities. The net change in unrealized appreciation or depreciation on written swaptions is separately reported in the Consolidated Statement of Operations. When a swaption is exercised, the cost of the swap is adjusted by the amount of premium paid or received. Upon the expiration or closing of an unexercised swaption contract, a gain or loss is reported in the Consolidated Statement of Operations for the amount of the premium paid or received.
The Fund generally will incur a greater risk when it writes a swaption than when it purchases a swaption. When the Fund writes a swaption it will become obligated, upon exercise of the swaption, according to the terms of the underlying agreement. Swaption contracts written by the Fund do not give rise to counterparty credit risk prior to exercise as they obligate the Fund, not its counterparty, to perform. When the Fund purchases a swaption it only risks losing the amount of the premium it paid if the swaption expires unexercised. However, when the Fund exercises a purchased swaption there is a risk that the counterparty will fail to perform or otherwise default on its obligations under the swaption contract.
The Fund purchased swaptions which gives it the option to enter into an interest rate swap in which it pays a floating interest rate and receives a fixed interest rate in order to increase exposure to interest rate risk. A purchased swaption of this type becomes more valuable as the reference interest rate decreases relative to the preset interest rate.
The Fund has purchased swaptions which gives it the option to enter into an interest rate swap in which it pays a fixed interest rate and receives a floating interest rate in order to decrease exposure to interest rate risk. A purchased swaption of this type becomes more valuable as the reference interest rate increases relative to the preset interest rate.
The Fund has purchased swaptions which gives it the option to sell credit protection through credit default swaps in order to increase exposure to the credit risk of individual issuers and/or indexes of issuers. A purchased swaption of this type becomes more valuable as the likelihood of a credit event on the reference asset decreases.
The Fund has purchased swaptions which gives it the option to buy credit protection through credit default swaps in order to decrease exposure to the credit risk of individual issuers and/or indexes of issuers. A purchased swaption of this type becomes more valuable as the likelihood of a credit event on the reference asset increases.
The Fund has written swaptions which gives it the obligation, if exercised by the purchaser, to enter into an interest rate swap in which it pays a floating interest rate and receives a fixed interest rate in order to increase exposure to interest rate risk. A written swaption of this type becomes more valuable as the reference interest rate decreases relative to the preset interest rate.
The Fund has written swaptions which gives it the obligation, if exercised by the purchaser, to enter into an interest rate swap in which it pays a fixed interest rate and receives a floating interest rate in order to decrease exposure to interest rate risk. A written swaption of this type becomes more valuable as the reference interest rate increases relative to the preset interest rate.
The Fund has written swaptions which give it the obligation, if exercised by the purchaser, to sell credit protection through credit default swaps in order to increase exposure to the credit risk of individual issuers and/or indexes of issuers. A written swaption of this type becomes more valuable as the likelihood of a credit event on the reference asset decreases.
The Fund has written swaptions which give it the obligation, if exercised by the purchaser, to buy credit protection through credit default swaps in order to decrease exposure to the credit risk of individual issuers and/or, indexes of issuers. A written swaption of this type becomes more valuable as the likelihood of a credit event on the reference asset increases.
| | | | |
| 80 | | | | OPPENHEIMER GLOBAL STRATEGIC INCOME FUND/VA |
During the six months ended June 28, 2013, the Fund had an ending monthly average market value of $5,768,811 and $6,111,075 on purchased and written swaptions, respectively.
Written swaption activity for the six months ended June 28, 2013 was as follows:
| | | | | | | | |
| | | Call Swaptions
| |
| | | Notional
Amount | | | Amount of
Premiums | |
Swaptions outstanding as of December 31, 2012 | | | 253,267,387 | | | $ | 5,033,479 | |
Swaptions written | | | 1,621,035,000 | | | | 14,023,241 | |
Swaptions closed or expired | | | (1,322,697,387 | ) | | | (12,950,557 | ) |
Swaptions exercised | | | (40,100,000 | ) | | | (564,850 | ) |
| | |
|
|
| |
|
|
|
| Swaptions outstanding as of June 28, 2013 | | | 511,505,000 | | | $ | 5,541,313 | |
| | |
|
|
| |
|
|
|
Counterparty Credit Risk. Derivative positions are subject to the risk that the counterparty will not fulfill its obligation to the Fund. The Fund intends to enter into derivative transactions with counterparties that the Manager believes to be creditworthy at the time of the transaction.
The Fund’s risk of loss from counterparty credit risk on OTC derivatives is generally limited to the aggregate unrealized gain netted against any collateral held by the Fund. For OTC options purchased, the Fund bears the risk of loss of the amount of the premiums paid plus the positive change in market values net of any collateral held by the Fund should the counterparty fail to perform under the contracts. Options written by the Fund do not typically give rise to counterparty credit risk, as options written generally obligate the Fund and not the counterparty to perform.
To reduce counterparty risk with respect to OTC transactions, the Fund has entered into master netting arrangements, established within the Fund’s International Swap and Derivatives Association, Inc. (“ISDA”) master agreements, which allow the Fund to make (or to have an entitlement to receive) a single net payment in the event of default (close-out netting) for outstanding payables and receivables with respect to certain OTC positions in swaps, options, swaptions, and forward currency exchange contracts for each individual counterparty. In addition, the Fund may require that certain counterparties post cash and/or securities in collateral accounts to cover their net payment obligations for those derivative contracts subject to ISDA master agreements. If the counterparty fails to perform under these contracts and agreements, the cash and/or securities will be made available to the Fund.
As of June 28, 2013 the Fund has required certain counterparties to post collateral of $10,964,446.
Certain ISDA master agreements include credit related contingent features which allow counterparties to OTC derivatives to terminate derivative contracts prior to maturity in the event the Fund’s net assets decline by a stated percentage or the Fund fails to meet the terms of its ISDA master agreements, which would cause the Fund to accelerate payment of any net liability owed to the counterparty. As of June 28, 2013, the aggregate fair value of derivative instruments with such credit related contingent features in a net liability position was $2,553,177 for which the Fund has posted collateral of $3,504,376.
For financial reporting purposes, the Fund does not offset derivative assets and derivative liabilities that are subject to netting arrangements in the Consolidated Statement of Assets and Liabilities. Bankruptcy or insolvency laws of a particular jurisdiction may impose restrictions on or prohibitions against the right of offset in bankruptcy, insolvency or other events.
The Fund’s risk of loss from counterparty credit risk on exchange-traded derivatives cleared through a clearinghouse and for cleared swaps is generally considered lower than as compared to OTC derivatives. However, counterparty credit risk exists with respect to initial and variation margin deposited/paid by the Fund that is held in futures commission merchant, broker and/or clearinghouse accounts for such exchange-traded derivatives and for cleared swaps.
With respect to cleared swaps, such transactions will be submitted for clearing, and if cleared, will be held in accounts at futures commission merchants or brokers that are members of clearinghouses. While brokers, futures commission merchants and clearinghouses are required to segregate customer margin from their own assets, in the event that a
| | | | |
| 81 | | | | OPPENHEIMER GLOBAL STRATEGIC INCOME FUND/VA |
NOTES TO CONSOLIDATED FINANCIAL STATEMENTS Unaudited / Continued
6. Risk Exposures and the Use of Derivative Instruments Continued
broker, futures commission merchant or clearinghouse becomes insolvent or goes into bankruptcy and at that time there is a shortfall in the aggregate amount of margin held by the broker, futures commission merchant or clearinghouse for all its customers, U.S. bankruptcy laws will typically allocate that shortfall on a pro-rata basis across all the broker’s, futures commission merchant’s or clearinghouse’s customers, potentially resulting in losses to the Fund.
There is the risk that a broker, futures commission merchant or clearinghouse will decline to clear a transaction on the Fund’s behalf, and the Fund may be required to pay a termination fee to the executing broker with whom the Fund initially enters into the transaction. Clearinghouses may also be permitted to terminate cleared swaps at any time. The Fund is also subject to the risk that the broker or futures commission merchant will improperly use the Fund’s assets deposited/paid as initial or variation margin to satisfy payment obligations of another customer. In the event of a default by another customer of the broker or futures commission merchant, the Fund might not receive its variation margin payments from the clearinghouse, due to the manner in which variation margin payments are aggregated for all customers of the broker/futures commission merchant.
Collateral and margin requirements differ by type of derivative. Margin requirements are established by the broker, futures commission merchant or clearinghouse for exchange-traded and cleared derivatives, including cleared swaps. Brokers, futures commission merchants and clearinghouses can ask for margin in excess of the regulatory minimum, or increase the margin amount, in certain circumstances.
Collateral terms are contract specific for OTC derivatives. For derivatives traded under an ISDA master agreement, the collateral requirements are typically calculated by netting the mark to market amount for each transaction under such agreement and comparing that amount to the value of any collateral currently pledged by the Fund or the counterparty.
For financial reporting purposes, cash collateral that has been pledged to cover obligations of the Fund, if any, is reported separately on the Consolidated Statement of Assets and Liabilities as cash pledged as collateral. Non-cash collateral pledged by the Fund, if any, is noted in the Consolidated Statement of Investments. Generally, the amount of collateral due from or to a party must exceed a minimum transfer amount threshold (e.g. $250,000) before a transfer has to be made. To the extent amounts due to the Fund from its counterparties are not fully collateralized, contractually or otherwise, the Fund bears the risk of loss from counterparty nonperformance.
The following table presents by counterparty the Fund’s OTC derivative assets net of the related collateral posted for the benefit of the Fund at June 28, 2013:
| | | | | | | | | | | | | | | | | | | | |
| | | | | | Gross Amounts Not Offset in the Consolidated
Statement of Assets and Liabilities | | | | |
| Counterparty | | Gross Amount of
Assets in the
Consolidated
Statement of
Assets and Liabilities* | | | Financial
Instruments
Available
for Offset | | | Financial
Instruments
Collateral
Received** | | | Cash Collateral
Received** | | | Net Amount | |
| Bank of America NA | | $ | 2,930,975 | | | $ | (1,892,967 | ) | | $ | (1,038,008 | ) | | $ | — | | | $ | — | |
| Barclays Bank plc | | | 4,163,289 | | | | (4,163,289 | ) | | | — | | | | — | | | | — | |
| BNP Paribas | | | — | | | | — | | | | — | | | | — | | | | — | |
| Citibank NA | | | 888,838 | | | | (888,838 | ) | | | — | | | | — | | | | — | |
| Credit Suisse International | | | 60,897 | | | | (60,897 | ) | | | — | | | | — | | | | — | |
| Deutsche Bank AG | | | 1,319,530 | | | | (1,319,530 | ) | | | — | | | | — | | | | — | |
| Goldman Sachs Bank USA | | | 1,863,724 | | | | (1,136,172 | ) | | | — | | | | — | | | | 727,552 | |
| Goldman Sachs International | | | 3,049,621 | | | | (2,852,227 | ) | | | — | | | | — | | | | 197,394 | |
| HSBC Bank USA, N.A. | | | 182,099 | | | | (182,099 | ) | | | — | | | | — | | | | — | |
| JPMorgan Chase Bank NA | | | 8,501,584 | | | | (2,191,297 | ) | | | (6,043,547 | ) | | | — | | | | 266,740 | |
| Morgan Stanley & Co. International plc | | | — | | | | — | | | | — | | | | — | | | | — | |
| Morgan Stanley Capital Services, LLC | | | 1,398,182 | | | | (1,069,926 | ) | | | (328,256 | ) | | | — | | | | — | |
| Nomura Global Financial Products, Inc | | | 321,136 | | | | (88,775 | ) | | | (232,361 | ) | | | — | | | | — | |
| | | | |
| 82 | | | | OPPENHEIMER GLOBAL STRATEGIC INCOME FUND/VA |
| | | | | | | | | | | | | | | | | | | | |
| | | | | | Gross Amounts Not Offset in the Consolidated
Statement of Assets and Liabilities | | | | |
| Counterparty: Continued | | Gross Amount of
Assets in the
Consolidated
Statement of
Assets and Liabilities* | | | Financial
Instruments
Available for
Offset | | | Financial
Instruments
Collateral
Received** | | | Cash Collateral
Received** | | | Net Amount | |
| Standard Chartered Bank | | $ | — | | | $ | — | | | $ | — | | | $ | — | | | $ | — | |
| The Royal Bank of Scotland plc | | | 819,904 | | | | (39,411 | ) | | | (780,493 | ) | | | — | | | | — | |
| UBS AG | | | 413,291 | | | | (413,291 | ) | | | — | | | | — | | | | — | |
| | |
|
|
| |
|
|
| |
|
|
| |
|
|
| |
|
|
|
| Total | | $ | 25,913,070 | | | $ | (16,298,719 | ) | | $ | (8,422,665 | ) | | $ | — | | | $ | 1,191,686 | |
| | |
|
|
| |
|
|
| |
|
|
| |
|
|
| |
|
|
|
* OTC derivatives are reported gross on the Consolidated Statement of Assets and Liabilities. Exchange traded options and margin related to cleared swaps and futures are excluded from these reported amounts.
** Reported collateral posted for the benefit of the Fund within this table is limited to the net outstanding amount due from an individual counterparty. The collateral posted for the benefit of the Fund may exceed these amounts.
The following table presents by counterparty the Fund’s OTC derivative liabilities net of the related collateral pledged by the Fund at June 28, 2013:
| | | | | | | | | | | | | | | | | | | | |
| | | | | | Gross Amounts Not Offset in the Consolidated
Statement of Assets and Liabilities | | | | |
| Counterparty | | Gross Amount of
Liabilities in the
Consolidated
Statement of
Assets and Liabilities* | | | Financial
Instruments
Available for
Offset | | | Financial
Instruments
Collateral
Pledged** | | | Cash Collateral
Pledged** | | | Net
Amount | |
| Bank of America NA | | $ | (1,892,967 | ) | | $ | 1,892,967 | | | $ | — | | | $ | — | | | $ | — | |
| Barclays Bank plc | | | (5,617,395 | ) | | | 4,163,289 | | | | 1,454,106 | | | | — | | | | — | |
| BNP Paribas | | | (10,263 | ) | | | — | | | | — | | | | — | | | | (10,263 | ) |
| Citibank NA | | | (1,196,547 | ) | | | 888,838 | | | | — | | | | — | | | | (307,709 | ) |
| Credit Suisse International | | | (232,481 | ) | | | 60,897 | | | | 171,584 | | | | — | | | | — | |
| Deutsche Bank AG | | | (1,457,175 | ) | | | 1,319,530 | | | | 137,645 | | | | — | | | | — | |
| Goldman Sachs Bank USA | | | (1,136,172 | ) | | | 1,136,172 | | | | — | | | | — | | | | — | |
| Goldman Sachs International | | | (2,852,227 | ) | | | 2,852,227 | | | | — | | | | — | | | | — | |
| HSBC Bank USA, N.A. | | | (244,893 | ) | | | 182,099 | | | | — | | | | — | | | | (62,794 | ) |
| JPMorgan Chase Bank NA | | | (2,191,297 | ) | | | 2,191,297 | | | | — | | | | — | | | | — | |
| Morgan Stanley & Co. International plc | | | (56,464 | ) | | | — | | | | — | | | | — | | | | (56,464 | ) |
| Morgan Stanley Capital Services, LLC | | | (1,069,926 | ) | | | 1,069,926 | | | | — | | | | — | | | | — | |
| Nomura Global Financial Products, Inc | | | (88,775 | ) | | | 88,775 | | | | — | | | | — | | | | — | |
| Standard Chartered Bank | | | (97,935 | ) | | | — | | | | — | | | | — | | | | (97,935 | ) |
| The Royal Bank of Scotland plc | | | (39,411 | ) | | | 39,411 | | | | — | | | | — | | | | — | |
| UBS AG | | | (667,968 | ) | | | 413,291 | | | | 212,962 | | | | — | | | | (41,715 | ) |
| | |
|
|
|
| Total | | $ | (18,851,896 | ) | | $ | 16,298,719 | | | $ | 1,976,297 | | | $ | — | | | $ | (576,880 | ) |
| | |
|
|
|
* OTC derivatives are reported gross on the Consolidated Statement of Assets and Liabilities. Exchange traded options and margin related to cleared swaps and futures are excluded from these reported amounts.
** Reported collateral pledged within this table is limited to the net outstanding amount due from the Fund. The securities pledged as collateral by the Fund as reported on the Consolidated Statement of Investments may exceed these amounts.
| | | | |
| 83 | | | | OPPENHEIMER GLOBAL STRATEGIC INCOME FUND/VA |
NOTES TO CONSOLIDATED FINANCIAL STATEMENTS Unaudited / Continued
6. Risk Exposures and the Use of Derivative Instruments Continued
The following table presents the valuations of derivative instruments by risk exposure as reported within the Consolidated Statement of Assets and Liabilities as of June 28, 2013:
| | | | | | | | | | | | |
| | | Asset Derivatives
| | | Liability Derivatives
| |
Derivatives Not
Accounted for as
Hedging Instruments | | Consolidated
Statement of Assets
and Liabilities Location | | Value | | | Consolidated
Statement of Assets
and Liabilities Location | | Value | |
| Credit contracts | | Swaps, at value | | $ | 108,451 | | | Swaps, at value | | $ | 102,930 | |
| Interest rate contracts | | Swaps, at value | | | 737,681 | | | Swaps, at value | | | 700,154 | |
| Interest rate contracts | | Variation margin receivable | | | 435,506 | * | | Variation margin payable | | | 108,220 | * |
| Foreign exchange contracts | | Closed currency contracts | | | 2,864,405 | | | Closed currency contracts | | | 2,736,562 | |
| Foreign exchange contracts | | Unrealized appreciation on foreign currency exchange contracts | | | 12,654,568 | | | Unrealized depreciation on foreign currency exchange contracts | | | 3,881,650 | |
| Foreign exchange contracts | | | | | | | | Options written, at value | | | 1,301,938 | |
| Interest rate contracts | | | | | | | | Options written, at value | | | 1,556,831 | |
| Credit contracts | | | | | | | | Swaptions written, at value | | | 107,954 | |
| Interest rate contracts | | | | | | | | Swaptions written, at value | | | 8,463,877 | |
| Credit contracts | | Investments, at value | | | 84,325 | ** | | | | | | |
| Foreign exchange contracts | | Investments, at value | | | 1,252,880 | ** | | | | | | |
| Interest rate contracts | | Investments, at value | | | 8,418,416 | ** | | | | | | |
| | | | |
|
|
| | | |
|
|
|
| Total | | | | $ | 26,556,232 | | | | | $ | 18,960,116 | |
| | | | |
|
|
| | | |
|
|
|
*Includes only the current day’s variation margin. Prior variation margin movements have been reflected in cash on the Consolidated Statement of Assets and Liabilities upon receipt or payment.
**Amounts relate to purchased options and purchased swaptions.
The effect of derivative instruments on the Consolidated Statement of Operations is as follows:
| | | | | | | | | | | | | | | | | | | | | | | | | | | | |
| Amount of Realized Gain or (Loss) Recognized on Derivatives | |
Derivatives Not Accounted
for as Hedging Instruments | | Investments
from
unaffiliated
companies
(including
premiums on
options and
swaptions
exercised)* | | | Closing and
expiration
of swaption
contracts
written | | | Closing and
expiration
of option
contracts
written | | | Closing and
expiration
of futures
contracts | | | Foreign
currency
transactions | | | Swap
contracts | | | Total | |
| Credit contracts | | $ | 10,737 | | | $ | 62,893 | | | $ | — | | | $ | — | | | $ | — | | | $ | (398,198 | ) | | $ | (324,568 | ) |
| Equity contracts | | | — | | | | — | | | | — | | | | (2,398,234) | | | | — | | | | 3,048,296 | | | | 650,062 | |
| Foreign exchange contracts | | | 5,685,561 | | | | — | | | | 6,605,917 | | | | 91,386 | | | | 2,231,353 | | | | — | | | | 14,614,217 | |
| Interest rate contracts | | | (1,251,019) | | | | (2,057,499) | | | | 466,043 | | | | (4,839,509) | | | | — | | | | (1,124,280) | | | | (8,806,264 | ) |
| Volatility contracts | | | — | | | | — | | | | — | | | | 113,779 | | | | — | | | | (5,060,619) | | | | (4,946,840 | ) |
| | |
|
|
| |
|
|
| |
|
|
| |
|
|
| |
|
|
| |
|
|
| |
|
|
|
| Total | | $ | 4,445,279 | | | $ | (1,994,606 | ) | | $ | 7,071,960 | | | $ | (7,032,578 | ) | | $ | 2,231,353 | | | $ | (3,534,801 | ) | | $ | 1,186,607 | |
| | |
|
|
| |
|
|
| |
|
|
| |
|
|
| |
|
|
| |
|
|
| |
|
|
|
*Includes purchased option contracts, purchased swaption contracts and written option contracts exercised, if any.
| | | | |
| 84 | | | | OPPENHEIMER GLOBAL STRATEGIC INCOME FUND/VA |
| | | | | | | | | | | | | | | | | | | | | | | | | | | | |
| Amount of Change in Unrealized Gain or (Loss) Recognized on Derivatives | |
Derivatives Not Accounted
for as Hedging Instruments | | Investments* | | | Option
contracts
written | | | Swaption
contracts
written | | | Futures
contracts | | | Translation of
assets and
liabilities
denominated
in foreign
currencies | | | Swap
contracts | | | Total | |
| Credit contracts | | $ | 14,625 | | | $ | — | | | $ | (16,628 | ) | | $ | — | | | $ | — | | | $ | 347,297 | | | $ | 345,294 | |
| Equity contracts | | | — | | | | — | | | | — | | | | 634,228 | | | | — | | | | (420,204 | ) | | | 214,024 | |
| Foreign exchange contracts | | | 241,465 | | | | (794,969 | ) | | | — | | | | 51,728 | | | | 9,406,321 | | | | — | | | | 8,904,545 | |
| Interest rate contracts | | | 4,935,428 | | | | (400,954 | ) | | | (2,866,266 | ) | | | (4,940,600 | ) | | | — | | | | (361,253 | ) | | | (3,633,645 | ) |
| Volatility contracts | | | — | | | | — | | | | — | | | | — | | | | — | | | | 562,515 | | | | 562,515 | |
| | |
|
|
|
| Total | | $ | 5,191,518 | | | $ | (1,195,923 | ) | | $ | (2,882,894 | ) | | $ | (4,254,644 | ) | | $ | 9,406,321 | | | $ | 128,355 | | | $ | 6,392,733 | |
| | |
|
|
|
* Includes purchased option contracts and purchased swaption contracts, if any.
7. Restricted Securities
As of June 28, 2013, investments in securities included issues that are restricted. A restricted security may have a contractual restriction on its resale and is valued under methods approved by the Board of Trustees as reflecting fair value. Securities that are restricted are marked with an applicable footnote on the Consolidated Statement of Investments. Restricted securities are reported on a schedule following the Consolidated Statement of Investments.
8. Loan Commitments
Pursuant to the terms of certain credit agreements, the Fund can have unfunded loan commitments. The Fund generally will maintain with its custodian, liquid investments having an aggregate value at least equal to the par value of unfunded loan commitments. Commitments of $3,1600,000 are contractually obligated to fund by a specified date and have been included as Corporate Loans in the Statement of Investments.
9. Acquisition of Oppenheimer High Income Fund/VA
On October 25, 2012, the Fund acquired all of the net assets of Oppenheimer High Income Fund/VA at a fair market value, pursuant to an Agreement and Plan of Reorganization approved by the Oppenheimer High Income Fund/VA shareholders on September 14, 2012. The purpose of this acquisition is to combine two funds with similar investment objectives, strategies and risks to allow shareholders to benefit from greater asset growth potential as well as lowered total expenses.
The transaction qualified as a tax-free reorganization, (the “merger”) for federal income tax purposes allowing the Fund to use the original cost basis of the investments received to calculate subsequent gains and losses for tax reporting purposes.
Details of the merger are shown in the following table:
| | | | | | | | | | | | | | | | |
| | | Exchange
Ratio to One
Share of the
Oppenheimer
High Income
Fund/VA | | | Shares of
Beneficial
Interest
Issued by
the Fund | | | Value of
Issued
Shares of
Beneficial
Interest | | | Combined Net Assets on
October 25, 20121 | |
Non-Service | | | 0.3227303411 | | | | 8,294,514 | | | $ | 46,200,443 | | | | $ 739,622,804 | |
Service | | | 0.3184024605 | | | | 9,433,727 | | | $ | 53,677,909 | | | | $1,819,058,909 | |
Class 3 | | | 0.3263655296 | | | | 832,737 | | | $ | 4,638,346 | | | | See Non-Service shares above | |
Class 4 | | | 0.3240643234 | | | | 1,130018 | | | $ | 6,429,800 | | | | See Service shares above | |
1. The net assets acquired included net unrealized depreciation of $3,949,765 and an unused capital loss carryforward of $225,414,822, potential utilization subject to tax limitations.
| | | | |
| 85 | | | | OPPENHEIMER GLOBAL STRATEGIC INCOME FUND/VA |
NOTES TO CONSOLIDATED FINANCIAL STATEMENTS Unaudited / Continued
9. Acquisition of Oppenheimer High Income Fund/VA Continued
Had the merger occurred at the beginning of the reporting period, the Fund’s Consolidated Statement of Operations would have been adjusted to the following amounts:
| | | | |
Net investment income | | $ | 147,886,894 | |
Net gain on investments | | | 162,844,456 | |
Net increase in net assets resulting from operations | | | 310,711,350 | |
10. Pending Litigation
Since 2009, a number of class action lawsuits have been pending in federal courts against OppenheimerFunds, Inc. (“OFI”), OppenheimerFunds Distributor, Inc., the Fund’s principal underwriter and distributor (the “Distributor”), and certain funds (but not including the Fund) advised by the Manager and distributed by the Distributor (the “Defendant Funds”). Several of these lawsuits also name as defendants certain officers and current and former trustees of the respective Defendant Funds. The lawsuits raise claims under federal securities law and allege, among other things, that the disclosure documents of the respective Defendant Funds contained misrepresentations and omissions and that the respective Defendant Funds’ investment policies were not followed. The plaintiffs in these actions seek unspecified damages, equitable relief and awards of attorneys’ fees and litigation expenses. The Defendant Funds’ Boards of Trustees have also engaged counsel to represent the Funds and the present and former Independent Trustees named in those suits.
Other class action and individual lawsuits have been filed since 2008 in various state and federal courts against OFI and certain of its affiliates by investors seeking to recover investments they allegedly lost as a result of the “Ponzi” scheme run by Bernard L. Madoff and his firm, Bernard L. Madoff Investment Securities, LLC (“BLMIS”). Plaintiffs in these suits allege that they suffered losses as a result of their investments in several funds managed by an affiliate of OFI and assert a variety of claims, including breach of fiduciary duty, fraud, negligent misrepresentation, unjust enrichment, and violation of federal and state securities laws and regulations, among others. They seek unspecified damages, equitable relief and awards of attorneys’ fees and litigation expenses. Neither the Distributor, nor any of the Oppenheimer mutual funds, their independent trustees or directors are named as defendants in these lawsuits. None of the Oppenheimer mutual funds invested in any funds or accounts managed by Madoff or BLMIS. On February 28, 2011, a stipulation of partial settlement of three groups of consolidated putative class action lawsuits relating to these matters was filed in the U.S. District Court for the Southern District of New York. On August 19, 2011, the court entered an order and final judgment approving the settlement as fair, reasonable and adequate. In September 2011, certain parties filed notices of appeal from the court’s order approving the settlement. The settlement does not resolve other outstanding lawsuits against OFI and its affiliates relating to BLMIS.
On April 16, 2010, a lawsuit was filed in New York state court against (i) OFI, (ii) an affiliate of OFI and (iii) AAArdvark IV Funding Limited (“AAArdvark IV”), an entity advised by OFI’s affiliate, in connection with investments made by the plaintiffs in AAArdvark IV. Plaintiffs allege breach of contract and common law fraud claims against the defendants and seek compensatory damages, costs and disbursements, including attorney fees. On April 11, 2013, the court granted defendants’ motion for summary judgment, dismissing plaintiffs’ fraud claim with prejudice and dismissing their contract claim without prejudice, and granted plaintiffs leave to replead their contract claim to assert a cause of action for specific performance within 30 days. On May 9, 2013, plaintiffs filed a notice of appeal from the court’s dismissal order. On July 15,2011, a lawsuit was filed in New York state court against OFI, an affiliate of OFI and AAArdvark Funding Limited (“AAArdvark I”), an entity advised by OFI’s affiliate, in connection with investments made by the plaintiffs in AAArdvark I. The complaint alleges breach of contract and common law fraud claims against the defendants and seeks compensatory damages, costs and disbursements, including attorney fees. On November 9, 2011, a lawsuit was filed in New York state court against OFI, an affiliate of OFI and AAArdvark XS Funding Limited (“AAArdvark XS”), an entity advised by OFI’s affiliate, in connection with investments made by the plaintiffs in AAArdvark XS. The complaint alleges
| | | | |
| 86 | | | | OPPENHEIMER GLOBAL STRATEGIC INCOME FUND/VA |
breach of contract against the defendants and seeks compensatory damages, costs and disbursements, including attorney fees.
OFI believes the lawsuits and appeals described above are without legal merit and, with the exception of actions it has settled, is defending against them vigorously. While it is premature to render any opinion as to the outcome in these lawsuits, or whether any costs that the Defendant Funds may bear in defending the suits might not be reimbursed by insurance, OFI believes that these suits should not impair the ability of OFI or the Distributor to perform their respective duties to the Fund, and that the outcome of all of the suits together should not have any material effect on the operations of any of the Oppenheimer mutual funds.
| | | | |
| 87 | | | | OPPENHEIMER GLOBAL STRATEGIC INCOME FUND/VA |
PORTFOLIO PROXY VOTING POLICIES AND PROCEDURES;
UPDATES TO STATEMENTS OF INVESTMENTS Unaudited
The Fund has adopted Portfolio Proxy Voting Policies and Procedures under which the Fund votes proxies relating to securities (“portfolio proxies”) held by the Fund. A description of the Fund’s Portfolio Proxy Voting Policies and Procedures is available (i) without charge, upon request, by calling the Fund toll-free at 1.800.525.7048, (ii) on the Fund’s website at oppenheimerfunds.com, and (iii) on the SEC’s website at www.sec.gov. In addition, the Fund is required to file Form N-PX, with its complete proxy voting record for the 12 months ended June 30th, no later than August 31st of each year. The Fund’s voting record is available (i) without charge, upon request, by calling the Fund toll-free at 1.800.525.7048, and (ii) in the Form N-PX filing on the SEC’s website at www.sec.gov.
The Fund files its complete schedule of portfolio holdings with the SEC for the first quarter and the third quarter of each fiscal year on Form N-Q. The Fund’s Form N-Q filings are available on the SEC’s website at www.sec.gov. Those forms may be reviewed and copied at the SEC’s Public Reference Room in Washington, D.C. Information on the operation of the Public Reference Room may be obtained by calling 1-800-SEC-0330.
| | | | |
| 88 | | | | OPPENHEIMER GLOBAL STRATEGIC INCOME FUND/VA |
OPPENHEIMER GLOBAL STRATEGIC INCOME FUND/VA
| | |
| A Series of Oppenheimer Variable Account Funds |
| Trustees and Officers | | Sam Freedman, Chairman of the Board of Trustees and Trustee Edward L. Cameron, Trustee Jon S. Fossel, Trustee Richard F. Grabish, Trustee Beverly L. Hamilton, Trustee Victoria J. Herget, Trustee Robert J. Malone, Trustee F. William Marshall, Jr., Trustee Karen L. Stuckey, Trustee James D. Vaughn, Trustee William F. Glavin, Jr., Trustee, President and Principal Executive Officer Arthur P. Steinmetz, Vice President Krishna Memani, Vice President Sara J. Zervos, Ph.D. Vice President Jack Brown, Vice President Arthur S. Gabinet, Secretary and Chief Legal Officer Christina M. Nasta, Vice President and Chief Business Officer Mark S. Vandehey, Vice President and Chief Compliance Officer Brian W. Wixted, Treasurer and Principal Financial & Accounting Officer |
| Manager | | OFI Global Asset Management, Inc. |
| Sub-Adviser | | OppenheimerFunds, Inc. |
| Distributor | | OppenheimerFunds Distributor, Inc. |
| Transfer and Shareholder Servicing Agent | | OFI Global Asset Management, Inc. |
| Sub-Transfer Agent | | Shareholder Services, Inc. DBA OppenheimerFunds Services |
| Independent Registered Public Accounting Firm | | KPMGLLP |
| Legal Counsel | | K&L Gates LLP |
Before investing in any of the Oppenheimer funds, investors should carefully consider a fund’s investment objectives, risks, charges and expenses. Fund prospectuses and summary prospectuses contain this and other information about the funds and may be obtained by asking your financial advisor, visiting oppenheimerfunds.com, or calling us at 1.800.988.8287. Read prospectuses and summary prospectuses, carefully before investing.
The financial statements included herein have been taken from the records of the Fund without examination of those records by the independent registered public accounting firm.
| | |
| ©2013 OppenheimerFunds, Inc. All rights reserved. Oppenheimer funds are distributed by OppenheimerFunds Distributor, Inc. | | |
| | | | |
| June 30, 2013 | | |
| | | Oppenheimer Equity Income Fund/VA A Series of Oppenheimer Variable Account Funds | | Semiannual Report |
| | |
| | SEMIANNUAL REPORT Listing of Top Holdings Fund Performance Discussion Financial Statements * Prior to 4/30/13, the Fund’s name was Oppenheimer Value Fund/VA | | |

Portfolio Manager: Michael S. Levine, CFA1
Cumulative Total Returns
For the 6-Month Period Ended 6/28/132
| | | | | | | | | | | | |
Non-Service Shares | | | 13.31 | % | | | | | | | | |
Service Shares | | | 13.29 | % | | | | | | | | |
Average Annual Total Returns For the Periods Ended 6/28/132 | |
| | | 1-Year | | | 5-Year | | | 10-Year | |
Non-Service Shares | | | 24.46 | % | | | 9.02% | | | | 9.13% | |
| | | |
| | | 1-Year | | | 5-Year | | | Since
Inception
(9/18/06) | |
Service Shares | | | 22.70 | % | | | 4.10% | | | | 3.07% | |
The performance data quoted represents past performance, which does not guarantee future results. The investment return and principal value of an investment in the Fund will fluctuate so that an investor’s shares, when redeemed, may be worth more or less than their original cost. Current performance may be lower or higher than the performance quoted. For performance data current to the most recent month end, call us at 1.800.988.8287. The Fund’s total returns should not be expected to be the same as the returns of other funds, whether or not both funds have the same portfolio managers and/or similar names. The Fund’s total returns include changes in share price and reinvested distributions but do not include the charges associated with the separate account products that offer this Fund. Such performance would have been lower if such charges were taken into account.
1. Effective April 30, 2013.
2. June 28, 2013, was the last business day of the Fund’s semiannual period. See Note 1 of the accompanying Notes to Financial Statements.
| | | | |
TOP TEN COMMON STOCK HOLDINGS | | | | |
Citigroup, Inc. | | | 3.4 | % |
Apple, Inc. | | | 3.3 | |
General Electric Co. | | | 3.3 | |
JPMorgan Chase & Co. | | | 3.1 | |
Chevron Corp. | | | 2.6 | |
MetLife, Inc. | | | 2.0 | |
Goldman Sachs Group, Inc. (The) | | | 2.0 | |
Pfizer, Inc. | | | 1.9 | |
CenturyLink, Inc. | | | 1.8 | |
BP plc, Sponsored ADR | | | 1.6 | |
Portfolio holdings and allocations are subject to change. Percentages are as of June 28, 2013, and are based on net assets. For more current Fund holdings, please visit oppenheimerfunds.com.
SECTOR ALLOCATION
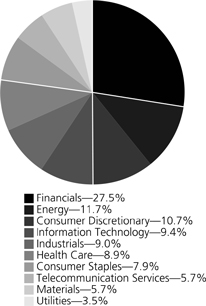
Portfolio holdings and allocations are subject to change. Percentages are as of June 28, 2013, and are based on the total market value of common stocks.
2 OPPENHEIMER EQUITY INCOME FUND/VA
| | |
Fund Performance Discussion |
The Fund’s Non-Service shares produced a return of 13.31% during the reporting period, underperforming the Russell 1000 Value Index (the “Index”), which returned 15.90%. The Fund’s underperformance relative to the Index stemmed from weaker relative stock selection in the information technology sector. Weaker relative stock selection in the financials and health care sectors detracted from performance to a lesser degree. The Fund outperformed the Index in the consumer staples and telecommunication services sectors due primarily to stronger stock selection. An underweight position in the energy sector, which was a weaker performing sector of the Index, also benefited relative results this period. The Fund also underperformed the S&P 500 Index, which returned 13.82%.
GLOBAL MARKET AND ECONOMIC ENVIRONMENT
Equities performed positively for the period as central banks throughout the world, including the United States, Europe and Japan, took steps to maintain highly accommodative monetary policy and stimulate their respective economies. In addition, a clear recovery in the U.S. provided further support for equity markets. However, later in the period, the Federal Reserve appeared to weigh the merits of backing away from its quantitative easing policy. As a result, the markets sold off sharply and made a quick reappraisal of interest rate risk in an array of credit markets and related currencies. Equities, particularly those in emerging markets and in interest rate sensitive sectors, experienced spillover effects as a result.
TOP INDIVIDUAL CONTRIBUTORS
The top performing stocks for the Fund were Walgreen Co., Verizon Communications, Inc., Honeywell International, Inc., Chevron Corp. and The Goldman Sachs Group, Inc. We exited our positions in Verizon Communications and Honeywell International by period end.
Drug store operator Walgreen performed particularly well for the period. In 2012, the company acquired a 45% stake in European pharmacy chain Alliance Boots. Synergies between the companies appeared strong and Alliance Boots contributed positively to Walgreen’s results this period. Verizon Communications is a provider of communications, information and entertainment products and services. Shares of Verizon rallied as the company continued to add wireless subscribers and its FiOs TV and internet service continued to grow. Honeywell is a diversified industrial company that released positive 2012 results during the period. The company also continued to grow despite global economic weakness. Oil company Chevron’s stock was driven partly by higher refining profitability and a rise in upstream volumes. In a favorable environment for financials, Goldman Sachs saw an increase in underwriting services and its investment banking business performed solidly. Goldman Sachs also took a number of cost-cutting measures during the period.
TOP INDIVIDUAL DETRACTORS
During the period, the most significant detractor from performance was Apple, Inc. Apple is the maker of the iPhone, iPod and iPad. Investors were concerned about the maturation of high end smartphones markets in developed countries. There were also concerns over increased competition from other smartphone makers such as Samsung and HTC. Also detracting from performance to a lesser degree were CYS Investments, Inc. and Celanese Corp. CYS Investments is a real estate investment trust (“REIT”) that invests in residential mortgage-backed securities primarily collateralized by adjustable-rate mortgage loans and guaranteed by government agencies Fannie Mae, Freddie Mac and Ginnie Mae. While the recent increase in interest rates improves CYS’ ability to pay its dividend, it also hurts the company’s book value as higher rates lead to lower bond prices. While book value will decline, we believe the recent sell off in the stock is overdone. Celanese is a manufacturer of chemical products that is heavily leveraged to the Chinese acetic acid market, which has remained weak. In addition, weak European auto demand has pressured the company’s advanced engineered materials segment.
STRATEGY & OUTLOOK
We remain cautiously optimistic about the market for remainder of 2013. We expect the U.S. economy to continue to improve. Overall, we believe corporate earnings are solid and balance sheets are in great shape. While the rise in interest rates will create some dislocation, we believe that this increase was inevitable and is a sign of a strengthening economy.
The Fund’s investment strategy and focus can change over time. The mention of specific fund holdings does not constitute a recommendation by OppenheimerFunds, Inc. or its affiliates.
Shares of Oppenheimer funds are not deposits or obligations of any bank, are not guaranteed by any bank, are not insured by the FDIC or any other agency, and involve investment risks, including the possible loss of the principal amount invested.
3 OPPENHEIMER EQUITY INCOME FUND/VA
Fund Expenses. As a shareholder of the Fund, you incur two types of costs: (1) transaction costs and (2) ongoing costs, including management fees; distribution and service fees; and other Fund expenses. These examples are intended to help you understand your ongoing costs (in dollars) of investing in the Fund and to compare these costs with the ongoing costs of investing in other mutual funds.
The examples are based on an investment of $1,000.00 invested at the beginning of the period and held for the entire 6-month period ended June 28, 2013.
Actual Expenses. The first section of the table provides information about actual account values and actual expenses. You may use the information in this section for the class of shares you hold, together with the amount you invested, to estimate the expense that you paid over the period. Simply divide your account value by $1,000.00 (for example, an $8,600.00 account value divided by $1,000.00 = 8.60), then multiply the result by the number in the first section under the heading entitled “Expenses Paid During Period” to estimate the expenses you paid on your account during this period.
Hypothetical Example for Comparison Purposes.
The second section of the table provides information about hypothetical account values and hypothetical expenses based on the Fund’s actual expense ratio for each class of shares, and an assumed rate of return of 5% per year for each class before expenses, which is not the actual return. The hypothetical account values and expenses may not be used to estimate the actual ending account balance or expenses you paid for the period. You may use this information to compare the ongoing costs of investing in the Fund and other funds. To do so, compare this 5% hypothetical example for the class of shares you hold with the 5% hypothetical examples that appear in the shareholder reports of the other funds.
Please note that the expenses shown in the table are meant to highlight your ongoing costs only and do not reflect any charges associated with the separate accounts that offer this Fund. Therefore, the “hypothetical” lines of the table are useful in comparing ongoing costs only, and will not help you determine the relative total costs of owning different funds. In addition, if these separate account charges were included your costs would have been higher.
| | | | | | | | | | | | | | |
| Actual | | Beginning
Account
Value
January 1, 2013 | | | Ending
Account
Value
June 28, 2013 | | | Expenses
Paid During
6 Months Ended
June 28, 2013 | | | |
Non-Service shares | | $ | 1,000.00 | | | $ | 1,133.10 | | | $ | 4.19 | | | |
Service shares | | | 1,000.00 | | | | 1,132.90 | | | | 5.50 | | | |
| | | | |
Hypothetical | | | | | | | | | | | | | | |
(5% return before expenses) | | | | | | | | | | | | | | |
Non-Service shares | | | 1,000.00 | | | | 1,020.60 | | | | 3.97 | | | |
Service shares | | | 1,000.00 | | | | 1,019.37 | | | | 5.21 | | | |
Expenses are equal to the Fund’s annualized expense ratio for that class, multiplied by the average account value over the period, multiplied by 179/365 (to reflect the one-half year period). Those annualized expense ratios, excluding indirect expenses from affiliated funds, based on the 6-month period ended June 28, 2013 are as follows:
| | | | |
| Class | | Expense Ratios | | |
Non-Service shares | | 0.80% | | |
Service shares | | 1.05 | | |
The expense ratios reflect voluntary waivers and/or reimbursements of expenses by the Fund’s Manager. Some of these undertakings may be modified or terminated at any time, as indicated in the Fund’s prospectus. The “Financial Highlights” tables in the Fund’s financial statements, included in this report, also show the gross expense ratios, without such waivers or reimbursements and reduction to custodian expenses, if applicable.
4 OPPENHEIMER EQUITY INCOME FUND/VA
| | |
STATEMENT OF INVESTMENTS June 28, 2013* / Unaudited |
| | | | | | | | | | |
| | | Shares | | | Value | | | |
Common Stocks—91.3% | | | | | | | | | | |
Consumer Discretionary—9.5% | | | | | | | | | | |
Auto Components—1.2% | | | | | | | | | | |
American Axle & Manufacturing Holdings, Inc.1 | | | 1,250 | | | $ | 23,287 | | | |
Lear Corp. | | | 1,250 | | | | 75,575 | | | |
| | | | | | | | 98,862 | | | |
Automobiles—1.3% | | | | | | | | | | |
Ford Motor Co. | | | 4,750 | | | | 73,482 | | | |
General Motors Co.1 | | | 1,000 | | | | 33,310 | | | |
| | | | | | | | 106,792 | | | |
Hotels, Restaurants & Leisure—0.9% | | | | | | | | | | |
McDonald’s Corp. | | | 750 | | | | 74,250 | | | |
Household Durables—0.5% | | | | | | | | | | |
MDC Holdings, Inc. | | | 1,350 | | | | 43,889 | | | |
Media—2.1% | | | | | | | | | | |
Cinemark Holdings, Inc. | | | 1,000 | | | | 27,920 | | | |
Comcast Corp., Special, Cl. A | | | 2,000 | | | | 79,340 | | | |
Time Warner Cable, Inc.2 | | | 575 | | | | 64,676 | | | |
| | | | | | | | 171,936 | | | |
Multiline Retail—2.4% | | | | | | | | | | |
Kohl’s Corp. | | | 1,500 | | | | 75,765 | | | |
Target Corp. | | | 1,750 | | | | 120,505 | | | |
| | | | | | | | 196,270 | | | |
Specialty Retail—1.1% | | | | | | | | | | |
Best Buy Co., Inc. | | | 1,750 | | | | 47,827 | | | |
Foot Locker, Inc. | | | 1,250 | | | | 43,912 | | | |
| | | | | | | | 91,739 | | | |
Consumer Staples—7.2% | | | | | | | | | | |
Beverages—2.0% | | | | | | | | | | |
Molson Coors Brewing Co., Cl. B, Non-Vtg. | | | 740 | | | | 35,416 | | | |
PepsiCo, Inc. | | | 1,550 | | | | 126,775 | | | |
| | | | | | | | 162,191 | | | |
Food & Staples Retailing—2.2% | | | | | | | | | | |
Rite Aid Corp.1 | | | 10,000 | | | | 28,600 | | | |
Safeway, Inc. | | | 1,500 | | | | 35,490 | | | |
Walgreen Co. | | | 2,600 | | | | 114,920 | | | |
| | | | | | | | 179,010 | | | |
Food Products—1.6% | | | | | | | | | | |
Archer-Daniels-Midland Co. | | | 1,500 | | | | 50,865 | | | |
General Mills, Inc. | | | 800 | | | | 38,824 | | | |
Pinnacle Foods, Inc. | | | 1,625 | | | | 39,244 | | | |
| | | | | | | | 128,933 | | | |
Household Products—1.0% | | | | | | | | | | |
Procter & Gamble Co. (The) | | | 1,000 | | | | 76,990 | | | |
Tobacco—0.4% | | | | | | | | | | |
Philip Morris International, Inc. | | | 400 | | | | 34,648 | | | |
Energy—10.7% | | | | | | | | | | |
Energy Equipment & Services—2.1% | | | | | | | | | | |
Baker Hughes, Inc. | | | 500 | | | | 23,065 | | | |
Ensco plc, Cl. A | | | 1,175 | | | | 68,291 | | | |
Halliburton Co. | | | 1,750 | | | | 73,010 | | | |
| | | | | | | | 164,366 | | | |
Oil, Gas & Consumable Fuels—8.6% | | | | | | | | | | |
Apache Corp. | | | 1,040 | | | | 87,183 | | | |
BP plc, Sponsored ADR | | | 3,135 | | | | 130,855 | | | |
Chevron Corp. | | | 1,750 | | | | 207,095 | | | |
HollyFrontier Corp. | | | 125 | | | | 5,348 | | | |
Kinder Morgan Management LLC1 | | | 500 | | | | 41,795 | | | |
Kinder Morgan, Inc. | | | 2,450 | | | | 93,468 | | | |
Royal Dutch Shell plc, ADR | | | 1,160 | | | | 74,008 | | | |
Williams Cos., Inc. (The) | | | 1,500 | | | | 48,705 | | | |
| | | | | | | | 688,457 | | | |
Financials—25.0% | | | | | | | | | | |
Capital Markets—3.0% | | | | | | | | | | |
Goldman Sachs Group, Inc. (The) | | | 1,040 | | | | 157,300 | | | |
Morgan Stanley | | | 3,450 | | | | 84,284 | | | |
| | | | | | | | 241,584 | | | |
Commercial Banks—0.8% | | | | | | | | | | |
CIT Group, Inc.1 | | | 1,320 | | | | 61,552 | | | |
| | | | | | | | |
| | | Shares | | | Value | |
Consumer Finance—0.9% | | | | | | | | |
Capital One Financial Corp. | | | 1,200 | | | $ | 75,372 | |
Diversified Financial Services—8.5% | | | | | | | | |
Bank of America Corp. | | | 7,770 | | | | 99,922 | |
Citigroup, Inc. | | | 5,755 | | | | 276,067 | |
JPMorgan Chase & Co. | | | 4,750 | | | | 250,753 | |
KKR Financial Holdings LLC | | | 6,250 | | | | 65,937 | |
| | | | | | | | 692,679 | |
Insurance—7.4% | | | | | | | | |
ACE Ltd. | | | 1,250 | | | | 111,850 | |
American International Group, Inc.1 | | | 2,890 | | | | 129,183 | |
Assured Guaranty Ltd. | | | 3,750 | | | | 82,725 | |
Everest Re Group Ltd. | | | 375 | | | | 48,097 | |
MetLife, Inc. | | | 3,500 | | | | 160,160 | |
XL Group plc | | | 2,000 | | | | 60,640 | |
| | | | | | | | 592,655 | |
Real Estate Investment Trusts (REITs)—4.4% | | | | | | | | |
Apollo Commercial Real Estate Finance, Inc. | | | 3,625 | | | | 57,565 | |
Ashford Hospitality Trust, Inc. | | | 2,375 | | | | 27,194 | |
Colony Financial, Inc. | | | 3,750 | | | | 74,587 | |
CYS Investments, Inc. | | | 6,125 | | | | 56,411 | |
Rayonier, Inc. | | | 750 | | | | 41,542 | |
Starwood Property Trust, Inc. | | | 3,500 | | | | 86,625 | |
Two Harbors Investment Corp. | | | 1,250 | | | | 12,813 | |
| | | | | | | | 356,737 | |
Health Care—8.2% | | | | | | | | |
Health Care Equipment & Supplies—0.7% | | | | | | | | |
Baxter International, Inc. | | | 500 | | | | 34,635 | |
Medtronic, Inc. | | | 500 | | | | 25,735 | |
| | | | | | | | 60,370 | |
Health Care Providers & Services—2.4% | | | | | | | | |
Cardinal Health, Inc. | | | 1,460 | | | | 68,912 | |
UnitedHealth Group, Inc. | | | 1,800 | | | | 117,864 | |
| | | | | | | | 186,776 | |
Pharmaceuticals—5.1% | | | | | | | | |
Johnson & Johnson | | | 680 | | | | 58,385 | |
Merck & Co., Inc. | | | 2,000 | | | | 92,900 | |
Novartis AG, ADR | | | 125 | | | | 8,839 | |
Pfizer, Inc. | | | 5,500 | | | | 154,055 | |
Teva Pharmaceutical Industries Ltd., Sponsored ADR | | | 2,500 | | | | 98,000 | |
| | | | | | | | 412,179 | |
Industrials—8.1% | | | | | | | | |
Aerospace & Defense—0.8% | | | | | | | | |
General Dynamics Corp. | | | 500 | | | | 39,165 | |
Textron, Inc. | | | 1,000 | | | | 26,050 | |
| | | | | | | | 65,215 | |
Airlines—1.4% | | | | | | | | |
United Continental Holdings, Inc.1 | | | 3,500 | | | | 109,515 | |
Commercial Services & Supplies—1.0% | | | | | | | | |
ADT Corp. (The) | | | 950 | | | | 37,857 | |
RR Donnelley & Sons Co. | | | 3,000 | | | | 42,030 | |
| | | | | | | | 79,887 | |
Electrical Equipment—0.4% | | | | | | | | |
General Cable Corp. | | | 1,000 | | | | 30,750 | |
Industrial Conglomerates—3.3% | | | | | | | | |
General Electric Co. | | | 11,350 | | | | 263,207 | |
Machinery—0.4% | | | | | | | | |
Navistar International Corp.1 | | | 1,250 | | | | 34,700 | |
Marine—0.3% | | | | | | | | |
Costamare, Inc. | | | 1,500 | | | | 25,845 | |
Road & Rail—0.5% | | | | | | | | |
CSX Corp. | | | 1,750 | | | | 40,582 | |
Information Technology—8.7% | | | | | | | | |
Communications Equipment—2.1% | | | | | | | | |
Cisco Systems, Inc. | | | 3,630 | | | | 88,245 | |
QUALCOMM, Inc. | | | 1,375 | | | | 83,985 | |
| | | | | | | | 172,230 | |
Computers & Peripherals—3.3% | | | | | | | | |
Apple, Inc. | | | 675 | | | | 267,354 | |
5 OPPENHEIMER EQUITY INCOME FUND/VA
| | |
STATEMENT OF INVESTMENTS Unaudited / (Continued) |
| | | | | | | | | | |
| | | Shares | | | Value | | | |
Computers & Peripherals (Continued) | | | | | | | | | | |
EMC Corp. | | | 100 | | | $ | 2,362 | | | |
| | | | | | | | 269,716 | | | |
Semiconductors & Semiconductor Equipment—1.8% | | | |
Analog Devices, Inc. | | | 1,030 | | | | 46,412 | | | |
Intel Corp. | | | 2,660 | | | | 64,425 | | | |
Maxim Integrated Products, Inc. | | | 1,190 | | | | 33,058 | | | |
| | | | | | | | 143,895 | | | |
Software—1.5% | | | | | | | | | | |
Microsoft Corp. | | | 3,500 | | | | 120,855 | | | |
Materials—5.1% | | | | | | | | | | |
Chemicals—2.2% | | | |
Celanese Corp., Series A | | | 750 | | | | 33,600 | | | |
LyondellBasell Industries NV, Cl. A | | | 950 | | | | 62,947 | | | |
Mosaic Co. (The) | | | 1,500 | | | | 80,715 | | | |
| | | | | | | | 177,262 | | | |
Metals & Mining—1.1% | | | | | | | | | | |
Allegheny Technologies, Inc. | | | 2,250 | | | | 59,197 | | | |
Freeport-McMoRan Copper & Gold, Inc. | | | 1,250 | | | | 34,512 | | | |
| | | | | | | | 93,709 | | | |
Paper & Forest Products—1.8% | | | | | | | | | | |
Domtar Corp. | | | 550 | | | | 36,575 | | | |
International Paper Co. | | | 2,350 | | | | 104,129 | | | |
| | | | | | | | 140,704 | | | |
Telecommunication Services—5.3% | | | | | | | | | | |
Diversified Telecommunication Services—5.3% | | | |
AT&T, Inc. | | | 2,900 | | | | 102,660 | | | |
CenturyLink, Inc. | | | 4,000 | | | | 141,400 | | | |
Consolidated Communications Holdings, Inc. | | | 3,275 | | | | 57,018 | | | |
Frontier Communications Corp. | | | 19,250 | | | | 77,963 | | | |
Windstream Corp. | | | 5,000 | | | | 38,550 | | | |
| | | | | | | | 417,591 | | | |
Wireless Telecommunication Services—0.0% | | | |
Telephone & Data Systems, Inc. | | | 120 | | | | 2,958 | | | |
Utilities—3.4% | | | | | | | | | | |
Electric Utilities—3.1% | | | |
American Electric Power Co., Inc. | | | 1,000 | | | | 44,780 | | | |
Edison International | | | 1,250 | | | | 60,200 | | | |
Exelon Corp. | | | 1,250 | | | | 38,600 | | | |
FirstEnergy Corp. | | | 1,250 | | | | 46,675 | | | |
PPL Corp. | | | 1,500 | | | | 45,390 | | | |
| | | | | | | 235,645 | | | |
| | | | | | | | |
| | | Shares | | | Value | |
Energy Traders—0.3% | | | | | | | | |
NRG Energy, Inc. | | | 1,000 | | | $ | 26,700 | |
Total Common Stocks
(Cost $6,992,555) | | | | | | | 7,349,203 | |
| | |
| | | Principal
Amount | | | | |
Convertible Corporate Bonds and Notes—2.1% | |
| Micron Technology, Inc., 2.125% Cv. Sr. Unsec. Nts., Series F, 2/15/333 | | $ | 35,000 | | | | 51,034 | |
| Navistar International Corp., 3% Cv. Sr. Sub. Nts., 10/15/14 | | | 55,000 | | | | 53,694 | |
| Radian Group, Inc., 2.25% Cv. Sr. Unsec. Nts., 3/1/19 | | | 25,000 | | | | 32,016 | |
| Starwood Property Trust, Inc., 4% Cv. Sr. Unsec. Nts., 1/15/19 | | | 35,000 | | | | 35,875 | |
Total Convertible Corporate Bonds and Notes | |
(Cost $172,482) | | | | | | | 172,619 | |
| | |
| | | Shares | | | | |
Preferred Stocks—2.5% | |
| Beazer Homes USA, Inc., 7.50% Cv. | | | 250 | | | | 7,310 | |
| Continental Airlines Finance Trust II, 6% Cv., Non-Vtg. | | | 1,250 | | | | 55,664 | |
| General Motors Co., 4.75% Cv., Series B, Non-Vtg. | | | 2,500 | | | | 121,406 | |
| Weyerhaeuser Co., 6.375% Cv., Series A, Non-Vtg.1 | | | 250 | | | | 12,753 | |
Total Preferred Stocks | |
(Cost $195,849) | | | | | | | 197,133 | |
Investment Company—3.7% | |
Oppenheimer Institutional Money Market Fund, Cl. E, 0.11%4,5
(Cost $295,446) | | | 295,446 | | | | 295,446 | |
Total Investments,
at Value (Cost $7,656,332) | | | 99.6 | % | | | 8,014,401 | |
Assets in Excess of Other Liabilities | | | 0.4 | | | | 36,175 | |
Net Assets | | | 100.0 | % | | $ | 8,050,576 | |
Footnotes to Statement of Investments
* June 28, 2013 represents the last business day of the Fund’s semiannual period. See Note 1 of the accompanying Notes.
1. Non-income producing security.
2. All or a portion of the security position is held in segregated accounts and pledges to cover margin requirements with respect to outstanding written options. The aggregate market value of such securities is $64,676. See Note 6 of the accompanying Notes.
3. Represents securities sold under Rule 144A, which are exempt from registration under the Securities Act of 1933, as amended. These securities have been determined to be liquid under guidelines established by the Board of Trustees. These securities amount to $51,034 or 0.63% of the Fund’s net assets as of June 28, 2013.
4. Is or was an affiliate, as defined in the Investment Company Act of 1940, at or during the period ended June 28, 2013, by virtue of the Fund owning at least 5% of the voting securities of the issuer or as a result of the Fund and the issuer having the same investment adviser. Transactions during the period in which the issuer was an affiliate are as follows:
| | | | | | | | | | | | | | | | |
| | | Shares
December 31,
2012 | | | Gross
Additions | | | Gross
Reductions | | | Shares
June 28,
2013 | |
Oppenheimer Institutional Money Market Fund, Cl. E | | | 60,104 | | | | 2,442,069 | | | | 2,206,727 | | | | 295,446 | |
| | | | |
| | | | | | | | | Value | | | Income | |
Oppenheimer Institutional Money Market Fund, Cl. E | | | | | | | | | | $ | 295,446 | | | $ | 113 | |
5. Rate shown is the 7-day yield as of June 28, 2013.
6 OPPENHEIMER EQUITY INCOME FUND/VA
| | | | | | | | | | | | | | | | | | | | | | | | | | | | |
Exchange Traded Written Option Contracts as of June 28, 2013 are as follows: | |
| Description | | Type | | | Number of
Contracts | | | Exercise
Price | | | Expiration
Date | | | Premiums
Received | | | Value | | | Unrealized
Depreciation | |
Time Warner Cable, Inc. | | | Call | | | | 5 | | | $ | 105.00 | | | | 7/20/13 | | | $ | 787 | | | $ | (4,250) | | | $ | 3,463 | |
See accompanying Notes to Financial Statements.
7 OPPENHEIMER EQUITY INCOME FUND/VA
| | |
STATEMENT OF ASSETS AND LIABILITIES |
| | | | |
Assets | | | | |
Investments, at value—see accompanying statement of investments: | | | | |
Unaffiliated companies (cost $7,360,886) | | $ | 7,718,955 | |
Affiliated companies (cost $295,446) | | | 295,446 | |
| | | | 8,014,401 | |
Receivables and other assets: | | | | |
Investments sold | | | 151,097 | |
Dividends | | | 17,081 | |
Shares of beneficial interest sold | | | 16,481 | |
Other | | | 9,519 | |
Total assets | | | 8,208,579 | |
|
| |
Liabilities | | | | |
Bank overdraft | | | 1,503 | |
Options written, at value (premiums received $787) | | | 4,250 | |
Payables and other liabilities: | | | | |
Investments purchased | | | 125,930 | |
Legal, auditing and other professional fees | | | 9,139 | |
Trustees’ compensation | | | 7,766 | |
Shareholder communications | | | 5,770 | |
Distribution and service plan fees | | | 1,478 | |
Shares of beneficial interest redeemed | | | 1,263 | |
Transfer and shareholder servicing agent fees | | | 607 | |
Other | | | 297 | |
Total liabilities | | | 158,003 | |
|
| | |
Net Assets | | $ | 8,050,576 | |
|
| |
Composition of Net Assets | | | | |
Par value of shares of beneficial interest | | $ | 667 | |
Additional paid-in capital | | | 7,464,739 | |
Accumulated net investment income | | | 42,296 | |
Accumulated net realized gain on investments and foreign currency transactions | | | 188,268 | |
Net unrealized appreciation on investments and translation of assets and liabilities denominated in foreign currencies | | | 354,606 | |
Net Assets | | $ | 8,050,576 | |
|
| |
Net Asset Value Per Share | | | | |
Non-Service Shares: | | | | |
| Net asset value, redemption price per share and offering price per share (based on net assets of $191,250 and 18,684 shares of beneficial interest outstanding) | | | $10.24 | |
Service Shares: | | | | |
| Net asset value, redemption price per share and offering price per share (based on net assets of $7,859,326 and 647,975 shares of beneficial interest outstanding) | | | $12.13 | |
1. June 28, 2013 represents the last business day of the Fund’s semiannual period. See Note 1 of the accompanying Notes.
See accompanying Notes to Financial Statements.
8 OPPENHEIMER EQUITY INCOME FUND/VA
| | |
STATEMENT OF OPERATIONS For the Six Months Ended June 28, 20131 / Unaudited |
| | | | |
Investment Income | | | | |
Dividends: | | | | |
Unaffiliated companies (net of foreign withholding taxes of $914) | | $ | 91,138 | |
Affiliated companies | | | 113 | |
Total investment income | | | 91,251 | |
|
| | |
Expenses | | | | |
Management fees | | | 28,072 | |
Distribution and service plan fees—Service shares | | | 9,127 | |
Transfer and shareholder servicing agent fees: | | | | |
Non-Service shares | | | 88 | |
Service shares | | | 3,655 | |
Shareholder communications: | | | | |
Non-Service shares | | | 154 | |
Service shares | | | 6,357 | |
Custodian fees and expenses | | | 605 | |
Trustees’ compensation | | | 6,090 | |
Legal, auditing and other professional fees | | | 14,499 | |
Other | | | 3,503 | |
Total expenses | | | 72,150 | |
Less waivers and reimbursements of expenses | | | (32,636) | |
Net expenses | | | 39,514 | |
|
| | |
Net Investment Income | | | 51,737 | |
|
| | |
Realized and Unrealized Gain (Loss) | | | | |
Net realized gain (loss) on: | | | | |
Investments from unaffiliated companies | | | 1,285,341 | |
Closing and expiration of option contracts written | | | 240 | |
Foreign currency transactions | | | (11) | |
Net realized gain | | | 1,285,570 | |
Net change in unrealized appreciation/depreciation on: | | | | |
Investments | | | (416,216) | |
Translation of assets and liabilities denominated in foreign currencies | | | (3) | |
Option contracts written | | | (3,463) | |
Net change in unrealized appreciation/depreciation | | | (419,682) | |
|
| | |
Net Increase in Net Assets Resulting from Operations | | $ | 917,625 | |
1. June 28, 2013 represents the last business day of the Fund’s semiannual period. See Note 1 of the accompanying Notes.
See accompanying Notes to Financial Statements.
9 OPPENHEIMER EQUITY INCOME FUND/VA
| | |
STATEMENTS OF CHANGES IN NET ASSETS |
| | | | | | | | | | |
| | | Six Months Ended
June 28, 20131
(Unaudited) | | | | | Year Ended
December 31, 2012 | |
Operations | | | | | | | | | | |
Net investment income | | $ | 51,737 | | | | | $ | 92,067 | |
Net realized gain | | | 1,285,570 | | | | | | 255,102 | |
Net change in unrealized appreciation/depreciation | | | (419,682) | | | | | | 530,259 | |
Net increase in net assets resulting from operations | | | 917,625 | | | | | | 877,428 | |
| | | | |
Dividends and/or Distributions to Shareholders | | | | | | | | | | |
Dividends from net investment income: | | | | | | | | | | |
Non-Service shares | | | (2,605) | | | | | | (1,809) | |
Service shares | | | (91,168) | | | | | | (81,182) | |
| | | (93,773) | | | | | | (82,991) | |
| | | | |
Beneficial Interest Transactions | | | | | | | | | | |
Net increase (decrease) in net assets resulting from beneficial interest transactions: | | | | | | | | | | |
Non-Service shares | | | 18,161 | | | | | | 33,842 | |
Service shares | | | 157,227 | | | | | | (766,376) | |
| | | 175,388 | | | | | | (732,534) | |
| | | | |
Net Assets | | | | | | | | | | |
Total increase | | | 999,240 | | | | | | 61,903 | |
Beginning of period | | | 7,051,336 | | | | | | 6,989,433 | |
| | | |
End of period (including accumulated net investment income of $42,296 and $84,332, respectively) | | $ | 8,050,576 | | | | | $ | 7,051,336 | |
1. June 28, 2013 represents the last business day of the Fund’s semiannual period. See Note 1 of the accompanying Notes.
See accompanying Notes to Financial Statements.
10 OPPENHEIMER EQUITY INCOME FUND/VA
| | | | | | | | | | | | | | | | | | | | | | | | |
Non-Service Shares | |
| Six Months
Ended
June 28, 20131
(Unaudited) |
| |
| Year Ended
December
31, 2012 |
| |
| Year Ended
December
30, 2011 |
1 | |
| Year Ended
December
31, 2010 |
| |
| Year Ended
December
31, 2009 |
| |
| Year Ended
December
31, 2008 |
|
Per Share Operating Data | | | | | | | | | | | | | | | | | | | | | | | | |
Net asset value, beginning of period | | $ | 9.15 | | | $ | 8.00 | | | $ | 8.49 | | | $ | 7.22 | | | $ | 4.99 | | | $ | 11.73 | |
Income (loss) from investment operations: | | | | | | | | | | | | | | | | | | | | | | | | |
Net investment income2 | | | 0.08 | | | | 0.16 | | | | 0.15 | | | | 0.11 | | | | 0.11 | | | | 0.12 | |
Net realized and unrealized gain (loss) | | | 1.15 | | | | 1.11 | | | | (0.56 | ) | | | 1.24 | | | | 2.14 | | | | (4.44 | ) |
Total from investment operations | | | 1.23 | | | | 1.27 | | | | (0.41 | ) | | | 1.35 | | | | 2.25 | | | | (4.32 | ) |
Dividends and/or distributions to shareholders: | | | | | | | | | | | | | | | | | | | | | | | | |
Dividends from net investment income | | | (0.14 | ) | | | (0.12 | ) | | | (0.08 | ) | | | (0.08 | ) | | | (0.02 | ) | | | (2.42 | ) |
Net asset value, end of period | | $ | 10.24 | | | $ | 9.15 | | | $ | 8.00 | | | $ | 8.49 | | | $ | 7.22 | | | $ | 4.99 | |
| | | | | | | | | | | | | | | | | | | | | | | | | |
Total Return, at Net Asset Value3 | | | 13.31 | % | | | 16.08 | % | | | (4.93 | )% | | | 18.85 | % | | | 45.08 | % | | | (36.43 | )% |
| | | | | | | | | | | | | | | | | | | | | | | | | |
Ratios/Supplemental Data | | | | | | | | | | | | | | | | | | | | | | | | |
Net assets, end of period (in thousands) | | $ | 191 | | | $ | 154 | | | $ | 104 | | | $ | 92 | | | $ | 38 | | | $ | 6 | |
Average net assets (in thousands) | | $ | 177 | | | $ | 132 | | | $ | 101 | | | $ | 57 | | | $ | 20 | | | $ | 857 | |
Ratios to average net assets:4 | | | | | | | | | | | | | | | | | | | | | | | | |
Net investment income | | | 1.63 | % | | | 1.82 | % | | | 1.78 | % | | | 1.46 | % | | | 1.75 | % | | | 1.07 | % |
Total expenses5 | | | 1.68 | % | | | 1.75 | % | | | 1.83 | % | | | 2.05 | % | | | 2.30 | % | | | 1.48 | % |
Expenses after payments, waivers and/or reimbursements and reduction to custodian expenses | | | 0.80 | % | | | 0.80 | % | | | 0.80 | % | | | 0.57 | % | | | 0.85 | % | | | 1.25 | % |
Portfolio turnover rate | | | 160 | % | | | 87 | % | | | 86 | % | | | 109 | % | | | 122 | % | | | 175 | % |
1. June 28, 2013 and December 30, 2011 represent the last business days of the Fund’s reporting periods. See Note 1 of the accompanying Notes.
2. Per share amounts calculated based on the average shares outstanding during the period.
3. Assumes an initial investment on the business day before the first day of the fiscal period, with all dividends and distributions reinvested in additional shares on the reinvestment date, and redemption at the net asset value calculated on the last business day of the fiscal period. Total returns are not annualized for periods less than one full year. Total return information does not reflect expenses that apply at the separate account level or to related insurance products. Inclusion of these charges would reduce the total return figures for all periods shown. Returns do not reflect the deduction of taxes that a shareholder would pay on fund distributions or the redemption of fund shares.
4. Annualized for periods less than one full year.
5. Total expenses including indirect expenses from affiliated fund were as follows:
| | | | |
Six Months Ended June 28, 2013 | | | 1.68 | % |
Year Ended December 31, 2012 | | | 1.75 | % |
Year Ended December 30, 2011 | | | 1.83 | % |
Year Ended December 31, 2010 | | | 2.05 | % |
Year Ended December 31, 2009 | | | 2.31 | % |
Year Ended December 31, 2008 | | | 1.48 | % |
See accompanying Notes to Financial Statements.
11 OPPENHEIMER EQUITY INCOME FUND/VA
| | |
FINANCIAL HIGHLIGHTS Continued |
| | | | | | | | | | | | | | | | | | | | | | | | |
Service Shares | |
| Six Months
Ended
June 28, 20131
(Unaudited) |
| |
| Year Ended
December
31, 2012 |
| |
| Year Ended
December
30, 2011 |
1 | |
| Year Ended
December
31, 2010 |
| |
| Year Ended
December
31, 2009 |
| |
| Year Ended
December
31, 2008 |
|
Per Share Operating Data | | | | | | | | | | | | | | | | | | | | | | | | |
Net asset value, beginning of period | | $ | 10.83 | | | $ | 9.69 | | | $ | 10.23 | | | $ | 8.99 | | | $ | 6.79 | | | $ | 11.75 | |
Income (loss) from investment operations: | | | | | | | | | | | | | | | | | | | | | | | | |
Net investment income2 | | | 0.08 | | | | 0.13 | | | | 0.11 | | | | 0.08 | | | | 0.09 | | | | 0.08 | |
Net realized and unrealized gain (loss) | | | 1.36 | | | | 1.13 | | | | (0.56 | ) | | | 1.24 | | | | 2.12 | | | | (4.97 | ) |
Total from investment operations | | | 1.44 | | | | 1.26 | | | | (0.45 | ) | | | 1.32 | | | | 2.21 | | | | (4.89 | ) |
Dividends and/or distributions to shareholders: | | | | | | | | | | | | | | | | | | | | | | | | |
Dividends from net investment income | | | (0.14 | ) | | | (0.12 | ) | | | (0.09 | ) | | | (0.08 | ) | | | (0.01 | ) | | | (0.07 | ) |
Net asset value, end of period | | $ | 12.13 | | | $ | 10.83 | | | $ | 9.69 | | | $ | 10.23 | | | $ | 8.99 | | | $ | 6.79 | |
| | | | | | | | | | | | | | | | | | | | | | | | | |
Total Return, at Net Asset Value3 | | | 13.29 | % | | | 13.09 | % | | | (4.48 | )% | | | 14.81 | % | | | 32.57 | % | | | (41.62 | )% |
| | | | | | | | | | | | | | | | | | | | | | | | | |
Ratios/Supplemental Data | | | | | | | | | | | | | | | | | | | | | | | | |
Net assets, end of period (in thousands) | | $ | 7,860 | | | $ | 6,897 | | | $ | 6,885 | | | $ | 7,311 | | | $ | 7,505 | | | $ | 4,690 | |
Average net assets (in thousands) | | $ | 7,418 | | | $ | 7,095 | | | $ | 7,449 | | | $ | 7,008 | | | $ | 5,501 | | | $ | 5,561 | |
Ratios to average net assets:4 | | | | | | | | | | | | | | | | | | | | | | | | |
Net investment income | | | 1.37 | % | | | 1.26 | % | | | 1.08 | % | | | 0.85 | % | | | 1.10 | % | | | 0.84 | % |
Total expenses5 | | | 1.92 | % | | | 1.93 | % | | | 1.90 | % | | | 2.08 | % | | | 2.17 | % | | | 2.13 | % |
Expenses after payments, waivers and/or reimbursements and reduction to custodian expenses | | | 1.05 | % | | | 1.04 | % | | | 1.05 | % | | | 0.93 | % | | | 1.15 | % | | | 1.50 | % |
Portfolio turnover rate | | | 160 | % | | | 87 | % | | | 86 | % | | | 109 | % | | | 122 | % | | | 175 | % |
1. June 28, 2013 and December 30, 2011 represent the last business days of the Fund’s reporting periods. See Note 1 of the accompanying Notes.
2. Per share amounts calculated based on the average shares outstanding during the period.
3. Assumes an initial investment on the business day before the first day of the fiscal period, with all dividends and distributions reinvested in additional shares on the reinvestment date, and redemption at the net asset value calculated on the last business day of the fiscal period. Total returns are not annualized for periods less than one full year. Total return information does not reflect expenses that apply at the separate account level or to related insurance products. Inclusion of these charges would reduce the total return figures for all periods shown. Returns do not reflect the deduction of taxes that a shareholder would pay on fund distributions or the redemption of fund shares.
4. Annualized for periods less than one full year.
5. Total expenses including indirect expenses from affiliated fund were as follows:
| | | | |
Six Months Ended June 28, 2013 | | | 1.92 | % |
Year Ended December 31, 2012 | | | 1.93 | % |
Year Ended December 30, 2011 | | | 1.90 | % |
Year Ended December 31, 2010 | | | 2.08 | % |
Year Ended December 31, 2009 | | | 2.18 | % |
Year Ended December 31, 2008 | | | 2.13 | % |
See accompanying Notes to Financial Statements.
12 OPPENHEIMER EQUITY INCOME FUND/VA
| | |
NOTES TO FINANCIAL STATEMENTS Unaudited |
1. Significant Accounting Policies
Oppenheimer Equity Income Fund/VA (the “Fund”), formerly Oppenheimer Value Fund/VA, is a separate series of Oppenheimer Variable Account Funds, a diversified open-end management investment company registered under the Investment Company Act of 1940, as amended. The Fund’s investment objective is to seek total return. The Fund’s investment adviser is OFI Global Asset Management, Inc. (“OFI Global” or the “Manager”), a wholly-owned subsidiary of OppenheimerFunds, Inc. (“OFI” or the “Sub-Adviser”). The Manager has entered into a sub-advisory agreement with OFI. Shares of the Fund are sold only to separate accounts of life insurance companies.
The Fund offers two classes of shares. Both classes are sold at their offering price, which is the net asset value per share, to separate investment accounts of participating insurance companies as an underlying investment for variable life insurance policies, variable annuity contracts or other investment products. The class of shares designated as Service shares is subject to a distribution and service plan. Both classes of shares have identical rights and voting privileges with respect to the Fund in general and exclusive voting rights on matters that affect that class alone. Earnings, net assets and net asset value per share may differ due to each class having its own expenses, such as transfer and shareholder servicing agent fees and shareholder communications, directly attributable to that class.
The following is a summary of significant accounting policies consistently followed by the Fund.
Semiannual and Annual Periods. The Fund’s financial statements are presented through the last day the New York Stock Exchange was open for trading during each reporting period. The Fund’s financial statements have been presented through that date to maintain consistency with the Fund’s net asset value calculations used for shareholder transactions.
Investment in Oppenheimer Institutional Money Market Fund. The Fund is permitted to invest daily available cash balances in an affiliated money market fund. The Fund may invest the available cash in Class E shares of Oppenheimer Institutional Money Market Fund (“IMMF”) to seek current income while preserving liquidity. IMMF is a registered open-end management investment company, regulated as a money market fund under the Investment Company Act of 1940, as amended. The Manager is the investment adviser of IMMF, and the Sub-Adviser provides investment and related advisory services to IMMF. When applicable, the Fund’s investment in IMMF is included in the Statement of Investments. Shares of IMMF are valued at their net asset value per share. As a shareholder, the Fund is subject to its proportional share of IMMF’s Class E expenses, including its management fee. The Manager will waive fees and/or reimburse Fund expenses in an amount equal to the indirect management fees incurred through the Fund’s investment in IMMF.
Foreign Currency Translation. The Fund’s accounting records are maintained in U.S. dollars. The values of securities denominated in foreign currencies and amounts related to the purchase and sale of foreign securities and foreign investment income are translated into U.S. dollars as of the close of the New York Stock Exchange (the “Exchange”), normally 4:00 P.M. Eastern time, on each day the Exchange is open for trading. Foreign exchange rates may be valued primarily using a reliable bank, dealer or service authorized by the Board of Trustees.
Reported net realized gains and losses from foreign currency transactions arise from sales of portfolio securities, sales and maturities of short-term securities, sales of foreign currencies, exchange rate fluctuations between the trade and settlement dates on securities transactions, and the difference between the amounts of dividends, interest, and foreign withholding taxes recorded on the Fund’s books and the U.S. dollar equivalent of the amounts actually received or paid. Net unrealized appreciation and depreciation on the translation of assets and liabilities denominated in foreign currencies arise from changes in the values of assets and liabilities, including investments in securities at fiscal period end, resulting from changes in exchange rates.
The effect of changes in foreign currency exchange rates on investments is separately identified from the fluctuations arising from changes in market values of securities held and reported with all other foreign currency gains and losses in the Fund’s Statement of Operations.
Allocation of Income, Expenses, Gains and Losses. Income, expenses (other than those attributable to a specific class), gains and losses are allocated on a daily basis to each class of shares based upon the relative proportion of net assets represented by such class. Operating expenses directly attributable to a specific class are charged against the operations of that class.
Federal Taxes. The Fund intends to comply with provisions of the Internal Revenue Code applicable to regulated investment companies and to distribute substantially all of its investment company taxable income, including any net realized gain on investments not offset by capital loss carryforwards, if any, to shareholders. Therefore, no federal income or excise tax provision is required. The Fund files income tax returns in U.S. federal and applicable state jurisdictions. The statute of limitations on the Fund’s tax return filings generally remain open for the three preceding fiscal reporting period ends.
During the fiscal year ended December 31, 2012, the Fund utilized $231,212 of capital loss carryforward to offset capital gains realized in that fiscal year. Details of the fiscal year ended December 31, 2012 capital loss carryforwards are included in the table below. Capital loss carryforwards with no expiration, if any, must be utilized prior to those with expiration dates. Capital losses with no expiration will be carried forward to future years if not offset by gains.
As of June 28, 2013, it is estimated that there are no capital loss carryforwards. The estimated capital loss carryforward represents the carryforward as of the end of the last fiscal year, increased or decreased by capital losses or gains realized in the first six months of the current fiscal year. During the six months ended June 28, 2013, it is estimated that the Fund will utilize $973,499 of capital loss carryforward to offset realized capital gains.
13 OPPENHEIMER EQUITY INCOME FUND/VA
| | |
NOTES TO FINANCIAL STATEMENTS Unaudited / (Continued) |
1. Significant Accounting Policies (Continued)
Net investment income (loss) and net realized gain (loss) may differ for financial statement and tax purposes. The character of dividends and distributions made during the fiscal year from net investment income or net realized gains may differ from their ultimate characterization for federal income tax purposes. Also, due to timing of dividends and distributions, the fiscal year in which amounts are distributed may differ from the fiscal year in which the income or net realized gain was recorded by the Fund.
The aggregate cost of securities and other investments and the composition of unrealized appreciation and depreciation of securities and other investments for federal income tax purposes as of June 28, 2013 are noted in the following table. The primary difference between book and tax appreciation or depreciation of securities and other investments, if applicable, is attributable to the tax deferral of losses or tax realization of financial statement unrealized gain or loss.
| | | | |
Federal tax cost of securities | | $ | 7,729,820 | |
Federal tax cost of other investments | | | (787 | ) |
| | | | |
Total federal tax cost | | $ | 7,729,033 | |
| | | | |
Gross unrealized appreciation | | $ | 456,114 | |
Gross unrealized depreciation | | | (174,996 | ) |
| | | | |
Net unrealized appreciation | | $ | 281,118 | |
| | | | |
Trustees’ Compensation. The Board of Trustees has adopted a compensation deferral plan for independent trustees that enables trustees to elect to defer receipt of all or a portion of the annual compensation they are entitled to receive from the Fund. For purposes of determining the amount owed to the Trustee under the plan, deferred amounts are treated as though equal dollar amounts had been invested in shares of the Fund or in other Oppenheimer funds selected by the Trustee. The Fund purchases shares of the funds selected for deferral by the Trustee in amounts equal to his or her deemed investment, resulting in a Fund asset equal to the deferred compensation liability. Such assets are included as a component of “Other” within the asset section of the Statement of Assets and Liabilities. Deferral of trustees’ fees under the plan will not affect the net assets of the Fund, and will not materially affect the Fund’s assets, liabilities or net investment income per share. Amounts will be deferred until distributed in accordance with the compensation deferral plan.
Dividends and Distributions to Shareholders. Dividends and distributions to shareholders, which are determined in accordance with income tax regulations and may differ from U.S. generally accepted accounting principles, are recorded on the ex-dividend date. Income and capital gain distributions, if any, are declared and paid annually or at other times as deemed necessary by the Manager. The tax character of distributions is determined as of the Fund’s fiscal year end. Therefore, a portion of the Fund’s distributions made to shareholders prior to the Fund’s fiscal year end may ultimately be categorized as a tax return of capital.
Investment Income. Dividend income is recorded on the ex-dividend date or upon ex-dividend notification in the case of certain foreign dividends where the ex-dividend date may have passed. Non-cash dividends included in dividend income, if any, are recorded at the fair market value of the securities received. Interest income is recognized on an accrual basis. Discount and premium, which are included in interest income on the Statement of Operations, are amortized or accreted daily.
Custodian Fees. “Custodian fees and expenses” in the Statement of Operations may include interest expense incurred by the Fund on any cash overdrafts of its custodian account during the period. Such cash overdrafts may result from the effects of failed trades in portfolio securities and from cash outflows resulting from unanticipated shareholder redemption activity. The Fund pays interest to its custodian on such cash overdrafts, to the extent they are not offset by positive cash balances maintained by the Fund, at a rate equal to the Federal Funds Rate plus 0.50%. The “Reduction to custodian expenses” line item, if applicable, represents earnings on cash balances maintained by the Fund during the period. Such interest expense and other custodian fees may be paid with these earnings.
Security Transactions. Security transactions are recorded on the trade date. Realized gains and losses on securities sold are determined on the basis of identified cost.
Indemnifications. The Fund’s organizational documents provide current and former trustees and officers with a limited indemnification against liabilities arising in connection with the performance of their duties to the Fund. In the normal course of business, the Fund may also enter into contracts that provide general indemnifications. The Fund’s maximum exposure under these arrangements is unknown as this would be dependent on future claims that may be made against the Fund. The risk of material loss from such claims is considered remote.
Other. The preparation of financial statements in conformity with accounting principles generally accepted in the United States of America requires management to make estimates and assumptions that affect the reported amounts of assets and liabilities and disclosure of contingent assets and liabilities at the date of the financial statements and the reported amounts of increases and decreases in net assets from operations during the reporting period. Actual results could differ from those estimates.
14 OPPENHEIMER EQUITY INCOME FUND/VA
| | |
NOTES TO FINANCIAL STATEMENTS Unaudited / (Continued) |
2. Securities Valuation
The Fund calculates the net asset value of its shares as of the close of the New York Stock Exchange (the “Exchange”), normally 4:00 P.M. Eastern time, on each day the Exchange is open for trading.
The Fund’s Board has adopted procedures for the valuation of the Fund’s securities and has delegated the day-to-day responsibility for valuation determinations under those procedures to the Manager. The Manager has established a Valuation Committee which is responsible for determining a “fair valuation” for any security for which market quotations are not “readily available.” The Valuation Committee’s fair valuation determinations are subject to review, approval and ratification by the Fund’s Board at its next regularly scheduled meeting covering the calendar quarter in which the fair valuation was determined.
Valuation Methods and Inputs
Securities are valued using unadjusted quoted market prices, when available, as supplied primarily by third party pricing services or dealers.
The following methodologies are used to determine the market value or the fair value of the types of securities described below:
Securities traded on a registered U.S. securities exchange (including exchange-traded derivatives other than futures and futures options) are valued based on the last sale price of the security reported on the principal exchange on which it is traded, prior to the time when the Fund’s assets are valued. In the absence of a sale, the security is valued at the last sale price on the prior trading day, if it is within the spread of the current day’s closing “bid” and “asked” prices, and if not, at the current day’s closing bid price. A security of a foreign issuer traded on a foreign exchange but not listed on a registered U.S. securities exchange is valued based on the last sale price on the principal exchange on which the security is traded, as identified by the third party pricing service used by the Manager, prior to the time when the Fund’s assets are valued. If the last sale price is unavailable, the security is valued at the most recent official closing price on the principal exchange on which it is traded. If the last sales price or official closing price for a foreign security is not available, the security is valued at the mean between the bid and asked price per the exchange or, if not available from the exchange, obtained from two dealers. If bid and asked prices are not available from either the exchange or two dealers, the security is valued by using one of the following methodologies (listed in order of priority); (1) using a bid from the exchange, (2) the mean between the bid and asked price as provided by a single dealer, or (3) a bid from a single dealer.
Shares of a registered investment company that are not traded on an exchange are valued at that investment company’s net asset value per share.
Corporate and government debt securities (of U.S. or foreign issuers) and municipal debt securities, event-linked bonds, loans, mortgage-backed securities, collateralized mortgage obligations, and asset-backed securities are valued at the mean between the “bid” and “asked” prices utilizing evaluated prices obtained from third party pricing services or broker-dealers who may use matrix pricing methods to determine the evaluated prices.
Short-term money market type debt securities with a remaining maturity of sixty days or less are valued at cost adjusted by the amortization of discount or premium to maturity (amortized cost), which approximates market value. Short-term debt securities with a remaining maturity in excess of sixty days are valued at the mean between the “bid” and “asked” prices utilizing evaluated prices obtained from third party pricing services or broker-dealers.
A description of the standard inputs that may generally be considered by the third party pricing vendors in determining their evaluated prices is provided below.
| | |
| Security Type | | Standard inputs generally considered by third-party pricing vendors |
| Corporate debt, government debt, municipal, mortgage-backed and asset-backed securities | | Reported trade data, broker-dealer price quotations, benchmark yields, issuer spreads on comparable securities, the credit quality, yield, maturity, and other appropriate factors. |
| Loans | | Information obtained from market participants regarding reported trade data and broker-dealer price quotations. |
| Event-linked bonds | | Information obtained from market participants regarding reported trade data and broker-dealer price quotations. |
If a market value or price cannot be determined for a security using the methodologies described above, or if, in the “good faith” opinion of the Manager, the market value or price obtained does not constitute a “readily available market quotation,” or a significant event has occurred that would materially affect the value of the security the security is fair valued either (i) by a standardized fair valuation methodology applicable to the security type or the significant event as previously approved by the Valuation Committee and the Fund’s Board or (ii) as determined in good faith by the Manager’s Valuation Committee. The Valuation Committee considers all relevant facts that are reasonably available, through either public information or information available to the Manager, when determining the fair value of a security. Fair value determinations by the Manager are subject to review, approval and ratification by the Fund’s Board at its next regularly scheduled meeting covering the calendar quarter in which the fair valuation was determined. Those fair valuation standardized methodologies include, but are not limited to, valuing securities at the last sale price or initially at cost and subsequently adjusting the value based on: changes in company specific fundamentals, changes in an appropriate securities index, or changes in the value of similar securities which may be further adjusted for any discounts related to security-specific resale restrictions. When possible, such methodologies use observable market inputs such as unadjusted quoted prices of similar securities, observable interest rates, currency rates and yield curves. The methodologies used for valuing securities are not necessarily an indication of the risks associated with investing in those securities nor can it be assured that the Fund can obtain the fair value assigned to a security if it were to sell the security.
To assess the continuing appropriateness of security valuations, the Manager, or its third party service provider who is subject to oversight by the Manager, regularly compares prior day prices, prices on comparable securities, and sale prices to the current day prices and challenges those prices exceeding certain tolerance levels with the third party pricing service or broker source. For those securities valued by fair valuations, whether through a standardized fair valuation methodology or a fair valuation determination, the Valuation Committee reviews and affirms the reasonableness of the valuations based on such methodologies and fair valuation determinations on a regular basis after considering all relevant information that is reasonably available.
15 OPPENHEIMER EQUITY INCOME FUND/VA
| | |
NOTES TO FINANCIAL STATEMENTS Unaudited / (Continued) |
2. Securities Valuation (Continued)
Classifications
Each investment asset or liability of the Fund is assigned a level at measurement date based on the significance and source of the inputs to its valuation. Various data inputs are used in determining the value of each of the Fund’s investments as of the reporting period end. These data inputs are categorized in the following hierarchy under applicable financial accounting standards:
1) Level 1-unadjusted quoted prices in active markets for identical assets or liabilities (including securities actively traded on a securities exchange)
2) Level 2-inputs other than unadjusted quoted prices that are observable for the asset or liability (such as unadjusted quoted prices for similar assets and market corroborated inputs such as interest rates, prepayment speeds, credit risks, etc.)
3) Level 3-significant unobservable inputs (including the Manager’s own judgments about assumptions that market participants would use in pricing the asset or liability).
The inputs used for valuing securities are not necessarily an indication of the risks associated with investing in those securities.
The table below categorizes amounts that are included in the Fund’s Statement of Assets and Liabilities as of June 28, 2013 based on valuation input level:
| | | | | | | | | | | | | | | | |
| | | Level 1—
Unadjusted
Quoted Prices | | | Level 2—
Other Significant
Observable Inputs | | | Level 3—
Significant
Unobservable
Inputs | | | Value | |
Assets Table | | | | | | | | | | | | | | | | |
Investments, at Value: | | | | | | | | | | | | | | | | |
Common Stocks | | | | | | | | | | | | | | | | |
Consumer Discretionary | | $ | 783,738 | | | $ | — | | | $ | — | | | $ | 783,738 | |
Consumer Staples | | | 581,772 | | | | — | | | | — | | | | 581,772 | |
Energy | | | 852,823 | | | | — | | | | — | | | | 852,823 | |
Financials | | | 2,020,579 | | | | — | | | | — | | | | 2,020,579 | |
Health Care | | | 659,325 | | | | — | | | | — | | | | 659,325 | |
Industrials | | | 649,701 | | | | — | | | | — | | | | 649,701 | |
Information Technology | | | 706,696 | | | | — | | | | — | | | | 706,696 | |
Materials | | | 411,675 | | | | — | | | | — | | | | 411,675 | |
Telecommunication Services | | | 420,549 | | | | — | | | | — | | | | 420,549 | |
Utilities | | | 262,345 | | | | — | | | | — | | | | 262,345 | |
Convertible Corporate Bonds and Notes | | | — | | | | 172,619 | | | | — | | | | 172,619 | |
Preferred Stock | | | 20,063 | | | | 177,070 | | | | — | | | | 197,133 | |
Investment Company | | | 295,446 | | | | — | | | | — | | | | 295,446 | |
| | | | |
Total Assets | | $ | 7,664,712 | | | $ | 349,689 | | | $ | — | | | $ | 8,014,401 | |
| | | | |
| | | | |
Liabilities Table | | | | | | | | | | | | | | | | |
Other Financial Instruments: | | | | | | | | | | | | | | | | |
Option written, at value | | $ | (4,250 | ) | | $ | — | | | $ | — | | | $ | (4,250) | |
| | | | |
Total Liabilities | | $ | (4,250 | ) | | $ | — | | | $ | — | | | $ | (4,250) | |
| | | | |
Currency contracts and forwards, if any, are reported at their unrealized appreciation/depreciation at measurement date, which represents the change in the contract’s value from trade date. Futures, if any, are reported at their variation margin at measurement date, which represents the amount due to/from the Fund at that date. All additional assets and liabilities included in the above table are reported at their market value at measurement date.
3. Shares of Beneficial Interest
The Fund has authorized an unlimited number of $0.001 par value shares of beneficial interest of each class. Transactions in shares of beneficial interest were as follows:
| | | | | | | | | | | | | | | | | | |
| | | | | Six Months Ended June 28, 2013 | | | Year Ended December 31, 2012 | |
| | | | | Shares | | | Amount | | | Shares | | | Amount | |
Non-Service Shares | | | | | | | | | | | | | | | | | | |
Sold | | | | | 1,988 | | | $ | 19,993 | | | | 5,406 | | | $ | 47,076 | |
Dividends and/or distributions reinvested | | | | | 247 | | | | 2,605 | | | | 219 | | | | 1,809 | |
Redeemed | | | | | (442 | ) | | | (4,437 | ) | | | (1,790 | ) | | | (15,043 | ) |
| | | |
Net increase | | | | | 1,793 | | | $ | 18,161 | | | | 3,835 | | | $ | 33,842 | |
| | | |
16 OPPENHEIMER EQUITY INCOME FUND/VA
| | |
NOTES TO FINANCIAL STATEMENTS Unaudited / (Continued) |
3. Shares of Beneficial Interest (Continued)
| | | | | | | | | | | | | | | | | | |
| | | | | Six Months Ended June 28, 2013 | | | Year Ended December 31, 2012 | |
| | | | | Shares | | | Amount | | | Shares | | | Amount | |
Service Shares | | | | | | | | | | | | | | | | | | |
Sold | | | | | 60,355 | | | $ | 734,920 | | | | 50,121 | | | $ | 518,469 | |
Dividends and/or distributions reinvested | | | | | 7,299 | | | | 91,168 | | | | 8,159 | | | | 81,182 | |
Redeemed | | | | | (56,401 | ) | | | (668,861 | ) | | | (132,292 | ) | | | (1,366,027 | ) |
| | | |
Net increase (decrease) | | | | | 11,253 | | | $ | 157,227 | | | | (74,012 | ) | | $ | (766,376 | ) |
| | | |
4. Purchases and Sales of Securities
The aggregate cost of purchases and proceeds from sales of securities, other than short-term obligations and investments in IMMF, for the six months ended June 28, 2013, were as follows:
| | | | | | | | | | |
| | | Purchases | | | | | Sales | |
Investment securities | | $ | 11,842,126 | | | | | $ | 12,008,106 | |
5. Fees and Other Transactions with Affiliates
Management Fees. Under the investment advisory agreement, the Fund pays the Manager a management fee based on the daily net assets of the Fund at an annual rate as shown in the following table:
| | | | |
| Fee Schedule | | | |
Up to $200 million | | | 0.75% | |
Next $200 million | | | 0.72 | |
Next $200 million | | | 0.69 | |
Next $200 million | | | 0.66 | |
Over $800 million | | | 0.60 | |
Sub-Adviser Fees. The Manager has retained the Sub-Adviser to provide the day-to-day portfolio management of the Fund. Under the Sub-Advisory Agreement, the Manager pays the Sub-Adviser an annual fee in monthly installments, equal to a percentage of the investment management fee collected by the Manager from the Fund, which shall be calculated after any investment management fee waivers. The fee paid to the Sub-Adviser is paid by the Manager, not by the Fund.
Transfer Agent Fees. OFI Global (the “Transfer Agent”) serves as the transfer and shareholder servicing agent for the Fund. Fees incurred by the Fund with respect to these services are detailed in the statement of operations.
Sub-Transfer Agent Fees. The Transfer Agent has retained Shareholder Services, Inc., a wholly-owned subsidiary of OFI (the “Sub-Transfer Agent”), to provide the day-to-day transfer agent and shareholder servicing of the Fund. Under the Sub-Transfer Agency Agreement, the Transfer Agent pays the Sub-Transfer Agent an annual fee in monthly installments, equal to a percentage of the transfer agent fee collected by the Transfer Agent from the Fund, which shall be calculated after any applicable fee waivers. The fee paid to the Sub-Transfer Agent is paid by the Transfer Agent, not by the Fund.
Distribution and Service Plan for Service Shares. The Fund has adopted a Distribution and Service Plan (the “Plan”) in accordance with Rule 12b-1 under the Investment Company Act of 1940 for Service shares to pay OppenheimerFunds Distributor, Inc. (the “Distributor”), for distribution related services, personal service and account maintenance for the Fund’s Service shares. Under the Plan, payments are made periodically at an annual rate of 0.25% of the daily net assets of Service shares of the Fund. The Distributor currently uses all of those fees to compensate sponsors of the insurance product that offers Fund shares, for providing personal service and maintenance of accounts of their variable contract owners that hold Service shares. These fees are paid out of the Fund’s assets on an on-going basis and increase operating expenses of the Service shares, which results in lower performance compared to the Fund’s shares that are not subject to a service fee. Fees incurred by the Fund under the Plan are detailed in the Statement of Operations.
Waivers and Reimbursements of Expenses. The Manager has voluntarily agreed to limit the Fund’s expenses after payments, waivers and/or reimbursements and reduction to custodian expenses, excluding expenses incurred directly or indirectly by the Fund as a result of investments in other investment companies, wholly-owned subsidiaries and pooled investment vehicles; so that those expenses, as percentages of daily net assets, will not exceed the annual rate of 0.80% for Non-Service shares and 1.05% for Service shares. During the six months ended June 28, 2013, the Manager waived fees and/or reimbursed the Fund $765 and $31,784 for Non-Service and Service shares, respectively.
The Manager will waive fees and/or reimburse Fund expenses in an amount equal to the indirect management fees incurred through the Fund’s investment in IMMF. During the six months ended June 28, 2013, the Manager waived fees and/or reimbursed the Fund $87 for IMMF management fees.
Some of these undertakings may be modified or terminated at any time; some may not be modified or terminated until after one year from the date of the current prospectus, as indicated therein.
17 OPPENHEIMER EQUITY INCOME FUND/VA
| | |
NOTES TO FINANCIAL STATEMENTS Unaudited / (Continued) |
6. Risk Exposures and the Use of Derivative Instruments
The Fund’s investment objectives not only permit the Fund to purchase investment securities, they also allow the Fund to enter into various types of derivatives contracts, including, but not limited to, futures contracts, forward currency exchange contracts, credit default swaps, interest rate swaps, total return swaps, and purchased and written options. In doing so, the Fund will employ strategies in differing combinations to permit it to increase, decrease, or change the level or types of exposure to market risk factors. These instruments may allow the Fund to pursue its objectives more quickly and efficiently than if it were to make direct purchases or sales of securities capable of effecting a similar response to market factors. Such contracts may be entered into through a bilateral over-the-counter (“OTC”) transaction, or through a securities or futures exchange and cleared through a clearinghouse.
Market Risk Factors. In accordance with its investment objectives, the Fund may use derivatives to increase or decrease its exposure to one or more of the following market risk factors:
Commodity Risk. Commodity risk relates to the change in value of commodities or commodity indexes as they relate to increases or decreases in the commodities market. Commodities are physical assets that have tangible properties. Examples of these types of assets are crude oil, heating oil, metals, livestock, and agricultural products.
Credit Risk. Credit risk relates to the ability of the issuer to meet interest and principal payments, or both, as they come due. In general, lower-grade, higher-yield bonds are subject to credit risk to a greater extent than lower-yield, higher-quality bonds.
Equity Risk. Equity risk relates to the change in value of equity securities as they relate to increases or decreases in the general market.
Foreign Exchange Rate Risk. Foreign exchange rate risk relates to the change in the U.S. dollar value of a security held that is denominated in a foreign currency. The U.S. dollar value of a foreign currency denominated security will decrease as the dollar appreciates against the currency, while the U.S. dollar value will increase as the dollar depreciates against the currency.
Interest Rate Risk. Interest rate risk refers to the fluctuations in value of fixed-income securities resulting from the inverse relationship between price and yield. For example, an increase in general interest rates will tend to reduce the market value of already issued fixed-income investments, and a decline in general interest rates will tend to increase their value. In addition, debt securities with longer maturities, which tend to have higher yields, are subject to potentially greater fluctuations in value from changes in interest rates than obligations with shorter maturities.
Volatility Risk. Volatility risk refers to the magnitude of the movement, but not the direction of the movement, in a financial instrument’s price over a defined time period. Large increases or decreases in a financial instrument’s price over a relative time period typically indicate greater volatility risk, while small increases or decreases in its price typically indicate lower volatility risk.
Derivatives may have little or no initial cash investment relative to their market value exposure and therefore can produce significant gains or losses in excess of their cost due to unanticipated changes in the market risk factors and the overall market. This use of embedded leverage allows the Fund to increase its market value exposure relative to its net assets and can substantially increase the volatility of the Fund’s performance. In instances where the Fund is using derivatives to decrease, or hedge, exposures to market risk factors for securities held by the Fund, there are also risks that those derivatives may not perform as expected resulting in losses for the combined or hedged positions. Some derivatives have the potential for unlimited loss, regardless of the size of the Fund’s initial investment.
Additional associated risks from investing in derivatives also exist and potentially could have significant effects on the valuation of the derivative and the Fund. Typically, the associated risks are not the risks that the Fund is attempting to increase or decrease exposure to, per its investment objectives, but are the additional risks from investing in derivatives. Examples of these associated risks are liquidity risk, which is the risk that the Fund will not be able to sell the derivative in the open market in a timely manner, and counterparty credit risk, which is the risk that the counterparty will not fulfill its obligation to the Fund.
The Fund’s actual exposures to these market risk factors and associated risks during the period are discussed in further detail, by derivative type, below.
Option Activity
The Fund may buy and sell put and call options, or write put and call options. When an option is written, the Fund receives a premium and becomes obligated to sell or purchase the underlying security, currency or other underlying financial instrument at a fixed price, upon exercise of the option.
Options can be traded through an exchange or through a privately negotiated arrangement with a dealer in an OTC transaction. Options traded through an exchange are generally cleared through a clearinghouse (such as The Options Clearing Corporation). The difference between the premium received or paid, and market value of the option, is recorded as unrealized appreciation or depreciation. The net change in unrealized appreciation or depreciation is reported in the Statement of Operations. When an option is exercised, the cost of the security purchased or the proceeds of the security sale are adjusted by the amount of premium received or paid. Upon the expiration or closing of the option transaction, a gain or loss is reported in the Statement of Operations.
Options written, if any, are reported in a schedule following the Statement of Investments and as a liability in the Statement of Assets and Liabilities. Securities held in collateral accounts to cover potential obligations with respect to outstanding written options are noted in the Statement of Investments.
The risk in writing a call option is that the market price of the security increases and if the option is exercised, the Fund must either purchase the security at a higher price for delivery or, if the Fund owns the underlying security, give up the opportunity for profit. The risk in writing a put option is that the Fund may incur a loss if the market price of the security decreases and the option is exercised. The risk in buying an option is that the Fund pays a premium whether or not the option is exercised. The Fund also has the additional risk that there may be an illiquid market where the Fund is unable to close the contract.
18 OPPENHEIMER EQUITY INCOME FUND/VA
| | |
NOTES TO FINANCIAL STATEMENTS Unaudited / (Continued) |
6. Risk Exposures and the Use of Derivative Instruments (Continued)
The Fund has written call options on individual equity securities and/or equity indexes to decrease exposure to equity risk. A written call option becomes more valuable as the price of the underlying financial instrument depreciates relative to the strike price.
During the six months ended June 28, 2013, the Fund had an ending monthly average market value of $607 on written call options.
Additional associated risks to the Fund include counterparty credit risk and liquidity risk.
Written option activity for the six months ended June 28, 2013 was as follows:
| | | | | | | | |
| | | Call Options | |
| | | Number of
Contracts | | | Amount of
Premiums | |
Options outstanding as of December 31, 2012 | | | — | | | $ | — | |
Options written | | | 14 | | | | 1,027 | |
Options closed or expired | | | (9 | ) | | | (240 | ) |
| | | | |
Options outstanding as of June 28, 2013 | | | 5 | | | $ | 787 | |
| | | | |
Counterparty Credit Risk. Derivative positions are subject to the risk that the counterparty will not fulfill its obligation to the Fund. The Fund intends to enter into derivative transactions with counterparties that the Manager believes to be creditworthy at the time of the transaction.
For financial reporting purposes, the Fund does not offset derivative assets and derivative liabilities that are subject to netting arrangements in the Statements of Assets and Liabilities. Bankruptcy or insolvency laws of a particular jurisdiction may impose restrictions on or prohibitions against the right of offset in bankruptcy, insolvency or other events.
The Fund’s risk of loss from counterparty credit risk on exchange-traded derivatives cleared through a clearinghouse and for cleared swaps is generally considered lower than as compared to OTC derivatives. However, counterparty credit risk exists with respect to initial and variation margin deposited/paid by the Fund that is held in futures commission merchant, broker and/or clearinghouse accounts for such exchange-traded derivatives and for cleared swaps.
With respect to cleared swaps, such transactions will be submitted for clearing, and if cleared, will be held in accounts at futures commission merchants or brokers that are members of clearinghouses. While brokers, futures commission merchants and clearinghouses are required to segregate customer margin from their own assets, in the event that a broker, futures commission merchant or clearinghouse becomes insolvent or goes into bankruptcy and at that time there is a shortfall in the aggregate amount of margin held by the broker, futures commission merchant or clearinghouse for all its customers, U.S. bankruptcy laws will typically allocate that shortfall on a pro-rata basis across all the broker’s, futures commission merchant’s or clearinghouse’s customers, potentially resulting in losses to the Fund.
There is the risk that a broker, futures commission merchant or clearinghouse will decline to clear a transaction on the Fund’s behalf, and the Fund may be required to pay a termination fee to the executing broker with whom the Fund initially enters into the transaction. Clearinghouses may also be permitted to terminate cleared swaps at any time. The Fund is also subject to the risk that the broker or futures commission merchant will improperly use the Fund’s assets deposited/paid as initial or variation margin to satisfy payment obligations of another customer. In the event of a default by another customer of the broker or futures commission merchant, the Fund might not receive its variation margin payments from the clearinghouse, due to the manner in which variation margin payments are aggregated for all customers of the broker/futures commission merchant.
Collateral and margin requirements differ by type of derivative. Margin requirements are established by the broker, futures commission merchant or clearinghouse for exchange-traded and cleared derivatives, including cleared swaps. Brokers, futures commission merchants and clearinghouses can ask for margin in excess of the regulatory minimum, or increase the margin amount, in certain circumstances.
For financial reporting purposes, cash collateral that has been pledged to cover obligations of the Fund, if any, is reported separately on the Statements of Assets and Liabilities as cash pledged as collateral. Non-cash collateral pledged by the Fund, if any, is noted in the Schedules of Investments. Generally, the amount of collateral due from or to a party must exceed a minimum transfer amount threshold (e.g. $250,000) before a transfer has to be made. To the extent amounts due to the Fund from its counterparties are not fully collateralized, contractually or otherwise, the Fund bears the risk of loss from counterparty nonperformance.
The following table presents the valuations of derivative instruments by risk exposure as reported within the Statement of Assets and Liabilities as of June 28, 2013:
| | | | | | |
| | | Liability Derivatives | |
Derivatives Not Accounted for as Hedging Instruments | | Statement of Assets and Liabilities Location | | Value | |
| Equity contracts | | Options written, at value | | | $4,250 | |
The effect of derivative instruments on the Statement of Operations is as follows:
| | | | |
| Amount of Realized Gain or (Loss) Recognized on Derivatives | |
Derivatives Not Accounted for as Hedging Instruments | | Closing and expiration of option
contracts written | |
| Equity contracts | | | $240 | |
| | | | |
| Amount of Change in Unrealized Gain or (Loss) Recognized on Derivatives | |
Derivatives Not Accounted for as Hedging Instruments | | Option contracts written | |
| Equity contracts | | | $(3,463 | ) |
19 OPPENHEIMER EQUITY INCOME FUND/VA
| | |
NOTES TO FINANCIAL STATEMENTS Unaudited / (Continued) |
7. Pending Litigation
Since 2009, a number of class action lawsuits have been pending in federal courts against OppenheimerFunds, Inc. (“OFI”), OppenheimerFunds Distributor, Inc., the Fund’s principal underwriter and distributor (the “Distributor”), and certain funds (but not including the Fund) advised by the Manager and distributed by the Distributor (the “Defendant Funds”). Several of these lawsuits also name as defendants certain officers and current and former trustees of the respective Defendant Funds. The lawsuits raise claims under federal securities law and allege, among other things, that the disclosure documents of the respective Defendant Funds contained misrepresentations and omissions and that the respective Defendant Funds’ investment policies were not followed. The plaintiffs in these actions seek unspecified damages, equitable relief and awards of attorneys’ fees and litigation expenses. The Defendant Funds’ Boards of Trustees have also engaged counsel to represent the Funds and the present and former Independent Trustees named in those suits.
Other class action and individual lawsuits have been filed since 2008 in various state and federal courts against OFI and certain of its affiliates by investors seeking to recover investments they allegedly lost as a result of the “Ponzi” scheme run by Bernard L. Madoff and his firm, Bernard L. Madoff Investment Securities, LLC (“BLMIS”). Plaintiffs in these suits allege that they suffered losses as a result of their investments in several funds managed by an affiliate of OFI and assert a variety of claims, including breach of fiduciary duty, fraud, negligent misrepresentation, unjust enrichment, and violation of federal and state securities laws and regulations, among others. They seek unspecified damages, equitable relief and awards of attorneys’ fees and litigation expenses. Neither the Distributor, nor any of the Oppenheimer mutual funds, their independent trustees or directors are named as defendants in these lawsuits. None of the Oppenheimer mutual funds invested in any funds or accounts managed by Madoff or BLMIS. On February 28, 2011, a stipulation of partial settlement of three groups of consolidated putative class action lawsuits relating to these matters was filed in the U.S. District Court for the Southern District of New York. On August 19, 2011, the court entered an order and final judgment approving the settlement as fair, reasonable and adequate. In September 2011, certain parties filed notices of appeal from the court’s order approving the settlement. The settlement does not resolve other outstanding lawsuits against OFI and its affiliates relating to BLMIS.
On April 16, 2010, a lawsuit was filed in New York state court against (i) OFI, (ii) an affiliate of OFI and (iii) AAArdvark IV Funding Limited (“AAArdvark IV”), an entity advised by OFI’s affiliate, in connection with investments made by the plaintiffs in AAArdvark IV. Plaintiffs allege breach of contract and common law fraud claims against the defendants and seek compensatory damages, costs and disbursements, including attorney fees. On April 11, 2013, the court granted defendants’ motion for summary judgment, dismissing plaintiffs’ fraud claim with prejudice and dismissing their contract claim without prejudice, and granted plaintiffs leave to replead their contract claim to assert a cause of action for specific performance within 30 days. On May 9, 2013, plaintiffs filed a notice of appeal from the court’s dismissal order. On July 15, 2011, a lawsuit was filed in New York state court against OFI, an affiliate of OFI and AAArdvark Funding Limited (“AAArdvark I”), an entity advised by OFI’s affiliate, in connection with investments made by the plaintiffs in AAArdvark I. The complaint alleges breach of contract and common law fraud claims against the defendants and seeks compensatory damages, costs and disbursements, including attorney fees. On November 9, 2011, a lawsuit was filed in New York state court against OFI, an affiliate of OFI and AAArdvark XS Funding Limited (“AAArdvark XS”), an entity advised by OFI’s affiliate, in connection with investments made by the plaintiffs in AAArdvark XS. The complaint alleges breach of contract against the defendants and seeks compensatory damages, costs and disbursements, including attorney fees.
OFI believes the lawsuits and appeals described above are without legal merit and, with the exception of actions it has settled, is defending against them vigorously. While it is premature to render any opinion as to the outcome in these lawsuits, or whether any costs that the Defendant Funds may bear in defending the suits might not be reimbursed by insurance, OFI believes that these suits should not impair the ability of OFI or the Distributor to perform their respective duties to the Fund, and that the outcome of all of the suits together should not have any material effect on the operations of any of the Oppenheimer mutual funds.
20 OPPENHEIMER EQUITY INCOME FUND/VA
| | |
PORTFOLIO PROXY VOTING POLICIES AND PROCEDURES; UPDATES TO STATEMENTS OF INVESTMENTS Unaudited |
The Fund has adopted Portfolio Proxy Voting Policies and Procedures under which the Fund votes proxies relating to securities (“portfolio proxies”) held by the Fund. A description of the Fund’s Portfolio Proxy Voting Policies and Procedures is available (i) without charge, upon request, by calling the Fund toll-free at 1.800.CALL OPP (225.5677), (ii) on the Fund’s website at oppenheimerfunds.com, and (iii) on the SEC’s website at www.sec.gov. In addition, the Fund is required to file Form N-PX, with its complete proxy voting record for the 12 months ended June 30th, no later than August 31st of each year. The Fund’s voting record is available (i) without charge, upon request, by calling the Fund toll-free at 1.800.CALL OPP (225.5677), and (ii) in the Form N-PX filing on the SEC’s website at www.sec.gov.
The Fund files its complete schedule of portfolio holdings with the SEC for the first quarter and the third quarter of each fiscal year on Form N-Q. The Fund’s Form N-Q filings are available on the SEC’s website at www.sec.gov. Those forms may be reviewed and copied at the SEC’s Public Reference Room in Washington, D.C. Information on the operation of the Public Reference Room may be obtained by calling 1-800-SEC-0330.
21 OPPENHEIMER EQUITY INCOME FUND/VA
| | |
OPPENHEIMER EQUITY INCOME FUND/VA |
| | |
| A Series of Oppenheimer Variable Account Funds |
| Trustees and Officers | | Sam Freedman, Chairman of the Board of Trustees and Trustee Edward L. Cameron, Trustee Jon S. Fossel, Trustee Richard F. Grabish, Trustee Beverly L. Hamilton, Trustee Victoria J. Herget, Trustee Robert J. Malone, Trustee F. William Marshall, Jr., Trustee Karen L. Stuckey, Trustee James D. Vaughn, Trustee William F. Glavin, Jr., Trustee, President and Principal Executive Officer Michael S. Levine, Vice President Arthur S. Gabinet, Secretary and Chief Legal Officer Christina M. Nasta, Vice President and Chief Business Officer Mark S. Vandehey, Vice President and Chief Compliance Officer Brian W. Wixted, Treasurer and Principal Financial & Accounting Officer |
| |
| Manager | | OFI Global Asset Management, Inc. |
| |
| Sub-Adviser | | OppenheimerFunds, Inc. |
| |
| Distributor | | OppenheimerFunds Distributor, Inc. |
| |
Transfer and Shareholder Servicing Agent | | OFI Global Asset Management, Inc. |
| |
Sub-Transfer Agent | | Shareholder Services, Inc. DBA OppenheimerFunds Services |
| |
Independent Registered Public Accounting Firm | | KPMGLLP |
| |
| Legal Counsel | | K&L GatesLLP |
| |
| | Before investing, investors should carefully consider a fund’s investment objectives, risks, charges and expenses. Fund prospectuses and summary prospectuses contain this and other information about the funds, and may be obtained by asking your financial advisor, or calling us at 1.800.988.8287. Read prospectuses and summary prospectuses carefully before investing. |
| |
| | The financial statements included herein have been taken from the records of the Fund without examination of those records by the independent registered public accounting firm. |
© 2013 OppenheimerFunds, Inc. All rights reserved. Oppenheimer funds are distributed by OppenheimerFunds Distributor, Inc.
Item 2. Code of Ethics.
Not applicable to semiannual reports.
Item 3. Audit Committee Financial Expert.
Not applicable to semiannual reports.
Item 4. Principal Accountant Fees and Services.
Not applicable to semiannual reports.
Item 5. Audit Committee of Listed Registrants
Not applicable.
Item 6. Schedule of Investments.
a) Not applicable. The complete schedule of investments is included in Item 1 of this Form N-CSR.
b) Not applicable.
Item 7. Disclosure of Proxy Voting Policies and Procedures for Closed-End Management Investment Companies.
Not applicable.
Item 8. Portfolio Managers of Closed-End Management Investment Companies.
Not applicable.
Item 9. Purchases of Equity Securities by Closed-End Management Investment Company and Affiliated Purchasers.
Not applicable.
Item 10. Submission of Matters to a Vote of Security Holders.
The Fund’s Governance Committee Provisions with Respect to Nominations of Directors/Trustees to the Respective Boards
None
Item 11. Controls and Procedures.
Based on their evaluation of the registrant’s disclosure controls and procedures (as defined in rule 30a-3(c) under the Investment Company Act of 1940 (17 CFR 270.30a-3(c)) as of 6/28/2013, the registrant’s principal executive officer and principal financial officer found the registrant’s disclosure controls and procedures to provide reasonable assurances that information required to be disclosed by the registrant in the reports that it files under the Securities Exchange Act of 1934 (a) is accumulated and communicated to registrant’s management, including its principal executive officer and principal financial officer, to allow timely decisions regarding required disclosure, and (b) is recorded, processed, summarized and reported, within the time periods specified in the rules and forms adopted by the U.S. Securities and Exchange Commission.
There have been no changes in the registrant’s internal controls over financial reporting that occurred during the registrant’s second fiscal quarter of the period covered by this report that have materially affected, or are reasonably likely to materially affect, the registrant’s internal control over financial reporting.
Item 12. Exhibits.
| (a) | (1) Not applicable to semiannual reports. |
| | (2) | Exhibits attached hereto. |
| (b) | Exhibit attached hereto. |
SIGNATURES
Pursuant to the requirements of the Securities Exchange Act of 1934 and the Investment Company Act of 1940, the registrant has duly caused this report to be signed on its behalf by the undersigned, thereunto duly authorized.
Oppenheimer Variable Account Funds
| | |
| By: | | /s/ William F. Glavin, Jr. |
| | William F. Glavin, Jr. |
| | Principal Executive Officer |
| Date: | | 8/9/2013 |
Pursuant to the requirements of the Securities Exchange Act of 1934 and the Investment Company Act of 1940, this report has been signed below by the following persons on behalf of the registrant and in the capacities and on the dates indicated.
| | |
By: | | /s/ William F. Glavin, Jr. |
| | William F. Glavin, Jr. |
| | Principal Executive Officer |
| Date: | | 8/9/2013 |
| |
| By: | | /s/ Brian W. Wixted |
| | Brian W. Wixted |
| | Principal Financial Officer |
| Date: | | 8/9/2013 |