UNITED STATES
SECURITIES AND EXCHANGE COMMISSION
WASHINGTON, D.C. 20549
FORM N-CSR
CERTIFIED SHAREHOLDER REPORT OF REGISTERED
MANAGEMENT INVESTMENT COMPANIES
Investment Company Act file number 811-4108
Oppenheimer Variable Account Funds
(Exact name of registrant as specified in charter)
6803 South Tucson Way, Centennial, Colorado 80112-3924
(Address of principal executive offices) (Zip code)
Arthur S. Gabinet
OFI Global Asset Management, Inc.
Two World Financial Center, New York, New York 10281-1008
(Name and address of agent for service)
Registrant’s telephone number, including area code: (303) 768-3200
Date of fiscal year end: December 31
Date of reporting period: 6/30/2014
Item 1. Reports to Stockholders.
| | | | |
| June 30, 2014 | | |
| | | Oppenheimer Discovery Mid Cap Growth Fund/VA A Series of Oppenheimer Variable Account Funds | | Semiannual Report |
| | |
| | SEMIANNUAL REPORT Listing of Top Holdings Fund Performance Discussion Financial Statements | | |

Portfolio Managers: Ronald J. Zibelli, Jr., CFA and Justin Livengood, CFA1
| | | | | | | | |
Cumulative Total Returns For the 6-Month Period Ended 6/30/14 | | |
Non-Service Shares | | | 0.71 | % | | | | |
Service Shares | | | 0.59 | % | | | | |
Average Annual Total Returns For the Periods Ended 6/30/14 | | |
| | | 1-Year | | | 5-Year | | 10-Year |
Non-Service Shares | | | 23.56% | | | 20.43% | | 6.39% |
Service Shares | | | 23.24% | | | 20.13% | | 6.10% |
Performance data quoted represents past performance, which does not guarantee future results. The investment return and principal value of an investment in the Fund will fluctuate so that an investor’s shares, when redeemed, may be worth more or less than their original cost. Current performance may be lower or higher than the performance quoted. For performance data current to the most recent month end, call us at 1.800.988.8287. The Fund’s total returns should not be expected to be the same as the returns of other funds, whether or not both funds have the same portfolio managers and/or similar names. The Fund’s total returns include changes in share price and reinvested distributions but do not include the charges associated with the separate account products that offer this Fund. Such performance would have been lower if such charges were taken into account.
| | | | |
TOP TEN COMMON STOCK HOLDINGS | | | | |
Harman International Industries, Inc. | | | 1.8 | % |
SBA Communications Corp., Cl. A | | | 1.8 | |
United Rentals, Inc. | | | 1.7 | |
Illumina, Inc. | | | 1.6 | |
Actavis plc | | | 1.5 | |
CoStar Group, Inc. | | | 1.5 | |
Westlake Chemical Corp. | | | 1.5 | |
Concho Resources, Inc. | | | 1.4 | |
NXP Semiconductors NV | �� | | 1.4 | |
ServiceNow, Inc. | | | 1.3 | |
Portfolio holdings and allocations are subject to change. Percentages are as of June 30, 2014, and are based on net assets. For more current Fund holdings, please visit oppenheimerfunds.com.
SECTOR ALLOCATION
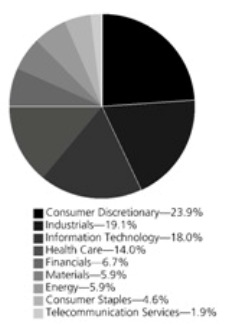
Portfolio holdings and allocations are subject to change. Percentages are as of June 30, 2014, and are based on the total market value of common stocks.
1. Justin Livengood became a Portfolio Manager in April 2014.
2 OPPENHEIMER DISCOVERY MID CAP GROWTH FUND/VA
| | |
Fund Performance Discussion |
The Fund’s Non-Service shares produced a return of 0.71% during the reporting period, underperforming the Russell Midcap Growth Index, (the “Index”), which returned 6.51%. The Fund’s underperformance stemmed primarily from weaker relative stock selection in the information technology, industrials and energy sectors. Somewhat offsetting this negative performance, the Fund outperformed the Index in the consumer discretionary and materials sectors due to stronger relative stock selection. The investment environment changed significantly during the reporting period. In late 2013 and early 2014, high-quality growth companies continued to outperform the broader market as they had over the previous few years. But in March 2014, the tone of the market changed abruptly where companies with larger market capitalizations and lower valuations began to materially outperform smaller companies with higher valuations. Our investment style, which favors high-quality, high-growth companies that often have above average valuations, began to underperform in mid-March despite little or no change to the underlying fundamentals of the companies we own. In fact, the vast majority of the Fund’s underperformance relative to the benchmark occurred in April 2014.
Over the longer term, the Fund had stronger absolute results. For the 1-year, 3-year, 5-year and 10-year periods ended June 30, 2014, the Fund’s Non-Service shares produced returns of 23.56%, 12.03%, 20.43% and 6.39%, respectively. Over those same periods, the Index generated returns of 26.04%, 14.54%, 21.16% and 9.83%, respectively.
GLOBAL MARKET AND ECONOMIC ENVIRONMENT
Despite market volatility early in the reporting period and rising geopolitical risks in Ukraine and the Middle East, global equities generally rebounded and produced positive returns in the first half of 2014, thanks largely to a continued global economic recovery and stimulative monetary policies from central banks throughout the world. Markets were volatile to start the reporting period in January 2014 amid fears that political and economic instability in the world’s emerging markets might further dampen the U.S. economic recovery. However, equities rebounded later in the reporting period. Among the central bank measures that boosted the markets this reporting period, the European Central Bank (the “ECB”) announced numerous measures in June, including a benchmark interest rate cut, the introduction of a negative deposit rate to encourage banks to lend, among various other measures to flood the system with liquidity. Beyond that, the ECB said it would prepare to purchase packages of loans from banks to allow for increased lending. In June, the U.S. Federal Reserve (the “Fed”) also stated it would reduce the amount of monthly bond purchases by an additional $10 billion and reaffirmed its intention to keep short-term interest rates near zero. U.S. economic data released in April and May was positive, as the unemployment rate fell to 6.3%, the economy finally regained all of the jobs lost during the 2008 recession, and the U.S. stock market achieved record highs. Shortly after the reporting period ended, a positive June jobs report was released, in which the official unemployment rate fell to 6.1%, its lowest level since September 2008.
TOP INDIVIDUAL CONTRIBUTORS
During the reporting period, top contributors to performance included health care stocks Illumina, Inc. and Actavis plc, and industrials stock United Rentals, Inc. Illumina Inc., a leading developer of genetic analysis tools, reported very strong financial results during the reporting period, raised full year guidance and announced a series of innovative new products, all of which were well received by investors and provided tailwinds for share price performance. Actavis is an integrated specialty pharmaceutical company that rallied after reporting strong fourth quarter results. The company benefited from its recent acquisitions of Warner Chilcott, which has produced revenue synergies and cost savings beyond the expectations of most analysts, and Forest Labs, which we believe should result in increased profitability as higher margin branded drugs become a larger percentage of the company’s business. United Rentals, an equipment rental company, reported strong first quarter financial results. The company has been benefiting from a growing trend toward leasing equipment, rather than buying, with especially good demand from energy customers.
TOP INDIVIDUAL DETRACTORS
The most significant detractors from the Fund’s performance included Nu Skin Enterprises, Inc., Tractor Supply Co. and Stratasys Ltd., each of which we exited by period end. Nu Skin Enterprises Inc., a major direct seller of personal care products and nutritional supplements, sold off sharply following a critical article published in China Daily, a state-owned periodical. This caused investors to worry about the company’s operations in China. Tractor Supply, an operator of retail farm and ranch stores, experienced declines early in the reporting period after reporting guidance below analysts’ expectations. Stratasys, one of the leading makers of 3D printers, performed poorly during the reporting period. The company issued earnings per share guidance that was moderately below consensus estimates due to higher than expected operating expenses and share count.
3 OPPENHEIMER DISCOVERY MID CAP GROWTH FUND/VA
STRATEGY & OUTLOOK
Our long-term investment process remains the same. We seek dynamic companies with above-average and sustainable revenue and earnings growth that we believe are positioned to outperform. This includes leading firms in structurally attractive industries with management teams that have proven records of performance.
We made a number of changes to the Fund during the period. We reduced exposure to the information technology sector and invested the proceeds in the energy, materials and consumer staples sectors. As a result, the Fund is no longer overweight information technology and its underweight in consumer staples is smaller.
The macroeconomic environment is characterized by modest economic expansion, very low interest rates, single digit corporate profit growth and increased merger and acquisition activity. We believe that this is an environment that favors growth companies and are optimistic regarding the Fund’s investment strategy. Our focus on well-established, higher quality growth companies has the potential to provide both upside participation and a degree of downside protection over the long term.
The Fund’s investment strategy and focus can change over time. The mention of specific fund holdings does not constitute a recommendation by OppenheimerFunds, Inc. or its affiliates.
Shares of Oppenheimer funds are not deposits or obligations of any bank, are not guaranteed by any bank, are not insured by the FDIC or any other agency, and involve investment risks, including the possible loss of the principal amount invested.
4 OPPENHEIMER DISCOVERY MID CAP GROWTH FUND/VA
Fund Expenses. As a shareholder of the Fund, you incur two types of costs: (1) transaction costs and (2) ongoing costs, including management fees; distribution and service fees; and other Fund expenses. These examples are intended to help you understand your ongoing costs (in dollars) of investing in the Fund and to compare these costs with the ongoing costs of investing in other mutual funds.
The examples are based on an investment of $1,000.00 invested at the beginning of the period and held for the entire
6-month period ended June 30, 2014.
Actual Expenses. The first section of the table provides information about actual account values and actual expenses. You may use the information in this section for the class of shares you hold, together with the amount you invested, to estimate the expense that you paid over the period. Simply divide your account value by $1,000.00 (for example, an $8,600.00 account value divided by $1,000.00 = 8.60), then multiply the result by the number in the first section under the heading entitled “Expenses Paid During Period” to estimate the expenses you paid on your account during this period.
Hypothetical Example for Comparison Purposes.
The second section of the table provides information about hypothetical account values and hypothetical expenses based on the Fund’s actual expense ratio for each class of shares, and an assumed rate of return of 5% per year for each class before expenses, which is not the actual return. The hypothetical account values and expenses may not be used to estimate the actual ending account balance or expenses you paid for the period. You may use this information to compare the ongoing costs of investing in the Fund and other funds. To do so, compare this 5% hypothetical example for the class of shares you hold with the 5% hypothetical examples that appear in the shareholder reports of the other funds.
Please note that the expenses shown in the table are meant to highlight your ongoing costs only and do not reflect any charges associated with the separate accounts that offer this Fund. Therefore, the “hypothetical” lines of the table are useful in comparing ongoing costs only, and will not help you determine the relative total costs of owning different funds. In addition, if these separate account charges were included your costs would have been higher.
| | | | | | | | | | | | | | |
| Actual | | Beginning
Account
Value
January 1, 2014 | | | Ending
Account
Value
June 30, 2014 | | | Expenses
Paid During
6 Months Ended
June 30, 2014 | | | |
Non-Service shares | | $ | 1,000.00 | | | $ | 1,007.10 | | | $ | 3.99 | | | |
Service shares | | | 1,000.00 | | | | 1,005.90 | | | | 5.24 | | | |
| | | | |
Hypothetical | | | | | | | | | | | | | | |
(5% return before expenses) | | | | | | | | | | | | | | |
Non-Service shares | | | 1,000.00 | | | | 1,020.83 | | | | 4.02 | | | |
Service shares | | | 1,000.00 | | | | 1,019.59 | | | | 5.27 | | | |
Expenses are equal to the Fund’s annualized expense ratio for that class, multiplied by the average account value over the period, multiplied by 181/365 (to reflect the one-half year period). Those annualized expense ratios, excluding indirect expenses from affiliated funds, based on the 6-month period ended June 30, 2014 are as follows:
| | | | | | | | | | |
| Class | | Expense Ratios | | |
Non-Service shares | | | | 0.80 | % | | |
Service shares | | | | 1.05 | | | |
The expense ratios reflect voluntary and/or contractual waivers and/or reimbursements of expenses by the Fund’s Manager. Some of these undertakings may be modified or terminated at any time, as indicated in the Fund’s prospectus. The “Financial Highlights” tables in the Fund’s financial statements, included in this report, also show the gross expense ratios, without such waivers or reimbursements and reduction to custodian expenses, if applicable.
5 OPPENHEIMER DISCOVERY MID CAP GROWTH FUND/VA
| | |
STATEMENT OF INVESTMENTS June 30, 2014 Unaudited |
| | | | | | | | | | |
| | | Shares | | | Value | | | |
Common Stocks—95.4% | | | | | | | | | | |
Consumer Discretionary—22.8% | | | | | | | |
Auto Components—3.1% | | | | | | | | | | |
| BorgWarner, Inc. | | | 109,080 | | | $ | 7,110,925 | | | |
| Delphi Automotive plc | | | 120,850 | | | | 8,307,229 | | | |
| TRW Automotive Holdings Corp.1 | | | 80,790 | | | | 7,232,321 | | | |
| | | | | | | 22,650,475 | | | |
Automobiles—0.7% | | | | | | | | | | |
| Harley-Davidson, Inc. | | | 75,174 | | | | 5,250,904 | | | |
| | | | | | | | | | | |
Hotels, Restaurants & Leisure—5.3% | | | | | | | |
| Chipotle Mexican Grill, Inc.1 | | | 16,150 | | | | 9,569,037 | | | |
| Domino’s Pizza, Inc. | | | 69,170 | | | | 5,055,635 | | | |
| Dunkin’ Brands Group, Inc. | | | 82,340 | | | | 3,771,995 | | | |
| Marriott International, Inc., Cl. A | | | 134,200 | | | | 8,602,220 | | | |
| MGM Resorts International1 | | | 219,300 | | | | 5,789,520 | | | |
| Wynn Resorts Ltd. | | | 27,060 | | | | 5,616,574 | | | |
| | | | | | | 38,404,981 | | | |
Household Durables—2.5% | | | | | | | | | | |
| GoPro, Inc., Cl. A1 | | | 112,011 | | | | 4,542,046 | | | |
| Harman International Industries, Inc. | | | 123,640 | | | | 13,282,645 | | | |
| | | | | | | 17,824,691 | | | |
Internet & Catalog Retail—2.7% | | | | | | | | | | |
| Netflix, Inc.1 | | | 21,610 | | | | 9,521,366 | | | |
| TripAdvisor, Inc.1 | | | 48,960 | | | | 5,319,994 | | | |
| Vipshop Holdings Ltd., ADS1 | | | 25,004 | | | | 4,694,251 | | | |
| | | | | | | 19,535,611 | | | |
Leisure Products—1.1% | | | | | | | | | | |
| Polaris Industries, Inc. | | | 61,050 | | | | 7,951,152 | | | |
| | | | | | | | | | | |
Specialty Retail—2.9% | | | | | | | | | | |
| Foot Locker, Inc. | | | 123,430 | | | | 6,260,370 | | | |
| O’Reilly Automotive, Inc.1 | | | 64,020 | | | | 9,641,412 | | | |
| Tiffany & Co. | | | 52,390 | | | | 5,252,097 | | | |
| | | | | | | 21,153,879 | | | |
Textiles, Apparel & Luxury Goods—4.5% | | | | | | | |
| Hanesbrands, Inc. | | | 75,740 | | | | 7,455,846 | | | |
| Kate Spade & Co.1 | | | 185,750 | | | | 7,084,505 | | | |
| Michael Kors Holdings Ltd.1 | | | 101,320 | | | | 8,982,018 | | | |
| Under Armour, Inc., Cl. A1 | | | 146,650 | | | | 8,724,208 | | | |
| �� | | | | | | 32,246,577 | | | |
Consumer Staples—4.4% | | | | | | | | | | |
Beverages—1.3% | | | | | | | | | | |
Constellation Brands, Inc., Cl. A1 | | | 108,910 | | | | 9,598,238 | | | |
| | | | | | | | | | | |
Food Products—3.1% | | | | | | | | | | |
Hormel Foods Corp. | | | 72,790 | | | | 3,592,187 | | | |
Keurig Green Mountain, Inc. | | | 55,300 | | | | 6,890,933 | | | |
Tyson Foods, Inc., Cl. A | | | 118,592 | | | | 4,451,944 | | | |
WhiteWave Foods Co.1 | | | 220,460 | | | | 7,136,290 | | | |
| | | | | | | 22,071,354 | | | |
Energy—5.7% | | | | | | | | | | |
Energy Equipment & Services—1.6% | | | | | | | |
Dril-Quip, Inc.1 | | | 33,360 | | | | 3,644,246 | | | |
Helmerich & Payne, Inc. | | | 64,490 | | | | 7,487,934 | | | |
| | | | | | | 11,132,180 | | | |
Oil, Gas & Consumable Fuels—4.1% | | | | | | | |
Antero Resources Corp.1 | | | 85,170 | | | | 5,589,707 | | | |
Concho Resources, Inc.1 | | | 71,230 | | | | 10,292,735 | | | |
Diamondback Energy, Inc.1 | | | 60,200 | | | | 5,345,760 | | | |
| Memorial Resource Development Corp.1 | | | 355,916 | | | | 8,670,114 | | | |
| | | | | | | 29,898,316 | | | |
| | | | | | | | |
| | | Shares | | | Value | |
Financials—6.4% | | | | | | | | |
Capital Markets—1.5% | | | | | | | | |
Affiliated Managers Group, Inc.1 | | | 34,820 | | | $ | 7,152,028 | |
Waddell & Reed Financial, Inc., Cl. A | | | 58,670 | | | | 3,672,155 | |
| | | | | | | 10,824,183 | |
Commercial Banks—2.7% | | | | | | | | |
First Republic Bank | | | 109,630 | | | | 6,028,554 | |
Signature Bank1 | | | 61,170 | | | | 7,718,431 | |
SVB Financial Group1 | | | 49,060 | | | | 5,721,377 | |
| | | | | | | 19,468,362 | |
Diversified Financial Services—1.0% | | | | | | | | |
Moody’s Corp. | | | 80,361 | | | | 7,044,445 | |
| | | | | | | | | |
Real Estate Investment Trusts (REITs)—0.5% | | | | | |
Host Hotels & Resorts, Inc. | | | 158,570 | | | | 3,490,126 | |
| | | | | | | | | |
Real Estate Management & Development—0.7% | | | | | |
CBRE Group, Inc., Cl. A1 | | | 172,387 | | | | 5,523,279 | |
| | | | | | | | | |
Health Care—13.4% | | | | | | | | |
Biotechnology—1.8% | | | | | | | | |
BioMarin Pharmaceutical, Inc.1 | | | 58,420 | | | | 3,634,308 | |
Cubist Pharmaceuticals, Inc.1 | | | 82,580 | | | | 5,765,736 | |
Incyte Corp.1 | | | 70,920 | | | | 4,002,725 | |
| | | | | | | 13,402,769 | |
Health Care Equipment & Supplies—2.3% | | | | | |
Cooper Cos., Inc. (The) | | | 38,620 | | | | 5,234,169 | |
DexCom, Inc.1 | | | 108,340 | | | | 4,296,764 | |
IDEXX Laboratories, Inc.1 | | | 54,130 | | | | 7,230,144 | |
| | | | | | | 16,761,077 | |
Health Care Providers & Services—4.4% | | | | | | | | |
AmerisourceBergen Corp. SA | | | 126,310 | | | | 9,177,684 | |
Centene Corp.1 | | | 93,820 | | | | 7,093,730 | |
Envision Healthcare Holdings, Inc.1 | | | 172,870 | | | | 6,207,762 | |
Universal Health Services, Inc., Cl. B | | | 95,030 | | | | 9,100,073 | |
| | | | | | | 31,579,249 | |
Health Care Technology—0.7% | | | | | | | | |
Cerner Corp.1 | | | 104,370 | | | | 5,383,405 | |
| | | | | | | | | |
Life Sciences Tools & Services—2.1% | | | | | | | | |
Covance, Inc.1 | | | 41,460 | | | | 3,548,147 | |
Illumina, Inc.1 | | | 64,206 | | | | 11,463,339 | |
| | | | | | | 15,011,486 | |
Pharmaceuticals—2.1% | | | | | | | | |
Actavis plc1 | | | 50,380 | | | | 11,237,259 | |
Salix Pharmaceuticals Ltd.1 | | | 29,660 | | | | 3,658,561 | |
| | | | | | | 14,895,820 | |
Industrials—18.2% | | | | | | | | |
Aerospace & Defense—1.3% | | | | | | | | |
Hexcel Corp.1 | | | 87,390 | | | | 3,574,251 | |
TransDigm Group, Inc. | | | 36,680 | | | | 6,135,097 | |
| | | | | | | 9,709,348 | |
Airlines—1.1% | | | | | | | | |
Spirit Airlines, Inc.1 | | | 120,730 | | | | 7,634,965 | |
| | | | | | | | | |
Building Products—0.8% | | | | | | | | |
A.O. Smith Corp. | | | 113,180 | | | | 5,611,464 | |
| | | | | | | | | |
Commercial Services & Supplies—0.8% | | | | | | | | |
Mobile Mini, Inc. | | | 118,800 | | | | 5,689,332 | |
| | | | | | | | | |
Electrical Equipment—1.1% | | | | | | | | |
Acuity Brands, Inc. | | | 55,300 | | | | 7,645,225 | |
| | | | | | | | | |
Industrial Conglomerates—0.7% | | | | | | | | |
Roper Industries, Inc. | | | 36,317 | | | | 5,302,645 | |
| | | | | | | | |
6 OPPENHEIMER DISCOVERY MID CAP GROWTH FUND/VA
| | | | | | | | | | |
| | | Shares | | | Value | | | |
| Machinery—7.9% | | | | | | | |
| Colfax Corp.1 | | | 124,300 | | | $ | 9,265,322 | | | |
| Flowserve Corp. | | | 70,000 | | | | 5,204,500 | | | |
| Middleby Corp. (The)1 | | | 103,350 | | | | 8,549,112 | | | |
| Nordson Corp. | | | 64,744 | | | | 5,191,822 | | | |
| Snap-on, Inc. | | | 43,856 | | | | 5,197,813 | | | |
| Trinity Industries, Inc. | | | 121,218 | | | | 5,299,651 | | | |
| WABCO Holdings, Inc.1 | | | 85,600 | | | | 9,143,792 | | | |
| Wabtec Corp. | | | 116,770 | | | | 9,644,034 | | | |
| | | | | | | 57,496,046 | | | |
| Marine—1.0% | | | | | | | |
| Kirby Corp.1 | | | 61,646 | | | | 7,221,213 | | | |
| | | | | | | | | | | |
| Professional Services—0.8% | | | | | | | |
| On Assignment, Inc.1 | | | 67,200 | | | | 2,390,304 | | | |
| Robert Half International, Inc. | | | 75,200 | | | | 3,590,048 | | | |
| | | | | | | 5,980,352 | | | |
| Trading Companies & Distributors—2.7% | | | | | | | |
| HD Supply Holdings, Inc.1 | | | 249,410 | | | | 7,080,750 | | | |
| United Rentals, Inc.1 | | | 119,230 | | | | 12,486,958 | | | |
| | | | | | | 19,567,708 | | | |
| Information Technology—17.1% | | | | | | | |
| Communications Equipment—0.9% | | | | | | | |
| Arista Networks, Inc.1 | | | 6,958 | | | | 434,110 | | | |
| Palo Alto Networks, Inc.1 | | | 76,780 | | | | 6,438,003 | | | |
| | | | | | | 6,872,113 | | | |
| Electronic Equipment, Instruments, & Components—0.7% | | | |
| Amphenol Corp., Cl. A | | | 52,570 | | | | 5,064,594 | | | |
| | | | | | | | | | | |
| Internet Software & Services—3.7% | | | |
| CoStar Group, Inc.1 | | | 69,890 | | | | 11,054,501 | | | |
| Pandora Media, Inc.1 | | | 229,720 | | | | 6,776,740 | | | |
| Shutterstock, Inc.1 | | | 49,530 | | | | 4,110,000 | | | |
| Yelp, Inc.1 | | | 60,490 | | | | 4,638,373 | | | |
| | | | | | | 26,579,614 | | | |
| IT Services—2.0% | | | |
| FleetCor Technologies, Inc.1 | | | 48,570 | | | | 6,401,526 | | | |
| MAXIMUS, Inc. | | | 117,030 | | | | 5,034,631 | | | |
| Vantiv, Inc., Cl. A1 | | | 88,220 | | | | 2,965,956 | | | |
| | | | | | | 14,402,113 | | | |
| Semiconductors & Semiconductor Equipment—2.8% | | | |
| Applied Materials, Inc. | | | 243,760 | | | | 5,496,788 | | | |
| Avago Technologies Ltd. | | | 73,960 | | | | 5,330,297 | | | |
| NXP Semiconductors NV1 | | | 149,150 | | | | 9,870,747 | | | |
| | | | | | | 20,697,832 | | | |
| | | | | | | | |
| | | Shares | | | Value | |
Software—5.9% | |
| Aspen Technology, Inc.1 | | | 113,050 | | | $ | 5,245,520 | |
| Concur Technologies, Inc.1 | | | 85,778 | | | | 8,006,518 | |
| NetSuite, Inc.1 | | | 71,177 | | | | 6,183,858 | |
| ServiceNow, Inc.1 | | | 156,010 | | | | 9,666,380 | |
| Tableau Software, Inc., Cl. A1 | | | 110,940 | | | | 7,913,350 | |
| Ultimate Software Group, Inc. (The)1 | | | 44,190 | | | | 6,105,732 | |
| | | | | | | 43,121,358 | |
| Technology Hardware, Storage & Peripherals—1.1% | |
| SanDisk Corp. | | | 73,350 | | | | 7,659,940 | |
| | | | | | | | | |
| Materials—5.6% | |
| Chemicals—2.5% | |
| PolyOne Corp. | | | 167,020 | | | | 7,038,223 | |
| Westlake Chemical Corp. | | | 130,710 | | | | 10,948,269 | |
| | | | | | | 17,986,492 | |
| Construction Materials—1.7% | |
| Eagle Materials, Inc. | | | 80,340 | | | | 7,574,455 | |
| Vulcan Materials Co. | | | 81,110 | | | | 5,170,763 | |
| | | | | | | 12,745,218 | |
| Containers & Packaging—0.7% | |
| Crown Holdings, Inc.1 | | | 107,262 | | | | 5,337,357 | |
| | | | | | | | | |
| Metals & Mining—0.7% | |
| Carpenter Technology Corp. | | | 77,140 | | | | 4,879,105 | |
| | | | | | | | | |
| Telecommunication Services—1.8% | |
| Wireless Telecommunication Services—1.8% | |
| SBA Communications Corp., Cl. A1 | | | 130,870 | | | | 13,388,001 | |
Total Common Stocks (Cost $515,691,114) | | | | 691,694,594 | |
| Investment Company—4.2% | |
Oppenheimer Institutional Money Market Fund, Cl. E, 0.09%2,3 (Cost $30,638,203) | | | 30,638,203 | | | | 30,638,203 | |
| Total Investments, at Value | | | | | | | | |
| (Cost $546,329,317) | | | 99.6 | % | | | 722,332,797 | |
| Net Other Assets (Liabilities) | | | 0.4 | | | | 2,740,599 | |
| Net Assets | | | 100.0 | % | | $ | 725,073,396 | |
Footnotes to Statement of Investments
1. Non-income producing security.
2. Is or was an affiliate, as defined in the Investment Company Act of 1940, at or during the period ended June 30, 2014, by virtue of the Fund owning at least 5% of the voting securities of the issuer or as a result of the Fund and the issuer having the same investment adviser. Transactions during the period in which the issuer was an affiliate are as follows:
| | | | | | | | | | | | | | | | |
| | | Shares
December 31, 2013 | | | Gross
Additions | | | Gross
Reductions | | | Shares
June 30, 2014 | |
Oppenheimer Institutional Money Market Fund, Cl. E | | | 5,136,594 | | | | 166,717,747 | | | | 141,216,138 | | | | 30,638,203 | |
| | | | |
| | | | | | | | | Value | | | Income | |
Oppenheimer Institutional Money Market Fund, Cl. E | | | | | | | | | | $ | 30,638,203 | | | $ | 5,900 | |
3. Rate shown is the 7-day yield as of June 30, 2014.
See accompanying Notes to Financial Statements.
7 OPPENHEIMER DISCOVERY MID CAP GROWTH FUND/VA
| | |
STATEMENT OF ASSETS AND LIABILITIES June 30, 2014 Unaudited |
| | | | |
Assets | | | | |
Investments, at value—see accompanying statement of investments: | | | | |
Unaffiliated companies (cost $515,691,114) | | $ | 691,694,594 | |
Affiliated companies (cost $30,638,203) | | | 30,638,203 | |
| | | | |
| | | | 722,332,797 | |
Receivables and other assets: | | | | |
Investments sold | | | 7,900,894 | |
Shares of beneficial interest sold | | | 4,522,435 | |
Dividends | | | 88,745 | |
Other | | | 47,473 | |
| | | | |
Total assets | | | 734,892,344 | |
|
| |
Liabilities | | | | |
Payables and other liabilities: | | | | |
Investments purchased | | | 9,506,101 | |
Shares of beneficial interest redeemed | | | 220,328 | |
Trustees’ compensation | | | 41,518 | |
Shareholder communications | | | 35,138 | |
Distribution and service plan fees | | | 6,725 | |
Other | | | 9,138 | |
| | | | |
Total liabilities | | | 9,818,948 | |
|
| | |
Net Assets | | $ | 725,073,396 | |
| | | | |
|
| |
Composition of Net Assets | | | | |
Par value of shares of beneficial interest | | $ | 9,677 | |
Additional paid-in capital | | | 527,162,813 | |
Accumulated net investment loss | | | (1,757,369 | ) |
Accumulated net realized gain on investments | | | 23,654,795 | |
Net unrealized appreciation on investments | | | 176,003,480 | |
| | | | |
Net Assets | | $ | 725,073,396 | |
| | | | |
|
| |
Net Asset Value Per Share | | | | |
Non-Service Shares: | | | | |
| Net asset value, redemption price (excludes applicable contingent deferred sales charge) and offering price per share (based on net assets of $692,365,005 and 9,227,184 shares of beneficial interest outstanding) | | $ | 75.04 | |
| |
Service Shares: | | | | |
| Net asset value, redemption price (excludes applicable contingent deferred sales charge) and offering price per share (based on net assets of $32,708,391 and 450,251 shares of beneficial interest outstanding) | | $ | 72.64 | |
See accompanying Notes to Financial Statements.
8 OPPENHEIMER DISCOVERY MID CAP GROWTH FUND/VA
| | |
STATEMENT OF OPERATIONS For the Six Months Ended June 30, 2014 Unaudited |
| | | | |
Investment Income | | | | |
Dividends: | | | | |
Unaffiliated companies (net of foreign withholding taxes of $7,351) | | $ | 1,225,356 | |
Affiliated companies | | | 5,900 | |
| | | | |
Total investment income | | | 1,231,256 | |
|
| | |
Expenses | | | | |
Management fees | | | 2,564,130 | |
Distribution and service plan fees - Service shares | | | 42,456 | |
Transfer and shareholder servicing agent fees: | | | | |
Non-Service shares | | | 344,613 | |
Service shares | | | 17,003 | |
Shareholder communications: | | | | |
Non-Service shares | | | 16,876 | |
Service shares | | | 844 | |
Trustees’ compensation | | | 16,801 | |
Custodian fees and expenses | | | 2,718 | |
Other | | | 30,031 | |
| | | | |
Total expenses | | | 3,035,472 | |
Less waivers and reimbursements of expenses | | | (100,010 | ) |
| | | | |
Net expenses | | | 2,935,462 | |
|
| | |
Net Investment Loss | | | (1,704,206 | ) |
|
| | |
Realized and Unrealized Gain (Loss) | | | | |
Net realized gain on investments from unaffiliated companies | | | 75,908,879 | |
Net change in unrealized appreciation/depreciation on investments | | | (69,763,305 | ) |
Net Increase in Net Assets Resulting from Operations | | $ | 4,441,368 | |
| | | | |
See accompanying Notes to Financial Statements.
9 OPPENHEIMER DISCOVERY MID CAP GROWTH FUND/VA
| | |
STATEMENTS OF CHANGES IN NET ASSETS |
| | | | | | | | | | |
| | | Six Months Ended
June 30, 2014
(Unaudited) | | | | | Year Ended
December 31, 2013 | |
Operations | | | | | | | | | | |
Net investment loss | | $ | (1,704,206 | ) | | | | $ | (1,689,339 | ) |
Net realized gain | | | 75,908,879 | | | | | | 122,245,177 | |
Net change in unrealized appreciation/depreciation | | | (69,763,305 | ) | | | | | 79,850,119 | |
| | | | | | | | | | |
Net increase in net assets resulting from operations | | | 4,441,368 | | | | | | 200,405,957 | |
|
| |
Dividends and/or Distributions to Shareholders | | | | | | | | | | |
Dividends from net investment income: | | | | | | | | | | |
Non-Service shares | | | — | | | | | | (73,101 | ) |
Service shares | | | — | | | | | | — | |
| | | | |
| | | — | | | | | | (73,101 | ) |
|
| |
Beneficial Interest Transactions | | | | | | | | | | |
Net decrease in net assets resulting from beneficial interest transactions: | | | | | | | | | | |
Non-Service shares | | | (37,328,219 | ) | | | | | (22,913,255 | ) |
Service shares | | | (3,994,353 | ) | | | | | (10,340,669 | ) |
| | | | | | | | | | |
| | | (41,322,572 | ) | | | | | (33,253,924 | ) |
|
| |
Net Assets | | | | | | | | | | |
Total increase (decrease) | | | (36,881,204 | ) | | | | | 167,078,932 | |
Beginning of period | | | 761,954,600 | | | | | | 594,875,668 | |
| | | | | | | | | | |
| | | |
End of period (including accumulated net investment loss of $1,757,369 and $53,163, respectively) | | $ | 725,073,396 | | | | | $ | 761,954,600 | |
| | | | |
See accompanying Notes to Financial Statements.
10 OPPENHEIMER DISCOVERY MID CAP GROWTH FUND/VA
| | | | | | | | | | | | | | | | | | | | | | | | |
Non-Service Shares | |
| Six Months
Ended June 30, 2014 (Unaudited) |
| |
| Year Ended
December 31, 2013 |
| |
| Year Ended
December 31, 2012 |
| |
| Year Ended
December 30, 2011 |
1 | |
| Year Ended
December 31, 2010 |
| |
| Year Ended
December 31, 2009 |
|
Per Share Operating Data | | | | | | | | | | | | | | | | | | | | | | | | |
| Net asset value, beginning of period | | $ | 74.51 | | | $ | 54.80 | | | $ | 47.06 | | | $ | 46.55 | | | $ | 36.52 | | | $ | 27.54 | |
| Income (loss) from investment operations: | | | | | | | | | | | | | | | | | | | | | | | | |
| Net investment income (loss)2 | | | (0.17 | )3 | | | (0.16 | ) | | | 0.01 | | | | (0.26 | ) | | | (0.11 | ) | | | (0.05 | ) |
| Net realized and unrealized gain | | | 0.70 | | | | 19.88 | | | | 7.73 | | | | 0.77 | | | | 10.14 | | | | 9.03 | |
| Total from investment operations | | | 0.53 | | | | 19.72 | | | | 7.74 | | | | 0.51 | | | | 10.03 | | | | 8.98 | |
| Dividends and/or distributions to shareholders: | | | | | | | | | | | | | | | | | | | | | | | | |
| Dividends from net investment income | | | 0.00 | | | | (0.01 | ) | | | 0.00 | | | | 0.00 | | | | 0.00 | | | | 0.00 | |
| Net asset value, end of period | | $ | 75.04 | | | $ | 74.51 | | | $ | 54.80 | | | $ | 47.06 | | | $ | 46.55 | | | $ | 36.52 | |
| | | | |
| | | | | | |
| | | | | | | | | | | | | | | | | | | | | | | | | |
Total Return, at Net Asset Value4 | | | 0.71 | % | | | 35.98 | % | | | 16.45 | % | | | 1.09 | % | | | 27.46 | % | | | 32.61 | % |
| | | | | | | | | | | | | | | | | | | | | | | | | |
Ratios/Supplemental Data | | | | | | | | | | | | | | | | | | | | | | | | |
| Net assets, end of period (in thousands) | | $ | 692,365 | | | $ | 725,406 | | | $ | 558,934 | | | $ | 543,020 | | | $ | 611,872 | | | $ | 547,683 | |
| Average net assets (in thousands) | | $ | 698,176 | | | $ | 618,970 | | | $ | 575,072 | | | $ | 605,083 | | | $ | 548,739 | | | $ | 478,968 | |
| Ratios to average net assets:5 | | | | | | | | | | | | | | | | | | | | | | | | |
| Net investment income (loss) | | | (0.46 | )%3 | | | (0.24 | )% | | | 0.03 | % | | | (0.53 | )% | | | (0.29 | )% | | | (0.17 | )% |
| Total expenses6 | | | 0.82 | % | | | 0.84 | % | | | 0.85 | % | | | 0.84 | % | | | 0.85 | % | | | 0.86 | % |
| Expenses after payments, waivers and/or reimbursements and reduction to custodian expenses | | | 0.80 | % | | | 0.80 | % | | | 0.80 | % | | | 0.80 | % | | | 0.76 | % | | | 0.71 | % |
| Portfolio turnover rate | | | 52 | % | | | 84 | % | | | 66 | % | | | 91 | % | | | 95 | % | | | 102 | % |
1. December 30, 2011 represents the last business day of the Fund’s reporting period.
2. Per share amounts calculated based on the average shares outstanding during the period.
3. Net investment income per share and the net investment income ratio include $0.09 and 0.25%, respectively, resulting from a special dividend from TransDigm Group Inc. in June 2014.
4. Assumes an initial investment on the business day before the first day of the fiscal period, with all dividends and distributions reinvested in additional shares on the reinvestment date, and redemption at the net asset value calculated on the last business day of the fiscal period. Total returns are not annualized for periods less than one full year. Total return information does not reflect expenses that apply at the separate account level or to related insurance products. Inclusion of these charges would reduce the total return figures for all periods shown. Returns do not reflect the deduction of taxes that a shareholder would pay on fund distributions or the redemption of fund shares.
5. Annualized for periods less than one full year.
6. Total expenses including indirect expenses from affiliated fund were as follows:
| | | | |
Six Months Ended June 30, 2014 | | | 0.82 | % |
Year Ended December 31, 2013 | | | 0.84 | % |
Year Ended December 31, 2012 | | | 0.85 | % |
Year Ended December 30, 2011 | | | 0.84 | % |
Year Ended December 31, 2010 | | | 0.85 | % |
Year Ended December 31, 2009 | | | 0.86 | % |
See accompanying Notes to Financial Statements.
11 OPPENHEIMER DISCOVERY MID CAP GROWTH FUND/VA
| | |
FINANCIAL HIGHLIGHTS Continued |
| | | | | | | | | | | | | | | | | | | | | | | | |
Service Shares | |
| Six Months
Ended June 30, 2014 (Unaudited) |
| |
| Year Ended
December 31, 2013 |
| |
| Year Ended
December 31, 2012 |
| |
| Year Ended
December 30, 2011 |
1 | |
| Year Ended
December
31, 2010 |
| |
| Year Ended
December 31, 2009 |
|
Per Share Operating Data | | | | | | | | | | | | | | | | | | | | | | | | |
| Net asset value, beginning of period | | $ | 72.22 | | | $ | 53.25 | | | $ | 45.84 | | | $ | 45.46 | | | $ | 35.75 | | | $ | 27.03 | |
| Income (loss) from investment operations: | | | | | | | | | | | | | | | | | | | | | | | | |
| Net investment loss2 | | | (0.25 | )3 | | | (0.30 | ) | | | (0.12 | ) | | | (0.37 | ) | | | (0.20 | ) | | | (0.13 | ) |
| Net realized and unrealized gain | | | 0.67 | | | | 19.27 | | | | 7.53 | | | | 0.75 | | | | 9.91 | | | | 8.85 | |
| Total from investment operations | | | 0.42 | | | | 18.97 | | | | 7.41 | | | | 0.38 | | | | 9.71 | | | | 8.72 | |
| Dividends and/or distributions to shareholders: | | | | | | | | | | | | | | | | | | | | | | | | |
| Dividends from net investment income | | | 0.00 | | | | 0.00 | | | | 0.00 | | | | 0.00 | | | | 0.00 | | | | 0.00 | |
| Net asset value, end of period | | $ | 72.64 | | | $ | 72.22 | | | $ | 53.25 | | | $ | 45.84 | | | $ | 45.46 | | | $ | 35.75 | |
| | | | |
| | | | | | |
| | | | | | | | | | | | | | | | | | | | | | | | | |
Total Return, at Net Asset Value4 | | | 0.59 | % | | | 35.62 | % | | | 16.17 | % | | | 0.83 | % | | | 27.16 | % | | | 32.26 | % |
| | | | | | | | | | | | | | | | | | | | | | | | | |
Ratios/Supplemental Data | | | | | | | | | | | | | | | | | | | | | | | | |
| Net assets, end of period (in thousands) | | $ | 32,708 | | | $ | 36,549 | | | $ | 35,942 | | | $ | 35,773 | | | $ | 32,669 | | | $ | 26,098 | |
| Average net assets (in thousands) | | $ | 34,451 | | | $ | 35,905 | | | $ | 37,842 | | | $ | 37,775 | | | $ | 27,552 | | | $ | 22,605 | |
| Ratios to average net assets:5 | | | | | | | | | | | | | | | | | | | | | | | | |
| Net investment loss | | | (0.71 | )%3 | | | (0.49 | )% | | | (0.22 | )% | | | (0.78 | )% | | | (0.53 | )% | | | (0.44 | )% |
| Total expenses6 | | | 1.07 | % | | | 1.09 | % | | | 1.10 | % | | | 1.09 | % | | | 1.10 | % | | | 1.12 | % |
| Expenses after payments, waivers and/or reimbursements and reduction to custodian expenses | | | 1.05 | % | | | 1.05 | % | | | 1.05 | % | | | 1.05 | % | | | 1.01 | % | | | 0.97 | % |
| Portfolio turnover rate | | | 52 | % | | | 84 | % | | | 66 | % | | | 91 | % | | | 95 | % | | | 102 | % |
1. December 30, 2011 represents the last business day of the Fund’s reporting period.
2. Per share amounts calculated based on the average shares outstanding during the period.
3. Net investment income per share and the net investment income ratio include $0.09 and 0.25%, respectively, resulting from a special dividend from TransDigm Group Inc. in June 2014.
4. Assumes an initial investment on the business day before the first day of the fiscal period, with all dividends and distributions reinvested in additional shares on the reinvestment date, and redemption at the net asset value calculated on the last business day of the fiscal period. Total returns are not annualized for periods less than one full year. Total return information does not reflect expenses that apply at the separate account level or to related insurance products. Inclusion of these charges would reduce the total return figures for all periods shown. Returns do not reflect the deduction of taxes that a shareholder would pay on fund distributions or the redemption of fund shares.
5. Annualized for periods less than one full year.
6. Total expenses including indirect expenses from affiliated fund were as follows:
| | | | |
Six Months Ended June 30, 2014 | | | 1.07 | % |
Year Ended December 31, 2013 | | | 1.09 | % |
Year Ended December 31, 2012 | | | 1.10 | % |
Year Ended December 30, 2011 | | | 1.09 | % |
Year Ended December 31, 2010 | | | 1.10 | % |
Year Ended December 31, 2009 | | | 1.12 | % |
See accompanying Notes to Financial Statements.
12 OPPENHEIMER DISCOVERY MID CAP GROWTH FUND/VA
| | |
NOTESTO FINANCIAL STATEMENTS June 30, 2014 Unaudited |
1. Significant Accounting Policies
Oppenheimer Discovery Mid Cap Growth Fund/VA (the “Fund”) is a separate series of Oppenheimer Variable Account Funds, as a diversified open-end management investment company registered under the Investment Company Act of 1940, as amended. The Fund’s investment objective is to seek capital appreciation. The Fund’s investment adviser is OFI Global Asset Management, Inc. (“OFI Global” or the “Manager”), a wholly-owned subsidiary of OppenheimerFunds Inc. (“OFI” or the “Sub-Adviser”). The Manager has entered into a sub-advisory agreement with OFI. Shares of the Fund are sold only to separate accounts of life insurance companies.
The Fund offers two classes of shares. Both classes are sold at their offering price, which is the net asset value per share, to separate investment accounts of participating insurance companies as an underlying investment for variable life insurance policies, variable annuity contracts or other investment products. The class of shares designated as Service shares is subject to a distribution and service plan. Both classes of shares have identical rights and voting privileges with respect to the Fund in general and exclusive voting rights on matters that affect that class alone. Earnings, net assets and net asset value per share may differ due to each class having its own expenses, such as transfer and shareholder servicing agent fees and shareholder communications, directly attributable to that class.
The following is a summary of significant accounting policies consistently followed by the Fund.
Investment in Oppenheimer Institutional Money Market Fund. The Fund is permitted to invest daily available cash balances in an affiliated money market fund. The Fund may invest the available cash in Class E shares of Oppenheimer Institutional Money Market Fund (“IMMF”) to seek current income while preserving liquidity. IMMF is a registered open-end management investment company, regulated as a money market fund under the Investment Company Act of 1940, as amended. The Manager is the investment adviser of IMMF, and the Sub-Adviser provides investment and related advisory services to IMMF. When applicable, the Fund’s investment in IMMF is included in the Statement of Investments. Shares of IMMF are valued at their net asset value per share. As a shareholder, the Fund is subject to its proportional share of IMMF’s Class E expenses, including its management fee. The Manager will waive fees and/or reimburse Fund expenses in an amount equal to the indirect management fees incurred through the Fund’s investment in IMMF.
Allocation of Income, Expenses, Gains and Losses. Income, expenses (other than those attributable to a specific class), gains and losses are allocated on a daily basis to each class of shares based upon the relative proportion of net assets represented by such class. Operating expenses directly attributable to a specific class are charged against the operations of that class.
Federal Taxes. The Fund intends to comply with provisions of the Internal Revenue Code applicable to regulated investment companies and to distribute substantially all of its investment company taxable income to shareholders. Therefore, no federal income or excise tax provision is required. The Fund files income tax returns in U.S. federal and applicable state jurisdictions. The statute of limitations on the Fund’s tax return filings generally remain open for the three preceding fiscal reporting period ends.
During the fiscal year ended December 31, 2013, the Fund utilized $121,849,981 of capital loss carryforward to offset capital gains realized in that fiscal year. The Fund had post-October losses of $1,131,911. Details of the fiscal year ended December 31, 2013 capital loss carryforwards are included in the table below. Capital loss carryforwards with no expiration, if any, must be utilized prior to those with expiration dates. Capital losses with no expiration will be carried forward to future years if not offset by gains.
| | | | |
| Expiring | |
2017 | | $ | 50,885,832 | |
As of June 30, 2014, it is estimated that the fund will have no capital loss carryforwards. The estimated capital loss carryforward represents the carryforward as of the end of the last fiscal year, increased or decreased by capital losses or gains realized in the first six months of the current fiscal year. During the six months ended June 30, 2014, it is estimated that the Fund will utilize $52,017,743 of capital loss carryforward to offset realized capital gains.
Net investment income (loss) and net realized gain (loss) may differ for financial statement and tax purposes. The character of dividends and distributions made during the fiscal year from net investment income or net realized gains may differ from their ultimate characterization for federal income tax purposes. Also, due to timing of dividends and distributions, the fiscal year in which amounts are distributed may differ from the fiscal year in which the income or net realized gain was recorded by the Fund.
The aggregate cost of securities and other investments and the composition of unrealized appreciation and depreciation of securities and other investments for federal income tax purposes as of June 30, 2014 are noted in the following table. The primary difference between book and tax appreciation or depreciation of securities and other investments, if applicable, is attributable to the tax deferral of losses or tax realization of financial statement unrealized gain or loss.
| | | | |
Federal tax cost of securities | | $ | 546,709,119 | |
| | | | |
Gross unrealized appreciation | | $ | 177,782,740 | |
Gross unrealized depreciation | | | (2,159,062 | ) |
| | | | |
Net unrealized appreciation | | $ | 175,623,678 | |
| | | | |
Trustees’ Compensation. The Board of Trustees has adopted a compensation deferral plan for independent trustees that enables trustees to elect to defer receipt of all or a portion of the annual compensation they are entitled to receive from the Fund. For purposes of determining the amount owed to the Trustee under the plan, deferred amounts are treated as though equal dollar amounts had been invested in shares of the Fund or in other Oppenheimer funds selected by the Trustee. The Fund purchases shares of the funds selected for deferral by the Trustee in amounts equal to his or her
13 OPPENHEIMER DISCOVERY MID CAP GROWTH FUND/VA
| | |
NOTESTO FINANCIAL STATEMENTS Unaudited / Continued |
1. Significant Accounting Policies (Continued)
deemed investment, resulting in a Fund asset equal to the deferred compensation liability. Such assets are included as a component of “Other” within the asset section of the Statement of Assets and Liabilities. Deferral of trustees’ fees under the plan will not affect the net assets of the Fund, and will not materially affect the Fund’s assets, liabilities or net investment income per share. Amounts will be deferred until distributed in accordance with the compensation deferral plan.
Dividends and Distributions to Shareholders. Dividends and distributions to shareholders, which are determined in accordance with income tax regulations and may differ from U.S. generally accepted accounting principles, are recorded on the ex-dividend date. Income and capital gain distributions, if any, are declared and paid annually or at other times as deemed necessary by the Manager. The tax character of distributions is determined as of the Fund’s fiscal year end. Therefore, a portion of the Fund’s distributions made to shareholders prior to the Fund’s fiscal year end may ultimately be categorized as a tax return of capital.
Investment Income. Dividend income is recorded on the ex-dividend date or upon ex-dividend notification in the case of certain foreign dividends where the ex-dividend date may have passed. Non-cash dividends included in dividend income, if any, are recorded at the fair market value of the securities received. Interest income is recognized on an accrual basis. Discount and premium, which are included in interest income on the Statement of Operations, are amortized or accreted daily.
Custodian Fees. “Custodian fees and expenses” in the Statement of Operations may include interest expense incurred by the Fund on any cash overdrafts of its custodian account during the period. Such cash overdrafts may result from the effects of failed trades in portfolio securities and from cash outflows resulting from unanticipated shareholder redemption activity. The Fund pays interest to its custodian on such cash overdrafts, to the extent they are not offset by positive cash balances maintained by the Fund, at a rate equal to the Federal Funds Rate plus 0.50%. The “Reduction to custodian expenses” line item, if applicable, represents earnings on cash balances maintained by the Fund during the period. Such interest expense and other custodian fees may be paid with these earnings.
Security Transactions. Security transactions are recorded on the trade date. Realized gains and losses on securities sold are determined on the basis of identified cost.
Indemnifications. The Fund’s organizational documents provide current and former trustees and officers with a limited indemnification against liabilities arising in connection with the performance of their duties to the Fund. In the normal course of business, the Fund may also enter into contracts that provide general indemnifications. The Fund’s maximum exposure under these arrangements is unknown as this would be dependent on future claims that may be made against the Fund. The risk of material loss from such claims is considered remote.
Other. The preparation of financial statements in conformity with accounting principles generally accepted in the United States of America requires management to make estimates and assumptions that affect the reported amounts of assets and liabilities and disclosure of contingent assets and liabilities at the date of the financial statements and the reported amounts of increases and decreases in net assets from operations during the reporting period. Actual results could differ from those estimates.
2. Securities Valuation
The Fund calculates the net asset value of its shares as of the close of the New York Stock Exchange (the “Exchange”), normally 4:00 P.M. Eastern time, on each day the Exchange is open for trading.
The Fund’s Board has adopted procedures for the valuation of the Fund’s securities and has delegated the day-to-day responsibility for valuation determinations under those procedures to the Manager. The Manager has established a Valuation Committee which is responsible for determining a “fair valuation” for any security for which market quotations are not “readily available.” The Valuation Committee’s fair valuation determinations are subject to review, approval and ratification by the Fund’s Board at its next regularly scheduled meeting covering the calendar quarter in which the fair valuation was determined.
Valuation Methods and Inputs
Securities are valued using unadjusted quoted market prices, when available, as supplied primarily by third party pricing services or dealers.
The following methodologies are used to determine the market value or the fair value of the types of securities described below:
Securities traded on a registered U.S. securities exchange (including exchange-traded derivatives other than futures and futures options) are valued based on the last sale price of the security reported on the principal exchange on which it is traded, prior to the time when the Fund’s assets are valued. In the absence of a sale, the security is valued at the last sale price on the prior trading day, if it is within the spread of the current day’s closing “bid” and “asked” prices, and if not, at the current day’s closing bid price. A security of a foreign issuer traded on a foreign exchange, but not listed on a registered U.S. securities exchange, is valued based on the last sale price on the principal exchange on which the security is traded, as identified by the third party pricing service used by the Manager, prior to the time when the Fund’s assets are valued. If the last sale price is unavailable, the security is valued at the most recent official closing price on the principal exchange on which it is traded. If the last sales price or official closing price for a foreign security is not available, the security is valued at the mean between the bid and asked price per the exchange or, if not available from the exchange,
14 OPPENHEIMER DISCOVERY MID CAP GROWTH FUND/VA
2. Securities Valuation (Continued)
obtained from two dealers. If bid and asked prices are not available from either the exchange or two dealers, the security is valued by using one of the following methodologies (listed in order of priority): (1) using a bid from the exchange, (2) the mean between the bid and asked price as provided by a single dealer, or (3) a bid from a single dealer.
Shares of a registered investment company that are not traded on an exchange are valued at that investment company’s net asset value per share.
Corporate and government debt securities (of U.S. or foreign issuers) and municipal debt securities, event-linked bonds, loans, mortgage-backed securities, collateralized mortgage obligations, and asset-backed securities are valued at the mean between the “bid” and “asked” prices utilizing evaluated prices obtained from third party pricing services or broker-dealers who may use matrix pricing methods to determine the evaluated prices.
Short-term money market type debt securities with a remaining maturity of sixty days or less are valued at cost adjusted by the amortization of discount or premium to maturity (amortized cost), which approximates market value. Short-term debt securities with a remaining maturity in excess of sixty days are valued at the mean between the “bid” and “asked” prices utilizing evaluated prices obtained from third party pricing services or broker-dealers.
A description of the standard inputs that may generally be considered by the third party pricing vendors in determining their evaluated prices is provided below.
| | |
| Security Type | | Standard inputs generally considered by third-party pricing vendors |
| Corporate debt, government debt, municipal, mortgage-backed and asset-backed securities | | Reported trade data, broker-dealer price quotations, benchmark yields, issuer spreads on comparable securities, the credit quality, yield, maturity, and other appropriate factors. |
| Loans | | Information obtained from market participants regarding reported trade data and broker-dealer price quotations. |
| Event-linked bonds | | Information obtained from market participants regarding reported trade data and broker-dealer price quotations. |
If a market value or price cannot be determined for a security using the methodologies described above, or if, in the “good faith” opinion of the Manager, the market value or price obtained does not constitute a “readily available market quotation,” or a significant event has occurred that would materially affect the value of the security the security is fair valued either (i) by a standardized fair valuation methodology applicable to the security type or the significant event as previously approved by the Valuation Committee and the Fund’s Board or (ii) as determined in good faith by the Manager’s Valuation Committee. The Valuation Committee considers all relevant facts that are reasonably available, through either public information or information available to the Manager, when determining the fair value of a security. Fair value determinations by the Manager are subject to review, approval and ratification by the Fund’s Board at its next regularly scheduled meeting covering the calendar quarter in which the fair valuation was determined. Those fair valuation standardized methodologies include, but are not limited to, valuing securities at the last sale price or initially at cost and subsequently adjusting the value based on: changes in company specific fundamentals, changes in an appropriate securities index, or changes in the value of similar securities which may be further adjusted for any discounts related to security-specific resale restrictions. When possible, such methodologies use observable market inputs such as unadjusted quoted prices of similar securities, observable interest rates, currency rates and yield curves. The methodologies used for valuing securities are not necessarily an indication of the risks associated with investing in those securities nor can it be assured that the Fund can obtain the fair value assigned to a security if it were to sell the security.
To assess the continuing appropriateness of security valuations, the Manager, or its third party service provider who is subject to oversight by the Manager, regularly compares prior day prices, prices on comparable securities, and sale prices to the current day prices and challenges those prices exceeding certain tolerance levels with the third party pricing service or broker source. For those securities valued by fair valuations, whether through a standardized fair valuation methodology or a fair valuation determination, the Valuation Committee reviews and affirms the reasonableness of the valuations based on such methodologies and fair valuation determinations on a regular basis after considering all relevant information that is reasonably available.
Classifications
Each investment asset or liability of the Fund is assigned a level at measurement date based on the significance and source of the inputs to its valuation. Various data inputs are used in determining the value of each of the Fund’s investments as of the reporting period end. These data inputs are categorized in the following hierarchy under applicable financial accounting standards:
1) Level 1-unadjusted quoted prices in active markets for identical assets or liabilities (including securities actively traded on a securities exchange)
2) Level 2-inputs other than unadjusted quoted prices that are observable for the asset or liability (such as unadjusted quoted prices for similar assets and market corroborated inputs such as interest rates, prepayment speeds, credit risks, etc.)
3) Level 3-significant unobservable inputs (including the Manager’s own judgments about assumptions that market participants would use in pricing the asset or liability).
The inputs used for valuing securities are not necessarily an indication of the risks associated with investing in those securities.
15 OPPENHEIMER DISCOVERY MID CAP GROWTH FUND
| | |
NOTES TO FINANCIAL STATEMENTS Unaudited / Continued |
2. Securities Valuation (Continued)
The table below categorizes amounts that are included in the Fund’s Statement of Assets and Liabilities as of June 30, 2014 based on valuation input level:
| | | | | | | | | | | | | | | | |
| | | Level 1—
Unadjusted
Quoted Prices | | | Level 2—
Other Significant
Observable Inputs | | | Level 3—
Significant
Unobservable
Inputs | | | Value | |
Assets Table | | | | | | | | | | | | | | | | |
Investments, at Value: | | | | | | | | | | | | | | | | |
Common Stocks | | | | | | | | | | | | | | | | |
Consumer Discretionary | | $ | 165,018,270 | | | $ | — | | | $ | — | | | $ | 165,018,270 | |
Consumer Staples | | | 31,669,592 | | | | — | | | | — | | | | 31,669,592 | |
Energy | | | 41,030,496 | | | | — | | | | — | | | | 41,030,496 | |
Financials | | | 46,350,395 | | | | — | | | | — | | | | 46,350,395 | |
Health Care | | | 97,033,806 | | | | — | | | | — | | | | 97,033,806 | |
Industrials | | | 131,858,298 | | | | — | | | | — | | | | 131,858,298 | |
Information Technology | | | 124,397,564 | | | | — | | | | — | | | | 124,397,564 | |
Materials | | | 40,948,172 | | | | — | | | | — | | | | 40,948,172 | |
Telecommunication Services | | | 13,388,001 | | | | — | | | | — | | | | 13,388,001 | |
Investment Company | | | 30,638,203 | | | | — | | | | — | | | | 30,638,203 | |
| | | | |
Total Assets | | $ | 722,332,797 | | | $ | — | | | $ | — | | | $ | 722,332,797 | |
| | | | |
Forward currency exchanges contracts and futures contracts, if any, are reported at their unrealized appreciation/ depreciation at measurement date, which represents the change in the contract’s value from trade date. All additional assets and liabilities included in the above table are reported at their market value at measurement date.
3. Shares of Beneficial Interest
The Fund has authorized an unlimited number of $0.001 par value shares of beneficial interest of each class. Transactions in shares of beneficial interest were as follows:
| | | | | | | | | | | | | | | | | | | | |
| | | Six Months Ended June 30, 2014 | | | | | Year Ended December 31, 2013 | | | |
| | | Shares | | | Amount | | | | | Shares | | | Amount | | | |
Class Non-Service | | | | | | | | | | | | | | | | | | | | |
Sold | | | 295,660 | | | $ | 22,222,141 | | | | | | 1,267,875 | | | $ | 87,221,834 | | | |
Dividends and/or distributions reinvested | | | — | | | | — | | | | | | 1,176 | | | | 73,101 | | | |
Redeemed | | | (804,460 | ) | | | (59,550,360 | ) | | | | | (1,732,026 | ) | | | (110,208,190 | ) | | |
| | | |
Net decrease | | | (508,800 | ) | | $ | (37,328,219 | ) | | | | | (462,975 | ) | | $ | (22,913,255 | ) | | |
| | | |
| | | | | | | | | | | | | | | | | | | | |
Class Service | | | | | | | | | | | | | | | | | | | | |
Sold | | | 25,991 | | | $ | 1,866,972 | | | | | | 78,939 | | | $ | 4,862,175 | | | |
Dividends and/or distributions reinvested | | | — | | | | — | | | | | | — | | | | — | | | |
Redeemed | | | (81,799 | ) | | | (5,861,325 | ) | | | | | (247,872 | ) | | | (15,202,844 | ) | | |
| | | |
Net decrease | | | (55,808 | ) | | $ | (3,994,353 | ) | | | | | (168,933 | ) | | $ | (10,340,669 | ) | | |
| | | |
4. Purchases and Sales of Securities
The aggregate cost of purchases and proceeds from sales of securities, other than short-term obligations and investments in IMMF, for the six months ended June 30, 2014 were as follows:
| | | | | | | | | | |
| | | Purchases | | | | | Sales | |
Investment securities | | $ | 372,432,426 | | | | | $ | 442,357,136 | |
5. Fees and Other Transactions with Affiliates
Management Fees. Under the investment advisory agreement, the Fund pays the Manager a management fee based on the daily net assets of the Fund at an annual rate as shown in the following table:
| | | | |
| Fee Schedule | | | |
Up to $200 million | | | 0.75% | |
Next $200 million | | | 0.72 | |
Next $200 million | | | 0.69 | |
Next $200 million | | | 0.66 | |
Next $700 million | | | 0.60 | |
Over $1.5 billion | | | 0.58 | |
Sub-Adviser Fees. The Manager has retained the Sub-Adviser to provide the day-to-day portfolio management of the Fund. Under the Sub-Advisory Agreement, the Manager pays the Sub-Adviser an annual fee in monthly installments, equal to a percentage of the investment management fee collected by the Manager from the Fund, which shall be calculated after any investment management fee waivers. The fee paid to the Sub-Adviser is paid by the Manager, not by the Fund.
16 OPPENHEIMER DISCOVERY MID CAP GROWTH FUND/VA
5. Fees and Other Transactions with Affiliates (Continued)
Transfer Agent Fees. OFI Global (the “Transfer Agent”) serves as the transfer and shareholder servicing agent for the Fund. The Fund pays the Transfer Agent a fee based on annual net assets. Fees incurred and average net assets for each class with respect to these services are detailed in the Statement of Operations and Financial Highlights, respectively.
Sub-Transfer Agent Fees. The Transfer Agent has retained Shareholder Services, Inc., a wholly-owned subsidiary of OFI (the “Sub-Transfer Agent”), to provide the day-to-day transfer agent and shareholder servicing of the Fund. Under the Sub-Transfer Agency Agreement, the Transfer Agent pays the Sub-Transfer Agent an annual fee in monthly installments, equal to a percentage of the transfer agent fee collected by the Transfer Agent from the Fund, which shall be calculated after any applicable fee waivers. The fee paid to the Sub-Transfer Agent is paid by the Transfer Agent, not by the Fund.
Distribution and Service Plan for Service Shares. The Fund has adopted a Distribution and Service Plan (the “Plan”) in accordance with Rule 12b-1 under the Investment Company Act of 1940 for Service shares to pay OppenheimerFunds Distributor, Inc. (the “Distributor”), for distribution related services, personal service and account maintenance for the Fund’s Service shares. Under the Plan, payments are made periodically at an annual rate of 0.25% of the daily net assets of Service shares of the Fund. The Distributor currently uses all of those fees to compensate sponsors of the insurance product that offers Fund shares, for providing personal service and maintenance of accounts of their variable contract owners that hold Service shares. These fees are paid out of the Fund’s assets on an on-going basis and increase operating expenses of the Service shares, which results in lower performance compared to the Fund’s shares that are not subject to a service fee. Fees incurred by the Fund under the Plan are detailed in the Statement of Operations.
Waivers and Reimbursements of Expenses. The Manager has contractually agreed to limit the Fund’s expenses after payments, waivers and/or reimbursements and reduction to custodian expenses, excluding expenses incurred directly or indirectly by the Fund as a result of investments in other investment companies, wholly-owned subsidiaries and pooled investment vehicles; so that those expenses, as percentages of daily net assets, will not exceed the annual rate of 0.80% for Non-Service shares and 1.05% for Service shares. During the six months ended June 30, 2014, the Manager waived fees and/or reimbursed the Fund $88,397 and $4,221 for Non-Service and Service shares, respectively.
The Manager will waive fees and/or reimburse Fund expenses in an amount equal to the indirect management fees incurred through the Fund’s investment in IMMF. During the six months ended June 30, 2014, the Manager waived fees and/or reimbursed the Fund $7,392 for IMMF management fees.
Some of these undertakings may be modified or terminated at any time; some may not be modified or terminated until after one year from the date of the current prospectus, as indicated therein.
6. Pending Litigation
In 2009, seven class action lawsuits were filed in the U.S. District Court for the District of Colorado against OppenheimerFunds, Inc. (“OFI”), OppenheimerFunds Distributor, Inc., the Fund’s principal underwriter and distributor (the “Distributor”), and certain funds (but not including the Fund) advised by OFI Global Asset Management, Inc. and distributed by the Distributor (the “Defendant Funds”). The lawsuits also named as defendants certain officers and current and former trustees of the respective Defendant Funds. The lawsuits raised claims under federal securities law and alleged, among other things, that the disclosure documents of the respective Defendant Funds contained misrepresentations and omissions and that the respective Defendant Funds’ investment policies were not followed. The plaintiffs in these actions sought unspecified damages, equitable relief and awards of attorneys’ fees and litigation expenses. The Defendant Funds’ Boards of Trustees also engaged counsel to represent the Funds and the present and former Independent Trustees named in those suits. On March 5, 2014, the parties in six of these lawsuits executed stipulations and agreements of settlement resolving those actions. On July 31, 2014, the court entered an order and final judgment approving the settlements as fair, reasonable and adequate. The settlements do not resolve a seventh outstanding lawsuit relating to Oppenheimer Rochester California Municipal Fund.
Other class action and individual lawsuits have been filed since 2008 in various state and federal courts against OFI and certain of its affiliates by investors seeking to recover investments they allegedly lost as a result of the “Ponzi” scheme run by Bernard L. Madoff and his firm, Bernard L. Madoff Investment Securities, LLC (“BLMIS”). Plaintiffs in these suits allege that they suffered losses as a result of their investments in several funds managed by an affiliate of OFI and assert a variety of claims, including breach of fiduciary duty, fraud, negligent misrepresentation, unjust enrichment, and violation of federal and state securities laws and regulations, among others. They seek unspecified damages, equitable relief and awards of attorneys’ fees and litigation expenses. Neither the Distributor, nor any of the Oppenheimer mutual funds, their independent trustees or directors are named as defendants in these lawsuits. None of the Oppenheimer mutual funds invested in any funds or accounts managed by Madoff or BLMIS. On February 28, 2011, a stipulation of partial settlement of three groups of consolidated putative class action lawsuits relating to these matters was filed in the U.S. District Court for the Southern District of New York. On August 19, 2011, the court entered an order and final
judgment approving the settlement as fair, reasonable and adequate. In September 2011, certain parties filed notices of appeal from the court’s order approving the settlement. In June 2014, the appellate court affirmed the lower court’s order approving the settlement. Certain parties subsequently filed a petition for certiorari before the U.S. Supreme Court further challenging the settlement approval order. The settlement does not resolve other outstanding lawsuits against OFI and its affiliates relating to BLMIS.
OFI believes the lawsuits and appeals described above are without legal merit and, with the exception of actions it has settled, is defending against them vigorously. While it is premature to render any opinion as to the outcome in these lawsuits, or whether any costs that the Defendant Funds may bear in defending the suits might not be reimbursed by insurance, OFI believes that these suits should not impair the ability of OFI or the Distributor to perform their respective duties to the Fund, and that the outcome of all of the suits together should not have any material effect on the operations of any of the Oppenheimer mutual funds.
17 OPPENHEIMER DISCOVERY MID CAP GROWTH FUND
| | |
PORTFOLIO PROXY VOTING POLICIESAND PROCEDURES; UPDATES TO STATEMENTS OF INVESTMENTS Unaudited / Continued |
The Fund has adopted Portfolio Proxy Voting Policies and Procedures under which the Fund votes proxies relating to securities (“portfolio proxies”) held by the Fund. A description of the Fund’s Portfolio Proxy Voting Policies and Procedures is available (i) without charge, upon request, by calling the Fund toll-free at 1.800.525.7048, (ii) on the Fund’s website at oppenheimerfunds.com, and (iii) on the SEC’s website at www.sec.gov. In addition, the Fund is required to file Form N-PX, with its complete proxy voting record for the 12 months ended June 30th, no later than August 31st of each year. The Fund’s voting record is available (i) without charge, upon request, by calling the Fund toll-free at 1.800.525.7048, and (ii) in the Form N-PX filing on the SEC’s website at www.sec.gov.
The Fund files its complete schedule of portfolio holdings with the SEC for the first quarter and the third quarter of each fiscal year on Form N-Q. The Fund’s Form N-Q filings are available on the SEC’s website at www.sec.gov. Those forms may be reviewed and copied at the SEC’s Public Reference Room in Washington, D.C. Information on the operation of the Public Reference Room may be obtained by calling 1-800-SEC-0330.
18 OPPENHEIMER DISCOVERY MID CAP GROWTH FUND/VA
THIS PAGE INTENTIONALLY LEFT BLANK.
19 OPPENHEIMER DISCOVERY MID CAP GROWTH FUND
| | |
| OPPENHEIMER DISCOVERY MID CAP GROWTH FUND/VA |
| | |
| A Series of Oppenheimer Variable Account Funds |
| |
| Trustees and Officers | | Sam Freedman, Chairman of the Board of Trustees and Trustee Edward L. Cameron, Trustee Jon S. Fossel, Trustee Richard F. Grabish, Trustee Beverly L. Hamilton, Trustee Victoria J. Herget, Trustee Robert J. Malone, Trustee F. William Marshall, Jr., Trustee Karen L. Stuckey, Trustee James D. Vaughn, Trustee William F. Glavin, Jr., Trustee, President and Principal Executive Officer Ronald J. Zibelli, Jr., Vice President Justin Livengood, Vice President Arthur S. Gabinet, Secretary and Chief Legal Officer Christina M. Nasta, Vice President and Chief Business Officer Mary Ann Picciotto, Chief Compliance Officer and Chief Anti-Money Laundering Officer Brian W. Wixted, Treasurer and Principal Financial & Accounting Officer |
| |
| Manager | | OFI Global Asset Management, Inc. |
| |
| Sub-Adviser | | OppenheimerFunds, Inc. |
| |
| Distributor | | OppenheimerFunds Distributor, Inc. |
| |
| Transfer and Shareholder Servicing Agent | | OFI Global Asset Management, Inc. |
| |
Sub-Transfer
Agent | | Shareholder Services, Inc. DBA OppenheimerFunds Services |
| |
Independent Registered
Public
Accounting
Firm | | KPMGLLP |
| |
| Counsel | | K&L Gates LLP |
| |
| | Before investing in any of the Oppenheimer funds, investors should carefully consider a fund’s investment objectives, risks, charges and expenses. Fund prospectuses and summary prospectuses contain this and other information about the funds and may be obtained by asking your financial advisor, visiting oppenheimerfunds.com or calling us at 1.800.988.8287. Read prospectuses and summary prospectuses carefully before investing. |
| |
| | The financial statements included herein have been taken from the records of the Fund without examination of those records by the independent registered public accounting firm. |
| |
| | © 2014 OppenheimerFunds, Inc. All rights reserved. Oppenheimer funds are distributed by OppenheimerFunds Distributor, Inc. |
Portfolio Managers: Krishna Memani and Magnus Krantz
Cumulative Total Returns
For the 6-Month Period Ended 6/30/14
| | | | | | |
Non-Service Shares | | | 5.47 | % | | |
Service Shares | | | 5.41 | % | | |
Average Annual Total Returns
For the Periods Ended 6/30/14
| | | | | | | | |
| | | 1-Year | | 5-Year | | 10-Year | | |
Non-Service Shares | | 12.98% | | 11.46% | | 3.18% | | |
Service Shares | | 12.67% | | 11.17% | | 2.93% | | |
Performance data quoted represents past performance, which does not guarantee future results. The investment return and principal value of an investment in the Fund will fluctuate so that an investor’s shares, when redeemed, may be worth more or less than their original cost. Current performance may be lower or higher than the performance quoted. For performance data current to the most recent month end, call us at 1.800.988.8287. The Fund’s total returns should not be expected to be the same as the returns of other funds, whether or not both funds have the same portfolio managers and/or similar names. The Fund’s total returns include changes in share price and reinvested distributions but do not include the charges associated with the separate account products that offer this Fund. Such performance would have been lower if such charges were taken into account.
TOP TEN COMMON STOCK HOLDINGS
| | | | | | |
Apple, Inc. | | | 1.1 | % | | |
Actavis plc | | | 0.9 | | | |
Chevron Corp. | | | 0.9 | | | |
Noble Energy, Inc. | | | 0.8 | | | |
Pfizer, Inc. | | | 0.8 | | | |
Mondelez International, Inc., Cl. A | | | 0.8 | | | |
JPMorgan Chase & Co. | | | 0.8 | | | |
Exelon Corp. | | | 0.8 | | | |
Citigroup, Inc. | | | 0.7 | | | |
National Oilwell Varco, Inc. | | | 0.7 | | | |
Portfolio holdings and allocations are subject to change. Percentages are as of June 30, 2014, and are based on net assets. For more current Fund holdings, please visit oppenheimerfunds.com.
PORTFOLIO ALLOCATION
| | | | | | |
Mortgage-Backed Obligations | | | | | | |
Government Agency | | | 22.1 | % | | |
Non-Agency | | | 7.3 | | | |
Common Stocks | | | 28.1 | | | |
Non-Convertible Corporate Bonds and Notes | | | 25.5 | | | |
Asset-Backed Securities | | | 9.9 | | | |
Investment Company | | | | | | |
Oppenheimer Institutional Money Market Fund | | | 3.6 | | | |
U.S. Government Obligations | | | 3.2 | | | |
Preferred Stocks | | | 0.3 | | | |
Over-the-Counter Credit Default Swaptions Purchased | | | — | * | | |
*Less than 0.005%.
Portfolio holdings and allocations are subject to change. Percentages are as of June 30, 2014, and are based on the total market value of investments.
2 OPPENHEIMER CAPITAL INCOME FUND/VA
Fund Performance Discussion
The Fund’s Non-Service shares produced a return of 5.47% during the reporting period. On a relative basis, the Fund outperformed its Reference Index, which returned 5.06%. The Fund’s Reference Index is a customized weighted index currently comprised of the following underlying broad-based security indices: 65% of the Barclays U.S. Aggregate Bond Index and 35% of the Russell 3000 Index. Measured separately, the Barclays U.S. Aggregate Bond Index returned 3.93% and the Russell 3000 Index returned 6.94%.
GLOBAL MARKET AND ECONOMIC ENVIRONMENT
The global economy started 2014 with continued slow and steady growth throughout the developed world. However, data in the U.S. softened for the first quarter, partially attributed to cold weather effects across much of the country. This resulted in heightened volatility across multiple asset classes to begin the year, with U.S. high grade bonds and U.S. Treasuries delivering the strongest returns in January.
However, the U.S. released positive economic data later in the reporting period. The unemployment rate fell to 6.3%, the economy finally regained all of the jobs lost during the 2008 recession, and the U.S. stock market achieved record highs. In June, the U.S. Federal Reserve (the “Fed”) also stated it would reduce the amount of monthly bond purchases by an additional $10 billion and reaffirmed its intention to keep short-term interest rates near zero. Shortly after the reporting period ended, a positive June jobs report was released, in which the official unemployment rate fell to 6.1%, its lowest level since September 2008.
The Eurozone also grew at a slightly faster pace, but has continued to struggle with very low inflation and weak bank lending. In response, the European Central Bank (the “ECB”) announced numerous measures this reporting period, which also bolstered the markets. Measures included a benchmark interest rate cut, the introduction of a negative deposit rate to encourage banks to lend, among various other measures to flood the system with liquidity. Beyond that, the ECB said it would prepare to purchase packages of loans from banks to allow for increased lending.
Against this backdrop, global equities and higher-yielding fixed-income securities generally rallied through the end of the reporting period and outperformed U.S. Treasuries.
EQUITY STRATEGY REVIEW
The equity strategy produced positive absolute performance during the reporting period, but underperformed the Russell 3000 Index. The underperformance was largely the result of less favorable stock selection in the financials and consumer staples sectors. The Fund outperformed the Russell 3000 Index in the health care, industrials and information technology sectors, due to stronger relative stock selection.
The equity strategy’s top contributors to performance included Actavis plc, Exelon Corp. and Apple, Inc. Actavis develops and markets branded, generic, and over-the-counter products worldwide. The stock reacted favorably after management preannounced a positive earnings surprise due mostly to revenue synergies and cost savings from the recent merger with Warner Chilcott. Free cash generation was above expectations as well, and was used to pay down debt. This reduced balance sheet leverage, thus providing financial flexibility for additional acquisitions to further the company’s growth initiatives. Later in the reporting period, management announced the acquisition of Forest Labs. This news was well received as Forest not only accelerates the revenue growth potential for Actavis, but, in our opinion, also should result in increased profitability as higher margin branded drugs become a larger percentage of the company’s business. Exelon is an energy provider and holding company for several energy businesses. Over the first half of the reporting period, natural gas prices rallied in the midst of a harsh winter. The increase in natural gas prices benefited Exelon this reporting period. Apple performed well during the second half of 2013 due to excitement surrounding the introduction of two new iPhones as well as the addition of China Mobile as a distribution partner. Apple also rallied strongly in April 2014 after iPhone sales came in higher than analysts anticipated and the company announced a 7-for-1 stock split and increased both its dividend and share repurchases.
The most significant detractors from the equity strategy’s performance included Ocwen Financial Corp., Pier 1 Imports, Inc. and CIT Group, Inc. Ocwen Financial’s primary business is the acquisition, servicing, and resolution of sub-and nonperforming residential and commercial mortgages. The stock declined during the reporting period due primarily to heightened regulatory scrutiny which became evident when the New York Department of Financial Services blocked the sale of a portfolio of mortgage servicing rights (MSR) from Wells Fargo to Ocwen. The latter has exhibited strong business growth, in part, due to ongoing acquisitions of MSR portfolios from large mortgage lenders. Consequently, this blocked purchase raised investor concerns about fewer opportunities for growth. Because of these rising worries, we have eliminated our position in the company. Pier 1 Imports, a specialty retailer of home furnishings and accessories, detracted from performance as result of earnings that fell short of consensus estimates – leading to falling forecasts. Revenues largely met expectations, with comparable store
3 OPPENHEIMER CAPITAL INCOME FUND/VA
sales better-than-anticipated; however, profitability was under pressure due to increased promotional activity that helped to drive store traffic – but at a cost to gross margins. The company was also negatively impacted by the severe winter weather in the U.S. over the first half of the period. We believe improved merchandising can lead to both rising same-store-sales and expanding profitability, thus we have maintained our holdings in Pier 1. CIT Group is a commercial bank holding company that offers lending, leasing, debt restructuring, equipment financing and advisory services to small- and mid-sized businesses. Shares of CIT Group declined after the company reported a drop in net income due mostly to a narrowing of net interest margin – a key measure of profitability.
FIXED-INCOME STRATEGY REVIEW
The Fund’s fixed-income strategy maintained a significant underweight position to government bonds, and instead sourced its exposure primarily through corporate bonds, mortgages and other securitized products. This positioning drove the strategy’s performance during the reporting period, as corporate bond performance versus U.S. Treasuries was strong. Given the reporting period was mostly favorable for credit markets and the low default rate environment, the Fund was well positioned given its emphasis on bonds with better than average yields. Overall, the corporate bonds in which the Fund invests continued to perform well during the reporting period. A few stand-outs were from the finance and telecommunications sectors, but overall performance was positive across corporate bond sectors. New issuance provided an opportunity to find attractive yield opportunities. Our modest exposure to high yield bonds in the form of BB corporates also contributed positively to Fund returns during the reporting period.
Among mortgages, the Fund had its largest exposure to government agency mortgage-backed securities (“MBS”), with a smaller allocation to non-agency MBS. The Fund also had positions in collateralized MBS and asset-backed securities (“ABS”). Each of these positions produced positive results this reporting period as they offered relatively attractive yields, sparking greater demand as investors resumed their search for more competitive levels of current income.
Detracting from relative performance this reporting period was the Fund’s modest exposure to U.S. Treasuries, which produced positive returns despite underperforming higher-yielding fixed-income securities.
The Fund’s investment strategy and focus can change over time. The mention of specific fund holdings does not constitute a recommendation by OppenheimerFunds, Inc. or its affiliates.
Shares of Oppenheimer funds are not deposits or obligations of any bank, are not guaranteed by any bank, are not insured by the FDIC or any other agency, and involve investment risks, including the possible loss of the principal amount invested.
4 OPPENHEIMER CAPITAL INCOME FUND/VA
Fund Expenses
Fund Expenses. As a shareholder of the Fund, you incur two types of costs: (1) transaction costs and (2) ongoing costs, including management fees; distribution and service fees; and other Fund expenses. These examples are intended to help you understand your ongoing costs (in dollars) of investing in the Fund and to compare these costs with the ongoing costs of investing in other mutual funds.
The examples are based on an investment of $1,000.00 invested at the beginning of the period and held for the entire 6-month period ended June 30, 2014.
Actual Expenses. The first section of the table provides information about actual account values and actual expenses. You may use the information in this section for the class of shares you hold, together with the amount you invested, to estimate the expense that you paid over the period. Simply divide your account value by $1,000.00 (for example, an $8,600.00 account value divided by $1,000.00 = 8.60), then multiply the result by the number in the first section under the heading entitled “Expenses Paid During Period” to estimate the expenses you paid on your account during this period.
Hypothetical Example for Comparison Purposes.
The second section of the table provides information about hypothetical account values and hypothetical expenses based on the Fund’s actual expense ratio for each class of shares, and an assumed rate of return of 5% per year for each class before expenses, which is not the actual return. The hypothetical account values and expenses may not be used to estimate the actual ending account balance or expenses you paid for the period. You may use this information to compare the ongoing costs of investing in the Fund and other funds. To do so, compare this 5% hypothetical example for the class of shares you hold with the 5% hypothetical examples that appear in the shareholder reports of the other funds.
Please note that the expenses shown in the table are meant to highlight your ongoing costs only and do not reflect any charges associated with the separate accounts that offer this Fund. Therefore, the “hypothetical” lines of the table are useful in comparing ongoing costs only, and will not help you determine the relative total costs of owning different funds. In addition, if these separate account charges were included your costs would have been higher.
| | | | | | | | | | | | | | | | | | |
| Actual | | Beginning
Account Value
January 1, 2014 | | | | | Ending
Account
Value
June 30, 2014 | | | | | Expenses Paid During
6 Months Ended
June 30, 2014 | | | |
Non-Service shares | | $ | 1,000.00 | | | | | $ | 1,054.70 | | | | | $ | 3.42 | | | |
Service shares | | | 1,000.00 | | | | | | 1,054.10 | | | | | | 4.70 | | | |
| | | | | | |
Hypothetical | | | | | | | | | | | | | | | | | | |
(5% return before expenses) | | | | | | | | | | | | | | | | | | |
| | | | | | |
Non-Service shares | | | 1,000.00 | | | | | | 1,021.47 | | | | | | 3.36 | | | |
Service shares | | | 1,000.00 | | | | | | 1,020.23 | | | | | | 4.62 | | | |
Expenses are equal to the Fund’s annualized expense ratio for that class, multiplied by the average account value over the period, multiplied by 181/365 (to reflect the one-half year period). Those annualized expense ratios, excluding indirect expenses from affiliated funds, based on the 6-month period ended June 30, 2014 are as follows:
| | | | |
| Class | | Expense Ratios | | |
Non-Service shares | | 0.67% | | |
Service shares | | 0.92 | | |
The expense ratios reflect voluntary and/or contractual waivers and/or reimbursements of expenses by the Fund’s Manager. Some of these undertakings may be modified or terminated at any time, as indicated in the Fund’s prospectus. The “Financial Highlights” tables in the Fund’s financial statements, included in this report, also show the gross expense ratios, without such waivers or reimbursements and reduction to custodian expenses, if applicable.
5 OPPENHEIMER CAPITAL INCOME FUND/VA
| | | | |
| STATEMENTOF INVESTMENTS June 30, 2014 Unaudited | | |
| | | | |
| | | | | | | | |
| | | Shares | | | Value | |
| |
| Common Stocks—33.6% | |
| |
Consumer Discretionary—4.7% | |
Auto Components—0.4% | |
| Delphi Automotive plc | | | 16,870 | | | $ | 1,159,644 | |
| | | | | | | | |
| |
Automobiles—0.3% | |
| General Motors Co. | | | 20,120 | | | | 730,356 | |
| | | | | | | | |
| |
| Diversified Consumer Services—0.3% | |
| |
| LifeLock, Inc.1 | | | 57,000 | | | | 795,720 | |
| | | | | | | | |
| |
| Household Durables—0.3% | |
| |
| Toll Brothers, Inc.1 | | | 22,620 | | | | 834,678 | |
| | | | | | | | |
| |
| Media—1.4% | |
| |
| Comcast Corp., Cl. A | | | 31,470 | | | | 1,689,310 | |
| |
| Time Warner, Inc. | | | 15,370 | | | | 1,079,742 | |
| |
| Time, Inc.1 | | | 1,921 | | | | 46,527 | |
| |
| Twenty-First Century Fox, Inc., Cl. A | | | 30,380 | | | | 1,067,857 | |
| | | | | | | | |
| | | | | | | 3,883,436 | |
| | | | | | | | |
| |
| Specialty Retail—1.5% | |
| |
| AutoZone, Inc.1 | | | 2,450 | | | | 1,313,788 | |
| |
| Pier 1 Imports, Inc. | | | 40,090 | | | | 617,787 | |
| |
| Ross Stores, Inc. | | | 15,680 | | | | 1,036,918 | |
| |
| Signet Jewelers Ltd. | | | 10,930 | | | | 1,208,749 | |
| | | | | | | | |
| | | | | | | 4,177,242 | |
| | | | | | | | |
| |
| Textiles, Apparel & Luxury Goods—0.5% | |
| |
| PVH Corp. | | | 11,570 | | | | 1,349,062 | |
| | | | | | | | |
| |
| Consumer Staples—2.2% | |
| |
| Food Products—1.2% | |
| |
| Flowers Foods, Inc. | | | 46,655 | | | | 983,487 | |
| |
| Mondelez International, Inc., Cl. A | | | 58,560 | | | | 2,202,442 | |
| | | | | | | | |
| | | | | | | 3,185,929 | |
| | | | | | | | |
| |
| Household Products—0.3% | |
| |
| Henkel AG & Co. KGaA | | | 10,595 | | | | 1,066,172 | |
| | | | | | | | |
| |
| Tobacco—0.7% | |
| |
| Philip Morris International, Inc. | | | 23,430 | | | | 1,975,383 | |
| | | | | | | | |
| |
| Energy—3.4% | |
| |
| Energy Equipment & Services—0.7% | |
| |
| National Oilwell Varco, Inc. | | | 25,060 | | | | 2,063,691 | |
| | | | | | | | |
| |
| Oil, Gas & Consumable Fuels—2.7% | |
| |
| Chevron Corp. | | | 18,630 | | | | 2,432,146 | |
| |
| Energy XXI Bermuda Ltd. | | | 31,363 | | | | 741,108 | |
| |
| Noble Energy, Inc. | | | 30,310 | | | | 2,347,813 | |
| |
| Plains All American Pipeline LP | | | 14,422 | | | | 866,041 | |
| |
| Western Refining, Inc. | | | 27,120 | | | | 1,018,356 | |
| | | | | | | | |
| | | | | | | 7,405,464 | |
| | | | | | | | |
| | | | | | | | |
| |
| Financials—5.9% | |
| |
| Capital Markets—0.2% | |
| |
| WisdomTree Investments, Inc.1 | | | 42,790 | | | | 528,884 | |
| | | | | | | | |
| |
| Commercial Banks—2.7% | |
| |
| BancorpSouth, Inc. | | | 19,660 | | | | 483,046 | |
| |
| CIT Group, Inc. | | | 33,690 | | | | 1,541,654 | |
| |
| Citigroup, Inc. | | | 44,040 | | | | 2,074,284 | |
| |
| Huntington Bancshares, Inc. | | | 52,190 | | | | 497,893 | |
| |
| JPMorgan Chase & Co. | | | 37,860 | | | | 2,181,493 | |
| |
| Webster Financial Corp. | | | 18,620 | | | | 587,275 | |
| | | | | | | | |
| | | | | | | 7,365,645 | |
| | | | | | | | |
| |
| Consumer Finance—0.7% | |
| |
| Discover Financial Services | | | 32,651 | | | | 2,023,709 | |
| |
| | | | | | | | |
| | | Shares | | | Value | |
Insurance—1.3% | |
| |
American International Group, Inc. | | | 24,960 | | | $ | 1,362,317 | |
| |
Fidelity National Financial, Inc., Cl. A | | | 38,610 | | | | 1,264,864 | |
| |
Genworth Financial, Inc., Cl. A1 | | | 54,390 | | | | 946,386 | |
| | | | | | | | |
| | | | | | | 3,573,567 | |
| | | | | | | | |
| |
Real Estate Investment Trusts (REITs)—1.0% | |
| |
Apollo Commercial Real Estate Finance, Inc. | | | 58,470 | | | | 964,170 | |
| |
Digital Realty Trust, Inc. | | | 23,830 | | | | 1,389,766 | |
| |
STAG Industrial, Inc. | | | 19,950 | | | | 478,999 | |
| | | | | | | | |
| | | | | | | 2,832,935 | |
| | | | | | | | |
| |
Health Care—4.9% | |
| |
Biotechnology—0.7% | |
| |
BioMarin Pharmaceutical, Inc.1 | | | 4,730 | | | | 294,253 | |
| |
Celldex Therapeutics, Inc.1 | | | 15,320 | | | | 250,023 | |
| |
Gilead Sciences, Inc.1 | | | 16,230 | | | | 1,345,629 | |
| | | | | | | | |
| | | | | | | 1,889,905 | |
| | | | | | | | |
| |
Health Care Equipment & Supplies—0.4% | |
| |
Covidien plc | | | 7,290 | | | | 657,412 | |
| |
DexCom, Inc.1 | | | 13,310 | | | | 527,875 | |
| | | | | | | | |
| | | | | | | 1,185,287 | |
| | | | | | | | |
| |
Health Care Providers & Services—0.9% | |
| |
Omnicare, Inc. | | | 8,580 | | | | 571,170 | |
| |
Team Health Holdings, Inc.1 | | | 8,420 | | | | 420,495 | |
| |
Universal Health Services, Inc., Cl. B | | | 10,140 | | | | 971,006 | |
| |
WellCare Health Plans, Inc.1 | | | 6,230 | | | | 465,132 | |
| | | | | | | | |
| | | | | | | 2,427,803 | |
| | | | | | | | |
| |
Pharmaceuticals—2.9% | |
| |
AbbVie, Inc. | | | 17,070 | | | | 963,431 | |
| |
Actavis plc1 | | | 11,690 | | | | 2,607,455 | |
| |
Allergan, Inc. | | | 4,360 | | | | 737,799 | |
| |
Bristol-Myers Squibb Co. | | | 17,950 | | | | 870,754 | |
| |
Pfizer, Inc. | | | 75,695 | | | | 2,246,628 | |
| |
Prestige Brands Holdings, Inc.1 | | | 15,580 | | | | 528,006 | |
| | | | | | | | |
| | | | | | | 7,954,073 | |
| | | | | | | | |
| |
Industrials—3.8% | |
| |
Airlines—0.2% | |
| |
United Continental Holdings, Inc.1 | | | 16,150 | | | | 663,280 | |
| | | | | | | | |
| |
Commercial Services & Supplies—0.8% | |
| |
Republic Services, Inc., Cl. A | | | 19,700 | | | | 748,009 | |
| |
Tyco International Ltd. | | | 31,260 | | | | 1,425,456 | |
| | | | | | | | |
| | | | | | | 2,173,465 | |
| | | | | | | | |
| |
Construction & Engineering—0.4% | |
| |
AECOM Technology Corp.1 | | | 15,730 | | | | 506,506 | |
| |
MasTec, Inc.1 | | | 15,100 | | | | 465,382 | |
| | | | | | | | |
| | | | | | | 971,888 | |
| | | | | | | | |
| |
Industrial Conglomerates—0.7% | |
| |
General Electric Co. | | | 72,420 | | | | 1,903,198 | |
| | | | | | | | |
| |
Machinery—0.6% | |
| |
Deere & Co. | | | 11,050 | | | | 1,000,577 | |
| |
Joy Global, Inc. | | | 11,550 | | | | 711,249 | |
| | | | | | | | |
| | | | | | | 1,711,826 | |
| | | | | | | | |
| |
Professional Services—0.4% | |
| |
Robert Half International, Inc. | | | 24,750 | | | | 1,181,565 | |
| | | | | | | | |
| |
Road & Rail—0.6% | |
| |
Canadian National Railway Co. | | | 27,280 | | | | 1,773,746 | |
| | | | | | | | |
| |
Trading Companies & Distributors—0.1% | |
| |
NOW, Inc.1 | | | 6,265 | | | | 226,856 | |
6 OPPENHEIMER CAPITAL INCOME FUND/VA
| | | | | | | | |
| | | Shares | | | Value | |
| |
| Information Technology—6.0% | |
| |
| Communications Equipment—0.2% | |
| |
| Finisar Corp.1 | | | 31,330 | | | $ | 618,768 | |
| | | | | | | | |
| |
| Internet Software & Services—1.6% | |
| |
| Facebook, Inc., Cl. A1 | | | 20,880 | | | | 1,405,015 | |
| |
| Google, Inc., Cl. A1 | | | 1,480 | | | | 865,312 | |
| |
| Google, Inc., Cl. C1 | | | 2,340 | | | | 1,346,155 | |
| |
| Web.com Group, Inc.1 | | | 26,740 | | | | 771,984 | |
| | | | | | | | |
| | | | | | | 4,388,466 | |
| | | | | | | | |
| |
| IT Services—1.0% | | | | | | | | |
| |
| Amdocs Ltd. | | | 22,910 | | | | 1,061,420 | |
| |
| MasterCard, Inc., Cl. A | | | 13,240 | | | | 972,743 | |
| |
| Xerox Corp. | | | 61,150 | | | | 760,706 | |
| | | | | | | | |
| | | | | | | 2,794,869 | |
| | | | | | | | |
| |
| Semiconductors & Semiconductor Equipment—0.9% | |
| |
| Applied Materials, Inc. | | | 38,020 | | | | 857,351 | |
| |
| Cavium, Inc.1 | | | 11,080 | | | | 550,233 | |
| |
| Skyworks Solutions, Inc. | | | 22,400 | | | | 1,051,904 | |
| | | | | | | | |
| | | | | | | 2,459,488 | |
| | | | | | | | |
| |
| Software—0.8% | |
| |
| Fortinet, Inc.1 | | | 32,620 | | | | 819,740 | |
| |
| Guidewire Software, Inc.1 | | | 11,170 | | | | 454,172 | |
| |
| ServiceNow, Inc.1 | | | 8,210 | | | | 508,692 | |
| |
| Splunk, Inc.1 | | | 6,590 | | | | 364,625 | |
| | | | | | | | |
| | | | | | | 2,147,229 | |
| | | | | | | | |
| |
| Technology Hardware, Storage & Peripherals—1.5% | |
| |
| Apple, Inc. | | | 32,410 | | | | 3,011,861 | |
| |
| Western Digital Corp. | | | 13,280 | | | | 1,225,744 | |
| | | | | | | | |
| | | | | | | 4,237,605 | |
| | | | | | | | |
| |
| Materials—1.3% | |
| |
| Construction Materials—0.4% | |
| |
| Vulcan Materials Co. | | | 19,310 | | | | 1,231,012 | |
| | | | | | | | |
| |
| Containers & Packaging—0.4% | |
| |
| Packaging Corp. of America | | | 14,210 | | | | 1,015,873 | |
| | | | | | | | |
| |
| Metals & Mining—0.2% | |
| |
| Kaiser Aluminum Corp. | | | 6,980 | | | | 508,633 | |
| | | | | | | | |
| |
| Paper & Forest Products—0.3% | |
| |
| P.H. Glatfelter Co. | | | 27,990 | | | | 742,575 | |
| | | | | | | | |
| |
| Telecommunication Services—0.6% | |
| |
| Diversified Telecommunication Services—0.6% | |
| |
| ORBCOMM, Inc.1 | | | 375 | | | | 2,471 | |
| |
| Verizon Communications, Inc. | | | 31,450 | | | | 1,538,849 | |
| | | | | | | | |
| | | | | | | 1,541,320 | |
| | | | | | | | |
| |
| Utilities—0.8% | |
| |
| Electric Utilities—0.8% | |
| |
| Exelon Corp. | | | 59,130 | | | | 2,157,062 | |
| | | | | | | | |
| Total Common Stocks (Cost $77,224,303) | | | | | | | 92,857,309 | |
| | | | | | | | |
| |
| Preferred Stock—0.4% | |
| |
| Henkel AG & Co. KGaA, Preference (Cost $814,599) | | | 8,650 | | | | 1,000,581 | |
| | | | | | | | |
| | | Principal
Amount | | | | |
| |
| Asset-Backed Securities—11.9% | |
| |
| Auto Loan—9.6% | |
| |
| American Credit Acceptance Receivables Trust: | | | | | | | | |
| Series 2012-2,Cl. A, 1.89%, 7/15/162 | | $ | 39,707 | | | | 39,797 | |
| Series 2012-3,Cl. A, 1.64%, 11/15/162 | | | 28,391 | | | | 28,451 | |
| Series 2012-3,Cl. C, 2.78%, 9/17/182 | | | 955,000 | | | | 963,755 | |
| Series 2013-2,Cl. B, 2.84%, 5/15/192 | | | 443,000 | | | | 451,333 | |
| Series 2014-1,Cl. B, 2.39%, 11/12/192 | | | 625,000 | | | | 628,211 | |
| Series 2014-2,Cl. A, 0.99%, 10/10/172 | | | 483,272 | | | | 483,339 | |
| | | | | | | | |
| | | Principal
Amount | | | Value | |
| |
| Auto Loan (Continued) | | | | | | | | |
| |
| American Credit Acceptance Receivables Trust: (Continued) | |
| Series 2014-2,Cl. B, 2.26%, 3/10/202 | | $ | 160,000 | | | $ | 160,069 | |
| |
| AmeriCredit Automobile Receivables Trust: | | | | | | | | |
| Series 2012-2,Cl. D, 3.38%, 4/9/18 | | | 485,000 | | | | 503,792 | |
| Series 2012-4,Cl. D, 2.68%, 10/9/18 | | | 70,000 | | | | 71,912 | |
| Series 2012-5,Cl. C, 1.69%, 11/8/18 | | | 165,000 | | | | 166,719 | |
| Series 2012-5,Cl. D, 2.35%, 12/10/18 | | | 925,000 | | | | 940,452 | |
| Series 2013-1,Cl. C, 1.57%, 1/8/19 | | | 725,000 | | | | 728,261 | |
| Series 2013-1,Cl. E, 2.64%, 7/8/202 | | | 75,000 | | | | 76,229 | |
| Series 2013-2,Cl. E, 3.41%, 10/8/202 | | | 415,000 | | | | 423,936 | |
| Series 2013-4,Cl. D, 3.31%, 10/8/19 | | | 677,000 | | | | 702,232 | |
| Series 2014-2,Cl. D, 2.57%, 7/8/20 | | | 225,000 | | | | 226,350 | |
| |
| California Republic Auto Receivables Trust, Series | |
| 2014-2, Cl. C, 3.29%, 3/15/21 | | | 95,000 | | | | 95,154 | |
| |
| Capital Auto Receivables Asset Trust: | | | | | | | | |
| Series 2013-1,Cl. D, 2.19%, 9/20/21 | | | 125,000 | | | | 125,467 | |
| Series 2014-1,Cl. D, 3.39%, 7/22/19 | | | 140,000 | | | | 143,886 | |
| |
| CarFinance Capital Auto Trust: | | | | | | | | |
| Series 2013-1A,Cl. A, 1.65%, 7/17/172 | | | 76,017 | | | | 76,266 | |
| Series 2013-2A,Cl. B, 3.15%, 8/15/192 | | | 635,000 | | | | 644,514 | |
| Series 2014-1A,Cl. A, 1.46%, 12/17/182 | | | 164,504 | | | | 164,584 | |
| |
| CarMax Auto Owner Trust, Series 2014-2, Cl. D, | |
| 2.58%, 11/16/20 | | | 335,000 | | | | 336,119 | |
| |
| Centre Point Funding LLC, Series 2010-1A, Cl. 1, | |
| 5.43%, 7/20/162 | | | 34,457 | | | | 35,254 | |
| |
| CPS Auto Receivables Trust: | | | | | | | | |
| Series 2012-B,Cl. A, 2.52%, 9/16/192 | | | 163,854 | | | | 166,290 | |
| Series 2012-C,Cl. A, 1.82%, 12/16/192 | | | 57,507 | | | | 58,040 | |
| Series 2014-A,Cl. A, 1.21%, 8/15/182 | | | 553,607 | | | | 552,842 | |
| Series 2014-B,Cl. A, 1.11%, 11/15/182 | | | 290,000 | | | | 290,308 | |
| |
| Credit Acceptance Auto Loan Trust: | | | | | | | | |
| Series 2012-2A,Cl. B, 2.21%, 9/15/202 | | | 50,000 | | | | 50,678 | |
| Series 2013-1A,Cl. B, 1.83%, 4/15/212 | | | 165,000 | | | | 166,507 | |
| Series 2013-2A,Cl. B, 2.26%, 10/15/213 | | | 310,000 | | | | 314,222 | |
| Series 2014-1A,Cl. B, 2.29%, 4/15/222 | | | 240,000 | | | | 242,296 | |
| |
| DT Auto Owner Trust: | | | | | | | | |
| Series 2012-1A,Cl. D, 4.94%, 7/16/182 | | | 150,000 | | | | 152,939 | |
| Series 2013-1A,Cl. D, 3.74%, 5/15/202 | | | 200,000 | | | | 204,063 | |
| Series 2013-2A,Cl. D, 4.18%, 6/15/202 | | | 545,000 | | | | 561,295 | |
| Series 2014-1A,Cl. D, 3.98%, 1/15/212 | | | 435,000 | | | | 441,356 | |
| Series 2014-2A,Cl. D, 3.68%, 4/15/212 | | | 615,000 | | | | 616,438 | |
| |
| Exeter Automobile Receivables Trust: | | | | | | | | |
| Series 2012-2A,Cl. B, 2.22%, 12/15/172 | | | 130,000 | | | | 131,575 | |
| Series 2012-2A,Cl. C, 3.06%, 7/16/182 | | | 516,000 | | | | 527,228 | |
| Series 2013-2A,Cl. B, 3.09%, 7/16/182 | | | 940,000 | | | | 963,663 | |
| Series 2013-2A,Cl. C, 4.35%, 1/15/192 | | | 480,000 | | | | 499,926 | |
| Series 2014-1A,Cl. B, 2.42%, 1/15/192 | | | 280,000 | | | | 282,501 | |
| Series 2014-1A,Cl. C, 3.57%, 7/15/192 | | | 280,000 | | | | 288,224 | |
| Series 2014-2A,Cl. A, 1.06%, 8/15/182 | | | 135,000 | | | | 135,009 | |
| Series 2014-2A,Cl. C, 3.26%, 12/16/192 | | | 135,000 | | | | 135,897 | |
| |
| First Investors Auto Owner Trust: | | | | | | | | |
| Series 2012-1A,Cl. D, 5.65%, 4/15/182 | | | 140,000 | | | | 147,132 | |
| Series 2013-3A,Cl. B, 2.32%, 10/15/192 | | | 465,000 | | | | 470,516 | |
| Series 2013-3A,Cl. C, 2.91%, 1/15/202 | | | 200,000 | | | | 203,697 | |
| Series 2013-3A,Cl. D, 3.67%, 5/15/202 | | | 165,000 | | | | 169,391 | |
| Series 2014-1A,Cl. D, 3.28%, 4/15/212 | | | 270,000 | | | | 272,415 | |
| |
| Flagship Credit Auto Trust, Series 2014-1, Cl. A, | |
| 1.21%, 4/15/192 | | | 249,592 | | | | 249,664 | |
| |
| Ford Credit Auto Owner Trust, Series 2013-A, Cl. D, | |
| 1.86%, 8/15/19 | | | 195,000 | | | | 194,233 | |
| |
| Ford Credit Floorplan Master Owner Trust A, | | | | | | | | |
| Series 2012-2, Cl. C, 2.86%, 1/15/19 | | | 215,000 | | | | 222,974 | |
| |
| GM Financial Automobile Leasing Trust, | | | | | | | | |
| Series 2014-1A, Cl. D, 2.51%, 3/20/192 | | | 470,000 | | | | 471,628 | |
| |
| Prestige Auto Receivables Trust, Series 2011-1A, | |
| Cl. D, 5.18%, 7/16/182 | | | 300,000 | | | | 305,035 | |
| |
| Santander Drive Auto Receivables Trust: | | | | | | | | |
| Series 2012-2,Cl. D, 3.87%, 2/15/18 | | | 375,000 | | | | 390,545 | |
| Series 2012-4,Cl. D, 3.50%, 6/15/18 | | | 495,000 | | | | 514,564 | |
| Series 2012-5,Cl. D, 3.30%, 9/17/18 | | | 540,000 | | | | 561,821 | |
7 OPPENHEIMER CAPITAL INCOME FUND/VA
| | |
| STATEMENT OF INVESTMENTS Unaudited / Continued | | |
| | | | | | | | |
| | | Principal
Amount | | | Value | |
| |
| Auto Loan (Continued) | |
| |
| Santander Drive Auto Receivables Trust: (Continued) | |
| Series 2012-6,Cl. D, 2.52%, 9/17/18 | | $ | 235,000 | | | $ | 240,528 | |
| Series 2012-AA,Cl. D, 2.46%, 12/17/182 | | | 945,000 | | | | 961,343 | |
| Series 2013-1,Cl. C, 1.76%, 1/15/19 | | | 295,000 | | | | 297,799 | |
| Series 2013-1,Cl. D, 2.27%, 1/15/19 | | | 155,000 | | | | 157,149 | |
| Series 2013-2,Cl. D, 2.57%, 3/15/19 | | | 715,000 | | | | 731,519 | |
| Series 2013-3,Cl. C, 1.81%, 4/15/19 | | | 950,000 | | | | 956,403 | |
| Series 2013-3,Cl. D, 2.42%, 4/15/19 | | | 245,000 | | | | 249,033 | |
| Series 2013-4,Cl. D, 3.92%, 1/15/20 | | | 130,000 | | | | 137,696 | |
| Series 2013-5,Cl. C, 2.25%, 6/17/19 | | | 715,000 | | | | 722,142 | |
| Series 2013-A,Cl. C, 3.12%, 10/15/192 | | | 315,000 | | | | 325,380 | |
| Series 2014-1,Cl. D, 2.91%, 4/15/20 | | | 265,000 | | | | 271,053 | |
| |
| SNAAC Auto Receivables Trust: | | | | | | | | |
| Series 2012-1A,Cl. C, 4.38%, 6/15/172 | | | 395,000 | | | | 401,367 | |
| Series 2013-1A,Cl. C, 3.07%, 8/15/182 | | | 100,000 | | | | 102,192 | |
| Series 2014-1A,Cl. A, 1.03%, 9/17/182 | | | 213,752 | | | | 213,836 | |
| Series 2014-1A,Cl. D, 2.88%, 1/15/202 | | | 165,000 | | | | 165,865 | |
| |
| United Auto Credit Securitization Trust: | | | | | | | | |
| Series 2012-1,Cl. C, 2.52%, 3/15/162 | | | 120,000 | | | | 120,608 | |
| Series 2012-1,Cl. D, 3.12%, 3/15/182 | | | 605,000 | | | | 609,266 | |
| Series 2013-1,Cl. B, 1.74%, 4/15/162 | | | 265,000 | | | | 266,084 | |
| Series 2013-1,Cl. C, 2.22%, 12/15/172 | | | 170,000 | | | | 171,187 | |
| Series 2013-1,Cl. D, 2.90%, 12/15/172 | | | 30,000 | | | | 30,280 | |
| |
| Westlake Automobile Receivables Trust, | | | | | | | | |
| Series 2014-1A, Cl. D, 2.20%, 2/15/212 | | | 180,000 | | | | 179,917 | |
| | | | | | | | |
| | | | | | | 26,481,641 | |
| | | | | | | | |
| |
| Credit Card—1.4% | | | | | | | | |
| |
| Capital One Multi-Asset Execution Trust: | | | | | | | | |
| Series 2006-A11,Cl. A11, 0.242%, 6/17/194 | | | 665,000 | | | | 663,092 | |
| Series 2006-A3,Cl. A3, 5.05%, 12/17/18 | | | 715,000 | | | | 766,125 | |
| |
| Chase Issuance Trust, Series 2012-A3, Cl. A3, 0.79%, | | | | | | | | |
| 6/15/17 | | | 650,000 | | | | 652,518 | |
| |
| Citibank Credit Card Issuance Trust: | | | | | | | | |
| Series 2013-A11,Cl. A11, 0.391%, 2/7/184 | | | 400,000 | | | | 400,451 | |
| Series 2013-A6,Cl. A6, 1.32%, 9/7/18 | | | 680,000 | | | | 686,842 | |
| |
| GE Capital Credit Card Master Note Trust: | | | | | | | | |
| Series 2010-1,Cl. A, 3.69%, 3/15/18 | | | 355,000 | | | | 362,935 | |
| Series 2012-1,Cl. A, 1.03%, 1/15/18 | | | 370,000 | | | | 371,143 | |
| | | | | | | | |
| | | | | | | 3,903,106 | |
| | | | | | | | |
| |
| Equipment—0.2% | | | | | | | | |
| |
| CLI Funding V LLC, Series 2014-1A, Cl. A, 3.29%, | | | | | | | | |
| 6/18/292 | | | 375,000 | | | | 377,235 | |
| |
| FRS I LLC, Series 2013-1A, Cl. A1, 1.80%, 4/15/432 | | | 64,695 | | | | 64,486 | |
| |
| Trip Rail Master Funding LLC, Series 2014-1A, Cl. A1, | | | | | | | | |
| 2.863%, 4/15/442 | | | 114,296 | | | | 115,131 | |
| | | | | | | | |
| | | | | | | 556,852 | |
| | | | | | | | |
| |
| Home Equity Loan—0.7% | | | | | | | | |
| |
| Element Rail Leasing I LLC, Series 2014-1A, Cl. A1, | | | | | | | | |
| 2.299%, 4/19/442 | | | 365,759 | | | | 365,735 | |
| |
| New Residential Advance Receivables Trust: | | | | | | | | |
| Series 2014-T1,Cl. A1, 1.274%, 3/15/452 | | | 490,000 | | | | 490,633 | |
| Series 2014-T1,Cl. B1, 1.671%, 3/15/452 | | | 420,000 | | | | 420,333 | |
| |
| TAL Advantage LLC: | | | | | | | | |
| Series 2014-1A,Cl. A, 3.51%, 2/22/392 | | | 449,500 | | | | 457,218 | |
| Series 2014-2A,Cl. A1, 1.70%, 5/20/392 | | | 151,703 | | | | 151,877 | |
| | | | | | | | |
| | | | | | | 1,885,796 | |
| | | | | | | | |
| Total Asset-Backed Securities (Cost $32,513,223) | | | | | | | 32,827,395 | |
| | | | | | | | |
| |
| Mortgage-Backed Obligations—35.3% | |
| |
| Government Agency—26.5% | |
| |
| FHLMC/FNMA/FHLB/Sponsored—26.4% | |
| |
| Federal Home Loan Mortgage Corp. Gold Pool: | | | | | | | | |
| 4.50%, 10/1/18 | | | 58,345 | | | | 61,901 | |
| 5.00%, 12/1/34 | | | 4,349 | | | | 4,830 | |
| 5.50%, 9/1/39 | | | 703,508 | | | | 793,086 | |
| 6.50%, 4/1/18-4/1/34 | | | 51,780 | | | | 57,402 | |
| 7.00%, 10/1/31-10/1/37 | | | 260,163 | | | | 291,933 | |
| | | | | | | | |
| | | Principal
Amount | | | Value | |
| |
FHLMC/FNMA/FHLB/Sponsored (Continued) | |
| |
| Federal Home Loan Mortgage Corp. Gold Pool: (Continued) | |
| 8.00%, 4/1/16 | | $ | 7,831 | | | $ | 8,043 | |
| 9.00%, 8/1/22-5/1/25 | | | 6,482 | | | | 7,125 | |
| |
| Federal Home Loan Mortgage Corp., Interest-Only Stripped Mtg.-Backed Security: | |
| Series 183,Cl. IO, 13.814%, 4/1/275 | | | 113,883 | | | | 21,227 | |
| Series 192,Cl. IO, 8.098%, 2/1/285 | | | 31,347 | | | | 6,918 | |
| Series 243,Cl. 6, 0.00%, 12/15/325,6 | | | 94,959 | | | | 19,098 | |
| |
| Federal Home Loan Mortgage Corp., Principal-Only Stripped Mtg.-Backed Security, Series 176, Cl. PO, | | | | | | | | |
| 4.007%, 6/1/267 | | | 34,583 | | | | 33,035 | |
| |
| Federal Home Loan Mortgage Corp., Real Estate Mtg. Investment Conduit Multiclass | |
| Pass-Through Certificates: | | | | | | | | |
| Series 2426,Cl. BG, 6.00%, 3/15/17 | | | 90,401 | | | | 95,501 | |
| Series 2427,Cl. ZM, 6.50%, 3/15/32 | | | 177,048 | | | | 200,169 | |
| Series 2461,Cl. PZ, 6.50%, 6/15/32 | | | 86,041 | | | | 96,944 | |
| Series 2500,Cl. FD, 0.652%, 3/15/324 | | | 13,366 | | | | 13,513 | |
| Series 2526,Cl. FE, 0.552%, 6/15/294 | | | 16,445 | | | | 16,569 | |
| Series 2551,Cl. FD, 0.552%, 1/15/334 | | | 10,181 | | | | 10,247 | |
| Series 2626,Cl. TB, 5.00%, 6/15/33 | | | 215,967 | | | | 234,522 | |
| Series 2635,Cl. AG, 3.50%, 5/15/32 | | | 67,746 | | | | 71,014 | |
| Series 2707,Cl. QE, 4.50%, 11/15/18 | | | 545,714 | | | | 578,981 | |
| Series 2770,Cl. TW, 4.50%, 3/15/19 | | | 23,638 | | | | 25,175 | |
| Series 3025,Cl. SJ, 24.194%, 8/15/354 | | | 31,467 | | | | 47,129 | |
| Series 3030,Cl. FL, 0.552%, 9/15/354 | | | 153,940 | | | | 154,353 | |
| Series 3741,Cl. PA, 2.15%, 2/15/35 | | | 494,702 | | | | 506,246 | |
| Series 3815,Cl. BD, 3.00%, 10/15/20 | | | 22,218 | | | | 22,883 | |
| Series 3822,Cl. JA, 5.00%, 6/15/40 | | | 163,279 | | | | 174,642 | |
| Series 3840,Cl. CA, 2.00%, 9/15/18 | | | 16,397 | | | | 16,690 | |
| Series 3848,Cl. WL, 4.00%, 4/15/40 | | | 256,341 | | | | 265,480 | |
| Series 3857,Cl. GL, 3.00%, 5/15/40 | | | 14,315 | | | | 14,703 | |
| Series 4221,Cl. HJ, 1.50%, 7/15/23 | | | 1,285,824 | | | | 1,289,122 | |
| |
| Federal Home Loan Mortgage Corp., Real Estate Mtg. Investment Conduit Multiclass Pass-Through Certificates, Interest-Only Stripped Mtg.-Backed Security: | |
| Series 2130,Cl. SC, 52.104%, 3/15/295 | | | 110,626 | | | | 27,421 | |
| Series 2796,Cl. SD, 53.848%, 7/15/265 | | | 151,262 | | | | 34,587 | |
| Series 2920,Cl. S, 54.426%, 1/15/355 | | | 736,717 | | | | 131,151 | |
| Series 2922,Cl. SE, 6.844%, 2/15/355 | | | 43,677 | | | | 7,880 | |
| Series 3201,Cl. SG, 4.659%, 8/15/365 | | | 120,692 | | | | 20,880 | |
| Series 3397,Cl. GS, 14.721%, 12/15/375 | | | 49,076 | | | | 9,106 | |
| Series 3424,Cl. EI, 8.548%, 4/15/385 | | | 38,867 | | | | 5,437 | |
| Series 3450,Cl. BI, 11.522%, 5/15/385 | | | 140,064 | | | | 20,734 | |
| Series 3606,Cl. SN, 3.74%, 12/15/395 | | | 76,042 | | | | 10,736 | |
| |
| Federal National Mortgage Assn.: | | | | | | | | |
| 2.50%, 6/18/278 | | | 2,885,000 | | | | 2,931,430 | |
| 3.00%, 7/1/278 | | | 2,030,000 | | | | 2,109,297 | |
| 3.50%, 7/17/278 | | | 2,800,000 | | | | 2,968,438 | |
| 4.00%, 7/1/28-7/1/418 | | | 20,895,000 | | | | 22,182,117 | |
| 4.50%, 7/1/22-7/1/398 | | | 10,419,000 | | | | 11,275,842 | |
| 5.00%, 7/1/378 | | | 13,975,000 | | | | 15,520,989 | |
| 6.00%, 7/1/378 | | | 425,000 | | | | 478,789 | |
| |
| Federal National Mortgage Assn. Pool: | | | | | | | | |
| 3.50%, 12/1/20-2/1/22 | | | 595,171 | | | | 631,842 | |
| 5.00%, 3/1/21 | | | 28,193 | | | | 29,925 | |
| 5.50%, 9/1/20 | | | 5,062 | | | | 5,495 | |
| 6.00%, 11/1/17-3/1/37 | | | 352,955 | | | | 395,831 | |
| 6.50%, 5/1/17-10/1/19 | | | 81,254 | | | | 85,456 | |
| 7.00%, 11/1/17-10/1/35 | | | 30,657 | | | | 33,216 | |
| 7.50%, 1/1/33 | | | 106,019 | | | | 125,138 | |
| 8.50%, 7/1/32 | | | 6,276 | | | | 7,227 | |
| |
| Federal National Mortgage Assn., Interest-Only Stripped Mtg.-Backed Security: | |
| Series 222,Cl. 2, 19.638%, 6/1/235 | | | 244,619 | | | | 49,345 | |
| Series 233,Cl. 2, 50.419%, 8/1/235 | | | 178,348 | | | | 42,912 | |
| Series 252,Cl. 2, 40.782%, 11/1/235 | | | 234,205 | | | | 47,389 | |
| Series 319,Cl. 2, 0.00%, 2/1/325,6 | | | 51,655 | | | | 10,718 | |
| Series 320,Cl. 2, 7.126%, 4/1/325 | | | 16,239 | | | | 3,705 | |
| Series 321,Cl. 2, 0.00%, 4/1/325,6 | | | 179,388 | | | | 37,706 | |
| Series 331,Cl. 9, 5.415%, 2/1/335 | | | 196,063 | | | | 47,915 | |
| Series 334,Cl. 17, 12.469%, 2/1/335 | | | 117,130 | | | | 27,225 | |
| Series 339,Cl. 12, 0.00%, 6/25/335,6 | | | 167,756 | | | | 33,631 | |
| Series 339,Cl. 7, 0.00%, 11/25/335,6 | | | 484,637 | | | | 97,136 | |
| Series 343,Cl. 13, 0.00%, 9/1/335,6 | | | 162,470 | | | | 29,790 | |
8 OPPENHEIMER CAPITAL INCOME FUND/VA
| | | | | | | | |
| | | Principal
Amount | | | Value | |
| |
| FHLMC/FNMA/FHLB/Sponsored (Continued) | |
| |
| Federal National Mortgage Assn., Interest-Only Stripped Mtg.-Backed Security: (Continued) | |
| Series 345,Cl. 9, 0.00%, 1/1/345,6 | | $ | 146,593 | | | $ | 31,141 | |
| Series 351,Cl. 10, 0.00%, 4/1/345,6 | | | 22,500 | | | | 4,213 | |
| Series 351,Cl. 8, 0.00%, 4/1/345,6 | | | 74,321 | | | | 13,821 | |
| Series 356,Cl. 10, 0.00%, 6/1/355,6 | | | 54,021 | | | | 10,004 | |
| Series 356,Cl. 12, 0.00%, 2/1/355,6 | | | 28,902 | | | | 5,381 | |
| Series 362,Cl. 13, 0.00%, 8/1/355,6 | | | 195,873 | | | | 35,597 | |
| Series 364,Cl. 16, 0.00%, 9/1/355,6 | | | 137,775 | | | | 25,606 | |
| |
| Federal National Mortgage Assn., Real Estate Mtg. Investment Conduit Multiclass Pass-Through Certificates: | |
| Series 1998-61,Cl. PL, 6.00%, 11/25/28 | | | 81,220 | | | | 89,896 | |
| Series 2003-130,Cl. CS, 13.796%, 12/25/334 | | | 20,423 | | | | 23,802 | |
| Series 2003-28,Cl. KG, 5.50%, 4/25/23 | | | 368,726 | | | | 402,594 | |
| Series 2003-84,Cl. GE, 4.50%, 9/25/18 | | | 35,089 | | | | 36,947 | |
| Series 2004-101,Cl. BG, 5.00%, 1/25/20 | | | 290,298 | | | | 302,367 | |
| Series 2004-25,Cl. PC, 5.50%, 1/25/34 | | | 288,541 | | | | 307,730 | |
| Series 2005-104,Cl. MC, 5.50%, 12/25/25 | | | 398,259 | | | | 438,691 | |
| Series 2005-31,Cl. PB, 5.50%, 4/25/35 | | | 250,000 | | | | 283,685 | |
| Series 2005-73,Cl. DF, 0.402%, 8/25/354 | | | 393,705 | | | | 394,283 | |
| Series 2006-11,Cl. PS, 24.009%, 3/25/364 | | | 115,990 | | | | 178,823 | |
| Series 2006-46,Cl. SW, 23.642%, 6/25/364 | | | 85,413 | | | | 120,260 | |
| Series 2006-50,Cl. KS, 23.643%, 6/25/364 | | | 19,124 | | | | 29,340 | |
| Series 2008-14,Cl. BA, 4.25%, 3/25/23 | | | 154,800 | | | | 162,523 | |
| Series 2008-75,Cl. DB, 4.50%, 9/25/23 | | | 133,183 | | | | 140,435 | |
| Series 2009-113,Cl. DB, 3.00%, 12/25/20 | | | 468,857 | | | | 483,163 | |
| Series 2009-36,Cl. FA, 1.092%, 6/25/374 | | | 148,383 | | | | 151,604 | |
| Series 2009-37,Cl. HA, 4.00%, 4/25/19 | | | 141,549 | | | | 147,746 | |
| Series 2009-70,Cl. NT, 4.00%, 8/25/19 | | | 15,592 | | | | 16,274 | |
| Series 2009-70,Cl. TL, 4.00%, 8/25/19 | | | 1,521,485 | | | | 1,588,003 | |
| Series 2010-43,Cl. KG, 3.00%, 1/25/21 | | | 218,080 | | | | 226,061 | |
| Series 2011-15,Cl. DA, 4.00%, 3/25/41 | | | 72,536 | | | | 76,140 | |
| Series 2011-3,Cl. EL, 3.00%, 5/25/20 | | | 791,122 | | | | 815,328 | |
| Series 2011-3,Cl. KA, 5.00%, 4/25/40 | | | 272,012 | | | | 294,429 | |
| Series 2011-38,Cl. AH, 2.75%, 5/25/20 | | | 18,040 | | | | 18,572 | |
| Series 2011-82,Cl. AD, 4.00%, 8/25/26 | | | 469,128 | | | | 491,974 | |
| |
| Federal National Mortgage Assn., Real Estate Mtg. Investment Conduit Multiclass Pass-Through Certificates, Interest-Only Stripped Mtg.-Backed Security: | |
| Series 2001-65,Cl. S, 27.451%, 11/25/315 | | | 189,687 | | | | 40,810 | |
| Series 2001-81,Cl. S, 24.292%, 1/25/325 | | | 49,342 | | | | 12,974 | |
| Series 2002-47,Cl. NS, 30.021%, 4/25/325 | | | 136,266 | | | | 30,393 | |
| Series 2002-51,Cl. S, 30.214%, 8/25/325 | | | 125,125 | | | | 27,908 | |
| Series 2002-52,Cl. SD, 34.767%, 9/25/325 | | | 174,421 | | | | 47,480 | |
| Series 2002-77,Cl. SH, 34.87%, 12/18/325 | | | 77,102 | | | | 17,058 | |
| Series 2002-84,Cl. SA, 33.689%, 12/25/325 | | | 190,171 | | | | 48,586 | |
| Series 2002-9,Cl. MS, 25.126%, 3/25/325 | | | 54,108 | | | | 10,936 | |
| Series 2003-33,Cl. SP, 28.112%, 5/25/335 | | | 207,725 | | | | 41,633 | |
| Series 2003-4,Cl. S, 29.773%, 2/25/335 | | | 118,434 | | | | 31,029 | |
| Series 2003-46,Cl. IH, 0.00%, 6/25/235,6 | | | 435,074 | | | | 62,331 | |
| Series 2004-54,Cl. DS, 38.925%, 11/25/305 | | | 141,896 | | | | 26,859 | |
| Series 2004-56,Cl. SE, 10.798%, 10/25/335 | | | 39,810 | | | | 7,220 | |
| Series 2005-12,Cl. SC, 9.023%, 3/25/355 | | | 21,886 | | | | 4,635 | |
| Series 2005-14,Cl. SE, 36.859%, 3/25/355 | | | 70,106 | | | | 10,934 | |
| Series 2005-40,Cl. SA, 48.516%, 5/25/355 | | | 377,880 | | | | 78,769 | |
| Series 2005-52,Cl. JH, 1.85%, 5/25/355 | | | 897,179 | | | | 141,805 | |
| Series 2005-93,Cl. SI, 16.734%, 10/25/355 | | | 95,990 | | | | 15,433 | |
| Series 2007-88,Cl. XI, 34.68%, 6/25/375 | | | 245,793 | | | | 32,528 | |
| Series 2008-55,Cl. SA, 16.593%, 7/25/385 | | | 142,328 | | | | 19,982 | |
| Series 2009-8,Cl. BS, 0.00%, 2/25/245,6 | | | 56,568 | | | | 4,252 | |
| Series 2012-40,Cl. PI, 1.527%, 4/25/415 | | | 410,231 | | | | 69,755 | |
| |
| Federal National Mortgage Assn., Real Estate Mtg. Investment Conduit Multiclass Pass-Through Certificates, Principal-Only Stripped Mtg.-Backed | |
| Security, Series 1993-184, Cl. M, 4.861%, 9/25/237 | | | 89,406 | | | | 86,522 | |
| | | | | | | | |
| | | | | | | 72,831,182 | |
| | | | | | | | |
| |
| GNMA/Guaranteed—0.1% | |
| |
| Government National Mortgage Assn. I Pool: | |
| 7.00%, 1/15/24 | | | 59,982 | | | | 65,601 | |
| 7.50%, 1/15/23-6/15/24 | | | 44,237 | | | | 48,083 | |
| 8.00%, 5/15/17-4/15/23 | | | 31,926 | | | | 35,046 | |
| | | | | | | | |
| | | Principal
Amount | | | Value | |
| |
| GNMA/Guaranteed (Continued) | |
| |
| Government National Mortgage Assn. I Pool: (Continued) | |
| 8.50%, 8/15/17-12/15/17 | | $ | 7,588 | | | $ | 8,089 | |
| |
| Government National Mortgage Assn., Interest-Only Stripped Mtg.-Backed Security: | |
| Series 2002-15,Cl. SM, 61.323%, 2/16/325 | | | 231,319 | | | | 42,383 | |
| Series 2002-76,Cl. SY, 63.582%, 12/16/265 | | | 501,433 | | | | 110,649 | |
| Series 2007-17,Cl. AI, 13.767%, 4/16/375 | | | 515,785 | | | | 95,266 | |
| Series 2011-52,Cl. HS, 9.557%, 4/16/415 | | | 254,235 | | | | 49,881 | |
| | | | | | | | |
| | | | | | | 454,998 | |
| | | | | | | | |
| |
| Non-Agency—8.8% | | | | | | | | |
| |
| Commercial—7.5% | | | | | | | | |
| |
| Banc of America Commercial Mortgage Trust: | |
| Series 2006-5,Cl. AM, 5.448%, 9/10/47 | | | 85,000 | | | | 91,499 | |
| Series 2006-6,Cl. AM, 5.39%, 10/10/45 | | | 830,000 | | | | 896,891 | |
| |
| BCAP LLC Trust, Series 2011-R11, Cl. 18A5, 2.20%, 9/26/352,4 | | | 359,628 | | | | 369,836 | |
| |
| Bear Stearns Adjustable Rate Mortgage Trust, | |
| Series 2005-9, Cl. A1, 2.41%, 10/25/354 | | | 1,104,185 | | | | 1,096,919 | |
| |
| Bear Stearns Commercial Mortgage Securities Trust, | | | | | | | | |
| Series 2006-T24, Cl. AM, 5.568%, 10/12/414 | | | 365,000 | | | | 396,986 | |
| |
| CD Commercial Mortgage Trust, Series 2006-CD2, | | | | | | | | |
| Cl. AM, 5.527%, 1/15/464 | | | 515,000 | | | | 547,096 | |
| |
| Citigroup Commercial Mortgage Trust: | | | | | | | | |
| Series 2008-C7,Cl. AM, 6.341%, 12/10/494 | | | 105,000 | | | | 117,994 | |
| Series 2013-GC11,Cl. D, 4.606%, 4/10/462,4 | | | 185,000 | | | | 173,899 | |
| |
| Citigroup Mortgage Loan Trust, Inc., Series 2006-AR1, | | | | | | | | |
| Cl. 1A1, 2.50%, 10/25/354 | | | 757,292 | | | | 745,806 | |
| |
| COMM Mortgage Trust: | |
| Series 2006-C7,Cl. AM, 5.97%, 6/10/464 | | | 855,000 | | | | 920,263 | |
| Series 2012-CR4,Cl. D, 4.729%, 10/15/452,4 | | | 185,000 | | | | 180,709 | |
| Series 2012-CR5,Cl. E, 4.48%, 12/10/452,4 | | | 225,000 | | | | 215,811 | |
| Series 2013-CR7,Cl. D, 4.496%, 3/10/462,4 | | | 200,000 | | | | 187,022 | |
| |
| COMM Mortgage Trust, Interest-Only Stripped Mtg.-Backed Security: | |
| Series 2010-C1,Cl. XPA, 0.00%, 7/10/462,5,6 | | | 2,525,983 | | | | 80,152 | |
| Series 2012-CR5,Cl. XA, 0.00%, 12/10/455,6 | | | 439,257 | | | | 44,632 | |
| |
| Credit Suisse Commercial Mortgage Trust: | |
| Series 2006-6,Cl. 1A4, 6.00%, 7/25/36 | | | 239,847 | | | | 192,854 | |
| Series 2006-C1,Cl. AJ, 5.643%, 2/15/394 | | | 208,000 | | | | 220,889 | |
| |
| Credit Suisse First Boston Commercial Trust, Series | |
| 2005-C6, Cl. AJ, 5.23%, 12/15/404 | | | 275,000 | | | | 287,778 | |
| |
| Credit Suisse Mortgage Trust, Series 2009-13R, Cl. 4A1, 2.619%, 9/26/362,4 | | | 196,159 | | | | 198,357 | |
| |
| DBUBS Mortgage Trust, Series 2011-LC1A, Cl. E, | | | | | | | | |
| 5.73%, 11/10/462,4 | | | 50,000 | | | | 54,322 | |
| |
| First Horizon Alternative Mortgage Securities Trust: | | | | | | | | |
| Series 2004-FA2,Cl. 3A1, 6.00%, 1/25/35 | | | 194,422 | | | | 192,678 | |
| Series 2005-FA8,Cl. 1A6, 0.802%, 11/25/354 | | | 182,613 | | | | 141,329 | |
| |
| FREMF Mortgage Trust: | | | | | | | | |
| Series 2011-K702,Cl. B, 4.936%, 4/25/442,4 | | | 275,000 | | | | 299,093 | |
| Series 2012-K501,Cl. C, 3.609%, 11/25/462,4 | | | 50,000 | | | | 51,373 | |
| Series 2013-K25,Cl. C, 3.618%, 11/25/452,4 | | | 60,000 | | | | 59,101 | |
| Series 2013-K26,Cl. C, 3.723%, 12/25/452,4 | | | 40,000 | | | | 39,302 | |
| Series 2013-K27,Cl. C, 3.616%, 1/25/462,4 | | | 110,000 | | | | 107,052 | |
| Series 2013-K28,Cl. C, 3.614%, 6/25/462,4 | | | 110,000 | | | | 106,836 | |
| Series 2013-K502,Cl. C, 3.31%, 3/25/452,4 | | | 220,000 | | | | 223,707 | |
| Series 2013-K712,Cl. C, 3.483%, 5/25/452,4 | | | 70,000 | | | | 70,283 | |
| Series 2013-K713,Cl. C, 3.274%, 4/25/462,4 | | | 145,000 | | | | 143,538 | |
| Series 2014-K715,Cl. C, 4.265%, 2/25/462,4 | | | 35,000 | | | | 36,231 | |
| |
| GCCFC Commercial Mortgage Trust: | | | | | | | | |
| Series 2006-GG7,Cl. AM, 6.015%, 7/10/384 | | | 230,000 | | | | 249,736 | |
| Series 2007-GG11,Cl. AM, 5.867%, 12/10/494 | | | 500,000 | | | | 553,463 | |
| Series 2007-GG9,Cl. AM, 5.475%, 3/10/39 | | | 615,000 | | | | 663,475 | |
| |
| GE Capital Commercial Mortgage Corp., | | | | | | | | |
| Series 2005-C4, Cl. AJ, 5.489%, 11/10/454 | | | 180,000 | | | | 183,738 | |
| |
| GS Mortgage Securities Trust, Series 2006-GG6, Cl. AM, 5.622%, 4/10/384 | | | 200,000 | | | | 213,392 | |
| |
| GSMSC Pass-Through Trust, Series 2009-3R, Cl. 1A2, 6%, 4/25/372,4 | | | 487,883 | | | | 460,653 | |
| |
| GSR Mortgage Loan Trust, Series 2005-AR4, Cl. 6A1, 5.211%, 7/25/354 | | | 64,717 | | | | 65,165 | |
9 OPPENHEIMER CAPITAL INCOME FUND/VA
| | |
| STATEMENT OF INVESTMENTS Unaudited / Continued | | |
| | | | | | | | |
| | | Principal
Amount | | | Value | |
| |
| Commercial (Continued) | | | | | | | | |
| |
| JP Morgan Chase Commercial Mortgage Securities Trust: | |
| Series 2006-CB16,Cl. AJ, 5.623%, 5/12/45 | | $ | 470,000 | | | $ | 483,471 | |
| Series 2006-LDP8,Cl. AJ, 5.48%, 5/15/454 | | | 450,000 | | | | 480,637 | |
| Series 2012-LC9,Cl. E, 4.573%, 12/15/472,4 | | | 225,000 | | | | 219,415 | |
| |
| JP Morgan Mortgage Trust, Series 2007-S3, Cl. 1A90, 7%, 8/25/37 | | | 223,842 | | | | 206,105 | |
| |
| JP Morgan Resecuritization Trust: | |
| Series 2009-11,Cl. 5A1, 2.619%, 9/26/362,4 | | | 728,644 | | | | 731,207 | |
| Series 2009-5,Cl. 1A2, 2.612%, 7/26/362,4 | | | 254,004 | | | | 216,731 | |
| |
| LB-UBS Commercial Mortgage Trust, Series 2006-C4, | | | | | | | | |
| Cl. AM, 6.049%, 6/15/384 | | | 225,000 | | | | 244,396 | |
| |
| MASTR Adjustable Rate Mortgages Trust, | | | | | | | | |
| Series 2004-13, Cl. 2A2, 2.642%, 4/21/344 | | | 96,981 | | | | 99,648 | |
| |
| Merrill Lynch Mortgage Trust, Series 2006-C2, Cl. AM, 5.782%, 8/12/434 | | | 500,000 | | | | 542,707 | |
| |
| Morgan Stanley Bank of America Merrill Lynch Trust: | |
| Series 2012-C6,Cl. E, 4.818%, 11/15/452,4 | | | 95,000 | | | | 93,128 | |
| Series 2013-C7,Cl. D, 4.442%, 2/15/462,4 | | | 115,000 | | | | 108,205 | |
| Series 2013-C8,Cl. D, 4.311%, 12/15/482,4 | | | 80,000 | | | | 74,784 | |
| |
| Morgan Stanley Capital I Trust: | |
| Series 2007-IQ13,Cl. AM, 5.406%, 3/15/44 | | | 470,000 | | | | 512,740 | |
| Series 2007-IQ15,Cl. AM, 6.105%, 6/11/494 | | | 345,000 | | | | 380,829 | |
| |
| Morgan Stanley Re-Remic Trust, Series 2012-R3, Cl. 1B, 2.049%, 11/26/363,4 | | | 257,384 | | | | 157,601 | |
| |
| Morgan Stanley Resecuritization Trust, | | | | | | | | |
| Series 2013-R9, Cl. 3A, 2.395%, 6/26/462,4 | | | 754,376 | | | | 761,952 | |
| |
| Structured Adjustable Rate Mortgage Loan Trust: | |
| Series 2004-10,Cl. 2A, 2.387%, 8/25/344 | | | 444,432 | | | | 440,860 | |
| Series 2007-6,Cl. 3A1, 4.807%, 7/25/374 | | | 213,129 | | | | 168,040 | |
| |
| UBS-Barclays Commercial Mortgage Trust, Series 2012-C2, Cl. E, 5.048%, 5/10/632,4 | | | 45,000 | | | | 42,885 | |
| |
| Wachovia Bank Commercial Mortgage Trust, Series 2005-C17, Cl. AJ, 5.224%, 3/15/424 | | | 205,000 | | | | 210,485 | |
| |
| WaMu Mortgage Pass-Through Certificates Trust, Series 2005-AR14, Cl. 1A4, 2.376%, 12/25/354 | | | 188,849 | | | | 183,773 | |
| |
| Wells Fargo Mortgage-Backed Securities Trust: | |
| Series 2005-AR1,Cl. 1A1, 2.61%, 2/25/354 | | | 44,041 | | | | 44,498 | |
| Series 2005-AR10,Cl. 1A1, 2.614%, 6/25/354 | | | 805,627 | | | | 824,014 | |
| Series 2005-AR15,Cl. 1A6, 2.606%, 9/25/354 | | | 588,178 | | | | 557,837 | |
| Series 2006-AR7,Cl. 2A4, 2.613%, 5/25/364 | | | 275,546 | | | | 258,319 | |
| Series 2006-AR8,Cl. 2A4, 2.622%, 4/25/364 | | | 217,201 | | | | 213,603 | |
| Series 2007-16,Cl. 1A1, 6.00%, 12/28/37 | | | 162,548 | | | | 168,872 | |
| Series 2007-AR8,Cl. A1, 6.118%, 11/25/374 | | | 591,200 | | | | 549,461 | |
| |
| WF-RBS Commercial Mortgage Trust: | |
| Series 2012-C10,Cl. D, 4.608%, 12/15/452,4 | | | 50,000 | | | | 48,506 | |
| Series 2012-C7,Cl. E, 5.002%, 6/15/452,4 | | | 80,000 | | | | 80,166 | |
| Series 2012-C8,Cl. E, 5.04%, 8/15/452,4 | | | 95,000 | | | | 96,253 | |
| Series 2013-C11,Cl. D, 4.322%, 3/15/452,4 | | | 49,000 | | | | 46,857 | |
| Series 2013-C15,Cl. D, 4.634%, 8/15/462,4 | | | 225,000 | | | | 214,661 | |
| |
| WF-RBS Commercial Mortgage Trust, Interest-Only Commercial Mtg. Pass-Through Certificates, Series | |
| 2011-C3, Cl. XA, 0%, 3/15/442,5,6 | | | 3,900,298 | | | | 240,600 | |
| | | | | | | | |
| | | | | | | 20,583,106 | |
| | | | | | | | |
| |
| Multi-Family—0.1% | |
| |
| Citigroup Mortgage Loan Trust, Inc., Series 2006-AR3, | | | | | | | | |
| Cl. 1A2A, 5.359%, 6/25/364 | | | 120,138 | | | | 112,073 | |
| |
| Wells Fargo Mortgage-Backed Securities Trust, Series 2006-AR2, Cl. 2A3, 2.613%, 3/25/364 | | | 54,829 | | | | 55,074 | |
| | | | | | | | |
| | | | | | | 167,147 | |
| | | | | | | | |
| |
| Residential—1.2% | |
| |
| Banc of America Commercial Mortgage Trust, Series 2007-4, Cl. AM, 6.015%, 2/10/514 | | | 820,000 | | | | 918,987 | |
| |
| Banc of America Funding Trust: | |
| Series 2007-1,Cl. 1A3, 6.00%, 1/25/37 | | | 130,286 | | | | 118,140 | |
| Series 2007-C,Cl. 1A4, 5.354%, 5/20/364 | | | 50,967 | | | | 49,877 | |
| |
Banc of America Mortgage Trust, Series 2004-E, Cl. 2A6, 2.645%, 6/25/344 | | | 142,343 | | | | 142,898 | |
| | | | | | | | |
| | | Principal
Amount | | | Value | |
| |
| Residential (Continued) | |
| |
| Carrington Mortgage Loan Trust, Series 2006-FRE1, Cl. A2, 0.262%, 7/25/364 | | $ | 103,127 | | | $ | 100,867 | |
| |
| CD Commercial Mortgage Trust, Series 2007-CD4, Cl. AMFX, 5.366%, 12/11/494 | | | 885,000 | | | | 935,098 | |
| |
| Countrywide Alternative Loan Trust, Series 2005-29CB, Cl. A4, 5%, 7/25/35 | | | 533,632 | | | | 462,550 | |
| |
| Countrywide Home Loans: | |
| Series 2005-26,Cl. 1A8, 5.50%, 11/25/35 | | | 158,941 | | | | 151,173 | |
| Series 2006-6,Cl. A3, 6.00%, 4/25/36 | | | 80,391 | | | | 78,196 | |
| |
| GSR Mortgage Loan Trust, Series 2006-5F, Cl. 2A1, 6%, 6/25/36 | | | 62,664 | | | | 60,478 | |
| |
| RALI Trust: | |
| Series 2003-QS1,Cl. A2, 5.75%, 1/25/33 | | | 49,995 | | | | 50,826 | |
| Series 2006-QS13,Cl. 1A8, 6.00%, 9/25/36 | | | 16,907 | | | | 13,514 | |
| |
| WaMu Mortgage Pass-Through Certificates Trust, Series 2003-AR10, Cl. A7, 2.422%, 10/25/334 | | | 198,893 | | | | 202,118 | |
| |
| Wells Fargo Mortgage-Backed Securities Trust, Series 2006-AR14, Cl. 1A2, 5.684%, 10/25/364 | | | 115,736 | | | | 113,802 | |
| | | | | | | | |
| | | | | | | 3,398,524 | |
| | | | | | | | |
| Total Mortgage-Backed Obligations | | | | | | | | |
| (Cost $96,252,045) | | | | | | | 97,434,957 | |
| | | | | | | | |
| | | | | | | | |
| |
| U.S. Government Obligations—3.9% | |
| |
| Federal Home Loan Mortgage Corp. Nts., 5.50%, 7/18/16 | | | 65,000 | | | | 71,641 | |
| |
| United States Treasury Nts.: | |
| 0.625%, 5/31/17 | | | 1,485,000 | | | | 1,475,080 | |
| 0.75%, 6/30/17 | | | 7,575,000 | | | | 7,544,526 | |
| 0.875%, 6/15/17 | | | 1,030,000 | | | | 1,030,281 | |
| 1.625%, 4/30/19 | | | 552,000 | | | | 552,971 | |
| | | | | | | | |
| Total U.S. Government Obligations | | | | | | | | |
| (Cost $10,655,416) | | | | | | | 10,674,499 | |
| | | | | | | | |
| | | | | | | | |
| |
| Non-Convertible Corporate Bonds and Notes—30.6% | |
| |
| Consumer Discretionary—5.0% | |
| |
| Auto Components—0.5% | |
| |
| Dana Holding Corp., 6.75% Sr. Unsec. Nts., 2/15/21 | | | 439,000 | | | | 475,766 | |
| |
| Johnson Controls, Inc., 4.625% Sr. Unsec. Nts., 7/2/44 | | | 238,000 | | | | 238,718 | |
| |
| TRW Automotive, Inc.: | |
| 4.50% Sr. Unsec. Nts., 3/1/212 | | | 290,000 | | | | 306,675 | |
| 7.25% Sr. Unsec. Nts., 3/15/172 | | | 389,000 | | | | 444,433 | |
| | | | | | | | |
| | | | | | | 1,465,592 | |
| | | | | | | | |
| |
| Automobiles—1.3% | |
| |
| Daimler Finance North America LLC: | |
| 1.30% Sr. Unsec. Nts., 7/31/152 | | | 463,000 | | | | 466,859 | |
| 8.50% Sr. Unsec. Unsub. Nts., 1/18/31 | | | 271,000 | | | | 411,660 | |
| |
| Ford Motor Credit Co. LLC, 5.875% Sr. Unsec. Unsub. Nts., 8/2/21 | | | 1,062,000 | | | | 1,248,167 | |
| |
| General Motors Co., 6.25% Sr. Unsec. Nts., 10/2/432 | | | 437,000 | | | | 502,550 | |
| |
| Hyundai Capital America, 1.45% Sr. Unsec. Nts., 2/6/172 | | | 468,000 | | | | 469,997 | |
| |
| Kia Motors Corp., 3.625% Sr. Unsec. Nts., 6/14/162 | | | 341,000 | | | | 357,204 | |
| | | | | | | | |
| | | | | | | 3,456,437 | |
| | | | | | | | |
| |
| Hotels, Restaurants & Leisure—0.5% | |
| |
| Brinker International, Inc., 2.60% Sr. Unsec. Nts., 5/15/18 | | | 151,000 | | | | 151,119 | |
| |
| Carnival Corp., 1.20% Sr. Unsec. Nts., 2/5/16 | | | 465,000 | | | | 467,910 | |
| |
| Hyatt Hotels Corp., 3.875% Sr. Unsec. Unsub. Nts., 8/15/16 | | | 77,000 | | | | 81,189 | |
| |
| Starwood Hotels & Resorts Worldwide, Inc., 7.15% Sr. Unsec. Unsub. Nts., 12/1/19 | | | 164,000 | | | | 195,172 | |
10 OPPENHEIMER CAPITAL INCOME FUND/VA
| | | | | | | | |
| | | Principal
Amount | | | Value | |
| |
| Hotels, Restaurants & Leisure (Continued) | |
| |
| Wyndham Worldwide Corp., 6% Sr. Unsec. Nts., 12/1/16 | | $ | 396,000 | | | $ | 439,749 | |
| | | | | | | | |
| | | | | | | 1,335,139 | |
| | | | | | | | |
| |
| Household Durables—0.4% | |
| |
| Jarden Corp., 6.125% Sr. Unsec. Nts., 11/15/22 | | | 416,000 | | | | 442,520 | |
| |
| Toll Brothers Finance Corp., 4% Sr. Unsec. Nts., 12/31/18 | | | 430,000 | | | | 443,975 | |
| |
| Whirlpool Corp., 1.35% Sr. Unsec. Nts., 3/1/17 | | | 123,000 | | | | 123,143 | |
| | | | | | | | |
| | | | | | | 1,009,638 | |
| | | | | | | | |
| |
| Media—1.5% | |
| |
| 21st Century Fox America, Inc., 6.15% Sr. Unsec. Nts., 2/15/41 | | | 183,000 | | | | 222,224 | |
| |
Comcast Cable Communications Holdings, Inc.,
9.455% Sr. Unsec. Nts., 11/15/22 | | | 205,000 | | | | 298,302 | |
| |
| Comcast Corp., 4.65% Sr. Unsec. Unsub. Nts., 7/15/42 | | | 433,000 | | | | 449,906 | |
| |
DIRECTV Holdings LLC/DIRECTV Financing Co., Inc.,
5.15% Sr. Unsec. Nts., 3/15/42 | | | 275,000 | | | | 289,382 | |
| |
| DISH DBS Corp., 5.875% Sr. Unsec. Nts., 7/15/22 | | | 401,000 | | | | 436,087 | |
| |
| Historic TW, Inc.: | |
| 8.05% Sr. Unsec. Nts., 1/15/16 | | | 77,000 | | | | 84,601 | |
| 9.15% Debs., 2/1/23 | | | 38,000 | | | | 52,700 | |
| |
| Interpublic Group of Cos., Inc. (The), 4.20% Sr. Unsec. Nts., 4/15/24 | | | 226,000 | | | | 233,535 | |
| |
| Lamar Media Corp., 5% Sr. Unsec. Sub. Nts., 5/1/23 | | | 441,000 | | | | 445,961 | |
| |
| Numericable Group SA, 4.875% Sr. Sec. Nts., 5/15/192 | | | 448,000 | | | | 460,320 | |
| |
| Pearson Funding Two plc, 4% Sr. Unsec. Nts., 5/17/162 | | | 101,000 | | | | 106,317 | |
| |
| Time Warner Cable, Inc., 4.50% Sr. Unsec. Unsub. Nts., 9/15/42 | | | 450,000 | | | | 439,013 | |
| |
| Time Warner, Inc., 4.875% Sr. Unsec. Nts., 3/15/20 | | | 312,000 | | | | 349,947 | |
| |
| WPP Finance 2010, 4.75% Sr. Unsec. Nts., 11/21/21 | | | 315,000 | | | | 346,041 | |
| | | | | | | | |
| | | | | | | 4,214,336 | |
| | | | | | | | |
| |
| Multiline Retail—0.3% | |
| |
| Dollar General Corp., 4.125% Sr. Unsec. Nts., 7/15/17 | | | 498,000 | | | | 533,372 | |
| |
| Macy’s Retail Holdings, Inc., 5.75% Sr. Unsec. Nts., 7/15/14 | | | 414,000 | | | | 414,814 | |
| | | | | | | | |
| | | | | | | 948,186 | |
| | | | | | | | |
| |
| Specialty Retail—0.2% | |
| |
| Home Depot, Inc. (The), 4.875% Sr. Unsec. Nts., 2/15/44 | | | 167,000 | | | | 182,383 | |
| |
| L Brands, Inc., 7% Sr. Unsec. Nts., 5/1/20 | | | 51,000 | | | | 58,841 | |
| |
| Signet UK Finance plc, 4.70% Sr. Unsec. Nts., 6/15/24 | | | 228,000 | | | | 232,004 | |
| | | | | | | | |
| | | | | | | 473,228 | |
| | | | | | | | |
| |
| Textiles, Apparel & Luxury Goods—0.3% | |
| |
| Levi Strauss & Co., 7.625% Sr. Unsec. Nts., 5/15/20 | | | 411,000 | | | | 444,394 | |
| |
| PVH Corp., 4.50% Sr. Unsec. Unsub. Nts., 12/15/22 | | | 472,000 | | | | 467,280 | |
| | | | | | | | |
| | | | | | | 911,674 | |
| | | | | | | | |
| |
| Consumer Staples—1.6% | |
| |
| Beverages—0.6% | |
| |
| Anheuser-Busch InBev Worldwide, Inc., 8.20% Sr. Unsec. Unsub. Nts., 1/15/39 | | | 386,000 | | | | 591,713 | |
| |
| Constellation Brands, Inc., 3.75% Sr. Unsec. Nts., 5/1/21 | | | 472,000 | | | | 470,820 | |
| |
| Foster’s Finance Corp., 4.875% Sr. Unsec. Nts., 10/1/142 | | | 270,000 | | | | 272,937 | |
| |
| SABMiller Holdings, Inc., 4.95% Sr. Unsec. Unsub. Nts., 1/15/422 | | | 235,000 | | | | 254,483 | |
| | | | | | | | |
| | | | | | | 1,589,953 | |
| | | | | | | | |
| |
| Food & Staples Retailing—0.2% | |
| |
| Delhaize Group SA, 5.70% Sr. Unsec. Nts., 10/1/40 | | | 251,000 | | | | 268,238 | |
| |
| Kroger Co., 6.40% Sr. Unsec. Nts., 8/15/17 | | | 258,000 | | | | 295,737 | |
| | | | | | | | |
| | | Principal
Amount | | | Value | |
| |
| Food & Staples Retailing (Continued) | |
| |
| Safeway, Inc., 5.625% Sr. Unsec. Nts., 8/15/14 | | $ | 98,000 | | | $ | 98,578 | |
| | | | | | | | |
| | | | | | | 662,553 | |
| | | | | | | | |
| |
| Food Products—0.5% | |
| |
| Bunge Ltd. Finance Corp.: | | | | | | | | |
| 5.10% Sr. Unsec. Unsub. Nts., 7/15/15 | | | 381,000 | | | | 396,925 | |
| 8.50% Sr. Unsec. Nts., 6/15/19 | | | 320,000 | | | | 402,485 | |
| |
| Tyson Foods, Inc., 6.60% Sr. Unsec. Nts., 4/1/16 | | | 402,000 | | | | 440,493 | |
| | | | | | | | |
| | | | | | | 1,239,903 | |
| | | | | | | | |
| |
| Tobacco—0.3% | |
| |
| Altria Group, Inc., 10.20% Sr. Unsec. Nts., 2/6/39 | | | 261,000 | | | | 443,289 | |
| |
| Lorillard Tobacco Co., 3.75% Sr. Unsec. Nts., 5/20/23 | | | 243,000 | | | | 240,311 | |
| |
| Reynolds American, Inc., 6.75% Sr. Unsec. Nts., 6/15/17 | | | 232,000 | | | | 266,495 | |
| | | | | | | | |
| | | | | | | 950,095 | |
| | | | | | | | |
| Energy—3.6% | | | | | | | | |
| |
| Energy Equipment & Services—0.6% | |
| |
| Ensco plc, 4.70% Sr. Unsec. Nts., 3/15/21 | | | 119,000 | | | | 129,771 | |
| |
| Nabors Industries, Inc.: | | | | | | | | |
| 2.35% Sr. Unsec. Nts., 9/15/16 | | | 348,000 | | | | 355,423 | |
| 4.625% Sr. Unsec. Nts., 9/15/21 | | | 237,000 | | | | 256,996 | |
| 5.00% Sr. Unsec. Nts., 9/15/20 | | | 138,000 | | | | 155,021 | |
| |
| Rowan Cos., Inc., 4.875% Sr. Unsec. Unsub. Nts., 6/1/22 | | | 179,000 | | | | 191,956 | |
| |
| Weatherford International Ltd., 5.95% Sr. Unsec. Nts., 4/15/42 | | | 353,000 | | | | 401,119 | |
| | | | | | | | |
| | | | | | | 1,490,286 | |
| | | | | | | | |
| |
| Oil, Gas & Consumable Fuels—3.0% | |
| |
| Anadarko Petroleum Corp., 6.20% Sr. Unsec. Nts., 3/15/40 | | | 186,000 | | | | 234,993 | |
| |
| Canadian Oil Sands Ltd., 6% Sr. Unsec. Nts., 4/1/422 | | | 210,000 | | | | 242,844 | |
| |
| Chesapeake Energy Corp., 6.625% Sr. Unsec. Nts., 8/15/20 | | | 389,000 | | | | 449,295 | |
| |
| Cimarex Energy Co., 4.375% Sr. Unsec. Nts., 6/1/24 | | | 342,000 | | | | 349,695 | |
| |
| CNOOC Finance 2013 Ltd., 4.25% Sr. Unsec. Unsub. Nts., 5/9/43 | | | 164,000 | | | | 152,498 | |
| |
| CNOOC Finance 2014 ULC, 1.625% Sr. Unsec. Nts., 4/30/17 | | | 356,000 | | | | 357,159 | |
| |
| Continental Resources, Inc., 4.50% Sr. Unsec. Nts., 4/15/23 | | | 509,000 | | | | 544,395 | |
| |
| DCP Midstream LLC, 5.375% Sr. Unsec. Nts., 10/15/152 | | | 342,000 | | | | 357,674 | |
| |
| DCP Midstream Operating LP, 3.875% Sr. Unsec. Nts., 3/15/23 | | | 504,000 | | | | 510,931 | |
| |
| El Paso Pipeline Partners Operating Co. LLC, 4.10% Sr. Unsec. Nts., 11/15/15 | | | 181,000 | | | | 189,192 | |
| |
| Enbridge Energy Partners LP, 5.35% Sr. Unsec. Nts., 12/15/14 | | | 209,000 | | | | 213,428 | |
| |
| EnLink Midstream Partners LP: | |
| 2.70% Sr. Unsec. Nts., 4/1/19 | | | 356,000 | | | | 361,414 | |
| 4.40% Sr. Unsec. Nts., 4/1/24 | | | 221,000 | | | | 232,232 | |
| |
| Origin Energy Finance Ltd.: | |
| 3.50% Sr. Unsec. Nts., 10/9/182 | | | 468,000 | | | | 486,097 | |
| 5.45% Sr. Unsec. Nts., 10/14/212 | | | 295,000 | | | | 329,099 | |
| |
| Pioneer Natural Resources Co., 6.65% Sr. Unsec. Nts., 3/15/17 | | | 83,000 | | | | 94,523 | |
| |
| Range Resources Corp., 5.75% Sr. Unsec. Sub. Nts., 6/1/21 | | | 435,000 | | | | 471,975 | |
| |
| Ras Laffan Liquefied Natural Gas Co. Ltd. III, 5.50% Sr. Sec. Nts., 9/30/142 | | | 291,000 | | | | 294,565 | |
| |
| Southwestern Energy Co., 4.10% Sr. Unsec. Nts., 3/15/22 | | | 255,000 | | | | 270,575 | |
| |
| Spectra Energy Partners LP: | |
| 4.60% Sr. Unsec. Nts., 6/15/21 | | | 277,000 | | | | 302,836 | |
| 4.75% Sr. Unsec. Nts., 3/15/24 | | | 229,000 | | | | 248,440 | |
| |
| Targa Resources Partners LP/Targa Resources Partners Finance Corp., 5.25% Sr. Unsec. Nts., 5/1/23 | | | 470,000 | | | | 493,500 | |
11 OPPENHEIMER CAPITAL INCOME FUND/VA
| | | | |
| STATEMENTOF INVESTMENTS Unaudited / Continued | | |
| | | | |
| | | | | | | | |
| | | Principal
Amount | | | Value | |
| |
| Oil, Gas & Consumable Fuels (Continued) | |
| |
| Whiting Petroleum Corp., 5.75% Sr. Unsec. Nts., 3/15/21 | | $ | 465,000 | | | $ | 510,338 | |
| |
| Williams Partners LP, 4.50% Sr. Unsec. Nts., 11/15/23 | | | 228,000 | | | | 242,167 | |
| |
| Woodside Finance Ltd., 4.60% Sr. Unsec. Unsub. Nts., 5/10/212 | | | 372,000 | | | | 406,482 | |
| | | | | | | | |
| | | | | | | 8,346,347 | |
| | | | | | | | |
| |
| Financials—9.4% | |
| |
| Capital Markets—2.1% | |
| |
| Apollo Management Holdings LP, 4% Sr. Unsec. Nts., 5/30/242 | | | 368,000 | | | | 370,894 | |
| |
| Blackstone Holdings Finance Co. LLC, 5% Sr. Unsec. Nts., 6/15/442 | | | 458,000 | | | | 473,409 | |
| |
| Carlyle Holdings II Finance LLC, 5.625% Sr. Sec. Nts., 3/30/432 | | | 243,000 | | | | 270,353 | |
| |
| Goldman Sachs Group, Inc. (The): | |
| 4.00% Sr. Unsec. Nts., 3/3/24 | | | 499,000 | | | | 509,090 | |
| 4.80% Sr. Unsec. Nts., 7/8/448 | | | 75,000 | | | | 74,634 | |
| 5.70% Jr. Sub. Perpetual Bonds, Series L4,9 | | | 448,000 | | | | 465,106 | |
| |
| Lazard Group LLC, 4.25% Sr. Unsec. Nts., 11/14/20 | | | 401,000 | | | | 420,635 | |
| |
| Macquarie Bank Ltd., 6.625% Unsec. Sub. Nts., 4/7/212 | | | 716,000 | | | | 822,750 | |
| |
| Morgan Stanley, 5% Sub. Nts., 11/24/25 | | | 847,000 | | | | 905,976 | |
| |
| Nomura Holdings, Inc., 2% Sr. Unsec. Nts., 9/13/16 | | | 452,000 | | | | 459,584 | |
| |
| Raymond James Financial, Inc., 5.625% Sr. Unsec. Unsub. Nts., 4/1/24 | | | 265,000 | | | | 299,264 | |
| |
| UBS Preferred Funding Trust V, 6.243% Jr. Sub. Perpetual Bonds, Series 14,9 | | | 826,000 | | | | 882,787 | |
| | | | | | | | |
| | | | | | | 5,954,482 | |
| | | | | | | | |
| |
| Commercial Banks—3.6% | |
| |
| Amsouth Bank NA, 5.20% Sub. Nts., 4/1/15 | | | 276,000 | | | | 284,773 | |
| |
| Bank of America Corp.: | | | | | | | | |
| 7.75% Jr. Sub. Nts., 5/14/38 | | | 424,000 | | | | 582,732 | |
| 8.00% Jr. Sub. Perpetual Bonds, Series K4,9 | | | 390,000 | | | | 433,722 | |
| 5.125% Jr. Sub. Perpetual Bonds, Series V4,9 | | | 83,000 | | | | 82,926 | |
| |
| Barclays Bank plc: | | | | | | | | |
| 3.75% Sr. Unsec. Nts., 5/15/24 | | | 357,000 | | | | 359,682 | |
| 5.14% Sub. Nts., 10/14/20 | | | 460,000 | | | | 504,428 | |
| |
| Citigroup, Inc.: | | | | | | | | |
| 6.675% Sub. Nts., 9/13/43 | | | 405,000 | | | | 505,187 | |
| 5.95% Jr. Sub. Perpetual Bonds, Series D4,9 | | | 465,000 | | | | 470,231 | |
| |
| Commerzbank AG, 8.125% Sub. Nts., 9/19/232 | | | 458,000 | | | | 557,667 | |
| |
| Credit Agricole SA, 6.637% Jr. Sub. Perpetual Bonds2,4,9 | | | 736,000 | | | | 783,380 | |
| |
| HSBC Finance Capital Trust IX, 5.911% Unsec. Sub. Nts., 11/30/354 | | | 1,120,000 | | | | 1,169,000 | |
| |
| JPMorgan Chase & Co., 6.75% Jr. Sub. Perpetual Bonds4,9 | | | 399,000 | | | | 431,419 | |
| |
| Lloyds Bank plc, 6.50% Sub. Nts., 9/14/202 | | | 382,000 | | | | 448,888 | |
| |
| Lloyds Banking Group plc, 6.657% Jr. Sub. Perpetual Bonds2,4,9 | | | 400,000 | | | | 449,000 | |
| |
| Rabobank Capital Funding Trust III, 5.254% Jr. Sub. Perpetual Bonds3,4,9 | | | 751,000 | | | | 792,305 | |
| |
| Regions Bank, 7.50% Sub. Nts., 5/15/18 | | | 150,000 | | | | 178,513 | |
| |
| Royal Bank of Scotland Group plc, 7.64% Jr. Sub. Perpetual Bonds, Series U4,9 | | | 500,000 | | | | 535,000 | |
| |
| Societe Generale SA, 5.922% Jr. Sub. Perpetual Bonds2,4,9 | | | 440,000 | | | | 471,900 | |
| |
| SunTrust Banks, Inc., 3.60% Sr. Unsec. Nts., 4/15/16 | | | 460,000 | | | | 482,428 | |
| |
| Wells Fargo & Co., 5.90% Jr. Sub. Perpetual Bonds, Series S4,9 | | | 449,000 | | | | 476,501 | |
| | | | | | | | |
| | | | | | | 9,999,682 | |
| | | | | | | | |
| |
| Consumer Finance—0.2% | |
| |
| Ally Financial, Inc., 4.75% Sr. Unsec. Nts., 9/10/18 | | | 455,000 | | | | 484,006 | |
| | | | | | | | |
| | | Principal
Amount | | | Value | |
| |
| Diversified Financial Services—0.6% | |
| |
| Burlington Northern Santa Fe LLC, 3% Sr. Unsec. Nts., 3/15/23 | | $ | 365,000 | | | $ | 359,533 | |
| |
| Leucadia National Corp., 5.50% Sr. Unsec. Nts., 10/18/23 | | | 652,000 | | | | 693,470 | |
| |
| Voya Financial, Inc., 5.65% Jr. Sub. Nts., 5/15/534 | | | 495,000 | | | | 506,138 | |
| | | | | | | | |
| | | | | | | 1,559,141 | |
| | | | | | | | |
| |
| Insurance—2.0% | |
| |
| AIA Group Ltd., 4.875% Sr. Unsec. Nts., 3/11/442 | | | 347,000 | | | | 364,604 | |
| |
| Arch Capital Group US, Inc., 5.144% Sr. Unsec. Nts., 11/1/43 | | | 419,000 | | | | 454,330 | |
| |
| AXIS Specialty Finance plc, 5.15% Sr. Unsec. Nts., 4/1/45 | | | 368,000 | | | | 381,542 | |
| |
| Five Corners Funding Trust, 4.419% Unsec. Nts., 11/15/232 | | | 374,000 | | | | 394,860 | |
| |
| Genworth Holdings, Inc., 4.80% Sr. Unsec. Nts., 2/15/24 | | | 733,000 | | | | 784,346 | |
| |
| Liberty Mutual Group, Inc., 4.25% Sr. Unsec. Nts., 6/15/232 | | | 543,000 | | | | 563,547 | |
| |
| Lincoln National Corp., 6.05% Jr. Unsec. Sub. Nts., 4/20/674 | | | 811,000 | | | | 824,179 | |
| |
| Marsh & McLennan Cos., Inc., 5.375% Sr. Unsec. Nts., 7/15/14 | | | 64,000 | | | | 64,116 | |
| |
| Prudential Financial, Inc., 5.20% Jr. Sub. Nts., 3/15/444 | | | 331,000 | | | | 338,861 | |
| |
| Swiss Re Capital I LP, 6.854% Jr. Sub. Perpetual Bonds2,4,9 | | | 780,000 | | | | 836,550 | |
| |
| ZFS Finance USA Trust V, 6.50% Jr. Sub. Nts., 5/9/373,4 | | | 437,000 | | | | 469,775 | |
| | | | | | | | |
| | | | | | | 5,476,710 | |
| | | | | | | | |
| |
| Real Estate—0.1% | |
| |
| Ventas Realty LP, 1.25% Sr. Unsec. Nts., 4/17/17 | | | 178,000 | | | | 178,119 | |
| | | | | | | | |
| |
| Real Estate Investment Trusts (REITs)—0.8% | |
| |
| American Tower Corp.: | |
| 5.05% Sr. Unsec. Unsub. Nts., 9/1/20 | | | 285,000 | | | | 317,935 | |
| 5.90% Sr. Unsec. Nts., 11/1/21 | | | 233,000 | | | | 269,048 | |
| |
| ARC Properties Operating Partnership LP/Clark Acquisition LLC, 2% Sr. Unsec. Nts., 2/6/172 | | | 454,000 | | | | 455,317 | |
| |
| CC Holdings GS V LLC/Crown Castle GS III Corp., 3.849% Sr. Sec. Nts., 4/15/23 | | | 255,000 | | | | 256,328 | |
| |
| Corrections Corp. of America, 4.125% Sr. Unsec. Nts., 4/1/20 | | | 457,000 | | | | 455,857 | |
| |
| Hospitality Properties Trust: | | | | | | | | |
| 4.65% Sr. Unsec. Nts., 3/15/24 | | | 225,000 | | | | 236,094 | |
| 5.125% Sr. Unsec. Nts., 2/15/15 | | | 262,000 | | | | 263,320 | |
| | | | | | | | |
| | | | | | | 2,253,899 | |
| | | | | | | | |
| |
| Health Care—1.6% | |
| |
| Biotechnology—0.1% | |
| |
| Gilead Sciences, Inc., 5.65% Sr. Unsec. Unsub. Nts., 12/1/41 | | | 263,000 | | | | 310,550 | |
| | | | | | | | |
| |
| Health Care Equipment & Supplies—0.6% | |
| |
| Boston Scientific Corp., 4.125% Sr. Unsec. Nts., 10/1/23 | | | 465,000 | | | | 483,857 | |
| |
| CareFusion Corp.: | |
| 1.45% Sr. Unsec. Nts., 5/15/17 | | | 453,000 | | | | 452,911 | |
| 3.875% Sr. Unsec. Nts., 5/15/24 | | | 221,000 | | | | 223,603 | |
| |
| DENTSPLY International, Inc., 2.75% Sr. Unsec. Nts., 8/15/16 | | | 425,000 | | | | 440,344 | |
| | | | | | | | |
| | | | | | | 1,600,715 | |
| | | | | | | | |
| |
| Health Care Providers & Services—0.3% | |
| |
| CHS/Community Health Systems, Inc., 5.125% Sr. Sec. Nts., 8/1/212 | | | 350,000 | | | | 360,500 | |
| |
| Fresenius Medical Care US Finance II, Inc., 5.875% Sr. Unsec. Nts., 1/31/222 | | | 422,000 | | | | 468,420 | |
| | | | | | | | |
| | | | | | | 828,920 | |
12 OPPENHEIMER CAPITAL INCOME FUND/VA
| | | | | | | | |
| | | Principal
Amount | | | Value | |
| |
| Life Sciences Tools & Services—0.1% | |
| |
| Thermo Fisher Scientific, Inc.: | | | | | | | | |
| 4.15% Sr. Unsec. Nts., 2/1/24 | | $ | 144,000 | | | $ | 150,800 | |
| 5.30% Sr. Unsec. Nts., 2/1/44 | | | 165,000 | | | | 183,529 | |
| | | | | | | | |
| | | | | | | 334,329 | |
| | | | | | | | |
| |
| Pharmaceuticals—0.5% | |
| |
| Actavis Funding SCS, 1.30% Sr. Unsec. Nts., 6/15/172 | | | 287,000 | | | | 286,614 | |
| |
| Hospira, Inc., 5.20% Sr. Unsec. Nts., 8/12/20 | | | 441,000 | | | | 483,232 | |
| |
| Mallinckrodt International Finance SA, 3.50% Sr. Unsec. Nts., 4/15/18 | | | 468,000 | | | | 468,000 | |
| |
| Zoetis, Inc., 1.875% Sr. Unsec. Nts., 2/1/18 | | | 158,000 | | | | 158,474 | |
| | | | | | | | |
| | | | | | | 1,396,320 | |
| | | | | | | | |
| |
| Industrials—2.8% | |
| |
| Aerospace & Defense—0.6% | |
| |
| B/E Aerospace, Inc., 5.25% Sr. Unsec. Nts., 4/1/22 | | | 444,000 | | | | 485,625 | |
| |
| Huntington Ingalls Industries, Inc., 7.125% Sr. Unsec. Unsub. Nts., 3/15/21 | | | 402,000 | | | | 441,195 | |
| |
| L-3 Communications Corp.: | | | | | | | | |
| 1.50% Sr. Unsec. Nts., 5/28/17 | | | 118,000 | | | | 118,294 | |
| 3.95% Sr. Unsec. Nts., 5/28/24 | | | 214,000 | | | | 215,949 | |
| |
| Textron, Inc.: | | | | | | | | |
| 4.30% Sr. Unsec. Nts., 3/1/24 | | | 230,000 | | | | 238,501 | |
| 6.20% Sr. Unsec. Nts., 3/15/15 | | | 34,000 | | | | 35,392 | |
| | | | | | | | |
| | | | | | | 1,534,956 | |
| | | | | | | | |
| |
| Building Products—0.2% | |
| |
| Owens Corning, 4.20% Sr. Unsec. Nts., 12/15/22 | | | 505,000 | | | | 519,191 | |
| | | | | | | | |
| |
| Commercial Services & Supplies—0.4% | |
| |
| Clean Harbors, Inc., 5.25% Sr. Unsec. Unsub. Nts., 8/1/20 | | | 468,000 | | | | 484,965 | |
| |
| Pitney Bowes, Inc., 4.625% Sr. Unsec. Nts., 3/15/24 | | | 575,000 | | | | 595,560 | |
| | | | | | | | |
| | | | | | | 1,080,525 | |
| | | | | | | | |
| |
| Electrical Equipment—0.1% | |
| |
| Sensata Technologies BV, 4.875% Sr. Unsec. Nts., 10/15/232 | | | 349,000 | | | | 348,127 | |
| | | | | | | | |
| |
| Industrial Conglomerates—0.3% | |
| |
| General Electric Capital Corp., 6.25% Jr. Sub. Perpetual Bonds, Series B4,9 | | | 682,000 | | | | 759,987 | |
| | | | | | | | |
| |
| Machinery—0.3% | |
| |
| Crane Co., 4.45% Sr. Unsec. Nts., 12/15/23 | | | 234,000 | | | | 246,498 | |
| |
| Ingersoll-Rand Global Holding Co. Ltd., 4.25% Sr. Unsec. Nts., 6/15/23 | | | 410,000 | | | | 431,892 | |
| |
| Starwood Hotels & Resorts Worldwide, Inc., 7.375% Sr. Unsec. Nts., 11/15/15 | | | 172,000 | | | | 187,262 | |
| | | | | | | | |
| | | | | | | 865,652 | |
| | | | | | | | |
| |
| Professional Services—0.2% | |
| |
| Nielsen Finance LLC/Nielsen Finance Co., 4.50% Sr. | | | | | | | | |
| Unsec. Nts., 10/1/20 | | | 470,000 | | | | 475,875 | |
| | | | | | | | |
| |
| Road & Rail—0.4% | |
| |
| ERAC USA Finance LLC, 2.35% Sr. Unsec. Nts., 10/15/192 | | | 79,000 | | | | 78,884 | |
| |
| Kansas City Southern de Mexico SA de CV, 3% Sr. Unsec. Nts., 5/15/23 | | | 372,000 | | | | 352,507 | |
| |
| Penske Truck Leasing Co. LP/PTL Finance Corp.: | | | | | | | | |
| 2.50% Sr. Unsec. Nts., 3/15/162 | | | 446,000 | | | | 458,616 | |
| 4.25% Sr. Unsec. Nts., 1/17/232 | | | 250,000 | | | | 259,091 | |
| | | | | | | | |
| | | | | | | 1,149,098 | |
| | | | | | | | |
| |
| Trading Companies & Distributors—0.3% | |
| |
| Air Lease Corp., 3.875% Sr. Unsec. Nts., 4/1/21 | | | 456,000 | | | | 467,400 | |
| |
| International Lease Finance Corp., 5.875% Sr. Unsec. Unsub. Nts., 4/1/19 | | | 437,000 | | | | 482,339 | |
| | | | | | | | |
| | | | | | | 949,739 | |
| | | | | | | | |
| | | Principal
Amount | | | Value | |
| |
| Information Technology—1.4% | |
| |
| Communications Equipment—0.1% | |
| |
| Motorola Solutions, Inc., 3.50% Sr. Unsec. Nts., 3/1/23 | | $ | 248,000 | | | $ | 240,258 | |
| | | | | | | | |
| |
| Electronic Equipment, Instruments, & Components—0.4% | |
| |
| Amphenol Corp., 4.75% Sr. Unsec. Nts., 11/15/14 | | | 79,000 | | | | 80,222 | |
| |
| Arrow Electronics, Inc., 5.125% Sr. Unsec. Unsub. Nts., 3/1/21 | | | 525,000 | | | | 572,726 | |
| |
| Avnet, Inc., 4.875% Sr. Unsec. Unsub. Nts., 12/1/22 | | | 550,000 | | | | 586,163 | |
| | | | | | | | |
| | | | | | | 1,239,111 | |
| | | | | | | | |
| |
| IT Services—0.4% | | | | | | | | |
| |
| Fidelity National Information Services, Inc.: | | | | | | | | |
| 1.45% Sr. Unsec. Nts., 6/5/17 | | | 351,000 | | | | 350,779 | |
| 3.50% Sr. Unsec. Nts., 4/15/23 | | | 244,000 | | | | 240,392 | |
| |
| Xerox Corp., 4.25% Sr. Unsec. Nts., 2/15/15 | | | 449,000 | | | | 459,399 | |
| | | | | | | | |
| | | | | | | 1,050,570 | |
| | | | | | | | |
| |
| Software—0.1% | |
| |
| Oracle Corp., 3.40% Sr. Unsec. Nts., 7/8/248 | | | 322,000 | | | | 321,269 | |
| | | | | | | | |
| |
| Technology Hardware, Storage & Peripherals—0.4% | |
| |
| Apple, Inc., 4.45% Sr. Unsec. Nts., 5/6/44 | | | 248,000 | | | | 251,860 | |
| |
| Hewlett-Packard Co., 2.65% Sr. Unsec. Unsub. Nts., 6/1/16 | | | 443,000 | | | | 457,478 | |
| |
| Seagate HDD Cayman, 3.75% Sr. Unsec. Nts., 11/15/182 | | | 410,000 | | | | 420,250 | |
| | | | | | | | |
| | | | | | | 1,129,588 | |
| | | | | | | | |
| |
| Materials—2.2% | | | | | | | | |
| |
| Chemicals—0.4% | | | | | | | | |
| |
| Agrium, Inc., 3.50% Sr. Unsec. Nts., 6/1/23 | | | 262,000 | | | | 261,577 | |
| |
| LYB International Finance BV, 5.25% Sr. Unsec. Nts., 7/15/43 | | | 144,000 | | | | 158,028 | |
| |
| Rockwood Specialties Group, Inc., 4.625% Sr. Unsec. Nts., 10/15/20 | | | 450,000 | | | | 469,125 | |
| |
| RPM International, Inc., 3.45% Sr. Unsec. Unsub. Nts., 11/15/22 | | | 349,000 | | | | 339,859 | |
| | | | | | | | |
| | | | | | | 1,228,589 | |
| | | | | | | | |
| |
| Construction Materials—0.2% | |
| |
| CRH America, Inc., 4.125% Sr. Unsec. Nts., 1/15/16 | | | 440,000 | | | | 461,436 | |
| | | | | | | | |
| |
| Containers & Packaging—0.5% | |
| |
| Crown Americas LLC/Crown Americas Capital Corp. III, 6.25% Sr. Unsec. Nts., 2/1/21 | | | 184,000 | | | | 197,800 | |
| |
| Packaging Corp. of America, 4.50% Sr. Unsec. Nts., 11/1/23 | | | 358,000 | | | | 383,958 | |
| |
| Rock-Tenn Co., 3.50% Sr. Unsec. Unsub. Nts., 3/1/20 | | | 729,000 | | | | 750,984 | |
| | | | | | | | |
| | | | | | | 1,332,742 | |
| | | | | | | | |
| |
| Metals & Mining—1.0% | |
| |
| Allegheny Technologies, Inc., 5.95% Sr. Unsec. Unsub. Nts., 1/15/21 | | | 282,000 | | | | 311,662 | |
| |
| Barrick Gold Corp., 3.85% Sr. Unsec. Nts., 4/1/22 | | | 220,000 | | | | 219,141 | |
| |
| Carpenter Technology Corp., 4.45% Sr. Unsec. Unsub. Nts., 3/1/23 | | | 159,000 | | | | 163,743 | |
| |
| Freeport-McMoRan Copper & Gold, Inc.: | | | | | | | | |
| 1.40% Sr. Unsec. Nts., 2/13/15 | | | 464,000 | | | | 465,896 | |
| 3.875% Sr. Unsec. Nts., 3/15/23 | | | 250,000 | | | | 249,564 | |
| 5.45% Sr. Unsec. Nts., 3/15/43 | | | 157,000 | | | | 163,212 | |
| |
| Glencore Canada Corp.: | | | | | | | | |
| 5.375% Sr. Unsec. Unsub. Nts., 6/1/15 | | | 342,000 | | | | 355,796 | |
| 6.00% Sr. Unsec. Unsub. Nts., 10/15/15 | | | 391,000 | | | | 415,323 | |
| |
| Glencore Funding LLC, 4.625% Sr. Unsec. Nts., 4/29/242 | | | 339,000 | | | | 350,865 | |
| |
| Rio Tinto Finance USA plc, 4.125% Sr. Unsec. Nts., 8/21/42 | | | 125,000 | | | | 117,728 | |
| | | | | | | | |
| | | | | | | 2,812,930 | |
13 OPPENHEIMER CAPITAL INCOME FUND/VA
| | | | |
| STATEMENTOF INVESTMENTS Unaudited / Continued | | |
| | | | |
| | | | | | | | |
| | | Principal
Amount | | | Value | |
| |
Paper & Forest Products—0.1% | |
| |
| International Paper Co., 4.80% Sr. Unsec. Nts., 6/15/44 | | $ | 183,000 | | | $ | 183,973 | |
| |
| |
Telecommunication Services—1.7% | |
| |
Diversified Telecommunication Services—1.5% | |
| |
| AT&T, Inc., 4.35% Sr. Unsec. Nts., 6/15/45 | | | 297,000 | | | | 282,171 | |
| |
| British Telecommunications plc, 9.625% Sr. Unsec. Nts., 12/15/30 | | | 313,000 | | | | 499,215 | |
| |
| Frontier Communications Corp., 8.50% Sr. Unsec. Nts., 4/15/20 | | | 405,000 | | | | 479,925 | |
| |
| Telecom Italia Capital SA, 7.721% Sr. Unsec. Unsub. Nts., 6/4/38 | | | 277,000 | | | | 320,627 | |
| |
| Telefonica Emisiones SAU, 7.045% Sr. Unsec. Unsub. Nts., 6/20/36 | | | 450,000 | | | | 574,947 | |
| |
| T-Mobile USA, Inc., 6.25% Sr. Unsec. Nts., 4/1/21 | | | 455,000 | | | | 485,144 | |
| |
| Verizon Communications, Inc.: | | | | | | | | |
| 4.50% Sr. Unsec. Nts., 9/15/20 | | | 1,050,000 | | | | 1,156,360 | |
| 6.40% Sr. Unsec. Nts., 2/15/38 | | | 223,000 | | | | 272,853 | |
| | | | | | | | |
| | | | | | | 4,071,242 | |
| |
Wireless Telecommunication Services—0.2% | |
| |
| America Movil SAB de CV, 4.375% Sr. Unsec. Unsub. Nts., 7/16/42 | | | 361,000 | | | | 342,487 | |
| |
| Vodafone Group plc: | | | | | | | | |
| 4.375% Sr. Unsec. Unsub. Nts., 2/19/43 | | | 142,000 | | | | 135,718 | |
| 6.25% Sr. Unsec. Nts., 11/30/32 | | | 150,000 | | | | 184,411 | |
| | | | | | | | |
| | | | | | | 662,616 | |
| |
Utilities—1.3% | | | | | | | | |
| |
| Electric Utilities—0.8% | | | | | | |
| |
| Exelon Generation Co. LLC, 4.25% Sr. Unsec. Unsub. Nts., 6/15/22 | | | 257,000 | | | | 268,669 | |
| |
ITC Holdings Corp.: | | | | | | | | |
| 3.65% Sr. Unsec. Nts., 6/15/24 | | | 390,000 | | | | 389,239 | |
| 5.30% Sr. Unsec. Nts., 7/1/43 | | | 93,000 | | | | 102,634 | |
| | | | | | | | |
| | | Principal
Amount | | | Value | |
| |
| Electric Utilities (Continued) | | | | | | |
| |
| Jersey Central Power & Light Co., 4.70% Sr. Unsec. Nts., 4/1/242 | | $ | 237,000 | | | $ | 253,860 | |
| |
| Pennsylvania Electric Co., 5.20% Sr. Unsec. Nts., 4/1/20 | | | 88,000 | | | | 97,568 | |
| |
| PPL Capital Funding, Inc., 3.50% Sr. Unsec. Unsub. Nts., 12/1/22 | | | 223,000 | | | | 226,935 | |
| |
| PPL WEM Holdings Ltd., 5.375% Sr. Unsec. Unsub. Nts., 5/1/212 | | | 590,000 | | | | 664,336 | |
| | | | | | | | |
| | | | | | | 2,003,241 | |
| |
| Independent Power and Renewable Electricity Producers—0.1% | |
| |
| Dayton Power & Light Co., 1.875% Sr. Sec. Nts., 9/15/162 | | | 329,000 | | | | 334,724 | |
| |
Multi-Utilities—0.4% | | | | | | | | |
| |
| CenterPoint Energy, Inc., 5.95% Sr. Unsec. Nts., 2/1/17 | | | 386,000 | | | | 431,343 | |
| |
| CMS Energy Corp.: | | | | | | | | |
| 3.875% Sr. Unsec. Nts., 3/1/24 | | | 240,000 | | | | 249,750 | |
| 5.05% Sr. Unsec. Unsub. Nts., 3/15/22 | | | 172,000 | | | | 195,717 | |
| |
| PG&E Corp., 2.40% Sr. Unsec. Nts., 3/1/19 | | | 290,000 | | | | 292,895 | |
| | | | | | | | |
| | | | | | | 1,169,705 | |
| | | | | | | | |
| Total Non-Convertible Corporate Bonds and Notes (Cost $80,856,181) | | | | | | | 84,395,384 | |
| | | | | | | | |
| | | Shares | | | | |
| |
Investment Company—4.3% | | | | | | | | |
| |
| Oppenheimer Institutional Money Market Fund, Cl. E, 0.09%10,11 (Cost $11,967,607) | | | 11,967,607 | | | | 11,967,607 | |
| | | | | | | | | | | | | | | | | | | | | | | | | | | | | | | | |
| | | Counterparty | | | Buy /Sell
Protection | | | Reference Asset | | | Fixed Rate | | | Expiration
Date | | | | | | Notional
(000’s) | | | | |
| |
Over-the-Counter Credit Default Swaptions Purchased—0.0% | |
| |
| Credit Default Swap maturing 6/20/19 Call1 | | | JPM | | | | Buy | | | | CDX.NA.IG. 22 | | | | 1.000% | | | | 12/17/14 | | | | USD | | | | 15,449 | | | | 20,778 | |
| |
| Credit Default Swap maturing 6/20/19 Call1 | | | JPM | | | | Buy | | | | CDX.NA.IG. 22 | | | | 1.000 | | | | 10/15/14 | | | | USD | | | | 16,188 | | | | 9,928 | |
| |
| Credit Default Swap maturing 6/20/19 Call1 | | | DEU | | | | Buy | | | | CDX.NA.IG. 22 | | | | 1.000 | | | | 10/15/14 | | | | USD | | | | 16,335 | | | | 10,018 | |
| | | | | | | | | | | | | | | | | | | | | | | | | | | | | | | | |
| Total Over-the-Counter Credit Default Swaptions Purchased (Cost $91,069) | | | | | | | | | | | | | | | | | | | | 40,724 | |
| |
| Total Investments, at Value (Cost $310,374,443) | | | | | | | | | | | | | | | | | | | | 120.0 | % | | | 331,198,456 | |
| |
Net Other Assets (Liabilities) | | | | | | | | | | | | | | | | | | | | | | | | (20.0 | ) | | | (55,132,393) | |
| | | | | | | | | | | | | | | | | | | | | | | | | | | | |
Net Assets | | | | | | | | | | | | | | | | | | | | | | | | | | | 100.0 | % | | $ | 276,066,063 | |
| | | | | | | | | | | | | | | | | | | | | | | | | | | | |
Footnotes to Statement of Investments
1. Non-income producing security.
2. Represents securities sold under Rule 144A, which are exempt from registration under the Securities Act of 1933, as amended. These securities have been determined to be liquid under guidelines established by the Board of Trustees. These securities amount to $42,260,833 or 15.31% of the Fund’s net assets as of June 30, 2014.
3. Restricted security. The aggregate value of restricted securities as of June 30, 2014 was $1,733,903, which represents 0.63% of the Fund’s net assets. See Note 7 of the accompanying Notes. Information concerning restricted securities is as follows:
| | | | | | | | | | | | | | | | |
| Security | | Acquisition Dates | | | Cost | | | Value | | | Unrealized
Appreciation | |
| |
Credit Acceptance Auto Loan Trust, Series 2013-2A,
Cl. B, 2.26%, 10/15/21 | | | 10/22/13 | | | $ | 309,913 | | | $ | 314,222 | | | $ | 4,309 | |
Morgan Stanley Re-Remic Trust, Series 2012-R3,
Cl. 1B, 2.049%, 11/26/36 | | | 10/24/13-6/1/14 | | | | 131,731 | | | | 157,601 | | | | 25,870 | |
Rabobank Capital Funding Trust III, 5.254% Jr. Sub.
Perpetual Bonds | | | 5/1/13-5/8/13 | | | | 764,244 | | | | 792,305 | | | | 28,061 | |
ZFS Finance USA Trust V, 6.50% Jr. Sub. Nts., 5/9/37 | | | 11/20/13 | | | | 460,288 | | | | 469,775 | | | | 9,487 | |
| | | | | | | | |
| | | | | | $ | 1,666,176 | | | $ | 1,733,903 | | | $ | 67,727 | |
| | | | | | | | |
14 OPPENHEIMER CAPITAL INCOME FUND/VA
Footnotes to Statement of Investments (Continued)
4. Represents the current interest rate for a variable or increasing rate security.
5. Interest-Only Strips represent the right to receive the monthly interest payments on an underlying pool of mortgage loans. These securities typically decline in price as interest rates decline. Most other fixed income securities increase in price when interest rates decline. The principal amount of the underlying pool represents the notional amount on which current interest is calculated. The price of these securities is typically more sensitive to changes in prepayment rates than traditional mortgage-backed securities (for example, GNMA pass-throughs). Interest rates disclosed represent current yields based upon the current cost basis and estimated timing and amount of future cash flows. These securities amount to $2,315,283 or 0.84% of the Fund’s net assets as of June 30, 2014.
6. Interest rate is less than 0.0005%.
7. Principal-Only Strips represent the right to receive the monthly principal payments on an underlying pool of mortgage loans. The value of these securities generally increases as interest rates decline and prepayment rates rise. The price of these securities is typically more volatile than that of coupon-bearing bonds of the same maturity. Interest rates disclosed represent current yields based upon the current cost basis and estimated timing of future cash flows. These securities amount to $119,557 or 0.04% of the Fund’s net assets as of June 30, 2014.
8. All or a portion of the security position is when-issued or delayed delivery to be delivered and settled after June 30, 2014. See Note 1 of the accompanying Notes.
9. This bond has no contractual maturity date, is not redeemable and contractually pays an indefinite stream of interest. Rate reported represents the current interest rate for this variable rate security.
10. Is or was an affiliate, as defined in the Investment Company Act of 1940, at or during the period ended June 30, 2014, by virtue of the Fund owning at least 5% of the voting securities of the issuer or as a result of the Fund and the issuer having the same investment adviser. Transactions during the period in which the issuer was an affiliate are as follows:
| | | | | | | | | | | | | | | | |
| | | Shares
December 31, 2013 | | | Gross
Additions | | | Gross Reductions | | | Shares
June 30, 2014 | |
| |
Oppenheimer Institutional Money Market Fund, Cl. E | | | 19,917,607 | | | | — | | | | 7,950,000 | | | | 11,967,607 | |
| | | | |
| | | | | | | | | Value | | | Income | |
| |
Oppenheimer Institutional Money Market Fund, Cl. E | | | | | | | | | | $ | 11,967,607 | | | $ | 7,830 | |
11. Rate shown is the 7-day yield as of June 30, 2014.
| | | | | | | | | | | | | | | | | | | | | | | | |
| |
Futures Contracts as of June 30, 2014 | |
| Description | | Exchange | | | Buy/Sell | | | Expiration Date | | | Number of
Contracts | | | Value | | | Unrealized Appreciation
(Depreciation) | |
| |
United States Treasury Long Bonds | | | CBT | | | | Buy | | | | 9/19/14 | | | | 44 | | | $ | 6,036,250 | | | $ | 79,664 | |
United States Treasury Nts., 2 yr. | | | CBT | | | | Sell | | | | 9/30/14 | | | | 182 | | | | 39,966,064 | | | | 11,431 | |
United States Treasury Nts., 5 yr. | | | CBT | | | | Sell | | | | 9/30/14 | | | | 9 | | | | 1,075,148 | | | | 3,140 | |
United States Treasury Nts., 10 yr. | | | CBT | | | | Sell | | | | 9/19/14 | | | | 20 | | | | 2,503,438 | | | | (1,412) | |
United States Treasury Ultra Bonds | | | CBT | | | | Buy | | | | 9/19/14 | | | | 34 | | | | 5,097,875 | | | | 64,826 | |
| | | | | | | | | | | | | | | | | | | | | | | | |
| | | | | | | | | | | | | | | | | | | | | | $ | 157,649 | |
| | | | | | | | | | | | | | | | | | | | | | | | |
Glossary:
Counterparty Abbreviations
| | |
| DEU | | Deutsche Bank AG |
| JPM | | JPMorgan Chase Bank NA |
Definition
| | |
| CDX.NA.IG.22 | | Markit CDX North American Investment Grade High Volatility |
Exchange Abbreviations
| | |
| CBT | | Chicago Board of Trade |
See accompanying Notes to Financial Statements.
15 OPPENHEIMER CAPITAL INCOME FUND/VA
STATEMENTOF ASSETS AND LIABILITIES June 30, 2014 Unaudited
| | | | |
| | | | |
| |
Assets | | | | |
Investments, at value—see accompanying statement of investments: | | | | |
Unaffiliated companies (cost $298,406,836) | | $ | 319,230,849 | |
Affiliated companies (cost $11,967,607) | | | 11,967,607 | |
| | | | |
| | | 331,198,456 | |
| |
Cash | | | 1,001,909 | |
| |
Cash used for collateral on futures | | | 260,000 | |
| |
Receivables and other assets: | | | | |
| Investments sold (including $3,516,793 sold on a when-issued or delayed delivery basis) | | | 4,250,161 | |
Interest, dividends and principal paydowns | | | 1,264,782 | |
Variation margin receivable | | | 35,098 | |
Other | | | 41,464 | |
| | | | |
Total assets | | | 338,051,870 | |
|
| |
Liabilities | | | | |
Payables and other liabilities: | | | | |
| Investments purchased (including $61,029,944 purchased on a when-issued or delayed delivery basis) | | | 61,718,246 | |
Shares of beneficial interest redeemed | | | 182,378 | |
Trustees’ compensation | | | 36,527 | |
Distribution and service plan fees | | | 13,434 | |
Variation margin payable | | | 8,470 | |
Shareholder communications | | | 8,201 | |
Other | | | 18,551 | |
| | | | |
Total liabilities | | | 61,985,807 | |
|
| |
Net Assets | | $ | 276,066,063 | |
| | | | |
|
| |
Composition of Net Assets | | | | |
Par value of shares of beneficial interest | | $ | 19,355 | |
| |
Additional paid-in capital | | | 277,739,878 | |
| |
Accumulated net investment income | | | 2,796,996 | |
| |
Accumulated net realized loss on investments and foreign currency transactions | | | (25,472,336) | |
| |
| Net unrealized appreciation on investments and translation of assets and liabilities denominated in foreign currencies | | | 20,982,170 | |
| | | | |
Net Assets | | $ | 276,066,063 | |
| | | | |
|
| |
Net Asset Value Per Share | | | | |
Non-Service Shares: | | | | |
| |
| Net asset value, redemption price (excludes applicable contingent deferred sales charge) and offering price per share (based on net assets of $210,636,302 and 14,727,041 shares of beneficial interest outstanding) | | | $14.30 | |
| |
| |
Service Shares: | | | | |
| |
| Net asset value, redemption price (excludes applicable contingent deferred sales charge) and offering price per share (based on net assets of $65,429,761 and 4,627,596 shares of beneficial interest outstanding) | | | $14.14 | |
See accompanying Notes to Financial Statements.
16 OPPENHEIMER CAPITAL INCOME FUND/VA
STATEMENTOF OPERATIONS For the Six Months Ended June 30, 2014 Unaudited
| | | | |
| | | | |
| |
Investment Income | | | | |
Interest | | $ | 2,831,439 | |
| |
Dividends: | | | | |
Unaffiliated companies (net of foreign withholding taxes of $7,495) | | | 797,324 | |
Affiliated companies | | | 7,830 | |
| | | | |
Total investment income | | | 3,636,593 | |
| |
Expenses | | | | |
Management fees | | | 1,017,005 | |
| |
Distribution and service plan fees - Service shares | | | 82,437 | |
| |
Transfer and shareholder servicing agent fees: | | | | |
Non-Service shares | | | 104,155 | |
Service shares | | | 32,986 | |
| |
Shareholder communications: | | | | |
Non-Service shares | | | 12,105 | |
Service shares | | | 3,857 | |
| |
Custodian fees and expenses | | | 15,420 | |
| |
Trustees’ compensation | | | 7,434 | |
| |
Other | | | 31,334 | |
| | | | |
Total expenses | | | 1,306,733 | |
Less waivers and reimbursements of expenses | | | (305,313) | |
| | | | |
Net expenses | | | 1,001,420 | |
| |
| | | | |
Net Investment Income | | | 2,635,173 | |
| |
Realized and Unrealized Gain (Loss) | | | | |
Net realized gain on: | | | | |
Investments from unaffiliated companies | | | 6,515,634 | |
Closing and expiration of futures contracts | | | 868,918 | |
Foreign currency transactions | | | 157 | |
| | | | |
Net realized gain | | | 7,384,709 | |
| |
Net change in unrealized appreciation/depreciation on: | | | | |
Investments | | | 4,616,465 | |
Translation of assets and liabilities denominated in foreign currencies | | | (32,676) | |
Futures contracts | | | 213,080 | |
| | | | |
Net change in unrealized appreciation/depreciation | | | 4,796,869 | |
| |
Net Increase in Net Assets Resulting from Operations | | $ | 14,816,751 | |
| | | | |
See accompanying Notes to Financial Statements.
17 OPPENHEIMER CAPITAL INCOME FUND/VA
STATEMENTSOF CHANGES IN NET ASSETS
| | | | | | | | |
| | | Six Months Ended
June 30, 2014
(Unaudited) | | | Year Ended
December 31, 2013 | |
| |
Operations | | | | | | | | |
Net investment income | | $ | 2,635,173 | | | $ | 5,247,717 | |
| |
Net realized gain | | | 7,384,709 | | | | 37,714,451 | |
| |
Net change in unrealized appreciation/depreciation | | | 4,796,869 | | | | (7,198,564) | |
| | | | | | | | |
Net increase in net assets resulting from operations | | | 14,816,751 | | | | 35,763,604 | |
| |
Dividends and/or Distributions to Shareholders | | | | | | | | |
Dividends from net investment income: | | | | | | | | |
Non-Service shares | | | (4,273,014) | | | | (5,107,178) | |
Service shares | | | (1,173,552) | | | | (1,549,784) | |
| | | | | | | | |
| | | (5,446,566) | | | | (6,656,962) | |
| |
Beneficial Interest Transactions | | | | | | | | |
Net decrease in net assets resulting from beneficial interest transactions: | | | | | | | | |
Non-Service shares | | | (10,113,544) | | | | (26,201,767) | |
Service shares | | | (6,488,918) | | | | (10,510,886) | |
| | | | | | | | |
| | | (16,602,462) | | | | (36,712,653) | |
| |
Net Assets | | | | | | | | |
Total decrease | | | (7,232,277) | | | | (7,606,011) | |
| |
Beginning of period | | | 283,298,340 | | | | 290,904,351 | |
| | | | | | | | |
| End of period (including accumulated net investment income of $ 2,796,996 and $ 5,608,389, respectively) | | $ | 276,066,063 | | | $ | 283,298,340 | |
| | | | |
See accompanying Notes to Financial Statements.
18 OPPENHEIMER CAPITAL INCOME FUND/VA
FINANCIAL HIGHLIGHTS
| | | | | | | | | | | | | | | | | | | | | | | | |
| Non-Service Shares | | Six Months
Ended
June 30,
2014
(Unaudited) | | | Year Ended
December 31,
2013 | | | Year Ended
December 31,
2012 | | | Year Ended
December 30,
2011 1 | | | Year Ended
December 31,
2010 | | | Year Ended
December 31,
2009 | |
| |
| Per Share Operating Data | | | | | | | | | | | | | | | | | | | | | | | | |
| Net asset value, beginning of period | | $ | 13 .84 | | | $ | 12 .52 | | | $ | 11 .30 | | | $ | 11 .47 | | | $ | 10 .30 | | | $ | 8 .45 | |
| |
| Income (loss) from investment operations: | | | | | | | | | | | | | | | | | | | | | | | | |
| Net investment income2 | | | 0 .14 | | | | 0 .25 | | | | 0 .29 | | | | 0 .20 | | | | 0 .23 | | | | 0 .25 | |
| Net realized and unrealized gain (loss) | | | 0 .61 | | | | 1 .38 | | | | 1 .09 | | | | (0 .11) | | | | 1 .09 | | | | 1 .60 | |
| | | | |
| Total from investment operations | | | 0 .75 | | | | 1 .63 | | | | 1 .38 | | | | 0 .09 | | | | 1 .32 | | | | 1 .85 | |
| |
| Dividends and/or distributions to shareholders: | | | | | | | | | | | | | | | | | | | | | | | | |
| Dividends from net investment income | | | (0 .29) | | | | (0 .31) | | | | (0 .16) | | | | (0 .26) | | | | (0 .15) | | | | 0 .00 | |
| |
| Net asset value, end of period | | $ | 14 .30 | | | $ | 13 .84 | | | $ | 12 .52 | | | $ | 11 .30 | | | $ | 11 .47 | | | $ | 10 .30 | |
| | | | |
| |
| Total Return, at Net Asset Value3 | | | 5 .47% | | | | 13 .17% | | | | 12 .34% | | | | 0 .72% | | | | 12 .91% | | | | 21 .89% | |
| |
| Ratios/Supplemental Data | | | | | | | | | | | | | | | | | | | | | | | | |
| Net assets, end of period (in thousands) | | $ | 210,636 | | | $ | 213,697 | | | $ | 218,032 | | | $ | 128,383 | | | $ | 150,622 | | | $ | 159,797 | |
| |
| Average net assets (in thousands) | | $ | 211,153 | | | $ | 218,090 | | | $ | 191,416 | | | $ | 141,848 | | | $ | 151,620 | | | $ | 159,013 | |
| |
| Ratios to average net assets:4 | | | | | | | | | | | | | | | | | | | | | | | | |
| Net investment income | | | 1 .97% | | | | 1 .87% | | | | 2 .46% | | | | 1 .70% | | | | 2 .13% | | | | 2 .71% | |
| Total expenses5 | | | 0 .89% | | | | 0 .89% | | | | 0 .90% | | | | 0 .91% | | | | 0 .91% | | | | 0 .89% | |
| Expenses after payments, waivers and/or reimbursements and reduction to custodian expenses | | | 0 .67% | | | | 0 .66% | | | | 0 .66% | | | | 0 .67% | | | | 0 .65% | | | | 0 .60% | |
| |
| Portfolio turnover rate6 | | | 55% | | | | 187% | | | | 110% | | | | 102% | | | | 54% | | | | 87% | |
1. December 30, 2011 represents the last business day of the Fund’s reporting period.
2. Per share amounts calculated based on the average shares outstanding during the period.
3. Assumes an initial investment on the business day before the first day of the fiscal period, with all dividends and distributions reinvested in additional shares on the reinvestment date, and redemption at the net asset value calculated on the last business day of the fiscal period. Total returns are not annualized for periods less than one full year. Total return information does not reflect expenses that apply at the separate account level or to related insurance products. Inclusion of these charges would reduce the total return figures for all periods shown. Returns do not reflect the deduction of taxes that a shareholder would pay on fund distributions or the redemption of fund shares.
4. Annualized for periods less than one full year.
5. Total expenses including indirect expenses from affiliated fund were as follows:
| | | | | | | | |
Six Months Ended June 30, 2014 | | | 0 .90 | % | | | | |
Year Ended December 31, 2013 | | | 0 .90 | % | | | | |
Year Ended December 31, 2012 | | | 0 .91 | % | | | | |
Year Ended December 30, 2011 | | | 0 .93 | % | | | | |
Year Ended December 31, 2010 | | | 0 .92 | % | | | | |
Year Ended December 31, 2009 | | | 0 .91 | % | | | | |
6. The portfolio turnover rate excludes purchase and sale transactions of To Be Announced (TBA) mortgage-related securities as follows:
| | | | | | | | | | |
| | | Purchase Transactions | | | Sale Transactions | | | |
| | | |
Six Months Ended June 30, 2014 | | | $337,475,550 | | | | $322,331,170 | | | |
Year Ended December 31, 2013 | | | $794,398,216 | | | | $800,879,825 | | | |
Year Ended December 31, 2012 | | | $555,111,600 | | | | $549,805,766 | | | |
Year Ended December 30, 2011 | | | $450,804,195 | | | | $453,759,282 | | | |
Year Ended December 31, 2010 | | | $412,930,431 | | | | $414,511,903 | | | |
Year Ended December 31, 2009 | | | $504,698,365 | | | | $520,212,670 | | | |
See accompanying Notes to Financial Statements.
19 OPPENHEIMER CAPITAL INCOME FUND/VA
| | | | |
| FINANCIAL HIGHLIGHTS Continued | | |
| | | | | | | | | | | | | | | | | | | | | | | | |
| Service Shares | | Six Months
Ended
June 30, 2014
(Unaudited) | | | Year Ended
December 31,
2013 | | | Year Ended
December 31,
2012 | | | Year Ended
December 30,
2011 1 | | | Year Ended
December 31,
2010 | | | Year Ended
December 31,
2009 | |
| |
Per Share Operating Data | | | | | | | | | | | | | | | | | | | | | | | | |
| Net asset value, beginning of period | | $ | 13 .66 | | | $ | 12 .37 | | | $ | 11 .17 | | | $ | 11 .35 | | | $ | 10 .19 | | | $ | 8 .38 | |
| |
| Income (loss) from investment operations: | | | | | | | | | | | | | | | | | | | | | | | | |
| Net investment income2 | | | 0 .12 | | | | 0 .21 | | | | 0 .26 | | | | 0 .16 | | | | 0 .20 | | | | 0 .22 | |
| Net realized and unrealized gain (loss) | | | 0 .62 | | | | 1 .36 | | | | 1 .08 | | | | (0 .11) | | | | 1 .08 | | | | 1 .59 | |
| Total from investment operations | | | 0 .74 | | | | 1 .57 | | | | 1 .34 | | | | 0 .05 | | | | 1 .28 | | | | 1 .81 | |
| |
| Dividends and/or distributions to shareholders: | | | | | | | | | | | | | | | | | | | | | | | | |
| Dividends from net investment income | | | (0 .26) | | | | (0 .28) | | | | (0 .14) | | | | (0 .23) | | | | (0 .12) | | | | 0 .00 | |
| |
| Net asset value, end of period | | $ | 14 .14 | | | $ | 13 .66 | | | $ | 12 .37 | | | $ | 11 .17 | | | $ | 11 .35 | | | $ | 10 .19 | |
| | | | |
| |
| Total Return, at Net Asset Value3 | | | 5 .41% | | | | 12 .83% | | | | 12 .11% | | | | 0 .38% | | | | 12 .68% | | | | 21 .60% | |
| |
| Ratios/Supplemental Data | | | | | | | | | | | | | | | | | | | | | | | | |
| Net assets, end of period (in thousands) | | $ | 65,430 | | | $ | 69,601 | | | $ | 72,872 | | | $ | 77,551 | | | $ | 89,580 | | | $ | 88,746 | |
| |
| Average net assets (in thousands) | | $ | 66,884 | | | $ | 72,332 | | | $ | 76,257 | | | $ | 85,157 | | | $ | 87,280 | | | $ | 77,101 | |
| |
| Ratios to average net assets:4 | | | | | | | | | | | | | | | | | | | | | | | | |
| Net investment income | | | 1 .72% | | | | 1 .62% | | | | 2 .18% | | | | 1 .45% | | | | 1 .87% | | | | 2 .42% | |
| Total expenses5 | | | 1 .14% | | | | 1 .15% | | | | 1 .16% | | | | 1 .16% | | | | 1 .16% | | | | 1 .15% | |
| Expenses after payments, waivers and/or reimbursements and reduction to custodian expenses | | | 0 .92% | | | | 0 .92% | | | | 0 .92% | | | | 0 .92% | | | | 0 .90% | | | | 0 .85% | |
| |
Portfolio turnover rate6 | | | 55% | | | | 187% | | | | 110% | | | | 102% | | | | 54% | | | | 87% | |
1. December 30, 2011 represents the last business day of the Fund’s reporting period.
2. Per share amounts calculated based on the average shares outstanding during the period.
3. Assumes an initial investment on the business day before the first day of the fiscal period, with all dividends and distributions reinvested in additional shares on the reinvestment date, and redemption at the net asset value calculated on the last business day of the fiscal period. Total returns are not annualized for periods less than one full year. Total return information does not reflect expenses that apply at the separate account level or to related insurance products. Inclusion of these charges would reduce the total return figures for all periods shown. Returns do not reflect the deduction of taxes that a shareholder would pay on fund distributions or the redemption of fund shares.
4. Annualized for periods less than one full year.
5. Total expenses including indirect expenses from affiliated fund were as follows:
| | | | | | | | |
Six Months Ended June 30, 2014 | | | 1 .15 | % | | | | |
Year Ended December 31, 2013 | | | 1 .16 | % | | | | |
Year Ended December 31, 2012 | | | 1 .17 | % | | | | |
Year Ended December 30, 2011 | | | 1 .18 | % | | | | |
Year Ended December 31, 2010 | | | 1 .17 | % | | | | |
Year Ended December 31, 2009 | | | 1 .17 | % | | | | |
6. The portfolio turnover rate excludes purchase and sale transactions of To Be Announced (TBA) mortgage-related securities as follows:
| | | | | | | | | | |
| | | Purchase Transactions | | | Sale Transactions | | | |
| | | |
Six Months Ended June 30, 2014 | | | $337,475,550 | | | | $322,331,170 | | | |
Year Ended December 31, 2013 | | | $794,398,216 | | | | $800,879,825 | | | |
Year Ended December 31, 2012 | | | $555,111,600 | | | | $549,805,766 | | | |
Year Ended December 30, 2011 | | | $450,804,195 | | | | $453,759,282 | | | |
Year Ended December 31, 2010 | | | $412,930,431 | | | | $414,511,903 | | | |
Year Ended December 31, 2009 | | | $504,698,365 | | | | $520,212,670 | | | |
See accompanying Notes to Financial Statements.
20 OPPENHEIMER CAPITAL INCOME FUND/VA
NOTESTO FINANCIAL STATEMENTS June 30, 2014 Unaudited
1. Significant Accounting Policies
Oppenheimer Capital Income Fund/VA (the “Fund”) is a separate series of Oppenheimer Variable Account Funds, a diversified open-end management investment company registered under the Investment Company Act of 1940, as amended. The Fund’s investment objective is to seek total return. The Fund’s investment adviser is OFI Global Asset Management, Inc. (“OFI Global” or the “Manager”), a wholly-owned subsidiary of OppenheimerFunds, Inc. (“OFI” or the “Sub-Adviser”). The Manager has entered into a sub-advisory agreement with OFI. Shares of the Fund are sold only to separate accounts of life insurance companies.
The Fund offers two classes of shares. Both classes are sold at their offering price, which is the net asset value per share, to separate investment accounts of participating insurance companies as an underlying investment for variable life insurance policies, variable annuity contracts or other investment products. The class of shares designated as Service shares is subject to a distribution and service plan. Both classes of shares have identical rights and voting privileges with respect to the Fund in general and exclusive voting rights on matters that affect that class alone. Earnings, net assets and net asset value per share may differ due to each class having its own expenses, such as transfer and shareholder servicing agent fees and shareholder communications, directly attributable to that class.
The following is a summary of significant accounting policies consistently followed by the Fund.
Securities on a When-Issued or Delayed Delivery Basis. The Fund may purchase securities on a “when-issued” basis, and may purchase or sell securities on a “delayed delivery” basis. “When-issued” or “delayed delivery” refers to securities whose terms and indenture are available and for which a market exists, but which are not available for immediate delivery. Delivery and payment for securities that have been purchased by the Fund on a when-issued basis normally takes place within six months and possibly as long as two years or more after the trade date. During this period, such securities do not earn interest, are subject to market fluctuation and may increase or decrease in value prior to their delivery. The purchase of securities on a when-issued basis may increase the volatility of the Fund’s net asset value to the extent the Fund executes such transactions while remaining substantially fully invested. When the Fund engages in when-issued or delayed delivery transactions, it relies on the buyer or seller, as the case may be, to complete the transaction. Their failure to do so may cause the Fund to lose the opportunity to obtain or dispose of the security at a price and yield it considers advantageous. The Fund may also sell securities that it purchased on a when-issued basis or forward commitment prior to settlement of the original purchase.
As of June 30, 2014, the Fund had purchased securities issued on a when-issued or delayed delivery basis and sold securities issued on a delayed delivery basis as follows:
| | | | |
| | | When-Issued or
Delayed Delivery
Basis Transactions | |
| |
Purchased securities | | | $61,029,944 | |
Sold securities | | | 3,516,793 | |
The Fund may enter into “forward roll” transactions with respect to mortgage-related securities. In this type of transaction, the Fund sells a mortgage-related security to a buyer and simultaneously agrees to repurchase a similar security (same type, coupon and maturity) at a later date at a set price. During the period between the sale and the repurchase, the Fund will not be entitled to receive interest and principal payments on the securities that have been sold. The Fund records the incremental difference between the forward purchase and sale of each forward roll as realized gain (loss) on investments or as fee income in the case of such transactions that have an associated fee in lieu of a difference in the forward purchase and sale price.
Forward roll transactions may be deemed to entail embedded leverage since the Fund purchases mortgage-related securities with extended settlement dates rather than paying for the securities under a normal settlement cycle. This embedded leverage increases the Fund’s market value of investments relative to its net assets which can incrementally increase the volatility of the Fund’s performance. Forward roll transactions can be replicated over multiple settlement periods.
Risks of entering into forward roll transactions include the potential inability of the counterparty to meet the terms of the agreement; the potential of the Fund to receive inferior securities at redelivery as compared to the securities sold to the counterparty; and counterparty credit risk.
Investment in Oppenheimer Institutional Money Market Fund. The Fund is permitted to invest daily available cash balances in an affiliated money market fund. The Fund may invest the available cash in Class E shares of Oppenheimer Institutional Money Market Fund (“IMMF”) to seek current income while preserving liquidity. IMMF is a registered open-end management investment company, regulated as a money market fund under the Investment Company Act of 1940, as amended. The Manager is the investment adviser of IMMF, and the Sub-Adviser provides investment and related advisory services to IMMF. When applicable, the Fund’s investment in IMMF is included in the Statement of Investments. Shares of IMMF are valued at their net asset value per share. As a shareholder, the Fund is subject to its proportional share of IMMF’s Class E expenses, including its management fee. The Manager will waive fees and/or reimburse Fund expenses in an amount equal to the indirect management fees incurred through the Fund’s investment in IMMF.
Foreign Currency Translation. The Fund’s accounting records are maintained in U.S. dollars. The values of securities denominated in foreign currencies and amounts related to the purchase and sale of foreign securities and foreign investment income are translated into U.S. dollars as of the close of the New York Stock Exchange (the “Exchange”), normally 4:00 P.M. Eastern time, on each day the Exchange is open for trading. Foreign exchange rates may be valued primarily using a reliable bank, dealer or service authorized by the Board of Trustees.
21 OPPENHEIMER CAPITAL INCOME FUND/VA
| | |
| NOTES TO FINANCIAL STATEMENTS Unaudited / Continued | | |
| | |
| 1. Significant Accounting Policies (Continued) | | |
Reported net realized gains and losses from foreign currency transactions arise from sales of portfolio securities, sales and maturities of short-term securities, sales of foreign currencies, exchange rate fluctuations between the trade and settlement dates on securities transactions, and the difference between the amounts of dividends, interest, and foreign withholding taxes recorded on the Fund’s books and the U.S. dollar equivalent of the amounts actually received or paid. Net unrealized appreciation and depreciation on the translation of assets and liabilities denominated in foreign currencies arise from changes in the values of assets and liabilities, including investments in securities at fiscal period end, resulting from changes in exchange rates.
The effect of changes in foreign currency exchange rates on investments is separately identified from the fluctuations arising from changes in market values of securities held and reported with all other foreign currency gains and losses in the Fund’s Statement of Operations.
Allocation of Income, Expenses, Gains and Losses. Income, expenses (other than those attributable to a specific class), gains and losses are allocated on a daily basis to each class of shares based upon the relative proportion of net assets represented by such class. Operating expenses directly attributable to a specific class are charged against the operations of that class.
Federal Taxes. The Fund intends to comply with provisions of the Internal Revenue Code applicable to regulated investment companies and to distribute substantially all of its investment company taxable income to shareholders. Therefore, no federal income or excise tax provision is required. The Fund files income tax returns in U.S. federal and applicable state jurisdictions. The statute of limitations on the Fund’s tax return filings generally remain open for the three preceding fiscal reporting period ends.
During the fiscal year ended December 31, 2013, the Fund utilized $36,236,660 of capital loss carryforward to offset capital gains realized in that fiscal year. Details of the fiscal year ended December 31, 2013 capital loss carryforwards are included in the table below. Capital loss carryforwards with no expiration, if any, must be utilized prior to those with expiration dates. Capital losses with no expiration will be carried forward to future years if not offset by gains.
| | | | |
| Expiring | | | |
| |
2015 | | $ | 6,646,488 | |
2016 | | | 3,323,244 | |
2017 | | | 22,894,743 | |
| | | | |
Total | | $ | 32,864,475 | |
| | | | |
As of June 30, 2014, it is estimated that the capital loss carryforwards would be $25,479,766 expiring by 2017. The estimated capital loss carryforward represents the carryforward as of the end of the last fiscal year, increased or decreased by capital losses or gains realized in the first six months of the current fiscal year. During the six months ended June 30, 2014, it is estimated that the Fund will utilize $7,384,709 of capital loss carryforward to offset realized capital gains.
Net investment income (loss) and net realized gain (loss) may differ for financial statement and tax purposes. The character of dividends and distributions made during the fiscal year from net investment income or net realized gains may differ from their ultimate characterization for federal income tax purposes. Also, due to timing of dividends and distributions, the fiscal year in which amounts are distributed may differ from the fiscal year in which the income or net realized gain was recorded by the Fund.
The aggregate cost of securities and other investments and the composition of unrealized appreciation and depreciation of securities and other investments for federal income tax purposes as of June 30, 2014 are noted in the following table. The primary difference between book and tax appreciation or depreciation of securities and other investments, if applicable, is attributable to the tax deferral of losses or tax realization of financial statement unrealized gain or loss.
| | | | |
Federal tax cost of securities | | $ | 310,393,866 | |
Federal tax cost of other investments | | | (32,568,174) | |
| | | | |
Total federal tax cost | | $ | 277,825,692 | |
| | | | |
Gross unrealized appreciation | | $ | 23,220,864 | |
Gross unrealized depreciation | | | (2,258,625) | |
| | | | |
Net unrealized appreciation | | $ | 20,962,239 | |
| | | | |
Trustees’ Compensation. The Board of Trustees has adopted a compensation deferral plan for independent trustees that enables trustees to elect to defer receipt of all or a portion of the annual compensation they are entitled to receive from the Fund. For purposes of determining the amount owed to the Trustee under the plan, deferred amounts are treated as though equal dollar amounts had been invested in shares of the Fund or in other Oppenheimer funds selected by the Trustee. The Fund purchases shares of the funds selected for deferral by the Trustee in amounts equal to his or her deemed investment, resulting in a Fund asset equal to the deferred compensation liability. Such assets are included as a component of “Other” within the asset section of the Statement of Assets and Liabilities. Deferral of trustees’ fees under the plan will not affect the net assets of the Fund, and will not materially affect the Fund’s assets, liabilities or net investment income per share. Amounts will be deferred until distributed in accordance with the compensation deferral plan.
Dividends and Distributions to Shareholders. Dividends and distributions to shareholders, which are determined in accordance with income tax regulations and may differ from U.S. generally accepted accounting principles, are recorded on the ex-dividend date. Income and capital gain distributions, if any, are declared and paid annually or at other times as deemed necessary by the Manager. The tax character of distributions is determined as of the Fund’s fiscal year end. Therefore, a portion of the Fund’s distributions made to shareholders prior to the Fund’s fiscal year end may ultimately be categorized as a tax return of capital.
22 OPPENHEIMER CAPITAL INCOME FUND/VA
| | |
| | |
| 1. Significant Accounting Policies (Continued) | | |
Investment Income. Dividend income is recorded on the ex-dividend date or upon ex-dividend notification in the case of certain foreign dividends where the ex-dividend date may have passed. Non-cash dividends included in dividend income, if any, are recorded at the fair market value of the securities received. Interest income is recognized on an accrual basis. Discount and premium, which are included in interest income on the Statement of Operations, are amortized or accreted daily.
Custodian Fees. “Custodian fees and expenses” in the Statement of Operations may include interest expense incurred by the Fund on any cash overdrafts of its custodian account during the period. Such cash overdrafts may result from the effects of failed trades in portfolio securities and from cash outflows resulting from unanticipated shareholder redemption activity. The Fund pays interest to its custodian on such cash overdrafts, to the extent they are not offset by positive cash balances maintained by the Fund, at a rate equal to the Federal Funds Rate plus 0.50%. The “Reduction to custodian expenses” line item, if applicable, represents earnings on cash balances maintained by the Fund during the period. Such interest expense and other custodian fees may be paid with these earnings.
Security Transactions. Security transactions are recorded on the trade date. Realized gains and losses on securities sold are determined on the basis of identified cost.
Indemnifications. The Fund’s organizational documents provide current and former trustees and officers with a limited indemnification against liabilities arising in connection with the performance of their duties to the Fund. In the normal course of business, the Fund may also enter into contracts that provide general indemnifications. The Fund’s maximum exposure under these arrangements is unknown as this would be dependent on future claims that may be made against the Fund. The risk of material loss from such claims is considered remote.
Other. The preparation of financial statements in conformity with accounting principles generally accepted in the United States of America requires management to make estimates and assumptions that affect the reported amounts of assets and liabilities and disclosure of contingent assets and liabilities at the date of the financial statements and the reported amounts of increases and decreases in net assets from operations during the reporting period. Actual results could differ from those estimates.
2. Securities Valuation
The Fund calculates the net asset value of its shares as of the close of the New York Stock Exchange (the “Exchange”), normally 4:00 P.M. Eastern time, on each day the Exchange is open for trading.
The Fund’s Board has adopted procedures for the valuation of the Fund’s securities and has delegated the day-to-day responsibility for valuation determinations under those procedures to the Manager. The Manager has established a Valuation Committee which is responsible for determining a “fair valuation” for any security for which market quotations are not “readily available.” The Valuation Committee’s fair valuation determinations are subject to review, approval and ratification by the Fund’s Board at its next regularly scheduled meeting covering the calendar quarter in which the fair valuation was determined.
Valuation Methods and Inputs
Securities are valued using unadjusted quoted market prices, when available, as supplied primarily by third party pricing services or dealers.
The following methodologies are used to determine the market value or the fair value of the types of securities described below:
Securities traded on a registered U.S. securities exchange (including exchange-traded derivatives other than futures and futures options) are valued based on the last sale price of the security reported on the principal exchange on which it is traded, prior to the time when the Fund’s assets are valued. In the absence of a sale, the security is valued at the last sale price on the prior trading day, if it is within the spread of the current day’s closing “bid” and “asked” prices, and if not, at the current day’s closing bid price. A security of a foreign issuer traded on a foreign exchange, but not listed on a registered U.S. securities exchange, is valued based on the last sale price on the principal exchange on which the security is traded, as identified by the third party pricing service used by the Manager, prior to the time when the Fund’s assets are valued. If the last sale price is unavailable, the security is valued at the most recent official closing price on the principal exchange on which it is traded. If the last sales price or official closing price for a foreign security is not available, the security is valued at the mean between the bid and asked price per the exchange or, if not available from the exchange, obtained from two dealers. If bid and asked prices are not available from either the exchange or two dealers, the security is valued by using one of the following methodologies (listed in order of priority): (1) using a bid from the exchange, (2) the mean between the bid and asked price as provided by a single dealer, or (3) a bid from a single dealer.
Shares of a registered investment company that are not traded on an exchange are valued at that investment company’s net asset value per share.
Corporate and government debt securities (of U.S. or foreign issuers) and municipal debt securities, event-linked bonds, loans, mortgage-backed securities, collateralized mortgage obligations, and asset-backed securities are valued at the mean between the “bid” and “asked” prices utilizing evaluated prices obtained from third party pricing services or broker-dealers who may use matrix pricing methods to determine the evaluated prices.
Short-term money market type debt securities with a remaining maturity of sixty days or less are valued at cost adjusted by the amortization of discount or premium to maturity (amortized cost), which approximates market value. Short-term debt securities with a remaining maturity in excess of sixty days are valued at the mean between the “bid” and “asked” prices utilizing evaluated prices obtained from third party pricing services or broker-dealers.
23 OPPENHEIMER CAPITAL INCOME FUND/VA
| | |
| NOTES TO FINANCIAL STATEMENTS Unaudited / Continued | | |
| | |
| 2. Securities Valuation (Continued) | | |
Structured securities, swaps, swaptions, and other over-the-counter derivatives are valued utilizing evaluated prices obtained from third party pricing services or broker-dealers.
Futures contracts and futures options traded on a commodities or futures exchange will be valued at the final settlement price or official closing price on the principal exchange as reported by such principal exchange at its trading session ending at, or most recently prior to, the time when the Fund’s assets are valued.
A description of the standard inputs that may generally be considered by the third party pricing vendors in determining their evaluated prices is provided below.
| | | | |
| Security Type | | Standard inputs generally considered by third-party pricing vendors | | |
| | |
| Corporate debt, government debt, municipal, mortgage-backed and asset-backed securities | | Reported trade data, broker-dealer price quotations, benchmark yields, issuer spreads on comparable securities, the credit quality, yield, maturity, and other appropriate factors. | | |
| | |
Loans | | Information obtained from market participants regarding reported trade data and broker-dealer price quotations. | | |
| | |
Event-linked bonds | | Information obtained from market participants regarding reported trade data and broker-dealer price quotations. | | |
| | |
Structured securities | | Relevant market information such as the price of underlying financial instruments, stock market indices, foreign currencies, interest rate spreads, commodities, or the occurrence of other specific events. | | |
| | |
Swaps | | Relevant market information, including underlying reference assets such as credit spreads, credit event probabilities, index values, individual security values, forward interest rates, variable interest rates, volatility measures, and forward currency rates. | | |
If a market value or price cannot be determined for a security using the methodologies described above, or if, in the “good faith” opinion of the Manager, the market value or price obtained does not constitute a “readily available market quotation,” or a significant event has occurred that would materially affect the value of the security the security is fair valued either (i) by a standardized fair valuation methodology applicable to the security type or the significant event as previously approved by the Valuation Committee and the Fund’s Board or (ii) as determined in good faith by the Manager’s Valuation Committee. The Valuation Committee considers all relevant facts that are reasonably available, through either public information or information available to the Manager, when determining the fair value of a security. Fair value determinations by the Manager are subject to review, approval and ratification by the Fund’s Board at its next regularly scheduled meeting covering the calendar quarter in which the fair valuation was determined. Those fair valuation standardized methodologies include, but are not limited to, valuing securities at the last sale price or initially at cost and subsequently adjusting the value based on: changes in company specific fundamentals, changes in an appropriate securities index, or changes in the value of similar securities which may be further adjusted for any discounts related to security-specific resale restrictions. When possible, such methodologies use observable market inputs such as unadjusted quoted prices of similar securities, observable interest rates, currency rates and yield curves. The methodologies used for valuing securities are not necessarily an indication of the risks associated with investing in those securities nor can it be assured that the Fund can obtain the fair value assigned to a security if it were to sell the security.
To assess the continuing appropriateness of security valuations, the Manager, or its third party service provider who is subject to oversight by the Manager, regularly compares prior day prices, prices on comparable securities, and sale prices to the current day prices and challenges those prices exceeding certain tolerance levels with the third party pricing service or broker source. For those securities valued by fair valuations, whether through a standardized fair valuation methodology or a fair valuation determination, the Valuation Committee reviews and affirms the reasonableness of the valuations based on such methodologies and fair valuation determinations on a regular basis after considering all relevant information that is reasonably available.
Classifications
Each investment asset or liability of the Fund is assigned a level at measurement date based on the significance and source of the inputs to its valuation. Various data inputs are used in determining the value of each of the Fund’s investments as of the reporting period end. These data inputs are categorized in the following hierarchy under applicable financial accounting standards:
1) Level 1-unadjusted quoted prices in active markets for identical assets or liabilities (including securities actively traded on a securities exchange)
2) Level 2-inputs other than unadjusted quoted prices that are observable for the asset or liability (such as unadjusted quoted prices for similar assets and market corroborated inputs such as interest rates, prepayment speeds, credit risks, etc.)
3) Level 3-significant unobservable inputs (including the Manager’s own judgments about assumptions that market participants would use in pricing the asset or liability).
The inputs used for valuing securities are not necessarily an indication of the risks associated with investing in those securities.
24 OPPENHEIMER CAPITAL INCOME FUND/VA
| | |
| | |
| 2. Securities Valuation (Continued) | | |
The table below categorizes amounts that are included in the Fund’s Statement of Assets and Liabilities as of June 30, 2014 based on valuation input level:
| | | | | | | | | | | | | | | | |
| | | Level 1—
Unadjusted
Quoted Prices | | | Level 2— Other Significant
Observable Inputs | | | Level 3—
Significant
Unobservable
Inputs | | | Value | |
| |
Assets Table | | | | | | | | | | | | | | | | |
Investments, at Value: | | | | | | | | | | | | | | | | |
Common Stocks | | | | | | | | | | | | | | | | |
Consumer Discretionary | | $ | 12,930,138 | | | $ | — | | | $ | — | | | $ | 12,930,138 | |
Consumer Staples | | | 5,161,312 | | | | 1,066,172 | | | | — | | | | 6,227,484 | |
Energy | | | 9,469,155 | | | | — | | | | — | | | | 9,469,155 | |
Financials | | | 16,324,740 | | | | — | | | | — | | | | 16,324,740 | |
Health Care | | | 13,457,068 | | | | — | | | | — | | | | 13,457,068 | |
Industrials | | | 10,605,824 | | | | — | | | | — | | | | 10,605,824 | |
Information Technology | | | 16,646,425 | | | | — | | | | — | | | | 16,646,425 | |
Materials | | | 3,498,093 | | | | — | | | | — | | | | 3,498,093 | |
Telecommunication Services | | | 1,541,320 | | | | — | | | | — | | | | 1,541,320 | |
Utilities | | | 2,157,062 | | | | — | | | | — | | | | 2,157,062 | |
Preferred Stock | | | — | | | | 1,000,581 | | | | — | | | | 1,000,581 | |
Asset-Backed Securities | | | — | | | | 32,827,395 | | | | — | | | | 32,827,395 | |
Mortgage-Backed Obligations | | | — | | | | 97,434,957 | | | | — | | | | 97,434,957 | |
U.S. Government Obligations | | | — | | | | 10,674,499 | | | | — | | | | 10,674,499 | |
Non-Convertible Corporate Bonds and Notes | | | — | | | | 84,395,384 | | | | — | | | | 84,395,384 | |
Investment Company | | | 11,967,607 | | | | — | | | | — | | | | 11,967,607 | |
Over-the-Counter Credit Default Swaptions Purchased | | | — | | | | 40,724 | | | | — | | | | 40,724 | |
| | | | |
Total Investments, at Value | | | 103,758,744 | | | | 227,439,712 | | | | — | | | | 331,198,456 | |
Other Financial Instruments: | | | | | | | | | | | | | | | | |
Futures contracts | | | 159,061 | | | | — | | | | — | | | | 159,061 | |
| | | | |
Total Assets | | $ | 103,917,805 | | | $ | 227,439,712 | | | $ | — | | | $ | 331,357,517 | |
| | | | |
| | | | |
Liabilities Table | | | | | | | | | | | | | | | | |
Other Financial Instruments: | | | | | | | | | | | | | | | | |
Futures contracts | | $ | (1,412) | | | $ | — | | | $ | — | | | $ | (1,412) | |
| | | | |
Total Liabilities | | $ | (1,412) | | | $ | — | | | $ | — | | | $ | (1,412) | |
| | | | |
Foreign currency exchange contracts and futures contracts, if any, are reported at their unrealized appreciation/depreciation at measurement date, which represents the change in the contract’s value from trade date. All additional assets and liabilities included in the above table are reported at their market value at measurement date.
3. Shares of Beneficial Interest
The Fund has authorized an unlimited number of $0.001 par value shares of beneficial interest of each class. Transactions in shares of beneficial interest were as follows:
| | | | | | | | | | | | | | | | |
| | | Six Months Ended June 30, 2014 | | | Year Ended December 31, 2013 | |
| | | Shares | | | Amount | | | Shares | | | Amount | |
| |
Non-Service Shares | | | | | | | | | | | | | | | | |
Sold | | | 103,176 | | | $ | 1,454,461 | | | | 172,668 | | | $ | 2,290,240 | |
Dividends and/or distributions reinvested | | | 300,916 | | | | 4,273,014 | | | | 387,201 | | | | 5,107,178 | |
Redeemed | | | (1,121,736 | ) | | | (15,841,019 | ) | | | (2,531,989 | ) | | | (33,599,185) | |
| | | | |
Net decrease | | | (717,644 | ) | | $ | (10,113,544 | ) | | | (1,972,120 | ) | | $ | (26,201,767) | |
| | | | |
| | | | | | | | | | | | | | | | |
| |
Service Shares | | | | | | | | | | | | | | | | |
Sold | | | 99,130 | | | $ | 1,381,972 | | | | 183,862 | | | $ | 2,416,107 | |
Dividends and/or distributions reinvested | | | 83,586 | | | | 1,173,552 | | | | 118,848 | | | | 1,549,784 | |
Redeemed | | | (649,813 | ) | | | (9,044,442 | ) | | | (1,100,257 | ) | | | (14,476,777) | |
| | | | |
Net decrease | | | (467,097 | ) | | $ | (6,488,918 | ) | | | (797,547 | ) | | $ | (10,510,886) | |
| | | | |
4. Purchases and Sales of Securities
The aggregate cost of purchases and proceeds from sales of securities, other than short-term obligations and investments in IMMF, for the six months ended June 30, 2014 were as follows:
| | | | | | | | | | | | |
| | | Purchases | | | | | | | Sales | |
| |
Investment securities | | $ | 117,443,193 | | | | | | | $ | 107,377,539 | |
U.S. government and government agency obligations | | | 40,850,610 | | | | | | | | 31,154,754 | |
To Be Announced (TBA) mortgage-related securities | | | 337,475,550 | | | | | | | | 322,331,170 | |
25 OPPENHEIMER CAPITAL INCOME FUND/VA
| | |
| NOTES TO FINANCIAL STATEMENTS Unaudited / Continued | | |
| | |
5. Fees and Other Transactions with Affiliates
Management Fees. Under the investment advisory agreement, the Fund pays the Manager a management fee based on the daily net assets of the Fund at an annual rate as shown in the following table:
| | | | |
| Fee Schedule | | | |
| |
Up to $200 million | | | 0.75% | |
Next $200 million | | | 0.72 | |
Next $200 million | | | 0.69 | |
Next $200 million | | | 0.66 | |
Over $800 million | | | 0.60 | |
Sub-Adviser Fees. The Manager has retained the Sub-Adviser to provide the day-to-day portfolio management of the Fund. Under the Sub-Advisory Agreement, the Manager pays the Sub-Adviser an annual fee in monthly installments, equal to a percentage of the investment management fee collected by the Manager from the Fund, which shall be calculated after any investment management fee waivers. The fee paid to the Sub-Adviser is paid by the Manager, not by the Fund.
Transfer Agent Fees. OFI Global (the “Transfer Agent”) serves as the transfer and shareholder servicing agent for the Fund. The Fund pays the Transfer Agent a fee based on annual net assets. Fees incurred and average net assets for each class with respect to these services are detailed in the Statement of Operations and Financial Highlights, respectively.
Sub-Transfer Agent Fees. The Transfer Agent has retained Shareholder Services, Inc., a wholly-owned subsidiary of OFI (the “Sub-Transfer Agent”), to provide the day-to-day transfer agent and shareholder servicing of the Fund. Under the Sub-Transfer Agency Agreement, the Transfer Agent pays the Sub-Transfer Agent an annual fee in monthly installments, equal to a percentage of the transfer agent fee collected by the Transfer Agent from the Fund, which shall be calculated after any applicable fee waivers. The fee paid to the Sub-Transfer Agent is paid by the Transfer Agent, not by the Fund.
Distribution and Service Plan for Service Shares. The Fund has adopted a Distribution and Service Plan (the “Plan”) in accordance with Rule 12b-1 under the Investment Company Act of 1940 for Service shares to pay OppenheimerFunds Distributor, Inc. (the “Distributor”), for distribution related services, personal service and account maintenance for the Fund’s Service shares. Under the Plan, payments are made periodically at an annual rate of 0.25% of the daily net assets of Service shares of the Fund. The Distributor currently uses all of those fees to compensate sponsors of the insurance product that offers Fund shares, for providing personal service and maintenance of accounts of their variable contract owners that hold Service shares. These fees are paid out of the Fund’s assets on an on-going basis and increase operating expenses of the Service shares, which results in lower performance compared to the Fund’s shares that are not subject to a service fee. Fees incurred by the Fund under the Plan are detailed in the Statement of Operations.
Waivers and Reimbursements of Expenses. The Manager has contractually agreed to limit the Fund’s expenses after payments, waivers and/or reimbursements and reduction to custodian expenses, excluding expenses incurred directly or indirectly by the Fund as a result of investments in other investment companies, wholly-owned subsidiaries and pooled investment vehicles; so that those expenses, as percentages of daily net assets, will not exceed the annual rate of 0.67% for Non-Service shares and 0.92% for Service shares. During the six months ended June 30, 2014, the Manager waived fees and/or reimbursed the Fund $224,240 and $70,880 for Non-Service and Service shares, respectively.
The Manager will waive fees and/or reimburse Fund expenses in an amount equal to the indirect management fees incurred through the Fund’s investment in IMMF. During the six months ended June 30, 2014, the Manager waived fees and/or reimbursed the Fund $10,193 for IMMF management fees.
Some of these undertakings may be modified or terminated at any time; some may not be modified or terminated until after one year from the date of the current prospectus, as indicated therein.
6. Risk Exposures and the Use of Derivative Instruments
The Fund’s investment objective not only permits the Fund to purchase investment securities, it also allows the Fund to enter into various types of derivatives contracts, including, but not limited to, futures contracts, forward currency exchange contracts, credit default swaps, interest rate swaps, total return swaps, variance swaps and purchased and written options. In doing so, the Fund will employ strategies in differing combinations to permit it to increase, decrease, or change the level or types of exposure to market risk factors. These instruments may allow the Fund to pursue its objectives more quickly and efficiently than if it were to make direct purchases or sales of securities capable of effecting a similar response to market factors. Such contracts may be entered into through a bilateral over-the-counter (“OTC”) transaction, or through a securities or futures exchange and cleared through a clearinghouse.
Market Risk Factors. In accordance with its investment objectives, the Fund may use derivatives to increase or decrease its exposure to one or more of the following market risk factors:
Commodity Risk. Commodity risk relates to the change in value of commodities or commodity indexes as they relate to increases or decreases in the commodities market. Commodities are physical assets that have tangible properties. Examples of these types of assets are crude oil, heating oil, metals, livestock, and agricultural products.
26 OPPENHEIMER CAPITAL INCOME FUND/VA
6. Risk Exposures and the Use of Derivative Instruments (Continued)
Credit Risk. Credit risk relates to the ability of the issuer to meet interest and principal payments, or both, as they come due. In general, lower-grade, higher-yield bonds are subject to credit risk to a greater extent than lower-yield, higher-quality bonds.
Equity Risk. Equity risk relates to the change in value of equity securities as they relate to increases or decreases in the general market.
Foreign Exchange Rate Risk. Foreign exchange rate risk relates to the change in the U.S. dollar value of a security held that is denominated in a foreign currency. The U.S. dollar value of a foreign currency denominated security will decrease as the dollar appreciates against the currency, while the U.S. dollar value will increase as the dollar depreciates against the currency.
Interest Rate Risk. Interest rate risk refers to the fluctuations in value of fixed-income securities resulting from the inverse relationship between price and yield. For example, an increase in general interest rates will tend to reduce the market value of already issued fixed-income investments, and a decline in general interest rates will tend to increase their value. In addition, debt securities with longer maturities, which tend to have higher yields, are subject to potentially greater fluctuations in value from changes in interest rates than obligations with shorter maturities.
Volatility Risk. Volatility risk refers to the magnitude of the movement, but not the direction of the movement, in a financial instrument’s price over a defined time period. Large increases or decreases in a financial instrument’s price over a relative time period typically indicate greater volatility risk, while small increases or decreases in its price typically indicate lower volatility risk.
Derivatives may have little or no initial cash investment relative to their market value exposure and therefore can produce significant gains or losses in excess of their cost due to unanticipated changes in the market risk factors and the overall market. This use of embedded leverage allows the Fund to increase its market value exposure relative to its net assets and can substantially increase the volatility of the Fund’s performance. In instances where the Fund is using derivatives to decrease, or hedge, exposures to market risk factors for securities held by the Fund, there are also risks that those derivatives may not perform as expected resulting in losses for the combined or hedged positions. Some derivatives have the potential for unlimited loss, regardless of the size of the Fund’s initial investment.
Additional associated risks from investing in derivatives also exist and potentially could have significant effects on the valuation of the derivative and the Fund. Typically, the associated risks are not the risks that the Fund is attempting to increase or decrease exposure to, per its investment objectives, but are the additional risks from investing in derivatives. Examples of these associated risks are liquidity risk, which is the risk that the Fund will not be able to sell the derivative in the open market in a timely manner, and counterparty credit risk, which is the risk that the counterparty will not fulfill its obligation to the Fund.
The Fund’s actual exposures to these market risk factors and associated risks during the period are discussed in further detail, by derivative type, below.
Futures Contracts
A futures contract is a commitment to buy or sell a specific amount of a commodity, financial instrument or currency at a negotiated price on a stipulated future date. The Fund may buy and sell futures contracts and may also buy or write put or call options on these futures contracts. Futures contracts and options thereon are generally entered into on a regulated futures exchange and cleared through a clearinghouse associated with the exchange.
Upon entering into a futures contract, the Fund is required to deposit either cash or securities (initial margin) in an amount equal to a certain percentage of the contract value in an account registered in the futures commission merchant’s name. Subsequent payments (variation margin) are paid to or from the futures commission merchant each day equal to the daily changes in the contract value. Such payments are recorded as unrealized gains and losses. Should the Fund fail to make requested variation margin payments, the futures commission merchant can gain access to the initial margin to satisfy the Fund’s payment obligations.
Futures contracts are reported on a schedule following the Statement of Investments. Securities held by a futures commission merchant to cover initial margin requirements on open futures contracts are noted in the Statement of Investments. Cash held by a futures commission merchant to cover initial margin requirements on open futures contracts and the receivable and/or payable for the daily mark to market for the variation margin are noted in the Statement of Assets and Liabilities. The net change in unrealized appreciation and depreciation is reported in the Statement of Operations. Realized gains (losses) are reported in the Statement of Operations at the closing or expiration of futures contracts.
The Fund has purchased futures contracts on various bonds and notes to increase exposure to interest rate risk.
The Fund has sold futures contracts on various bonds and notes to decrease exposure to interest rate risk.
During the six months ended June 30, 2014, the Fund had an ending monthly average market value of $14,615,379 and $24,311,532 on futures contracts purchased and sold, respectively.
Additional associated risks of entering into futures contracts (and related options) include the possibility that there may be an illiquid market where the Fund is unable to liquidate the contract or enter into an offsetting position and, if used for hedging purposes, the risk that the price of the contract will correlate imperfectly with the prices of the Fund’s securities.
Swaption Transactions
The Fund may enter into a swaption contract which grants the purchaser the right, but not the obligation, to enter into a swap transaction at preset terms detailed in the underlying agreement within a specified period of time. The purchaser pays a premium to the swaption writer who bears the risk of unfavorable changes in the preset terms on the underlying swap.
Purchased swaptions are reported as a component of investments in the Statement of Investments and the Statement of Assets and Liabilities. Written swaptions are reported on a schedule following the Statement of Investments and their value is reported as a separate asset or liability line item in the Statement of Assets and Liabilities. The net change in unrealized appreciation or depreciation on written swaptions is separately reported in the Statement of Operations. When a swaption is exercised, the cost of the swap is adjusted by the amount of premium paid or received. Upon the expiration or closing of an unexercised swaption contract, a gain or loss is reported in the Statement of Operations for the amount of the premium paid or received.
27 OPPENHEIMER CAPITAL INCOME FUND/VA
| | |
| NOTES TO FINANCIAL STATEMENTS Unaudited / Continued | | |
| | |
| 6. Risk Exposures and the Use of Derivative Instruments (Continued) | | |
The Fund generally will incur a greater risk when it writes a swaption than when it purchases a swaption. When the Fund writes a swaption it will become obligated, upon exercise of the swaption, according to the terms of the underlying agreement. Swaption contracts written by the Fund do not give rise to counterparty credit risk prior to exercise as they obligate the Fund, not its counterparty, to perform. When the Fund purchases a swaption it only risks losing the amount of the premium it paid if the swaption expires unexercised. However, when the Fund exercises a purchased swaption there is a risk that the counterparty will fail to perform or otherwise default on its obligations under the swaption contract.
The Fund has purchased swaptions which gives it the option to buy credit protection through credit default swaps in order to decrease exposure to the credit risk of individual issuers and/or indexes of issuers. A purchased swaption of this type becomes more valuable as the likelihood of a credit event on the reference asset increases.
During the six months ended June 30, 2014, the Fund had an ending monthly average market value of $10,818 on purchased swaptions.
Counterparty Credit Risk. Derivative positions are subject to the risk that the counterparty will not fulfill its obligation to the Fund. The Fund intends to enter into derivative transactions with counterparties that the Manager believes to be creditworthy at the time of the transaction.
The Fund’s risk of loss from counterparty credit risk on OTC derivatives is generally limited to the aggregate unrealized gain netted against any collateral held by the Fund. For OTC options purchased, the Fund bears the risk of loss of the amount of the premiums paid plus the positive change in market values net of any collateral held by the Fund should the counterparty fail to perform under the contracts. Options written by the Fund do not typically give rise to counterparty credit risk, as options written generally obligate the Fund and not the counterparty to perform.
To reduce counterparty risk with respect to OTC transactions, the Fund has entered into master netting arrangements, established within the Fund’s International Swap and Derivatives Association, Inc. (“ISDA”) master agreements, which allow the Fund to make (or to have an entitlement to receive) a single net payment in the event of default (close-out netting) for outstanding payables and receivables with respect to certain OTC positions in swaps, options, swaptions, and forward currency exchange contracts for each individual counterparty. In addition, the Fund may require that certain counterparties post cash and/or securities in collateral accounts to cover their net payment obligations for those derivative contracts subject to ISDA master agreements. If the counterparty fails to perform under these contracts and agreements, the cash and/or securities will be made available to the Fund.
ISDA master agreements include credit related contingent features which allow counterparties to OTC derivatives to terminate derivative contracts prior to maturity in the event that, for example, the Fund’s net assets decline by a stated percentage or the Fund fails to meet the terms of its ISDA master agreements, which would cause the Fund to accelerate payment of any net liability owed to the counterparty.
For financial reporting purposes, the Fund does not offset derivative assets and derivative liabilities that are subject to netting arrangements in the Statement of Assets and Liabilities. Bankruptcy or insolvency laws of a particular jurisdiction may impose restrictions on or prohibitions against the right of offset in bankruptcy, insolvency or other events.
The Fund’s risk of loss from counterparty credit risk on exchange-traded derivatives cleared through a clearinghouse and for centrally cleared swaps is generally considered lower than as compared to OTC derivatives. However, counterparty credit risk exists with respect to initial and variation margin deposited/paid by the Fund that is held in futures commission merchant, broker and/or clearinghouse accounts for such exchange-traded derivatives and for centrally cleared swaps.
With respect to centrally cleared swaps, such transactions will be submitted for clearing, and if cleared, will be held in accounts at futures commission merchants or brokers that are members of clearinghouses. While brokers, futures commission merchants and clearinghouses are required to segregate customer margin from their own assets, in the event that a broker, futures commission merchant or clearinghouse becomes insolvent or goes into bankruptcy and at that time there is a shortfall in the aggregate amount of margin held by the broker, futures commission merchant or clearinghouse for all its customers, U.S. bankruptcy laws will typically allocate that shortfall on a pro-rata basis across all the broker’s, futures commission merchant’s or clearinghouse’s customers, potentially resulting in losses to the Fund.
There is the risk that a broker, futures commission merchant or clearinghouse will decline to clear a transaction on the Fund’s behalf, and the Fund may be required to pay a termination fee to the executing broker with whom the Fund initially enters into the transaction. Clearinghouses may also be permitted to terminate centrally cleared swaps at any time. The Fund is also subject to the risk that the broker or futures commission merchant will improperly use the Fund’s assets deposited/paid as initial or variation margin to satisfy payment obligations of another customer. In the event of a default by another customer of the broker or futures commission merchant, the Fund might not receive its variation margin payments from the clearinghouse, due to the manner in which variation margin payments are aggregated for all customers of the broker/futures commission merchant.
Collateral and margin requirements differ by type of derivative. Margin requirements are established by the broker, futures commission merchant or clearinghouse for exchange-traded and cleared derivatives, including centrally cleared swaps. Brokers, futures commission merchants and clearinghouses can ask for margin in excess of the regulatory minimum, or increase the margin amount, in certain circumstances.
Collateral terms are contract specific for OTC derivatives. For derivatives traded under an ISDA master agreement, the collateral requirements are typically calculated by netting the mark to market amount for each transaction under such agreement and comparing that amount to the value of any collateral currently pledged by the Fund or the counterparty.
For financial reporting purposes, cash collateral that has been pledged to cover obligations of the Fund, if any, is reported separately on the Statement of Assets and Liabilities as cash pledged as collateral. Non-cash collateral pledged by the Fund, if any, is noted in the Statement of Investments.
28 OPPENHEIMER CAPITAL INCOME FUND/VA
6. Risk Exposures and the Use of Derivative Instruments (Continued)
Generally, the amount of collateral due from or to a party must exceed a minimum transfer amount threshold (e.g. $250,000) before a transfer has to be made. To the extent amounts due to the Fund from its counterparties are not fully collateralized, contractually or otherwise, the Fund bears the risk of loss from counterparty nonperformance.
The following table presents by counterparty the Fund’s OTC derivative assets net of the related collateral pledged by the Fund at June 30, 2014
| | | | | | | | | | | | | | | | | | | | |
| | | | | | Gross Amounts Not Offset in the Statement of Assets & Liabilities | | | | |
| Counterparty | | Gross Amount of Assets
in the Statement of
Assets & Liabilities* | | | Financial Instruments
Available for Offset | | | Financial Instruments
Collateral Received** | | | Cash Collateral
Received** | | | Net Amount | |
| |
Deutsche Bank Securities, Inc. | | $ | 10,018 | | | $ | — | | | $ | — | | | $ | — | | | $ | 10,018 | |
JPMorgan Chase Bank NA | | | 30,706 | | | | — | | | | — | | | | — | | | | 30,706 | |
| | | | |
| | $ | 40,724 | | | $ | — | | | $ | — | | | $ | — | | | $ | 40,724 | |
| | | | |
* OTC derivatives are reported gross on the Statement of Assets and Liabilities. Exchange traded options and margin related to cleared swaps and futures are excluded from these reported amounts.
** Reported collateral posted for the benefit of the Fund within this table is limited to the net outstanding amount due from an individual counterparty. The collateral posted for the benefit of the Fund may exceed these amounts.
The following table presents the valuations of derivative instruments by risk exposure as reported within the Statement of Assets and Liabilities as of June 30, 2014:
| | | | | | | | | | | | |
| | | Asset Derivatives | | | Liability Derivatives | |
Derivatives Not Accounted for as Hedging Instruments | | Statement of Assets and Liabilities Location | | Value | | | Statement of Assets and Liabilities Location | | Value | |
| |
Interest rate contracts | | Variation margin receivable | | $ | 35,098 * | | | Variation margin payable | | $ | 8,470 * | |
Credit contracts | | Investments, at value | | | 40,724 ** | | | | | | | |
| | | | | | | | | | | | |
Total | | | | $ | 75,822 | | | | | $ | 8,470 | |
| | | | | | | | | | | | |
*Includes only the current day’s variation margin. Prior variation margin movements have been reflected in cash on the Statement of Assets and Liabilities upon receipt or payment.
**Amounts relate to purchased option contracts and purchased swaption contracts, if any.
The effect of derivative instruments on the Statement of Operations is as follows:
| | | | | | | | | | | | |
| Amount of Realized Gain or (Loss) Recognized on Derivatives | |
| |
Derivatives Not Accounted for as Hedging Instruments | | | | | | | | Closing and expiration of
Futures contracts | |
| |
Interest rate contracts | | | | | | | | | | | $868,918 | |
|
| Amount of Change in Unrealized Gain or (Loss) Recognized on Derivatives | |
| |
Derivatives Not Accounted for as Hedging Instruments | | Investments* | | | Futures contracts | | | Total | |
| |
Credit contracts | | | $ (50,345) | | | | $ — | | | $ | (50,345) | |
Interest rate contracts | | | — | | | | 213,080 | | | | 213,080 | |
| | | | |
Total | | | $ (50,345) | | | | $ 213,080 | | | $ | 162,735 | |
| | | | |
*Includes purchased option contracts and purchased swaption contracts, if any.
7. Restricted Security
As of June 30, 2014, investments in securities included issues that are restricted. A restricted security may have a contractual restriction on its resale and is valued under methods approved by the Board of Trustees as reflecting fair value. Securities that are restricted are marked with an applicable footnote on the Statement of Investments. Restricted securities are reported on a schedule following the Statement of Investments.
8. Pending Litigation
In 2009, seven class action lawsuits were filed in the U.S. District Court for the District of Colorado against OppenheimerFunds, Inc. (“OFI”), OppenheimerFunds Distributor, Inc., the Fund’s principal underwriter and distributor (the “Distributor”), and certain funds (but not including the Fund) advised by OFI Global Asset Management, Inc. and distributed by the Distributor (the “Defendant Funds”). The lawsuits also named as defendants certain officers and current and former trustees of the respective Defendant Funds. The lawsuits raised claims under federal securities law and alleged, among other things, that the disclosure documents of the respective Defendant Funds contained misrepresentations and omissions and that the respective Defendant Funds’ investment policies were not followed. The plaintiffs in these actions sought unspecified damages, equitable relief and awards of attorneys’ fees and litigation expenses. The Defendant Funds’ Boards of Trustees also engaged counsel to represent the Funds and the present and former Independent Trustees named in those suits. On March 5, 2014, the parties in six of these lawsuits executed stipulations and agreements of settlement resolving those actions. On July 31, 2014, the court entered an order and final judgment approving the settlements as fair, reasonable and adequate. The settlements do not resolve a seventh outstanding lawsuit relating to Oppenheimer Rochester California Municipal Fund.
29 OPPENHEIMER CAPITAL INCOME FUND/VA
| | |
| NOTES TO FINANCIAL STATEMENTS Unaudited / Continued | | |
| | |
| 8. Pending Litigation (Continued) | | |
Other class action and individual lawsuits have been filed since 2008 in various state and federal courts against OFI and certain of its affiliates by investors seeking to recover investments they allegedly lost as a result of the “Ponzi” scheme run by Bernard L. Madoff and his firm, Bernard L. Madoff Investment Securities, LLC (“BLMIS”). Plaintiffs in these suits allege that they suffered losses as a result of their investments in several funds managed by an affiliate of OFI and assert a variety of claims, including breach of fiduciary duty, fraud, negligent misrepresentation, unjust enrichment, and violation of federal and state securities laws and regulations, among others. They seek unspecified damages, equitable relief and awards of attorneys’ fees and litigation expenses. Neither the Distributor, nor any of the Oppenheimer mutual funds, their independent trustees or directors are named as defendants in these lawsuits. None of the Oppenheimer mutual funds invested in any funds or accounts managed by Madoff or BLMIS. On February 28, 2011, a stipulation of partial settlement of three groups of consolidated putative class action lawsuits relating to these matters was filed in the U.S. District Court for the Southern District of New York. On August 19, 2011, the court entered an order and final judgment approving the settlement as fair, reasonable and adequate. In September 2011, certain parties filed notices of appeal from the court’s order approving the settlement. In June 2014, the appellate court affirmed the lower court’s order approving the settlement. Certain parties subsequently filed a petition for certiorari before the U.S. Supreme Court further challenging the settlement approval order. The settlement does not resolve other outstanding lawsuits against OFI and its affiliates relating to BLMIS.
OFI believes the lawsuits and appeals described above are without legal merit and, with the exception of actions it has settled, is defending against them vigorously. While it is premature to render any opinion as to the outcome in these lawsuits, or whether any costs that the Defendant Funds may bear in defending the suits might not be reimbursed by insurance, OFI believes that these suits should not impair the ability of OFI or the Distributor to perform their respective duties to the Fund, and that the outcome of all of the suits together should not have any material effect on the operations of any of the Oppenheimer mutual funds.
30 OPPENHEIMER CAPITAL INCOME FUND/VA
PORTFOLIO PROXY VOTING POLICIES AND PROCEDURES;
UPDATES TO STATEMENTS OF INVESTMENTS Unaudited
The Fund has adopted Portfolio Proxy Voting Policies and Procedures under which the Fund votes proxies relating to securities (“portfolio proxies”) held by the Fund. A description of the Fund’s Portfolio Proxy Voting Policies and Procedures is available (i) without charge, upon request, by calling the Fund toll-free at 1.800.525.7048, (ii) on the Fund’s website at oppenheimerfunds.com, and (iii) on the SEC’s website at www.sec.gov. In addition, the Fund is required to file Form N-PX, with its complete proxy voting record for the 12 months ended June 30th, no later than August 31st of each year. The Fund’s voting record is available (i) without charge, upon request, by calling the Fund toll-free at 1.800.525.7048, and (ii) in the Form N-PX filing on the SEC’s website at www.sec.gov.
The Fund files its complete schedule of portfolio holdings with the SEC for the first quarter and the third quarter of each fiscal year on Form N-Q. The Fund’s Form N-Q filings are available on the SEC’s website at www.sec.gov. Those forms may be reviewed and copied at the SEC’s Public Reference Room in Washington, D.C. Information on the operation of the Public Reference Room may be obtained by calling 1-800-SEC-0330.
31 OPPENHEIMER CAPITAL INCOME FUND/VA
OPPENHEIMER CAPITAL INCOME FUND/VA
A Series of Oppenheimer Variable Account Funds
| | |
| Trustees and Officers | | Sam Freedman, Chairman of the Board of Trustees and Trustee |
| | Edward L. Cameron, Trustee |
| | Jon S. Fossel, Trustee |
| | Richard F. Grabish, Trustee |
| | Beverly L. Hamilton, Trustee |
| | Victoria J. Herget, Trustee |
| | Robert J. Malone, Trustee |
| | F. William Marshall, Jr., Trustee |
| | Karen L. Stuckey, Trustee |
| | James D. Vaughn, Trustee |
| | William F. Glavin, Jr., Trustee, President and Principal Executive Officer |
| | Magnus Krantz, Vice President |
| | Krishna Memani, Vice President |
| | Arthur S. Gabinet, Secretary and Chief Legal Officer |
| | Christina M. Nasta, Vice President and Chief Business Officer |
| | Mary Ann Picciotto, Chief Compliance Officer and Chief Anti-Money Laundering Officer |
| | Brian W. Wixted, Treasurer and Principal Financial & Accounting Officer |
| |
| Manager | | OFI Global Asset Management, Inc. |
| |
| Sub-Adviser | | OppenheimerFunds, Inc. |
| |
| Distributor | | OppenheimerFunds Distributor, Inc. |
| |
Transfer and Shareholder Servicing Agent | | OFI Global Asset Management, Inc. |
| |
| Sub-Transfer Agent | | Shareholder Services, Inc. |
| | DBA OppenheimerFunds Services |
| |
| Independent | | KPMG LLP |
| Registered Public | | |
| Accounting Firm | | |
| |
| Counsel | | K&L Gates LLP |
| |
| | Before investing in any of the Oppenheimer funds, investors should carefully consider a fund’s investment objectives, risks, charges and expenses. Fund prospectuses and summary prospectuses contain this and other information about the funds, and may be obtained by asking your financial advisor, visiting oppenheimerfunds.com or calling us at 1.800.988.8287. Read prospectuses and summary prospectuses carefully before investing. |
| |
| | The financial statements included herein have been taken from the records of the Fund without examination of those records by the independent registered public accounting firm. |
| |
| | © 2014 OppenheimerFunds, Inc. All rights reserved. Oppenheimer funds are distributed by OppenheimerFunds Distributor, Inc. |

Portfolio Manager: Michael Kotlarz
Cumulative Total Returns
For the 6-Month Period Ended 6/30/14
| | | | |
Non-Service Shares | | | 6.41 | % |
Service Shares | | | 6.28 | % |
Average Annual Total Returns
For the Periods Ended 6/30/14
| | | | | | | | | | | | |
| | | 1-Year | | | 5-Year | | | 10-Year | |
Non-Service Shares | | | 27.01 | % | | | 15.88 | % | | | 6.14% | |
Service Shares | | | 26.69 | % | | | 15.59 | % | | | 5.87% | |
Performance data quoted represents past performance, which does not guarantee future results. The investment return and principal value of an investment in the Fund will fluctuate so that an investor’s shares, when redeemed, may be worth more or less than their original cost. Current performance may be lower or higher than the performance quoted. For performance data current to the most recent month end, call us at 1.800.988.8287. The Fund’s total returns should not be expected to be the same as the returns of other funds, whether or not both funds have the same portfolio managers and/or similar names. The Fund’s total returns include changes in share price and reinvested distributions but do not include the charges associated with the separate account products that offer this Fund. Such performance would have been lower if such charges were taken into account.
TOP TEN COMMON STOCK HOLDINGS
| | | | | | |
Apple, Inc. | | | 6.6 | % | | |
Facebook, Inc., Cl. A | | | 4.5 | | | |
Biogen Idec, Inc. | | | 4.4 | | | |
Gilead Sciences, Inc. | | | 3.9 | | | |
Twenty-First Century Fox, Inc., Cl. B | | | 2.6 | | | |
Walt Disney Co. (The) | | | 2.5 | | | |
MasterCard, Inc., Cl. A | | | 2.4 | | | |
LinkedIn Corp., Cl. A | | | 2.2 | | | |
Celgene Corp. | | | 2.2 | | | |
CVS Caremark Corp. | | | 2.1 | | | |
Portfolio holdings and allocations are subject to change. Percentages are as of June 30, 2014, and are based on net assets. For more current Fund holdings, please visit oppenheimerfunds.com.
SECTOR ALLOCATION
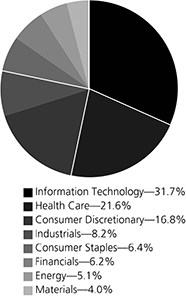
Portfolio holdings and allocations are subject to change. Percentages are as of June 30, 2014, and are based on the total market value of common stocks.
2 OPPENHEIMER CAPITAL APPRECIATION FUND/VA
Fund Performance Discussion
The Fund’s Non-Service shares produced a return of 6.41% during the reporting period, outperforming the Russell 1000 Growth Index (the “Index”), which returned 6.31%. The Fund’s outperformance relative to the Index stemmed primarily from stronger relative stock selection in the consumer discretionary and information technology sectors. Stock selection in health care was the largest detractor from a sector perspective, though our overweight to the sector was accretive to relative performance. The Fund underperformed the S&P 500 Index, which returned 7.14% this reporting period.
GLOBAL MARKET AND ECONOMIC ENVIRONMENT
Despite market volatility early in the reporting period and rising geopolitical risks in Ukraine and the Middle East, global equities generally rebounded and produced positive returns in the first half of 2014, thanks largely to a continued global economic recovery and stimulative monetary policies from central banks throughout the world. Markets were volatile to start the reporting period in January 2014 amid fears that political and economic instability in the world’s emerging markets might further dampen the U.S. economic recovery. However, equities rebounded later in the reporting period. Among the central bank measures that boosted the markets this reporting period, the European Central Bank (the “ECB”) announced numerous measures in June, including a benchmark interest rate cut, the introduction of a negative deposit rate to encourage banks to lend, among various other measures to flood the system with liquidity. Beyond that, the ECB said it would prepare to purchase packages of loans from banks to allow for increased lending. In June, the U.S. Federal Reserve (the “Fed”) also stated it would reduce the amount of monthly bond purchases by an additional $10 billion and reaffirmed its intention to keep short-term interest rates near zero. U.S. economic data released in April and May was positive, as the unemployment rate fell to 6.3%, the economy finally regained all of the jobs lost during the 2008 recession, and the U.S. stock market achieved record highs. Shortly after the reporting period ended, a positive June jobs report was released, in which the official unemployment rate fell to 6.1%, its lowest level since September 2008.
TOP INDIVIDUAL CONTRIBUTORS
During the reporting period, top contributors to performance included Apple, Inc., Facebook, Inc. and EOG Resources, Inc. Apple performed well during the second half of 2013 due to excitement surrounding the introduction of two new iPhones as well as the addition of China Mobile as a distribution partner. Apple also rallied strongly in April 2014 after iPhone sales came in higher than analysts anticipated and the company announced a 7-for-1 stock split and increased both its dividend and share repurchases. Facebook, the world’s number one social network, delivered strong evidence that it can thrive on smartphones and tablets, with increases in mobile advertising revenue. EOG Resources, the second-largest U.S. independent oil and natural gas producer by market value, reported a fourth-quarter profit and plans for a stock split as crude and liquids output increased strongly. By focusing on increasing the flow from every well, EOG raised estimates for how much oil and gas it can recover from its flagship Eagle Ford development in South Texas during the reporting period.
TOP INDIVIDUAL DETRACTORS
Top detractors from performance this reporting period included LinkedIn Corp., Amazon.com, Inc. and MasterCard, Inc. LinkedIn, the largest professional networking website, finished 2013 with a strong showing, but the online professional networking service rattled already jittery investors by indicating its performance will weaken in 2014 as management ramps up spending while revenue growth slows. Online retailer Amazon.com experienced declines this reporting period as increased spending limited profit growth. MasterCard, the second largest U.S. payments network, reported profit that missed analyst estimates as rebates to card issuers fueled a jump in expenses.
STRATEGY & OUTLOOK
The Fund continues to seek to invest in high quality growth stocks. We combine strategic top-down sector analysis with bottom up fundamental research, focusing on high quality companies with historically consistent growth and capital discipline.
The U.S. economy remains resilient with stable to improving economic fundamentals despite headwinds from difficult winter weather and an uptick in geopolitical posturing. Though the pace of economic expansion remains muted, the global economy appears to be on stable ground, and underpins the Fed’s decision to continue the reduction of its accommodative policies. We remain confident that the U.S. economy retains many of its attractive competitive advantages including high productivity and cost-effective infrastructure. In addition, we are seeing further evidence of a more synchronized global rebound as evidenced by stability in Europe and receding fears of a hard landing in China. We are watching carefully for signs that the opportunity for growth is broadening across industries and geographies worldwide. The current political turmoil in Ukraine and the Middle East has added some uncertainty, but the financial markets have remained resilient. We believe that companies with capital discipline, strong management and sustainable competitive advantages have the greatest prospects to succeed.
3 OPPENHEIMER CAPITAL APPRECIATION FUND/VA
The Fund’s investment strategy and focus can change over time. The mention of specific fund holdings does not constitute a recommendation by OppenheimerFunds, Inc. or its affiliates.
Shares of Oppenheimer funds are not deposits or obligations of any bank, are not guaranteed by any bank, are not insured by the FDIC or any other agency, and involve investment risks, including the possible loss of the principal amount invested.
4 OPPENHEIMER CAPITAL APPRECIATION FUND/VA
Fund Expenses
Fund Expenses. As a shareholder of the Fund, you incur two types of costs: (1) transaction costs and (2) ongoing costs, including management fees; distribution and service fees; and other Fund expenses. These examples are intended to help you understand your ongoing costs (in dollars) of investing in the Fund and to compare these costs with the ongoing costs of investing in other mutual funds.
The examples are based on an investment of $1,000.00 invested at the beginning of the period and held for the entire 6-month period ended June 30, 2014.
Actual Expenses. The first section of the table provides information about actual account values and actual expenses. You may use the information in this section for the class of shares you hold, together with the amount you invested, to estimate the expense that you paid over the period. Simply divide your account value by $1,000.00 (for example, an $8,600.00 account value divided by $1,000.00 = 8.60), then multiply the result by the number in the first section under the heading entitled “Expenses Paid During Period” to estimate the expenses you paid on your account during this period.
Hypothetical Example for Comparison Purposes.
The second section of the table provides information about hypothetical account values and hypothetical expenses based on the Fund’s actual expense ratio for each class of shares, and an assumed rate of return of 5% per year for each class before expenses, which is not the actual return. The hypothetical account values and expenses may not be used to estimate the actual ending account balance or expenses you paid for the period. You may use this information to compare the ongoing costs of investing in the Fund and other funds. To do so, compare this 5% hypothetical example for the class of shares you hold with the 5% hypothetical examples that appear in the shareholder reports of the other funds.
Please note that the expenses shown in the table are meant to highlight your ongoing costs only and do not reflect any charges associated with the separate accounts that offer this Fund. Therefore, the “hypothetical” lines of the table are useful in comparing ongoing costs only, and will not help you determine the relative total costs of owning different funds. In addition, if these separate account charges were included your costs would have been higher.
| | | | | | | | | | | | | | |
| Actual | | Beginning
Account Value
January 1, 2014 | | | Ending
Account Value
June 30, 2014 | | | Expenses Paid During
6 Months Ended
June 30, 2014 | | | |
Non-Service shares | | $ | 1,000.00 | | | $ | 1,064.10 | | | $ | 4.10 | | | |
Service shares | | | 1,000.00 | | | | 1,062.80 | | | | 5.38 | | | |
| | | | |
Hypothetical
(5% return before expenses) | | | | | | | | | | | |
Non-Service shares | | | 1,000.00 | | | | 1,020.83 | | | | 4.02 | | | |
Service shares | | | 1,000.00 | | | | 1,019.59 | | | | 5.27 | | | |
Expenses are equal to the Fund’s annualized expense ratio for that class, multiplied by the average account value over the period, multiplied by 181/365 (to reflect the one-half year period). Those annualized expense ratios, excluding indirect expenses from affiliated funds, based on the 6-month period ended June 30, 2014 are as follows:
| | | | | | |
| Class | | Expense Ratios | | | |
Non-Service shares | | | 0.80% | | | |
Service shares | | | 1.05 | | | |
The expense ratios reflect voluntary and/or contractual waivers and/or reimbursements of expenses by the Fund’s Manager. Some of these undertakings may be modified or terminated at any time, as indicated in the Fund’s prospectus. The “Financial Highlights” tables in the Fund’s financial statements, included in this report, also show the gross expense ratios, without such waivers or reimbursements and reduction to custodian expenses, if applicable.
5 OPPENHEIMER CAPITAL APPRECIATION FUND/VA
STATEMENT OF INVESTMENTS June 30, 2014 Unaudited
| | | | | | | | |
| | | Shares | | | Value | |
| Common Stocks—98.6% | |
| Consumer Discretionary—16.6% | |
| Auto Components—1.0% | |
| Magna International, Inc. | | | 90,610 | | | $ | 9,763,227 | |
| | | | | | | | | |
| Hotels, Restaurants & Leisure—1.9% | |
| Chipotle Mexican Grill, Inc.1 | | | 21,490 | | | | 12,733,040 | |
| Wynn Resorts Ltd. | | | 27,300 | | | | 5,666,388 | |
| | | | 18,399,428 | |
| | | | | | | | | |
| Household Durables—1.1% | |
| Harman International Industries, Inc. | | | 97,560 | | | | 10,480,871 | |
| | | | | | | | | |
| Internet & Catalog Retail—2.6% | |
| Amazon.com, Inc.1 | | | 22,384 | | | | 7,269,876 | |
| Priceline.com, Inc. (The)1 | | | 2,240 | | | | 2,694,720 | |
| TripAdvisor, Inc.1 | | | 140,070 | | | | 15,220,006 | |
| | | | 25,184,602 | |
| | | | | | | | | |
| Media—6.8% | |
| Time Warner, Inc. | | | 246,966 | | | | 17,349,361 | |
Twenty-First Century Fox, Inc.,
Cl. B | | | 735,890 | | | | 25,189,515 | |
| Walt Disney Co. (The) | | | 278,830 | | | | 23,906,884 | |
| | | | 66,445,760 | |
| | | | | | | | | |
| Specialty Retail—1.9% | |
| Tiffany & Co. | | | 109,320 | | | | 10,959,330 | |
| TJX Cos., Inc. (The) | | | 134,470 | | | | 7,147,081 | |
| | | | 18,106,411 | |
| | | | | | | | | |
| Textiles, Apparel & Luxury Goods—1.3% | |
| Nike, Inc., Cl. B | | | 113,260 | | | | 8,783,313 | |
| VF Corp. | | | 54,420 | | | | 3,428,460 | |
| | | | 12,211,773 | |
| | | | | | | | | |
| Consumer Staples—6.3% | |
| Beverages—2.1% | |
| Brown-Forman Corp., Cl. B | | | 109,465 | | | | 10,308,319 | |
| SABMiller plc | | | 165,600 | | | | 9,594,445 | |
| | | | 19,902,764 | |
| | | | | | | | | |
| Food & Staples Retailing—2.9% | |
| Costco Wholesale Corp. | | | 68,430 | | | | 7,880,399 | |
| CVS Caremark Corp. | | | 271,330 | | | | 20,450,142 | |
| | | | 28,330,541 | |
| | | | | | | | | |
| Food Products—1.3% | |
| Hershey Co. (The) | | | 134,060 | | | | 13,053,422 | |
| | | | | | | | | |
| Energy—5.1% | |
| Energy Equipment & Services—1.5% | |
| Halliburton Co. | | | 104,260 | | | | 7,403,503 | |
| Oceaneering International, Inc. | | | 86,730 | | | | 6,776,215 | |
| | | | 14,179,718 | |
| | | | | | | | | |
| Oil, Gas & Consumable Fuels—3.6% | |
| Antero Resources Corp.1 | | | 94,810 | | | | 6,222,380 | |
| Cimarex Energy Co. | | | 37,500 | | | | 5,379,750 | |
| EOG Resources, Inc. | | | 122,320 | | | | 14,294,315 | |
| Pioneer Natural Resources Co. | | | 38,350 | | | | 8,813,214 | |
| | | | 34,709,659 | |
| | | | | | | | | |
| Financials—6.1% | |
| Capital Markets—3.3% | |
| Ameriprise Financial, Inc. | | | 65,510 | | | | 7,861,200 | |
| Charles Schwab Corp. (The) | | | 277,490 | | | | 7,472,806 | |
| Invesco Ltd. | | | 238,060 | | | | 8,986,765 | |
| Northern Trust Corp. | | | 119,210 | | | | 7,654,474 | |
| | | | 31,975,245 | |
| | | | | | | | | |
| Consumer Finance—1.0% | |
| Discover Financial Services | | | 163,840 | | | | 10,154,803 | |
| | | | | | | | |
| | | Shares | | | Value | |
| Insurance—1.8% | |
| Aon plc | | | 190,670 | | | $ | 17,177,460 | |
| | | | | | | | | |
| Health Care—21.2% | |
| Biotechnology—10.7% | |
| Biogen Idec, Inc.1 | | | 135,160 | | | | 42,617,300 | |
| Celgene Corp.1 | | | 243,074 | | | | 20,875,195 | |
| Gilead Sciences, Inc.1 | | | 456,040 | | | | 37,810,276 | |
| Vertex Pharmaceuticals, Inc.1 | | | 25,535 | | | | 2,417,654 | |
| | | | | | | 103,720,425 | |
| | | | | | | | | |
| Health Care Technology—0.9% | |
| Cerner Corp.1 | | | 165,130 | | | | 8,517,405 | |
| | | | | | | | | |
| Life Sciences Tools & Services—1.4% | |
| Thermo Fisher Scientific, Inc. | | | 120,450 | | | | 14,213,100 | |
| | | | | | | | | |
| Pharmaceuticals—8.2% | |
| Actavis plc1 | | | 85,020 | | | | 18,963,711 | |
| Allergan, Inc. | | | 50,350 | | | | 8,520,227 | |
| Bristol-Myers Squibb Co. | | | 300,590 | | | | 14,581,621 | |
| Perrigo Co. plc | | | 75,180 | | | | 10,958,237 | |
| Pfizer, Inc. | | | 234,230 | | | | 6,951,946 | |
| Roche Holding AG | | | 17,600 | | | | 5,251,867 | |
| Valeant Pharmaceuticals International, Inc.1 | | | 111,919 | | | | 14,115,224 | |
| | | | 79,342,833 | |
| | | | | | | | | |
| Industrials—8.1% | |
| Aerospace & Defense—1.0% | |
| B/E Aerospace, Inc.1 | | | 104,750 | | | | 9,688,328 | |
| | | | | | | | | |
| Building Products—0.6% | |
| Allegion plc | | | 103,880 | | | | 5,887,918 | |
| | | | | | | | | |
| Commercial Services & Supplies—1.2% | |
| Tyco International Ltd. | | | 257,210 | | | | 11,728,776 | |
| | | | | | | | | |
| Electrical Equipment—0.9% | |
| AMETEK, Inc. | | | 162,040 | | | | 8,471,451 | |
| | | | | | | | | |
| Machinery—4.1% | |
| Caterpillar, Inc. | | | 117,530 | | | | 12,771,985 | |
| Pall Corp. | | | 108,380 | | | | 9,254,568 | |
| Parker Hannifin Corp. | | | 111,090 | | | | 13,967,346 | |
| Pentair plc | | | 48,160 | | | | 3,473,299 | |
| | | | 39,467,198 | |
| | | | | | | | | |
| Trading Companies & Distributors—0.3% | |
| United Rentals, Inc.1 | | | 31,980 | | | | 3,349,266 | |
| | | | | | | | | |
| Information Technology—31.3% | |
| Communications Equipment—1.4% | |
| Cisco Systems, Inc. | | | 547,730 | | | | 13,611,091 | |
| | | | | | | | | |
| Internet Software & Services—9.5% | |
| Facebook, Inc., Cl. A1 | | | 651,680 | | | | 43,851,547 | |
| Google, Inc., Cl. A1 | | | 28,780 | | | | 16,826,803 | |
| Google, Inc., Cl. C1 | | | 18,820 | | | | 10,826,770 | |
| LinkedIn Corp., Cl. A1 | | | 122,250 | | | | 20,962,207 | |
| | | | 92,467,327 | |
| | | | | | | | | |
| IT Services—5.8% | |
| Alliance Data Systems Corp.1 | | | 18,440 | | | | 5,186,250 | |
| FleetCor Technologies, Inc.1 | | | 77,370 | | | | 10,197,366 | |
| MasterCard, Inc., Cl. A | | | 312,170 | | | | 22,935,130 | |
| Visa, Inc., Cl. A | | | 84,107 | | | | 17,722,186 | |
| | | | 56,040,932 | |
| | | | | | | | | |
| Software—4.9% | |
| Autodesk, Inc.1 | | | 346,060 | | | | 19,510,863 | |
| Oracle Corp. | | | 343,370 | | | | 13,916,786 | |
| ServiceNow, Inc.1 | | | 61,160 | | | | 3,789,473 | |
| Splunk, Inc.1 | | | 63,770 | | | | 3,528,394 | |
6 OPPENHEIMER CAPITAL APPRECIATION FUND/VA
| | | | | | | | |
| | | Shares | | | Value | |
| Software (Continued) | |
| Workday, Inc., Cl. A1 | | | 70,880 | | | $ | 6,369,277 | |
| | | | | | | 47,114,793 | |
| | | | | | | | | |
| Technology Hardware, Storage & Peripherals—9.7% | |
| Apple, Inc. | | | 689,920 | | | | 64,114,266 | |
| EMC Corp. | | | 674,160 | | | | 17,757,374 | |
| Western Digital Corp. | | | 130,580 | | | | 12,052,534 | |
| | | | | | | 93,924,174 | |
| | | | | | | | | |
| Materials—3.9% | |
| Chemicals—3.9% | |
| Dow Chemical Co. (The) | | | 243,720 | | | | 12,541,831 | |
| Methanex Corp. | | | 110,770 | | | | 6,843,371 | |
| PPG Industries, Inc. | | | 88,330 | | | | 18,562,549 | |
| | | | | | | 37,947,751 | |
Total Common Stocks
(Cost $682,210,116) | | | | 955,568,452 | |
| | | | | | | | |
| | | Shares | | | Value | |
| Investment Company—2.1% | |
| Oppenheimer Institutional Money Market Fund, Cl. E, 0.09%2,3 (Cost $20,379,910) | | | 20,379,910 | | | $ | 20,379,910 | |
| | | | | | | | | |
| Total Investments, at Value (Cost $702,590,026) | | | 100.7 | % | | | 975,948,362 | |
| Net Other Assets (Liabilities) | | | (0.7 | ) | | | (6,324,411 | ) |
| Net Assets | | | 100.0 | % | | $ | 969,623,951 | |
| | | | | | | | |
| | | | | | | | | |
Footnotes to Statement of Investments
1. Non-income producing security.
2. Rate shown is the 7-day yield as of June 30, 2014.
3. Is or was an affiliate, as defined in the Investment Company Act of 1940, at or during the six months ended June 30, 2014, by virtue of the Fund owning at least 5% of the voting securities of the issuer or as a result of the Fund and the issuer having the same investment adviser. Transactions during the period in which the issuer was an affiliate are as follows:
| | | | | | | | | | | | | | | | |
| | | Shares
December 31,
2013 | | | Gross
Additions | | | Gross
Reductions | | | Shares
June 30, 2014 | |
Oppenheimer Institutional Money Market Fund, Cl. E | | | 3,644,176 | | | | 136,435,485 | | | | 119,699,751 | | | | 20,379,910 | |
| | | | |
| | | | | | | | | Value | | | Income | |
Oppenheimer Institutional Money Market Fund, Cl. E | | | $ | 20,379,910 | | | $ | 4,959 | |
See accompanying Notes to Financial Statements.
7 OPPENHEIMER CAPITAL APPRECIATION FUND/VA
STATEMENTOF ASSETS AND LIABILITIES June 30, 2014 Unaudited
| | | | |
| |
| Assets | | | | |
| Investments, at value—see accompanying statement of investments: | | | | |
| Unaffiliated companies (cost $682,210,116) | | $ | 955,568,452 | |
| Affiliated companies (cost $20,379,910) | | | 20,379,910 | |
| | | | |
| | | 975,948,362 | |
| |
| Cash | | | 2,001,662 | |
| |
| Receivables and other assets: | | | | |
| Investments sold | | | 1,085,652 | |
| Dividends | | | 866,688 | |
| Shares of beneficial interest sold | | | 193,529 | |
| Other | | | 74,145 | |
| | | | |
| Total assets | | | 980,170,038 | |
| |
| Liabilities | | | | |
| Payables and other liabilities: | | | | |
| Shares of beneficial interest redeemed | | | 5,666,931 | |
| Investments purchased | | | 4,694,503 | |
| Distribution and service plan fees | | | 70,977 | |
| Trustees’ compensation | | | 67,432 | |
| Shareholder communications | | | 30,802 | |
| Dividends | | | 221 | |
| Other | | | 15,221 | |
| | | | |
| Total liabilities | | | 10,546,087 | |
| |
| Net Assets | | $ | 969,623,951 | |
| | | | |
|
| |
| Composition of Net Assets | | | | |
| Par value of shares of beneficial interest | | $ | 16,256 | |
| |
| Additional paid-in capital | | | 597,297,245 | |
| |
| Accumulated net investment loss | | | (1,104,528) | |
| |
| Accumulated net realized gain on investments and foreign currency transactions | | | 100,039,181 | |
| |
| Net unrealized appreciation on investments and translation of assets and liabilities denominated in foreign currencies | | | 273,375,797 | |
| | | | |
| Net Assets | | $ | 969,623,951 | |
| | | | |
|
| |
| Net Asset Value Per Share | | | | |
| Non-Service Shares: | | | | |
| Net asset value, redemption price (excludes applicable contingent deferred sales charge) and offering price per share (based on net assets of $621,140,630 and 10,384,731 shares of beneficial interest outstanding) | | | $59.81 | |
| |
| Service Shares: | | | | |
| Net asset value, redemption price (excludes applicable contingent deferred sales charge) and offering price per share (based on net assets of $348,483,321 and 5,870,790 shares of beneficial interest outstanding) | | | $59.36 | |
See accompanying Notes to Financial Statements.
8 OPPENHEIMER CAPITAL APPRECIATION FUND/VA
STATEMENTOF OPERATIONS For the Six Months Ended June 30, 2014 Unaudited
| | | | |
| |
| Investment Income | | | | |
| |
Dividends: | | | | |
Unaffiliated companies (net of foreign withholding taxes of $61,035) | | $ | 4,532,081 | |
Affiliated companies | | | 4,959 | |
| |
Interest | | | 32 | |
| | | | |
Total investment income | | | 4,537,072 | |
| |
| Expenses | | | | |
Management fees | | | 3,255,876 | |
| |
Distribution and service plan fees - Service shares | | | 428,845 | |
| |
Transfer and shareholder servicing agent fees: | | | | |
Non-Service shares | | | 301,888 | |
Service shares | | | 171,718 | |
| |
Shareholder communications: | | | | |
Non-Service shares | | | 16,247 | |
Service shares | | | 9,292 | |
| |
Custodian fees and expenses | | | 8,006 | |
| |
Trustees’ compensation | | | 20,260 | |
| |
Other | | | 35,320 | |
| | | | |
Total expenses | | | 4,247,452 | |
Less waivers and reimbursements of expenses | | | (29,185) | |
| | | | |
Net expenses | | | 4,218,267 | |
|
| |
Net Investment Income | | | 318,805 | |
| |
| Realized and Unrealized Gain (Loss) | | | | |
Net realized gain (loss) on: | | | | |
Investments from unaffiliated companies | | | 100,128,189 | |
Foreign currency transactions | | | (910) | |
| | | | |
Net realized gain | | | 100,127,279 | |
| |
Net change in unrealized appreciation/depreciation on: | | | | |
Investments | | | (40,925,683) | |
Translation of assets and liabilities denominated in foreign currencies | | | (890,784) | |
| | | | |
Net change in unrealized appreciation/depreciation | | | (41,816,467) | |
|
| |
Net Increase in Net Assets Resulting from Operations | | $ | 58,629,617 | |
| | | | |
See accompanying Notes to Financial Statements.
9 OPPENHEIMER CAPITAL APPRECIATION FUND/VA
STATEMENTSOF CHANGES IN NET ASSETS
| | | | | | | | |
| | | Six Months Ended
June 30, 2014
(Unaudited) | | | Year Ended
December 31, 2013 | |
| |
Operations | | | | | | | | |
Net investment income | | $ | 318,805 | | | $ | 3,375,027 | |
| |
Net realized gain | | | 100,127,279 | | | | 226,957,048 | |
| |
Net change in unrealized appreciation/depreciation | | | (41,816,467) | | | | 19,646,381 | |
| | | | | | | | |
Net increase in net assets resulting from operations | | | 58,629,617 | | | | 249,978,456 | |
| |
Dividends and/or Distributions to Shareholders | | | | | | | | |
Dividends from net investment income: | | | | | | | | |
Non-Service shares | | | (2,755,816) | | | | (5,856,634) | |
Service shares | | | (632,318) | | | | (2,798,285) | |
| | | | |
| | | (3,388,134) | | | | (8,654,919) | |
| |
Distributions from net realized gain: | | | | | | | | |
Non-Service shares | | | (15,002,872) | | | | — | |
Service shares | | | (8,466,690) | | | | — | |
| | | | |
| | | (23,469,562) | | | | — | |
| |
Beneficial Interest Transactions | | | | | | | | |
Net increase (decrease) in net assets resulting from beneficial interest transactions: | | | | | | | | |
Non-Service shares | | | (25,880,262) | | | | (96,658,801) | |
Service shares | | | (27,388,917) | | | | (93,891,544) | |
| | | | | | | | |
| | | (53,269,179) | | | | (190,550,345) | |
| |
Net Assets | | | | | | | | |
Total increase (decrease) | | | (21,497,258) | | | | 50,773,192 | |
| |
Beginning of period | | | 991,121,209 | | | | 940,348,017 | |
| | | | | | | | |
| End of period (including accumulated net investment income (loss) of ($1,104,528) and $1,964,801, respectively) | | $ | 969,623,951 | | | $ | 991,121,209 | |
| | | | | | | | |
See accompanying Notes to Financial Statements.
10 OPPENHEIMER CAPITAL APPRECIATION FUND/VA
FINANCIAL HIGHLIGHTS
| | | | | | | | | | | | | | | | | | | | | | | | |
| Non-Service Shares | | Six Months
Ended
June 30,
2014
(Unaudited) | | | Year Ended
December 31, 2013 | | | Year Ended
December 31, 2012 | | | Year Ended
December 30, 20111 | | | Year Ended
December 31, 2010 | | | Year Ended
December 31,
2009 | |
| |
Per Share Operating Data | | | | | | | | | | | | | | | | | | | | | | | | |
Net asset value, beginning of period | | $ | 57.88 | | | $ | 45.06 | | | | 39 .75 | | | | 40 .35 | | | | 36 .94 | | | | 25 .67 | |
| |
Income (loss) from investment operations: | | | | | | | | | | | | | | | | | | | | | | | | |
Net investment income2 | | | 0.05 | | | | 0.23 | | | | 0.42 | | | | 0.23 | | | | 0.11 | | | | 0.09 | |
Net realized and unrealized gain (loss) | | | 3.62 | | | | 13.09 | | | | 5.18 | | | | (0.69) | | | | 3.36 | | | | 11.27 | |
| | | | |
Total from investment operations | | | 3.67 | | | | 13.32 | | | | 5.60 | | | | (0.46) | | | | 3.47 | | | | 11.36 | |
| |
Dividends and/or distributions to shareholders: | | | | | | | | | | | | | | | | | | | | | | | | |
Dividends from net investment income | | | (0.27) | | | | (0.50) | | | | (0.29) | | | | (0.14) | | | | (0.06) | | | | (0.09) | |
Distributions from net realized gain | | | (1.47) | | | | 0.00 | | | | 0.00 | | | | 0.00 | | | | 0.00 | | | | 0.00 | |
| | | | |
Total dividends and/or distributions to shareholders | | | (1.74) | | | | (0.50) | | | | (0.29) | | | | (0.14) | | | | (0.06) | | | | (0.09) | |
| |
Net asset value, end of period | | $ | 59.81 | | | $ | 57.88 | | | $ | 45.06 | | | $ | 39.75 | | | $ | 40.35 | | | $ | 36.94 | |
| | | | |
| | | | | | | | | | | | | | | | | | | | | | | | |
| |
Total Return, at Net Asset Value3 | | | 6.41% | | | | 29.74% | | | | 14.12% | | | | (1.15)% | | | | 9.42% | | | | 44.52% | |
|
| |
Ratios/Supplemental Data | | | | | | | | | | | | | | | | | | | | | | | | |
Net assets, end of period (in thousands) | | $ | 621,141 | | | $ | 626,907 | | | $ | 573,684 | | | $ | 637,868 | | | $ | 771,086 | | | $ | 1,074,190 | |
| |
Average net assets (in thousands) | | $ | 611,620 | | | $ | 595,912 | | | $ | 600,121 | | | $ | 713,770 | | | $ | 976,242 | | | $ | 927,670 | |
| |
Ratios to average net assets:4 | | | | | | | | | | | | | | | | | | | | | | | | |
Net investment income | | | 0.16% | | | | 0.44% | | | | 0.95% | | | | 0.57% | | | | 0.31% | | | | 0.29% | |
Total expenses5 | | | 0.80% | | | | 0.81% | | | | 0.81% | | | | 0.80% | | | | 0.79% | | | | 0.78% | |
| Expenses after payments, waivers and/or reimbursements and reduction to custodian expenses | | | 0.79% | | | | 0.80% | | | | 0.80% | | | | 0.80% | | | | 0.79% | | | | 0.78% | |
| |
Portfolio turnover rate | | | 33% | | | | 77% | | | | 28% | | | | 27% | | | | 58% | | | | 46% | |
1. December 30, 2011 represents the last business day of the Fund’s 2011 fiscal year.
2. Per share amounts calculated based on the average shares outstanding during the period.
3. Assumes an initial investment on the business day before the first day of the fiscal period, with all dividends and distributions reinvested in additional shares on the reinvestment date, and redemption at the net asset value calculated on the last business day of the fiscal period. Total returns are not annualized for periods less than one full year. Total return information does not reflect expenses that apply at the separate account level or to related insurance products. Inclusion of these charges would reduce the total return figures for all periods shown. Returns do not reflect the deduction of taxes that a shareholder would pay on fund distributions or the redemption of fund shares.
4. Annualized for periods less than one full year.
5. Total expenses including indirect expenses from affiliated fund were as follows:
| | | | | | |
| | Six Months Ended June 30, 2014 | | | 0.80 | % |
| | Year Ended December 31, 2013 | | | 0.81 | % |
| | Year Ended December 31, 2012 | | | 0.81 | % |
| | Year Ended December 30, 2011 | | | 0.80 | % |
| | Year Ended December 31, 2010 | | | 0.79 | % |
| | Year Ended December 31, 2009 | | | 0.78 | % |
See accompanying Notes to Financial Statements.
11 OPPENHEIMER CAPITAL APPRECIATION FUND/VA
FINANCIAL HIGHLIGHTS Continued
| | | | | | | | | | | | | | | | | | | | | | | | |
| Service Shares | | Six Months
Ended
June 30,
2014
(Unaudited) | | | Year Ended
December 31, 2013 | | | Year Ended
December 31, 2012 | | | Year Ended
December 30, 20111 | | | Year Ended
December 31, 2010 | | | Year Ended
December 31, 2009 | |
| |
Per Share Operating Data | | | | | | | | | | | | | | | | | | | | | | | | |
Net asset value, beginning of period | | $ | 57.37 | | | $ | 44.66 | | | $ | 39.40 | | | $ | 39.99 | | | $ | 36.64 | | | $ | 25.42 | |
| |
Income (loss) from investment operations: | | | | | | | | | | | | | | | | | | | | | | | | |
Net investment income (loss)2 | | | (0.03) | | | | 0.10 | | | | 0.31 | | | | 0.13 | | | | 0.02 | | | | 0.01 | |
Net realized and unrealized gain (loss) | | | 3.60 | | | | 12.98 | | | | 5.12 | | | | (0.68) | | | | 3.33 | | | | 11.21 | |
| | | | |
Total from investment operations | | | 3.57 | | | | 13.08 | | | | 5.43 | | | | (0.55) | | | | 3.35 | | | | 11.22 | |
| |
Dividends and/or distributions to shareholders: | | | | | | | | | | | | | | | | | | | | | | | | |
Dividends from net investment income | | | (0.11) | | | | (0.37) | | | | (0.17) | | | | (0.04) | | | | 0.00 | | | | 0.003 | |
Distributions from net realized gain | | | (1.47) | | | | 0.00 | | | | 0.00 | | | | 0.00 | | | | 0.00 | | | | 0.00 | |
| | | | |
Total dividends and/or distributions to shareholders | | | (1.58) | | | | (0.37) | | | | (0.17) | | | | (0.04) | | | | 0.00 | | | | 0.00 | |
| |
Net asset value, end of period | | $ | 59.36 | | | $ | 57.37 | | | $ | 44.66 | | | $ | 39.40 | | | $ | 39.99 | | | $ | 36.64 | |
| | | | |
| | | | | | | | | | | | | | | | | | | | | | | | |
| |
Total Return, at Net Asset Value4 | | | 6.28% | | | | 29.43% | | | | 13.81% | | | | (1.37)% | | | | 9.15% | | | | 44.15% | |
|
| |
Ratios/Supplemental Data | | | | | | | | | | | | | | | | | | | | | | | | |
Net assets, end of period (in thousands) | | $ | 348,483 | | | $ | 364,214 | | | $ | 366,664 | | | $ | 375,330 | | | $ | 423,989 | | | $ | 444,170 | |
| |
Average net assets (in thousands) | | $ | 347,911 | | | $ | 367,615 | | | $ | 382,196 | | | $ | 407,413 | | | $ | 427,640 | | | $ | 368,634 | |
| |
Ratios to average net assets:5 | | | | | | | | | | | | | | | | | | | | | | | | |
Net investment income (loss) | | | (0.09)% | | | | 0.20% | | | | 0.71% | | | | 0.32% | | | | 0.06% | | | | 0.03% | |
Total expenses6 | | | 1.05% | | | | 1.06% | | | | 1.06% | | | | 1.05% | | | | 1.04% | | | | 1.04% | |
| Expenses after payments, waivers and/or reimbursements and reduction to custodian expenses | | | 1.05% | | | | 1.05% | | | | 1.05% | | | | 1.05% | | | | 1.04% | | | | 1.03% | |
| |
Portfolio turnover rate | | | 33% | | | | 77% | | | | 28% | | | | 27% | | | | 58% | | | | 46% | |
1. December 30, 2011 represents the last business day of the Fund’s 2011 fiscal year.
2. Per share amounts calculated based on the average shares outstanding during the period.
3. Less then $0.005 per share.
4. Assumes an initial investment on the business day before the first day of the fiscal period, with all dividends and distributions reinvested in additional shares on the reinvestment date, and redemption at the net asset value calculated on the last business day of the fiscal period. Total returns are not annualized for periods less than one full year. Total return information does not reflect expenses that apply at the separate account level or to related insurance products. Inclusion of these charges would reduce the total return figures for all periods shown. Returns do not reflect the deduction of taxes that a shareholder would pay on fund distributions or the redemption of fund shares.
5. Annualized for periods less than one full year.
6. Total expenses including indirect expenses from affiliated fund were as follows:
| | | | | | |
| | Six Months Ended June 30, 2014 | | | 1.05 | % |
| | Year Ended December 31, 2013 | | | 1.06 | % |
| | Year Ended December 31, 2012 | | | 1.06 | % |
| | Year Ended December 30, 2011 | | | 1.05 | % |
| | Year Ended December 31, 2010 | | | 1.04 | % |
| | Year Ended December 31, 2009 | | | 1.04 | % |
See accompanying Notes to Financial Statements.
12 OPPENHEIMER CAPITAL APPRECIATION FUND/VA
NOTESTO FINANCIAL STATEMENTS June 30, 2014 Unaudited
1. Significant Accounting Policies
Oppenheimer Capital Appreciation Fund/VA (the “Fund”) is a separate series of Oppenheimer Variable Account Funds, a diversified open-end management investment company registered under the Investment Company Act of 1940, as amended. The Fund’s investment objective is to seek capital appreciation. The Fund’s investment adviser is OFI Global Asset Management, Inc. (“OFI Global” or the “Manager”), a wholly-owned subsidiary of OppenheimerFunds, Inc. (“OFI” or the “Sub-Adviser”). The Manager has entered into a sub-advisory agreement with OFI. Shares of the Fund are sold only to separate accounts of life insurance companies.
The Fund offers two classes of shares. Both classes are sold at their offering price, which is the net asset value per share, to separate investment accounts of participating insurance companies as an underlying investment for variable life insurance policies, variable annuity contracts or other investment products. The class of shares designated as Service shares is subject to a distribution and service plan. Both classes of shares have identical rights and voting privileges with respect to the Fund in general and exclusive voting rights on matters that affect that class alone. Earnings, net assets and net asset value per share may differ due to each class having its own expenses, such as transfer and shareholder servicing agent fees and shareholder communications, directly attributable to that class.
The following is a summary of significant accounting policies consistently followed by the Fund.
Investment in Oppenheimer Institutional Money Market Fund. The Fund is permitted to invest daily available cash balances in an affiliated money market fund. The Fund may invest the available cash in Class E shares of Oppenheimer Institutional Money Market Fund (“IMMF”) to seek current income while preserving liquidity. IMMF is a registered open-end management investment company, regulated as a money market fund under the Investment Company Act of 1940, as amended. The Manager is the investment adviser of IMMF, and the Sub-Adviser provides investment and related advisory services to IMMF. When applicable, the Fund’s investment in IMMF is included in the Statement of Investments. Shares of IMMF are valued at their net asset value per share. As a shareholder, the Fund is subject to its proportional share of IMMF’s Class E expenses, including its management fee. The Manager will waive fees and/or reimburse Fund expenses in an amount equal to the indirect management fees incurred through the Fund’s investment in IMMF.
Foreign Currency Translation. The Fund’s accounting records are maintained in U.S. dollars. The values of securities denominated in foreign currencies and amounts related to the purchase and sale of foreign securities and foreign investment income are translated into U.S. dollars as of the close of the New York Stock Exchange (the “Exchange”), normally 4:00 P.M. Eastern time, on each day the Exchange is open for trading. Foreign exchange rates may be valued primarily using a reliable bank, dealer or service authorized by the Board of Trustees.
Reported net realized gains and losses from foreign currency transactions arise from sales of portfolio securities, sales and maturities of short-term securities, sales of foreign currencies, exchange rate fluctuations between the trade and settlement dates on securities transactions, and the difference between the amounts of dividends, interest, and foreign withholding taxes recorded on the Fund’s books and the U.S. dollar equivalent of the amounts actually received or paid. Net unrealized appreciation and depreciation on the translation of assets and liabilities denominated in foreign currencies arise from changes in the values of assets and liabilities, including investments in securities at fiscal period end, resulting from changes in exchange rates.
The effect of changes in foreign currency exchange rates on investments is separately identified from the fluctuations arising from changes in market values of securities held and reported with all other foreign currency gains and losses in the Fund’s Statement of Operations.
Allocation of Income, Expenses, Gains and Losses. Income, expenses (other than those attributable to a specific class), gains and losses are allocated on a daily basis to each class of shares based upon the relative proportion of net assets represented by such class. Operating expenses directly attributable to a specific class are charged against the operations of that class.
Federal Taxes. The Fund intends to comply with provisions of the Internal Revenue Code applicable to regulated investment companies and to distribute substantially all of its investment company taxable income to shareholders. Therefore, no federal income or excise tax provision is required. The Fund files income tax returns in U.S. federal and applicable state jurisdictions. The statute of limitations on the Fund’s tax return filings generally remain open for the three preceding fiscal reporting period ends.
During the fiscal year ended December 31, 2013, the Fund utilized $197,794,392 of capital loss carryforward to offset capital gains realized in that fiscal year.
Net investment income (loss) and net realized gain (loss) may differ for financial statement and tax purposes. The character of dividends and distributions made during the fiscal year from net investment income or net realized gains may differ from their ultimate characterization for federal income tax purposes. Also, due to timing of dividends and distributions, the fiscal year in which amounts are distributed may differ from the fiscal year in which the income or net realized gain was recorded by the Fund.
The aggregate cost of securities and other investments and the composition of unrealized appreciation and depreciation of securities and other investments for federal income tax purposes as of June 30, 2014 are noted in the following table. The primary difference between book and tax appreciation or depreciation of securities and other investments, if applicable, is attributable to the tax deferral of losses or tax realization of financial statement unrealized gain or loss.
13 OPPENHEIMER CAPITAL APPRECIATION FUND/VA
NOTES TO FINANCIAL STATEMENTS Unaudited / Continued
1. Significant Accounting Policies (Continued)
| | | | |
Federal tax cost of securities | | $ | 702,693,251 | |
| | | | |
| |
Gross unrealized appreciation | | $ | 280,795,861 | |
Gross unrealized depreciation | | | (7,540,750) | |
| | | | |
Net unrealized appreciation | | $ | 273,255,111 | |
| | | | |
Trustees’ Compensation. The Board of Trustees has adopted a compensation deferral plan for independent trustees that enables trustees to elect to defer receipt of all or a portion of the annual compensation they are entitled to receive from the Fund. For purposes of determining the amount owed to the Trustee under the plan, deferred amounts are treated as though equal dollar amounts had been invested in shares of the Fund or in other Oppenheimer funds selected by the Trustee. The Fund purchases shares of the funds selected for deferral by the Trustee in amounts equal to his or her deemed investment, resulting in a Fund asset equal to the deferred compensation liability. Such assets are included as a component of “Other” within the asset section of the Statement of Assets and Liabilities. Deferral of trustees’ fees under the plan will not affect the net assets of the Fund, and will not materially affect the Fund’s assets, liabilities or net investment income per share. Amounts will be deferred until distributed in accordance with the compensation deferral plan.
Dividends and Distributions to Shareholders. Dividends and distributions to shareholders, which are determined in accordance with income tax regulations and may differ from U.S. generally accepted accounting principles, are recorded on the ex-dividend date. Income and capital gain distributions, if any, are declared and paid annually or at other times as deemed necessary by the Manager. The tax character of distributions is determined as of the Fund’s fiscal year end. Therefore, a portion of the Fund’s distributions made to shareholders prior to the Fund’s fiscal year end may ultimately be categorized as a tax return of capital.
Investment Income. Dividend income is recorded on the ex-dividend date or upon ex-dividend notification in the case of certain foreign dividends where the ex-dividend date may have passed. Non-cash dividends included in dividend income, if any, are recorded at the fair market value of the securities received. Interest income is recognized on an accrual basis. Discount and premium, which are included in interest income on the Statement of Operations, are amortized or accreted daily.
Custodian Fees. “Custodian fees and expenses” in the Statement of Operations may include interest expense incurred by the Fund on any cash overdrafts of its custodian account during the period. Such cash overdrafts may result from the effects of failed trades in portfolio securities and from cash outflows resulting from unanticipated shareholder redemption activity. The Fund pays interest to its custodian on such cash overdrafts, to the extent they are not offset by positive cash balances maintained by the Fund, at a rate equal to the Federal Funds Rate plus 0.50%. The “Reduction to custodian expenses” line item, if applicable, represents earnings on cash balances maintained by the Fund during the period. Such interest expense and other custodian fees may be paid with these earnings.
Security Transactions. Security transactions are recorded on the trade date. Realized gains and losses on securities sold are determined on the basis of identified cost.
Indemnifications. The Fund’s organizational documents provide current and former trustees and officers with a limited indemnification against liabilities arising in connection with the performance of their duties to the Fund. In the normal course of business, the Fund may also enter into contracts that provide general indemnifications. The Fund’s maximum exposure under these arrangements is unknown as this would be dependent on future claims that may be made against the Fund. The risk of material loss from such claims is considered remote.
Other. The preparation of financial statements in conformity with accounting principles generally accepted in the United States of America requires management to make estimates and assumptions that affect the reported amounts of assets and liabilities and disclosure of contingent assets and liabilities at the date of the financial statements and the reported amounts of increases and decreases in net assets from operations during the reporting period. Actual results could differ from those estimates.
2. Securities Valuation
The Fund calculates the net asset value of its shares as of the close of the New York Stock Exchange (the “Exchange”), normally 4:00 P.M. Eastern time, on each day the Exchange is open for trading.
The Fund’s Board has adopted procedures for the valuation of the Fund’s securities and has delegated the day-to-day responsibility for valuation determinations under those procedures to the Manager. The Manager has established a Valuation Committee which is responsible for determining a “fair valuation” for any security for which market quotations are not “readily available.” The Valuation Committee’s fair valuation determinations are subject to review, approval and ratification by the Fund’s Board at its next regularly scheduled meeting covering the calendar quarter in which the fair valuation was determined.
14 OPPENHEIMER CAPITAL APPRECIATION FUND/VA
| | | | |
| | |
| | | | |
2. Securities Valuation (Continued) |
Valuation Methods and Inputs
Securities are valued using unadjusted quoted market prices, when available, as supplied primarily by third party pricing services or dealers.
The following methodologies are used to determine the market value or the fair value of the types of securities described below:
Securities traded on a registered U.S. securities exchange (including exchange-traded derivatives other than futures and futures options) are valued based on the last sale price of the security reported on the principal exchange on which it is traded, prior to the time when the Fund’s assets are valued. In the absence of a sale, the security is valued at the last sale price on the prior trading day, if it is within the spread of the current day’s closing “bid” and “asked” prices, and if not, at the current day’s closing bid price. A security of a foreign issuer traded on a foreign exchange, but not listed on a registered U.S. securities exchange, is valued based on the last sale price on the principal exchange on which the security is traded, as identified by the third party pricing service used by the Manager, prior to the time when the Fund’s assets are valued. If the last sale price is unavailable, the security is valued at the most recent official closing price on the principal exchange on which it is traded. If the last sales price or official closing price for a foreign security is not available, the security is valued at the mean between the bid and asked price per the exchange or, if not available from the exchange, obtained from two dealers. If bid and asked prices are not available from either the exchange or two dealers, the security is valued by using one of the following methodologies (listed in order of priority): (1) using a bid from the exchange, (2) the mean between the bid and asked price as provided by a single dealer, or (3) a bid from a single dealer.
Shares of a registered investment company that are not traded on an exchange are valued at that investment company’s net asset value per share.
Corporate and government debt securities (of U.S. or foreign issuers) and municipal debt securities, event-linked bonds, loans, mortgage-backed securities, collateralized mortgage obligations, and asset-backed securities are valued at the mean between the “bid” and “asked” prices utilizing evaluated prices obtained from third party pricing services or broker-dealers who may use matrix pricing methods to determine the evaluated prices.
Short-term money market type debt securities with a remaining maturity of sixty days or less are valued at cost adjusted by the amortization of discount or premium to maturity (amortized cost), which approximates market value. Short-term debt securities with a remaining maturity in excess of sixty days are valued at the mean between the “bid” and “asked” prices utilizing evaluated prices obtained from third party pricing services or broker-dealers.
A description of the standard inputs that may generally be considered by the third party pricing vendors in determining their evaluated prices is provided below.
| | |
| Security Type | | Standard inputs generally considered by third-party pricing vendors |
| Corporate debt, government debt, municipal, mortgage-backed and asset-backed securities | | Reported trade data, broker-dealer price quotations, benchmark yields, issuer spreads on comparable securities, the credit quality, yield, maturity, and other appropriate factors. |
| Loans | | Information obtained from market participants regarding reported trade data and broker-dealer price quotations. |
| Event-linked bonds | | Information obtained from market participants regarding reported trade data and broker-dealer price quotations. |
If a market value or price cannot be determined for a security using the methodologies described above, or if, in the “good faith” opinion of the Manager, the market value or price obtained does not constitute a “readily available market quotation,” or a significant event has occurred that would materially affect the value of the security the security is fair valued either (i) by a standardized fair valuation methodology applicable to the security type or the significant event as previously approved by the Valuation Committee and the Fund’s Board or (ii) as determined in good faith by the Manager’s Valuation Committee. The Valuation Committee considers all relevant facts that are reasonably available, through either public information or information available to the Manager, when determining the fair value of a security. Fair value determinations by the Manager are subject to review, approval and ratification by the Fund’s Board at its next regularly scheduled meeting covering the calendar quarter in which the fair valuation was determined. Those fair valuation standardized methodologies include, but are not limited to, valuing securities at the last sale price or initially at cost and subsequently adjusting the value based on: changes in company specific fundamentals, changes in an appropriate securities index, or changes in the value of similar securities which may be further adjusted for any discounts related to security-specific resale restrictions. When possible, such methodologies use observable market inputs such as unadjusted quoted prices of similar securities, observable interest rates, currency rates and yield curves. The methodologies used for valuing securities are not necessarily an indication of the risks associated with investing in those securities nor can it be assured that the Fund can obtain the fair value assigned to a security if it were to sell the security.
To assess the continuing appropriateness of security valuations, the Manager, or its third party service provider who is subject to oversight by the Manager, regularly compares prior day prices, prices on comparable securities, and sale prices to the current day prices and challenges those prices exceeding certain tolerance levels with the third party pricing service or broker source. For those securities valued by fair valuations, whether through a standardized fair valuation methodology or a fair valuation determination, the Valuation Committee reviews and affirms the reasonableness of the valuations based on such methodologies and fair valuation determinations on a regular basis after considering all relevant information that is reasonably available.
Classifications
Each investment asset or liability of the Fund is assigned a level at measurement date based on the significance and source of the inputs to its valuation. Various data inputs are used in determining the value of each of the Fund’s investments as of the reporting period end. These data inputs are categorized in the following hierarchy under applicable financial accounting standards:
15 OPPENHEIMER CAPITAL APPRECIATION FUND/VA
NOTES TO FINANCIAL STATEMENTS Unaudited / Continued
2. Securities Valuation (Continued)
1) Level 1-unadjusted quoted prices in active markets for identical assets or liabilities (including securities actively traded on a securities exchange)
2) Level 2-inputs other than unadjusted quoted prices that are observable for the asset or liability (such as unadjusted quoted prices for similar assets and market corroborated inputs such as interest rates, prepayment speeds, credit risks, etc.)
3) Level 3-significant unobservable inputs (including the Manager’s own judgments about assumptions that market participants would use in pricing the asset or liability).
The inputs used for valuing securities are not necessarily an indication of the risks associated with investing in those securities.
The table below categorizes amounts that are included in the Fund’s Statement of Assets and Liabilities as of June 30, 2014 based on valuation input level:
| | | | | | | | | | | | | | | | |
| | | Level 1—
Unadjusted
Quoted Prices | | | Level 2— Other Significant
Observable Inputs | | | Level 3—
Significant
Unobservable
Inputs | | | Value | |
| |
Assets Table | | | | | | | | | | | | | | | | |
Investments, at Value: | | | | | | | | | | | | | | | | |
Common Stocks | | | | | | | | | | | | | | | | |
Consumer Discretionary | | $ | 160,592,072 | | | $ | — | | | $ | — | | | $ | 160,592,072 | |
Consumer Staples | | | 51,692,282 | | | | 9,594,445 | | | | — | | | | 61,286,727 | |
Energy | | | 48,889,377 | | | | — | | | | — | | | | 48,889,377 | |
Financials | | | 59,307,508 | | | | — | | | | — | | | | 59,307,508 | |
Health Care | | | 200,541,896 | | | | 5,251,867 | | | | — | | | | 205,793,763 | |
Industrials | | | 78,592,937 | | | | — | | | | — | | | | 78,592,937 | |
Information Technology | | | 303,158,317 | | | | — | | | | — | | | | 303,158,317 | |
Materials | | | 37,947,751 | | | | — | | | | — | | | | 37,947,751 | |
Investment Company | | | 20,379,910 | | | | — | | | | — | | | | 20,379,910 | |
| | | | |
Total Assets | | $ | 961,102,050 | | | $ | 14,846,312 | | | $ | — | | | $ | 975,948,362 | |
| | | | |
Foreign currency exchange contracts and futures contracts, if any, are reported at their unrealized appreciation/ depreciation at measurement date, which represents the change in the contract’s value from trade date. All additional assets and liabilities included in the above table are reported at their market value at measurement date.
3. Shares of Beneficial Interest
The Fund has authorized an unlimited number of $0.001 par value shares of beneficial interest of each class. Transactions in shares of beneficial interest were as follows:
| | | | | | | | | | | | | | | | |
| | | Six Months Ended June 30, 2014 | | | Year Ended December 31, 2013 | |
| | | Shares | | | Amount | | | Shares | | | Amount | |
| |
Non-Service Shares | | | | | | | | | | | | | | | | |
Sold | | | 157,383 | | | $ | 9,138,309 | | | | 300,888 | | | $ | 15,140,401 | |
Dividends and/or distributions reinvested | | | 303,563 | | | | 17,758,688 | | | | 117,415 | | | | 5,856,634 | |
Redeemed | | | (907,099 | ) | | | (52,777,259 | ) | | | (2,319,735 | ) | | | (117,655,836) | |
| | | | |
Net decrease | | | (446,153 | ) | | $ | (25,880,262 | ) | | | (1,901,432 | ) | | $ | (96,658,801) | |
| | | | |
|
| |
Service Shares | | | | | | | | | | | | | | | | |
Sold | | | 120,191 | | | $ | 6,846,035 | | | | 192,139 | | | $ | 9,432,352 | |
Dividends and/or distributions reinvested | | | 156,717 | | | | 9,099,008 | | | | 56,519 | | | | 2,798,285 | |
Redeemed | | | (754,437 | ) | | | (43,333,960 | ) | | | (2,109,967 | ) | | | (106,122,181) | |
| | | | |
Net decrease | | | (477,529 | ) | | $ | (27,388,917 | ) | | | (1,861,309 | ) | | $ | (93,891,544) | |
| | | | |
4. Purchases and Sales of Securities
The aggregate cost of purchases and proceeds from sales of securities, other than short-term obligations and investments in IMMF, for the six months ended June 30, 2014 were as follows:
| | | | | | | | |
| | | Purchases | | | Sales | |
Investment securities | | $ | 316,083,189 | | | $ | 414,009,402 | |
5. Fees and Other Transactions with Affiliates
Management Fees. Under the investment advisory agreement, the Fund pays the Manager a management fee based on the daily net assets of the Fund at an annual rate as shown in the following table:
16 OPPENHEIMER CAPITAL APPRECIATION FUND/VA
| | | | |
| | |
| | | | |
5. Fees and Other Transactions with Affiliates (Continued) |
| | | | |
| Fee Schedule | | | |
Up to $200 million | | | 0.75% | |
Next $200 million | | | 0.72 | |
Next $200 million | | | 0.69 | |
Next $200 million | | | 0.66 | |
Next $200 million | | | 0.60 | |
Over $1 billion | | | 0.58 | |
Sub-Adviser Fees. The Manager has retained the Sub-Adviser to provide the day-to-day portfolio management of the Fund. Under the Sub-Advisory Agreement, the Manager pays the Sub-Adviser an annual fee in monthly installments, equal to a percentage of the investment management fee collected by the Manager from the Fund, which shall be calculated after any investment management fee waivers. The fee paid to the Sub-Adviser is paid by the Manager, not by the Fund.
Transfer Agent Fees. OFI Global (the “Transfer Agent”) serves as the transfer and shareholder servicing agent for the Fund. The Fund pays the Transfer Agent a fee based on annual net assets. Fees incurred and average net assets for each class with respect to these services are detailed in the Statement of Operations and Financial Highlights, respectively.
Sub-Transfer Agent Fees. The Transfer Agent has retained Shareholder Services, Inc., a wholly-owned subsidiary of OFI (the “Sub-Transfer Agent”), to provide the day-to-day transfer agent and shareholder servicing of the Fund. Under the Sub-Transfer Agency Agreement, the Transfer Agent pays the Sub-Transfer Agent an annual fee in monthly installments, equal to a percentage of the transfer agent fee collected by the Transfer Agent from the Fund, which shall be calculated after any applicable fee waivers. The fee paid to the Sub-Transfer Agent is paid by the Transfer Agent, not by the Fund.
Distribution and Service Plan for Service Shares. The Fund has adopted a Distribution and Service Plan (the “Plan”) in accordance with Rule 12b-1 under the Investment Company Act of 1940 for Service shares to pay OppenheimerFunds Distributor, Inc. (the “Distributor”), for distribution related services, personal service and account maintenance for the Fund’s Service shares. Under the Plan, payments are made periodically at an annual rate of 0.25% of the daily net assets of Service shares of the Fund. The Distributor currently uses all of those fees to compensate sponsors of the insurance product that offers Fund shares, for providing personal service and maintenance of accounts of their variable contract owners that hold Service shares. These fees are paid out of the Fund’s assets on an on-going basis and increase operating expenses of the Service shares, which results in lower performance compared to the Fund’s shares that are not subject to a service fee. Fees incurred by the Fund under the Plan are detailed in the Statement of Operations.
Waivers and Reimbursements of Expenses. The Manager has contractually agreed to limit the Fund’s expenses after payments, waivers and/or reimbursements and reduction to custodian expenses, excluding expenses incurred directly or indirectly by the Fund as a result of investments in other investment companies, wholly-owned subsidiaries and pooled investment vehicles; so that those expenses, as percentages of daily net assets, will not exceed the annual rate of 0.80% for Non-Service shares and 1.05% for Service shares. During the six months ended June 30, 2014, the Manager waived fees and/or reimbursed the Fund $15,225 and $7,491 for Non-Service and Service shares, respectively.
The Manager will waive fees and/or reimburse Fund expenses in an amount equal to the indirect management fees incurred through the Fund’s investment in IMMF. During the six months ended June 30, 2014, the Manager waived fees and/or reimbursed the Fund $6,469 for IMMF management fees.
Some of these undertakings may be modified or terminated at any time; some may not be modified or terminated until after one year from the date of the current prospectus, as indicated therein.
6. Pending Litigation
In 2009, seven class action lawsuits were filed in the U.S. District Court for the District of Colorado against OppenheimerFunds, Inc. (“OFI”), OppenheimerFunds Distributor, Inc., the Fund’s principal underwriter and distributor (the “Distributor”), and certain funds (but not including the Fund) advised by OFI Global Asset Management, Inc. and distributed by the Distributor (the “Defendant Funds”). The lawsuits also named as defendants certain officers and current and former trustees of the respective Defendant Funds. The lawsuits raised claims under federal securities law and alleged, among other things, that the disclosure documents of the respective Defendant Funds contained misrepresentations and omissions and that the respective Defendant Funds’ investment policies were not followed. The plaintiffs in these actions sought unspecified damages, equitable relief and awards of attorneys’ fees and litigation expenses. The Defendant Funds’ Boards of Trustees also engaged counsel to represent the Funds and the present and former Independent Trustees named in those suits. On March 5, 2014, the parties in six of these lawsuits executed stipulations and agreements of settlement resolving those actions. On July 31, 2014, the court entered an order and final judgment approving the settlements as fair, reasonable and adequate. The settlements do not resolve a seventh outstanding lawsuit relating to Oppenheimer Rochester California Municipal Fund.
Other class action and individual lawsuits have been filed since 2008 in various state and federal courts against OFI and certain of its affiliates by investors seeking to recover investments they allegedly lost as a result of the “Ponzi” scheme run by Bernard L. Madoff and his firm, Bernard L. Madoff Investment Securities, LLC (“BLMIS”). Plaintiffs in these suits allege that they suffered losses as a result of their investments in several funds managed by an affiliate of OFI and assert a variety of claims, including breach of fiduciary duty, fraud, negligent misrepresentation, unjust enrichment, and violation
17 OPPENHEIMER CAPITAL APPRECIATION FUND/VA
NOTES TO FINANCIAL STATEMENTS Unaudited / Continued
6. Pending Litigation (Continued)
of federal and state securities laws and regulations, among others. They seek unspecified damages, equitable relief and awards of attorneys’ fees and litigation expenses. Neither the Distributor, nor any of the Oppenheimer mutual funds, their independent trustees or directors are named as defendants in these lawsuits. None of the Oppenheimer mutual funds invested in any funds or accounts managed by Madoff or BLMIS. On February 28, 2011, a stipulation of partial settlement of three groups of consolidated putative class action lawsuits relating to these matters was filed in the U.S. District Court for the Southern District of New York. On August 19, 2011, the court entered an order and final judgment approving the settlement as fair, reasonable and adequate. In September 2011, certain parties filed notices of appeal from the court’s order approving the settlement. In June 2014, the appellate court affirmed the lower court’s order approving the settlement. Certain parties subsequently filed a petition for certiorari before the U.S. Supreme Court further challenging the settlement approval order. The settlement does not resolve other outstanding lawsuits against OFI and its affiliates relating to BLMIS.
OFI believes the lawsuits and appeals described above are without legal merit and, with the exception of actions it has settled, is defending against them vigorously. While it is premature to render any opinion as to the outcome in these lawsuits, or whether any costs that the Defendant Funds may bear in defending the suits might not be reimbursed by insurance, OFI believes that these suits should not impair the ability of OFI or the Distributor to perform their respective duties to the Fund, and that the outcome of all of the suits together should not have any material effect on the operations of any of the Oppenheimer mutual funds.
18 OPPENHEIMER CAPITAL APPRECIATION FUND/VA
PORTFOLIO PROXY VOTING POLICIES AND PROCEDURES; UPDATES TO
STATEMENTS OF INVESTMENTS Unaudited
The Fund has adopted Portfolio Proxy Voting Policies and Procedures under which the Fund votes proxies relating to securities (“portfolio proxies”) held by the Fund. A description of the Fund’s Portfolio Proxy Voting Policies and Procedures is available (i) without charge, upon request, by calling the Fund toll-free at 1.800.525.7048, (ii) on the Fund’s website at oppenheimerfunds.com, and (iii) on the SEC’s website at www.sec.gov. In addition, the Fund is required to file Form N-PX, with its complete proxy voting record for the 12 months ended June 30th, no later than August 31st of each year. The Fund’s voting record is available (i) without charge, upon request, by calling the Fund toll-free at 1.800.525.7048, and (ii) in the Form N-PX filing on the SEC’s website at www.sec.gov.
The Fund files its complete schedule of portfolio holdings with the SEC for the first quarter and the third quarter of each fiscal year on Form N-Q. The Fund’s Form N-Q filings are available on the SEC’s website at www.sec.gov. Those forms may be reviewed and copied at the SEC’s Public Reference Room in Washington, D.C. Information on the operation of the Public Reference Room may be obtained by calling 1-800-SEC-0330.
19 OPPENHEIMER CAPITAL APPRECIATION FUND/VA
OPPENHEIMER CAPITAL APPRECIATION FUND/VA
A Series of Oppenheimer Variable Account Funds
| | |
| Trustees and Officers | | Sam Freedman, Chairman of the Board of Trustees and Trustee |
| | Edward L. Cameron, Trustee |
| | Jon S. Fossel, Trustee |
| | Richard F. Grabish, Trustee |
| | Beverly L. Hamilton, Trustee |
| | Victoria J. Herget, Trustee |
| | Robert J. Malone, Trustee |
| | F. William Marshall, Jr., Trustee |
| | Karen L. Stuckey, Trustee |
| | James D. Vaughn, Trustee |
| | William F. Glavin, Jr., Trustee, President and Principal Executive Officer |
| | Michael Kotlarz, Vice President |
| | Arthur S. Gabinet, Secretary and Chief Legal Officer |
| | Christina M. Nasta, Vice President and Chief Business Officer |
| | Mary Ann Picciotto, Chief Compliance Officer and Chief Anti-Money Laundering Officer |
| | Brian W. Wixted, Treasurer and Principal Financial & Accounting Officer |
| |
| Manager | | OFI Global Asset Management, Inc. |
| |
| Sub-Adviser | | OppenheimerFunds, Inc. |
| |
| Distributor | | OppenheimerFunds Distributor, Inc. |
| |
Transfer and Shareholder Servicing Agent | | OFI Global Asset Management, Inc. |
| |
| Sub-Transfer Agent | | Shareholder Services, Inc. OppenheimerFunds Services |
| |
Independent Registered Public Accounting Firm | | KPMG LLP |
| |
| Counsel | | K&L Gates LLP |
| |
| | Before investing in any of the Oppenheimer funds, investors should carefully consider a fund’s investment objectives, risks, charges and expenses. Fund prospectuses and summary prospectuses contain this and other information about the funds and may be obtained by asking your financial advisor, visiting oppenheimerfuinds.com or calling us at 1.800.988.8287. Read prospectuses and summary prospectuses carefully before investing. |
| |
| | The financial statements included herein have been taken from the records of the Fund without examination of those records by the independent registered public accounting firm. |
| |
| | © 2014 OppenheimerFunds, Inc. All rights reserved. Oppenheimer funds are distributed by OppenheimerFunds Distributor, Inc. |

Portfolio Managers: Krishna Memani and Peter A. Strzalkowski, CFA
| | | | |
Cumulative Total Returns For the 6-Month Period Ended 6/30/14 | |
Non-Service Shares | | | 5.51% | |
Service Shares | | | 5.29% | |
| | | | | | | | |
Average Annual Total Returns For the Periods Ended 6/30/14 | | |
| | | 1-Year | | 5-Year | | 10-Year | | |
|
Non-Service Shares | | 7.43% | | 9.35% | | 1.03% | | |
Service Shares | | 7.09% | | 9.09% | | 0.77% | | |
Performance data quoted represents past performance, which does not guarantee future results. The investment return and principal value of an investment in the Fund will fluctuate so that an investor’s shares, when redeemed, may be worth more or less than their original cost. Current performance may be lower or higher than the performance quoted. For performance data current to the most recent month end, call us at 1.800.988.8287. The Fund’s total returns should not be expected to be the same as the returns of other funds, whether or not both funds have the same portfolio managers and/or similar names. The Fund’s total returns include changes in share price and reinvested distributions but do not include the charges associated with the separate account products that offer this Fund. Such performance would have been lower if such charges were taken into account.
| | |
CORPORATE BONDS & NOTES - TOP TEN INDUSTRIES |
|
| Commercial Banks | | 5.4% |
|
| Oil, Gas & Consumable Fuels | | 5.0 |
|
| Capital Markets | | 3.4 |
|
| Insurance | | 3.1 |
|
| Media | | 2.5 |
|
| Diversified Telecommunication Services | | 2.3 |
|
| Automobiles | | 2.0 |
|
| Metals & Mining | | 1.6 |
|
| Real Estate Investment Trusts (REITs) | | 1.3 |
|
| Electric Utilities | | 1.2 |
|
| Portfolio holdings and allocations are subject to change. Percentages are as of June 30, 2014, and are based on net assets. |
| | | | | |
CREDIT RATING BREAKDOWN | | NRSRO ONLY TOTAL |
AAA | | 40.2% |
AA | | 6.6 |
A | | 12.2 |
BBB | | 29.6 |
BB | | 7.7 |
B | | 0.4 |
CCC | | 1.4 |
CC | | 0.3 |
D | | 1.4 |
Unrated | | 0.2 |
Total | | 100.0% |
The percentages above are based on the market value of the Fund’s securities as of June 30, 2014, and are subject to change. Except for securities labeled “Unrated” and securities issued or guaranteed by a foreign sovereign or supranational entity, all securities have been rated by at least one Nationally Recognized Statistical Rating Organization (“NRSRO”), such as Standard & Poor’s (“S&P”). For securities rated only by an NRSRO other than S&P, OppenheimerFunds, Inc. (the “Sub-Adviser”) converts that rating to the equivalent S&P rating. If two or more NRSROs have assigned a rating to a security, the highest S&P equivalent rating is used. Unrated securities issued or guaranteed by a foreign sovereign are assigned a credit rating equal to the highest NRSRO rating assigned to that foreign sovereign. For securities not rated by an NRSRO, the Sub-Adviser uses its own credit analysis to assign ratings in categories similar to those of S&P. The use of similar categories is not an indication that the sub-adviser’s credit analysis process is consistent or comparable with any NRSRO’s process were that NRSRO to rate the same security. Fund assets invested in Oppenheimer Institutional Money Market Fund are assigned that fund’s S&P rating, which is currently AAA. For the purposes of this table, “investment-grade” securities are securities rated within the NRSROs’ four highest rating categories (AAA, AA, A and BBB). Unrated securities do not necessarily indicate low credit quality, and may or may not be the equivalent of investment-grade. Please consult the Fund’s prospectus and Statement of Additional Information for further information.
2 OPPENHEIMER CORE BOND FUND/VA
Fund Performance Discussion
The Fund’s Non-Service shares returned 5.51% during the reporting period. On a relative basis, the Barclays U.S. Aggregate Bond Index, the Barclays Credit Index and the Citigroup Broad Investment Grade Bond Index returned 3.93%, 5.70% and 3.90%, respectively. The Fund’s positive absolute performance was driven by its investments in mortgages and corporate bonds.
GLOBAL MARKET AND ECONOMIC ENVIRONMENT
The global economy started 2014 with continued slow and steady growth throughout the developed world. However, data in the U.S. softened for the first quarter, partially attributed to cold weather effects across much of the country. This resulted in heightened volatility across multiple asset classes to begin the year, with U.S. high grade bonds and U.S. Treasuries delivering the strongest returns in January.
However, the U.S. released positive economic data later in the reporting period. The unemployment rate fell to 6.3%, the economy finally regained all of the jobs lost during the 2008 recession, and the U.S. stock market achieved record highs. In June, the U.S. Federal Reserve (the “Fed”) also stated it would reduce the amount of monthly bond purchases by an additional $10 billion and reaffirmed its intention to keep short-term interest rates near zero. Shortly after the reporting period ended, a positive June jobs report was released, in which the official unemployment rate fell to 6.1%, its lowest level since September 2008.
The Eurozone also grew at a slightly faster pace, but has continued to struggle with very low inflation and weak bank lending. In response, the European Central Bank (the “ECB”) announced numerous measures this reporting period, which also bolstered the markets. Measures included a benchmark interest rate cut, the introduction of a negative deposit rate to encourage banks to lend, among various other measures to flood the system with liquidity. Beyond that, the ECB said it would prepare to purchase packages of loans from banks to allow for increased lending.
Against this backdrop, global equities and higher-yielding fixed-income securities generally rallied through the end of the reporting period and outperformed U.S. Treasuries.
FUND REVIEW
The Fund maintained a significant underweight position to government bonds, and instead sourced its exposure primarily through corporate bonds, mortgages and other securitized products. This positioning drove the Fund’s performance during the reporting period, as corporate bond performance versus U.S. Treasuries was strong, with the Barclays Credit Index outperforming the Barclays U.S. Aggregate Bond Index. Given the reporting period was mostly favorable for credit markets and the low default rate environment, the Fund was well positioned given its emphasis on bonds with better than average yields. Overall, the corporate bonds in which the Fund invests continued to perform well during the reporting period. A few stand-outs were from the finance and telecommunications sectors, but overall performance was positive across corporate bond sectors. New issuance provided an opportunity to find attractive yield opportunities. Our modest exposure to high yield bonds in the form of BB corporates also contributed positively to Fund returns during the reporting period.
Among mortgages, the Fund had its largest exposure to government agency mortgage-backed securities (“MBS”), with a smaller allocation to non-agency MBS. The Fund also had positions in collateralized MBS and asset-backed securities (“ABS”). Each of these positions produced positive results this reporting period as they offered relatively attractive yields, sparking greater demand as investors resumed their search for more competitive levels of current income.
Detracting from relative performance this reporting period was the Fund’s modest exposure to U.S. Treasuries, which produced positive returns despite underperforming higher-yielding fixed income securities.
STRATEGY & OUTLOOK
Despite the recent tapering by the Fed, central banks around the globe are executing exceedingly loose monetary policy, which provides plenty of liquidity to the markets. Indeed, policies instituted by the ECB during the reporting period indicate that central banks are determined to provide a strong backstop to the financial system. While U.S. growth slowed rather dramatically over the first half of the reporting period, most signs appear to be pointing towards a rebound in growth for the remainder of 2014. In such an environment, we remain constructive on credit spreads, as the markets become less concerned about potentially negative global macroeconomic events, and instead focus on the fundamental strength of corporate balance sheets.
3 OPPENHEIMER CORE BOND FUND/VA
The Fund’s investment strategy and focus can change over time. The mention of specific fund holdings does not constitute a recommendation by OppenheimerFunds, Inc. or its affiliates.
Shares of Oppenheimer funds are not deposits or obligations of any bank, are not guaranteed by any bank, are not insured by the FDIC or any other agency, and involve investment risks, including the possible loss of the principal amount invested.
4 OPPENHEIMER CORE BOND FUND/VA
Fund Expenses
Fund Expenses. As a shareholder of the Fund, you incur two types of costs: (1) transaction costs and (2) ongoing costs, including management fees; distribution and service fees; and other Fund expenses. These examples are intended to help you understand your ongoing costs (in dollars) of investing in the Fund and to compare these costs with the ongoing costs of investing in other mutual funds.
The examples are based on an investment of $1,000.00 invested at the beginning of the period and held for the entire 6-month period ended June 30, 2014.
Actual Expenses. The first section of the table provides information about actual account values and actual expenses. You may use the information in this section for the class of shares you hold, together with the amount you invested, to estimate the expense that you paid over the period. Simply divide your account value by $1,000.00 (for example, an $8,600.00 account value divided by $1,000.00 = 8.60), then multiply the result by the number in the first section under the heading entitled “Expenses Paid During Period” to estimate the expenses you paid on your account during this period.
Hypothetical Example for Comparison Purposes.
The second section of the table provides information about hypothetical account values and hypothetical expenses based on the Fund’s actual expense ratio for each class of shares, and an assumed rate of return of 5% per year for each class before expenses, which is not the actual return. The hypothetical account values and expenses may not be used to estimate the actual ending account balance or expenses you paid for the period. You may use this information to compare the ongoing costs of investing in the Fund and other funds. To do so, compare this 5% hypothetical example for the class of shares you hold with the 5% hypothetical examples that appear in the shareholder reports of the other funds.
Please note that the expenses shown in the table are meant to highlight your ongoing costs only and do not reflect any charges associated with the separate accounts that offer this Fund. Therefore, the “hypothetical” lines of the table are useful in comparing ongoing costs only, and will not help you determine the relative total costs of owning different funds. In addition, if these separate account charges were included your costs would have been higher.
| | | | | | | | | | | | | | | | | | |
| Actual | | Beginning
Account Value
January 1, 2014 | | | | | Ending
Account
Value
June 30, 2014 | | | | | Expenses
Paid During
6 Months Ended
June 30, 2014 | | | |
Non-Service shares | | $ | 1,000.00 | | | | | $ | 1,055.10 | | | | | $ | 3.78 | | | |
Service shares | | | 1,000.00 | | | | | | 1,052.90 | | | | | | 5.05 | | | |
| | | | | | |
Hypothetical (5% return before expenses) | | | | | | | | | | | | | | | | | | |
Non-Service shares | | | 1,000 .00 | | | | | | 1,021 .12 | | | | | | 3 .72 | | | |
Service shares | | | 1,000 .00 | | | | | | 1,019 .89 | | | | | | 4 .97 | | | |
Expenses are equal to the Fund’s annualized expense ratio for that class, multiplied by the average account value over the period, multiplied by 181/365 (to reflect the one-half year period). Those annualized expense ratios, excluding indirect expenses from affiliated funds, based on the 6-month period ended June 30, 2014 are as follows:
| | |
| Class | | Expense Ratios |
Non-Service shares | | 0.74% |
Service shares | | 0.99 |
The expense ratios reflect voluntary and/or contractual waivers and/or reimbursements of expenses by the Fund’s Manager. Some of these undertakings may be modified or terminated at any time, as indicated in the Fund’s prospectus. The “Financial Highlights” tables in the Fund’s financial statements, included in this report, also show the gross expense ratios, without such waivers or reimbursements and reduction to custodian expenses, if applicable.
5 OPPENHEIMER CORE BOND FUND/VA
| | |
| STATEMENT OF INVESTMENTS June 30, 2014 Unaudited | | |
| | | | | | | | |
| | | Principal
Amount | | | Value | |
| |
| Asset-Backed Securities—18.5% | |
| |
Auto Loan—15.0% | |
| |
| American Credit Acceptance Receivables Trust: | | | | | | | | |
| Series 2012-2,Cl. A, 1.89%, 7/15/161 | | $ | 63,532 | | | $ | 63,675 | |
| Series 2012-3,Cl. A, 1.64%, 11/15/161 | | | 45,672 | | | | 45,769 | |
| Series 2012-3,Cl. C, 2.78%, 9/17/181 | | | 90,000 | | | | 90,825 | |
| Series 2013-2,Cl. B, 2.84%, 5/15/191 | | | 381,000 | | | | 388,166 | |
| Series 2014-1,Cl. B, 2.39%, 11/12/191 | | | 520,000 | | | | 522,671 | |
| Series 2014-2,Cl. A, 0.99%, 10/10/171 | | | 410,325 | | | | 410,383 | |
| Series 2014-2,Cl. B, 2.26%, 3/10/201 | | | 135,000 | | | | 135,058 | |
| |
| AmeriCredit Automobile Receivables Trust: | |
| Series 2012-1,Cl. D, 4.72%, 3/8/18 | | | 155,000 | | | | 163,450 | |
| Series 2012-2,Cl. D, 3.38%, 4/9/18 | | | 700,000 | | | | 727,122 | |
| Series 2012-4,Cl. D, 2.68%, 10/9/18 | | | 75,000 | | | | 77,049 | |
| Series 2012-5,Cl. C, 1.69%, 11/8/18 | | | 255,000 | | | | 257,657 | |
| Series 2012-5,Cl. D, 2.35%, 12/10/18 | | | 365,000 | | | | 371,097 | |
| Series 2013-1,Cl. C, 1.57%, 1/8/19 | | | 420,000 | | | | 421,889 | |
| Series 2013-1,Cl. E, 2.64%, 7/8/201 | | | 135,000 | | | | 137,212 | |
| Series 2013-2,Cl. E, 3.41%, 10/8/201 | | | 345,000 | | | | 352,429 | |
| Series 2013-4,Cl. D, 3.31%, 10/8/19 | | | 30,000 | | | | 31,118 | |
| Series 2013-5,Cl. D, 2.86%, 12/8/19 | | | 625,000 | | | | 637,308 | |
| Series 2014-2,Cl. D, 2.57%, 7/8/20 | | | 190,000 | | | | 191,140 | |
| |
| California Republic Auto Receivables Trust: | |
| Series 2013-2,Cl. C, 3.32%, 8/17/20 | | | 230,000 | | | | 232,787 | |
| Series 2014-2,Cl. C, 3.29%, 3/15/21 | | | 80,000 | | | | 80,129 | |
| |
| Capital Auto Receivables Asset Trust: | |
| Series 2013-1,Cl. D, 2.19%, 9/20/21 | | | 195,000 | | | | 195,729 | |
| Series 2013-4,Cl. D, 3.22%, 5/20/19 | | | 105,000 | | | | 107,531 | |
| Series 2014-1,Cl. D, 3.39%, 7/22/19 | | | 115,000 | | | | 118,192 | |
| |
| CarFinance Capital Auto Trust: | | | | | | | | |
| Series 2013-1A,Cl. A, 1.65%, 7/17/171 | | | 66,271 | | | | 66,488 | |
| Series 2013-2A,Cl. B, 3.15%, 8/15/191 | | | 530,000 | | | | 537,941 | |
| Series 2014-1A,Cl. A, 1.46%, 12/17/181 | | | 141,656 | | | | 141,725 | |
| |
| CarMax Auto Owner Trust, Series 2014-2, Cl. D, 2.58%, 11/16/20 | | | 285,000 | | | | 285,952 | |
| |
| Centre Point Funding LLC, Series 2010-1A, Cl. 1, 5.43%, 7/20/161 | | | 46,442 | | | | 47,516 | |
| |
| CPS Auto Receivables Trust: | |
| Series 2012-B,Cl. A, 2.52%, 9/16/191 | | | 265,185 | | | | 269,128 | |
| Series 2014-A,Cl. A, 1.21%, 8/15/181 | | | 464,812 | | | | 464,170 | |
| Series 2014-B,Cl. A, 1.11%, 11/15/181 | | | 235,000 | | | | 235,250 | |
| |
| Credit Acceptance Auto Loan Trust: | |
| Series 2012-2A,Cl. B, 2.21%, 9/15/201 | | | 80,000 | | | | 81,085 | |
| Series 2013-1A,Cl. B, 1.83%, 4/15/211 | | | 235,000 | | | | 237,146 | |
| Series 2013-2A,Cl. B, 2.26%, 10/15/212 | | | 260,000 | | | | 263,541 | |
| Series 2014-1A,Cl. B, 2.29%, 4/15/221 | | | 200,000 | | | | 201,914 | |
| |
| DT Auto Owner Trust: | |
| Series 2012-1A,Cl. D, 4.94%, 7/16/181 | | | 25,000 | | | | 25,490 | |
| Series 2013-1A,Cl. D, 3.74%, 5/15/201 | | | 175,000 | | | | 178,555 | |
| Series 2013-2A,Cl. D, 4.18%, 6/15/201 | | | 485,000 | | | | 499,501 | |
| Series 2014-1A,Cl. D, 3.98%, 1/15/211 | | | 360,000 | | | | 365,260 | |
| Series 2014-2A,Cl. D, 3.68%, 4/15/211 | | | 525,000 | | | | 526,228 | |
| |
| Exeter Automobile Receivables Trust: | |
| Series 2012-2A,Cl. B, 2.22%, 12/15/171 | | | 205,000 | | | | 207,484 | |
| Series 2012-2A,Cl. C, 3.06%, 7/16/181 | | | 35,000 | | | | 35,762 | |
| Series 2013-2A,Cl. B, 3.09%, 7/16/181 | | | 595,000 | | | | 609,978 | |
| Series 2013-2A,Cl. C, 4.35%, 1/15/191 | | | 405,000 | | | | 421,812 | |
| Series 2014-1A,Cl. B, 2.42%, 1/15/191 | | | 230,000 | | | | 232,055 | |
| Series 2014-1A,Cl. C, 3.57%, 7/15/191 | | | 230,000 | | | | 236,755 | |
| Series 2014-2A,Cl. A, 1.06%, 8/15/181 | | | 110,000 | | | | 110,007 | |
| Series 2014-2A,Cl. C, 3.26%, 12/16/191 | | | 110,000 | | | | 110,731 | |
| |
| First Investors Auto Owner Trust: | |
| Series 2012-1A,Cl. C, 3.54%, 11/15/171 | | | 60,000 | | | | 61,558 | |
| Series 2012-1A,Cl. D, 5.65%, 4/15/181 | | | 155,000 | | | | 162,896 | |
| Series 2013-3A,Cl. B, 2.32%, 10/15/191 | | | 385,000 | | | | 389,567 | |
| Series 2013-3A,Cl. C, 2.91%, 1/15/201 | | | 165,000 | | | | 168,050 | |
| Series 2013-3A,Cl. D, 3.67%, 5/15/201 | | | 125,000 | | | | 128,326 | |
| Series 2014-1A,Cl. D, 3.28%, 4/15/211 | | | 225,000 | | | | 227,012 | |
| |
| Flagship Credit Auto Trust, Series 2014-1, Cl. A, 1.21%, 4/15/191 | | | 216,627 | | | | 216,689 | |
| | | | | | | | |
| | | Principal
Amount | | | Value | |
| |
Auto Loan (Continued) | |
| |
| Ford Credit Auto Owner Trust, Series 2013-A, Cl. D, 1.86%, 8/15/19 | | $ | 280,000 | | | $ | 278,899 | |
| |
| Ford Credit Floorplan Master Owner Trust A, Series 2012-2, Cl. C, 2.86%, 1/15/19 | | | 295,000 | | | | 305,942 | |
| |
| GM Financial Automobile Leasing Trust, Series 2014-1A, Cl. D, 2.51%, 3/20/191 | | | 545,000 | | | | 546,888 | |
| |
| Navistar Financial Dealer Note Master Trust, Series 2013-2, Cl. D, 2.402%, 9/25/181,3 | | | 385,000 | | | | 385,611 | |
| |
| Prestige Auto Receivables Trust, Series 2011-1A, Cl. D, 5.18%, 7/16/181 | | | 180,000 | | | | 183,021 | |
| |
| Santander Drive Auto Receivables Trust: | |
| Series 2012-4,Cl. D, 3.50%, 6/15/18 | | | 680,000 | | | | 706,876 | |
| Series 2012-5,Cl. D, 3.30%, 9/17/18 | | | 835,000 | | | | 868,741 | |
| Series 2012-6,Cl. D, 2.52%, 9/17/18 | | | 880,000 | | | | 900,699 | |
| Series 2012-AA,Cl. D, 2.46%, 12/17/181 | | | 480,000 | | | | 488,301 | |
| Series 2013-1,Cl. C, 1.76%, 1/15/19 | | | 455,000 | | | | 459,316 | |
| Series 2013-1,Cl. D, 2.27%, 1/15/19 | | | 240,000 | | | | 243,328 | |
| Series 2013-2,Cl. D, 2.57%, 3/15/19 | | | 325,000 | | | | 332,509 | |
| Series 2013-3,Cl. C, 1.81%, 4/15/19 | | | 100,000 | | | | 100,674 | |
| Series 2013-3,Cl. D, 2.42%, 4/15/19 | | | 215,000 | | | | 218,539 | |
| Series 2013-4,Cl. D, 3.92%, 1/15/20 | | | 110,000 | | | | 116,512 | |
| Series 2013-5,Cl. C, 2.25%, 6/17/19 | | | 35,000 | | | | 35,350 | |
| Series 2013-5,Cl. D, 2.73%, 10/15/19 | | | 330,000 | | | | 336,874 | |
| Series 2013-A,Cl. C, 3.12%, 10/15/191 | | | 780,000 | | | | 805,703 | |
| Series 2014-1,Cl. D, 2.91%, 4/15/20 | | | 160,000 | | | | 163,655 | |
| |
| SNAAC Auto Receivables Trust: | |
| Series 2012-1A,Cl. C, 4.38%, 6/15/171 | | | 190,000 | | | | 193,063 | |
| Series 2013-1A,Cl. C, 3.07%, 8/15/181 | | | 145,000 | | | | 148,179 | |
| Series 2014-1A,Cl. A, 1.03%, 9/17/181 | | | 183,216 | | | | 183,288 | |
| Series 2014-1A,Cl. D, 2.88%, 1/15/201 | | | 140,000 | | | | 140,734 | |
| |
| United Auto Credit Securitization Trust: | |
| Series 2012-1,Cl. C, 2.52%, 3/15/161 | | | 190,000 | | | | 190,962 | |
| Series 2012-1,Cl. D, 3.12%, 3/15/181 | | | 135,000 | | | | 135,952 | |
| Series 2013-1,Cl. B, 1.74%, 4/15/161 | | | 230,000 | | | | 230,941 | |
| Series 2013-1,Cl. C, 2.22%, 12/15/171 | | | 145,000 | | | | 146,013 | |
| Series 2013-1,Cl. D, 2.90%, 12/15/171 | | | 30,000 | | | | 30,280 | |
| |
Westlake Automobile Receivables Trust, Series 2014-1A, Cl. D, 2.20%, 2/15/211 | | | 155,000 | | | | 154,929 | |
| | | | | | | | |
| | | | 22,535,737 | |
|
| |
Credit Card—2.1% | | | | | | | | |
| |
| Capital One Multi-Asset Execution Trust: | |
| Series 2006-A11,Cl. A11, 0.242%, 6/17/193 | | | 495,000 | | | | 493,579 | |
| Series 2006-A3,Cl. A3, 5.05%, 12/17/18 | | | 535,000 | | | | 573,254 | |
| |
| Chase Issuance Trust, Series 2012-A3, Cl. A3, 0.79%, 6/15/17 | | | 465,000 | | | | 466,802 | |
| |
| Citibank Credit Card Issuance Trust: | |
| Series 2013-A11,Cl. A11, 0.391%, 2/7/183 | | | 300,000 | | | | 300,338 | |
| Series 2013-A6,Cl. A6, 1.32%, 9/7/18 | | | 505,000 | | | | 510,081 | |
| |
| GE Capital Credit Card Master Note Trust: | |
| Series 2010-1,Cl. A, 3.69%, 3/15/18 | | | 370,000 | | | | 378,270 | |
| Series 2012-1,Cl. A, 1.03%, 1/15/18 | | | 385,000 | | | | 386,190 | |
| | | | | | | | |
| | | | 3,108,514 | |
|
| |
Equipment—0.3% | | | | | | | | |
| |
| CLI Funding V LLC, Series 2014-1A, Cl. A, 3.29%, 6/18/291 | | | 310,000 | | | | 311,847 | |
| |
| FRS I LLC, Series 2013-1A, Cl. A1, 1.80%, 4/15/431 | | | 92,999 | | | | 92,699 | |
| |
| Trip Rail Master Funding LLC, Series 2014-1A, Cl. A1, 2.863%, 4/15/441 | | | 99,388 | | | | 100,114 | |
| | | | | | | | |
| | | | 504,660 | |
|
| |
Home Equity Loan—1.1% | | | | | | | | |
| |
| Element Rail Leasing I LLC, Series 2014-1A, Cl. A1, 2.299%, 4/19/441 | | | 307,237 | | | | 307,218 | |
| |
| New Residential Advance Receivables Trust: | |
| Series 2014-T1,Cl. A1, 1.274%, 3/15/451 | | | 405,000 | | | | 405,523 | |
| Series 2014-T1,Cl. B1, 1.671%, 3/15/451 | | | 350,000 | | | | 350,277 | |
| |
| TAL Advantage LLC: | | | | | | | | |
| Series 2014-1A,Cl. A, 3.51%, 2/22/391 | | | 372,167 | | | | 378,557 | |
6 OPPENHEIMER CORE BOND FUND/VA
| | | | | | | | |
| | | Principal
Amount | | | Value | |
| |
Home Equity Loan (Continued) | |
| |
| TAL Advantage LLC: (Continued) | |
| Series 2014-2A,Cl. A1, 1.70%, 5/20/391 | | $ | 127,235 | | | $ | 127,381 | |
| | | | | | | | |
| | | | 1,568,956 | |
| | | | | | | | |
| Total Asset-Backed Securities (Cost $27,447,599) | | | | | | | 27,717,867 | |
|
| |
| Mortgage-Backed Obligations—55.5% | |
| |
Government Agency—41.9% | |
| |
FHLMC/FNMA/FHLB/Sponsored—41.7% | |
| |
| Federal Home Loan Mortgage Corp. Gold Pool: | |
| 5.00%, 12/1/34 | | | 7,392 | | | | 8,211 | |
| 5.50%, 9/1/39 | | | 685,652 | | | | 772,957 | |
| 6.00%, 5/1/18-10/1/29 | | | 1,089,099 | | | | 1,220,156 | |
| 6.50%, 4/1/18-4/1/34 | | | 276,391 | | | | 307,432 | |
| 7.00%, 8/1/16-10/1/37 | | | 326,295 | | | | 375,459 | |
| 8.00%, 4/1/16 | | | 36,472 | | | | 37,460 | |
| 9.00%, 8/1/22-5/1/25 | | | 28,594 | | | | 31,437 | |
| |
| Federal Home Loan Mortgage Corp. Non Gold Pool, 10.50%, 10/1/20 | | | 1,808 | | | | 2,055 | |
| |
| Federal Home Loan Mortgage Corp., Interest-Only Stripped Mtg.-Backed Security: | |
| Series 205,Cl. IO, 13.035%, 9/1/294 | | | 10,561 | | | | 2,497 | |
| Series 206,Cl. IO, 0.00%, 12/1/294,5 | | | 156,559 | | | | 43,654 | |
| Series 243,Cl. 6, 0.00%, 12/15/324,5 | | | 128,655 | | | | 25,874 | |
| |
| Federal Home Loan Mortgage Corp., Principal-Only Stripped Mtg.-Backed Security, Series 176, Cl. PO, 4.029%, 6/1/266 | | | 57,638 | | | | 55,058 | |
| |
| Federal Home Loan Mortgage Corp., Real Estate Mtg. Investment Conduit Multiclass Pass-Through Certificates: | |
| Series 151,Cl. F, 9.00%, 5/15/21 | | | 7,277 | | | | 8,049 | |
| Series 1674,Cl. Z, 6.75%, 2/15/24 | | | 22,996 | | | | 25,679 | |
| Series 2034,Cl. Z, 6.50%, 2/15/28 | | | 2,956 | | | | 3,304 | |
| Series 2042,Cl. N, 6.50%, 3/15/28 | | | 7,637 | | | | 8,576 | |
| Series 2043,Cl. ZP, 6.50%, 4/15/28 | | | 368,416 | | | | 415,892 | |
| Series 2046,Cl. G, 6.50%, 4/15/28 | | | 22,663 | | | | 25,503 | |
| Series 2053,Cl. Z, 6.50%, 4/15/28 | | | 3,644 | | | | 4,075 | |
| Series 2066,Cl. Z, 6.50%, 6/15/28 | | | 424,985 | | | | 472,037 | |
| Series 2195,Cl. LH, 6.50%, 10/15/29 | | | 300,660 | | | | 337,212 | |
| Series 2220,Cl. PD, 8.00%, 3/15/30 | | | 1,913 | | | | 2,225 | |
| Series 2326,Cl. ZP, 6.50%, 6/15/31 | | | 78,126 | | | | 88,140 | |
| Series 2461,Cl. PZ, 6.50%, 6/15/32 | | | 363,409 | | | | 409,461 | |
| Series 2470,Cl. LF, 1.152%, 2/15/323 | | | 2,845 | | | | 2,924 | |
| Series 2500,Cl. FD, 0.652%, 3/15/323 | | | 84,431 | | | | 85,364 | |
| Series 2526,Cl. FE, 0.552%, 6/15/293 | | | 112,046 | | | | 112,886 | |
| Series 2538,Cl. F, 0.752%, 12/15/323 | | | 314,839 | | | | 318,726 | |
| Series 2551,Cl. FD, 0.552%, 1/15/333 | | | 67,775 | | | | 68,210 | |
| Series 2635,Cl. AG, 3.50%, 5/15/32 | | | 53,709 | | | | 56,300 | |
| Series 2707,Cl. QE, 4.50%, 11/15/18 | | | 31,363 | | | | 33,275 | |
| Series 2770,Cl. TW, 4.50%, 3/15/19 | | | 18,910 | | | | 20,140 | |
| Series 3025,Cl. SJ, 24.194%, 8/15/353 | | | 31,467 | | | | 47,129 | |
| Series 3030,Cl. FL, 0.552%, 9/15/353 | | | 4,441 | | | | 4,452 | |
| Series 3645,Cl. EH, 3.00%, 12/15/20 | | | 164,832 | | | | 170,809 | |
| Series 3741,Cl. PA, 2.15%, 2/15/35 | | | 401,110 | | | | 410,470 | |
| Series 3815,Cl. BD, 3.00%, 10/15/20 | | | 11,109 | | | | 11,442 | |
| Series 3822,Cl. JA, 5.00%, 6/15/40 | | | 16,081 | | | | 17,200 | |
| Series 3840,Cl. CA, 2.00%, 9/15/18 | | | 8,199 | | | | 8,345 | |
| Series 3848,Cl. WL, 4.00%, 4/15/40 | | | 61,712 | | | | 63,912 | |
| Series 3857,Cl. GL, 3.00%, 5/15/40 | | | 12,270 | | | | 12,602 | |
| Series 4221,Cl. HJ, 1.50%, 7/15/23 | | | 143,383 | | | | 143,751 | |
| |
| Federal Home Loan Mortgage Corp., Real Estate Mtg. Investment Conduit Multiclass Pass-Through Certificates, Interest-Only Stripped Mtg.-Backed Security: | |
| Series 2074,Cl. S, 50.109%, 7/17/284 | | | 2,300 | | | | 477 | |
| Series 2079,Cl. S, 19.45%, 7/17/284 | | | 4,338 | | | | 917 | |
| Series 2130,Cl. SC, 52.223%, 3/15/294 | | | 170,755 | | | | 42,326 | |
| Series 2526,Cl. SE, 30.826%, 6/15/294 | | | 5,060 | | | | 1,107 | |
| Series 2796,Cl. SD, 52.556%, 7/15/264 | | | 256,934 | | | | 58,750 | |
| Series 2920,Cl. S, 54.746%, 1/15/354 | | | 935,305 | | | | 166,504 | |
| Series 2922,Cl. SE, 6.889%, 2/15/354 | | | 111,338 | | | | 20,088 | |
| Series 3004,Cl. SB, 0.00%, 7/15/354,5 | | | 49,024 | | | | 7,523 | |
| Series 3201,Cl. SG, 4.792%, 8/15/364 | | | 279,176 | | | | 48,298 | |
| Series 3397,Cl. GS, 14.721%, 12/15/374 | | | 22,846 | | | | 4,239 | |
| Series 3424,Cl. EI, 8.548%, 4/15/384 | | | 34,881 | | | | 4,879 | |
| | | | | | | | |
| | | Principal
Amount | | | Value | |
| |
FHLMC/FNMA/FHLB/Sponsored (Continued) | |
| |
| Federal Home Loan Mortgage Corp., Real Estate Mtg. Investment Conduit Multiclass Pass-Through Certificates, Interest-Only Stripped Mtg.-Backed Security: (Continued) | |
| Series 3450,Cl. BI, 11.827%, 5/15/384 | | $ | 611,499 | | | $ | 90,523 | |
| Series 3606,Cl. SN, 3.74%, 12/15/394 | | | 164,757 | | | | 23,261 | |
| |
| Federal National Mortgage Assn.: | |
| 2.50%, 6/18/277 | | | 2,420,000 | | | | 2,458,947 | |
| 3.00%, 7/1/277 | | | 1,700,000 | | | | 1,766,406 | |
| 3.50%, 7/17/277 | | | 2,335,000 | | | | 2,475,465 | |
| 4.00%, 7/1/28-7/1/417 | | | 17,470,000 | | | | 18,546,141 | |
| 4.50%, 7/1/397 | | | 8,280,000 | | | | 8,969,571 | |
| 5.00%, 7/1/377 | | | 10,465,000 | | | | 11,622,694 | |
| 6.00%, 7/1/377 | | | 160,000 | | | | 180,250 | |
| |
| Federal National Mortgage Assn. Pool: | |
| 3.50%, 12/1/20-2/1/22 | | | 347,870 | | | | 369,279 | |
| 5.00%, 3/1/21-7/1/22 | | | 26,097 | | | | 27,794 | |
| 5.50%, 2/1/35-5/1/36 | | | 279,752 | | | | 314,731 | |
| 6.50%, 5/1/17-1/1/34 | | | 371,080 | | | | 391,621 | |
| 7.00%, 11/1/17-7/1/35 | | | 149,810 | | | | 163,034 | |
| 7.50%, 1/1/33 | | | 6,775 | | | | 7,997 | |
| 8.50%, 7/1/32 | | | 14,793 | | | | 17,034 | |
| |
| Federal National Mortgage Assn., Interest-Only Stripped Mtg.-Backed Security: | |
| Series 221,Cl. 2, 41.927%, 5/1/234 | | | 3,915 | | | | 771 | |
| Series 222,Cl. 2, 20.145%, 6/1/234 | | | 406,279 | | | | 81,955 | |
| Series 252,Cl. 2, 40.351%, 11/1/234 | | | 399,364 | | | | 80,808 | |
| Series 294,Cl. 2, 12.13%, 2/1/284 | | | 42,747 | | | | 10,159 | |
| Series 301,Cl. 2, 0.00%, 4/1/294,5 | | | 3,921 | | | | 819 | |
| Series 303,Cl. IO, 9.597%, 11/1/294 | | | 74,573 | | | | 16,263 | |
| Series 320,Cl. 2, 7.208%, 4/1/324 | | | 286,025 | | | | 65,254 | |
| Series 321,Cl. 2, 0.00%, 4/1/324,5 | | | 799,271 | | | | 168,001 | |
| Series 324,Cl. 2, 0.00%, 7/1/324,5 | | | 8,384 | | | | 1,768 | |
| Series 331,Cl. 5, 0.00%, 2/1/334,5 | | | 11,878 | | | | 2,562 | |
| Series 331,Cl. 9, 5.184%, 2/1/334 | | | 243,075 | | | | 59,405 | |
| Series 334,Cl. 12, 0.00%, 3/1/334,5 | | | 19,999 | | | | 4,213 | |
| Series 334,Cl. 17, 12.538%, 2/1/334 | | | 167,209 | | | | 38,865 | |
| Series 339,Cl. 12, 0.00%, 6/25/334,5 | | | 283,345 | | | | 56,804 | |
| Series 339,Cl. 7, 0.00%, 11/25/334,5 | | | 606,165 | | | | 121,494 | |
| Series 343,Cl. 13, 0.00%, 9/1/334,5 | | | 272,789 | | | | 50,018 | |
| Series 343,Cl. 18, 0.00%, 5/1/344,5 | | | 72,508 | | | | 13,545 | |
| Series 345,Cl. 9, 0.00%, 1/1/344,5 | | | 194,761 | | | | 41,373 | |
| Series 351,Cl. 10, 0.00%, 4/1/344,5 | | | 98,100 | | | | 18,369 | |
| Series 351,Cl. 8, 0.00%, 4/1/344,5 | | | 158,797 | | | | 29,531 | |
| Series 356,Cl. 10, 0.00%, 6/1/354,5 | | | 118,204 | | | | 21,890 | |
| Series 356,Cl. 12, 0.00%, 2/1/354,5 | | | 57,804 | | | | 10,762 | |
| Series 362,Cl. 13, 0.00%, 8/1/354,5 | | | 216,331 | | | | 39,315 | |
| Series 364,Cl. 15, 0.00%, 9/1/354,5 | | | 11,523 | | | | 2,077 | |
| Series 364,Cl. 16, 0.00%, 9/1/354,5 | | | 233,202 | | | | 43,342 | |
| Series 365,Cl. 16, 0.00%, 3/1/364,5 | | | 355,590 | | | | 66,413 | |
| |
| Federal National Mortgage Assn., Real Estate Mtg. Investment Conduit Multiclass Pass-Through Certificates: | |
| Series 1993-87,Cl. Z, 6.50%, 6/25/23 | | | 284,162 | | | | 317,899 | |
| Series 1998-58,Cl. PC, 6.50%, 10/25/28 | | | 217,910 | | | | 244,797 | |
| Series 1998-61,Cl. PL, 6.00%, 11/25/28 | | | 105,367 | | | | 116,621 | |
| Series 1999-54,Cl. LH, 6.50%, 11/25/29 | | | 179,822 | | | | 199,650 | |
| Series 2001-44,Cl. QC, 6.00%, 9/25/16 | | | 5,398 | | | | 5,614 | |
| Series 2001-51,Cl. OD, 6.50%, 10/25/31 | | | 13,981 | | | | 15,447 | |
| Series 2001-74,Cl. QE, 6.00%, 12/25/31 | | | 267,764 | | | | 297,465 | |
| Series 2002-12,Cl. PG, 6.00%, 3/25/17 | | | 3,167 | | | | 3,318 | |
| Series 2003-28,Cl. KG, 5.50%, 4/25/23 | | | 2,207,902 | | | | 2,410,701 | |
| Series 2003-84,Cl. GE, 4.50%, 9/25/18 | | | 16,195 | | | | 17,052 | |
| Series 2004-101,Cl. BG, 5.00%, 1/25/20 | | | 394,862 | | | | 411,277 | |
| Series 2004-25,Cl. PC, 5.50%, 1/25/34 | | | 11,542 | | | | 12,309 | |
| Series 2005-73,Cl. DF, 0.402%, 8/25/353 | | | 16,167 | | | | 16,190 | |
| Series 2006-11,Cl. PS, 24.009%, 3/25/363 | | | 155,020 | | | | 238,996 | |
| Series 2006-46,Cl. SW, 23.642%, 6/25/363 | | | 114,258 | | | | 160,874 | |
| Series 2006-50,Cl. KS, 23.643%, 6/25/363 | | | 166,490 | | | | 255,429 | |
| Series 2008-14,Cl. BA, 4.25%, 3/25/23 | | | 53,357 | | | | 56,019 | |
| Series 2008-75,Cl. DB, 4.50%, 9/25/23 | | | 104,231 | | | | 109,906 | |
| Series 2009-113,Cl. DB, 3.00%, 12/25/20 | | | 345,053 | | | | 355,582 | |
| Series 2009-36,Cl. FA, 1.092%, 6/25/373 | | | 157,045 | | | | 160,454 | |
| Series 2009-70,Cl. NT, 4.00%, 8/25/19 | | | 7,386 | | | | 7,709 | |
| Series 2009-70,Cl. TL, 4.00%, 8/25/19 | | | 164,130 | | | | 171,306 | |
7 OPPENHEIMER CORE BOND FUND/VA
| | |
| STATEMENT OF INVESTMENTS Unaudited / Continued | | |
| | | | | | | | |
| | | Principal
Amount | | | Value | |
| |
FHLMC/FNMA/FHLB/Sponsored (Continued) | |
| |
| Federal National Mortgage Assn., Real Estate Mtg. Investment Conduit Multiclass Pass-Through Certificates: (Continued) | |
| Series 2010-43,Cl. KG, 3.00%, 1/25/21 | | $ | 93,150 | | | $ | 96,559 | |
| Series 2011-3,Cl. EL, 3.00%, 5/25/20 | | | 582,223 | | | | 600,037 | |
| Series 2011-38,Cl. AH, 2.75%, 5/25/20 | | | 9,714 | | | | 10,000 | |
| Series 2011-82,Cl. AD, 4.00%, 8/25/26 | | | 181,215 | | | | 190,040 | |
| |
| Federal National Mortgage Assn., Real Estate Mtg. Investment Conduit Multiclass Pass-Through Certificates, Interest-Only Stripped Mtg.-Backed Security: | |
| Series 2001-61,Cl. SH, 28.043%, 11/18/314 | | | 10,074 | | | | 2,229 | |
| Series 2001-63,Cl. SD, 29.095%, 12/18/314 | | | 3,711 | | | | 753 | |
| Series 2001-65,Cl. S, 27.485%, 11/25/314 | | | 252,755 | | | | 54,379 | |
| Series 2001-68,Cl. SC, 19.665%, 11/25/314 | | | 2,309 | | | | 508 | |
| Series 2001-81,Cl. S, 24.331%, 1/25/324 | | | 74,846 | | | | 19,680 | |
| Series 2002-28,Cl. SA, 33.645%, 4/25/324 | | | 2,327 | | | | 501 | |
| Series 2002-38,Cl. SO, 45.432%, 4/25/324 | | | 6,350 | | | | 1,263 | |
| Series 2002-39,Cl. SD, 36.459%, 3/18/324 | | | 4,199 | | | | 1,137 | |
| Series 2002-47,Cl. NS, 30.035%, 4/25/324 | | | 231,569 | | | | 51,649 | |
| Series 2002-48,Cl. S, 29.314%, 7/25/324 | | | 3,846 | | | | 1,033 | |
| Series 2002-51,Cl. S, 30.251%, 8/25/324 | | | 212,581 | | | | 47,414 | |
| Series 2002-52,Cl. SD, 34.513%, 9/25/324 | | | 295,504 | | | | 80,441 | |
| Series 2002-52,Cl. SL, 31.826%, 9/25/324 | | | 2,405 | | | | 536 | |
| Series 2002-53,Cl. SK, 31.677%, 4/25/324 | | | 14,629 | | | | 4,044 | |
| Series 2002-56,Cl. SN, 31.059%, 7/25/324 | | | 5,244 | | | | 1,409 | |
| Series 2002-60,Cl. SM, 29.258%, 8/25/324 | | | 34,130 | | | | 6,504 | |
| Series 2002-7,Cl. SK, 25.751%, 1/25/324 | | | 15,921 | | | | 3,235 | |
| Series 2002-77,Cl. BS, 23.872%, 12/18/324 | | | 21,404 | | | | 5,481 | |
| Series 2002-77,Cl. IS, 40.934%, 12/18/324 | | | 10,818 | | | | 2,976 | |
| Series 2002-77,Cl. SH, 31.503%, 12/18/324 | | | 110,397 | | | | 24,424 | |
| Series 2002-84,Cl. SA, 33.714%, 12/25/324 | | | 253,598 | | | | 64,791 | |
| Series 2002-9,Cl. MS, 25.371%, 3/25/324 | | | 4,020 | | | | 813 | |
| Series 2002-90,Cl. SN, 30.366%, 8/25/324 | | | 17,558 | | | | 3,348 | |
| Series 2002-90,Cl. SY, 36.017%, 9/25/324 | | | 12,692 | | | | 2,414 | |
| Series 2003-26,Cl. DI, 6.873%, 4/25/334 | | | 11,157 | | | | 2,303 | |
| Series 2003-33,Cl. SP, 28.151%, 5/25/334 | | | 262,269 | | | | 52,566 | |
| Series 2003-4,Cl. S, 29.838%, 2/25/334 | | | 169,597 | | | | 44,433 | |
| Series 2004-54,Cl. DS, 39.025%, 11/25/304 | | | 208,692 | | | | 39,503 | |
| Series 2005-12,Cl. SC, 9.023%, 3/25/354 | | | 55,913 | | | | 11,840 | |
| Series 2005-14,Cl. SE, 37.014%, 3/25/354 | | | 167,216 | | | | 26,080 | |
| Series 2005-40,Cl. SA, 48.646%, 5/25/354 | | | 481,991 | | | | 100,470 | |
| Series 2005-40,Cl. SB, 53.344%, 5/25/354 | | | 22,791 | | | | 4,696 | |
| Series 2005-52,Cl. JH, 1.85%, 5/25/354 | | | 116,462 | | | | 18,408 | |
| Series 2005-93,Cl. SI, 10.794%, 10/25/354 | | | 394,847 | | | | 63,481 | |
| Series 2008-55,Cl. SA, 15.959%, 7/25/384 | | | 37,786 | | | | 5,305 | |
| Series 2009-8,Cl. BS, 0.00%, 2/25/244,5 | | | 182,709 | | | | 13,735 | |
| Series 2012-40,Cl. PI, 1.527%, 4/25/414 | | | 205,116 | | | | 34,878 | |
| |
| Federal National Mortgage Assn., Real Estate Mtg. Investment Conduit Multiclass Pass-Through Certificates, Principal-Only Stripped Mtg.-Backed Security, Series 1993-184, Cl. M, 4.871%, 9/25/236 | | | 128,118 | | | | 123,985 | |
| | | | | | | | |
| | | | 62,499,868 | |
|
| |
GNMA/Guaranteed—0.2% | | | | | | | | |
| |
| Government National Mortgage Assn. I Pool: | |
| 7.00%, 12/15/23-3/15/26 | | | 13,134 | | | | 14,590 | |
| 8.50%, 8/15/17-12/15/17 | | | 35,263 | | | | 37,593 | |
| |
| Government National Mortgage Assn., Interest-Only Stripped Mtg.-Backed Security: | |
| Series 2002-15,Cl. SM, 62.628%, 2/16/324 | | | 355,553 | | | | 65,146 | |
| Series 2007-17,Cl. AI, 13.767%, 4/16/374 | | | 107,955 | | | | 19,939 | |
| Series 2011-52,Cl. HS, 9.553%, 4/16/414 | | | 724,275 | | | | 142,104 | |
| |
| Government National Mortgage Assn., Real Estate Mtg. Investment Conduit Multiclass Pass-Through Certificates: | |
| Series 1999-32,Cl. ZB, 8.00%, 9/16/29 | | | 49,967 | | | | 59,192 | |
| Series 2000-7,Cl. Z, 8.00%, 1/16/30 | | | 18,794 | | | | 21,801 | |
| | | | | | | | |
| | | | 360,365 | |
|
| |
Non-Agency—13.6% | | | | | | | | |
| |
Commercial—11.7% | | | | | | | | |
| |
| Asset Securitization Corp., Interest-Only Stripped Mtg.-Backed Security, Series 1997-D4, Cl. PS1, 0%, 4/14/294,5 | | | 1,762,644 | | | | 70,359 | |
| | | | | | | | |
| | | Principal
Amount | | | Value | |
| |
Commercial (Continued) | |
| |
| Banc of America Commercial Mortgage Trust: | |
| Series 2006-5,Cl. AM, 5.448%, 9/10/47 | | $ | 425,000 | | | $ | 457,495 | |
| Series 2006-6,Cl. AM, 5.39%, 10/10/45 | | | 685,000 | | | | 740,206 | |
| |
| BCAP LLC Trust, Series 2011-R11, Cl. 18A5, 2.20%, 9/26/351,3 | | | 272,219 | | | | 279,946 | |
| |
| Bear Stearns Adjustable Rate Mortgage Trust, Series 2005-9, Cl. A1, 2.41%, 10/25/353 | | | 297,690 | | | | 295,731 | |
| |
| Bear Stearns Commercial Mortgage Securities Trust, Series 2006-T24, Cl. AM, 5.568%, 10/12/413 | | | 295,000 | | | | 320,852 | |
| |
| Capital Lease Funding Securitization LP, Interest-Only Commercial Mtg. Pass-Through Certificates, Series 1997-CTL1, Cl. IO, 0%, 6/22/242,4,5 | | | 1,653,585 | | | | 73,947 | |
| |
CD Commercial Mortgage Trust, Series 2006-CD2, Cl. AM, 5.527%, 1/15/463 | | | 420,000 | | | | 446,176 | |
| |
| Citigroup Commercial Mortgage Trust: | |
| Series 2008-C7,Cl. AM, 6.341%, 12/10/493 | | | 410,000 | | | | 460,739 | |
| Series 2013-GC11,Cl. D, 4.606%, 4/10/461,3 | | | 160,000 | | | | 150,399 | |
| |
| Citigroup Mortgage Loan Trust, Inc., Series 2006-AR1, Cl. 1A1, 2.50%, 10/25/353 | | | 510,732 | | | | 502,985 | |
| |
| COMM Mortgage Trust: | | | | | | | | |
| Series 2006-C7,Cl. AM, 5.97%, 6/10/463 | | | 695,000 | | | | 748,050 | |
| Series 2012-CR4,Cl. D, 4.729%, 10/15/451,3 | | | 50,000 | | | | 48,840 | |
| Series 2012-CR5,Cl. E, 4.48%, 12/10/451,3 | | | 75,000 | | | | 71,937 | |
| Series 2013-CR7,Cl. D, 4.496%, 3/10/461,3 | | | 175,000 | | | | 163,644 | |
| |
| COMM Mortgage Trust, Interest-Only Stripped Mtg.-Backed Security: | |
| Series 2010-C1,Cl. XPA, 0.00%, 7/10/461,4,5 | | | 3,555,778 | | | | 112,828 | |
| Series 2012-CR5,Cl. XA, 0.00%, 12/10/454,5 | | | 2,772,198 | | | | 281,680 | |
| |
| Countrywide Home Loans, Series 2005-17, Cl. 1A8, 5.50%, 9/25/35 | | | 35,715 | | | | 35,441 | |
| |
| Credit Suisse Commercial Mortgage Trust: | |
| Series 2006-6,Cl. 1A4, 6.00%, 7/25/36 | | | 281,681 | | | | 226,491 | |
| Series 2006-C1,Cl. AJ, 5.643%, 2/15/393 | | | 275,000 | | | | 292,040 | |
| Series 2006-C4,Cl. AM, 5.509%, 9/15/39 | | | 155,000 | | | | 166,920 | |
| |
Credit Suisse First Boston Commercial Trust, Series 2005-C6, Cl. AJ, 5.23%, 12/15/403 | | | 410,000 | | | | 429,050 | |
| |
Credit Suisse Mortgage Trust, Series 2009-13R, Cl. 4A1, 2.619%, 9/26/361,3 | | | 109,289 | | | | 110,513 | |
| |
| DBUBS Mortgage Trust, Series 2011-LC1A, Cl. E, 5.73%, 11/10/461,3 | | | 75,000 | | | | 81,483 | |
| |
| First Horizon Alternative Mortgage Securities Trust: | |
| Series 2004-FA2,Cl. 3A1, 6.00%, 1/25/35 | | | 281,640 | | | | 279,113 | |
| Series 2005-FA8,Cl. 1A6, 0.802%, 11/25/353 | | | 276,689 | | | | 214,138 | |
| |
| FREMF Mortgage Trust: | | | | | | | | |
| Series 2011-K702,Cl. B, 4.936%, 4/25/441,3 | | | 155,000 | | | | 168,580 | |
| Series 2012-K501,Cl. C, 3.609%, 11/25/461,3 | | | 35,000 | | | | 35,961 | |
| Series 2013-K25,Cl. C, 3.618%, 11/25/451,3 | | | 90,000 | | | | 88,652 | |
| Series 2013-K26,Cl. C, 3.723%, 12/25/451,3 | | | 60,000 | | | | 58,953 | |
| Series 2013-K27,Cl. C, 3.616%, 1/25/461,3 | | | 95,000 | | | | 92,454 | |
| Series 2013-K28,Cl. C, 3.614%, 6/25/461,3 | | | 95,000 | | | | 92,267 | |
| Series 2013-K502,Cl. C, 3.31%, 3/25/451,3 | | | 175,000 | | | | 177,949 | |
| Series 2013-K712,Cl. C, 3.483%, 5/25/451,3 | | | 75,000 | | | | 75,303 | |
| Series 2013-K713,Cl. C, 3.274%, 4/25/461,3 | | | 115,000 | | | | 113,841 | |
| Series 2014-K715,Cl. C, 4.265%, 2/25/461,3 | | | 50,000 | | | | 51,758 | |
| |
| GCCFC Commercial Mortgage Trust: | |
| Series 2006-GG7,Cl. AM, 6.015%, 7/10/383 | | | 35,000 | | | | 38,003 | |
| Series 2007-GG11,Cl. AM, 5.867%, 12/10/493 | | | 475,000 | | | | 525,790 | |
| |
| GE Capital Commercial Mortgage Corp., Series 2005-C4, Cl. AJ, 5.489%, 11/10/453 | | | 165,000 | | | | 168,427 | |
| |
| GS Mortgage Securities Trust, Series 2006-GG6, Cl. AM, 5.622%, 4/10/383 | | | 165,000 | | | | 176,048 | |
| |
| GSMSC Pass-Through Trust, Series 2009-3R, Cl. 1A2, 6%, 4/25/371,3 | | | 453,944 | | | | 428,608 | |
| |
| GSR Mortgage Loan Trust, Series 2005-AR4, Cl. 6A1, 5.211%, 7/25/353 | | | 182,863 | | | | 184,129 | |
| |
| JP Morgan Chase Commercial Mortgage Securities Trust: | |
| Series 2006-CB16,Cl. AJ, 5.623%, 5/12/45 | | | 415,000 | | | | 426,895 | |
| Series 2006-LDP8,Cl. AJ, 5.48%, 5/15/453 | | | 60,000 | | | | 64,085 | |
| Series 2012-LC9,Cl. E, 4.573%, 12/15/471,3 | | | 185,000 | | | | 180,408 | |
8 OPPENHEIMER CORE BOND FUND/VA
| | | | | | | | |
| | | Principal
Amount | | | Value | |
| |
Commercial (Continued) | |
| |
| JP Morgan Mortgage Trust, Series 2007-S3, Cl. 1A90, 7%, 8/25/37 | | $ | 435,248 | | | $ | 400,759 | |
| |
| JP Morgan Resecuritization Trust: | |
| Series 2009-11,Cl. 5A1, 2.619%, 9/26/361,3 | | | 416,168 | | | | 417,632 | |
| Series 2009-5,Cl. 1A2, 2.612%, 7/26/361,3 | | | 407,042 | | | | 347,404 | |
| |
| LB Commercial Conduit Mortgage Trust, Interest-Only Stripped Mtg.-Backed Security, Series 1998-C1, Cl. IO, 0%, 2/18/304,5 | | | 743,303 | | | | 18,267 | |
| |
| LB-UBS Commercial Mortgage Trust, Series 2006-C4, Cl. AM, 6.049%, 6/15/383 | | | 185,000 | | | | 200,948 | |
| |
| Lehman Structured Securities Corp., Series 2002-GE1, Cl. A, 2.514%, 7/26/242,3 | | | 76,140 | | | | 67,081 | |
| |
| Merrill Lynch Mortgage Trust, Series 2006-C2, Cl. AM, 5.782%, 8/12/433 | | | 565,000 | | | | 613,259 | |
| |
| Morgan Stanley Bank of America Merrill Lynch Trust: | |
| Series 2012-C6,Cl. E, 4.818%, 11/15/451,3 | | | 145,000 | | | | 142,142 | |
| Series 2013-C7,Cl. D, 4.442%, 2/15/461,3 | | | 175,000 | | | | 164,660 | |
| Series 2013-C8,Cl. D, 4.311%, 12/15/481,3 | | | 130,000 | | | | 121,523 | |
| |
| Morgan Stanley Capital I Trust: | |
| Series 2007-IQ13,Cl. AM, 5.406%, 3/15/44 | | | 540,000 | | | | 589,106 | |
| Series 2007-IQ15,Cl. AM, 6.105%, 6/11/493 | | | 490,000 | | | | 540,888 | |
| |
Morgan Stanley Re-Remic Trust, Series 2012-R3, Cl. 1B, 2.049%, 11/26/362,3 | | | 464,380 | | | | 284,070 | |
| |
Morgan Stanley Resecuritization Trust, Series 2013-R9, Cl. 3A, 2.395%, 6/26/461,3 | | | 417,601 | | | | 421,795 | |
| |
Salomon Brothers Mortgage Securities VII, Inc., Interest-Only Stripped Mtg.-Backed Security, Series 1999-C1, Cl. X, 0%, 5/18/324,5 | | | 3,048,971 | | | | 46 | |
| |
| Structured Adjustable Rate Mortgage Loan Trust, Series 2007-6, Cl. 3A1, 4.807%, 7/25/373 | | | 413,720 | | | | 326,196 | |
| |
UBS-Barclays Commercial Mortgage Trust, Series 2012-C2, Cl. E, 5.048%, 5/10/631,3 | | | 65,000 | | | | 61,945 | |
| |
| Wachovia Bank Commercial Mortgage Trust: | |
| Series 2005-C17,Cl. AJ, 5.224%, 3/15/423 | | | 175,000 | | | | 179,683 | |
| Series 2005-C22,Cl. AM, 5.505%, 12/15/443 | | | 260,000 | | | | 274,414 | |
| |
| WaMu Mortgage Pass-Through Certificates Trust, Series 2005-AR14, Cl. 1A4, 2.376%, 12/25/353 | | | 325,918 | | | | 317,157 | |
| |
| Wells Fargo Mortgage-Backed Securities Trust: | |
| Series 2005-AR10,Cl. 1A1, 2.614%, 6/25/353 | | | 680,075 | | | | 695,596 | |
| Series 2005-AR15,Cl. 1A6, 2.606%, 9/25/353 | | | 82,842 | | | | 78,569 | |
| Series 2006-AR8,Cl. 2A4, 2.622%, 4/25/363 | | | 202,461 | | | | 199,107 | |
| Series 2007-16,Cl. 1A1, 6.00%, 12/28/37 | | | 248,675 | | | | 258,349 | |
| Series 2007-AR3,Cl. A4, 5.673%, 4/25/373 | | | 91,740 | | | | 91,167 | |
| Series 2007-AR8,Cl. A1, 6.118%, 11/25/373 | | | 244,276 | | | | 227,030 | |
| |
| WF-RBS Commercial Mortgage Trust: | |
| Series 2012-C10,Cl. D, 4.608%, 12/15/451,3 | | | 75,000 | | | | 72,759 | |
| Series 2012-C7,Cl. E, 5.002%, 6/15/451,3 | | | 120,000 | | | | 120,249 | |
| Series 2012-C8,Cl. E, 5.04%, 8/15/451,3 | | | 145,000 | | | | 146,912 | |
| Series 2013-C11,Cl. D, 4.322%, 3/15/451,3 | | | 74,000 | | | | 70,764 | |
| | | | | | | | |
| | | | 17,658,591 | |
|
| |
Multi-Family—0.3% | | | | | | | | |
| |
| Citigroup Mortgage Loan Trust, Inc., Series 2006-AR3, Cl. 1A2A, 5.359%, 6/25/363 | | | 245,675 | | | | 229,184 | |
| |
Wells Fargo Mortgage-Backed Securities Trust, Series 2006-AR2, Cl. 2A3, 2.613%, 3/25/363 | | | 175,148 | | | | 175,930 | |
| | | | | | | | |
| | | | 405,114 | |
|
| |
Residential—1.6% | | | | | | | | |
| |
Banc of America Commercial Mortgage Trust, Series 2007-4, Cl. AM, 6.015%, 2/10/513 | | | 470,000 | | | | 526,737 | |
| |
| Banc of America Funding Trust: | |
| Series 2007-1,Cl. 1A3, 6.00%, 1/25/37 | | | 243,200 | | | | 220,528 | |
| Series 2007-C,Cl. 1A4, 5.354%, 5/20/363 | | | 98,748 | | | | 96,637 | |
| |
Banc of America Mortgage Securities Trust, Series 2007-1, Cl. 1A24, 6%, 3/25/37 | | | 170,816 | | | | 161,113 | |
| |
| Carrington Mortgage Loan Trust, Series 2006-FRE1, Cl. A2, 0.262%, 7/25/363 | | | 199,875 | | | | 195,494 | |
| | | | | | | | |
| | | Principal
Amount | | | Value | |
| |
Residential (Continued) | |
| |
CD Commercial Mortgage Trust, Series 2007-CD4, Cl. AMFX, 5.366%, 12/11/493 | | $ | 100,000 | | | $ | 105,661 | |
| |
| Countrywide Home Loans: | | | | | | | | |
| Series 2005-26,Cl. 1A8, 5.50%, 11/25/35 | | | 188,219 | | | | 179,021 | |
| Series 2005-J4,Cl. A7, 5.50%, 11/25/35 | | | 26,099 | | | | 27,380 | |
| |
| GSR Mortgage Loan Trust, Series 2006-5F, Cl. 2A1, 6%, 6/25/36 | | | 140,791 | | | | 135,879 | |
| |
MASTR Asset Backed Securities Trust, Series 2006-WMC3, Cl. A3, 0.252%, 8/25/363 | | | 56,234 | | | | 28,867 | |
| |
MLCC Mortgage Investors, Inc., Series 2006-3, Cl. 2A1, 2.335%, 10/25/363 | | | 33,481 | | | | 33,262 | |
| |
| NC Finance Trust, Series 1999-I, Cl. D, 8.75%, 1/25/292,8 | | | 3,370,016 | | | | 217,366 | |
| |
| RALI Trust: | | | | | | | | |
| Series 2003-QS1,Cl. A2, 5.75%, 1/25/33 | | | 67,913 | | | | 69,042 | |
| Series 2006-QS13,Cl. 1A8, 6.00%, 9/25/36 | | | 1,338 | | | | 1,069 | |
| Series 2007-QS6,Cl. A28, 5.75%, 4/25/37 | | | 16,510 | | | | 13,146 | |
| |
| WaMu Mortgage Pass-Through Certificates Trust, Series 2003-AR10, Cl. A7, 2.422%, 10/25/333 | | | 175,585 | | | | 178,433 | |
| |
Wells Fargo Mortgage-Backed Securities Trust, Series 2006-AR14, Cl. 1A2, 5.684%, 10/25/363 | | | 226,350 | | | | 222,571 | |
| | | | | | | | |
| | | | 2,412,206 | |
| | | | | | | | |
Total Mortgage-Backed Obligations (Cost $86,488,842) | | | | | | | 83,336,144 | |
|
| |
| U.S. Government Obligations—6.9% | |
| |
| United States Treasury Nts.: | | | | | | | | |
| 0.625%, 5/31/17 | | | 1,248,000 | | | | 1,239,663 | |
| 0.75%, 6/30/17 | | | 6,372,000 | | | | 6,346,366 | |
| 0.875%, 6/15/17 | | | 1,387,000 | | | | 1,387,379 | |
| 1.625%, 4/30/19 | | | 1,438,000 | | | | 1,440,528 | |
| | | | | | | | |
Total U.S. Government Obligations (Cost $10,396,343) | | | | | | | 10,413,936 | |
|
| |
| Corporate Bonds and Notes—49.0% | |
| |
Consumer Discretionary—8.3% | |
| |
Auto Components—0.8% | | | | | | | | |
| |
| Dana Holding Corp., 6.75% Sr. Unsec. Nts., 2/15/21 | | | 395,000 | | | | 428,081 | |
| |
| Johnson Controls, Inc., 4.625% Sr. Unsec. Nts., 7/2/44 | | | 200,000 | | | | 200,604 | |
| |
| TRW Automotive, Inc.: | | | | | | | | |
| 4.50% Sr. Unsec. Nts., 3/1/211 | | | 245,000 | | | | 259,087 | |
| 7.25% Sr. Unsec. Nts., 3/15/171 | | | 328,000 | | | | 374,740 | |
| | | | | | | | |
| | | | 1,262,512 | |
|
| |
Automobiles—2.0% | | | | | | | | |
| |
| Daimler Finance North America LLC: | |
| 1.30% Sr. Unsec. Nts., 7/31/151 | | | 406,000 | | | | 409,384 | |
| 8.50% Sr. Unsec. Unsub. Nts., 1/18/31 | | | 237,000 | | | | 360,013 | |
| |
| Ford Motor Credit Co. LLC, 5.875% Sr. Unsec. Unsub. Nts., 8/2/21 | | | 894,000 | | | | 1,050,717 | |
| |
| General Motors Co., 6.25% Sr. Unsec. Nts., 10/2/431 | | | 363,000 | | | | 417,450 | |
| |
| Hyundai Capital America, 1.45% Sr. Unsec. Nts., 2/6/171 | | | 392,000 | | | | 393,673 | |
| |
| Kia Motors Corp., 3.625% Sr. Unsec. Nts., 6/14/161 | | | 284,000 | | | | 297,495 | |
| | | | | | | | |
| | | | 2,928,732 | |
|
| |
Hotels, Restaurants & Leisure—0.8% | |
| |
| Brinker International, Inc., 2.60% Sr. Unsec. Nts., 5/15/18 | | | 134,000 | | | | 134,106 | |
| |
| Carnival Corp., 1.20% Sr. Unsec. Nts., 2/5/16 | | | 386,000 | | | | 388,416 | |
| |
| Hyatt Hotels Corp., 3.875% Sr. Unsec. Unsub. Nts., 8/15/16 | | | 65,000 | | | | 68,536 | |
| |
| Starwood Hotels & Resorts Worldwide, Inc., 7.15% Sr. Unsec. Unsub. Nts., 12/1/19 | | | 261,000 | | | | 310,608 | |
9 OPPENHEIMER CORE BOND FUND/VA
| | |
| STATEMENT OF INVESTMENTS Unaudited / Continued | | |
| | | | | | | | |
| | | Principal
Amount | | | Value | |
| |
Hotels, Restaurants & Leisure (Continued) | |
| |
| Wyndham Worldwide Corp., 6% Sr. Unsec. Nts., 12/1/16 | | $ | 335,000 | | | $ | 372,010 | |
| | | | | | | | |
| | | | 1,273,676 | |
|
| |
Household Durables—0.6% | |
| |
| Jarden Corp., 6.125% Sr. Unsec. Nts., 11/15/22 | | | 354,000 | | | | 376,567 | |
| |
| Toll Brothers Finance Corp., 4% Sr. Unsec. Nts., 12/31/18 | | | 364,000 | | | | 375,830 | |
| |
| Whirlpool Corp., 1.35% Sr. Unsec. Nts., 3/1/17 | | | 104,000 | | | | 104,121 | |
| | | | | | | | |
| | | | 856,518 | |
|
| |
Media—2.5% | | | | | | | | |
| |
| 21st Century Fox America, Inc., 6.15% Sr. Unsec. Nts., 2/15/41 | | | 162,000 | | | | 196,723 | |
| |
| Comcast Cable Communications Holdings, Inc., 9.455% Sr. Unsec. Nts., 11/15/22 | | | 292,000 | | | | 424,899 | |
| |
| Comcast Corp., 4.65% Sr. Unsec. Unsub. Nts., 7/15/42 | | | 365,000 | | | | 379,251 | |
| |
| DIRECTV Holdings LLC/DIRECTV Financing Co., Inc., 5.15% Sr. Unsec. Nts., 3/15/42 | | | 235,000 | | | | 247,290 | |
| |
| DISH DBS Corp., 5.875% Sr. Unsec. Nts., 7/15/22 | | | 340,000 | | | | 369,750 | |
| |
| Historic TW, Inc.: | | | | | | | | |
| 8.05% Sr. Unsec. Nts., 1/15/16 | | | 64,000 | | | | 70,317 | |
| 9.15% Debs., 2/1/23 | | | 61,000 | | | | 84,597 | |
| |
| Interpublic Group of Cos., Inc. (The), 4.20% Sr. Unsec. Nts., 4/15/24 | | | 191,000 | | | | 197,368 | |
| |
| Lamar Media Corp., 5% Sr. Unsec. Sub. Nts., 5/1/23 | | | 373,000 | | | | 377,196 | |
| |
| Numericable Group SA, 4.875% Sr. Sec. Nts., 5/15/191 | | | 381,000 | | | | 391,478 | |
| |
| Pearson Funding Two plc, 4% Sr. Unsec. Nts., 5/17/161 | | | 85,000 | | | | 89,474 | |
| |
| Time Warner Cable, Inc., 4.50% Sr. Unsec. Unsub. Nts., 9/15/42 | | | 381,000 | | | | 371,698 | |
| |
| Time Warner, Inc., 4.875% Sr. Unsec. Nts., 3/15/20 | | | 264,000 | | | | 296,109 | |
| |
| WPP Finance 2010, 4.75% Sr. Unsec. Nts., 11/21/21 | | | 267,000 | | | | 293,311 | |
| | | | | | | | |
| | | | 3,789,461 | |
|
| |
Multiline Retail—0.8% | | | | | | | | |
| |
| Dollar General Corp., 4.125% Sr. Unsec. Nts., 7/15/17 | | | 469,000 | | | | 502,312 | |
| |
| Macy’s Retail Holdings, Inc., 5.75% Sr. Unsec. Nts., 7/15/14 | | | 650,000 | | | | 651,278 | |
| | | | | | | | |
| | | | 1,153,590 | |
|
| |
Specialty Retail—0.3% | | | | | | | | |
| |
| Home Depot, Inc. (The), 4.875% Sr. Unsec. Nts., 2/15/44 | | | 142,000 | | | | 155,080 | |
| |
| L Brands, Inc., 7% Sr. Unsec. Nts., 5/1/20 | | | 42,000 | | | | 48,458 | |
| |
| Signet UK Finance plc, 4.70% Sr. Unsec. Nts., 6/15/24 | | | 192,000 | | | | 195,372 | |
| | | | | | | | |
| | | | 398,910 | |
|
| |
Textiles, Apparel & Luxury Goods—0.5% | |
| |
| Levi Strauss & Co., 7.625% Sr. Unsec. Nts., 5/15/20 | | | 346,000 | | | | 374,113 | |
| |
| PVH Corp., 4.50% Sr. Unsec. Unsub. Nts., 12/15/22 | | | 405,000 | | | | 400,950 | |
| | | | | | | | |
| | | | 775,063 | |
|
| |
Consumer Staples—2.7% | |
| |
Beverages—1.1% | | | | | | | | |
| |
| Anheuser-Busch InBev Worldwide, Inc., 8.20% Sr. Unsec. Unsub. Nts., 1/15/39 | | | 324,000 | | | | 496,671 | |
| | | | | | | | |
| | | Principal
Amount | | | Value | |
| |
Beverages (Continued) | |
| |
| Constellation Brands, Inc., 3.75% Sr. Unsec. Nts., 5/1/21 | | $ | 423,000 | | | $ | 421,942 | |
| |
| Foster’s Finance Corp., 4.875% Sr. Unsec. Nts., 10/1/141 | | | 433,000 | | | | 437,711 | |
| |
| SABMiller Holdings, Inc., 4.95% Sr. Unsec. Unsub. Nts., 1/15/421 | | | 206,000 | | | | 223,079 | |
| | | | | | | | |
| | | | 1,579,403 | |
|
| |
Food & Staples Retailing—0.4% | |
| |
| Delhaize Group SA, 5.70% Sr. Unsec. Nts., 10/1/40 | | | 215,000 | | | | 229,766 | |
| |
| Kroger Co., 6.40% Sr. Unsec. Nts., 8/15/17 | | | 217,000 | | | | 248,739 | |
| |
| Safeway, Inc., 5.625% Sr. Unsec. Nts., 8/15/14 | | | 86,000 | | | | 86,508 | |
| | | | | | | | |
| | | | 565,013 | |
|
| |
Food Products—0.7% | |
| |
| Bunge Ltd. Finance Corp.: | | | | | | | | |
| 5.10% Sr. Unsec. Unsub. Nts., 7/15/15 | | | 332,000 | | | | 345,877 | |
| 8.50% Sr. Unsec. Nts., 6/15/19 | | | 289,000 | | | | 363,495 | |
| |
| Tyson Foods, Inc., 6.60% Sr. Unsec. Nts., 4/1/16 | | | 341,000 | | | | 373,652 | |
| | | | | | | | |
| | | | 1,083,024 | |
|
| |
Tobacco—0.5% | | | | | | | | |
| |
| Altria Group, Inc., 10.20% Sr. Unsec. Nts., 2/6/39 | | | 227,000 | | | | 385,543 | |
| |
| Lorillard Tobacco Co., 3.75% Sr. Unsec. Nts., 5/20/23 | | | 206,000 | | | | 203,720 | |
| |
| Reynolds American, Inc., 6.75% Sr. Unsec. Nts., 6/15/17 | | | 198,000 | | | | 227,439 | |
| | | | | | | | |
| | | | 816,702 | |
|
| |
Energy—5.9% | |
| |
Energy Equipment & Services—0.9% | |
| |
| Ensco plc, 4.70% Sr. Unsec. Nts., 3/15/21 | | | 100,000 | | | | 109,052 | |
| |
| Nabors Industries, Inc.: | | | | | | | | |
| 2.35% Sr. Unsec. Nts., 9/15/16 | | | 294,000 | | | | 300,271 | |
| 4.625% Sr. Unsec. Nts., 9/15/21 | | | 201,000 | | | | 217,959 | |
| 5.00% Sr. Unsec. Nts., 9/15/20 | | | 117,000 | | | | 131,431 | |
| |
| Rowan Cos., Inc., 4.875% Sr. Unsec. Unsub. Nts., 6/1/22 | | | 153,000 | | | | 164,074 | |
| |
| Weatherford International Ltd., 5.95% Sr. Unsec. Nts., 4/15/42 | | | 300,000 | | | | 340,894 | |
| | | | | | | | |
| | | | 1,263,681 | |
|
| |
Oil, Gas & Consumable Fuels—5.0% | |
| |
| Anadarko Petroleum Corp., 6.20% Sr. Unsec. Nts., 3/15/40 | | | 163,000 | | | | 205,935 | |
| |
| Canadian Oil Sands Ltd., 6% Sr. Unsec. Nts., 4/1/421 | | | 182,000 | | | | 210,465 | |
| |
| Chesapeake Energy Corp., 6.625% Sr. Unsec. Nts., 8/15/20 | | | 334,000 | | | | 385,770 | |
| |
| Cimarex Energy Co., 4.375% Sr. Unsec. Nts., 6/1/24 | | | 289,000 | | | | 295,503 | |
| |
| CNOOC Finance 2013 Ltd., 4.25% Sr. Unsec. Unsub. Nts., 5/9/43 | | | 147,000 | | | | 136,690 | |
| |
| CNOOC Finance 2014 ULC, 1.625% Sr. Unsec. Nts., 4/30/17 | | | 302,000 | | | | 302,984 | |
| |
| Continental Resources, Inc., 4.50% Sr. Unsec. Nts., 4/15/23 | | | 428,000 | | | | 457,762 | |
| |
| DCP Midstream LLC, 5.375% Sr. Unsec. Nts., 10/15/151 | | | 290,000 | | | | 303,291 | |
| |
| DCP Midstream Operating LP, 3.875% Sr. Unsec. Nts., 3/15/23 | | | 423,000 | | | | 428,817 | |
| |
| El Paso Pipeline Partners Operating Co. LLC, 4.10% Sr. Unsec. Nts., 11/15/15 | | | 152,000 | | | | 158,879 | |
| |
| Enbridge Energy Partners LP, 5.35% Sr. Unsec. Nts., 12/15/14 | | | 326,000 | | | | 332,907 | |
| |
| EnLink Midstream Partners LP: | | | | | | | | |
| 2.70% Sr. Unsec. Nts., 4/1/19 | | | 299,000 | | | | 303,547 | |
10 OPPENHEIMER CORE BOND FUND/VA
| | | | | | | | |
| | | Principal
Amount | | | Value | |
| |
Oil, Gas & Consumable Fuels (Continued) | |
| |
| EnLink Midstream Partners LP: (Continued) | | | | | | | | |
| 4.40% Sr. Unsec. Nts., 4/1/24 | | $ | 185,000 | | | $ | 194,402 | |
| |
| Origin Energy Finance Ltd.: | |
| 3.50% Sr. Unsec. Nts., 10/9/181 | | | 394,000 | | | | 409,235 | |
| 5.45% Sr. Unsec. Nts., 10/14/211 | | | 245,000 | | | | 273,320 | |
| |
| Pioneer Natural Resources Co., 6.65% Sr. Unsec. Nts., 3/15/17 | | | 70,000 | | | | 79,718 | |
| |
| Range Resources Corp., 5.75% Sr. Unsec. Sub. Nts., 6/1/21 | | | 398,000 | | | | 431,830 | |
| |
| Ras Laffan Liquefied Natural Gas Co. Ltd. III, 5.50% Sr. Sec. Nts., 9/30/141 | | | 420,000 | | | | 425,145 | |
| |
| Southwestern Energy Co., 4.10% Sr. Unsec. Nts., 3/15/22 | | | 232,000 | | | | 246,171 | |
| |
| Spectra Energy Partners LP: | |
| 4.60% Sr. Unsec. Nts., 6/15/21 | | | 238,000 | | | | 260,198 | |
| 4.75% Sr. Unsec. Nts., 3/15/24 | | | 194,000 | | | | 210,469 | |
| |
| Targa Resources Partners LP/Targa Resources Partners Finance Corp., 5.25% Sr. Unsec. Nts., 5/1/23 | | | 390,000 | | | | 409,500 | |
| |
| Whiting Petroleum Corp., 5.75% Sr. Unsec. Nts., 3/15/21 | | | 395,000 | | | | 433,512 | |
| |
| Williams Partners LP, 4.50% Sr. Unsec. Nts., 11/15/23 | | | 194,000 | | | | 206,054 | |
| |
| Woodside Finance Ltd., 4.60% Sr. Unsec. Unsub. Nts., 5/10/211 | | | 354,000 | | | | 386,814 | |
| | | | | | | | |
| | | | 7,488,918 | |
|
| |
Financials—14.8% | |
| |
Capital Markets—3.5% | |
| |
| Apollo Management Holdings LP, 4% Sr. Unsec. Nts., 5/30/241 | | | 312,000 | | | | 314,453 | |
| |
| Blackstone Holdings Finance Co. LLC, 5% Sr. Unsec. Nts., 6/15/441 | | | 382,000 | | | | 394,852 | |
| |
| Carlyle Holdings II Finance LLC, 5.625% Sr. Sec. Nts., 3/30/431 | | | 209,000 | | | | 232,526 | |
| |
| Goldman Sachs Group, Inc. (The): | | | | | |
| 4.00% Sr. Unsec. Nts., 3/3/24 | | | 347,000 | | | | 354,016 | |
| 4.80% Sr. Unsec. Nts., 7/8/447 | | | 63,000 | | | | 62,693 | |
| 5.70% Jr. Sub. Perpetual Bonds, Series L3,9 | | | 381,000 | | | | 395,548 | |
| |
| Lazard Group LLC, 4.25% Sr. Unsec. Nts., 11/14/20 | | | 337,000 | | | | 353,501 | |
| |
| Macquarie Bank Ltd., 6.625% Unsec. Sub. Nts., 4/7/211 | | | 603,000 | | | | 692,903 | |
| |
| Morgan Stanley, 5% Sub. Nts., 11/24/25 | | | 714,000 | | | | 763,715 | |
| |
| Nomura Holdings, Inc., 2% Sr. Unsec. Nts., 9/13/16 | | | 373,000 | | | | 379,259 | |
| |
| Raymond James Financial, Inc., 5.625% Sr. Unsec. Unsub. Nts., 4/1/24 | | | 417,000 | | | | 470,917 | |
| |
| UBS Preferred Funding Trust V, 6.243% Jr. Sub. Perpetual Bonds, Series 13,9 | | | 695,000 | | | | 742,781 | |
| | | | | | | | |
| | | | 5,157,164 | |
|
| |
Commercial Banks—5.6% | |
| |
| Amsouth Bank NA, 5.20% Sub. Nts., 4/1/15 | | | 419,000 | | | | 432,319 | |
| |
| Bank of America Corp.: | | | | | | | | |
| 7.75% Jr. Sub. Nts., 5/14/38 | | | 354,000 | | | | 486,526 | |
| 8.00% Jr. Sub. Perpetual Bonds, Series K3,9 | | | 330,000 | | | | 366,996 | |
| 5.125% Jr. Sub. Perpetual Bonds, Series V3,9 | | | 70,000 | | | | 69,938 | |
| |
| Barclays Bank plc: | | | | | | | | |
| 3.75% Sr. Unsec. Nts., 5/15/24 | | | 303,000 | | | | 305,276 | |
| 5.14% Sub. Nts., 10/14/20 | | | 399,000 | | | | 437,536 | |
| |
| Citigroup, Inc.: | | | | | | | | |
| 6.675% Sub. Nts., 9/13/43 | | | 344,000 | | | | 429,097 | |
| 5.95% Jr. Sub. Perpetual Bonds, Series D3,9 | | | 398,000 | | | | 402,477 | |
| |
| Commerzbank AG, 8.125% Sub. Nts., 9/19/231 | | | 388,000 | | | | 472,434 | |
| |
| Credit Agricole SA, 6.637% Jr. Sub. Perpetual Bonds1,3,9 | | | 627,000 | | | | 667,363 | |
| |
| HSBC Finance Capital Trust IX, 5.911% Unsec. Sub. Nts., 11/30/353 | | | 890,000 | | | | 928,937 | |
| | | | | | | | |
| | | Principal
Amount | | | Value | |
| |
Commercial Banks (Continued) | |
| |
| JPMorgan Chase & Co., 6.75% Jr. Sub. Perpetual Bonds3,9 | | $ | 330,000 | | | $ | 356,813 | |
| |
| Lloyds Bank plc, 6.50% Sub. Nts., 9/14/201 | | | 319,000 | | | | 374,857 | |
| |
| Lloyds Banking Group plc, 6.657% Jr. Sub. Perpetual Bonds1,3,9 | | | 334,000 | | | | 374,915 | |
| |
| Rabobank Capital Funding Trust III, 5.254% Jr. Sub. Perpetual Bonds2,3,9 | | | 667,000 | | | | 703,685 | |
| |
| Royal Bank of Scotland Group plc, 7.64% Jr. Sub. Perpetual Bonds, Series U3,9 | | | 400,000 | | | | 428,000 | |
| |
| Societe Generale SA, 5.922% Jr. Sub. Perpetual Bonds1,3,9 | | | 370,000 | | | | 396,825 | |
| |
| SunTrust Banks, Inc., 3.60% Sr. Unsec. Nts., 4/15/16 | | | 385,000 | | | | 403,771 | |
| |
| Wells Fargo & Co., 5.90% Jr. Sub. Perpetual Bonds, Series S3,9 | | | 383,000 | | | | 406,459 | |
| | | | | | | | |
| | | | 8,444,224 | |
|
| |
Consumer Finance—0.3% | | | | | | | | |
| |
| Ally Financial, Inc., 4.75% Sr. Unsec. Nts., 9/10/18 | | | 389,000 | | | | 413,799 | |
|
| |
Diversified Financial Services—0.9% | |
| |
| Burlington Northern Santa Fe LLC, 3% Sr. Unsec. Nts., 3/15/23 | | | 309,000 | | | | 304,372 | |
| |
| Leucadia National Corp., 5.50% Sr. Unsec. Nts., 10/18/23 | | | 548,000 | | | | 582,855 | |
| |
| Voya Financial, Inc., 5.65% Jr. Sub. Nts., 5/15/533 | | | 420,000 | | | | 429,450 | |
| | | | | | | | |
| | | | 1,316,677 | |
|
| |
Insurance—3.1% | | | | | | | | |
| |
| AIA Group Ltd., 4.875% Sr. Unsec. Nts., 3/11/441 | | | 292,000 | | | | 306,814 | |
| |
| Arch Capital Group US, Inc., 5.144% Sr. Unsec. Nts., 11/1/43 | | | 347,000 | | | | 376,259 | |
| |
| AXIS Specialty Finance plc, 5.15% Sr. Unsec. Nts., 4/1/45 | | | 308,000 | | | | 319,334 | |
| |
| Five Corners Funding Trust, 4.419% Unsec. Nts., 11/15/231 | | | 310,000 | | | | 327,290 | |
| |
| Genworth Holdings, Inc., 4.80% Sr. Unsec. Nts., 2/15/24 | | | 608,000 | | | | 650,590 | |
| |
| Liberty Mutual Group, Inc., 4.25% Sr. Unsec. Nts., 6/15/231 | | | 456,000 | | | | 473,255 | |
| |
| Lincoln National Corp., 6.05% Jr. Unsec. Sub. Nts., 4/20/673 | | | 688,000 | | | | 699,180 | |
| |
| Marsh & McLennan Cos., Inc., 5.375% Sr. Unsec. Nts., 7/15/14 | | | 101,000 | | | | 101,183 | |
| |
| Prudential Financial, Inc., 5.20% Jr. Sub. Nts., 3/15/443 | | | 300,000 | | | | 307,125 | |
| |
| Swiss Re Capital I LP, 6.854% Jr. Sub. Perpetual Bonds1,3,9 | | | 663,000 | | | | 711,067 | |
| |
| ZFS Finance USA Trust V, 6.50% Jr. Sub. Nts., 5/9/372,3 | | | 365,000 | | | | 392,375 | |
| | | | | | | | |
| | | | 4,664,472 | |
|
| |
Real Estate—0.1% | | | | | | | | |
| |
| Ventas Realty LP, 1.25% Sr. Unsec. Nts., 4/17/17 | | | 151,000 | | | | 151,101 | |
|
| |
Real Estate Investment Trusts (REITs)—1.3% | |
| |
| American Tower Corp.: | | | | | | | | |
| 5.05% Sr. Unsec. Unsub. Nts., 9/1/20 | | | 149,000 | | | | 166,218 | |
| 5.90% Sr. Unsec. Nts., 11/1/21 | | | 200,000 | | | | 230,943 | |
| |
| ARC Properties Operating Partnership LP/Clark Acquisition LLC, 2% Sr. Unsec. Nts., 2/6/171 | | | 391,000 | | | | 392,134 | |
| |
| CC Holdings GS V LLC/Crown Castle GS III Corp., 3.849% Sr. Sec. Nts., 4/15/23 | | | 227,000 | | | | 228,182 | |
| |
| Corrections Corp. of America, 4.125% Sr. Unsec. Nts., 4/1/20 | | | 381,000 | | | | 380,048 | |
| |
| Hospitality Properties Trust: | | | | | | | | |
| 4.65% Sr. Unsec. Nts., 3/15/24 | | | 186,000 | | | | 195,171 | |
11 OPPENHEIMER CORE BOND FUND/VA
| | |
| STATEMENT OF INVESTMENTS Unaudited / Continued | | |
| | | | | | | | |
| | | Principal
Amount | | | Value | |
| |
Real Estate Investment Trusts (REITs) (Continued) | |
| |
| Hospitality Properties Trust: (Continued) | |
| 5.125% Sr. Unsec. Nts., 2/15/15 | | $ | 411,000 | | | $ | 413,071 | |
| | | | | | | | |
| | | | 2,005,767 | |
|
| |
Health Care—2.5% | |
| |
Biotechnology—0.2% | |
| |
| Gilead Sciences, Inc., 5.65% Sr. Unsec. Unsub. Nts., 12/1/41 | | | 232,000 | | | | 273,945 | |
|
| |
Health Care Equipment & Supplies—0.9% | |
| |
| Boston Scientific Corp., 4.125% Sr. Unsec. Nts., 10/1/23 | | | 394,000 | | | | 409,978 | |
| |
CareFusion Corp.: | |
| 1.45% Sr. Unsec. Nts., 5/15/17 | | | 384,000 | | | | 383,924 | |
| 3.875% Sr. Unsec. Nts., 5/15/24 | | | 188,000 | | | | 190,215 | |
| |
| DENTSPLY International, Inc., 2.75% Sr. Unsec. Nts., 8/15/16 | | | 352,000 | | | | 364,708 | |
| | | | | | | | |
| | | | 1,348,825 | |
|
| |
Health Care Providers & Services—0.4% | |
| |
| CHS/Community Health Systems, Inc., 5.125% Sr. Sec. Nts., 8/1/211 | | | 295,000 | | | | 303,850 | |
| |
| Fresenius Medical Care US Finance II, Inc., 5.875% Sr. Unsec. Nts., 1/31/221 | | | 350,000 | | | | 388,500 | |
| | | | | | | | |
| | | | 692,350 | |
|
| |
Life Sciences Tools & Services—0.2% | |
| |
| Thermo Fisher Scientific, Inc.: | | | | | | | | |
| 4.15% Sr. Unsec. Nts., 2/1/24 | | | 121,000 | | | | 126,714 | |
| 5.30% Sr. Unsec. Nts., 2/1/44 | | | 140,000 | | | | 155,721 | |
| | | | | | | | |
| | | | 282,435 | |
|
| |
Pharmaceuticals—0.8% | |
| |
| Actavis Funding SCS, 1.30% Sr. Unsec. Nts., 6/15/171 | | | 243,000 | | | | 242,673 | |
| |
| Hospira, Inc., 5.20% Sr. Unsec. Nts., 8/12/20 | | | 373,000 | | | | 408,721 | |
| |
| Mallinckrodt International Finance SA, 3.50% Sr. Unsec. Nts., 4/15/18 | | | 386,000 | | | | 386,000 | |
| |
| Zoetis, Inc., 1.875% Sr. Unsec. Nts., 2/1/18 | | | 151,000 | | | | 151,453 | |
| | | | | | | | |
| | | | 1,188,847 | |
|
| |
Industrials—4.3% | |
| |
Aerospace & Defense—0.9% | |
| |
| B/E Aerospace, Inc., 5.25% Sr. Unsec. Nts., 4/1/22 | | | 382,000 | | | | 417,813 | |
| |
| Huntington Ingalls Industries, Inc., 7.125% Sr. Unsec. Unsub. Nts., 3/15/21 | | | 342,000 | | | | 375,345 | |
| |
| L-3 Communications Corp.: | | | | | | | | |
| 1.50% Sr. Unsec. Nts., 5/28/17 | | | 100,000 | | | | 100,249 | |
| 3.95% Sr. Unsec. Nts., 5/28/24 | | | 181,000 | | | | 182,649 | |
| |
| Textron, Inc.: | | | | | | | | |
| 4.30% Sr. Unsec. Nts., 3/1/24 | | | 189,000 | | | | 195,985 | |
| 6.20% Sr. Unsec. Nts., 3/15/15 | | | 28,000 | | | | 29,146 | |
| | | | | | | | |
| | | | 1,301,187 | |
|
| |
Building Products—0.3% | |
| |
| Owens Corning, 4.20% Sr. Unsec. Nts., 12/15/22 | | | 422,000 | | | | 433,859 | |
|
| |
Commercial Services & Supplies—0.6% | |
| |
| Clean Harbors, Inc., 5.25% Sr. Unsec. Unsub. Nts., 8/1/20 | | | 395,000 | | | | 409,319 | |
| |
| Pitney Bowes, Inc., 4.625% Sr. Unsec. Nts., 3/15/24 | | | 485,000 | | | | 502,342 | |
| | | | | | | | |
| | | | 911,661 | |
|
| |
Electrical Equipment—0.2% | | | | | | | | |
| |
| Sensata Technologies BV, 4.875% Sr. Unsec. Nts., 10/15/231 | | | 294,000 | | | | 293,265 | |
| | | | | | | | |
| | | Principal
Amount | | | Value | |
| |
Industrial Conglomerates—0.4% | |
| |
| General Electric Capital Corp., 6.25% Jr. Sub. Perpetual Bonds, Series B3,9 | | $ | 574,000 | | | $ | 639,637 | |
|
| |
Machinery—0.5% | |
| |
| Crane Co., 4.45% Sr. Unsec. Nts., 12/15/23 | | | 193,000 | | | | 203,308 | |
| |
| Ingersoll-Rand Global Holding Co. Ltd., 4.25% Sr. Unsec. Nts., 6/15/23 | | | 340,000 | | | | 358,154 | |
| |
| Starwood Hotels & Resorts Worldwide, Inc., 7.375% Sr. Unsec. Nts., 11/15/15 | | | 148,000 | | | | 161,132 | |
| | | | | | | | |
| | | | 722,594 | |
|
| |
Professional Services—0.3% | |
| |
| Nielsen Finance LLC/Nielsen Finance Co., 4.50% Sr. Unsec. Nts., 10/1/20 | | | 400,000 | | | | 405,000 | |
|
| |
Road & Rail—0.6% | |
| |
| ERAC USA Finance LLC, 2.35% Sr. Unsec. Nts., 10/15/191 | | | 66,000 | | | | 65,903 | |
| |
| Kansas City Southern de Mexico SA de CV, 3% Sr. Unsec. Nts., 5/15/23 | | | 315,000 | | | | 298,494 | |
| |
| Penske Truck Leasing Co. LP/PTL Finance Corp.: | |
| 2.50% Sr. Unsec. Nts., 3/15/161 | | | 368,000 | | | | 378,409 | |
| 4.25% Sr. Unsec. Nts., 1/17/231 | | | 230,000 | | | | 238,364 | |
| | | | | | | | |
| | | | 981,170 | |
|
| |
Trading Companies & Distributors—0.5% | |
| |
| Air Lease Corp., 3.875% Sr. Unsec. Nts., 4/1/21 | | | 383,000 | | | | 392,575 | |
| |
| International Lease Finance Corp., 5.875% Sr. Unsec. Unsub. Nts., 4/1/19 | | | 376,000 | | | | 415,010 | |
| | | | | | | | |
| | | | 807,585 | |
|
| |
Information Technology—2.4% | |
| |
Communications Equipment—0.2% | |
| |
| Motorola Solutions, Inc., 3.50% Sr. Unsec. Nts., 3/1/23 | | | 212,000 | | | | 205,382 | |
|
| |
Electronic Equipment, Instruments, & Components— 0.8% | |
| |
| Amphenol Corp., 4.75% Sr. Unsec. Nts., 11/15/14 | | | 124,000 | | | | 125,917 | |
| |
| Arrow Electronics, Inc., 5.125% Sr. Unsec. Unsub. Nts., 3/1/21 | | | 527,000 | | | | 574,908 | |
| |
| Avnet, Inc., 4.875% Sr. Unsec. Unsub. Nts., 12/1/22 | | | 500,000 | | | | 532,875 | |
| | | | | | | | |
| | | | 1,233,700 | |
|
| |
IT Services—0.6% | |
| |
| Fidelity National Information Services, Inc.: | |
| 1.45% Sr. Unsec. Nts., 6/5/17 | | | 297,000 | | | | 296,813 | |
| 3.50% Sr. Unsec. Nts., 4/15/23 | | | 207,000 | | | | 203,939 | |
| |
| Xerox Corp., 4.25% Sr. Unsec. Nts., 2/15/15 | | | 391,000 | | | | 400,056 | |
| | | | | | | | |
| | | | 900,808 | |
|
| |
Software—0.2% | |
| |
| Oracle Corp., 3.40% Sr. Unsec. Nts., 7/8/247 | | | 269,000 | | | | 268,389 | |
|
| |
Technology Hardware, Storage & Peripherals—0.6% | |
| |
| Apple, Inc., 4.45% Sr. Unsec. Nts., 5/6/44 | | | 211,000 | | | | 214,284 | |
| |
| Hewlett-Packard Co., 2.65% Sr. Unsec. Unsub. Nts., 6/1/16 | | | 367,000 | | | | 378,995 | |
| |
| Seagate HDD Cayman, 3.75% Sr. Unsec. Nts., 11/15/181 | | | 340,000 | | | | 348,500 | |
| | | | | | | | |
| | | | 941,779 | |
|
| |
Materials—3.4% | |
| |
Chemicals—0.7% | |
| |
| Agrium, Inc., 3.50% Sr. Unsec. Nts., 6/1/23 | | | 222,000 | | | | 221,641 | |
| |
| LYB International Finance BV, 5.25% Sr. Unsec. Nts., 7/15/43 | | | 123,000 | | | | 134,982 | |
| |
| Rockwood Specialties Group, Inc., 4.625% Sr. Unsec. Nts., 10/15/20 | | | 380,000 | | | | 396,150 | |
12 OPPENHEIMER CORE BOND FUND/VA
| | | | | | | | |
| | | Principal
Amount | | | Value | |
| |
Chemicals (Continued) | |
| |
| RPM International, Inc., 3.45% Sr. Unsec. Unsub. Nts., 11/15/22 | | $ | 306,000 | | | $ | 297,986 | |
| | | | | | | | |
| | | | 1,050,759 | |
|
| |
| Construction Materials—0.2% | | | | | | | | |
| |
| CRH America, Inc., 4.125% Sr. Unsec. Nts., 1/15/16 | | | 365,000 | | | | 382,782 | |
|
| |
| Containers & Packaging—0.8% | |
| |
| Crown Americas LLC/Crown Americas Capital Corp. III, 6.25% Sr. Unsec. Nts., 2/1/21 | | | 180,000 | | | | 193,500 | |
| |
| Packaging Corp. of America, 4.50% Sr. Unsec. Nts., 11/1/23 | | | 300,000 | | | | 321,752 | |
| |
| Rock-Tenn Co., 3.50% Sr. Unsec. Unsub. Nts., 3/1/20 | | | 617,000 | | | | 635,607 | |
| | | | | | | | |
| | | | 1,150,859 | |
|
| |
| Metals & Mining—1.6% | | | | | | | | |
| |
| Allegheny Technologies, Inc., 5.95% Sr. Unsec. Unsub. Nts., 1/15/21 | | | 238,000 | | | | 263,034 | |
| |
| Barrick Gold Corp., 3.85% Sr. Unsec. Nts., 4/1/22 | | | 190,000 | | | | 189,258 | |
| |
| Carpenter Technology Corp., 4.45% Sr. Unsec. Unsub. Nts., 3/1/23 | | | 145,000 | | | | 149,326 | |
| |
| Freeport-McMoRan Copper & Gold, Inc.: | |
| 1.40% Sr. Unsec. Nts., 2/13/15 | | | 403,000 | | | | 404,647 | |
| 3.875% Sr. Unsec. Nts., 3/15/23 | | | 215,000 | | | | 214,625 | |
| 5.45% Sr. Unsec. Nts., 3/15/43 | | | 113,000 | | | | 117,471 | |
| |
| Glencore Canada Corp.: | | | | | | | | |
| 5.375% Sr. Unsec. Unsub. Nts., 6/1/15 | | | 245,000 | | | | 254,883 | |
| 6.00% Sr. Unsec. Unsub. Nts., 10/15/15 | | | 370,000 | | | | 393,017 | |
| |
| Glencore Funding LLC, 4.625% Sr. Unsec. Nts., 4/29/241 | | | 284,000 | | | | 293,940 | |
| |
| Rio Tinto Finance USA plc, 4.125% Sr. Unsec. Nts., 8/21/42 | | | 105,000 | | | | 98,891 | |
| | | | | | | | |
| | | | 2,379,092 | |
|
| |
| Paper & Forest Products—0.1% | |
| |
| International Paper Co., 4.80% Sr. Unsec. Nts., 6/15/44 | | | 153,000 | | | | 153,813 | |
|
| |
| Telecommunication Services—2.7% | |
| |
| Diversified Telecommunication Services—2.3% | |
| |
| AT&T, Inc., 4.35% Sr. Unsec. Nts., 6/15/45 | | | 252,000 | | | | 239,418 | |
| |
| British Telecommunications plc, 9.625% Sr. Unsec. Nts., 12/15/30 | | | 264,000 | | | | 421,063 | |
| |
| Frontier Communications Corp., 8.50% Sr. Unsec. Nts., 4/15/20 | | | 344,000 | | | | 407,640 | |
| | | | | | | | |
| | | Principal
Amount | | | Value | |
| |
| Diversified Telecommunication Services (Continued) | |
| |
| Telecom Italia Capital SA, 7.721% Sr. Unsec. Unsub. Nts., 6/4/38 | | $ | 230,000 | | | $ | 266,225 | |
| |
| Telefonica Emisiones SAU, 7.045% Sr. Unsec. Unsub. Nts., 6/20/36 | | | 380,000 | | | | 485,510 | |
| |
| T-Mobile USA, Inc., 6.25% Sr. Unsec. Nts., 4/1/21 | | | 426,000 | | | | 454,222 | |
| |
| Verizon Communications, Inc.: | | | | | | | | |
| 4.50% Sr. Unsec. Nts., 9/15/20 | | | 891,000 | | | | 981,254 | |
| 6.40% Sr. Unsec. Nts., 2/15/38 | | | 195,000 | | | | 238,594 | |
| | | | | | | | |
| | | | 3,493,926 | |
|
| |
| Wireless Telecommunication Services—0.4% | |
| |
| America Movil SAB de CV, 4.375% Sr. Unsec. Unsub. Nts., 7/16/42 | | | 334,000 | | | | 316,871 | |
| |
| Vodafone Group plc: | | | | | | | | |
| 4.375% Sr. Unsec. Unsub. Nts., 2/19/43 | | | 119,000 | | | | 113,736 | |
| 6.25% Sr. Unsec. Nts., 11/30/32 | | | 125,000 | | | | 153,676 | |
| | | | | | | 584,283 | |
|
| |
| Utilities—2.0% | |
| |
| Electric Utilities—1.2% | |
| |
| Exelon Generation Co. LLC, 4.25% Sr. Unsec. Unsub. Nts., 6/15/22 | | | 230,000 | | | | 240,443 | |
| |
| ITC Holdings Corp.: | | | | | | | | |
| 3.65% Sr. Unsec. Nts., 6/15/24 | | | 329,000 | | | | 328,358 | |
| 5.30% Sr. Unsec. Nts., 7/1/43 | | | 78,000 | | | | 86,081 | |
| |
| Jersey Central Power & Light Co., 4.70% Sr. Unsec. Nts., 4/1/241 | | | 198,000 | | | | 212,085 | |
| |
| Pennsylvania Electric Co., 5.20% Sr. Unsec. Nts., 4/1/20 | | | 73,000 | | | | 80,937 | |
| |
| PPL Capital Funding, Inc., 3.50% Sr. Unsec. Unsub. Nts., 12/1/22 | | | 329,000 | | | | 334,805 | |
| |
| PPL WEM Holdings Ltd., 5.375% Sr. Unsec. Unsub. Nts., 5/1/211 | | | 429,000 | | | | 483,051 | |
| | | | | | | | |
| | | | 1,765,760 | |
|
| |
| Independent Power and Renewable Electricity Producers—0.2% | |
| |
| Dayton Power & Light Co., 1.875% Sr. Sec. Nts., 9/15/161 | | | 272,000 | | | | 276,733 | |
|
| |
| Multi-Utilities—0.6% | | | | | | | | |
| |
| CenterPoint Energy, Inc., 5.95% Sr. Unsec. Nts., 2/1/17 | | | 327,000 | | | | 365,412 | |
| |
| CMS Energy Corp.: | | | | | | | | |
| 3.875% Sr. Unsec. Nts., 3/1/24 | | | 202,000 | | | | 210,206 | |
| 5.05% Sr. Unsec. Unsub. Nts., 3/15/22 | | | 155,000 | | | | 176,373 | |
| |
| PG&E Corp., 2.40% Sr. Unsec. Nts., 3/1/19 | | | 244,000 | | | | 246,436 | |
| | | | | | | | |
| | | | 998,427 | |
| | | | | | | | |
Total Corporate Bonds and Notes (Cost $69,963,650) | | | | 73,457,259 | |
| | | | | | | | | | | | | | | | | | | | | | | | | | | | | | | | | | |
| | | Counterparty | | | Buy /Sell
Protection | | | Reference Asset | | | Fixed
Rate | | | Expiration Date | | | Notional (000’s) | | | | | | |
| |
| Over-the-Counter Credit Default Swaptions Purchased—0.0% | |
| |
| Credit Default Swap maturing 6/20/19 Call10 | | | JPM | | | | Buy | | | | CDX.NA.IG.22 | | | | 1.000 | % | | | 12/17/14 | | | | USD | | | | 13,008 | | | | | | 17,494 | |
| |
| Credit Default Swap maturing 6/20/19 Call10 | | | JPM | | | | Buy | | | | CDX.NA.IG.22 | | | | 1.000 | | | | 10/15/14 | | | | USD | | | | 13,729 | | | | | | 8,420 | |
13 OPPENHEIMER CORE BOND FUND/VA
|
| STATEMENT OF INVESTMENTS Unaudited / Continued |
| | | | | | | | | | | | | | | | | | | | | | | | | | | | | | | | |
| | | Counterparty | | | Buy /Sell
Protection | | | Reference Asset | | | Fixed
Rate | | | Expiration Date | | | | | | Notional (000’s) | | | Value | |
| |
| Over-the-Counter Credit Default Swaptions Purchased (Continued) | | | | | |
| |
Credit Default Swap maturing 6/20/19 Call10 | | | DEU | | | | Buy | | | | CDX.NA.IG.22 | | | | 1.000 | | | | 10/15/14 | | | | USD | | | | 13,730 | | | $ | 8,421 | |
| | | | | | | | | | | | | | | | | | | | | | | | | | | | | | | | |
| Total Over-the-Counter Credit Default Swaptions Purchased (Cost $76,819) | | | | | | | | | | | | 34,335 | |
|
| |
| Total Investments, at Value (Cost $194,373,253) | | | | | | | | | | | | | | | | 129.9 | % | | | 194,959,541 | |
| |
| Net Other Assets (Liabilities) | | | | | | | | | | | | | | | | | | | | (29.9 | ) | | | (44,899,099) | |
| | | | | | | | | | | | | | | | | | | | | | | | | | | | |
Net Assets | | | | | | | | | | | | | | | | | | | | | | | | | | | 100.0 | % | | $ | 150,060,442 | |
| | | | | | | | | | | | | | | | | | | | | | | | | | | | |
Footnotes to Statement of Investments
1. Represents securities sold under Rule 144A, which are exempt from registration under the Securities Act of 1933, as amended. These securities have been determined to be liquid under guidelines established by the Board of Trustees. These securities amount to $35,010,659 or 23.33% of the Fund’s net assets as of June 30, 2014.
2. Restricted security. The aggregate value of restricted securities as of June 30, 2014 was $2,002,065, which represents 1.33% of the Fund’s net assets. See Note 7 of the accompanying Notes. Information concerning restricted securities is as follows:
| | | | | | | | | | | | | | | | |
| Security | | Acquisition
Dates | | | Cost | | | Value | | | Unrealized
Appreciation/
(Depreciation) | |
| |
| Capital Lease Funding Securitization LP, Interest-Only Commercial Mtg. Pass-Through Certificates, Series 1997-CTL1, Cl. IO, 0%, 6/22/24 | | | 4/21/97 | | | $ | 370,303 | | | $ | 73,947 | | | $ | (296,356) | |
| Credit Acceptance Auto Loan Trust, Series 2013-2A, Cl. B, 2.26%, 10/15/21 | | | 10/22/13 | | | | 259,927 | | | | 263,541 | | | | 3,614 | |
| Lehman Structured Securities Corp., Series 2002-GE1, Cl. A, 2.514%, 7/26/24 | | | 1/28/02 | | | | 74,594 | | | | 67,081 | | | | (7,513) | |
| Morgan Stanley Re-Remic Trust, Series 2012-R3, Cl. 1B, 2.049%, 11/26/36 | | | 10/24/12-6/1/14 | | | | 240,295 | | | | 284,070 | | | | 43,775 | |
| NC Finance Trust, Series 1999-I, Cl. D, 8.75%, 1/25/29 | | | 8/10/10 | | | | 3,281,116 | | | | 217,366 | | | | (3,063,750) | |
| Rabobank Capital Funding Trust III, 5.254% Jr. Sub. Perpetual Bonds | | | 5/1/13-5/8/13 | | | | 678,762 | | | | 703,685 | | | | 24,923 | |
| ZFS Finance USA Trust V, 6.50% Jr. Sub. Nts., 5/9/37 | | | 11/20/13 | | | | 384,451 | | | | 392,375 | | | | 7,924 | |
| | | | | | | | |
| | | | | | $ | 5,289,448 | | | $ | 2,002,065 | | | $ | (3,287,383) | |
| | | | | | | | |
3. Represents the current interest rate for a variable or increasing rate security.
4. Interest-Only Strips represent the right to receive the monthly interest payments on an underlying pool of mortgage loans. These securities typically decline in price as interest rates decline. Most other fixed income securities increase in price when interest rates decline. The principal amount of the underlying pool represents the notional amount on which current interest is calculated. The price of these securities is typically more sensitive to changes in prepayment rates than traditional mortgage-backed securities (for example, GNMA pass-throughs). Interest rates disclosed represent current yields based upon the current cost basis and estimated timing and amount of future cash flows. These securities amount to $3,169,669 or 2.11% of the Fund’s net assets as of June 30, 2014.
5. Interest rate is less than 0.0005%.
6. Principal-Only Strips represent the right to receive the monthly principal payments on an underlying pool of mortgage loans. The value of these securities generally increases as interest rates decline and prepayment rates rise. The price of these securities is typically more volatile than that of coupon-bearing bonds of the same maturity. Interest rates disclosed represent current yields based upon the current cost basis and estimated timing of future cash flows. These securities amount to $179,043 or 0.12% of the Fund’s net assets as of June 30, 2014.
7. All or a portion of the security position is when-issued or delayed delivery to be delivered and settled after June 30, 2014. See Note 1 of the accompanying Notes.
8. This security is not accruing income because the issuer has missed an interest payment on it and/or is not anticipated to make future interest and or principal payments. The rate shown is the original contractual interest rate. See Note 1 of the accompanying Notes.
9. This bond has no contractual maturity date, is not redeemable and contractually pays an indefinite stream of interest. Rate reported represents the current interest rate for this variable rate security.
10. Non-income producing security.
The following issuer is or was an affiliate, as defined in the Investment Company Act of 1940, at or during the period ended June 30, 2014 by virtue of the Fund owning at least 5% of the voting securities of the issuer or as a result of the Fund and the issuer having the same investment adviser. There were no affiliate securities held by the Fund as of June 30, 2014. Transactions during the period in which the issuer was an affiliate are as follows:
| | | | | | | | | | | | | | | | | | | | | | | | | | |
| | | Shares
December 31, 2013 | | | | | Gross
Additions | | | | | | Gross
Reductions | | | | | | Shares
June 30, 2014 | |
| |
| Oppenheimer Institutional Money Market Fund, Cl. E | | | 22,407,494 | | | | | | 24,855,693 | | | | | | | | 47,263,187 | | | | | | | | — | |
| | | | |
| | | Income | |
| |
| Oppenheimer Institutional Money Market Fund, Cl. E | | | $4,812 | |
14 OPPENHEIMER CORE BOND FUND/VA
| | | | | | | | | | | | | | | | | | | | | | | | |
| |
| Futures Contracts as of June 30, 2014 | |
| Description | | Exchange | | | Buy/Sell | | | Expiration Date | | | Number of Contracts | | | Value | | | Unrealized Appreciation
(Depreciation) | |
| |
| United States Treasury Long Bonds | | | CBT | | | | Sell | | | | 9/19/14 | | | | 16 | | | $ | 2,195,000 | | | $ | (2,501) | |
| United States Treasury Nts., 2 yr. | | | CBT | | | | Sell | | | | 9/30/14 | | | | 190 | | | | 41,722,814 | | | | 16,244 | |
| United States Treasury Nts., 5 yr. | | | CBT | | | | Sell | | | | 9/30/14 | | | | 7 | | | | 836,227 | | | | 2,346 | |
| United States Treasury Nts., 10 yr. | | | CBT | | | | Sell | | | | 9/19/14 | | | | 11 | | | | 1,376,891 | | | | (402) | |
| United States Treasury Ultra Bonds | | | CBT | | | | Buy | | | | 9/19/14 | | | | 54 | | | | 8,096,625 | | | | 102,394 | |
| | | | | | | | | | | | | | | | | | | | | | | | |
| | | | | | | | | | | | | | | | | | | | | | $ | 118,081 | |
| | | | | | | | | | | | | | | | | | | | | | | | |
| | |
| Glossary: | | |
| Counterparty Abbreviations |
| DEU | | Deutsche Bank AG |
| JPM | | JPMorgan Chase Bank NA |
| |
| Definitions | | |
| CDX.NA.IG.22 | | Markit CDX North American Investment Grade High Volatility |
| |
| Exchange Abbreviations | | |
| CBT | | Chicago Board of Trade |
See accompanying Notes to Financial Statements.
15 OPPENHEIMER CORE BOND FUND/VA
STATEMENTOF ASSETS AND LIABILITIES June 30, 2014 Unaudited
| | | | |
| |
| Assets | | | | |
| Investments, at value—see accompanying statement of investments (cost $194,373,253) | | $ | 194,959,541 | |
| |
| Cash used for collateral on futures | | | 200,000 | |
| |
| Receivables and other assets: | | | | |
| Investments sold (including $3,173,841 sold on a when-issued or delayed delivery basis) | | | 3,783,360 | |
| Interest, dividends and principal paydowns | | | 1,019,873 | |
| Shares of beneficial interest sold | | | 132,388 | |
| Variation margin receivable | | | 35,438 | |
| Other | | | 33,864 | |
| | | | |
| Total assets | | | 200,164,464 | |
|
| |
| Liabilities | | | | |
| Bank overdraft | | | 110,327 | |
| |
| Payables and other liabilities: | | | | |
| Investments purchased (including $49,238,677 purchased on a when-issued or delayed delivery basis) | | | 49,815,347 | |
| Shares of beneficial interest redeemed | | | 91,835 | |
| Trustees’ compensation | | | 27,920 | |
| Shareholder communications | | | 17,926 | |
| Distribution and service plan fees | | | 11,412 | |
| Variation margin payable | | | 11,177 | |
| Other | | | 18,078 | |
| | | | |
| Total liabilities | | | 50,104,022 | |
|
| |
| Net Assets | | $ | 150,060,442 | |
| | | | |
|
| |
| Composition of Net Assets | | | | |
| Par value of shares of beneficial interest | | $ | 19,249 | |
| |
| Additional paid-in capital | | | 229,245,816 | |
| |
| Accumulated net investment income | | | 2,265,404 | |
| |
| Accumulated net realized loss on investments | | | (82,174,396) | |
| |
| Net unrealized appreciation on investments | | | 704,369 | |
| | | | |
| Net Assets | | $ | 150,060,442 | |
| | | | |
|
| |
| Net Asset Value Per Share | | | | |
| Non-Service Shares: | | | | |
| Net asset value, redemption price (excludes applicable contingent deferred sales charge) and offering price per share (based on net assets of $94,757,438 and 12,105,176 shares of beneficial interest outstanding) | | | $7.83 | |
| |
| |
| Service Shares: | | | | |
| |
| Net asset value, redemption price (excludes applicable contingent deferred sales charge) and offering price per share (based on net assets of $55,303,004 and 7,143,979 shares of beneficial interest outstanding) | | | $7.74 | |
See accompanying Notes to Financial Statements.
16 OPPENHEIMER CORE BOND FUND/VA
STATEMENTOF OPERATIONS For the Six Months Ended June 30, 2014 Unaudited
| | | | |
| |
| Investment Income | | | | |
| Interest | | $ | 2,839,365 | |
| |
| Fee income on when-issued securities | | | 510,830 | |
| |
| Dividends from affiliated companies | | | 4,812 | |
| | | | |
| Total investment income | | | 3,355,007 | |
|
| |
| Expenses | | | | |
| Management fees | | | 449,849 | |
| |
| Distribution and service plan fees - Service shares | | | 68,943 | |
| |
| Transfer and shareholder servicing agent fees: | | | | |
| Non-Service shares | | | 47,403 | |
| Service shares | | | 27,572 | |
| |
| Shareholder communications: | | | | |
| Non-Service shares | | | 10,322 | |
| Service shares | | | 5,983 | |
| |
| Custodian fees and expenses | | | 14,573 | |
| |
| Trustees’ compensation | | | 8,840 | |
| |
| Other | | | 31,008 | |
| | | | |
| Total expenses | | | 664,493 | |
| Less waivers and reimbursements of expenses | | | (33,260) | |
| | | | |
| Net expenses | | | 631,233 | |
|
| |
| Net Investment Income | | | 2,723,774 | |
|
| |
| Realized and Unrealized Gain | | | | |
| Net realized gain on: | | | | |
| Investments from unaffiliated companies | | | 1,381,834 | |
| Closing and expiration of futures contracts | | | 578,649 | |
| | | | |
| Net realized gain | | | 1,960,483 | |
| |
| Net change in unrealized appreciation/depreciation on: | | | | |
| Investments | | | 3,226,409 | |
| Futures contracts | | | 110,463 | |
| | | | |
| Net change in unrealized appreciation/depreciation | | | 3,336,872 | |
|
| |
| Net Increase in Net Assets Resulting from Operations | | $ | 8,021,129 | |
| | | | |
See accompanying Notes to Financial Statements.
17 OPPENHEIMER CORE BOND FUND/VA
STATEMENTSOF CHANGES IN NET ASSETS
| | | | | | | | |
| | | Six Months Ended June 30, 2014 (Unaudited) | | | Year Ended December 31, 2013 | |
| |
| Operations | | | | | | | | |
| Net investment income | | $ | 2,723,774 | | | $ | 7,267,680 | |
| |
| Net realized gain | | | 1,960,483 | | | | 125,040 | |
| |
| Net change in unrealized appreciation/depreciation | | | 3,336,872 | | | | (7,829,173) | |
| | | | | | | | |
| Net increase (decrease) in net assets resulting from operations | | | 8,021,129 | | | | (436,453) | |
|
| |
| Dividends and/or Distributions to Shareholders | | | | | | | | |
| Dividends from net investment income: | | | | | | | | |
| Non-Service shares | | | (4,942,639) | | | | (5,333,237) | |
| Service shares | | | (2,786,113) | | | | (3,004,980) | |
| | | | |
| | | (7,728,752) | | | | (8,338,217) | |
|
| |
| Beneficial Interest Transactions | | | | | | | | |
| Net increase (decrease) in net assets resulting from beneficial interest transactions: | | | | | | | | |
| Non-Service shares | | | (2,223,606) | | | | (14,737,860) | |
| Service shares | | | 260,693 | | | | (6,439,915) | |
| | | (1,962,913) | | | | (21,177,775) | |
| | | | | | | | |
|
| |
| Net Assets | | | | | | | | |
| Total decrease | | | (1,670,536) | | | | (29,952,445) | |
| |
| Beginning of period | | | 151,730,978 | | | | 181,683,423 | |
| | | | | | | | |
| End of period (including accumulated net investment income of $2,265,404 and $7,270,382, respectively) | | $ | 150,060,442 | | | $ | 151,730,978 | |
| | | | |
See accompanying Notes to Financial Statements.
18 OPPENHEIMER CORE BOND FUND/VA
FINANCIAL HIGHLIGHTS
| | | | | | | | | | | | | | | | | | | | | | | | |
| Non-Service Shares | | Six Months
Ended
June 30,
2014
(Unaudited) | | | Year Ended
December 31, 2013 | | | Year
Ended
December 31, 2012 | | | Year Ended
December 30, 20111 | | | Year Ended
December 31, 2010 | | | Year Ended
December 31, 2009 | |
| |
| Per Share Operating Data | | | | | | | | | | | | | | | | | | | | | | | | |
| Net asset value, beginning of period | | $ | 7.83 | | | $ | 8.26 | | | $ | 7.88 | | | $ | 7.73 | | | $ | 7.07 | | | $ | 6.45 | |
| |
| Income (loss) from investment operations: | | | | | | | | | | | | | | | | | | | | | | | | |
| Net investment income2 | | | 0.15 | | | | 0.36 | | | | 0.35 | | | | 0.36 | | | | 0.40 | | | | 0.48 | |
| Net realized and unrealized gain (loss) | | | 0.28 | | | | (0.37 | ) | | | 0.44 | | | | 0.25 | | | | 0.40 | | | | 0.14 | |
| | | | |
| Total from investment operations | | | 0.43 | | | | (0.01 | ) | | | 0.79 | | | | 0.61 | | | | 0.80 | | | | 0.62 | |
| |
| Dividends and/or distributions to shareholders: | | | | | | | | | | | | | | | | | | | | | | | | |
| Dividends from net investment income | | | (0.43 | ) | | | (0.42 | ) | | | (0.41 | ) | | | (0.46 | ) | | | (0.14 | ) | | | 0.00 | |
| |
| Net asset value, end of period | | $ | 7.83 | | | $ | 7.83 | | | $ | 8.26 | | | $ | 7.88 | | | $ | 7.73 | | | $ | 7.07 | |
| | | | |
|
| |
| Total Return, at Net Asset Value3 | | | 5.51% | | | | (0.10 | )% | | | 10.29% | | | | 8.27% | | | | 11.42% | | | | 9.61% | |
|
| |
| Ratios/Supplemental Data | | | | | | | | | | | | | | | | | | | | | | | | |
| Net assets, end of period (in thousands) | | $ | 94,757 | | | $ | 96,785 | | | $ | 116,989 | | | $ | 122,271 | | | $ | 132,557 | | | $ | 137,597 | |
| |
| Average net assets (in thousands) | | $ | 96,123 | | | $ | 105,012 | | | $ | 119,547 | | | $ | 127,341 | | | $ | 136,333 | | | $ | 137,631 | |
| |
| Ratios to average net assets:4 | | | | | | | | | | | | | | | | | | | | | | | | |
| Net investment income | | | 3.70% | | | | 4.51% | | | | 4.34% | | | | 4.71% | | | | 5.32% | | | | 7.40% | |
| Total expenses5 | | | 0.79% | | | | 0.80% | | | | 0.77% | | | | 0.77% | | | | 0.79% | | | | 0.75% | |
| Expenses after payments, waivers and/or reimbursements and reduction to custodian expenses | | | 0.74% | | | | 0.75% | | | | 0.75% | | | | 0.75% | | | | 0.70% | | | | 0.61% | |
| |
| Portfolio turnover rate6 | | | 74% | | | | 115% | | | | 140% | | | | 99% | | | | 98% | | | | 143% | |
1. December 30, 2011 represents the last business day of the Fund’s reporting period.
2. Per share amounts calculated based on the average shares outstanding during the period.
3. Assumes an initial investment on the business day before the first day of the fiscal period, with all dividends and distributions reinvested in additional shares on the reinvestment date, and redemption at the net asset value calculated on the last business day of the fiscal period. Total returns are not annualized for periods less than one full year. Total return information does not reflect expenses that apply at the separate account level or to related insurance products. Inclusion of these charges would reduce the total return figures for all periods shown. Returns do not reflect the deduction of taxes that a shareholder would pay on fund distributions or the redemption of fund shares.
4. Annualized for periods less than one full year.
5. Total expenses including indirect expenses from affiliated fund were as follows:
| | | | | | |
| | Six Months Ended June 30, 2014 | | | 0.80 | % |
| | Year Ended December 31, 2013 | | | 0.81 | % |
| | Year Ended December 31, 2012 | | | 0.79 | % |
| | Year Ended December 30, 2011 | | | 0.79 | % |
| | Year Ended December 31, 2010 | | | 0.80 | % |
| | Year Ended December 31, 2009 | | | 0.76 | % |
6. The portfolio turnover rate excludes purchase and sale transactions of To Be Announced (TBA) mortgage-related securities as follows:
| | | | | | | | |
| | | Purchase Transactions | | | Sale Transactions | |
| |
Six Months Ended June 30, 2014 | | | $271,747,712 | | | | $257,723,644 | |
Year Ended December 31, 2013 | | | $776,927,298 | | | | $806,883,121 | |
Year Ended December 31, 2012 | | | $930,202,858 | | | | $942,406,652 | |
Year Ended December 30, 2011 | | | $911,850,847 | | | | $909,531,196 | |
Year Ended December 31, 2010 | | | $775,240,942 | | | | $766,486,357 | |
Year Ended December 31, 2009 | | | $977,840,247 | | | | $1,009,549,121 | |
See accompanying Notes to Financial Statements.
19 OPPENHEIMER CORE BOND FUND/VA
| | |
| FINANCIAL HIGHLIGHTS Continued | | |
| | | | | | | | | | | | | | | | | | | | | | | | |
| Service Shares | | Six Months
Ended
June 30,
2014
(Unaudited) | | | Year Ended
December
31, 2013 | | | Year Ended
December
31, 2012 | | | Year Ended
December
30, 20111 | | | Year Ended
December
31, 2010 | | | Year Ended
December
31, 2009 | |
| |
| Per Share Operating Data | | | | | | | | | | | | | | | | | | | | | | | | |
| Net asset value, beginning of period | | $ | 7.74 | | | $ | 8.17 | | | $ | 7.79 | | | $ | 7.65 | | | $ | 6.99 | | | $ | 6.41 | |
| |
| Income (loss) from investment operations: | | | | | | | | | | | | | | | | | | | | | | | | |
| Net investment income2 | | | 0.14 | | | | 0.34 | | | | 0.33 | | | | 0.34 | | | | 0.37 | | | | 0.46 | |
| Net realized and unrealized gain (loss) | | | 0.27 | | | | (0.37 | ) | | | 0.44 | | | | 0.24 | | | | 0.41 | | | | 0.12 | |
| | | | |
| Total from investment operations | | | 0.41 | | | | (0.03 | ) | | | 0.77 | | | | 0.58 | | | | 0.78 | | | | 0.58 | |
| |
| Dividends and/or distributions to shareholders: | | | | | | | | | | | | | | | | | | | | | | | | |
| Dividends from net investment income | | | (0.41 | ) | | | (0.40 | ) | | | (0.39 | ) | | | (0.44 | ) | | | (0.12 | ) | | | 0.00 | |
| |
| Net asset value, end of period | | $ | 7.74 | | | $ | 7.74 | | | $ | 8.17 | | | $ | 7.79 | | | $ | 7.65 | | | $ | 6.99 | |
| | | | |
|
| |
| Total Return, at Net Asset Value3 | | | 5.29% | | | | (0.38 | )% | | | 10.17% | | | | 7.93% | | | | 11.28% | | | | 9.05% | |
|
| |
| Ratios/Supplemental Data | | | | | | | | | | | | | | | | | | | | | | | | |
| Net assets, end of period (in thousands) | | $ | 55,303 | | | $ | 54,946 | | | $ | 64,694 | | | $ | 62,294 | | | $ | 56,562 | | | $ | 56,717 | |
| |
| Average net assets (in thousands) | | $ | 55,903 | | | $ | 59,523 | | | $ | 67,116 | | | $ | 58,629 | | | $ | 57,313 | | | $ | 52,648 | |
| |
| Ratios to average net assets:4 | | | | | | | | | | | | | | | | | | | | | | | | |
| Net investment income | | | 3.46% | | | | 4.26% | | | | 4.07% | | | | 4.42% | | | | 5.06% | | | | 7.16% | |
| Total expenses5 | | | 1.04% | | | | 1.05% | | | | 1.02% | | | | 1.02% | | | | 1.04% | | | | 1.01% | |
| Expenses after payments, waivers and/or reimbursements and reduction to custodian expenses | | | 0.99% | | | | 1.00% | | | | 1.00% | | | | 1.00% | | | | 0.95% | | | | 0.86% | |
| |
| Portfolio turnover rate6 | | | 74% | | | | 115% | | | | 140% | | | | 99% | | | | 98% | | | | 143% | |
1. December 30, 2011 represents the last business day of the Fund’s reporting period.
2. Per share amounts calculated based on the average shares outstanding during the period.
3. Assumes an initial investment on the business day before the first day of the fiscal period, with all dividends and distributions reinvested in additional shares on the reinvestment date, and redemption at the net asset value calculated on the last business day of the fiscal period. Total returns are not annualized for periods less than one full year. Total return information does not reflect expenses that apply at the separate account level or to related insurance products. Inclusion of these charges would reduce the total return figures for all periods shown. Returns do not reflect the deduction of taxes that a shareholder would pay on fund distributions or the redemption of fund shares.
4. Annualized for periods less than one full year.
5. Total expenses including indirect expenses from affiliated fund were as follows:
| | | | | | |
| | Six Months Ended June 30, 2014 | | | 1.05 | % |
| | Year Ended December 31, 2013 | | | 1.06 | % |
| | Year Ended December 31, 2012 | | | 1.04 | % |
| | Year Ended December 30, 2011 | | | 1.04 | % |
| | Year Ended December 31, 2010 | | | 1.05 | % |
| | Year Ended December 31, 2009 | | | 1.02 | % |
6. The portfolio turnover rate excludes purchase and sale transactions of To Be Announced (TBA) mortgage-related securities as follows:
| | | | | | | | |
| | | Purchase Transactions | | | Sale Transactions | |
| |
Six Months Ended June 30, 2014 | | | $271,747,712 | | | | $257,723,644 | |
Year Ended December 31, 2013 | | | $776,927,298 | | | | $806,883,121 | |
Year Ended December 31, 2012 | | | $930,202,858 | | | | $942,406,652 | |
Year Ended December 30, 2011 | | | $911,850,847 | | | | $909,531,196 | |
Year Ended December 31, 2010 | | | $775,240,942 | | | | $766,486,357 | |
Year Ended December 31, 2009 | | | $977,840,247 | | | | $1,009,549,121 | |
See accompanying Notes to Financial Statements.
20 OPPENHEIMER CORE BOND FUND/VA
|
| NOTES TO FINANCIAL STATEMENTS June 30, 2014 Unaudited |
1. Significant Accounting Policies
Oppenheimer Core Bond Fund/VA (the “Fund”) is a separate series of Oppenheimer Variable Account Funds, a diversified open-end management investment company registered under the Investment Company Act of 1940, as amended. The Fund’s main investment objective is to seek total return. The Fund’s investment adviser is OFI Global Asset Management, Inc. (“OFI Global” or the “Manager”), a wholly-owned subsidiary of OppenheimerFunds, Inc. (“OFI” or the “Sub-Adviser”). The Manager has entered into a sub-advisory agreement with OFI. Shares of the Fund are sold only to separate accounts of life insurance companies.
The Fund offers two classes of shares. Both classes are sold at their offering price, which is the net asset value per share, to separate investment accounts of participating insurance companies as an underlying investment for variable life insurance policies, variable annuity contracts or other investment products. The class of shares designated as Service shares is subject to a distribution and service plan. Both classes of shares have identical rights and voting privileges with respect to the Fund in general and exclusive voting rights on matters that affect that class alone. Earnings, net assets and net asset value per share may differ due to each class having its own expenses, such as transfer and shareholder servicing agent fees and shareholder communications, directly attributable to that class.
The following is a summary of significant accounting policies consistently followed by the Fund.
Securities on a When-Issued or Delayed Delivery Basis. The Fund may purchase securities on a “when-issued” basis, and may purchase or sell securities on a “delayed delivery” basis. “When-issued” or “delayed delivery” refers to securities whose terms and indenture are available and for which a market exists, but which are not available for immediate delivery. Delivery and payment for securities that have been purchased by the Fund on a when-issued basis normally takes place within six months and possibly as long as two years or more after the trade date. During this period, such securities do not earn interest, are subject to market fluctuation and may increase or decrease in value prior to their delivery. The purchase of securities on a when-issued basis may increase the volatility of the Fund’s net asset value to the extent the Fund executes such transactions while remaining substantially fully invested. When the Fund engages in when-issued or delayed delivery transactions, it relies on the buyer or seller, as the case may be, to complete the transaction. Their failure to do so may cause the Fund to lose the opportunity to obtain or dispose of the security at a price and yield it considers advantageous. The Fund may also sell securities that it purchased on a when-issued basis or forward commitment prior to settlement of the original purchase.
As of June 30, 2014, the Fund had purchased securities issued on a when-issued or delayed delivery basis and sold securities issued on a delayed delivery basis as follows:
| | | | |
| | | When-Issued or Delayed Delivery Basis Transactions | |
| |
Purchased securities | | | $49,238,677 | |
Sold securities | | | 3,173,841 | |
The Fund may enter into “forward roll” transactions with respect to mortgage-related securities. In this type of transaction, the Fund sells a mortgage-related security to a buyer and simultaneously agrees to repurchase a similar security (same type, coupon and maturity) at a later date at a set price. During the period between the sale and the repurchase, the Fund will not be entitled to receive interest and principal payments on the securities that have been sold. The Fund records the incremental difference between the forward purchase and sale of each forward roll as realized gain (loss) on investments or as fee income in the case of such transactions that have an associated fee in lieu of a difference in the forward purchase and sale price.
Forward roll transactions may be deemed to entail embedded leverage since the Fund purchases mortgage-related securities with extended settlement dates rather than paying for the securities under a normal settlement cycle. This embedded leverage increases the Fund’s market value of investments relative to its net assets which can incrementally increase the volatility of the Fund’s performance. Forward roll transactions can be replicated over multiple settlement periods.
Risks of entering into forward roll transactions include the potential inability of the counterparty to meet the terms of the agreement; the potential of the Fund to receive inferior securities at redelivery as compared to the securities sold to the counterparty; and counterparty credit risk.
Credit Risk. The Fund invests in high-yield, non-investment-grade bonds, which may be subject to a greater degree of credit risk. Credit risk relates to the ability of the issuer to meet interest or principal payments or both as they become due. The Fund may acquire securities that have missed an interest payment, and is not obligated to dispose of securities whose issuers or underlying obligors subsequently miss an interest payment. Information concerning securities not accruing interest as of June 30, 2014 is as follows:
| | | | |
Cost | | | $3,281,116 | |
Market Value | | | $217,366 | |
Market value as % of Net Assets | | | 0.14% | |
Investment in Oppenheimer Institutional Money Market Fund. The Fund is permitted to invest daily available cash balances in an affiliated money market fund. The Fund may invest the available cash in Class E shares of Oppenheimer Institutional Money Market Fund (“IMMF”) to seek current income while preserving liquidity. IMMF is a registered open-end management investment company, regulated as a money market fund under the Investment Company Act of 1940, as amended. The Manager is the investment adviser of IMMF, and the Sub-Adviser provides investment and related advisory services to IMMF. When applicable, the Fund’s investment in IMMF is included in the Statement of Investments. Shares of IMMF are valued at their net asset value per share. As a shareholder, the Fund is subject to its proportional share of IMMF’s Class E expenses, including its management fee.
21 OPPENHEIMER CORE BOND FUND/VA
|
| NOTES TO FINANCIAL STATEMENTS Unaudited / Continued |
1. Significant Accounting Policies (Continued)
The Manager will waive fees and/or reimburse Fund expenses in an amount equal to the indirect management fees incurred through the Fund’s investment in IMMF.
Allocation of Income, Expenses, Gains and Losses. Income, expenses (other than those attributable to a specific class), gains and losses are allocated on a daily basis to each class of shares based upon the relative proportion of net assets represented by such class. Operating expenses directly attributable to a specific class are charged against the operations of that class.
Federal Taxes. The Fund intends to comply with provisions of the Internal Revenue Code applicable to regulated investment companies and to distribute substantially all of its investment company taxable income to shareholders. Therefore, no federal income or excise tax provision is required. The Fund files income tax returns in U.S. federal and applicable state jurisdictions. The statute of limitations on the Fund’s tax return filings generally remain open for the three preceding fiscal reporting period ends.
During the fiscal year ended December 31, 2013, the Fund utilized $62,802 of capital loss carryforward to offset capital gains realized in that fiscal year. The Fund had post-October losses of $372,480. Details of the fiscal year ended December 31, 2013 capital loss carryforwards are included in the table below. Capital loss carryforwards with no expiration, if any, must be utilized prior to those with expiration dates. Capital losses with no expiration will be carried forward to future years if not offset by gains.
| | | | |
| Expiring | | | |
| |
2016 | | | $ 8,625,089 | |
2017 | | | 75,069,850 | |
| | | | |
Total | | | $ 83,694,939 | |
| | | | |
As of June 30, 2014, it is estimated that the capital loss carryforwards would be $81,734,456 expiring by 2017. The estimated capital loss carryforward represents the carryforward as of the end of the last fiscal year, increased or decreased by capital losses or gains realized in the first six months of the current fiscal year. During the six months ended June 30, 2014, it is estimated that the Fund will utilize $1,960,483 of capital loss carryforward to offset realized capital gains.
Net investment income (loss) and net realized gain (loss) may differ for financial statement and tax purposes. The character of dividends and distributions made during the fiscal year from net investment income or net realized gains may differ from their ultimate characterization for federal income tax purposes. Also, due to timing of dividends and distributions, the fiscal year in which amounts are distributed may differ from the fiscal year in which the income or net realized gain was recorded by the Fund.
The aggregate cost of securities and other investments and the composition of unrealized appreciation and depreciation of securities and other investments for federal income tax purposes as of June 30, 2014 are noted in the following table. The primary difference between book and tax appreciation or depreciation of securities and other investments, if applicable, is attributable to the tax deferral of losses or tax realization of financial statement unrealized gain or loss.
| | | | |
Federal tax cost of securities | | $ | 194,425,607 | |
Federal tax cost of other investments | | | (38,152,388) | |
| | | | |
Total federal tax cost | | $ | 156,273,219 | |
| | | | |
Gross unrealized appreciation | | $ | 6,460,332 | |
Gross unrealized depreciation | | | (5,808,317) | |
| | | | |
Net unrealized appreciation | | $ | 652,015 | |
| | | | |
Trustees’ Compensation. The Board of Trustees has adopted a compensation deferral plan for independent trustees that enables trustees to elect to defer receipt of all or a portion of the annual compensation they are entitled to receive from the Fund. For purposes of determining the amount owed to the Trustee under the plan, deferred amounts are treated as though equal dollar amounts had been invested in shares of the Fund or in other Oppenheimer funds selected by the Trustee. The Fund purchases shares of the funds selected for deferral by the Trustee in amounts equal to his or her deemed investment, resulting in a Fund asset equal to the deferred compensation liability. Such assets are included as a component of “Other” within the asset section of the Statement of Assets and Liabilities. Deferral of trustees’ fees under the plan will not affect the net assets of the Fund, and will not materially affect the Fund’s assets, liabilities or net investment income per share. Amounts will be deferred until distributed in accordance with the compensation deferral plan.
Dividends and Distributions to Shareholders. Dividends and distributions to shareholders, which are determined in accordance with income tax regulations and may differ from U.S. generally accepted accounting principles, are recorded on the ex-dividend date. Income and capital gain distributions, if any, are declared and paid annually or at other times as deemed necessary by the Manager. The tax character of distributions is determined as of the Fund’s fiscal year end. Therefore, a portion of the Fund’s distributions made to shareholders prior to the Fund’s fiscal year end may ultimately be categorized as a tax return of capital.
Investment Income. Dividend income is recorded on the ex-dividend date or upon ex-dividend notification in the case of certain foreign dividends where the ex-dividend date may have passed. Non-cash dividends included in dividend income, if any, are recorded at the fair market value of the
22 OPPENHEIMER CORE BOND FUND/VA
1. Significant Accounting Policies (Continued)
securities received. Interest income is recognized on an accrual basis. Discount and premium, which are included in interest income on the Statement of Operations, are amortized or accreted daily.
Custodian Fees. “Custodian fees and expenses” in the Statement of Operations may include interest expense incurred by the Fund on any cash overdrafts of its custodian account during the period. Such cash overdrafts may result from the effects of failed trades in portfolio securities and from cash outflows resulting from unanticipated shareholder redemption activity. The Fund pays interest to its custodian on such cash overdrafts, to the extent they are not offset by positive cash balances maintained by the Fund, at a rate equal to the Federal Funds Rate plus 0.50%. The “Reduction to custodian expenses” line item, if applicable, represents earnings on cash balances maintained by the Fund during the period. Such interest expense and other custodian fees may be paid with these earnings.
Security Transactions. Security transactions are recorded on the trade date. Realized gains and losses on securities sold are determined on the basis of identified cost.
Indemnifications. The Fund’s organizational documents provide current and former trustees and officers with a limited indemnification against liabilities arising in connection with the performance of their duties to the Fund. In the normal course of business, the Fund may also enter into contracts that provide general indemnifications. The Fund’s maximum exposure under these arrangements is unknown as this would be dependent on future claims that may be made against the Fund. The risk of material loss from such claims is considered remote.
Other. The preparation of financial statements in conformity with accounting principles generally accepted in the United States of America requires management to make estimates and assumptions that affect the reported amounts of assets and liabilities and disclosure of contingent assets and liabilities at the date of the financial statements and the reported amounts of increases and decreases in net assets from operations during the reporting period. Actual results could differ from those estimates.
2. Securities Valuation
The Fund calculates the net asset value of its shares as of the close of the New York Stock Exchange (the “Exchange”), normally 4:00 P.M. Eastern time, on each day the Exchange is open for trading.
The Fund’s Board has adopted procedures for the valuation of the Fund’s securities and has delegated the day-to-day responsibility for valuation determinations under those procedures to the Manager. The Manager has established a Valuation Committee which is responsible for determining a “fair valuation” for any security for which market quotations are not “readily available.” The Valuation Committee’s fair valuation determinations are subject to review, approval and ratification by the Fund’s Board at its next regularly scheduled meeting covering the calendar quarter in which the fair valuation was determined.
Valuation Methods and Inputs
Securities are valued using unadjusted quoted market prices, when available, as supplied primarily by third party pricing services or dealers.
The following methodologies are used to determine the market value or the fair value of the types of securities described below:
Securities traded on a registered U.S. securities exchange (including exchange-traded derivatives other than futures and futures options) are valued based on the last sale price of the security reported on the principal exchange on which it is traded, prior to the time when the Fund’s assets are valued. In the absence of a sale, the security is valued at the last sale price on the prior trading day, if it is within the spread of the current day’s closing “bid” and “asked” prices, and if not, at the current day’s closing bid price. A security of a foreign issuer traded on a foreign exchange, but not listed on a registered U.S. securities exchange, is valued based on the last sale price on the principal exchange on which the security is traded, as identified by the third party pricing service used by the Manager, prior to the time when the Fund’s assets are valued. If the last sale price is unavailable, the security is valued at the most recent official closing price on the principal exchange on which it is traded. If the last sales price or official closing price for a foreign security is not available, the security is valued at the mean between the bid and asked price per the exchange or, if not available from the exchange, obtained from two dealers. If bid and asked prices are not available from either the exchange or two dealers, the security is valued by using one of the following methodologies (listed in order of priority): (1) using a bid from the exchange, (2) the mean between the bid and asked price as provided by a single dealer, or (3) a bid from a single dealer.
Shares of a registered investment company that are not traded on an exchange are valued at that investment company’s net asset value per share.
Corporate and government debt securities (of U.S. or foreign issuers) and municipal debt securities, event-linked bonds, loans, mortgage-backed securities, collateralized mortgage obligations, and asset-backed securities are valued at the mean between the “bid” and “asked” prices utilizing evaluated prices obtained from third party pricing services or broker-dealers who may use matrix pricing methods to determine the evaluated prices.
Short-term money market type debt securities with a remaining maturity of sixty days or less are valued at cost adjusted by the amortization of discount or premium to maturity (amortized cost), which approximates market value. Short-term debt securities with a remaining maturity in excess of sixty days are valued at the mean between the “bid” and “asked” prices utilizing evaluated prices obtained from third party pricing services or broker-dealers.
Structured securities, swaps, swaptions, and other over-the-counter derivatives are valued utilizing evaluated prices obtained from third party pricing services or broker-dealers.
23 OPPENHEIMER CORE BOND FUND/VA
|
| NOTES TO FINANCIAL STATEMENTS Unaudited / Continued |
2. Securities Valuation (Continued)
Futures contracts and futures options traded on a commodities or futures exchange will be valued at the final settlement price or official closing price on the principal exchange as reported by such principal exchange at its trading session ending at, or most recently prior to, the time when the Fund’s assets are valued.
A description of the standard inputs that may generally be considered by the third party pricing vendors in determining their evaluated prices is provided below.
| | |
| Security Type | | Standard inputs generally considered by third-party pricing vendors |
|
| Corporate debt, government debt, municipal, mortgage-backed and asset-backed securities | | Reported trade data, broker-dealer price quotations, benchmark yields, issuer spreads on comparable securities, the credit quality, yield, maturity, and other appropriate factors. |
|
| Loans | | Information obtained from market participants regarding reported trade data and broker-dealer price quotations. |
|
| Event-linked bonds | | Information obtained from market participants regarding reported trade data and broker-dealer price quotations. |
|
| Structured securities | | Relevant market information such as the price of underlying financial instruments, stock market indices, foreign currencies, interest rate spreads, commodities, or the occurrence of other specific events. |
|
| Swaps | | Relevant market information, including underlying reference assets such as credit spreads, credit event probabilities, index values, individual security values, forward interest rates, variable interest rates, volatility measures, and forward currency rates. |
If a market value or price cannot be determined for a security using the methodologies described above, or if, in the “good faith” opinion of the Manager, the market value or price obtained does not constitute a “readily available market quotation,” or a significant event has occurred that would materially affect the value of the security the security is fair valued either (i) by a standardized fair valuation methodology applicable to the security type or the significant event as previously approved by the Valuation Committee and the Fund’s Board or (ii) as determined in good faith by the Manager’s Valuation Committee. The Valuation Committee considers all relevant facts that are reasonably available, through either public information or information available to the Manager, when determining the fair value of a security. Fair value determinations by the Manager are subject to review, approval and ratification by the Fund’s Board at its next regularly scheduled meeting covering the calendar quarter in which the fair valuation was determined. Those fair valuation standardized methodologies include, but are not limited to, valuing securities at the last sale price or initially at cost and subsequently adjusting the value based on: changes in company specific fundamentals, changes in an appropriate securities index, or changes in the value of similar securities which may be further adjusted for any discounts related to security-specific resale restrictions. When possible, such methodologies use observable market inputs such as unadjusted quoted prices of similar securities, observable interest rates, currency rates and yield curves. The methodologies used for valuing securities are not necessarily an indication of the risks associated with investing in those securities nor can it be assured that the Fund can obtain the fair value assigned to a security if it were to sell the security.
To assess the continuing appropriateness of security valuations, the Manager, or its third party service provider who is subject to oversight by the Manager, regularly compares prior day prices, prices on comparable securities, and sale prices to the current day prices and challenges those prices exceeding certain tolerance levels with the third party pricing service or broker source. For those securities valued by fair valuations, whether through a standardized fair valuation methodology or a fair valuation determination, the Valuation Committee reviews and affirms the reasonableness of the valuations based on such methodologies and fair valuation determinations on a regular basis after considering all relevant information that is reasonably available.
Classifications
Each investment asset or liability of the Fund is assigned a level at measurement date based on the significance and source of the inputs to its valuation. Various data inputs are used in determining the value of each of the Fund’s investments as of the reporting period end. These data inputs are categorized in the following hierarchy under applicable financial accounting standards:
1) Level 1-unadjusted quoted prices in active markets for identical assets or liabilities (including securities actively traded on a securities exchange)
2) Level 2-inputs other than unadjusted quoted prices that are observable for the asset or liability (such as unadjusted quoted prices for similar assets and market corroborated inputs such as interest rates, prepayment speeds, credit risks, etc.)
3) Level 3-significant unobservable inputs (including the Manager’s own judgments about assumptions that market participants would use in pricing the asset or liability).
The inputs used for valuing securities are not necessarily an indication of the risks associated with investing in those securities.
The table below categorizes amounts that are included in the Fund’s Statement of Assets and Liabilities as of June 30, 2014 based on valuation input level:
24 OPPENHEIMER CORE BOND FUND/VA
2. Securities Valuation (Continued)
| | | | | | | | | | | | | | | | |
| | | Level 1—
Unadjusted
Quoted Prices | | | Level 2—
Other Significant
Observable Inputs | | | Level 3—
Significant
Unobservable
Inputs | | | Value | |
| |
| Assets Table | | | | | | | | | | | | | | | | |
| Investments, at Value: | | | | | | | | | | | | | | | | |
| Asset-Backed Securities | | $ | — | | | $ | 27,717,867 | | | $ | — | | | $ | 27,717,867 | |
| Mortgage-Backed Obligations | | | — | | | | 83,118,778 | | | | 217,366 | | | | 83,336,144 | |
| U.S. Government Obligations | | | — | | | | 10,413,936 | | | | — | | | | 10,413,936 | |
| Corporate Bonds and Notes | | | — | | | | 73,457,259 | | | | — | | | | 73,457,259 | |
| Over-the-Counter Credit Default Swaptions Purchased | | | — | | | | 34,335 | | | | — | | | | 34,335 | |
| | | | |
| Total Investments, at Value | | | — | | | | 194,742,175 | | | | 217,366 | | | | 194,959,541 | |
| Other Financial Instruments: | | | | | | | | | | | | | | | | |
| Futures contracts | | | 120,984 | | | | — | | | | — | | | | 120,984 | |
| | | | |
| Total Assets | | $ | 120,984 | | | $ | 194,742,175 | | | $ | 217,366 | | | $ | 195,080,525 | |
| | | | |
| | | | |
| Liabilities Table | | | | | | | | | | | | | | | | |
| Other Financial Instruments: | | | | | | | | | | | | | | | | |
| Futures contracts | | $ | (2,903 | ) | | $ | — | | | $ | — | | | $ | (2,903) | |
| | | | |
| Total Liabilities | | $ | (2,903 | ) | | $ | — | | | $ | — | | | $ | (2,903) | |
| | | | |
Foreign currency exchange contracts and futures contracts, if any, are reported at their unrealized appreciation/ depreciation at measurement date, which represents the change in the contract’s value from trade date. All additional assets and liabilities included in the above table are reported at their market value at measurement date.
The table below shows the transfers between Level 2 and Level 3. The Fund’s policy is to recognize transfers in and transfers out as of the beginning of the reporting period.
| | | | | | | | | | |
| | | Transfers into Level 2* | | | | | Transfers out of Level 3* | |
| |
| Assets Table | | | | | | | | | | |
| Investments, at Value: | | | | | | | | | | |
| Mortgage-Backed Obligations | | $ | 73,738 | | | | | $ | (73,738 | ) |
* Transferred from Level 3 to Level 2 due to the availability of market data for this security.
3. Shares of Beneficial Interest
The Fund has authorized an unlimited number of $0.001 par value shares of beneficial interest of each class. Transactions in shares of beneficial interest were as follows:
| | | | | | | | | | | | | | | | |
| | | Six Months Ended June 30, 2014 | | | Year Ended December 31, 2013 | |
| | | Shares | | | Amount | | | Shares | | | Amount | |
| |
| Class Non-Service | | | | | | | | | | | | | | | | |
| Sold | | | 216,269 | | | $ | 1,738,001 | | | | 533,702 | | | $ | 4,292,431 | |
| Dividends and/or distributions reinvested | | | 636,119 | | | | 4,942,639 | | | | 682,873 | | | | 5,333,237 | |
| Redeemed | | | (1,107,171 | ) | | | (8,904,246 | ) | | | (3,017,265 | ) | | | (24,363,528) | |
| | | | |
| Net decrease | | | (254,783 | ) | | $ | (2,223,606 | ) | | | (1,800,690 | ) | | $ | (14,737,860) | |
| | | | |
|
| |
| Class Service | | | | | | | | | | | | | | | | |
| Sold | | | 1,134,870 | | | $ | 8,995,324 | | | | 1,641,559 | | | $ | 13,196,539 | |
| Dividends and/or distributions reinvested | | | 362,777 | | | | 2,786,113 | | | | 388,743 | | | | 3,004,980 | |
| Redeemed | | | (1,454,980 | ) | | | (11,520,744 | ) | | | (2,851,850 | ) | | | (22,641,434) | |
| | | | |
| Net increase (decrease) | | | 42,667 | | | $ | 260,693 | | | | (821,548 | ) | | $ | (6,439,915) | |
| | | | |
4. Purchases and Sales of Securities
The aggregate cost of purchases and proceeds from sales of securities, other than short-term obligations and investments in IMMF, for the six months ended June 30, 2014 were as follows:
| | | | | | | | | | | | |
| | | Purchases | | | | | | Sales | |
| |
Investment securities | | $ | 83,424,357 | | | | | | | $ | 72,601,974 | |
U.S. government and government agency obligations | | | 38,918,444 | | | | | | | | 31,722,015 | |
To Be Announced (TBA) mortgage-related securities | | | 271,747,712 | | | | | | | | 257,723,644 | |
5. Fees and Other Transactions with Affiliates
Management Fees. Under the investment advisory agreement, the Fund pays the Manager a management fee based on the daily net assets of the Fund at an annual rate as shown in the following table:
25 OPPENHEIMER CORE BOND FUND/VA
|
| NOTES TO FINANCIAL STATEMENTS Unaudited / Continued |
5. Fees and Other Transactions with Affiliates (Continued)
| | | | |
| Fee Schedule | | | |
| |
| Up to $1 billion | | | 0.60% | |
| Over $1 billion | | | 0.50 | |
Sub-Adviser Fees. The Manager has retained the Sub-Adviser to provide the day-to-day portfolio management of the Fund. Under the Sub-Advisory Agreement, the Manager pays the Sub-Adviser an annual fee in monthly installments, equal to a percentage of the investment management fee collected by the Manager from the Fund, which shall be calculated after any investment management fee waivers. The fee paid to the Sub-Adviser is paid by the Manager, not by the Fund.
Transfer Agent Fees. OFI Global (the “Transfer Agent”) serves as the transfer and shareholder servicing agent for the Fund. The Fund pays the Transfer Agent a fee based on annual net assets. Fees incurred and average net assets for each class with respect to these services are detailed in the Statement of Operations and Financial Highlights, respectively.
Sub-Transfer Agent Fees. The Transfer Agent has retained Shareholder Services, Inc., a wholly-owned subsidiary of OFI (the “Sub-Transfer Agent”), to provide the day-to-day transfer agent and shareholder servicing of the Fund. Under the Sub-Transfer Agency Agreement, the Transfer Agent pays the Sub-Transfer Agent an annual fee in monthly installments, equal to a percentage of the transfer agent fee collected by the Transfer Agent from the Fund, which shall be calculated after any applicable fee waivers. The fee paid to the Sub-Transfer Agent is paid by the Transfer Agent, not by the Fund.
Distribution and Service Plan for Service Shares. The Fund has adopted a Distribution and Service Plan (the “Plan”) in accordance with Rule 12b-1 under the Investment Company Act of 1940 for Service shares to pay OppenheimerFunds Distributor, Inc. (the “Distributor”), for distribution related services, personal service and account maintenance for the Fund’s Service shares. Under the Plan, payments are made periodically at an annual rate of 0.25% of the daily net assets of Service shares of the Fund. The Distributor currently uses all of those fees to compensate sponsors of the insurance product that offers Fund shares, for providing personal service and maintenance of accounts of their variable contract owners that hold Service shares. These fees are paid out of the Fund’s assets on an on-going basis and increase operating expenses of the Service shares, which results in lower performance compared to the Fund’s shares that are not subject to a service fee. Fees incurred by the Fund under the Plan are detailed in the Statement of Operations.
Waivers and Reimbursements of Expenses. The Manager has contractually agreed to limit the Fund’s expenses after payments, waivers and/or reimbursements and reduction to custodian expenses, excluding expenses incurred directly or indirectly by the Fund as a result of investments in other investment companies, wholly-owned subsidiaries and pooled investment vehicles; so that those expenses, as percentages of daily net assets, will not exceed the annual rate of 0.75% for Non-Service shares and 1.00% for Service shares. During the six months ended June 30, 2014, the Manager waived fees and/or reimbursed the Fund $17,337 and $10,116 for Non-Service and Service shares, respectively.
The Manager will waive fees and/or reimburse Fund expenses in an amount equal to the indirect management fees incurred through the Fund’s investment in IMMF. During the six months ended June 30, 2014, the Manager waived fees and/or reimbursed the Fund $5,807 for IMMF management fees.
Some of these undertakings may be modified or terminated at any time; some may not be modified or terminated until after one year from the date of the current prospectus, as indicated therein.
6. Risk Exposures and the Use of Derivative Instruments
The Fund’s investment objective not only permits the Fund to purchase investment securities, it also allows the Fund to enter into various types of derivatives contracts, including, but not limited to, futures contracts, forward currency exchange contracts, credit default swaps, interest rate swaps, total return swaps, variance swaps and purchased and written options. In doing so, the Fund will employ strategies in differing combinations to permit it to increase, decrease, or change the level or types of exposure to market risk factors. These instruments may allow the Fund to pursue its objectives more quickly and efficiently than if it were to make direct purchases or sales of securities capable of effecting a similar response to market factors. Such contracts may be entered into through a bilateral over-the-counter (“OTC”) transaction, or through a securities or futures exchange and cleared through a clearinghouse.
Market Risk Factors. In accordance with its investment objectives, the Fund may use derivatives to increase or decrease its exposure to one or more of the following market risk factors:
Commodity Risk. Commodity risk relates to the change in value of commodities or commodity indexes as they relate to increases or decreases in the commodities market. Commodities are physical assets that have tangible properties. Examples of these types of assets are crude oil, heating oil, metals, livestock, and agricultural products.
Credit Risk. Credit risk relates to the ability of the issuer to meet interest and principal payments, or both, as they come due. In general, lower-grade, higher-yield bonds are subject to credit risk to a greater extent than lower-yield, higher-quality bonds.
Equity Risk. Equity risk relates to the change in value of equity securities as they relate to increases or decreases in the general market.
Foreign Exchange Rate Risk. Foreign exchange rate risk relates to the change in the U.S. dollar value of a security held that is denominated in a foreign currency. The U.S. dollar value of a foreign currency denominated security will decrease as the dollar appreciates against the currency, while the U.S. dollar value will increase as the dollar depreciates against the currency.
26 OPPENHEIMER CORE BOND FUND/VA
6. Risk Exposures and the Use of Derivative Instruments (Continued)
Interest Rate Risk. Interest rate risk refers to the fluctuations in value of fixed-income securities resulting from the inverse relationship between price and yield. For example, an increase in general interest rates will tend to reduce the market value of already issued fixed-income investments, and a decline in general interest rates will tend to increase their value. In addition, debt securities with longer maturities, which tend to have higher yields, are subject to potentially greater fluctuations in value from changes in interest rates than obligations with shorter maturities.
Volatility Risk. Volatility risk refers to the magnitude of the movement, but not the direction of the movement, in a financial instrument’s price over a defined time period. Large increases or decreases in a financial instrument’s price over a relative time period typically indicate greater volatility risk, while small increases or decreases in its price typically indicate lower volatility risk.
Derivatives may have little or no initial cash investment relative to their market value exposure and therefore can produce significant gains or losses in excess of their cost due to unanticipated changes in the market risk factors and the overall market. This use of embedded leverage allows the Fund to increase its market value exposure relative to its net assets and can substantially increase the volatility of the Fund’s performance. In instances where the Fund is using derivatives to decrease, or hedge, exposures to market risk factors for securities held by the Fund, there are also risks that those derivatives may not perform as expected resulting in losses for the combined or hedged positions. Some derivatives have the potential for unlimited loss, regardless of the size of the Fund’s initial investment.
Additional associated risks from investing in derivatives also exist and potentially could have significant effects on the valuation of the derivative and the Fund. Typically, the associated risks are not the risks that the Fund is attempting to increase or decrease exposure to, per its investment objectives, but are the additional risks from investing in derivatives. Examples of these associated risks are liquidity risk, which is the risk that the Fund will not be able to sell the derivative in the open market in a timely manner, and counterparty credit risk, which is the risk that the counterparty will not fulfill its obligation to the Fund.
The Fund’s actual exposures to these market risk factors and associated risks during the period are discussed in further detail, by derivative type, below.
Futures Contracts
A futures contract is a commitment to buy or sell a specific amount of a commodity, financial instrument or currency at a negotiated price on a stipulated future date. The Fund may buy and sell futures contracts and may also buy or write put or call options on these futures contracts. Futures contracts and options thereon are generally entered into on a regulated futures exchange and cleared through a clearinghouse associated with the exchange.
Upon entering into a futures contract, the Fund is required to deposit either cash or securities (initial margin) in an amount equal to a certain percentage of the contract value in an account registered in the futures commission merchant’s name. Subsequent payments (variation margin) are paid to or from the futures commission merchant each day equal to the daily changes in the contract value. Such payments are recorded as unrealized gains and losses. Should the Fund fail to make requested variation margin payments, the futures commission merchant can gain access to the initial margin to satisfy the Fund’s payment obligations.
Futures contracts are reported on a schedule following the Statement of Investments. Securities held by a futures commission merchant to cover initial margin requirements on open futures contracts are noted in the Statement of Investments. Cash held by a futures commission merchant to cover initial margin requirements on open futures contracts and the receivable and/or payable for the daily mark to market for the variation margin are noted in the Statement of Assets and Liabilities. The net change in unrealized appreciation and depreciation is reported in the Statement of Operations. Realized gains (losses) are reported in the Statement of Operations at the closing or expiration of futures contracts.
The Fund has purchased futures contracts on various bonds and notes to increase exposure to interest rate risk.
The Fund has sold futures contracts on various bonds and notes to decrease exposure to interest rate risk.
During the six months ended June 30, 2014, the Fund had an ending monthly average market value of $11,749,366 and $33,022,887 on futures contracts purchased and sold, respectively.
Additional associated risks of entering into futures contracts (and related options) include the possibility that there may be an illiquid market where the Fund is unable to liquidate the contract or enter into an offsetting position and, if used for hedging purposes, the risk that the price of the contract will correlate imperfectly with the prices of the Fund’s securities.
Swaption Transactions
The Fund may enter into a swaption contract which grants the purchaser the right, but not the obligation, to enter into a swap transaction at preset terms detailed in the underlying agreement within a specified period of time. The purchaser pays a premium to the swaption writer who bears the risk of unfavorable changes in the preset terms on the underlying swap.
Purchased swaptions are reported as a component of investments in the Statement of Investments and the Statement of Assets and Liabilities. Written swaptions are reported on a schedule following the Statement of Investments and their value is reported as a separate asset or liability line item in the Statement of Assets and Liabilities. The net change in unrealized appreciation or depreciation on written swaptions is separately reported in the Statement of Operations. When a swaption is exercised, the cost of the swap is adjusted by the amount of premium paid or received. Upon the expiration or closing of an unexercised swaption contract, a gain or loss is reported in the Statement of Operations for the amount of the premium paid or received.
The Fund generally will incur a greater risk when it writes a swaption than when it purchases a swaption. When the Fund writes a swaption it will become obligated, upon exercise of the swaption, according to the terms of the underlying agreement. Swaption contracts written by the Fund do not give rise to counterparty credit risk prior to exercise as they obligate the Fund, not its counterparty, to perform. When the Fund purchases a swaption it only risks losing the amount of the premium it paid if the swaption expires unexercised. However, when the Fund exercises a purchased swaption there is a risk that the counterparty will fail to perform or otherwise default on its obligations under the swaption contract.
27 OPPENHEIMER CORE BOND FUND/VA
|
| NOTES TO FINANCIAL STATEMENTS Unaudited / Continued |
6. Risk Exposures and the Use of Derivative Instruments (Continued)
The Fund has purchased swaptions which gives it the option to buy credit protection through credit default swaps in order to decrease exposure to the credit risk of individual issuers and/or indexes of issuers. A purchased swaption of this type becomes more valuable as the likelihood of a credit event on the reference asset increases.
During the six months ended June 30, 2014, the Fund had an ending monthly average market value of $9,127 on purchased swaptions.
Counterparty Credit Risk. Derivative positions are subject to the risk that the counterparty will not fulfill its obligation to the Fund. The Fund intends to enter into derivative transactions with counterparties that the Manager believes to be creditworthy at the time of the transaction.
The Fund’s risk of loss from counterparty credit risk on OTC derivatives is generally limited to the aggregate unrealized gain netted against any collateral held by the Fund. For OTC options purchased, the Fund bears the risk of loss of the amount of the premiums paid plus the positive change in market values net of any collateral held by the Fund should the counterparty fail to perform under the contracts. Options written by the Fund do not typically give rise to counterparty credit risk, as options written generally obligate the Fund and not the counterparty to perform.
To reduce counterparty risk with respect to OTC transactions, the Fund has entered into master netting arrangements, established within the Fund’s International Swap and Derivatives Association, Inc. (“ISDA”) master agreements, which allow the Fund to make (or to have an entitlement to receive) a single net payment in the event of default (close-out netting) for outstanding payables and receivables with respect to certain OTC positions in swaps, options, swaptions, and forward currency exchange contracts for each individual counterparty. In addition, the Fund may require that certain counterparties post cash and/or securities in collateral accounts to cover their net payment obligations for those derivative contracts subject to ISDA master agreements. If the counterparty fails to perform under these contracts and agreements, the cash and/or securities will be made available to the Fund.
ISDA master agreements include credit related contingent features which allow counterparties to OTC derivatives to terminate derivative contracts prior to maturity in the event that, for example, the Fund’s net assets decline by a stated percentage or the Fund fails to meet the terms of its ISDA master agreements, which would cause the Fund to accelerate payment of any net liability owed to the counterparty.
For financial reporting purposes, the Fund does not offset derivative assets and derivative liabilities that are subject to netting arrangements in the Statement of Assets and Liabilities. Bankruptcy or insolvency laws of a particular jurisdiction may impose restrictions on or prohibitions against the right of offset in bankruptcy, insolvency or other events.
The Fund’s risk of loss from counterparty credit risk on exchange-traded derivatives cleared through a clearinghouse and for centrally cleared swaps is generally considered lower than as compared to OTC derivatives. However, counterparty credit risk exists with respect to initial and variation margin deposited/paid by the Fund that is held in futures commission merchant, broker and/or clearinghouse accounts for such exchange-traded derivatives and for centrally cleared swaps.
With respect to centrally cleared swaps, such transactions will be submitted for clearing, and if cleared, will be held in accounts at futures commission merchants or brokers that are members of clearinghouses. While brokers, futures commission merchants and clearinghouses are required to segregate customer margin from their own assets, in the event that a broker, futures commission merchant or clearinghouse becomes insolvent or goes into bankruptcy and at that time there is a shortfall in the aggregate amount of margin held by the broker, futures commission merchant or clearinghouse for all its customers, U.S. bankruptcy laws will typically allocate that shortfall on a pro-rata basis across all the broker’s, futures commission merchant’s or clearinghouse’s customers, potentially resulting in losses to the Fund.
There is the risk that a broker, futures commission merchant or clearinghouse will decline to clear a transaction on the Fund’s behalf, and the Fund may be required to pay a termination fee to the executing broker with whom the Fund initially enters into the transaction. Clearinghouses may also be permitted to terminate centrally cleared swaps at any time. The Fund is also subject to the risk that the broker or futures commission merchant will improperly use the Fund’s assets deposited/paid as initial or variation margin to satisfy payment obligations of another customer. In the event of a default by another customer of the broker or futures commission merchant, the Fund might not receive its variation margin payments from the clearinghouse, due to the manner in which variation margin payments are aggregated for all customers of the broker/futures commission merchant.
Collateral and margin requirements differ by type of derivative. Margin requirements are established by the broker, futures commission merchant or clearinghouse for exchange-traded and cleared derivatives, including centrally cleared swaps. Brokers, futures commission merchants and clearinghouses can ask for margin in excess of the regulatory minimum, or increase the margin amount, in certain circumstances.
Collateral terms are contract specific for OTC derivatives. For derivatives traded under an ISDA master agreement, the collateral requirements are typically calculated by netting the mark to market amount for each transaction under such agreement and comparing that amount to the value of any collateral currently pledged by the Fund or the counterparty.
For financial reporting purposes, cash collateral that has been pledged to cover obligations of the Fund, if any, is reported separately on the Statement of Assets and Liabilities as cash pledged as collateral. Non-cash collateral pledged by the Fund, if any, is noted in the Statement of Investments. Generally, the amount of collateral due from or to a party must exceed a minimum transfer amount threshold (e.g. $250,000) before a transfer has to be made. To the extent amounts due to the Fund from its counterparties are not fully collateralized, contractually or otherwise, the Fund bears the risk of loss from counterparty nonperformance.
The following table presents by counterparty the Fund’s OTC derivative assets net of the related collateral posted for the benefit of the Fund at June 30, 2014:
28 OPPENHEIMER CORE BOND FUND/VA
6. Risk Exposures and the Use of Derivative Instruments (Continued)
| | | | | | | | | | | | | | | | | | | | | | |
| | | | | | Gross Amounts Not Offset in the | | | | | | |
| | | | | | Statement of Assets & Liabilities | | | | | | |
| Counterparty | | Gross Amount of Assets
in the Statement of
Assets & Liabilities* | | | Financial Instruments Available for Offset | | | Financial Instruments Collateral Received** | | | Cash Collateral Received** | | | | | Net Amount | |
| |
| Deutsche Bank Securities, Inc. | | $ | 8,421 | | | | $ — | | | | $ — | | | | $ — | | | | | $ | 8,421 | |
| JPMorgan Chase Bank NA | | | 25,914 | | | | — | | | | — | | | | — | | | | | | 25,914 | |
| | | | |
| | $ | 34,335 | | | | $ — | | | | $ — | | | | $ — | | | | | $ | 34,335 | |
| | | | |
* OTC derivatives are reported gross on the Statement of Assets and Liabilities. Exchange traded options and margin related to cleared swaps and futures are excluded from these reported amounts.
** Reported collateral posted for the benefit of the Fund within this table is limited to the net outstanding amount due from an individual counterparty. The collateral posted for the benefit of the Fund may exceed these amounts.
The following table presents the valuations of derivative instruments by risk exposure as reported within the Statement of Assets and Liabilities as of June 30, 2014:
| | | | | | | | | | | | |
| | | Asset Derivatives | | | Liability Derivatives | |
Derivatives Not Accounted for as Hedging Instruments | | Statement of Assets and Liabilities Location | | Value | | | Statement of Assets and Liabilities Location | | Value | |
| |
| Interest rate contracts | | Variation margin receivable | | $ | 35,438* | | | Variation margin payable | | $ | 11,177* | |
| Credit contracts | | Investments, at value | | | 34,335** | | | Investments, at value | | | — | |
| | | | | | | | | | | | |
| Total | | | | $ | 69,773 | | | | | $ | 11,177 | |
| | | | | | | | | | | | |
*Includes only the current day’s variation margin. Prior variation margin movements have been reflected in cash on the Statement of Assets and Liabilities upon receipt or payment.
**Amounts relate to purchased option contracts and purchased swaption contracts, if any.
The effect of derivative instruments on the Statement of Operations is as follows:
| | | | |
| | | Amount of Realized Gain or (Loss) Recognized on Derivatives | | |
|
| Derivatives Not Accounted for as | | | | Closing and expiration of |
| Hedging Instruments | | | | futures contracts |
|
| Interest rate contracts | | | | $578,649 |
| | | | | | | | | | | | |
| | | Amount of Change in Unrealized Gain or (Loss) Recognized on Derivatives | | | | |
| |
Derivatives Not Accounted for as Hedging Instruments | | Investments* | | | Futures contracts | | | Total | |
| |
| Credit contracts | | $ | (42,484 | ) | | $ | — | | | $ | (42,484) | |
| Interest rate contracts | | | — | | | | 110,463 | | | | 110,463 | |
| | | | |
| Total | | $ | (42,484 | ) | | $ | 110,463 | | | $ | 67,979 | |
| | | | |
*Includes purchased option contracts and purchased swaption contracts, if any.
7. Restricted Securities
As of June 30, 2014, investments in securities included issues that are restricted. A restricted security may have a contractual restriction on its resale and is valued under methods approved by the Board of Trustees as reflecting fair value. Securities that are restricted are marked with an applicable footnote on the Statement of Investments. Restricted securities are reported on a schedule following the Statement of Investments.
8. Pending Litigation
In 2009, seven class action lawsuits were filed in the U.S. District Court for the District of Colorado against OppenheimerFunds, Inc. (“OFI”), OppenheimerFunds Distributor, Inc., the Fund’s principal underwriter and distributor (the “Distributor”), and certain funds (but not including the Fund) advised by OFI Global Asset Management, Inc. and distributed by the Distributor (the “Defendant Funds”). The lawsuits also named as defendants certain officers and current and former trustees of the respective Defendant Funds. The lawsuits raised claims under federal securities law and alleged, among other things, that the disclosure documents of the respective Defendant Funds contained misrepresentations and omissions and that the respective Defendant Funds’ investment policies were not followed. The plaintiffs in these actions sought unspecified damages, equitable relief and awards of attorneys’ fees and litigation expenses. The Defendant Funds’ Boards of Trustees also engaged counsel to represent the Funds and the present and former Independent Trustees named in those suits. On March 5, 2014, the parties in six of these lawsuits executed stipulations and agreements of settlement resolving those actions. On July 31, 2014, the court entered an order and final judgment approving the settlements as fair, reasonable and adequate. The settlements do not resolve a seventh outstanding lawsuit relating to Oppenheimer Rochester California Municipal Fund.
Other class action and individual lawsuits have been filed since 2008 in various state and federal courts against OFI and certain of its affiliates by investors seeking to recover investments they allegedly lost as a result of the “Ponzi” scheme run by Bernard L. Madoff and his firm, Bernard L. Madoff Investment Securities, LLC (“BLMIS”). Plaintiffs in these suits allege that they suffered losses as a result of their investments in several funds managed by an affiliate of OFI and assert a variety of claims, including breach of fiduciary duty, fraud, negligent misrepresentation, unjust enrichment, and violation of federal and state securities laws and regulations, among others. They seek unspecified damages, equitable relief and awards of attorneys’ fees and
29 OPPENHEIMER CORE BOND FUND/VA
|
| NOTES TO FINANCIAL STATEMENTS Unaudited / Continued |
8. Pending Litigation (Continued)
litigation expenses. Neither the Distributor, nor any of the Oppenheimer mutual funds, their independent trustees or directors are named as defendants in these lawsuits. None of the Oppenheimer mutual funds invested in any funds or accounts managed by Madoff or BLMIS. On February 28, 2011, a stipulation of partial settlement of three groups of consolidated putative class action lawsuits relating to these matters was filed in the U.S. District Court for the Southern District of New York. On August 19, 2011, the court entered an order and final judgment approving the settlement as fair, reasonable and adequate. In September 2011, certain parties filed notices of appeal from the court’s order approving the settlement. In June 2014, the appellate court affirmed the lower court’s order approving the settlement. Certain parties subsequently filed a petition for certiorari before the U.S. Supreme Court further challenging the settlement approval order. The settlement does not resolve other outstanding lawsuits against OFI and its affiliates relating to BLMIS.
OFI believes the lawsuits and appeals described above are without legal merit and, with the exception of actions it has settled, is defending against them vigorously. While it is premature to render any opinion as to the outcome in these lawsuits, or whether any costs that the Defendant Funds may bear in defending the suits might not be reimbursed by insurance, OFI believes that these suits should not impair the ability of OFI or the Distributor to perform their respective duties to the Fund, and that the outcome of all of the suits together should not have any material effect on the operations of any of the Oppenheimer mutual funds.
30 OPPENHEIMER CORE BOND FUND/VA
PORTFOLIO PROXY VOTING POLICIESAND PROCEDURES;
UPDATES TO STATEMENTS OF INVESTMENTS Unaudited
The Fund has adopted Portfolio Proxy Voting Policies and Procedures under which the Fund votes proxies relating to securities (“portfolio proxies”) held by the Fund. A description of the Fund’s Portfolio Proxy Voting Policies and Procedures is available (i) without charge, upon request, by calling the Fund toll-free at 1.800.525.7048, (ii) on the Fund’s website at oppenheimerfunds.com, and (iii) on the SEC’s website at www.sec.gov. In addition, the Fund is required to file Form N-PX, with its complete proxy voting record for the 12 months ended June 30th, no later than August 31st of each year. The Fund’s voting record is available (i) without charge, upon request, by calling the Fund toll-free at 1.800.525.7048, and (ii) in the Form N-PX filing on the SEC’s website at www.sec.gov.
The Fund files its complete schedule of portfolio holdings with the SEC for the first quarter and the third quarter of each fiscal year on Form N-Q. The Fund’s Form N-Q filings are available on the SEC’s website at www.sec.gov. Those forms may be reviewed and copied at the SEC’s Public Reference Room in Washington, D.C. Information on the operation of the Public Reference Room may be obtained by calling 1-800-SEC-0330.
31 OPPENHEIMER CORE BOND FUND/VA
OPPENHEIMER CORE BOND FUND/VA
A Series of Oppenheimer Variable Account Funds
| | |
| Trustees and Officers | | Sam Freedman, Chairman of the Board of Trustees and Trustee |
| | Edward L. Cameron, Trustee |
| | Jon S. Fossel, Trustee |
| | Richard F. Grabish, Trustee |
| | Beverly L. Hamilton, Trustee |
| | Victoria J. Herget, Trustee |
| | Robert J. Malone, Trustee |
| | F. William Marshall, Jr., Trustee |
| | Karen L. Stuckey, Trustee |
| | James D. Vaughn, Trustee |
| | William F. Glavin, Jr., Trustee, President and Principal Executive Officer |
| | Krishna Memani, Vice President |
| | Peter A. Strzalkowski, Vice President |
| | Arthur S. Gabinet, Secretary and Chief Legal Officer |
| | Christina M. Nasta, Vice President and Chief Business Officer |
| | Mary Ann Picciotto, Chief Compliance Officer and Chief Anti-Money Laundering Officer |
| | Brian W. Wixted, Treasurer and Principal Financial & Accounting Officer |
| |
| Manager | | OFI Global Asset Management, Inc. |
| |
| Sub-Adviser | | OppenheimerFunds, Inc. |
| |
| Distributor | | OppenheimerFunds Distributor, Inc. |
| |
| Transfer and | | OFI Global Asset Management, Inc. |
| Shareholder | | |
| Servicing Agent | | |
| |
| Sub-Transfer Agent | | Shareholder Services, Inc. |
| | DBA OppenheimerFunds Services |
| |
| Independent | | KPMG LLP |
| Registered Public | | |
| Accounting Firm | | |
| |
| Counsel | | K&L Gates LLP |
| |
| | Before investing in any of the Oppenheimer funds, investors should carefully consider a fund’s investment objectives, risks, charges and expenses. Fund prospectuses and summary prospectuses contain this and other information about the funds and may be obtained by asking your financial advisor, visiting oppenheimerfunds.com or calling us at 1.800.988.8287. Read prospectuses and summary prospectuses carefully before investing. |
| |
| | The financial statements included herein have been taken from the records of the Fund without examination of those records by the independent auditors. |
| |
| | © 2014 OppenheimerFunds, Inc. All rights reserved. Oppenheimer funds are distributed by OppenheimerFunds Distributor, Inc. |

June 30, 2014
| | | | |
| | | | | |
| | Oppenheimer Global Fund/VA A Series of Oppenheimer Variable Account Funds | | Semiannual Report |
| | | | | |
| | SEMIANNUAL REPORT Listing of Top Holdings Fund Performance Discussion Financial Statements | | |

Portfolio Manager: Rajeev Bhaman, CFA
Cumulative Total Returns
For the 6-Month Period Ended 6/30/14
| | | | |
Non-Service Shares | | | 4.57% | |
Service Shares | | | 4.46% | |
| | | | | | |
Average Annual Total Returns
For the Periods Ended 6/30/14 |
| | | 1-Year | | 5-Year | | 10-Year |
Non-Service Shares | | 23.31% | | 16.42% | | 9.00% |
Service Shares | | 23.00% | | 16.13% | | 8.73% |
Performance data quoted represents past performance, which does not guarantee future results. The investment return and principal value of an investment in the Fund will fluctuate so that an investor’s shares, when redeemed, may be worth more or less than their original cost. Current performance may be lower or higher than the performance quoted. For performance data current to the most recent month end, call us at 1.800.988.8287. The Fund’s total returns include changes in share price and reinvested distributions but should not be expected to be the same as the returns of other funds, whether or not both funds have the same portfolio managers and/or similar names. The Fund’s total returns do not include the charges associated with the separate account products that offer this Fund. Such performance would have been lower if such charges were taken into account.
TOP TEN COMMON STOCK HOLDINGS
| | | | |
Telefonaktiebolaget LM Ericsson, Cl. B | | | 2.7% | |
McGraw Hill Financial, Inc. | | | 2.2 | |
Walt Disney Co. (The) | | | 2.1 | |
SAP AG | | | 1.9 | |
LVMH Moet Hennessy Louis Vuitton SA | | | 1.9 | |
eBay, Inc. | | | 1.9 | |
UBS AG | | | 1.9 | |
Colgate-Palmolive Co. | | | 1.9 | |
Airbus Group NV | | | 1.8 | |
Technip SA | | | 1.8 | |
Portfolio holdings and allocations are subject to change. Percentages are as of June 30, 2014, and are based on net assets. For more current Fund holdings, please visit oppenheimerfunds.com.
Regional Allocation
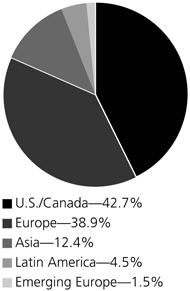
Portfolio holdings and allocations are subject to change. Percentages are as of June 30, 2014, and are based on the total market value of investments.
2 OPPENHEIMER GLOBAL FUND/VA
Fund Performance Discussion
During the six-month reporting period, the Fund’s Non-Service shares produced a return of 4.57%. By comparison, the MSCI AC World Index (the “Index”) returned 6.18%. The Fund underperformed the Index primarily due to stock selection in the financials, information technology and industrials sectors and systematic underweight positions in the energy and utilities sectors. The Fund outperformed the Index in the health care and consumer discretionary sectors due to stock selection.
GLOBAL MARKET AND ECONOMIC ENVIRONMENT
Despite market volatility early in the reporting period and rising geopolitical risks in Ukraine and the Middle East, global equities generally rebounded and produced positive returns in the first half of 2014, thanks largely to a continued global economic recovery and stimulative monetary policies from central banks throughout the world. Among the central bank measures that boosted the markets, the European Central Bank (the “ECB”) announced numerous measures in June, including a benchmark interest rate cut, the introduction of a negative deposit rate to encourage banks to lend, among various other measures to flood the system with liquidity. Beyond that, the ECB said it would prepare to purchase packages of loans from banks to allow for increased lending. In June, the U.S. Federal Reserve (the “Fed”) also stated it would reduce the amount of monthly bond purchases by an additional $10 billion and reaffirmed its intention to keep short-term interest rates near zero. U.S. economic data released in April and May was positive, as the unemployment rate fell to 6.3%, the economy finally regained all of the jobs lost during the 2008 recession, and the U.S. stock market achieved record highs. Shortly after the reporting period ended, a positive June jobs report was released, in which the official unemployment rate fell to 6.1%, its lowest level since September 2008.
TOP INDIVIDUAL CONTRIBUTORS
During the reporting period, top contributors to performance included health care stocks Shire plc and Allergan, Inc., and ICICI Bank Ltd. Shire is a pharmaceutical company that focuses on attention deficit and hyperactivity disorders as well as gastrointestinal and renal diseases. During the reporting period, AbbVie, a U.S. pharmaceuticals company, offered to buy Shire at a significant premium to the share price and the shares rallied. Allergan is a drug company that addresses several specialty markets such as ophthalmology, obesity, medical aesthetics and dermatology (the company manufactures Botox). During the reporting period, Allergan became the subject of a bid from pharmaceutical company Valeant and the hedge fund Pershing Square. It also announced a restructuring, targeted to cut $475 million in costs in 2015. ICICI Bank is the largest private sector bank in India, a country where more than half the banking sector is state-owned. In an environment where the public sector banks are inadequately capitalized for the level of non-performing loans on their books and where the government’s ability to continually inject new capital is impaired as a result of its financial position, we believe ICICI should be able to grow faster with less competition. The recent victory of the Bharatiya Janata Party (BJP) in the national elections, which resulted in a significant mandate for the newly elected Prime Minister, Narendra Modi, has led to great expectations of a meaningful acceleration in growth in the Indian economy and the prospects of banks.
TOP INDIVIDUAL DETRACTORS
The most significant detractors from the Fund’s performance included Deutsche Bank AG, Airbus Group NV and luxury shoemaker Tod’s. Continued prosecutorial activism and litigation activity has led to the financial industry paying significant fines for past transgressions. Heightened concerns about the persistence of such fines and their increasing magnitude have led to worries about the adequacy of capital at global investment banks in particular. This, combined with low levels of market activity that detracted from profits, led to Deutsche Bank’s underperformance. During the reporting period, Deutsche Bank raised over $10 billion in fresh capital, increasing its equity level significantly. In our opinion, the stock is trading at attractive valuations. Airbus Group along with Boeing constitutes a global duopoly in the large jet airplane market. It has a product refresh coming with the re-engining of both its single aisle A320 and dual aisle A330 products that we believe has the potential to improve profitability over the next several years. The newest Airbus product, the Airbus A350, is expected to be in commercial service by the first quarter of 2015. Concerns about the near-term impact on margins of these developments led to a pullback in the shares after substantial outperformance in the past year. We continue to believe that the industry construct combined with approximately nine years of backlog make the shares an attractive proposition at this time. A slowdown in growth for luxury goods in China and Asia Pacific has affected the share performance of Tod’s. We believe that Tod’s’ iconic products and ethos have long-term appeal to the luxury goods consumer that should result in a reacceleration in growth and share price performance.
STRATEGY & OUTLOOK
The Fund is a long-term, growth oriented investment portfolio. We use a bottom-up, fundamental approach, combined with an understanding of longer-term macroeconomic trends, in seeking to identify the high-quality companies with superior, sustainable characteristics, that we favor. We seek to add value via our individual stock selection, and make no effort to mimic Index weights for industries, sectors, regions or countries. Valuation is critical to our investment
3 OPPENHEIMER GLOBAL FUND/VA
decisions. Assuming we properly understand a given set of business economics, our return structure is principally a function of paying an appropriate price for the growth and returns inherent in a company.
In our opinion, the outlook for the world economy continues to improve. U.S. economic activity and employment is rising, enabling the Fed to continue tapering its quantitative easing activity. In response, U.S. interest rates have been rising but, interestingly, longer-term rates have not, usually a sign that market expectations regarding rising rates are restrained. European monetary conditions are quite different, with the ECB providing increased liquidity. In our opinion, business conditions in Europe are improving, the Spanish economy being a good example. In any case, the vast majority of the companies in our portfolio, especially our European companies, address worldwide, as opposed to local, markets. In Japan we are seeing continued efforts at reform. In the emerging markets too we are seeing the middle class exert pressure for reform, especially in the election results in India. We view these pressures positively and are optimistic about the potential outcomes they may produce.
The Fund’s investment strategy and focus can change over time. The mention of specific fund holdings does not constitute a recommendation by OppenheimerFunds, Inc. or its affiliates.
Shares of Oppenheimer funds are not deposits or obligations of any bank, are not guaranteed by any bank, are not insured by the FDIC or any other agency, and involve investment risks, including the possible loss of the principal amount invested.
4 OPPENHEIMER GLOBAL FUND/VA
Fund Expenses
Fund Expenses. As a shareholder of the Fund, you incur two types of costs: (1) transaction costs and (2) ongoing costs, including management fees; distribution and service fees; and other Fund expenses. These examples are intended to help you understand your ongoing costs (in dollars) of investing in the Fund and to compare these costs with the ongoing costs of investing in other mutual funds.
The examples are based on an investment of $1,000.00 invested at the beginning of the period and held for the entire 6-month period ended June 30, 2014.
Actual Expenses. The first section of the table provides information about actual account values and actual expenses. You may use the information in this section for the class of shares you hold, together with the amount you invested, to estimate the expense that you paid over the period. Simply divide your account value by $1,000.00 (for example, an $8,600.00 account value divided by $1,000.00 = 8.60), then multiply the result by the number in the first section under the heading entitled “Expenses Paid During Period” to estimate the expenses you paid on your account during this period.
Hypothetical Example for Comparison Purposes.
The second section of the table provides information about hypothetical account values and hypothetical expenses based on the Fund’s actual expense ratio for each class of shares, and an assumed rate of return of 5% per year for each class before expenses, which is not the actual return. The hypothetical account values and expenses may not be used to estimate the actual ending account balance or expenses you paid for the period. You may use this information to compare the ongoing costs of investing in the Fund and other funds. To do so, compare this 5% hypothetical example for the class of shares you hold with the 5% hypothetical examples that appear in the shareholder reports of the other funds.
Please note that the expenses shown in the table are meant to highlight your ongoing costs only and do not reflect any charges associated with the separate accounts that offer this Fund. Therefore, the “hypothetical” lines of the table are useful in comparing ongoing costs only, and will not help you determine the relative total costs of owning different funds. In addition, if these separate account charges were included your costs would have been higher.
| | | | | | | | |
| Actual | | Beginning Account Value January 1, 2014 | | Ending Account Value June 30, 2014 | | Expenses Paid During
6 Months Ended
June 30, 2014 | | |
Non-Service shares | | $ 1,000.00 | | $ 1,045.70 | | $ 3.81 | | |
Service shares | | 1,000.00 | | 1,044.60 | | 5.08 | | |
| | | | |
Hypothetical (5% return before expenses) | | | | | | | | |
Non-Service shares | | 1,000.00 | | 1,021.08 | | 3.77 | | |
Service shares | | 1,000.00 | | 1,019.84 | | 5.02 | | |
Expenses are equal to the Fund’s annualized expense ratio for that class, multiplied by the average account value over the period, multiplied by 181/365 (to reflect the one-half year period). Those annualized expense ratios, excluding indirect expenses from affiliated funds, based on the 6-month period ended June 30, 2014 are as follows:
| | |
| Class | | Expense Ratios |
Non-Service shares | | 0.75% |
Service shares | | 1.00 |
The expense ratios reflect voluntary and/or contractual waivers and/or reimbursements of expenses by the Fund’s Manager. Some of these undertakings may be modified or terminated at any time, as indicated in the Fund’s prospectus. The “Financial Highlights” tables in the Fund’s financial statements, included in this report, also show the gross expense ratios, without such waivers or reimbursements and reduction to custodian expenses, if applicable.
5 OPPENHEIMER GLOBAL FUND/VA
STATEMENTOF INVESTMENTS June 30, 2014 Unaudited
| | | | | | | | | | |
| | | Shares | | | Value | | | |
Common Stocks—96.7% | | | | | | | | | | |
Consumer Discretionary—12.2% | | | | | | | | | | |
Hotels, Restaurants & Leisure—1.2% | | | |
Gtech SpA | | | 315,720 | | | $ | 7,716,329 | | | |
McDonald’s Corp. | | | 280,580 | | | | 28,265,629 | | | |
| | | | | | | 35,981,958 | | | |
| | | | | | | | | | | |
Internet & Catalog Retail—0.3% | | | | | | | | | | |
JD.com, Inc., ADR1 | | | 267,101 | | | | 7,615,050 | | | |
| | | | | | | | | | | |
Media—2.7% | | | | | | | | | | |
Walt Disney Co. (The) | | | 696,590 | | | | 59,725,627 | | | |
Zee Entertainment Enterprises Ltd. | | | 3,773,981 | | | | 18,384,901 | | | |
| | | | | | | 78,110,528 | | | |
| | | | | | | | | | | |
Specialty Retail—3.2% | | | | | | | | | | |
Industria de Diseno Textil SA (Inditex) | | | 312,987 | | | | 48,261,890 | | | |
Tiffany & Co. | | | 428,770 | | | | 42,984,192 | | | |
| | | | | | | 91,246,082 | | | |
| | | | | | | | | | | |
Textiles, Apparel & Luxury Goods—4.8% | | | |
Brunello Cucinelli SpA | | | 78,468 | | | | 1,783,481 | | | |
Kering | | | 222,980 | | | | 48,861,905 | | | |
lululemon athletica, Inc.1 | | | 344,020 | | | | 13,925,929 | | | |
LVMH Moet Hennessy Louis Vuitton SA | | | 284,120 | | | | 54,730,171 | | | |
Tod’s SpA | | | 150,735 | | | | 19,183,613 | | | |
| | | | | | | 138,485,099 | | | |
| | | | | | | | | | | |
Consumer Staples—6.2% | | | | | | | | | | |
Beverages—1.5% | | | | | | | | | | |
AMBEV SA, ADR | | | 2,673,445 | | | | 18,821,053 | | | |
| Fomento Economico Mexicano SAB de CV, ADR | | | 278,545 | | | | 26,085,739 | | | |
| | | | | | | 44,906,792 | | | |
| | | | | | | | | | | |
Food Products—2.8% | | | | | | | | | | |
Nestle SA | | | 369,303 | | | | 28,614,688 | | | |
Unilever plc | | | 1,125,413 | | | | 51,032,092 | | | |
| | | | | | | 79,646,780 | | | |
| | | | | | | | | | | |
Household Products—1.9% | | | | | | | | | | |
Colgate-Palmolive Co. | | | 786,210 | | | | 53,603,798 | | | |
| | | | | | | | | | | |
Energy—3.7% | | | | | | | | | | |
Energy Equipment & Services—2.5% | | | |
Technip SA | | | 473,720 | | | | 51,889,613 | | | |
Transocean Ltd. | | | 434,362 | | | | 19,559,321 | | | |
| | | | | | | 71,448,934 | | | |
| | | | | | | | | | | |
Oil, Gas & Consumable Fuels—1.2% | | | |
Gazprom OAO, Sponsored ADR1 | | | 1,514,190 | | | | 13,203,622 | | | |
Repsol SA | | | 812,996 | | | | 21,479,593 | | | |
| | | | | | | 34,683,215 | | | |
| | | | | | | | | | | |
Financials—20.9% | | | | | | | | | | |
Capital Markets—5.2% | | | | | | | | | | |
Credit Suisse Group AG1 | | | 884,526 | | | | 25,187,213 | | | |
Deutsche Bank AG | | | 1,136,309 | | | | 39,977,883 | | | |
Goldman Sachs Group, Inc. (The) | | | 173,930 | | | | 29,122,839 | | | |
UBS AG1 | | | 2,936,157 | | | | 53,802,425 | | | |
| | | | | | | 148,090,360 | | | |
| | | | | | | | | | | |
Commercial Banks—6.1% | | | | | | | | | | |
Banco Bilbao Vizcaya Argentaria SA | | | 3,095,157 | | | | 39,403,955 | | | |
Citigroup, Inc. | | | 1,047,100 | | | | 49,318,410 | | | |
ICICI Bank Ltd., Sponsored ADR1 | | | 813,970 | | | | 40,617,103 | | | |
Societe Generale SA | | | 428,189 | | | | 22,392,071 | | | |
Sumitomo Mitsui Financial Group, Inc. | | | 562,400 | | | | 23,615,284 | | | |
| | | | | | | 175,346,823 | | | |
| | | | | | | | | | | |
Diversified Financial Services—3.6% | | | |
BM&FBovespa SA | | | 4,424,200 | | | | 23,207,276 | | | |
McGraw Hill Financial, Inc. | | | 749,530 | | | | 62,233,476 | | | |
| | | | | | | | |
| | | Shares | | | Value | |
Diversified Financial Services (Continued) | |
Moscow Exchange (The)1 | | | 9,064,495 | | | $ | 17,995,588 | |
| | | | | | | 103,436,340 | |
| | | | | | | | | |
Insurance—5.1% | |
Allianz SE | | | 272,189 | | | | 45,364,554 | |
Dai-ichi Life Insurance Co. Ltd. (The) | | | 2,079,700 | | | | 31,051,855 | |
Fidelity National Financial, Inc., Cl. A | | | 588,960 | | | | 19,294,330 | |
Prudential plc | | | 2,198,417 | | | | 50,429,023 | |
| | | | | | | 146,139,762 | |
| | | | | | | | | |
Real Estate Management & Development—0.9% | |
DLF Ltd. | | | 7,586,088 | | | | 27,049,901 | |
| | | | | | | | | |
Health Care—15.2% | |
Biotechnology—4.7% | |
Biogen Idec, Inc.1 | | | 70,840 | | | | 22,336,560 | |
Celldex Therapeutics, Inc.1 | | | 1,102,650 | | | | 17,995,248 | |
Circassia Pharmaceuticals plc1 | | | 2,380,770 | | | | 11,237,169 | |
Clovis Oncology, Inc.1 | | | 174,790 | | | | 7,238,054 | |
Gilead Sciences, Inc.1 | | | 443,450 | | | | 36,766,440 | |
Medivation, Inc.1 | | | 134,320 | | | | 10,353,386 | |
Vertex Pharmaceuticals, Inc.1 | | | 307,560 | | | | 29,119,781 | |
| | | | | | | 135,046,638 | |
| | | | | | | | | |
Health Care Equipment & Supplies—1.6% | |
St. Jude Medical, Inc. | | | 264,970 | | | | 18,349,172 | |
Zimmer Holdings, Inc. | | | 280,930 | | | | 29,177,390 | |
| | | | | | | 47,526,562 | |
| | | | | | | | | |
Health Care Providers & Services—3.1% | |
Aetna, Inc. | | | 558,090 | | | | 45,249,937 | |
WellPoint, Inc. | | | 405,555 | | | | 43,641,774 | |
| | | | | | | 88,891,711 | |
| | | | | | | | | |
Pharmaceuticals—5.8% | |
Allergan, Inc. | | | 178,410 | | | | 30,190,540 | |
Bayer AG | | | 311,253 | | | | 43,963,982 | |
Roche Holding AG | | | 115,755 | | | | 34,541,467 | |
Shire plc | | | 474,780 | | | | 37,227,958 | |
Theravance Biopharma, Inc.1 | | | 157,022 | | | | 5,005,861 | |
Theravance, Inc.1 | | | 546,860 | | | | 16,285,491 | |
| | | | | | | 167,215,299 | |
| | | | | | | | | |
Industrials—11.8% | |
Aerospace & Defense—2.7% | |
Airbus Group NV | | | 787,480 | | | | 52,854,043 | |
Embraer SA, ADR | | | 702,013 | | | | 25,574,333 | |
| | | | | | | 78,428,376 | |
| | | | | | | | | |
Air Freight & Couriers—1.1% | |
United Parcel Service, Inc., Cl. B | | | 308,370 | | | | 31,657,264 | |
| | | | | | | | | |
Building Products—1.5% | |
Assa Abloy AB, Cl. B | | | 821,221 | | | | 41,739,624 | |
| | | | | | | | | |
Construction & Engineering—0.5% | |
FLSmidth & Co. AS | | | 276,960 | | | | 15,481,532 | |
| | | | | | | | | |
Electrical Equipment—2.5% | |
Emerson Electric Co. | | | 376,570 | | | | 24,989,185 | |
Nidec Corp. | | | 556,700 | | | | 34,228,624 | |
Prysmian SpA | | | 510,996 | | | | 11,532,602 | |
| | | | | | | 70,750,411 | |
| | | | | | | | | |
Industrial Conglomerates—2.9% | |
3M Co. | | | 248,650 | | | | 35,616,626 | |
Seibu Holdings, Inc. | | | 412,000 | | | | 8,551,301 | |
Siemens AG | | | 287,655 | | | | 37,991,900 | |
| | | | | | | 82,159,827 | |
| | | | | | | | | |
Machinery—0.6% | |
FANUC Corp. | | | 106,300 | | | | 18,369,551 | |
6 OPPENHEIMER GLOBAL FUND/VA
| | | | | | | | | | |
| | | Shares | | | Value | | | |
Information Technology—23.3% | | | |
Communications Equipment—3.5% | | | |
Juniper Networks, Inc.1 | | | 929,320 | | | $ | 22,805,513 | | | |
| Telefonaktiebolaget LM Ericsson, Cl. B | | | 6,353,181 | | | | 76,820,265 | | | |
| | | | | | | 99,625,778 | | | |
| | | | | | | | | | | |
Electronic Equipment, Instruments, & Components—3.9% | | | |
Keyence Corp. | | | 92,211 | | | | 40,334,002 | | | |
Kyocera Corp. | | | 610,400 | | | | 29,039,994 | | | |
Murata Manufacturing Co. Ltd. | | | 473,000 | | | | 44,367,839 | | | |
| | | | | | | 113,741,835 | | | |
| | | | | | | | | | | |
Internet Software & Services—6.0% | | | |
eBay, Inc.1 | | | 1,078,410 | | | | 53,985,205 | | | |
Facebook, Inc., Cl. A1 | | | 568,410 | | | | 38,248,309 | | | |
Google, Inc., Cl. A1 | | | 69,750 | | | | 40,780,732 | | | |
Google, Inc., Cl. C1 | | | 69,750 | | | | 40,125,780 | | | |
| | | | | | | 173,140,026 | | | |
| | | | | | | | | | | |
Semiconductors & Semiconductor Equipment—3.2% | | | |
Altera Corp. | | | 1,355,560 | | | | 47,119,265 | | | |
Maxim Integrated Products, Inc. | | | 1,295,165 | | | | 43,789,529 | | | |
| | | | | | | 90,908,794 | | | |
| | | | | | | | | | | |
Software—6.3% | | | |
Adobe Systems, Inc.1 | | | 668,703 | | | | 48,387,349 | | | |
Intuit, Inc. | | | 540,430 | | | | 43,520,828 | | | |
Microsoft Corp. | | | 785,250 | | | | 32,744,925 | | | |
SAP AG | | | 724,117 | | | | 55,929,362 | | | |
| | | | | | | 180,582,464 | | | |
| | | | | | | | | | | |
Technology Hardware, Storage & Peripherals—0.4% | | | |
Fusion-io, Inc.1 | | | 1,020,920 | | | | 11,536,396 | | | |
| | | | | | | | | | |
| | | | | | | | | | |
| | | | | | | | | | |
| | | | | | | | | | |
| | | | | | | | |
| | | Shares | | | Value | |
Materials—1.9% | |
Chemicals—1.1% | |
Linde AG | | | 145,665 | | | $ | 30,976,956 | |
| | | | | | | | | |
Metals & Mining—0.8% | |
Alrosa AO1 | | | 8,201,668 | | | | 10,090,643 | |
Vale SA, Cl. B, Sponsored ADR | | | 950,880 | | | | 12,580,142 | |
| | | | | | | 22,670,785 | |
| | | | | | | | | |
Telecommunication Services—1.5% | |
Wireless Telecommunication Services—1.5% | |
KDDI Corp. | | | 726,800 | | | | 44,428,031 | |
| Total Common Stocks (Cost $1,526,525,231) | | | | 2,780,669,282 | |
| | | | | | | | | |
Preferred Stocks—3.0% | | | | | | | | |
| Bayerische Motoren Werke (BMW) AG, Preferred Stock | | | 603,767 | | | | 57,886,883 | |
| Itau Unibanco Holding SA, Preference, ADR | | | 1,785,054 | | | | 25,669,077 | |
| Zee Entertainment Enterprises Ltd., 6% Cum. Non-Cv. | | | 79,253,601 | | | | 1,001,459 | |
| Total Preferred Stocks (Cost $42,804,333) | | | | 84,557,419 | |
| | |
| | | Units | | | | |
Rights, Warrants and Certificates—0.0% | |
Repsol SA Rts., Strike Price 0.0001EUR, Exp. 7/4/141 (Cost $—) | | | 812,996 | | | | 553,278 | |
| | |
| | | Shares | | | | |
Investment Company—0.3% | |
| Oppenheimer Institutional Money Market Fund, Cl. E, | | | | | | | | |
0.09%2,3 (Cost $9,733,919) | | | 9,733,919 | | | | 9,733,919 | |
| | | | | | | | | |
Total Investments, at Value (Cost $1,579,063,483) | | | 100.0% | | | | 2,875,513,898 | |
Net Other Assets (Liabilities) | | | 0.0 | | | | 1,256,630 | |
Net Assets | | | 100.0% | | | $ | 2,876,770,528 | |
Footnotes to Statement of Investments
Strike price is reported in U.S. Dollars, except for those denoted in the following currency:
EUR European Dollar
1. Non-income producing security.
2. Is or was an affiliate, as defined in the Investment Company Act of 1940, at or during the period ended June 30, 2014, by virtue of the Fund owning at least 5% of the voting securities of the issuer or as a result of the Fund and the issuer having the same investment adviser. Transactions during the period in which the issuer was an affiliate are as follows:
| | | | | | | | | | | | | | | | |
| | | Shares
December 31, 2013 | | | Gross
Additions | | | Gross Reductions | | | Shares
June 30, 2014 | |
| |
Oppenheimer Institutional Money Market Fund, Cl. E | | | 9,026,377 | | | | 148,271,773 | | | | 147,564,231 | | | | 9,733,919 | |
| | | | |
| | | | | | | | | Value | | | Income | |
| |
Oppenheimer Institutional Money Market Fund, Cl. E | | | $ | 9,733,919 | | | $ | 5,859 | |
3. Rate shown is the 7-day yield as of June 30, 2014.
| | | | | | | | |
| Distribution of investments representing geographic holdings, as a percentage of total investments at value, is as follows: | |
| Geographic Holdings | | Value | | | Percent | |
United States | | $ | 1,222,399,060 | | | | 42.5% | |
Germany | | | 312,091,519 | | | | 10.9 | |
Japan | | | 273,986,480 | | | | 9.5 | |
France | | | 230,727,803 | | | | 8.0 | |
United Kingdom | | | 149,926,243 | | | | 5.2 | |
Switzerland | | | 142,145,793 | | | | 5.0 | |
Sweden | | | 118,559,890 | | | | 4.1 | |
Spain | | | 109,698,717 | | | | 3.8 | |
Brazil | | | 105,851,882 | | | | 3.7 | |
India | | | 87,053,364 | | | | 3.0 | |
Russia | | | 41,289,853 | | | | 1.4 | |
Italy | | | 40,216,023 | | | | 1.4 | |
Mexico | | | 26,085,739 | | | | 0.9 | |
Denmark | | | 15,481,532 | | | | 0.6 | |
Total | | $ | 2,875,513,898 | | | | 100.0% | |
See accompanying Notes to Financial Statements.
7 OPPENHEIMER GLOBAL FUND/VA
STATEMENTOF ASSETS AND LIABILITIES June 30, 2014 Unaudited
| | | | |
Assets | | | | |
Investments, at value—see accompanying statement of investments: | | | | |
Unaffiliated companies (cost $1,569,329,564) | | $ | 2,865,779,979 | |
Affiliated companies (cost $9,733,919) | | | 9,733,919 | |
| | | | 2,875,513,898 | |
Cash | | | 2,022,267 | |
Receivables and other assets: | | | | |
Dividends | | | 3,849,102 | |
Other | | | 107,996 | |
Total assets | | | 2,881,493,263 | |
| |
| | | | | |
Liabilities | | | | |
Payables and other liabilities: | | | | |
Shares of beneficial interest redeemed | | | 2,706,563 | |
Investments purchased | | | 1,196,365 | |
Distribution and service plan fees | | | 266,898 | |
Foreign capital gains tax | | | 158,819 | |
Shareholder communications | | | 126,279 | |
Trustees’ compensation | | | 92,413 | |
Other | | | 175,398 | |
Total liabilities | | | 4,722,735 | |
| |
| | | | | |
Net Assets | | $ | 2,876,770,528 | |
| |
| | | | | |
Composition of Net Assets | | | | |
Par value of shares of beneficial interest | | $ | 71,520 | |
Additional paid-in capital | | | 1,444,445,852 | |
Accumulated net investment income | | | 23,647,260 | |
Accumulated net realized gain on investments and foreign currency transactions | | | 112,242,322 | |
Net unrealized appreciation on investments and translation of assets and liabilities denominated in foreign currencies | | | 1,296,363,574 | |
Net Assets | | $ | 2,876,770,528 | |
| |
| | | | | |
Net Asset Value Per Share | | | | |
Non-Service Shares: | | | | |
| Net asset value, redemption price (excludes applicable contingent deferred sales charge) and offering price per share (based on net assets of $1,576,525,380 and 39,039,282 shares of beneficial interest outstanding) | | | $40.38 | |
| |
Service Shares: | | | | |
| Net asset value, redemption price (excludes applicable contingent deferred sales charge) and offering price per share (based on net assets of $1,300,245,148 and 32,480,741 shares of beneficial interest outstanding) | | | $40.03 | |
See accompanying Notes to Financial Statements.
8 OPPENHEIMER GLOBAL FUND/VA
STATEMENTOF OPERATIONS For the Six Months Ended June 30, 2014 Unaudited
| | | | |
Investment Income | | | | |
Dividends: | | | | |
Unaffiliated companies (net of foreign withholding taxes of $3,681,838) | | $ | 36,144,542 | |
Affiliated companies | | | 5,859 | |
Interest | | | 19 | |
Total investment income | | | 36,150,420 | |
| |
| | | | | |
Expenses | | | | |
Management fees | | | 8,827,064 | |
Distribution and service plan fees - Service shares | | | 1,586,249 | |
Transfer and shareholder servicing agent fees: | | | | |
Non-Service shares | | | 767,492 | |
Service shares | | | 634,644 | |
Shareholder communications: | | | | |
Non-Service shares | | | 47,872 | |
Service shares | | | 39,595 | |
Custodian fees and expenses | | | 124,086 | |
Trustees’ compensation | | | 32,359 | |
Other | | | 158,322 | |
Total expenses | | | 12,217,683 | |
Less waivers and reimbursements of expenses | | | (7,631) | |
Net expenses | | | 12,210,052 | |
| |
| | | | | |
Net Investment Income | | | 23,940,368 | |
| |
| | | | | |
Realized and Unrealized Gain (Loss) | | | | |
Net realized gain (loss) on: | | | | |
Investments from unaffiliated companies | | | 137,060,053 | |
Foreign currency transactions | | | (37,360) | |
Net realized gain | | | 137,022,693 | |
Net change in unrealized appreciation/depreciation on: | | | | |
Investments (net of foreign capital gains tax of $158,819) | | | (38,589,044) | |
Translation of assets and liabilities denominated in foreign currencies | | | 2,864,584 | |
Net change in unrealized appreciation/depreciation | | | (35,724,460) | |
| |
| | | | | |
Net Increase in Net Assets Resulting from Operations | | $ | 125,238,601 | |
See accompanying Notes to Financial Statements.
9 OPPENHEIMER GLOBAL FUND/VA
STATEMENTSOF CHANGES IN NET ASSETS
| | | | | | | | | | |
| | | Six Months Ended
June 30, 2014
(Unaudited) | | | | | Year Ended
December 31, 2013 | |
Operations | | | | | | | | | | |
Net investment income | | $ | 23,940,368 | | | | | $ | 28,157,519 | |
Net realized gain | | | 137,022,693 | | | | | | 152,735,701 | |
Net change in unrealized appreciation/depreciation | | | (35,724,460) | | | | | | 483,471,092 | |
Net increase in net assets resulting from operations | | | 125,238,601 | | | | | | 664,364,312 | |
| | | |
| | | | | | | | | | | |
Dividends and/or Distributions to Shareholders | | | | | | | | | | |
Dividends from net investment income: | | | | | | | | | | |
Non-Service shares | | | (16,920,300) | | | | | | (18,448,869) | |
Service shares | | | (10,958,440) | | | | | | (13,851,660) | |
Class 3 shares1 | | | — | | | | | | (2,430,857) | |
Class 4 shares1 | | | — | | | | | | (953,729) | |
| | | (27,878,740) | | | | | | (35,685,115) | |
| | | |
| | | | | | | | | | | |
Distributions from net realized gain: | | | | | | | | | | |
Non-Service shares | | | (69,030,952) | | | | | | — | |
Service shares | | | (57,658,820) | | | | | | — | |
| | | (126,689,772) | | | | | | — | |
| | | |
| | | | | | | | | | | |
Beneficial Interest Transactions | | | | | | | | | | |
Net increase (decrease) in net assets resulting from beneficial interest transactions: | | | | | | | | | | |
Non-Service shares | | | 4,087,046 | | | | | | (158,236,204) | |
Service shares | | | 494,337 | | | | | | (180,268,543) | |
Class 3 shares1 | | | — | | | | | | (12,837,160) | |
Class 4 shares1 | | | — | | | | | | 1,813,300 | |
| | | 4,581,383 | | | | | | (349,528,607) | |
| | | |
| | | | | | | | | | | |
Net Assets | | | | | | | | | | |
Total increase (decrease) | | | (24,748,528) | | | | | | 279,150,590 | |
Beginning of period | | | 2,901,519,056 | | | | | | 2,622,368,466 | |
| | | |
| End of period (including accumulated net investment income of $23,647,260 and $27,585,632, respectively) | | $ | 2,876,770,528 | | | | | $ | 2,901,519,056 | |
1. Effective April 30, 2014, Class 3 and Class 4 shares of the Fund were reclassified as Non-Service shares and Service shares, respectively.
See accompanying Notes to Financial Statements.
10 OPPENHEIMER GLOBAL FUND/VA
FINANCIAL HIGHLIGHTS
| | | | | | | | | | | | | | | | | | | | | | | | |
| Non-Service Shares | | Six Months
Ended
June 30, 2014
(Unaudited) | | | Year Ended
December 31,
2013 | | | Year Ended
December 31,
2012 | | | Year Ended
December 30,
20111 | | | Year Ended
December 31,
2010 | | | Year Ended
December 31,
2009 | |
Per Share Operating Data | | | | | | | | | | | | | | | | | | | | | | | | |
Net asset value, beginning of period | | $ | 40.86 | | | $ | 32.55 | | | $ | 27.46 | | | $ | 30.30 | | | $ | 26.50 | | | $ | 20.21 | |
Income (loss) from investment operations: | | | | | | | | | | | | | | | | | | | | | | | | |
Net investment income2 | | | 0.37 | | | | 0.41 | | | | 0.44 | | | | 0.65 | | | | 0.33 | | | | 0.33 | |
Net realized and unrealized gain (loss) | | | 1.47 | | | | 8.40 | | | | 5.29 | | | | (3.11) | | | | 3.85 | | | | 6.94 | |
Total from investment operations | | | 1.84 | | | | 8.81 | | | | 5.73 | | | | (2.46) | | | | 4.18 | | | | 7.27 | |
Dividends and/or distributions to shareholders: | | | | | | | | | | | | | | | | | | | | | | | | |
Dividends from net investment income | | | (0.46) | | | | (0.50) | | | | (0.64) | | | | (0.38) | | | | (0.38) | | | | (0.50) | |
Distributions from net realized gain | | | (1.86) | | | | 0.00 | | | | 0.00 | | | | 0.00 | | | | 0.00 | | | | (0.48) | |
Total dividends and/or distributions to shareholders | | | (2.32) | | | | (0.50) | | | | (0.64) | | | | (0.38) | | | | (0.38) | | | | (0.98) | |
Net asset value, end of period | | $ | 40.38 | | | $ | 40.86 | | | $ | 32.55 | | | $ | 27.46 | | | $ | 30.30 | | | $ | 26.50 | |
| | | | | | |
| | | | | | | | | | | | | | | | | | | | | | | | | |
Total Return, at Net Asset Value3 | | | 4.57% | | | | 27.31% | | | | 21.27% | | | | (8.29)% | | | | 15.96% | | | | 39.77% | |
| | | | | | |
| | | | | | | | | | | | | | | | | | | | | | | | | |
Ratios/Supplemental Data | | | | | | | | | | | | | | | | | | | | | | | | |
Net assets, end of period (in thousands) | | $ | 1,576,526 | | | $ | 1,397,026 | | | $ | 1,252,127 | | | $ | 1,165,141 | | | $ | 1,410,764 | | | $ | 1,364,597 | |
Average net assets (in thousands) | | $ | 1,555,592 | | | $ | 1,333,848 | | | $ | 1,206,244 | | | $ | 1,335,403 | | | $ | 1,336,110 | | | $ | 1,206,240 | |
Ratios to average net assets:4 | | | | | | | | | | | | | | | | | | | | | | | | |
Net investment income | | | 1.81% | | | | 1.13% | | | | 1.48% | | | | 2.17% | | | | 1.22% | | | | 1.51% | |
Total expenses5 | | | 0.75% | | | | 0.77% | | | | 0.76% | | | | 0.76% | | | | 0.76% | | | | 0.75% | |
Expenses after payments, waivers and/or reimbursements and reduction to custodian expenses | | | 0.75% | | | | 0.77% | | | | 0.76% | | | | 0.76% | | | | 0.76% | | | | 0.75% | |
Portfolio turnover rate | | | 5% | | | | 11% | | | | 14% | | | | 13% | | | | 15% | | | | 11% | |
1. December 30, 2011 represents the last business day of the Fund’s reporting period.
2. Per share amounts calculated based on the average shares outstanding during the period.
3. Assumes an initial investment on the business day before the first day of the fiscal period, with all dividends and distributions reinvested in additional shares on the reinvestment date, and redemption at the net asset value calculated on the last business day of the fiscal period. Total returns are not annualized for periods less than one full year. Total return information does not reflect expenses that apply at the separate account level or to related insurance products. Inclusion of these charges would reduce the total return figures for all periods shown. Returns do not reflect the deduction of taxes that a shareholder would pay on fund distributions or the redemption of fund shares.
4. Annualized for periods less than one full year.
5. Total expenses including indirect expenses from affiliated fund were as follows:
| | | | | | |
| | Six Months Ended June 30, 2014 | | 0.75% | | |
| | Year Ended December 31, 2013 | | 0.77% | | |
| | Year Ended December 31, 2012 | | 0.76% | | |
| | Year Ended December 30, 2011 | | 0.76% | | |
| | Year Ended December 31, 2010 | | 0.76% | | |
| | Year Ended December 31, 2009 | | 0.75% | | |
See accompanying Notes to Financial Statements.
11 OPPENHEIMER GLOBAL FUND/VA
FINANCIAL HIGHLIGHTS Continued
| | | | | | | | | | | | | | | | | | | | | | | | |
| Service Shares | | Six Months
Ended
June 30, 2014
(Unaudited) | | | Year Ended
December 31,
2013 | | | Year Ended
December 31,
2012 | | | Year Ended
December 30,
20111 | | | Year Ended
December 31,
2010 | | | Year Ended
December 31,
2009 | |
Per Share Operating Data | | | | | | | | | | | | | | | | | | | | | | | | |
Net asset value, beginning of period | | $ | 40.47 | | | $ | 32.25 | | | $ | 27.21 | | | $ | 30.04 | | | $ | 26.28 | | | $ | 20.02 | |
Income (loss) from investment operations: | | | | | | | | | | | | | | | | | | | | | | | | |
Net investment income2 | | | 0.31 | | | | 0.32 | | | | 0.36 | | | | 0.56 | | | | 0.26 | | | | 0.27 | |
Net realized and unrealized gain (loss) | | | 1.46 | | | | 8.32 | | | | 5.25 | | | | (3.08) | | | | 3.82 | | | | 6.90 | |
Total from investment operations | | | 1.77 | | | | 8.64 | | | | 5.61 | | | | (2.52) | | | | 4.08 | | | | 7.17 | |
Dividends and/or distributions to shareholders: | | | | | | | | | | | | | | | | | | | | | | | | |
Dividends from net investment income | | | (0.35) | | | | (0.42) | | | | (0.57) | | | | (0.31) | | | | (0.32) | | | | (0.43) | |
Distributions from net realized gain | | | (1.86) | | | | 0.00 | | | | 0.00 | | | | 0.00 | | | | 0.00 | | | | (0.48) | |
Total dividends and/or distributions to shareholders | | | (2.21) | | | | (0.42) | | | | (0.57) | | | | (0.31) | | | | (0.32) | | | | (0.91) | |
Net asset value, end of period | | $ | 40.03 | | | $ | 40.47 | | | $ | 32.25 | | | $ | 27.21 | | | $ | 30.04 | | | $ | 26.28 | |
| | | | | | |
| | | | | | | | | | | | | | | | | | | | | | | | | |
Total Return, at Net Asset Value3 | | | 4.46% | | | | 26.99% | | | | 20.95% | | | | (8.53)% | | | | 15.70% | | | | 39.36% | |
| | | | | | |
| | | | | | | | | | | | | | | | | | | | | | | | | |
Ratios/Supplemental Data | | | | | | | | | | | | | | | | | | | | | | | | |
Net assets, end of period (in thousands) | | $ | 1,300,245 | | | $ | 1,216,285 | | | $ | 1,130,388 | | | $ | 1,003,839 | | | $ | 1,101,584 | | | $ | 980,485 | |
Average net assets (in thousands) | | $ | 1,286,307 | | | $ | 1,174,119 | | | $ | 1,069,295 | | | $ | 1,091,128 | | | $ | 997,627 | | | $ | 830,887 | |
Ratios to average net assets:4 | | | | | | | | | | | | | | | | | | | | | | | | |
Net investment income | | | 1.56% | | | | 0.89% | | | | 1.23% | | | | 1.90% | | | | 0.96% | | | | 1.23% | |
Total expenses5 | | | 1.00% | | | | 1.02% | | | | 1.01% | | | | 1.01% | | | | 1.01% | | | | 1.00% | |
Expenses after payments, waivers and/or reimbursements and reduction to custodian expenses | | | 1.00% | | | | 1.02% | | | | 1.01% | | | | 1.01% | | | | 1.01% | | | | 1.00% | |
Portfolio turnover rate | | | 5% | | | | 11% | | | | 14% | | | | 13% | | | | 15% | | | | 11% | |
1. December 30, 2011 represents the last business day of the Fund’s reporting period.
2. Per share amounts calculated based on the average shares outstanding during the period.
3. Assumes an initial investment on the business day before the first day of the fiscal period, with all dividends and distributions reinvested in additional shares on the reinvestment date, and redemption at the net asset value calculated on the last business day of the fiscal period. Total returns are not annualized for periods less than one full year. Total return information does not reflect expenses that apply at the separate account level or to related insurance products. Inclusion of these charges would reduce the total return figures for all periods shown. Returns do not reflect the deduction of taxes that a shareholder would pay on fund distributions or the redemption of fund shares.
4. Annualized for periods less than one full year.
5. Total expenses including indirect expenses from affiliated fund were as follows:
| | | | | | |
| | Six Months Ended June 30, 2014 | | 1.00% | | |
| | Year Ended December 31, 2013 | | 1.03% | | |
| | Year Ended December 31, 2012 | | 1.01% | | |
| | Year Ended December 30, 2011 | | 1.01% | | |
| | Year Ended December 31, 2010 | | 1.01% | | |
| | Year Ended December 31, 2009 | | 1.00% | | |
See accompanying Notes to Financial Statements.
12 OPPENHEIMER GLOBAL FUND/VA
NOTESTO FINANCIAL STATEMENTS June 30, 2014 Unaudited
1. Significant Accounting Policies
Oppenheimer Global Fund/VA (the “Fund”), formerly Oppenheimer Global Securities Fund/VA, a separate series of Oppenheimer Variable Account Funds, is a diversified open-end management investment company registered under the Investment Company Act of 1940, as amended. The Fund’s investment objective is to seek capital appreciation. The Fund’s investment adviser is OFI Global Asset Management, Inc. (“OFI Global” or the “Manager”), a wholly-owned subsidiary of OppenheimerFunds, Inc. (“OFI” or the “Sub-Adviser”). The Manager has entered into a sub-advisory agreement with OFI. Shares of the Fund are sold only to separate accounts of life insurance companies.
The Fund offers two classes of shares. Both classes are sold at their offering price, which is the net asset value per share, to separate investment accounts of participating insurance companies as an underlying investment for variable life insurance policies, variable annuity contracts or other investment products. The class of shares designated as Service shares is subject to a distribution and service plan. Both classes of shares have identical rights and voting privileges with respect to the Fund in general and exclusive voting rights on matters that affect that class alone. Earnings, net assets and net asset value per share may differ due to each class having its own expenses, such as transfer and shareholder servicing agent fees and shareholder communications, directly attributable to that class.
The following is a summary of significant accounting policies consistently followed by the Fund.
Investment in Oppenheimer Institutional Money Market Fund. The Fund is permitted to invest daily available cash balances in an affiliated money market fund. The Fund may invest the available cash in Class E shares of Oppenheimer Institutional Money Market Fund (“IMMF”) to seek current income while preserving liquidity. IMMF is a registered open-end management investment company, regulated as a money market fund under the Investment Company Act of 1940, as amended. The Manager is the investment adviser of IMMF, and the Sub-Adviser provides investment and related advisory services to IMMF. When applicable, the Fund’s investment in IMMF is included in the Statement of Investments. Shares of IMMF are valued at their net asset value per share. As a shareholder, the Fund is subject to its proportional share of IMMF’s Class E expenses, including its management fee. The Manager will waive fees and/or reimburse Fund expenses in an amount equal to the indirect management fees incurred through the Fund’s investment in IMMF.
Foreign Currency Translation. The Fund’s accounting records are maintained in U.S. dollars. The values of securities denominated in foreign currencies and amounts related to the purchase and sale of foreign securities and foreign investment income are translated into U.S. dollars as of the close of the New York Stock Exchange (the “Exchange”), normally 4:00 P.M. Eastern time, on each day the Exchange is open for trading. Foreign exchange rates may be valued primarily using a reliable bank, dealer or service authorized by the Board of Trustees.
Reported net realized gains and losses from foreign currency transactions arise from sales of portfolio securities, sales and maturities of short-term securities, sales of foreign currencies, exchange rate fluctuations between the trade and settlement dates on securities transactions, and the difference between the amounts of dividends, interest, and foreign withholding taxes recorded on the Fund’s books and the U.S. dollar equivalent of the amounts actually received or paid. Net unrealized appreciation and depreciation on the translation of assets and liabilities denominated in foreign currencies arise from changes in the values of assets and liabilities, including investments in securities at fiscal period end, resulting from changes in exchange rates.
The effect of changes in foreign currency exchange rates on investments is separately identified from the fluctuations arising from changes in market values of securities held and reported with all other foreign currency gains and losses in the Fund’s Statement of Operations.
Allocation of Income, Expenses, Gains and Losses. Income, expenses (other than those attributable to a specific class), gains and losses are allocated on a daily basis to each class of shares based upon the relative proportion of net assets represented by such class. Operating expenses directly attributable to a specific class are charged against the operations of that class.
Federal Taxes. The Fund intends to comply with provisions of the Internal Revenue Code applicable to regulated investment companies and to distribute substantially all of its investment company taxable income to shareholders. Therefore, no federal income or excise tax provision is required. The Fund files income tax returns in U.S. federal and applicable state jurisdictions. The statute of limitations on the Fund’s tax return filings generally remain open for the three preceding fiscal reporting period ends.
During the fiscal year ended December 31, 2013, the Fund utilized $9,934,353 of capital loss carryforward to offset capital gains realized in that fiscal year.
Net investment income (loss) and net realized gain (loss) may differ for financial statement and tax purposes. The character of dividends and distributions made during the fiscal year from net investment income or net realized gains may differ from their ultimate characterization for federal income tax purposes. Also, due to timing of dividends and distributions, the fiscal year in which amounts are distributed may differ from the fiscal year in which the income or net realized gain was recorded by the Fund.
The aggregate cost of securities and other investments and the composition of unrealized appreciation and depreciation of securities and other investments for federal income tax purposes as of June 30, 2014 are noted in the following table. The primary difference between book and tax appreciation or depreciation of securities and other investments, if applicable, is attributable to the tax deferral of losses or tax realization of financial statement unrealized gain or loss.
13 OPPENHEIMER GLOBAL FUND/VA
NOTESTO FINANCIAL STATEMENTS Unaudited / Continued
1. Significant Accounting Policies (Continued)
| | | | |
Federal tax cost of securities | | $ | 1,602,839,102 | |
| |
Gross unrealized appreciation | | $ | 1,326,697,056 | |
Gross unrealized depreciation | | | (54,022,260) | |
Net unrealized appreciation | | $ | 1,272,674,796 | |
Certain foreign countries impose a tax on capital gains which is accrued by the Fund based on unrealized appreciation, if any, on affected securities. The tax is paid when the gain is realized.
Trustees’ Compensation. The Board of Trustees has adopted a compensation deferral plan for independent trustees that enables trustees to elect to defer receipt of all or a portion of the annual compensation they are entitled to receive from the Fund. For purposes of determining the amount owed to the Trustee under the plan, deferred amounts are treated as though equal dollar amounts had been invested in shares of the Fund or in other Oppenheimer funds selected by the Trustee. The Fund purchases shares of the funds selected for deferral by the Trustee in amounts equal to his or her deemed investment, resulting in a Fund asset equal to the deferred compensation liability. Such assets are included as a component of “Other” within the asset section of the Statement of Assets and Liabilities. Deferral of trustees’ fees under the plan will not affect the net assets of the Fund, and will not materially affect the Fund’s assets, liabilities or net investment income per share. Amounts will be deferred until distributed in accordance with the compensation deferral plan.
Dividends and Distributions to Shareholders. Dividends and distributions to shareholders, which are determined in accordance with income tax regulations and may differ from U.S. generally accepted accounting principles, are recorded on the ex-dividend date. Income and capital gain distributions, if any, are declared and paid annually or at other times as deemed necessary by the Manager. The tax character of distributions is determined as of the Fund’s fiscal year end. Therefore, a portion of the Fund’s distributions made to shareholders prior to the Fund’s fiscal year end may ultimately be categorized as a tax return of capital.
Investment Income. Dividend income is recorded on the ex-dividend date or upon ex-dividend notification in the case of certain foreign dividends where the ex-dividend date may have passed. Non-cash dividends included in dividend income, if any, are recorded at the fair market value of the securities received. Interest income is recognized on an accrual basis. Discount and premium, which are included in interest income on the Statement of Operations, are amortized or accreted daily.
Custodian Fees. “Custodian fees and expenses” in the Statement of Operations may include interest expense incurred by the Fund on any cash overdrafts of its custodian account during the period. Such cash overdrafts may result from the effects of failed trades in portfolio securities and from cash outflows resulting from unanticipated shareholder redemption activity. The Fund pays interest to its custodian on such cash overdrafts, to the extent they are not offset by positive cash balances maintained by the Fund, at a rate equal to the Federal Funds Rate plus 0.50%. The “Reduction to custodian expenses” line item, if applicable, represents earnings on cash balances maintained by the Fund during the period. Such interest expense and other custodian fees may be paid with these earnings.
Security Transactions. Security transactions are recorded on the trade date. Realized gains and losses on securities sold are determined on the basis of identified cost.
Indemnifications. The Fund’s organizational documents provide current and former trustees and officers with a limited indemnification against liabilities arising in connection with the performance of their duties to the Fund. In the normal course of business, the Fund may also enter into contracts that provide general indemnifications. The Fund’s maximum exposure under these arrangements is unknown as this would be dependent on future claims that may be made against the Fund. The risk of material loss from such claims is considered remote.
Other. The preparation of financial statements in conformity with accounting principles generally accepted in the United States of America requires management to make estimates and assumptions that affect the reported amounts of assets and liabilities and disclosure of contingent assets and liabilities at the date of the financial statements and the reported amounts of increases and decreases in net assets from operations during the reporting period. Actual results could differ from those estimates.
2. Securities Valuation
The Fund calculates the net asset value of its shares as of the close of the New York Stock Exchange (the “Exchange”), normally 4:00 P.M. Eastern time, on each day the Exchange is open for trading.
The Fund’s Board has adopted procedures for the valuation of the Fund’s securities and has delegated the day-to-day responsibility for valuation determinations under those procedures to the Manager. The Manager has established a Valuation Committee which is responsible for determining a “fair valuation” for any security for which market quotations are not “readily available.” The Valuation Committee’s fair valuation determinations are subject to review, approval and ratification by the Fund’s Board at its next regularly scheduled meeting covering the calendar quarter in which the fair valuation was determined.
14 OPPENHEIMER GLOBAL FUND/VA
2. Securities Valuation (Continued)
Valuation Methods and Inputs
Securities are valued using unadjusted quoted market prices, when available, as supplied primarily by third party pricing services or dealers.
The following methodologies are used to determine the market value or the fair value of the types of securities described below:
Securities traded on a registered U.S. securities exchange (including exchange-traded derivatives other than futures and futures options) are valued based on the last sale price of the security reported on the principal exchange on which it is traded, prior to the time when the Fund’s assets are valued. In the absence of a sale, the security is valued at the last sale price on the prior trading day, if it is within the spread of the current day’s closing “bid” and “asked” prices, and if not, at the current day’s closing bid price. A security of a foreign issuer traded on a foreign exchange, but not listed on a registered U.S. securities exchange, is valued based on the last sale price on the principal exchange on which the security is traded, as identified by the third party pricing service used by the Manager, prior to the time when the Fund’s assets are valued. If the last sale price is unavailable, the security is valued at the most recent official closing price on the principal exchange on which it is traded. If the last sales price or official closing price for a foreign security is not available, the security is valued at the mean between the bid and asked price per the exchange or, if not available from the exchange, obtained from two dealers. If bid and asked prices are not available from either the exchange or two dealers, the security is valued by using one of the following methodologies (listed in order of priority): (1) using a bid from the exchange, (2) the mean between the bid and asked price as provided by a single dealer, or (3) a bid from a single dealer.
Shares of a registered investment company that are not traded on an exchange are valued at that investment company’s net asset value per share.
Corporate and government debt securities (of U.S. or foreign issuers) and municipal debt securities, event-linked bonds, loans, mortgage-backed securities, collateralized mortgage obligations, and asset-backed securities are valued at the mean between the “bid” and “asked” prices utilizing evaluated prices obtained from third party pricing services or broker-dealers who may use matrix pricing methods to determine the evaluated prices.
Short-term money market type debt securities with a remaining maturity of sixty days or less are valued at cost adjusted by the amortization of discount or premium to maturity (amortized cost), which approximates market value. Short-term debt securities with a remaining maturity in excess of sixty days are valued at the mean between the “bid” and “asked” prices utilizing evaluated prices obtained from third party pricing services or broker-dealers.
A description of the standard inputs that may generally be considered by the third party pricing vendors in determining their evaluated prices is provided below.
| | |
| Security Type | | Standard inputs generally considered by third-party pricing vendors |
| Corporate debt, government debt, municipal, mortgage-backed and asset-backed securities | | Reported trade data, broker-dealer price quotations, benchmark yields, issuer spreads on comparable securities, the credit quality, yield, maturity, and other appropriate factors. |
| Loans | | Information obtained from market participants regarding reported trade data and broker-dealer price quotations. |
| Event-linked bonds | | Information obtained from market participants regarding reported trade data and broker-dealer price quotations. |
If a market value or price cannot be determined for a security using the methodologies described above, or if, in the “good faith” opinion of the Manager, the market value or price obtained does not constitute a “readily available market quotation,” or a significant event has occurred that would materially affect the value of the security the security is fair valued either (i) by a standardized fair valuation methodology applicable to the security type or the significant event as previously approved by the Valuation Committee and the Fund’s Board or (ii) as determined in good faith by the Manager’s Valuation Committee. The Valuation Committee considers all relevant facts that are reasonably available, through either public information or information available to the Manager, when determining the fair value of a security. Fair value determinations by the Manager are subject to review, approval and ratification by the Fund’s Board at its next regularly scheduled meeting covering the calendar quarter in which the fair valuation was determined. Those fair valuation standardized methodologies include, but are not limited to, valuing securities at the last sale price or initially at cost and subsequently adjusting the value based on: changes in company specific fundamentals, changes in an appropriate securities index, or changes in the value of similar securities which may be further adjusted for any discounts related to security-specific resale restrictions. When possible, such methodologies use observable market inputs such as unadjusted quoted prices of similar securities, observable interest rates, currency rates and yield curves. The methodologies used for valuing securities are not necessarily an indication of the risks associated with investing in those securities nor can it be assured that the Fund can obtain the fair value assigned to a security if it were to sell the security.
To assess the continuing appropriateness of security valuations, the Manager, or its third party service provider who is subject to oversight by the Manager, regularly compares prior day prices, prices on comparable securities, and sale prices to the current day prices and challenges those prices exceeding certain tolerance levels with the third party pricing service or broker source. For those securities valued by fair valuations, whether through a standardized fair valuation methodology or a fair valuation determination, the Valuation Committee reviews and affirms the reasonableness of the valuations based on such methodologies and fair valuation determinations on a regular basis after considering all relevant information that is reasonably available.
Classifications
Each investment asset or liability of the Fund is assigned a level at measurement date based on the significance and source of the inputs to its valuation. Various data inputs are used in determining the value of each of the Fund’s investments as of the reporting period end. These data inputs are categorized in the following hierarchy under applicable financial accounting standards:
15 OPPENHEIMER GLOBAL FUND/VA
NOTESTO FINANCIAL STATEMENTS Unaudited / Continued
2. Securities Valuation (Continued)
1) Level 1-unadjusted quoted prices in active markets for identical assets or liabilities (including securities actively traded on a securities exchange)
2) Level 2-inputs other than unadjusted quoted prices that are observable for the asset or liability (such as unadjusted quoted prices for similar assets and market corroborated inputs such as interest rates, prepayment speeds, credit risks, etc.)
3) Level 3-significant unobservable inputs (including the Manager’s own judgments about assumptions that market participants would use in pricing the asset or liability).
The inputs used for valuing securities are not necessarily an indication of the risks associated with investing in those securities.
The table below categorizes amounts that are included in the Fund’s Statement of Assets and Liabilities as of June 30, 2014 based on valuation input level:
| | | | | | | | | | | | | | | | |
| | | Level 1— Unadjusted Quoted Prices | | | Level 2— Other Significant Observable Inputs | | | Level 3— Significant Unobservable Inputs | | | Value | |
Assets Table | | | | | | | | | | | | | | | | |
Investments, at Value: | | | | | | | | | | | | | | | | |
Common Stocks | | | | | | | | | | | | | | | | |
Consumer Discretionary | | $ | 152,516,427 | | | $ | 198,922,290 | | | $ | — | | | $ | 351,438,717 | |
Consumer Staples | | | 98,510,590 | | | | 79,646,780 | | | | — | | | | 178,157,370 | |
Energy | | | 19,559,321 | | | | 86,572,828 | | | | — | | | | 106,132,149 | |
Financials | | | 200,586,158 | | | | 399,477,028 | | | | — | | | | 600,063,186 | |
Health Care | | | 311,709,634 | | | | 126,970,576 | | | | — | | | | 438,680,210 | |
Industrials | | | 117,837,408 | | | | 220,749,177 | | | | — | | | | 338,586,585 | |
Information Technology | | | 423,043,831 | | | | 246,491,462 | | | | — | | | | 669,535,293 | |
Materials | | | 12,580,142 | | | | 41,067,599 | | | | — | | | | 53,647,741 | |
Telecommunication Services | | | — | | | | 44,428,031 | | | | — | | | | 44,428,031 | |
Preferred Stocks | | | 26,670,536 | | | | 57,886,883 | | | | — | | | | 84,557,419 | |
Rights, Warrants and Certificates | | | — | | | | 553,278 | | | | — | | | | 553,278 | |
Investment Company | | | 9,733,919 | | | | — | | | | — | | | | 9,733,919 | |
Total Assets | | $ | 1,372,747,966 | | | $ | 1,502,765,932 | | | $ | — | | | $ | 2,875,513,898 | |
Foreign currency exchange contracts and futures contracts, if any, are reported at their unrealized appreciation/ depreciation at measurement date, which represents the change in the contract’s value from trade date. All additional assets and liabilities included in the above table are reported at their market value at measurement date.
3. Shares of Beneficial Interest
The Fund has authorized an unlimited number of $0.001 par value shares of beneficial interest of each class. Transactions in shares of beneficial interest were as follows:
| | | | | | | | | | | | | | | | |
| | | Six Months Ended June 30, 2014 | | | Year Ended December 31, 2013 | |
| | | Shares | | | Amount | | | Shares | | | Amount | |
Non-Service Shares | | | | | | | | | | | | | | | | |
Sold | | | 5,282,795 | | | $ | 216,175,530 | | | | 2,054,395 | | | $ | 74,312,252 | |
Dividends and/or distributions reinvested | | | 2,154,167 | | | | 85,951,252 | | | | 517,530 | | | | 18,448,869 | |
Redeemed | | | (7,255,075) | | | | (298,039,736)1 | | | | (6,851,884 | ) | | | (250,997,325) | |
Net increase (decrease) | | | 181,887 | | | $ | 4,087,046 | | | | (4,279,959 | ) | | $ | (158,236,204) | |
| | | | |
| | | | | | | | | | | | | | | | | |
Service Shares | | | | | | | | | | | | | | | | |
Sold | | | 3,084,747 | | | $ | 124,874,680 | | | | 1,803,731 | | | $ | 65,522,799 | |
Dividends and/or distributions reinvested | | | 1,734,511 | | | | 68,617,260 | | | | 391,733 | | | | 13,851,660 | |
Redeemed | | | (4,760,096) | | | | (192,997,603)1 | | | | (7,192,815 | ) | | | (259,643,002) | |
Net increase (decrease) | | | 59,162 | | | $ | 494,337 | | | | (4,997,351 | ) | | $ | (180,268,543) | |
| | | | |
| | | | | | | | | | | | | | | | | |
Class 3 Shares2 | | | | | | | | | | | | | | | | |
Sold | | | — | | | $ | — | | | | 274,924 | | | $ | 9,972,302 | |
Dividends and/or distributions reinvested | | | — | | | | — | | | | 67,712 | | | | 2,430,857 | |
Redeemed | | | — | | | | — | | | | (693,858 | ) | | | (25,240,319)3 | |
Net decrease | | | — | | | $ | — | | | | (351,222 | ) | | $ | (12,837,160) | |
| | | | |
| | | | | | | | | | | | | | | | | |
Class 4 Shares2 | | | | | | | | | | | | | | | | |
Sold | | | — | | | $ | — | | | | 301,288 | | | $ | 11,069,712 | |
Dividends and/or distributions reinvested | | | — | | | | — | | | | 26,919 | | | | 953,729 | |
Redeemed | | | — | | | | — | | | | (289,896 | ) | | | (10,210,141)3 | |
Net increase | | | — | | | $ | — | | | | 38,311 | | | $ | 1,813,300 | |
16 OPPENHEIMER GLOBAL FUND/VA
3. Shares of Beneficial Interest (Continued)
1. Net of redemption fees of $1,517 and $1,367 for Class Non-Service and Class Service, respectively.
2. Effective April 30, 2014, Class 3 and Class 4 shares of the Fund were reclassified as Non-Service shares and Service shares, respectively.
3. Net of redemption fees of $11,326 and $4,748 for Class 3 and Class 4, respectively.
4. Purchases and Sales of Securities
The aggregate cost of purchases and proceeds from sales of securities, other than short-term obligations and investments in IMMF, for the six months ended June 30, 2014 were as follows:
| | | | | | | | |
| | | Purchases | | | Sales | |
| |
Investment securities | | $ | 154,186,612 | | | $ | 293,197,518 | |
5. Fees and Other Transactions with Affiliates
Management Fees. Under the investment advisory agreement, the Fund pays the Manager a management fee based on the daily net assets of the Fund at an annual rate as shown in the following table:
| | | | |
| Fee Schedule | | | |
Up to $200 million | | | 0.75% | |
Next $200 million | | | 0.72 | |
Next $200 million | | | 0.69 | |
Next $200 million | | | 0.66 | |
Next $4.2 billion | | | 0.60 | |
Over $5 billion | | | 0.58 | |
Sub-Adviser Fees. The Manager has retained the Sub-Adviser to provide the day-to-day portfolio management of the Fund. Under the Sub-Advisory Agreement, the Manager pays the Sub-Adviser an annual fee in monthly installments, equal to a percentage of the investment management fee collected by the Manager from the Fund, which shall be calculated after any investment management fee waivers. The fee paid to the Sub-Adviser is paid by the Manager, not by the Fund.
Transfer Agent Fees. OFI Global (the “Transfer Agent”) serves as the transfer and shareholder servicing agent for the Fund. The Fund pays the Transfer Agent a fee based on annual net assets. Fees incurred and average net assets for each class with respect to these services are detailed in the Statement of Operations and Financial Highlights, respectively.
Sub-Transfer Agent Fees. The Transfer Agent has retained Shareholder Services, Inc., a wholly-owned subsidiary of OFI (the “Sub-Transfer Agent”), to provide the day-to-day transfer agent and shareholder servicing of the Fund. Under the Sub-Transfer Agency Agreement, the Transfer Agent pays the Sub-Transfer Agent an annual fee in monthly installments, equal to a percentage of the transfer agent fee collected by the Transfer Agent from the Fund, which shall be calculated after any applicable fee waivers. The fee paid to the Sub-Transfer Agent is paid by the Transfer Agent, not by the Fund.
Distribution and Service Plan for Service Shares. The Fund has adopted a Distribution and Service Plan (the “Plan”) in accordance with Rule 12b-1 under the Investment Company Act of 1940 for Service shares to pay OppenheimerFunds Distributor, Inc. (the “Distributor”), for distribution related services, personal service and account maintenance for the Fund’s Service shares. Under the Plan, payments are made periodically at an annual rate of 0.25% of the daily net assets of Service shares of the Fund. The Distributor currently uses all of those fees to compensate sponsors of the insurance product that offers Fund shares, for providing personal service and maintenance of accounts of their variable contract owners that hold Service shares. These fees are paid out of the Fund’s assets on an on-going basis and increase operating expenses of the Service shares, which results in lower performance compared to the Fund’s shares that are not subject to a service fee. Fees incurred by the Fund under the Plan are detailed in the Statement of Operations.
Waivers and Reimbursements of Expenses. The Manager has voluntarily agreed to limit the Fund’s expenses after payments, waivers and/or reimbursements and reduction to custodian expenses, excluding expenses incurred directly or indirectly by the Fund as a result of investments in other investment companies, wholly-owned subsidiaries and pooled investment vehicles; so that those expenses, as percentages of daily net assets, will not exceed the annual rate of 1.00% for Non-Service shares and 1.25% for Service shares.
The Manager will waive fees and/or reimburse Fund expenses in an amount equal to the indirect management fees incurred through the Fund’s investment in IMMF. During the six months ended June 30, 2014, the Manager waived fees and/or reimbursed the Fund $7,631 for IMMF management fees.
Some of these undertakings may be modified or terminated at any time; some may not be modified or terminated until after one year from the date of the current prospectus, as indicated therein.
6. Pending Litigation
In 2009, seven class action lawsuits were filed in the U.S. District Court for the District of Colorado against OppenheimerFunds, Inc. (“OFI”), OppenheimerFunds Distributor, Inc., the Fund’s principal underwriter and distributor (the “Distributor”), and certain funds (but not including the Fund) advised by OFI Global Asset Management, Inc. and distributed by the Distributor (the “Defendant Funds”). The lawsuits also named as defendants
17 OPPENHEIMER GLOBAL FUND/VA
NOTESTO FINANCIAL STATEMENTS Unaudited / Continued
6. Pending Litigation (Continued)
certain officers and current and former trustees of the respective Defendant Funds. The lawsuits raised claims under federal securities law and alleged, among other things, that the disclosure documents of the respective Defendant Funds contained misrepresentations and omissions and that the respective Defendant Funds’ investment policies were not followed. The plaintiffs in these actions sought unspecified damages, equitable relief and awards of attorneys’ fees and litigation expenses. The Defendant Funds’ Boards of Trustees also engaged counsel to represent the Funds and the present and former Independent Trustees named in those suits. On March 5, 2014, the parties in six of these lawsuits executed stipulations and agreements of settlement resolving those actions. On July 31, 2014, the court entered an order and final judgment approving the settlements as fair, reasonable and adequate. The settlements do not resolve a seventh outstanding lawsuit relating to Oppenheimer Rochester California Municipal Fund.
Other class action and individual lawsuits have been filed since 2008 in various state and federal courts against OFI and certain of its affiliates by investors seeking to recover investments they allegedly lost as a result of the “Ponzi” scheme run by Bernard L. Madoff and his firm, Bernard L. Madoff Investment Securities, LLC (“BLMIS”). Plaintiffs in these suits allege that they suffered losses as a result of their investments in several funds managed by an affiliate of OFI and assert a variety of claims, including breach of fiduciary duty, fraud, negligent misrepresentation, unjust enrichment, and violation of federal and state securities laws and regulations, among others. They seek unspecified damages, equitable relief and awards of attorneys’ fees and litigation expenses. Neither the Distributor, nor any of the Oppenheimer mutual funds, their independent trustees or directors are named as defendants in these lawsuits. None of the Oppenheimer mutual funds invested in any funds or accounts managed by Madoff or BLMIS. On February 28, 2011, a stipulation of partial settlement of three groups of consolidated putative class action lawsuits relating to these matters was filed in the U.S. District Court for the Southern District of New York. On August 19, 2011, the court entered an order and final judgment approving the settlement as fair, reasonable and adequate. In September 2011, certain parties filed notices of appeal from the court’s order approving the settlement. In June 2014, the appellate court affirmed the lower court’s order approving the settlement. Certain parties subsequently filed a petition for certiorari before the U.S. Supreme Court further challenging the settlement approval order. The settlement does not resolve other outstanding lawsuits against OFI and its affiliates relating to BLMIS.
OFI believes the lawsuits and appeals described above are without legal merit and, with the exception of actions it has settled, is defending against them vigorously. While it is premature to render any opinion as to the outcome in these lawsuits, or whether any costs that the Defendant Funds may bear in defending the suits might not be reimbursed by insurance, OFI believes that these suits should not impair the ability of OFI or the Distributor to perform their respective duties to the Fund, and that the outcome of all of the suits together should not have any material effect on the operations of any of the Oppenheimer mutual funds.
18 OPPENHEIMER GLOBAL FUND/VA
PORTFOLIO PROXY VOTING POLICIES AND PROCEDURES; UPDATES TO STATEMENTS OF INVESTMENTS Unaudited
The Fund has adopted Portfolio Proxy Voting Policies and Procedures under which the Fund votes proxies relating to securities (“portfolio proxies”) held by the Fund. A description of the Fund’s Portfolio Proxy Voting Policies and Procedures is available (i) without charge, upon request, by calling the Fund toll-free at 1.800.525.7048, (ii) on the Fund’s website at oppenheimerfunds.com, and (iii) on the SEC’s website at www.sec.gov. In addition, the Fund is required to file Form N-PX, with its complete proxy voting record for the 12 months ended June 30th, no later than August 31st of each year. The Fund’s voting record is available (i) without charge, upon request, by calling the Fund toll-free at 1.800.525.7048, and (ii) in the Form N-PX filing on the SEC’s website at www.sec.gov.
The Fund files its complete schedule of portfolio holdings with the SEC for the first quarter and the third quarter of each fiscal year on Form N-Q. The Fund’s Form N-Q filings are available on the SEC’s website at www.sec.gov. Those forms may be reviewed and copied at the SEC’s Public Reference Room in Washington, D.C. Information on the operation of the Public Reference Room may be obtained by calling 1-800-SEC-0330.
19 OPPENHEIMER GLOBAL FUND/VA
OPPENHEIMER GLOBAL FUND/VA
| | |
A Series of Oppenheimer Variable Account Funds |
| Trustees and Officers | | Sam Freedman, Chairman of the Board of Trustees and Trustee |
| | Edward L. Cameron, Trustee |
| | Jon S. Fossel, Trustee |
| | Richard F. Grabish, Trustee |
| | Beverly L. Hamilton, Trustee |
| | Victoria J. Herget, Trustee |
| | Robert J. Malone, Trustee |
| | F. William Marshall, Jr., Trustee |
| | Karen L. Stuckey, Trustee |
| | James D. Vaughn, Trustee |
| | William F. Glavin, Jr., Trustee, President and Principal Executive Officer |
| | Rajeev Bhaman, Vice President |
| | Arthur S. Gabinet, Secretary and Chief Legal Officer |
| | Christina M. Nasta, Vice President and Chief Business Officer |
| | Mary Ann Picciotto, Chief Compliance Officer and Chief Anti-Money Laundering Officer |
| | Brian W. Wixted, Treasurer and Principal Financial & Accounting Officer |
| |
| Manager | | OFI Global Asset Management, Inc. |
| |
| Sub-Adviser | | OppenheimerFunds, Inc. |
| |
| Distributor | | OppenheimerFunds Distributor, Inc. |
| |
| Transfer and | | OFI Global Asset Management, Inc. |
| Shareholder | | |
| Servicing Agent | | |
| |
| Sub-Transfer Agent | | Shareholder Services, Inc. |
| | DBA OppenheimerFunds Services |
| |
| Independent | | KPMG LLP |
| Registered | | |
| Public | | |
| Accounting | | |
| Firm | | |
| |
| Counsel | | K&L Gates LLP |
| |
| | Before investing in any of the Oppenheimer funds, investors should carefully consider a Fund’s investment objective, risks, and charges and expenses. Fund prospectuses and summary prospectuses contain this and other information about the funds, and may be obtained by asking your financial advisor, visiting oppenheimerfunds.com or calling us at 1.800.988.8287. Read prospectuses and summary prospectuses carefully before investing. |
| |
| | The financial statements included herein have been taken from the records of the Fund without examination of those records by the independent registered public accounting firm. |
| |
| | © 2014 OppenheimerFunds, Inc. All rights reserved. Oppenheimer funds are distributed by OppenheimerFunds Distributor, Inc. |


Portfolio Managers: Manind Govil, CFA, Benjamin Ram and Paul Larson1
| | |
Cumulative Total Returns For the 6-Month Period Ended 6/30/14 |
| | | | |
Non-Service Shares | | | 6.19 | % |
Service Shares | | | 6.06 | % |
| | | | | | | | |
Average Annual Total Returns For the Periods Ended 6/30/14 | | |
| | | 1-Year | | 5-Year | | 10-Year | | |
Non-Service Shares | | 25.80% | | 17.85% | | 7.37% | | |
Service Shares | | 25.50% | | 17.56% | | 7.10% | | |
Performance data quoted represents past performance, which does not guarantee future results. The investment return and principal value of an investment in the Fund will fluctuate so that an investor’s shares, when redeemed, may be worth more or less than their original cost. Current performance may be lower or higher than the performance quoted. For performance data current to the most recent month end, call us at 1.800.988.8287. The Fund’s total returns should not be expected to be the same as the returns of other funds, whether or not both funds have the same portfolio managers and/or similar names. The Fund’s total returns include changes in share price and reinvested distributions but do not include the charges associated with the separate account products that offer this Fund. Such performance would have been lower if such charges were taken into account.
| | | | | | |
TOP TEN COMMON STOCK HOLDINGS | | | |
Apple, Inc. | | | 4.1 | % | | |
Chevron Corp. | | | 3.8 | | | |
National Oilwell Varco, Inc. | | | 3.2 | | | |
General Electric Co. | | | 3.1 | | | |
Google, Inc., Cl. C | | | 2.9 | | | |
Noble Energy, Inc. | | | 2.9 | | | |
Philip Morris International, Inc. | | | 2.9 | | | |
Tyco International Ltd. | | | 2.9 | | | |
Mondelez International, Inc., Cl. A | | | 2.9 | | | |
Citigroup, Inc. | | | 2.7 | | | |
Portfolio holdings and allocations are subject to change. Percentages are as of June 30, 2014, and are based on net assets. For more current Fund holdings, please visit oppenheimerfunds.com.
Sector Allocation
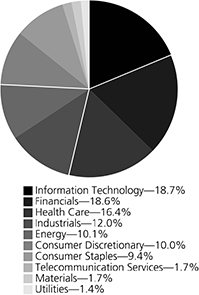
Portfolio holdings and allocations are subject to change. Percentages are as of June 30, 2014, and are based on the total market value of common stocks.
1. Paul Larson became a Portfolio Manager in April 2014.
2 OPPENHEIMER MAIN STREET FUND/VA
Fund Performance Discussion
The Fund’s Non-Service shares produced a return of 6.19% during the period, underperforming the S&P 500 Index (the “Index”), which returned 7.14%. The Fund’s underperformance relative to the Index stemmed primarily from weaker relative stock selection in the financials sector. Also detracting from performance were information technology, energy and consumer staples, where less favorable stock selection resulted in underperformance. The Fund outperformed in the health care sector due to stronger relative stock selection and an overweight position, and in the consumer discretionary sector, as a result of stock selection and an underweight position.
GLOBAL MARKET AND ECONOMIC ENVIRONMENT
Despite market volatility early in the reporting period and rising geopolitical risks in Ukraine and the Middle East, global equities generally rebounded and produced positive returns in the first half of 2014, thanks largely to a continued global economic recovery and stimulative monetary policies from central banks throughout the world. Markets were volatile to start the reporting period in January 2014 amid fears that political and economic instability in the world’s emerging markets might further dampen the U.S. economic recovery. However, equities rebounded later in the reporting period. Among the central bank measures that boosted the markets this reporting period, the European Central Bank (the “ECB”) announced numerous measures in June, including a benchmark interest rate cut, the introduction of a negative deposit rate to encourage banks to lend, among various other measures to flood the system with liquidity. Beyond that, the ECB said it would prepare to purchase packages of loans from banks to allow for increased lending. In June, the U.S. Federal Reserve (the “Fed”) also stated it would reduce the amount of monthly bond purchases by an additional $10 billion and reaffirmed its intention to keep short-term interest rates near zero. U.S. economic data released in April and May was positive, as the unemployment rate fell to 6.3%, the economy finally regained all of the jobs lost during the 2008 recession, and the U.S. stock market achieved record highs. Shortly after the reporting period ended, a positive June jobs report was released, in which the official unemployment rate fell to 6.1%, its lowest level since September 2008.
Against this backdrop, sustained low interest rates continued to boost demand for higher dividend yielding stocks as investors sought alternative sources of current income. As a result, utilities remained one of the top performing sectors. Oil prices spiked during the reporting period, reflecting increased tensions in the Middle East and concerns that output from the Iraqi oil fields would be curtailed. Not surprisingly, energy stocks responded by rallying strongly, making this sector another strong performer this period.
Finally, there was a pick-up in mergers and acquisitions (M&A). A driving force that has garnered considerable headline attention was Corporate America’s aim to put the cash that has built-up on overseas balance sheets to productive use. This, combined with an opportunity to lower overall corporate tax rates, resulted in a plethora of proposed acquisitions – targeted at companies domiciled in desirable geographic tax havens. This was especially evident in the health care sector – with Pfizer attempting to merge with Astra-Zeneca and, more recently, Medtronic communicating its intention to acquire Covidien. Regardless of the motivation, the pick-up in M&A activity generally benefited the stock price of both acquiree and acquirer.
TOP INDIVIDUAL CONTRIBUTORS
Top contributing holdings this reporting period included health care stocks Allergan, Inc. and Actavis plc, along with information technology holding Apple, Inc. Allergan is a leading maker of eye care, skin care and aesthetic products, including Botox. Allergan’s stock price jumped when pharmaceutical firm Valeant, in conjunction with activist investor Bill Ackman of Pershing Square, announced their intention to acquire the company. While Allergan’s management has so far resisted this overture, on the premise that the acquisition price underestimates the company’s worth, Allergan’s stock price has remained elevated, trading within close range of the valuation proposed by the Valeant/Pershing Square team. Actavis develops and markets branded, generic, and over-the-counter products worldwide. The stock reacted favorably after management preannounced a positive earnings surprise due mostly to revenue synergies and cost savings from the recent merger with Warner Chilcott. Free cash generation was above expectations as well, and was used to pay down debt. This reduced balance sheet leverage, thus providing financial flexibility for additional acquisitions to further the company’s growth initiatives. Later in the reporting period, management announced the acquisition of Forest Labs. This news was well received as Forest not only accelerates the revenue growth potential for Actavis, but in our opinion, also should result in increased profitability as higher margin branded drugs become a larger percentage of the company’s business. Apple performed well during the second half of 2013 due to excitement surrounding the introduction of two new iPhones as well as the addition of China Mobile as a distribution partner. Apple also rallied strongly in April 2014 after iPhone sales came in higher than analysts anticipated and the company announced a 7-for-1 stock split and increased both its dividend and share repurchases.
3 OPPENHEIMER MAIN STREET FUND/VA
TOP INDIVIDUAL DETRACTORS
Detractors from performance this reporting period included CIT Group, Inc., Towers Watson & Co. and eBay, Inc. The financials sector was a weaker performing sector of the Index as ongoing low rates of interest continued to pressure the profitability of most stocks in the sector, including CIT Group, a lender to small and middle market customers. Lower than expected fee revenue hurt profit margins – and this, combined with a contracting net interest margin, resulted in a diminished earnings outlook. As a partial offset, management announced further share repurchases. Towers Watson provides human resource and financial services consulting, including employee benefit programs such as retirement-related services and health exchange solutions. The stock reacted negatively when earnings were reported. Retirement revenues were shy of expectations and the company’s bottom-line result was mostly driven by lower quality items, such as a reduced tax rate. Impacting the stock most significantly was lowered guidance from management. We have sold our holdings as our conviction in management’s ability to execute has been reduced. eBay operates both an online auction and third party sales site and the internet-based payment service PayPal. Despite an earnings report that topped expectations the stock reacted negatively when management lowered guidance. We believe PayPal, eBay’s payments business, should continue its strong upward trajectory, but a growth deceleration for Marketplace, eBay’s on-line retailing, is projected to detract from results near-term. Additionally, eBay continues to invest for growth, which should keep expenses elevated above normal. Helping to partly offset these headwinds, management announced its intention to repatriate cash from overseas operations and is expected to use much of this to accelerate its stock repurchases. We lowered our exposure in the stock.
STRATEGY & OUTLOOK
Corporate profitability — at, or near peak levels — looks vulnerable, especially if employment picks-up and wage inflation begins to affect profit margins. In our view, productivity gains and even the pick-up in M&A activity could help sustain operating profitability. However, after tax margins may be poised to contract as these have benefited greatly from financial engineering, including lower tax rates and, more importantly, lower cost of debt financing due to the Fed’s actions. We believe both are likely to have a diminished impact going forward.
While we are mindful of the potential pressure on profitability, we are also increasingly cognizant of “industry disruptors.” New and innovative technologies have always had a transformational effect, but other forms of disruption are now becoming pervasive across industries. The emergence of online retailing, the boom of shale oil and gas in North America, and the Affordable Care Act in health care are examples of industry disruptors likely to have a substantial and sustainable impact. These disruptors can be either opportunities or threats. Our job is to figure out which.
Given this backdrop, our approach remains consistent. We aim to construct an “all weather” portfolio by targeting companies that we believe have: 1) sustainable competitive advantages; 2) skilled management with a proven track record of executing effectively; and 3) financial resources to generate improving profitability, gain market share, and/or return significant cash to shareholders. During times of volatile or slow economic growth such companies frequently widen their lead over weaker competitors. We seek to invest in companies characterized by these qualities at compelling valuations and believe this disciplined approach is essential in seeking to generate superior long-term performance.
The Fund’s investment strategy and focus can change over time. The mention of specific fund holdings does not constitute a recommendation by OppenheimerFunds, Inc. or its affiliates.
Shares of Oppenheimer funds are not deposits or obligations of any bank, are not guaranteed by any bank, are not insured by the FDIC or any other agency, and involve investment risks, including the possible loss of the principal amount invested.
4 OPPENHEIMER MAIN STREET FUND/VA
Fund Expenses
Fund Expenses. As a shareholder of the Fund, you incur two types of costs: (1) transaction costs and (2) ongoing costs, including management fees; distribution and service fees; and other Fund expenses. These examples are intended to help you understand your ongoing costs (in dollars) of investing in the Fund and to compare these costs with the ongoing costs of investing in other mutual funds.
The examples are based on an investment of $1,000.00 invested at the beginning of the period and held for the entire 6-month period ended June 30, 2014.
Actual Expenses. The first section of the table provides information about actual account values and actual expenses. You may use the information in this section for the class of shares you hold, together with the amount you invested, to estimate the expense that you paid over the period. Simply divide your account value by $1,000.00 (for example, an $8,600.00 account value divided by $1,000.00 = 8.60), then multiply the result by the number in the first section under the heading entitled “Expenses Paid During Period” to estimate the expenses you paid on your account during this period.
Hypothetical Example for Comparison Purposes.
The second section of the table provides information about hypothetical account values and hypothetical expenses based on the Fund’s actual expense ratio for each class of shares, and an assumed rate of return of 5% per year for each class before expenses, which is not the actual return. The hypothetical account values and expenses may not be used to estimate the actual ending account balance or expenses you paid for the period. You may use this information to compare the ongoing costs of investing in the Fund and other funds. To do so, compare this 5% hypothetical example for the class of shares you hold with the 5% hypothetical examples that appear in the shareholder reports of the other funds.
Please note that the expenses shown in the table are meant to highlight your ongoing costs only and do not reflect any charges associated with the separate accounts that offer this Fund. Therefore, the “hypothetical” lines of the table are useful in comparing ongoing costs only, and will not help you determine the relative total costs of owning different funds. In addition, if these separate account charges were included your costs would have been higher.
| | | | | | | | | | | | | | | | | | | | |
| Actual | | Beginning Account Value
January 1, 2014 | | | | | Ending Account
Value June 30, 2014 | | | | | Expenses Paid During
6 Months Ended
June 30, 2014 | | | | |
Non-Service shares | | $ | 1,000.00 | | | | | $ | 1,061.90 | | | | | $ | 3.94 | | | | | |
Service shares | | | 1,000.00 | | | | | | 1,060.60 | | | | | | 5.22 | | | | | |
| | | | | | |
Hypothetical (5% return before expenses) | | | | | | | | | | | | | | | | | | | | |
Non-Service shares | | | 1,000.00 | | | | | | 1,020.98 | | | | | | 3.87 | | | | | |
Service shares | | | 1,000.00 | | | | | | 1,019.74 | | | | | | 5.12 | | | | | |
Expenses are equal to the Fund’s annualized expense ratio for that class, multiplied by the average account value over the period, multiplied by 181/365 (to reflect the one-half year period). Those annualized expense ratios, excluding indirect expenses from affiliated funds, based on the 6-month period ended June 30, 2014 are as follows:
| | | | |
| Class | | Expense Ratios | | |
Non-Service shares | | 0.77% | | |
Service shares | | 1.02 | | |
The expense ratios reflect voluntary and/or contractual waivers and/or reimbursements of expenses by the Fund’s Manager. Some of these undertakings may be modified or terminated at any time, as indicated in the Fund’s prospectus. The “Financial Highlights” tables in the Fund’s financial statements, included in this report, also show the gross expense ratios, without such waivers or reimbursements and reduction to custodian expenses, if applicable.
5 OPPENHEIMER MAIN STREET FUND/VA
| | | | |
| STATEMENTOF INVESTMENTS June 30, 2014 Unaudited | | |
| | | | |
| | | | | | | | |
| | | Shares | | | Value | |
| |
Common Stocks—98.0% | |
| |
Consumer Discretionary—9.8% | |
| |
Auto Components—1.5% | |
| |
Delphi Automotive plc | | | 312,130 | | | $ | 21,455,816 | |
| | | | | | | | |
| |
Automobiles—1.1% | |
| |
General Motors Co. | | | 417,110 | | | | 15,141,093 | |
| | | | | | | | |
| |
Media—3.4% | |
| |
Comcast Corp., Cl. A | | | 696,180 | | | | 37,370,942 | |
| |
| Twenty-First Century Fox, Inc., Cl. A | | | 332,710 | | | | 11,694,757 | |
| | | | | | | | |
| | | | | | | 49,065,699 | |
| | | | | | | | |
| |
Specialty Retail—3.2% | |
| |
AutoZone, Inc.1 | | | 68,600 | | | | 36,786,064 | |
| |
TJX Cos., Inc. (The) | | | 185,680 | | | | 9,868,892 | |
| | | | | | | | |
| | | | | | | 46,654,956 | |
| | | | | | | | |
| |
Textiles, Apparel & Luxury Goods—0.6% | |
| |
PVH Corp. | | | 70,530 | | | | 8,223,798 | |
| | | | | | | | |
| |
Consumer Staples—9.2% | |
| |
Beverages—2.0% | |
| |
Diageo plc | | | 922,160 | | | | 29,355,395 | |
| | | | | | | | |
| |
Food Products—2.9% | |
| |
| Mondelez International, Inc., Cl. A | | | 1,095,210 | | | | 41,190,848 | |
| | | | | | | | |
| |
Household Products—1.4% | |
| |
Henkel AG & Co. KGaA | | | 194,208 | | | | 19,543,105 | |
| | | | | | | | |
| |
Tobacco—2.9% | |
| |
| Philip Morris International, Inc. | | | 501,989 | | | | 42,322,693 | |
| | | | | | | | |
| |
Energy—9.9% | |
| |
Energy Equipment & Services—3.2% | |
| |
| National Oilwell Varco, Inc. | | | 559,360 | | | | 46,063,296 | |
| | | | | | | | |
| |
Oil, Gas & Consumable Fuels—6.7% | |
| |
Chevron Corp. | | | 414,720 | | | | 54,141,696 | |
| |
Noble Energy, Inc. | | | 546,610 | | | | 42,340,411 | |
| | | | | | | | |
| | | | | | | 96,482,107 | |
| | | | | | | | |
| |
Financials—18.2% | |
| |
Commercial Banks—7.0% | |
| |
CIT Group, Inc. | | | 643,610 | | | | 29,451,593 | |
| |
Citigroup, Inc. | | | 818,518 | | | | 38,552,198 | |
| |
JPMorgan Chase & Co. | | | 564,290 | | | | 32,514,390 | |
| | | | | | | | |
| | | | | | | 100,518,181 | |
| | | | | | | | |
| |
Consumer Finance—1.6% | |
| |
| Discover Financial Services | | | 361,403 | | | | 22,399,758 | |
| | | | | | | | |
| |
Diversified Financial Services—3.8% | |
| |
CME Group, Inc. | | | 387,880 | | | | 27,520,086 | |
| |
| McGraw Hill Financial, Inc. | | | 330,151 | | | | 27,412,438 | |
| | | | | | | | |
| | | | | | | 54,932,524 | |
| | | | | | | | |
| |
Insurance—5.3% | |
| |
| American International Group, Inc. | | | 635,240 | | | | 34,671,399 | |
| |
| Genworth Financial, Inc., Cl. A1 | | | 824,450 | | | | 14,345,430 | |
| |
| Lincoln National Corp. | | | 194,250 | | | | 9,992,220 | |
| |
| Marsh & McLennan Cos., Inc. | | | 333,820 | | | | 17,298,553 | |
| | | | | | | | |
| | | | | | | 76,307,602 | |
| | | | | | | | |
| |
Real Estate Investment Trusts (REITs)—0.5% | |
| |
Digital Realty Trust, Inc. | | | 116,920 | | | | 6,818,774 | |
| | | | | | | | |
| |
Health Care—16.1% | |
| |
Biotechnology—2.2% | |
| |
Gilead Sciences, Inc.1 | | | 383,320 | | | | 31,781,061 | |
| | | | | | | | |
| | | Shares | | | Value | |
| |
Health Care Equipment & Supplies—1.4% | |
| |
Covidien plc | | | 147,700 | | | $ | 13,319,586 | |
| |
Intuitive Surgical, Inc.1 | | | 18,010 | | | | 7,416,518 | |
| | | | | | | | |
| | | | | | | 20,736,104 | |
| | | | | | | | |
| |
Health Care Providers & Services—3.9% | |
| |
| Express Scripts Holding Co.1 | | | 532,697 | | | | 36,931,883 | |
| |
| UnitedHealth Group, Inc. | | | 225,790 | | | | 18,458,332 | |
| | | | | | | | |
| | | | | | | 55,390,215 | |
| | | | | | | | |
| |
Pharmaceuticals—8.6% | |
| |
AbbVie, Inc. | | | 285,210 | | | | 16,097,252 | |
| |
Actavis plc1 | | | 148,670 | | | | 33,160,844 | |
| |
Allergan, Inc. | | | 141,290 | | | | 23,909,094 | |
| |
Pfizer, Inc. | | | 1,158,009 | | | | 34,369,707 | |
| |
Zoetis, Inc. | | | 479,940 | | | | 15,487,664 | |
| | | | | | | | |
| | | | | | | 123,024,561 | |
| | | | | | | | |
| |
Industrials—11.7% | |
| |
Commercial Services & Supplies—3.5% | |
| |
| Republic Services, Inc., Cl. A | | | 244,630 | | | | 9,288,601 | |
| |
Tyco International Ltd. | | | 909,225 | | | | 41,460,660 | |
| | | | | | | | |
| | | | | | | 50,749,261 | |
| | | | | | | | |
| |
Industrial Conglomerates—3.1% | |
| |
General Electric Co. | | | 1,689,120 | | | | 44,390,074 | |
| | | | | | | | |
| |
Machinery—2.7% | |
| |
Deere & Co. | | | 424,110 | | | | 38,403,160 | |
| | | | | | | | |
| |
Road & Rail—2.4% | |
| |
| Canadian National Railway Co. | | | 452,980 | | | | 29,452,760 | |
| |
CSX Corp. | | | 174,960 | | | | 5,390,517 | |
| | | | | | | | |
| | | | | | | 34,843,277 | |
| | | | | | | | |
| |
Information Technology—18.3% | |
| |
| Electronic Equipment, Instruments, & Components—0.4% | |
| |
Corning, Inc. | | | 262,940 | | | | 5,771,533 | |
| | | | | | | | |
| |
Internet Software & Services—7.7% | |
| |
eBay, Inc.1 | | | 490,135 | | | | 24,536,158 | |
| |
Facebook, Inc., Cl. A1 | | | 222,680 | | | | 14,984,138 | |
| |
Google, Inc., Cl. A1 | | | 48,700 | | | | 28,473,429 | |
| |
Google, Inc., Cl. C1 | | | 73,490 | | | | 42,277,327 | |
| | | | | | | | |
| | | | | | | 110,271,052 | |
| | | | | | | | |
| |
IT Services—3.5% | |
| |
Amdocs Ltd. | | | 372,170 | | | | 17,242,636 | |
| |
MasterCard, Inc., Cl. A | | | 366,710 | | | | 26,942,184 | |
| |
Xerox Corp. | | | 526,340 | | | | 6,547,669 | |
| | | | | | | | |
| | | | | | | 50,732,489 | |
| | | | | | | | |
| |
Semiconductors & Semiconductor Equipment—0.4% | |
| |
Applied Materials, Inc. | | | 279,210 | | | | 6,296,185 | |
| | | | | | | | |
| |
Technology Hardware, Storage & Peripherals—6.3% | |
| |
Apple, Inc. | | | 632,104 | | | | 58,741,425 | |
| |
Western Digital Corp. | | | 337,800 | | | | 31,178,940 | |
| | | | | | | | |
| | | | | | | 89,920,365 | |
| | | | | | | | |
| |
Materials—1.7% | |
| |
Construction Materials—1.7% | |
| |
Vulcan Materials Co. | | | 379,300 | | | | 24,180,375 | |
| | | | | | | | |
| |
Telecommunication Services—1.7% | |
| |
Diversified Telecommunication Services—1.7% | |
| |
| Verizon Communications, Inc. | | | 493,110 | | | | 24,127,872 | |
| | | | | | | | |
| |
Utilities—1.4% | |
| |
Electric Utilities—1.4% | |
| |
Exelon Corp. | | | 548,222 | | | | 19,999,139 | |
| | | | | | | | |
| Total Common Stocks (Cost $963,378,028) | | | | | | | 1,407,092,367 | |
6 OPPENHEIMER MAIN STREET FUND/VA
| | | | | | | | |
| | | Shares | | | Value | |
| |
Preferred Stock—0.4% | |
| |
| Henkel AG & Co. KGaA, Preference (Cost $3,560,676) | | | 47,970 | | | $ | 5,548,884 | |
| | | | | | | | |
| |
Investment Company—1.9% | | | | | | | | |
| |
| Oppenheimer Institutional Money Market Fund, Cl. E, 0.09%2,3 (Cost $27,280,094) | | | 27,280,094 | | | | 27,280,094 | |
| | | | | | | | |
| |
| Total Investments, at Value (Cost $994,218,798) | | | 100.3% | | | | 1,439,921,345 | |
| |
Net Other Assets (Liabilities) | | | (0.3) | | | | (3,832,777) | |
| | | | |
Net Assets | | | 100.0% | | | $ | 1,436,088,568 | |
| | | | |
Footnotes to Statement of Investments
1. Non-income producing security.
2. Rate shown is the 7-day yield as of June 30, 2014.
3. Is or was an affiliate, as defined in the Investment Company Act of 1940, at or during the period ended June 30, 2014, by virtue of the Fund owning at least 5% of the voting securities of the issuer or as a result of the Fund and the issuer having the same investment adviser. Transactions during the period in which the issuer was an affiliate are as follows:
| | | | | | | | | | | | | | | | |
| | | Shares
December 31,
2013 | | | Gross
Additions | | | Gross
Reductions | | | Shares
June 30, 2014 | |
| |
| Oppenheimer Institutional Money Market Fund, Cl. E | | | 28,023,569 | | | | 185,832,470 | | | | 186,575,945 | | | | 27,280,094 | |
| | | | |
| | | | | | | | | Value | | | Income | |
| |
| Oppenheimer Institutional Money Market Fund, Cl. E | | | $ | 27,280,094 | | | $ | 5,388 | |
See accompanying Notes to Financial Statements.
7 OPPENHEIMER MAIN STREET FUND/VA
STATEMENTOF ASSETS AND LIABILITIES June 30, 2014 Unaudited
| | | | |
| | | | |
| |
Assets | | | | |
Investments, at value—see accompanying statement of investments: | | | | |
Unaffiliated companies (cost $966,938,704) | | $ | 1,412,641,251 | |
Affiliated companies (cost $27,280,094) | | | 27,280,094 | |
| | | | |
| | | 1,439,921,345 | |
| |
Cash | | | 501,644 | |
| |
Receivables and other assets: | | | | |
Dividends | | | 1,775,412 | |
Shares of beneficial interest sold | | | 1,835 | |
Other | | | 92,186 | |
| | | | |
Total assets | | | 1,442,292,422 | |
|
| |
Liabilities | | | | |
Payables and other liabilities: | | | | |
Investments purchased | | | 3,572,497 | |
Shares of beneficial interest redeemed | | | 2,283,501 | |
Distribution and service plan fees | | | 179,768 | |
Trustees’ compensation | | | 83,464 | |
Shareholder communications | | | 71,174 | |
Other | | | 13,450 | |
| | | | |
Total liabilities | | | 6,203,854 | |
|
| |
Net Assets | | $ | 1,436,088,568 | |
| | | | |
|
| |
Composition of Net Assets | | | | |
Par value of shares of beneficial interest | | $ | 44,730 | |
| |
Additional paid-in capital | | | 875,936,745 | |
| |
Accumulated net investment income | | | 4,704,994 | |
| |
Accumulated net realized gain on investments and foreign currency transactions | | | 109,702,429 | |
| |
Net unrealized appreciation on investments and translation of assets and liabilities denominated in foreign currencies | | | 445,699,670 | |
| | | | |
Net Assets | | $ | 1,436,088,568 | |
| | | | |
|
| |
Net Asset Value Per Share | | | | |
Non-Service Shares: | | | | |
| Net asset value, redemption price (excludes applicable contingent deferred sales charge) and offering price per share (based on net assets of $563,344,520 and 17,473,822 shares of beneficial interest outstanding) | | | $32.24 | |
| |
Service Shares: | | | | |
| Net asset value, redemption price (excludes applicable contingent deferred sales charge) and offering price per share (based on net assets of $872,744,048 and 27,256,230 shares of beneficial interest outstanding) | | | $32.02 | |
See accompanying Notes to Financial Statements.
8 OPPENHEIMER MAIN STREET FUND/VA
STATEMENTOF OPERATIONS For the Six Months Ended June 30, 2014 Unaudited
| | | | |
| | | | |
| |
Investment Income | | | | |
Dividends: | | | | |
Unaffiliated companies (net of foreign withholding taxes of $70,445) | | $ | 11,343,635 | |
Affiliated companies | | | 5,388 | |
| | | | |
Total investment income | | | 11,349,023 | |
|
| |
Expenses | | | | |
Management fees | | | 4,593,372 | |
| |
Distribution and service plan fees - Service shares | | | 1,080,157 | |
| |
Transfer and shareholder servicing agent fees: | | | | |
Non-Service shares | | | 271,259 | |
Service shares | | | 432,275 | |
| |
Shareholder communications: | | | | |
Non-Service shares | | | 25,205 | |
Service shares | | | 40,270 | |
| |
Custodian fees and expenses | | | 5,130 | |
| |
Trustees’ compensation | | | 27,625 | |
| |
Other | | | 39,928 | |
| | | | |
Total expenses | | | 6,515,221 | |
Less waivers and reimbursements of expenses | | | (7,040) | |
| | | | |
Net expenses | | | 6,508,181 | |
|
| |
Net Investment Income | | | 4,840,842 | |
|
| |
Realized and Unrealized Gain (Loss) | | | | |
Net realized gain on: | | | | |
Investments from unaffiliated companies | | | 118,472,845 | |
Foreign currency transactions | | | 10,144 | |
| | | | |
Net realized gain | | | 118,482,989 | |
| |
Net change in unrealized appreciation/depreciation on: | | | | |
Investments | | | (39,043,724) | |
Translation of assets and liabilities denominated in foreign currencies | | | (363,062) | |
| | | | |
Net change in unrealized appreciation/depreciation | | | (39,406,786) | |
|
| |
Net Increase in Net Assets Resulting from Operations | | $ | 83,917,045 | |
| | | | |
See accompanying Notes to Financial Statements.
9 OPPENHEIMER MAIN STREET FUND/VA
STATEMENTSOF CHANGES IN NET ASSETS
| | | | | | | | |
| | | Six Months Ended
June 30, 2014
(Unaudited) | | | Year Ended
December 31, 2013 | |
| |
Operations | | | | | | | | |
Net investment income | | $ | 4,840,842 | | | $ | 9,996,436 | |
| |
Net realized gain | | | 118,482,989 | | | | 233,270,981 | |
| |
Net change in unrealized appreciation/depreciation | | | (39,406,786) | | | | 144,474,017 | |
| | | | | | | | |
Net increase in net assets resulting from operations | | | 83,917,045 | | | | 387,741,434 | |
|
| |
Dividends and/or Distributions to Shareholders | | | | | | | | |
Dividends from net investment income: | | | | | | | | |
Non-Service shares | | | (4,608,478) | | | | (5,738,189) | |
Service shares | | | (4,983,477) | | | | (7,658,030) | |
| | | | |
| | | (9,591,955) | | | | (13,396,219) | |
| |
Distributions from net realized gain: | | | | | | | | |
Non-Service shares | | | (11,141,625) | | | | — | |
Service shares | | | (17,524,841) | | | | — | |
| | | | |
| | | (28,666,466) | | | | — | |
|
| |
Beneficial Interest Transactions | | | | | | | | |
Net decrease in net assets resulting from beneficial interest transactions: | | | | | | | | |
Non-Service shares | | | (14,988,899) | | | | (57,546,662) | |
Service shares | | | (70,623,665) | | | | (191,217,253) | |
| | | | | | | | |
| | | (85,612,564) | | | | (248,763,915) | |
|
| |
Net Assets | | | | | | | | |
Total increase (decrease) | | | (39,953,940) | | | | 125,581,300 | |
| |
Beginning of period | | | 1,476,042,508 | | | | 1,350,461,208 | |
| | | | | | | | |
| End of period (including accumulated net investment income of $4,704,994 and $9,456,107, respectively) | | $ | 1,436,088,568 | | | $ | 1,476,042,508 | |
| | | | |
See accompanying Notes to Financial Statements.
10 OPPENHEIMER MAIN STREET FUND/VA
FINANCIAL HIGHLIGHTS
| | | | | | | | | | | | | | | | | | | | | | | | |
| Non-Service Shares | | Six Months
Ended
June 30,
2014
(Unaudited) | | | Year Ended
December
31, 2013 | | | Year Ended
December
31, 2012 | | | Year Ended
December
30, 20111 | | | Year Ended
December
31, 2010 | | | Year Ended
December
31, 2009 | |
| |
Per Share Operating Data | | | | | | | | | | | | | | | | | | | | | | | | |
Net asset value, beginning of period | | $ | 31.24 | | | $ | 23.97 | | | $ | 20.71 | | | $ | 20.88 | | | $ | 18.18 | | | $ | 14.56 | |
| |
Income (loss) from investment operations: | | | | | | | | | | | | | | | | | | | | | | | | |
Net investment income2 | | | 0.13 | | | | 0.24 | | | | 0.26 | | | | 0.16 | | | | 0.17 | | | | 0.21 | |
Net realized and unrealized gain (loss) | | | 1.79 | | | | 7.33 | | | | 3.22 | | | | (0.16) | | | | 2.73 | | | | 3.71 | |
| | | | |
Total from investment operations | | | 1.92 | | | | 7.57 | | | | 3.48 | | | | 0.00 | | | | 2.90 | | | | 3.92 | |
| |
Dividends and/or distributions to shareholders: | | | | | | | | | | | | | | | | | | | | | | | | |
Dividends from net investment income | | | (0.27) | | | | (0.30) | | | | (0.22) | | | | (0.17) | | | | (0.20) | | | | (0.30) | |
Distributions from net realized gain | | | (0.65) | | | | 0.00 | | | | 0.00 | | | | 0.00 | | | | 0.00 | | | | 0.00 | |
| | | | |
Total dividends and/or distributions to shareholders | | | (0.92) | | | | (0.30) | | | | (0.22) | | | | (0.17) | | | | (0.20) | | | | (0.30) | |
| |
Net asset value, end of period | | $ | 32.24 | | | $ | 31.24 | | | $ | 23.97 | | | $ | 20.71 | | | $ | 20.88 | | | $ | 18.18 | |
| | | | |
|
| |
Total Return, at Net Asset Value3 | | | 6.19% | | | | 31.77% | | | | 16.87% | | | | (0.01)% | | | | 16.11% | | | | 28.29% | |
| |
Ratios/Supplemental Data | | | | | | | | | | | | | | | | | | | | | | | | |
Net assets, end of period (in thousands) | | $ | 563,345 | | | $ | 561,016 | | | $ | 481,089 | | | $ | 392,861 | | | $ | 469,720 | | | $ | 474,637 | |
| |
Average net assets (in thousands) | | $ | 549,789 | | | $ | 517,750 | | | $ | 466,231 | | | $ | 426,354 | | | $ | 454,937 | | | $ | 430,517 | |
| |
Ratios to average net assets:4 | | | | | | | | | | | | | | | | | | | | | | | | |
Net investment income | | | 0.84% | | | | 0.87% | | | | 1.12% | | | | 0.79% | | | | 0.93% | | | | 1.35% | |
Total expenses5 | | | 0.77% | | | | 0.78% | | | | 0.78% | | | | 0.78% | | | | 0.78% | | | | 0.78% | |
| Expenses after payments, waivers and/or reimbursements and reduction to custodian expenses | | | 0.77% | | | | 0.78% | | | | 0.78% | | | | 0.78% | | | | 0.78% | | | | 0.78% | |
| |
Portfolio turnover rate | | | 26% | | | | 49% | | | | 37% | | | | 38% | | | | 45% | | | | 128% | |
1. December 30, 2011 represents the last business day of the Fund’s 2011 fiscal year.
2. Per share amounts calculated based on the average shares outstanding during the period.
3. Assumes an initial investment on the business day before the first day of the fiscal period, with all dividends and distributions reinvested in additional shares on the reinvestment date, and redemption at the net asset value calculated on the last business day of the fiscal period. Total returns are not annualized for periods less than one full year. Total return information does not reflect expenses that apply at the separate account level or to related insurance products. Inclusion of these charges would reduce the total return figures for all periods shown. Returns do not reflect the deduction of taxes that a shareholder would pay on fund distributions or the redemption of fund shares.
4. Annualized for periods less than one full year.
5. Total expenses including indirect expenses from affiliated fund were as follows:
| | | | | | |
| | Six Months Ended June 30, 2014 | | | 0.77 | % |
| | Year Ended December 31, 2013 | | | 0.78 | % |
| | Year Ended December 31, 2012 | | | 0.78 | % |
| | Year Ended December 30, 2011 | | | 0.78 | % |
| | Year Ended December 31, 2010 | | | 0.78 | % |
| | Year Ended December 31, 2009 | | | 0.78 | % |
See accompanying Notes to Financial Statements.
11 OPPENHEIMER MAIN STREET FUND/VA
| | | | |
| FINANCIAL HIGHLIGHTS Continued | | |
| | | | | | | | | | | | | | | | | | | | | | | | |
| Service Shares | | Six Months
Ended
June 30,
2014
(Unaudited) | | | Year Ended
December
31, 2013 | | | Year Ended
December
31, 2012 | | | Year Ended
December 30,
20111 | | | Year Ended
December 31,
2010 | | | Year Ended
December 31,
2009 | |
| |
Per Share Operating Data | | | | | | | | | | | | | | | | | | | | | | | | |
Net asset value, beginning of period | | $ | 30.99 | | | $ | 23.78 | | | $ | 20.53 | | | $ | 20.71 | | | $ | 18.04 | | | $ | 14.42 | |
| |
Income (loss) from investment operations: | | | | | | | | | | | | | | | | | | | | | | | | |
Net investment income2 | | | 0.09 | | | | 0.17 | | | | 0.20 | | | | 0.11 | | | | 0.13 | | | | 0.17 | |
Net realized and unrealized gain (loss) | | | 1.78 | | | | 7.27 | | | | 3.20 | | | | (0.17) | | | | 2.70 | | | | 3.70 | |
| | | | |
Total from investment operations | | | 1.87 | | | | 7.44 | | | | 3.40 | | | | (0.06) | | | | 2.83 | | | | 3.87 | |
| |
Dividends and/or distributions to shareholders: | | | | | | | | | | | | | | | | | | | | | | | | |
Dividends from net investment income | | | (0.19) | | | | (0.23) | | | | (0.15) | | | | (0.12) | | | | (0.16) | | | | (0.25) | |
Distributions from net realized gain | | | (0.65) | | | | 0.00 | | | | 0.00 | | | | 0.00 | | | | 0.00 | | | | 0.00 | |
| | | | |
Total dividends and/or distributions to shareholders | | | (0.84) | | | | (0.23) | | | | (0.15) | | | | (0.12) | | | | (0.16) | | | | (0.25) | |
| |
Net asset value, end of period | | $ | 32.02 | | | $ | 30.99 | | | $ | 23.78 | | | $ | 20.53 | | | $ | 20.71 | | | $ | 18.04 | |
| | | | |
|
| |
Total Return, at Net Asset Value3 | | | 6.06% | | | | 31.44% | | | | 16.61% | | | | (0.32)% | | | | 15.83% | | | | 27.99% | |
| |
Ratios/Supplemental Data | | | | | | | | | | | | | | | | | | | | | | | | |
Net assets, end of period (in thousands) | | $ | 872,744 | | | $ | 915,027 | | | $ | 869,372 | | | $ | 1,003,184 | | | $ | 1,185,456 | | | $ | 1,154,210 | |
| |
Average net assets (in thousands) | | $ | 876,244 | | | $ | 895,073 | | | $ | 913,871 | | | $ | 1,094,254 | | | $ | 1,193,630 | | | $ | 1,029,909 | |
| |
Ratios to average net assets:4 | | | | | | | | | | | | | | | | | | | | | | | | |
Net investment income | | | 0.59% | | | | 0.62% | | | | 0.85% | | | | 0.54% | | | | 0.68% | | | | 1.10% | |
Total expenses5 | | | 1.02% | | | | 1.04% | | | | 1.03% | | | | 1.03% | | | | 1.03% | | | | 1.03% | |
| Expenses after payments, waivers and/or reimbursements and reduction to custodian expenses | | | 1.02% | | | | 1.04% | | | | 1.03% | | | | 1.03% | | | | 1.03% | | | | 1.03% | |
| |
Portfolio turnover rate | | | 26% | | | | 49% | | | | 37% | | | | 38% | | | | 45% | | | | 128% | |
1. December 30, 2011 represents the last business day of the Fund’s 2011 fiscal year.
2. Per share amounts calculated based on the average shares outstanding during the period.
3. Assumes an initial investment on the business day before the first day of the fiscal period, with all dividends and distributions reinvested in additional shares on the reinvestment date, and redemption at the net asset value calculated on the last business day of the fiscal period. Total returns are not annualized for periods less than one full year. Total return information does not reflect expenses that apply at the separate account level or to related insurance products. Inclusion of these charges would reduce the total return figures for all periods shown. Returns do not reflect the deduction of taxes that a shareholder would pay on fund distributions or the redemption of fund shares.
4. Annualized for periods less than one full year.
5. Total expenses including indirect expenses from affiliated fund were as follows:
| | | | | | |
| | Six Months Ended June 30, 2014 | | | 1.02 | % |
| | Year Ended December 31, 2013 | | | 1.04 | % |
| | Year Ended December 31, 2012 | | | 1.03 | % |
| | Year Ended December 30, 2011 | | | 1.03 | % |
| | Year Ended December 31, 2010 | | | 1.03 | % |
| | Year Ended December 31, 2009 | | | 1.03 | % |
See accompanying Notes to Financial Statements.
12 OPPENHEIMER MAIN STREET FUND/VA
NOTESTO FINANCIAL STATEMENTS June 30, 2014 Unaudited
1. Significant Accounting Policies
Oppenheimer Main Street Fund/VA (the “Fund”) is a separate series of Oppenheimer Variable Account Funds, a diversified open-end management investment company registered under the Investment Company Act of 1940, as amended. The Fund’s investment objective is to seek capital appreciation. The Fund’s investment adviser is OFI Global Asset Management, Inc. (“OFI Global” or the “Manager”), a wholly-owned subsidiary of OppenheimerFunds, Inc. (“OFI” or the “Sub-Adviser”). The Manager has entered into a sub-advisory agreement with OFI. Shares of the Fund are sold only to separate accounts of life insurance companies.
The Fund offers two classes of shares. Both classes are sold at their offering price, which is the net asset value per share, to separate investment accounts of participating insurance companies as an underlying investment for variable life insurance policies, variable annuity contracts or other investment products. The class of shares designated as Service shares is subject to a distribution and service plan. Both classes of shares have identical rights and voting privileges with respect to the Fund in general and exclusive voting rights on matters that affect that class alone. Earnings, net assets and net asset value per share may differ due to each class having its own expenses, such as transfer and shareholder servicing agent fees and shareholder communications, directly attributable to that class.
The following is a summary of significant accounting policies consistently followed by the Fund.
Investment in Oppenheimer Institutional Money Market Fund. The Fund is permitted to invest daily available cash balances in an affiliated money market fund. The Fund may invest the available cash in Class E shares of Oppenheimer Institutional Money Market Fund (“IMMF”) to seek current income while preserving liquidity. IMMF is a registered open-end management investment company, regulated as a money market fund under the Investment Company Act of 1940, as amended. The Manager is the investment adviser of IMMF, and the Sub-Adviser provides investment and related advisory services to IMMF. When applicable, the Fund’s investment in IMMF is included in the Statement of Investments. Shares of IMMF are valued at their net asset value per share. As a shareholder, the Fund is subject to its proportional share of IMMF’s Class E expenses, including its management fee. The Manager will waive fees and/or reimburse Fund expenses in an amount equal to the indirect management fees incurred through the Fund’s investment in IMMF.
Foreign Currency Translation. The Fund’s accounting records are maintained in U.S. dollars. The values of securities denominated in foreign currencies and amounts related to the purchase and sale of foreign securities and foreign investment income are translated into U.S. dollars as of the close of the New York Stock Exchange (the “Exchange”), normally 4:00 P.M. Eastern time, on each day the Exchange is open for trading. Foreign exchange rates may be valued primarily using a reliable bank, dealer or service authorized by the Board of Trustees.
Reported net realized gains and losses from foreign currency transactions arise from sales of portfolio securities, sales and maturities of short-term securities, sales of foreign currencies, exchange rate fluctuations between the trade and settlement dates on securities transactions, and the difference between the amounts of dividends, interest, and foreign withholding taxes recorded on the Fund’s books and the U.S. dollar equivalent of the amounts actually received or paid. Net unrealized appreciation and depreciation on the translation of assets and liabilities denominated in foreign currencies arise from changes in the values of assets and liabilities, including investments in securities at fiscal period end, resulting from changes in exchange rates.
The effect of changes in foreign currency exchange rates on investments is separately identified from the fluctuations arising from changes in market values of securities held and reported with all other foreign currency gains and losses in the Fund’s Statement of Operations.
Allocation of Income, Expenses, Gains and Losses. Income, expenses (other than those attributable to a specific class), gains and losses are allocated on a daily basis to each class of shares based upon the relative proportion of net assets represented by such class. Operating expenses directly attributable to a specific class are charged against the operations of that class.
Federal Taxes. The Fund intends to comply with provisions of the Internal Revenue Code applicable to regulated investment companies and to distribute substantially all of its investment company taxable income to shareholders. Therefore, no federal income or excise tax provision is required. The Fund files income tax returns in U.S. federal and applicable state jurisdictions. The statute of limitations on the Fund’s tax return filings generally remain open for the three preceding fiscal reporting period ends.
During the fiscal year ended December 31, 2013, the Fund utilized $198,916,700 of capital loss carryforward to offset capital gains realized in that fiscal year. Details of the fiscal year ended December 31, 2013 capital loss carryforwards are included in the table below. Capital loss carryforwards with no expiration, if any, must be utilized prior to those with expiration dates. Capital losses with no expiration will be carried forward to future years if not offset by gains.
| | | | |
| Expiring | | | |
| |
2015 | | $ | 5,027,976 | |
2016 | | | 2,513,988 | |
| | | | |
Total | | $ | 7,541,964 | |
| | | | |
As of June 30, 2014, it is estimated that there will be no capital loss carryforwards. The estimated capital loss carryforward represents the carryforward as of the end of the last fiscal year, increased or decreased by capital losses or gains realized in the first six months of the current fiscal year. During the six months ended June 30, 2014, it is estimated that the Fund will utilize $7,541,964 of capital loss carryforward to offset realized capital gains.
Net investment income (loss) and net realized gain (loss) may differ for financial statement and tax purposes. The character of dividends and distributions made during the fiscal year from net investment income or net realized gains may differ from their ultimate characterization for federal income tax purposes. Also, due to timing of dividends and distributions, the fiscal year in which amounts are distributed may differ from the fiscal year in which the income or net realized gain was recorded by the Fund.
13 OPPENHEIMER MAIN STREET FUND/VA
| | |
| NOTES TO FINANCIAL STATEMENTS Unaudited / Continued | | |
| | |
| 1. Significant Accounting Policies (Continued) | | |
The aggregate cost of securities and other investments and the composition of unrealized appreciation and depreciation of securities and other investments for federal income tax purposes as of June 30, 2014 are noted in the following table. The primary difference between book and tax appreciation or depreciation of securities and other investments, if applicable, is attributable to the tax deferral of losses or tax realization of financial statement unrealized gain or loss.
| | | | |
Federal tax cost of securities | | $ | 995,190,582 | |
| | | | |
Gross unrealized appreciation | | $ | 447,208,517 | |
Gross unrealized depreciation | | | (2,477,754) | |
| | | | |
Net unrealized appreciation | | $ | 444,730,763 | |
| | | | |
Trustees’ Compensation. The Board of Trustees has adopted a compensation deferral plan for independent trustees that enables trustees to elect to defer receipt of all or a portion of the annual compensation they are entitled to receive from the Fund. For purposes of determining the amount owed to the Trustee under the plan, deferred amounts are treated as though equal dollar amounts had been invested in shares of the Fund or in other Oppenheimer funds selected by the Trustee. The Fund purchases shares of the funds selected for deferral by the Trustee in amounts equal to his or her deemed investment, resulting in a Fund asset equal to the deferred compensation liability. Such assets are included as a component of “Other” within the asset section of the Statement of Assets and Liabilities. Deferral of trustees’ fees under the plan will not affect the net assets of the Fund, and will not materially affect the Fund’s assets, liabilities or net investment income per share. Amounts will be deferred until distributed in accordance with the compensation deferral plan.
Dividends and Distributions to Shareholders. Dividends and distributions to shareholders, which are determined in accordance with income tax regulations and may differ from U.S. generally accepted accounting principles, are recorded on the ex-dividend date. Income and capital gain distributions, if any, are declared and paid annually or at other times as deemed necessary by the Manager.
The tax character of distributions is determined as of the Fund’s fiscal year end. Therefore, a portion of the Fund’s distributions made to shareholders prior to the Fund’s fiscal year end may ultimately be categorized as a tax return of capital.
Investment Income. Dividend income is recorded on the ex-dividend date or upon ex-dividend notification in the case of certain foreign dividends where the ex-dividend date may have passed. Non-cash dividends included in dividend income, if any, are recorded at the fair market value of the securities received. Interest income is recognized on an accrual basis. Discount and premium, which are included in interest income on the Statement of Operations, are amortized or accreted daily.
Custodian Fees. “Custodian fees and expenses” in the Statement of Operations may include interest expense incurred by the Fund on any cash overdrafts of its custodian account during the period. Such cash overdrafts may result from the effects of failed trades in portfolio securities and from cash outflows resulting from unanticipated shareholder redemption activity. The Fund pays interest to its custodian on such cash overdrafts, to the extent they are not offset by positive cash balances maintained by the Fund, at a rate equal to the Federal Funds Rate plus 0.50%. The “Reduction to custodian expenses” line item, if applicable, represents earnings on cash balances maintained by the Fund during the period. Such interest expense and other custodian fees may be paid with these earnings.
Security Transactions. Security transactions are recorded on the trade date. Realized gains and losses on securities sold are determined on the basis of identified cost.
Indemnifications. The Fund’s organizational documents provide current and former trustees and officers with a limited indemnification against liabilities arising in connection with the performance of their duties to the Fund. In the normal course of business, the Fund may also enter into contracts that provide general indemnifications. The Fund’s maximum exposure under these arrangements is unknown as this would be dependent on future claims that may be made against the Fund. The risk of material loss from such claims is considered remote.
Other. The preparation of financial statements in conformity with accounting principles generally accepted in the United States of America requires management to make estimates and assumptions that affect the reported amounts of assets and liabilities and disclosure of contingent assets and liabilities at the date of the financial statements and the reported amounts of increases and decreases in net assets from operations during the reporting period. Actual results could differ from those estimates.
2. Securities Valuation
The Fund calculates the net asset value of its shares as of the close of the New York Stock Exchange (the “Exchange”), normally 4:00 P.M. Eastern time, on each day the Exchange is open for trading.
The Fund’s Board has adopted procedures for the valuation of the Fund’s securities and has delegated the day-to-day responsibility for valuation determinations under those procedures to the Manager. The Manager has established a Valuation Committee which is responsible for determining a “fair valuation” for any security for which market quotations are not “readily available.” The Valuation Committee’s fair valuation determinations are subject to review, approval and ratification by the Fund’s Board at its next regularly scheduled meeting covering the calendar quarter in which the fair valuation was determined.
14 OPPENHEIMER MAIN STREET FUND/VA
| | |
| | |
| 2. Securities Valuation (Continued) | | |
Valuation Methods and Inputs
Securities are valued using unadjusted quoted market prices, when available, as supplied primarily by third party pricing services or dealers.
The following methodologies are used to determine the market value or the fair value of the types of securities described below:
Securities traded on a registered U.S. securities exchange (including exchange-traded derivatives other than futures and futures options) are valued based on the last sale price of the security reported on the principal exchange on which it is traded, prior to the time when the Fund’s assets are valued. In the absence of a sale, the security is valued at the last sale price on the prior trading day, if it is within the spread of the current day’s closing “bid” and “asked” prices, and if not, at the current day’s closing bid price. A security of a foreign issuer traded on a foreign exchange, but not listed on a registered U.S. securities exchange, is valued based on the last sale price on the principal exchange on which the security is traded, as identified by the third party pricing service used by the Manager, prior to the time when the Fund’s assets are valued. If the last sale price is unavailable, the security is valued at the most recent official closing price on the principal exchange on which it is traded. If the last sales price or official closing price for a foreign security is not available, the security is valued at the mean between the bid and asked price per the exchange or, if not available from the exchange, obtained from two dealers. If bid and asked prices are not available from either the exchange or two dealers, the security is valued by using one of the following methodologies (listed in order of priority): (1) using a bid from the exchange, (2) the mean between the bid and asked price as provided by a single dealer, or (3) a bid from a single dealer.
Shares of a registered investment company that are not traded on an exchange are valued at that investment company’s net asset value per share.
Corporate and government debt securities (of U.S. or foreign issuers) and municipal debt securities, event-linked bonds, loans, mortgage-backed securities, collateralized mortgage obligations, and asset-backed securities are valued at the mean between the “bid” and “asked” prices utilizing evaluated prices obtained from third party pricing services or broker-dealers who may use matrix pricing methods to determine the evaluated prices.
Short-term money market type debt securities with a remaining maturity of sixty days or less are valued at cost adjusted by the amortization of discount or premium to maturity (amortized cost), which approximates market value. Short-term debt securities with a remaining maturity in excess of sixty days are valued at the mean between the “bid” and “asked” prices utilizing evaluated prices obtained from third party pricing services or broker-dealers.
A description of the standard inputs that may generally be considered by the third party pricing vendors in determining their evaluated prices is provided below.
| | |
| Security Type | | Standard inputs generally considered by third-party pricing vendors |
| Corporate debt, government debt, municipal, mortgage-backed and asset-backed securities | | Reported trade data, broker-dealer price quotations, benchmark yields, issuer spreads on comparable securities, the credit quality, yield, maturity, and other appropriate factors. |
|
| Loans | | Information obtained from market participants regarding reported trade data and broker-dealer price quotations. |
|
| Event-linked bonds | | Information obtained from market participants regarding reported trade data and broker-dealer price quotations. |
If a market value or price cannot be determined for a security using the methodologies described above, or if, in the “good faith” opinion of the Manager, the market value or price obtained does not constitute a “readily available market quotation,” or a significant event has occurred that would materially affect the value of the security the security is fair valued either (i) by a standardized fair valuation methodology applicable to the security type or the significant event as previously approved by the Valuation Committee and the Fund’s Board or (ii) as determined in good faith by the Manager’s Valuation Committee. The Valuation Committee considers all relevant facts that are reasonably available, through either public information or information available to the Manager, when determining the fair value of a security. Fair value determinations by the Manager are subject to review, approval and ratification by the Fund’s Board at its next regularly scheduled meeting covering the calendar quarter in which the fair valuation was determined. Those fair valuation standardized methodologies include, but are not limited to, valuing securities at the last sale price or initially at cost and subsequently adjusting the value based on: changes in company specific fundamentals, changes in an appropriate securities index, or changes in the value of similar securities which may be further adjusted for any discounts related to security-specific resale restrictions. When possible, such methodologies use observable market inputs such as unadjusted quoted prices of similar securities, observable interest rates, currency rates and yield curves. The methodologies used for valuing securities are not necessarily an indication of the risks associated with investing in those securities nor can it be assured that the Fund can obtain the fair value assigned to a security if it were to sell the security.
To assess the continuing appropriateness of security valuations, the Manager, or its third party service provider who is subject to oversight by the Manager, regularly compares prior day prices, prices on comparable securities, and sale prices to the current day prices and challenges those prices exceeding certain tolerance levels with the third party pricing service or broker source. For those securities valued by fair valuations, whether through a standardized fair valuation methodology or a fair valuation determination, the Valuation Committee reviews and affirms the reasonableness of the valuations based on such methodologies and fair valuation determinations on a regular basis after considering all relevant information that is reasonably available.
Classifications
Each investment asset or liability of the Fund is assigned a level at measurement date based on the significance and source of the inputs to its valuation. Various data inputs are used in determining the value of each of the Fund’s investments as of the reporting period end. These data inputs are categorized in the following hierarchy under applicable financial accounting standards:
1) Level 1-unadjusted quoted prices in active markets for identical assets or liabilities (including securities actively traded on a securities exchange)
15 OPPENHEIMER MAIN STREET FUND/VA
| | |
| NOTES TO FINANCIAL STATEMENTS Unaudited / Continued | | |
| | |
| 2. Securities Valuation (Continued) | | |
2) Level 2-inputs other than unadjusted quoted prices that are observable for the asset or liability (such as unadjusted quoted prices for similar assets and market corroborated inputs such as interest rates, prepayment speeds, credit risks, etc.)
3) Level 3-significant unobservable inputs (including the Manager’s own judgments about assumptions that market participants would use in pricing the asset or liability).
The inputs used for valuing securities are not necessarily an indication of the risks associated with investing in those securities.
The table below categorizes amounts that are included in the Fund’s Statement of Assets and Liabilities as of June 30, 2014 based on valuation input level:
| | | | | | | | | | | | | | | | |
| | | Level 1—
Unadjusted
Quoted Prices | | | Level 2—
Other Significant
Observable Inputs | | | Level 3—
Significant
Unobservable
Inputs | | | Value | |
| |
Assets Table | | | | | | | | | | | | | | | | |
Investments, at Value: | | | | | | | | | | | | | | | | |
Common Stocks | | | | | | | | | | | | | | | | |
Consumer Discretionary | | $ | 140,541,362 | | | $ | — | | | $ | — | | | $ | 140,541,362 | |
Consumer Staples | | | 83,513,541 | | | | 48,898,500 | | | | — | | | | 132,412,041 | |
Energy | | | 142,545,403 | | | | — | | | | — | | | | 142,545,403 | |
Financials | | | 260,976,839 | | | | — | | | | — | | | | 260,976,839 | |
Health Care | | | 230,931,941 | | | | — | | | | — | | | | 230,931,941 | |
Industrials | | | 168,385,772 | | | | — | | | | — | | | | 168,385,772 | |
Information Technology | | | 262,991,624 | | | | — | | | | — | | | | 262,991,624 | |
Materials | | | 24,180,374 | | | | — | | | | — | | | | 24,180,374 | |
Telecommunication Services | | | 24,127,872 | | | | — | | | | — | | | | 24,127,872 | |
Utilities | | | 19,999,139 | | | | — | | | | — | | | | 19,999,139 | |
Preferred Stock | | | — | | | | 5,548,884 | | | | — | | | | 5,548,884 | |
Investment Company | | | 27,280,094 | | | | — | | | | — | | | | 27,280,094 | |
| | | | |
Total Assets | | $ | 1,385,473,961 | | | $ | 54,447,384 | | | $ | — | | | $ | 1,439,921,345 | |
| | | | |
Foreign currency exchange contracts and futures contracts, if any, are reported at their unrealized appreciation/ depreciation at measurement date, which represents the change in the contract’s value from trade date. All additional assets and liabilities included in the above table are reported at their market value at measurement date.
3. Shares of Beneficial Interest
The Fund has authorized an unlimited number of $0.001 par value shares of beneficial interest of each class. Transactions in shares of beneficial interest were as follows:
| | | | | | | | | | | | | | | | |
| | | Six Months Ended June 30, 2014 | | | Year Ended December 31, 2013 | |
| | | Shares | | | Amount | | | Shares | | | Amount | |
| |
Non-Service Shares | | | | | | | | | | | | | | | | |
Sold | | | 268,164 | | | $ | 8,439,528 | | | | 1,001,432 | | | $ | 27,082,174 | |
Dividends and/or distributions reinvested | | | 493,447 | | | | 15,750,103 | | | | 211,118 | | | | 5,738,189 | |
Redeemed | | | (1,246,055) | | | | (39,178,530) | | | | (3,327,965) | | | | (90,367,025) | |
| | | | |
Net decrease | | | (484,444) | | | $ | (14,988,899) | | | | (2,115,415) | | | $ | (57,546,662) | |
| | | | |
| | | | | | | | | | | | | | | | |
| |
Service Shares | | | | | | | | | | | | | | | | |
Sold | | | 144,115 | | | $ | 4,444,551 | | | | 590,719 | | | $ | 15,489,645 | |
Dividends and/or distributions reinvested | | | 709,853 | | | | 22,508,318 | | | | 283,631 | | | | 7,658,030 | |
Redeemed | | | (3,123,317) | | | | (97,576,534) | | | | (7,913,253) | | | | (214,364,928) | |
| | | | |
Net decrease | | | (2,269,349) | | | $ | (70,623,665) | | | | (7,038,903) | | | $ | (191,217,253) | |
| | | | |
4. Purchases and Sales of Securities
The aggregate cost of purchases and proceeds from sales of securities, other than short-term obligations and investments in IMMF, for the six months ended June 30, 2014 were as follows:
| | | | | | | | | | | | |
| | | Purchases | | | | | | | Sales | |
| |
Investment securities | | $ | 363,419,285 | | | | | | | $ | 482,917,176 | |
16 OPPENHEIMER MAIN STREET FUND/VA
5. Fees and Other Transactions with Affiliates
Management Fees. Under the investment advisory agreement, the Fund pays the Manager a management fee based on the daily net assets of the Fund at an annual rate as shown in the following table:
| | | | |
| Fee Schedule | | | |
Up to $200 million | | | 0.75% | |
Next $200 million | | | 0.72 | |
Next $200 million | | | 0.69 | |
Next $200 million | | | 0.66 | |
Next $200 million | | | 0.60 | |
Over $1 billion | | | 0.58 | |
Sub-Adviser Fees. The Manager has retained the Sub-Adviser to provide the day-to-day portfolio management of the Fund. Under the Sub-Advisory Agreement, the Manager pays the Sub-Adviser an annual fee in monthly installments, equal to a percentage of the investment management fee collected by the Manager from the Fund, which shall be calculated after any investment management fee waivers. The fee paid to the Sub-Adviser is paid by the Manager, not by the Fund.
Transfer Agent Fees. OFI Global (the “Transfer Agent”) serves as the transfer and shareholder servicing agent for the Fund. The Fund pays the Transfer Agent a fee based on annual net assets. Fees incurred and average net assets for each class with respect to these services are detailed in the Statement of Operations and Financial Highlights, respectively.
Sub-Transfer Agent Fees. The Transfer Agent has retained Shareholder Services, Inc., a wholly-owned subsidiary of OFI (the “Sub-Transfer Agent”), to provide the day-to-day transfer agent and shareholder servicing of the Fund. Under the Sub-Transfer Agency Agreement, the Transfer Agent pays the Sub-Transfer Agent an annual fee in monthly installments, equal to a percentage of the transfer agent fee collected by the Transfer Agent from the Fund, which shall be calculated after any applicable fee waivers. The fee paid to the Sub-Transfer Agent is paid by the Transfer Agent, not by the Fund.
Distribution and Service Plan for Service Shares. The Fund has adopted a Distribution and Service Plan (the “Plan”) in accordance with Rule 12b-1 under the Investment Company Act of 1940 for Service shares to pay OppenheimerFunds Distributor, Inc. (the “Distributor”), for distribution related services, personal service and account maintenance for the Fund’s Service shares. Under the Plan, payments are made periodically at an annual rate of 0.25% of the daily net assets of Service shares of the Fund. The Distributor currently uses all of those fees to compensate sponsors of the insurance product that offers Fund shares, for providing personal service and maintenance of accounts of their variable contract owners that hold Service shares. These fees are paid out of the Fund’s assets on an on-going basis and increase operating expenses of the Service shares, which results in lower performance compared to the Fund’s shares that are not subject to a service fee. Fees incurred by the Fund under the Plan are detailed in the Statement of Operations.
Waivers and Reimbursements of Expenses. The Manager has voluntarily agreed to limit the Fund’s expenses after payments, waivers and/or reimbursements and reduction to custodian expenses, excluding expenses incurred directly or indirectly by the Fund as a result of investments in other investment companies, wholly-owned subsidiaries and pooled investment vehicles; so that those expenses, as percentages of daily net assets, will not exceed the annual rate of 0.80% for Non-Service shares and 1.05% for Service shares.
The Manager will waive fees and/or reimburse Fund expenses in an amount equal to the indirect management fees incurred through the Fund’s investment in IMMF. During the six months ended June 30, 2014, the Manager waived fees and/or reimbursed the Fund $7,040 for IMMF management fees.
Some of these undertakings may be modified or terminated at any time; some may not be modified or terminated until after one year from the date of the current prospectus, as indicated therein.
6. Pending Litigation
In 2009, seven class action lawsuits were filed in the U.S. District Court for the District of Colorado against OppenheimerFunds, Inc. (“OFI”), OppenheimerFunds Distributor, Inc., the Fund’s principal underwriter and distributor (the “Distributor”), and certain funds (but not including the Fund) advised by OFI Global Asset Management, Inc. and distributed by the Distributor (the “Defendant Funds”). The lawsuits also named as defendants certain officers and current and former trustees of the respective Defendant Funds. The lawsuits raised claims under federal securities law and alleged, among other things, that the disclosure documents of the respective Defendant Funds contained misrepresentations and omissions and that the respective Defendant Funds’ investment policies were not followed. The plaintiffs in these actions sought unspecified damages, equitable relief and awards of attorneys’ fees and litigation expenses. The Defendant Funds’ Boards of Trustees also engaged counsel to represent the Funds and the present and former Independent Trustees named in those suits. On March 5, 2014, the parties in six of these lawsuits executed stipulations and agreements of settlement resolving those actions. On July 31, 2014, the court entered an order and final judgment approving the settlements as fair, reasonable and adequate. The settlements do not resolve a seventh outstanding lawsuit relating to Oppenheimer Rochester California Municipal Fund.
Other class action and individual lawsuits have been filed since 2008 in various state and federal courts against OFI and certain of its affiliates by investors seeking to recover investments they allegedly lost as a result of the “Ponzi” scheme run by Bernard L. Madoff and his firm, Bernard L. Madoff Investment Securities, LLC (“BLMIS”). Plaintiffs in these suits allege that they suffered losses as a result of their investments in several funds managed by an affiliate of OFI and assert a variety of claims, including breach of fiduciary duty, fraud, negligent misrepresentation, unjust enrichment, and violation
17 OPPENHEIMER MAIN STREET FUND/VA
| | |
| NOTES TO FINANCIAL STATEMENTS Unaudited / Continued | | |
| | |
| 6. Pending Litigation (Continued) | | |
of federal and state securities laws and regulations, among others. They seek unspecified damages, equitable relief and awards of attorneys’ fees and litigation expenses. Neither the Distributor, nor any of the Oppenheimer mutual funds, their independent trustees or directors are named as defendants in these lawsuits. None of the Oppenheimer mutual funds invested in any funds or accounts managed by Madoff or BLMIS. On February 28, 2011, a stipulation of partial settlement of three groups of consolidated putative class action lawsuits relating to these matters was filed in the U.S. District Court for the Southern District of New York. On August 19, 2011, the court entered an order and final judgment approving the settlement as fair, reasonable and adequate. In September 2011, certain parties filed notices of appeal from the court’s order approving the settlement. In June 2014, the appellate court affirmed the lower court’s order approving the settlement. Certain parties subsequently filed a petition for certiorari before the U.S. Supreme Court further challenging the settlement approval order. The settlement does not resolve other outstanding lawsuits against OFI and its affiliates relating to BLMIS.
OFI believes the lawsuits and appeals described above are without legal merit and, with the exception of actions it has settled, is defending against them vigorously. While it is premature to render any opinion as to the outcome in these lawsuits, or whether any costs that the Defendant Funds may bear in defending the suits might not be reimbursed by insurance, OFI believes that these suits should not impair the ability of OFI or the Distributor to perform their respective duties to the Fund, and that the outcome of all of the suits together should not have any material effect on the operations of any of the Oppenheimer mutual funds.
18 OPPENHEIMER MAIN STREET FUND/VA
PORTFOLIO PROXY VOTING POLICIES AND PROCEDURES; UPDATES TO STATEMENTS OF INVESTMENTS Unaudited
The Fund has adopted Portfolio Proxy Voting Policies and Procedures under which the Fund votes proxies relating to securities (“portfolio proxies”) held by the Fund. A description of the Fund’s Portfolio Proxy Voting Policies and Procedures is available (i) without charge, upon request, by calling the Fund toll-free at 1.800.525.7048, (ii) on the Fund’s website at oppenheimerfunds.com, and (iii) on the SEC’s website at www.sec.gov. In addition, the Fund is required to file Form N-PX, with its complete proxy voting record for the 12 months ended June 30th, no later than August 31st of each year. The Fund’s voting record is available (i) without charge, upon request, by calling the Fund toll-free at 1.800.525.7048, and (ii) in the Form N-PX filing on the SEC’s website at www.sec.gov.
The Fund files its complete schedule of portfolio holdings with the SEC for the first quarter and the third quarter of each fiscal year on Form N-Q. The Fund’s Form N-Q filings are available on the SEC’s website at www.sec.gov. Those forms may be reviewed and copied at the SEC’s Public Reference Room in Washington, D.C. Information on the operation of the Public Reference Room may be obtained by calling 1-800-SEC-0330.
19 OPPENHEIMER MAIN STREET FUND/VA
OPPENHEIMER MAIN STREET FUND/VA
A Series of Oppenheimer Variable Account Funds
| | |
| Trustees and Officers | | Sam Freedman, Chairman of the Board of Trustees and Trustee |
| | Edward L. Cameron, Trustee |
| | Jon S. Fossel, Trustee |
| | Richard F. Grabish, Trustee |
| | Beverly L. Hamilton, Trustee |
| | Victoria J. Herget, Trustee |
| | Robert J. Malone, Trustee |
| | F. William Marshall, Jr., Trustee |
| | Karen L. Stuckey, Trustee |
| | James D. Vaughn, Trustee |
| | William F. Glavin, Jr., Trustee, President and Principal Executive Officer |
| | Manind Govil, Vice President |
| | Benjamin Ram, Vice President |
| | Paul Larson, Vice President |
| | Arthur S. Gabinet, Secretary and Chief Legal Officer |
| | Christina M. Nasta, Vice President and Chief Business Officer Mary Ann Picciotto, Chief Compliance Officer and Chief Anti-Money Laundering Officer Brian W. Wixted, Treasurer and Principal Financial & Accounting Officer |
| |
| Manager | | OFI Global Asset Management, Inc. |
| |
| Sub-Adviser | | OppenheimerFunds, Inc. |
| |
| Distributor | | OppenheimerFunds Distributor, Inc. |
| |
Transfer and Shareholder Servicing Agent | | OFI Global Asset Management, Inc. |
| |
| Sub-Transfer Agent | | Shareholder Services, Inc. |
| | DBA OppenheimerFunds Services |
| |
| Independent | | KPMG LLP |
| Registered | | |
| Public | | |
| Accounting | | |
| Firm | | |
| |
| Counsel | | K&L Gates LLP |
| |
| | Before investing in any of the Oppenheimer funds, investors should carefully consider a fund’s investment objectives, risks, charges and expenses. Fund prospectuses and summary prospectuses contain this and other information about the funds and may be obtained by asking your financial advisor, visiting oppenheimerfunds.com or calling us at 1.800.988.8287. Read prospectuses and summary prospectuses carefully before investing. |
| |
| | The financial statements included herein have been taken from the records of the Fund without examination of those records by the independent registered public accounting firm. |
| |
| | © 2014 OppenheimerFunds, Inc. All rights reserved. Oppenheimer funds are distributed by OppenheimerFunds Distributor, Inc. |

Portfolio Managers: Matthew P. Ziehl, CFA, Raymond Anello, CFA, Raman Vardharaj, CFA, Joy Budzinski, Kristin Ketner Pak, Magnus Krantz and Adam Weiner.
Cumulative Total Returns
For the 6-Month Period Ended 6/30/14
| | | | |
Non-Service Shares | | | 4.52 | % |
Service Shares | | | 4.38 | |
Average Annual Total Returns
For the Periods Ended 6/30/14
| | | | | | | | | | | | |
| | | 1-Year | | | 5-Year | | | 10-Year | |
Non-Service Shares | | | 23.33 | % | | | 20.53 | % | | | 9.73 | % |
Service Shares | | | 23.02 | % | | | 20.22 | % | | | 9.47 | % |
Performance data quoted represents past performance, which does not guarantee future results. The investment return and principal value of an investment in the Fund will fluctuate so that an investor’s shares, when redeemed, may be worth more or less than their original cost. Current performance may be lower or higher than the performance quoted. For performance data current to the most recent month end, call us at 1.800.988.8287. The Fund’s total returns include changes in share price and reinvested distributions but should not be expected to be the same as the returns of other funds, whether or not both funds have the same portfolio managers and/or similar names. The Fund’s total returns do not include the charges associated with the separate account products that offer this Fund. Such performance would have been lower if such charges were taken into account.
| | | | | | |
TOP TEN COMMON STOCK HOLDINGS | | | |
LaSalle Hotel Properties | | | 2.6 | % | | |
Dana Holding Corp. | | | 2.3 | | | |
Korn/Ferry International | | | 2.3 | | | |
KAR Auction Services, Inc. | | | 2.1 | | | |
STAG Industrial, Inc. | | | 1.9 | | | |
Redwood Trust, Inc. | | | 1.9 | | | |
P.H. Glatfelter Co. | | | 1.8 | | | |
Fortinet, Inc. | | | 1.8 | | | |
Finisar Corp. | | | 1.8 | | | |
WellCare Health Plans, Inc. | | | 1.8 | | | |
Portfolio holdings and allocations are subject to change. Percentages are as of June 30, 2014, and are based on net assets. For more current Fund holdings, please visit oppenheimerfunds.com.
SECTOR ALLOCATION
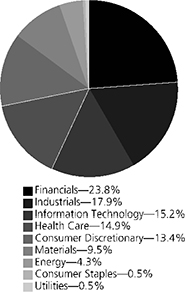
Portfolio holdings and allocations are subject to change. Percentages are as of June 30, 2014, and are based on the total market value of common stocks.
2 OPPENHEIMER MAIN STREET SMALL CAP FUND/VA
Fund Performance Discussion
The Fund’s Non-Service shares produced a return of 4.52% during the period, outperforming the Russell 2000 Index (the “Index”), which returned 3.19%. The Fund outperformed the Index primarily in the industrials, consumer discretionary and materials sectors due to favorable stock selection. The Fund underperformed the Index in the information technology and consumer staples sectors as a result of weaker relative stock selection. An underweight position in the utilities sector also detracted from the Fund’s performance versus the Index.
GLOBAL MARKET AND ECONOMIC ENVIRONMENT
Despite market volatility early in the reporting period and rising geopolitical risks in Ukraine and the Middle East, global equities generally rebounded and produced positive returns in the first half of 2014, thanks largely to a continued global economic recovery and stimulative monetary policies from central banks throughout the world. Markets were volatile to start the reporting period in January 2014 amid fears that political and economic instability in the world’s emerging markets might further dampen the U.S. economic recovery. However, equities rebounded later in the reporting period. Among the central bank measures that boosted the markets this reporting period, the European Central Bank (the “ECB”) announced numerous measures in June, including a benchmark interest rate cut, the introduction of a negative deposit rate to encourage banks to lend, among various other measures to flood the system with liquidity. Beyond that, the ECB said it would prepare to purchase packages of loans from banks to allow for increased lending. In June, the U.S. Federal Reserve (the “Fed”) also stated it would reduce the amount of monthly bond purchases by an additional $10 billion and reaffirmed its intention to keep short-term interest rates near zero. U.S. economic data released in April and May was positive, as the unemployment rate fell to 6.3%, the economy finally regained all of the jobs lost during the 2008 recession, and the U.S. stock market achieved record highs. Shortly after the reporting period ended, a positive June jobs report was released, in which the official unemployment rate fell to 6.1%, its lowest level since September 2008.
Against this backdrop, sustained low interest rates continued to boost demand for higher dividend yielding stocks as investors sought alternative sources of current income. As a result, utilities remained one of the top performing sectors. Oil prices spiked during the reporting period, reflecting increased tensions in the Middle East and concerns that output from the Iraqi oil fields would be curtailed. Not surprisingly, energy stocks responded by rallying strongly, making this sector another strong performer this period.
Finally, there was a pick-up in mergers and acquisitions (M&A). A driving force that has garnered considerable headline attention was Corporate America’s aim to put the cash that has built-up on overseas’ balance sheets to productive use. This, combined with an opportunity to lower overall corporate tax rates, resulted in a plethora of proposed acquisitions – targeted at companies domiciled in desirable geographic tax havens. This was especially evident in the health care sector – with Pfizer attempting to merge with Astra-Zeneca and, more recently, Medtronic communicating its intention to acquire Covidien. Regardless of the motivation, the pick-up in M&A activity generally benefited the stock price of both acquiree and acquirer.
TOP INDIVIDUAL CONTRIBUTORS
Top performing stocks for the Fund this period included Cavium, Inc., EPL Oil & Gas, Inc. and Dana Holding Corp. Cavium is a provider of integrated semiconductor processors enabling processing for networks, communications, storage, wireless, security and video applications. Rising expectations for accelerating revenue growth propelled this stock higher during the reporting period. The improving outlook reflects a solid pipeline of products to be delivered to enterprise and wireless customers, plus promising new product designs that have the potential to further fuel demand coming from wireless infrastructure and data center providers. We believe Cavium is at a positive inflection point in its revenue cycle, and added to our position size to reflect the strengthening fundamentals.
EPL Oil & Gas is an independent oil and natural gas exploration & production company with operations concentrated in the shallow waters of the Gulf of Mexico. The stock spiked higher after Energy XXI announced its intention to acquire EPL. The acquisition was completed in June 2014, and we have maintained our holdings in the combined entity, Energy XXI Bermuda Ltd.
Dana Holding manufactures components and systems for the global automotive, truck and industrial markets. The stock’s positive performance largely reflects guidance from management that was not nearly as dire as had been expected — leading to both improved sentiment towards the stock and, eventually, to increased analysts’ estimates. Longer term, the company expects an economic rebound in a number of business segments — notably North American Class 8 heavy-duty truck components — and significant margin improvement stemming, in part, from operating leverage as volume production improves. Furthering the earnings growth potential is management’s choice to use free cash generation for aggressive share repurchase.
3 OPPENHEIMER MAIN STREET SMALL CAP FUND/VA
TOP INDIVIDUAL DETRACTORS
Detractors from performance this reporting period included Infoblox, Inc., Pier 1 Imports, Inc. and Finisar Corp. Infoblox is a leader in “automated network control” solutions and security – allowing companies to manage large and complex data networks, and the proliferation of mobile devices connected to them. The stock suffered a setback after management preannounced a deceleration in growth and guided to a further slowdown for the full fiscal year. As a result, analyst estimates were revised down significantly, putting selling pressure on the company’s stock. The disappointing guidance for both revenues and earnings was largely attributable to a “slippage” of large deal signings and ongoing weakness in business with the U.S. federal government. We exited the position after another disappointing report and the CEO’s unexpected departure, as we lost confidence in our thesis. The stock of Pier 1 Imports, a specialty retailer of decorative home furnishings and accessories, declined as a result of earnings that fell short of consensus estimates – leading to falling forecasts. Revenues largely met expectations, with comparable store sales better-than-anticipated; however, profitability was under pressure due to increased promotional activity which helped to drive store traffic – but at a cost to gross margins. We believe improved merchandising can lead to both rising same-store-sales and expanding profitability, thus we have maintained our holdings in Pier 1. Finisar’s products enable high-speed data communications over both local and storage area networks. A disappointing quarterly result, with earnings that missed estimates, combined with lowered guidance from management drove the stock’s negative results. Despite these near-term profitability headwinds, we have maintained our holdings as we believe Finisar is well positioned to benefit from growth in spending by both telecommunications and large data center dependent firms.
STRATEGY & OUTLOOK
Corporate profitability — at, or near peak levels — looks vulnerable, especially if employment picks-up and wage inflation begins to affect profit margins. In our view, productivity gains and even the pick-up in M&A activity could help sustain operating profitability. However, after tax margins may be poised to contract as these have benefited greatly from financial engineering, including lower tax rates and, more importantly, lower cost of debt financing due to the Fed’s actions. We believe both are likely to have a diminished impact going forward.
While we are mindful of the potential pressure on profitability, we are also increasingly cognizant of “industry disruptors.” New and innovative technologies have always had a transformational effect, but other forms of disruption are now becoming pervasive across industries. The emergence of online retailing, the boom of shale oil and gas in North America, and the Affordable Care Act in health care are examples of industry disruptors likely to have a substantial and sustainable impact. These disruptors can be either opportunities or threats. Our job is to figure out which.
Given this backdrop, our approach remains consistent. We aim to construct an “all weather” portfolio by targeting companies that we believe have: 1) sustainable competitive advantages; 2) skilled management with a proven track record of executing effectively; and 3) financial resources to generate improving profitability, gain market share, and/or return significant cash to shareholders. During times of volatile or slow economic growth such companies frequently widen their lead over weaker competitors. We seek to invest in companies characterized by these qualities at compelling valuations and believe this disciplined approach is essential in seeking to generate superior long-term performance.
The Fund’s investment strategy and focus can change over time. The mention of specific fund holdings does not constitute a recommendation by OppenheimerFunds, Inc. or its affiliates.
Shares of Oppenheimer funds are not deposits or obligations of any bank, are not guaranteed by any bank, are not insured by the FDIC or any other agency, and involve investment risks, including the possible loss of the principal amount invested.
4 OPPENHEIMER MAIN STREET SMALL CAP FUND/VA
Fund Expenses
Fund Expenses. As a shareholder of the Fund, you incur two types of costs: (1) transaction costs and (2) ongoing costs, including management fees; distribution and service fees; and other Fund expenses. These examples are intended to help you understand your ongoing costs (in dollars) of investing in the Fund and to compare these costs with the ongoing costs of investing in other mutual funds.
The examples are based on an investment of $1,000.00 invested at the beginning of the period and held for the entire 6-month period ended June 30, 2014.
Actual Expenses. The first section of the table provides information about actual account values and actual expenses. You may use the information in this section for the class of shares you hold, together with the amount you invested, to estimate the expense that you paid over the period. Simply divide your account value by $1,000.00 (for example, an $8,600.00 account value divided by $1,000.00 = 8.60), then multiply the result by the number in the first section under the heading entitled “Expenses Paid During Period” to estimate the expenses you paid on your account during this period.
Hypothetical Example for Comparison Purposes.
The second section of the table provides information about hypothetical account values and hypothetical expenses based on the Fund’s actual expense ratio for each class of shares, and an assumed rate of return of 5% per year for each class before expenses, which is not the actual return. The hypothetical account values and expenses may not be used to estimate the actual ending account balance or expenses you paid for the period. You may use this information to compare the ongoing costs of investing in the Fund and other funds. To do so, compare this 5% hypothetical example for the class of shares you hold with the 5% hypothetical examples that appear in the shareholder reports of the other funds.
Please note that the expenses shown in the table are meant to highlight your ongoing costs only and do not reflect any charges associated with the separate accounts that offer this Fund. Therefore, the “hypothetical” lines of the table are useful in comparing ongoing costs only, and will not help you determine the relative total costs of owning different funds. In addition, if these separate account charges were included your costs would have been higher.
| | | | | | | | | | | | | | | | | | |
| Actual | | Beginning
Account Value
January 1, 2014 | | | | | Ending Account Value
June 30, 2014 | | | | | Expenses
Paid During 6 Months Ended
June 30, 2014 | | | |
Non-Service shares | | $ | 1,000.00 | | | | | $ | 1,045.20 | | | | | $ | 4.01 | | | |
Service shares | | | 1,000.00 | | | | | | 1,043.80 | | | | | | 5.28 | | | |
| | | | | | |
Hypothetical (5% return before expenses) | | | | | | | | | | | | | | | | | | |
Non-Service shares | | | 1,000.00 | | | | | | 1,020.88 | | | | | | 3.97 | | | |
Service shares | | | 1,000.00 | | | | | | 1,019.64 | | | | | | 5.22 | | | |
Expenses are equal to the Fund’s annualized expense ratio for that class, multiplied by the average account value over the period, multiplied by 181/365 (to reflect the one-half year period). Those annualized expense ratios, excluding indirect expenses from affiliated funds, based on the 6-month period ended June 30, 2014 are as follows:
| | | | | | |
| Class | | Expense Ratios | | | |
Non-Service shares | | | 0.79% | | | |
Service shares | | | 1.04 | | | |
The expense ratios reflect voluntary and/or contractual waivers and/or reimbursements of expenses by the Fund’s Manager. Some of these undertakings may be modified or terminated at any time, as indicated in the Fund’s prospectus. The “Financial Highlights” tables in the Fund’s financial statements, included in this report, also show the gross expense ratios, without such waivers or reimbursements and reduction to custodian expenses, if applicable.
5 OPPENHEIMER MAIN STREET SMALL CAP FUND/VA
| | |
| |
| STATEMENT OF INVESTMENTS June 30, 2014 Unaudited | | |
| | | | | | | | |
| | | Shares | | | Value | |
| |
Common Stocks—97.5% | | | | | | | | |
| |
Consumer Discretionary—12.9% | |
| |
Auto Components—2.3% | |
| Dana Holding Corp. | | | 1,063,751 | | | $ | 25,976,799 | |
| |
Diversified Consumer Services—1.8% | |
LifeLock, Inc.1 | | | 1,029,710 | | | | 14,374,751 | |
| |
Matthews International Corp., Cl. A | | | 149,710 | | | | 6,223,445 | |
| | | | | | | | |
| | | | 20,598,196 | |
| |
Hotels, Restaurants & Leisure—4.5% | |
Brinker International, Inc. | | | 339,720 | | | | 16,527,378 | |
| |
Dunkin’ Brands Group, Inc. | | | 139,803 | | | | 6,404,375 | |
| |
Popeyes Louisiana Kitchen, Inc.1 | | | 263,200 | | | | 11,504,472 | |
| |
Texas Roadhouse, Inc. | | | 640,580 | | | | 16,655,080 | |
| | | | | | | | |
| | | | 51,091,305 | |
| |
Household Durables—1.0% | |
KB Home | | | 611,760 | | | | 11,427,677 | |
| |
Specialty Retail—3.3% | |
Mattress Firm Holding Corp.1 | | | 334,070 | | | | 15,951,842 | |
| |
Monro Muffler Brake, Inc. | | | 102,879 | | | | 5,472,134 | |
| |
Pier 1 Imports, Inc. | | | 534,120 | | | | 8,230,789 | |
| |
Signet Jewelers Ltd. | | | 69,640 | | | | 7,701,488 | |
| | | | | | | | |
| | | | 37,356,253 | |
| |
Consumer Staples—0.5% | |
| |
Food Products—0.5% | |
Flowers Foods, Inc. | | | 269,190 | | | | 5,674,525 | |
| |
Energy—4.2% | |
Oil, Gas & Consumable Fuels—4.2% | |
Energy XXI Bermuda Ltd. | | | 385,143 | | | | 9,100,929 | |
| |
Renewable Energy Group, Inc.1 | | | 971,772 | | | | 11,146,225 | |
| |
Valero Energy Partners LP | | | 314,965 | | | | 15,845,889 | |
| |
Western Refining, Inc. | | | 283,591 | | | | 10,648,842 | |
| | | | | | | | |
| | | | 46,741,885 | |
| |
Financials—23.2% | |
| |
Commercial Banks—8.9% | |
BancorpSouth, Inc. | | | 590,480 | | | | 14,508,094 | |
| |
BankUnited, Inc. | | | 522,015 | | | | 17,477,062 | |
| |
First Niagara Financial Group, Inc. | | | 1,963,300 | | | | 17,159,242 | |
| |
FirstMerit Corp. | | | 746,826 | | | | 14,749,813 | |
| |
MB Financial, Inc. | | | 525,080 | | | | 14,203,414 | |
| |
Talmer Bancorp, Inc., Cl. A1 | | | 422,890 | | | | 5,831,653 | |
| |
Webster Financial Corp. | | | 498,450 | | | | 15,721,113 | |
| | | | | | | | |
| | | | 99,650,391 | |
| |
Insurance—0.9% | |
AmTrust Financial Services, Inc. | | | 236,597 | | | | 9,892,121 | |
| |
Real Estate Investment Trusts (REITs)—11.8% | |
Apollo Commercial Real Estate Finance, Inc. | | | 857,432 | | | | 14,139,054 | |
| |
Chatham Lodging Trust | | | 691,970 | | | | 15,154,143 | |
| |
DuPont Fabros Technology, Inc. | | | 493,430 | | | | 13,302,873 | |
| |
LaSalle Hotel Properties | | | 812,626 | | | | 28,677,571 | |
| |
Mid-America Apartment Communities, Inc. | | | 162,025 | | | | 11,835,926 | |
| |
Redwood Trust, Inc. | | | 1,077,040 | | | | 20,969,969 | |
| |
STAG Industrial, Inc. | | | 873,850 | | | | 20,981,138 | |
| |
Starwood Property Trust, Inc. | | | 335,522 | | | | 7,975,358 | |
| | | | | | | | |
| | | | 133,036,032 | |
| |
Thrifts & Mortgage Finance—1.6% | |
Flagstar Bancorp, Inc.1 | | | 518,591 | | | | 9,386,497 | |
| |
Oritani Financial Corp. | | | 576,090 | | | | 8,866,025 | |
| | | | | | | | |
| | | | 18,252,522 | |
| |
Health Care—14.6% | |
| |
Biotechnology—1.4% | |
Celldex Therapeutics, Inc.1 | | | 232,000 | | | | 3,786,240 | |
| |
Keryx Biopharmaceuticals, Inc.1 | | | 568,590 | | | | 8,744,914 | |
| |
Ultragenyx Pharmaceutical, Inc.1 | | | 70,320 | | | | 3,156,665 | |
| | | | | | | | |
| | | | 15,687,819 | |
| |
Health Care Equipment & Supplies—4.0% | |
DexCom, Inc.1 | | | 237,480 | | | | 9,418,457 | |
| |
Endologix, Inc.1 | | | 425,530 | | | | 6,472,311 | |
| |
Greatbatch, Inc.1 | | | 223,471 | | | | 10,963,487 | |
| |
Integra LifeSciences Holdings Corp.1 | | | 200,730 | | | | 9,446,354 | |
| | | | | | | | |
| | | Shares | | | Value | |
| |
Health Care Equipment & Supplies (Continued) | |
| |
Spectranetics Corp.1 | | | 381,160 | | | $ | 8,720,941 | |
| | | | | | | | |
| | | | 45,021,550 | |
| |
Health Care Providers & Services—4.7% | |
Acadia Healthcare Co., Inc.1 | | | 205,750 | | | | 9,361,625 | |
| |
HealthSouth Corp. | | | 430,150 | | | | 15,429,481 | |
| |
Team Health Holdings, Inc.1 | | | 161,290 | | | | 8,054,823 �� | |
| |
WellCare Health Plans, Inc.1 | | | 264,781 | | | | 19,768,549 | |
| | | | | | | | |
| | | | 52,614,478 | |
| |
Health Care Technology—0.9% | |
HMS Holdings Corp.1 | | | 507,636 | | | | 10,360,851 | |
| |
Life Sciences Tools & Services—0.7% | |
Fluidigm Corp.1 | | | 99,170 | | | | 2,915,598 | |
| |
MorphoSys AG1 | | | 56,999 | | | | 5,347,418 | |
| | | | | | | | |
| | | | 8,263,016 | |
| |
Pharmaceuticals—2.9% | |
AcelRx Pharmaceuticals, Inc.1 | | | 252,380 | | | | 2,586,895 | |
| |
Aratana Therapeutics, Inc.1 | | | 234,040 | | | | 3,653,365 | |
| |
Horizon Pharma, Inc.1 | | | 395,393 | | | | 6,255,117 | |
| |
Prestige Brands Holdings, Inc.1 | | | 580,416 | | | | 19,670,298 | |
| | | | | | | | |
| | | | 32,165,675 | |
| |
Industrials—17.7% | |
| |
Aerospace & Defense—2.3% | |
AAR Corp. | | | 196,085 | | | | 5,404,103 | |
| |
Orbital Sciences Corp.1 | | | 392,040 | | | | 11,584,782 | |
| |
Triumph Group, Inc. | | | 121,600 | | | | 8,490,112 | |
| | | | | | | | |
| | | | 25,478,997 | |
| |
Air Freight & Couriers—0.8% | |
XPO Logistics, Inc.1 | | | 297,150 | | | | 8,504,433 | |
| |
Airlines—0.9% | | | | | | | | |
Spirit Airlines, Inc.1 | | | 152,620 | | | | 9,651,689 | |
| |
Commercial Services & Supplies—5.1% | |
ABM Industries, Inc. | | | 337,680 | | | | 9,110,606 | |
| |
ACCO Brands Corp.1 | | | 1,793,117 | | | | 11,493,880 | |
| |
KAR Auction Services, Inc. | | | 747,830 | | | | 23,833,342 | |
| |
Waste Connections, Inc. | | | 255,350 | | | | 12,397,243 | |
| | | | | | | | |
| | | | 56,835,071 | |
| |
Construction & Engineering—1.6% | |
AECOM Technology Corp.1 | | | 299,543 | | | | 9,645,285 | |
| |
MasTec, Inc.1 | | | 252,350 | | | | 7,777,427 | |
| | | | | | | | |
| | | | 17,422,712 | |
| |
Machinery—1.0% | |
Titan International, Inc. | | | 320,230 | | | | 5,386,269 | |
| |
Wabash National Corp.1 | | | 412,410 | | | | 5,876,842 | |
| | | | | | | | |
| | | | 11,263,111 | |
| |
Professional Services—4.0% | |
Korn/Ferry International1 | | | 882,251 | | | | 25,911,712 | |
| |
Paylocity Holding Corp.1 | | | 176,190 | | | | 3,810,989 | |
| |
Robert Half International, Inc. | | | 328,485 | | | | 15,681,874 | |
| | | | | | | | |
| | | | 45,404,575 | |
| |
Road & Rail—2.0% | |
Saia, Inc.1 | | | 249,220 | | | | 10,948,235 | |
| |
Swift Transportation Co.1 | | | 440,524 | | | | 11,114,420 | |
| | | | | | | | |
| | | | 22,062,655 | |
| |
Information Technology—14.7% | |
| |
Communications Equipment—1.8% | |
Finisar Corp.1 | | | 1,003,091 | | | | 19,811,047 | |
| |
Internet Software & Services—2.1% | |
j2 Global, Inc. | | | 203,613 | | | | 10,355,757 | |
| |
Web.com Group, Inc.1 | | | 474,020 | | | | 13,684,958 | |
| | | | | | | | |
| | | | 24,040,715 | |
| |
IT Services—3.0% | |
Booz Allen Hamilton Holding Corp. | | | 422,250 | | | | 8,968,590 | |
| |
CACI International, Inc., Cl. A1 | | | 47,790 | | | | 3,355,336 | |
| |
MAXIMUS, Inc. | | | 240,015 | | | | 10,325,445 | |
| |
Unisys Corp.1 | | | 462,830 | | | | 11,450,414 | |
| | | | | | | | |
| | | | 34,099,785 | |
| |
Semiconductors & Semiconductor Equipment—2.9% | |
Cavium, Inc.1 | | | 350,250 | | | | 17,393,415 | |
6 OPPENHEIMER MAIN STREET SMALL CAP FUND/VA
| | | | | | | | | | |
| | | Shares | | | Value | | | |
| | | |
Semiconductors & Semiconductor Equipment (Continued) | | | |
| | | |
Semtech Corp.1 | | | 570,038 | | | $ | 14,906,494 | | | |
| | | | | | | | | | |
| | | | 32,299,909 | | | |
| | | |
Software—4.9% | | | |
FleetMatics Group plc1 | | | 154,700 | | | | 5,002,998 | | | |
| | | |
Fortinet, Inc.1 | | | 792,401 | | | | 19,913,037 | | | |
| | | |
Guidewire Software, Inc.1 | | | 402,680 | | | | 16,372,969 | | | |
| | | |
Imperva, Inc.1 | | | 166,280 | | | | 4,353,211 | | | |
| | | |
Proofpoint, Inc.1 | | | 262,040 | | | | 9,816,018 | | | |
| | | | | | | | | | |
| | | | 55,458,233 | | | |
| | | |
Materials—9.3% | | | |
| | | |
Chemicals—3.4% | | | |
A. Schulman, Inc. | | | 230,128 | | | | 8,905,954 | | | |
| | | |
Cytec Industries, Inc. | | | 86,968 | | | | 9,168,167 | | | |
| | | |
Intrepid Potash, Inc.1 | | | 526,640 | | | | 8,826,486 | | | |
| | | |
Tronox Ltd., Cl. A | | | 436,270 | | | | 11,735,663 | | | |
| | | | | | | | | | |
| | | | 38,636,270 | | | |
| | | |
Containers & Packaging—0.6% | | | |
Packaging Corp. of America | | | 93,620 | | | | 6,692,894 | | | |
| | | |
Metals & Mining—2.2% | | | | | | | | | | |
Century Aluminum Co.1 | | | 598,640 | | | | 9,386,675 | | | |
| | | |
Kaiser Aluminum Corp. | | | 205,710 | | | | 14,990,088 | | | |
| | | | | | | | | | |
| | | | 24,376,763 | | | |
| | | | | | | | |
| | | Shares | | | Value | |
| |
Paper & Forest Products—3.1% | |
Boise Cascade Co.1 | | | 501,590 | | | $ | 14,365,538 | |
| |
P.H. Glatfelter Co. | | | 758,423 | | | | 20,120,962 | |
| | | | | | | | |
| | | | 34,486,500 | |
| |
Utilities—0.4% | |
| |
Water Utilities—0.4% | |
Aqua America, Inc. | | | 191,823 | | | | 5,029,599 | |
| | | | | | | | |
Total Common Stocks (Cost $882,894,498) | | | | 1,095,366,053 | |
| Investment Company—2.1% | |
Oppenheimer Institutional Money Market Fund, Cl. E, 0.09%2,3 (Cost $23,062,033) | | | 23,062,033 | | | | 23,062,033 | |
| |
Total Investments, at Value (Cost $905,956,531) | | | 99.6 | % | | | 1,118,428,086 | |
| |
Net Other Assets (Liabilities) | | | 0.4 | | | | 4,312,938 | |
| | | | |
Net Assets | | | 100.0 | % | | $ | 1,122,741,024 | |
| | | | |
Footnotes to Statement of Investments
1. Non-income producing security.
2. Is or was an affiliate, as defined in the Investment Company Act of 1940, at or during the period ended June 30, 2014, by virtue of the Fund owning at least 5% of the voting securities of the issuer or as a result of the Fund and the issuer having the same investment adviser. Transactions during the period in which the issuer was an affiliate are as follows:
| | | | | | | | | | | | | | | | | | |
| | | | | Shares
December 31, 2013 | | | Gross
Additions | | | Gross Reductions | | | Shares
June 30, 2014 | |
| |
| Oppenheimer Institutional Money Market Fund, Cl. E | | | | | 33,794,445 | | | | 223,898,354 | | | | 234,630,766 | | | | 23,062,033 | |
| | | | | |
| | | | | | | | | | | Value | | | Income | |
| |
Oppenheimer Institutional Money Market Fund, Cl. E | | | | | | | $ | 23,062,033 | | | $ | 8,483 | |
3. Rate shown is the 7-day yield as of June 30, 2014.
See accompanying Notes to Financial Statements.
7 OPPENHEIMER MAIN STREET SMALL CAP FUND/VA
STATEMENTOF ASSETS AND LIABILITIES June 30, 2014 Unaudited
| | | | |
| |
Assets | | | | |
Investments, at value—see accompanying statement of investments: | | | | |
Unaffiliated companies (cost $882,894,498) | | $ | 1,095,366,053 | |
Affiliated companies (cost $23,062,033) | | | 23,062,033 | |
| | | | |
| | | 1,118,428,086 | |
| |
Cash | | | 605,329 | |
| |
Receivables and other assets: | | | | |
Investments sold | | | 19,577,920 | |
Dividends | | | 1,630,377 | |
Shares of beneficial interest sold | | | 495,705 | |
Other | | | 44,848 | |
| | | | |
Total assets | | | 1,140,782,265 | |
|
| |
Liabilities | | | | |
Payables and other liabilities: | | | | |
Investments purchased | | | 17,310,643 | |
Shares of beneficial interest redeemed | | | 381,120 | |
Distribution and service plan fees | | | 200,228 | |
Shareholder communications | | | 100,736 | |
Trustees’ compensation | | | 37,451 | |
Other | | | 11,063 | |
| | | | |
Total liabilities | | | 18,041,241 | |
|
| |
Net Assets | | $ | 1,122,741,024 | |
| | | | |
|
| |
Composition of Net Assets | | | | |
Par value of shares of beneficial interest | | $ | 45,670 | |
| |
Additional paid-in capital | | | 773,670,469 | |
| |
Accumulated net investment income | | | 1,223,059 | |
| |
Accumulated net realized gain on investments and foreign currency transactions | | | 135,330,271 | |
| |
Net unrealized appreciation on investments and translation of assets and liabilities denominated in foreign currencies | | | 212,471,555 | |
| | | | |
Net Assets | | $ | 1,122,741,024 | |
| | | | |
|
| |
Net Asset Value Per Share | | | | |
Non-Service Shares: | | | | |
| Net asset value, redemption price (excludes applicable contingent deferred sales charge) and offering price per share (based on net assets of $137,372,064 and 5,538,718 shares of beneficial interest outstanding) | | | $24.80 | |
| |
Service Shares: | | | | |
| Net asset value, redemption price (excludes applicable contingent deferred sales charge) and offering price per share (based on net assets of $985,368,960 and 40,130,910 shares of beneficial interest outstanding) | | | $24.55 | |
See accompanying Notes to Financial Statements.
8 OPPENHEIMER MAIN STREET SMALL CAP FUND/VA
STATEMENTOF OPERATIONS For the Six Months Ended June 30, 2014 Unaudited
| | | | |
| |
Investment Income | | | | |
Dividends: | | | | |
Unaffiliated companies | | $ | 10,652,371 | |
Affiliated companies | | | 8,483 | |
| | | | |
Total investment income | | | 10,660,854 | |
| |
Expenses | | | | |
Management fees | | | 3,690,527 | |
| |
Distribution and service plan fees - Service shares | | | 1,202,605 | |
| |
Transfer and shareholder servicing agent fees: | | | | |
Non-Service shares | | | 66,754 | |
Service shares | | | 481,121 | |
| |
Shareholder communications: | | | | |
Non-Service shares | | | 11,181 | |
Service shares | | | 80,969 | |
| |
Custodian fees and expenses | | | 3,076 | |
| |
Trustees’ compensation | | | 22,379 | |
| |
Other | | | 62,042 | |
| | | | |
Total expenses | | | 5,620,654 | |
Less waivers and reimbursements of expenses | | | (52,296) | |
| | | | |
Net expenses | | | 5,568,358 | |
|
| |
Net Investment Income | | | 5,092,496 | |
|
| |
Realized and Unrealized Gain (Loss) | | | | |
Net realized gain on: | | | | |
Investments from unaffiliated companies | | | 136,463,411 | |
Foreign currency transactions | | | 2,093 | |
| | | | |
Net realized gain | | | 136,465,504 | |
| |
Net change in unrealized appreciation/depreciation on: | | | | |
Investments | | | (93,022,275) | |
Translation of assets and liabilities denominated in foreign currencies | | | (31,376) | |
| | | | |
Net change in unrealized appreciation/depreciation | | | (93,053,651) | |
|
| |
Net Increase in Net Assets Resulting from Operations | | $ | 48,504,349 | |
| | | | |
See accompanying Notes to Financial Statements.
9 OPPENHEIMER MAIN STREET SMALL CAP FUND/VA
STATEMENTSOF CHANGES IN NET ASSETS
| | | | | | |
| | | Six Months Ended June 30, 2014 (Unaudited) | | | Year Ended December 31, 2013 |
|
Operations | | | | | | |
Net investment income | | $ | 5,092,496 | | | $ 4,792,644 |
|
Net realized gain | | | 136,465,504 | | | 175,049,148 |
|
Net change in unrealized appreciation/depreciation | | | (93,053,651) | | | 173,986,568 |
| | | | | | |
Net increase in net assets resulting from operations | | | 48,504,349 | | | 353,828,360 |
|
Dividends and/or Distributions to Shareholders | | | | | | |
Dividends from net investment income: | | | | | | |
Non-Service shares | | | (1,181,630) | | | (978,410) |
Service shares | | | (6,176,459) | | | (6,606,031) |
| | | |
| | | (7,358,089) | | | (7,584,441) |
|
Distributions from net realized gain: | | | | | | |
Non-Service shares | | | (18,983,832) | | | (1,288,110) |
Service shares | | | (137,086,830) | | | (11,405,204) |
| | | |
| | | (156,070,662) | | | (12,693,314) |
|
Beneficial Interest Transactions | | | | | | |
Net increase (decrease) in net assets resulting from beneficial interest transactions: | | | | | | |
Non-Service shares | | | 16,797,524 | | | 11,660,720 |
Service shares | | | 96,007,986 | | | (157,538,740) |
| | | | | | |
| | | 112,805,510 | | | (145,878,020) |
|
Net Assets | | | | | | |
Total increase (decrease) | | | (2,118,892) | | | 187,672,585 |
|
Beginning of period | | | 1,124,859,916 | | | 937,187,331 |
| | | | | | |
| End of period (including accumulated net investment income of $1,223,059 and $3,488,652, respectively) | | $ | 1,122,741,024 | | | $ 1,124,859,916 |
| | | |
See accompanying Notes to Financial Statements.
10 OPPENHEIMER MAIN STREET SMALL CAP FUND/VA
FINANCIAL HIGHLIGHTS
| | | | | | | | | | | | | | | | | | | | | | | | |
| Non-Service Shares | | Six Months
Ended June 30, 2014
(Unaudited) | | | Year Ended
December 31, 2013 | | | Year Ended
December 31, 2012 | | | Year Ended
December 30, 20111 | | | Year Ended
December 31, 2010 | | | Year Ended
December 31, 2009 | |
| |
Per Share Operating Data | | | | | | | | | | | | | | | | | | | | | | | | |
Net asset value, beginning of period | | $ | 27.80 | | | $ | 20.14 | | | $ | 17.17 | | | $ | 17.66 | | | $ | 14.40 | | | $ | 10.65 | |
| |
Income (loss) from investment operations: | | | | | | | | | | | | | | | | | | | | | | | | |
Net investment income2 | | | 0.15 | | | | 0.16 | | | | 0.21 | | | | 0.10 | | | | 0.10 | | | | 0.08 | |
Net realized and unrealized gain (loss) | | | 1.09 | | | | 8.01 | | | | 2.87 | | | | (0.48) | | | | 3.25 | | | | 3.78 | |
| | | | |
Total from investment operations | | | 1.24 | | | | 8.17 | | | | 3.08 | | | | (0.38) | | | | 3.35 | | | | 3.86 | |
| |
Dividends and/or distributions to shareholders: | | | | | | | | | | | | | | | | | | | | | | | | |
Dividends from net investment income | | | (0.25) | | | | (0.22) | | | | (0.11) | | | | (0.11) | | | | (0.09) | | | | (0.11) | |
Distributions from net realized gain | | | (3.99) | | | | (0.29) | | | | 0.00 | | | | 0.00 | | | | 0.00 | | | | 0.00 | |
| | | | |
Total dividends and/or distributions to shareholders | | | (4.24) | | | | (0.51) | | | | (0.11) | | | | (0.11) | | | | (0.09) | | | | (0.11) | |
| |
Net asset value, end of period | | $ | 24.80 | | | $ | 27.80 | | | $ | 20.14 | | | $ | 17.17 | | | $ | 17.66 | | | $ | 14.40 | |
| | | | |
| | | | | | | | | | | | | | | | | | | | | | | | |
| |
| Total Return, at Net Asset Value3 | | | 4.52% | | | | 41.01% | | | | 17.99% | | | | (2.21)% | | | | 23.41% | | | | 37.20% | |
| | | | | | |
| | | | | | | | | | | | | | | | | | | | | | | | | |
Ratios/Supplemental Data | | | | | | | | | | | | | | | | | | | | | | | | |
Net assets, end of period (in thousands) | | $ | 137,372 | | | $ | 134,692 | | | $ | 87,267 | | | $ | 79,722 | | | $ | 95,576 | | | $ | 81,814 | |
| |
Average net assets (in thousands) | | $ | 135,317 | | | $ | 113,522 | | | $ | 83,790 | | | $ | 86,796 | | | $ | 88,063 | | | $ | 69,585 | |
| |
Ratios to average net assets:4 | | | | | | | | | | | | | | | | | | | | | | | | |
Net investment income | | | 1.12% | | | | 0.67% | | | | 1.09% | | | | 0.58% | | | | 0.68% | | | | 0.71% | |
Total expenses5 | | | 0.80% | | | | 0.81% | | | | 0.83% | | | | 0.83% | | | | 0.85% | | | | 0.91% | |
Expenses after payments, waivers and/or reimbursements and reduction to custodian expenses | | | 0.79% | | | | 0.80% | | | | 0.80% | | | | 0.80% | | | | 0.80% | | | | 0.82% | |
| |
Portfolio turnover rate | | | 37% | | | | 60% | | | | 92% | | | | 108% | | | | 73% | | | | 140% | |
1. December 30, 2011 represents the last business day of the Fund’s reporting period.
2. Per share amounts calculated based on the average shares outstanding during the period.
3. Assumes an initial investment on the business day before the first day of the fiscal period, with all dividends and distributions reinvested in additional shares on the reinvestment date, and redemption at the net asset value calculated on the last business day of the fiscal period. Total returns are not annualized for periods less than one full year. Total return information does not reflect expenses that apply at the separate account level or to related insurance products. Inclusion of these charges would reduce the total return figures for all periods shown. Returns do not reflect the deduction of taxes that a shareholder would pay on fund distributions or the redemption of fund shares.
4. Annualized for periods less than one full year.
5. Total expenses including indirect expenses from affiliated fund were as follows:
| | | | | | | | | | |
| | Six Months Ended June 30, 2014 | | | 0 .80 | % |
| | Year Ended December 31, 2013 | | | 0 .81 | % |
| | Year Ended December 31, 2012 | | | 0 .83 | % |
| | Year Ended December 30, 2011 | | | 0 .83 | % |
| | Year Ended December 31, 2010 | | | 0 .85 | % |
| | Year Ended December 31, 2009 | | | 0 .91 | % |
See accompanying Notes to Financial Statements.
11 OPPENHEIMER MAIN STREET SMALL CAP FUND/VA
FINANCIAL HIGHLIGHTS Continued
| | | | | | | | | | | | | | | | | | | | | | | | |
| Service Shares | | Six Months
Ended
June 30,
2014
(Unaudited) | | | Year Ended
December 31, 2013 | | | Year Ended
December 31, 2012 | | | Year Ended
December 30, 20111 | | | Year Ended
December 31, 2010 | | | Year Ended
December 31, 2009 | |
| |
| Per Share Operating Data | | | | | | | | | | | | | | | | | | | | | | | | |
Net asset value, beginning of period | | $ | 27.53 | | | $ | 19.96 | | | $ | 17.02 | | | $ | 17.50 | | | $ | 14.28 | | | $ | 10.54 | |
| |
Income (loss) from investment operations: | | | | | | | | | | | | | | | | | | | | | | | | |
Net investment income2 | | | 0.12 | | | | 0.10 | | | | 0.15 | | | | 0.06 | | | | 0.07 | | | | 0.05 | |
Net realized and unrealized gain (loss) | | | 1.07 | | | | 7.93 | | | | 2.85 | | | | (0.47) | | | | 3.21 | | | | 3.76 | |
| | | | |
Total from investment operations | | | 1.19 | | | | 8.03 | | | | 3.00 | | | | (0.41) | | | | 3.28 | | | | 3.81 | |
| |
| Dividends and/or distributions to shareholders: | | | | | | | | | | | | | | | | | | | | | | | | |
Dividends from net investment income | | | (0.18) | | | | (0.17) | | | | (0.06) | | | | (0.07) | | | | (0.06) | | | | (0.07) | |
Distributions from net realized gain | | | (3.99) | | | | (0.29) | | | | 0.00 | | | | 0.00 | | | | 0.00 | | | | 0.00 | |
| | | | |
| Total dividends and/or distributions to shareholders | | | (4.17) | | | | (0.46) | | | | (0.06) | | | | (0.07) | | | | (0.06) | | | | (0.07) | |
| |
Net asset value, end of period | | $ | 24.55 | | | $ | 27.53 | | | $ | 19.96 | | | $ | 17.02 | | | $ | 17.50 | | | $ | 14.28 | |
| | | | |
| | | | | | | | | | | | | | | | | | | | | | | | |
| |
| Total Return, at Net Asset Value3 | | | 4 .38% | | | | 40 .62% | | | | 17 .67% | | | | (2 .38)% | | | | 23 .06% | | | | 36 .88% | |
|
| |
| Ratios/Supplemental Data | | | | | | | | | | | | | | | | | | | | | | | | |
Net assets, end of period (in thousands) | | $ | 985,369 | | | $ | 990,168 | | | $ | 849,920 | | | $ | 790,752 | | | $ | 859,710 | | | $ | 662,347 | |
| |
Average net assets (in thousands) | | $ | 975,371 | | | $ | 935,083 | | | $ | 836,487 | | | $ | 823,201 | | | $ | 730,069 | | | $ | 612,651 | |
| |
Ratios to average net assets:4 | | | | | | | | | | | | | | | | | | | | | | | | |
Net investment income | | | 0 .90% | | | | 0 .43% | | | | 0 .82% | | | | 0 .34% | | | | 0 .45% | | | | 0 .47% | |
Total expenses5 | | | 1 .05% | | | | 1 .06% | | | | 1 .08% | | | | 1 .08% | | | | 1 .10% | | | | 1 .15% | |
| Expenses after payments, waivers and/or reimbursements and reduction to custodian expenses | | | 1 .04% | | | | 1 .05% | | | | 1 .05% | | | | 1 .05% | | | | 1 .05% | | | | 1 .07% | |
| |
Portfolio turnover rate | | | 37% | | | | 60% | | | | 92% | | | | 108% | | | | 73% | | | | 140% | |
1. December 30, 2011 represents the last business day of the Fund’s reporting period.
2. Per share amounts calculated based on the average shares outstanding during the period.
3. Assumes an initial investment on the business day before the first day of the fiscal period, with all dividends and distributions reinvested in additional shares on the reinvestment date, and redemption at the net asset value calculated on the last business day of the fiscal period. Total returns are not annualized for periods less than one full year. Total return information does not reflect expenses that apply at the separate account level or to related insurance products. Inclusion of these charges would reduce the total return figures for all periods shown. Returns do not reflect the deduction of taxes that a shareholder would pay on fund distributions or the redemption of fund shares.
4. Annualized for periods less than one full year.
5. Total expenses including indirect expenses from affiliated fund were as follows:
| | | | | | | | | | |
| | Six Months Ended June 30, 2014 | | | 1 .05 | % |
| | Year Ended December 31, 2013 | | | 1 .06 | % |
| | Year Ended December 31, 2012 | | | 1 .08 | % |
| | Year Ended December 30, 2011 | | | 1 .08 | % |
| | Year Ended December 31, 2010 | | | 1 .10 | % |
| | Year Ended December 31, 2009 | | | 1 .15 | % |
See accompanying Notes to Financial Statements.
12 OPPENHEIMER MAIN STREET SMALL CAP FUND/VA
NOTESTO FINANCIAL STATEMENTS June 30, 2014 Unaudited
1. Significant Accounting Policies
Oppenheimer Main Street Small Cap Fund/VA (the “Fund”), formerly Oppenheimer Main Street Small- & Mid-Cap Fund/VA, is a separate series of Oppenheimer Variable Account Funds, a diversified open-end management investment company registered under the Investment Company Act of 1940, as amended. The Fund’s investment objective is to seek capital appreciation. The Fund’s investment adviser is OFI Global Asset Management, Inc. (“OFI Global” or the “Manager”), a wholly-owned subsidiary of OppenheimerFunds, Inc. (“OFI” or the “Sub-Adviser”). The Manager has entered into a sub-advisory agreement with OFI. Shares of the Fund are sold only to separate accounts of life insurance companies.
The Fund offers two classes of shares. Both classes are sold at their offering price, which is the net asset value per share, to separate investment accounts of participating insurance companies as an underlying investment for variable life insurance policies, variable annuity contracts or other investment products. The class of shares designated as Service shares is subject to a distribution and service plan. Both classes of shares have identical rights and voting privileges with respect to the Fund in general and exclusive voting rights on matters that affect that class alone. Earnings, net assets and net asset value per share may differ due to each class having its own expenses, such as transfer and shareholder servicing agent fees and shareholder communications, directly attributable to that class.
The following is a summary of significant accounting policies consistently followed by the Fund.
Investment in Oppenheimer Institutional Money Market Fund. The Fund is permitted to invest daily available cash balances in an affiliated money market fund. The Fund may invest the available cash in Class E shares of Oppenheimer Institutional Money Market Fund (“IMMF”) to seek current income while preserving liquidity. IMMF is a registered open-end management investment company, regulated as a money market fund under the Investment Company Act of 1940, as amended. The Manager is the investment adviser of IMMF, and the Sub-Adviser provides investment and related advisory services to IMMF. When applicable, the Fund’s investment in IMMF is included in the Statement of Investments. Shares of IMMF are valued at their net asset value per share. As a shareholder, the Fund is subject to its proportional share of IMMF’s Class E expenses, including its management fee. The Manager will waive fees and/or reimburse Fund expenses in an amount equal to the indirect management fees incurred through the Fund’s investment in IMMF.
Foreign Currency Translation. The Fund’s accounting records are maintained in U.S. dollars. The values of securities denominated in foreign currencies and amounts related to the purchase and sale of foreign securities and foreign investment income are translated into U.S. dollars as of the close of the New York Stock Exchange (the “Exchange”), normally 4:00 P.M. Eastern time, on each day the Exchange is open for trading. Foreign exchange rates may be valued primarily using a reliable bank, dealer or service authorized by the Board of Trustees.
Reported net realized gains and losses from foreign currency transactions arise from sales of portfolio securities, sales and maturities of short-term securities, sales of foreign currencies, exchange rate fluctuations between the trade and settlement dates on securities transactions, and the difference between the amounts of dividends, interest, and foreign withholding taxes recorded on the Fund’s books and the U.S. dollar equivalent of the amounts actually received or paid. Net unrealized appreciation and depreciation on the translation of assets and liabilities denominated in foreign currencies arise from changes in the values of assets and liabilities, including investments in securities at fiscal period end, resulting from changes in exchange rates.
The effect of changes in foreign currency exchange rates on investments is separately identified from the fluctuations arising from changes in market values of securities held and reported with all other foreign currency gains and losses in the Fund’s Statement of Operations.
Allocation of Income, Expenses, Gains and Losses. Income, expenses (other than those attributable to a specific class), gains and losses are allocated on a daily basis to each class of shares based upon the relative proportion of net assets represented by such class. Operating expenses directly attributable to a specific class are charged against the operations of that class.
Federal Taxes. The Fund intends to comply with provisions of the Internal Revenue Code applicable to regulated investment companies and to distribute substantially all of its investment company taxable income to shareholders. Therefore, no federal income or excise tax provision is required. The Fund files income tax returns in U.S. federal and applicable state jurisdictions. The statute of limitations on the Fund’s tax return filings generally remain open for the three preceding fiscal reporting period ends.
During the fiscal year ended December 31, 2013, the Fund did not utilize any capital loss carryforward to offset capital gains realized in that fiscal year.
Net investment income (loss) and net realized gain (loss) may differ for financial statement and tax purposes. The character of dividends and distributions made during the fiscal year from net investment income or net realized gains may differ from their ultimate characterization for federal income tax purposes. Also, due to timing of dividends and distributions, the fiscal year in which amounts are distributed may differ from the fiscal year in which the income or net realized gain was recorded by the Fund.
The aggregate cost of securities and other investments and the composition of unrealized appreciation and depreciation of securities and other investments for federal income tax purposes as of June 30, 2014 are noted in the following table. The primary difference between book and tax appreciation or depreciation of securities and other investments, if applicable, is attributable to the tax deferral of losses or tax realization of financial statement unrealized gain or loss.
| | | | |
Federal tax cost of securities | | $ | 906,958,682 | |
| | | | |
| |
Gross unrealized appreciation | | $ | 229,326,232 | |
Gross unrealized depreciation | | | (17,856,828) | |
| | | | |
Net unrealized appreciation | | $ | 211,469,404 | |
| | | | |
13 OPPENHEIMER MAIN STREET SMALL CAP FUND/VA
|
|
| NOTES TO FINANCIAL STATEMENTS Unaudited / Continued |
|
| 1. Significant Accounting Policies (Continued) |
Trustees’ Compensation. The Board of Trustees has adopted a compensation deferral plan for independent trustees that enables trustees to elect to defer receipt of all or a portion of the annual compensation they are entitled to receive from the Fund. For purposes of determining the amount owed to the Trustee under the plan, deferred amounts are treated as though equal dollar amounts had been invested in shares of the Fund or in other Oppenheimer funds selected by the Trustee. The Fund purchases shares of the funds selected for deferral by the Trustee in amounts equal to his or her deemed investment, resulting in a Fund asset equal to the deferred compensation liability. Such assets are included as a component of “Other” within the asset section of the Statement of Assets and Liabilities. Deferral of trustees’ fees under the plan will not affect the net assets of the Fund, and will not materially affect the Fund’s assets, liabilities or net investment income per share. Amounts will be deferred until distributed in accordance with the compensation deferral plan.
Dividends and Distributions to Shareholders. Dividends and distributions to shareholders, which are determined in accordance with income tax regulations and may differ from U.S. generally accepted accounting principles, are recorded on the ex-dividend date. Income and capital gain distributions, if any, are declared and paid annually or at other times as deemed necessary by the Manager. The tax character of distributions is determined as of the Fund’s fiscal year end. Therefore, a portion of the Fund’s distributions made to shareholders prior to the Fund’s fiscal year end may ultimately be categorized as a tax return of capital.
Investment Income. Dividend income is recorded on the ex-dividend date or upon ex-dividend notification in the case of certain foreign dividends where the ex-dividend date may have passed. Non-cash dividends included in dividend income, if any, are recorded at the fair market value of the securities received. Interest income is recognized on an accrual basis. Discount and premium, which are included in interest income on the Statement of Operations, are amortized or accreted daily.
Custodian Fees. “Custodian fees and expenses” in the Statement of Operations may include interest expense incurred by the Fund on any cash overdrafts of its custodian account during the period. Such cash overdrafts may result from the effects of failed trades in portfolio securities and from cash outflows resulting from unanticipated shareholder redemption activity. The Fund pays interest to its custodian on such cash overdrafts, to the extent they are not offset by positive cash balances maintained by the Fund, at a rate equal to the Federal Funds Rate plus 0.50%. The “Reduction to custodian expenses” line item, if applicable, represents earnings on cash balances maintained by the Fund during the period. Such interest expense and other custodian fees may be paid with these earnings.
Security Transactions. Security transactions are recorded on the trade date. Realized gains and losses on securities sold are determined on the basis of identified cost.
Indemnifications. The Fund’s organizational documents provide current and former trustees and officers with a limited indemnification against liabilities arising in connection with the performance of their duties to the Fund. In the normal course of business, the Fund may also enter into contracts that provide general indemnifications. The Fund’s maximum exposure under these arrangements is unknown as this would be dependent on future claims that may be made against the Fund. The risk of material loss from such claims is considered remote.
Other. The preparation of financial statements in conformity with accounting principles generally accepted in the United States of America requires management to make estimates and assumptions that affect the reported amounts of assets and liabilities and disclosure of contingent assets and liabilities at the date of the financial statements and the reported amounts of increases and decreases in net assets from operations during the reporting period. Actual results could differ from those estimates.
2. Securities Valuation
The Fund calculates the net asset value of its shares as of the close of the New York Stock Exchange (the “Exchange”), normally 4:00 P.M. Eastern time, on each day the Exchange is open for trading.
The Fund’s Board has adopted procedures for the valuation of the Fund’s securities and has delegated the day-to-day responsibility for valuation determinations under those procedures to the Manager. The Manager has established a Valuation Committee which is responsible for determining a “fair valuation” for any security for which market quotations are not “readily available.” The Valuation Committee’s fair valuation determinations are subject to review, approval and ratification by the Fund’s Board at its next regularly scheduled meeting covering the calendar quarter in which the fair valuation was determined.
Valuation Methods and Inputs
Securities are valued using unadjusted quoted market prices, when available, as supplied primarily by third party pricing services or dealers.
The following methodologies are used to determine the market value or the fair value of the types of securities described below:
Securities traded on a registered U.S. securities exchange (including exchange-traded derivatives other than futures and futures options) are valued based on the last sale price of the security reported on the principal exchange on which it is traded, prior to the time when the Fund’s assets are valued. In the absence of a sale, the security is valued at the last sale price on the prior trading day, if it is within the spread of the current day’s closing “bid” and “asked” prices, and if not, at the current day’s closing bid price. A security of a foreign issuer traded on a foreign exchange, but not listed on a registered U.S. securities exchange, is valued based on the last sale price on the principal exchange on which the security is traded, as identified by the third party pricing service used by the Manager, prior to the time when the Fund’s assets are valued. If the last sale price is unavailable, the security is
14 OPPENHEIMER MAIN STREET SMALL CAP FUND/VA
2. Securities Valuation (Continued)
valued at the most recent official closing price on the principal exchange on which it is traded. If the last sales price or official closing price for a foreign security is not available, the security is valued at the mean between the bid and asked price per the exchange or, if not available from the exchange, obtained from two dealers. If bid and asked prices are not available from either the exchange or two dealers, the security is valued by using one of the following methodologies (listed in order of priority): (1) using a bid from the exchange, (2) the mean between the bid and asked price as provided by a single dealer, or (3) a bid from a single dealer.
Shares of a registered investment company that are not traded on an exchange are valued at that investment company’s net asset value per share.
Corporate and government debt securities (of U.S. or foreign issuers) and municipal debt securities, event-linked bonds, loans, mortgage-backed securities, collateralized mortgage obligations, and asset-backed securities are valued at the mean between the “bid” and “asked” prices utilizing evaluated prices obtained from third party pricing services or broker-dealers who may use matrix pricing methods to determine the evaluated prices.
Short-term money market type debt securities with a remaining maturity of sixty days or less are valued at cost adjusted by the amortization of discount or premium to maturity (amortized cost), which approximates market value. Short-term debt securities with a remaining maturity in excess of sixty days are valued at the mean between the “bid�� and “asked” prices utilizing evaluated prices obtained from third party pricing services or broker-dealers.
A description of the standard inputs that may generally be considered by the third party pricing vendors in determining their evaluated prices is provided below.
| | |
| Security Type | | Standard inputs generally considered by third-party pricing vendors |
| Corporate debt, government debt, municipal, mortgage-backed and asset-backed securities | | Reported trade data, broker-dealer price quotations, benchmark yields, issuer spreads on comparable securities, the credit quality, yield, maturity, and other appropriate factors. |
| Loans | | Information obtained from market participants regarding reported trade data and broker-dealer price quotations. |
| Event-linked bonds | | Information obtained from market participants regarding reported trade data and broker-dealer price quotations. |
If a market value or price cannot be determined for a security using the methodologies described above, or if, in the “good faith” opinion of the Manager, the market value or price obtained does not constitute a “readily available market quotation,” or a significant event has occurred that would materially affect the value of the security the security is fair valued either (i) by a standardized fair valuation methodology applicable to the security type or the significant event as previously approved by the Valuation Committee and the Fund’s Board or (ii) as determined in good faith by the Manager’s Valuation Committee. The Valuation Committee considers all relevant facts that are reasonably available, through either public information or information available to the Manager, when determining the fair value of a security. Fair value determinations by the Manager are subject to review, approval and ratification by the Fund’s Board at its next regularly scheduled meeting covering the calendar quarter in which the fair valuation was determined. Those fair valuation standardized methodologies include, but are not limited to, valuing securities at the last sale price or initially at cost and subsequently adjusting the value based on: changes in company specific fundamentals, changes in an appropriate securities index, or changes in the value of similar securities which may be further adjusted for any discounts related to security-specific resale restrictions. When possible, such methodologies use observable market inputs such as unadjusted quoted prices of similar securities, observable interest rates, currency rates and yield curves. The methodologies used for valuing securities are not necessarily an indication of the risks associated with investing in those securities nor can it be assured that the Fund can obtain the fair value assigned to a security if it were to sell the security.
To assess the continuing appropriateness of security valuations, the Manager, or its third party service provider who is subject to oversight by the Manager, regularly compares prior day prices, prices on comparable securities, and sale prices to the current day prices and challenges those prices exceeding certain tolerance levels with the third party pricing service or broker source. For those securities valued by fair valuations, whether through a standardized fair valuation methodology or a fair valuation determination, the Valuation Committee reviews and affirms the reasonableness of the valuations based on such methodologies and fair valuation determinations on a regular basis after considering all relevant information that is reasonably available.
Classifications
Each investment asset or liability of the Fund is assigned a level at measurement date based on the significance and source of the inputs to its valuation. Various data inputs are used in determining the value of each of the Fund’s investments as of the reporting period end. These data inputs are categorized in the following hierarchy under applicable financial accounting standards:
1) Level 1-unadjusted quoted prices in active markets for identical assets or liabilities (including securities actively traded on a securities exchange)
2) Level 2-inputs other than unadjusted quoted prices that are observable for the asset or liability (such as unadjusted quoted prices for similar assets and market corroborated inputs such as interest rates, prepayment speeds, credit risks, etc.)
3) Level 3-significant unobservable inputs (including the Manager’s own judgments about assumptions that market participants would use in pricing the asset or liability).
The inputs used for valuing securities are not necessarily an indication of the risks associated with investing in those securities.
15 OPPENHEIMER MAIN STREET SMALL CAP FUND/VA
|
|
| NOTES TO FINANCIAL STATEMENTS Unaudited / Continued |
|
| 2. Securities Valuation (Continued) |
The table below categorizes amounts that are included in the Fund’s Statement of Assets and Liabilities as of June 30, 2014 based on valuation input level:
| | | | | | | | | | | | | | | | |
| | | Level 1— Unadjusted Quoted Prices | | | Level 2— Other Significant Observable Inputs | | | Level 3— Significant Unobservable Inputs | | | Value | |
Assets Table | |
Investments, at Value: | |
Common Stocks | | | | | | | | | | | | | | | | |
Consumer Discretionary | | $ | 146,450,230 | | | $ | — | | | $ | — | | | $ | 146,450,230 | |
Consumer Staples | | | 5,674,525 | | | | — | | | | — | | | | 5,674,525 | |
Energy | | | 46,741,885 | | | | — | | | | — | | | | 46,741,885 | |
Financials | | | 260,831,066 | | | | — | | | | — | | | | 260,831,066 | |
Health Care | | | 158,765,971 | | | | 5,347,418 | | | | — | | | | 164,113,389 | |
Industrials | | | 196,623,243 | | | | — | | | | — | | | | 196,623,243 | |
Information Technology | | | 165,709,689 | | | | — | | | | — | | | | 165,709,689 | |
Materials | | | 104,192,427 | | | | — | | | | — | | | | 104,192,427 | |
Utilities | | | 5,029,599 | | | | — | | | | — | | | | 5,029,599 | |
Investment Company | | | 23,062,033 | | | | — | | | | — | | | | 23,062,033 | |
| | | | |
Total Assets | | $ | 1,113,080,668 | | | $ | 5,347,418 | | | $ | — | | | $ | 1,118,428,086 | |
| | | | |
Forward currency exchange contracts and futures contracts, if any, are reported at their unrealized appreciation/depreciation at measurement date, which represents the change in the contract’s value from trade date. All additional assets and liabilities included in the above table are reported at their market value at measurement date.
3. Shares of Beneficial Interest
The Fund has authorized an unlimited number of $0.001 par value shares of beneficial interest of each class. Transactions in shares of beneficial interest were as follows:
| | | | | | | | | | | | | | | | |
| | | Six Months Ended June 30, 2014 | | | Year Ended December 31, 2013 | |
| | | Shares | | | Amount | | | Shares | | | Amount | |
Non-Service Shares | | | | | | | | | | | | | | | | |
Sold | | | 511,647 | | | $ | 14,382,561 | | | | 2,050,901 | | | $ | 49,473,567 | |
Dividends and/or distributions reinvested | | | 817,408 | | | | 20,165,462 | | | | 95,274 | | | | 2,266,520 | |
Redeemed | | | (635,999 | ) | | | (17,750,499 | ) | | | (1,633,467 | ) | | | (40,079,367) | |
| | | | |
Net increase | | | 693,056 | | | $ | 16,797,524 | | | | 512,708 | | | $ | 11,660,720 | |
| | | | |
| | | | |
| | | | | | | | | | | | | | | | | |
Service Shares | | | | | | | | | | | | | | | | |
Sold | | | 1,351,858 | | | $ | 37,218,362 | | | | 3,333,649 | | | $ | 79,750,169 | |
Dividends and/or distributions reinvested | | | 5,866,634 | | | | 143,263,289 | | | | 763,535 | | | | 18,011,235 | |
Redeemed | | | (3,057,737 | ) | | | (84,473,665 | ) | | | (10,718,072 | ) | | | (255,300,144) | |
| | | | |
Net increase (decrease) | | | 4,160,755 | | | $ | 96,007,986 | | | | (6,620,888 | ) | | $ | (157,538,740) | |
| | | | |
4. Purchases and Sales of Securities
The aggregate cost of purchases and proceeds from sales of securities, other than short-term obligations and investments in IMMF, for the six months ended June 30, 2014 were as follows:
| | | | | | | | | | |
| | | Purchases | | | | | Sales | |
Investment securities | | $ | 407,965,252 | | | | | $ | 433,692,846 | |
5. Fees and Other Transactions with Affiliates
Management Fees. Under the investment advisory agreement, the Fund pays the Manager a management fee based on the daily net assets of the Fund at an annual rate as shown in the following table:
| | | | |
| Fee Schedule | | | |
Up to $200 million | | | 0.75% | |
Next $200 million | | | 0.72 | |
Next $200 million | | | 0.69 | |
Next $200 million | | | 0.66 | |
Next $200 million | | | 0.60 | |
Over $1 billion | | | 0.58 | |
Sub-Adviser Fees. The Manager has retained the Sub-Adviser to provide the day-to-day portfolio management of the Fund. Under the Sub-Advisory Agreement, the Manager pays the Sub-Adviser an annual fee in monthly installments, equal to a percentage of the investment management fee collected by the Manager from the Fund, which shall be calculated after any investment management fee waivers. The fee paid to the Sub-Adviser is paid by the Manager, not by the Fund.
16 OPPENHEIMER MAIN STREET SMALL CAP FUND/VA
5. Fees and Other Transactions with Affiliates (Continued)
Transfer Agent Fees. OFI Global (the “Transfer Agent”) serves as the transfer and shareholder servicing agent for the Fund. The Fund pays the Transfer Agent a fee based on annual net assets. Fees incurred and average net assets for each class with respect to these services are detailed in the Statement of Operations and Financial Highlights, respectively.
Sub-Transfer Agent Fees. The Transfer Agent has retained Shareholder Services, Inc., a wholly-owned subsidiary of OFI (the “Sub-Transfer Agent”), to provide the day-to-day transfer agent and shareholder servicing of the Fund. Under the Sub-Transfer Agency Agreement, the Transfer Agent pays the Sub-Transfer Agent an annual fee in monthly installments, equal to a percentage of the transfer agent fee collected by the Transfer Agent from the Fund, which shall be calculated after any applicable fee waivers. The fee paid to the Sub-Transfer Agent is paid by the Transfer Agent, not by the Fund.
Distribution and Service Plan for Service Shares. The Fund has adopted a Distribution and Service Plan (the “Plan”) in accordance with Rule 12b-1 under the Investment Company Act of 1940 for Service shares to pay OppenheimerFunds Distributor, Inc. (the “Distributor”), for distribution related services, personal service and account maintenance for the Fund’s Service shares. Under the Plan, payments are made periodically at an annual rate of 0.25% of the daily net assets of Service shares of the Fund. The Distributor currently uses all of those fees to compensate sponsors of the insurance product that offers Fund shares, for providing personal service and maintenance of accounts of their variable contract owners that hold Service shares. These fees are paid out of the Fund’s assets on an on-going basis and increase operating expenses of the Service shares, which results in lower performance compared to the Fund’s shares that are not subject to a service fee. Fees incurred by the Fund under the Plan are detailed in the Statement of Operations.
Waivers and Reimbursements of Expenses. The Manager has contractually agreed to limit the Fund’s expenses after payments, waivers and/or reimbursements and reduction to custodian expenses, excluding expenses incurred directly or indirectly by the Fund as a result of investments in other investment companies, wholly-owned subsidiaries and pooled investment vehicles; so that those expenses, as percentages of daily net assets, will not exceed the annual rate of 0.80% for Non-Service shares and 1.05% for Service shares. During the six months ended June 30, 2014, the Manager waived fees and/or reimbursed the Fund $5,115 for Non-Service shares and $35,985 for Service shares, respectively.
The Manager will waive fees and/or reimburse Fund expenses in an amount equal to the indirect management fees incurred through the Fund’s investment in IMMF. During the six months ended June 30, 2014, the Manager waived fees and/or reimbursed the Fund $11,196 for IMMF management fees.
Some of these undertakings may be modified or terminated at any time; some may not be modified or terminated until after one year from the date of the current prospectus, as indicated therein.
6. Pending Litigation
In 2009, seven class action lawsuits were filed in the U.S. District Court for the District of Colorado against OppenheimerFunds, Inc. (“OFI”), OppenheimerFunds Distributor, Inc., the Fund’s principal underwriter and distributor (the “Distributor”), and certain funds (but not including the Fund) advised by OFI Global Asset Management, Inc. and distributed by the Distributor (the “Defendant Funds”). The lawsuits also named as defendants certain officers and current and former trustees of the respective Defendant Funds. The lawsuits raised claims under federal securities law and alleged, among other things, that the disclosure documents of the respective Defendant Funds contained misrepresentations and omissions and that the respective Defendant Funds’ investment policies were not followed. The plaintiffs in these actions sought unspecified damages, equitable relief and awards of attorneys’ fees and litigation expenses. The Defendant Funds’ Boards of Trustees also engaged counsel to represent the Funds and the present and former Independent Trustees named in those suits. On March 5, 2014, the parties in six of these lawsuits executed stipulations and agreements of settlement resolving those actions. On July 31, 2014, the court entered an order and final judgment approving the settlements as fair, reasonable and adequate. The settlements do not resolve a seventh outstanding lawsuit relating to Oppenheimer Rochester California Municipal Fund.
Other class action and individual lawsuits have been filed since 2008 in various state and federal courts against OFI and certain of its affiliates by investors seeking to recover investments they allegedly lost as a result of the “Ponzi” scheme run by Bernard L. Madoff and his firm, Bernard L. Madoff Investment Securities, LLC (“BLMIS”). Plaintiffs in these suits allege that they suffered losses as a result of their investments in several funds managed by an affiliate of OFI and assert a variety of claims, including breach of fiduciary duty, fraud, negligent misrepresentation, unjust enrichment, and violation of federal and state securities laws and regulations, among others. They seek unspecified damages, equitable relief and awards of attorneys’ fees and litigation expenses. Neither the Distributor, nor any of the Oppenheimer mutual funds, their independent trustees or directors are named as defendants in these lawsuits. None of the Oppenheimer mutual funds invested in any funds or accounts managed by Madoff or BLMIS. On February 28, 2011, a stipulation of partial settlement of three groups of consolidated putative class action lawsuits relating to these matters was filed in the U.S. District Court for the Southern District of New York. On August 19, 2011, the court entered an order and final judgment approving the settlement as fair, reasonable and adequate. In September 2011, certain parties filed notices of appeal from the court’s order approving the settlement. In June 2014, the appellate court affirmed the lower court’s order approving the settlement. Certain parties subsequently filed a petition for certiorari before the U.S. Supreme Court further challenging the settlement approval order. The settlement does not resolve other outstanding lawsuits against OFI and its affiliates relating to BLMIS.
OFI believes the lawsuits and appeals described above are without legal merit and, with the exception of actions it has settled, is defending against them vigorously. While it is premature to render any opinion as to the outcome in these lawsuits, or whether any costs that the Defendant Funds may bear in defending the suits might not be reimbursed by insurance, OFI believes that these suits should not impair the ability of OFI or the Distributor to perform their respective duties to the Fund, and that the outcome of all of the suits together should not have any material effect on the operations of any of the Oppenheimer mutual funds.
17 OPPENHEIMER MAIN STREET SMALL CAP FUND/VA
PORTFOLIO PROXY VOTING POLICIES AND PROCEDURES; UPDATES TO STATEMENTS OF INVESTMENTS Unaudited
The Fund has adopted Portfolio Proxy Voting Policies and Procedures under which the Fund votes proxies relating to securities (“portfolio proxies”) held by the Fund. A description of the Fund’s Portfolio Proxy Voting Policies and Procedures is available (i) without charge, upon request, by calling the Fund toll-free at 1.800.525.7048, (ii) on the Fund’s website at oppenheimerfunds.com, and (iii) on the SEC’s website at www.sec.gov. In addition, the Fund is required to file Form N-PX, with its complete proxy voting record for the 12 months ended June 30th, no later than August 31st of each year. The Fund’s voting record is available (i) without charge, upon request, by calling the Fund toll-free at 1.800.525.7048, and (ii) in the Form N-PX filing on the SEC’s website at www.sec.gov.
The Fund files its complete schedule of portfolio holdings with the SEC for the first quarter and the third quarter of each fiscal year on Form N-Q. The Fund’s Form N-Q filings are available on the SEC’s website at www.sec.gov. Those forms may be reviewed and copied at the SEC’s Public Reference Room in Washington, D.C. Information on the operation of the Public Reference Room may be obtained by calling 1-800-SEC-0330.
18 OPPENHEIMER MAIN STREET SMALL CAP FUND/VA
THIS PAGE INTENTIONALLY LEFT BLANK.
19 OPPENHEIMER MAIN STREET SMALL CAP FUND/VA
OPPENHEIMER MAIN STREET SMALL CAP FUND/VA
A Series of Oppenheimer Variable Account Funds
| | |
Trustees and Officers | | Sam Freedman, Chairman of the Board of Trustees and Trustee |
| | Edward L. Cameron, Trustee |
| | Jon S. Fossel, Trustee |
| | Richard F. Grabish, Trustee |
| | Beverly L. Hamilton, Trustee |
| | Victoria J. Herget, Trustee |
| | Robert J. Malone, Trustee |
| | F. William Marshall, Jr., Trustee |
| | Karen L. Stuckey, Trustee |
| | James D. Vaughn, Trustee |
| | William F. Glavin, Jr., Trustee, President and Principal Executive Officer |
| | Matthew P. Ziehl, Vice President |
| | Raymond Anello, Vice President |
| | Raman Vardharaj, Vice President |
| | Joy Budzinski, Vice President |
| | Kristin Ketner Pak, Vice President |
| | Magnus Krantz, Vice President |
| | Adam Weiner, Vice President |
| | Arthur S. Gabinet, Secretary and Chief Legal Officer |
| | Christina M. Nasta, Vice President and Chief Business Officer |
| | Mary Ann Picciotto, Chief Compliance Officer and Chief Anti-Money Laundering Officer |
| | Brian W. Wixted, Treasurer and Principal Financial & Accounting Officer |
| |
Manager | | OFI Global Asset Management, Inc. |
| |
Sub-Adviser | | OppenheimerFunds, Inc. |
| |
Distributor | | OppenheimerFunds Distributor, Inc. |
| |
Transfer and | | OFI Global Asset Management, Inc. |
Shareholder | | |
Servicing Agent | | |
| |
Sub-Transfer Agent | | Shareholder Services, Inc. |
| | DBA OppenheimerFunds Services |
| |
Independent Registered | | KPMGLLP |
Public Accounting Firm | | |
| |
Counsel | | K&L Gates LLP |
| |
| | Before investing in any of the Oppenheimer funds, investors should carefully consider a fund’s investment objective, risks, and charges and expenses. Fund prospectuses and summary prospectuses contain this and other information about the funds, and may be obtained by asking your financial advisor, visiting oppenheimerfunds.com, or calling us at 1.800.988.8287. Read prospectuses and summary prospectuses carefully before investing. |
| |
| | The financial statements included herein have been taken from the records of the Fund without examination of those records by the independent registered public accounting firm. |
| |
| | © 2014 OppenheimerFunds, Inc. All rights reserved. Oppenheimer funds are distributed by OppenheimerFunds Distributor, Inc. |

| | | | |
| | June 30, 2014 | | |
| | | Oppenheimer Money Fund/VA A Series of Oppenheimer Variable Account Funds | | Semiannual Report |
| | SEMIANNUAL REPORT Listing of Top Holdings Fund Performance Discussion Financial Statements | | |

| | | | | | |
Portfolio Managers: Christopher Proctor, CFA and Adam S. Wilde, CFA |
Current Yield | | | | | | |
For the 7-Day Period Ended 6/30/14 | | | | | | |
With Compounding | | | 0.01% | | | |
Without Compounding | | | 0.01% | | | |
| | | | | | |
For the 6-Month Period Ended 6/30/14 |
With Compounding | | | 0.01% | | | |
Without Compounding | | | 0.01% | | | |
Performance data quoted represents past performance, which does not guarantee future results. Yields are annualized and include dividends in a hypothetical investment for the periods shown. The investment return and principal value of an investment in the Fund will fluctuate so that an investor’s shares, when redeemed, may be worth more or less than their original cost. Current performance may be lower or higher than the performance quoted. For performance data current to the most recent month end, call us at 1.800.988.8287. The Fund’s total returns should not be expected to be the same as the returns of other funds, whether or not both funds have the same portfolio managers and/or similar names. The Fund’s total returns do not include the charges associated with the separate account products that offer this Fund. Such performance would have been lower if such charges were taken into account.
| | | | |
| PORTFOLIO ALLOCATION | | | | |
Short-Term Notes/Commercial Paper | | | 41.5% | |
Certificates of Deposit | | | 37.6 | |
Direct Bank Obligations | | | 20.9 | |
Portfolio holdings and allocations are subject to change. Percentages are as of June 30, 2014, and are based on the total market value of investments.
2 OPPENHEIMER MONEY FUND/VA
Fund Performance Discussion
Despite volatility among long-term interest rates stemming from changing economic expectations and a shift in U.S. monetary policy, short-term rates and money market yields remained stable near historical lows, anchored by the Federal Reserve’s (the “Fed”) unchanged target of between 0% and 0.25% for the overnight federal funds rate.
MARKET OVERVIEW
Markets were volatile to start the reporting period in January 2014 amid fears that political and economic instability in the world’s emerging markets might further dampen the U.S. economic recovery. While these fears generally failed to materialize, economic activity was constrained by unusually harsh winter weather over much of the United States, which caused downturns in consumer spending, corporate investment, and business inventory replenishment. Therefore, despite an additional cut in quantitative easing and signs of ongoing strength in U.S. labor markets, U.S. Gross Domestic Product contracted at a 2.1% annualized rate over the first quarter of 2014. Bonds generally rallied in this environment, and yields fell at the longer end of the market’s maturity range.
Many investors appeared to shrug off the economy’s weak quarterly performance in light of expectations that economic activity would bounce back in warmer weather. Economic data released in April and May lent credence to this view, as the unemployment rate fell to 6.3%, the economy finally regained all of the jobs lost during the 2008 recession, and the U.S. stock market achieved record highs. Shortly after the period ended, a positive June jobs report was released, in which the official unemployment rate fell to 6.1%, its lowest level since September 2008.
In spite of all the recent changes in investor sentiment, money market yields largely remained unchanged. Indeed, the Fed’s new chairperson in early 2014 backed away from previously established targets for unemployment and inflation, indicating that short-term rates would likely remain at current levels at least through the end of the year.
PORTFOLIO STRATEGY
In addition to the persistently low interest rate environment, money market yields were restrained by robust demand for a limited supply of eligible instruments and uncertainty surrounding proposed regulatory changes governing money market funds. Within these constraints, the Fund continued to generate consistent and competitive levels of current income.
As we have for some time, we maintained the Fund’s weighted average maturity throughout the reporting period in a range we considered to be in line with market averages for AAA-rated money market funds. From a portfolio composition perspective, we continued to avoid repurchase agreements due to the uncertainty surrounding potential regulatory changes. Instead, we have continued to favor commercial paper issued by global banks meeting our stringent credit criteria. We also increased the Fund’s exposure to floating rate securities on which yields are reset monthly or quarterly. In light of their low yields, the Fund held few U.S. Treasury securities over the reporting period.
Additionally, while the Fund did not partake in the Fed’s reverse repurchase program, we’ve experienced benefits from it this reporting period. The Fed’s reverse repurchase program was introduced as a method to help control short-term interest rates. Under the program, the Fed borrows funds overnight from money market funds, banks and other entities, offering Treasury securities as collateral. The borrowing entity receives 0.05% for the overnight loan. Although the Fund did not participate in the Fed’s program, we indirectly benefited from the increased supply of funds to the market.
STRATEGY & OUTLOOK
We currently expect the U.S. economy to rebound from its poor first quarter performance, but we have seen little change in the current imbalance of supply-and-demand dynamics. Consequently, we expect money market yields to remain range-bound for the foreseeable future. Over the longer term, however, we have begun to see some light at the end of the tunnel with regard to short-term interest rates. Should a 2015 rate hike by the Fed become more likely, we expect yields to rise in anticipation. The prospect of higher yields may prompt us to adjust our strategies, but in the meantime we intend to maintain a roughly market-neutral weighted average maturity, and we have retained our focus on high-quality instruments from fundamentally strong issuers.
An investment in the Fund is not insured or guaranteed by the Federal Deposit Insurance Corporation or any other government agency. Although the Fund seeks to preserve the value of your investment at $1.00 per share, it is possible to lose money by investing in the Fund.
Shares of Oppenheimer funds are not deposits or obligations of any bank, are not guaranteed by any bank, are not insured by the FDIC or any other agency, and involve investment risks, including the possible loss of the principal amount invested.
3 OPPENHEIMER MONEY FUND/VA
Fund Expenses
Fund Expenses. As a shareholder of the Fund, you incur two types of costs: (1) transaction costs and (2) ongoing costs, including management fees; distribution and service fees; and other Fund expenses. These examples are intended to help you understand your ongoing costs (in dollars) of investing in the Fund and to compare these costs with the ongoing costs of investing in other mutual funds.
The examples are based on an investment of $1,000.00 invested at the beginning of the period and held for the entire 6-month period ended June 30, 2014.
Actual Expenses. The first section of the table provides information about actual account values and actual expenses. You may use the information in this section for the class of shares you hold, together with the amount you invested, to estimate the expense that you paid over the period. Simply divide your account value by $1,000.00 (for example, an $8,600.00 account value divided by $1,000.00 = 8.60), then multiply the result by the number in the first section under the heading entitled “Expenses Paid During Period” to estimate the expenses you paid on your account during this period.
Hypothetical Example for Comparison Purposes.
The second section of the table provides information about hypothetical account values and hypothetical expenses based on the Fund’s actual expense ratio for each class of shares, and an assumed rate of return of 5% per year for each class before expenses, which is not the actual return. The hypothetical account values and expenses may not be used to estimate the actual ending account balance or expenses you paid for the period. You may use this information to compare the ongoing costs of investing in the Fund and other funds. To do so, compare this 5% hypothetical example for the class of shares you hold with the 5% hypothetical examples that appear in the shareholder reports of the other funds.
Please note that the expenses shown in the table are meant to highlight your ongoing costs only and do not reflect any charges associated with the separate accounts that offer this Fund. Therefore, the “hypothetical” lines of the table are useful in comparing ongoing costs only, and will not help you determine the relative total costs of owning different funds. In addition, if these separate account charges were included your costs would have been higher.
| | | | | | | | | | | | | | | | | | |
| Actual | | Beginning Account Value
January 1, 2014 | | | | | Ending Account Value June 30, 2014 | | | | | Expenses Paid During 6 Months Ended June 30, 2014 | | | |
| | $ | 1,000.00 | | | | | $ | 1,000.10 | | | | | $ | 0.89 | | | |
| | | | | | |
Hypothetical | | | | | | | | | | | | | | | | | | |
(5% return before expenses) | | | | | | | | | | | | | | | | | | |
| | | 1,000.00 | | | | | | 1,023.90 | | | | | | 0.90 | | | |
Expenses are equal to the Fund’s annualized expense ratio for that class, multiplied by the average account value over the period, multiplied by 181/365 (to reflect the one-half year period). Those annualized expense ratios, excluding indirect expenses from affiliated funds, based on the 6-month period ended June 30, 2014 are as follows:
The expense ratios reflect voluntary and/or contractual waivers and/or reimbursements of expenses by the Fund’s Manager. Some of these undertakings may be modified or terminated at any time, as indicated in the Fund’s prospectus. The “Financial Highlights” tables in the Fund’s financial statements, included in this report, also show the gross expense ratios, without such waivers or reimbursements and reduction to custodian expenses, if applicable.
4 OPPENHEIMER MONEY FUND/VA
STATEMENT OF INVESTMENTS June 30, 2014 Unaudited
| | | | | | | | | | | | | | | | | | | | |
| | | Maturity Date* | | | Final Legal Maturity Date** | | | Principal Amount | | | | | | | Value | |
Certificates of Deposit—38.4% | | | | | | | | | | | | | | | | | | | | |
Yankee Certificates of Deposit—38.4% | | | | | | | | | | | | | | | | | | | | |
Bank of Montreal, Chicago: | | | | | | | | | | | | | | | | | | | | |
0.06% | | | 7/7/14 | | | | 7/7/14 | | | $ | 3,600,000 | | | $ | | | | | 3,600,000 | |
0.06% | | | 7/3/14 | | | | 7/3/14 | | | | 1,300,000 | | | | | | | | 1,300,000 | |
0.17% | | | 8/27/14 | | | | 8/27/14 | | | | 3,500,000 | | | | | | | | 3,500,000 | |
Bank of Nova Scotia, Houston TX: | | | | | | | | | | | | | | | | | | | | |
0.239%1 | | | 8/20/14 | | | | 2/20/15 | | | | 2,300,000 | | | | | | | | 2,300,000 | |
0.25% | | | 1/5/15 | | | | 1/5/15 | | | | 2,000,000 | | | | | | | | 2,000,000 | |
BNP Paribas, New York: | | | | | | | | | | | | | | | | | | | | |
0.34% | | | 8/7/14 | | | | 8/7/14 | | | | 3,000,000 | | | | | | | | 3,000,000 | |
0.45% | | | 9/19/14 | | | | 9/19/14 | | | | 3,000,000 | | | | | | | | 3,000,000 | |
Credit Suisse, New York Branch, 0.21% | | | 7/29/14 | | | | 7/29/14 | | | | 1,000,000 | | | | | | | | 1,000,000 | |
DnB Bank ASA NY, 0.195% | | | 9/24/14 | | | | 9/24/14 | | | | 4,700,000 | | | | | | | | 4,700,000 | |
Nordea Bank Finland plc, New York: | | | | | | | | | | | | | | | | | | | | |
0.21% | | | 11/14/14 | | | | 11/14/14 | | | | 1,700,000 | | | | | | | | 1,700,000 | |
0.21% | | | 11/4/14 | | | | 11/4/14 | | | | 2,000,000 | | | | | | | | 2,000,000 | |
0.22% | | | 7/1/14 | | | | 7/1/14 | | | | 3,700,000 | | | | | | | | 3,700,000 | |
Rabobank Nederland NV, New York: | | | | | | | | | | | | | | | | | | | | |
0.251%1 | | | 7/7/14 | | | | 3/9/15 | | | | 4,000,000 | | | | | | | | 4,000,000 | |
0.255%1 | | | 7/31/14 | | | | 10/31/14 | | | | 800,000 | | | | | | | | 800,000 | |
0.27%1 | | | 7/7/14 | | | | 10/7/14 | | | | 1,500,000 | | | | | | | | 1,500,000 | |
0.314%1 | | | 10/20/14 | | | | 7/17/15 | | | | 1,800,000 | | | | | | | | 1,800,000 | |
Royal Bank of Canada, New York, 0.234%1 | | | 7/18/14 | | | | 2/18/15 | | | | 2,000,000 | | | | | | | | 2,000,000 | |
Skandinaviska Enskilda Bank, New York: | | | | | | | | | | | | | | | | | | | | |
0.20% | | | 9/11/14 | | | | 9/11/14 | | | | 4,000,000 | | | | | | | | 4,000,000 | |
0.20% | | | 9/4/14 | | | | 9/4/14 | | | | 3,000,000 | | | | | | | | 3,000,000 | |
Sumitomo Mutsui Bank NY, 0.08% | | | 7/8/14 | | | | 7/8/14 | | | | 5,500,000 | | | | | | | | 5,500,000 | |
Svenska Handelsbanken, New York, 0.205% | | | 11/17/14 | | | | 11/17/14 | | | | 800,000 | | | | | | | | 800,015 | |
Toronto Dominion Bank, New York, 0.24% | | | 9/4/14 | | | | 9/4/14 | | | | 2,000,000 | | | | | | | | 2,000,144 | |
Wells Fargo Bank NA: | | | | | | | | | | | | | | | | | | | | |
0.222%1 | | | 7/6/14 | | | | 12/5/14 | | | | 3,500,000 | | | | | | | | 3,500,000 | |
0.235%1 | | | 7/21/14 | | | | 5/19/15 | | | | 3,500,000 | | | | | | | | 3,500,000 | |
Total Certificates of Deposit (Cost $64,200,159) | | | | | | | | | | | | | | | | | | | 64,200,159 | |
Direct Bank Obligations—21.4% | | | | | | | | | | | | | | | | | | | | |
Bank of Nova Scotia, New York: | | | | | | | | | | | | | | | | | | | | |
0.205% | | | 9/22/14 | | | | 9/22/14 | | | | 500,000 | | | | | | | | 499,764 | |
0.205% | | | 8/4/14 | | | | 8/4/14 | | | | 2,500,000 | | | | | | | | 2,499,516 | |
Bank of Tokyo-Mitsubishi UFJ NY, 0.10%2 | | | 7/3/14 | | | | 7/3/14 | | | | 6,000,000 | | | | | | | | 5,999,967 | |
Credit Suisse, New York Branch: | | | | | | | | | | | | | | | | | | | | |
0.17% | | | 7/1/14 | | | | 7/1/14 | | | | 251,000 | | | | | | | | 251,000 | |
0.21% | | | 8/12/14 | | | | 8/12/14 | | | | 1,100,000 | | | | | | | | 1,099,731 | |
0.24% | | | 9/4/14 | | | | 9/4/14 | | | | 1,700,000 | | | | | | | | 1,699,263 | |
0.27% | | | 9/15/14 | | | | 9/15/14 | | | | 2,500,000 | | | | | | | | 2,498,575 | |
DnB Bank ASA: | | | | | | | | | | | | | | | | | | | | |
0.17%3 | | | 8/4/14 | | | | 8/4/14 | | | | 250,000 | | | | | | | | 249,960 | |
0.195%3 | | | 7/1/14 | | | | 7/1/14 | | | | 3,000,000 | | | | | | | | 3,000,000 | |
HSBC USA, Inc.: | | | | | | | | | | | | | | | | | | | | |
0.23% | | | 8/8/14 | | | | 8/8/14 | | | | 3,000,000 | | | | | | | | 2,999,272 | |
0.23% | | | 8/4/14 | | | | 8/4/14 | | | | 3,000,000 | | | | | | | | 2,999,348 | |
0.24% | | | 8/26/14 | | | | 8/26/14 | | | | 1,600,000 | | | | | | | | 1,599,403 | |
PNC Bank NA, 0.31% | | | 2/23/15 | | | | 2/23/15 | | | | 5,000,000 | | | | | | | | 5,000,000 | |
Skandinaviska Enskilda BankenAB: | | | | | | | | | | | | | | | | | | | | |
0.18%3 | | | 7/11/14 | | | | 7/11/14 | | | | 600,000 | | | | | | | | 599,970 | |
0.18%3 | | | 7/14/14 | | | | 7/14/14 | | | | 600,000 | | | | | | | | 599,961 | |
Svenska Handelsbanken, Inc., 0.20%3 | | | 10/24/14 | | | | 10/24/14 | | | | 3,500,000 | | | | | | | | 3,497,764 | |
Swedbank AB, 0.19% | | | 8/20/14 | | | | 8/20/14 | | | | 620,000 | | | | | | | | 619,836 | |
Total Direct Bank Obligations (Cost $35,713,330) | | | | | | | | | | | | | | | | | | | 35,713,330 | |
Short-Term Notes/Commercial Paper—42.5% | | | | | | | | | | | | | | | | | | | | |
Capital Markets—0.9% | | | | | | | | | | | | | | | | | | | | |
BNP Paribas Finance, Inc., 0.29% | | | 11/24/14 | | | | 11/24/14 | | | | 1,500,000 | | | | | | | | 1,498,236 | |
Leasing & Factoring—9.6% | | | | | | | | | | | | | | | | | | | | |
American Honda Finance Corp.: | | | | | | | | | | | | | | | | | | | | |
0.23%1 | | | 9/4/14 | | | | 6/4/15 | | | | 5,000,000 | | | | | | | | 5,000,000 | |
0.23%1 | | | 9/12/14 | | | | 12/5/14 | | | | 1,000,000 | | | | | | | | 1,000,000 | |
0.246%1,2 | | | 7/17/14 | | | | 7/17/14 | | | | 2,000,000 | | | | | | | | 2,000,000 | |
Toyota Motor Credit Corp.: | | | | | | | | | | | | | | | | | | | | |
0.191%1 | | | 7/4/14 | | | | 8/28/14 | | | | 2,000,000 | | | | | | | | 2,000,000 | |
5 OPPENHEIMER MONEY FUND/VA
STATEMENT OF INVESTMENTS Unaudited / Continued
| | | | | | | | | | | | | | | | | | | | | | |
| | | Maturity Date* | | | Final Legal Maturity Date** | | | Principal Amount | | | | | | | | Value | |
Leasing & Factoring (Continued) | | | | | | | | | | | | | | | | | | | | | | |
Toyota Motor Credit Corp.: (Continued) | | | | | | | | | | | | | | | | | | | | | | |
0.227%1 | | | 7/14/14 | | | | 1/14/15 | | | $ | 2,000,000 | | | $ | | | | | | | 2,000,000 | |
0.23% | | | 2/9/15 | | | | 2/9/15 | | | | 4,000,000 | | | | | | | | | | 3,994,301 | |
| | | | | | | | | | | | | | | | | | | | | 15,994,301 | |
| | | | | | |
| | | | | | | | | | | | | | | | | | | | | | | |
Municipal—5.9% | | | | | | | | | | | | | | | | | | | | | | |
| CA Pollution Control Financing Authority Solid Waste Disposal Revenue Bonds, Zerep Management Corp., Series 2014, 0.10%1 | | | 7/7/14 | | | | 7/7/14 | | | | 1,400,000 | | | | | | | | | | 1,400,000 | |
| Calcasieu Parish, LA Public Trust Authority Solid Waste Disposal Revenue Bonds, WPT Corp. Project, Series 1997, 0.07%1 | | | 7/7/14 | | | | 7/7/14 | | | | 5,600,000 | | | | | | | | | | 5,600,000 | |
| San Antonio, TX Industrial Development Authority Revenue Bonds, Tindall Corp. Project, 0.20%1 | | | 7/7/14 | | | | 7/7/14 | | | | 1,900,000 | | | | | | | | | | 1,900,000 | |
| St. Paul, MN Bonds, Rivercentre Arena Project, Series 2009A, 0.15%1 | | | 7/7/14 | | | | 7/7/14 | | | | 1,000,000 | | | | | | | | | | 1,000,000 | |
| | | | | | | | | | | | | | | | | | | | | 9,900,000 | |
| | | | | | |
| | | | | | | | | | | | | | | | | | | | | | | |
Receivables Finance—10.6% | | | | | | | | | | | | | | | | | | | | | | |
| Barton Capital Corp., 0.07%3 | | | 7/1/14 | | | �� | 7/1/14 | | | | 2,848,000 | | | | | | | | | | 2,848,000 | |
| Gemini Securitization Corp., 0.11%3 | | | 7/1/14 | | | | 7/1/14 | | | | 4,000,000 | | | | | | | | | | 4,000,000 | |
| Manhattan Asset Funding Co., 0.16%3 | | | 7/1/14 | | | | 7/1/14 | | | | 600,000 | | | | | | | | | | 600,000 | |
Old Line Funding Corp.: | | | | | | | | | | | | | | | | | | | | | | |
0.22%3 | | | 11/25/14 | | | | 11/25/14 | | | | 2,000,000 | | | | | | | | | | 1,998,203 | |
| 0.22%3 | | | 10/6/14 | | | | 10/6/14 | | | | 1,500,000 | | | | | | | | | | 1,499,111 | |
Thunder Bay Funding LLC: | | | | | | | | | | | | | | | | | | | | | | |
0.22%3 | | | 10/10/14 | | | | 10/10/14 | | | | 2,000,000 | | | | | | | | | | 1,998,765 | |
| 0.24%3 | | | 9/8/14 | | | | 9/8/14 | | | | 1,500,000 | | | | | | | | | | 1,499,310 | |
| Victory Receivables Corp., 0.06%3 | | | 7/2/14 | | | | 7/2/14 | | | | 2,400,000 | | | | | | | | | | 2,399,996 | |
| White Plains Capital Co. LLC, 0.17% | | | 7/1/14 | | | | 7/1/14 | | | | 1,000,000 | | | | | | | | | | 1,000,000 | |
| | | | | | | | | | | | | | | | | | | | | 17,843,385 | |
| | | | | | |
| | | | | | | | | | | | | | | | | | | | | | | |
Special Purpose Financial—15.5% | | | | | | | | | | | | | | | | | | | | | | |
| Anglesea Funding LLC, 0.10%2 | | | 7/1/14 | | | | 7/1/14 | | | | 3,000,000 | | | | | | | | | | 3,000,000 | |
| Collateralized Commercial Paper II Co. LLC, 0.401% | | | 10/24/14 | | | | 10/24/14 | | | | 1,000,000 | | | | | | | | | | 998,722 | |
Concord Minutemen Cap. Corp. LLC: | | | | | | | | | | | | | | | | | | | | | | |
0.20% | | | 7/7/14 | | | | 7/7/14 | | | | 1,000,000 | | | | | | | | | | 999,967 | |
0.20% | | | 7/24/14 | | | | 7/24/14 | | | | 1,600,000 | | | | | | | | | | 1,599,796 | |
| 0.20% | | | 7/21/14 | | | | 7/21/14 | | | | 2,900,000 | | | | | | | | | | 2,899,678 | |
Crown Point Capital Co.: | | | | | | | | | | | | | | | | | | | | | | |
0.18% | | | 7/14/14 | | | | 7/14/14 | | | | 1,100,000 | | | | | | | | | | 1,099,928 | |
0.20% | | | 7/25/14 | | | | 7/25/14 | | | | 2,100,000 | | | | | | | | | | 2,099,720 | |
0.20% | | | 7/1/14 | | | | 7/1/14 | | | | 1,600,000 | | | | | | | | | | 1,600,000 | |
| 0.20% | | | 7/8/14 | | | | 7/8/14 | | | | 1,000,000 | | | | | | | | | | 999,961 | |
Govco LLC: | | | | | | | | | | | | | | | | | | | | | | |
0.18%3 | | | 8/15/14 | | | | 8/15/14 | | | | 1,900,000 | | | | | | | | | | 1,899,573 | |
0.18%3 | | | 7/17/14 | | | | 7/17/14 | | | | 3,000,000 | | | | | | | | | | 2,999,760 | |
| 0.18%3 | | | 8/1/14 | | | | 8/1/14 | | | | 3,100,000 | | | | | | | | | | 3,099,519 | |
Ridgefield Funding Co. LLC, 0.221%1 | | | 7/3/14 | | | | 11/3/14 | | | | 2,500,000 | | | | | | | | | | 2,500,000 | |
| | | | | | | | | | | | | | | | | | | | | 25,796,624 | |
| Total Short-Term Notes/Commercial Paper (Cost $71,032,546) | | | | | | | | | | | | | | | | | | | | | 71,032,546 | |
Total Investments, at Value (Cost $170,946,035) | | | | | | | | | | | 102.3% | | | | | | | | | | 170,946,035 | |
Net Other Assets (Liabilities) | | | | | | | | | | | (2.3) | | | | | | | | | | (3,906,570) | |
Net Assets | | | | | | | | | | | 100.0% | | | $ | | | | | | | 167,039,465 | |
Footnotes to Statement of Investments
Short-term notes and direct bank obligations are generally traded on a discount basis; the interest rate shown is the discount rate received by the Fund at the time of purchase. Other securities normally bear interest at the rates shown.
* The Maturity Date represents the date used to calculate the Fund’s weighted average maturity as determined under Rule 2a-7.
** If different from the Maturity Date, the Final Legal Maturity Date includes any maturity date extensions which may be affected at the option of the issuer or unconditional payments of principal by the issuer which may be affected at the option of the Fund, and represents the date used to calculate the Fund’s weighted average life as determined under Rule 2a-7.
1. Represents the current interest rate for a variable or increasing rate security.
2. Represents securities sold under Rule 144A, which are exempt from registration under the Securities Act of 1933, as amended. These securities have been determined to be liquid under guidelines established by the Board of Trustees. These securities amount to $10,999,967 or 6.59% of the Fund’s net assets as of June 30, 2014.
3. Security issued in an exempt transaction without registration under the Securities Act of 1933. Such securities amount to $32,789,892 or 19.63% of the Fund’s net assets, and have been determined to be liquid pursuant to guidelines adopted by the Board of Trustees.
See accompanying Notes to Financial Statements.
6 OPPENHEIMER MONEY FUND/VA
STATEMENT OF ASSETS AND LIABILITIES June 30, 2014 Unaudited
| | | | |
Assets | | | | |
Investments, at value (cost $170,946,035)—see accompanying statement of investments | | $ | 170,946,035 | |
Cash | | | 2,021,931 | |
Receivables and other assets: | | | | |
Shares of beneficial interest sold | | | 103,660 | |
Interest | | | 35,716 | |
Other | | | 22,771 | |
Total assets | | | 173,130,113 | |
Liabilities | | | | |
Payables and other liabilities: | | | | |
Shares of beneficial interest redeemed | | | 6,065,665 | |
Trustees’ compensation | | | 18,398 | |
Dividends | | | 404 | |
Other | | | 6,181 | |
Total liabilities | | | 6,090,648 | |
Net Assets | | $ | 167,039,465 | |
| | | | |
Composition of Net Assets | | | | |
Par value of shares of beneficial interest | | $ | 167,032 | |
Additional paid-in capital | | | 166,869,824 | |
Accumulated net investment loss | | | (121) | |
Accumulated net realized gain on investments | | | 2,730 | |
Net Assets - applicable to 167,032,241 shares of beneficial interest outstanding | | $ | 167,039,465 | |
| |
| | | | |
Net Asset Value. Redemption Price Per Share and Offering Price Per Share | | | $1.00 | |
See accompanying Notes to Financial Statements.
7 OPPENHEIMER MONEY FUND/VA
STATEMENT OF OPERATIONS For the Six Months Ended June 30, 2014 Unaudited
| | | | |
Investment Income | | | | |
Interest | | $ | 172,380 | |
| | | | |
Expenses | | | | |
Management fees | | | 403,222 | |
Transfer and shareholder servicing agent fees | | | 89,605 | |
Trustees’ compensation | | | 12,995 | |
Custodian fees and expenses | | | 814 | |
Shareholder communications: | | | 812 | |
Other | | | 25,436 | |
Total expenses | | | 532,884 | |
Less waivers and reimbursements of expenses | | | (369,460) | |
Net expenses | | | 163,424 | |
Net Investment Income | | | 8,956 | |
| | | | |
Realized Gain | | | 2,730 | |
| | | | |
Net Increase in Net Assets Resulting from Operations | | $ | 11,686 | |
See accompanying Notes to Financial Statements.
8 OPPENHEIMER MONEY FUND/VA
STATEMENT OF CHANGES IN NET ASSETS
| | | | | | |
| | | Six Months Ended
June 30, 2014
(Unaudited) | | | Year Ended
December 31, 2013 |
Operations | | | | | | |
Net investment income | | $ | 8,956 | | | $ 18,234 |
Net realized gain | | | 2,730 | | | 2,445 |
| | | | | | |
Net increase in net assets resulting from operations | | | 11,686 | | | 20,679 |
|
|
Dividends and/or Distributions to Shareholders | | | | | | |
Dividends from net investment income | | | (9,328) | | | (24,504) |
Beneficial Interest Transactions | | | | | | |
Net increase (decrease) in net assets resulting from beneficial interest transactions | | | (9,989,296) | | | 2,601,903 |
Net Assets | | | | | | |
Total increase (decrease) | | | (9,986,938) | | | 2,598,078 |
Beginning of period | | | 177,026,403 | | | 174,428,325 |
| | | | | | |
| | |
End of period (including accumulated net investment income (loss) of $(121) and $251, respectively) | | $ | 167,039,465 | | | $ 177,026,403 |
| | | |
See accompanying Notes to Financial Statements.
9 OPPENHEIMER MONEY FUND/VA
FINANCIAL HIGHLIGHTS
| | | | | | | | | | | | | | | | | | | | | | |
| | | Six Months
Ended
June 30, 2014
(Unaudited) | | | Year Ended
December 31,
2013 | | | Year Ended
December 31,
2012 | | | Year Ended
December 30,
20111 | | | Year Ended
December 31,
2010 | | | Year Ended
December 31,
2009 |
Per Share Operating Data | | | | | | | | | | | | | | | | | | | | | | |
Net asset value, beginning of period | | $ | 1.00 | | | $ | 1.00 | | | $ | 1.00 | | | $ | 1.00 | | | $ | 1.00 | | | $ 1.00 |
Income from investment operations -net investment income and net realized gain2 | | | 0.003 | | | | 0.003 | | | | 0.003 | | | | 0.003 | | | | 0.003 | | | 0.003 |
| Dividends and/or distributions to shareholders: | | | | | | | | | | | | | | | | | | | | | | |
Dividends from net investment income | | | 0.003 | | | | 0.003 | | | | 0.003 | | | | 0.003 | | | | 0.003 | | | 0.003 |
Net asset value, end of period | | $ | 1.00 | | | $ | 1.00 | | | $ | 1.00 | | | $ | 1.00 | | | $ | 1.00 | | | $ 1.00 |
| | | |
|
|
Total Return, at Net Asset Value4 | | | 0.01% | | | | 0.01% | | | | 0.01% | | | | 0.01% | | | | 0.03% | | | 0.32% |
|
|
Ratios/Supplemental Data | | | | | | | | | | | | | | | | | | | | | | |
Net assets, end of period (in thousands) | | $ | 167,039 | | | $ | 177,026 | | | $ | 174,428 | �� | | $ | 163,973 | | | $ | 149,697 | | | $ 180,955 |
Average net assets (in thousands) | | $ | 181,606 | | | $ | 178,263 | | | $ | 164,276 | | | $ | 156,127 | | | $ | 164,258 | | | $ 218,079 |
Ratios to average net assets:5 | | | | | | | | | | | | | | | | | | | | | | |
Net investment income | | | 0.01% | | | | 0.01% | | | | 0.01% | | | | 0.01% | | | | 0.01% | | | 0.35% |
Total expenses | | | 0.59% | | | | 0.61% | | | | 0.62% | | | | 0.61% | | | | 0.61% | | | 0.57% |
Expenses after payments, waivers and/or reimbursements and reduction to custodian expenses | | | 0.18% | | | | 0.22% | | | | 0.30% | | | | 0.29% | | | | 0.35% | | | 0.48% |
1. December 30, 2011 represents the last business day of the Fund’s reporting period.
2. Per share amounts calculated based on the average shares outstanding during the period.
3. Less than $0.005 per share.
4. Assumes an initial investment on the business day before the first day of the fiscal period, with all dividends and distributions reinvested in additional shares on the reinvestment date, and redemption at the net asset value calculated on the last business day of the fiscal period. Total returns are not annualized for periods less than one full year. Total return information does not reflect expenses that apply at the separate account level or to related insurance products. Inclusion of these charges would reduce the total return figures for all periods shown. Returns do not reflect the deduction of taxes that a shareholder would pay on fund distributions or the redemption of fund shares.
5. Annualized for periods less than one full year.
See accompanying Notes to Financial Statements.
10 OPPENHEIMER MONEY FUND/VA
NOTES TO FINANCIAL STATEMENTS June 30, 2014 Unaudited
1. Significant Accounting Policies
Oppenheimer Money Fund/VA (the “Fund”), a separate series of Oppenheimer Variable Account Funds, is a diversified open-end management investment company registered under the Investment Company Act of 1940, as amended. The Fund’s investment objective is to seek income consistent with stability of principal. The Fund’s investment adviser is OFI Global Asset Management, Inc. (“OFI Global” or the “Manager”), a wholly-owned subsidiary of OppenheimerFunds Inc. (“OFI” or the “Sub-Adviser”). The Manager has entered into a sub-advisory agreement with OFI. Shares of the Fund are sold only to separate accounts of life insurance companies.
The following is a summary of significant accounting policies consistently followed by the Fund.
Federal Taxes. The Fund intends to comply with provisions of the Internal Revenue Code applicable to regulated investment companies and to distribute substantially all of its investment company taxable income to shareholders. Therefore, no federal income or excise tax provision is required. The Fund files income tax returns in U.S. federal and applicable state jurisdictions. The statute of limitations on the Fund’s tax return filings generally remain open for the three preceding fiscal reporting period ends.
Trustees’ Compensation. The Board of Trustees has adopted a compensation deferral plan for independent trustees that enables trustees to elect to defer receipt of all or a portion of the annual compensation they are entitled to receive from the Fund. For purposes of determining the amount owed to the Trustee under the plan, deferred amounts are treated as though equal dollar amounts had been invested in shares of the Fund or in other Oppenheimer funds selected by the Trustee. The Fund purchases shares of the funds selected for deferral by the Trustee in amounts equal to his or her deemed investment, resulting in a Fund asset equal to the deferred compensation liability. Such assets are included as a component of “Other” within the asset section of the Statement of Assets and Liabilities. Deferral of trustees’ fees under the plan will not affect the net assets of the Fund, and will not materially affect the Fund’s assets, liabilities or net investment income per share. Amounts will be deferred until distributed in accordance with the compensation deferral plan.
Dividends and Distributions to Shareholders. Dividends and distributions to shareholders, which are determined in accordance with income tax regulations and may differ from U.S. generally accepted accounting principles, are recorded on the ex-dividend date. Income distributions, if any, are declared daily and paid monthly. Capital gain distributions, if any, are declared and paid annually but may be paid at other times to maintain the net asset value per share at $1.00. The tax character of distributions is determined as of the Fund’s fiscal year end. Therefore, a portion of the Fund’s distributions made to shareholders prior to the Fund’s fiscal year end may ultimately be categorized as a tax return of capital.
Investment Income. Interest income is recognized on an accrual basis. Discount and premium, which are included in interest income on the Statement of Operations, are amortized or accreted daily.
Custodian Fees. “Custodian fees and expenses” in the Statement of Operations may include interest expense incurred by the Fund on any cash overdrafts of its custodian account during the period. Such cash overdrafts may result from the effects of failed trades in portfolio securities and from cash outflows resulting from unanticipated shareholder redemption activity. The Fund pays interest to its custodian on such cash overdrafts, to the extent they are not offset by positive cash balances maintained by the Fund, at a rate equal to the Federal Funds Rate plus 0.50%. The “Reduction to custodian expenses” line item, if applicable, represents earnings on cash balances maintained by the Fund during the period. Such interest expense and other custodian fees may be paid with these earnings.
Security Transactions. Security transactions are recorded on the trade date. Realized gains and losses on securities sold are determined on the basis of identified cost.
Indemnifications. The Fund’s organizational documents provide current and former trustees and officers with a limited indemnification against liabilities arising in connection with the performance of their duties to the Fund. In the normal course of business, the Fund may also enter into contracts that provide general indemnifications. The Fund’s maximum exposure under these arrangements is unknown as this would be dependent on future claims that may be made against the Fund. The risk of material loss from such claims is considered remote.
Other. The preparation of financial statements in conformity with accounting principles generally accepted in the United States of America requires management to make estimates and assumptions that affect the reported amounts of assets and liabilities and disclosure of contingent assets and liabilities at the date of the financial statements and the reported amounts of increases and decreases in net assets from operations during the reporting period. Actual results could differ from those estimates.
2. Securities Valuation
The Fund calculates the net asset value of its shares as of the close of the New York Stock Exchange (the “Exchange”), normally 4:00 P.M. Eastern time, on each day the Exchange is open for trading.
The Fund’s Board has adopted procedures for the valuation of the Fund’s securities and has delegated the day-to-day responsibility for valuation determinations under those procedures to the Manager. The Manager has established a Valuation Committee which is responsible for determining a “fair valuation” for any security for which market quotations are not “readily available.” The Valuation Committee’s fair valuation determinations are subject to review, approval and ratification by the Fund’s Board at its next regularly scheduled meeting covering the calendar quarter in which the fair valuation was determined.
11 OPPENHEIMER MONEY FUND/VA
NOTESTO FINANCIAL STATEMENTS Unaudited / Continued
2. Securities Valuation (Continued)
Valuation Methods and Inputs
Securities are valued at cost adjusted by the amortization of discount or premium to maturity (amortized cost), which approximates market value. If amortized cost is determined not to approximate market value, the fair value of the portfolio securities will be determined under procedures approved by the Fund’s Board of Trustees.
If a market value or price cannot be determined for a security using the methodologies described above, or if, in the “good faith” opinion of the Manager, the market value or price obtained does not constitute a “readily available market quotation,” or a significant event has occurred that would materially affect the value of the security the security is fair valued either (i) by a standardized fair valuation methodology applicable to the security type or the significant event as previously approved by the Valuation Committee and the Fund’s Board or (ii) as determined in good faith by the Manager’s Valuation Committee. The Valuation Committee considers all relevant facts that are reasonably available, through either public information or information available to the Manager, when determining the fair value of a security. Fair value determinations by the Manager are subject to review, approval and ratification by the Fund’s Board at its next regularly scheduled meeting covering the calendar quarter in which the fair valuation was determined. Those fair valuation standardized methodologies include, but are not limited to, valuing securities at the last sale price or initially at cost and subsequently adjusting the value based on: changes in company specific fundamentals, changes in an appropriate securities index, or changes in the value of similar securities which may be further adjusted for any discounts related to security-specific resale restrictions. When possible, such methodologies use observable market inputs such as unadjusted quoted prices of similar securities, observable interest rates, currency rates and yield curves. The methodologies used for valuing securities are not necessarily an indication of the risks associated with investing in those securities nor can it be assured that the Fund can obtain the fair value assigned to a security if it were to sell the security.
To assess the continuing appropriateness of security valuations, the Manager, or its third party service provider who is subject to oversight by the Manager, regularly compares prior day prices, prices on comparable securities, and sale prices to the current day prices and challenges those prices exceeding certain tolerance levels with the third party pricing service or broker source. For those securities valued by fair valuations, whether through a standardized fair valuation methodology or a fair valuation determination, the Valuation Committee reviews and affirms the reasonableness of the valuations based on such methodologies and fair valuation determinations on a regular basis after considering all relevant information that is reasonably available.
Classifications
Each investment asset or liability of the Fund is assigned a level at measurement date based on the significance and source of the inputs to its valuation. Various data inputs are used in determining the value of each of the Fund’s investments as of the reporting period end. These data inputs are categorized in the following hierarchy under applicable financial accounting standards:
1) Level 1-unadjusted quoted prices in active markets for identical assets or liabilities (including securities actively traded on a securities exchange)
2) Level 2-inputs other than unadjusted quoted prices that are observable for the asset or liability (such as unadjusted quoted prices for similar assets and market corroborated inputs such as interest rates, prepayment speeds, credit risks, etc.)
3) Level 3-significant unobservable inputs (including the Manager’s own judgments about assumptions that market participants would use in pricing the asset or liability).
The inputs used for valuing securities are not necessarily an indication of the risks associated with investing in those securities.
The table below categorizes amounts that are included in the Fund’s Statement of Assets and Liabilities as of June 30, 2014 based on valuation input level:
| | | | | | | | | | | | | | | | |
| | | Level 1—
Unadjusted Quoted Prices | | | Level 2— Other Significant
Observable Inputs | | | Level 3—
Significant
Unobservable
Inputs | | | Value | |
| |
Investments, at Value: | | | | | | | | | | | | | | | | |
Assets Table | | | | | | | | | | | | | | | | |
Certificates of Deposit | | $ | — | | | $ | 64,200,159 | | | $ | — | | | $ | 64,200,159 | |
Direct Bank Obligations | | | — | | | | 35,713,330 | | | | — | | | | 35,713,330 | |
Short-Term Notes/Commercial Paper | | | — | | | | 71,032,546 | | | | — | | | | 71,032,546 | |
| | | | |
Total Assets | | $ | — | | | $ | 170,946,035 | | | $ | — | | | $ | 170,946,035 | |
| | | | |
3. Shares of Beneficial Interest
The Fund has authorized an unlimited number of $0.001 par value shares of beneficial interest of each class. Transactions in shares of beneficial interest were as follows:
| | | | | | | | | | | | | | | | | | |
| | | Six Months Ended June 30, 2014 | | | Year Ended December 31, 2013 | | | |
| | | Shares | | | Amount | | | Shares | | | Amount | | | |
| | | |
Sold | | | 75,020,548 | | | $ | 75,020,548 | | | | 101,203,375 | | | $ | 101,203,375 | | | |
Dividends and/or distributions reinvested | | | 9,328 | | | | 9,328 | | | | 24,504 | | | | 24,504 | | | |
Redeemed | | | (85,019,172) | | | | (85,019,172) | | | | (98,625,976) | | | | (98,625,976) | | | |
| | | | | | |
Net increase (decrease) | | | (9,989,296) | | | $ | (9,989,296) | | | | 2,601,903 | | | $ | 2,601,903 | | | |
| | | | | | |
12 OPPENHEIMER MONEY FUND/VA
4. Fees and Other Transactions with Affiliates
Management Fees. Under the investment advisory agreement, the Fund pays the Manager a management fee based on the daily net assets of the Fund at an annual rate as shown in the following table:
| | | | |
| Fee Schedule | | | |
| |
Up to $500 million | | | 0.450% | |
Next $500 million | | | 0.425 | |
Next $500 million | | | 0.400 | |
Over $1.5 billion | | | 0.375 | |
Sub-Adviser Fees. The Manager has retained the Sub-Adviser to provide the day-to-day portfolio management of the Fund. Under the Sub-Advisory Agreement, the Manager pays the Sub-Adviser an annual fee in monthly installments, equal to a percentage of the investment management fee collected by the Manager from the Fund, which shall be calculated after any investment management fee waivers. The fee paid to the Sub-Adviser is paid by the Manager, not by the Fund.
Transfer Agent Fees. OFI Global (the “Transfer Agent”) serves as the transfer and shareholder servicing agent for the Fund. The Fund pays the Transfer Agent a fee based on annual net assets. Fees incurred and average net assets for each class with respect to these services are detailed in the Statement of Operations and Financial Highlights, respectively.
Sub-Transfer Agent Fees. The Transfer Agent has retained Shareholder Services, Inc., a wholly-owned subsidiary of OFI (the “Sub-Transfer Agent”), to provide the day-to-day transfer agent and shareholder servicing of the Fund. Under the Sub-Transfer Agency Agreement, the Transfer Agent pays the Sub-Transfer Agent an annual fee in monthly installments, equal to a percentage of the transfer agent fee collected by the Transfer Agent from the Fund, which shall be calculated after any applicable fee waivers. The fee paid to the Sub-Transfer Agent is paid by the Transfer Agent, not by the Fund.
Waivers and Reimbursements of Expenses. The Manager has voluntarily undertaken to waive fees and/or reimburse expenses to the extent necessary to assist the Fund in attempting to maintain a positive yield. There is no guarantee that the Fund will maintain a positive yield. During the six months ended June 30, 2014, the Manager waived fees and/or reimbursed the Fund $286,859.
The Manager has contractually agreed to limit the Fund’s expenses after payments, waivers and/or reimbursements and reduction to custodian expenses, excluding expenses incurred directly or indirectly by the Fund as a result of investments in other investment companies, wholly-owned subsidiaries and pooled investment vehicles; so that those expenses, as percentages of daily net assets, will not exceed the annual rate of 0.50%. As a result of this limitation, the Manager waived $82,601 for the six months ended June 30, 2014.
Effective April 30, 2013, the Manager is permitted to recapture previously waived and/or reimbursed fees in any given fiscal year if the recapture would not: 1) cause the Fund to generate a negative daily yield, and 2) exceed amounts previously waived and/or reimbursed under this arrangement during the current and prior three fiscal years. The reimbursement to the Manager of such previous waivers and reimbursements would not include any portion of distribution and/or service fees. As of June 30, 2014, the following waived and/or reimbursed amounts are eligible for recapture:
| | | | |
| Expires | | | |
| |
December 31, 2016 | | $ | 486,156 | |
December 31, 2017 | | | 369,460 | |
The Manager has not recaptured any previously waived and/or reimbursed amounts during the six months ended June 30, 2014.
Some of these undertakings may be modified or terminated at any time; some may not be modified or terminated until after one year from the date of the current prospectus, as indicated therein.
5. Pending Litigation
In 2009, seven class action lawsuits were filed in the U.S. District Court for the District of Colorado against OppenheimerFunds, Inc. (“OFI”), OppenheimerFunds Distributor, Inc., the Fund’s principal underwriter and distributor (the “Distributor”), and certain funds (but not including the Fund) advised by OFI Global Asset Management, Inc. and distributed by the Distributor (the “Defendant Funds”). The lawsuits also named as defendants certain officers and current and former trustees of the respective Defendant Funds. The lawsuits raised claims under federal securities law and alleged, among other things, that the disclosure documents of the respective Defendant Funds contained misrepresentations and omissions and that the respective Defendant Funds’ investment policies were not followed. The plaintiffs in these actions sought unspecified damages, equitable relief and awards of attorneys’ fees and litigation expenses. The Defendant Funds’ Boards of Trustees also engaged counsel to represent the Funds and the present and former Independent Trustees named in those suits. On March 5, 2014, the parties in six of these lawsuits executed stipulations and agreements of settlement resolving those actions. On July 31, 2014, the court entered an order and final judgment approving the settlements as fair, reasonable and adequate. The settlements do not resolve a seventh outstanding lawsuit relating to Oppenheimer Rochester California Municipal Fund.
Other class action and individual lawsuits have been filed since 2008 in various state and federal courts against OFI and certain of its affiliates by investors seeking to recover investments they allegedly lost as a result of the “Ponzi” scheme run by Bernard L. Madoff and his firm, Bernard L. Madoff Investment Securities, LLC (“BLMIS”). Plaintiffs in these suits allege that they suffered losses as a result of their investments in several funds managed by an affiliate of OFI and assert a variety of claims, including breach of fiduciary duty, fraud, negligent misrepresentation, unjust enrichment, and violation of federal and state securities laws and regulations, among others. They seek unspecified damages, equitable relief and awards of attorneys’ fees and
13 OPPENHEIMER MONEY FUND/VA
NOTESTO FINANCIAL STATEMENTS Unaudited / Continued
5. Pending Litigation (Continued)
litigation expenses. Neither the Distributor, nor any of the Oppenheimer mutual funds, their independent trustees or directors are named as defendants in these lawsuits. None of the Oppenheimer mutual funds invested in any funds or accounts managed by Madoff or BLMIS. On February 28, 2011, a stipulation of partial settlement of three groups of consolidated putative class action lawsuits relating to these matters was filed in the U.S. District Court for the Southern District of New York. On August 19, 2011, the court entered an order and final judgment approving the settlement as fair, reasonable and adequate. In September 2011, certain parties filed notices of appeal from the court’s order approving the settlement. In June 2014, the appellate court affirmed the lower court’s order approving the settlement. Certain parties subsequently filed a petition for certiorari before the U.S. Supreme Court further challenging the settlement approval order. The settlement does not resolve other outstanding lawsuits against OFI and its affiliates relating to BLMIS.
OFI believes the lawsuits and appeals described above are without legal merit and, with the exception of actions it has settled, is defending against them vigorously. While it is premature to render any opinion as to the outcome in these lawsuits, or whether any costs that the Defendant Funds may bear in defending the suits might not be reimbursed by insurance, OFI believes that these suits should not impair the ability of OFI or the Distributor to perform their respective duties to the Fund, and that the outcome of all of the suits together should not have any material effect on the operations of any of the Oppenheimer mutual funds.
14 OPPENHEIMER MONEY FUND/VA
PORTFOLIO PROXY VOTING POLICIES AND PROCEDURES; UPDATES TO
STATEMENTS Unaudited
The Fund has adopted Portfolio Proxy Voting Policies and Procedures under which the Fund votes proxies relating to securities (“portfolio proxies”) held by the Fund. A description of the Fund’s Portfolio Proxy Voting Policies and Procedures is available (i) without charge, upon request, by calling the Fund toll-free at 1.800.525.7048, (ii) on the Fund’s website at oppenheimerfunds.com, and (iii) on the SEC’s website at www.sec.gov. In addition, the Fund is required to file Form N-PX, with its complete proxy voting record for the 12 months ended June 30th, no later than August 31st of each year. The Fund’s voting record is available (i) without charge, upon request, by calling the Fund toll-free at 1.800.525.7048, and (ii) in the Form N-PX filing on the SEC’s website at www.sec.gov.
The Fund files its complete schedule of portfolio holdings with the SEC for the first quarter and the third quarter of each fiscal year on Form N-Q. The Fund’s Form N-Q filings are available on the SEC’s website at www.sec.gov. Those forms may be reviewed and copied at the SEC’s Public Reference Room in Washington, D.C. Information on the operation of the Public Reference Room may be obtained by calling 1-800-SEC-0330.
15 OPPENHEIMER MONEY FUND/VA
OPPENHEIMER MONEY FUND/VA
A Series of Oppenheimer Variable Account Funds
| | |
| Trustees and Officers | | Sam Freedman, Chairman of the Board of Trustees and Trustee |
| | Edward L. Cameron, Trustee |
| | Jon S. Fossel, Trustee |
| | Richard F. Grabish, Trustee |
| | Beverly L. Hamilton, Trustee |
| | Victoria J. Herget, Trustee |
| | Robert J. Malone, Trustee |
| | F. William Marshall, Jr., Trustee |
| | Karen L. Stuckey, Trustee |
| | James D. Vaughn, Trustee |
| | William F. Glavin, Jr., Trustee, President and Principal Executive Officer |
| | Christopher Proctor, Vice President |
| | Adam Wilde, Vice President |
| | Arthur S. Gabinet, Secretary and Chief Legal Officer |
| | Christina M. Nasta, Vice President and Chief Business Officer |
| | Mary Ann Picciotto, Chief Compliance Officer and Chief Anti-Money Laundering Officer |
| | Brian W. Wixted, Treasurer and Principal Financial & Accounting Officer |
| |
| Manager | | OFI Global Asset Management, Inc. |
| |
| Sub-Adviser | | OppenheimerFunds, Inc. |
| |
| Distributor | | OppenheimerFunds Distributor, Inc. |
| |
| Transfer and | | OFI Global Asset Management, Inc. |
| Shareholder | | |
| Servicing Agent | | |
| |
| Sub-Transfer Agent | | Shareholder Services, Inc. |
| | DBA OppenheimerFunds Services |
| |
| Independent | | KPMG LLP |
| Registered | | |
| Public | | |
| Accounting | | |
| Firm | | |
| |
| Counsel | | K&L Gates LLP |
| |
| | Before investing in any of the Oppenheimer funds, investors should carefully consider a fund’s investment objectives, risks, charges and expenses. Fund prospectuses and summary prospectuses contain this and other information about the funds and may be obtained by asking your financial advisor, visiting oppenheimerfunds.com or calling us at 1.800.988.8287. Read prospectuses and summary prospectuses carefully before investing. |
| |
| | The financial statements included herein have been taken from the records of the Fund without examination of those records by the independent registered public accounting firm. |
| |
| | © 2014 OppenheimerFunds, Inc. All rights reserved. Oppenheimer funds are distributed by OppenheimerFunds Distributor, Inc. |

Portfolio Managers: Krishna Memani, Sara J. Zervos, Ph.D. and Jack Brown, CFA
Cumulative Total Returns
For the 6-Month Period Ended 6/30/14
| | | | |
Non-Service Shares | | | 4.39 | % |
Service Shares | | | 4.19 | |
Average Annual Total Returns
For the Periods Ended 6/30/14
| | | | | | | | | | | | |
| | | 1-Year | | | 5-Year | | | 10-Year | |
Non-Service Shares | | | 6.77% | | | | 8.99% | | | | 6.28% | |
Service Shares | | | 6.52% | | | | 8.70% | | | | 6.01% | |
Performance data quoted represents past performance, which does not guarantee future results. The investment return and principal value of an investment in the Fund will fluctuate so that an investor’s shares, when redeemed, may be worth more or less than their original cost. Current performance may be lower or higher than the performance quoted. For performance data current to the most recent month end, call us at 1.800.988.8287. The Fund’s total returns should not be expected to be the same as the returns of other funds, whether or not both funds have the same portfolio managers and/or similar names. The Fund’s total returns include changes in share price and reinvested distributions but do not include the charges associated with the separate account products that offer this Fund. Such performance would have been lower if such charges were taken into account.
| | | | |
PORTFOLIO ALLOCATION | |
Corporate Bonds and Notes | | | 40.5% | |
Foreign Government Obligations | | | 16.0 | |
Mortgage-Backed Obligations | | | | |
Government Agency | | | 6.2 | |
Non-Agency | | | 9.5 | |
Investment Companies | | | | |
Oppenheimer Institutional Money Market Fund | | | 2.6 | |
Oppenheimer Master Event-Linked Bond Fund, LLC | | | 2.2 | |
Oppenheimer Master Loan Fund, LLC | | | 4.9 | |
Oppenheimer Ultra-Short Duration Fund | | | 2.2 | |
U.S. Government Obligations | | | 5.3 | |
Short-Term Notes | | | 3.6 | |
Corporate Loans | | | 3.6 | |
Asset-Backed Securities | | | 2.4 | |
Structured Securities | | | 0.8 | |
Preferred Stocks | | | 0.1 | |
Common Stocks | | | 0.1 | |
Over-the-Counter Credit Default Swaptions Purchased | | | —* | |
Over-the-Counter Options Purchased | | | —* | |
Rights, Warrants and Certificates | | | —* | |
Over-the-Counter Interest Rate Swaptions Purchased | | | —* | |
| * | Represents a value of less than 0.005%. |
Portfolio holdings and allocations are subject to change. Percentages are as of June 30, 2014, and are based on the total market value of investments.
| | |
| CREDIT RATING BREAKDOWN | | NRSRO ONLY TOTAL |
AAA | | 14.3% |
AA | | 1.1 |
A | | 6.8 |
BBB | | 25.0 |
BB | | 14.0 |
B | | 20.7 |
CCC | | 6.8 |
CC | | 0.4 |
C | | 0.0 |
D | | 0.6 |
Unrated | | 10.3 |
Total | | 100.0% |
The percentages above are based on the market value of the Fund’s securities as of June 30, 2014, and are subject to change. Except for securities labeled “Unrated,” and except for certain securities issued or guaranteed by a foreign sovereign, all securities have been rated by at least one Nationally Recognized Statistical Rating Organization (“NRSRO”), such as Standard & Poor’s (“S&P”). For securities rated only by an NRSRO other than S&P, OppenheimerFunds, Inc. (the “Sub-Adviser”) converts that rating to the equivalent S&P rating. If two or more NRSROs have assigned a rating to a security, the highest S&P equivalent rating is used. Unrated securities issued or guaranteed by a foreign sovereign are assigned a credit rating equal to the highest NRSRO rating assigned to that foreign sovereign. For securities not rated by an NRSRO, the Sub-Adviser uses its own credit analysis to assign ratings in categories similar to those of S&P. The use of similar categories is not an indication that the sub-adviser’s credit analysis process is consistent or comparable with any NRSRO’s process were that NRSRO to rate the same security. Fund assets invested in Oppenheimer Institutional Money Market Fund are assigned that fund’s S&P rating, which is currently AAA. For the purposes of this table, “investment-grade” securities are securities rated within the NRSROs’ four highest rating categories (AAA, AA, A and BBB). Unrated securities do not necessarily indicate low credit quality, and may or may not be the equivalent of investment-grade. Please consult the Fund’s prospectus and Statement of Additional Information for further information.
2 OPPENHEIMER GLOBAL STRATEGIC INCOME FUND/VA
Fund Performance Discussion
The Fund’s Non-Service shares returned 4.39% during the period, underperforming its Reference Index, which returned 5.29%. The Fund’s Reference Index (the “Index”) is a customized weighted index currently comprised of 40% of the Citigroup Non-U.S. World Government Bond Index, 30% of the JPMorgan Domestic High Yield Index and 30% of the Barclays U.S. Aggregate Bond Index.
The Fund’s underperformance to the Reference Index occurred primarily over the first half of the reporting period, and was largely the result of its exposure to emerging market debt denominated in local currencies. The Fund received its best results from its investment in mortgages this reporting period.
GLOBAL MARKET AND ECONOMIC ENVIRONMENT
The global economy started 2014 with continued slow and steady growth throughout the developed world. However, data in the U.S. softened for the first quarter, partially attributed to cold weather effects across much of the country. In addition, renewed concerns about economic instability in the emerging markets caused some analysts to question the sustainability of the global economic recovery, and the markets responded negatively to rising geopolitical tensions between Russia and Ukraine. This resulted in heightened volatility across multiple asset classes to begin the year. Growth in the Eurozone remained anemic, and the outlook for China softened a bit on the back of weaker economic data.
However, in the spring, the U.S. and global economic recoveries seemed to get back on track. Robust U.S. employment gains and mildly encouraging economic data in Europe helped address investors’ concerns. Central banks throughout the world also maintained stimulative monetary policies. Among the central bank measures that boosted the markets this reporting period, the European Central Bank (the “ECB”) announced numerous measures in June, including a benchmark interest rate cut, the introduction of a negative deposit rate to encourage banks to lend, among various other measures to flood the system with liquidity. Beyond that, the ECB said it would prepare to purchase packages of loans from banks to allow for increased lending. In June, the Fed also stated it would reduce the amount of monthly bond purchases by an additional $10 billion and reaffirmed its intention to keep short-term interest rates near zero. U.S. economic data released in April and May was positive, as the unemployment rate fell to 6.3%, the economy finally regained all of the jobs lost during the 2008 recession, and the U.S. stock market achieved record highs. Shortly after the reporting period ended, a positive June jobs report was released, in which the unemployment rate fell to 6.1%, its lowest level since September 2008.
FUND REVIEW
Our security selection in emerging market debt was a negative this reporting period and our allocation to Russia hurt performance on the back of geopolitical turmoil in Ukraine. While we continue to have a sizable investment in emerging market debt (primarily denominated in U.S. dollars) at period end, we have reduced our exposure to Russia and emerging market debt in general this reporting period. We remain cautious that the possibility of earlier-than-expected Fed tightening could negatively impact emerging market debt, but we continue to view emerging market debt as an important diversifier and attractive potential source of returns for several reasons. First, emerging market default risk is significantly lower than in the past as many economies have grown stronger, their balance sheets are in better shape and their monetary/fiscal policies are much improved. Second, many emerging market countries have the flexibility to run countercyclical monetary policies. Third, several countries that have been raising rates are at or near the end of their respective tightening cycles and considering moves toward easing. Based on our assessment of the underlying fundamentals, including current valuations, we remain optimistic on the prospects of emerging market debt at period end. Also detracting from relative performance was an underweight position in the yen, which rallied this reporting period.
The Fund received strong absolute and relative results from mortgages this reporting period as interest rates rallied. These investment-grade securities offered relatively attractive yields, sparking greater demand as investors resumed their search for more competitive levels of current income. However, we began to reduce the Fund’s exposure to mortgage-backed securities later in the reporting period when valuations rose to richer levels and re-allocated the capital into high yield. The Fund’s investments in mortgages at period end include new vintage collateralized mortgage-backed securities (“CMBS”) and some older subprime CMBS. Although high yield spreads are tighter than they were a year ago, we continue to believe high yield has some of the most attractive fundamentals in the fixed income universe. The high yield portfolio produced positive absolute results during the reporting period, with contributions coming from bonds in the transportation, technology and health care sectors. However, the high yield portfolio underperformed the JPMorgan Domestic High Yield Index. Overall, the Fund has maintained a focus on lower-rated bonds at period end, favoring B-rated bonds over BB-rated bonds, and also maintained an allocation to CCC-rated bonds. While the performance of lower-rated bonds was positive on an absolute basis, this positioning detracted from relative performance for the period as lower-rated bonds generally underperformed higher-rated bonds.
3 OPPENHEIMER GLOBAL STRATEGIC INCOME FUND/VA
Also producing positive absolute performance were our positions in European credit. Our rationale for owning this exposure is simple. We view the risk of the Eurozone breaking up as small and getting smaller, and the U.S. economy has stabilized. For the global economy to improve, we believe Europe will need to stabilize further. It appears as though European credit quality is no longer deteriorating, and we believe spreads are attractive versus their U.S. counterparts. We believe one of the bigger potential surprises for the market might be if Europe can stabilize faster than investors expect. We are prepared for that possibility. It was our view that if the ECB decided to ease, European credit would benefit, and that view has proved correct so far.
Finally, we ended the reporting period with a relatively short average duration. Our short duration positioning contributed to relative performance in 2013 but detracted this reporting period as rates rallied. More broadly, we expect rates to continue rising for several years, although with some volatility. As a result, we expect to be short duration for quite some time.
STRATEGY & OUTLOOK
We believe the market will continue to react strongly to changes in expectations about the rate of growth in the U.S. and when the Fed will start tightening. However, at period end, we do not believe that tightening in the U.S. will begin in 2014. We think the Fed is on a steady path of tapering, and we expect there will be consistency in domestic monetary policy, with potentially positive changes coming from other regions. For example, the ECB has eased once and could ease again to address anemic growth and low inflation in Europe, Japan could undertake additional stimulus as it continues to implement its monetary policies (known as “Abenomics”) in the wake of slow economic growth, and certain emerging market countries are at or near the end of their respective tightening cycles and contemplating a move toward easing. We also believe the U.S. dollar has the potential to strengthen. In our opinion, such an environment would favor credit and spread products.
The Fund’s investment strategy and focus can change over time. The mention of specific fund holdings does not constitute a recommendation by OppenheimerFunds, Inc. or its affiliates.
Shares of Oppenheimer funds are not deposits or obligations of any bank, are not guaranteed by any bank, are not insured by the FDIC or any other agency, and involve investment risks, including the possible loss of the principal amount invested.
4 OPPENHEIMER GLOBAL STRATEGIC INCOME FUND/VA
Fund Expenses
Fund Expenses. As a shareholder of the Fund, you incur two types of costs: (1) transaction costs and (2) ongoing costs, including management fees; distribution and service fees; and other Fund expenses. These examples are intended to help you understand your ongoing costs (in dollars) of investing in the Fund and to compare these costs with the ongoing costs of investing in other mutual funds.
The examples are based on an investment of $1,000.00 invested at the beginning of the period and held for the entire 6-month period ended June 30, 2014.
Actual Expenses. The first section of the table provides information about actual account values and actual expenses. You may use the information in this section for the class of shares you hold, together with the amount you invested, to estimate the expense that you paid over the period. Simply divide your account value by $1,000.00 (for example, an $8,600.00 account value divided by $1,000.00 = 8.60), then multiply the result by the number in the first section under the heading entitled “Expenses Paid During Period” to estimate the expenses you paid on your account during this period.
Hypothetical Example for Comparison Purposes.
The second section of the table provides information about hypothetical account values and hypothetical expenses based on the Fund’s actual expense ratio for each class of shares, and an assumed rate of return of 5% per year for each class before expenses, which is not the actual return. The hypothetical account values and expenses may not be used to estimate the actual ending account balance or expenses you paid for the period. You may use this information to compare the ongoing costs of investing in the Fund and other funds. To do so, compare this 5% hypothetical example for the class of shares you hold with the 5% hypothetical examples that appear in the shareholder reports of the other funds.
Please note that the expenses shown in the table are meant to highlight your ongoing costs only and do not reflect any charges associated with the separate accounts that offer this Fund. Therefore, the “hypothetical” lines of the table are useful in comparing ongoing costs only, and will not help you determine the relative total costs of owning different funds. In addition, if these separate account charges were included your costs would have been higher.
| | | | | | | | | | | | | | | | |
| Actual | | Beginning
Account Value
January 1, 2014 | | | Ending Account
Value
June 30, 2014 | | | | | Expenses Paid During 6 Months Ended June 30, 2014 | | | |
Non-Service shares | | $ | 1,000.00 | | | $ | 1,043.90 | | | | | $ | 3.60 | | | |
Service shares | | | 1,000.00 | | | | 1,041.90 | | | | | | 4.82 | | | |
| | | | | |
Hypothetical (5% return before expenses) | | | | | | | | | | | | | | | | |
Non-Service shares | | | 1,000.00 | | | | 1,021.27 | | | | | | 3.56 | | | |
Service shares | | | 1,000.00 | | | | 1,020.08 | | | | | | 4.77 | | | |
Expenses are equal to the Fund’s annualized expense ratio for that class, multiplied by the average account value over the period, multiplied by 181/365 (to reflect the one-half year period). Those annualized expense ratios, excluding indirect expenses from affiliated funds, based on the 6-month period ended June 30, 2014 are as follows:
| | | | | | |
| Class | | Expense Ratios | | | |
Non-Service shares | | | 0.71% | | | |
Service shares | | | 0.95 | | | |
The expense ratios reflect voluntary and/or contractual waivers and/or reimbursements of expenses by the Fund’s Manager. Some of these undertakings may be modified or terminated at any time, as indicated in the Fund’s prospectus. The “Consolidated Financial Highlights” tables in the Fund’s consolidated financial statements, included in this report, also show the gross expense ratios, without such waivers or reimbursements and reduction to custodian expenses, if applicable.
5 OPPENHEIMER GLOBAL STRATEGIC INCOME FUND/VA
| | |
| |
| CONSOLIDATED STATEMENT OF INVESTMENTS June 30, 2014 Unaudited | | |
| | | | | | | | |
| | | Principal Amount | | | Value | |
| |
Asset-Backed Securities—2.4% | |
| |
| American Credit Acceptance Receivables Trust: | |
| Series 2012-2, Cl. D, 5.91%, 7/15/191 | | $ | 2,100,000 | | | $ | 2,142,902 | |
| Series 2012-3, Cl. C, 2.78%, 9/17/181 | | | 125,000 | | | | 126,146 | |
| Series 2013-2, Cl. C, 3.96%, 5/15/191 | | | 2,051,000 | | | | 2,087,818 | |
| |
| AmeriCredit Automobile Receivables Trust: | |
| Series 2012-3, Cl. E, 4.46%, 11/8/191 | | | 360,000 | | | | 382,403 | |
| Series 2012-4, Cl. D, 2.68%, 10/9/18 | | | 220,000 | | | | 226,010 | |
| Series 2013-2, Cl. E, 3.41%, 10/8/201 | | | 560,000 | | | | 572,058 | |
| Series 2013-3, Cl. D, 3.00%, 7/8/19 | | | 440,000 | | | | 453,393
| |
| Series 2013-3, Cl. E, 3.74%, 12/8/201 | | | 1,995,000 | | | | 2,054,137 | |
| Series 2013-5, Cl. D, 2.86%, 12/8/19 | | | 220,000 | | | | 224,333 | |
| Series 2014-2, Cl. D, 2.57%, 7/8/20 | | | 300,000 | | | | 301,800 | |
| |
| Axius Europe CLO SA, Series 2007-1X, Cl. E, 4.929%, 11/15/232 | | EUR | 212,712 | | | | 277,002 | |
| |
| Cadogan Square CLO IV BV, Series 4X, Cl. D, 1.956%, 7/24/232 | | EUR
|
1,200,000 |
| | | 1,443,945 | |
| |
| California Republic Auto Receivables Trust: | |
| Series 2013-2, Cl. C, 3.32%, 8/17/20 | | | 365,000 | | | | 369,423 | |
| Series 2014-2, Cl. C, 3.29%, 3/15/21 | | | 130,000 | | | | 130,210 | |
| |
| Capital Auto Receivables Asset Trust: | |
| Series 2013-1, Cl. D, 2.19%, 9/20/21 | | | 275,000 | | | | 276,028 | |
| Series 2013-4, Cl. D, 3.22%, 5/20/19 | | | 170,000 | | | | 174,098 | |
| Series 2014-1, Cl. D, 3.39%, 7/22/19 | | | 185,000 | | | | 190,135 | |
| |
CarMax Auto Owner Trust, Series 2014-2, Cl. D, 2.58%, 11/16/20 | | | 450,000 | | | | 451,503 | |
| |
CPS Auto Receivables Trust, Series 2012-C, Cl. A, 1.82%, 12/16/191 | | | 112,802 | | | | 113,847 | |
| |
Credit Acceptance Auto Loan Trust, Series 2012-2A, Cl. B, 2.21%, 9/15/201 | | | 100,000 | | | | 101,356 | |
| |
| DT Auto Owner Trust: | | | | | | | | |
| Series 2012-2A, Cl. D, 4.35%, 3/15/191 | | | 605,000 | | | | 616,918 | |
| Series 2013-1A, Cl. D, 3.74%, 5/15/201 | | | 7,285,000 | | | | 7,432,980 | |
| Series 2013-2A, Cl. D, 4.18%, 6/15/201 | | | 675,000 | | | | 695,182 | |
| Series 2014-1A, Cl. D, 3.98%, 1/15/211 | | | 580,000 | | | | 588,474 | |
| |
| Exeter Automobile Receivables Trust: | |
| Series 2012-2A, Cl. C, 3.06%, 7/16/181 | | | 65,000 | | | | 66,414 | |
| Series 2013-2A, Cl. C, 4.35%, 1/15/191 | | | 635,000 | | | | 661,360 | |
| Series 2014-1A, Cl. B, 2.42%, 1/15/191 | | | 370,000 | | | | 373,305 | |
| Series 2014-1A, Cl. C, 3.57%, 7/15/191 | | | 370,000 | | | | 380,867 | |
| Series 2014-2A, Cl. A, 1.06%, 8/15/181 | | | 180,000 | | | | 180,011 | |
| Series 2014-2A, Cl. C, 3.26%, 12/16/191 | | | 180,000 | | | | 181,196 | |
| |
| First Investors Auto Owner Trust: | |
| Series 2012-1A, Cl. D, 5.65%, 4/15/181 | | | 285,000 | | | | 299,519 | |
| Series 2013-3A, Cl. C, 2.91%, 1/15/201 | | | 265,000 | | | | 269,898 | |
| Series 2013-3A, Cl. D, 3.67%, 5/15/201 | | | 195,000 | | | | 200,189 | |
| |
GM Financial Automobile Leasing Trust, Series 2014-1A, Cl. D, 2.51%, 3/20/191 | | | 305,000 | | | | 306,057 | |
| |
| Halcyon Structured Asset Management European CLO BV, Series 2006-IIX, Cl. E, 4.254%, 1/25/232 | | EUR | 1,405,000 | | | | 1,826,134 | |
| |
| Harvest CLO IA SA: | |
| Series I-X, Cl. C, 2.216%, 3/29/172 | | EUR | 235,000 | | | | 321,746 | |
| Series I-X, Cl. D, 3.316%, 3/29/172 | | EUR | 595,000 | | | | 798,047 | |
| Series I-X, Cl. E, 7.916%, 3/29/172 | | EUR | 595,000 | | | | 785,695 | |
| |
Highlander Euro CDO II Cayman Ltd.,
Series 2006-2CX, Cl. E, 3.811%, 12/14/222 | | EUR | 1,388,921 | | | | 1,809,040 | |
| | | | | | | | |
| | | Principal Amount | | | Value | |
| |
Asset-Backed Securities (Continued) | |
| |
| ICE EM CLO: | | | | | | | | |
| Series 2007-1A, Cl. B, 2.029%, 8/15/222,3 | | $ | 7,870,000 | | | $ | 6,886,250 | |
| Series 2007-1A, Cl. C, 3.329%, 8/15/222,3 | | | 5,270,000 | | | | 4,268,700 | |
| Series 2007-1A, Cl. D, 5.329%, 8/15/222,3 | | | 5,270,000 | | | | 4,532,200 | |
| |
| Santander Drive Auto Receivables Trust: | |
| Series 2012-3, Cl. D, 3.64%, 5/15/18 | | | 880,000 | | | | 919,362 | |
| Series 2012-5, Cl. D, 3.30%, 9/17/18 | | | 540,000 | | | | 561,821 | |
| Series 2012-AA, Cl. D, 2.46%, 12/17/181 | | | 825,000 | | | | 839,268 | |
| Series 2013-1, Cl. D, 2.27%, 1/15/19 | | | 920,000 | | | | 932,758 | |
| Series 2013-2, Cl. D, 2.57%, 3/15/19 | | | 1,110,000 | | | | 1,135,645 | |
| Series 2013-3, Cl. D, 2.42%, 4/15/19 | | | 950,000 | | | | 965,638 | |
| Series 2013-5, Cl. D, 2.73%, 10/15/19 | | | 520,000 | | | | 530,832 | |
| Series 2013-A, Cl. C, 3.12%, 10/15/191 | | | 1,195,000 | | | | 1,234,378 | |
| |
| SLM Private Credit Student Loan Trust, Series 2005-B, Cl. B, 0.631%, 6/15/392 | | | 1,882,470 | | | | 1,656,699 | |
| |
| SNAAC Auto Receivables Trust: | |
| Series 2012-1A, Cl. C, 4.38%, 6/15/171 | | | 50,000 | | | | 50,806 | |
| Series 2013-1A, Cl. C, 3.07%, 8/15/181 | | | 220,000 | | | | 224,823 | |
| |
Stichting Halcyon Structured Asset Management European, Series 2007-IX, Cl. E, 4.206%, 7/24/232 | | EUR | 706,933 | | | | 828,796 | |
| |
| TAL Advantage LLC, Series 2014-2A, Cl. A1, 1.70%, 5/20/391 | | | 205,533 | | | | 205,769 | |
| |
Theseus European CLO SA, Series 2006-1X, Cl. E, 4.387%, 8/27/222 | | EUR | 1,490,000 | | | | 1,930,297 | |
| |
Trip Rail Master Funding LLC, Series 2014-1A, Cl. A1, 2.863%, 4/15/441 | | | 154,051 | | | | 155,176 | |
| |
| United Auto Credit Securitization Trust: | |
| Series 2012-1, Cl. C, 2.52%, 3/15/161 | | | 245,000 | | | | 246,241 | |
| Series 2013-1, Cl. B, 1.74%, 4/15/161 | | | 360,000 | | | | 361,473 | |
| Series 2013-1, Cl. C, 2.22%, 12/15/171 | | | 230,000 | | | | 231,607 | |
| Series 2013-1, Cl. D, 2.90%, 12/15/171 | | | 40,000 | | | | 40,373 | |
| |
| Westlake Automobile Receivables Trust, Series 2014-1A, Cl. D, 2.20%, 2/15/211 | | | 245,000 | | | | 244,888 | |
| | | | | | | | |
| Total Asset-Backed Securities (Cost $59,349,998) | | | | | | | 58,875,379 | |
|
| |
Mortgage-Backed Obligations—16.3% | |
| |
| Government Agency—6.4% | |
| |
| FHLMC/FNMA/FHLB/Sponsored—6.3% | |
| |
| Federal Home Loan Mortgage Corp. Gold Pool: | |
| 5.00%, 9/1/33 | | | 589,411 | | | | 654,812 | |
| 5.50%, 9/1/39 | | | 746,361 | | | | 841,396 | |
| 6.00%, 5/1/18-11/1/21 | | | 185,605 | | | | 205,135 | |
| 6.50%, 3/1/18-8/1/32 | | | 788,041 | | | | 887,869 | |
| 7.00%, 10/1/31-10/1/37 | | | 161,928 | | | | 184,011 | |
| 7.50%, 1/1/32 | | | 436,411 | | | | 512,697 | |
| |
| Federal Home Loan Mortgage Corp., Interest-Only Stripped Mtg.-Backed Security: | |
| Series 192,Cl. IO, 8.457%, 2/1/284 | | | 11,220 | | | | 2,476 | |
| Series 205,Cl. IO, 12.106%, 9/1/294 | | | 65,248 | | | | 15,424 | |
| Series 243,Cl. 6, 0.00%, 12/15/324,5 | | | 156,223 | | | | 31,419 | |
| |
| Federal Home Loan Mortgage Corp., Mtg.-Linked Amortizing Global Debt Securities, Series 2012-1, Cl. A10, 2.06%, 1/15/22 | | | 603,214 | | | | 608,299 | |
| |
| Federal Home Loan Mortgage Corp., Real Estate Mtg. Investment Conduit Multiclass Pass-Through Certificates: | |
| Series 1360,Cl. PZ, 7.50%, 9/15/22 | | | 478,246 | | | | 537,544 | |
| Series 151,Cl. F, 9.00%, 5/15/21 | | | 10,915 | | | | 12,073 | |
| Series 1674,Cl. Z, 6.75%, 2/15/24 | | | 310,441 | | | | 346,669 | |
| Series 1897,Cl. K, 7.00%, 9/15/26 | | | 866,848 | | | | 980,650 | |
| Series 2043,Cl. ZP, 6.50%, 4/15/28 | | | 327,481 | | | | 369,682 | |
6 OPPENHEIMER GLOBAL STRATEGIC INCOME FUND/VA
| | | | | | | | |
| | | Principal Amount | | | Value | |
| |
FHLMC/FNMA/FHLB/Sponsored (Continued) | |
| |
| Federal Home Loan Mortgage Corp., Real Estate Mtg. Investment Conduit Multiclass Pass-Through Certificates: (Continued) | |
| Series 2106,Cl. FG, 0.602%, 12/15/282 | | $ | 567,668 | | | $ | 572,920 | |
| Series 2122,Cl. F, 0.602%, 2/15/292 | | | 15,623 | | | | 15,761 | |
| Series 2148,Cl. ZA, 6.00%, 4/15/29 | | | 384,362 | | | | 425,691 | |
| Series 2195,Cl. LH, 6.50%, 10/15/29 | | | 240,368 | | | | 269,590 | |
| Series 2326,Cl. ZP, 6.50%, 6/15/31 | | | 30,049 | | | | 33,900 | |
| Series 2344,Cl. FP, 1.102%, 8/15/312 | | | 150,475 | | | | 154,534 | |
| Series 2368,Cl. PR, 6.50%, 10/15/31 | | | 118,952 | | | | 134,279 | |
| Series 2412,Cl. GF, 1.102%, 2/15/322 | | | 247,717 | | | | 254,474 | |
| Series 2449,Cl. FL, 0.702%, 1/15/322 | | | 173,790 | | | | 175,897 | |
| Series 2451,Cl. FD, 1.152%, 3/15/322 | | | 94,511 | | | | 97,250 | |
| Series 2453,Cl. BD, 6.00%, 5/15/17 | | | 27,668 | | | | 29,313 | |
| Series 2461,Cl. PZ, 6.50%, 6/15/32 | | | 437,751 | | | | 493,224 | |
| Series 2464,Cl. FI, 1.152%, 2/15/322 | | | 78,714 | | | | 80,909 | |
| Series 2470,Cl. AF, 1.152%, 3/15/322 | | | 162,159 | | | | 166,860 | |
| Series 2470,Cl. LF, 1.152%, 2/15/322 | | | 80,553 | | | | 82,798 | |
| Series 2471,Cl. FD, 1.152%, 3/15/322 | | | 120,971 | | | | 124,367 | |
| Series 2477,Cl. FZ, 0.702%, 6/15/312 | | | 330,667 | | | | 334,640 | |
| Series 2500,Cl. FD, 0.652%, 3/15/322 | | | 14,181 | | | | 14,337 | |
| Series 2517,Cl. GF, 1.152%, 2/15/322 | | | 70,036 | | | | 71,989 | |
| Series 2526,Cl. FE, 0.552%, 6/15/292 | | | 24,758 | | | | 24,944 | |
| Series 2551,Cl. FD, 0.552%, 1/15/332 | | | 10,485 | | | | 10,553 | |
| Series 2635,Cl. AG, 3.50%, 5/15/32 | | | 103,959 | | | | 108,974 | |
| Series 2668,Cl. AZ, 4.00%, 9/15/18 | | | 58,241 | | | | 60,895 | |
| Series 2676,Cl. KY, 5.00%, 9/15/23 | | | 1,391,808 | | | | 1,518,661 | |
| Series 2707,Cl. QE, 4.50%, 11/15/18 | | | 203,859 | | | | 216,286 | |
| Series 2770,Cl. TW, 4.50%, 3/15/19 | | | 28,365 | | | | 30,210 | |
| Series 3025,Cl. SJ, 24.194%, 8/15/352 | | | 210,330 | | | | 315,023 | |
| Series 3465,Cl. HA, 4.00%, 7/15/17 | | | 22,048 | | | | 22,414 | |
| Series 3617,Cl. DC, 4.00%, 7/15/27 | | | 55,824 | | | | 56,412 | |
| Series 3741,Cl. PA, 2.15%, 2/15/35 | | | 989,405 | | | | 1,012,492 | |
| Series 3815,Cl. BD, 3.00%, 10/15/20 | | | 34,715 | | | | 35,755 | |
| Series 3822,Cl. JA, 5.00%, 6/15/40 | | | 47,005 | | | | 50,276 | |
| Series 3840,Cl. CA, 2.00%, 9/15/18 | | | 25,962 | | | | 26,425 | |
| Series 3848,Cl. WL, 4.00%, 4/15/40 | | | 453,344 | | | | 469,506 | |
| Series 3857,Cl. GL, 3.00%, 5/15/40 | | | 18,405 | | | | 18,904 | |
| Series 3917,Cl. BA, 4.00%, 6/15/38 | | | 297,681 | | | | 311,442 | |
| Series 4221,Cl. HJ, 1.50%, 7/15/23 | | | 513,405 | | | | 514,721 | |
| |
| Federal Home Loan Mortgage Corp., Real Estate Mtg. Investment Conduit Multiclass Pass-Through Certificates, Interest-Only Stripped Mtg.-Backed Security: | |
| Series 2074,Cl. S, 50.427%, 7/17/284 | | | 17,632 | | | | 3,654 | |
| Series 2079,Cl. S, 30.382%, 7/17/284 | | | 32,613 | | | | 6,897 | |
| Series 2136,Cl. SG, 66.745%, 3/15/294 | | | 838,268 | | | | 205,192 | |
| Series 2399,Cl. SG, 57.191%, 12/15/264 | | | 463,596 | | | | 110,889 | |
| Series 2437,Cl. SB, 68.895%, 4/15/324 | | | 1,504,686 | | | | 327,032 | |
| Series 2526,Cl. SE, 28.92%, 6/15/294 | | | 31,084 | | | | 6,798 | |
| Series 2682,Cl. TQ, 99.999%, 10/15/334 | | | 305,663 | | | | 61,133 | |
| Series 2795,Cl. SH, 12.633%, 3/15/244 | | | 681,332 | | | | 103,828 | |
| Series 2920,Cl. S, 48.563%, 1/15/354 | | | 304,808 | | | | 54,262 | |
| Series 2922,Cl. SE, 6.021%, 2/15/354 | | | 51,574 | | | | 9,305 | |
| Series 2981,Cl. BS, 99.999%, 5/15/354 | | | 565,352 | | | | 115,813 | |
| Series 3201,Cl. SG, 5.254%, 8/15/364 | | | 282,833 | | | | 48,930 | |
| Series 3397,Cl. GS, 12.159%, 12/15/374 | | | 212,379 | | | | 39,405 | |
| Series 3424,Cl. EI, 2.039%, 4/15/384 | | | 135,039 | | | | 18,890 | |
| Series 3450,Cl. BI, 9.842%, 5/15/384 | | | 363,825 | | | | 53,859 | |
| Series 3606,Cl. SN, 3.131%, 12/15/394 | | | 112,252 | | | | 15,848 | |
| Series 3659,Cl. IE, 0.00%, 3/15/194,5 | | | 560,802 | | | | 42,064 | |
| Series 3685,Cl. EI, 0.00%, 3/15/194,5 | | | 440,160 | | | | 29,295 | |
| |
| Federal National Mortgage Assn.: | |
| 2.50%, 6/18/276 | | | 6,635,000 | | | | 6,741,781 | |
| 3.00%, 7/1/276 | | | 4,665,000 | | | | 4,847,227 | |
| 3.50%, 7/17/276 | | | 4,805,000 | | | | 5,094,051 | |
| 4.00%, 7/1/28-7/1/416 | | | 45,685,000 | | | | 48,498,748 | |
| 4.50%, 7/1/22-7/1/396 | | | 21,535,000 | | | | 23,287,390 | |
| 5.00%, 7/1/376 | | | 16,785,000 | | | | 18,641,846 | |
| 6.00%, 7/1/376 | | | 4,305,000 | | | | 4,849,852 | |
| |
| Federal National Mortgage Assn. Pool: | |
| 3.50%, 12/1/20-2/1/22 | | | 826,685 | | | | 877,617 | |
| 5.00%, 2/1/18-7/1/33 | | | 2,290,571 | | | | 2,466,132 | |
| 5.50%, 4/1/21-5/1/36 | | | 418,415 | | | | 467,643 | |
| 6.00%, 10/1/16-1/1/19 | | | 129,430 | | | | 134,791 | |
| | | | | | | | |
| | | Principal Amount | | | Value | |
| |
FHLMC/FNMA/FHLB/Sponsored (Continued) | |
| |
| Federal National Mortgage Assn. Pool: (Continued) | |
| 6.50%, 4/1/17-1/1/34 | | $ | 1,068,297 | | | $ | 1,212,395 | |
| 7.00%, 11/1/17-6/1/34 | | | 1,221,075 | | | | 1,405,672 | |
| 7.50%, 2/1/27-3/1/33 | | | 1,455,737 | | | | 1,712,912 | |
| 8.50%, 7/1/32 | | | 2,167 | | | | 2,495 | |
| |
| Federal National Mortgage Assn., Interest-Only Stripped Mtg.-Backed Security: | |
| Series 214,Cl. 2, 40.605%, 3/1/234 | | | 191,011 | | | | 36,921 | |
| Series 221,Cl. 2, 43.862%, 5/1/234 | | | 23,457 | | | | 4,617 | |
| Series 254,Cl. 2, 33.689%, 1/1/244 | | | 383,214 | | | | 67,103 | |
| Series 301,Cl. 2, 0.00%, 4/1/294,5 | | | 71,821 | | | | 15,011 | |
| Series 313,Cl. 2, 3.312%, 6/1/314 | | | 685,452 | | | | 120,002 | |
| Series 319,Cl. 2, 0.00%, 2/1/324,5 | | | 337,994 | | | | 70,130 | |
| Series 321,Cl. 2, 2.348%, 4/1/324 | | | 97,233 | | | | 20,438 | |
| Series 324,Cl. 2, 0.00%, 7/1/324,5 | | | 102,353 | | | | 21,583 | |
| Series 328,Cl. 2, 0.00%, 12/1/324,5 | | | 210,940 | | | | 31,114 | |
| Series 331,Cl. 5, 0.00%, 2/1/334,5 | | | 388,532 | | | | 83,813 | |
| Series 332,Cl. 2, 0.00%, 3/1/334,5 | | | 1,648,700 | | | | 278,367 | |
| Series 334,Cl. 12, 0.00%, 3/1/334,5 | | | 321,274 | | | | 67,683 | |
| Series 339,Cl. 15, 0.00%, 10/25/334,5 | | | 972,675 | | | | 195,200 | |
| Series 345,Cl. 9, 0.00%, 1/1/344,5 | | | 272,688 | | | | 57,927 | |
| Series 351,Cl. 10, 0.00%, 4/1/344,5 | | | 192,600 | | | | 36,063 | |
| Series 351,Cl. 8, 0.00%, 4/1/344,5 | | | 323,595 | | | | 60,178 | |
| Series 356,Cl. 10, 0.00%, 6/1/354,5 | | | 241,757 | | | | 44,771 | |
| Series 356,Cl. 12, 0.00%, 2/1/354,5 | | | 118,498 | | | | 22,063 | |
| Series 362,Cl. 13, 0.00%, 8/1/354,5 | | | 149,516 | | | | 27,172 | |
| |
| Federal National Mortgage Assn., Real Estate Mtg. Investment Conduit Multiclass Pass-Through Certificates: | |
| Series 1999-54,Cl. LH, 6.50%, 11/25/29 | | | 216,520 | | | | 240,395 | |
| Series 2001-51,Cl. OD, 6.50%, 10/25/31 | | | 118,836 | | | | 131,303 | |
| Series 2001-69,Cl. PF, 1.152%, 12/25/312 | | | 187,650 | | | | 192,930 | |
| Series 2001-80,Cl. ZB, 6.00%, 1/25/32 | | | 216,989 | | | | 237,686 | |
| Series 2002-12,Cl. PG, 6.00%, 3/25/17 | | | 85,832 | | | | 89,915 | |
| Series 2002-29,Cl. F, 1.152%, 4/25/322 | | | 84,084 | | | | 86,441 | |
| Series 2002-60,Cl. FH, 1.152%, 8/25/322 | | | 167,258 | | | | 171,945 | |
| Series 2002-64,Cl. FJ, 1.152%, 4/25/322 | | | 25,892 | | | | 26,618 | |
| Series 2002-68,Cl. FH, 0.654%, 10/18/322 | | | 56,766 | | | | 57,361 | |
| Series 2002-84,Cl. FB, 1.152%, 12/25/322 | | | 378,079 | | | | 388,694 | |
| Series 2002-9,Cl. PC, 6.00%, 3/25/17 | | | 84,773 | | | | 88,754 | |
| Series 2002-9,Cl. PR, 6.00%, 3/25/17 | | | 103,801 | | | | 108,675 | |
| Series 2002-90,Cl. FH, 0.652%, 9/25/322 | | | 211,536 | | | | 213,600 | |
| Series 2003-11,Cl. FA, 1.152%, 9/25/322 | | | 378,088 | | | | 388,702 | |
| Series 2003-112,Cl. AN, 4.00%, 11/25/18 | | | 126,255 | | | | 132,575 | |
| Series 2003-116,Cl. FA, 0.552%, 11/25/332 | | | 37,112 | | | | 37,248 | |
| Series 2003-119,Cl. FK, 0.652%, 5/25/182 | | | 694,311 | | | | 698,225 | |
| Series 2003-84,Cl. GE, 4.50%, 9/25/18 | | | 53,983 | | | | 56,841 | |
| Series 2004-101,Cl. BG, 5.00%, 1/25/20 | | | 364,872 | | | | 380,041 | |
| Series 2004-25,Cl. PC, 5.50%, 1/25/34 | | | 109,646 | | | | 116,937 | |
| Series 2005-109,Cl. AH, 5.50%, 12/25/25 | | | 1,740,444 | | | | 1,913,405 | |
| Series 2005-31,Cl. PB, 5.50%, 4/25/35 | | | 560,000 | | | | 635,454 | |
| Series 2005-71,Cl. DB, 4.50%, 8/25/25 | | | 256,889 | | | | 277,281 | |
| Series 2006-11,Cl. PS, 24.009%, 3/25/362 | | | 179,573 | | | | 276,851 | |
| Series 2006-46,Cl. SW, 23.642%, 6/25/362 | | | 301,192 | | | | 424,074 | |
| Series 2008-14,Cl. BA, 4.25%, 3/25/23 | | | 225,284 | | | | 236,523 | |
| Series 2008-75,Cl. DB, 4.50%, 9/25/23 | | | 173,718 | | | | 183,176 | |
| Series 2009-113,Cl. DB, 3.00%, 12/25/20 | | | 516,366 | | | | 532,122 | |
| Series 2009-114,Cl. AC, 2.50%, 12/25/23 | | | 103,366 | | | | 105,429 | |
| Series 2009-36,Cl. FA, 1.092%, 6/25/372 | | | 107,333 | | | | 109,663 | |
| Series 2009-70,Cl. NT, 4.00%, 8/25/19 | | | 22,978 | | | | 23,983 | |
| Series 2009-70,Cl. TL, 4.00%, 8/25/19 | | | 670,471 | | | | 699,783 | |
| Series 2010-43,Cl. KG, 3.00%, 1/25/21 | | | 243,285 | | | | 252,189 | |
| Series 2011-122,Cl. EC, 1.50%, 1/25/20 | | | 319,092 | | | | 322,103 | |
| Series 2011-15,Cl. DA, 4.00%, 3/25/41 | | | 240,780 | | | | 252,742 | |
| Series 2011-3,Cl. EL, 3.00%, 5/25/20 | | | 871,286 | | | | 897,945 | |
| Series 2011-3,Cl. KA, 5.00%, 4/25/40 | | | 376,632 | | | | 407,670 | |
| Series 2011-38,Cl. AH, 2.75%, 5/25/20 | | | 27,753 | | | | 28,573 | |
| Series 2011-6,Cl. BA, 2.75%, 6/25/20 | | | 344,954 | | | | 356,130 | |
| Series 2011-69,Cl. EA, 3.00%, 11/25/29 | | | 279,198 | | | | 285,563 | |
| Series 2011-82,Cl. AD, 4.00%, 8/25/26 | | | 486,064 | | | | 509,734 | |
| Series 2012-20,Cl. FD, 0.552%, 3/25/422 | | | 746,704 | | | | 746,078 | |
| |
| Federal National Mortgage Assn., Real Estate Mtg. Investment Conduit Multiclass Pass-Through Certificates, Interest-Only Stripped Mtg.-Backed Security: | |
| Series 2001-61,Cl. SH, 21.026%, 11/18/314 | | | 92,555 | | | | 20,480 | |
7 OPPENHEIMER GLOBAL STRATEGIC INCOME FUND/VA
| | |
| |
| CONSOLIDATED STATEMENT OF INVESTMENTS Unaudited / Continued | | |
| | | | | | | | |
| | | Principal Amount | | | Value | |
| |
| FHLMC/FNMA/FHLB/Sponsored (Continued) | |
| |
| Federal National Mortgage Assn., Real Estate Mtg. Investment Conduit Multiclass Pass-Through Certificates, Interest-Only Stripped Mtg.-Backed Security: (Continued) | |
| Series 2001-63,Cl. SD, 25.41%, 12/18/314 | | $ | 26,650 | | | $ | 5,410 | |
| Series 2001-68,Cl. SC, 16.339%, 11/25/314 | | | 16,545 | | | | 3,640 | |
| Series 2001-81,Cl. S, 18.614%, 1/25/324 | | | 20,362 | | | | 5,354 | |
| Series 2002-28,Cl. SA, 28.855%, 4/25/324 | | | 14,784 | | | | 3,180 | |
| Series 2002-38,Cl. SO, 41.945%, 4/25/324 | | | 89,384 | | | | 17,776 | |
| Series 2002-48,Cl. S, 24.513%, 7/25/324 | | | 23,224 | | | | 6,237 | |
| Series 2002-52,Cl. SL, 27.382%, 9/25/324 | | | 14,856 | | | | 3,313 | |
| Series 2002-56,Cl. SN, 26.056%, 7/25/324 | | | 31,913 | | | | 8,574 | |
| Series 2002-77,Cl. IS, 37.678%, 12/18/324 | | | 152,284 | | | | 41,894 | |
| Series 2002-77,Cl. SH, 29.527%, 12/18/324 | | | 31,701 | | | | 7,014 | |
| Series 2002-9,Cl. MS, 21.051%, 3/25/324 | | | 28,249 | | | | 5,710 | |
| Series 2003-13,Cl. IO, 6.612%, 3/25/334 | | | 277,810 | | | | 58,384 | |
| Series 2003-26,Cl. DI, 7.976%, 4/25/334 | | | 226,266 | | | | 46,715 | |
| Series 2003-33,Cl. SP, 22.699%, 5/25/334 | | | 170,907 | | | | 34,254 | |
| Series 2003-38,Cl. SA, 0.00%, 3/25/234,5 | | | 166,366 | | | | 13,728 | |
| Series 2003-4,Cl. S, 24.60%, 2/25/334 | | | 50,690 | | | | 13,280 | |
| Series 2004-56,Cl. SE, 8.464%, 10/25/334 | | | 811,253 | | | | 147,140 | |
| Series 2005-12,Cl. SC, 8.009%, 3/25/354 | | | 25,905 | | | | 5,486 | |
| Series 2005-14,Cl. SE, 31.705%, 3/25/354 | | | 905,148 | | | | 141,170 | |
| Series 2005-40,Cl. SA, 44.208%, 5/25/354 | | | 785,002 | | | | 163,633 | |
| Series 2005-40,Cl. SB, 59.004%, 5/25/354 | | | 1,302,177 | | | | 268,324 | |
| Series 2005-52,Cl. JH, 3.15%, 5/25/354 | | | 432,821 | | | | 68,410 | |
| Series 2005-63,Cl. SA, 42.604%, 10/25/314 | | | 45,481 | | | | 9,780 | |
| Series 2006-90,Cl. SX, 0.00%, 9/25/364,7 | | | 820,830 | | | | 179,298 | |
| Series 2007-88,Cl. XI, 27.123%, 6/25/374 | | | 1,117,591 | | | | 147,900 | |
| Series 2008-55,Cl. SA, 0.00%, 7/25/384,5 | | | 115,563 | | | | 16,224 | |
| Series 2009-8,Cl. BS, 0.00%, 2/25/244,5 | | | 180,758 | | | | 13,588 | |
| Series 2010-95,Cl. DI, 0.00%, 11/25/204,5 | | | 738,864 | | | | 55,323 | |
| Series 2012-40,Cl. PI, 1.917%, 4/25/414 | | | 1,640,925 | | | | 279,021 | |
| |
| Federal National Mortgage Asss., Interest-Only Mtg.-Backed Security, Series 302, Cl. 2, 6%, 5/1/292 | | | 3 | | | | 1 | |
| | | | | | | | |
| | | | 152,392,182 | |
|
| |
| GNMA/Guaranteed—0.1% | |
| |
| Government National Mortgage Assn. I Pool: | |
| 7.00%, 3/15/28-7/15/28 | | | 158,718 | | | | 176,484 | |
| 7.50%, 2/15/27 | | | 9,308 | | | | 10,034 | |
| 8.00%, 11/15/25-5/15/26 | | | 33,658 | | | | 33,945 | |
| |
| Government National Mortgage Assn. II Pool, 1.625%, 11/20/252 | | | 3,872 | | | | 3,985 | |
| |
| Government National Mortgage Assn., Interest-Only Stripped Mtg.-Backed Security: | |
| Series 1998-6,Cl. SA, 55.573%, 3/16/284 | | | 41,665 | | | | 8,909 | |
| Series 2007-17,Cl. AI, 13.433%, 4/16/374 | | | 385,173 | | | | 71,141 | |
| Series 2011-52,Cl. HS, 9.678%, 4/16/414 | | | 659,238 | | | | 129,344 | |
| |
| Government National Mortgage Assn., Real Estate Mtg. Investment Conduit Multiclass Pass-Through Certificates: | |
| Series 1999-32,Cl. ZB, 8.00%, 9/16/29 | | | 630,832 | | | | 747,304 | |
| Series 2000-12,Cl. ZA, 8.00%, 2/16/30 | | | 1,381,673 | | | | 1,614,187 | |
| | | | | | | | |
| | | | 2,795,333 | |
|
| |
| Non-Agency—9.9% | | | | | | | | |
| |
| Commercial—8.2% | | | | | | | | |
| |
| Banc of America Commercial Mortgage Trust, Series 2006-3, Cl. AM, 6.043%, 7/10/442 | | | 4,242,000 | | | | 4,508,542 | |
| |
| BCAP LLC Trust: | | | | | | | | |
| Series 2011-R11,Cl. 18A5, 2.20%, 9/26/351,2 | | | 297,193 | | | | 305,629 | |
| Series 2012-RR2,Cl. 6A3, 2.767%, 9/26/351,2 | | | 522,558 | | | | 526,386 | |
| Series 2012-RR6, 2.404%, 11/26/361 | | | 379,605 | | | | 381,511 | |
| Series 2013-RR2,Cl. 5A2, 2.628%, 3/26/361,2 | | | 7,454,451 | | | | 6,122,243 | |
| |
| Bear Stearns Commercial Mortgage Securities Trust: | | | | | | | | |
| Series 2006-PW13,Cl. AJ, 5.611%, 9/11/412 | | | 8,145,000 | | | | 8,532,547 | |
| Series 2007-PW17,Cl. AJ, 6.079%, 6/11/502 | | | 7,400,000 | | | | 7,627,620 | |
| Series 2007-T26,Cl. AJ, 5.566%, 1/12/452 | | | 2,603,000 | | | | 2,686,832 | |
| |
| Citigroup Commercial Mortgage Trust, Series 2013-GC11, Cl. D, 4.606%, 4/10/461,2 | | | | | | | | |
| |
| Citigroup Mortgage Loan Trust, Inc.: | | | 3,125,000 | | | | 2,937,481 | |
| Series 2009-8,Cl. 7A2, 2.613%, 3/25/361,2 | | | 10,474,197 | | | | 9,756,454 | |
| Series 2012-8,Cl. 1A1, 2.663%, 10/25/351,2 | | | 906,508 | | | | 916,682 | |
| | | | | | | | |
| | | Principal Amount | | | Value | |
| |
Commercial (Continued) | |
| |
COMM Mortgage Trust: | |
| Series 2012-CR4,Cl. D, 4.729%, 10/15/451,2 | | $ | 70,000 | | | $ | 68,377 | |
| Series 2012-CR5,Cl. E, 4.48%, 12/10/451,2 | | | 2,970,000 | | | | 2,848,699 | |
| Series 2013-CR6,Cl. D, 4.314%, 3/10/461,2 | | | 1,525,000 | | | | 1,423,392 | |
| Series 2013-CR7,Cl. D, 4.496%, 3/10/461,2 | | | 3,245,000 | | | | 3,034,424 | |
| Series 2013-CR9,Cl. D, 4.402%, 7/10/451,2 | | | 2,685,000 | | | | 2,497,407 | |
| Series 2013-LC13,Cl. D, 5.217%, 8/10/461,2 | | | 3,579,000 | | | | 3,557,227 | |
| Series 2014-UBS3,Cl. D, 4.815%, 6/10/471,2 | | | 8,145,000 | | | | 7,772,130 | |
| |
| COMM Mortgage Trust, Interest-Only Stripped Mtg.-Backed Security: | |
| Series 2010-C1,Cl. XPA, 0.00%, 7/10/461,4,5 | | | 4,346,779 | | | | 137,928 | |
| Series 2012-CR5,Cl. XA, 0.00%, 12/10/454,5 | | | 3,494,531 | | | | 355,076 | |
| |
Countrywide Home Loans, Series 2005-17, Cl. 1A8, 5.50%, 9/25/35 | | | 1,669,669 | | | | 1,656,873 | |
| |
| Credit Suisse Commercial Mortgage Trust: | |
| Series 2006-C1,Cl. AJ, 5.643%, 2/15/392 | | | 695,000 | | | | 738,066 | |
| Series 2006-C4,Cl. AM, 5.509%, 9/15/39 | | | 4,315,000 | | | | 4,646,828 | |
| |
| Credit Suisse First Boston Commercial Trust, Series 2005-C6, Cl. AJ, 5.23%, 12/15/402 | | | 600,000 | | | | 627,878 | |
| |
Credit Suisse Mortgage Trust, Series 2009-13R, Cl. 4A1, 2.619%, 9/26/361,2 | | | 93,176 | | | | 94,220 | |
| |
DBUBS Mortgage Trust, Series 2011-LC1A, Cl. E, 5.73%, 11/10/461,2 | | | 100,000 | | | | 108,645 | |
| |
| Deutsche Alt-B Securities, Inc. Mortgage Loan Trust, Series 2006-AB2, Cl. A1, 5.888%, 6/25/362 | | | 94,283 | | | | 75,992 | |
| |
| Deutsche Mortgage Securities, Inc., Series 2013-RS1, Cl. 1A2, 0.373%, 7/22/362,3 | | | 5,060,144 | | | | 4,222,068 | |
| |
| FREMF Mortgage Trust: | |
| Series 2012-K501,Cl. C, 3.609%, 11/25/461,2 | | | 40,000 | | | | 41,099 | |
| Series 2013-K25,Cl. C, 3.618%, 11/25/451,2 | | | 2,000,000 | | | | 1,970,044 | |
| Series 2013-K26,Cl. C, 3.723%, 12/25/451,2 | | | 1,040,000 | | | | 1,021,850 | |
| Series 2013-K27,Cl. C, 3.616%, 1/25/461,2 | | | 1,630,000 | | | | 1,586,315 | |
| Series 2013-K28,Cl. C, 3.614%, 6/25/461,2 | | | 1,605,000 | | | | 1,558,828 | |
| Series 2013-K502,Cl. C, 3.31%, 3/25/451,2 | | | 220,000 | | | | 223,707 | |
| Series 2013-K712,Cl. C, 3.483%, 5/25/451,2 | | | 265,000 | | | | 266,071 | |
| Series 2013-K713,Cl. C, 3.274%, 4/25/461,2 | | | 535,000 | | | | 529,606 | |
| |
| GE Capital Commercial Mortgage Corp., Series 2005-C4, Cl. AJ, 5.489%, 11/10/452 | | | 2,730,000 | | | | 2,786,697 | |
| |
| GS Mortgage Securities Trust, Series 2014-GC22, Cl. D, 4.646%, 6/10/47 | | | 1,515,000 | | | | 1,413,860 | |
| |
| GSR Mortgage Loan Trust, Series 2005-AR4, Cl. 6A1, 5.211%, 7/25/352 | | | 38,379 | | | | 38,644 | |
| |
| JP Morgan Chase Commercial Mortgage Securities Trust: | |
| Series 2006-CB16,Cl. AJ, 5.623%, 5/12/45 | | | 2,695,000 | | | | 2,772,243 | |
| Series 2006-LDP8,Cl. AJ, 5.48%, 5/15/452 | | | 445,000 | | | | 475,296 | |
| Series 2007-CB18,Cl. AJ, 5.502%, 6/12/472 | | | 4,031,000 | | | | 4,037,004 | |
| Series 2012-LC9,Cl. E, 4.573%, 12/15/471,2 | | | 3,025,000 | | | | 2,949,917 | |
| Series 2013-C10,Cl. D, 4.298%, 12/15/472 | | | 4,665,000 | | | | 4,402,750 | |
| |
| JP Morgan Resecuritization Trust: | |
| Series 2009-11,Cl. 5A1, 2.619%, 9/26/361,2 | | | 353,112 | | | | 354,354 | |
| Series 2009-5,Cl. 1A2, 2.612%, 7/26/361,2 | | | 5,154,638 | | | | 4,399,684 | |
| |
| JPMBB Commercial Mortgage Securities Trust: | |
| Series 2013-C14,Cl. D, 4.713%, 8/15/461,2 | | | 2,500,000 | | | | 2,406,159 | |
| Series 2013-C15,Cl. D, 5.251%, 11/15/451,2 | | | 1,245,000 | | | | 1,237,677 | |
| |
| Merrill Lynch Mortgage Trust, Series 2006-C1, Cl. AJ, 5.862%, 5/12/392 | | | 6,860,000 | | | | 7,008,862 | |
| |
| Morgan Stanley Bank of America Merrill Lynch Trust: | |
| Series 2012-C6,Cl. E, 4.818%, 11/15/451,2 | | | 2,290,000 | | | | 2,244,865 | |
| Series 2013-C12,Cl. D, 4.929%, 10/15/461,2 | | | 2,370,000 | | | | 2,300,494 | |
| Series 2013-C7,Cl. D, 4.442%, 2/15/461,2 | | | 4,250,000 | | | | 3,998,893 | |
| Series 2013-C8,Cl. D, 4.311%, 12/15/481,2 | | | 2,020,000 | | | | 1,888,287 | |
| Series 2014-C14,Cl. D, 4.996%, 2/15/471,2 | | | 5,060,000 | | | | 4,909,184 | |
| |
| Morgan Stanley Capital I Trust: | |
| Series 2006-HQ10,Cl. AJ, 5.389%, 11/12/412 | | | 5,225,000 | | | | 5,440,539 | |
| Series 2007-HQ11,Cl. AJ, 5.508%, 2/12/442 | | | 2,115,000 | | | | 2,248,244 | |
| Series 2007-IQ13,Cl. AM, 5.406%, 3/15/44 | | | 765,000 | | | | 834,567 | |
| |
Morgan Stanley Re-Remic Trust, Series 2012-R3, Cl. 1A, 2.049%, 11/26/361,2 | | | 36,859 | | | | 36,491 | |
| |
| Morgan Stanley Resecuritization Trust, Series 2013-R9, Cl. 3A, 2.395%, 6/26/461,2 | | | 368,207 | | | | 371,905 | |
8 OPPENHEIMER GLOBAL STRATEGIC INCOME FUND/VA
| | | | | | | | |
| | | Principal Amount | | | Value | |
| |
| Commercial (Continued) | |
| |
| RALI Trust, Series 2005-QA4, Cl. A32, 3.063%, 4/25/352 | | $ | 67,908 | | | $ | 11,730 | |
| |
| Structured Adjustable Rate Mortgage Loan Trust: | |
| Series 2004-10,Cl. 2A, 2.387%, 8/25/342 | | | 6,444,260 | | | | 6,392,471 | |
| Series 2007-6,Cl. 3A1, 4.807%, 7/25/372 | | | 4,889,420 | | | | 3,855,044 | |
| |
| UBS-Barclays Commercial Mortgage Trust: | |
| Series 2012-C2,Cl. E, 5.048%, 5/10/631,2 | | | 3,450,000 | | | | 3,287,841 | |
| Series 2013-C5,Cl. D, 4.23%, 3/10/461,2 | | | 4,200,000 | | | | 3,868,017 | |
| |
| Wachovia Bank Commercial Mortgage Trust: | |
| Series 2006-C25,Cl. AJ, 5.904%, 5/15/432 | | | 5,315,000 | | | | 5,665,633 | |
| Series 2007-C30,Cl. AM, 5.383%, 12/15/43 | | | 5,900,000 | | | | 6,426,103 | |
| |
| Washington Mutual Mortgage Pass-Through Certificates Trust, Series 2007-OA3, Cl. 5A, 1.951%, 4/25/472 | | | 565,991 | | | | 428,243 | |
| |
| Wells Fargo Mortgage-Backed Securities Trust: | |
| Series 2004-W,Cl. B2, 2.616%, 11/25/342 | | | 36,822 | | | | 372 | |
| Series 2005-AR1,Cl. 1A1, 2.61%, 2/25/352 | | | 2,507,094 | | | | 2,533,105 | |
| Series 2005-AR10,Cl. 1A1, 2.614%, 6/25/352 | | | 1,098,582 | | | | 1,123,655 | |
| Series 2005-AR15,Cl. 1A6, 2.606%, 9/25/352 | | | 5,000,895 | | | | 4,742,924 | |
| Series 2006-8,Cl. A15, 6.00%, 7/25/36 | | | 2,661,238 | | | | 2,702,647 | |
| Series 2006-AR7,Cl. 2A4, 2.613%, 5/25/362 | | | 2,025,771 | | | | 1,899,119 | |
| Series 2007-AR3,Cl. A4, 5.673%, 4/25/372 | | | 1,224,928 | | | | 1,217,274 | |
| |
| WF-RBS Commercial Mortgage Trust: | |
| Series 2012-C10,Cl. D, 4.608%, 12/15/451,2 | | | 105,000 | | | | 101,863 | |
| Series 2012-C7,Cl. E, 5.002%, 6/15/451,2 | | | 2,040,000 | | | | 2,044,235 | |
| Series 2012-C8,Cl. E, 5.04%, 8/15/451,2 | | | 2,275,000 | | | | 2,304,998 | |
| Series 2013-C11,Cl. D, 4.322%, 3/15/451,2 | | | 1,168,000 | | | | 1,116,919 | |
| Series 2013-C15,Cl. D, 4.634%, 8/15/461,2 | | | 4,145,000 | | | | 3,954,535 | |
| |
| WF-RBS Commercial Mortgage Trust, Interest-Only Commercial Mtg. Pass-Through Certificates, Series 2011-C3, Cl. XA, 0%, 3/15/441,4,5 | | | 5,750,021 | | | | 354,704 | |
| | | | | | | | |
| | | | 197,952,725 | |
|
| |
Multi-Family—0.5% | |
| |
| Banc of America Commercial Mortgage Trust, Series 2006-2, Cl. AJ, 5.954%, 5/10/452 | | | 4,295,000 | | | | 4,586,343 | |
| |
| Citigroup Mortgage Loan Trust, Inc., Series 2006-AR3, Cl. 1A2A, 5.359%, 6/25/362 | | | 3,606,839 | | | | 3,364,726 | |
| |
| Wells Fargo Mortgage-Backed Securities Trust: | |
| Series 2005-AR15,Cl. 1A2, 2.606%, 9/25/352 | | | 267,989 | | | | 262,349 | |
| Series 2006-AR2,Cl. 2A3, 2.613%, 3/25/362 | | | 4,154,812 | | | | 4,173,371 | |
| | | | | | | | |
| | | | 12,386,789 | |
|
| |
Residential—1.2% | |
| |
| Banc of America Commercial Mortgage Trust, Series 2007-4, Cl. AM, 6.015%, 2/10/512 | | | 800,000 | | | | 896,573 | |
| |
| Banc of America Funding Trust: | |
| Series 2007-1,Cl. 1A3, 6.00%, 1/25/37 | | | 1,473,674 | | | | 1,336,297 | |
| Series 2007-C,Cl. 1A4, 5.354%, 5/20/362 | | | 1,290,100 | | | | 1,262,515 | |
| |
| CD Commercial Mortgage Trust, Series 2007-CD4, Cl. AMFX, 5.366%, 12/11/492 | | | 8,565,000 | | | | 9,049,843 | |
| |
| Citigroup Mortgage Loan Trust, Inc.: | |
| Series 2005-2,Cl. 1A3, 2.665%, 5/25/352 | | | 1,727,728 | | | | 1,733,265 | |
| Series 2005-3,Cl. 2A4, 2.548%, 8/25/352 | | | 3,300,068 | | | | 2,894,127 | |
| |
| Countrywide Home Loans, Series 2005-J4, Cl. A7, 5.50%, 11/25/35 | | | 1,376,744 | | | | 1,444,307 | |
| |
| CWHEQ Revolving Home Equity Loan Trust: | |
| Series 2005-G,Cl. 2A, 0.382%, 12/15/352 | | | 99,224 | | | | 80,224 | |
| Series 2006-H,Cl. 2A1A, 0.302%, 11/15/362 | | | 41,468 | | | | 26,631 | |
| |
| GSR Mortgage Loan Trust, Series 2006-5F, Cl. 2A1, 6%, 6/25/36 | | | 391,449 | | | | 377,790 | |
| |
| Home Equity Mortgage Trust, Series 2005-1, Cl. M6, 5.863%, 6/25/352 | | | 885,944 | | | | 905,509 | |
| |
| MASTR Asset Backed Securities Trust, Series 2006-WMC3, Cl. A3, 0.252%, 8/25/362 | | | 1,052,381 | | | | 540,222 | |
| |
| MLCC Mortgage Investors, Inc., Series 2006-3, Cl. 2A1, 2.335%, 10/25/362 | | | 1,253,010 | | | | 1,244,790 | |
| |
| NC Finance Trust, Series 1999-I, Cl. D, 8.75%, 1/25/293,8 | | | 66,744 | | | | 4,305 | |
| | | | | | | | |
| | | Principal Amount | | | Value | |
| |
Residential (Continued) | | | | | | | | |
| |
| RALI Trust, Series 2006-QS13, Cl. 1A8, 6%, 9/25/36 | | $ | 26,759 | | | $ | 21,389 | |
| |
| Residential Asset Securitization Trust, Series 2005-A6CB, Cl. A7, 6%, 6/25/35 | | | 3,351,211 | | | | 3,246,674 | |
| |
| WaMu Mortgage Pass-Through Certificates Trust, Series 2003-AR10, Cl. A7, 2.422%, 10/25/332 | | | 144,508 | | | | 146,852 | |
| |
| Wells Fargo Mortgage-Backed Securities Trust, Series 2006-AR14, Cl. 1A2, 5.684%, 10/25/362 | | | 2,059,684 | | | | 2,025,298 | |
| | | | | | | | |
| | | | | | | 27,236,611 | |
| | | | | | | | |
Total Mortgage-Backed Obligations (Cost $377,390,461) | | | | | | | 392,763,640 | |
|
| |
| U.S. Government Obligations—5.5% | |
| |
| United States Treasury Nts.: | |
| 0.375%, 3/31/16 | | | 100,000,000 | | | | 100,019,500 | |
| 0.875%, 6/15/17 | | | 4,531,000 | | | | 4,532,237 | |
| 1.375%, 9/30/189,10 | | | 16,696,000 | | | | 16,673,828 | |
| 2.00%, 9/30/20 | | | 9,509,000 | | | | 9,525,346 | |
| 2.50%, 8/15/23 | | | 735,000 | | | | 739,048 | |
| |
| United States Treasury Nts. Strips, 6.16%, 2/15/16 | | | 2,116,000 | | | | 2,106,080 | |
| | | | | | | | |
Total U.S. Government Obligations (Cost $133,262,853) | | | | | | | 133,596,039 | |
|
| |
| Foreign Government Obligations—16.6% | |
| |
| Angola—0.1% | |
| Republic of Angola Via Northern Lights III BV Sr. Unsec. Nts., 7% Sr. Unsec. Nts., 8/16/19 | | | 2,360,000 | | | | 2,581,722 | |
| |
| Argentina—0.1% | |
| Republic of Argentina Sr. Unsec. Nts., 7%, 4/17/17 | | | 1,485,000 | | | | 1,394,415 | |
| |
| Republic of Argentina Unsec. Nts., 8.75%, 5/7/24 | | | 420,000 | | | | 394,800 | |
| | | | | | | | |
| | | | | | | 1,789,215 | |
|
| |
| Brazil—3.2% | |
| Brazil Minas SPE via State of Minas Gerais Sec. Bonds, 5.333%, 2/15/281 | | | 1,970,000 | | | | 1,997,580 | |
| |
| Federative Republic of Brazil International Bonds, 4.25%, 1/7/25 | | | 1,010,000 | | | | 1,024,897 | |
| |
| Federative Republic of Brazil Letra Tesouro Nacional Treasury Bills, 10.999%, 1/1/15 | | BRL | 145,180,000 | | | | 62,255,510 | |
| |
| Federative Republic of Brazil Nota Do Tesouro Nacional Unsec. Nts.: | | | | | | | | |
| 9.762%, 1/1/18 | | BRL | 9,290,000 | | | | 4,003,293 | |
| 9.762%, 1/1/21 | | BRL | 5,190,000 | | | | 2,147,417 | |
| 10.00%, 1/1/23 | | BRL | 6,730,000 | | | | 2,732,646 | |
| |
| Federative Republic of Brazil Sr. Unsec. Nts., 4.875%, 1/22/21 | | | 2,027,000 | | | | 2,219,565 | |
| | | | | | | | |
| | | | | | | 76,380,908 | |
|
| |
| Colombia—0.6% | |
| Republic of Colombia Sr. Unsec. Nts.: | |
| 4.00%, 2/26/24 | | | 1,680,000 | | | | 1,736,280 | |
| 4.375%, 7/12/21 | | | 2,265,000 | | | | 2,436,008 | |
| 5.625%, 2/26/44 | | | 2,845,000 | | | | 3,200,625 | |
| 8.125%, 5/21/24 | | | 1,880,000 | | | | 2,538,000 | |
| Series B, 6.00%, 4/28/28 | | COP | 2,633,000,000 | | | | 1,280,248 | |
| Series B, 7.00%, 5/4/22 | | COP | 2,781,000,000 | | | | 1,527,143 | |
| Series B, 10.00%, 7/24/24 | | COP | 2,662,000,000 | | | | 1,768,759 | |
| | | | | | | | |
| | | | | | | 14,487,063 | |
|
| |
| Croatia—0.2% | |
| Republic of Croatia Sr. Unsec. Nts.: | |
| 5.50%, 4/4/231 | | | 3,570,000 | | | | 3,726,187 | |
9 OPPENHEIMER GLOBAL STRATEGIC INCOME FUND/VA
| | |
| |
| CONSOLIDATED STATEMENT OF INVESTMENTS Unaudited / Continued | | |
| | | | | | | | |
| | | Principal Amount | | | Value | |
| |
| Croatia (Continued) | |
| Republic of Croatia Sr. Unsec. Nts.: (Continued) | |
| 6.375%, 3/24/211 | | $ | 805,000 | | | $ | 888,519 | |
| 6.75%, 11/5/191 | | | 805,000 | | | | 906,631 | |
| | | | | | | | |
| | | | | | | 5,521,337 | |
|
| |
| Dominican Republic—0.1% | |
| Banco de Reservas de la Republica Dominicana Sub. Nts., 7%, 2/1/231 | | | 1,290,000 | | | | 1,354,500 | |
| |
| Dominican Republic Sr. Unsec. Bonds, 5.875%, 4/18/241 | | | 1,455,000 | | | | 1,525,567 | |
| | | | | | | | |
| | | | | | | 2,880,067 | |
|
| |
| Ecuador—0.1% | |
| Republic of Ecuador Sr. Unsec. Bonds, 7.95%, 6/20/241 | | | 1,920,000 | | | | 1,984,320 | |
|
| |
| Gabon—0.1% | |
| Gabonese Republic Unsec. Bonds, 6.375%, 12/12/241 | | | 1,640,000 | | | | 1,799,638 | |
|
| |
| Greece—1.4% | |
| Athens Urban Transportation Organisation Sr. Unsec. Nts., 4.851%, 9/19/16 | | EUR | 2,435,000 | | | | 3,301,470 | |
| |
| Hellenic Republic Sr. Unsec. Nts.: | |
| 5.20%, 7/17/34 | | EUR | 5,795,000 | | | | 6,495,334 | |
| 6.14%, 4/14/28 | | EUR | 10,900,000 | | | | 14,321,803 | |
| Series 15BR, 5.00%, 8/22/16 | | JPY | 143,000,000 | | | | 1,386,174 | |
| |
| Hellenic Republic Unsec. Bonds, 3.80%, 8/8/17 | | JPY | 867,000,000 | | | | 8,270,695 | |
| | | | | | | | |
| | | | | | | 33,775,476 | |
|
| |
| Hungary—0.6% | |
| Hungary Sr. Unsec. Nts.: | |
| 5.375%, 2/21/23 | | | 1,880,000 | | | | 2,032,750 | |
| 5.375%, 3/25/24 | | | 895,000 | | | | 959,888 | |
| 7.625%, 3/29/41 | | | 365,000 | | | | 469,251 | |
| |
| Hungary Unsec. Bonds: | |
| Series 14/D, 6.75%, 8/22/14 | | HUF | 997,000,000 | | | | 4,430,618 | |
| Series 20/A, 7.50%, 11/12/20 | | HUF | 392,000,000 | | | | 2,100,177 | |
| Series 22/A, 7.00%, 6/24/22 | | HUF | 238,000,000 | | | | 1,260,067 | |
| Series 23/A, 6.00%, 11/24/23 | | HUF | 537,000,000 | | | | 2,697,605 | |
| | | | | | | | |
| | | | | | | 13,950,356 | |
|
| |
| India—0.9% | |
| Republic of India Sr. Unsec. Bonds: | |
| 7.28%, 6/3/19 | | INR | 839,000,000 | | | | 13,316,853 | |
| 8.83%, 11/25/23 | | INR | 549,000,000 | | | | 9,215,669 | |
| | | | | | | | |
| | | | | | | 22,532,522 | |
|
| |
| Indonesia—1.0% | |
| Perusahaan Penerbit SBSN Indonesia Sr. Unsec. Nts., 4%, 11/21/181 | | | 3,260,000 | | | | 3,382,250 | |
| |
| Perusahaan Penerbit SBSN Indonesia Unsec. Nts., 6.125%, 3/15/191 | | | 1,910,000 | | | | 2,132,038 | |
| |
| Republic of Indonesia Sr. Unsec. Bonds: | |
| 3.375%, 4/15/231 | | | 1,040,000 | | | | 969,800 | |
| 4.875%, 5/5/211 | | | 2,475,000 | | | | 2,611,125 | |
| 5.375%, 10/17/231 | | | 880,000 | | | | 938,300 | |
| 5.875%, 1/15/241 | | | 1,230,000 | | | | 1,360,687 | |
| 11.625%, 3/4/191 | | | 560,000 | | | | 764,400 | |
| |
| Republic of Indonesia Treasury Bonds: | |
| Series FR68, 8.375%, 3/15/34 | | IDR | 43,960,000,000 | | | | 3,531,024 | |
| Series FR70, 8.375%, 3/15/24 | | IDR | 57,490,000,000 | | | | 4,905,117 | |
| Series FR71, 9.00%, 3/15/29 | | IDR | 47,570,000,000 | | | | 4,133,269 | |
| | | | | | | | |
| | | | | | | 24,728,010 | |
|
| |
| Ivory Coast—0.2% | |
| Republic of Cote d’Ivoire Sr. Unsec. Bonds, 5.75%, 12/31/322 | | | 4,635,000 | | | | 4,524,919 | |
| | | | | | | | |
| | | Principal Amount | | | Value | |
| |
| Kazakhstan—0.0% | |
| Development Bank of Kazakhstan JSC Sr. Unsec. Bonds, 4.125%, 12/10/221 | | $ | 930,000 | | | $ | 884,895 | |
|
| |
| Kenya—0.1% | |
| Republic of Kenya Sr. Unsec. Bonds: | |
| 5.875%, 6/24/191 | | | 640,000 | | | | 654,080 | |
| 6.875%, 6/24/241 | | | 905,000 | | | | 943,010 | |
| | | | | | | | |
| | | | | | | 1,597,090 | |
|
| |
| Latvia—0.1% | |
| Republic of Latvia Sr. Unsec. Nts., 5.25%, 6/16/211 | | | 1,635,000 | | | | 1,837,331 | |
|
| |
| Lithuania—0.3% | |
| Republic of Lithuania Sr. Unsec. Bonds: | |
| 5.125%, 9/14/171 | | | 2,890,000 | | | | 3,191,658 | |
| 6.125%, 3/9/211 | | | 2,600,000 | | | | 3,050,840 | |
| | | | | | | | |
| | | | | | | 6,242,498 | |
|
| |
| Mexico—0.7% | |
| United Mexican States Treasury Bills, 3.06% | | MXN | 46,900,000 | | | | 3,570,741 | |
| |
| United Mexican States Unsec. Bonds: | |
| Series M, 6.50%, 6/9/22 | | MXN | 70,400,000 | | | | 5,781,255 | |
| Series M, 8.00% Bonds, 12/7/23 | | MXN | 10,400,000 | | | | 938,144 | |
| Series M20, 7.50%, 6/3/27 | | MXN | 22,100,000 | | | | 1,936,668 | |
| Series M20, 8.50%, 5/31/29 | | MXN | 31,740,000 | | | | 2,994,765 | |
| Series M30, 8.50%, 11/18/38 | | MXN | 15,200,000 | | | | 1,433,813 | |
| Series M30, 10.00%, 11/20/36 | | MXN | 7,100,000 | | | | 763,187 | |
| | | | | | | | |
| | | | | | | 17,418,573 | |
|
| |
| Morocco—0.1% | |
| Kingdom of Morocco Sr. Unsec. Nts., 4.25%, 12/11/221 | | | 2,310,000 | | | | 2,324,437 | |
|
| |
| Panama—0.2% | |
| Republic of Panama Sr. Unsec. Bonds: | |
| 5.20%, 1/30/20 | | | 1,215,000 | | | | 1,362,015 | |
| 6.70%, 1/26/36 | | | 700,000 | | | | 866,950 | |
| 8.875%, 9/30/27 | | | 835,000 | | | | 1,200,312 | |
| 9.375%, 4/1/29 | | | 730,000 | | | | 1,089,890 | |
| | | | | | | | |
| | | | | | | 4,519,167 | |
|
| |
| Peru—0.4% | |
| Republic of Peru Sr. Unsec. Bonds: | |
| 6.55%, 3/14/37 | | | 1,275,000 | | | | 1,608,412 | |
| 7.35%, 7/21/25 | | | 1,885,000 | | | | 2,507,050 | |
| 7.84%, 8/12/201 | | PEN | 5,390,000 | | | | 2,216,882 | |
| 8.20%, 8/12/261 | | PEN | 5,290,000 | | | | 2,315,937 | |
| | | | | | | | |
| | | | | | | 8,648,281 | |
|
| |
| Philippines—0.3% | |
| Republic of the Philippines Sr. Unsec. Bonds: | |
| 6.375%, 1/15/32 | | | 1,935,000 | | | | 2,396,981 | |
| 6.375%, 10/23/34 | | | 2,350,000 | | | | 2,966,875 | |
| 7.75%, 1/14/31 | | | 380,000 | | | | 526,300 | |
| 9.875%, 1/15/19 | | | 1,005,000 | | | | 1,335,394 | |
| 10.625%, 3/16/25 | | | 455,000 | | | | 716,056 | |
| | | | | | | | |
| | | | | | | 7,941,606 | |
|
| |
| Poland—0.2% | |
| Republic of Poland Sr. Unsec. Bonds: | |
| 3.00%, 3/17/23 | | | 2,765,000 | | | | 2,693,110 | |
| 5.125%, 4/21/21 | �� | | 1,765,000 | | | | 1,990,038 | |
| | | | | | | | |
| | | | | | | 4,683,148 | |
|
| |
| Portugal—0.1% | |
| Republic of Portugal Obrigacoes do Tesouro OT Sr. Unsec. Bonds, 4.75%, 6/14/19 | | EUR | 1,975,000 | | | | 3,006,178 | |
|
| |
| Romania—0.4% | |
| Romania Sr. Unsec. Bonds: | |
| 4.875%, 1/22/241 | | | 800,000 | | | | 855,000 | |
10 OPPENHEIMER GLOBAL STRATEGIC INCOME FUND/VA
| | | | | | | | |
| | | Principal Amount | | | Value | |
| |
| Romania (Continued) | |
| Romania Sr. Unsec. Bonds: (Continued) | |
| 6.125%, 1/22/441 | | $ | 930,000 | | | $ | 1,059,130 | |
| 6.75%, 2/7/221 | | | 3,150,000 | | | | 3,772,125 | |
| |
| Romania Unsec. Bonds: | | | | | | | | |
| 5.85%, 4/26/23 | | RON | 4,190,000 | | | | 1,455,044 | |
| 5.90%, 7/26/17 | | RON | 10,110,000 | | | | 3,439,282 | |
| | | | | | | | |
| | | | 10,580,581 | |
|
| |
| Russia—1.3% | |
| AHML Via AHML Finance Ltd., 7.75% Unsec. Nts., 2/13/181 | | RUB | 20,500,000 | | | | 563,779 | |
| |
| Russian Federation Sr. Unsec. Bonds: | |
| 4.875%, 9/16/231 | | | 1,465,000 | | | | 1,519,937 | |
| 5.875%, 9/16/431 | | | 1,510,000 | | | | 1,623,250 | |
| 7.50%, 3/31/301,2 | | | 3,168,125 | | | | 3,675,469 | |
| |
| Russian Federation Sr. Unsec. Nts., 5%, 4/29/201 | | | 2,900,000 | | | | 3,105,900 | |
| |
| Russian Federation Unsec. Bonds: | |
| Series 6203, 6.90%, 8/3/16 | | RUB | 80,600,000 | | | | 2,332,878 | |
| Series 6205, 7.60%, 4/14/21 | | RUB | 39,100,000 | | | | 1,123,801 | |
| Series 6206, 7.40%, 6/14/17 | | RUB | 59,800,000 | | | | 1,734,596 | |
| Series 6209, 7.60%, 7/20/22 | | RUB | 32,300,000 | | | | 918,851 | |
| Series 6210, 6.80%, 12/11/19 | | RUB | 167,700,000 | | | | 4,692,145 | |
| Series 6212, 7.05%, 1/19/28 | | RUB | 32,400,000 | | | | 857,324 | |
| Series 6215, 7.00%, 8/16/23 | | RUB | 65,900,000 | | | | 1,805,243 | |
| Series 6216, 6.70%, 5/15/19 | | RUB | 191,500,000 | | | | 5,365,946 | |
| |
| Vnesheconombank Sr. Unsec. Bonds, Series 9, 7.90%, 3/18/212 | | RUB | 33,200,000 | | | | 965,463 | |
| |
| Vnesheconombank Via VEB Finance plc Sr. Unsec. Nts., 5.942%, 11/21/231 | | | 925,000 | | | | 935,360 | |
| | | | | | | | |
| | | | 31,219,942 | |
|
| |
| Serbia—0.1% | |
| Republic of Serbia Sr. Unsec. Bonds, 5.25%, 11/21/171 | | | 1,420,000 | | | | 1,487,450 | |
| |
| Republic of Serbia Unsec. Bonds, 5.875%, 12/3/181 | | | 1,575,000 | | | | 1,683,281 | |
| | | | | | | | |
| | | | 3,170,731 | |
|
| |
| Slovenia—0.2% | |
| Republic of Slovenia Bonds, 4.125%, 2/18/191 | | | 3,330,000 | | | | 3,516,314 | |
|
| |
| South Africa—1.0% | |
| Republic of South Africa Sr. Unsec. Bonds: | |
| 5.875%, 5/30/22 | | | 650,000 | | | | 726,375 | |
| 5.875%, 9/16/25 | | | 2,580,000 | | | | 2,875,410 | |
| Series R207, 7.25%, 1/15/20 | | ZAR | 42,800,000 | | | | 3,929,044 | |
| Series R208, 6.75%, 3/31/21 | | ZAR | 42,500,000 | | | | 3,747,145 | |
| |
| Republic of South Africa Unsec. Bonds: | |
| Series 2023, 7.75%, 2/28/23 | | ZAR | 54,500,000 | | | | 5,000,830 | |
| Series R186, 10.50%, 12/21/26 | | ZAR | 72,900,000 | | | | 8,002,042 | |
| | | | | | | | |
| | | | 24,280,846 | |
|
| |
| Sri Lanka—0.1% | |
| Democratic Socialist Republic of Sri Lanka Sr. Unsec. Bonds: | |
| 5.875%, 7/25/221 | | �� | 1,010,000 | | | | 1,049,138 | |
| 6.00%, 1/14/191 | | | 1,070,000 | | | | 1,128,850 | |
| 6.25%, 10/4/201 | | | 1,200,000 | | | | 1,281,000 | |
| | | | | | | | |
| | | | 3,458,988 | |
|
| |
| Tanzania—0.1% | |
| United Republic of Tanzania Sr. Unsec. Nts., 6.332%, 3/9/202 | | | 1,675,000 | | | | 1,792,250 | |
|
| |
| Thailand—0.3% | |
| Kingdom of Thailand Sr. Unsec. Bonds: | |
| 3.25%, 6/16/17 | | THB | 69,400,000 | | | | 2,183,918 | |
| 5.125%, 3/13/18 | | THB | 62,300,000 | | | | 2,072,036 | |
| |
| Kingdom of Thailand Sr. Unsec. Nts., 3.875%, 6/13/19 | | THB | 96,500,000 | | | | 3,076,609 | |
| | | | | | | | |
| | | | 7,332,563 | |
| | | | | | | | |
| | | Principal Amount | | | Value | |
| |
| Turkey—1.3% | |
| Republic of Turkey Bonds: | |
| 8.30%, 10/7/15 | | TRY | 2,240,000 | | | $ | 1,061,531 | |
| 8.80%, 11/14/18 | | TRY | 6,860,000 | | | | 3,300,319 | |
| 8.80%, 9/27/23 | | TRY | 5,425,000 | | | | 2,577,298 | |
| 10.40%, 3/20/24 | | TRY | 3,180,000 | | | | 1,670,228 | |
| 10.50%, 1/15/20 | | TRY | 1,880,000 | | | | 967,243 | |
| 10.70%, 2/24/16 | | TRY | 9,430,000 | | | | 4,637,552 | |
| |
| Republic of Turkey Sr. Unsec. Bonds: | |
| 4.35%, 11/12/21 | | EUR | 1,040,000 | | | | 1,528,029 | |
| 6.25%, 9/26/22 | | | 2,145,000 | | | | 2,422,349 | |
| 6.625%, 2/17/45 | | | 1,600,000 | | | | 1,860,000 | |
| 6.875%, 3/17/36 | | | 810,000 | | | | 956,812 | |
| 7.375%, 2/5/25 | | | 1,375,000 | | | | 1,674,062 | |
| |
| Republic of Turkey Unsec. Bonds: | |
| 5.828%, 2/11/1511 | | TRY | 2,905,000 | | | | 1,959,878 | |
| 6.30%, 2/14/18 | | TRY | 4,550,000 | | | | 2,024,155 | |
| 7.10%, 3/8/23 | | TRY | 4,025,000 | | | | 1,726,954 | |
| 9.00%, 3/8/17 | | TRY | 4,490,000 | | | | 2,165,928 | |
| | | | | | | | |
| | | | 30,532,338 | |
|
| |
| Ukraine—0.1% | |
| Ukraine International Bonds: | |
| 6.875%, 9/23/151 | | | 255,000 | | | | 250,588 | |
| 7.50%, 4/17/231 | | | 695,000 | | | | 657,644 | |
| 7.80%, 11/28/221 | | | 1,835,000 | | | | 1,745,544 | |
| 7.95%, 2/23/211 | | | 695,000 | | | | 668,069 | |
| | | | | | | | |
| | | | 3,321,845 | |
|
| |
| United Arab Emirates—0.2% | |
| Dubai DOF Sukuk Ltd., 3.875% Sr. Unsec. Nts., 1/30/23 | | | 560,000 | | | | 555,212 | |
| |
| Emirate of Dubai Sr. Unsec. International Bonds: | |
| 5.25%, 1/30/43 | | | 1,155,000 | | | | 1,080,156 | |
| 5.591%, 6/22/21 | | | 2,255,000 | | | | 2,526,728 | |
| 7.75%, 10/5/20 | | | 820,000 | | | | 1,031,970 | |
| | | | | | | | |
| | | | 5,194,066 | |
|
| |
| Uruguay—0.2% | |
| Oriental Republic of Uruguay Sr. Unsec. Bonds: | |
| 4.50%, 8/14/24 | | | 3,580,000 | | | | 3,807,330 | |
| 5.10%, 6/18/50 | | | 360,000 | | | | 356,400 | |
| | | | | | | | |
| | | | 4,163,730 | |
|
| |
| Venezuela—0.2% | |
| Bolivarian Republic of Venezuela Sr. Unsec. Bonds: | |
| 7.00%, 3/31/38 | | | 360,000 | | | | 254,700 | |
| 7.75%, 10/13/19 | | | 2,295,000 | | | | 1,996,650 | |
| 8.25%, 10/13/24 | | | 1,220,000 | | | | 985,150 | |
| 13.625%, 8/15/181 | | | 2,265,000 | | | | 2,400,900 | |
| | | | | | | | |
| | | | 5,637,400 | |
| | | | | | | | |
| Total Foreign Government Obligations (Cost $390,224,341) | | | | 400,240,351 | |
|
| |
| Corporate Loans—3.7% | |
| |
| Accellent, Inc., Sr. Sec. Credit Facilities 2nd Lien Term Loan, 7.50%, 3/11/222 | | | 1,360,000 | | | | 1,354,333 | |
| |
| Affinion Group, Inc., Sr. Sec. Credit Facilities 1st Lien Term Loan, 6.75%, 4/30/182 | | | 801,367 | | | | 806,188 | |
| |
| Affinion Group, Inc., Sr. Sec. Credit Facilities 2nd Lien Term Loan, 8.50%, 10/31/182 | | | 432,587 | | | | 435,020 | |
| |
| Asurion LLC, Sr. Sec. Credit Facilities 2nd Lien Term Loan, 8.50%, 3/3/212 | | | 3,550,000 | | | | 3,689,781 | |
| |
| AZ Chem US, Inc., Sr. Sec. Credit Facilities 2nd Lien Term Loan, 7.50%, 6/10/222,6 | | | 1,180,000 | | | | 1,201,388 | |
| |
| BJ’s Wholesale Club, Inc., Sr. Sec. Credit Facilities 2nd Lien Term Loan, 8.50%, 3/26/202 | | | 1,775,000 | | | | 1,824,182 | |
11 OPPENHEIMER GLOBAL STRATEGIC INCOME FUND/VA
| | |
| |
| CONSOLIDATED STATEMENT OF INVESTMENTS Unaudited / Continued | | |
| | | | | | | | |
| | | Principal Amount | | | Value | |
| |
Corporate Loans (Continued) | |
| |
| Blue Coat Systems, Inc., Sr. Sec. Credit Facilities 2nd Lien Term Loan, 9.50%, 6/26/202 | | $ | 895,000 | | | $ | 912,341 | |
| |
| Brock Holdings III, Inc., Sr. Sec. Credit Facilities 2nd Lien Term Loan, 10.00%, 3/16/182 | | | 775,000 | | | | 782,905 | |
| |
| Caesars Entertainment Operating Co., Inc., Sr. Sec. Credit Facilities 1st Lien Term Loan, 9.75%, 3/1/172,6 | | | 1,090,000 | | | | 1,077,397 | |
| |
| Caesars Entertainment Resort Properties LLC, Sr. Sec. Credit Facilities 1st Lien Term Loan, 7.00%, 10/11/202,6 | | | 4,377,688 | | | | 4,407,483 | |
| |
| Caesars Growth Properties Holdings LLC/Caesars Growth Properties Finance, Inc., Sr. Sec. Credit Facilities 1st Lien Term Loan, 6.25%, 5/10/212 | | | 1,066,000 | | | | 1,066,761 | |
| |
| Catalent Pharma Solutions, Inc., Sr. Sec. Credit Facilities 1st Lien Term Loan, 6.50%, 12/31/172 | | | 1,265,000 | | | | 1,279,231 | |
| |
| Clear Channel Communications, Inc., Extended Sr. Sec. Credit Facilities 1st Lien Term Loan, 6.90%, 1/30/192 | | | 6,103,532 | | | | 6,089,036 | |
| |
| Clear Channel Communications, Inc., Sr. Sec. Credit Facilities 1st Lien Term Loan: | |
| Tranche B, 3.80%, 1/29/16 | | | 50,160 | | | | 49,862 | |
| Tranche E, 7.65%, 7/30/19 | | | 926,326 | | | | 930,250 | |
| |
| Connolly Corp., Sr. Sec. Credit Facilities 2nd Lien Term Loan, 8.00%, 5/9/222 | | | 1,880,000 | | | | 1,915,250 | |
| |
| CRC Health Corp., Sr. Sec. Credit Facilities 2nd Lien Term Loan, 9.00%, 9/28/212 | | | 2,325,000 | | | | 2,349,703 | |
| |
| Del Monte Pacific Ltd., Sr. Sec. Credit Facilities 2nd Lien Term Loan, 8.25%, 8/18/212 | | | 1,835,000 | | | | 1,806,710 | |
| |
| Deltek, Inc., Sr. Sec. Credit Facilities 2nd Lien Term Loan, 10.00%, 10/10/192 | | | 2,050,000 | | | | 2,095,270 | |
| |
| Dialysis Newco, Inc., Sr. Sec. Credit Facilities 2nd Lien Term Loan, 7.75%, 10/21/212 | | | 2,835,000 | | | | 2,856,263 | |
| |
| Entegra Holdings LLC, Sr. Sec. Credit Facilities 3rd Lien Term Loan, 3.815%, 10/19/152,12 | | | 5,173,693 | | | | 3,207,689 | |
| |
| Fairpoint Communications, Inc., Sr. Sec. Credit Facilities 1st Lien Term Loan, 7.50%, 2/14/192,6 | | | 1,806,281 | | | | 1,871,759 | |
| |
| Fieldwood Energy LLC, Sr. Sec. Credit Facilities 2nd Lien Term Loan, 8.375%, 9/30/202 | | | 3,632,184 | | | | 3,756,056 | |
| |
| Flint Group GmbH, Sr. Sec. Credit Facilities 2nd Lien Term Loan, 8.25%, 5/2/222,6 | | | 710,000 | | | | 715,621 | |
| |
| Fram Group Holdings, Sr. Sec. Credit Facilities 1st Lien Term Loan, 6.50%, 7/31/172 | | | 1,019,605 | | | | 1,022,154 | |
| |
| GYP Holdings III Corp., Sr. Sec. Credit Facilities 2nd Lien Term Loan, 7.75%, 3/27/222 | | | 2,325,000 | | | | 2,356,969 | |
| |
| Internet Brands, Sr. Sec. Credit Facilities 2nd Lien Term Loan, 8.50%, 6/27/222,6 | | | 2,120,000 | | | | 2,113,375 | |
| |
| IPC Systems, Inc., Sr. Sec. Credit Facilities 1st Term Loan, 6.00%, 11/9/202 | | | 1,580,000 | | | | 1,588,888 | |
| |
| IPC Systems, Inc., Sr. Sec. Credit Facilities 2nd Term Loan, 9.50%, 5/10/212 | | | 860,000 | | | | 855,700 | |
| |
| iStar Financial, Inc., Sr. Sec. Credit Facilities 1st Lien Term Loan, 7.00%, 3/19/172 | | | 912,118 | | | | 944,042 | |
| |
| Liberty Cablevision of Puerto Rico LLC, Sr. Sec. Credit Facilities 2nd Lien Term Loan, 10.00%, 6/26/232,6 | | | 745,000 | | | | 747,328 | |
| | | | | | | | |
| | | Principal Amount | | | Value | |
| |
| Corporate Loans (Continued) | |
| |
| Moxie Patriot LLC, Sr. Sec. Credit Facilities 1st Lien Term Loan, 6.75%, 12/19/202 | | $ | 1,370,000 | | | $ | 1,397,400 | |
| |
| NewPage Corp., Sr. Sec. Credit Facilities 1st Lien Term Loan, 9.50%, 2/5/212 | | | 3,555,000 | | | | 3,569,664 | |
| |
| NTELOS, Inc., Sr. Sec. Credit Facilities 1st Lien Term Loan, 5.75%, 11/9/192 | | | 1,111,625 | | | | 1,114,404 | |
| |
| Nuveen Investments, Inc., Sr. Sec. Credit Facilities 2nd Lien Term Loan, 6.50%, 2/28/192 | | | 2,475,000 | | | | 2,503,287 | |
| |
| OneLink Communications/San Juan Cable LLC, Sr. Sec. Credit Facilities 2nd Lien Term Loan, 10.00%, 6/9/182 | | | 1,885,000 | | | | 1,907,384 | |
| |
| Orchard Acquisition Co., Sr. Sec. Credit Facilities 1st Lien Term Loan, 7.00%, 2/8/192 | | | 300,970 | | | | 302,098 | |
| |
| Quicksilver Resources, Inc., Sr. Sec. Credit Facilities 2nd Lien Term Loan, 7.00%, 6/21/192 | | | 3,135,000 | | | | 3,070,341 | |
| |
| Radnet Management, Inc., Sr. Sec. Credit Facilities 2nd Lien Term Loan, 8.00%, 3/25/212 | | | 1,740,000 | | | | 1,750,875 | |
| |
| Revel Entertainment, Inc., Sr. Sec. Credit Facilities 2nd Lien Exit Term Loan, 14.50%, 5/20/182,8,12 | | | 1,490,134 | | | | 484,294 | |
| |
| Rexam plc, Sr. Sec. Credit Facilities 2nd Lien Term Loan, 8.00%, 5/2/222 | | | 1,860,000 | | | | 1,871,625 | |
| |
| Road Infrastructure Investment LLC, Sr. Sec. Credit Facilities 2nd Lien Term Loan, 7.75%, 9/21/212 | | | 1,860,000 | | | | 1,855,350 | |
| |
| RP Crown Parent LLC, Sr. Sec. Credit Facilities 1st Lien Term Loan, 6.00%, 12/21/182 | | | 1,805,464 | | | | 1,807,560 | |
| |
| RP Crown Parent LLC, Sr. Sec. Credit Facilities 2nd Lien Term Loan, 11.25%, 12/21/192 | | | 720,000 | | | | 727,200 | |
| |
| Sabine Oil & Gas LLC, Sr. Sec. Credit Facilities 2nd Lien Term Loan, 8.75%, 12/31/182 | | | 3,590,000 | | | | 3,649,461 | |
| |
| Templar Energy, Sr. Sec. Credit Facilities 2nd Lien Term Loan, 8.00%, 11/25/202 | | | 5,420,000 | | | | 5,392,900 | |
| |
| TWCC Holding Corp., Sr. Sec. Credit Facilities 2nd Lien Term Loan, 7.00%, 6/26/202 | | | 2,185,000 | | | | 2,167,247 | |
| | | | | | | | |
| Total Corporate Loans (Cost $90,104,793) | | | | | | | 89,680,025 | |
|
| |
| Corporate Bonds and Notes—42.1% | |
| |
| Consumer Discretionary—6.6% | | | | | |
| |
| Auto Components—0.7% | |
| |
| Affinia Group, Inc., 7.75% Sr. Unsec. Nts., 5/1/21 | | | 2,615,000 | | | | 2,765,362 | |
| |
| GKN Holdings plc: | |
| 5.375% Sr. Unsec. Nts., 9/19/22 | | GBP | 795,000 | | | | 1,491,048 | |
| 6.75% Sr. Unsec. Nts., 10/28/19 | | GBP | 1,465,000 | | | | 2,904,853 | |
| |
| Goodyear Tire & Rubber Co., 8.25% Sr. Unsec. Nts., 8/15/20 | | | 3,760,000 | | | | 4,145,400 | |
| |
| Icahn Enterprises LP/Icahn Enterprises Finance Corp., 5.875% Sr. Unsec. Nts., 2/1/22 | | | 3,135,000 | | | | 3,299,588 | |
| |
| Lear Corp., 4.75% Sr. Unsec. Nts., 1/15/23 | | | 2,925,000 | | | | 2,925,000 | |
| | | | | | | | |
| | | | 17,531,251 | |
|
| |
| Automobiles—0.3% | |
| |
| Daimler Finance North America LLC, 2.375% Sr. Unsec. Nts., 8/1/181 | | | 1,375,000 | | | | 1,409,627 | |
| |
| Ford Motor Co., 7.45% Sr. Unsec. Nts., 7/16/31 | | | 1,025,000 | | | | 1,372,363 | |
12 OPPENHEIMER GLOBAL STRATEGIC INCOME FUND/VA
| | | | | | | | |
| | | Principal Amount | | | Value | |
| |
| Automobiles (Continued) | |
| |
| Jaguar Land Rover Automotive plc, 5.625% Sr. Unsec. Nts., 2/1/231 | | $ | 2,065,000 | | | $ | 2,201,806 | |
| |
| Toyota Motor Credit Corp., 1.80% Sr. Unsec. Nts., 7/23/20 | | EUR | 1,015,000 | | | | 1,438,604 | |
| | | | | | | | |
| | | | 6,422,400 | |
|
| |
| Diversified Consumer Services—0.1% | |
| |
| Monitronics International, Inc., 9.125% Sr. Unsec. Nts., 4/1/20 | | | 2,865,000 | | | | 3,072,713 | |
|
| |
| Hotels, Restaurants & Leisure—1.3% | |
| |
| Boyd Gaming Corp., 9.125% Sr. Unsec. Nts., 12/1/18 | | | 900,000 | | | | 961,875 | |
| |
| Caesars Entertainment Resort Properties LLC, 11% Sec. Nts., 10/1/211 | | | 1,725,000 | | | | 1,863,000 | |
| |
| Caesars Growth Properties Holdings LLC/Caesars Growth Properties Finance, Inc., 9.375% Sec. Nts., 5/1/221 | | | 1,885,000 | | | | 1,916,809 | |
| |
| Churchill Downs, Inc., 5.375% Sr. Unsec. Nts., 12/15/211 | | | 1,130,000 | | | | 1,161,075 | |
| |
| Greektown Holdings LLC/Greektown Mothership Corp., 8.875% Sr. Sec. Nts., 3/15/191 | | | 2,080,000 | | | | 2,132,000 | |
| |
| GTECH SpA, 8.25% Jr. Sub. Nts., 3/31/661,2 | | EUR | 1,925,000 | | | | 2,844,271 | |
| |
| HOA Restaurant Group LLC/HOA Finance Corp., 11.25% Sec. Nts., 4/1/173 | | | 1,861,000 | | | | 1,972,660 | |
| |
| Isle of Capri Casinos, Inc., 7.75% Sr. Unsec. Nts., 3/15/19 | | | 1,350,000 | | | | 1,447,875 | |
| |
| Landry’s, Inc., 9.375% Sr. Unsec. Nts., 5/1/201 | | | 2,505,000 | | | | 2,768,025 | |
| |
| MCE Finance Ltd., 5% Sr. Unsec. Nts., 2/15/211 | | | 1,805,000 | | | | 1,832,075 | |
| |
| MGM Resorts International: | |
| 6.625% Sr. Unsec. Nts., 12/15/21 | | | 1,710,000 | | | | 1,904,513 | |
| 6.75% Sr. Unsec. Nts., 10/1/20 | | | 1,650,000 | | | | 1,845,937 | |
| |
| MTR Gaming Group, Inc., 11.50% Sec. Nts., 8/1/19 | | | 2,510,825 | | | | 2,834,094 | |
| |
| PF Chang’s China Bistro, Inc., 10.25% Sr. Unsec. Nts., 6/30/201 | | | 1,700,000 | | | | 1,742,500 | |
| |
| Pinnacle Entertainment, Inc., 6.375% Sr. Unsec. Nts., 8/1/21 | | | 1,670,000 | | | | 1,770,200 | |
| |
| Premier Cruises Ltd., 11% Sr. Unsec. Nts., 3/15/083,8 | | | 250,000 | | | | — | |
| |
| Sugarhouse HSP Gaming Prop Mezz LP/Sugarhouse HSP Gaming Finance Corp., 6.375% Sr. Sec. Nts., 6/1/211 | | | 1,250,000 | | | | 1,231,250 | |
| |
| Viking Cruises Ltd., 8.50% Sr. Unsec. Nts., 10/15/221 | | | 930,000 | | | | 1,032,300 | |
| | | | | | | | |
| | | | 31,260,459 | |
|
| |
| Household Durables—0.5% | |
| |
| Beazer Homes USA, Inc., 9.125% Sr. Unsec. Nts., 5/15/19 | | | 2,815,000 | | | | 3,015,569 | |
| |
| Jarden Corp., 6.125% Sr. Unsec. Nts., 11/15/22 | | | 540,000 | | | | 574,425 | |
| |
| K Hovnanian Enterprises, Inc.: | | | | | | | | |
| 7.00% Sr. Unsec. Nts., 1/15/191 | | | 1,200,000 | | | | 1,227,750 | |
| 9.125% Sec. Nts., 11/15/203 | | | 1,790,000 | | | | 2,004,800 | |
| |
| KB Home, 7% Sr. Unsec. Nts., 12/15/21 | | | 1,965,000 | | | | 2,146,762 | |
| |
| Meritage Homes Corp., 7.15% Sr. Unsec. Nts., 4/15/20 | | | 1,960,000 | | | | 2,195,200 | |
| |
| Taylor Morrison Communities, Inc./Monarch Communities, Inc., 5.25% Sr. Unsec. Nts., 4/15/211 | | | 1,050,000 | | | | 1,071,000 | |
| | | | | | | | |
| | | | 12,235,506 | |
| | | | | | | | |
| | | Principal Amount | | | Value | |
| |
| Media—2.4% | |
| |
| Altice Financing SA, 6.50% Sec. Nts., 1/15/221 | | $ | 905,000 | | | $ | 966,087 | |
| |
| Altice Finco SA, 8.125% Sr. Sec. Nts., 1/15/241 | | | 720,000 | | | | 797,400 | |
| |
| Altice SA, 7.25% Sr. Sec. Nts., 5/15/221 | | EUR | 4,220,000 | | | | 6,130,931 | |
| |
| Belo Corp., 7.75% Sr. Unsec. Nts., 6/1/27 | | | 3,132,000 | | | | 3,476,520 | |
| |
| CBS Outdoor Americas Capital LLC/CBS Outdoor Americas Capital Corp., 5.25% Sr. Unsec. Nts., 2/15/221 | | | 460,000 | | | | 473,800 | |
| |
| CCO Holdings LLC/CCO Holdings Capital Corp., 5.75% Sr. Unsec. Nts., 9/1/23 | | | 1,620,000 | | | | 1,684,800 | |
| |
| Cumulus Media Holdings, Inc., 7.75% Sr. Unsec. Nts., 5/1/19 | | | 1,715,000 | | | | 1,807,181 | |
| |
| DISH DBS Corp.: | | | | | | | | |
| 5.875% Sr. Unsec. Nts., 7/15/22 | | | 1,295,000 | | | | 1,408,312 | |
| 6.75% Sr. Unsec. Nts., 6/1/21 | | | 835,000 | | | | 953,987 | |
| 7.875% Sr. Unsec. Nts., 9/1/19 | | | 1,580,000 | | | | 1,880,200 | |
| |
| DreamWorks Animation SKG, Inc., 6.875% Sr. Unsec. Nts., 8/15/201 | | | 1,260,000 | | | | 1,363,950 | |
| |
| Entercom Radio LLC, 10.50% Sr. Unsec. Nts., 12/1/19 | | | 1,125,000 | | | | 1,293,750 | |
| |
| Gannett Co., Inc., 5.125% Sr. Unsec. Nts., 7/15/201 | | | 1,740,000 | | | | 1,794,375 | |
| |
| Gray Television, Inc., 7.50% Sr. Unsec. Nts., 10/1/20 | | | 3,340,000 | | | | 3,615,550 | |
| |
| Myriad International Holdings BV, 6% Sr. Unsec. Nts., 7/18/201 | | | 1,040,000 | | | | 1,151,800 | |
| |
| Nexstar Broadcasting, Inc., 6.875% Sr. Unsec. Nts., 11/15/20 | | | 2,305,000 | | | | 2,495,163 | |
| |
| Numericable Group SA, 6% Sr. Sec. Nts., 5/15/221 | | | 3,585,000 | | | | 3,732,881 | |
| |
| Sinclair Television Group, Inc.: | |
| 5.375% Sr. Unsec. Nts., 4/1/21 | | | 1,800,000 | | | | 1,820,250 | |
| 6.125% Sr. Unsec. Nts., 10/1/22 | | | 2,410,000 | | | | 2,530,500 | |
| |
| Univision Communications, Inc., 8.50% Sr. Unsec. Nts., 5/15/211 | | | 1,590,000 | | | | 1,770,863 | |
| |
| UPC Holding BV, 6.75% Sr. Unsec. Nts., 3/15/231 | | EUR | 2,720,000 | | | | 4,143,502 | |
| |
| UPCB Finance V Ltd., 7.25% Sr. Sec. Nts., 11/15/211 | | | 2,215,000 | | | | 2,447,575 | |
| |
| UPCB Finance VI Ltd., 6.875% Sr. Sec. Nts., 1/15/221 | | | 3,275,000 | | | | 3,594,313 | |
| |
| Virgin Media Finance plc, 7% Sr. Unsec. Nts., 4/15/231 | | GBP | 755,000 | | | | 1,420,026 | |
| |
| Virgin Media Secured Finance plc, 6% Sr. Sec. Nts., 4/15/211 | | GBP | 2,470,000 | | | | 4,446,970 | |
| |
| VTR Finance BV, 6.875% Sr. Sec. Nts., 1/15/241 | | | 1,375,000 | | | | 1,479,266 | |
| | | | | | | | |
| | | | 58,679,952 | |
|
| |
| Multiline Retail—0.3% | |
| |
| Burlington Holdings LLC/Burlington Holding Finance, Inc., 9% Sr. Unsec. Nts., 2/15/183,12 | | | 692,000 | | | | 711,044 | |
| |
| Neiman Marcus Group Ltd., Inc.: | |
| 8.00% Sr. Unsec. Nts., 10/15/211 | | | 665,000 | | | | 719,862 | |
| 8.75% Sr. Unsec. Nts., 10/15/211,12 | | | 4,255,000 | | | | 4,659,225 | |
| | | | | | | | |
| | | | 6,090,131 | |
|
| |
| Specialty Retail—0.7% | |
| |
| BC Mountain LLC/BC Mountain Finance, Inc., 7% Sr. Unsec. Nts., 2/1/211 | | | 3,240,000 | | | | 3,150,900 | |
| |
| Claire’s Stores, Inc., 8.875% Sr. Unsec. Nts., 3/15/19 | | | 3,195,000 | | | | 2,795,625 | |
| |
| Hot Topic, Inc., 9.25% Sr. Sec. Nts., 6/15/211 | | | 4,410,000 | | | | 4,917,150 | |
13 OPPENHEIMER GLOBAL STRATEGIC INCOME FUND/VA
| | |
| |
| CONSOLIDATED STATEMENT OF INVESTMENTS Unaudited / Continued | | |
| | | | | | | | |
| | | Principal Amount | | | Value | |
| |
| Specialty Retail (Continued) | |
| |
| L Brands, Inc., 6.625% Sr. Unsec. Nts., 4/1/21 | | $ | 1,295,000 | | | $ | 1,477,919 | |
| |
| Party City Holdings, Inc., 8.875% Sr. Unsec. Nts., 8/1/20 | | | 1,630,000 | | | | 1,813,375 | |
| |
| Sally Holdings LLC/Sally Capital, Inc., 5.75% Sr. Unsec. Nts., 6/1/22 | | | 655,000 | | | | 700,850 | |
| |
| Stackpole International Intermediate Co., 7.75% Sr. Sec. Nts., 10/15/211 | | | 1,230,000 | | | | 1,291,500 | |
| | | | | | | | |
| | | | 16,147,319 | |
|
| |
| Textiles, Apparel & Luxury Goods—0.3% | |
| |
| Levi Strauss & Co., 7.75% Sr. Unsec. Nts., 5/15/18 | | EUR | 72,500 | | | | 103,846 | |
| |
| Polymer Group, Inc., 6.875% Sr. Unsec. Nts., 6/1/191 | | | 705,000 | | | | 719,100 | |
| |
| Quiksilver, Inc./QS Wholesale, Inc.: | |
| 7.875% Sr. Sec. Nts., 8/1/181 | | | 1,060,000 | | | | 1,081,200 | |
| 10.00% Sr. Unsec. Nts., 8/1/20 | | | 701,000 | | | | 708,010 | |
| |
| Springs Industries, Inc., 6.25% Sr. Sec. Nts., 6/1/21 | | | 4,110,000 | | | | 4,207,612 | |
| | | | | | | | |
| | | | 6,819,768 | |
|
| |
| Consumer Staples—1.0% | |
| |
| Beverages—0.1% | |
| |
| Compania Brasileira de Aluminio, 4.75% Sr. Unsec. Nts., 6/17/241 | | | 1,200,000 | | | | 1,182,000 | |
| |
| Pernod Ricard SA: | |
| 4.45% Sr. Unsec. Nts., 1/15/221 | | | 695,000 | | | | 741,789 | |
| 5.75% Sr. Unsec. Nts., 4/7/211 | | | 585,000 | | | | 673,168 | |
| | | | | | | | |
| | | | 2,596,957 | |
|
| |
| Food & Staples Retailing—0.1% | |
| |
| BI-LO LLC/BI-LO Finance Corp., 8.625% Sr. Unsec. Nts., 9/15/181,12 | | | 1,755,000 | | | | 1,785,713 | |
| |
| Rite Aid Corp., 6.75% Sr. Unsec. Nts., 6/15/21 | | | 1,010,000 | | | | 1,098,375 | |
| | | | | | | | |
| | | | 2,884,088 | |
|
| |
| Food Products—0.7% | |
| |
| American Seafoods Group LLC/American Seafoods Finance, Inc., 10.75% Sr. Sub. Nts., 5/15/161 | | | 2,770,000 | | | | 2,776,925 | |
| |
| ASG Consolidated LLC/ASG Finance, Inc., 15% Sr. Unsec. Nts., 5/15/173,12 | | | 3,004,334 | | | | 2,824,074 | |
| |
| BRF SA: | | | | | | | | |
| 4.75% Sr. Unsec. Nts., 5/22/241 | | | 715,000 | | | | 706,062 | |
| 5.875% Sr. Unsec. Nts., 6/6/221 | | | 1,830,000 | | | | 1,985,550 | |
| |
| Bumble Bee Holdings, Inc., 9% Sr. Sec. Nts., 12/15/171 | | | 1,374,000 | | | | 1,470,180 | |
| |
| Chiquita Brands International, Inc./Chiquita Brands LLC, 7.875% Sr. Sec. Nts., 2/1/21 | | | 1,591,000 | | | | 1,738,168 | |
| |
| HJ Heinz Co., 4.25% Sec. Nts., 10/15/20 | | | 1,450,000 | | | | 1,460,875 | |
| |
| Marfrig Holding Europe BV, 6.875% Sr. Unsec. Nts., 6/24/191 | | | 870,000 | | | | 882,180 | |
| |
| Marfrig Overseas Ltd., 9.50% Sr. Unsec. Nts., 5/4/201 | | | 925,000 | | | | 1,003,625 | |
| |
| Post Holdings, Inc., 7.375% Sr. Unsec. Nts., 2/15/22 | | | 1,315,000 | | | | 1,426,775 | |
| |
| Wells Enterprises, Inc., 6.75% Sr. Sec. Nts., 2/1/201 | | | 912,000 | | | | 961,020 | |
| | | | | | | | |
| | | | 17,235,434 | |
|
| |
| Tobacco—0.1% | |
| |
| Vector Group Ltd.: | | | | | | | | |
| 7.75% Sr. Sec. Nts., 2/15/211 | | | 580,000 | | | | 620,600 | |
| 7.75% Sr. Sec. Nts., 2/15/21 | | | 1,145,000 | | | | 1,225,150 | |
| | | | | | | | |
| | | | 1,845,750 | |
| | | | | | | | |
| | | Principal Amount | | | Value | |
| |
| Energy—7.1% | |
| |
| Energy Equipment & Services—1.2% | |
| |
| Eletson Holdings, 9.625% Sr. Sec. Nts., 1/15/221 | | $ | 1,245,000 | | | $ | 1,341,487 | |
| |
| Exterran Partners LP/EXLP Finance Corp., 6% Sr. Unsec. Nts., 4/1/21 | | | 1,525,000 | | | | 1,547,875 | |
| |
| Forbes Energy Services Ltd., 9% Sr. Unsec. Nts., 6/15/19 | | | 1,520,000 | | | | 1,584,600 | |
| |
| Hornbeck Offshore Services, Inc., 5.875% Sr. Unsec. Nts., 4/1/20 | | | 2,360,000 | | | | 2,454,400 | |
| |
| McDermott International, Inc., 8% Sec. Nts., 5/1/211 | | | 1,885,000 | | | | 1,946,263 | |
| |
| North Atlantic Drilling Ltd.: | |
| 6.16% Sr. Unsec. Nts., 10/30/181,2 | | NOK | 8,000,000 | | | | 1,312,389 | |
| 6.25% Sr. Unsec. Nts., 2/1/191 | | | 1,605,000 | | | | 1,588,950 | |
| |
| Odebrecht Offshore Drilling Finance Ltd., 6.75% Sr. Sec. Nts., 10/1/221 | | | 2,516,562 | | | | 2,700,271 | |
| |
| Offshore Group Investment Ltd., 7.50% Sr. Sec. Nts., 11/1/19 | | | 2,120,000 | | | | 2,252,500 | |
| |
| Pertamina Persero PT, 5.625% Sr. Unsec. Nts., 5/20/431 | | | 955,000 | | | | 861,888 | |
| |
| Precision Drilling Corp., 6.625% Sr. Unsec. Nts., 11/15/20 | | | 1,395,000 | | | | 1,499,625 | |
| |
| QGOG Constellation SA, 6.25% Sr. Unsec. Nts., 11/9/191 | | | 2,375,000 | | | | 2,410,625 | |
| |
| Seadrill Ltd., 6.125% Sr. Unsec. Nts., 9/15/171 | | | 2,820,000 | | | | 2,982,150 | |
| |
| Sinopec Group Overseas Development 2013 Ltd., 4.375% Sr. Unsec. Nts., 10/17/231 | | | 1,320,000 | | | | 1,384,083 | |
| |
| Sinopec Group Overseas Development 2014 Ltd., 2.75% Sr. Unsec. Nts., 4/10/191 | | | 1,760,000 | | | | 1,772,373 | |
| | | | | | | | |
| | | | 27,639,479 | |
|
| |
| Oil, Gas & Consumable Fuels—5.9% | |
| |
| Access Midstream Partners LP/ACMP Finance Corp.: | |
| 4.875% Sr. Unsec. Nts., 3/15/24 | | | 680,000 | | | | 720,800 | |
| 6.125% Sr. Unsec. Nts., 7/15/22 | | | 1,390,000 | | | | 1,542,900 | |
| |
| Afren plc, 6.625% Sr. Sec. Nts., 12/9/201 | | | 1,290,000 | | | | 1,338,375 | |
| |
| Alliance Oil Co. Ltd., 7% Sr. Unsec. Nts., 5/4/201 | | | 1,605,000 | | | | 1,488,637 | |
| |
| Antero Resources Finance Corp., 6% Sr. Unsec. Nts., 12/1/20 | | | 1,410,000 | | | | 1,519,275 | |
| |
| Arch Coal, Inc.: | |
| 7.25% Sr. Unsec. Nts., 6/15/21 | | | 505,000 | | | | 371,175 | |
| 8.00% Sec. Nts., 1/15/191 | | | 1,760,000 | | | | 1,746,800 | |
| |
| Athlon Holdings LP/Athlon Finance Corp., 6% Sr. Unsec. Nts., 5/1/221 | | | 710,000 | | | | 736,625 | |
| |
| Atlas Pipeline Partners LP/Atlas Pipeline Finance Corp.: | |
| 5.875% Sr. Unsec. Nts., 8/1/23 | | | 1,280,000 | | | | 1,308,800 | |
| 6.625% Sr. Unsec. Nts., 10/1/20 | | | 1,435,000 | | | | 1,531,862 | |
| |
| Baytex Energy Corp., 5.125% Sr. Unsec. Nts., 6/1/211 | | | 705,000 | | | | 710,287 | |
| |
| Bill Barrett Corp., 7.625% Sr. Unsec. Nts., 10/1/19 | | | 2,355,000 | | | | 2,549,287 | |
| |
| BreitBurn Energy Partners LP/BreitBurn Finance Corp., 8.625% Sr. Unsec. Nts., 10/15/20 | | | 2,705,000 | | | | 2,989,025 | |
| |
| Chaparral Energy, Inc., 7.625% Sr. Unsec. Nts., 11/15/22 | | | 1,400,000 | | | | 1,519,000 | |
| |
| Chesapeake Energy Corp.: | |
| 4.875% Sr. Unsec. Nts., 4/15/22 | | | 705,000 | | | | 730,556 | |
| 5.75% Sr. Unsec. Nts., 3/15/23 | | | 1,425,000 | | | | 1,590,585 | |
| |
| Cloud Peak Energy Resources LLC/Cloud Peak Energy Finance Corp.: | |
| 6.375% Sr. Unsec. Nts., 3/15/24 | | | 1,740,000 | | | | 1,827,000 | |
| 8.50% Sr. Unsec. Nts., 12/15/19 | | | 485,000 | | | | 521,375 | |
| |
| CNOOC Curtis Funding No 1 Pty Ltd., 4.50% Sr. Unsec. Nts., 10/3/231 | | | 1,310,000 | | | | 1,375,382 | |
| |
| Cosan Luxembourg SA, 5% Sr. Unsec. Nts., 3/14/231 | | | 620,000 | | | | 593,650 | |
14 OPPENHEIMER GLOBAL STRATEGIC INCOME FUND/VA
| | | | | | | | |
| | | Principal Amount | | | Value | |
| |
Oil, Gas & Consumable Fuels (Continued) | |
| |
| Crestwood Midstream Partners LP/Crestwood Midstream Finance Corp.: | |
| 6.00% Sr. Unsec. Nts., 12/15/20 | | $ | 495,000 | | | $ | 522,225 | |
| 6.125% Sr. Unsec. Nts., 3/1/221 | | | 2,055,000 | | | | 2,173,162 | |
| |
| Delek & Avner Tamar Bond Ltd.: | |
| 3.839% Sr. Sec. Nts., 12/30/181 | | | 615,000 | | | | 620,184 | |
| 5.082% Sr. Sec. Nts., 12/30/231 | | | 610,000 | | | | 621,948 | |
| |
| Denbury Resources, Inc., 4.625% Sr. Sub. Nts., 7/15/23 | | | 1,040,000 | | | | 1,014,218 | |
| |
| Dolphin Energy Ltd., 5.50% Sr. Sec. Nts., 12/15/211 | | | 1,790,000 | | | | 2,038,362 | |
| |
| Ecopetrol SA: | | | | | | | | |
| 5.875% Sr. Unsec. Nts., 5/28/45 | | | 1,550,000 | | | | 1,613,550 | |
| 7.625% Sr. Unsec. Nts., 7/23/19 | | | 370,000 | | | | 455,100 | |
| |
| Empresa Nacional del Petroleo: | |
| 4.75% Sr. Unsec. Nts., 12/6/211 | | | 1,725,000 | | | | 1,838,157 | |
| 5.25% Sr. Unsec. Nts., 8/10/201 | | | 910,000 | | | | 999,237 | |
| |
| Energy Transfer Equity LP, 5.875% Sr. Sec. Nts., 1/15/241 | | | 1,175,000 | | | | 1,233,750 | |
| |
| Energy XXI Gulf Coast, Inc., 6.875% Sr. Unsec. Nts., 3/15/241 | | | 470,000 | | | | 480,575 | |
| |
| EP Energy LLC/Everest Acquisition Finance, Inc., 7.75% Sr. Unsec. Nts., 9/1/22 | | | 2,665,000 | | | | 3,018,112 | |
| |
| EXCO Resources, Inc., 7.50% Sr. Unsec. Nts., 9/15/18 | | | 1,745,000 | | | | 1,797,350 | |
| |
| Gazprom OAO Via Gaz Capital SA: | |
| 4.95% Sr. Unsec. Nts., 7/19/221 | | | 1,240,000 | | | | 1,239,752 | |
| 5.999% Sr. Unsec. Nts., 1/23/211 | | | 1,135,000 | | | | 1,215,869 | |
| |
| Genesis Energy LP/Genesis Energy Finance Corp., 5.75% Sr. Unsec. Nts., 2/15/21 | | | 1,720,000 | | | | 1,797,400 | |
| |
| Halcon Resources Corp.: | |
| 8.875% Sr. Unsec. Nts., 5/15/21 | | | 2,580,000 | | | | 2,786,400 | |
| 9.75% Sr. Unsec. Nts., 7/15/20 | | | 995,000 | | | | 1,090,769 | |
| |
| Hiland Partners LP/Hiland Partners Finance Corp., 7.25% Sr. Unsec. Nts., 10/1/201 | | | 1,430,000 | | | | 1,565,850 | |
| |
| KazMunayGas National Co. JSC: | |
| 5.75% Sr. Unsec. Nts., 4/30/431 | | | 650,000 | | | | 627,250 | |
| 7.00% Sr. Unsec. Nts., 5/5/201 | | | 435,000 | | | | 496,988 | |
| 9.125% Sr. Unsec. Nts., 7/2/181 | | | 985,000 | | | | 1,190,471 | |
| |
| Kodiak Oil & Gas Corp., 5.50% Sr. Unsec. Nts., 1/15/21 | | | 1,735,000 | | | | 1,817,413 | |
| |
| Laredo Petroleum, Inc., 5.625% Sr. Unsec. Nts., 1/15/22 | | | 1,765,000 | | | | 1,833,394 | |
| |
| LBC Tank Terminals Holding Netherlands BV, 6.875% Sr. Unsec. Nts., 5/15/233 | | | 1,530,000 | | | | 1,617,975 | |
| |
| Lightstream Resources Ltd., 8.625% Sr. Unsec. Nts., 2/1/201 | | | 1,765,000 | | | | 1,862,075 | |
| |
| Linn Energy LLC/Linn Energy Finance Corp.: | |
| 7.75% Sr. Unsec. Nts., 2/1/21 | | | 3,370,000 | | | | 3,652,238 | |
| 8.625% Sr. Unsec. Nts., 4/15/20 | | | 1,370,000 | | | | 1,486,450 | |
| |
| MarkWest Energy Partners LP/MarkWest Energy Finance Corp., 4.50% Sr. Unsec. Nts., 7/15/23 | | | 730,000 | | | | 748,250 | |
| |
| MEG Energy Corp.: | |
| 6.50% Sr. Unsec. Nts., 3/15/211 | | | 6,740,000 | | | | 7,178,100 | |
| 7.00% Sr. Unsec. Nts., 3/31/241 | | | 1,065,000 | | | | 1,176,825 | |
| |
| Memorial Production Partners LP/Memorial Production Finance Corp., 7.625% Sr. Unsec. Nts., 5/1/21 | | | 1,425,000 | | | | 1,503,375 | |
| |
| Midstates Petroleum Co., Inc./Midstates Petroleum Co. LLC, 9.25% Sr. Unsec. Nts., 6/1/21 | | | 1,440,000 | | | | 1,591,200 | |
| |
| Murray Energy Corp.: | |
| 8.625% Sr. Sec. Nts., 6/15/211 | | | 635,000 | | | | 690,563 | |
| 9.50% Sr. Sec. Nts., 12/5/201 | | | 2,820,000 | | | | 3,165,450 | |
| |
| Navios Maritime Acquisition Corp./Navios Acquisition Finance US, Inc., 8.125% Sr. Sec. Nts., 11/15/211 | | | 1,245,000 | | | | 1,307,250 | |
| | | | | | | | | | | | |
| | | | | | Principal Amount | | | Value | |
| |
| Oil, Gas & Consumable Fuels (Continued) | |
| |
| Novatek OAO via Novatek Finance Ltd.: | |
| 4.422% Sr. Unsec. Nts., 12/13/221 | | | $ | 1,120,000 | | | $ | 1,051,400 | |
| 7.75% Sr. Unsec. Nts., 2/21/171 | | | RUB | | | | 9,460,000 | | | | 269,062 | |
| |
| Oasis Petroleum, Inc., 6.875% Sr. Unsec. Nts., 1/15/23 | | | | 1,975,000 | | | | 2,162,625 | |
| |
| Odebrecht Drilling Norbe VIII/IX Ltd., 6.35% Sr. Sec. Nts., 6/30/211 | | | | 323,750 | | | | 350,459 | |
| |
| Origin Energy Finance Ltd.: | |
| 3.50% Sr. Unsec. Nts., 10/9/181 | | | | 2,114,000 | | | | 2,195,744 | |
| 5.45% Sr. Unsec. Nts., 10/14/211 | | | | 1,372,000 | | | | 1,530,589 | |
| |
| Pacific Rubiales Energy Corp., 5.125% Sr. Unsec. Nts., 3/28/231 | | | | 1,905,000 | | | | 1,900,238 | |
| |
| Parsley Energy LLC/Parsley Finance Corp., 7.50% Sr. Unsec. Nts., 2/15/221 | | | | 1,520,000 | | | | 1,630,200 | |
| |
| Peabody Energy Corp., 6.25% Sr. Unsec. Nts., 11/15/21 | | | | 1,735,000 | | | | 1,737,169 | |
| |
| Penn Virginia Corp., 8.50% Sr. Unsec. Nts., 5/1/20 | | | | 1,715,000 | | | | 1,925,088 | |
| |
| Petroleos de Venezuela SA: | |
| 6.00% Sr. Unsec. Nts., 11/15/261 | | | | 2,685,000 | | | | 1,731,825 | |
| 9.00% Sr. Unsec. Nts., 11/17/21 | | | | 1,160,000 | | | | 991,684 | |
| |
| Petroleos Mexicanos: | |
| 1.95% Sr. Unsec. Nts., 12/20/22 | | | | 157,250 | | | | 156,220 | |
| 2.00% Sec. Nts., 12/20/22 | | | | 777,750 | | | | 774,305 | |
| 3.50% Sr. Unsec. Nts., 1/30/23 | | | | 1,470,000 | | | | 1,439,130 | |
| 6.375% Sr. Unsec. Nts., 1/23/451 | | | | 2,565,000 | | | | 2,985,019 | |
| 6.625% Sr. Unsec. Nts., 6/15/35 | | | | 1,020,000 | | | | 1,206,150 | |
| 8.00% Sr. Unsec. Nts., 5/3/19 | | | | 4,135,000 | | | | 5,143,940 | |
| |
| Petroleum Co. of Trinidad & Tobago Ltd.: | |
| 6.00% Sr. Unsec. Nts., 5/8/221 | | | | 346,667 | | | | 372,667 | |
| 9.75% Sr. Unsec. Nts., 8/14/191 | | | | 515,000 | | | | 651,475 | |
| |
| Petronas Capital Ltd., 7.875% Sr. Unsec. Nts., 5/22/221 | | | | 1,725,000 | | | | 2,297,277 | |
| |
| Range Resources Corp.: | |
| 5.00% Sr. Sub. Nts., 8/15/22 | | | | 145,000 | | | | 154,425 | |
| 5.00% Sr. Sub. Nts., 3/15/23 | | | | 325,000 | | | | 347,750 | |
| |
| Rice Energy, Inc., 6.25% Sr. Unsec. Nts., 5/1/221 | | | | 1,085,000 | | | | 1,113,481 | |
| |
| Rosetta Resources, Inc., 5.625% Sr. Unsec. Nts., 5/1/21 | | | | 1,525,000 | | | | 1,576,469 | |
| |
| Sabine Pass Liquefaction LLC, 5.625% Sr. Sec. Nts., 2/1/21 | | | | 1,056,000 | | | | 1,122,000 | |
| |
| Samson Investment Co., 10.75% Sr. Unsec. Nts., 2/15/201 | | | | 4,105,000 | | | | 4,346,169 | |
| |
| Sanchez Energy Corp.: | |
| 6.125% Sr. Unsec. Nts., 1/15/231 | | | | 945,000 | | | | 978,075 | |
| 7.75% Sr. Unsec. Nts., 6/15/211 | | | | 1,695,000 | | | | 1,847,550 | |
| |
| SandRidge Energy, Inc.: | |
| 7.50% Sr. Unsec. Nts., 2/15/23 | | | | 1,675,000 | | | | 1,825,750 | |
| 7.51% Sr. Unsec. Nts., 3/15/21 | | | | 3,062,000 | | | | 3,333,753 | |
| |
| Seventy Seven Energy, Inc., 6.50% Sr. Unsec. Nts., 7/15/221 | | | | 235,000 | | | | 241,169 | |
| |
| Sibur Securities Ltd., 3.914% Sr. Unsec. Nts., 1/31/181 | | | | 650,000 | | | | 628,875 | |
| |
| SM Energy Co., 6.50% Sr. Unsec. Nts., 1/1/23 | | | | 1,990,000 | | | | 2,164,125 | |
| |
| Tengizchevroil Finance Co. Sarl, 6.124% Sr. Sec. Nts., 11/15/141 | | | | 141,871 | | | | 144,199 | |
| |
| Tesoro Logistics LP/Tesoro Logistics Finance Corp., 5.875% Sr. Unsec. Nts., 10/1/20 | | | | 1,475,000 | | | | 1,563,500 | |
| |
| Tullow Oil plc, 6% Sr. Unsec. Nts., 11/1/201 | | | | 1,301,000 | | | | 1,356,293 | |
| |
| Whiting Petroleum Corp., 5.75% Sr. Unsec. Nts., 3/15/21 | | | | 1,015,000 | | | | 1,113,963 | |
| | | | | | | | | | | | |
| | | | 143,138,445 | |
|
| |
| Financials—8.3% | |
| |
| Capital Markets—1.1% | |
| |
| American Capital Ltd., 6.50% Sr. Unsec. Nts., 9/15/181 | | | | 1,315,000 | | | | 1,407,050 | |
15 OPPENHEIMER GLOBAL STRATEGIC INCOME FUND/VA
| | |
| |
| CONSOLIDATED STATEMENT OF INVESTMENTS Unaudited / Continued | | |
| | | | | | | | | | |
| | | | | Principal Amount | | | Value | |
| |
| Capital Markets (Continued) | |
| |
| Axalta Coating Systems Dutch Holding BV, 7.375% Sr. Unsec. Nts., 5/1/211 | | $ | 1,675,000 | | | $ | 1,834,125 | |
| |
| Cantor Commercial Real Estate Co. LP/CCRE Finance Corp., 7.75% Sr. Unsec. Nts., 2/15/183 | | | 1,880,000 | | | | 2,039,800 | |
| |
| Fermaca Enterprises S de RL de CV, 6.375% Sr. Sec. Nts., 3/30/381 | | | 1,035,000 | | | | 1,084,162 | |
| |
| Gates Investments LLC/Gates Investments, Inc., 9% Sec. Nts., 10/1/18 | | | 1,473,000 | | | | 1,570,292 | |
| |
| Hilton Worldwide Finance LLC/Hilton Worldwide Finance Corp., 5.625% Sr. Unsec. Nts., 10/15/211 | | | 1,035,000 | | | | 1,101,628 | |
| |
| Mdc-Gmtn BV, 3.25% Sr. Unsec. Nts., 4/28/221 | | | 1,805,000 | | | | 1,820,794 | |
| |
| MPH Acquisition Holdings LLC, 6.625% Sr. Unsec. Nts., 4/1/221 | | | 700,000 | | | | 735,000 | |
| |
| Nationstar Mortgage LLC/Nationstar Capital Corp.: | |
| 6.50% Sr. Unsec. Nts., 8/1/18 | | | 430,000 | | | | 443,975 | |
| 7.875% Sr. Unsec. Nts., 10/1/20 | | | 1,655,000 | | | | 1,746,025 | |
| 10.875% Sr. Unsec. Nts., 4/1/15 | | | 1,295,000 | | | | 1,303,955 | |
| |
| Prospect Medical Holdings, Inc., 8.375% Sr. Sec. Nts., 5/1/191 | | | 2,160,000 | | | | 2,365,200 | |
| |
| Red de Carreteras de Occidente SAPIB de CV, 9% Sr. Sec. Nts., 6/10/281 | | MXN | | | 22,700,000 | | | | 1,682,127 | |
| |
| Signode Industrial Group Lux SA/Signode Industrial Group US, Inc., 6.375% Sr. Unsec. Nts., 5/1/221 | | | 1,165,000 | | | | 1,182,475 | |
| |
| UBS AG (Jersey Branch), 7.25% Sub. Nts., 2/22/222 | | | 3,520,000 | | | | 3,863,647 | |
| |
| Walter Investment Management Corp., 7.875% Sr. Unsec. Nts., 12/15/211 | | | 2,855,000 | | | | 2,990,613 | |
| | | | | | | | | | |
| | | | | | | | | 27,170,868 | |
|
| |
| Commercial Banks—3.8% | |
| |
| Akbank TAS, 7.50% Sr. Unsec. Nts., 2/5/181 | | TRY | | | 1,805,000 | | | | 795,107 | |
| |
| America Movil SAB de CV, 8.46% Sr. Unsec. Nts., 12/18/36 | | MXN | | | 14,700,000 | | | | 1,120,669 | |
| |
| Banco ABC Brasil SA, 8.50% Sr. Unsec. Nts., 3/28/161 | | BRL | | | 1,080,000 | | | | 466,802 | |
| |
| Banco del Estado de Chile, 4.125% Sr. Unsec. Nts., 10/7/201 | | | 2,060,000 | | | | 2,191,325 | |
| |
| Banco do Brasil SA (Cayman), 9% Jr. Sub. Perpetual Bonds1,2,13 | | | 465,000 | | | | 460,931 | |
| |
| Banco do Estado do Rio Grande do Sul SA, 7.375% Sub. Nts., 2/2/221 | | | 1,630,000 | | | | 1,752,250 | |
| |
| Banco Santander Brasil SA (Cayman Islands), 8% Sr. Unsec. Unsub. Nts., 3/18/161 | | BRL | | | 1,850,000 | | | | 807,988 | |
| |
| Banco Santander Mexico SA Institucion de Banca Multiple Grupo Financiero Santand, 4.125% Sr. Unsec. Nts., 11/9/221 | | | 515,000 | | | | 526,587 | |
| |
| Bancolombia SA, 5.125% Unsec. Sub. Nts., 9/11/22 | | | 2,405,000 | | | | 2,430,493 | |
| |
| Barclays plc, 7% Jr. Sub. Perpetual Bonds2,13 | | GBP | | | 3,666,000 | | | | 6,219,208 | |
| |
| BBVA Banco Continental SA, 5% Sr. Unsec. Nts., 8/26/221 | | | 1,600,000 | | | | 1,700,000 | |
| |
| BNP Paribas SA, 5.945% Jr. Sub. Perpetual Bonds2,13 | | GBP | | | 3,190,000 | | | | 5,679,897 | |
| |
| BPCE SA: | |
| 5.25% Jr. Sub. Perpetual Bonds2,13 | | EUR | | | 1,010,000 | | | | 1,386,727 | |
| 5.70% Sub. Nts., 10/22/231 | | | 1,365,000 | | | | 1,507,438 | |
| 9.00% Jr. Sub. Perpetual Bonds2,13 | | EUR | | | 1,985,000 | | | | 2,837,897 | |
| |
| Brazil Loan Trust 1, 5.477% Sec. Nts., 7/24/231 | | | 1,420,000 | | | | 1,462,600 | |
| |
| CIT Group, Inc.: | | | | | | | | |
| 4.25% Sr. Unsec. Nts., 8/15/17 | | | 575,000 | | | | 601,234 | |
| 5.00% Sr. Unsec. Nts., 8/15/22 | | | 2,465,000 | | | | 2,560,519 | |
| | | | | | | | | | |
| | | | | Principal Amount | | | Value | |
| |
| Commercial Banks (Continued) | |
| |
| Commerzbank AG, 8.125% Sub. Nts., 9/19/231 | | $ | 5,050,000 | | | $ | 6,148,951 | |
| |
| Corp. Financiera de Desarrollo SA, 4.75% Sr. Unsec. Nts., 2/8/221 | | | 1,535,000 | | | | 1,607,912 | |
| |
| CorpGroup Banking SA, 6.75% Sr. Unsec. Nts., 3/15/231 | | | 1,790,000 | | | | 1,782,085 | |
| |
| Credit Agricole SA: | |
| 6.637% Jr. Sub. Perpetual Bonds1,2,13 | | | 3,480,000 | | | | 3,704,025 | |
| 8.375% Jr. Sub. Perpetual Bonds2,3,13 | | | 1,855,000 | | | | 2,200,494 | |
| |
| Danske Bank, 5.684% Jr. Sub. Perpetual Bonds2,13 | | GBP | | | 2,250,000 | | | | 4,072,062 | |
| |
| DTEK Finance plc, 7.875% Sr. Unsec. Nts., 4/4/181 | | | 115,000 | | | | 96,911 | |
| |
| Export-Import Bank of India, 4% Sr. Unsec. Nts., 1/14/23 | | | 690,000 | | | | 689,924 | |
| |
| Finansbank AS, 6.25% Sr. Unsec. Nts., 4/30/191 | | | 810,000 | | | | 838,431 | |
| |
| Grupo Aval Ltd.: | |
| 4.75% Sr. Unsec. Nts., 9/26/221 | | | 2,190,000 | | | | 2,168,100 | |
| 5.25% Sr. Unsec. Nts., 2/1/171 | | | 480,000 | | | | 513,600 | |
| |
| HBOS Capital Funding LP, 6.461% Jr. Sub. Perpetual Bonds2,13 | | GBP | | | 1,085,000 | | | | 2,005,883 | |
| |
| Hungarian Development Bank, 6.25% Sr. Unsec. Nts., 10/21/201 | | | 1,645,000 | | | | 1,833,583 | |
| |
| ICICI Bank Ltd., 6.375% Jr. Sub. Nts., 4/30/221,2 | | | 910,000 | | | | 946,400 | |
| |
| ICICI Bank Ltd. (Dubai), 4.80% Sr. Unsec. Nts., 5/22/191 | | | 980,000 | | | | 1,037,678 | |
| |
| Intesa Sanpaolo SpA, 5.017% Sub. Nts., 6/26/241 | | | 2,820,000 | | | | 2,857,283 | |
| |
| Jones Energy Holdings LLC/Jones Energy Finance Corp., 6.75% Sr. Unsec. Nts., 4/1/221 | | | 1,195,000 | | | | 1,263,713 | |
| |
| Mizuho Bank Ltd., 2.45% Sr. Unsec. Nts., 4/16/191 | | | 1,275,000 | | | | 1,288,614 | |
| |
| Rabobank Capital Funding Trust IV, 5.556% Jr. Sub. Perpetual Bonds1,2,13 | | GBP | | | 150,000 | | | | 273,417 | |
| |
| RBS Capital Trust III, 5.512% Jr. Sub. Perpetual Bonds2,13 | | | 1,445,000 | | | | 1,437,775 | |
| |
| Royal Bank of Scotland Group plc, 6% Sub. Nts., 12/19/23 | | | 2,795,000 | | | | 3,032,977 | |
| |
| Santander UK plc, 5% Sub. Nts., 11/7/231 | | | 1,490,000 | | | | 1,611,399 | |
| |
| Scottish Widows plc, 5.125% Jr. Sub. Perpetual Bonds2,13 | | GBP | | | 565,000 | | | | 986,812 | |
| |
| Skandinaviska Enskilda Banken AB, 2.375% Sr. Unsec. Nts., 11/20/181 | | | 1,410,000 | | | | 1,432,426 | |
| |
| Societe Generale SA: | |
| 5.00% Sub. Nts., 1/17/241 | | | 1,450,000 | | | | 1,518,511 | |
| 5.922% Jr. Sub. Perpetual Bonds1,2,13 | | | 4,000,000 | | | | 4,290,000 | |
| |
| State Bank of India (London), 4.875% Sr. Unsec. Nts., 4/17/241 | | | 720,000 | | | | 730,576 | |
| |
| TC Ziraat Bankasi AS, 4.25% Sr. Unsec. Nts., 7/3/191,6 | | | 1,870,000 | | | | 1,860,650 | |
| |
| Toronto-Dominion Bank (The), 2.625% Sr. Unsec. Nts., 9/10/18 | | | 1,395,000 | | | | 1,441,572 | |
| |
| Turkiye Garanti Bankasi AS, 4.75% Sr. Unsec. Nts., 10/17/191 | | | 1,035,000 | | | | 1,047,938 | |
| |
| Turkiye Halk Bankasi AS, 4.75% Sr. Unsec. Nts., 6/4/191 | | | 825,000 | | | | 826,320 | |
| |
| Turkiye Sise ve Cam Fabrikalari AS, 4.25% Sr. Unsec. Nts., 5/9/201 | | | 580,000 | | | | 562,600 | |
| | | | | | | | | | |
| | | | | | | | | 90,616,294 | |
|
| |
| Consumer Finance—0.6% | |
| |
| Ahern Rentals, Inc., 9.50% Sec. Nts., 6/15/181 | | | 1,460,000 | | | | 1,616,950 | |
| |
| Ally Financial, Inc., 7.50% Sr. Unsec. Nts., 9/15/20 | | | 1,175,000 | | | | 1,420,281 | |
16 OPPENHEIMER GLOBAL STRATEGIC INCOME FUND/VA
| | | | | | |
| | | Principal Amount | | | Value |
|
| Consumer Finance (Continued) |
|
| Astana Finance JSC, 9.16% Sr. Unsec. Nts., 3/14/128 | | $ | 7,200,000 | | | $414,000 |
|
| Cash America International, Inc., 5.75% Sr. Unsec. Nts., 5/15/18 | | | 1,045,000 | | | 1,078,962 |
|
| Enova International, Inc., 9.75% Sr. Nts., 6/1/211 | | | 1,880,000 | | | 1,877,650 |
|
| Milestone Aviation Group Ltd. (The), 8.625% Sr. Unsec. Nts., 12/15/171 | | | 1,380,000 | | | 1,516,275 |
|
| Navient Corp.: | | | | | | |
| 6.125% Sr. Unsec. Nts., 3/25/24 | | | 1,820,000 | | | 1,849,575 |
| 7.25% Sr. Unsec. Nts., 1/25/22 | | | 2,230,000 | | | 2,472,513 |
|
| Speedy Cash Intermediate Holdings Corp., 10.75% Sec. Nts., 5/15/181 | | | 990,000 | | | 1,009,800 |
|
| TMX Finance LLC/TitleMax Finance Corp., 8.50% Sr. Sec. Nts., 9/15/181 | | | 1,445,000 | | | 1,538,925 |
| | | | | | |
| | | 14,794,931 |
|
| Diversified Financial Services—1.5% |
|
| ABN AMRO Bank NV, 4.31% Jr. Sub. Perpetual Bonds2,13 | | EUR | 4,340,000 | | | 6,099,092 |
|
| AG Spring Finance II Ltd., 9.50% Sr. Sec. Nts., 6/1/191 | | EUR | 640,000 | | | 836,040 |
|
| AG Spring Finance Ltd., 7.50% Sr. Sec. Nts., 6/1/181 | | EUR | 640,000 | | | 876,352 |
|
| Baggot Securities Ltd., 10.25% Sec. Perpetual Bonds1,13 | | EUR | 1,905,000 | | | 2,875,889 |
|
| Banco BTG Pactual SA (Cayman Islands): | | | | | | |
| 4.00% Sr. Unsec. Nts., 1/16/201 | | | 2,275,000 | | | 2,184,000 |
| 5.75% Sub. Nts., 9/28/221 | | | 1,190,000 | | | 1,173,031 |
|
| Banco Invex SA/Hipotecaria Credito y Casa SA de CV, 6.45% Sec. Nts., 3/13/348 | | MXN | 4,830,531 | | | — |
|
| Capsugel SA, 7% Sr. Unsec. Nts., 5/15/191,12 | | | 1,500,000 | | | 1,547,812 |
|
| Columbus International, Inc., 7.375% Sr. Unsec. Nts., 3/30/211 | | | 1,185,000 | | | 1,281,281 |
|
| Export Credit Bank of Turkey, 5.875% Sr. Unsec. Nts., 4/24/191 | | | 3,270,000 | | | 3,475,847 |
|
| First Data Holdings, Inc., 14.50% Sr. Unsec. Nts., 9/24/191,12 | | | 1,199,880 | | | 1,339,366 |
|
| FTE Verwaltungs GmbH, 9% Sr. Sec. Nts., 7/15/201 | | EUR | 1,545,000 | | | 2,320,514 |
|
| Jefferies Finance LLC/JFIN Co.-Issuer Corp., 7.375% Sr. Unsec. Nts., 4/1/201 | | | 1,715,000 | | | 1,809,325 |
|
| Jefferies LoanCore LLC/JLC Finance Corp., 6.875% Sr. Unsec. Nts., 6/1/201 | | | 1,470,000 | | | 1,492,050 |
|
| JPMorgan Hipotecaria su Casita: |
| 6.10% Sec. Nts., 9/25/3511 | | MXN | 1,137,637 | | | 120,110 |
| 6.47% Sec. Nts., 8/26/353,11 | | MXN | 5,808,600 | | | 44,619 |
|
| Magyar Export-Import Bank Zrt, 5.50% Sr. Unsec. Nts., 2/12/181 | | | 1,310,000 | | | 1,414,590 |
|
| National Savings Bank, 8.875% Sr. Unsec. Nts., 9/18/181 | | | 1,315,000 | | | 1,495,813 |
|
| NN Group NV, 6.375% Sub. Nts., 5/7/272 | | EUR | 2,565,000 | | | 3,913,969 |
|
| Opal Acquisition, Inc., 8.875% Sr. Unsec. Nts., 12/15/211 | | | 610,000 | | | 644,313 |
|
| SPCM SA, 5.50% Sr. Unsec. Nts., 6/15/201 | | EUR | 270,000 | | | 400,212 |
| | | | | | |
| | | 35,344,225 |
|
| Insurance—0.5% | | | |
|
| Aviva plc: | | | | | | |
| 5.902% Jr. Sub. Perpetual Bonds2,13 | | GBP | 750,000 | | | 1,350,192 |
| 6.125% Jr. Sub. Perpetual Bonds2,13 | | GBP | 1,545,000 | | | 2,836,551 |
|
| Hockey Merger Sub 2, Inc., 7.875% Sr. Unsec. Nts., 10/1/211 | | | 2,695,000 | | | 2,900,494 |
|
| National Financial Partners Corp., 9% Sr. Unsec. Nts., 7/15/211 | | | 1,860,000 | | | 2,036,700 |
| | | | | | |
| | | Principal Amount | | | Value |
|
| Insurance (Continued) | | | |
|
| Swiss Re Capital I LP, 6.854% Jr. Sub. Perpetual Bonds1,2,13 | | $ | 3,538,000 | | | $ 3,794,505 |
| | | | | | |
| | | 12,918,442 |
|
| Real Estate Investment Trusts (REITs)—0.3% |
|
| CTR Partnership LP/CareTrust Capital Corp., 5.875% Sr. Unsec. Nts., 6/1/211 | | | 1,645,000 | | | 1,665,562 |
|
| DuPont Fabros Technology LP, 5.875% Sr. Unsec. Nts., 9/15/21 | | | 1,535,000 | | | 1,611,750 |
|
| iStar Financial, Inc., 4.875% Sr. Unsec. Nts., 7/1/18 | | | 1,770,000 | | | 1,783,275 |
|
| TRUST F/1401, 5.25% Sr. Unsec. Nts., 12/15/241 | | | 1,245,000 | | | 1,310,363 |
| | | | | | |
| | | 6,370,950 |
|
| Real Estate Management & Development—0.5% |
|
| Country Garden Holdings Co. Ltd., 7.875% Sr. Unsec. Nts., 5/27/191 | | | 1,150,000 | | | 1,197,495 |
|
| Emaar Sukuk Ltd., 6.40% Sr. Unsec. Nts., 7/18/19 | | | 225,000 | | | 255,139 |
|
| Fondo MIVIVIENDA SA, 3.50% Sr. Unsec. Nts., 1/31/231 | | | 2,360,000 | | | 2,259,700 |
|
| Jafz Sukuk Ltd., 7% Sr. Unsec. Nts., 6/19/19 | | | 1,775,000 | | | 2,041,250 |
|
| Realogy Group LLC: | | | | | | |
| 7.625% Sr. Sec. Nts., 1/15/201 | | | 1,330,000 | | | 1,472,975 |
| 9.00% Sr. Sec. Nts., 1/15/203 | | | 865,000 | | | 988,263 |
|
| Sukuk Funding No 3 Ltd., 4.348% Sr. Unsec. Nts., 12/3/18 | | | 1,145,000 | | | 1,195,264 |
|
| Techem GmbH, 6.125% Sr. Sec. Nts., 10/1/191 | | EUR | 1,025,000 | | | 1,522,889 |
| | | | | | |
| | | 10,932,975 |
|
| Thrifts & Mortgage Finance—0.0% | | | |
|
Jefferies Finance LLC/JFIN Co.-Issuer Corp., 6.875% Sr. Unsec. Nts., 4/15/221 | | | 1,165,000 | | | 1,185,387 |
|
| Health Care—1.9% | | | |
|
| Biotechnology—0.1% | | | |
|
Universal Hospital Services, Inc., 7.625% Sec. Nts., 8/15/20 | | | 1,570,000 | | | 1,652,425 |
|
| Health Care Equipment & Supplies—0.4% |
|
| Alere, Inc., 6.50% Sr. Sub. Nts., 6/15/20 | | | 1,045,000 | | | 1,102,475 |
|
| ConvaTec Healthcare D Sarl, 10.875% Sr. Unsec. Nts., 12/15/181 | | EUR | 1,140,000 | | | 1,708,985 |
|
| Crimson Merger Sub, Inc., 6.625% Sr. Unsec. Nts., 5/15/221 | | | 3,590,000 | | | 3,567,563 |
|
| DJO Finance LLC/DJO Finance Corp., 8.75% Sec. Nts., 3/15/18 | | | 1,125,000 | | | 1,215,000 |
|
| Hologic, Inc., 6.25% Sr. Unsec. Nts., 8/1/20 | | | 185,000 | | | 196,100 |
|
| Kinetic Concepts, Inc./KCI USA, Inc., 10.50% Sec. Nts., 11/1/18 | | | 1,840,000 | | | 2,083,800 |
| | | | | | |
| | | 9,873,923 |
|
| Health Care Providers & Services—1.1% |
|
| Acadia Healthcare Co., Inc., 6.125% Sr. Unsec. Nts., 3/15/21 | | | 440,000 | | | 464,200 |
|
| CHS/Community Health Systems, Inc.: |
| 6.875% Sr. Unsec. Nts., 2/1/221 | | | 1,000,000 | | | 1,065,000 |
| 7.125% Sr. Unsec. Nts., 7/15/20 | | | 970,000 | | | 1,054,875 |
|
| DaVita HealthCare Partners, Inc.: |
| 5.125% Sr. Unsec. Nts., 7/15/24 | | | 825,000 | | | 831,703 |
| 5.75% Sr. Unsec. Nts., 8/15/22 | | | 895,000 | | | 959,887 |
|
| Envision Healthcare Corp., 5.125% Sr. Unsec. Nts., 7/1/221 | | | 590,000 | | | 596,637 |
|
| FGI Operating Co. LLC/FGI Finance, Inc., 7.875% Sec. Nts., 5/1/20 | | | 3,945,000 | | | 4,221,150 |
17 OPPENHEIMER GLOBAL STRATEGIC INCOME FUND/VA
| | |
| |
| CONSOLIDATED STATEMENT OF INVESTMENTS Unaudited / Continued | | |
| | | | | | |
| | | Principal Amount | | | Value |
|
| Health Care Providers & Services (Continued) |
|
| Fresenius Medical Care US Finance II, Inc.: |
| 5.625% Sr. Unsec. Nts., 7/31/191 | | $ | 805,000 | | | $ 881,475 |
| 5.875% Sr. Unsec. Nts., 1/31/221 | | | 405,000 | | | 449,550 |
|
| Gentiva Health Services, Inc., 11.50% Sr. Unsec. Nts., 9/1/18 | | | 1,370,000 | | | 1,464,187 |
|
| HCA, Inc., 7.50% Sr. Unsec. Nts., 2/15/22 | | | 2,695,000 | | | 3,116,094 |
|
| IASIS Healthcare LLC/IASIS Capital Corp., 8.375% Sr. Unsec. Nts., 5/15/19 | | | 2,270,000 | | | 2,426,063 |
|
| Kindred Healthcare, Inc., 6.375% Sr. Unsec. Nts., 4/15/221 | | | 1,395,000 | | | 1,408,950 |
|
| LifePoint Hospitals, Inc., 5.50% Sr. Unsec. Nts., 12/1/211 | | | 3,070,000 | | | 3,223,500 |
|
| Select Medical Corp.: | | | | | | |
| 6.375% Sr. Unsec. Nts., 6/1/21 | | | 1,055,000 | | | 1,107,750 |
| 6.375% Sr. Unsec. Nts., 6/1/211 | | | 695,000 | | | 729,750 |
|
| Tenet Healthcare Corp., 6% Sr. Sec. Nts., 10/1/20 | | | 2,035,000 | | | 2,213,063 |
| | | | | | |
| | | | | | 26,213,834 |
|
| Pharmaceuticals—0.3% |
|
| Endo Finance LLC & Endo Finco, Inc., 5.375% Sr. Unsec. Nts., 1/15/231 | | | 2,500,000 | | | 2,503,125 |
|
| JLL/Delta Dutch Newco BV, 7.50% Sr. Unsec. Nts., 2/1/221 | | | 1,265,000 | | | 1,314,019 |
|
| Salix Pharmaceuticals Ltd., 6% Sr. Unsec. Nts., 1/15/211 | | | 3,060,000 | | | 3,289,500 |
|
| Valeant Pharmaceuticals International, Inc.: |
| 6.375% Sr. Unsec. Nts., 10/15/201 | | | 920,000 | | | 980,950 |
| 7.25% Sr. Unsec. Nts., 7/15/221 | | | 115,000 | | | 124,631 |
| | | | | | |
| | | | | | 8,212,225 |
|
| Industrials—5.6% |
|
| Aerospace & Defense—1.1% |
|
| B/E Aerospace, Inc., 6.875% Sr. Unsec. Nts., 10/1/20 | | | 1,255,000 | | | 1,369,519 |
|
| CBC Ammo LLC/CBC FinCo, Inc., 7.25% Sr. Unsec. Nts., 11/15/211 | | | 5,860,000 | | | 6,079,750 |
|
| Embraer Overseas Ltd., 5.696% Sr. Unsec. Nts., 9/16/231 | | | 1,035,000 | | | 1,124,320 |
|
| Erickson, Inc., 8.25% Sec. Nts., 5/1/20 | | | 3,057,000 | | | 3,156,352 |
|
| GenCorp, Inc., 7.125% Sec. Nts., 3/15/21 | | | 3,980,000 | | | 4,368,050 |
|
| Huntington Ingalls Industries, Inc., 7.125% Sr. Unsec. Unsub. Nts., 3/15/21 | | | 1,940,000 | | | 2,129,150 |
|
| Kratos Defense & Security Solutions, Inc., 7% Sr. Sec. Nts., 5/15/191 | | | 1,805,000 | | | 1,881,712 |
|
| Spirit AeroSystems, Inc., 5.25% Sr. Unsec. Nts., 3/15/221 | | | 2,165,000 | | | 2,202,888 |
|
| TransDigm, Inc., 6% Sr. Sub. Nts., 7/15/221 | | | 1,810,000 | | | 1,862,038 |
|
| Triumph Group, Inc., 5.25% Sr. Unsec. Nts., 6/1/221 | | | 2,555,000 | | | 2,570,969 |
| | | | | | |
| | | | | | 26,744,748 |
|
| Air Freight & Couriers—0.4% |
|
| CEVA Group plc, 7% Sr. Sec. Nts., 3/1/211 | | | 7,090,000 | | | 7,320,425 |
|
| Kazakhstan Temir Zholy Finance BV, 6.95% Sr. Unsec. Nts., 7/10/421 | | | 190,000 | | | 208,525 |
|
| SPL Logistics Escrow LLC/SPL Logistics Finance Corp., 8.875% Sr. Sec. Nts., 8/1/201 | | | 2,560,000 | | | 2,880,000 |
| | | | | | |
| | | | | | 10,408,950 |
|
| Airlines—0.2% |
|
| Air Canada, 6.75% Sr. Sec. Nts., 10/1/191 | | | 1,100,000 | | | 1,197,625 |
|
| Emirates Airline, 4.50% Sr. Unsec. Nts., 2/6/251 | | | 1,585,000 | | | 1,561,225 |
| | | | | | |
| | | Principal Amount | | | Value |
|
| Airlines (Continued) |
|
| US Airways 2011-1 Class A Pass Through Trust, 7.125% Pass-Through Certificates, 10/22/23 | | $ | 1,167,931 | | | $ 1,369,399 |
| | | | | | |
| | | | | | 4,128,249 |
|
| Building Products—0.1% |
|
Nortek, Inc., 8.50% Sr. Unsec. Nts., 4/15/21 | | | 2,740,000 | | | 3,041,400 |
|
| Commercial Services & Supplies—1.2% |
|
| Affinion Group, Inc., 7.875% Sr. Unsec. Nts., 12/15/18 | | | 3,020,000 | | | 2,755,750 |
|
| Brand Energy & Infrastructure Services, Inc., 8.50% Sr. Unsec. Nts., 12/1/213 | | | 3,070,000 | | | 3,284,900 |
|
| Cenveo Corp.: | | | | | | |
| 6.00% Sr. Sec. Nts., 8/1/191 | | | 2,925,000 | | | 2,939,625 |
| 8.50% Sec. Nts., 9/15/221 | | | 2,550,000 | | | 2,543,625 |
| 8.875% Sec. Nts., 2/1/18 | | | 3,020,000 | | | 3,174,080 |
|
| First Data Corp., 6.75% Sr. Sec. Nts., 11/1/201 | | | 2,340,000 | | | 2,538,900 |
|
| Quad Graphics, Inc., 7% Sr. Unsec. Nts., 5/1/221 | | | 1,795,000 | | | 1,803,975 |
|
| R.R. Donnelley & Sons Co., 7.875% Sr. Unsec. Nts., 3/15/21 | | | 1,190,000 | | | 1,374,450 |
|
| Spectrum Brands, Inc., 6.375% Sr. Unsec. Nts., 11/15/20 | | | 1,010,000 | | | 1,093,325 |
|
| Tervita Corp., 8% Sr. Sec. Nts., 11/15/181 | | | 3,495,000 | | | 3,652,275 |
|
| West Corp., 5.375% Sr. Unsec. Nts., 7/15/221,6 | | | 3,535,000 | | | 3,499,650 |
| | | | | | |
| | | | | | 28,660,555 |
|
| Construction & Engineering—0.2% |
|
| Andrade Gutierrez International SA, 4% Sr. Unsec. Nts., 4/30/181 | | | 1,915,000 | | | 1,910,212 |
|
| OAS Financial Ltd., 8% Sr. Unsec. Nts., 7/2/211,6 | | | 755,000 | | | 764,438 |
|
| OAS Investments GmbH, 8.25% Sr. Nts., 10/19/191 | | | 1,160,000 | | | 1,203,500 |
|
| Odebrecht Finance Ltd.: |
| 5.25% Sr. Unsec. Nts., 6/27/291 | | | 895,000 | | | 899,923 |
| 8.25% Sr. Unsec. Nts., 4/25/181 | | BRL | 1,130,000 | | | 462,842 |
| | | | | | |
| | | | | | 5,240,915 |
|
| Electrical Equipment—0.2% |
|
| General Cable Corp., 6.50% Sr. Unsec. Nts., 10/1/221 | | | 2,615,000 | | | 2,673,838 |
|
| Orion Engineered Carbons Bondco GmbH, 10% Sr. Sec. Nts., 6/15/181 | | EUR | 1,084,000 | | | 1,602,176 |
| | | | | | |
| | | | | | 4,276,014 |
|
| Industrial Conglomerates—0.1% |
|
| Alfa SA, 5.25% Sr. Unsec. Nts., 3/25/241 | | | 810,000 | | | 847,260 |
|
| KOC Holding AS, 3.50% Sr. Unsec. Nts., 4/24/201 | | | 1,035,000 | | | 992,513 |
| | | | | | |
| | | | | | 1,839,773 |
|
| Machinery—1.1% |
|
| Actuant Corp., 5.625% Sr. Unsec. Nts., 6/15/22 | | | 1,325,000 | | | 1,397,875 |
|
| Amsted Industries, Inc., 5% Sr. Unsec. Nts., 3/15/221 | | | 2,190,000 | | | 2,198,212 |
|
| Cleaver-Brooks, Inc., 8.75% Sr. Sec. Nts., 12/15/191 | | | 2,490,000 | | | 2,798,138 |
|
| CNH Industrial Capital LLC, 6.25% Sr. Unsec. Nts., 11/1/16 | | | 670,000 | | | 730,300 |
|
| KION Finance SA, 6.75% Sr. Sec. Nts., 2/15/201 | | EUR | 1,650,000 | | | 2,478,501 |
|
| Manitowoc Co., Inc. (The), 8.50% Sr. Unsec. Nts., 11/1/20 | | | 2,685,000 | | | 3,007,200 |
18 OPPENHEIMER GLOBAL STRATEGIC INCOME FUND/VA
| | | | | | |
| | | Principal Amount | | | Value |
|
| Machinery (Continued) |
|
| Meritor, Inc., 6.25% Sr. Unsec. Nts., 2/15/24 | | $ | 3,585,000 | | | $ 3,773,213 |
|
| Navistar International Corp., 8.25% Sr. Unsec. Nts., 11/1/21 | | | 2,070,000 | | | 2,168,325 |
|
| Servus Luxembourg Holding SCA, 7.75% Sr. Sec. Nts., 6/15/181 | | EUR | 1,821,319 | | | 2,693,945 |
|
| Terex Corp., 6% Sr. Unsec. Nts., 5/15/21 | | | 2,640,000 | | | 2,857,800 |
|
| Xerium Technologies, Inc., 8.875% Sr. Unsec. Nts., 6/15/18 | | | 1,580,000 | | | 1,681,713 |
| | | | | | |
| | | | | | 25,785,222 |
|
| Marine—0.2% |
|
| Drill Rigs Holdings, Inc., 6.50% Sr. Sec. Nts., 10/1/171 | | | 2,780,000 | | | 2,856,450 |
|
| Navios Maritime Holdings, Inc./Navios Maritime Finance II US, Inc., 7.375% Sr. Nts., 1/15/221 | | | 1,330,000 | | | 1,373,225 |
| | | | | | |
| | | | | | 4,229,675 |
|
| Professional Services—0.1% |
|
FTI Consulting, Inc., 6% Sr. Unsec. Nts., 11/15/22 | | | 2,740,000 | | | 2,832,475 |
|
| Road & Rail—0.3% |
|
| Kazakhstan Temir Zholy Finance BV, 6.375% Sr. Unsec. Nts., 10/6/201 | | | 955,000 | | | 1,061,244 |
|
| Kenan Advantage Group, Inc. (The), 8.375% Sr. Unsec. Nts., 12/15/183 | | | 2,265,000 | | | 2,429,212 |
|
| REFER-Rede Ferroviaria Nacional, 4% Sr. Unsec. Nts., 3/16/15 | | EUR | 540,000 | | | 753,475 |
|
| Western Express, Inc., 12.50% Sr. Sec. Nts., 4/15/153 | | | 4,775,000 | | | 3,903,562 |
| | | | | | |
| | | | | | 8,147,493 |
|
| Trading Companies & Distributors—0.4% |
|
| AerCap Ireland Capital Ltd./AerCap Global Aviation Trust, 4.50% Sr. Unsec. Nts., 5/15/211 | | | 1,645,000 | | | 1,675,844 |
|
| Fly Leasing Ltd., 6.75% Sr. Unsec. Nts., 12/15/20 | | | 2,365,000 | | | 2,524,637 |
|
| HD Supply, Inc., 7.50% Sr. Unsec. Nts., 7/15/20 | | | 3,620,000 | | | 3,972,950 |
|
| Jurassic Holdings III, Inc., 6.875% Sec. Nts., 2/15/211 | | | 1,545,000 | | | 1,579,763 |
| | | | | | |
| | | | | | 9,753,194 |
|
| Transportation Infrastructure—0.0% |
|
Empresa de Transporte de Pasajeros Metro SA, 4.75% Unsec. Nts., 2/4/241 | | | 720,000 | | | 761,928 |
|
| Information Technology—2.1% |
|
| Communications Equipment—0.4% |
|
| Alcatel-Lucent USA, Inc., 6.75% Sr. Unsec. Nts., 11/15/201 | | | 3,345,000 | | | 3,579,150 |
|
| Avaya, Inc., 7% Sr. Sec. Nts., 4/1/191 | | | 2,875,000 | | | 2,889,375 |
|
| ViaSat, Inc., 6.875% Sr. Unsec. Nts., 6/15/20 | | | 1,481,000 | | | 1,603,182 |
| | | | | | |
| | | | | | 8,071,707 |
|
| Electronic Equipment, Instruments, & Components—0.1% |
|
| Anixter, Inc., 5.625% Sr. Unsec. Nts., 5/1/19 | | | 980,000 | | | 1,057,175 |
|
| Belden, Inc., 5.50% Sr. Sub. Nts., 9/1/221 | | | 1,405,000 | | | 1,461,200 |
| | | | | | |
| | | | | | 2,518,375 |
|
| Internet Software & Services—0.4% |
|
| Baidu, Inc., 2.75% Sr. Unsec. Nts., 6/9/19 | | | 515,000 | | | 517,521 |
|
| Cerved Group SpA, 6.375% Sr. Sec. Nts., 1/15/201 | | EUR | 1,705,000 | | | 2,537,015 |
| | | | | | |
| | | Principal Amount | | | Value |
|
| Internet Software & Services (Continued) |
|
| EarthLink Holdings Corp., 7.375% Sr. Sec. Nts., 6/1/20 | | $ | 3,160,000 | | | $ 3,385,150 |
|
| Equinix, Inc., 4.875% Sr. Unsec. Nts., 4/1/20 | | | 1,220,000 | | | 1,256,600 |
|
| IAC/InterActiveCorp, 4.75% Sr. Unsec. Nts., 12/15/22 | | | 1,255,000 | | | 1,240,881 |
|
| Tencent Holdings Ltd., 3.375% Sr. Unsec. Nts., 5/2/191 | | | 1,200,000 | | | 1,228,168 |
| | | | | | |
| | | | | | 10,165,335 |
|
| IT Services—0.5% |
|
| Ceridian LLC/Comdata, Inc., 8.125% Sr. Unsec. Nts., 11/15/173 | | | 585,000 | | | 592,312 |
|
| First Data Corp.: | | | | | | |
| 8.25% Sec. Nts., 1/15/211 | | | 3,300,000 | | | 3,630,000 |
| 10.625% Sr. Unsec. Nts., 6/15/21 | | | 1,280,000 | | | 1,497,600 |
|
| Harland Clarke Holdings Corp., 6.875% Sr. Sec. Nts., 3/1/201 | | | 1,765,000 | | | 1,877,519 |
|
| iPayment, Inc., 10.25% Sr. Unsec. Nts., 5/15/18 | | | 2,945,000 | | | 2,694,675 |
|
| Sabre GLBL, Inc., 8.50% Sr. Sec. Nts., 5/15/191 | | | 1,281,000 | | | 1,426,714 |
| | | | | | |
| | | | | | 11,718,820 |
|
| Semiconductors & Semiconductor Equipment—0.3% |
|
| Freescale Semiconductor, Inc.: | | | | | | |
| 6.00% Sr. Sec. Nts., 1/15/221 | | | 3,355,000 | | | 3,581,463 |
| 8.05% Sr. Unsec. Nts., 2/1/20 | | | 562,000 | | | 608,365 |
| 10.75% Sr. Unsec. Nts., 8/1/20 | | | 1,708,000 | | | 1,934,310 |
|
| Micron Technology, Inc., 5.875% Sr. Unsec. Nts., 2/15/221 | | | 1,385,000 | | | 1,488,875 |
| | | | | | |
| | | | | | 7,613,013 |
|
| Software—0.3% |
|
| Blackboard, Inc., 7.75% Sr. Unsec. Nts., 11/15/193 | | | 2,640,000 | | | 2,772,000 |
|
| BMC Software Finance, Inc., 8.125% Sr. Unsec. Nts., 7/15/211 | | | 3,040,000 | | | 3,142,600 |
|
| Interactive Data Corp., 5.875% Sr. Unsec. Nts., 4/15/191 | | | 1,890,000 | | | 1,934,887 |
| | | | | | |
| | | | | | 7,849,487 |
|
| Technology Hardware, Storage & Peripherals—0.1% |
|
Denali Borrower LLC/Denali Finance Corp., 5.625% Sr. Sec. Nts., 10/15/201 | | | 2,485,000 | | | 2,640,313 |
|
| Materials—3.3% |
|
| Chemicals—0.6% |
|
| ADS Waste Holdings, Inc., 8.25% Sr. Unsec. Nts., 10/1/20 | | | 1,075,000 | | | 1,163,687 |
|
| Braskem Finance Ltd., 5.375% Sr. Unsec. Nts., 5/2/221 | | | 2,175,000 | | | 2,213,063 |
|
| Hexion US Finance Corp., 6.625% Sr. Sec. Nts., 4/15/20 | | | 1,185,000 | | | 1,262,025 |
|
| Hexion US Finance Corp./Hexion Nova Scotia Finance ULC, 8.875% Sr. Sec. Nts., 2/1/18 | | | 680,000 | | | 708,900 |
|
| INEOS Group Holdings SA, 6.125% Sr. Unsec. Nts., 8/15/181 | | | 1,465,000 | | | 1,521,769 |
|
| Mexichem SAB de CV, 4.875% Sr. Unsec. Nts., 9/19/221 | | | 1,610,000 | | | 1,678,425 |
|
| Momentive Performance Materials, Inc., 8.875% Sr. Sec. Nts., 10/15/20 | | | 1,160,000 | | | 1,244,100 |
|
| PetroLogistics LP/PetroLogistics Finance Corp., 6.25% Sr. Unsec. Nts., 4/1/20 | | | 915,000 | | | 1,001,925 |
|
| PQ Corp., 8.75% Sec. Nts., 5/1/181 | | | 1,140,000 | | | 1,241,175 |
|
| Rentech Nitrogen Partners LP/Rentech Nitrogen Finance Corp., 6.50% Sec. Nts., 4/15/211 | | | 1,555,000 | | | 1,578,325 |
19 OPPENHEIMER GLOBAL STRATEGIC INCOME FUND/VA
| | |
| |
| CONSOLIDATED STATEMENT OF INVESTMENTS Unaudited / Continued | | |
| | | | | | | | |
| | | Principal Amount | | | Value | |
| |
| Chemicals (Continued) | |
| |
| Trinseo Materials Operating SCA/Trinseo Materials Finance, Inc., 8.75% Sr. Sec. Nts., 2/1/19 | | $ | 1,445,000 | | | $ | 1,560,600 | |
| | | | | | | | |
| | | | 15,173,994 | |
|
| |
| Construction Materials—0.3% | |
| |
| Building Materials Corp. of America, 6.75% Sr. Unsec. Nts., 5/1/211 | | | 1,975,000 | | | | 2,133,000 | |
| |
| Calcipar SA, 6.875% Sr. Sec. Nts., 5/1/181 | | | 90,000 | | | | 95,400 | |
| |
| Cemex Finance LLC: | |
| 6.00% Sr. Sec. Nts., 4/1/241 | | | 1,085,000 | | | | 1,132,469 | |
| 9.375% Sr. Sec. Nts., 10/12/221 | | | 670,000 | | | | 791,437 | |
| |
| HeidelbergCement Finance Luxembourg SA: | |
| 3.25% Sr. Unsec. Nts., 10/21/21 | | EUR | 625,000 | | | | 899,623 | |
| 7.50% Sr. Unsec. Nts., 4/3/20 | | EUR | 570,000 | | | | 985,383 | |
| 8.00% Sr. Unsec. Nts., 1/31/17 | | EUR | 655,000 | | | | 1,045,336 | |
| |
| Lafarge SA, 5.375% Sr. Unsec. Nts., 6/26/17 | | EUR | 495,000 | | | | 754,772 | |
| | | | | | | | |
| | | | 7,837,420 | |
|
| |
| Containers & Packaging—0.8% | |
| |
| Ardagh Packaging Finance plc/Ardagh Holdings USA, Inc.: | |
| 6.00% Sr. Unsec. Nts., 6/30/211,6 | | | 475,000 | | | | 476,781 | |
| 6.75% Sr. Unsec. Nts., 1/31/211 | | | 1,150,000 | | | | 1,190,250 | |
| |
| Ardagh Packaging Finance plc/Ardagh MP Holdings USA, Inc., 7% Sr. Unsec. Nts., 11/15/201 | | | 541,765 | | | | 563,435 | |
| |
| Berry Plastics Corp., 5.50% Sec. Nts., 5/15/22 | | | 700,000 | | | | 704,812 | |
| |
| Cascades, Inc., 7.875% Sr. Unsec. Nts., 1/15/20 | | | 1,955,000 | | | | 2,086,963 | |
| |
| Consolidated Container Co. LLC/Consolidated Container Capital, Inc., 10.125% Sr. Unsec. Nts., 7/15/201 | | | 590,000 | | | | 595,900 | |
| |
| Crown Americas LLC/Crown Americas Capital Corp. IV, 4.50% Sr. Unsec. Nts., 1/15/23 | | | 890,000 | | | | 871,310 | |
| |
| Exopack Holdings SA, 7.875% Sr. Unsec. Nts., 11/1/193 | | | 1,335,000 | | | | 1,435,125 | |
| |
| Polymer Group, Inc., 7.75% Sr. Sec. Nts., 2/1/19 | | | 1,540,000 | | | | 1,643,950 | |
| |
| Reynolds Group Issuer, Inc./Reynolds Group Issuer LLC/Reynolds Group Issuer Luxembourg SA: | |
| 5.75% Sr. Sec. Nts., 10/15/20 | | | 3,420,000 | | | | 3,625,200 | |
| 9.00% Sr. Unsec. Nts., 4/15/19 | | | 1,285,000 | | | | 1,366,919 | |
| |
| Sealed Air Corp., 6.50% Sr. Unsec. Nts., 12/1/201 | | | 1,555,000 | | | | 1,757,150 | |
| |
| Smurfit Kappa Acquisitions: | |
| 4.875% Sr. Sec. Nts., 9/15/181 | | | 1,280,000 | | | | 1,353,600 | |
| 7.75% Sr. Sec. Nts., 11/15/191 | | EUR | 1,210,000 | | | | 1,764,482 | |
| | | | | | | | |
| | | | 19,435,877 | |
|
| |
| Metals & Mining—1.4% | |
| |
| Aleris International, Inc.: | |
| 7.625% Sr. Unsec. Nts., 2/15/18 | | | 2,765,000 | | | | 2,872,144 | |
| 7.875% Sr. Unsec. Nts., 11/1/20 | | | 2,870,000 | | | | 3,006,325 | |
| |
| ALROSA Finance SA, 7.75% Sr. Unsec. Nts., 11/3/201 | | | 800,000 | | | | 893,040 | |
| |
| Constellium NV, 5.75% Sr. Unsec. Nts., 5/15/241 | | | 710,000 | | | | 746,387 | |
| |
| Ferrexpo Finance plc, 7.875% Sr. Unsec. Nts., 4/7/161 | | | 760,000 | | | | 741,000 | |
| |
| FMG Resources August 2006 Pty Ltd.: | |
| 6.875% Sr. Unsec. Nts., 2/1/181 | | | 1,555,000 | | | | 1,636,638 | |
| 6.875% Sr. Unsec. Nts., 4/1/221 | | | 1,685,000 | | | | 1,813,481 | |
| 8.25% Sr. Unsec. Nts., 11/1/191 | | | 1,180,000 | | | | 1,289,150 | |
| |
| Gerdau Trade, Inc., 5.75% Sr. Unsec. Nts., 1/30/211 | | | 1,285,000 | | | | 1,378,162 | |
| |
| Gestamp Funding Luxembourg SA: | |
| 5.875% Sr. Sec. Nts., 5/31/201 | | EUR | 1,835,000 | | | | 2,687,924 | |
| | | | | | | | |
| | | Principal Amount | | | Value | |
| |
| Metals & Mining (Continued) | |
| |
| Gestamp Funding Luxembourg SA: (Continued) | |
| 5.875% Sr. Sec. Nts., 5/31/20 | | EUR | 105,000 | | | $ | 153,805 | |
| |
| Glencore Finance Canada Ltd.: | |
| 2.05% Sr. Unsec. Nts., 10/23/151 | | | 1,383,000 | | | | 1,399,117 | |
| 4.95% Sr. Unsec. Nts., 11/15/211 | | | 560,000 | | | | 604,820 | |
| |
| GTL Trade Finance, Inc., 5.893% Sr. Unsec. Nts., 4/29/241 | | | 305,000 | | | | 320,707 | |
| |
| JMC Steel Group, Inc., 8.25% Sr. Nts., 3/15/181 | | | 1,575,000 | | | | 1,614,375 | |
| |
| Metalloinvest Finance Ltd., 5.625% Unsec. Nts., 4/17/201 | | | 675,000 | | | | 658,125 | |
| |
| Metinvest BV, 8.75% Sr. Unsec. Nts., 2/14/181 | | | 115,000 | | | | 101,775 | |
| |
| Mexico Generadora de Energia S de RL, 5.50% Sr. Sec. Nts., 12/6/321 | | | 1,490,000 | | | | 1,527,250 | |
| |
| MMC Norilsk Nickel OJSC via MMC Finance Ltd., 5.55% Sr. Unsec. Nts., 10/28/201 | | | 1,565,000 | | | | 1,580,650 | |
| |
| Novelis, Inc., 8.75% Sr. Unsec. Nts., 12/15/20 | | | 1,285,000 | | | | 1,432,775 | |
| |
| Polyus Gold International Ltd., 5.625% Sr. Unsec. Nts., 4/29/201 | | | 1,130,000 | | | | 1,124,350 | |
| |
| Samarco Mineracao SA, 5.75% Sr. Unsec. Nts., 10/24/231 | | | 1,475,000 | | | | 1,551,995 | |
| |
| Severstal OAO Via Steel Capital SA, 5.90% Sr. Unsec. Nts., 10/17/221 | | | 650,000 | | | | 639,438 | |
| |
| Thompson Creek Metals Co., Inc., 7.375% Sr. Unsec. Nts., 6/1/18 | | | 1,680,000 | | | | 1,667,400 | |
| |
| Walter Energy, Inc., 9.50% Sr. Sec. Nts., 10/15/191 | | | 1,565,000 | | | | 1,594,344 | |
| |
| Wise Metals Group LLC/Wise Alloys Finance Corp., 8.75% Sr. Sec. Nts., 12/15/181 | | | 905,000 | | | | 986,450 | |
| | | | | | | | |
| | | | 34,021,627 | |
|
| |
| Paper & Forest Products—0.2% | |
| |
| Fibria Overseas Finance Ltd., 5.25% Sr. Unsec. Nts., 5/12/24 | | | 1,130,000 | | | | 1,127,175 | |
| |
| Sappi Papier Holding GmbH, 6.625% Sr. Sec. Nts., 4/15/211 | | | 1,730,000 | | | | 1,833,800 | |
| |
| Suzano Trading Ltd., 5.875% Sr. Unsec. Nts., 1/23/211 | | | 600,000 | | | | 630,000 | |
| | | | | | | | |
| | | | 3,590,975 | |
|
| |
| Telecommunication Services—3.2% | |
| |
| Diversified Telecommunication Services—2.6% | |
| |
| Cequel Communications Holdings I LLC/Cequel Capital Corp., 6.375% Sr. Unsec. Nts., 9/15/201 | | | 6,770,000 | | | | 7,226,975 | |
| |
| Colombia Telecomunicaciones SA ESP, 5.375% Sr. Unsec. Nts., 9/27/221 | | | 950,000 | | | | 952,375 | |
| |
| FairPoint Communications, Inc., 8.75% Sr. Sec. Nts., 8/15/191 | | | 3,600,000 | | | | 3,897,000 | |
| |
| Frontier Communications Corp.: | |
| 7.125% Sr. Unsec. Nts., 1/15/23 | | | 2,190,000 | | | | 2,332,350 | |
| 7.625% Sr. Unsec. Nts., 4/15/24 | | | 2,850,000 | | | | 3,081,562 | |
| |
| Intelsat Luxembourg SA, 7.75% Sr. Unsec. Nts., 6/1/21 | | | 3,400,000 | | | | 3,612,500 | |
| |
| Koninklijke KPN NV, 8.375% Sr. Unsec. Nts., 10/1/30 | | | 3,005,000 | | | | 4,264,149 | |
| |
| Koninklijke KPN NV, 6.125% Sr. Sub. Perpetual Bonds2,13 | | EUR | 2,265,000 | | | | 3,350,512 | |
| |
| MetroPCS Wireless, Inc., 6.625% Sr. Unsec. Nts., 11/15/20 | | | 4,340,000 | | | | 4,649,225 | |
| |
| Oi SA: | | | | | | | | |
| 5.75% Sr. Unsec. Nts., 2/10/221 | | | 3,135,000 | | | | 3,160,080 | |
| 9.75% Sr. Unsec. Nts., 9/15/161 | | BRL | 2,550,000 | | | | 1,087,746 | |
| |
| Telecom Italia Capital SA, 7.721% Sr. Unsec. Unsub. Nts., 6/4/38 | | | 4,863,000 | | | | 5,628,923 | |
| |
| Telefonica Chile SA, 3.875% Sr. Unsec. Nts., 10/12/221 | | | 810,000 | | | | 800,377 | |
20 OPPENHEIMER GLOBAL STRATEGIC INCOME FUND/VA
| | | | | | | | |
| | | Principal Amount | | | Value | |
| |
| Diversified Telecommunication Services (Continued) | |
| |
| Telefonica Emisiones SAU, 7.045% Sr. Unsec. Unsub. Nts., 6/20/36 | | $ | 1,530,000 | | | $ | 1,954,818 | |
| |
| Telefonica Europe BV, 6.50% Sr. Sub. Perpetual Bonds2,13 | | EUR | 3,760,000 | | | | 5,681,960 | |
| |
| Telekom Austria AG, 5.625% Jr. Sub. Perpetual Bonds2,13 | | EUR | 1,435,000 | | | | 2,117,117 | |
| |
| T-Mobile USA, Inc., 6.25% Sr. Unsec. Nts., 4/1/21 | | | 1,610,000 | | | | 1,716,662 | |
| |
| Turk Telekomunikasyon AS: | |
| 3.75% Sr. Unsec. Nts., 6/19/191 | | | 575,000 | | | | 570,127 | |
| 4.875% Sr. Unsec. Nts., 6/19/241 | | | 1,155,000 | | | | 1,123,353 | |
| |
| Windstream Corp.: | |
| 6.375% Sr. Unsec. Nts., 8/1/23 | | | 1,155,000 | | | | 1,175,213 | |
| 7.75% Sr. Unsec. Nts., 10/15/20 | | | 1,645,000 | | | | 1,790,994 | |
| 7.75% Sr. Unsec. Nts., 10/1/21 | | | 2,180,000 | | | | 2,392,550 | |
| | | | | | | | |
| | | | 62,566,568 | |
|
| |
| Wireless Telecommunication Services—0.6% | |
| |
| Digicel Group Ltd., 7.125% Sr. Unsec. Nts., 4/1/221 | | | 1,815,000 | | | | 1,896,675 | |
| |
| ENTEL Chile SA, 4.875% Sr. Unsec. Nts., 10/30/241 | | | 1,850,000 | | | | 1,930,003 | |
| |
| Millicom International Cellular SA, 6.625% Sr. Unsec. Nts., 10/15/211 | | | 1,255,000 | | | | 1,355,400 | |
| |
| Mobile Telesystems OJSC via MTS International Funding Ltd., 5% Sr. Unsec. Nts., 5/30/231 | | | 1,545,000 | | | | 1,508,306 | |
| |
| SBA Telecommunications, Inc., 5.75% Sr. Unsec. Nts., 7/15/20 | | | 785,000 | | | | 837,006 | |
| |
| Sistema JSFC via Sistema International Funding SA, 6.95% Sr. Unsec. Nts., 5/17/191 | | | 945,000 | | | | 996,975 | |
| |
| Sprint Corp., 7.25% Sr. Unsec. Nts., 9/15/211 | | | 1,610,000 | | | | 1,781,063 | |
| |
| VimpelCom Holdings BV, 9% Sr. Unsec. Nts., 2/13/181 | | RUB | 19,800,000 | | | | 565,071 | |
| |
| Vimpel-Communications OJSC, 8.85% Sr. Unsec. Nts., 3/8/222 | | RUB | 12,300,000 | | | | 361,741 | |
| |
| Wind Acquisition Finance SA, 4% Sr. Sec. Nts., 7/15/201,6 | | EUR | 1,405,000 | | | | 1,921,462 | |
| | | | | | | | |
| | | | 13,153,702 | |
|
| |
| Utilities—3.0% | |
| |
| Electric Utilities—1.3% | |
| |
| EDP Finance BV: | |
| 5.25% Sr. Unsec. Nts., 1/14/211 | | | 1,380,000 | | | | 1,466,250 | |
| 6.00% Sr. Unsec. Nts., 2/2/181 | | | 2,300,000 | | | | 2,535,727 | |
| |
| Electricite de France SA: | |
| 5.25% Jr. Sub. Perpetual Bonds1,2,13 | | | 1,950,000 | | | | 1,994,128 | |
| 5.625% Jr. Sub. Perpetual Bonds1,2,13 | | | 990,000 | | | | 1,035,094 | |
| |
| Empresas Publicas de Medellin ESP: | |
| 7.625% Sr. Unsec. Nts., 7/29/191 | | | 970,000 | | | | 1,164,475 | |
| 8.375% Sr. Unsec. Nts., 2/1/211 | | COP | 662,465,000 | | | | 376,400 | |
| |
| Enel SpA, 5% Sub. Nts., 1/15/752 | | EUR | 2,465,000 | | | | 3,561,231 | |
| |
| Eskom Holdings Ltd., 6.75% Sr. Unsec. Nts., 8/6/231 | | | 2,590,000 | | | | 2,758,350 | |
| |
| Iberdrola International BV, 5.75% Sub. Perpetual Bonds, 5.75%2,13 | | EUR | 2,935,000 | | | | 4,408,314 | |
| |
| Israel Electric Corp. Ltd.: | |
| 6.70% Sr. Sec. Nts., 2/10/171 | | | 765,000 | | | | 838,865 | |
| 7.25% Sr. Sec. Nts., 1/15/191 | | | 5,180,000 | | | | 5,911,675 | |
| 9.375% Sr. Sec. Nts., 1/28/201 | | | 365,000 | | | | 457,382 | |
| |
| National Power Corp., 5.875% Sr. Unsec. Nts., 12/19/16 | | PHP | 109,600,000 | | | | 2,666,055 | |
| |
| Perusahaan Listrik Negara PT, 5.50% Sr. Unsec. Nts., 11/22/211 | | | 1,485,000 | | | | 1,566,675 | |
| |
| Saudi Electricity Global Sukuk Co. 3, 4% Sr. Unsec. Nts., 4/8/241 | | | 1,030,000 | | | | 1,053,175 | |
| | | | | | | | |
| | | | 31,793,796 | |
| | | | | | | | |
| | | Principal Amount | | | Value | |
| |
| Gas Utilities—0.3% | |
| |
| AmeriGas Finance LLC/AmeriGas Finance Corp., 7% Sr. Unsec. Nts., 5/20/22 | | $ | 145,000 | | | $ | 161,312 | |
| |
| Empresa de Energia de Bogota SA, 6.125% Sr. Unsec. Nts., 11/10/211 | | | 1,620,000 | | | | 1,774,548 | |
| |
| Ferrellgas LP/Ferrellgas Finance Corp., 6.50% Sr. Unsec. Nts., 5/1/21 | | | 1,670,000 | | | | 1,751,412 | |
| |
| Gas Natural Capital Markets SA, 4.375% Sr. Unsec. Nts., 11/2/16 | | EUR | 895,000 | | | | 1,328,876 | |
| |
| Gas Natural de Lima y Callao SA, 4.375% Sr. Unsec. Nts., 4/1/231 | | | 840,000 | | | | 819,000 | |
| |
| Perusahaan Gas Negara Persero Tbk PT, 5.125% Sr. Unsec. Nts., 5/16/241 | | | 1,545,000 | | | | 1,535,344 | |
| |
| Transportadora de Gas Internacional SA ESP, 5.70% Sr. Unsec. Nts., 3/20/221 | | | 575,000 | | | | 622,576 | |
| | | | | | | | |
| | | | 7,993,068 | |
|
| |
| Independent Power and Renewable Electricity Producers—1.0% | |
| |
| AES Corp., 7.375% Sr. Unsec. Nts., 7/1/21 | | | 1,045,000 | | | | 1,227,875 | |
| |
| Atlantic Power Corp., 9% Sr. Unsec. Nts., 11/15/18 | | | 1,390,000 | | | | 1,462,975 | |
| |
| Calpine Corp.: | |
| 7.50% Sr. Sec. Nts., 2/15/211 | | | 912,000 | | | | 990,660 | |
| 7.875% Sr. Sec. Nts., 1/15/231 | | | 884,000 | | | | 990,080 | |
| |
| Colbun SA, 6% Sr. Unsec. Nts., 1/21/201 | | | 2,580,000 | | | | 2,875,810 | |
| |
| Comision Federal de Electricidad, 4.875% Sr. Unsec. Nts., 1/15/241 | | | 1,690,000 | | | | 1,808,300 | |
| |
| Dynegy, Inc., 5.875% Sr. Unsec. Nts., 6/1/23 | | | 420,000 | | | | 425,250 | |
| |
| Edison SpA, 3.875% Sr. Unsec. Nts., 11/10/17 | | EUR | 955,000 | | | | 1,435,459 | |
| |
| GenOn Energy, Inc., 9.50% Sr. Unsec. Nts., 10/15/18 | | | 1,730,000 | | | | 1,907,325 | |
| |
| Infinis plc, 7% Sr. Sec. Nts., 2/15/193 | | GBP | 1,285,000 | | | | 2,375,081 | |
| |
| Miran Mid-Atlantic Trust, 10.06% Sec. Pass-Through Certificates, Series C, 12/30/28 | | | 1,573,485 | | | | 1,779,022 | |
| |
| NRG Energy, Inc.: | |
| 6.25% Sr. Unsec. Nts., 7/15/221 | | | 1,605,000 | | | | 1,713,338 | |
| 6.25% Sr. Unsec. Nts., 5/1/241 | | | 2,220,000 | | | | 2,322,675 | |
| 6.625% Sr. Unsec. Nts., 3/15/23 | | | 1,455,000 | | | | 1,582,312 | |
| |
| Power Sector Assets & Liabilities Management Corp., 7.39% Sr. Unsec. Nts., 12/2/241 | | | 520,000 | | | | 670,800 | |
| | | | | | | | |
| | | | 23,566,962 | |
|
| |
| Multi-Utilities—0.4% | |
| |
| Abu Dhabi National Energy Co., 3.875% Sr. Unsec. Nts., 5/6/241 | | | 1,805,000 | | | | 1,793,719 | |
| |
| InterGen NV, 7% Sr. Sec. Nts., 6/30/231 | | | 1,685,000 | | | | 1,748,188 | |
| |
| National Grid North America, Inc., 1.75% Sr. Unsec. Nts., 2/20/18 | | EUR | 990,000 | | | | 1,395,349 | |
| |
| NGG Finance plc, 4.25% Sub. Nts., 6/18/762 | | EUR | 2,630,000 | | | | 3,843,363 | |
| | | | | | | | |
| | | | 8,780,619 | |
| | | | | | | | |
Total Corporate Bonds and Notes (Cost $985,737,593) | | | | | | | 1,013,228,380 | |
| | |
| | | Shares | | | | |
| |
| Preferred Stock—0.2% | |
| |
Ally Financial, Inc., 7% Cum., Series G, Non-Vtg.1 (Cost $3,475,867) | | | 3,632 | | | | 3,659,354 | |
|
| |
| Common Stocks—0.1% | |
| |
| American Media Operations, Inc.14 | | | 219,796 | | | | 2,198 | |
| |
| Arco Capital Corp. Ltd.3,14 | | | 690,638 | | | | — | |
| |
| Astana Finance JSC, ADR14 | | | 60,552 | | | | 606 | |
21 OPPENHEIMER GLOBAL STRATEGIC INCOME FUND/VA
| | |
| |
| CONSOLIDATED STATEMENT OF INVESTMENTS Unaudited / Continued | | |
| | | | | | | | |
| | | Shares | | | Value | |
| |
| Common Stocks (Continued) | |
| |
| Nortek, Inc.14 | | | 24,095 | | | $ | 2,162,767 | |
| |
| Premier Holdings Ltd.14 | | | 18,514 | | | | — | |
| |
| Revel Entertainment, Inc.14 | | | 16,153 | | | | — | |
| |
| Wallace Theater Holdings, Inc.3,14 | | | 1,525 | | | | 11,788 | |
| | | | | | | | |
| Total Common Stocks (Cost $9,558,022) | | | | | | | 2,177,359 | |
| | |
| | | Units | | | | |
| |
| Rights, Warrants and Certificates—0.0% | |
| |
| MediaNews Group, Inc. Wts., Strike Price $48.72, 3/19/1714 (Cost $6,331,150) | | | 22,685 | | | | — | |
| | |
| | | Principal Amount | | | | |
| |
| Structured Securities—0.8% | |
| |
| Credit Suisse First Boston International, Moitk Total Return Linked Nts., 21%, 3/30/118 | | RUB | 53,910,000 | | | | — | |
| |
| Credit Suisse First Boston, Inc. (Nassau Branch), Russian Specialized Construction & Installation Administration Total Return Linked Nts., 13%, 5/24/108 | | RUB | 97,250,000 | | | | — | |
| |
| Deutsche Bank AG, Coriolanus Ltd. Sec. Credit Linked Bonds: | |
| 3.01%, 4/30/251,15 | | | 1,492,192 | | | | 986,421 | |
| 3.138%, 4/30/251,15 | | | 1,467,253 | | | | 969,935 | |
| 3.191%, 4/30/251,15 | | | 1,826,848 | | | | 1,207,647 | |
| 3.242%, 4/30/251,15 | | | 2,085,070 | | | | 1,378,346 | |
| 3.269%, 4/30/251,15 | | | 1,665,727 | | | | 1,101,137 | |
| 3.346%, 4/30/251,15 | | | 1,565,713 | | | | 1,035,022 | |
| 3.905%, 4/30/251,15 | | | 1,901,283 | | | | 1,256,853 | |
| 4.005%, 4/30/251,15 | | | 1,641,454 | | | | 1,085,091 | |
| 33.77%, 12/31/173,11 | | BRL | 10,280,000 | | | | 7,113,881 | |
| |
| Deutsche Bank AG, Opic Reforma I Credit Linked Nts.: | |
| Cl. 2A, 7.208%, 5/22/152,3 | | MXN | 697,693 | | | | 50,423 | |
| Cl. 2B, 7.208%, 5/22/152,3 | | MXN | 1,220,632 | | | | 88,216 | |
| Cl. 2C, 7.208%, 5/22/152,3 | | MXN | 18,404,162 | | | | 1,330,076 | |
| Cl. 2D, 7.208%, 5/22/152,3 | | MXN | 1,341,270 | | | | 96,934 | |
| Cl. 2E, 7.208%, 5/22/152,3 | | MXN | 974,458 | | | | 70,424 | |
| Cl. 2F, 7.208%, 5/22/152,3 | | MXN | 622,337 | | | | 44,977 | |
| Cl. 2G, 7.208%, 5/22/152,3 | | MXN | 114,609 | | | | 8,283 | |
| |
| Goldman Sachs Capital Markets LP, Republic of Colombia Credit Linked Nts., Cl. B, 10%, 7/30/241 | | COP | 1,604,000,000 | | | | 1,065,774 | |
| | | | | | | | |
| | | Principal Amount | | | Value | |
| |
| Structured Securities (Continued) | |
| |
| LB Peru Trust II Certificates, Series 1998-A, 3.796%, 2/28/168,15 | | $ | 2,994 | | | $ | — | |
| |
| Morgan Stanley, Russian Federation Total Return Linked Bonds, Series 007, Cl. VR, 5%, 8/22/34 | | RUB | 42,719,328 | | | | 630,249 | |
| | | | | | | | |
| Total Structured Securities (Cost $24,748,587) | | | | | | | 19,519,689 | |
|
| |
| Short-Term Notes—3.8% | |
| |
| Federal Republic of Nigeria Treasury Bills: | |
| 12.695%, 4/9/15 | | NGN | 441,000,000 | | | | 2,494,022 | |
| 12.698%, 4/23/15 | | NGN | 317,000,000 | | | | 1,786,009 | |
| 12.70%, 3/5/15 | | NGN | 93,000,000 | | | | 531,199 | |
| |
| Hungary Treasury Bills, 3.021%, 11/26/1415 | | HUF | 2,480,000,000 | | | | 10,877,039 | |
| |
| Korea Monetary Stabilization Bonds: | |
| Series 1411, 2.73% Sr. Unsec. Nts., 11/9/14 | | KRW | 2,704,000,000 | | | | 2,673,873 | |
| Series 1412, 2.72% Sr. Unsec. Nts., 12/9/14 | | KRW | 4,416,000,000 | | | | 4,367,170 | |
| |
| United Mexican States Treasury Bills: | |
| 2.933%, 8/21/14 | | MXN | 46,900,000 | | | | 3,599,987 | |
| 3.235%, 12/11/14 | | MXN | 368,000,000 | | | | 27,979,176 | |
| 3.503%, 10/16/14 | | MXN | 373,000,000 | | | | 28,501,645 | |
| |
| United States Treasury Bills, 0.015%, 8/14/1415 | | | 7,700,000 | | | | 7,699,837 | |
| | | | | | | | |
| Total Short-Term Notes (Cost $89,617,660) | | | | | | | 90,509,957 | |
| | |
| | | Shares | | | | |
| |
| Investment Companies—12.4% | |
| |
| Oppenheimer Institutional Money Market Fund, Cl. E, 0.09%16,17 | | | 63,849,901 | | | | 63,849,901 | |
| |
| Oppenheimer Master Event-Linked Bond Fund, LLC16 | | | 3,835,870 | | | | 54,051,682 | |
| |
| Oppenheimer Master Loan Fund, LLC16 | | | 8,486,824 | | | | 123,541,887 | |
| |
| Oppenheimer Ultra-Short Duration Fund, Cl. Y16 | | | 5,598,448 | | | | 56,152,430 | |
| | | | | | | | |
| Total Investment Companies (Cost $297,035,897) | | | | | | | 297,595,900 | |
| | | | | | | | | | | | | | | | | | | | | | | | | | | | |
| | | Counterparty | | | | | | Exercise Price | | | Expiration Date | | | | | | Contracts | | | | |
| |
Over-the-Counter Options Purchased—0.0% | | | | | | | | | | | | | | | | | |
| |
CNH Currency Put14 | | | JPM | | | | CNH | | | | 6.153 | | | | 1/12/16 | | | | CNH | | | | 55,650,000 | | | | 271,516 | |
| |
CNH Currency Call14 | | | JPM | | | | CNH | | | | 6.147 | | | | 10/16/14 | | | | CNH | | | | 8,100,000 | | | | 373 | |
| |
INR Currency Call14 | | | JPM | | | | INR | | | | 58.750 | | | | 7/3/14 | | | | INR | | | | 1,091,000,000 | | | | — | |
| |
RUB Currency Call14 | | | JPM | | | | RUB | | | | 33.500 | | | | 8/22/14 | | | | RUB | | | | 692,200,000 | | | | 72,681 | |
Total Over-the-Counter Options Purchased (Cost $408,840) | | | | | | | | | | | | | | | | 344,570 | |
| | | | | | | | | | | | | | | | | | | | | | | | | | | | | | | | |
| | | Counterparty | | | Buy /Sell
Protection | | | Reference Asset | | | Fixed Rate | | | Expiration
Date | | | | | | Notional Amount (000’s) | | | | |
| |
Over-the-Counter Credit Default Swaption Purchased—0.0% | | | | | | | | | | | | | | | | | | | | | |
| |
| Credit Default Swap maturing 6/20/19 Call14 (Cost $63,875) | | | BOA | | | | Buy | | |
| iTraxx Europe Series
21 Version 1 |
| | | 1.000% | | | | 9/17/14 | | | | EUR | | | | 30,200 | | | | 27,309 | |
22 OPPENHEIMER GLOBAL STRATEGIC INCOME FUND/VA
| | | | | | | | | | | | | | | | | | | | | | | | |
| | | Counterparty | | Pay / Receive
Floating Rate | | Floating Rate | | Fixed Rate | | | Expiration
Date | | | Notional Amount (000’s) | | | Value | |
Over-the-Counter Interest Rate Swaptions Purchased—0.0% | |
| |
| Interest Rate Swap maturing 11/18/24 Call14 | | JPM | | Receive | | Six-Month EUR EURIBOR | | | 2.798% | | | | 11/14/14 | | | EUR | | | 31,790 | | | $ | 122,321 | |
| |
| Interest Rate Swap maturing 5/30/33 Call14 | | BAC | | Receive | | Six-Month GBP BBA LIBOR | | | 3.990 | | | | 5/30/23 | | | GBP | | | 1,235 | | | | 101,385 | |
| |
| Interest Rate Swap maturing 7/21/19 Call14 | | BOA | | Receive | | Three-Month USD BBA LIBOR | | | 2.200 | | | | 7/17/14 | | | USD | | | 38,170 | | | | 85 | |
| |
| Interest Rate Swap maturing 7/28/44 Call14 | | JPM | | Receive | | Six-Month EUR EURIBOR | | | 2.638 | | | | 7/24/14 | | | EUR | | | 15,140 | | | | 23 | |
| |
| Interest Rate Swap maturing 8/4/46 Call14 | | BOA | | Receive | | Three-Month USD BBA LIBOR | | | 4.860 | | | | 8/2/16 | | | USD | | | 1,395 | | | | 19,729 | |
| |
| Interest Rate Swap maturing 9/8/19 Call14 | | JPM | | Receive | | Three-Month USD BBA LIBOR | | | 2.105 | | | | 9/4/14 | | | USD | | | 19,500 | | | | 23,610 | |
| |
| Interest Rate Swap maturing 9/8/19 Call14 | | BOA | | Receive | | Three-Month USD BBA LIBOR | | | 2.093 | | | | 9/4/14 | | | USD | | | 32,040 | | | | 41,513 | |
| |
| Interest Rate Swap maturing 9/8/24 Call14 | | JPM | | Receive | | Three-Month USD BBA LIBOR | | | 3.035 | | | | 9/4/14 | | | USD | | | 11,700 | | | | 16,749 | |
| |
| Interest Rate Swap maturing 9/8/24 Call14 | | BOA | | Receive | | Three-Month USD BBA LIBOR | | | 3.023 | | | | 9/4/14 | | | USD | | | 18,110 | | | | 28,012 | |
| | | | | | | | | | | | | | | |
Total Over-the-Counter Interest Rate Swaptions Purchased (Cost $1,039,339) | | | | 353,427 | |
| |
Total Investments, at Value (Cost $2,468,349,276) | | | 103 .9% | | | | 2,502,571,379 | |
| |
Net Other Assets (Liabilities) | | | (3.9) | | | | (94,732,252) | |
| | | | | | | | | | | |
Net Assets | | | 100.0% | | | $ | 2,407,839,127 | |
| | | | | | | | | | | | | | | | | | | | |
Footnotes to Consolidated Statement of Investments
1. Represents securities sold under Rule 144A, which are exempt from registration under the Securities Act of 1933, as amended. These securities have been determined to be liquid under guidelines established by the Board of Trustees. These securities amount to $754,264,615 or 31.33% of the Fund’s net assets as of June 30, 2014.
2. Represents the current interest rate for a variable or increasing rate security.
3. Restricted security. The aggregate value of restricted securities as of June 30, 2014 was $59,924,446, which represents 2.49% of the Fund’s net assets. See Note 7 of the accompanying Consolidated Notes. Information concerning restricted securities is as follows:
| | | | | | | | | | | | | | | | |
| Security | | Acquisition
Dates | | | Cost | | | Value | | | Unrealized
Appreciation/
(Depreciation) | |
| |
| Arco Capital Corp. Ltd. | | | 6/28/13 | | | $ | — | | | $ | — | | | $ | — | |
| ASG Consolidated LLC/ASG Finance, Inc., 15% Sr. Unsec. Nts., 5/15/17 | | | 8/19/10-5/16/14 | | | | 2,870,085 | | | | 2,824,074 | | | | (46,011 | ) |
| Blackboard, Inc., 7.75% Sr. Unsec. Nts., 11/15/19 | | | 10/24/13-5/1/14 | | | | 2,678,584 | | | | 2,772,000 | | | | 93,416 | |
| Brand Energy & Infrastructure Services, Inc., 8.50% Sr. Unsec. Nts., 12/1/21 | | | 11/22/13-11/25/13 | | | | 3,100,892 | | | | 3,284,900 | | | | 184,008 | |
| Burlington Holdings LLC/Burlington Holding Finance, Inc., 9% Sr. Unsec. Nts., 2/15/18 | | | 4/12/13-10/21/13 | | | | 703,290 | | | | 711,044 | | | | 7,754 | |
| Cantor Commercial Real Estate Co. LP/CCRE Finance Corp., 7.75% Sr. Unsec. Nts., 2/15/18 | | | 2/7/13 | | | | 1,863,767 | | | | 2,039,800 | | | | 176,033 | |
| Ceridian LLC/Comdata, Inc., 8.125% Sr. Unsec. Nts., 11/15/17 | | | 5/21/14 | | | | 583,537 | | | | 592,312 | | | | 8,775 | |
| Credit Agricole SA, 8.375% Jr. Sub. Perpetual Bonds | | | 7/17/13 | | | | 1,994,704 | | | | 2,200,494 | | | | 205,790 | |
| Deutsche Bank AG, Coriolanus Ltd. Sec. Credit Linked Bonds, 33.77% Sr. Sec. Nts., 12/31/17 | | | 9/19/07 | | | | 4,879,748 | | | | 7,113,881 | | | | 2,234,133 | |
| Deutsche Bank AG, Opic Reforma I Credit Linked Nts., Cl. 2A, 7.208%, 5/22/15 | | | 5/21/08 | | | | 67,269 | | | | 50,423 | | | | (16,846 | ) |
| Deutsche Bank AG, Opic Reforma I Credit Linked Nts., Cl. 2B, 7.208%, 5/22/15 | | | 6/12/08 | | | | 117,680 | | | | 88,216 | | | | (29,464 | ) |
| Deutsche Bank AG, Opic Reforma I Credit Linked Nts., Cl. 2C, 7.208%, 5/22/15 | | | 6/18/08 | | | | 1,785,486 | | | | 1,330,076 | | | | (455,410 | ) |
| Deutsche Bank AG, Opic Reforma I Credit Linked Nts., Cl. 2D, 7.208%, 5/22/15 | | | 7/8/08 | | | | 130,028 | | | | 96,934 | | | | (33,094 | ) |
| Deutsche Bank AG, Opic Reforma I Credit Linked Nts., Cl. 2E, 7.208%, 5/22/15 | | | 7/15/08 | | | | 94,626 | | | | 70,424 | | | | (24,202 | ) |
| Deutsche Bank AG, Opic Reforma I Credit Linked Nts., Cl. 2F, 7.208%, 5/22/15 | | | 8/8/08 | | | | 61,263 | | | | 44,977 | | | | (16,286 | ) |
| Deutsche Bank AG, Opic Reforma I Credit Linked Nts., Cl. 2G, 7.208%, 5/22/15 | | | 8/22/08 | | | | 11,304 | | | | 8,283 | | | | (3,021 | ) |
| Deutsche Mortgage Securities, Inc., Series 2013-RS1, Cl. 1A2, 0.373%, 7/22/36 | | | 9/23/13 | | | | 3,804,863 | | | | 4,222,068 | | | | 417,205 | |
23 OPPENHEIMER GLOBAL STRATEGIC INCOME FUND/VA
CONSOLIDATEDSTATEMENTOF INVESTMENTS Unaudited / Continued
Footnotes to Consolidated Statement of Investments (Continued)
| | | | | | | | | | | | | | | | |
| Security | | Acquisition
Dates | | | Cost | | | Value | | | Unrealized
Appreciation/
(Depreciation) | |
| |
Exopack Holdings SA, 7.875% Sr. Unsec. Nts., 11/1/19 | | | 10/24/13 | | | $ | 1,335,000 | | | $ | 1,435,125 | | | $ | 100,125 | |
HOA Restaurant Group LLC/HOA Finance Corp., 11.25% Sec. Nts., 4/1/17 | | | 3/10/11-2/15/12 | | | | 1,870,875 | | | | 1,972,660 | | | | 101,785 | |
| ICE EM CLO, Series 2007-1A, Cl. B, 2.029%, 8/15/22 | | | 11/6/07 | | | | 7,210,089 | | | | 6,886,250 | | | | (323,839) | |
| ICE EM CLO, Series 2007-1A, Cl. C, 3.329%, 8/15/22 | | | 6/8/07 | | | | 5,270,000 | | | | 4,268,700 | | | | (1,001,300) | |
| ICE EM CLO, Series 2007-1A, Cl. D, 5.329%, 8/15/22 | | | 6/8/07 | | | | 5,270,000 | | | | 4,532,200 | | | | (737,800) | |
| Infinis plc, 7% Sr. Sec. Nts., 2/15/19 | | | 10/2/13-5/12/14 | | | | 2,232,238 | | | | 2,375,081 | | | | 142,843 | |
| JPMorgan Hipotecaria su Casita, 6.47% Sec. Nts., 8/26/35 | | | 3/21/07 | | | | 528,994 | | | | 44,619 | | | | (484,375) | |
| K Hovnanian Enterprises, Inc., 9.125% Sec. Nts., 11/15/20 | | | 9/19/12-12/6/13 | | | | 1,912,467 | | | | 2,004,800 | | | | 92,333 | |
Kenan Advantage Group, Inc. (The), 8.375% Sr. Unsec. Nts., 12/15/18 | | | 12/7/12-12/12/13 | | | | 2,316,592 | | | | 2,429,212 | | | | 112,620 | |
LBC Tank Terminals Holding Netherlands BV, 6.875% Sr. Unsec. Nts., 5/15/23 | | | 5/8/13-4/17/14 | | | | 1,589,407 | | | | 1,617,975 | | | | 28,568 | |
| NC Finance Trust, Series 1999-I, Cl. D, 8.75%, 1/25/29 | | | 8/10/10 | | | | 66,025 | | | | 4,305 | | | | (61,720) | |
| Premier Cruises Ltd., 11% Sr. Unsec. Nts., 3/15/08 | | | 3/6/98 | | | | 242,675 | | | | — | | | | (242,675) | |
| Realogy Group LLC, 9% Sr. Sec. Nts., 1/15/20 | | | 1/25/12-2/1/12 | | | | 862,550 | | | | 988,263 | | | | 125,713 | |
| Wallace Theater Holdings, Inc. | | | 3/28/13 | | | | 15 | | | | 11,788 | | | | 11,773 | |
| Western Express, Inc., 12.50% Sr. Sec. Nts., 4/15/15 | | | 4/9/10-5/4/11 | | | | 4,758,886 | | | | 3,903,562 | | | | (855,324) | |
| | | | | | | | |
| | | | | | $ | 60,212,939 | | | $ | 59,924,446 | | | $ | (288,493) | |
| | | | | | | | |
4. Interest-Only Strips represent the right to receive the monthly interest payments on an underlying pool of mortgage loans. These securities typically decline in price as interest rates decline. Most other fixed income securities increase in price when interest rates decline. The principal amount of the underlying pool represents the notional amount on which current interest is calculated. The price of these securities is typically more sensitive to changes in prepayment rates than traditional mortgage-backed securities (for example, GNMA pass-throughs). Interest rates disclosed represent current yields based upon the current cost basis and estimated timing and amount of future cash flows. These securities amount to $5,409,911 or 0.22% of the Fund’s net assets as of June 30, 2014.
5. Interest rate is less than 0.0005%.
6. All or a portion of the security position is when-issued or delayed delivery to be delivered and settled after June 30, 2014. See Note 1 of the accompanying Consolidated Notes.
7. The current amortization rate of the security’s cost basis exceeds the future interest payments currently estimated to be received. Both the amortization rate and interest payments are contingent on future mortgage pre-payment speeds and are therefore subject to change.
8. This security is not accruing income because the issuer has missed an interest payment on it and/or is not anticipated to make future interest and or principal payments. The rate shown is the original contractual interest rate. See Note 1 of the accompanying Consolidated Notes.
9. All or a portion of the security position is held in accounts at a futures clearing merchant and pledged to cover margin requirements on open futures contracts and written options on futures, if applicable. The aggregate market value of such securities is $1,997,344. See Note 6 of the accompanying Consolidated Notes.
10. All or a portion of the security position is held in segregated accounts and pledged to cover margin requirements under certain derivative contracts. The aggregate market value of such securities is $7,305,286. See Note 6 of the accompanying Consolidated Notes.
11. Denotes an inflation-index security: coupon or principal are indexed to a consumer price index.
12. Interest or dividend is paid-in-kind, when applicable.
13. This bond has no contractual maturity date, is not redeemable and contractually pays an indefinite stream of interest. Rate reported represents the current interest rate for this variable rate security.
14. Non-income producing security.
15. Zero coupon bond reflects effective yield on the date of purchase.
16. Is or was an affiliate, as defined in the Investment Company Act of 1940, at or during the period ended June 30, 2014, by virtue of the Fund owning at least 5% of the voting securities of the issuer or as a result of the Fund and the issuer having the same investment adviser. Transactions during the period in which the issuer was an affiliate are as follows:
| | | | | | | | | | | | | | | | |
| | | Shares
December 31, 2013 | | | Gross Additions | | | Gross Reductions | | | Shares June 30, 2014 | |
| |
| Oppenheimer Institutional Money Market Fund, Cl. E | | | 33,054,028 | | | | 576,788,954 | | | | 545,993,081 | | | | 63,849,901 | |
| Oppenheimer Master Event-Linked Bond Fund, LLC | | | 4,827,322 | | | | — | | | | 991,452 | | | | 3,835,870 | |
| Oppenheimer Master Loan Fund, LLC | | | 1,023,461 | | | | 8,129,839 | | | | 666,476 | | | | 8,486,824 | |
| Oppenheimer Ultra-Short Duration Fund, Cl. Y | | | 3,707,723 | | | | 1,890,725 | | | | — | | | | 5,598,448 | |
| | | | |
| | | | | | Value | | | Income | | | Realized Gain | |
| |
| Oppenheimer Institutional Money Market Fund, Cl. E | | | | | | $ | 63,849,901 | | | $ | 23,362 | | | $ | — | |
| Oppenheimer Master Event-Linked Bond Fund, LLC | | | | | | | 54,051,682 | | | | 1,769,541 a | | | | 326,180 a | |
| Oppenheimer Master Loan Fund, LLC | | | | | | | 123,541,887 | | | | 2,977,358 b | | | | 103,633 b | |
| Oppenheimer Ultra-Short Duration Fund, Cl. Y | | | | | | | 56,152,430 | | | | 74,197 | | | | — | |
| | | | | | | | |
Total | | | | | | $ | 297,595,900 | | | $ | 4,844,458 | | | $ | 429,813 | |
| | | | | | | | |
a. Represents the amount allocated to the Fund from Oppenheimer Master Event-Linked Bond fund, LLC.
b. Represents the amount allocated to the Fund from Oppenheimer Master Loan Fund, LLC.
17. Rate shown is the 7-day yield as of June 30, 2014.
24 OPPENHEIMER GLOBAL STRATEGIC INCOME FUND/VA
| | | | | | | | |
Distribution of investments representing geographic holdings, as a percentage of total investments at value, is as follows: Geographic Holdings | | Value | | | Percent | |
| |
United States | | $ | 1,509,489,077 | | | | 60.3% | |
Brazil | | | 121,450,979 | | | | 4.9 | |
Mexico | | | 104,567,256 | | | | 4.2 | |
United Kingdom | | | 50,334,178 | | | | 2.0 | |
Russia | | | 46,144,162 | | | | 1.8 | |
Turkey | | | 42,625,223 | | | | 1.7 | |
Greece | | | 37,973,414 | | | | 1.5 | |
Netherlands | | | 35,136,862 | | | | 1.4 | |
France | | | 32,457,034 | | | | 1.3 | |
Colombia | | | 30,879,691 | | | | 1.2 | |
South Africa | | | 30,024,796 | | | | 1.2 | |
Indonesia | | | 28,691,917 | | | | 1.1 | |
India | | | 27,369,875 | | | | 1.1 | |
Hungary | | | 28,075,568 | | | | 1.1 | |
Canada | | | 24,225,415 | | | | 1.0 | |
Peru | | | 24,055,347 | | | | 1.0 | |
Italy | | | 20,785,643 | | | | 0.8 | |
Germany | | | 20,459,646 | | | | 0.8 | |
Spain | | | 17,928,088 | | | | 0.7 | |
Israel | | | 16,344,473 | | | | 0.7 | |
Luxembourg | | | 15,782,779 | | | | 0.6 | |
Supranational | | | 15,687,150 | | | | 0.6 | |
United Arab Emirates | | | 15,644,680 | | | | 0.6 | |
Chile | | | 14,658,188 | | | | 0.6 | |
Philippines | | | 11,278,461 | | | | 0.5 | |
Romania | | | 10,580,581 | | | | 0.4 | |
Ireland | | | 10,185,640 | | | | 0.4 | |
China | | | 9,307,097 | | | | 0.4 | |
Venezuela | | | 8,360,909 | | | | 0.3 | |
Australia | | | 8,465,602 | | | | 0.3 | |
Portugal | | | 7,761,629 | | | | 0.3 | |
Switzerland | | | 7,658,152 | | | | 0.3 | |
Thailand | | | 7,332,563 | | | | 0.3 | |
South Korea | | | 7,041,043 | | | | 0.3 | |
Lithuania | | | 6,242,498 | | | | 0.2 | |
Nigeria | | | 6,149,604 | | | | 0.2 | |
Norway | | | 5,883,489 | | | | 0.2 | |
Croatia | | | 5,793,226 | | | | 0.2 | |
Poland | | | 4,683,148 | | | | 0.2 | |
Kazakhstan | | | 5,028,177 | | | | 0.2 | |
Sri Lanka | | | 4,954,800 | | | | 0.2 | |
Ivory Coast | | | 4,524,919 | | | | 0.2 | |
Panama | | | 4,519,168 | | | | 0.2 | |
Ukraine | | | 4,261,530 | | | | 0.2 | |
Uruguay | | | 4,163,730 | | | | 0.2 | |
Denmark | | | 4,072,062 | | | | 0.2 | |
Slovenia | | | 3,516,314 | | | | 0.1 | |
Serbia | | | 3,170,731 | | | | 0.1 | |
Dominican Republic | | | 2,880,068 | | | | 0.1 | |
Japan | | | 2,727,218 | | | | 0.1 | |
Angola | | | 2,581,722 | | | | 0.1 | |
Malaysia | | | 2,297,277 | | | | 0.1 | |
Morocco | | | 2,324,438 | | | | 0.1 | |
Austria | | | 2,117,117 | | | | 0.1 | |
Ecuador | | | 1,984,320 | | | | 0.1 | |
Jamaica | | | 1,896,675 | | | | 0.1 | |
Latvia | | | 1,837,331 | | | | 0.1 | |
Jersey, Channel Islands | | | 1,809,040 | | | | 0.1 | |
Gabon | | | 1,799,638 | | | | 0.1 | |
Tanzania | | | 1,792,250 | | | | 0.1 | |
Argentina | | | 1,789,215 | | | | 0.1 | |
Belgium | | | 1,617,975 | | | | 0.1 | |
Kenya | | | 1,597,090 | | | | 0.1 | |
Sweden | | | 1,432,426 | | | | 0.1 | |
Barbados | | | 1,281,281 | | | | 0.1 | |
Saudi Arabia | | | 1,053,175 | | | | 0.0 | |
Trinidad | | | 1,024,142 | | | | 0.0 | |
Puerto Rico | | | 747,328 | | | | 0.0 | |
| | | 255,139 | | | | 0.0 | |
| | | | |
Total | | $ | 2,502,571,379 | | | | 100.0% | |
| | | | |
25 OPPENHEIMER GLOBAL STRATEGIC INCOME FUND/VA
| | |
| |
| CONSOLIDATEDSTATEMENTOF INVESTMENTS Unaudited / Continued | | |
| | | | | | | | | | | | | | | | | | | | | | | | |
Forward Currency Exchange Contracts as of June 30, 2014 | |
| Counterparty | | Settlement Month(s) | | | Currency Purchased (000’s) | | | Currency Sold (000’s) | | | Unrealized
Appreciation | | | Unrealized
Depreciation | |
| |
BAC | | | 07/2014 - 10/2014 | | | BRL | | | 151,595 | | | USD | | | 67,343 | | | $ | 896,419 | | | $ | – | |
BAC | | | 08/2014 | | | IDR | | | 112,508,000 | | | USD | | | 9,655 | | | | – | | | | 223,333 | |
BAC | | | 07/2014 | | | MXN | | | 35,800 | | | USD | | | 2,762 | | | | – | | | | 3,532 | |
BAC | | | 08/2014 | | | PLN | | | 5,070 | | | USD | | | 1,665 | | | | – | | | | 1,988 | |
BAC | | | 07/2014 | | | RUB | | | 252,960 | | | USD | | | 6,905 | | | | 499,854 | | | | – | |
BAC | | | 09/2014 | | | THB | | | 298,000 | | | USD | | | 9,181 | | | | – | | | | 33,505 | |
BAC | | | 08/2014 | | | TRY | | | 3,910 | | | USD | | | 1,825 | | | | – | | | | 1,904 | |
BAC | | | 07/2014 - 01/2015 | | | �� USD | | | 48,705 | | | BRL | | | 113,130 | | | | – | | | | 1,550,007 | |
BAC | | | 08/2014 | | | USD | | | 2,456 | | | IDR | | | 29,410,000 | | | | – | | | | 7,541 | |
BAC | | | 07/2014 - 08/2014 | | | USD | | | 9,094 | | | RUB | | | 322,700 | | | | – | | | | 328,125 | |
BAC | | | 09/2014 | | | USD | | | 5,727 | | | THB | | | 187,000 | | | | – | | | | 12,499 | |
BAC | | | 08/2014 | | | USD | | | 8,643 | | | TRY | | | 18,600 | | | | 1,711 | | | | 33,809 | |
BAC | | | 08/2014 | | | USD | | | 3,733 | | | ZAR | | | 40,020 | | | | 7,861 | | | | 14,602 | |
BAC | | | 08/2014 | | | ZAR | | | 35,050 | | | USD | | | 3,288 | | | | – | | | | 12,727 | |
BNP | | | 07/2014 | | | EUR | | | 465 | | | USD | | | 633 | | | | 3,999 | | | | – | |
BNP | | | 07/2014 | | | RON | | | 4,400 | | | USD | | | 1,341 | | | | 32,824 | | | | – | |
BNP | | | 09/2014 | | | USD | | | 10,638 | | | CAD | | | 11,615 | | | | – | | | | 223,664 | |
BNP | | | 07/2014 | | | USD | | | 5,920 | | | EUR | | | 4,335 | | | | – | | | | 16,254 | |
BOA | | | 12/2014 | | | GBP | | | 8,080 | | | USD | | | 13,560 | | | | 247,118 | | | | – | |
BOA | | | 08/2014 | | | IDR | | | 34,389,000 | | | USD | | | 2,985 | | | | 192 | | | | 105,343 | |
BOA | | | 07/2014 | | | INR | | | 817,250 | | | USD | | | 13,567 | | | | 21,267 | | | | – | |
BOA | | | 08/2014 | | | KRW | | | 8,121,000 | | | USD | | | 7,891 | | | | 116,172 | | | | – | |
BOA | | | 07/2014 | | | MXN | | | 24,300 | | | USD | | | 1,882 | | | | – | | | | 9,242 | |
BOA | | | 08/2014 - 09/2014 | | | MYR | | | 68,040 | | | USD | | | 21,031 | | | | 115,769 | | | | – | |
BOA | | | 07/2014 | | | PEN | | | 1,760 | | | USD | | | 632 | | | | – | | | | 3,670 | |
BOA | | | 09/2014 | | | THB | | | 301,000 | | | USD | | | 9,187 | | | | 52,196 | | | | – | |
BOA | | | 07/2014 - 01/2015 | | | USD | | | 14,445 | | | BRL | | | 35,320 | | | | – | | | | 1,334,147 | |
BOA | | | 08/2014 | | | USD | | | 1,385 | | | COP | | | 2,653,000 | | | | – | | | | 25,566 | |
BOA | | | 07/2014 | | | USD | | | 49,267 | | | GBP | | | 29,375 | | | | – | | | | 1,000,567 | |
BOA | | | 07/2014 - 10/2014 | | | USD | | | 26,714 | | | INR | | | 1,638,500 | | | | – | | | | 255,260 | |
BOA | | | 08/2014 | | | USD | | | 553 | | | PEN | | | 1,590 | | | | – | | | | 12,548 | |
BOA | | | 09/2014 | | | USD | | | 6,584 | | | THB | | | 217,000 | | | | – | | | | 76,473 | |
CITNA-B | | | 07/2014 | | | MXN | | | 41,500 | | | USD | | | 3,212 | | | | 7,862 | | | | 22,069 | |
CITNA-B | | | 07/2014 | | | PEN | | | 6,970 | | | USD | | | 2,486 | | | | 1,084 | | | | – | |
CITNA-B | | | 07/2014 | | | RON | | | 675 | | | USD | | | 209 | | | | 1,925 | | | | – | |
CITNA-B | | | 08/2014 | | | TRY | | | 31,310 | | | USD | | | 14,342 | | | | 260,181 | | | | – | |
CITNA-B | | | 07/2014 | | | USD | | | 59,099 | | | EUR | | | 42,560 | | | | 817,835 | | | | – | |
CITNA-B | | | 08/2014 | | | USD | | | 2,157 | | | HUF | | | 483,000 | | | | 26,630 | | | | – | |
CITNA-B | | | 07/2014 | | | USD | | | 704 | | | RON | | | 2,285 | | | | – | | | | 9,608 | |
CITNA-B | | | 08/2014 | | | ZAR | | | 53,880 | | | USD | | | 5,129 | | | | – | | | | 93,658 | |
DEU | | | 07/2014 | | | RON | | | 2,650 | | | USD | | | 820 | | | | 6,877 | | | | – | |
DEU | | | 08/2014 | | | TRY | | | 9,200 | | | USD | | | 4,282 | | | | 8,450 | | | | – | |
DEU | | | 12/2014 | | | USD | | | 9,453 | | | JPY | | | 963,000 | | | | – | | | | 65,419 | |
DEU | | | 08/2014 | | | USD | | | 14,390 | | | TRY | | | 30,620 | | | | 109,640 | | | | – | |
GSCO-OT | | | 09/2014 | | | AUD | | | 130 | | | USD | | | 123 | | | | – | | | | 879 | |
GSCO-OT | | | 07/2014 - 01/2015 | | | BRL | | | 111,615 | | | USD | | | 48,608 | | | | 1,565,686 | | | | – | |
GSCO-OT | | | 09/2014 | | | INR | | | 90,200 | | | USD | | | 1,405 | | | | 81,239 | | | | – | |
GSCO-OT | | | 09/2014 | | | USD | | | 118 | | | AUD | | | 130 | | | | – | | | | 3,747 | |
GSCO-OT | | | 07/2014 - 01/2015 | | | USD | | | 82,205 | | | BRL | | | 196,885 | | | | 3,493 | | | | 4,215,345 | |
GSCO-OT | | | 09/2014 | | | USD | | | 1,258 | | | INR | | | 90,200 | | | | – | | | | 227,361 | |
GSCO-OT | | | 10/2014 | | | USD | | | 458 | | | MXN | | | 6,200 | | | | – | | | | 16,454 | |
JPM | | | 01/2016 | | | CNH | | | 55,600 | | | USD | | | 9,041 | | | | – | | | | 264,388 | |
JPM | | | 08/2014 | | | COP | | | 17,457,000 | | | USD | | | 8,997 | | | | 286,391 | | | | – | |
JPM | | | 12/2014 | | | EUR | | | 6,180 | | | USD | | | 8,419 | | | | 48,860 | | | | – | |
JPM | | | 07/2014 | | | INR | | | 426,000 | | | USD | | | 7,071 | | | | 11,923 | | | | – | |
JPM | | | 08/2014 - 09/2014 | | | MYR | | | 16,270 | | | USD | | | 5,017 | | | | 37,965 | | | | – | |
JPM | | | 08/2014 | | | PEN | | | 26,470 | | | USD | | | 9,453 | | | | 6,917 | | | | 43,857 | |
JPM | | | 08/2014 | | | PLN | | | 41,720 | | | USD | | | 13,591 | | | | 97,188 | | | | 2,803 | |
JPM | | | 10/2014 | | | RON | | | 5,440 | | | USD | | | 1,683 | | | | 9,365 | | | | – | |
JPM | | | 07/2014 - 08/2014 | | | RUB | | | 558,000 | | | USD | | | 15,859 | | | | 432,980 | | | | 13,690 | |
JPM | | | 10/2014 | | | USD | | | 3,972 | | | BRL | | | 10,060 | | | | – | | | | 462,135 | |
JPM | | | 12/2014 | | | USD | | | 31,657 | | | EUR | | | 23,235 | | | | – | | | | 178,234 | |
JPM | | | 07/2014 - 08/2014 | | | USD | | | 3,975 | | | IDR | | | 46,670,000 | | | | 61,025 | | | | 2,942 | |
JPM | | | 07/2014 - 09/2014 | | | USD | | | 17,580 | | | INR | | | 1,072,000 | | | | – | | | | 146,376 | |
JPM | | | 07/2014 | | | USD | | | 3,739 | | | MXN | | | 48,800 | | | | – | | | | 20,744 | |
JPM | | | 08/2014 | | | USD | | | 1,813 | | | MYR | | | 5,885 | | | | – | | | | 17,115 | |
26 OPPENHEIMER GLOBAL STRATEGIC INCOME FUND/VA
| | | | | | | | | | | | | | | | | | | | | | | | | | |
| |
Forward Currency Exchange Contracts (Continued) | |
| Counterparty | | Settlement Month(s) | | | Currency Purchased (000’s) | | | | | | Currency Sold (000’s) | | | Unrealized
Appreciation | | | Unrealized
Depreciation | |
| |
JPM | | | 08/2014 | | | USD | | | 2,606 | | | | PHP | | | | 119,000 | | | $ | – | | | $ | 121,574 | |
JPM | | | 07/2014 | | | USD | | | 1,688 | | | | RON | | | | 5,440 | | | | – | | | | 10,085 | |
JPM | | | 07/2014 - 08/2014 | | | USD | | | 12,022 | | | | RUB | | | | 432,190 | | | | – | | | | 592,326 | |
JPM | | | 08/2014 | | | USD | | | 3,565 | | | | TRY | | | | 7,590 | | | | 24,795 | | | | – | |
JPM | | | 08/2014 | | | USD | | | 12,644 | | | | ZAR | | | | 135,060 | | | | 21,817 | | | | – | |
MSCO | | | 08/2014 | | | COP | | | 15,234,000 | | | | USD | | | | 7,949 | | | | 151,509 | | | | – | |
MSCO | | | 08/2014 | | | INR | | | 144,000 | | | | USD | | | | 2,363 | | | | 18,044 | | | | – | |
MSCO | | | 07/2014 - 10/2014 | | | MXN | | | 97,530 | | | | USD | | | | 7,474 | | | | 24,077 | | | | – | |
MSCO | | | 08/2014 | | | TRY | | | 17,000 | | | | USD | | | | 7,873 | | | | 55,789 | | | | – | |
MSCO | | | 07/2014 | | | USD | | | 5,755 | | | | BRL | | | | 13,300 | | | | – | | | | 264,377 | |
MSCO | | | 07/2014 - 12/2014 | | | USD | | | 83,098 | | | | EUR | | | | 61,235 | | | | – | | | | 782,559 | |
MSCO | | | 08/2014 - 11/2014 | | | USD | | | 15,302 | | | | HUF | | | | 3,477,000 | | | | 23,404 | | | | 27,285 | |
MSCO | | | 07/2014 - 12/2014 | | | USD | | | 67,876 | | | | MXN | | | | 899,900 | | | | – | | | | 914,441 | |
NOM | | | 07/2014 | | | USD | | | 3,052 | | | | MXN | | | | 39,300 | | | | 24,319 | | | | – | |
RBS | | | 09/2014 | | | CAD | | | 11,615 | | | | USD | | | | 10,525 | | | | 336,829 | | | | – | |
RBS | | | 08/2014 | | | HUF | | | 1,832,300 | | | | USD | | | | 8,161 | | | | – | | | | 78,475 | |
RBS | | | 08/2014 | | | IDR | | | 16,375,000 | | | | USD | | | | 1,345 | | | | 25,971 | | | | – | |
RBS | | | 08/2014 | | | TRY | | | 24,150 | | | | USD | | | | 11,309 | | | | – | | | | 45,925 | |
RBS | | | 07/2014 | | | USD | | | 1,444 | | | | EUR | | | | 1,055 | | | | – | | | | 469 | |
RBS | | | 07/2014 | | | USD | | | 1,359 | | | | NOK | | | | 8,070 | | | | 43,701 | | | | – | |
RBS | | | 08/2014 | | | ZAR | | | 25,140 | | | | USD | | | | 2,398 | | | | – | | | | 51,082 | |
TDB | | | 07/2014 | | | IDR | | | 28,169,000 | | | | USD | | | | 2,330 | | | | 45,471 | | | | – | |
TDB | | | 07/2014 | | | MYR | | | 5,240 | | | | USD | | | | 1,629 | | | | 2,668 | | | | – | |
TDB | | | 09/2014 - 12/2014 | | | USD | | | 64,044 | | | | EUR | | | | 46,345 | | | | 593,222 | | | | 31,530 | |
TDB | | | 07/2014 - 11/2014 | | | USD | | | 3,482 | | | | IDR | | | | 42,411,000 | | | | 8,010 | | | | 50,021 | |
TDB | | | 07/2014 | | | USD | | | 842 | | | | MXN | | | | 11,000 | | | | – | | | | 5,061 | |
TDB | | | 08/2014 | | | ZAR | | | 25,440 | | | | USD | | | | 2,411 | | | | – | | | | 33,762 | |
| | | | | | | | | | | | | | | | | | | | | | |
Total Unrealized Appreciation and Depreciation | | | $ | 7,278,524 | | | $ | 14,102,102 | |
| | | | | | | | | | | | | | | | | | | | | | |
| |
| | | | | | | | | | | | | | | | | | | | | | | | |
| |
Futures Contracts as of June 30, 2014 | |
| | | | | | |
| Description | | Exchange | | | Buy/Sell | | | Expiration Date | | | Number of Contracts | | | Value | | | Unrealized Appreciation
(Depreciation) | |
| |
| United States Treasury Long Bonds | | | CBT | | | | Buy | | | | 9/19/14 | | | | 253 | | | $ | 34,708,438 | | | $ | 236,578 | |
| United States Treasury Long Bonds | | | CBT | | | | Sell | | | | 9/19/14 | | | | 27 | | | | 3,704,063 | | | | (6,623) | |
| United States Treasury Nts., 2 yr. | | | CBT | | | | Sell | | | | 9/30/14 | | | | 73 | | | | 16,030,345 | | | | (11,726) | |
| United States Treasury Nts., 2 yr. | | | CBT | | | | Buy | | | | 9/30/14 | | | | 146 | | | | 32,060,689 | | | | (1,095) | |
| United States Treasury Nts., 10 yr. | | | CBT | | | | Sell | | | | 9/19/14 | | | | 204 | | | | 25,535,063 | | | | (53,755) | |
| United States Treasury Nts., 10 yr. | | | CBT | | | | Buy | | | | 9/19/14 | | | | 191 | | | | 23,907,829 | | | | (19,436) | |
| United States Treasury Ultra Bonds | | | CBT | | | | Buy | | | | 9/19/14 | | | | 197 | | | | 29,537,687 | | | | 373,208 | |
| | | | | | | | | | | | | | | | | | | | | | | | |
| | | | | | | | | | | | | | | | | | | | | | $ | 517,151 | |
| | | | | | | | | | | | | | | | | | | | | | | | |
| | | | | | | | | | | | | | | | | | | | | | | | | | | | | | | | |
| |
Over-the-Counter Options Written at June 30, 2014 | |
| Description | | Counterparty | | | | | | Exercise Price | | | Expiration Date | | | Number of Contracts | | | Premiums Received | | | Value | |
| |
| BRL Currency Put | | | GSG | | | | BRL | | | | 2 .316 | | | | 8/8/14 | | | | BRL | | | | (15,910,000) | | | $ | 93,083 | | | $ | (19,442) | |
| |
| EUR Currency Call | | | BAC | | | | PLN | | | | 4 .275 | | | | 8/1/14 | | | | EUR | | | | (6,250,000) | | | | 65,428 | | | | (5,563) | |
| |
| EUR Currency Call | | | GSG | | | | PLN | | | | 4 .280 | | | | 8/1/14 | | | | EUR | | | | (12,500,000) | | | | 123,056 | | | | (11,422) | |
| |
| EUR Currency Call | | | JPM | | | | PLN | | | | 4 .275 | | | | 8/4/14 | | | | EUR | | | | (9,375,000) | | | | 89,940 | | | | (11,648) | |
| |
| IDR Currency Put | | | JPM | | | | IDR | | | | 11,700.000 | | | | 8/15/14 | | | | IDR | | | | (40,229,000,000) | | | | 34,356 | | | | (80,458) | |
| |
| JPY Currency Call | | | GSG | | | | JPY | | | | 84 .550 | | | | 12/18/15 | | | | JPY | | | | (446,000,000) | | | | 132,033 | | | | (20,962) | |
| |
| Portuguese Government Bond Put | | | JPM | | | | EUR | | | | 110 .000 | | | | 7/22/14 | | | | EUR | | | | (7,270,000) | | | | 71,213 | | | | (5,356) | |
| |
| Portuguese Government Bond Put | | | JPM | | | | EUR | | | | 115 .000 | | | | 7/23/14 | | | | EUR | | | | (7,280,000) | | | | 128,869 | | | | (22,924) | |
| | | | | | | | | | | | | | | | | | | | | | | | | | | | |
| Total Over-the-Counter Options Written | | | | | | | | | | | | | | | | | | | | | | | | | | $ | 737,978 | | | $ | (177,775) | |
| | | | | | | | | | | | | | | | | | | | | | | | | | | | |
| | | | | | | | | | | | | | | | | | | | | | | | | | | | | | | | |
| |
Over-the-Counter Credit Default Swaps at June 30, 2014 | |
| Reference Asset | | Counterparty | | | Buy/Sell
Protection | | | Fixed Rate | | | Maturity Date | | | Notional Amount (000’s) | | | Premiums Received/(Paid) | | | Value | |
| |
| Banco Bilbao Vizcaya Argentaria Sociedad Anonima | | | UBS | | | | Sell | | | | 3.000 | % | | | 12/20/17 | | | | EUR | | | | 125 | | | $ | (60) | | | $ | 13,371 | |
| |
| Banco Bilbao Vizcaya Argentaria Sociedad Anonima | | | UBS | | | | Sell | | | | 3.000 | | | | 12/20/17 | | | | EUR | | | | 125 | | | | (60) | | | | 13,371 | |
| |
| Banco Santander SA | | | UBS | | | | Sell | | | | 3.000 | | | | 9/20/17 | | | | EUR | | | | 250 | | | | (997) | | | | 25,736 | |
| |
| Bolivarian Republic of Venezuela | | | FIB | | | | Buy | | | | 5.000 | | | | 6/20/19 | | | | USD | | | | 2,170 | | | | (404,122) | | | | 365,765 | |
| |
| Republic of Ireland | | | GSG | | | | Buy | | | | 1.000 | | | | 3/20/18 | | | | EUR | | | | 585 | | | | (21,618) | | | | (18,324) | |
| |
| Republic of Ireland | | | GSG | | | | Buy | | | | 1.000 | | | | 3/20/18 | | | | USD | | | | 660 | | | | (27,725) | | | | (15,154) | |
| |
| Republic of Italy | | | GSG | | | | Sell | | | | 1.000 | | | | 3/20/23 | | | | USD | | | | 660 | | | | 105,519 | | | | (19,837) | |
| | | | | | | | | | | | | | | | | | | | | | | | | | | | |
| Total Over-the-Counter Credit Default Swaps | | | | | | | | | | | | | | | | | | | | | | | | | | $ | (349,063) | | | $ | 364,928 | |
| | | | | | | | | | | | | | | | | | | | | | | | | | | | |
27 OPPENHEIMER GLOBAL STRATEGIC INCOME FUND/VA
| | |
| |
| CONSOLIDATEDSTATEMENTOF INVESTMENTS Unaudited / Continued | | |
The table that follows shows the undiscounted maximum potential payment by the Fund related to selling credit protection in credit default swaps:
| | | | | | | | | | | | | | | | |
Type of Reference Asset on which the Fund Sold Protection | | Total Maximum Potential
Payments for Selling
Credit Protection
(Undiscounted) | | | | | Amount Recoverable* | | | | | Reference Asset Rating
Range** | |
| |
Investment Grade Single Name Corporate Debt | | | 500,000 | | | EUR | | | — | | | EUR | | | BBB+ | |
Investment Grade Sovereign Debt | | $ | 660,000 | | | | | $ | — | | | | | | BBB+ | |
| | �� | | | | | | | | | | | | | | |
Total USD | | $ | 660,000 | | | | | $ | — | | | | | | | |
| | | | | | | | | | | | | | | | |
Total EUR | | | 500,000 | | | EUR | | | — | | | EUR | | | | |
| | | | | | | | | | | | | | | | |
*The Fund has no amounts recoverable from related purchased protection. In addition, the Fund has no recourse provisions under the credit derivatives and holds no collateral which can offset or reduce potential payments under a triggering event.
**The period end reference asset security ratings, as rated by any rating organization, are included in the equivalent Standard & Poor’s rating category. The reference asset rating represents the likelihood of a potential credit event on the reference asset which would result in a related payment by the Fund.
| | | | | | | | | | | | | | | | | | | | | | | | | | | | | | | | |
| Over-the-Counter Currency Swap at June 30, 2014 | |
| Counterparty | | Pay/Receive Floating
Rate | | | Floating Rate | | | Fixed
Rate | | | Maturity
Date | | | Notional Amount
Currency Received
(000’s) | | | Notional Amount
Currency Delivered
(000’s) | | | Value | |
| |
BOA | | | Pay | | |
| Six-Month USD BBA
LIBOR |
| | | 7.100% | | | | 1/21/19 | | | | INR | | | | 139,250 | | | | 2,270 | | | $ | 162,914 | |
| |
GSG | | | Pay | | |
| Six-Month USD BBA
LIBOR |
| | | 7.210 | | | | 1/13/19 | | | | INR | | | | 140,500 | | | | 2,260 | | | | 223,752 | |
| |
GSG | | | Pay | | |
| Six-Month USD BBA
LIBOR |
| | | 7.100 | | | | 1/15/19 | | | | INR | | | | 140,000 | | | | 2,261 | | | | 202,306 | |
| | | | | | | | | | | | | | | | | | | | | | | | | | | | | | | | |
Total Over-the-Counter Currency Swap | | | $ | 588,972 | |
| | | | | | | | | | | | | | | | | | | | | | | | | | | | | | | | |
| | | | | | | | | | | | | | | | | | | | | | | | | | |
| Cleared Interest Rate Swaps at June 30, 2014 | |
| Counterparty | | Pay/Receive
Floating Rate | | | Floating Rate | | | Fixed Rate | | | Maturity Date | | | Notional Amount (000’s) | | | Value | |
| |
BAC | | | Receive | | |
| Three-Month USD
BBA LIBOR |
| | | 2.702% | | | | 6/18/24 | | | USD | | | 2,590 | | | $ | (22,206) | |
| |
GSG | | | Receive | | |
| Three-Month USD
BBA LIBOR |
| | | 2.695 | | | | 6/19/24 | | | USD | | | 2,570 | | | | (20,174) | |
| | | | | | | | | | | | | | | | | | | | | | | | | | |
Total Cleared Interest Rate Swaps | | | $ | (42,380) | |
| | | | | | | | | | | | | | | | | | | | | | | | | | |
| | | | | | | | | | | | | | | | | | | | | | | | | | |
| Over-the-Counter Interest Rate Swaps at June 30, 2014 | |
| Counterparty | | Pay/Receive
Floating Rate | | | Floating Rate | | | Fixed Rate | | | Maturity Date | | | Notional Amount (000’s) | | | Value | |
| |
BOA | | | Pay | | |
| Three-Month
MYR KLIBOR |
| | | 4.510% | | | | 6/17/24 | | | MYR | | | 8,600 | | | $ | 42,042 | |
| |
BOA | | | Pay | | |
| MXN TIIE
BANXICO |
| | | 4.345 | | | | 1/11/16 | | | MXN | | | 153,700 | | | | 130,343 | |
| |
GSG | | | Pay | | |
| Three-Month PLN
WIBOR WIBO |
| | | 3.145 | | | | 5/5/16 | | | PLN | | | 128,600 | | | | 264,415 | |
| |
GSG | | | Pay | | |
| Three-Month PLN
WIBOR WIBO |
| | | 3.115 | | | | 5/6/16 | | | PLN | | | 127,000 | | | | 248,841 | |
| |
GSG | | | Pay | | |
| MXN TIIE
BANXICO |
| | | 4.260 | | | | 6/15/16 | | | MXN | | | 126,300 | | | | 10,111 | |
| |
GSG | | | Pay | | |
| Three-Month
MYR KLIBOR |
| | | 4.515 | | | | 6/17/24 | | | MYR | | | 8,570 | | | | 42,915 | |
| |
GSG | | | Pay | | | | BZDI | | | | 12.703 | | | | 1/4/16 | | | BRL | | | 49,410 | | | | 222,325 | |
| |
GSG | | | Pay | | |
| Six-Month INR
MIBOR |
| | | 8.490 | | | | 4/29/19 | | | INR | | | 578,000 | | | | 219,094 | |
| |
HSBC | | | Pay | | |
| MXN TIIE
BANXICO |
| | | 4.760 | | | | 1/13/16 | | | MXN | | | 247,500 | | | | 181,943 | |
| |
JPM | | | Pay | | |
| MXN TIIE
BANXICO |
| | | 4.280 | | | | 6/15/16 | | | MXN | | | 125,400 | | | | 11,889 | |
| |
JPM | | | Pay | | | | BZDI | | | | 12.090 | | | | 1/4/16 | | | BRL | | | 24,120 | | | | 146,808 | |
| |
JPM | | | Pay | | | | BZDI | | | | 11.880 | | | | 1/4/16 | | | BRL | | | 56,280 | | | | 271,311 | |
| | | | | | | | | | | | | | | | | | | | | | | | | | |
Total Over-the-Counter Interest Rate Swaps | | | $ | 1,792,037 | |
| | | | | | | | | | | | | | | | | | | | | | | | | | |
| | | | | | | | | | | | | | | | | | | | | | | | | | | | | | | | |
| Over-the-Counter Credit Default Swaptions Written at June 30, 2014 | |
| Description | | Counterparty | | | Buy/Sell
Protection | | | Reference Asset | | | Fixed Rate | | | Expiration
Date | | | Notional Amount
(000’s) | | | Premiums Received | | | Value | |
| |
| Credit Default Swap maturing 6/20/19 Call | | | BOA | | | | Sell | | |
| iTraxx Europe Senior
Financials Series 21
Version 1 |
| | | 1.000% | | | | 9/17/14 | | | | EUR 30,200 | | | $ | 82,419 | | | $ | (44,922) | |
| |
| Credit Default Swap maturing 6/20/19 Call | | | JPM | | | | Sell | | |
| iTraxx Europe
Crossover Series 21
Version 1 |
| | | 5.000 | | | | 9/17/14 | | | | EUR 22,734 | | | | 194,384 | | | | (241,846) | |
28 OPPENHEIMER GLOBAL STRATEGIC INCOME FUND/VA
| | | | | | | | | | | | | | | | | | | | | | | | | | | | | | | | |
| Over-the-Counter Credit Default Swaptions Written (Continued) | |
| Description | | Counterparty | | | Buy/Sell
Protection | | | Reference Asset | | | Fixed Rate | | | Expiration
Date | | | Notional Amount
(000’s) | | | Premiums Received | | | Value | |
| |
| Credit Default Swap maturing 6/20/19 Call | | | JPM | | | | Sell | | |
| iTraxx Europe
Crossover Series 21
Version 1 |
| | | 5.000% | | | | 9/17/14 | | | | EUR 37,660 | | | $ | 322,007 | | | $ | (400,631) | |
| |
| Credit Default Swap maturing 6/20/19 Call | | | JPM | | | | Buy | | |
| iTraxx Europe
Crossover Series 21
Version 1 |
| | | 5.000 | | | | 9/17/14 | | | | EUR 22,734 | | | | 129,589 | | | | (127,379) | |
| |
| Credit Default Swap maturing 6/20/19 Call | | | JPM | | | | Buy | | |
| iTraxx Europe
Crossover Series 21
Version 1 |
| | | 5.000 | | | | 9/17/14 | | | | EUR 37,660 | | | | 214,671 | | | | (211,010) | |
| | | | | | | | | | | | | | | | | | | | | | | | | | | | |
| Total Over-the-Counter Credit Default Swaptions Written | | | $ | 943,070 | | | $ | (1,025,788) | |
| | | | | | | | | | | | | | | | | | | | | | | | | | | | |
| | | | | | | | | | | | | | | | | | | | | | | | | | | | | | | | | | | | |
| Over-the-Counter Interest Rate Swaptions Written at June 30, 2014 | |
| Description | | Counterparty | | | Pay/Receive
Floating Rate | | | Floating Rate | | | Fixed Rate | | | Expiration
Date | | | Notional Amount
(000’s) | | | Premiums Received | | | Value | |
| |
| Interest Rate Swap maturing 10/6/24 Call | | | BOA | | | | Receive | | |
| Three-Month
USD BBA
LIBOR |
| | | 2.690% | | | | 10/2/14 | | | | USD | | | | 29,950 | | | $ | 164,725 | | | $ | (301,382) | |
| |
| Interest Rate Swap maturing 8/4/21 Call | | | BOA | | | | Pay | | |
| Three-Month
USD BBA
LIBOR |
| | | 4.860 | | | | 8/2/16 | | | | USD | | | | 5,515 | | | | 82,725 | | | | (28,140) | |
| |
| Interest Rate Swap maturing 7/28/44 Call | | | JPM | | | | Receive | | |
| Six-Month
EUR
EURIBOR |
| | | 2.238 | | | | 7/24/14 | | | | EUR | | | | 15,140 | | | | 125,536 | | | | (352,033) | |
| | | | | | | | | | | | | | | | | | | | | | | | | | | | | | | | |
Total Over-the-Counter Interest Rate Swaptions Written | | | $ | 372,986 | | | $ | (681,555) | |
| | | | | | | | | | | | | | | | | | | | | | | | | | | | | | | | |
| | |
Glossary: | | |
Counterparty Abbreviations | | |
BAC | | Barclays Bank plc |
BNP | | BNP Paribas |
BOA | | Bank of America NA |
CITNA-B | | Citibank NA |
DEU | | Deutsche Bank AG |
FIB | | Credit Suisse International |
GSCO-OT | | Goldman Sachs Bank USA |
GSG | | Goldman Sachs Group, Inc. (The) |
HSBC | | HSBC Bank USA NA |
JPM | | JPMorgan Chase Bank NA |
MSCO | | Morgan Stanley Capital Services, Inc. |
NOM | | Nomura Global Financial Products, Inc. |
RBS | | Royal Bank of Scotland plc (The) |
TDB | | Toronto Dominion Bank |
UBS | | UBS AG |
|
Currency abbreviations indicate amounts reporting in currencies |
AUD | | Australian Dollar |
BRL | | Brazilian Real |
CAD | | Canadian Dollar |
CNH | | Offshore Chinese Renminbi |
COP | | Colombian Peso |
EUR | | Euro |
GBP | | British Pound Sterling |
HUF | | Hungarian Forint |
IDR | | Indonesia Rupiah |
INR | | Indian Rupee |
JPY | | Japanese Yen |
KRW | | South Korean Won |
MXN | | Mexican Nuevo Peso |
MYR | | Malaysian Ringgit |
NGN | | Nigerian Naira |
NOK | | Norwegian Krone |
PEN | | Peruvian New Sol |
PHP | | Philippines Peso |
PLN | | Polish Zloty |
RON | | New Romanian Leu |
RUB | | Russian Ruble |
THB | | Thailand Baht |
TRY | | New Turkish Lira |
ZAR | | South African Rand |
29 OPPENHEIMER GLOBAL STRATEGIC INCOME FUND/VA
| | |
| |
| CONSOLIDATEDSTATEMENTOF INVESTMENTS Unaudited / Continued | | |
| | |
Definitions | | |
BANXICO | | Banco de Mexico |
BBA LIBOR | | British Bankers’ Association London - Interbank Offered Rate |
BZDI | | Brazil Interbank Deposit Rate |
EURIBOR | | Euro Interbank Offered Rate |
iTraxx Europe Crossover Series 21 Version 1 | | Credit Default Swap Trading Index for a Specific Basket of Securities |
iTraxx Europe Senior Financials Series 21 Version 1 | | Credit Default Swap Trading Index for a Specific Basket of Securities |
iTraxx Europe Series 21 Version 1 | | Credit Default Swap Trading Index for a Specific Basket of Securities |
KLIBOR | | Kaula Lumpur Interbank Offered Rate |
MIBOR | | Mumbai Interbank Offered Rate |
TIIE | | Interbank Equilibrium Interest Rate |
WIBOR WIBO | | Poland Warsaw Interbank Offer Bid Rate |
| |
Exchange Abbreviations | | |
CBT | | Chicago Board of Trade |
See accompanying Notes to Consolidated Financial Statements.
30 OPPENHEIMER GLOBAL STRATEGIC INCOME FUND/VA
| | |
| |
| CONSOLIDATED STATEMENT OF ASSETS AND LIABILITIES June 30, 2014 Unaudited | | |
| | | | |
Assets | | | | |
Investments, at value—see accompanying consolidated statement of investments: | | | | |
Unaffiliated companies (cost $2,171,313,379) | | $ | 2,204,975,479 | |
Affiliated companies (cost $297,035,897) | | | 297,595,900 | |
| | | | 2,502,571,379 | |
Cash | | | 11,627,553 | |
Cash used for collateral on Centrally Cleared Swaps | | | 169,084 | |
Unrealized appreciation on foreign currency exchange contracts | | | 7,278,524 | |
Swaps, at value (premiums paid $405,239) | | | 2,799,252 | |
Receivables and other assets: | | | | |
Investments sold (including $13,516,826 sold on a when-issued or delayed delivery basis) | | | 42,918,632 | |
Interest, dividends and principal paydowns | | | 24,453,322 | |
Shares of beneficial interest sold | | | 2,590,542 | |
Variation margin receivable | | | 194,871 | |
Other | | | 193,482 | |
Total assets | | | 2,594,796,641 | |
Liabilities | | | | |
Bank overdraft-foreign | | | 17,934,607 | |
Unrealized depreciation on foreign currency exchange contracts | | | 14,102,102 | |
Options written, at value (premiums received $737,978) | | | 177,775 | |
Swaps, at value (premiums received $56,176) | | | 53,315 | |
Centrally cleared swaps, at value | | | 42,380 | |
Swaptions written, at value (premiums received $1,316,056) | | | 1,707,343 | |
Payables and other liabilities: | | | | |
Investments purchased (including $137,985,528 purchased on a when-issued or delayed delivery basis) | | | 150,953,166 | |
Shares of beneficial interest redeemed | | | 1,186,402 | |
Distribution and service plan fees | | | 340,660 | |
Shareholder communications | | | 165,354 | |
Trustees’ compensation | | | 91,737 | |
Variation margin payable | | | 841 | |
Other | | | 201,832 | |
Total liabilities | | | 186,957,514 | |
Net Assets | | $ | 2,407,839,127 | |
| | | | |
| | | | |
Composition of Net Assets | | | | |
Par value of shares of beneficial interest | | $ | 440,044 | |
Additional paid-in capital | | | 2,388,535,171 | |
Accumulated net investment income | | | 78,730,535 | |
Accumulated net realized loss on investments and foreign currency transactions | | | (90,300,953) | |
Net unrealized appreciation on investments and translation of assets and liabilities denominated in foreign currencies | | | 30,434,330 | |
Net Assets | | $ | 2,407,839,127 | |
| | | | |
| | | | |
Net Asset Value Per Share | | | | |
| Non-Service Shares: | | | | |
| Net asset value, redemption price (excludes applicable contingent deferred sales charge) and offering price per share (based on net assets of $748,828,716 and 139,152,086 shares of beneficial interest outstanding) | | | $5.38 | |
Service Shares: | | | | |
| Net asset value, redemption price (excludes applicable contingent deferred sales charge) and offering price per share (based on net assets of $1,659,010,411 and 300,892,246 shares of beneficial interest outstanding) | | | $5.51 | |
See accompanying Notes to Consolidated Financial Statements.
31 OPPENHEIMER GLOBAL STRATEGIC INCOME FUND/VA
| | |
| |
| CONSOLIDATED STATEMENT OF OPERATIONS For the Six Months Ended June 30, 2014 Unaudited | | |
| | | | |
Allocation of Income and Expenses from Master Funds1 | | | | |
Net investment income allocated from Oppenheimer Master Event-Linked Bond Fund, LLC: | | | | |
Interest | | $ | 1,769,134 | |
Dividends | | | 407 | |
Net expenses | | | (114,670) | |
Net investment income allocated from Oppenheimer Master Event-Linked Bond Fund, LLC | | | 1,654,871 | |
Net investment income allocated from Oppenheimer Master Loan Fund, LLC | | | | |
Interest | | | 2,918,398 | |
Dividends | | | 58,960 | |
Net expenses | | | (185,603) | |
Net investment income allocated from Oppenheimer Master Loan Fund, LLC | | | 2,791,755 | |
Total allocation of net investment income from master funds | | | 4,446,626 | |
Investment Income | | | | |
Interest (net of foreign withholding taxes of $182,279) | | | 58,039,936 | |
Fee income on when-issued securities | | | 1,335,560 | |
Dividends: | | | | |
Unaffiliated companies | | | 110,272 | |
Affiliated companies | | | 97,559 | |
Total investment income | | | 59,583,327 | |
Expenses | | | | |
Management fees | | | 6,894,967 | |
Distribution and service plan fees—Service shares | | | 2,077,658 | |
Transfer and shareholder servicing agent fees: | | | | |
Non-Service shares | | | 365,274 | |
Service shares | | | 831,221 | |
Shareholder communications: | | | | |
Non-Service shares | | | 50,367 | |
Service shares | | | 116,601 | |
Custodian fees and expenses | | | 135,565 | |
Trustees’ compensation | | | 34,531 | |
Other | | | 148,492 | |
Total expenses | | | 10,654,676 | |
Less waivers and reimbursements of expenses | | | (428,158) | |
Net expenses | | | 10,226,518 | |
Net Investment Income | | | 53,803,435 | |
32 OPPENHEIMER GLOBAL STRATEGIC INCOME FUND/VA
| | | | |
| |
Realized and Unrealized Gain (Loss) | | | | |
Net realized gain (loss) on: | | | | |
Investments from unaffiliated companies (includes premiums on options and swaptions exercised) | | $ | 8,739,433 | |
Closing and expiration of option contracts written | | | 955,008 | |
Closing and expiration of futures contracts | | | 6,308,973 | |
Foreign currency transactions | |
| (20,555,296)
|
|
Swap contracts | | | (3,037,919) | |
Swaption contracts | | | 907,395 | |
| |
Net realized gain allocated from: | | | | |
Oppenheimer Master Event-Linked Bond Fund, LLC | | | 326,180 | |
Oppenheimer Master Loan Fund, LLC | | | 103,633 | |
| | | | |
Net realized loss | |
| (6,252,593)
|
|
| |
Net change in unrealized appreciation/depreciation on: | | | | |
Investments | | | 55,418,312 | |
Translation of assets and liabilities denominated in foreign currencies | | | (4,417,700) | |
Futures contracts | |
| 3,141,197
|
|
Option contracts written | | | 51,985 | |
Swap contracts | |
| 1,960,781
|
|
Swaption contracts written | | | 1,257,869 | |
| |
Net change in unrealized appreciation/depreciation allocated from: | | | | |
Oppenheimer Master Event-Linked Bond Fund, LLC | | | (805,933) | |
Oppenheimer Master Loan Fund, LLC | | | (591,087) | |
| | | | |
Net change in unrealized appreciation/depreciation | | | 56,015,424 | |
| |
Net Increase in Net Assets Resulting from Operations | | $ | 103,566,266 | |
| | | | |
| 1. | The Fund invests in certain affiliated mutual funds that expect to be treated as partnerships for tax purposes. See Note 1 of the accompanying Consolidated Notes. |
See accompanying Notes to Consolidated Financial Statements.
33 OPPENHEIMER GLOBAL STRATEGIC INCOME FUND/VA
| | |
| |
| CONSOLIDATEDSTATEMENTSOF CHANGES IN NET ASSETS | | |
| | | | | | | | |
| | | Six Months Ended
June 30, 2014
(Unaudited) | | | Year Ended
December 31, 2013 | |
| |
Operations | |
Net investment income | | $ | 53,803,435 | | | $ | 125,129,462 | |
| |
Net realized gain (loss) | | | (6,252,593) | | | | (60,454,641) | |
| |
Net change in unrealized appreciation/depreciation | | | 56,015,424 | | | | (73,550,244) | |
| | | | | | | | |
Net increase (decrease) in net assets resulting from operations | | | 103,566,266 | | | | (8,875,423) | |
| |
Dividends and/or Distributions to Shareholders | | | | | | | | |
Dividends from net investment income: | | | | | | | | |
Non-Service shares | | | (31,299,754) | | | | (36,272,242) | |
Service shares | | | (63,703,195) | | | | (83,922,335) | |
| | | | |
| | | (95,002,949) | | | | (120,194,577) | |
| |
Beneficial Interest Transactions | |
Net increase (decrease) in net assets resulting from beneficial interest transactions: | | | | | | | | |
Non-Service shares | | | 9,082,480 | | | | 33,900,242 | |
Service shares | | | (64,573,848) | | | | (32,780,220) | |
| | | | | | | | |
| | | (55,491,368) | | | | 1,120,022 | |
| |
Net Assets | |
Total decrease | | | (46,928,051) | | | | (127,949,978) | |
| |
Beginning of period | | | 2,454,767,178 | | | | 2,582,717,156 | |
| | | | | | | | |
End of period (including accumulated net investment income of $78,730,535 and $119,930,049, respectively) | | $ | 2,407,839,127 | | | $ | 2,454,767,178 | |
| | | | |
See accompanying Notes to Consolidated Financial Statements.
34 OPPENHEIMER GLOBAL STRATEGIC INCOME FUND/VA
| | |
| |
| CONSOLIDATED FINANCIAL HIGHLIGHTS | | |
| | | | | | | | | | | | | | | | | | | | | | | | |
| Non-Service Shares | | Six Months
Ended
June 30,
2014
(Unaudited) | | | Year Ended
December
31, 2013 | | | Year Ended
December
31, 2012 | | | Year Ended
December
30, 20111 | | | Year Ended
December
31, 2010 | | | Year Ended
December
31, 2009 | |
| |
| Per Share Operating Data | | | | | | | | | | | | | | | | | | | | | | | | |
| Net asset value, beginning of period | | $ | 5.38 | | | $ | 5.67 | | | $ | 5.38 | | | $ | 5.58 | | | $ | 5.30 | | | $ | 4.49 | |
| |
| Income (loss) from investment operations: | | | | | | | | | | | | | | | | | | | | | | | | |
| Net investment income2 | | | 0.13 | | | | 0.28 | | | | 0.33 | | | | 0.36 | | | | 0.34 | | | | 0.30 | |
| Net realized and unrealized gain (loss) | | | 0.10 | | | | (0.29) | | | | 0.36 | | | | (0.31) | | | | 0.40 | | | | 0.53 | |
| | | | |
| Total from investment operations | | | 0.23 | | | | (0.01) | | | | 0.69 | | | | 0.05 | | | | 0.74 | | | | 0.83 | |
| |
| Dividends and/or distributions to shareholders: | | | | | | | | | | | | | | | | | | | | | | | | |
| Dividends from net investment income | | | (0.23) | | | | (0.28) | | | | (0.34) | | | | (0.18) | | | | (0.46) | | | | (0.02) | |
| Distributions from net realized gain | | | 0.00 | | | | 0.00 | | | | (0.06) | | | | (0.07) | | | | 0.00 | | | | 0.003 | |
| | | | |
| Total dividends and distributions to shareholders | | | (0.23) | | | | (0.28) | | | | (0.40) | | | | (0.25) | | | | (0.46) | | | | (0.02) | |
| |
| Net asset value, end of period | | $ | 5.38 | | | $ | 5.38 | | | $ | 5.67 | | | $ | 5.38 | | | $ | 5.58 | | | $ | 5.30 | |
| | | | |
| | | | | | | | | | | | | | | | | | | | | | | | |
| |
| Total Return, at Net Asset Value4 | | | 4.39% | | | | (0.13)% | | | | 13.53% | | | | 0.85% | | | | 14.97% | | | | 18.83% | |
|
| |
| Ratios/Supplemental Data | | | | | | | | | | | | | | | | | | | | | | | | |
| Net assets, end of period (in thousands) | | $ | 748,829 | | | $ | 738,741 | | | $ | 741,996 | | | $ | 648,084 | | | $ | 771,755 | | | $ | 757,772 | |
| |
| Average net assets (in thousands) | | $ | 740,488 | | | $ | 734,707 | | | $ | 690,351 | | | $ | 694,868 | | | $ | 737,071 | | | $ | 681,926 | |
| |
| Ratios to average net assets:5,6 | | | | | | | | | | | | | | | | | | | | | | | | |
| Net investment income | | | 4.65% | | | | 5.12% | | | | 6.01% | | | | 6.50% | | | | 6.47% | | | | 6.20% | |
| Total expenses7 | | | 0.74% | | | | 0.74% | | | | 0.77% | | | | 0.77% | | | | 0.75% | | | | 0.67% | |
| Expenses after payments, waivers and/or reimbursements and reduction to custodian expenses | | | 0.71% | | | | 0.72% | | | | 0.71% | | | | 0.71% | | | | 0.71% | | | | 0.64% | |
| |
| Portfolio turnover rate8 | | | 82% | | | | 107% | | | | 78% | | | | 49% | | | | 99% | | | | 110% | |
1. December 30, 2011 represents the last business day of the Fund’s reporting period.
2. Per share amounts calculated based on the average shares outstanding during the period.
3. Less than $0.005 per share.
4. Assumes an initial investment on the business day before the first day of the fiscal period, with all dividends and distributions reinvested in additional shares on the reinvestment date, and redemption at the net asset value calculated on the last business day of the fiscal period. Total returns are not annualized for periods less than one full year. Total return information does not reflect expenses that apply at the separate account level or to related insurance products. Inclusion of these charges would reduce the total return figures for all periods shown. Returns do not reflect the deduction of taxes that a shareholder would pay on fund distributions or the redemption of fund shares.
5. Annualized for periods less than one full year.
6. Includes the Fund’s share of the allocated expenses and/or net investment income from the master funds.
7. Total expenses including indirect expenses from affiliated fund were as follows:
| | | | | | |
| | Six Months Ended June 30, 2014 | | | 0.75 | % |
| | Year Ended December 31, 2013 | | | 0.74 | % |
| | Year Ended December 31, 2012 | | | 0.77 | % |
| | Year Ended December 30, 2011 | | | 0.77 | % |
| | Year Ended December 31, 2010 | | | 0.75 | % |
| | Year Ended December 31, 2009 | | | 0.68 | % |
8. The portfolio turnover rate excludes purchase and sale transactions of To Be Announced (TBA) mortgage-related securities as follows:
| | | | | | | | |
| | | Purchase Transactions | | | Sale Transactions | |
| |
Six Months Ended June 30, 2014 | | | $669,081,642 | | | | $650,302,657 | |
Year Ended December 31, 2013 | | | $4,294,357,677 | | | | $4,679,296,373 | |
Year Ended December 31, 2012 | | | $3,862,820,437 | | | | $3,466,796,233 | |
Year Ended December 30, 2011 | | | $1,050,654,783 | | | | $1,039,506,614 | |
Year Ended December 31, 2010 | | | $1,034,550,699 | | | | $1,085,289,655 | |
Year Ended December 31, 2009 | | | $1,909,574,925 | | | | $1,836,038,328 | |
See accompanying Notes to Consolidated Financial Statements.
35 OPPENHEIMER GLOBAL STRATEGIC INCOME FUND/VA
| | |
| |
| CONSOLIDATEDFINANCIAL HIGHLIGHTS Continued | | |
| | | | | | | | | | | | | | | | | | | | | | | | |
| Service Shares | | Six Months
Ended
June 30, 2014
(Unaudited) | | | Year Ended
December 31,
2013 | | | Year Ended
December 31,
2012 | | | Year Ended
December 30,
20111 | | | Year Ended
December 31,
2010 | | | Year Ended
December 31,
2009 | |
| |
| Per Share Operating Data | | | | | | | | | | | | | | | | | | | | | | | | |
| Net asset value, beginning of period | | $ | 5.50 | | | $ | 5.79 | | | $ | 5.49 | | | $ | 5.68 | | | $ | 5.38 | | | $ | 4.56 | |
| |
| Income (loss) from investment operations: | | | | | | | | | | | | | | | | | | | | | | | | |
| Net investment income2 | | | 0.12 | | | | 0.27 | | | | 0.33 | | | | 0.35 | | | | 0.33 | | | | 0.29 | |
| Net realized and unrealized gain (loss) | | | 0.11 | | | | (0.29) | | | | 0.36 | | | | (0.31) | | | | 0.42 | | | | 0.54 | |
| | | | |
| Total from investment operations | | | 0.23 | | | | (0.02) | | | | 0.69 | | | | 0.04 | | | | 0.75 | | | | 0.83 | |
| |
| Dividends and/or distributions to shareholders: | | | | | | | | | | | | | | | | | | | | | | | | |
| Dividends from net investment income | | | (0.22) | | | | (0.27) | | | | (0.33) | | | | (0.16) | | | | (0.45) | | | | (0.01) | |
| Distributions from net realized gain | | | 0.00 | | | | 0.00 | | | | (0.06) | | | | (0.07) | | | | 0.00 | | | | 0.003 | |
| | | | |
| Total dividends and distributions to shareholders | | | (0.22) | | | | (0.27) | | | | (0.39) | | | | (0.23) | | | | (0.45) | | | | (0.01) | |
| |
| Net asset value, end of period | | $ | 5.51 | | | $ | 5.50 | | | $ | 5.79 | | | $ | 5.49 | | | $ | 5.68 | | | $ | 5.38 | |
| | | | |
| | | | | | | | | | | | | | | | | | | | | | | | |
| |
| Total Return, at Net Asset Value4 | | | 4.19% | | | | (0.37)% | | | | 13.15% | | | | 0.65% | | | | 14.77% | | | | 18.41% | |
|
| |
| Ratios/Supplemental Data | | | | | | | | | | | | | | | | | | | | | | | | |
| Net assets, end of period (in thousands) | | $ | 1,659,010 | | | $ | 1,716,026 | | | $ | 1,840,721 | | | $ | 1,604,906 | | | $ | 1,670,340 | | | $ | 3,656,726 | |
| |
| Average net assets (in thousands) | | $ | 1,685,367 | | | $ | 1,794,640 | | | $ | 1,715,995 | | | $ | 1,673,715 | | | $ | 2,485,427 | | | $ | 3,143,836 | |
| |
| Ratios to average net assets:5,6 | | | | | | | | | | | | | | | | | | | | | | | | |
| Net investment income | | | 4.40% | | | | 4.88% | | | | 5.76% | | | | 6.25% | | | | 6.15% | | | | 5.95% | |
| Total expenses7 | | | 0.98% | | | | 0.99% | | | | 1.02% | | | | 1.02% | | | | 0.99% | | | | 0.92% | |
| Expenses after payments, waivers and/or reimbursements and reduction to custodian expenses | | | 0.95% | | | | 0.97% | | | | 0.96% | | | | 0.96% | | | | 0.95% | | | | 0.89% | |
| |
| Portfolio turnover rate8 | | | 82% | | | | 107% | | | | 78% | | | | 49% | | | | 99% | | | | 110% | |
1. December 30, 2011 represents the last business day of the Fund’s reporting period.
2. Per share amounts calculated based on the average shares outstanding during the period.
3. Less than $0.005 per share.
4. Assumes an initial investment on the business day before the first day of the fiscal period, with all dividends and distributions reinvested in additional shares on the reinvestment date, and redemption at the net asset value calculated on the last business day of the fiscal period. Total returns are not annualized for periods less than one full year. Total return information does not reflect expenses that apply at the separate account level or to related insurance products. Inclusion of these charges would reduce the total return figures for all periods shown. Returns do not reflect the deduction of taxes that a shareholder would pay on fund distributions or the redemption of fund shares.
5. Annualized for periods less than one full year.
6. Includes the Fund’s share of the allocated expenses and/or net investment income from the master funds.
7. Total expenses including indirect expenses from affiliated fund were as follows:
| | | | | | |
| | Six Months Ended June 30, 2014 | | | 0.99 | % |
| | Year Ended December 31, 2013 | | | 0.99 | % |
| | Year Ended December 31, 2012 | | | 1.02 | % |
| | Year Ended December 30, 2011 | | | 1.02 | % |
| | Year Ended December 31, 2010 | | | 0.99 | % |
| | Year Ended December 31, 2009 | | | 0.93 | % |
8. The portfolio turnover rate excludes purchase and sale transactions of To Be Announced (TBA) mortgage-related securities as follows:
| | | | | | | | |
| | | Purchase Transactions | | | Sale Transactions | |
| |
Six Months Ended June 30, 2014 | | | $669,081,642 | | | | $650,302,657 | |
Year Ended December 31, 2013 | | | $4,294,357,677 | | | | $4,679,296,373 | |
Year Ended December 31, 2012 | | | $3,862,820,437 | | | | $3,466,796,233 | |
Year Ended December 30, 2011 | | | $1,050,654,783 | | | | $1,039,506,614 | |
Year Ended December 31, 2010 | | | $1,034,550,699 | | | | $1,085,289,655 | |
Year Ended December 31, 2009 | | | $1,909,574,925 | | | | $1,836,038,328 | |
See accompanying Notes to Consolidated Financial Statements.
36 OPPENHEIMER GLOBAL STRATEGIC INCOME FUND/VA
| | |
| |
| NOTESTOCONSOLIDATED FINANCIAL STATEMENTS June 30, 2014 Unaudited | | |
1. Significant Accounting Policies
Oppenheimer Global Strategic Income Fund/VA (the “Fund”) is a separate series of Oppenheimer Variable Account Funds, a diversified open-end management investment company registered under the Investment Company Act of 1940, as amended. The Fund’s main investment objective is to seek total return. The Fund’s investment adviser is OFI Global Asset Management, Inc. (“OFI Global” or the “Manager”), a wholly-owned subsidiary of OppenheimerFunds, Inc. (“OFI” or the “Sub-Adviser”). The Manager has entered into a sub-advisory agreement with OFI. Shares of the Fund are sold only to separate accounts of life insurance companies.
The Fund offers two classes of shares. Both classes are sold at their offering price, which is the net asset value per share, to separate investment accounts of participating insurance companies as an underlying investment for variable life insurance policies, variable annuity contracts or other investment products. The class of shares designated as Service shares is subject to a distribution and service plan. Both classes of shares have identical rights and voting privileges with respect to the Fund in general and exclusive voting rights on matters that affect that class alone. Earnings, net assets and net asset value per share may differ due to each class having its own expenses, such as transfer and shareholder servicing agent fees and shareholder communications, directly attributable to that class.
The following is a summary of significant accounting policies consistently followed by the Fund.
Basis for Consolidation. The Fund has established a Cayman Islands exempted company, Oppenheimer Global Strategic Income Fund (Cayman) Ltd., which is wholly-owned and controlled by the Fund (the “Subsidiary”). The Fund and Subsidiary are both managed by the Manager. The Fund may invest up to 25% of its total assets in the Subsidiary. The Subsidiary invests primarily in commodity-linked derivatives (including commodity futures, financial futures, options and swap contracts) and exchange traded funds related to gold or other special minerals (“Gold ETFs”). The Subsidiary may also invest in certain fixed-income securities and other investments that may serve as margin or collateral for its derivatives positions. Investments in the Subsidiary are expected to provide the Fund with exposure to commodities markets within the limitations of the federal tax requirements that apply to the Fund. The Subsidiary is subject to the same investment restrictions and guidelines, and follows the same compliance policies and procedures, as the Fund.
The financial statements have been consolidated and include accounts of the Fund and the Subsidiary. Accordingly, all inter-company transactions and balances have been eliminated. At June 30, 2014, the Fund owned 15,000 shares with a market value of $1,365,859.
Structured Securities. The Fund invests in structured securities whose market values, interest rates and/or redemption prices are linked to the performance of underlying foreign currencies, interest rate spreads, stock market indices, prices of individual securities, commodities or other financial instruments or the occurrence of other specific events. The structured securities are often leveraged, increasing the volatility of each note’s market value relative to the change in the underlying linked financial element or event. Fluctuations in value of these securities are recorded as unrealized gains and losses in the accompanying Consolidated Statement of Operations. The Fund records a realized gain or loss when a structured security is sold or matures.
Securities on a When-Issued or Delayed Delivery Basis. The Fund may purchase securities on a “when-issued” basis, and may purchase or sell securities on a “delayed delivery” basis. “When-issued” or “delayed delivery” refers to securities whose terms and indenture are available and for which a market exists, but which are not available for immediate delivery. Delivery and payment for securities that have been purchased by the Fund on a when-issued basis normally takes place within six months and possibly as long as two years or more after the trade date. During this period, such securities do not earn interest, are subject to market fluctuation and may increase or decrease in value prior to their delivery. The purchase of securities on a when-issued basis may increase the volatility of the Fund’s net asset value to the extent the Fund executes such transactions while remaining substantially fully invested. When the Fund engages in when-issued or delayed delivery transactions, it relies on the buyer or seller, as the case may be, to complete the transaction. Their failure to do so may cause the Fund to lose the opportunity to obtain or dispose of the security at a price and yield it considers advantageous. The Fund may also sell securities that it purchased on a when-issued basis or forward commitment prior to settlement of the original purchase.
As of June 30, 2014, the Fund had purchased securities issued on a when-issued or delayed delivery basis and sold securities issued on a delayed delivery basis as follows:
| | | | |
| | | When-Issued or
Delayed Delivery
Basis Transactions | |
| |
Purchased securities | | | $137,985,528 | |
Sold securities | | | 13,516,826 | |
The Fund may enter into “forward roll” transactions with respect to mortgage-related securities. In this type of transaction, the Fund sells a mortgage-related security to a buyer and simultaneously agrees to repurchase a similar security (same type, coupon and maturity) at a later date at a set price. During the period between the sale and the repurchase, the Fund will not be entitled to receive interest and principal payments on the securities that have been sold. The Fund records the incremental difference between the forward purchase and sale of each forward roll as realized gain (loss) on investments or as fee income in the case of such transactions that have an associated fee in lieu of a difference in the forward purchase and sale price.
Forward roll transactions may be deemed to entail embedded leverage since the Fund purchases mortgage-related securities with extended settlement dates rather than paying for the securities under a normal settlement cycle. This embedded leverage increases the Fund’s market value of investments relative to its net assets which can incrementally increase the volatility of the Fund’s performance. Forward roll transactions can be replicated over multiple settlement periods.
37 OPPENHEIMER GLOBAL STRATEGIC INCOME FUND/VA
|
|
| CONSOLIDATED NOTES TO FINANCIAL STATEMENTS Unaudited / Continued |
1. Significant Accounting Policies (Continued)
Risks of entering into forward roll transactions include the potential inability of the counterparty to meet the terms of the agreement; the potential of the Fund to receive inferior securities at redelivery as compared to the securities sold to the counterparty; and counterparty credit risk.
Credit Risk. The Fund invests in high-yield, non-investment-grade bonds, which may be subject to a greater degree of credit risk. Credit risk relates to the ability of the issuer to meet interest or principal payments or both as they become due. The Fund may acquire securities that have missed an interest payment, and is not obligated to dispose of securities whose issuers or underlying obligors subsequently miss an interest payment. Information concerning securities not accruing interest as of June 30, 2014 is as follows:
| | | | | | | | |
Cost | | $ | 15,777,324 | | | | | |
Market Value | | $ | 902,599 | | | | | |
Market value as % of Net Assets | | | 0.04% | | | | | |
Sovereign Debt Risk. The Fund invests in sovereign debt securities, which are subject to certain special risks. These risks include, but are not limited to, the risk that a governmental entity may delay or refuse, or otherwise be unable, to pay interest or repay the principal on its sovereign debt. There may also be no legal process for collecting sovereign debt that a government does not pay or bankruptcy proceedings through which all or part of such sovereign debt may be collected. In addition, a restructuring or default of sovereign debt may also cause additional impacts to the financial markets, such as downgrades to credit ratings, reduced liquidity and increased volatility, among others.
Investment in Oppenheimer Institutional Money Market Fund. The Fund is permitted to invest daily available cash balances in an affiliated money market fund. The Fund may invest the available cash in Class E shares of Oppenheimer Institutional Money Market Fund (“IMMF”) to seek current income while preserving liquidity. IMMF is a registered open-end management investment company, regulated as a money market fund under the Investment Company Act of 1940, as amended. The Manager is the investment adviser of IMMF, and the Sub-Adviser provides investment and related advisory services to IMMF. When applicable, the Fund’s investment in IMMF is included in the Consolidated Statement of Investments. Shares of IMMF are valued at their net asset value per share. As a shareholder, the Fund is subject to its proportional share of IMMF’s Class E expenses, including its management fee. The Manager will waive fees and/or reimburse Fund expenses in an amount equal to the indirect management fees incurred through the Fund’s investment in IMMF.
Investment in Oppenheimer Master Funds. The Fund is permitted to invest in entities sponsored and/or advised by the Manager or an affiliate. Certain of these entities in which the Fund invests are mutual funds registered under the Investment Company Act of 1940 that expect to be treated as partnerships for tax purposes, specifically Oppenheimer Master Loan Fund, LLC and Oppenheimer Master Event-Linked Bond Fund, LLC (the “Master Funds”). Each Master Fund has its own investment risks, and those risks can affect the value of the Fund’s investments and therefore the value of the Fund’s shares. To the extent that the Fund invests more of its assets in one Master Fund than in another, the Fund will have greater exposure to the risks of that Master Fund.
The investment objective of Oppenheimer Master Loan Fund, LLC is to seek income. The investment objective of Oppenheimer Master Event-Linked Bond Fund, LLC is to seek total return. The Fund’s investments in the Master Funds are included in the Consolidated Statement of Investments. The Fund recognizes income and gain/(loss) on its investments in each Master Fund according to its allocated pro-rata share, based on its relative proportion of total outstanding Master Fund shares held, of the total net income earned and the net gain/(loss) realized on investments sold by the Master Funds. As a shareholder, the Fund is subject to its proportional share of the Master Funds’ expenses, including their management fee. The Manager will waive fees and/or reimburse Fund expenses in an amount equal to the indirect management fees incurred through the Fund’s investment in the Master Funds.
Foreign Currency Translation. The Fund’s accounting records are maintained in U.S. dollars. The values of securities denominated in foreign currencies and amounts related to the purchase and sale of foreign securities and foreign investment income are translated into U.S. dollars as of the close of the New York Stock Exchange (the “Exchange”), normally 4:00 P.M. Eastern time, on each day the Exchange is open for trading. Foreign exchange rates may be valued primarily using a reliable bank, dealer or service authorized by the Board of Trustees.
Reported net realized gains and losses from foreign currency transactions arise from sales of portfolio securities, sales and maturities of short-term securities, sales of foreign currencies, exchange rate fluctuations between the trade and settlement dates on securities transactions, and the difference between the amounts of dividends, interest, and foreign withholding taxes recorded on the Fund’s books and the U.S. dollar equivalent of the amounts actually received or paid. Net unrealized appreciation and depreciation on the translation of assets and liabilities denominated in foreign currencies arise from changes in the values of assets and liabilities, including investments in securities at fiscal period end, resulting from changes in exchange rates.
The effect of changes in foreign currency exchange rates on investments is separately identified from the fluctuations arising from changes in market values of securities held and reported with all other foreign currency gains and losses in the Fund’s Consolidated Statement of Operations.
Allocation of Income, Expenses, Gains and Losses. Income, expenses (other than those attributable to a specific class), gains and losses are allocated on a daily basis to each class of shares based upon the relative proportion of net assets represented by such class. Operating expenses directly attributable to a specific class are charged against the operations of that class.
38 OPPENHEIMER GLOBAL STRATEGIC INCOME FUND/VA
1. Significant Accounting Policies (Continued)
Federal Taxes. The Fund intends to comply with provisions of the Internal Revenue Code applicable to regulated investment companies and to distribute substantially all of its investment company taxable income to shareholders. Therefore, no federal income or excise tax provision is required. The Fund files income tax returns in U.S. federal and applicable state jurisdictions. The statute of limitations on the Fund’s tax return filings generally remain open for the three preceding fiscal reporting period ends.
Subchapter M requires, among other things, that at least 90% of the Fund’s gross income be derived from securities or derived with respect to its business of investing in securities (typically referred to as “qualifying income”). Income from commodity-linked derivatives may not be treated as “qualifying income” for purposes of the 90% gross income requirement. The Internal Revenue Service (IRS) has previously issued a number of private letter rulings which conclude that income derived from commodity index-linked notes and investments in a wholly-owned subsidiary will be “qualifying income.” As a result, the Fund will gain exposure to commodities through commodity-linked notes and its wholly-owned subsidiary.
The IRS has suspended the granting of private letter rulings pending further review. As a result, there can be no assurance that the IRS will not change its position with respect to commodity-linked notes and wholly-owned subsidiaries. In addition, future legislation and guidance from Treasury and the IRS may adversely affect the fund’s ability to gain exposure to commodities through commodity-linked notes and its wholly-owned subsidiary.
During the fiscal year ended December 31, 2013, the Fund utilized $3,174,670 of capital loss carryforward to offset capital gains realized in that fiscal year. The Fund had straddle losses of $235,525. Details of the fiscal year ended December 31, 2013 capital loss carryforwards are included in the table below. Capital loss carryforwards with no expiration, if any, must be utilized prior to those with expiration dates. Capital losses with no expiration will be carried forward to future years if not offset by gains.
| | | | |
| Expiring | | | |
| |
2015 | | $ | 5,751,368 | |
2016 | | | 3,339,490 | |
No expiration | | | 64,685,012 | |
| | | | |
Total | | $ | 73,775,870 | |
| | | | |
As of June 30, 2014, it is estimated that the capital loss carryforwards would be $9,090,858 expiring by 2016 and $70,937,605 which will not expire. The estimated capital loss carryforward represents the carryforward as of the end of the last fiscal year, increased or decreased by capital losses or gains realized in the first six months of the current fiscal year. During the six months ended June 30, 2014, it is estimated that the Fund will not utilize any capital loss carryforward to offset realized capital gains.
Net investment income (loss) and net realized gain (loss) may differ for financial statement and tax purposes. The character of dividends and distributions made during the fiscal year from net investment income or net realized gains may differ from their ultimate characterization for federal income tax purposes. Also, due to timing of dividends and distributions, the fiscal year in which amounts are distributed may differ from the fiscal year in which the income or net realized gain was recorded by the Fund.
The aggregate cost of securities and other investments and the composition of unrealized appreciation and depreciation of securities and other investments for federal income tax purposes as of June 30, 2014 are noted in the following table. The primary difference between book and tax appreciation or depreciation of securities and other investments, if applicable, is attributable to the tax deferral of losses or tax realization of financial statement unrealized gain or loss.
| | | | |
Federal tax cost of securities | | $ | 2,469,501,647 | |
Federal tax cost of other investments | | | 145,322,709 | |
| | | | |
Total federal tax cost | | $ | 2,614,824,356 | |
| | | | |
Gross unrealized appreciation | | $ | 85,685,349 | |
Gross unrealized depreciation | | | (49,570,380) | |
| | | | |
Net unrealized appreciation | | $ | 36,114,969 | |
| | | | |
Trustees’ Compensation. The Board of Trustees has adopted a compensation deferral plan for independent trustees that enables trustees to elect to defer receipt of all or a portion of the annual compensation they are entitled to receive from the Fund. For purposes of determining the amount owed to the Trustee under the plan, deferred amounts are treated as though equal dollar amounts had been invested in shares of the Fund or in other Oppenheimer funds selected by the Trustee. The Fund purchases shares of the funds selected for deferral by the Trustee in amounts equal to his or her deemed investment, resulting in a Fund asset equal to the deferred compensation liability. Such assets are included as a component of “Other” within the asset section of the Consolidated Statement of Assets and Liabilities. Deferral of trustees’ fees under the plan will not affect the net assets of the Fund, and will not materially affect the Fund’s assets, liabilities or net investment income per share. Amounts will be deferred until distributed in accordance with the compensation deferral plan.
Dividends and Distributions to Shareholders. Dividends and distributions to shareholders, which are determined in accordance with income tax regulations and may differ from U.S. generally accepted accounting principles, are recorded on the ex-dividend date. Income and capital gain distributions, if any, are declared and paid annually or at other times as deemed necessary by the Manager. The tax character of distributions is determined as of the Fund’s fiscal year end. Therefore, a portion of the Fund’s distributions made to shareholders prior to the Fund’s fiscal year end may ultimately be categorized as a tax return of capital.
Investment Income. Dividend income is recorded on the ex-dividend date or upon ex-dividend notification in the case of certain foreign dividends where the ex-dividend date may have passed. Non-cash dividends included in dividend income, if any, are recorded at the fair market value of the securities received. Interest income is recognized on an accrual basis. Discount and premium, which are included in interest income on the Consolidated Statement of Operations, are amortized or accreted daily.
39 OPPENHEIMER GLOBAL STRATEGIC INCOME FUND/VA
|
|
| CONSOLIDATED NOTES TO FINANCIAL STATEMENTS Unaudited / Continued |
1. Significant Accounting Policies (Continued)
Custodian Fees. “Custodian fees and expenses” in the Consolidated Statement of Operations may include interest expense incurred by the Fund on any cash overdrafts of its custodian account during the period. Such cash overdrafts may result from the effects of failed trades in portfolio securities and from cash outflows resulting from unanticipated shareholder redemption activity. The Fund pays interest to its custodian on such cash overdrafts, to the extent they are not offset by positive cash balances maintained by the Fund, at a rate equal to the Federal Funds Rate plus 0.50%. The “Reduction to custodian expenses” line item, if applicable, represents earnings on cash balances maintained by the Fund during the period. Such interest expense and other custodian fees may be paid with these earnings.
Security Transactions. Security transactions are recorded on the trade date. Realized gains and losses on securities sold are determined on the basis of identified cost.
Indemnifications. The Fund’s organizational documents provide current and former trustees and officers with a limited indemnification against liabilities arising in connection with the performance of their duties to the Fund. In the normal course of business, the Fund may also enter into contracts that provide general indemnifications. The Fund’s maximum exposure under these arrangements is unknown as this would be dependent on future claims that may be made against the Fund. The risk of material loss from such claims is considered remote.
Other. The preparation of financial statements in conformity with accounting principles generally accepted in the United States of America requires management to make estimates and assumptions that affect the reported amounts of assets and liabilities and disclosure of contingent assets and liabilities at the date of the financial statements and the reported amounts of increases and decreases in net assets from operations during the reporting period. Actual results could differ from those estimates.
2. Securities Valuation
The Fund calculates the net asset value of its shares as of the close of the New York Stock Exchange (the “Exchange”), normally 4:00 P.M. Eastern time, on each day the Exchange is open for trading.
The Fund’s Board has adopted procedures for the valuation of the Fund’s securities and has delegated the day-to-day responsibility for valuation determinations under those procedures to the Manager. The Manager has established a Valuation Committee which is responsible for determining a “fair valuation” for any security for which market quotations are not “readily available.” The Valuation Committee’s fair valuation determinations are subject to review, approval and ratification by the Fund’s Board at its next regularly scheduled meeting covering the calendar quarter in which the fair valuation was determined.
Valuation Methods and Inputs
Securities are valued using unadjusted quoted market prices, when available, as supplied primarily by third party pricing services or dealers.
The following methodologies are used to determine the market value or the fair value of the types of securities described below:
Securities traded on a registered U.S. securities exchange (including exchange-traded derivatives other than futures and futures options) are valued based on the last sale price of the security reported on the principal exchange on which it is traded, prior to the time when the Fund’s assets are valued. In the absence of a sale, the security is valued at the last sale price on the prior trading day, if it is within the spread of the current day’s closing “bid” and “asked” prices, and if not, at the current day’s closing bid price. A security of a foreign issuer traded on a foreign exchange, but not listed on a registered U.S. securities exchange, is valued based on the last sale price on the principal exchange on which the security is traded, as identified by the third party pricing service used by the Manager, prior to the time when the Fund’s assets are valued. If the last sale price is unavailable, the security is valued at the most recent official closing price on the principal exchange on which it is traded. If the last sales price or official closing price for a foreign security is not available, the security is valued at the mean between the bid and asked price per the exchange or, if not available from the exchange, obtained from two dealers. If bid and asked prices are not available from either the exchange or two dealers, the security is valued by using one of the following methodologies (listed in order of priority): (1) using a bid from the exchange, (2) the mean between the bid and asked price as provided by a single dealer, or (3) a bid from a single dealer.
Shares of a registered investment company that are not traded on an exchange are valued at that investment company’s net asset value per share.
Corporate and government debt securities (of U.S. or foreign issuers) and municipal debt securities, event-linked bonds, loans, mortgage-backed securities, collateralized mortgage obligations, and asset-backed securities are valued at the mean between the “bid” and “asked” prices utilizing evaluated prices obtained from third party pricing services or broker-dealers who may use matrix pricing methods to determine the evaluated prices.
Short-term money market type debt securities with a remaining maturity of sixty days or less are valued at cost adjusted by the amortization of discount or premium to maturity (amortized cost), which approximates market value. Short-term debt securities with a remaining maturity in excess of sixty days are valued at the mean between the “bid” and “asked” prices utilizing evaluated prices obtained from third party pricing services or broker-dealers.
Structured securities, swaps, swaptions, and other over-the-counter derivatives are valued utilizing evaluated prices obtained from third party pricing services or broker-dealers.
40 OPPENHEIMER GLOBAL STRATEGIC INCOME FUND/VA
2. Securities Valuation (Continued)
Forward foreign currency exchange contracts are valued utilizing current and forward currency rates obtained from third party pricing services. When the settlement date of a contract is an interim date for which a quotation is not available, interpolated values are derived using the nearest dated forward currency rate.
Futures contracts and futures options traded on a commodities or futures exchange will be valued at the final settlement price or official closing price on the principal exchange as reported by such principal exchange at its trading session ending at, or most recently prior to, the time when the Fund’s assets are valued.
A description of the standard inputs that may generally be considered by the third party pricing vendors in determining their evaluated prices is provided below.
| | |
| Security Type | | Standard inputs generally considered by third-party pricing vendors |
| Corporate debt, government debt, municipal, mortgage-backed and asset-backed securities | | Reported trade data, broker-dealer price quotations, benchmark yields, issuer spreads on comparable securities, the credit quality, yield, maturity, and other appropriate factors. |
| Loans | | Information obtained from market participants regarding reported trade data and broker-dealer price quotations. |
| Event-linked bonds | | Information obtained from market participants regarding reported trade data and broker-dealer price quotations. |
| Structured securities | | Relevant market information such as the price of underlying financial instruments, stock market indices, foreign currencies, interest rate spreads, commodities, or the occurrence of other specific events. |
| Swaps | | Relevant market information, including underlying reference assets such as credit spreads, credit event probabilities, index values, individual security values, forward interest rates, variable interest rates, volatility measures, and forward currency rates. |
If a market value or price cannot be determined for a security using the methodologies described above, or if, in the “good faith” opinion of the Manager, the market value or price obtained does not constitute a “readily available market quotation,” or a significant event has occurred that would materially affect the value of the security the security is fair valued either (i) by a standardized fair valuation methodology applicable to the security type or the significant event as previously approved by the Valuation Committee and the Fund’s Board or (ii) as determined in good faith by the Manager’s Valuation Committee. The Valuation Committee considers all relevant facts that are reasonably available, through either public information or information available to the Manager, when determining the fair value of a security. Fair value determinations by the Manager are subject to review, approval and ratification by the Fund’s Board at its next regularly scheduled meeting covering the calendar quarter in which the fair valuation was determined. Those fair valuation standardized methodologies include, but are not limited to, valuing securities at the last sale price or initially at cost and subsequently adjusting the value based on: changes in company specific fundamentals, changes in an appropriate securities index, or changes in the value of similar securities which may be further adjusted for any discounts related to security-specific resale restrictions. When possible, such methodologies use observable market inputs such as unadjusted quoted prices of similar securities, observable interest rates, currency rates and yield curves. The methodologies used for valuing securities are not necessarily an indication of the risks associated with investing in those securities nor can it be assured that the Fund can obtain the fair value assigned to a security if it were to sell the security.
To assess the continuing appropriateness of security valuations, the Manager, or its third party service provider who is subject to oversight by the Manager, regularly compares prior day prices, prices on comparable securities, and sale prices to the current day prices and challenges those prices exceeding certain tolerance levels with the third party pricing service or broker source. For those securities valued by fair valuations, whether through a standardized fair valuation methodology or a fair valuation determination, the Valuation Committee reviews and affirms the reasonableness of the valuations based on such methodologies and fair valuation determinations on a regular basis after considering all relevant information that is reasonably available.
Classifications
Each investment asset or liability of the Fund is assigned a level at measurement date based on the significance and source of the inputs to its valuation. Various data inputs are used in determining the value of each of the Fund’s investments as of the reporting period end. These data inputs are categorized in the following hierarchy under applicable financial accounting standards:
1) Level 1-unadjusted quoted prices in active markets for identical assets or liabilities (including securities actively traded on a securities exchange)
2) Level 2-inputs other than unadjusted quoted prices that are observable for the asset or liability (such as unadjusted quoted prices for similar assets and market corroborated inputs such as interest rates, prepayment speeds, credit risks, etc.)
3) Level 3-significant unobservable inputs (including the Manager’s own judgments about assumptions that market participants would use in pricing the asset or liability).
The inputs used for valuing securities are not necessarily an indication of the risks associated with investing in those securities.
The table below categorizes amounts that are included in the Fund’s Consolidated Statement of Assets and Liabilities as of June 30, 2014 based on valuation input level:
41 OPPENHEIMER GLOBAL STRATEGIC INCOME FUND/VA
|
|
| CONSOLIDATED NOTES TO FINANCIAL STATEMENTS Unaudited / Continued |
2. Securities Valuation (Continued)
| | | | | | | | | | | | | | | | |
| | | Level 1— Unadjusted Quoted Prices | | | Level 2— Other Significant Observable Inputs | | | Level 3— Significant Unobservable Inputs | | | Value | |
| |
Assets Table | | | | | | | | | | | | | | | | |
Investments, at Value: | | | | | | | | | | | | | | | | |
Asset-Backed Securities | | $ | — | | | $ | 57,066,339 | | | $ | 1,809,040 | | | $ | 58,875,379 | |
Mortgage-Backed Obligations | | | — | | | | 392,759,335 | | | | 4,305 | | | | 392,763,640 | |
U.S. Government Obligations | | | — | | | | 133,596,039 | | | | — | | | | 133,596,039 | |
Foreign Government Obligations | | | — | | | | 400,240,351 | | | | — | | | | 400,240,351 | |
Corporate Loans | | | — | | | | 89,680,025 | | | | — | | | | 89,680,025 | |
Corporate Bonds and Notes | | | — | | | | 1,010,562,325 | | | | 2,666,055 | | | | 1,013,228,380 | |
Preferred Stock | | | — | | | | 3,659,354 | | | | — | | | | 3,659,354 | |
Common Stocks | | | 2,162,767 | | | | 606 | | | | 13,986 | | | | 2,177,359 | |
Rights, Warrants and Certificates | | | — | | | | — | | | | — | | | | — | |
Structured Securities | | | — | | | | 10,086,226 | | | | 9,433,463 | | | | 19,519,689 | |
Short-Term Notes | | | — | | | | 90,509,957 | | | | — | | | | 90,509,957 | |
Investment Companies | | | 120,002,330 | | | | 177,593,570 | | | | — | | | | 297,595,900 | |
Over-the-Counter Options Purchased | | | — | | | | 344,570 | | | | — | | | | 344,570 | |
Over-the-Counter Credit Default Swaption Purchased | | | — | | | | 27,309 | | | | — | | | | 27,309 | |
Over-the-Counter Interest Rate Swaptions Purchased | | | — | | | | 353,427 | | | | — | | | | 353,427 | |
| | | | |
Total Investments, at Value | | | 122,165,097 | | | | 2,366,479,433 | | | | 13,926,849 | | | | 2,502,571,379 | |
Other Financial Instruments: | | | | | | | | | | | | | | | | |
Swaps, at value | | | — | | | | 2,799,252 | | | | — | | | | 2,799,252 | |
Futures contracts | | | 609,786 | | | | — | | | | — | | | | 609,786 | |
Foreign currency exchange contracts | | | — | | | | 7,278,524 | | | | — | | | | 7,278,524 | |
| | | | |
Total Assets | | $ | 122,774,883 | | | $ | 2,376,557,209 | | | $ | 13,926,849 | | | $ | 2,513,258,941 | |
| | | | |
| | | | |
Liabilities Table | | | | | | | | | | | | | | | | |
Other Financial Instruments: | | | | | | | | | | | | | | | | |
Swaps, at value | | $ | — | | | $ | (53,315) | | | $ | — | | | $ | (53,315) | |
Centrally cleared swaps, at value | | | — | | | | (42,380) | | | | — | | | | (42,380) | |
Options written, at value | | | — | | | | (177,775) | | | | — | | | | (177,775) | |
Futures contracts | | | (92,635) | | | | — | | | | — | | | | (92,635) | |
Foreign currency exchange contracts | | | — | | | | (14,102,102) | | | | — | | | | (14,102,102) | |
Swaptions written, at value | | | — | | | | (1,707,343) | | | | — | | | | (1,707,343) | |
| | | | |
Total Liabilities | | $ | (92,635) | | | $ | (16,082,915) | | | $ | — | | | $ | (16,175,550) | |
| | | | |
Foreign currency exchange contracts and futures contracts, if any, are reported at their unrealized appreciation/depreciation at measurement date, which represents the change in the contract’s value from trade date. All additional assets and liabilities included in the above table are reported at their market value at measurement date.
The table below shows the transfers between Level 2 and Level 3. The Fund’s policy is to recognize transfers in and transfers out as of the beginning of the reporting period.
| | | | | | | | | | | | | | | | |
| | | Transfers into Level 2* | | | Transfers out of Level 2** | | | Transfers into Level 3** | | | Transfers out of Level 3* | |
| |
Assets Table | | | | | | | | | | | | | | | | |
Investments, at Value: | | | | | | | | | | | | | | | | |
Asset-Backed Securities | | $ | 16,206,250 | | | $ | (1,804,570) | | | $ | 1,804,570 | | | $ | (16,206,250) | |
Corporate Bonds and Notes | | | 441,000 | | | | – | | | | – | | | | (441,000) | |
Common Stocks | | | – | | | | (1,428,674) | | | | 1,428,674 | | | | – | |
Structured Securities | | | 2,998 | | | | – | | | | – | | | | (2,998) | |
| | | | |
Total Assets | | $ | 16,650,248 | | | $ | (3,233,244) | | | $ | 3,233,244 | | | $ | (16,650,248) | |
| | | | |
* Transferred from Level 3 to Level 2 due to the availability of market data for this security.
** Transferred from Level 2 to Level 3 because of the lack of observable market data.
3. Shares of Beneficial Interest
The Fund has authorized an unlimited number of $0.001 par value shares of beneficial interest of each class. Transactions in shares of beneficial interest were as follows:
42 OPPENHEIMER GLOBAL STRATEGIC INCOME FUND/VA
3. Shares of Beneficial Interest
| | | | | | | | | | | | | | | | | | | | |
| | | Six Months Ended June 30, 2014 | | | | | | | Year Ended December 31, 2013 | |
| | | Shares | | | Amount | | | | | | | Shares | | | Amount | |
| |
Non-Service Shares | | | | | | | | | | | | | | | | | | | | |
Sold | | | 5,373,098 | | | $ | 29,343,045 | | | | | | | | 20,825,193 | | | $ | 114,175,644 | |
Dividends and/or distributions reinvested | | | 5,850,421 | | | | 31,299,754 | | | | | | | | 6,754,607 | | | | 36,272,242 | |
Redeemed | | | (9,437,421) | | | | (51,560,319) | | | | | | | | (21,107,392) | | | | (116,547,644) | |
| | | | |
Net increase | | | 1,786,098 | | | $ | 9,082,480 | | | | | | | | 6,472,408 | | | $ | 33,900,242 | |
| | | | |
| | | | |
| | | | | | | | | | | | | | | | | | | | |
| |
Service Shares | | | | | | | | | | | | | | | | | | | | |
Sold | | | 5,725,365 | | | $ | 31,870,488 | | | | | | | | 32,262,956 | | | $ | 181,229,821 | |
Dividends and/or distributions reinvested | | | 11,624,670 | | | | 63,703,195 | | | | | | | | 15,286,400 | | | | 83,922,335 | |
Redeemed | | | (28,666,941) | | | | (160,147,531) | | | | | | | | (53,354,375) | | | | (297,932,376) | |
| | | | |
Net decrease | | | (11,316,906) | | | $ | (64,573,848) | | | | | | | | (5,805,019) | | | $ | (32,780,220) | |
| | | | |
| | | | |
4. Purchases and Sales of Securities
The aggregate cost of purchases and proceeds from sales of securities, other than short-term obligations and investments in IMMF, for the six months ended June 30, 2014 were as follows:
| | | | | | | | |
| | | Purchases | | | Sales | |
| |
Investment securities | | $ | 1,625,046,468 | | | $ | 1,532,101,694 | |
U.S. government and government agency obligations | | | 232,071,458 | | | | 237,464,932 | |
To Be Announced (TBA) mortgage-relates securities | | | 669,081,642 | | | | 650,302,657 | |
5. Fees and Other Transactions with Affiliates
Management Fees. Under the investment advisory agreement, the Fund pays the Manager a management fee based on the daily net assets of the Fund at an annual rate as shown in the following table:
| | | | | | |
| Fee Schedule | | | | | |
|
Up to $200 million | | | 0.75 | % | | |
Next $200 million | | | 0.72 | | | |
Next $200 million | | | 0.69 | | | |
Next $200 million | | | 0.66 | | | |
Next $200 million | | | 0.60 | | | |
Over $4 billion | | | 0.50 | | | |
Over $5 billion | | | 0.48 | | | |
The Manager also provides investment management related services to the Subsidiary. The Subsidiary pays the Manager a monthly management fee at an annual rate according to the above schedule. The Subsidiary also pays certain other expenses including custody and directors’ fees.
Sub-Adviser Fees. The Manager has retained the Sub-Adviser to provide the day-to-day portfolio management of the Fund. Under the Sub-Advisory Agreement, the Manager pays the Sub-Adviser an annual fee in monthly installments, equal to a percentage of the investment management fee collected by the Manager from the Fund, which shall be calculated after any investment management fee waivers. The fee paid to the Sub-Adviser is paid by the Manager, not by the Fund.
Transfer Agent Fees. OFI Global (the “Transfer Agent”) serves as the transfer and shareholder servicing agent for the Fund. The Fund pays the Transfer Agent a fee based on annual net assets. Fees incurred and average net assets for each class with respect to these services are detailed in the Consolidated Statement of Operations and Financial Highlights, respectively.
Sub-Transfer Agent Fees. The Transfer Agent has retained Shareholder Services, Inc., a wholly-owned subsidiary of OFI (the “Sub-Transfer Agent”), to provide the day-to-day transfer agent and shareholder servicing of the Fund and the Subsidiary. Under the Sub-Transfer Agency Agreement, the Transfer Agent pays the Sub-Transfer Agent an annual fee in monthly installments, equal to a percentage of the transfer agent fee collected by the Transfer Agent from the Fund, which shall be calculated after any applicable fee waivers. The fee paid to the Sub-Transfer Agent is paid by the Transfer Agent, not by the Fund.
Distribution and Service Plan for Service Shares. The Fund has adopted a Distribution and Service Plan (the “Plan”) in accordance with Rule 12b-1 under the Investment Company Act of 1940 for Service shares to pay OppenheimerFunds Distributor, Inc. (the “Distributor”), for distribution related services, personal service and account maintenance for the Fund’s Service shares. Under the Plan, payments are made periodically at an annual rate of 0.25% of the daily net assets of Service shares of the Fund. The Distributor currently uses all of those fees to compensate sponsors of the insurance product that offers Fund shares, for providing personal service and maintenance of accounts of their variable contract owners that hold Service
43 OPPENHEIMER GLOBAL STRATEGIC INCOME FUND/VA
|
|
| CONSOLIDATED NOTES TO FINANCIAL STATEMENTS Unaudited / Continued |
5. Fees and Other Transactions with Affiliates (Continued)
shares. These fees are paid out of the Fund’s assets on an on-going basis and increase operating expenses of the Service shares, which results in lower performance compared to the Fund’s shares that are not subject to a service fee. Fees incurred by the Fund under the Plan are detailed in the Consolidated Statement of Operations.
Waivers and Reimbursements of Expenses. The Manager has voluntarily agreed to limit the Fund’s expenses after payments, waivers and/or reimbursements and reduction to custodian expenses, excluding expenses incurred directly or indirectly by the Fund as a result of investments in other investment companies, wholly-owned subsidiaries and pooled investment vehicles; so that those expenses, as percentages of daily net assets, will not exceed the annual rate of 0.75% for Non-Service shares and 1.00% for Service shares. During the six months ended June 30, 2014, the Manager waived fees and/or reimbursed the Fund $12,241 and $28,028 for Non-Service and Service shares, respectively.
The Manager has contractually agreed to waive the management fee it receives from the Fund in an amount equal to the management fee it receives from the Subsidiary. This undertaking will continue in effect for so long as the Fund invests in the Subsidiary and may not be terminated unless approved by the Fund’s Board of Trustees. During the six months ended June 30, 2014, the Manager waived $5,098.
The Manager will waive fees and/or reimburse Fund expenses in an amount equal to the indirect management fees incurred through the Fund’s investment in IMMF, Oppenheimer Ultra-Short Duration Fund and the Master Funds. During the six months ended June 30, 2014, the Manager waived fees and/or reimbursed the Fund $382,791 for management fees.
Some of these undertakings may be modified or terminated at any time; some may not be modified or terminated until after one year from the date of the current prospectus, as indicated therein.
6. Risk Exposures and the Use of Derivative Instruments
The Fund’s investment objective not only permits the Fund to purchase investment securities, it also allows the Fund to enter into various types of derivatives contracts, including, but not limited to, futures contracts, forward currency exchange contracts, credit default swaps, interest rate swaps, total return swaps, variance swaps and purchased and written options. In doing so, the Fund will employ strategies in differing combinations to permit it to increase, decrease, or change the level or types of exposure to market risk factors. These instruments may allow the Fund to pursue its objectives more quickly and efficiently than if it were to make direct purchases or sales of securities capable of effecting a similar response to market factors. Such contracts may be entered into through a bilateral over-the-counter (“OTC”) transaction, or through a securities or futures exchange and cleared through a clearinghouse.
Market Risk Factors. In accordance with its investment objectives, the Fund may use derivatives to increase or decrease its exposure to one or more of the following market risk factors:
Commodity Risk. Commodity risk relates to the change in value of commodities or commodity indexes as they relate to increases or decreases in the commodities market. Commodities are physical assets that have tangible properties. Examples of these types of assets are crude oil, heating oil, metals, livestock, and agricultural products.
Credit Risk. Credit risk relates to the ability of the issuer to meet interest and principal payments, or both, as they come due. In general, lower-grade, higher-yield bonds are subject to credit risk to a greater extent than lower-yield, higher-quality bonds.
Equity Risk. Equity risk relates to the change in value of equity securities as they relate to increases or decreases in the general market.
Foreign Exchange Rate Risk. Foreign exchange rate risk relates to the change in the U.S. dollar value of a security held that is denominated in a foreign currency. The U.S. dollar value of a foreign currency denominated security will decrease as the dollar appreciates against the currency, while the U.S. dollar value will increase as the dollar depreciates against the currency.
Interest Rate Risk. Interest rate risk refers to the fluctuations in value of fixed-income securities resulting from the inverse relationship between price and yield. For example, an increase in general interest rates will tend to reduce the market value of already issued fixed-income investments, and a decline in general interest rates will tend to increase their value. In addition, debt securities with longer maturities, which tend to have higher yields, are subject to potentially greater fluctuations in value from changes in interest rates than obligations with shorter maturities.
Volatility Risk. Volatility risk refers to the magnitude of the movement, but not the direction of the movement, in a financial instrument’s price over a defined time period. Large increases or decreases in a financial instrument’s price over a relative time period typically indicate greater volatility risk, while small increases or decreases in its price typically indicate lower volatility risk.
Derivatives may have little or no initial cash investment relative to their market value exposure and therefore can produce significant gains or losses in excess of their cost due to unanticipated changes in the market risk factors and the overall market. This use of embedded leverage allows the Fund to increase its market value exposure relative to its net assets and can substantially increase the volatility of the Fund’s performance. In instances where the Fund is using derivatives to decrease, or hedge, exposures to market risk factors for securities held by the Fund, there are also risks that those derivatives may not perform as expected resulting in losses for the combined or hedged positions. Some derivatives have the potential for unlimited loss, regardless of the size of the Fund’s initial investment.
Additional associated risks from investing in derivatives also exist and potentially could have significant effects on the valuation of the derivative and the Fund. Typically, the associated risks are not the risks that the Fund is attempting to increase or decrease exposure to, per its investment objectives, but are the additional risks from investing in derivatives. Examples of these associated risks are liquidity risk, which is the risk that the Fund will not be able to sell the derivative in the open market in a timely manner, and counterparty credit risk, which is the risk that the counterparty will not fulfill its obligation to the Fund.
44 OPPENHEIMER GLOBAL STRATEGIC INCOME FUND/VA
6. Risk Exposures and the Use of Derivative Instruments (Continued)
The Fund’s actual exposures to these market risk factors and associated risks during the period are discussed in further detail, by derivative type, below.
Forward Currency Exchange Contracts
The Fund may enter into forward currency exchange contracts (“forward contracts”) for the purchase or sale of a foreign currency at a negotiated rate at a future date. Such contracts are traded in the OTC inter-bank currency dealer market.
Forward contracts are reported on a schedule following the Consolidated Statement of Investments. The unrealized appreciation (depreciation) is reported in the Consolidated Statement of Assets and Liabilities as a receivable (or payable) and in the Consolidated Statement of Operations within the change in unrealized appreciation (depreciation). At contract close, the difference between the original cost of the contract and the value at the close date is recorded as a realized gain (loss) in the Consolidated Statement of Operations.
The Fund has entered into forward contracts with the obligation to purchase specified foreign currencies in the future at a currently negotiated forward rate in order to take a positive investment perspective on the related currency. These forward contracts seek to increase exposure to foreign exchange rate risk.
The Fund has entered into forward contracts with the obligation to purchase specified foreign currencies in the future at a currently negotiated forward rate in order to decrease exposure to foreign exchange rate risk associated with foreign currency denominated securities held by the Fund.
The Fund has entered into forward contracts with the obligation to sell specified foreign currencies in the future at a currently negotiated forward rate in order to take a negative investment perspective on the related currency. These forward contracts seek to increase exposure to foreign exchange rate risk.
The Fund has entered into forward contracts with the obligation to sell specified foreign currencies in the future at a currently negotiated forward rate in order to decrease exposure to foreign exchange rate risk associated with foreign currency denominated securities held by the Fund.
During the six months ended June 30, 2014, the Fund had daily average contract amounts on forward contracts to buy and sell of $428,008,266 and $788,165,396, respectively.
Additional associated risk to the Fund includes counterparty credit risk. Counterparty credit risk arises from the possibility that the counterparty to a forward contract will default and fail to perform its obligations to the Fund.
Futures Contracts
A futures contract is a commitment to buy or sell a specific amount of a commodity, financial instrument or currency at a negotiated price on a stipulated future date. The Fund may buy and sell futures contracts and may also buy or write put or call options on these futures contracts. Futures contracts and options thereon are generally entered into on a regulated futures exchange and cleared through a clearinghouse associated with the exchange.
Upon entering into a futures contract, the Fund is required to deposit either cash or securities (initial margin) in an amount equal to a certain percentage of the contract value in an account registered in the futures commission merchant’s name. Subsequent payments (variation margin) are paid to or from the futures commission merchant each day equal to the daily changes in the contract value. Such payments are recorded as unrealized gains and losses. Should the Fund fail to make requested variation margin payments, the futures commission merchant can gain access to the initial margin to satisfy the Fund’s payment obligations.
Futures contracts are reported on a schedule following the Consolidated Statement of Investments. Securities held by a futures commission merchant to cover initial margin requirements on open futures contracts are noted in the Consolidated Statement of Investments. Cash held by a futures commission merchant to cover initial margin requirements on open futures contracts and the receivable and/or payable for the daily mark to market for the variation margin are noted in the Consolidated Statement of Assets and Liabilities. The net change in unrealized appreciation and depreciation is reported in the Consolidated Statement of Operations. Realized gains (losses) are reported in the Consolidated Statement of Operations at the closing or expiration of futures contracts.
The Fund has purchased futures contracts on various bonds and notes to increase exposure to interest rate risk.
The Fund has sold futures contracts on various bonds and notes to decrease exposure to interest rate risk.
During the six months ended June 30, 2014, the Fund had an ending monthly average market value of $166,034,660 and $44,973,279 on futures contracts purchased and sold, respectively.
Additional associated risks of entering into futures contracts (and related options) include the possibility that there may be an illiquid market where the Fund is unable to liquidate the contract or enter into an offsetting position and, if used for hedging purposes, the risk that the price of the contract will correlate imperfectly with the prices of the Fund’s securities.
Option Activity
The Fund may buy and sell put and call options, or write put and call options. When an option is written, the Fund receives a premium and becomes obligated to sell or purchase the underlying security, currency or other underlying financial instrument at a fixed price, upon exercise of the option.
Options can be traded through an exchange or through a privately negotiated arrangement with a dealer in an OTC transaction. Options traded through an exchange are generally cleared through a clearinghouse (such as The Options Clearing Corporation). The difference between the premium received or paid, and market value of the option, is recorded as unrealized appreciation or depreciation. The net change in unrealized appreciation or depreciation is reported in the Consolidated Statement of Operations. When an option is exercised, the cost of the security purchased or the proceeds of the security sale are adjusted by the amount of premium received or paid. Upon the expiration or closing of the option transaction, a gain or loss is reported in the Consolidated Statement of Operations.
The Fund has purchased call options on currencies to increase exposure to foreign exchange rate risk. A purchased call option becomes more valuable as the price of the underlying financial instrument appreciates relative to the strike price.
45 OPPENHEIMER GLOBAL STRATEGIC INCOME FUND/VA
|
|
| CONSOLIDATED NOTES TO FINANCIAL STATEMENTS Unaudited / Continued |
6. Risk Exposures and the Use of Derivative Instruments (Continued)
The Fund has purchased put options on currencies to decrease exposure to foreign exchange rate risk. A purchased put option becomes more valuable as the price of the underlying financial instrument depreciates relative to the strike price.
The Fund has purchased call options on treasury and/or euro futures to increase exposure to interest rate risk. A purchased call option becomes more valuable as the price of the underlying financial instrument appreciates relative to the strike price.
The Fund has purchased call options on volatility indexes to increase exposure to volatility risk. A purchased call option becomes more valuable as the level of the underlying volatility index increases relative to the strike price.
During the six months ended June 30, 2014, the Fund had an ending monthly average market value of $1,194,300 and $419,679 on purchased call options and purchased put options, respectively.
Options written, if any, are reported in a schedule following the Consolidated Statement of Investments and as a liability in the Consolidated Statement of Assets and Liabilities. Securities held in collateral accounts to cover potential obligations with respect to outstanding written options are noted in the Consolidated Statement of Investments.
The risk in writing a call option is that the market price of the security increases and if the option is exercised, the Fund must either purchase the security at a higher price for delivery or, if the Fund owns the underlying security, give up the opportunity for profit. The risk in writing a put option is that the Fund may incur a loss if the market price of the security decreases and the option is exercised. The risk in buying an option is that the Fund pays a premium whether or not the option is exercised. The Fund also has the additional risk that there may be an illiquid market where the Fund is unable to close the contract.
The Fund has written put options on currencies to increase exposure to foreign exchange rate risk. A written put option becomes more valuable as the price of the underlying financial instrument appreciates relative to the strike price.
The Fund has written call options on currencies to decrease exposure to foreign exchange rate risk. A written call option becomes more valuable as the price of the underlying financial instrument depreciates relative to the strike price.
The Fund has written put options on treasury and/or euro futures to increase exposure to interest rate risk. A written put option becomes more valuable as the price of the underlying financial instrument appreciates relative to the strike price.
The Fund has written call options on volatility indexes to decrease exposure to volatility risk. A written call option becomes more valuable as the level of the underlying volatility index decreases relative to the strike price.
During the six months ended June 30, 2014, the Fund had an ending monthly average market value of $109,453 and $218,112 on written call options and written put options, respectively.
Additional associated risks to the Fund include counterparty credit risk and liquidity risk.
Written option activity for the six months ended June 30, 2014 was as follows:
| | | | | | | | | | | | | | | | | | |
| | | Call Options | | | | | Put Options | |
| | | Number of Contracts | | | Amount of Premiums | | | | | Number of Contracts | | | Amount of Premiums | |
| |
Options outstanding as of December 31, 2013 | | | 821,440,000 | | | $ | 353,460 | | | | | | 1,466,295,000 | | | $ | 550,387 | |
Options written | | | 152,274,860 | | | | 984,830 | | | | | | 55,511,440,000 | | | | 1,059,939 | |
Options closed or expired | | | (462,409,860) | | | | (788,407) | | | | | | (184,830,000) | | | | (166,601) | |
Options exercised | | | (37,180,000) | | | | (139,426) | | | | | | (16,533,445,000) | | | | (1,116,204) | |
| | | | |
Options outstanding as of June 30, 2014 | | | 474,125,000 | | | $ | 410,457 | | | | | | 40,259,460,000 | | | $ | 327,521 | |
| | | | |
| | | | |
Swap Contracts
The Fund may enter into swap contract agreements with a counterparty to exchange a series of cash flows based on either specified reference rates, the price or volatility of asset or non-asset references, or the occurrence of a credit event, over a specified period. Swaps can be executed in a bi-lateral privately negotiated arrangement with a dealer in an OTC transaction (“OTC swaps”) or executed on a regulated market. Certain swaps, regardless of the venue of their execution, are required to be cleared through a clearinghouse (“centrally cleared swaps”). Swap contracts may include interest rate, equity, debt, index, total return, credit default, currency, and volatility swaps.
Swap contracts are reported on a schedule following the Consolidated Statement of Investments. The values of centrally cleared swap and OTC swap contracts are aggregated by positive and negative values and disclosed separately on the Consolidated Statement of Assets and Liabilities. The unrealized appreciation (depreciation) related to the change in the valuation of the notional amount of the swap is combined with the accrued interest due to (owed by) the Fund, if any, at termination or settlement. The net change in this amount during the period is included on the Consolidated Statement of Operations. The Fund also records any periodic payments received from (paid to) the counterparty, including at termination, under such contracts as realized gain (loss) on the Consolidated Statement of Operations.
Swap contract agreements are exposed to the market risk factor of the specific underlying reference rate or asset. Swap contracts are typically more attractively priced compared to similar investments in related cash securities because they isolate the risk to one market risk factor and eliminate the other market risk factors. Investments in cash securities (for instance bonds) have exposure to multiple risk factors (credit and interest rate risk). Because swaps have embedded leverage, they can expose the Fund to substantial risk in the isolated market risk factor.
Credit Default Swap Contracts. A credit default swap is a contract that enables an investor to buy or sell protection against a defined-issuer credit event, such as the issuer’s failure to make timely payments of interest or principal on a debt security, bankruptcy or restructuring. The Fund may enter into credit default swaps either by buying or selling protection on a corporate issuer, sovereign issuer, or a basket or index of issuers (the “reference asset”).
46 OPPENHEIMER GLOBAL STRATEGIC INCOME FUND/VA
6. Risk Exposures and the Use of Derivative Instruments (Continued)
The buyer of protection pays a periodic fee to the seller of protection based on the notional amount of the swap contract. The seller of protection agrees to compensate the buyer of protection for future potential losses as a result of a credit event on the reference asset. The contract effectively transfers the credit event risk of the reference asset from the buyer of protection to the seller of protection.
The ongoing value of the contract will fluctuate throughout the term of the contract based primarily on the credit risk of the reference asset. If the credit quality of the reference asset improves relative to the credit quality at contract initiation, the buyer of protection may have an unrealized loss greater than the anticipated periodic fee owed. This unrealized loss would be the result of current credit protection being cheaper than the cost of credit protection at contract initiation. If the buyer elects to terminate the contract prior to its maturity, and there has been no credit event, this unrealized loss will become realized. If the contract is held to maturity, and there has been no credit event, the realized loss will be equal to the periodic fee paid over the life of the contract.
If there is a credit event, the buyer of protection can exercise its rights under the contract and receive a payment from the seller of protection equal to the notional amount of the swap less the market value of specified debt securities issued by the reference asset. Upon exercise of the contract the difference between such value and the notional amount is recorded as realized gain (loss) and is included on the Consolidated Statement of Operations.
The Fund has sold credit protection through credit default swaps to increase exposure to the credit risk of individual issuers and/or indexes of issuers that are either unavailable or considered to be less attractive in the bond market.
The Fund has purchased credit protection through credit default swaps to decrease exposure to the credit risk of individual issuers and/or indexes of issuers.
The Fund has engaged in spread curve trades by simultaneously purchasing and selling protection through credit default swaps referenced to the same reference asset but with different maturities. Spread curve trades attempt to gain exposure to credit risk on a forward basis by realizing gains on the expected differences in spreads.
For the six months ended June 30, 2014, the Fund had ending monthly average notional amounts of $6,422,781 and $1,623,011 on credit default swaps to buy protection and credit default swaps to sell protection, respectively.
Additional associated risks to the Fund include counterparty credit risk and liquidity risk.
Interest Rate Swap Contracts. An interest rate swap is an agreement between counterparties to exchange periodic payments based on interest rates. One cash flow stream will typically be a floating rate payment based upon a specified floating interest rate while the other is typically a fixed interest rate.
The Fund has entered into interest rate swaps in which it pays a floating interest rate and receives a fixed interest rate in order to increase exposure to interest rate risk. Typically, if relative interest rates rise, payments made by the Fund under a swap agreement will be greater than the payments received by the Fund.
The Fund has entered into interest rate swaps in which it pays a fixed interest rate and receives a floating interest rate in order to decrease exposure to interest rate risk. Typically, if relative interest rates rise, payments received by the Fund under the swap agreement will be greater than the payments made by the Fund.
For the six months ended June 30, 2014, the Fund had ending monthly average notional amounts of $60,059,549 and $185,282,297 on interest rate swaps which pay a fixed rate and interest rate swaps which receive a fixed rate, respectively.
Additional associated risks to the Fund include counterparty credit risk and liquidity risk.
Currency Swap Contracts. A currency swap contract is an agreement between counterparties to exchange different currencies at contract inception that are equivalent to a notional value. The exchange at contract inception is made at the current spot rate. The contract also includes an agreement to reverse the exchange of the same notional values of those currencies at contract termination. The re-exchange at contract termination may take place at the same exchange rate, a specified rate or the then current spot rate. Certain currency swap contracts provide for exchanging the currencies only at contract termination and can provide for only a net payment in the settlement currency, typically USD. A currency swap contract may also include the exchange of periodic payments, between the counterparties, that are based on interest rates available in the respective currencies at contract inception. Other currency swap contracts may not provide for exchanging the different currencies at all, and only for exchanging interest cash flows based on the notional value in the contract.
The Fund has entered into currency swap contracts with the obligation to pay an interest rate on the dollar notional amount and receive an interest rate on the various foreign currency notional amounts in order to take a positive investment perspective on the related currencies for which the Fund receives a payment. These currency swap contracts increase exposure to foreign exchange rate risk.
For the six months ended June 30, 2014, the Fund had ending monthly average notional amounts of $ 5,934,558 on currency swaps which receive a fixed rate.
Additional associated risks to the Fund include counterparty credit risk and liquidity risk.
Swaption Transactions
The Fund may enter into a swaption contract which grants the purchaser the right, but not the obligation, to enter into a swap transaction at preset terms detailed in the underlying agreement within a specified period of time. The purchaser pays a premium to the swaption writer who bears the risk of unfavorable changes in the preset terms on the underlying swap.
Purchased swaptions are reported as a component of investments in the Consolidated Statement of Investments and the Consolidated Statement of Assets and Liabilities. Written swaptions are reported on a schedule following the Consolidated Statement of Investments and their value is reported as a separate asset or liability line item in the Consolidated Statement of Assets and Liabilities. The net change in unrealized appreciation or depreciation on written swaptions is separately reported in the Consolidated Statement of Operations. When a swaption is exercised, the cost of the swap is adjusted by the amount of premium paid or received. Upon the expiration or closing of an unexercised swaption contract, a gain or loss is reported in the Consolidated Statement of Operations for the amount of the premium paid or received.
47 OPPENHEIMER GLOBAL STRATEGIC INCOME FUND/VA
|
|
| CONSOLIDATED NOTES TO FINANCIAL STATEMENTS Unaudited / Continued |
6. Risk Exposures and the Use of Derivative Instruments (Continued)
The Fund generally will incur a greater risk when it writes a swaption than when it purchases a swaption. When the Fund writes a swaption it will become obligated, upon exercise of the swaption, according to the terms of the underlying agreement. Swaption contracts written by the Fund do not give rise to counterparty credit risk prior to exercise as they obligate the Fund, not its counterparty, to perform. When the Fund purchases a swaption it only risks losing the amount of the premium it paid if the swaption expires unexercised. However, when the Fund exercises a purchased swaption there is a risk that the counterparty will fail to perform or otherwise default on its obligations under the swaption contract.
The Fund has purchased swaptions which gives it the option to enter into an interest rate swap in which it pays a floating interest rate and receives a fixed interest rate in order to increase exposure to interest rate risk. A purchased swaption of this type becomes more valuable as the reference interest rate decreases relative to the preset interest rate.
The Fund has purchased swaptions which gives it the option to enter into an interest rate swap in which it pays a fixed interest rate and receives a floating interest rate in order to decrease exposure to interest rate risk. A purchased swaption of this type becomes more valuable as the reference interest rate increases relative to the preset interest rate.
The Fund has purchased swaptions which gives it the option to buy credit protection through credit default swaps in order to decrease exposure to the credit risk of individual issuers and/or indexes of issuers. A purchased swaption of this type becomes more valuable as the likelihood of a credit event on the reference asset increases.
The Fund has written swaptions which gives it the obligation, if exercised by the purchaser, to enter into an interest rate swap in which it pays a floating interest rate and receives a fixed interest rate in order to increase exposure to interest rate risk. A written swaption of this type becomes more valuable as the reference interest rate decreases relative to the preset interest rate.
The Fund has written swaptions which gives it the obligation, if exercised by the purchaser, to enter into an interest rate swap in which it pays a fixed interest rate and receives a floating interest rate in order to decrease exposure to interest rate risk. A written swaption of this type becomes more valuable as the reference interest rate increases relative to the preset interest rate.
The Fund has written swaptions which give it the obligation, if exercised by the purchaser, to sell credit protection through credit default swaps in order to increase exposure to the credit risk of individual issuers and/or indexes of issuers. A written swaption of this type becomes more valuable as the likelihood of a credit event on the reference asset decreases.
The Fund has written swaptions which give it the obligation, if exercised by the purchaser, to buy credit protection through credit default swaps in order to decrease exposure to the credit risk of individual issuers and/or, indexes of issuers. A written swaption of this type becomes more valuable as the likelihood of a credit event on the reference asset increases.
During the six months ended June 30, 2014, the Fund had an ending monthly average market value of $1,835,478 and $2,726,252 on purchased and written swaptions, respectively.
Written swaption activity for the six months ended June 30, 2014 was as follows:
| | | | | | |
| | | Call Swaptions | |
| | | Notional Amount | | Amount of Premiums | |
| |
| Swaptions outstanding as of December 31, 2013 | | 472,545,000 | | $ | 4,075,481 | |
| Swaptions written | | 1,776,943,000 | | | 7,470,683 | |
| Swaptions closed or expired | | (369,325,000) | | | (907,395) | |
| Swaptions exercised | | (1,678,570,000) | | | (9,322,713) | |
| | | |
| Swaptions outstanding as of June 30, 2014 | | 201,593,000 | | $ | 1,316,056 | |
| | | |
| | | |
Counterparty Credit Risk. Derivative positions are subject to the risk that the counterparty will not fulfill its obligation to the Fund. The Fund intends to enter into derivative transactions with counterparties that the Manager believes to be creditworthy at the time of the transaction.
The Fund’s risk of loss from counterparty credit risk on OTC derivatives is generally limited to the aggregate unrealized gain netted against any collateral held by the Fund. For OTC options purchased, the Fund bears the risk of loss of the amount of the premiums paid plus the positive change in market values net of any collateral held by the Fund should the counterparty fail to perform under the contracts. Options written by the Fund do not typically give rise to counterparty credit risk, as options written generally obligate the Fund and not the counterparty to perform.
To reduce counterparty risk with respect to OTC transactions, the Fund has entered into master netting arrangements, established within the Fund’s International Swap and Derivatives Association, Inc. (“ISDA”) master agreements, which allow the Fund to make (or to have an entitlement to receive) a single net payment in the event of default (close-out netting) for outstanding payables and receivables with respect to certain OTC positions in swaps, options, swaptions, and forward currency exchange contracts for each individual counterparty. In addition, the Fund may require that certain counterparties post cash and/or securities in collateral accounts to cover their net payment obligations for those derivative contracts subject to ISDA master agreements. If the counterparty fails to perform under these contracts and agreements, the cash and/or securities will be made available to the Fund.
As of June 30, 2014, the Fund has required certain counterparties to post collateral of $4,053,132.
48 OPPENHEIMER GLOBAL STRATEGIC INCOME FUND/VA
6. Risk Exposures and the Use of Derivative Instruments (Continued)
ISDA master agreements include credit related contingent features which allow counterparties to OTC derivatives to terminate derivative contracts prior to maturity in the event that, for example, the Fund’s net assets decline by a stated percentage or the Fund fails to meet the terms of its ISDA master agreements, which would cause the Fund to accelerate payment of any net liability owed to the counterparty.
For financial reporting purposes, the Fund does not offset derivative assets and derivative liabilities that are subject to netting arrangements in the Consolidated Statement of Assets and Liabilities. Bankruptcy or insolvency laws of a particular jurisdiction may impose restrictions on or prohibitions against the right of offset in bankruptcy, insolvency or other events.
The Fund’s risk of loss from counterparty credit risk on exchange-traded derivatives cleared through a clearinghouse and for centrally cleared swaps is generally considered lower than as compared to OTC derivatives. However, counterparty credit risk exists with respect to initial and variation margin deposited/paid by the Fund that is held in futures commission merchant, broker and/or clearinghouse accounts for such exchange-traded derivatives and for centrally cleared swaps.
With respect to centrally cleared swaps, such transactions will be submitted for clearing, and if cleared, will be held in accounts at futures commission merchants or brokers that are members of clearinghouses. While brokers, futures commission merchants and clearinghouses are required to segregate customer margin from their own assets, in the event that a broker, futures commission merchant or clearinghouse becomes insolvent or goes into bankruptcy and at that time there is a shortfall in the aggregate amount of margin held by the broker, futures commission merchant or clearinghouse for all its customers, U.S. bankruptcy laws will typically allocate that shortfall on a pro-rata basis across all the broker’s, futures commission merchant’s or clearinghouse’s customers, potentially resulting in losses to the Fund.
There is the risk that a broker, futures commission merchant or clearinghouse will decline to clear a transaction on the Fund’s behalf, and the Fund may be required to pay a termination fee to the executing broker with whom the Fund initially enters into the transaction. Clearinghouses may also be permitted to terminate centrally cleared swaps at any time. The Fund is also subject to the risk that the broker or futures commission merchant will improperly use the Fund’s assets deposited/paid as initial or variation margin to satisfy payment obligations of another customer. In the event of a default by another customer of the broker or futures commission merchant, the Fund might not receive its variation margin payments from the clearinghouse, due to the manner in which variation margin payments are aggregated for all customers of the broker/futures commission merchant.
Collateral and margin requirements differ by type of derivative. Margin requirements are established by the broker, futures commission merchant or clearinghouse for exchange-traded and cleared derivatives, including centrally cleared swaps. Brokers, futures commission merchants and clearinghouses can ask for margin in excess of the regulatory minimum, or increase the margin amount, in certain circumstances.
Collateral terms are contract specific for OTC derivatives. For derivatives traded under an ISDA master agreement, the collateral requirements are typically calculated by netting the mark to market amount for each transaction under such agreement and comparing that amount to the value of any collateral currently pledged by the Fund or the counterparty.
For financial reporting purposes, cash collateral that has been pledged to cover obligations of the Fund, if any, is reported separately on the Consolidated Statement of Assets and Liabilities as cash pledged as collateral. Non-cash collateral pledged by the Fund, if any, is noted in the Consolidated Statement of Investments. Generally, the amount of collateral due from or to a party must exceed a minimum transfer amount threshold (e.g. $250,000) before a transfer has to be made. To the extent amounts due to the Fund from its counterparties are not fully collateralized, contractually or otherwise, the Fund bears the risk of loss from counterparty nonperformance.
The following table presents by counterparty the Fund’s OTC derivative assets net of the related collateral posted for the benefit of the Fund at June 30, 2014:
| | | | | | | | | | | | | | | | | | | | |
| | | | | | Gross Amounts Not Offset in the Consolidated
Statement of Assets & Liabilities | | | | |
| Counterparty | | Gross Amount of Assets in the Consolidated Statement of Assets & Liabilities* | | | Financial Instruments Available for Offset | | | Financial Instruments Collateral Received** | | | Cash Collateral Received** | | | Net Amount | |
| |
Bank of America NA | | $ | 1,004,661 | | | $ | (1,004,661) | | | $ | — | | | $ | — | | | $ | — | |
Barclays Bank plc | | | 1,507,230 | | | | (1,507,230) | | | | — | | | | — | | | | — | |
BNP Paribas | | | 36,823 | | | | (36,823) | | | | — | | | | — | | | | — | |
Citibank NA | | | 1,115,517 | | | | (125,335) | | | | (990,182) | | | | — | | | | — | |
Credit Suisse International | | | 365,765 | | | | — | | | | (365,765) | | | | — | | | | — | |
Deutsche Bank AG | | | 124,967 | | | | (65,419) | | | | — | | | | (59,548) | | | | — | |
Goldman Sachs Bank USA | | | 1,650,418 | | | | (1,650,418) | | | | — | | | | — | | | | — | |
Goldman Sachs Group, Inc. (The) | | | 1,433,759 | | | | (105,141) | | | | — | | | | — | | | | 1,328,618 | |
HSBC Bank USA NA | | | 181,943 | | | | — | | | | (53,161) | | | | — | | | | 128,782 | |
JPMorgan Chase Bank NA | | | 1,976,507 | | | | (1,976,507) | | | | — | | | | — | | | | — | |
Morgan Stanley Capital Services, Inc. | | | 272,823 | | | | (272,823) | | | | — | | | | — | | | | — | |
Nomura Global Financial Products, Inc. | | | 24,319 | | | | — | | | | — | | | | — | | | | 24,319 | |
Royal Bank of Scotland plc (The) | | | 406,501 | | | | (175,951) | | | | — | | | | — | | | | 230,550 | |
Toronto Dominion Bank | | | 649,371 | | | | (120,374) | | | | (528,997) | | | | — | | | | — | |
UBS AG | | | 52,478 | | | | — | | | | — | | | | — | | | | 52,478 | |
| | | | |
| | $ | 10,803,082 | | | $ | (7,040,682) | | | $ | (1,938,105) | | | $ | (59,548) | | | $ | 1,764,747 | |
| | | | |
| | | | |
* OTC derivatives are reported gross on the Consolidated Statement of Assets and Liabilities. Exchange traded options and margin related to cleared swaps and futures are excluded from these reported amounts.
** Reported collateral posted for the benefit of the Fund within this table is limited to the net outstanding amount due from an individual counterparty. The collateral posted for the benefit of the Fund may exceed these amounts.
49 OPPENHEIMER GLOBAL STRATEGIC INCOME FUND/VA
|
|
| CONSOLIDATED NOTES TO FINANCIAL STATEMENTS Unaudited / Continued |
6. Risk Exposures and the Use of Derivative Instruments (Continued)
The following table presents by counterparty the Fund’s OTC derivative liabilities net of the related collateral pledged by the Fund at June 30, 2014:
| | | | | | | | | | | | | | | | | | | | |
| | | | | | Gross Amounts Not Offset in the Consolidated
Statement of Assets & Liabilities | | | | |
| Counterparty | | Gross Amount of Liabilities in the Consolidated Statement of Assets & Liabilities* | | | Financial Instruments Available for Offset | | | Financial Instruments Collateral Pledged** | | | Cash Collateral Pledged** | | | Net Amount | |
| |
Bank of America NA | | $ | (3,197,260) | | | $ | 1,004,661 | | | $ | 2,192,599 | | | $ | — | | | $ | — | |
Barclays Bank plc | | | (2,229,135) | | | | 1,507,230 | | | | 721,905 | | | | — | | | | — | |
BNP Paribas | | | (239,918) | | | | 36,823 | | | | 130,826 | | | | — | | | | (72,269) | |
Citibank NA | | | (125,335) | | | | 125,335 | | | | — | | | | — | | | | — | |
Deutsche Bank AG | | | (65,419) | | | | 65,419 | | | | — | | | | — | | | | — | |
Goldman Sachs Bank USA | | | (4,463,786) | | | | 1,650,418 | | | | 2,813,368 | | | | — | | | | — | |
Goldman Sachs Group, Inc. (The) | | | (105,141) | | | | 105,141 | | | | — | | | | — | | | | — | |
JPMorgan Chase Bank NA | | | (3,329,554) | | | | 1,976,507 | | | | — | | | | — | | | | (1,353,047) | |
Morgan Stanley Capital Services, Inc. | | | (1,988,662) | | | | 272,823 | | | | 1,043,612 | | | | — | | | | (672,227) | |
Royal Bank of Scotland plc (The) | | | (175,951) | | | | 175,951 | | | | — | | | | — | | | | — | |
Toronto Dominion Bank | | | (120,374) | | | | 120,374 | | | | — | | | | — | | | | — | |
| | | | |
| | $ | (16,040,535) | | | $ | 7,040,682 | | | $ | 6,902,310 | | | $ | — | | | $ | (2,097,543) | |
| | | | |
| | | | |
* OTC derivatives are reported gross on the Consolidated Statement of Assets and Liabilities. Exchange traded options and margin related to cleared swaps and futures are excluded from these reported amounts.
** Reported collateral pledged within this table is limited to the net outstanding amount due from the Fund. The securities pledged as collateral by the Fund as reported on the Consolidated Statements of investments may exceed these amounts.
The following table presents the valuations of derivative instruments by risk exposure as reported within the Consolidated Statement of Assets and Liabilities as of June 30, 2014:
| | | | | | | | | | | | | | |
| | | | | Asset Derivatives | | | Liability Derivatives | |
Derivatives Not Accounted for as Hedging Instruments | | | | Consolidated Statement of Assets and Liabilities Location | | Value | | | Consolidated Statement of Assets and Liabilities Location | | Value | |
| |
Credit contracts | | | | Swaps, at value | | $ | 418,243 | | | Swaps, at value | | $ | 53,315 | |
Foreign exchange contracts | | | | Swaps, at value | | | 588,972 | | | | | | | |
Interest rate contracts | | | | Swaps, at value | | | 1,792,037 | | | | | | | |
Interest rate contracts | | | | | | | | | | Centrally cleared swaps, at value | | | 42,380 | |
Interest rate contracts | | | | Variation margin receivable | | | 194,871* | | | Variation margin payable | | | 841 * | |
Foreign exchange contracts | | | | Unrealized appreciation on foreign currency exchange contracts | | | 7,278,524 | | | Unrealized depreciation on foreign currency exchange contracts | | | 14,102,102 | |
Foreign exchange contracts | | | | | | | | | | Options written, at value | | | 149,495 | |
Interest rate contracts | | | | | | | | | | Options written, at value | | | 28,280 | |
Credit contracts | | | | | | | | | | Swaptions written, at value | | | 1,025,788 | |
Interest rate contracts | | | | | | | | | | Swaptions written, at value | | | 681,555 | |
Credit contracts | | | | Investments, at value | | | 27,309** | | | | | | | |
Foreign exchange contracts | | | | Investments, at value | | | 344,570** | | | | | | | |
Interest rate contracts | | | | Investments, at value | | | 353,427** | | | | | | | |
| | | | | | | | | | | | | | |
Total | | | | | | $ | 10,997,953 | | | | | $ | 16,083,756 | |
| | | | | | | | | | | | | | |
* Includes only the current day’s variation margin. Prior variation margin movements have been reflected in cash on the Consolidated Statement of Assets and Liabilities upon receipt or payment.
**Amounts relate to purchased option contracts and purchased swaption contracts, if any.
The effect of derivative instruments on the Consolidated Statement of Operations is as follows:
| | | | | | | | | | | | | | | | | | | | | | | | | | | | |
Amount of Realized Gain or (Loss) Recognized on Derivatives | |
Derivatives Not Accounted for as Hedging Instruments | | Investment from unaffiliated companies (including premiums on options and swaptions exercised* | | | Closing and expiration of swaption contracts written | | | Closing and expiration of option contracts written | | | Closing and expiration of futures contracts | | | Foreign currency transactions | | | Swap contracts | | | Total | |
| |
| Credit contracts | | $ | (337,383) | | | $ | 88,926 | | | $ | — | | | $ | — | | | $ | — | | | $ | (586,760) | | | $ | (835,217) | |
| Foreign exchange contracts | | | 130,651 | | | | — | | | | 416,208 | | | | — | | | | (4,209,920) | | | | — | | | | (3,663,061) | |
| Interest rate contracts | | | (3,476,560) | | | | 818,469 | | | | — | | | | 6,308,973 | | | | — | | | | (2,451,159) | | | | 1,199,723 | |
| Volatility contracts | | | (1,785,217) | | | | — | | | | 538,800 | | | | — | | | | — | | | | — | | | | (1,246,417) | |
| | | | |
| Total | | $ | (5,468,509) | | | $ | 907,395 | | | $ | 955,008 | | | $ | 6,308,973 | | | $ | (4,209,920) | | | $ | (3,037,919) | | | $ | (4,544,972) | |
| | | | |
| | | | |
*Includes purchased option contracts, purchased swaption contracts, written option contracts exercised and written swaption contracts exercised, if any.
50 OPPENHEIMER GLOBAL STRATEGIC INCOME FUND/VA
6. Risk Exposures and the Use of Derivative Instruments (Continued)
| | | | | | | | | | | | | | | | | | | | | | | | | | | | |
Amount of Change in Unrealized Gain or (Loss) Recognized on Derivatives | | | | |
Derivatives Not Accounted for as Hedging Instruments | | Investments* | | | Swaption contracts written | | | Option contracts written | | | Futures contracts | | | Translation of assets and liabilities denominated in foreign currency transactions | | | Swap contracts | | | Total | |
| |
| Credit contracts | | $ | 55,372 | | | $ | (61,851) | | | $ | — | | | $ | — | | | $ | — | | | $ | 118,273 | | | $ | 111,794 | |
| Foreign exchange contracts | | | 734,043 | | | | — | | | | (119,817) | | | | — | | | | (3,615,945) | | | | 588,972 | | | | (2,412,747) | |
| Interest rate contracts | | | (1,787,818) | | | | 1,319,720 | | | | 171,802 | | | | 3,141,197 | | | | — | | | | 1,253,536 | | | | 4,098,437 | |
| | | | |
| Total | | $ | (998,403) | | | $ | 1,257,869 | | | $ | 51,985 | | | $ | 3,141,197 | | | $ | (3,615,945) | | | $ | 1,960,781 | | | $ | 1,797,484 | |
| | | | |
| | | | |
*Includes purchased option contracts and purchased swaption contracts, if any.
7. Restricted Securities
As of June 30, 2014, investments in securities included issues that are restricted. A restricted security may have a contractual restriction on its resale and is valued under methods approved by the Board of Trustees as reflecting fair value. Securities that are restricted are marked with an applicable footnote on the Consolidated Statement of Investments. Restricted securities are reported on a schedule following the Consolidated Statement of Investments.
8. Pending Litigation
In 2009, seven class action lawsuits were filed in the U.S. District Court for the District of Colorado against OppenheimerFunds, Inc. (“OFI”), OppenheimerFunds Distributor, Inc., the Fund’s principal underwriter and distributor (the “Distributor”), and certain funds (but not including the Fund) advised by OFI Global Asset Management, Inc. and distributed by the Distributor (the “Defendant Funds”). The lawsuits also named as defendants certain officers and current and former trustees of the respective Defendant Funds. The lawsuits raised claims under federal securities law and alleged, among other things, that the disclosure documents of the respective Defendant Funds contained misrepresentations and omissions and that the respective Defendant Funds’ investment policies were not followed. The plaintiffs in these actions sought unspecified damages, equitable relief and awards of attorneys’ fees and litigation expenses. The Defendant Funds’ Boards of Trustees also engaged counsel to represent the Funds and the present and former Independent Trustees named in those suits. On March 5, 2014, the parties in six of these lawsuits executed stipulations and agreements of settlement resolving those actions. On July 31, 2014, the court entered an order and final judgment approving the settlements as fair, reasonable and adequate. The settlements do not resolve a seventh outstanding lawsuit relating to Oppenheimer Rochester California Municipal Fund.
Other class action and individual lawsuits have been filed since 2008 in various state and federal courts against OFI and certain of its affiliates by investors seeking to recover investments they allegedly lost as a result of the “Ponzi” scheme run by Bernard L. Madoff and his firm, Bernard L. Madoff Investment Securities, LLC (“BLMIS”). Plaintiffs in these suits allege that they suffered losses as a result of their investments in several funds managed by an affiliate of OFI and assert a variety of claims, including breach of fiduciary duty, fraud, negligent misrepresentation, unjust enrichment, and violation of federal and state securities laws and regulations, among others. They seek unspecified damages, equitable relief and awards of attorneys’ fees and litigation expenses. Neither the Distributor, nor any of the Oppenheimer mutual funds, their independent trustees or directors are named as defendants in these lawsuits. None of the Oppenheimer mutual funds invested in any funds or accounts managed by Madoff or BLMIS. On February 28, 2011, a stipulation of partial settlement of three groups of consolidated putative class action lawsuits relating to these matters was filed in the U.S. District Court for the Southern District of New York. On August 19, 2011, the court entered an order and final judgment approving the settlement as fair, reasonable and adequate. In September 2011, certain parties filed notices of appeal from the court’s order approving the settlement. In June 2014, the appellate court affirmed the lower court’s order approving the settlement. Certain parties subsequently filed a petition for certiorari before the U.S. Supreme Court further challenging the settlement approval order. The settlement does not resolve other outstanding lawsuits against OFI and its affiliates relating to BLMIS.
OFI believes the lawsuits and appeals described above are without legal merit and, with the exception of actions it has settled, is defending against them vigorously. While it is premature to render any opinion as to the outcome in these lawsuits, or whether any costs that the Defendant Funds may bear in defending the suits might not be reimbursed by insurance, OFI believes that these suits should not impair the ability of OFI or the Distributor to perform their respective duties to the Fund, and that the outcome of all of the suits together should not have any material effect on the operations of any of the Oppenheimer mutual funds.
51 OPPENHEIMER GLOBAL STRATEGIC INCOME FUND/VA
|
|
PORTFOLIO PROXY VOTING POLICIES AND PROCEDURES; UPDATES TO STATEMENTS OF INVESTMENTS Unaudited |
The Fund has adopted Portfolio Proxy Voting Policies and Procedures under which the Fund votes proxies relating to securities (“portfolio proxies”) held by the Fund. A description of the Fund’s Portfolio Proxy Voting Policies and Procedures is available (i) without charge, upon request, by calling the Fund toll-free at 1.800.525.7048, (ii) on the Fund’s website at oppenheimerfunds.com, and (iii) on the SEC’s website at www.sec.gov. In addition, the Fund is required to file Form N-PX, with its complete proxy voting record for the 12 months ended June 30th, no later than August 31st of each year. The Fund’s voting record is available (i) without charge, upon request, by calling the Fund toll-free at 1.800.525.7048, and (ii) in the Form N-PX filing on the SEC’s website at www.sec.gov.
The Fund files its complete schedule of portfolio holdings with the SEC for the first quarter and the third quarter of each fiscal year on Form N-Q. The Fund’s Form N-Q filings are available on the SEC’s website at www.sec.gov. Those forms may be reviewed and copied at the SEC’s Public Reference Room in Washington, D.C. Information on the operation of the Public Reference Room may be obtained by calling 1-800-SEC-0330.
52 OPPENHEIMER GLOBAL STRATEGIC INCOME FUND/VA
THIS PAGE INTENTIONALLY LEFT BLANK.
53 OPPENHEIMER GLOBAL STRATEGIC INCOME FUND/VA
THIS PAGE INTENTIONALLY LEFT BLANK.
54 OPPENHEIMER GLOBAL STRATEGIC INCOME FUND/VA
THIS PAGE INTENTIONALLY LEFT BLANK.
55 OPPENHEIMER GLOBAL STRATEGIC INCOME FUND/VA
OPPENHEIMER GLOBAL STRATEGIC INCOME FUND/VA
A Series of Oppenheimer Variable Account Funds
| | |
| Trustees and Officers | | Sam Freedman, Chairman of the Board of Trustees and Trustee |
| | Edward L. Cameron, Trustee |
| | Jon S. Fossel, Trustee |
| | Richard F. Grabish, Trustee |
| | Beverly L. Hamilton, Trustee |
| | Victoria J. Herget, Trustee |
| | Robert J. Malone, Trustee |
| | F. William Marshall, Jr., Trustee |
| | Karen L. Stuckey, Trustee |
| | James D. Vaughn, Trustee |
| | William F. Glavin, Jr., Trustee, President and Principal Executive Officer |
| �� | Krishna Memani, Vice President |
| | Sara J. Zervos, Ph.D. Vice President |
| | Jack Brown, Vice President |
| | Arthur S. Gabinet, Secretary and Chief Legal Officer |
| | Christina M. Nasta, Vice President and Chief Business Officer |
| | Mary Ann Picciotto, Chief Compliance Officer and Chief Anti-Money Laundering Officer |
| | Brian W. Wixted, Treasurer and Principal Financial & Accounting Officer |
| |
| Manager | | OFI Global Asset Management, Inc. |
| |
| Sub-Adviser | | OppenheimerFunds, Inc. |
| |
| Distributor | | OppenheimerFunds Distributor, Inc. |
| |
| Transfer and | | OFI Global Asset Management, Inc. |
| Shareholder | | |
| Servicing Agent | | |
| |
| Sub-Transfer Agent | | Shareholder Services, Inc. |
| | DBA OppenheimerFunds Services |
| |
| Independent | | KPMG LLP |
| Registered Public | | |
| Accounting Firm | | |
| |
| Counsel | | K&L Gates LLP |
| |
| | Before investing in any of the Oppenheimer funds, investors should carefully consider a fund’s investment objectives, risks, charges and expenses. Fund prospectuses and summary prospectuses contain this and other information about the funds and may be obtained by asking your financial advisor, visiting oppenheimerfunds.com or calling us at 1.800.988.8287. Read prospectuses and summary prospectuses, carefully before investing. |
| |
| | The financial statements included herein have been taken from the records of the Fund without examination of those records by the independent auditors. |
| |
| | © 2014 OppenheimerFunds, Inc. All rights reserved. Oppenheimer funds are distributed by OppenheimerFunds Distributor, Inc. |

Portfolio Manager: Michael S. Levine, CFA
| | | | | | |
Cumulative Total Returns For the 6-Month Period Ended 6/30/14 |
Non-Service Shares | | 8.41% | | | | |
Service Shares | | 8.27% | | | | |
|
Average Annual Total Returns For the Periods Ended 6/30/14 |
| | | 1-Year | | 5-Year | | 10-Year |
Non-Service Shares | | 23.35% | | 18.00% | | 9.32% |
| | | |
| | | 1-Year | | 5-Year | | Since Inception (9/18/06) |
Service Shares | | 23.00% | | 15.46% | | 5.44% |
Performance data quoted represents past performance, which does not guarantee future results. The investment return and principal value of an investment in the Fund will fluctuate so that an investor’s shares, when redeemed, may be worth more or less than their original cost. Current performance may be lower or higher than the performance quoted. For performance data current to the most recent month end, call us at 1.800.988.8287. The Fund’s total returns should not be expected to be the same as the returns of other funds, whether or not both funds have the same portfolio managers and/or similar names. The Fund’s total returns include changes in share price and reinvested distributions but do not include the charges associated with the separate account products that offer this Fund. Such performance would have been lower if such charges were taken into account.
| | | | | | |
TOP TEN COMMON STOCK HOLDINGS | | | |
JPMorgan Chase & Co. | | | 3.8 | % | | |
Citigroup, Inc. | | | 3.7 | | | |
Apple, Inc. | | | 3.5 | | | |
Chevron Corp. | | | 3.0 | | | |
Ford Motor Co. | | | 2.6 | | | |
General Motors Co. | | | 2.4 | | | |
MetLife, Inc. | | | 2.4 | | | |
Kinder Morgan, Inc. | | | 2.1 | | | |
Microsoft Corp. | | | 2.0 | | | |
CenturyLink, Inc. | | | 1.9 | | | |
Portfolio holdings and allocations are subject to change. Percentages are as of June 30, 2014, and are based on net assets. For more current Fund holdings, please visit oppenheimerfunds.com.
SECTOR ALLOCATION
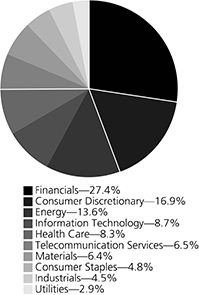
Portfolio holdings and allocations are subject to change. Percentages are as of June 30, 2014, and are based on the total market value of common stocks.
2 OPPENHEIMER EQUITY INCOME FUND/VA
Fund Performance Discussion
The Fund’s Non-Service shares produced a return of 8.41% during the reporting period, outperforming the Russell 1000 Value Index (the “Index”), which returned 8.28%. The Fund’s outperformance relative to the Index stemmed from stronger relative stock selection in the consumer staples and telecommunication services sectors, along with an underweight position in the industrials sector. The Fund underperformed in the consumer discretionary sector due to less favorable stock selection and an overweight position. Weaker relative stock selection in the financials sector and an underweight position in the utilities sector also detracted from the Fund’s performance versus the Index. The Fund also outperformed the S&P 500 Index, which returned 7.14% during the reporting period.
GLOBAL MARKET AND ECONOMIC ENVIRONMENT
Despite market volatility early in the reporting period and rising geopolitical risks in Ukraine and the Middle East, global equities generally rebounded and produced positive returns in the first half of 2014, thanks largely to a continued global economic recovery and stimulative monetary policies from central banks throughout the world. Markets were volatile to start the reporting period in January 2014 amid fears that political and economic instability in the world’s emerging markets might further dampen the U.S. economic recovery. However, equities rebounded later in the reporting period. Among the central bank measures that boosted the markets this reporting period, the European Central Bank (the “ECB”) announced numerous measures in June, including a benchmark interest rate cut, the introduction of a negative deposit rate to encourage banks to lend, among various other measures to flood the system with liquidity. Beyond that, the ECB said it would prepare to purchase packages of loans from banks to allow for increased lending. In June, the U.S. Federal Reserve (the “Fed”) also stated it would reduce the amount of monthly bond purchases by an additional $10 billion and reaffirmed its intention to keep short-term interest rates near zero. U.S. economic data released in April and May was positive, as the unemployment rate fell to 6.3%, the economy finally regained all of the jobs lost during the 2008 recession, and the U.S. stock market achieved record highs. Shortly after the reporting period ended, a positive June jobs report was released, in which the official unemployment rate fell to 6.1%, its lowest level since September 2008.
Against this backdrop, sustained low interest rates continued to boost demand for higher dividend yielding stocks as investors sought alternative sources of current income. As a result, utilities remained one of the top performing sectors. Oil prices spiked during the reporting period, reflecting increased tensions in the Middle East and concerns that output from the Iraqi oil fields would be curtailed. Not surprisingly, energy stocks responded by rallying strongly, making this sector another strong performer this period.
TOP INDIVIDUAL CONTRIBUTORS
Top contributors to the Fund’s performance this reporting period included Apple, Inc., Teva Pharmaceutical Industries Ltd. and Halliburton Co. Apple performed well during the second half of 2013 due to excitement surrounding the introduction of two new iPhones as well as the addition of China Mobile as a distribution partner. Apple also rallied strongly in April 2014 after iPhone sales came in higher than analysts anticipated and the company announced a 7-for-1 stock split and increased both its dividend and share repurchases. Teva Pharmaceuticals, a pharmaceutical manufacturer based in Israel, benefited from improving prospects for its branded multiple sclerosis drug, Copaxone. Most market participants had been expecting competition from generic drug manufacturers when Copaxone’s patent expired in May 2014. However, news during the reporting period made it increasingly clear that the Food and Drug Administration (“FDA”) was unlikely to approve any generics by the time the patent ran out. With Copaxone remaining exclusive past May, many analysts raised their earnings expectations for Teva, helping to drive share price gains. Halliburton is an oilfield services company that benefited from the strong performance of the energy sector, with oil prices rising amid heightened geopolitical tensions in the Middle East and Ukraine. As the fundamentals have improved for the North American companies Halliburton serves, it is anticipated that demand for Halliburton’s services can potentially will increase.
TOP INDIVIDUAL DETRACTORS
Top detractors from performance this reporting period included Citigroup Inc. and General Motors Co. (“GM”). Shares of Citigroup Inc., a global financial services company, performed poorly during the reporting period due, in part, to investor concerns about the bank’s exposure to emerging markets. Citi also got a negative surprise when the Fed rejected the firm’s capital plan. While Citi did pass the Fed’s stress tests, regulators expressed qualitative concerns about the firm’s internal controls, and thus halted plans to return additional capital to shareholders. Investors reacted unfavorably to this news, driving down Citi’s share price. At period end, we continued to like the risk/reward of Citigroup.
After a strong performance for most of 2013, consumer discretionary was one of the worst performing sectors of the Russell 1000 Value Index during the six-month reporting period. Auto stocks, such as GM, suffered early in 2014 as investors became concerned that the sales momentum from 2013 would not be sustained. Additionally, recently announced recalls have weighed on GM’s stock price as they hurt both the consumer’s perception of manufacturing quality and
3 OPPENHEIMER EQUITY INCOME FUND/VA
the company’s profitability. As of the reporting period’s end, we remain positive on the outlook for autos because we believe pent-up demand may continue to drive sales higher.
STRATEGY & OUTLOOK
The Fund aims to provide shareholders with long-term growth of capital and a competitive level of income. It invests primarily in the common stocks of large, dividend-paying companies, but may also own income-oriented investments such as preferred shares, convertible bonds and other types of fixed income securities. Through intensive fundamental research and the careful management of portfolio risks, the Fund aims to deliver strong returns compared to its peers.
We are optimistic about the market for the remainder of 2014. We believe the economy can continue to improve, driven by an ongoing recovery in the housing market, still low interest rates and better consumer balance sheets. In our view, corporate earnings should continue to grow in-line with an improving economy and dividends should increase in-line with earnings. We expect interest rates to grind higher during 2014, which should result in flat to negative returns for most fixed income asset classes and make equities look even more appealing. Wildcards remain, including the Middle East, Ukraine and Washington D.C., but overall our outlook for equities in 2014 remains positive at period end.
The Fund’s investment strategy and focus can change over time. The mention of specific fund holdings does not constitute a recommendation by OppenheimerFunds, Inc. or its affiliates.
Shares of Oppenheimer funds are not deposits or obligations of any bank, are not guaranteed by any bank, are not insured by the FDIC or any other agency, and involve investment risks, including the possible loss of the principal amount invested.
4 OPPENHEIMER EQUITY INCOME FUND/VA
Fund Expenses
Fund Expenses. As a shareholder of the Fund, you incur two types of costs: (1) transaction costs and (2) ongoing costs, including management fees; distribution and service fees; and other Fund expenses. These examples are intended to help you understand your ongoing costs (in dollars) of investing in the Fund and to compare these costs with the ongoing costs of investing in other mutual funds.
The examples are based on an investment of $1,000.00 invested at the beginning of the period and held for the entire 6-month period ended June 30, 2014.
Actual Expenses. The first section of the table provides information about actual account values and actual expenses. You may use the information in this section for the class of shares you hold, together with the amount you invested, to estimate the expense that you paid over the period. Simply divide your account value by $1,000.00 (for example, an $8,600.00 account value divided by $1,000.00 = 8.60), then multiply the result by the number in the first section under the heading entitled “Expenses Paid During Period” to estimate the expenses you paid on your account during this period.
Hypothetical Example for Comparison Purposes.
The second section of the table provides information about hypothetical account values and hypothetical expenses based on the Fund’s actual expense ratio for each class of shares, and an assumed rate of return of 5% per year for each class before expenses, which is not the actual return. The hypothetical account values and expenses may not be used to estimate the actual ending account balance or expenses you paid for the period. You may use this information to compare the ongoing costs of investing in the Fund and other funds. To do so, compare this 5% hypothetical example for the class of shares you hold with the 5% hypothetical examples that appear in the shareholder reports of the other funds.
Please note that the expenses shown in the table are meant to highlight your ongoing costs only and do not reflect any charges associated with the separate accounts that offer this Fund. Therefore, the “hypothetical” lines of the table are useful in comparing ongoing costs only, and will not help you determine the relative total costs of owning different funds. In addition, if these separate account charges were included your costs would have been higher.
| | | | | | | | | | | | | | |
| Actual | | Beginning Account Value January 1, 2014 | | | Ending Account Value June 30, 2014 | | | Expenses Paid During 6 Months Ended June 30, 2014 | | | |
Non-Service shares | | $ | 1,000.00 | | | $ | 1,084.10 | | | $ | 4.09 | | | |
Service shares | | | 1,000.00 | | | | 1,082.70 | | | | 5.38 | | | |
| | | | |
Hypothetical (5% return before expenses) | | | | | | | | | | | | | | |
Non-Service shares | | | 1,000.00 | | | | 1,020.88 | | | | 3.97 | | | |
Service shares | | | 1,000.00 | | | | 1,019.64 | | | | 5.22 | | | |
Expenses are equal to the Fund’s annualized expense ratio for that class, multiplied by the average account value over the period, multiplied by 181/365 (to reflect the one-half year period). Those annualized expense ratios, excluding indirect expenses from affiliated funds, based on the 6-month period ended June 30, 2014 are as follows:
| | | | | | |
| Class | | Expense Ratios | | | |
Non-Service shares | | | 0.79% | | | |
Service shares | | | 1.04 | | | |
The expense ratios reflect voluntary and/or contractual waivers and/or reimbursements of expenses by the Fund’s Manager. Some of these undertakings may be modified or terminated at any time, as indicated in the Fund’s prospectus. The “Financial Highlights” tables in the Fund’s financial statements, included in this report, also show the gross expense ratios, without such waivers or reimbursements and reduction to custodian expenses, if applicable.
5 OPPENHEIMER EQUITY INCOME FUND/VA
STATEMENTOF INVESTMENTS June 30, 2014 Unaudited
| | | | | | | | |
| | | Shares | | | Value | |
| |
Common Stocks—86.6% | |
| |
Consumer Discretionary—14.7% | |
| |
Auto Components—2.2% | |
| |
American Axle & Manufacturing Holdings, Inc.1 | | | 2,750 | | | $ | 51,947 | |
| |
Lear Corp. | | | 2,325 | | | | 207,669 | |
| | | | | | | | |
| | | | 259,616 | |
|
| |
Automobiles—5.0% | | | | | | | | |
| |
Ford Motor Co.2 | | | 17,500 | | | | 301,700 | |
| |
General Motors Co. | | | 7,750 | | | | 281,325 | |
| | | | | | | | |
| | | | 583,025 | |
|
| |
Household Durables—1.4% | | | | | | | | |
| |
MDC Holdings, Inc. | | | 3,950 | | | | 119,646 | |
| |
Standard Pacific Corp.1 | | | 4,865 | | | | 41,839 | |
| | | | | | | | |
| | | | 161,485 | |
|
| |
Media—1.1% | | | | | | | | |
| |
Time Warner Cable, Inc. | | | 825 | | | | 121,523 | |
|
| |
Multiline Retail—2.1% | | | | | | | | |
| |
J.C. Penney Co., Inc.1 | | | 2,130 | | | | 19,276 | |
| |
Kohl’s Corp. | | | 1,900 | | | | 100,092 | |
| |
Target Corp. | | | 2,100 | | | | 121,695 | |
| | | | | | | | |
| | | | 241,063 | |
|
| |
Specialty Retail—2.9% | | | | | | | | |
| |
Best Buy Co., Inc. | | | 5,825 | | | | 180,633 | |
| |
Foot Locker, Inc. | | | 2,500 | | | | 126,800 | |
| |
Staples, Inc. | | | 2,375 | | | | 25,745 | |
| | | | | | | | |
| | | | 333,178 | |
|
| |
Consumer Staples—4.1% | | | | | | | | |
| |
Beverages—0.9% | | | | | | | | |
| |
Molson Coors Brewing Co., Cl. B, Non-Vtg., Cl. B | | | 500 | | | | 37,080 | |
| |
PepsiCo, Inc. | | | 725 | | | | 64,772 | |
| | | | | | | | |
| | | | 101,852 | |
|
| |
Food & Staples Retailing—1.4% | | | | | | | | |
| |
Kroger Co. (The) | | | 1,750 | | | | 86,502 | |
| |
Walgreen Co. | | | 1,000 | | | | 74,130 | |
| | | | | | | | |
| | | | 160,632 | |
|
| |
Food Products—1.2% | | | | | | | | |
| |
Archer-Daniels-Midland Co. | | | 1,350 | | | | 59,548 | |
| |
ConAgra Foods, Inc. | | | 1,150 | | | | 34,132 | |
| |
Pinnacle Foods, Inc. | | | 1,600 | | | | 52,640 | |
| | | | | | | | |
| | | | 146,320 | |
|
| |
Tobacco—0.6% | | | | | | | | |
| |
Philip Morris International, Inc. | | | 850 | | | | 71,664 | |
|
| |
Energy—11.8% | | | | | | | | |
| |
Energy Equipment & Services—2.1% | |
| |
Ensco plc, Cl. A | | | 2,250 | | | | 125,032 | |
| |
Halliburton Co. | | | 1,675 | | | | 118,942 | |
| | | | | | | | |
| | | | 243,974 | |
|
| |
Oil, Gas & Consumable Fuels—9.7% | |
| |
Apache Corp. | | | 1,200 | | | | 120,744 | |
| |
BP plc, Sponsored ADR | | | 3,135 | | | | 165,371 | |
| |
Chevron Corp. | | | 2,700 | | | | 352,485 | |
| |
Kinder Morgan, Inc. | | | 6,550 | | | | 237,503 | |
| |
Marathon Oil Corp. | | | 525 | | | | 20,958 | |
| |
Royal Dutch Shell plc, Cl. A, ADR | | | 1,475 | | | | 121,496 | |
| |
Williams Cos., Inc. (The) | | | 1,700 | | | | 98,957 | |
| | | | | | | | |
| | | | 1,117,514 | |
|
| |
Financials—23.7% | | | | | | | | |
| |
Capital Markets—4.3% | | | | | | | | |
| |
Credit Suisse Group AG, Sponsored ADR1 | | | 2,025 | | | | 57,449 | |
| |
Goldman Sachs Group, Inc. (The) | | | 900 | | | | 150,696 | |
| |
KKR & Co. LP | | | 4,100 | | | | 99,753 | |
| | | | | | | | |
| | | Shares | | | Value | |
| |
Capital Markets (Continued) | |
| |
Morgan Stanley | | | 4,200 | | | $ | 135,786 | |
| |
State Street Corp. | | | 725 | | | | 48,764 | |
| | | | | | | | |
| | | | 492,448 | |
|
| |
Commercial Banks—8.9% | | | | | | | | |
| |
Banco Bilbao Vizcaya Argentaria SA, Sponsored ADR | | | 1,875 | | | | 23,944 | |
| |
Bank of America Corp. | | | 2,750 | | | | 42,267 | |
| |
CIT Group, Inc. | | | 1,400 | | | | 64,064 | |
| |
Citigroup, Inc. | | | 9,175 | | | | 432,142 | |
| |
JPMorgan Chase & Co. | | | 7,750 | | | | 446,555 | |
| |
M&T Bank Corp. | | | 50 | | | | 6,203 | |
| |
Wells Fargo & Co. | | | 375 | | | | 19,710 | |
| | | | | | | | |
| | | | 1,034,885 | |
|
| |
Insurance—6.1% | | | | | | | | |
| |
American International Group, Inc. | | | 750 | | | | 40,935 | |
| |
Assured Guaranty Ltd. | | | 9,175 | | | | 224,787 | |
| |
Everest Re Group Ltd. | | | 375 | | | | 60,184 | |
| |
MBIA, Inc.1 | | | 1,350 | | | | 14,904 | |
| |
MetLife, Inc. | | | 5,000 | | | | 277,800 | |
| |
XL Group plc, Cl. A | | | 2,750 | | | | 90,008 | |
| | | | | | | | |
| | | | 708,618 | |
|
| |
Real Estate Investment Trusts (REITs)—4.4% | |
| |
Apollo Commercial Real Estate Finance, Inc. | | | 4,000 | | | | 65,960 | |
| |
Ashford Hospitality Trust, Inc. | | | 4,250 | | | | 49,045 | |
| |
Blackstone Mortgage Trust, Inc., Cl. A | | | 300 | | | | 8,700 | |
| |
Colony Financial, Inc. | | | 5,000 | | | | 116,100 | |
| |
CYS Investments, Inc. | | | 1,875 | | | | 16,912 | |
| |
Digital Realty Trust, Inc. | | | 1,075 | | | | 62,694 | |
| |
Rayonier, Inc. | | | 625 | | | | 22,219 | |
| |
Starwood Property Trust, Inc. | | | 5,000 | | | | 118,850 | |
| |
Two Harbors Investment Corp. | | | 5,225 | | | | 54,758 | |
| | | | | | | | |
| | | | 515,238 | |
|
| |
Health Care—7.2% | | | | | | | | |
| |
Health Care Equipment & Supplies—0.9% | |
| |
Baxter International, Inc. | | | 775 | | | | 56,032 | |
| |
Medtronic, Inc. | | | 825 | | | | 52,602 | |
| | | | | | | | |
| | | | 108,634 | |
|
| |
Health Care Providers & Services—1.0% | |
| |
UnitedHealth Group, Inc. | | | 1,350 | | | | 110,363 | |
|
| |
Pharmaceuticals—5.3% | | | | | | | | |
| |
AbbVie, Inc. | | | 150 | | | | 8,466 | |
| |
GlaxoSmithKline plc, Sponsored ADR | | | 1,275 | | | | 68,187 | |
| |
Merck & Co., Inc. | | | 3,550 | | | | 205,367 | |
| |
Pfizer, Inc.2 | | | 6,450 | | | | 191,436 | |
| |
Roche Holding AG, Sponsored ADR | | | 200 | | | | 7,460 | |
| |
Teva Pharmaceutical Industries Ltd., Sponsored ADR | | | 2,500 | | | | 131,050 | |
| | | | | | | | |
| | | | 611,966 | |
|
| |
Industrials—3.9% | | | | | | | | |
| |
Aerospace & Defense—0.8% | | | | | |
| |
General Dynamics Corp. | | | 500 | | | | 58,275 | |
| |
Textron, Inc. | | | 1,000 | | | | 38,290 | |
| | | | | | | | |
| | | | 96,565 | |
|
| |
Commercial Services & Supplies—0.8% | |
| |
R.R. Donnelley & Sons Co. | | | 5,375 | | | | 91,160 | |
|
| |
Electrical Equipment—0.3% | | | | | |
| |
General Cable Corp. | | | 1,325 | | | | 34,000 | |
|
| |
Industrial Conglomerates—0.9% | |
| |
General Electric Co.2 | | | 4,250 | | | | 111,690 | |
|
| |
Machinery—0.5% | | | | | | | | |
| |
Navistar International Corp.1 | | | 1,500 | | | | 56,220 | |
6 OPPENHEIMER EQUITY INCOME FUND/VA
| | | | | | | | |
| | | Shares | | | Value | |
| |
| Marine—0.3% | |
| |
| Costamare, Inc. | | | 1,350 | | | $ | 31,482 | |
|
| |
| Road & Rail—0.3% | | | | | | | | |
| |
| CSX Corp. | | | 1,000 | | | | 30,810 | |
|
| |
| Information Technology—7.6% | | | | | | | | |
| |
| Communications Equipment—1.3% | |
| |
| Cisco Systems, Inc. | | | 3,000 | | | | 74,550 | |
| |
| QUALCOMM, Inc. | | | 1,000 | | | | 79,200 | |
| | | | | | | | |
| | | | 153,750 | |
|
| |
| Semiconductors & Semiconductor Equipment—0.5% | |
| |
| Intel Corp. | | | 1,750 | | | | 54,075 | |
|
| |
| Software—2.0% | | | | | | | | |
| |
| Microsoft Corp. | | | 5,500 | | | | 229,350 | |
|
| |
| Technology Hardware, Storage & Peripherals—3.8% | |
| |
| Apple, Inc. | | | 4,340 | | | | 403,316 | |
| |
| EMC Corp. | | | 600 | | | | 15,804 | |
| |
| Seagate Technology plc | | | 325 | | | | 18,467 | |
| | | | | | | | |
| | | | 437,587 | |
|
| |
| Materials—5.5% | | | | | | | | |
| |
| Chemicals—1.8% | | | | | | | | |
| |
| Celanese Corp., Series A | | | 925 | | | | 59,459 | |
| |
| LyondellBasell Industries NV, Cl. A | | | 750 | | | | 73,238 | |
| |
| Mosaic Co. (The) | | | 825 | | | | 40,796 | |
| |
| Potash Corp. of Saskatchewan, Inc. | | | 750 | | | | 28,470 | |
| |
| Rayonier Advanced Materials1 | | | 208 | | | | 8,060 | |
| | | | | | | | |
| | | | 210,023 | |
|
| |
| Metals & Mining—1.2% | | | | | | | | |
| |
| Allegheny Technologies, Inc. | | | 1,500 | | | | 67,650 | |
| |
| Freeport-McMoRan Copper & Gold, Inc. | | | 2,000 | | | | 73,000 | |
| | | | | | | | |
| | | | 140,650 | |
|
| |
| Paper & Forest Products—2.5% | | | | | | | | |
| |
| Domtar Corp. | | | 2,300 | | | | 98,555 | |
| |
| International Paper Co. | | | 2,575 | | | | 129,960 | |
| |
| Louisiana-Pacific Corp.1 | | | 4,150 | | | | 62,333 | |
| | | | | | | | |
| | | | 290,848 | |
|
| |
| Telecommunication Services—5.6% | |
| |
| Diversified Telecommunication Services—5.6% | |
| |
| AT&T, Inc. | | | 3,125 | | | | 110,500 | |
| |
| CenturyLink, Inc. | | | 6,225 | | | | 225,345 | |
| |
| Consolidated Communications Holdings, Inc. | | | 1,675 | | | | 37,252 | |
| |
| Verizon Communications, Inc. | | | 2,300 | | | | 112,539 | |
| |
| Windstream Holdings, Inc. | | | 16,750 | | | | 166,830 | |
| | | | | | | | |
| | | | 652,466 | |
|
| |
| Utilities—2.5% | | | | | | | | |
| |
| Electric Utilities—2.5% | | | | | | | | |
| |
| American Electric Power Co., Inc. | | | 1,325 | | | | 73,895 | |
| |
| Edison International | | | 1,325 | | | | 76,996 | |
| |
| FirstEnergy Corp. | | | 2,000 | | | | 69,440 | |
| |
| PPL Corp. | | | 1,750 | | | | 62,178 | |
| |
| Southern Co. (The) | | | 250 | | | | 11,344 | |
| | | | | | | | |
| | | | 293,853 | |
| | | | | | | | |
| Total Common Stocks (Cost $8,578,894) | | | | 10,038,527 | |
|
| |
| Preferred Stocks—2.5% | | | | | | | | |
| |
| American Homes 4 Rent, 5% Cum., Series A, Non-Vtg. | | | 1,000 | | | | 25,210 | |
| |
| American Homes 4 Rent, 5% Cum., Series B, Non-Vtg. | | | 1,300 | | | | 31,993 | |
| |
| Beazer Homes USA, Inc., 7.50% Cv. | | | 2,725 | | | | 87,718 | |
| |
| Continental Airlines Finance Trust II, 6% Cv., Non-Vtg. | | | 761 | | | | 37,883 | |
| |
| Dominion Resources, Inc., 6.375% Cv.1 | | | 200 | | | | 10,525 | |
| |
| iStar Financial, Inc., 4.50% Cv., Non-Vtg. | | | 875 | | | | 56,223 | |
| |
| Post Holdings, Inc., 2.50% Cv.3 | | | 100 | | | | 10,194 | |
| | | | | | | | |
| | | Shares | | | Value | |
| |
| Preferred Stocks (Continued) | |
| |
| Post Holdings, Inc., 3.75% Cv.3 | | | 100 | | | $ | 11,920 | |
| |
| Post Holdings, Inc., 5.25% Cv.1 | | | 200 | | | | 21,056 | |
| | | | | | | | |
| Total Preferred Stocks (Cost $272,922) | | | | 292,722 | |
| | |
| | | Principal
Amount | | | | |
| |
| Non-Convertible Corporate Bonds and Notes—0.9% | |
| |
| J.C. Penney Co., Inc., 5.65% Sr. Unsec. Nts., 6/1/20 | | $ | 30,000 | | | | 26,400 | |
| |
| MBIA Insurance Corp., 11.486% Sub. Nts., 1/15/333,4 | | | 65,000 | | | | 51,187 | |
| |
| NII Capital Corp., 7.625% Sr. Unsec. Nts., 4/1/21 | | | 87,500 | | | | 25,594 | |
| | | | | | | | |
| Total Non-Convertible Corporate Bonds and Notes (Cost $131,583) | | | | 103,181 | |
|
| |
| Convertible Corporate Bonds and Notes—8.2% | |
| |
| General Cable Corp., 4.50% Cv. Unsec. Sub. Nts., 11/15/295 | | | 100,000 | | | | 99,375 | |
| |
| iStar Financial, Inc., 3% Cv. Sr. Unsec. Nts., 11/15/16 | | | 50,000 | | | | 70,969 | |
| |
| Liberty Interactive LLC, 0.75% Cv. Sr. Unsec. Nts., 3/30/43 | | | 35,000 | | | | 47,075 | |
| |
| MGIC Investment Corp.: | | | | | | | | |
| 5.00% Cv. Sr. Unsec. Nts., 5/1/17 | | | 45,000 | | | | 52,650 | |
| 9.00% Cv. Jr. Sub. Nts., 4/1/633 | | | 150,000 | | | | 193,594 | |
| |
| Micron Technology, Inc., 3% Cv. Sr. Unsec. Nts., 11/15/43 | | | 55,000 | | | | 71,122 | |
| |
| Navistar International Corp.: | | | | | | | | |
| 4.50% Cv. Sr. Sub. Nts., 10/15/183 | | | 85,000 | | | | 88,134 | |
| 4.75% Cv. Sr. Sub. Nts., 4/15/193 | | | 23,000 | | | | 24,653 | |
| |
| Peabody Energy Corp., 4.75% Cv. Jr. Sub. Nts., 12/15/41 | | | 90,000 | | | | 68,006 | |
| |
| Radian Group, Inc., 2.25% Cv. Sr. Unsec. Nts., 3/1/192 | | | 60,000 | | | | 90,225 | |
| |
| Starwood Property Trust, Inc., 4% Cv. Sr. Unsec. Nts., 1/15/19 | | | 15,000 | | | | 17,241 | |
| |
| United Airlines, Inc., 4.50% Cv. Sr. Unsec. Nts., 1/15/15 | | | 55,000 | | | | 120,828 | |
| | | | | | | | |
| Total Convertible Corporate Bonds and Notes (Cost $829,703) | | | | 943,872 | |
| | |
| | | Shares | | | | |
| |
| Structured Securities—2.0% | | | | | | | | |
| |
| Bank of America Corp., American Axle & Manufacturing Holdings, Inc. Equity Linked Nts., 11/3/143 | | | 1,150 | | | | 21,639 | |
| |
| Citigroup, Inc., J.C. Penney Co., Inc. Equity Linked Nts., 11/19/143 | | | 1,098 | | | | 10,333 | |
| |
| Credit Suisse AG (New York Branch), Apple, Inc. Equity Linked Nts., 12/3/14 | | | 40 | | | | 25,706 | |
| |
| Credit Suisse AG (New York Branch), J.C. Penney Co., Inc. Equity Linked Nts., 11/21/14 | | | 2,650 | | | | 25,358 | |
| |
| Credit Suisse AG (New York Branch), Standard Pacific Corp. Equity Linked Nts., 11/7/14 | | | 1,269 | | | | 10,844 | |
| |
| Deutsche Bank AG (London Branch), J.C. Penney Co., Inc. Equity Linked Nts., 12/24/14 | | | 1,738 | | | | 15,459 | |
| |
| Goldman Sachs Group, Inc. (The), Apple, Inc. Equity Linked Nts., 12/5/143 | | | 55 | | | | 35,441 | |
| |
| Goldman Sachs Group, Inc. (The), MBIA, Inc. Equity Linked Nts., 1/2/153 | | | 1,266 | | | | 14,185 | |
| |
| JPMorgan Chase & Co., Navistar International Corp. Equity Linked Nts., 11/25/143 | | | 398 | | | | 15,107 | |
| |
| Merrill Lynch International & Co. CV Curacao, Standard Pacific Corp. Equity Linked Nts., 11/12/14 | | | 1,316 | | | | 11,064 | |
| |
| Merrill Lynch International & Co. CV, Apple, Inc. Equity Linked Nts., 12/9/14 | | | 39 | | | | 25,358 | |
| |
| Morgan Stanley, Rite Aid Corp. Performance Equity Linked Redemption Quarterly-pay Securities, 12/15/143 | | | 3,234 | | | | 23,106 | |
| | | | | | | | |
| Total Structured Securities (Cost $228,533) | | | | 233,600 | |
7 OPPENHEIMER EQUITY INCOME FUND/VA
STATEMENTOF INVESTMENTS Unaudited / Continued
| | | | | | | | |
| | | Shares | | | Value | |
| |
Investment Company—0.4% | |
| |
| Oppenheimer Institutional Money Market Fund, Cl. E, 0.09%6,7 (Cost $48,832) | | | 48,832 | | | $ | 48,832 | |
| | | | | | | | | | | | | | | | | | | | | | | | |
| | | | | | Exercise
Price | | | Expiration
Date | | | | | | Contracts | | | | |
| |
| Exchange-Traded Options Purchased—0.0% | |
| |
| Baxter International, Inc. Put1 | | | USD | | | | 67.500 | | | | 8/16/14 | | | | USD | | | | 10 | | | | 510 | |
| |
| Exxon Mobil Corp. Put1 | | | USD | | | | 90.000 | | | | 8/16/14 | | | | USD | | | | 10 | | | | 250 | |
| |
| Marathon Oil Corp. Put1 | | | USD | | | | 36.000 | | | | 7/19/14 | | | | USD | | | | 10 | | | | 55 | |
| |
| United Continental Holdings, Inc. Put1 | | | USD | | | | 36.000 | | | | 7/19/14 | | | | USD | | | | 10 | | | | 210 | |
| |
| Walgreen Co. Put1 | | | USD | | | | 65.000 | | | | 7/19/14 | | | | USD | | | | 10 | | | | 20 | |
| | | | | | | | | | | | | | | | | | | | | | | | |
| Total Exchange-Traded Options Purchased (Cost $1,163) | | | | 1,045 | |
|
| |
| Total Investments, at Value (Cost $10,091,630) | | | | 100.6% | | | | 11,661,779 | |
| |
| Net Other Assets (Liabilities) | | | | (0.6) | | | | (69,760) | |
| | | | | | | | | | | | | | | | | | | | |
| Net Assets | | | | 100.0% | | | $ | 11,592,019 | |
| | | | | | | | | | | | | | | | | | | | |
Footnotes to Statement of Investments
1. Non-income producing security.
2. All or a portion of the security position is held in segregated accounts and pledged to cover margin requirements with respect to outstanding written options. The aggregate market value of such securities is $122,360. See Note 6 of the accompanying Notes.
3. Represents securities sold under Rule 144A, which are exempt from registration under the Securities Act of 1933, as amended. These securities have been determined to be liquid under guidelines established by the Board of Trustees. These securities amount to $499,493 or 4.31% of the Fund’s net assets as of June 30, 2014.
4. This security is not accruing income because the issuer has missed an interest payment on it and/or is not anticipated to make future interest and or principal payments. The rate shown is the original contractual interest rate. See Note 1 of the accompanying Notes.
5. Represents the current interest rate for a variable or increasing rate security.
6. Is or was an affiliate, as defined in the Investment Company Act of 1940, at or during the period ended June 30, 2014, by virtue of the Fund owning at least 5% of the voting securities of the issuer or as a result of the Fund and the issuer having the same investment adviser. Transactions during the period in which the issuer was an affiliate are as follows:
| | | | | | | | | | | | | | | | |
| | | Shares | | | Gross | | | Gross | | | Shares | |
| | | December 31, 2013 | | | Additions | | | Reductions | | | June 30, 2014 | |
| |
Oppenheimer Institutional Money Market Fund, Cl. E | | | 59,001 | | | | 1,023,421 | | | | 1,033,590 | | | | 48,832 | |
| | | | | | | | |
| | | Value | | | Income | |
| |
Oppenheimer Institutional Money Market Fund, Cl. E | | $ | 48,832 | | | $ | 18 | |
7. Rate shown is the 7-day yield as of June 30, 2014.
| | | | | | | | | | | | | | | | | | | | | | | | |
| |
| Exchange-Traded Options Written at June 30, 2014 | |
| Description | | | | | Exercise Price | | | Expiration Date | | | Number of Contracts | | | Premiums Received | | | Value | |
| |
Allegheny Technologies, Inc. Call | | | USD | | | | 42.500 | | | | 7/19/14 | | | USD | (5) | | | $ | 540 | | | $ | (1,400) | |
| |
AT&T, Inc. Call | | | USD | | | | 37.000 | | | | 7/19/14 | | | USD | (10) | | | | 588 | | | | (10) | |
| |
Baxter International, Inc. Put | | | USD | | | | 72.500 | | | | 8/16/14 | | | USD | (5) | | | | 808 | | | | (960) | |
| |
Exxon Mobil Corp. Put | | | USD | | | | 97.500 | | | | 8/16/14 | | | USD | (5) | | | | 560 | | | | (610) | |
| |
J.C. Penney Co., Inc. Put | | | USD | | | | 9.000 | | | | 8/16/14 | | | USD | (55) | | | | 12,152 | | | | (3,025) | |
| |
J.C. Penney Co., Inc. Put | | | USD | | | | 9.000 | | | | 7/19/14 | | | USD | (5) | | | | 221 | | | | (135) | |
| |
Louisiana-Pacific Corp. Put | | | USD | | | | 14.000 | | | | 7/19/14 | | | USD | (5) | | | | 320 | | | | (60) | |
| |
Marathon Oil Corp. Put | | | USD | | | | 40.000 | | | | 7/19/14 | | | USD | (5) | | | | 323 | | | | (390) | |
| |
MBIA, Inc. Put | | | USD | | | | 11.000 | | | | 8/16/14 | | | USD | (5) | | | | 215 | | | | (310) | |
| |
MDC Holdings, Inc. Put | | | USD | | | | 29.000 | | | | 7/19/14 | | | USD | (5) | | | | 515 | | | | (100) | |
| |
Pfizer, Inc. Put | | | USD | | | | 29.000 | | | | 7/19/14 | | | USD | (5) | | | | 206 | | | | (40) | |
| |
Rite Aid Corp. Put | | | USD | | | | 7.000 | | | | 7/19/14 | | | USD | (5) | | | | 95 | | | | (75) | |
| |
United Continental Holdings, Inc. Put | | | USD | | | | 40.000 | | | | 7/19/14 | | | USD | (5) | | | | 415 | | | | (540) | |
| |
Walgreen Co. Put | | | USD | | | | 70.000 | | | | 7/19/14 | | | USD | (5) | | | | 396 | | | | (120) | |
| | | | | | | | | | | | | | | | | | | | |
Total of Exchange-Traded Options Written | | | $ | 17,354 | | | $ | (7,775) | |
| | | | | | | | | | | | | | | | | | | | |
See accompanying Notes to Financial Statements.
8 OPPENHEIMER EQUITY INCOME FUND/VA
STATEMENTOF ASSETS AND LIABILITIES June 30, 2014 Unaudited
| | | | |
| |
| Assets | | | | |
| Investments, at value—see accompanying statement of investments: | | | | |
| Unaffiliated companies (cost $10,042,798) | | $ | 11,612,947 | |
| Affiliated companies (cost $48,832) | | | 48,832 | |
| | | | |
| | | 11,661,779 | |
| |
| Cash | | | 5,954 | |
| |
| Receivables and other assets: | | | | |
| Investments sold | | | 60,077 | |
| Dividends | | | 31,697 | |
| Shares of beneficial interest sold | | | 2,057 | |
| Other | | | 11,203 | |
| | | | |
| Total assets | | | 11,772,767 | |
|
| |
| Liabilities | | | | |
| Options written, at value (premiums received $17,354) | | | 7,775 | |
| |
| Payables and other liabilities: | | | | |
| Shares of beneficial interest redeemed | | | 72,414 | |
| Investments purchased | | | 71,649 | |
| Shareholder communications | | | 9,933 | |
| Trustees’ compensation | | | 9,710 | |
| Distribution and service plan fees | | | 2,317 | |
| Other | | | 6,950 | |
| | | | |
| Total liabilities | | | 180,748 | |
| |
| Net Assets | | $ | 11,592,019 | |
| | | | |
|
| |
| Composition of Net Assets | | | | |
| Par value of shares of beneficial interest | | $ | 825 | |
| |
| Additional paid-in capital | | | 9,519,154 | |
| |
| Accumulated net investment income | | | 84,606 | |
| |
| Accumulated net realized gain on investments | | | 407,706 | |
| |
| Net unrealized appreciation on investments | | | 1,579,728 | |
| | | | |
| Net Assets | | $ | 11,592,019 | |
| | | | |
|
| |
| Net Asset Value Per Share | | | | |
| Non-Service Shares: | | | | |
| Net asset value, redemption price (excludes applicable contingent deferred sales charge) and offering price per share (based on net assets of $278,475 and 23,590 shares of beneficial interest outstanding) | | | $11.80 | |
| |
| Service Shares: | | | | |
| Net asset value, redemption price (excludes applicable contingent deferred sales charge) and offering price per share (based on net assets of $11,313,544 and 801,733 shares of beneficial interest outstanding) | | | $14.11 | |
See accompanying Notes to Financial Statements.
9 OPPENHEIMER EQUITY INCOME FUND/VA
STATEMENTOF OPERATIONS For the Six Months Ended June 30, 2014 Unaudited
| | | | |
| |
Investment Income | | | | |
| |
Dividends: | | | | |
Unaffiliated companies (net of foreign withholding taxes of $1,121) | | $ | 160,472 | |
Affiliated companies | | | 18 | |
| | | | |
Total investment income | | | 160,490 | |
|
| |
Expenses | | | | |
Management fees | | | 41,148 | |
| |
Distribution and service plan fees - Service shares | | | 13,418 | |
| |
Transfer and shareholder servicing agent fees: | | | | |
Non-Service shares | | | 119 | |
Service shares | | | 5,367 | |
| |
Shareholder communications: | | | | |
Non-Service shares | | | 142 | |
Service shares | | | 6,562 | |
| |
Custodian fees and expenses | | | 707 | |
| |
Trustees’ compensation | | | 4,885 | |
| |
Legal, auditing and other professional fees | | | 17,717 | |
| |
Other | | | 3,091 | |
| | | | |
Total expenses | | | 93,156 | |
Less waivers and reimbursements of expenses | | | (35,841) | |
| | | | |
Net expenses | | | 57,315 | |
|
| |
Net Investment Income | | | 103,175 | |
|
| |
Realized and Unrealized Gain | | | | |
Net realized gain on: | | | | |
Investments from unaffiliated companies (including premiums on options exercised) | | | 456,564 | |
Closing and expiration of option contracts written | | | 31,952 | |
| | | | |
Net realized gain | | | 488,516 | |
| |
Net change in unrealized appreciation/depreciation on: | | | | |
Investments | | | 308,826 | |
Option contracts written | | | 4,851 | |
| | | | |
Net change in unrealized appreciation/depreciation | | | 313,677 | |
|
| |
Net Increase in Net Assets Resulting from Operations | | $ | 905,368 | |
| | | | |
See accompanying Notes to Financial Statements.
10 OPPENHEIMER EQUITY INCOME FUND/VA
STATEMENTSOF CHANGES IN NET ASSETS
| | | | | | | | |
| | | Six Months Ended
June 30, 2014
(Unaudited) | | | Year Ended
December 31, 2013 | |
| |
Operations | | | | | | | | |
Net investment income | | $ | 103,175 | | | $ | 155,694 | |
| |
Net realized gain | | | 488,516 | | | | 1,528,329 | |
| |
Net change in unrealized appreciation/depreciation | | | 313,677 | | | | 491,763 | |
| | | | | | | | |
Net increase in net assets resulting from operations | | | 905,368 | | | | 2,175,786 | |
|
| |
Dividends and/or Distributions to Shareholders | | | | | | | | |
Dividends from net investment income: | | | | | | | | |
Non-Service shares | | | (4,861) | | | | (2,605) | |
Service shares | | | (162,231) | | | | (91,168) | |
| | | | |
| | | (167,092) | | | | (93,773) | |
|
| |
Distributions from net realized gain: | | | | | | | | |
Non-Service shares | | | (12,986) | | | | — | |
Service shares | | | (451,817) | | | | — | |
| | | | |
| | | (464,803) | | | | — | |
|
| |
Beneficial Interest Transactions | | | | | | | | |
Net increase in net assets resulting from beneficial interest transactions: | | | | | | | | |
Non-Service shares | | | 48,350 | | | | 26,808 | |
Service shares | | | 181,467 | | | | 1,928,572 | |
| | | | | | | | |
| | | 229,817 | | | | 1,955,380 | |
|
| |
Net Assets | | | | | | | | |
Total increase | | | 503,290 | | | | 4,037,393 | |
| |
Beginning of period | | | 11,088,729 | | | | 7,051,336 | |
| | | | | | | | |
| | |
End of period (including accumulated net investment income of $84,606 and $148,523, respectively) | | $ | 11,592,019 | | | $ | 11,088,729 | |
| | | | |
See accompanying Notes to Financial Statements.
11 OPPENHEIMER EQUITY INCOME FUND/VA
FINANCIAL HIGHLIGHTS
| | | | | | | | | | | | | | | | | | | | | | | | |
| Non-Service Shares | | Six Months Ended June 30, 2014 (Unaudited) | | | Year Ended December 31, 2013 | | | Year Ended December 31, 2012 | | | Year Ended December 30, 20111 | | | Year Ended December 31, 2010 | | | Year Ended December 31, 2009 | |
| |
Per Share Operating Data | | | | | | | | | | | | | | | | | | | | | | | | |
Net asset value, beginning of period | | $ | 11.64 | | | $ | 9.15 | | | $ | 8.00 | | | $ | 8.49 | | | $ | 7.22 | | | $ | 4.99 | |
| |
Income (loss) from investment operations: | | | | | | | | | | | | | | | | | | | | | | | | |
Net investment income2 | | | 0.12 | | | | 0.21 | | | | 0.16 | | | | 0.15 | | | | 0.11 | | | | 0.11 | |
Net realized and unrealized gain (loss) | | | 0.85 | | | | 2.42 | | | | 1.11 | | | | (0.56) | | | | 1.24 | | | | 2.14 | |
| | | | |
Total from investment operations | | | 0.97 | | | | 2.63 | | | | 1.27 | | | | (0.41) | | | | 1.35 | | | | 2.25 | |
| |
Dividends and/or distributions to shareholders: | | | | | | | | | | | | | | | | | | | | | | | | |
Dividends from net investment income | | | (0.22) | | | | (0.14) | | | | (0.12) | | | | (0.08) | | | | (0.08) | | | | (0.02) | |
Distributions from net realized gain | | | (0.59) | | | | 0.00 | | | | 0.00 | | | | 0.00 | | | | 0.00 | | | | 0.00 | |
| | | | |
Total dividends and/or distributions to shareholders | | | (0.81) | | | | (0.14) | | | | (0.12) | | | | (0.08) | | | | (0.08) | | | | (0.02) | |
| |
Net asset value, end of period | | $ | 11.80 | | | $ | 11.64 | | | $ | 9.15 | | | $ | 8.00 | | | $ | 8.49 | | | $ | 7.22 | |
| | | | |
|
| |
Total Return, at Net Asset Value3 | | | 8.41% | | | | 28.93% | | | | 16.08% | | | | (4.93)% | | | | 18.85% | | | | 45.08% | |
|
| |
Ratios/Supplemental Data | | | | | | | | | | | | | | | | | | | | | | | | |
Net assets, end of period (in thousands) | | $ | 278 | | | $ | 227 | | | $ | 154 | | | $ | 104 | | | $ | 92 | | | $ | 38 | |
| |
Average net assets (in thousands) | | $ | 242 | | | $ | 195 | | | $ | 132 | | | $ | 101 | | | $ | 57 | | | $ | 20 | |
| |
Ratios to average net assets:4 | | | | | | | | | | | | | | | | | | | | | | | | |
Net investment income | | | 2.11% | | | | 2.00% | | | | 1.82% | | | | 1.78% | | | | 1.46% | | | | 1.75% | |
Total expenses5 | | | 1.44% | | | | 1.64% | | | | 1.75% | | | | 1.83% | | | | 2.05% | | | | 2.30% | |
Expenses after payments, waivers and/or reimbursements and reduction to custodian expenses | | | 0.79% | | | | 0.80% | | | | 0.80% | | | | 0.80% | | | | 0.57% | | | | 0.85% | |
| |
Portfolio turnover rate | | | 21% | | | | 159% | | | | 87% | | | | 86% | | | | 109% | | | | 122% | |
1. December 30, 2011 represents the last business day of the Fund’s reporting period.
2. Per share amounts calculated based on the average shares outstanding during the period.
3. Assumes an initial investment on the business day before the first day of the fiscal period, with all dividends and distributions reinvested in additional shares on the reinvestment date, and redemption at the net asset value calculated on the last business day of the fiscal period. Total returns are not annualized for periods less than one full year. Total return information does not reflect expenses that apply at the separate account level or to related insurance products. Inclusion of these charges would reduce the total return figures for all periods shown. Returns do not reflect the deduction of taxes that a shareholder would pay on fund distributions or the redemption of fund shares.
4. Annualized for periods less than one full year.
5. Total expenses including indirect expenses from affiliated fund were as follows:
| | | | | | |
| | Six Months Ended June 30, 2014 | | | 1.44 | % |
| | Year Ended December 31, 2013 | | | 1.64 | % |
| | Year Ended December 31, 2012 | | | 1.75 | % |
| | Year Ended December 30, 2011 | | | 1.83 | % |
| | Year Ended December 31, 2010 | | | 2.05 | % |
| | Year Ended December 31, 2009 | | | 2.31 | % |
See accompanying Notes to Financial Statements.
12 OPPENHEIMER EQUITY INCOME FUND/VA
FINANCIAL HIGHLIGHTS Continued
| | | | | | | | | | | | | | | | | | | | | | | | |
| Service Shares | | Six Months Ended June 30, 2014 (Unaudited) | | | Year Ended
December 31, 2013 | | | Year Ended
December 31, 2012 | | | Year Ended
December 30, 20111 | | | Year Ended
December 31, 2010 | | | Year Ended
December 31, 2009 | |
| |
Per Share Operating Data | | | | | | | | | | | | | | | | | | | | | | | | |
Net asset value, beginning of period | | $ | 13.78 | | | $ | 10.83 | | | $ | 9.69 | | | $ | 10.23 | | | $ | 8.99 | | | $ | 6.79 | |
| |
Income (loss) from investment operations: | | | | | | | | | | | | | | | | | | | | | | | | |
Net investment income2 | | | 0.13 | | | | 0.22 | | | | 0.13 | | | | 0.11 | | | | 0.08 | | | | 0.09 | |
Net realized and unrealized gain (loss) | | | 1.00 | | | | 2.87 | | | | 1.13 | | | | (0.56) | | | | 1.24 | | | | 2.12 | |
| | | | |
Total from investment operations | | | 1.13 | | | | 3.09 | | | | 1.26 | | | | (0.45) | | | | 1.32 | | | | 2.21 | |
| |
Dividends and/or distributions to shareholders: | | | | | | | | | | | | | | | | | | | | | | | | |
Dividends from net investment income | | | (0.21) | | | | (0.14) | | | | (0.12) | | | | (0.09) | | | | (0.08) | | | | (0.01) | |
Distributions from net realized gain | | | (0.59) | | | | 0.00 | | | | 0.00 | | | | 0.00 | | | | 0.00 | | | | 0.00 | |
| | | | |
Total dividends and/or distributions to shareholders | | | (0.80) | | | | (0.14) | | | | (0.12) | | | | (0.09) | | | | (0.08) | | | | (0.01) | |
| |
Net asset value, end of period | | $ | 14.11 | | | $ | 13.78 | | | $ | 10.83 | | | $ | 9.69 | | | $ | 10.23 | | | $ | 8.99 | |
| | | | |
|
| |
Total Return, at Net Asset Value3 | | | 8.27% | | | | 28.70% | | | | 13.09% | | | | (4.48)% | | | | 14.81% | | | | 32.57% | |
|
| |
Ratios/Supplemental Data | | | | | | | | | | | | | | | | | | | | | | | | |
Net assets, end of period (in thousands) | | $ | 11,314 | | | $ | 10,862 | | | $ | 6,897 | | | $ | 6,885 | | | $ | 7,311 | | | $ | 7,505 | |
| |
Average net assets (in thousands) | | $ | 10,883 | | | $ | 8,549 | | | $ | 7,095 | | | $ | 7,449 | | | $ | 7,008 | | | $ | 5,501 | |
| |
Ratios to average net assets:4 | | | | | | | | | | | | | | | | | | | | | | | | |
Net investment income | | | 1.86% | | | | 1.78% | | | | 1.26% | | | | 1.08% | | | | 0.85% | | | | 1.10% | |
Total expenses5 | | | 1.69% | | | | 1.89% | | | | 1.93% | | | | 1.90% | | | | 2.08% | | | | 2.17% | |
Expenses after payments, waivers and/or reimbursements and reduction to custodian expenses | | | 1.04% | | | | 1.05% | | | | 1.04% | | | | 1.05% | | | | 0.93% | | | | 1.15% | |
| |
Portfolio turnover rate | | | 21% | | | | 159% | | | | 87% | | | | 86% | | | | 109% | | | | 122% | |
1. December 30, 2011 represents the last business day of the Fund’s reporting period.
2. Per share amounts calculated based on the average shares outstanding during the period.
3. Assumes an initial investment on the business day before the first day of the fiscal period, with all dividends and distributions reinvested in additional shares on the reinvestment date, and redemption at the net asset value calculated on the last business day of the fiscal period. Total returns are not annualized for periods less than one full year. Total return information does not reflect expenses that apply at the separate account level or to related insurance products. Inclusion of these charges would reduce the total return figures for all periods shown. Returns do not reflect the deduction of taxes that a shareholder would pay on fund distributions or the redemption of fund shares.
4. Annualized for periods less than one full year.
5. Total expenses including indirect expenses from affiliated fund were as follows:
| | | | | | |
| | Six Months Ended June 30, 2014 | | | 1.69 | % |
| | Year Ended December 31, 2013 | | | 1.89 | % |
| | Year Ended December 31, 2012 | | | 1.93 | % |
| | Year Ended December 30, 2011 | | | 1.90 | % |
| | Year Ended December 31, 2010 | | | 2.08 | % |
| �� | Year Ended December 31, 2009 | | | 2.18 | % |
See accompanying Notes to Financial Statements.
13 OPPENHEIMER EQUITY INCOME FUND/VA
NOTESTO FINANCIAL STATEMENTS June 30, 2014 Unaudited
1. Significant Accounting Policies
Oppenheimer Equity Income Fund/VA (the “Fund”), is a separate series of Oppenheimer Variable Account Funds, a diversified open-end management investment company registered under the Investment Company Act of 1940, as amended. The Fund’s investment objective is to seek total return. The Fund’s investment adviser is OFI Global Asset Management, Inc. (“OFI Global” or the “Manager”), a wholly-owned subsidiary of OppenheimerFunds, Inc. (“OFI” or the “Sub-Adviser”). The Manager has entered into a sub-advisory agreement with OFI. Shares of the Fund are sold only to separate accounts of life insurance companies.
The Fund offers two classes of shares. Both classes are sold at their offering price, which is the net asset value per share, to separate investment accounts of participating insurance companies as an underlying investment for variable life insurance policies, variable annuity contracts or other investment products. The class of shares designated as Service shares is subject to a distribution and service plan. Both classes of shares have identical rights and voting privileges with respect to the Fund in general and exclusive voting rights on matters that affect that class alone. Earnings, net assets and net asset value per share may differ due to each class having its own expenses, such as transfer and shareholder servicing agent fees and shareholder communications, directly attributable to that class.
The following is a summary of significant accounting policies consistently followed by the Fund.
Credit Risk. The Fund invests in high-yield, non-investment-grade bonds, which may be subject to a greater degree of credit risk. Credit risk relates to the ability of the issuer to meet interest or principal payments or both as they become due. The Fund may acquire securities that have missed an interest payment, and is not obligated to dispose of securities whose issuers or underlying obligors subsequently miss an interest payment. Information concerning securities not accruing interest as of June 30, 2014 is as follows:
| | | | | | |
Cost | | | $48,696 | | | |
Market value | | | $51,187 | | | |
Market value as % of Net Assets | | | 0.44% | | | |
Investment in Oppenheimer Institutional Money Market Fund. The Fund is permitted to invest daily available cash balances in an affiliated money market fund. The Fund may invest the available cash in Class E shares of Oppenheimer Institutional Money Market Fund (“IMMF”) to seek current income while preserving liquidity. IMMF is a registered open-end management investment company, regulated as a money market fund under the Investment Company Act of 1940, as amended. The Manager is the investment adviser of IMMF, and the Sub-Adviser provides investment and related advisory services to IMMF. When applicable, the Fund’s investment in IMMF is included in the Statement of Investments. Shares of IMMF are valued at their net asset value per share. As a shareholder, the Fund is subject to its proportional share of IMMF’s Class E expenses, including its management fee. The Manager will waive fees and/or reimburse Fund expenses in an amount equal to the indirect management fees incurred through the Fund’s investment in IMMF.
Foreign Currency Translation. The Fund’s accounting records are maintained in U.S. dollars. The values of securities denominated in foreign currencies and amounts related to the purchase and sale of foreign securities and foreign investment income are translated into U.S. dollars as of the close of the New York Stock Exchange (the “Exchange”), normally 4:00 P.M. Eastern time, on each day the Exchange is open for trading. Foreign exchange rates may be valued primarily using a reliable bank, dealer or service authorized by the Board of Trustees.
Reported net realized gains and losses from foreign currency transactions arise from sales of portfolio securities, sales and maturities of short-term securities, sales of foreign currencies, exchange rate fluctuations between the trade and settlement dates on securities transactions, and the difference between the amounts of dividends, interest, and foreign withholding taxes recorded on the Fund’s books and the U.S. dollar equivalent of the amounts actually received or paid. Net unrealized appreciation and depreciation on the translation of assets and liabilities denominated in foreign currencies arise from changes in the values of assets and liabilities, including investments in securities at fiscal period end, resulting from changes in exchange rates.
The effect of changes in foreign currency exchange rates on investments is separately identified from the fluctuations arising from changes in market values of securities held and reported with all other foreign currency gains and losses in the Fund’s Statement of Operations.
Allocation of Income, Expenses, Gains and Losses. Income, expenses (other than those attributable to a specific class), gains and losses are allocated on a daily basis to each class of shares based upon the relative proportion of net assets represented by such class. Operating expenses directly attributable to a specific class are charged against the operations of that class.
Federal Taxes. The Fund intends to comply with provisions of the Internal Revenue Code applicable to regulated investment companies and to distribute substantially all of its investment company taxable income to shareholders. Therefore, no federal income or excise tax provision is required. The Fund files income tax returns in U.S. federal and applicable state jurisdictions. The statute of limitations on the Fund’s tax return filings generally remain open for the three preceding fiscal reporting period ends.
During the fiscal year ended December 31, 2013, the Fund utilized $973,499 capital loss carryforward to offset capital gains realized in that fiscal year.
Net investment income (loss) and net realized gain (loss) may differ for financial statement and tax purposes. The character of dividends and distributions made during the fiscal year from net investment income or net realized gains may differ from their ultimate characterization for federal income tax purposes. Also, due to timing of dividends and distributions, the fiscal year in which amounts are distributed may differ from the fiscal year in which the income or net realized gain was recorded by the Fund.
The aggregate cost of securities and other investments and the composition of unrealized appreciation and depreciation of securities and other investments for federal income tax purposes as of June 30, 2014 are noted in the following table. The primary difference between book and tax
14 OPPENHEIMER EQUITY INCOME FUND/VA
|
|
|
|
| 1. Significant Accounting Policies (Continued) |
appreciation or depreciation of securities and other investments, if applicable, is attributable to the tax deferral of losses or tax realization of financial statement unrealized gain or loss.
| | | | |
Federal tax cost of securities | | $ | 10,163,119 | |
Federal tax cost of other investments | | | (17,353) | |
| | | | |
Total federal tax cost | | $ | 10,145,766 | |
| | | | |
Gross unrealized appreciation | | $ | 1,616,897 | |
Gross unrealized depreciation | | | (108,659) | |
| | | | |
Net unrealized appreciation | | $ | 1,508,238 | |
| | | | |
Trustees’ Compensation. The Board of Trustees has adopted a compensation deferral plan for independent trustees that enables trustees to elect to defer receipt of all or a portion of the annual compensation they are entitled to receive from the Fund. For purposes of determining the amount owed to the Trustee under the plan, deferred amounts are treated as though equal dollar amounts had been invested in shares of the Fund or in other Oppenheimer funds selected by the Trustee. The Fund purchases shares of the funds selected for deferral by the Trustee in amounts equal to his or her deemed investment, resulting in a Fund asset equal to the deferred compensation liability. Such assets are included as a component of “Other” within the asset section of the Statement of Assets and Liabilities. Deferral of trustees’ fees under the plan will not affect the net assets of the Fund, and will not materially affect the Fund’s assets, liabilities or net investment income per share. Amounts will be deferred until distributed in accordance with the compensation deferral plan.
Dividends and Distributions to Shareholders. Dividends and distributions to shareholders, which are determined in accordance with income tax regulations and may differ from U.S. generally accepted accounting principles, are recorded on the ex-dividend date. Income and capital gain distributions, if any, are declared and paid annually or at other times as deemed necessary by the Manager. The tax character of distributions is determined as of the Fund’s fiscal year end. Therefore, a portion of the Fund’s distributions made to shareholders prior to the Fund’s fiscal year end may ultimately be categorized as a tax return of capital.
Investment Income. Dividend income is recorded on the ex-dividend date or upon ex-dividend notification in the case of certain foreign dividends where the ex-dividend date may have passed. Non-cash dividends included in dividend income, if any, are recorded at the fair market value of the securities received. Interest income is recognized on an accrual basis. Discount and premium, which are included in interest income on the Statement of Operations, are amortized or accreted daily.
Custodian Fees. “Custodian fees and expenses” in the Statement of Operations may include interest expense incurred by the Fund on any cash overdrafts of its custodian account during the period. Such cash overdrafts may result from the effects of failed trades in portfolio securities and from cash outflows resulting from unanticipated shareholder redemption activity. The Fund pays interest to its custodian on such cash overdrafts, to the extent they are not offset by positive cash balances maintained by the Fund, at a rate equal to the Federal Funds Rate plus 0.50%. The “Reduction to custodian expenses” line item, if applicable, represents earnings on cash balances maintained by the Fund during the period. Such interest expense and other custodian fees may be paid with these earnings.
Security Transactions. Security transactions are recorded on the trade date. Realized gains and losses on securities sold are determined on the basis of identified cost.
Indemnifications. The Fund’s organizational documents provide current and former trustees and officers with a limited indemnification against liabilities arising in connection with the performance of their duties to the Fund. In the normal course of business, the Fund may also enter into contracts that provide general indemnifications. The Fund’s maximum exposure under these arrangements is unknown as this would be dependent on future claims that may be made against the Fund. The risk of material loss from such claims is considered remote.
Other. The preparation of financial statements in conformity with accounting principles generally accepted in the United States of America requires management to make estimates and assumptions that affect the reported amounts of assets and liabilities and disclosure of contingent assets and liabilities at the date of the financial statements and the reported amounts of increases and decreases in net assets from operations during the reporting period. Actual results could differ from those estimates.
2. Securities Valuation
The Fund calculates the net asset value of its shares as of the close of the New York Stock Exchange (the “Exchange”), normally 4:00 P.M. Eastern time, on each day the Exchange is open for trading.
The Fund’s Board has adopted procedures for the valuation of the Fund’s securities and has delegated the day-to-day responsibility for valuation determinations under those procedures to the Manager. The Manager has established a Valuation Committee which is responsible for determining a “fair valuation” for any security for which market quotations are not “readily available.” The Valuation Committee’s fair valuation determinations are subject to review, approval and ratification by the Fund’s Board at its next regularly scheduled meeting covering the calendar quarter in which the fair valuation was determined.
15 OPPENHEIMER EQUITY INCOME FUND/VA
|
|
| NOTES TO FINANCIAL STATEMENTS Unaudited / Continued |
|
| 2. Securities Valuation (Continued) |
Valuation Methods and Inputs
Securities are valued using unadjusted quoted market prices, when available, as supplied primarily by third party pricing services or dealers.
The following methodologies are used to determine the market value or the fair value of the types of securities described below:
Securities traded on a registered U.S. securities exchange (including exchange-traded derivatives other than futures and futures options) are valued based on the last sale price of the security reported on the principal exchange on which it is traded, prior to the time when the Fund’s assets are valued. In the absence of a sale, the security is valued at the last sale price on the prior trading day, if it is within the spread of the current day’s closing “bid” and “asked” prices, and if not, at the current day’s closing bid price. A security of a foreign issuer traded on a foreign exchange, but not listed on a registered U.S. securities exchange, is valued based on the last sale price on the principal exchange on which the security is traded, as identified by the third party pricing service used by the Manager, prior to the time when the Fund’s assets are valued. If the last sale price is unavailable, the security is valued at the most recent official closing price on the principal exchange on which it is traded. If the last sales price or official closing price for a foreign security is not available, the security is valued at the mean between the bid and asked price per the exchange or, if not available from the exchange, obtained from two dealers. If bid and asked prices are not available from either the exchange or two dealers, the security is valued by using one of the following methodologies (listed in order of priority): (1) using a bid from the exchange, (2) the mean between the bid and asked price as provided by a single dealer, or (3) a bid from a single dealer.
Shares of a registered investment company that are not traded on an exchange are valued at that investment company’s net asset value per share.
Corporate and government debt securities (of U.S. or foreign issuers) and municipal debt securities, event-linked bonds, loans, mortgage-backed securities, collateralized mortgage obligations, and asset-backed securities are valued at the mean between the “bid” and “asked” prices utilizing evaluated prices obtained from third party pricing services or broker-dealers who may use matrix pricing methods to determine the evaluated prices.
Short-term money market type debt securities with a remaining maturity of sixty days or less are valued at cost adjusted by the amortization of discount or premium to maturity (amortized cost), which approximates market value. Short-term debt securities with a remaining maturity in excess of sixty days are valued at the mean between the “bid” and “asked” prices utilizing evaluated prices obtained from third party pricing services or broker-dealers.
A description of the standard inputs that may generally be considered by the third party pricing vendors in determining their evaluated prices is provided below.
| | |
| Security Type | | Standard inputs generally considered by third-party pricing vendors |
| Corporate debt, government debt, municipal, mortgage-backed and asset-backed securities | | Reported trade data, broker-dealer price quotations, benchmark yields, issuer spreads on comparable securities, the credit quality, yield, maturity, and other appropriate factors. |
| Loans | | Information obtained from market participants regarding reported trade data and broker-dealer price quotations. |
| Event-linked bonds | | Information obtained from market participants regarding reported trade data and broker-dealer price quotations. |
If a market value or price cannot be determined for a security using the methodologies described above, or if, in the “good faith” opinion of the Manager, the market value or price obtained does not constitute a “readily available market quotation,” or a significant event has occurred that would materially affect the value of the security the security is fair valued either (i) by a standardized fair valuation methodology applicable to the security type or the significant event as previously approved by the Valuation Committee and the Fund’s Board or (ii) as determined in good faith by the Manager’s Valuation Committee. The Valuation Committee considers all relevant facts that are reasonably available, through either public information or information available to the Manager, when determining the fair value of a security. Fair value determinations by the Manager are subject to review, approval and ratification by the Fund’s Board at its next regularly scheduled meeting covering the calendar quarter in which the fair valuation was determined. Those fair valuation standardized methodologies include, but are not limited to, valuing securities at the last sale price or initially at cost and subsequently adjusting the value based on: changes in company specific fundamentals, changes in an appropriate securities index, or changes in the value of similar securities which may be further adjusted for any discounts related to security-specific resale restrictions. When possible, such methodologies use observable market inputs such as unadjusted quoted prices of similar securities, observable interest rates, currency rates and yield curves. The methodologies used for valuing securities are not necessarily an indication of the risks associated with investing in those securities nor can it be assured that the Fund can obtain the fair value assigned to a security if it were to sell the security.
To assess the continuing appropriateness of security valuations, the Manager, or its third party service provider who is subject to oversight by the Manager, regularly compares prior day prices, prices on comparable securities, and sale prices to the current day prices and challenges those prices exceeding certain tolerance levels with the third party pricing service or broker source. For those securities valued by fair valuations, whether through a standardized fair valuation methodology or a fair valuation determination, the Valuation Committee reviews and affirms the reasonableness of the valuations based on such methodologies and fair valuation determinations on a regular basis after considering all relevant information that is reasonably available.
Classifications
Each investment asset or liability of the Fund is assigned a level at measurement date based on the significance and source of the inputs to its valuation. Various data inputs are used in determining the value of each of the Fund’s investments as of the reporting period end. These data inputs are categorized in the following hierarchy under applicable financial accounting standards:
1) Level 1-unadjusted quoted prices in active markets for identical assets or liabilities (including securities actively traded on a securities exchange)
16 OPPENHEIMER EQUITY INCOME FUND/VA
|
|
|
|
| 2. Securities Valuation (Continued) |
2) Level 2-inputs other than unadjusted quoted prices that are observable for the asset or liability (such as unadjusted quoted prices for similar assets and market corroborated inputs such as interest rates, prepayment speeds, credit risks, etc.)
3) Level 3-significant unobservable inputs (including the Manager’s own judgments about assumptions that market participants would use in pricing the asset or liability).
The inputs used for valuing securities are not necessarily an indication of the risks associated with investing in those securities.
The table below categorizes amounts that are included in the Fund’s Statement of Assets and Liabilities as of June 30, 2014 based on valuation input level:
| | | | | | | | | | | | | | | | |
| | | Level 1— Unadjusted Quoted Prices | | | Level 2— Other Significant Observable Inputs | | | Level 3— Significant Unobservable Inputs | | | Value | |
| |
Assets Table | |
Investments, at Value: | |
Common Stocks | | | | | | | | | | | | | | | | |
Consumer Discretionary | | $ | 1,699,890 | | | $ | — | | | $ | — | | | $ | 1,699,890 | |
Consumer Staples | | | 480,468 | | | | — | | | | — | | | | 480,468 | |
Energy | | | 1,361,488 | | | | — | | | | — | | | | 1,361,488 | |
Financials | | | 2,751,189 | | | | — | | | | — | | | | 2,751,189 | |
Health Care | | | 830,963 | | | | — | | | | — | | | | 830,963 | |
Industrials | | | 451,927 | | | | — | | | | — | | | | 451,927 | |
Information Technology | | | 874,762 | | | | — | | | | — | | | | 874,762 | |
Materials | | | 641,521 | | | | — | | | | — | | | | 641,521 | |
Telecommunication Services | | | 652,466 | | | | — | | | | — | | | | 652,466 | |
Utilities | | | 293,853 | | | | — | | | | — | | | | 293,853 | |
Preferred Stocks | | | 176,502 | | | | 116,220 | | | | — | | | | 292,722 | |
Non-Convertible Corporate Bonds and Notes | | | — | | | | 103,181 | | | | — | | | | 103,181 | |
Convertible Corporate Bonds and Notes | | | — | | | | 943,872 | | | | — | | | | 943,872 | |
Structured Securities | | | — | | | | 233,600 | | | | — | | | | 233,600 | |
Exchange-Traded Options Purchased | | | 1,045 | | | | — | | | | — | | | | 1,045 | |
Investment Company | | | 48,832 | | | | — | | | | — | | | | 48,832 | |
| | | | |
Total Assets | | $ | 10,264,906 | | | $ | 1,396,873 | | | $ | — | | | $ | 11,661,779 | |
| | | | |
| | | | |
Liabilities Table | | | | | | | | | | | | | | | | |
Other Financial Instruments: | | | | | | | | | | | | | | | | |
Options written, at value | | $ | — | | | $ | (7,775) | | | $ | — | | | $ | (7,775) | |
| | | | |
Total Liabilities | | $ | — | | | $ | (7,775) | | | $ | — | | | $ | (7,775) | |
| | | | |
Foreign currency exchange contracts and futures contracts, if any, are reported at their unrealized appreciation/ depreciation at measurement date, which represents the change in the contract’s value from trade date. All additional assets and liabilities included in the above table are reported at their market value at measurement date.
3. Shares of Beneficial Interest
The Fund has authorized an unlimited number of $0.001 par value shares of beneficial interest of each class. Transactions in shares of beneficial interest were as follows:
| | | | | | | | | | | | | | | | |
| | | Six Months Ended June 30, 2014 | | | Year Ended December 31, 2013 | |
| | | Shares | | | Amount | | | Shares | | | Amount | |
| |
Non-Service Shares | | | | | | | | | | | | | | | | |
Sold | | | 3,736 | | | $ | 44,466 | | | | 4,307 | | | $ | 45,267 | |
Dividends and/or distributions reinvested | | | 1,525 | | | | 17,847 | | | | 247 | | | | 2,605 | |
Redeemed | | | (1,190 | ) | | | (13,963 | ) | | | (1,926 | ) | | | (21,064) | |
| | | | |
Net increase | | | 4,071 | | | $ | 48,350 | | | | 2,628 | | | $ | 26,808 | |
| | | | |
| | | | | | | | | | | | | | | | |
| |
Service Shares | | | | | | | | | | | | | | | | |
Sold | | | 25,314 | | | $ | 352,155 | | | | 274,115 | | | $ | 3,450,352 | |
Dividends and/or distributions reinvested | | | 43,892 | | | | 614,048 | | | | 7,299 | | | | 91,168 | |
Redeemed | | | (55,840 | ) | | | (784,736 | ) | | | (129,769 | ) | | | (1,612,948) | |
| | | | |
Net increase | | | 13,366 | | | $ | 181,467 | | | | 151,645 | | | $ | 1,928,572 | |
| | | | |
4. Purchases and Sales of Securities
The aggregate cost of purchases and proceeds from sales of securities, other than short-term obligations and investments in IMMF, for the six months ended June 30, 2014 were as follows:
| | | | | | | | |
| | | Purchases | | | Sales | |
| |
Investment securities | | | $2,318,616 | | | | $2,529,033 | |
17 OPPENHEIMER EQUITY INCOME FUND/VA
|
|
| NOTES TO FINANCIAL STATEMENTS Unaudited / Continued |
5. Fees and Other Transactions with Affiliates
Management Fees. Under the investment advisory agreement, the Fund pays the Manager a management fee based on the daily net assets of the Fund at an annual rate as shown in the following table:
| | | | | | |
| Fee Schedule | | | | | |
Up to $200 million | | | 0.75 | % | | |
Next $200 million | | | 0.72 | | | |
Next $200 million | | | 0.69 | | | |
Next $200 million | | | 0.66 | | | |
Over $800 million | | | 0.60 | | | |
Sub-Adviser Fees. The Manager has retained the Sub-Adviser to provide the day-to-day portfolio management of the Fund. Under the Sub-Advisory Agreement, the Manager pays the Sub-Adviser an annual fee in monthly installments, equal to a percentage of the investment management fee collected by the Manager from the Fund, which shall be calculated after any investment management fee waivers. The fee paid to the Sub-Adviser is paid by the Manager, not by the Fund.
Transfer Agent Fees. OFI Global (the “Transfer Agent”) serves as the transfer and shareholder servicing agent for the Fund. The Fund pays the Transfer Agent a fee based on annual net assets. Fees incurred and average net assets for each class with respect to these services are detailed in the Statement of Operations and Financial Highlights, respectively.
Sub-Transfer Agent Fees. The Transfer Agent has retained Shareholder Services, Inc., a wholly-owned subsidiary of OFI (the “Sub-Transfer Agent”), to provide the day-to-day transfer agent and shareholder servicing of the Fund. Under the Sub-Transfer Agency Agreement, the Transfer Agent pays the Sub-Transfer Agent an annual fee in monthly installments, equal to a percentage of the transfer agent fee collected by the Transfer Agent from the Fund, which shall be calculated after any applicable fee waivers. The fee paid to the Sub-Transfer Agent is paid by the Transfer Agent, not by the Fund.
Distribution and Service Plan for Service Shares. The Fund has adopted a Distribution and Service Plan (the “Plan”) in accordance with Rule 12b-1 under the Investment Company Act of 1940 for Service shares to pay OppenheimerFunds Distributor, Inc. (the “Distributor”), for distribution related services, personal service and account maintenance for the Fund’s Service shares. Under the Plan, payments are made periodically at an annual rate of 0.25% of the daily net assets of Service shares of the Fund. The Distributor currently uses all of those fees to compensate sponsors of the insurance product that offers Fund shares, for providing personal service and maintenance of accounts of their variable contract owners that hold Service shares. These fees are paid out of the Fund’s assets on an on-going basis and increase operating expenses of the Service shares, which results in lower performance compared to the Fund’s shares that are not subject to a service fee. Fees incurred by the Fund under the Plan are detailed in the Statement of Operations.
Waivers and Reimbursements of Expenses. The Manager has contractually agreed to limit the Fund’s expenses after payments, waivers and/or reimbursements and reduction to custodian expenses, excluding expenses incurred directly or indirectly by the Fund as a result of investments in other investment companies, wholly-owned subsidiaries and pooled investment vehicles; so that those expenses, as percentages of daily net assets, will not exceed the annual rate of 0.80% for Non-Service shares and 1.05% for Service shares. During the six months ended June 30, 2014, the Manager waived fees and/or reimbursed the Fund $776 and $35,042 for Non-Service and Service shares, respectively.
The Manager will waive fees and/or reimburse Fund expenses in an amount equal to the indirect management fees incurred through the Fund’s investment in IMMF. During the six months ended June 30, 2014, the Manager waived fees and/or reimbursed the Fund $23 for IMMF management fees.
Some of these undertakings may be modified or terminated at any time; some may not be modified or terminated until after one year from the date of the current prospectus, as indicated therein.
6. Risk Exposures and the Use of Derivative Instruments
The Fund’s investment objectives not only permits the Fund to purchase investment securities, they also allows the Fund to enter into various types of derivatives contracts, including, but not limited to, futures contracts, forward currency exchange contracts, credit default swaps, interest rate swaps, total return swaps, variance swaps and purchased and written options. In doing so, the Fund will employ strategies in differing combinations to permit it to increase, decrease, or change the level or types of exposure to market risk factors. These instruments may allow the Fund to pursue its objectives more quickly and efficiently than if it were to make direct purchases or sales of securities capable of effecting a similar response to market factors. Such contracts may be entered into through a bilateral over-the-counter (“OTC”) transaction, or through a securities or futures exchange and cleared through a clearinghouse.
Market Risk Factors. In accordance with its investment objectives, the Fund may use derivatives to increase or decrease its exposure to one or more of the following market risk factors:
Commodity Risk. Commodity risk relates to the change in value of commodities or commodity indexes as they relate to increases or decreases in the commodities market. Commodities are physical assets that have tangible properties. Examples of these types of assets are crude oil, heating oil, metals, livestock, and agricultural products.
18 OPPENHEIMER EQUITY INCOME FUND/VA
|
|
|
|
| 6. Risk Exposures and the Use of Derivative Instruments (Continued) |
Credit Risk. Credit risk relates to the ability of the issuer to meet interest and principal payments, or both, as they come due. In general, lower-grade, higher-yield bonds are subject to credit risk to a greater extent than lower-yield, higher-quality bonds.
Equity Risk. Equity risk relates to the change in value of equity securities as they relate to increases or decreases in the general market.
Foreign Exchange Rate Risk. Foreign exchange rate risk relates to the change in the U.S. dollar value of a security held that is denominated in a foreign currency. The U.S. dollar value of a foreign currency denominated security will decrease as the dollar appreciates against the currency, while the U.S. dollar value will increase as the dollar depreciates against the currency.
Interest Rate Risk. Interest rate risk refers to the fluctuations in value of fixed-income securities resulting from the inverse relationship between price and yield. For example, an increase in general interest rates will tend to reduce the market value of already issued fixed-income investments, and a decline in general interest rates will tend to increase their value. In addition, debt securities with longer maturities, which tend to have higher yields, are subject to potentially greater fluctuations in value from changes in interest rates than obligations with shorter maturities.
Volatility Risk. Volatility risk refers to the magnitude of the movement, but not the direction of the movement, in a financial instrument’s price over a defined time period. Large increases or decreases in a financial instrument’s price over a relative time period typically indicate greater volatility risk, while small increases or decreases in its price typically indicate lower volatility risk.
Derivatives may have little or no initial cash investment relative to their market value exposure and therefore can produce significant gains or losses in excess of their cost due to unanticipated changes in the market risk factors and the overall market. This use of embedded leverage allows the Fund to increase its market value exposure relative to its net assets and can substantially increase the volatility of the Fund’s performance. In instances where the Fund is using derivatives to decrease, or hedge, exposures to market risk factors for securities held by the Fund, there are also risks that those derivatives may not perform as expected resulting in losses for the combined or hedged positions. Some derivatives have the potential for unlimited loss, regardless of the size of the Fund’s initial investment.
Additional associated risks from investing in derivatives also exist and potentially could have significant effects on the valuation of the derivative and the Fund. Typically, the associated risks are not the risks that the Fund is attempting to increase or decrease exposure to, per its investment objectives, but are the additional risks from investing in derivatives. Examples of these associated risks are liquidity risk, which is the risk that the Fund will not be able to sell the derivative in the open market in a timely manner, and counterparty credit risk, which is the risk that the counterparty will not fulfill its obligation to the Fund.
The Fund’s actual exposures to these market risk factors and associated risks during the period are discussed in further detail, by derivative type, below.
Option Activity
The Fund may buy and sell put and call options, or write put and call options. When an option is written, the Fund receives a premium and becomes obligated to sell or purchase the underlying security, currency or other underlying financial instrument at a fixed price, upon exercise of the option.
Options can be traded through an exchange or through a privately negotiated arrangement with a dealer in an OTC transaction. Options traded through an exchange are generally cleared through a clearinghouse (such as The Options Clearing Corporation). The difference between the premium received or paid, and market value of the option, is recorded as unrealized appreciation or depreciation. The net change in unrealized appreciation or depreciation is reported in the Statement of Operations. When an option is exercised, the cost of the security purchased or the proceeds of the security sale are adjusted by the amount of premium received or paid. Upon the expiration or closing of the option transaction, a gain or loss is reported in the Statement of Operations.
The Fund has purchased call options on individual equity securities and/or equity indexes to increase exposure to equity risk. A purchased call option becomes more valuable as the price of the underlying financial instrument appreciates relative to the strike price.
The Fund has purchased put options on individual equity securities and/or equity indexes to decrease exposure to equity risk. A purchased put option becomes more valuable as the price of the underlying financial instrument depreciates relative to the strike price.
During the six months ended June 30, 2014, the Fund had an ending monthly average market value of $340 on purchased put options.
Options written, if any, are reported in a schedule following the Statement of Investments and as a liability in the Statement of Assets and Liabilities. Securities held in collateral accounts to cover potential obligations with respect to outstanding written options are noted in the Statement of Investments.
The risk in writing a call option is that the market price of the security increases and if the option is exercised, the Fund must either purchase the security at a higher price for delivery or, if the Fund owns the underlying security, give up the opportunity for profit. The risk in writing a put option is that the Fund may incur a loss if the market price of the security decreases and the option is exercised. The risk in buying an option is that the Fund pays a premium whether or not the option is exercised. The Fund also has the additional risk that there may be an illiquid market where the Fund is unable to close the contract.
The Fund has written put options on individual equity securities and/or equity indexes to increase exposure to equity risk. A written put option becomes more valuable as the price of the underlying financial instrument appreciates relative to the strike price.
The Fund has written call options on individual equity securities and/or equity indexes to decrease exposure to equity risk. A written call option becomes more valuable as the price of the underlying financial instrument depreciates relative to the strike price.
During the six months ended June 30, 2014, the Fund had an ending monthly average market value of $2,501 and $6,937 on written call options and written put options, respectively.
Additional associated risks to the Fund include counterparty credit risk and liquidity risk.
Written option activity for the six months ended June 30, 2014 was as follows:
19 OPPENHEIMER EQUITY INCOME FUND/VA
|
|
| NOTES TO FINANCIAL STATEMENTS Unaudited / Continued |
|
| 6. Risk Exposures and the Use of Derivative Instruments (Continued) |
| | | | | | | | | | | | | | | | |
| | | Call Options | | | Put Options | |
| | | Number of
Contracts | | | Amount of
Premiums | | | Number of
Contracts | | | Amount of
Premiums | |
| |
Options outstanding as of December 31, 2013 | | | 25 | | | $ | 2,744 | | | | 85 | | | $ | 6,599 | |
Options written | | | 281 | | | | 20,864 | | | | 397 | | | | 44,779 | |
Options closed or expired | | | (217 | ) | | | (15,730) | | | | (195 | ) | | | (16,222) | |
Options exercised | | | (74 | ) | | | (6,750) | | | | (177 | ) | | | (18,930) | |
| | | | |
Options outstanding as of June 30, 2014 | | | 15 | | | $ | 1,128 | | | | 110 | | | $ | 16,226 | |
| | | | |
Counterparty Credit Risk. Derivative positions are subject to the risk that the counterparty will not fulfill its obligation to the Fund. The Fund intends to enter into derivative transactions with counterparties that the Manager believes to be creditworthy at the time of the transaction.
For financial reporting purposes, the Fund does not offset derivative assets and derivative liabilities that are subject to netting arrangements in the Statement of Assets and Liabilities. Bankruptcy or insolvency laws of a particular jurisdiction may impose restrictions on or prohibitions against the right of offset in bankruptcy, insolvency or other events.
The Fund’s risk of loss from counterparty credit risk on exchange-traded derivatives cleared through a clearinghouse and for centrally cleared swaps is generally considered lower than as compared to OTC derivatives. However, counterparty credit risk exists with respect to initial and variation margin deposited/paid by the Fund that is held in futures commission merchant, broker and/or clearinghouse accounts for such exchange-traded derivatives and for centrally cleared swaps.
With respect to centrally cleared swaps, such transactions will be submitted for clearing, and if cleared, will be held in accounts at futures commission merchants or brokers that are members of clearinghouses. While brokers, futures commission merchants and clearinghouses are required to segregate customer margin from their own assets, in the event that a broker, futures commission merchant or clearinghouse becomes insolvent or goes into bankruptcy and at that time there is a shortfall in the aggregate amount of margin held by the broker, futures commission merchant or clearinghouse for all its customers, U.S. bankruptcy laws will typically allocate that shortfall on a pro-rata basis across all the broker’s, futures commission merchant’s or clearinghouse’s customers, potentially resulting in losses to the Fund.
There is the risk that a broker, futures commission merchant or clearinghouse will decline to clear a transaction on the Fund’s behalf, and the Fund may be required to pay a termination fee to the executing broker with whom the Fund initially enters into the transaction. Clearinghouses may also be permitted to terminate centrally cleared swaps at any time. The Fund is also subject to the risk that the broker or futures commission merchant will improperly use the Fund’s assets deposited/paid as initial or variation margin to satisfy payment obligations of another customer. In the event of a default by another customer of the broker or futures commission merchant, the Fund might not receive its variation margin payments from the clearinghouse, due to the manner in which variation margin payments are aggregated for all customers of the broker/futures commission merchant.
Collateral and margin requirements differ by type of derivative. Margin requirements are established by the broker, futures commission merchant or clearinghouse for exchange-traded and cleared derivatives, including centrally cleared swaps. Brokers, futures commission merchants and clearinghouses can ask for margin in excess of the regulatory minimum, or increase the margin amount, in certain circumstances.
For financial reporting purposes, cash collateral that has been pledged to cover obligations of the Fund, if any, is reported separately on the Statement of Assets and Liabilities as cash pledged as collateral. Non-cash collateral pledged by the Fund, if any, is noted in the Statement of Investments. Generally, the amount of collateral due from or to a party must exceed a minimum transfer amount threshold (e.g. $250,000) before a transfer has to be made. To the extent amounts due to the Fund from its counterparties are not fully collateralized, contractually or otherwise, the Fund bears the risk of loss from counterparty nonperformance.
The following table presents the valuations of derivative instruments by risk exposure as reported within the Statement of Assets and Liabilities as of June 30, 2014:
| | | | | | | | | | | | |
| | | Asset Derivatives | | | Liability Derivatives | |
Derivatives Not Accounted for as Hedging Instruments | | Statement of Assets and Liabilities Location | | Value | | | Statement of Assets and Liabilities Location | | Value | |
| |
Equity contracts | | Investments, at value | | $ | 1,045* | | | Options written, at value | | $ | 7,775 | |
*Amounts relate to purchased option contracts.
The effect of derivative instruments on the Statement of Operations is as follows:
| | | | | | | | | | | | |
Amount of Realized Gain or (Loss) Recognized on Derivatives | |
| | | |
Derivatives Not Accounted for as Hedging Instruments | | Investment from unaffiliated companies* | | | Closing and expiration of option contracts written | | | Total | |
| |
Equity contracts | | $ | (4,458) | | | $ | 31,952 | | | $ | 27,494 | |
*Includes purchased option contracts, purchased swaption contracts and written option contracts exercised, if any.
20 OPPENHEIMER EQUITY INCOME FUND/VA
|
|
|
|
| 6. Risk Exposures and the Use of Derivative Instruments (Continued) |
| | | | | | | | | | | | |
Amount of Change in Unrealized Gain or (Loss) Recognized on Derivatives | |
| | | |
Derivatives Not Accounted for as Hedging Instruments | | Investments* | | | Option contracts written | | | Total | |
| |
Equity contracts | | $ | (118) | | | $ | 4,851 | | | $ | 4,733 | |
*Includes purchased option contracts and purchased swaption contracts, if any.
7. Pending Litigation
In 2009, seven class action lawsuits were filed in the U.S. District Court for the District of Colorado against OppenheimerFunds, Inc. (“OFI”), OppenheimerFunds Distributor, Inc., the Fund’s principal underwriter and distributor (the “Distributor”), and certain funds (but not including the Fund) advised by OFI Global Asset Management, Inc. and distributed by the Distributor (the “Defendant Funds”). The lawsuits also named as defendants certain officers and current and former trustees of the respective Defendant Funds. The lawsuits raised claims under federal securities law and alleged, among other things, that the disclosure documents of the respective Defendant Funds contained misrepresentations and omissions and that the respective Defendant Funds’ investment policies were not followed. The plaintiffs in these actions sought unspecified damages, equitable relief and awards of attorneys’ fees and litigation expenses. The Defendant Funds’ Boards of Trustees also engaged counsel to represent the Funds and the present and former Independent Trustees named in those suits. On March 5, 2014, the parties in six of these lawsuits executed stipulations and agreements of settlement resolving those actions. On July 31, 2014, the court entered an order and final judgment approving the settlements as fair, reasonable and adequate. The settlements do not resolve a seventh outstanding lawsuit relating to Oppenheimer Rochester California Municipal Fund.
Other class action and individual lawsuits have been filed since 2008 in various state and federal courts against OFI and certain of its affiliates by investors seeking to recover investments they allegedly lost as a result of the “Ponzi” scheme run by Bernard L. Madoff and his firm, Bernard L. Madoff Investment Securities, LLC (“BLMIS”). Plaintiffs in these suits allege that they suffered losses as a result of their investments in several funds managed by an affiliate of OFI and assert a variety of claims, including breach of fiduciary duty, fraud, negligent misrepresentation, unjust enrichment, and violation of federal and state securities laws and regulations, among others. They seek unspecified damages, equitable relief and awards of attorneys’ fees and litigation expenses. Neither the Distributor, nor any of the Oppenheimer mutual funds, their independent trustees or directors are named as defendants in these lawsuits. None of the Oppenheimer mutual funds invested in any funds or accounts managed by Madoff or BLMIS. On February 28, 2011, a stipulation of partial settlement of three groups of consolidated putative class action lawsuits relating to these matters was filed in the U.S. District Court for the Southern District of New York. On August 19, 2011, the court entered an order and final judgment approving the settlement as fair, reasonable and adequate. In September 2011, certain parties filed notices of appeal from the court’s order approving the settlement. In June 2014, the appellate court affirmed the lower court’s order approving the settlement. Certain parties subsequently filed a petition for certiorari before the U.S. Supreme Court further challenging the settlement approval order. The settlement does not resolve other outstanding lawsuits against OFI and its affiliates relating to BLMIS.
OFI believes the lawsuits and appeals described above are without legal merit and, with the exception of actions it has settled, is defending against them vigorously. While it is premature to render any opinion as to the outcome in these lawsuits, or whether any costs that the Defendant Funds may bear in defending the suits might not be reimbursed by insurance, OFI believes that these suits should not impair the ability of OFI or the Distributor to perform their respective duties to the Fund, and that the outcome of all of the suits together should not have any material effect on the operations of any of the Oppenheimer mutual funds.
21 OPPENHEIMER EQUITY INCOME FUND/VA
PORTFOLIO PROXY VOTING POLICIES AND PROCEDURES; UPDATES TO STATEMENTS OF INVESTMENTS Unaudited
The Fund has adopted Portfolio Proxy Voting Policies and Procedures under which the Fund votes proxies relating to securities (“portfolio proxies”) held by the Fund. A description of the Fund’s Portfolio Proxy Voting Policies and Procedures is available (i) without charge, upon request, by calling the Fund toll-free at 1.800.525.7048, (ii) on the Fund’s website at oppenheimerfunds.com, and (iii) on the SEC’s website at www.sec.gov. In addition, the Fund is required to file Form N-PX, with its complete proxy voting record for the 12 months ended June 30th, no later than August 31st of each year. The Fund’s voting record is available (i) without charge, upon request, by calling the Fund toll-free at 1.800.525.7048, and (ii) in the Form N-PX filing on the SEC’s website at www.sec.gov.
The Fund files its complete schedule of portfolio holdings with the SEC for the first quarter and the third quarter of each fiscal year on Form N-Q. The Fund’s Form N-Q filings are available on the SEC’s website at www.sec.gov. Those forms may be reviewed and copied at the SEC’s Public Reference Room in Washington, D.C. Information on the operation of the Public Reference Room may be obtained by calling 1-800-SEC-0330.
22 OPPENHEIMER EQUITY INCOME FUND/VA
THIS PAGE INTENTIONALLY LEFT BLANK.
23 OPPENHEIMER EQUITY INCOME FUND/VA
OPPENHEIMER EQUITY INCOME FUND/VA
A Series of Oppenheimer Variable Account Funds
| | |
| Trustees and Officers | | Sam Freedman, Chairman of the Board of Trustees and Trustee |
| | Edward L. Cameron, Trustee |
| | Jon S. Fossel, Trustee |
| | Richard F. Grabish, Trustee |
| | Beverly L. Hamilton, Trustee |
| | Victoria J. Herget, Trustee |
| | Robert J. Malone, Trustee |
| | F. William Marshall, Jr., Trustee |
| | Karen L. Stuckey, Trustee |
| | James D. Vaughn, Trustee |
| | William F. Glavin, Jr., Trustee, President and Principal Executive Officer |
| | Michael S. Levine, Vice President |
| | Arthur S. Gabinet, Secretary and Chief Legal Officer |
| | Christina M. Nasta, Vice President and Chief Business Officer |
| | Mary Ann Picciotto, Chief Compliance Officer and Chief Anti-Money Laundering Officer |
| | Brian W. Wixted, Treasurer and Principal Financial & Accounting Officer |
| |
| Manager | | OFI Global Asset Management, Inc. |
| |
| Sub-Adviser | | OppenheimerFunds, Inc. |
| |
| Distributor | | OppenheimerFunds Distributor, Inc. |
| |
| Transfer and | | OFI Global Asset Management, Inc. |
| Shareholder | | |
| Servicing Agent | | |
| |
| Sub-Transfer Agent | | Shareholder Services, Inc. |
| | DBA OppenheimerFunds Services |
| |
| Independent | | KPMG LLP |
| Registered | | |
| Public | | |
| Accounting | | |
| Firm | | |
| |
| Counsel | | K&L Gates LLP |
| |
| | Before investing in any of the Oppenheimer funds, investors should carefully consider a fund’s investment objectives, risks, charges and expenses. Fund prospectuses and summary prospectuses contain this and other information about the funds and may be obtained by asking your financial advisor, visiting oppenheimerfunds.com or calling us at 1.800.988.8287. Read prospectuses and summary prospectuses carefully before investing. The financial statements included herein have been taken from the records of the Fund without examination of those records by the independent registered public accounting firm. © 2014 OppenheimerFunds, Inc. All rights reserved. Oppenheimer funds are distributed by OppenheimerFunds Distributor, Inc. |

| | | | |
| June 30, 2014 | | |
| | | Oppenheimer Diversified Alternatives Fund/VA A Series of Oppenheimer Variable Account Funds | | Semiannual Report |
| | |
| | SEMIANNUAL REPORT Listing of Top Holdings Fund Performance Discussion Financial Statements | | |

Portfolio Managers: Mark Hamilton; David Wharmby, CFA;
Brian Watson, CFA; Benjamin Rockmuller, CFA; and Dokyoung Lee1
| | | | | | |
Cumulative Total Returns For the Periods Ended 6/30/14 | | |
| | | Since Inception
(11/14/13) | | 6-Month | | |
| Non-Service Shares | | 8.03% | | 8.78% | | |
| Service Shares | | 7.99% | | 8.77% | | |
Performance data quoted represents past performance, which does not guarantee future results. The investment return and principal value of an investment in the Fund will fluctuate so that an investor’s shares, when redeemed, may be worth more or less than their original cost. Current performance may be lower or higher than the performance quoted. For performance data current to the most recent month end, call us at 1.800.988.8287. The Fund’s total returns should not be expected to be the same as the returns of other funds, whether or not both funds have the same portfolio managers and/or similar names. The Fund’s total returns include changes in share price and reinvested distributions but do not include the charges associated with the separate account products that offer this Fund. Such performance would have been lower if such charges were taken into account.
1. Benjamin Rockmuller and Dokyoung Lee became Portfolio Managers in April 2014.
TOP TEN COMMON STOCK HOLDINGS
| | |
| Energy Transfer Equity LP | | 1.0% |
| Enterprise Products Partners LP | | 0.8 |
| Plains All American Pipeline LP | | 0.7 |
| Regency Energy Partners LP | | 0.7 |
| Sunoco Logistics Partners LP | | 0.6 |
| Simon Property Group, Inc. | | 0.6 |
| Magellan Midstream Partners LP | | 0.6 |
| TC PipeLines LP | | 0.5 |
| EQT Midstream Partners LP | | 0.5 |
| Mitsui Fudosan Co. Ltd. | | 0.5 |
Portfolio holdings and allocations are subject to change. Percentages are as of June 30, 2014, and are based on net assets. For more current Fund holdings, please visit oppenheimerfunds.com.
SECTOR ALLOCATION
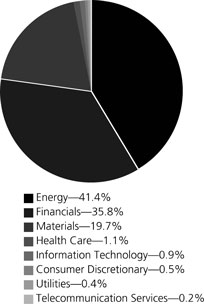
Portfolio holdings and allocations are subject to change. Percentages are as of June 30, 2014, and are based on the total market value of common stocks.
2 OPPENHEIMER DIVERSIFIED ALTERNATIVES FUND/VA
| | |
Fund Performance Discussion |
During the six-month reporting period ended June 30, 2014, the Fund’s Non-Service shares produced a return of 8.78%. In comparison, the Barclays U.S. Aggregate Bond Index returned 3.93% during the same period. The Fund’s outperformance occurred in a period when several of the alternative asset classes the Fund invests in outperformed the broader fixed income markets.
MARKET OVERVIEW
The global economy in general started 2014 with continued slow and steady growth throughout the developed world. However, the U.S. economy weakened in the first quarter due in part to cold weather effects across much of the country. The yield on the 10-Year U.S. Treasury fell in the first quarter, and the U.S. dollar remained somewhat weak, falling against 10 out of 16 currencies of the largest U.S. trading partners. Growth in the Eurozone remained anemic, and the outlook for China softened a bit on the back of weaker economic data. These developments resulted in heightened volatility across multiple asset classes to begin the year.
Economic data in the U.S. generally strengthened over the second half of the reporting period. The unemployment rate fell to 6.3% from 6.7%, the economy finally regained all of the jobs lost during the 2008 recession, and the U.S. stock market achieved record highs. In June, the Federal Reserve (the “Fed”) also stated it would continue with its tapering strategy and reaffirmed its intention to keep short-term interest rates near zero. Shortly after the reporting period ended, a positive June jobs report was released, in which the official unemployment rate fell to 6.1%, its lowest level since September 2008. Over the second half of the reporting period, the Eurozone continued to struggle with very low inflation and weak bank lending. In response, the European Central Bank (the “ECB”) announced numerous measures designed to bolster the markets. They included a benchmark interest rate cut and the introduction of a negative deposit rate to encourage banks to lend, among other measures. Beyond that, the ECB said it would prepare to purchase packages of loans from banks to allow for increased lending. In Japan, the Bank of Japan (the “BoJ”) also maintained highly accommodative monetary policies.
Against this backdrop, global equities generally rallied through the end of the reporting period. However, several emerging market countries continued to face the triple threat of inflation, slowing growth and foreign capital flight, and resorted to hiking interest rates in an effort to address economic problems at home. Under circumstances where many central banks around the world are maintaining highly accommodative monetary policies, interest rates are close to zero and policymakers face budget deficits and unfunded entitlements far into the future, we believe a diversified approach to portfolio construction can help investors manage a host of macroeconomic risks that haven’t gone away.
FUND REVIEW
During the reporting period, the Fund’s allocation to gold and precious metals equities benefited performance. After falling sharply in 2013, gold prices rose during the reporting period. This, combined with falling real interest rates, turmoil in the Middle East and elsewhere, and a renewed focus on geopolitical risks, helped support both gold and the gold mining equities. Top performing stocks for the Fund included Royal Gold, Inc., Randgold Resources Ltd. and Franco-Nevada Corp.
The Fund’s exposure to master limited partnership (“MLPs”) also contributed to performance as MLPs rallied during the second half of the reporting period. A top performing holding in this area included Energy Transfer Equity LP, which benefited from acquisition activity at Regency Energy Partners LP and Energy Transfer Partners LP, two of the partnership’s operating affiliates. We believe investor interest in distributions remains strong in a low-yield world, and MLPs are positioned to benefit from the infrastructure build-out necessary to bring both shale oil and gas to market.
In addition, the Fund’s allocation to global real estate contributed positively to performance. We have a procyclical tilt to the portfolio, which we believe can perform well if global growth improves during the rest of 2014. Many investors remain interested in attractive yields, and we believe the combination of an improving global economy, falling unemployment, growing demand for commercial real estate, tight supply and accommodative monetary policies should be positive for the asset class.
The primary detractor from performance this reporting period was the Fund’s exposure to commodities, which we source through commodity futures, options, swaps and structured notes as well as U.S. Government and other fixed income securities. Our term structure strategies, where we select which parts of the futures curves to invest in, were the largest detractors. Simply put, weather was extreme in North America this winter, with the West and Southwest of the U.S. suffering record heat while near record cold gripped much of the rest of the country. The impact weather had on curve dynamics was apparent in our performance during the first quarter of 2014. The front of the curve outperformed deferred contracts in energy, agriculture, and livestock commodities. Our
3 OPPENHEIMER DIVERSIFIED ALTERNATIVES FUND/VA
strategies, which are designed to be less volatile and collect the more stable roll yield of these deferred contracts, detracted from performance in the bullish environment driven by weather and investment flows.
More broadly, early in the reporting period we adjusted the Fund’s allocations in an effort to improve diversification, lower volatility and reduce both equity and interest rate sensitivity. These adjustments included reducing exposure to real estate, MLPs, and gold miners while increasing exposure to senior bank loans, event linked bonds and alpha alternatives.
STRATEGY & OUTLOOK
In our view, the key macro factors that help drive performance of the alternative asset classes in which we invest remain in place, including accommodative monetary policies in the U.S. and around the world, competitive currency debasement, near zero interest rates and geopolitical turmoil. At the same time, valuations for these asset classes are mixed. The strong bull market in U.S. equities over the last five years has given way to more measured returns year to date, intermittent spikes in volatility and a more challenging market environment. We believe a dominant investment theme in 2013 was concentrating risk as greater exposure to equities, higher beta securities and smaller market capitalization companies generally led to better performance. For the rest of 2014, we believe that diversifying risk, controlling volatility and managing the downside will be the winning strategy. Because the Fund is comprised of a number of different alternative asset classes, with their diversifying properties as well as their potential for generating attractive total returns, we believe it can play an important role in investors’ portfolios.
The Fund’s investment strategy and focus can change over time. The mention of specific fund holdings does not constitute a recommendation by OppenheimerFunds, Inc. or its affiliates.
Shares of Oppenheimer funds are not deposits or obligations of any bank, are not guaranteed by any bank, are not insured by the FDIC or any other agency, and involve investment risks, including the possible loss of the principal amount invested.
4 OPPENHEIMER DIVERSIFIED ALTERNATIVES FUND/VA
Fund Expenses. As a shareholder of the Fund, you incur two types of costs: (1) transaction costs and (2) ongoing costs, including management fees; distribution and service fees; and other Fund expenses. These examples are intended to help you understand your ongoing costs (in dollars) of investing in the Fund and to compare these costs with the ongoing costs of investing in other mutual funds.
The examples are based on an investment of $1,000.00 invested at the beginning of the period and held for the entire 6-month period ended June 30, 2014.
Actual Expenses. The first section of the table provides information about actual account values and actual expenses. You may use the information in this section for the class of shares you hold, together with the amount you invested, to estimate the expense that you paid over the period. Simply divide your account value by $1,000.00 (for example, an $8,600.00 account value divided by $1,000.00 = 8.60), then multiply the result by the number in the first section under the heading entitled “Expenses Paid During Period” to estimate the expenses you paid on your account during this period.
Hypothetical Example for Comparison Purposes.
The second section of the table provides information about hypothetical account values and hypothetical expenses based on the Fund’s actual expense ratio for each class of shares, and an assumed rate of return of 5% per year for each class before expenses, which is not the actual return. The hypothetical account values and expenses may not be used to estimate the actual ending account balance or expenses you paid for the period. You may use this information to compare the ongoing costs of investing in the Fund and other funds. To do so, compare this 5% hypothetical example for the class of shares you hold with the 5% hypothetical examples that appear in the shareholder reports of the other funds.
Please note that the expenses shown in the table are meant to highlight your ongoing costs only and do not reflect any charges associated with the separate accounts that offer this Fund. Therefore, the “hypothetical” lines of the table are useful in comparing ongoing costs only, and will not help you determine the relative total costs of owning different funds. In addition, if these separate account charges were included your costs would have been higher.
| | | | | | | | | | | | | | | | | | |
| Actual | | Beginning Account Value January 1, 2014 | | | | | Ending Account Value June 30, 2014 | | | | | Expenses Paid During 6 Months Ended June 30, 2014 | | | |
Non-Service shares | | $ | 1,000.00 | | | | | $ | 1,087.80 | | | | | $ | 5.81 | | | |
Service shares | | | 1,000.00 | | | | | | 1,087.70 | | | | | | 7.22 | | | |
| | | | | | |
Hypothetical | | | | | | | | | | | | | | | | | | |
(5% return before expenses) | | | | | | | | | | | | | | | | | | |
Non-Service shares | | | 1,000.00 | | | | | | 1,019.24 | | | | | | 5.62 | | | |
Service shares | | | 1,000.00 | | | | | | 1,017.90 | | | | | | 6.98 | | | |
Expenses are equal to the Fund’s annualized expense ratio for that class, multiplied by the average account value over the period, multiplied by 181/365 (to reflect the one-half year period). Those annualized expense ratios, excluding indirect expenses from affiliated funds, based on the 6-month period ended June 30, 2014 are as follows:
| | | | | | |
| Class | | Expense Ratios | | | |
Non-Service shares | | | 1.12% | | | |
Service shares | | | 1.39 | | | |
The expense ratios reflect voluntary and/or contractual waivers and/or reimbursements of expenses by the Fund’s Manager. Some of these undertakings may be modified or terminated at any time, as indicated in the Fund’s prospectus. The “Consolidated Financial Highlights” tables in the Fund’s financial statements, included in this report, also show the gross expense ratios, without such waivers or reimbursements and reduction to custodian expenses, if applicable.
5 OPPENHEIMER DIVERSIFIED ALTERNATIVES FUND/VA
CONSOLIDATED STATEMENT OF INVESTMENTS June 30, 2014 Unaudited
| | | | | | | | | | |
| | | Shares | | | Value | | | |
| Common Stocks—26.1% | | | | | | | | | | |
| Consumer Discretionary—0.1% | | | |
| Hotels, Restaurants & Leisure—0.1% | | | |
| PokerTek, Inc.1 | | | 52,807 | | | $ | 69,705 | | | |
| | | | | | | | | | |
| Media—0.0% | | | |
| mktg, inc.1 | | | 25,645 | | | | 67,446 | | | |
| | | | | | | | | | |
| Specialty Retail—0.0% | | | |
| Hastings Entertainment, Inc.1 | | | 8,471 | | | | 24,990 | | | |
| | | | | | | | | | |
| Energy—10.8% | | | |
| Energy Equipment & Services—0.5% | | | |
| Seadrill Partners LLC | | | 15,796 | | | | 523,795 | | | |
| | | | | | | | | | |
| Oil, Gas & Consumable Fuels—10.3% | | | |
| Access Midstream Partners LP | | | 5,635 | | | | 358,104 | | | |
| Buckeye Partners LP | | | 5,645 | | | | 468,874 | | | |
| DCP Midstream Partners LP2 | | | 8,955 | | | | 510,435 | | | |
| Energy Transfer Equity LP2 | | | 18,770 | | | | 1,106,304 | | | |
| Enterprise Products Partners LP | | | 12,575 | | | | 984,497 | | | |
| EQT Midstream Partners LP | | | 5,780 | | | | 559,157 | | | |
| Genesis Energy LP | | | 7,595 | | | | 425,624 | | | |
| Holly Energy Partners LP2 | | | 8,875 | | | | 305,211 | | | |
| Magellan Midstream Partners LP | | | 7,860 | | | | 660,555 | | | |
| MarkWest Energy Partners LP | | | 6,995 | | | | 500,702 | | | |
| NGL Energy Partners LP2 | | | 8,395 | | | | 363,839 | | | |
| NuStar Energy LP | | | 1,635 | | | | 101,386 | | | |
| NuStar GP Holdings LLC | | | 4,250 | | | | 166,218 | | | |
| ONEOK Partners LP | | | 6,160 | | | | 360,976 | | | |
| ONEOK, Inc. | | | 4,690 | | | | 319,295 | | | |
| Plains All American Pipeline LP | | | 14,085 | | | | 845,804 | | | |
| Regency Energy Partners LP2 | | | 25,565 | | | | 823,449 | | | |
| Spectra Energy Partners LP | | | 5,335 | | | | 284,622 | | | |
| Summit Midstream Partners LP | | | 3,125 | | | | 158,906 | | | |
| Sunoco Logistics Partners LP | | | 15,210 | | | | 716,543 | | | |
| Targa Resources Partners LP | | | 5,770 | | | | 414,978 | | | |
| TC PipeLines LP | | | 10,990 | | | | 567,743 | | | |
| Tesoro Logistics LP | | | 3,550 | | | | 260,570 | | | |
| TransMontaigne Partners LP | | | 4,590 | | | | 200,813 | | | |
| Western Gas Partners LP | | | 2,870 | | | | 219,498 | | | |
| Williams Partners LP | | | 7,245 | | | | 393,331 | | | |
| | | | | | | 12,077,434 | | | |
| | | | | | | | | | |
| Financials—9.3% | | | |
| Capital Markets—0.0% | | | |
| Goldman Sachs Group, Inc. (The) | | | 196 | | | | 32,818 | | | |
| | | | | | | | | | |
| Commercial Banks—0.1% | | | |
| Centrix Bank & Trust1 | | | 855 | | | | 34,756 | | | |
| First Mountain Bank1 | | | 7,860 | | | | 68,382 | | | |
| | | | | | | 103,138 | | | |
| | | | | | | | | | |
| Insurance—0.1% | | | | | | | |
| Protective Life Corp. | | | 1,007 | | | | 69,815 | | | |
| | | | | | | | | | |
| Real Estate Investment Trusts (REITs)—7.0% | | | |
| Acadia Realty Trust | | | 5,750 | | | | 161,517 | | | |
| Alexandria Real Estate Equities, Inc. | | | 960 | | | | 74,534 | | | |
| Alstria Office REIT AG | | | 9,574 | | | | 126,798 | | | |
| American Campus Communities, Inc. | | | 5,970 | | | | 228,293 | | | |
| Ascendas Real Estate Investment Trust | | | 62,000 | | | | 114,394 | | | |
| AvalonBay Communities, Inc. | | | 741 | | | | 105,363 | | | |
| Boston Properties, Inc. | | | 1,720 | | | | 203,269 | | | |
| British Land Co. plc | | | 4,130 | | | | 49,611 | | | |
| Canadian Real Estate Investment Trust | | | 1,706 | | | | 73,529 | | | |
| CapitaMall Trust | | | 52,000 | | | | 82,390 | | | |
| Charter Hall Retail REIT | | | 22,300 | | | | 81,618 | | | |
| Chesapeake Lodging Trust | | | 7,830 | | | | 236,701 | | | |
| Corio NV | | | 1,371 | | | | 70,032 | | | |
| Cousins Properties, Inc. | | | 6,660 | | | | 82,917 | | | |
| CubeSmart | | | 8,680 | | | | 159,018 | | | |
| | | | | | | | |
| | | Shares | | | Value | |
| Real Estate Investment Trusts (REITs) (Continued) | |
| Derwent London plc | | | 3,060 | | | $ | 140,122 | |
| Douglas Emmett, Inc. | | | 5,020 | | | | 141,664 | |
| Education Realty Trust, Inc. | | | 16,850 | | | | 180,969 | |
| Equity Residential | | | 2,090 | | | | 131,670 | |
| Essex Property Trust, Inc. | | | 1,430 | | | | 264,421 | |
| Eurocommercial Properties NV | | | 1,787 | | | | 88,111 | |
| Extra Space Storage, Inc. | | | 5,370 | | | | 285,952 | |
| FelCor Lodging Trust, Inc. | | | 12,210 | | | | 128,327 | |
| First Industrial Realty Trust, Inc. | | | 4,540 | | | | 85,534 | |
| General Growth Properties, Inc. | | | 8,060 | | | | 189,894 | |
| Glimcher Realty Trust | | | 5,990 | | | | 64,872 | |
| GLP J-Reit | | | 117 | | | | 131,039 | |
| GPT Group (The) | | | 31,000 | | | | 112,278 | |
| Great Portland Estates plc | | | 13,380 | | | | 147,994 | |
| Hammerson plc | | | 13,580 | | | | 134,672 | |
| Highwoods Properties, Inc. | | | 4,340 | | | | 182,063 | |
| Host Hotels & Resorts, Inc. | | | 12,552 | | | | 276,269 | |
| Hudson Pacific Properties, Inc. | | | 7,810 | | | | 197,905 | |
| Industrial & Infrastructure Fund Investment Corp. | | | 7 | | | | 62,685 | |
| Kilroy Realty Corp. | | | 1,910 | | | | 118,955 | |
| Kimco Realty Corp. | | | 2,940 | | | | 67,561 | |
| Kite Realty Group Trust | | | 16,940 | | | | 104,012 | |
| Klepierre | | | 2,230 | | | | 113,642 | |
| Land Securities Group plc | | | 9,500 | | | | 168,252 | |
| LaSalle Hotel Properties | | | 3,810 | | | | 134,455 | |
| Link REIT (The) | | | 12,500 | | | | 67,257 | |
| Mirvac Group | | | 57,131 | | | | 96,205 | |
| Morguard Real Estate Investment Trust | | | 3,650 | | | | 60,751 | |
| Prologis, Inc. | | | 2,530 | | | | 103,958 | |
| Ramco-Gershenson Properties Trust | | | 6,140 | | | | 102,047 | |
| Regency Centers Corp. | | | 2,990 | | | | 166,483 | |
| Sabra Health Care REIT, Inc. | | | 2,130 | | | | 61,152 | |
| Scentre Group1 | | | 30,153 | | | | 90,985 | |
| Simon Property Group, Inc. | | | 4,160 | | | | 691,725 | |
| STAG Industrial, Inc. | | | 3,345 | | | | 80,313 | |
| Stockland | | | 28,400 | | | | 103,944 | |
| Tanger Factory Outlet Centers, Inc. | | | 3,160 | | | | 110,505 | |
| UDR, Inc. | | | 5,349 | | | | 153,142 | |
| Unibail-Rodamco SE | | | 1,350 | | | | 392,322 | |
| Vastned Retail NV | | | 1,192 | | | | 60,702 | |
| Vornado Realty Trust | | | 1,720 | | | | 183,576 | |
| Washington Prime Group, Inc.1 | | | 2,080 | | | | 38,979 | |
| Westfield Corp. | | | 24,200 | | | | 163,254 | |
| | | | | | | 8,230,602 | |
|
| |
| Real Estate Management & Development—2.0% | |
| CapitaLand Ltd. | | | 60,000 | | | | 153,989 | |
| China Overseas Land & Investment Ltd. | | | 32,000 | | | | 77,619 | |
| China Resources Land Ltd. | | | 38,000 | | | | 69,704 | |
| Daiwa House Industry Co. Ltd. | | | 6,000 | | | | 124,595 | |
| Global Logistic Properties Ltd. | | | 29,000 | | | | 62,799 | |
| Hang Lung Properties Ltd. | | | 38,000 | | | | 117,205 | |
| Helical Bar plc | | | 10,940 | | | | 65,532 | |
| Hufvudstaden AB, Cl. A | | | 5,302 | | | | 74,366 | |
| Keppel Land Ltd. | | | 27,000 | | | | 73,214 | |
| Mitsubishi Estate Co. Ltd. | | | 7,100 | | | | 175,661 | |
| Mitsui Fudosan Co. Ltd. | | | 16,000 | | | | 541,067 | |
| Sino Land Co. Ltd. | | | 74,000 | | | | 121,592 | |
| St. Modwen Properties plc | | | 10,290 | | | | 63,279 | |
| Sumitomo Realty & Development Co. Ltd. | | | 6,400 | | | | 275,379 | |
| Sun Hung Kai Properties Ltd. | | | 13,000 | | | | 178,512 | |
| Unite Group plc (The) | | | 8,670 | | | | 58,411 | |
| Wharf Holdings Ltd. | | | 24,000 | | | | 173,524 | |
| | | | | | | 2,406,448 | |
|
| |
| Thrifts & Mortgage Finance—0.1% | |
| SP Bancorp, Inc.1 | | | 2,390 | | | | 68,952 | |
6 OPPENHEIMER DIVERSIFIED ALTERNATIVES FUND/VA
| | | | | | | | | | |
| | | Shares | | | Value | | | |
| Health Care—0.3% | | | | | | | | | | |
| Biotechnology—0.1% | | | | | | | | | | |
| Chelsea Therapeutics, Inc.1 | | | 10,531 | | | $ | — | | | |
| Idenix Pharmaceuticals, Inc.1 | | | 2,907 | | | | 70,059 | | | |
| | | | | | | 70,059 | | | |
| | | | | | | | | | |
| Health Care Equipment & Supplies—0.1% | | | |
| Medical Action Industries, Inc.1 | | | 5,203 | | | | 71,437 | | | |
| | | | | | | | | | |
| Health Care Providers & Services—0.1% | | | |
| Capital Senior Living Corp.1 | | | 2,860 | | | | 68,182 | | | |
| Chindex International, Inc.1 | | | 1,778 | | | | 42,121 | | | |
| Gentiva Health Services, Inc.1 | | | 742 | | | | 11,175 | | | |
| | | | | | | 121,478 | | | |
| | | | | | | | | | |
| Life Sciences Tools & Services—0.0% | | | |
| Furiex Pharmaceuticals, Inc.1 | | | 636 | | | | 67,530 | | | |
| | | | | | | | | | |
| Pharmaceuticals—0.0% | | | | | | | | | | |
| Teva Pharmaceutical Industries Ltd.1 | | | 10 | | | | — | | | |
| | | | | | | | | | |
| Information Technology—0.3% | | | | | | | | | | |
| Electronic Equipment, Instruments, & Components—0.1% | | | |
| Aeroflex Holding Corp.1 | | | 6,732 | | | | 70,686 | | | |
| | | | | | | | | | |
| Semiconductors & Semiconductor Equipment—0.1% | | | |
| Hittite Microwave Corp. | | | 912 | | | | 71,091 | | | |
| PLX Technology, Inc.1 | | | 11,060 | | | | 71,558 | | | |
| | | | | | | 142,649 | | | |
| | | | | | | | | | |
| Software—0.1% | | | | | | | | | | |
| MICROS Systems, Inc.1 | | | 1,055 | | | | 71,634 | | | |
| | | | | | | | | | |
| Materials—5.1% | | | | | | | | | | |
| Chemicals—0.0% | | | | | | | | | | |
| PetroLogistics LP | | | 4,924 | | | | 70,709 | | | |
| | | | | | | | | | |
| Metals & Mining—5.1% | | | |
| Agnico Eagle Mines Ltd. | | | 5,800 | | | | 222,140 | | | |
| Alamos Gold, Inc. | | | 13,182 | | | | 133,348 | | | |
| Allied Nevada Gold Corp.1 | | | 2,720 | | | | 10,227 | | | |
| AngloGold Ashanti Ltd., Sponsored ADR1 | | | 1,692 | | | | 29,119 | | | |
| Argonaut Gold, Inc.1 | | | 17,171 | | | | 71,127 | | | |
| Asanko Gold, Inc.1 | | | 1,714 | | | | 4,465 | | | |
| AuRico Gold, Inc. | | | 13,970 | | | | 59,512 | | | |
| B2Gold Corp.1 | | | 79,083 | | | | 230,559 | | | |
| Barrick Gold Corp. | | | 220 | | | | 4,026 | | | |
| Beadell Resources Ltd.1 | | | 60,400 | | | | 35,325 | | | |
| Centamin plc1 | | | 12,373 | | | | 13,544 | | | |
| Centerra Gold, Inc. | | | 21,307 | | | | 134,386 | | | |
| Continental Gold Ltd.1 | | | 13,770 | | | | 45,167 | | | |
| Detour Gold Corp.1 | | | 12,573 | | | | 172,031 | | | |
| Dominion Diamond Corp.1 | | | 1,070 | | | | 15,461 | | | |
| Duluth Metals Ltd.1 | | | 15,101 | | | | 8,350 | | | |
| Eldorado Gold Corp.3 | | | 28,698 | | | | 219,461 | | | |
| Eldorado Gold Corp.3 | | | 18,980 | | | | 145,007 | | | |
| First Majestic Silver Corp.1 | | | 7,831 | | | | 84,618 | | | |
| First Quantum Minerals Ltd. | | | 3,010 | | | | 64,372 | | | |
| Franco-Nevada Corp. | | | 6,410 | | | | 367,549 | | | |
| Freeport-McMoRan Copper & Gold, Inc. | | | 80 | | | | 2,920 | | | |
| Fresnillo plc | | | 11,410 | | | | 170,118 | | | |
| Gold Standard Ventures Corp.1 | | | 8,440 | | | | 6,668 | | | |
| Goldcorp, Inc. | | | 11,640 | | | | 324,872 | | | |
| IAMGOLD Corp. | | | 32,920 | | | | 135,630 | | | |
| Ivanhoe Mines Ltd., Cl. A1 | | | 24,841 | | | | 31,661 | | | |
| Ivanhoe Mines Ltd., Legend Shares, Cl. A1 | | | 8,660 | | | | 11,038 | �� | | |
| Kinross Gold Corp.1 | | | 18,440 | | | | 76,342 | | | |
| Klondex Mines Ltd.1 | | | 13,979 | | | | 26,201 | | | |
| Koza Altin Isletmeleri AS | | | 9,131 | | | | 104,309 | | | |
| Lake Shore Gold Corp.1 | | | 73,516 | | | | 66,830 | | | |
| Lundin Mining Corp.1 | | | 6,483 | | | | 35,664 | | | |
| | | | | | | | | | | | |
| | | | | | Shares | | | Value | |
| Metals & Mining (Continued) | |
| MAG Silver Corp.1 | | | | | | | 5,699 | | | $ | 53,890 | |
| McEwen Mining, Inc.1 | | | | | | | 8,050 | | | | 23,184 | |
| Nevsun Resources Ltd. | | | | | | | 29,890 | | | | 112,087 | |
| New Gold, Inc.1,3 | | | | | | | 28,698 | | | | 182,077 | |
| New Gold, Inc.1,3 | | | | | | | 20,710 | | | | 131,923 | |
| Newcrest Mining Ltd.1 | | | | | | | 5,900 | | | | 59,676 | |
| Newmont Mining Corp. | | | | | | | 1,220 | | | | 31,037 | |
| Northern Star Resources Ltd. | | | | | | | 24,500 | | | | 29,643 | |
| Novagold Resources, Inc.1 | | | | | | | 9,830 | | | | 41,384 | |
| OceanaGold Corp.1 | | | | | | | 12,784 | | | | 39,656 | |
| Orocobre Ltd.1 | | | | | | | 4,200 | | | | 8,956 | |
| Osisko Gold Royalties Ltd.1 | | | | | | | 2,431 | | | | 36,565 | |
| Pan American Silver Corp. | | | | | | | 3,460 | | | | 53,111 | |
| Papillon Resources Ltd.1 | | | | | | | 8,400 | | | | 15,363 | |
| Polymetal International plc | | | | | | | 9,140 | | | | 90,370 | |
| Pretium Resources, Inc.1 | | | | | | | 2,553 | | | | 21,126 | |
| Primero Mining Corp.1 | | | | | | | 21,263 | | | | 170,375 | |
| Primero Mining Corp., Legend Shares1,4 | | | | | | | 2,492 | | | | 19,968 | |
| Randgold Resources Ltd., ADR | | | | | | | 4,710 | | | | 398,466 | |
| Regis Resources Ltd. | | | | | | | 23,200 | | | | 36,474 | |
| Rio Alto Mining Ltd.1 | | | | | | | 25,955 | | | | 60,324 | |
| Romarco Minerals, Inc.1 | | | | | | | 127,145 | | | | 106,048 | |
| Royal Gold, Inc.2 | | | | | | | 4,270 | | | | 325,032 | |
| Rubicon Minerals Corp.1 | | | | | | | 12,155 | | | | 17,998 | |
| Sandstorm Gold Ltd.1 | | | | | | | 3,380 | | | | 23,390 | |
| SEMAFO, Inc.1 | | | | | | | 21,926 | | | | 102,947 | |
| Sibanye Gold Ltd., Sponsored ADR | | | | | | | 5,430 | | | | 59,893 | |
| Silver Wheaton Corp. | | | | | | | 10,200 | | | | 267,954 | |
| Tahoe Resources, Inc.1 | | | | | | | 4,500 | | | | 117,900 | |
| Torex Gold Resources, Inc.1 | | | | | | | 20,299 | | | | 31,008 | |
| Turquoise Hill Resources Ltd.1 | | | | | | | 6,532 | | | | 21,817 | |
| Yamana Gold, Inc. | | | | | | | 20,810 | | | | 171,058 | |
| | | | | | | | | | | 5,922,747 | |
| | | | | | | | | | | | |
| Telecommunication Services—0.1% | |
| Diversified Telecommunication Services—0.1% | |
| Cbeyond, Inc.1 | | | | | | | 7,010 | | | | 69,750 | |
| | | | | | | | | | | | |
| Utilities—0.1% | | | | | | | | | | | | |
| Electric Utilities—0.1% | | | | | | | | | | | | |
| Pepco Holdings, Inc. | | | | | | | 2,556 | | | | 70,239 | |
| | | | | | | | | | | | |
| Gas Utilities—0.0% | | | | | | | | | | | | |
| Sino Gas International Holdings, Inc.1 | | | | | | | 27,782 | | | | 33,894 | |
| | | | | | | | | | | | |
| Independent Power and Renewable Electricity Producers—0.0% | |
| EME Reorganization Trust1 | | | | | | | 52,072 | | | | 8,284 | |
| NRG Energy, Inc. | | | | | | | 171 | | | | 6,370 | |
| | | | | | | | | | | 14,654 | |
Total Common Stocks
(Cost $26,052,564) | | | | | | | | 30,472,609 | |
| | | | | | | | | | | | |
| | | | | | | | Units | | | | | |
| Rights, Warrants and Certificates—0.0% | |
| Ivanhoe Mines Ltd., Cl. A Wts., Strike Price | | | | | | | | | | | | |
| 1.80CAD, 12/10/151 | | | | | | | 8,660 | | | | 1,623 | |
| Sun Hung Kai Properties Ltd. Wts., Strike Price | | | | | | | | | | | | |
| 98.60HKD, 4/22/16, 0%1 | | | | | | | 1,098 | | | | 1,434 | |
| Total Rights, Warrants and Certificates (Cost $1,257) | | | | | | | | 3,057 | |
| | | |
| | | | | | |
| Principal
Amount |
| | | | |
| Foreign Government Obligations—3.2% | |
| Brazil—0.5% | | | | | | | | | | | | |
| Federative Republic of Brazil Letra Tesouro Nacional Treasury Bills, 11.13%, 1/1/15 | | | BRL | | | | 1,270,000 | | | | 544,596 | |
7 OPPENHEIMER DIVERSIFIED ALTERNATIVES FUND/VA
| | |
CONSOLIDATED STATEMENT OF INVESTMENTS Unaudited / Continued |
| | | | | | | | | | |
| | | Principal
Amount | | | Value | | | |
| Malaysia—0.3% | | | | | | | | | | |
| Malaysia Sr. Unsec. Bonds, 3.197%, 10/15/15 | | MYR | 1,295,000 | | | $ | 403,555 | | | |
| | | | | | | | | | |
| Singapore—0.5% | | | | | | | | | | |
| Republic of Singapore Sr. Unsec. Bonds, 0.25%, 2/1/15 | | SGD | 665,000 | | | | 533,212 | | | |
| | | | | | | | | | |
| South Korea—1.9% | | | | | | | |
| Republic of South Korea Treasury Bonds: | | | | | | | | | | |
| 2.75%, 12/10/15 | | KRW | 954,000,000 | | | | 944,763 | | | |
| 3.25%, 6/10/15 | | KRW | 1,289,000,000 | | | | 1,281,722 | | | |
| | | | | | | 2,226,485 | | | |
| Total Foreign Government Obligations (Cost $3,556,452) | | | | | | | 3,707,848 | | | |
| | | | | | | | | | |
| Non-Convertible Corporate Bonds and Notes—6.5% | | | |
| Access Midstream Partners LP/ACMP Finance Corp., 4.875% Sr. Unsec. Nts., 5/15/23 | | | 50,000 | | | | 52,937 | | | |
| Activision Blizzard, Inc., 5.625% Sr. Unsec. Nts., 9/15/215 | | | 50,000 | | | | 54,000 | | | |
| Alcatel-Lucent USA, Inc., 6.45% Sr. Unsec. Nts., 3/15/29 | | | 100,000 | | | | 99,500 | | | |
| Alliance Oil Co. Ltd., 9.875% Sr. Unsec. Nts., 3/11/155 | | | 200,000 | | | | 204,760 | | | |
| AngloGold Ashanti Holdings plc, 8.50% Sr. Unsec. Nts., 7/30/20 | | | 100,000 | | | | 112,375 | | | |
| Arch Coal, Inc., 7.25% Sr. Unsec. Nts., 6/15/21 | | | 50,000 | | | | 36,750 | | | |
| Audatex North America, Inc., 6% Sr. Unsec. Nts., 6/15/214 | | | 50,000 | | | | 53,625 | | | |
| Avaya, Inc., 7% Sr. Sec. Nts., 4/1/195 | | | 100,000 | | | | 100,500 | | | |
| Banco BMG SA, 8.875% Sub. Nts., 8/5/205 | | | 100,000 | | | | 106,250 | | | |
| Banco Panamericano SA, 8.50% Sub. Nts., 4/23/205 | | | 100,000 | | | | 109,764 | | | |
| Bancolombia SA, 5.125% Unsec. Sub. Nts., 9/11/22 | | | 50,000 | | | | 50,530 | | | |
| Biomet, Inc., 6.50% Sr. Unsec. Nts., 8/1/20 | | | 100,000 | | | | 108,250 | | | |
| BMC Software Finance, Inc., 8.125% Sr. Unsec. Nts., 7/15/215 | | | 50,000 | | | | 51,687 | | | |
| Bombardier, Inc., 6.125% Sr. Nts., 1/15/235 | | | 100,000 | | | | 103,500 | | | |
| Caesars Entertainment Operating Co., Inc., 10% Sec. Nts., 12/15/18 | | | 50,000 | | | | 19,188 | | | |
| CCO Holdings LLC/CCO Holdings Capital Corp., 6.50% Sr. Unsec. Nts., 4/30/21 | | | 100,000 | | | | 106,875 | | | |
| Cemex Finance LLC, 6% Sr. Sec. Nts., 4/1/245 | | | 150,000 | | | | 156,562 | | | |
| CenturyLink, Inc., 5.80% Sr. Unsec. Nts., 3/15/22 | | | 100,000 | | | | 104,625 | | | |
| Cequel Communications Holdings I LLC/Cequel Capital Corp., 6.375% Sr. Unsec. Nts., 9/15/205 | | | 100,000 | | | | 106,750 | | | |
| CHC Helicopter SA, 9.25% Sr. Sec. Nts., 10/15/20 | | | 90,000 | | | | 98,550 | | | |
| CHS/Community Health Systems, Inc., 8% Sr. Unsec. Nts., 11/15/19 | | | 100,000 | | | | 109,750 | | | |
| Claire’s Stores, Inc., 9% Sr. Sec. Nts., 3/15/195 | | | 50,000 | | | | 52,437 | | | |
| Clear Channel Communications, Inc., 9% Sr. Sec. Nts., 3/1/21 | | | 100,000 | | | | 107,375 | | | |
| Country Garden Holdings Co. Ltd., 7.875% Sr. Unsec. Nts., 5/27/195 | | | 100,000 | | | | 104,130 | | | |
| Crown Castle International Corp., 5.25% Sr. Unsec. Nts., 1/15/23 | | | 100,000 | | | | 104,750 | | | |
| CSN Resources SA, 6.50% Sr. Unsec. Nts., 7/21/205 | | | 200,000 | | | | 208,000 | | | |
| DaVita HealthCare Partners, Inc., 5.75% Sr. Unsec. Nts., 8/15/22 | | | 100,000 | | | | 107,250 | | | |
| Denali Borrower LLC/Denali Finance Corp., 5.625% Sr. Sec. Nts., 10/15/205 | | | 100,000 | | | | 106,250 | | | |
| Denbury Resources, Inc., 4.625% Sr. Sub. Nts., 7/15/23 | | | 100,000 | | | | 97,521 | | | |
| DISH DBS Corp., 5.875% Sr. Unsec. Nts., 7/15/22 | | | 100,000 | | | | 108,750 | | | |
| | | | | | | | |
| | | Principal
Amount | | | Value | |
Non-Convertible Corporate Bonds and Notes (Continued) | |
| Energy Future Intermediate Holding Co. LLC/EFIH Finance, Inc., 10% Sr. Sec. Nts., 12/1/206 | | $ | 50,000 | | | $ | 53,375 | |
| Energy Transfer Equity LP, 7.50% Sr. Sec. Nts., 10/15/20 | | | 50,000 | | | | 58,000 | |
| EP Energy LLC/EP Energy Finance, Inc., 9.375% Sr. Unsec. Nts., 5/1/20 | | | 50,000 | | | | 57,500 | |
| Ferrexpo Finance plc, 7.875% Sr. Unsec. Nts., 4/7/165 | | | 200,000 | | | | 195,000 | |
| First Data Corp., 12.625% Sr. Unsec. Nts., 1/15/21 | | | 50,000 | | | | 61,687 | |
| First Quantum Minerals Ltd.: | | | | | | | | |
| 6.75% Sr. Unsec. Nts., 2/15/205 | | | 28,000 | | | | 28,980 | |
| 7.00% Sr. Unsec. Nts., 2/15/215 | | | 328,000 | | | | 339,070 | |
| FirstEnergy Corp., 7.375% Sr. Unsec. Nts., 11/15/31 | | | 50,000 | | | | 59,176 | |
| Frontier Communications Corp., 8.50% Sr. Unsec. Nts., 4/15/20 | | | 100,000 | | | | 118,500 | |
| Halcon Resources Corp., 8.875% Sr. Unsec. Nts., 5/15/21 | | | 100,000 | | | | 108,000 | |
| HD Supply, Inc., 7.50% Sr. Unsec. Nts., 7/15/20 | | | 50,000 | | | | 54,875 | |
| Hexion US Finance Corp./Hexion Nova Scotia Finance ULC, 8.875% Sr. Sec. Nts., 2/1/18 | | | 50,000 | | | | 52,125 | |
| Icahn Enterprises LP/Icahn Enterprises Finance Corp., 5.875% Sr. Unsec. Nts., 2/1/22 | | | 100,000 | | | | 105,250 | |
| ICICI Bank Ltd., 6.375% Jr. Sub. Nts., 4/30/225,7 | | | 100,000 | | | | 104,000 | |
| Infor US, Inc., 9.375% Sr. Unsec. Nts., 4/1/19 | | | 50,000 | | | | 55,875 | |
| International Lease Finance Corp., 8.75% Sr. Unsec. Nts., 3/15/17 | | | 50,000 | | | | 58,219 | |
| Kaisa Group Holdings Ltd., 8.875% Sr. Unsec. Nts., 3/19/185 | | | 200,000 | | | | 206,500 | |
| Kinetic Concepts, Inc./KCI USA, Inc., 10.50% Sec. Nts., 11/1/18 | | | 50,000 | | | | 56,625 | |
| Laureate Education, Inc., 9.25% Sr. Unsec. Nts., 9/1/195 | | | 50,000 | | | | 51,750 | |
| Level 3 Financing, Inc., 8.125% Sr. Unsec. Nts., 7/1/19 | | | 100,000 | | | | 109,625 | |
| Linn Energy LLC/Linn Energy Finance Corp., 8.625% Sr. Unsec. Nts., 4/15/20 | | | 100,000 | | | | 108,500 | |
| MGM Resorts International, 7.75% Sr. Unsec. Nts., 3/15/22 | | | 100,000 | | | | 117,500 | |
| MHP SA, 8.25% Sr. Unsec. Nts., 4/2/205 | | | 200,000 | | | | 186,040 | |
| Mobile Telesystems OJSC via MTS International Funding Ltd., 5% Sr. Unsec. Nts., 5/30/235 | | | 200,000 | | | | 195,250 | |
| Momentive Performance Materials, Inc., 8.875% Sr. Sec. Nts., 10/15/20 | | | 100,000 | | | | 107,250 | |
| Navient Corp., 8.45% Sr. Unsec. Nts., 6/15/18 | | | 50,000 | | | | 59,219 | |
| Navistar International Corp., 8.25% Sr. Unsec. Nts., 11/1/21 | | | 100,000 | | | | 104,750 | |
| NGPL PipeCo LLC, 7.119% Sr. Sec. Nts., 12/15/175 | | | 50,000 | | | | 51,000 | |
| NII Capital Corp., 7.625% Sr. Unsec. Nts., 4/1/21 | | | 50,000 | | | | 14,625 | |
| Novelis, Inc., 8.75% Sr. Unsec. Nts., 12/15/20 | | | 50,000 | | | | 55,750 | |
| Offshore Group Investment Ltd., 7.50% Sr. Sec. Nts., 11/1/19 | | | 50,000 | | | | 53,125 | |
| Petroleos de Venezuela SA, 12.75% Sr. Unsec. Nts., 2/17/225 | | | 100,000 | | | | 101,375 | |
| Post Holdings, Inc., 7.375% Sr. Unsec. Nts., 2/15/22 | | | 100,000 | | | | 108,500 | |
| Reynolds Group Issuer, Inc./Reynolds Group Issuer LLC/Reynolds Group Issuer Luxembourg SA, 5.75% Sr. Sec. Nts., 10/15/20 | | | 50,000 | | | | 53,000 | |
| Royal Bank of Scotland Group plc, 6.125% Sub. Nts., 12/15/22 | | | 50,000 | | | | 54,843 | |
| Sabine Pass Liquefaction LLC, 5.625% Sr. Sec. Nts., 2/1/21 | | | 100,000 | | | | 106,250 | |
| Samson Investment Co., 10.75% Sr. Unsec. Nts., 2/15/205 | | | 50,000 | | | | 52,938 | |
| SandRidge Energy, Inc., 7.51% Sr. Unsec. Nts., 3/15/21 | | | 100,000 | | | | 108,875 | |
| Sears Holdings Corp., 6.625% Sec. Nts., 10/15/18 | | | 50,000 | | | | 46,313 | |
8 OPPENHEIMER DIVERSIFIED ALTERNATIVES FUND/VA
| | | | | | | | | | |
| | | Principal
Amount | | | Value | | | |
Non-Convertible Corporate Bonds and Notes (Continued) | | | |
| First Quantum Minerals Ltd.: (Continued) | | | | | | | | | | |
| Sprint Corp., 7.875% Sr. Unsec. Nts., 9/15/235 | | $ | 100,000 | | | $ | 111,500 | | | |
| Tenet Healthcare Corp., 8.125% Sr. Unsec. Nts., 4/1/22 | | | 100,000 | | | | 116,000 | | | |
| Trinseo Materials Operating SCA/Trinseo Materials Finance, Inc., 8.75% Sr. Sec. Nts., 2/1/19 | | | 100,000 | | | | 108,000 | | | |
| United Rentals North America, Inc., 7.625% Sr. Unsec. Nts., 4/15/22 | | | 100,000 | | | | 112,750 | | | |
| Valeant Pharmaceuticals International, Inc., 6.375% Sr. Unsec. Nts., 10/15/205 | | | 100,000 | | | | 106,625 | | | |
| Vimpel Communications Via VIP Finance Ireland Ltd. OJSC, 7.748% Sr. Unsec. Nts., 2/2/215 | | | 200,000 | | | | 220,500 | | | |
| Yapi ve Kredi Bankasi AS, 6.75% Sr. Unsec. Nts., 2/8/175 | | | 200,000 | | | | 214,750 | | | |
| Total Non-Convertible Corporate Bonds and Notes (Cost $7,370,807) | | | | | | | 7,552,551 | | | |
| | | | | | | | | | |
| Event-Linked Bonds—12.9% | | | | | | | | | | |
| Earthquake—2.8% | | | | | | | | | | |
| Bosphorus 1 Re Ltd. Catastrophe Linked Nts., 2.52%, 5/3/164,7 | | | 250,000 | | | | 250,231 | | | |
| Embarcadero Re Ltd. Catastrophe Linked Nts., 5.02%, 8/7/155,7 | | | 250,000 | | | | 255,675 | | | |
| Golden State Re Ltd. Catastrophe Linked Nts., 3.77%, 1/8/155,7 | | | 500,000 | | | | 505,850 | | | |
| Kizuna II Re Ltd. Catastrophe Linked Nts.: | | | | | | | | | | |
| 2.27%, 4/6/184,7 | | | 250,000 | | | | 251,562 | | | |
| 2.52%, 4/6/184,7 | | | 250,000 | | | | 251,562 | | | |
| Merna Reinsurance V Ltd. Catastrophe Linked Nts., 2.02%, 4/7/174,7 | | | 750,000 | | | | 754,238 | | | |
| MultiCat Mexico Ltd. 2012 Catastrophe Linked Nts., 8.02%, 12/4/155,7 | | | 500,000 | | | | 514,913 | | | |
| Nakama Re Ltd. Catastrophe Linked Nts.: | | | | | | | | | | |
| 2.52%, 4/13/185,7 | | | 250,000 | | | | 250,650 | | | |
| 2.77%, 9/29/165,7 | | | 250,000 | | | | 252,481 | | | |
| | | | | | | 3,287,162 | | | |
| | | | | | | | | | |
| Longevity—0.2% | | | | | | | | | | |
| Vita Capital V Ltd. Catastrophe Linked Nts., 3.438%, 1/15/175,7 | | | 250,000 | | | | 257,188 | | | |
| | | | | | | | | | |
| Multiple Event—5.1% | | | | | | | | | | |
| Blue Danube II Ltd. Catastrophe Linked Nts., 4.273%, 5/23/165,7 | | | 250,000 | | | | 253,081 | | | |
| Citrus Re Ltd. Catastrophe Linked Nts., 4.27%, 4/18/175,7 | | | 500,000 | | | | 491,725 | | | |
| Combine Re Ltd. Catastrophe Linked Nts.: | | | | | | | | | | |
| 4.52%, 1/7/155,7 | | | 250,000 | | | | 253,400 | | | |
| 17.77%, 1/7/155,7 | | | 600,000 | | | | 633,840 | | | |
| East Lane Re Ltd. Catastrophe Linked Nts., 6.67%, 3/13/155,7 | | | 250,000 | | | | 254,375 | | | |
| East Lane Re VI Ltd. Catastrophe Linked Nts., 2.77%, 3/14/185,7 | | | 500,000 | | | | 495,225 | | | |
| Kilimanjaro Re Ltd. Catastrophe Linked Nts.: | | | | | | | | | | |
| 4.52%, 4/30/185,7 | | | 250,000 | | | | 246,487 | | | |
| 4.77%, 4/30/185,7 | | | 250,000 | | | | 247,537 | | | |
| Loma Reinsurance Ltd. Catastrophe Linked Nts., 17.02%, 1/8/185,7 | | | 250,000 | | | | 252,462 | | | |
| Mystic Re Ltd. Catastrophe Linked Nts., 9.02%, 3/12/155,7 | | | 250,000 | | | | 255,625 | | | |
| Residential Reinsurance 2012 Ltd. Catastrophe Linked Nts., 22.02%, 6/6/165,7 | | | 250,000 | | | | 299,531 | | | |
| Residential Reinsurance 2014 Ltd. Catastrophe Linked Nts., 15.02%, 6/6/185,7 | | | 250,000 | | | | 252,487 | | | |
| Riverfront Re Ltd. Catastrophe Linked Nts., 4.02%, 1/6/175,7 | | | 250,000 | | | | 245,038 | | | |
| | | | | | | | |
| | | Principal
Amount | | | Value | |
| Multiple Event (Continued) | |
| Sanders Re Ltd. Catastrophe Linked Nts.: | | | | | | | | |
| 3.02%, 5/25/185,7 | | $ | 250,000 | | | $ | 248,463 | |
| 3.27%, 5/25/185,7 | | | 250,000 | | | | 247,513 | |
| 3.92%, 6/7/175,7 | | | 250,000 | | | | 249,050 | |
| 4.02%, 5/5/175,7 | | | 500,000 | | | | 497,175 | |
| Tradewynd Re Ltd. Catastrophe Linked Nts.: | | | | | | | | |
| 6.27%, 1/9/175,7 | | | 250,000 | | | | 256,538 | |
| 7.02%, 1/9/175,7 | | | 250,000 | | | | 258,188 | |
| | | | | | | 5,937,740 | |
| | | | | | | | |
| Other—0.4% | | | | | | | | |
| Kortis Capital Ltd. Catastrophe Linked Nts., 5.042%, 1/15/175,7 | | | 250,000 | | | | 262,013 | |
| Vitality Re III Ltd. Catastrophe Linked Nts., 4.22%, 1/7/155,7 | | | 250,000 | | | | 254,675 | |
| | | | | | | 516,688 | |
| | | | | | | | |
| Windstorm—4.4% | | | | | | | | |
| Aozora Re Ltd. Catastrophe Linked Nts., 2.02%, 4/7/175,7 | | JPY | 25,000,000 | | | | 252,086 | |
| Armor Re Ltd. Catastrophe Linked Nts., 4.02%, 12/15/165,7 | | | 750,000 | | | | 740,044 | |
| Calypso Capital II Ltd. Catastrophe Linked Nts., 2.60%, 1/9/175,7 | | EUR | 500,000 | | | | 688,347 | |
| Eurus Ltd. Catastrophe Linked Nts., 3.75%, 4/7/165,7 | | | 250,000 | | | | 349,308 | |
| Everglades Re Ltd. Catastrophe Linked Nts., 7.52%, 4/28/175,7 | | | 250,000 | | | | 252,087 | |
| Foundation Re III Ltd. Catastrophe Linked Nts., 5.02%, 2/25/155,7 | | | 250,000 | | | | 251,425 | |
| Green Fields II Capital Ltd. Catastrophe Linked Nts., 2.75%, 1/9/175,7 | | EUR | 250,000 | | | | 346,159 | |
| Lion I Re Ltd. Catastrophe Linked Nts., 1.722%, 4/28/175,7 | | EUR | 250,000 | | | | 341,358 | |
| Longpoint Re III Ltd. Catastrophe Linked Nts.: | | | | | | | | |
| 3.98%, 5/18/165,7 | | | 250,000 | | | | 252,956 | |
| 6.02%, 6/12/155,7 | | | 250,000 | | | | 257,475 | |
| MultiCat Mexico Ltd. 2012 Catastrophe Linked Nts., 7.77%, 12/4/155,7 | | | 250,000 | | | | 257,756 | |
| Pylon II Capital Ltd. Catastrophe Linked Nts., 5.642%, 5/5/167 | | | 250,000 | | | | 358,851 | |
| Queen City Re Catastrophe Linked Nts., 3.52%, 1/6/175,7 | | | 250,000 | | | | 243,663 | |
| Successor X Ltd. Catastrophe Linked Nts., 16.27%, 11/10/155,7 | | | 250,000 | | | | 254,550 | |
| Tar Heel Re Ltd. Catastrophe Linked Nts., 8.52%, 5/9/165,7 | | | 250,000 | | | | 259,713 | |
| | | | | | | 5,105,778 | |
| Total Event-Linked Bonds (Cost $15,225,241) | | | | 15,104,556 | |
| | | | | | | | |
| Short-Term Notes—21.7% | |
| Mexico—0.7% | | | | | | | | |
| United Mexican States Treasury Bills, | | | | | | | | |
| 3.646%, 12/11/14 | | MXN | 11,300,000 | | | | 859,143 | |
| | | | | | | | |
| United States—21.0% | | | | | | | | |
| United States Treasury Bills: | | | | | | | | |
| 0.032%, 10/30/148 | | | 11,800,000 | | | | 11,798,667 | |
| 0.036%, 9/4/148 | | USD | 6,250,000 | | | | 6,249,844 | |
| 0.05%, 7/24/148,9 | | USD | 6,500,000 | | | | 6,499,792 | |
| | | | | | | 24,548,303 | |
| Total Short-Term Notes (Cost $25,399,562) | | | | 25,407,446 | |
| | | | | | | | |
| Municipal Bonds and Notes—0.1% | | | | | |
| University of Puerto Rico, Series P: | | | | | | | | |
| 5.00%, 6/1/23 | | | 70,000 | | | | 45,622 | |
| 5.00%, 6/1/30 | | | 70,000 | | | | 42,096 | |
Total Municipal Bonds and Notes
(Cost $87,850) | | | | 87,718 | |
9 OPPENHEIMER DIVERSIFIED ALTERNATIVES FUND/VA
| | |
CONSOLIDATED STATEMENT OF INVESTMENTS Unaudited / Continued |
| | | | | | | | |
| | | Shares | | | Value | |
Investment Companies—27.3% | |
| Oppenheimer Institutional Money Market Fund, Cl. E, 0.09%10,11,12 | | | 31,662,226 | | | $ | 31,662,226 | |
| SPDR Gold Trust Exchange Traded Fund1,12 | | | 2,550 | | | | 326,502 | |
| Total Investment Companies (Cost $31,964,524) | | | | | | | 31,988,728 | |
| | | | | | | | | | | | | | | | | | | | | | | | |
| | | | | | Exercise Price | | | Expiration
Date | | | | | | Contracts | | | Value | |
Exchange-Traded Options Purchased—0.0% | | | | | | | | | | | | | | | | | | | | | | | | |
Dow Jones-UBS Commodity Index Put1,12 | | | USD | | | | 135.300 | | | | 9/10/14 | | | | USD | | | | 2,956 | | | $ | 6,395 | |
Gold Fields Ltd. Call1 | | | USD | | | | 4.000 | | | | 10/18/14 | | | | USD | | | | 46 | | | | 1,012 | |
Kinross Gold Corp. Call1 | | | USD | | | | 5.000 | | | | 8/16/14 | | | | USD | | | | 32 | | | | 256 | |
Total Exchange-Traded Options Purchased (Cost $17,359) | | | | | | | | | | | | | | | | | | | | | | | 7,663 | |
| | | | | | | | | | | | | | | | | | | | | | | | |
Total Investments, at Value (Cost $109,675,616) | | | | | | | | | | | | | | | | | | | 97.8 | % | | | 114,332,176 | |
Net Other Assets (Liabilities) | | | | | | | | | | | | | | | | | | | 2.2 | | | | 2,607,751 | |
Net Assets | | | | | | | | | | | | | | | | | | | 100.0 | % | | $ | 116,939,927 | |
Footnotes to Consolidated Statement of Investments
1. Non-income producing security.
2. All or a portion of the security position is held in segregated accounts and pledged to cover margin requirements with respect to outstanding written options. The aggregate market value of such securities is $535,643. See Note 6 of the accompanying Consolidated Notes.
3. The Fund holds securities which have been issued by the same entity and that trade on separate exchanges.
4. Restricted security. The aggregate value of restricted securities as of June 30, 2014 was $1,581,186, which represents 1.35% of the Fund’s net assets. See Note 7 of the accompanying Consolidated Notes. Information concerning restricted securities is as follows:
| | | | | | | | | | | | | | | | |
| Security | | Acquisition
Dates | | | Cost | | | Value | | | Unrealized
Appreciation/
(Depreciation) | |
Audatex North America, Inc., 6% Sr. Unsec. Nts., 6/15/21 | | | 4/25/14 | | | $ | 53,634 | | | $ | 53,625 | | | $ | (9 | ) |
Bosphorus 1 Re Ltd. Catastrophe Linked Nts., 2.52%, 5/3/16 | | | 3/11/14 | | | | 249,625 | | | | 250,231 | | | | 606 | |
Kizuna II Re Ltd. Catastrophe Linked Nts., 2.27%, 4/6/18 | | | 3/13/14 | | | | 251,981 | | | | 251,562 | | | | (419 | ) |
Kizuna II Re Ltd. Catastrophe Linked Nts., 2.52%, 4/6/18 | | | 5/2/14 | | | | 252,839 | | | | 251,562 | | | | (1,277 | ) |
Merna Reinsurance V Ltd. Catastrophe Linked Nts., 2.02%, 4/7/17 | | | 3/18/14-5/30/14 | | | | 752,379 | | | | 754,238 | | | | 1,859 | |
Primero Mining Corp., Legend Shares | | | 3/6/14 | | | | 16,364 | | | | 19,968 | | | | 3,604 | |
| | | | | | $ | 1,576,822 | | | $ | 1,581,186 | | | $ | 4,364 | |
5. Represents securities sold under Rule 144A, which are exempt from registration under the Securities Act of 1933, as amended. These securities have been determined to be liquid under guidelines established by the Board of Trustees. These securities amount to $16,867,980 or 14.42% of the Fund’s net assets as of June 30, 2014.
6. This security is not accruing income because the issuer has missed an interest payment on it and/or is not anticipated to make future interest and or principal payments. The rate shown is the original contractual interest rate. See Note 1 of the accompanying Consolidated Notes.
7. Represents the current interest rate for a variable or increasing rate security.
8. Zero coupon bond reflects effective yield on the date of purchase.
9. All or a portion of the security position is held in accounts at a futures clearing merchant and pledged to cover margin requirements on open futures contracts and written options on futures, if applicable. The aggregate market value of such securities is $599,980. See Note 6 of the accompanying Consolidated Notes.
10. Is or was an affiliate, as defined in the Investment Company Act of 1940, at or during the period ended June 30, 2014, by virtue of the Fund owning at least 5% of the voting securities of the issuer or as a result of the Fund and the issuer having the same investment adviser. Transactions during the period in which the issuer was an affiliate are as follows:
| | | | | | | | | | | | | | | | |
| | | Shares December 31, 2013 | | | Gross
Additions | | | Gross Reductions | | | Shares
June 30, 2014 | |
Oppenheimer Institutional Money Market Fund, Cl. E | | | 2,007,344 | | | | 207,651,575 | | | | 177,996,693 | | | | 31,662,226 | |
Oppenheimer Master Event-Linked Bond Fund, LLC | | | 10,967 | | | | — | | | | 10,967 | | | | — | |
Oppenheimer Master Loan Fund, LLC | | | 3,578 | | | | — | | | | 3,578 | | | | — | |
| | | | |
| | | | | | Value | | | Income | | | Realized Gain
(Loss) | |
Oppenheimer Institutional Money Market Fund, Cl. E | | | | | | $ | 31,662,226 | | | $ | 11,991 | | | $ | — | |
Oppenheimer Master Event-Linked Bond Fund, LLC | | | | | | | — | | | | 207 | a | | | (193 | )a |
Oppenheimer Master Loan Fund, LLC | | | | | | | — | | | | 141 | b | | | 634 | b |
Total | | | | | | $ | 31,662,226 | | | $ | 12,339 | | | $ | 441 | |
a. Represents the amount allocated to the Fund from Oppenheimer Master Event-Linked Bond Fund, LLC.
b. Represents the amount allocated to the Fund from Oppenheimer Master Loan Fund, LLC.
11. Rate shown is the 7-day yield as of June 30, 2014.
12. All or a portion of this security is owned by the subsidiary. See Note 1 of the accompanying Consolidated Notes.
10 OPPENHEIMER DIVERSIFIED ALTERNATIVES FUND/VA
| | | | | | | | | | | | | | | | | | |
Forward Currency Exchange Contracts as of June 30, 2014 | |
| Counterparty | | Settlement Month(s) | | Currency Purchased (000’s) | | Currency Sold (000’s) | | Unrealized
Appreciation | | | Unrealized
Depreciation | |
BAC | | 01/2015 | | AUD | | 40 | | USD | | 35 | | $ | 1,874 | | | $ | – | |
BAC | | 07/2014 - 08/2014 | | BRL | | 670 | | USD | | 300 | | | 717 | | | | – | |
BAC | | 01/2015 | | CAD | | 128 | | USD | | 116 | | | 3,663 | | | | – | |
BAC | | 01/2015 | | CHF | | 25 | | USD | | 28 | | | 52 | | | | – | |
BAC | | 08/2014 | | CZK | | 10,440 | | USD | | 518 | | | 2,955 | | | | – | |
BAC | | 07/2014 | | INR | | 7,800 | | USD | | 127 | | | 2,265 | | | | – | |
BAC | | 01/2015 | | JPY | | 17,000 | | USD | | 166 | | | 1,922 | | | | – | |
BAC | | 08/2014 | | PHP | | 24,500 | | USD | | 543 | | | 18,711 | | | | – | |
BAC | | 08/2014 | | PLN | | 3,755 | | USD | | 1,223 | | | 10,506 | | | | – | |
BAC | | 07/2014 - 08/2014 | | RUB | | 51,200 | | USD | | 1,439 | | | 57,989 | | | | – | |
BAC | | 08/2014 | | SEK | | 6,660 | | USD | | 1,028 | | | – | | | | 32,137 | |
BAC | | 08/2014 | | SGD | | 490 | | USD | | 391 | | | 1,838 | | | | – | |
BAC | | 01/2015 | | USD | | 186 | | AUD | | 215 | | | – | | | | 14,029 | |
BAC | | 07/2014 | | USD | | 264 | | BRL | | 585 | | | – | | | | 299 | |
BAC | | 08/2014 | | USD | | 1,689 | | CZK | | 33,810 | | | 5,794 | | | | 4,479 | |
BAC | | 01/2015 | | USD | | 58 | | GBP | | 35 | | | – | | | | 1,956 | |
BAC | | 07/2014 | | USD | | 512 | | INR | | 30,500 | | | 5,277 | | | | – | |
BAC | | 07/2014 | | USD | | 2 | | NOK | | 10 | | | – | | | | – | |
BAC | | 08/2014 | | USD | | 559 | | PHP | | 24,500 | | | – | | | | 3,043 | |
BAC | | 07/2014 - 08/2014 | | USD | | 1,422 | | RUB | | 51,200 | | | – | | | | 74,712 | |
BAC | | 07/2014 - 08/2014 | | USD | | 509 | | SEK | | 3,430 | | | – | | | | 4,095 | |
BAC | | 08/2014 | | USD | | 387 | | SGD | | 490 | | | – | | | | 6,219 | |
BAC | | 01/2015 | | USD | | 343 | | TRY | | 790 | | | – | | | | 14,678 | |
BAC | | 08/2014 | | USD | | 539 | | ZAR | | 5,810 | | | – | | | | 3,562 | |
BAC | | 08/2014 | | ZAR | | 5,810 | | USD | | 506 | | | 36,108 | | | | – | |
BNP | | 08/2014 | | CNH | | 3,125 | | USD | | 515 | | | – | | | | 13,278 | |
BNP | | 08/2014 | | THB | | 17,500 | | USD | | 526 | | | 12,501 | | | | – | |
BNP | | 08/2014 | | USD | | 500 | | CNH | | 3,125 | | | – | | | | 2,073 | |
BNP | | 08/2014 | | USD | | 494 | | PLN | | 1,510 | | | – | | | | 1,753 | |
BNP | | 08/2014 | | USD | | 538 | | THB | | 17,500 | | | – | | | | 353 | |
BNP | | 07/2014 | | ZAR | | 4,900 | | USD | | 460 | | | – | | | | 38 | |
BOA | | 07/2014 - 01/2015 | | AUD | | 265 | | USD | | 244 | | | 5,447 | | | | – | |
BOA | | 07/2014 | | CAD | | 1,980 | | USD | | 1,811 | | | 43,666 | | | | – | |
BOA | | 01/2015 | | CHF | | 20 | | USD | | 23 | | | 9 | | | | – | |
BOA | | 08/2014 | | CLP | | 584,900 | | USD | | 1,056 | | | 445 | | | | 3,570 | |
BOA | | 08/2014 | | COP | | 1,050,000 | | USD | | 505 | | | 52,933 | | | | – | |
BOA | | 07/2014 - 01/2015 | | GBP | | 185 | | USD | | 309 | | | 7,409 | | | | – | |
BOA | | 07/2014 - 08/2014 | | HUF | | 73,700 | | USD | | 327 | | | 1,746 | | | | 2,898 | |
BOA | | 08/2014 | | IDR | | 6,332,600 | | USD | | 510 | | | 20,474 | | | | – | |
BOA | | 08/2014 - 01/2015 | | INR | | 100,000 | | USD | | 1,586 | | | 35,757 | | | | – | |
BOA | | 07/2014 - 01/2015 | | JPY | | 36,000 | | USD | | 351 | | | 4,236 | | | | – | |
BOA | | 07/2014 - 01/2015 | | KRW | | 1,264,000 | | USD | | 1,233 | | | 8,324 | | | | – | |
BOA | | 07/2014 | | MXN | | 3,000 | | USD | | 232 | | | – | | | | 921 | |
BOA | | 08/2014 | | MYR | | 445 | | USD | | 132 | | | 6,132 | | | | – | |
BOA | | 07/2014 | | NOK | | 1,370 | | USD | | 228 | | | – | | | | 4,762 | |
BOA | | 01/2015 | | NZD | | 435 | | USD | | 361 | | | 11,622 | | | | – | |
BOA | | 08/2014 | | PEN | | 1,549 | | USD | | 534 | | | 17,249 | | | | – | |
BOA | | 07/2014 | | TRY | | 1,190 | | USD | | 557 | | | 1,853 | | | | – | |
BOA | | 08/2014 - 01/2015 | | TWD | | 58,300 | | USD | | 1,934 | | | 21,580 | | | | – | |
BOA | | 07/2014 | | USD | | 457 | | AUD | | 490 | | | – | | | | 4,429 | |
BOA | | 07/2014 - 12/2014 | | USD | | 774 | | BRL | | 1,787 | | | $118 | | | | $6,498 | |
BOA | | 01/2015 | | USD | | 931 | | CAD | | 1,000 | | | – | | | | 1,821 | |
BOA | | 07/2014 | | USD | | 229 | | CHF | | 205 | | | – | | | | 2,617 | |
BOA | | 08/2014 - 01/2015 | | USD | | 2,753 | | CLP | | 1,550,410 | | | 3,942 | | | | 28,906 | |
BOA | | 08/2014 | | USD | | 555 | | COP | | 1,050,000 | | | – | | | | 3,302 | |
BOA | | 07/2014 | | USD | | 231 | | EUR | | 170 | | | – | | | | 1,414 | |
BOA | | 07/2014 - 08/2014 | | USD | | 616 | | HUF | | 138,000 | | | 6,047 | | | | 3 | |
BOA | | 08/2014 | | USD | | 525 | | IDR | | 6,332,600 | | | – | | | | 6,262 | |
BOA | | 08/2014 | | USD | | 527 | | INR | | 32,000 | | | – | | | | 2,020 | |
BOA | | 07/2014 - 12/2014 | | USD | | 714 | | JPY | | 73,000 | | | – | | | | 7,444 | |
BOA | | 06/2015 | | USD | | 559 | | KRW | | 576,666 | | | – | | | | 3,244 | |
BOA | | 06/2015 | | USD | | 523 | | MYR | | 1,720 | | | – | | | | 2,442 | |
BOA | | 07/2014 | | USD | | 459 | | NOK | | 2,740 | | | 12,026 | | | | – | |
BOA | | 07/2014 - 01/2015 | | USD | | 1,242 | | NZD | | 1,460 | | | 1,352 | | | | 15,882 | |
BOA | | 08/2014 | | USD | | 548 | | PEN | | 1,549 | | | – | | | | 2,571 | |
BOA | | 07/2014 - 08/2014 | | USD | | 1,756 | | SEK | | 11,490 | | | 36,851 | | | | 218 | |
BOA | | 08/2014 | | USD | | 547 | | TWD | | 16,400 | | | – | | | | 2,885 | |
BOA | | 07/2014 | | USD | | 226 | | ZAR | | 2,430 | | | – | | | | 1,725 | |
CITNA-B | | 07/2014 - 08/2014 | | AUD | | 1,077 | | USD | | 1,005 | | | 8,816 | | | | – | |
11 OPPENHEIMER DIVERSIFIED ALTERNATIVES FUND/VA
| | |
CONSOLIDATED STATEMENT OF INVESTMENTS Unaudited / Continued |
| | | | | | | | | | | | | | | | | | |
Forward Currency Exchange Contracts (Continued) | |
| Counterparty | | Settlement Month(s) | | Currency Purchased (000’s) | | Currency Sold (000’s) | | Unrealized
Appreciation | | | Unrealized
Depreciation | |
CITNA-B | | 01/2015 | | CAD | | 430 | | USD | | 390 | | $ | 10,907 | | | $ | – | |
CITNA-B | | 08/2014 - 01/2015 | | EUR | | 4,755 | | USD | | 6,486 | | | 38,225 | | | | 10,019 | |
CITNA-B | | 01/2015 | | GBP | | 155 | | USD | | 255 | | | 10,057 | | | | – | |
CITNA-B | | 08/2014 | | HKD | | 4,015 | | USD | | 518 | | | 127 | | | | – | |
CITNA-B | | 08/2014 | | HUF | | 16,000 | | USD | | 70 | | | 180 | | | | – | |
CITNA-B | | 08/2014 | | ILS | | 1,810 | | USD | | 513 | | | 14,643 | | | | – | |
CITNA-B | | 08/2014 | | JPY | | 300,000 | | USD | | 2,938 | | | 24,546 | | | | – | |
CITNA-B | | 08/2014 | | MXN | | 5,840 | | USD | | 437 | | | 11,948 | | | | – | |
CITNA-B | | 07/2014 | | NZD | | 535 | | USD | | 463 | | | 5,052 | | | | – | |
CITNA-B | | 08/2014 - 01/2015 | | PLN | | 8,400 | | USD | | 2,728 | | | 10,551 | | | | – | |
CITNA-B | | 08/2014 | | SEK | | 3,390 | | USD | | 507 | | | 522 | | | | – | |
CITNA-B | | 08/2014 | | USD | | 549 | | AUD | | 587 | | | – | | | | 2,734 | |
CITNA-B | | 01/2015 | | USD | | 1,002 | | CAD | | 1,107 | | | – | | | | 29,614 | |
CITNA-B | | 01/2015 | | USD | | 1,112 | | CZK | | 22,400 | | | – | | | | 8,011 | |
CITNA-B | | 08/2014 - 01/2015 | | USD | | 2,946 | | EUR | | 2,155 | | | 11,397 | | | | 18,165 | |
CITNA-B | | 08/2014 - 01/2015 | | USD | | 897 | | GBP | | 529 | | | – | | | | 7,573 | |
CITNA-B | | 08/2014 | | USD | | 518 | | HKD | | 4,015 | | | 168 | | | | – | |
CITNA-B | | 08/2014 | | USD | | 525 | | ILS | | 1,810 | | | – | | | | 2,659 | |
CITNA-B | | 08/2014 - 01/2015 | | USD | | 2,728 | | JPY | | 278,700 | | | – | | | | 23,699 | |
CITNA-B | | 07/2014 | | USD | | 460 | | MXN | | 6,000 | | | – | | | | 2,684 | |
CITNA-B | | 07/2014 - 08/2014 | | USD | | 1,384 | | NZD | | 1,640 | | | – | | | | 46,476 | |
CITNA-B | | 01/2015 | | USD | | 529 | | SGD | | 660 | | | – | | | | 1,095 | |
CITNA-B | | 07/2014 | | USD | | 456 | | TRY | | 980 | | | – | | | | 5,902 | |
CITNA-B | | 01/2015 | | USD | | 371 | | ZAR | | 4,140 | | | 37 | | | | 3,626 | |
CITNA-B | | 01/2015 | | ZAR | | 4,140 | | USD | | 376 | | | – | | | | 1,000 | |
DEU | | 07/2014 | | AUD | | 5 | | USD | | 5 | | | – | | | | – | |
DEU | | 01/2015 | | CHF | | 45 | | USD | | 51 | | | 369 | | | | 101 | |
DEU | | 01/2015 | | EUR | | 610 | | USD | | 840 | | | – | | | | 4,079 | |
DEU | | 01/2015 | | GBP | | 1,125 | | USD | | 1,893 | | | 27,553 | | | | – | |
DEU | | 08/2014 - 01/2015 | | SEK | | 20,190 | | USD | | 3,008 | | | 19,307 | | | | 9,696 | |
DEU | | 01/2015 | | TRY | | 790 | | USD | | 351 | | | 5,939 | | | | – | |
DEU | | 01/2015 | | USD | | 1,424 | | CHF | | 1,270 | | | – | | | | 10,942 | |
DEU | | 08/2014 - 01/2015 | | USD | | 4,321 | | EUR | | 3,145 | | | 22,353 | | | | 9,938 | |
DEU | | 01/2015 | | USD | | 1,819 | | GBP | | 1,105 | | | – | | | | 68,112 | |
DEU | | 08/2014 | | USD | | 445 | | MXN | | 5,840 | | | – | | | | 3,759 | |
DEU | | 01/2015 | | USD | | 2,253 | | NOK | | 13,930 | | | – | | | | 945 | |
GSCO-OT | | 01/2015 | | AUD | | 45 | | USD | | 41 | | | 627 | | | | – | |
GSCO-OT | | 07/2014 | | BRL | | 1,020 | | USD | | 456 | | | 5,162 | | | | – | |
GSCO-OT | | 08/2014 | | CHF | | 472 | | USD | | 527 | | | 5,384 | | | | – | |
GSCO-OT | | 08/2014 | | COP | | 631,700 | | USD | | 326 | | | 10,163 | | | | – | |
GSCO-OT | | 07/2014 | | INR | | 43,300 | | USD | | 707 | | | 12,226 | | | | – | |
GSCO-OT | | 07/2014 | | KRW | | 586,000 | | USD | | 575 | | | 3,516 | | | | – | |
GSCO-OT | | 08/2014 | | NOK | | 9,440 | | USD | | 1,532 | | | 4,088 | | | | – | |
GSCO-OT | | 08/2014 | | NZD | | 623 | | USD | | 508 | | | 35,763 | | | | – | |
GSCO-OT | | 08/2014 | | SEK | | 6,690 | | USD | | 1,017 | | | – | | | | 16,074 | |
GSCO-OT | | 01/2015 | | USD | | 26 | | AUD | | 30 | | | – | | | | 1,665 | |
GSCO-OT | | 07/2014 - 08/2014 | | USD | | 1,905 | | CHF | | 1,724 | | | – | | | | 39,193 | |
GSCO-OT | | 08/2014 | | USD | | 307 | | COP | | 631,700 | | | – | | | | 29,131 | |
GSCO-OT | | 01/2015 | | USD | | 1,363 | | EUR | | 1,000 | | | – | | | | 7,117 | |
GSCO-OT | | 08/2014 - 01/2015 | | USD | | 685 | | JPY | | 69,800 | | | – | | | | 4,353 | |
GSCO-OT | | 08/2014 | | USD | | 2,115 | | KRW | | 2,268,000 | | | – | | | | 123,215 | |
GSCO-OT | | 08/2014 | | USD | | 292 | | MXN | | 3,920 | | | – | | | | 9,203 | |
GSCO-OT | | 08/2014 | | USD | | 1,557 | | NOK | | 9,440 | | | 20,319 | | | | – | |
GSCO-OT | | 08/2014 | | USD | | 539 | | NZD | | 623 | | | – | | | | 4,129 | |
GSCO-OT | | 07/2014 - 08/2014 | | USD | | 547 | | TRY | | 1,180 | | | – | | | | 6,368 | |
JPM | | 01/2015 | | GBP | | 100 | | USD | | 167 | | | 3,456 | | | | – | |
JPM | | 08/2014 | | HUF | | 73,800 | | USD | | 321 | | | 4,941 | | | | – | |
JPM | | 07/2014 | | INR | | 48,000 | | USD | | 763 | | | 34,221 | | | | – | |
JPM | | 07/2014 | | KRW | | 758,000 | | USD | | 724 | | | 24,517 | | | | – | |
JPM | | 07/2014 | | MXN | | 13,700 | | USD | | 1,050 | | | 3,913 | | | | – | |
JPM | | 07/2014 | | MYR | | 1,285 | | USD | | 392 | | | 8,197 | | | | – | |
JPM | | 08/2014 | | PLN | | 1,585 | | USD | | 511 | | | 9,588 | | | | – | |
JPM | | 08/2014 | | TRY | | 470 | | USD | | 202 | | | 18,370 | | | | – | |
JPM | | 01/2015 | | USD | | 577 | | CAD | | 640 | | | – | | | | 19,929 | |
JPM | | 01/2015 | | USD | | 114 | | GBP | | 70 | | | – | | | | 5,039 | |
JPM | | 08/2014 | | USD | | 321 | | HUF | | 73,800 | | | – | | | | 4,748 | |
JPM | | 12/2014 | | USD | | 550 | | MXN | | 7,239 | | | – | | | | 2,172 | |
JPM | | 08/2014 | | USD | | 399 | | MYR | | 1,315 | | | – | | | | 10,452 | |
JPM | | 08/2014 | | USD | | 515 | | PLN | | 1,585 | | | – | | | | 5,188 | |
12 OPPENHEIMER DIVERSIFIED ALTERNATIVES FUND/VA
| | | | | | | | | | | | | | | | | | |
Forward Currency Exchange Contracts (Continued) | |
| Counterparty | | Settlement Month(s) | | Currency Purchased (000’s) | | Currency Sold (000’s) | | Unrealized
Appreciation | | | Unrealized
Depreciation | |
| |
JPM | | 08/2014 | | USD | | 4 | | SGD | | 5 | | $ | – | | | $ | 74 | |
MSCO | | 01/2015 | | AUD | | 230 | | USD | | 197 | | | 16,425 | | | | – | |
MSCO | | 01/2015 | | CHF | | 10 | | USD | | 11 | | | 169 | | | | – | |
MSCO | | 07/2014 - 01/2015 | | JPY | | 68,000 | | USD | | 669 | | | 2,614 | | | | 464 | |
MSCO | | 01/2015 | | MXN | | 15,900 | | USD | | 1,204 | | | 4,902 | | | | – | |
MSCO | | 07/2014 | | USD | | 6 | | CHF | | 5 | | | – | | | | – | |
MSCO | | 07/2014 | | USD | | 524 | | INR | | 31,100 | | | 7,500 | | | | – | |
MSCO | | 08/2014 | | USD | | 216 | | JPY | | 22,000 | | | – | | | | 1,213 | |
MSCO | | 07/2014 - 08/2014 | | USD | | 964 | | NOK | | 5,840 | | | 13,242 | | | | – | |
MSCO | | 08/2014 | | USD | | 508 | | NZD | | 620 | | | – | | | | 32,683 | |
RBS | | 01/2015 | | CAD | | 120 | | USD | | 107 | | | 4,553 | | | | – | |
RBS | | 01/2015 | | EUR | | 1,135 | | USD | | 1,545 | | | 10,838 | | | | – | |
RBS | | 08/2014 | | GBP | | 335 | | USD | | 570 | | | 3,325 | | | | – | |
RBS | | 01/2015 | | JPY | | 26,000 | | USD | | 256 | | | 1,173 | | | | – | |
RBS | | 07/2014 | | KRW | | 3,000 | | USD | | 3 | | | – | | | | – | |
RBS | | 07/2014 | | NOK | | 2,750 | | USD | | 458 | | | – | | | | 9,766 | |
RBS | | 01/2015 | | USD | | 83 | | AUD | | 90 | | | – | | | | 719 | |
RBS | | 08/2014 | | USD | | 1,014 | | CAD | | 1,125 | | | – | | | | 39,392 | |
RBS | | 01/2015 | | USD | | 90 | | CHF | | 80 | | | 13 | | | | – | |
RBS | | 07/2014 - 01/2015 | | USD | | 3,765 | | EUR | | 2,745 | | | 14,683 | | | | 11,038 | |
RBS | | 08/2014 | | USD | | 43 | | GBP | | 26 | | | – | | | | 1,890 | |
RBS | | 01/2015 | | USD | | 1,102 | | JPY | | 112,000 | | | – | | | | 5,427 | |
RBS | | 08/2014 | | USD | | 759 | | NOK | | 4,520 | | | 23,013 | | | | – | |
| | | | | | | | | | | | | | |
Total Unrealized Appreciation and Depreciation | | $ | 990,988 | | | $ | 944,009 | |
| | | | | | | | | | | | | | |
| | | | | | | | | | | | | | | | |
| Futures Contracts as of June 30, 2014 | |
| Description | | Exchange | | Buy/Sell | | Expiration Date | | Number of Contracts | | Value | | | Unrealized Appreciation
(Depreciation) | |
| |
Aluminum* | | LME | | Sell | | 10/13/14 | | 1 | | $ | 47,375 | | | $ | (651) | |
Aluminum* | | LME | | Sell | | 9/15/14 | | 1 | | | 47,269 | | | | 412 | |
Brent Crude Oil* | | ICE | | Sell | | 8/14/14 | | 1 | | | 112,070 | | | | (4,791) | |
Brent Crude Oil* | | ICE | | Buy | | 7/16/14 | | 4 | | | 449,440 | | | | (3,237) | |
CAC 40 10 Index | | PAR | | Sell | | 7/18/14 | | 46 | | | 2,785,320 | | | | 52,844 | |
CBOE Volatility Index | | CBE | | Sell | | 8/19/14 | | 17 | | | 226,950 | | | | 19,789 | |
Copper* | | LME | | Sell | | 9/15/14 | | 3 | | | 526,800 | | | | (9,057) | |
Corn* | | CBT | | Sell | | 12/12/14 | | 5 | | | 106,313 | | | | 4,238 | |
FTSE 100 Index | | LIF | | Sell | | 9/19/14 | | 26 | | | 2,986,153 | | | | 1,291 | |
Lean Hogs* | | CME | | Buy | | 10/14/14 | | 1 | | | 46,400 | | | | 8,867 | |
Natural Gas* | | NYM | | Sell | | 7/29/14 | | 7 | | | 312,270 | | | | 6,282 | |
Natural Gas* | | NYM | | Sell | | 8/27/14 | | 3 | | | 133,200 | | | | 3,014 | |
New York Harbor ULSD* | | NYM | | Buy | | 7/31/14 | | 7 | | | 874,738 | | | | 12,920 | |
Nickel* | | LME | | Buy | | 10/13/14 | | 2 | | | 228,636 | | | | 339 | |
Palladium* | | NYM | | Sell | | 9/26/14 | | 2 | | | 168,630 | | | | (409) | |
Platinum* | | NYM | | Buy | | 10/29/14 | | 4 | | | 296,580 | | | | 1,257 | |
Platinum* | | NYM | | Sell | | 7/29/14 | | 2 | | | 148,100 | | | | (256) | |
RBOB Gasoline* | | NYM | | Sell | | 7/31/14 | | 8 | | | 1,022,549 | | | | (18,953) | |
S&P 500 E-Mini Index | | CME | | Buy | | 9/19/14 | | 37 | | | 3,611,940 | | | | 43,119 | |
S&P/TSE 60 Index | | MON | | Sell | | 9/18/14 | | 5 | | | 809,428 | | | | (9,362) | |
Silver* | | CMX | | Sell | | 9/26/14 | | 2 | | | 210,560 | | | | 186 | |
Soybean* | | CBT | | Sell | | 11/14/14 | | 6 | | | 347,175 | | | | 21,308 | |
SPI 200 Index | | SFE | | Sell | | 9/18/14 | | 7 | | | 883,497 | | | | 4,443 | |
United States Treasury Long Bonds | | CBT | | Buy | | 9/19/14 | | 9 | | | 1,234,688 | | | | (1,978) | |
WTI Crude Oil* | | NYM | | Sell | | 7/22/14 | | 12 | | | 1,264,440 | | | | 16,676 | |
WTI Crude Oil* | | NYM | | Buy | | 11/20/14 | | 11 | | | 1,123,980 | | | | 154,148 | |
WTI Crude Oil* | | ICE | | Sell | | 7/21/14 | | 4 | | | 421,480 | | | | 3,085 | |
| | | | | | | | | | | | | | | | |
| | | | | | | | | | | | | | $ | 305,524 | |
| | | | | | | | | | | | | | | | |
*All or a portion of this security is owned by the subsidiary. See Note 1 of the accompanying Consolidated Notes.
13 OPPENHEIMER DIVERSIFIED ALTERNATIVES FUND/VA
CONSOLIDATED STATEMENT OF INVESTMENTS Unaudited / Continued
| | | | | | | | | | | | | | | | | | | | | | | | |
| Exchange-Traded Options Written at June 30, 2014 | |
| Description | | | | | Exercise Price | | | Expiration Date | | | | | Number of Contracts | | Premiums Received | | | Value | |
| |
| Agnico Eagle Mines Ltd. Call | | | USD | | | | 42.500 | | | | 11/22/14 | | | USD | | (8) | | $ | 1,296 | | | $ | (1,488) | |
| |
| Agnico Eagle Mines Ltd. Call | | | USD | | | | 40.000 | | | | 1/17/15 | | | USD | | (7) | | | 1,055 | | | | (2,205) | |
| |
| Agnico Eagle Mines Ltd. Call | | | USD | | | | 32.500 | | | | 8/16/14 | | | USD | | (2) | | | 234 | | | | (1,130) | |
| |
| Agnico Eagle Mines Ltd. Call | | | USD | | | | 47.500 | | | | 1/17/15 | | | USD | | (11) | | | 1,121 | | | | (1,133) | |
| |
| Agnico Eagle Mines Ltd. Put | | | USD | | | | 30.000 | | | | 1/17/15 | | | USD | | (11) | | | 1,134 | | | | (1,034) | |
| |
| Agnico Eagle Mines Ltd. Call | | | USD | | | | 35.000 | | | | 1/17/15 | | | USD | | (8) | | | 4,102 | | | | (4,480) | |
| |
| Alamos Gold, Inc. Put | | | CAD | | | | 11.000 | | | | 7/19/14 | | | CAD | | (25) | | | 2,277 | | | | (1,054) | |
| |
| AngloGold Ashanti Ltd. Call | | | USD | | | | 18.000 | | | | 1/17/15 | | | USD | | (6) | | | 612 | | | | (900) | |
| |
| Coeur D Alene Mines Put | | | USD | | | | 10.000 | | | | 9/20/14 | | | USD | | (12) | | | 1,374 | | | | (1,920) | |
| |
| Detour Gold Corp. Call | | | CAD | | | | 18.000 | | | | 1/17/15 | | | CAD | | (10) | | | 1,184 | | | | (1,078) | |
| |
| Detour Gold Corp. Put | | | CAD | | | | 11.000 | | | | 1/17/15 | | | CAD | | (9) | | | 844 | | | | (717) | |
| |
| Detour Gold Corp. Call | | | CAD | | | | 16.000 | | | | 1/17/15 | | | CAD | | (9) | | | 1,258 | | | | (1,518) | |
| |
| Detour Gold Corp. Call | | | CAD | | | | 17.000 | | | | 10/18/14 | | | CAD | | (6) | | | 579 | | | | (506) | |
| |
| Detour Gold Corp. Put | | | CAD | | | | 12.000 | | | | 1/17/15 | | | CAD | | (8) | | | 1,121 | | | | (900) | |
| |
| Detour Gold Corp. Put | | | CAD | | | | 9.000 | | | | 10/18/14 | | | CAD | | (21) | | | 1,788 | | | | (295) | |
| |
| First Majestic Silver Corp. Call | | | CAD | | | | 12.000 | | | | 1/17/15 | | | CAD | | (10) | | | 1,090 | | | | (1,125) | |
| |
| Franco-Nevada Corp. Call | | | USD | | | | 60.000 | | | | 10/18/14 | | | USD | | (8) | | | 1,296 | | | | (1,880) | |
| |
| Franco-Nevada Corp. Call | | | USD | | | | 60.000 | | | | 1/17/15 | | | USD | | (12) | | | 1,498 | | | | (3,600) | |
| |
| Freeport-McMoRan Copper & Gold, Inc. Put | | | USD | | | | 32.000 | | | | 11/22/14 | | | USD | | (8) | | | 1,151 | | | | (552) | |
| |
| Freeport-McMoRan Copper & Gold, Inc. Put | | | USD | | | | 31.000 | | | | 1/17/15 | | | USD | | (8) | | | 1,200 | | | | (656) | |
| |
| Goldcorp, Inc. Call | | | USD | | | | 29.000 | | | | 1/17/15 | | | USD | | (11) | | | 1,097 | | | | (1,793) | |
| |
| Goldcorp, Inc. Put | | | USD | | | | 20.000 | | | | 1/17/15 | | | USD | | (16) | | | 1,656 | | | | (368) | |
| |
| Kinross Gold Corp. Put | | | USD | | | | 5.000 | | | | 1/17/15 | | | USD | | (20) | | | 2,206 | | | | (2,240) | |
| |
| Newmont Mining Corp. Call | | | USD | | | | 25.000 | | | | 1/17/15 | | | USD | | (9) | | | 1,737 | | | | (1,944) | |
| |
| Randgold Resources Ltd. Put | | | USD | | | | 67.500 | | | | 1/17/15 | | | USD | | (4) | | | 578 | | | | (550) | |
| |
| Randgold Resources Ltd. Call | | | USD | | | | 82.500 | | | | 12/20/14 | | | USD | | (4) | | | 2,408 | | | | (3,000) | |
| |
| Randgold Resources Ltd. Call | | | USD | | | | 100.000 | | | | 1/17/15 | | | USD | | (10) | | | 1,196 | | | | (2,000) | |
| |
| Randgold Resources Ltd. Call | | | USD | | | | 95.000 | | | | 12/20/14 | | | USD | | (8) | | | 1,019 | | | | (2,000) | |
| |
| Randgold Resources Ltd. Call | | | USD | | | | 100.000 | | | | 12/20/14 | | | USD | | (4) | | | 588 | | | | (650) | |
| |
| Rio Tinto plc Put | | | USD | | | | 52.500 | | | | 7/19/14 | | | USD | | (23) | | | 3,336 | | | | (1,380) | |
| |
| Royal Gold, Inc. Call | | | USD | | | | 90.000 | | | | 1/17/15 | | | USD | | (12) | | | 2,175 | | | | (2,724) | |
| |
| Royal Gold, Inc. Call | | | USD | | | | 77.500 | | | | 10/18/14 | | | USD | | (12) | | | 4,208 | | | | (5,160) | |
| |
| Royal Gold, Inc. Call | | | USD | | | | 85.000 | | | | 1/17/15 | | | USD | | (9) | | | 1,188 | | | | (2,790) | |
| |
| Silver Wheaton Corp. Call | | | USD | | | | 27.000 | | | | 1/17/15 | | | USD | | (10) | | | 1,090 | | | | (2,090) | |
| |
| Silver Wheaton Corp. Call | | | USD | | | | 28.000 | | | | 12/20/14 | | | USD | | (9) | | | 1,135 | | | | (1,350) | |
| |
| Silver Wheaton Corp. Call | | | USD | | | | 30.000 | | | | 1/17/15 | | | USD | | (5) | | | 505 | | | | (515) | |
| |
| Silver Wheaton Corp. Call | | | USD | | | | 29.000 | | | | 12/20/14 | | | USD | | (11) | | | 1,132 | | | | (1,265) | |
| |
| Tahoe Resources, Inc. Call | | | USD | | | | 25.000 | | | | 12/20/14 | | | USD | | (10) | | | 1,769 | | | | (3,300) | |
| |
| Tahoe Resources, Inc. Put | | | USD | | | | 20.000 | | | | 9/20/14 | | | USD | | (28) | | | 3,905 | | | | (560) | |
| | | | | | | | | | | | | | | | | | | | |
| Total of Exchange-Traded Options Written | | | | | | | | | | | | | | | | | | $ | 59,142 | | | $ | (63,850) | |
| | | | | | | | | | | | | | | | | | | | |
| | | | | | | | | | | | | | | | | | | | | | | | | | |
| Over-the-Counter Credit Default Swaps at June 30, 2014 | |
Reference Asset | | Counterparty | | Buy/Sell Protection | | | Fixed Rate | | | | Maturity Date | | | | |
| Notional Amount
(000’s) |
| | | Premiums Received/(Paid) | | | | Value | |
| |
| Aetna, Inc. | | GSG | | Sell | | | 1.000 | % | | | 9/20/19 | | | USD | | | 580 | | | $ | (18,192) | | | $ | 17,672 | |
| |
| Avon Products, Inc. | | CITNA-B | | Buy | | | 1.000 | | | | 9/20/19 | | | USD | | | 580 | | | | (40,202) | | | | 47,870 | |
| |
| Barrick Gold Corp. | | GSG | | Buy | | | 1.000 | | | | 9/20/19 | | | USD | | | 580 | | | | (11,300) | | | | 14,098 | |
| |
| Boeing Capital Corp. | | DEU | | Sell | | | 1.000 | | | | 9/20/19 | | | USD | | | 580 | | | | (26,361) | | | | 26,865 | |
| |
| Capital One Bank (USA) NA | | CITNA-B | | Sell | | | 1.000 | | | | 9/20/19 | | | USD | | | 580 | | | | (18,644) | | | | 16,778 | |
| |
| Hartford Financial Services Group, Inc. (The) | | BNP | | Buy | | | 1.000 | | | | 9/20/19 | | | USD | | | 580 | | | | 11,319 | | | | (7,929) | |
| |
| Hillshire Brands Co. (The) | | CITNA-B | | Sell | | | 1.000 | | | | 9/20/19 | | | USD | | | 580 | | | | (19,399) | | | | 18,094 | |
| |
| International Business Machines Corp. | | CITNA-B | | Buy | | | 1.000 | | | | 9/20/19 | | | USD | | | 580 | | | | 17,005 | | | | (16,712) | |
| |
| Kohl’s Corp. | | DEU | | Buy | | | 1.000 | | | | 9/20/19 | | | USD | | | 580 | | | | (6,530) | | | | 11,676 | |
| |
| Mckesson Corp. | | BNP | | Sell | | | 1.000 | | | | 9/20/19 | | | USD | | | 580 | | | | (21,370) | | | | 20,653 | |
| |
| Newell Rubbermaid, Inc. | | DEU | | Buy | | | 1.000 | | | | 9/20/19 | | | USD | | | 580 | | | | 9,543 | | | | (7,255) | |
| |
| Newmont Mining Corp. | | FIB | | Buy | | | 1.000 | | | | 9/20/19 | | | USD | | | 580 | | | | (16,575) | | | | 15,544 | |
| |
| Norfolk Southern Corp. | | CITNA-B | | Sell | | | 1.000 | | | | 9/20/19 | | | USD | | | 580 | | | | (23,198) | | | | 22,405 | |
| |
| Ryder System, Inc. | | BNP | | Sell | | | 1.000 | | | | 9/20/19 | | | USD | | | 580 | | | | (11,330) | | | | 9,232 | |
| |
| Staples, Inc. | | BOA | | Buy | | | 1.000 | | | | 9/20/19 | | | USD | | | 580 | | | | (38,810) | | | | 44,237 | |
| |
| Target Corp. | | DEU | | Buy | | | 1.000 | | | | 9/20/19 | | | USD | | | 580 | | | | 15,500 | | | | (15,078) | |
| |
| Union Pacific Corp. | | CITNA-B | | Sell | | | 1.000 | | | | 9/20/19 | | | USD | | | 580 | | | | (24,270) | | | | 22,743 | |
| |
| United Parcel Service, Inc. | | CITNA-B | | Sell | | | 1.000 | | | | 9/20/19 | | | USD | | | 580 | | | | (23,963) | | | | 22,743 | |
| |
| Walt Disney Co. (The) | | GSG | | Sell | | | 1.000 | | | | 9/20/19 | | | USD | | | 580 | | | | (24,116) | | | | 22,902 | |
| |
| Whirlpool Corp. | | DEU | | Buy | | | 1.000 | | | | 9/20/19 | | | USD | | | 580 | | | | 6,164 | | | | (3,137) | |
| | | | | | | | | | | | | | | | | | | | | | |
| Total of Over-the-Counter Credit Default Swaps | | | | | | | | | | | | | | | | $ | (264,729) | | | $ | 283,401 | |
| | | | | | | | | | | | | | | | | | | | | | |
14 OPPENHEIMER DIVERSIFIED ALTERNATIVES FUND/VA
The table that follows shows the undiscounted maximum potential payment by the Fund related to selling credit protection in credit default swaps:
| | | | | | | | | | | | |
Type of Reference Asset on
which the Fund Sold Protection | | Total Maximum Potential
Payments for Selling
Credit Protection
(Undiscounted) | | | Amount Recoverable* | | | Reference Asset
Rating Range** | |
Investment Grade Single Name Corporate Debt | | | $5,800,000 | | | | — | | | | BBB to AA- | |
* The Fund has no amounts recoverable from related purchased protection. In addition, the Fund has no recourse provisions under the credit derivatives and holds no collateral which can offset or reduce potential payments under a triggering event.
** The period end reference asset security ratings, as rated by any rating organization, are included in the equivalent Standard & Poor’s rating category. The reference asset rating represents the likelihood of a potential credit event on the reference asset which would result in a related payment of the Fund.
| | | | | | | | | | | | | | | | | | | | | | | | | | | | |
Centrally Cleared Interest Rate Swaps at June 30, 2014 | | | | | | | | | | | | | | | | | |
Counterparty | |
| Pay/Receive Floating
Rate |
| | | Floating Rate | | | | Fixed Rate | | | | Maturity Date | | | | | | | | Notional Amount (000’s) | | | | Value | |
| | | | | | | Six-Month CHF BBA | | | | | | | | | | | | | | | | | | | | | |
BAC | | | Pay | | | | LIBOR | | | | 1.180% | | | | 5/8/24 | | | | CHF | | | | 1,505 | | | $ | (32,763) | |
| | | | | | | Six-Month GBP BBA | | | | | | | | | | | | | | | | | | | | | |
BAC | | | Receive | | | | LIBOR | | | | 2.740 | | | | 5/6/24 | | | | GBP | | | | 1,010 | | | | 2,232 | |
| | | | | | | Three-Month USD | | | | | | | | | | | | | | | | | | | | | |
BAC | | | Receive | | | | BBA LIBOR | | | | 2.734 | | | | 5/6/24 | | | | USD | | | | 1,710 | | | | 26,433 | |
| | | | | | | Six-Month JPY BBA | | | | | | | | | | | | | | | | | | | | | |
BAC | | | Pay | | | | LIBOR | | | | 0.795 | | | | 5/7/24 | | | | JPY | | | | 175,000 | | | | (19,325) | |
| | | | | | | | | | | | | | | | | | | | | | | | | | | | |
Total of Centrally Cleared Interest Rate Swaps | | | | | | | | | | | | | | | $ | (23,423) | |
| | | | | | | | | | | | | | | | | | | | | | | | | | | | |
| | | | | | | | | | | | | | | | | | | | |
Over-the-Counter Total Return Swaps at June 30, 2014 | | | | | | | | | | | | | | |
Reference Asset | | Counterparty | | Pay/Receive Total Return* | | Floating Rate | | Maturity Date | | | | | |
| Notional
Amount (000’s) |
| | | Value | |
| CGAUOPAU Custom Basket | | CITNA-B | | Receive | | One-Month AUD BBR BBSW | | 3/11/15 | | | AUD | | | | 1,321 | | | $ | 4,461 | |
| CGCNOCAD Custom Basket | | CITNA-B | | Receive | | One-Month CAD BA CDOR | | 4/8/15 | | | CAD | | | | 1,149 | | | | 57,097 | |
CIBZC8DE Index** | | CIBC | | Receive | | Official settlement price of CIBZC8DE Index | | 8/5/14 | | | USD | | | | 6,000 | | | | (2 | ) |
CIBZGSPP Index** | | CIBC | | Receive | | Official settlement price of CIBZGSPP Index | | 8/5/14 | | | USD | | | | 580 | | | | — | |
CIBZNGLO Index** | | CIBC | | Receive | | Official settlement price of CIBZNGLO Index | | 8/5/14 | | | USD | | | | 920 | | | | — | |
CIBZOPQR Index** | | CIBC | | Receive | | Official settlement price of CIBZOPQR Index | | 8/5/14 | | | USD | | | | 3,050 | | | | 1 | |
| DBOPSPLG Custom Basket | | DEU | | Receive | | One-Month USD BBA LIBOR | | 2/6/15 | | | USD | | | | 1,739 | | | | 41,011 | |
| DBOPSPST Custom Basket | | DEU | | Pay | | One-Month USD BBA LIBOR | | 2/6/15 | | | USD | | | | 1,738 | | | | (52,989 | ) |
DJUBS Index** | | MAC | | Receive | | Official settlement price of DJUBS Index | | 8/5/14 | | | USD | | | | 1,370 | | | | 1 | |
DJUBS Index** | | MAC | | Receive | | Official settlement price of DJUBS Index | | 7/3/14 | | | USD | | | | 1,350 | | | | 7,889 | |
GSEHOPHK Custom Basket | | GSG | | Receive | | One-Month HKD HIBOR HKAB plus 40 basis points | | 6/12/15 | | | HKD | | | | 8,860 | | | | (3,772 | ) |
GSOPSPS3 Custom Basket | | GSG | | Receive | | One-Month USD BBA LIBOR minus 35 basis points | | 4/20/15 | | | USD | | | | 4,066 | | | | 49,816 | |
HIN4 Index | | GSG | | Pay | | No floating rate | | 8/7/14 | | | HKD | | | | 5,694 | | | | (10,580 | ) |
| iBoxx USD Liquid Leveraged Loans Index | | JPM | | Pay | | Three-Month USD BBA LIBOR | | 9/26/14 | | | USD | | | | 12,770 | | | | 178,649 | |
MLCILRIE Index** | | MLCI | | Receive | | Official settlement price of MLCILRIE Index | | 8/5/14 | | | USD | | | | (1,200 | ) | | | (1 | ) |
MLCILRLE Index** | | MLCI | | Receive | | Official settlement price of MLCILRLE Index | | 7/3/14 | | | USD | | | | (380 | ) | | | 28,424 | |
MLCILRLE Index** | | MLCI | | Receive | | Official settlement price of MLCILRLE Index | | 8/5/14 | | | USD | | | | (400 | ) | | | — | |
MLCILRME Index** | | MLCI | | Receive | | Official settlement price of MLCILRME Index | | 8/5/14 | | | USD | | | | (1,650 | ) | | | (1 | ) |
MLCILROE Index** | | MLCI | | Receive | | Official settlement price of MLCILROE Index | | 8/5/14 | | | USD | | | | (1,500 | ) | | | 1 | |
MLCILRSE Index** | | MLCI | | Receive | | Official settlement price of MLCILRSE Index | | 8/5/14 | | | USD | | | | (540 | ) | | | (1 | ) |
MLTROPF4 Custom Basket | | BOA | | Pay | | One-Month EUR EURIBOR plus 29 basis points | | 4/13/15 | | | EUR | | | | 1,045 | | | | (36,901 | ) |
MLTROPFR Custom Basket | | BOA | | Pay | | One-Month EUR EURIBOR plus 29 basis points | | 4/10/15 | | | EUR | | | | 1,035 | | | | (37,074 | ) |
MLTROPU4 Custom Basket | | BOA | | Pay | | One-Month GBP BBA LIBOR plus 34 basis points | | 4/13/15 | | | GBP | | | | 860 | | | | (15,339 | ) |
MLTROPUK Custom Basket | | BOA | | Pay | | One-Month GBP BBA LIBOR plus 34 basis points | | 4/10/15 | | | GBP | | | | 854 | | | | (15,142 | ) |
OEX Index | | GSG | | Pay | | One-Month USD BBA LIBOR plus 5 basis points | | 1/16/15 | | | USD | | | | 2,087 | | | | (4,223 | ) |
OEX Index | | GSG | | Pay | | One-Month USD BBA LIBOR plus 5 basis points | | 11/20/14 | | | USD | | | | 3 | | | | (25 | ) |
15 OPPENHEIMER DIVERSIFIED ALTERNATIVES FUND/VA
| | |
CONSOLIDATED STATEMENT OF INVESTMENTS Unaudited / Continued |
| | | | | | | | | | | | | | | | | | | | | | | | | | |
Over-the-Counter Total Return Swaps (Continued) | | | | | | | | | | | | | | | | |
Reference Asset | | | Counterparty | | |
| Pay/Receive Total
Return* |
| | Floating Rate | | | Maturity Date | | | | | | | | Notional Amount (000’s) | | | | Value | |
| | | | | | | | | | One-Month USD BBA LIBOR | | | | | | | | | | | | | | | | |
OEX Index | | | GSG | | | | Pay | | | plus 5 basis points | | | 1/8/15 | | | | USD | | | | 181 | | | $ | (2,924 | ) |
| | | | | | | | | | One-Month USD BBA LIBOR | | | | | | | | | | | | | | | | |
OEX Index | | | GSG | | | | Pay | | | minus 5 basis points | | | 4/8/15 | | | | USD | | | | 1 | | | | (13 | ) |
| | | | | | | | | | One-Month USD BBA LIBOR | | | | | | | | | | | | | | | | |
OEX Index | | | GSG | | | | Pay | | | plus 5 basis points | | | 1/15/15 | | | | USD | | | | 1,857 | | | | (3,758 | ) |
Total of Over-the-Counter Total Return Swaps | | | | | | | | | | | | | | $ | 184,605 | |
*Fund will pay ore receive the total return of the reference asset depending on whether the return is positive or negative. For contracts where the Fund has elected to receive the total return of the reference asset if positive, it will be responsible for paying the floating rate and the total return of the reference asset if negative. If the Fund has elected to pay the total return of the reference asset if positive, it will receive the floating rate and the total return of the reference asset if negative.
** All or a portion of this security is owned by the subsidiary. See Note 1 of the accompanying Consolidated Notes.
| | | | | | | | | | | | | | | | | | | | | | | | | | | | |
Over-the-Counter Volatility Swaps at June 30, 2014 | | | | | | | | | | | | | | | | | |
Reference Asset | | | Counterparty | | |
| Pay/Receive
Volatility* |
| | | Strike Price | | | | Maturity Date | | | | | | | | Notional Amount | | | | Value | |
AUD/JPY spot exchange rate | | | MOS-A | | | | Pay | | | $ | 5 .900 | | | | 7/31/14 | | | | AUD | | | | 850 | | | $ | (265) | |
AUD/JPY spot exchange rate | | | BOA | | | | Pay | | | | 5 .900 | | | | 8/1/14 | | | | AUD | | | | 850 | | | | (321) | |
AUD/JPY spot exchange rate | | | MOS-A | | | | Pay | | | | 6 .050 | | | | 8/5/14 | | | | AUD | | | | 850 | | | | (120) | |
CAD/JPY spot exchange rate | | | BOA | | | | Pay | | | | 5 .050 | | | | 7/22/14 | | | | CAD | | | | 870 | | | | 196 | |
CAD/JPY spot exchange rate | | | DEU | | | | Pay | | | | 5 .500 | | | | 7/22/14 | | | | CAD | | | | 870 | | | | 457 | |
CAD/JPY spot exchange rate | | | DEU | | | | Pay | | | | 5 .300 | | | | 7/18/14 | | | | CAD | | | | 870 | | | | 489 | |
CAD/JPY spot exchange rate | | | MOS-A | | | | Pay | | | | 6 .300 | | | | 7/7/14 | | | | CAD | | | | 870 | | | | 1,973 | |
CHF/NOK spot exchange rate | | | JPM | | | | Receive | | | | 6 .750 | | | | 7/28/14 | | | | CHF | | | | 710 | | | | (64) | |
EUR/NZD spot exchange rate | | | MOS-A | | | | Pay | | | | 7 .400 | | | | 7/7/14 | | | | EUR | | | | 590 | | | | (307) | |
EUR/NZD spot exchange rate | | | DEU | | | | Pay | | | | 7 .000 | | | | 7/14/14 | | | | EUR | | | | 590 | | | | (800) | |
EUR/NZD spot exchange rate | | | BOA | | | | Pay | | | | 7 .200 | | | | 7/7/14 | | | | EUR | | | | 590 | | | | (549) | |
EUR/USD spot exchange rate | | | DEU | | | | Pay | | | | 5 .900 | | | | 7/9/14 | | | | USD | | | | 800 | | | | 1,736 | |
EUR/USD spot exchange rate | | | JPM | | | | Pay | | | | 6 .625 | | | | 7/7/14 | | | | USD | | | | 800 | | | | 2,160 | |
GBP/NOK spot exchange rate | | | BOA | | | | Receive | | | | 6 .350 | | | | 7/23/14 | | | | GBP | | | | 470 | | | | (298) | |
GBP/NOK spot exchange rate | | | JPM | | | | Receive | | | | 6 .700 | | | | 7/24/14 | | | | GBP | | | | 470 | | | | (483) | |
GBP/NOK spot exchange rate | | | DEU | | | | Receive | | | | 6 .500 | | | | 7/28/14 | | | | GBP | | | | 470 | | | | (80) | |
GBP/NOK spot exchange rate | | | JPM | | | | Receive | | | | 6 .600 | | | | 7/25/14 | | | | GBP | | | | 470 | | | | (273) | |
GBP/SEK spot exchange rate | | | JPM | | | | Receive | | | | 5 .950 | | | | 7/10/14 | | | | GBP | | | | 480 | | | | 813 | |
GBP/SEK spot exchange rate | | | JPM | | | | Receive | | | | 6 .000 | | | | 7/11/14 | | | | GBP | | | | 480 | | | | 427 | |
iShares MSCI Emerging Markets | | | GSG | | | | Receive | | | | 517 .108 | | | | 7/9/14 | | | | USD | | | | 88 | | | | (31,137) | |
iShares MSCI Emerging Markets | | | GSG | | | | Pay | | | | 503 .554 | | | | 7/8/14 | | | | USD | | | | 90 | | | | 33,775 | |
iShares MSCI Emerging Markets | | | GSG | | | | Pay | | | | 499 .076 | | | | 7/9/14 | | | | USD | | | | 90 | | | | 36,068 | |
iShares MSCI Emerging Markets | | | GSG | | | | Receive | | | | 541 .958 | | | | 7/7/14 | | | | USD | | | | 86 | | | | (32,716) | |
iShares MSCI Emerging Markets | | | GSG | | | | Pay | | | | 523 .494 | | | | 7/7/14 | | | | USD | | | | 88 | | | | 35,141 | |
iShares MSCI Emerging Markets | | | GSG | | | | Receive | | | | 521 .666 | | | | 7/8/14 | | | | USD | | | | 88 | | | | (31,650) | |
iShares MSCI Emerging Markets | | | GSG | | | | Receive | | | | 551 .780 | | | | 7/10/14 | | | | USD | | | | 85 | | | | (35,703) | |
iShares MSCI Emerging Markets | | | GSG | | | | Pay | | | | 528 .540 | | | | 7/11/14 | | | | USD | | | | 78 | | | | 34,443 | |
iShares MSCI Emerging Markets | | | GSG | | | | Receive | | | | 555 .545 | | | | 7/11/14 | | | | USD | | | | 76 | | | | (32,099) | |
iShares MSCI Emerging Markets | | | GSG | | | | Pay | | | | 533 .148 | | | | 7/10/14 | | | | USD | | | | 87 | | | | 35,526 | |
NZD/USD spot exchange rate | | | JPM | | | | Receive | | | | 6 .250 | | | | 7/16/14 | | | | USD | | | | 800 | | | | (808) | |
NZD/USD spot exchange rate | | | DEU | | | | Receive | | | | 6 .300 | | | | 7/17/14 | | | | USD | | | | 800 | | | | (672) | |
USD/CHF spot exchange rate | | | GSG | | | | Pay | | | | 5 .750 | | | | 7/14/14 | | | | USD | | | | 800 | | | | 1,072 | |
Total of Over-the-Counter Volatility Swaps | | | | | | | | | | | | | | | | | | | $ | 15,931 | |
*Fund will pay or receive the volatility of the reference asset depending on whether the realized volatility of the reference asset exceeds or is less than the strike price. For contracts where the Fund has elected to receive the volatility of the reference asset, it will receive a net payment of the difference between the realized volatility and the strike price multiplied by the notional amount if the realized volatility exceeds the strike price; the Fund will make a net payment of the absolute value of the difference of the realized volatility and the strike price multiplied by the notional amount if the realized volatility is less than the strike price. For contracts where the Fund has elected to pay the volatility of the reference asset, it will make a net payment of the difference between the realized volatility and the strike price multiplied by the notional amount if the realized volatility exceeds the strike price; the Fund will receive a net payment of the absolute value of the difference of the realized and the strike price multiplied by the notional amount if the realized volatility is less than the strike price.
| | |
| Glossary: | | |
| Counterparty Abbreviations | | |
| BAC | | Barclays Bank plc |
| BNP | | BNP Paribas |
| BOA | | Bank of America NA |
| CIBC | | Canadian Imperial Bank of Commerce |
| CITNA-B | | Citibank NA |
| DEU | | Deutsche Bank AG |
| FIB | | Credit Suisse International |
| GSCO-OT | | Goldman Sachs Bank USA |
| GSG | | Goldman Sachs Group, Inc. (The) |
| JPM | | JPMorgan Chase Bank NA |
| MAC | | Macquarie Bank Ltd. |
| MLCI | | Merrill Lynch Commodities, Inc. |
16 OPPENHEIMER DIVERSIFIED ALTERNATIVES FUND/VA
| | |
Counterparty Abbreviations (Continued) | | |
MOS-A | | Morgan Stanley |
MSCO | | Morgan Stanley Capital Services, Inc. |
RBS | | Royal Bank of Scotland plc (The) |
|
Currency abbreviations indicate amounts reporting in currencies |
AUD | | Australian Dollar |
BRL | | Brazilian Real |
CAD | | Canadian Dollar |
CHF | | Swiss Franc |
CLP | | Chilean Peso |
CNH | | Offshore Chinese Renminbi |
COP | | Colombian Peso |
CZK | | Czech Koruna |
EUR | | Euro |
GBP | | British Pound Sterling |
HKD | | Hong Kong Dollar |
HUF | | Hungarian Forint |
IDR | | Indonesia Rupiah |
ILS | | Israeli Shekel |
INR | | Indian Rupee |
JPY | | Japanese Yen |
KRW | | South Korean Won |
MXN | | Mexican Nuevo Peso |
MYR | | Malaysian Ringgit |
NOK | | Norwegian Krone |
NZD | | New Zealand Dollar |
PEN | | Peruvian New Sol |
PHP | | Philippines Peso |
PLN | | Polish Zloty |
RUB | | Russian Ruble |
SEK | | Swedish Krona |
SGD | | Singapore Dollar |
THB | | Thailand Baht |
TRY | | New Turkish Lira |
TWD | | New Taiwan Dollar |
ZAR | | South African Rand |
| |
Definitions | | |
BA CDOR | | Canada Bankers Acceptances Deposit Offering Rate |
BBA LIBOR | | British Bankers’ Association London - Interbank Offered Rate |
BBR BBSW | | Bank Bill Swap Reference Rate (Australian Financial Market) |
CDOR | | Canada Bankers Acceptances Rate |
CIBZC8DE | | CIBC Custom 8 Enhanced Roll Commodity Index |
CIBZGSPP | | CIBC Custom 16 Commodity Index |
CIBZNGLO | | CIBC Natural Gas Long Only Commodity Index |
CIBZOPQR | | CIBC Oppenheimer Quarterly Roll Index |
DBOPSPST | | Custom Basket of Securities |
DJUBS | | Dow Jones-UBS Index |
EURIBOR | | Euro Interbank Offered Rate |
GSEHOPHK | | Custom Basket of Securities |
GSGPSPS3 | | Custom Basket of Securities |
HIA4 | | Hang Seng Index |
HIBOR | | Hong Kong Interbank Offered Rate |
HKAB | | Hong Kong Association of Banks |
MSCI | | Morgan Stanley Capital International |
MLCILRIE | | Merrill Lynch Commodities Long Pre-Roll Industrial Metals ER Index |
MLCILRLE | | Merrill Lynch Commodities Long Pre-Roll Livestock ER Index |
MLCILROE | | DJ Petroleum rolling from -11 to 4 ER Index |
MLCILRSE | | Merrill Lynch Commodities DJ Softs rolling from -11 to 4 |
OEX | | S&P 100 Index |
| |
Exchange Abbreviations | | |
CBE | | Chicago Board Options Exchange |
CBT | | Chicago Board of Trade |
CME | | Chicago Mercantile Exchanges |
CMX | | Commodity Exchange, Inc. |
ICE | | Intercontinental Exchange |
LIF | | London International Financial Futures and Options Exchange |
LME | | London Metal Exchange |
17 OPPENHEIMER DIVERSIFIED ALTERNATIVES FUND/VA
| | |
CONSOLIDATED STATEMENT OF INVESTMENTS Unaudited / Continued |
| | |
Exchange Abbreviations (Continued) | | |
MON | | Montreal Exchange |
NYM | | New York Mercantile Exchange |
PAR | | Paris Stock Exchange |
SFE | | Sydney Futures Exchange |
See accompanying Notes to Consolidated Financial Statements.
18 OPPENHEIMER DIVERSIFIED ALTERNATIVES FUND/VA
| | |
CONSOLIDATED STATEMENT OF ASSETS AND LIABILITIES June 30, 2014 Unaudited |
| | | | |
Assets | | | | |
Investments, at value—see accompanying consolidated statement of investments: | | | | |
Unaffiliated companies (cost $78,013,391) | | $ | 82,669,950 | |
Affiliated companies (cost $31,662,225) | | | 31,662,226 | |
| | | | 114,332,176 | |
Cash | | | 274,849 | |
Cash used for collateral on futures | | | 385,000 | |
Cash used for collateral on OTC derivatives | | | 1,190,000 | |
Cash used for collateral on centrally cleared swaps | | | 121,200 | |
Unrealized appreciation on foreign currency exchange contracts | | | 990,988 | |
Swaps, at value (premiums paid $324,260) | | | 885,138 | |
Centrally cleared swaps, at value | | | 28,665 | |
Receivables and other assets: | | | | |
Interest and dividends | | | 311,584 | |
Investments sold | | | 306,684 | |
Variation margin receivable | | | 75,368 | |
Other | | | 21,223 | |
Total assets | | | 118,922,875 | |
|
| |
Liabilities | | | | |
Unrealized depreciation on foreign currency exchange contracts | | | 944,009 | |
Options written, at value (premiums received $59,142) | | | 63,850 | |
Swaps, at value (premiums received $59,531) | | | 401,201 | |
Centrally cleared swaps, at value | | | 52,088 | |
Payables and other liabilities: | | | | |
Investments purchased | | | 477,354 | |
Variation margin payable | | | 28,179 | |
Trustees’ compensation | | | 2,492 | |
Distribution and service plan fees | | | 34 | |
Shares of beneficial interest redeemed | | | 4 | |
Other | | | 13,737 | |
Total liabilities | | | 1,982,948 | |
|
| |
Net Assets | | $ | 116,939,927 | |
|
| |
Composition of Net Assets | | | | |
Par value of shares of beneficial interest | | $ | 10,838 | |
Additional paid-in capital | | | 107,304,353 | |
Accumulated net investment income | | | 471,057 | |
Accumulated net realized gain on investments and foreign currency transactions | | | 3,954,537 | |
Net unrealized appreciation on investments and translation of assets and liabilities denominated in foreign currencies | | | 5,199,142 | |
Net Assets | | $ | 116,939,927 | |
|
| |
Net Asset Value Per Share | | | | |
Non-Service Shares: | | | | |
| Net asset value, redemption price (excludes applicable contingent deferred sales charge) and offering price per share (based on net assets of $116,737,343 and 10,819,535 shares of beneficial interest outstanding) | | | $10.79 | |
| |
Service Shares: | | | | |
| Net asset value, redemption price (excludes applicable contingent deferred sales charge) and offering price per share (based on net assets of $202,584 and 18,776 shares of beneficial interest outstanding) | | | $10.79 | |
See accompanying Notes to Consolidated Financial Statements.
19 OPPENHEIMER DIVERSIFIED ALTERNATIVES FUND/VA
| | |
CONSOLIDATED STATEMENT OF OPERATIONS For the Six Months Ended June 30, 2014 Unaudited |
| | | | |
Allocation of Income and Expenses from master funds1 | | | | |
Net investment income allocated from Oppenheimer Master Event-Linked Bond Fund, LLC: | | | | |
Interest | | $ | 207 | |
Net expenses | | | (12) | |
Net investment income allocated from Oppenheimer Master Event-Linked Bond Fund, LLC | | | 195 | |
Net investment income allocated from Oppenheimer Master Loan Fund, LLC | | | | |
Interest | | | 14 | |
Dividends | | | 127 | |
Net expenses | | | (4) | |
Net investment income allocated from Oppenheimer Master Loan Fund, LLC | | | 137 | |
Total allocation of net investment income from master funds | | | 332 | |
|
| |
Investment Income | | | | |
Interest (net of foreign withholding taxes of $7,406) | | | 326,889 | |
Dividends: | | | | |
Unaffiliated companies (net of foreign withholding taxes of $22,927) | | | 800,065 | |
Affiliated companies | | | 11,991 | |
Total investment income | | | 1,138,945 | |
|
| |
Expenses | | | | |
Management fees | | | 619,863 | |
Distribution and service plan fees - Service shares | | | 37 | |
Transfer and shareholder servicing agent fees: | | | | |
Non-Service shares | | | 53,590 | |
Service shares | | | 22 | |
Shareholder communications: | | | | |
Non-Service shares | | | 236 | |
Legal, auditing and other professional fees | | | 23,153 | |
Trustees’ compensation | | | 11,790 | |
Custodian fees and expenses | | | 8,295 | |
Other | | | 21,125 | |
| | | | |
Total expenses | | | 738,111 | |
Less waivers and reimbursements of expenses | | | (131,954) | |
Net expenses | | | 606,157 | |
|
| |
Net Investment Income | | | 533,120 | |
20 OPPENHEIMER DIVERSIFIED ALTERNATIVES FUND/VA
| | | | |
Realized and Unrealized Gain (Loss) | | | | |
Net realized gain (loss) on: | | | | |
Investments from unaffiliated companies (including premiums on options exercised) | | $ | 2,575,015 | |
Closing and expiration of option contracts written | | | 49,462 | |
Closing and expiration of futures contracts | | | (173,764) | |
Foreign currency transactions | | | 497,093 | |
Swap contracts | | | 1,017,719 | |
Net realized gain (loss) allocated from: | | | | |
Oppenheimer Master Event-Linked Bond Fund, LLC | | | (193) | |
Oppenheimer Master Loan Fund, LLC | | | 634 | |
Net realized gain | | | 3,965,966 | |
Net change in unrealized appreciation/depreciation on: | | | | |
Investments | | | 4,403,702 | |
Translation of assets and liabilities denominated in foreign currencies | | | 344,268 | |
Futures contracts | | | 285,945 | |
Option contracts written | | | (8,344) | |
Swap contracts | | | 184,103 | |
Net change in unrealized appreciation/depreciation allocated from: | | | | |
Oppenheimer Master Event-Linked Bond Fund, LLC | | | 173 | |
Oppenheimer Master Loan Fund, LLC | | | (635) | |
Net change in unrealized appreciation/depreciation | | | 5,209,212 | |
|
| |
Net Increase in Net Assets Resulting from Operations | | $ | 9,708,298 | |
1. The Fund invests in certain affiliated funds that expect to be treated as partnerships for tax purposes. See Note 1 of the accompanying Consolidated Notes.
See accompanying Notes to Consolidated Financial Statements.
21 OPPENHEIMER DIVERSIFIED ALTERNATIVES FUND/VA
| | |
CONSOLIDATED STATEMENTS OF CHANGES IN NET ASSETS |
| | | | | | | | | | |
| | | Six Months Ended
June 30, 2014
(Unaudited) | | | | | Period Ended
December 31,
20131 | |
Operations | | | | | | | | | | |
Net investment income (loss) | | $ | 533,120 | | | | | $ | (24,007) | |
Net realized gain (loss) | | | 3,965,966 | | | | | | (23,232) | |
Net change in unrealized appreciation/depreciation | | | 5,209,212 | | | | | | (10,070) | |
Net increase (decrease) in net assets resulting from operations | | | 9,708,298 | | | | | | (57,309) | |
|
| |
Dividends and/or Distributions to Shareholders | | | | | | | | | | |
Dividends from net investment income: | | | | | | | | | | |
Non-Service shares | | | (15,253) | | | | | | (10,989) | |
Service shares | | | (6) | | | | | | (8) | |
| | | (15,259) | | | | | | (10,997) | |
| | | | | | | | | | |
Beneficial Interest Transactions | | | | | | | | | | |
Net increase in net assets resulting from beneficial interest transactions: | | | | | | | | | | |
Non-Service shares | | | 97,115,254 | | | | | | 10,000,989 | |
Service shares | | | 188,943 | | | | | | 10,008 | |
| | | 97,304,197 | | | | | | 10,010,997 | |
| | | | | | | | | | |
Net Assets | | | | | | | | | | |
Total increase | | | 106,997,236 | | | | | | 9,942,691 | |
Beginning of period | | | 9,942,691 | | | | | | — | |
| | | | | | | | | | |
| End of period (including accumulated net investment income (loss) of $471,057 and $(46,804), respectively) | | $ | 116,939,927 | | | | | $ | 9,942,691 | |
1. For the period from November 14, 2013 (commencement of operations) to December 31, 2013.
See accompanying Notes to Consolidated Financial Statements.
22 OPPENHEIMER DIVERSIFIED ALTERNATIVES FUND/VA
| | |
CONSOLIDATED FINANCIAL HIGHLIGHTS |
| | | | | | | | |
Non-Service Shares | |
| Six Months
Ended
June 30, 2014
(Unaudited) |
| |
| Period Ended
December 31,
2013 |
1 |
Per Share Operating Data | | | | | | | | |
Net asset value, beginning of period | | $ | 9.92 | | | $ | 10.00 | |
Income (loss) from investment operations: | | | | | | | | |
Net investment income (loss)2 | | | 0.05 | | | | (0.02) | |
Net realized and unrealized gain (loss) | | | 0.82 | | | | (0.05) | |
Total from investment operations | | | 0.87 | | | | (0.07) | |
Dividends and/or distributions to shareholders: | | | | | | | | |
Dividends from net investment income | | | 0.003 | | | | (0.01) | |
Net asset value, end of period | | $ | 10.79 | | | $ | 9.92 | |
|
| |
Total Return, at Net Asset Value4 | | | 8.78% | | | | (0.69)% | |
| | | | | | | | |
Ratios/Supplemental Data | | | | | | | | |
Net assets, end of period (in thousands) | | $ | 116,737 | | | $ | 9,917 | |
Average net assets (in thousands) | | $ | 108,760 | | | $ | 9,827 | |
Ratios to average net assets:5,6 | | | | | | | | |
Net investment income (loss) | | | 0.99% | | | | (1.85)% | |
Total expenses7 | | | 1.37% | | | | 7.16% | |
Expenses after payments, waivers and/or reimbursements and reduction to custodian expenses | | | 1.12% | | | | 3.33% | |
Portfolio turnover rate | | | 124% | | | | 11% | |
1. For the period from November 14, 2013 (commencement of operations) to December 31, 2013.
2. Per share amounts calculated based on the average shares outstanding during the period.
3. Less than $0.005 per share.
4. Assumes an initial investment on the business day before the first day of the fiscal period, with all dividends and distributions reinvested in additional shares on the reinvestment date, and redemption at the net asset value calculated on the last business day of the fiscal period. Total returns are not annualized for periods less than one full year. Total return information does not reflect expenses that apply at the separate account level or to related insurance products. Inclusion of these charges would reduce the total return figures for all periods shown. Returns do not reflect the deduction of taxes that a shareholder would pay on fund distributions or the redemption of fund shares.
5. Annualized for periods less than one full year.
6. Includes the Fund’s shares of the allocated expenses and/or net investment income from the master funds.
7. Total expenses including indirect expenses from affiliated fund were as follows:
| | | | |
Six Months Ended June 30, 2014 | | | 1.40 | % |
Period Ended December 31, 2013 | | | 7.18 | % |
See accompanying Notes to Consolidated Financial Statements.
23 OPPENHEIMER DIVERSIFIED ALTERNATIVES FUND/VA
| | |
CONSOLIDATED FINANCIAL HIGHLIGHTS Continued |
| | | | | | | | |
Service Shares | |
| Six Months
Ended
June 30, 2014
(Unaudited) |
| |
| Period Ended
December 31,
2013 |
1 |
Per Share Operating Data | | | | | | | | |
Net asset value, beginning of period | | $ | 9.92 | | | $ | 10.00 | |
Income (loss) from investment operations: | | | | | | | | |
Net investment income (loss)2 | | | 0.03 | | | | (0.03) | |
Net realized and unrealized gain (loss) | | | 0.84 | | | | (0.04) | |
Total from investment operations | | | 0.87 | | | | (0.07) | |
Dividends and/or distributions to shareholders: | | | | | | | | |
Dividends from net investment income | | | 0.003 | | | | (0.01) | |
Net asset value, end of period | | $ | 10.79 | | | $ | 9 .92 | |
|
| |
Total Return, at Net Asset Value4 | | | 8.77% | | | | (0.72)% | |
| | | | | | | | |
Ratios/Supplemental Data | | | | | | | | |
Net assets, end of period (in thousands) | | $ | 203 | | | $ | 10 | |
Average net assets (in thousands) | | $ | 44 | | | $ | 10 | |
Ratios to average net assets:5,6 | | | | | | | | |
Net investment income (loss) | | | 0.58% | | | | (2.12)% | |
Total expenses7 | | | 1.59% | | | | 7.43% | |
Expenses after payments, waivers and/or reimbursements and reduction to custodian expenses | | | 1.39% | | | | 3.50% | |
Portfolio turnover rate | | | 124% | | | | 11% | |
1. For the period from November 14, 2013 (commencement of operations) to December 31, 2013.
2. Per share amounts calculated based on the average shares outstanding during the period.
3. Less than $0.005 per share.
4. Assumes an initial investment on the business day before the first day of the fiscal period, with all dividends and distributions reinvested in additional shares on the reinvestment date, and redemption at the net asset value calculated on the last business day of the fiscal period. Total returns are not annualized for periods less than one full year. Total return information does not reflect expenses that apply at the separate account level or to related insurance products. Inclusion of these charges would reduce the total return figures for all periods shown. Returns do not reflect the deduction of taxes that a shareholder would pay on fund distributions or the redemption of fund shares.
5. Annualized for periods less than one full year.
6. Includes the Fund’s shares of the allocated expenses and/or net investment income from the master funds.
7. Total expenses including indirect expenses from affiliated fund were as follows:
| | | | |
Six Months Ended June 30, 2014 | | | 1.62 | % |
Period Ended December 31, 2013 | | | 7.45 | % |
See accompanying Notes to Consolidated Financial Statements.
24 OPPENHEIMER DIVERSIFIED ALTERNATIVES FUND/VA
| | |
NOTESTOCONSOLIDATED FINANCIAL STATEMENTS June 30, 2014 Unaudited |
1. Significant Accounting Policies
Oppenheimer Diversified Alternatives Fund/VA (the “Fund”) is a separate series of Oppenheimer Variable Account Funds, a diversified open-end management investment company registered under the Investment Company Act of 1940, as amended. The Fund’s investment objective is to seek total return. The Fund’s investment adviser is OFI Global Asset Management, Inc. (“OFI Global” or the “Manager”), a wholly-owned subsidiary of OppenheimerFunds, Inc. (“OFI” or the “Sub-Adviser”). The Manager has entered into a sub-advisory agreement with OFI. The Sub-Adviser has entered into a sub-sub-advisory agreement with Cornerstone Real Estate Advisers LLC and OFI SteelPath, Inc. (collectively, the “Sub-Sub-Advisers”). Shares of the Fund are sold only to separate accounts of life insurance companies.
The Fund offers two classes of shares. Both classes are sold at their offering price, which is the net asset value per share, to separate investment accounts of participating insurance companies as an underlying investment for variable life insurance policies, variable annuity contracts or other investment products. The class of shares designated as Service shares is subject to a distribution and service plan. Both classes of shares have identical rights and voting privileges with respect to the Fund in general and exclusive voting rights on matters that affect that class alone. Earnings, net assets and net asset value per share may differ due to each class having its own expenses, such as transfer and shareholder servicing agent fees and shareholder communications, directly attributable to that class.
The following is a summary of significant accounting policies consistently followed by the Fund.
Event-Linked Bonds. The Fund may invest in “event-linked” bonds. Event-linked bonds, which are sometimes referred to as “catastrophe” bonds, are fixed income securities for which the return of principal and payment of interest is contingent on the non-occurrence of a specific trigger event, such as a hurricane, earthquake, or other occurrence that leads to physical or economic loss. If the trigger event occurs prior to maturity, the Fund may lose all or a portion of its principal in addition to interest otherwise due from the security. Event-linked bonds may expose the Fund to certain other risks, including issuer default, adverse regulatory or jurisdictional interpretations, liquidity risk and adverse tax consequences. The Fund records the net change in market value of event-linked bonds on the Consolidated Statement of Operations as a change in unrealized appreciation or depreciation on investments. The Fund records a realized gain or loss on the Consolidated Statement of Operations upon the sale or maturity of such securities.
Credit Risk. The Fund invests in high-yield, non-investment-grade bonds, which may be subject to a greater degree of credit risk. Credit risk relates to the ability of the issuer to meet interest or principal payments or both as they become due. The Fund may acquire securities that have missed an interest payment, and is not obligated to dispose of securities whose issuers or underlying obligors subsequently miss an interest payment. Information concerning securities not accruing interest as of June 30, 2014 is as follows:
| | | | |
Cost | | $ | 53,625 | |
Market Value | | $ | 53,375 | |
Market Value as % of Net Assets | | | 0.05% | |
Sovereign Debt Risk. The Fund invests in sovereign debt securities, which are subject to certain special risks. These risks include, but are not limited to, the risk that a governmental entity may delay or refuse, or otherwise be unable, to pay interest or repay the principal on its sovereign debt. There may also be no legal process for collecting sovereign debt that a government does not pay or bankruptcy proceedings through which all or part of such sovereign debt may be collected. In addition, a restructuring or default of sovereign debt may also cause additional impacts to the financial markets, such as downgrades to credit ratings, reduced liquidity and increased volatility, among others.
Basis for Consolidation. The Fund has established a Cayman Islands exempted company, Oppenheimer Diversified Alternatives Fund/VA (Cayman) Ltd., which is wholly-owned and controlled by the Fund (the “Subsidiary”). The Fund and Subsidiary are both managed by the Manager. The Fund may invest up to 25% of its total assets in the Subsidiary. The Subsidiary invests primarily in commodity-linked derivatives (including commodity futures, financial futures, options and swap contracts) and exchange-traded funds related to gold or other special minerals. The Subsidiary may also invest in certain fixed-income securities and other investments that may serve as margin or collateral for its derivatives positions. Investments in the Subsidiary are expected to provide the Fund with exposure to commodities markets within the limitations of the federal tax requirements that apply to the Fund. The Subsidiary is subject to the same investment restrictions and guidelines, and follows the same compliance policies and procedures, as the Fund.
The financial statements have been consolidated and include accounts of the Fund and the Subsidiary. Accordingly, all inter-company transactions and balances have been eliminated. At June 30, 2014, the Fund owned 15,186 shares with a market value of $17,986,107.
Other financial information at June 30, 2014:
| | | | |
Total market value | | $ | 16,351,179 | |
Net assets | | $ | 17,986,107 | |
Net income (loss) | | $ | (87,918) | |
Net realized gain (loss) | | $ | 1,148,306 | |
Net change in unrealized appreciation/depreciation | | $ | 228,666 | |
Investment in Oppenheimer Institutional Money Market Fund. The Fund is permitted to invest daily available cash balances in an affiliated money market fund. The Fund may invest the available cash in Class E shares of Oppenheimer Institutional Money Market Fund (“IMMF”) to seek current income while preserving liquidity. IMMF is a registered open-end management investment company, regulated as a money market fund under the Investment Company Act of 1940, as amended. The Manager is the investment adviser of IMMF, and the Sub-Adviser provides investment and related advisory services to IMMF. When applicable, the Fund’s investment in IMMF is included in the Consolidated Statement of Investments. Shares of IMMF
25 OPPENHEIMER DIVERSIFIED ALTERNATIVES FUND/VA
| | |
NOTESTOCONSOLIDATED FINANCIAL STATEMENTS Unaudited / Continued |
1. Significant Accounting Policies (Continued)
are valued at their net asset value per share. As a shareholder, the Fund is subject to its proportional share of IMMF’s Class E expenses, including its management fee. The Manager will waive fees and/or reimburse Fund expenses in an amount equal to the indirect management fees incurred through the Fund’s investment in IMMF.
Investment in Oppenheimer Master Funds. The Fund is permitted to invest in entities sponsored and/or advised by the Manager or an affiliate. Certain of these entities in which the Fund invests are mutual funds registered under the Investment Company Act of 1940 that expect to be treated as partnerships for tax purposes, specifically Oppenheimer Master Loan Fund, LLC and Oppenheimer Master Event-Linked Bond Fund, LLC (the “Master Funds”). Each Master Fund has its own investment risks, and those risks can affect the value of the Fund’s investments and therefore the value of the Fund’s shares. To the extent that the Fund invests more of its assets in one Master Fund than in another, the Fund will have greater exposure to the risks of that Master Fund.
The investment objective of Oppenheimer Master Loan Fund, LLC is to seek income. The investment objective of Oppenheimer Master Event-Linked Bond Fund, LLC is to seek total return. The Fund’s investments in the Master Funds are included in the Consolidated Statement of Investments. The Fund recognizes income and gain/(loss) on its investments in each Master Fund according to its allocated pro-rata share, based on its relative proportion of total outstanding Master Fund shares held, of the total net income earned and the net gain/(loss) realized on investments sold by the Master Funds. As a shareholder, the Fund is subject to its proportional share of the Master Funds’ expenses, including their management fee. The Manager will waive fees and/or reimburse Fund expenses in an amount equal to the indirect management fees incurred through the Fund’s investment in the Master Funds.
Master Limited Partnerships (“MLPs”). MLPs issue common units that represent an equity ownership interest in a partnership and provide limited voting rights. MLP common units are registered with the Securities and Exchange Commission (“SEC”), and are freely tradable on securities exchanges such as the NYSE and the NASDAQ Stock Market (“NASDAQ”), or in the over-the-counter (“OTC”) market. An MLP consists of one or more general partners, who conduct the business, and one or more limited partners, who contribute capital. MLP common unit holders have a limited role in the partnership’s operations and management. The Fund, as a limited partner, normally would not be liable for the debts of the MLP beyond the amounts the Fund has contributed, but would not be shielded to the same extent that a shareholder of a corporation would be. In certain circumstances creditors of an MLP would have the right to seek return of capital distributed to a limited partner. This right of an MLP’s creditors would continue after the Fund sold its investment in the MLP.
Foreign Currency Translation. The Fund’s accounting records are maintained in U.S. dollars. The values of securities denominated in foreign currencies and amounts related to the purchase and sale of foreign securities and foreign investment income are translated into U.S. dollars as of the close of the New York Stock Exchange (the “Exchange”), normally 4:00 P.M. Eastern time, on each day the Exchange is open for trading. Foreign exchange rates may be valued primarily using a reliable bank, dealer or service authorized by the Board of Trustees.
Reported net realized gains and losses from foreign currency transactions arise from sales of portfolio securities, sales and maturities of short-term securities, sales of foreign currencies, exchange rate fluctuations between the trade and settlement dates on securities transactions, and the difference between the amounts of dividends, interest, and foreign withholding taxes recorded on the Fund’s books and the U.S. dollar equivalent of the amounts actually received or paid. Net unrealized appreciation and depreciation on the translation of assets and liabilities denominated in foreign currencies arise from changes in the values of assets and liabilities, including investments in securities at fiscal period end, resulting from changes in exchange rates.
The effect of changes in foreign currency exchange rates on investments is separately identified from the fluctuations arising from changes in market values of securities held and reported with all other foreign currency gains and losses in the Fund’s Consolidated Statement of Operations.
Allocation of Income, Expenses, Gains and Losses. Income, expenses (other than those attributable to a specific class), gains and losses are allocated on a daily basis to each class of shares based upon the relative proportion of net assets represented by such class. Operating expenses directly attributable to a specific class are charged against the operations of that class.
Federal Taxes. The Fund intends to comply with provisions of the Internal Revenue Code applicable to regulated investment companies and to distribute substantially all of its investment company taxable income to shareholders. Therefore, no federal income or excise tax provision is required. The Fund files income tax returns in U.S. federal and applicable state jurisdictions. The statute of limitations on the Fund’s tax return filings generally remain open for the three preceding fiscal reporting period ends.
Subchapter M requires, among other things, that at least 90% of the Fund’s gross income be derived from securities or derived with respect to its business of investing in securities (typically referred to as “qualifying income”). Income from commodity-linked derivatives may not be treated as “qualifying income” for purposes of the 90% gross income requirement. The Internal Revenue Service (IRS) has previously issued a number of private letter rulings which conclude that income derived from commodity index-linked notes and investments in a wholly-owned subsidiary will be “qualifying income.” As a result, the Fund will gain exposure to commodities through commodity-linked notes and its wholly-owned subsidiary.
The IRS has suspended the granting of private letter rulings pending further review. As a result, there can be no assurance that the IRS will not change its position with respect to commodity-linked notes and wholly-owned subsidiaries. In addition, future legislation and guidance from Treasury and the IRS may adversely affect the fund’s ability to gain exposure to commodities through commodity-linked notes and its wholly-owned subsidiary.
The Fund is required to include in income for federal income tax purposes all of the subsidiary’s net income and gains whether or not such income is distributed by the subsidiary. Net income and gains from the subsidiary are generally treated as ordinary income by the Fund, regardless of the character of the subsidiary’s underlying income. Net losses from the subsidiary do not pass through to the Fund for federal income tax purposes.
26 OPPENHEIMER DIVERSIFIED ALTERNATIVES FUND/VA
1. Significant Accounting Policies (Continued)
During the fiscal year ended December 31, 2013, the Fund did not utilize any capital loss carryforward to offset capital gains realized in that fiscal year. Details of the fiscal year ended December 31, 2013 capital loss carryforwards are included in the table below. Capital loss carryforwards with no expiration, if any, must be utilized prior to those with expiration dates. Capital losses with no expiration will be carried forward to future years if not offset by gains.
| | | | |
| Expiring | | | |
No expiration | | $ | 6,513 | |
As of June 30, 2014, it is estimated that the Fund will have no capital loss carryforwards. The estimated capital loss carryforward represents the carryforward as of the end of the last fiscal year, increased or decreased by capital losses or gains realized in the first six months of the current fiscal year. During the six months ended June 30, 2014, it is estimated that the Fund will utilize $6,513 of capital loss carryforward to offset realized capital gains.
Net investment income (loss) and net realized gain (loss) may differ for financial statement and tax purposes. The character of dividends and distributions made during the fiscal year from net investment income or net realized gains may differ from their ultimate characterization for federal income tax purposes. Also, due to timing of dividends and distributions, the fiscal year in which amounts are distributed may differ from the fiscal year in which the income or net realized gain was recorded by the Fund.
The aggregate cost of securities and other investments and the composition of unrealized appreciation and depreciation of securities and other investments for federal income tax purposes as of June 30, 2014 are noted in the following table. The primary difference between book and tax appreciation or depreciation of securities and other investments, if applicable, is attributable to the tax deferral of losses or tax realization of financial statement unrealized gain or loss.
| | | | |
Federal tax cost of securities | | $ | 109,755,712 | |
Federal tax cost of other investments | | | (4,793,104) | |
| | | | |
Total federal tax cost | | $ | 104,962,608 | |
| | | | |
Gross unrealized appreciation | | $ | 7,634,503 | |
Gross unrealized depreciation | | | (2,561,438) | |
| | | | |
Net unrealized appreciation | | $ | 5,073,065 | |
| | | | |
Trustees’ Compensation. The Board of Trustees has adopted a compensation deferral plan for independent trustees that enables trustees to elect to defer receipt of all or a portion of the annual compensation they are entitled to receive from the Fund. For purposes of determining the amount owed to the Trustee under the plan, deferred amounts are treated as though equal dollar amounts had been invested in shares of the Fund or in other Oppenheimer funds selected by the Trustee. The Fund purchases shares of the funds selected for deferral by the Trustee in amounts equal to his or her deemed investment, resulting in a Fund asset equal to the deferred compensation liability. Such assets are included as a component of “Other” within the asset section of the Consolidated Statement of Assets and Liabilities. Deferral of trustees’ fees under the plan will not affect the net assets of the Fund, and will not materially affect the Fund’s assets, liabilities or net investment income per share. Amounts will be deferred until distributed in accordance with the compensation deferral plan.
Dividends and Distributions to Shareholders. Dividends and distributions to shareholders, which are determined in accordance with income tax regulations and may differ from U.S. generally accepted accounting principles, are recorded on the ex-dividend date. Income and capital gain distributions, if any, are declared and paid annually or at other times as deemed necessary by the Manager.
The tax character of distributions is determined as of the Fund’s fiscal year end. Therefore, a portion of the Fund’s distributions made to shareholders prior to the Fund’s fiscal year end may ultimately be categorized as a tax return of capital.
Investment Income. Dividend income is recorded on the ex-dividend date or upon ex-dividend notification in the case of certain foreign dividends where the ex-dividend date may have passed. Non-cash dividends included in dividend income, if any, are recorded at the fair market value of the securities received. Interest income is recognized on an accrual basis. Discount and premium, which are included in interest income on the Consolidated Statement of Operations, are amortized or accreted daily.
Custodian Fees. “Custodian fees and expenses” in the Consolidated Statement of Operations may include interest expense incurred by the Fund on any cash overdrafts of its custodian account during the period. Such cash overdrafts may result from the effects of failed trades in portfolio securities and from cash outflows resulting from unanticipated shareholder redemption activity. The Fund pays interest to its custodian on such cash overdrafts, to the extent they are not offset by positive cash balances maintained by the Fund, at a rate equal to the Federal Funds Rate plus 0.50%. The “Reduction to custodian expenses” line item, if applicable, represents earnings on cash balances maintained by the Fund during the period. Such interest expense and other custodian fees may be paid with these earnings.
Security Transactions. Security transactions are recorded on the trade date. Realized gains and losses on securities sold are determined on the basis of identified cost.
27 OPPENHEIMER DIVERSIFIED ALTERNATIVES FUND/VA
| | |
NOTESTOCONSOLIDATED FINANCIAL STATEMENTS Unaudited / Continued |
1. Significant Accounting Policies (Continued)
Indemnifications. The Fund’s organizational documents provide current and former trustees and officers with a limited indemnification against liabilities arising in connection with the performance of their duties to the Fund. In the normal course of business, the Fund may also enter into contracts that provide general indemnifications. The Fund’s maximum exposure under these arrangements is unknown as this would be dependent on future claims that may be made against the Fund. The risk of material loss from such claims is considered remote.
Other. The preparation of financial statements in conformity with accounting principles generally accepted in the United States of America requires management to make estimates and assumptions that affect the reported amounts of assets and liabilities and disclosure of contingent assets and liabilities at the date of the financial statements and the reported amounts of increases and decreases in net assets from operations during the reporting period. Actual results could differ from those estimates.
2. Securities Valuation
The Fund calculates the net asset value of its shares as of the close of the New York Stock Exchange (the “Exchange”), normally 4:00 P.M. Eastern time, on each day the Exchange is open for trading.
The Fund’s Board has adopted procedures for the valuation of the Fund’s securities and has delegated the day-to-day responsibility for valuation determinations under those procedures to the Manager. The Manager has established a Valuation Committee which is responsible for determining a “fair valuation” for any security for which market quotations are not “readily available.” The Valuation Committee’s fair valuation determinations are subject to review, approval and ratification by the Fund’s Board at its next regularly scheduled meeting covering the calendar quarter in which the fair valuation was determined.
Valuation Methods and Inputs
Securities are valued using unadjusted quoted market prices, when available, as supplied primarily by third party pricing services or dealers.
The following methodologies are used to determine the market value or the fair value of the types of securities described below:
Securities traded on a registered U.S. securities exchange (including exchange-traded derivatives other than futures and futures options) are valued based on the last sale price of the security reported on the principal exchange on which it is traded, prior to the time when the Fund’s assets are valued. In the absence of a sale, the security is valued at the last sale price on the prior trading day, if it is within the spread of the current day’s closing “bid” and “asked” prices, and if not, at the current day’s closing bid price. A security of a foreign issuer traded on a foreign exchange, but not listed on a registered U.S. securities exchange, is valued based on the last sale price on the principal exchange on which the security is traded, as identified by the third party pricing service used by the Manager, prior to the time when the Fund’s assets are valued. If the last sale price is unavailable, the security is valued at the most recent official closing price on the principal exchange on which it is traded. If the last sales price or official closing price for a foreign security is not available, the security is valued at the mean between the bid and asked price per the exchange or, if not available from the exchange, obtained from two dealers. If bid and asked prices are not available from either the exchange or two dealers, the security is valued by using one of the following methodologies (listed in order of priority): (1) using a bid from the exchange, (2) the mean between the bid and asked price as provided by a single dealer, or (3) a bid from a single dealer.
Shares of a registered investment company that are not traded on an exchange are valued at that investment company’s net asset value per share.
Corporate and government debt securities (of U.S. or foreign issuers) and municipal debt securities, event-linked bonds, loans, mortgage-backed securities, collateralized mortgage obligations, and asset-backed securities are valued at the mean between the “bid” and “asked” prices utilizing evaluated prices obtained from third party pricing services or broker-dealers who may use matrix pricing methods to determine the evaluated prices.
Short-term money market type debt securities with a remaining maturity of sixty days or less are valued at cost adjusted by the amortization of discount or premium to maturity (amortized cost), which approximates market value. Short-term debt securities with a remaining maturity in excess of sixty days are valued at the mean between the “bid” and “asked” prices utilizing evaluated prices obtained from third party pricing services or broker-dealers.
Structured securities, swaps, swaptions, and other over-the-counter derivatives are valued utilizing evaluated prices obtained from third party pricing services or broker-dealers.
Forward foreign currency exchange contracts are valued utilizing current and forward currency rates obtained from third party pricing services. When the settlement date of a contract is an interim date for which a quotation is not available, interpolated values are derived using the nearest dated forward currency rate.
Futures contracts and futures options traded on a commodities or futures exchange will be valued at the final settlement price or official closing price on the principal exchange as reported by such principal exchange at its trading session ending at, or most recently prior to, the time when the Fund’s assets are valued.
A description of the standard inputs that may generally be considered by the third party pricing vendors in determining their evaluated prices is provided below.
28 OPPENHEIMER DIVERSIFIED ALTERNATIVES FUND/VA
| | |
2. Securities Valuation (Continued) | | |
| Security Type | | Standard inputs generally considered by third-party pricing vendors |
| Corporate debt, government debt, municipal, mortgage-backed and asset-backed securities | | Reported trade data, broker-dealer price quotations, benchmark yields, issuer spreads on comparable securities, the credit quality, yield, maturity, and other appropriate factors. |
| Loans | | Information obtained from market participants regarding reported trade data and broker-dealer price quotations. |
| Event-linked bonds | | Information obtained from market participants regarding reported trade data and broker-dealer price quotations. |
| Structured securities | | Relevant market information such as the price of underlying financial instruments, stock market indices, foreign currencies, interest rate spreads, commodities, or the occurrence of other specific events. |
| Swaps | | Relevant market information, including underlying reference assets such as credit spreads, credit event probabilities, index values, individual security values, forward interest rates, variable interest rates, volatility measures, and forward currency rates. |
If a market value or price cannot be determined for a security using the methodologies described above, or if, in the “good faith” opinion of the Manager, the market value or price obtained does not constitute a “readily available market quotation,” or a significant event has occurred that would materially affect the value of the security the security is fair valued either (i) by a standardized fair valuation methodology applicable to the security type or the significant event as previously approved by the Valuation Committee and the Fund’s Board or (ii) as determined in good faith by the Manager’s Valuation Committee. The Valuation Committee considers all relevant facts that are reasonably available, through either public information or information available to the Manager, when determining the fair value of a security. Fair value determinations by the Manager are subject to review, approval and ratification by the Fund’s Board at its next regularly scheduled meeting covering the calendar quarter in which the fair valuation was determined. Those fair valuation standardized methodologies include, but are not limited to, valuing securities at the last sale price or initially at cost and subsequently adjusting the value based on: changes in company specific fundamentals, changes in an appropriate securities index, or changes in the value of similar securities which may be further adjusted for any discounts related to security-specific resale restrictions. When possible, such methodologies use observable market inputs such as unadjusted quoted prices of similar securities, observable interest rates, currency rates and yield curves. The methodologies used for valuing securities are not necessarily an indication of the risks associated with investing in those securities nor can it be assured that the Fund can obtain the fair value assigned to a security if it were to sell the security.
To assess the continuing appropriateness of security valuations, the Manager, or its third party service provider who is subject to oversight by the Manager, regularly compares prior day prices, prices on comparable securities, and sale prices to the current day prices and challenges those prices exceeding certain tolerance levels with the third party pricing service or broker source. For those securities valued by fair valuations, whether through a standardized fair valuation methodology or a fair valuation determination, the Valuation Committee reviews and affirms the reasonableness of the valuations based on such methodologies and fair valuation determinations on a regular basis after considering all relevant information that is reasonably available.
Classifications
Each investment asset or liability of the Fund is assigned a level at measurement date based on the significance and source of the inputs to its valuation. Various data inputs are used in determining the value of each of the Fund’s investments as of the reporting period end. These data inputs are categorized in the following hierarchy under applicable financial accounting standards:
1) Level 1-unadjusted quoted prices in active markets for identical assets or liabilities (including securities actively traded on a securities exchange)
2) Level 2-inputs other than unadjusted quoted prices that are observable for the asset or liability (such as unadjusted quoted prices for similar assets and market corroborated inputs such as interest rates, prepayment speeds, credit risks, etc.)
3) Level 3-significant unobservable inputs (including the Manager’s own judgments about assumptions that market participants would use in pricing the asset or liability).
The inputs used for valuing securities are not necessarily an indication of the risks associated with investing in those securities.
The table below categorizes amounts that are included in the Fund’s Consolidated Statement of Assets and Liabilities as of June 30, 2014 based on valuation input level:
| | | | | | | | | | | | | | | | | | | | | | | | | | | | | | | | |
| | | | | | Level 1—
Unadjusted
Quoted Prices | | | | | | Level 2—
Other Significant
Observable Inputs | | | | | | Level 3—
Significant
Unobservable
Inputs | | | | | | Value | |
Assets Table | | | | | | | | | | | | | | | | | | | | | | | | | | | | | | | | |
Investments, at Value: | | | | | | | | | | | | | | | | | | | | | | | | | | | | | | | | |
Common Stocks | | | | | | | | | | | | | | | | | | | | | | | | | | | | | | | | |
Consumer Discretionary | | $ | | | | | 162,141 | | | $ | | | | | — | | | $ | | | | | — | | | $ | | | | | 162,141 | |
Energy | | | | | | | 12,601,229 | | | | | | | | — | | | | | | | | — | | | | | | | | 12,601,229 | |
Financials | | | | | | | 5,907,018 | | | | | | | | 5,004,755 | | | | | | | | — | | | | | | | | 10,911,773 | |
Health Care | | | | | | | 330,504 | | | | | | | | — | | | | | | | | — | | | | | | | | 330,504 | |
Information Technology | | | | | | | 284,969 | | | | | | | | — | | | | | | | | — | | | | | | | | 284,969 | |
Materials | | | | | | | 5,398,672 | | | | | | | | 594,784 | | | | | | | | — | | | | | | | | 5,993,456 | |
Telecommunication Services | | | | | | | 69,750 | | | | | | | | — | | | | | | | | — | | | | | | | | 69,750 | |
Utilities | | | | | | | 118,787 | | | | | | | | — | | | | | | | | — | | | | | | | | 118,787 | |
29 OPPENHEIMER DIVERSIFIED ALTERNATIVES FUND/VA
| | |
NOTESTOCONSOLIDATED FINANCIAL STATEMENTS Unaudited / Continued |
2. Securities Valuation (Continued)
| | | | | | | | | | | | | | | | | | | | | | | | | | | | | | | | |
| | | | | | Level 1—
Unadjusted
Quoted Prices | | | | | | Level 2—
Other Significant
Observable Inputs | | | | | | Level 3—
Significant
Unobservable
Inputs | | | | | | Value | |
Investments, at Value: (Continued) | | | | | | | | | | | | | | | | | | | | | | | | | | | | | | | | |
Rights, Warrants and Certificates | | $ | | | | | 3,057 | | | $ | | | | | — | | | $ | | | | | — | | | $ | | | | | 3,057 | |
Foreign Government Obligations | | | | | | | — | | | | | | | | 3,707,848 | | | | | | | | — | | | | | | | | 3,707,848 | |
Non-Convertible Corporate Bonds and Notes | | | | | | | — | | | | | | | | 7,552,551 | | | | | | | | — | | | | | | | | 7,552,551 | |
Event-Linked Bonds | | | | | | | — | | | | | | | | 15,104,556 | | | | | | | | — | | | | | | | | 15,104,556 | |
Exchange-Traded Options Purchased | | | | | | | 1,268 | | | | | | | | 6,395 | | | | | | | | — | | | | | | | | 7,663 | |
Investment Companies | | | | | | | 31,988,728 | | | | | | | | — | | | | | | | | — | | | | | | | | 31,988,728 | |
Short-Term Notes | | | | | | | — | | | | | | | | 25,407,446 | | | | | | | | — | | | | | | | | 25,407,446 | |
Municipal Bonds and Notes | | | | | | | — | | | | | | | | 87,718 | | | | | | | | — | | | | | | | | 87,718 | |
Total Investments, at Value | | | | | | | 56,866,123 | | | | | | | | 57,466,053 | | | | | | | | — | | | | | | | | 114,332,176 | |
Other Financial Instruments: | | | | | | | | | | | | | | | | | | | | | | | | | | | | | | | | |
Swaps, at value | | | | | | | — | | | | | | | | 885,138 | | | | | | | | — | | | | | | | | 885,138 | |
Centrally cleared swaps, at value | | | | | | | — | | | | | | | | 28,665 | | | | | | | | — | | | | | | | | 28,665 | |
Futures contracts | | | | | | | 354,218 | | | | | | | | — | | | | | | | | — | | | | | | | | 354,218 | |
Foreign currency exchange contracts | | | | | | | — | | | | | | | | 990,988 | | | | | | | | — | | | | | | | | 990,988 | |
Total Assets | | $ | | | | | 57,220,341 | | | $ | | | | | 59,370,844 | | | $ | | | | | — | | | $ | | | | | 116,591,185 | |
| | | | | | | | |
Liabilities Table | | | | | | | | | | | | | | | | | | | | | | | | | | | | | | | | |
Other Financial Instruments: | | | | | | | | | | | | | | | | | | | | | | | | | | | | | | | | |
Swaps, at value | | $ | | | | | — | | | $ | | | | | (401,201 | ) | | $ | | | | | — | | | $ | | | | | (401,201 | ) |
Centrally cleared swaps, at value | | | | | | | — | | | | | | | | (52,088 | ) | | | | | | | — | | | | | | | | (52,088 | ) |
Options written, at value | | | | | | | (63,850 | ) | | | | | | | — | | | | | | | | — | | | | | | | | (63,850 | ) |
Futures contracts | | | | | | | (48,694 | ) | | | | | | | — | | | | | | | | — | | | | | | | | (48,694 | ) |
Foreign currency exchange contracts | | | | | | | — | | | | | | | | (944,009 | ) | | | | | | | — | | | | | | | | (944,009 | ) |
Total Liabilities | | $ | | | | | (112,544 | ) | | $ | | | | | (1,397,298 | ) | | $ | | | | | — | | | $ | | | | | (1,509,842 | ) |
Forward currency exchange contracts and futures contracts, if any, are reported at their unrealized appreciation/ depreciation at measurement date, which represents the change in the contract’s value from trade date. All additional assets and liabilities included in the above table are reported at their market value at measurement date.
3. Shares of Beneficial Interest
The Fund has authorized an unlimited number of $0.001 par value shares of beneficial interest of each class. Transactions in shares of beneficial interest were as follows:
| | | | | | | | | | | | | | | | |
| | | Six Months Ended June 30, 2014 | | | Period Ended December 31, 20131 | |
| | | Shares | | | Amount | | | Shares | | | Amount | |
Class Non-Service | | | | | | | | | | | | | | | | |
Sold | | | 9,817,998 | | | $ | 97,100,001 | | | | 999,000 | | | $ | 9,990,000 | |
Dividends and/or distributions reinvested | | | 1,429 | | | | 15,253 | | | | 1,108 | | | | 10,989 | |
Redeemed | | | — | | | | — | | | | — | | | | — | |
| | | | |
Net increase | | | 9,819,427 | | | $ | 97,115,254 | | | | 1,000,108 | | | $ | 10,000,989 | |
| | | | |
|
| |
Class Service | | | | | | | | | | | | | | | | |
Sold | | | 17,778 | | | $ | 188,984 | | | | 1,000 | | | $ | 10,000 | |
Dividends and/or distributions reinvested | | | 1 | | | | 6 | | | | 1 | | | | 8 | |
Redeemed | | | (4 | ) | | | (47 | ) | | | — | | | | — | |
| | | | |
Net increase | | | 17,775 | | | $ | 188,943 | | | | 1,001 | | | $ | 10,008 | |
| | | | |
1. For the period from November 14, 2013 (commencement of operations) to December 31, 2013.
4. Purchases and Sales of Securities
The aggregate cost of purchases and proceeds from sales of securities, other than short-term obligations and investments in IMMF, for the six months ended June 30, 2014 were as follows:
| | | | | | | | | | |
| | | Purchases | | | | | Sales | |
Investment securities | | | $110,303,951 | | | | | | $68,501,084 | |
5. Fees and Other Transactions with Affiliates
Management Fees. Under the investment advisory agreement, the Fund pays the Manager a management fee based on the daily net assets of the Fund at an annual rate as shown in the following table:
30 OPPENHEIMER DIVERSIFIED ALTERNATIVES FUND/VA
5. Fees and Other Transactions with Affiliates (Continued)
| | | | |
Fee Schedule | | | |
Up to $500 million | | | 1.00 | % |
Next $500 million | | | 0.95 | |
Next $4 billion | | | 0.90 | |
Over $5 billion | | | 0.88 | |
The Manager also provides investment management related services to the Subsidiary. The Subsidiary pays the Manager a monthly management fee at an annual rate according to the above schedule. The Subsidiary also pays certain other expenses including custody and directors’ fees.
Sub-Adviser Fees. The Manager has retained the Sub-Adviser to provide the day-to-day portfolio management of the Fund. Under the Sub-Advisory Agreement, the Manager pays the Sub-Adviser an annual fee in monthly installments, equal to a percentage of the investment management fee collected by the Manager from the Fund and the Subsidiary, which shall be calculated after any investment management fee waivers. The fee paid to the Sub-Adviser is paid by the Manager, not by the Fund.
Sub-Sub-Adviser Fees. The Sub-Adviser retains the Sub-Sub-Adviser to provide the day-to-day portfolio management of the Fund. Under the Sub-Sub-Advisory Agreement, the Sub-Adviser pays the Sub-Sub-Adviser an annual fee in monthly installments, based on the average daily net assets of the Fund. The fee paid to the Sub-Sub-Adviser under the Sub-Sub-Advisory agreement is paid by the Sub-Adviser, not by the Fund.
Transfer Agent Fees. OFI Global (the “Transfer Agent”) serves as the transfer and shareholder servicing agent for the Fund. The Fund pays the Transfer Agent a fee based on annual net assets. Fees incurred and average net assets for each class with respect to these services are detailed in the Consolidated Statement of Operations and Consolidated Financial Highlights, respectively.
Sub-Transfer Agent Fees. The Transfer Agent has retained Shareholder Services, Inc., a wholly-owned subsidiary of OFI (the “Sub-Transfer Agent”), to provide the day-to-day transfer agent and shareholder servicing of the Fund and the Subsidiary. Under the Sub-Transfer Agency Agreement, the Transfer Agent pays the Sub-Transfer Agent an annual fee in monthly installments, equal to a percentage of the transfer agent fee collected by the Transfer Agent from the Fund, which shall be calculated after any applicable fee waivers. The fee paid to the Sub-Transfer Agent is paid by the Transfer Agent, not by the Fund.
Distribution and Service Plan for Service Shares. The Fund has adopted a Distribution and Service Plan (the “Plan”) in accordance with Rule 12b-1 under the Investment Company Act of 1940 for Service shares to pay OppenheimerFunds Distributor, Inc. (the “Distributor”), for distribution related services, personal service and account maintenance for the Fund’s Service shares. Under the Plan, payments are made periodically at an annual rate of 0.25% of the daily net assets of Service shares of the Fund. The Distributor currently uses all of those fees to compensate sponsors of the insurance product that offers Fund shares, for providing personal service and maintenance of accounts of their variable contract owners that hold Service shares. These fees are paid out of the Fund’s assets on an on-going basis and increase operating expenses of the Service shares, which results in lower performance compared to the Fund’s shares that are not subject to a service fee. Fees incurred by the Fund under the Plan are detailed in the Consolidated Statement of Operations.
Waivers and Reimbursements of Expenses. The Manager has contractually agreed to waive fees and/or reimburse expenses to limit the Fund’s “Expenses after payments, waivers and/or reimbursements and reduction to custodian expenses” (excluding any applicable dividend expense, taxes, interest and fees from borrowing, any subsidiary expenses, Acquired Fund Fees and Expenses, brokerage commissions, extraordinary expenses and certain other Fund expenses) so that, as percentages of average daily net assets, those expenses will not exceed the annual rate of 1.20% for Non-Service shares and 1.45% for Service shares. During the six months ended June 30, 2014, the Manager waived fees and/or reimbursed the Fund $34,189 and $4 for Non-Service and Service, respectively.
The Manager has contractually agreed to waive the Fund’s management fee in an amount equal to the management fee of the Subsidiary. During the six months ended June 30, 2014, this waiver reduced the Fund’s management fee by $83,280.
The Manager will waive fees and/or reimburse Fund expenses in an amount equal to the indirect management fees incurred through the Fund’s investment in IMMF and the Master Funds. During the six months ended June 30, 2014, the Manager waived fees and/or reimbursed the Fund $14,481 for management fees.
Some of these undertakings may be modified or terminated at any time; some may not be modified or terminated until after one year from the date of the current prospectus, as indicated therein.
6. Risk Exposures and the Use of Derivative Instruments
The Fund’s investment objective not only permits the Fund to purchase investment securities, it also allows the Fund to enter into various types of derivatives contracts, including, but not limited to, futures contracts, forward currency exchange contracts, credit default swaps, interest rate swaps, total return swaps, variance swaps and purchased and written options. In doing so, the Fund will employ strategies in differing combinations to permit it to increase, decrease, or change the level or types of exposure to market risk factors. These instruments may allow the Fund to pursue its objectives more quickly and efficiently than if it were to make direct purchases or sales of securities capable of effecting a similar response to market factors. Such
31 OPPENHEIMER DIVERSIFIED ALTERNATIVES FUND/VA
| | |
NOTES TO CONSOLIDATED FINANCIAL STATEMENTS Unaudited / Continued |
6. Risk Exposures and the Use of Derivative Instruments (Continued)
contracts may be entered into through a bilateral over-the-counter (“OTC”) transaction, or through a securities or futures exchange and cleared through a clearinghouse.
Market Risk Factors. In accordance with its investment objectives, the Fund may use derivatives to increase or decrease its exposure to one or more of the following market risk factors:
Commodity Risk. Commodity risk relates to the change in value of commodities or commodity indexes as they relate to increases or decreases in the commodities market. Commodities are physical assets that have tangible properties. Examples of these types of assets are crude oil, heating oil, metals, livestock, and agricultural products.
Credit Risk. Credit risk relates to the ability of the issuer to meet interest and principal payments, or both, as they come due. In general, lower-grade, higher-yield bonds are subject to credit risk to a greater extent than lower-yield, higher-quality bonds.
Equity Risk. Equity risk relates to the change in value of equity securities as they relate to increases or decreases in the general market.
Foreign Exchange Rate Risk. Foreign exchange rate risk relates to the change in the U.S. dollar value of a security held that is denominated in a foreign currency. The U.S. dollar value of a foreign currency denominated security will decrease as the dollar appreciates against the currency, while the U.S. dollar value will increase as the dollar depreciates against the currency.
Interest Rate Risk. Interest rate risk refers to the fluctuations in value of fixed-income securities resulting from the inverse relationship between price and yield. For example, an increase in general interest rates will tend to reduce the market value of already issued fixed-income investments, and a decline in general interest rates will tend to increase their value. In addition, debt securities with longer maturities, which tend to have higher yields, are subject to potentially greater fluctuations in value from changes in interest rates than obligations with shorter maturities.
Volatility Risk. Volatility risk refers to the magnitude of the movement, but not the direction of the movement, in a financial instrument’s price over a defined time period. Large increases or decreases in a financial instrument’s price over a relative time period typically indicate greater volatility risk, while small increases or decreases in its price typically indicate lower volatility risk.
Derivatives may have little or no initial cash investment relative to their market value exposure and therefore can produce significant gains or losses in excess of their cost due to unanticipated changes in the market risk factors and the overall market. This use of embedded leverage allows the Fund to increase its market value exposure relative to its net assets and can substantially increase the volatility of the Fund’s performance. In instances where the Fund is using derivatives to decrease, or hedge, exposures to market risk factors for securities held by the Fund, there are also risks that those derivatives may not perform as expected resulting in losses for the combined or hedged positions. Some derivatives have the potential for unlimited loss, regardless of the size of the Fund’s initial investment.
Additional associated risks from investing in derivatives also exist and potentially could have significant effects on the valuation of the derivative and the Fund. Typically, the associated risks are not the risks that the Fund is attempting to increase or decrease exposure to, per its investment objectives, but are the additional risks from investing in derivatives. Examples of these associated risks are liquidity risk, which is the risk that the Fund will not be able to sell the derivative in the open market in a timely manner, and counterparty credit risk, which is the risk that the counterparty will not fulfill its obligation to the Fund.
The Fund’s actual exposures to these market risk factors and associated risks during the period are discussed in further detail, by derivative type, below.
Forward Currency Exchange Contracts
The Fund may enter into forward currency exchange contracts (“forward contracts”) for the purchase or sale of a foreign currency at a negotiated rate at a future date. Such contracts are traded in the OTC inter-bank currency dealer market.
Forward contracts are reported on a schedule following the Consolidated Statement of Investments. The unrealized appreciation (depreciation) is reported in the Consolidated Statement of Assets and Liabilities as a receivable (or payable) and in the Consolidated Statement of Operations within the change in unrealized appreciation (depreciation). At contract close, the difference between the original cost of the contract and the value at the close date is recorded as a realized gain (loss) in the Consolidated Statement of Operations.
The Fund has entered into forward contracts with the obligation to purchase specified foreign currencies in the future at a currently negotiated forward rate in order to take a positive investment perspective on the related currency. These forward contracts seek to increase exposure to foreign exchange rate risk.
The Fund has entered into forward contracts with the obligation to purchase specified foreign currencies in the future at a currently negotiated forward rate in order to decrease exposure to foreign exchange rate risk associated with foreign currency denominated securities held by the Fund.
The Fund has entered into forward contracts with the obligation to sell specified foreign currencies in the future at a currently negotiated forward rate in order to take a negative investment perspective on the related currency. These forward contracts seek to increase exposure to foreign exchange rate risk.
The Fund has entered into forward contracts with the obligation to sell specified foreign currencies in the future at a currently negotiated forward rate in order to decrease exposure to foreign exchange rate risk associated with foreign currency denominated securities held by the Fund.
During the six months ended June 30, 2014, the Fund had daily average contract amounts on forward contracts to buy and sell of $55,609,194 and $64,860,956, respectively.
Additional associated risk to the Fund includes counterparty credit risk. Counterparty credit risk arises from the possibility that the counterparty to a forward contract will default and fail to perform its obligations to the Fund.
32 OPPENHEIMER DIVERSIFIED ALTERNATIVES FUND/VA
6. Risk Exposures and the Use of Derivative Instruments (Continued)
Futures Contracts
A futures contract is a commitment to buy or sell a specific amount of a commodity, financial instrument or currency at a negotiated price on a stipulated future date. The Fund may buy and sell futures contracts and may also buy or write put or call options on these futures contracts. Futures contracts and options thereon are generally entered into on a regulated futures exchange and cleared through a clearinghouse associated with the exchange.
Upon entering into a futures contract, the Fund is required to deposit either cash or securities (initial margin) in an amount equal to a certain percentage of the contract value in an account registered in the futures commission merchant’s name. Subsequent payments (variation margin) are paid to or from the futures commission merchant each day equal to the daily changes in the contract value. Such payments are recorded as unrealized gains and losses. Should the Fund fail to make requested variation margin payments, the futures commission merchant can gain access to the initial margin to satisfy the Fund’s payment obligations.
Futures contracts are reported on a schedule following the Consolidated Statement of Investments. Securities held by a futures commission merchant to cover initial margin requirements on open futures contracts are noted in the Consolidated Statement of Investments. Cash held by a futures commission merchant to cover initial margin requirements on open futures contracts and the receivable and/or payable for the daily mark to market for the variation margin are noted in the Consolidated Statement of Assets and Liabilities. The net change in unrealized appreciation and depreciation is reported in the Consolidated Statement of Operations. Realized gains (losses) are reported in the Consolidated Statement of Operations at the closing or expiration of futures contracts.
The Fund has purchased futures contracts on various bonds and notes to increase exposure to interest rate risk.
The Fund has sold futures contracts on various bonds and notes to decrease exposure to interest rate risk.
The Fund has purchased futures contracts on various equity indexes to increase exposure to equity risk.
The Fund has sold futures contracts on various equity indexes to decrease exposure to equity risk.
The Fund has purchased futures contracts, which have values that are linked to the price movement of the related volatility indexes, in order to increase exposure to volatility risk.
The Fund has sold futures contracts, which have values that are linked to the price movement of the related volatility indexes, in order to decrease exposure to volatility risk.
The Fund has purchased futures contracts, which have values that are linked to the price movement of the related commodities, in order to increase exposure to commodity risk.
The Fund has sold futures contracts, which have values that are linked to the price movement of the related commodities, in order to decrease exposure to commodity risk.
During the six months ended June 30, 2014, the Fund had an ending monthly average market value of $6,803,409 and $9,805,918 on futures contracts purchased and sold, respectively.
Additional associated risks of entering into futures contracts (and related options) include the possibility that there may be an illiquid market where the Fund is unable to liquidate the contract or enter into an offsetting position and, if used for hedging purposes, the risk that the price of the contract will correlate imperfectly with the prices of the Fund’s securities.
Option Activity
The Fund may buy and sell put and call options, or write put and call options. When an option is written, the Fund receives a premium and becomes obligated to sell or purchase the underlying security, currency or other underlying financial instrument at a fixed price, upon exercise of the option.
Options can be traded through an exchange or through a privately negotiated arrangement with a dealer in an OTC transaction. Options traded through an exchange are generally cleared through a clearinghouse (such as The Options Clearing Corporation). The difference between the premium received or paid, and market value of the option, is recorded as unrealized appreciation or depreciation. The net change in unrealized appreciation or depreciation is reported in the Consolidated Statement of Operations. When an option is exercised, the cost of the security purchased or the proceeds of the security sale are adjusted by the amount of premium received or paid. Upon the expiration or closing of the option transaction, a gain or loss is reported in the Consolidated Statement of Operations.
The Fund has purchased call options on currencies to increase exposure to foreign exchange rate risk. A purchased call option becomes more valuable as the price of the underlying financial instrument appreciates relative to the strike price.
The Fund has purchased put options on currencies to decrease exposure to foreign exchange rate risk. A purchased put option becomes more valuable as the price of the underlying financial instrument depreciates relative to the strike price.
The Fund has purchased call options on individual equity securities and/or equity indexes to increase exposure to equity risk. A purchased call option becomes more valuable as the price of the underlying financial instrument appreciates relative to the strike price.
The Fund has purchased put options on individual commodities and/or commodity indexes to decrease exposure to commodity risk. A purchased put option becomes more valuable as the price of the underlying financial instrument depreciates relative to the strike price.
During the six months ended June 30, 2014, the Fund had an ending monthly average market value of $83,959 and $53,981 on purchased call options and purchased put options, respectively.
Options written, if any, are reported in a schedule following the Consolidated Statement of Investments and as a liability in the Consolidated Statement of Assets and Liabilities. Securities held in collateral accounts to cover potential obligations with respect to outstanding written options are noted in the Consolidated Statement of Investments.
The risk in writing a call option is that the market price of the security increases and if the option is exercised, the Fund must either purchase the security at a higher price for delivery or, if the Fund owns the underlying security, give up the opportunity for profit. The risk in writing a put option is that the Fund may incur a loss if the market price of the security decreases and the option is exercised. The risk in buying an option is that the Fund pays a
33 OPPENHEIMER DIVERSIFIED ALTERNATIVES FUND/VA
| | |
NOTES TO CONSOLIDATED FINANCIAL STATEMENTS Unaudited / Continued |
6. Risk Exposures and the Use of Derivative Instruments (Continued)
premium whether or not the option is exercised. The Fund also has the additional risk that there may be an illiquid market where the Fund is unable to close the contract.
The Fund has written put options on currencies to increase exposure to foreign exchange rate risk. A written put option becomes more valuable as the price of the underlying financial instrument appreciates relative to the strike price.
The Fund has written call options on currencies to decrease exposure to foreign exchange rate risk. A written call option becomes more valuable as the price of the underlying financial instrument depreciates relative to the strike price.
The Fund has written put options on individual equity securities and/or equity indexes to increase exposure to equity risk. A written put option becomes more valuable as the price of the underlying financial instrument appreciates relative to the strike price.
The Fund has written call options on individual equity securities and/or equity indexes to decrease exposure to equity risk. A written call option becomes more valuable as the price of the underlying financial instrument depreciates relative to the strike price.
During the six months ended June 30, 2014, the Fund had an ending monthly average market value of $53,189 and $47,826 on written call options and written put options, respectively.
Additional associated risks to the Fund include counterparty credit risk and liquidity risk.
Written option activity for the six months ended June 30, 2014 was as follows:
| | | | | | | | | | | | | | | | |
| | | Call Options | | | Put Options | |
| | | Number of Contracts | | | Amount of
Premiums | | | Number of Contracts | | | Amount of
Premiums | |
Options outstanding as of December 31, 2013 | | | 9,380,006 | | | $ | 6,517 | | | | 29,725,128 | | | $ | 14,506 | |
Options written | | | 397,235,537 | | | | 243,227 | | | | 1,544,317,639 | | | | 255,303 | |
Options closed or expired | | | (139,818,039) | | | | (38,436) | | | | (758,057) | | | | (11,026) | |
Options exercised | | | (266,797,283) | | | | (174,736) | | | | (1,573,284,517) | | | | (236,213) | |
| | | | |
Options outstanding as of June 30, 2014 | | | 221 | | | $ | 36,572 | | | | 193 | | | $ | 22,570 | |
| | | | |
Swap Contracts
The Fund may enter into swap contract agreements with a counterparty to exchange a series of cash flows based on either specified reference rates, the price or volatility of asset or non-asset references, or the occurrence of a credit event, over a specified period. Swaps can be executed in a bi-lateral privately negotiated arrangement with a dealer in an OTC transaction (“OTC swaps”) or executed on a regulated market. Certain swaps, regardless of the venue of their execution, are required to be cleared through a clearinghouse (“centrally cleared swaps”). Swap contracts may include interest rate, equity, debt, index, total return, credit default, currency, and volatility swaps.
Swap contracts are reported on a schedule following the Consolidated Statement of Investments. The values of centrally cleared swap and OTC swap contracts are aggregated by positive and negative values and disclosed separately on the Consolidated Statement of Assets and Liabilities. The unrealized appreciation (depreciation) related to the change in the valuation of the notional amount of the swap is combined with the accrued interest due to (owed by) the Fund, if any, at termination or settlement. The net change in this amount during the period is included on the Consolidated Statement of Operations. The Fund also records any periodic payments received from (paid to) the counterparty, including at termination, under such contracts as realized gain (loss) on the Consolidated Statement of Operations.
Swap contract agreements are exposed to the market risk factor of the specific underlying reference rate or asset. Swap contracts are typically more attractively priced compared to similar investments in related cash securities because they isolate the risk to one market risk factor and eliminate the other market risk factors. Investments in cash securities (for instance bonds) have exposure to multiple risk factors (credit and interest rate risk). Because swaps have embedded leverage, they can expose the Fund to substantial risk in the isolated market risk factor.
Credit Default Swap Contracts. A credit default swap is a contract that enables an investor to buy or sell protection against a defined-issuer credit event, such as the issuer’s failure to make timely payments of interest or principal on a debt security, bankruptcy or restructuring. The Fund may enter into credit default swaps either by buying or selling protection on a corporate issuer, sovereign issuer, or a basket or index of issuers (the “reference asset”).
The buyer of protection pays a periodic fee to the seller of protection based on the notional amount of the swap contract. The seller of protection agrees to compensate the buyer of protection for future potential losses as a result of a credit event on the reference asset. The contract effectively transfers the credit event risk of the reference asset from the buyer of protection to the seller of protection.
The ongoing value of the contract will fluctuate throughout the term of the contract based primarily on the credit risk of the reference asset. If the credit quality of the reference asset improves relative to the credit quality at contract initiation, the buyer of protection may have an unrealized loss greater than the anticipated periodic fee owed. This unrealized loss would be the result of current credit protection being cheaper than the cost of credit protection at contract initiation. If the buyer elects to terminate the contract prior to its maturity, and there has been no credit event, this unrealized loss will become realized. If the contract is held to maturity, and there has been no credit event, the realized loss will be equal to the periodic fee paid over the life of the contract.
If there is a credit event, the buyer of protection can exercise its rights under the contract and receive a payment from the seller of protection equal to the notional amount of the swap less the market value of specified debt securities issued by the reference asset. Upon exercise of the contract the difference between such value and the notional amount is recorded as realized gain (loss) and is included on the Consolidated Statement of Operations.
The Fund has sold credit protection through credit default swaps to increase exposure to the credit risk of individual issuers and/or indexes of issuers that are either unavailable or considered to be less attractive in the bond market.
34 OPPENHEIMER DIVERSIFIED ALTERNATIVES FUND/VA
6. Risk Exposures and the Use of Derivative Instruments (Continued)
The Fund has purchased credit protection through credit default swaps to decrease exposure to the credit risk of individual issuers and/or indexes of issuers.
For the six months ended June 30, 2014, the Fund had ending monthly average notional amounts of $3,072,857 and $3,152,857 on credit default swaps to buy protection and credit default swaps to sell protection, respectively.
Additional associated risks to the Fund include counterparty credit risk and liquidity risk.
Interest Rate Swap Contracts. An interest rate swap is an agreement between counterparties to exchange periodic payments based on interest rates. One cash flow stream will typically be a floating rate payment based upon a specified floating interest rate while the other is typically a fixed interest rate.
The Fund has entered into interest rate swaps in which it pays a floating interest rate and receives a fixed interest rate in order to increase exposure to interest rate risk. Typically, if relative interest rates rise, payments made by the Fund under a swap agreement will be greater than the payments received by the Fund.
The Fund has entered into interest rate swaps in which it pays a fixed interest rate and receives a floating interest rate in order to decrease exposure to interest rate risk. Typically, if relative interest rates rise, payments received by the Fund under the swap agreement will be greater than the payments made by the Fund.
For the six months ended June 30, 2014, the Fund had ending monthly average notional amounts of $2,084,175 and $2,085,244 on interest rate swaps which pay a fixed rate and interest rate swaps which receive a fixed rate, respectively.
Additional associated risks to the Fund include counterparty credit risk and liquidity risk.
Total Return Swap Contracts. A total return swap is an agreement between counterparties to exchange periodic payments based on the value of asset or non-asset references. One cash flow is typically based on a non-asset reference (such as an interest rate) and the other on the total return of a reference asset (such as a security or a basket of securities or securities index). The total return of the reference asset typically includes appreciation or depreciation on the reference asset, plus any interest or dividend payments.
Total return swap contracts are exposed to the market risk factor of the specific underlying financial instrument or index. Total return swaps are less standard in structure than other types of swaps and can isolate and/or include multiple types of market risk factors including equity risk, credit risk, and interest rate risk.
The Fund has entered into total return swaps on various equity securities or indexes to increase exposure to equity risk. These equity risk related total return swaps require the Fund to pay a floating reference interest rate, and an amount equal to the negative price movement of securities or an index (expressed as a percentage) multiplied by the notional amount of the contract. The Fund will receive payments equal to the positive price movement of the same securities or index (expressed as a percentage) multiplied by the notional amount of the contract and, in some cases, dividends paid on the securities.
The Fund has entered into total return swaps on various equity securities or indexes to decrease exposure to equity risk. These equity risk related total return swaps require the Fund to pay an amount equal to the positive price movement of securities or an index (expressed as a percentage) multiplied by the notional amount of the contract and, in some cases, dividends paid on the securities. The Fund will receive payments of a floating reference interest rate and an amount equal to the negative price movement of the same securities or index (expressed as a percentage) multiplied by the notional amount of the contract.
The Fund has entered into total return swaps to increase exposure to the credit risk of various indexes or basket of securities. These credit risk related total return swaps require the Fund to pay to, or receive payments from, the counterparty based on the movement of credit spreads of the related indexes or securities.
The Fund has entered into total return swaps on various commodity indexes to increase exposure to commodity risk. These commodity risk related total return swaps require the Fund to pay a fixed or a floating reference interest rate, and an amount equal to the negative price movement of an index (expressed as a percentage) multiplied by the notional amount of the contract. The Fund will receive payments equal to the positive price movement of the same index (expressed as a percentage) multiplied by the notional amount of the contract.
For the six months ended June 30, 2014, the Fund had ending monthly average notional amounts of $27,499,549 and $4,524,889 on total return swaps which are long the reference asset and total return swaps which are short the reference asset, respectively.
Additional associated risks to the Fund include counterparty credit risk and liquidity risk.
Volatility Swap Contracts. A volatility swap is an agreement between counterparties to exchange periodic payments based on the measured volatility of a reference security, index, currency or other reference investment over a specified time frame. One cash flow is typically based on the realized volatility of the reference investment as measured by changes in its price or level over the specified time period while the other cash flow is based on a specified rate representing expected volatility for the reference investment at the time the swap is executed, or the measured volatility of a different reference investment over the specified time period. The appreciation or depreciation on a volatility swap will typically depend on the magnitude of the reference investment’s volatility, or size of the movements in its price, over the specified time period, rather than general directional increases or decreases in its price.
Volatility swaps are less standard in structure than other types of swaps and provide pure, or isolated, exposure to volatility risk of the specific underlying reference investment. Volatility swaps are typically used to speculate on future volatility levels, to trade the spread between realized and expected volatility, or to decrease the volatility exposure of investments held by the Fund.
Variance swaps are a type of volatility swap where counterparties agree to exchange periodic payments based on the measured variance (or the volatility squared) of a reference security, index, or other reference investment over a specified time period. At payment date, a net cash flow will be exchanged based on the difference between the realized variance of the reference investment over the specified time period and the specified rate representing expected variance for the reference investment at the time the swap is executed multiplied by the notional amount of the contract.
35 OPPENHEIMER DIVERSIFIED ALTERNATIVES FUND/VA
| | |
NOTES TO CONSOLIDATED FINANCIAL STATEMENTS Unaudited / Continued |
6. Risk Exposures and the Use of Derivative Instruments (Continued)
The Fund has entered into volatility swaps to increase exposure to the volatility risk of various reference investments. These types of volatility swaps require the Fund to pay the measured volatility and receive a fixed rate payment. If the measured volatility of the related reference investment increases over the period, the swaps will depreciate in value. Conversely, if the measured volatility of the related reference investment decreases over the period, the swaps will appreciate in value.
The Fund has entered into volatility swaps to decrease exposure to the volatility risk of various reference investments. These types of volatility swaps require the Fund to pay a fixed rate payment and receive the measured volatility. If the measured volatility of the related reference investment increases over the period, the swaps will appreciate in value. Conversely, if the measured volatility of the related reference investment decreases over the period, the swaps will depreciate in value.
The Fund has entered into variance swaps to increase exposure to the volatility risk of various reference investments. These types of volatility swaps require the Fund to make a payment if the measured price variance of the reference investment exceeds the specified fixed rate. If the measured variance of the related reference investment increases over the period, the swaps will depreciate in value. Conversely, if the measured variance of the related reference investment decreases over the period, the swaps will appreciate in value.
The Fund has entered into variance swaps to decrease exposure to the volatility risk of various reference investments. These types of volatility swaps require the Fund to make a payment if the measured price variance of the reference asset is less than the specified fixed rate. If the measured variance of the related reference investment increases over the period, the swaps will appreciate in value. Conversely, if the measured variance of the related reference investment decreases over the period, the swaps will depreciate in value.
For the six months ended June 30, 2014, the Fund had ending monthly average notional amounts of $8,707 and $1,888 on volatility swaps which pay measured volatility/variance and volatility swaps which receive measured volatility/variance, respectively.
Additional associated risks to the Fund include counterparty credit risk and liquidity risk.
Counterparty Credit Risk. Derivative positions are subject to the risk that the counterparty will not fulfill its obligation to the Fund. The Fund intends to enter into derivative transactions with counterparties that the Manager believes to be creditworthy at the time of the transaction.
The Fund’s risk of loss from counterparty credit risk on OTC derivatives is generally limited to the aggregate unrealized gain netted against any collateral held by the Fund. For OTC options purchased, the Fund bears the risk of loss of the amount of the premiums paid plus the positive change in market values net of any collateral held by the Fund should the counterparty fail to perform under the contracts. Options written by the Fund do not typically give rise to counterparty credit risk, as options written generally obligate the Fund and not the counterparty to perform.
To reduce counterparty risk with respect to OTC transactions, the Fund has entered into master netting arrangements, established within the Fund’s International Swap and Derivatives Association, Inc. (“ISDA”) master agreements, which allow the Fund to make (or to have an entitlement to receive) a single net payment in the event of default (close-out netting) for outstanding payables and receivables with respect to certain OTC positions in swaps, options, swaptions, and forward currency exchange contracts for each individual counterparty. In addition, the Fund may require that certain counterparties post cash and/or securities in collateral accounts to cover their net payment obligations for those derivative contracts subject to ISDA master agreements. If the counterparty fails to perform under these contracts and agreements, the cash and/or securities will be made available to the Fund.
As of June 30, 2014, the Fund has required certain counterparties to post collateral of $2,142,581.
ISDA master agreements include credit related contingent features which allow counterparties to OTC derivatives to terminate derivative contracts prior to maturity in the event that, for example, the Fund’s net assets decline by a stated percentage or the Fund fails to meet the terms of its ISDA master agreements, which would cause the Fund to accelerate payment of any net liability owed to the counterparty.
For financial reporting purposes, the Fund does not offset derivative assets and derivative liabilities that are subject to netting arrangements in the Consolidated Statement of Assets and Liabilities. Bankruptcy or insolvency laws of a particular jurisdiction may impose restrictions on or prohibitions against the right of offset in bankruptcy, insolvency or other events.
The Fund’s risk of loss from counterparty credit risk on exchange-traded derivatives cleared through a clearinghouse and for centrally cleared swaps is generally considered lower than as compared to OTC derivatives. However, counterparty credit risk exists with respect to initial and variation margin deposited/paid by the Fund that is held in futures commission merchant, broker and/or clearinghouse accounts for such exchange-traded derivatives and for centrally cleared swaps.
With respect to centrally cleared swaps, such transactions will be submitted for clearing, and if cleared, will be held in accounts at futures commission merchants or brokers that are members of clearinghouses. While brokers, futures commission merchants and clearinghouses are required to segregate customer margin from their own assets, in the event that a broker, futures commission merchant or clearinghouse becomes insolvent or goes into bankruptcy and at that time there is a shortfall in the aggregate amount of margin held by the broker, futures commission merchant or clearinghouse for all its customers, U.S. bankruptcy laws will typically allocate that shortfall on a pro-rata basis across all the broker’s, futures commission merchant’s or clearinghouse’s customers, potentially resulting in losses to the Fund.
There is the risk that a broker, futures commission merchant or clearinghouse will decline to clear a transaction on the Fund’s behalf, and the Fund may be required to pay a termination fee to the executing broker with whom the Fund initially enters into the transaction. Clearinghouses may also be permitted to terminate centrally cleared swaps at any time. The Fund is also subject to the risk that the broker or futures commission merchant will improperly use the Fund’s assets deposited/paid as initial or variation margin to satisfy payment obligations of another customer. In the event of a default by another customer of the broker or futures commission merchant, the Fund might not receive its variation margin payments from the clearinghouse, due to the manner in which variation margin payments are aggregated for all customers of the broker/futures commission merchant.
36 OPPENHEIMER DIVERSIFIED ALTERNATIVES FUND/VA
6. Risk Exposures and the Use of Derivative Instruments (Continued)
Collateral and margin requirements differ by type of derivative. Margin requirements are established by the broker, futures commission merchant or clearinghouse for exchange-traded and cleared derivatives, including centrally cleared swaps. Brokers, futures commission merchants and clearinghouses can ask for margin in excess of the regulatory minimum, or increase the margin amount, in certain circumstances.
Collateral terms are contract specific for OTC derivatives. For derivatives traded under an ISDA master agreement, the collateral requirements are typically calculated by netting the mark to market amount for each transaction under such agreement and comparing that amount to the value of any collateral currently pledged by the Fund or the counterparty.
For financial reporting purposes, cash collateral that has been pledged to cover obligations of the Fund, if any, is reported separately on the Consolidated Statement of Assets and Liabilities as cash pledged as collateral. Non-cash collateral pledged by the Fund, if any, is noted in the Consolidated Statement of Investments. Generally, the amount of collateral due from or to a party must exceed a minimum transfer amount threshold (e.g. $250,000) before a transfer has to be made. To the extent amounts due to the Fund from its counterparties are not fully collateralized, contractually or otherwise, the Fund bears the risk of loss from counterparty nonperformance.
The following table presents by counterparty the Fund’s OTC derivative assets net of the related collateral posted for the benefit of the Fund at June 30, 2014:
| | | | | | | | | | | | | | | | | | | | |
| | | | | | Gross Amounts Not Offset in the Consolidated Statement of
Assets & Liabilities | | | | |
| Counterparty | | Gross Amount of Assets
in the Consolidated
Statement of Assets &
Liabilities* | | | Financial Instruments
Available for Offset | | | Financial Instruments
Collateral Received** | | | Cash Collateral
Received** | | | Net Amount | |
| |
| Bank of America NA | | $ | 343,651 | | | $ | (211,458 | ) | | $ | (132,193 | ) | | $ | — | | | $ | — | |
| Barclays Bank plc | | | 149,671 | | | | (149,671 | ) | | | — | | | | — | | | | — | |
| BNP Paribas | | | 42,386 | | | | (25,424 | ) | | | — | | | | — | | | | 16,962 | |
| Canadian Imperial Bank of Commerce | | | 1 | | | | (1 | ) | | | — | | | | — | | | | — | |
| Citibank NA | | | 359,367 | | | | (179,969 | ) | | | — | | | | — | | | | 179,398 | |
| Credit Suisse International | | | 15,544 | | | | — | | | | — | | | | — | | | | 15,544 | |
| Deutsche Bank Securities, Inc. | | | 157,755 | | | | (157,755 | ) | | | — | | | | — | | | | — | |
| Goldman Sachs Bank USA | | | 97,248 | | | | (97,248 | ) | | | — | | | | — | | | | — | |
| Goldman Sachs Group, Inc. (The) | | | 280,513 | | | | (188,600 | ) | | | — | | | | — | | | | 91,913 | |
| JPMorgan Chase Bank NA | | | 289,252 | | | | (49,230 | ) | | | (240,022 | ) | | | — | | | | — | |
| Macquarie Bank Ltd. | | | 7,890 | | | | — | | | | — | | | | — | | | | 7,890 | |
| Merrill Lynch Commodities, Inc. | | | 28,425 | | | | (3 | ) | | | — | | | | — | | | | 28,422 | |
| Morgan Stanley | | | 1,973 | | | | (692 | ) | | | — | | | | — | | | | 1,281 | |
| Morgan Stanley Capital Services, Inc. | | | 44,852 | | | | (34,360 | ) | | | — | | | | — | | | | 10,492 | |
| Royal Bank of Scotland plc (The) | | | 57,598 | | | | (57,598 | ) | | | — | | | | — | | | | — | |
| | | | |
| | $ | 1,876,126 | | | $ | (1,152,009 | ) | | $ | (372,215 | ) | | $ | — | | | $ | 351,902 | |
| | | | |
* OTC derivatives are reported gross on the Consolidated Statement of Assets and Liabilities. Exchange traded options and margin related to centrally cleared swaps and futures are excluded from these reported amounts.
** Reported collateral posted for the benefit of the Fund within this table is limited to the net outstanding amount due from an individual counterparty. The collateral posted for the benefit of the Fund may exceed these amounts.
The following table presents by counterparty the Fund’s OTC derivative liabilities net of the related collateral pledged by the Fund at June 30, 2014:
| | | | | | | | | | | | | | | | | | | | |
| | | | | | Gross Amounts Not Offset in the Consolidated Statement of
Assets & Liabilities | | | | |
| Counterparty | | Gross Amount of
Liabilities in the
Consolidated
Statement
of Assets &
Liabilities* | | | Financial Instruments
Available for Offset | | | Financial Instruments
Collateral Pledged** | | | Cash Collateral
Pledged** | | | Net Amount | |
| |
| Bank of America NA | | $ | (211,458) | | | $ | 211,458 | | | $ | — | | | $ | — | | | $ | — | |
| Barclays Bank plc | | | (159,209) | | | | 149,671 | | | | — | | | | — | | | | (9,538) | |
| BNP Paribas | | | (25,424) | | | | 25,424 | | | | — | | | | — | | | | — | |
| Canadian Imperial Bank of Commerce | | | (2) | | | | 1 | | | | — | | | | 1 | | | | — | |
| Citibank NA | | | (179,969) | | | | 179,969 | | | | — | | | | — | | | | — | |
| Deutsche Bank Securities, Inc. | | | (187,583) | | | | 157,755 | | | | — | | | | — | | | | (29,828) | |
| Goldman Sachs Bank USA | | | (240,448) | | | | 97,248 | | | | — | | | | — | | | | (143,200) | |
| Goldman Sachs Group, Inc. (The) | | | (188,600) | | | | 188,600 | | | | — | | | | — | | | | — | |
| JPMorgan Chase Bank NA | | | (49,230) | | | | 49,230 | | | | — | | | | — | | | | — | |
| Merrill Lynch Commodities, Inc. | | | (3) | | | | 3 | | | | — | | | | — | | | | — | |
| Morgan Stanley | | | (692) | | | | 692 | | | | — | | | | — | | | | — | |
| Morgan Stanley Capital Services, Inc. | | | (34,360) | | | | 34,360 | | | | — | | | | — | | | | — | |
| Royal Bank of Scotland plc (The) | | | (68,232) | | | | 57,598 | | | | — | | | | — | | | | (10,634) | |
| | | | |
| | $ | (1,345,210) | | | $ | 1,152,009 | | | $ | — | | | $ | 1 | | | $ | (193,200) | |
| | | | |
* OTC derivatives are reported gross on the Consolidated Statement of Assets and Liabilities. Exchange traded options and margin related to centrally cleared swaps and futures are excluded from these reported amounts.
** Reported collateral pledged within this table is limited to the net outstanding amount due from the Fund. The securities pledged as collateral by the Fund as reported on the Consolidated Statements of investments may exceed these amounts.
35 OPPENHEIMER DIVERSIFIED ALTERNATIVES FUND/VA
| | |
NOTES TO CONSOLIDATED FINANCIAL STATEMENTS Unaudited / Continued |
6. Risk Exposures and the Use of Derivative Instruments (Continued)
The following table presents the valuations of derivative instruments by risk exposure as reported within the Consolidated Statement of Assets and Liabilities as of June 30, 2014:
| | | | | | | | | | | | |
| | | Asset Derivatives | | | Liability Derivatives | |
Derivatives Not Accounted for as Hedging Instruments | | Consolidated Statement of Assets and
Liabilities Location | | Value | | | Consolidated Statement of Assets and
Liabilities Location | | Value | |
| |
Commodity contracts | | Swaps, at value | | $ | 36,316 | | | Swaps, at value | | $ | 5 | |
Credit contracts | | Swaps, at value | | | 512,161 | | | Swaps, at value | | | 50,111 | |
Equity contracts | | Swaps, at value | | | 152,385 | | | Swaps, at value | | | 182,740 | |
Volatility contracts | | Swaps, at value | | | 184,276 | | | Swaps, at value | | | 168,345 | |
Interest rate contracts | | Centrally cleared swaps, at value | | | 28,665 | | | Centrally cleared swaps, at value | | | 52,088 | |
Commodity contracts | | Variation margin receivable | | | 47,039 * | | | Variation margin payable | | | 26,210 * | |
Equity contracts | | Variation margin receivable | | | 23,248 * | | | Variation margin payable | | | 1,969 * | |
Interest rate contracts | | Variation margin receivable | | | 2,531 * | | | | | | | |
Volatility contracts | | Variation margin receivable | | | 2,550 * | | | | | | | |
Foreign exchange contracts | | Unrealized appreciation on foreign currency exchange contracts | | | 990,988 | | | Unrealized depreciation on foreign currency exchange contracts | | | 944,009 | |
Equity contracts | | | | | | | | Options written, at value | | | 63,850 | |
Commodity contracts | | Investments, at value | | | 6,395 ** | | | | | | | |
Equity contracts | | Investments, at value | | | 1,268 ** | | | | | | | |
| | | | | | | | | | | | |
Total | | | | $ | 1,987,822 | | | | | $ | 1,489,327 | |
| | | | | | | | | | | | |
* Includes only the current day’s variation margin. Prior variation margin movements have been reflected in cash on the Consolidated Statement of Assets and Liabilities upon receipt or payment.
** Amounts relate to purchased option contracts and purchased swaption contracts, if any.
The effect of derivative instruments on the Consolidated Statement of Operations is as follows:
| | | | | | | | | | | | | | | | | | | | | | | | |
| Amount of Realized Gain or (Loss) Recognized on Derivatives | |
| |
Derivatives Not Accounted for as Hedging Instruments | | Investment from
unaffiliated
companies (including
premiums on options
exercised)* | | | Closing and
expiration of option
contracts written | | | Closing and
expiration of futures
contracts | | | Foreign currency
transactions | | | Swap contracts | | | Total | |
| |
Commodity contracts | | $ | — | | | $ | — | | | $ | (30,136) | | | $ | — | | | $ | 1,175,103 | | | $ | 1,144,967 | |
Credit contracts | | | — | | | | — | | | | — | | | | — | | | | (55,218) | | | | (55,218) | |
Equity contracts | | | 49,805 | | | | 10,185 | | | | (236,544) | | | | — | | | | 354,482 | | | | 177,928 | |
Foreign exchange contracts | | | 41,427 | | | | 39,277 | | | | — | | | | (15,274) | | | | — | | | | 65,430 | |
Interest rate contracts | | | — | | | | — | | | | 76,958 | | | | — | | | | 10,711 | | | | 87,669 | |
Volatility contracts | | | — | | | | — | | | | 15,958 | | | | — | | | | (467,359) | | | | (451,401) | |
| | | | |
Total | | $ | 91,232 | | | $ | 49,462 | | | $ | (173,764) | | | $ | (15,274) | | | $ | 1,017,719 | | | $ | 969,375 | |
| | | | |
* Includes purchased option contracts, purchased swaption contracts, written option contracts exercised and written swaption contracts exercised, if any. | |
| Amount of Change in Unrealized Gain or (Loss) Recognized on Derivatives | |
| |
Derivatives Not Accounted for as Hedging Instruments | | Investments* | | | Option contracts
written | | | Futures contracts | | | Translation of assets
and liabilities
denominated in
foreign currencies | | | Swap contracts | | | Total | |
| |
Commodity contracts | | $ | (6,804) | | | $ | — | | | $ | 173,758 | | | $ | — | | | $ | 36,311 | | | $ | 203,265 | |
Credit contracts | | | — | | | | — | | | | — | | | | — | | | | 197,321 | | | | 197,321 | |
Equity contracts | | | (192) | | | | (5,869) | | | | 116,265 | | | | — | | | | (41,823) | | | | 68,381 | |
Foreign exchange contracts | | | (2,440) | | | | (2,475) | | | | — | | | | 43,633 | | | | — | | | | 38,718 | |
Interest rate contracts | | | — | | | | — | | | | (4,180) | | | | — | | | | (23,423) | | | | (27,603) | |
Volatility contracts | | | — | | | | — | | | | 102 | | | | — | | | | 15,717 | | | | 15,819 | |
| | | | |
Total | | $ | (9,436) | | | $ | (8,344) | | | $ | 285,945 | | | $ | 43,633 | | | $ | 184,103 | | | $ | 495,901 | |
| | | | |
*Includes purchased option contracts and purchased swaption contracts, if any.
7. Restricted Securities
As of June 30, 2014, investments in securities included issues that are restricted. A restricted security may have a contractual restriction on its resale and is valued under methods approved by the Board of Trustees as reflecting fair value. Securities that are restricted are marked with an applicable footnote on the Consolidated Statement of Investments. Restricted securities are reported on a schedule following the Consolidated Statement of Investments.
8. Pending Litigation
In 2009, seven class action lawsuits were filed in the U.S. District Court for the District of Colorado against OppenheimerFunds, Inc. (“OFI”), OppenheimerFunds Distributor, Inc., the Fund’s principal underwriter and distributor (the “Distributor”), and certain funds (but not including the Fund) advised by OFI Global Asset Management, Inc. and distributed by the Distributor (the “Defendant Funds”). The lawsuits also named as defendants certain officers and current and former trustees of the respective Defendant Funds. The lawsuits raised claims under federal securities law and alleged,
38 OPPENHEIMER DIVERSIFIED ALTERNATIVES FUND/VA
8. Pending Litigation (Continued)
among other things, that the disclosure documents of the respective Defendant Funds contained misrepresentations and omissions and that the respective Defendant Funds’ investment policies were not followed. The plaintiffs in these actions sought unspecified damages, equitable relief and awards of attorneys’ fees and litigation expenses. The Defendant Funds’ Boards of Trustees also engaged counsel to represent the Funds and the present and former Independent Trustees named in those suits. On March 5, 2014, the parties in six of these lawsuits executed stipulations and agreements of settlement resolving those actions. On July 31, 2014, the court entered an order and final judgment approving the settlements as fair, reasonable and adequate. The settlements do not resolve a seventh outstanding lawsuit relating to Oppenheimer Rochester California Municipal Fund.
Other class action and individual lawsuits have been filed since 2008 in various state and federal courts against OFI and certain of its affiliates by investors seeking to recover investments they allegedly lost as a result of the “Ponzi” scheme run by Bernard L. Madoff and his firm, Bernard L. Madoff Investment Securities, LLC (“BLMIS”). Plaintiffs in these suits allege that they suffered losses as a result of their investments in several funds managed by an affiliate of OFI and assert a variety of claims, including breach of fiduciary duty, fraud, negligent misrepresentation, unjust enrichment, and violation of federal and state securities laws and regulations, among others. They seek unspecified damages, equitable relief and awards of attorneys’ fees and litigation expenses. Neither the Distributor, nor any of the Oppenheimer mutual funds, their independent trustees or directors are named as defendants in these lawsuits. None of the Oppenheimer mutual funds invested in any funds or accounts managed by Madoff or BLMIS. On February 28, 2011, a stipulation of partial settlement of three groups of consolidated putative class action lawsuits relating to these matters was filed in the U.S. District Court for the Southern District of New York. On August 19, 2011, the court entered an order and final judgment approving the settlement as fair, reasonable and adequate. In September 2011, certain parties filed notices of appeal from the court’s order approving the settlement. In June 2014, the appellate court affirmed the lower court’s order approving the settlement. Certain parties subsequently filed a petition for certiorari before the U.S. Supreme Court further challenging the settlement approval order. The settlement does not resolve other outstanding lawsuits against OFI and its affiliates relating to BLMIS.
OFI believes the lawsuits and appeals described above are without legal merit and, with the exception of actions it has settled, is defending against them vigorously. While it is premature to render any opinion as to the outcome in these lawsuits, or whether any costs that the Defendant Funds may bear in defending the suits might not be reimbursed by insurance, OFI believes that these suits should not impair the ability of OFI or the Distributor to perform their respective duties to the Fund, and that the outcome of all of the suits together should not have any material effect on the operations of any of the Oppenheimer mutual funds.
39 OPPENHEIMER DIVERSIFIED ALTERNATIVES FUND/VA
| | |
| PORTFOLIO PROXY VOTING POLICIES AND PROCEDURES; UPDATES TO STATEMENTS OF INVESTMENTS Unaudited |
The Fund has adopted Portfolio Proxy Voting Policies and Procedures under which the Fund votes proxies relating to securities (“portfolio proxies”) held by the Fund. A description of the Fund’s Portfolio Proxy Voting Policies and Procedures is available (i) without charge, upon request, by calling the Fund toll-free at 1.800.525.7048, (ii) on the Fund’s website at oppenheimerfunds.com, and (iii) on the SEC’s website at www.sec.gov. In addition, the Fund is required to file Form N-PX, with its complete proxy voting record for the 12 months ended June 30th, no later than August 31st of each year. The Fund’s voting record is available (i) without charge, upon request, by calling the Fund toll-free at 1.800.525.7048, and (ii) in the Form N-PX filing on the SEC’s website at www.sec.gov.
The Fund files its complete schedule of portfolio holdings with the SEC for the first quarter and the third quarter of each fiscal year on Form N-Q. The Fund’s Form N-Q filings are available on the SEC’s website at www.sec.gov. Those forms may be reviewed and copied at the SEC’s Public Reference Room in Washington, D.C. Information on the operation of the Public Reference Room may be obtained by calling 1-800-SEC-0330.
40 OPPENHEIMER DIVERSIFIED ALTERNATIVES FUND/VA
THIS PAGE INTENTIONALLY LEFT BLANK.
41 OPPENHEIMER DIVERSIFIED ALTERNATIVES FUND/VA
THIS PAGE INTENTIONALLY LEFT BLANK.
42 OPPENHEIMER DIVERSIFIED ALTERNATIVES FUND/VA
THIS PAGE INTENTIONALLY LEFT BLANK.
43 OPPENHEIMER DIVERSIFIED ALTERNATIVES FUND/VA
OPPENHEIMER DIVERSIFIED ALTERNATIVES FUND/VA
A Series of Oppenheimer Variable Account Funds
Trustees and Officers | Sam Freedman, Chairman of the Board of Trustees and Trustee |
| | Edward L. Cameron, Trustee |
| | Richard F. Grabish, Trustee |
| | Beverly L. Hamilton, Trustee |
| | Victoria J. Herget, Trustee |
| | Robert J. Malone, Trustee |
| | F. William Marshall, Jr., Trustee |
| | Karen L. Stuckey, Trustee |
| | William F. Glavin, Jr., Trustee, President and Principal Executive Officer |
| | Mark Hamilton, Vice President |
| | Benjamin Rockmuller, Vice President |
| | Dokyoung Lee, Vice President |
| | Arthur S. Gabinet, Secretary and Chief Legal Officer |
| | Christina M. Nasta, Vice President and Chief Business Officer |
| | Mary Ann Picciotto, Chief Compliance Officer and Chief Anti-Money Laundering Officer |
| | Brian W. Wixted, Treasurer and Principal Financial & Accounting Officer |
Manager | OFI Global Asset Management, Inc. |
Sub-Adviser | OppenheimerFunds, Inc. |
Distributor | OppenheimerFunds Distributor, Inc. |
Transfer and | OFI Global Asset Management, Inc. |
Shareholder
Servicing Agent
Sub-Transfer Agent | Shareholder Services, Inc. |
| | DBA OppenheimerFunds Services |
Registered Public
Accounting Firm
| | Before investing in any of the Oppenheimer funds, investors should carefully consider a fund’s investment objectives, risks, charges and expenses. Fund prospectuses and summary prospectuses contain this and other information about the funds and may be obtained by asking your financial advisor, visiting oppenheimerfunds.com or calling us at 1.800.988.8287. Read prospectuses and summary prospectuses carefully before investing. |
| | The financial statements included herein have been taken from the records of the Fund without examination of those records by the independent registered public accounting firm. |
| | © 2014 OppenheimerFunds, Inc. All rights reserved. Oppenheimer funds are distributed by OppenheimerFunds Distributor, Inc. |


Portfolio Managers: George R. Evans, CFA, and Robert B. Dunphy, CFA
Cumulative Total Returns
For the 6-Month Period Ended 6/30/14
| | | | |
Non-Service Shares | | | 2.42 | % |
Service Shares | | | 2.52 | % |
| | | | | | | | | | |
Average Annual Total Returns For the Periods Ended 6/30/14 |
| | | | 1-Year | | | | 5-Year | | | 10-Year |
Non-Service Shares | | | 21.30% | | | | 15.80% | | | 10.09% |
Service Shares | | | 21.20% | | | | 15.53% | | | 9.81% |
Performance data quoted represents past performance, which does not guarantee future results. The investment return and principal value of an investment in the Fund will fluctuate so that an investor’s shares, when redeemed, may be worth more or less than their original cost. Current performance may be lower or higher than the performance quoted. For performance data current to the most recent month end, call us at 1.800.988.8287. The Fund’s total returns should not be expected to be the same as the returns of other funds, whether or not both funds have the same portfolio managers and/or similar names. The Fund’s total returns include changes in share price and reinvested distributions but do not include the charges associated with the separate account products that offer this Fund. Such performance would have been lower if such charges were taken into account.
| | | | | | |
TOP TEN COMMON STOCK HOLDINGS | | | |
SAP AG | | | 1.6 | % | | |
BT Group plc | | | 1.5 | | | |
Aalberts Industries NV | | | 1.4 | | | |
Roche Holding AG | | | 1.4 | | | |
Industria de Diseno Textil SA (Inditex) | | | 1.4 | | | |
Novo Nordisk AS, Cl. B | | | 1.4 | | | |
Aryzta AG | | | 1.4 | | | |
Syngenta AG | | | 1.3 | | | |
Diageo plc | | | 1.3 | | | |
Unilever plc | | | 1.3 | | | |
Portfolio holdings and allocations are subject to change. Percentages are as of June 30, 2014, and are based on net assets. For more current Fund holdings, please visit oppenheimerfunds.com.
REGIONAL ALLOCATION
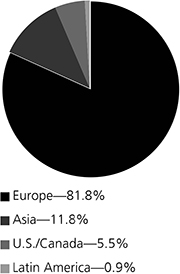
Portfolio holdings and allocations are subject to change. Percentages are as of June 30, 2014, and are based on the total market value of investments.
2 OPPENHEIMER INTERNATIONAL GROWTH FUND/VA
Fund Performance Discussion
The Fund’s Non-Service shares produced a return of 2.42% for the period, underperforming the MSCI AC World ex-U.S. Index (the “Index”), which returned 5.56%. The Fund underperformed the Index in the information technology, energy and consumer discretionary sectors due primarily to weaker relative stock selection. An underweight position in energy and an overweight position in consumer discretionary also contributed to the underperformance in those sectors. The Fund outperformed the Index in the consumer staples, telecommunication services and materials sectors, where stronger stock selection benefited, and in the financials sector due to an underweight position.
GLOBAL MARKET AND ECONOMIC ENVIRONMENT
Despite market volatility early in the reporting period and rising geopolitical risks in Ukraine and the Middle East, global equities generally rebounded and produced positive returns in the first half of 2014, thanks largely to a continued global economic recovery and stimulative monetary policies from central banks throughout the world. Markets were volatile to start the reporting period in January 2014 amid fears that political and economic instability in the world’s emerging markets might further dampen the U.S. economic recovery. However, equities rebounded later in the reporting period. Among the central bank measures that boosted the markets this reporting period, the European Central Bank (the “ECB”) announced numerous measures in June, including a benchmark interest rate cut, the introduction of a negative deposit rate to encourage banks to lend, among various other measures to flood the system with liquidity. Beyond that, the ECB said it would prepare to purchase packages of loans from banks to allow for increased lending. In June, the U.S. Federal Reserve (the “Fed”) also stated it would reduce the amount of monthly bond purchases by an additional $10 billion and reaffirmed its intention to keep short-term interest rates near zero.
TOP INDIVIDUAL CONTRIBUTORS
Top contributors to the Fund’s performance this period included Weir Group plc, Aryzta AG and Novo Nordisk AS. Weir Group is a global engineering solutions company providing components and services mainly to companies in the mining and energy industries. The company’s innovative products, including pumps and valves, are designed for difficult operating environments and can play a critical role in improving operational efficiency for companies operating in the resource markets. Weir also has a complementary aftermarket business that focuses on repair and upgrades of equipment. The stock rallied on the heels of fourth-quarter results that flagged a solid recovery in demand after a period of destocking on the part of clients. The sequential pick up in Weir’s order book also supports an improving outlook. Aryzta provides a wide range of pre-baked bakery food products including bread, cookies and other pastries. Aryzta expanded its presence in North America by acquiring Canada-based Pineridge Bakery and U.S.-based Cloverhill Bakery, helping to drive its stock up. Aryzta has a healthy mergers and acquisitions (M&A) track record in a fragmented bakery industry. Novo Nordisk, a Danish company, is the global leader in diabetes care. The stock rallied during the reporting period as concerns surrounding growth and competition moderated. Investors instead focused on Novo’s track record of delivering consistent results as well as the company’s long-term growth potential. The U.S. diabetes market is estimated at over $40 billion and growing strongly. That growth is supported by increased incidence, diagnosis and treatment of the disease in the United States. Growth is also evident in the emerging markets due to changing dietary habits and increasing disposable income that can be used to better meet healthcare needs.
TOP INDIVIDUAL DETRACTORS
Detractors from performance this reporting period included YOOX SpA, BG Group plc and ARM Holdings plc. YOOX, based in Italy, is a leading online retailer in the luxury goods space. The company’s business model includes a multi-brand business that sells discounted products from a variety of designers, as well as a mono-brand business that offers a shop-in-shop platform for a growing number of brands. Both consumers of luxury goods and luxury goods manufacturers had been relatively slow to embrace e-commerce. In our opinion, as the shift to online sales accelerates, it presents a large growth opportunity for YOOX. Full year 2013 results were announced in March and while underlying metrics were solid, currency proved to be a headwind for the company. At period end, we continue to focus on the long-term structural growth opportunities for YOOX. BG Group, a global integrated oil and gas company, is one of the major players in the Brazilian pre-salt basins. We believe that Brazil, along with BG’s LNG (liquefied natural gas) project in Australia, offers significant growth potential over the next few years. However, the company reported disappointing results recently, which were related to weak production and higher costs in its legacy base business. Its exposure to Egypt has also created some concern. We exited our position. ARM Holdings licenses intellectual property to semiconductor companies, who then incorporate its designs into their own products. The company’s designs are the de-facto chip standard for mobile devices, and they are expanding into other areas as well, such as digital TVs and servers. The stock has been off this year as the growth of high end smartphones has been decelerating, though it is still fast. The stock price has gone up by almost 50% a year for the last 5-years, so a breather is not surprising.
3 OPPENHEIMER INTERNATIONAL GROWTH FUND/VA
STRATEGY & OUTLOOK
We continue to seek to invest in companies that may benefit from long-term secular growth trends, have significant and durable competitive advantages, and the financial flexibility to increase their relative market position against their competitors during downtrends in the business cycle. We are long-term investors with an average holding period of more than seven years.
We continue to see gradual improvement in the macroeconomic environment in the developed world. The U.S. economy is setting the pace and received a vote of confidence from the Fed to continue tapering its quantitative easing program. Europe appears to be turning the corner. The headwinds created by austerity and stressed financial markets are diminishing. While there is still some disparity in fundamentals across Euro area economies, we continue to get positive signals on several fronts. Even the peripheral European economies have shown signs of stability and marginal improvement.
The emerging markets are likely to be a continued source of concern for investors as they weigh the impact of issues such as tightening global liquidity, slowing growth in China, and the events in the Ukraine. However, we believe that the rebound in emerging markets that occurred over the second half of the reporting period would suggest that investors realize some of these headwinds are more than reflected in the market valuation.
The Fund’s investment strategy and focus can change over time. The mention of specific fund holdings does not constitute a recommendation by OppenheimerFunds, Inc. or its affiliates.
Shares of Oppenheimer funds are not deposits or obligations of any bank, are not guaranteed by any bank, are not insured by the FDIC or any other agency, and involve investment risks, including the possible loss of the principal amount invested.
4 OPPENHEIMER INTERNATIONAL GROWTH FUND/VA
Fund Expenses
Fund Expenses. As a shareholder of the Fund, you incur two types of costs: (1) transaction costs and (2) ongoing costs, including management fees; distribution and service fees; and other Fund expenses. These examples are intended to help you understand your ongoing costs (in dollars) of investing in the Fund and to compare these costs with the ongoing costs of investing in other mutual funds.
The examples are based on an investment of $1,000.00 invested at the beginning of the period and held for the entire 6-month period ended June 30, 2014.
Actual Expenses. The first section of the table provides information about actual account values and actual expenses. You may use the information in this section for the class of shares you hold, together with the amount you invested, to estimate the expense that you paid over the period. Simply divide your account value by $1,000.00 (for example, an $8,600.00 account value divided by $1,000.00 = 8.60), then multiply the result by the number in the first section under the heading entitled “Expenses Paid During Period” to estimate the expenses you paid on your account during this period.
Hypothetical Example for Comparison Purposes.
The second section of the table provides information about hypothetical account values and hypothetical expenses based on the Fund’s actual expense ratio for each class of shares, and an assumed rate of return of 5% per year for each class before expenses, which is not the actual return. The hypothetical account values and expenses may not be used to estimate the actual ending account balance or expenses you paid for the period. You may use this information to compare the ongoing costs of investing in the Fund and other funds. To do so, compare this 5% hypothetical example for the class of shares you hold with the 5% hypothetical examples that appear in the shareholder reports of the other funds.
Please note that the expenses shown in the table are meant to highlight your ongoing costs only and do not reflect any charges associated with the separate accounts that offer this Fund. Therefore, the “hypothetical” lines of the table are useful in comparing ongoing costs only, and will not help you determine the relative total costs of owning different funds. In addition, if these separate account charges were included your costs would have been higher.
| | | | | | | | | | | | | | | | | | |
| Actual | | Beginning
Account Value January 1, 2014 | | | | | Ending Account Value June 30, 2014 | | | | | Expenses Paid During 6 Months Ended
June 30, 2014 | | | |
Non-Service shares | | $ | 1,000.00 | | | | | $ | 1,024.20 | | | | | $ | 5.03 | | | |
Service shares | | | 1,000.00 | | | | | | 1,025.20 | | | | | | 6.25 | | | |
| | | | | | |
Hypothetical (5% return before expenses) | | | | | | | | | | | | | | | | | | |
Non-Service shares | | | 1,000.00 | | | | | | 1,019.84 | | | | | | 5.02 | | | |
Service shares | | | 1,000.00 | | | | | | 1,018.65 | | | | | | 6.23 | | | |
Expenses are equal to the Fund’s annualized expense ratio for that class, multiplied by the average account value over the period, multiplied by 181/365 (to reflect the one-half year period). Those annualized expense ratios, excluding indirect expenses from affiliated funds, based on the 6-month period ended June 30, 2014 are as follows:
| | | | | | |
| Class | | Expense Ratios | | | |
Non-Service shares | | | 1.00% | | | |
Service shares | | | 1.24 | | | |
The expense ratios reflect voluntary and/or contractual waivers and/or reimbursements of expenses by the Fund’s Manager. Some of these undertakings may be modified or terminated at any time, as indicated in the Fund’s prospectus. The “Financial Highlights” tables in the Fund’s financial statements, included in this report, also show the gross expense ratios, without such waivers or reimbursements and reduction to custodian expenses, if applicable.
5 OPPENHEIMER INTERNATIONAL GROWTH FUND/VA
| | |
| STATEMENT OF INVESTMENTS June 30, 2014 Unaudited | | |
| | | | | | | | |
| | | Shares | | | Value | |
| |
Common Stocks—96.7% | | | | | | | | |
| |
Consumer Discretionary—20.1% | |
| |
Automobiles—1.1% | |
| |
| Bayerische Motoren Werke (BMW) AG | | | 46,216 | | | $ | 5,862,180 | |
| | | | | | | | |
| |
Diversified Consumer Services—1.3% | |
| |
Benesse Holdings, Inc. | | | 82,825 | | | | 3,595,800 | |
| |
Dignity plc | | | 145,626 | | | | 3,415,882 | |
| | | | | | | | |
| | | | 7,011,682 | |
| | | | | | | | |
| |
Hotels, Restaurants & Leisure—2.9% | |
| |
Carnival Corp. | | | 134,840 | | | | 5,076,726 | |
| |
Domino’s Pizza Group plc | | | 483,786 | | | | 4,335,545 | |
| |
William Hill plc | | | 1,210,517 | | | | 6,785,247 | |
| | | | | | | | |
| | | | | | | 16,197,518 | |
| | | | | | | | |
| |
Household Durables—0.8% | |
| |
SEB SA | | | 52,130 | | | | 4,611,521 | |
| | | | | | | | |
| |
Internet & Catalog Retail—1.5% | |
| |
| Ctrip.com International Ltd., ADR1 | | | 67,650 | | | | 4,332,306 | |
| |
Yoox SpA1 | | | 140,426 | | | | 3,782,172 | |
| | | | | | | | |
| | | | 8,114,478 | |
| | | | | | | | |
| |
Media—3.1% | |
| |
| British Sky Broadcasting Group plc | | | 432,221 | | | | 6,680,603 | |
| |
| Grupo Televisa SAB, Sponsored ADR | | | 30,580 | | | | 1,049,200 | |
| |
Liberty Global plc, Cl. A1 | | | 14,332 | | | | 633,761 | |
| |
Liberty Global plc,
Series C1 | | | 35,910 | | | | 1,519,352 | |
| |
SES SA | | | 158,580 | | | | 6,012,369 | |
| |
| Zee Entertainment Enterprises Ltd. | | | 246,278 | | | | 1,199,740 | |
| | | | | | | | |
| | | | | | | 17,095,025 | |
| | | | | | | | |
| |
Multiline Retail—1.1% | |
| |
Dollarama, Inc. | | | 75,522 | | | | 6,217,710 | |
| | | | | | | | |
| |
Specialty Retail—1.4% | |
| |
| Industria de Diseno Textil SA (Inditex) | | | 50,373 | | | | 7,767,403 | |
| | | | | | | | |
| |
Textiles, Apparel & Luxury Goods—6.9% | |
| |
Burberry Group plc | | | 263,840 | | | | 6,689,412 | |
| |
| Cie Financiere Richemont SA | | | 67,421 | | | | 7,076,221 | |
| |
Kering | | | 18,840 | | | | 4,128,434 | |
| |
Luxottica Group SpA | | | 43,523 | | | | 2,518,971 | |
| |
| LVMH Moet Hennessy Louis Vuitton SA | | | 24,800 | | | | 4,777,236 | |
| |
Prada SpA | | | 826,800 | | | | 5,877,684 | |
| |
Swatch Group AG (The) | | | 11,005 | | | | 6,646,904 | |
| | | | | | | | |
| | | | | | | 37,714,862 | |
| | | | | | | | |
| |
Consumer Staples—11.4% | |
| |
Beverages—3.2% | |
| |
Diageo plc | | | 229,652 | | | | 7,310,581 | |
| |
Heineken NV | | | 79,257 | | | | 5,690,346 | |
| |
Pernod-Ricard SA | | | 37,170 | | | | 4,463,786 | |
| | | | | | | | |
| | | | | | | 17,464,713 | |
| | | | | | | | |
| |
Food & Staples Retailing—1.3% | |
| |
CP ALL PCL | | | 4,835,400 | | | | 7,151,192 | |
| | | | | | | | |
| |
Food Products—4.9% | |
| |
Aryzta AG1 | | | 81,211 | | | | 7,686,224 | |
| |
Barry Callebaut AG1 | | | 4,202 | | | | 5,709,035 | |
| |
DANONE SA | | | 67,990 | | | | 5,046,058 | |
| |
Saputo, Inc. | | | 20,256 | | | | 1,213,595 | |
| |
Unilever plc | | | 160,802 | | | | 7,291,601 | |
| | | | | | | | |
| | | | | | | 26,946,513 | |
| | | | | | | | |
| |
Household Products—1.1% | |
| |
| Reckitt Benckiser Group plc | | | 72,804 | | | | 6,349,066 | |
| | | | | | | | |
| |
Personal Products—0.2% | |
| |
L’Oreal SA | | | 5,660 | | | | 975,966 | |
| | | | | | | | |
| | | Shares | | | Value | |
| |
Tobacco—0.7% | |
| |
Swedish Match AB | | | 103,929 | | | $ | 3,605,450 | |
| | | | | | | | |
| |
Energy—3.5% | |
| |
Energy Equipment & Services—2.5% | |
| |
Hunting plc | | | 26,590 | | | | 390,500 | |
| |
Saipem SpA1 | | | 185,800 | | | | 5,007,042 | |
| |
| Schoeller-Bleckmann Oilfield Equipment AG | | | 24,829 | | | | 3,199,913 | |
| |
Technip SA | | | 44,810 | | | | 4,908,329 | |
| | | | | | | | |
| | | | 13,505,784 | |
| | | | | | | | |
| |
Oil, Gas & Consumable Fuels—1.0% | |
| |
Koninklijke Vopak NV | | | 115,490 | | | | 5,642,814 | |
| | | | | | | | |
| |
Financials—4.1% | |
| |
Capital Markets—2.2% | |
| |
ICAP plc | | | 945,849 | | | | 6,143,975 | |
| |
Tullett Prebon plc | | | 316,444 | | | | 1,431,804 | |
| |
UBS AG1 | | | 260,622 | | | | 4,775,663 | |
| | | | | | | | |
| | | | 12,351,442 | |
| | | | | | | | |
| |
Commercial Banks—0.8% | |
| |
| ICICI Bank Ltd., Sponsored ADR1 | | | 88,565 | | | | 4,419,394 | |
| | | | | | | | |
| |
Insurance—1.0% | |
| |
Prudential plc | | | 242,617 | | | | 5,565,340 | |
| | | | | | | | |
| |
Thrifts & Mortgage Finance—0.1% | |
| |
| Housing Development Finance Corp. Ltd.1 | | | 25,497 | | | | 418,598 | |
| | | | | | | | |
| |
Health Care—10.5% | |
| |
Biotechnology—2.3% | |
| |
CSL Ltd. | | | 92,900 | | | | 5,832,529 | |
| |
Grifols SA | | | 127,438 | | | | 6,957,575 | |
| | | | | | | | |
| | | | 12,790,104 | |
| | | | | | | | |
| |
Health Care Equipment & Supplies—3.4% | |
| |
DiaSorin SpA | | | 97,486 | | | | 4,084,585 | |
| |
Essilor International SA | | | 44,000 | | | | 4,671,368 | |
| |
Sonova Holding AG | | | 39,113 | | | | 5,970,185 | |
| |
William Demant Holding1 | | | 45,444 | | | | 4,126,255 | |
| | | | | | | | |
| | | | 18,852,393 | |
| | | | | | | | |
| |
Health Care Providers & Services—0.8% | |
| |
Sonic Healthcare Ltd. | | | 279,158 | | | | 4,564,954 | |
| | | | | | | | |
| |
Health Care Technology—0.3% | |
| |
CompuGroup Medical AG | | | 50,384 | | | | 1,435,765 | |
| | | | | | | | |
| |
Pharmaceuticals—3.7% | |
| |
Galenica AG | | | 4,622 | | | | 4,510,345 | |
| |
Novo Nordisk AS, Cl. B | | | 166,577 | | | | 7,689,631 | |
| |
Roche Holding AG | | | 26,229 | | | | 7,826,773 | |
| | | | | | | | |
| | | | 20,026,749 | |
| | | | | | | | |
| |
Industrials—23.9% | |
| |
Aerospace & Defense—2.9% | |
| |
Airbus Group NV | | | 80,650 | | | | 5,413,063 | |
| |
Embraer SA | | | 409,026 | | | | 3,737,603 | |
| |
Rolls-Royce Holdings plc1 | | | 376,620 | | | | 6,878,616 | |
| | | | | | | | |
| | | | 16,029,282 | |
| | | | | | | | |
| |
Air Freight & Couriers—0.6% | |
| |
Royal Mail plc1 | | | 400,050 | | | | 3,413,734 | |
| | | | | | | | |
| |
Commercial Services & Supplies—3.4% | |
| |
Aggreko plc | | | 208,344 | | | | 5,879,179 | |
| |
Edenred | | | 185,508 | | | | 5,621,069 | |
| |
| Prosegur Compania de Seguridad SA | | | 984,004 | | | | 7,060,613 | |
| | | | | | | | |
| | | | 18,560,861 | |
| | | | | | | | |
| |
Construction & Engineering—2.3% | |
| |
| Koninklijke Boskalis Westminster NV | | | 119,443 | | | | 6,843,251 | |
| |
Leighton Holdings Ltd. | | | 196,080 | | | | 3,648,685 | |
6 OPPENHEIMER INTERNATIONAL GROWTH FUND/VA
| | | | | | | | |
| | | Shares | | | Value | |
| |
Construction & Engineering (Continued) | |
| |
| Trevi Finanziaria Industriale SpA | | | 268,890 | | | $ | 2,431,717 | |
| | | | | | | | |
| | | | 12,923,653 | |
| | | | | | | | |
| |
Electrical Equipment—3.5% | |
| |
ABB Ltd.1 | | | 230,602 | | | | 5,321,559 | |
| |
Legrand SA | | | 98,090 | | | | 5,996,442 | |
| |
Nidec Corp. | | | 49,800 | | | | 3,061,946 | |
| |
Schneider Electric SE | | | 52,750 | | | | 4,975,074 | |
| | | | | | | | |
| | | | 19,355,021 | |
| | | | | | | | |
| |
Machinery—4.2% | |
| |
Aalberts Industries NV | | | 244,360 | | | | 7,971,782 | |
| |
Atlas Copco AB, Cl. A | | | 227,871 | | | | 6,577,580 | |
| |
FANUC Corp. | | | 7,800 | | | | 1,347,907 | |
| |
Weir Group plc (The) | | | 155,654 | | | | 6,968,221 | |
| | | | | | | | |
| | | | 22,865,490 | |
| | | | | | | | |
| |
Professional Services—3.5% | |
| |
Experian plc | | | 379,453 | | | | 6,408,819 | |
| |
Intertek Group plc | | | 134,120 | | | | 6,307,590 | |
| |
SGS SA | | | 2,623 | | | | 6,287,102 | |
| | | | | | | | |
| | | | 19,003,511 | |
| | | | | | | | |
| |
Trading Companies & Distributors—3.5% | |
| |
Brenntag AG | | | 30,629 | | | | 5,470,800 | |
| |
Bunzl plc | | | 249,617 | | | | 6,922,741 | |
| |
Wolseley plc | | | 129,251 | | | | 7,077,127 | |
| | | | | | | | |
| | | | 19,470,668 | |
| | | | | | | | |
| |
Information Technology—14.0% | |
| |
Communications Equipment—1.1% | |
| |
| Telefonaktiebolaget LM Ericsson, Cl. B | | | 490,235 | | | | 5,927,737 | |
| | | | | | | | |
| |
| Electronic Equipment, Instruments, & Components—2.5% | |
| |
Hoya Corp. | | | 195,893 | | | | 6,518,575 | |
| |
Keyence Corp. | | | 12,906 | | | | 5,645,212 | |
| |
Omron Corp. | | | 39,086 | | | | 1,651,351 | |
| | | | | | | | |
| | | | 13,815,138 | |
| | | | | | | | |
| |
Internet Software & Services—2.6% | |
| |
Telecity Group plc | | | 238,710 | | | | 3,074,574 | |
| |
United Internet AG | | | 130,271 | | | | 5,739,672 | |
| |
Yahoo Japan Corp. | | | 1,172,500 | | | | 5,433,399 | |
| | | | | | | | |
| | | | 14,247,645 | |
| | | | | | | | |
| |
IT Services—1.3% | |
| |
Amadeus IT Holding SA,
Cl. A | | | 162,978 | | | | 6,714,561 | |
| |
Infosys Ltd. | | | 10,780 | | | | 582,518 | |
| | | | | | | | |
| | | | 7,297,079 | |
| | | | | | | | |
| |
Semiconductors & Semiconductor Equipment—1.1% | |
| |
ARM Holdings plc | | | 421,330 | | | | 6,359,976 | |
| | | | | | | | |
| | | Shares | | | Value | |
| |
Software—5.4% | |
| |
Aveva Group plc | | | 81,584 | | | $ | 2,842,065 | |
| |
Dassault Systemes SA | | | 41,633 | | | | 5,351,196 | |
| |
Gemalto NV | | | 50,681 | | | | 5,250,722 | |
| |
Sage Group plc (The) | | | 503,073 | | | | 3,303,290 | |
| |
SAP AG | | | 114,130 | | | | 8,815,175 | |
| |
Temenos Group AG | | | 103,497 | | | | 4,031,799 | |
| | | | | | | | |
| | | | 29,594,247 | |
| | | | | | | | |
| |
Materials—4.9% | |
| |
Chemicals—3.8% | |
| |
Essentra plc | | | 544,707 | | | | 7,107,884 | |
| |
Sika AG | | | 1,560 | | | | 6,380,763 | |
| |
Syngenta AG | | | 19,753 | | | | 7,380,109 | |
| | | | | | | | |
| | | | 20,868,756 | |
| | | | | | | | |
| |
Construction Materials—1.1% | |
| |
| James Hardie Industries plc | | | 479,600 | | | | 6,265,826 | |
| | | | | | | | |
| |
Telecommunication Services—4.0% | |
| |
Diversified Telecommunication Services—4.0% | |
| |
BT Group plc | | | 1,238,556 | | | | 8,148,334 | |
| |
Iliad SA | | | 13,950 | | | | 4,210,016 | |
| |
Inmarsat plc | | | 478,530 | | | | 6,116,439 | |
| |
Ziggo NV | | | 71,681 | | | | 3,312,522 | |
| | | | | | | | |
| | | | 21,787,311 | |
| | | | | | | | |
| |
Utilities—0.3% | |
| |
| Independent Power and Renewable Electricity Producers—0.3% | |
| |
APR Energy plc | | | 153,454 | | | | 1,707,225 | |
| | | | | | | | |
| Total Common Stocks (Cost $329,367,604) | | | | 532,151,776 | |
| | | | | | | | |
| |
| Preferred Stock—0.0% | |
| |
| Zee Entertainment Enterprises Ltd., 6% Cum. Non-Cv. (Cost $12,273) | | | 5,995,416 | | | | 75,759 | |
| | | | | | | | |
| | | Units | | | | |
| |
| Rights, Warrants and Certificates—0.0% | |
| |
| MEI Pharma, Inc. Wts., Strike Price $1.19, Exp. 5/10/171 (Cost $35,548) | | | 151,358 | | | | 56,199 | |
| | | | | | | | |
| | | Shares | | | | |
| |
| Investment Company—2.9% | |
| |
| Oppenheimer Institutional Money Market Fund, Cl. E, 0.09%2,3 (Cost $15,904,339) | | | 15,904,339 | | | | 15,904,339 | |
| | | | | | | | |
| |
| Total Investments, at Value (Cost $345,319,764) | | | 99.6 | % | | | 548,188,073 | |
| |
| Net Other Assets (Liabilities) | | | 0.4 | | | | 2,144,096 | |
| | | | |
| Net Assets | | | 100.0 | % | | $ | 550,332,169 | |
| | | | |
Footnotes to Statement of Investments
1. Non-income producing security.
2. Rate shown is the 7-day yield as of June 30, 2014.
3. Is or was an affiliate, as defined in the Investment Company Act of 1940, at or during the period ended June 30, 2014, by virtue of the Fund owning at least 5% of the voting securities of the issuer or as a result of the Fund and the issuer having the same investment adviser. Transactions during the period in which the issuer was an affiliate are as follows:
| | | | | | | | | | | | | | | | |
| | | Shares December 31, 2013 | | | Gross Additions | | | Gross Reductions | | | Shares June 30, 2014 | |
| |
| Oppenheimer Institutional Money Market Fund, Cl. E | | | 18,850,174 | | | | 123,423,446 | | | | 126,369,281 | | | | 15,904,339 | |
| | | | |
| | | | | | Value | | | | | | Income | |
| |
Oppenheimer Institutional Money Market Fund, Cl. E | | | $ | 15,904,339 | | | | | | | $ | 4,873 | |
7 OPPENHEIMER INTERNATIONAL GROWTH FUND/VA
| | |
| STATEMENT OF INVESTMENTS Continued | | |
Distribution of investments representing geographic holdings, as a percentage of total investments at value, is as follows:
| | | | | | | | |
| Geographic Holdings | | Value | | | Percent | |
United Kingdom | | $ | 150,905,371 | | | | 27.5% | |
Switzerland | | | 79,602,682 | | | | 14.5 | |
France | | | 71,161,928 | | | | 13.0 | |
Netherlands | | | 34,711,436 | | | | 6.3 | |
Spain | | | 28,500,152 | | | | 5.2 | |
Germany | | | 27,323,591 | | | | 5.0 | |
Japan | | | 27,254,190 | | | | 5.0 | |
Italy | | | 23,702,171 | | | | 4.3 | |
United States | | | 23,190,378 | | | | 4.2 | |
Australia | | | 20,311,994 | | | | 3.7 | |
Sweden | | | 16,110,766 | | | | 2.9 | |
Denmark | | | 11,815,886 | | | | 2.2 | |
Canada | | | 7,431,305 | | | | 1.4 | |
Thailand | | | 7,151,192 | | | | 1.3 | |
India | | | 6,696,009 | | | | 1.2 | |
China | | | 4,332,306 | | | | 0.8 | |
Brazil | | | 3,737,603 | | | | 0.7 | |
Austria | | | 3,199,913 | | | | 0.6 | |
Mexico | | | 1,049,200 | | | | 0.2 | |
| | | | |
Total | | $ | 548,188,073 | | | | 100.0% | |
| | | | |
See accompanying Notes to Financial Statements.
8 OPPENHEIMER INTERNATIONAL GROWTH FUND/VA
| | |
| STATEMENT OF ASSETS AND LIABILITIES June 30, 2014 Unaudited | | |
| | | | |
| |
Assets | | | | |
Investments, at value—see accompanying statement of investments: | | | | |
Unaffiliated companies (cost $329,415,425) | | $ | 532,283,734 | |
Affiliated companies (cost $15,904,339) | | | 15,904,339 | |
| | | | |
| | | 548,188,073 | |
| |
Cash | | | 500,370 | |
| |
Receivables and other assets: | | | | |
Dividends | | | 1,148,291 | |
Shares of beneficial interest sold | | | 893,431 | |
Investments sold | | | 143,749 | |
Other | | | 24,015 | |
| | | | |
Total assets | | | 550,897,929 | |
|
| |
Liabilities | | | | |
Payables and other liabilities: | | | | |
Investments purchased | | | 208,977 | |
Foreign capital gains tax | | | 207,261 | |
Shares of beneficial interest redeemed | | | 65,382 | |
Distribution and service plan fees | | | 26,676 | |
Trustees’ compensation | | | 18,781 | |
Legal, auditing and other professional fees | | | 18,060 | |
Shareholder communications | | | 8,410 | |
Other | | | 12,213 | |
| | | | |
Total liabilities | | | 565,760 | |
|
| |
Net Assets | | $ | 550,332,169 | |
| | | | |
|
| |
Composition of Net Assets | | | | |
Par value of shares of beneficial interest | | $ | 214,114 | |
| |
Additional paid-in capital | | | 321,561,396 | |
| |
Accumulated net investment income | | | 4,059,145 | |
| |
Accumulated net realized gain on investments and foreign currency transactions | | | 21,820,547 | |
| |
Net unrealized appreciation on investments and translation of assets and liabilities denominated in foreign currencies | | | 202,676,967 | |
| | | | |
Net Assets | | $ | 550,332,169 | |
| | | | |
|
| |
Net Asset Value Per Share | | | | |
Non-Service Shares: | | | | |
| Net asset value, redemption price (excludes applicable contingent deferred sales charge) and offering price per share (based on net assets of $418,699,050 and 164,367,827 shares of beneficial interest outstanding) | | | $2.55 | |
| |
Service Shares: | | | | |
| Net asset value, redemption price (excludes applicable contingent deferred sales charge) and offering price per share (based on net assets of $131,633,119 and 49,746,236 shares of beneficial interest outstanding) | | | $2.65 | |
See accompanying Notes to Financial Statements.
9 OPPENHEIMER INTERNATIONAL GROWTH FUND/VA
| | |
| STATEMENT OF OPERATIONS For the Six Months Ended June 30, 2014 Unaudited | | |
| | | | |
| |
Investment Income | | | | |
Dividends: | | | | |
Unaffiliated companies (net of foreign withholding taxes of $767,466) | | $ | 7,504,330 | |
Affiliated companies | | | 4,873 | |
| |
Interest | | | 236 | |
| | | | |
Total investment income | | | 7,509,439 | |
| |
Expenses | | | | |
Management fees | | | 2,519,821 | |
| |
Distribution and service plan fees - Service shares | | | 150,915 | |
| |
Transfer and shareholder servicing agent fees: | | | | |
Non-Service shares | | | 207,066 | |
Service shares | | | 60,375 | |
| |
Shareholder communications: | | | | |
Non-Service shares | | | 936 | |
Service shares | | | 247 | |
| |
Custodian fees and expenses | | | 25,790 | |
| |
Trustees’ compensation | | | 9,980 | |
| |
Other | | | 33,426 | |
| | | | |
Total expenses | | | 3,008,556 | |
Less waivers and reimbursements of expenses | | | (182,932) | |
| | | | |
Net expenses | | | 2,825,624 | |
|
| |
Net Investment Income | | | 4,683,815 | |
| |
Realized and Unrealized Gain (Loss) | | | | |
Net realized gain on: | | | | |
Investments from unaffiliated companies (net of foreign capital gains tax of $22,281) | | | 29,012,936 | |
Foreign currency transactions | | | 35,573 | |
| | | | |
Net realized gain | | | 29,048,509 | |
| |
Net change in unrealized appreciation/depreciation on: | | | | |
Investments (net of foreign capital gains tax of $189,442) | | | (24,534,454) | |
Translation of assets and liabilities denominated in foreign currencies | | | 2,684,293 | |
| | | | |
Net change in unrealized appreciation/depreciation | | | (21,850,161) | |
|
| |
Net Increase in Net Assets Resulting from Operations | | $ | 11,882,163 | |
| | | | |
See accompanying Notes to Financial Statements.
10 OPPENHEIMER INTERNATIONAL GROWTH FUND/VA
| | |
| STATEMENTS OF CHANGES IN NET ASSETS | | |
| | | | | | |
| | | Six Months Ended June 30, 2014 (Unaudited) | | | Year Ended December 31, 2013 |
|
Operations | | | | | | |
Net investment income | | $ | 4,683,815 | | | $ 5,818,170 |
|
Net realized gain | | | 29,048,509 | | | 27,279,495 |
|
Net change in unrealized appreciation/depreciation | | | (21,850,161) | | | 81,110,996 |
| | | | | | |
Net increase in net assets resulting from operations | | | 11,882,163 | | | 114,208,661 |
|
Dividends and/or Distributions to Shareholders | | | | | | |
Dividends from net investment income: | | | | | | |
Non-Service shares | | | (4,715,943) | | | (5,541,706) |
Service shares | | | (1,167,654) | | | (927,692) |
| | | |
| | | (5,883,597) | | | (6,469,398) |
|
Distributions from net realized gain: | | | | | | |
Non-Service shares | | | (8,305,904) | | | — |
Service shares | | | (2,491,854) | | | — |
| | | |
| | | (10,797,758) | | | — |
|
Beneficial Interest Transactions | | | | | | |
Net increase (decrease) in net assets resulting from beneficial interest transactions: | | | | | | |
Non-Service shares | | | (35,409,292) | | | 21,565,103 |
Service shares | | | 14,442,918 | | | 29,347,067 |
| | | | | | |
| | | (20,966,374) | | | 50,912,170 |
|
Net Assets | | | | | | |
Total increase (decrease) | | | (25,765,566) | | | 158,651,433 |
|
Beginning of period | | | 576,097,735 | | | 417,446,302 |
| | | | | | |
| | |
End of period (including accumulated net investment income of $4,059,145 and $5,258,927, respectively) | | $ | 550,332,169 | | | $ 576,097,735 |
| | | |
See accompanying Notes to Financial Statements.
11 OPPENHEIMER INTERNATIONAL GROWTH FUND/VA
| | | | | | | | | | | | | | | | | | | | | | | | |
| Non-Service Shares | | Six Months
Ended
June 30, 2014
(Unaudited) | | | Year Ended
December 31, 2013 | | | Year Ended December 31, 2012 | | | Year Ended December 30, 20111 | | | Year Ended December 31, 2010 | | | Year Ended December 31, 2009 | |
| |
| Per Share Operating Data | | | | | | | | | | | | | | | | | | | | | | | | |
| Net asset value, beginning of period | | $ | 2.57 | | | $ | 2.07 | | | $ | 1.72 | | | $ | 1.87 | | | $ | 1.65 | | | $ | 1.21 | |
| |
| Income (loss) from investment operations: | | | | | | | | | | | | | | | | | | | | | | | | |
| Net investment income2 | | | 0.02 | | | | 0.03 | | | | 0.03 | | | | 0.02 | | | | 0.02 | | | | 0.02 | |
| Net realized and unrealized gain (loss) | | | 0.04 | | | | 0.50 | | | | 0.35 | | | | (0.15) | | | | 0.22 | | | | 0.44 | |
| | | | |
| Total from investment operations | | | 0.06 | | | | 0.53 | | | | 0.38 | | | | (0.13) | | | | 0.24 | | | | 0.46 | |
| |
| Dividends and/or distributions to shareholders: | | | | | | | | | | | | | | | | | | | | | | | | |
| Dividends from net investment income | | | (0.03) | | | | (0.03) | | | | (0.03) | | | | (0.02) | | | | (0.02) | | | | (0.02) | |
| Distributions from net realized gain | | | (0.05) | | | | 0.00 | | | | 0.00 | | | | 0.00 | | | | 0.00 | | | | 0.00 | |
| | | | |
| Total dividends and/or distributions to shareholders | | | (0.08) | | | | (0.03) | | | | (0.03) | | | | (0.02) | | | | (0.02) | | | | (0.02) | |
| |
| Net asset value, end of period | | $ | 2.55 | | | $ | 2.57 | | | $ | 2.07 | | | $ | 1.72 | | | $ | 1.87 | | | $ | 1.65 | |
| | | | |
| | | | | | | | | | | | | | | | | | | | | | | | |
| |
| Total Return, at Net Asset Value3 | | | 2.42% | | | | 25.87% | | | | 22.22% | | | | (7.16)% | | | | 14.76% | | | | 39.24% | |
|
| |
| Ratios/Supplemental Data | | | | | | | | | | | | | | | | | | | | | | | | |
| Net assets, end of period (in thousands) | | $ | 418,699 | | | $ | 458,038 | | | $ | 348,449 | | | $ | 364,221 | | | $ | 417,141 | | | $ | 369,575 | |
| |
| Average net assets (in thousands) | | $ | 419,608 | | | $ | 404,859 | | | $ | 332,018 | | | $ | 406,974 | | | $ | 376,612 | | | $ | 328,763 | |
| |
| Ratios to average net assets:4 | | | | | | | | | | | | | | | | | | | | | | | | |
| Net investment income | | | 1.78% | | | | 1.24% | | | | 1.68% | | | | 1.21% | | | | 1.04% | | | | 1.35% | |
| Total expenses5 | | | 1.06% | | | | 1.09% | | | | 1.13% | | | | 1.09% | | | | 1.10% | | | | 1.08% | |
| Expenses after payments, waivers and/or reimbursements and reduction to custodian expenses | | | 1.00% | | | | 1.00% | | | | 1.00% | | | | 1.00% | | | | 1.00% | | | | 1.00% | |
| |
| Portfolio turnover rate | | | 25% | | | | 32% | | | | 22% | | | | 25% | | | | 19% | | | | 34% | |
1. December 30, 2011 represents the last business day of the Fund’s 2011 fiscal year.
2. Per share amounts calculated based on the average shares outstanding during the period.
3. Assumes an initial investment on the business day before the first day of the fiscal period, with all dividends and distributions reinvested in additional shares on the reinvestment date, and redemption at the net asset value calculated on the last business day of the fiscal period. Total returns are not annualized for periods less than one full year. Total return information does not reflect expenses that apply at the separate account level or to related insurance products. Inclusion of these charges would reduce the total return figures for all periods shown. Returns do not reflect the deduction of taxes that a shareholder would pay on fund distributions or the redemption of fund shares.
4. Annualized for periods less than one full year.
5. Total expenses including indirect expenses from affiliated fund were as follows:
| | | | | | |
| | Six Months Ended June 30, 2014 | | | 1.06 | % |
| | Year Ended December 31, 2013 | | | 1.09 | % |
| | Year Ended December 31, 2012 | | | 1.13 | % |
| | Year Ended December 30, 2011 | | | 1.09 | % |
| | Year Ended December 31, 2010 | | | 1.10 | % |
| | Year Ended December 31, 2009 | | | 1.09 | % |
See accompanying Notes to Financial Statements.
12 OPPENHEIMER INTERNATIONAL GROWTH FUND/VA
| | | | | | | | | | | | | | | | | | | | | | | | |
| Service Shares | | Six Months
Ended
June 30, 2014
(Unaudited) | | | Year Ended December 31, 2013 | | | Year Ended December 31, 2012 | | | Year Ended December 30, 20111 | | | Year Ended
December 31, 2010 | | | Year Ended
December 31, 2009 | |
| |
| Per Share Operating Data | | | | | | | | | | | | | | | | | | | | | | | | |
| Net asset value, beginning of period | | $ | 2.66 | | | $ | 2.14 | | | $ | 1.78 | | | $ | 1.94 | | | $ | 1.71 | | | $ | 1.25 | |
| |
| Income (loss) from investment operations: | | | | | | | | | | | | | | | | | | | | | | | | |
| Net investment income2 | | | 0.02 | | | | 0.02 | | | | 0.03 | | | | 0.02 | | | | 0.01 | | | | 0.01 | |
| Net realized and unrealized gain (loss) | | | 0.04 | | | | 0.53 | | | | 0.35 | | | | (0.17) | | | | 0.24 | | | | 0.47 | |
| | | | |
| Total from investment operations | | | 0.06 | | | | 0.55 | | | | 0.38 | | | | (0.15) | | | | 0.25 | | | | 0.48 | |
| |
| Dividends and/or distributions to shareholders: | | | | | | | | | | | | | | | | | | | | | | | | |
| Dividends from net investment income | | | (0.02) | | | | (0.03) | | | | (0.02) | | | | (0.01) | | | | (0.02) | | | | (0.02) | |
| Distributions from net realized gain | | | (0.05) | | | | 0.00 | | | | 0.00 | | | | 0.00 | | | | 0.00 | | | | 0.00 | |
| | | | |
| Total dividends and/or distributions to shareholders | | | (0.07) | | | | (0.03) | | | | (0.02) | | | | (0.01) | | | | (0.02) | | | | (0.02) | |
| |
| Net asset value, end of period | | $ | 2.65 | | | $ | 2.66 | | | $ | 2.14 | | | $ | 1.78 | | | $ | 1.94 | | | $ | 1.71 | |
| | | | |
| | | | | | | | | | | | | | | | | | | | | | | | |
| |
| Total Return, at Net Asset Value3 | | | 2.52% | | | | 25.71% | | | | 21.68% | | | | (7.61)% | | | | 14.62% | | | | 39.06% | |
|
| |
| Ratios/Supplemental Data | | | | | | | | | | | | | | | | | | | | | | | | |
| Net assets, end of period (in thousands) | | $ | 131,633 | | | $ | 118,060 | | | $ | 68,997 | | | $ | 57,276 | | | $ | 61,630 | | | $ | 43,376 | |
| |
| Average net assets (in thousands) | | $ | 122,353 | | | $ | 88,647 | | | $ | 63,118 | | | $ | 62,359 | | | $ | 50,420 | | | $ | 30,629 | |
| |
| Ratios to average net assets:4 | | | | | | | | | | | | | | | | | | | | | | | | |
| Net investment income | | | 1.61% | | | | 0.89% | | | | 1.43% | | | | 0.96% | | | | 0.78% | | | | 0.94% | |
| Total expenses5 | | | 1.31% | | | | 1.34% | | | | 1.38% | | | | 1.34% | | | | 1.35% | | | | 1.34% | |
| Expenses after payments, waivers and/or reimbursements and reduction to custodian expenses | | | 1.24% | | | | 1.25% | | | | 1.25% | | | | 1.25% | | | | 1.25% | | | | 1.26% | |
| |
| Portfolio turnover rate | | | 25% | | | | 32% | | | | 22% | | | | 25% | | | | 19% | | | | 34% | |
1. December 30, 2011 represents the last business day of the Fund’s 2011 fiscal year.
2. Per share amounts calculated based on the average shares outstanding during the period.
3. Assumes an initial investment on the business day before the first day of the fiscal period, with all dividends and distributions reinvested in additional shares on the reinvestment date, and redemption at the net asset value calculated on the last business day of the fiscal period. Total returns are not annualized for periods less than one full year. Total return information does not reflect expenses that apply at the separate account level or to related insurance products. Inclusion of these charges would reduce the total return figures for all periods shown. Returns do not reflect the deduction of taxes that a shareholder would pay on fund distributions or the redemption of fund shares.
4. Annualized for periods less than one full year.
5. Total expenses including indirect expenses from affiliated fund were as follows:
| | | | | | |
| | Six Months Ended June 30, 2014 | | | 1.31 | % |
| | Year Ended December 31, 2013 | | | 1.34 | % |
| | Year Ended December 31, 2012 | | | 1.38 | % |
| | Year Ended December 30, 2011 | | | 1.34 | % |
| | Year Ended December 31, 2010 | | | 1.35 | % |
| | Year Ended December 31, 2009 | | | 1.35 | % |
See accompanying Notes to Financial Statements.
13 OPPENHEIMER INTERNATIONAL GROWTH FUND/VA
| | |
| NOTES TO FINANCIAL STATEMENTS June 30, 2014 Unaudited | | |
1. Significant Accounting Policies
Oppenheimer International Growth Fund/VA (the “Fund”), formerly a series of Panorama Series, is a separate series of Oppenheimer Variable Account Funds, which is registered under the Investment Company Act of 1940, as amended, as a diversified open-end management investment company. The Fund’s investment objective is to seek capital appreciation. The Fund’s investment adviser is OFI Global Asset Management, Inc. (“OFI Global” or the “Manager”), a wholly-owned subsidiary of OppenheimerFunds, Inc., (“OFI” or the “Sub-Adviser”). The Manager has entered into a sub-advisory agreement with OFI. Shares of the Fund are sold only to separate accounts of life insurance companies.
The Fund offers two classes of shares. Both classes are sold at their offering price, which is the net asset value per share, to separate investment accounts of participating insurance companies as an underlying investment for variable life insurance policies, variable annuity contracts or other investment products. The class of shares designated as Service shares is subject to a distribution and service plan. Both classes of shares have identical rights and voting privileges with respect to the Fund in general and exclusive voting rights on matters that affect that class alone. Earnings, net assets and net asset value per share may differ due to each class having its own expenses, such as transfer and shareholder servicing agent fees and shareholder communications, directly attributable to that class.
The following is a summary of significant accounting policies consistently followed by the Fund.
Investment in Oppenheimer Institutional Money Market Fund. The Fund is permitted to invest daily available cash balances in an affiliated money market fund. The Fund may invest the available cash in Class E shares of Oppenheimer Institutional Money Market Fund (“IMMF”) to seek current income while preserving liquidity. IMMF is a registered open-end management investment company, regulated as a money market fund under the Investment Company Act of 1940, as amended. The Manager is the investment adviser of IMMF, and the Sub-Adviser provides investment and related advisory services to IMMF. When applicable, the Fund’s investment in IMMF is included in the Statement of Investments. Shares of IMMF are valued at their net asset value per share. As a shareholder, the Fund is subject to its proportional share of IMMF’s Class E expenses, including its management fee. The Manager will waive fees and/or reimburse Fund expenses in an amount equal to the indirect management fees incurred through the Fund’s investment in IMMF.
Foreign Currency Translation. The Fund’s accounting records are maintained in U.S. dollars. The values of securities denominated in foreign currencies and amounts related to the purchase and sale of foreign securities and foreign investment income are translated into U.S. dollars as of the close of the New York Stock Exchange (the “Exchange”), normally 4:00 P.M. Eastern time, on each day the Exchange is open for trading. Foreign exchange rates may be valued primarily using a reliable bank, dealer or service authorized by the Board of Trustees.
Reported net realized gains and losses from foreign currency transactions arise from sales of portfolio securities, sales and maturities of short-term securities, sales of foreign currencies, exchange rate fluctuations between the trade and settlement dates on securities transactions, and the difference between the amounts of dividends, interest, and foreign withholding taxes recorded on the Fund’s books and the U.S. dollar equivalent of the amounts actually received or paid. Net unrealized appreciation and depreciation on the translation of assets and liabilities denominated in foreign currencies arise from changes in the values of assets and liabilities, including investments in securities at fiscal period end, resulting from changes in exchange rates.
The effect of changes in foreign currency exchange rates on investments is separately identified from the fluctuations arising from changes in market values of securities held and reported with all other foreign currency gains and losses in the Fund’s Statement of Operations.
Allocation of Income, Expenses, Gains and Losses. Income, expenses (other than those attributable to a specific class), gains and losses are allocated on a daily basis to each class of shares based upon the relative proportion of net assets represented by such class. Operating expenses directly attributable to a specific class are charged against the operations of that class.
Federal Taxes. The Fund intends to comply with provisions of the Internal Revenue Code applicable to regulated investment companies and to distribute substantially all of its investment company taxable income to shareholders. Therefore, no federal income or excise tax provision is required. The Fund files income tax returns in U.S. federal and applicable state jurisdictions. The statute of limitations on the Fund’s tax return filings generally remain open for the three preceding fiscal reporting period ends.
During the fiscal year ended December 31, 2013, the Fund utilized $13,674,717 capital loss carryforward to offset capital gains realized in that fiscal year. Capital loss carryforwards with no expiration, if any, must be utilized prior to those with expiration dates. Capital losses with no expiration will be carried forward to future years if not offset by gains.
Net investment income (loss) and net realized gain (loss) may differ for financial statement and tax purposes. The character of dividends and distributions made during the fiscal year from net investment income or net realized gains may differ from their ultimate characterization for federal income tax purposes. Also, due to timing of dividends and distributions, the fiscal year in which amounts are distributed may differ from the fiscal year in which the income or net realized gain was recorded by the Fund.
14 OPPENHEIMER INTERNATIONAL GROWTH FUND/VA
|
| 1. Significant Accounting Policies (Continued) |
The aggregate cost of securities and other investments and the composition of unrealized appreciation and depreciation of securities and other investments for federal income tax purposes as of June 30, 2014 are noted in the following table. The primary difference between book and tax appreciation or depreciation of securities and other investments, if applicable, is attributable to the tax deferral of losses or tax realization of financial statement unrealized gain or loss.
| | | | |
Federal tax cost of securities | | $ | 352,161,506 | |
| | | | |
| |
Gross unrealized appreciation | | $ | 201,421,277 | |
Gross unrealized depreciation | | | (5,394,710) | |
| | | | |
Net unrealized appreciation | | $ | 196,026,567 | |
| | | | |
Certain foreign countries impose a tax on capital gains which is accrued by the Fund based on unrealized appreciation, if any, on affected securities. The tax is paid when the gain is realized.
Trustees’ Compensation. The Board of Trustees has adopted a compensation deferral plan for independent trustees that enables trustees to elect to defer receipt of all or a portion of the annual compensation they are entitled to receive from the Fund. For purposes of determining the amount owed to the Trustee under the plan, deferred amounts are treated as though equal dollar amounts had been invested in shares of the Fund or in other Oppenheimer funds selected by the Trustee. The Fund purchases shares of the funds selected for deferral by the Trustee in amounts equal to his or her deemed investment, resulting in a Fund asset equal to the deferred compensation liability. Such assets are included as a component of “Other” within the asset section of the Statement of Assets and Liabilities. Deferral of trustees’ fees under the plan will not affect the net assets of the Fund, and will not materially affect the Fund’s assets, liabilities or net investment income per share. Amounts will be deferred until distributed in accordance with the compensation deferral plan.
Dividends and Distributions to Shareholders. Dividends and distributions to shareholders, which are determined in accordance with income tax regulations and may differ from U.S. generally accepted accounting principles, are recorded on the ex-dividend date. Income and capital gain distributions, if any, are declared and paid annually or at other times as deemed necessary by the Manager.
The tax character of distributions is determined as of the Fund’s fiscal year end. Therefore, a portion of the Fund’s distributions made to shareholders prior to the Fund’s fiscal year end may ultimately be categorized as a tax return of capital.
Investment Income. Dividend income is recorded on the ex-dividend date or upon ex-dividend notification in the case of certain foreign dividends where the ex-dividend date may have passed. Non-cash dividends included in dividend income, if any, are recorded at the fair market value of the securities received. Interest income is recognized on an accrual basis. Discount and premium, which are included in interest income on the Statement of Operations, are amortized or accreted daily.
Custodian Fees. “Custodian fees and expenses” in the Statement of Operations may include interest expense incurred by the Fund on any cash overdrafts of its custodian account during the period. Such cash overdrafts may result from the effects of failed trades in portfolio securities and from cash outflows resulting from unanticipated shareholder redemption activity. The Fund pays interest to its custodian on such cash overdrafts, to the extent they are not offset by positive cash balances maintained by the Fund, at a rate equal to the Federal Funds Rate plus 0.50%. The “Reduction to custodian expenses” line item, if applicable, represents earnings on cash balances maintained by the Fund during the period. Such interest expense and other custodian fees may be paid with these earnings.
Security Transactions. Security transactions are recorded on the trade date. Realized gains and losses on securities sold are determined on the basis of identified cost.
Indemnifications. The Fund’s organizational documents provide current and former trustees and officers with a limited indemnification against liabilities arising in connection with the performance of their duties to the Fund. In the normal course of business, the Fund may also enter into contracts that provide general indemnifications. The Fund’s maximum exposure under these arrangements is unknown as this would be dependent on future claims that may be made against the Fund. The risk of material loss from such claims is considered remote.
Other. The preparation of financial statements in conformity with accounting principles generally accepted in the United States of America requires management to make estimates and assumptions that affect the reported amounts of assets and liabilities and disclosure of contingent assets and liabilities at the date of the financial statements and the reported amounts of increases and decreases in net assets from operations during the reporting period. Actual results could differ from those estimates.
2. Securities Valuation
The Fund calculates the net asset value of its shares as of the close of the New York Stock Exchange (the “Exchange”), normally 4:00 P.M. Eastern time, on each day the Exchange is open for trading.
The Fund’s Board has adopted procedures for the valuation of the Fund’s securities and has delegated the day-to-day responsibility for valuation determinations under those procedures to the Manager. The Manager has established a Valuation Committee which is responsible for determining a
15 OPPENHEIMER INTERNATIONAL GROWTH FUND/VA
|
| NOTES TO FINANCIAL STATEMENTS Unaudited / Continued |
|
| 2. Securities Valuation (Continued) |
“fair valuation” for any security for which market quotations are not “readily available.” The Valuation Committee’s fair valuation determinations are subject to review, approval and ratification by the Fund’s Board at its next regularly scheduled meeting covering the calendar quarter in which the fair valuation was determined.
Valuation Methods and Inputs
Securities are valued using unadjusted quoted market prices, when available, as supplied primarily by third party pricing services or dealers.
The following methodologies are used to determine the market value or the fair value of the types of securities described below:
Securities traded on a registered U.S. securities exchange (including exchange-traded derivatives other than futures and futures options) are valued based on the last sale price of the security reported on the principal exchange on which it is traded, prior to the time when the Fund’s assets are valued. In the absence of a sale, the security is valued at the last sale price on the prior trading day, if it is within the spread of the current day’s closing “bid” and “asked” prices, and if not, at the current day’s closing bid price. A security of a foreign issuer traded on a foreign exchange, but not listed on a registered U.S. securities exchange, is valued based on the last sale price on the principal exchange on which the security is traded, as identified by the third party pricing service used by the Manager, prior to the time when the Fund’s assets are valued. If the last sale price is unavailable, the security is valued at the most recent official closing price on the principal exchange on which it is traded. If the last sales price or official closing price for a foreign security is not available, the security is valued at the mean between the bid and asked price per the exchange or, if not available from the exchange, obtained from two dealers. If bid and asked prices are not available from either the exchange or two dealers, the security is valued by using one of the following methodologies (listed in order of priority): (1) using a bid from the exchange, (2) the mean between the bid and asked price as provided by a single dealer, or (3) a bid from a single dealer.
Shares of a registered investment company that are not traded on an exchange are valued at that investment company’s net asset value per share.
Corporate and government debt securities (of U.S. or foreign issuers) and municipal debt securities, event-linked bonds, loans, mortgage-backed securities, collateralized mortgage obligations, and asset-backed securities are valued at the mean between the “bid” and “asked” prices utilizing evaluated prices obtained from third party pricing services or broker-dealers who may use matrix pricing methods to determine the evaluated prices.
Short-term money market type debt securities with a remaining maturity of sixty days or less are valued at cost adjusted by the amortization of discount or premium to maturity (amortized cost), which approximates market value. Short-term debt securities with a remaining maturity in excess of sixty days are valued at the mean between the “bid” and “asked” prices utilizing evaluated prices obtained from third party pricing services or broker-dealers.
A description of the standard inputs that may generally be considered by the third party pricing vendors in determining their evaluated prices is provided below.
| | |
| Security Type | | Standard inputs generally considered by third-party pricing vendors |
| Corporate debt, government debt, municipal, mortgage-backed and asset-backed securities | | Reported trade data, broker-dealer price quotations, benchmark yields, issuer spreads on comparable securities, the credit quality, yield, maturity, and other appropriate factors. |
| Loans | | Information obtained from market participants regarding reported trade data and broker-dealer price quotations. |
| Event-linked bonds | | Information obtained from market participants regarding reported trade data and broker-dealer price quotations. |
If a market value or price cannot be determined for a security using the methodologies described above, or if, in the “good faith” opinion of the Manager, the market value or price obtained does not constitute a “readily available market quotation,” or a significant event has occurred that would materially affect the value of the security the security is fair valued either (i) by a standardized fair valuation methodology applicable to the security type or the significant event as previously approved by the Valuation Committee and the Fund’s Board or (ii) as determined in good faith by the Manager’s Valuation Committee. The Valuation Committee considers all relevant facts that are reasonably available, through either public information or information available to the Manager, when determining the fair value of a security. Fair value determinations by the Manager are subject to review, approval and ratification by the Fund’s Board at its next regularly scheduled meeting covering the calendar quarter in which the fair valuation was determined. Those fair valuation standardized methodologies include, but are not limited to, valuing securities at the last sale price or initially at cost and subsequently adjusting the value based on: changes in company specific fundamentals, changes in an appropriate securities index, or changes in the value of similar securities which may be further adjusted for any discounts related to security-specific resale restrictions. When possible, such methodologies use observable market inputs such as unadjusted quoted prices of similar securities, observable interest rates, currency rates and yield curves. The methodologies used for valuing securities are not necessarily an indication of the risks associated with investing in those securities nor can it be assured that the Fund can obtain the fair value assigned to a security if it were to sell the security.
To assess the continuing appropriateness of security valuations, the Manager, or its third party service provider who is subject to oversight by the Manager, regularly compares prior day prices, prices on comparable securities, and sale prices to the current day prices and challenges those prices exceeding certain tolerance levels with the third party pricing service or broker source. For those securities valued by fair valuations, whether through a standardized fair valuation methodology or a fair valuation determination, the Valuation Committee reviews and affirms the reasonableness of the valuations based on such methodologies and fair valuation determinations on a regular basis after considering all relevant information that is reasonably available.
16 OPPENHEIMER INTERNATIONAL GROWTH FUND/VA
|
| 2. Securities Valuation (Continued) |
Classifications
Each investment asset or liability of the Fund is assigned a level at measurement date based on the significance and source of the inputs to its valuation. Various data inputs are used in determining the value of each of the Fund’s investments as of the reporting period end. These data inputs are categorized in the following hierarchy under applicable financial accounting standards:
1) Level 1-unadjusted quoted prices in active markets for identical assets or liabilities (including securities actively traded on a securities exchange)
2) Level 2-inputs other than unadjusted quoted prices that are observable for the asset or liability (such as unadjusted quoted prices for similar assets and market corroborated inputs such as interest rates, prepayment speeds, credit risks, etc.)
3) Level 3-significant unobservable inputs (including the Manager’s own judgments about assumptions that market participants would use in pricing the asset or liability).
The inputs used for valuing securities are not necessarily an indication of the risks associated with investing in those securities.
The table below categorizes amounts that are included in the Fund’s Statement of Assets and Liabilities as of June 30, 2014 based on valuation input level:
| | | | | | | | | | | | | | | | |
| | | Level 1— Unadjusted Quoted Prices | | | Level 2— Other Significant Observable Inputs | | | Level 3— Significant Unobservable Inputs | | | Value | |
Assets Table | |
Investments, at Value: | |
Common Stocks | | | | | | | | | | | | | | | | |
Consumer Discretionary | | $ | 18,829,055 | | | $ | 91,763,324 | | | $ | — | | | $ | 110,592,379 | |
Consumer Staples | | | 1,213,595 | | | | 61,279,305 | | | | — | | | | 62,492,900 | |
Energy | | | — | | | | 19,148,598 | | | | — | | | | 19,148,598 | |
Financials | | | 4,419,394 | | | | 18,335,380 | | | | — | | | | 22,754,774 | |
Health Care | | | — | | | | 57,669,965 | | | | — | | | | 57,669,965 | |
Industrials | | | — | | | | 131,622,220 | | | | — | | | | 131,622,220 | |
Information Technology | | | — | | | | 77,241,822 | | | | — | | | | 77,241,822 | |
Materials | | | — | | | | 27,134,582 | | | | — | | | | 27,134,582 | |
Telecommunication Services | | | — | | | | 21,787,311 | | | | — | | | | 21,787,311 | |
Utilities | | | — | | | | 1,707,225 | | | | — | | | | 1,707,225 | |
Preferred Stock | | | 75,759 | | | | — | | | | — | | | | 75,759 | |
Rights, Warrants and Certificates | | | — | | | | 56,199 | | | | — | | | | 56,199 | |
Investment Company | | | 15,904,339 | | | | — | | | | — | | | | 15,904,339 | |
| | | | |
Total Assets | | $ | 40,442,142 | | | $ | 507,745,931 | | | $ | — | | | $ | 548,188,073 | |
| | | | |
Foreign currency exchange contracts and futures contracts, if any, are reported at their unrealized appreciation/ depreciation at measurement date, which represents the change in the contract’s value from trade date. All additional assets and liabilities included in the above table are reported at their market value at measurement date.
3. Shares of Beneficial Interest
The Fund has authorized an unlimited number of $0.001 par value shares of beneficial interest of each class. Transactions in shares of beneficial interest were as follows:
| | | | | | | | | | | | | | | | |
| | | Six Months Ended June 30, 2014 | | | Year Ended December 31, 2013 | |
| | | Shares | | | Amount | | | Shares | | | Amount | |
Non-Service Shares | | | | | | | | | | | | | | | | |
Sold | | | 13,113,200 | | | $ | 33,681,351 | | | | 49,717,056 | | | $ | 113,109,115 | |
Dividends and/or distributions reinvested | | | 5,127,853 | | | | 13,021,847 | | | | 2,452,083 | | | | 5,541,706 | |
Redeemed | | | (32,232,786 | ) | | | (82,112,490 | ) | | | (42,327,625 | ) | | | (97,085,718) | |
| | | | |
Net increase (decrease) | | | (13,991,733 | ) | | $ | (35,409,292 | ) | | | 9,841,514 | | | $ | 21,565,103 | |
| | | | |
| | | | |
| | | | | | | | | | | | | | | | | |
Service Shares | | | | | | | | | | | | | | | | |
Sold | | | 6,322,116 | | | $ | 16,887,828 | | | | 16,576,608 | | | $ | 39,884,179 | |
Dividends and/or distributions reinvested | | | 1,386,507 | | | | 3,659,508 | | | | 396,450 | | | | 927,692 | |
Redeemed | | | (2,299,957 | ) | | | (6,104,418 | ) | | | (4,816,049 | ) | | | (11,464,804) | |
| | | | |
Net increase | | | 5,408,666 | | | $ | 14,442,918 | | | | 12,157,009 | | | $ | 29,347,067 | |
| | | | |
4. Purchases and Sales of Securities
The aggregate cost of purchases and proceeds from sales of securities, other than short-term obligations and investments in IMMF, for the six months ended June 30, 2014 were as follows:
| | | | | | | | | | |
| | | Purchases | | | | | Sales | |
Investment securities | | $ | 132,058,186 | | | | | $ | 163,516,624 | |
17 OPPENHEIMER INTERNATIONAL GROWTH FUND/VA
|
| NOTES TO FINANCIAL STATEMENTS Unaudited / Continued |
5. Fees and Other Transactions with Affiliates
Management Fees. Under the investment advisory agreement, the Fund pays the Manager a management fee based on the daily net assets of the Fund at an annual rate as shown in the following table:
| | | | |
| Fee Schedule | | | |
Up to $250 million | | | 1.00% | |
Next $250 million | | | 0.90 | |
Over $500 million | | | 0.85 | |
Sub-Adviser Fees. The Manager has retained the Sub-Adviser to provide the day-to-day portfolio management of the Fund. Under the Sub-Advisory Agreement, the Manager pays the Sub-Adviser an annual fee in monthly installments, equal to a percentage of the investment management fee collected by the Manager from the Fund, which shall be calculated after any investment management fee waivers. The fee paid to the Sub-Adviser is paid by the Manager, not by the Fund.
Transfer Agent Fees. OFI Global (the “Transfer Agent”) serves as the transfer and shareholder servicing agent for the Fund. The Fund pays the Transfer Agent a fee based on annual net assets. Fees incurred and average net assets for each class with respect to these services are detailed in the Statement of Operations and Financial Highlights, respectively.
Sub-Transfer Agent Fees. The Transfer Agent has retained Shareholder Services, Inc., a wholly-owned subsidiary of OFI (the “Sub-Transfer Agent”), to provide the day-to-day transfer agent and shareholder servicing of the Fund. Under the Sub-Transfer Agency Agreement, the Transfer Agent pays the Sub-Transfer Agent an annual fee in monthly installments, equal to a percentage of the transfer agent fee collected by the Transfer Agent from the Fund, which shall be calculated after any applicable fee waivers. The fee paid to the Sub-Transfer Agent is paid by the Transfer Agent, not by the Fund.
Distribution and Service Plan for Service Shares. The Fund has adopted a Distribution and Service Plan (the “Plan”) in accordance with Rule 12b-1 under the Investment Company Act of 1940 for Service shares to pay OppenheimerFunds Distributor, Inc. (the “Distributor”), for distribution related services, personal service and account maintenance for the Fund’s Service shares. Under the Plan, payments are made periodically at an annual rate of 0.25% of the daily net assets of Service shares of the Fund. The Distributor currently uses all of those fees to compensate sponsors of the insurance product that offers Fund shares, for providing personal service and maintenance of accounts of their variable contract owners that hold Service shares. These fees are paid out of the Fund’s assets on an on-going basis and increase operating expenses of the Service shares, which results in lower performance compared to the Fund’s shares that are not subject to a service fee. Fees incurred by the Fund under the Plan are detailed in the Statement of Operations.
Waivers and Reimbursements of Expenses. The Manager has contractually agreed to limit the Fund’s expenses after payments, waivers and/or reimbursements and reduction to custodian expenses, excluding expenses incurred directly or indirectly by the Fund as a result of investments in other investment companies, wholly-owned subsidiaries and pooled investment vehicles; so that those expenses, as percentages of daily net assets, will not exceed the annual rate of 1.00% for Non-Service shares and 1.25% for Service shares. During the year ended June 30, 2014, the Manager waived fees and/or reimbursed the Fund $136,082 and $40,631 for Non-Service and Service shares, respectively.
The Manager will waive fees and/or reimburse Fund expenses in an amount equal to the indirect management fees incurred through the Fund’s investment in IMMF. During the six months ended June 30, 2014, the Manager waived fees and/or reimbursed the Fund $6,219 for IMMF management fees.
Some of these undertakings may be modified or terminated at any time; some may not be modified or terminated until after one year from the date of the current prospectus, as indicated therein.
6. Pending Litigation
In 2009, seven class action lawsuits were filed in the U.S. District Court for the District of Colorado against OppenheimerFunds, Inc. (“OFI”), OppenheimerFunds Distributor, Inc., the Fund’s principal underwriter and distributor (the “Distributor”), and certain funds (but not including the Fund) advised by OFI Global Asset Management, Inc. and distributed by the Distributor (the “Defendant Funds”). The lawsuits also named as defendants certain officers and current and former trustees of the respective Defendant Funds. The lawsuits raised claims under federal securities law and alleged, among other things, that the disclosure documents of the respective Defendant Funds contained misrepresentations and omissions and that the respective Defendant Funds’ investment policies were not followed. The plaintiffs in these actions sought unspecified damages, equitable relief and awards of attorneys’ fees and litigation expenses. The Defendant Funds’ Boards of Trustees also engaged counsel to represent the Funds and the present and former Independent Trustees named in those suits. On March 5, 2014, the parties in six of these lawsuits executed stipulations and agreements of settlement resolving those actions. On July 31, 2014, the court entered an order and final judgment approving the settlements as fair, reasonable and adequate. The settlements do not resolve a seventh outstanding lawsuit relating to Oppenheimer Rochester California Municipal Fund.
Other class action and individual lawsuits have been filed since 2008 in various state and federal courts against OFI and certain of its affiliates by investors seeking to recover investments they allegedly lost as a result of the “Ponzi” scheme run by Bernard L. Madoff and his firm, Bernard L. Madoff Investment Securities, LLC (“BLMIS”). Plaintiffs in these suits allege that they suffered losses as a result of their investments in several funds managed by an affiliate of OFI and assert a variety of claims, including breach of fiduciary duty, fraud, negligent misrepresentation, unjust enrichment, and violation of federal and state securities laws and regulations, among others. They seek unspecified damages, equitable relief and awards of attorneys’ fees and
18 OPPENHEIMER INTERNATIONAL GROWTH FUND/VA
|
| 6. Pending Litigation (Continued) |
litigation expenses. Neither the Distributor, nor any of the Oppenheimer mutual funds, their independent trustees or directors are named as defendants in these lawsuits. None of the Oppenheimer mutual funds invested in any funds or accounts managed by Madoff or BLMIS. On February 28, 2011, a stipulation of partial settlement of three groups of consolidated putative class action lawsuits relating to these matters was filed in the U.S. District Court for the Southern District of New York. On August 19, 2011, the court entered an order and final judgment approving the settlement as fair, reasonable and adequate. In September 2011, certain parties filed notices of appeal from the court’s order approving the settlement. In June 2014, the appellate court affirmed the lower court’s order approving the settlement. Certain parties subsequently filed a petition for certiorari before the U.S. Supreme Court further challenging the settlement approval order. The settlement does not resolve other outstanding lawsuits against OFI and its affiliates relating to BLMIS.
OFI believes the lawsuits and appeals described above are without legal merit and, with the exception of actions it has settled, is defending against them vigorously. While it is premature to render any opinion as to the outcome in these lawsuits, or whether any costs that the Defendant Funds may bear in defending the suits might not be reimbursed by insurance, OFI believes that these suits should not impair the ability of OFI or the Distributor to perform their respective duties to the Fund, and that the outcome of all of the suits together should not have any material effect on the operations of any of the Oppenheimer mutual funds.
19 OPPENHEIMER INTERNATIONAL GROWTH FUND/VA
PORTFOLIO PROXY VOTING POLICIES AND PROCEDURES;
UPDATES TO STATEMENTS OF INVESTMENTS Unaudited
The Fund has adopted Portfolio Proxy Voting Policies and Procedures under which the Fund votes proxies relating to securities (“portfolio proxies”) held by the Fund. A description of the Fund’s Portfolio Proxy Voting Policies and Procedures is available (i) without charge, upon request, by calling the Fund toll-free at 1.800.525.7048, (ii) on the Fund’s website at oppenheimerfunds.com, and (iii) on the SEC’s website at www.sec.gov. In addition, the Fund is required to file Form N-PX, with its complete proxy voting record for the 12 months ended June 30th, no later than August 31st of each year. The Fund’s voting record is available (i) without charge, upon request, by calling the Fund toll-free at 1.800.525.7048, and (ii) in the Form N-PX filing on the SEC’s website at www.sec.gov.
The Fund files its complete schedule of portfolio holdings with the SEC for the first quarter and the third quarter of each fiscal year on Form N-Q. The Fund’s Form N-Q filings are available on the SEC’s website at www.sec.gov. Those forms may be reviewed and copied at the SEC’s Public Reference Room in Washington, D.C. Information on the operation of the Public Reference Room may be obtained by calling 1-800-SEC-0330.
20 OPPENHEIMER INTERNATIONAL GROWTH FUND/VA
THIS PAGE INTENTIONALLY LEFT BLANK.
21 OPPENHEIMER INTERNATIONAL GROWTH FUND/VA
THIS PAGE INTENTIONALLY LEFT BLANK.
22 OPPENHEIMER INTERNATIONAL GROWTH FUND/VA
THIS PAGE INTENTIONALLY LEFT BLANK.
23 OPPENHEIMER INTERNATIONAL GROWTH FUND/VA
| | | | |
| OPPENHEIMER INTERNATIONAL GROWTH FUND/VA | | |
A Series of Oppenheimer Variable Account Funds
| | |
| Trustees and Officers | | Sam Freedman, Chairman of the Board of Trustees and Trustee |
| | Edward L. Cameron, Trustee |
| | Jon S. Fossel, Trustee |
| | Richard F. Grabish, Trustee |
| | Beverly L. Hamilton, Trustee |
| | Victoria J. Herget, Trustee |
| | Robert J. Malone, Trustee |
| | F. William Marshall, Jr., Trustee |
| | Karen L. Stuckey, Trustee |
| | James D. Vaughn, Trustee |
| | William F. Glavin, Jr., Trustee, President and Principal Executive Officer |
| | George R. Evans, Vice President |
| | Robert B. Dunphy, Vice President |
| | Arthur S. Gabinet, Secretary and Chief Legal Officer |
| | Christina M. Nasta, Vice President and Chief Business Officer |
| | Mary Ann Picciotto, Chief Compliance Officer and Chief Anti-Money Laundering Officer |
| | Brian W. Wixted, Treasurer and Principal Financial & Accounting Officer |
| |
| Manager | | OFI Global Asset Management, Inc. |
| |
| Sub-Adviser | | OppenheimerFunds, Inc. |
| |
| Distributor | | OppenheimerFunds Distributor, Inc. |
| |
| Transfer and | | OFI Global Asset Management, Inc. |
| Shareholder | | |
| Servicing Agent | | |
| |
| Sub-Transfer Agent | | Shareholder Services, Inc. |
| | DBA OppenheimerFunds Services |
| |
| Independent | | KPMGLLP |
| Registered | | |
| Public | | |
| Accounting | | |
| Firm | | |
| |
| Counsel | | K&L Gates LLP |
| |
| | Before investing in any of the Oppenheimer funds, investors should carefully consider a fund’s investment objectives, risks, charges and expenses. Fund prospectuses and summary prospectuses contain this and other information about the funds and may be obtained by asking your financial advisor, visiting oppenheimerfunds.com or calling us at 1.800.988.8287. Read prospectuses and summary prospectuses carefully before investing. |
| |
| | The financial statements included herein have been taken from the records of the Fund without examination of those records by the independent registered public accounting firm. |
| |
| | © 2014 OppenheimerFunds, Inc. All rights reserved. Oppenheimer funds are distributed by OppenheimerFunds Distributor, Inc. |

Item 2. Code of Ethics.
Not applicable to semiannual reports.
Item 3. Audit Committee Financial Expert.
Not applicable to semiannual reports.
Item 4. Principal Accountant Fees and Services.
Not applicable to semiannual reports.
Item 5. Audit Committee of Listed Registrants
Not applicable.
Item 6. Schedule of Investments.
a) Not applicable. The complete schedule of investments is included in Item 1 of this Form N-CSR.
b) Not applicable.
Item 7. Disclosure of Proxy Voting Policies and Procedures for Closed-End Management Investment Companies.
Not applicable.
Item 8. Portfolio Managers of Closed-End Management Investment Companies.
Not applicable.
Item 9. Purchases of Equity Securities by Closed-End Management Investment Company and Affiliated Purchasers.
Not applicable.
Item 10. Submission of Matters to a Vote of Security Holders.
The Fund’s Governance Committee Provisions with Respect to Nominations of Directors/Trustees to the Respective Boards
None
Item 11. Controls and Procedures.
Based on their evaluation of the registrant’s disclosure controls and procedures (as defined in rule 30a-3(c) under the Investment Company Act of 1940 (17 CFR 270.30a-3(c)) as of 6/30/2014, the registrant’s principal executive officer and principal financial officer found the registrant’s disclosure controls and procedures to provide reasonable assurances that information required to be disclosed by the registrant in the reports that it files under the Securities Exchange Act of 1934 (a) is accumulated and communicated to registrant’s management, including its principal executive officer and principal financial officer, to allow timely decisions regarding required disclosure, and (b) is recorded, processed, summarized and reported, within the time periods specified in the rules and forms adopted by the U.S. Securities and Exchange Commission.
There have been no changes in the registrant’s internal controls over financial reporting that occurred during the registrant’s second fiscal quarter of the period covered by this report that have materially affected, or are reasonably likely to materially affect, the registrant’s internal control over financial reporting.
Item 12. Exhibits.
| (a) | (1) Not applicable to semiannual reports. |
| | (2) | Exhibits attached hereto. |
| (b) | Exhibit attached hereto. |
SIGNATURES
Pursuant to the requirements of the Securities Exchange Act of 1934 and the Investment Company Act of 1940, the registrant has duly caused this report to be signed on its behalf by the undersigned, thereunto duly authorized.
Oppenheimer Variable Account Funds
| | |
| By: | | /s/ William F. Glavin, Jr. |
| | William F. Glavin, Jr. |
| | Principal Executive Officer |
| |
| Date: | | 8/8/2014 |
Pursuant to the requirements of the Securities Exchange Act of 1934 and the Investment Company Act of 1940, this report has been signed below by the following persons on behalf of the registrant and in the capacities and on the dates indicated.
| | |
By: | | /s/ William F. Glavin, Jr. |
| | William F. Glavin, Jr. |
| | Principal Executive Officer |
| |
| Date: | | 8/8/2014 |
| |
| By: | | /s/ Brian W. Wixted |
| | Brian W. Wixted |
| | Principal Financial Officer |
| |
| Date: | | 8/8/2014 |