UNITED STATES
SECURITIES AND EXCHANGE COMMISSION
WASHINGTON, D.C. 20549
FORM N-CSR
CERTIFIED SHAREHOLDER REPORT OF REGISTERED MANAGEMENT
INVESTMENT COMPANIES
Investment Company Act file number 811-4108
Oppenheimer Variable Account Funds
(Exact name of registrant as specified in charter)
6803 South Tucson Way, Centennial, Colorado 80112-3924
(Address of principal executive offices) (Zip code)
Arthur S. Gabinet
OppenheimerFunds, Inc.
Two World Financial Center, New York, New York 10281-1008
(Name and address of agent for service)
Registrant’s telephone number, including area code: (303) 768-3200
Date of fiscal year end: December 31
Date of reporting period: 6/29/2012
Item 1. Reports to Stockholders.
June 30, 2012
| | | | |
| | | Oppenheimer Small- & Mid-Cap Growth Fund/VA A Series of Oppenheimer Variable Account Funds | | Semiannual Report |

SEMIANNUAL REPORT
Fund Performance Discussion
Listing of Top Holdings
Financial Statements

OPPENHEIMER SMALL- & MID-CAP GROWTH FUND/VA
Portfolio Manager: Ronald J. Zibelli, Jr., CFA
| | | | | | |
Cumulative Total Returns
For the 6-Month Period Ended 6/29/121 |
| Non-Service Shares | | 13.77% | | | | |
| Service Shares | | 13.61 | | | | |
Average Annual Total Returns
For the Periods Ended 6/29/121 | | |
| | | |
| | | 1-Year | | 5-Year | | 10-Year |
| Non-Service Shares | | 0.30% | | –0.46% | | 4.80% |
| Service Shares | | 0.04 | | –0.73 | | 4.52 |
Expense Ratios For the Fiscal Year Ended 12/30/111 | | |
| | | |
| | | Gross
Expense
Ratios | | | | Net
Expense
Ratios |
| Non-Service Shares | | 0.84% | | | | 0.80% |
| Service Shares | | 1.09 | | | | 1.05 |
The performance data quoted represents past performance, which does not guarantee future results. The investment return and principal value of an investment in the Fund will fluctuate so that an investor’s shares, when redeemed, may be worth more or less than their original cost. Current performance and expense ratios may be lower or higher than the data quoted. For performance data current to the most recent month end, call us at 1.800.988.8287. The Fund’s total returns should not be expected to be the same as the returns of other funds, whether or not both funds have the same portfolio managers and/or similar names. The Fund’s total returns do not include the charges associated with the separate account products that offer this Fund. Such performance would have been lower if such charges were taken into account. Expense ratios are as stated in the Fund’s prospectus current as of the date of this report. The net expense ratios take into account voluntary fee waivers and/or expense reimbursements, without which performance would have been less. Some of these undertakings may be modified or terminated at any time, as indicated in the Fund’s prospectus.
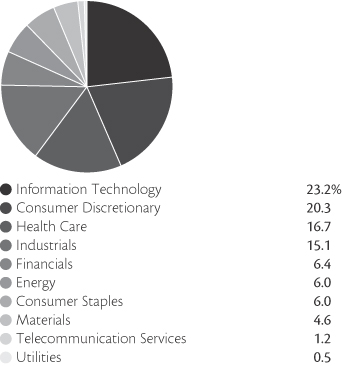
Portfolio holdings and allocations are subject to change. Percentages are as of June 29, 2012, and are based on the total market value of common stocks.
| | |
| Top Ten Common Stock Holdings | | |
| Ulta Salon, Cosmetics & Fragrance, Inc. | | 2.2% |
| Dollar Tree, Inc. | | 2.2 |
| Alexion Pharmaceuticals, Inc. | | 2.2 |
| TransDigm Group, Inc. | | 2.1 |
| Monster Beverage Corp. | | 1.9 |
| Whole Foods Market, Inc. | | 1.9 |
| Chipotle Mexican Grill, Inc., Cl. A | | 1.7 |
| Cerner Corp. | | 1.7 |
| Equinix, Inc. | | 1.6 |
| Teradata Corp. | | 1.6 |
Portfolio holdings and allocations are subject to change. Percentages are as of June 29, 2012, and are based on net assets.
2 | OPPENHEIMER SMALL- & MID-CAP GROWTH FUND/VA
|
FUND PERFORMANCE DISCUSSION
During the six-month period ended June 29, 2012, the Fund’s Non-Service shares returned 13.77%. In comparison, the Fund outperformed the Russell 2500 Growth Index (the “Index”), which returned 8.44%. The Fund’s outperformance was led by stock selection in the information technology, consumer discretionary and consumer staples sectors. The Fund underperformed the Index in industrials and enjoyed outperformance or roughly equal performance against the Index’s other nine sectors. The Fund also outperformed the Russell 2000 Growth Index and the Russell MidCap Growth Index, which returned 8.81% and 8.10%, respectively.1
Economic and Market Environment
The period began during a time of improved market sentiment in which the United States managed to avoid a return to recession and European policymakers appeared to take steps to address the region’s sovereign debt and banking sector crises. Renewed investor optimism helped produce gains across a number of international equity markets over the first three months of 2012. The rebound across equities gained momentum after the European Central Bank implemented the Long-Term Refinancing Operation (“LTRO”) to enhance liquidity for troubled banks and reduce rates on newly issued sovereign debt securities.
However, the second quarter was a volatile time for global markets. The fear of contagion from the worsening European sovereign debt crisis and a recession across much of Europe drove negative market sentiment, particularly over May and June. Very high unemployment, soaring debt and higher borrowing costs in Greece, Spain and Italy contributed to serious questions over how to implement austerity measures and restructure debt or instead take a different tact and provide some or all of those countries with additional funds. Perhaps most worrisome of all to investors was the possibility of Greece pulling out of the euro and its ramifications for the future of the Eurozone and its common currency. In the U.S., slower than expected first quarter growth also contributed to a sell-off in the U.S. stock market. Consumer confidence dropped as U.S. unemployment figures ticked slightly upwards after showing signs of improvement from the recession highs. However, the period ended on a positive note for the markets. The results of elections in Greece and continued efforts by European policymakers to stabilize the situation in the region appeared to soothe market jitters slightly in the final days of the period.
Fund Review
During the period, the top performing stocks for the Fund were Monster Beverage Corp., SXC Health Solutions Corp. and Alexion Pharmaceuticals, Inc. Monster Beverage, previously known as Hansen Natural Corp., is a producer of energy beverages. The company benefited from strong growth in its core products, as well as a successful roll-out of new products. First quarter financial results featured 28% revenue growth and 41% earnings growth. SXC Health Solutions is a pharmacy benefit manager that reported strong quarterly results during the period. In April, SXC also announced the acquisition of competitor Catalyst Healthcare for $4.4 billion, which led to additional outperformance. The Fund also owned shares of Catalyst Healthcare. Alexion is a global biopharmaceutical company that focuses on developing drugs for ultra-rare diseases. The company’s lead drug Soliris treats patients with rare, life-threatening blood disorders. In addition to growing quickly in its original indication, Soliris was recently approved for patients in a second indication that significantly increases its potential market opportunity.
The two largest underperformers were Nuance Communications, Inc. and Oil States International, Inc. Nuance Communications is a provider of voice and language solutions for businesses and consumers globally. The company’s stock experienced declines this period and we exited our position by period end. Oil States International provides specialty products and services to oil and gas drilling companies. Low gas prices and declining oil prices at the end of the period hampered the company’s stock in May and June. Detractors from performance also included four industrial stocks, which were adversely affected by slowing economic growth and fears of a global recession.
1. June 29, 2012, was the last business day of the Fund’s semiannual period. See Note 1 of the accompanying Notes to Financial Statements. Index returns are calculated through June 30, 2012. December 30, 2011 was the last business day of the Fund’s 2011 fiscal year.
3 | OPPENHEIMER SMALL- & MID-CAP GROWTH FUND/VA
|
FUND PERFORMANCE DISCUSSION
Outlook
The macroeconomic environment is characterized by modest economic growth, very low interest rates and decelerating profit growth. We believe that this is an environment that favors growth companies and are optimistic regarding the Fund’s investment strategy. We seek dynamic companies with above-average and sustainable revenue and earnings growth that we believe are positioned to outperform. This includes leading firms in structurally attractive industries with committed management teams that have proven records of performance.
Investors should consider the Fund’s investment objective, risks, and charges and expenses carefully before investing. The Fund’s prospectus and summary prospectus contain this and other information about the Fund, and may be obtained by asking your financial advisor or calling us at 1.800.988.8287. Read prospectuses and summary prospectuses carefully before investing.
Total returns include changes in share price and reinvestment of dividends and capital gains distributions in a hypothetical investment for the periods shown.
The Fund’s investment strategy and focus can change over time. The mention of specific fund holdings does not constitute a recommendation by OppenheimerFunds, Inc.
Shares of Oppenheimer funds are not deposits or obligations of any bank, are not guaranteed by any bank, are not insured by the FDIC or any other agency, and involve investment risks, including the possible loss of the principal amount invested.
4 | OPPENHEIMER SMALL- & MID-CAP GROWTH FUND/VA
|
FUND EXPENSE
Fund Expenses. As a shareholder of the Fund, you incur two types of costs: (1) transaction costs and (2) ongoing costs, including management fees; distribution and service fees; and other Fund expenses. These examples are intended to help you understand your ongoing costs (in dollars) of investing in the Fund and to compare these costs with the ongoing costs of investing in other mutual funds.
The examples are based on an investment of $1,000.00 invested at the beginning of the period and held for the entire 6-month period ended June 29, 2012.
Actual Expenses. The first section of the table provides information about actual account values and actual expenses. You may use the information in this section for the class of shares you hold, together with the amount you invested, to estimate the expense that you paid over the period. Simply divide your account value by $1,000.00 (for example, an $8,600.00 account value divided by $1,000.00 = 8.60), then multiply the result by the number in the first section under the heading entitled “Expenses Paid During Period” to estimate the expenses you paid on your account during this period.
Hypothetical Example for Comparison Purposes. The second section of the table provides information about hypothetical account values and hypothetical expenses based on the Fund’s actual expense ratio for each class of shares, and an assumed rate of return of 5% per year for each class before expenses, which is not the actual return. The hypothetical account values and expenses may not be used to estimate the actual ending account balance or expenses you paid for the period. You may use this information to compare the ongoing costs of investing in the Fund and other funds. To do so, compare this 5% hypothetical example for the class of shares you hold with the 5% hypothetical examples that appear in the shareholder reports of the other funds.
Please note that the expenses shown in the table are meant to highlight your ongoing costs only and do not reflect any charges associated with the separate accounts that offer this Fund. Therefore, the “hypothetical” lines of the table are useful in comparing ongoing costs only, and will not help you determine the relative total costs of owning different funds. In addition, if these separate account charges were included your costs would have been higher.
| | | | | | | | | | | | |
| Actual | | Beginning
Account
Value
January 1, 2012 | | | Ending
Account
Value
June 29, 2012 | | | Expenses
Paid During
6 Months Ended
June 29, 2012 | |
| Non-Service shares | | $ | 1,000.00 | | | $ | 1,137.70 | | | $ | 4.24 | |
| Service shares | | | 1,000.00 | | | | 1,136.10 | | | | 5.56 | |
| | | |
Hypothetical
(5% return before expenses) | | | | | | | | | |
| Non-Service shares | | | 1,000.00 | | | | 1,020.77 | | | | 4.01 | |
| Service shares | | | 1,000.00 | | | | 1,019.53 | | | | 5.26 | |
Expenses are equal to the Fund’s annualized expense ratio for that class, multiplied by the average account value over the period, multiplied by 181/366 (to reflect the one-half year period). Those annualized expense ratios, excluding indirect expenses from affiliated fund, based on the 6-month period ended June 29, 2012 are as follows:
| | | | |
| Class | | Expense Ratios | |
| Non-Service shares | | | 0.80 | % |
| Service shares | | | 1.05 | |
The expense ratios reflect voluntary waivers and/or reimbursements of expenses by the Fund’s Manager. Some of these undertakings may be modified or terminated at any time, as indicated in the Fund’s prospectus. The “Financial Highlights” tables in the Fund’s financial statements, included in this report, also show the gross expense ratios, without such waivers or reimbursements and reduction to custodian expenses, if applicable.
5 | OPPENHEIMER SMALL- & MID-CAP GROWTH FUND/VA
|
STATEMENT OF INVESTMENTS June 29, 2012* Unaudited
| | | | | | | | |
| | | Shares | | | Value | |
| | | | | | | | | |
| | | | | | | | | |
| Common Stocks—98.3% | | | | | | | | |
| Consumer Discretionary—20.0% | | | | | |
| Hotels, Restaurants & Leisure—5.3% | | | | | | | | |
| Bally Technologies, Inc.1 | | | 132,370 | | | $ | 6,176,384 | |
| Chipotle Mexican Grill, Inc., Cl. A1 | | | 27,741 | | | | 10,540,193 | |
| Dunkin’ Brands Group, Inc. | | | 140,030 | | | | 4,808,630 | |
| Panera Bread Co., Cl. A1 | | | 57,660 | | | | 8,040,110 | |
| Tim Hortons, Inc. | | | 56,560 | | | | 2,977,318 | |
| | | | | | |
|
|
|
| | | | | | | | 32,542,635 | |
| Household Durables—0.6% | | | | | |
| Lennar Corp., Cl. A | | | 104,540 | | | | 3,231,331 | |
| Internet & Catalog Retail—0.5% | | | | | |
| TripAdvisor, Inc.1 | | | 68,210 | | | | 3,048,305 | |
| Multiline Retail—2.9% | | | | | | | | |
| Dollar Tree, Inc.1 | | | 245,590 | | | | 13,212,742 | |
| Nordstrom, Inc. | | | 90,190 | | | | 4,481,541 | |
| | | | | | |
|
|
|
| | | | | | | | 17,694,283 | |
| Specialty Retail—7.9% | | | | | | | | |
| Genesco, Inc.1 | | | 44,010 | | | | 2,647,202 | |
| GNC Holdings, Inc., Cl. A | | | 62,480 | | | | 2,449,216 | |
| O’Reilly Automotive, Inc.1 | | | 61,930 | | | | 5,187,876 | |
| PetSmart, Inc. | | | 108,750 | | | | 7,414,575 | |
| Sally Beauty Holdings, Inc.1 | | | 296,220 | | | | 7,624,703 | |
| Tractor Supply Co. | | | 115,290 | | | | 9,575,987 | |
| Ulta Salon, Cosmetics & Fragrance, Inc. | | | 143,490 | | | | 13,399,096 | |
| | | | | | |
|
|
|
| | | | | | | | 48,298,655 | |
| Textiles, Apparel & Luxury Goods—2.8% | |
| lululemon athletica, Inc.1 | | | 73,180 | | | | 4,363,723 | |
| Michael Kors Holdings Ltd.1 | | | 156,950 | | | | 6,566,788 | |
| Under Armour, Inc., Cl. A1 | | | 65,650 | | | | 6,202,612 | |
| | | | | | |
|
|
|
| | | | | | | | 17,133,123 | |
| Consumer Staples—5.9% | | | | | | | | |
| Beverages—1.9% | | | | | | | | |
| Monster Beverage Corp.1 | | | 161,690 | | | | 11,512,328 | |
| Food & Staples Retailing—2.9% | | | | | |
| Fresh Market, Inc. (The)1 | | | 112,880 | | | | 6,053,754 | |
| Whole Foods Market, Inc. | | | 119,990 | | | | 11,437,447 | |
| | | | | | |
|
|
|
| | | | | | | | 17,491,201 | |
| Personal Products—1.1% | | | | | | | | |
| Estee Lauder Cos., Inc. (The), Cl. A | | | 130,860 | | | | 7,082,143 | |
| Energy—5.9% | | | | | | | | |
| Energy Equipment & Services—3.5% | | | | | | | | |
| Atwood Oceanics, Inc.1 | | | 122,510 | | | | 4,635,778 | |
| Core Laboratories NV | | | 41,640 | | | | 4,826,076 | |
| Oceaneering International, Inc. | | | 115,310 | | | | 5,518,737 | |
| | | | | | | | |
| | | Shares | | | Value | |
| | | | | | | | | |
| Energy Equipment & Services Continued | |
| Oil States International, Inc.1 | | | 99,440 | | | $ | 6,582,928 | |
| | | | | | |
|
|
|
| | | | | | | | 21,563,519 | |
| Oil, Gas & Consumable Fuels—2.4% | | | | | | | | |
| Cabot Oil & Gas Corp., Cl. A | | | 91,220 | | | | 3,594,068 | |
| Concho Resources, Inc.1 | | | 100,430 | | | | 8,548,602 | |
| Laredo Petroleum Holdings, Inc.1 | | | 120,960 | | | | 2,515,968 | |
| | | | | | |
|
|
|
| | | | | | | | 14,658,638 | |
| Financials—6.2% | | | | | | | | |
| Capital Markets—1.5% | | | | | | | | |
| Affiliated Managers Group, Inc.1 | | | 50,160 | | | | 5,490,012 | |
| LPL Financial Holdings, Inc. | | | 106,840 | | | | 3,607,987 | |
| | | | | | |
|
|
|
| | | | | | | | 9,097,999 | |
| Commercial Banks—1.7% | | | | | | | | |
| First Republic Bank1 | | | 99,560 | | | | 3,345,216 | |
| Signature Bank1 | | | 75,060 | | | | 4,576,408 | |
| SVB Financial Group1 | | | 47,940 | | | | 2,815,037 | |
| | | | | | |
|
|
|
| | | | | | | | 10,736,661 | |
| Insurance—2.2% | | | | | | | | |
| Arthur J. Gallagher & Co. | | | 171,690 | | | | 6,021,168 | |
| ProAssurance Corp. | | | 83,240 | | | | 7,415,852 | |
| | | | | | |
|
|
|
| | | | | | | | 13,437,020 | |
| Real Estate Investment Trusts—0.8% | | | | | | | | |
| Digital Realty Trust, Inc. | | | 63,640 | | | | 4,777,455 | |
| Health Care—16.4% | | | | | | | | |
| Biotechnology—3.5% | | | | | | | | |
| Alexion Pharmaceuticals, Inc.1 | | | 132,510 | | | | 13,158,243 | |
| Incyte Corp.1 | | | 132,670 | | | | 3,011,609 | |
| Medivation, Inc.1 | | | 34,400 | | | | 3,144,160 | |
| Onyx Pharmaceuticals, Inc.1 | | | 33,980 | | | | 2,257,971 | |
| | | | | | |
|
|
|
| | | | | | | | 21,571,983 | |
| Health Care Equipment & Supplies—3.8% | | | | | |
| Cooper Cos., Inc. (The) | | | 92,760 | | | | 7,398,538 | |
| Edwards Lifesciences Corp.1 | | | 57,420 | | | | 5,931,486 | |
| IDEXX Laboratories, Inc.1 | | | 56,020 | | | | 5,385,203 | |
| Sirona Dental Systems, Inc.1 | | | 98,340 | | | | 4,426,283 | |
| | | | | | |
|
|
|
| | | | | | | | 23,141,510 | |
Health Care Providers &
Services—3.0% | | | | | |
| Catalyst Health Solutions, Inc.1 | | | 89,900 | | | | 8,400,256 | |
| DaVita, Inc.1 | | | 36,180 | | | | 3,553,238 | |
| HMS Holdings Corp.1 | | | 179,370 | | | | 5,974,815 | |
| | | | | | |
|
|
|
| | | | | | | | 17,928,309 | |
6 | OPPENHEIMER SMALL- & MID-CAP GROWTH FUND/VA
|
| | | | | | | | |
| | | Shares | | | Value | |
| | | | | | | | | |
| Health Care Technology—2.9% | | | | | |
| Cerner Corp.1 | | | 123,760 | | | $ | 10,230,002 | |
| SXC Health Solutions Corp.1 | | | 74,950 | | | | 7,435,790 | |
| | | | | | |
|
|
|
| | | | | | | | 17,665,792 | |
| Pharmaceuticals—3.2% | | | | | | | | |
| Perrigo Co. | | | 61,520 | | | | 7,255,054 | |
| Salix Pharmaceuticals Ltd.1 | | | 117,750 | | | | 6,410,310 | |
| Watson Pharmaceuticals, Inc.1 | | | 79,960 | | | | 5,916,240 | |
| | | | | | |
|
|
|
| | | | | | | | 19,581,604 | |
| Industrials—14.9% | | | | | | | | |
| Aerospace & Defense—4.6% | | | | | |
| B/E Aerospace, Inc.1 | | | 175,500 | | | | 7,662,330 | |
| Hexcel Corp.1 | | | 288,330 | | | | 7,436,031 | |
| TransDigm Group, Inc.1 | | | 94,160 | | | | 12,645,688 | |
| | | | | | |
|
|
|
| | | | | | | | 27,744,049 | |
| Building Products—0.5% | | | | | | | | |
| Fortune Brands Home & Security, Inc.1 | | | 134,380 | | | | 2,992,643 | |
| Commercial Services & Supplies—1.3% | |
| Clean Harbors, Inc.1 | | | 68,710 | | | | 3,876,618 | |
| Stericycle, Inc.1 | | | 45,320 | | | | 4,154,484 | |
| | | | | | |
|
|
|
| | | | | | | | 8,031,102 | |
| Electrical Equipment—3.0% | | | | | |
| AMETEK, Inc. | | | 180,095 | | | | 8,988,541 | |
| Polypore International, Inc.1 | | | 75,880 | | | | 3,064,793 | |
| Roper Industries, Inc. | | | 64,530 | | | | 6,361,367 | |
| | | | | | |
|
|
|
| | | | | | | | 18,414,701 | |
| Machinery—2.2% | | | | | | | | |
| Timken Co. | | | 115,400 | | | | 5,284,166 | |
| Wabtec Corp. | | | 102,770 | | | | 8,017,088 | |
| | | | | | |
|
|
|
| | | | | | | | 13,301,254 | |
| Professional Services—0.8% | | | | | |
| IHS, Inc., Cl. A1 | | | 45,810 | | | | 4,935,111 | |
| Road & Rail—1.3% | | | | | | | | |
| Kansas City Southern, Inc. | | | 112,950 | | | | 7,856,802 | |
| Trading Companies & Distributors—1.2% | |
| Fastenal Co. | | | 63,610 | | | | 2,564,119 | |
| United Rentals, Inc.1 | | | 144,450 | | | | 4,917,078 | |
| | | | | | |
|
|
|
| | | | | | | | 7,481,197 | |
| Information Technology—22.8% | | | | | |
| Communications Equipment—0.8% | | | | | | | | |
| F5 Networks, Inc.1 | | | 47,380 | | | | 4,717,153 | |
| Internet Software��& Services—5.5% | | | | | | | | |
| Akamai Technologies, Inc.1 | | | 127,570 | | | | 4,050,348 | |
| Equinix, Inc.1 | | | 56,080 | | | | 9,850,452 | |
| IAC/InterActiveCorp | | | 96,550 | | | | 4,402,680 | |
| | | | | | | | |
| | | Shares | | | Value | |
| | | | | | | | | |
| Internet Software & Services Continued | |
| LinkedIn Corp., Cl. A1 | | | 65,470 | | | $ | 6,957,497 | |
| Mercadolibre, Inc. | | | 34,840 | | | | 2,640,872 | |
| Rackspace Hosting, Inc.1 | | | 126,930 | | | | 5,577,304 | |
| | | | | | |
|
|
|
| | | | | | | | 33,479,153 | |
| IT Services—3.1% | | | | | | | | |
| Alliance Data Systems Corp.1 | | | 37,570 | | | | 5,071,950 | |
| Teradata Corp.1 | | | 135,780 | | | | 9,777,518 | |
| Vantiv, Inc., Cl. A1 | | | 173,360 | | | | 4,037,554 | |
| | | | | | |
|
|
|
| | | | | | | | 18,887,022 | |
| Semiconductors & Semiconductor Equipment—2.8% | |
| Avago Technologies Ltd. | | | 132,640 | | | | 4,761,776 | |
| Mellanox Technologies Ltd.1 | | | 51,640 | | | | 3,658,178 | |
| Skyworks Solutions, Inc.1 | | | 202,030 | | | | 5,529,561 | |
| Teradyne, Inc.1 | | | 223,040 | | | | 3,135,942 | |
| | | | | | |
|
|
|
| | | | | | | | 17,085,457 | |
| Software—10.6% | | | | | | | | |
| Ariba, Inc.1 | | | 136,840 | | | | 6,124,958 | |
| Citrix Systems, Inc.1 | | | 93,560 | | | | 7,853,426 | |
| Commvault Systems, Inc.1 | | | 68,670 | | | | 3,403,972 | |
| Concur Technologies, Inc.1 | | | 128,248 | | | | 8,733,689 | |
| Fortinet, Inc.1 | | | 289,170 | | | | 6,714,527 | |
| MICROS Systems, Inc.1 | | | 61,530 | | | | 3,150,336 | |
| NetSuite, Inc.1 | | | 100,252 | | | | 5,490,802 | |
| Red Hat, Inc.1 | | | 130,150 | | | | 7,350,872 | |
| ServiceNow, Inc.1 | | | 124,922 | | | | 3,073,081 | |
| Solarwinds, Inc.1 | | | 132,120 | | | | 5,755,147 | |
| TIBCO Software, Inc.1 | | | 246,930 | | | | 7,388,146 | |
| | | | | | |
|
|
|
| | | | | | | | 65,038,956 | |
| Materials—4.5% | | | | | | | | |
| Chemicals—3.9% | | | | | | | | |
| Airgas, Inc. | | | 76,190 | | | | 6,400,722 | |
| Albemarle Corp. | | | 58,140 | | | | 3,467,470 | |
| CF Industries Holdings, Inc. | | | 34,140 | | | | 6,614,284 | |
| Cytec Industries, Inc. | | | 25,030 | | | | 1,467,759 | |
| Sigma-Aldrich Corp. | | | 43,990 | | | | 3,252,181 | |
| Westlake Chemical Corp. | | | 48,680 | | | | 2,544,017 | |
| | | | | | |
|
|
|
| | | | | | | | 23,746,433 | |
| Containers & Packaging—0.6% | | | | | |
| Ball Corp. | | | 98,130 | | | | 4,028,237 | |
| Telecommunication Services—1.2% | | | | | | | | |
| Wireless Telecommunication Services—1.2% | | | | | |
| SBA Communications Corp.1 | | | 129,300 | | | | 7,376,565 | |
7 | OPPENHEIMER SMALL- & MID-CAP GROWTH FUND/VA
|
STATEMENT OF INVESTMENTS Unaudited / Continued
| | | | | | | | |
| | | Shares | | | Value | |
| | | | | | | | | |
| Utilities—0.5% | | | | | | | | |
| Electric Utilities—0.5% | | | | | | | | |
| ITC Holdings Corp. | | | 44,910 | | | $ | 3,094,748 | |
| | | | | | |
|
|
|
| Total Common Stocks (Cost $416,677,490) | | | | | | | 600,405,077 | |
| | | | | | | | |
| | | Shares | | | Value | |
| | | | | | | | | |
| Investment Company—2.2% | | | | | |
| Oppenheimer Institutional Money Market Fund, Cl. E, 0.20%2,3 | | | | | | | | |
| (Cost $13,045,599) | | | 13,045,599 | | | $ | 13,045,599 | |
Total Investments, at Value
(Cost $429,723,089) | | | 100.5 | % | | | 613,450,676 | |
| Liabilities in Excess of Other Assets | | | (0.5 | ) | | | (2,788,924 | ) |
| Net Assets | |
| 100.0
| %
| | $
| 610,661,752
|
|
Footnotes to Statement of Investments
* June 29, 2012 represents the last business day of the Fund’s 2012 semiannual period. See Note 1 of accompanying Notes.
1. Non-income producing security.
2. Is or was an affiliate, as defined in the Investment Company Act of 1940, at or during the period ended June 29, 2012, by virtue of the Fund owning at least 5% of the voting securities of the issuer or as a result of the Fund and the issuer having the same investment adviser. Transactions during the period in which the issuer was an affiliate are as follows:
| | | | | | | | | | | | | | | | |
| | | Shares
December 30, 2011a | | | Gross
Additions | | | Gross
Reductions | | | Shares
June 29, 2012 | |
| Oppenheimer Institutional Money Market Fund, Cl. E | | | 14,138,260 | | | | 104,025,768 | | | | 105,118,429 | | | | 13,045,599 | |
| | | | |
| | | | | | | | | Value | | | Income | |
| Oppenheimer Institutional Money Market Fund, Cl. E | | | | | | | | | | | $13,045,599 | | | | $6,095 | |
a. December 30, 2011 represents the last business day of the Fund’s 2011 fiscal year. See Note 1 of the accompanying Notes.
3. Rate shown is the 7-day yield as of June 29, 2012.
See accompanying Notes to Financial Statements.
8 | OPPENHEIMER SMALL- & MID-CAP GROWTH FUND/VA
|
STATEMENT OF ASSETS AND LIABILITIES Unaudited
| | | | |
| June 29, 20121 | | | |
| Assets | | | |
| Investments, at value—see accompanying statement of investments: | | | | |
| Unaffiliated companies (cost $416,677,490) | | $ | 600,405,077 | |
| Affiliated companies (cost $13,045,599) | |
| 13,045,599
|
|
| | | | 613,450,676 | |
| Cash | | | 7,432 | |
| Receivables and other assets: | | | | |
| Investments sold | | | 1,950,181 | |
| Shares of beneficial interest sold | | | 332,145 | |
| Dividends | | | 134,892 | |
| Other | |
| 32,873
|
|
| Total assets | | | 615,908,199 | |
| Liabilities | | | |
| Payables and other liabilities: | | | | |
| Investments purchased | | | 4,895,830 | |
| Shares of beneficial interest redeemed | | | 224,954 | |
| Transfer and shareholder servicing agent fees | | | 48,903 | |
| Shareholder communications | | | 32,742 | |
| Trustees’ compensation | | | 25,397 | |
| Distribution and service plan fees | | | 6,863 | |
| Other | |
| 11,758
|
|
| Total liabilities | | | 5,246,447 | |
| Net Assets | | $
| 610,661,752
|
|
| Composition of Net Assets | | | |
| Par value of shares of beneficial interest | | $ | 11,426 | |
| Additional paid-in capital | | | 633,238,478 | |
| Accumulated net investment loss | | | (1,093,327 | ) |
| Accumulated net realized loss on investments | | | (205,222,412 | ) |
| Net unrealized appreciation on investments | |
| 183,727,587
|
|
| Net Assets | | $
| 610,661,752
|
|
| Net Asset Value Per Share | | | |
| Non-Service Shares: | | | | |
Net asset value, redemption price per share and offering price per share (based on net assets of $573,126,023
and 10,705,631 shares of beneficial interest outstanding) | | | $53.54 | |
| Service Shares: | | | | |
Net asset value, redemption price per share and offering price per share (based on net assets of $37,535,729
and 720,723 shares of beneficial interest outstanding) | | | $52.08 | |
1. June 29, 2012 represents the last business day of the Fund’s 2012 semiannual period. See Note 1 of the accompanying Notes
See accompanying Notes to Financial Statements.
9 | OPPENHEIMER SMALL- & MID-CAP GROWTH FUND/VA
|
STATEMENT OF OPERATIONS Unaudited
| | | | |
| For the Six Months Ended June 29, 20121 | | | |
| Investment Income | | | |
| Dividends: | | | | |
| Unaffiliated companies (net of foreign withholding taxes of $7,620) | | $ | 1,446,175 | |
| Affiliated companies | | | 6,095 | |
| Interest | |
| 256
|
|
| Total investment income | | | 1,452,526 | |
| Expenses | | | |
| Management fees | | | 2,220,457 | |
| Distribution and service plan fees—Service shares | | | 47,244 | |
| Transfer and shareholder servicing agent fees: | | | | |
| Non-Service shares | | | 290,456 | |
| Service shares | | | 18,897 | |
| Shareholder communications: | | | | |
| Non-Service shares | | | 8,057 | |
| Service shares | | | 526 | |
| Trustees’ compensation | | | 17,171 | |
| Custodian fees and expenses | | | 1,686 | |
| Administration service fees | | | 750 | |
| Other | |
| 28,069
|
|
| Total expenses | | | 2,633,313 | |
| Less waivers and reimbursements of expenses | |
| (110,514
| )
|
| Net expenses | | | 2,522,799 | |
| Net Investment Loss | | | (1,070,273 | ) |
| Realized and Unrealized Gain | | | |
| Net realized gain on investments from unaffiliated companies | | | 20,134,093 | |
| Net change in unrealized appreciation/depreciation on investments | | | 60,123,428 | |
| | |
| Net Increase in Net Assets Resulting from Operations | | $
| 79,187,248
|
|
1. June 29, 2012 represents the last business day of the Fund’s 2012 semiannual period. See Note 1 of the accompanying Notes.
See accompanying Notes to Financial Statements.
10 | OPPENHEIMER SMALL- & MID-CAP GROWTH FUND/VA
|
STATEMENTS OF CHANGES IN NET ASSETS
| | | | | | | | |
| | | Six Months
Ended
June 29, 20121
(Unaudited) | | | Year
Ended
December 30,
20111 | |
| Operations | | | | | | |
| Net investment loss | | $ | (1,070,273 | ) | | $ | (3,504,153 | ) |
| Net realized gain | | | 20,134,093 | | | | 77,531,562 | |
| Net change in unrealized appreciation/depreciation | |
| 60,123,428
|
| |
| (62,965,525
| )
|
| Net increase in net assets resulting from operations | | | 79,187,248 | | | | 11,061,884 | |
| Beneficial Interest Transactions | | | | | | |
| Net increase (decrease) in net assets resulting from beneficial interest transactions: | | | | | | | | |
| Non-Service shares | | | (44,277,733 | ) | | | (80,390,137 | ) |
| Service shares | |
| (3,040,340
| )
| |
| 3,579,422
|
|
| | | | (47,318,073 | ) | | | (76,810,715 | ) |
| Net Assets | | | | | | |
| Total increase (decrease) | | | 31,869,175 | | | | (65,748,831 | ) |
| Beginning of period | |
| 578,792,577
|
| |
| 644,541,408
|
|
| End of period (including accumulated net investment loss of $1,093,327 and $23,054, respectively) | | $
| 610,661,752
|
| | $
| 578,792,577
|
|
1. June 29, 2012 and December 30, 2011 represents the last business days of the Fund’s respective reporting periods. See Note 1 of the accompanying Notes.
See accompanying Notes to Financial Statements.
11 | OPPENHEIMER SMALL- & MID-CAP GROWTH FUND/VA
|
FINANCIAL HIGHLIGHTS
| | | | | | | | | | | | | | | | | | | | | | | | |
| | | Six Months
Ended
June 29, 20121 | | | Year Ended
December 30, | | | Year Ended December 31, | |
| Non-Service Shares | | (Unaudited) | | | 20111 | | | 2010 | | | 2009 | | | 2008 | | | 2007 | |
| | | | | | | | | | | | | | | | | | | | | | | | | |
| Per Share Operating Data | | | | | | | | | | | | | | | | | | |
| Net asset value, beginning of period | | | $47.06 | | | | $46.55 | | | | $36.52 | | | | $27.54 | | | | $54.07 | | | | $50.85 | |
| Income (loss) from investment operations: | | | | | | | | | | | | | | | | | | | | | | | | |
| Net investment loss2 | | | (.09 | ) | | | (.26 | ) | | | (.11 | ) | | | (.05 | ) | | | (.13 | ) | | | (.02 | ) |
| Net realized and unrealized gain (loss) | |
| 6.57
|
| |
| .77
|
| |
| 10.14
|
| |
| 9.03
|
| |
| (26.40
| )
| |
| 3.24
|
|
| Total from investment operations | | | 6.48 | | | | .51 | | | | 10.03 | | | | 8.98 | | | | (26.53 | ) | | | 3.22 | |
| Net asset value, end of period | |
| $53.54
|
| |
| $47.06
|
| |
| $46.55
|
| |
| $36.52
|
| |
| $27.54
|
| |
| $54.07
|
|
| Total Return, at Net Asset Value3 | | 13.77% | | | 1.09% | | | 27.46% | | | 32.61% | | | (49.07)% | | | 6.33% | |
| | | | | | | | | | | | | | | | | | | | | | | | | |
| Ratios/Supplemental Data | | | | | | | | | | | | | | | | | | |
| Net assets, end of period (in thousands) | | | $573,126 | | | | $543,020 | | | | $611,872 | | | | $547,683 | | | | $461,684 | | | | $1,002,442 | |
| Average net assets (in thousands) | | | $584,275 | | | | $605,083 | | | | $548,739 | | | | $478,968 | | | | $754,170 | | | | $1,045,592 | |
| Ratios to average net assets:4 | | | | | | | | | | | | | | | | | | | | | | | | |
| Net investment loss | | | (0.33 | )% | | | (0.53 | )% | | | (0.29 | )% | | | (0.17 | )% | | | (0.30 | )% | | | (0.04 | )% |
| Total expenses5 | | | 0.84 | % | | | 0.84 | % | | | 0.85 | % | | | 0.86 | % | | | 0.71 | % | | | 0.69 | % |
| Expenses after payments, waivers and/or reimbursements and reduction to custodian expenses | | | 0.80 | % | | | 0.80 | % | | | 0.76 | % | | | 0.71 | % | | | 0.68 | % | | | 0.69 | % |
| Portfolio turnover rate | | | 34 | % | | | 91 | % | | | 95 | % | | | 102 | % | | | 78 | % | | | 112 | % |
1. June 29, 2012 and December 30, 2011 represent the last business days of the Fund’s respective reporting periods. See Note 1 of the accompanying Notes.
2. Per share amounts calculated based on the average shares outstanding during the period.
3. Assumes an initial investment on the business day before the first day of the fiscal period, with all dividends and distributions reinvested in additional shares on the reinvestment date, and redemption at the net asset value calculated on the last business day of the fiscal period. Total returns are not annualized for periods less than one full year. Total return information does not reflect expenses that apply at the separate account level or to related insurance products. Inclusion of these charges would reduce the total return figures for all periods shown. Returns do not reflect the deduction of taxes that a shareholder would pay on fund distributions or the redemption of fund shares.
4. Annualized for periods less than one full year.
5. Total expenses including indirect expenses from affiliated fund were as follows:
| | | | |
| Six Months Ended June 29, 2012 | | | 0.84 | % |
| Year Ended December 30, 2011 | | | 0.84 | % |
| Year Ended December 31, 2010 | | | 0.85 | % |
| Year Ended December 31, 2009 | | | 0.86 | % |
| Year Ended December 31, 2008 | | | 0.71 | % |
| Year Ended December 31, 2007 | | | 0.69 | % |
See accompanying Notes to Financial Statements.
12 | OPPENHEIMER SMALL- & MID-CAP GROWTH FUND/VA
|
| | | | | | | | | | | | | | | | | | | | | | | | |
| | | Six Months
Ended
June 29, 20121 | | | Year Ended
December 30, | | | Year Ended December 31, | |
| Service Shares | | (Unaudited) | | | 20111 | | | 2010 | | | 2009 | | | 2008 | | | 2007 | |
| | | | | | | | | | | | | | | | | | | | | | | | | |
| Per Share Operating Data | | | | | | | | | | | | | | | | | | |
| Net asset value, beginning of period | | | $45.84 | | | | $45.46 | | | | $35.75 | | | | $27.03 | | | | $53.22 | | | | $50.19 | |
| Income (loss) from investment operations: | | | | | | | | | | | | | | | | | | | | | | | | |
| Net investment loss2 | | | (.15 | ) | | | (.37 | ) | | | (.20 | ) | | | (.13 | ) | | | (.24 | ) | | | (.17 | ) |
| Net realized and unrealized gain (loss) | |
| 6.39
|
| |
| .75
|
| |
| 9.91
|
| |
| 8.85
|
| |
| (25.95
| )
| |
| 3.20
|
|
| Total from investment operations | | | 6.24 | | | | .38 | | | | 9.71 | | | | 8.72 | | | | (26.19 | ) | | | 3.03 | |
| Net asset value, end of period | |
| $52.08
|
| |
| $45.84
|
| |
| $45.46
|
| |
| $35.75
|
| |
| $27.03
|
| |
| $53.22
|
|
| Total Return, at Net Asset Value3 | | 13.61% | | | 0.83% | | | 27.16% | | | 32.26% | | | (49.21)% | | | 6.04% | |
| | | | | | | | | | | | | | | | | | | | | | | | | |
| Ratios/Supplemental Data | | | | | | | | | | | | | | | | | | |
| Net assets, end of period (in thousands) | | | $37,536 | | | | $35,773 | | | | $32,669 | | | | $26,098 | | | | $21,952 | | | | $47,270 | |
| Average net assets (in thousands) | | | $38,013 | | | | $37,775 | | | | $27,552 | | | | $22,605 | | | | $35,815 | | | | $49,421 | |
| Ratios to average net assets:4 | | | | | | | | | | | | | | | | | | | | | | | | |
| Net investment loss | | | (0.58 | )% | | | (0.78 | )% | | | (0.53 | )% | | | (0.44 | )% | | | (0.57 | )% | | | (0.31 | )% |
| Total expenses5 | | | 1.09 | % | | | 1.09 | % | | | 1.10 | % | | | 1.12 | % | | | 0.98 | % | | | 0.96 | % |
Expenses after payments, waivers and/or
reimbursements and reduction to custodian expenses | | | 1.05 | % | | | 1.05 | % | | | 1.01 | % | | | 0.97 | % | | | 0.95 | % | | | 0.96 | % |
| Portfolio turnover rate | | | 34 | % | | | 91 | % | | | 95 | % | | | 102 | % | | | 78 | % | | | 112 | % |
1. June 29, 2012 and December 30, 2011 represent the last business days of the Fund’s respective reporting periods. See Note 1 of the accompanying Notes.
2. Per share amounts calculated based on the average shares outstanding during the period.
3. Assumes an initial investment on the business day before the first day of the fiscal period, with all dividends and distributions reinvested in additional shares on the reinvestment date, and redemption at the net asset value calculated on the last business day of the fiscal period. Total returns are not annualized for periods less than one full year. Total return information does not reflect expenses that apply at the separate account level or to related insurance products. Inclusion of these charges would reduce the total return figures for all periods shown. Returns do not reflect the deduction of taxes that a shareholder would pay on fund distributions or the redemption of fund shares.
4. Annualized for periods less than one full year.
5. Total expenses including indirect expenses from affiliated fund were as follows:
| | | | |
| Six Months Ended June 29, 2012 | | | 1.09 | % |
| Year Ended December 30, 2011 | | | 1.09 | % |
| Year Ended December 31, 2010 | | | 1.10 | % |
| Year Ended December 31, 2009 | | | 1.12 | % |
| Year Ended December 31, 2008 | | | 0.98 | % |
| Year Ended December 31, 2007 | | | 0.96 | % |
See accompanying Notes to Financial Statements.
13 | OPPENHEIMER SMALL- & MID-CAP GROWTH FUND/VA
|
NOTES TO FINANCIAL STATEMENTS Unaudited
1. Significant Accounting Policies
Oppenheimer Small- & Mid-Cap Growth Fund/VA (the “Fund”) is a separate series of Oppenheimer Variable Account Funds, an open-end management investment company registered under the Investment Company Act of 1940, as amended. The Fund’s investment objective is to seek capital appreciation by investing in “growth type” companies. The Fund’s investment adviser is OppenheimerFunds, Inc. (the “Manager”).
The Fund offers two classes of shares. Both classes are sold at their offering price, which is the net asset value per share, to separate investment accounts of participating insurance companies as an underlying investment for variable life insurance policies, variable annuity contracts or other investment products. The class of shares designated as Service shares is subject to a distribution and service plan. Both classes of shares have identical rights and voting privileges with respect to the Fund in general and exclusive voting rights on matters that affect that class alone. Earnings, net assets and net asset value per share may differ due to each class having its own expenses, such as transfer and shareholder servicing agent fees and shareholder communications, directly attributable to that class.
The following is a summary of significant accounting policies consistently followed by the Fund.
Semiannual and Annual Periods. The last day of the Fund’s semiannual period was the last day the New York Stock Exchange was open for trading. The Fund’s financial statements have been presented through that date to maintain consistency with the Fund’s net asset value calculations used for shareholder transactions.
The last day of the Fund’s fiscal year was the last day the New York Stock Exchange was open for trading. The Fund’s financial statements have been presented through that date to maintain consistency with the Fund’s net asset value calculations used for shareholder transactions.
Investment in Oppenheimer Institutional Money Market Fund. The Fund is permitted to invest daily available cash balances in an affiliated money market fund. The Fund may invest the available cash in Class E shares of Oppenheimer Institutional Money Market Fund (“IMMF”) to seek current income while preserving liquidity. IMMF is a registered open-end management investment company, regulated as a money market fund under the Investment Company Act of 1940, as amended. The Manager is also the investment adviser of IMMF. When applicable, the Fund’s investment in IMMF is included in the Statement of Investments. Shares of IMMF are valued at their net asset value per share. As a shareholder, the Fund is subject to its proportional share of IMMF’s Class E expenses, including its management fee. The Manager will waive fees and/or reimburse Fund expenses in an amount equal to the indirect management fees incurred through the Fund’s investment in IMMF.
Allocation of Income, Expenses, Gains and Losses. Income, expenses (other than those attributable to a specific class), gains and losses are allocated on a daily basis to each class of shares based upon the relative proportion of net assets represented by such class. Operating expenses directly attributable to a specific class are charged against the operations of that class.
Federal Taxes. The Fund intends to comply with provisions of the Internal Revenue Code applicable to regulated investment companies and to distribute substantially all of its investment company taxable income, including any net realized gain on investments not offset by capital loss carryforwards, if any, to shareholders. Therefore, no federal income or excise tax provision is required. The Fund files income tax returns in U.S. federal and applicable state jurisdictions. The statute of limitations on the Fund’s tax return filings generally remain open for the three preceding fiscal reporting period ends.
During the fiscal year ended December 30, 2011, the Fund utilized $83,964,525 of capital loss carryforward to offset capital gains realized in that fiscal year. The Fund had post-October losses of $7,541,352. Details of the fiscal year ended December 30, 2011 capital loss carryforwards are included in the table below. Capital loss carryforwards with no
14 | OPPENHEIMER SMALL- & MID-CAP GROWTH FUND/VA
|
expiration, if any, must be utilized prior to those with expiration dates. Capital losses with no expiration will be carried forward to future years if not offset by gains.
| | | | |
| Expiring | | | |
| 2017 | | $ | 217,070,467 | |
| No expiration | | | 7,541,352 | |
| | |
|
|
|
| Total | | $ | 224,611,819 | |
| | |
|
|
|
As of June 29, 2012, it is estimated that the capital loss carryforwards would be $204,477,726 expiring by 2017. The estimated capital loss carryforward represents the carryforward as of the end of the last fiscal year, increased or decreased by capital losses or gains realized in the first six months of the current fiscal year. During the six months ended June 29, 2012, it is estimated that the Fund will utilize $20,134,093 of capital loss carryforward to offset realized capital gains.
Net investment income (loss) and net realized gain (loss) may differ for financial statement and tax purposes. The character of dividends and distributions made during the fiscal year from net investment income or net realized gains may differ from their ultimate characterization for federal income tax purposes. Also, due to timing of dividends and distributions, the fiscal year in which amounts are distributed may differ from the fiscal year in which the income or net realized gain was recorded by the Fund.
The aggregate cost of securities and other investments and the composition of unrealized appreciation and depreciation of securities and other investments for federal income tax purposes as of June 29, 2012 are noted in the following table. The primary difference between book and tax appreciation or depreciation of securities and other investments, if applicable, is attributable to the tax deferral of losses or tax realization of financial statement unrealized gain or loss.
| | | | |
| Federal tax cost of securities | | $ | 430,737,442 | |
| | |
|
|
|
| Gross unrealized appreciation | | $ | 190,468,585 | |
| Gross unrealized depreciation | | | (7,755,351) | |
| | |
|
|
|
| Net unrealized appreciation | | $ | 182,713,234 | |
| | |
|
|
|
Trustees’ Compensation. The Board of Trustees has adopted a compensation deferral plan for independent trustees that enables trustees to elect to defer receipt of all or a portion of the annual compensation they are entitled to receive from the Fund. For purposes of determining the amount owed to the Trustee under the plan, deferred amounts are treated as though equal dollar amounts had been invested in shares of the Fund or in other Oppenheimer funds selected by the Trustee. The Fund purchases shares of the funds selected for deferral by the Trustee in amounts equal to his or her deemed investment, resulting in a Fund asset equal to the deferred compensation liability. Such assets are included as a component of “Other” within the asset section of the Statement of Assets and Liabilities. Deferral of trustees’ fees under the plan will not affect the net assets of the Fund, and will not materially affect the Fund’s assets, liabilities or net investment income per share. Amounts will be deferred until distributed in accordance with the compensation deferral plan.
Dividends and Distributions to Shareholders. Dividends and distributions to shareholders, which are determined in accordance with income tax regulations and may differ from U.S. generally accepted accounting principles, are recorded on the ex-dividend date. Income and capital gain distributions, if any, are declared and paid annually or at other times as deemed necessary by the Manager. The tax character of distributions is determined as of the Fund’s fiscal year end. Therefore, a portion of the Fund’s distributions made to shareholders prior to the Fund’s fiscal year end may ultimately be categorized as a tax return of capital.
Investment Income. Dividend income is recorded on the ex-dividend date or upon ex-dividend notification in the case of certain foreign dividends where the ex-dividend date may have passed. Non-cash dividends included in dividend
15 | OPPENHEIMER SMALL- & MID-CAP GROWTH FUND/VA
|
NOTES TO FINANCIAL STATEMENTS Unaudited / Continued
1. Significant Accounting Policies Continued
income, if any, are recorded at the fair market value of the securities received. Interest income is recognized on an accrual basis. Discount and premium, which are included in interest income on the Statement of Operations, are amortized or accreted daily.
Custodian Fees. “Custodian fees and expenses” in the Statement of Operations may include interest expense incurred by the Fund on any cash overdrafts of its custodian account during the period. Such cash overdrafts may result from the effects of failed trades in portfolio securities and from cash outflows resulting from unanticipated shareholder redemption activity. The Fund pays interest to its custodian on such cash overdrafts, to the extent they are not offset by positive cash balances maintained by the Fund, at a rate equal to the Federal Funds Rate plus 0.50%. The “Reduction to custodian expenses” line item, if applicable, represents earnings on cash balances maintained by the Fund during the period. Such interest expense and other custodian fees may be paid with these earnings.
Security Transactions. Security transactions are recorded on the trade date. Realized gains and losses on securities sold are determined on the basis of identified cost.
Indemnifications. The Fund’s organizational documents provide current and former trustees and officers with a limited indemnification against liabilities arising in connection with the performance of their duties to the Fund. In the normal course of business, the Fund may also enter into contracts that provide general indemnifications. The Fund’s maximum exposure under these arrangements is unknown as this would be dependent on future claims that may be made against the Fund. The risk of material loss from such claims is considered remote.
Other. The preparation of financial statements in conformity with accounting principles generally accepted in the United States of America requires management to make estimates and assumptions that affect the reported amounts of assets and liabilities and disclosure of contingent assets and liabilities at the date of the financial statements and the reported amounts of increases and decreases in net assets from operations during the reporting period. Actual results could differ from those estimates.
2. Securities Valuation
The Fund calculates the net asset value of its shares as of the close of the New York Stock Exchange (the “Exchange”), normally 4:00 P.M. Eastern time, on each day the Exchange is open for trading.
The Fund’s Board has adopted procedures for the valuation of the Fund’s securities and has delegated the day-to-day responsibility for valuation determinations under those procedures to the Manager. The Manager has established a Valuation Committee which is responsible for determining a “fair valuation” for any security for which market quotations are not “readily available.” The Valuation Committee’s fair valuation determinations are subject to review, approval and ratification by the Fund’s Board at its next regularly scheduled meeting covering the calendar quarter in which the fair valuation was determined.
Valuation Methods and Inputs
Securities are valued using unadjusted quoted market prices, when available, as supplied primarily by third party pricing services or dealers.
The following methodologies are used to determine the market value or the fair value of the types of securities described below:
Securities traded on a registered U.S. securities exchange (including exchange-traded derivatives other than futures and futures options) are valued based on the last sale price of the security reported on the principal exchange on which it is traded, prior to the time when the Fund’s assets are valued. In the absence of a sale, the security is valued at the last sale price on the prior trading day, if it is within the spread of the current day’s closing “bid” and “asked” prices, and if
16 | OPPENHEIMER SMALL- & MID-CAP GROWTH FUND/VA
|
not, at the current day’s closing bid price. A security of a foreign issuer traded on a foreign exchange but not listed on a registered U.S. securities exchange is valued based on the last sale price on the principal exchange on which the security is traded, as identified by the third party pricing service used by the Manager, prior to the time when the Fund’s assets are valued. If the last sale price is unavailable, the security is valued at the most recent official closing price on the principal exchange on which it is traded. If the last sales price or official closing price for a foreign security is not available, the security is valued at the mean between the bid and asked price per the exchange or, if not available from the exchange, obtained from two dealers. If bid and asked prices are not available from either the exchange or two dealers, the security is valued by using one of the following methodologies (listed in order of priority); (1) using a bid from the exchange, (2) the mean between the bid and asked price as provided by a single dealer, or (3) a bid from a single dealer.
Shares of a registered investment company that are not traded on an exchange are valued at that investment company’s net asset value per share.
Corporate and government debt securities (of U.S. or foreign issuers) and municipal debt securities, event-linked bonds, loans, mortgage-backed securities, collateralized mortgage obligations, and asset-backed securities are valued at the mean between the “bid” and “asked” prices utilizing evaluated prices obtained from third party pricing services or broker-dealers who may use matrix pricing methods to determine the evaluated prices.
Short-term money market type debt securities with a remaining maturity of sixty days or less are valued at cost adjusted by the amortization of discount or premium to maturity (amortized cost), which approximates market value. Short-term debt securities with a remaining maturity in excess of sixty days are valued at the mean between the “bid” and “asked” prices utilizing evaluated prices obtained from third party pricing services or broker-dealers.
A description of the standard inputs that may generally be considered by the third party pricing vendors in determining their evaluated prices is provided below.
| | |
| Security Type | | Standard inputs generally considered by third-party pricing vendors |
| Corporate debt, government debt, municipal, mortgage-backed and asset-backed securities | | Reported trade data, broker-dealer price quotations, benchmark yields, issuer spreads on comparable securities, the credit quality, yield, maturity, and other appropriate factors. |
| Loans | | Information obtained from market participants regarding reported trade data and broker-dealer price quotations. |
| Event-linked bonds | | Information obtained from market participants regarding reported trade data and broker-dealer price quotations. |
If a market value or price cannot be determined for a security using the methodologies described above, or if, in the “good faith” opinion of the Manager, the market value or price obtained does not constitute a “readily available market quotation,” or a significant event has occurred that would materially affect the value of the security the security is fair valued either (i) by a standardized fair valuation methodology applicable to the security type or the significant event as previously approved by the Valuation Committee and the Fund’s Board or (ii) as determined in good faith by the Manager’s Valuation Committee. The Valuation Committee considers all relevant facts that are reasonably available, through either public information or information available to the Manager, when determining the fair value of a security. Fair value determinations by the Manager are subject to review, approval and ratification by the Fund’s Board at its next regularly scheduled meeting covering the calendar quarter in which the fair valuation was determined. Those fair valuation standardized methodologies include, but are not limited to, valuing securities at the last sale price or initially at cost and subsequently adjusting the value based on: changes in company specific fundamentals, changes in an appropriate securities index, or changes in the value of similar securities which may be further adjusted for any discounts related to security-specific resale restrictions. When possible, such methodologies use observable market inputs such as unadjusted quoted prices of similar securities, observable interest rates, currency rates and yield curves. The methodologies used for valuing securities are not necessarily an indication of the risks associated with investing in those securities nor can it be assured that the Fund can obtain the fair value assigned to a security if it were to sell the security.
17 | OPPENHEIMER SMALL- & MID-CAP GROWTH FUND/VA
|
NOTES TO FINANCIAL STATEMENTS Unaudited / Continued
2. Securities Valuation Continued
To assess the continuing appropriateness of security valuations, the Manager, or its third party service provider who is subject to oversight by the Manager, regularly compares prior day prices, prices on comparable securities, and sale prices to the current day prices and challenges those prices exceeding certain tolerance levels with the third party pricing service or broker source. For those securities valued by fair valuations, whether through a standardized fair valuation methodology or a fair valuation determination, the Valuation Committee reviews and affirms the reasonableness of the valuations based on such methodologies and fair valuation determinations on a regular basis after considering all relevant information that is reasonably available.
Classifications
Each investment asset or liability of the Fund is assigned a level at measurement date based on the significance and source of the inputs to its valuation. Various data inputs are used in determining the value of each of the Fund’s investments as of the reporting period end. These data inputs are categorized in the following hierarchy under applicable financial accounting standards:
| | 1) | Level 1—unadjusted quoted prices in active markets for identical assets or liabilities (including securities actively traded on a securities exchange) |
| | 2) | Level 2—inputs other than unadjusted quoted prices that are observable for the asset or liability (such as unadjusted quoted prices for similar assets and market corroborated inputs such as interest rates, prepayment speeds, credit risks, etc.) |
| | 3) | Level 3—significant unobservable inputs (including the Manager’s own judgments about assumptions that market participants would use in pricing the asset or liability). |
The inputs used for valuing securities are not necessarily an indication of the risks associated with investing in those securities.
The table below categorizes amounts that are included in the Fund’s Statement of Assets and Liabilities as of June 29, 2012 based on valuation input level:
| | | | | | | | | | | | | | | | |
| | | Level 1—
Unadjusted
Quoted Prices | | | Level 2—
Other Significant
Observable Inputs | | | Level 3—
Significant
Unobservable
Inputs | | | Value | |
| Assets Table | | | | | | | | | | | | | | | | |
| Investments, at Value: | | | | | | | | | | | | | | | | |
| Common Stocks | | | | | | | | | | | | | | | | |
Consumer Discretionary | | $ | 121,948,332 | | | $ | — | | | $ | — | | | $ | 121,948,332 | |
Consumer Staples | | | 36,085,672 | | | | — | | | | — | | | | 36,085,672 | |
Energy | | | 36,222,157 | | | | — | | | | — | | | | 36,222,157 | |
Financials | | | 38,049,135 | | | | — | | | | — | | | | 38,049,135 | |
Health Care | | | 99,889,198 | | | | — | | | | — | | | | 99,889,198 | |
Industrials | | | 90,756,859 | | | | — | | | | — | | | | 90,756,859 | |
Information Technology | | | 139,207,741 | | | | — | | | | — | | | | 139,207,741 | |
Materials | | | 27,774,670 | | | | — | | | | — | | | | 27,774,670 | |
Telecommunication Services | | | 7,376,565 | | | | — | | | | — | | | | 7,376,565 | |
Utilities | | | 3,094,748 | | | | — | | | | — | | | | 3,094,748 | |
| Investment Company | | | 13,045,599 | | | | — | | | | — | | | | 13,045,599 | |
| | |
|
|
| |
|
|
| |
|
|
| |
|
|
|
| Total Assets | | $ | 613,450,676 | | | $ | — | | | $ | — | | | $ | 613,450,676 | |
| | |
|
|
| |
|
|
| |
|
|
| |
|
|
|
Currency contracts and forwards, if any, are reported at their unrealized appreciation/depreciation at measurement date, which represents the change in the contract’s value from trade date. Futures, if any, are reported at their variation
18 | OPPENHEIMER SMALL- & MID-CAP GROWTH FUND/VA
|
margin at measurement date, which represents the amount due to/from the Fund at that date. All additional assets and liabilities included in the above table are reported at their market value at measurement date.
There have been no significant changes to the fair valuation methodologies of the Fund during the period.
3. Shares of Beneficial Interest
The Fund has authorized an unlimited number of $0.001 par value shares of beneficial interest of each class. Transactions in shares of beneficial interest were as follows:
| | | | | | | | | | | | | | | | |
| | | Six Months Ended June 29, 2012 | | | Year Ended December 30, 2011 | |
| | | Shares | | | Amount | | | Shares | | | Amount | |
| Non-Service Shares | | | | | | | | | | | | | | | | |
| Sold | | | 182,639 | | | | $ 9,500,273 | | | | 665,252 | | | | $ 32,309,437 | |
| Redeemed | | | (1,016,411 | ) | | | (53,778,006 | ) | | | (2,270,275 | ) | | | (112,699,574 | ) |
| | |
|
|
| |
|
|
| |
|
|
| |
|
|
|
| Net decrease | | | (833,772 | ) | | | $(44,277,733 | ) | | | (1,605,023 | ) | | | $(80,390,137 | ) |
| | |
|
|
| |
|
|
| |
|
|
| |
|
|
|
| | | | | | | | | | | | | |
| Service Shares | | | | | | | | | | | | | | | | |
| Sold | | | 61,579 | | | | $ 3,111,290 | | | | 366,560 | | | | $ 18,018,685 | |
| Redeemed | | | (121,296 | ) | | | (6,151,630 | ) | | | (304,822 | ) | | | (14,439,263 | ) |
| | |
|
|
| |
|
|
| |
|
|
| |
|
|
|
| Net increase (decrease) | | | (59,717 | ) | | | $ (3,040,340 | ) | | | 61,738 | | | | $ 3,579,422 | |
| | |
|
|
| |
|
|
| |
|
|
| |
|
|
|
4. Purchases and Sales of Securities
The aggregate cost of purchases and proceeds from sales of securities, other than short-term obligations and investments in IMMF, for the six months ended June 29, 2012, were as follows:
| | | | | | | | |
| | | Purchases | | | Sales | |
| Investment securities | | $ | 206,968,316 | | | $ | 253,865,991 | |
5. Fees and Other Transactions with Affiliates
Management Fees. Under the investment advisory agreement, the Fund pays the Manager a management fee based on the daily net assets of the Fund at an annual rate as shown in the following table:
| | | | |
| Fee Schedule | | | |
| Up to $200 million | | | 0.75 | % |
| Next $200 million | | | 0.72 | |
| Next $200 million | | | 0.69 | |
| Next $200 million | | | 0.66 | |
| Next $700 million | | | 0.60 | |
| Over $1.5 billion | | | 0.58 | |
Administration Service Fees. The Fund pays the Manager a fee of $1,500 per year for preparing and filing the Fund’s tax returns.
Transfer Agent Fees. OppenheimerFunds Services (“OFS”), a division of the Manager, acts as the transfer and shareholder servicing agent for the Fund. For the six months ended June 29, 2012, the Fund paid $310,680 to OFS for services to the Fund.
Distribution and Service Plan for Service Shares. The Fund has adopted a Distribution and Service Plan (the “Plan”) in accordance with Rule 12b-1 under the Investment Company Act of 1940 for Service shares to pay OppenheimerFunds Distributor, Inc. (the “Distributor”), for distribution related services, personal service and account maintenance for the Fund’s Service shares. Under the Plan, payments are made periodically at an annual rate of 0.25% of the daily net assets of
19 | OPPENHEIMER SMALL- & MID-CAP GROWTH FUND/VA
|
NOTES TO FINANCIAL STATEMENTS Unaudited / Continued
5. Fees and Other Transactions with Affiliates Continued
Service shares of the Fund. The Distributor currently uses all of those fees to compensate sponsors of the insurance product that offers Fund shares, for providing personal service and maintenance of accounts of their variable contract owners that hold Service shares. These fees are paid out of the Fund’s assets on an on-going basis and increase operating expenses of the Service shares, which results in lower performance compared to the Fund’s shares that are not subject to a service fee. Fees incurred by the Fund under the Plan are detailed in the Statement of Operations.
Waivers and Reimbursements of Expenses. The Manager has voluntarily agreed to limit the Fund’s total annual operating expenses so that those expenses, as percentages of daily net assets, will not exceed the annual rate of 0.80% for Non-Service shares and 1.05% for Service shares. During the six months ended June 29, 2012, the Manager waived fees and/or reimbursed the Fund $101,199 and $6,581 for Non-Service and Service shares, respectively.
The Manager will waive fees and/or reimburse Fund expenses in an amount equal to the indirect management fees incurred through the Fund’s investment in IMMF. During the six months ended June 29, 2012, the Manager waived fees and/or reimbursed the Fund $2,734 for IMMF management fees.
Some of these undertakings may be modified or terminated at any time; some may not be modified or terminated until after one year from the date of the current prospectus, as indicated therein.
6. Pending Litigation
Since 2009, a number of class action, derivative and individual lawsuits have been pending in federal and state courts against OppenheimerFunds, Inc., the Fund’s investment advisor (the “Manager”), OppenheimerFunds Distributor, Inc., the Fund’s principal underwriter and distributor (the “Distributor”), and certain funds (but not including the Fund) advised by the Manager and distributed by the Distributor (the “Defendant Funds”). Several of these lawsuits also name as defendants certain officers and current and former trustees of the respective Defendant Funds. The lawsuits raise claims under federal securities laws and various states’ securities, consumer protection and common law and allege, among other things, that the disclosure documents of the respective Defendant Funds contained misrepresentations and omissions and that the respective Defendant Funds’ investment policies were not followed. The plaintiffs in these actions seek unspecified damages, equitable relief and awards of attorneys’ fees and litigation expenses.
Other class action and individual lawsuits have been filed since 2008 in various state and federal courts against the Manager and certain of its affiliates by investors seeking to recover investments they allegedly lost as a result of the “Ponzi” scheme run by Bernard L. Madoff and his firm, Bernard L. Madoff Investment Securities, LLC (“BLMIS”). Plaintiffs in these suits allege that they suffered losses as a result of their investments in several funds managed by an affiliate of the Manager and assert a variety of claims, including breach of fiduciary duty, fraud, negligent misrepresentation, unjust enrichment, and violation of federal and state securities laws and regulations, among others. They seek unspecified damages, equitable relief and awards of attorneys’ fees and litigation expenses. Neither the Distributor, nor any of the Oppenheimer mutual funds, their independent trustees or directors are named as defendants in these lawsuits. None of the Oppenheimer mutual funds invested in any funds or accounts managed by Madoff or BLMIS. On February 28, 2011, a stipulation of partial settlement of three groups of consolidated putative class action lawsuits relating to these matters was filed in the U.S. District Court for the Southern District of New York. On August 19, 2011, the court entered an order and final judgment approving the settlement as fair, reasonable and adequate. In September 2011, certain parties filed notices of appeal from the court’s order approving the settlement. On July 29, 2011, a stipulation of settlement between certain affiliates of the Manager and the Trustee appointed under the Securities Investor Protection Act to liquidate BLMIS was filed in the U.S. Bankruptcy Court for the Southern District of New York to resolve purported preference and fraudulent transfer claims by the Trustee. On September 22, 2011, the court entered an order approving the settlement as fair, reasonable and adequate. In October 2011, certain parties filed notices of appeal from the court’s order approving the settlement. The aforementioned settlements do not resolve other outstanding lawsuits against the Manager and its affiliates relating to BLMIS.
20 | OPPENHEIMER SMALL- & MID-CAP GROWTH FUND/VA
|
On April 16, 2010, a lawsuit was filed in New York state court against the Manager, an affiliate of the Manager and AAArdvark IV Funding Limited (“AAArdvark IV”), an entity advised by the Manager’s affiliate, in connection with investments made by the plaintiffs in AAArdvark IV. Plaintiffs allege breach of contract against the defendants and seek compensatory damages, costs and disbursements, including attorney fees. On July 15, 2011, a lawsuit was filed in New York state court against the Manager, an affiliate of the Manager and AAArdvark Funding Limited (“AAArdvark I”), an entity advised by the Manager’s affiliate, in connection with investments made by the plaintiffs in AAArdvark I. The complaint alleges breach of contract against the defendants and seeks compensatory damages, costs and disbursements, including attorney fees. On November 9, 2011, a lawsuit was filed in New York state court against the Manager, an affiliate of the Manager and AAArdvark XS Funding Limited (“AAArdvark XS”), an entity advised by the Manager’s affiliate, in connection with investments made by the plaintiffs in AAArdvark XS. The complaint alleges breach of contract against the defendants and seeks compensatory damages, costs and disbursements, including attorney fees.
The Manager believes the lawsuits and appeals described above are without legal merit and, with the exception of actions it has settled, is defending against them vigorously. The Defendant Funds’ Boards of Trustees have also engaged counsel to represent the Funds and the present and former Independent Trustees named in those suits. While it is premature to render any opinion as to the outcome in these lawsuits, or whether any costs that the Defendant Funds may bear in defending the suits might not be reimbursed by insurance, the Manager believes that these suits should not impair the ability of the Manager or the Distributor to perform their respective duties to the Fund, and that the outcome of all of the suits together should not have any material effect on the operations of any of the Oppenheimer mutual funds.
21 | OPPENHEIMER SMALL- & MID-CAP GROWTH FUND/VA
|
SPECIAL SHAREHOLDER MEETING Unaudited
On February 29, 2012, a shareholder meeting of the Oppenheimer Variable Account Funds, on behalf of Oppenheimer Small- & Mid-Cap Growth Fund/VA (the “Fund”) was held at which the twelve Trustees identified below were elected to the Trust (Proposal No. 1). At the meeting Proposal No. 2 (including all of its sub-proposals) and Proposal No. 3 were approved as described in the Fund’s proxy statement for that meeting. The following is a report of the votes cast:
| | | | | | | | |
| Nominee/Proposal | | For | | | Withheld | |
| Trustees | | | | | | | | |
| William L. Armstrong | | | 859,155,000 | | | | 36,277,763 | |
| Edward L. Cameron | | | 860,463,149 | | | | 34,969,615 | |
| Jon S. Fossel | | | 861,382,389 | | | | 34,050,375 | |
| Sam Freedman | | | 860,173,958 | | | | 35,258,806 | |
| Richard F. Grabish | | | 862,692,974 | | | | 32,739,789 | |
| Beverly L. Hamilton | | | 862,904,192 | | | | 32,528,571 | |
| Robert J. Malone | | | 862,354,488 | | | | 33,078,275 | |
| F. William Marshall, Jr. | | | 860,997,182 | | | | 34,435,581 | |
| Victoria J. Herget | | | 861,814,105 | | | | 33,618,659 | |
| Karen L. Stuckey | | | 861,434,246 | | | | 33,998,517 | |
| James D. Vaughn | | | 861,208,178 | | | | 34,224,585 | |
| William F. Glavin, Jr. | | | 861,148,846 | | | | 34,283,917 | |
2a: Proposal to revise the fundamental policy relating to borrowing
| | | | | | | | | | | | |
| For | | Against | | | Abstain | | | Broker Non Vote | |
| 10,738,046 | | | 994,639 | | | | 734,165 | | | | N/A | |
2b: Proposal to revise the fundamental policy relating to concentration of investments
| | | | | | | | | | | | |
| For | | Against | | | Abstain | | | Broker Non Vote | |
| 10,848,738 | | | 999,379 | | | | 618,734 | | | | N/A | |
2c: Proposal to remove the fundamental policy relating to diversification of investments
| | | | | | | | | | | | |
| For | | Against | | | Abstain | | | Broker Non Vote | |
| 10,634,507 | | | 1,018,768 | | | | 813,576 | | | | N/A | |
2d: Proposal to revise the fundamental policy relating to lending
| | | | | | | | | | | | |
| For | | Against | | | Abstain | | | Broker Non Vote | |
| 10,754,568 | | | 1,023,804 | | | | 688,479 | | | | N/A | |
2e-1: Proposal to revise the fundamental policy relating to real estate and commodities
| | | | | | | | | | | | |
| For | | Against | | | Abstain | | | Broker Non Vote | |
| 10,766,185 | | | 1,023,074 | | | | 677,591 | | | | N/A | |
2e-2: Proposal to remove the additional fundamental policy relating to real estate and commodities
| | | | | | | | | | | | |
| For | | Against | | | Abstain | | | Broker Non Vote | |
| 10,679,775 | | | 1,039,043 | | | | 748,033 | | | | N/A | |
22 | OPPENHEIMER SMALL- & MID-CAP GROWTH FUND/VA
|
2f: Proposal to revise the fundamental policy relating to senior securities
| | | | | | | | | | | | |
| For | | Against | | | Abstain | | | Broker Non Vote | |
| 10,726,511 | | | 1,002,845 | | | | 737,495 | | | | N/A | |
2g: Proposal to revise the fundamental policy relating to underwriting
| | | | | | | | | | | | |
| For | | Against | | | Abstain | | | Broker Non Vote | |
| 10,757,607 | | | 1,020,891 | | | | 688,353 | | | | N/A | |
2i: Convert the Fund’s investment objective from fundamental to non-fundamental
| | | | | | | | | | | | |
| For | | Against | | | Abstain | | | Broker Non Vote | |
| 10,494,590 | | | 1,087,623 | | | | 884,638 | | | | N/A | |
2j: Approve a change in the fund’s investment objective
| | | | | | | | | | | | |
| For | | Against | | | Abstain | | | Broker Non Vote | |
| 10,733,510 | | | 1,012,791 | | | | 720,549 | | | | N/A | |
Proposal 3: To approve an Agreement and Plan of Reorganization that provides for the reorganization of a Fund from a Maryland corporation or Massachusetts business trust, as applicable, into a Delaware statutory trust.
| | | | | | | | | | | | |
| For | | Against | | | Abstain | | | Broker Non Vote | |
| 821,085,084 | | | 23,597,959 | | | | 50,749,721 | | | | N/A | |
23 | OPPENHEIMER SMALL- & MID-CAP GROWTH FUND/VA
|
PORTFOLIO PROXY VOTING POLICIES AND PROCEDURES;
UPDATES TO STATEMENTS OF INVESTMENTS Unaudited
The Fund has adopted Portfolio Proxy Voting Policies and Procedures under which the Fund votes proxies relating to securities (“portfolio proxies”) held by the Fund. A description of the Fund’s Portfolio Proxy Voting Policies and Procedures is available (i) without charge, upon request, by calling the Fund toll-free at 1.800.525.7048, (ii) on the Fund’s website at oppenheimerfunds.com, and (iii) on the SEC’s website at www.sec.gov. In addition, the Fund is required to file Form N-PX, with its complete proxy voting record for the 12 months ended June 30th, no later than August 31st of each year. The Fund’s voting record is available (i) without charge, upon request, by calling the Fund toll-free at 1.800.525.7048, and (ii) in the Form N-PX filing on the SEC’s website at www.sec.gov.
The Fund files its complete schedule of portfolio holdings with the SEC for the first quarter and the third quarter of each fiscal year on Form N-Q. The Fund’s Form N-Q filings are available on the SEC’s website at www.sec.gov. Those forms may be reviewed and copied at the SEC’s Public Reference Room in Washington, D.C. Information on the operation of the Public Reference Room may be obtained by calling 1-800-SEC-0330.
24 | OPPENHEIMER SMALL- & MID-CAP GROWTH FUND/VA
|
OPPENHEIMER SMALL- & MID-CAP GROWTH FUND/VA
| | |
| A Series of Oppenheimer Variable Account Funds |
| Trustees and Officers | | William L. Armstrong, Chairman of the Board of Trustees and Trustee Edward L. Cameron, Trustee Jon S. Fossel, Trustee Sam Freedman, Trustee Richard F. Grabish, Trustee Beverly L. Hamilton, Trustee Victoria J. Herget, Trustee Robert J. Malone, Trustee F. William Marshall, Jr., Trustee Karen L. Stuckey, Trustee James D. Vaughn, Trustee William F .Glavin, Jr., Trustee, President and Principal Executive Officer Ronald J. Zibelli, Jr., Vice President Arthur S. Gabinet, Secretary and Chief Legal Officer Christina M. Nasta, Vice President and Chief Business Officer Mark S. Vandehey, Vice President and Chief Compliance Officer Brian W. Wixted, Treasurer and Principal Financial & Accounting Officer |
| Manager | | OppenheimerFunds, Inc. |
| Distributor | | OppenheimerFunds Distributor, Inc. |
| Transfer Agent | | OppenheimerFunds Services |
| Independent Registered Public Accounting Firm | | KPMGLLP |
| Counsel | | K&L Gates LLP |
Before investing, investors should carefully consider a fund’s investment objectives, risks, charges and expenses. Fund prospectuses and summary prospectuses contain this and other information about the funds and may be obtained by asking your financial advisor, or calling us at 1.800.988.8287. Read prospectuses and summary prospectuses carefully before investing.
The financial statements included herein have been taken from the records of the Fund without examination of those records by the independent registered public accounting firm.
| | |
| ©2012 OppenheimerFunds, Inc. All rights reserved. | |  |
June 30, 2012
| | | | |
| | | |
| | | Oppenheimer Balanced Fund/VA A Series of Oppenheimer Variable Account Funds | | Semiannual Report |

SEMIANNUAL REPORT
Fund Performance Discussion
Listing of Top Holdings
Financial Statements

OPPENHEIMER BALANCED FUND/VA
Portfolio Managers: Mitch Williams, CFA,1 Krishna Memani and Peter A. Strzalkowski, CFA
| | | | | | |
Cumulative Total Returns
For the 6-Month Period Ended 6/29/122 |
| Non-Service Shares | | 4.53% | | | | |
| Service Shares | | 4.40 | | | | |
Average Annual Total Returns
For the Periods Ended 6/29/122 |
| | | |
| | | 1-Year | | 5-Year | | 10-Year |
| Non-Service Shares | | 0.96% | | –4.30% | | 2.67% |
| Service Shares | | 0.62 | | –4.55 | | 2.41 |
Expense Ratios
For the Fiscal Year Ended 12/30/112 |
| | | |
| | | Gross
Expense
Ratios | | | | Net
Expense
Ratios |
| Non-Service Shares | | 0.93% | | | | 0.69% |
| Service Shares | | 1.18 | | | | 0.94 |
The performance data quoted represents past performance, which does not guarantee future results. The investment return and principal value of an investment in the Fund will fluctuate so that an investor’s shares, when redeemed, may be worth more or less than their original cost. Current performance and expense ratios may be lower or higher than the data quoted. For performance data current to the most recent month end, call us at 1.800.988.8287. The Fund’s total returns should not be expected to be the same as the returns of other funds, whether or not both funds have the same portfolio managers and/or similar names. The Fund’s total returns do not include the charges associated with the separate account products that offer this Fund. Such performance would have been lower if such charges were taken into account. Expense ratios are as stated in the Fund’s prospectus current as of the date of this report. The net expense ratios take into account voluntary fee waivers and/or expense reimbursements, without which performance would have been less. Some of these undertakings may be modified or terminated at any time, as indicated in the Fund’s prospectus.
1. Became a portfolio manager November 2011.
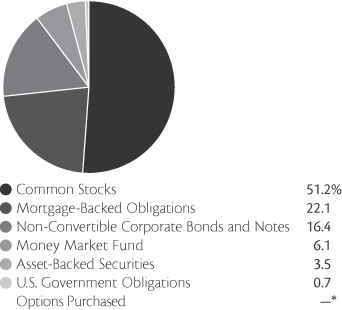
* Represents a value of less than 0.05%.
Portfolio holdings and allocations are subject to change. Percentages are as of June 29, 2012, and are based on the total market value of investments.
| | |
| Top Ten Common Stock Holdings |
| Chevron Corp. | | 3.2% |
| Humana, Inc. | | 2.3 |
| Coca-Cola Co. (The) | | 2.3 |
| Honeywell International, Inc. | | 2.1 |
| Merck & Co., Inc. | | 2.1 |
| Wells Fargo & Co. | | 2.0 |
| Target Corp. | | 2.0 |
| Exxon Mobil Corp. | | 1.9 |
| UnitedHealth Group, Inc. | | 1.8 |
| Goldman Sachs Group, Inc. (The) | | 1.8 |
Portfolio holdings and allocations are subject to change. Percentages are as of June 29, 2012, and are based on net assets.
2 | OPPENHEIMER BALANCED FUND/VA
|
FUND PERFORMANCE DISCUSSION
During the six-month reporting period, the Fund’s Non-Service shares produced a return of 4.53%. In comparison, the Russell 1000 Value Index returned 8.68% and the Barclays Capital U.S. Aggregate Bond Index returned 2.37%.2 Measured separately, the Fund’s equity component underperformed the Russell 1000 Value Index and its fixed-income component outperformed the Barclays Capital U.S. Aggregate Bond Index.
Economic and Market Environment
The period began during a time of improved market sentiment in which the United States managed to avoid a return to recession and European policymakers appeared to take steps to address the region’s sovereign debt and banking sector crises. Renewed investor optimism helped produce gains across a number of international equity markets and historically riskier asset classes over the first three months of 2012. The rebound across risk markets gained momentum after the European Central Bank implemented the Long-Term Refinancing Operation (“LTRO”) to enhance liquidity for troubled banks and reduce rates on newly issued sovereign debt securities.
However, the second quarter was a volatile time for global markets. The fear of contagion from the worsening European sovereign debt crisis and a recession across much of Europe drove negative market sentiment, particularly over May and June. Very high unemployment, soaring debt and higher borrowing costs in Greece, Spain and Italy contributed to serious questions over how to implement austerity measures and restructure debt or instead take a different tact and provide some or all of those countries with additional funds. Perhaps most worrisome of all to investors was the possibility of Greece pulling out of the euro and its ramifications for the future of the Eurozone and its common currency.
In the U.S., slower than expected first quarter growth also contributed to a sell-off in the U.S. stock market. Consumer confidence dropped as U.S. unemployment figures ticked slightly upwards after showing signs of improvement from the recession highs. Bond markets were not immune to the market volatility, posting modest returns across most sectors. The period ended on a positive note for the markets. The results of elections in Greece and continued efforts by European policymakers to stabilize the situation in the region appeared to soothe market jitters slightly in the final days of the period.
Fund Review
The fixed-income component’s positive performance was driven by its exposure to spread products—credit, mortgage-backed obligations, non-prime asset-backed securities (ABS)—at the expense of government debt. The Fund’s investments in mortgage-backed obligations included residential mortgage-backed securities (RMBS) and commercial mortgage-backed securities, both of which benefited results. Despite bouts of risk aversion, mortgage-backed obligations generally produced positive results as housing in the U.S. began to stabilize. The Fund’s exposure to RMBS included securities guaranteed by government-sponsored enterprises, commonly referred to as agency RMBS, as well as a smaller allocation to RMBS originated by private entities, also known as non-agency RMBS. The fixed-income component also received positive results from its exposure to high yield and investment grade debt.
The Fund’s equity component outperformed in the consumer staples sector as a result of superior stock selection. Four out of the top five performing stocks were in the financials sector: Wells Fargo & Co., JPMorgan Chase & Co., U.S. Bancorp and MetLife, Inc. Following another round of bank stress tests by the Federal Reserve in March 2012, stocks of banks, including Wells Fargo, JPMorgan Chase and U.S. Bancorp, rallied. We exited our position in JPMorgan by period end. The stock of insurance company MetLife performed positively early in the period, and we exited our position over the first quarter, locking in gains. Also contributing to performance was consumer discretionary stock Comcast Corp. The cable provider’s high-speed Internet subscriptions increased during the period, which contributed to a positive earnings surprise. Additionally, Comcast aggressively repurchased shares and increased its dividend by over forty percent.
2. June 29, 2012, was the last business day of the Fund’s semiannual period. See Note 1 of the accompanying Notes to Financial Statements. Index returns are calculated through June 30, 2012. December 30, 2011 was the last business day of the Fund’s 2011 fiscal year.
3 | OPPENHEIMER BALANCED FUND/VA
|
FUND PERFORMANCE DISCUSSION
The Fund’s equity component underperformed the Russell 1000 Value Index primarily in the industrials and information technology sectors. The most significant detractors from the equity component’s performance were Juniper Networks, Inc., Navistar International Corp. and GenOn Energy, Inc. Networking company Juniper experienced declines over the second quarter of 2012, announcing a decrease in revenue. Navistar, a manufacturer of commercial and military trucks, was negatively impacted by higher costs. It also has lost share in the Heavy Duty Class 8 truck market as the company struggled to develop an engine that meets new emissions rules. GenOn Energy is one of the largest generators of wholesale electricity in the United States. Shares of GenOn were hampered by declining natural gas prices, which hit 10-year lows during the period. We continue to believe that GenOn will benefit from its healthy balance sheet and the potential for higher power prices stemming from EPA regulations that may essentially force the closure of several competing power plants. Also hurting performance were Humana, Inc. and Cisco Systems, Inc. Humana, Inc. detracted from results as the managed health care company reported a decrease in profit in its first quarter, breaking a streak of four straight profit increases. Networking company Cisco declined after releasing earnings guidance below analysts’ expectations.
Outlook
Given the recent spate of weaker economic news globally and the ongoing crisis in Europe, we are cognizant that headwinds exist for risk-based assets. While a softening in the Chinese economy is evident, we do not believe that it heralds a hard landing. Indeed, policy makers in Beijing have taken steps to ease liquidity in the Middle Kingdom while attempting to take some of the froth out of the property sector. Despite fresh pronouncements from the EU Summit in late June, it is premature to sound the all-clear on peripheral Europe and important details remain unsettled much to the chagrin of debt markets near the epicenter and abroad. We do not expect these concerns to abate quickly and acknowledge the risk they present for seemingly unrelated asset classes.
The upcoming congressional and presidential elections in the U.S. may provide some volatility, especially given the contentious debate over entitlements, taxes, and the deficit. Markets seemed to welcome Operation Twist, and we believe that the Fed will respond to any downdraft in domestic economic activity with additional measures such as additional quantitative easing or outright buying of U.S. mortgages in order to keep the modest revival of the economy on track.
Investors should consider the Fund’s investment objective, risks, and charges and expenses carefully before investing. The Fund’s prospectus and summary prospectus contain this and other information about the Fund, and may be obtained by asking your financial advisor or calling us at 1.800.988.8287. Read prospectuses and summary prospectuses carefully before investing.
Total returns include changes in share price and reinvestment of dividends and capital gains distributions in a hypothetical investment for the periods shown. Cumulative total returns are not annualized.
The Fund’s investment strategy and focus can change over time. The mention of specific fund holdings does not constitute a recommendation by OppenheimerFunds, Inc.
Shares of Oppenheimer funds are not deposits or obligations of any bank, are not guaranteed by any bank, are not insured by the FDIC or any other agency, and involve investment risks, including the possible loss of the principal amount invested. The performance data quoted represents past performance, which does not guarantee future results.
4 | OPPENHEIMER BALANCED FUND/VA
|
FUND EXPENSES
Fund Expenses. As a shareholder of the Fund, you incur two types of costs: (1) transaction costs and (2) ongoing costs, including management fees; distribution and service fees; and other Fund expenses. These examples are intended to help you understand your ongoing costs (in dollars) of investing in the Fund and to compare these costs with the ongoing costs of investing in other mutual funds.
The examples are based on an investment of $1,000.00 invested at the beginning of the period and held for the entire 6-month period ended June 29, 2012.
Actual Expenses. The first section of the table provides information about actual account values and actual expenses. You may use the information in this section for the class of shares you hold, together with the amount you invested, to estimate the expense that you paid over the period. Simply divide your account value by $1,000.00 (for example, an $8,600.00 account value divided by $1,000.00 = 8.60), then multiply the result by the number in the first section under the heading entitled “Expenses Paid During Period” to estimate the expenses you paid on your account during this period.
Hypothetical Example for Comparison Purposes. The second section of the table provides information about hypothetical account values and hypothetical expenses based on the Fund’s actual expense ratio for each class of shares, and an assumed rate of return of 5% per year for each class before expenses, which is not the actual return. The hypothetical account values and expenses may not be used to estimate the actual ending account balance or expenses you paid for the period. You may use this information to compare the ongoing costs of investing in the Fund and other funds. To do so, compare this 5% hypothetical example for the class of shares you hold with the 5% hypothetical examples that appear in the shareholder reports of the other funds.
Please note that the expenses shown in the table are meant to highlight your ongoing costs only and do not reflect any charges associated with the separate accounts that offer this Fund. Therefore, the “hypothetical” lines of the table are useful in comparing ongoing costs only, and will not help you determine the relative total costs of owning different funds. In addition, if these separate account charges were included your costs would have been higher.
| | | | | | | | | | | | |
| Actual | | Beginning
Account
Value
January 1, 2012 | | | Ending
Account
Value
June 29, 2012 | | | Expenses
Paid During
6 Months Ended
June 29, 2012 | |
| Non-Service Shares | | $ | 1,000.00 | | | $ | 1,045.30 | | | $ | 3.39 | |
| Service Shares | | | 1,000.00 | | | | 1,044.00 | | | | 4.66 | |
| | | |
Hypothetical
(5% return before expenses) | | | | | | | | | |
| Non-Service Shares | | | 1,000.00 | | | | 1,021.41 | | | | 3.35 | |
| Service Shares | | | 1,000.00 | | | | 1,020.18 | | | | 4.61 | |
Expenses are equal to the Fund’s annualized expense ratio for that class, multiplied by the average account value over the period, multiplied by 181/366 (to reflect the one-half year period). Those annualized expense ratios, excluding indirect expenses from affiliated fund, based on the 6-month period ended June 29, 2012 are as follows:
| | | | |
| Class | | Expense Ratios | |
| Non-Service Shares | | | 0.67 | % |
| Service Shares | | | 0.92 | |
The expense ratios reflect voluntary waivers and/or reimbursements of expenses by the Fund’s Manager. Some of these undertakings may be modified or terminated at any time, as indicated in the Fund’s prospectus. The “Financial Highlights” tables in the Fund’s financial statements, included in this report, also show the gross expense ratios, without such waivers or reimbursements and reduction to custodian expenses, if applicable.
5 | OPPENHEIMER BALANCED FUND/VA
|
STATEMENT OF INVESTMENTS June 29, 2012* / Unaudited
| | | | | | | | |
| | |
Shares | | | Value | |
| | | | | | | | | |
| Common Stocks—59.1% | | | | | | | | |
| Consumer Discretionary—5.8% | |
| Automobiles—0.8% | | | | | | | | |
| Ford Motor Co. | | | 254,690 | | | $ | 2,442,477 | |
| Household Durables—1.4% | |
| Mohawk Industries, Inc.1 | | | 58,500 | | | | 4,085,055 | |
| Media—1.6% | | | | | | | | |
| Comcast Corp., Cl. A | | | 127,060 | | | | 4,062,108 | |
| Viacom, Inc., Cl. B | | | 18,130 | | | | 852,473 | |
| | | | | | |
|
|
|
| | | | | | | | 4,914,581 | |
| Multiline Retail—2.0% | | | | | | | | |
| Target Corp. | | | 99,030 | | | | 5,762,556 | |
| Consumer Staples—4.9% | | | | | | | | |
| Beverages—4.1% | | | | | | | | |
| Coca-Cola Co. (The) | | | 85,750 | | | | 6,704,793 | |
Molson Coors Brewing Co.,
Cl. B, Non-Vtg. | | | 90,690 | | | | 3,773,611 | |
| PepsiCo, Inc. | | | 25,500 | | | | 1,801,830 | |
| | | | | | |
|
|
|
| | | | | | | | 12,280,234 | |
| Household Products—0.8% | |
| Church & Dwight Co., Inc. | | | 41,040 | | | | 2,276,489 | |
| Energy—7.0% | | | | | | | | |
| Energy Equipment & Services—0.9% | |
| Baker Hughes, Inc. | | | 66,680 | | | | 2,740,548 | |
| Oil, Gas & Consumable Fuels—6.1% | |
| Apache Corp. | | | 17,910 | | | | 1,574,110 | |
| Chevron Corp. | | | 89,870 | | | | 9,481,285 | |
| Exxon Mobil Corp. | | | 64,730 | | | | 5,538,946 | |
| Valero Energy Corp. | | | 53,150 | | | | 1,283,573 | |
| | | | | | |
|
|
|
| | | | | | | | 17,877,914 | |
| Financials—13.3% | | | | | | | | |
| Capital Markets—3.1% | | | | | | | | |
| BlackRock, Inc. | | | 23,240 | | | | 3,946,617 | |
| Goldman Sachs Group, Inc. (The) | | | 54,740 | | | | 5,247,376 | |
| | | | | | |
|
|
|
| | | | | | | | 9,193,993 | |
| Commercial Banks—5.9% | | | | | | | | |
| M&T Bank Corp. | | | 47,870 | | | | 3,952,626 | |
| PNC Financial Services Group, Inc. | | | 42,610 | | | | 2,603,897 | |
| SunTrust Banks, Inc. | | | 134,570 | | | | 3,260,631 | |
| U.S. Bancorp | | | 56,830 | | | | 1,827,653 | |
| Wells Fargo & Co. | | | 173,060 | | | | 5,787,126 | |
| | | | | | |
|
|
|
| | | | | | | | 17,431,933 | |
| Diversified Financial Services—1.5% | | | | | | | | |
| Citigroup, Inc. | | | 162,130 | | | | 4,443,983 | |
| Insurance—2.8% | | | | | | | | |
| ACE Ltd. | | | 59,410 | | | | 4,404,063 | |
| | | | | | | | |
| | |
Shares | | | Value | |
| | | | | | | | | |
| Insurance Continued | | | | | | | | |
| Marsh & McLennan Cos., Inc. | | | 49,970 | | | $ | 1,610,533 | |
| Travelers Cos., Inc. (The) | | | 32,790 | | | | 2,093,314 | |
| | | | | | |
|
|
|
| | | | | | | | 8,107,910 | |
| Health Care—9.2% | | | | | | | | |
| Health Care Equipment & Supplies—0.8% | |
| Baxter International, Inc. | | | 45,590 | | | | 2,423,109 | |
| Health Care Providers & Services—4.1% | |
| Humana, Inc. | | | 87,140 | | | | 6,748,122 | |
| UnitedHealth Group, Inc. | | | 90,890 | | | | 5,317,065 | |
| | | | | | |
|
|
|
| | | | | | | | 12,065,187 | |
| Pharmaceuticals—4.3% | | | | | | | | |
| Merck & Co., Inc. | | | 146,030 | | | | 6,096,753 | |
| Pfizer, Inc. | | | 168,460 | | | | 3,874,580 | |
Teva Pharmaceutical Industries Ltd.,
Sponsored ADR | | | 67,750 | | | | 2,672,060 | |
| | | | | | |
|
|
|
| | | | | | | | 12,643,393 | |
| Industrials—5.7% | | | | | | | | |
| Aerospace & Defense—2.1% | |
| Honeywell International, Inc. | | | 110,200 | | | | 6,153,568 | |
| Airlines—0.3% | | | | | | | | |
| United Continental Holdings, Inc.1 | | | 35,660 | | | | 867,608 | |
| Construction & Engineering—0.6% | | | | | | | | |
| Quanta Services, Inc.1 | | | 77,940 | | | | 1,876,016 | |
| Industrial Conglomerates—1.2% | | | | | | | | |
| Tyco International Ltd. | | | 67,920 | | | | 3,589,572 | |
| Machinery—0.5% | | | | | | | | |
| Navistar International Corp.1 | | | 47,140 | | | | 1,337,362 | |
| Trading Companies & Distributors—1.0% | |
| AerCap Holdings NV1 | | | 256,730 | | | | 2,895,914 | |
| Information Technology—5.3% | |
| Communications Equipment—2.7% | | | | | | | | |
| Cisco Systems, Inc. | | | 190,360 | | | | 3,268,481 | |
| Juniper Networks, Inc.1 | | | 299,530 | | | | 4,885,334 | |
| | | | | | |
|
|
|
| | | | | | | | 8,153,815 | |
| Electronic Equipment & Instruments—1.2% | |
| TE Connectivity Ltd. | | | 109,740 | | | | 3,501,803 | |
Semiconductors & Semiconductor
Equipment—1.4% | |
| Analog Devices, Inc. | | | 49,420 | | | | 1,861,651 | |
| Xilinx, Inc. | | | 66,570 | | | | 2,234,755 | |
| | | | | | |
|
|
|
| | | | | | | | 4,096,406 | |
| Materials—2.4% | | | | | | | | |
| Chemicals—1.5% | | | | | | | | |
| Celanese Corp., Series A | | | 23,950 | | | | 829,149 | |
| Mosaic Co. (The) | | | 67,200 | | | | 3,679,872 | |
| | | | | | |
|
|
|
| | | | | | | | 4,509,021 | |
6 | OPPENHEIMER BALANCED FUND/VA
|
| | | | | | | | |
| | |
Shares | | | Value | |
| | | | | | | | | |
| Containers & Packaging—0.9% | | | | | | | | |
| Rock-Tenn Co., Cl. A | | | 47,340 | | | $ | 2,582,397 | |
| Telecommunication Services—1.7% | | | | | | | | |
| Diversified Telecommunication Services—1.7% | |
| AT&T, Inc. | | | 74,880 | | | | 2,670,221 | |
| Orbcomm, Inc.1 | | | 375 | | | | 1,223 | |
| Verizon Communications, Inc. | | | 50,790 | | | | 2,257,108 | |
| | | | | | |
|
|
|
| | | | | | | | 4,928,552 | |
| Utilities—3.8% | | | | | | | | |
| Electric Utilities—2.2% | |
| American Electric Power Co., Inc. | | | 54,240 | | | | 2,164,153 | |
| Edison International, Inc. | | | 95,630 | | | | 4,418,106 | |
| | | | | | |
|
|
|
| | | | | | | | 6,582,259 | |
| Energy Traders—0.7% | |
| GenOn Energy, Inc.1 | | | 1,120,620 | | | | 1,916,260 | |
| Multi-Utilities—0.9% | | | | | | | | |
| NiSource, Inc. | | | 41,040 | | | | 1,015,740 | |
| Public Service Enterprise Group, Inc. | | | 49,800 | | | | 1,618,500 | |
| | | | | | |
|
|
|
| | | | | | |
| 2,634,240
|
|
Total Common Stocks
(Cost $167,453,428) | | | | 174,314,155 | |
| | |
| | | Principal
Amount | | | | |
| Asset-Backed Securities—4.1% | | | | | | | | |
AESOP Funding II LLC,
Automobile Receivables Nts.,
Series 2011-1A, Cl. A, 1.85%, 11/20/132 | | $ | 185,000 | | | | 186,260 | |
Ally Master Owner Trust,
Asset-Backed Nts.,
Series 2012-2, Cl. A, 0.742%, 3/15/163 | | | 350,000 | | | | 350,453 | |
Ally Master Owner Trust,
Automobile Receivables Nts.,
Series 2011-4, Cl. A2, 1.54%, 9/15/16 | | | 460,000 | | | | 464,690 | |
American Credit Acceptance
Receivables Trust 2012-1,
Automobile Receivables Nts.,
Series 2012-1, Cl. A1, 1.96%, 1/5/142 | | | 107,041 | | | | 107,049 | |
AmeriCredit Automobile
Receivables Trust 2009-1,
Automobile Receivables-Backed Nts.,
Series 2009-1, Cl. A3, 3.04%, 10/15/13 | | | 12,745 | | | | 12,761 | |
AmeriCredit Automobile
Receivables Trust 2010-1,
Automobile Receivables-Backed Nts.,
Series 2010-1, Cl. D, 6.65%, 7/17/17 | | | 210,000 | | | | 226,886 | |
AmeriCredit Automobile
Receivables Trust 2010-2,
Automobile Receivables-Backed Nts.:
Series 2010-2, Cl. C, 4.52%, 10/8/15 | | | 290,000 | | | | 302,769 | |
| Series 2010-2, Cl. D, 6.24%, 6/8/16 | | | 40,000 | | | | 43,266 | |
| | | | | | | | |
| | | Principal
Amount | | | Value | |
| | | | | | | | | |
| Asset-Backed Securities Continued | | | | | | | | |
AmeriCredit Automobile
Receivables Trust 2011-1,
Automobile Receivables-Backed Nts.,
Series 2011-1, Cl. D, 4.26%, 2/8/17 | | $ | 90,000 | | | $ | 95,581 | |
AmeriCredit Automobile
Receivables Trust 2011-2,
Automobile Receivables-Backed Nts.:
Series 2011-2, Cl. A3, 1.61%, 10/8/15 | | | 105,000 | | | | 105,803 | |
| Series 2011-2, Cl. B, 2.33%, 3/8/16 | | | 300,000 | | | | 304,662 | |
| Series 2011-2, Cl. D, 4%, 5/8/17 | | | 300,000 | | | | 313,712 | |
AmeriCredit Automobile
Receivables Trust 2011-4,
Automobile Receivables-Backed Nts.,
Series 2011-4, Cl. D, 4.08%, 7/10/17 | | | 500,000 | | | | 509,563 | |
AmeriCredit Automobile
Receivables Trust 2011-5,
Automobile Receivables-Backed Nts.,
Series 2011-5, Cl. D, 5.05%, 12/8/17 | | | 305,000 | | | | 318,780 | |
AmeriCredit Automobile
Receivables Trust 2012-1,
Automobile Receivables-Backed Nts.,
Series 2012-1, Cl. D, 4.72%, 3/8/18 | | | 270,000 | | | | 285,425 | |
AmeriCredit Automobile
Receivables Trust 2012-2,
Automobile Receivables-Backed Nts.,
Series 2012-2, Cl. D, 3.38%, 4/9/18 | | | 455,000 | | | | 458,104 | |
Avis Budget Rental Car Funding AESOP LLC,
Automobile Receivable Nts.:
Series 2011-2A, Cl. A, 2.37%, 11/20/142 | | | 300,000 | | | | 306,011 | |
| Series 2012-1A, Cl. A, 2.044%, 8/20/162 | | | 235,000 | | | | 237,442 | |
Centre Point Funding LLC,
Asset-Backed Nts.,
Series 2010-1A, Cl. 1, 5.43%, 7/20/152 | | | 62,266 | | | | 65,304 | |
Citibank Credit Card Issuance Trust,
Credit Card Receivable Nts.,
Series 2003-C4, Cl. C4, 5%, 6/10/15 | | | 250,000 | | | | 258,589 | |
Citibank Omni Master Trust,
Credit Card Receivables:
Series 2009-A13, Cl. A13,
5.35%, 8/15/182 | | | 430,000 | | | | 469,852 | |
Series 2009-A17, Cl. A17,
| | | | | | | | |
| 4.90%, 11/15/182 | | | 40,000 | | | | 43,698 | |
CNH Wholesale Master
Note Trust 2011-1, Equipment Nts.,
Series 2011-1, Cl. 1A, 1.042%, 1/20/413 | | | 115,000 | | | | 115,348 | |
CPS Auto Trust,
Automobile Receivable Nts.,
Series 2012-B, Cl. A, 3.09%, 9/1/192 | | | 380,000 | | | | 380,147 | |
Credit Acceptance Auto Loan Trust,
Automobile Receivable Nts.,
Series 2012-1A, Cl. A, 2.20%, 9/16/192 | | | 175,000 | | | | 175,624 | |
7 | OPPENHEIMER BALANCED FUND/VA
|
STATEMENT OF INVESTMENTS Unaudited / Continued
| | | | | | | | |
| | | Principal
Amount | | | Value | |
| | | | | | | | | |
| Asset-Backed Securities Continued | | | | | | | | |
DSC Floorplan Master Owner Trust,
Automobile Receivable Nts.,
Series 2011-1, Cl. A, 3.91%, 3/15/16 | | $ | 310,000 | | | $ | 318,273 | |
DT Auto Owner Trust 2009-1,
Automobile Receivable Nts.,
Series 2009-1, Cl. A1, 2.98%, 10/15/152 | | | 32,070 | | | | 32,119 | |
DT Auto Owner Trust 2011-1A,
Automobile Receivable Nts.,
Series 2011-1A, Cl. C, 3.05%, 8/15/152 | | | 430,000 | | | | 431,052 | |
DT Auto Owner Trust 2011-2A,
Automobile Receivable Nts.,
Series 2011-2A, Cl. C, 3.05%, 7/15/132 | | | 105,000 | | | | 104,970 | |
DT Auto Owner Trust 2011-3A,
Automobile Receivable Nts.,
Series 2011-3A, Cl. C, 4.03%, 12/15/412 | | | 299,000 | | | | 303,599 | |
DT Auto Owner Trust 2012-1A,
Automobile Receivable Nts.,
Series 2012-1A, Cl. A, 1.06%, 1/15/152 | | | 245,690 | | | | 245,717 | |
Exeter Automobile Receivables Trust,
Automobile Receivable Nts.,
Series 2012-1A, Cl. A, 2.02%, 8/15/162 | | | 215,639 | | | | 215,781 | |
First Investors Auto Owner
Trust 2011-1,
Automobile Receivable Nts.,
Series 2011-1, Cl. A2, 1.47%, 3/16/15 | | | 130,711 | | | | 130,656 | |
Ford Credit Floorplan Master
Owner Trust,
Automobile Receivable Nts.,
Series 2012-1, Cl. A, 0.712%, 1/15/163 | | | 155,000 | | | | 155,609 | |
Hertz Vehicle Financing LLC,
Automobile Receivable Nts.,
Series 2010-1A, Cl. A1, 2.60%, 2/25/152 | | | 490,000 | | | | 499,956 | |
MBNA Credit Card Master Note Trust,
Credit Card Receivables,
Series 2003-C7, Cl. C7,
1.592%, 3/15/163 | | | 375,000 | | | | 377,186 | |
Rental Car Finance Corp.,
Automobile Receivable Nts.,
Series 2011-1A, Cl. A1, 2.51%, 2/25/162 | | | 265,000 | | | | 269,475 | |
Santander Drive Auto
Receivables Trust 2010-2,
Automobile Receivables Nts.,
Series 2010-2, Cl. A2, 0.95%, 8/15/13 | | | 25,023 | | | | 25,026 | |
Santander Drive Auto
Receivables Trust 2010-3,
Automobile Receivables Nts.,
Series 2010-3, Cl. C, 3.06%, 11/15/17 | | | 350,000 | | | | 354,613 | |
Santander Drive Auto
Receivables Trust 2010-A,
Automobile Receivables Nts.:
Series 2010-A, Cl. A2, 1.37%, 8/15/132 | | | 32,770 | | | | 32,790 | |
| Series 2010-A, Cl. A3, 1.83%, 11/17/142 | | | 95,000 | | | | 95,844 | |
| | | | | | | | |
| | | Principal
Amount | | | Value | |
| | | | | | | | | |
| Asset-Backed Securities Continued | | | | | | | | |
Santander Drive Auto
Receivables Trust 2010-B,
Automobile Receivables Nts.,
Series 2010-B, Cl. C, 3.02%, 10/17/162 | | $ | 290,000 | | | $ | 295,203 | |
Santander Drive Auto
Receivables Trust 2011-1,
Automobile Receivables Nts.,
Series 2011-1, Cl. D, 4.01%, 2/15/17 | | | 360,000 | | | | 367,088 | |
Santander Drive Auto
Receivables Trust 2011-4,
Automobile Receivables Nts.,
Series 2011-4, Cl. B, 2.90%, 5/16/16 | | | 105,000 | | | | 108,148 | |
Santander Drive Auto
Receivables Trust 2011-S1A,
Automobile Receivables Nts.,
Series 2011-S1A, Cl. D, 3.10%, 5/15/174 | | | 288,732 | | | | 289,494 | |
Santander Drive Auto
Receivables Trust 2011-S2A,
Automobile Receivables Nts.,
Series 2011-S2A, Cl. D, 3.35%, 6/15/174 | | | 201,658 | | | | 201,658 | |
Santander Drive Auto
Receivables Trust 2012-1,
Automobile Receivables Nts.,
Series 2012-1, Cl. A2, 1.25%, 4/15/15 | | | 75,000 | | | | 75,338 | |
Santander Drive Auto
Receivables Trust 2012-2,
Automobile Receivables Nts.,
Series 2012-2, Cl. D, 5%, 2/15/18 | | | 355,000 | | | | 358,960 | |
SNAAC Auto Receivables Trust,
Automobile Receivable Nts.,
Series 2012-1A, Cl. A, 1.78%, 6/15/162 | | | 215,000 | | | | 215,117 | |
Westlake Automobile
Receivables Trust 2011-1,
Automobile Receivables Nts.,
Series 2011-1, Cl. A3, 1.49%, 6/16/142 | | | 155,000 | | | | 155,262 | |
Wheels SPV LLC, Asset-Backed Nts.,
Series 2012-1, Cl. A2, 1.47%, 3/20/212 | | | 170,000 | | | | 170,118 | |
| | | | | | |
|
|
|
Total Asset-Backed Securities
(Cost $11,855,402) | | | | | | | 11,966,831 | |
| Mortgage-Backed Obligations—25.6% | |
| Government Agency—20.6% | | | | | | | | |
| FHLMC/FNMA/FHLB/Sponsored—20.1% | |
Federal Home Loan Mortgage Corp.:
4.50%, 10/15/18 | | | 130,085 | | | | 139,159 | |
| 4.50%, 8/1/425 | | | 2,375,000 | | | | 2,536,426 | |
| 5%, 12/15/34 | | | 9,439 | | | | 10,215 | |
| 5.50%, 9/1/39 | | | 1,178,393 | | | | 1,283,902 | |
| 6.50%, 4/15/18-4/1/34 | | | 92,818 | | | | 103,554 | |
| 7%, 10/1/31-10/1/37 | | | 694,474 | | | | 808,340 | |
| 8%, 4/1/16 | | | 28,932 | | | | 31,220 | |
| 9%, 8/1/22-5/1/25 | | | 12,467 | | | | 14,443 | |
8 | OPPENHEIMER BALANCED FUND/VA
|
| | | | | | | | |
| | | Principal
Amount | | | Value | |
| | | | | | | | | |
| FHLMC/FNMA/FHLB/Sponsored Continued | |
Federal Home Loan Mortgage Corp.,
Gtd. Real Estate Mtg. Investment
Conduit Multiclass
Pass-Through Certificates:
Series 2006-11, Cl. PS,
23.667%, 3/25/363 | | $ | 256,020 | | | $ | 370,733 | |
| Series 2426, Cl. BG, 6%, 3/15/17 | | | 243,327 | | | | 261,651 | |
| Series 2427, Cl. ZM, 6.50%, 3/15/32 | | | 322,972 | | | | 372,659 | |
| Series 2461, Cl. PZ, 6.50%, 6/15/32 | | | 161,506 | | | | 186,369 | |
| Series 2500, Cl. FD, 0.742%, 3/15/323 | | | 21,413 | | | | 21,612 | |
| Series 2526, Cl. FE, 0.642%, 6/15/293 | | | 28,455 | | | | 28,612 | |
| Series 2551, Cl. FD, 0.642%, 1/15/333 | | | 18,818 | | | | 18,929 | |
| Series 2626, Cl. TB, 5%, 6/1/33 | | | 418,326 | | | | 460,585 | |
| Series 3025, Cl. SJ, 23.864%, 8/15/353 | | | 68,864 | | | | 102,188 | |
| Series 3822, Cl. JA, 5%, 6/1/40 | | | 519,346 | | | | 552,757 | |
| Series 3848, Cl. WL, 4%, 4/1/40 | | | 399,339 | | | | 422,819 | |
Federal Home Loan Mortgage Corp.,
Interest-Only Stripped
Mtg.-Backed Security:
Series 183, Cl. IO, 14.834%, 4/1/276 | | | 194,663 | | | | 41,848 | |
| Series 192, Cl. IO, 12.769%, 2/1/286 | | | 53,939 | | | | 8,842 | |
| Series 2130, Cl. SC, 50.812%, 3/15/296 | | | 161,930 | | | | 32,780 | |
| Series 243, Cl. 6, 0.513%, 12/15/326 | | | 175,672 | | | | 38,310 | |
| Series 2531, Cl. ST, 99.999%, 2/15/306 | | | 145,022 | | | | 1,742 | |
| Series 2796, Cl. SD, 65.819%, 7/15/266 | | | 234,720 | | | | 47,351 | |
| Series 2802, Cl. AS, 83.524%, 4/15/336 | | | 122,517 | | | | 7,358 | |
| Series 2920, Cl. S, 66.067%, 1/15/356 | | | 1,186,287 | | | | 202,810 | |
| Series 3110, Cl. SL, 99.999%, 2/15/266 | | | 157,861 | | | | 22,043 | |
| Series 3450, Cl. BI, 12.367%, 5/15/386 | | | 222,961 | | | | 36,998 | |
| Series 3662, Cl. SM, 24.868%, 10/15/326 | | | 174,999 | | | | 23,346 | |
| Series 3736, Cl. SN, 6.506%, 10/15/406 | | | 813,675 | | | | 133,969 | |
| Federal Home Loan Mortgage Corp., | | | | | | | | |
| Principal-Only Stripped Mtg.-Backed | | | | | | | | |
| Security, Series 176, Cl. PO, | | | | | | | | |
| 3.829%, 6/1/267 | | | 55,432 | | | | 48,438 | |
| Federal National Mortgage Assn.: | | | | | | | | |
| 2.50%, 7/1/275 | | | 5,620,000 | | | | 5,792,113 | |
| 3.50%, 8/1/425 | | | 5,410,000 | | | | 5,673,738 | |
| 4%, 7/1/275 | | | 350,000 | | | | 372,313 | |
| 4.50%, 7/1/275 | | | 794,000 | | | | 851,193 | |
| 5.50%, 9/25/20 | | | 8,312 | | | | 9,109 | |
| 5.50%, 7/1/27-8/1/425 | | | 2,018,000 | | | | 2,197,471 | |
| 6%, 11/25/17-3/1/37 | | | 879,777 | | | | 967,137 | |
| 6%, 8/1/425 | | | 1,140,000 | | | | 1,252,753 | |
| 6.50%, 5/25/17-10/25/19 | | | 195,422 | | | | 210,880 | |
| 7%, 11/1/17-10/25/35 | | | 107,531 | | | | 116,199 | |
| 7.50%, 1/1/33 | | | 160,388 | | | | 195,080 | |
| 8.50%, 7/1/32 | | | 7,112 | | | | 8,842 | |
Federal National Mortgage Assn., 15 yr.:
3%, 7/1/275 | | | 8,640,000 | | | | 9,054,450 | |
| 3.50%, 7/1/275 | | | 755,000 | | | | 797,941 | |
Federal National Mortgage Assn., 30 yr.:
4%, 8/1/425 | | | 9,455,000 | | | | 10,047,415 | |
| 4.50%, 8/1/425 | | | 4,985,000 | | | | 5,344,854 | |
| | | | | | | | |
| | | Principal
Amount | | | Value | |
| | | | | | | | | |
| FHLMC/FNMA/FHLB/Sponsored Continued | |
| Federal National Mortgage Assn., | | | | | | | | |
| Gtd. Real Estate Mtg. Investment | | | | | | | | |
| Conduit Multiclass | | | | | | | | |
| Pass-Through Certificates: | | | | | | | | |
| Trust 1998-61, Cl. PL, 6%, 11/25/28 | | $ | 145,421 | | | $ | 162,885 | |
Trust 2003-130, Cl. CS,
13.61%, 12/25/333 | | | 38,095 | | | | 45,651 | |
| Trust 2003-28, Cl. KG, 5.50%, 4/25/23 | | | 662,000 | | | | 736,396 | |
| Trust 2004-101, Cl. BG, 5%, 1/25/20 | | | 838,515 | | | | 898,447 | |
| Trust 2004-9, Cl. AB, 4%, 7/1/17 | | | 30,296 | | | | 30,333 | |
Trust 2005-104, Cl. MC,
5.50%, 12/25/25 | | | 700,000 | | | | 776,908 | |
| Trust 2005-31, Cl. PB, 5.50%, 4/25/35 | | | 250,000 | | | | 313,154 | |
| Trust 2005-69, Cl. LE, 5.50%, 11/1/33 | | | 183,264 | | | | 189,593 | |
| Trust 2006-46, Cl. SW, 23.30%, 6/25/363 | | | 185,910 | | | | 267,433 | |
| Trust 2006-50, Cl. KS, 23.301%, 6/25/363 | | | 41,193 | | | | 59,849 | |
| Trust 2007-42, Cl. A, 6%, 2/1/33 | | | 402,561 | | | | 418,850 | |
| Trust 2009-36, Cl. FA, 1.185%, 6/25/373 | | | 456,623 | | | | 463,709 | |
| Trust 2009-37, Cl. HA, 4%, 4/1/19 | | | 353,430 | | | | 374,208 | |
| Trust 2009-70, Cl. PA, 5%, 8/1/35 | | | 366,908 | | | | 373,047 | |
| Trust 2011-15, Cl. DA, 4%, 3/1/41 | | | 225,788 | | | | 241,332 | |
| Trust 2011-3, Cl. KA, 5%, 4/1/40 | | | 387,725 | | | | 422,360 | |
| Federal National Mortgage Assn., | | | | | | | | |
| Interest-Only Stripped | | | | | | | | |
| Mtg.-Backed Security: | | | | | | | | |
| Trust 2001-65, Cl. S, 34.443%, 11/25/316 | | | 407,680 | | | | 79,328 | |
| Trust 2001-81, Cl. S, 26.301%, 1/25/326 | | | 98,300 | | | | 20,749 | |
Trust 2002-47, Cl. NS,
33.878%, 4/25/326 | | | 248,591 | | | | 49,682 | |
| Trust 2002-51, Cl. S, 34.116%, 8/25/326 | | | 228,266 | | | | 45,618 | |
| Trust 2002-52, Cl. SD, 40.43%, 9/25/326 | | | 295,994 | | | | 65,446 | |
Trust 2002-77, Cl. SH,
42.876%, 12/18/326 | | | 146,409 | | | | 30,398 | |
Trust 2002-84, Cl. SA,
36.534%, 12/25/326 | | | 379,458 | | | | 69,002 | |
| Trust 2002-9, Cl. MS, 30.893%, 3/25/326 | | | 104,411 | | | | 20,521 | |
| Trust 2003-33, Cl. SP, 99.999%, 5/25/336 | | | 430,084 | | | | 67,658 | |
| Trust 2003-4, Cl. S, 32.188%, 2/25/336 | | | 242,480 | | | | 44,012 | |
| Trust 2003-46, Cl. IH, 99.999%, 6/1/236 | | | 883,806 | | | | 120,962 | |
Trust 2003-89, Cl. XS,
99.999%, 11/25/326 | | | 59,398 | | | | 1,332 | |
Trust 2004-54, Cl. DS,
48.962%, 11/25/306 | | | 240,776 | | | | 48,658 | |
| Trust 2004-56, Cl. SE, 17.45%, 10/25/336 | | | 77,158 | | | | 13,071 | |
| Trust 2005-14, Cl. SE, 45.002%, 3/25/356 | | | 121,998 | | | | 20,079 | |
| Trust 2005-40, Cl. SA, 57.95%, 5/25/356 | | | 635,981 | | | | 124,580 | |
| Trust 2005-5, Cl. SD, 11.622%, 1/25/356 | | | 172,117 | | | | 27,086 | |
Trust 2005-71, Cl. SA,
63.085%, 8/25/256 | | | 663,088 | | | | 95,002 | |
Trust 2005-93, Cl. SI,
21.417%, 10/25/356 | | | 187,295 | | | | 27,647 | |
| Trust 2006-60, Cl. DI, 43.055%, 4/25/356 | | | 71,781 | | | | 9,776 | |
Trust 2007-84, Cl. DS,
12.971%, 8/25/376 | | | 238,243 | | | | 41,978 | |
| Trust 2007-88, Cl. XI, 42.67%, 6/25/376 | | | 502,266 | | | | 84,564 | |
| Trust 2008-46, Cl. EI, 12.78%, 6/25/386 | | | 228,236 | | | | 40,657 | |
9 | OPPENHEIMER BALANCED FUND/VA
|
STATEMENT OF INVESTMENTS Unaudited / Continued
| | | | | | | | |
| | | Principal
Amount | | | Value | |
| | | | | | | | | |
| FHLMC/FNMA/FHLB/Sponsored Continued | |
| Federal National Mortgage Assn., | | | | | | | | |
| Interest-Only Stripped | | | | | | | | |
| Mtg.-Backed Security: Continued | | | | | | | | |
Trust 2008-55, Cl. SA,
22.774%, 7/25/386 | | $ | 564,180 | | | $ | 90,759 | |
| Trust 2008-67, Cl. KS, 56.708%, 8/25/346 | | | 318,833 | | | | 24,035 | |
| Trust 2009-8, Cl. BS, 18.395%, 2/25/246 | | | 145,261 | | | | 14,423 | |
| Trust 222, Cl. 2, 24.455%, 6/1/236 | | | 423,719 | | | | 79,309 | |
| Trust 233, Cl. 2, 44.351%, 8/1/236 | | | 276,221 | | | | 61,889 | |
| Trust 252, Cl. 2, 37.95%, 11/1/236 | | | 361,910 | | | | 77,681 | |
| Trust 319, Cl. 2, 4.842%, 2/1/326 | | | 99,677 | | | | 15,476 | |
| Trust 320, Cl. 2, 10.38%, 4/1/326 | | | 27,559 | | | | 4,366 | |
| Trust 321, Cl. 2, 0.922%, 4/1/326 | | | 327,257 | | | | 50,478 | |
| Trust 331, Cl. 9, 12.993%, 2/1/336 | | | 329,407 | | | | 51,646 | |
| Trust 334, Cl. 17, 20.54%, 2/1/336 | | | 199,677 | | | | 44,343 | |
| Trust 339, Cl. 12, 1.903%, 7/1/336 | | | 319,355 | | | | 61,310 | |
| Trust 339, Cl. 7, 0%, 7/1/336,8 | | | 972,855 | | | | 134,313 | |
| Trust 343, Cl. 13, 0%, 9/1/336,8 | | | 299,066 | | | | 41,480 | |
| Trust 345, Cl. 9, 0%, 1/1/346,8 | | | 353,020 | | | | 44,024 | |
| Trust 351, Cl. 10, 0%, 4/1/346,8 | | | 43,470 | | | | 6,393 | |
| Trust 351, Cl. 8, 0%, 4/1/346,8 | | | 141,556 | | | | 20,168 | |
| Trust 356, Cl. 10, 0%, 6/1/356,8 | | | 110,998 | | | | 15,504 | |
| Trust 356, Cl. 12, 0%, 2/1/356,8 | | | 60,393 | | | | 8,471 | |
| Trust 362, Cl. 13, 0%, 8/1/356,8 | | | 394,710 | | | | 65,013 | |
| Trust 364, Cl. 16, 0%, 9/1/356,8 | | | 297,978 | | | | 47,704 | |
| Federal National Mortgage Assn., | | | | | | | | |
| Principal-Only Stripped Mtg.-Backed | | | | | | | | |
| Security, Trust 1993-184, Cl. M, | | | | | | | | |
| 4.355%, 9/25/237 | | | 153,374 | | | | 144,407 | |
| | | | | | |
|
|
|
| | | | | | | | 59,288,649 | |
| GNMA/Guaranteed—0.3% | | | | | | | | |
Government National Mortgage Assn.:
7%, 1/30/24 | | | 72,348 | | | | 85,072 | |
| 7.50%, 1/30/23-6/30/24 | | | 70,839 | | | | 81,123 | |
| 8%, 5/30/17-4/15/23 | | | 63,136 | | | | 73,337 | |
| 8.50%, 8/1/17-12/15/17 | | | 16,919 | | | | 18,164 | |
Government National Mortgage Assn., Interest-Only Stripped Mtg.-Backed Security: Series 2001-21, Cl. SB,
88.053%, 1/16/276 | | | 291,417 | | | | 54,004 | |
Series 2002-15, Cl. SM,
79.607%, 2/16/326 | | | 337,904 | | | | 66,737 | |
Series 2002-76, Cl. SY,
81.88%, 12/16/266 | | | 751,087 | | | | 157,222 | |
Series 2004-11, Cl. SM,
70.41%, 1/17/306 | | | 265,519 | | | | 62,327 | |
Series 2007-17, Cl. AI,
22.03%, 4/16/376 | | | 751,548 | | | | 149,458 | |
Series 2011-52, Cl. HS,
9.436%, 4/16/416 | | | 357,224 | | | | 91,547 | |
| | | | | | |
|
|
|
| | | | | | | | 838,991 | |
| | | | | | | | |
| | | Principal
Amount | | | Value | |
| | | | | | | | | |
| Other Agency—0.2% | | | | | | | | |
NCUA Guaranteed Notes
Trust 2010-R3, Gtd. Nts.,
Series 2010-R3, Cl. 2A,
0.799%, 12/8/203 | | $ | 535,030 | | | $ | 537,287 | |
| Non-Agency—5.0% | | | | | | | | |
| Commercial—3.2% | | | | | | | | |
Banc of America Commercial Mortgage Trust 2007-1,
Commercial Mtg. Pass-Through
Certificates, Series 2007-1, Cl. A4,
5.451%, 1/1/49 | | | 515,000 | | | | 585,872 | |
Banc of America Commercial Mortgage, Inc., Commercial Mtg.
Pass-Through Certificates,
Series 2007-3, Cl. A4, 5.805%, 6/1/493 | | | 270,000 | | | | 306,418 | |
Bear Stearns ARM Trust 2007-4, Mtg.
Pass-Through Certificates, Series 2007-4, Cl. 22A1, 5.569%, 6/1/473 | | | 222,838 | | | | 165,784 | |
Bear Stearns Commercial Mortgage Securities Trust2007-PWR17,
Commercial Mtg.
Pass-Through Certificates,
Series 2007-PWR17, Cl. AM,
5.915%, 6/1/503 | | | 305,000 | | | | 323,129 | |
CFCRE Commercial Mortgage Trust,
Commercial Mtg. Pass-Through
Certificates, Series 2011-C1, Cl. A1,
1.871%, 4/1/442 | | | 89,375 | | | | 89,877 | |
CHL Mortgage Pass-Through
Trust 2007-J3, Mtg. Pass-Through
Certificates, Series 2007-J3, Cl. A9,
6%, 7/1/37 | | | 45,933 | | | | 33,625 | |
Citigroup Commercial Mortgage
Trust 2008-C7, Commercial Mtg.
Pass-Through Certificates,
Series 2008-C7, Cl. A4,
6.276%, 12/1/493 | | | 460,000 | | | | 539,410 | |
Citigroup, Inc./Deutsche
Bank 2007-CD4 Commercial Mortgage Trust,
Commercial Mtg. Pass-Through Certificates, Series 2007-CD4, Cl. A4,
5.322%, 12/1/49 | | | 425,000 | | | | 474,031 | |
Deutsche Alt-B Securities, Inc., Mtg.
Pass-Through Certificates,
Series 2006-AB4, Cl. A1A,
6.005%, 10/25/36 | | | 317,733 | | | | 187,114 | |
Deutsche Mortgage & Asset
Receiving, Commercial Mtg.
Pass-Through Certificates,
Interest-Only Stripped Mtg.-Backed Security, Series 2010-C1, Cl. XPA,
4.883%, 9/1/202,6 | | | 3,091,820 | | | | 210,006 | |
10 | OPPENHEIMER BALANCED FUND/VA
|
| | | | | | | | |
| | | Principal
Amount | | | Value | |
| | | | | | | | | |
| Commercial Continued | | | | | | | | |
First Horizon Alternative
Mortgage Securities Trust 2004-FA2,
Mtg. Pass-Through Certificates,
Series 2004-FA2, Cl. 3A1, 6%, 1/25/35 | | $ | 312,733 | | | $ | 301,941 | |
First Horizon Alternative
Mortgage Securities Trust 2007-FA2,
Mtg. Pass-Through Certificates,
Series 2007-FA2, Cl. 1A1,
5.50%, 4/25/37 | �� | | 506,085 | | | | 317,430 | |
Greenwich Capital Commercial Funding Corp./Commercial Mortgage Trust 2006-GG7, Commercial Mtg. Pass-Through Certificates,
Series 2006-GG7, Cl. AM,
6.071%, 7/1/383 | | | 190,000 | | | | 199,071 | |
Greenwich Capital Commercial Funding Corp./Commercial Mortgage Trust 2007-GG11, Commercial Mtg. Pass-Through Certificates,
Series 2007-GG11, Cl. A4,
5.736%, 12/1/49 | | | 300,000 | | | | 333,720 | |
Greenwich Capital Commercial Funding Corp./Commercial Mortgage Trust 2007-GG9, Commercial Mtg. Pass-Through Certificates,
Series 2007-GG9, Cl. AM,
5.475%, 3/1/39 | | | 115,000 | | | | 114,518 | |
GS Mortgage Securities Corp. II, Commercial Mtg. Obligations,
Series 2011-GC3, Cl. A1,
2.331%, 3/1/44 | | | 239,769 | | | | 245,071 | |
GS Mortgage Securities
Trust 2006-GG6, Commercial Mtg.
Pass-Through Certificates,
Series 2006-GG6, Cl. AM,
5.622%, 4/1/38 | | | 286,699 | | | | 292,568 | |
GSR Mortgage Loan Trust 2005-AR4,
Mtg. Pass-Through Certificates,
Series 2005-AR4, Cl. 6A1, 5.25%, 7/1/35 | | | 115,632 | | | | 113,351 | |
IndyMac Index Mortgage
Loan Trust 2005-AR23, Mtg.
Pass-Through Certificates,
Series 2005-AR23, Cl. 6A1,
5.009%, 11/1/353 | | | 293,110 | | | | 214,783 | |
JPMorgan Chase Commercial Mortgage Securities Corp.,
Commercial Mtg.
Pass-Through Certificates:
Series 2011-C3, Cl. A1,
1.875%, 2/1/462 | | | 283,252 | | | | 286,169 | |
Series 2007-LDPX, Cl. A2S2,
5.187%, 1/1/492 | | | 128,494 | | | | 129,887 | |
Series 2007-LDP10, Cl. A3S,
5.317%, 1/1/49 | | | 520,000 | | | | 534,014 | |
| | | | | | | | |
| | | Principal
Amount | | | Value | |
| | | | | | | | | |
| Commercial Continued | | | | | | | | |
JPMorgan Chase Commercial Mortgage Securities Corp.,
Commercial Mtg.
Pass-Through
Certificates: Continued | | | | | | | | |
Series 2007-LDPX, Cl. A3,
5.42%, 1/15/49 | | $ | 60,000 | | | $ | 67,437 | |
| Series 2007-LD11, Cl. A2, | | | | | | | | |
| 5.994%, 6/15/493 | | | 214,369 | | | | 214,715 | |
JPMorgan Mortgage Trust 2007-S3,
Mtg. Pass-Through Certificates,
Series 2007-S3, Cl. 1A90, 7%, 8/1/37 | | | 313,103 | | | | 271,429 | |
LB-UBS Commercial Mortgage
Trust 2007-C1, Commercial Mtg.
Pass-Through Certificates,
Series 2007-C1, Cl. A2, 5.318%, 2/11/40 | | | 51,224 | | | | 51,629 | |
LB-UBS Commercial
Mortgage Trust 2007-C6,
Commercial Mtg.
Pass-Through Certificates,
Series 2007-C6, Cl. A4, 5.858%, 7/11/40 | | | 620,000 | | | | 711,212 | |
Mastr Adjustable Rate Mortgages
Trust 2004-13, Mtg. Pass-Through
Certificates, Series 2004-13,
Cl. 2A2, 2.634%, 4/1/343 | | | 176,493 | | | | 177,264 | |
Merrill Lynch Mortgage
Trust 2006-C2, Commercial Mtg.
Pass-Through Certificates,
Series 2006-C2, Cl. AM, 5.782%, 8/1/43 | | | 290,000 | | | | 302,756 | |
Morgan Stanley Capital I
Trust 2007-IQ15, Commercial Mtg.
Pass-Through Certificates,
Series 2007-IQ15, Cl. AM,
6.076%, 6/1/493 | | | 345,000 | | | | 344,365 | |
Structured Adjustable Rate
Mortgage Loan Trust, Mtg.
Pass-Through Certificates,
Series 2007-6, Cl. 3A1, 4.89%, 7/1/373 | | | 297,065 | | | | 196,327 | |
Wachovia Bank Commercial
Mortgage Trust 2006-C28,
Commercial Mtg. Pass-Through
Certificates, Series 2006-C28, Cl. A4,
5.572%, 10/1/48 | | | 40,000 | | | | 44,495 | |
Wachovia Bank Commercial
Mortgage Trust 2007-C34,
Commercial Mtg. Pass-Through Certificates, Series 2007-C34, Cl. A3,
5.678%, 5/1/46 | | | 380,000 | | | | 438,967 | |
WaMu Mortgage Pass-Through
Certificates 2005-AR14 Trust,
Mtg. Pass-Through Certificates,
Series 2005-AR14, Cl. 1A4,
2.451%, 12/1/353 | | | 144,798 | | | | 124,061 | |
11 | OPPENHEIMER BALANCED FUND/VA
|
STATEMENT OF INVESTMENTS Unaudited / Continued
| | | | | | | | |
| | | Principal
Amount | | | Value | |
| | | | | | | | | |
| Commercial Continued | | | | | | | | |
Wells Fargo Mortgage-Backed
Securities 2005-AR1 Trust,
Mtg. Pass-Through Certificates,
Series 2005-AR1, Cl. 1A1,
2.61%, 2/1/353 | | $ | 63,101 | | | $ | 58,932 | |
Wells Fargo Mortgage-Backed
Securities 2007-AR8 Trust,
Mtg. Pass-Through Certificates,
Series 2007-AR8, Cl. A1,
6.019%, 11/1/373 | | | 194,997 | | | | 160,340 | |
WFRBS Commercial Mortgage
Trust 2011-C3, Interest-Only
Commercial Mtg. Pass-Through
Certificates, Series 2011-C3, Cl. XA,
8.956%, 3/1/446 | | | 4,109,964 | | | | 352,121 | |
| | | | | | |
|
|
|
| | | | | | | | 9,513,839 | |
| Multifamily—0.3% | | | | | | | | |
Citigroup Mortgage Loan Trust,
Inc. 2006-AR3, Mtg. Pass-Through
Certificates, Series 2006-AR3, Cl. 1A2A,
5.625%, 6/1/363 | | | 185,000 | | | | 160,188 | |
JPMorgan Mortgage
Trust 2007-A3, Mtg. Pass-Through
Certificates, Series 2007-A3, Cl. 3A2M,
5.133%, 5/1/373 | | | 39,431 | | | | 33,720 | |
Wells Fargo Mortgage-Backed
Securities 2006-AR6 Trust, Mtg.
Pass-Through Certificates,
Series 2006-AR6, Cl. 3A1, | | | | | | | | |
| 2.668%, 3/25/363 | | | 708,936 | | | | 602,507 | |
| | | | | | |
|
|
|
| | | | | | | | 796,415 | |
| Other—0.2% | | | | | | | | |
Greenwich Capital Commercial
Funding Corp./Commercial
Mortgage Trust 2007-GG9, Commercial Mtg.
Pass-Through Certificates,
Series 2007-GG9, Cl. A4,
5.444%, 3/1/39 | | | 555,000 | | | | 617,921 | |
| Residential—1.3% | | | | | | | | |
Argent Securities Trust 2004-W8,
Asset-Backed Pass-Through Certificates, Series 2004-W8, Cl. A2,
1.205%, 5/25/343 | | | 140,887 | | | | 121,152 | |
Banc of America Commercial Mortgage, Inc., Commercial Mtg.
Pass-Through Certificates,
Series 2007-4, Cl. AM, 5.984%, 2/1/513 | | | 320,000 | | | | 321,856 | |
Banc of America Funding 2007-C
Trust, Mtg. Pass-Through Certificates,
Series 2007-C, Cl. 1A4,
5.532%, 5/1/363 | | | 80,000 | | | | 71,609 | |
| | | | | | | | |
| | | Principal
Amount | | | Value | |
| | | | | | | | | |
| Residential Continued | | | | | | | | |
Banc of America Mortgage
Securities, Inc., Mtg. Pass-Through
Certificates, Series 2004-E, Cl. 2A6,
3.109%, 6/1/343 | | $ | 235,383 | | | $ | 224,839 | |
Carrington Mortgage Loan Trust,
Asset-Backed Pass-Through
Certificates, Series 2006-FRE1, Cl. A2,
0.355%, 7/25/363 | | | 153,464 | | | | 142,293 | |
CHL Mortgage Pass-Through
Trust 2005-29, Mtg. Pass-Through
Certificates, Series 2005-29, Cl. A1,
5.75%, 12/1/35 | | | 57,034 | | | | 50,124 | |
CHL Mortgage Pass-Through
Trust 2006-17, Mtg. Pass-Through
Certificates, Series 2006-17, Cl. A2,
6%, 12/1/36 | | | 311,779 | | | | 262,529 | |
CHL Mortgage Pass-Through
Trust 2006-6, Mtg. Pass-Through
Certificates, Series 2006-6, Cl. A3,
6%, 4/1/36 | | | 124,973 | | | | 113,249 | |
Countrywide Alternative Loan
Trust 2005-29CB, Mtg.
Pass-Through Certificates,
Series 2005-29CB, Cl. A4, 5%, 7/1/35 | | | 750,799 | | | | 542,725 | |
Countrywide Alternative Loan
Trust 2007-19, Mtg. Pass-Through
Certificates, Series 2007-19, Cl. 1A34,
6%, 8/1/37 | | | 182,731 | | | | 128,922 | |
Countrywide Home Loans,
Asset-Backed Certificates:
Series 2002-4, Cl. A1,
0.985%, 2/25/333 | | | 6,454 | | | | 6,316 | |
Series 2005-16, Cl. 2AF2,
5.331%, 5/1/363 | | | 399,697 | | | | 310,748 | |
CSMC Mortgage-Backed Trust 2007-3,
Mtg. Pass-Through Certificates,
Series 2007-3, Cl. 2A10, 6%, 4/1/37 | | | 198,497 | | | | 166,573 | |
CWABS Asset-Backed Certificates Trust 2006-25, Asset-Backed Certificates, Series 2006-25, Cl. 2A2,
0.365%, 6/25/473 | | | 303,177 | | | | 298,737 | |
GSR Mortgage Loan Trust 2006-5F,
Mtg. Pass-Through Certificates,
Series 2006-5F, Cl. 2A1, 6%, 6/1/36 | | | 124,526 | | | | 113,412 | |
JPMorgan Alternative Loan
Trust 2006-S4, Mtg. Pass-Through
Certificates, Series 2006-S4, Cl. A6,
5.71%, 12/1/36 | | | 113,934 | | | | 98,989 | |
RALI Series 2003-QS1 Trust,
Mtg. Asset-Backed Pass-Through
Certificates, Series 2003-QS1, Cl. A2,
5.75%, 1/25/33 | | | 142,915 | | | | 148,604 | |
12 | OPPENHEIMER BALANCED FUND/VA
|
| | | | | | | | |
| | | Principal
Amount | | | Value | |
| | | | | | | | | |
| Residential Continued | | | | | | | | |
RALI Series 2006-QS13 Trust, Mtg.
Asset-Backed Pass-Through
Certificates, Series 2006-QS13, Cl. 1A8,
6%, 9/25/36 | | $ | 22,465 | | | $ | 14,803 | |
Residential Asset Securitization
Trust 2005-A15, Mtg. Pass-Through
Certificates, Series 2005-A15, Cl. 1A4,
5.75%, 2/1/36 | | | 37,341 | | | | 29,339 | |
WaMu Mortgage Pass-Through
Certificates 2007-HY5 Trust, Mtg.
Pass-Through Certificates,
Series 2007-HY5, Cl. 3A1,
5.312%, 5/1/373 | | | 180,844 | | | | 160,865 | |
Wells Fargo Alternative
Loan 2007-PA5 Trust, Mtg.
Asset-Backed Pass-Through Certificates, Series 2007-PA5, Cl. 1A1,
6.25%, 11/1/37 | | | 164,017 | | | | 148,785 | |
Wells Fargo Mortgage-Backed Securities 2005-9 Trust, Mtg.
Pass-Through Certificates,
Series 2005-9, Cl. 2A6, 5.25%, 10/25/35 | | | 99,100 | | | | 100,272 | |
Wells Fargo Mortgage-Backed Securities 2006-AR14 Trust, Mtg.
Pass-Through Certificates,
Series 2006-AR14, Cl. 1A2,
5.662%, 10/1/363 | | | 182,644 | | | | 165,210 | |
| | | | | | |
|
|
|
| | | | | | |
| 3,741,951
|
|
Total Mortgage-Backed Obligations
(Cost $73,509,290) | | | | | | | 75,335,053 | |
| U.S. Government Obligations—0.8% | | | | | | | | |
Federal Home Loan
Mortgage Corp. Nts.:
1%, 7/28/17 | | | 105,000 | | | | 105,127 | |
| 1.25%, 5/12/17 | | | 150,000 | | | | 152,233 | |
| 1.75%, 5/30/19 | | | 215,000 | | | | 220,407 | |
| 2.375%, 1/13/229 | | | 611,000 | | | | 628,913 | |
| 5.25%, 4/18/16 | | | 300,000 | | | | 351,494 | |
| 5.50%, 7/18/16 | �� | | 65,000 | | | | 77,316 | |
| Federal National Mortgage Assn. Nts.: | | | | | | | | |
| 1.125%, 4/27/17 | | | 549,000 | | | | 555,062 | |
| 5.375%, 6/12/17 | | | 175,000 | | | | 212,358 | |
| U.S. Treasury Nts., 1.75%, 5/15/22 | | | 82,000 | | | | 82,756 | |
| | | | | | |
|
|
|
Total U.S. Government Obligations
(Cost $2,313,595) | | | | | | | 2,385,666 | |
Non-Convertible Corporate Bonds and
Notes—18.9% | |
| Consumer Discretionary—3.1% | | | | | | | | |
| Auto Components—0.1% | |
| Dana Holding Corp., 6.75% Sr. Unsec. Nts., 2/15/21 | | | 289,000 | | | | 313,565 | |
| | | | | | | | |
| | | Principal
Amount | | | Value | |
| | | | | | | | | |
| Automobiles—0.3% | | | | | | | | |
DaimlerChrysler NA Holdings Corp.,
8.50% Nts., 1/18/31 | | $ | 164,000 | | | $ | 251,855 | |
Ford Motor Credit Co. LLC,
5.875% Sr. Unsec. Nts., 8/2/21 | | | 600,000 | | | | 669,172 | |
| | | | | | |
|
|
|
| | | | | | | | 921,027 | |
| Diversified Consumer Services—0.1% | |
Service Corp. International,
6.75% Sr. Unsec. Nts., 4/1/15 | | | 344,000 | | | | 374,960 | |
| Hotels, Restaurants & Leisure—0.3% | | | | | | | | |
| Darden Restaurants, Inc., 4.50% Sr. Unsec. Unsub. Nts., 10/15/21 | | | 163,000 | | | | 172,562 | |
| Hyatt Hotels Corp., 5.75% Sr. Unsec. Unsub. Nts., 8/15/152 | | | 520,000 | | | | 570,693 | |
| Starwood Hotels & Resorts Worldwide, Inc., 7.15% Sr. Unsec. Unsub. Nts., 12/1/19 | | | 79,000 | | | | 93,284 | |
| | | | | | |
|
|
|
| | | | | | | | 836,539 | |
| Household Durables—0.3% | |
| Jarden Corp., 6.125% Sr. Unsec. Nts., 11/15/22 | | | 323,000 | | | | 342,380 | |
Newell Rubbermaid, Inc.,
5.50% Sr. Unsec. Nts., 4/15/13 | | | 330,000 | | | | 341,245 | |
| Whirlpool Corp., 5.50% Sr. Unsec. Unsub. Nts., 3/1/13 | | | 134,000 | | | | 137,565 | |
| | | | | | |
|
|
|
| | | | | | | | 821,190 | |
| Media—1.0% | | | | | | | | |
| CBS Corp., 4.85% Sr. Unsec. Unsub. Nts., 7/1/42 | | | 97,000 | | | | 95,444 | |
| Comcast Cable Communications Holdings, Inc., 9.455% Sr. Unsec. Nts., 11/15/22 | | | 205,000 | | | | 299,189 | |
| CSC Holdings, Inc., 7.625% Sr. Unsec. Debs., 7/15/18 | | | 298,000 | | | | 334,505 | |
| DIRECTV Holdings LLC/DIRECTV Financing Co., Inc., 5.15% Sr. Unsec. Nts., 3/15/42 | | | 180,000 | | | | 182,099 | |
| DISH DBS Corp., 6.75% Sr. Unsec. Nts., 6/1/21 | | | 317,000 | | | | 343,945 | |
| Historic TW, Inc., 9.125% Debs., 1/15/13 | | | 115,000 | | | | 119,801 | |
| Interpublic Group of Cos., Inc. (The): | | | | | | | | |
| 6.25% Sr. Unsec. Nts., 11/15/14 | | | 120,000 | | | | 131,700 | |
| 10% Sr. Unsec. Nts., 7/15/17 | | | 324,000 | | | | 367,740 | |
| News America, Inc., 6.15% Sr. Unsec. Nts., 2/15/41 | | | 109,000 | | | | 128,090 | |
Time Warner Entertainment Co. LP,
8.375% Sr. Nts., 7/15/33 | | | 181,000 | | | | 246,132 | |
| Time Warner, Inc., 9.15% Debs., 2/1/23 | | | 38,000 | | | | 52,950 | |
13 | OPPENHEIMER BALANCED FUND/VA
|
STATEMENT OF INVESTMENTS Unaudited / Continued
| | | | | | | | |
| | | Principal
Amount | | | Value | |
| | | | | | | | | |
| Media Continued | | | | | | | | |
| Virgin Media Secured Finance plc: | | | | | | | | |
| 5.25% Sr. Sec. Nts., 1/15/21 | | $ | 195,000 | | | $ | 216,554 | |
| 6.50% Sr. Sec. Nts., 1/15/18 | | | 417,000 | | | | 455,573 | |
| | | | | | |
|
|
|
| | | | | | | | 2,973,722 | |
| Multiline Retail—0.4% | | | | | | | | |
| Dollar General Corp., 4.125% Nts., 7/15/175 | | | 289,000 | | | | 294,419 | |
| Family Dollar Stores, Inc., 5% Sr. Unsec. Nts., 2/1/21 | | | 189,000 | | | | 203,520 | |
Macy’s Retail Holdings, Inc., 5.75%
Sr. Unsec. Nts., 7/15/14 | | | 500,000 | | | | 542,954 | |
| Target Corp., 4% Sr. Unsec. Nts., 7/1/42 | | | 212,000 | | | | 210,057 | |
| | | | | | |
|
|
|
| | | | | | | | 1,250,950 | |
| Specialty Retail—0.5% | | | | | | | | |
| Limited Brands, Inc., 6.625% Sr. Nts., 4/1/21 | | | 315,000 | | | | 345,713 | |
| Rent-A-Center, Inc., 6.625% Sr. Unsec. Nts., 11/15/20 | | | 355,000 | | | | 379,850 | |
Sally Holdings LLC/Sally Capital, Inc.,
6.875% Sr. Unsec. Nts., 11/15/19 | | | 323,000 | | | | 352,878 | |
| Staples, Inc., 9.75% Sr. Unsec. Unsub. Nts., 1/15/14 | | | 273,000 | | | | 305,267 | |
| | | | | | |
|
|
|
| | | | | | | | 1,383,708 | |
| Textiles, Apparel & Luxury Goods—0.1% | |
Phillips-Van Heusen Corp., 7.375%
Sr. Unsec. Unsub. Nts., 5/15/20 | | | 277,000 | | | | 308,163 | |
| Consumer Staples—1.3% | | | | | | | | |
| Beverages—0.4% | | | | | | | | |
Anheuser-Busch InBev Worldwide, Inc.,
8.20% Sr. Unsec. Unsub. Nts., 1/15/39 | | | 125,000 | | | | 199,668 | |
Constellation Brands, Inc.,
6% Sr. Unsec. Unsub. Nts., 5/1/22 | | | 315,000 | | | | 339,413 | |
| Fortune Brands, Inc., 6.375% Sr. Unsec. Unsub. Nts., 6/15/14 | | | 87,000 | | | | 95,351 | |
| Pernod-Ricard SA, 4.25% Sr. Unsec. Nts., 7/15/222 | | | 307,000 | | | | 315,715 | |
| SABMiller Holdings, Inc., 4.95% Sr. Unsec. Nts., 1/15/42 | | | 122,000 | | | | 135,781 | |
| | | | | | |
|
|
|
| | | | | | | | 1,085,928 | |
| Food & Staples Retailing—0.1% | | | | | | | | |
Delhaize Group:
5.70% Sr. Unsec. Nts., 10/1/40 | | | 94,000 | | | | 79,305 | |
| 5.875% Sr. Unsec. Unsub. Bonds, 2/1/14 | | | 279,000 | | | | 293,928 | |
| | | | | | |
|
|
|
| | | | | | | | 373,233 | |
| Food Products—0.5% | | | | | | | | |
Bunge Ltd. Finance Corp.:
5.35% Sr. Unsec. Unsub. Nts., 4/15/14 | | | 236,000 | | | | 249,155 | |
| | | | | | | | |
| | | Principal
Amount | | | Value | |
| | | | | | | | | |
| Food Products Continued | | | | | | | | |
| Bunge Ltd. Finance Corp.: Continued | | | | | | | | |
| 8.50% Sr. Unsec. Nts., 6/15/19 | | $ | 207,000 | | | $ | 258,922 | |
Kraft Foods Group, Inc.,
5% Sr. Unsec. Nts., 6/4/422 | | | 76,000 | | | | 80,872 | |
Kraft Foods, Inc.,
6.50% Sr. Unsec. Unsub. Nts., 2/9/40 | | | 192,000 | | | | 247,857 | |
TreeHouse Foods, Inc.,
7.75% Sr. Unsec. Nts., 3/1/18 | | | 353,000 | | | | 383,446 | |
Tyson Foods, Inc.,
4.50% Sr. Unsec. Unsub. Nts., 6/15/22 | | | 150,000 | | | | 155,250 | |
| | | | | | |
|
|
|
| | | | | | | | 1,375,502 | |
| Tobacco—0.3% | | | | | | | | |
Altria Group, Inc.,
10.20% Sr. Unsec. Nts., 2/6/39 | | | 262,000 | | | | 427,993 | |
Lorillard Tobacco Co.,
7% Sr. Unsec. Nts., 8/4/41 | | | 221,000 | | | | 240,775 | |
Reynolds American, Inc.,
7.25% Sr. Sec. Nts., 6/1/13 | | | 319,000 | | | | 336,816 | |
| | | | | | |
|
|
|
| | | | | | | | 1,005,584 | |
| Energy—2.3% | | | | | | | | |
| Energy Equipment & Services—0.6% | | | | | | | | |
Ensco plc,
4.70% Sr. Unsec. Nts., 3/15/21 | | | 350,000 | | | | 382,194 | |
Nabors Industries, Inc.,
6.15% Sr. Unsec. Unsub. Nts., 2/15/18 | | | 425,000 | | | | 488,535 | |
Noble Holding International Ltd.,
7.375% Sr. Unsec. Bonds, 3/15/14 | | | 276,000 | | | | 301,867 | |
Precision Drilling Corp.:
6.50% Sr. Unsec. Nts., 12/15/21 | | | 152,000 | | | | 155,800 | |
| 6.625% Sr. Unsec. Nts., 11/15/20 | | | 145,000 | | | | 150,075 | |
Rowan Cos., Inc.,
4.875% Sr. Unsec. Nts., 6/1/22 | | | 198,000 | | | | 200,277 | |
| | | | | | |
|
|
|
| | | | | | | | 1,678,748 | |
| Oil, Gas & Consumable Fuels—1.7% | | | | | | | | |
Anadarko Petroleum Corp.,
6.20% Sr. Unsec. Nts., 3/15/40 | | | 117,000 | | | | 133,438 | |
Apache Corp.,
4.75% Sr. Unsec. Unsub. Nts., 4/15/43 | | | 107,000 | | | | 119,532 | |
Canadian Oil Sands Ltd.,
5.80% Sr. Unsec. Nts., 8/15/132 | | | 318,000 | | | | 331,953 | |
El Paso Pipeline Partners LP,
6.50% Sr. Unsec. Nts., 4/1/20 | | | 488,000 | | | | 569,153 | |
Energy Transfer Partners LP:
4.65% Sr. Unsec. Unsub. Nts., 6/1/21 | | | 256,000 | | | | 265,150 | |
| 5.20% Sr. Unsec. Unsub. Nts., 2/1/22 | | | 92,000 | | | | 98,780 | |
Kaneb Pipe Line Operating
Partnership LP,
5.875% Sr. Unsec. Nts., 6/1/13 | | | 566,000 | | | | 584,136 | |
14 | OPPENHEIMER BALANCED FUND/VA
|
| | | | | | | | |
| | | Principal
Amount | | | Value | |
| | | | | | | | | |
| Oil, Gas & Consumable Fuels Continued | |
Kinder Morgan Energy Partners LP,
3.95% Sr. Unsec. Unsub. Nts., 9/1/22 | | $ | 109,000 | | | $ | 110,745 | |
Newfield Exploration Co.,
6.875% Sr. Unsec. Sub. Nts., 2/1/20 | | | 308,000 | | | | 329,560 | |
Nexen, Inc., 6.40% Sr. Unsec.
Unsub. Bonds, 5/15/37 | | | 363,000 | | | | 386,333 | |
| Phillips 66, 4.30% Unsec. Nts., 4/1/222 | | | 214,000 | | | | 225,750 | |
Plains All American Pipeline LP/PAA
Finance Corp., 5.15% Sr. Unsec.
Unsub. Nts., 6/1/42 | | | 114,000 | | | | 121,103 | |
| Range Resources Corp., 8% Sr. Unsec. Sub. Nts., 5/15/19 | | | 314,000 | | | | 344,615 | |
| Ras Laffan Liquefied Natural Gas Co. Ltd. III, 5.50% Sr. Sec. Nts., 9/30/144 | | | 291,000 | | | | 314,644 | |
Rockies Express Pipeline LLC,
3.90% Sr. Unsec. Unsub. Nts., 4/15/152 | | | 327,000 | | | | 316,373 | |
Southwestern Energy Co.,
4.10% Sr. Unsec. Nts., 3/15/222 | | | 160,000 | | | | 162,619 | |
Woodside Finance Ltd.:
4.60% Sr. Unsec. Nts., 5/10/212 | | | 245,000 | | | | 262,932 | |
| 5% Sr. Unsec. Nts., 11/15/132 | | | 312,000 | | | | 325,418 | |
| | | | | | |
|
|
|
| | | | | | | | 5,002,234 | |
| Financials—6.6% | | | | | | | | |
| Capital Markets—1.5% | | | | | | | | |
Blackstone Holdings Finance Co. LLC,
6.625% Sr. Unsec. Nts., 8/15/192 | | | 600,000 | | | | 658,646 | |
Goldman Sachs Capital, Inc. (The),
6.345% Sub. Bonds, 2/15/34 | | | 340,000 | | | | 322,839 | |
Goldman Sachs Group, Inc. (The):
5.25% Sr. Unsec. Nts., 7/27/21 | | | 271,000 | | | | 275,978 | |
| 6.25% Sr. Nts., 2/1/41 | | | 307,000 | | | | 321,606 | |
Macquarie Bank Ltd.:
5% Sr. Nts., 2/22/172
| | | 101,000 | | | | 103,017 | |
| 6.625% Unsec. Sub. Nts., 4/7/212 | | | 466,000 | | | | 468,323 | |
Morgan Stanley:
5.50% Sr. Unsec. Unsub. Nts., 7/24/202 | | | 114,000 | | | | 111,784 | |
| 5.625% Sr. Unsec. Nts., 9/23/19 | | | 753,000 | | | | 746,773 | |
Nomura Holdings, Inc.:
4.125% Sr. Unsec. Unsub. Nts., 1/19/16 | | | 330,000 | | | | 336,188 | |
| 6.70% Sr. Unsec. Nts., 3/4/20 | | | 28,000 | | | | 31,089 | |
Raymond James Financial, Inc.,
5.625% Sr. Nts., 4/1/24 | | | 314,000 | | | | 336,285 | |
TD Ameritrade Holding Corp.,
2.95% Sr. Unsec. Unsub. Nts., 12/1/12 | | | 354,000 | | | | 356,777 | |
| UBS AG Stamford CT, | | | | | | | | |
| 2.25% Sr. Unsec. Nts., 8/12/13 | | | 139,000 | | | | 139,473 | |
UBS Preferred Funding Trust V,
6.243% Jr. Sub. Perpetual Nts.10 | | | 302,000 | | | | 286,900 | |
| | | | | | |
|
|
|
| | | | | | | | 4,495,678 | |
| | | | | | | | |
| | | Principal
Amount | | | Value | |
| | | | | | | | | |
| Commercial Banks—1.2% | |
ANZ National International Ltd.,
2.375% Sr. Unsec. Nts., 12/21/122 | | $ | 382,000 | | | $ | 384,625 | |
Fifth Third Cap Trust IV,
6.50% Jr. Unsec. Sub. Nts., 4/15/37 | | | 641,000 | | | | 639,398 | |
HSBC Finance Capital Trust IX,
5.911% Nts., 11/30/353 | | | 820,000 | | | | 773,875 | |
Lloyds TSB Bank plc, 6.50% Unsec. Sub.
Nts., 9/14/202 | | | 562,000 | | | | 554,757 | |
Mercantile Bankshares Corp.,
4.625% Unsec. Sub. Nts.,
Series B, 4/15/13 | | | 218,000 | | | | 223,756 | |
| Wells Fargo & Co., 7.98% Jr. Sub. Perpetual Bonds, Series K10 | | | 333,000 | | | | 367,133 | |
Zions Bancorp, 4.50% Sr. Unsec. Unsub.
Nts., 3/27/17 | | | 438,000 | | | | 441,021 | |
| | | | | | |
|
|
|
| | | | | | | | 3,384,565 | |
| Consumer Finance—0.5% | |
American Express Bank FSB,
5.50% Sr. Unsec. Nts., 4/16/13 | | | 329,000 | | | | 341,344 | |
| Discover Bank, 8.70% Unsec. Sub. Nts., 11/18/19 | | | 457,000 | | | | 568,903 | |
| SLM Corp., 6.25% Sr. Nts., 1/25/16 | | | 483,000 | | | | 509,565 | |
| | | | | | |
|
|
|
| | | | | | | | 1,419,812 | |
| Diversified Financial Services—1.1% | | | | | | | | |
Bank of America Corp., 5.70%
Sr. Unsec. Unsub. Nts., 1/24/22 | | | 466,000 | | | | 514,543 | |
Citigroup, Inc.:
4.45% Sr. Unsec. Unsub. Nts., 1/10/17 | | | 191,000 | | | | 200,501 | |
| 4.50% Sr. Unsec. Nts., 1/14/225 | | | 279,000 | | | | 288,947 | |
| 6.125% Sr. Unsec. Unsub. Nts., 11/21/17 | | | 519,000 | | | | 575,942 | |
| ING Bank NV, 3.75% Unsec. Nts., 3/7/172 | | | 108,000 | | | | 107,653 | |
| JPMorgan Chase & Co., 7.90% Perpetual Bonds, Series 110 | | | 1,037,000 | | | | 1,140,800 | |
| Merrill Lynch & Co., Inc., 7.75% Jr. Sub. Bonds, 5/14/38 | | | 453,000 | | | | 518,825 | |
| | | | | | |
|
|
|
| | | | | | | | 3,347,211 | |
| Insurance—1.8% | | | | | | | | |
American International Group, Inc.:
4.875% Sr. Unsec. Nts., 6/1/22 | | | 255,000 | | | | 261,637 | |
| 6.25% Jr. Sub. Bonds, 3/15/37 | | | 147,000 | | | | 136,710 | |
Burlington Northern Santa Fe LLC,
5.75% Sr. Unsec. Bonds, 5/1/40 | | | 97,000 | | | | 116,248 | |
CNA Financial Corp.:
5.75% Sr. Unsec. Unsub. Nts., 8/15/21 | | | 290,000 | | | | 319,455 | |
5.875% Sr. Unsec. Unsub.
Bonds, 8/15/20 | | | 169,000 | | | | 186,265 | |
15 | OPPENHEIMER BALANCED FUND/VA
|
STATEMENT OF INVESTMENTS Unaudited / Continued
| | | | | | | | |
| | | Principal
Amount | | | Value | |
| | | | | | | | | |
| Insurance Continued | | | | | | | | |
Gulf South Pipeline Co. LP,
5.75% Sr. Unsec. Nts., 8/15/122 | | $ | 317,000 | | | $ | 318,430 | |
Hartford Financial Services Group, Inc.,
6.625% Sr. Unsec. Unsub. Nts., 4/15/42 | | | 178,000 | | | | 184,166 | |
Irish Life & Permanent Group
Holdings plc, 3.60% Sr. Unsec. Unsub. Nts., 1/14/132 | | | 170,000 | | | | 166,446 | |
Liberty Mutual Group, Inc.,
5% Sr. Nts., 6/1/212 | | | 506,000 | | | | 510,502 | |
| Lincoln National Corp., 6.05% Jr. Unsec. Sub. Bonds, 4/20/67 | | | 688,000 | | | | 634,680 | |
Prudential Covered Trust 2012-1,
2.997% Sec. Nts., 9/30/152 | | | 412,000 | | | | 418,910 | |
Swiss Re Capital I LP, 6.854% Perpetual Bonds2,10 | | | 673,000 | | | | 620,701 | |
| Unum Group, 5.625% Sr. Unsec. Unsub. Nts., 9/15/20 | | | 520,000 | | | | 560,609 | |
| Willis Group Holdings plc, 4.125% Sr. Unsec. Unsub. Nts., 3/15/16 | | | 116,000 | | | | 121,413 | |
ZFS Finance USA Trust V,
6.50% Jr. Sub. Bonds, 5/9/373,4 | | | 587,000 | | | | 578,195 | |
| | | | | | |
|
|
|
| | | | | | | | 5,134,367 | |
| Real Estate Investment Trusts—0.5% | | | | | | | | |
| American Tower Corp.: | | | | | | | | |
| 5.05% Sr. Unsec. Unsub. Nts., 9/1/20 | | | 75,000 | | | | 78,963 | |
| 7% Sr. Unsec. Nts., 10/15/17 | | | 294,000 | | | | 342,159 | |
| CommonWealth REIT, 5.75% Sr. Unsec. Unsub. Bonds, 2/15/14 | | | 295,000 | | | | 302,207 | |
| Duke Realty LP, 6.25% Sr. Unsec. Unsub. Nts., 5/15/13 | | | 322,000 | | | | 332,873 | |
National Retail Properties, Inc.,
6.25% Sr. Unsec. Unsub. Nts., 6/15/14 | | | 211,000 | | | | 224,110 | |
WEA Finance LLC/WT Finance
Aust Pty Ltd., 7.50% Sr. Unsec. Nts., 6/2/142 | | | 283,000 | | | | 308,944 | |
| | | | | | |
|
|
|
| | | | | | | | 1,589,256 | |
| Health Care—0.6% | | | | | | | | |
| Biotechnology—0.3% | | | | | | | | |
| Amgen, Inc., 3.625% Sr. Unsec. Unsub. Nts., 5/15/22 | | | 299,000 | | | | 310,069 | |
| Celgene Corp., 5.70% Sr. Unsec. Nts., 10/15/40 | | | 215,000 | | | | 242,118 | |
| Gilead Sciences, Inc., 5.65% Sr. Unsec. Nts., 12/1/41 | | | 167,000 | | | | 195,678 | |
| | | | | | |
|
|
|
| | | | | | | | 747,865 | |
| Health Care Providers & Services—0.2% | |
Aristotle Holding, Inc.,
3.90% Unsec. Nts., 2/15/222 | | | 221,000 | | | | 229,712 | |
| | | | | | | | |
| | | Principal
Amount | | | Value | |
| | | | | | | | | |
| Health Care Providers & Services Continued | |
| McKesson Corp., 6% Sr. Unsec. Unsub. Nts., 3/1/41 | | $ | 183,000 | | | $ | 242,302 | |
| Quest Diagnostics, Inc., 5.75% Sr. Unsec. Nts., 1/30/40 | | | 215,000 | | | | 247,374 | |
| | | | | | |
|
|
|
| | | | | | | | 719,388 | |
| Pharmaceuticals—0.1% | |
| Mylan, Inc., 6% Sr. Nts., 11/15/182 | | | 365,000 | | | | 385,988 | |
| Industrials—1.4% | | | | | | | | |
| Aerospace & Defense—0.2% | | | | | | | | |
Huntington Ingalls Industries, Inc.,
7.125% Sr. Unsec. Unsub. Nts., 3/15/21 | | | 280,000 | | | | 294,000 | |
United Technologies Corp.,
3.10% Sr. Unsec. Unsub. Nts., 6/1/22 | | | 204,000 | | | | 214,403 | |
| | | | | | |
|
|
|
| | | | | | | | 508,403 | |
| Commercial Services & Supplies—0.1% | |
Corrections Corp. of America,
7.75% Sr. Nts., 6/1/17 | | | 344,000 | | | | 374,100 | |
R.R. Donnelley & Sons Co.,
8.60% Sr. Unsec. Unsub. Nts., 8/15/16 | | | 50,000 | | | | 53,250 | |
| | | | | | |
|
|
|
| | | | | | | | 427,350 | |
| Industrial Conglomerates—0.4% | | | | | | | | |
General Electric Capital Corp.:
5.25% Sr. Unsec. Nts., 10/19/12 | | | 49,000 | | | | 49,690 | |
| 6.375% Unsec. Sub. Bonds, 11/15/67 | | | 644,000 | | | | 672,175 | |
| 7.125% Unsec. Sub. Nts., 12/15/49 | | | 300,000 | | | | 318,113 | |
| | | | | | |
|
|
|
| | | | | | | | 1,039,978 | |
| Machinery—0.5% | | | | | | | | |
| CNH Capital LLC, 6.25% Sr. Unsec. Nts., 11/1/162 | | | 338,000 | | | | 363,350 | |
| ITT Corp., 7.375% Unsec. Debs., 11/15/15 | | | 217,000 | | | | 249,272 | |
| Joy Global, Inc., 5.125% Sr. Unsec. Unsub. Nts., 10/15/21 | | | 163,000 | | | | 179,410 | |
| Kennametal, Inc., 3.875% Sr. Unsec. Unsub. Nts., 2/15/22 | | | 234,000 | | | | 241,425 | |
| SPX Corp., 6.875% Sr. Unsec. Nts., 9/1/172 | | | 286,000 | | | | 313,170 | |
| | | | | | |
|
|
|
| | | | | | | | 1,346,627 | |
| Professional Services—0.1% | | | | | | | | |
| FTI Consulting, Inc., 6.75% Sr. Unsec. Nts., 10/1/20 | | | 288,000 | | | | 305,280 | |
| Road & Rail—0.1% | | | | | | | | |
| CSX Corp., 5.50% Sr. Unsec. Nts., 4/15/41 | | | 101,000 | | | | 114,136 | |
Kansas City Southern de Mexico,
8% Sr. Unsec. Unsub. Nts., 2/1/18 | | | 297,000 | | | | 333,769 | |
| | | | | | |
|
|
|
| | | | | | | | 447,905 | |
16 | OPPENHEIMER BALANCED FUND/VA
|
| | | | | | | | |
| | | Principal
Amount | | | Value | |
| | | | | | | | | |
| Information Technology—0.6% | | | | | | | | |
| Communications Equipment—0.1% | | | | | |
| Juniper Networks, Inc., 5.95% Sr. Unsec. Unsub. Nts., 3/15/41 | | $ | 138,000 | | | $ | 159,646 | |
| Computers & Peripherals—0.1% | | | | | | | | |
| Hewlett-Packard Co., 4.65% Sr. Unsec. Nts., 12/9/21 | | | 249,000 | | | | 261,701 | |
| Electronic Equipment & Instruments—0.1% | |
| Arrow Electronics, Inc., 5.125% Sr. Unsec. Unsub. Nts., 3/1/21 | | | 340,000 | | | | 357,440 | |
| Corning, Inc., 4.75% Sr. Unsec. Unsub. Nts., 3/15/42 | | | 125,000 | | | | 131,710 | |
| | | | | | |
|
|
|
| | | | | | | | 489,150 | |
| Office Electronics—0.1% | | | | | | | | |
| Xerox Corp., 5.65% Sr. Unsec. Nts., 5/15/13 | | | 330,000 | | | | 341,997 | |
| Semiconductors & Semiconductor Equipment—0.1% | |
Advanced Micro Devices, Inc.,
7.75% Sr. Unsec. Nts., 8/1/20 | | | 274,000 | | | | 302,770 | |
| Software—0.1% | | | | | | | | |
| Symantec Corp., 4.20% Sr. Unsec. Unsub. Nts., 9/15/20 | | | 391,000 | | | | 400,936 | |
| Materials—1.3% | | | | | | | | |
| Chemicals—0.3% | | | | | | | | |
| Agrium, Inc., 6.125% Sr. Unsec. Nts., 1/15/41 | | | 155,000 | | | | 190,830 | |
| Airgas, Inc., 3.25% Sr. Nts., 10/1/15 | | | 565,000 | | | | 589,310 | |
| Eastman Chemical Co., 4.80% Sr. Unsec. Nts., 9/1/42 | | | 208,000 | | | | 213,183 | |
| | | | | | |
|
|
|
| | | | | | | | 993,323 | |
| Containers & Packaging—0.2% | | | | | | | | |
Crown Americas LLC/Crown
Americas Capital Corp. III,
6.25% Sr. Unsec. Nts., 2/1/21 | | | 308,000 | | | | 338,030 | |
| Rock-Tenn Co., 4.90% Sr. Unsec. Nts., 3/1/222 | | | 112,000 | | | | 115,692 | |
| Sealed Air Corp., 8.375% Sr. Unsec. Nts., 9/15/212 | | | 270,000 | | | | 306,450 | |
| | | | | | |
|
|
|
| | | | | | | | 760,172 | |
| Metals & Mining—0.7% | | | | | | | | |
| ArcelorMittal, 6.25% Sr. Unsec. Unsub. Nts., 2/25/22 | | | 171,000 | | | | 167,897 | |
Cliffs Natural Resources, Inc.,
6.25% Sr. Unsec. Unsub. Nts., 10/1/40 | | | 86,000 | | | | 84,834 | |
| Freeport-McMoRan Copper & Gold, Inc., 3.55% Sr. Unsec. Nts., 3/1/22 | | | 227,000 | | | | 223,974 | |
Petrohawk Energy Corp.,
6.25% Sr. Unsec. Nts., 6/1/19 | | | 499,000 | | | | 559,443 | |
| | | | | | | | |
| | | Principal
Amount | | | Value | |
| | | | | | | | | |
| Metals & Mining Continued | | | | | | | | |
| Teck Resources Ltd., 7% Sr. Unsec. Unsub. Nts., 9/15/12 | | $ | 322,000 | | | $ | 325,630 | |
Xstrata Canada Corp.:
5.375% Sr. Unsec. Unsub. Nts., 6/1/15 | | | 135,000 | | | | 146,505 | |
| 6% Sr. Unsec. Unsub. Nts., 10/15/15 | | | 264,000 | | | | 291,193 | |
| 7.25% Sr. Unsec. Unsub. Nts., 7/15/12 | | | 122,000 | | | | 122,226 | |
Xstrata Finance Canada Ltd.,
5.80% Sr. Unsec. Unsub. Bonds, 11/15/162 | | | 35,000 | | | | 39,150 | |
| | | | | | |
|
|
|
| | | | | | | | 1,960,852 | |
| Paper & Forest Products—0.1% | | | | | |
| International Paper Co., 6% Sr. Unsec. Unsub. Nts., 11/15/41 | | | 139,000 | | | | 157,487 | |
| Westvaco Corp., 7.95% Sr. Unsec. Unsub. Nts., 2/15/31 | | | 66,000 | | | | 75,670 | |
| | | | | | |
|
|
|
| | | | | | | | 233,157 | |
| Telecommunication Services—1.0% | | | | | |
| Diversified Telecommunication Services—0.9% | |
| AT&T, Inc., 6.30% Sr. Unsec. Bonds, 1/15/38 | | | 409,000 | | | | 511,874 | |
British Telecommunications plc,
9.875% Bonds, 12/15/30 | | | 209,000 | | | | 315,434 | |
| CenturyLink, Inc., 7.65% Sr. Unsec. Unsub. Nts., 3/15/42 | | | 244,000 | | | | 237,741 | |
Frontier Communications Corp.,
8.25% Sr. Unsec. Nts., 4/15/17 | | | 343,000 | | | | 370,440 | |
| Telecom Italia Capital SA, 7.721% Sr. Unsec. Unsub. Nts., 6/4/38 | | | 383,000 | | | | 337,040 | |
| Telefonica Emisiones SAU, 5.462% Sr. Unsec. Unsub. Nts., 2/16/21 | | | 469,000 | | | | 409,346 | |
Verizon Communications, Inc.,
6.40% Sr. Unsec. Nts., 2/15/38 | | | 199,000 | | | | 259,661 | |
| Vivendi SA, 4.75% Sr. Unsec. Nts., 4/12/222 | | | 20,000 | | | | 19,791 | |
| Windstream Corp., 7.875% Sr. Unsec. Unsub. Nts., 11/1/17 | | | 303,000 | | | | 331,785 | |
| | | | | | |
|
|
|
| | | | | | | | 2,793,112 | |
| Wireless Telecommunication Services—0.1% | |
America Movil SAB de CV,
6.125% Sr. Unsec. Unsub. Nts., 3/30/40 | | | 149,000 | | | | 185,125 | |
| Utilities—0.7% | | | | | | | | |
| Electric Utilities—0.5% | | | | | | | | |
| Edison International, 3.75% Sr. Unsec. Unsub. Nts., 9/15/17 | | | 438,000 | | | | 462,620 | |
| Great Plains Energy, Inc., 2.75% Sr. Unsec. Unsub. Nts., 8/15/13 | | | 354,000 | | | | 359,303 | |
Oncor Electric Delivery Co. LLC,
4.10% Sr. Sec. Nts., 6/1/222 | | | 60,000 | | | | 61,347 | |
17 | OPPENHEIMER BALANCED FUND/VA
|
STATEMENT OF INVESTMENTS Unaudited / Continued
| | | | | | | | |
| | | Principal
Amount | | | Value | |
| | | | | | | | | |
| Electric Utilities Continued | | | | | | | | |
PPL WEM Holdings plc,
5.375% Sr. Unsec. Nts., 5/1/212 | | $ | 492,000 | | | $ | 531,397 | |
| | | | | | |
|
|
|
| | | | | | | | 1,414,667 | |
| Energy Traders—0.1% | |
TransAlta Corp.,
5.75% Sr. Unsec. Nts., 12/15/13 | | | 316,000 | | | | 331,923 | |
| Gas Utilities—0.1% | | | | | | | | |
Southwest Gas Corp.,
3.875% Sr. Unsec. Unsub. Nts., 4/1/22 | | | 215,000 | | | | 227,244 | |
| | | | | | |
|
|
|
Total Non-Convertible Corporate
Bonds and Notes (Cost $53,493,534) | | | | | | | 55,860,501 | |
| | | | | | | | | | | | | | | | |
| | | | |
| | | Expiration
Date | | | Strike
Price | | | Contracts | | | | |
| | | | | | | | | | | | | | | | | |
| Options Purchased—0.0% | | | | | | | | | |
| Humana, Inc. Put1 | | | 7/23/12 | | | $ | 72.500 | | | | 128 | | | | 3,840 | |
| Humana, Inc. Put1 | | | 8/20/12 | | | | 67.500 | | | | 132 | | | | 6,600 | |
| | | | | | | | | | | | | | | | |
| | | Expiration
Date | | | Strike
Price | | | Contracts | | | Value | |
| | | | | | | | | | | | | | | | | |
| Options Purchased Continued | | | | | | | | | |
| UnitedHealth Group, Inc. Put1 | | | 7/23/12 | | | $ | 55.000 | | | | 209 | | | $ | 9,405 | |
| UnitedHealth Group, Inc. Put1 | | | 8/20/12 | | | | 52.500 | | | | 209 | | | | 12,540 | |
| | | | | | | | | | | | | | |
|
|
|
Total Options Purchased
(Cost $67,584) | | | | | | | | | | | | 32,385 | |
| | | | | | | | |
| | |
| | | Shares | | | | |
| | | | | | | | | |
| Investment Company—7.0% | | | | | | | | |
| Oppenheimer Institutional Money | | | | | | | | |
| Market Fund, Cl. E, 0.20%11,12 | | | | | | | | |
| (Cost $20,688,419) | | | 20,688,419 | | | | 20,688,419 | |
Total Investments, at Value
(Cost $329,381,252) | | | 115.5 | % | | | 340,583,010 | |
| Liabilities in Excess of Other Assets | |
| (15.5
| )
| |
| (45,804,517
| )
|
| Net Assets | |
| 100.0
| %
| | $
| 294,778,493
|
|
Footnotes to Statement of Investments
* June 29, 2012 represents the last business day of the Fund’s 2012 semiannual period. See Note 1 of the accompanying Notes.
1. Non-income producing security.
2. Represents securities sold under Rule 144A, which are exempt from registration under the Securities Act of 1933, as amended. These securities have been determined to be liquid under guidelines established by the Board of Trustees. These securities amount to $15,445,439 or 5.24% of the Fund’s net assets as of June 29, 2012.
3. Represents the current interest rate for a variable or increasing rate security.
4. Restricted security. The aggregate value of restricted securities as of June 29, 2012 was $1,383,991, which represents 0.47% of the Fund’s net assets. See Note 7 of the accompanying Notes. Information concerning restricted securities is as follows:
| | | | | | | | | | | | | | | | |
| Security | | Acquisition
Dates | | | Cost | | | Value | | | Unrealized
Appreciation
(Depreciation) | |
Ras Laffan Liquefied Natural Gas Co. Ltd. III,
5.50% Sr. Sec. Nts., 9/30/14 | | | 7/16/09-2/16/12 | | | $ | 296,554 | | | $ | 314,644 | | | $ | 18,090 | |
Santander Drive Auto Receivables Trust 2011-S1A,
Automobile Receivables Nts., Series 2011-S1A, Cl. D,
3.10%, 5/15/17 | | | 2/4/11-2/9/12 | | | | 289,052 | | | | 289,494 | | | | 442 | |
Santander Drive Auto Receivables Trust 2011-S2A,
Automobile Receivables Nts., Series 2011-S2A, Cl. D,
3.35%, 6/15/17 | | | 5/19/11-11/18/11 | | | | 201,306 | | | | 201,658 | | | | 352 | |
| ZFS Finance USA Trust V, 6.50% Jr. Sub. Bonds, 5/9/37 | | | 2/24/11-2/23/12 | | | | 578,689 | | | | 578,195 | | | | (494 | ) |
| | | | | | |
|
|
| |
|
|
| |
|
|
|
| | | | | | | $ | 1,365,601 | | | $ | 1,383,991 | | | $ | 18,390 | |
| | | | | | |
|
|
| |
|
|
| |
|
|
|
5. All or a portion of the security position is when-issued or delayed delivery to be delivered and settled after June 29, 2012. See Note 1 of the accompanying Notes.
6. Interest-Only Strips represent the right to receive the monthly interest payments on an underlying pool of mortgage loans or other receivables. These securities typically decline in price as interest rates decline. Most other fixed income securities increase in price when interest rates decline. The principal amount of the underlying pool represents the notional amount on which current interest is calculated. The price of these securities is typically more sensitive to changes in prepayment rates than traditional mortgage or asset-backed securities (for example, GNMA pass-throughs). Interest rates disclosed represent current yields based upon the current cost basis and estimated timing and amount of future cash flows. These securities amount to $3,847,410 or 1.31% of the Fund’s net assets as of June 29, 2012.
18 | OPPENHEIMER BALANCED FUND/VA
|
Footnotes to Statement of Investments Continued
7. Principal-Only Strips represent the right to receive the monthly principal payments on an underlying pool of mortgage loans. The value of these securities generally increases as interest rates decline and prepayment rates rise. The price of these securities is typically more volatile than that of coupon-bearing bonds of the same maturity. Interest rates disclosed represent current yields based upon the current cost basis and estimated timing of future cash flows. These securities amount to $192,845 or 0.07% of the Fund’s net assets as of June 29, 2012.
8. The current amortization rate of the security’s cost basis exceeds the future interest payments currently estimated to be received. Both the amortization rate and interest payments are contingent on future mortgage pre-payment speeds and are therefore subject to change.
9. All or a portion of the security position is held in accounts at a futures clearing merchant and pledged to cover margin requirements on open futures contracts and written options on futures, if applicable. The aggregate market value of such securities is $200,717. See Note 6 of the accompanying Notes.
10. This bond has no contractual maturity date, is not redeemable and contractually pays an indefinite stream of interest. Rate reported represents the current interest rate for this variable rate security.
11. Is or was an affiliate, as defined in the Investment Company Act of 1940, at or during the period ended June 29, 2012, by virtue of the Fund owning at least 5% of the voting securities of the issuer or as a result of the Fund and the issuer having the same investment adviser. Transactions during the period in which the issuer was an affiliate are as follows:
| | | | | | | | | | | | | | | | |
| | | Shares
December 30, 2011a | | | Gross
Additions | | | Gross
Reductions | | | Shares
June 29, 2012 | |
| Oppenheimer Institutional Money Market Fund, Cl. E | | | 32,784,414 | | | | 65,254,581 | | | | 77,350,576 | | | | 20,688,419 | |
| | | | |
| | | | | | | | | Value | | | Income | |
| Oppenheimer Institutional Money Market Fund, Cl. E | | | | | | | | | | $ | 20,688,419 | | | | $19,442 | |
a. December 30, 2011 represents the last business day of the Fund’s 2011 fiscal year. See Note 1 of the accompanying Notes. | |
12. Rate shown is the 7-day yield as of June 29, 2012.
| | | | | | | | | | | | | | | | | | | | |
| Futures Contracts as of June 29, 2012 are as follows: | | | | | | | | | | | | | |
| Contract Description | | Buy/Sell | | | Number
of
Contracts | | | Expiration
Date | | | Value | | | Unrealized
Appreciation
(Depreciation) | |
| U.S. Treasury Long Bonds | | | Sell | | | | 4 | | | | 9/19/12 | | | $ | 591,875 | | | $ | 2,512 | |
| U.S. Treasury Nts., 2 yr. | | | Sell | | | | 64 | | | | 9/28/12 | | | | 14,092,000 | | | | 10,829 | |
| U.S. Treasury Nts., 5 yr. | | | Sell | | | | 45 | | | | 9/28/12 | | | | 5,578,594 | | | | (6,769 | ) |
| U.S. Treasury Nts., 10 yr. | | | Sell | | | | 13 | | | | 9/19/12 | | | | 1,733,875 | | | | 3,789 | |
| U.S. Treasury Ultra Bonds | | | Buy | | | | 34 | | | | 9/19/12 | | | | 5,672,688 | | | | 86,004 | |
| | | | | | | | | | | | | | | | | | |
|
|
|
| | | | | | | | | | | | | | | | | | | $ | 96,365 | |
| | | | | | | | | | | | | | | | | | |
|
|
|
See accompanying Notes to Financial Statements.
19 | OPPENHEIMER BALANCED FUND/VA
|
STATEMENT OF ASSETS AND LIABILITIES Unaudited
| | | | |
| June 29, 20121 | | | |
| Assets | | | |
| Investments, at value—see accompanying statement of investments: | | | | |
| Unaffiliated companies (cost $308,692,833) | | $ | 319,894,591 | |
| Affiliated companies (cost $20,688,419) | |
| 20,688,419
|
|
| | | | 340,583,010 | |
| Cash | | | 45,783 | |
| Receivables and other assets: | | | | |
| Investments sold (including $32,940,818 sold on a when-issued or delayed delivery basis) | | | 35,930,155 | |
| Interest, dividends and principal paydowns | | | 1,280,381 | |
| Futures margins | | | 23,933 | |
| Shares of beneficial interest sold | | | 22,547 | |
| Other | |
| 28,635
|
|
| Total assets | | | 377,914,444 | |
| Liabilities | | | |
| Payables and other liabilities: | | | | |
| Investments purchased (including $77,300,714 purchased on a when-issued or delayed delivery basis) | | | 82,810,594 | |
| Shares of beneficial interest redeemed | | | 111,507 | |
| Futures margins | | | 95,913 | |
| Trustees’ compensation | | | 25,115 | |
| Transfer and shareholder servicing agent fees | | | 23,627 | |
| Shareholder communications | | | 22,604 | |
| Distribution and service plan fees | | | 13,757 | |
| Other | |
| 32,834
|
|
| Total liabilities | | | 83,135,951 | |
| Net Assets | | $
| 294,778,493
|
|
| Composition of Net Assets | | | |
| Par value of shares of beneficial interest | | $ | 25,377 | |
| Additional paid-in capital | | | 340,719,229 | |
| Accumulated net investment income | | | 2,806,871 | |
| Accumulated net realized loss on investments and foreign currency transactions | | | (60,071,154 | ) |
| Net unrealized appreciation on investments and translation of assets and liabilities denominated in foreign currencies | |
| 11,298,170
|
|
| Net Assets | | $
| 294,778,493
|
|
| Net Asset Value Per Share | | | |
| Non-Service Shares: | | | | |
Net asset value, redemption price per share and offering price per share (based on net assets of $219,712,673
and 18,862,204 shares of beneficial interest outstanding) | | | $11.65 | |
| Service Shares: | | | | |
Net asset value, redemption price per share and offering price per share (based on net assets of $75,065,820
and 6,514,816 shares of beneficial interest outstanding) | | | $11.52 | |
1. June 29, 2012 represents the last business day of the Fund’s 2012 semiannual period. See Note 1 of the accompanying Notes.
See accompanying Notes to Financial Statements.
20 | OPPENHEIMER BALANCED FUND/VA
|
STATEMENT OF OPERATIONS Unaudited
| | | | |
| For the Six Months Ended June 29, 20121 | | | |
| Investment Income | | | |
| Interest | | $ | 2,085,837 | |
| Dividends: | | | | |
| Unaffiliated companies | | | 1,647,142 | |
| Affiliated companies | |
| 19,442
|
|
| Total investment income | | | 3,752,421 | |
| Expenses | | | |
| Management fees | | | 883,223 | |
| Distribution and service plan fees—Service shares | | | 96,577 | |
| Transfer and shareholder servicing agent fees: | | | | |
| Non-Service shares | | | 79,963 | |
| Service shares | | | 38,561 | |
| Shareholder communications: | | | | |
| Non-Service shares | | | 6,267 | |
| Service shares | | | 3,191 | |
| Custodian fees and expenses | | | 14,910 | |
| Trustees’ compensation | | | 6,315 | |
| Administration service fees | | | 750 | |
| Other | |
| 44,564
|
|
| Total expenses | | | 1,174,321 | |
| Less waivers and reimbursements of expenses | |
| (282,010
| )
|
| Net expenses | | | 892,311 | |
| Net Investment Income | | | 2,860,110 | |
| Realized and Unrealized Gain (Loss) | | | |
| Net realized gain on: | | | | |
| Investments from unaffiliated companies | | | 4,046,782 | |
| Closing and expiration of futures contracts | | | 165,985 | |
| Foreign currency transactions | |
| 710,919
|
|
| Net realized gain | | | 4,923,686 | |
| Net change in unrealized appreciation/depreciation on: | | | | |
| Investments | | | 216,639 | |
| Translation of assets and liabilities denominated in foreign currencies | | | (684,363 | ) |
| Futures contracts | |
| 53,563
|
|
| Net change in unrealized appreciation/depreciation | | | (414,161 | ) |
| | |
| Net Increase in Net Assets Resulting from Operations | | $
| 7,369,635
|
|
1. June 29, 2012 represents the last business day of the Fund’s 2012 semiannual period. See Note 1 of the accompanying Notes.
See accompanying Notes to Financial Statements.
21 | OPPENHEIMER BALANCED FUND/VA
|
STATEMENTS OF CHANGES IN NET ASSETS
| | | | | | | | |
| | | Six Months
Ended
June 29, 20121
(Unaudited) | | | Year
Ended
December 30,
20111 | |
| Operations | | | | | | |
| Net investment income | | $ | 2,860,110 | | | $ | 3,643,156 | |
| Net realized gain | | | 4,923,686 | | | | 9,575,957 | |
| Net change in unrealized appreciation/depreciation | |
| (414,161
| )
| |
| (11,457,323
| )
|
| Net increase in net assets resulting from operations | | | 7,369,635 | | | | 1,761,790 | |
| Dividends and/or Distributions to Shareholders | | | | | | |
| Dividends from net investment income: | | | | | | | | |
| Non-Service shares | | | (3,027,836 | ) | | | (3,355,682 | ) |
| Service shares | |
| (910,776
| )
| |
| (1,802,307
| )
|
| | | | (3,938,612 | ) | | | (5,157,989 | ) |
| Beneficial Interest Transactions | | | | | | |
| Net increase (decrease) in net assets resulting from beneficial interest transactions: | | | | | | | | |
| Non-Service shares | | | 90,423,821 | | | | (20,174,392 | ) |
| Service shares | |
| (5,010,412
| )
| |
| (10,697,145
| )
|
| | | | 85,413,409 | | | | (30,871,537 | ) |
| Net Assets | | | | | | |
| Total increase (decrease) | | | 88,844,432 | | | | (34,267,736 | ) |
| Beginning of period | |
| 205,934,061
|
| |
| 240,201,797
|
|
| End of period (including accumulated net investment income of $2,806,871 and $3,885,373, respectively) | | $
| 294,778,493
|
| | $
| 205,934,061
|
|
1. June 29, 2012 and December 30, 2011 represent the last business days of the Fund’s respective reporting periods. See Note 1 of the accompanying Notes.
See accompanying Notes to Financial Statements.
22 | OPPENHEIMER BALANCED FUND/VA
|
FINANCIAL HIGHLIGHTS
| | | | | | | | | | | | | | | | | | | | | | | | |
| | | Six Months
Ended
June 29, 20121 | | | Year Ended
December 30, | | | | | | Year Ended December 31, | |
| Non-Service Shares | | (Unaudited) | | | 20111 | | | 2010 | | | 2009 | | | 2008 | | | 2007 | |
| | | | | | | | | | | | | | | | | | | | | | | | | |
| Per Share Operating Data | | | | | | | | | | | | | | | | | | |
| Net asset value, beginning of period | | $ | 11.30 | | | $ | 11.47 | | | $ | 10.30 | | | $ | 8.45 | | | $ | 16.41 | | | $ | 17.69 | |
| Income (loss) from investment operations: | | | | | | | | | | | | | | | | | | | | | | | | |
| Net investment income2 | | | .15 | | | | .20 | | | | .23 | | | | .25 | | | | .41 | | | | .43 | |
| Net realized and unrealized gain (loss) | |
| .36
|
| |
| (.11
| )
| |
| 1.09
|
| |
| 1.60
|
| |
| (7.03
| )
| |
| .19
|
|
| Total from investment operations | | | .51 | | | | .09 | | | | 1.32 | | | | 1.85 | | | | (6.62 | ) | | | .62 | |
| Dividends and/or distributions to shareholders: | | | | | | | | | | | | | | | | | | | | | | | | |
| Dividends from net investment income | | | (.16 | ) | | | (.26 | ) | | | (.15 | ) | | | — | | | | (.39 | ) | | | (.46 | ) |
| Distributions from net realized gain | |
| —
|
| |
| —
|
| |
| —
|
| |
| —
|
| |
| (.95
| )
| |
| (1.44
| )
|
| Total dividends and/or distributions to shareholders | | | (.16 | ) | | | (.26 | ) | | | (.15 | ) | | | — | | | | (1.34 | ) | | | (1.90 | ) |
| Net asset value, end of period | | $
| 11.65
|
| | $
| 11.30
|
| | $
| 11.47
|
| | $
| 10.30
|
| | $
| 8.45
|
| | $
| 16.41
|
|
| Total Return, at Net Asset Value3 | | 4.53% | | | 0.72% | | | 12.91% | | | 21.89% | | | (43.47)% | | | 3.79% | |
| | | | | | | | | | | | | | | | | | | | | | | | | |
| Ratios/Supplemental Data | | | | | | | | | | | | | | | | | | |
| Net assets, end of period (in thousands) | | | $219,712 | | | | $128,383 | | | | $150,622 | | | | $159,797 | | | | $169,621 | | | | $385,948 | |
| Average net assets (in thousands) | | | $161,170 | | | | $141,848 | | | | $151,620 | | | | $159,013 | | | | $295,669 | | | | $418,103 | |
| Ratios to average net assets:4 | | | | | | | | | | | | | | | | | | | | | | | | |
| Net investment income | | | 2.51 | % | | | 1.70 | % | | | 2.13 | % | | | 2.71 | % | | | 3.14 | % | | | 2.55 | % |
| Total expenses5 | | | 0.90 | % | | | 0.91 | % | | | 0.91 | % | | | 0.89 | % | | | 0.76 | % | | | 0.75 | % |
| Expenses after payments, waivers and/or reimbursements and reduction to custodian expenses | | | 0.67 | % | | | 0.67 | % | | | 0.65 | % | | | 0.60 | % | | | 0.67 | % | | | 0.73 | % |
| Portfolio turnover rate6 | | | 62 | % | | | 102 | % | | | 54 | % | | | 87 | % | | | 67 | % | | | 68 | % |
1. June 29, 2012 and December 30, 2011 represent the last business days of the Fund’s respective reporting periods. See Note 1 of the accompanying Notes.
2. Per share amounts calculated based on the average shares outstanding during the period.
3. Assumes an initial investment on the business day before the first day of the fiscal period, with all dividends and distributions reinvested in additional shares on the reinvestment date, and redemption at the net asset value calculated on the last business day of the fiscal period. Total returns are not annualized for periods less than one full year. Total return information does not reflect expenses that apply at the separate account level or to related insurance products. Inclusion of these charges would reduce the total return figures for all periods shown. Returns do not reflect the deduction of taxes that a shareholder would pay on fund distributions or the redemption of fund shares.
4. Annualized for periods less than one full year.
5. Total expenses including indirect expenses from affiliated fund were as follows:
| | | | |
| Six Months Ended June 29, 2012 | | | 0.91 | % |
| Year Ended December 30, 2011 | | | 0.93 | % |
| Year Ended December 31, 2010 | | | 0.92 | % |
| Year Ended December 31, 2009 | | | 0.91 | % |
| Year Ended December 31, 2008 | | | 0.76 | % |
| Year Ended December 31, 2007 | | | 0.75 | % |
6. The portfolio turnover rate excludes purchase and sale transactions of To Be Announced (TBA) mortgage-related securities as follows:
| | | | | | | | |
| | | Purchase Transactions | | | Sale Transactions | |
| Six Months Ended June 29, 2012 | | $ | 260,922,077 | | | $ | 266,102,858 | |
| Year Ended December 30, 2011 | | $ | 450,804,195 | | | $ | 453,759,282 | |
| Year Ended December 31, 2010 | | $ | 412,930,431 | | | $ | 414,511,903 | |
| Year Ended December 31, 2009 | | $ | 504,698,365 | | | $ | 520,212,670 | |
| Year Ended December 31, 2008 | | $ | 474,582,075 | | | $ | 434,587,487 | |
| Year Ended December 31, 2007 | | $ | 296,201,319 | | | $ | 315,527,720 | |
See accompanying Notes to Financial Statements.
23 | OPPENHEIMER BALANCED FUND/VA
|
FINANCIAL HIGHLIGHTS Continued
| | | | | | | | | | | | | | | | | | | | | | | | |
| | | Six Months
Ended
June 29, 20121 | | | Year Ended
December 30, | | | Year Ended December 31, | |
| Service Shares | | (Unaudited) | | | 20111 | | | 2010 | | | 2009 | | | 2008 | | | 2007 | |
| | | | | | | | | | | | | | | | | | | | | | | | | |
| Per Share Operating Data | | | | | | | | | | | | | | | | | | |
| Net asset value, beginning of period | | $ | 11.17 | | | $ | 11.35 | | | $ | 10.19 | | | $ | 8.38 | | | $ | 16.28 | | | $ | 17.57 | |
| Income (loss) from investment operations: | | | | | | | | | | | | | | | | | | | | | | | | |
| Net investment income2 | | | .13 | | | | .16 | | | | .20 | | | | .22 | | | | .37 | | | | .38 | |
| Net realized and unrealized gain (loss) | |
| .36
|
| |
| (.11
| )
| |
| 1.08
|
| |
| 1.59
|
| |
| (6.97
| )
| |
| .19
|
|
| Total from investment operations | | | .49 | | | | .05 | | | | 1.28 | | | | 1.81 | | | | (6.60 | ) | | | .57 | |
| Dividends and/or distributions to shareholders: | | | | | | | | | | | | | | | | | | | | | | | | |
| Dividends from net investment income | | | (.14 | ) | | | (.23 | ) | | | (.12 | ) | | | — | | | | (.35 | ) | | | (.42 | ) |
| Distributions from net realized gain | |
| —
|
| |
| —
|
| |
| —
|
| |
| —
|
| |
| (.95
| )
| |
| (1.44
| )
|
| Total dividends and/or distributions to shareholders | | | (.14 | ) | | | (.23 | ) | | | (.12 | ) | | | — | | | | (1.30 | ) | | | (1.86 | ) |
| Net asset value, end of period | | $
| 11.52
|
| | $
| 11.17
|
| | $
| 11.35
|
| | $
| 10.19
|
| | $
| 8.38
|
| | $
| 16.28
|
|
| Total Return, at Net Asset Value3 | | 4.40% | | | 0.38% | | | 12.68% | | | 21.60% | | | (43.62)% | | | 3.49% | |
| | | | | | | | | | | | | | | | | | | | | | | | | |
| Ratios/Supplemental Data | | | | | | | | | | | | | | | | | | |
| Net assets, end of period (in thousands) | | | $75,066 | | | | $77,551 | | | | $89,580 | | | | $88,746 | | | | $ 68,798 | | | | $121,399 | |
| Average net assets (in thousands) | | | $77,672 | | | | $85,157 | | | | $87,280 | | | | $77,101 | | | | $100,164 | | | | $117,012 | |
| Ratios to average net assets:4 | | | | | | | | | | | | | | | | | | | | | | | | |
| Net investment income | | | 2.19 | % | | | 1.45 | % | | | 1.87 | % | | | 2.42 | % | | | 2.90 | % | | | 2.30 | % |
| Total expenses5 | | | 1.16 | % | | | 1.16 | % | | | 1.16 | % | | | 1.15 | % | | | 1.01 | % | | | 1.00 | % |
| Expenses after payments, waivers and/or reimbursements and reduction to custodian expenses | | | 0.92 | % | | | 0.92 | % | | | 0.90 | % | | | 0.85 | % | | | 0.92 | % | | | 0.98 | % |
| Portfolio turnover rate6 | | | 62 | % | | | 102 | % | | | 54 | % | | | 87 | % | | | 67 | % | | | 68 | % |
1. June 29, 2012 and December 30, 2011 represent the last business days of the Fund’s respective reporting periods. See Note 1 of the accompanying Notes.
2. Per share amounts calculated based on the average shares outstanding during the period.
3. Assumes an initial investment on the business day before the first day of the fiscal period, with all dividends and distributions reinvested in additional shares on the reinvestment date, and redemption at the net asset value calculated on the last business day of the fiscal period. Total returns are not annualized for periods less than one full year. Total return information does not reflect expenses that apply at the separate account level or to related insurance products. Inclusion of these charges would reduce the total return figures for all periods shown. Returns do not reflect the deduction of taxes that a shareholder would pay on fund distributions or the redemption of fund shares.
4. Annualized for periods less than one full year.
5. Total expenses including indirect expenses from affiliated fund were as follows:
| | | | |
| Six Months Ended June 29, 2012 | | | 1.17 | % |
| Year Ended December 30, 2011 | | | 1.18 | % |
| Year Ended December 31, 2010 | | | 1.17 | % |
| Year Ended December 31, 2009 | | | 1.17 | % |
| Year Ended December 31, 2008 | | | 1.01 | % |
| Year Ended December 31, 2007 | | | 1.00 | % |
6. The portfolio turnover rate excludes purchase and sale transactions of To Be Announced (TBA) mortgage-related securities as follows:
| | | | | | | | |
| | | Purchase Transactions | | | Sale Transactions | |
| Six Months Ended June 29, 2012 | | $ | 260,922,077 | | | $ | 266,102,858 | |
| Year Ended December 30, 2011 | | $ | 450,804,195 | | | $ | 453,759,282 | |
| Year Ended December 31, 2010 | | $ | 412,930,431 | | | $ | 414,511,903 | |
| Year Ended December 31, 2009 | | $ | 504,698,365 | | | $ | 520,212,670 | |
| Year Ended December 31, 2008 | | $ | 474,582,075 | | | $ | 434,587,487 | |
| Year Ended December 31, 2007 | | $ | 296,201,319 | | | $ | 315,527,720 | |
See accompanying Notes to Financial Statements.
24 | OPPENHEIMER BALANCED FUND/VA
|
NOTES TO FINANCIAL STATEMENTS Unaudited
1. Significant Accounting Policies
Oppenheimer Balanced Fund/VA (the “Fund”) is a separate series of Oppenheimer Variable Account Funds, an open end management investment company registered under the Investment Company Act of 1940, as amended. The Fund’s investment objective is to seek high total investment return, which includes current income and capital appreciation. The Fund’s investment adviser is OppenheimerFunds, Inc. (the “Manager”).
The Fund offers two classes of shares. Both classes are sold at their offering price, which is the net asset value per share, to separate investment accounts of participating insurance companies as an underlying investment for variable life insurance policies, variable annuity contracts or other investment products. The class of shares designated as Service shares is subject to a distribution and service plan. Both classes of shares have identical rights and voting privileges with respect to the Fund in general and exclusive voting rights on matters that affect that class alone. Earnings, net assets and net asset value per share may differ due to each class having its own expenses, such as transfer and shareholder servicing agent fees and shareholder communications, directly attributable to that class.
The following is a summary of significant accounting policies consistently followed by the Fund.
Semiannual and Annual Periods. The last day of the Fund’s semiannual period was the last day the New York Stock Exchange was open for trading. The Fund’s financial statements have been presented through that date to maintain consistency with the Fund’s net asset value calculations used for shareholder transactions.
The last day of the Fund’s fiscal year was the last day the New York Stock Exchange was open for trading. The Fund’s financial statements have been presented through that date to maintain consistency with the Fund’s net asset value calculations used for shareholder transactions.
Securities on a When-Issued or Delayed Delivery Basis. The Fund may purchase securities on a “when-issued” basis, and may purchase or sell securities on a “delayed delivery” basis. “When-issued” or “delayed delivery” refers to securities whose terms and indenture are available and for which a market exists, but which are not available for immediate delivery. Delivery and payment for securities that have been purchased by the Fund on a when-issued basis normally takes place within six months and possibly as long as two years or more after the trade date. During this period, such securities do not earn interest, are subject to market fluctuation and may increase or decrease in value prior to their delivery. The purchase of securities on a when-issued basis may increase the volatility of the Fund’s net asset value to the extent the Fund executes such transactions while remaining substantially fully invested. When the Fund engages in when-issued or delayed delivery transactions, it relies on the buyer or seller, as the case may be, to complete the transaction. Their failure to do so may cause the Fund to lose the opportunity to obtain or dispose of the security at a price and yield it considers advantageous. The Fund may also sell securities that it purchased on a when-issued basis or forward commitment prior to settlement of the original purchase.
As of June 29, 2012, the Fund had purchased securities issued on a when-issued or delayed delivery basis and sold securities issued on a delayed delivery basis as follows:
| | | | |
| | | When-Issued or Delayed Delivery
Basis Transactions | |
| Purchased securities | | $ | 77,300,714 | |
| Sold securities | | | 32,940,818 | |
The Fund may enter into “forward roll” transactions with respect to mortgage-related securities. In this type of transaction, the Fund sells a mortgage-related security to a buyer and simultaneously agrees to repurchase a similar security (same type, coupon and maturity) at a later date at a set price. During the period between the sale and the repurchase, the Fund will not be entitled to receive interest and principal payments on the securities that have been sold. The Fund records the incremental difference between the forward purchase and sale of each forward roll as realized gain (loss) on investments or as fee income in the case of such transactions that have an associated fee in lieu of a difference in the forward purchase and sale price.
25 | OPPENHEIMER BALANCED FUND/VA
|
NOTES TO FINANCIAL STATEMENTS Unaudited / Continued
1. Significant Accounting Policies Continued
Forward roll transactions may be deemed to entail embedded leverage since the Fund purchases mortgage-related securities with extended settlement dates rather than paying for the securities under a normal settlement cycle. This embedded leverage increases the Fund’s market value of investments relative to its net assets which can incrementally increase the volatility of the Fund’s performance. Forward roll transactions can be replicated over multiple settlement periods.
Risks of entering into forward roll transactions include the potential inability of the counterparty to meet the terms of the agreement; the potential of the Fund to receive inferior securities at redelivery as compared to the securities sold to the counterparty; and counterparty credit risk.
Investment in Oppenheimer Institutional Money Market Fund. The Fund is permitted to invest daily available cash balances in an affiliated money market fund. The Fund may invest the available cash in Class E shares of Oppenheimer Institutional Money Market Fund (“IMMF”) to seek current income while preserving liquidity. IMMF is a registered open-end management investment company, regulated as a money market fund under the Investment Company Act of 1940, as amended. The Manager is also the investment adviser of IMMF. When applicable, the Fund’s investment in IMMF is included in the Statement of Investments. Shares of IMMF are valued at their net asset value per share. As a shareholder, the Fund is subject to its proportional share of IMMF’s Class E expenses, including its management fee. The Manager will waive fees and/or reimburse Fund expenses in an amount equal to the indirect management fees incurred through the Fund’s investment in IMMF.
Foreign Currency Translation. The Fund’s accounting records are maintained in U.S. dollars. The values of securities denominated in foreign currencies and amounts related to the purchase and sale of foreign securities and foreign investment income are translated into U.S. dollars as of the close of the Exchange, normally 4:00 P.M. Eastern time, on each day the Exchange is open for trading. Foreign exchange rates may be valued primarily using a reliable bank, dealer or service authorized by the Board of Directors.
Reported net realized gains and losses from foreign currency transactions arise from sales of portfolio securities, sales and maturities of short-term securities, sales of foreign currencies, exchange rate fluctuations between the trade and settlement dates on securities transactions, and the difference between the amounts of dividends, interest, and foreign withholding taxes recorded on the Fund’s books and the U.S. dollar equivalent of the amounts actually received or paid. Net unrealized appreciation and depreciation on the translation of assets and liabilities denominated in foreign currencies arise from changes in the values of assets and liabilities, including investments in securities at fiscal period end, resulting from changes in exchange rates.
The effect of changes in foreign currency exchange rates on investments is separately identified from the fluctuations arising from changes in market values of securities held and reported with all other foreign currency gains and losses in the Fund’s Statement of Operations.
Allocation of Income, Expenses, Gains and Losses. Income, expenses (other than those attributable to a specific class), gains and losses are allocated on a daily basis to each class of shares based upon the relative proportion of net assets represented by such class. Operating expenses directly attributable to a specific class are charged against the operations of that class.
Federal Taxes. The Fund intends to comply with provisions of the Internal Revenue Code applicable to regulated investment companies and to distribute substantially all of its investment company taxable income, including any net realized gain on investments not offset by capital loss carryforwards, if any, to shareholders. Therefore, no federal income or excise tax provision is required. The Fund files income tax returns in U.S. federal and applicable state jurisdictions. The statute of limitations on the Fund’s tax return filings generally remain open for the three preceding fiscal reporting period ends.
26 | OPPENHEIMER BALANCED FUND/VA
|
During the fiscal year ended December 30, 2011, the Fund utilized $15,143,099 of capital loss carryforward to offset capital gains realized in that fiscal year. The Fund had post-October losses of $6,584,156. Details of the fiscal year ended December 30, 2011 capital loss carryforwards are included in the table below. Capital loss carryforwards with no expiration, if any, must be utilized prior to those with expiration dates. Capital losses with no expiration will be carried forward to future years if not offset by gains.
| | | | |
| Expiring | | | |
| 2016 | | $ | 13,408,759 | |
| 2017 | | | 44,728,707 | |
| No expiration | | | 6,584,156 | |
| | |
|
|
|
| Total | | $ | 64,721,622 | |
| | |
|
|
|
As of June 29, 2012, it is estimated that the capital loss carryforwards would be $58,137,466 expiring by 2017 and $1,660,470 which will not expire. The estimated capital loss carryforward represents the carryforward as of the end of the last fiscal year, increased or decreased by capital losses or gains realized in the first six months of the current fiscal year. During the six months ended June 29, 2012, it is estimated that the Fund will utilize $4,923,686 of capital loss carryforward to offset realized capital gains.
Net investment income (loss) and net realized gain (loss) may differ for financial statement and tax purposes. The character of dividends and distributions made during the fiscal year from net investment income or net realized gains may differ from their ultimate characterization for federal income tax purposes. Also, due to timing of dividends and distributions, the fiscal year in which amounts are distributed may differ from the fiscal year in which the income or net realized gain was recorded by the Fund.
The aggregate cost of securities and other investments and the composition of unrealized appreciation and depreciation of securities and other investments for federal income tax purposes as of June 29, 2012 are noted in the following table. The primary difference between book and tax appreciation or depreciation of securities and other investments, if applicable, is attributable to the tax deferral of losses or tax realization of financial statement unrealized gain or loss.
| | | | |
| Federal tax cost of securities | | $ | 330,311,620 | |
| Federal tax cost of other investments | | | (16,420,021) | |
| | |
|
|
|
| Total federal tax cost | | $ | 313,891,599 | |
| | |
|
|
|
| |
| Gross unrealized appreciation | | $ | 17,360,114 | |
| Gross unrealized depreciation | | | (6,992,359) | |
| | |
|
|
|
| Net unrealized appreciation | | $ | 10,367,755 | |
| | |
|
|
|
Trustees’ Compensation. The Board of Trustees has adopted a compensation deferral plan for independent trustees that enables trustees to elect to defer receipt of all or a portion of the annual compensation they are entitled to receive from the Fund. For purposes of determining the amount owed to the Trustee under the plan, deferred amounts are treated as though equal dollar amounts had been invested in shares of the Fund or in other Oppenheimer funds selected by the Trustee. The Fund purchases shares of the funds selected for deferral by the Trustee in amounts equal to his or her deemed investment, resulting in a Fund asset equal to the deferred compensation liability. Such assets are included as a component of “Other” within the asset section of the Statement of Assets and Liabilities. Deferral of trustees’ fees under the plan will not affect the net assets of the Fund, and will not materially affect the Fund’s assets, liabilities or net investment income per share. Amounts will be deferred until distributed in accordance with the compensation deferral plan.
Dividends and Distributions to Shareholders. Dividends and distributions to shareholders, which are determined in accordance with income tax regulations and may differ from U.S. generally accepted accounting principles, are recorded
27 | OPPENHEIMER BALANCED FUND/VA
|
NOTES TO FINANCIAL STATEMENTS Unaudited / Continued
1. Significant Accounting Policies Continued
on the ex-dividend date. Income and capital gain distributions, if any, are declared and paid annually or at other times as deemed necessary by the Manager. The tax character of distributions is determined as of the Fund’s fiscal year end. Therefore, a portion of the Fund’s distributions made to shareholders prior to the Fund’s fiscal year end may ultimately be categorized as a tax return of capital.
Investment Income. Dividend income is recorded on the ex-dividend date or upon ex-dividend notification in the case of certain foreign dividends where the ex-dividend date may have passed. Non-cash dividends included in dividend income, if any, are recorded at the fair market value of the securities received. Interest income is recognized on an accrual basis. Discount and premium, which are included in interest income on the Statement of Operations, are amortized or accreted daily.
Custodian Fees. “Custodian fees and expenses” in the Statement of Operations may include interest expense incurred by the Fund on any cash overdrafts of its custodian account during the period. Such cash overdrafts may result from the effects of failed trades in portfolio securities and from cash outflows resulting from unanticipated shareholder redemption activity. The Fund pays interest to its custodian on such cash overdrafts, to the extent they are not offset by positive cash balances maintained by the Fund, at a rate equal to the Federal Funds Rate plus 0.50%. The “Reduction to custodian expenses” line item, if applicable, represents earnings on cash balances maintained by the Fund during the period. Such interest expense and other custodian fees may be paid with these earnings.
Security Transactions. Security transactions are recorded on the trade date. Realized gains and losses on securities sold are determined on the basis of identified cost.
Indemnifications. The Fund’s organizational documents provide current and former trustees and officers with a limited indemnification against liabilities arising in connection with the performance of their duties to the Fund. In the normal course of business, the Fund may also enter into contracts that provide general indemnifications. The Fund’s maximum exposure under these arrangements is unknown as this would be dependent on future claims that may be made against the Fund. The risk of material loss from such claims is considered remote.
Other. The preparation of financial statements in conformity with accounting principles generally accepted in the United States of America requires management to make estimates and assumptions that affect the reported amounts of assets and liabilities and disclosure of contingent assets and liabilities at the date of the financial statements and the reported amounts of increases and decreases in net assets from operations during the reporting period. Actual results could differ from those estimates.
2. Securities Valuation
The Fund calculates the net asset value of its shares as of the close of the New York Stock Exchange (the “Exchange”), normally 4:00 P.M. Eastern time, on each day the Exchange is open for trading.
The Fund’s Board has adopted procedures for the valuation of the Fund’s securities and has delegated the day-to-day responsibility for valuation determinations under those procedures to the Manager. The Manager has established a Valuation Committee which is responsible for determining a “fair valuation” for any security for which market quotations are not “readily available.” The Valuation Committee’s fair valuation determinations are subject to review, approval and ratification by the Fund’s Board at its next regularly scheduled meeting covering the calendar quarter in which the fair valuation was determined.
Valuation Methods and Inputs
Securities are valued using unadjusted quoted market prices, when available, as supplied primarily by third party pricing services or dealers.
28 | OPPENHEIMER BALANCED FUND/VA
|
The following methodologies are used to determine the market value or the fair value of the types of securities described below:
Securities traded on a registered U.S. securities exchange (including exchange-traded derivatives other than futures and futures options) are valued based on the last sale price of the security reported on the principal exchange on which it is traded, prior to the time when the Fund’s assets are valued. In the absence of a sale, the security is valued at the last sale price on the prior trading day, if it is within the spread of the current day’s closing “bid” and “asked” prices, and if not, at the current day’s closing bid price. A security of a foreign issuer traded on a foreign exchange but not listed on a registered U.S. securities exchange is valued based on the last sale price on the principal exchange on which the security is traded, as identified by the third party pricing service used by the Manager, prior to the time when the Fund’s assets are valued. If the last sale price is unavailable, the security is valued at the most recent official closing price on the principal exchange on which it is traded. If the last sales price or official closing price for a foreign security is not available, the security is valued at the mean between the bid and asked price per the exchange or, if not available from the exchange, obtained from two dealers. If bid and asked prices are not available from either the exchange or two dealers, the security is valued by using one of the following methodologies (listed in order of priority); (1) using a bid from the exchange, (2) the mean between the bid and asked price as provided by a single dealer, or (3) a bid from a single dealer.
Shares of a registered investment company that are not traded on an exchange are valued at that investment company’s net asset value per share.
Corporate and government debt securities (of U.S. or foreign issuers) and municipal debt securities, event-linked bonds, loans, mortgage-backed securities, collateralized mortgage obligations, and asset-backed securities are valued at the mean between the “bid” and “asked” prices utilizing evaluated prices obtained from third party pricing services or broker-dealers who may use matrix pricing methods to determine the evaluated prices.
Short-term money market type debt securities with a remaining maturity of sixty days or less are valued at cost adjusted by the amortization of discount or premium to maturity (amortized cost), which approximates market value. Short-term debt securities with a remaining maturity in excess of sixty days are valued at the mean between the “bid” and “asked” prices utilizing evaluated prices obtained from third party pricing services or broker-dealers.
Futures contracts and futures options traded on a commodities or futures exchange will be valued at the final settlement price or official closing price on the principal exchange as reported by such principal exchange at its trading session ending at, or most recently prior to, the time when the Fund’s assets are valued.
A description of the standard inputs that may generally be considered by the third party pricing vendors in determining their evaluated prices is provided below.
| | |
| Security Type | | Standard Inputs Generally Considered by Third-Party Pricing Vendors |
| Corporate debt, government debt, municipal, mortgage-backed and asset-backed securities | | Reported trade data, broker-dealer price quotations, benchmark yields, issuer spreads on comparable securities, the credit quality, yield, maturity, and other appropriate factors. |
| Loans | | Information obtained from market participants regarding reported trade data and broker-dealer price quotations. |
| Event-linked bonds | | Information obtained from market participants regarding reported trade data and broker-dealer price quotations. |
If a market value or price cannot be determined for a security using the methodologies described above, or if, in the “good faith” opinion of the Manager, the market value or price obtained does not constitute a “readily available market quotation,” or a significant event has occurred that would materially affect the value of the security the security is fair valued either (i) by a standardized fair valuation methodology applicable to the security type or the significant event as previously approved by the Valuation Committee and the Fund’s Board or (ii) as determined in good faith by the Manager’s Valuation Committee. The Valuation Committee considers all relevant facts that are reasonably available, through either public information or information available to the Manager, when determining the fair value of a security.
29 | OPPENHEIMER BALANCED FUND/VA
|
NOTES TO FINANCIAL STATEMENTS Unaudited / Continued
2. Securities Valuation Continued
Fair value determinations by the Manager are subject to review, approval and ratification by the Fund’s Board at its next regularly scheduled meeting covering the calendar quarter in which the fair valuation was determined. Those fair valuation standardized methodologies include, but are not limited to, valuing securities at the last sale price or initially at cost and subsequently adjusting the value based on: changes in company specific fundamentals, changes in an appropriate securities index, or changes in the value of similar securities which may be further adjusted for any discounts related to security-specific resale restrictions. When possible, such methodologies use observable market inputs such as unadjusted quoted prices of similar securities, observable interest rates, currency rates and yield curves. The methodologies used for valuing securities are not necessarily an indication of the risks associated with investing in those securities nor can it be assured that the Fund can obtain the fair value assigned to a security if it were to sell the security.
To assess the continuing appropriateness of security valuations, the Manager, or its third party service provider who is subject to oversight by the Manager, regularly compares prior day prices, prices on comparable securities, and sale prices to the current day prices and challenges those prices exceeding certain tolerance levels with the third party pricing service or broker source. For those securities valued by fair valuations, whether through a standardized fair valuation methodology or a fair valuation determination, the Valuation Committee reviews and affirms the reasonableness of the valuations based on such methodologies and fair valuation determinations on a regular basis after considering all relevant information that is reasonably available.
Classifications
Each investment asset or liability of the Fund is assigned a level at measurement date based on the significance and source of the inputs to its valuation. Various data inputs are used in determining the value of each of the Fund’s investments as of the reporting period end. These data inputs are categorized in the following hierarchy under applicable financial accounting standards:
| | 1) | Level 1—unadjusted quoted prices in active markets for identical assets or liabilities (including securities actively traded on a securities exchange) |
| | 2) | Level 2—inputs other than unadjusted quoted prices that are observable for the asset or liability (such as unadjusted quoted prices for similar assets and market corroborated inputs such as interest rates, prepayment speeds, credit risks, etc.) |
| | 3) | Level 3—significant unobservable inputs (including the Manager’s own judgments about assumptions that market participants would use in pricing the asset or liability). |
The inputs used for valuing securities are not necessarily an indication of the risks associated with investing in those securities.
The table below categorizes amounts that are included in the Fund’s Statement of Assets and Liabilities as of June 29, 2012 based on valuation input level:
| | | | | | | | | | | | | | | | |
| | | Level 1—
Unadjusted
Quoted Prices | | | Level 2—
Other Significant
Observable Inputs | | | Level 3—
Significant
Unobservable
Inputs | | | Value | |
| Assets Table | | | | | | | | | | | | | | | | |
| Investments, at Value: | | | | | | | | | | | | | | | | |
| Common Stocks | | | | | | | | | | | | | | | | |
Consumer Discretionary | | $ | 17,204,669 | | | $ | — | | | $ | — | | | $ | 17,204,669 | |
Consumer Staples | | | 14,556,723 | | | | — | | | | — | | | | 14,556,723 | |
Energy | | | 20,618,462 | | | | — | | | | — | | | | 20,618,462 | |
Financials | | | 39,177,819 | | | | — | | | | — | | | | 39,177,819 | |
Health Care | | | 27,131,689 | | | | — | | | | — | | | | 27,131,689 | |
Industrials | | | 16,720,040 | | | | — | | | | — | | | | 16,720,040 | |
30 | OPPENHEIMER BALANCED FUND/VA
|
| | | | | | | | | | | | | | | | |
| | | Level 1—
Unadjusted
Quoted Prices | | | Level 2—
Other Significant
Observable Inputs | | | Level 3—
Significant
Unobservable
Inputs | | | Value | |
| Common Stocks Continued | | | | | | | | | | | | | | | | |
Information Technology | | $ | 15,752,024 | | | $ | — | | | $ | — | | | $ | 15,752,024 | |
Materials | | | 7,091,418 | | | | — | | | | — | | | | 7,091,418 | |
Telecommunication Services | | | 4,928,552 | | | | — | | | | — | | | | 4,928,552 | |
Utilities | | | 11,132,759 | | | | — | | | | — | | | | 11,132,759 | |
| Asset-Backed Securities | | | — | | | | 11,966,831 | | | | — | | | | 11,966,831 | |
| Mortgage-Backed Obligations | | | — | | | | 75,335,053 | | | | — | | | | 75,335,053 | |
| U.S. Government Obligations | | | — | | | | 2,385,666 | | | | — | | | | 2,385,666 | |
| Non-Convertible Corporate Bonds and Notes | | | — | | | | 55,860,501 | | | | — | | | | 55,860,501 | |
| Options Purchased | | | 32,385 | | | | — | | | | — | | | | 32,385 | |
| Investment Company | | | 20,688,419 | | | | — | | | | — | | | | 20,688,419 | |
| | |
|
|
| |
|
|
| |
|
|
| |
|
|
|
| Total Investments, at Value | | | 195,034,959 | | | | 145,548,051 | | | | — | | | | 340,583,010 | |
| Other Financial Instruments: | | | | | | | | | | | | | | | | |
| Futures margins | | | 23,933 | | | | — | | | | — | | | | 23,933 | |
| | |
|
|
| |
|
|
| |
|
|
| |
|
|
|
| Total Assets | | $ | 195,058,892 | | | $ | 145,548,051 | | | $ | — | | | $ | 340,606,943 | |
| | |
|
|
| |
|
|
| |
|
|
| |
|
|
|
| Liabilities Table | | | | | | | | | | | | | | | | |
| Other Financial Instruments: | | | | | | | | | | | | | | | | |
| Futures margins | | $ | (95,913 | ) | | $ | — | | | $ | — | | | $ | (95,913 | ) |
| | |
|
|
| |
|
|
| |
|
|
| |
|
|
|
| Total Liabilities | | $ | (95,913 | ) | | $ | — | | | $ | — | | | $ | (95,913 | ) |
| | |
|
|
| |
|
|
| |
|
|
| |
|
|
|
Currency contracts and forwards, if any, are reported at their unrealized appreciation/depreciation at measurement date, which represents the change in the contract’s value from trade date. Futures, if any, are reported at their variation margin at measurement date, which represents the amount due to/from the Fund at that date. All additional assets and liabilities included in the above table are reported at their market value at measurement date.
There have been no significant changes to the fair valuation methodologies of the Fund during the period.
3. Shares of Beneficial Interest
The Fund has authorized an unlimited number of $0.001 par value shares of beneficial interest of each class. Transactions in shares of beneficial interest were as follows:
| | | | | | | | | | | | | | | | |
| | | Six Months Ended June 29, 2012 | | | Year Ended December 30, 2011 | |
| | | Shares | | | Amount | | | Shares | | | Amount | |
| Non-Service Shares | | | | | | | | | | | | | | | | |
Sold | | | 129,590 | | | $ | 1,521,427 | | | | 252,001 | | | $ | 2,909,335 | |
Dividends and/or distributions reinvested | | | 261,020 | | | | 3,027,836 | | | | 287,056 | | | | 3,355,682 | |
Acquisition—Note 8 | | | 8,473,818 | | | | 101,940,025 | | | | — | | | | — | |
Redeemed | | | (1,368,485 | ) | | | (16,065,467 | ) | | | (2,302,830 | ) | | | (26,439,409 | ) |
| | |
|
|
| |
|
|
| |
|
|
| |
|
|
|
| Net increase (decrease) | | | 7,495,943 | | | $ | 90,423,821 | | | | (1,763,773 | ) | | $ | (20,174,392 | ) |
| | |
|
|
| |
|
|
| |
|
|
| |
|
|
|
| | | | | | | | | | | | | |
| Service Shares | | | | | | | | | | | | | | | | |
Sold | | | 171,239 | | | $ | 1,998,739 | | | | 423,625 | | | $ | 4,837,026 | |
Dividends and/or distributions reinvested | | | 79,405 | | | | 910,776 | | | | 155,505 | | | | 1,802,307 | |
Redeemed | | | (679,744 | ) | | | (7,919,927 | ) | | | (1,531,184 | ) | | | (17,336,478 | ) |
| | |
|
|
| |
|
|
| |
|
|
| |
|
|
|
| Net decrease | | | (429,100 | ) | | $ | (5,010,412 | ) | | | (952,054 | ) | | $ | (10,697,145 | ) |
| | |
|
|
| |
|
|
| |
|
|
| |
|
|
|
31 | OPPENHEIMER BALANCED FUND/VA
|
NOTES TO FINANCIAL STATEMENTS Unaudited / Continued
4. Purchases and Sales of Securities
The aggregate cost of purchases and proceeds from sales of securities, other than short-term obligations and investments in IMMF, for the six months ended June 29, 2012, were as follows:
| | | | | | | | |
| | | Purchases | | | Sales | |
| Investment securities | | | $143,910,985 | | | | $133,900,674 | |
| U.S. government and government agency obligations | | | 2,295,043 | | | | 1,154,343 | |
| To Be Announced (TBA) mortgage-related securities | | | 260,922,077 | | | | 266,102,858 | |
5. Fees and Other Transactions with Affiliates
Management Fees. Under the investment advisory agreement, the Fund pays the Manager a management fee based on the daily net assets of the Fund at an annual rate as shown in the following table:
| | | | |
| Fee Schedule | | | |
| Up to $200 million | | | 0.75 | % |
| Next $200 million | | | 0.72 | |
| Next $200 million | | | 0.69 | |
| Next $200 million | | | 0.66 | |
| Over $800 million | | | 0.60 | |
Administration Service Fees. The Fund pays the Manager a fee of $1,500 per year for preparing and filing the Fund’s tax returns.
Transfer Agent Fees. OppenheimerFunds Services (“OFS”), a division of the Manager, acts as the transfer and shareholder servicing agent for the Fund. For the six months ended June 29, 2012, the Fund paid $112,503 to OFS for services to the Fund.
Distribution and Service Plan for Service Shares. The Fund has adopted a Distribution and Service Plan (the “Plan”) in accordance with Rule 12b-1 under the Investment Company Act of 1940 for Service shares to pay OppenheimerFunds Distributor, Inc. (the “Distributor”), for distribution related services, personal service and account maintenance for the Fund’s Service shares. Under the Plan, payments are made periodically at an annual rate of 0.25% of the daily net assets of Service shares of the Fund. The Distributor currently uses all of those fees to compensate sponsors of the insurance product that offers Fund shares, for providing personal service and maintenance of accounts of their variable contract owners that hold Service shares. These fees are paid out of the Fund’s assets on an on-going basis and increase operating expenses of the Service shares, which results in lower performance compared to the Fund’s shares that are not subject to a service fee. Fees incurred by the Fund under the Plan are detailed in the Statement of Operations.
Waivers and Reimbursements of Expenses. The Manager has voluntarily agreed to waive a portion of the advisory fee and/or reimburse certain expenses so that the “Expenses after payments, waivers and/or reimbursements and reduction to custodian expenses” will not exceed 0.67% of average annual net assets for Non-Service shares and 0.92% of average annual net assets for Service shares. During the six months ended June 29, 2012, the Manager waived fees and/or reimbursed the Fund $182,391 and $90,790 for Non-Service and Service shares, respectively.
The Manager will waive fees and/or reimburse Fund expenses in an amount equal to the indirect management fees incurred through the Fund’s investment in IMMF. During the six months ended June 29, 2012, the Manager waived fees and/or reimbursed the Fund $8,829 for IMMF management fees.
Some of these undertakings may be modified or terminated at any time; some may not be modified or terminated until after one year from the date of the current prospectus, as indicated therein.
32 | OPPENHEIMER BALANCED FUND/VA
|
6. Risk Exposures and the Use of Derivative Instruments
The Fund’s investment objectives not only permit the Fund to purchase investment securities, they also allow the Fund to enter into various types of derivatives contracts, including, but not limited to, futures contracts, forward foreign currency exchange contracts, credit default swaps, interest rate swaps, total return swaps, and purchased and written options. In doing so, the Fund will employ strategies in differing combinations to permit it to increase, decrease, or change the level or types of exposure to market risk factors. Central to those strategies are features inherent to derivatives that make them more attractive for this purpose than equity and debt securities: they require little or no initial cash investment, they can focus exposure on only certain selected risk factors, and they may not require the ultimate receipt or delivery of the underlying security (or securities) to the contract. This may allow the Fund to pursue its objectives more quickly and efficiently than if it were to make direct purchases or sales of securities capable of effecting a similar response to market factors.
Market Risk Factors. In accordance with its investment objectives, the Fund may use derivatives to increase or decrease its exposure to one or more of the following market risk factors:
Commodity Risk. Commodity risk relates to the change in value of commodities or commodity indexes as they relate to increases or decreases in the commodities market. Commodities are physical assets that have tangible properties. Examples of these types of assets are crude oil, heating oil, metals, livestock, and agricultural products.
Credit Risk. Credit risk relates to the ability of the issuer to meet interest and principal payments, or both, as they come due. In general, lower-grade, higher-yield bonds are subject to credit risk to a greater extent than lower-yield, higher-quality bonds.
Equity Risk. Equity risk relates to the change in value of equity securities as they relate to increases or decreases in the general market.
Foreign Exchange Rate Risk. Foreign exchange rate risk relates to the change in the U.S. dollar value of a security held that is denominated in a foreign currency. The U.S. dollar value of a foreign currency denominated security will decrease as the dollar appreciates against the currency, while the U.S. dollar value will increase as the dollar depreciates against the currency.
Interest Rate Risk. Interest rate risk refers to the fluctuations in value of fixed-income securities resulting from the inverse relationship between price and yield. For example, an increase in general interest rates will tend to reduce the market value of already issued fixed-income investments, and a decline in general interest rates will tend to increase their value. In addition, debt securities with longer maturities, which tend to have higher yields, are subject to potentially greater fluctuations in value from changes in interest rates than obligations with shorter maturities.
Volatility Risk. Volatility risk refers to the magnitude of the movement, but not the direction of the movement, in a financial instrument’s price over a defined time period. Large increases or decreases in a financial instrument’s price over a relative time period typically indicate greater volatility risk, while small increases or decreases in its price typically indicate lower volatility risk.
The Fund’s actual exposures to these market risk factors during the period are discussed in further detail, by derivative type, below.
Risks of Investing in Derivatives. The Fund’s use of derivatives can result in losses due to unanticipated changes in the market risk factors and the overall market. In instances where the Fund is using derivatives to decrease, or hedge, exposures to market risk factors for securities held by the Fund, there are also risks that those derivatives may not perform as expected resulting in losses for the combined or hedged positions.
Derivatives may have little or no initial cash investment relative to their market value exposure and therefore can produce significant gains or losses in excess of their cost. This use of embedded leverage allows the Fund to increase its market value exposure relative to its net assets and can substantially increase the volatility of the Fund’s performance.
33 | OPPENHEIMER BALANCED FUND/VA
|
NOTES TO FINANCIAL STATEMENTS Unaudited / Continued
6. Risk Exposures and the Use of Derivative Instruments Continued
Additional associated risks from investing in derivatives also exist and potentially could have significant effects on the valuation of the derivative and the Fund. Typically, the associated risks are not the risks that the Fund is attempting to increase or decrease exposure to, per its investment objectives, but are the additional risks from investing in derivatives. Examples of these associated risks are liquidity risk, which is the risk that the Fund will not be able to sell the derivative in the open market in a timely manner, and counterparty credit risk, which is the risk that the counterparty will not fulfill its obligation to the Fund. Associated risks can be different for each type of derivative and are discussed by each derivative type in the notes that follow.
Counterparty Credit Risk. Certain derivative positions are subject to counterparty credit risk, which is the risk that the counterparty will not fulfill its obligation to the Fund. The Fund’s derivative counterparties are financial institutions who are subject to market conditions that may weaken their financial position. The Fund intends to enter into financial transactions with counterparties that the Manager believes to be creditworthy at the time of the transaction.
Credit Related Contingent Features. The Fund’s agreements with derivative counterparties have several credit related contingent features that if triggered would allow its derivatives counterparties to close out and demand payment or additional collateral to cover their exposure from the Fund. Credit related contingent features are established between the Fund and its derivatives counterparties to reduce the risk that the Fund will not fulfill its payment obligations to its counterparties. These triggering features include, but are not limited to, a percentage decrease in the Fund’s net assets and or a percentage decrease in the Fund’s Net Asset Value or NAV. The contingent features are established within the Fund’s International Swap and Derivatives Association, Inc. master agreements which govern certain positions in swaps, over-the-counter options and swaptions, and forward currency exchange contracts for each individual counterparty.
Valuations of derivative instruments as of June 29, 2012 are as follows:
| | | | | | | | | | | | |
| | | Asset Derivatives
| | | Liability Derivatives
| |
Derivatives Not
Accounted for as
Hedging Instruments | | Statement of Assets
and Liabilities Location | | Value | | | Statement of Assets
and Liabilities Location | | Value | |
| Interest rate contracts | | Futures margins | | $ | 23,933 | * | | Futures margins | | $ | 95,913 | * |
| Equity contracts | | Investments, at value | | | 32,385 | ** | | | | | | |
| | | | |
|
|
| | | |
|
|
|
| Total | | | | $ | 56,318 | | | | | $ | 95,913 | |
| | | | |
|
|
| | | |
|
|
|
*Includes only the current day’s variation margin. Prior variation margin movements have been reflected in cash on the Statement of Assets and Liabilities upon receipt or payment.
**Amounts relate to purchased options.
The effect of derivative instruments on the Statement of Operations is as follows:
| | | | | | | | | | | | |
| Amount of Realized Gain or (Loss) Recognized on Derivatives | |
Derivatives Not Accounted
for as Hedging Instruments | | Closing and expiration
of futures contracts | | | Foreign currency transactions | | | Total | |
| Foreign exchange contracts | | $ | — | | | $ | (19,339 | ) | | $ | (19,339 | ) |
| Interest rate contracts | | | 165,985 | | | | — | | | | 165,985 | |
| | |
|
|
| |
|
|
| |
|
|
|
| Total | | $ | 165,985 | | | $ | (19,339 | ) | | $ | 146,646 | |
| | |
|
|
| |
|
|
| |
|
|
|
34 | OPPENHEIMER BALANCED FUND/VA
|
| | | | | | | | | | | | | | | | |
| Amount of Change in Unrealized Gain or (Loss) Recognized on Derivatives | |
Derivatives Not Accounted
for as Hedging Instruments | | Investments* | | | Futures contracts | | | Translation
of assets and
liabilities
denominated
in foreign
currencies | | | Total | |
| Equity contracts | | $ | (35,199 | ) | | $ | — | | | $ | — | | | $ | (35,199 | ) |
| Foreign exchange contracts | | | — | | | | — | | | | (20,189 | ) | | | (20,189 | ) |
| Interest rate contracts | | | — | | | | 53,563 | | | | — | | | | 53,563 | |
| | |
|
|
| |
|
|
| |
|
|
| |
|
|
|
| Total | | $ | (35,199 | ) | | $ | 53,563 | | | $ | (20,189 | ) | | $ | (1,825 | ) |
| | |
|
|
| |
|
|
| |
|
|
| |
|
|
|
*Includes purchased option contracts and purchased swaption contracts, if any.
Foreign Currency Exchange Contracts
The Fund may enter into foreign currency exchange contracts (“forward contracts”) for the purchase or sale of a foreign currency at a negotiated rate at a future date.
Forward contracts are reported on a schedule following the Statement of Investments. The unrealized appreciation (depreciation) is reported in the Statement of Assets and Liabilities as a receivable or payable and in the Statement of Operations within the change in unrealized appreciation (depreciation). At contract close, the difference between the original cost of the contract and the value at the close date is recorded as a realized gain (loss) in the Statement of Operations.
The Fund has purchased and sold certain forward foreign currency exchange contracts of different currencies in order to acquire currencies to pay for or sell currencies to acquire related foreign securities purchase and sale transactions, respectively, or to convert foreign currencies to U.S. dollars from related foreign securities transactions. These foreign currency exchange contracts are negotiated at the current spot exchange rate with settlement typically within two business days thereafter.
During the six months ended June 29, 2012, the Fund had daily average contract amounts on forward foreign currency contracts to sell of $112,408.
Additional associated risk to the Fund includes counterparty credit risk. Counterparty credit risk arises from the possibility that the counterparty will default.
As of June 29, 2012, the Fund had no outstanding forward contracts.
Futures Contracts
A futures contract is a commitment to buy or sell a specific amount of a financial instrument, or currency, at a negotiated price on a stipulated future date. The Fund may buy and sell futures contracts and may also buy or write put or call options on these futures contracts.
Futures contracts traded on a commodities or futures exchange will be valued at the final settlement price or official closing price on the principal exchange as reported by such principal exchange at its trading session ending at, or most recently prior to, the time when the Fund’s assets are valued.
Upon entering into a futures contract, the Fund is required to deposit either cash or securities (initial margin) in an amount equal to a certain percentage of the contract value. Subsequent payments (variation margin) are made or received by the Fund each day. The variation margin payments are equal to the daily changes in the contract value and are recorded as unrealized gains and losses.
Futures contracts are reported on a schedule following the Statement of Investments. Securities held in collateralized accounts to cover initial margin requirements on open futures contracts are noted in the Statement of Investments. Cash held by the broker to cover initial margin requirements on open futures contracts and the receivable and/or payable for the daily mark to market for the variation margin are noted in the Statement of Assets and Liabilities. The
35 | OPPENHEIMER BALANCED FUND/VA
|
NOTES TO FINANCIAL STATEMENTS Unaudited / Continued
6. Risk Exposures and the Use of Derivative Instruments Continued
net change in unrealized appreciation and depreciation is reported in the Statement of Operations. Realized gains (losses) are reported in the Statement of Operations at the closing or expiration of futures contracts.
The Fund has purchased futures contracts on various bonds and notes to increase exposure to interest rate risk.
The Fund has sold futures contracts on various bonds and notes to decrease exposure to interest rate risk.
During the six months ended June 29, 2012, the Fund had an ending monthly average market value of $6,927,496 and $19,752,098 on futures contracts purchased and sold, respectively.
Additional associated risks of entering into futures contracts (and related options) include the possibility that there may be an illiquid market where the Fund is unable to liquidate the contract or enter into an offsetting position and, if used for hedging purposes, the risk that the price of the contract will correlate imperfectly with the prices of the Fund’s securities.
Option Activity
The Fund may buy and sell put and call options, or write put and call options. When an option is written, the Fund receives a premium and becomes obligated to sell or purchase the underlying security at a fixed price, upon exercise of the option.
Options are valued daily based upon the last sale price on the principal exchange on which the option is traded. The difference between the premium received or paid, and market value of the option, is recorded as unrealized appreciation or depreciation. The net change in unrealized appreciation or depreciation is reported in the Statement of Operations. When an option is exercised, the cost of the security purchased or the proceeds of the security sale are adjusted by the amount of premium received or paid. Upon the expiration or closing of the option transaction, a gain or loss is reported in the Statement of Operations.
The Fund has purchased put options on individual equity securities and/or equity indexes to decrease exposure to equity risk. A purchased put option becomes more valuable as the price of the underlying financial instrument depreciates relative to the strike price.
During the six months ended June 29, 2012, the Fund had an ending monthly average market value of $4,626 on purchased put options.
Options written, if any, are reported in a schedule following the Statement of Investments and as a liability in the Statement of Assets and Liabilities. Securities held in collateralized accounts to cover potential obligations with respect to outstanding written options are noted in the Statement of Investments.
The risk in writing a call option is that the Fund gives up the opportunity for profit if the market price of the security increases and the option is exercised. The risk in writing a put option is that the Fund may incur a loss if the market price of the security decreases and the option is exercised. The risk in buying an option is that the Fund pays a premium whether or not the option is exercised. The Fund also has the additional risk that there may be an illiquid market where the Fund is unable to close the contract.
Additional associated risks to the Fund include counterparty credit risk for over-the-counter options and liquidity risk.
As of June 29, 2012, the Fund had no outstanding written options.
7. Restricted Securities
As of June 29, 2012, investments in securities included issues that are restricted. A restricted security may have a contractual restriction on its resale and is valued under methods approved by the Board of Trustees as reflecting fair value. Securities that are restricted are marked with an applicable footnote on the Statement of Investments. Restricted securities are reported on a schedule following the Statement of Investments.
36 | OPPENHEIMER BALANCED FUND/VA
|
8. Acquisition of Total Return Portfolio
On April 26, 2012, the Fund acquired all of the net assets of Total Return Portfolio, pursuant to an Agreement and Plan of Reorganization approved by the Total Return Portfolio shareholders on April 20, 2012. The exchange qualified as a tax-free reorganization for federal income tax purposes. The purpose of this acquisition is to combine two funds with similar investment objectives, strategies and risks to allow shareholders to benefit from greater asset growth potential, as well as lowered total expenses.
The transaction qualified as a tax-free reorganization, (the “merger”) for federal income tax purposes allowing the Fund to use the original cost basis of the investments received to calculate subsequent gains and losses for tax reporting purposes.
Details of the merger are shown in the following table:
| | | | | | | | | | | | | | | | |
| | | Exchange
Ratio to
One Share
of the Total
Return
Portfolio | | | Shares of
Beneficial
Interest
Issued by
the Fund | | | Value of
Issued
Shares of
Beneficial
Interest | | | Combined
Net Assets
on April 26,
20121 | |
| Class A | | | 0.1049625104 | | | | 8,473,818 | | | $ | 101,940,025 | | | $ | 230,906,772 | |
1. The net assets acquired included net unrealized appreciation of $6,091,953 and an unused capital loss carryforward of $46,084,065, potential utilization subject to tax limitations.
Had the merger occurred at the beginning of the reporting period, the Fund’s Statement of Operations would have been adjusted to the following amounts:
| | | | |
| Net investment income | | $ | 3,321,068 | |
| Net loss on investments | | | 10,291,352 | |
| Net increase in net assets resulting from operations | | | 13,612,420 | |
9. Pending Litigation
Since 2009, a number of class action, derivative and individual lawsuits have been pending in federal and state courts against OppenheimerFunds, Inc., the Fund’s investment advisor (the “Manager”), OppenheimerFunds Distributor, Inc., the Fund’s principal underwriter and distributor (the “Distributor”), and certain funds (but not including the Fund) advised by the Manager and distributed by the Distributor (the “Defendant Funds”). Several of these lawsuits also name as defendants certain officers and current and former trustees of the respective Defendant Funds. The lawsuits raise claims under federal securities laws and various states’ securities, consumer protection and common law and allege, among other things, that the disclosure documents of the respective Defendant Funds contained misrepresentations and omissions and that the respective Defendant Funds’ investment policies were not followed. The plaintiffs in these actions seek unspecified damages, equitable relief and awards of attorneys’ fees and litigation expenses.
Other class action and individual lawsuits have been filed since 2008 in various state and federal courts against the Manager and certain of its affiliates by investors seeking to recover investments they allegedly lost as a result of the “Ponzi” scheme run by Bernard L. Madoff and his firm, Bernard L. Madoff Investment Securities, LLC (“BLMIS”). Plaintiffs in these suits allege that they suffered losses as a result of their investments in several funds managed by an affiliate of the Manager and assert a variety of claims, including breach of fiduciary duty, fraud, negligent misrepresentation, unjust enrichment, and violation of federal and state securities laws and regulations, among others. They seek unspecified damages, equitable relief and awards of attorneys’ fees and litigation expenses. Neither the Distributor, nor any of the Oppenheimer mutual funds, their independent trustees or directors are named as defendants in these lawsuits. None of the Oppenheimer mutual funds invested in any funds or accounts managed by Madoff or BLMIS. On February 28, 2011, a stipulation of partial settlement of three groups of consolidated putative class action lawsuits relating to these matters was filed in the U.S. District Court for the Southern District of New York. On August 19, 2011, the court entered an order and final judgment approving the settlement as fair, reasonable and adequate. In September 2011, certain parties
37 | OPPENHEIMER BALANCED FUND/VA
|
NOTES TO FINANCIAL STATEMENTS Unaudited / Continued
9. Pending Litigation Continued
filed notices of appeal from the court’s order approving the settlement. On July 29, 2011, a stipulation of settlement between certain affiliates of the Manager and the Trustee appointed under the Securities Investor Protection Act to liquidate BLMIS was filed in the U.S. Bankruptcy Court for the Southern District of New York to resolve purported preference and fraudulent transfer claims by the Trustee. On September 22, 2011, the court entered an order approving the settlement as fair, reasonable and adequate. In October 2011, certain parties filed notices of appeal from the court’s order approving the settlement. The aforementioned settlements do not resolve other outstanding lawsuits against the Manager and its affiliates relating to BLMIS.
On April 16, 2010, a lawsuit was filed in New York state court against the Manager, an affiliate of the Manager and AAArdvark IV Funding Limited (“AAArdvark IV”), an entity advised by the Manager’s affiliate, in connection with investments made by the plaintiffs in AAArdvark IV. Plaintiffs allege breach of contract against the defendants and seek compensatory damages, costs and disbursements, including attorney fees. On July 15, 2011, a lawsuit was filed in New York state court against the Manager, an affiliate of the Manager and AAArdvark Funding Limited (“AAArdvark I”), an entity advised by the Manager’s affiliate, in connection with investments made by the plaintiffs in AAArdvark I. The complaint alleges breach of contract against the defendants and seeks compensatory damages, costs and disbursements, including attorney fees. On November 9, 2011, a lawsuit was filed in New York state court against the Manager, an affiliate of the Manager and AAArdvark XS Funding Limited (“AAArdvark XS”), an entity advised by the Manager’s affiliate, in connection with investments made by the plaintiffs in AAArdvark XS. The complaint alleges breach of contract against the defendants and seeks compensatory damages, costs and disbursements, including attorney fees.
The Manager believes the lawsuits and appeals described above are without legal merit and, with the exception of actions it has settled, is defending against them vigorously. The Defendant Funds’ Boards of Trustees have also engaged counsel to represent the Funds and the present and former Independent Trustees named in those suits. While it is premature to render any opinion as to the outcome in these lawsuits, or whether any costs that the Defendant Funds may bear in defending the suits might not be reimbursed by insurance, the Manager believes that these suits should not impair the ability of the Manager or the Distributor to perform their respective duties to the Fund, and that the outcome of all of the suits together should not have any material effect on the operations of any of the Oppenheimer mutual funds.
38 | OPPENHEIMER BALANCED FUND/VA
|
SPECIAL SHAREHOLDER MEETING Unaudited
On February 29, 2012, a shareholder meeting of the Oppenheimer Variable Account Funds, on behalf of Oppenheimer Balanced Fund/VA (the “Fund”) was held at which the twelve Trustees identified below were elected to the Trust (Proposal No. 1). At the meeting Proposal No. 2 (including all of its sub-proposals) and Proposal No. 3 were approved as described in the Fund’s proxy statement for that meeting. The following is a report of the votes cast:
| | | | | | | | |
| Nominee/Proposal | | For | | | Withheld | |
| Trustees | | | | | | | | |
| William L. Armstrong | | | 859,155,000 | | | | 36,277,763 | |
| Edward L. Cameron | | | 860,463,149 | | | | 34,969,615 | |
| Jon S. Fossel | | | 861,382,389 | | | | 34,050,375 | |
| Sam Freedman | | | 860,173,958 | | | | 35,258,806 | |
| Richard F. Grabish | | | 862,692,974 | | | | 32,739,789 | |
| Beverly L. Hamilton | | | 862,904,192 | | | | 32,528,571 | |
| Robert J. Malone | | | 862,354,488 | | | | 33,078,275 | |
| F. William Marshall, Jr. | | | 860,997,182 | | | | 34,435,581 | |
| Victoria J. Herget | | | 861,814,105 | | | | 33,618,659 | |
| Karen L. Stuckey | | | 861,434,246 | | | | 33,998,517 | |
| James D. Vaughn | | | 861,208,178 | | | | 34,224,585 | |
| William F. Glavin, Jr. | | | 861,148,846 | | | | 34,283,917 | |
2a: Proposal to revise the fundamental policy relating to borrowing
| | | | | | | | | | | | |
| For | | Against | | | Abstain | | | Broker Non Vote | |
| 17,193,173 | | | 948,698 | | | | 617,252 | | | | N/A | |
2b: Proposal to revise the fundamental policy relating to concentration of investments
| | | | | | | | | | | | |
| For | | Against | | | Abstain | | | Broker Non Vote | |
| 17,332,147 | | | 905,677 | | | | 521,299 | | | | N/A | |
2c: Proposal to remove the fundamental policy relating to diversification of investments
| | | | | | | | | | | | |
| For | | Against | | | Abstain | | | Broker Non Vote | |
| 17,095,479 | | | 944,228 | | | | 719,415 | | | | N/A | |
2d: Proposal to revise the fundamental policy relating to lending
| | | | | | | | | | | | |
| For | | Against | | | Abstain | | | Broker Non Vote | |
| 17,091,961 | | | 876,674 | | | | 790,488 | | | | N/A | |
2e-1: Proposal to revise the fundamental policy relating to real estate and commodities
| | | | | | | | | | | | |
| For | | Against | | | Abstain | | | Broker Non Vote | |
| 17,229,468 | | | 973,504 | | | | 556,151 | | | | N/A | |
2e-2: Proposal to remove the additional fundamental policy relating to real estate and commodities
| | | | | | | | | | | | |
| For | | Against | | | Abstain | | | Broker Non Vote | |
| 17,130,450 | | | 1,006,646 | | | | 622,027 | | | | N/A | |
39 | OPPENHEIMER BALANCED FUND/VA
|
SPECIAL SHAREHOLDER MEETING Unaudited / Continued
2f: Proposal to revise the fundamental policy relating to senior securities
| | | | | | | | | | | | |
| For | | Against | | | Abstain | | | Broker Non Vote | |
| 17,127,270 | | | 1,009,929 | | | | 621,924 | | | | N/A | |
2g: Proposal to revise the fundamental policy relating to underwriting
| | | | | | | | | | | | |
| For | | Against | | | Abstain | | | Broker Non Vote | |
| 17,208,411 | | | 948,414 | | | | 602,297 | | | | N/A | |
2i: Convert the Fund’s investment objective from fundamental to non-fundamental
| | | | | | | | | | | | |
| For | | Against | | | Abstain | | | Broker Non Vote | |
| 17,078,696 | | | 974,462 | | | | 705,965 | | | | N/A | |
2j: Approve a change in the fund’s investment objective
| | | | | | | | | | | | |
| For | | Against | | | Abstain | | | Broker Non Vote | |
| 17,117,489 | | | 990,369 | | | | 651,265 | | | | N/A | |
Proposal 3: To approve an Agreement and Plan of Reorganization that provides for the reorganization of a Fund from a Maryland corporation or Massachusetts business trust, as applicable, into a Delaware statutory trust.
| | | | | | | | | | | | |
| For | | Against | | | Abstain | | | Broker Non Vote | |
| 821,085,084 | | | 23,597,959 | | | | 50,749,721 | | | | N/A | |
40 | OPPENHEIMER BALANCED FUND/VA
|
PORTFOLIO PROXY VOTING POLICIES AND PROCEDURES;
UPDATES TO STATEMENTS OF INVESTMENTS Unaudited
The Fund has adopted Portfolio Proxy Voting Policies and Procedures under which the Fund votes proxies relating to securities (“portfolio proxies”) held by the Fund. A description of the Fund’s Portfolio Proxy Voting Policies and Procedures is available (i) without charge, upon request, by calling the Fund toll-free at 1.800.525.7048, (ii) on the Fund’s website at oppenheimerfunds.com, and (iii) on the SEC’s website at www.sec.gov. In addition, the Fund is required to file Form N-PX, with its complete proxy voting record for the 12 months ended June 30th, no later than August 31st of each year. The Fund’s voting record is available (i) without charge, upon request, by calling the Fund toll-free at 1.800.525.7048, and (ii) in the Form N-PX filing on the SEC’s website at www.sec.gov.
The Fund files its complete schedule of portfolio holdings with the SEC for the first quarter and the third quarter of each fiscal year on Form N-Q. The Fund’s Form N-Q filings are available on the SEC’s website at www.sec.gov. Those forms may be reviewed and copied at the SEC’s Public Reference Room in Washington, D.C. Information on the operation of the Public Reference Room may be obtained by calling 1-800-SEC-0330.
41 | OPPENHEIMER BALANCED FUND/VA
|
OPPENHEIMER BALANCED FUND/VA
| | |
| A Series of Oppenheimer Variable Account Funds |
| Trustees and Officers | | William L. Armstrong, Chairman of the Board of Trustees and Trustee Edward L. Cameron, Trustee Jon S. Fossel, Trustee Sam Freedman, Trustee Richard F. Grabish, Trustee Beverly L. Hamilton, Trustee Victoria J. Herget, Trustee Robert J. Malone, Trustee F. William Marshall, Jr., Trustee Karen L. Stuckey, Trustee James D. Vaughn, Trustee William F. Glavin, Jr., Trustee, President and Principal Executive Officer Mitch Williams, Vice President Krishna Memani, Vice President Peter A. Strzalkowski, Vice President Arthur S. Gabinet, Secretary and Chief Legal Officer Christina M. Nasta, Vice President and Chief Business Officer Mark S. Vandehey, Vice President and Chief Compliance Officer Brian W. Wixted, Treasurer and Principal Financial & Accounting Officer |
| Manager | | OppenheimerFunds, Inc. |
| Distributor | | OppenheimerFunds Distributor, Inc. |
| Transfer Agent | | OppenheimerFunds Services |
| Independent Registered Public Accounting Firm | | KPMGLLP |
| Counsel | | K&L Gates LLP |
Before investing, investors should carefully consider a fund’s investment objectives, risks, charges and expenses. Fund prospectuses and summary prospectuses contain this and other information about the funds, and may be obtained by asking your financial advisor, or calling us at 1.800.988.8287. Read prospectuses and summary prospectuses carefully before investing.
The financial statements included herein have been taken from the records of the Fund without examination of those records by the independent registered public accounting firm.
| | |
| ©2012 OppenheimerFunds, Inc. All rights reserved. | |  |
June 30, 2012
| | | | |
| | | Oppenheimer Capital Appreciation Fund/VA A Series of Oppenheimer Variable Account Funds | | Semiannual Report |

SEMIANNUAL REPORT
Fund Performance Discussion
Listing of Top Holdings
Financial Statements

OPPENHEIMER CAPITAL APPRECIATION FUND/VA
Portfolio Managers: Julie Van Cleave, CFA and Michael Kotlarz1
| | | | | | |
Cumulative Total Returns
For the 6-Month Period Ended 6/29/122 | | |
| Non-Service Shares | | 8.24% | | | | |
| Service Shares | | 8.07 | | | | |
Average Annual Total Returns For the Periods Ended 6/29/122 | | |
| | | |
| | | 1-Year | | 5-Year | | 10-Year |
| Non-Service Shares | | 1.45% | | –0.77% | | 4.23% |
| Service Shares | | 1.19 | | –1.02 | | 3.97 |
Expense Ratios For the Fiscal Year Ended 12/30/112 | | |
| Non-Service Shares | | 0.80% | | | | |
| Service Shares | | 1.05 | | | | |
The performance data quoted represents past performance, which does not guarantee future results. The investment return and principal value of an investment in the Fund will fluctuate so that an investor’s shares, when redeemed, may be worth more or less than their original cost. Current performance and expense ratios may be lower or higher than the data quoted. For performance data current to the most recent month end, call us at 1.800.988.8287. The Fund’s total returns should not be expected to be the same as the returns of other funds, whether or not both funds have the same portfolio managers and/or similar names. The Fund’s total returns do not include the charges associated with the separate account products that offer this Fund. Such performance would have been lower if such charges were taken into account. Expense ratios are as stated in the Fund’s prospectus current as of the date of this report.
1. Became a co-portfolio manager June 29, 2012.
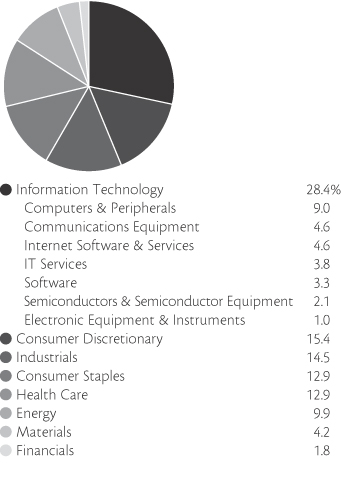
Portfolio holdings and allocations are subject to change. Percentages are as of June 29, 2012, and are based on the total market value of common stocks.
| | |
| Top Ten Common Stock Holdings | | |
| Apple, Inc. | | 8.6% |
| QUALCOMM, Inc. | | 3.9 |
| Google, Inc., Cl. A | | 2.8 |
| McDonald’s Corp. | | 2.2 |
| Costco Wholesale Corp. | | 2.2 |
| Allergan, Inc. | | 2.0 |
| Walt Disney Co. (The) | | 1.9 |
| Coca-Cola Co. (The) | | 1.8 |
| eBay, Inc. | | 1.8 |
| Union Pacific Corp. | | 1.7 |
Portfolio holdings and allocations are subject to change. Percentages are as of June 29, 2012, and are based on net assets.
2 | OPPENHEIMER CAPITAL APPRECIATION FUND/VA
|
FUND PERFORMANCE DISCUSSION
The Fund’s Non-Service shares returned 8.24% during the six-month reporting period. In comparison, the Fund underperformed the Russell 1000 Growth Index (the “Index”), which returned 10.08%, and the S&P 500 Index, which returned 9.49%2. Relative to the Index, the Fund underperformed primarily due to weaker stock selection within the consumer discretionary, information technology and industrials sectors. The Fund outperformed the Index within the health care and materials sectors due to stronger stock selection.
Economic and Market Environment
The period began during a time of improved market sentiment in which the U.S. managed to avoid a return to recession and European policymakers appeared to take steps to address the region’s sovereign debt and banking sector crises. Renewed investor optimism helped produce gains across a number of international equity markets over the first three months of 2012. The rebound across equities gained momentum after the European Central Bank implemented the Long-Term Refinancing Operation (“LTRO”) to enhance liquidity for troubled banks and reduce rates on newly issued sovereign debt securities.
However, the second quarter was a volatile time for global markets. The fear of contagion from the worsening European sovereign debt crisis and a recession across much of Europe drove negative market sentiment, particularly over May and June. Very high unemployment, soaring debt and higher borrowing costs in Greece, Spain and Italy contributed to serious questions over how to implement austerity measures and restructure debt or instead take a different tact and provide some or all of those countries with additional funds. Perhaps most worrisome of all to investors was the possibility of Greece pulling out of the euro and its ramifications for the future of the Eurozone and its common currency. In the U.S., slower than expected first quarter growth also contributed to a sell-off in the U.S. stock market. Consumer confidence dropped as U.S. unemployment figures ticked slightly upwards after showing signs of improvement from the recession highs. However, the period ended on a positive note for the markets. The results of elections in Greece and continued efforts by European policymakers to stabilize the situation in the region appeared to soothe market jitters slightly in the final days of the period.
Fund Review
During the reporting period, information technology stock Apple, Inc., the top holding of the Fund at period end, was the Fund’s strongest performing holding. Apple continued to out-execute its peers, and its success at innovation and highly recognizable brand led to global growth and share gains across its top revenue producing products—iPhones, iPads and Mac PCs. Also contributing to performance within information technology was eBay, Inc. eBay provides online marketplaces, including its flagship e-commerce platform eBay.com, as well as StubHub, Half.com and Shopping.com. Online payment services are provided by PayPal and Bill Me Later. The continued growth of PayPal played a large role in the positive performance of eBay this period.
Other positive contributors to Fund performance included pharmaceutical stocks Vertex Pharmaceuticals, Inc. and Novo Nordisk AS. Vertex released promising data from a Phase 2 study, which showed that combining experimental drug VX-809 with its recently FDA approved drug Kalydeco led to improvements in lung function in adults with cystic fibrosis. This announcement significantly boosted the company’s stock price in May. Novo Nordisk’s stock was driven largely by increased sales of Victoza, which is a diabetes drug.
The most significant detractor from performance was information technology holding Google, Inc. Google’s stock underperformed after reporting fourth quarter results. The U.S. dollar’s appreciation against the euro also negatively impacted results, as it impacted the company’s translation of euro revenues and profits into U.S. dollars. We remain optimistic about Google’s outlook for growth of both revenues and earnings. Juniper Networks, Inc., another information technology stock, also detracted from performance. Juniper, which offers network infrastructure solutions, experienced volatility this period as it reported a decline in revenue.
2. June 29, 2012, was the last business day of the Fund’s semiannual period. See Note 1 of the accompanying Notes to Financial Statements. Index returns are calculated through June 30, 2012. December 30, 2011 was the last business day of the Fund’s 2011 fiscal year.
3 | OPPENHEIMER CAPITAL APPRECIATION FUND/VA
|
FUND PERFORMANCE DISCUSSION
Outside of the information technology sector, McDonald’s Corp. and Joy Global, Inc. hurt the Fund’s performance this period. McDonald’s stock declined due partly to a decrease in sales in Asian markets, including Japan and China, in the volatile market environment. Joy Global, a manufacturer of mining equipment, experienced a decrease in orders due to a weak coal market in the U.S.
Outlook
Uncertainty about the Eurozone crisis, the U.S. “fiscal cliff” and the risk of a hard landing in China continues to weigh on the global economy. Although the U.S. economy continues to grow at a slow pace, it has proven to be more flexible and resilient in comparison to many other developed nations.
Looking forward, we expect to see significantly greater differentiation in valuations to occur in the equity market with better valuations awarded to companies with high quality earnings. We employ a disciplined investment process that combines strategic, top-down sector analysis with bottom-up fundamental research. We continue to focus on companies with consistent revenue and earnings growth, which we expect will benefit as investors seek to invest in companies with the brightest prospects.
Investors should consider the Fund’s investment objective, risks, and charges and expenses carefully before investing. The Fund’s prospectus and summary prospectus contain this and other information about the Fund, and may be obtained by asking your financial advisor or calling us at 1.800.988.8287. Read prospectuses and summary prospectuses carefully before investing.
Total returns include changes in share price and reinvestment of dividends and capital gains distributions in a hypothetical investment for the periods shown. Cumulative total returns are not annualized.
The Fund’s investment strategy and focus can change over time. The mention of specific fund holdings does not constitute a recommendation by OppenheimerFunds, Inc.
Shares of Oppenheimer funds are not deposits or obligations of any bank, are not guaranteed by any bank, are not insured by the FDIC or any other agency, and involve investment risks, including the possible loss of the principal amount invested.
4 | OPPENHEIMER CAPITAL APPRECIATION FUND/VA
|
FUND EXPENSES
Fund Expenses. As a shareholder of the Fund, you incur two types of costs: (1) transaction costs and (2) ongoing costs, including management fees; distribution and service fees; and other Fund expenses. These examples are intended to help you understand your ongoing costs (in dollars) of investing in the Fund and to compare these costs with the ongoing costs of investing in other mutual funds.
The examples are based on an investment of $1,000.00 invested at the beginning of the period and held for the entire 6-month period ended June 29, 2012.
Actual Expenses. The first section of the table provides information about actual account values and actual expenses. You may use the information in this section for the class of shares you hold, together with the amount you invested, to estimate the expense that you paid over the period. Simply divide your account value by $1,000.00 (for example, an $8,600.00 account value divided by $1,000.00 = 8.60), then multiply the result by the number in the first section under the heading entitled “Expenses Paid During Period” to estimate the expenses you paid on your account during this period.
Hypothetical Example for Comparison Purposes. The second section of the table provides information about hypothetical account values and hypothetical expenses based on the Fund’s actual expense ratio for each class of shares, and an assumed rate of return of 5% per year for each class before expenses, which is not the actual return. The hypothetical account values and expenses may not be used to estimate the actual ending account balance or expenses you paid for the period. You may use this information to compare the ongoing costs of investing in the Fund and other funds. To do so, compare this 5% hypothetical example for the class of shares you hold with the 5% hypothetical examples that appear in the shareholder reports of the other funds.
Please note that the expenses shown in the table are meant to highlight your ongoing costs only and do not reflect any charges associated with the separate accounts that offer this Fund. Therefore, the “hypothetical” lines of the table are useful in comparing ongoing costs only, and will not help you determine the relative total costs of owning different funds. In addition, if these separate account charges were included your costs would have been higher.
| | | | | | | | | | | | |
| Actual | | Beginning
Account
Value
January 1, 2012 | | | Ending
Account
Value
June 29, 2012 | | | Expenses
Paid During
6 Months Ended
June 29, 2012 | |
| Non-Service Shares | | $ | 1,000.00 | | | $ | 1,082.40 | | | $ | 4.13 | |
| Service Shares | | | 1,000.00 | | | | 1,080.70 | | | | 5.42 | |
| | | |
Hypothetical
(5% return before expenses) | | | | | | | | | |
| Non-Service Shares | | | 1,000.00 | | | | 1,020.77 | | | | 4.01 | |
| Service Shares | | | 1,000.00 | | | | 1,019.53 | | | | 5.26 | |
Expenses are equal to the Fund’s annualized expense ratio for that class, multiplied by the average account value over the period, multiplied by 181/366 (to reflect the one-half year period). Those annualized expense ratios, excluding indirect expenses from affiliated fund, based on the 6-month period ended June 29, 2012 are as follows:
| | | | |
| Class | | Expense Ratios | |
| Non-Service shares | | | 0.80 | % |
| Service shares | | | 1.05 | |
The expense ratios reflect voluntary waivers and/or reimbursements of expenses by the Fund’s Manager. Some of these undertakings may be modified or terminated at any time, as indicated in the Fund’s prospectus. The “Financial Highlights” tables in the Fund’s financial statements, included in this report, also show the gross expense ratios, without such waivers or reimbursements and reduction to custodian expenses, if applicable.
5 | OPPENHEIMER CAPITAL APPRECIATION FUND/VA
|
STATEMENT OF INVESTMENTS June 29, 2012* / Unaudited
| | | | | | | | |
| | | Shares | | | Value | |
| | | | | | | | | |
| Common Stocks—99.5% | | | | | | | | |
| Consumer Discretionary—15.4% | |
| Auto Components—0.9% | | | | | | | | |
| Johnson Controls, Inc. | | | 303,850 | | | $ | 8,419,684 | |
| Hotels, Restaurants & Leisure—3.4% | |
| McDonald’s Corp. | | | 235,790 | | | | 20,874,489 | |
| Yum! Brands, Inc. | | | 165,630 | | | | 10,669,885 | |
| | | | | | |
|
|
|
| | | | | | | | 31,544,374 | |
| Internet & Catalog Retail—1.7% | |
| Amazon.com, Inc.1 | | | 70,984 | | | | 16,209,196 | |
| Media—1.9% | | | | | | | | |
| Walt Disney Co. (The) | | | 372,640 | | | | 18,073,040 | |
| Specialty Retail—4.2% | |
| Bed Bath & Beyond, Inc.1 | | | 38,520 | | | | 2,380,536 | |
| O’Reilly Automotive, Inc.1 | | | 177,940 | | | | 14,906,034 | |
| Tiffany & Co. | | | 138,750 | | | | 7,346,813 | |
| TJX Cos., Inc. (The) | | | 343,960 | | | | 14,766,203 | |
| | | | | | |
|
|
|
| | | | | | | | 39,399,586 | |
| Textiles, Apparel & Luxury Goods—3.3% | |
| Coach, Inc. | | | 189,620 | | | | 11,088,978 | |
| Nike, Inc., Cl. B | | | 141,620 | | | | 12,431,404 | |
| Ralph Lauren Corp. | | | 56,030 | | | | 7,847,562 | |
| | | | | | |
|
|
|
| | | | | | | | 31,367,944 | |
| Consumer Staples—12.8% | |
| Beverages—4.5% | |
| Brown-Forman Corp., Cl. B | | | 121,130 | | | | 11,731,441 | |
| Coca-Cola Co. (The) | | | 219,570 | | | | 17,168,178 | |
| SABMiller plc | | | 340,520 | | | | 13,677,739 | |
| | | | | | |
|
|
|
| | | | | | | | 42,577,358 | |
| Food & Staples Retailing—2.2% | |
| Costco Wholesale Corp. | | | 214,980 | | | | 20,423,100 | |
| Food Products—2.5% | |
| Mead Johnson Nutrition Co., Cl. A | | | 123,420 | | | | 9,936,544 | |
| Nestle SA | | | 232,803 | | | | 13,870,315 | |
| | | | | | |
|
|
|
| | | | | | | | 23,806,859 | |
| Household Products—1.4% | |
| Colgate-Palmolive Co. | | | 125,250 | | | | 13,038,525 | |
| Personal Products—1.0% | |
| Estee Lauder Cos., Inc. (The), Cl. A | | | 179,580 | | | | 9,718,870 | |
| Tobacco—1.2% | | | | | | | | |
| Philip Morris International, Inc. | | | 130,610 | | | | 11,397,029 | |
| Energy—9.8% | | | | | | | | |
| Energy Equipment & Services—4.5% | |
| Cameron International Corp.1 | | | 211,270 | | | | 9,023,342 | |
| Ensco plc, Cl. A | | | 179,530 | | | | 8,432,524 | |
| | | | | | | | |
| | | Shares | | | Value | |
| | | | | | | | | |
| Energy Equipment & Services Continued | |
| National Oilwell Varco, Inc. | | | 165,540 | | | $ | 10,667,398 | |
| Schlumberger Ltd. | | | 229,510 | | | | 14,897,494 | |
| | | | | | |
|
|
|
| | | | | | | | 43,020,758 | |
| Oil, Gas & Consumable Fuels—5.3% | |
| Apache Corp. | | | 24,600 | | | | 2,162,094 | |
| Chevron Corp. | | | 141,510 | | | | 14,929,305 | |
| ConocoPhillips | | | 116,460 | | | | 6,507,785 | |
| Noble Energy, Inc. | | | 102,070 | | | | 8,657,577 | |
| Occidental Petroleum Corp. | | | 180,650 | | | | 15,494,351 | |
| Phillips 661 | | | 58,880 | | | | 1,957,171 | |
| | | | | | |
|
|
|
| | | | | | | | 49,708,283 | |
| Financials—1.9% | |
| Commercial Banks—0.7% | |
| Standard Chartered plc | | | 309,610 | | | | 6,749,738 | |
| Consumer Finance—1.2% | |
| American Express Co. | | | 189,350 | | | | 11,022,064 | |
| Health Care—12.8% | |
| Biotechnology—2.4% | |
| Alexion Pharmaceuticals, Inc.1 | | | 67,650 | | | | 6,717,645 | |
| Vertex Pharmaceuticals, Inc.1 | | | 285,790 | | | | 15,981,377 | |
| | | | | | |
|
|
|
| | | | | | | | 22,699,022 | |
| Health Care Equipment & Supplies—1.3% | |
| Baxter International, Inc. | | | 236,470 | | | | 12,568,381 | |
| Health Care Technology—0.7% | |
| Cerner Corp.1 | | | 80,000 | | | | 6,612,800 | |
| Life Sciences Tools & Services—0.8% | |
| Mettler-Toledo International, Inc.1 | | | 47,620 | | | | 7,421,577 | |
| Pharmaceuticals—7.6% | |
| Allergan, Inc. | | | 208,280 | | | | 19,280,480 | |
| Bristol-Myers Squibb Co. | | | 442,620 | | | | 15,912,189 | |
| Novo Nordisk AS, Cl. B | | | 111,030 | | | | 16,035,840 | |
| Perrigo Co. | | | 70,740 | | | | 8,342,368 | |
| Roche Holding AG | | | 69,001 | | | | 11,893,340 | |
| | | | | | |
|
|
|
| | | | | | | | 71,464,217 | |
| Industrials—14.4% | |
| Aerospace & Defense—3.2% | |
| Precision Castparts Corp. | | | 76,440 | | | | 12,573,616 | |
| TransDigm Group, Inc.1 | | | 43,280 | | | | 5,812,504 | |
| United Technologies Corp. | | | 163,380 | | | | 12,340,091 | |
| | | | | | |
|
|
|
| | | | | | | | 30,726,211 | |
| Air Freight & Logistics—1.4% | |
| United Parcel Service, Inc., Cl. B | | | 165,280 | | | | 13,017,453 | |
| Industrial Conglomerates—1.6% | |
| Danaher Corp. | | | 286,080 | | | | 14,899,046 | |
6 | OPPENHEIMER CAPITAL APPRECIATION FUND/VA
|
| | | | | | | | |
| | | Shares | | | Value | |
| | | | | | | | | |
| Machinery—5.2% | |
| Caterpillar, Inc. | | | 129,660 | | | $ | 11,009,431 | |
| Cummins, Inc. | | | 78,560 | | | | 7,613,250 | |
| Deere & Co. | | | 122,240 | | | | 9,885,549 | |
| Joy Global, Inc. | | | 156,127 | | | | 8,857,085 | |
| Parker-Hannifin Corp. | | | 150,420 | | | | 11,564,290 | |
| | | | | | |
|
|
|
| | | | | | | | 48,929,605 | |
| Road & Rail—3.0% | |
| Hunt (J.B.) Transport Services, Inc. | | | 108,490 | | | | 6,466,004 | |
| Kansas City Southern, Inc. | | | 80,250 | | | | 5,582,190 | |
| Union Pacific Corp. | | | 136,880 | | | | 16,331,153 | |
| | | | | | |
|
|
|
| | | | | | | | 28,379,347 | |
| Information Technology—28.3% | |
| Communications Equipment—4.6% | |
| Juniper Networks, Inc.1 | | | 431,650 | | | | 7,040,212 | |
| QUALCOMM, Inc. | | | 654,800 | | | | 36,459,257 | |
| | | | | | |
|
|
|
| | | | | | | | 43,499,469 | |
| Computers & Peripherals—8.9% | |
| Apple, Inc.1 | | | 138,190 | | | | 80,702,960 | |
| SanDisk Corp.1 | | | 101,070 | | | | 3,687,034 | |
| | | | | | |
|
|
|
| | | | | | | | 84,389,994 | |
| Electronic Equipment & Instruments—1.0% | |
| Corning, Inc. | | | 745,330 | | | | 9,637,117 | |
| Internet Software & Services—4.6% | |
| eBay, Inc.1 | | | 407,620 | | | | 17,124,116 | |
| Google, Inc., Cl. A1 | | | 45,070 | | | | 26,143,755 | |
| | | | | | |
|
|
|
| | | | | | | | 43,267,871 | |
| IT Services—3.8% | |
| International Business Machines Corp. | | | 53,590 | | | | 10,481,132 | |
| Teradata Corp.1 | | | 184,980 | | | | 13,320,410 | |
| Visa, Inc., Cl. A | | | 98,017 | | | | 12,117,842 | |
| | | | | | |
|
|
|
| | | | | | | | 35,919,384 | |
| | | | | | | | |
| | | Shares | | | Value | |
| | | | | | | | | |
Semiconductors & Semiconductor
Equipment—2.1% | |
| Broadcom Corp., Cl. A | | | 345,290 | | | $ | 11,670,802 | |
| Texas Instruments, Inc. | | | 272,690 | | | | 7,823,476 | |
| | | | | | |
|
|
|
| | | | | | | | 19,494,278 | |
| Software—3.3% | |
| Intuit, Inc. | | | 206,890 | | | | 12,278,922 | |
| Salesforce.com, Inc.1 | | | 56,290 | | | | 7,782,655 | |
| Vmware, Inc., Cl. A1 | | | 116,320 | | | | 10,589,773 | |
| | | | | | |
|
|
|
| | | | | | | | 30,651,350 | |
| Materials—4.1% | |
| Chemicals—4.1% | |
| Ecolab, Inc. | | | 185,470 | | | | 12,710,257 | |
| Monsanto Co. | | | 123,820 | | | | 10,249,820 | |
| Praxair, Inc. | | | 149,062 | | | | 16,207,511 | |
| | | | | | |
|
|
|
| | | | | | |
| 39,167,588
|
|
| Total Common Stocks (Cost $642,633,539) | | | | | | | 939,221,118 | |
| Investment Company—0.3% | |
| Oppenheimer Institutional Money Market Fund, Cl. E, 0.20%2,3 | | | | | | | | |
| (Cost $2,421,103) | | | 2,421,103 | | | | 2,421,103 | |
Total Investments, at Value
(Cost $645,054,642) | | | 99.8 | % | | | 941,642,221 | |
| | | | | | | | |
| Other Assets Net of Liabilities | |
| 0.2
|
| |
| 1,820,679
|
|
| Net Assets | |
| 100.0
| %
| | $
| 943,462,900
|
|
Footnotes to Statement of Investments
* June 29, 2012 represents the last business day of the Fund’s 2012 semiannual period. See Note 1 of the accompanying Notes.
1. Non-income producing security.
2. Is or was an affiliate, as defined in the Investment Company Act of 1940, at or during the period ended June 29, 2012, by virtue of the Fund owning at least 5% of the voting securities of the issuer or as a result of the Fund and the issuer having the same investment adviser. Transactions during the period in which the issuer was an affiliate are as follows:
| | | | | | | | | | | | | | | | |
| | | Shares
December 30, 2011a | | | Gross
Additions | | | Gross
Reductions | | | Shares
June 29, 2012 | |
| Oppenheimer Institutional Money Market Fund, Cl. E | | | 8,136,365 | | | | 80,942,823 | | | | 86,658,085 | | | | 2,421,103 | |
| | | | |
| | | | | | | | | Value | | | Income | |
| Oppenheimer Institutional Money Market Fund, Cl. E | | | | | | | | | | | $2,421,103 | | | | $4,516 | |
| a. December 30, 2011 represents the last business day of the Fund’s 2011 fiscal year. See Note 1 of the accompanying Notes. | |
3. Rate shown is the 7-day yield as of June 29, 2012.
See accompanying Notes to Financial Statements.
7 | OPPENHEIMER CAPITAL APPRECIATION FUND/VA
|
STATEMENT OF ASSETS AND LIABILITIES Unaudited
| | | | |
| June 29, 20121 | | | |
| Assets | | | |
| Investments, at value—see accompanying statement of investments: | | | | |
| Unaffiliated companies (cost $642,633,539) | | $ | 939,221,118 | |
| Affiliated companies (cost $2,421,103) | |
| 2,421,103
|
|
| | | | 941,642,221 | |
| Cash | | | 14 | |
| Receivables and other assets: | | | | |
| Dividends | | | 2,233,045 | |
| Investments sold | | | 924,301 | |
| Other | |
| 53,891
|
|
| Total assets | | | 944,853,472 | |
| Liabilities | | | |
| Payables and other liabilities: | | | | |
| Shares of beneficial interest redeemed | | | 619,416 | |
| Investments purchased | | | 457,474 | |
| Shareholder communications | | | 108,692 | |
| Transfer and shareholder servicing agent fees | | | 76,705 | |
| Distribution and service plan fees | | | 66,385 | |
| Trustees’ compensation | | | 42,790 | |
| Other | |
| 19,110
|
|
| Total liabilities | | | 1,390,572 | |
| Net Assets | | $
| 943,462,900
|
|
| Composition of Net Assets | | | |
| Par value of shares of beneficial interest | | $ | 22,143 | |
| Additional paid-in capital | | | 891,694,025 | |
| Accumulated net investment income | | | 1,676,303 | |
| Accumulated net realized loss on investments and foreign currency transactions | | | (246,651,011 | ) |
| Net unrealized appreciation on investments and translation of assets and liabilities denominated in foreign currencies | |
| 296,721,440
|
|
| Net Assets | | $
| 943,462,900
|
|
| Net Asset Value Per Share | | | |
| Non-Service Shares: | | | | |
Net asset value, redemption price per share and offering price per share (based on net assets of $573,554,436
and 13,421,137 shares of beneficial interest outstanding) | | | $42.74 | |
| Service Shares: | | | | |
Net asset value, redemption price per share and offering price per share (based on net assets of $369,908,464
and 8,721,378 shares of beneficial interest outstanding) | | | $42.41 | |
1. June 29, 2012 represents the last business day of the Fund’s 2012 semiannual period. See Note 1 of the accompanying Notes.
See accompanying Notes to Financial Statements.
8 | OPPENHEIMER CAPITAL APPRECIATION FUND/VA
|
STATEMENT OF OPERATIONS Unaudited
| | | | |
| For the Six Months Ended June 29, 20121 | | | |
| Investment Income | | | |
| Dividends: | | | | |
| Unaffiliated companies (net of foreign withholding taxes of $229,184) | | $ | 7,562,326 | |
| Affiliated companies | | | 4,516 | |
| Interest | |
| 395
|
|
| Total investment income | | | 7,567,237 | |
| Expenses | | | |
| Management fees | | | 3,431,960 | |
| Distribution and service plan fees—Service shares | | | 485,757 | |
| Transfer and shareholder servicing agent fees: | | | | |
| Non-Service shares | | | 308,009 | |
| Service shares | | | 194,360 | |
| Shareholder communications: | | | | |
| Non-Service shares | | | 11,368 | |
| Service shares | | | 6,778 | |
| Trustees’ compensation | | | 26,745 | |
| Custodian fees and expenses | | | 13,420 | |
| Administration service fees | | | 750 | |
| Other | |
| 42,145
|
|
| Total expenses | | | 4,521,292 | |
| Less waivers and reimbursements of expenses | |
| (18,543
| )
|
| Net expenses | | | 4,502,749 | |
| Net Investment Income | | | 3,064,488 | |
| Realized and Unrealized Gain (Loss) | | | |
| Net realized gain on: | | | | |
| Investments from unaffiliated companies | | | 51,058,068 | |
| Foreign currency transactions | |
| 891,402
|
|
| Net realized gain | | | 51,949,470 | |
| Net change in unrealized appreciation/depreciation on: | | | | |
| Investments | | | 33,083,149 | |
| Translation of assets and liabilities denominated in foreign currencies | |
| (3,746,717
| )
|
| Net change in unrealized appreciation/depreciation | | | 29,336,432 | |
| | |
| Net Increase in Net Assets Resulting from Operations | | $
| 84,350,390
|
|
1. June 29, 2012 represents the last business day of the Fund’s 2012 semiannual period. See Note 1 of the accompanying Notes.
See accompanying Notes to Financial Statements.
9 | OPPENHEIMER CAPITAL APPRECIATION FUND/VA
|
STATEMENTS OF CHANGES IN NET ASSETS
| | | | | | | | |
| | | Six Months
Ended
June 29, 20121
(Unaudited) | | | Year
Ended
December 30,
20111 | |
| Operations | | | | | | |
| Net investment income | | $ | 3,064,488 | | | $ | 5,322,690 | |
| Net realized gain | | | 51,949,470 | | | | 59,047,435 | |
| Net change in unrealized appreciation/depreciation | |
| 29,336,432
|
| |
| (73,931,651
| )
|
| Net increase (decrease) in net assets resulting from operations | | | 84,350,390 | | | | (9,561,526 | ) |
| Dividends and/or Distributions to Shareholders | | | | | | |
| Dividends from net investment income: | | | | | | | | |
| Non-Service shares | | | (3,878,050 | ) | | | (2,685,368 | ) |
| Service shares | |
| (1,503,957
| )
| |
| (448,818
| )
|
| | | | (5,382,007 | ) | | | (3,134,186 | ) |
| Beneficial Interest Transactions | | | | | | |
| Net decrease in net assets resulting from beneficial interest transactions: | | | | | | | | |
| Non-Service shares | | | (113,871,807 | ) | | | (125,913,455 | ) |
| Service shares | |
| (34,831,884
| )
| |
| (43,268,026
| )
|
| | | | (148,703,691 | ) | | | (169,181,481 | ) |
| Net Assets | | | | | | |
| Total decrease | | | (69,735,308 | ) | | | (181,877,193 | ) |
| Beginning of period | |
| 1,013,198,208
|
| |
| 1,195,075,401
|
|
| End of period (including accumulated net investment income of $1,676,303 and $3,993,822, respectively) | | $
| 943,462,900
|
| | $
| 1,013,198,208
|
|
1. June 29, 2012 and December 30, 2011 represent the last business days of the Fund’s respective reporting periods. See Note 1 of the accompanying Notes.
See accompanying Notes to Financial Statements.
10 | OPPENHEIMER CAPITAL APPRECIATION FUND/VA
|
FINANCIAL HIGHLIGHTS
| | | | | | | | | | | | | | | | | | | | | | | | |
| | | Six Months
Ended
June 29, 20121 | | | Year Ended
December 30, | | | | | | Year Ended December 31, | |
| Non-Service Shares | | (Unaudited) | | | 20111 | | | 2010 | | | 2009 | | | 2008 | | | 2007 | |
| | | | | | | | | | | | | | | | | | | | | | | | | |
| Per Share Operating Data | | | | | | | | | | | | | | | | | | |
| Net asset value, beginning of period | | | $39.75 | | | | $40.35 | | | | $36.94 | | | | $25.67 | | | | $47.18 | | | | $41.43 | |
| Income (loss) from investment operations: | | | | | | | | | | | | | | | | | | | | | | | | |
| Net investment income2 | | | .15 | | | | .23 | | | | .11 | | | | .09 | | | | .10 | | | | .07 | |
| Net realized and unrealized gain (loss) | |
| 3.13
|
| |
| (.69
| )
| |
| 3.36
|
| |
| 11.27
|
| |
| (21.55
| )
| |
| 5.78
|
|
| Total from investment operations | | | 3.28 | | | | (.46 | ) | | | 3.47 | | | | 11.36 | | | | (21.45 | ) | | | 5.85 | |
| Dividends and/or distributions to shareholders: | | | | | | | | | | | | | | | | | | | | | | | | |
| Dividends from net investment income | | | (.29 | ) | | | (.14 | ) | | | (.06 | ) | | | (.09 | ) | | | (.06 | ) | | | (.10 | ) |
| Net asset value, end of period | |
| $42.74
|
| |
| $39.75
|
| |
| $40.35
|
| |
| $36.94
|
| |
| $25.67
|
| |
| $47.18
|
|
| Total Return, at Net Asset Value3 | | 8.24% | | | (1.15)% | | | 9.42% | | | 44.52% | | | (45.52)% | | | 14.15% | |
| | | | | | | | | | | | | | | | | | | | | | | | | |
| Ratios/Supplemental Data | | | | | | | | | | | | | | | | | | |
| Net assets, end of period (in thousands) | | $ | 573,554 | | | $ | 637,868 | | | $ | 771,086 | | | $ | 1,074,190 | | | $ | 829,931 | | | $ | 1,631,791 | |
| Average net assets (in thousands) | | $ | 619,180 | | | $ | 713,770 | | | $ | 976,242 | | | $ | 927,670 | | | $ | 1,256,525 | | | $ | 1,631,686 | |
| Ratios to average net assets:4 | | | | | | | | | | | | | | | | | | | | | | | | |
| Net investment income | | | 0.71 | % | | | 0.57 | % | | | 0.31 | % | | | 0.29 | % | | | 0.25 | % | | | 0.15 | % |
| Total expenses5 | | | 0.80 | % | | | 0.80 | % | | | 0.79 | % | | | 0.78 | % | | | 0.66 | % | | | 0.65 | % |
| Expenses after payments, waivers and/or reimbursements and reduction to custodian expenses | | | 0.80 | % | | | 0.80 | % | | | 0.79 | % | | | 0.78 | % | | | 0.66 | % | | | 0.65 | % |
| Portfolio turnover rate | | | 15 | % | | | 27 | % | | | 58 | % | | | 46 | % | | | 67 | % | | | 59 | % |
1. June 29, 2012 and December 30, 2011 represent the last business days of the Fund’s respective reporting periods. See Note 1 of the accompanying Notes.
2. Per share amounts calculated based on the average shares outstanding during the period.
3. Assumes an initial investment on the business day before the first day of the fiscal period, with all dividends and distributions reinvested in additional shares on the reinvestment date, and redemption at the net asset value calculated on the last business day of the fiscal period. Total returns are not annualized for periods less than one full year. Total return information does not reflect expenses that apply at the separate account level or to related insurance products. Inclusion of these charges would reduce the total return figures for all periods shown. Returns do not reflect the deduction of taxes that a shareholder would pay on fund distributions or the redemption of fund shares.
4. Annualized for periods less than one full year.
5. Total expenses including indirect expenses from affiliated fund were as follows:
| | | | |
| Six Months Ended June 29, 2012 | | | 0.80 | % |
| Year Ended December 30, 2011 | | | 0.80 | % |
| Year Ended December 31, 2010 | | | 0.79 | % |
| Year Ended December 31, 2009 | | | 0.78 | % |
| Year Ended December 31, 2008 | | | 0.66 | % |
| Year Ended December 31, 2007 | | | 0.65 | % |
See accompanying Notes to Financial Statements.
11 | OPPENHEIMER CAPITAL APPRECIATION FUND/VA
|
FINANCIAL HIGHLIGHTS Continued
| | | | | | | | | | | | | | | | | | | | | | | | |
| | | Six Months
Ended
June 29, 20121 | | | Year Ended
December 30, | | | | | | Year Ended December 31, | |
| Service Shares | | (Unaudited) | | | 20111 | | | 2010 | | | 2009 | | | 2008 | | | 2007 | |
| | | | | | | | | | | | | | | | | | | | | | | | | |
| Per Share Operating Data | | | | | | | | | | | | | | | | | | |
| Net asset value, beginning of period | | | $39.40 | | | | $39.99 | | | | $36.64 | | | | $25.42 | | | | $46.78 | | | | $41.09 | |
| Income (loss) from investment operations: | | | | | | | | | | | | | | | | | | | | | | | | |
| Net investment income (loss)2 | | | .10 | | | | .13 | | | | .02 | | | | .01 | | | | —3 | | | | (.05 | ) |
| Net realized and unrealized gain (loss) | |
| 3.08
|
| |
| (.68
| )
| |
| 3.33
|
| |
| 11.21
|
| |
| (21.36
| )
| |
| 5.74
|
|
| Total from investment operations | | | 3.18 | | | | (.55 | ) | | | 3.35 | | | | 11.22 | | | | (21.36 | ) | | | 5.69 | |
| Dividends and/or distributions to shareholders: | | | | | | | | | | | | | | | | | | | | | | | | |
| Dividends from net investment income | | | (.17 | ) | | | (.04 | ) | | | — | | | | —3 | | | | — | | | | —3 | |
| Net asset value, end of period | |
| $42.41
|
| |
| $39.40
|
| |
| $39.99
|
| |
| $36.64
|
| |
| $25.42
|
| |
| $46.78
|
|
| Total Return, at Net Asset Value4 | | 8.07% | | | (1.37)% | | | 9.15% | | | 44.15% | | | (45.66)% | | | 13.86% | |
| | | | | | | | | | | | | | | | | | | | | | | | | |
| Ratios/Supplemental Data | | | | | | | | | | | | | | | | | | |
| Net assets, end of period (in thousands) | | $ | 369,909 | | | $ | 375,330 | | | $ | 423,989 | | | $ | 444,170 | | | $ | 313,931 | | | $ | 546,887 | |
| Average net assets (in thousands) | | $ | 390,710 | | | $ | 407,413 | | | $ | 427,640 | | | $ | 368,634 | | | $ | 454,558 | | | $ | 510,874 | |
| Ratios to average net assets:5 | | | | | | | | | | | | | | | | | | | | | | | | |
| Net investment income (loss) | | | 0.46 | % | | | 0.32 | % | | | 0.06 | % | | | 0.03 | % | | | 0.00 | %6 | | | (0.10 | )% |
| Total expenses7 | | | 1.05 | % | | | 1.05 | % | | | 1.04 | % | | | 1.04 | % | | | 0.91 | % | | | 0.91 | % |
| Expenses after payments, waivers and/or reimbursements and reduction to custodian expenses | | | 1.05 | % | | | 1.05 | % | | | 1.04 | % | | | 1.03 | % | | | 0.91 | % | | | 0.91 | % |
| Portfolio turnover rate | | | 15 | % | | | 27 | % | | | 58 | % | | | 46 | % | | | 67 | % | | | 59 | % |
1. June 29, 2012 and December 30, 2011 represent the last business days of the Fund’s respective reporting periods. See Note 1 of the accompanying Notes.
2. Per share amounts calculated based on the average shares outstanding during the period.
3. Less than $0.005 per share.
4. Assumes an initial investment on the business day before the first day of the fiscal period, with all dividends and distributions reinvested in additional shares on the reinvestment date, and redemption at the net asset value calculated on the last business day of the fiscal period. Total returns are not annualized for periods less than one full year. Total return information does not reflect expenses that apply at the separate account level or to related insurance products. Inclusion of these charges would reduce the total return figures for all periods shown. Returns do not reflect the deduction of taxes that a shareholder would pay on fund distributions or the redemption of fund shares.
5. Annualized for periods less than one full year.
6. Less than 0.005%.
7. Total expenses including indirect expenses from affiliated fund were as follows:
| | | | |
| Six Months Ended June 29, 2012 | | | 1.05 | % |
| Year Ended December 30, 2011 | | | 1.05 | % |
| Year Ended December 31, 2010 | | | 1.04 | % |
| Year Ended December 31, 2009 | | | 1.04 | % |
| Year Ended December 31, 2008 | | | 0.91 | % |
| Year Ended December 31, 2007 | | | 0.91 | % |
See accompanying Notes to Financial Statements.
12 | OPPENHEIMER CAPITAL APPRECIATION FUND/VA
|
NOTES TO FINANCIAL STATEMENTS Unaudited
1. Significant Accounting Policies
Oppenheimer Capital Appreciation Fund/VA (the “Fund”) is a separate series of Oppenheimer Variable Account Funds, an open-end management investment company registered under the Investment Company Act of 1940, as amended. The Fund’s investment objective is to seek capital appreciation by investing in securities of well-known, established companies. The Fund’s investment adviser is OppenheimerFunds, Inc. (the “Manager”).
The Fund offers two classes of shares. Both classes are sold at their offering price, which is the net asset value per share, to separate investment accounts of participating insurance companies as an underlying investment for variable life insurance policies, variable annuity contracts or other investment products. The class of shares designated as Service shares is subject to a distribution and service plan. Both classes of shares have identical rights and voting privileges with respect to the Fund in general and exclusive voting rights on matters that affect that class alone. Earnings, net assets and net asset value per share may differ due to each class having its own expenses, such as transfer and shareholder servicing agent fees and shareholder communications, directly attributable to that class.
The following is a summary of significant accounting policies consistently followed by the Fund.
Semiannual and Annual Periods. The last day of the Fund’s semiannual period was the last day the New York Stock Exchange was open for trading. The Fund’s financial statements have been presented through that date to maintain consistency with the Fund’s net asset value calculations used for shareholder transactions.
The last day of the Fund’s fiscal year was the last day the New York Stock Exchange was open for trading. The Fund’s financial statements have been presented through that date to maintain consistency with the Fund’s net asset value calculations used for shareholder transactions.
Investment in Oppenheimer Institutional Money Market Fund. The Fund is permitted to invest daily available cash balances in an affiliated money market fund. The Fund may invest the available cash in Class E shares of Oppenheimer Institutional Money Market Fund (“IMMF”) to seek current income while preserving liquidity. IMMF is a registered open-end management investment company, regulated as a money market fund under the Investment Company Act of 1940, as amended. The Manager is also the investment adviser of IMMF. When applicable, the Fund’s investment in IMMF is included in the Statement of Investments. Shares of IMMF are valued at their net asset value per share. As a shareholder, the Fund is subject to its proportional share of IMMF’s Class E expenses, including its management fee. The Manager will waive fees and/or reimburse Fund expenses in an amount equal to the indirect management fees incurred through the Fund’s investment in IMMF.
Foreign Currency Translation. The Fund’s accounting records are maintained in U.S. dollars. The values of securities denominated in foreign currencies and amounts related to the purchase and sale of foreign securities and foreign investment income are translated into U.S. dollars as of the close of the Exchange, normally 4:00 P.M. Eastern time, on each day the Exchange is open for trading. Foreign exchange rates may be valued primarily using a reliable bank, dealer or service authorized by the Board of Trustees.
Reported net realized gains and losses from foreign currency transactions arise from sales of portfolio securities, sales and maturities of short-term securities, sales of foreign currencies, exchange rate fluctuations between the trade and settlement dates on securities transactions, and the difference between the amounts of dividends, interest, and foreign withholding taxes recorded on the Fund’s books and the U.S. dollar equivalent of the amounts actually received or paid. Net unrealized appreciation and depreciation on the translation of assets and liabilities denominated in foreign currencies arise from changes in the values of assets and liabilities, including investments in securities at fiscal period end, resulting from changes in exchange rates.
The effect of changes in foreign currency exchange rates on investments is separately identified from the fluctuations arising from changes in market values of securities held and reported with all other foreign currency gains and losses in the Fund’s Statement of Operations.
13 | OPPENHEIMER CAPITAL APPRECIATION FUND/VA
|
NOTES TO FINANCIAL STATEMENTS Unaudited / Continued
1. Significant Accounting Policies Continued
Allocation of Income, Expenses, Gains and Losses. Income, expenses (other than those attributable to a specific class), gains and losses are allocated on a daily basis to each class of shares based upon the relative proportion of net assets represented by such class. Operating expenses directly attributable to a specific class are charged against the operations of that class.
Federal Taxes. The Fund intends to comply with provisions of the Internal Revenue Code applicable to regulated investment companies and to distribute substantially all of its investment company taxable income, including any net realized gain on investments not offset by capital loss carryforwards, if any, to shareholders. Therefore, no federal income or excise tax provision is required. The Fund files income tax returns in U.S. federal and applicable state jurisdictions. The statute of limitations on the Fund’s tax return filings generally remain open for the three preceding fiscal reporting period ends.
During the fiscal year ended December 30, 2011, the Fund utilized $62,322,990 of capital loss carryforward to offset capital gains realized in that fiscal year. The Fund had post-October losses of $6,794,494. Details of the fiscal year ended December 30, 2011 capital loss carryforwards are included in the table below. Capital loss carryforwards with no expiration, if any, must be utilized prior to those with expiration dates. Capital losses with no expiration will be carried forward to future years if not offset by gains.
| | | | |
| Expiring | | | |
| 2016 | | $ | 109,362,611 | |
| 2017 | | | 180,633,172 | |
| No expiration | | | 6,794,494 | |
| | |
|
|
|
| Total | | $ | 296,790,277 | |
| | |
|
|
|
As of June 29, 2012, it is estimated that the capital loss carryforwards would be $244,840,807 expiring by 2017. The estimated capital loss carryforward represents the carryforward as of the end of the last fiscal year, increased or decreased by capital losses or gains realized in the first six months of the current fiscal year. During the six months ended June 29, 2012, it is estimated that the Fund will utilize $51,949,470 capital loss carryforward to offset realized capital gains.
Net investment income (loss) and net realized gain (loss) may differ for financial statement and tax purposes. The character of dividends and distributions made during the fiscal year from net investment income or net realized gains may differ from their ultimate characterization for federal income tax purposes. Also, due to timing of dividends and distributions, the fiscal year in which amounts are distributed may differ from the fiscal year in which the income or net realized gain was recorded by the Fund.
The aggregate cost of securities and other investments and the composition of unrealized appreciation and depreciation of securities and other investments for federal income tax purposes as of June 29, 2012 are noted in the following table. The primary difference between book and tax appreciation or depreciation of securities and other investments, if applicable, is attributable to the tax deferral of losses or tax realization of financial statement unrealized gain or loss.
| | | | |
| Federal tax cost of securities | | $ | 647,632,126 | |
| | |
|
|
|
| |
| Gross unrealized appreciation | | $ | 313,078,311 | |
| Gross unrealized depreciation | | | (19,068,216) | |
| | |
|
|
|
| Net unrealized appreciation | | $ | 294,010,095 | |
| | |
|
|
|
Trustees’ Compensation. The Board of Trustees has adopted a compensation deferral plan for independent trustees that enables trustees to elect to defer receipt of all or a portion of the annual compensation they are entitled to receive from the Fund. For purposes of determining the amount owed to the Trustee under the plan, deferred amounts are treated as though equal dollar amounts had been invested in shares of the Fund or in other Oppenheimer funds
14 | OPPENHEIMER CAPITAL APPRECIATION FUND/VA
|
selected by the Trustee. The Fund purchases shares of the funds selected for deferral by the Trustee in amounts equal to his or her deemed investment, resulting in a Fund asset equal to the deferred compensation liability. Such assets are included as a component of “Other” within the asset section of the Statement of Assets and Liabilities. Deferral of trustees’ fees under the plan will not affect the net assets of the Fund, and will not materially affect the Fund’s assets, liabilities or net investment income per share. Amounts will be deferred until distributed in accordance with the compensation deferral plan.
Dividends and Distributions to Shareholders. Dividends and distributions to shareholders, which are determined in accordance with income tax regulations and may differ from U.S. generally accepted accounting principles, are recorded on the ex-dividend date. Income and capital gain distributions, if any, are declared and paid annually or at other times as deemed necessary by the Manager. The tax character of distributions is determined as of the Fund’s fiscal year end. Therefore, a portion of the Fund’s distributions made to shareholders prior to the Fund’s fiscal year end may ultimately be categorized as a tax return of capital.
Investment Income. Dividend income is recorded on the ex-dividend date or upon ex-dividend notification in the case of certain foreign dividends where the ex-dividend date may have passed. Non-cash dividends included in dividend income, if any, are recorded at the fair market value of the securities received. Interest income is recognized on an accrual basis. Discount and premium, which are included in interest income on the Statement of Operations, are amortized or accreted daily.
Custodian Fees. “Custodian fees and expenses” in the Statement of Operations may include interest expense incurred by the Fund on any cash overdrafts of its custodian account during the period. Such cash overdrafts may result from the effects of failed trades in portfolio securities and from cash outflows resulting from unanticipated shareholder redemption activity. The Fund pays interest to its custodian on such cash overdrafts, to the extent they are not offset by positive cash balances maintained by the Fund, at a rate equal to the Federal Funds Rate plus 0.50%. The “Reduction to custodian expenses” line item, if applicable, represents earnings on cash balances maintained by the Fund during the period. Such interest expense and other custodian fees may be paid with these earnings.
Security Transactions. Security transactions are recorded on the trade date. Realized gains and losses on securities sold are determined on the basis of identified cost.
Indemnifications. The Fund’s organizational documents provide current and former trustees and officers with a limited indemnification against liabilities arising in connection with the performance of their duties to the Fund. In the normal course of business, the Fund may also enter into contracts that provide general indemnifications. The Fund’s maximum exposure under these arrangements is unknown as this would be dependent on future claims that may be made against the Fund. The risk of material loss from such claims is considered remote.
Other. The preparation of financial statements in conformity with accounting principles generally accepted in the United States of America requires management to make estimates and assumptions that affect the reported amounts of assets and liabilities and disclosure of contingent assets and liabilities at the date of the financial statements and the reported amounts of increases and decreases in net assets from operations during the reporting period. Actual results could differ from those estimates.
2. Securities Valuation
The Fund calculates the net asset value of its shares as of the close of the New York Stock Exchange (the “Exchange”), normally 4:00 P.M. Eastern time, on each day the Exchange is open for trading.
15 | OPPENHEIMER CAPITAL APPRECIATION FUND/VA
|
NOTES TO FINANCIAL STATEMENTS Unaudited / Continued
2. Securities Valuation Continued
The Fund’s Board has adopted procedures for the valuation of the Fund’s securities and has delegated the day-to-day responsibility for valuation determinations under those procedures to the Manager. The Manager has established a Valuation Committee which is responsible for determining a “fair valuation” for any security for which market quotations are not “readily available.” The Valuation Committee’s fair valuation determinations are subject to review, approval and ratification by the Fund’s Board at its next regularly scheduled meeting covering the calendar quarter in which the fair valuation was determined.
Valuation Methods and Inputs
Securities are valued using unadjusted quoted market prices, when available, as supplied primarily by third party pricing services or dealers.
The following methodologies are used to determine the market value or the fair value of the types of securities described below:
Securities traded on a registered U.S. securities exchange (including exchange-traded derivatives other than futures and futures options) are valued based on the last sale price of the security reported on the principal exchange on which it is traded, prior to the time when the Fund’s assets are valued. In the absence of a sale, the security is valued at the last sale price on the prior trading day, if it is within the spread of the current day’s closing “bid” and “asked” prices, and if not, at the current day’s closing bid price. A security of a foreign issuer traded on a foreign exchange but not listed on a registered U.S. securities exchange is valued based on the last sale price on the principal exchange on which the security is traded, as identified by the third party pricing service used by the Manager, prior to the time when the Fund’s assets are valued. If the last sale price is unavailable, the security is valued at the most recent official closing price on the principal exchange on which it is traded. If the last sales price or official closing price for a foreign security is not available, the security is valued at the mean between the bid and asked price per the exchange or, if not available from the exchange, obtained from two dealers. If bid and asked prices are not available from either the exchange or two dealers, the security is valued by using one of the following methodologies (listed in order of priority); (1) using a bid from the exchange, (2) the mean between the bid and asked price as provided by a single dealer, or (3) a bid from a single dealer.
Shares of a registered investment company that are not traded on an exchange are valued at that investment company’s net asset value per share.
Corporate and government debt securities (of U.S. or foreign issuers) and municipal debt securities, event-linked bonds, loans, mortgage-backed securities, collateralized mortgage obligations, and asset-backed securities are valued at the mean between the “bid” and “asked” prices utilizing evaluated prices obtained from third party pricing services or broker-dealers who may use matrix pricing methods to determine the evaluated prices.
Short-term money market type debt securities with a remaining maturity of sixty days or less are valued at cost adjusted by the amortization of discount or premium to maturity (amortized cost), which approximates market value. Short-term debt securities with a remaining maturity in excess of sixty days are valued at the mean between the “bid” and “asked” prices utilizing evaluated prices obtained from third party pricing services or broker-dealers.
Forward foreign currency exchange contracts are valued utilizing current and forward currency rates obtained from third party pricing services. When the settlement date of a contract is an interim date for which a quotation is not available, interpolated values are derived using the nearest dated forward currency rate.
16 | OPPENHEIMER CAPITAL APPRECIATION FUND/VA
|
A description of the standard inputs that may generally be considered by the third party pricing vendors in determining their evaluated prices is provided below.
| | |
| Security Type | | Standard Inputs Generally Considered by Third-Party Pricing Vendors |
| Corporate debt, government debt, municipal, mortgage-backed and asset-backed securities | | Reported trade data, broker-dealer price quotations, benchmark yields, issuer spreads on comparable securities, the credit quality, yield, maturity, and other appropriate factors. |
| Loans | | Information obtained from market participants regarding reported trade data and broker-dealer price quotations. |
| Event-linked bonds | | Information obtained from market participants regarding reported trade data and broker-dealer price quotations. |
If a market value or price cannot be determined for a security using the methodologies described above, or if, in the “good faith” opinion of the Manager, the market value or price obtained does not constitute a “readily available market quotation,” or a significant event has occurred that would materially affect the value of the security the security is fair valued either (i) by a standardized fair valuation methodology applicable to the security type or the significant event as previously approved by the Valuation Committee and the Fund’s Board or (ii) as determined in good faith by the Manager’s Valuation Committee. The Valuation Committee considers all relevant facts that are reasonably available, through either public information or information available to the Manager, when determining the fair value of a security. Fair value determinations by the Manager are subject to review, approval and ratification by the Fund’s Board at its next regularly scheduled meeting covering the calendar quarter in which the fair valuation was determined. Those fair valuation standardized methodologies include, but are not limited to, valuing securities at the last sale price or initially at cost and subsequently adjusting the value based on: changes in company specific fundamentals, changes in an appropriate securities index, or changes in the value of similar securities which may be further adjusted for any discounts related to security-specific resale restrictions. When possible, such methodologies use observable market inputs such as unadjusted quoted prices of similar securities, observable interest rates, currency rates and yield curves. The methodologies used for valuing securities are not necessarily an indication of the risks associated with investing in those securities nor can it be assured that the Fund can obtain the fair value assigned to a security if it were to sell the security.
To assess the continuing appropriateness of security valuations, the Manager, or its third party service provider who is subject to oversight by the Manager, regularly compares prior day prices, prices on comparable securities, and sale prices to the current day prices and challenges those prices exceeding certain tolerance levels with the third party pricing service or broker source. For those securities valued by fair valuations, whether through a standardized fair valuation methodology or a fair valuation determination, the Valuation Committee reviews and affirms the reasonableness of the valuations based on such methodologies and fair valuation determinations on a regular basis after considering all relevant information that is reasonably available.
Classifications
Each investment asset or liability of the Fund is assigned a level at measurement date based on the significance and source of the inputs to its valuation. Various data inputs are used in determining the value of each of the Fund’s investments as of the reporting period end. These data inputs are categorized in the following hierarchy under applicable financial accounting standards:
| | 1) | Level 1—unadjusted quoted prices in active markets for identical assets or liabilities (including securities actively traded on a securities exchange) |
| | 2) | Level 2—inputs other than unadjusted quoted prices that are observable for the asset or liability (such as unadjusted quoted prices for similar assets and market corroborated inputs such as interest rates, prepayment speeds, credit risks, etc.) |
| | 3) | Level 3—significant unobservable inputs (including the Manager’s own judgments about assumptions that market participants would use in pricing the asset or liability). |
17 | OPPENHEIMER CAPITAL APPRECIATION FUND/VA
|
NOTES TO FINANCIAL STATEMENTS Unaudited / Continued
2. Securities Valuation Continued
The inputs used for valuing securities are not necessarily an indication of the risks associated with investing in those securities.
| | | | | | | | | | | | | | | | |
| | | Level 1—
Unadjusted
Quoted Prices | | | Level 2—
Other Significant
Observable Inputs | | | Level 3—
Significant
Unobservable
Inputs | | | Value | |
| Assets Table | | | | | | | | | | | | | | | | |
| Investments, at Value: | | | | | | | | | | | | | | | | |
| Common Stocks | | | | | | | | | | | | | | | | |
Consumer Discretionary | | $ | 145,013,824 | | | $ | — | | | $ | — | | | $ | 145,013,824 | |
Consumer Staples | | | 107,284,002 | | | | 13,677,739 | | | | — | | | | 120,961,741 | |
Energy | | | 92,729,041 | | | | — | | | | — | | | | 92,729,041 | |
Financials | | | 11,022,064 | | | | 6,749,738 | | | | — | | | | 17,771,802 | |
Health Care | | | 120,765,997 | | | | — | | | | — | | | | 120,765,997 | |
Industrials | | | 135,951,662 | | | | — | | | | — | | | | 135,951,662 | |
Information Technology | | | 266,859,463 | | | | — | | | | — | | | | 266,859,463 | |
Materials | | | 39,167,588 | | | | — | | | | — | | | | 39,167,588 | |
| Investment Company | | | 2,421,103 | | | | — | | | | — | | | | 2,421,103 | |
| | |
|
|
| |
|
|
| |
|
|
| |
|
|
|
| Total Assets | | $ | 921,214,744 | | | $ | 20,427,477 | | | $ | — | | | $ | 941,642,221 | |
| | |
|
|
| |
|
|
| |
|
|
| |
|
|
|
There have been no significant changes to the fair valuation methodologies of the Fund during the period.
3. Shares of Beneficial Interest
The Fund has authorized an unlimited number of $0.001 par value shares of beneficial interest of each class. Transactions in shares of beneficial interest were as follows:
| | | | | | | | | | | | | | | | |
| | | Six Months Ended June 29, 2012 | | | Year Ended December 30, 2011 | |
| | | Shares | | | Amount | | | Shares | | | Amount | |
| Non-Service Shares | | | | | | | | | | | | | | | | |
| Sold | | | 296,805 | | | $ | 12,887,816 | | | | 1,249,985 | | | $ | 50,511,923 | |
| Dividends and/or distributions reinvested | | | 89,832 | | | | 3,878,050 | | | | 63,634 | | | | 2,685,368 | |
| Redeemed | | | (3,011,413 | ) | | | (130,637,673 | ) | | | (4,379,711 | ) | | | (179,110,746 | ) |
| | |
|
|
| |
|
|
| |
|
|
| |
|
|
|
| Net decrease | | | (2,624,776 | ) | | $ | (113,871,807 | ) | | | (3,066,092 | ) | | $ | (125,913,455 | ) |
| | |
|
|
| |
|
|
| |
|
|
| |
|
|
|
| | | | | | | | | | | | | |
| Service Shares | | | | | | | | | | | | | | | | |
| Sold | | | 114,021 | | | $ | 4,865,455 | | | | 696,209 | | | $ | 28,336,802 | |
| Dividends and/or distributions reinvested | | | 35,098 | | | | 1,503,957 | | | | 10,709 | | | | 448,818 | |
| Redeemed | | | (954,473 | ) | | | (41,201,296 | ) | | | (1,782,789 | ) | | | (72,053,646 | ) |
| | |
|
|
| |
|
|
| |
|
|
| |
|
|
|
| Net decrease | | | (805,354 | ) | | $ | (34,831,884 | ) | | | (1,075,871 | ) | | $ | (43,268,026 | ) |
| | |
|
|
| |
|
|
| |
|
|
| |
|
|
|
4. Purchases and Sales of Securities
The aggregate cost of purchases and proceeds from sales of securities, other than short-term obligations and investments in IMMF, for the six months ended June 29, 2012, were as follows:
| | | | | | | | |
| | | Purchases | | | Sales | |
| Investment securities | | $ | 151,643,318 | | | $ | 296,560,637 | |
18 | OPPENHEIMER CAPITAL APPRECIATION FUND/VA
|
5. Fees and Other Transactions with Affiliates
Management Fees. Under the investment advisory agreement, the Fund pays the Manager a management fee based on the daily net assets of the Fund at an annual rate as shown in the following table:
| | | | |
| Fee Schedule | | | |
| Up to $200 million | | | 0.75 | % |
| Next $200 million | | | 0.72 | |
| Next $200 million | | | 0.69 | |
| Next $200 million | | | 0.66 | |
| Over $800 million | | | 0.60 | |
Administration Service Fees. The Fund pays the Manager a fee of $1,500 per year for preparing and filing the Fund’s tax returns.
Transfer Agent Fees. OppenheimerFunds Services (“OFS”), a division of the Manager, acts as the transfer and shareholder servicing agent for the Fund. For the six months ended June 29, 2012, the Fund paid $ 512,586 to OFS for services to the Fund.
Distribution and Service Plan for Service Shares. The Fund has adopted a Distribution and Service Plan (the “Plan”) in accordance with Rule 12b-1 under the Investment Company Act of 1940 for Service shares to pay OppenheimerFunds Distributor, Inc. (the “Distributor”), for distribution related services, personal service and account maintenance for the Fund’s Service shares. Under the Plan, payments are made periodically at an annual rate of 0.25% of the daily net assets of Service shares of the Fund. The Distributor currently uses all of those fees to compensate sponsors of the insurance product that offers Fund shares, for providing personal service and maintenance of accounts of their variable contract owners that hold Service shares. These fees are paid out of the Fund’s assets on an on-going basis and increase operating expenses of the Service shares, which results in lower performance compared to the Fund’s shares that are not subject to a service fee. Fees incurred by the Fund under the Plan are detailed in the Statement of Operations.
Waivers and Reimbursements of Expenses. The Manager has voluntarily agreed to limit the Fund’s total annual operating expenses so that those expenses, as percentages of daily net assets, will not exceed the annual rate of 0.80% for Non-Service shares and 1.05% for Service shares. During the six months ended June 29, 2012, the Manager waived fees and/or reimbursed the Fund $10,188 and $6,354 for Non-Service and Service shares, respectively.
The Manager will waive fees and/or reimburse Fund expenses in an amount equal to the indirect management fees incurred through the Fund’s investment in IMMF. During the six months ended June 29, 2012, the Manager waived fees and/or reimbursed the Fund $2,001 for IMMF management fees.
Some of these undertakings may be modified or terminated at any time; some may not be modified or terminated until after one year from the date of the current prospectus, as indicated therein.
6. Risk Exposures and the Use of Derivative Instruments
The Fund’s investment objectives not only permit the Fund to purchase investment securities, they also allow the Fund to enter into various types of derivatives contracts, including, but not limited to, futures contracts, forward foreign currency exchange contracts, credit default swaps, interest rate swaps, total return swaps, and purchased and written options. In doing so, the Fund will employ strategies in differing combinations to permit it to increase, decrease, or change the level or types of exposure to market risk factors. Central to those strategies are features inherent to derivatives that make them more attractive for this purpose than equity and debt securities: they require little or no initial cash investment, they can focus exposure on only certain selected risk factors, and they may not require the ultimate receipt or delivery of the underlying security (or securities) to the contract. This may allow the Fund to pursue its objectives more quickly and efficiently than if it were to make direct purchases or sales of securities capable of effecting a similar response to market factors.
19 | OPPENHEIMER CAPITAL APPRECIATION FUND/VA
|
NOTES TO FINANCIAL STATEMENTS Unaudited / Continued
6. Risk Exposures and the Use of Derivative Instruments Continued
Market Risk Factors. In accordance with its investment objectives, the Fund may use derivatives to increase or decrease its exposure to one or more of the following market risk factors:
Commodity Risk. Commodity risk relates to the change in value of commodities or commodity indexes as they relate to increases or decreases in the commodities market. Commodities are physical assets that have tangible properties. Examples of these types of assets are crude oil, heating oil, metals, livestock, and agricultural products.
Credit Risk. Credit risk relates to the ability of the issuer to meet interest and principal payments, or both, as they come due. In general, lower-grade, higher-yield bonds are subject to credit risk to a greater extent than lower-yield, higher-quality bonds.
Equity Risk. Equity risk relates to the change in value of equity securities as they relate to increases or decreases in the general market.
Foreign Exchange Rate Risk. Foreign exchange rate risk relates to the change in the U.S. dollar value of a security held that is denominated in a foreign currency. The U.S. dollar value of a foreign currency denominated security will decrease as the dollar appreciates against the currency, while the U.S. dollar value will increase as the dollar depreciates against the currency.
Interest Rate Risk. Interest rate risk refers to the fluctuations in value of fixed-income securities resulting from the inverse relationship between price and yield. For example, an increase in general interest rates will tend to reduce the market value of already issued fixed-income investments, and a decline in general interest rates will tend to increase their value. In addition, debt securities with longer maturities, which tend to have higher yields, are subject to potentially greater fluctuations in value from changes in interest rates than obligations with shorter maturities.
Volatility Risk. Volatility risk refers to the magnitude of the movement, but not the direction of the movement, in a financial instrument’s price over a defined time period. Large increases or decreases in a financial instrument’s price over a relative time period typically indicate greater volatility risk, while small increases or decreases in its price typically indicate lower volatility risk.
The Fund’s actual exposures to these market risk factors during the period are discussed in further detail, by derivative type, below.
Risks of Investing in Derivatives. The Fund’s use of derivatives can result in losses due to unanticipated changes in the market risk factors and the overall market. In instances where the Fund is using derivatives to decrease, or hedge, exposures to market risk factors for securities held by the Fund, there are also risks that those derivatives may not perform as expected resulting in losses for the combined or hedged positions.
Derivatives may have little or no initial cash investment relative to their market value exposure and therefore can produce significant gains or losses in excess of their cost. This use of embedded leverage allows the Fund to increase its market value exposure relative to its net assets and can substantially increase the volatility of the Fund’s performance.
Additional associated risks from investing in derivatives also exist and potentially could have significant effects on the valuation of the derivative and the Fund. Typically, the associated risks are not the risks that the Fund is attempting to increase or decrease exposure to, per its investment objectives, but are the additional risks from investing in derivatives. Examples of these associated risks are liquidity risk, which is the risk that the Fund will not be able to sell the derivative in the open market in a timely manner, and counterparty credit risk, which is the risk that the counterparty will not fulfill its obligation to the Fund. Associated risks can be different for each type of derivative and are discussed by each derivative type in the notes that follow.
Counterparty Credit Risk. Certain derivative positions are subject to counterparty credit risk, which is the risk that the counterparty will not fulfill its obligation to the Fund. The Fund’s derivative counterparties are financial institutions who are subject to market conditions that may weaken their financial position. The Fund intends to enter into financial transactions with counterparties that the Manager believes to be creditworthy at the time of the transaction.
20 | OPPENHEIMER CAPITAL APPRECIATION FUND/VA
|
Credit Related Contingent Features. The Fund’s agreements with derivative counterparties have several credit related contingent features that if triggered would allow its derivatives counterparties to close out and demand payment or additional collateral to cover their exposure from the Fund. Credit related contingent features are established between the Fund and its derivatives counterparties to reduce the risk that the Fund will not fulfill its payment obligations to its counterparties. These triggering features include, but are not limited to, a percentage decrease in the Fund’s net assets and or a percentage decrease in the Fund’s Net Asset Value or NAV. The contingent features are established within the Fund’s International Swap and Derivatives Association, Inc. master agreements which govern certain positions in swaps, over-the-counter options and swaptions, and forward currency exchange contracts for each individual counterparty.
The effect of derivative instruments on the Statement of Operations is as follows:
| | | | |
| Amount of Realized Gain or (Loss) Recognized on Derivatives | |
Derivatives Not Accounted
for as Hedging Instruments | | Foreign currency transactions | |
Foreign exchange contracts | | | $58,014 | |
Foreign Currency Exchange Contracts
The Fund may enter into foreign currency exchange contracts (“forward contracts”) for the purchase or sale of a foreign currency at a negotiated rate at a future date.
Forward contracts are reported on a schedule following the Statement of Investments. The unrealized appreciation (depreciation) is reported in the Statement of Assets and Liabilities as a receivable or payable and in the Statement of Operations within the change in unrealized appreciation (depreciation). At contract close, the difference between the original cost of the contract and the value at the close date is recorded as a realized gain (loss) in the Statement of Operations.
The Fund has purchased and sold certain forward foreign currency exchange contracts of different currencies in order to acquire currencies to pay for or sell currencies to acquire related foreign securities purchase and sale transactions, respectively, or to convert foreign currencies to U.S. dollars from related foreign securities transactions. These foreign currency exchange contracts are negotiated at the current spot exchange rate with settlement typically within two business days thereafter.
During the six months ended June 29, 2012, the Fund had daily average contract amounts on forward foreign currency contracts to buy and sell of $58,057 and $860,324 respectively.
As of June 29, 2012, the Fund had no outstanding forward contracts.
7. Pending Litigation
Since 2009, a number of class action, derivative and individual lawsuits have been pending in federal and state courts against OppenheimerFunds, Inc., the Fund’s investment advisor (the “Manager”), OppenheimerFunds Distributor, Inc., the Fund’s principal underwriter and distributor (the “Distributor”), and certain funds (but not including the Fund) advised by the Manager and distributed by the Distributor (the “Defendant Funds”). Several of these lawsuits also name as defendants certain officers and current and former trustees of the respective Defendant Funds. The lawsuits raise claims under federal securities laws and various states’ securities, consumer protection and common law and allege, among other things, that the disclosure documents of the respective Defendant Funds contained misrepresentations and omissions and that the respective Defendant Funds’ investment policies were not followed. The plaintiffs in these actions seek unspecified damages, equitable relief and awards of attorneys’ fees and litigation expenses.
Other class action and individual lawsuits have been filed since 2008 in various state and federal courts against the Manager and certain of its affiliates by investors seeking to recover investments they allegedly lost as a result of the “Ponzi” scheme run by Bernard L. Madoff and his firm, Bernard L. Madoff Investment Securities, LLC (“BLMIS”). Plaintiffs
21 | OPPENHEIMER CAPITAL APPRECIATION FUND/VA
|
NOTES TO FINANCIAL STATEMENTS Unaudited / Continued
7. Pending Litigation Continued
in these suits allege that they suffered losses as a result of their investments in several funds managed by an affiliate of the Manager and assert a variety of claims, including breach of fiduciary duty, fraud, negligent misrepresentation, unjust enrichment, and violation of federal and state securities laws and regulations, among others. They seek unspecified damages, equitable relief and awards of attorneys’ fees and litigation expenses. Neither the Distributor, nor any of the Oppenheimer mutual funds, their independent trustees or directors are named as defendants in these lawsuits. None of the Oppenheimer mutual funds invested in any funds or accounts managed by Madoff or BLMIS. On February 28, 2011, a stipulation of partial settlement of three groups of consolidated putative class action lawsuits relating to these matters was filed in the U.S. District Court for the Southern District of New York. On August 19, 2011, the court entered an order and final judgment approving the settlement as fair, reasonable and adequate. In September 2011, certain parties filed notices of appeal from the court’s order approving the settlement. On July 29, 2011, a stipulation of settlement between certain affiliates of the Manager and the Trustee appointed under the Securities Investor Protection Act to liquidate BLMIS was filed in the U.S. Bankruptcy Court for the Southern District of New York to resolve purported preference and fraudulent transfer claims by the Trustee. On September 22, 2011, the court entered an order approving the settlement as fair, reasonable and adequate. In October 2011, certain parties filed notices of appeal from the court’s order approving the settlement. The aforementioned settlements do not resolve other outstanding lawsuits against the Manager and its affiliates relating to BLMIS.
On April 16, 2010, a lawsuit was filed in New York state court against the Manager, an affiliate of the Manager and AAArdvark IV Funding Limited (“AAArdvark IV”), an entity advised by the Manager’s affiliate, in connection with investments made by the plaintiffs in AAArdvark IV. Plaintiffs allege breach of contract against the defendants and seek compensatory damages, costs and disbursements, including attorney fees. On July 15, 2011, a lawsuit was filed in New York state court against the Manager, an affiliate of the Manager and AAArdvark Funding Limited (“AAArdvark I”), an entity advised by the Manager’s affiliate, in connection with investments made by the plaintiffs in AAArdvark I. The complaint alleges breach of contract against the defendants and seeks compensatory damages, costs and disbursements, including attorney fees. On November 9, 2011, a lawsuit was filed in New York state court against the Manager, an affiliate of the Manager and AAArdvark XS Funding Limited (“AAArdvark XS”), an entity advised by the Manager’s affiliate, in connection with investments made by the plaintiffs in AAArdvark XS. The complaint alleges breach of contract against the defendants and seeks compensatory damages, costs and disbursements, including attorney fees.
The Manager believes the lawsuits and appeals described above are without legal merit and, with the exception of actions it has settled, is defending against them vigorously. The Defendant Funds’ Boards of Trustees have also engaged counsel to represent the Funds and the present and former Independent Trustees named in those suits. While it is premature to render any opinion as to the outcome in these lawsuits, or whether any costs that the Defendant Funds may bear in defending the suits might not be reimbursed by insurance, the Manager believes that these suits should not impair the ability of the Manager or the Distributor to perform their respective duties to the Fund, and that the outcome of all of the suits together should not have any material effect on the operations of any of the Oppenheimer mutual funds.
22 | OPPENHEIMER CAPITAL APPRECIATION FUND/VA
|
SPECIAL SHAREHOLDER MEETING Unaudited
On February 29, 2012, a shareholder meeting of the Oppenheimer Variable Account Funds, on behalf of Oppenheimer Capital Appreciation Fund/VA (the “Fund”) was held at which the twelve Trustees identified below were elected to the Trust (Proposal No. 1). At the meeting Proposal No. 2 (including all of its sub-proposals) and Proposal No. 3 were approved as described in the Fund’s proxy statement for that meeting. The following is a report of the votes cast:
| | | | | | | | |
| Nominee/Proposal | | For | | | Withheld | |
| Trustees | | | | | | | | |
| William L. Armstrong | | | 859,155,000 | | | | 36,277,763 | |
| Edward L. Cameron | | | 860,463,149 | | | | 34,969,615 | |
| Jon S. Fossel | | | 861,382,389 | | | | 34,050,375 | |
| Sam Freedman | | | 860,173,958 | | | | 35,258,806 | |
| Richard F. Grabish | | | 862,692,974 | | | | 32,739,789 | |
| Beverly L. Hamilton | | | 862,904,192 | | | | 32,528,571 | |
| Robert J. Malone | | | 862,354,488 | | | | 33,078,275 | |
| F. William Marshall, Jr. | | | 860,997,182 | | | | 34,435,581 | |
| Victoria J. Herget | | | 861,814,105 | | | | 33,618,659 | |
| Karen L. Stuckey | | | 861,434,246 | | | | 33,998,517 | |
| James D. Vaughn | | | 861,208,178 | | | | 34,224,585 | |
| William F. Glavin, Jr. | | | 861,148,846 | | | | 34,283,917 | |
2a: Proposal to revise the fundamental policy relating to borrowing
| | | | | | | | | | | | |
| For | | Against | | | Abstain | | | Broker Non Vote | |
| 21,720,185 | | | 1,450,559 | | | | 973,654 | | | | N/A | |
2b: Proposal to revise the fundamental policy relating to concentration of investments
| | | | | | | | | | | | |
| For | | Against | | | Abstain | | | Broker Non Vote | |
| 21,878,439 | | | 1,451,349 | | | | 814,610 | | | | N/A | |
2c: Proposal to remove the fundamental policy relating to diversification of investments
| | | | | | | | | | | | |
| For | | Against | | | Abstain | | | Broker Non Vote | |
| 21,549,511 | | | 1,451,652 | | | | 1,113,235 | | | | N/A | |
2d: Proposal to revise the fundamental policy relating to lending
| | | | | | | | | | | | |
| For | | Against | | | Abstain | | | Broker Non Vote | |
| 21,640,361 | | | 1,525,559 | | | | 978,478 | | | | N/A | |
2e-1: Proposal to revise the fundamental policy relating to real estate and commodities
| | | | | | | | | | | | |
| For | | Against | | | Abstain | | | Broker Non Vote | |
| 21,660,498 | | | 1,503,758 | | | | 980,142 | | | | N/A | |
2e-2: Proposal to remove the additional fundamental policy relating to real estate and commodities
| | | | | | | | | | | | |
| For | | Against | | | Abstain | | | Broker Non Vote | |
| 21,558,859 | | | 1,529,520 | | | | 1,056,019 | | | | N/A | |
23 | OPPENHEIMER CAPITAL APPRECIATION FUND/VA
|
SPECIAL SHAREHOLDER MEETING Unaudited / Continued
2f: Proposal to revise the fundamental policy relating to senior securities
| | | | | | | | | | | | |
| For | | Against | | | Abstain | | | Broker Non Vote | |
| 21,672,633 | | | 1,492,021 | | | | 979,743 | | | | N/A | |
2g: Proposal to revise the fundamental policy relating to underwriting
| | | | | | | | | | | | |
| For | | Against | | | Abstain | | | Broker Non Vote | |
| 21,704,774 | | | 1,499,706 | | | | 939,919 | | | | N/A | |
2i: Convert the Fund’s investment objective from fundamental to non-fundamental
| | | | | | | | | | | | |
| For | | Against | | | Abstain | | | Broker Non Vote | |
| 21,337,152 | | | 1,672,734 | | | | 1,134,512 | | | | N/A | |
2j: Approve a change in the fund’s investment objective
| | | | | | | | | | | | |
| For | | Against | | | Abstain | | | Broker Non Vote | |
| 21,563,288 | | | 1,482,324 | | | | 1,098,787 | | | | N/A | |
Proposal 3: To approve an Agreement and Plan of Reorganization that provides for the reorganization of a Fund from a Maryland corporation or Massachusetts business trust, as applicable, into a Delaware statutory trust.
| | | | | | | | | | | | |
| For | | Against | | | Abstain | | | Broker Non Vote | |
| 821,085,084 | | | 23,597,959 | | | | 50,749,721 | | | | N/A | |
24 | OPPENHEIMER CAPITAL APPRECIATION FUND/VA
|
PORTFOLIO PROXY VOTING POLICIES AND PROCEDURES;
UPDATES TO STATEMENTS OF INVESTMENTS Unaudited
The Fund has adopted Portfolio Proxy Voting Policies and Procedures under which the Fund votes proxies relating to securities (“portfolio proxies”) held by the Fund. A description of the Fund’s Portfolio Proxy Voting Policies and Procedures is available (i) without charge, upon request, by calling the Fund toll-free at 1.800.525.7048, (ii) on the Fund’s website at oppenheimerfunds.com, and (iii) on the SEC’s website at www.sec.gov. In addition, the Fund is required to file Form N-PX, with its complete proxy voting record for the 12 months ended June 30th, no later than August 31st of each year. The Fund’s voting record is available (i) without charge, upon request, by calling the Fund toll-free at 1.800.525.7048, and (ii) in the Form N-PX filing on the SEC’s website at www.sec.gov.
The Fund files its complete schedule of portfolio holdings with the SEC for the first quarter and the third quarter of each fiscal year on Form N-Q. The Fund’s Form N-Q filings are available on the SEC’s website at www.sec.gov. Those forms may be reviewed and copied at the SEC’s Public Reference Room in Washington, D.C. Information on the operation of the Public Reference Room may be obtained by calling 1-800-SEC-0330.
25 | OPPENHEIMER CAPITAL APPRECIATION FUND/VA
|
OPPENHEIMER CAPITAL APPRECIATION FUND/VA
| | |
| A Series of Oppenheimer Variable Account Funds |
| Trustees and Officers | | William L. Armstrong, Chairman of the Board of Trustees and Trustee Edward L. Cameron, Trustee Jon S. Fossel, Trustee Sam Freedman, Trustee Richard F. Grabish, Trustee Beverly L. Hamilton, Trustee Victoria J. Herget, Trustee Robert J. Malone, Trustee F. William Marshall, Jr., Trustee Karen L. Stuckey, Trustee James D. Vaughn, Trustee William F. Glavin, Jr., Trustee, President and Principal Executive Officer Julie Van Cleave, Vice President Arthur S. Gabinet, Secretary and Chief Legal Officer Christina M. Nasta, Vice President and Chief Business Officer Mark S. Vandehey, Vice President and Chief Compliance Officer Brian W. Wixted, Treasurer and Principal Financial & Accounting Officer |
| Manager | | OppenheimerFunds, Inc. |
| Distributor | | OppenheimerFunds Distributor, Inc. |
| Transfer Agent | | OppenheimerFunds Services |
| Independent Registered Public Accounting Firm | | KPMG LLP |
| Counsel | | K&L Gates LLP |
Before investing, investors should carefully consider a fund’s investment objectives, risks, charges and expenses. Fund prospectuses and summary prospectuses contain this and other information about the funds and may be obtained by asking your financial advisor, or calling us at 1.800.988.8287. Read prospectuses and summary prospectuses carefully before investing.
The financial statements included herein have been taken from the records of the Fund without examination of those records by the independent registered public accounting firm.
| | |
| ©2012 OppenheimerFunds, Inc. All rights reserved. | |  |
June 30, 2012
| | | | |
| | | Oppenheimer Core Bond Fund/VA A Series of Oppenheimer Variable Account Funds | | Semiannual Report |

SEMIANNUAL REPORT
Fund Performance Discussion
Fund Allocations
Financial Statements

OPPENHEIMER CORE BOND FUND/VA
Portfolio Managers: Krishna Memani and Peter A. Strzalkowski, CFA
| | | | | | |
Cumulative Total Returns
For the 6-Month Period Ended 6/29/121 |
| Non-Service Shares | | 4.95% | | | | |
| Service Shares | | 4.78 | | | | |
Average Annual Total Returns
For the Periods Ended 6/29/121 |
| | | |
| | | 1-Year | | 5-Year | | 10-Year |
| Non-Service Shares | | 9.39% | | –2.67% | | 1.43% |
| Service Shares | | 8.98 | | –2.91 | | 1.16 |
Expense Ratios
For the Fiscal Year Ended 12/30/111 |
| | | |
| | | Gross
Expense
Ratios | | | | Net Expense
Ratios |
| Non-Service Shares | | 0.79% | | | | 0.77% |
| Service Shares | | 1.04 | | | | 1.02 |
The performance data quoted represents past performance, which does not guarantee future results. The investment return and principal value of an investment in the Fund will fluctuate so that an investor’s shares, when redeemed, may be worth more or less than their original cost. Current performance and expense ratios may be lower or higher than the data quoted. For performance data current to the most recent month end, call us at 1.800.988.8287. The Fund’s total returns should not be expected to be the same as the returns of other funds, whether or not both funds have the same portfolio managers and/or similar names. The Fund’s total returns do not include the charges associated with the separate account products that offer this Fund. Such performance would have been lower if such charges were taken into account. Expense ratios are as stated in the Fund’s prospectus current as of the date of this report. The net expense ratios take into account voluntary fee waivers and/or expense reimbursements, without which performance would have been less. Some of these undertakings may be modified or terminated at any time, as indicated in the Fund’s prospectus.
| | | | |
| Credit Rating Breakdown | | NRSRO Only Total | |
| AAA | | | 59.9 | % |
| AA | | | 2.1 | |
| A | | | 8.4 | |
| BBB | | | 20.6 | |
| BB | | | 5.5 | |
| B | | | 0.5 | |
| CCC | | | 2.5 | |
| CC | | | 0.3 | |
| Other Securities | | | 0.2 | |
| | |
|
|
|
| Total | | | 100.0% | |
The percentages above are based on the market value of the Fund’s securities as of June 29, 2012, and are subject to change. Except for securities issued or guaranteed by a foreign sovereign, all securities have been rated by at least one Nationally Recognized Statistical Rating Organization (“NRSRO”), such as Standard & Poor’s (“S&P”). For securities rated only by an NRSRO other than S&P, OppenheimerFunds, Inc. converts that rating to the equivalent S&P rating. If two or more NRSROs have assigned a rating to a security, the highest S&P equivalent rating is used. Unrated securities issued or guaranteed by a foreign sovereign are assigned a credit rating equal to the highest NRSRO rating assigned to that foreign sovereign. Fund assets invested in Oppenheimer Institutional Money Market Fund are assigned that fund’s S&P rating, which is currently AAA. For the purposes of this table, “investment-grade” securities are securities rated within the NRSROs’ four highest rating categories, which include AAA, AA, A and BBB. Unrated securities do not necessarily indicate low credit quality, and may or may not be the equivalent of investment-grade. Please consult the Fund’s prospectus and Statement of Additional Information for further information.
| | |
| Corporate Bonds & Notes—Top Ten Industries |
| Insurance | | 3.9% |
| Oil, Gas & Consumable Fuels | | 3.8 |
| Capital Markets | | 3.4 |
| Commercial Banks | | 2.7 |
| Diversified Financial Services | | 2.6 |
| Media | | 2.3 |
| Diversified Telecommunication Services | | 2.2 |
| Metals & Mining | | 1.5 |
| Energy Equipment & Services | | 1.3 |
| Real Estate Investment Trusts | | 1.2 |
Portfolio holdings and allocations are subject to change. Percentages are as of June 29, 2012, and are based on net assets.
2 | OPPENHEIMER CORE BOND FUND/VA
|
FUND PERFORMANCE DISCUSSION
During the six-month reporting period, the Fund’s Non-Service shares produced a return of 4.95%. The Fund outperformed its benchmarks, the Barclays Capital U.S. Aggregate Bond Index, the Barclays Capital Credit Index and the Citigroup Broad Investment Grade Bond Index, which produced returns of 2.37%, 4.55% and 2.33%, respectively.1
Economic and Market Environment
The period began during a time of improved market sentiment in which the United States managed to avoid a return to recession and European policymakers appeared to take steps to address the region’s sovereign debt and banking sector crises. Renewed investor optimism helped produce gains across a number of international equity markets and historically riskier asset classes over the first three months of 2012. The rebound across risk markets gained momentum after the European Central Bank implemented the Long-Term Refinancing Operation (“LTRO”) to enhance liquidity for troubled banks and reduce rates on newly issued sovereign debt securities.
However, the second quarter was a volatile time for global markets. The fear of contagion from the worsening European sovereign debt crisis and a recession across much of Europe drove negative market sentiment, particularly over May and June. Very high unemployment, soaring debt and higher borrowing costs in Greece, Spain and Italy contributed to serious questions over how to implement austerity measures and restructure debt or instead take a different tact and provide some or all of those countries with additional funds. Perhaps most worrisome of all to investors was the possibility of Greece pulling out of the euro and its ramifications for the future of the Eurozone and its common currency. In the U.S., slower than expected first quarter growth also contributed to a sell-off in the U.S. stock market. Consumer confidence dropped as U.S. unemployment figures ticked slightly upwards after showing signs of improvement from the recession highs. The Federal Reserve announced the continuation of Operation Twist in response to an uneven domestic economic picture; yet, the U.S. housing market appears to be bottoming.
Fund Review
During the period, the Fund’s positive results were driven by its exposure to spread products—credit, mortgage-backed obligations, non-prime asset-backed securities (ABS)—at the expense of government debt. The Fund’s investments in mortgage-backed obligations included residential mortgage-backed securities (RMBS) and commercial mortgage-backed securities, both of which benefited results. Despite bouts of risk aversion, mortgage-backed obligations generally produced positive results as housing in the U.S. began to stabilize. The Fund’s exposure to RMBS included securities guaranteed by government-sponsored enterprises, commonly referred to as agency RMBS, as well as a smaller allocation to RMBS originated by private entities, also known as non-agency RMBS. The Fund also received positive results from its exposure to high yield and investment grade debt.
Outlook
Given the recent spate of weaker economic news globally and the ongoing crisis in Europe, we are cognizant that headwinds exist for risk-based assets. In the U.S., the upcoming congressional and presidential elections may provide some volatility especially given the contentious debate over entitlements, taxes, and the deficit. Markets seemed to welcome Operation Twist, and we believe that the Federal Reserve will respond to any downdraft in domestic economic activity with additional measures such as quantitative easing or outright buying of U.S. mortgages in order to keep the modest revival of the economy on track. Such a macro environment is behind our bias to be overweight domestic spread products at the expense of low-yielding U.S. Treasuries.
1. June 29, 2012, was the last business day of the Fund’s semiannual period. See Note 1 of the accompanying Notes to Financial Statements. Index returns are calculated through June 30, 2012. December 30, 2011 was the last business day of the Fund’s 2011 fiscal year.
3 | OPPENHEIMER CORE BOND FUND/VA
|
FUND PERFORMANCE DISCUSSION Continued
Investors should consider the Fund’s investment objective, risks, and charges and expenses carefully before investing. The Fund’s prospectus and summary prospectus contain this and other information about the Fund, and may be obtained by asking your financial advisor or calling us at 1.800.988.8287. Read prospectuses and summary prospectuses carefully before investing.
Total returns include changes in share price and reinvestment of dividends and capital gains distributions in a hypothetical investment for the periods shown. Cumulative total returns are not annualized.
The Fund’s investment strategy and focus can change over time. The mention of specific fund holdings does not constitute a recommendation by OppenheimerFunds, Inc.
Shares of Oppenheimer funds are not deposits or obligations of any bank, are not guaranteed by any bank, are not insured by the FDIC or any other agency, and involve investment risks, including the possible loss of the principal amount invested.
4 | OPPENHEIMER CORE BOND FUND/VA
|
FUND EXPENSE
Fund Expenses. As a shareholder of the Fund, you incur two types of costs: (1) transaction costs and (2) ongoing costs, including management fees; distribution and service fees; and other Fund expenses. These examples are intended to help you understand your ongoing costs (in dollars) of investing in the Fund and to compare these costs with the ongoing costs of investing in other mutual funds.
The examples are based on an investment of $1,000.00 invested at the beginning of the period and held for the entire 6-month period ended June 29, 2012.
Actual Expenses. The first section of the table provides information about actual account values and actual expenses. You may use the information in this section for the class of shares you hold, together with the amount you invested, to estimate the expense that you paid over the period. Simply divide your account value by $1,000.00 (for example, an $8,600.00 account value divided by $1,000.00 = 8.60), then multiply the result by the number in the first section under the heading entitled “Expenses Paid During Period” to estimate the expenses you paid on your account during this period.
Hypothetical Example for Comparison Purposes. The second section of the table provides information about hypothetical account values and hypothetical expenses based on the Fund’s actual expense ratio for each class of shares, and an assumed rate of return of 5% per year for each class before expenses, which is not the actual return. The hypothetical account values and expenses may not be used to estimate the actual ending account balance or expenses you paid for the period. You may use this information to compare the ongoing costs of investing in the Fund and other funds. To do so, compare this 5% hypothetical example for the class of shares you hold with the 5% hypothetical examples that appear in the shareholder reports of the other funds.
Please note that the expenses shown in the table are meant to highlight your ongoing costs only and do not reflect any charges associated with the separate accounts that offer this Fund. Therefore, the “hypothetical” lines of the table are useful in comparing ongoing costs only, and will not help you determine the relative total costs of owning different funds. In addition, if these separate account charges were included your costs would have been higher.
| | | | | | | | | | | | |
| Actual | | Beginning
Account
Value
January 1, 2012 | | | Ending
Account
Value
June 29, 2012 | | | Expenses
Paid During
6 Months Ended
June 29, 2012 | |
| Non-Service shares | | $ | 1,000.00 | | | $ | 1,049.50 | | | $ | 3.76 | |
| Service shares | | | 1,000.00 | | | | 1,047.80 | | | | 5.02 | |
| | | |
Hypothetical
(5% return before expenses) | | | | | | | | | |
| Non-Service shares | | | 1,000.00 | | | | 1,021.07 | | | | 3.70 | |
| Service shares | | | 1,000.00 | | | | 1,019.83 | | | | 4.96 | |
Expenses are equal to the Fund’s annualized expense ratio for that class, multiplied by the average account value over the period, multiplied by 181/366 (to reflect the one-half year period). Those annualized expense ratios, excluding indirect expenses from affiliated fund, based on the 6-month period ended June 29, 2012 are as follows:
| | | | |
| Class | | Expense Ratios | |
| Non-Service shares | | | 0.74 | % |
| Service shares | | | 0.99 | |
The expense ratios reflect voluntary waivers and/or reimbursements of expenses by the Fund’s Manager. Some of these undertakings may be modified or terminated at any time, as indicated in the Fund’s prospectus. The “Financial Highlights” tables in the Fund’s financial statements, included in this report, also show the gross expense ratios, without such waivers or reimbursements and reduction to custodian expenses, if applicable.
5 | OPPENHEIMER CORE BOND FUND/VA
|
STATEMENT OF INVESTMENTS June 29, 2012* / Unaudited
| | | | | | | | |
| | | Principal
Amount | | | Value | |
| | | | | | | | | |
| Asset-Backed Securities—9.7% | | | | | | | | |
| AESOP Funding II LLC, Automobile Receivables Nts., Series 2011-1A, Cl. A, 1.85%, 11/20/131 | | $ | 235,000 | | | $ | 236,601 | |
Ally Master Owner Trust, Asset-Backed Nts.:
Series 2011-1, Cl. A2, 2.15%, 1/15/16 | | | 230,000 | | | | 234,259 | |
| Series 2012-2, Cl. A, 0.742%, 3/15/162 | | | 515,000 | | | | 515,667 | |
| Ally Master Owner Trust, Automobile Receivables Nts., Series 2011-4, Cl. A2, 1.54%, 9/15/16 | | | 715,000 | | | | 722,289 | |
| American Credit Acceptance Receivables Trust 2012-1, Automobile Receivables Nts., Series 2012-1, Cl. A1, 1.96%, 1/15/141 | | | 535,206 | | | | 535,243 | |
| AmeriCredit Automobile Receivables Trust 2009-1, Automobile Receivables-Backed Nts., Series 2009-1, Cl. A3, 3.04%, 10/15/13 | | | 1,939 | | | | 1,942 | |
| AmeriCredit Automobile Receivables Trust 2010-1, Automobile Receivables-Backed Nts., Series 2010-1, Cl. D, 6.65%, 7/17/17 | | | 300,000 | | | | 324,123 | |
AmeriCredit Automobile Receivables Trust 2010-2, Automobile Receivables-Backed Nts.:
Series 2010-2, Cl. C, 4.52%, 10/8/15 | | | 430,000 | | | | 448,933 | |
| Series 2010-2, Cl. D, 6.24%, 6/8/16 | | | 275,000 | | | | 297,453 | |
| AmeriCredit Automobile Receivables Trust 2011-1, Automobile Receivables-Backed Nts., Series 2011-1, Cl. D, 4.26%, 2/8/17 | | | 120,000 | | | | 127,441 | |
AmeriCredit Automobile Receivables Trust 2011-2, Automobile Receivables-Backed Nts.:
Series 2011-2, Cl. A3, 1.61%, 10/8/15 | | | 140,000 | | | | 141,070 | |
| Series 2011-2, Cl. B, 2.33%, 3/8/16 | | | 440,000 | | | | 446,838 | |
| Series 2011-2, Cl. D, 4%, 5/8/17 | | | 525,000 | | | | 548,995 | |
| AmeriCredit Automobile Receivables Trust 2011-4, Automobile Receivables-Backed Nts., Series 2011-4, Cl. D, 4.08%, 7/10/17 | | | 650,000 | | | | 662,432 | |
AmeriCredit Automobile Receivables Trust 2011-5, Automobile Receivables-Backed Nts.:
Series 2011-5, Cl. D, 1.55%, 7/8/16 | | | 360,000 | | | | 364,316 | |
| Series 2011-5, Cl. D, 5.05%, 12/8/17 | | | 435,000 | | | | 454,654 | |
| AmeriCredit Automobile Receivables Trust 2012-1, Automobile Receivables-Backed Nts., Series 2012-1, Cl. D, 4.72%, 3/8/18 | | | 425,000 | | | | 449,280 | |
| AmeriCredit Automobile Receivables Trust 2012-2, Automobile Receivables-Backed Nts., Series 2012-2, Cl. D, 3.38%, 4/9/18 | | | 695,000 | | | | 699,741 | |
| | | | | | | | |
| | | Principal
Amount | | | Value | |
| | | | | | | | | |
| Asset-Backed Securities Continued | |
Avis Budget Rental Car Funding AESOP LLC, Automobile Receivable Nts.:
Series 2011-2A, Cl. A, 2.37%, 11/20/141 | | $ | 455,000 | | | $ | 464,117 | |
| Series 2012-1A, Cl. A, 2.054%, 8/20/161 | | | 345,000 | | | | 348,585 | |
| Centre Point Funding LLC, Asset-Backed Nts., Series 2010-1A, Cl. 1, 5.43%, 7/20/151 | | | 83,924 | | | | 88,018 | |
Citibank Credit Card Issuance Trust,
Credit Card Receivable Nts.,
Series 2003-C4, Cl. C4, 5%, 6/10/15 | | | 310,000 | | | | 320,651 | |
Citibank Omni Master Trust, Credit Card Receivables:
Series 2009-A13, Cl. A13, 5.35%, 8/15/181 | | | 480,000 | | | | 524,485 | |
| Series 2009-A17, Cl. A17, 4.90%, 11/15/181 | | | 665,000 | | | | 726,476 | |
| CPS Auto Trust, Automobile Receivable Nts., Series 2012-B, Cl. A, 3.09%, 9/1/191 | | | 615,000 | | | | 615,237 | |
Credit Acceptance Auto Loan Trust, Automobile Receivable Nts.,
Series 2012-1A, Cl. A, 2.20%, 9/16/191 | | | 260,000 | | | | 260,927 | |
DSC Floorplan Master Owner Trust, Automobile Receivable Nts.,
Series 2011-1, Cl. A, 3.91%, 3/15/16 | | | 400,000 | | | | 410,675 | |
| DT Auto Owner Trust 2009-1, Automobile Receivable Nts., Series 2009-1, Cl. A1, 2.98%, 10/15/151 | | | 43,056 | | | | 43,121 | |
| DT Auto Owner Trust 2011-1A, Automobile Receivable Nts., Series 2011-1A, Cl. C, 3.05%, 8/15/151 | | | 570,000 | | | | 571,395 | |
DT Auto Owner Trust 2011-2A, Automobile Receivable Nts.,
Series 2011-2A, Cl. C, 3.05%, 7/15/131 | | | 134,000 | | | | 133,962 | |
| DT Auto Owner Trust 2011-3A, Automobile Receivable Nts., Series 2011-3A, Cl. C, 4.03%, 12/15/411 | | | 435,000 | | | | 441,690 | |
| DT Auto Owner Trust 2012-1A, Automobile Receivable Nts., Series 2012-1A, Cl. A, 1.05%, 1/15/151 | | | 370,690 | | | | 370,731 | |
| Exeter Automobile Receivables Trust, Automobile Receivable Nts., Series 2012-1A, Cl. A, 2.02%, 8/15/161 | | | 306,871 | | | | 307,073 | |
| First Investors Auto Owner Trust 2011-1, Automobile Receivable Nts., Series 2011-1, Cl. A2, 1.47%, 3/16/15 | | | 171,893 | | | | 171,822 | |
| Hertz Vehicle Financing LLC, Automobile Receivable Nts., Series 2010-1A, Cl. A1, 2.60%, 2/25/151 | | | 1,015,000 | | | | 1,035,624 | |
6 | OPPENHEIMER CORE BOND FUND/VA
|
| | | | | | | | |
| | | Principal
Amount | | | Value | |
| | | | | | | | | |
| Asset-Backed Securities Continued | |
| Rental Car Finance Corp., Automobile Receivable Nts., Series 2011-1A, Cl. A1, 2.51%, 2/25/161 | | $ | 365,000 | | | $ | 371,163 | |
| Santander Drive Auto Receivables Trust 2010-2, Automobile Receivables Nts., Series 2010-2, Cl. A2, 0.95%, 8/15/13 | | | 36,227 | | | | 36,231 | |
| Santander Drive Auto Receivables Trust 2010-3, Automobile Receivables Nts., Series 2010-3, Cl. C, 3.06%, 11/15/17 | | | 485,000 | | | | 491,392 | |
| Santander Drive Auto Receivables Trust 2010-A, Automobile Receivables Nts., Series 2010-A, Cl. A2, 1.37%, 8/15/131 | | | 42,467 | | | | 42,493 | |
| Santander Drive Auto Receivables Trust 2010-B, Automobile Receivables Nts., Series 2010-B, Cl. C, 3.02%, 10/17/161 | | | 470,000 | | | | 478,432 | |
| Santander Drive Auto Receivables Trust 2011-1, Automobile Receivables Nts., Series 2011-1, Cl. D, 4.01%, 2/15/17 | | | 465,000 | | | | 474,155 | |
Santander Drive Auto Receivables Trust 2011-4, Automobile Receivables Nts.:
Series 2011-4, Cl. A3, 1.64%, 9/15/15 | | | 40,000 | | | | 40,113 | |
| Series 2011-4, Cl. B, 2.90%, 5/16/16 | | | 180,000 | | | | 185,397 | |
| Santander Drive Auto Receivables Trust 2011-S1A, Automobile Receivables Nts., Series 2011-S1A, Cl. D, 3.10%, 5/15/173 | | | 377,976 | | | | 378,974 | |
| Santander Drive Auto Receivables Trust 2011-S2A, Automobile Receivables Nts., Series 2011-S2A, Cl. D, 3.35%, 6/15/173 | | | 292,819 | | | | 292,819 | |
| Santander Drive Auto Receivables Trust 2012-2, Automobile Receivables Nts., Series 2012-2, Cl. D, 5%, 2/15/18 | | | 515,000 | | | | 520,745 | |
SNAAC Auto Receivables Trust, Automobile Receivable Nts.,
Series 2012-1A, Cl. A, 1.78%, 6/15/161 | | | 350,000 | | | | 350,190 | |
| Westlake Automobile Receivables Trust 2011-1, Automobile Receivables Nts., Series 2011-1, Cl. A3, 1.49%, 6/16/141 | | | 205,000 | | | | 205,347 | |
| Wheels SPV LLC, Asset-Backed Nts., Series 2012-1, Cl. A2, 1.19%, 3/20/211 | | | 260,000 | | | | 260,181 | |
| | | | | | |
|
|
|
Total Asset-Backed Securities
(Cost $18,019,568) | | | | | | | 18,173,498 | |
| | | | | | | | |
| | | Principal
Amount | | | Value | |
| | | | | | | | | |
| Mortgage-Backed Obligations—63.3% | |
| Government Agency—51.9% | |
| FHLMC/FNMA/FHLB/Sponsored—51.5% | |
Federal Home Loan Mortgage Corp.:
4.50%, 8/1/424 | | $ | 3,455,000 | | | $ | 3,689,832 | |
| 5%, 12/15/34 | | | 16,047 | | | | 17,365 | |
| 5.50%, 9/1/39 | | | 1,148,484 | | | | 1,251,316 | |
| 6%, 5/15/18-10/15/29 | | | 2,164,778 | | | | 2,385,274 | |
| 6.50%, 4/15/18-4/1/34 | | | 502,955 | | | | 563,393 | |
| 7%, 8/15/16-10/1/37 | | | 585,571 | | | | 687,111 | |
| 8%, 4/1/16 | | | 134,753 | | | | 145,408 | |
| 9%, 8/1/22-5/1/25 | | | 54,947 | | | | 63,666 | |
| 10.50%, 11/14/20 | | | 2,530 | | | | 3,084 | |
Federal Home Loan Mortgage Corp.,
Gtd. Real Estate Mtg. Investment Conduit Multiclass Pass-Through Certificates:
Series 151, Cl. F, 9%, 5/15/21 | | | 14,286 | | | | 16,431 | |
| Series 1674, Cl. Z, 6.75%, 2/15/24 | | | 42,040 | | | | 47,812 | |
| Series 2006-11, Cl. PS, 23.667%, 3/25/362 | | | 342,169 | | | | 495,481 | |
| Series 2034, Cl. Z, 6.50%, 2/15/28 | | | 4,891 | | | | 5,599 | |
| Series 2042, Cl. N, 6.50%, 3/15/28 | | | 14,123 | | | | 16,173 | |
| Series 2043, Cl. ZP, 6.50%, 4/15/28 | | | 595,237 | | | | 686,351 | |
| Series 2046, Cl. G, 6.50%, 4/15/28 | | | 37,823 | | | | 43,315 | |
| Series 2053, Cl. Z, 6.50%, 4/15/28 | | | 6,335 | | | | 7,261 | |
| Series 2066, Cl. Z, 6.50%, 6/15/28 | | | 639,075 | | | | 732,390 | |
| Series 2195, Cl. LH, 6.50%, 10/15/29 | | | 499,266 | | | | 573,057 | |
| Series 2220, Cl. PD, 8%, 3/15/30 | | | 2,541 | | | | 3,018 | |
| Series 2326, Cl. ZP, 6.50%, 6/15/31 | | | 138,005 | | | | 159,019 | |
| Series 2461, Cl. PZ, 6.50%, 6/15/32 | | | 682,151 | | | | 787,165 | |
| Series 2470, Cl. LF, 1.242%, 2/15/322 | | | 5,847 | | | | 5,962 | |
| Series 2500, Cl. FD, 0.742%, 3/15/322 | | | 135,266 | | | | 136,523 | |
| Series 2526, Cl. FE, 0.642%, 6/15/292 | | | 193,868 | | | | 194,938 | |
| Series 2538, Cl. F, 0.842%, 12/15/322 | | | 704,353 | | | | 710,833 | |
| Series 2551, Cl. FD, 0.642%, 1/15/332 | | | 125,266 | | | | 126,007 | |
| Series 2936, Cl. PE, 5%, 2/1/35 | | | 69,000 | | | | 78,380 | |
| Series 3025, Cl. SJ, 23.864%, 8/15/352 | | | 68,864 | | | | 102,188 | |
| Series 3822, Cl. JA, 5%, 6/1/40 | | | 51,148 | | | | 54,438 | |
| Series 3848, Cl. WL, 4%, 4/1/40 | | | 60,769 | | | | 64,342 | |
Federal Home Loan Mortgage Corp.,
Interest-Only Stripped Mtg.-Backed Security: Series 205, Cl. IO, 14.04%, 9/1/295 | | | 17,675 | | | | 3,021 | |
| Series 206, Cl. IO, 0%, 12/1/295,6 | | | 221,717 | | | | 45,824 | |
| Series 2074, Cl. S, 57.854%, 7/17/285 | | | 3,730 | | | | 813 | |
| Series 2079, Cl. S, 67.037%, 7/17/285 | | | 6,599 | | | | 1,480 | |
| Series 2130, Cl. SC, 50.959%, 3/15/295 | | | 249,943 | | | | 50,597 | |
| Series 243, Cl. 6, 0.513%, 12/15/325 | | | 238,008 | | | | 51,904 | |
| Series 2526, Cl. SE, 44.943%, 6/15/295 | | | 8,755 | | | | 1,839 | |
| Series 2531, Cl. ST, 99.999%, 2/15/305 | | | 43,079 | | | | 518 | |
| Series 2796, Cl. SD, 65.921%, 7/15/265 | | | 398,695 | | | | 80,430 | |
| Series 2802, Cl. AS, 83.838%, 4/15/335 | | | 167,068 | | | | 10,034 | |
| Series 2819, Cl. S, 58.469%, 6/15/345 | | | 83,280 | | | | 16,646 | |
| Series 2920, Cl. S, 66.684%, 1/15/355 | | | 1,506,061 | | | | 257,479 | |
| Series 3004, Cl. SB, 99.999%, 7/15/355 | | | 84,138 | | | | 15,096 | |
| Series 3110, Cl. SL, 99.999%, 2/15/265 | | | 219,400 | | | | 30,636 | |
| Series 3450, Cl. BI, 12.377%, 5/15/385 | | | 973,417 | | | | 161,530 | |
7 | OPPENHEIMER CORE BOND FUND/VA
|
STATEMENT OF INVESTMENTS Unaudited / Continued
| | | | | | | | |
| | | Principal
Amount | | | Value | |
| | | | | | | | | |
| FHLMC/FNMA/FHLB/Sponsored Continued | |
Federal Home Loan Mortgage Corp.,
Interest-Only Stripped Mtg.-Backed Security: Continued | | | | | | | | |
| Series 3662, Cl. SM, 24.883%, 10/15/325 | | $ | 734,995 | | | $ | 98,054 | |
| Series 3736, Cl. SN, 6.506%, 10/15/405 | | | 2,074,505 | | | | 341,561 | |
Federal Home Loan Mortgage Corp.,
Principal-Only Stripped Mtg.-Backed
Security, Series 176, Cl. PO,
3.819%, 6/1/267 | | | 92,386 | | | | 80,729 | |
Federal National Mortgage Assn.:
2.50%, 7/1/274 | | | 9,185,000 | | | | 9,466,291 | |
| 2.74%, 10/1/362 | | | 172,854 | | | | 184,568 | |
| 3.50%, 8/1/424 | | | 8,545,000 | | | | 8,961,569 | |
| 4%, 7/1/274 | | | 490,000 | | | | 521,238 | |
| 4.50%, 7/1/274 | | | 1,405,000 | | | | 1,506,204 | |
| 5%, 2/25/22-7/25/22 | | | 12,412 | | | | 13,405 | |
| 5.50%, 8/1/424 | | | 3,014,000 | | | | 3,286,673 | |
| 6%, 8/1/424 | | | 1,460,000 | | | | 1,604,403 | |
| 6.50%, 5/25/17-1/1/34 | | | 888,940 | | | | 961,117 | |
| 7%, 11/1/17-7/25/35 | | | 414,769 | | | | 464,309 | |
| 7.50%, 1/1/33 | | | 10,249 | | | | 12,466 | |
| 8.50%, 7/1/32 | | | 16,764 | | | | 20,841 | |
Federal National Mortgage Assn., 15 yr.:
3%, 7/1/274 | | | 13,850,000 | | | | 14,514,367 | |
| 3.50%, 7/1/274 | | | 1,230,000 | | | | 1,299,956 | |
Federal National Mortgage Assn., 30 yr.:
4%, 8/1/424 | | | 15,145,000 | | | | 16,093,930 | |
| 4.50%, 8/1/424 | | | 8,455,000 | | | | 9,065,345 | |
Federal National Mortgage Assn.,
Gtd. Real Estate Mtg. Investment Conduit Multiclass Pass-Through Certificates:
Trust 1989-17, Cl. E, 10.40%, 4/25/19 | | | 7,836 | | | | 8,542 | |
| Trust 1993-87, Cl. Z, 6.50%, 6/25/23 | | | 492,214 | | | | 562,423 | |
| Trust 1998-58, Cl. PC, 6.50%, 10/25/28 | | | 388,355 | | | | 444,896 | |
| Trust 1998-61, Cl. PL, 6%, 11/25/28 | | | 188,654 | | | | 211,310 | |
| Trust 1999-54, Cl. LH, 6.50%, 11/25/29 | | | 327,259 | | | | 374,845 | |
| Trust 2001-44, Cl. QC, 6%, 9/25/16 | | | 16,278 | | | | 17,378 | |
| Trust 2001-51, Cl. OD, 6.50%, 10/25/31 | | | 24,995 | | | | 28,924 | |
| Trust 2001-74, Cl. QE, 6%, 12/25/31 | | | 552,577 | | | | 621,204 | |
| Trust 2002-12, Cl. PG, 6%, 3/25/17 | | | 8,472 | | | | 9,174 | |
| Trust 2003-28, Cl. KG, 5.50%, 4/25/23 | | | 3,964,000 | | | | 4,409,479 | |
| Trust 2004-101, Cl. BG, 5%, 1/25/20 | | | 1,140,542 | | | | 1,222,061 | |
| Trust 2004-9, Cl. AB, 4%, 7/1/17 | | | 49,804 | | | | 49,864 | |
| Trust 2006-46, Cl. SW, 23.30%, 6/25/362 | | | 248,696 | | | | 357,750 | |
| Trust 2006-50, Cl. KS, 23.301%, 6/25/362 | | | 358,620 | | | | 521,043 | |
| Trust 2007-42, Cl. A, 6%, 2/1/33 | | | 555,952 | | | | 578,447 | |
| Trust 2009-36, Cl. FA, 1.185%, 6/25/372 | | | 483,279 | | | | 490,779 | |
Federal National Mortgage Assn.,
Interest-Only Stripped Mtg.-Backed Security:
Trust 2001-61, Cl. SH,
35.633%, 11/18/315 | | | 21,651 | | | | 4,081 | |
Trust 2001-63, Cl. SD,
33.896%, 12/18/315 | | | 7,009 | | | | 1,275 | |
| Trust 2001-65, Cl. S, 34.484%, 11/25/315 | | | 543,228 | | | | 105,703 | |
Trust 2001-68, Cl. SC,
24.647%, 11/25/315 | | | 4,604 | | | | 879 | |
| | | | | | | | |
| | | Principal
Amount | | | Value | |
| | | | | | | | | |
| FHLMC/FNMA/FHLB/Sponsored Continued | |
Federal National Mortgage Assn.,
Interest-Only Stripped Mtg.-Backed Security: Continued | | | | | | | | |
| Trust 2001-81, Cl. S, 26.341%, 1/25/325 | | $ | 149,112 | | | $ | 31,474 | |
Trust 2002-28, Cl. SA,
37.895%, 4/25/325 | | | 4,245 | | | | 824 | |
Trust 2002-38, Cl. SO,
52.506%, 4/25/325 | | | 10,775 | | | | 1,987 | |
Trust 2002-39, Cl. SD,
42.779%, 3/18/325 | | | 7,125 | | | | 1,535 | |
Trust 2002-47, Cl. NS,
33.919%, 4/25/325 | | | 422,451 | | | | 84,429 | |
| Trust 2002-48, Cl. S, 33.12%, 7/25/325 | | | 6,917 | | | | 1,379 | |
| Trust 2002-51, Cl. S, 34.157%, 8/25/325 | | | 387,812 | | | | 77,503 | |
Trust 2002-52, Cl. SD,
40.161%, 9/25/325 | | | 501,475 | | | | 110,879 | |
| Trust 2002-52, Cl. SL, 35.895%, 9/25/325 | | | 4,388 | | | | 877 | |
| Trust 2002-53, Cl. SK, 40.84%, 4/25/325 | | | 24,825 | | | | 5,554 | |
Trust 2002-56, Cl. SN,
36.686%, 7/25/325 | | | 9,431 | | | | 1,883 | |
Trust 2002-60, Cl. SM,
31.988%, 8/25/325 | | | 73,520 | | | | 12,805 | |
| Trust 2002-7, Cl. SK, 32.234%, 1/25/325 | | | 33,138 | | | | 6,147 | |
Trust 2002-77, Cl. BS,
27.475%, 12/18/325 | | | 44,200 | | | | 7,881 | |
Trust 2002-77, Cl. IS,
47.908%, 12/18/325 | | | 18,358 | | | | 4,012 | |
Trust 2002-77, Cl. JS,
22.615%, 12/18/325 | | | 71,512 | | | | 13,001 | |
Trust 2002-77, Cl. SA,
26.199%, 12/18/325 | | | 70,305 | | | | 12,826 | |
Trust 2002-77, Cl. SH,
42.055%, 12/18/325 | | | 209,631 | | | | 43,525 | |
Trust 2002-84, Cl. SA,
36.59%, 12/25/325 | | | 506,017 | | | | 92,016 | |
| Trust 2002-9, Cl. MS, 31.163%, 3/25/325 | | | 7,757 | | | | 1,525 | |
Trust 2002-90, Cl. SN,
33.132%, 8/25/325 | | | 37,822 | | | | 6,587 | |
Trust 2002-90, Cl. SY,
38.897%, 9/25/325 | | | 25,325 | | | | 4,529 | |
| Trust 2003-26, Cl. DI, 11.174%, 4/25/335 | | | 17,559 | | | | 3,944 | |
| Trust 2003-33, Cl. SP, 99.999%, 5/25/335 | | | 543,017 | | | | 85,424 | |
| Trust 2003-4, Cl. S, 32.266%, 2/25/335 | | | 347,232 | | | | 63,025 | |
Trust 2003-89, Cl. XS,
99.999%, 11/25/325 | | | 149,124 | | | | 3,343 | |
Trust 2004-54, Cl. DS,
48.397%, 11/25/305 | | | 354,118 | | | | 71,563 | |
| Trust 2005-14, Cl. SE, 45.122%, 3/25/355 | | | 290,988 | | | | 47,892 | |
Trust 2005-40, Cl. SA,
58.042%, 5/25/355 | | | 811,202 | | | | 158,903 | |
Trust 2005-40, Cl. SB,
67.984%, 5/25/355 | | | 38,286 | | | | 8,366 | |
Trust 2005-5, Cl. SD,
11.403%, 1/25/355 | | | 390,219 | | | | 61,408 | |
Trust 2005-71, Cl. SA,
63.201%, 8/25/255 | | | 933,693 | | | | 133,773 | |
8 | OPPENHEIMER CORE BOND FUND/VA
|
| | | | | | | | |
| | | Principal
Amount | | | Value | |
| | | | | | | | | |
| FHLMC/FNMA/FHLB/Sponsored Continued | |
Federal National Mortgage Assn.,
Interest-Only Stripped Mtg.-Backed Security: Continued | | | | | | | | |
Trust 2005-93, Cl. SI,
22.73%, 10/25/355 | | $ | 770,421 | | | $ | 113,721 | |
Trust 2006-60, Cl. DI,
43.097%, 4/25/355 | | | 192,271 | | | | 26,185 | |
Trust 2007-84, Cl. DS,
12.147%, 8/25/375 | | | 548,125 | | | | 96,578 | |
Trust 2008-46, Cl. EI,
12.785%, 6/25/385 | | | 996,446 | | | | 177,502 | |
Trust 2008-55, Cl. SA,
24.795%, 7/25/385 | | | 149,782 | | | | 24,095 | |
| Trust 2008-67, Cl. KS, 56.782%, 8/25/345 | | | 1,545,007 | | | | 116,469 | |
| Trust 2009-8, Cl. BS, 18.395%, 2/25/245 | | | 469,177 | | | | 46,583 | |
| Trust 221, Cl. 2, 41.06%, 5/1/235 | | | 6,433 | | | | 1,379 | |
| Trust 222, Cl. 2, 25.181%, 6/1/235 | | | 703,740 | | | | 131,722 | |
| Trust 252, Cl. 2, 38.075%, 11/1/235 | | | 617,125 | | | | 132,460 | |
| Trust 294, Cl. 2, 14.933%, 2/1/285 | | | 69,980 | | | | 11,119 | |
| Trust 301, Cl. 2, 2.363%, 4/1/295 | | | 7,446 | | | | 1,195 | |
| Trust 303, Cl. IO, 7.61%, 11/1/295 | | | 110,952 | | | | 22,544 | |
| Trust 320, Cl. 2, 10.392%, 4/1/325 | | | 485,388 | | | | 76,891 | |
| Trust 321, Cl. 2, 1.148%, 4/1/325 | | | 1,458,107 | | | | 224,906 | |
| Trust 324, Cl. 2, 0%, 7/1/325,6 | | | 15,078 | | | | 2,344 | |
| Trust 331, Cl. 5, 0%, 2/1/335,6 | | | 21,200 | | | | 4,469 | |
| Trust 331, Cl. 9, 13.071%, 2/1/335 | | | 408,392 | | | | 64,030 | |
| Trust 334, Cl. 12, 0%, 2/1/335,6 | | | 37,466 | | | | 7,208 | |
| Trust 334, Cl. 17, 20.657%, 2/1/335 | | | 285,050 | | | | 63,302 | |
| Trust 339, Cl. 12, 1.911%, 7/1/335 | | | 539,398 | | | | 103,554 | |
| Trust 339, Cl. 7, 0%, 7/1/335,6 | | | 1,216,809 | | | | 167,994 | |
| Trust 343, Cl. 13, 0%, 9/1/335,6 | | | 502,136 | | | | 69,645 | |
| Trust 343, Cl. 18, 0%, 5/1/345,6 | | | 139,730 | | | | 19,908 | |
| Trust 345, Cl. 9, 0%, 1/1/345,6 | | | 469,016 | | | | 58,490 | |
| Trust 351, Cl. 10, 0%, 4/1/345,6 | | | 189,529 | | | | 27,874 | |
| Trust 351, Cl. 8, 0%, 4/1/345,6 | | | 302,456 | | | | 43,092 | |
| Trust 356, Cl. 10, 0%, 6/1/355,6 | | | 242,877 | | | | 33,924 | |
| Trust 356, Cl. 12, 0%, 2/1/355,6 | | | 120,786 | | | | 16,942 | |
| Trust 362, Cl. 13, 0%, 8/1/355,6 | | | 435,935 | | | | 71,803 | |
| Trust 364, Cl. 15, 0%, 9/1/355,6 | | | 25,830 | | | | 4,076 | |
| Trust 364, Cl. 16, 0%, 9/1/355,6 | | | 504,364 | | | | 80,745 | |
| Trust 365, Cl. 16, 2.259%, 3/1/365 | | | 809,263 | | | | 128,137 | |
Federal National Mortgage Assn.,
Principal-Only Stripped Mtg.-Backed Security, Trust 1993-184, Cl. M, | | | | | | | | |
| 4.333%, 9/25/237 | | | 219,781 | | | | 206,932 | |
| | | | | | |
|
|
|
| | | | | | | | 96,636,699 | |
| GNMA/Guaranteed—0.4% | |
Government National Mortgage Assn.:
7%, 12/29/23-3/15/26 | | | 18,637 | | | | 22,031 | |
| 8.50%, 8/1/17-12/15/17 | | | 78,595 | | | | 84,376 | |
| | | | | | | | |
| | | Principal
Amount | | | Value | |
| | | | | | | | | |
| GNMA/Guaranteed Continued | |
Government National Mortgage
Assn., Gtd. Real Estate Mtg. Investment Conduit Pass-Through Certificates:
Series 1999-32, Cl. ZB, 8%, 9/16/29 | | $ | 68,776 | | | $ | 83,921 | |
| Series 2000-7, Cl. Z, 8%, 1/16/30 | | | 27,659 | | | | 33,282 | |
Government National Mortgage
Assn., Interest-Only Stripped
Mtg.-Backed Security:
Series 1998-19, Cl. SB, 68.87%, 7/16/285 | | | 13,864 | | | | 3,066 | |
| Series 2001-21, Cl. SB, 88.182%, 1/16/275 | | | 496,396 | | | | 91,990 | |
| Series 2002-15, Cl. SM, 79.59%, 2/16/325 | | | 519,382 | | | | 102,579 | |
| Series 2004-11, Cl. SM, 70.953%, 1/17/305 | | | 402,706 | | | | 94,529 | |
| Series 2007-17, Cl. AI, 22.033%, 4/16/375 | | | 157,301 | | | | 31,282 | |
| Series 2011-52, Cl. HS, 9.436%, 4/16/415 | | | 1,017,672 | | | | 260,803 | |
| | | | | | |
|
|
|
| | | | | | | | 807,859 | |
| Non-Agency—11.4% | | | | | | | | |
| Commercial—7.1% | | | | | | | | |
Asset Securitization Corp.,
Commercial Interest-Only Stripped
Mtg.-Backed Security, Series 1997-D4, Cl. PS1, 0%, 4/14/295,6 | | | 2,786,681 | | | | 124,538 | |
Banc of America Commercial
Mortgage Trust 2007-1, Commercial Mtg. Pass-Through Certificates, Series 2007-1, Cl. A4, 5.451%, 1/1/49 | | | 710,000 | | | | 807,707 | |
Banc of America Commercial
Mortgage, Inc., Commercial Mtg. Pass-Through Certificates, Series 2007-3, Cl. A4, 5.805%, 6/1/492 | | | 385,000 | | | | 436,930 | |
| Bear Stearns Commercial Mortgage Securities Trust 2007-PWR17, Commercial Mtg. Pass-Through Certificates, Series 2007-PWR17, Cl. AM, 5.915%, 6/1/502 | | | 440,000 | | | | 466,154 | |
Capital Lease Funding Securitization LP, Interest-Only Corporate-Backed
Pass-Through Certificates,
Series 1997-CTL1, 0%, 6/15/243,5,6 | | | 2,520,753 | | | | 123,013 | |
CFCRE Commercial Mortgage Trust, Commercial Mtg. Pass-Through
Certificates, Series 2011-C1, Cl. A1,
1.871%, 4/1/441 | | | 121,875 | | | | 122,560 | |
CHL Mortgage Pass-Through
Trust 2005-17, Mtg. Pass-Through Certificates, Series 2005-17, Cl. 1A8,
5.50%, 9/1/35 | | | 62,004 | | | | 60,550 | |
CHL Mortgage Pass-Through
Trust 2007-J3, Mtg. Pass-Through Certificates, Series 2007-J3, Cl. A9,
6%, 7/1/37 | | | 286,403 | | | | 209,664 | |
9 | OPPENHEIMER CORE BOND FUND/VA
|
STATEMENT OF INVESTMENTS Unaudited / Continued
| | | | | | | | |
| | | Principal
Amount | | | Value | |
| | | | | | | | | |
| Commercial Continued | | | | | | | | |
Citigroup, Inc./Deutsche Bank
2007-CD4 Commercial
Mortgage Trust, Commercial
Mtg. Pass-Through Certificates:
Series 2007-CD4, Cl. A2B,
5.205%, 12/11/49 | | $ | 93,310 | | | $ | 94,903 | |
Series 2007-CD4, Cl. A4,
5.322%, 12/1/49 | | | 875,000 | | | | 975,946 | |
Deutsche Mortgage & Asset Receiving, Commercial Mtg. Pass-Through
Certificates, Interest-Only Stripped
Mtg.-Backed Security,
Series 2010-C1, Cl. XPA,
4.884%, 9/1/201,5 | | | 4,352,296 | | | | 295,621 | |
| First Horizon Alternative Mortgage Securities Trust 2004-FA2, Mtg. Pass-Through Certificates, Series 2004-FA2, Cl. 3A1, 6%, 1/25/35 | | | 453,025 | | | | 437,391 | |
First Horizon Alternative
Mortgage Securities Trust
2007-FA2, Mtg. Pass-Through Certificates, Series 2007-FA2, Cl. 1A1,
5.50%, 4/25/37 | | | 185,801 | | | | 116,539 | |
Greenwich Capital Commercial Funding Corp./Commercial
Mortgage Trust 2007-GG11, Commercial Mtg. Pass-Through Certificates, Series 2007-GG11, Cl. A4,
5.736%, 12/1/49 | | | 1,280,000 | | | | 1,423,873 | |
GS Mortgage Securities Corp. II, Commercial Mtg. Obligations,
Series 2011-GC3, Cl. A1,
2.331%, 3/1/44 | | | 313,246 | | | | 320,173 | |
GS Mortgage Securities Trust 2006-GG6, Commercial Mtg. Pass-Through Certificates, Series 2006-GG6, Cl. AM,
5.622%, 4/1/38 | | | 420,274 | | | | 428,877 | |
GSR Mortgage Loan Trust 2005-AR4,
Mtg. Pass-Through Certificates,
Series 2005-AR4, Cl. 6A1,
5.25%, 7/1/35 | | | 326,729 | | | | 320,282 | |
IndyMac Index Mortgage
Loan Trust 2005-AR23, Mtg. Pass-Through Certificates,
Series 2005-AR23, Cl. 6A1,
5.009%, 11/1/352 | | | 609,088 | | | | 446,322 | |
JPMorgan Chase Commercial Mortgage Securities Corp.,
Commercial Mtg. Pass-Through Certificates:
Series 2011-C3, Cl. A1,
1.875%, 2/1/461 | | | 360,134 | | | | 363,843 | |
Series 2007-LDPX, Cl. A2S2,
5.187%, 1/1/491 | | | 919,230 | | | | 929,195 | |
JPMorgan Mortgage Trust 2007-S3,
Mtg. Pass-Through Certificates,
Series 2007-S3, Cl. 1A90, 7%, 8/1/37 | | | 608,811 | | | | 527,779 | |
| | | | | | | | |
| | | Principal
Amount | | | Value | |
| | | | | | | | | |
| Commercial Continued | | | | | | | | |
LB-UBS Commercial Mortgage
Trust 2007-C6, Commercial Mtg.
Pass-Through Certificates,
Series 2007-C6, Cl. A4, 5.858%, 7/11/40 | | $ | 880,000 | | | $ | 1,009,462 | |
| Lehman Brothers Commercial Conduit Mortgage Trust, Interest-Only Stripped Mtg.-Backed Security, Series 1998-C1, Cl. IO, 40.408%, 2/18/305 | | | 2,962,514 | | | | 37,883 | |
| Lehman Structured Securities Corp., Commercial Mtg. Pass-Through Certificates, Series 2002-GE1, Cl. A, 2.514%, 7/1/241 | | | 119,220 | | | | 106,602 | |
Merrill Lynch Mortgage
Trust 2006-C2, Commercial Mtg.
Pass-Through Certificates,
Series 2006-C2, Cl. AM, 5.782%, 8/1/43 | | | 425,000 | | | | 443,694 | |
Morgan Stanley Capital I Trust 2007-IQ15, Commercial Mtg. Pass-Through Certificates:
Series 2007-IQ15, Cl. AM,
6.076%, 6/1/492 | | | 490,000 | | | | 489,098 | |
Series 2007-IQ15, Cl. A4,
6.076%, 6/1/492 | | | 400,000 | | | | 454,833 | |
Salomon Brothers Mortgage
Securities VII, Inc., Interest-Only Commercial Mtg. Pass-Through Certificates, Series 1999-C1, Cl. X, 99.999%, 5/18/325 | | | 38,913,975 | | | | 65,337 | |
Structured Adjustable Rate
Mortgage Loan Trust, Mtg.
Pass-Through Certificates,
Series 2007-6, Cl. 3A1, 4.89%, 7/1/372 | | | 576,656 | | | | 381,106 | |
Wachovia Bank Commercial
Mortgage Trust 2007-C34, Commercial Mtg. Pass-Through Certificates, Series 2007-C34, Cl. A3, 5.678%, 5/1/46 | | | 520,000 | | | | 600,692 | |
WaMu Mortgage Pass-Through Certificates 2005-AR14 Trust, Mtg.
Pass-Through Certificates,
Series 2005-AR14, Cl. 1A4,
2.451%, 12/1/352 | | | 339,242 | | | | 290,658 | |
Wells Fargo Mortgage-Backed
Securities 2007-AR3 Trust, Mtg.
Pass-Through Certificates,
Series 2007-AR3, Cl. A4,
5.749%, 4/1/372 | | | 164,796 | | | | 143,679 | |
Wells Fargo Mortgage-Backed
Securities 2007-AR8 Trust, Mtg.
Pass-Through Certificates,
Series 2007-AR8, Cl. A1,
6.019%, 11/1/372 | | | 415,837 | | | | 341,929 | |
| | | | | | |
|
|
|
| | | | | 13,396,833 | |
10 | OPPENHEIMER CORE BOND FUND/VA
|
| | | | | | | | |
| | | Principal
Amount | | | Value | |
| | | | | | | | | |
| Multifamily—0.6% | | | | | | | | |
Citigroup Mortgage Loan Trust,
Inc. 2006-AR3, Mtg. Pass-Through Certificates, Series 2006-AR3,
Cl. 1A2A, 5.625%, 6/1/362 | | $ | 378,315 | | | $ | 327,576 | |
| JPMorgan Mortgage Trust 2007-A3, Mtg. Pass-Through Certificates, Series 2007-A3, Cl. 3A2M, 5.133%, 5/1/372 | | | 144,579 | | | | 123,639 | |
Wells Fargo Mortgage-Backed
Securities 2006-AR2 Trust, Mtg. Pass-Through Certificates,
Series 2006-AR2, Cl. 2A3,
2.622%, 3/1/362 | | | 221,041 | | | | 191,957 | |
| Wells Fargo Mortgage-Backed Securities 2006-AR6 Trust, Mtg. | | | | | | | | |
Pass-Through Certificates,
Series 2006-AR6, Cl. 3A1,
2.668%, 3/25/362 | | | 481,996 | | | | 409,637 | |
| | | | | | |
|
|
|
| | | | | | | | 1,052,809 | |
| Other—0.4% | | | | | | | | |
Greenwich Capital Commercial Funding Corp./Commercial
Mortgage Trust 2007-GG9, Commercial Mtg. Pass-Through Certificates, Series 2007-GG9, Cl. A4,
5.444%, 3/1/39 | | | 700,000 | | | | 779,360 | |
Salomon Brothers Mortgage
Securities VI, Inc., Interest-Only Stripped Mtg.-Backed Security,
Series 1987-3, Cl. B, 97.913%, 10/23/175 | | | 401 | | | | 26 | |
Salomon Brothers Mortgage
Securities VI, Inc., Principal-Only Stripped Mtg.-Backed Security, | | | | | | | | |
| Series 1987-3, Cl. A, 3.315%, 10/23/177 | | | 593 | | | | 592 | |
| | | | | | |
|
|
|
| | | | | | | | 779,978 | |
| Residential—3.3% | | | | | | | | |
| Argent Securities Trust 2006-M3, Asset-Backed Pass-Through Certificates, Series 2006-M3, Cl. A2B, 0.345%, 9/25/362 | | | 19,379 | | | | 6,200 | |
Banc of America Commercial
Mortgage, Inc., Commercial Mtg.
Pass-Through Certificates,
Series 2007-4, Cl. AM, 5.984%, 2/1/512 | | | 470,000 | | | | 472,727 | |
Banc of America Funding 2007-C Trust, Mtg. Pass-Through Certificates,
Series 2007-C, Cl. 1A4, 5.532%, 5/1/362 | | | 155,000 | | | | 138,742 | |
Banc of America Mortgage 2007-1 Trust, Mtg. Pass-Through Certificates,
Series 2007-1, Cl. 1A24, 6%, 3/1/37 | | | 266,970 | | | | 248,905 | |
| | | | | | | | |
| | | Principal
Amount | | | Value | |
| | | | | | | | | |
| Residential Continued | | | | | | | | |
Carrington Mortgage Loan Trust,
Asset-Backed Pass-Through Certificates, Series 2006-FRE1, Cl. A2, 0.355%, 7/25/362 | | $ | 297,436 | | | $ | 275,784 | |
CHL Mortgage Pass-Through
Trust 2005-29, Mtg. Pass-Through Certificates, Series 2005-29, Cl. A1, 5.75%, 12/1/35 | | | 211,840 | | | | 186,174 | |
CHL Mortgage Pass-Through
Trust 2005-30, Mtg. Pass-Through Certificates, Series 2005-30, Cl. A5, 5.50%, 1/1/36 | | | 268,403 | | | | 259,948 | |
CHL Mortgage Pass-Through
Trust 2005-J4, Mtg. Pass-Through Certificates, Series 2005-J4, Cl. A7, 5.50%, 11/1/35 | | | 34,982 | | | | 34,862 | |
CHL Mortgage Pass-Through
Trust 2006-17, Mtg. Pass-Through Certificates, Series 2006-17, Cl. A2,
6%, 12/1/36 | | | 490,593 | | | | 413,097 | |
Countrywide Alternative Loan
Trust 2007-19, Mtg. Pass-Through Certificates, Series 2007-19, Cl. 1A34, 6%, 8/1/37 | | | 349,432 | | | | 246,536 | |
Countrywide Home Loans,
Asset-Backed Certificates:
Series 2002-4, Cl. A1,
0.985%, 2/25/332 | | | 8,562 | | | | 8,379 | |
Series 2005-16, Cl. 2AF2,
5.331%, 5/1/362 | | | 368,142 | | | | 286,215 | |
CSMC Mortgage-Backed Trust 2007-3,
Mtg. Pass-Through Certificates,
Series 2007-3, Cl. 2A10, 6%, 4/1/37 | | | 370,014 | | | | 310,504 | |
CWABS Asset-Backed Certificates Trust 2006-25, Asset-Backed Certificates, Series 2006-25, Cl. 2A2,
0.365%, 6/25/472 | | | 25,265 | | | | 24,895 | |
GSR Mortgage Loan Trust 2006-5F,
Mtg. Pass-Through Certificates,
Series 2006-5F, Cl. 2A1, 6%, 6/1/36 | | | 279,779 | | | | 254,809 | |
JPMorgan Alternative Loan
Trust 2006-S4,
Mtg. Pass-Through Certificates,
Series 2006-S4, Cl. A6, 5.71%, 12/1/36 | | | 497,933 | | | | 432,619 | |
Mastr Asset-Backed Securities Trust 2006-WMC3, Mtg.
Pass-Through Certificates,
Series 2006-WMC3, Cl. A3,
0.345%, 8/25/362 | | | 62,055 | | | | 19,868 | |
11 | OPPENHEIMER CORE BOND FUND/VA
|
STATEMENT OF INVESTMENTS Unaudited / Continued
| | | | | | | | |
| | | Principal
Amount | | | Value | |
| | | | | | | | | |
| Residential Continued | | | | | | | | |
| Merrill Lynch Mortgage Investors Trust 2006-3, Mtg. Pass-Through Certificates, Series MLCC 2006-3, Cl. 2A1, 2.563%, 10/25/362 | | $ | 42,628 | | | $ | 39,217 | |
NC Finance Trust, Collateralized Mtg.
Obligation Pass-Through Certificates,
Series 1999-I, Cl. ECFD, 3.405%, 1/25/293,8 | | | 3,370,016 | | | | 294,876 | |
RALI Series 2003-QS1 Trust,
Mtg. Asset-Backed Pass-Through Certificates, Series 2003-QS1,
Cl. A2, 5.75%, 1/25/33 | | | 194,136 | | | | 201,864 | |
RALI Series 2006-QS13 Trust,
Mtg. Asset-Backed Pass-Through Certificates:
Series 2006-QS13, Cl. 1A5, 6%, 9/25/36 | | | 50,726 | | | | 33,426 | |
| Series 2006-QS13, Cl. 1A8, 6%, 9/25/36 | | | 1,778 | | | | 1,171 | |
RALI Series 2007-QS6 Trust, Mtg.
Asset-Backed Pass-Through Certificates, Series 2007-QS6, Cl. A28,
5.75%, 4/25/37 | | | 22,288 | | | | 13,769 | |
Residential Asset Securitization
Trust 2005-A15, Mtg. Pass-Through Certificates, Series 2005-A15,
Cl. 1A4, 5.75%, 2/1/36 | | | 145,216 | | | | 114,098 | |
WaMu Mortgage Pass-Through Certificates 2007-HY1 Trust, Mtg.
Pass-Through Certificates,
Series 2007-HY1, Cl. 4A1,
2.713%, 2/1/372 | | | 56,766 | | | | 41,682 | |
WaMu Mortgage Pass-Through Certificates 2007-HY5 Trust, Mtg.
Pass-Through Certificates,
Series 2007-HY5, Cl. 3A1,
5.312%, 5/1/372 | | | 751,557 | | | | 668,531 | |
Wells Fargo Alternative Loan 2007-PA5 Trust, Mtg. Asset-Backed Pass-Through Certificates,
Series 2007-PA5, Cl. 1A1,
6.25%, 11/1/37 | | | 334,109 | | | | 303,081 | |
Wells Fargo Mortgage-Backed Securities 2005-9 Trust,
Mtg. Pass-Through Certificates,
Series 2005-9, Cl. 2A6, 5.25%, 10/25/35 | | | 433,563 | | | | 438,692 | |
Wells Fargo Mortgage-Backed Securities 2006-AR14 Trust,
Mtg. Pass-Through Certificates, | | | | | | | | |
Series 2006-AR14, Cl. 1A2,
5.662%, 10/1/362 | | | 357,206 | | | | 323,109 | |
| | | | | | |
|
|
|
| | | | | | |
| 6,093,780
|
|
Total Mortgage-Backed Obligations
(Cost $119,530,104) | | | | | | | 118,767,958 | |
| | | | | | | | |
| | | Principal
Amount | | | Value | |
| | | | | | | | | |
| U.S. Government Obligations—2.0% | |
Federal Home Loan Mortgage
Corp. Nts.:
1%, 7/28/17 | | $ | 285,000 | | | $ | 285,344 | |
| 1.25%, 5/12/17 | | | 245,000 | | | | 248,648 | |
| 1.75%, 5/30/19 | | | 355,000 | | | | 363,928 | |
| 2.375%, 1/13/229 | | | 894,000 | | | | 920,209 | |
| 5.25%, 4/18/16 | | | 515,000 | | | | 603,397 | |
Federal National Mortgage Assn. Nts.:
1.125%, 4/27/17 | | | 927,000 | | | | 937,236 | |
| 5.375%, 6/12/17 | | | 260,000 | | | | 315,503 | |
| U.S. Treasury Nts., 1.75%, 5/15/22 | | | 140,000 | | | | 141,291 | |
| | | | | | |
|
|
|
Total U.S. Government Obligations
(Cost $3,706,602) | | | | | | | 3,815,556 | |
| Corporate Bonds and Notes—43.1% | |
| Consumer Discretionary—7.1% | |
| Auto Components—0.2% | |
| Dana Holding Corp., 6.75% Sr. Unsec. Nts., 2/15/21 | | | 420,000 | | | | 455,700 | |
| Automobiles—0.8% | | | | | | | | |
DaimlerChrysler NA Holdings Corp.,
8.50% Nts., 1/18/31 | | | 237,000 | | | | 363,962 | |
| Ford Motor Credit Co. LLC, 5.875% Sr. Unsec. Nts., 8/2/21 | | | 958,000 | | | | 1,068,444 | |
| | | | | | |
|
|
|
| | | | | | | | 1,432,406 | |
| Diversified Consumer Services—0.3% | |
| Service Corp. International, 6.75% Sr. Unsec. Nts., 4/1/15 | | | 496,000 | | | | 540,640 | |
| Hotels, Restaurants & Leisure—0.6% | | | | | | | | |
| Darden Restaurants, Inc., 4.50% Sr. Unsec. Unsub. Nts., 10/15/21 | | | 238,000 | | | | 251,962 | |
| Hyatt Hotels Corp., 5.75% Sr. Unsec. Unsub. Nts., 8/15/151 | | | 753,000 | | | | 826,408 | |
Starwood Hotels & Resorts
Worldwide, Inc., 7.15% Sr. Unsec. Unsub. Nts., 12/1/19 | | | 116,000 | | | | 136,973 | |
| | | | | | |
|
|
|
| | | | | | | | 1,215,343 | |
| Household Durables—0.6% | | | | | | | | |
| Jarden Corp., 6.125% Sr. Unsec. Nts., 11/15/22 | | | 467,000 | | | | 495,020 | |
Newell Rubbermaid, Inc.,
5.50% Sr. Unsec. Nts., 4/15/13 | | | 438,000 | | | | 452,925 | |
Whirlpool Corp.,
5.50% Sr. Unsec. Unsub. Nts., 3/1/13 | | | 152,000 | | | | 156,043 | |
| | | | | | |
|
|
|
| | | | | | | | 1,103,988 | |
| Media—2.3% | | | | | | | | |
CBS Corp.,
4.85% Sr. Unsec. Unsub. Nts., 7/1/42 | | | 155,000 | | | | 152,513 | |
12 | OPPENHEIMER CORE BOND FUND/VA
|
| | | | | | | | |
| | | Principal
Amount | | | Value | |
| | | | | | | | | |
| Media Continued | | | | | | | | |
| Comcast Cable Communications Holdings, Inc., 9.455% Sr. Unsec. Nts., 11/15/22 | | $ | 292,000 | | | $ | 426,162 | |
| CSC Holdings, Inc., 7.625% Sr. Unsec. Debs., 7/15/18 | | | 430,000 | | | | 482,675 | |
| DIRECTV Holdings LLC/DIRECTV Financing Co., Inc., 5.15% Sr. Unsec. Nts., 3/15/42 | | | 268,000 | | | | 271,126 | |
| DISH DBS Corp., 6.75% Sr. Unsec. Nts., 6/1/21 | | | 459,000 | | | | 498,015 | |
| Historic TW, Inc., 9.125% Debs., 1/15/13 | | | 149,000 | | | | 155,221 | |
Interpublic Group of Cos., Inc. (The):
6.25% Sr. Unsec. Nts., 11/15/14 | | | 190,000 | | | | 208,525 | |
| 10% Sr. Unsec. Nts., 7/15/17 | | | 458,000 | | | | 519,830 | |
| News America, Inc., 6.15% Sr. Unsec. Nts., 2/15/41 | | | 162,000 | | | | 190,373 | |
Time Warner Entertainment Co. LP,
8.375% Sr. Nts., 7/15/33 | | | 257,000 | | | | 349,480 | |
Time Warner, Inc., 9.15%
Debs., 2/1/23 | | | 61,000 | | | | 84,998 | |
Virgin Media Secured Finance plc:
5.25% Sr. Sec. Nts., 1/15/21 | | | 254,000 | | | | 282,075 | |
| 6.50% Sr. Sec. Nts., 1/15/18 | | | 555,000 | | | | 606,338 | |
| | | | | | |
|
|
|
| | | | | | | | 4,227,331 | |
| Multiline Retail—1.0% | |
Dollar General Corp.,
4.125% Nts., 7/15/174 | | | 469,000 | | | | 477,794 | |
| Family Dollar Stores, Inc., 5% Sr. Unsec. Nts., 2/1/21 | | | 261,000 | | | | 281,052 | |
Macy’s Retail Holdings, Inc.,
5.75% Sr. Unsec. Nts., 7/15/14 | | | 765,000 | | | | 830,720 | |
Target Corp., 4% Sr. Unsec.
Nts., 7/1/42 | | | 338,000 | | | | 334,902 | |
| | | | | | |
|
|
|
| | | | | | | | 1,924,468 | |
| Specialty Retail—1.1% | |
| Limited Brands, Inc., 6.625% Sr. Nts., 4/1/21 | | | 455,000 | | | | 499,363 | |
| Rent-A-Center, Inc., 6.625% Sr. Unsec. Nts., 11/15/20 | | | 508,000 | | | | 543,560 | |
Sally Holdings LLC/Sally Capital, Inc.,
6.875% Sr. Unsec. Nts., 11/15/19 | | | 467,000 | | | | 510,198 | |
| Staples, Inc., 9.75% Sr. Unsec. Unsub. Nts., 1/15/14 | | | 398,000 | | | | 445,042 | |
| | | | | | |
|
|
|
| | | | | | | | 1,998,163 | |
| | | | | | | | |
| | | Principal
Amount | | | Value | |
| | | | | | | | | |
| Textiles, Apparel & Luxury Goods—0.2% | |
Phillips-Van Heusen Corp.,
7.375% Sr. Unsec. Unsub. Nts., 5/15/20 | | $ | 400,000 | | | $ | 445,000 | |
| Consumer Staples—3.0% | |
| Beverages—0.9% | |
Anheuser-Busch InBev Worldwide, Inc.,
8.20% Sr. Unsec. Unsub. Nts., 1/15/39 | | | 181,000 | | | | 289,119 | |
| Constellation Brands, Inc., 6% Sr. Unsec. Unsub. Nts., 5/1/22 | | | 475,000 | | | | 511,813 | |
| Fortune Brands, Inc., 6.375% Sr. Unsec. Unsub. Nts., 6/15/14 | | | 126,000 | | | | 138,094 | |
| Pernod-Ricard SA, 4.25% Sr. Unsec. Nts., 7/15/221 | | | 459,000 | | | | 472,031 | |
| SABMiller Holdings, Inc., 4.95% Sr. Unsec. Nts., 1/15/42 | | | 198,000 | | | | 220,366 | |
| | | | | | |
|
|
|
| | | | | | | | 1,631,423 | |
| Food & Staples Retailing—0.3% | |
Delhaize Group:
5.70% Sr. Unsec. Nts., 10/1/40 | | | 133,000 | | | | 112,208 | |
| 5.875% Sr. Unsec. Unsub. Bonds, 2/1/14 | | | 407,000 | | | | 428,776 | |
| | | | | | |
|
|
|
| | | | | | | | 540,984 | |
| Food Products—1.1% | |
Bunge Ltd. Finance Corp.:
5.35% Sr. Unsec. Unsub. Nts., 4/15/14 | | | 434,000 | | | | 458,191 | |
| 8.50% Sr. Unsec. Nts., 6/15/19 | | | 235,000 | | | | 293,945 | |
| Kraft Foods Group, Inc., 5% Sr. Unsec. Nts., 6/4/421 | | | 119,000 | | | | 126,628 | |
| Kraft Foods, Inc., 6.50% Sr. Unsec. Unsub. Nts., 2/9/40 | | | 290,000 | | | | 374,368 | |
| TreeHouse Foods, Inc., 7.75% Sr. Unsec. Nts., 3/1/18 | | | 485,000 | | | | 526,831 | |
| Tyson Foods, Inc., 4.50% Sr. Unsec. Unsub. Nts., 6/15/22 | | | 244,000 | | | | 252,540 | |
| | | | | | |
|
|
|
| | | | | | | | 2,032,503 | |
| Tobacco—0.7% | |
| Altria Group, Inc., 10.20% Sr. Unsec. Nts., 2/6/39 | | | 358,000 | | | | 584,815 | |
| Lorillard Tobacco Co., 7% Sr. Unsec. Nts., 8/4/41 | | | 311,000 | | | | 338,828 | |
| Reynolds American, Inc., 7.25% Sr. Sec. Nts., 6/1/13 | | | 460,000 | | | | 485,691 | |
| | | | | | |
|
|
|
| | | | | | | | 1,409,334 | |
| Energy—5.1% | | | | | | | | |
| Energy Equipment & Services—1.3% | |
Ensco plc,
4.70% Sr. Unsec. Nts., 3/15/21 | | | 524,000 | | | | 572,199 | |
Nabors Industries, Inc.,
6.15% Sr. Unsec. Unsub. Nts., 2/15/18 | | | 593,000 | | | | 681,650 | |
13 | OPPENHEIMER CORE BOND FUND/VA
|
STATEMENT OF INVESTMENTS Unaudited / Continued
| | | | | | | | |
| | | Principal
Amount | | | Value | |
| | | | | | | | | |
| Energy Continued | | | | | | | | |
Noble Holding International Ltd.,
7.375% Sr. Unsec. Bonds, 3/15/14 | | $ | 403,000 | | | $ | 440,769 | |
Precision Drilling Corp.:
6.50% Sr. Unsec. Nts., 12/15/21 | | | 217,000 | | | | 222,425 | |
| 6.625% Sr. Unsec. Nts., 11/15/20 | | | 208,000 | | | | 215,280 | |
Rowan Cos., Inc., 4.875% Sr. Unsec.
Nts., 6/1/22 | | | 314,000 | | | | 317,611 | |
| | | | | | |
|
|
|
| | | | | | | | 2,449,934 | |
| Oil, Gas & Consumable Fuels—3.8% | |
Anadarko Petroleum Corp.,
6.20% Sr. Unsec. Nts., 3/15/40 | | | 178,000 | | | | 203,009 | |
Apache Corp., 4.75% Sr. Unsec.
Unsub. Nts., 4/15/43 | | | 157,000 | | | | 175,387 | |
| Canadian Oil Sands Ltd., 5.80% Sr. Unsec. Nts., 8/15/131 | | | 457,000 | | | | 477,051 | |
El Paso Pipeline Partners LP,
6.50% Sr. Unsec. Nts., 4/1/20 | | | 665,000 | | | | 775,588 | |
Energy Transfer Partners LP:
4.65% Sr. Unsec. Unsub. Nts., 6/1/21 | | | 374,000 | | | | 387,368 | |
| 5.20% Sr. Unsec. Unsub. Nts., 2/1/22 | | | 136,000 | | | | 146,023 | |
Kaneb Pipe Line Operating
Partnership LP, 5.875%
Sr. Unsec. Nts., 6/1/13 | | | 757,000 | | | | 781,256 | |
Kinder Morgan Energy Partners LP,
3.95% Sr. Unsec. Unsub. Nts., 9/1/22 | | | 246,000 | | | | 249,938 | |
Newfield Exploration Co.,
6.875% Sr. Unsec. Sub. Nts., 2/1/20 | | | 446,000 | | | | 477,220 | |
| Nexen, Inc., 6.40% Sr. Unsec. Unsub. Bonds, 5/15/37 | | | 466,000 | | | | 495,954 | |
| Phillips 66, 4.30% Unsec. Nts., 4/1/221 | | | 314,000 | | | | 331,240 | |
Plains All American
Pipeline LP/PAA Finance Corp.,
5.15% Sr. Unsec. Unsub. Nts., 6/1/42 | | | 126,000 | | | | 133,851 | |
Range Resources Corp.,
8% Sr. Unsec. Sub. Nts., 5/15/19 | | | 451,000 | | | | 494,973 | |
| Ras Laffan Liquefied Natural Gas Co. Ltd. III, 5.50% Sr. Sec. Nts., 9/30/143 | | | 420,000 | | | | 454,125 | |
Rockies Express Pipeline LLC,
3.90% Sr. Unsec. Unsub. Nts., 4/15/151 | | | 471,000 | | | | 455,693 | |
Southwestern Energy Co.,
4.10% Sr. Unsec. Nts., 3/15/221 | | | 232,000 | | | | 235,797 | |
Woodside Finance Ltd.:
4.60% Sr. Unsec. Nts., 5/10/211 | | | 354,000 | | | | 379,909 | |
| 5% Sr. Unsec. Nts., 11/15/131 | | | 455,000 | | | | 474,568 | |
| | | | | | |
|
|
|
| | | | | | | | 7,128,950 | |
| | | | | | | | |
| | | Principal
Amount | | | Value | |
| | | | | | | | | |
| Financials—14.9% | |
| Capital Markets—3.4% | |
Blackstone Holdings Finance Co. LLC,
6.625% Sr. Unsec. Nts., 8/15/191 | | $ | 800,000 | | | $ | 878,194 | |
Goldman Sachs Capital, Inc. (The),
6.345% Sub. Bonds, 2/15/34 | | | 477,000 | | | | 452,924 | |
Goldman Sachs Group, Inc. (The):
5.25% Sr. Unsec. Nts., 7/27/21 | | | 396,000 | | | | 403,274 | |
| 6.25% Sr. Nts., 2/1/41 | | | 443,000 | | | | 464,076 | |
Macquarie Bank Ltd.:
5% Sr. Nts., 2/22/171 | | | 146,000 | | | | 148,915 | |
| 6.625% Unsec. Sub. Nts., 4/7/211 | | | 672,000 | | | | 675,350 | |
Morgan Stanley:
5.50% Sr. Unsec. Unsub. Nts., 7/24/201 | | | 262,000 | | | | 256,908 | |
| 5.625% Sr. Unsec. Nts., 9/23/19 | | | 1,091,000 | | | | 1,081,979 | |
Nomura Holdings, Inc.:
4.125% Sr. Unsec. Unsub. Nts., 1/19/16 | | | 433,000 | | | | 441,120 | |
| 6.70% Sr. Unsec. Nts., 3/4/20 | | | 42,000 | | | | 46,633 | |
Raymond James Financial, Inc.,
5.625% Sr. Nts., 4/1/24 | | | 458,000 | | | | 490,505 | |
TD Ameritrade Holding Corp.,
2.95% Sr. Unsec. Unsub. Nts., 12/1/12 | | | 509,000 | | | | 512,993 | |
| UBS AG Stamford CT, 2.25% Sr. Unsec. Nts., 8/12/13 | | | 181,000 | | | | 181,616 | |
UBS Preferred Funding Trust V,
6.243% Jr. Sub. Perpetual Nts.10 | | | 488,000 | | | | 463,600 | |
| | | | | | |
|
|
|
| | | | | | | | 6,498,087 | |
| Commercial Banks—2.7% | |
ANZ National International Ltd.,
2.375% Sr. Unsec. Nts., 12/21/121 | | | 507,000 | | | | 510,484 | |
Fifth Third Cap Trust IV, 6.50%
Jr. Unsec. Sub. Nts., 4/15/37 | | | 845,000 | | | | 842,888 | |
HSBC Finance Capital Trust IX,
5.911% Nts., 11/30/352 | | | 1,190,000 | | | | 1,123,063 | |
Lloyds TSB Bank plc, 6.50% Unsec.
Sub. Nts., 9/14/201 | | | 810,000 | | | | 799,561 | |
Mercantile Bankshares Corp.,
4.625% Unsec. Sub. Nts.,
Series B, 4/15/13 | | | 308,000 | | | | 316,132 | |
Wells Fargo & Co., 7.98% Jr. Sub.
Perpetual Bonds, Series K10 | | | 528,000 | | | | 582,120 | |
Zions Bancorp, 4.50% Sr. Unsec.
Unsub. Nts., 3/27/17 | | | 826,000 | | | | 831,697 | |
| | | | | | |
|
|
|
| | | | | | | | 5,005,945 | |
| Consumer Finance—1.1% | |
American Express Bank FSB,
5.50% Sr. Unsec. Nts., 4/16/13 | | | 441,000 | | | | 457,547 | |
14 | OPPENHEIMER CORE BOND FUND/VA
|
| | | | | | | | |
| | | Principal
Amount | | | Value | |
| | | | | | | | | |
| Consumer Finance Continued | |
Discover Bank, 8.70% Unsec. Sub.
Nts., 11/18/19 | | $ | 659,000 | | | $ | 820,366 | |
| SLM Corp., 6.25% Sr. Nts., 1/25/16 | | | 697,000 | | | | 735,335 | |
| | | | | | |
|
|
|
| | | | | | | | 2,013,248 | |
| Diversified Financial Services—2.6% | |
| Bank of America Corp., 5.70% Sr. Unsec. Unsub. Nts., 1/24/22 | | | 716,000 | | | | 790,585 | |
Citigroup, Inc.:
4.45% Sr. Unsec. Unsub. Nts., 1/10/17 | | | 310,000 | | | | 325,420 | |
| 4.50% Sr. Unsec. Nts., 1/14/224 | | | 452,000 | | | | 468,115 | |
| 6.125% Sr. Unsec. Unsub. Nts., 11/21/17 | | | 756,000 | | | | 838,945 | |
JPMorgan Chase & Co., 7.90%
Perpetual Bonds, Series 110 | | | 1,494,000 | | | | 1,643,543 | |
| Merrill Lynch & Co., Inc., 7.75% Jr. Sub. Bonds, 5/14/38 | | | 655,000 | | | | 750,177 | |
| | | | | | |
|
|
|
| | | | | | | | 4,816,785 | |
| Insurance—3.9% | | | | | | | | |
American International Group, Inc.:
4.875% Sr. Unsec. Nts., 6/1/22 | | | 415,000 | | | | 425,802 | |
| 6.25% Jr. Sub. Bonds, 3/15/37 | | | 225,000 | | | | 209,250 | |
Burlington Northern Santa Fe LLC,
5.75% Sr. Unsec. Bonds, 5/1/40 | | | 143,000 | | | | 171,375 | |
CNA Financial Corp.:
5.75% Sr. Unsec. Unsub. Nts., 8/15/21 | | | 368,000 | | | | 405,377 | |
| 5.875% Sr. Unsec. Unsub. Bonds, 8/15/20 | | | 260,000 | | | | 286,562 | |
| Gulf South Pipeline Co. LP, 5.75% Sr. Unsec. Nts., 8/15/121 | | | 455,000 | | | | 457,053 | |
Hartford Financial Services Group, Inc.,
6.625% Sr. Unsec. Unsub. Nts., 4/15/42 | | | 289,000 | | | | 299,011 | |
Irish Life & Permanent Group Holdings plc, 3.60% Sr. Unsec. Unsub.
Nts., 1/14/131 | | | 320,000 | | | | 313,310 | |
Liberty Mutual Group, Inc., 5% Sr.
Nts., 6/1/211 | | | 685,000 | | | | 691,095 | |
| Lincoln National Corp., 6.05% Jr. Unsec. Sub. Bonds, 4/20/67 | | | 945,000 | | | | 871,763 | |
Prudential Covered Trust 2012-1,
2.997% Sec. Nts., 9/30/151 | | | 600,000 | | | | 610,063 | |
Swiss Re Capital I LP, 6.854%
Perpetual Bonds1,10 | | | 958,000 | | | | 883,554 | |
Unum Group, 5.625% Sr. Unsec.
Unsub. Nts., 9/15/20 | | | 779,000 | | | | 839,835 | |
| ZFS Finance USA Trust V, 6.50% Jr. Sub. Bonds, 5/9/372,3 | | | 848,000 | | | | 835,280 | |
| | | | | | |
|
|
|
| | | | | | | | 7,299,330 | |
| | | | | | | | |
| | | Principal
Amount | | | Value | |
| | | | | | | | | |
| Real Estate Investment Trusts—1.2% | |
American Tower Corp.:
5.05% Sr. Unsec. Unsub. Nts., 9/1/20 | | $ | 130,000 | | | $ | 136,869 | |
| 7% Sr. Unsec. Nts., 10/15/17 | | | 413,000 | | | | 480,651 | |
CommonWealth REIT, 5.75% Sr. Unsec.
Unsub. Bonds, 2/15/14 | | | 425,000 | | | | 435,384 | |
| Duke Realty LP, 6.25% Sr. Unsec. Unsub. Nts., 5/15/13 | | | 476,000 | | | | 492,073 | |
National Retail Properties, Inc.,
6.25% Sr. Unsec. Unsub. Nts., 6/15/14 | | | 332,000 | | | | 352,628 | |
| WEA Finance LLC/WT Finance Aust Pty Ltd., 7.50% Sr. Unsec. Nts., 6/2/141 | | | 408,000 | | | | 445,403 | |
| | | | | | |
|
|
|
| | | | | | | | 2,343,008 | |
| Health Care—1.4% | |
| Biotechnology—0.6% | |
| Amgen, Inc., 3.625% Sr. Unsec. Unsub. Nts., 5/15/22 | | | 467,000 | | | | 484,289 | |
Celgene Corp., 5.70% Sr. Unsec.
Nts., 10/15/40 | | | 291,000 | | | | 327,704 | |
| Gilead Sciences, Inc., 5.65% Sr. Unsec. Nts., 12/1/41 | | | 243,000 | | | | 284,729 | |
| | | | | | |
|
|
|
| | | | | | | | 1,096,722 | |
| Health Care Providers & Services—0.5% | |
| Aristotle Holding, Inc., 3.90% Unsec. Nts., 2/15/221 | | | 318,000 | | | | 330,536 | |
| McKesson Corp., 6% Sr. Unsec. Unsub. Nts., 3/1/41 | | | 237,000 | | | | 313,801 | |
| Quest Diagnostics, Inc., 5.75% Sr. Unsec. Nts., 1/30/40 | | | 310,000 | | | | 356,679 | |
| | | | | | |
|
|
|
| | | | | | | | 1,001,016 | |
| Pharmaceuticals—0.3% | |
| Mylan, Inc., 6% Sr. Nts., 11/15/181 | | | 511,000 | | | | 540,383 | |
| Industrials—3.1% | | | | | | | | |
| Aerospace & Defense—0.4% | |
Huntington Ingalls Industries, Inc.,
7.125% Sr. Unsec. Unsub. Nts., 3/15/21 | | | 448,000 | | | | 470,400 | |
United Technologies Corp.,
3.10% Sr. Unsec. Unsub. Nts., 6/1/22 | | | 324,000 | | | | 340,523 | |
| | | | | | |
|
|
|
| | | | | | | | 810,923 | |
| Commercial Services & Supplies—0.3% | |
Corrections Corp. of America,
7.75% Sr. Nts., 6/1/17 | | | 483,000 | | | | 525,263 | |
| Industrial Conglomerates—0.8% | |
General Electric Capital Corp.:
5.25% Sr. Unsec. Nts., 10/19/12 | | | 28,000 | | | | 28,394 | |
| 6.375% Unsec. Sub. Bonds, 11/15/67 | | | 934,000 | | | | 974,863 | |
| 7.125% Unsec. Sub. Nts., 12/15/49 | | | 400,000 | | | | 424,150 | |
| | | | | | |
|
|
|
| | | | | | | | 1,427,407 | |
15 | OPPENHEIMER CORE BOND FUND/VA
|
STATEMENT OF INVESTMENTS Unaudited / Continued
| | | | | | | | |
| | | Principal
Amount | | | Value | |
| | | | | | | | | |
| Machinery—1.0% | | | | | | | | |
CNH Capital LLC,
6.25% Sr. Unsec. Nts., 11/1/161 | | $ | 489,000 | | | $ | 525,675 | |
ITT Corp.,
7.375% Unsec. Debs., 11/15/15 | | | 320,000 | | | | 367,589 | |
Joy Global, Inc.,
5.125% Sr. Unsec. Unsub. Nts., 10/15/21 | | | 242,000 | | | | 266,363 | |
Kennametal, Inc.,
3.875% Sr. Unsec. Unsub. Nts., 2/15/22 | | | 342,000 | | | | 352,852 | |
SPX Corp.,
6.875% Sr. Unsec. Nts., 9/1/171 | | | 412,000 | | | | 451,140 | |
| | | | | | |
|
|
|
| | | | | | | | 1,963,619 | |
| Professional Services—0.2% | | | | | | | | |
FTI Consulting, Inc.,
6.75% Sr. Unsec. Nts., 10/1/20 | | | 436,000 | | | | 462,160 | |
| Road & Rail—0.4% | | | | | | | | |
CSX Corp.,
5.50% Sr. Unsec. Nts., 4/15/41 | | | 150,000 | | | | 169,509 | |
Kansas City Southern de Mexico,
8% Sr. Unsec. Unsub. Nts., 2/1/18 | | | 430,000 | | | | 483,234 | |
| | | | | | |
|
|
|
| | | | | | | | 652,743 | |
| Information Technology—1.5% | | | | | | | | |
| Communications Equipment—0.1% | | | | | | | | |
Juniper Networks, Inc.,
5.95% Sr. Unsec. Unsub. Nts., 3/15/41 | | | 201,000 | | | | 232,527 | |
| Computers & Peripherals—0.2% | | | | | | | | |
Hewlett-Packard Co.,
4.65% Sr. Unsec. Nts., 12/9/21 | | | 363,000 | | | | 381,516 | |
| Electronic Equipment & Instruments—0.4% | |
Arrow Electronics, Inc.,
5.125% Sr. Unsec. Unsub. Nts., 3/1/21 | | | 491,000 | | | | 516,185 | |
Corning, Inc.,
4.75% Sr. Unsec. Unsub. Nts., 3/15/42 | | | 182,000 | | | | 191,769 | |
| | | | | | |
|
|
|
| | | | | | | | 707,954 | |
| Office Electronics—0.2% | | | | | | | | |
Xerox Corp.,
5.65% Sr. Unsec. Nts., 5/15/13 | | | 435,000 | | | | 450,814 | |
| Semiconductors & Semiconductor Equipment—0.3% | |
Advanced Micro Devices, Inc.,
7.75% Sr. Unsec. Nts., 8/1/20 | | | 415,000 | | | | 458,575 | |
| Software—0.3% | | | | | | | | |
Symantec Corp., 4.20% Sr. Unsec.
Unsub. Nts., 9/15/20 | | | 573,000 | | | | 587,561 | |
| Materials—3.1% | | | | | | | | |
| Chemicals—0.8% | | | | | | | | |
Agrium, Inc.,
6.125% Sr. Unsec. Nts., 1/15/41 | | | 230,000 | | | | 283,168 | |
| Airgas, Inc., 3.25% Sr. Nts., 10/1/15 | | | 842,000 | | | | 878,229 | |
| | | | | | | | |
| | | Principal
Amount | | | Value | |
| | | | | | | | | |
| Chemicals Continued | | | | | | | | |
Eastman Chemical Co.,
4.80% Sr. Unsec. Nts., 9/1/42 | | $ | 333,000 | | | $ | 341,297 | |
| | | | | | |
|
|
|
| | | | | | | | 1,502,694 | |
| Containers & Packaging—0.6% | | | | | | | | |
Crown Americas LLC/Crown Americas Capital Corp. II I,
6.25% Sr. Unsec. Nts., 2/1/21 | | | 446,000 | | | | 489,485 | |
Rock-Tenn Co.,
4.90% Sr. Unsec.
Nts., 3/1/221 | | | 162,000 | | | | 167,340 | |
| Sealed Air Corp., | | | | | | | | |
| 8.375% Sr. Unsec. Nts., 9/15/211 | | | 388,000 | | | | 440,380 | |
| | | | | | |
|
|
|
| | | | | | | | 1,097,205 | |
| Metals & Mining—1.5% | | | | | | | | |
ArcelorMittal, 6.25% Sr. Unsec.
Unsub. Nts., 2/25/22 | | | 256,000 | | | | 251,355 | |
| Cliffs Natural Resources, Inc., 6.25% Sr. Unsec. Unsub. Nts., 10/1/40 | | | 124,000 | | | | 122,318 | |
| Freeport-McMoRan Copper & Gold, Inc., 3.55% Sr. Unsec. Nts., 3/1/22 | | | 331,000 | | | | 326,588 | |
Petrohawk Energy Corp., 6.25% Sr. Unsec.
Nts., 6/1/19 | | | 720,000 | | | | 807,213 | |
| Teck Resources Ltd., 7% Sr. Unsec. Unsub. Nts., 9/15/12 | | | 476,000 | | | | 481,365 | |
Xstrata Canada Corp.: 5.375% Sr. Unsec.
Unsub. Nts., 6/1/15 | | | 245,000 | | | | 265,879 | |
| 6% Sr. Unsec. Unsub. Nts., 10/15/15 | | | 463,000 | | | | 510,691 | |
| 7.25% Sr. Unsec. Unsub. Nts., 7/15/12 | | | 80,000 | | | | 80,148 | |
| | | | | | |
|
|
|
| | | | | | | | 2,845,557 | |
| Paper & Forest Products—0.2% | | | | | | | | |
International Paper Co., 6% Sr. Unsec.
Unsub. Nts., 11/15/41 | | | 202,000 | | | | 228,866 | |
Westvaco Corp., 7.95% Sr. Unsec.
Unsub. Nts., 2/15/31 | | | 102,000 | | | | 116,944 | |
| | | | | | |
|
|
|
| | | | | | | | 345,810 | |
| Telecommunication Services—2.3% | | | | | | | | |
| Diversified Telecommunication Services—2.2% | | | | | |
| AT&T, Inc., 6.30% Sr. Unsec. | | | | | | | | |
| Bonds, 1/15/38 | | | 590,000 | | | | 738,400 | |
| British Telecommunications plc, 9.875% Bonds, 12/15/30 | | | 298,000 | | | | 449,757 | |
| CenturyLink, Inc., 7.65% Sr. Unsec. Unsub. Nts., 3/15/42 | | | 362,000 | | | | 352,715 | |
Frontier Communications Corp.,
8.25% Sr. Unsec. Nts., 4/15/17 | | | 495,000 | | | | 534,600 | |
Telecom Italia Capital SA,
7.721%
Sr. Unsec. Unsub. Nts., 6/4/38 | | | 582,000 | | | | 512,160 | |
16 | OPPENHEIMER CORE BOND FUND/VA
|
| | | | | | | | |
| | | Principal
Amount | | | Value | |
| | | | | | | | | |
| Diversified Telecommunication Services Continued | |
| Telefonica Emisiones SAU, 5.462% Sr. Unsec. Unsub. Nts., 2/16/21 | | $ | 692,000 | | | $ | 603,982 | |
| Verizon Communications, Inc., 6.40% Sr. Unsec. Nts., 2/15/38 | | | 286,000 | | | | 373,181 | |
Vivendi SA, 4.75% Sr. Unsec.
Nts., 4/12/221 | | | 45,000 | | | | 44,529 | |
| Windstream Corp., 7.875% Sr. Unsec. | | | | | | | | |
| Unsub. Nts., 11/1/17 | | | 439,000 | | | | 480,705 | |
| | | | | | |
|
|
|
| | | | | | | | 4,090,029 | |
| Wireless Telecommunication Services—0.1% | | | | | |
| America Movil SAB de CV, 6.125% Sr. Unsec. Unsub. Nts., 3/30/40 | | | 215,000 | | | | 267,126 | |
| Utilities—1.6% | | | | | | | | |
| Electric Utilities—1.1% | | | | | | | | |
| Edison International, 3.75% Sr. Unsec. Unsub. Nts., 9/15/17 | | | 663,000 | | | | 700,268 | |
| Great Plains Energy, Inc., 2.75% Sr. Unsec. Unsub. Nts., 8/15/13 | | | 464,000 | | | | 470,951 | |
Oncor Electric Delivery Co. LLC,
4.10% Sr. Sec. Nts., 6/1/221 | | | 93,000 | | | | 95,087 | |
| | | | | | | | |
| | | Principal
Amount | | | Value | |
| | | | | | | | | |
| Electric Utilities Continued | |
| PPL WEM Holdings plc, | | | | | | | | |
| 5.375% Sr. Unsec. Nts., 5/1/211 | | $ | 761,000 | | | $ | 821,938 | |
| | | | | | |
|
|
|
| | | | | | | | 2,088,244 | |
| Energy Traders—0.3% | | | | | | | | |
TransAlta Corp., 5.75% Sr. Unsec.
Nts., 12/15/13 | | | 455,000 | | | | 477,927 | |
| Gas Utilities—0.2% | | | | | | | | |
| Southwest Gas Corp., 3.875% | | | | | | | | |
| Sr. Unsec. Unsub. Nts., 4/1/22 | | | 320,000 | | | | 338,212 | |
| | | | | | |
|
|
|
| Total Corporate Bonds and Notes (Cost $77,625,033) | | | | | | | 80,864,557 | |
| | |
| | | Shares | | | | |
| Investment Company—17.7% | | | | | | | | |
| Oppenheimer Institutional Money Market Fund, Cl. E, 0.20%11,12 | | | | | | | | |
| (Cost $33,155,457) | | | 33,155,457 | | | | 33,155,457 | |
Total Investments, at Value
(Cost $252,036,764) | | | 135.8 | % | | | 254,777,026 | |
| Liabilities in Excess of Other Assets | |
| (35.8
| )
| |
| (67,098,630
| )
|
| Net Assets | |
| 100.0
| %
| | $
| 187,678,396
|
|
Footnotes to Statement of Investments
* June 29, 2012 represents the last business day of the Fund’s 2012 semiannual period. See Note 1 of the accompanying Notes.
1. Represents securities sold under Rule 144A, which are exempt from registration under the Securities Act of 1933, as amended. These securities have been determined to be liquid under guidelines established by the Board of Trustees. These securities amount to $24,095,135 or 12.84% of the Fund’s net assets as of June 29, 2012.
2. Represents the current interest rate for a variable or increasing rate security.
3. Restricted security. The aggregate value of restricted securities as of June 29, 2012 was $2,379,087, which represents 1.27% of the Fund’s net assets. See Notes 7 of the accompanying Notes. Information concerning restricted securities is as follows:
| | | | | | | | | | | | | | | | |
| Security | | Acquisition
Dates | | | Cost | | | Value | | | Unrealized
Appreciation
(Depreciation) | |
Capital Lease Funding Securitization LP, Interest-Only Corporate-Backed Pass-Through Certificates,
Series 1997-CTL1, 0%, 6/15/24 | | | 4/21/97 | | | $ | 404,914 | | | $ | 123,013 | | | $ | (281,901 | ) |
NC Finance Trust, Collateralized Mtg. Obligation Pass-Through Certificates, Series 1999-I,
Cl. ECFD, 3.405%, 1/25/29 | | | 8/10/10 | | | | 3,281,116 | | | | 294,876 | | | | (2,986,240 | ) |
Ras Laffan Liquefied Natural Gas Co. Ltd. III,
5.50% Sr. Sec. Nts., 9/30/14 | | | 7/16/09-2/16/12 | | | | 429,293 | | | | 454,125 | | | | 24,832 | |
Santander Drive Auto Receivables Trust 2011-S1A, Automobile Receivables Nts., Series 2011-S1A,
Cl. D, 3.10%, 5/15/17 | | | 2/4/11-2/9/12 | | | | 378,372 | | | | 378,974 | | | | 602 | |
Santander Drive Auto Receivables Trust 2011-S2A, Automobile Receivables Nts., Series 2011-S2A,
Cl. D, 3.35%, 6/15/17 | | | 5/19/11-1/19/12 | | | | 292,191 | | | | 292,819 | | | | 628 | |
| ZFS Finance USA Trust V, 6.50% Jr. Sub. Bonds, 5/9/37 | | | 2/24/11-2/23/12 | | | | 833,958 | | | | 835,280 | | | | 1,322 | |
| | | | | | |
|
|
| |
|
|
| |
|
|
|
| | | | | | | $ | 5,619,844 | | | $ | 2,379,087 | | | $ | (3,240,757 | ) |
| | | | | | |
|
|
| |
|
|
| |
|
|
|
17 | OPPENHEIMER CORE BOND FUND/VA
|
STATEMENT OF INVESTMENTS Unaudited / Continued
Footnotes to Statement of Investments Continued
4. All or a portion of the security position is when-issued or delayed delivery to be delivered and settled after June 29, 2012. See Note 1 of the accompanying Notes.
5. Interest-Only Strips represent the right to receive the monthly interest payments on an underlying pool of mortgage loans or other receivables. These securities typically decline in price as interest rates decline. Most other fixed income securities increase in price when interest rates decline. The principal amount of the underlying pool represents the notional amount on which current interest is calculated. The price of these securities is typically more sensitive to changes in prepayment rates than traditional mortgage or asset-backed securities (for example, GNMA pass-throughs). Interest rates disclosed represent current yields based upon the current cost basis and estimated timing and amount of future cash flows. These securities amount to $5,841,772 or 3.11% of the Fund’s net assets as of June 29, 2012.
6. The current amortization rate of the security’s cost basis exceeds the future interest payments currently estimated to be received. Both the amortization rate and interest payments are contingent on future mortgage pre-payment speeds and are therefore subject to change.
7. Principal-Only Strips represent the right to receive the monthly principal payments on an underlying pool of mortgage loans. The value of these securities generally increases as interest rates decline and prepayment rates rise. The price of these securities is typically more volatile than that of coupon-bearing bonds of the same maturity. Interest rates disclosed represent current yields based upon the current cost basis and estimated timing of future cash flows. These securities amount to $288,253 or 0.15% of the Fund’s net assets as of June 29, 2012.
8. This security is not accruing income because the issuer has missed an interest payment on it and/or is not anticipated to make future interest and/or principal payments. The rate shown is the original contractual interest rate. See Note 1 of the accompanying Notes.
9. All or a portion of the security position is held in accounts at a futures clearing merchant and pledged to cover margin requirements on open futures contracts and written options on futures, if applicable. The aggregate market value of such securities is $439,518. See Note 6 of the accompanying Notes.
10. This bond has no contractual maturity date, is not redeemable and contractually pays an indefinite stream of interest. Rate reported represents the current interest rate for this variable rate security.
11. Is or was an affiliate, as defined in the Investment Company Act of 1940, at or during the period ended June 29, 2012, by virtue of the Fund owning at least 5% of the voting securities of the issuer or as a result of the Fund and the issuer having the same investment adviser. Transactions during the period in which the issuer was an affiliate are as follows:
| | | | | | | | | | | | | | | | |
| | | Shares
December 30, 2011a | | | Gross
Additions | | | Gross
Reductions | | | Shares
June 29, 2012 | |
| Oppenheimer Institutional Money Market Fund, Cl. E | | | 28,319,973 | | | | 44,080,650 | | | | 39,245,166 | | | | 33,155,457 | |
| | | | |
| | | | | | | | | Value | | | Income | |
| Oppenheimer Institutional Money Market Fund, Cl. E | | | | | | | | | | $ | 33,155,457 | | | | $30,663 | |
a. December 30, 2011 represents the last business day of the Fund’s 2011 fiscal year. See Note 1 of the accompanying Notes.
12. Rate shown is the 7-day yield as of June 29, 2012.
| | | | | | | | | | | | | | | | | | | | |
| Futures Contracts as of June 29, 2012 are as follows: | | | | | | | | | | |
| | | | | |
| Contract Description | | Buy/Sell | | | Number
of
Contracts | | | Expiration
Date | | | Value | | | Unrealized
Appreciation
(Depreciation) | |
| U.S. Treasury Long Bonds | | | Buy | | | | 21 | | | | 9/19/12 | | | $ | 3,107,344 | | | $ | (17,151 | ) |
| U.S. Treasury Nts., 2 yr. | | | Sell | | | | 82 | | | | 9/28/12 | | | | 18,055,375 | | | | 12,516 | |
| U.S. Treasury Nts., 5 yr. | | | Sell | | | | 67 | | | | 9/28/12 | | | | 8,305,906 | | | | (10,235 | ) |
| U.S. Treasury Nts., 10 yr. | | | Sell | | | | 4 | | | | 9/19/12 | | | | 533,500 | | | | 27 | |
| U.S. Treasury Ultra Bonds | | | Buy | | | | 54 | | | | 9/19/12 | | | | 9,009,563 | | | | 136,731 | |
| | | | | | | | | | | | | | | | | | |
|
|
|
| | | | | | | | | | | | | | | | | | | $ | 121,888 | |
| | | | | | | | | | | | | | | | | | |
|
|
|
See accompanying Notes to Financial Statements.
18 | OPPENHEIMER CORE BOND FUND/VA
|
STATEMENT OF ASSETS AND LIABILITIES Unaudited
| | | | |
| June 29, 20121 | | | |
| Assets | | | |
| Investments, at value—see accompanying statement of investments: | | | | |
| Unaffiliated companies (cost $218,881,307) | | $ | 221,621,569 | |
| Affiliated companies (cost $33,155,457) | |
| 33,155,457
|
|
| | | | 254,777,026 | |
| Cash | | | 296,425 | |
| Receivables and other assets: | | | | |
| Investments sold (including $52,500,875 sold on a when-issued or delayed delivery basis) | | | 58,190,321 | |
| Interest, dividends and principal paydowns | | | 1,478,146 | |
| Futures margins | | | 23,553 | |
| Other | |
| 24,804
|
|
| Total assets | | | 314,790,275 | |
| Liabilities | | | |
| Payables and other liabilities: | | | | |
| Investments purchased (including $123,281,697 purchased on a when-issued or delayed delivery basis) | | | 126,137,476 | |
| Shares of beneficial interest redeemed | | | 689,343 | |
| Futures margins | | | 187,949 | |
| Shareholder communications | | | 29,033 | |
| Trustees’ compensation | | | 18,082 | |
| Transfer and shareholder servicing agent fees | | | 15,264 | |
| Distribution and service plan fees | | | 13,934 | |
| Other | |
| 20,798
|
|
| Total liabilities | | | 127,111,879 | |
| Net Assets | | $
| 187,678,396
|
|
| Composition of Net Assets | | | |
| Par value of shares of beneficial interest | | $ | 23,983 | |
| Additional paid-in capital | | | 267,791,007 | |
| Accumulated net investment income | | | 3,740,566 | |
| Accumulated net realized loss on investments | | | (86,739,310 | ) |
| Net unrealized appreciation on investments | |
| 2,862,150
|
|
| Net Assets | | $
| 187,678,396
|
|
| Net Asset Value Per Share | | | |
| Non-Service Shares: | | | | |
Net asset value, redemption price per share and offering price per share (based on net assets of $118,292,090
and 15,057,562 shares of beneficial interest outstanding) | | | $7.86 | |
| Service Shares: | | | | |
Net asset value, redemption price per share and offering price per share (based on net assets of $69,386,306
and 8,925,415 shares of beneficial interest outstanding) | | | $7.77 | |
1. June 29, 2012 represents the last business day of the Fund’s 2012 semiannual period. See Note 1 of the accompanying Notes.
See accompanying Notes to Financial Statements.
19 | OPPENHEIMER CORE BOND FUND/VA
|
STATEMENT OF OPERATIONS Unaudited
| | | | |
| For the Six Months Ended June 29, 20121 | | | |
| Investment Income | | | |
| Interest | | $ | 4,151,879 | |
| Dividends from affiliated companies | | | 30,663 | |
| Fee income on when-issued securities | |
| 642,157
|
|
| Total investment income | | | 4,824,699 | |
| Expenses | | | |
| Management fees | | | 553,092 | |
| Distribution and service plan fees—Service shares | | | 81,466 | |
| Transfer and shareholder servicing agent fees: | | | | |
| Non-Service shares | | | 59,576 | |
| Service shares | | | 32,605 | |
| Shareholder communications: | | | | |
| Non-Service shares | | | 3,815 | |
| Service shares | | | 1,934 | |
| Custodian fees and expenses | | | 13,104 | |
| Trustees’ compensation | | | 8,284 | |
| Administration service fees | | | 750 | |
| Other | |
| 25,736
|
|
| Total expenses | | | 780,362 | |
| Less waivers and reimbursements of expenses | |
| (20,766
| )
|
| Net expenses | | | 759,596 | |
| Net Investment Income | | | 4,065,103 | |
| Realized and Unrealized Gain | | | |
| Net realized gain on: | | | | |
| Investments from unaffiliated companies | | | 2,777,854 | |
| Closing and expiration of futures contracts | |
| 317,518
|
|
| Net realized gain | | | 3,095,372 | |
| Net change in unrealized appreciation/depreciation on: | | | | |
| Investments | | | 1,583,706 | |
| Futures contracts | |
| 35,672
|
|
| Net change in unrealized appreciation/depreciation | | | 1,619,378 | |
| | |
| Net Increase in Net Assets Resulting from Operations | | $
| 8,779,853
|
|
1. June 29, 2012 represents the last business day of the Fund’s 2012 semiannual period. See Note 1 of the accompanying Notes.
See accompanying Notes to Financial Statements.
20 | OPPENHEIMER CORE BOND FUND/VA
|
STATEMENTS OF CHANGES IN NET ASSETS
| | | | | | | | |
| | | Six Months
Ended
June 29, 20121
(Unaudited) | | | Year
Ended
December 30,
20111 | |
| Operations | | | | | | |
| Net investment income | | $ | 4,065,103 | | | $ | 8,584,025 | |
| Net realized gain | | | 3,095,372 | | | | 7,156,870 | |
| Net change in unrealized appreciation/depreciation | |
| 1,619,378
|
| |
| (1,111,204
| )
|
| Net increase in net assets resulting from operations | | | 8,779,853 | | | | 14,629,691 | |
| Dividends and/or Distributions to Shareholders | | | | | | |
| Dividends from net investment income: | | | | | | | | |
| Non-Service shares | | | (5,870,393 | ) | | | (7,632,636 | ) |
| Service shares | |
| (3,356,788
| )
| |
| (3,102,242
| )
|
| | | | (9,227,181 | ) | | | (10,734,878 | ) |
| Beneficial Interest Transactions | | | | | | |
| Net increase (decrease) in net assets resulting from beneficial interest transactions: | | | | | | | | |
| Non-Service shares | | | (3,872,554 | ) | | | (12,784,495 | ) |
| Service shares | |
| 7,432,980
|
| |
| 4,335,577
|
|
| | | | 3,560,426 | | | | (8,448,918 | ) |
| Net Assets | | | | | | |
| Total increase (decrease) | | | 3,113,098 | | | | (4,554,105 | ) |
| Beginning of period | |
| 184,565,298
|
| |
| 189,119,403
|
|
| End of period (including accumulated net investment income of $3,740,566 and $8,902,644, respectively) | | $
| 187,678,396
|
| | $
| 184,565,298
|
|
1. June 29, 2012 and December 30, 2011 represents the last business days of the Fund’s respective reporting periods. See Note 1 of the accompanying Notes.
See accompanying Notes to Financial Statements.
21 | OPPENHEIMER CORE BOND FUND/VA
|
FINANCIAL HIGHLIGHTS
| | | | | | | | | | | | | | | | | | | | | | | | |
| | | Six Months
Ended
June 29, 20121 | | | Year Ended
December 30, | | | Year Ended December 31, | |
| Non-Service Shares | | (Unaudited) | | | 20111 | | | 2010 | | | 2009 | | | 2008 | | | 2007 | |
| | | | | | | | | | | | | | | | | | | | | | | | | |
| Per Share Operating Data | | | | | | | | | | | | | | | | | | |
| Net asset value, beginning of period | | | $7.88 | | | | $7.73 | | | | $7.07 | | | | $6.45 | | | | $11.06 | | | | $11.16 | |
| Income (loss) from investment operations: | | | | | | | | | | | | | | | | | | | | | | | | |
| Net investment income2 | | | .18 | | | | .36 | | | | .40 | | | | .48 | | | | .66 | | | | .55 | |
| Net realized and unrealized gain (loss) | |
| .21
|
| |
| .25
|
| |
| .40
|
| |
| .14
|
| |
| (4.82
| )
| |
| (.08
| )
|
| Total from investment operations | | | .39 | | | | .61 | | | | .80 | | | | .62 | | | | (4.16 | ) | | | .47 | |
| Dividends and/or distributions to shareholders: | | | | | | | | | | | | | | | | | | | | | | | | |
| Dividends from net investment income | | | (.41 | ) | | | (.46 | ) | | | (.14 | ) | | | — | | | | (.45 | ) | | | (.57 | ) |
| Net asset value, end of period | |
| $7.86
|
| |
| $7.88
|
| |
| $7.73
|
| |
| $7.07
|
| |
| $ 6.45
|
| |
| $11.06
|
|
| Total Return, at Net Asset Value3 | | 4.95% | | | 8.27% | | | 11.42% | | | 9.61% | | | (39.05)% | | | 4.39% | |
| | | | | | | | | | | | | | | | | | | | | | | | | |
| Ratios/Supplemental Data | | | | | | | | | | | | | | | | | | |
| Net assets, end of period (in thousands) | | $ | 118,292 | | | $ | 122,271 | | | $ | 132,557 | | | $ | 137,597 | | | $ | 156,339 | | | $ | 325,661 | |
| Average net assets (in thousands) | | $ | 119,825 | | | $ | 127,341 | | | $ | 136,333 | | | $ | 137,631 | | | $ | 271,355 | | | $ | 345,723 | |
| Ratios to average net assets:4 | | | | | | | | | | | | | | | | | | | | | | | | |
| Net investment income | | | 4.50 | % | | | 4.71 | % | | | 5.32 | % | | | 7.40 | % | | | 6.76 | % | | | 5.07 | % |
| Total expenses5 | | | 0.76 | % | | | 0.77 | % | | | 0.79 | % | | | 0.75 | % | | | 0.63 | % | | | 0.68 | % |
Expenses after payments, waivers and/or
reimbursements and reduction to custodian expenses | | | 0.74 | % | | | 0.75 | % | | | 0.70 | % | | | 0.61 | % | | | 0.62 | % | | | 0.68 | % |
| Portfolio turnover rate6 | | | 81 | % | | | 99 | % | | | 98 | % | | | 143 | % | | | 51 | % | | | 89 | % |
1. June 29, 2012 and December 30, 2011 represent the last business days of the Fund’s respective reporting periods. See Note 1 of the accompanying Notes.
2. Per share amounts calculated based on the average shares outstanding during the period.
3. Assumes an initial investment on the business day before the first day of the fiscal period, with all dividends and distributions reinvested in additional shares on the reinvestment date, and redemption at the net asset value calculated on the last business day of the fiscal period. Total returns are not annualized for periods less than one full year. Total return information does not reflect expenses that apply at the separate account level or to related insurance products. Inclusion of these charges would reduce the total return figures for all periods shown. Returns do not reflect the deduction of taxes that a shareholder would pay on fund distributions or the redemption of fund shares.
4. Annualized for periods less than one full year.
5. Total expenses including indirect expenses from affiliated fund were as follows:
| | | | |
| Six Months Ended June 29, 2012 | | | 0.77 | % |
| Year Ended December 30, 2011 | | | 0.79 | % |
| Year Ended December 31, 2010 | | | 0.80 | % |
| Year Ended December 31, 2009 | | | 0.76 | % |
| Year Ended December 31, 2008 | | | 0.63 | % |
| Year Ended December 31, 2007 | | | 0.68 | % |
6. The portfolio turnover rate excludes purchase and sale transactions of To Be Announced (TBA) mortgage-related securities as follows:
| | | | | | | | |
| | | Purchase Transactions | | | Sale Transactions | |
| Six Months Ended June 29, 2012 | | $ | 489,373,619 | | | $ | 494,049,812 | |
| Year Ended December 30, 2011 | | $ | 911,850,847 | | | $ | 909,531,196 | |
| Year Ended December 31, 2010 | | $ | 775,240,942 | | | $ | 766,486,357 | |
| Year Ended December 31, 2009 | | $ | 977,840,247 | | | $ | 1,009,549,121 | |
| Year Ended December 31, 2008 | | $ | 1,019,711,829 | | | $ | 963,377,934 | |
| Year Ended December 31, 2007 | | $ | 662,784,931 | | | $ | 678,316,693 | |
See accompanying Notes to Financial Statements.
22 | OPPENHEIMER CORE BOND FUND/VA
|
| | | | | | | | | | | | | | | | | | | | | | | | |
| | | Six Months
Ended
June 29, 20121 | | | Year Ended
December 30, | | | Year Ended December 31, | |
| Service Shares | | (Unaudited) | | | 20111 | | | 2010 | | | 2009 | | | 2008 | | | 2007 | |
| | | | | | | | | | | | | | | | | | | | | | | | | |
| Per Share Operating Data | | | | | | | | | | | | | | | | | | |
| Net asset value, beginning of period | | | $7.79 | | | | $7.65 | | | | $6.99 | | | | $6.41 | | | | $10.98 | | | | $11.10 | |
| Income (loss) from investment operations: | | | | | | | | | | | | | | | | | | | | | | | | |
| Net investment income2 | | | .17 | | | | .34 | | | | .37 | | | | .46 | | | | .63 | | | | .52 | |
| Net realized and unrealized gain (loss) | |
| .20
|
| |
| .24
|
| |
| .41
|
| |
| .12
|
| |
| (4.77
| )
| |
| (.08
| )
|
| Total from investment operations | | | .37 | | | | .58 | | | | .78 | | | | .58 | | | | (4.14 | ) | | | .44 | |
| Dividends and/or distributions to shareholders: | | | | | | | | | | | | | | | | | | | | | | | | |
| Dividends from net investment income | | | (.39 | ) | | | (.44 | ) | | | (.12 | ) | | | — | | | | (.43 | ) | | | (.56 | ) |
| Net asset value, end of period | |
| $7.77
|
| |
| $7.79
|
| |
| $7.65
|
| |
| $6.99
|
| |
| $ 6.41
|
| |
| $10.98
|
|
| Total Return, at Net Asset Value3 | | 4.78% | | | 7.93% | | | 11.28% | | | 9.05% | | | (39.07)% | | | 4.09% | |
| | | | | | | | | | | | | | | | | | | | | | | | | |
| Ratios/Supplemental Data | | | | | | | | | | | | | | | | | | |
| Net assets, end of period (in thousands) | | $ | 69,386 | | | $ | 62,294 | | | $ | 56,562 | | | $ | 56,717 | | | $ | 63,093 | | | $ | 103,542 | |
| Average net assets (in thousands) | | $ | 65,580 | | | $ | 58,629 | | | $ | 57,313 | | | $ | 52,648 | | | $ | 101,597 | | | $ | 70,116 | |
| Ratios to average net assets:4 | | | | | | | | | | | | | | | | | | | | | | | | |
| Net investment income | | | 4.24 | % | | | 4.42 | % | | | 5.06 | % | | | 7.16 | % | | | 6.55 | % | | | 4.85 | % |
| Total expenses5 | | | 1.01 | % | | | 1.02 | % | | | 1.04 | % | | | 1.01 | % | | | 0.88 | % | | | 0.92 | % |
Expenses after payments, waivers and/or
reimbursements and reduction to custodian expenses | | | 0.99 | % | | | 1.00 | % | | | 0.95 | % | | | 0.86 | % | | | 0.87 | % | | | 0.92 | % |
| Portfolio turnover rate6 | | | 81 | % | | | 99 | % | | | 98 | % | | | 143 | % | | | 51 | % | | | 89 | % |
1. June 29, 2012 and December 30, 2011 represent the last business days of the Fund’s respective reporting periods. See Note 1 of the accompanying Notes.
2. Per share amounts calculated based on the average shares outstanding during the period.
3. Assumes an initial investment on the business day before the first day of the fiscal period, with all dividends and distributions reinvested in additional shares on the reinvestment date, and redemption at the net asset value calculated on the last business day of the fiscal period. Total returns are not annualized for periods less than one full year. Total return information does not reflect expenses that apply at the separate account level or to related insurance products. Inclusion of these charges would reduce the total return figures for all periods shown. Returns do not reflect the deduction of taxes that a shareholder would pay on fund distributions or the redemption of fund shares.
4. Annualized for periods less than one full year.
5. Total expenses including indirect expenses from affiliated fund were as follows:
| | | | |
| Six Months Ended June 29, 2012 | | | 1.02 | % |
| Year Ended December 30, 2011 | | | 1.04 | % |
| Year Ended December 31, 2010 | | | 1.05 | % |
| Year Ended December 31, 2009 | | | 1.02 | % |
| Year Ended December 31, 2008 | | | 0.88 | % |
| Year Ended December 31, 2007 | | | 0.92 | % |
6. The portfolio turnover rate excludes purchase and sale transactions of To Be Announced (TBA) mortgage-related securities as follows:
| | | | | | | | |
| | | Purchase Transactions | | | Sale Transactions | |
| Six Months Ended June 29, 2012 | | $ | 489,373,619 | | | $ | 494,049,812 | |
| Year Ended December 30, 2011 | | $ | 911,850,847 | | | $ | 909,531,196 | |
| Year Ended December 31, 2010 | | $ | 775,240,942 | | | $ | 766,486,357 | |
| Year Ended December 31, 2009 | | $ | 977,840,247 | | | $ | 1,009,549,121 | |
| Year Ended December 31, 2008 | | $ | 1,019,711,829 | | | $ | 963,377,934 | |
| Year Ended December 31, 2007 | | $ | 662,784,931 | | | $ | 678,316,693 | |
See accompanying Notes to Financial Statements.
23 | OPPENHEIMER CORE BOND FUND/VA
|
NOTES TO FINANCIAL STATEMENTS Unaudited
1. Significant Accounting Policies
Oppenheimer Core Bond Fund/VA (the “Fund”) is a separate series of Oppenheimer Variable Account Funds, a diversified open-end management investment company registered under the Investment Company Act of 1940, as amended. The Fund’s main investment objective is to seek a high level of current income. As a secondary objective, the Fund seeks capital appreciation when consistent with its primary objective. The Fund’s investment adviser is OppenheimerFunds, Inc. (the “Manager”).
The Fund offers two classes of shares. Both classes are sold at their offering price, which is the net asset value per share, to separate investment accounts of participating insurance companies as an underlying investment for variable life insurance policies, variable annuity contracts or other investment products. The class of shares designated as Service shares is subject to a distribution and service plan. Both classes of shares have identical rights and voting privileges with respect to the Fund in general and exclusive voting rights on matters that affect that class alone. Earnings, net assets and net asset value per share may differ due to each class having its own expenses, such as transfer and shareholder servicing agent fees and shareholder communications, directly attributable to that class.
The following is a summary of significant accounting policies consistently followed by the Fund.
Semiannual and Annual Periods. The last day of the Fund’s semiannual period was the last day the New York Stock Exchange was open for trading. The Fund’s financial statements have been presented through that date to maintain consistency with the Fund’s net asset value calculations used for shareholder transactions.
The last day of the Fund’s fiscal year was the last day the New York Stock Exchange was open for trading. The Fund’s financial statements have been presented through that date to maintain consistency with the Fund’s net asset value calculations used for shareholder transactions.
Securities on a When-Issued or Delayed Delivery Basis. The Fund may purchase securities on a “when-issued” basis, and may purchase or sell securities on a “delayed delivery” basis. “When-issued” or “delayed delivery” refers to securities whose terms and indenture are available and for which a market exists, but which are not available for immediate delivery. Delivery and payment for securities that have been purchased by the Fund on a when-issued basis normally takes place within six months and possibly as long as two years or more after the trade date. During this period, such securities do not earn interest, are subject to market fluctuation and may increase or decrease in value prior to their delivery. The purchase of securities on a when-issued basis may increase the volatility of the Fund’s net asset value to the extent the Fund executes such transactions while remaining substantially fully invested. When the Fund engages in when-issued or delayed delivery transactions, it relies on the buyer or seller, as the case may be, to complete the transaction. Their failure to do so may cause the Fund to lose the opportunity to obtain or dispose of the security at a price and yield it considers advantageous. The Fund may also sell securities that it purchased on a when-issued basis or forward commitment prior to settlement of the original purchase.
As of June 29, 2012, the Fund had purchased securities issued on a when-issued or delayed delivery basis and sold securities issued on a delayed delivery basis as follows:
| | | | |
| | | When-Issued or Delayed Delivery
Basis Transactions | |
| Purchased securities | | $ | 123,281,697 | |
| Sold securities | | | 52,500,875 | |
The Fund may enter into “forward roll” transactions with respect to mortgage-related securities. In this type of transaction, the Fund sells a mortgage-related security to a buyer and simultaneously agrees to repurchase a similar security (same type, coupon and maturity) at a later date at a set price. During the period between the sale and the repurchase, the Fund will not be entitled to receive interest and principal payments on the securities that have been sold. The Fund records the incremental difference between the forward purchase and sale of each forward roll as realized gain (loss) on investments or as fee income in the case of such transactions that have an associated fee in lieu of a difference in the forward purchase and sale price.
24 | OPPENHEIMER CORE BOND FUND/VA
|
Forward roll transactions may be deemed to entail embedded leverage since the Fund purchases mortgage-related securities with extended settlement dates rather than paying for the securities under a normal settlement cycle. This embedded leverage increases the Fund’s market value of investments relative to its net assets which can incrementally increase the volatility of the Fund’s performance. Forward roll transactions can be replicated over multiple settlement periods.
Risks of entering into forward roll transactions include the potential inability of the counterparty to meet the terms of the agreement; the potential of the Fund to receive inferior securities at redelivery as compared to the securities sold to the counterparty; and counterparty credit risk.
Credit Risk. The Fund invests in high-yield, non-investment-grade bonds, which may be subject to a greater degree of credit risk. Credit risk relates to the ability of the issuer to meet interest or principal payments or both as they become due. The Fund may acquire securities that have missed an interest payment, and is not obligated to dispose of securities whose issuers or underlying obligors subsequently miss an interest payment. Information concerning securities not accruing interest as of June 29, 2012 is as follows:
| | | | |
| Cost | | $ | 3,281,116 | |
| Market Value | | $ | 294,876 | |
| Market Value as a % of Net Assets | | | 0.16 | % |
Investment in Oppenheimer Institutional Money Market Fund. The Fund is permitted to invest daily available cash balances in an affiliated money market fund. The Fund may invest the available cash in Class E shares of Oppenheimer Institutional Money Market Fund (“IMMF”) to seek current income while preserving liquidity. IMMF is a registered open-end management investment company, regulated as a money market fund under the Investment Company Act of 1940, as amended. The Manager is also the investment adviser of IMMF. When applicable, the Fund’s investment in IMMF is included in the Statement of Investments. Shares of IMMF are valued at their net asset value per share. As a shareholder, the Fund is subject to its proportional share of IMMF’s Class E expenses, including its management fee. The Manager will waive fees and/or reimburse Fund expenses in an amount equal to the indirect management fees incurred through the Fund’s investment in IMMF.
Allocation of Income, Expenses, Gains and Losses. Income, expenses (other than those attributable to a specific class), gains and losses are allocated on a daily basis to each class of shares based upon the relative proportion of net assets represented by such class. Operating expenses directly attributable to a specific class are charged against the operations of that class.
Federal Taxes. The Fund intends to comply with provisions of the Internal Revenue Code applicable to regulated investment companies and to distribute substantially all of its investment company taxable income, including any net realized gain on investments not offset by capital loss carryforwards, if any, to shareholders. Therefore, no federal income or excise tax provision is required. The Fund files income tax returns in U.S. federal and applicable state jurisdictions. The statute of limitations on the Fund’s tax return filings generally remain open for the three preceding fiscal reporting period ends.
During the fiscal year ended December 30, 2011, the Fund utilized $5,723,749 of capital loss carryforward to offset capital gains realized in that fiscal year. Details of the fiscal year ended December 30, 2011 capital loss carryforwards are included in the table below. Capital loss carryforwards with no expiration, if any, must be utilized prior to those with expiration dates. Capital losses with no expiration will be carried forward to future years if not offset by gains
| | | | |
| Expiring | | | |
| 2014 | | $ | 609,788 | |
| 2015 | | | 1,245,459 | |
| 2016 | | | 12,777,851 | |
| 2017 | | | 75,069,850 | |
| | |
|
|
|
| Total | | $ | 89,702,948 | |
| | |
|
|
|
25 | OPPENHEIMER CORE BOND FUND/VA
|
NOTES TO FINANCIAL STATEMENTS Unaudited / Continued
1. Significant Accounting Policies Continued
As of June 29, 2012, it is estimated that the capital loss carryforwards would be $86,607,576 expiring by 2017. The estimated capital loss carryforward represents the carryforward as of the end of the last fiscal year, increased or decreased by capital losses or gains realized in the first six months of the current fiscal year. During the six months ended June 29, 2012, it is estimated that the Fund will utilize $3,095,372 of capital loss carryforward to offset realized capital gains.
Net investment income (loss) and net realized gain (loss) may differ for financial statement and tax purposes. The character of dividends and distributions made during the fiscal year from net investment income or net realized gains may differ from their ultimate characterization for federal income tax purposes. Also, due to timing of dividends and distributions, the fiscal year in which amounts are distributed may differ from the fiscal year in which the income or net realized gain was recorded by the Fund.
The aggregate cost of securities and other investments and the composition of unrealized appreciation and depreciation of securities and other investments for federal income tax purposes as of June 29, 2012 are noted in the following table. The primary difference between book and tax appreciation or depreciation of securities and other investments, if applicable, is attributable to the tax deferral of losses or tax realization of financial statement unrealized gain or loss.
| | | | |
| Federal tax cost of securities | | $ | 252,086,136 | |
| Federal tax cost of other investments | | | (14,899,763) | |
| | |
|
|
|
| Total federal tax cost | | $ | 237,186,373 | |
| | |
|
|
|
| |
| Gross unrealized appreciation | | $ | 8,129,939 | |
| Gross unrealized depreciation | | | (5,317,161) | |
| | |
|
|
|
| Net unrealized appreciation | | $ | 2,812,778 | |
| | |
|
|
|
Trustees’ Compensation. The Board of Trustees has adopted a compensation deferral plan for independent trustees that enables trustees to elect to defer receipt of all or a portion of the annual compensation they are entitled to receive from the Fund. For purposes of determining the amount owed to the Trustee under the plan, deferred amounts are treated as though equal dollar amounts had been invested in shares of the Fund or in other Oppenheimer funds selected by the Trustee. The Fund purchases shares of the funds selected for deferral by the Trustee in amounts equal to his or her deemed investment, resulting in a Fund asset equal to the deferred compensation liability. Such assets are included as a component of “Other” within the asset section of the Statement of Assets and Liabilities. Deferral of trustees’ fees under the plan will not affect the net assets of the Fund, and will not materially affect the Fund’s assets, liabilities or net investment income per share. Amounts will be deferred until distributed in accordance with the compensation deferral plan.
Dividends and Distributions to Shareholders. Dividends and distributions to shareholders, which are determined in accordance with income tax regulations and may differ from U.S. generally accepted accounting principles, are recorded on the ex-dividend date. Income and capital gain distributions, if any, are declared and paid annually or at other times as deemed necessary by the Manager. The tax character of distributions is determined as of the Fund’s fiscal year end. Therefore, a portion of the Fund’s distributions made to shareholders prior to the Fund’s fiscal year end may ultimately be categorized as a tax return of capital.
Investment Income. Dividend income is recorded on the ex-dividend date or upon ex-dividend notification in the case of certain foreign dividends where the ex-dividend date may have passed. Non-cash dividends included in dividend income, if any, are recorded at the fair market value of the securities received. Interest income is recognized on an accrual basis. Discount and premium, which are included in interest income on the Statement of Operations, are amortized or accreted daily.
Custodian Fees. “Custodian fees and expenses” in the Statement of Operations may include interest expense incurred by the Fund on any cash overdrafts of its custodian account during the period. Such cash overdrafts may result from the effects of failed trades in portfolio securities and from cash outflows resulting from unanticipated shareholder
26 | OPPENHEIMER CORE BOND FUND/VA
|
redemption activity. The Fund pays interest to its custodian on such cash overdrafts, to the extent they are not offset by positive cash balances maintained by the Fund, at a rate equal to the Federal Funds Rate plus 0.50%. The “Reduction to custodian expenses” line item, if applicable, represents earnings on cash balances maintained by the Fund during the period. Such interest expense and other custodian fees may be paid with these earnings.
Security Transactions. Security transactions are recorded on the trade date. Realized gains and losses on securities sold are determined on the basis of identified cost.
Indemnifications. The Fund’s organizational documents provide current and former trustees and officers with a limited indemnification against liabilities arising in connection with the performance of their duties to the Fund. In the normal course of business, the Fund may also enter into contracts that provide general indemnifications. The Fund’s maximum exposure under these arrangements is unknown as this would be dependent on future claims that may be made against the Fund. The risk of material loss from such claims is considered remote.
Other. The preparation of financial statements in conformity with accounting principles generally accepted in the United States of America requires management to make estimates and assumptions that affect the reported amounts of assets and liabilities and disclosure of contingent assets and liabilities at the date of the financial statements and the reported amounts of increases and decreases in net assets from operations during the reporting period. Actual results could differ from those estimates.
2. Securities Valuation
The Fund calculates the net asset value of its shares as of the close of the New York Stock Exchange (the “Exchange”), normally 4:00 P.M. Eastern time, on each day the Exchange is open for trading.
The Fund’s Board has adopted procedures for the valuation of the Fund’s securities and has delegated the day-to-day responsibility for valuation determinations under those procedures to the Manager. The Manager has established a Valuation Committee which is responsible for determining a “fair valuation” for any security for which market quotations are not “readily available.” The Valuation Committee’s fair valuation determinations are subject to review, approval and ratification by the Fund’s Board at its next regularly scheduled meeting covering the calendar quarter in which the fair valuation was determined.
Valuation Methods and Inputs
Securities are valued using unadjusted quoted market prices, when available, as supplied primarily by third party pricing services or dealers.
The following methodologies are used to determine the market value or the fair value of the types of securities described below:
Securities traded on a registered U.S. securities exchange (including exchange-traded derivatives other than futures and futures options) are valued based on the last sale price of the security reported on the principal exchange on which it is traded, prior to the time when the Fund’s assets are valued. In the absence of a sale, the security is valued at the last sale price on the prior trading day, if it is within the spread of the current day’s closing “bid” and “asked” prices, and if not, at the current day’s closing bid price. A security of a foreign issuer traded on a foreign exchange but not listed on a registered U.S. securities exchange is valued based on the last sale price on the principal exchange on which the security is traded, as identified by the third party pricing service used by the Manager, prior to the time when the Fund’s assets are valued. If the last sale price is unavailable, the security is valued at the most recent official closing price on the principal exchange on which it is traded. If the last sales price or official closing price for a foreign security is not available, the security is valued at the mean between the bid and asked price per the exchange or, if not available from the exchange, obtained from two dealers. If bid and asked prices are not available from either the exchange or two dealers, the security
27 | OPPENHEIMER CORE BOND FUND/VA
|
NOTES TO FINANCIAL STATEMENTS Unaudited / Continued
2. Securities Valuation Continued
is valued by using one of the following methodologies (listed in order of priority); (1) using a bid from the exchange, (2) the mean between the bid and asked price as provided by a single dealer, or (3) a bid from a single dealer.
Shares of a registered investment company that are not traded on an exchange are valued at that investment company’s net asset value per share.
Corporate and government debt securities (of U.S. or foreign issuers) and municipal debt securities, event-linked bonds, loans, mortgage-backed securities, collateralized mortgage obligations, and asset-backed securities are valued at the mean between the “bid” and “asked” prices utilizing evaluated prices obtained from third party pricing services or broker-dealers who may use matrix pricing methods to determine the evaluated prices.
Short-term money market type debt securities with a remaining maturity of sixty days or less are valued at cost adjusted by the amortization of discount or premium to maturity (amortized cost), which approximates market value. Short-term debt securities with a remaining maturity in excess of sixty days are valued at the mean between the “bid” and “asked” prices utilizing evaluated prices obtained from third party pricing services or broker-dealers.
Futures contracts and futures options traded on a commodities or futures exchange will be valued at the final settlement price or official closing price on the principal exchange as reported by such principal exchange at its trading session ending at, or most recently prior to, the time when the Fund’s assets are valued.
A description of the standard inputs that may generally be considered by the third party pricing vendors in determining their evaluated prices is provided below.
| | |
| Security Type | | Standard Inputs Generally Considered by Third-Party Pricing Vendors |
| Corporate debt, government debt, municipal, mortgage-backed and asset-backed securities | | Reported trade data, broker-dealer price quotations, benchmark yields, issuer spreads on comparable securities, the credit quality, yield, maturity, and other appropriate factors. |
| Loans | | Information obtained from market participants regarding reported trade data and broker-dealer price quotations. |
| Event-linked bonds | | Information obtained from market participants regarding reported trade data and broker-dealer price quotations. |
If a market value or price cannot be determined for a security using the methodologies described above, or if, in the “good faith” opinion of the Manager, the market value or price obtained does not constitute a “readily available market quotation,” or a significant event has occurred that would materially affect the value of the security the security is fair valued either (i) by a standardized fair valuation methodology applicable to the security type or the significant event as previously approved by the Valuation Committee and the Fund’s Board or (ii) as determined in good faith by the Manager’s Valuation Committee. The Valuation Committee considers all relevant facts that are reasonably available, through either public information or information available to the Manager, when determining the fair value of a security. Fair value determinations by the Manager are subject to review, approval and ratification by the Fund’s Board at its next regularly scheduled meeting covering the calendar quarter in which the fair valuation was determined. Those fair valuation standardized methodologies include, but are not limited to, valuing securities at the last sale price or initially at cost and subsequently adjusting the value based on: changes in company specific fundamentals, changes in an appropriate securities index, or changes in the value of similar securities which may be further adjusted for any discounts related to security-specific resale restrictions. When possible, such methodologies use observable market inputs such as unadjusted quoted prices of similar securities, observable interest rates, currency rates and yield curves. The methodologies used for valuing securities are not necessarily an indication of the risks associated with investing in those securities nor can it be assured that the Fund can obtain the fair value assigned to a security if it were to sell the security.
To assess the continuing appropriateness of security valuations, the Manager, or its third party service provider who is subject to oversight by the Manager, regularly compares prior day prices, prices on comparable securities, and sale prices to the current day prices and challenges those prices exceeding certain tolerance levels with the third party pricing service or broker source. For those securities valued by fair valuations, whether through a standardized fair valuation
28 | OPPENHEIMER CORE BOND FUND/VA
|
methodology or a fair valuation determination, the Valuation Committee reviews and affirms the reasonableness of the valuations based on such methodologies and fair valuation determinations on a regular basis after considering all relevant information that is reasonably available.
Classifications
Each investment asset or liability of the Fund is assigned a level at measurement date based on the significance and source of the inputs to its valuation. Various data inputs are used in determining the value of each of the Fund’s investments as of the reporting period end. These data inputs are categorized in the following hierarchy under applicable financial accounting standards:
| | 1) | Level 1—unadjusted quoted prices in active markets for identical assets or liabilities (including securities actively traded on a securities exchange) |
| | 2) | Level 2—inputs other than unadjusted quoted prices that are observable for the asset or liability (such as unadjusted quoted prices for similar assets and market corroborated inputs such as interest rates, prepayment speeds, credit risks, etc.) |
| | 3) | Level 3—significant unobservable inputs (including the Manager’s own judgments about assumptions that market participants would use in pricing the asset or liability). |
The inputs used for valuing securities are not necessarily an indication of the risks associated with investing in those securities.
The table below categorizes amounts that are included in the Fund’s Statement of Assets and Liabilities as of June 29, 2012 based on valuation input level:
| | | | | | | | | | | | | | | | |
| | | Level 1—
Unadjusted
Quoted Prices | | | Level 2—
Other Significant
Observable Inputs | | | Level 3—
Significant
Unobservable
Inputs | | | Value | |
| Assets Table | | | | | | | | | | | | | | | | |
| Investments, at Value: | | | | | | | | | | | | | | | | |
| Asset-Backed Securities | | $ | — | | | $ | 18,173,498 | | | $ | — | | | $ | 18,173,498 | |
| Mortgage-Backed Obligations | | | — | | | | 118,767,958 | | | | — | | | | 118,767,958 | |
| U.S. Government Obligations | | | — | | | | 3,815,556 | | | | — | | | | 3,815,556 | |
| Corporate Bonds and Notes | | | — | | | | 80,864,557 | | | | — | | | | 80,864,557 | |
| Investment Company | | | 33,155,457 | | | | — | | | | — | | | | 33,155,457 | |
| | |
|
|
| |
|
|
| |
|
|
| |
|
|
|
| Total Investments, at Value | | | 33,155,457 | | | | 221,621,569 | | | | — | | | | 254,777,026 | |
| Other Financial Instruments: | | | | | | | | | | | | | | | | |
| Futures margins | | | 23,553 | | | | — | | | | — | | | | 23,553 | |
| | |
|
|
| |
|
|
| |
|
|
| |
|
|
|
| Total Assets | | $ | 33,179,010 | | | $ | 221,621,569 | | | $ | — | | | $ | 254,800,579 | |
| | |
|
|
| |
|
|
| |
|
|
| |
|
|
|
| Liabilities Table | | | | | | | | | | | | | | | | |
| Other Financial Instruments: | | | | | | | | | | | | | | | | |
| Futures margins | | $ | (187,949 | ) | | $ | — | | | $ | — | | | $ | (187,949 | ) |
| | |
|
|
| |
|
|
| |
|
|
| |
|
|
|
| Total Liabilities | | $ | (187,949 | ) | | $ | — | | | $ | — | | | $ | (187,949 | ) |
| | |
|
|
| |
|
|
| |
|
|
| |
|
|
|
Currency contracts and forwards, if any, are reported at their unrealized appreciation/depreciation at measurement date, which represents the change in the contract’s value from trade date. Futures, if any, are reported at their variation margin at measurement date, which represents the amount due to/from the Fund at that date. All additional assets and liabilities included in the above table are reported at their market value at measurement date.
There have been no significant changes to the fair valuation methodologies of the Fund during the period.
29 | OPPENHEIMER CORE BOND FUND/VA
|
NOTES TO FINANCIAL STATEMENTS Unaudited / Continued
3. Shares of Beneficial Interest
The Fund has authorized an unlimited number of $0.001 par value shares of beneficial interest of each class. Transactions in shares of beneficial interest were as follows:
| | | | | | | | | | | | | | | | |
| | | Six Months Ended June 29, 2012 | | | Year Ended December 30, 2011 | |
| | | Shares | | | Amount | | | Shares | | | Amount | |
| Non-Service Shares | | | | | | | | | | | | | | | | |
| Sold | | | 510,341 | | | $ | 4,139,415 | | | | 1,525,561 | | | $ | 11,724,677 | |
| Dividends and/or distributions reinvested | | | 749,731 | | | | 5,870,393 | | | | 1,028,657 | | | | 7,632,636 | |
| Redeemed | | | (1,722,659 | ) | | | (13,882,362 | ) | | | (4,179,877 | ) | | | (32,141,808 | ) |
| | |
|
|
| |
|
|
| |
|
|
| |
|
|
|
| Net decrease | | | (462,587 | ) | | $ | (3,872,554 | ) | | | (1,625,659 | ) | | $ | (12,784,495 | ) |
| | |
|
|
| |
|
|
| |
|
|
| |
|
|
|
| | | | | | | | | | | | | |
| Service Shares | | | | | | | | | | | | | | | | |
| Sold | | | 1,982,805 | | | $ | 15,875,942 | | | | 2,658,754 | | | $ | 20,149,296 | |
| Dividends and/or distributions reinvested | | | 433,134 | | | | 3,356,788 | | | | 422,074 | | | | 3,102,242 | |
| Redeemed | | | (1,484,090 | ) | | | (11,799,750 | ) | | | (2,480,364 | ) | | | (18,915,961 | ) |
| | |
|
|
| |
|
|
| |
|
|
| |
|
|
|
| Net increase | | | 931,849 | | | $ | 7,432,980 | | | | 600,464 | | | $ | 4,335,577 | |
| | |
|
|
| |
|
|
| |
|
|
| |
|
|
|
4. Purchases and Sales of Securities
The aggregate cost of purchases and proceeds from sales of securities, other than short-term obligations and investments in IMMF, for the six months ended June 29, 2012, were as follows:
| | | | | | | | |
| | | Purchases | | | Sales | |
| Investment securities | | $ | 112,296,197 | | | $ | 112,527,041 | |
| U.S. government and government agency obligations | | | 3,632,196 | | | | 3,015,383 | |
| To Be Announced (TBA) mortgage-related securities | | | 489,373,619 | | | | 494,049,812 | |
5. Fees and Other Transactions with Affiliates
Management Fees. Under the investment advisory agreement, the Fund pays the Manager a management fee based on the daily net assets of the Fund at an annual rate as shown in the following table:
| | | | |
| Fee Schedule | | | |
| Up to $1 billion | | | 0.60 | % |
| Over $1 billion | | | 0.50 | |
Administration Service Fees. The Fund pays the Manager a fee of $1,500 per year for preparing and filing the Fund’s tax returns.
Transfer Agent Fees. OppenheimerFunds Services (“OFS”), a division of the Manager, acts as the transfer and shareholder servicing agent for the Fund. For the six months ended June 29, 2012, the Fund paid $92,370 to OFS for services to the Fund.
Distribution and Service Plan for Service Shares. The Fund has adopted a Distribution and Service Plan (the “Plan”) in accordance with Rule 12b-1 under the Investment Company Act of 1940 for Service shares to pay OppenheimerFunds Distributor, Inc. (the “Distributor”), for distribution related services, personal service and account maintenance for the Fund’s Service shares. Under the Plan, payments are made periodically at an annual rate of 0.25% of the daily net assets of Service shares of the Fund. The Distributor currently uses all of those fees to compensate sponsors of the insurance product that offers Fund shares, for providing personal service and maintenance of accounts of their variable contract owners that hold Service shares. These fees are paid out of the Fund’s assets on an on-going basis and increase operating
30 | OPPENHEIMER CORE BOND FUND/VA
|
expenses of the Service shares, which results in lower performance compared to the Fund’s shares that are not subject to a service fee. Fees incurred by the Fund under the Plan are detailed in the Statement of Operations.
Waivers and Reimbursements of Expenses. The Manager has voluntarily agreed to limit the Fund’s total annual operating expenses so that those expenses, as percentages of daily net assets, will not exceed the annual rate of 0.75% for Non-Service shares and 1.00% for Service shares. During the six months ended June 29, 2012, the Manager waived fees and/or reimbursed the Fund $4,631 and $2,350 for Non-Service and Service shares, respectively.
The Manager will waive fees and/or reimburse Fund expenses in an amount equal to the indirect management fees incurred through the Fund’s investment in IMMF. During the six months ended June 29, 2012, the Manager waived fees and/or reimbursed the Fund $13,785 for IMMF management fees.
Some of these undertakings may be modified or terminated at any time; some may not be modified or terminated until after one year from the date of the current prospectus, as indicated therein.
6. Risk Exposures and the Use of Derivative Instruments
The Fund’s investment objectives not only permit the Fund to purchase investment securities, they also allow the Fund to enter into various types of derivatives contracts, including, but not limited to, futures contracts, forward foreign currency exchange contracts, credit default swaps, interest rate swaps, total return swaps, and purchased and written options. In doing so, the Fund will employ strategies in differing combinations to permit it to increase, decrease, or change the level or types of exposure to market risk factors. Central to those strategies are features inherent to derivatives that make them more attractive for this purpose than equity and debt securities: they require little or no initial cash investment, they can focus exposure on only certain selected risk factors, and they may not require the ultimate receipt or delivery of the underlying security (or securities) to the contract. This may allow the Fund to pursue its objectives more quickly and efficiently than if it were to make direct purchases or sales of securities capable of effecting a similar response to market factors.
Market Risk Factors. In accordance with its investment objectives, the Fund may use derivatives to increase or decrease its exposure to one or more of the following market risk factors:
Commodity Risk. Commodity risk relates to the change in value of commodities or commodity indexes as they relate to increases or decreases in the commodities market. Commodities are physical assets that have tangible properties. Examples of these types of assets are crude oil, heating oil, metals, livestock, and agricultural products.
Credit Risk. Credit risk relates to the ability of the issuer to meet interest and principal payments, or both, as they come due. In general, lower-grade, higher-yield bonds are subject to credit risk to a greater extent than lower-yield, higher-quality bonds.
Equity Risk. Equity risk relates to the change in value of equity securities as they relate to increases or decreases in the general market.
Foreign Exchange Rate Risk. Foreign exchange rate risk relates to the change in the U.S. dollar value of a security held that is denominated in a foreign currency. The U.S. dollar value of a foreign currency denominated security will decrease as the dollar appreciates against the currency, while the U.S. dollar value will increase as the dollar depreciates against the currency.
Interest Rate Risk. Interest rate risk refers to the fluctuations in value of fixed-income securities resulting from the inverse relationship between price and yield. For example, an increase in general interest rates will tend to reduce the market value of already issued fixed-income investments, and a decline in general interest rates will tend to increase their value. In addition, debt securities with longer maturities, which tend to have higher yields, are subject to potentially greater fluctuations in value from changes in interest rates than obligations with shorter maturities.
31 | OPPENHEIMER CORE BOND FUND/VA
|
NOTES TO FINANCIAL STATEMENTS Unaudited / Continued
6. Risk Exposures and the Use of Derivative Instruments Continued
Volatility Risk. Volatility risk refers to the magnitude of the movement, but not the direction of the movement, in a financial instrument’s price over a defined time period. Large increases or decreases in a financial instrument’s price over a relative time period typically indicate greater volatility risk, while small increases or decreases in its price typically indicate lower volatility risk.
The Fund’s actual exposures to these market risk factors during the period are discussed in further detail, by derivative type, below.
Risks of Investing in Derivatives. The Fund’s use of derivatives can result in losses due to unanticipated changes in the market risk factors and the overall market. In instances where the Fund is using derivatives to decrease, or hedge, exposures to market risk factors for securities held by the Fund, there are also risks that those derivatives may not perform as expected resulting in losses for the combined or hedged positions.
Derivatives may have little or no initial cash investment relative to their market value exposure and therefore can produce significant gains or losses in excess of their cost. This use of embedded leverage allows the Fund to increase its market value exposure relative to its net assets and can substantially increase the volatility of the Fund’s performance.
Additional associated risks from investing in derivatives also exist and potentially could have significant effects on the valuation of the derivative and the Fund. Typically, the associated risks are not the risks that the Fund is attempting to increase or decrease exposure to, per its investment objectives, but are the additional risks from investing in derivatives. Examples of these associated risks are liquidity risk, which is the risk that the Fund will not be able to sell the derivative in the open market in a timely manner, and counterparty credit risk, which is the risk that the counterparty will not fulfill its obligation to the Fund. Associated risks can be different for each type of derivative and are discussed by each derivative type in the notes that follow.
Valuations of derivative instruments as of June 29, 2012 are as follows:
| | | | | | | | | | | | |
| | | Asset Derivatives
| | | Liability Derivatives
| |
Derivatives Not Accounted for as Hedging Instruments | | Statement of Assets and Liabilities Location | | Value | | | Statement of Assets and Liabilities Location | | Value | |
| Interest rate contracts | | Futures margins | | | $23,553 | * | | Futures margins | | | $187,949 | * |
*Includes only the current day’s variation margin. Prior variation margin movements have been reflected in cash on the Statement of Assets and Liabilities upon receipt or payment.
The effect of derivative instruments on the Statement of Operations is as follows:
| | | | |
| Amount of Realized Gain or (Loss) Recognized on Derivatives | |
Derivatives Not Accounted
for as Hedging Instruments | | Closing and expiration
of futures contracts | |
| Interest rate contracts | | | $317,518 | |
|
| Amount of Change in Unrealized Gain or (Loss) Recognized on Derivatives | |
Derivatives Not Accounted
for as Hedging Instruments | | Futures contracts | |
| Interest rate contracts | | | $35,672 | |
Futures Contracts
A futures contract is a commitment to buy or sell a specific amount of a financial instrument, or currency, at a negotiated price on a stipulated future date. The Fund may buy and sell futures contracts and may also buy or write put or call options on these futures contracts.
Futures contracts traded on a commodities or futures exchange will be valued at the final settlement price or official closing price on the principal exchange as reported by such principal exchange at its trading session ending at, or most recently prior to, the time when the Fund’s assets are valued.
32 | OPPENHEIMER CORE BOND FUND/VA
|
Upon entering into a futures contract, the Fund is required to deposit either cash or securities (initial margin) in an amount equal to a certain percentage of the contract value. Subsequent payments (variation margin) are made or received by the Fund each day. The variation margin payments are equal to the daily changes in the contract value and are recorded as unrealized gains and losses.
Futures contracts are reported on a schedule following the Statement of Investments. Securities held in collateralized accounts to cover initial margin requirements on open futures contracts are noted in the Statement of Investments. Cash held by the broker to cover initial margin requirements on open futures contracts and the receivable and/or payable for the daily mark to market for the variation margin are noted in the Statement of Assets and Liabilities. The net change in unrealized appreciation and depreciation is reported in the Statement of Operations. Realized gains (losses) are reported in the Statement of Operations at the closing or expiration of futures contracts.
The Fund has purchased futures contracts on various bonds and notes to increase exposure to interest rate risk.
The Fund has sold futures contracts on various bonds and notes to decrease exposure to interest rate risk.
During the six months ended June 29, 2012, the Fund had an ending monthly average market value of $14,003,670 and $34,545,669 on futures contracts purchased and sold, respectively.
Additional associated risks of entering into futures contracts (and related options) include the possibility that there may be an illiquid market where the Fund is unable to liquidate the contract or enter into an offsetting position and, if used for hedging purposes, the risk that the price of the contract will correlate imperfectly with the prices of the Fund’s securities.
7. Restricted Securities
As of June 29, 2012, investments in securities included issues that are restricted. A restricted security may have a contractual restriction on its resale and is valued under methods approved by the Board of Trustees as reflecting fair value. Securities that are restricted are marked with an applicable footnote on the Statement of Investments. Restricted securities are reported on a schedule following the Statement of Investments.
8. Pending Litigation
Since 2009, a number of class action, derivative and individual lawsuits have been pending in federal and state courts against OppenheimerFunds, Inc., the Fund’s investment advisor (the “Manager”), OppenheimerFunds Distributor, Inc., the Fund’s principal underwriter and distributor (the “Distributor”), and certain funds (but not including the Fund) advised by the Manager and distributed by the Distributor (the “Defendant Funds”). Several of these lawsuits also name as defendants certain officers and current and former trustees of the respective Defendant Funds. The lawsuits raise claims under federal securities laws and various states’ securities, consumer protection and common law and allege, among other things, that the disclosure documents of the respective Defendant Funds contained misrepresentations and omissions and that the respective Defendant Funds’ investment policies were not followed. The plaintiffs in these actions seek unspecified damages, equitable relief and awards of attorneys’ fees and litigation expenses.
Other class action and individual lawsuits have been filed since 2008 in various state and federal courts against the Manager and certain of its affiliates by investors seeking to recover investments they allegedly lost as a result of the “Ponzi” scheme run by Bernard L. Madoff and his firm, Bernard L. Madoff Investment Securities, LLC (“BLMIS”). Plaintiffs in these suits allege that they suffered losses as a result of their investments in several funds managed by an affiliate of the Manager and assert a variety of claims, including breach of fiduciary duty, fraud, negligent misrepresentation, unjust enrichment, and violation of federal and state securities laws and regulations, among others. They seek unspecified damages, equitable relief and awards of attorneys’ fees and litigation expenses. Neither the Distributor, nor any of the Oppenheimer mutual funds, their independent trustees or directors are named as defendants in these lawsuits. None of the Oppenheimer mutual funds invested in any funds or accounts managed by Madoff or BLMIS. On February 28, 2011,
33 | OPPENHEIMER CORE BOND FUND/VA
|
NOTES TO FINANCIAL STATEMENTS Unaudited / Continued
8. Pending Litigation Continued
a stipulation of partial settlement of three groups of consolidated putative class action lawsuits relating to these matters was filed in the U.S. District Court for the Southern District of New York. On August 19, 2011, the court entered an order and final judgment approving the settlement as fair, reasonable and adequate. In September 2011, certain parties filed notices of appeal from the court’s order approving the settlement. On July 29, 2011, a stipulation of settlement between certain affiliates of the Manager and the Trustee appointed under the Securities Investor Protection Act to liquidate BLMIS was filed in the U.S. Bankruptcy Court for the Southern District of New York to resolve purported preference and fraudulent transfer claims by the Trustee. On September 22, 2011, the court entered an order approving the settlement as fair, reasonable and adequate. In October 2011, certain parties filed notices of appeal from the court’s order approving the settlement. The aforementioned settlements do not resolve other outstanding lawsuits against the Manager and its affiliates relating to BLMIS.
On April 16, 2010, a lawsuit was filed in New York state court against the Manager, an affiliate of the Manager and AAArdvark IV Funding Limited (“AAArdvark IV”), an entity advised by the Manager’s affiliate, in connection with investments made by the plaintiffs in AAArdvark IV. Plaintiffs allege breach of contract against the defendants and seek compensatory damages, costs and disbursements, including attorney fees. On July 15, 2011, a lawsuit was filed in New York state court against the Manager, an affiliate of the Manager and AAArdvark Funding Limited (“AAArdvark I”), an entity advised by the Manager’s affiliate, in connection with investments made by the plaintiffs in AAArdvark I. The complaint alleges breach of contract against the defendants and seeks compensatory damages, costs and disbursements, including attorney fees. On November 9, 2011, a lawsuit was filed in New York state court against the Manager, an affiliate of the Manager and AAArdvark XS Funding Limited (“AAArdvark XS”), an entity advised by the Manager’s affiliate, in connection with investments made by the plaintiffs in AAArdvark XS. The complaint alleges breach of contract against the defendants and seeks compensatory damages, costs and disbursements, including attorney fees.
The Manager believes the lawsuits and appeals described above are without legal merit and, with the exception of actions it has settled, is defending against them vigorously. The Defendant Funds’ Boards of Trustees have also engaged counsel to represent the Funds and the present and former Independent Trustees named in those suits. While it is premature to render any opinion as to the outcome in these lawsuits, or whether any costs that the Defendant Funds may bear in defending the suits might not be reimbursed by insurance, the Manager believes that these suits should not impair the ability of the Manager or the Distributor to perform their respective duties to the Fund, and that the outcome of all of the suits together should not have any material effect on the operations of any of the Oppenheimer mutual funds.
34 | OPPENHEIMER CORE BOND FUND/VA
|
SPECIAL SHAREHOLDER MEETING Unaudited
On February 29, 2012, a shareholder meeting of the Oppenheimer Variable Account Funds, on behalf of Oppenheimer Core Bond Fund/VA (the “Fund”) was held at which the twelve Trustees identified below were elected to the Trust (Proposal No. 1). At the meeting Proposal No. 2 (including all of its sub-proposals) and Proposal No. 3 were approved as described in the Fund’s proxy statement for that meeting. The following is a report of the votes cast:
| | | | | | | | |
| Nominee/Proposal | | For | | | Withheld | |
| Trustees | | | | | | | | |
| William L. Armstrong | | | 859,155,000 | | | | 36,277,763 | |
| Edward L. Cameron | | | 860,463,149 | | | | 34,969,615 | |
| Jon S. Fossel | | | 861,382,389 | | | | 34,050,375 | |
| Sam Freedman | | | 860,173,958 | | | | 35,258,806 | |
| Richard F. Grabish | | | 862,692,974 | | | | 32,739,789 | |
| Beverly L. Hamilton | | | 862,904,192 | | | | 32,528,571 | |
| Robert J. Malone | | | 862,354,488 | | | | 33,078,275 | |
| F. William Marshall, Jr. | | | 860,997,182 | | | | 34,435,581 | |
| Victoria J. Herget | | | 861,814,105 | | | | 33,618,659 | |
| Karen L. Stuckey | | | 861,434,246 | | | | 33,998,517 | |
| James D. Vaughn | | | 861,208,178 | | | | 34,224,585 | |
| William F. Glavin, Jr. | | | 861,148,846 | | | | 34,283,917 | |
2a: Proposal to revise the fundamental policy relating to borrowing
| | | | | | | | | | | | |
| For | | Against | | | Abstain | | | Broker Non Vote | |
| 20,280,711 | | | 1,096,313 | | | | 1,128,381 | | | | N/A | |
2b: Proposal to revise the fundamental policy relating to concentration of investments
| | | | | | | | | | | | |
| For | | Against | | | Abstain | | | Broker Non Vote | |
| 20,419,547 | | | 1,106,922 | | | | 978,937 | | | | N/A | |
2c: Proposal to remove the fundamental policy relating to diversification of investments
| | | | | | | | | | | | |
| For | | Against | | | Abstain | | | Broker Non Vote | |
| 20,054,108 | | | 1,245,742 | | | | 1,205,556 | | | | N/A | |
2d: Proposal to revise the fundamental policy relating to lending
| | | | | | | | | | | | |
| For | | Against | | | Abstain | | | Broker Non Vote | |
| 20,319,631 | | | 1,066,597 | | | | 1,119,178 | | | | N/A | |
2e-1: Proposal to revise the fundamental policy relating to real estate and commodities
| | | | | | | | | | | | |
| For | | Against | | | Abstain | | | Broker Non Vote | |
| 20,150,952 | | | 1,171,521 | | | | 1,182,933 | | | | N/A | |
2e-2: Proposal to remove the additional fundamental policy relating to real estate and commodities
| | | | | | | | | | | | |
| For | | Against | | | Abstain | | | Broker Non Vote | |
| 20,075,505 | | | 1,263,179 | | | | 1,166,722 | | | | N/A | |
2f: Proposal to revise the fundamental policy relating to senior securities
| | | | | | | | | | | | |
| For | | Against | | | Abstain | | | Broker Non Vote | |
| 20,151,248 | | | 1,164,958 | | | | 1,189,199 | | | | N/A | |
35 | OPPENHEIMER CORE BOND FUND/VA
|
SPECIAL SHAREHOLDER MEETING Unaudited / Continued
2g: Proposal to revise the fundamental policy relating to underwriting
| | | | | | | | | | | | |
| For | | Against | | | Abstain | | | Broker Non Vote | |
| 20,255,607 | | | 1,113,113 | | | | 1,136,686 | | | | N/A | |
2i: Convert the Fund’s investment objective from fundamental to non-fundamental
| | | | | | | | | | | | |
| For | | Against | | | Abstain | | | Broker Non Vote | |
| 19,902,096 | | | 1,245,377 | | | | 1,357,933 | | | | N/A | |
2j: Approve a change in the fund’s investment objective
| | | | | | | | | | | | |
| For | | Against | | | Abstain | | | Broker Non Vote | |
| 20,177,574 | | | 1,182,437 | | | | 1,145,395 | | | | N/A | |
Proposal 3: To approve an Agreement and Plan of Reorganization that provides for the reorganization of a Fund from a Maryland corporation or Massachusetts business trust, as applicable, into a Delaware statutory trust.
| | | | | | | | | | | | |
| For | | Against | | | Abstain | | | Broker Non Vote | |
| 821,085,084 | | | 23,597,959 | | | | 50,749,721 | | | | N/A | |
36 | OPPENHEIMER CORE BOND FUND/VA
|
PORTFOLIO PROXY VOTING POLICIES AND PROCEDURES;
UPDATES TO STATEMENTS OF INVESTMENTS Unaudited
The Fund has adopted Portfolio Proxy Voting Policies and Procedures under which the Fund votes proxies (“portfolio proxies”) relating to securities held by the Fund. A description of the Fund’s Portfolio Proxy Voting Policies and Procedures is available (i) without charge, upon request, by calling the Fund toll-free at 1.800.CALL OPP (225.5677), (ii) on the Fund’s website at oppenheimerfunds.com, and (iii) on the SEC’s website at www.sec.gov. In addition, the Fund is required to file Form N-PX, with its complete proxy voting record for the 12 months ended June 30th, no later than August 31st of each year. The Fund’s voting record is available (i) without charge, upon request, by calling the Fund toll-free at 1.800.525.7048, and (ii) in the Fund’s Form N-PX filing on the SEC’s website at www.sec.gov.
The Fund files its complete schedule of portfolio holdings with the SEC for the first quarter and the third quarter of each fiscal year on Form N-Q. The Fund’s Form N-Q filings are available on the SEC’s website at www.sec.gov. Those forms may be reviewed and copied at the SEC’s Public Reference Room in Washington, D.C. Information on the operation of the Public Reference Room may be obtained by calling 1-800-SEC-0330.
37 | OPPENHEIMER CORE BOND FUND/VA
|
OPPENHEIMER CORE BOND FUND/VA
| | |
| A Series of Oppenheimer Variable Account Funds |
| Trustees and Officers | | William L. Armstrong, Chairman of the Board of Trustees and Trustee Edward L. Cameron, Trustee Jon S. Fossel, Trustee Sam Freedman, Trustee Richard F. Grabish, Trustee Beverly L. Hamilton, Trustee Victoria J. Herget, Trustee Robert J. Malone, Trustee F. William Marshall, Jr., Trustee Karen L. Stuckey, Trustee James D. Vaughn, Trustee William F. Glavin, Jr., Trustee, President and Principal Executive Officer Krishna Memani, Vice President Peter A. Strzalkowski, Vice President Arthur S. Gabinet, Secretary and Chief Legal Officer Christina M. Nasta, Vice President and Chief Business Officer Mark S. Vandehey, Vice President and Chief Compliance Officer Brian W. Wixted, Treasurer and Principal Financial & Accounting Officer |
| Manager | | OppenheimerFunds, Inc. |
| Distributor | | OppenheimerFunds Distributor, Inc. |
| Transfer Agent | | OppenheimerFunds Services |
| Independent Registered Public Accounting Firm | | KPMG LLP |
| Counsel | | K&L Gates LLP |
Before investing, investors should carefully consider a fund’s investment objectives, risks, charges and expenses. Fund prospectuses and summary prospectuses contain this and other information about the funds and may be obtained by asking your financial advisor, or calling us at 1.800.988.8287. Read prospectuses and summary prospectuses carefully before investing.
The financial statements included herein have been taken from the records of the Fund without examination of those records by the independent auditors.
| | |
| ©2012 OppenheimerFunds, Inc. All rights reserved. | |  |
June 30, 2012
| | | | |
| | | Oppenheimer Global Securities Fund/VA A Series of Oppenheimer Variable Account Funds | | Semiannual Report |

SEMIANNUAL REPORT
Fund Performance Discussion
Listing of Top Holdings
Financial Statements

OPPENHEIMER GLOBAL SECURITIES FUND/VA
Portfolio Manager: Rajeev Bhaman, CFA
| | | | | | |
Cumulative Total Returns
For the 6-Month Period Ended 6/29/121 |
| Non-Service Shares | | 4.87% | | | | |
| Service Shares | | 4.75 | | | | |
| Class 3 Shares | | 4.88 | | | | |
| Class 4 Shares | | 4.75 | | | | |
Average Annual Total Returns
For the Periods Ended 6/29/121 | | |
| | | |
| | | 1-Year | | 5-Year | | 10-Year |
| Non-Service Shares | | -10.57% | | -1.79% | | 6.67% |
| Service Shares | | -10.79% | | -2.04% | | 6.41% |
| | | |
| | | 1-Year | | 5-Year | | Since
Inception
(5/1/03) |
| Class 3 Shares | | -10.56% | | -1.80% | | 9.42% |
| | | |
| | | 1-Year | | 5-Year | | Since
Inception
(5/3/04) |
| Class 4 Shares | | -10.79% | | -2.04% | | 5.30% |
Expense Ratios
For the Fiscal Year Ended 12/30/111 | | |
| Non-Service Shares | | 0.76% | | | | |
| Service Shares | | 1.01 | | | | |
| Class 3 Shares | | 0.76 | | | | |
| Class 4 Shares | | 1.01 | | | | |
The performance data quoted represents past performance, which does not guarantee future results. The investment return and principal value of an investment in the Fund will fluctuate so that an investor’s shares, when redeemed, may be worth more or less than their original cost. Current performance and expense ratios may be lower or higher than the data quoted. For performance data current to the most recent month end, call us at 1.800.988.8287. The Fund’s total returns should not be expected to be the same as the returns of other funds, whether or not both funds have the same portfolio managers and/or similar names. The Fund’s total returns do not include the charges associated with the separate account products that offer this Fund. Such performance would have been lower if such charges were taken into account. Expense ratios are as stated in the Fund’s prospectus current as of the date of this report.
Regional Allocation
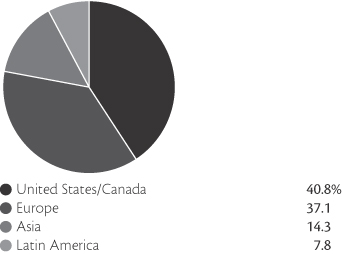
Portfolio holdings and allocations are subject to change. Percentages are as of June 29, 2012, and are based on the total market value of investments.
| | |
| Top Ten Common Stock Holdings | | |
| Telefonaktiebolaget LM Ericsson, B Shares | | 3.5% |
| eBay, Inc. | | 3.1 |
| Siemens AG | | 2.3 |
| Colgate-Palmolive Co. | | 2.1 |
| SAP AG | | 2.0 |
| Walt Disney Co. (The) | | 2.0 |
| Altera Corp. | | 2.0 |
| McDonald’s Corp. | | 1.9 |
| Fomento Economico Mexicano SA de CV, UBD | | 1.9 |
| European Aeronautic Defense & Space Co. | | 1.9 |
Portfolio holdings and allocations are subject to change. Percentages are as of June 29, 2012, and are based on net assets.
2 | OPPENHEIMER GLOBAL SECURITIES FUND/VA
|
FUND PERFORMANCE DISCUSSION
The Fund’s Non-Service shares returned 4.87% during the six-month reporting period. In comparison, the Fund underperformed the MSCI World Index (the “Index”), which returned 5.91%.1 The Fund’s underperformance relative to the Index stemmed primarily from weaker relative stock selection within the information technology and financials sectors. The greatest area of outperformance for the Fund was energy, where an underweight position to what was the weakest performing sector of the Index benefited performance. The Fund also outperformed the Index within the consumer staples and health care sectors due to stronger relative stock selection.
Economic and Market Environment
The period began during a time of improved market sentiment in which the United States managed to avoid a return to recession and European policymakers appeared to take steps to address the region’s sovereign debt and banking sector crises. Renewed investor optimism helped produce gains across a number of international equity markets over the first three months of 2012. The rebound across equities gained momentum after the European Central Bank implemented the Long-Term Refinancing Operation (“LTRO”) to enhance liquidity for troubled banks and reduce rates on newly issued sovereign debt securities.
However, the second quarter was a volatile time for global markets. The fear of contagion from the worsening European sovereign debt crisis and a recession across much of Europe drove negative market sentiment, particularly over May and June. Very high unemployment, soaring debt and higher borrowing costs in Greece, Spain and Italy contributed to serious questions over how to implement austerity measures and restructure debt or instead take a different tact and provide some or all of those countries with additional funds. Perhaps most worrisome of all to investors was the possibility of Greece pulling out of the euro and its ramifications for the future of the Eurozone and its common currency. In the U.S., slower-than-expected first-quarter growth also contributed to a sell-off in the stock market. Consumer confidence dropped as U.S. unemployment figures ticked slightly upwards after showing signs of improvement from the recession highs. However, the period ended on a positive note for the markets. The results of elections in Greece and continued efforts by European policymakers to stabilize the situation in the region appeared to soothe market jitters slightly in the final days of the period.
Fund Review
During the reporting period, the strongest individual stock contributors were eBay, Inc., Amylin Pharmaceuticals, Inc. and The Walt Disney Co. eBay provides online marketplaces, including its flagship e-commerce platform eBay.com, as well as StubHub, Half.com and Shopping.com. Online payment services are provided by PayPal and Bill Me Later. eBay does not compete with merchants, but continues to position itself as a commerce enabler across all selling platforms. We regard eBay as a global leader in the eCommerce ecosystem. Amylin Pharmaceuticals is a San Diego-based biopharmaceutical company. During the first quarter of 2012, Amylin announced that its Type II diabetes drug, Bydureon, injected once weekly may improve an adult patient’s ability to control blood sugar by helping the body make its own insulin only at the times it is needed. This triggered an initial buyout offer from Bristol-Myers Squibb, which Amylin rejected. Amylin’s shares rallied on the offer and the anticipated subsequent offers. Shortly after the reporting period ended, Amylin accepted a second offer from Bristol-Myers Squibb. Walt Disney performed well for the Fund, as the company reported stronger-than-expected earnings mainly driven by higher theme park attendance, thanks to warmer weather in North America, and by broadcasting (particularly ESPN). The company has many ways to monetize its different brands including its Disney theme parks and related merchandising, Pixar animation, Marvel comics, ESPN content and its distribution joint venture with DreamWorks. Disney also has plans to develop its network of theme parks, hotels and travel cruises in China and India. We like the company’s wide reach in comparison to its competitors.
1. June 29, 2012, was the last business day of the Fund’s semiannual period. See Note 1 of the accompanying Notes to Financial Statements. Index returns are calculated through June 30, 2012. December 30, 2011 was the last business day of the Fund’s 2011 fiscal year.
3 | OPPENHEIMER GLOBAL SECURITIES FUND/VA
|
FUND PERFORMANCE DISCUSSION
The most significant detractors from the Fund’s performance were Tiffany & Co., Iluka Resources Ltd. and Telefonaktiebolaget LM Ericsson (Ericsson). Tiffany, the American luxury goods brand, lowered its outlook for sales growth, which negatively impacted its stock price over the second half of the period. We retain our conviction in Tiffany as we believe the company’s strong brand should enable it to continue raising prices to mitigate rising product costs due to higher commodity prices. Iluka Resources is a mining company focused on the production of zircon and titanium-based products with operations in Australia and the U.S. It is the world’s largest producer of zircon. Iluka experienced declines over the second quarter of 2012 as heightened macroeconomic concerns weakened demand for its products, forcing it to dampen its sales forecast. Ericsson is a leading supplier to the mobile telecom service industry. The Swedish company’s stock had a volatile period, declining over the first quarter on the back of lower-than-expected earnings figures. A decrease in sales for its 3G CDMA technology also negatively impacted its stock price this period. We continue to believe in the stock, which was the top holding of the Fund at period end.
Outlook
We believe that our method of investment, which focuses on purchasing high quality companies positioned to capitalize on structural growth trends will serve us well in the periods to come. Purchasing shares of quality companies at attractive valuations offers the potential for those shares to substantially appreciate over our investment horizon of three to five years. Regardless of whether we are in a fast or a slow growth world, we believe the companies in the Fund have the potential to grow at or above the general rate of the economies in which they operate by virtue of the secular currents driving them and their advantages globally.
We have a long-term investment horizon and build the Fund from the bottom up, focusing on businesses advantaged by long-term trends. We invest in companies that we believe are capable of producing solid and sustainable growth through the business cycle, that have made strong returns on invested capital, and that demonstrate good cash flow generation characteristics. We are patient investors and generally wait for those companies to be out of favor so that they are reasonably priced when we buy.
Investors should consider the Fund’s investment objective, risks, and charges and expenses carefully before investing. The Fund’s prospectus and summary prospectus contain this and other information about the Fund, and may be obtained by asking your financial advisor or calling us at 1.800.988.8287. Read prospectuses and summary prospectuses carefully before investing.
Total returns include changes in share price and reinvestment of dividends and capital gains distributions in a hypothetical investment for the periods shown. Cumulative total returns are not annualized.
The Fund’s investment strategy and focus can change over time. The mention of specific fund holdings does not constitute a recommendation by OppenheimerFunds, Inc.
Shares of Oppenheimer funds are not deposits or obligations of any bank, are not guaranteed by any bank, are not insured by the FDIC or any other agency, and involve investment risks, including the possible loss of the principal amount invested.
4 | OPPENHEIMER GLOBAL SECURITIES FUND/VA
|
FUND EXPENSES
Fund Expenses. As a shareholder of the Fund, you incur two types of costs: (1) transaction costs and (2) ongoing costs, including management fees; distribution and service fees; and other Fund expenses. These examples are intended to help you understand your ongoing costs (in dollars) of investing in the Fund and to compare these costs with the ongoing costs of investing in other mutual funds.
The examples are based on an investment of $1,000.00 invested at the beginning of the period and held for the entire 6-month period ended June 29, 2012.
Actual Expenses. The first section of the table provides information about actual account values and actual expenses. You may use the information in this section for the class of shares you hold, together with the amount you invested, to estimate the expense that you paid over the period. Simply divide your account value by $1,000.00 (for example, an $8,600.00 account value divided by $1,000.00 = 8.60), then multiply the result by the number in the first section under the heading entitled “Expenses Paid During Period” to estimate the expenses you paid on your account during this period.
Hypothetical Example for Comparison Purposes. The second section of the table provides information about hypothetical account values and hypothetical expenses based on the Fund’s actual expense ratio for each class of shares, and an assumed rate of return of 5% per year for each class before expenses, which is not the actual return. The hypothetical account values and expenses may not be used to estimate the actual ending account balance or expenses you paid for the period. You may use this information to compare the ongoing costs of investing in the Fund and other funds. To do so, compare this 5% hypothetical example for the class of shares you hold with the 5% hypothetical examples that appear in the shareholder reports of the other funds.
Please note that the expenses shown in the table are meant to highlight your ongoing costs only and do not reflect any charges associated with the separate accounts that offer this Fund. Therefore, the “hypothetical” lines of the table are useful in comparing ongoing costs only, and will not help you determine the relative total costs of owning different funds. In addition, if these separate account charges were included your costs would have been higher.
| | | | | | | | | | | | |
| Actual | | Beginning
Account
Value
January 1, 2012 | | | Ending
Account
Value
June 29, 2012 | | | Expenses
Paid During
6 Months Ended
June 29, 2012 | |
| Non-Service Shares | | $ | 1,000.00 | | | $ | 1,048.70 | | | $ | 3.81 | |
| Service Shares | | | 1,000.00 | | | | 1,047.50 | | | | 5.08 | |
| Class 3 | | | 1,000.00 | | | | 1,048.80 | | | | 3.81 | |
| Class 4 | | | 1,000.00 | | | | 1,047.50 | | | | 5.08 | |
| | | |
Hypothetical
(5% return before expenses) | | | | | | | | | |
| Non-Service Shares | | | 1,000.00 | | | | 1,021.02 | | | | 3.75 | |
| Service Shares | | | 1,000.00 | | | | 1,019.78 | | | | 5.01 | |
| Class 3 | | | 1,000.00 | | | | 1,021.02 | | | | 3.75 | |
| Class 4 | | | 1,000.00 | | | | 1,019.78 | | | | 5.01 | |
Expenses are equal to the Fund’s annualized expense ratio for that class, multiplied by the average account value over the period, multiplied by 181/366 (to reflect the one-half year period). Those annualized expense ratios, excluding indirect expenses from affiliated fund, based on the 6-month period ended June 29, 2012 are as follows:
| | | | |
| Class | | Expense Ratios | |
| Non-Service shares | | | 0.75 | % |
| Service shares | | | 1.00 | |
| Class 3 | | | 0.75 | |
| Class 4 | | | 1.00 | |
The expense ratios reflect voluntary waivers and/or reimbursements of expenses by the Fund’s Manager. Some of these undertakings may be modified or terminated at any time, as indicated in the Fund’s prospectus. The “Financial Highlights” tables in the Fund’s financial statements, included in this report, also show the gross expense ratios, without such waivers or reimbursements and reduction to custodian expenses, if applicable.
5 | OPPENHEIMER GLOBAL SECURITIES FUND/VA
|
STATEMENT OF INVESTMENTS June 29, 2012* / Unaudited
| | | | | | | | |
| | | Shares | | | Value | |
| | | | | | | | | |
| Common Stocks—97.4% | |
| Consumer Discretionary—17.2% | |
| Diversified Consumer Services—0.0% | |
| Zee Learn Ltd.1 | | | 492,103 | | | $ | 223,423 | |
| Hotels, Restaurants & Leisure—4.0% | | | | | | | | |
| Carnival Corp. | | | 1,178,236 | | | | 40,378,143 | |
| Lottomatica SpA | | | 552,870 | | | | 10,680,015 | |
| McDonald’s Corp. | | | 521,140 | | | | 46,136,524 | |
| | | | | | |
|
|
|
| | | | | | | | 97,194,682 | |
| Household Durables—0.2% | |
| Sony Corp. | | | 293,300 | | | | 4,173,838 | |
| Leisure Equipment & Products—0.3% | |
| Nintendo Co. Ltd. | | | 61,000 | | | | 7,117,731 | |
| Media—4.7% | | | | | | | | |
| Grupo Televisa SA, Sponsored GDR | | | 1,165,476 | | | | 25,034,424 | |
| McGraw-Hill Cos., Inc. (The) | | | 634,460 | | | | 28,550,700 | |
| Walt Disney Co. (The) | | | 971,920 | | | | 47,138,120 | |
| Wire & Wireless India Ltd.1 | | | 2,281,600 | | | | 547,878 | |
| Zee Entertainment Enterprises Ltd. | | | 4,094,715 | | | | 10,765,723 | |
| | | | | | |
|
|
|
| | | | | | | | 112,036,845 | |
| Multiline Retail—1.0% | |
| Pinault-Printemps-Redoute SA | | | 164,970 | | | | 23,557,713 | |
| Specialty Retail—4.1% | | | | | |
| Abercrombie & Fitch Co., Cl. A | | | 350,430 | | | | 11,963,680 | |
| Industria de Diseno Textil SA | | | 433,646 | | | | 44,742,038 | |
| Kingfisher plc | | | 1,968,942 | | | | 8,902,578 | |
| Tiffany & Co. | | | 633,480 | | | | 33,542,766 | |
| | | | | | |
|
|
|
| | | | | | | | 99,151,062 | |
| Textiles, Apparel & Luxury Goods—2.9% | |
| Brunello Cucinelli SpA1 | | | 143,920 | | | | 2,047,154 | |
LVMH Moet Hennessy Louis
Vuitton SA | | | 281,770 | | | | 42,947,004 | |
| Tod’s SpA | | | 238,587 | | | | 23,967,193 | |
| | | | | | |
|
|
|
| | | | | | | | 68,961,351 | |
| Consumer Staples—9.9% | |
| Beverages—4.3% | | | | | | | | |
| Carlsberg AS, Cl. B | | | 199,346 | | | | 15,707,927 | |
| Companhia de Bebidas das Americas, Sponsored ADR, Preference | | | 614,175 | | | | 23,541,328 | |
| Fomento Economico Mexicano SA de CV, UBD | | | 5,141,501 | | | | 45,912,247 | |
| Grupo Modelo SA de CV, Series C | | | 2,015,307 | | | | 17,826,955 | |
| | | | | | |
|
|
|
| | | | | | | | 102,988,457 | |
| Food & Staples Retailing—0.5% | | | | | |
| E-Mart Co. Ltd. | | | 61,139 | | | | 13,428,868 | |
| | | | | | | | |
| | | Shares | | | Value | |
| | | | | | | | | |
| Food Products—3.0% | | | | | |
| Nestle SA | | | 456,400 | | | $ | 27,192,140 | |
| Unilever plc | | | 1,310,443 | | | | 44,002,283 | |
| | | | | | |
|
|
|
| | | | | | | | 71,194,423 | |
| Household Products—2.1% | | | | | |
| Colgate-Palmolive Co. | | | 475,810 | | | | 49,531,821 | |
| Energy—4.0% | | | | | | | | |
| Energy Equipment & Services—2.8% | | | | | | | | |
| Technip SA | | | 419,990 | | | | 43,828,169 | |
| Transocean Ltd. | | | 505,762 | | | | 22,622,734 | |
| | | | | | |
|
|
|
| | | | | | | | 66,450,903 | |
| Oil, Gas & Consumable Fuels—1.2% | | | | | | | | |
| Repsol YPF SA | | | 941,660 | | | | 15,140,229 | |
| Total SA | | | 277,850 | | | | 12,539,163 | |
| YPF SA, Sponsored ADR | | | 214,830 | | | | 2,653,151 | |
| | | | | | |
|
|
|
| | | | | | | | 30,332,543 | |
| Financials—13.6% | | | | | | | | |
| Capital Markets—3.3% | | | | | | | | |
| Credit Suisse Group AG | | | 1,266,800 | | | | 23,142,887 | |
| Goldman Sachs Group, Inc. (The) | | | 259,310 | | | | 24,857,457 | |
| UBS AG | | | 2,716,046 | | | | 31,762,518 | |
| | | | | | |
|
|
|
| | | | | | | | 79,762,862 | |
| Commercial Banks—4.7% | |
| Banco Bilbao Vizcaya Argentaria SA | | | 3,656,994 | | | | 26,357,315 | |
| ICICI Bank Ltd., Sponsored ADR | | | 961,860 | | | | 31,173,883 | |
| Itau Unibanco Holding SA, ADR, Preference | | | 1,642,800 | | | | 22,867,776 | |
| Societe Generale SA, Cl. A1 | | | 425,759 | | | | 10,038,193 | |
| Sumitomo Mitsui Financial Group, Inc. | | | 655,000 | | | | 21,607,711 | |
| | | | | | |
|
|
|
| | | | | | | | 112,044,878 | |
| Diversified Financial Services—0.9% | | | | | | | | |
| BM&F BOVESPA SA | | | 4,348,400 | | | | 21,931,437 | |
| Insurance—4.2% | | | | | | | | |
| Allianz SE | | | 324,402 | | | | 32,620,275 | |
| Dai-ichi Life Insurance Co. | | | 21,622 | | | | 25,046,857 | |
| Fidelity National Financial, Inc., Cl. A | | | 687,020 | | | | 13,232,005 | |
| Prudential plc | | | 2,651,717 | | | | 30,648,966 | |
| | | | | | |
|
|
|
| | | | | | | | 101,548,103 | |
| Real Estate Management & Development—0.5% | |
| DLF Ltd. | | | 3,100,027 | | | | 11,130,546 | |
| Health Care—10.5% | | | | | | | | |
| Biotechnology—3.7% | | | | | | | | |
| Amgen, Inc. | | | 353,590 | | | | 25,826,214 | |
| Amylin Pharmaceuticals, Inc.1 | | | 1,101,708 | | | | 31,101,217 | |
6 | OPPENHEIMER GLOBAL SECURITIES FUND/VA
|
| | | | | | | | |
| | | Shares | | | Value | |
| | | | | | | | | |
| Biotechnology Continued | | | | | | | | |
| Gilead Sciences, Inc.1 | | | 299,030 | | | $ | 15,334,258 | |
| Theravance, Inc.1 | | | 598,130 | | | | 13,290,449 | |
| ThromboGenics NV1 | | | 131,644 | | | | 3,548,491 | |
| | | | | | |
|
|
|
| | | | | | | | 89,100,629 | |
| Health Care Equipment & Supplies—1.4% | |
| Zimmer Holdings, Inc. | | | 531,810 | | | | 34,227,292 | |
| Health Care Providers & Services—3.1% | |
| Aetna, Inc. | | | 847,050 | | | | 32,840,129 | |
| WellPoint, Inc. | | | 657,315 | | | | 41,930,124 | |
| | | | | | |
|
|
|
| | | | | | | | 74,770,253 | |
| Pharmaceuticals—2.3% | |
| Allergan, Inc. | | | 93,810 | | | | 8,683,992 | |
| Bayer AG | | | 444,545 | | | | 32,055,608 | |
| Roche Holding AG | | | 74,409 | | | | 12,825,488 | |
| | | | | | |
|
|
|
| | | | | | | | 53,565,088 | |
| Industrials—12.3% | | | | | | | | |
| Aerospace & Defense—2.9% | |
| Embraer SA, ADR | | | 867,823 | | | | 23,023,344 | |
| European Aeronautic Defense & Space Co. | | | 1,297,340 | | | | 45,871,526 | |
| | | | | | |
|
|
|
| | | | | | | | 68,894,870 | |
| Air Freight & Logistics—0.2% | |
| United Parcel Service, Inc., Cl. B | | | 62,210 | | | | 4,899,660 | |
| Building Products—1.8% | |
| Assa Abloy AB, Cl. B | | | 1,514,863 | | | | 42,360,062 | |
| Construction & Engineering—0.6% | |
| FLSmidth & Co. AS | | | 282,798 | | | | 15,507,318 | |
| Electrical Equipment—2.0% | |
| Emerson Electric Co. | | | 461,440 | | | | 21,493,875 | |
| Nidec Corp. | | | 212,700 | | | | 16,130,004 | |
| Prysmian SpA | | | 683,137 | | | | 10,217,904 | |
| | | | | | |
|
|
|
| | | | | | | | 47,841,783 | |
| Industrial Conglomerates—3.8% | |
| 3M Co. | | | 397,600 | | | | 35,624,960 | |
| Siemens AG | | | 649,181 | | | | 54,568,789 | |
| | | | | | |
|
|
|
| | | | | | | | 90,193,749 | |
| Machinery—0.8% | |
| Fanuc Ltd. | | | 115,300 | | | | 18,943,472 | |
| Road & Rail—0.2% | |
| All America Latina Logistica | | | 1,308,600 | | | | 5,524,983 | |
| Information Technology—26.6% | | | | | | | | |
| Communications Equipment—4.4% | |
| Juniper Networks, Inc.1 | | | 1,426,760 | | | | 23,270,456 | |
| | | | | | | | |
| | | Shares | | | Value | |
| | | | | | | | | |
| Communications Equipment Continued | |
| Telefonaktiebolaget LM Ericsson, B Shares | | | 9,111,743 | | | $ | 83,050,170 | |
| | | | | | |
|
|
|
| | | | | | | | 106,320,626 | |
| Computers & Peripherals—0.4% | |
| Fusion-io, Inc.1 | | | 422,440 | | | | 8,824,772 | |
| Electronic Equipment & Instruments—3.6% | |
| Hoya Corp. | | | 686,800 | | | | 15,132,839 | |
| Keyence Corp. | | | 109,311 | | | | 27,034,582 | |
| Kyocera Corp. | | | 172,300 | | | | 14,877,598 | |
| Murata Manufacturing Co. Ltd. | | | 553,500 | | | | 29,035,646 | |
| | | | | | |
|
|
|
| | | | | | | | 86,080,665 | |
| Internet Software & Services—5.7% | |
| eBay, Inc.1 | | | 1,791,000 | | | | 75,239,910 | |
| Facebook, Inc., Cl. A1 | | | 607,960 | | | | 18,919,715 | |
| Google, Inc., Cl. A1 | | | 72,900 | | | | 42,287,103 | |
| | | | | | |
|
|
|
| | | | | | | | 136,446,728 | |
| IT Services—1.0% | |
| Infosys Ltd. | | | 557,544 | | | | 25,280,203 | |
| Semiconductors & Semiconductor Equipment—4.6% | |
| Altera Corp. | | | 1,387,340 | | | | 46,947,586 | |
| Maxim Integrated Products, Inc. | | | 1,475,275 | | | | 37,826,051 | |
| Taiwan Semiconductor Manufacturing Co. Ltd.1 | | | 9,048,184 | | | | 24,766,096 | |
| | | | | | |
|
|
|
| | | | | | | | 109,539,733 | |
| Software—6.9% | |
| Adobe Systems, Inc.1 | | | 1,012,583 | | | | 32,777,312 | |
| Intuit, Inc. | | | 762,290 | | | | 45,241,912 | |
| Microsoft Corp. | | | 1,331,090 | | | | 40,718,043 | |
| SAP AG | | | 818,930 | | | | 48,237,278 | |
| | | | | | |
|
|
|
| | | | | | | | 166,974,545 | |
| Materials—1.4% | | | | | | | | |
| Chemicals—0.8% | | | | | | | | |
| Linde AG | | | 125,495 | | | | 19,546,895 | |
| Metals & Mining—0.6% | |
| Iluka Resources Ltd. | | | 1,165,200 | | | | 13,653,912 | |
| Telecommunication Services—1.3% | | | | | | | | |
| Wireless Telecommunication Services—1.3% | |
| KDDI Corp. | | | 4,861 | | | | 31,355,113 | |
| Utilities—0.6% | | | | | | | | |
| Electric Utilities—0.6% | |
| Fortum OYJ | | | 809,831 | | | | 15,341,901 | |
| | | | | | |
|
|
|
Total Common Stocks
(Cost $1,869,289,545) | | | | | | | 2,337,955,738 | |
7 | OPPENHEIMER GLOBAL SECURITIES FUND/VA
|
STATEMENT OF INVESTMENTS Unaudited / Continued
| | | | | | | | |
| | | Shares | | | Value | |
| | | | | | | | | |
| Preferred Stocks—1.6% | | | | | | | | |
Bayerische Motoren Werke (BMW) AG, Preference
(Cost $28,429,596) | | | 771,969 | | | $ | 38,084,140 | |
| | | | | | | | |
| | | Shares | | | Value | |
| Investment Company—0.9% | | | | | | | | |
| Oppenheimer Institutional Money Market Fund, Cl. E, 0.20% 2,3 | | | | | | | | |
| (Cost $22,142,619) | | | 22,142,619 | | | $ | 22,142,619 | |
Total Investments, at Value
(Cost $1,919,861,760) | | | 99.9 | % | | | 2,398,182,497 | |
| Other Assets Net of Liabilities | |
| 0.1
|
| |
| 1,307,988
|
|
| Net Assets | |
| 100.0
| %
| | $
| 2,399,490,485
|
|
Footnotes to Statement of Investments
* June 29, 2012 represents the last business day of the Fund’s 2012 semiannual period. See Note 1 of the accompanying Notes.
1. Non-income producing security.
2. Is or was an affiliate, as defined in the Investment Company Act of 1940, at or during the period ended June 29, 2012, by virtue of the Fund owning at least 5% of the voting securities of the issuer or as a result of the Fund and the issuer having the same investment adviser. Transactions during the period in which the issuer was an affiliate are as follows:
| | | | | | | | | | | | | | | | |
| | | Shares
December 30, 2011a | | | Gross
Additions | | | Gross
Reductions | | | Shares
June 29, 2012 | |
| Oppenheimer Institutional Money Market Fund, Cl. E | | | 36,459,796 | | | | 121,959,315 | | | | 136,276,492 | | | | 22,142,619 | |
| | | | |
| | | | | | | | | Value | | | Income | |
| Oppenheimer Institutional Money Market Fund, Cl. E | | | | | | | | | | | $22,142,619 | | | | $24,209 | |
a. December 30, 2011 represents the last business day of the Fund’s 2011 fiscal year. See Note 1 of the accompanying Notes.
3. Rate shown is the 7-day yield as of June 29, 2012.
Distribution of investments representing geographic holdings, as a percentage of total investments at value, is as follows:
| | | | | | | | |
| Geographic Holdings | | Value | | | Percent | |
| United States | | $ | 977,401,599 | | | | 40.8 | % |
| Germany | | | 225,112,985 | | | | 9.4 | |
| Japan | | | 210,455,391 | | | | 8.8 | |
| France | | | 178,781,768 | | | | 7.4 | |
| Sweden | | | 125,410,232 | | | | 5.2 | |
| Brazil | | | 96,888,868 | | | | 4.0 | |
| Switzerland | | | 94,923,033 | | | | 4.0 | |
| Mexico | | | 88,773,626 | | | | 3.7 | |
| Spain | | | 86,239,582 | | | | 3.6 | |
| United Kingdom | | | 83,553,827 | | | | 3.5 | |
| India | | | 79,121,656 | | | | 3.3 | |
| Italy | | | 46,912,266 | | | | 2.0 | |
| Denmark | | | 31,215,245 | | | | 1.3 | |
| Taiwan | | | 24,766,096 | | | | 1.0 | |
| Finland | | | 15,341,901 | | | | 0.6 | |
| Australia | | | 13,653,912 | | | | 0.6 | |
| Korea, Republic of South | | | 13,428,868 | | | | 0.6 | |
| Belgium | | | 3,548,491 | | | | 0.1 | |
| Argentina | | | 2,653,151 | | | | 0.1 | |
| | |
|
|
| |
|
|
|
| Total | | $ | 2,398,182,497 | | | | 100.0 | % |
| | |
|
|
| |
|
|
|
8 | OPPENHEIMER GLOBAL SECURITIES FUND/VA
|
| | | | | | | | | | | | | | | | | | | | | | | | |
| Foreign Currency Exchange Contracts as of June 29, 2012 are as follows: | |
| Counterparty/Contract Description | | Buy/Sell | | | Contract Amount
(000’s) | | | Expiration
Dates | | | Value | | | Unrealized
Appreciation | | | Unrealized
Depreciation | |
| Deutsche Bank Securities Inc.: | | | | | | | | | | | | | | | | | | | | | | | | |
| Euro (EUR) | | | Buy | | | | 3,549 | EUR | | | 7/3/12 | | | $ | 4,491,435 | | | $ | 7,932 | | | $ | 437 | |
| Euro (EUR) | | | Sell | | | | 3,110 | EUR | | | 7/3/12-7/5/12 | | | | 3,935,809 | | | | 427 | | | | 6,927 | |
| | | | | | | | | | | | | | | | | | |
|
|
| |
|
|
|
| | | | | | | | | | | | | | | | | | | | 8,359 | | | | 7,364 | |
| State Street: | | | | | | | | | | | | | | | | | | | | | | | | |
| Euro (EUR) | | | Buy | | | | 7,515 | EUR | | | 7/3/12 | | | | 9,510,905 | | | | 158,618 | | | | — | |
| Euro (EUR) | | | Sell | | | | 7,950 | EUR | | | 7/3/12 | | | | 10,061,185 | | | | — | | | | 167,794 | |
| | | | | | | | | | | | | | | | | | |
|
|
| |
|
|
|
| | | | | | | | | | | | | | | | | | | | 158,618 | | | | 167,794 | |
| | | | | | | | | | | | | | | | | | |
|
|
| |
|
|
|
| Total unrealized appreciation and depreciation | | | | | | | | | | | | | | | | | | $ | 166,977 | | | $ | 175,158 | |
| | | | | | | | | | | | | | | | | | |
|
|
| |
|
|
|
See accompanying Notes to Financial Statements.
9 | OPPENHEIMER GLOBAL SECURITIES FUND/VA
|
STATEMENT OF ASSETS AND LIABILITIES Unaudited
| | | | |
| June 29, 20121 | | | |
| Assets | | | |
| Investments, at value—see accompanying statement of investments: | | | | |
| Unaffiliated companies (cost $1,897,719,141) | | $ | 2,376,039,878 | |
| Affiliated companies (cost $22,142,619) | |
| 22,142,619
|
|
| | | | 2,398,182,497 | |
| Cash | | | 381,726 | |
| Unrealized appreciation on foreign currency exchange contracts | | | 166,977 | |
| Receivables and other assets: | | | | |
| Investments sold | | | 13,996,743 | |
| Dividends | | | 3,665,502 | |
| Other | |
| 219,976
|
|
| Total assets | | | 2,416,613,421 | |
| Liabilities | | | |
| Unrealized depreciation on foreign currency exchange contracts | | | 175,158 | |
| Payables and other liabilities: | | | | |
| Investments purchased | | | 14,002,100 | |
| Shares of beneficial interest redeemed | | | 2,271,529 | |
| Distribution and service plan fees | | | 206,857 | |
| Transfer and shareholder servicing agent fees | | | 190,927 | |
| Foreign capital gains tax | | | 83,391 | |
| Shareholder communications | | | 69,866 | |
| Trustees’ compensation | | | 59,185 | |
| Other | |
| 63,923
|
|
| Total liabilities | | | 17,122,936 | |
| Net Assets | | $
| 2,399,490,485
|
|
| Composition of Net Assets | | | |
| Par value of shares of beneficial interest | | $ | 85,501 | |
| Additional paid-in capital | | | 1,917,862,020 | |
| Accumulated net investment income | | | 21,729,785 | |
| Accumulated net realized loss on investments and foreign currency transactions | | | (18,648,458 | ) |
| Net unrealized appreciation on investments and translation of assets and liabilities denominated in foreign currencies | |
| 478,461,637
|
|
| Net Assets | | $
| 2,399,490,485
|
|
| Net Asset Value Per Share | | | |
| Non-Service Shares: | | | | |
| Net asset value, redemption price per share and offering price per share (based on net assets of $1,149,827,372 and 40,844,752 shares of beneficial interest outstanding) | | | $28.15 | |
| Service Shares: | | | | |
| Net asset value, redemption price per share and offering price per share (based on net assets of $1,029,408,992 and 36,856,534 shares of beneficial interest outstanding) | | | $27.93 | |
| Class 3 Shares: | | | | |
| Net asset value, redemption price per share and offering price per share (based on net assets of $153,905,475 and 5,429,333 shares of beneficial interest outstanding) | | | $28.35 | |
| Class 4 Shares: | | | | |
| Net asset value, redemption price per share and offering price per share (based on net assets of $66,348,646 and 2,370,740 shares of beneficial interest outstanding) | | | $27.99 | |
1. June 29, 2012 represents the last business day of the Fund’s 2012 semiannual period. See Note 1 of the accompanying Notes.
See accompanying Notes to Financial Statements.
10 | OPPENHEIMER GLOBAL SECURITIES FUND/VA
|
STATEMENT OF OPERATIONS Unaudited
| | | | |
| For the Six Months Ended June 29, 20121 | | | |
| Investment Income | | | |
| Dividends: | | | | |
| Unaffiliated companies (net of foreign withholding taxes of $3,801,383) | | $ | 37,376,487 | |
| Affiliated companies | | | 24,209 | |
| Interest | |
| 972
|
|
| Total investment income | | | 37,401,668 | |
| Expenses | | | |
| Management fees | | | 7,866,551 | |
| Distribution and service plan fees: | | | | |
| Service shares | | | 1,312,995 | |
| Class 4 shares | | | 88,116 | |
| Transfer and shareholder servicing agent fees: | | | | |
| Non-Service shares | | | 600,153 | |
| Service shares | | | 525,252 | |
| Class 3 shares | | | 80,810 | |
| Class 4 shares | | | 35,243 | |
| Shareholder communications: | | | | |
| Non-Service shares | | | 21,398 | |
| Service shares | | | 18,752 | |
| Class 3 shares | | | 2,887 | |
| Class 4 shares | | | 1,256 | |
| Custodian fees and expenses | | | 117,043 | |
| Trustees’ compensation | | | 29,374 | |
| Administration service fees | | | 750 | |
| Other | |
| 72,796
|
|
| Total expenses | | | 10,773,376 | |
| Less waivers and reimbursements of expenses | |
| (10,946
| )
|
| Net expenses | | | 10,762,430 | |
| Net Investment Income | | | 26,639,238 | |
| Realized and Unrealized Gain (Loss) | | | |
| Net realized gain on: | | | | |
| Investments from unaffiliated companies | | | 25,811,902 | |
| Foreign currency transactions | |
| 8,188,782
|
|
| Net realized gain | | | 34,000,684 | |
| Net change in unrealized appreciation/depreciation on: | | | | |
| Investments (net of foreign capital gains tax of $93,435) | | | 90,330,813 | |
| Translation of assets and liabilities denominated in foreign currencies | |
| (33,244,199
| )
|
| Net change in unrealized appreciation/depreciation | | | 57,086,614 | |
| | |
| Net Increase in Net Assets Resulting from Operations | | $
| 117,726,536
|
|
1. June 29, 2012 represents the last business day of the Fund’s 2012 semiannual period. See Note 1 of the accompanying Notes.
See accompanying Notes to Financial Statements.
11 | OPPENHEIMER GLOBAL SECURITIES FUND/VA
|
STATEMENTS OF CHANGES IN NET ASSETS
| | | | | | | | |
| | | Six Months
Ended
June 29, 20121
(Unaudited) | | | Year
Ended
December 30,
20111 | |
| Operations | | | | | | |
| Net investment income | | $ | 26,639,238 | | | $ | 55,375,926 | |
| Net realized gain (loss) | | | 34,000,684 | | | | (4,932,906 | ) |
| Net change in unrealized appreciation/depreciation | |
| 57,086,614
|
| |
| (266,645,479
| )
|
| Net increase (decrease) in net assets resulting from operations | | | 117,726,536 | | | | (216,202,459 | ) |
| Dividends and/or Distributions to Shareholders | | | | | | |
| Dividends from net investment income: | | | | | | | | |
| Non-Service shares | | | (25,848,197 | ) | | | (17,234,287 | ) |
| Service shares | | | (20,625,132 | ) | | | (11,357,368 | ) |
| Class 3 shares | | | (3,444,499 | ) | | | (2,447,497 | ) |
| Class 4 shares | |
| (1,338,372
| )
| |
| (819,361
| )
|
| | | | (51,256,200 | ) | | | (31,858,513 | ) |
| Beneficial Interest Transactions | | | | | | |
| Net increase (decrease) in net assets resulting from beneficial interest transactions: | | | | | | | | |
| Non-Service shares | | | (47,502,354 | ) | | | (124,782,917 | ) |
| Service shares | | | (2,323,398 | ) | | | 5,153,335 | |
| Class 3 shares | | | (8,943,764 | ) | | | (27,368,355 | ) |
| Class 4 shares | |
| (4,002,187
| )
| |
| (5,984,377
| )
|
| | | | (62,771,703 | ) | | | (152,982,314 | ) |
| Net Assets | | | | | | |
| Total increase (decrease) | | | 3,698,633 | | | | (401,043,286 | ) |
| Beginning of period | |
| 2,395,791,852
|
| |
| 2,796,835,138
|
|
| End of period (including accumulated net investment income of $21,729,785 and $46,346,747, respectively) | | $
| 2,399,490,485
|
| | $
| 2,395,791,852
|
|
1. June 29, 2012 and December 30, 2011 represent the last business days of the Fund’s respective reporting periods. See Note 1 of the accompanying Notes.
See accompanying Notes to Financial Statements.
12 | OPPENHEIMER GLOBAL SECURITIES FUND/VA
|
FINANCIAL HIGHLIGHTS
| | | | | | | | | | | | | | | | | | | | | | | | |
| | | Six Months
Ended
June 29, 20121 | | | Year Ended
December 30, | | | Year Ended December 31, | |
| Non-Service Shares | | (Unaudited) | | | 20111 | | | 2010 | | | 2009 | | | 2008 | | | 2007 | |
| | | | | | | | | | | | | | | | | | | | | | | | | |
| Per Share Operating Data | | | | | | | | | | | | | | | | | | |
| Net asset value, beginning of period | | | $27.46 | | | | $30.30 | | | | $26.50 | | | | $20.21 | | | | $36.60 | | | | $36.79 | |
| Income (loss) from investment operations: | | | | | | | | | | | | | | | | | | | | | | | | |
| Net investment income2 | | | .33 | | | | .65 | | | | .33 | | | | .33 | | | | .55 | | | | .45 | |
| Net realized and unrealized gain (loss) | |
| 1.00
|
| |
| (3.11
| )
| |
| 3.85
|
| |
| 6.94
|
| |
| (14.46
| )
| |
| 1.69
|
|
| Total from investment operations | | | 1.33 | | | | (2.46 | ) | | | 4.18 | | | | 7.27 | | | | (13.91 | ) | | | 2.14 | |
| Dividends and/or distributions to shareholders: | | | | | | | | | | | | | | | | | | | | | | | | |
| Dividends from net investment income | | | (.64 | ) | | | (.38 | ) | | | (.38 | ) | | | (.50 | ) | | | (.46 | ) | | | (.50 | ) |
| Distributions from net realized gain | |
| —
|
| |
| —
|
| |
| —
|
| |
| (.48
| )
| |
| (2.02
| )
| |
| (1.83
| )
|
| Total dividends and/or distributions to shareholders | | | (.64 | ) | | | (.38 | ) | | | (.38 | ) | | | (.98 | ) | | | (2.48 | ) | | | (2.33 | ) |
| Net asset value, end of period | |
| $28.15
|
| |
| $27.46
|
| |
| $30.30
|
| |
| $26.50
|
| |
| $20.21
|
| |
| $36.60
|
|
| Total Return, at Net Asset Value3 | | | 4.87 | % | | | (8.29 | )% | | | 15.96 | % | | | 39.77 | % | | | (40.19 | )% | | | 6.32 | % |
| | | | | | | | | | | | | | | | | | | | | | | | | |
| Ratios/Supplemental Data | | | | | | | | | | | | | | | | | | |
| Net assets, end of period (in thousands) | | | $1,149,827 | | | | $1,165,141 | | | | $1,410,764 | | | | $1,364,597 | | | | $1,150,113 | | | | $2,193,638 | |
| Average net assets (in thousands) | | | $1,206,928 | | | | $1,335,403 | | | | $1,336,110 | | | | $1,206,240 | | | | $1,679,720 | | | | $2,302,726 | |
| Ratios to average net assets:4 | | | | | | | | | | | | | | | | | | | | | | | | |
| Net investment income | | | 2.26 | % | | | 2.17 | % | | | 1.22 | % | | | 1.51 | % | | | 1.95 | % | | | 1.21 | % |
| Total expenses5 | | | 0.75 | % | | | 0.76 | % | | | 0.76 | % | | | 0.75 | % | | | 0.65 | % | | | 0.65 | % |
| Expenses after payments, waivers and/or reimbursements and reduction to custodian expenses | | | 0.75 | % | | | 0.76 | % | | | 0.76 | % | | | 0.75 | % | | | 0.65 | % | | | 0.65 | % |
| Portfolio turnover rate | | | 8 | % | | | 13 | % | | | 15 | % | | | 11 | % | | | 19 | % | | | 18 | % |
1. June 29, 2012 and December 30, 2011 represent the last business days of the Fund’s respective reporting periods. See Note 1 of the accompanying Notes.
2. Per share amounts calculated based on the average shares outstanding during the period.
3. Assumes an initial investment on the business day before the first day of the fiscal period, with all dividends and distributions reinvested in additional shares on the reinvestment date, and redemption at the net asset value calculated on the last business day of the fiscal period. Total returns are not annualized for periods less than one full year. Total return information does not reflect expenses that apply at the separate account level or to related insurance products. Inclusion of these charges would reduce the total return figures for all periods shown. Returns do not reflect the deduction of taxes that a shareholder would pay on fund distributions or the redemption of fund shares.
4. Annualized for periods less than one full year.
5. Total expenses including indirect expenses from affiliated fund were as follows:
| | | | |
| Six Months Ended June 29, 2012 | | | 0.75 | % |
| Year Ended December 30, 2011 | | | 0.76 | % |
| Year Ended December 31, 2010 | | | 0.76 | % |
| Year Ended December 31, 2009 | | | 0.75 | % |
| Year Ended December 31, 2008 | | | 0.65 | % |
| Year Ended December 31, 2007 | | | 0.65 | % |
See accompanying Notes to Financial Statements.
13 | OPPENHEIMER GLOBAL SECURITIES FUND/VA
|
FINANCIAL HIGHLIGHTS Continued
| | | | | | | | | | | | | | | | | | | | | | | | |
| | | Six Months
Ended
June 29, 20121 | | | Year Ended
December 30, | | | Year Ended December 31, | |
| Service Shares | | (Unaudited) | | | 20111 | | | 2010 | | | 2009 | | | 2008 | | | 2007 | |
| | | | | | | | | | | | | | | | | | | | | | | | | |
| Per Share Operating Data | | | | | | | | | | | | | | | | | | |
| Net asset value, beginning of period | | | $27.21 | | | | $30.04 | | | | $26.28 | | | | $20.02 | | | | $36.27 | | | | $36.49 | |
| Income (loss) from investment operations: | | | | | | | | | | | | | | | | | | | | | | | | |
| Net investment income2 | | | .29 | | | | .56 | | | | .26 | | | | .27 | | | | .47 | | | | .33 | |
| Net realized and unrealized gain (loss) | |
| 1.00
|
| |
| (3.08
| )
| |
| 3.82
|
| |
| 6.90
|
| |
| (14.32
| )
| |
| 1.72
|
|
| Total from investment operations | | | 1.29 | | | | (2.52 | ) | | | 4.08 | | | | 7.17 | | | | (13.85 | ) | | | 2.05 | |
| Dividends and/or distributions to shareholders: | | | | | | | | | | | | | | | | | | | | | | | | |
| Dividends from net investment income | | | (.57 | ) | | | (.31 | ) | | | (.32 | ) | | | (.43 | ) | | | (.38 | ) | | | (.44 | ) |
| Distributions from net realized gain | |
| —
|
| |
| —
|
| |
| —
|
| |
| (.48
| )
| |
| (2.02
| )
| |
| (1.83
| )
|
| Total dividends and/or distributions to shareholders | | | (.57 | ) | | | (.31 | ) | | | (.32 | ) | | | (.91 | ) | | | (2.40 | ) | | | (2.27 | ) |
| Net asset value, end of period | |
| $27.93
|
| |
| $27.21
|
| |
| $30.04
|
| |
| $26.28
|
| |
| $20.02
|
| |
| $36.27
|
|
| Total Return, at Net Asset Value3 | | | 4.75 | % | | | (8.53 | )% | | | 15.70 | % | | | 39.36 | % | | | (40.33 | )% | | | 6.08 | % |
| | | | | | | | | | | | | | | | | | | | | | | | | |
| Ratios/Supplemental Data | | | | | | | | | | | | | | | | | | |
| Net assets, end of period (in thousands) | | $ | 1,029,409 | | | $ | 1,003,839 | | | $ | 1,101,584 | | | $ | 980,485 | | | $ | 772,107 | | | $ | 1,300,989 | |
| Average net assets (in thousands) | | $ | 1,056,309 | | | $ | 1,091,128 | | | $ | 997,627 | | | $ | 830,887 | | | $ | 1,051,239 | | | $ | 1,180,656 | |
| Ratios to average net assets:4 | | | | | | | | | | | | | | | | | | | | | | | | |
| Net investment income | | | 2.01 | % | | | 1.90 | % | | | 0.96 | % | | | 1.23 | % | | | 1.70 | % | | | 0.91 | % |
| Total expenses5 | | | 1.00 | % | | | 1.01 | % | | | 1.01 | % | | | 1.00 | % | | | 0.90 | % | | | 0.89 | % |
| Expenses after payments, waivers and/or reimbursements and reduction to custodian expenses | | | 1.00 | % | | | 1.01 | % | | | 1.01 | % | | | 1.00 | % | | | 0.90 | % | | | 0.89 | % |
| Portfolio turnover rate | | | 8 | % | | | 13 | % | | | 15 | % | | | 11 | % | | | 19 | % | | | 18 | % |
1. June 29, 2012 and December 30, 2011 represent the last business days of the Fund’s respective reporting periods. See Note 1 of the accompanying Notes.
2. Per share amounts calculated based on the average shares outstanding during the period.
3. Assumes an initial investment on the business day before the first day of the fiscal period, with all dividends and distributions reinvested in additional shares on the reinvestment date, and redemption at the net asset value calculated on the last business day of the fiscal period. Total returns are not annualized for periods less than one full year. Total return information does not reflect expenses that apply at the separate account level or to related insurance products. Inclusion of these charges would reduce the total return figures for all periods shown. Returns do not reflect the deduction of taxes that a shareholder would pay on fund distributions or the redemption of fund shares.
4. Annualized for periods less than one full year.
5. Total expenses including indirect expenses from affiliated fund were as follows:
| | | | |
| Six Months Ended June 29, 2012 | | | 1.00 | % |
| Year Ended December 30, 2011 | | | 1.01 | % |
| Year Ended December 31, 2010 | | | 1.01 | % |
| Year Ended December 31, 2009 | | | 1.00 | % |
| Year Ended December 31, 2008 | | | 0.90 | % |
| Year Ended December 31, 2007 | | | 0.89 | % |
See accompanying Notes to Financial Statements.
14 | OPPENHEIMER GLOBAL SECURITIES FUND/VA
|
FINANCIAL HIGHLIGHTS Continued
| | | | | | | | | | | | | | | | | | | | | | | | |
| | | Six Months
Ended
June 29, 20121 | | | Year Ended
December 30, | | | Year Ended December 31, | |
| Class 3 Shares | | (Unaudited) | | | 20111 | | | 2010 | | | 2009 | | | 2008 | | | 2007 | |
| | | | | | | | | | | | | | | | | | | | | | | | | |
| Per Share Operating Data | | | | | | | | | | | | | | | | | | |
| Net asset value, beginning of period | | | $27.65 | | | | $30.50 | | | | $26.67 | | | | $20.34 | | | | $36.82 | | | | $36.99 | |
| Income (loss) from investment operations: | | | | | | | | | | | | | | | | | | | | | | | | |
| Net investment income2 | | | .33 | | | | .66 | | | | .33 | | | | .33 | | | | .56 | | | | .45 | |
| Net realized and unrealized gain (loss) | |
| 1.01
|
| |
| (3.13
| )
| |
| 3.88
|
| |
| 6.98
|
| |
| (14.56
| )
| |
| 1.71
|
|
| Total from investment operations | | | 1.34 | | | | (2.47 | ) | | | 4.21 | | | | 7.31 | | | | (14.00 | ) | | | 2.16 | |
| Dividends and/or distributions to shareholders: | | | | | | | | | | | | | | | | | | | | | | | | |
| Dividends from net investment income | | | (.64 | ) | | | (.38 | ) | | | (.38 | ) | | | (.50 | ) | | | (.46 | ) | | | (.50 | ) |
| Distributions from net realized gain | |
| —
|
| |
| —
|
| |
| —
|
| |
| (.48
| )
| |
| (2.02
| )
| |
| (1.83
| )
|
| Total dividends and/or distributions to shareholders | | | (.64 | ) | | | (.38 | ) | | | (.38 | ) | | | (.98 | ) | | | (2.48 | ) | | | (2.33 | ) |
| Net asset value, end of period | |
| $28.35
|
| |
| $27.65
|
| |
| $30.50
|
| |
| $26.67
|
| |
| $20.34
|
| |
| $36.82
|
|
| Total Return, at Net Asset Value3 | | | 4.88 | % | | | (8.27 | )% | | | 15.97 | % | | | 39.70 | % | | | (40.19 | )% | | | 6.34 | % |
| | | | | | | | | | | | | | | | | | | | | | | | | |
| Ratios/Supplemental Data | | | | | | | | | | | | | | | | | | |
| Net assets, end of period (in thousands) | | | $153,905 | | | | $158,343 | | | | $202,621 | | | | $206,356 | | | | $175,971 | | | | $361,621 | |
| Average net assets (in thousands) | | | $162,514 | | | | $187,804 | | | | $196,495 | | | | $182,553 | | | | $269,650 | | | | $391,270 | |
| Ratios to average net assets:4 | | | | | | | | | | | | | | | | | | | | | | | | |
| Net investment income | | | 2.25 | % | | | 2.17 | % | | | 1.22 | % | | | 1.49 | % | | | 1.95 | % | | | 1.22 | % |
| Total expenses5 | | | 0.75 | % | | | 0.76 | % | | | 0.76 | % | | | 0.75 | % | | | 0.65 | % | | | 0.65 | % |
| Expenses after payments, waivers and/or reimbursements and reduction to custodian expenses | | | 0.75 | % | | | 0.76 | % | | | 0.76 | % | | | 0.75 | % | | | 0.65 | % | | | 0.65 | % |
| Portfolio turnover rate | | | 8 | % | | | 13 | % | | | 15 | % | | | 11 | % | | | 19 | % | | | 18 | % |
1. June 29, 2012 and December 30, 2011 represent the last business days of the Fund’s respective reporting periods. See Note 1 of the accompanying Notes.
2. Per share amounts calculated based on the average shares outstanding during the period.
3. Assumes an initial investment on the business day before the first day of the fiscal period, with all dividends and distributions reinvested in additional shares on the reinvestment date, and redemption at the net asset value calculated on the last business day of the fiscal period. Total returns are not annualized for periods less than one full year. Total return information does not reflect expenses that apply at the separate account level or to related insurance products. Inclusion of these charges would reduce the total return figures for all periods shown. Returns do not reflect the deduction of taxes that a shareholder would pay on fund distributions or the redemption of fund shares.
4. Annualized for periods less than one full year.
5. Total expenses including indirect expenses from affiliated fund were as follows:
| | | | |
| Six Months Ended June 29, 2012 | | | 0.75 | % |
| Year Ended December 30, 2011 | | | 0.76 | % |
| Year Ended December 31, 2010 | | | 0.76 | % |
| Year Ended December 31, 2009 | | | 0.75 | % |
| Year Ended December 31, 2008 | | | 0.65 | % |
| Year Ended December 31, 2007 | | | 0.65 | % |
See accompanying Notes to Financial Statements.
15 | OPPENHEIMER GLOBAL SECURITIES FUND/VA
|
FINANCIAL HIGHLIGHTS Continued
| | | | | | | | | | | | | | | | | | | | | | | | |
| | | Six Months
Ended
June 29, 20121 | | | Year Ended
December 30, | | | Year Ended December 31, | |
| Class 4 Shares | | (Unaudited) | | | 20111 | | | 2010 | | | 2009 | | | 2008 | | | 2007 | |
| | | | | | | | | | | | | | | | | | | | | | | | | |
| Per Share Operating Data | | | | | | | | | | | | | | | | | | |
| Net asset value, beginning of period | | | $27.26 | | | | $30.08 | | | | $26.32 | | | | $20.03 | | | | $36.28 | | | | $36.49 | |
| Income (loss) from investment operations: | | | | | | | | | | | | | | | | | | | | | | | | |
| Net investment income2 | | | .29 | | | | .57 | | | | .26 | | | | .27 | | | | .47 | | | | .34 | |
| Net realized and unrealized gain (loss) | |
| 1.00
|
| |
| (3.08
| )
| |
| 3.82
|
| |
| 6.92
|
| |
| (14.34
| )
| |
| 1.70
|
|
| Total from investment operations | | | 1.29 | | | | (2.51 | ) | | | 4.08 | | | | 7.19 | | | | (13.87 | ) | | | 2.04 | |
| Dividends and/or distributions to shareholders: | | | | | | | | | | | | | | | | | | | | | | | | |
| Dividends from net investment income | | | (.56 | ) | | | (.31 | ) | | | (.32 | ) | | | (.42 | ) | | | (.36 | ) | | | (.42 | ) |
| Distributions from net realized gain | |
| —
|
| |
| —
|
| |
| ���
|
| |
| (.48
| )
| |
| (2.02
| )
| |
| (1.83
| )
|
| Total dividends and/or distributions to shareholders | | | (.56 | ) | | | (.31 | ) | | | (.32 | ) | | | (.90 | ) | | | (2.38 | ) | | | (2.25 | ) |
| Net asset value, end of period | |
| $27.99
|
| |
| $27.26
|
| |
| $30.08
|
| |
| $26.32
|
| |
| $20.03
|
| |
| $36.28
|
|
| Total Return, at Net Asset Value3 | | | 4.75 | % | | | (8.49 | )% | | | 15.67 | % | | | 39.38 | % | | | (40.35 | )% | | | 6.06 | % |
| | | | | | | | | | | | | | | | | | | | | | | | | |
| Ratios/Supplemental Data | | | | | | | | | | | | | | | | | | |
| Net assets, end of period (in thousands) | | | $66,349 | | | | $68,469 | | | | $81,866 | | | | $78,043 | | | | $63,099 | | | | $123,542 | |
| Average net assets (in thousands) | | | $70,875 | | | | $78,655 | | | | $76,519 | | | | $66,965 | | | | $93,909 | | | | $122,385 | |
| Ratios to average net assets:4 | | | | | | | | | | | | | | | | | | | | | | | | |
| Net investment income | | | 2.01 | % | | | 1.93 | % | | | 0.97 | % | | | 1.22 | % | | | 1.69 | % | | | 0.93 | % |
| Total expenses5 | | | 1.00 | % | | | 1.01 | % | | | 1.01 | % | | | 1.00 | % | | | 0.91 | % | | | 0.90 | % |
| Expenses after payments, waivers and/or reimbursements and reduction to custodian expenses | | | 1.00 | % | | | 1.01 | % | | | 1.01 | % | | | 1.00 | % | | | 0.91 | % | | | 0.90 | % |
| Portfolio turnover rate | | | 8 | % | | | 13 | % | | | 15 | % | | | 11 | % | | | 19 | % | | | 18 | % |
1. June 29, 2012 and December 30, 2011 represent the last business days of the Fund’s respective reporting periods. See Note 1 of the accompanying Notes.
2. Per share amounts calculated based on the average shares outstanding during the period.
3. Assumes an initial investment on the business day before the first day of the fiscal period, with all dividends and distributions reinvested in additional shares on the reinvestment date, and redemption at the net asset value calculated on the last business day of the fiscal period. Total returns are not annualized for periods less than one full year. Total return information does not reflect expenses that apply at the separate account level or to related insurance products. Inclusion of these charges would reduce the total return figures for all periods shown. Returns do not reflect the deduction of taxes that a shareholder would pay on fund distributions or the redemption of fund shares.
4. Annualized for periods less than one full year.
5. Total expenses including indirect expenses from affiliated fund were as follows:
| | | | |
| Six Months Ended June 29, 2012 | | | 1.00 | % |
| Year Ended December 30, 2011 | | | 1.01 | % |
| Year Ended December 31, 2010 | | | 1.01 | % |
| Year Ended December 31, 2009 | | | 1.00 | % |
| Year Ended December 31, 2008 | | | 0.91 | % |
| Year Ended December 31, 2007 | | | 0.90 | % |
See accompanying Notes to Financial Statements.
16 | OPPENHEIMER GLOBAL SECURITIES FUND/VA
|
NOTES TO FINANCIAL STATEMENTS June 29, 2012 / Unaudited
1. Significant Accounting Policies
Oppenheimer Global Securities Fund/VA (the “Fund”) is a separate series of Oppenheimer Variable Account Funds, an open-end management investment company registered under the Investment Company Act of 1940, as amended. The Fund’s investment objective is to seek long-term capital appreciation by investing a substantial portion of its assets in securities of foreign issuers, “growth-type” companies, cyclical industries and special situations that are considered to have appreciation possibilities. The Fund’s investment adviser is OppenheimerFunds, Inc. (the “Manager”).
The Fund offers Non-Service, Service, Class 3 and Class 4 shares. All classes are sold at their offering price, which is the net asset value per share, to separate investment accounts of participating insurance companies as an underlying investment for variable life insurance policies, variable annuity contracts or other investment products. The classes of shares being designated as Service shares and Class 4 shares are subject to a distribution and service plan. All classes of shares have identical rights and voting privileges with respect to the Fund in general and exclusive voting rights on matters that affect that class alone. Earnings, net assets and net asset value per share may differ due to each class having its own expenses, such as transfer and shareholder servicing agent fees and shareholder communications, directly attributable to that class. The Fund assesses a 1% fee on the proceeds of Class 3 and Class 4 shares that are redeemed (either by selling or exchanging to another Oppenheimer fund or other investment option offered through your variable life insurance or variable annuity contract) within 60 days of their purchase. The fee, which is retained by the Fund, is accounted for as an addition to paid-in capital.
The following is a summary of significant accounting policies consistently followed by the Fund.
Semiannual and Annual Periods. The last day of the Fund’s semiannual period was the last day the New York Stock Exchange was open for trading. The Fund’s financial statements have been presented through that date to maintain consistency with the Fund’s net asset value calculations used for shareholder transactions.
The last day of the Fund’s fiscal year was the last day the New York Stock Exchange was open for trading. The Fund’s financial statements have been presented through that date to maintain consistency with the Fund’s net asset value calculations used for shareholder transactions.
Investment in Oppenheimer Institutional Money Market Fund. The Fund is permitted to invest daily available cash balances in an affiliated money market fund. The Fund may invest the available cash in Class E shares of Oppenheimer Institutional Money Market Fund (“IMMF”) to seek current income while preserving liquidity. IMMF is a registered open-end management investment company, regulated as a money market fund under the Investment Company Act of 1940, as amended. The Manager is also the investment adviser of IMMF. When applicable, the Fund’s investment in IMMF is included in the Statement of Investments. Shares of IMMF are valued at their net asset value per share. As a shareholder, the Fund is subject to its proportional share of IMMF’s Class E expenses, including its management fee. The Manager will waive fees and/or reimburse Fund expenses in an amount equal to the indirect management fees incurred through the Fund’s investment in IMMF.
Foreign Currency Translation. The Fund’s accounting records are maintained in U.S. dollars. The values of securities denominated in foreign currencies and amounts related to the purchase and sale of foreign securities and foreign investment income are translated into U.S. dollars as of the close of the Exchange, normally 4:00 P.M. Eastern time, on each day the Exchange is open for trading. Foreign exchange rates may be valued primarily using a reliable bank, dealer or service authorized by the Board of Trustees.
Reported net realized gains and losses from foreign currency transactions arise from sales of portfolio securities, sales and maturities of short-term securities, sales of foreign currencies, exchange rate fluctuations between the trade and settlement dates on securities transactions, and the difference between the amounts of dividends, interest, and foreign withholding taxes recorded on the Fund’s books and the U.S. dollar equivalent of the amounts actually received or paid. Net unrealized appreciation and depreciation on the translation of assets and liabilities denominated in foreign currencies arise from changes in the values of assets and liabilities, including investments in securities at fiscal period end, resulting from changes in exchange rates.
17 | OPPENHEIMER GLOBAL SECURITIES FUND/VA
|
NOTES TO FINANCIAL STATEMENTS Unaudited / Continued
1. Significant Accounting Policies Continued
The effect of changes in foreign currency exchange rates on investments is separately identified from the fluctuations arising from changes in market values of securities held and reported with all other foreign currency gains and losses in the Fund’s Statement of Operations.
Allocation of Income, Expenses, Gains and Losses. Income, expenses (other than those attributable to a specific class), gains and losses are allocated on a daily basis to each class of shares based upon the relative proportion of net assets represented by such class. Operating expenses directly attributable to a specific class are charged against the operations of that class.
Federal Taxes. The Fund intends to comply with provisions of the Internal Revenue Code applicable to regulated investment companies and to distribute substantially all of its investment company taxable income, including any net realized gain on investments not offset by capital loss carryforwards, if any, to shareholders. Therefore, no federal income or excise tax provision is required. The Fund files income tax returns in U.S. federal and applicable state jurisdictions. The statute of limitations on the Fund’s tax return filings generally remain open for the three preceding fiscal reporting period ends.
During the fiscal year ended December 30, 2011, the Fund did not utilize any capital loss carryforward to offset capital gains realized in that fiscal year. The Fund had post-October losses of $4,541,346. Details of the fiscal year ended December 30, 2011 capital loss carryforwards are included in the table below. Capital loss carryforwards with no expiration, if any, must be utilized prior to those with expiration dates. Capital losses with no expiration will be carried forward to future years if not offset by gains.
| | | | |
| Expiring | | | |
| 2017 | | $ | 17,214,823 | |
| No expiration | | | 6,482,606 | |
| | |
|
|
|
| Total | | $ | 23,697,429 | |
| | |
|
|
|
As of June 29, 2012, it is estimated that the Fund will have no capital loss carryforwards. The estimated capital loss carryforward represents the carryforward as of the end of the last fiscal year, increased or decreased by capital losses or gains realized in the first six months of the current fiscal year. During the six months ended June 29, 2012, it is estimated that the Fund will utilize $23,697,429 of capital loss carryforward to offset realized capital gains.
Net investment income (loss) and net realized gain (loss) may differ for financial statement and tax purposes. The character of dividends and distributions made during the fiscal year from net investment income or net realized gains may differ from their ultimate characterization for federal income tax purposes. Also, due to timing of dividends and distributions, the fiscal year in which amounts are distributed may differ from the fiscal year in which the income or net realized gain was recorded by the Fund.
The aggregate cost of securities and other investments and the composition of unrealized appreciation and depreciation of securities and other investments for federal income tax purposes as of June 29, 2012 are noted in the following table. The primary difference between book and tax appreciation or depreciation of securities and other investments, if applicable, is attributable to the tax deferral of losses or tax realization of financial statement unrealized gain or loss.
| | | | |
| Federal tax cost of securities | | $ | 1,948,813,629 | |
| | |
|
|
|
| |
| Gross unrealized appreciation | | $ | 605,865,086 | |
| Gross unrealized depreciation | | | (156,442,909) | |
| | |
|
|
|
| Net unrealized appreciation | | $ | 449,422,177 | |
| | |
|
|
|
18 | OPPENHEIMER GLOBAL SECURITIES FUND/VA
|
Certain foreign countries impose a tax on capital gains which is accrued by the Fund based on unrealized appreciation, if any, on affected securities. The tax is paid when the gain is realized.
Trustees’ Compensation. The Board of Trustees has adopted a compensation deferral plan for independent trustees that enables trustees to elect to defer receipt of all or a portion of the annual compensation they are entitled to receive from the Fund. For purposes of determining the amount owed to the Trustee under the plan, deferred amounts are treated as though equal dollar amounts had been invested in shares of the Fund or in other Oppenheimer funds selected by the Trustee. The Fund purchases shares of the funds selected for deferral by the Trustee in amounts equal to his or her deemed investment, resulting in a Fund asset equal to the deferred compensation liability. Such assets are included as a component of “Other” within the asset section of the Statement of Assets and Liabilities. Deferral of trustees’ fees under the plan will not affect the net assets of the Fund, and will not materially affect the Fund’s assets, liabilities or net investment income per share. Amounts will be deferred until distributed in accordance with the compensation deferral plan.
Dividends and Distributions to Shareholders. Dividends and distributions to shareholders, which are determined in accordance with income tax regulations and may differ from U.S. generally accepted accounting principles, are recorded on the ex-dividend date. Income and capital gain distributions, if any, are declared and paid annually or at other times as deemed necessary by the Manager. The tax character of distributions is determined as of the Fund’s fiscal year end. Therefore, a portion of the Fund’s distributions made to shareholders prior to the Fund’s fiscal year end may ultimately be categorized as a tax return of capital.
Investment Income. Dividend income is recorded on the ex-dividend date or upon ex-dividend notification in the case of certain foreign dividends where the ex-dividend date may have passed. Non-cash dividends included in dividend income, if any, are recorded at the fair market value of the securities received. Interest income is recognized on an accrual basis. Discount and premium, which are included in interest income on the Statement of Operations, are amortized or accreted daily.
Custodian Fees. “Custodian fees and expenses” in the Statement of Operations may include interest expense incurred by the Fund on any cash overdrafts of its custodian account during the period. Such cash overdrafts may result from the effects of failed trades in portfolio securities and from cash outflows resulting from unanticipated shareholder redemption activity. The Fund pays interest to its custodian on such cash overdrafts, to the extent they are not offset by positive cash balances maintained by the Fund, at a rate equal to the Federal Funds Rate plus 0.50%. The “Reduction to custodian expenses” line item, if applicable, represents earnings on cash balances maintained by the Fund during the period. Such interest expense and other custodian fees may be paid with these earnings.
Security Transactions. Security transactions are recorded on the trade date. Realized gains and losses on securities sold are determined on the basis of identified cost.
Indemnifications. The Fund’s organizational documents provide current and former trustees and officers with a limited indemnification against liabilities arising in connection with the performance of their duties to the Fund. In the normal course of business, the Fund may also enter into contracts that provide general indemnifications. The Fund’s maximum exposure under these arrangements is unknown as this would be dependent on future claims that may be made against the Fund. The risk of material loss from such claims is considered remote.
Other. The preparation of financial statements in conformity with accounting principles generally accepted in the United States of America requires management to make estimates and assumptions that affect the reported amounts of assets and liabilities and disclosure of contingent assets and liabilities at the date of the financial statements and the reported amounts of increases and decreases in net assets from operations during the reporting period. Actual results could differ from those estimates.
19 | OPPENHEIMER GLOBAL SECURITIES FUND/VA
|
NOTES TO FINANCIAL STATEMENTS Unaudited / Continued
2. Securities Valuation
The Fund calculates the net asset value of its shares as of the close of the New York Stock Exchange (the “Exchange”), normally 4:00 P.M. Eastern time, on each day the Exchange is open for trading.
The Fund’s Board has adopted procedures for the valuation of the Fund’s securities and has delegated the day-to-day responsibility for valuation determinations under those procedures to the Manager. The Manager has established a Valuation Committee which is responsible for determining a “fair valuation” for any security for which market quotations are not “readily available.” The Valuation Committee’s fair valuation determinations are subject to review, approval and ratification by the Fund’s Board at its next regularly scheduled meeting covering the calendar quarter in which the fair valuation was determined.
Valuation Methods and Inputs
Securities are valued using unadjusted quoted market prices, when available, as supplied primarily by third party pricing services or dealers.
The following methodologies are used to determine the market value or the fair value of the types of securities described below:
Securities traded on a registered U.S. securities exchange (including exchange-traded derivatives other than futures and futures options) are valued based on the last sale price of the security reported on the principal exchange on which it is traded, prior to the time when the Fund’s assets are valued. In the absence of a sale, the security is valued at the last sale price on the prior trading day, if it is within the spread of the current day’s closing “bid” and “asked” prices, and if not, at the current day’s closing bid price. A security of a foreign issuer traded on a foreign exchange but not listed on a registered U.S. securities exchange is valued based on the last sale price on the principal exchange on which the security is traded, as identified by the third party pricing service used by the Manager, prior to the time when the Fund’s assets are valued. If the last sale price is unavailable, the security is valued at the most recent official closing price on the principal exchange on which it is traded. If the last sales price or official closing price for a foreign security is not available, the security is valued at the mean between the bid and asked price per the exchange or, if not available from the exchange, obtained from two dealers. If bid and asked prices are not available from either the exchange or two dealers, the security is valued by using one of the following methodologies (listed in order of priority); (1) using a bid from the exchange, (2) the mean between the bid and asked price as provided by a single dealer, or (3) a bid from a single dealer.
Shares of a registered investment company that are not traded on an exchange are valued at that investment company’s net asset value per share.
Corporate and government debt securities (of U.S. or foreign issuers) and municipal debt securities, event-linked bonds, loans, mortgage-backed securities, collateralized mortgage obligations, and asset-backed securities are valued at the mean between the “bid” and “asked” prices utilizing evaluated prices obtained from third party pricing services or broker-dealers who may use matrix pricing methods to determine the evaluated prices.
Short-term money market type debt securities with a remaining maturity of sixty days or less are valued at cost adjusted by the amortization of discount or premium to maturity (amortized cost), which approximates market value. Short-term debt securities with a remaining maturity in excess of sixty days are valued at the mean between the “bid” and “asked” prices utilizing evaluated prices obtained from third party pricing services or broker-dealers.
Forward foreign currency exchange contracts are valued utilizing current and forward currency rates obtained from third party pricing services. When the settlement date of a contract is an interim date for which a quotation is not available, interpolated values are derived using the nearest dated forward currency rate.
20 | OPPENHEIMER GLOBAL SECURITIES FUND/VA
|
A description of the standard inputs that may generally be considered by the third party pricing vendors in determining their evaluated prices is provided below.
| | |
| Security Type | | Standard Inputs Generally Considered by Third-party Pricing Vendors |
| Corporate debt, government debt, municipal, mortgage-backed and asset-backed securities | | Reported trade data, broker-dealer price quotations, benchmark yields, issuer spreads on comparable securities, the credit quality, yield, maturity, and other appropriate factors. |
| Loans | | Information obtained from market participants regarding reported trade data and broker-dealer price quotations. |
| Event-linked bonds | | Information obtained from market participants regarding reported trade data and broker-dealer price quotations. |
If a market value or price cannot be determined for a security using the methodologies described above, or if, in the “good faith” opinion of the Manager, the market value or price obtained does not constitute a “readily available market quotation,” or a significant event has occurred that would materially affect the value of the security the security is fair valued either (i) by a standardized fair valuation methodology applicable to the security type or the significant event as previously approved by the Valuation Committee and the Fund’s Board or (ii) as determined in good faith by the Manager’s Valuation Committee. The Valuation Committee considers all relevant facts that are reasonably available, through either public information or information available to the Manager, when determining the fair value of a security. Fair value determinations by the Manager are subject to review, approval and ratification by the Fund’s Board at its next regularly scheduled meeting covering the calendar quarter in which the fair valuation was determined. Those fair valuation standardized methodologies include, but are not limited to, valuing securities at the last sale price or initially at cost and subsequently adjusting the value based on: changes in company specific fundamentals, changes in an appropriate securities index, or changes in the value of similar securities which may be further adjusted for any discounts related to security-specific resale restrictions. When possible, such methodologies use observable market inputs such as unadjusted quoted prices of similar securities, observable interest rates, currency rates and yield curves. The methodologies used for valuing securities are not necessarily an indication of the risks associated with investing in those securities nor can it be assured that the Fund can obtain the fair value assigned to a security if it were to sell the security.
To assess the continuing appropriateness of security valuations, the Manager, or its third party service provider who is subject to oversight by the Manager, regularly compares prior day prices, prices on comparable securities, and sale prices to the current day prices and challenges those prices exceeding certain tolerance levels with the third party pricing service or broker source. For those securities valued by fair valuations, whether through a standardized fair valuation methodology or a fair valuation determination, the Valuation Committee reviews and affirms the reasonableness of the valuations based on such methodologies and fair valuation determinations on a regular basis after considering all relevant information that is reasonably available.
Classifications
Each investment asset or liability of the Fund is assigned a level at measurement date based on the significance and source of the inputs to its valuation. Various data inputs are used in determining the value of each of the Fund’s investments as of the reporting period end. These data inputs are categorized in the following hierarchy under applicable financial accounting standards:
| | 1) | Level 1—unadjusted quoted prices in active markets for identical assets or liabilities (including securities actively traded on a securities exchange) |
| | 2) | Level 2—inputs other than unadjusted quoted prices that are observable for the asset or liability (such as unadjusted quoted prices for similar assets and market corroborated inputs such as interest rates, prepayment speeds, credit risks, etc.) |
| | 3) | Level 3—significant unobservable inputs (including the Manager’s own judgments about assumptions that market participants would use in pricing the asset or liability). |
21 | OPPENHEIMER GLOBAL SECURITIES FUND/VA
|
NOTES TO FINANCIAL STATEMENTS Unaudited / Continued
2. Securities Valuation Continued
The inputs used for valuing securities are not necessarily an indication of the risks associated with investing in those securities.
The table below categorizes amounts that are included in the Fund’s Statement of Assets and Liabilities as of June 29, 2012 based on valuation input level:
| | | | | | | | | | | | | | | | |
| | | Level 1—
Unadjusted
Quoted
Prices | | | Level 2—
Other Significant
Observable Inputs | | | Level 3—
Significant
Unobservable
Inputs | | | Value | |
| Assets Table | | | | | | | | | | | | | | | | |
| Investments, at Value: | | | | | | | | | | | | | | | | |
| Common Stocks | | | | | | | | | | | | | | | | |
Consumer Discretionary | | $ | 290,522,695 | | | $ | 121,893,950 | | | $ | — | | | $ | 412,416,645 | |
Consumer Staples | | | 208,006,774 | | | | 29,136,795 | | | | — | | | | 237,143,569 | |
Energy | | | 25,275,885 | | | | 71,507,561 | | | | — | | | | 96,783,446 | |
Financials | | | 144,711,524 | | | | 181,706,302 | | | | — | | | | 326,417,826 | |
Health Care | | | 219,607,654 | | | | 32,055,608 | | | | — | | | | 251,663,262 | |
Industrials | | | 136,438,348 | | | | 157,727,549 | | | | — | | | | 294,165,897 | |
Information Technology | | | 503,340,308 | | | | 136,126,964 | | | | — | | | | 639,467,272 | |
Materials | | | — | | | | 33,200,807 | | | | — | | | | 33,200,807 | |
Telecommunication Services | | | — | | | | 31,355,113 | | | | — | | | | 31,355,113 | |
Utilities | | | 15,341,901 | | | | — | | | | — | | | | 15,341,901 | |
| Preferred Stocks | | | — | | | | 38,084,140 | | | | — | | | | 38,084,140 | |
| Investment Company | | | 22,142,619 | | | | — | | | | — | | | | 22,142,619 | |
| | |
|
|
| |
|
|
| |
|
|
| |
|
|
|
| Total Investments, at Value | | | 1,565,387,708 | | | | 832,794,789 | | | | — | | | | 2,398,182,497 | |
| Other Financial Instruments: | | | | | | | | | | | | | | | | |
| Foreign currency exchange contracts | | | — | | | | 166,977 | | | | — | | | | 166,977 | |
| | |
|
|
| |
|
|
| |
|
|
| |
|
|
|
| Total Assets | | $ | 1,565,387,708 | | | $ | 832,961,766 | | | $ | — | | | $ | 2,398,349,474 | |
| | |
|
|
| |
|
|
| |
|
|
| |
|
|
|
| Liabilities Table | | | | | | | | | | | | | | | | |
| Other Financial Instruments: | | | | | | | | | | | | | | | | |
| Foreign currency exchange contracts | | $ | — | | | $ | (175,158 | ) | | $ | — | | | $ | (175,158 | ) |
| | |
|
|
| |
|
|
| |
|
|
| |
|
|
|
| Total Liabilities | | $ | — | | | $ | (175,158 | ) | | $ | — | | | $ | (175,158 | ) |
| | |
|
|
| |
|
|
| |
|
|
| |
|
|
|
Currency contracts and forwards, if any, are reported at their unrealized appreciation/depreciation at measurement date, which represents the change in the contract’s value from trade date. Futures, if any, are reported at their variation margin at measurement date, which represents the amount due to/from the Fund at that date. All additional assets and liabilities included in the above table are reported at their market value at measurement date.
22 | OPPENHEIMER GLOBAL SECURITIES FUND/VA
|
The table below shows the significant transfers between Level 1 and Level 2. The Fund’s policy is to recognize transfers in and transfers out as of the beginning of the reporting period.
| | | | | | | | | | | | | | | | |
| | | Transfers into
Level 1* | | | Transfers out
of Level 1** | | | Transfers into
Level 2** | | | Transfers out of
Level 2* | |
| Assets Table | | | | | | | | | | | | | | | | |
| Investments, at Value: | | | | | | | | | | | | | | | | |
| Common Stocks | | | | | | | | | | | | | | | | |
Consumer Discretionary | | $ | — | | | $ | (73,681,595 | ) | | $ | 73,681,595 | | | $ | — | |
Consumer Staples | | | — | | | | (28,864,374 | ) | | | 28,864,374 | | | | — | |
Energy | | | — | | | | (28,057,704 | ) | | | 28,057,704 | | | | — | |
Financials | | | 26,128,476 | | | | (132,340,094 | ) | | | 132,340,094 | | | | (26,128,476 | ) |
Health Care | | | — | | | | (28,422,343 | ) | | | 28,422,343 | | | | — | |
Industrials | | | 45,187,675 | | | | (136,239,282 | ) | | | 136,239,282 | | | | (45,187,675 | ) |
Information Technology | | | 94,139,824 | | | | (139,391,318 | ) | | | 139,391,318 | | | | (94,139,824 | ) |
Materials | | | — | | | | (18,670,356 | ) | | | 18,670,356 | | | | — | |
Telecommunication Services | | | — | | | | (31,261,466 | ) | | | 31,261,466 | | | | — | |
Utilities | | | 17,229,805 | | | | — | | | | — | | | | (17,229,805 | ) |
| | |
|
|
| |
|
|
| |
|
|
| |
|
|
|
| Total Assets | | $ | 182,685,780 | | | $ | (616,928,532 | ) | | $ | 616,928,532 | | | $ | (182,685,780 | ) |
| | |
|
|
| |
|
|
| |
|
|
| |
|
|
|
*Transferred from Level 2 to Level 1 due to the presence of a readily available unadjusted quoted market price. As of the prior reporting period end, these securities were absent of a readily available unadjusted quoted market price due to a significant event occurring before the Fund’s assets were valued but after the close of the securities’ respective exchanges.
**Transferred from Level 1 to Level 2 because of the absence of a readily available unadjusted quoted market price due to a significant event occurring before the Fund’s assets were valued but after the close of the securities’ respective exchanges.
There have been no significant changes to the fair valuation methodologies of the Fund during the period.
3. Shares of Beneficial Interest
The Fund has authorized an unlimited number of $0.001 par value shares of beneficial interest of each class. Transactions in shares of beneficial interest were as follows:
| | | | | | | | | | | | | | | | |
| | | Six Months Ended June 29, 2012 | | | Year Ended December 30, 2011 | |
| | | Shares | | | Amount | | | Shares | | | Amount | |
| Non-Service Shares | | | | | | | | | | | | | | | | |
Sold | | | 915,084 | | | $ | 26,762,504 | | | | 2,898,558 | | | $ | 85,697,523 | |
Dividends and/or distributions reinvested | | | 923,150 | | | | 25,848,197 | | | | 544,183 | | | | 17,234,287 | |
Redeemed | | | (3,417,538 | ) | | | (100,113,055 | ) | | | (7,582,244 | ) | | | (227,714,727 | ) |
| | |
|
|
| |
|
|
| |
|
|
| |
|
|
|
| Net decrease | | | (1,579,304 | ) | | $ | (47,502,354 | ) | | | (4,139,503 | ) | | $ | (124,782,917 | ) |
| | |
|
|
| |
|
|
| |
|
|
| |
|
|
|
| | | | | | | | | | | | | |
| Service Shares | | | | | | | | | | | | | | | | |
Sold | | | 2,004,576 | | | $ | 57,683,021 | | | | 5,113,489 | | | $ | 150,060,254 | |
Dividends and/or distributions reinvested | | | 742,178 | | | | 20,625,132 | | | | 361,125 | | | | 11,357,368 | |
Redeemed | | | (2,775,946 | ) | | | (80,631,551 | ) | | | (5,264,551 | ) | | | (156,264,287 | ) |
| | |
|
|
| |
|
|
| |
|
|
| |
|
|
|
| Net increase (decrease) | | | (29,192 | ) | | $ | (2,323,398 | ) | | | 210,063 | | | $ | 5,153,335 | |
| | |
|
|
| |
|
|
| |
|
|
| |
|
|
|
| | | | | | | | | | | | | |
| Class 3 Shares | | | | | | | | | | | | | | | | |
Sold | | | 68,094 | | | $ | 2,005,083 | | | | 210,150 | | | $ | 6,434,653 | |
Dividends and/or distributions reinvested | | | 122,145 | | | | 3,444,499 | | | | 76,748 | | | | 2,447,497 | |
Redeemed | | | (487,480 | ) | | | (14,393,346 | )1 | | | (1,203,693 | ) | | | (36,250,505 | )2 |
| | |
|
|
| |
|
|
| |
|
|
| |
|
|
|
| Net decrease | | | (297,241 | ) | | $ | (8,943,764 | ) | | | (916,795 | ) | | $ | (27,368,355 | ) |
| | |
|
|
| |
|
|
| |
|
|
| |
|
|
|
| | | | | | | | | | | | | |
23 | OPPENHEIMER GLOBAL SECURITIES FUND/VA
|
NOTES TO FINANCIAL STATEMENTS Unaudited / Continued
3. Shares of Beneficial Interest Continued
| | | | | | | | | | | | | | | | |
| | | Six Months Ended June 29, 2012 | | | Year Ended December 30, 2011 | |
| | | Shares | | | Amount | | | Shares | | | Amount | |
| Class 4 Shares | | | | | | | | | | | | | | | | |
Sold | | | 41,291 | | | $ | 1,340,646 | | | | 153,872 | | | $ | 4,648,188 | |
Dividends and/or distributions reinvested | | | 48,073 | | | | 1,338,372 | | | | 26,011 | | | | 819,361 | |
Redeemed | | | (230,210 | ) | | | (6,681,205 | )1 | | | (389,690 | ) | | | (11,451,926 | )2 |
| | |
|
|
| |
|
|
| |
|
|
| |
|
|
|
| Net decrease | | | (140,846 | ) | | $ | (4,002,187 | ) | | | (209,807 | ) | | $ | (5,984,377 | ) |
| | |
|
|
| |
|
|
| |
|
|
| |
|
|
|
1. Net of redemption fees of $2,066 and $786 for Class 3 and Class 4, respectively.
2. Net of redemption fees of $1,073 and $1,794 for Class 3 and Class 4, respectively.
4. Purchases and Sales of Securities
The aggregate cost of purchases and proceeds from sales of securities, other than short-term obligations and investments in IMMF, for the six months ended June 29, 2012, were as follows:
| | | | | | | | |
| | | Purchases | | | Sales | |
Investment securities | | $ | 207,842,711 | | | $ | 278,592,783 | |
5. Fees and Other Transactions with Affiliates
Management Fees. Under the investment advisory agreement, the Fund pays the Manager a management fee based on the daily net assets of the Fund at an annual rate as shown in the following table:
| | | | |
| Fee Schedule | | | |
Up to $200 million | | | 0.75 | % |
Next $200 million | | | 0.72 | |
Next $200 million | | | 0.69 | |
Next $200 million | | | 0.66 | |
Over $800 million | | | 0.60 | |
Administration Service Fees. The Fund pays the Manager a fee of $1,500 per year for preparing and filing the Fund’s tax returns.
Transfer Agent Fees. OppenheimerFunds Services (“OFS”), a division of the Manager, acts as the transfer and shareholder servicing agent for the Fund. For the six months ended June 29, 2012, the Fund paid $1,255,407 to OFS for services to the Fund.
Distribution and Service Plan for Service Shares and Class 4 Shares. The Fund has adopted a Distribution and Service Plan (the “Plan”) in accordance with Rule 12b-1 under the Investment Company Act of 1940 for Service shares and Class 4 shares to pay OppenheimerFunds Distributor, Inc. (the “Distributor”), for distribution related services, personal service and account maintenance for the Fund’s Service shares and Class 4 shares. Under the Plan, payments are made periodically at an annual rate of 0.25% of the daily net assets of Service shares and Class 4 shares of the Fund. The Distributor currently uses all of those fees to compensate sponsors of the insurance product that offers Fund shares, for providing personal service and maintenance of accounts of their variable contract owners that hold Service shares and Class 4 shares. These fees are paid out of the Fund’s assets on an on-going basis and increase operating expenses of the Service shares and Class 4 shares, which results in lower performance compared to the Fund’s shares that are not subject to a service fee. Fees incurred by the Fund under the Plan are detailed in the Statement of Operations.
24 | OPPENHEIMER GLOBAL SECURITIES FUND/VA
|
Waivers and Reimbursements of Expenses. The Manager has voluntarily agreed to limit the Fund’s total annual operating expenses so that those expenses, as percentages of daily net assets, will not exceed the annual rate of 1.00% for Non-Service and Class 3 shares and 1.25% for Service and Class 4 shares.
The Manager will waive fees and/or reimburse Fund expenses in an amount equal to the indirect management fees incurred through the Fund’s investment in IMMF. During the six months ended June 29, 2012, the Manager waived fees and/or reimbursed the Fund $10,946 for IMMF management fees.
Some of these undertakings may be modified or terminated at any time; some may not be modified or terminated until after one year from the date of the current prospectus, as indicated therein.
6. Risk Exposures and the Use of Derivative Instruments
The Fund’s investment objectives not only permit the Fund to purchase investment securities, they also allow the Fund to enter into various types of derivatives contracts, including, but not limited to, futures contracts, forward foreign currency exchange contracts, credit default swaps, interest rate swaps, total return swaps, and purchased and written options. In doing so, the Fund will employ strategies in differing combinations to permit it to increase, decrease, or change the level or types of exposure to market risk factors. Central to those strategies are features inherent to derivatives that make them more attractive for this purpose than equity and debt securities: they require little or no initial cash investment, they can focus exposure on only certain selected risk factors, and they may not require the ultimate receipt or delivery of the underlying security (or securities) to the contract. This may allow the Fund to pursue its objectives more quickly and efficiently than if it were to make direct purchases or sales of securities capable of effecting a similar response to market factors.
Market Risk Factors. In accordance with its investment objectives, the Fund may use derivatives to increase or decrease its exposure to one or more of the following market risk factors:
Commodity Risk. Commodity risk relates to the change in value of commodities or commodity indexes as they relate to increases or decreases in the commodities market. Commodities are physical assets that have tangible properties. Examples of these types of assets are crude oil, heating oil, metals, livestock, and agricultural products.
Credit Risk. Credit risk relates to the ability of the issuer to meet interest and principal payments, or both, as they come due. In general, lower-grade, higher-yield bonds are subject to credit risk to a greater extent than lower-yield, higher-quality bonds.
Equity Risk. Equity risk relates to the change in value of equity securities as they relate to increases or decreases in the general market.
Foreign Exchange Rate Risk. Foreign exchange rate risk relates to the change in the U.S. dollar value of a security held that is denominated in a foreign currency. The U.S. dollar value of a foreign currency denominated security will decrease as the dollar appreciates against the currency, while the U.S. dollar value will increase as the dollar depreciates against the currency.
Interest Rate Risk. Interest rate risk refers to the fluctuations in value of fixed-income securities resulting from the inverse relationship between price and yield. For example, an increase in general interest rates will tend to reduce the market value of already issued fixed-income investments, and a decline in general interest rates will tend to increase their value. In addition, debt securities with longer maturities, which tend to have higher yields, are subject to potentially greater fluctuations in value from changes in interest rates than obligations with shorter maturities.
Volatility Risk. Volatility risk refers to the magnitude of the movement, but not the direction of the movement, in a financial instrument’s price over a defined time period. Large increases or decreases in a financial instrument’s price over a relative time period typically indicate greater volatility risk, while small increases or decreases in its price typically indicate lower volatility risk.
25 | OPPENHEIMER GLOBAL SECURITIES FUND/VA
|
NOTES TO FINANCIAL STATEMENTS Unaudited / Continued
6. Risk Exposures and the Use of Derivative Instruments Continued
The Fund’s actual exposures to these market risk factors during the period are discussed in further detail, by derivative type, below.
Risks of Investing in Derivatives. The Fund’s use of derivatives can result in losses due to unanticipated changes in the market risk factors and the overall market. In instances where the Fund is using derivatives to decrease, or hedge, exposures to market risk factors for securities held by the Fund, there are also risks that those derivatives may not perform as expected resulting in losses for the combined or hedged positions.
Derivatives may have little or no initial cash investment relative to their market value exposure and therefore can produce significant gains or losses in excess of their cost. This use of embedded leverage allows the Fund to increase its market value exposure relative to its net assets and can substantially increase the volatility of the Fund’s performance.
Additional associated risks from investing in derivatives also exist and potentially could have significant effects on the valuation of the derivative and the Fund. Typically, the associated risks are not the risks that the Fund is attempting to increase or decrease exposure to, per its investment objectives, but are the additional risks from investing in derivatives. Examples of these associated risks are liquidity risk, which is the risk that the Fund will not be able to sell the derivative in the open market in a timely manner, and counterparty credit risk, which is the risk that the counterparty will not fulfill its obligation to the Fund. Associated risks can be different for each type of derivative and are discussed by each derivative type in the notes that follow.
Counterparty Credit Risk. Certain derivative positions are subject to counterparty credit risk, which is the risk that the counterparty will not fulfill its obligation to the Fund. The Fund’s derivative counterparties are financial institutions who are subject to market conditions that may weaken their financial position. The Fund intends to enter into financial transactions with counterparties that the Manager believes to be creditworthy at the time of the transaction. As of June 29, 2012, the maximum amount of loss that the Fund would incur if the counterparties to its derivative transactions failed to perform would be $166,977, which represents gross payments to be received by the Fund on these derivative contracts were they to be unwound as of period end.
Credit Related Contingent Features. The Fund’s agreements with derivative counterparties have several credit related contingent features that if triggered would allow its derivatives counterparties to close out and demand payment or additional collateral to cover their exposure from the Fund. Credit related contingent features are established between the Fund and its derivatives counterparties to reduce the risk that the Fund will not fulfill its payment obligations to its counterparties. These triggering features include, but are not limited to, a percentage decrease in the Fund’s net assets and or a percentage decrease in the Fund’s Net Asset Value or NAV. The contingent features are established within the Fund’s International Swap and Derivatives Association, Inc. master agreements which govern certain positions in swaps, over-the-counter options and swaptions, and forward currency exchange contracts for each individual counterparty.
Valuations of derivative instruments as of June 29, 2012 are as follows:
| | | | | | | | | | | | |
| | | Asset Derivatives
| | | Liability Derivatives
| |
Derivatives Not
Accounted for as
Hedging Instruments | | Statement of Assets
and Liabilities Location | | Value | | | Statement of Assets
and Liabilities Location | | Value | |
| Foreign exchange contracts | | Unrealized appreciation on foreign currency exchange contracts | | | $166,977 | | | Unrealized depreciation on foreign currency exchange contracts | | | $175,158 | |
26 | OPPENHEIMER GLOBAL SECURITIES FUND/VA
|
The effect of derivative instruments on the Statement of Operations is as follows:
| | | | |
| Amount of Realized Gain or (Loss) Recognized on Derivatives | |
Derivatives Not Accounted
for as Hedging Instruments | | Foreign currency transactions | |
| Foreign exchange contracts | | | $27,787 | |
|
| Amount of Change in Unrealized Gain or (Loss) Recognized on Derivatives | |
Derivatives Not Accounted
for as Hedging Instruments | | Translation of assets and liabilities
denominated in foreign currencies | |
| Foreign exchange contracts | | | $(8,181 | ) |
Foreign Currency Exchange Contracts
The Fund may enter into foreign currency exchange contracts (“forward contracts”) for the purchase or sale of a foreign currency at a negotiated rate at a future date.
Forward contracts are reported on a schedule following the Statement of Investments. The unrealized appreciation (depreciation) is reported in the Statement of Assets and Liabilities as a receivable or payable and in the Statement of Operations within the change in unrealized appreciation (depreciation). At contract close, the difference between the original cost of the contract and the value at the close date is recorded as a realized gain (loss) in the Statement of Operations.
The Fund has purchased and sold certain forward foreign currency exchange contracts of different currencies in order to acquire currencies to pay for or sell currencies to acquire related foreign securities purchase and sale transactions, respectively, or to convert foreign currencies to U.S. dollars from related foreign securities transactions. These foreign currency exchange contracts are negotiated at the current spot exchange rate with settlement typically within two business days thereafter.
During the six months ended June 29, 2012, the Fund had daily average contract amounts on forward foreign currency contracts to buy and sell of $2,053,633 and $3,034,145, respectively.
Additional associated risk to the Fund includes counterparty credit risk. Counterparty credit risk arises from the possibility that the counterparty will default.
7. Pending Litigation
Since 2009, a number of class action, derivative and individual lawsuits have been pending in federal and state courts against OppenheimerFunds, Inc., the Fund’s investment advisor (the “Manager”), OppenheimerFunds Distributor, Inc., the Fund’s principal underwriter and distributor (the “Distributor”), and certain funds (but not including the Fund) advised by the Manager and distributed by the Distributor (the “Defendant Funds”). Several of these lawsuits also name as defendants certain officers and current and former trustees of the respective Defendant Funds. The lawsuits raise claims under federal securities laws and various states’ securities, consumer protection and common law and allege, among other things, that the disclosure documents of the respective Defendant Funds contained misrepresentations and omissions and that the respective Defendant Funds’ investment policies were not followed. The plaintiffs in these actions seek unspecified damages, equitable relief and awards of attorneys’ fees and litigation expenses.
Other class action and individual lawsuits have been filed since 2008 in various state and federal courts against the Manager and certain of its affiliates by investors seeking to recover investments they allegedly lost as a result of the “Ponzi” scheme run by Bernard L. Madoff and his firm, Bernard L. Madoff Investment Securities, LLC (“BLMIS”). Plaintiffs in these suits allege that they suffered losses as a result of their investments in several funds managed by an affiliate of the Manager and assert a variety of claims, including breach of fiduciary duty, fraud, negligent misrepresentation, unjust enrichment, and violation of federal and state securities laws and regulations, among others. They seek unspecified damages, equitable relief and awards of attorneys’ fees and litigation expenses. Neither the Distributor, nor any of the
27 | OPPENHEIMER GLOBAL SECURITIES FUND/VA
|
NOTES TO FINANCIAL STATEMENTS Unaudited / Continued
7. Pending Litigation Continued
Oppenheimer mutual funds, their independent trustees or directors are named as defendants in these lawsuits. None of the Oppenheimer mutual funds invested in any funds or accounts managed by Madoff or BLMIS. On February 28, 2011, a stipulation of partial settlement of three groups of consolidated putative class action lawsuits relating to these matters was filed in the U.S. District Court for the Southern District of New York. On August 19, 2011, the court entered an order and final judgment approving the settlement as fair, reasonable and adequate. In September 2011, certain parties filed notices of appeal from the court’s order approving the settlement. On July 29, 2011, a stipulation of settlement between certain affiliates of the Manager and the Trustee appointed under the Securities Investor Protection Act to liquidate BLMIS was filed in the U.S. Bankruptcy Court for the Southern District of New York to resolve purported preference and fraudulent transfer claims by the Trustee. On September 22, 2011, the court entered an order approving the settlement as fair, reasonable and adequate. In October 2011, certain parties filed notices of appeal from the court’s order approving the settlement. The aforementioned settlements do not resolve other outstanding lawsuits against the Manager and its affiliates relating to BLMIS.
On April 16, 2010, a lawsuit was filed in New York state court against the Manager, an affiliate of the Manager and AAArdvark IV Funding Limited (“AAArdvark IV”), an entity advised by the Manager’s affiliate, in connection with investments made by the plaintiffs in AAArdvark IV. Plaintiffs allege breach of contract against the defendants and seek compensatory damages, costs and disbursements, including attorney fees. On July 15, 2011, a lawsuit was filed in New York state court against the Manager, an affiliate of the Manager and AAArdvark Funding Limited (“AAArdvark I”), an entity advised by the Manager’s affiliate, in connection with investments made by the plaintiffs in AAArdvark I. The complaint alleges breach of contract against the defendants and seeks compensatory damages, costs and disbursements, including attorney fees. On November 9, 2011, a lawsuit was filed in New York state court against the Manager, an affiliate of the Manager and AAArdvark XS Funding Limited (“AAArdvark XS”), an entity advised by the Manager’s affiliate, in connection with investments made by the plaintiffs in AAArdvark XS. The complaint alleges breach of contract against the defendants and seeks compensatory damages, costs and disbursements, including attorney fees.
The Manager believes the lawsuits and appeals described above are without legal merit and, with the exception of actions it has settled, is defending against them vigorously. The Defendant Funds’ Boards of Trustees have also engaged counsel to represent the Funds and the present and former Independent Trustees named in those suits. While it is premature to render any opinion as to the outcome in these lawsuits, or whether any costs that the Defendant Funds may bear in defending the suits might not be reimbursed by insurance, the Manager believes that these suits should not impair the ability of the Manager or the Distributor to perform their respective duties to the Fund, and that the outcome of all of the suits together should not have any material effect on the operations of any of the Oppenheimer mutual funds.
28 | OPPENHEIMER GLOBAL SECURITIES FUND/VA
|
SPECIAL SHAREHOLDER MEETING Unaudited
On February 29, 2012, a shareholder meeting of the Oppenheimer Variable Account Funds, on behalf of Oppenheimer Global Securities Fund/VA (the “Fund”) was held at which the twelve Trustees identified below were elected to the Trust (Proposal No. 1). At the meeting the Proposal No. 2 (including all of its sub-proposals) and Proposal No. 3 were approved as described in the Fund’s proxy statement for that meeting. The following is a report of the votes cast:
| | | | | | | | |
| Nominee/Proposal | | For | | | Withheld | |
| Trustees | | | | | | | | |
| William L. Armstrong | | | 859,155,000 | | | | 36,277,763 | |
| Edward L. Cameron | | | 860,463,149 | | | | 34,969,615 | |
| Jon S. Fossel | | | 861,382,389 | | | | 34,050,375 | |
| Sam Freedman | | | 860,173,958 | | | | 35,258,806 | |
| Richard F. Grabish | | | 862,692,974 | | | | 32,739,789 | |
| Beverly L. Hamilton | | | 862,904,192 | | | | 32,528,571 | |
| Robert J. Malone | | | 862,354,488 | | | | 33,078,275 | |
| F. William Marshall, Jr. | | | 860,997,182 | | | | 34,435,581 | |
| Victoria J. Herget | | | 861,814,105 | | | | 33,618,659 | |
| Karen L. Stuckey | | | 861,434,246 | | | | 33,998,517 | |
| James D. Vaughn | | | 861,208,178 | | | | 33,998,517 | |
| William F. Glavin, Jr. | | | 861,148,846 | | | | 34,283,917 | |
2a: Proposal to revise the fundamental policy relating to borrowing
| | | | | | | | | | | | |
| For | | Against | | | Abstain | | | Broker Non Vote | |
| 73,480,280 | | | 6,518,185 | | | | 3,982,980 | | | | N/A | |
2b: Proposal to revise the fundamental policy relating to concentration of investments
| | | | | | | | | | | | |
| For | | Against | | | Abstain | | | Broker Non Vote | |
| 74,114,746 | | | 6,318,655 | | | | 3,548,044 | | | | N/A | |
2c: Proposal to remove the fundamental policy relating to diversification of investments
| | | | | | | | | | | | |
| For | | Against | | | Abstain | | | Broker Non Vote | |
| 73,185,000 | | | 6,477,746 | | | | 4,318,700 | | | | N/A | |
2d: Proposal to revise the fundamental policy relating to lending
| | | | | | | | | | | | |
| For | | Against | | | Abstain | | | Broker Non Vote | |
| 73,206,034 | | | 6,497,182 | | | | 4,278,229 | | | | N/A | |
2e-1: Proposal to revise the fundamental policy relating to real estate and commodities
| | | | | | | | | | | | |
| For | | Against | | | Abstain | | | Broker Non Vote | |
| 73,729,848 | | | 6,587,137 | | | | 3,664,460 | | | | N/A | |
2e-2: Proposal to remove the additional fundamental policy relating to real estate and commodities
| | | | | | | | | | | | |
| For | | Against | | | Abstain | | | Broker Non Vote | |
| 73,185,831 | | | 6,778,168 | | | | 4,017,446 | | | | N/A | |
29 | OPPENHEIMER GLOBAL SECURITIES FUND/VA
|
SPECIAL SHAREHOLDER MEETING Unaudited / Continued
2f: Proposal to revise the fundamental policy relating to senior securities
| | | | | | | | | | | | |
| For | | Against | | | Abstain | | | Broker Non Vote | |
| 73,795,656 | | | 6,420,158 | | | | 3,765,632 | | | | N/A | |
2g: Proposal to revise the fundamental policy relating to underwriting
| | | | | | | | | | | | |
| For | | Against | | | Abstain | | | Broker Non Vote | |
| 73,687,494 | | | 6,546,579 | | | | 3,747,373 | | | | N/A | |
2h: Proposal to remove miscellaneous fundamental policy relating to investment strategy restriction
| | | | | | | | | | | | |
| For | | Against | | | Abstain | | | Broker Non Vote | |
| 73,096,953 | | | 6,812,377 | | | | 4,072,115 | | | | N/A | |
2i: Convert the Fund’s investment objective from fundamental to non-fundamental
| | | | | | | | | | | | |
| For | | Against | | | Abstain | | | Broker Non Vote | |
| 72,595,371 | | | 6,784,455 | | | | 4,601,619 | | | | N/A | |
2j: Approve a change in the fund’s investment objective
| | | | | | | | | | | | |
| For | | Against | | | Abstain | | | Broker Non Vote | |
| 73,362,485 | | | 6,655,630 | | | | 3,963,330 | | | | N/A | |
Proposal 3: To approve an Agreement and Plan of Reorganization that provides for the reorganization of a Fund from a Maryland corporation or Massachusetts business trust, as applicable, into a Delaware statutory trust.
| | | | | | | | | | | | |
| For | | Against | | | Abstain | | | Broker Non Vote | |
| 821,085,084 | | | 23,597,959 | | | | 50,749,721 | | | | N/A | |
30 | OPPENHEIMER GLOBAL SECURITIES FUND/VA
|
PORTFOLIO PROXY VOTING POLICIES AND PROCEDURES;
UPDATES TO STATEMENTS OF INVESTMENTS Unaudited
The Fund has adopted Portfolio Proxy Voting Policies and Procedures under which the Fund votes proxies relating to securities (“portfolio proxies”) held by the Fund. A description of the Fund’s Portfolio Proxy Voting Policies and Procedures is available (i) without charge, upon request, by calling the Fund toll-free at 1.800.525.7048, (ii) on the Fund’s website at oppenheimerfunds.com, and (iii) on the SEC’s website at www.sec.gov. In addition, the Fund is required to file Form N-PX, with its complete proxy voting record for the 12 months ended June 30th, no later than August 31st of each year. The Fund’s voting record is available (i) without charge, upon request, by calling the Fund toll-free at 1.800.525.7048, and (ii) in the Form N-PX filing on the SEC’s website at www.sec.gov.
The Fund files its complete schedule of portfolio holdings with the SEC for the first quarter and the third quarter of each fiscal year on Form N-Q. The Fund’s Form N-Q filings are available on the SEC’s website at www.sec.gov. Those forms may be reviewed and copied at the SEC’s Public Reference Room in Washington, D.C. Information on the operation of the Public Reference Room may be obtained by calling 1-800-SEC-0330.
31 | OPPENHEIMER GLOBAL SECURITIES FUND/VA
|
OPPENHEIMER GLOBAL SECURITIES FUND/VA
| | |
| A Series of Oppenheimer Variable Account Funds |
| Trustees and Officers | | William L. Armstrong, Chairman of the Board of Trustees and Trustee Edward L. Cameron, Trustee Jon S. Fossel, Trustee Sam Freedman, Trustee Richard F. Grabish, Trustee Beverly L. Hamilton, Trustee Victoria J. Herget, Trustee Robert J. Malone, Trustee F. William Marshall, Jr., Trustee Karen L. Stuckey, Trustee James D. Vaughn, Trustee William F. Glavin, Jr., Trustee, President and Principal Executive Officer Rajeev Bhaman, Vice President Arthur S. Gabinet, Secretary and Chief Legal Officer Christina M. Nasta, Vice President and Chief Business Officer Mark S. Vandehey, Vice President and Chief Compliance Officer Brian W. Wixted, Treasurer and Principal Financial & Accounting Officer |
| Manager | | OppenheimerFunds, Inc. |
| Distributor | | OppenheimerFunds Distributor, Inc. |
| Transfer Agent | | OppenheimerFunds Services |
| Independent Registered Public Accounting Firm | | KPMG LLP |
| Counsel | | K&L Gates LLP |
Before investing, investors should carefully consider a fund’s investment objectives, risks, charges and expenses. Fund prospectuses and summary prospectuses contain this and other information about the funds and may be obtained by asking your financial advisor, or calling us at 1.800.988.8287. Read prospectuses and summary prospectuses carefully before investing.
The financial statements included herein have been taken from the records of the Fund without examination of those records by the independent registered public accounting firms.
| | |
| ©2012 OppenheimerFunds, Inc. All rights reserved. | |  |
June 30, 2012
| | | | |
| | | Oppenheimer High Income Fund/VA A Series of Oppenheimer Variable Account Funds | | Semiannual Report |

SEMIANNUAL REPORT
Fund Performance Discussion
Listing of Top Holdings
Financial Statements

OPPENHEIMER HIGH INCOME FUND/VA
Portfolio Manager: Joseph Welsh, CFA
| | | | | | |
Cumulative Total Returns For the 6-Month Period Ended 6/29/121 |
| Non-Service Shares | | 7.52% | | | | |
| Service Shares | | 7.16 | | | | |
| Class 3 Shares | | 7.46 | | | | |
| Class 4 Shares | | 7.04 | | | | |
Average Annual Total Returns For the Periods Ended 6/29/121 |
| | | |
| | | 1-Year | | 5-Year | | 10-Year |
| Non-Service Shares | | 0.14% | | –20.78% | | –6.83% |
| Service Shares | | –0.64 | | –20.79 | | –6.95 |
| | | |
| | | 1-Year | | 5-Year | | Since
Inception
(5/1/07) |
| Class 3 Shares | | 0.16% | | –20.67% | | –20.16% |
| Class 4 Shares | | –0.16 | | –20.67 | | –20.18 |
Expense Ratios For the Fiscal Year Ended 12/30/111 |
| | | |
| | | Gross
Expense
Ratios | | | | Net
Expense
Ratios |
| Non-Service Shares | | 0.98% | | | | 0.75% |
| Service Shares | | 1.23 | | | | 1.00 |
| Class 3 Shares | | 0.98 | | | | 0.75 |
| Class 4 Shares | | 1.23 | | | | 1.00 |
The performance data quoted represents past performance, which does not guarantee future results. The investment return and principal value of an investment in the Fund will fluctuate so that an investor’s shares, when redeemed, may be worth more or less than their original cost. Current performance and expense ratios may be lower or higher than the data quoted. For performance data current to the most recent month end, call us at 1.800.988.8287. The Fund’s total returns should not be expected to be the same as the returns of other funds, whether or not both funds have the same portfolio managers and/or similar names. The Fund’s total returns do not include the charges associated with the separate account products that offer this Fund. Such performance would have been lower if such charges were taken into account. Expense ratios are as stated in the Fund’s prospectus current as of the date of this report. The net expense ratios take into account voluntary fee waivers and/or expense reimbursements, without which performance would have been less. Some of these undertakings may be modified or terminated at any time, as indicated in the Fund’s prospectus.
| | | | |
| Credit Rating Breakdown | | NRSRO Only Total | |
| AAA | | | 1.9 | % |
| BBB | | | 2.6 | |
| BB | | | 24.5 | |
| B | | | 52.3 | |
| CCC | | | 15.8 | |
| Unrated | | | 2.9 | |
| Total | | | 100.0 | % |
The percentages above are based on the market value of the Fund’s securities as of June 29, 2012, and are subject to change. Except for securities labeled “Unrated” and except for certain securities issued or guaranteed by a foreign sovereign, all securities have been rated by at least one Nationally Recognized Statistical Rating Organization (“NRSRO”), such as Standard & Poor’s (“S&P”). For securities rated only by an NRSRO other than S&P, OppenheimerFunds, Inc. converts that rating to the equivalent S&P rating. If two or more NRSROs have assigned a rating to a security, the highest S&P equivalent rating is used. Unrated securities issued or guaranteed by a foreign sovereign are assigned a credit rating equal to the highest NRSRO rating assigned to that foreign sovereign. Fund assets invested in Oppenheimer Institutional Money Market Fund are assigned that fund’s S&P rating, which is currently AAA. For the purposes of this Credit Allocation table, “investment-grade” securities are securities rated within the NRSROs’ four highest rating categories, which include AAA, AA, A and BBB. Unrated securities do not necessarily indicate low credit quality, and may or may not be the equivalent of investment-grade. Please consult the Fund’s prospectus and Statement of Additional Information for further information.
| | |
| Corporate Bonds & Notes—Top Ten Industries | | |
| Media | | 9.5% |
| Oil, Gas & Consumable Fuels | | 8.2 |
| Hotels, Restaurants & Leisure | | 6.4 |
| Aerospace & Defense | | 3.5 |
| Health Care Providers & Services | | 3.3 |
| Capital Markets | | 3.2 |
| Diversified Telecommunication Services | | 3.1 |
| Energy Equipment & Services | | 3.1 |
| Food Products | | 3.1 |
| Machinery | | 2.9 |
Portfolio holdings and allocations are subject to change. Percentages are as of June 29, 2012, and are based on net assets.
2 | OPPENHEIMER HIGH INCOME FUND/VA
|
FUND PERFORMANCE DISCUSSION
Economic and Market Environment
The period began during a time of improved market sentiment in which the United States managed to avoid a return to recession and European policymakers appeared to take steps to address the region’s sovereign debt and banking sector crises. Renewed investor optimism helped produce gains across a number of international equity markets and historically riskier asset classes over the first three months of 2012. The rebound across risk markets gained momentum after the European Central Bank implemented the Long-Term Refinancing Operation (“LTRO”) to enhance liquidity for troubled banks and reduce rates on newly issued sovereign debt securities.
However, the second quarter was a volatile time for global markets. The fear of contagion from the worsening European sovereign debt crisis and a recession across much of Europe drove negative market sentiment, particularly over May and June. Very high unemployment, soaring debt and higher borrowing costs in Greece, Spain and Italy contributed to serious questions over how to implement austerity measures and restructure debt or instead take a different tact and provide some or all of those countries with additional funds. Perhaps most worrisome of all to investors was the possibility of Greece pulling out of the euro and its ramifications for the future of the Eurozone and its common currency. In the U.S., slower than expected first quarter growth also contributed to a sell-off in the U.S. stock market. Consumer confidence dropped as U.S. unemployment figures ticked slightly upwards after showing signs of improvement from the recession highs. The Fed announced the continuation of Operation Twist in response to an uneven domestic economic picture, yet, the U.S. housing market appears to be bottoming. Despite risk aversion stemming from Europe, the high yield bond market witnessed steady inflows during the quarter and reached $19.8 billion year-to-date according to AMG Data Services.
Fund Performance Discussion
During the six-month reporting period, the Fund’s Non-Service shares produced a return of 7.52%. In comparison, the JPMorgan Domestic High Yield Index returned 7.36% and the BofA Merrill Lynch High Yield Master Index returned 7.02%1. The Fund maintained its focus on higher-yielding (lower credit quality) securities, which benefited performance particularly over the first half of the reporting period amid the rally in risk assets. While the performance of the Fund slowed over the volatile second half of the reporting period, absolute performance was still positive during that time.
The best performing securities of the Fund included broadcasting; chemicals; gaming, lodging and leisure; financial; paper and packaging; housing; and transportation. While most areas of the Fund produced positive absolute results this period, the most significant detractors were investments in utilities and diversified media.
Investors should consider the Fund’s investment objective, risks, and charges and expenses carefully before investing. The Fund’s prospectus and summary prospectus contain this and other information about the Fund, and may be obtained by asking your financial advisor or calling us at 1.800.988.8287. Read prospectuses and summary prospectuses carefully before investing.
Total returns include changes in share price and reinvestment of dividends and capital gains distributions in a hypothetical investment for the periods shown. Cumulative total returns are not annualized.
The Fund’s investment strategy and focus can change over time. The mention of specific fund holdings does not constitute a recommendation by OppenheimerFunds, Inc.
Shares of Oppenheimer funds are not deposits or obligations of any bank, are not guaranteed by any bank, are not insured by the FDIC or any other agency, and involve investment risks, including the possible loss of the principal amount invested.
1. June 29, 2012 was the last business day of the Fund’s semiannual period. See Note 1 of the accompanying Notes to Financial Statements. Index returns are calculated through June 30, 2012. December 30, 2011 was the last business day of the Fund’s 2011 fiscal year.
3 | OPPENHEIMER HIGH INCOME FUND/VA
|
FUND EXPENSES
Fund Expenses. As a shareholder of the Fund, you incur two types of costs: (1) transaction costs and (2) ongoing costs, including management fees; distribution and service fees; and other Fund expenses. These examples are intended to help you understand your ongoing costs (in dollars) of investing in the Fund and to compare these costs with the ongoing costs of investing in other mutual funds.
The examples are based on an investment of $1,000.00 invested at the beginning of the period and held for the entire 6-month period ended June 29, 2012.
Actual Expenses. The first section of the table provides information about actual account values and actual expenses. You may use the information in this section for the class of shares you hold, together with the amount you invested, to estimate the expense that you paid over the period. Simply divide your account value by $1,000.00 (for example, an $8,600.00 account value divided by $1,000.00 = 8.60), then multiply the result by the number in the first section under the heading entitled “Expenses Paid During Period” to estimate the expenses you paid on your account during this period.
Hypothetical Example for Comparison Purposes. The second section of the table provides information about hypothetical account values and hypothetical expenses based on the Fund’s actual expense ratio for each class of shares, and an assumed rate of return of 5% per year for each class before expenses, which is not the actual return. The hypothetical account values and expenses may not be used to estimate the actual ending account balance or expenses you paid for the period. You may use this information to compare the ongoing costs of investing in the Fund and other funds. To do so, compare this 5% hypothetical example for the class of shares you hold with the 5% hypothetical examples that appear in the shareholder reports of the other funds.
Please note that the expenses shown in the table are meant to highlight your ongoing costs only and do not reflect any charges associated with the separate accounts that offer this Fund. Therefore, the “hypothetical” lines of the table are useful in comparing ongoing costs only, and will not help you determine the relative total costs of owning different funds. In addition, if these separate account charges were included your costs would have been higher.
4 | OPPENHEIMER HIGH INCOME FUND/VA
|
| | | | | | | | | | | | |
| Actual | | Beginning
Account
Value
January 1, 2012 | | | Ending
Account
Value
June 29, 2012 | | | Expenses
Paid During
6 Months Ended
June 29, 2012 | |
| Non-Service Shares | | $ | 1,000.00 | | | $ | 1,075.20 | | | $ | 3.86 | |
| Service shares | | | 1,000.00 | | | | 1,071.60 | | | | 5.13 | |
| Class 3 | | | 1,000.00 | | | | 1,074.60 | | | | 3.85 | |
| Class 4 | | | 1,000.00 | | | | 1,070.40 | | | | 5.13 | |
| | | |
Hypothetical
(5% return before expenses) | | | | | | | | | |
| Non-Service Shares | | | 1,000.00 | | | | 1,021.02 | | | | 3.75 | |
| Service shares | | | 1,000.00 | | | | 1,019.78 | | | | 5.01 | |
| Class 3 | | | 1,000.00 | | | | 1,021.02 | | | | 3.75 | |
| Class 4 | | | 1,000.00 | | | | 1,019.78 | | | | 5.01 | |
Expenses are equal to the Fund’s annualized expense ratio for that class, multiplied by the average account value over the period, multiplied by 181/366 (to reflect the one-half year period). Those annualized expense ratios, excluding indirect expenses from affiliated fund, based on the 6-month period ended June 29, 2012 are as follows:
| | | | |
| Class | | Expense Ratios | |
| Non-Service Shares | | | 0.75 | % |
| Service shares | | | 1.00 | |
| Class 3 | | | 0.75 | |
| Class 4 | | | 1.00 | |
The expense ratios reflect voluntary waivers and/or reimbursements of expenses by the Fund’s Manager. Some of these undertakings may be modified or terminated at any time, as indicated in the Fund’s prospectus. The “Financial Highlights” tables in the Fund’s financial statements, included in this report, also show the gross expense ratios, without such waivers or reimbursements and reduction to custodian expenses, if applicable.
5 | OPPENHEIMER HIGH INCOME FUND/VA
|
STATEMENT OF INVESTMENTS June 29, 2012* / Unaudited
| | | | | | | | |
| | | Principal
Amount | | | Value | |
| | | | | | | | | |
| Corporate Loans—0.4% | | | | | | | | |
Autoparts Holdings Ltd., Sr. Sec. Credit Facilities 1st Lien Term Loan, 5%, 7/21/171,2 | | $ | 214,460 | | | $ | 207,356 | |
Chesapeake Energy Corp., Sr. Sec. Credit Facilities Term Loan, 7%, 12/2/171,2 | | | 280,000 | | | | 277,900 | |
| | | | | | |
|
|
|
Total Corporate Loans (Cost $484,154) | | | | | | | 485,256 | |
| Loan Participations—5.8% | |
Atlantic Broadband Finance LLC, Sr. Sec. Credit Facilities 2nd Lien Term Loan, 9.75%, 9/20/191 | | | 190,000 | | | | 188,496 | |
Brock Holdings III, Inc., Sr. Sec. Credit Facilities 2nd Lien Term Loan, 10%, 2/15/181 | | | 155,000 | | | | 153,450 | |
Cengage Learning Holdings II LP, Sr. Sec. Credit Facilities 1st Lien Exit Term Loan, 5.74%, 7/5/171 | | | 447,945 | | | | 387,262 | |
Clear Channel Communications, Inc., Sr. Sec. Credit Facilities 1st Lien Term Loan, Tranche B, 3.889%, 1/29/161 | | | 452,763 | | | | 361,289 | |
Crestwood Holdings LLC, Sr. Sec. Credit Facilities 1st Lien Term Loan, Tranche B, 9.75%, 3/8/181 | | | 280,000 | | | | 281,983 | |
Entegra Holdings LLC, Sr. Sec. Credit Facilities 3rd Lien Term Loan: Tranche B, 3.709%, 10/19/151,3 | | | 459,325 | | | | 249,184 | |
| Tranche B, 3.709%, 10/19/151,2,3 | | | 588,704 | | | | 319,372 | |
iStar Financial, Inc., Sr. Sec. Credit Facilities 1st Lien Term Loan, Tranche A2, 7%, 3/19/171 | | | 565,000 | | | | 565,565 | |
Lone Star Intermediate Super Holdings LLC, Sr. Sec. Credit Facilities Term Loan, 11%, 8/7/191 | | | 340,000 | | | | 349,690 | |
Nuveen Investments, Inc., Sr. Sec. Credit Facilities 2nd Lien Term Loan, 8.25%, 3/1/191 | | | 640,000 | | | | 642,400 | |
| OneLink Communications/San Juan Cable LLC, Sr. Sec. Credit Facilities 2nd Lien Term Loan, Tranche B, 10%, 6/9/181 | | | 420,000 | | | | 421,050 | |
PQ Corp., Sr. Sec. Credit Facilities 2nd Lien Term Loan, 6.739%, 7/30/151 | | | 625,000 | | | | 595,964 | |
Revel Entertainment LLC, Sr. Sec. Credit Facilities 1st Lien Term Loan: 7.50%, 2/17/171,2 | | | 85,000 | | | | 73,100 | |
| 9%, 2/17/171,2 | | | 485,000 | | | | 417,100 | |
Springleaf Financial Services, Sr. Sec. Credit Facilities 1st Lien Term Loan, 5.50%, 5/10/171 | | | 305,000 | | | | 288,007 | |
| | | | | | | | |
| | | Principal
Amount | | | Value | |
| | | | | | | | | |
| Loan Participations Continued | |
Texas Competitive Electric Holdings Co. LLC, Non-Extended Sr. Sec. Credit Facilities 1st Lien Term Loan: 3.739%, 10/10/141 | | $ | 180,000 | | | $ | 113,379 | |
| 3.741%, 10/10/141 | | | 445,000 | | | | 280,299 | |
| Walter Investment Management Corp., Sr. Sec. Credit Facilities 2nd Lien Term Loan, 12.50%, 9/28/161 | | | 655,000 | | | | 676,833 | |
| | | | | | |
|
|
|
Total Loan Participations (Cost $6,475,345) | | | | | | | 6,364,423 | |
| Corporate Bonds and Notes—88.2% | |
| Consumer Discretionary—23.1% | | | | | | | | |
| Auto Components—2.6% | | | | | |
Goodyear Tire & Rubber Co. (The),
8.25% Sr. Unsec. Unsub. Nts., 8/15/20 | | | 610,000 | | | | 648,888 | |
| Tower Automotive Holdings USA LLC/TA Holdings Finance, Inc., 10.625% Sr. Sec. Nts., 9/1/174 | | | 1,335,000 | | | | 1,421,775 | |
| UCI International, Inc., 8.625% Sr. Unsec. Nts., 2/15/19 | | | 170,000 | | | | 171,913 | |
| Visteon Corp., 6.75% Sr. Unsec. Nts., 4/15/19 | | | 690,000 | | | | 674,475 | |
| | | | | | |
|
|
|
| | | | | | | | 2,917,051 | |
| Automobiles—0.1% | |
| Jaguar Land Rover plc, 7.75% Sr. Unsec. Bonds, 5/15/184 | | | 110,000 | | | | 113,850 | |
| Diversified Consumer Services—0.4% | |
Monitronics International, Inc.,
9.125% Sr. Nts., 4/1/204 | | | 280,000 | | | | 270,200 | |
| ServiceMaster Co., 8% Sr. Unsec. Unsub. Nts., 2/15/20 | | | 170,000 | | | | 185,938 | |
| | | | | | |
|
|
|
| | | | | | | | 456,138 | |
| Hotels, Restaurants & Leisure—6.4% | |
| Boyd Gaming Corp., 9.125% Sr. Unsec. Nts., 12/1/18 | | | 530,000 | | | | 548,550 | |
| Burger King Corp., 9.875% Sr. Unsec. Unsub. Nts., 10/15/18 | | | 245,000 | | | | 280,219 | |
Chester Downs & Marina LLC,
9.25% Sr. Sec. Nts., 1/15/204 | | | 275,000 | | | | 287,375 | |
| CKE Restaurants, Inc., 11.375% Sec. Nts., 7/15/18 | | | 245,000 | | | | 281,138 | |
| Equinox Holdings, Inc., 9.50% Sr. Sec. Nts., 2/1/164 | | | 510,000 | | | | 543,150 | |
Harrah’s Operating Co., Inc.,
10% Sr. Sec. Nts., 12/15/18 | | | 2,703,000 | | | | 1,861,691 | |
HOA Restaurants Group LLC/HOA
Finance Corp., 11.25% Sr. Sec. Nts., 4/1/174 | | | 640,000 | | | | 596,000 | |
6 | OPPENHEIMER HIGH INCOME FUND/VA
|
| | | | | | | | |
| | | Principal
Amount | | | Value | |
| | | | | | | | | |
| Hotels, Restaurants & Leisure Continued | |
| Isle of Capri Casinos, Inc., 7.75% Sr. Unsec. Unsub. Nts., 3/15/19 | | $ | 585,000 | | | $ | 602,550 | |
| Landry’s, Inc., 9.375% Sr. Unsec. Nts., 5/1/204 | | | 555,000 | | | | 566,794 | |
| MGM Mirage, Inc., 6.625% Sr. Unsec. Nts., 7/15/15 | | | 955,000 | | | | 988,425 | |
Penn National Gaming, Inc.,
8.75% Sr. Unsec. Sub. Nts., 8/15/19 | | | 435,000 | | | | 483,938 | |
| | | | | | |
|
|
|
| | | | | | | | 7,039,830 | |
| Household Durables—1.7% | |
Beazer Homes USA, Inc.:
6.875% Sr. Unsec. Nts., 7/15/15 | | | 280,000 | | | | 270,200 | |
| 9.125% Sr. Unsec. Nts., 5/15/19 | | | 790,000 | | | | 693,225 | |
| Jarden Corp., 6.125% Sr. Unsec. Nts., 11/15/22 | | | 65,000 | | | | 68,900 | |
| Libbey Glass, Inc., 6.875% Sr. Sec. Nts., 5/15/204 | | | 210,000 | | | | 216,825 | |
| Reynolds Group Issuer, Inc./Reynolds Group Issuer LLC/Reynolds Group Issuer Luxembourg SA: | | | | | | | | |
| 9% Sr. Nts., 5/15/184 | | | 295,000 | | | | 290,575 | |
| 9% Sr. Nts., 4/15/194 | | | 285,000 | | | | 285,713 | |
| | | | | | |
|
|
|
| | | | | | | | 1,825,438 | |
| Leisure Equipment & Products—0.5% | |
FGI Operating Co. LLC/FGI
Finance, Inc., 7.875% Sr. Sec. Nts., 5/1/204 | | | 555,000 | | | �� | 579,975 | |
| Media—9.5% | |
Affinion Group Holdings, Inc.,
11.625% Sr. Unsec. Nts., 11/15/15 | | | 325,000 | | | | 258,375 | |
| Affinion Group, Inc., 7.875% Sr. Unsec. Nts., 12/15/18 | | | 760,000 | | | | 651,700 | |
AMC Entertainment, Inc.,
8.75% Sr. Unsec. Nts., 6/1/19 | | | 265,000 | | | | 285,538 | |
| Belo (A.H.) Corp., 7.75% Sr. Unsec. Unsub. Debs., 6/1/27 | | | 719,000 | | | | 708,215 | |
| Cequel Communications Holdings I LLC, 8.625% Sr. Unsec. Nts., 11/15/174 | | | 505,000 | | | | 546,663 | |
Clear Channel Communications, Inc.,
5.75% Sr. Unsec. Unsub. Nts., 1/15/13 | | | 860,000 | | | | 856,775 | |
| CSC Holdings LLC, 6.75% Sr. Unsec. Nts., 11/15/214 | | | 520,000 | | | | 556,400 | |
Cumulus Media Holdings, Inc.,
7.75% Sr. Unsec. Unsub. Nts., 5/1/19 | | | 350,000 | | | | 331,625 | |
DISH DBS Corp.:
5.875% Sr. Unsec. Nts., 7/15/224 | | | 210,000 | | | | 213,150 | |
| 7.875% Sr. Unsec. Nts., 9/1/19 | | | 605,000 | | | | 700,288 | |
Entravision Communications Corp.,
8.75% Sr. Sec. Nts., 8/1/17 | | | 507,000 | | | | 539,955 | |
| | | | | | | | |
| | | Principal
Amount | | | Value | |
| | | | | | | | | |
| Media Continued | |
| Gray Television, Inc., 10.50% Sr. Sec. Nts., 6/29/15 | | $ | 520,000 | | | $ | 543,400 | |
| Lamar Media Corp., 5.875% Sr. Sub. Nts., 2/1/224 | | | 220,000 | | | | 226,600 | |
Newport Television LLC/NTV
Finance Corp., 13.75% Sr. Nts., 3/15/174 | | | 624,232 | | | | 649,201 | |
| Nexstar Broadcasting, Inc./Mission Broadcasting, Inc., 8.875% Sec. Nts., 4/15/17 | | | 515,000 | | | | 546,544 | |
Sinclair Television Group, Inc.,
8.375% Sr. Unsec. Nts., 10/15/18 | | | 705,000 | | | | 771,975 | |
| Unitymedia Hessen GmbH & Co. KG/Unitymedia NRW GmbH, 7.50% Sr. Sec. Nts., 3/15/19 | | | 395,000 | | | | 420,675 | |
Univision Communications, Inc.,
7.875% Sr. Sec. Nts., 11/1/204 | | | 250,000 | | | | 268,750 | |
| UPCB Finance V Ltd., 7.25% Sr. Sec. Nts., 11/15/214 | | | 350,000 | | | | 367,500 | |
| UPCB Finance VI Ltd., 6.875% Sr. Sec. Nts., 1/15/224 | | | 560,000 | | | | 574,000 | |
| Virgin Media Finance plc: | | | | | | | | |
| 5.25% Sr. Unsec. Unsub. Nts., 2/15/22 | | | 215,000 | | | | 220,913 | |
| 8.375% Sr. Unsec. Unsub. Nts., 10/15/19 | | | 245,000 | | | | 276,544 | |
| | | | | | |
|
|
|
| | | | | | | | 10,514,786 | |
| Specialty Retail—1.5% | |
| Burlington Coat Factory Warehouse Corp., 10% Sr. Unsec. Nts., 2/15/19 | | | 140,000 | | | | 149,100 | |
| J. Crew Group, Inc., 8.125% Sr. Unsec. Nts., 3/1/19 | | | 275,000 | | | | 285,313 | |
| Limited Brands, Inc., 5.625% Sr. Nts., 2/15/22 | | | 560,000 | | | | 579,600 | |
| Michaels Stores, Inc., 7.75% Sr. Unsec. Nts., 11/1/18 | | | 45,000 | | | | 47,700 | |
| Sally Holdings LLC/Sally Capital, Inc., 6.875% Sr. Unsec. Nts., 11/15/19 | | | 515,000 | | | | 562,638 | |
| | | | | | |
|
|
|
| | | | | | | | 1,624,351 | |
| Textiles, Apparel & Luxury Goods—0.4% | |
| Levi Strauss & Co., 7.625% Sr. Unsec. Unsub. Nts., 5/15/20 | | | 265,000 | | | | 282,888 | |
| Quiksilver, Inc., 6.875% Sr. Unsec. Nts., 4/15/15 | | | 210,000 | | | | 203,700 | |
| | | | | | |
|
|
|
| | | | | | | | 486,588 | |
| Consumer Staples—3.9% | |
| Food & Staples Retailing—0.2% | |
| Rite Aid Corp., 7.50% Sr. Sec. Nts., 3/1/17 | | | 265,000 | | | | 271,625 | |
| Food Products—3.1% | |
American Seafoods Group LLC,
10.75% Sr. Sub. Nts., 5/15/164 | | | 620,000 | | | | 585,900 | |
7 | OPPENHEIMER HIGH INCOME FUND/VA
|
STATEMENT OF INVESTMENTS Unaudited / Continued
| | | | | | | | |
| | | Principal
Amount | | | Value | |
| | | | | | | | | |
| Food Products Continued | |
ASG Consolidated LLC,
12.075% Sr. Nts., 5/15/173,4 | | $ | 1,292,721 | | | $ | 1,034,177 | |
Bumble Bee Acquisition Corp.,
9% Sr. Sec. Nts., 12/15/174 | | | 471,000 | | | | 472,178 | |
| Post Holdings, Inc., 7.375% Sr. Unsec. Nts., 2/15/224 | | | 535,000 | | | | 565,763 | |
Southern States Cooperative, Inc.,
11.25% Sr. Nts., 5/15/154 | | | 690,000 | | | | 727,950 | |
| | | | | | |
|
|
|
| | | | | | | | 3,385,968 | |
| Household Products—0.3% | |
Spectrum Brands Holdings, Inc.,
9.50% Sr. Sec. Nts., 6/15/18 | | | 250,000 | | | | 283,750 | |
| Personal Products—0.1% | |
| NBTY, Inc., 9% Sr. Unsec. Nts., 10/1/18 | | | 125,000 | | | | 138,750 | |
| Tobacco—0.2% | |
Alliance One International, Inc.,
10% Sr. Unsec. Nts., 7/15/16 | | | 260,000 | | | | 261,950 | |
| Energy—11.3% | |
| Energy Equipment & Services—3.1% | |
Forbes Energy Services Ltd.,
9% Sr. Unsec. Nts., 6/15/19 | | | 335,000 | | | | 318,250 | |
Global Geophysical Services, Inc.,
10.50% Sr. Unsec. Nts., 5/1/17 | | | 425,000 | | | | 406,938 | |
Hercules Offshore, Inc.,
7.125% Sr. Sec. Nts., 4/1/174 | | | 280,000 | | | | 271,950 | |
Hornbeck Offshore Services, Inc.,
5.875% Sr. Unsec. Nts., 4/1/204 | | | 565,000 | | | | 563,588 | |
Offshore Group Investments Ltd.:
11.50% Sr. Sec. Nts., 8/1/154 | | | 225,000 | | | | 245,250 | |
| 11.50% Sr. Sec. Nts., 8/1/15 | | | 765,000 | | | | 833,850 | |
| Precision Drilling Corp., 6.625% Sr. Unsec. Nts., 11/15/20 | | | 525,000 | | | | 543,375 | |
| SESI LLC, 6.375% Sr. Unsec. Nts., 5/1/19 | | | 200,000 | | | | 210,500 | |
| | | | | | |
|
|
|
| | | | | | | | 3,393,701 | |
| Oil, Gas & Consumable Fuels—8.2% | | | | | | | | |
Antero Resources Finance Corp., 9.375% Sr. Unsec. Nts., 12/1/17 | | | 585,000 | | | | 649,350 | |
| Atlas Pipeline Partners LP/Atlas Pipeline Finance Corp., 8.75% Sr. Unsec. Sub. Nts., 6/15/18 | | | 440,000 | | | | 471,900 | |
| Bill Barrett Corp., 7.625% Sr. Unsec. Unsub. Nts., 10/1/19 | | | 220,000 | | | | 221,100 | |
| BreitBurn Energy Partners LP/BreitBurn Finance Corp., 8.625% Sr. Unsec. Nts., 10/15/20 | | | 665,000 | | | | 706,563 | |
| Chaparral Energy, Inc., 9.875% Sr. Unsec. Nts., 10/1/20 | | | 510,000 | | | | 569,288 | |
| Chesapeake Midstream Partners LP/CHKM Finance Corp., 6.125% Sr. Unsec. Unsub. Nts., 7/15/22 | | | 540,000 | | | | 531,900 | |
| | | | | | | | |
| | | Principal
Amount | | | Value | |
| | | | | | | | | |
Oil, Gas & Consumable
Fuels Continued | | | | | |
| Cimarex Energy Co., 5.875% Sr. Unsec. Unsub. Nts., 5/1/22 | | $ | 850,000 | | | $ | 885,063 | |
Cloud Peak Energy Resources LLC/Cloud Peak Energy Finance Corp., 8.50% Sr. Unsec. Unsub. Nts., 12/15/19 | | | 105,000 | | | | 109,463 | |
Continental Resources, Inc., 5% Sr. Unsec. Nts., 9/15/224 | | | 340,000 | | | | 345,525 | |
| James River Coal Co., 7.875% Sr. Unsec. Unsub. Nts., 4/1/19 | | | 395,000 | | | | 201,450 | |
| Linn Energy LLC/Linn Energy Finance Corp., 8.625% Sr. Unsec. Nts., 4/15/20 | | | 735,000 | | | | 795,638 | |
| MEG Energy Corp., 6.50% Sr. Unsec. Nts., 3/15/214 | | | 795,000 | | | | 815,869 | |
| Murray Energy Corp., 10.25% Sr. Sec. Nts., 10/15/154 | | | 380,000 | | | | 335,350 | |
Navios Maritime Acquisition Corp., 8.625% Sr. Sec. Nts., 11/1/17 | | | 195,000 | | | | 182,325 | |
| Quicksilver Resources, Inc.: | | | | | | | | |
| 8.25% Sr. Unsec. Nts., 8/1/15 | | | 280,000 | | | | 263,200 | |
| 11.75% Sr. Nts., 1/1/16 | | | 395,000 | | | | 386,606 | |
Samson Investment Co., 9.75% Sr. Unsec. Nts., 2/15/204 | | | 425,000 | | | | 423,406 | |
SandRidge Energy, Inc.: 8.75% Sr. Unsec. Nts., 1/15/20 | | | 255,000 | | | | 267,113 | |
| 9.875% Sr. Unsec. Nts., 5/15/16 | | | 305,000 | | | | 335,500 | |
| SM Energy Co., 6.50% Sr. Nts., 1/1/234 | | | 270,000 | | | | 272,363 | |
| Venoco, Inc., 8.875% Sr. Unsec. Nts., 2/15/19 | | | 345,000 | | | | 315,675 | |
| | | | | | |
|
|
|
| | | | | | | | 9,084,647 | |
| Financials—9.4% | | | | | | | | |
| Capital Markets—3.2% | | | | | |
| Edgen Murray Corp., 12.25% Sr. Sec. Nts., 1/15/15 | | | 360,000 | | | | 360,000 | |
| Nationstar Mortgage/Nationstar Capital Corp., 10.875% Sr. Unsec. Nts., 4/1/15 | | | 1,015,000 | | | | 1,101,275 | |
Nuveen Investments, Inc.: 5.50% Sr. Unsec. Nts., 9/15/15 | | | 235,000 | | | | 213,850 | |
| 10.50% Sr. Unsec. Unsub. Nts., 11/15/15 | | | 240,000 | | | | 244,800 | |
Pinafore LLC/Pinafore, Inc., 9% Sec. Nts., 10/1/18 | | | 790,000 | | | | 882,825 | |
Springleaf Finance Corp., 6.90% Nts., Series J, 12/15/17 | | | 370,000 | | | | 297,154 | |
Verso Paper Holdings LLC, 11.375% Sr. Unsec. Sub. Nts., Series B, 8/1/16 | | | 412,000 | | | | 195,700 | |
| Verso Paper Holdings LLC/Verso Paper, Inc., 8.75% Sr. Sec. Nts., 2/1/19 | | | 625,000 | | | | 250,000 | |
| | | | | | |
|
|
|
| | | | | | | | 3,545,604 | |
8 | OPPENHEIMER HIGH INCOME FUND/VA
|
| | | | | | | | |
| | | Principal
Amount | | | Value | |
| | | | | | | | | |
| Commercial Banks—0.4% | | | | | |
| CIT Group, Inc., 7% Sec. Bonds, 5/2/175 | | $ | 422,302 | | | $ | 423,622 | |
| Consumer Finance—0.6% | | | | | |
| Speedy Cash, Inc., 10.75% Sr. Sec. Nts., 5/15/184 | | | 330,000 | | | | 342,375 | |
| TMX Finance LLC/TitleMax Finance Corp., 13.25% Sr. Sec. Nts., 7/15/15 | | | 255,000 | | | | 283,050 | |
| | | | | | |
|
|
|
| | | | | | | | 625,425 | |
| Diversified Financial Services—0.8% | | | | | | | | |
| GMAC LLC, 8% Sr. Unsec. Nts., 11/1/31 | | | 240,000 | | | | 282,600 | |
| PHH Corp., 9.25% Sr. Unsec. Unsub. Nts., 3/1/16 | | | 585,000 | | | | 624,488 | |
| | | | | | |
|
|
|
| | | | | | | | 907,088 | |
| Insurance—1.0% | | | | | | | | |
International Lease Finance Corp.: 8.625% Sr. Unsec. Unsub. Nts., 9/15/15 | | | 410,000 | | | | 454,588 | |
| 8.75% Sr. Unsec. Unsub. Nts., 3/15/17 | | | 622,000 | | | | 701,305 | |
| | | | | | |
|
|
|
| | | | | | | | 1,155,893 | |
| Real Estate Investment Trusts—1.5% | | | | | | | | |
DuPont Fabros Technology LP, 8.50% Sr. Unsec. Nts., 12/15/17 | | | 255,000 | | | | 281,775 | |
FelCor Escrow Holdings LLC, 6.75% Sr. Sec. Nts., 6/1/19 | | | 565,000 | | | | 581,244 | |
OMEGA Healthcare Investors, Inc., 6.75% Sr. Unsec. Nts., 10/15/22 | | | 695,000 | | | | 745,388 | |
| | | | | | |
|
|
|
| | | | | | | | 1,608,407 | |
| Real Estate Management & Development—1.9% | |
Ainsworth Lumber Co. Ltd., 11% Sr. Unsec. Unsub. Nts., 7/29/153,4 | | | 858,277 | | | | 750,992 | |
Realogy Corp.: 7.625% Sr. Sec. Nts., 1/15/204 | | | 560,000 | | | | 581,000 | |
| 9% Sr. Sec. Nts., 1/15/204 | | | 285,000 | | | | 294,975 | |
Wallace Theater Holdings, Inc., 12.50% Sr. Sec. Nts., 6/15/131,4 | | | 490,000 | | | | 463,663 | |
| | | | | | |
|
|
|
| | | | | | | | 2,090,630 | |
| Health Care—5.6% | | | | | | | | |
| Biotechnology—0.2% | | | | | | | | |
| Grifols SA, 8.25% Sr. Sec. Nts., 2/1/18 | | | 195,000 | | | | 210,113 | |
| Health Care Equipment & Supplies—1.3% | | | | | |
| Accellent, Inc., 10% Sr. Unsec. Sub. Nts., 11/1/17 | | | 325,000 | | | | 274,625 | |
Alere, Inc.: 7.875% Sr. Unsec. Unsub. Nts., 2/1/16 | | | 290,000 | | | | 298,700 | |
| 8.625% Sr. Unsec. Sub. Nts., 10/1/18 | | | 290,000 | | | | 294,350 | |
| Biomet, Inc., 11.625% Sr. Unsec. Sub. Nts., 10/15/17 | | | 275,000 | | | | 298,031 | |
| Chiron Merger Sub, Inc., 10.50% Sec. Nts., 11/1/184 | | | 290,000 | | | | 305,950 | |
| | | | | | |
|
|
|
| | | | | | | | 1,471,656 | |
| | | | | | | | |
| | | Principal
Amount | | | Value | |
| | | | | | | | | |
| Health Care Providers & Services—3.3% | | | | | |
Catalent Pharma Solutions, Inc., 9.50% Sr. Unsec. Nts., 4/15/15 | | $ | 441,151 | | | $ | 453,834 | |
Fresenius Medical Care US Finance II, Inc.: 5.625% Sr. Unsec. Nts., 7/31/194 | | | 180,000 | | | | 188,100 | |
| 5.875% Sr. Unsec. Nts., 1/31/224 | | | 90,000 | | | | 93,938 | |
| Gentiva Health Services, Inc., 11.50% Sr. Unsec. Unsub. Nts., 9/1/18 | | | 340,000 | | | | 297,500 | |
| HealthSouth Corp., 8.125% Sr. Unsec. Unsub. Nts., 2/15/20 | | | 514,000 | | | | 564,115 | |
| Kindred Healthcare, Inc., 8.25% Sr. Unsec. Nts., 6/1/19 | | | 620,000 | | | | 578,150 | |
| Multiplan, Inc., 9.875% Sr. Nts., 9/1/184 | | | 240,000 | | | | 264,000 | |
| Oncure Holdings, Inc., 11.75% Sr. Sec. Nts., 5/15/17 | | | 315,000 | | | | 226,800 | |
| PSS World Medical, Inc., 6.375% Sr. Unsec. Unsub. Nts., 3/1/224 | | | 130,000 | | | | 133,900 | |
Radiation Therapy Services, Inc.: 8.875% Sec. Nts., 1/15/174 | | | 295,000 | | | | 284,675 | |
| 9.875% Sr. Unsec. Sub. Nts., 4/15/17 | | | 250,000 | | | | 196,875 | |
US Oncology, Inc., Escrow Shares (related to 9.125% Sr. Sec. Nts., 8/15/17)6 | | | 435,000 | | | | 8,700 | |
Vanguard Health Holding Co. II LLC/Vanguard Holding Co. II, Inc.,
8% Sr. Nts., 2/1/18 | | | 375,000 | | | | 385,313 | |
| | | | | | |
|
|
|
| | | | | | | | 3,675,900 | |
| Health Care Technology—0.1% | | | | | | | | |
| MedAssets, Inc., 8% Sr. Unsec. Nts., 11/15/18 | | | 75,000 | | | | 79,500 | |
| Life Sciences Tools & Services—0.2% | | | | | | | | |
| Jaguar Holding Co./Jaguar Merger Sub, Inc., 9.50% Sr. Unsec. Nts., 12/1/194 | | | 220,000 | | | | 241,725 | |
| Pharmaceuticals—0.5% | | | | | |
DJO Finance LLC/DJO Finance Corp., 10.875% Sr. Unsec. Nts., 11/15/14 | | | 150,000 | | | | 155,625 | |
| Valeant Pharmaceuticals International, Inc., 6.875% Sr. Unsec. Nts., 12/1/184 | | | 190,000 | | | | 197,363 | |
| Warner Chilcott Co. LLC/Warner Chilcott Finance LLC, 7.75% Sr. Unsec. Nts., 9/15/18 | | | 145,000 | | | | 156,238 | |
| | | | | | |
|
|
|
| | | | | | | | 509,226 | |
| Industrials—13.1% | | | | | | | | |
| Aerospace & Defense—3.5% | | | | | | | | |
| BE Aerospace, Inc., 6.875% Sr. Nts., 10/1/20 | | | 240,000 | | | | 266,400 | |
DynCorp International, Inc., 10.375% Sr. Unsec. Nts., 7/1/17 | | | 1,085,000 | | | | 933,100 | |
Huntington Ingalls Industries, Inc., 7.125% Sr. Unsec. Unsub. Nts., 3/15/21 | | | 805,000 | | | | 845,250 | |
9 | OPPENHEIMER HIGH INCOME FUND/VA
|
STATEMENT OF INVESTMENTS Unaudited / Continued
| | | | | | | | |
| | | Principal
Amount | | | Value | |
| | | | | | | | | |
| Aerospace & Defense Continued | | | | | | | | |
| Kratos Defense & Security Solutions, Inc., 10% Sr. Sec. Nts., 6/1/17 | | $ | 267,000 | | | $ | 289,028 | |
| Schaeffler Finance BV, 8.50% Sr. Sec. Nts., 2/15/194 | | | 300,000 | | | | 321,750 | |
| TransDigm, Inc., 7.75% Sr. Unsec. Sub. Nts., 12/15/18 | | | 480,000 | | | | 529,200 | |
| Triumph Group, Inc., 8.625% Sr. Unsec. Nts., 7/15/18 | | | 650,000 | | | | 724,750 | |
| | | | | | |
|
|
|
| | | | | | | | 3,909,478 | |
| Air Freight & Logistics—0.5% | | | | | | | | |
| AMGH Merger Sub, Inc., 9.25% Sr. Sec. Nts., 11/1/184 | | | 510,000 | | | | 532,950 | |
| Airlines—0.5% | | | | | | | | |
| American Airlines 2011-2 Class A Pass-Through Trust, 8.625% Sec. Certificates, 4/15/23 | | | 543,468 | | | | 570,641 | |
| Building Products—0.7% | | | | | |
Associated Materials LLC, 9.125% Sr. Sec. Nts., 11/1/174 | | | 265,000 | | | | 237,838 | |
| Ply Gem Industries, Inc., 13.125% Sr. Unsec. Sub. Nts., 7/15/14 | | | 535,000 | | | | 544,363 | |
| | | | | | |
|
|
|
| | | | | | | | 782,201 | |
| Commercial Services & Supplies—1.7% | | | | | |
R.R. Donnelley & Sons Co., 7.25% Sr. Nts., 5/15/18 | | | 1,130,000 | | | | 1,081,975 | |
| STHI Holding Corp., 8% Sec. Nts., 3/15/184 | | | 200,000 | | | | 212,500 | |
| West Corp., 8.625% Sr. Unsec. Nts., 10/1/18 | | | 500,000 | | | | 532,500 | |
| | | | | | |
|
|
|
| | | | | | | | 1,826,975 | |
| Machinery—2.9% | | | | | | | | |
| Actuant Corp., 5.625% Sr. Unsec. Unsub. Nts., 6/15/224 | | | 340,000 | | | | 351,050 | |
| Cleaver-Brooks, Inc., 12.25% Sr. Sec. Nts., 5/1/164 | | | 540,000 | | | | 576,450 | |
| CNH Capital LLC, 6.25% Sr. Unsec. Nts., 11/1/164 | | | 150,000 | | | | 161,250 | |
Manitowoc Co., Inc. (The), 8.50% Sr. Unsec. Nts., 11/1/20 | | | 755,000 | | | | 819,175 | |
| Terex Corp., 8% Sr. Unsec. Sub. Nts., 11/15/17 | | | 540,000 | | | | 562,950 | |
| Thermadyne Holdings Corp., 9% Sr. Sec. Nts., 12/15/17 | | | 505,000 | | | | 518,888 | |
| Xerium Technologies, Inc., 8.875% Sr. Unsec. Nts., 6/15/18 | | | 335,000 | | | | 265,488 | |
| | | | | | |
|
|
|
| | | | | | | | 3,255,251 | |
| | | | | | | | |
| | | Principal
Amount | | | Value | |
| Marine—0.9% | | | | | | | | |
| Marquette Transportation Co./Marquette Transportation Finance Corp., 10.875% Sec. Nts., 1/15/17 | | $ | 780,000 | | | $ | 824,850 | |
Navios Maritime Holdings, Inc., 8.875% Sr. Sec. Nts., 11/1/17 | | | 160,000 | | | | 162,000 | |
| | | | | | |
|
|
|
| | | | | | | | 986,850 | |
| Professional Services—0.2% | | | | | | | | |
| Altegrity, Inc., 10.50% Sr. Unsec. Sub. Nts., 11/1/155 | | | 280,000 | | | | 256,200 | |
| Road & Rail—1.4% | | | | | | | | |
| Avis Budget Car Rental LLC/Avis Budget Finance, Inc., 8.25% Sr. Unsec. Unsub. Nts., 1/15/19 | | | 170,000 | | | | 183,175 | |
| Hertz Corp. (The), 7.50% Sr. Unsec. Nts., 10/15/18 | | | 670,000 | | | | 721,925 | |
| Western Express, Inc., 12.50% Sr. Sec. Nts., 4/15/154 | | | 1,045,000 | | | | 637,450 | |
| | | | | | |
|
|
|
| | | | | | | | 1,542,550 | |
| Trading Companies & Distributors—0.8% | |
UR Financing Escrow Corp.: 7.375% Sr. Unsec. Nts., 5/15/204 | | | 685,000 | | | | 717,538 | |
| 7.625% Sr. Unsec. Nts., 4/15/224 | | | 170,000 | | | | 178,500 | |
| | | | | | |
|
|
|
| | | | | | | | 896,038 | |
| Information Technology—6.7% | | | | | | | | |
| Communications Equipment—0.9% | | | | | | | | |
| Avaya, Inc., 7% Sr. Sec. Nts., 4/1/194 | | | 550,000 | | | | 512,875 | |
| ViaSat, Inc., 6.875% Sr. Unsec. Unsub. Nts., 6/15/205 | | | 253,000 | | | | 256,795 | |
Zayo Escrow Corp.: 8.125% Sr. Sec. Nts., 1/1/20 | | | 125,000 | | | | 131,250 | |
| 10.125% Sr. Unsec. Nts., 7/1/204 | | | 80,000 | | | | 85,400 | |
| | | | | | |
|
|
|
| | | | | | | | 986,320 | |
| Computers & Peripherals—0.5% | | | | | | | | |
| Seagate HDD (Cayman), 7% Sr. Unsec. Nts., 11/1/21 | | | 470,000 | | | | 508,775 | |
| Electronic Equipment & Instruments—0.7% | | | | | |
| Anixter, Inc., 5.625% Sr. Unsec. Nts., 5/1/19 | | | 210,000 | | | | 217,875 | |
CDW LLC/CDW Finance Corp., 12.535% Sr. Unsec. Sub. Nts., 10/12/17 | | | 550,000 | | | | 599,500 | |
| | | | | | |
|
|
|
| | | | | | | | 817,375 | |
| Internet Software & Services—1.0% | | | | | | | | |
| ITC DeltaCom, Inc., 10.50% Sr. Sec. Nts., 4/1/16 | | | 1,035,000 | | | | 1,107,450 | |
| IT Services—1.4% | | | | | | | | |
| Ceridian Corp., 11.25% Sr. Unsec. Nts., 11/15/15 | | | 535,000 | | | | 516,275 | |
10 | OPPENHEIMER HIGH INCOME FUND/VA
|
| | | | | | | | |
| | | Principal
Amount | | | Value | |
| | | | | | | | | |
| IT Services Continued | | | | | | | | |
First Data Corp.: 8.875% Sr. Sec. Nts., 8/15/204 | | $ | 255,000 | | | $ | 277,313 | |
| 9.875% Sr. Unsec. Nts., 9/24/15 | | | 265,000 | | | | 269,638 | |
| 12.625% Sr. Unsec. Nts., 1/15/21 | | | 475,000 | | | | 477,969 | |
| | | | | | |
|
|
|
| | | | | | | | 1,541,195 | |
Semiconductors & Semiconductor
Equipment—2.0% | |
Advanced Micro Devices, Inc., 7.75% Sr. Unsec. Nts., 8/1/20 | | | 775,000 | | | | 856,375 | |
Amkor Technologies, Inc., 6.625% Sr. Unsec. Nts., 6/1/21 | | | 265,000 | | | | 265,663 | |
Freescale Semiconductor, Inc.: 9.25% Sr. Sec. Nts., 4/15/184 | | | 225,000 | | | | 241,875 | |
| 10.75% Sr. Unsec. Nts., 8/1/20 | | | 503,000 | | | | 543,240 | |
NXP BV/NXP Funding LLC, 9.75% Sr. Sec. Nts., 8/1/184 | | | 245,000 | | | | 280,525 | |
| | | | | | |
|
|
|
| | | | | | | | 2,187,678 | |
| Software—0.2% | |
| Lawson Software, Inc., 9.375% Sr. Nts., 4/1/194 | | | 105,000 | | | | 112,613 | |
SunGard Data Systems, Inc.,
7.375% Sr. Unsec. Nts., 11/15/18 | | | 160,000 | | | | 172,400 | |
| | | | | | |
|
|
|
| | | | | | | | 285,013 | |
| Materials—7.5% | | | | | | | | |
| Chemicals—2.1% | |
| Ferro Corp., 7.875% Sr. Unsec. Nts., 8/15/18 | | | 260,000 | | | | 254,800 | |
Hexion U.S. Finance Corp./Hexion Nova Scotia Finance ULC:
8.875% Sr. Sec. Nts., 2/1/18 | | | 280,000 | | | | 287,000 | |
| 9% Sec. Nts., 11/15/20 | | | 380,000 | | | | 329,650 | |
| Ineos Finance plc, 8.375% Sr. Sec. Bonds, 2/15/194 | | | 440,000 | | | | 456,500 | |
| LyondellBasell Industries NV, 6% Sr. Nts., 11/15/214 | | | 440,000 | | | | 485,100 | |
Momentive Performance Materials, Inc.,
9% Sec. Nts., 1/15/21 | | | 615,000 | | | | 468,938 | |
| Scotts Miracle-Gro Co. (The), 6.625% Sr. Unsec. Unsub. Nts., 12/15/20 | | | 70,000 | | | | 75,425 | |
| | | | | | |
|
|
|
| | | | | | | | 2,357,413 | |
| Construction Materials—0.8% | |
Building Materials Corp. of America,
6.75% Sr. Nts., 5/1/214 | | | 435,000 | | | | 466,538 | |
| Ply Gem Industries, Inc., 8.25% Sr. Sec. Nts., 2/15/18 | | | 370,000 | | | | 364,450 | |
| | | | | | |
|
|
|
| | | | | | | | 830,988 | |
| | | | | | | | |
| | | Principal
Amount | | | Value | |
| | | | | | | | | |
| Containers & Packaging—1.3% | |
Consolidated Container Co. LLC/Consolidated Container Capital, Inc.,
10.125% Sr. Unsec. Nts., 7/15/202, 4 | | $ | 125,000 | | | $ | 129,375 | |
| Polymer Group, Inc., 7.75% Sr. Sec. Nts., 2/1/19 | | | 650,000 | | | | 689,813 | |
| Rock-Tenn Co., 4.45% Sr. Unsec. Nts., 3/1/194 | | | 130,000 | | | | 133,803 | |
| Verso Paper Holdings LLC/Verso Paper, Inc., 11.75% Sr. Sec. Nts., 1/15/194 | | | 550,000 | | | | 420,750 | |
| | | | | | |
|
|
|
| | | | | | | | 1,373,741 | |
| Metals & Mining—0.8% | |
| Aleris International, Inc., 7.625% Sr. Unsec. Nts., 2/15/18 | | | 760,000 | | | | 775,200 | |
| Novelis, Inc., 8.75% Sr. Unsec. Nts., 12/15/20 | | | 135,000 | | | | 146,138 | |
| | | | | | |
|
|
|
| | | | | | | | 921,338 | |
| Paper & Forest Products—2.5% | |
| Appleton Papers, Inc., 10.50% Sr. Sec. Nts., 6/15/154 | | | 985,000 | | | | 1,058,875 | |
| Catalyst Paper Corp., 11% Sr. Sec. Nts., 12/15/164,6 | | | 1,117,000 | | | | 552,915 | |
| Mercer International, Inc., 9.50% Sr. Unsec. Nts., 12/1/17 | | | 475,000 | | | | 495,188 | |
| NewPage Corp., 11.375% Sr. Sec. Nts., 12/31/146 | | | 600,000 | | | | 393,000 | |
Norske Skogindustrier ASA,
6.125% Unsec. Bonds, 10/15/154 | | | 375,000 | | | | 264,375 | |
| | | | | | |
|
|
|
| | | | | | | | 2,764,353 | |
| Telecommunication Services—5.4% | | | | | | | | |
| Diversified Telecommunication Services—3.1% | |
Cincinnati Bell, Inc.:
8.25% Sr. Nts., 10/15/17 | | | 385,000 | | | | 402,325 | |
| 8.75% Sr. Unsec. Sub. Nts., 3/15/18 | | | 325,000 | | | | 314,438 | |
Frontier Communications Corp.:
8.25% Sr. Unsec. Nts., 4/15/17 | | | 270,000 | | | | 291,600 | |
| 8.50% Sr. Unsec. Nts., 4/15/20 | | | 180,000 | | | | 191,700 | |
Intelsat Bermuda Ltd.:
11.25% Sr. Unsec. Nts., 2/4/17 | | | 585,000 | | | | 604,744 | |
| 11.50% Sr. Unsec. Nts., 2/4/173 | | | 710 | | | | 736 | |
| Level 3 Financing, Inc., 9.375% Sr. Unsec. Unsub. Nts., 4/1/19 | | | 535,000 | | | | 580,475 | |
Wind Acquisition Finance SA, 7.25% Sr. Sec. Nts., 2/15/184 | | | 560,000 | | | | 492,800 | |
| Windstream Corp., 7.50% Sr. Unsec. Unsub. Nts., 6/1/224 | | | 570,000 | | | | 589,950 | |
| | | | | | |
|
|
|
| | | | | | | | 3,468,768 | |
11 | OPPENHEIMER HIGH INCOME FUND/VA
|
STATEMENT OF INVESTMENTS Unaudited / Continued
| | | | | | | | |
| | | Principal
Amount | | | Value | |
| | | | | | | | | |
| Wireless Telecommunication Services—2.3% | |
Cricket Communications, Inc., 7.75% Sr. Unsec. Nts., 10/15/20 | | $ | 700,000 | | | $ | 672,000 | |
| MetroPCS Wireless, Inc., 6.625% Sr. Unsec. Nts., 11/15/20 | | | 545,000 | | | | 538,188 | |
Nextel Communications, Inc.,
7.375% Sr. Nts., Series D, 8/1/15 | | | 590,000 | | | | 593,688 | |
| Sprint Capital Corp., 8.75% Nts., 3/15/32 | | | 135,000 | | | | 123,525 | |
| Sprint Nextel Corp., 9% Sr. Unsec. Nts., 11/15/184 | | | 515,000 | | | | 576,800 | |
| | | | | | |
|
|
|
| | | | | | | | 2,504,201 | |
| Utilities—2.2% | | | | | | | | |
| Electric Utilities—0.5% | |
| Energy Future Intermediate Holding Co. LLC, 10% Sr. Sec. Nts., 12/1/20 | | | 507,000 | | | | 553,898 | |
| Energy Traders—1.2% | |
| AES Corp. (The), 8% Sr. Unsec. Unsub. Nts., 10/15/17 | | | 245,000 | | | | 279,913 | |
| Calpine Corp., 7.50% Sr. Sec. Nts., 2/15/214 | | | 255,000 | | | | 276,675 | |
Energy Future Holdings Corp., 10% Sr. Sec. Nts., 1/15/20 | | | 530,000 | | | | 568,425 | |
| First Wind Capital LLC, 10.25% Sr. Sec. Nts., 6/1/184 | | | 75,000 | | | | 75,375 | |
| Foresight Energy LLC, 9.625% Sr. Unsec. Nts., 8/15/174 | | | 160,000 | | | | 161,000 | |
| | | | | | |
|
|
|
| | | | | | | | 1,361,388 | |
| Gas Utilities—0.5% | |
| AmeriGas Finance LLC/AmeriGas Finance Corp., 6.75% Sr. Unsec. Nts., 5/20/20 | | | 545,000 | | | | 557,263 | |
| | | | | | |
|
|
|
Total Corporate Bonds and Notes
(Cost $98,200,442) | | | | | | | 97,609,478 | |
| | | | | | | | |
| | |
Shares | | | Value | |
| | | | | | | | | |
| Preferred Stocks—0.9% | |
| Ally Financial, Inc., 7% Cum., Series G, Non-Vtg. | | | 584 | | | $ | 520,326 | |
Greektown Superholdings, Inc., Cv.,
Series A-17 | | | 7,236 | | | | 510,138 | |
| | | | | | |
|
|
|
Total Preferred Stocks
(Cost $1,253,803) | | | | | | | 1,030,464 | |
| Common Stocks—1.4% | |
| American Media Operations, Inc.7 | | | 58,065 | | | | 754,845 | |
| Dana Holding Corp. | | | 17,634 | | | | 225,892 | |
| Global Aviation Holdings, Inc.7 | | | 300 | | | | — | |
| Greektown Superholdings, Inc., Series A-17 | | | 874 | | | | 45,448 | |
| Kaiser Aluminum Corp. | | | 458 | | | | 23,743 | |
| LyondellBasell Industries NV, Cl. A | | | 6,926 | | | | 278,910 | |
| Magellan Health Services, Inc.7 | | | 33 | | | | 1,496 | |
| Orbcomm, Inc.7 | | | 1,127 | | | | 3,648 | |
| Resolute Forest Products7 | | | 18,220 | | | | 210,988 | |
| | | | | | |
|
|
|
Total Common Stocks
(Cost $3,748,890) | | | | | | | 1,544,970 | |
| | |
| | | Units | | | | |
| Rights, Warrants and Certificates—0.0% | |
| MediaNews Group, Inc. Wts., Strike Price $0.001, Exp. 3/19/177 | | | | | | | | |
| (Cost $3,168,495) | | | 11,017 | | | | 396 | |
| | |
| | | Shares | | | | |
| Investment Company—1.8% | | | | | | | | |
| Oppenheimer Institutional Money Market Fund, Cl. E, 0.20%8,9 | | | | | | | | |
| (Cost $2,035,961) | | | 2,035,961 | | | | 2,035,961 | |
Total Investments, at Value
(Cost $115,367,090) | | | 98.5 | % | | | 109,070,948 | |
| Other Assets Net of Liabilities | |
| 1.5
|
| |
| 1,673,552
|
|
| Net Assets | |
| 100.0
| %
| | $
| 110,744,500
|
|
12 | OPPENHEIMER HIGH INCOME FUND/VA
|
Footnotes to Statement of Investments
* June 29, 2012 represents the last business day of the Fund’s 2012 semiannual period. See Note 1 of the accompanying Notes.
1. Represents the current interest rate for a variable or increasing rate security.
2. All or a portion of the security position is when-issued or delayed delivery to be delivered and settled after June 29, 2012. See Note 1 of the accompanying Notes.
3. Interest or dividend is paid-in-kind, when applicable.
4. Represents securities sold under Rule 144A, which are exempt from registration under the Securities Act of 1933, as amended. These securities have been determined to be liquid under guidelines established by the Board of Trustees. These securities amount to $30,955,129 or 27.95% of the Fund’s net assets as of June 29, 2012.
5. Restricted security. The aggregate value of restricted securities as of June 29, 2012 was $936,617, which represents 0.85% of the Fund’s net assets. See Note 6 of the accompanying Notes. Information concerning restricted securities is as follow:
| | | | | | | | | | | | | | | | |
| Security | | Acquisition
Dates | | | Cost | | | Value | | | Unrealized
Appreciation
(Depreciation) | |
| Altegrity, Inc., 10.50% Sr. Unsec. Sub. Nts., 11/1/15 | | | 5/14/09-2/8/10 | | | $ | 257,268 | | | $ | 256,200 | | | $ | (1,068 | ) |
| CIT Group, Inc., 7% Sec. Bonds, 5/2/17 | | | 10/31/11-2/1/12 | | | | 423,757 | | | | 423,622 | | | | (135 | ) |
| ViaSat, Inc., 6.875% Sr. Unsec. Unsub. Nts., 6/15/20 | | | 2/22/12 | | | | 254,486 | | | | 256,795 | | | | 2,309 | |
| | | | | | |
|
|
| |
|
|
| |
|
|
|
| | | | | | | $ | 935,511 | | | $ | 936,617 | | | $ | 1,106 | |
| | | | | | |
|
|
| |
|
|
| |
|
|
|
6. This security is not accruing income because the issuer has missed an interest payment on it and/or is not anticipated to make future interest and/or principal payments. The rate shown is the original contractual interest rate. See Note 1 of the accompanying Notes.
7. Non-income producing security.
8. Is or was an affiliate, as defined in the Investment Company Act of 1940, at or during the period ended June 29, 2012, by virtue of the Fund owning at least 5% of the voting securities of the issuer or as a result of the Fund and the issuer having the same investment adviser. Transactions during the period in which the issuer was an affiliate are as follows:
| | | | | | | | | | | | | | | | |
| | | Shares
December 30, 2011a | | | Gross
Additions | | | Gross
Reductions | | | Shares
June 29, 2012 | |
| Oppenheimer Institutional Money Market Fund, Cl. E | | | 11,964,562 | | | | 20,803,303 | | | | 30,731,904 | | | | 2,035,961 | |
| | | | |
| | | | | | | | | Value | | | Income | |
| Oppenheimer Institutional Money Market Fund, Cl. E | | | | | | | | | | | $2,035,961 | | | | $5,873 | |
a. December 30, 2011 represents the last business day of the Fund’s 2011 fiscal year. See Note 1 of the accompanying Notes.
9. Rate shown is the 7-day yield as of June 29, 2012.
13 | OPPENHEIMER HIGH INCOME FUND/VA
|
STATEMENT OF ASSETS AND LIABILITIES Unaudited
| | | | |
| June 29, 20121 | | | |
| Assets | | | |
| Investments, at value—see accompanying statement of investments: | | | | |
| Unaffiliated companies (cost $113,331,129) | | $ | 107,034,987 | |
| Affiliated companies (cost $2,035,961) | |
| 2,035,961
|
|
| | | | 109,070,948 | |
| Cash | | | 3,355 | |
| Receivables and other assets: | | | | |
| Interest, dividends and principal paydowns | | | 2,143,917 | |
| Investments sold (including $263,820 sold on a when-issued or delayed delivery basis) | | | 567,671 | |
| Shares of beneficial interest sold | | | 67,084 | |
| Other | |
| 16,256
|
|
| Total assets | | | 111,869,231 | |
| Liabilities | | | |
| Payables and other liabilities: | | | | |
| Investments purchased (including $692,879 purchased on a when-issued or delayed delivery basis) | | | 960,856 | |
| Shares of beneficial interest redeemed | | | 67,239 | |
| Shareholder communications | | | 31,799 | |
| Trustees’ compensation | | | 13,313 | |
| Distribution and service plan fees | | | 11,978 | |
| Transfer and shareholder servicing agent fees | | | 8,926 | |
| Other | |
| 30,620
|
|
| Total liabilities | | | 1,124,731 | |
| Net Assets | | $
| 110,744,500
|
|
| Composition of Net Assets | | | |
| Par value of shares of beneficial interest | | $ | 59,882 | |
| Additional paid-in capital | | | 338,115,090 | |
| Accumulated net investment income | | | 4,280,812 | |
| Accumulated net realized loss on investments | | | (225,415,142 | ) |
| Net unrealized depreciation on investments | |
| (6,296,142
| )
|
| Net Assets | | $
| 110,744,500
|
|
| Net Asset Value Per Share | | | |
| Non-Service Shares: | | | | |
Net asset value, redemption price per share and offering price per share (based on net assets of $46,249,916 and 25,140,017 shares of beneficial interest outstanding) | | | $1.84 | |
| Service Shares: | | | | |
Net asset value, redemption price per share and offering price per share (based on net assets of $54,195,850 and 29,242,647 shares of beneficial interest outstanding) | | | $1.85 | |
| Class 3 Shares: | | | | |
Net asset value, redemption price per share and offering price per share (based on net assets of $4,361,788 and 2,346,294 shares of beneficial interest outstanding) | | | $1.86 | |
| Class 4 Shares: | | | | |
Net asset value, redemption price per share and offering price per share (based on net assets of $5,936,946 and 3,152,794 shares of beneficial interest outstanding) | | | $1.88 | |
1. June 29, 2012 represents the last business day of the Fund’s 2012 semiannual period. See Note 1 of the accompanying Notes.
See accompanying Notes to Financial Statements.
14 | OPPENHEIMER HIGH INCOME FUND/VA
|
STATEMENT OF OPERATIONS Unaudited
| | | | |
| For the Six Months Ended June 29, 20121 | | | |
| Investment Income | | | |
| Interest | | $ | 4,977,857 | |
| Dividends: | | | | |
| Unaffiliated companies (net of foreign withholding taxes of $675) | | | 29,147 | |
| Affiliated companies | |
| 5,873
|
|
| Total investment income | | | 5,012,877 | |
| Expenses | | | |
| Management fees | | | 424,004 | |
| Distribution and service plan fees: | | | | |
| Service shares | | | 68,257 | |
| Class 4 shares | | | 8,118 | |
| Transfer and shareholder servicing agent fees: | | | | |
| Non-Service shares | | | 23,797 | |
| Service shares | | | 27,305 | |
| Class 3 shares | | | 2,187 | |
| Class 4 shares | | | 3,244 | |
| Shareholder communications: | | | | |
| Non-Service shares | | | 2,553 | |
| Service shares | | | 2,929 | |
| Class 3 shares | | | 222 | |
| Class 4 shares | | | 363 | |
| Legal, auditing and other professional fees | | | 36,273 | |
| Custodian fees and expenses | | | 18,016 | |
| Trustees’ compensation | | | 5,391 | |
| Administration service fees | | | 750 | |
| Other | |
| 8,216
|
|
| Total expenses | | | 631,625 | |
| Less waivers and reimbursements of expenses | |
| (131,300
| )
|
| Net expenses | | | 500,325 | |
| Net Investment Income | | | 4,512,552 | |
| Realized and Unrealized Gain (Loss) | | | |
| Net realized loss on investments from unaffiliated companies | | | (3,344,440 | ) |
| Net change in unrealized appreciation/depreciation on investments | | | 6,882,113 | |
| | |
| Net Increase in Net Assets Resulting from Operations | | $
| 8,050,225
|
|
1. June 29, 2012 represents the last business day of the Fund’s 2012 semiannual period. See Note 1 of the accompanying Notes.
See accompanying Notes to Financial Statements.
15 | OPPENHEIMER HIGH INCOME FUND/VA
|
STATEMENTS OF CHANGES IN NET ASSETS
| | | | | | | | |
| | | Six Months
Ended
June 29, 20121
(Unaudited) | | | Year
Ended
December 30,
20111 | |
| Operations | | | | | | |
| Net investment income | | $ | 4,512,552 | | | $ | 10,829,321 | |
| Net realized gain (loss) | | | (3,344,440 | ) | | | 688,171 | |
| Net change in unrealized appreciation/depreciation | |
| 6,882,113
|
| |
| (13,278,671
| )
|
| Net increase (decrease) in net assets resulting from operations | | | 8,050,225 | | | | (1,761,179 | ) |
| Dividends and/or Distributions to Shareholders | | | | | | |
| Dividends from net investment income: | | | | | | | | |
| Non-Service shares | | | (4,546,496 | ) | | | (5,402,411 | ) |
| Service shares | | | (5,172,932 | ) | | | (5,518,442 | ) |
| Class 3 shares | | | (415,085 | ) | | | (555,527 | ) |
| Class 4 shares | |
| (554,166
| )
| |
| (704,748
| )
|
| | | | (10,688,679 | ) | | | (12,181,128 | ) |
| Beneficial Interest Transactions | | | | | | |
| Net increase (decrease) in net assets resulting from beneficial interest transactions: | | | | | | | | |
| Non-Service shares | | | (121,611 | ) | | | (8,185,815 | ) |
| Service shares | | | 1,099,411 | | | | (2,768,423 | ) |
| Class 3 shares | | | 441,188 | | | | (1,395,931 | ) |
| Class 4 shares | |
| (1,112,449
| )
| |
| 485,879
|
|
| | | | 306,539 | | | | (11,864,290 | ) |
| Net Assets | | | | | | |
| Total decrease | | | (2,331,915 | ) | | | (25,806,597 | ) |
| Beginning of period | |
| 113,076,415
|
| |
| 138,883,012
|
|
| End of period (including accumulated net investment income of $4,280,812 and $10,456,939, respectively) | | $
| 110,744,500
|
| | $
| 113,076,415
|
|
1. June 29, 2012 and December 30, 2011 represent the last business days of the Fund’s respective reporting periods. See Note 1 of the accompanying Notes.
See accompanying Notes to Financial Statements.
16 | OPPENHEIMER HIGH INCOME FUND/VA
|
FINANCIAL HIGHLIGHTS
| | | | | | | | | | | | | | | | | | | | | | | | |
| | | Six Months
Ended
June 29, 20121 | | | Year Ended
December 30, | | | | | | Year Ended December 31, | |
| Non-Service Shares | | (Unaudited) | | | 20111 | | | 2010 | | | 2009 | | | 2008 | | | 2007 | |
| | | | | | | | | | | | | | | | | | | | | | | | | |
| Per Share Operating Data | | | | | | | | | | | | | | | | | | |
| Net asset value, beginning of period | | | $1.90 | | | | $2.13 | | | | $1.98 | | | | $1.58 | | | | $ 7.95 | | | | $8.55 | |
| Income (loss) from investment operations: | | | | | | | | | | | | | | | | | | | | | | | | |
| Net investment income2 | | | .08 | | | | .17 | | | | .18 | | | | .17 | | | | .54 | | | | .57 | |
| Net realized and unrealized gain (loss) | |
| .06
|
| |
| (.21
| )
| |
| .10
|
| |
| .23
|
| |
| (6.44
| )
| |
| (.56
| )
|
| Total from investment operations | | | .14 | | | | (.04 | ) | | | .28 | | | | .40 | | | | (5.90 | ) | | | .01 | |
| Dividends and/or distributions to shareholders: | | | | | | | | | | | | | | | | | | | | | | | | |
| Dividends from net investment income | | | (.20 | ) | | | (.19 | ) | | | (.13 | ) | | | — | | | | (.47 | ) | | | (.61 | ) |
| Net asset value, end of period | |
| $1.84
|
| |
| $1.90
|
| |
| $2.13
|
| |
| $1.98
|
| |
| $ 1.58
|
| |
| $7.95
|
|
| Total Return, at Net Asset Value3 | | 7.52% | | | (2.34)% | | | 14.81% | | | 25.32% | | | (78.67)% | | | (0.10)% | |
| | | | | | | | | | | | | | | | | | | | | | | | | |
| Ratios/Supplemental Data | | | | | | | | | | | | | | | | | | |
| Net assets, end of period (in thousands) | | $ | 46,250 | | | $ | 47,500 | | | $ | 61,563 | | | $ | 67,385 | | | $ | 111,040 | | | $ | 294,819 | |
| Average net assets (in thousands) | | $ | 47,850 | | | $ | 54,997 | | | $ | 59,598 | | | $ | 71,782 | | | $ | 211,186 | | | $ | 335,702 | |
| Ratios to average net assets:4 | | | | | | | | | | | | | | | | | | | | | | | | |
| Net investment income | | | 8.12 | % | | | 8.55 | % | | | 9.01 | % | | | 9.78 | % | | | 9.30 | % | | | 6.96 | % |
| Total expenses5 | | | 0.98 | % | | | 0.98 | % | | | 0.98 | % | | | 0.94 | % | | | 0.80 | % | | | 0.75 | % |
| Expenses after payments, waivers and/or reimbursements and reduction to custodian expenses | | | 0.75 | % | | | 0.75 | % | | | 0.69 | % | | | 0.57 | % | | | 0.78 | % | | | 0.74 | % |
| Portfolio turnover rate | | | 27 | % | | | 54 | % | | | 132 | % | | | 128 | % | | | 53 | %6 | | | 67 | %6 |
1. June 29, 2012 and December 30, 2011 represent the last business days of the Fund’s respective reporting periods. See Note 1 of the accompanying Notes.
2. Per share amounts calculated based on the average shares outstanding during the period.
3. Assumes an initial investment on the business day before the first day of the fiscal period, with all dividends and distributions reinvested in additional shares on the reinvestment date, and redemption at the net asset value calculated on the last business day of the fiscal period. Total returns are not annualized for periods less than one full year. Total return information does not reflect expenses that apply at the separate account level or to related insurance products. Inclusion of these charges would reduce the total return figures for all periods shown. Returns do not reflect the deduction of taxes that a shareholder would pay on fund distributions or the redemption of fund shares.
4. Annualized for periods less than one full year.
5. Total expenses including indirect expenses from affiliated fund were as follows:
| | | | |
| Six Months Ended June 29, 2012 | | | 0.98 | % |
| Year Ended December 30, 2011 | | | 0.98 | % |
| Year Ended December 31, 2010 | | | 0.98 | % |
| Year Ended December 31, 2009 | | | 0.96 | % |
| Year Ended December 31, 2008 | | | 0.80 | % |
| Year Ended December 31, 2007 | | | 0.76 | % |
6. The portfolio turnover rate excludes purchase and sale transactions of To Be Announced (TBA) mortgage-related securities as follows:
| | | | | | | | |
| | | Purchase Transactions | | | Sale Transactions | |
| Year Ended December 31, 2008 | | $ | 40,240,084 | | | $ | 41,196,921 | |
| Year Ended December 31, 2007 | | $ | 30,798,147 | | | $ | 24,096,458 | |
See accompanying Notes to Financial Statements.
17 | OPPENHEIMER HIGH INCOME FUND/VA
|
FINANCIAL HIGHLIGHTS Continued
| | | | | | | | | | | | | | | | | | | | | | | | |
| | | Six Months
Ended
June 29, 20121 | | | Year Ended
December 30, | | | Year Ended December 31, | |
| Service Shares | | (Unaudited) | | | 20111 | | | 2010 | | | 2009 | | | 2008 | | | 2007 | |
| | | | | | | | | | | | | | | | | | | | | | | | | |
| Per Share Operating Data | | | | | | | | | | | | | | | | | | |
| Net asset value, beginning of period | | | $1.91 | | | | $2.14 | | | | $1.99 | | | | $1.58 | | | | $ 7.89 | | | | $8.50 | |
| Income (loss) from investment operations: | | | | | | | | | | | | | | | | | | | | | | | | |
| Net investment income2 | | | .08 | | | | .17 | | | | .17 | | | | .16 | | | | .54 | | | | .55 | |
| Net realized and unrealized gain (loss) | |
| .05
|
| |
| (.21
| )
| |
| .10
|
| |
| .25
|
| |
| (6.40
| )
| |
| (.57
| )
|
| Total from investment operations | | | .13 | | | | (.04 | ) | | | .27 | | | | .41 | | | | (5.86 | ) | | | (.02 | ) |
| Dividends and/or distributions to shareholders: | | | | | | | | | | | | | | | | | | | | | | | | |
| Dividends from net investment income | | | (.19 | ) | | | (.19 | ) | | | (.12 | ) | | | — | | | | (.45 | ) | | | (.59 | ) |
| Net asset value, end of period | |
| $1.85
|
| |
| $1.91
|
| |
| $2.14
|
| |
| $1.99
|
| |
| $ 1.58
|
| |
| $7.89
|
|
| Total Return, at Net Asset Value3 | | 7.16% | | | (2.56)% | | | 14.44% | | | 25.95% | | | (78.57)% | | | (0.47)% | |
| | | | | | | | | | | | | | | | | | | | | | | | | |
| Ratios/Supplemental Data | | | | | | | | | | | | | | | | | | |
| Net assets, end of period (in thousands) | | $ | 54,196 | | | $ | 54,394 | | | $ | 63,713 | | | $ | 64,440 | | | $ | 43,375 | | | $ | 157,333 | |
| Average net assets (in thousands) | | $ | 54,905 | | | $ | 60,391 | | | $ | 63,661 | | | $ | 54,202 | | | $ | 116,236 | | | $ | 169,569 | |
| Ratios to average net assets:4 | | | | | | | | | | | | | | | | | | | | | | | | |
| Net investment income | | | 7.87 | % | | | 8.31 | % | | | 8.76 | % | | | 9.60 | % | | | 9.13 | % | | | 6.71 | % |
| Total expenses5 | | | 1.23 | % | | | 1.23 | % | | | 1.23 | % | | | 1.21 | % | | | 1.05 | % | | | 1.01 | % |
| Expenses after payments, waivers and/or reimbursements and reduction to custodian expenses | | | 1.00 | % | | | 1.00 | % | | | 0.94 | % | | | 0.80 | % | | | 1.03 | % | | | 1.00 | % |
| Portfolio turnover rate | | | 27 | % | | | 54 | % | | | 132 | % | | | 128 | % | | | 53 | %6 | | | 67 | %6 |
1. June 29, 2012 and December 30, 2011 represent the last business days of the Fund’s respective reporting periods. See Note 1 of the accompanying Notes.
2. Per share amounts calculated based on the average shares outstanding during the period.
3. Assumes an initial investment on the business day before the first day of the fiscal period, with all dividends and distributions reinvested in additional shares on the reinvestment date, and redemption at the net asset value calculated on the last business day of the fiscal period. Total returns are not annualized for periods less than one full year. Total return information does not reflect expenses that apply at the separate account level or to related insurance products. Inclusion of these charges would reduce the total return figures for all periods shown. Returns do not reflect the deduction of taxes that a shareholder would pay on fund distributions or the redemption of fund shares.
4. Annualized for periods less than one full year.
5. Total expenses including indirect expenses from affiliated fund were as follows:
| | | | |
| Six Months Ended June 29, 2012 | | | 1.23 | % |
| Year Ended December 30, 2011 | | | 1.23 | % |
| Year Ended December 31, 2010 | | | 1.23 | % |
| Year Ended December 31, 2009 | | | 1.23 | % |
| Year Ended December 31, 2008 | | | 1.05 | % |
| Year Ended December 31, 2007 | | | 1.02 | % |
6. The portfolio turnover rate excludes purchase and sale transactions of To Be Announced (TBA) mortgage-related securities as follows:
| | | | | | | | |
| | | Purchase Transactions | | | Sale Transactions | |
| Year Ended December 31, 2008 | | $ | 40,240,084 | | | $ | 41,196,921 | |
| Year Ended December 31, 2007 | | $ | 30,798,147 | | | $ | 24,096,458 | |
See accompanying Notes to Financial Statements.
18 | OPPENHEIMER HIGH INCOME FUND/VA
|
FINANCIAL HIGHLIGHTS Continued
| | | | | | | | | | | | | | | | | | | | | | | | |
| | | Six Months
Ended
June 29, 20121 | | | Year Ended
December 30, | | | Year Ended December 31, | |
| Class 3 Shares | | (Unaudited) | | | 20111 | | | 2010 | | | 2009 | | | 2008 | | | 20072 | |
| | | | | | | | | | | | | | | | | | | | | | | | | |
| Per Share Operating Data | | | | | | | | | | | | | | | | | | |
| Net asset value, beginning of period | | | $1.92 | | | | $2.14 | | | | $1.99 | | | | $1.57 | | | | $ 7.98 | | | | $8.26 | |
| Income (loss) from investment operations: | | | | | | | | | | | | | | | | | | | | | | | | |
| Net investment income3 | | | .08 | | | | .17 | | | | .18 | | | | .17 | | | | .56 | | | | .37 | |
| Net realized and unrealized gain (loss) | |
| .06
|
| |
| (.20
| )
| |
| .10
|
| |
| .25
|
| |
| (6.50
| )
| |
| (.65
| )
|
| Total from investment operations | | | .14 | | | | (.03 | ) | | | .28 | | | | .42 | | | | (5.94 | ) | | | (.28 | ) |
| Dividends and/or distributions to shareholders: | | | | | | | | | | | | | | | | | | | | | | | | |
| Dividends from net investment income | | | (.20 | ) | | | (.19 | ) | | | (.13 | ) | | | — | | | | (.47 | ) | | | — | |
| Net asset value, end of period | |
| $1.86
|
| |
| $1.92
|
| |
| $2.14
|
| |
| $1.99
|
| |
| $ 1.57
|
| |
| $7.98
|
|
| Total Return, at Net Asset Value4 | | 7.46% | | | (1.88)% | | | 14.69% | | | 26.75% | | | (78.89)% | | | (3.39)% | |
| | | | | | | | | | | | | | | | | | | | | | | | | |
| Ratios/Supplemental Data | | | | | | | | | | | | | | | | | | |
| Net assets, end of period (in thousands) | | | $4,362 | | | | $4,034 | | | | $6,034 | | | | $4,684 | | | | $1,582 | | | | $4,921 | |
| Average net assets (in thousands) | | | $4,397 | | | | $5,432 | | | | $5,279 | | | | $3,568 | | | | $5,292 | | | | $3,750 | |
| Ratios to average net assets:5 | | | | | | | | | | | | | | | | | | | | | | | | |
| Net investment income | | | 8.11 | % | | | 8.52 | % | | | 8.97 | % | | | 9.86 | % | | | 9.29 | % | | | 6.90 | % |
| Total expenses6 | | | 0.98 | % | | | 0.98 | % | | | 0.99 | % | | | 0.97 | % | | | 0.80 | % | | | 0.76 | % |
| Expenses after payments, waivers and/or reimbursements and reduction to custodian expenses | | | 0.75 | % | | | 0.75 | % | | | 0.69 | % | | | 0.53 | % | | | 0.78 | % | | | 0.75 | % |
| Portfolio turnover rate | | | 27 | % | | | 54 | % | | | 132 | % | | | 128 | % | | | 53 | %7 | | | 67 | %7 |
1. June 29, 2012 and December 30, 2011 represent the last business days of the Fund’s respective reporting periods. See Note 1 of the accompanying Notes.
2. For the period from May 1, 2007 (inception of offering) to December 31, 2007.
3. Per share amounts calculated based on the average shares outstanding during the period.
4. Assumes an initial investment on the business day before the first day of the fiscal period, with all dividends and distributions reinvested in additional shares on the reinvestment date, and redemption at the net asset value calculated on the last business day of the fiscal period. Total returns are not annualized for periods less than one full year. Total return information does not reflect expenses that apply at the separate account level or to related insurance products. Inclusion of these charges would reduce the total return figures for all periods shown. Returns do not reflect the deduction of taxes that a shareholder would pay on fund distributions or the redemption of fund shares.
5. Annualized for periods less than one full year.
6. Total expenses including indirect expenses from affiliated fund were as follows:
| | | | |
| Six Months Ended June 29, 2012 | | | 0.98 | % |
| Year Ended December 30, 2011 | | | 0.98 | % |
| Year Ended December 31, 2010 | | | 0.99 | % |
| Year Ended December 31, 2009 | | | 0.99 | % |
| Year Ended December 31, 2008 | | | 0.80 | % |
| Period Ended December 31, 2007 | | | 0.77 | % |
7. The portfolio turnover rate excludes purchase and sale transactions of To Be Announced (TBA) mortgage-related securities as follows:
| | | | | | | | |
| | | Purchase Transactions | | | Sale Transactions | |
| Year Ended December 31, 2008 | | $ | 40,240,084 | | | $ | 41,196,921 | |
| Period Ended December 31, 2007 | | $ | 30,798,147 | | | $ | 24,096,458 | |
See accompanying Notes to Financial Statements.
19 | OPPENHEIMER HIGH INCOME FUND/VA
|
FINANCIAL HIGHLIGHTS Continued
| | | | | | | | | | | | | | | | | | | | | | | | |
| | | Six Months
Ended
June 29, 20121 | | | Year Ended
December 30, | | | Year Ended December 31, | |
| Class 4 Shares | | (Unaudited) | | | 20111 | | | 2010 | | | 2009 | | | 2008 | | | 20072 | |
| | | | | | | | | | | | | | | | | | | | | | | | | |
| Per Share Operating Data | | | | | | | | | | | | | | | | | | |
| Net asset value, beginning of period | | | $1.94 | | | | $2.16 | | | | $2.01 | | | | $1.59 | | | | $ 7.97 | | | | $8.26 | |
| Income (loss) from investment operations: | | | | | | | | | | | | | | | | | | | | | | | | |
| Net investment income3 | | | .08 | | | | .17 | | | | .18 | | | | .16 | | | | .54 | | | | .36 | |
| Net realized and unrealized gain (loss) | |
| .05
|
| |
| (.20
| )
| |
| .09
|
| |
| .26
|
| |
| (6.46
| )
| |
| (.65
| )
|
| Total from investment operations | | | .13 | | | | (.03 | ) | | | .27 | | | | .42 | | | | (5.92 | ) | | | (.29 | ) |
| Dividends and/or distributions to shareholders: | | | | | | | | | | | | | | | | | | | | | | | | |
| Dividends from net investment income | | | (.19 | ) | | | (.19 | ) | | | (.12 | ) | | | — | | | | (.46 | ) | | | — | |
| Net asset value, end of period | |
| $1.88
|
| |
| $1.94
|
| |
| $2.16
|
| |
| $2.01
|
| |
| $ 1.59
|
| |
| $7.97
|
|
| Total Return, at Net Asset Value4 | | 7.04% | | | (2.06)% | | | 14.27% | | | 26.42% | | | (78.63)% | | | (3.51)% | |
| | | | | | | | | | | | | | | | | | | | | | | | | |
| Ratios/Supplemental Data | | | | | | | | | | | | | | | | | | |
| Net assets, end of period (in thousands) | | | $5,937 | | | | $7,148 | | | | $7,573 | | | | $7,107 | | | | $ 4,167 | | | | $9,476 | |
| Average net assets (in thousands) | | | $6,524 | | | | $7,852 | | | | $7,278 | | | | $6,285 | | | | $10,658 | | | | $7,201 | |
| Ratios to average net assets:5 | | | | | | | | | | | | | | | | | | | | | | | | |
| Net investment income | | | 7.88 | % | | | 8.29 | % | | | 8.74 | % | | | 9.62 | % | | | 9.00 | % | | | 6.61 | % |
| Total expenses6 | | | 1.23 | % | | | 1.23 | % | | | 1.23 | % | | | 1.19 | % | | | 1.07 | % | | | 1.05 | % |
| Expenses after payments, waivers and/or reimbursements and reduction to custodian expenses | | | 1.00 | % | | | 1.00 | % | | | 0.94 | % | | | 0.80 | % | | | 1.05 | % | | | 1.04 | % |
| Portfolio turnover rate | | | 27 | % | | | 54 | % | | | 132 | % | | | 128 | % | | | 53 | %7 | | | 67 | %7 |
1. June 29, 2012 and December 30, 2011 represent the last business days of the Fund’s respective reporting periods. See Note 1 of the accompanying Notes.
2. For the period from May 1, 2007 (inception of offering) to December 31, 2007.
3. Per share amounts calculated based on the average shares outstanding during the period.
4. Assumes an initial investment on the business day before the first day of the fiscal period, with all dividends and distributions reinvested in additional shares on the reinvestment date, and redemption at the net asset value calculated on the last business day of the fiscal period. Total returns are not annualized for periods less than one full year. Total return information does not reflect expenses that apply at the separate account level or to related insurance products. Inclusion of these charges would reduce the total return figures for all periods shown. Returns do not reflect the deduction of taxes that a shareholder would pay on fund distributions or the redemption of fund shares.
5. Annualized for periods less than one full year.
6. Total expenses including indirect expenses from affiliated fund were as follows:
| | | | |
| Six Months Ended June 29, 2012 | | | 1.23 | % |
| Year Ended December 30, 2011 | | | 1.23 | % |
| Year Ended December 31, 2010 | | | 1.23 | % |
| Year Ended December 31, 2009 | | | 1.21 | % |
| Year Ended December 31, 2008 | | | 1.07 | % |
| Period Ended December 31, 2007 | | | 1.06 | % |
7. The portfolio turnover rate excludes purchase and sale transactions of To Be Announced (TBA) mortgage-related securities as follows:
| | | | | | | | |
| | | Purchase Transactions | | | Sale Transactions | |
| Year Ended December 31, 2008 | | $ | 40,240,084 | | | $ | 41,196,921 | |
| Period Ended December 31, 2007 | | $ | 30,798,147 | | | $ | 24,096,458 | |
See accompanying Notes to Financial Statements.
20 | OPPENHEIMER HIGH INCOME FUND/VA
|
NOTES TO FINANCIAL STATEMENTS June 29, 2012 / Unaudited
1. Significant Accounting Policies
Oppenheimer High Income Fund/VA (the “Fund”) is a separate series of Oppenheimer Variable Account Funds, a diversified open-end management investment company registered under the Investment Company Act of 1940, as amended. The Fund’s investment objective is to seek total return. The Fund’s investment adviser is OppenheimerFunds, Inc. (the “Manager”).
The Fund offers Non-Service, Service, Class 3 and Class 4 shares. All classes are sold at their offering price, which is the net asset value per share, to separate investment accounts of participating insurance companies as an underlying investment for variable life insurance policies, variable annuity contracts or other investment products. The classes of shares being designated as Service shares and Class 4 shares are subject to a distribution and service plan. All classes of shares have identical rights and voting privileges with respect to the Fund in general and exclusive voting rights on matters that affect that class alone. Earnings, net assets and net asset value per share may differ due to each class having its own expenses, such as transfer and shareholder servicing agent fees and shareholder communications, directly attributable to that class. The Fund assesses a 1% fee on the proceeds of Class 3 and Class 4 shares that are redeemed (either by selling or exchanging to another Oppenheimer fund or other investment option offered through your variable life insurance or variable annuity contract) within 60 days of their purchase. The fee, which is retained by the Fund, is accounted for as an addition to paid-in capital.
The following is a summary of significant accounting policies consistently followed by the Fund.
Semiannual and Annual Periods. The last day of the Fund’s semiannual period was the last day the New York Stock Exchange was open for trading. The Fund’s financial statements have been presented through that date to maintain consistency with the Fund’s net asset value calculations used for shareholder transactions.
The last day of the Fund’s fiscal year was the last day the New York Stock Exchange was open for trading. The Fund’s financial statements have been presented through that date to maintain consistency with the Fund’s net asset value calculations used for shareholder transactions.
Securities on a When-Issued or Delayed Delivery Basis. The Fund may purchase securities on a “when-issued” basis, and may purchase or sell securities on a “delayed delivery” basis. “When-issued” or “delayed delivery” refers to securities whose terms and indenture are available and for which a market exists, but which are not available for immediate delivery. Delivery and payment for securities that have been purchased by the Fund on a when-issued basis normally takes place within six months and possibly as long as two years or more after the trade date. During this period, such securities do not earn interest, are subject to market fluctuation and may increase or decrease in value prior to their delivery. The purchase of securities on a when-issued basis may increase the volatility of the Fund’s net asset value to the extent the Fund executes such transactions while remaining substantially fully invested. When the Fund engages in when-issued or delayed delivery transactions, it relies on the buyer or seller, as the case may be, to complete the transaction. Their failure to do so may cause the Fund to lose the opportunity to obtain or dispose of the security at a price and yield it considers advantageous. The Fund may also sell securities that it purchased on a when-issued basis or forward commitment prior to settlement of the original purchase.
As of June 29, 2012, the Fund had purchased securities issued on a when-issued or delayed delivery basis and sold securities issued on a delayed delivery basis as follows:
| | | | |
| | | When-Issued or Delayed Delivery
Basis Transactions | |
| Purchased securities | | $ | 692,879 | |
| Sold securities | | | 263,820 | |
Credit Risk. The Fund invests in high-yield, non-investment-grade bonds, which may be subject to a greater degree of credit risk. Credit risk relates to the ability of the issuer to meet interest or principal payments or both as they become
21 | OPPENHEIMER HIGH INCOME FUND/VA
|
NOTES TO FINANCIAL STATEMENTS Unaudited / Continued
1. Significant Accounting Policies Continued
due. The Fund may acquire securities that have missed an interest payment, and is not obligated to dispose of securities whose issuers or underlying obligors subsequently miss an interest payment. Information concerning securities not accruing interest as of June 29, 2012 is as follows:
| | | | |
| Cost | | $ | 1,663,016 | |
| Market Value | | $ | 954,615 | |
| Market Value as a % of Net Assets | | | 0.86 | % |
Investment in Oppenheimer Institutional Money Market Fund. The Fund is permitted to invest daily available cash balances in an affiliated money market fund. The Fund may invest the available cash in Class E shares of Oppenheimer Institutional Money Market Fund (“IMMF”) to seek current income while preserving liquidity. IMMF is a registered open-end management investment company, regulated as a money market fund under the Investment Company Act of 1940, as amended. The Manager is also the investment adviser of IMMF. When applicable, the Fund’s investment in IMMF is included in the Statement of Investments. Shares of IMMF are valued at their net asset value per share. As a shareholder, the Fund is subject to its proportional share of IMMF’s Class E expenses, including its management fee. The Manager will waive fees and/or reimburse Fund expenses in an amount equal to the indirect management fees incurred through the Fund’s investment in IMMF.
Allocation of Income, Expenses, Gains and Losses. Income, expenses (other than those attributable to a specific class), gains and losses are allocated on a daily basis to each class of shares based upon the relative proportion of net assets represented by such class. Operating expenses directly attributable to a specific class are charged against the operations of that class.
Federal Taxes. The Fund intends to comply with provisions of the Internal Revenue Code applicable to regulated investment companies and to distribute substantially all of its investment company taxable income, including any net realized gain on investments not offset by capital loss carryforwards, if any, to shareholders. Therefore, no federal income or excise tax provision is required. The Fund files income tax returns in U.S. federal and applicable state jurisdictions. The statute of limitations on the Fund’s tax return filings generally remain open for the three preceding fiscal reporting period ends.
During the fiscal year ended December 30, 2011, the Fund utilized $1,949,628 of capital loss carryforward to offset capital gains realized in that fiscal year. The Fund had post-October losses of $1,447,657. Details of the fiscal year ended December 30, 2011 capital loss carryforwards are included in the table below. Capital loss carryforwards with no expiration, if any, must be utilized prior to those with expiration dates. Capital losses with no expiration will be carried forward to future years if not offset by gains.
| | | | |
| Expiring | | | |
| 2012 | | $ | 128,504 | |
| 2016 | | | 48,495,519 | |
| 2017 | | | 171,938,143 | |
| No expiration | | | 1,447,657 | |
| | |
|
|
|
| Total | | $ | 222,009,823 | |
| | |
|
|
|
As of June 29, 2012, it is estimated that the capital loss carryforwards would be $220,562,166 expiring by 2017 and $4,792,097 which will not expire. The estimated capital loss carryforward represents the carryforward as of the end of the last fiscal year, increased or decreased by capital losses or gains realized in the first six months of the current fiscal year. During the six months ended June 29, 2012, it is estimated that the Fund will not utilize any capital loss carryforward to offset realized capital gains.
22 | OPPENHEIMER HIGH INCOME FUND/VA
|
Net investment income (loss) and net realized gain (loss) may differ for financial statement and tax purposes. The character of dividends and distributions made during the fiscal year from net investment income or net realized gains may differ from their ultimate characterization for federal income tax purposes. Also, due to timing of dividends and distributions, the fiscal year in which amounts are distributed may differ from the fiscal year in which the income or net realized gain was recorded by the Fund.
The aggregate cost of securities and other investments and the composition of unrealized appreciation and depreciation of securities and other investments for federal income tax purposes as of June 29, 2012 are noted in the following table. The primary difference between book and tax appreciation or depreciation of securities and other investments, if applicable, is attributable to the tax deferral of losses or tax realization of financial statement unrealized gain or loss.
| | | | |
| Federal tax cost of securities | | $ | 115,509,946 | |
| | |
|
|
|
| |
| Gross unrealized appreciation | | $ | 3,885,940 | |
| Gross unrealized depreciation | | | (10,324,938) | |
| | |
|
|
|
| Net unrealized depreciation | | $ | (6,438,998) | |
| | |
|
|
|
Trustees’ Compensation. The Board of Trustees has adopted a compensation deferral plan for independent trustees that enables trustees to elect to defer receipt of all or a portion of the annual compensation they are entitled to receive from the Fund. For purposes of determining the amount owed to the Trustee under the plan, deferred amounts are treated as though equal dollar amounts had been invested in shares of the Fund or in other Oppenheimer funds selected by the Trustee. The Fund purchases shares of the funds selected for deferral by the Trustee in amounts equal to his or her deemed investment, resulting in a Fund asset equal to the deferred compensation liability. Such assets are included as a component of “Other” within the asset section of the Statement of Assets and Liabilities. Deferral of trustees’ fees under the plan will not affect the net assets of the Fund, and will not materially affect the Fund’s assets, liabilities or net investment income per share. Amounts will be deferred until distributed in accordance with the compensation deferral plan.
Dividends and Distributions to Shareholders. Dividends and distributions to shareholders, which are determined in accordance with income tax regulations and may differ from U.S. generally accepted accounting principles, are recorded on the ex-dividend date. Income and capital gain distributions, if any, are declared and paid annually or at other times as deemed necessary by the Manager. The tax character of distributions is determined as of the Fund’s fiscal year end. Therefore, a portion of the Fund’s distributions made to shareholders prior to the Fund’s fiscal year end may ultimately be categorized as a tax return of capital.
Investment Income. Dividend income is recorded on the ex-dividend date or upon ex-dividend notification in the case of certain foreign dividends where the ex-dividend date may have passed. Non-cash dividends included in dividend income, if any, are recorded at the fair market value of the securities received. Interest income is recognized on an accrual basis. Discount and premium, which are included in interest income on the Statement of Operations, are amortized or accreted daily.
Custodian Fees. “Custodian fees and expenses” in the Statement of Operations may include interest expense incurred by the Fund on any cash overdrafts of its custodian account during the period. Such cash overdrafts may result from the effects of failed trades in portfolio securities and from cash outflows resulting from unanticipated shareholder redemption activity. The Fund pays interest to its custodian on such cash overdrafts, to the extent they are not offset by positive cash balances maintained by the Fund, at a rate equal to the Federal Funds Rate plus 0.50%. The “Reduction to custodian expenses” line item, if applicable, represents earnings on cash balances maintained by the Fund during the period. Such interest expense and other custodian fees may be paid with these earnings.
23 | OPPENHEIMER HIGH INCOME FUND/VA
|
NOTES TO FINANCIAL STATEMENTS Unaudited / Continued
1. Significant Accounting Policies Continued
Security Transactions. Security transactions are recorded on the trade date. Realized gains and losses on securities sold are determined on the basis of identified cost.
Indemnifications. The Fund’s organizational documents provide current and former trustees and officers with a limited indemnification against liabilities arising in connection with the performance of their duties to the Fund. In the normal course of business, the Fund may also enter into contracts that provide general indemnifications. The Fund’s maximum exposure under these arrangements is unknown as this would be dependent on future claims that may be made against the Fund. The risk of material loss from such claims is considered remote.
Other. The preparation of financial statements in conformity with accounting principles generally accepted in the United States of America requires management to make estimates and assumptions that affect the reported amounts of assets and liabilities and disclosure of contingent assets and liabilities at the date of the financial statements and the reported amounts of increases and decreases in net assets from operations during the reporting period. Actual results could differ from those estimates.
2. Securities Valuation
The Fund calculates the net asset value of its shares as of the close of the New York Stock Exchange (the “Exchange”), normally 4:00 P.M. Eastern time, on each day the Exchange is open for trading.
The Fund’s Board has adopted procedures for the valuation of the Fund’s securities and has delegated the day-to-day responsibility for valuation determinations under those procedures to the Manager. The Manager has established a Valuation Committee which is responsible for determining a “fair valuation” for any security for which market quotations are not “readily available.” The Valuation Committee’s fair valuation determinations are subject to review, approval and ratification by the Fund’s Board at its next regularly scheduled meeting covering the calendar quarter in which the fair valuation was determined.
Valuation Methods and Inputs
Securities are valued using unadjusted quoted market prices, when available, as supplied primarily by third party pricing services or dealers.
The following methodologies are used to determine the market value or the fair value of the types of securities described below:
Securities traded on a registered U.S. securities exchange (including exchange-traded derivatives other than futures and futures options) are valued based on the last sale price of the security reported on the principal exchange on which it is traded, prior to the time when the Fund’s assets are valued. In the absence of a sale, the security is valued at the last sale price on the prior trading day, if it is within the spread of the current day’s closing “bid” and “asked” prices, and if not, at the current day’s closing bid price. A security of a foreign issuer traded on a foreign exchange but not listed on a registered U.S. securities exchange is valued based on the last sale price on the principal exchange on which the security is traded, as identified by the third party pricing service used by the Manager, prior to the time when the Fund’s assets are valued. If the last sale price is unavailable, the security is valued at the most recent official closing price on the principal exchange on which it is traded. If the last sales price or official closing price for a foreign security is not available, the security is valued at the mean between the bid and asked price per the exchange or, if not available from the exchange, obtained from two dealers. If bid and asked prices are not available from either the exchange or two dealers, the security is valued by using one of the following methodologies (listed in order of priority); (1) using a bid from the exchange, (2) the mean between the bid and asked price as provided by a single dealer, or (3) a bid from a single dealer.
Shares of a registered investment company that are not traded on an exchange are valued at that investment company’s net asset value per share.
24 | OPPENHEIMER HIGH INCOME FUND/VA
|
Corporate and government debt securities (of U.S. or foreign issuers) and municipal debt securities, event-linked bonds, loans, mortgage-backed securities, collateralized mortgage obligations, and asset-backed securities are valued at the mean between the “bid” and “asked” prices utilizing evaluated prices obtained from third party pricing services or broker-dealers who may use matrix pricing methods to determine the evaluated prices.
Short-term money market type debt securities with a remaining maturity of sixty days or less are valued at cost adjusted by the amortization of discount or premium to maturity (amortized cost), which approximates market value. Short-term debt securities with a remaining maturity in excess of sixty days are valued at the mean between the “bid” and “asked” prices utilizing evaluated prices obtained from third party pricing services or broker-dealers.
A description of the standard inputs that may generally be considered by the third party pricing vendors in determining their evaluated prices is provided below.
| | |
| Security Type | | Standard inputs generally considered by third-party pricing vendors |
| Corporate debt, government debt, municipal, mortgage-backed and asset-backed securities | | Reported trade data, broker-dealer price quotations, benchmark yields, issuer spreads on comparable securities, the credit quality, yield, maturity, and other appropriate factors. |
| Loans | | Information obtained from market participants regarding reported trade data and broker-dealer price quotations. |
| Event-linked bonds | | Information obtained from market participants regarding reported trade data and broker-dealer price quotations. |
If a market value or price cannot be determined for a security using the methodologies described above, or if, in the “good faith” opinion of the Manager, the market value or price obtained does not constitute a “readily available market quotation,” or a significant event has occurred that would materially affect the value of the security the security is fair valued either (i) by a standardized fair valuation methodology applicable to the security type or the significant event as previously approved by the Valuation Committee and the Fund’s Board or (ii) as determined in good faith by the Manager’s Valuation Committee. The Valuation Committee considers all relevant facts that are reasonably available, through either public information or information available to the Manager, when determining the fair value of a security. Fair value determinations by the Manager are subject to review, approval and ratification by the Fund’s Board at its next regularly scheduled meeting covering the calendar quarter in which the fair valuation was determined. Those fair valuation standardized methodologies include, but are not limited to, valuing securities at the last sale price or initially at cost and subsequently adjusting the value based on: changes in company specific fundamentals, changes in an appropriate securities index, or changes in the value of similar securities which may be further adjusted for any discounts related to security-specific resale restrictions. When possible, such methodologies use observable market inputs such as unadjusted quoted prices of similar securities, observable interest rates, currency rates and yield curves. The methodologies used for valuing securities are not necessarily an indication of the risks associated with investing in those securities nor can it be assured that the Fund can obtain the fair value assigned to a security if it were to sell the security.
To assess the continuing appropriateness of security valuations, the Manager, or its third party service provider who is subject to oversight by the Manager, regularly compares prior day prices, prices on comparable securities, and sale prices to the current day prices and challenges those prices exceeding certain tolerance levels with the third party pricing service or broker source. For those securities valued by fair valuations, whether through a standardized fair valuation methodology or a fair valuation determination, the Valuation Committee reviews and affirms the reasonableness of the valuations based on such methodologies and fair valuation determinations on a regular basis after considering all relevant information that is reasonably available.
Classifications
Each investment asset or liability of the Fund is assigned a level at measurement date based on the significance and source of the inputs to its valuation. Various data inputs are used in determining the value of each of the Fund’s
25 | OPPENHEIMER HIGH INCOME FUND/VA
|
NOTES TO FINANCIAL STATEMENTS Unaudited / Continued
2. Securities Valuation Continued
investments as of the reporting period end. These data inputs are categorized in the following hierarchy under applicable financial accounting standards:
| | 1) | Level 1-unadjusted quoted prices in active markets for identical assets or liabilities (including securities actively traded on a securities exchange) |
| | 2) | Level 2-inputs other than unadjusted quoted prices that are observable for the asset or liability (such as unadjusted quoted prices for similar assets and market corroborated inputs such as interest rates, prepayment speeds, credit risks, etc.) |
| | 3) | Level 3-significant unobservable inputs (including the Manager’s own judgments about assumptions that market participants would use in pricing the asset or liability). |
The inputs used for valuing securities are not necessarily an indication of the risks associated with investing in those securities.
The table below categorizes amounts that are included in the Fund’s Statement of Assets and Liabilities as of June 29, 2012 based on valuation input level:
| | | | | | | | | | | | | | | | |
| | | Level 1—
Unadjusted
Quoted Prices | | | Level 2—
Other Significant
Observable Inputs | | | Level 3—
Significant
Unobservable
Inputs | | | Value | |
| Assets Table | | | | | | | | | | | | | | | | |
| Investments, at Value: | | | | | | | | | | | | | | | | |
| Corporate Loans | | $ | — | | | $ | 485,256 | | | $ | — | | | $ | 485,256 | |
| Loan Participations | | | — | | | | 6,364,423 | | | | — | | | | 6,364,423 | |
| Corporate Bonds and Notes | | | — | | | | 97,609,478 | | | | — | | | | 97,609,478 | |
| Preferred Stocks | | | — | | | | 520,326 | | | | 510,138 | | | | 1,030,464 | |
| Common Stocks | | | 744,677 | | | | 800,293 | | | | — | | | | 1,544,970 | |
| Rights, Warrants and Certificates | | | — | | | | — | | | | 396 | | | | 396 | |
| Investment Company | | | 2,035,961 | | | | — | | | | — | | | | 2,035,961 | |
| | |
|
|
| |
|
|
| |
|
|
| |
|
|
|
| Total Assets | | $ | 2,780,638 | | | $ | 105,779,776 | | | $ | 510,534 | | | $ | 109,070,948 | |
| | |
|
|
| |
|
|
| |
|
|
| |
|
|
|
Currency contracts and forwards, if any, are reported at their unrealized appreciation/depreciation at measurement date, which represents the change in the contract’s value from trade date. Futures, if any, are reported at their variation margin at measurement date, which represents the amount due to/from the Fund at that date. All additional assets and liabilities included in the above table are reported at their market value at measurement date.
The table below shows the significant transfers between Level 2 and Level 3. The Fund’s policy is to recognize transfers in and transfers out as of the beginning of the reporting period.
| | | | | | | | |
| | | Transfers into
Level 2* | | | Transfers out of
Level 3* | |
| Assets Table | | | | | | | | |
| Investments, at Value: | | | | | | | | |
Common Stocks | | $ | 52,929 | | | $ | (52,929 | ) |
| | |
|
|
| |
|
|
|
| Total Assets | | $ | 52,929 | | | $ | (52,929 | ) |
| | |
|
|
| |
|
|
|
* Transferred from Level 3 to Level 2 due to the availability of market data for this security.
There have been no significant changes to the fair valuation methodologies of the Fund during the period.
26 | OPPENHEIMER HIGH INCOME FUND/VA
|
3. Shares of Beneficial Interest
The Fund has authorized an unlimited number of $0.001 par value shares of beneficial interest of each class. Transactions in shares of beneficial interest were as follows:
| | | | | | | | | | | | | | | | |
| | | Six Months Ended June 29, 2012 | | | Year Ended December 30, 2011 | |
| | | Shares | | | Amount | | | Shares | | | Amount | |
| Non-Service Shares | | | | | | | | | | | | | | | | |
| Sold | | | 1,416,021 | | | $ | 2,807,810 | | | | 4,435,498 | | | $ | 8,942,368 | |
| Dividends and/or distributions reinvested | | | 2,498,075 | | | | 4,546,496 | | | | 2,648,241 | | | | 5,402,411 | |
| Redeemed | | | (3,753,308 | ) | | | (7,475,917 | ) | | | (11,071,648 | ) | | | (22,530,594 | ) |
| | |
|
|
| |
|
|
| |
|
|
| |
|
|
|
| Net increase (decrease) | | | 160,788 | | | $ | (121,611 | ) | | | (3,987,909 | ) | | $ | (8,185,815 | ) |
| | |
|
|
| |
|
|
| |
|
|
| |
|
|
|
| | | | | | | | | | | | | |
| Service Shares | | | | | | | | | | | | | | | | |
| Sold | | | 1,083,782 | | | $ | 2,171,392 | | | | 3,015,631 | | | $ | 6,027,667 | |
| Dividends and/or distributions reinvested | | | 2,826,739 | | | | 5,172,932 | | | | 2,691,923 | | | | 5,518,442 | |
| Redeemed | | | (3,127,951 | ) | | | (6,244,913 | ) | | | (7,087,393 | ) | | | (14,314,532 | ) |
| | |
|
|
| |
|
|
| |
|
|
| |
|
|
|
| Net increase (decrease) | | | 782,570 | | | $ | 1,099,411 | | | | (1,379,839 | ) | | $ | (2,768,423 | ) |
| | |
|
|
| |
|
|
| |
|
|
| |
|
|
|
| | | | | | | | | | | | | |
| Class 3 Shares | | | | | | | | | | | | | | | | |
| Sold | | | 502,370 | | | $ | 999,451 | | | | 805,055 | | | $ | 1,675,197 | |
| Dividends and/or distributions reinvested | | | 225,590 | | | | 415,086 | | | | 269,673 | | | | 555,527 | |
| Redeemed | | | (483,518 | ) | | | (973,349 | )1 | | | (1,789,726 | ) | | | (3,626,655 | )2 |
| | |
|
|
| |
|
|
| |
|
|
| |
|
|
|
| Net increase (decrease) | | | 244,442 | | | $ | 441,188 | | | | (714,998 | ) | | $ | (1,395,931 | ) |
| | |
|
|
| |
|
|
| |
|
|
| |
|
|
|
| | | | | | | | | | | | | |
| Class 4 Shares | | | | | | | | | | | | | | | | |
| Sold | | | 352,977 | | | $ | 717,792 | | | | 1,952,890 | | | $ | 4,030,364 | |
| Dividends and/or distributions reinvested | | | 297,938 | | | | 554,165 | | | | 338,821 | | | | 704,748 | |
| Redeemed | | | (1,187,383 | ) | | | (2,384,406 | )1 | | | (2,103,972 | ) | | | (4,249,233 | )2 |
| | |
|
|
| |
|
|
| |
|
|
| |
|
|
|
| Net increase (decrease) | | | (536,468 | ) | | $ | (1,112,449 | ) | | | 187,739 | | | $ | 485,879 | |
| | |
|
|
| |
|
|
| |
|
|
| |
|
|
|
1. Net of redemption fees of $598 and $4,196 for Class 3 and Class 4 shares, respectively.
2. Net of redemption fees of $621 and $235 for Class 3 and Class 4 shares, respectively.
4. Purchases and Sales of Securities
The aggregate cost of purchases and proceeds from sales of securities, other than short-term obligations and investments in IMMF, for the six months ended June 29, 2012, were as follows:
| | | | | | | | |
| | | Purchases | | | Sales | |
| Investment securities | | $ | 30,854,300 | | | $ | 27,919,931 | |
5. Fees and Other Transactions with Affiliates
Management Fees. Under the investment advisory agreement, the Fund pays the Manager a management fee based on the daily net assets of the Fund at an annual rate as shown in the following table:
| | | | |
| Fee Schedule | | | |
| Up to $200 million | | | 0.75 | % |
| Next $200 million | | | 0.72 | |
| Next $200 million | | | 0.69 | |
| Next $200 million | | | 0.66 | |
| Next $200 million | | | 0.60 | |
| Over $1 billion | | | 0.50 | |
Administration Service Fees. The Fund pays the Manager a fee of $1,500 per year for preparing and filing the Fund’s tax returns.
27 | OPPENHEIMER HIGH INCOME FUND/VA
|
NOTES TO FINANCIAL STATEMENTS Unaudited / Continued
4. Purchases and Sales of Securities Continued
Transfer Agent Fees. OppenheimerFunds Services (“OFS”), a division of the Manager, acts as the transfer and shareholder servicing agent for the Fund. For the six months ended June 29, 2012, the Fund paid $57,226 to OFS for services to the Fund.
Distribution and Service Plan for Service Shares and Class 4 Shares. The Fund has adopted a Distribution and Service Plan (the “Plan”) in accordance with Rule 12b-1 under the Investment Company Act of 1940 for Service shares and Class 4 shares to pay OppenheimerFunds Distributor, Inc. (the “Distributor”), for distribution related services, personal service and account maintenance for the Fund’s Service shares and Class 4 shares. Under the Plan, payments are made periodically at an annual rate of 0.25% of the daily net assets of Service shares and Class 4 shares of the Fund. The Distributor currently uses all of those fees to compensate sponsors of the insurance product that offers Fund shares, for providing personal service and maintenance of accounts of their variable contract owners that hold Service shares and Class 4 shares. These fees are paid out of the Fund’s assets on an on-going basis and increase operating expenses of the Service shares and Class 4 shares, which results in lower performance compared to the Fund’s shares that are not subject to a service fee. Fees incurred by the Fund under the Plan are detailed in the Statement of Operations.
Waivers and Reimbursements of Expenses. The Manager has voluntarily agreed to limit the Fund’s total annual operating expenses so that those expenses, as percentages of daily net assets, will not exceed the annual rate of 0.75% for Non-Service and Class 3 shares and 1.00% for Service and Class 4 shares. During the six months ended June 29, 2012, the Manager waived fees and/or reimbursed the Fund $54,124, $62,154, $4,954 and $7,413 for Non-Service, Service, Class 3 and Class 4 shares, respectively.
The Manager will waive fees and/or reimburse Fund expenses in an amount equal to the indirect management fees incurred through the Fund’s investment in IMMF. During the six months ended June 29, 2012, the Manager waived fees and/or reimbursed the Fund $2,655 for IMMF management fees.
Some of these undertakings may be modified or terminated at any time; some may not be modified or terminated until after one year from the date of the current prospectus, as indicated therein.
6. Restricted Securities
As of June 29, 2012, investments in securities included issues that are restricted. A restricted security may have a contractual restriction on its resale and is valued under methods approved by the Board of Trustees as reflecting fair value. Securities that are restricted are marked with an applicable footnote on the Statement of Investments. Restricted securities are reported on a schedule following the Statement of Investments.
7. Pending Litigation
Since 2009, a number of class action, derivative and individual lawsuits have been pending in federal and state courts against OppenheimerFunds, Inc., the Fund’s investment advisor (the “Manager”), OppenheimerFunds Distributor, Inc., the Fund’s principal underwriter and distributor (the “Distributor”), and certain funds (but not including the Fund) advised by the Manager and distributed by the Distributor (the “Defendant Funds”). Several of these lawsuits also name as defendants certain officers and current and former trustees of the respective Defendant Funds. The lawsuits raise claims under federal securities laws and various states’ securities, consumer protection and common law and allege, among other things, that the disclosure documents of the respective Defendant Funds contained misrepresentations and omissions and that the respective Defendant Funds’ investment policies were not followed. The plaintiffs in these actions seek unspecified damages, equitable relief and awards of attorneys’ fees and litigation expenses.
Other class action and individual lawsuits have been filed since 2008 in various state and federal courts against the Manager and certain of its affiliates by investors seeking to recover investments they allegedly lost as a result of the “Ponzi” scheme run by Bernard L. Madoff and his firm, Bernard L. Madoff Investment Securities, LLC (“BLMIS”). Plaintiffs
28 | OPPENHEIMER HIGH INCOME FUND/VA
|
in these suits allege that they suffered losses as a result of their investments in several funds managed by an affiliate of the Manager and assert a variety of claims, including breach of fiduciary duty, fraud, negligent misrepresentation, unjust enrichment, and violation of federal and state securities laws and regulations, among others. They seek unspecified damages, equitable relief and awards of attorneys’ fees and litigation expenses. Neither the Distributor, nor any of the Oppenheimer mutual funds, their independent trustees or directors are named as defendants in these lawsuits. None of the Oppenheimer mutual funds invested in any funds or accounts managed by Madoff or BLMIS. On February 28, 2011, a stipulation of partial settlement of three groups of consolidated putative class action lawsuits relating to these matters was filed in the U.S. District Court for the Southern District of New York. On August 19, 2011, the court entered an order and final judgment approving the settlement as fair, reasonable and adequate. In September 2011, certain parties filed notices of appeal from the court’s order approving the settlement. On July 29, 2011, a stipulation of settlement between certain affiliates of the Manager and the Trustee appointed under the Securities Investor Protection Act to liquidate BLMIS was filed in the U.S. Bankruptcy Court for the Southern District of New York to resolve purported preference and fraudulent transfer claims by the Trustee. On September 22, 2011, the court entered an order approving the settlement as fair, reasonable and adequate. In October 2011, certain parties filed notices of appeal from the court’s order approving the settlement. The aforementioned settlements do not resolve other outstanding lawsuits against the Manager and its affiliates relating to BLMIS.
On April 16, 2010, a lawsuit was filed in New York state court against the Manager, an affiliate of the Manager and AAArdvark IV Funding Limited (“AAArdvark IV”), an entity advised by the Manager’s affiliate, in connection with investments made by the plaintiffs in AAArdvark IV. Plaintiffs allege breach of contract against the defendants and seek compensatory damages, costs and disbursements, including attorney fees. On July 15, 2011, a lawsuit was filed in New York state court against the Manager, an affiliate of the Manager and AAArdvark Funding Limited (“AAArdvark I”), an entity advised by the Manager’s affiliate, in connection with investments made by the plaintiffs in AAArdvark I. The complaint alleges breach of contract against the defendants and seeks compensatory damages, costs and disbursements, including attorney fees. On November 9, 2011, a lawsuit was filed in New York state court against the Manager, an affiliate of the Manager and AAArdvark XS Funding Limited (“AAArdvark XS”), an entity advised by the Manager’s affiliate, in connection with investments made by the plaintiffs in AAArdvark XS. The complaint alleges breach of contract against the defendants and seeks compensatory damages, costs and disbursements, including attorney fees.
The Manager believes the lawsuits and appeals described above are without legal merit and, with the exception of actions it has settled, is defending against them vigorously. The Defendant Funds’ Boards of Trustees have also engaged counsel to represent the Funds and the present and former Independent Trustees named in those suits. While it is premature to render any opinion as to the outcome in these lawsuits, or whether any costs that the Defendant Funds may bear in defending the suits might not be reimbursed by insurance, the Manager believes that these suits should not impair the ability of the Manager or the Distributor to perform their respective duties to the Fund, and that the outcome of all of the suits together should not have any material effect on the operations of any of the Oppenheimer mutual funds.
29 | OPPENHEIMER HIGH INCOME FUND/VA
|
SPECIAL SHAREHOLDER MEETING Unaudited
On February 29, 2012, a shareholder meeting of the Oppenheimer Variable Account Funds, on behalf of Oppenheimer High Income Fund/VA (the “Fund”) was held at which the twelve Trustees identified below were elected to the Trust (Proposal No. 1). At the meeting the Proposal No. 2 (including all of its sub-proposals) and Proposal No. 3 were approved as described in the Fund’s proxy statement for that meeting. The following is a report of the votes cast:
| | | | | | | | |
| Nominee/Proposal | | For | | | Withheld | |
| Trustees | | | | | | | | |
| William L. Armstrong | | | 859,155,000 | | | | 36,277,763 | |
| Edward L. Cameron | | | 860,463,149 | | | | 34,969,615 | |
| Jon S. Fossel | | | 861,382,389 | | | | 34,050,375 | |
| Sam Freedman | | | 860,173,958 | | | | 35,258,806 | |
| Richard F. Grabish | | | 862,692,974 | | | | 32,739,789 | |
| Beverly L. Hamilton | | | 862,904,192 | | | | 32,528,571 | |
| Robert J. Malone | | | 862,354,488 | | | | 33,078,275 | |
| F. William Marshall, Jr. | | | 860,997,182 | | | | 34,435,581 | |
| Victoria J. Herget | | | 861,814,105 | | | | 33,618,659 | |
| Karen L. Stuckey | | | 861,434,246 | | | | 33,998,517 | |
| James D. Vaughn | | | 861,208,178 | | | | 34,224,585 | |
| William F. Glavin, Jr. | | | 861,148,846 | | | | 34,283,917 | |
2a: Proposal to revise the fundamental policy relating to borrowing
| | | | | | | | | | | | |
| For | | Against | | | Abstain | | | Broker Non Vote | |
| 54,407,005 | | | 2,509,716 | | | | 2,195,202 | | | | N/A | |
2b: Proposal to revise the fundamental policy relating to concentration of investments
| | | | | | | | | | | | |
| For | | Against | | | Abstain | | | Broker Non Vote | |
| 54,647,038 | | | 2,477,955 | | | | 1,986,930 | | | | N/A | |
2c: Proposal to remove the fundamental policy relating to diversification of investments
| | | | | | | | | | | | |
| For | | Against | | | Abstain | | | Broker Non Vote | |
| 54,053,138 | | | 2,734,608 | | | | 2,324,177 | | | | N/A | |
2d: Proposal to revise the fundamental policy relating to lending
| | | | | | | | | | | | |
| For | | Against | | | Abstain | | | Broker Non Vote | |
| 54,239,501 | | | 2,535,089 | | | | 2,337,334 | | | | N/A | |
2e-1: Proposal to revise the fundamental policy relating to real estate and commodities
| | | | | | | | | | | | |
| For | | Against | | | Abstain | | | Broker Non Vote | |
| 54,719,026 | | | 2,496,254 | | | | 1,896,644 | | | | N/A | |
2e-2: Proposal to remove the additional fundamental policy relating to real estate and commodities
| | | | | | | | | | | | |
| For | | Against | | | Abstain | | | Broker Non Vote | |
| 54,164,587 | | | 2,601,440 | | | | 2,345,897 | | | | N/A | |
30 | OPPENHEIMER HIGH INCOME FUND/VA
|
2f: Proposal to revise the fundamental policy relating to senior securities
| | | | | | | | | | | | |
| For | | Against | | | Abstain | | | Broker Non Vote | |
| 54,592,773 | | | 2,396,336 | | | | 2,122,815 | | | | N/A | |
2g: Proposal to revise the fundamental policy relating to underwriting
| | | | | | | | | | | | |
| For | | Against | | | Abstain | | | Broker Non Vote | |
| 54,491,631 | | | 2,449,923 | | | | 2,170,370 | | | | N/A | |
2i: Convert the Fund’s investment objective from fundamental to non-fundamental
| | | | | | | | | | | | |
| For | | Against | | | Abstain | | | Broker Non Vote | |
| 53,839,248 | | | 2,595,671 | | | | 2,677,005 | | | | N/A | |
2j: Approve a change in the fund’s investment objective
| | | | | | | | | | | | |
| For | | Against | | | Abstain | | | Broker Non Vote | |
| 54,202,406 | | | 2,495,844 | | | | 2,413,674 | | | | N/A | |
Proposal 3: To approve an Agreement and Plan of Reorganization that provides for the reorganization of a Fund from a Maryland corporation or Massachusetts business trust, as applicable, into a Delaware statutory trust.
| | | | | | | | | | | | |
| For | | Against | | | Abstain | | | Broker Non Vote | |
| 821,085,084 | | | 23,597,959 | | | | 50,749,721 | | | | N/A | |
31 | OPPENHEIMER HIGH INCOME FUND/VA
|
PORTFOLIO PROXY VOTING POLICIES AND PROCEDURES;
UPDATES TO STATEMENTS OF INVESTMENTS Unaudited
The Fund has adopted Portfolio Proxy Voting Policies and Procedures under which the Fund votes proxies relating to securities (“portfolio proxies”) held by the Fund. A description of the Fund’s Portfolio Proxy Voting Policies and Procedures is available (i) without charge, upon request, by calling the Fund toll-free at 1.800.525.7048, (ii) on the Fund’s website at oppenheimerfunds.com, and (iii) on the SEC’s website at www.sec.gov. In addition, the Fund is required to file Form N-PX, with its complete proxy voting record for the 12 months ended June 30th, no later than August 31st of each year. The Fund’s voting record is available (i) without charge, upon request, by calling the Fund toll-free at 1.800.525.7048, and (ii) in the Form N-PX filing on the SEC’s website at www.sec.gov.
The Fund files its complete schedule of portfolio holdings with the SEC for the first quarter and the third quarter of each fiscal year on Form N-Q. The Fund’s Form N-Q filings are available on the SEC’s website at www.sec.gov. Those forms may be reviewed and copied at the SEC’s Public Reference Room in Washington, D.C. Information on the operation of the Public Reference Room may be obtained by calling 1-800-SEC-0330.
32 | OPPENHEIMER HIGH INCOME FUND/VA
|
OPPENHEIMER HIGH INCOME FUND/VA
| | |
| A Series of Oppenheimer Variable Accounts |
| Trustees and Officers | | William L. Armstrong, Chairman of the Board of Trustees and Trustee Edward L. Cameron, Trustee Jon S. Fossel, Trustee Sam Freedman, Trustee Richard F. Grabish, Trustee Beverly L. Hamilton, Trustee Victoria J. Herget, Trustee Robert J. Malone, Trustee F. William Marshall, Jr., Trustee Karen L. Stuckey, Trustee James D. Vaughn, Trustee William F. Glavin, Jr., Trustee, President and Principal Executive Officer Joseph Welsh, Vice President Arthur S. Gabinet, Secretary and Chief Legal Officer Christina M. Nasta, Vice President and Chief Business Officer Mark S. Vandehey, Vice President and Chief Compliance Officer Brian W. Wixted, Treasurer and Principal Financial & Accounting Officer |
| Manager | | OppenheimerFunds, Inc. |
| Distributor | | OppenheimerFunds Distributor, Inc. |
Transfer Agent | | OppenheimerFunds Services |
| Independent Registered Public Accounting Firm | | KPMG LLP |
| Counsel | | K&L Gates LLP |
Before investing, investors should carefully consider a fund’s investment objectives, risks, charges and expenses. Fund prospectuses and summary prospectuses contain this and other information about the funds and may be obtained by asking your financial advisor, or calling us at 1.800.988.8287. Read prospectuses and summary prospectuses carefully before investing.
The financial statements included herein have been taken from the records of the Fund without examination of those records by the independent registered public accounting firm.
| | |
| ©2012 OppenheimerFunds, Inc. All rights reserved. | |  |
June 30, 2012
| | | | |
| | | |
| | | Oppenheimer Main Street Fund®/VA A Series of Oppenheimer Variable Account Funds | | Semiannual
Report |

SEMIANNUAL REPORT
Fund Performance Discussion
Listing of Top Holdings
Financial Statements

OPPENHEIMER MAIN STREET FUND®/VA
Portfolio Managers: Manind Govil, CFA and Benjamin Ram
| | | | | | |
Cumulative Total Returns
For the 6-Month Period Ended 6/29/121 |
| Non-Service Shares | | 9.02% | | | | |
| Service Shares | | 8.91 | | | | |
Average Annual Total Returns For the Periods Ended 6/29/121 | | |
| | | |
| | | 1-Year | | 5-Year | | 10-Year |
| Non-Service Shares | | 6.05% | | –0.52% | | 4.42% |
| Service Shares | | 5.82 | | –0.77 | | 4.16 |
Expense Ratios For the Fiscal Year Ended 12/30/111 | | |
| | | |
| | | Expense
Ratios | | | | |
| Non-Service Shares | | 0.78% | | | | |
| Service Shares | | 1.03 | | | | |
The performance data quoted represents past performance, which does not guarantee future results. The investment return and principal value of an investment in the Fund will fluctuate so that an investor’s shares, when redeemed, may be worth more or less than their original cost. Current performance and expense ratios may be lower or higher than the data quoted. For performance data current to the most recent month end, call us at 1.800.988.8287. The Fund’s total returns should not be expected to be the same as the returns of other funds, whether or not both funds have the same portfolio managers and/or similar names. The Fund’s total returns do not include the charges associated with the separate account products that offer this Fund. Such performance would have been lower if such charges were taken into account. Expense ratios are as stated in the Fund’s prospectus current as of the date of this report.
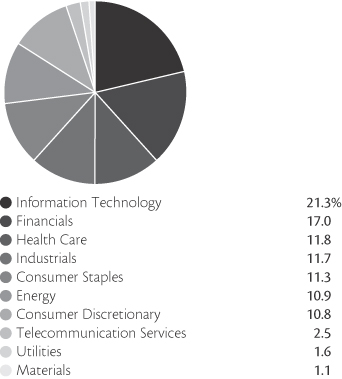
Portfolio holdings and allocations are subject to change. Percentages are as of June 29, 2012, and are based on the total market value of common stocks.
| | |
| Top Ten Common Stock Holdings | | |
| Apple, Inc. | | 7.7% |
| Chevron Corp. | | 4.9 |
| Philip Morris International, Inc. | | 4.5 |
| International Business Machines Corp. | | 4.3 |
| eBay, Inc. | | 3.9 |
| Citigroup, Inc. | | 3.7 |
| JPMorgan Chase & Co. | | 3.4 |
| Dr. Pepper Snapple Group, Inc. | | 3.2 |
| McGraw-Hill Cos., Inc. (The) | | 3.2 |
| CIT Group, Inc. | | 3.2 |
Portfolio holdings and allocations are subject to change. Percentages are as of June 29, 2012, and are based on net assets.
2 | OPPENHEIMER MAIN STREET FUND/VA
|
FUND PERFORMANCE DISCUSSION
During the six-month period, the Fund’s Non-Service shares returned 9.02%. In comparison, the Fund’s benchmark, the S&P 500 Index (the “Index”), returned 9.49%.1 The Fund underperformed the benchmark primarily due to weaker relative stock selection in the consumer discretionary sector. Relative to the Index, the strongest performing sector for the Fund was information technology.
Economic and Market Environment
The period began during a time of improved market sentiment in which the United States managed to avoid a return to recession and European policymakers appeared to take steps to address the region’s sovereign debt and banking sector crises. Renewed investor optimism helped produce gains across a number of international equity markets over the first three months of 2012. The rebound across equities gained momentum after the European Central Bank implemented the Long-Term Refinancing Operation (“LTRO”) to enhance liquidity for troubled banks and reduce rates on newly issued sovereign debt securities.
However, the second quarter was a volatile time for global markets. The fear of contagion from the worsening European sovereign debt crisis and a recession across much of Europe drove negative market sentiment, particularly over May and June. Very high unemployment, soaring debt and higher borrowing costs in Greece, Spain and Italy contributed to serious questions over how to implement austerity measures and restructure debt or instead take a different tact and provide some or all of those countries with additional funds. Perhaps most worrisome of all to investors was the possibility of Greece pulling out of the euro and its ramifications for the future of the Eurozone and its common currency. In the U.S., slower than expected first quarter growth also contributed to a sell-off in the U.S. stock market. Consumer confidence dropped as U.S. unemployment figures ticked slightly upwards after showing signs of improvement from the recession highs. However, the period ended on a positive note for the markets. The results of elections in Greece and continued efforts by European policymakers to stabilize the situation in the region appeared to soothe market jitters slightly in the final days of the period.
Fund Review
During the reporting period, information technology stock Apple, Inc., the top holding of the Fund at period end, was the Fund’s strongest performing holding. Apple continued to out-execute its peers, and its success at innovation and highly recognizable brand led to global growth and share gains across its top revenue producing products—iPhones, iPads and Mac PCs. Also contributing to performance within information technology was eBay, Inc. The company’s first quarter earnings report beat expectations and management raised guidance for both revenues and profits. eBay continued to benefit from a turnaround in its Marketplace segment with improvements to the user experience leading to increased loyalty and great volumes of transactions. PayPal, eBay’s online payment service, also continued to be a significant contributor to growth with results that exceeded expectations.
Also contributing to performance this period were Philip Morris International, Inc. and Discover Financial Services. Philip Morris continued to generate substantial free cash flow stemming from ongoing market share gains and its considerable ability to raise prices. Discover Financial Services, which operates one of the two closed-loop credit card networks in the United States, continued to experience strong revenue growth. Its stock performed positively during the six-month period. The most significant detractors from performance were Google, Inc. and Ford Motor Co. Google’s stock underperformed after reporting fourth quarter results. Unexpectedly, pricing declined as a result of relatively faster growth in smaller markets and products. The U.S. dollar’s appreciation against the euro also hurt results, as it negatively impacted the company’s translation of euro revenues and profits into U.S. dollars. We remain optimistic about Google’s outlook for growth of both revenues and earnings. While North American results for Ford and most of its peers have been solid, weakness in international markets, particularly Europe, have resulted in lowered revenue and profit expectations. Ford’s market share of the U.S. market remained strong and domestic auto manufacturers enjoyed a substantially better year-over-year selling rate as consumers continued to replace older cars.
1. June 29, 2012, was the last business day of the Fund’s semiannual period. See Note 1 of the accompanying Notes to Financial Statements. Index returns are calculated through June 30, 2012. December 30, 2011 was the last business day of the Fund’s 2011 fiscal year.
3 | OPPENHEIMER MAIN STREET FUND/VA
|
FUND PERFORMANCE DISCUSSION
Also detracting from performance this period were energy stocks Occidental Petroleum Corp. (which we exited by period end) and Noble Energy, Inc. Declining oil prices challenged these stocks and the energy sector in general, particularly over the second half of the period.
Outlook
We expect market volatility to continue through 2012. That being said, we believe that even in an uncertain macroeconomic environment, there exist solid investment opportunities.
Our long-term investment process remains the same. We seek companies with sustainable competitive advantages, with the management skill and financial resources to generate stronger profit margins, take market share from weaker players, and/or return significant capital to shareholders. We focus on leading firms in structurally attractive industries with committed management teams that have proven records of performance. We seek to invest in such companies when their valuations are attractive, and believe that this disciplined approach is the key to generating positive long-term returns. We are optimistic regarding our investment strategy and believe it has the potential to provide both upside participation and a degree of downside protection.
Investors should consider the Fund’s investment objective, risks, and charges and expenses carefully before investing. The Fund’s prospectus and summary prospectus contain this and other information about the Fund, and may be obtained by asking your financial advisor or calling us at 1.800.988.8287. Read prospectuses and summary prospectuses carefully before investing.
Total returns include changes in share price and reinvestment of dividends and capital gains distributions in a hypothetical investment for the periods shown. Cumulative total returns are not annualized.
The Fund’s investment strategy and focus can change over time. The mention of specific fund holdings does not constitute a recommendation by OppenheimerFunds, Inc.
Shares of Oppenheimer funds are not deposits or obligations of any bank, are not guaranteed by any bank, are not insured by the FDIC or any other agency, and involve investment risks, including the possible loss of the principal amount invested.
4 | OPPENHEIMER MAIN STREET FUND/VA
|
FUND EXPENSES
Fund Expenses. As a shareholder of the Fund, you incur two types of costs: (1) transaction costs and (2) ongoing costs, including management fees; distribution and service fees; and other Fund expenses. These examples are intended to help you understand your ongoing costs (in dollars) of investing in the Fund and to compare these costs with the ongoing costs of investing in other mutual funds.
The examples are based on an investment of $1,000.00 invested at the beginning of the period and held for the entire 6-month period ended June 29, 2012.
Actual Expenses. The first section of the table provides information about actual account values and actual expenses. You may use the information in this section for the class of shares you hold, together with the amount you invested, to estimate the expense that you paid over the period. Simply divide your account value by $1,000.00 (for example, an $8,600.00 account value divided by $1,000.00 = 8.60), then multiply the result by the number in the first section under the heading entitled “Expenses Paid During Period” to estimate the expenses you paid on your account during this period.
Hypothetical Example for Comparison Purposes. The second section of the table provides information about hypothetical account values and hypothetical expenses based on the Fund’s actual expense ratio for each class of shares, and an assumed rate of return of 5% per year for each class before expenses, which is not the actual return. The hypothetical account values and expenses may not be used to estimate the actual ending account balance or expenses you paid for the period. You may use this information to compare the ongoing costs of investing in the Fund and other funds. To do so, compare this 5% hypothetical example for the class of shares you hold with the 5% hypothetical examples that appear in the shareholder reports of the other funds.
Please note that the expenses shown in the table are meant to highlight your ongoing costs only and do not reflect any charges associated with the separate accounts that offer this Fund. Therefore, the “hypothetical” lines of the table are useful in comparing ongoing costs only, and will not help you determine the relative total costs of owning different funds. In addition, if these separate account charges were included your costs would have been higher.
| | | | | | | | | | | | |
| Actual | | Beginning
Account
Value
January 1, 2012 | | | Ending
Account
Value
June 29, 2012 | | | Expenses
Paid During
6 Months Ended
June 29, 2012 | |
| Non-Service Shares | | $ | 1,000.00 | | | $ | 1,090.20 | | | $ | 4.04 | |
| Service Shares | | | 1,000.00 | | | | 1,089.10 | | | | 5.33 | |
| | | |
Hypothetical
(5% return before expenses) | | | | | | | | | |
| Non-Service Shares | | | 1,000.00 | | | | 1,020.87 | | | | 3.91 | |
| Service Shares | | | 1,000.00 | | | | 1,019.63 | | | | 5.16 | |
Expenses are equal to the Fund’s annualized expense ratio for that class, multiplied by the average account value over the period, multiplied by 181/366 (to reflect the one-half year period). Those annualized expense ratios, excluding indirect expenses from affiliated fund, based on the 6-month period ended June 29, 2012 are as follows:
| | | | |
| Class | | Expense Ratios | |
| Non-Service Shares | | | 0.78 | % |
| Service Shares | | | 1.03 | |
The expense ratios reflect voluntary waivers and/or reimbursements of expenses by the Fund’s Manager. Some of these undertakings may be modified or terminated at any time, as indicated in the Fund’s prospectus. The “Financial Highlights” tables in the Fund’s financial statements, included in this report, also show the gross expense ratios, without such waivers or reimbursements and reduction to custodian expenses, if applicable.
5 | OPPENHEIMER MAIN STREET FUND/VA
|
STATEMENT OF INVESTMENTS June 29, 2012*/ Unaudited
| | | | | | | | |
| | | Shares | | | Value | |
| | | | | | | | | |
| Common Stocks—96.5% | | | | | |
| Consumer Discretionary—10.4% | | | | | | | | |
| Automobiles—2.1% | | | | | | | | |
| Ford Motor Co. | | | 3,019,510 | | | $ | 28,957,101 | |
| Hotels, Restaurants & Leisure—0.8% | | | | | | | | |
| Hyatt Hotels Corp., Cl. A1 | | | 290,668 | | | | 10,801,223 | |
| Media—3.2% | | | | | | | | |
| McGraw-Hill Cos., Inc. (The) | | | 979,521 | | | | 44,078,445 | |
| Specialty Retail—4.3% | | | | | | | | |
| AutoZone, Inc.1 | | | 52,190 | | | | 19,162,602 | |
| CarMax, Inc.1 | | | 485,240 | | | | 12,587,126 | |
| TJX Cos., Inc. (The) | | | 612,210 | | | | 26,282,175 | |
| | | | | | |
|
|
|
| | | | | | | | 58,031,903 | |
| Consumer Staples—10.9% | |
| Beverages—3.2% | | | | | | | | |
| Dr. Pepper Snapple Group, Inc. | | | 1,008,150 | | | | 44,106,563 | |
| Food Products—3.2% | | | | | | | | |
| J.M. Smucker Co. (The) | | | 364,830 | | | | 27,551,962 | |
| Mead Johnson Nutrition Co., Cl. A | | | 195,762 | | | | 15,760,799 | |
| | | | | | |
|
|
|
| | | | | | | | 43,312,761 | |
| Tobacco—4.5% | | | | | | | | |
| Philip Morris International, Inc. | | | 700,529 | | | | 61,128,161 | |
| Energy—10.5% | | | | | | | | |
| Energy Equipment & Services—2.9% | | | | | | | | |
| National Oilwell Varco, Inc. | | | 614,990 | | | | 39,629,956 | |
| Oil, Gas & Consumable Fuels—7.6% | | | | | | | | |
| Chevron Corp. | | | 624,660 | | | | 65,901,630 | |
| Kinder Morgan, Inc. | | | 336,647 | | | | 10,846,766 | |
| Noble Energy, Inc. | | | 302,670 | | | | 25,672,469 | |
| | | | | | |
|
|
|
| | | | | | | | 102,420,865 | |
| Financials—16.4% | | | | | | | | |
| Commercial Banks—3.8% | |
| CIT Group, Inc.1 | | | 1,236,740 | | | | 44,077,414 | |
| M&T Bank Corp. | | | 83,490 | | | | 6,893,769 | |
| | | | | | |
|
|
|
| | | | | | | | 50,971,183 | |
| Consumer Finance—1.3% | |
| Discover Financial Services | | | 510,470 | | | | 17,652,053 | |
| Diversified Financial Services—9.6% | | | | | | | | |
| Citigroup, Inc. | | | 1,848,568 | | | | 50,669,249 | |
| CME Group, Inc. | | | 84,380 | | | | 22,623,122 | |
| JPMorgan Chase & Co. | | | 1,288,680 | | | | 46,044,536 | |
| MSCI, Inc., Cl. A1 | | | 320,420 | | | | 10,900,688 | |
| | | | | | |
|
|
|
| | | | | | | | 130,237,595 | |
| Insurance—1.7% | | | | | | | | |
| Marsh & McLennan Cos., Inc. | | | 724,970 | | | | 23,365,783 | |
| | | | | | | | |
| | | Shares | | | Value | |
| | | | | | | | | |
| Health Care—11.4% | | | | | | | | |
| Health Care Equipment & Supplies—2.7% | | | | | |
| Covidien plc | | | 540,430 | | | $ | 28,913,005 | |
| Edwards Lifesciences Corp.1 | | | 79,710 | | | | 8,234,043 | |
| | | | | | |
|
|
|
| | | | | | | | 37,147,048 | |
| Health Care Providers & Services—2.3% | |
| DaVita, Inc.1 | | | 176,090 | | | | 17,293,799 | |
| Express Scripts Holding Co.1 | | | 248,587 | | | | 13,878,612 | |
| | | | | | |
|
|
|
| | | | | | | | 31,172,411 | |
| Pharmaceuticals—6.4% | | | | | | | | |
| Abbott Laboratories | | | 630,660 | | | | 40,658,650 | |
| Bristol-Myers Squibb Co. | | | 909,470 | | | | 32,695,447 | |
| Watson Pharmaceuticals, Inc.1 | | | 178,340 | | | | 13,195,377 | |
| | | | | | |
|
|
|
| | | | | | | | 86,549,474 | |
| Industrials—11.2% | | | | | | | | |
| Aerospace & Defense—2.0% | |
| Boeing Co. (The) | | | 368,130 | | | | 27,352,059 | |
| Air Freight & Logistics—2.5% | | | | | | | | |
| United Parcel Service, Inc., Cl. B | | | 431,310 | | | | 33,969,976 | |
| Industrial Conglomerates—3.0% | | | | | | | | |
| Tyco International Ltd. | | | 767,605 | | | | 40,567,924 | |
| Professional Services—1.2% | | | | | | | | |
| Towers Watson & Co., Cl. A | | | 273,480 | | | | 16,381,452 | |
| Road & Rail—2.5% | | | | | | | | |
| CSX Corp. | | | 1,404,580 | | | | 31,406,409 | |
| QR National Ltd. | | | 824,500 | | | | 2,890,988 | |
| | | | | | |
|
|
|
| | | | | | | | 34,297,397 | |
| Information Technology—20.6% | | | | | | | | |
| Communications Equipment—1.3% | | | | | | | | |
| QUALCOMM, Inc. | | | 303,741 | | | | 16,912,299 | |
| Computers & Peripherals—8.2% | | | | | | | | |
| Apple, Inc.1 | | | 179,212 | | | | 104,659,808 | |
| Western Digital Corp.1 | | | 233,270 | | | | 7,110,070 | |
| | | | | | |
|
|
|
| | | | | | | | 111,769,878 | |
| Electronic Equipment & Instruments—0.8% | |
| Corning, Inc. | | | 825,920 | | | | 10,679,146 | |
| Internet Software & Services—6.0% | | | | | | | | |
| eBay, Inc.1 | | | 1,256,345 | | | | 52,779,053 | |
| Facebook, Inc., Cl. A1 | | | 387,680 | | | | 12,064,602 | |
| Google, Inc., Cl. A1 | | | 29,390 | | | | 17,048,257 | |
| | | | | | |
|
|
|
| | | | | | | | 81,891,912 | |
| IT Services—4.3% | | | | | | | | |
| International Business Machines Corp. | | | 298,060 | | | | 58,294,575 | |
6 | OPPENHEIMER MAIN STREET FUND/VA
|
| | | | | | | | |
| | | Shares | | | Value | |
| | | | | | | | | |
| Materials—1.1% | | | | | | | | |
| Construction Materials—1.1% | | | | | | | | |
| Vulcan Materials Co. | | | 374,920 | | | $ | 14,888,073 | |
| Telecommunication Services—2.4% | |
| Wireless Telecommunication Services—2.4% | |
| America Movil SAB de CV, ADR, Series L | | | 1,227,852 | | | | 31,997,823 | |
| Utilities—1.6% | | | | | | | | |
| Energy Traders—1.6% | |
| AES Corp. (The)1 | | | 1,676,070 | | | | 21,503,975 | |
| | | | | | |
|
|
|
| Total Common Stocks (Cost $994,921,434) | | | | 1,310,069,014 | |
| | |
| | | Units | | | | |
| | | | | | | | | |
| Rights, Warrants and Certificates—0.0% | | | | | |
Kinder Morgan, Inc. Wts.,
Strike Price $40, Exp. 2/15/171
(Cost $68,117) | | | 38,054 | | | | 82,197 | |
| | | | | | | | |
| | | Shares | | | Value | |
| | | | | | | | | |
| Investment Company—2.5% | | | | | | | | |
Oppenheimer Institutional Money Market Fund, Cl. E, 0.20%2,3
(Cost $33,627,488) | | | 33,627,488 | | | $ | 33,627,488 | |
Total Investments, at Value
(Cost $1,028,617,039) | | | 99.0 | % | | | 1,343,778,699 | |
| Other Assets Net of Liabilities | |
| 1.0
|
| |
| 14,058,903
|
|
| Net Assets | |
| 100.0
| %
| | $
| 1,357,837,602
|
|
Footnotes to Statement of Investments
* June 29, 2012 represents the last business day of the Fund’s 2012 semiannual period. See Note 1 of the accompanying Notes.
1. Non-income producing security.
2. Is or was an affiliate, as defined in the Investment Company Act of 1940, at or during the period ended June 29, 2012, by virtue of the Fund owning at least 5% of the voting securities of the issuer or as a result of the Fund and the issuer having the same investment adviser. Transactions during the period in which the issuer was an affiliate are as follows:
| | | | | | | | | | | | | | | | |
| | | Shares
December 30, 2011a | | | Gross
Additions | | | Gross
Reductions | | | Shares
June 29, 2012 | |
| Oppenheimer Institutional Money Market Fund, Cl. E | | | — | | | | 179,933,560 | | | | 146,306,072 | | | | 33,627,488 | |
| | | | |
| | | | | | | | | Value | | | Income | |
| Oppenheimer Institutional Money Market Fund, Cl. E | | | | | | | | | | | $33,627,488 | | | | $10,269 | |
a. December 30, 2011 represents the last business day of the Fund’s 2011 fiscal year. See Note 1 of the accompanying Notes.
3. Rate shown is the 7-day yield as of June 29, 2012.
See accompanying Notes to Financial Statements.
7 | OPPENHEIMER MAIN STREET FUND/VA
|
STATEMENT OF ASSETS AND LIABILITIES Unaudited
| | | | |
| June 29, 20121 | | | |
| Assets | | | |
| Investments, at value—see accompanying statement of investments: | | | | |
| Unaffiliated companies (cost $994,989,551) | | $ | 1,310,151,211 | |
| Affiliated companies (cost $33,627,488) | |
| 33,627,488
|
|
| | | | 1,343,778,699 | |
| Cash | | | 43 | |
| Receivables and other assets: | | | | |
| Investments sold | | | 51,397,906 | |
| Dividends | | | 975,221 | |
| Other | |
| 66,263
|
|
| Total assets | | | 1,396,218,132 | |
| Liabilities | | | |
| Payables and other liabilities: | | | | |
| Investments purchased | | | 36,035,398 | |
| Shares of beneficial interest redeemed | | | 1,883,985 | |
| Distribution and service plan fees | | | 153,533 | |
| Transfer and shareholder servicing agent fees | | | 109,752 | |
| Shareholder communications | | | 108,772 | |
| Trustees’ compensation | | | 52,058 | |
| Other | |
| 37,032
|
|
| Total liabilities | | | 38,380,530 | |
| Net Assets | | $
| 1,357,837,602
|
|
| Composition of Net Assets | | | |
| Par value of shares of beneficial interest | | $ | 61,001 | |
| Additional paid-in capital | | | 1,297,857,780 | |
| Accumulated net investment loss | | | (839,504 | ) |
| Accumulated net realized loss on investments and foreign currency transactions | | | (254,403,335 | ) |
| Net unrealized appreciation on investments and translation of assets and liabilities denominated in foreign currencies | |
| 315,161,660
|
|
| Net Assets | | $
| 1,357,837,602
|
|
| Net Asset Value Per Share | | | |
| Non-Service Shares: | | | | |
Net asset value, redemption price per share and offering price per share (based on net assets of $481,776,181
and 21,550,399 shares of beneficial interest outstanding) | | | $22.36 | |
| Service Shares: | | | | |
Net asset value, redemption price per share and offering price per share (based on net assets of $876,061,421
and 39,450,118 shares of beneficial interest outstanding) | | | $22.21 | |
1. June 29, 2012 represents the last business day of the Fund’s 2012 semiannual period. See Note 1 of the accompanying Notes.
See accompanying Notes to Financial Statements.
8 | OPPENHEIMER MAIN STREET FUND/VA
|
STATEMENT OF OPERATIONS Unaudited
| | | | |
| For the Six Months Ended June 29, 20121 | | | |
| Investment Income | | | |
| Dividends: | | | | |
| Unaffiliated companies | | $ | 11,622,599 | |
| Affiliated companies | | | 10,269 | |
| Interest | |
| 498
|
|
| Total investment income | | | 11,633,366 | |
| Expenses | | | |
| Management fees | | | 4,558,552 | |
| Distribution and service plan fees—Service shares | | | 1,172,694 | |
| Transfer and shareholder servicing agent fees: | | | | |
| Non-Service shares | | | 221,349 | |
| Service shares | | | 468,783 | |
| Shareholder communications: | | | | |
| Non-Service shares | | | 5,019 | |
| Service shares | | | 12,418 | |
| Trustees’ compensation | | | 34,602 | |
| Custodian fees and expenses | | | 6,886 | |
| Administration service fees | | | 750 | |
| Other | |
| 67,772
|
|
| Total expenses | | | 6,548,825 | |
| Less waivers and reimbursements of expenses | |
| (4,484
| )
|
| Net expenses | | | 6,544,341 | |
| Net Investment Income | | | 5,089,025 | |
| Realized and Unrealized Gain (Loss) | | | |
| Net realized gain (loss) on: | | | | |
| Investments from unaffiliated companies | | | 114,929,512 | |
| Foreign currency transactions | |
| (2,292
| )
|
| Net realized gain | | | 114,927,220 | |
| Net change in unrealized appreciation/depreciation on: | | | | |
| Investments | | | (2,678,054 | ) |
| Translation of assets and liabilities denominated in foreign currencies | |
| 44,402
|
|
| Net change in unrealized appreciation/depreciation | | | (2,633,652 | ) |
| | |
| Net Increase in Net Assets Resulting from Operations | | $
| 117,382,593
|
|
1. June 29, 2012 represents the last business day of the Fund’s 2012 semiannual period. See Note 1 of the accompanying Notes.
See accompanying Notes to Financial Statements.
9 | OPPENHEIMER MAIN STREET FUND/VA
|
STATEMENTS OF CHANGES IN NET ASSETS
| | | | | | | | |
| | | Six Months
Ended June 29, 20121
(Unaudited) | | | Year
Ended
December 30,
20111 | |
| Operations | | | | | | |
| Net investment income | | $ | 5,089,025 | | | $ | 9,303,117 | |
| Net realized gain | | | 114,927,220 | | | | 60,012,332 | |
| Net change in unrealized appreciation/depreciation | |
| (2,633,652
| )
| |
| (72,180,291
| )
|
| Net increase (decrease) in net assets resulting from operations | | | 117,382,593 | | | | (2,864,842 | ) |
| Dividends and/or Distributions to Shareholders | | | | | | |
| Dividends from net investment income: | | | | | | | | |
| Non-Service shares | | | (4,702,221 | ) | | | (3,755,987 | ) |
| Service shares | |
| (5,916,709
| )
| |
| (6,566,777
| )
|
| | | | (10,618,930 | ) | | | (10,322,764 | ) |
| Beneficial Interest Transactions | | | | | | |
| Net increase (decrease) in net assets resulting from beneficial interest transactions: | | | | | | | | |
| Non-Service shares | | | 61,959,854 | | | | (73,098,026 | ) |
| Service shares | |
| (206,931,054
| )
| |
| (172,844,897
| )
|
| | | | (144,971,200 | ) | | | (245,942,923 | ) |
| Net Assets | | | | | | |
| Total decrease | | | (38,207,537 | ) | | | (259,130,529 | ) |
| Beginning of period | |
| 1,396,045,139
|
| |
| 1,655,175,668
|
|
| End of period (including accumulated net investment income (loss) of $(839,504) and $4,690,401, respectively) | | $
| 1,357,837,602
|
| | $
| 1,396,045,139
|
|
1. June 29, 2012 and December 30, 2011 represent the last business days of the Fund’s respective reporting periods. See Note 1 of the accompanying Notes.
See accompanying Notes to Financial Statements.
10 | OPPENHEIMER MAIN STREET FUND/VA
|
FINANCIAL HIGHLIGHTS
| | | | | | | | | | | | | | | | | | | | | | | | |
| | | Six Months
Ended
June 29, 20121 | | | Year Ended
December 30,
| | | Year Ended December 31, | |
| Non-Service Shares | | (Unaudited) | | | 20111 | | | 2010 | | | 2009 | | | 2008 | | | 2007 | |
| | | | | | | | | | | | | | | | | | | | | | | | | |
| Per Share Operating Data | | | | | | | | | | | | | | | | | | |
| Net asset value, beginning of period | | $ | 20.71 | | | $ | 20.88 | | | $ | 18.18 | | | $ | 14.56 | | | $ | 25.61 | | | $ | 24.78 | |
| Income (loss) from investment operations: | | | | | | | | | | | | | | | | | | | | | | | | |
| Net investment income2 | | | .10 | | | | .16 | | | | .17 | | | | .21 | | | | .29 | | | | .33 | |
| Net realized and unrealized gain (loss) | |
| 1.77
|
| |
| (.16
| )
| |
| 2.73
|
| |
| 3.71
|
| |
| (9.64
| )
| |
| .75
|
|
| Total from investment operations | | | 1.87 | | | | — | | | | 2.90 | | | | 3.92 | | | | (9.35 | ) | | | 1.08 | |
| Dividends and/or distributions to shareholders: | | | | | | | | | | | | | | | | | | | | | | | | |
| Dividends from net investment income | | | (.22 | ) | | | (.17 | ) | | | (.20 | ) | | | (.30 | ) | | | (.32 | ) | | | (.25 | ) |
| Distributions from net realized gain | |
| —
|
| |
| —
|
| |
| —
|
| |
| —
|
| |
| (1.38
| )
| |
| —
|
|
| Total dividends and/or distributions to shareholders | | | (.22 | ) | | | (.17 | ) | | | (.20 | ) | | | (.30 | ) | | | (1.70 | ) | | | (.25 | ) |
| Net asset value, end of period | | $
| 22.36
|
| | $
| 20.71
|
| | $
| 20.88
|
| | $
| 18.18
|
| | $
| 14.56
|
| | $
| 25.61
|
|
| Total Return, at Net Asset Value3 | | 9.02% | | | (0.01)% | | | 16.11% | | | 28.29% | | | (38.47)% | | | 4.43% | |
| | | | | | | | | | | | | | | | | | | | | | | | | |
| Ratios/Supplemental Data | | | | | | | | | | | | | | | | | | |
| Net assets, end of period (in thousands) | | | $481,776 | | | | $392,861 | | | | $469,720 | | | | $474,637 | | | | $432,360 | | | | $907,727 | |
| Average net assets (in thousands) | | | $445,048 | | | | $426,354 | | | | $454,937 | | | | $430,517 | | | | $670,994 | | | | $1,006,655 | |
| Ratios to average net assets:4 | | | | | | | | | | | | | | | | | | | | | | | | |
| Net investment income | | | 0.90 | % | | | 0.79 | % | | | 0.93 | % | | | 1.35 | % | | | 1.42 | % | | | 1.28 | % |
| Total expenses5 | | | 0.78 | % | | | 0.78 | % | | | 0.78 | % | | | 0.78 | % | | | 0.66 | % | | | 0.65 | % |
| Expenses after payments, waivers and/or reimbursements and reduction to custodian expenses | | | 0.78 | % | | | 0.78 | % | | | 0.78 | % | | | 0.78 | % | | | 0.66 | % | | | 0.65 | % |
| Portfolio turnover rate | | | 21 | % | | | 38 | % | | | 45 | % | | | 128 | % | | | 132 | % | | | 111 | % |
1. June 29, 2012 and December 30, 2011 represent the last business days of the Fund’s respective reporting periods. See Note 1 of the accompanying Notes.
2. Per share amounts calculated based on the average shares outstanding during the period.
3. Assumes an initial investment on the business day before the first day of the fiscal period, with all dividends and distributions reinvested in additional shares on the reinvestment date, and redemption at the net asset value calculated on the last business day of the fiscal period. Total returns are not annualized for periods less than one full year. Total return information does not reflect expenses that apply at the separate account level or to related insurance products. Inclusion of these charges would reduce the total return figures for all periods shown. Returns do not reflect the deduction of taxes that a shareholder would pay on fund distributions or the redemption of fund shares.
4. Annualized for periods less than one full year.
5. Total expenses including indirect expenses from affiliated fund were as follows:
| | | | |
| Six Months Ended June 29, 2012 | | | 0.78 | % |
| Year Ended December 30, 2011 | | | 0.78 | % |
| Year Ended December 31, 2010 | | | 0.78 | % |
| Year Ended December 31, 2009 | | | 0.78 | % |
| Year Ended December 31, 2008 | | | 0.66 | % |
| Year Ended December 31, 2007 | | | 0.65 | % |
See accompanying Notes to Financial Statements.
11 | OPPENHEIMER MAIN STREET FUND/VA
|
FINANCIAL HIGHLIGHTS Continued
| | | | | | | | | | | | | | | | | | | | | | | | |
| | | Six Months
Ended
June 29, 20121 | | | Year Ended
December 30, | | | Year Ended December 31, | |
| Service Shares | | (Unaudited) | | | 20111 | | | 2010 | | | 2009 | | | 2008 | | | 2007 | |
| | | | | | | | | | | | | | | | | | | | | | | | | |
| Per Share Operating Data | | | | | | | | | | | | | | | | | | |
| Net asset value, beginning of period | | $ | 20.53 | | | $ | 20.71 | | | $ | 18.04 | | | $ | 14.42 | | | $ | 25.38 | | | $ | 24.58 | |
| Income (loss) from investment operations: | | | | | | | | | | | | | | | | | | | | | | | | |
| Net investment income2 | | | .07 | | | | .11 | | | | .13 | | | | .17 | | | | .24 | | | | .26 | |
| Net realized and unrealized gain (loss) | |
| 1.76
|
| |
| (.17
| )
| |
| 2.70
|
| |
| 3.70
|
| |
| (9.56
| )
| |
| .75
|
|
| Total from investment operations | | | 1.83 | | | | (.06 | ) | | | 2.83 | | | | 3.87 | | | | (9.32 | ) | | | 1.01 | |
| Dividends and/or distributions to shareholders: | | | | | | | | | | | | | | | | | | | | | | | | |
| Dividends from net investment income | | | (.15 | ) | | | (.12 | ) | | | (.16 | ) | | | (.25 | ) | | | (.26 | ) | | | (.21 | ) |
| Distributions from net realized gain | |
| —
|
| |
| —
|
| |
| —
|
| |
| —
|
| |
| (1.38
| )
| |
| —
|
|
| Total dividends and/or distributions to shareholders | | | (.15 | ) | | | (.12 | ) | | | (.16 | ) | | | (.25 | ) | | | (1.64 | ) | | | (.21 | ) |
| Net asset value, end of period | | $
| 22.21
|
| | $
| 20.53
|
| | $
| 20.71
|
| | $
| 18.04
|
| | $
| 14.42
|
| | $
| 25.38
|
|
| Total Return, at Net Asset Value3 | | 8.91% | | | (0.32)% | | | 15.83% | | | 27.99% | | | (38.63)% | | | 4.15% | |
| | | | | | | | | | | | | | | | | | | | | | | | | |
| Ratios/Supplemental Data | | | | | | | | | | | | | | | | | | |
| Net assets, end of period (in thousands) | | | $876,062 | | | | $1,003,184 | | | | $1,185,456 | | | | $1,154,210 | | | | $1,020,103 | | | | $1,464,690 | |
| Average net assets (in thousands) | | | $942,601 | | | | $1,094,254 | | | | $1,193,630 | | | | $1,029,909 | | | | $1,268,430 | | | | $1,315,488 | |
| Ratios to average net assets:4 | | | | | | | | | | | | | | | | | | | | | | | | |
| Net investment income | | | 0.66 | % | | | 0.54 | % | | | 0.68 | % | | | 1.10 | % | | | 1.20 | % | | | 1.03 | % |
| Total expenses5 | | | 1.03 | % | | | 1.03 | % | | | 1.03 | % | | | 1.03 | % | | | 0.91 | % | | | 0.90 | % |
| Expenses after payments, waivers and/or reimbursements and reduction to custodian expenses | | | 1.03 | % | | | 1.03 | % | | | 1.03 | % | | | 1.03 | % | | | 0.91 | % | | | 0.90 | % |
| Portfolio turnover rate | | | 21 | % | | | 38 | % | | | 45 | % | | | 128 | % | | | 132 | % | | | 111 | % |
1. June 29, 2012 and December 30, 2011 represent the last business days of the Fund’s respective reporting periods. See Note 1 of the accompanying Notes.
2. Per share amounts calculated based on the average shares outstanding during the period.
3. Assumes an initial investment on the business day before the first day of the fiscal period, with all dividends and distributions reinvested in additional shares on the reinvestment date, and redemption at the net asset value calculated on the last business day of the fiscal period. Total returns are not annualized for periods less than one full year. Total return information does not reflect expenses that apply at the separate account level or to related insurance products. Inclusion of these charges would reduce the total return figures for all periods shown. Returns do not reflect the deduction of taxes that a shareholder would pay on fund distributions or the redemption of fund shares.
4. Annualized for periods less than one full year.
5. Total expenses including indirect expenses from affiliated fund were as follows:
| | | | |
| Six Months Ended June 29, 2012 | | | 1.03 | % |
| Year Ended December 30, 2011 | | | 1.03 | % |
| Year Ended December 31, 2010 | | | 1.03 | % |
| Year Ended December 31, 2009 | | | 1.03 | % |
| Year Ended December 31, 2008 | | | 0.91 | % |
| Year Ended December 31, 2007 | | | 0.90 | % |
See accompanying Notes to Financial Statements.
12 | OPPENHEIMER MAIN STREET FUND/VA
|
NOTES TO FINANCIAL STATEMENTS Unaudited
1. Significant Accounting Policies
Oppenheimer Main Street Fund/VA (the “Fund”) is a separate series of Oppenheimer Variable Account Funds, a diversified open-end management investment company registered under the Investment Company Act of 1940, as amended. The Fund’s investment objective is to seek high total return. The Fund’s investment adviser is OppenheimerFunds, Inc. (the “Manager”).
The Fund offers two classes of shares. Both classes are sold at their offering price, which is the net asset value per share, to separate investment accounts of participating insurance companies as an underlying investment for variable life insurance policies, variable annuity contracts or other investment products. The class of shares designated as Service shares is subject to a distribution and service plan. Both classes of shares have identical rights and voting privileges with respect to the Fund in general and exclusive voting rights on matters that affect that class alone. Earnings, net assets and net asset value per share may differ due to each class having its own expenses, such as transfer and shareholder servicing agent fees and shareholder communications, directly attributable to that class.
The following is a summary of significant accounting policies consistently followed by the Fund.
Semiannual and Annual Periods. The last day of the Fund’s semiannual period was the last day the New York Stock Exchange was open for trading. The Fund’s financial statements have been presented through that date to maintain consistency with the Fund’s net asset value calculations used for shareholder transactions.
The last day of the Fund’s fiscal year was the last day the New York Stock Exchange was open for trading. The Fund’s financial statements have been presented through that date to maintain consistency with the Fund’s net asset value calculations used for shareholder transactions.
Investment in Oppenheimer Institutional Money Market Fund. The Fund is permitted to invest daily available cash balances in an affiliated money market fund. The Fund may invest the available cash in Class E shares of Oppenheimer Institutional Money Market Fund (“IMMF”) to seek current income while preserving liquidity. IMMF is a registered open-end management investment company, regulated as a money market fund under the Investment Company Act of 1940, as amended. The Manager is also the investment adviser of IMMF. When applicable, the Fund’s investment in IMMF is included in the Statement of Investments. Shares of IMMF are valued at their net asset value per share. As a shareholder, the Fund is subject to its proportional share of IMMF’s Class E expenses, including its management fee. The Manager will waive fees and/or reimburse Fund expenses in an amount equal to the indirect management fees incurred through the Fund’s investment in IMMF.
Foreign Currency Translation. The Fund’s accounting records are maintained in U.S. dollars. The values of securities denominated in foreign currencies and amounts related to the purchase and sale of foreign securities and foreign investment income are translated into U.S. dollars as of the close of the Exchange, normally 4:00 P.M. Eastern time, on each day the Exchange is open for trading. Foreign exchange rates may be valued primarily using a reliable bank, dealer or service authorized by the Board of Trustees.
Reported net realized gains and losses from foreign currency transactions arise from sales of portfolio securities, sales and maturities of short-term securities, sales of foreign currencies, exchange rate fluctuations between the trade and settlement dates on securities transactions, and the difference between the amounts of dividends, interest, and foreign withholding taxes recorded on the Fund’s books and the U.S. dollar equivalent of the amounts actually received or paid. Net unrealized appreciation and depreciation on the translation of assets and liabilities denominated in foreign currencies arise from changes in the values of assets and liabilities, including investments in securities at fiscal period end, resulting from changes in exchange rates.
The effect of changes in foreign currency exchange rates on investments is separately identified from the fluctuations arising from changes in market values of securities held and reported with all other foreign currency gains and losses in the Fund’s Statement of Operations.
13 | OPPENHEIMER MAIN STREET FUND/VA
|
NOTES TO FINANCIAL STATEMENTS Unaudited / Continued
1. Significant Accounting Policies Continued
Allocation of Income, Expenses, Gains and Losses. Income, expenses (other than those attributable to a specific class), gains and losses are allocated on a daily basis to each class of shares based upon the relative proportion of net assets represented by such class. Operating expenses directly attributable to a specific class are charged against the operations of that class.
Federal Taxes. The Fund intends to comply with provisions of the Internal Revenue Code applicable to regulated investment companies and to distribute substantially all of its investment company taxable income, including any net realized gain on investments not offset by capital loss carryforwards, if any, to shareholders. Therefore, no federal income or excise tax provision is required. The Fund files income tax returns in U.S. federal and applicable state jurisdictions. The statute of limitations on the Fund’s tax return filings generally remain open for the three preceding fiscal reporting period ends.
During the fiscal year ended December 30, 2011, the Fund utilized $71,694,516 of capital loss carryforward to offset capital gains realized in that fiscal year. The Fund had post-October losses of $4,974,129. Details of the fiscal year ended December 30, 2011 capital loss carryforwards are included in the table below. Capital loss carryforwards with no expiration, if any, must be utilized prior to those with expiration dates. Capital losses with no expiration will be carried forward to future years if not offset by gains.
| | | | |
| Expiring | | | |
| 2016 | | $ | 28,492,724 | |
| 2017 | | | 332,195,657 | |
| No expiration | | | 4,974,129 | |
| | |
|
|
|
| Total | | $ | 365,662,510 | |
| | |
|
|
|
As of June 29, 2012, it is estimated that the capital loss carryforwards would be $250,735,290 expiring by 2017. The estimated capital loss carryforward represents the carryforward as of the end of the last fiscal year, increased or decreased by capital losses or gains realized in the first six months of the current fiscal year. During the six months ended June 29, 2012, it is estimated that the Fund will utilize $114,927,220 of capital loss carryforward to offset realized capital gains.
Net investment income (loss) and net realized gain (loss) may differ for financial statement and tax purposes. The character of dividends and distributions made during the fiscal year from net investment income or net realized gains may differ from their ultimate characterization for federal income tax purposes. Also, due to timing of dividends and distributions, the fiscal year in which amounts are distributed may differ from the fiscal year in which the income or net realized gain was recorded by the Fund.
The aggregate cost of securities and other investments and the composition of unrealized appreciation and depreciation of securities and other investments for federal income tax purposes as of June 29, 2012 are noted in the following table. The primary difference between book and tax appreciation or depreciation of securities and other investments, if applicable, is attributable to the tax deferral of losses or tax realization of financial statement unrealized gain or loss.
| | | | |
| Federal tax cost of securities | | $ | 1,033,286,620 | |
| | |
|
|
|
| |
| Gross unrealized appreciation | | $ | 333,602,201 | |
| Gross unrealized depreciation | | | (23,110,122) | |
| | |
|
|
|
| Net unrealized appreciation | | $ | 310,492,079 | |
| | |
|
|
|
Trustees’ Compensation. The Board of Trustees has adopted a compensation deferral plan for independent trustees that enables trustees to elect to defer receipt of all or a portion of the annual compensation they are entitled to receive from the Fund. For purposes of determining the amount owed to the Trustee under the plan, deferred amounts are treated as though equal dollar amounts had been invested in shares of the Fund or in other Oppenheimer funds
14 | OPPENHEIMER MAIN STREET FUND/VA
|
selected by the Trustee. The Fund purchases shares of the funds selected for deferral by the Trustee in amounts equal to his or her deemed investment, resulting in a Fund asset equal to the deferred compensation liability. Such assets are included as a component of “Other” within the asset section of the Statement of Assets and Liabilities. Deferral of trustees’ fees under the plan will not affect the net assets of the Fund, and will not materially affect the Fund’s assets, liabilities or net investment income per share. Amounts will be deferred until distributed in accordance with the compensation deferral plan.
Dividends and Distributions to Shareholders. Dividends and distributions to shareholders, which are determined in accordance with income tax regulations and may differ from U.S. generally accepted accounting principles, are recorded on the ex-dividend date. Income and capital gain distributions, if any, are declared and paid annually or at other times as deemed necessary by the Manager. The tax character of distributions is determined as of the Fund’s fiscal year end. Therefore, a portion of the Fund’s distributions made to shareholders prior to the Fund’s fiscal year end may ultimately be categorized as a tax return of capital.
Investment Income. Dividend income is recorded on the ex-dividend date or upon ex-dividend notification in the case of certain foreign dividends where the ex-dividend date may have passed. Non-cash dividends included in dividend income, if any, are recorded at the fair market value of the securities received. Interest income is recognized on an accrual basis. Discount and premium, which are included in interest income on the Statement of Operations, are amortized or accreted daily.
Custodian Fees. “Custodian fees and expenses” in the Statement of Operations may include interest expense incurred by the Fund on any cash overdrafts of its custodian account during the period. Such cash overdrafts may result from the effects of failed trades in portfolio securities and from cash outflows resulting from unanticipated shareholder redemption activity. The Fund pays interest to its custodian on such cash overdrafts, to the extent they are not offset by positive cash balances maintained by the Fund, at a rate equal to the Federal Funds Rate plus 0.50%. The “Reduction to custodian expenses” line item, if applicable, represents earnings on cash balances maintained by the Fund during the period. Such interest expense and other custodian fees may be paid with these earnings.
Security Transactions. Security transactions are recorded on the trade date. Realized gains and losses on securities sold are determined on the basis of identified cost.
Indemnifications. The Fund’s organizational documents provide current and former trustees and officers with a limited indemnification against liabilities arising in connection with the performance of their duties to the Fund. In the normal course of business, the Fund may also enter into contracts that provide general indemnifications. The Fund’s maximum exposure under these arrangements is unknown as this would be dependent on future claims that may be made against the Fund. The risk of material loss from such claims is considered remote.
Other. The preparation of financial statements in conformity with accounting principles generally accepted in the United States of America requires management to make estimates and assumptions that affect the reported amounts of assets and liabilities and disclosure of contingent assets and liabilities at the date of the financial statements and the reported amounts of increases and decreases in net assets from operations during the reporting period. Actual results could differ from those estimates.
2. Securities Valuation
The Fund calculates the net asset value of its shares as of the close of the New York Stock Exchange (the “Exchange”), normally 4:00 P.M. Eastern time, on each day the Exchange is open for trading.
15 | OPPENHEIMER MAIN STREET FUND/VA
|
NOTES TO FINANCIAL STATEMENTS Unaudited / Continued
2. Securities Valuation Continued
The Fund’s Board has adopted procedures for the valuation of the Fund’s securities and has delegated the day-to-day responsibility for valuation determinations under those procedures to the Manager. The Manager has established a Valuation Committee which is responsible for determining a “fair valuation” for any security for which market quotations are not “readily available.” The Valuation Committee’s fair valuation determinations are subject to review, approval and ratification by the Fund’s Board at its next regularly scheduled meeting covering the calendar quarter in which the fair valuation was determined.
Valuation Methods and Inputs
Securities are valued using unadjusted quoted market prices, when available, as supplied primarily by third party pricing services or dealers.
The following methodologies are used to determine the market value or the fair value of the types of securities described below:
Securities traded on a registered U.S. securities exchange (including exchange-traded derivatives other than futures and futures options) are valued based on the last sale price of the security reported on the principal exchange on which it is traded, prior to the time when the Fund’s assets are valued. In the absence of a sale, the security is valued at the last sale price on the prior trading day, if it is within the spread of the current day’s closing “bid” and “asked” prices, and if not, at the current day’s closing bid price. A security of a foreign issuer traded on a foreign exchange but not listed on a registered U.S. securities exchange is valued based on the last sale price on the principal exchange on which the security is traded, as identified by the third party pricing service used by the Manager, prior to the time when the Fund’s assets are valued. If the last sale price is unavailable, the security is valued at the most recent official closing price on the principal exchange on which it is traded. If the last sales price or official closing price for a foreign security is not available, the security is valued at the mean between the bid and asked price per the exchange or, if not available from the exchange, obtained from two dealers. If bid and asked prices are not available from either the exchange or two dealers, the security is valued by using one of the following methodologies (listed in order of priority); (1) using a bid from the exchange, (2) the mean between the bid and asked price as provided by a single dealer, or (3) a bid from a single dealer.
Shares of a registered investment company that are not traded on an exchange are valued at that investment company’s net asset value per share.
Corporate and government debt securities (of U.S. or foreign issuers) and municipal debt securities, event-linked bonds, loans, mortgage-backed securities, collateralized mortgage obligations, and asset-backed securities are valued at the mean between the “bid” and “asked” prices utilizing evaluated prices obtained from third party pricing services or broker-dealers who may use matrix pricing methods to determine the evaluated prices.
Short-term money market type debt securities with a remaining maturity of sixty days or less are valued at cost adjusted by the amortization of discount or premium to maturity (amortized cost), which approximates market value. Short-term debt securities with a remaining maturity in excess of sixty days are valued at the mean between the “bid” and “asked” prices utilizing evaluated prices obtained from third party pricing services or broker-dealers.
A description of the standard inputs that may generally be considered by the third party pricing vendors in determining their evaluated prices is provided below.
| | |
| Security Type | | Standard inputs generally considered by third-party pricing vendors |
Corporate debt, government debt, municipal,
mortgage-backed and asset-backed securities | | Reported trade data, broker-dealer price quotations, benchmark yields, issuer spreads on comparable securities, the credit quality, yield, maturity, and other appropriate factors. |
| Loans | | Information obtained from market participants regarding reported trade data and broker-dealer price quotations. |
| Event-linked bonds | | Information obtained from market participants regarding reported trade data and broker-dealer price quotations. |
16 | OPPENHEIMER MAIN STREET FUND/VA
|
If a market value or price cannot be determined for a security using the methodologies described above, or if, in the “good faith” opinion of the Manager, the market value or price obtained does not constitute a “readily available market quotation,” or a significant event has occurred that would materially affect the value of the security the security is fair valued either (i) by a standardized fair valuation methodology applicable to the security type or the significant event as previously approved by the Valuation Committee and the Fund’s Board or (ii) as determined in good faith by the Manager’s Valuation Committee. The Valuation Committee considers all relevant facts that are reasonably available, through either public information or information available to the Manager, when determining the fair value of a security. Fair value determinations by the Manager are subject to review, approval and ratification by the Fund’s Board at its next regularly scheduled meeting covering the calendar quarter in which the fair valuation was determined. Those fair valuation standardized methodologies include, but are not limited to, valuing securities at the last sale price or initially at cost and subsequently adjusting the value based on: changes in company specific fundamentals, changes in an appropriate securities index, or changes in the value of similar securities which may be further adjusted for any discounts related to security-specific resale restrictions. When possible, such methodologies use observable market inputs such as unadjusted quoted prices of similar securities, observable interest rates, currency rates and yield curves. The methodologies used for valuing securities are not necessarily an indication of the risks associated with investing in those securities nor can it be assured that the Fund can obtain the fair value assigned to a security if it were to sell the security.
To assess the continuing appropriateness of security valuations, the Manager, or its third party service provider who is subject to oversight by the Manager, regularly compares prior day prices, prices on comparable securities, and sale prices to the current day prices and challenges those prices exceeding certain tolerance levels with the third party pricing service or broker source. For those securities valued by fair valuations, whether through a standardized fair valuation methodology or a fair valuation determination, the Valuation Committee reviews and affirms the reasonableness of the valuations based on such methodologies and fair valuation determinations on a regular basis after considering all relevant information that is reasonably available.
Classifications
Each investment asset or liability of the Fund is assigned a level at measurement date based on the significance and source of the inputs to its valuation. Various data inputs are used in determining the value of each of the Fund’s investments as of the reporting period end. These data inputs are categorized in the following hierarchy under applicable financial accounting standards:
| | 1) | Level 1—unadjusted quoted prices in active markets for identical assets or liabilities (including securities actively traded on a securities exchange) |
| | 2) | Level 2—inputs other than unadjusted quoted prices that are observable for the asset or liability (such as unadjusted quoted prices for similar assets and market corroborated inputs such as interest rates, prepayment speeds, credit risks, etc.) |
| | 3) | Level 3—significant unobservable inputs (including the Manager’s own judgments about assumptions that market participants would use in pricing the asset or liability). |
17 | OPPENHEIMER MAIN STREET FUND/VA
|
NOTES TO FINANCIAL STATEMENTS Unaudited / Continued
2. Securities Valuation Continued
The inputs used for valuing securities are not necessarily an indication of the risks associated with investing in those securities.
The table below categorizes amounts that are included in the Fund’s Statement of Assets and Liabilities as of June 29, 2012 based on valuation input level:
| | | | | | | | | | | | | | | | |
| | | Level 1—
Unadjusted
Quoted Prices | | | Level 2—
Other Significant
Observable Inputs | | | Level 3—
Significant
Unobservable
Inputs | | | Value | |
| Assets Table | | | | | | | | | | | | | | | | |
| Investments, at Value: | | | | | | | | | | | | | | | | |
Common Stocks | | | | | | | | | | | | | | | | |
Consumer Discretionary | | $ | 141,868,672 | | | $ | — | | | $ | — | | | $ | 141,868,672 | |
Consumer Staples | | | 148,547,485 | | | | — | | | | — | | | | 148,547,485 | |
Energy | | | 142,050,821 | | | | — | | | | — | | | | 142,050,821 | |
Financials | | | 222,226,614 | | | | — | | | | — | | | | 222,226,614 | |
Health Care | | | 154,868,933 | | | | — | | | | — | | | | 154,868,933 | |
Industrials | | | 149,677,820 | | | | 2,890,988 | | | | — | | | | 152,568,808 | |
Information Technology | | | 279,547,810 | | | | — | | | | — | | | | 279,547,810 | |
Materials | | | 14,888,073 | | | | — | | | | — | | | | 14,888,073 | |
Telecommunication Services | | | 31,997,823 | | | | — | | | | — | | | | 31,997,823 | |
Utilities | | | 21,503,975 | | | | — | | | | — | | | | 21,503,975 | |
Rights, Warrants and Certificates | | | 82,197 | | | | — | | | | — | | | | 82,197 | |
Investment Company | | | 33,627,488 | | | | — | | | | — | | | | 33,627,488 | |
| | |
|
|
| |
|
|
| |
|
|
| |
|
|
|
| Total Assets | | $ | 1,340,887,711 | | | $ | 2,890,988 | | | $ | — | | | $ | 1,343,778,699 | |
| | |
|
|
| |
|
|
| |
|
|
| |
|
|
|
Currency contracts and forwards, if any, are reported at their unrealized appreciation/depreciation at measurement date, which represents the change in the contract’s value from trade date. Futures, if any, are reported at their variation margin at measurement date, which represents the amount due to/from the Fund at that date. All additional assets and liabilities included in the above table are reported at their market value at measurement date.
The table below shows the significant transfers between Level 1 and Level 2. The Fund’s policy is to recognize transfers in and transfers out as of the beginning of the reporting period.
| | | | | | | | |
| | | Transfers
out of
Level 1* | | | Transfers
into
Level 2* | |
| Assets Table | | | | | | | | |
| Investments, at Value: | | | | | | | | |
Common Stocks | | | | | | | | |
Industrials | | $ | (1,538,407 | ) | | $ | 1,538,407 | |
| | |
|
|
| |
|
|
|
| Total Assets | | $ | (1,538,407 | ) | | $ | 1,538,407 | |
| | |
|
|
| |
|
|
|
*Transferred from Level 1 to Level 2 because of the absence of a readily available unadjusted quoted market price due to a significant event occurring before the Fund’s assets were valued but after the close of the securities’ respective exchanges.
There have been no significant changes to the fair valuation methodologies of the Fund during the period.
18 | OPPENHEIMER MAIN STREET FUND/VA
|
3. Shares of Beneficial Interest
The Fund has authorized an unlimited number of $0.001 par value shares of beneficial interest of each class. Transactions in shares of beneficial interest were as follows:
| | | | | | | | | | | | | | | | |
| | | Six Months Ended June 29, 2012 | | | Year Ended December 30, 2011 | |
| | | Shares | | | Amount | | | Shares | | | Amount | |
| Non-Service Shares | | | | | | | | | | | | | | | | |
| Sold | | | 822,993 | | | $ | 18,402,993 | | | | 2,028,214 | | | $ | 41,337,389 | |
| Dividends and/or distributions reinvested | | | 209,174 | | | | 4,702,221 | | | | 176,503 | | | | 3,755,987 | |
| Acquisition—Note 7 | | | 3,253,848 | | | | 77,116,190 | | | | — | | | | — | |
| Redeemed | | | (1,706,057 | ) | | | (38,261,550 | ) | | | (5,726,116 | ) | | | (118,191,402 | ) |
| | |
|
|
| |
|
|
| |
|
|
| |
|
|
|
| Net increase (decrease) | | | 2,579,958 | | | $ | 61,959,854 | | | | (3,521,399 | ) | | $ | (73,098,026 | ) |
| | |
|
|
| |
|
|
| |
|
|
| |
|
|
|
| | | | | | | | | | | | | |
| Service Shares | | | | | | | | | | | | | | | | |
| Sold | | | 494,958 | | | $ | 10,995,899 | | | | 2,150,725 | | | $ | 42,852,883 | |
| Dividends and/or distributions reinvested | | | 264,967 | | | | 5,916,709 | | | | 310,633 | | | | 6,566,777 | |
| Redeemed | | | (10,163,982 | ) | | | (223,843,662 | ) | | | (10,851,128 | ) | | | (222,264,557 | ) |
| | |
|
|
| |
|
|
| |
|
|
| |
|
|
|
| Net decrease | | | (9,404,057 | ) | | $ | (206,931,054 | ) | | | (8,389,770 | ) | | $ | (172,844,897 | ) |
| | |
|
|
| |
|
|
| |
|
|
| |
|
|
|
4. Purchases and Sales of Securities
The aggregate cost of purchases and proceeds from sales of securities, other than short-term obligations and investments in IMMF, for the six months ended June 29, 2012, were as follows:
| | | | | | | | |
| | | Purchases | | | Sales | |
| Investment securities | | $ | 291,743,852 | | | $ | 567,124,422 | |
5. Fees and Other Transactions with Affiliates
Management Fees. Under the investment advisory agreement, the Fund pays the Manager a management fee based on the daily net assets of the Fund at an annual rate as shown in the following table:
| | | | |
| Fee Schedule | | | |
| Up to $200 million | | | 0.75 | % |
| Next $200 million | | | 0.72 | |
| Next $200 million | | | 0.69 | |
| Next $200 million | | | 0.66 | |
| Over $800 million | | | 0.60 | |
Administration Service Fees. The Fund pays the Manager a fee of $1,500 per year for preparing and filing the Fund’s tax returns.
Transfer Agent Fees. OppenheimerFunds Services (“OFS”), a division of the Manager, acts as the transfer and shareholder servicing agent for the Fund. For the six months ended June 29, 2012, the Fund paid $699,545 to OFS for services to the Fund.
Distribution and Service Plan for Service Shares. The Fund has adopted a Distribution and Service Plan (the “Plan”) in accordance with Rule 12b-1 under the Investment Company Act of 1940 for Service shares to pay OppenheimerFunds Distributor, Inc. (the “Distributor”), for distribution related services, personal service and account maintenance for the Fund’s Service shares. Under the Plan, payments are made periodically at an annual rate of 0.25% of the daily net assets of Service shares of the Fund. The Distributor currently uses all of those fees to compensate sponsors of the insurance product that offers Fund shares, for providing personal service and maintenance of accounts of their variable contract owners that hold Service shares. These fees are paid out of the Fund’s assets on an on-going basis and increase operating
19 | OPPENHEIMER MAIN STREET FUND/VA
|
NOTES TO FINANCIAL STATEMENTS Unaudited / Continued
5. Fees and Other Transactions with Affiliates Continued
expenses of the Service shares, which results in lower performance compared to the Fund’s shares that are not subject to a service fee. Fees incurred by the Fund under the Plan are detailed in the Statement of Operations.
Waivers and Reimbursements of Expenses. The Manager has voluntarily agreed to limit the Fund’s total annual operating expenses so that those expenses, as percentages of daily net assets, will not exceed the annual rate of 0.80% for Non-Service shares and 1.05% for Service shares.
The Manager will waive fees and/or reimburse Fund expenses in an amount equal to the indirect management fees incurred through the Fund’s investment in IMMF. During the six months ended June 29, 2012, the Manager waived fees and/or reimbursed the Fund $4,484 for IMMF management fees.
Some of these undertakings may be modified or terminated at any time; some may not be modified or terminated until after one year from the date of the current prospectus, as indicated therein.
6. Risk Exposures and the Use of Derivative Instruments
The Fund’s investment objectives not only permit the Fund to purchase investment securities, they also allow the Fund to enter into various types of derivatives contracts, including, but not limited to, futures contracts, forward foreign currency exchange contracts, credit default swaps, interest rate swaps, total return swaps, and purchased and written options. In doing so, the Fund will employ strategies in differing combinations to permit it to increase, decrease, or change the level or types of exposure to market risk factors. Central to those strategies are features inherent to derivatives that make them more attractive for this purpose than equity and debt securities: they require little or no initial cash investment, they can focus exposure on only certain selected risk factors, and they may not require the ultimate receipt or delivery of the underlying security (or securities) to the contract. This may allow the Fund to pursue its objectives more quickly and efficiently than if it were to make direct purchases or sales of securities capable of effecting a similar response to market factors.
Market Risk Factors. In accordance with its investment objectives, the Fund may use derivatives to increase or decrease its exposure to one or more of the following market risk factors:
Commodity Risk. Commodity risk relates to the change in value of commodities or commodity indexes as they relate to increases or decreases in the commodities market. Commodities are physical assets that have tangible properties. Examples of these types of assets are crude oil, heating oil, metals, livestock, and agricultural products.
Credit Risk. Credit risk relates to the ability of the issuer to meet interest and principal payments, or both, as they come due. In general, lower-grade, higher-yield bonds are subject to credit risk to a greater extent than lower-yield, higher-quality bonds.
Equity Risk. Equity risk relates to the change in value of equity securities as they relate to increases or decreases in the general market.
Foreign Exchange Rate Risk. Foreign exchange rate risk relates to the change in the U.S. dollar value of a security held that is denominated in a foreign currency. The U.S. dollar value of a foreign currency denominated security will decrease as the dollar appreciates against the currency, while the U.S. dollar value will increase as the dollar depreciates against the currency.
Interest Rate Risk. Interest rate risk refers to the fluctuations in value of fixed-income securities resulting from the inverse relationship between price and yield. For example, an increase in general interest rates will tend to reduce the market value of already issued fixed-income investments, and a decline in general interest rates will tend to increase their value. In addition, debt securities with longer maturities, which tend to have higher yields, are subject to potentially greater fluctuations in value from changes in interest rates than obligations with shorter maturities.
20 | OPPENHEIMER MAIN STREET FUND/VA
|
Volatility Risk. Volatility risk refers to the magnitude of the movement, but not the direction of the movement, in a financial instrument’s price over a defined time period. Large increases or decreases in a financial instrument’s price over a relative time period typically indicate greater volatility risk, while small increases or decreases in its price typically indicate lower volatility risk.
The Fund’s actual exposures to these market risk factors during the period are discussed in further detail, by derivative type, below.
Risks of Investing in Derivatives. The Fund’s use of derivatives can result in losses due to unanticipated changes in the market risk factors and the overall market. In instances where the Fund is using derivatives to decrease, or hedge, exposures to market risk factors for securities held by the Fund, there are also risks that those derivatives may not perform as expected resulting in losses for the combined or hedged positions.
Derivatives may have little or no initial cash investment relative to their market value exposure and therefore can produce significant gains or losses in excess of their cost. This use of embedded leverage allows the Fund to increase its market value exposure relative to its net assets and can substantially increase the volatility of the Fund’s performance.
Additional associated risks from investing in derivatives also exist and potentially could have significant effects on the valuation of the derivative and the Fund. Typically, the associated risks are not the risks that the Fund is attempting to increase or decrease exposure to, per its investment objectives, but are the additional risks from investing in derivatives. Examples of these associated risks are liquidity risk, which is the risk that the Fund will not be able to sell the derivative in the open market in a timely manner, and counterparty credit risk, which is the risk that the counterparty will not fulfill its obligation to the Fund. Associated risks can be different for each type of derivative and are discussed by each derivative type in the notes that follow.
Counterparty Credit Risk. Certain derivative positions are subject to counterparty credit risk, which is the risk that the counterparty will not fulfill its obligation to the Fund. The Fund’s derivative counterparties are financial institutions who are subject to market conditions that may weaken their financial position. The Fund intends to enter into financial transactions with counterparties that the Manager believes to be creditworthy at the time of the transaction.
Credit Related Contingent Features. The Fund’s agreements with derivative counterparties have several credit related contingent features that if triggered would allow its derivatives counterparties to close out and demand payment or additional collateral to cover their exposure from the Fund. Credit related contingent features are established between the Fund and its derivatives counterparties to reduce the risk that the Fund will not fulfill its payment obligations to its counterparties. These triggering features include, but are not limited to, a percentage decrease in the Fund’s net assets and or a percentage decrease in the Fund’s Net Asset Value or NAV. The contingent features are established within the Fund’s International Swap and Derivatives Association, Inc. master agreements which govern certain positions in swaps, over-the-counter options and swaptions, and forward currency exchange contracts for each individual counterparty.
The effect of derivative instruments on the Statement of Operations is as follows:
| | | | |
| Amount of Realized Gain or (Loss) Recognized on Derivatives | |
Derivatives Not Accounted
for as Hedging Instruments | | Foreign currency transactions | |
| Foreign exchange contracts | | | $(2,219 | ) |
Foreign Currency Exchange Contracts
The Fund may enter into foreign currency exchange contracts (“forward contracts”) for the purchase or sale of a foreign currency at a negotiated rate at a future date.
21 | OPPENHEIMER MAIN STREET FUND/VA
|
NOTES TO FINANCIAL STATEMENTS Unaudited / Continued
6. Risk Exposures and the Use of Derivative Instruments Continued
Forward contracts are reported on a schedule following the Statement of Investments. The unrealized appreciation (depreciation) is reported in the Statement of Assets and Liabilities as a receivable or payable and in the Statement of Operations within the change in unrealized appreciation (depreciation). At contract close, the difference between the original cost of the contract and the value at the close date is recorded as a realized gain (loss) in the Statement of Operations.
The Fund has purchased and sold certain forward foreign currency exchange contracts of different currencies in order to acquire currencies to pay for or sell currencies to acquire related foreign securities purchase and sale transactions, respectively, or to convert foreign currencies to U.S. dollars from related foreign securities transactions. These foreign currency exchange contracts are negotiated at the current spot exchange rate with settlement typically within two business days thereafter.
During the six months ended June 29, 2012, the Fund had daily average contract amounts on forward foreign currency contracts to buy and sell of $33,569 and $397, respectively.
Additional associated risk to the Fund includes counterparty credit risk. Counterparty credit risk arises from the possibility that the counterparty will default.
As of June 29, 2012, the Fund had no outstanding forward contracts.
7. Acquisition of Growth Portfolio
On April 26, 2012, the Fund acquired all of the net assets of Growth Portfolio, pursuant to an Agreement and Plan of Reorganization approved by the Growth Portfolio shareholders on April 20, 2012. The purpose of this acquisition is to combine two funds with similar investment objectives, strategies and risks to allow shareholders to benefit from greater asset growth potential, as well as lowered total expenses.
The transaction qualified as a tax-free reorganization, (the “merger”) for federal income tax purposes allowing the Fund to use the original cost basis of the investments received to calculate subsequent gains and losses for tax reporting purposes.
Details of the merger are shown in the following table:
| | | | | | | | | | | | | | | | |
| | | Exchange
Ratio to One
Share of the
Growth
Portfolio | | | Shares of Beneficial
Interest Issued by
the Fund | | | Value of Issued
Shares of Beneficial
Interest | | | Combined Net Assets on
April 26, 20121 | |
| Class A | | | 0.0953467932 | | | | 3,253,848 | | | | $77,116,190 | | | | $517,094,352 | |
1. The net assets acquired included net unrealized appreciation of $18,020,315 and an unused capital loss carryforward of $35,875,587, potential utilization subject to tax limitations.
Had the merger occurred at the beginning of the reporting period, the Fund’s Statement of Operations would have been adjusted to the following amounts:
| | | | |
| Net investment income | | $ | 5,370,508 | |
| Net loss on investments | | | 122,008,030 | |
| Net increase in net assets resulting from operations | | | 127,378,538 | |
8. Pending Litigation
Since 2009, a number of class action, derivative and individual lawsuits have been pending in federal and state courts against OppenheimerFunds, Inc., the Fund’s investment advisor (the “Manager”), OppenheimerFunds Distributor, Inc., the Fund’s principal underwriter and distributor (the “Distributor”), and certain funds (but not including the Fund) advised by the Manager and distributed by the Distributor (the “Defendant Funds”). Several of these lawsuits also name as defendants certain officers and current and former trustees of the respective Defendant Funds. The lawsuits raise
22 | OPPENHEIMER MAIN STREET FUND/VA
|
claims under federal securities laws and various states’ securities, consumer protection and common law and allege, among other things, that the disclosure documents of the respective Defendant Funds contained misrepresentations and omissions and that the respective Defendant Funds’ investment policies were not followed. The plaintiffs in these actions seek unspecified damages, equitable relief and awards of attorneys’ fees and litigation expenses.
Other class action and individual lawsuits have been filed since 2008 in various state and federal courts against the Manager and certain of its affiliates by investors seeking to recover investments they allegedly lost as a result of the “Ponzi” scheme run by Bernard L. Madoff and his firm, Bernard L. Madoff Investment Securities, LLC (“BLMIS”). Plaintiffs in these suits allege that they suffered losses as a result of their investments in several funds managed by an affiliate of the Manager and assert a variety of claims, including breach of fiduciary duty, fraud, negligent misrepresentation, unjust enrichment, and violation of federal and state securities laws and regulations, among others. They seek unspecified damages, equitable relief and awards of attorneys’ fees and litigation expenses. Neither the Distributor, nor any of the Oppenheimer mutual funds, their independent trustees or directors are named as defendants in these lawsuits. None of the Oppenheimer mutual funds invested in any funds or accounts managed by Madoff or BLMIS. On February 28, 2011, a stipulation of partial settlement of three groups of consolidated putative class action lawsuits relating to these matters was filed in the U.S. District Court for the Southern District of New York. On August 19, 2011, the court entered an order and final judgment approving the settlement as fair, reasonable and adequate. In September 2011, certain parties filed notices of appeal from the court’s order approving the settlement. On July 29, 2011, a stipulation of settlement between certain affiliates of the Manager and the Trustee appointed under the Securities Investor Protection Act to liquidate BLMIS was filed in the U.S. Bankruptcy Court for the Southern District of New York to resolve purported preference and fraudulent transfer claims by the Trustee. On September 22, 2011, the court entered an order approving the settlement as fair, reasonable and adequate. In October 2011, certain parties filed notices of appeal from the court’s order approving the settlement. The aforementioned settlements do not resolve other outstanding lawsuits against the Manager and its affiliates relating to BLMIS.
On April 16, 2010, a lawsuit was filed in New York state court against the Manager, an affiliate of the Manager and AAArdvark IV Funding Limited (“AAArdvark IV”), an entity advised by the Manager’s affiliate, in connection with investments made by the plaintiffs in AAArdvark IV. Plaintiffs allege breach of contract against the defendants and seek compensatory damages, costs and disbursements, including attorney fees. On July 15, 2011, a lawsuit was filed in New York state court against the Manager, an affiliate of the Manager and AAArdvark Funding Limited (“AAArdvark I”), an entity advised by the Manager’s affiliate, in connection with investments made by the plaintiffs in AAArdvark I. The complaint alleges breach of contract against the defendants and seeks compensatory damages, costs and disbursements, including attorney fees. On November 9, 2011, a lawsuit was filed in New York state court against the Manager, an affiliate of the Manager and AAArdvark XS Funding Limited (“AAArdvark XS”), an entity advised by the Manager’s affiliate, in connection with investments made by the plaintiffs in AAArdvark XS. The complaint alleges breach of contract against the defendants and seeks compensatory damages, costs and disbursements, including attorney fees.
The Manager believes the lawsuits and appeals described above are without legal merit and, with the exception of actions it has settled, is defending against them vigorously. The Defendant Funds’ Boards of Trustees have also engaged counsel to represent the Funds and the present and former Independent Trustees named in those suits. While it is premature to render any opinion as to the outcome in these lawsuits, or whether any costs that the Defendant Funds may bear in defending the suits might not be reimbursed by insurance, the Manager believes that these suits should not impair the ability of the Manager or the Distributor to perform their respective duties to the Fund, and that the outcome of all of the suits together should not have any material effect on the operations of any of the Oppenheimer mutual funds.
23 | OPPENHEIMER MAIN STREET FUND/VA
|
SPECIAL SHAREHOLDER MEETING Unaudited
On February 29, 2012, a shareholder meeting of the Oppenheimer Variable Account Funds, on behalf of Oppenheimer Main Street Fund/VA (the “Fund”) was held at which the twelve Trustees identified below were elected to the Trust (Proposal No. 1). At the meeting Proposal No. 2 (including all of its sub-proposals) and Proposal No. 3 were approved as described in the Fund’s proxy statement for that meeting. The following is a report of the votes cast:
| | | | | | | | |
| Nominee/Proposal | | For | | | Withheld | |
| Trustees | | | | | | | | |
| William L. Armstrong | | | 859,155,000 | | | | 36,277,763 | |
| Edward L. Cameron | | | 860,463,149 | | | | 34,969,615 | |
| Jon S. Fossel | | | 861,382,389 | | | | 34,050,375 | |
| Sam Freedman | | | 860,173,958 | | | | 35,258,806 | |
| Richard F. Grabish | | | 862,692,974 | | | | 32,739,789 | |
| Beverly L. Hamilton | | | 862,904,192 | | | | 32,528,571 | |
| Robert J. Malone | | | 862,354,488 | | | | 33,078,275 | |
| F. William Marshall, Jr. | | | 860,997,182 | | | | 34,435,581 | |
| Victoria J. Herget | | | 861,814,105 | | | | 33,618,659 | |
| Karen L. Stuckey | | | 861,434,246 | | | | 33,998,517 | |
| James D. Vaughn | | | 861,208,178 | | | | 34,224,585 | |
| William F. Glavin, Jr. | | | 861,148,846 | | | | 34,283,917 | |
2a: Proposal to revise the fundamental policy relating to borrowing
| | | | | | | | | | | | |
| For | | Against | | | Abstain | | | Broker Non Vote | |
| 64,138,975 | | | 3,708,938 | | | | 2,626,079 | | | | N/A | |
2b: Proposal to revise the fundamental policy relating to concentration of investments
| | | | | | | | | | | | |
| For | | Against | | | Abstain | | | Broker Non Vote | |
| 64,447,979 | | | 3,673,653 | | | | 2,352,360 | | | | N/A | |
2c: Proposal to remove the fundamental policy relating to diversification of investments
| | | | | | | | | | | | |
| For | | Against | | | Abstain | | | Broker Non Vote | |
| 63,780,270 | | | 3,824,160 | | | | 2,869,561 | | | | N/A | |
2d: Proposal to revise the fundamental policy relating to lending
| | | | | | | | | | | | |
| For | | Against | | | Abstain | | | Broker Non Vote | |
| 63,851,146 | | | 3,848,296 | | | | 2,774,550 | | | | N/A | |
2e-1: Proposal to revise the fundamental policy relating to real estate and commodities
| | | | | | | | | | | | |
| For | | Against | | | Abstain | | | Broker Non Vote | |
| 64,031,649 | | | 3,838,470 | | | | 2,603,872 | | | | N/A | |
2e-2: Proposal to remove the additional fundamental policy relating to real estate and commodities
| | | | | | | | | | | | |
| For | | Against | | | Abstain | | | Broker Non Vote | |
| 63,663,469 | | | 4,024,234 | | | | 2,786,285 | | | | N/A | |
24 | OPPENHEIMER MAIN STREET FUND/VA
|
2f: Proposal to revise the fundamental policy relating to senior securities
| | | | | | | | | | | | |
| For | | Against | | | Abstain | | | Broker Non Vote | |
| 64,010,848 | | | 3,806,030 | | | | 2,657,114 | | | | N/A | |
2g: Proposal to revise the fundamental policy relating to underwriting
| | | | | | | | | | | | |
| For | | Against | | | Abstain | | | Broker Non Vote | |
| 63,847,976 | | | 3,871,861 | | | | 2,754,155 | | | | N/A | |
2i: Convert the Fund’s investment objective from fundamental to non-fundamental
| | | | | | | | | | | | |
| For | | Against | | | Abstain | | | Broker Non Vote | |
| 63,381,714 | | | 3,989,120 | | | | 3,103,157 | | | | N/A | |
2j: Approve a change in the fund’s investment objective
| | | | | | | | | | | | |
| For | | Against | | | Abstain | | | Broker Non Vote | |
| 64,028,261 | | | 3,841,441 | | | | 2,604,290 | | | | N/A | |
Proposal 3: To approve an Agreement and Plan of Reorganization that provides for the reorganization of a Fund from a Maryland corporation or Massachusetts business trust, as applicable, into a Delaware statutory trust.
| | | | | | | | | | | | |
| For | | Against | | | Abstain | | | Broker Non Vote | |
| 821,085,084 | | | 23,597,959 | | | | 50,749,721 | | | | N/A | |
25 | OPPENHEIMER MAIN STREET FUND/VA
|
PORTFOLIO PROXY VOTING POLICIES AND PROCEDURES;
UPDATES TO STATEMENTS OF INVESTMENTS Unaudited
The Fund has adopted Portfolio Proxy Voting Policies and Procedures under which the Fund votes proxies relating to securities (“portfolio proxies”) held by the Fund. A description of the Fund’s Portfolio Proxy Voting Policies and Procedures is available (i) without charge, upon request, by calling the Fund toll-free at 1.800.525.7048, (ii) on the Fund’s website at oppenheimerfunds.com, and (iii) on the SEC’s website at www.sec.gov. In addition, the Fund is required to file Form N-PX, with its complete proxy voting record for the 12 months ended June 30th, no later than August 31st of each year. The Fund’s voting record is available (i) without charge, upon request, by calling the Fund toll-free at 1.800.525.7048, and (ii) in the Form N-PX filing on the SEC’s website at www.sec.gov.
The Fund files its complete schedule of portfolio holdings with the SEC for the first quarter and the third quarter of each fiscal year on Form N-Q. The Fund’s Form N-Q filings are available on the SEC’s website at www.sec.gov. Those forms may be reviewed and copied at the SEC’s Public Reference Room in Washington, D.C. Information on the operation of the Public Reference Room may be obtained by calling 1-800-SEC-0330.
26 | OPPENHEIMER MAIN STREET FUND/VA
|
OPPENHEIMER MAIN STREET FUND®/VA
| | |
| A Series of Oppenheimer Variable Account Funds |
| Trustees and Officers | | William L. Armstrong, Chairman of the Board of Trustees and Trustee Edward L. Cameron, Trustee Jon S. Fossel, Trustee Sam Freedman, Trustee Richard F. Grabish, Trustee Beverly L. Hamilton, Trustee Victoria J. Herget, Trustee Robert J. Malone, Trustee F. William Marshall, Jr., Trustee Karen L. Stuckey, Trustee James D. Vaughn, Trustee William F. Glavin, Jr., Trustee, President and Principal Executive Officer Manind Govil, Vice President Benjamin Ram, Vice President Arthur S. Gabinet, Secretary and Chief Legal Officer Christina M. Nasta, Vice President and Chief Business Officer Mark S. Vandehey, Vice President and Chief Compliance Officer Brian W. Wixted, Treasurer and Principal Financial & Accounting Officer |
| Manager | | OppenheimerFunds, Inc. |
| Distributor | | OppenheimerFunds Distributor, Inc. |
| Transfer Agent | | OppenheimerFunds Services |
| Independent Registered Public Accounting Firm | | KPMG LLP |
| Counsel | | K&L Gates LLP |
Before investing, investors should carefully consider a fund’s investment objectives, risks, charges and expenses. Fund prospectuses and summary prospectuses contain this and other information about the funds and may be obtained by asking your financial advisor, or calling us at 1.800.988.8287. Read prospectuses and summary prospectuses carefully before investing.
The financial statements included herein have been taken from the records of the Fund without examination of those records by the independent registered public accounting firm.
| | |
| ©2012 OppenheimerFunds, Inc. All rights reserved. | |  |
June 30, 2012
| | | | |
| | | Oppenheimer Main Street Small- & Mid-Cap Fund®/VA A Series of Oppenheimer Variable Account Funds | | Semiannual Report |

SEMIANNUAL REPORT
Fund Performance Discussion
Listing of Top Holdings
Financial Statements

OPPENHEIMER MAIN STREET SMALL- & MID-CAP FUND®/VA
Portfolio Managers: Matthew P. Ziehl, CFA, Raymond Anello, CFA and Raman Vardharaj, CFA
| | | | | | |
Cumulative Total Returns
For the 6-Month Period Ended 6/29/121 |
| Non-Service Shares | | 9.73% | | | | |
| Service Shares | | 9.53 | | | | |
Average Annual Total Returns
For the Periods Ended 6/29/121 | | |
| | | |
| | | 1-Year | | 5-Year | | 10-Year |
| Non-Service Shares | | –0.32% | | 0.30% | | 7.40% |
| Service Shares | | –0.57 | | 0.05 | | 7.15 |
Expense Ratios
For the Fiscal Year Ended 12/30/111 | | |
| | | |
| | | Gross
Expense
Ratios | | | | Net
Expense
Ratios |
| Non-Service Shares | | 0.83% | | | | 0.80% |
| Service Shares | | 1.08 | | | | 1.05 |
The performance data quoted represents past performance, which does not guarantee future results. The investment return and principal value of an investment in the Fund will fluctuate so that an investor’s shares, when redeemed, may be worth more or less than their original cost. Current performance and expense ratios may be lower or higher than the data quoted. For performance data current to the most recent month end, call us at 1.800.988.8287. The Fund’s total returns should not be expected to be the same as the returns of other funds, whether or not both funds have the same portfolio managers and/or similar names. The Fund’s total returns do not include the charges associated with the separate account products that offer this Fund. Performance would have been lower if such charges were taken into account. Expense ratios are as stated in the Fund’s prospectus current as of the date of this report. The net expense ratios take into account voluntary fee waivers and/or expense reimbursements, without which performance would have been less. Some of these undertakings may be modified or terminated at any time, as indicated in the Fund’s prospectus.
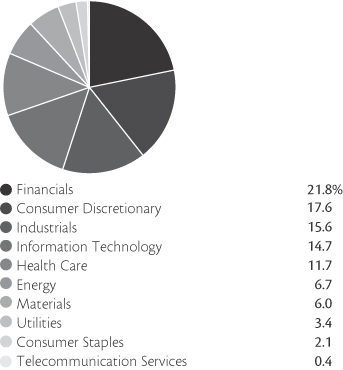
Portfolio holdings and allocations are subject to change. Percentages are as of June 29, 2012, and are based on the total market value of common stocks.
| | |
| Top Ten Common Stock Holdings | | |
| HollyFrontier Corp. | | 2.3% |
| Robert Half International, Inc. | | 1.8 |
| Dunkin’ Brands Group, Inc. | | 1.8 |
| Questcor Pharmaceuticals, Inc. | | 1.6 |
| MSCI, Inc., Cl. A | | 1.5 |
| Waste Connections, Inc. | | 1.5 |
| AES Corp. (The) | | 1.5 |
| Old Dominion Freight Line, Inc. | | 1.3 |
| KBR, Inc. | | 1.3 |
| PVH Corp. | | 1.3 |
Portfolio holdings and allocations are subject to change. Percentages are as of June 29, 2012, and are based on net assets.
2 | OPPENHEIMER MAIN STREET SMALL- & MID-CAP FUND/VA
|
FUND PERFORMANCE DISCUSSION
During the six-month period ended June 29, 2012, the Fund’s Non-Service shares returned 9.73%. In comparison, the Fund outperformed the Russell 2500 Index (the “Index”), which returned 8.31%.1 The Fund outperformed the Index primarily due to stronger relative stock selection in the energy and consumer discretionary sectors. While underperforming sectors were limited for the Fund this period, the most significant detractor was weaker relative stock selection in industrials.
Economic and Market Environment
The period began during a time of improved market sentiment in which the United States managed to avoid a return to recession and European policymakers appeared to take steps to address the region’s sovereign debt and banking sector crises. Renewed investor optimism helped produce gains across a number of international equity markets over the first three months of 2012. The rebound across equities gained momentum after the European Central Bank implemented the Long-Term Refinancing Operation (“LTRO”) to enhance liquidity for troubled banks and reduce rates on newly issued sovereign debt securities.
However, the second quarter was a volatile time for global markets. The fear of contagion from the worsening European sovereign debt crisis and a recession across much of Europe drove negative market sentiment, particularly over May and June. Very high unemployment, soaring debt and higher borrowing costs in Greece, Spain and Italy contributed to serious questions over how to implement austerity measures and restructure debt or instead take a different tact and provide some or all of those countries with additional funds. Perhaps most worrisome of all to investors was the possibility of Greece pulling out of the euro and its ramifications for the future of the Eurozone and its common currency. In the U.S., slower than expected first quarter growth also contributed to a sell-off in the U.S. stock market. Consumer confidence dropped as U.S. unemployment figures ticked slightly upwards after showing signs of improvement from the recession highs. However, the period ended on a positive note for the markets. The results of elections in Greece and continued efforts by European policymakers to stabilize the situation in the region appeared to soothe market jitters slightly in the final days of the period.
Fund Review
During the period, the strongest performing stocks for the Fund were HollyFrontier Corp., Skyworks Solutions, Inc., Questcor Pharmaceuticals, Inc. and Dunkin’ Brands Group Inc. HollyFrontier, the Fund’s largest holding at period end, is an oil refiner that benefited from a more persistent price spread between the company’s oil inputs, based on West Texas Intermediate (WTI) prices, and product outputs, based on Brent crude oil prices. This dynamic improved the outlook for both earnings and cash generation at the company. Semiconductor company Skyworks Solutions’ stock produced strong performance this period. Demand for the company’s radio frequency chips is expected to expand as both telecommunications companies upgrade networks from 2G to 3G, and 3G to 4G, and smartphones gain further share. Questcor Pharmaceuticals continued to benefit from new paid prescriptions for its Acthar drug for patients with multiple sclerosis as well as patients with nephrotic syndrome, which is a kidney disorder. Dunkin’ Brands Group’s subsidiary Dunkin Donuts remained focused on growth opportunities through single and multi-unit development of retail stores and announced deals to partner with multi-store franchisees in Alabama and Colorado. Operating under the Dunkin’ Donuts and Baskin-Robbins brands, Dunkin’ Brands had close to 17,000 locations at period end.
Although negative contributing stocks were minimal this period, the most significant detractors were Aruba Networks, Inc. and Aecom Technology Corp. Aruba is a global leader in enterprise network solutions. The company’s stock experienced declines over the closing months of the period as macroeconomic issues put pressure on tech stocks in general. The market grew concerned over information technology (IT) departments in the U.S. possibly deferring on IT investments as well as weakness in European government IT contracts. Aecom, a global provider of professional technical and management support services to a broad range of markets, declined in May after releasing a weakened outlook.
1. June 29, 2012, was the last business day of the Fund’s semiannual period. See Note 1 of the accompanying Notes to Financial Statements. Index returns are calculated through June 30, 2012. December 30, 2011 was the last business day of the Fund’s 2011 fiscal year.
3 | OPPENHEIMER MAIN STREET SMALL- & MID-CAP FUND/VA
|
FUND PERFORMANCE DISCUSSION
Outlook
We believe the U.S. economy will continue to improve at a gradual and perhaps uneven fashion. The slow-growth environment can continue to create a bifurcated stock market in which well-run companies with solid business models outperform. In our opinion, such a market environment favors our investment style and process, which focuses on companies with sustainable competitive advantages. We view such firms as well-positioned to generate stronger profit margins and take market share from weaker players. We seek to buy such companies when their valuations are attractive, and believe that this disciplined investment process is the key to generating solid long-term performance.
Investors should consider the Fund’s investment objective, risks, and charges and expenses carefully before investing. The Fund’s prospectus and summary prospectus contain this and other information about the Fund, and may be obtained by asking your financial advisor or calling us at 1.800.988.8287. Read prospectuses and summary prospectuses carefully before investing.
Total returns include changes in share price and reinvestment of dividends and capital gains distributions in a hypothetical investment for the periods shown. Cumulative total returns are not annualized.
The Fund’s investment strategy and focus can change over time. The mention of specific fund holdings does not constitute a recommendation by OppenheimerFunds, Inc.
Shares of Oppenheimer funds are not deposits or obligations of any bank, are not guaranteed by any bank, are not insured by the FDIC or any other agency, and involve investment risks, including the possible loss of the principal amount invested.
4 | OPPENHEIMER MAIN STREET SMALL- & MID-CAP FUND/VA
|
FUND EXPENSES
Fund Expenses. As a shareholder of the Fund, you incur two types of costs: (1) transaction costs and (2) ongoing costs, including management fees; distribution and service fees; and other Fund expenses. These examples are intended to help you understand your ongoing costs (in dollars) of investing in the Fund and to compare these costs with the ongoing costs of investing in other mutual funds.
The examples are based on an investment of $1,000.00 invested at the beginning of the period and held for the entire 6-month period ended June 29, 2012.
Actual Expenses. The first section of the table provides information about actual account values and actual expenses. You may use the information in this section for the class of shares you hold, together with the amount you invested, to estimate the expense that you paid over the period. Simply divide your account value by $1,000.00 (for example, an $8,600.00 account value divided by $1,000.00 = 8.60), then multiply the result by the number in the first section under the heading entitled “Expenses Paid During Period” to estimate the expenses you paid on your account during this period.
Hypothetical Example for Comparison Purposes. The second section of the table provides information about hypothetical account values and hypothetical expenses based on the Fund’s actual expense ratio for each class of shares, and an assumed rate of return of 5% per year for each class before expenses, which is not the actual return. The hypothetical account values and expenses may not be used to estimate the actual ending account balance or expenses you paid for the period. You may use this information to compare the ongoing costs of investing in the Fund and other funds. To do so, compare this 5% hypothetical example for the class of shares you hold with the 5% hypothetical examples that appear in the shareholder reports of the other funds.
Please note that the expenses shown in the table are meant to highlight your ongoing costs only and do not reflect any charges associated with the separate accounts that offer this Fund. Therefore, the “hypothetical” lines of the table are useful in comparing ongoing costs only, and will not help you determine the relative total costs of owning different funds. In addition, if these separate account charges were included your costs would have been higher.
| | | | | | | | | | | | |
| Actual | | Beginning
Account
Value
January 1, 2012 | | | Ending
Account
Value
June 29, 2012 | | | Expenses
Paid During
6 Months Ended
June 29, 2012 | |
| Non-Service Shares | | $ | 1,000.00 | | | $ | 1,097.30 | | | $ | 4.16 | |
| Service Shares | | | 1,000.00 | | | | 1,095.30 | | | | 5.45 | |
| | | |
Hypothetical
(5% return before expenses) | | | | | | | | | |
| Non-Service Shares | | | 1,000.00 | | | | 1,020.77 | | | | 4.01 | |
| Service Shares | | | 1,000.00 | | | | 1,019.53 | | | | 5.26 | |
Expenses are equal to the Fund’s annualized expense ratio for that class, multiplied by the average account value over the period, multiplied by 181/366 (to reflect the one-half year period). Those annualized expense ratios, excluding indirect expenses from affiliated fund, based on the 6-month period ended June 29, 2012 are as follows:
| | | | |
| Class | | Expense Ratios | |
| Non-Service shares | | | 0.80 | % |
| Service shares | | | 1.05 | |
The expense ratios reflect voluntary waivers and/or reimbursements of expenses by the Fund’s Manager. Some of these undertakings may be modified or terminated at any time, as indicated in the Fund’s prospectus. The “Financial Highlights” tables in the Fund’s financial statements, included in this report, also show the gross expense ratios, without such waivers or reimbursements and reduction to custodian expenses, if applicable.
5 | OPPENHEIMER MAIN STREET SMALL- & MID-CAP FUND/VA
|
STATEMENT OF INVESTMENTS June 29, 2012* / Unaudited
| | | | | | | | |
| | | Shares | | | Value | |
| Common Stocks—96.8% | | | | | | | | |
| Consumer Discretionary—17.1% | | | | | | | | |
| Auto Components—1.3% | | | | | |
| Amerigon, Inc.1 | | | 30,170 | | | $ | 346,653 | |
| Cooper Tire & Rubber Co. | | | 53,140 | | | | 932,076 | |
| Dana Holding Corp. | | | 708,217 | | | | 9,072,260 | |
| Standard Motor Products, Inc. | | | 62,832 | | | | 884,675 | |
| | | | | | |
|
|
|
| | | | | | | | 11,235,664 | |
| Distributors—1.0% | | | | | | | | |
| Pool Corp. | | | 200,969 | | | | 8,131,206 | |
| VOXX International Corp.1 | | | 69,240 | | | | 645,317 | |
| | | | | | |
|
|
|
| | | | | | | | 8,776,523 | |
| Diversified Consumer Services—0.6% | | | | | | | | |
| Bridgepoint Education, Inc.1 | | | 65,672 | | | | 1,431,650 | |
| Capella Education Co.1 | | | 440 | | | | 15,294 | |
| Coinstar, Inc.1 | | | 25,999 | | | | 1,785,091 | |
| DeVry, Inc. | | | 5,722 | | | | 177,210 | |
| Grand Canyon Education, Inc.1 | | | 42,530 | | | | 890,578 | |
| Regis Corp. | | | 44,757 | | | | 803,836 | |
| | | | | | |
|
|
|
| | | | | | | | 5,103,659 | |
| Hotels, Restaurants & Leisure—3.2% | | | | | | | | |
| Ameristar Casinos, Inc. | | | 84,204 | | | | 1,496,305 | |
| Bob Evans Farms, Inc. | | | 40,566 | | | | 1,630,753 | |
| Brinker International, Inc. | | | 79,944 | | | | 2,547,815 | |
| CEC Entertainment, Inc. | | | 24,030 | | | | 873,971 | |
| Cheesecake Factory, Inc. (The)1 | | | 50,242 | | | | 1,605,734 | |
| Cracker Barrel Old Country Store, Inc. | | | 25,549 | | | | 1,604,477 | |
| Denny’s Corp.1 | | | 47,570 | | | | 211,211 | |
| Dunkin’ Brands Group, Inc. | | | 466,033 | | | | 16,003,573 | |
| Multimedia Games, Inc.1 | | | 10,210 | | | | 142,940 | |
| P.F. Chang’s China Bistro, Inc. | | | 2,858 | | | | 147,101 | |
| Papa John’s International, Inc.1 | | | 34,063 | | | | 1,620,377 | |
| Red Robin Gourmet Burgers, Inc.1 | | | 29,000 | | | | 884,790 | |
| Ruth’s Chris Steak House, Inc.1 | | | 6,160 | | | | 40,656 | |
| Town Sports International Holdings, Inc.1 | | | 14,320 | | | | 190,313 | |
| | | | | | |
|
|
|
| | | | | | | | 29,000,016 | |
| Household Durables—1.4% | |
| CSS Industries, Inc. | | | 12,788 | | | | 262,793 | |
| Helen of Troy Ltd.1 | | | 26,713 | | | | 905,304 | |
| Jarden Corp. | | | 55,945 | | | | 2,350,809 | |
| La-Z-Boy, Inc.1 | | | 86,480 | | | | 1,062,839 | |
| Toll Brothers, Inc.1 | | | 253,020 | | | | 7,522,285 | |
| Zagg, Inc.1 | | | 70,500 | | | | 769,155 | |
| | | | | | |
|
|
|
| | | | | | | | 12,873,185 | |
| | | | | | | | |
| | | Shares | | | Value | |
| Internet & Catalog Retail—0.0% | | | | | | | | |
| HSN, Inc. | | | 3,436 | | | $ | 138,643 | |
| Leisure Equipment & Products—0.1% | | | | | | | | |
| Leapfrog Enterprises, Inc.1 | | | 61,860 | | | | 634,684 | |
| Polaris Industries, Inc. | | | 1,529 | | | | 109,293 | |
| | | | | | |
|
|
|
| | | | | | | | 743,977 | |
| Media—1.9% | |
| Cinemark Holdings, Inc. | | | 37,560 | | | | 858,246 | |
| Dish Network Corp., Cl. A | | | 30,319 | | | | 865,607 | |
| IMAX Corp.1 | | | 445,536 | | | | 10,706,230 | |
| Interpublic Group of Cos., Inc. (The) | | | 69,200 | | | | 750,820 | |
| Regal Entertainment Group | | | 48,320 | | | | 664,883 | |
| Scholastic Corp. | | | 47,515 | | | | 1,338,022 | |
| Sinclair Broadcast Group, Inc., Cl. A | | | 33,887 | | | | 307,016 | |
| Valassis Communications, Inc.1 | | | 84,071 | | | | 1,828,544 | |
| | | | | | |
|
|
|
| | | | | | | | 17,319,368 | |
| Multiline Retail—0.6% | |
| Big Lots, Inc.1 | | | 50,171 | | | | 2,046,475 | |
| Dillard’s, Inc., Cl. A | | | 18,453 | | | | 1,175,087 | |
| Fred’s, Inc. | | | 49,201 | | | | 752,283 | |
| Saks, Inc.1 | | | 166,182 | | | | 1,769,838 | |
| | | | | | |
|
|
|
| | | | | | | | 5,743,683 | |
| Specialty Retail—4.9% | |
| Aaron’s, Inc. | | | 39,930 | | | | 1,130,418 | |
| Advance Auto Parts, Inc. | | | 19,627 | | | | 1,338,954 | |
| AnnTaylor Stores Corp.1 | | | 71,173 | | | | 1,814,200 | |
| Ascena Retail Group, Inc.1 | | | 108,350 | | | | 2,017,477 | |
| Body Central Corp.1 | | | 42,140 | | | | 379,260 | |
| Buckle, Inc. (The) | | | 20,130 | | | | 796,544 | |
| CarMax, Inc.1 | | | 226,830 | | | | 5,883,970 | |
| Cato Corp., Cl. A | | | 76,887 | | | | 2,341,978 | |
| Chico’s FAS, Inc. | | | 148,459 | �� | | | 2,203,132 | |
| Dick’s Sporting Goods, Inc. | | | 3,196 | | | | 153,408 | |
| Express, Inc.1 | | | 90,526 | | | | 1,644,857 | |
| Finish Line, Inc. (The), Cl. A | | | 97,583 | | | | 2,040,461 | |
| Foot Locker, Inc. | | | 78,081 | | | | 2,387,717 | |
| GameStop Corp., Cl. A | | | 90,105 | | | | 1,654,328 | |
| Hibbett Sports, Inc.1 | | | 2,636 | | | | 152,124 | |
| Hot Topic, Inc. | | | 99,860 | | | | 967,643 | |
| Men’s Wearhouse, Inc. (The) | | | 36,585 | | | | 1,029,502 | |
| Monro Muffler Brake, Inc. | | | 186,339 | | | | 6,193,908 | |
| Pier 1 Imports, Inc. | | | 529,190 | | | | 8,694,592 | |
| RadioShack Corp. | | | 7,105 | | | | 27,283 | |
| Rent-A-Center, Inc. | | | 7,600 | | | | 256,424 | |
6 | OPPENHEIMER MAIN STREET SMALL- & MID-CAP FUND/VA
|
| | | | | | | | |
| | | Shares | | | Value | |
| Specialty Retail Continued | |
| Rue21, Inc.1 | | | 15,960 | | | $ | 402,830 | |
| Sally Beauty Holdings, Inc.1 | | | 8,635 | | | | 222,265 | |
| Staples, Inc. | | | 8,090 | | | | 105,575 | |
| Williams-Sonoma, Inc. | | | 22,000 | | | | 769,340 | |
| | | | | | |
|
|
|
| | | | | | | | 44,608,190 | |
| Textiles, Apparel & Luxury Goods—2.1% | | | | | |
| Fossil, Inc.1 | | | 101,122 | | | | 7,739,878 | |
| Iconix Brand Group, Inc.1 | | | 4,943 | | | | 86,354 | |
| Jones Group, Inc. (The) | | | 10,640 | | | | 101,718 | |
| PVH Corp. | | | 147,108 | | | | 11,443,531 | |
| | | | | | |
|
|
|
| | | | | | | | 19,371,481 | |
| Consumer Staples—2.1% | | | | | | | | |
| Beverages—0.0% | | | | | | | | |
| Constellation Brands, Inc., Cl. A1 | | | 628 | | | | 16,994 | |
| Cott Corp.1 | | | 14,376 | | | | 118,027 | |
| | | | | | |
|
|
|
| | | | | | | | 135,021 | |
| Food & Staples Retailing—0.4% | | | | | | | | |
| Andersons, Inc. (The) | | | 18,570 | | | | 792,196 | |
| Casey’s General Stores, Inc. | | | 180 | | | | 10,618 | |
| Harris Teeter Supermarkets, Inc. | | | 860 | | | | 35,251 | |
| Roundy’s, Inc. | | | 89,150 | | | | 910,222 | |
| Safeway, Inc. | | | 13,280 | | | | 241,032 | |
| Spartan Stores, Inc. | | | 21,297 | | | | 386,115 | |
| Village Super Market, Inc., Cl. A | | | 6,465 | | | | 210,630 | |
| Weis Markets, Inc. | | | 12,132 | | | | 540,117 | |
| | | | | | |
|
|
|
| | | | | | | | 3,126,181 | |
| Food Products—1.0% | | | | | | | | |
| Darling International, Inc.1 | | | 88,870 | | | | 1,465,466 | |
| Smithfield Foods, Inc.1 | | | 13,770 | | | | 297,845 | |
| TreeHouse Foods, Inc.1 | | | 115,252 | | | | 7,179,047 | |
| | | | | | |
|
|
|
| | | | | | | | 8,942,358 | |
| Household Products—0.3% | |
| Church & Dwight Co., Inc. | | | 48,149 | | | | 2,670,825 | |
| Harbinger Group, Inc.1 | | | 4,760 | | | | 37,080 | |
| Spectrum Brands Holdings, Inc.1 | | | 2,910 | | | | 94,779 | |
| | | | | | |
|
|
|
| | | | | | | | 2,802,684 | |
| Personal Products—0.4% | | | | | | | | |
| Medifast, Inc.1 | | | 99,922 | | | | 1,966,465 | |
| Nu Skin Asia Pacific, Inc., Cl. A | | | 5,700 | | | | 267,330 | |
| USANA Health Sciences, Inc.1 | | | 30,450 | | | | 1,252,104 | |
| | | | | | |
|
|
|
| | | | | | | | 3,485,899 | |
| Tobacco—0.0% | | | | | | | | |
| Universal Corp. | | | 4,707 | | | | 218,075 | |
| | | | | | | | |
| | | Shares | | | Value | |
| Energy—6.4% | | | | | | | | |
| Energy Equipment & Services—1.0% | | | | | | | | |
| Basic Energy Services, Inc.1 | | | 60,072 | | | $ | 619,943 | |
| C&J Energy Services, Inc.1 | | | 80,270 | | | | 1,484,995 | |
| Helix Energy Solutions Group, Inc.1 | | | 93,758 | | | | 1,538,569 | |
| Helmerich & Payne, Inc. | | | 17,030 | | | | 740,464 | |
| Key Energy Services, Inc.1 | | | 126,130 | | | | 958,588 | |
| Matrix Service Co.1 | | | 48,596 | | | | 551,565 | |
| Nabors Industries Ltd.1 | | | 17,650 | | | | 254,160 | |
| Parker Drilling Co.1 | | | 271,643 | | | | 1,225,110 | |
| Pioneer Drilling Co.1 | | | 14,600 | | | | 116,362 | |
| RPC, Inc. | | | 161,627 | | | | 1,921,745 | |
| | | | | | |
|
|
|
| | | | | | | | 9,411,501 | |
| Oil, Gas & Consumable Fuels—5.4% | | | | | | | | |
| Alon USA Energy, Inc. | | | 57,290 | | | | 484,673 | |
| Crosstex Energy, Inc. | | | 21,400 | | | | 299,600 | |
| CVR Energy, Inc.4 | | | 43,316 | | | | — | |
| CVR Energy, Inc. | | | 1,360 | | | | 36,149 | |
| Delek US Holdings, Inc. | | | 43,440 | | | | 764,110 | |
| Denbury Resources, Inc.1 | | | 58,060 | | | | 877,287 | |
| Energy Partners Ltd.1 | | | 230,880 | | | | 3,901,872 | |
| Energy XXI (Bermuda) Ltd. | | | 60,843 | | | | 1,903,777 | |
| Gran Tierra Energy, Inc.1 | | | 191,040 | | | | 938,006 | |
| Green Plains Renewable Energy, Inc.1 | | | 44,860 | | | | 279,926 | |
| HollyFrontier Corp. | | | 589,473 | | | | 20,885,028 | |
| Kosmos Energy Ltd.1 | | | 278,293 | | | | 3,075,138 | |
| PAA Natural Gas Storage LP | | | 258,233 | | | | 4,614,624 | |
| Renewable Energy Group, Inc.1 | | | 234,110 | | | | 1,739,437 | |
| Rex Stores Corp.1 | | | 18,130 | | | | 353,898 | |
| Stone Energy Corp.1 | | | 5,700 | | | | 144,438 | |
| Targa Resources Corp. | | | 30,900 | | | | 1,319,430 | |
| Tesoro Corp.1 | | | 67,651 | | | | 1,688,569 | |
| TransGlobe Energy Corp.1 | | | 85,383 | | | | 764,178 | |
| VAALCO Energy, Inc.1 | | | 229,497 | | | | 1,980,559 | |
| Venoco, Inc.1 | | | 61,730 | | | | 617,917 | |
| Warren Resources, Inc.1 | | | 114,690 | | | | 275,256 | |
| Western Refining, Inc. | | | 97,227 | | | | 2,165,245 | |
| | | | | | |
|
|
|
| | | | | | | | 49,109,117 | |
| Financials—21.1% | | | | | | | | |
| Capital Markets—1.0% | | | | | | | | |
| Federated Investors, Inc., Cl. B | | | 50,457 | | | | 1,102,485 | |
| Financial Engines, Inc.1 | | | 119,540 | | | | 2,564,133 | |
| KBW, Inc. | | | 250,591 | | | | 4,122,222 | |
| Knight Capital Group, Inc., Cl. A1 | | | 123,830 | | | | 1,478,530 | |
| | | | | | |
|
|
|
| | | | | | | | 9,267,370 | |
7 | OPPENHEIMER MAIN STREET SMALL- & MID-CAP FUND/VA
|
STATEMENT OF INVESTMENTS Unaudited / Continued
| | | | | | | | |
| | | Shares | | | Value | |
| Commercial Banks—2.4% | |
| Banco Latinoamericano de Exportaciones SA, Cl. E | | | 170 | | | $ | 3,643 | |
| CapitalSource, Inc. | | | 1,479,819 | | | | 9,944,384 | |
| Citizens & Northern Corp. | | | 9,086 | | | | 173,088 | |
| CVB Financial Corp. | | | 102,690 | | | | 1,196,339 | |
| Eagle Bancorp, Inc.1 | | | 23,763 | | | | 374,267 | |
| First Horizon National Corp. | | | 12,944 | | | | 111,966 | |
| FirstMerit Corp. | | | 361,166 | | | | 5,966,462 | |
| Huntington Bancshares, Inc. | | | 199,510 | | | | 1,276,864 | |
| Lakeland Financial Corp. | | | 4,189 | | | | 112,391 | |
| NBT Bancorp, Inc. | | | 2,697 | | | | 58,228 | |
| Old National Bancorp | | | 66,730 | | | | 801,427 | |
| Republic Bancorp, Inc., Cl. A | | | 14,202 | | | | 315,995 | |
| Southside Bancshares, Inc. | | | 14,192 | | | | 319,036 | |
| Univest Corp. of Pennsylvania | | | 20,020 | | | | 330,931 | |
| WesBanco, Inc. | | | 24,729 | | | | 525,739 | |
| | | | | | |
|
|
|
| | | | | | | | 21,510,760 | |
| Consumer Finance—0.2% | |
| Cash America International, Inc. | | | 10,480 | | | | 461,539 | |
| EZCORP, Inc., Cl. A1 | | | 59,014 | | | | 1,384,468 | |
| First Cash Financial Services, Inc.1 | | | 2,180 | | | | 87,571 | |
| World Acceptance Corp.1 | | | 704 | | | | 46,323 | |
| | | | | | |
|
|
|
| | | | | | | | 1,979,901 | |
| Diversified Financial Services—2.4% | | | | | | | | |
| Moody’s Corp. | | | 197,050 | | | | 7,202,178 | |
| MSCI, Inc., Cl. A1 | | | 411,996 | | | | 14,016,104 | |
| NASDAQ OMX Group, Inc. (The) | | | 28,000 | | | | 634,760 | |
| | | | | | |
|
|
|
| | | | | | | | 21,853,042 | |
| Insurance—4.2% | | | | | | | | |
| Allied World Assurance Holdings Ltd. | | | 2,540 | | | | 201,854 | |
| Alterra Capital Holdings Ltd. | | | 117,423 | | | | 2,741,827 | |
| American Equity Investment Life Holding Co. | | | 11,220 | | | | 123,532 | |
| American Financial Group, Inc. | | | 61,618 | | | | 2,417,274 | |
| AmTrust Financial Services, Inc. | | | 154,828 | | | | 4,599,940 | |
| Assurant, Inc. | | | 40,830 | | | | 1,422,517 | |
| Assured Guaranty Ltd. | | | 273 | | | | 3,849 | |
| Brown & Brown, Inc. | | | 177,440 | | | | 4,838,789 | |
| CNO Financial Group, Inc. | | | 245,471 | | | | 1,914,674 | |
| Everest Re Group Ltd. | | | 330 | | | | 34,152 | |
| FBL Financial Group, Inc., Cl. A | | | 6,955 | | | | 194,810 | |
| Greenlight Capital Re Ltd., Cl. A1 | | | 21,710 | | | | 551,868 | |
| Hanover Insurance Group, Inc. | | | 190 | | | | 7,435 | |
| HCC Insurance Holdings, Inc. | | | 67,880 | | | | 2,131,432 | |
| | | | | | | | |
| | | Shares | | | Value | |
| Insurance Continued | | | | | | | | |
| Horace Mann Educators Corp. | | | 76,824 | | | $ | 1,342,884 | |
| Maiden Holdings Ltd. | | | 35,240 | | | | 305,883 | |
| Meadowbrook Insurance Group, Inc. | | | 127,040 | | | | 1,116,682 | |
| Montpelier Re Holdings Ltd. | | | 34,360 | | | | 731,524 | |
| PartnerRe Ltd. | | | 11,740 | | | | 888,366 | |
| Primerica, Inc. | | | 80,435 | | | | 2,150,028 | |
| ProAssurance Corp. | | | 18,176 | | | | 1,619,300 | |
| Protective Life Corp. | | | 45,812 | | | | 1,347,331 | |
| Reinsurance Group of America, Inc. | | | 35,361 | | | | 1,881,559 | |
| RenaissanceRe Holdings Ltd. | | | 17,980 | | | | 1,366,660 | |
| StanCorp Financial Group, Inc. | | | 6,650 | | | | 247,114 | |
| Symetra Financial Corp. | | | 172,303 | | | | 2,174,464 | |
| Torchmark Corp. | | | 34,737 | | | | 1,755,955 | |
| Tower Group, Inc. | | | 8,180 | | | | 170,717 | |
| | | | | | |
|
|
|
| | | | | | | | 38,282,420 | |
| Real Estate Investment Trusts—9.4% | | | | | | | | |
| Acadia Realty Trust | | | 10,610 | | | | 245,940 | |
| American Campus Communities, Inc. | | | 24,817 | | | | 1,116,269 | |
| Apartment Investment & Management Co. | | | 26,880 | | | | 726,566 | |
| Ares Commercial Real Estate Corp. | | | 75,980 | | | | 1,328,130 | |
| BRE Properties, Inc., Cl. A | | | 5,607 | | | | 280,462 | |
| Camden Property Trust | | | 250 | | | | 16,918 | |
| CBL & Associates Properties, Inc. | | | 40,610 | | | | 793,519 | |
| Chatham Lodging Trust | | | 151,450 | | | | 2,162,706 | |
| Colonial Properties Trust | | | 10,050 | | | | 222,507 | |
| CubeSmart | | | 69,761 | | | | 814,111 | |
| CYS Investments, Inc. | | | 388,619 | | | | 5,351,284 | |
| DCT Industrial Trust, Inc. | | | 122,080 | | | | 769,104 | |
| Digital Realty Trust, Inc. | | | 138,435 | | | | 10,392,315 | |
| Douglas Emmett, Inc. | | | 11,330 | | | | 261,723 | |
| Duke Realty Corp. | | | 31,670 | | | | 463,649 | |
| EastGroup Properties, Inc. | | | 37,543 | | | | 2,001,042 | |
| Education Realty Trust, Inc. | | | 37,200 | | | | 412,176 | |
| Essex Property Trust, Inc. | | | 9,019 | | | | 1,388,204 | |
| Extra Space Storage, Inc. | | | 85,796 | | | | 2,625,358 | |
| Federal Realty Investment Trust | | | 18,231 | | | | 1,897,665 | |
| First Industrial Realty Trust, Inc.1 | | | 57,670 | | | | 727,795 | |
| Glimcher Realty Trust | | | 52,240 | | | | 533,893 | |
| Hatteras Financial Corp. | | | 229,270 | | | | 6,557,122 | |
| Healthcare Realty Trust, Inc. | | | 38,220 | | | | 911,165 | |
| Home Properties of New York, Inc. | | | 33,994 | | | | 2,085,872 | |
| LaSalle Hotel Properties | | | 370,486 | | | | 10,795,962 | |
| Liberty Property Trust | | | 29,640 | | | | 1,091,938 | |
8 | OPPENHEIMER MAIN STREET SMALL- & MID-CAP FUND/VA
|
| | | | | | | | |
| | | Shares | | | Value | |
| Real Estate Investment Trusts Continued | | | | | | | | |
| Mid-America Apartment Communities, Inc. | | | 99,135 | | | $ | 6,764,972 | |
| Omega Healthcare Investors, Inc. | | | 34,140 | | | | 768,150 | |
| Post Properties, Inc. | | | 24,329 | | | | 1,190,905 | |
| PS Business Parks, Inc. | | | 17,331 | | | | 1,173,655 | |
| Ramco-Gershenson Properties Trust | | | 58,030 | | | | 729,437 | |
| Realty Income Corp. | | | 26,510 | | | | 1,107,323 | |
| Regency Centers Corp. | | | 23,060 | | | | 1,096,964 | |
| RLJ Lodging Trust | | | 1,950 | | | | 35,354 | |
| Sabra Health Care REIT, Inc. | | | 16,380 | | | | 280,262 | |
| Sovran Self Storage, Inc. | | | 29,839 | | | | 1,494,636 | |
| Starwood Property Trust, Inc. | | | 357,262 | | | | 7,613,253 | |
| Sun Communities, Inc. | | | 27,507 | | | | 1,216,910 | |
| Sunstone Hotel Investors, Inc.1 | | | 52,800 | | | | 580,272 | |
| Tanger Factory Outlet Centers, Inc. | | | 74,187 | | | | 2,377,693 | |
| Taubman Centers, Inc. | | | 33,223 | | | | 2,563,487 | |
| Weingarten Realty Investors | | | 7,030 | | | | 185,170 | |
| | | | | | |
|
|
|
| | | | | | | | 85,151,838 | |
| Real Estate Management & Development—0.0% | |
| Granite Real Estate, Inc. | | | 440 | | | | 14,920 | |
| Thrifts & Mortgage Finance—1.5% | | | | | | | | |
| BankUnited, Inc. | | | 162,805 | | | | 3,838,942 | |
| Flushing Financial Corp. | | | 23,933 | | | | 326,207 | |
| OceanFirst Financial Corp. | | | 17,040 | | | | 244,694 | |
| Ocwen Financial Corp.1 | | | 296,170 | | | | 5,562,073 | |
| Oritani Financial Corp. | | | 209,090 | | | | 3,008,805 | |
| Washington Federal, Inc. | | | 52,240 | | | | 882,334 | |
| | | | | | |
|
|
|
| | | | | | | | 13,863,055 | |
| Health Care—11.3% | | | | | | | | |
| Biotechnology—1.3% | | | | | | | | |
| Achillion Pharmaceuticals, Inc.1 | | | 240,209 | | | | 1,489,296 | |
| Halozyme Therapeutics, Inc.1 | | | 250,182 | | | | 2,216,613 | |
| Indevus Pharmaceuticals, Inc.1 | | | 2,500 | | | | 25 | |
| Medivation, Inc.1 | | | 28,831 | | | | 2,635,153 | |
| Myriad Genetics, Inc.1 | | | 85,323 | | | | 2,028,128 | |
| PDL BioPharma, Inc. | | | 311,849 | | | | 2,067,559 | |
| SciClone Pharmaceuticals, Inc.1 | | | 91,020 | | | | 638,050 | |
| United Therapeutics Corp.1 | | | 16,014 | | | | 790,771 | |
| | | | | | |
|
|
|
| | | | | | | | 11,865,595 | |
| Health Care Equipment & Supplies—1.9% | | | | | |
| ConMed Corp. | | | 54,634 | | | | 1,511,723 | |
| Cyberonics, Inc.1 | | | 14,398 | | | | 647,046 | |
| Dexcom, Inc.1 | | | 364,450 | | | | 4,723,272 | |
| Greatbatch, Inc.1 | | | 196,051 | | | | 4,452,318 | |
| | | | | | | | |
| | | Shares | | | Value | |
| Health Care Equipment & Supplies Continued | | | | | |
| IDEXX Laboratories, Inc.1 | | | 1,225 | | | $ | 117,759 | |
| Orthofix International NV1 | | | 72,350 | | | | 2,984,438 | |
| ResMed, Inc.1 | | | 45,150 | | | | 1,408,680 | |
| RTI Biologics, Inc.1 | | | 171,282 | | | | 644,020 | |
| Steris Corp. | | | 5,680 | | | | 178,182 | |
| Vascular Solutions, Inc.1 | | | 25,920 | | | | 325,555 | |
| Young Innovations, Inc. | | | 10,022 | | | | 345,659 | |
| | | | | | |
|
|
|
| | | | | | | | 17,338,652 | |
| Health Care Providers & Services—4.3% | | | | | | | | |
| AMERIGROUP Corp.1 | | | 74,570 | | | | 4,914,909 | |
| AmSurg Corp.1 | | | 54,191 | | | | 1,624,646 | |
| Assisted Living Concepts, Inc. | | | 37,490 | | | �� | 533,108 | |
| Bio-Reference Laboratories, Inc.1 | | | 43,380 | | | | 1,140,026 | |
| Chemed Corp. | | | 25,040 | | | | 1,513,418 | |
| DaVita, Inc.1 | | | 7,510 | | | | 737,557 | |
| Ensign Group, Inc. (The) | | | 50,390 | | | | 1,424,525 | |
| Hanger Orthopedic Group, Inc.1 | | | 42,030 | | | | 1,077,649 | |
| Health Management Associates, Inc., Cl. A1 | | | 102,750 | | | | 806,588 | |
| HealthSouth Corp.1 | | | 423,380 | | | | 9,847,819 | |
| HMS Holdings Corp.1 | | | 85,339 | | | | 2,842,642 | |
| Laboratory Corp. of America Holdings1 | | | 2,510 | | | | 232,451 | |
| LifePoint Hospitals, Inc.1 | | | 4,331 | | | | 177,484 | |
| Lincare Holdings, Inc. | | | 72,087 | | | | 2,452,400 | |
| Magellan Health Services, Inc.1 | | | 1,651 | | | | 74,840 | |
| Metropolitan Health Networks, Inc.1 | | | 113,954 | | | | 1,090,540 | |
| MModal, Inc.1 | | | 5,880 | | | | 76,322 | |
| Molina Healthcare, Inc.1 | | | 154 | | | | 3,613 | |
| Omnicare, Inc. | | | 38,470 | | | | 1,201,418 | |
| Patterson Cos., Inc. | | | 47,886 | | | | 1,650,630 | |
| PSS World Medical, Inc.1 | | | 7,588 | | | | 159,272 | |
| Schein (Henry), Inc.1 | | | 18,430 | | | | 1,446,571 | |
| Select Medical Holdings Corp.1 | | | 142,132 | | | | 1,436,955 | |
| Skilled Healthcare Group, Inc., Cl. A1 | | | 12,120 | | | | 76,114 | |
| Triple-S Management Corp., Cl. B1 | | | 17,251 | | | | 315,348 | |
| U.S. Physical Therapy, Inc. | | | 36,293 | | | | 922,931 | |
| Universal Health Services, Inc., Cl. B | | | 26,280 | | | | 1,134,245 | |
| | | | | | |
|
|
|
| | | | | | | | 38,914,021 | |
| Health Care Technology—0.8% | | | | | | | | |
| Allscripts Healthcare Solutions, Inc.1 | | | 18,020 | | | | 196,959 | |
| MedAssets, Inc.1 | | | 96,640 | | | | 1,299,808 | |
| Medidata Solutions, Inc.1 | | | 236 | | | | 7,710 | |
| Omnicell, Inc.1 | | | 71,850 | | | | 1,051,884 | |
| SXC Health Solutions Corp.1 | | | 48,800 | | | | 4,841,448 | |
| | | | | | |
|
|
|
| | | | | | | | 7,397,809 | |
9 | OPPENHEIMER MAIN STREET SMALL- & MID-CAP FUND/VA
|
STATEMENT OF INVESTMENTS Unaudited / Continued
| | | | | | | | |
| | | Shares | | | Value | |
| Life Sciences Tools & Services—0.8% | | | | | | | | |
| Bruker Corp.1 | | | 32,820 | | | $ | 436,834 | |
| Cambrex Corp.1 | | | 137,894 | | | | 1,297,583 | |
| Charles River Laboratories International, Inc.1 | | | 19,990 | | | | 654,872 | |
| eResearch Technology, Inc.1 | | | 32,500 | | | | 259,675 | |
| PerkinElmer, Inc. | | | 6 | | | | 155 | |
| Waters Corp.1 | | | 59,105 | | | | 4,697,074 | |
| | | | | | |
|
|
|
| | | | | | | | 7,346,193 | |
| Pharmaceuticals—2.2% | | | | | | | | |
| Endo Pharmaceuticals Holdings, Inc.1 | | | 38,770 | | | | 1,201,095 | |
| MAP Pharmaceuticals, Inc.1 | | | 125,170 | | | | 1,875,047 | |
| Obagi Medical Products, Inc.1 | | | 31,810 | | | | 485,739 | |
| Questcor Pharmaceuticals, Inc.1 | | | 272,580 | | | | 14,512,159 | |
| Santarus, Inc.1 | | | 70,150 | | | | 497,364 | |
| Vivus, Inc.1 | | | 55,630 | | | | 1,587,680 | |
| | | | | | |
|
|
|
| | | | | | | | 20,159,084 | |
| Industrials—15.1% | | | | | | | | |
| Aerospace & Defense—1.3% | |
| B/E Aerospace, Inc.1 | | | 202,180 | | | | 8,827,179 | |
| Curtiss-Wright Corp. | | | 45,497 | | | | 1,412,682 | |
| Exelis, Inc. | | | 12,253 | | | | 120,815 | |
| LMI Aerospace, Inc.1 | | | 14,490 | | | | 251,836 | |
| Moog, Inc., Cl. A1 | | | 37,279 | | | | 1,541,487 | |
| | | | | | |
|
|
|
| | | | | | | | 12,153,999 | |
| Air Freight & Logistics—0.6% | |
| Forward Air Corp. | | | 16,390 | | | | 528,905 | |
| Hub Group, Inc., Cl. A1 | | | 111,518 | | | | 4,036,952 | |
| Park-Ohio Holdings Corp.1 | | | 17,052 | | | | 324,500 | |
| UTi Worldwide, Inc. | | | 41,530 | | | | 606,753 | |
| | | | | | |
|
|
|
| | | | | | | | 5,497,110 | |
| Airlines—0.3% | | | | | | | | |
| Alaska Air Group, Inc.1 | | | 1,650 | | | | 59,235 | |
| Delta Air Lines, Inc.1 | | | 60,950 | | | | 667,403 | |
| JetBlue Airways Corp.1 | | | 216,300 | | | | 1,146,390 | |
| Spirit Airlines, Inc.1 | | | 38,231 | | | | 743,975 | |
| | | | | | |
|
|
|
| | | | | | | | 2,617,003 | |
| Building Products—0.0% | | | | | | | | |
| Gibraltar Industries, Inc.1 | | | 5,980 | | | | 62,072 | |
| Commercial Services & Supplies—2.7% | | | | | | | | |
| Acco Brands Corp.1 | | | 39,600 | | | | 409,464 | |
| Cintas Corp. | | | 39,980 | | | | 1,543,628 | |
| Deluxe Corp. | | | 91,137 | | | | 2,272,957 | |
| Encore Capital Group, Inc.1 | | | 48,071 | | | | 1,423,863 | |
| Intersections, Inc. | | | 32,350 | | | | 512,748 | |
| | | | | | | | |
| | | Shares | | | Value | |
| Commercial Services & Supplies Continued | | | | | |
| Knoll, Inc. | | | 42,519 | | | $ | 570,605 | |
| Miller (Herman), Inc. | | | 47,870 | | | | 886,552 | |
| Mine Safety Appliances Co. | | | 880 | | | | 35,411 | |
| Quad Graphics, Inc. | | | 8,937 | | | | 128,514 | |
| Steelcase, Inc., Cl. A | | | 91,420 | | | | 825,523 | |
| Sykes Enterprises, Inc.1 | | | 27,236 | | | | 434,687 | |
| Tetra Tech, Inc.1 | | | 68,294 | | | | 1,781,108 | |
| Waste Connections, Inc. | | | 453,280 | | | | 13,562,138 | |
| | | | | | |
|
|
|
| | | | | | | | 24,387,198 | |
| Construction & Engineering—1.7% | | | | | | | | |
| Aecom Technology Corp.1 | | | 71,820 | | | | 1,181,439 | |
| Dycom Industries, Inc.1 | | | 10,280 | | | | 191,311 | |
| EMCOR Group, Inc. | | | 3,927 | | | | 109,249 | |
| KBR, Inc. | | | 486,491 | | | | 12,021,193 | |
| Primoris Services Corp. | | | 32,348 | | | | 388,176 | |
| URS Corp. | | | 50,031 | | | | 1,745,081 | |
| | | | | | |
|
|
|
| | | | | | | | 15,636,449 | |
| Electrical Equipment—1.3% | |
| AZZ, Inc. | | | 2,407 | | | | 147,453 | |
| Belden, Inc. | | | 31,100 | | | | 1,037,185 | |
| Brady Corp., Cl. A | | | 35,440 | | | | 974,954 | |
| EnerSys, Inc.1 | | | 43,660 | | | | 1,531,156 | |
| General Cable Corp.1 | | | 78,493 | | | | 2,036,108 | |
| Regal-Beloit Corp. | | | 101,289 | | | | 6,306,253 | |
| | | | | | |
|
|
|
| | | | | | | | 12,033,109 | |
| Industrial Conglomerates—0.1% | | | | | | | | |
| Standex International Corp. | | | 20,056 | | | | 853,784 | |
| Machinery—1.5% | | | | | | | | |
| Actuant Corp., Cl. A | | | 69,970 | | | | 1,900,385 | |
| AGCO Corp.1 | | | 240 | | | | 10,975 | |
| Altra Holdings, Inc. | | | 22,470 | | | | 354,577 | |
| Barnes Group, Inc. | | | 33,830 | | | | 821,731 | |
| Briggs & Stratton Corp. | | | 14,175 | | | | 247,921 | |
| Columbus McKinnon Corp.1 | | | 20,910 | | | | 315,532 | |
| EnPro Industries, Inc.1 | | | 870 | | | | 32,512 | |
| Freightcar America, Inc. | | | 21,090 | | | | 484,437 | |
| Gardner Denver, Inc. | | | 1,235 | | | | 65,344 | |
| Kadant, Inc.1 | | | 31,150 | | | | 730,468 | |
| Kennametal, Inc. | | | 970 | | | | 32,156 | |
| Miller Industries, Inc. | | | 30,206 | | | | 481,182 | |
| NACCO Industries, Inc., Cl. A | | | 4,970 | | | | 577,763 | |
| Navistar International Corp.1 | | | 20,081 | | | | 569,698 | |
| Tennant Co. | | | 1,810 | | | | 72,310 | |
| Toro Co. (The) | | | 1,164 | | | | 85,310 | |
10 | OPPENHEIMER MAIN STREET SMALL- & MID-CAP FUND/VA
|
| | | | | | | | |
| | | Shares | | | Value | |
| Machinery Continued | | | | | | | | |
| TriMas Corp.1 | | | 39,700 | | | $ | 797,970 | |
| Wabtec Corp. | | | 61,079 | | | | 4,764,773 | |
| Watts Water Technologies, Inc., Cl. A | | | 39,790 | | | | 1,326,599 | |
| Xylem, Inc. | | | 5,293 | | | | 133,225 | |
| | | | | | |
|
|
|
| | | | | | | | 13,804,868 | |
| Professional Services—3.1% | |
| Dun & Bradstreet Corp. | | | 1,354 | | | | 96,364 | |
| GP Strategies Corp.1 | | | 34,531 | | | | 637,788 | |
| ICF International, Inc.1 | | | 53,131 | | | | 1,266,643 | |
| Insperity, Inc. | | | 49,228 | | | | 1,331,617 | |
| Kforce, Inc.1 | | | 20,110 | | | | 270,681 | |
| Korn-Ferry International1 | | | 373,481 | | | | 5,359,452 | |
| Navigant Consulting, Inc.1 | | | 74,122 | | | | 936,902 | |
| Robert Half International, Inc. | | | 573,675 | | | | 16,389,895 | |
| TrueBlue, Inc.1 | | | 86,798 | | | | 1,343,633 | |
| | | | | | |
|
|
|
| | | | | | | | 27,632,975 | |
| Road & Rail—2.1% | |
| Celadon Group, Inc. | | | 29,350 | | | | 480,753 | |
| Genesee & Wyoming, Inc., Cl. A1 | | | 103,361 | | | | 5,461,595 | |
| Old Dominion Freight Line, Inc.1 | | | 278,144 | | | | 12,040,854 | |
| Swift Transportation Co.1 | | | 138,430 | | | | 1,308,164 | |
| | | | | | |
|
|
|
| | | | | | | | 19,291,366 | |
| Trading Companies & Distributors—0.4% | |
| Aceto Corp. | | | 6,330 | | | | 57,160 | |
| Applied Industrial Technologies, Inc. | | | 36,653 | | | | 1,350,663 | |
| Beacon Roofing Supply, Inc.1 | | | 73,754 | | | | 1,860,076 | |
| | | | | | |
|
|
|
| | | | | | | | 3,267,899 | |
| Information Technology—14.2% | |
| Communications Equipment—1.9% | | | | | | | | |
| Arris Group, Inc.1 | | | 80,270 | | | | 1,116,556 | |
| Aruba Networks, Inc.1 | | | 371,326 | | | | 5,588,456 | |
| Brocade Communications Systems, Inc.1 | | | 312,872 | | | | 1,542,459 | |
| Emulex Corp.1 | | | 135,510 | | | | 975,672 | |
| Finisar Corp.1 | | | 366,481 | | | | 5,482,556 | |
| Globecomm Systems, Inc.1 | | | 33,659 | | | | 341,302 | |
| Plantronics, Inc. | | | 28,972 | | | | 967,665 | |
| Polycom, Inc.1 | | | 94,660 | | | | 995,823 | |
| | | | | | |
|
|
|
| | | | | | | | 17,010,489 | |
| Computers & Peripherals—1.6% | |
| Diebold, Inc. | | | 31,830 | | | | 1,174,845 | |
| Electronics for Imaging, Inc.1 | | | 85,464 | | | | 1,388,790 | |
| Lexmark International, Inc., Cl. A | | | 3,655 | | | | 97,150 | |
| NCR Corp.1 | | | 69,720 | | | | 1,584,736 | |
| | | | | | | | |
| | | Shares | | | Value | |
| Computers & Peripherals Continued | |
| QLogic Corp.1 | | | 18,417 | | | $ | 252,129 | |
| Western Digital Corp.1 | | | 339,423 | | | | 10,345,613 | |
| | | | | | |
|
|
|
| | | | | | | | 14,843,263 | |
| Electronic Equipment & Instruments—0.4% | |
| Avnet, Inc.1 | | | 6,763 | | | | 208,706 | |
| Celestica, Inc.1 | | | 83,890 | | | | 609,041 | |
| Elster Group SE, ADR1 | | | 48,948 | | | | 993,644 | |
| Flextronics International Ltd.1 | | | 102,010 | | | | 632,462 | |
| GSI Group, Inc.1 | | | 46,190 | | | | 529,337 | |
| Itron, Inc.1 | | | 2,420 | | | | 99,801 | |
| Molex, Inc. | | | 9,450 | | | | 226,233 | |
| MTS Systems Corp. | | | 3,448 | | | | 132,920 | |
| Newport Corp.1 | | | 26,372 | | | | 316,991 | |
| SYNNEX Corp.1 | | | 8,650 | | | | 298,339 | |
| Zygo Corp.1 | | | 6,020 | | | | 107,517 | |
| | | | | | |
|
|
|
| | | | | | | | 4,154,991 | |
| Internet Software & Services—1.0% | |
| Ancestry.com, Inc.1 | | | 12,898 | | | | 355,082 | |
| AOL, Inc.1 | | | 12,898 | | | | 362,176 | |
| Demand Media, Inc.1 | | | 24,678 | | | | 276,394 | |
| Dice Holdings, Inc.1 | | | 82,060 | | | | 770,543 | |
| Digital River, Inc.1 | | | 8,971 | | | | 149,098 | |
| EasyLink Services International Corp.1 | | | 9,490 | | | | 68,708 | |
| IAC/InterActiveCorp | | | 21,450 | | | | 978,120 | |
| j2 Global, Inc. | | | 170,893 | | | | 4,514,993 | |
| Move, Inc.1 | | | 15,470 | | | | 140,932 | |
| Perficient, Inc.1 | | | 6,330 | | | | 71,086 | |
| ValueClick, Inc.1 | | | 79,867 | | | | 1,309,020 | |
| XO Group, Inc.1 | | | 6,370 | | | | 56,502 | |
| | | | | | |
|
|
|
| | | | | | | | 9,052,654 | |
| IT Services—2.9% | | | | | | | | |
| Acxiom Corp.1 | | | 134,812 | | | | 2,037,009 | |
| Alliance Data Systems Corp.1 | | | 920 | | | | 124,200 | |
| Amdocs Ltd.1 | | | 42,358 | | | | 1,258,880 | |
| Booz Allen Hamilton Holding Corp. | | | 92,425 | | | | 1,412,254 | |
| Broadridge Financial Solutions, Inc. | | | 72,375 | | | | 1,539,416 | |
| CACI International, Inc., Cl. A1 | | | 149,784 | | | | 8,241,116 | |
| Convergys Corp. | | | 18,079 | | | | 267,027 | |
| CSG Systems International, Inc.1 | | | 64,466 | | | | 1,113,972 | |
| Euronet Worldwide, Inc.1 | | | 77,436 | | | | 1,325,704 | |
| Genpact Ltd.1 | | | 17,660 | | | | 293,686 | |
| Global Cash Access, Inc.1 | | | 103,790 | | | | 748,326 | |
| Global Payments, Inc. | | | 4,200 | | | | 181,566 | |
11 | OPPENHEIMER MAIN STREET SMALL- & MID-CAP FUND/VA
|
STATEMENT OF INVESTMENTS Unaudited / Continued
| | | | | | | | |
| | | Shares | | | Value | |
| IT Services Continued | | | | | | | | |
| Heartland Payment Systems, Inc. | | | 40,530 | | | $ | 1,219,142 | |
| Henry (Jack) & Associates, Inc. | | | 697 | | | | 24,060 | |
| iGate Corp.1 | | | 41,780 | | | | 711,096 | |
| ManTech International Corp. | | | 11,020 | | | | 258,639 | |
| Maximus, Inc. | | | 24,779 | | | | 1,282,313 | |
| SAIC, Inc. | | | 5,590 | | | | 67,751 | |
| Sapient Corp. | | | 111,570 | | | | 1,123,510 | |
| TeleTech Holdings, Inc.1 | | | 44,380 | | | | 710,080 | |
| TNS, Inc.1 | | | 20,250 | | | | 363,285 | |
| Total System Services, Inc. | | | 71,800 | | | | 1,718,174 | |
| | | | | | |
|
|
|
| | | | | | | | 26,021,206 | |
| Office Electronics—0.1% | | | | | | | | |
| Zebra Technologies Corp., Cl. A1 | | | 19,330 | | | | 664,179 | |
| Semiconductors & Semiconductor Equipment—2.8% | |
| Advanced Micro Devices, Inc.1 | | | 167,810 | | | | 961,551 | |
| Brooks Automation, Inc. | | | 20,738 | | | | 195,767 | |
| Cabot Microelectronics Corp. | | | 2,566 | | | | 74,953 | |
| Cypress Semiconductor Corp. | | | 4,974 | | | | 65,756 | |
| Entegris, Inc.1 | | | 155,840 | | | | 1,330,874 | |
| GT Advanced Technologies, Inc.1 | | | 238,006 | | | | 1,256,672 | |
| Integrated Device Technology, Inc.1 | | | 2,560 | | | | 14,387 | |
| Integrated Silicon Solution, Inc.1 | | | 39,390 | | | | 397,445 | |
| IXYS Corp.1 | | | 51,189 | | | | 571,781 | |
| Magnachip Semiconductor Corp.1 | | | 15,120 | | | | 144,094 | |
| Semtech Corp.1 | | | 466,548 | | | | 11,346,447 | |
| Skyworks Solutions, Inc.1 | | | 351,649 | | | | 9,624,633 | |
| | | | | | |
|
|
|
| | | | | | | | 25,984,360 | |
| Software—3.5% | | | | | | | | |
| Actuate Corp.1 | | | 110,894 | | | | 768,495 | |
| BMC Software, Inc.1 | | | 6,270 | | | | 267,604 | |
| Cadence Design Systems, Inc.1 | | | 164,332 | | | | 1,806,009 | |
| Ebix, Inc. | | | 48,520 | | | | 967,974 | |
| FactSet Research Systems, Inc. | | | 40,383 | | | | 3,753,196 | |
| Fair Isaac Corp. | | | 3,606 | | | | 152,462 | |
| Fortinet, Inc.1 | | | 231,461 | | | | 5,374,524 | |
| Infoblox, Inc.1 | | | 9,130 | | | | 209,351 | |
| JDA Software Group, Inc.1 | | | 5,862 | | | | 174,043 | |
| Manhattan Associates, Inc.1 | | | 2,291 | | | | 104,722 | |
| Mentor Graphics Corp.1 | | | 88,840 | | | | 1,332,600 | |
| Net 1 UEPS Technologies, Inc.1 | | | 63,480 | | | | 531,328 | |
| NetScout Systems, Inc.1 | | | 44,305 | | | | 956,545 | |
| SeaChange International, Inc.1 | | | 37,740 | | | | 310,600 | |
| Splunk, Inc.1 | | | 3,000 | | | | 84,300 | |
| Synopsys, Inc.1 | | | 65,160 | | | | 1,917,659 | |
| | | | | | | | |
| | | Shares | | | Value | |
| Software Continued | | | | | | | | |
| TIBCO Software, Inc.1 | | | 364,616 | | | $ | 10,909,311 | |
| Vasco Data Security International, Inc.1 | | | 45,100 | | | | 368,918 | |
| Websense, Inc.1 | | | 85,776 | | | | 1,606,584 | |
| | | | | | |
|
|
|
| | | | | | | | 31,596,225 | |
| Materials—5.8% | | | | | | | | |
| Chemicals—2.4% | | | | | | | | |
| American Vanguard Corp. | | | 3,311 | | | | 88,039 | |
| Chemtura Corp.1 | | | 48,340 | | | | 700,930 | |
| Cytec Industries, Inc. | | | 108,208 | | | | 6,345,317 | |
| Fuller (H.B.) Co. | | | 68,113 | | | | 2,091,069 | |
| Huntsman Corp. | | | 118,892 | | | | 1,538,462 | |
| Innospec, Inc.1 | | | 20,540 | | | | 608,189 | |
| Koppers Holdings, Inc. | | | 27,827 | | | | 946,118 | |
| Kronos Worldwide, Inc. | | | 70,940 | | | | 1,120,143 | |
| LSB Industries, Inc.1 | | | 10,780 | | | | 333,210 | |
| Methanex Corp. | | | 30,300 | | | | 843,552 | |
| Olin Corp. | | | 71,838 | | | | 1,500,696 | |
| Omnova Solutions, Inc.1 | | | 2,570 | | | | 19,378 | |
| PolyOne Corp. | | | 5 | | | | 68 | |
| Schulman (A.), Inc. | | | 64,768 | | | | 1,285,645 | |
| TPC Group, Inc.1 | | | 7,470 | | | | 276,017 | |
| Tredegar Corp. | | | 8,157 | | | | 118,766 | |
| Valspar Corp. (The) | | | 4,309 | | | | 226,179 | |
| W.R. Grace & Co.1 | | | 76,990 | | | | 3,884,146 | |
| | | | | | |
|
|
|
| | | | | | | | 21,925,924 | |
| Containers & Packaging—1.4% | |
| Ball Corp. | | | 2,644 | | | | 108,536 | |
| Boise, Inc. | | | 28,549 | | | | 187,852 | |
| Graphic Packaging Holding Co.1 | | | 124,947 | | | | 687,209 | |
| Myers Industries, Inc. | | | 51,795 | | | | 888,802 | |
| Packaging Corp. of America | | | 365,050 | | | | 10,309,012 | |
| Silgan Holdings, Inc. | | | 7,784 | | | | 332,299 | |
| | | | | | |
|
|
|
| | | | | | | | 12,513,710 | |
| Metals & Mining—1.3% | | | | | | | | |
| Aurizon Mines Ltd.1 | | | 49,570 | | | | 223,561 | |
| Century Aluminum Co.1 | | | 342,087 | | | | 2,507,498 | |
| Compass Minerals International, Inc. | | | 65,864 | | | | 5,024,106 | |
| Metals USA Holdings Corp.1 | | | 33,180 | | | | 527,894 | |
| Nevsun Resources Ltd. | | | 20,820 | | | | 67,457 | |
| Noranda Aluminum Holding Corp. | | | 23,189 | | | | 184,584 | |
| Steel Dynamics, Inc. | | | 124,743 | | | | 1,465,730 | |
| Worthington Industries, Inc. | | | 103,337 | | | | 2,115,308 | |
| | | | | | |
|
|
|
| | | | | | | | 12,116,138 | |
12 | OPPENHEIMER MAIN STREET SMALL- & MID-CAP FUND/VA
|
| | | | | | | | |
| | | Shares | | | Value | |
| Paper & Forest Products—0.7% | | | | | | | | |
| Buckeye Technologies, Inc. | | | 60,202 | | | $ | 1,715,155 | |
| Glatfelter | | | 116,520 | | | | 1,907,432 | |
| KapStone Paper & Packing Corp.1 | | | 76,430 | | | | 1,211,416 | |
| Neenah Paper, Inc. | | | 33,070 | | | | 882,638 | |
| Schweitzer-Mauduit International, Inc. | | | 10,280 | | | | 700,479 | |
| | | | | | |
|
|
|
| | | | | | | | 6,417,120 | |
| Telecommunication Services—0.4% | |
| Diversified Telecommunication Services—0.2% | |
| Portugal Telecom SA, Sponsored ADR | | | 90,610 | | | | 403,215 | |
| Telecom Corp. of New Zealand Ltd., Sponsored ADR | | | 54,681 | | | | 515,642 | |
| Vonage Holdings Corp.1 | | | 589,148 | | | | 1,184,187 | |
| | | | | | |
|
|
|
| | | | | | | | 2,103,044 | |
| Wireless Telecommunication Services—0.2% | |
| Telephone & Data Systems, Inc. | | | 12,986 | | | | 276,472 | |
| USA Mobility, Inc. | | | 90,266 | | | | 1,160,821 | |
| | | | | | |
|
|
|
| | | | | | | | 1,437,293 | |
| Utilities—3.3% | | | | | | | | |
| Electric Utilities—0.4% | | | | | | | | |
| El Paso Electric Co. | | | 20,740 | | | | 687,738 | |
| NV Energy, Inc. | | | 51,910 | | | | 912,578 | |
| Portland General Electric Co. | | | 73,422 | | | | 1,957,431 | |
| | | | | | |
|
|
|
| | | | | | | | 3,557,747 | |
| | | | | | | | | | |
| | | Shares | | | Value | | | |
| Energy Traders—1.5% | | | | | | | | | | |
| AES Corp. (The)1 | | | 1,050,087 | | | $ | 13,472,616 | | | |
| Gas Utilities���0.1% | | | | | | | | | | |
| UGI Corp. | | | 29,680 | | | | 873,482 | | | |
| Multi-Utilities—0.8% | | | | | | | | | | |
| Avista Corp. | | | 32,100 | | | | 857,070 | | | |
| CenterPoint Energy, Inc. | | | 31,400 | | | | 649,038 | | | |
| CMS Energy Corp. | | | 18,533 | | | | 435,526 | | | |
| NorthWestern Corp. | | | 45,846 | | | | 1,682,548 | | | |
| Teco Energy, Inc. | | | 100,713 | | | | 1,818,877 | | | |
| Vectren Corp. | | | 51,839 | | | | 1,530,287 | | | |
| | | | | | |
|
|
| |
|
| | | | | | | | 6,973,346 | | | |
| Water Utilities—0.5% | | | | | | | | | | |
| American States Water Co. | | | 890 | | | | 35,226 | | | |
| Aqua America, Inc. | | | 191,513 | | | | 4,780,154 | | | |
| | | | | | |
|
|
| |
|
| | | | | | |
| 4,815,380
|
| |
|
Total Common Stocks (Cost $753,392,076) | | | | | | | 879,860,884 | | | |
| Investment Company—3.2% | | | |
| Oppenheimer Institutional Money Market Fund, Cl. E, 0.20%2,3 | | | | | | | | | | |
| (Cost $28,832,820) | | | 28,832,820 | | | | 28,832,820 | | | |
Total Investments, at Value
(Cost $782,224,896) | | | 100.0 | % | | | 908,693,704 | | | |
| Other Assets Net of Liabilities | |
| 0.0
|
| |
| 325,767
|
| |
|
| Net Assets | |
| 100.0
| %
| | $
| 909,019,471
|
| |
|
Footnotes to Statement of Investments
* June 29, 2012 represents the last business day of the Fund’s 2012 semiannual period. See Note 1 of the accompanying Notes.
1. Non-income producing security.
2. Is or was an affiliate, as defined in the Investment Company Act of 1940, at or during the period ended June 29, 2012, by virtue of the Fund owning at least 5% of the voting securities of the issuer or as a result of the Fund and the issuer having the same investment adviser. Transactions during the period in which the issuer was an affiliate are as follows:
| | | | | | | | | | | | | | | | |
| | | Shares
December 30, 2011a | | | Gross
Additions | | | Gross
Reductions | | | Shares
June 29, 2012 | |
| Oppenheimer Institutional Money Market Fund, Cl. E | | | 17,286,356 | | | | 148,578,566 | | | | 137,032,102 | | | | 28,832,820 | |
| | | | |
| | | | | | | | | Value | | | Income | |
| Oppenheimer Institutional Money Market Fund, Cl. E | | | | | | | | | | | $28,832,820 | | | | $27,220 | |
a. December 30, 2011 represents the last business day of the Fund’s 2011 fiscal year. See Note 1 of the accompanying Notes. | |
3. Rate shown is the 7-day yield as of June 29, 2012.
4. Escrow shares received as a result of issuer reorganization.
See accompanying Notes to Financial Statements.
13 | OPPENHEIMER MAIN STREET SMALL- & MID-CAP FUND/VA
|
STATEMENT OF ASSETS AND LIABILITIES Unaudited
| | | | |
| June 29, 20121 | | | |
| Assets | | | |
| Investments, at value—see accompanying statement of investments: | | | | |
| Unaffiliated companies (cost $753,392,076) | | $ | 879,860,884 | |
| Affiliated companies (cost $28,832,820) | |
| 28,832,820
|
|
| | | | 908,693,704 | |
| Cash | | | 912 | |
| Receivables and other assets: | | | | |
| Investments sold | | | 7,064,692 | |
| Dividends | | | 1,203,752 | |
| Shares of beneficial interest sold | | | 542,355 | |
| Other | |
| 27,882
|
|
| Total assets | | | 917,533,297 | |
| Liabilities | | | |
| Payables and other liabilities: | | | | |
| Investments purchased | | | 7,507,891 | |
| Shares of beneficial interest redeemed | | | 555,705 | |
| Shareholder communications | | | 173,366 | |
| Distribution and service plan fees | | | 159,617 | |
| Transfer and shareholder servicing agent fees | | | 71,373 | |
| Trustees’ compensation | | | 19,925 | |
| Other | |
| 25,949
|
|
| Total liabilities | | | 8,513,826 | |
| Net Assets | | $
| 909,019,471
|
|
| Composition of Net Assets | | | |
| Par value of shares of beneficial interest | | $ | 48,879 | |
| Additional paid-in capital | | | 823,590,611 | |
| Accumulated net investment income | | | 2,603,912 | |
| Accumulated net realized loss on investments | | | (43,692,739 | ) |
| Net unrealized appreciation on investments | |
| 126,468,808
|
|
| Net Assets | | $
| 909,019,471
|
|
| Net Asset Value Per Share | | | |
| Non-Service Shares: | | | | |
Net asset value, redemption price per share and offering price per share (based on net assets of $80,592,385
and 4,302,191 shares of beneficial interest outstanding) | | | $18.73 | |
| Service Shares: | | | | |
Net asset value, redemption price per share and offering price per share (based on net assets of $828,427,086
and 44,576,727 shares of beneficial interest outstanding) | | | $18.58 | |
1. June 29, 2012 represents the last business day of the Fund’s 2012 semiannual period. See Note 1 of the accompanying Notes.
See accompanying Notes to Financial Statements.
14 | OPPENHEIMER MAIN STREET SMALL- & MID-CAP FUND/VA
|
STATEMENT OF OPERATIONS Unaudited
| | | | |
| For the Six Months Ended June 29, 20121 | | | |
| Investment Income | | | |
| Dividends: | | | | |
| Unaffiliated companies (net of foreign withholding taxes of $11,246) | | $ | 6,608,964 | |
| Affiliated companies | | | 27,220 | |
| Interest | |
| 406
|
|
| Total investment income | | | 6,636,590 | |
| Expenses | | | |
| Management fees | | | 3,160,862 | |
| Distribution and service plan fees—Service shares | | | 1,040,233 | |
| Transfer and shareholder servicing agent fees: | | | | |
| Non-Service shares | | | 41,095 | |
| Service shares | | | 416,091 | |
| Shareholder communications: | | | | |
| Non-Service shares | | | 2,237 | |
| Service shares | | | 22,561 | |
| Trustees’ compensation | | | 22,652 | |
| Custodian fees and expenses | | | 2,287 | |
| Administration service fees | | | 750 | |
| Other | |
| 60,409
|
|
| Total expenses | | | 4,769,177 | |
| Less waivers and reimbursements of expenses | |
| (71,058
| )
|
| Net expenses | | | 4,698,119 | |
| Net Investment Income | | | 1,938,471 | |
| Realized and Unrealized Gain | | | |
| Net realized gain on investments from unaffiliated companies | | | 41,403,442 | |
| Net change in unrealized appreciation/depreciation on investments | | | 39,183,521 | |
| | |
| Net Increase in Net Assets Resulting from Operations | | $
| 82,525,434
|
|
1. June 29, 2012 represents the last business day of the Fund’s 2012 semiannual period. See Note 1 of the accompanying Notes.
See accompanying Notes to Financial Statements.
15 | OPPENHEIMER MAIN STREET SMALL- & MID-CAP FUND/VA
|
STATEMENTS OF CHANGES IN NET ASSETS
| | | | | | | | |
| | | Six Months
Ended
June 29, 20121
(Unaudited) | | | Year
Ended
December 30,
20111 | |
| Operations | | | | | | |
| Net investment income | | $ | 1,938,471 | | | $ | 3,290,932 | |
| Net realized gain | | | 41,403,442 | | | | 130,521,268 | |
| Net change in unrealized appreciation/depreciation | |
| 39,183,521
|
| |
| (149,938,873
| )
|
| Net increase (decrease) in net assets resulting from operations | | | 82,525,434 | | | | (16,126,673 | ) |
| Dividends and/or Distributions to Shareholders | | | | | | |
| Dividends from net investment income: | | | | | | | | |
| Non-Service shares | | | (465,213 | ) | | | (569,104 | ) |
| Service shares | |
| (2,756,105
| )
| |
| (3,235,789
| )
|
| | | | (3,221,318 | ) | | | (3,804,893 | ) |
| Beneficial Interest Transactions | | | | | | |
| Net decrease in net assets resulting from beneficial interest transactions: | | | | | | | | |
| Non-Service shares | | | (6,033,319 | ) | | | (13,898,613 | ) |
| Service shares | |
| (34,725,412
| )
| |
| (50,982,214
| )
|
| | | | (40,758,731 | ) | | | (64,880,827 | ) |
| Net Assets | | | | | | |
| Total increase (decrease) | | | 38,545,385 | | | | (84,812,393 | ) |
| Beginning of period | |
| 870,474,086
|
| |
| 955,286,479
|
|
| End of period (including accumulated net investment income of $2,603,912 and $3,886,759, respectively) | | $
| 909,019,471
|
| | $
| 870,474,086
|
|
1. June 29, 2012 and December 30, 2011 represent the last business days of the Fund’s respective reporting periods. See Note 1 of the accompanying Notes.
See accompanying Notes to Financial Statements.
16 | OPPENHEIMER MAIN STREET SMALL- & MID-CAP FUND/VA
|
FINANCIAL HIGHLIGHTS
| | | | | | | | | | | | | | | | | | | | | | | | |
| | | Six Month
Ended
June 29, 20121 | | | Year Ended
December 30, | | | Year Ended December 31, | |
| Non-Service Shares | | (Unaudited) | | | 20111 | | | 2010 | | | 2009 | | | 2008 | | | 2007 | |
| | | | | | | | | | | | | | | | | | | | | | | | | |
| Per Share Operating Data | | | | | | | | | | | | | | | | | | |
| Net asset value, beginning of period | | $ | 17.17 | | | $ | 17.66 | | | $ | 14.40 | | | $ | 10.65 | | | $ | 18.20 | | | $ | 19.15 | |
| Income (loss) from investment operations: | | | | | | | | | | | | | | | | | | | | | | | | |
| Net investment income2 | | | .06 | | | | .10 | | | | .10 | | | | .08 | | | | .12 | | | | .09 | |
| Net realized and unrealized gain (loss) | |
| 1.61
|
| |
| (.48
| )
| |
| 3.25
|
| |
| 3.78
|
| |
| (6.73
| )
| |
| (.30
| )
|
| Total from investment operations | | | 1.67 | | | | (.38 | ) | | | 3.35 | | | | 3.86 | | | | (6.61 | ) | | | (.21 | ) |
| Dividends and/or distributions to shareholders: | | | | | | | | | | | | | | | | | | | | | | | | |
| Dividends from net investment income | | | (.11 | ) | | | (.11 | ) | | | (.09 | ) | | | (.11 | ) | | | (.08 | ) | | | (.06 | ) |
| Distributions from net realized gain | |
| —
|
| |
| —
|
| |
| —
|
| |
| —
|
| |
| (.86
| )
| |
| (.68
| )
|
| Total dividends and/or distributions to shareholders | | | (.11 | ) | | | (.11 | ) | | | (.09 | ) | | | (.11 | ) | | | (.94 | ) | | | (.74 | ) |
| Net asset value, end of period | | $
| 18.73
|
| | $
| 17.17
|
| | $
| 17.66
|
| | $
| 14.40
|
| | $
| 10.65
|
| | $
| 18.20
|
|
| Total Return, at Net Asset Value3 | | 9.73% | | | (2.21)% | | | 23.41% | | | 37.20% | | | (37.83)% | | | (1.21)% | |
| | | | | | | | | | | | | | | | | | | | | | | | | |
| Ratios/Supplemental Data | | | | | | | | | | | | | | | | | | |
| Net assets, end of period (in thousands) | | $ | 80,592 | | | $ | 79,722 | | | $ | 95,576 | | | $ | 81,814 | | | $ | 58,478 | | | $ | 93,939 | |
| Average net assets (in thousands) | | $ | 82,653 | | | $ | 86,796 | | | $ | 88,063 | | | $ | 69,585 | | | $ | 80,406 | | | $ | 94,815 | |
| Ratios to average net assets:4 | | | | | | | | | | | | | | | | | | | | | | | | |
| Net investment income | | | 0.66 | % | | | 0.58 | % | | | 0.68 | % | | | 0.71 | % | | | 0.80 | % | | | 0.48 | % |
| Total expenses5 | | | 0.82 | % | | | 0.83 | % | | | 0.85 | % | | | 0.91 | % | | | 0.75 | % | | | 0.73 | % |
| Expenses after payments, waivers and/or reimbursements and reduction to custodian expenses | | | 0.80 | % | | | 0.80 | % | | | 0.80 | % | | | 0.82 | % | | | 0.75 | % | | | 0.73 | % |
| Portfolio turnover rate | | | 41 | % | | | 108 | % | | | 73 | % | | | 140 | % | | | 130 | % | | | 115 | % |
1. June 29, 2012 and December 30, 2011 represent the last business days of the Fund’s respective reporting periods. See Note 1 of the accompanying Notes.
2. Per share amounts calculated based on the average shares outstanding during the period.
3. Assumes an initial investment on the business day before the first day of the fiscal period, with all dividends and distributions reinvested in additional shares on the reinvestment date, and redemption at the net asset value calculated on the last business day of the fiscal period. Total returns are not annualized for periods less than one full year. Total return information does not reflect expenses that apply at the separate account level or to related insurance products. Inclusion of these charges would reduce the total return figures for all periods shown. Returns do not reflect the deduction of taxes that a shareholder would pay on fund distributions or the redemption of fund shares.
4. Annualized for periods less than one full year.
5. Total expenses including indirect expenses from affiliated fund were as follows:
| | | | |
| Six Months Ended June 29, 2012 | | | 0.82 | % |
| Year Ended December 30, 2011 | | | 0.83 | % |
| Year Ended December 31, 2010 | | | 0.85 | % |
| Year Ended December 31, 2009 | | | 0.91 | % |
| Year Ended December 31, 2008 | | | 0.75 | % |
| Year Ended December 31, 2007 | | | 0.73 | % |
See accompanying Notes to Financial Statements.
17 | OPPENHEIMER MAIN STREET SMALL- & MID-CAP FUND/VA
|
FINANCIAL HIGHLIGHTS Continued
| | | | | | | | | | | | | | | | | | | | | | | | |
| | | Six Month
Ended
June 29, 20121 | | | Year Ended
December 30, | | | Year Ended December 31, | |
| Service Shares | | (Unaudited) | | | 20111 | | | 2010 | | | 2009 | | | 2008 | | | 2007 | |
| | | | | | | | | | | | | | | | | | | | | | | | | |
| Per Share Operating Data | | | | | | | | | | | | | | | | | | |
| Net asset value, beginning of period | | | $17.02 | | | | $17.50 | | | | $14.28 | | | | $10.54 | | | | $18.03 | | | | $18.98 | |
| Income (loss) from investment operations: | | | | | | | | | | | | | | | | | | | | | | | | |
| Net investment income2 | | | .04 | | | | .06 | | | | .07 | | | | .05 | | | | .08 | | | | .05 | |
| Net realized and unrealized gain (loss) | |
| 1.58
|
| |
| (.47
| )
| |
| 3.21
|
| |
| 3.76
|
| |
| (6.67
| )
| |
| (.29
| )
|
| Total from investment operations | | | 1.62 | | | | (.41 | ) | | | 3.28 | | | | 3.81 | | | | (6.59 | ) | | | (.24 | ) |
| Dividends and/or distributions to shareholders: | | | | | | | | | | | | | | | | | | | | | | | | |
| Dividends from net investment income | | | (.06 | ) | | | (.07 | ) | | | (.06 | ) | | | (.07 | ) | | | (.04 | ) | | | (.03 | ) |
| Distributions from net realized gain | |
| —
|
| |
| —
|
| |
| —
|
| |
| —
|
| |
| (.86
| )
| |
| (.68
| )
|
| Total dividends and/or distributions to shareholders | | | (.06 | ) | | | (.07 | ) | | | (.06 | ) | | | (.07 | ) | | | (.90 | ) | | | (.71 | ) |
| Net asset value, end of period | |
| $18.58
|
| |
| $17.02
|
| |
| $17.50
|
| |
| $14.28
|
| |
| $10.54
|
| |
| $18.03
|
|
| Total Return, at Net Asset Value3 | | 9.53% | | | (2.38)% | | | 23.06% | | | 36.88% | | | (38.00)% | | | (1.39)% | |
| | | | | | | | | | | | | | | | | | | | | | | | | |
| Ratios/Supplemental Data | | | | | | | | | | | | | | | | | | |
| Net assets, end of period (in thousands) | | $ | 828,427 | | | $ | 790,752 | | | $ | 859,710 | | | $ | 662,347 | | | $ | 551,644 | | | $ | 821,642 | |
| Average net assets (in thousands) | | $ | 836,945 | | | $ | 823,201 | | | $ | 730,069 | | | $ | 612,651 | | | $ | 769,150 | | | $ | 766,102 | |
| Ratios to average net assets:4 | | | | | | | | | | | | | | | | | | | | | | | | |
| Net investment income | | | 0.40 | % | | | 0.34 | % | | | 0.45 | % | | | 0.47 | % | | | 0.52 | % | | | 0.23 | % |
| Total expenses5 | | | 1.07 | % | | | 1.08 | % | | | 1.10 | % | | | 1.15 | % | | | 0.99 | % | | | 0.97 | % |
| Expenses after payments, waivers and/or reimbursements and reduction to custodian expenses | | | 1.05 | % | | | 1.05 | % | | | 1.05 | % | | | 1.07 | % | | | 0.99 | % | | | 0.97 | % |
| Portfolio turnover rate | | | 41 | % | | | 108 | % | | | 73 | % | | | 140 | % | | | 130 | % | | | 115 | % |
1. June 29, 2012 and December 30, 2011 represent the last business days of the Fund’s respective reporting periods. See Note 1 of the accompanying Notes.
2. Per share amounts calculated based on the average shares outstanding during the period.
3. Assumes an initial investment on the business day before the first day of the fiscal period, with all dividends and distributions reinvested in additional shares on the reinvestment date, and redemption at the net asset value calculated on the last business day of the fiscal period. Total returns are not annualized for periods less than one full year. Total return information does not reflect expenses that apply at the separate account level or to related insurance products. Inclusion of these charges would reduce the total return figures for all periods shown. Returns do not reflect the deduction of taxes that a shareholder would pay on fund distributions or the redemption of fund shares.
4. Annualized for periods less than one full year.
5. Total expenses including indirect expenses from affiliated fund were as follows:
| | | | |
| Six Months Ended June 29, 2012 | | | 1.07 | % |
| Year Ended December 30, 2011 | | | 1.08 | % |
| Year Ended December 31, 2010 | | | 1.10 | % |
| Year Ended December 31, 2009 | | | 1.15 | % |
| Year Ended December 31, 2008 | | | 0.99 | % |
| Year Ended December 31, 2007 | | | 0.97 | % |
See accompanying Notes to Financial Statements.
18 | OPPENHEIMER MAIN STREET SMALL- & MID-CAP FUND/VA
|
NOTES TO FINANCIAL STATEMENTS Unaudited
1. Significant Accounting Policies
Oppenheimer Main Street Small- & Mid-Cap Fund/VA (the “Fund”) is a separate series of Oppenheimer Variable Account Funds, a diversified open-end management investment company registered under the Investment Company Act of 1940, as amended. The Fund’s investment objective is to seek capital appreciation. The Fund’s investment adviser is OppenheimerFunds, Inc. (the “Manager”).
The Fund offers two classes of shares. Both classes are sold at their offering price, which is the net asset value per share, to separate investment accounts of participating insurance companies as an underlying investment for variable life insurance policies, variable annuity contracts or other investment products. The class of shares designated as Service shares is subject to a distribution and service plan. Both classes of shares have identical rights and voting privileges with respect to the Fund in general and exclusive voting rights on matters that affect that class alone. Earnings, net assets and net asset value per share may differ due to each class having its own expenses, such as transfer and shareholder servicing agent fees and shareholder communications, directly attributable to that class.
The following is a summary of significant accounting policies consistently followed by the Fund.
Semiannual and Annual Periods. The last day of the Fund’s semiannual period was the last day the New York Stock Exchange was open for trading. The Fund’s financial statements have been presented through that date to maintain consistency with the Fund’s net asset value calculations used for shareholder transactions.
The last day of the Fund’s fiscal year was the last day the New York Stock Exchange was open for trading. The Fund’s financial statements have been presented through that date to maintain consistency with the Fund’s net asset value calculations used for shareholder transactions.
Investment in Oppenheimer Institutional Money Market Fund. The Fund is permitted to invest daily available cash balances in an affiliated money market fund. The Fund may invest the available cash in Class E shares of Oppenheimer Institutional Money Market Fund (“IMMF”) to seek current income while preserving liquidity. IMMF is a registered open-end management investment company, regulated as a money market fund under the Investment Company Act of 1940, as amended. The Manager is also the investment adviser of IMMF. When applicable, the Fund’s investment in IMMF is included in the Statement of Investments. Shares of IMMF are valued at their net asset value per share. As a shareholder, the Fund is subject to its proportional share of IMMF’s Class E expenses, including its management fee. The Manager will waive fees and/or reimburse Fund expenses in an amount equal to the indirect management fees incurred through the Fund’s investment in IMMF.
Allocation of Income, Expenses, Gains and Losses. Income, expenses (other than those attributable to a specific class), gains and losses are allocated on a daily basis to each class of shares based upon the relative proportion of net assets represented by such class. Operating expenses directly attributable to a specific class are charged against the operations of that class.
Federal Taxes. The Fund intends to comply with provisions of the Internal Revenue Code applicable to regulated investment companies and to distribute substantially all of its investment company taxable income, including any net realized gain on investments not offset by capital loss carryforwards, if any, to shareholders. Therefore, no federal income or excise tax provision is required. The Fund files income tax returns in U.S. federal and applicable state jurisdictions. The statute of limitations on the Fund’s tax return filings generally remain open for the three preceding fiscal reporting period ends.
During the fiscal year ended December 30, 2011, the Fund utilized $126,312,039 of capital loss carryforward to offset capital gains realized in that fiscal year. Details of the fiscal year ended December 30, 2011 capital loss carryforwards are included in the table below. Capital loss carryforwards with no expiration, if any, must be utilized prior to those with expiration dates. Capital losses with no expiration will be carried forward to future years if not offset by gains.
| | | | |
| Expiring | | | |
| 2017 | | $ | 80,902,957 | |
19 | OPPENHEIMER MAIN STREET SMALL- & MID-CAP FUND/VA
|
NOTES TO FINANCIAL STATEMENTS Unaudited / Continued
1. Significant Accounting Policies Continued
As of June 29, 2012, it is estimated that the capital loss carryforwards would be $39,499,515 expiring by 2017. The estimated capital loss carryforward represents the carryforward as of the end of the last fiscal year, increased or decreased by capital losses or gains realized in the first six months of the current fiscal year. During the six months ended June 29, 2012, it is estimated that the Fund will utilize $41,403,442 of capital loss carryforward to offset realized capital gains.
Net investment income (loss) and net realized gain (loss) may differ for financial statement and tax purposes. The character of dividends and distributions made during the fiscal year from net investment income or net realized gains may differ from their ultimate characterization for federal income tax purposes. Also, due to timing of dividends and distributions, the fiscal year in which amounts are distributed may differ from the fiscal year in which the income or net realized gain was recorded by the Fund.
The aggregate cost of securities and other investments and the composition of unrealized appreciation and depreciation of securities and other investments for federal income tax purposes as of June 29, 2012 are noted in the following table. The primary difference between book and tax appreciation or depreciation of securities and other investments, if applicable, is attributable to the tax deferral of losses or tax realization of financial statement unrealized gain or loss.
| | | | |
| Federal tax cost of securities | | $ | 787,847,078 | |
| | |
|
|
|
| |
| Gross unrealized appreciation | | $ | 151,497,635 | |
| Gross unrealized depreciation | | | (30,651,009) | |
| | |
|
|
|
| Net unrealized appreciation | | $ | 120,846,626 | |
| | |
|
|
|
Trustees’ Compensation. The Board of Trustees has adopted a compensation deferral plan for independent trustees that enables trustees to elect to defer receipt of all or a portion of the annual compensation they are entitled to receive from the Fund. For purposes of determining the amount owed to the Trustee under the plan, deferred amounts are treated as though equal dollar amounts had been invested in shares of the Fund or in other Oppenheimer funds selected by the Trustee. The Fund purchases shares of the funds selected for deferral by the Trustee in amounts equal to his or her deemed investment, resulting in a Fund asset equal to the deferred compensation liability. Such assets are included as a component of “Other” within the asset section of the Statement of Assets and Liabilities. Deferral of trustees’ fees under the plan will not affect the net assets of the Fund, and will not materially affect the Fund’s assets, liabilities or net investment income per share. Amounts will be deferred until distributed in accordance with the compensation deferral plan.
Dividends and Distributions to Shareholders. Dividends and distributions to shareholders, which are determined in accordance with income tax regulations and may differ from U.S. generally accepted accounting principles, are recorded on the ex-dividend date. Income and capital gain distributions, if any, are declared and paid annually or at other times as deemed necessary by the Manager. The tax character of distributions is determined as of the Fund’s fiscal year end. Therefore, a portion of the Fund’s distributions made to shareholders prior to the Fund’s fiscal year end may ultimately be categorized as a tax return of capital.
Investment Income. Dividend income is recorded on the ex-dividend date or upon ex-dividend notification in the case of certain foreign dividends where the ex-dividend date may have passed. Non-cash dividends included in dividend income, if any, are recorded at the fair market value of the securities received. Interest income is recognized on an accrual basis. Discount and premium, which are included in interest income on the Statement of Operations, are amortized or accreted daily.
Custodian Fees. “Custodian fees and expenses” in the Statement of Operations may include interest expense incurred by the Fund on any cash overdrafts of its custodian account during the period. Such cash overdrafts may result from the effects of failed trades in portfolio securities and from cash outflows resulting from unanticipated shareholder redemption activity. The Fund pays interest to its custodian on such cash overdrafts, to the extent they are not offset by
20 | OPPENHEIMER MAIN STREET SMALL- & MID-CAP FUND/VA
|
positive cash balances maintained by the Fund, at a rate equal to the Federal Funds Rate plus 0.50%. The “Reduction to custodian expenses” line item, if applicable, represents earnings on cash balances maintained by the Fund during the period. Such interest expense and other custodian fees may be paid with these earnings.
Security Transactions. Security transactions are recorded on the trade date. Realized gains and losses on securities sold are determined on the basis of identified cost.
Indemnifications. The Fund’s organizational documents provide current and former trustees and officers with a limited indemnification against liabilities arising in connection with the performance of their duties to the Fund. In the normal course of business, the Fund may also enter into contracts that provide general indemnifications. The Fund’s maximum exposure under these arrangements is unknown as this would be dependent on future claims that may be made against the Fund. The risk of material loss from such claims is considered remote.
Other. The preparation of financial statements in conformity with accounting principles generally accepted in the United States of America requires management to make estimates and assumptions that affect the reported amounts of assets and liabilities and disclosure of contingent assets and liabilities at the date of the financial statements and the reported amounts of increases and decreases in net assets from operations during the reporting period. Actual results could differ from those estimates.
2. Securities Valuation
The Fund calculates the net asset value of its shares as of the close of the New York Stock Exchange (the “Exchange”), normally 4:00 P.M. Eastern time, on each day the Exchange is open for trading.
The Fund’s Board has adopted procedures for the valuation of the Fund’s securities and has delegated the day-to-day responsibility for valuation determinations under those procedures to the Manager. The Manager has established a Valuation Committee which is responsible for determining a “fair valuation” for any security for which market quotations are not “readily available.” The Valuation Committee’s fair valuation determinations are subject to review, approval and ratification by the Fund’s Board at its next regularly scheduled meeting covering the calendar quarter in which the fair valuation was determined.
Valuation Methods and Inputs
Securities are valued using unadjusted quoted market prices, when available, as supplied primarily by third party pricing services or dealers.
The following methodologies are used to determine the market value or the fair value of the types of securities described below:
Securities traded on a registered U.S. securities exchange (including exchange-traded derivatives other than futures and futures options) are valued based on the last sale price of the security reported on the principal exchange on which it is traded, prior to the time when the Fund’s assets are valued. In the absence of a sale, the security is valued at the last sale price on the prior trading day, if it is within the spread of the current day’s closing “bid” and “asked” prices, and if not, at the current day’s closing bid price. A security of a foreign issuer traded on a foreign exchange but not listed on a registered U.S. securities exchange is valued based on the last sale price on the principal exchange on which the security is traded, as identified by the third party pricing service used by the Manager, prior to the time when the Fund’s assets are valued. If the last sale price is unavailable, the security is valued at the most recent official closing price on the principal exchange on which it is traded. If the last sales price or official closing price for a foreign security is not available, the security is valued at the mean between the bid and asked price per the exchange or, if not available from the exchange, obtained from two dealers. If bid and asked prices are not available from either the exchange or two dealers, the security is valued by using one of the following methodologies (listed in order of priority); (1) using a bid from the exchange, (2) the mean between the bid and asked price as provided by a single dealer, or (3) a bid from a single dealer.
21 | OPPENHEIMER MAIN STREET SMALL- & MID-CAP FUND/VA
|
NOTES TO FINANCIAL STATEMENTS Unaudited / Continued
2. Securities Valuation Continued
Shares of a registered investment company that are not traded on an exchange are valued at that investment company’s net asset value per share.
Corporate and government debt securities (of U.S. or foreign issuers) and municipal debt securities, event-linked bonds, loans, mortgage-backed securities, collateralized mortgage obligations, and asset-backed securities are valued at the mean between the “bid” and “asked” prices utilizing evaluated prices obtained from third party pricing services or broker-dealers who may use matrix pricing methods to determine the evaluated prices.
Short-term money market type debt securities with a remaining maturity of sixty days or less are valued at cost adjusted by the amortization of discount or premium to maturity (amortized cost), which approximates market value. Short-term debt securities with a remaining maturity in excess of sixty days are valued at the mean between the “bid” and “asked” prices utilizing evaluated prices obtained from third party pricing services or broker-dealers.
A description of the standard inputs that may generally be considered by the third party pricing vendors in determining their evaluated prices is provided below.
| | |
| Security Type | | Standard inputs generally considered by third-party pricing vendors |
| Corporate debt, government debt, municipal, mortgage-backed and asset-backed securities | | Reported trade data, broker-dealer price quotations, benchmark yields, issuer spreads on comparable securities, the credit quality, yield, maturity, and other appropriate factors. |
| Loans | | Information obtained from market participants regarding reported trade data and broker-dealer price quotations. |
| Event-linked bonds | | Information obtained from market participants regarding reported trade data and broker-dealer price quotations. |
If a market value or price cannot be determined for a security using the methodologies described above, or if, in the “good faith” opinion of the Manager, the market value or price obtained does not constitute a “readily available market quotation,” or a significant event has occurred that would materially affect the value of the security the security is fair valued either (i) by a standardized fair valuation methodology applicable to the security type or the significant event as previously approved by the Valuation Committee and the Fund’s Board or (ii) as determined in good faith by the Manager’s Valuation Committee. The Valuation Committee considers all relevant facts that are reasonably available, through either public information or information available to the Manager, when determining the fair value of a security. Fair value determinations by the Manager are subject to review, approval and ratification by the Fund’s Board at its next regularly scheduled meeting covering the calendar quarter in which the fair valuation was determined. Those fair valuation standardized methodologies include, but are not limited to, valuing securities at the last sale price or initially at cost and subsequently adjusting the value based on: changes in company specific fundamentals, changes in an appropriate securities index, or changes in the value of similar securities which may be further adjusted for any discounts related to security-specific resale restrictions. When possible, such methodologies use observable market inputs such as unadjusted quoted prices of similar securities, observable interest rates, currency rates and yield curves. The methodologies used for valuing securities are not necessarily an indication of the risks associated with investing in those securities nor can it be assured that the Fund can obtain the fair value assigned to a security if it were to sell the security.
To assess the continuing appropriateness of security valuations, the Manager, or its third party service provider who is subject to oversight by the Manager, regularly compares prior day prices, prices on comparable securities, and sale prices to the current day prices and challenges those prices exceeding certain tolerance levels with the third party pricing service or broker source. For those securities valued by fair valuations, whether through a standardized fair valuation methodology or a fair valuation determination, the Valuation Committee reviews and affirms the reasonableness of the valuations based on such methodologies and fair valuation determinations on a regular basis after considering all relevant information that is reasonably available.
22 | OPPENHEIMER MAIN STREET SMALL- & MID-CAP FUND/VA
|
Classifications
Each investment asset or liability of the Fund is assigned a level at measurement date based on the significance and source of the inputs to its valuation. Various data inputs are used in determining the value of each of the Fund’s investments as of the reporting period end. These data inputs are categorized in the following hierarchy under applicable financial accounting standards:
| | 1) | Level 1—unadjusted quoted prices in active markets for identical assets or liabilities (including securities actively traded on a securities exchange) |
| | 2) | Level 2—inputs other than unadjusted quoted prices that are observable for the asset or liability (such as unadjusted quoted prices for similar assets and market corroborated inputs such as interest rates, prepayment speeds, credit risks, etc.) |
| | 3) | Level 3—significant unobservable inputs (including the Manager’s own judgments about assumptions that market participants would use in pricing the asset or liability). |
The inputs used for valuing securities are not necessarily an indication of the risks associated with investing in those securities.
The table below categorizes amounts that are included in the Fund’s Statement of Assets and Liabilities as of June 29, 2012 based on valuation input level:
| | | | | | | | | | | | | | | | |
| | | Level 1—
Unadjusted
Quoted Prices | | | Level 2—
Other Significant
Observable Inputs | | | Level 3—
Significant
Unobservable
Inputs | | | Value | |
| Assets Table | | | | | | | | | | | | | | | | |
| Investments, at Value: | | | | | | | | | | | | | | | | |
| Common Stocks | | | | | | | | | | | | | | | | |
Consumer Discretionary | | $ | 154,914,389 | | | $ | — | | | $ | — | | | $ | 154,914,389 | |
Consumer Staples | | | 18,710,218 | | | | — | | | | — | | | | 18,710,218 | |
Energy | | | 58,520,618 | | | | — | | | | — | | | | 58,520,618 | |
Financials | | | 191,923,306 | | | | — | | | | — | | | | 191,923,306 | |
Health Care | | | 103,021,329 | | | | — | | | | 25 | | | | 103,021,354 | |
Industrials | | | 137,237,832 | | | | — | | | | — | | | | 137,237,832 | |
Information Technology | | | 129,327,367 | | | | — | | | | — | | | | 129,327,367 | |
Materials | | | 52,972,892 | | | | — | | | | — | | | | 52,972,892 | |
Telecommunication Services | | | 3,540,337 | | | | — | | | | — | | | | 3,540,337 | |
Utilities | | | 29,692,571 | | | | — | | | | — | | | | 29,692,571 | |
| Investment Company | | | 28,832,820 | | | | — | | | | — | | | | 28,832,820 | |
| | |
|
|
| |
|
|
| |
|
|
| |
|
|
|
| Total Assets | | $ | 908,693,679 | | | $ | — | | | $ | 25 | | | $ | 908,693,704 | |
| | |
|
|
| |
|
|
| |
|
|
| |
|
|
|
Currency contracts and forwards, if any, are reported at their unrealized appreciation/depreciation at measurement date, which represents the change in the contract’s value from trade date. Futures, if any, are reported at their variation margin at measurement date, which represents the amount due to/from the Fund at that date. All additional assets and liabilities included in the above table are reported at their market value at measurement date.
There have been no significant changes to the fair valuation methodologies of the Fund during the period.
23 | OPPENHEIMER MAIN STREET SMALL- & MID-CAP FUND/VA
|
NOTES TO FINANCIAL STATEMENTS Unaudited / Continued
3. Shares of Beneficial Interest
The Fund has authorized an unlimited number of $0.001 par value shares of beneficial interest of each class. Transactions in shares of beneficial interest were as follows:
| | | | | | | | | | | | | | | | |
| | | Six Months Ended June 29, 2012 | | | Year Ended December 30, 2011 | |
| | | Shares | | | Amount | | | Shares | | | Amount | |
| Non-Service Shares | | | | | | | | | | | | | | | | |
| Sold | | | 407,755 | | | $ | 7,738,228 | | | | 1,642,399 | | | $ | 27,944,106 | |
| Dividends and/or distributions reinvested | | | 25,160 | | | | 465,213 | | | | 30,896 | | | | 569,104 | |
| Redeemed | | | (773,029 | ) | | | (14,236,760 | ) | | | (2,443,618 | ) | | | (42,411,823 | ) |
| | |
|
|
| |
|
|
| |
|
|
| |
|
|
|
| Net decrease | | | (340,114 | ) | | $ | (6,033,319 | ) | | | (770,323 | ) | | $ | (13,898,613 | ) |
| | |
|
|
| |
|
|
| |
|
|
| |
|
|
|
| | | | | | | | | | | | | |
| Service Shares | | | | | | | | | | | | | | | | |
| Sold | | | 2,645,066 | | | $ | 49,062,732 | | | | 6,217,855 | | | $ | 105,066,282 | |
| Dividends and/or distributions reinvested | | | 150,278 | | | | 2,756,105 | | | | 176,916 | | | | 3,235,789 | |
| Redeemed | | | (4,691,537 | ) | | | (86,544,249 | ) | | | (9,038,872 | ) | | | (159,284,285 | ) |
| | |
|
|
| |
|
|
| |
|
|
| |
|
|
|
| Net decrease | | | (1,896,193 | ) | | $ | (34,725,412 | ) | | | (2,644,101 | ) | | $ | (50,982,214 | ) |
| | |
|
|
| |
|
|
| |
|
|
| |
|
|
|
4. Purchases and Sales of Securities
The aggregate cost of purchases and proceeds from sales of securities, other than short-term obligations and investments in IMMF, for the six months ended June 29, 2012, were as follows:
| | | | | | | | |
| | | Purchases | | | Sales | |
| Investment securities | | $ | 367,761,034 | | | $ | 427,063,539 | |
5. Fees and Other Transactions with Affiliates
Management Fees. Under the investment advisory agreement, the Fund pays the Manager a management fee based on the daily net assets of the Fund at an annual rate as shown in the following table:
| | | | |
| Fee Schedule | | | |
| Up to $200 million | | | 0.75 | % |
| Next $200 million | | | 0.72 | |
| Next $200 million | | | 0.69 | |
| Next $200 million | | | 0.66 | |
| Over $800 million | | | 0.60 | |
Administration Service Fees. The Fund pays the Manager a fee of $1,500 per year for preparing and filing the Fund’s tax returns.
Transfer Agent Fees. OppenheimerFunds Services (“OFS”), a division of the Manager, acts as the transfer and shareholder servicing agent for the Fund. For the six months ended June 29, 2012, the Fund paid $459,783 to OFS for services to the Fund.
Distribution and Service Plan for Service Shares. The Fund has adopted a Distribution and Service Plan (the “Plan”) in accordance with Rule 12b-1 under the Investment Company Act of 1940 for Service shares to pay OppenheimerFunds Distributor, Inc. (the “Distributor”), for distribution related services, personal service and account maintenance for the Fund’s Service shares. Under the Plan, payments are made periodically at an annual rate of 0.25% of the daily net assets of Service shares of the Fund. The Distributor currently uses all of those fees to compensate sponsors of the insurance product that offers Fund shares, for providing personal service and maintenance of accounts of their variable contract owners that hold Service shares. These fees are paid out of the Fund’s assets on an on-going basis and increase operating expenses of the Service shares, which results in lower performance compared to the Fund’s shares that are not subject to a service fee. Fees incurred by the Fund under the Plan are detailed in the Statement of Operations.
24 | OPPENHEIMER MAIN STREET SMALL- & MID-CAP FUND/VA
|
Waivers and Reimbursements of Expenses. The Manager has voluntarily agreed to limit the Fund’s total annual operating expenses so that those expenses, as percentages of daily net assets, will not exceed the annual rate of 0.80% for Non-Service shares and 1.05% for Service shares. During the six months ended June 29, 2012, the Manager waived fees and/or reimbursed the Fund $5,306 and $53,313 for Non-Service and Service shares, respectively.
The Manager will waive fees and/or reimburse Fund expenses in an amount equal to the indirect management fees incurred through the Fund’s investment in IMMF. During the six months ended June 29, 2012, the Manager waived fees and/or reimbursed the Fund $12,439 for IMMF management fees.
Some of these undertakings may be modified or terminated at any time; some may not be modified or terminated until after one year from the date of the current prospectus, as indicated therein.
6. Pending Litigation
Since 2009, a number of class action, derivative and individual lawsuits have been pending in federal and state courts against OppenheimerFunds, Inc., the Fund’s investment advisor (the “Manager”), OppenheimerFunds Distributor, Inc., the Fund’s principal underwriter and distributor (the “Distributor”), and certain funds (but not including the Fund) advised by the Manager and distributed by the Distributor (the “Defendant Funds”). Several of these lawsuits also name as defendants certain officers and current and former trustees of the respective Defendant Funds. The lawsuits raise claims under federal securities laws and various states’ securities, consumer protection and common law and allege, among other things, that the disclosure documents of the respective Defendant Funds contained misrepresentations and omissions and that the respective Defendant Funds’ investment policies were not followed. The plaintiffs in these actions seek unspecified damages, equitable relief and awards of attorneys’ fees and litigation expenses.
Other class action and individual lawsuits have been filed since 2008 in various state and federal courts against the Manager and certain of its affiliates by investors seeking to recover investments they allegedly lost as a result of the “Ponzi” scheme run by Bernard L. Madoff and his firm, Bernard L. Madoff Investment Securities, LLC (“BLMIS”). Plaintiffs in these suits allege that they suffered losses as a result of their investments in several funds managed by an affiliate of the Manager and assert a variety of claims, including breach of fiduciary duty, fraud, negligent misrepresentation, unjust enrichment, and violation of federal and state securities laws and regulations, among others. They seek unspecified damages, equitable relief and awards of attorneys’ fees and litigation expenses. Neither the Distributor, nor any of the Oppenheimer mutual funds, their independent trustees or directors are named as defendants in these lawsuits. None of the Oppenheimer mutual funds invested in any funds or accounts managed by Madoff or BLMIS. On February 28, 2011, a stipulation of partial settlement of three groups of consolidated putative class action lawsuits relating to these matters was filed in the U.S. District Court for the Southern District of New York. On August 19, 2011, the court entered an order and final judgment approving the settlement as fair, reasonable and adequate. In September 2011, certain parties filed notices of appeal from the court’s order approving the settlement. On July 29, 2011, a stipulation of settlement between certain affiliates of the Manager and the Trustee appointed under the Securities Investor Protection Act to liquidate BLMIS was filed in the U.S. Bankruptcy Court for the Southern District of New York to resolve purported preference and fraudulent transfer claims by the Trustee. On September 22, 2011, the court entered an order approving the settlement as fair, reasonable and adequate. In October 2011, certain parties filed notices of appeal from the court’s order approving the settlement. The aforementioned settlements do not resolve other outstanding lawsuits against the Manager and its affiliates relating to BLMIS.
On April 16, 2010, a lawsuit was filed in New York state court against the Manager, an affiliate of the Manager and AAArdvark IV Funding Limited (“AAArdvark IV”), an entity advised by the Manager’s affiliate, in connection with investments made by the plaintiffs in AAArdvark IV. Plaintiffs allege breach of contract against the defendants and seek compensatory damages, costs and disbursements, including attorney fees. On July 15, 2011, a lawsuit was filed in New York state court against the Manager, an affiliate of the Manager and AAArdvark Funding Limited (“AAArdvark I”), an entity advised by the Manager’s affiliate, in connection with investments made by the plaintiffs in AAArdvark I. The
25 | OPPENHEIMER MAIN STREET SMALL- & MID-CAP FUND/VA
|
NOTES TO FINANCIAL STATEMENTS Unaudited / Continued
6. Pending Litigation Continued
complaint alleges breach of contract against the defendants and seeks compensatory damages, costs and disbursements, including attorney fees. On November 9, 2011, a lawsuit was filed in New York state court against the Manager, an affiliate of the Manager and AAArdvark XS Funding Limited (“AAArdvark XS”), an entity advised by the Manager’s affiliate, in connection with investments made by the plaintiffs in AAArdvark XS. The complaint alleges breach of contract against the defendants and seeks compensatory damages, costs and disbursements, including attorney fees.
The Manager believes the lawsuits and appeals described above are without legal merit and, with the exception of actions it has settled, is defending against them vigorously. The Defendant Funds’ Boards of Trustees have also engaged counsel to represent the Funds and the present and former Independent Trustees named in those suits. While it is premature to render any opinion as to the outcome in these lawsuits, or whether any costs that the Defendant Funds may bear in defending the suits might not be reimbursed by insurance, the Manager believes that these suits should not impair the ability of the Manager or the Distributor to perform their respective duties to the Fund, and that the outcome of all of the suits together should not have any material effect on the operations of any of the Oppenheimer mutual funds.
26 | OPPENHEIMER MAIN STREET SMALL- & MID-CAP FUND/VA
|
SPECIAL SHAREHOLDER MEETING Unaudited
On February 29, 2012, a shareholder meeting of the Oppenheimer Variable Account Funds, on behalf of Oppenheimer Main Street Small- & Mid-Cap Fund/VA (the “Fund”) was held at which the twelve Trustees identified below were elected to the Trust (Proposal No. 1). At the meeting Proposal No. 2 (including all of its sub-proposals) and Proposal No. 3 were approved as described in the Fund’s proxy statement for that meeting. The following is a report of the votes cast:
| | | | | | | | |
| Nominee/Proposal | | For | | | Withheld | |
| Trustees | | | | | | | | |
| William L. Armstrong | | | 859,155,000 | | | | 36,277,763 | |
| Edward L. Cameron | | | 860,463,149 | | | | 34,969,615 | |
| Jon S. Fossel | | | 861,382,389 | | | | 34,050,375 | |
| Sam Freedman | | | 860,173,958 | | | | 35,258,806 | |
| Richard F. Grabish | | | 862,692,974 | | | | 32,739,789 | |
| Beverly L. Hamilton | | | 862,904,192 | | | | 32,528,571 | |
| Robert J. Malone | | | 862,354,488 | | | | 33,078,275 | |
| F. William Marshall, Jr. | | | 860,997,182 | | | | 34,435,581 | |
| Victoria J. Herget | | | 861,814,105 | | | | 33,618,659 | |
| Karen L. Stuckey | | | 861,434,246 | | | | 33,998,517 | |
| James D. Vaughn | | | 861,208,178 | | | | 34,224,585 | |
| William F. Glavin, Jr. | | | 861,148,846 | | | | 34,283,917 | |
2a: Proposal to revise the fundamental policy relating to borrowing
| | | | | | | | | | | | |
| For | | Against | | | Abstain | | | Broker Non Vote | |
| 42,758,913 | | | 3,026,233 | | | | 1,614,516 | | | | N/A | |
2b: Proposal to revise the fundamental policy relating to concentration of investments
| | | | | | | | | | | | |
| For | | Against | | | Abstain | | | Broker Non Vote | |
| 43,134,628 | | | 2,810,939 | | | | 1,454,096 | | | | N/A | |
2c: Proposal to remove the fundamental policy relating to diversification of investments
| | | | | | | | | | | | |
| For | | Against | | | Abstain | | | Broker Non Vote | |
| 42,630,422 | | | 2,832,322 | | | | 1,936,919 | | | | N/A | |
2d: Proposal to revise the fundamental policy relating to lending
| | | | | | | | | | | | |
| For | | Against | | | Abstain | | | Broker Non Vote | |
| 42,686,633 | | | 3,067,387 | | | | 1,645,643 | | | | N/A | |
2e-1: Proposal to revise the fundamental policy relating to real estate and commodities
| | | | | | | | | | | | |
| For | | Against | | | Abstain | | | Broker Non Vote | |
| 42,608,588 | | | 3,150,739 | | | | 1,640,336 | | | | N/A | |
2e-2: Proposal to remove the additional fundamental policy relating to real estate and commodities
| | | | | | | | | | | | |
| For | | Against | | | Abstain | | | Broker Non Vote | |
| 42,423,409 | | | 3,173,960 | | | | 1,802,294 | | | | N/A | |
27 | OPPENHEIMER MAIN STREET SMALL- & MID-CAP FUND/VA
|
SPECIAL SHAREHOLDER MEETING Unaudited / Continued
2f: Proposal to revise the fundamental policy relating to senior securities
| | | | | | | | | | | | |
| For | | Against | | | Abstain | | | Broker Non Vote | |
| 42,737,238 | | | 3,064,372 | | | | 1,598,053 | | | | N/A | |
2g: Proposal to revise the fundamental policy relating to underwriting
| | | | | | | | | | | | |
| For | | Against | | | Abstain | | | Broker Non Vote | |
| 42,604,242 | | | 3,201,194 | | | | 1,594,227 | | | | N/A | |
2i: Convert the Fund’s investment objective from fundamental to non-fundamental
| | | | | | | | | | | | |
| For | | Against | | | Abstain | | | Broker Non Vote | |
| 42,089,770 | | | 3,179,811 | | | | 2,130,083 | | | | N/A | |
Proposal 3: To approve an Agreement and Plan of Reorganization that provides for the reorganization of a Fund from a Maryland corporation or Massachusetts business trust, as applicable, into a Delaware statutory trust.
| | | | | | | | | | | | |
| For | | Against | | | Abstain | | | Broker Non Vote | |
| 821,085,084 | | | 23,597,959 | | | | 50,749,721 | | | | N/A | |
28 | OPPENHEIMER MAIN STREET SMALL- & MID-CAP FUND/VA
|
PORTFOLIO PROXY VOTING POLICIES AND PROCEDURES;
UPDATES TO STATEMENTS OF INVESTMENTS Unaudited
The Fund has adopted Portfolio Proxy Voting Policies and Procedures under which the Fund votes proxies relating to securities (“portfolio proxies”) held by the Fund. A description of the Fund’s Portfolio Proxy Voting Policies and Procedures is available (i) without charge, upon request, by calling the Fund toll-free at 1.800.525.7048, (ii) on the Fund’s website at oppenheimerfunds.com, and (iii) on the SEC’s website at www.sec.gov. In addition, the Fund is required to file Form N-PX, with its complete proxy voting record for the 12 months ended June 30th, no later than August 31st of each year. The Fund’s voting record is available (i) without charge, upon request, by calling the Fund toll-free at 1.800.525.7048, and (ii) in the Form N-PX filing on the SEC’s website at www.sec.gov.
The Fund files its complete schedule of portfolio holdings with the SEC for the first quarter and the third quarter of each fiscal year on Form N-Q. The Fund’s Form N-Q filings are available on the SEC’s website at www.sec.gov. Those forms may be reviewed and copied at the SEC’s Public Reference Room in Washington, D.C. Information on the operation of the Public Reference Room may be obtained by calling 1-800-SEC-0330.
29 | OPPENHEIMER MAIN STREET SMALL- & MID-CAP FUND/VA
|
OPPENHEIMER MAIN STREET SMALL- & MID-CAP FUND®/VA
| | |
| A Series of Oppenheimer Variable Account Funds |
| Trustees and Officers | | William L. Armstrong, Chairman of the Board of Trustees and Trustee Edward L. Cameron, Trustee Jon S. Fossel, Trustee Sam Freedman, Trustee Richard F. Grabish, Trustee Beverly L. Hamilton, Trustee Victoria J. Herget, Trustee Robert J. Malone, Trustee F. William Marshall, Jr., Trustee Karen L. Stuckey, Trustee James D. Vaughn, Trustee William F. Glavin, Jr., Trustee, President and Principal Executive Officer Matthew P. Ziehl, Vice President Raymond Anello, Vice President Raman Vardharaj, Vice President Arthur S. Gabinet, Secretary and Chief Legal Officer Christina M. Nasta, Vice President and Chief Business Officer Mark S. Vandehey, Vice President and Chief Compliance Officer Brian W. Wixted, Treasurer and Principal Financial & Accounting Officer |
| Manager | | OppenheimerFunds, Inc. |
| Distributor | | OppenheimerFunds Distributor, Inc. |
| Transfer Agent | | OppenheimerFunds Services |
| Independent Registered Public Accounting Firm | | KPMGLLP |
| Counsel | | K&L Gates LLP |
Before investing, investors should carefully consider a fund’s investment objectives, risks, charges and expenses. Fund prospectuses and summary prospectuses contain this and other information about the funds and may be obtained by asking your financial advisor, or calling us at 1.800.988.8287. Read prospectuses and summary prospectuses carefully before investing
The financial statements included herein have been taken from the records of the Fund without examination of those records by the independent registered public accounting firm.
| | |
| ©2012 OppenheimerFunds, Inc. All rights reserved. | |  |
June 30, 2012
| | | | |
| | | |
| | | Oppenheimer Money Fund/VA A Series of Oppenheimer Variable Account Funds | | Semiannual Report |

SEMIANNUAL REPORT
Fund Performance Discussion
Listing of Investments
Financial Statements

OPPENHEIMER MONEY FUND/VA
Portfolio Managers: Carol Wolf and Christopher Proctor, CFA
| | |
Current Yield
For the 7-Day Period Ended 6/29/121 | | |
| 0.01% | | |
| For the 6-Month Period Ended 6/29/121 |
| 0.01% | | |
The performance data quoted represents past performance, which does not guarantee future results. Yields include dividends in a hypothetical investment for the periods shown. Current performance may be lower or higher than the performance quoted. For performance data current to the most recent month end, call us at 1.800.988.8287. The yields take into account voluntary fee waivers and/or expense reimbursements, without which yields would have been lower. Some of these undertakings may be modified at any time, as indicated in the Fund’s prospectus. There is no guarantee that the Fund will maintain a positive yield. The Fund’s performance should not be expected to be the same as the returns of other funds, whether or not both funds have the same portfolio managers and/or similar names. The Fund’s performance does not include the charges associated with the separate account products that offer this Fund. Such performance would have been lower if such charges were taken into account.
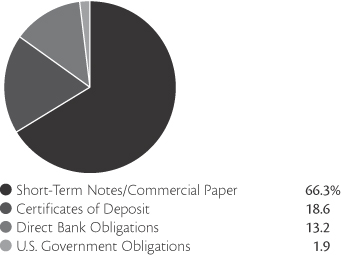
Portfolio holdings and allocations are subject to change. Percentages are as of June 29, 2012, and are based on the total market value of investments.
1. June 29, 2012 was the last business day of the Fund’s semiannual period. See Note 1 of the accompanying Notes to Financial Statements.
2 | OPPENHEIMER MONEY FUND/VA
|
FUND PERFORMANCE DISCUSSION
Although short-term interest rates remained near historical lows throughout the reporting period, the Fund produced competitive levels of current income while maintaining liquidity and a stable net asset value.
Economic and Market Environment
The Fund’s performance over the first half of 2012 was primarily influenced by an unchanged monetary policy from the Federal Reserve (the “Fed”), which maintained its target for short-term interest rates in a range between 0% and 0.25%. This aggressively accommodative policy has been in place since December 2008, and the Fed has indicated that it is likely to remain unchanged for some time to come.
While short-term interest rates remained stable during the reporting period, longer term interest rates exhibited greater levels of volatility as economic expectations changed. 2012 began in the midst of a global economic recovery, as investors were encouraged by improving U.S. economic data and measures by European policymakers to stave off a more serious banking crisis. Meanwhile, inflation in China moderated and the local economy appeared headed for a “soft landing.”
By March, the U.S. unemployment rate had fallen to 8.2% together with the addition of hundreds of thousands of new non-farm jobs to the labor force. However, financial instability resurfaced in Europe, particularly when political developments in Greece brought its austerity programs into question, and fiscal conditions worsened in Italy and Spain. It later was estimated that U.S. GDP growth moderated to a relatively disappointing 1.9% annualized rate during the first quarter of 2012.
These troubling macroeconomic trends intensified in April and May. Although the U.S. unemployment rate fell to 8.1% in April, fewer new jobs were created. In May, the unemployment rate reversed course, ticking upward to 8.2%. June also produced disappointing employment data and manufacturing activity contracted for the first time in approximately three years. However, the long moribund U.S. housing market began to show signs of life as sale prices of single family homes moved higher in the spring.
These developments drove short-term interest rates higher in Europe. In addition, several European banks stopped issuing money market instruments, while others suffered credit-rating downgrades that made their instruments ineligible for U.S. money market funds. A new international banking agreement calling for more stringent capital requirements also reduced the supply of money market instruments. Meanwhile, investor demand remained strong from institutions and individuals seeking capital preservation in a challenging economic climate.
Portfolio Strategy
As might be expected in a volatile and changing market environment, we continued to focus on liquidity and safety throughout the reporting period. We maintained our focus on careful credit analysis, which led us to reduce the Fund’s exposure to European issuers and increase its allocation to issuers in the United States, Canada and Australia. We boosted the Fund’s holdings of commercial paper and variable-rate demand notes (VRDNs) as their yields became more attractive.
We also adopted a more defensive posture with regard to interest-rate sensitivity as economic conditions deteriorated in 2012. Although the Fund began the reporting period with a slightly longer weighted average maturity than market averages, we moved to a relatively shorter position by the reporting period’s end.
As of midyear, we have continued to monitor developments in the global economy, especially with regard to fiscal and monetary policies in Europe and the United States. In our judgment, the Fed is likely to keep short-term interest rates near current levels, suggesting that yields of money market instruments will remain very low compared to long-term historical norms. However, changes in supply-and-demand dynamics, stemming in part from regulatory changes, could give rise to opportunities to capture modestly higher yields. Should such opportunities present themselves, we may increase the Fund’s weighted average maturity. Until then, we expect to retain a conservative investment posture.
3 | OPPENHEIMER MONEY FUND/VA
|
FUND PERFORMANCE DISCUSSION
An investment in the Fund is not insured or guaranteed by the Federal Deposit Insurance Corporation or any other government agency. Although the Fund seeks to preserve the value of your investment at $1.00 per share, it is possible to lose money by investing in the Fund.
Investors should consider the Fund’s investment objective, risks, and charges and expenses carefully before investing. The Fund’s prospectus and summary prospectus contain this and other information about the Fund, and may be obtained by asking your financial advisor or calling us at 1.800.988.8287. Read prospectuses and summary prospectuses carefully before investing.
Shares of Oppenheimer funds are not deposits or obligations of any bank, are not guaranteed by any bank, are not insured by the FDIC or any other agency, and involve investment risks, including the possible loss of the principal amount invested.
4 | OPPENHEIMER MONEY FUND/VA
|
FUND EXPENSES
Fund Expenses. As a shareholder of the Fund, you incur ongoing costs, including management fees; service fees; and other Fund expenses. These examples are intended to help you understand your ongoing costs (in dollars) of investing in the Fund and to compare these costs with the ongoing costs of investing in other mutual funds.
The examples are based on an investment of $1,000.00 invested at the beginning of the period and held for the entire 6-month period ended June 29, 2012.
Actual Expenses. The first section of the table provides information about actual account values and actual expenses. You may use the information in this section, together with the amount you invested, to estimate the expense that you paid over the period. Simply divide your account value by $1,000.00 (for example, an $8,600.00 account value divided by $1,000.00 = 8.60), then multiply the result by the number in the first section under the heading entitled “Expenses Paid During Period” to estimate the expenses you paid on your account during this period.
Hypothetical Example for Comparison Purposes. The second section of the table provides information about hypothetical account values and hypothetical expenses based on the Fund’s actual expense ratio, and an assumed rate of return of 5% per year before expenses, which is not the actual return. The hypothetical account values and expenses may not be used to estimate the actual ending account balance or expenses you paid for the period. You may use this information to compare the ongoing costs of investing in the Fund and other funds. To do so, compare this 5% hypothetical example with the 5% hypothetical examples that appear in the shareholder reports of the other funds.
Please note that the expenses shown in the table are meant to highlight your ongoing costs only and do not reflect any charges associated with the separate accounts that offer this Fund. Therefore, the “hypothetical” lines of the table are useful in comparing ongoing costs only, and will not help you determine the relative total costs of owning different funds. In addition, if these separate account charges were included your costs would have been higher.
| | | | | | | | | | | | |
| Actual | | Beginning
Account
Value
January 1, 2012 | | | Ending
Account
Value
June 29, 2012 | | | Expenses
Paid During 6 Months Ended
June 29, 2012 | |
| | | $ | 1,000.00 | | | $ | 1,000.10 | | | $ | 1.58 | |
| | | |
Hypothetical
(5% return before expenses) | | | | | | | | | |
| | | | 1,000.00 | | | | 1,023.14 | | | | 1.60 | |
Expenses are equal to the Fund’s annualized expense ratio, multiplied by the average account value over the period, multiplied by 181/366 (to reflect the one-half year period). The annualized expense ratio, excluding indirect expenses from affiliated fund, based on the 6-month period ended June 29, 2012 is as follows:
The expense ratio reflects reduction to voluntary waivers and/or reimbursements of expenses by the Fund’s Manager. Some of these undertakings may be modified or terminated at any time, as indicated in the Fund’s prospectus. The “Financial Highlights” table in the Fund’s financial statements, included in this report, also shows the gross expense ratio, without such waivers or reimbursements and reduction to custodian expenses, if applicable.
5 | OPPENHEIMER MONEY FUND/VA
|
STATEMENT OF INVESTMENTS June 29, 2012* / Unaudited
| | | | | | | | | | | | | | | | |
| | | Maturity
Date** | | | Final Legal
Maturity Date*** | | | Principal
Amount | | | Value | |
| | | | | | | | | | | | | | | | | |
| Certificates of Deposit—18.4% | | | | | | | | | | | | | | | | |
| Yankee Certificates of Deposit—18.4% | | | | | | | | | | | | | | | | |
| Bank of Nova Scotia, Houston TX: | | | | | | | | | | | | | | | | |
| 0.33% | | | 12/7/12 | | | | 12/7/12 | | | | $5,000,000 | | | $ | 5,000,000 | |
| 0.34% | | | 12/10/12 | | | | 12/10/12 | | | | 2,000,000 | | | | 2,000,000 | |
| 0.35% | | | 8/8/12 | | | | 8/8/12 | | | | 1,000,000 | | | | 1,000,000 | |
| DnB Bank ASA NY, 0.17% | | | 7/3/12 | | | | 7/3/12 | | | | 4,000,000 | | | | 4,000,000 | |
| Nordea Bank Finland plc, New York, 0.25% | | | 7/10/12 | | | | 7/10/12 | | | | 4,000,000 | | | | 4,000,000 | |
| Rabobank Nederland NV, New York, 0.39% | | | 7/20/12 | | | | 7/20/12 | | | | 3,000,000 | | | | 3,000,000 | |
| Royal Bank of Canada, New York: | | | | | | | | | | | | | | | | |
| 0.49%1 | | | 7/1/12 | | | | 6/7/13 | | | | 3,500,000 | | | | 3,500,000 | |
| 0.54%1 | | | 9/14/12 | | | | 12/11/12 | | | | 3,000,000 | | | | 3,000,000 | |
| 0.77% | | | 11/28/12 | | | | 11/28/12 | | | | 1,300,000 | | | | 1,300,000 | |
| Westpac Banking Corp., New York, 0.24% | | | 10/4/12 | | | | 10/4/12 | | | | 3,000,000 | | | | 3,000,000 | |
| | | | | | | | | | | | | | |
|
|
|
| Total Certificates of Deposit (Cost $29,800,000) | | | | | | | | | | | | | | | 29,800,000 | |
| Direct Bank Obligations—13.1% | | | | | | | | | | | | | | | | |
| Commonwealth Bank of Australia: | | | | | | | | | | | | | | | | |
| 0.23%2 | | | 9/6/12 | | | | 9/6/12 | | | | 2,500,000 | | | | 2,498,930 | |
| 0.24%2 | | | 9/7/12 | | | | 9/7/12 | | | | 4,600,000 | | | | 4,597,915 | |
| National Australia Funding (Delaware), Inc.: | | | | | | | | | | | | | | | | |
| 0.20%2 | | | 8/7/12 | | | | 8/7/12 | | | | 2,200,000 | | | | 2,199,548 | |
| 0.32%2 | | | 10/23/12 | | | | 10/23/12 | | | | 3,000,000 | | | | 2,997,008 | |
| Svenska Handelsbanken, Inc., 0.26%2 | | | 7/10/12 | | | | 7/10/12 | | | | 3,700,000 | | | | 3,699,760 | |
| Toronto Dominion Holdings USA, Inc., 0.20%2 | | | 9/5/12 | | | | 9/5/12 | | | | 5,200,000 | | | | 5,198,093 | |
| | | | | | | | | | | | | | |
|
|
|
| Total Direct Bank Obligations (Cost $21,191,254) | | | | | | | | | | | | | | | 21,191,254 | |
| Short-Term Notes/Commercial Paper—65.6% | | | | | | | | | | | | | | | | |
| Banks—2.6% | | | | | | | | | | | | | | | | |
| HSBC USA, Inc., 0.28% | | | 7/23/12 | | | | 7/23/12 | | | | 2,700,000 | | | | 2,699,538 | |
| PNC Bank NA, 0.21% | | | 7/23/12 | | | | 7/23/12 | | | | 1,500,000 | | | | 1,499,808 | |
| | | | | | | | | | | | | | |
|
|
|
| | | | | | | | | | | | | | | | 4,199,346 | |
| Diversified Financial Services—3.5% | | | | | | | | | | | | | | | | |
| General Electric Capital Corp.: | | | | | | | | | | | | | | | | |
| 0.32% | | | 8/3/12 | | | | 8/3/12 | | | | 1,600,000 | | | | 1,599,531 | |
| 0.33% | | | 10/29/12 | | | | 10/29/12 | | | | 4,000,000 | | | | 3,995,600 | |
| | | | | | | | | | | | | | |
|
|
|
| | | | | | | | | | | | | | | | 5,595,131 | |
| Food Products—2.0% | | | | | | | | | | | | | | | | |
| Nestle Financial International Ltd., 0.19% | | | 7/17/12 | | | | 7/17/12 | | | | 3,300,000 | | | | 3,299,721 | |
| Leasing & Factoring—5.9% | | | | | | | | | | | | | | | | |
| American Honda Finance Corp., 0.71%1,3 | | | 9/26/12 | | | | 9/26/12 | | | | 1,500,000 | | | | 1,500,000 | |
| Toyota Motor Credit Corp.: | | | | | | | | | | | | | | | | |
| 0.63% | | | 2/6/13 | | | | 2/6/13 | | | | 2,700,000 | | | | 2,689,605 | |
| 0.67%1 | | | 7/18/12 | | | | 10/18/12 | | | | 3,000,000 | | | | 3,000,000 | |
| 0.67%1 | | | 9/21/12 | | | | 12/17/12 | | | | 2,300,000 | | | | 2,300,000 | |
| | | | | | | | | | | | | | |
|
|
|
| | | | | | | | | | | | | | | | 9,489,605 | |
6 | OPPENHEIMER MONEY FUND/VA
|
| | | | | | | | | | | | | | | | |
| | | Maturity
Date** | | | Final Legal
Maturity Date*** | | | Principal
Amount | | | Value | |
| | | | | | | | | | | | | | | | | |
| Municipal—13.9% | | | | | | | | | | | | | | | | |
Austin Cnty., TX Industrial Development Corp. Revenue Bonds,
Justin Industries, Inc., Series 1984, 0.18%1 | | | 7/7/12 | | | | 7/7/12 | | | $ | 5,000,000 | | | $ | 5,000,000 | |
Carroll Cnty., KY Solid Waste Disposal Revenue Bonds,
North American Stainless Project, Series 2006, 0.20%1 | | | 7/7/12 | | | | 7/7/12 | | | | 4,300,000 | | | | 4,300,000 | |
Chicago, IL Industrial Development Revenue Bonds,
Freedman Seating Co. Project, Series 1998, 0.33%1 | | | 7/7/12 | | | | 7/7/12 | | | | 1,215,000 | | | | 1,215,000 | |
Cobb Cnty., GA Development Authority Revenue Bonds,
Presbyterian Village-Austell, Inc., 0.29%1 | | | 7/7/12 | | | | 7/7/12 | | | | 2,570,000 | | | | 2,570,000 | |
IL Finance Authority, Freedman Seating Co. Project,
Series 2005, 0.33%1 | | | 7/7/12 | | | | 7/7/12 | | | | 1,085,000 | | | | 1,085,000 | |
Jackson Cnty., MO Industrial Development Authority Bonds,
Kansas City Hospice, Inc., Series 2005, 0.30%1 | | | 7/7/12 | | | | 7/7/12 | | | | 5,600,000 | | | | 5,600,000 | |
San Antonio, TX Industrial Development Authority Revenue Bonds,
Tindall Corp. Project, 0.26%1 | | | 7/7/12 | | | | 7/7/12 | | | | 2,700,000 | | | | 2,700,000 | |
| | | | | | | | | | | | | | |
|
|
|
| | | | | | | | | | | | | | | | 22,470,000 | |
| Oil, Gas & Consumable Fuels—4.3% | | | | | | | | | | | | | | | | |
| Total Capital Canada: | | | | | | | | | | | | | | | | |
| 0.20%2 | | | 8/9/12 | | | | 8/9/12 | | | | 4,500,000 | | | | 4,499,025 | |
| 0.23%2 | | | 7/10/12 | | | | 7/10/12 | | | | 2,500,000 | | | | 2,499,856 | |
| | | | | | | | | | | | | | |
|
|
|
| | | | | | | | | | | | | | | | 6,998,881 | |
| Personal Products—4.9% | | | | | | | | | | | | | | | | |
| Reckitt Benckiser Treasury Services plc: | | | | | | | | | | | | | | | | |
| 0.38%2 | | | 11/7/12 | | | | 11/7/12 | | | | 1,000,000 | | | | 998,638 | |
| 0.55%2 | | | 10/11/12 | | | | 10/11/12 | | | | 4,000,000 | | | | 3,993,767 | |
| 0.55%2 | | | 10/18/12 | | | | 10/18/12 | | | | 1,000,000 | | | | 998,335 | |
| 0.70%2 | | | 7/6/12 | | | | 7/6/12 | | | | 2,000,000 | | | | 1,999,806 | |
| | | | | | | | | | | | | | |
|
|
|
| | | | | | | | | | | | | | | | 7,990,546 | |
| Receivables Finance—16.5% | | | | | | | | | | | | | | | | |
| Alpine Securitization Corp.: | | | | | | | | | | | | | | | | |
| 0.18% | | | 7/2/12 | | | | 7/2/12 | | | | 2,800,000 | | | | 2,799,986 | |
| 0.20% | | | 7/18/12 | | | | 7/18/12 | | | | 1,600,000 | | | | 1,599,849 | |
| 0.23% | | | 7/19/12 | | | | 7/19/12 | | | | 3,500,000 | | | | 3,499,598 | |
| Fairway Finance Corp., 0.20%2 | | | 8/17/12 | | | | 8/17/12 | | | | 5,000,000 | | | | 4,998,694 | |
| Gemini Securitization Corp., 0.22%2 | | | 7/2/12 | | | | 7/2/12 | | | | 7,800,000 | | | | 7,799,952 | |
| Market Street Funding LLC, 0.25%2 | | | 9/25/12 | | | | 9/25/12 | | | | 1,000,000 | | | | 999,403 | |
| Mont Blanc Capital Corp.: | | | | | | | | | | | | | | | | |
| 0.22%2 | | | 7/27/12 | | | | 7/27/12 | | | | 1,000,000 | | | | 999,841 | |
| 0.23%2 | | | 7/19/12 | | | | 7/19/12 | | | | 3,000,000 | | | | 2,999,655 | |
| Thunder Bay Funding LLC, 0.23%2,3 | | | 9/24/12 | | | | 9/24/12 | | | | 1,100,000 | | | | 1,099,403 | |
| | | | | | | | | | | | | | |
|
|
|
| | | | | | | | | | | | | | | | 26,796,381 | |
| Special Purpose Financial—12.0% | | | | | | | | | | | | | | | | |
| Concord Minutemen Cap. Corp. LLC: | | | | | | | | | | | | | | | | |
| 0.45% | | | 7/2/12 | | | | 7/2/12 | | | | 1,000,000 | | | | 999,988 | |
| 0.45% | | | 7/11/12 | | | | 7/11/12 | | | | 1,500,000 | | | | 1,499,813 | |
| 0.55% | | | 7/5/12 | | | | 7/5/12 | | | | 3,000,000 | | | | 2,999,817 | |
| Crown Point Capital Co., 0.18% | | | 7/2/12 | | | | 7/2/12 | | | | 5,800,000 | | | | 5,799,966 | |
| FCAR Owner Trust I, 0.27% | | | 9/6/12 | | | | 9/6/12 | | | | 3,000,000 | | | | 2,998,493 | |
7 | OPPENHEIMER MONEY FUND/VA
|
STATEMENT OF INVESTMENTS Unaudited / Continued
| | | | | | | | | | | | | | | | |
| | | Maturity
Date** | | | Final Legal
Maturity Date*** | | | Principal
Amount | | | Value | |
| | | | | | | | | | | | | | | | | |
| Special Purpose Financial Continued | | | | | | | | | | | | | | | | |
| Lexington Parker Capital Co. LLC: | | | | | | | | | | | | | | | | |
| 0.38%2 | | | 8/2/12 | | | | 8/2/12 | | | $ | 3,500,000 | | | $ | 3,498,818 | |
| 0.38%2 | | | 8/6/12 | | | | 8/6/12 | | | | 1,700,000 | | | | 1,699,354 | |
| | | | | | | | | | | | | | |
|
|
|
| | | | | | | | | | | | | | |
| 19,496,249
|
|
| Total Short-Term Notes/Commercial Paper (Cost $106,335,860) | | | | | | | | | | | | | | | 106,335,860 | |
| U.S. Government Obligations—1.8% | | | | | | | | | | | | | | | | |
| U.S. Treasury Nts.: | | | | | | | | | | | | | | | | |
| 0.38% | | | 6/30/13 | | | | 6/30/13 | | | | 2,000,000 | | | | 2,002,978 | |
| 1.00% | | | 7/15/13 | | | | 7/15/13 | | | | 1,000,000 | | | | 1,007,837 | |
| | | | | | | | | | | | | | |
|
|
|
| Total U.S. Government Obligations (Cost $3,010,815) | | | | | | | | | | | | | | | 3,010,815 | |
| Total Investments, at Value (Cost $160,337,929) | | | | | | | | | | | 98.9 | % | | | 160,337,929 | |
| Other Assets Net of Liabilities | | | | | | | | | |
| 1.1
|
| |
| 1,838,791
|
|
| Net Assets | | | | | | | | | |
| 100.0
| %
| | $
| 162,176,720
|
|
Footnotes to Statement of Investments
Short-term notes and direct bank obligations are generally traded on a discount basis; the interest rate shown is the discount rate received by the Fund at the time of purchase. Other securities normally bear interest at the rates shown.
* June 29, 2012 represents the last business day of the Fund’s 2012 semiannual period. See Note 1 of the accompanying Notes.
** The Maturity Date represents the date used to calculate the Fund’s weighted average maturity as determined under Rule 2a-7.
*** If different from the Maturity Date, the Final Legal Maturity Date includes any maturity date extensions which may be affected at the option of the issuer or unconditional payments of principal by the issuer which may be affected at the option of the Fund, and represents the date used to calculate the Fund’s weighted average life as determined under Rule 2a-7.
1. Represents the current interest rate for a variable or increasing rate security.
2. Security issued in an exempt transaction without registration under the Securities Act of 1933. Such securities amount to $60,275,801 or 37.17% of the Fund’s net assets, and have been determined to be liquid pursuant to guidelines adopted by the Board of Trustees.
3. Represents securities sold under Rule 144A, which are exempt from registration under the Securities Act of 1933, as amended. These securities have been determined to be liquid under guidelines established by the Board of Trustees. These securities amount to $2,599,403 or 1.60% of the Fund’s net assets as of June 29, 2012.
See accompanying Notes to Financial Statements
8 | OPPENHEIMER MONEY FUND/VA
|
STATEMENT OF ASSETS AND LIABILITIES Unaudited
| | | | |
| June 29, 20121 | | | |
| Assets | | | |
| Investments, at value (cost $160,337,929)—see accompanying statement of investments | | $ | 160,337,929 | |
| Cash | | | 1,659,910 | |
| Receivables and other assets: | | | | |
| Shares of beneficial interest sold | | | 245,327 | |
| Interest | | | 35,601 | |
| Other | |
| 14,685
|
|
| Total assets | | | 162,293,452 | |
| Liabilities | | | |
| Payables and other liabilities: | | | | |
| Shares of beneficial interest redeemed | | | 76,960 | |
| Transfer and shareholder servicing agent fees | | | 13,273 | |
| Trustees’ compensation | | | 9,659 | |
| Legal, auditing and other professional fees | | | 7,385 | |
| Shareholder communications | | | 4,695 | |
| Dividends | | | 607 | |
| Other | |
| 4,153
|
|
| Total liabilities | | | 116,732 | |
| Net Assets | | $162,176,720
| |
| Composition of Net Assets | | | |
| Par value of shares of beneficial interest | | $ | 162,169 | |
| Additional paid-in capital | | | 162,006,357 | |
| Accumulated net investment income | | | 2,303 | |
| Accumulated net realized gain on investments | |
| 5,891
|
|
| Net Assets—applicable to 162,168,610 shares of beneficial interest outstanding | | $
| 162,176,720
|
|
| Net Asset Value, Redemption Price Per Share and Offering Price Per Share | | | $1.00 | |
1. June 29, 2012 represents the last business day of the Fund’s 2012 semiannual period. See Note 1 of the accompanying Notes.
See accompanying Notes to Financial Statements.
9 | OPPENHEIMER MONEY FUND/VA
|
STATEMENT OF OPERATIONS Unaudited
| | | | |
| For the Six Months Ended June 29, 20121 | | | |
| Investment Income | | | |
| Interest | | $ | 265,825 | |
| Expenses | | | |
| Management fees | | | 360,922 | |
| Transfer and shareholder servicing agent fees | | | 80,204 | |
| Trustees’ compensation | | | 9,752 | |
| Shareholder communications | | | 8,234 | |
| Administration service fees | | | 750 | |
| Custodian fees and expenses | | | 696 | |
| Other | |
| 19,793
|
|
| Total expenses | | | 480,351 | |
| Less waivers and reimbursements of expenses | |
| (222,910
| )
|
| Net expenses | | | 257,441 | |
| Net Investment Income | | | 8,384 | |
| Net Realized Gain on Investments | | | 5,891 | |
| | |
| Net Increase in Net Assets Resulting from Operations | | $
| 14,275
|
|
1. June 29, 2012 represents the last business day of the Fund’s 2012 semiannual period. See Note 1 of the accompanying Notes.
See accompanying Notes to Financial Statements.
10 | OPPENHEIMER MONEY FUND/VA
|
STATEMENTS OF CHANGES IN NET ASSETS
| | | | | | | | |
| | | Six Months
Ended
June 29, 20121
(Unaudited) | | | Year
Ended
December 30,
20111 | |
| Operations | | | | | | |
| Net investment income | | $ | 8,384 | | | $ | 16,277 | |
| Net realized gain | |
| 5,891
|
| |
| 2,219
|
|
| Net increase in net assets resulting from operations | | | 14,275 | | | | 18,496 | |
| Dividends and/or Distributions to Shareholders | | | | | | |
| Dividends from net investment income | | | (8,384 | ) | | | (16,277 | ) |
| Beneficial Interest Transactions | | | | | | |
| Net increase (decrease) in net assets resulting from beneficial interest transactions | | | (1,802,565 | ) | | | 14,274,020 | |
| Net Assets | | | | | | |
| Total increase (decrease) | | | (1,796,674 | ) | | | 14,276,239 | |
| Beginning of period | |
| 163,973,394
|
| |
| 149,697,155
|
|
| End of period (including accumulated net investment income of $2,303 and $2,303, respectively) | | $
| 162,176,720
|
| | $
| 163,973,394
|
|
1. June 29, 2012 and December 30, 2011 represent the last business days of the Fund’s respective reporting periods. See Note 1 of the accompanying Notes.
See accompanying Notes to Financial Statements.
11 | OPPENHEIMER MONEY FUND/VA
|
FINANCIAL HIGHLIGHTS
| | | | | | | | | | | | | | | | | | | | | | | | |
| | | Six Months
Ended
June 29,
20121
(Unaudited) | | | Year Ended
December 30,
20111 | | | Year Ended December 31, | |
| | | | | 2010 | | | 2009 | | | 2008 | | | 2007 | |
| | | | | | | | | | | | | | | | | | | | | | | | | |
| Per Share Operating Data | | | | | | | | | | | | | | | | | | |
| Net asset value, beginning of period | | | $1.00 | | | | $1.00 | | | | $1.00 | | | | $1.00 | | | | $1.00 | | | | $1.00 | |
| Income from investment operations-net investment income and net realized gain2 | | | — | 3 | | | — | 3 | | | — | 3 | | | — | 3 | | | .03 | | | | .05 | |
| Dividends and/or distributions to shareholders: | | | | | | | | | | | | | | | | | | | | | | | | |
| Dividends from net investment income | | | — | 3 | | | — | 3 | | | — | 3 | | | — | 3 | | | (.03 | ) | | | (.05 | ) |
| Distributions from net realized gain | |
| —
|
| |
| —
|
| |
| —
|
| |
| —
|
| |
| —
|
| |
| —
| 3
|
| Total dividends and/or distributions to shareholders | | | — | 3 | | | — | 3 | | | — | 3 | | | — | 3 | | | (.03 | ) | | | (.05 | ) |
| Net asset value, end of period | |
| $1.00
|
| |
| $1.00
|
| |
| $1.00
|
| |
| $1.00
|
| |
| $1.00
|
| |
| $1.00
|
|
| Total Return4 | | 0.01% | | | 0.01% | | | 0.03% | | | 0.32% | | | 2.78% | | | 4.98% | |
| | | | | | | | | | | | | | | | | | | | | | | | | |
| Ratios/Supplemental Data | | | | | | | | | | | | | | | | | | |
| Net assets, end of period (in thousands) | | $ | 162,177 | | | $ | 163,973 | | | $ | 149,697 | | | $ | 180,955 | | | $ | 243,356 | | | $ | 189,749 | |
| Average net assets (in thousands) | | $ | 161,279 | | | $ | 156,127 | | | $ | 164,258 | | | $ | 218,079 | | | $ | 212,564 | | | $ | 181,271 | |
| Ratios to average net assets:5 | | | | | | | | | | | | | | | | | | | | | | | | |
| Net investment income | | | 0.01 | % | | | 0.01 | % | | | 0.01 | % | | | 0.35 | % | | | 2.72 | % | | | 4.86 | % |
| Total expenses | | | 0.60 | % | | | 0.61 | % | | | 0.61 | % | | | 0.57 | % | | | 0.50 | % | | | 0.50 | % |
| Expenses after payments, waivers and/or reimbursements and reduction to custodian expenses | | | 0.32 | % | | | 0.29 | % | | | 0.35 | % | | | 0.48 | % | | | 0.50 | % | | | 0.50 | % |
1. June 29, 2012 and December 30, 2011 represent the last business days of the Fund’s respective reporting periods. See Note 1 of the accompanying Notes.
2. Per share amounts calculated based on the average shares outstanding during the period.
3. Less than $0.005 per share.
4. Assumes an initial investment on the business day before the first day of the fiscal period, with all dividends and distributions reinvested in additional shares on the reinvestment date, and redemption at the net asset value calculated on the last business day of the fiscal period. Total returns are not annualized for periods less than one full year. Total return information does not reflect expenses that apply at the separate account level or to related insurance products. Inclusion of these charges would reduce the total return figures for all periods shown. Returns do not reflect the deduction of taxes that a shareholder would pay on fund distributions or the redemption of fund shares.
5. Annualized for periods less than one full year.
See accompanying Notes to Financial Statements.
12 | OPPENHEIMER MONEY FUND/VA
|
NOTES TO FINANCIAL STATEMENTS Unaudited
1. Significant Accounting Policies
Oppenheimer Money Fund/VA (the “Fund”) is a separate series of Oppenheimer Variable Account Funds, an open-end management investment company registered under the Investment Company Act of 1940, as amended. The Fund’s investment objective is to seek maximum current income from investments in “money market” securities consistent with low capital risk and the maintenance of liquidity. The Fund’s investment adviser is OppenheimerFunds, Inc. (the “Manager”).
The following is a summary of significant accounting policies consistently followed by the Fund.
Semiannual and Annual Periods. The last day of the Fund’s semiannual period was the last day the New York Stock Exchange was open for trading. The Fund’s financial statements have been presented through that date to maintain consistency with the Fund’s net asset value calculations used for shareholder transactions.
The last day of the Fund’s fiscal year was the last day the New York Stock Exchange was open for trading. The Fund’s financial statements have been presented through that date to maintain consistency with the Fund’s net asset value calculations used for shareholder transactions.
Federal Taxes. The Fund intends to comply with provisions of the Internal Revenue Code applicable to regulated investment companies and to distribute substantially all of its investment company taxable income to shareholders. Therefore, no federal income or excise tax provision is required. The Fund files income tax returns in U.S. federal and applicable state jurisdictions. The statute of limitations on the Fund’s tax return filings generally remain open for the three preceding fiscal reporting period ends.
Trustees’ Compensation. The Board of Trustees has adopted a compensation deferral plan for independent trustees that enables trustees to elect to defer receipt of all or a portion of the annual compensation they are entitled to receive from the Fund. For purposes of determining the amount owed to the Trustee under the plan, deferred amounts are treated as though equal dollar amounts had been invested in shares of the Fund or in other Oppenheimer funds selected by the Trustee. The Fund purchases shares of the funds selected for deferral by the Trustee in amounts equal to his or her deemed investment, resulting in a Fund asset equal to the deferred compensation liability. Such assets are included as a component of “Other” within the asset section of the Statement of Assets and Liabilities. Deferral of trustees’ fees under the plan will not affect the net assets of the Fund, and will not materially affect the Fund’s assets, liabilities or net investment income per share. Amounts will be deferred until distributed in accordance with the compensation deferral plan.
Dividends and Distributions to Shareholders. Dividends and distributions to shareholders, which are determined in accordance with income tax regulations and may differ from U.S. generally accepted accounting principles, are recorded on the ex-dividend date. Income distributions, if any, are declared daily and paid monthly. Capital gain distributions, if any, are declared and paid annually but may be paid at other times to maintain the net asset value per share at $1.00. The tax character of distributions is determined as of the Fund’s fiscal year end. Therefore, a portion of the Fund’s distributions made to shareholders prior to the Fund’s fiscal year end may ultimately be categorized as a tax return of capital.
Investment Income. Interest income is recognized on an accrual basis. Discount and premium, which are included in interest income on the Statement of Operations, are amortized or accreted daily.
Custodian Fees. “Custodian fees and expenses” in the Statement of Operations may include interest expense incurred by the Fund on any cash overdrafts of its custodian account during the period. Such cash overdrafts may result from the effects of failed trades in portfolio securities and from cash outflows resulting from unanticipated shareholder redemption activity. The Fund pays interest to its custodian on such cash overdrafts, to the extent they are not offset by positive cash balances maintained by the Fund, at a rate equal to the Federal Funds Rate plus 0.50%. The “Reduction to
13 | OPPENHEIMER MONEY FUND/VA
|
NOTES TO FINANCIAL STATEMENTS Unaudited / Continued
1. Significant Accounting Policies Continued
custodian expenses” line item, if applicable, represents earnings on cash balances maintained by the Fund during the period. Such interest expense and other custodian fees may be paid with these earnings.
Security Transactions. Security transactions are recorded on the trade date. Realized gains and losses on securities sold are determined on the basis of identified cost.
Indemnifications. The Fund’s organizational documents provide current and former trustees and officers with a limited indemnification against liabilities arising in connection with the performance of their duties to the Fund. In the normal course of business, the Fund may also enter into contracts that provide general indemnifications. The Fund’s maximum exposure under these arrangements is unknown as this would be dependent on future claims that may be made against the Fund. The risk of material loss from such claims is considered remote.
Other. The preparation of financial statements in conformity with accounting principles generally accepted in the United States of America requires management to make estimates and assumptions that affect the reported amounts of assets and liabilities and disclosure of contingent assets and liabilities at the date of the financial statements and the reported amounts of increases and decreases in net assets from operations during the reporting period. Actual results could differ from those estimates.
2. Securities Valuation
The Fund calculates the net asset value of its shares as of the close of the New York Stock Exchange (the “Exchange”), normally 4:00 P.M. Eastern time, on each day the Exchange is open for trading.
The Fund’s Board has adopted procedures for the valuation of the Fund’s securities and has delegated the day-to-day responsibility for valuation determinations under those procedures to the Manager. The Manager has established a Valuation Committee which is responsible for determining a “fair valuation” for any security for which market quotations are not “readily available.” The Valuation Committee’s fair valuation determinations are subject to review, approval and ratification by the Fund’s Board at its next regularly scheduled meeting covering the calendar quarter in which the fair valuation was determined.
Valuation Methods and Inputs
Securities are valued at cost adjusted by the amortization of discount or premium to maturity (amortized cost), which approximates market value. If amortized cost is determined not to approximate market value, the fair value of the portfolio securities will be determined under procedures approved by the Fund’s Board of Trustees’.
If a market value or price cannot be determined for a security using the methodologies described above, or if, in the “good faith” opinion of the Manager, the market value or price obtained does not constitute a “readily available market quotation,” or a significant event has occurred that would materially affect the value of the security the security is fair valued either (i) by a standardized fair valuation methodology applicable to the security type or the significant event as previously approved by the Valuation Committee and the Fund’s Board or (ii) as determined in good faith by the Manager’s Valuation Committee. The Valuation Committee considers all relevant facts that are reasonably available, through either public information or information available to the Manager, when determining the fair value of a security. Fair value determinations by the Manager are subject to review, approval and ratification by the Fund’s Board at its next regularly scheduled meeting covering the calendar quarter in which the fair valuation was determined. Those fair valuation standardized methodologies include, but are not limited to, valuing securities at the last sale price or initially at cost and subsequently adjusting the value based on: changes in company specific fundamentals, changes in an appropriate securities index, or changes in the value of similar securities which may be further adjusted for any discounts related to security-specific resale restrictions. When possible, such methodologies use observable market inputs such as unadjusted quoted prices of similar securities, observable interest rates, currency rates and yield curves. The
14 | OPPENHEIMER MONEY FUND/VA
|
methodologies used for valuing securities are not necessarily an indication of the risks associated with investing in those securities nor can it be assured that the Fund can obtain the fair value assigned to a security if it were to sell the security.
To assess the continuing appropriateness of security valuations, the Manager, or its third party service provider who is subject to oversight by the Manager, regularly compares prior day prices, prices on comparable securities, and sale prices to the current day prices and challenges those prices exceeding certain tolerance levels with the third party pricing service or broker source. For those securities valued by fair valuations, whether through a standardized fair valuation methodology or a fair valuation determination, the Valuation Committee reviews and affirms the reasonableness of the valuations based on such methodologies and fair valuation determinations on a regular basis after considering all relevant information that is reasonably available.
Classifications
Each investment asset or liability of the Fund is assigned a level at measurement date based on the significance and source of the inputs to its valuation. Various data inputs are used in determining the value of each of the Fund’s investments as of the reporting period end. These data inputs are categorized in the following hierarchy under applicable financial accounting standards:
| | 1) | Level 1—unadjusted quoted prices in active markets for identical assets or liabilities (including securities actively traded on a securities exchange) |
| | 2) | Level 2—inputs other than unadjusted quoted prices that are observable for the asset or liability (such as unadjusted quoted prices for similar assets and market corroborated inputs such as interest rates, prepayment speeds, credit risks, etc.) |
| | 3) | Level 3—significant unobservable inputs (including the Manager’s own judgments about assumptions that market participants would use in pricing the asset or liability). |
The inputs used for valuing securities are not necessarily an indication of the risks associated with investing in those securities.
The table below categorizes amounts that are included in the Fund’s Statement of Assets and Liabilities as of June 29, 2012 based on valuation input level:
| | | | | | | | | | | | | | | | |
| | | Level 1—
Unadjusted
Quoted Prices | | | Level 2—
Other Significant
Observable Inputs | | | Level 3—
Significant
Unobservable
Inputs | | | Value | |
| Assets Table | | | | | | | | | | | | | | | | |
| Investments, at Value: | | | | | | | | | | | | | | | | |
| Certificates of Deposit | | $ | — | | | $ | 29,800,000 | | | $ | — | | | $ | 29,800,000 | |
| Direct Bank Obligations | | | — | | | | 21,191,254 | | | | — | | | | 21,191,254 | |
| Short-Term Notes/Commercial Paper | | | — | | | | 106,335,860 | | | | — | | | | 106,335,860 | |
| U.S. Government Obligations | | | — | | | | 3,010,815 | | | | — | | | | 3,010,815 | |
| | |
|
|
| |
|
|
| |
|
|
| |
|
|
|
| Total Assets | | $ | — | | | $ | 160,337,929 | | | $ | — | | | $ | 160,337,929 | |
| | |
|
|
| |
|
|
| |
|
|
| |
|
|
|
There have been no significant changes to the fair valuation methodologies of the Fund during the period.
3. Shares of Beneficial Interest
The Fund has authorized an unlimited number of $0.001 par value shares of beneficial interest. Transactions in shares of beneficial interest were as follows:
| | | | | | | | | | | | | | | | |
| | | Six Months Ended June 29, 2012 | | | Year Ended December 30, 2011 | |
| | | Shares | | | Amount | | | Shares | | | Amount | |
| Sold | | | 32,123,803 | | | | $ 32,123,803 | | | | 112,694,489 | | | | $112,694,489 | |
| Dividends and/or distributions reinvested | | | 8,384 | | | | 8,384 | | | | 16,277 | | | | 16,277 | |
| Redeemed | | | (33,934,752 | ) | | | (33,934,752 | ) | | | (98,436,746 | ) | | | (98,436,746 | ) |
| | |
|
|
| |
|
|
| |
|
|
| |
|
|
|
| Net increase (decrease) | | | (1,802,565 | ) | | | $(1,802,565 | ) | | | 14,274,020 | | | | $14,274,020 | |
| | |
|
|
| |
|
|
| |
|
|
| |
|
|
|
15 | OPPENHEIMER MONEY FUND/VA
|
NOTES TO FINANCIAL STATEMENTS Unaudited / Continued
4. Fees and Other Transactions with Affiliates
Management Fees. Under the investment advisory agreement, the Fund pays the Manager a management fee based on the daily net assets of the Fund at an annual rate as shown in the following table:
| | | | |
| Fee Schedule | | | |
| Up to $500 million | | | 0.450 | % |
| Next $500 million | | | 0.425 | |
| Next $500 million | | | 0.400 | |
| Over $1.5 billion | | | 0.375 | |
Administration Service Fees. The Fund pays the Manager a fee of $1,500 per year for preparing and filing the Fund’s tax returns.
Transfer Agent Fees. OppenheimerFunds Services (“OFS”), a division of the Manager, acts as the transfer and shareholder servicing agent for the Fund. For the six months ended June 29, 2012, the Fund paid $81,146 to OFS for services to the Fund.
Waivers and Reimbursements of Expenses. The Manager has voluntarily undertaken to waive fees and/or reimburse expenses to the extent necessary to assist the Fund in attempting to maintain a positive yield. There is no guarantee that the Fund will maintain a positive yield. During the six months ended June 29, 2012, the Manager waived fees and/or reimbursed the Fund $222,910.
The Manager has voluntarily agreed to limit the Fund’s total annual operating expenses so that those expenses, as a percentage of daily net assets, will not exceed the annual rate of 0.50%.
Some of these undertakings may be modified or terminated at any time; some may not be modified or terminated until after one year from the date of the current prospectus, as indicated therein.
5. Pending Litigation
Since 2009, a number of class action, derivative and individual lawsuits have been pending in federal and state courts against OppenheimerFunds, Inc., the Fund’s investment advisor (the “Manager”), OppenheimerFunds Distributor, Inc., the Fund’s principal underwriter and distributor (the “Distributor”), and certain funds (but not including the Fund) advised by the Manager and distributed by the Distributor (the “Defendant Funds”). Several of these lawsuits also name as defendants certain officers and current and former trustees of the respective Defendant Funds. The lawsuits raise claims under federal securities laws and various states’ securities, consumer protection and common law and allege, among other things, that the disclosure documents of the respective Defendant Funds contained misrepresentations and omissions and that the respective Defendant Funds’ investment policies were not followed. The plaintiffs in these actions seek unspecified damages, equitable relief and awards of attorneys’ fees and litigation expenses.
Other class action and individual lawsuits have been filed since 2008 in various state and federal courts against the Manager and certain of its affiliates by investors seeking to recover investments they allegedly lost as a result of the “Ponzi” scheme run by Bernard L. Madoff and his firm, Bernard L. Madoff Investment Securities, LLC (“BLMIS”). Plaintiffs in these suits allege that they suffered losses as a result of their investments in several funds managed by an affiliate of the Manager and assert a variety of claims, including breach of fiduciary duty, fraud, negligent misrepresentation, unjust enrichment, and violation of federal and state securities laws and regulations, among others. They seek unspecified damages, equitable relief and awards of attorneys’ fees and litigation expenses. Neither the Distributor, nor any of the Oppenheimer mutual funds, their independent trustees or directors are named as defendants in these lawsuits. None of the Oppenheimer mutual funds invested in any funds or accounts managed by Madoff or BLMIS. On February 28, 2011, a stipulation of partial settlement of three groups of consolidated putative class action lawsuits relating to these matters was filed in the U.S. District Court for the Southern District of New York. On August 19, 2011, the court entered an order and final judgment approving the settlement as fair, reasonable and adequate. In September 2011, certain parties
16 | OPPENHEIMER MONEY FUND/VA
|
filed notices of appeal from the court’s order approving the settlement. On July 29, 2011, a stipulation of settlement between certain affiliates of the Manager and the Trustee appointed under the Securities Investor Protection Act to liquidate BLMIS was filed in the U.S. Bankruptcy Court for the Southern District of New York to resolve purported preference and fraudulent transfer claims by the Trustee. On September 22, 2011, the court entered an order approving the settlement as fair, reasonable and adequate. In October 2011, certain parties filed notices of appeal from the court’s order approving the settlement. The aforementioned settlements do not resolve other outstanding lawsuits against the Manager and its affiliates relating to BLMIS.
On April 16, 2010, a lawsuit was filed in New York state court against the Manager, an affiliate of the Manager and AAArdvark IV Funding Limited (“AAArdvark IV”), an entity advised by the Manager’s affiliate, in connection with investments made by the plaintiffs in AAArdvark IV. Plaintiffs allege breach of contract against the defendants and seek compensatory damages, costs and disbursements, including attorney fees. On July 15, 2011, a lawsuit was filed in New York state court against the Manager, an affiliate of the Manager and AAArdvark Funding Limited (“AAArdvark I”), an entity advised by the Manager’s affiliate, in connection with investments made by the plaintiffs in AAArdvark I. The complaint alleges breach of contract against the defendants and seeks compensatory damages, costs and disbursements, including attorney fees. On November 9, 2011, a lawsuit was filed in New York state court against the Manager, an affiliate of the Manager and AAArdvark XS Funding Limited (“AAArdvark XS”), an entity advised by the Manager’s affiliate, in connection with investments made by the plaintiffs in AAArdvark XS. The complaint alleges breach of contract against the defendants and seeks compensatory damages, costs and disbursements, including attorney fees.
The Manager believes the lawsuits and appeals described above are without legal merit and, with the exception of actions it has settled, is defending against them vigorously. The Defendant Funds’ Boards of Trustees have also engaged counsel to represent the Funds and the present and former Independent Trustees named in those suits. While it is premature to render any opinion as to the outcome in these lawsuits, or whether any costs that the Defendant Funds may bear in defending the suits might not be reimbursed by insurance, the Manager believes that these suits should not impair the ability of the Manager or the Distributor to perform their respective duties to the Fund, and that the outcome of all of the suits together should not have any material effect on the operations of any of the Oppenheimer mutual funds.
17 | OPPENHEIMER MONEY FUND/VA
|
SPECIAL SHAREHOLDER MEETING Unaudited
On February 29, 2012, a shareholder meeting of the Oppenheimer Variable Account Funds, on behalf of Oppenheimer Money Fund/VA (the “Fund”) was held at which the twelve Trustees identified below were elected to the Trust (Proposal No. 1). At the meeting Proposal No. 2 (including all of its sub-proposals) and Proposal No. 3 were approved as described in the Fund’s proxy statement for that meeting. The following is a report of the votes cast:
| | | | | | | | |
| Nominee/Proposal | | For | | | Withheld | |
| Trustees | | | | | | | | |
| William L. Armstrong | | | 859,155,000 | | | | 36,277,763 | |
| Edward L. Cameron | | | 860,463,149 | | | | 34,969,615 | |
| Jon S. Fossel | | | 861,382,389 | | | | 34,050,375 | |
| Sam Freedman | | | 860,173,958 | | | | 35,258,806 | |
| Richard F. Grabish | | | 862,692,974 | | | | 32,739,789 | |
| Beverly L. Hamilton | | | 862,904,192 | | | | 32,528,571 | |
| Robert J. Malone | | | 862,354,488 | | | | 33,078,275 | |
| F. William Marshall, Jr. | | | 860,997,182 | | | | 34,435,581 | |
| Victoria J. Herget | | | 861,814,105 | | | | 33,618,659 | |
| Karen L. Stuckey | | | 861,434,246 | | | | 33,998,517 | |
| James D. Vaughn | | | 861,208,178 | | | | 34,224,585 | |
| William F. Glavin, Jr. | | | 861,148,846 | | | | 34,283,917 | |
2a: Proposal to revise the fundamental policy relating to borrowing
| | | | | | | | | | | | |
| For | | Against | | | Abstain | | | Broker Non Vote | |
| 143,792,630 | | | 11,761,224 | | | | 7,542,630 | | | | N/A | |
2b: Proposal to revise the fundamental policy relating to concentration of investments
| | | | | | | | | | | | |
| For | | Against | | | Abstain | | | Broker Non Vote | |
| 143,287,584 | | | 12,360,528 | | | | 7,448,372 | | | | N/A | |
2c: Proposal to remove the fundamental policy relating to diversification of investments
| | | | | | | | | | | | |
| For | | Against | | | Abstain | | | Broker Non Vote | |
| 144,220,293 | | | 11,346,635 | | | | 7,529,555 | | | | N/A | |
2d: Proposal to revise the fundamental policy relating to lending
| | | | | | | | | | | | |
| For | | Against | | | Abstain | | | Broker Non Vote | |
| 140,754,722 | | | 11,368,890 | | | | 10,972,872 | | | | N/A | |
2e-1: Proposal to revise the fundamental policy relating to real estate and commodities
| | | | | | | | | | | | |
| For | | Against | | | Abstain | | | Broker Non Vote | |
| 141,638,879 | | | 11,410,951 | | | | 10,046,653 | | | | N/A | |
2e-2: Proposal to remove the additional fundamental policy relating to real estate and commodities
| | | | | | | | | | | | |
| For | | Against | | | Abstain | | | Broker Non Vote | |
| 140,627,091 | | | 12,443,690 | | | | 10,025,703 | | | | N/A | |
18 | OPPENHEIMER MONEY FUND/VA
|
2f: Proposal to revise the fundamental policy relating to senior securities
| | | | | | | | | | | | |
| For | | Against | | | Abstain | | | Broker Non Vote | |
| 140,719,480 | | | 12,149,168 | | | | 10,227,836 | | | | N/A | |
2g: Proposal to revise the fundamental policy relating to underwriting
| | | | | | | | | | | | |
| For | | Against | | | Abstain | | | Broker Non Vote | |
| 141,811,520 | | | 11,135,873 | | | | 10,149,090 | | | | N/A | |
2i: Convert the Fund’s investment objective from fundamental to non-fundamental
| | | | | | | | | | | | |
| For | | Against | | | Abstain | | | Broker Non Vote | |
| 141,662,727 | | | 11,475,382 | | | | 9,958,375 | | | | N/A | |
2j: Approve a change in the fund’s investment objective
| | | | | | | | | | | | |
| For | | Against | | | Abstain | | | Broker Non Vote | |
| 141,614,767 | | | 11,573,793 | | | | 9,907,924 | | | | 50,749,721 | |
Proposal 3: To approve an Agreement and Plan of Reorganization that provides for the reorganization of a Fund from a Maryland corporation or Massachusetts business trust, as applicable, into a Delaware statutory trust.
| | | | | | | | | | | | |
| For | | Against | | | Abstain | | | Broker Non Vote | |
| 821,085,084 | | | 23,597,959 | | | | 50,749,721 | | | | 50,749,721 | |
19 | OPPENHEIMER MONEY FUND/VA
|
PORTFOLIO PROXY VOTING POLICIES AND PROCEDURES;
UPDATES TO STATEMENTS OF INVESTMENTS Unaudited
The Fund has adopted Portfolio Proxy Voting Policies and Procedures under which the Fund votes proxies relating to securities (“portfolio proxies”) held by the Fund. A description of the Fund’s Portfolio Proxy Voting Policies and Procedures is available (i) without charge, upon request, by calling the Fund toll-free at 1.800.525.7048, (ii) on the Fund’s website at oppenheimerfunds.com, and (iii) on the SEC’s website at www.sec.gov. In addition, the Fund is required to file Form N-PX, with its complete proxy voting record for the 12 months ended June 30th, no later than August 31st of each year. The Fund’s voting record is available (i) without charge, upon request, by calling the Fund toll-free at 1.800.525.7048, and (ii) in the Form N-PX filing on the SEC’s website at www.sec.gov.
The Fund files its complete schedule of portfolio holdings with the SEC for the first quarter and the third quarter of each fiscal year on Form N-Q. The Fund’s Form N-Q filings are available on the SEC’s website at www.sec.gov. Those forms may be reviewed and copied at the SEC’s Public Reference Room in Washington, D.C. Information on the operation of the Public Reference Room may be obtained by calling 1-800-SEC-0330.
20 | OPPENHEIMER MONEY FUND/VA
|
OPPENHEIMER MONEY FUND/VA
| | |
| A Series of Oppenheimer Variable Account Funds |
| Trustees and Officers | | William L. Armstrong, Chairman of the Board of Trustees and Trustee Edward L. Cameron, Trustee Jon S. Fossel, Trustee Sam Freedman, Trustee Richard F. Grabish, Trustee Beverly L. Hamilton, Trustee Victoria J. Herget, Trustee Robert J. Malone, Trustee F. William Marshall, Jr., Trustee Karen L. Stuckey, Trustee James D. Vaughn, Trustee William F. Glavin, Jr., Trustee, President and Principal Executive Officer Carol E. Wolf, Vice President Christopher Proctor, Vice President Arthur S. Gabinet, Secretary and Chief Legal Officer Christina M. Nasta, Vice President and Chief Business Officer Mark S. Vandehey, Vice President and Chief Compliance Officer Brian W. Wixted, Treasurer and Principal Financial & Accounting Officer |
| Manager | | OppenheimerFunds, Inc. |
| Distributor | | OppenheimerFunds Distributor, Inc. |
| Transfer Agent | | OppenheimerFunds Services |
| Independent Registered Public Accounting Firm | | KPMG LLP |
| Counsel | | K&L Gates LLP |
Before investing, investors should carefully consider a fund’s investment objectives, risks, charges and expenses. Fund prospectuses and summary prospectuses contain this and other information about the funds and may be obtained by asking your financial advisor, or calling us at 1.800.988.8287. Read prospectuses and summary prospectuses carefully before investing.
The financial statements included herein have been taken from the records of the Fund without examination of those records by the independent registered public accounting firm.
| | |
| ©2012 OppenheimerFunds, Inc. All rights reserved. | |  |
June 30, 2012
| | | | |
| | | Oppenheimer Global Strategic Income Fund/VA A Series of Oppenheimer Variable Account Funds | | Semiannual Report |

SEMIANNUAL REPORT
Fund Performance Discussion
Listing of Top Holdings
Financial Statements

OPPENHEIMER GLOBAL STRATEGIC INCOME FUND/VA
Portfolio Managers: Arthur P. Steinmetz, Krishna Memani, Joseph Welsh, CFA and Sara J. Zervos, Ph.D.
| | | | | | |
Cumulative Total Returns For the 6-Month Period Ended 6/29/121 |
| Non-Service Shares | | 6.13% | | | | |
| Service Shares | | 5.92 | | | | |
Average Annual Total Returns For the Periods Ended 6/29/121 | | |
| | | |
| | | 1-Year | | 5-Year | | 10-Year |
| Non-Service Shares | | 2.14% | | 5.77% | | 7.45% |
| Service Shares | | 1.84 | | 5.48 | | 7.14 |
Expense Ratios For the Fiscal Year Ended 12/30/111 | | |
| | | |
| | | Gross Expense
Ratios | | | | Net
Expense
Ratios |
| Non-Service Shares | | 0.78% | | | | 0.72% |
| Service Shares | | 1.03 | | | | 0.97 |
The performance data quoted represents past performance, which does not guarantee future results. The investment return and principal value of an investment in the Fund will fluctuate so that an investor’s shares, when redeemed, may be worth more or less than their original cost. Current performance and expense ratios may be lower or higher than the data quoted. For performance data current to the most recent month end, call us at 1.800.988.8287. The Fund’s total returns should not be expected to be the same as the returns of other funds, whether or not both funds have the same portfolio managers and/or similar names. The Fund’s total returns do not include the charges associated with the separate account products that offer this Fund. Such performance would have been lower if such charges were taken into account. Expense ratios are as stated in the Fund’s prospectus current as of the date of this report. The net expense ratios take into account voluntary fee waivers and/or expense reimbursements, without which performance would have been less. Some of these undertakings may be modified or terminated at any time, as indicated in the Fund’s prospectus.
|
| Portfolio Allocation |
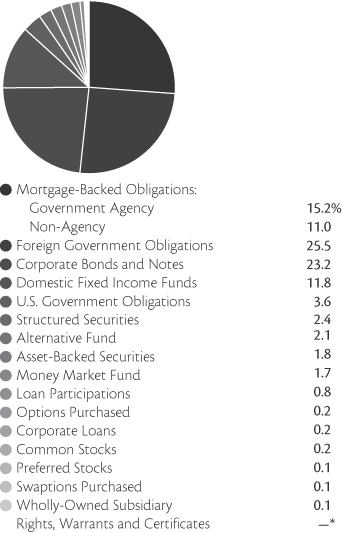
|
*Represents a value of less than 0.05%.
Portfolio holdings and allocations are subject to change. Percentages are as of June 29, 2012, and are based on the total market value of investments.
| | |
| Corporate Bonds & Notes—Top Ten Industries | | |
| Oil, Gas & Consumable Fuels | | 4.6% |
| Commercial Banks | | 3.1 |
| Media | | 1.5 |
| Electric Utilities | | 1.5 |
| Hotels, Restaurants & Leisure | | 1.1 |
| Wireless Telecommunication Services | | 1.0 |
| Diversified Telecommunication Services | | 1.0 |
| Capital Markets | | 0.7 |
| Diversified Financial Services | | 0.6 |
| Food Products | | 0.6 |
Portfolio holdings and allocations are subject to change. Percentages are as of June 29, 2012, and are based on net assets.
2 | OPPENHEIMER GLOBAL STRATEGIC INCOME FUND/VA
|
FUND PERFORMANCE DISCUSSION
For the six-month period, Oppenheimer Global Strategic Income Fund/VA’s Non-Service shares provided a total return of 6.13%. In comparison, the Fund’s benchmarks, the Barclays Capital U.S. Aggregate Bond Index and the Citigroup World Government Bond Index, returned 2.37% and 0.41%, respectively.1
The Fund produced higher returns than its benchmarks in a challenging market environment over the first half of 2012, primarily due to its allocation to credit both in the United States and internationally. A relatively defensive investment posture with regard to foreign currencies also helped fuel the Fund’s performance.
Economic and Market Overview
The reporting period began in the midst of a recovery from severe bouts of weakness in global financial markets, as investors were encouraged by the European Central Bank launching the Long Term Refinancing Operation (LTRO), a sign of apparent progress in addressing the European sovereign debt crisis. China also seemed to make progress in taming inflationary pressures while leaving its economic expansion largely intact, and U.S. employment and manufacturing trends showed marked improvement. These positive developments restored global investors’ appetite for risk, sparking a rebound during the first quarter of 2012 among securities and currencies that had been severely punished during the previous downturn. Yield differences narrowed along the global markets’ credit-quality spectrum, and yields of sovereign bonds from troubled European nations declined to more manageable levels.
However, investor sentiment again weakened early in the second quarter of the year, when U.S employment gains moderated, political developments in Europe threatened to derail proposed bailouts of some of the region’s troubled governments, and the economic slowdown in China appeared to be more severe than expected. While global bond markets again rallied to a degree in the final weeks of the reporting period, renewed market volatility offset a portion of their previous gains, particularly among European sovereign bonds. In contrast, U.S. and international high yield securities held up relatively well, withstanding economic concerns, while yields of U.S. Treasury securities plunged to record lows. Meanwhile, the U.S. dollar strengthened against most foreign currencies over the first half of 2012 as investors increasingly sought traditional safe havens, seemingly without regard to underlying market fundamentals and valuations.
Fund Review
During the reporting period, the Fund had its largest exposure to international bonds, followed by allocations to U.S. high yield securities and U.S. high-grade fixed-income securities. Towards the end of the period, the Fund substantially increased its allocation to U.S. mortgage-backed securities.
The Fund’s below investment grade investments contributed to Fund performance, due to our security selection strategy. An allocation to senior loans, which occupy a more senior position in corporations’ capital structures, also fared well. Our allocation to local currency-denominated debt performed well. We continued to favor countries with positive real interest rates such as Brazil, Mexico and South Africa. An emphasis on the Brazilian real was counterproductive as it ranked among the world’s weaker currencies over the first six months of the year. Overweight exposure to the Mexican peso and Colombian peso had relatively little impact on the Fund’s performance.
Investments in U.S. dollar-denominated debt were positive contributors to Fund performance. Our investments in Venezuelan debt performed well, as yield differences narrowed along the market’s quality spectrum in anticipation of a possible change in political leadership. Emerging market corporate debt also generated positive returns.
Early in the reporting period, we reduced the Fund’s sensitivity to fluctuating currency exchange rates, particularly with respect to developed markets in Europe and Japan. This move helped cushion the Fund from the full brunt of foreign currency weakness stemming from a stronger U.S. dollar compared to the euro. We continued to overweight
1. June 29, 2012 was the last business day of the Fund’s semiannual period. See Note 1 of the accompanying Notes to Financial Statements. Index returns are calculated through June 30, 2012. December 30, 2011 was the last business day of the Fund’s 2011 fiscal year.
3 | OPPENHEIMER GLOBAL STRATEGIC INCOME FUND/VA
|
FUND PERFORMANCE DISCUSSION
emerging markets over developed markets. The Fund also had an allocation to European covered bonds, which are bonds backed by pools of residential mortgage backed-securities. These investments fared well compared to their sovereign counterparts in the region. We were underweight the sovereign debt of Eastern European nations, which helped relative Fund performance as we generally avoided currency plays in this region. Eastern European markets were volatile during the period as a result of proximity to the European Union.
Within high-grade fixed income, we continued to own agency mortgage-backed securities rather than U.S. Treasuries given that prepayments remain low and the housing market may be bottoming. The Fund also had a significant allocation to non-agency mortgage-backed securities and commercial mortgage-backed securities, which generated strong returns over the period.
We reduced the portfolio’s average duration when yields fell to historically low levels, suggesting to us that further declines were unlikely. In hindsight, we made this move too early, as yields did fall further, detracting from the Fund’s relative performance.
Outlook
In our judgment, recent market volatility has created opportunities to purchase fundamentally sound bonds across a variety of markets at attractive valuations. In particular, we believe that economies in the emerging markets are now more resilient than has been the case historically due to banking and financial reforms, greater participation in global trade, relatively light sovereign debt loads, and ample flexibility among central banks to manage monetary policy. Conversely, we have continued to proceed cautiously in developed currency and bond markets. We currently favor credit over high-grade fixed income.
We believe that the economy will continue to improve albeit slowly and China does not have a hard landing. In addition, companies are in good financial shape, have cash on their balance sheets and have taken the opportunity to refinance their debt. In our opinion, this makes for a good environment to take credit risk.
Investors should consider the Fund’s investment objective, risks, and charges and expenses carefully before investing. The Fund’s prospectus and summary prospectus contain this and other information about the Fund, and may be obtained by asking your financial advisor or calling us at 1.800.988.8287. Read prospectuses and summary prospectuses carefully before investing.
Total returns include changes in share price and reinvestment of dividends and capital gains distributions in a hypothetical investment for the periods shown. Cumulative total returns are not annualized.
The Fund’s investment strategy and focus can change over time. The mention of specific fund holdings does not constitute a recommendation by OppenheimerFunds, Inc.
Shares of Oppenheimer funds are not deposits or obligations of any bank, are not guaranteed by any bank, are not insured by the FDIC or any other agency, and involve investment risks, including the possible loss of the principal amount invested.
4 | OPPENHEIMER GLOBAL STRATEGIC INCOME FUND/VA
|
FUND EXPENSE
Fund Expenses. As a shareholder of the Fund, you incur two types of costs: (1) transaction costs and (2) ongoing costs, including management fees; distribution and service fees; and other Fund expenses. These examples are intended to help you understand your ongoing costs (in dollars) of investing in the Fund and to compare these costs with the ongoing costs of investing in other mutual funds.
The examples are based on an investment of $1,000.00 invested at the beginning of the period and held for the entire 6-month period ended June 29, 2012.
Actual Expenses. The first section of the table provides information about actual account values and actual expenses. You may use the information in this section for the class of shares you hold, together with the amount you invested, to estimate the expense that you paid over the period. Simply divide your account value by $1,000.00 (for example, an $8,600.00 account value divided by $1,000.00 = 8.60), then multiply the result by the number in the first section under the heading entitled “Expenses Paid During Period” to estimate the expenses you paid on your account during this period.
Hypothetical Example for Comparison Purposes. The second section of the table provides information about hypothetical account values and hypothetical expenses based on the Fund’s actual expense ratio for each class of shares, and an assumed rate of return of 5% per year for each class before expenses, which is not the actual return. The hypothetical account values and expenses may not be used to estimate the actual ending account balance or expenses you paid for the period. You may use this information to compare the ongoing costs of investing in the Fund and other funds. To do so, compare this 5% hypothetical example for the class of shares you hold with the 5% hypothetical examples that appear in the shareholder reports of the other funds.
Please note that the expenses shown in the table are meant to highlight your ongoing costs only and do not reflect any charges associated with the separate accounts that offer this Fund. Therefore, the “hypothetical” lines of the table are useful in comparing ongoing costs only, and will not help you determine the relative total costs of owning different funds. In addition, if these separate account charges were included your costs would have been higher.
| | | | | | | | | | | | |
| Actual | | Beginning
Account
Value
January 1, 2012 | | | Ending
Account
Value
June 29, 2012 | | | Expenses
Paid During
6 Months Ended
June 29, 2012 | |
| Non-Service Shares | | $ | 1,000.00 | | | $ | 1,061.30 | | | $ | 3.63 | |
| Service shares | | | 1,000.00 | | | | 1,059.20 | | | | 4.90 | |
| | | |
Hypothetical (5% return before expenses) | | | | | | | | | |
| Non-Service Shares | | | 1,000.00 | | | | 1,021.22 | | | | 3.55 | |
| Service Shares | | | 1,000.00 | | | | 1,019.98 | | | | 4.81 | |
Expenses are equal to the Fund’s annualized expense ratio for that class, multiplied by the average account value over the period, multiplied by 181/366 (to reflect the one-half year period). Those annualized expense ratios, excluding indirect expenses from affiliated funds, based on the 6-month period ended June 29, 2012 are as follows:
| | | | |
| Class | | Expense Ratios | |
| Non-Service Shares | | | 0.71 | % |
| Service Shares | | | 0.96 | |
The expense ratios reflect voluntary waivers and/or reimbursements of expenses by the Fund’s Manager. Some of these undertakings may be modified or terminated at any time, as indicated in the Fund’s prospectus. The “Financial Highlights” tables in the Fund’s financial statements, included in this report, also show the gross expense ratios, without such waivers or reimbursements and reduction to custodian expenses, if applicable.
5 | OPPENHEIMER GLOBAL STRATEGIC INCOME FUND/VA
|
STATEMENT OF INVESTMENTS June 29, 2012*/ Unaudited
| | | | | | | | |
| | |
Shares | | | Value | |
| | | | | | | | | |
| Wholly-Owned Subsidiary—0.1% | | | | | | | | |
Oppenheimer Global Strategic Income Fund/VA (Cayman) Ltd.1,2
(Cost $1,500,000) | | | 15,000 | | | $ | 1,457,156 | |
| | |
| | | Principal
Amount | | | | |
| Asset-Backed Securities—2.0% | | | | | | | | |
Ally Auto Receviables Trust,
Automobile Receivable Nts.,
Series 2012-A, Cl. D, 3.15%, 10/15/183 | | $ | 2,125,000 | | | | 2,128,317 | |
AmeriCredit Automobile
Receivables Trust 2012-1,
Automobile Receivables-Backed Nts., Series 2012-1, Cl. D, 4.72%, 3/8/18 | | | 8,055,000 | | | | 8,515,185 | |
AmeriCredit Automobile
Receivables Trust 2012-3,
Automobile Receivable Nts.,
Series 2012-3, Cl. D, 3.59%, 7/9/18 | | | 2,625,000 | | | | 2,627,878 | |
| Avis Budget Rental Car Funding AESOP LLC, Automobile Receivable Nts., Series 2011-2A, Cl. A, 2.37%, 11/20/143 | | | 750,000 | | | | 765,028 | |
CarMax Auto Owner Trust 2012-2, Automobile Receivables Nts.,
Series 2012-2, Cl. D, 3.77%, 11/15/18 | | | 1,200,000 | | | | 1,204,759 | |
Citibank Omni Master Trust,
Credit Card Receivables,
Series 2009-A17, Cl. A17, 4.90%, 11/15/183 | | | 615,000 | | | | 671,853 | |
DSC Floorplan Master
Owner Trust, Automobile Receivable Nts.,
Series 2011-1, Cl. A, 3.91%, 3/15/16 | | | 520,000 | | | | 533,877 | |
DT Auto Owner Trust 2011-1A, Automobile Receivable Nts.,
Series 2011-1A, Cl. C, 3.05%, 8/15/153 | | | 720,000 | | | | 721,762 | |
Embarcadero Aircraft
Securitization Trust,
Airplane Receivable Nts.,
Series 2000-A, Cl. B, 0.656%, 8/15/254,5 | | | 1,820,063 | | | | — | |
Exeter Automobile
Receivables Trust,
Automobile Receivable Nts.,
Series 2012-1A, Cl. C, 5.27%, 10/16/173 | | | 1,200,000 | | | | 1,233,716 | |
Ice 1 Em CLO Ltd./Ice 1 Em CLO Corp., Sr. Sec. Sub. Term Nts.:
Series 2007-1A, Cl. B,
2.456%, 8/15/225,6 | | | 7,870,000 | | | | 5,351,600 | |
| | | | | | | | |
| | | Principal
Amount | | | Value | |
| | | | | | | | | |
| Asset-Backed Securities Continued | | | | | |
| Ice 1 Em CLO Ltd./Ice 1 Em CLO Corp., Sr. Sec. Sub. Term Nts.: Continued | | | | | | | | |
| Series 2007-1A, Cl. C, | | | | | | | | |
| 3.756%, 8/15/225,6 | | $ | 5,270,000 | | | $ | 3,372,800 | |
| Series 2007-1A, Cl. D, | | | | | | | | |
| 5.756%, 8/15/225,6 | | | 5,270,000 | | | | 3,267,400 | |
| Santander Drive Auto Receivables Trust 2010-B, Automobile Receivables Nts., Series 2010-B, Cl. C, 3.02%, 10/17/163 | | | 585,000 | | | | 595,495 | |
Santander Drive Auto
Receivables Trust 2011-S1A,
Automobile Receivables Nts.,
Series 2011-S1A, Cl. D,
3.10%, 5/15/175 | | | 173,239 | | | | 173,696 | |
Santander Drive Auto Receivables Trust 2012-3, Automobile Receivables Nts.:
Series 2012-3, Cl. C,
3.27%, 4/16/18 | | | 5,830,000 | | | | 5,844,085 | |
| Series 2012-3, Cl. D, | | | | | | | | |
| 3.91%, 5/15/18 | | | 4,380,000 | | | | 4,399,198 | |
Santander Drive Auto
Receivables Trust 2012-4,
Automobile Receivables Nts.,
Series 2012-4, Cl. D, 4.18%, 6/15/187 | | | 3,510,000 | | | | 3,526,761 | |
SLM Student Loan Trust,
Student Loan Receivables,
Series 2005-B, Cl. B, 0.868%, 6/15/396 | | | 2,487,000 | | | | 1,622,803 | |
SNAAC Auto Receivables Trust,
Automobile Receivable Nts.:
Series 2012-1A, Cl. B,
3.11%, 6/15/173 | | | 525,000 | | | | 526,819 | |
| Series 2012-1A, Cl. C, | | | | | | | | |
| 4.38%, 6/15/173 | | | 545,000 | | | | 546,813 | |
| | | | | | |
|
|
|
Total Asset-Backed Securities
(Cost $54,630,470) | | | | | | | 47,629,845 | |
| Corporate Loans—0.2% | |
Autoparts Holdings Ltd., Sr. Sec. Credit Facilities 1st Lien Term Loan,
5%, 7/21/176,7 | | | 718,191 | | | | 694,401 | |
| Chesapeake Energy Corp., Sr. Sec. Credit Facilities Term Loan, 7%, 12/2/176,7 | | | 1,015,000 | | | | 1,007,388 | |
| Hallertau SPC, Sr. Sec. Credit | | | | | | | | |
| Facilities Term Loan, 7.94%, 9/17/134 | | | 12,143,750 | | | | 4,250,313 | |
| | | | | | |
|
|
|
| Total Corporate Loans (Cost $6,001,311) | | | | | | | 5,952,102 | |
6 | OPPENHEIMER GLOBAL STRATEGIC INCOME FUND/VA
|
| | | | | | | | |
| | | Principal
Amount | | | Value | |
| | | | | | | | | |
| Mortgage-Backed Obligations—29.6% | |
| Government Agency—17.1% | | | | | | | | |
| FHLMC/FNMA/FHLB/Sponsored—16.7% | | | | | |
| Federal Home Loan Mortgage Corp.: | | | | | | | | |
| 4.50%, 8/1/427 | | $ | 4,305,000 | | | $ | 4,597,605 | |
| 5%, 9/15/33 | | | 1,278,031 | | | | 1,383,021 | |
| 5.50%, 9/1/39 | | | 1,250,173 | | | | 1,362,109 | |
| 6%, 5/15/18-10/1/37 | | | 628,028 | | | | 686,631 | |
| 6.50%, 3/15/18-8/15/32 | | | 1,528,011 | | | | 1,722,415 | |
| 7%, 10/1/31-10/1/37 | | | 366,746 | | | | 428,856 | |
| 7.50%, 1/1/32 | | | 649,643 | | | | 794,591 | |
| Federal Home Loan Mortgage Corp., | | | | | | | | |
| Gtd. Real Estate Mtg. Investment | | | | | | | | |
| Conduit Multiclass | | | | | | | | |
| Pass-Through Certificates: | | | | | | | | |
| Series 1360, Cl. PZ, | | | | | | | | |
| 7.50%, 9/15/22 | | | 739,342 | | | | 853,062 | |
| Series 151, Cl. F, 9%, 5/15/21 | | | 21,428 | | | | 24,646 | |
| Series 1674, Cl. Z, 6.75%, 2/15/24 | | | 567,545 | | | | 645,463 | |
| Series 1897, Cl. K, 7%, 9/15/26 | | | 1,322,113 | | | | 1,538,464 | |
| Series 2006-11, Cl. PS, 23.667%, 3/25/366 | | | 396,366 | | | | 573,962 | |
| Series 2043, Cl. ZP, 6.50%, 4/15/28 | | | 529,100 | | | | 610,090 | |
| Series 2106, Cl. FG, 0.692%, 12/15/286 | | | 908,905 | | | | 915,779 | |
| Series 2122, Cl. F, 0.692%, 2/15/296 | | | 27,003 | | | | 27,209 | |
| Series 2148, Cl. ZA, 6%, 4/15/29 | | | 718,886 | | | | 805,677 | |
| Series 2195, Cl. LH, 6.50%, 10/15/29 | | | 399,147 | | | | 458,141 | |
| Series 2326, Cl. ZP, 6.50%, 6/15/31 | | | 53,079 | | | | 61,161 | |
| Series 2344, Cl. FP, 1.192%, 8/15/316 | | | 277,301 | | | | 283,577 | |
| Series 2368, Cl. PR, 6.50%, 10/15/31 | | | 219,895 | | | | 253,426 | |
| Series 2412, Cl. GF, 1.192%, 2/15/326 | | | 496,873 | | | | 508,112 | |
| Series 2449, Cl. FL, 0.792%, 1/15/326 | | | 346,206 | | | | 350,376 | |
| Series 2451, Cl. FD, 1.242%, 3/15/326 | | | 177,334 | | | | 181,584 | |
| Series 2453, Cl. BD, 6%, 5/15/17 | | | 68,744 | | | | 74,007 | |
| Series 2461, Cl. PZ, 6.50%, 6/15/32 | | | 821,698 | | | | 948,195 | |
| Series 2464, Cl. FI, 1.242%, 2/15/326 | | | 161,768 | | | | 164,952 | |
| Series 2470, Cl. AF, 1.242%, 3/15/326 | | | 304,262 | | | | 311,553 | |
| Series 2470, Cl. LF, 1.242%, 2/15/326 | | | 165,546 | | | | 168,804 | |
| Series 2471, Cl. FD, 1.242%, 3/15/326 | | | 242,045 | | | | 246,879 | |
| Series 2477, Cl. FZ, 0.792%, 6/15/316 | | | 662,127 | | | | 668,775 | |
| Series 2500, Cl. FD, 0.742%, 3/15/326 | | | 22,718 | | | | 22,930 | |
| Series 2517, Cl. GF, 1.242%, 2/15/326 | | | 143,934 | | | | 146,767 | |
| Series 2526, Cl. FE, 0.642%, 6/15/296 | | | 42,839 | | | | 43,075 | |
| Series 2551, Cl. FD, 0.642%, 1/15/336 | | | 19,380 | | | | 19,494 | |
| Series 2668, Cl. AZ, 4%, 9/1/18 | | | 141,200 | | | | 148,715 | |
| Series 2676, Cl. KY, 5%, 9/15/23 | | | 2,947,209 | | | | 3,238,756 | |
| Series 3025, Cl. SJ, 23.864%, 8/15/356 | | | 460,303 | | | | 683,046 | |
| Series 3465, Cl. HA, 4%, 7/1/17 | | | 93,372 | | | | 96,421 | |
| Series 3617, Cl. DC, 4%, 7/1/27 | | | 433,922 | | | | 447,394 | |
| Series 3676, Cl. DA, 4%, 4/1/22 | | | 294,727 | | | | 298,061 | |
| Series 3822, Cl. JA, 5%, 6/1/40 | | | 149,509 | | | | 159,127 | |
| Series 3848, Cl. WL, 4%, 4/1/40 | | | 716,206 | | | | 758,316 | |
| Series 3917, Cl. BA, 4%, 6/1/38 | | | 1,006,742 | | | | 1,061,910 | |
| | | | | | | | |
| | | Principal
Amount | | | Value | |
| | | | | | | | | |
| FHLMC/FNMA/FHLB/Sponsored Continued | | | | | |
Federal Home Loan Mortgage Corp., Interest-Only Stripped Mtg.-Backed Security:
Series 192, Cl. IO, 12.741%, 2/1/288 | | $ | 19,306 | | | $ | 3,165 | |
| Series 205, Cl. IO, 14.026%, 9/1/298 | | | 109,195 | | | | 18,664 | |
| Series 2074, Cl. S, 57.575%, 7/17/288 | | | 28,594 | | | | 6,231 | |
| Series 2079, Cl. S, 68.89%, 7/17/288 | | | 49,616 | | | | 11,127 | |
| Series 2136, Cl. SG, 72.156%, 3/15/298 | | | 1,289,519 | | | | 257,871 | |
| Series 2399, Cl. SG, 67.824%, 12/15/268 | | | 744,443 | | | | 149,947 | |
| Series 243, Cl. 6, 0.505%, 12/15/328 | | | 289,009 | | | | 63,026 | |
| Series 2437, Cl. SB, 75.573%, 4/15/328 | | | 2,245,987 | | | | 487,245 | |
| Series 2526, Cl. SE, 43.335%, 6/15/298 | | | 53,783 | | | | 11,298 | |
| Series 2795, Cl. SH, 18.498%, 3/15/248 | | | 1,102,414 | | | | 178,052 | |
| Series 2802, Cl. AS, 87.879%, 4/15/338 | | | 218,780 | | | | 13,139 | |
| Series 2920, Cl. S, 66.285%, 1/15/358 | | | 490,812 | | | | 83,910 | |
| Series 3110, Cl. SL, 99.999%, 2/15/268 | | | 278,263 | | | | 38,855 | |
| Series 3450, Cl. BI, 12.377%, 5/15/388 | | | 579,156 | | | | 96,106 | |
| Series 3659, Cl. IE, 7.107%, 3/1/198 | | | 1,236,356 | | | | 116,189 | |
| Series 3662, Cl. SM, 24.883%, 10/15/328 | | | 379,997 | | | | 50,695 | |
| Series 3685, Cl. EI, 10.90%, 3/1/198 | | | 1,096,755 | | | | 87,786 | |
| Series 3736, Cl. SN, 6.506%, 10/15/408 | | | 960,283 | | | | 158,108 | |
| Federal Home Loan Mortgage Corp., Mtg.-Linked Global Debt Securities, 2.06%, 1/15/22 | | | 2,007,686 | | | | 2,050,786 | |
Federal National Mortgage Assn.:
2.50%, 7/1/277 | | | 90,885,000 | | | | 93,668,353 | |
| 2.74%, 10/1/366 | | | 4,001,974 | | | | 4,273,191 | |
| 3.50%, 8/1/427 | | | 77,555,000 | | | | 81,335,806 | |
| 4%, 9/1/18-10/1/18 | | | 1,778,107 | | | | 1,905,468 | |
| 4%, 7/1/277 | | | 355,000 | | | | 377,631 | |
| 4.50%, 7/1/277 | | | 2,910,000 | | | | 3,119,611 | |
| 5%, 2/25/18-7/25/33 | | | 5,522,087 | | | | 5,989,309 | |
| 5.50%, 4/25/21-1/1/36 | | | 643,957 | | | | 705,629 | |
| 5.50%, 7/1/27-8/1/427 | | | 3,938,000 | | | | 4,291,196 | |
| 6%, 10/25/16-1/25/19 | | | 368,790 | | | | 399,830 | |
| 6%, 8/1/427 | | | 4,680,000 | | | | 5,142,882 | |
| 6.50%, 4/25/17-1/1/34 | | | 1,935,105 | | | | 2,215,938 | |
| 7%, 11/1/17-6/25/34 | | | 2,097,224 | | | | 2,485,525 | |
| 7.50%, 2/25/27-3/25/33 | | | 2,342,403 | | | | 2,850,348 | |
| 8.50%, 7/1/32 | | | 2,455 | | | | 3,053 | |
Federal National Mortgage Assn., 15 yr.:
3%, 7/1/277 | | | 96,315,000 | | | | 100,935,105 | |
| 3.50%, 7/1/277 | | | 1,485,000 | | | | 1,569,459 | |
Federal National Mortgage Assn., 30 yr.:
4%, 8/1/427 | | | 15,910,000 | | | | 16,906,862 | |
| 4.50%, 8/1/427 | | | 10,320,000 | | | | 11,064,974 | |
7 | OPPENHEIMER GLOBAL STRATEGIC INCOME FUND/VA
|
STATEMENT OF INVESTMENTS Unaudited / Continued
| | | | | | | | |
| | | Principal
Amount | | | Value | |
| | | | | | | | | |
| FHLMC/FNMA/FHLB/Sponsored Continued | | | | | |
Federal National Mortgage Assn., Gtd. Real Estate Mtg. Investment Conduit Multiclass Pass-Through Certificates:
Trust 1999-54, Cl. LH, 6.50%, 11/25/29 | | $ | 394,047 | | | $ | 451,344 | |
| Trust 2001-51, Cl. OD, 6.50%, 10/25/31 | | | 212,456 | | | | 245,856 | |
| Trust 2001-69, Cl. PF, 1.245%, 12/25/316 | | | 362,766 | | | | 370,160 | |
| Trust 2001-80, Cl. ZB, 6%, 1/25/32 | | | 425,905 | | | | 477,852 | |
| Trust 2002-12, Cl. PG, 6%, 3/25/17 | | | 229,588 | | | | 248,622 | |
| Trust 2002-29, Cl. F, 1.245%, 4/25/326 | | | 173,636 | | | | 177,199 | |
| Trust 2002-60, Cl. FH, 1.245%, 8/25/326 | | | 360,289 | | | | 367,463 | |
| Trust 2002-64, Cl. FJ, 1.245%, 4/25/326 | | | 53,468 | | | | 54,565 | |
| Trust 2002-68, Cl. FH, 0.743%, 10/18/326 | | | 122,004 | | | | 123,079 | |
| Trust 2002-84, Cl. FB, 1.245%, 12/25/326 | | | 754,400 | | | | 769,446 | |
| Trust 2002-9, Cl. PC, 6%, 3/25/17 | | | 234,680 | | | | 253,875 | |
| Trust 2002-9, Cl. PR, 6%, 3/25/17 | | | 287,355 | | | | 308,301 | |
| Trust 2002-90, Cl. FH, 0.745%, 9/25/326 | | | 422,088 | | | | 425,611 | |
| Trust 2003-11, Cl. FA, 1.245%, 9/25/326 | | | 754,417 | | | | 769,464 | |
| Trust 2003-112, Cl. AN, 4%, 11/1/18 | | | 292,510 | | | | 308,132 | |
| Trust 2003-116, Cl. FA, 0.645%, 11/25/336 | | | 63,048 | | | | 63,420 | |
| Trust 2003-119, Cl. FK, 0.745%, 5/25/186,7 | | | 1,736,923 | | | | 1,746,826 | |
| Trust 2004-101, Cl. BG, 5%, 1/25/20 | | | 1,053,919 | | | | 1,129,247 | |
| Trust 2005-109, Cl. AH, 5.50%, 12/25/25 | | | 2,160,000 | | | | 2,471,331 | |
| Trust 2005-25, Cl. PS, 27.081%, 4/25/356 | | | 452,313 | | | | 777,623 | |
| Trust 2005-31, Cl. PB, 5.50%, 4/25/35 | | | 560,000 | | | | 701,465 | |
| Trust 2005-71, Cl. DB, 4.50%, 8/25/25 | | | 475,936 | | | | 518,215 | |
| Trust 2006-46, Cl. SW, 23.30%, 6/25/366 | | | 655,578 | | | | 943,052 | |
| Trust 2007-42, Cl. A, 6%, 2/1/33 | | | 711,503 | | | | 740,292 | |
| Trust 2008-14, Cl. BA, 4.25%, 3/1/23 | | | 138,831 | | | | 147,116 | |
| Trust 2009-114, Cl. AC, 2.50%, 12/1/23 | | | 255,973 | | | | 264,166 | |
| Trust 2009-36, Cl. FA, 1.185%, 6/25/376 | | | 330,298 | | | | 335,424 | |
| Trust 2011-122, Cl. EA, 3%, 11/1/29 | | | 895,749 | | | | 919,573 | |
| Trust 2011-122, Cl. EC, 1.50%, 1/1/20 | | | 683,306 | | | | 693,115 | |
| Trust 2011-15, Cl. DA, 4%, 3/1/41 | | | 749,491 | | | | 801,086 | |
| Trust 2011-3, Cl. KA, 5%, 4/1/40 | | | 536,851 | | | | 584,806 | |
| Trust 2011-6, Cl. BA, 2.75%, 6/1/20 | | | 744,657 | | | | 773,502 | |
| | | | | | | | |
| | | Principal
Amount | | | Value | |
| | | | | | | | | |
| FHLMC/FNMA/FHLB/Sponsored Continued | | | | | |
Federal National Mortgage Assn., Interest-Only Stripped Mtg.-Backed Security:
Trust 2001-61, Cl. SH, 35.024%, 11/18/318 | | $ | 198,923 | | | $ | 37,494 | |
| Trust 2001-63, Cl. SD, 33.317%, 12/18/318 | | | 50,338 | | | | 9,156 | |
| Trust 2001-68, Cl. SC, 24.461%, 11/25/318 | | | 32,996 | | | | 6,301 | |
| Trust 2001-81, Cl. S, 26.376%, 1/25/328 | | | 40,566 | | | | 8,563 | |
| Trust 2002-28, Cl. SA, 39.269%, 4/25/328 | | | 26,971 | | | | 5,234 | |
| Trust 2002-38, Cl. SO, 52.326%, 4/25/328 | | | 151,686 | | | | 27,972 | |
| Trust 2002-48, Cl. S, 32.933%, 7/25/328 | | | 41,767 | | | | 8,325 | |
| Trust 2002-52, Cl. SL, 35.76%, 9/25/328 | | | 27,101 | | | | 5,416 | |
| Trust 2002-56, Cl. SN, 34.89%, 7/25/328 | | | 57,393 | | | | 11,459 | |
| Trust 2002-77, Cl. IS, 47.574%, 12/18/328 | | | 258,429 | | | | 56,479 | |
| Trust 2002-77, Cl. SH, 42.088%, 12/18/328 | | | 60,197 | | | | 12,498 | |
| Trust 2002-9, Cl. MS, 31.019%, 3/25/328 | | | 54,512 | | | | 10,714 | |
| Trust 2003-13, Cl. IO, 14.502%, 3/25/338 | | | 482,218 | | | | 93,768 | |
| Trust 2003-26, Cl. DI, 11.332%, 4/25/338 | | | 356,115 | | | | 79,987 | |
| Trust 2003-33, Cl. SP, 86.997%, 5/25/338 | | | 353,855 | | | | 55,666 | |
| Trust 2003-38, Cl. SA, 31.367%, 3/25/238 | | | 474,102 | | | | 48,895 | |
| Trust 2003-4, Cl. S, 32.305%, 2/25/338 | | | 103,782 | | | | 18,837 | |
| Trust 2004-56, Cl. SE, 16.515%, 10/25/338 | | | 1,572,349 | | | | 266,373 | |
| Trust 2005-14, Cl. SE, 45.905%, 3/25/358 | | | 1,575,132 | | | | 259,241 | |
| Trust 2005-40, Cl. SA, 58.134%, 5/25/358 | | | 1,321,175 | | | | 258,800 | |
| Trust 2005-40, Cl. SB, 94.648%, 5/25/358 | | | 2,187,422 | | | | 477,990 | |
| Trust 2005-5, Cl. SD, 11.403%, 1/25/358 | | | 91,971 | | | | 14,473 | |
| Trust 2005-63, Cl. SA, 56.253%, 10/25/318 | | | 85,285 | | | | 17,394 | |
| Trust 2005-71, Cl. SA, 63.77%, 8/25/258 | | | 297,460 | | | | 42,618 | |
| Trust 2006-51, Cl. SA, 15.12%, 6/25/368 | | | 7,130,963 | | | | 971,869 | |
| Trust 2006-60, Cl. DI, 43.186%, 4/25/358 | | | 1,356,153 | | | | 184,692 | |
| Trust 2006-90, Cl. SX, 99.999%, 9/25/368 | | | 1,460,065 | | | | 331,788 | |
8 | OPPENHEIMER GLOBAL STRATEGIC INCOME FUND/VA
|
| | | | | | | | |
| | | Principal
Amount | | | Value | |
| | | | | | | | | |
| FHLMC/FNMA/FHLB/Sponsored Continued | | | | | |
| Federal National Mortgage Assn., Interest-Only Stripped Mtg.-Backed Security: Continued | | | | | | | | |
| Trust 2007-77, Cl. SB, 40.042%, 12/25/318 | | $ | 446,604 | | | $ | 15,477 | |
| Trust 2007-84, Cl. DS, 12.147%, 8/25/378 | | | 151,609 | | | | 26,713 | |
| Trust 2007-88, Cl. XI, 42.632%, 6/25/378 | | | 2,283,741 | | | | 384,501 | |
| Trust 2008-46, Cl. EI, 12.785%, 6/25/388 | | | 592,857 | | | | 105,609 | |
| Trust 2008-55, Cl. SA, 22.511%, 7/25/388 | | | 458,085 | | | | 73,692 | |
| Trust 2009-8, Cl. BS, 18.395%, 2/25/248 | | | 464,168 | | | | 46,086 | |
| Trust 2010-95, Cl. DI, 8.396%, 11/1/208 | | | 1,619,519 | | | | 121,557 | |
| Trust 2011-84, Cl. IG, 5.068%, 8/1/138 | | | 4,979,918 | | | | 87,461 | |
| Trust 214, Cl. 2, 40.424%, 3/1/238 | | | 322,562 | | | | 68,301 | |
| Trust 221, Cl. 2, 40.953%, 5/1/238 | | | 38,544 | | | | 8,263 | |
| Trust 254, Cl. 2, 32.653%, 1/1/248 | | | 628,064 | | | | 133,950 | |
| Trust 2682, Cl. TQ, 99.999%, 10/15/338 | | | 522,862 | | | | 98,783 | |
| Trust 2981, Cl. BS, 99.999%, 5/15/358 | | | 938,719 | | | | 169,699 | |
| Trust 301, Cl. 2, 2.323%, 4/1/298 | | | 136,381 | | | | 21,895 | |
| Trust 313, Cl. 2, 23.912%, 6/1/318 | | | 1,365,582 | | | | 224,459 | |
| Trust 319, Cl. 2, 2.10%, 2/1/328 | | | 652,217 | | | | 101,266 | |
| Trust 321, Cl. 2, 6.305%, 4/1/328 | | | 177,382 | | | | 27,360 | |
| Trust 324, Cl. 2, 0%, 7/1/328,9 | | | 184,072 | | | | 28,610 | |
| Trust 328, Cl. 2, 0%, 12/1/328,9 | | | 431,877 | | | | 82,192 | |
| Trust 331, Cl. 5, 0%, 2/1/338,9 | | | 693,464 | | | | 146,183 | |
| Trust 332, Cl. 2, 0%, 3/1/338,9 | | | 3,725,352 | | | | 688,664 | |
| Trust 334, Cl. 12, 0%, 2/1/338,9 | | | 601,866 | | | | 115,790 | |
| Trust 339, Cl. 15, 9.003%, 7/1/338 | | | 1,837,691 | | | | 350,446 | |
| Trust 345, Cl. 9, 0%, 1/1/348,9 | | | 656,676 | | | | 81,893 | |
| Trust 351, Cl. 10, 0%, 4/1/348,9 | | | 372,102 | | | | 54,724 | |
| Trust 351, Cl. 8, 0%, 4/1/348,9 | | | 616,342 | | | | 87,812 | |
| Trust 356, Cl. 10, 0%, 6/1/358,9 | | | 496,744 | | | | 69,384 | |
| Trust 356, Cl. 12, 0%, 2/1/358,9 | | | 247,612 | | | | 34,731 | |
| Trust 362, Cl. 13, 0%, 8/1/358,9 | | | 301,295 | | | | 49,626 | |
| | | | | | |
|
|
|
| | | | | | | | 397,683,861 | |
| GNMA/Guaranteed—0.2% | | | | | | | | |
Government National Mortgage Assn.:
1.625%, 12/9/256 | | | 4,967 | | | | 5,151 | |
| 7%, 3/29/28-7/29/28 | | | 206,121 | | | | 246,402 | |
| 7.50%, 3/1/27 | | | 11,967 | | | | 13,023 | |
| 8%, 11/29/25-5/29/26 | | | 48,471 | | | | 50,450 | |
Government National Mortgage
Assn., Gtd. Real Estate Mtg. Investment Conduit Pass-Through Certificates:
Series 1999-32, Cl. ZB, 8%, 9/16/29 | | | 868,293 | | | | 1,059,501 | |
| Series 2000-12, Cl. ZA, 8%, 2/16/30 | | | 1,918,483 | | | | 2,309,550 | |
| | | | | | | | |
| | | Principal
Amount | | | Value | |
| | | | | | | | | |
| GNMA/Guaranteed Continued | | | | | | | | |
Government National Mortgage
Assn., Interest-Only Stripped
Mtg.-Backed Security:
Series 1998-19, Cl. SB,
68.458%, 7/16/288 | | $ | 104,096 | | | $ | 23,019 | |
| Series 1998-6, Cl. SA, | | | | | | | | |
| 83.021%, 3/16/288 | | | 63,180 | | | | 14,360 | |
| Series 2001-21, Cl. SB, | | | | | | | | |
| 88.793%, 1/16/278 | | | 464,723 | | | | 86,120 | |
| Series 2007-17, Cl. AI, | | | | | | | | |
| 22.033%, 4/16/378 | | | 561,234 | | | | 111,611 | |
| Series 2010-111, Cl. GI, | | | | | | | | |
| 28.396%, 9/1/138 | | | 11,089,418 | | | | 200,058 | |
| Series 2011-52, Cl. HS, | | | | | | | | |
| 9.436%, 4/16/418 | | | 926,290 | | | | 237,384 | |
| | | | | | |
|
|
|
| | | | | | | | 4,356,629 | |
| Other Agency—0.2% | | | | | | | | |
| NCUA Guaranteed Notes | | | | | | | | |
Trust 2010-C1, Gtd. Nts.: | | | | | | | | |
Series 2010-C1, Cl. | | | | | | | | |
| A1, 1.60%, 10/29/20 | | | 481,667 | | | | 488,121 | |
| Series 2010-C1, Cl. A2, | | | | | | | | |
| 2.90%, 10/29/20 | | | 1,015,000 | | | | 1,082,244 | |
| Series 2010-C1, Cl. APT, | | | | | | | | |
| 2.65%, 10/29/20 | | | 1,139,493 | | | | 1,191,910 | |
| NCUA Guaranteed Notes | | | | | | | | |
| Trust 2010-R1, Gtd. Nts., | | | | | | | | |
| Series 2010-R1, Cl. 1A, | | | | | | | | |
| 0.689%, 10/7/206 | | | 907,717 | | | | 909,560 | |
| NCUA Guaranteed Notes | | | | | | | | |
| Trust 2010-R3, Gtd. Nts., | | | | | | | | |
| Series 2010-R3, Cl. 3A, | | | | | | | | |
| 2.40%, 12/8/20 | | | 744,713 | | | | 762,750 | |
| | | | | | |
|
|
|
| | | | | | | | 4,434,585 | |
| Non-Agency—12.5% | | | | | | | | |
| Commercial—7.7% | | | | | | | | |
Banc of America Commercial
| | | | | | | | |
| Mortgage Trust 2006-1, | | | | | | | | |
| Commercial Mtg. Pass-Through | | | | | | | | |
| Certificates, Series 2006-1, Cl. AJ, | | | | | | | | |
| 5.46%, 9/1/45 | | | 2,200,000 | | | | 2,041,740 | |
| Banc of America Commercial | | | | | | | | |
| Mortgage Trust 2006-3, | | | | | | | | |
| Commercial Mtg. Pass-Through | | | | | | | | |
| Certificates, Series 2006-3, Cl. AM, | | | | | | | | |
| 6.053%, 7/10/446 | | | 4,242,000 | | | | 4,139,870 | |
| Banc of America Commercial | | | | | | | | |
| Mortgage Trust 2006-5, | | | | | | | | |
| Commercial Mtg. Pass-Through | | | | | | | | |
| Certificates, Series 2006-5, Cl. AM, | | | | | | | | |
| 5.448%, 9/1/47 | | | 6,055,000 | | | | 5,900,694 | |
9 | OPPENHEIMER GLOBAL STRATEGIC INCOME FUND/VA
|
STATEMENT OF INVESTMENTS Unaudited / Continued
| | | | | | | | |
| | | Principal
Amount | | | Value | |
| | | | | | | | | |
| Commercial Continued | | | | | | | | |
| Banc of America Commercial | | | | | | | | |
| Mortgage Trust 2007-1, | | | | | | | | |
| Commercial Mtg. Pass-Through | | | | | | | | |
| Certificates, Series 2007-1, Cl. AMFX, | | | | | | | | |
| 5.482%, 1/1/49 | | $ | 4,159,386 | | | $ | 4,266,484 | |
| Banc of America Commercial | | | | | | | | |
| Mortgage Trust 2007-5, | | | | | | | | |
| Commercial Mtg. Pass-Through | | | | | | | | |
| Certificates, Series 2007-5, Cl. AM, | | | | | | | | |
| 5.772%, 2/1/51 | | | 8,090,000 | | | | 8,242,954 | |
| Banc of America Commercial | | | | | | | | |
| Mortgage, Inc., Commercial | | | | | | | | |
| Mtg. Pass-Through | | | | | | | | |
Certificates:
Series 2007-3, Cl. A4, | | | | | | | | |
| 5.805%, 6/1/496 | | | 480,000 | | | | 544,744 | |
| Series 2008-1, Cl. AM, | | | | | | | | |
| 6.438%, 2/10/516 | | | 3,415,000 | | | | 3,581,473 | |
| BCAP LLC Trust, | | | | | | | | |
| Mtg. Pass-Through | | | | | | | | |
Certificates:
Series 2012-RR2, Cl. 6A3, | | | | | | | | |
| 2.762%, 9/1/353,6 | | | 953,871 | | | | 943,418 | |
| Series 2012-RR6, Cl. 1A5, | | | | | | | | |
| 2.243%, 11/1/365,6 | | | 560,000 | | | | 552,300 | |
| Bear Stearns ARM Trust 2007-4, | | | | | | | | |
| Mtg. Pass-Through | | | | | | | | |
| Certificates, Series 2007-4, Cl. 22A1, | | | | | | | | |
| 5.569%, 6/1/476 | | | 999,839 | | | | 743,848 | |
| Bear Stearns Commercial | | | | | | | | |
| Mortgage Securities | | | | | | | | |
| Trust 2006-PWR13, | | | | | | | | |
| Commercial Mtg. Pass-Through | | | | | | | | |
| Certificates, Series 2006-PWR13, | | | | | | | | |
| Cl. AJ, 5.611%, 9/1/41 | | | 6,630,000 | | | | 5,659,620 | |
| Bear Stearns Commercial | | | | | | | | |
| Mortgage Securities | | | | | | | | |
| Trust 2007-PWR17, | | | | | | | | |
| Commercial Mtg. Pass-Through | | | | | | | | |
Certificates:
Series 2007-PWR17, Cl. AJ, | | | | | | | | |
| 5.897%, 6/1/506 | | | 7,400,000 | | | | 5,798,344 | |
| Series 2007-PWR17, Cl. AM, | | | | | | | | |
| 5.915%, 6/1/506 | | | 2,330,000 | | | | 2,468,496 | |
| CHL Mortgage Pass-Through | | | | | | | | |
| Trust 2005-17, Mtg. Pass-Through | | | | | | | | |
| Certificates, Series 2005-17, Cl. 1A8, | | | | | | | | |
| 5.50%, 9/1/35 | | | 2,898,695 | | | | 2,830,702 | |
| CHL Mortgage Pass-Through | | | | | | | | |
| Trust 2005-HYB8, Mtg. Pass-Through Certificates, Series 2005-HYB8, Cl. 4A1, 4.891%, 12/20/356 | | | 156,150 | | | | 110,971 | |
| | | | | | | | |
| | | Principal
Amount | | | Value | |
| | | | | | | | | |
| Commercial Continued | | | | | | | | |
| CHL Mortgage Pass-Through | | | | | | | | |
| Trust 2007-J3, Mtg. Pass-Through | | | | | | | | |
| Certificates, Series 2007-J3, Cl. A9, | | | | | | | | |
| 6%, 7/1/37 | | $ | 8,130,073 | | | $ | 5,951,689 | |
| Citigroup Commercial | | | | | | | | |
| Mortgage Trust 2008-C7, Commercial | | | | | | | | |
| Mtg. Pass-Through | | | | | | | | |
| Certificates, Series 2008-C7, Cl. AM, | | | | | | | | |
| 6.276%, 12/1/496 | | | 4,270,000 | | | | 4,172,302 | |
| Citigroup, Inc./Deutsche Bank | | | | | | | | |
2007-CD4 Commercial Mortgage Trust, Commercial Mtg. Pass-Through Certificates,
Series 2007-CD4, Cl. A4, | | | | | | | | |
| 5.322%, 12/1/49 | | | 955,000 | | | | 1,065,175 | |
| CSMC Mortgage-Backed Trust 2006-C1, Mtg. Pass-Through Certificates, Series 2006-C1, Cl. AJ, | | | | | | | | |
| 5.593%, 2/1/396 | | | 3,725,000 | | | | 3,606,143 | |
| DBUBS Mortgage Trust, Commercial | | | | | | | | |
| Mtg. Pass-Through | | | | | | | | |
| Certificates, Series 2011-LC1, Cl. E, | | | | | | | | |
| 5.728%, 11/1/463,6 | | | 2,515,000 | | | | 2,203,842 | |
Deutsche Alt-B Securities, Inc., Mtg. Pass-Through Certificates:
Series 2006-AB2, Cl. A1, | | | | | | | | |
| 5.885%, 6/25/36 | | | 125,413 | | | | 82,207 | |
| Series 2006-AB4, Cl. A1A, | | | | | | | | |
| 6.005%, 10/25/36 | | | 609,802 | | | | 359,115 | |
| Deutsche Mortgage & Asset Receiving, Commercial Mtg. Pass-Through Certificates, Interest-Only Stripped Mtg.-Backed Security, Series 2010-C1, Cl. XPA, | | | | | | | | |
| 4.885%, 9/1/203,8 | | | 5,320,488 | | | | 361,384 | |
| FDIC Trust, Commercial | | | | | | | | |
| Mtg. Pass-Through | | | | | | | | |
| Certificates, Series 2012-C1, Cl. A, | | | | | | | | |
| 0.841%, 5/1/355 | | | 1,556,650 | | | | 1,556,457 | |
| First Horizon Alternative Mortgage Securities Trust 2007-FA2, Mtg. Pass-Through Certificates, Series 2007-FA2, Cl. 1A1, | | | | | | | | |
| 5.50%, 4/25/37 | | | 569,788 | | | | 357,387 | |
| GMAC Commercial Mortgage Securities, Inc., Commercial Mtg. Pass-Through Certificates, Series 1998-C1, Cl. F, 7.111%, 5/15/306 | | | 1,567,000 | | | | 1,571,718 | |
10 | OPPENHEIMER GLOBAL STRATEGIC INCOME FUND/VA
|
| | | | | | | | |
| | | Principal
Amount | | | Value | |
| | | | | | | | | |
| Commercial Continued | | | | | | | | |
Greenwich Capital Commercial
Funding Corp./Commercial
Mortgage Trust 2006-GG7,
Commercial Mtg. Pass-Through Certificates, Series 2006-GG7,
Cl. AJ, 6.071%, 7/10/386 | | $ | 6,150,000 | | | $ | 5,477,162 | |
Greenwich Capital Commercial
Funding Corp./Commercial
Mortgage Trust 2007-GG11,
Commercial Mtg. Pass-Through Certificates, Series 2007-GG11,
Cl. AM, 5.867%, 12/1/49 | | | 5,550,000 | | | | 5,464,749 | |
Greenwich Capital Commercial
Funding Corp./Commercial
Mortgage Trust 2007-GG9,
Commercial Mtg. Pass-Through
Certificates, Series 2007-GG9,
Cl. AM, 5.475%, 3/1/39 | | | 5,035,000 | | | | 5,013,888 | |
GS Mortgage Securities Corp. II,
Commercial Mtg. Obligations,
Series 2011-GC3, Cl. D,
5.728%, 3/1/443,6 | | | 3,130,000 | | | | 2,719,208 | |
GSR Mortgage Loan Trust 2005-AR4, Mtg. Pass-Through Certificates,
Series 2005-AR4, Cl. 6A1,
5.25%, 7/1/35 | | | 68,573 | | | | 67,220 | |
IndyMac Index Mortgage Loan
Trust 2005-AR23, Mtg.
Pass-Through Certificates,
Series 2005-AR23, Cl. 6A1,
5.009%, 11/1/356 | | | 1,492,576 | | | | 1,093,717 | |
JPMorgan Chase Commercial
Mortgage Securities Corp.,
Commercial Mtg.
Pass-Through Certificates:
Series 2006-CIBC15, Cl. AM,
5.855%, 6/1/43 | | | 775,000 | | | | 771,641 | |
Series 2007-CB15, Cl. AJ,
5.502%, 6/1/47 | | | 8,281,000 | | | | 6,075,207 | |
Series 2007-CB18, Cl. A4,
5.44%, 6/1/47 | | | 2,315,000 | | | | 2,626,204 | |
Series 2007-CB18, Cl. AM,
5.466%, 6/1/47 | | | 6,400,000 | | | | 6,642,093 | |
JPMorgan Chase Commercial
Mortgage Securities
Trust 2006-CIBC16, Commercial Mtg. Pass-Through Certificates,
Series 2006-CIBC16, Cl. AJ,
5.623%, 5/1/45 | | | 2,175,000 | | | | 1,637,236 | |
JPMorgan Chase Commercial
Mortgage Securities
Trust 2006-LDP7, Commercial Mtg.
Pass-Through Certificates,
Series 2006-LDP7, 6.064%, 4/1/456 | | | 120,000 | | | | 129,864 | |
| | | | | | | | |
| | | Principal
Amount | | | Value | |
| | | | | | | | | |
| Commercial Continued | | | | | | | | |
JPMorgan Chase Commercial
Mortgage Securities Trust
2007-CB19, Commercial Mtg.
Pass-Through Certificates,
Series 2007-CB19, Cl. AM,
5.924%, 2/1/496 | | $ | 5,850,000 | | | $ | 5,910,682 | |
JPMorgan Chase Commercial
Mortgage Securities Trust
2007-LDP11, Commercial Mtg. Pass-Through Certificates,
Series 2007-LDP11, Cl. ASB,
6.009%, 6/1/496 | | | 531,179 | | | | 573,555 | |
JPMorgan Mortgage Trust 2006-A7,
Mtg. Pass-Through Certificates,
Series 2006-A7, Cl. 2A2,
2.72%, 1/1/376 | | | 302,355 | | | | 213,972 | |
LB-UBS Commercial Mortgage
Trust 2006-C3, Commercial Mtg.
Pass-Through Certificates,
Series 2006-C3, Cl. AJ,
5.72%, 3/11/39 | | | 1,325,000 | | | | 1,201,997 | |
LB-UBS Commercial Mortgage
Trust 2007-C6, Commercial Mtg.
Pass-Through Certificates:
Series 2007-C6, Cl. A4,
5.858%, 7/11/40 | | | 1,095,000 | | | | 1,256,092 | |
Series 2007-C6, Cl. AM,
6.114%, 7/11/40 | | | 5,855,000 | | | | 5,913,459 | |
LB-UBS Commercial Mortgage
Trust 2008-C1, Commercial Mtg.
Pass-Through Certificates,
Series 2008-C1, Cl. AM,
6.315%, 4/11/416 | | | 2,610,000 | | | | 2,757,836 | |
Lehman Structured Securities Corp.,
Mtg.-Backed Security, 6%, 5/1/29 | | | 63,408 | | | | 12,869 | |
Merrill Lynch Mortgage
Trust 2006-C1, Commercial Mtg.
Pass-Through Certificates,
Series 2006-C1, Cl. AJ,
5.848%, 5/1/396 | | | 3,845,000 | | | | 3,439,108 | |
ML-CFC Commercial Mortgage
Trust 2006-3, Commercial Mtg.
Pass-Through Certificates,
Series 2006-3, Cl. AJ,
5.485%, 7/1/46 | | | 5,820,000 | | | | 4,935,191 | |
Morgan Stanley Capital I Trust 2006-IQ12, Commercial Mtg.
Pass-Through Certificates,
Series 2006-IQ12, Cl. AJ,
5.399%, 12/1/43 | | | 7,734,000 | | | | 4,987,927 | |
11 | OPPENHEIMER GLOBAL STRATEGIC INCOME FUND/VA
|
STATEMENT OF INVESTMENTS Unaudited / Continued
| | | | | | | | |
| | | Principal
Amount | | | Value | |
| | | | | | | | | |
| Commercial Continued | | | | | | | | |
Morgan Stanley Capital I
Trust 2007-IQ15, Commercial Mtg.
Pass-Through Certificates,
Series 2007-IQ15, Cl. AM,
6.076%, 6/1/496 | | $ | 5,875,000 | | | $ | 5,864,190 | |
Morgan Stanley Capital I
Trust, Commercial Mtg.
Pass-Through Certificates,
Series 2006-HQ10, Cl. AM,
5.36%, 11/1/41 | | | 8,500,000 | | | | 8,958,558 | |
RALI Series 2005-QA4 Trust, Mtg.
Asset-Backed Pass-Through
Certificates, Series 2005-QA4,
Cl. A32, 3.477%, 4/25/356 | | | 113,884 | | | | 22,181 | |
Residential Asset Securitization
Trust 2006-A12, Mtg. Pass-Through
Certificates, Series 2006-A12,
Cl. 1A, 6.25%, 11/1/36 | | | 678,042 | | | | 454,524 | |
Sequoia Mortgage Trust, Mtg.
Pass-Through Certificates,
Series 2012-2, Cl. A2,
3.50%, 3/1/42 | | | 540,277 | | | | 556,026 | |
STARM Mortgage Loan Trust
2007-1, Mtg. Pass-Through Certificates, Series 2007-1, Cl. 2A1,
5.815%, 2/1/376 | | | 8,706,597 | | | | 6,301,991 | |
Structured Adjustable Rate
Mortgage Loan Trust, Mtg.
Pass-Through Certificates,
Series 2007-6, Cl. 3A1,
4.89%, 7/1/376 | | | 6,815,029 | | | | 4,503,981 | |
Wachovia Bank Commercial
Mortgage Trust 2006-C23,
Commercial Mtg. Pass-Through Certificates, Series 2006-C23,
Cl. AJ, 5.515%, 1/1/45 | | | 4,510,000 | | | | 4,298,093 | |
Wachovia Bank Commercial
Mortgage Trust 2006-C25,
Commercial Mtg. Pass-Through Certificates, Series 2006-C25, Cl. AJ, 5.922%, 5/1/436 | | | 5,315,000 | | | | 5,004,200 | |
WaMu Mortgage Pass-Through Certificates 2006-AR15 Trust,
Mtg. Pass-Through Certificates,
Series 2006-AR15, Cl. 1A,
0.987%, 11/1/466 | | | 1,117,177 | | | | 753,761 | |
WaMu Mortgage Pass-Through Certificates 2007-OA3 Trust,
Mtg. Pass-Through Certificates,
Series 2007-OA3, Cl. 5A,
2.413%, 4/1/476 | | | 774,902 | | | | 448,885 | |
| | | | | | | | |
| | | Principal
Amount | | | Value | |
| | | | | | | | | |
| Commercial Continued | | | | | | | | |
Wells Fargo Mortgage-Backed
Securities 2004-W Trust,
Mtg. Pass-Through Certificates,
Series 2004-W, Cl. B2,
2.607%, 11/1/346 | | $ | 494,714 | | | $ | 16,619 | |
Wells Fargo Mortgage-Backed
Securities 2005-AR1 Trust,
Mtg. Pass-Through Certificates,
Series 2005-AR1, Cl. 1A1,
2.61%, 2/1/356 | | | 3,592,166 | | | | 3,354,801 | |
Wells Fargo Mortgage-Backed
Securities 2007-AR3 Trust,
Mtg. Pass-Through Certificates,
Series 2007-AR3, Cl. A4,
5.749%, 4/1/376 | | | 2,200,378 | | | | 1,918,423 | |
WFRBS Commercial Mortgage
Trust 2011-C3, Interest-Only
Commercial Mtg. Pass-Through Certificates, Series 2011-C3, Cl. XA, 9.116%, 3/1/448 | | | 6,059,121 | | | | 519,115 | |
| WFRBS Commercial Mortgage | | | | | | | | |
Trust 2012-C7, Commercial
Mtg. Pass-Through Certificates,
Series 2012-C7, Cl. C,
4.851%, 6/1/456 | | | 2,295,000 | | | | 2,095,110 | |
| | | | | | |
|
|
|
| | | | | | | | 183,104,412 | |
| Multifamily—0.8% | | | | | | | | |
Banc of America Commercial
Mortgage, Inc., Commercial Mtg.
Pass-Through Certificates,
Series 2006-2, Cl. AJ,
5.954%, 5/1/456 | | | 4,295,000 | | | | 3,854,597 | |
Citigroup Mortgage Loan Trust,
Inc. 2006-AR3, Mtg. Pass-Through
Certificates, Series 2006-AR3,
Cl. 1A2A, 5.625%, 6/1/366 | | | 5,554,169 | | | | 4,809,252 | |
JPMorgan Mortgage Trust 2007-A3,
Mtg. Pass-Through Certificates,
Series 2007-A3, Cl. 3A2M,
5.133%, 5/1/376 | | | 4,376,811 | | | | 3,742,887 | |
Wells Fargo Mortgage-Backed
Securities 2005-AR15 Trust, Mtg.
Pass-Through Certificates,
Series 2005-AR15, Cl. 1A2,
5.077%, 9/1/356 | | | 401,678 | | | | 353,622 | |
Wells Fargo Mortgage-Backed
Securities 2006-AR2 Trust, Mtg.
Pass-Through Certificates,
Series 2006-AR2, Cl. 2A3,
2.622%, 3/1/366 | | | 3,534,545 | | | | 3,069,491 | |
12 | OPPENHEIMER GLOBAL STRATEGIC INCOME FUND/VA
|
| | | | | | | | |
| | | Principal
Amount | | | Value | |
| | | | | | | | | |
| Multifamily Continued | | | | | | | | |
| Wells Fargo Mortgage-Backed | | | | | | | | |
Securities 2006-AR6 Trust, Mtg.
Pass-Through Certificates,
Series 2006-AR6, Cl. 3A1,
2.668%, 3/25/366 | | $ | 3,145,026 | | | $ | 2,672,879 | |
| | | | | | |
|
|
|
| | | | | | | | 18,502,728 | |
| Other—0.1% | | | | | | | | |
Greenwich Capital Commercial Funding Corp./Commercial Mortgage Trust 2007-GG9, Commercial Mtg. Pass-Through Certificates, Series 2007-GG9, Cl. A4, 5.444%, 3/1/39 | | | 2,315,000 | | | | 2,577,454 | |
| Residential—3.9% | | | | | | | | |
Argent Securities Trust 2004-W8, Asset-Backed Pass-Through Certificates, Series 2004-W8, Cl. A2, 1.205%, 5/25/346 | | | 920,464 | | | | 791,525 | |
Argent Securities Trust 2006-M3, Asset-Backed Pass-Through Certificates, Series 2006-M3, Cl. A2B, 0.345%, 9/25/366 | | | 342,371 | | | | 109,534 | |
Banc of America Commercial Mortgage, Inc., Commercial Mtg. Pass-Through Certificates, Series 2007-4, Cl. AM, 5.984%, 2/1/516 | | | 3,960,000 | | | | 3,982,974 | |
Banc of America Funding 2007-C Trust, Mtg. Pass-Through Certificates, Series 2007-C, Cl. 1A4, 5.532%, 5/1/366 | | | 2,025,000 | | | | 1,812,600 | |
Bear Stearns ARM Trust 2004-2, Mtg. Pass-Through Certificates, Series 2004-2, Cl. 12A2, 2.972%, 5/1/346 | | | 2,761,123 | | | | 2,372,235 | |
CHL Mortgage Pass-Through Trust 2005-29, Mtg. Pass-Through Certificates, Series 2005-29, Cl. A1, 5.75%, 12/1/35 | | | 5,515,999 | | | | 4,847,675 | |
CHL Mortgage Pass-Through Trust 2005-J4, Mtg. Pass-Through Certificates, Series 2005-J4, Cl. A7, 5.50%, 11/1/35 | | | 1,845,297 | | | | 1,838,975 | |
CHL Mortgage Pass-Through Trust 2006-6, Mtg. Pass-Through Certificates, Series 2006-6, Cl. A3, 6%, 4/1/36 | | | 488,677 | | | | 442,832 | |
CHL Mortgage Pass-Through Trust 2007-HY3, Mtg. Pass-Through Certificates, Series 2007-HY3, Cl. 1A1, 3.253%, 6/1/476 | | | 2,054,132 | | | | 1,507,826 | |
| | | | | | | | |
| | | Principal
Amount | | | Value | |
| | | | | | | | | |
| Residential Continued | | | | | | | | |
Citigroup Mortgage Loan Trust, Inc. 2005-2, Mtg. Pass-Through Certificates, Series 2005-2, Cl. 1A3, 2.653%, 5/1/356 | | $ | 2,314,296 | | | $ | 2,103,240 | |
Citigroup Mortgage Loan Trust, Inc. 2005-3, Mtg. Pass-Through Certificates, Series 2005-3, Cl. 2A4, 4.353%, 8/1/356 | | | 4,598,692 | | | | 3,135,602 | |
Citigroup, Inc./Deutsche Bank 2007-CD4 Commercial Mortgage Trust, Commercial Mtg. Pass-Through Certificates, Series 2007-CD4, Cl. AMFX, 5.366%, 12/1/49 | | | 6,060,000 | | | | 5,940,430 | |
Countrywide Alternative Loan Trust 2006-43CB, Mtg. Pass-Through Certificates, Series 2006-43CB, Cl.1A10, 6%, 2/1/37 | | | 9,299,221 | | | | 6,335,043 | |
Countrywide Alternative Loan Trust 2007-19, Mtg. Pass-Through Certificates, Series 2007-19, Cl. 1A4, 6%, 8/1/37 | | | 2,629,501 | | | | 1,827,780 | |
Countrywide Home Loans, Asset-Backed Certificates, Series 2005-16, Cl. 2AF2, 5.331%, 5/1/366 | | | 804,653 | | | | 625,585 | |
CSMC Mortgage-Backed Trust 2007-3, Mtg. Pass-Through Certificates, Series 2007-3, Cl. 2A10, 6%, 4/1/37 | | | 2,528,427 | | | | 2,121,779 | |
CWABS Asset-Backed Certificates Trust 2006-25, Asset-Backed Certificates, Series 2006-25, Cl. 2A2, 0.365%, 6/25/476 | | | 3,360,215 | | | | 3,311,007 | |
CWHEQ Revolving Home Equity Loan Trust, Asset-Backed Certificates: Series 2005-G, Cl. 2A, 0.472%, 12/15/356 | | | 158,619 | | | | 87,065 | |
Series 2006-H, Cl. 2A1A, 0.392%, 11/15/366 | | | 64,534 | | | | 17,156 | |
GSR Mortgage Loan Trust 2006-5F, Mtg. Pass-Through Certificates, Series 2006-5F, Cl. 2A1, 6%, 6/1/36 | | | 777,884 | | | | 708,457 | |
| Home Equity Mortgage Trust 2005-1, Mtg. Pass-Through Certificates, Series 2005-1, Cl. M6, 5.863%, 6/1/35 | | | 1,046,000 | | | | 592,423 | |
JPMorgan Alternative Loan Trust 2006-S4, Mtg. Pass-Through Certificates, Series 2006-S4, Cl. A6, 5.71%, 12/1/36 | | | 291,164 | | | | 252,972 | |
13 | OPPENHEIMER GLOBAL STRATEGIC INCOME FUND/VA
|
STATEMENT OF INVESTMENTS Unaudited / Continued
| | | | | | | | |
| | | Principal
Amount | | | Value | |
| | | | | | | | | |
| Residential Continued | | | | | | | | |
LB-UBS Commercial Mortgage Trust 2007-C7, Commercial Mtg. Pass-Through Certificates, Series 2007-C7, Cl. AM, 6.367%, 9/11/456 | | $ | 10,430,000 | | | $ | 10,582,158 | |
Mastr Asset-Backed Securities Trust 2006-WMC3, Mtg. Pass-Through Certificates, Series 2006-WMC3, Cl. A3, 0.345%, 8/25/366 | | | 1,161,321 | | | | 371,810 | |
Merrill Lynch Mortgage Investors Trust 2006-3, Mtg. Pass-Through Certificates, Series MLCC 2006-3, Cl. 2A1, 2.563%, 10/25/366 | | | 1,595,304 | | | | 1,467,657 | |
NC Finance Trust, Collateralized Mtg. Obligation Pass-Through Certificates, Series 1999-I, Cl. ECFD, 3.405%, 1/25/294,5 | | | 66,744 | | | | 5,840 | |
Popular ABS Mortgage Pass-Through Trust 2005-6, Mtg. Pass-Through Certificates, Series 2005-6, Cl. A3, 5.284%, 1/1/366 | | | 182,203 | | | | 123,546 | |
RALI Series 2006-QS13 Trust, Mtg. Asset-Backed Pass-Through Certificates: Series 2006-QS13, Cl. 1A5, 6%, 9/25/36 | | | 1,778,782 | | | | 1,172,129 | |
| Series 2006-QS13, Cl. 1A8, 6%, 9/25/36 | | | 35,555 | | | | 23,429 | |
RALI Series 2007-QS6 Trust, Mtg. Asset-Backed Pass-Through Certificates, Series 2007-QS6, Cl. A28, 5.75%, 4/25/37 | | | 869,245 | | | | 536,985 | |
| Residential Asset Securitization Trust 2005-A14, Mtg. Pass-Through Certificates, Series 2005-A14, Cl. A1, 5.50%, 12/1/35 | | | 3,399,140 | | | | 2,819,443 | |
| Residential Asset Securitization Trust 2005-A15, Mtg. Pass-Through Certificates, Series 2005-A15, Cl. 1A4, 5.75%, 2/1/36 | | | 3,854,449 | | | | 3,028,483 | |
| Residential Asset Securitization Trust 2005-A6CB, Mtg. Pass-Through Certificates, Series 2005-A6CB, Cl. A7, 6%, 6/1/35 | | | 4,317,609 | | | | 3,584,442 | |
| Terwin Mortgage Trust, Home Equity Asset-Backed Securities, Series 2006-4SL, Cl. A1, 2.848%, 5/1/373,6,10 | | | 165,470 | | | | 78,096 | |
| WaMu Mortgage Pass-Through Certificates 2005-AR12 Trust, Mtg. Pass-Through Certificates, Series 2007-AR12, Cl. 1A8, 2.451%, 10/1/356 | | | 2,281,223 | | | | 1,941,033 | |
| | | | | | | | |
| | | Principal
Amount | | | Value | |
| | | | | | | | | |
| Residential Continued | | | | | | | | |
| WaMu Mortgage Pass-Through Certificates 2006-AR10 Trust, Mtg. Pass-Through Certificates, Series 2006-AR10, Cl. 1A2, 2.506%, 9/1/366 | | $ | 875,125 | | | $ | 629,960 | |
WaMu Mortgage Pass-Through Certificates 2007-HY1 Trust, Mtg. Pass-Through Certificates: Series 2007-HY1, Cl. 4A1, 2.713%, 2/1/376 | | | 13,237,922 | | | | 9,720,229 | |
Series 2007-HY1, Cl. 5A1,
4.971%, 2/1/376 | | | 8,025,111 | | | | 5,755,706 | |
| WaMu Mortgage Pass-Through Certificates 2007-HY5 Trust, Mtg. Pass-Through Certificates, Series 2007-HY5, Cl. 3A1, 5.312%, 5/1/376 | | | 974,676 | | | | 867,001 | |
| Wells Fargo Mortgage-Backed Securities 2005-9 Trust, Mtg. Pass-Through Certificates, Series 2005-9, Cl. 2A6, 5.25%, 10/25/35 | | | 384,013 | | | | 388,556 | |
| Wells Fargo Mortgage-Backed | | | | | | | | |
Securities 2006-AR14 Trust, Mtg. Pass-Through Certificates, Series 2006-AR14, Cl. 1A2, 5.662%, 10/1/366 | | | 3,250,410 | | | | 2,940,147 | |
| | | | | | |
|
|
|
| | | | | | | | 90,801,365 | |
| | | | | | |
|
|
|
| Total Mortgage-Backed Obligations (Cost $705,486,426) | | | | | | | 701,461,034 | |
| U.S. Government Obligations—4.0% | |
Federal Home Loan Mortgage Corp. Nts.: 1.25%, 5/12/17 | | | 955,000 | | | | 969,218 | |
| 1.75%, 5/30/19 | | | 9,085,000 | | | | 9,313,488 | |
| 2.375%, 1/13/22 | | | 1,113,000 | | | | 1,145,630 | |
Federal National Mortgage Assn. Nts.: 1.125%, 4/27/17 | | | 1,120,000 | | | | 1,132,367 | |
| 4.375%, 10/15/15 | | | 4,000,000 | | | | 4,493,180 | |
| 5.375%, 6/12/1711 | | | 7,297,000 | | | | 8,854,705 | |
U.S. Treasury Bonds, STRIPS,
4.833%, 2/15/1612,13 | | | 2,116,000 | | | | 2,072,180 | |
| U.S. Treasury Nts., | | | | | | | | |
| 2%, 2/15/2213 | | | 65,000,000 | | | | 67,249,650 | |
| | | | | | |
|
|
|
Total U.S. Government Obligations
(Cost $91,619,935) | | | | | | | 95,230,418 | |
| Foreign Government Obligations—28.8% | |
| Argentina—0.1% | | | | | | | | |
Argentina (Republic of) Bonds:
2.50%, 12/31/386 | | | 4,550,000 | | | | 1,478,750 | |
| 6.976%, 10/3/15 | | | 910,000 | | | | 691,275 | |
| Argentina (Republic of) Sr. Unsec. | | | | | | | | |
| Bonds, Series X, 6.976%, 4/17/17 | | | 830,000 | | | | 565,110 | |
| | | | | | |
|
|
|
| | | | | | | | 2,735,135 | |
14 | OPPENHEIMER GLOBAL STRATEGIC INCOME FUND/VA
|
| | | | | | | | |
| | | Principal
Amount | | | Value | |
| | | | | | | | | |
| Australia—0.4% | | | | | | | | |
New South Wales Treasury Corp. Bonds:
Series 14, 5.50%, 8/1/14 | | | 875,000 | AUD | | $ | 942,815 | |
| Series 15, 6%, 4/1/25 | | | 640,000 | AUD | | | 702,584 | |
| Series 17, 5.50%, 3/1/17 | | | 625,000 | AUD | | | 699,864 | |
Queensland Treasury Corp. Nts.:
Series 15, 6%, 10/14/15 | | | 1,275,000 | AUD | | | 1,420,129 | |
| Series 17, 6%, 9/14/17 | | | 1,020,000 | AUD | | | 1,164,832 | |
| Series 21, 6%, 6/14/21 | | | 1,255,000 | AUD | | | 1,485,989 | |
| Series 24, 5.75%, 7/22/24 | | | 1,065,000 | AUD | | | 1,194,457 | |
Victoria Treasury Corp. Nts.,
Series 1116, 5.75%, 11/15/16 | | | 1,555,000 | AUD | | | 1,741,564 | |
| Western Australia Treasury Corp. Nts., Series 15, 7%, 4/15/15 | | | 630,000 | AUD | | | 709,872 | |
| | | | | | |
|
|
|
| | | | | | | | 10,062,106 | |
| Austria—0.1% | | | | | | | | |
Austria (Republic of) Bonds,
6.25%, 7/15/27 | | | 820,000 | EUR | | | 1,454,911 | |
| Belgium—0.1% | | | | | | | | |
Belgium (Kingdom of) Bonds,
Series 58, 3.75%, 9/28/20 | | | 2,550,000 | EUR | | | 3,423,480 | |
| Brazil—2.4% | | | | | | | | |
Brazil (Federative Republic of) Nota Do Tesouro Nacional Nts.:
9.762%, 1/1/17 | | | 28,238,000 | BRR | | | 14,404,780 | |
| 9.762%, 1/1/21 | | | 33,538,000 | BRR | | | 16,753,877 | |
| 12.681%, 5/15/4514 | | | 6,470,000 | BRR | | | 8,400,679 | |
| Series NTNB, 12.205%, 8/15/5014 | | | 3,265,000 | BRR | | | 4,296,810 | |
| Series NTNB, 12.681%, 5/15/1514 | | | 10,930,000 | BRR | | | 12,533,688 | |
| | | | | | |
|
|
|
| | | | | | | | 56,389,834 | |
| Canada—0.2% | | | | | | | | |
Canada (Government of) Nts.,
3.75%, 6/1/19 | | | 1,850,000 | CAD | | | 2,089,822 | |
| Canada (Government of) Treasury Bills, Series 364, 0.896%, 7/5/1212 | | | 1,835,000 | CAD | | | 1,802,125 | |
| | | | | | |
|
|
|
| | | | | | | | 3,891,947 | |
| Colombia—0.5% | | | | | | | | |
Bogota Distrio Capital Sr. Bonds,
9.75%, 7/26/283 | | | 2,407,000,000 | COP | | | 1,882,697 | |
| Colombia (Republic of) Sr. Unsec. Bonds, 6.125%, 1/18/41 | | | 7,170,000 | | | | 9,356,850 | |
| | | | | | |
|
|
|
| | | | | | | | 11,239,547 | |
| Croatia—0.1% | | | | | | | | |
Croatia (Republic of) Unsec. Nts.,
6.25%, 4/27/173 | | | 2,570,000 | | | | 2,566,762 | |
| Denmark—0.1% | | | | | | | | |
Denmark (Kingdom of) Bonds,
4%, 11/15/19 | | | 5,560,000 | DKK | | | 1,144,480 | |
| | | | | | | | |
| | | Principal
Amount | | | Value | |
| | | | | | | | | |
| Finland—0.0% | | | | | | | | |
| Finland (Republic of) Sr. Unsec. Unsub. Nts., 3.875%, 9/15/17 | | | 585,000 | EUR | | $ | 841,957 | |
| France—0.5% | | | | | | | | |
Caisse D’Amortissement de la Dette Sociale Bonds,
1.625%, 7/6/155,7 | | | 640,000 | | | | 639,834 | |
France (Republic of) Bonds:
| | | | | | | | |
| 3.25%, 10/25/21 | | | 1,660,000 | EUR | | | 2,217,722 | |
| 3.75%, 4/25/17 | | | 1,975,000 | EUR | | | 2,762,166 | |
| 3.75% 10/25/19 | | | 2,460,000 | EUR | | | 3,446,229 | |
| 4%, 4/25/60 | | | 520,000 | EUR | | | 711,546 | |
| 4.50%, 4/25/41 | | | 660,000 | EUR | | | 976,051 | |
| | | | | | |
|
|
|
| | | | | | | | 10,753,548 | |
| Germany—0.1% | | | | | | | | |
Germany (Federal Republic of) Bonds:
2.25%, 9/4/21 | | | 625,000 | EUR | | | 843,253 | |
| 2.50%, 7/4/44 | | | 735,000 | EUR | | | 962,788 | |
| | | | | | |
|
|
|
| | | | | | | | 1,806,041 | |
| Ghana—0.1% | | | | | | | | |
Ghana (Republic of) Bonds,
8.50%, 10/4/173 | | | 1,255,000 | | | | 1,396,188 | |
| Hungary—2.1% | | | | | | | | |
Hungary (Republic of) Bonds:
4.75%, 2/3/15 | | | 980,000 | | | | 945,700 | |
| 6.75%, 11/24/17 | | | 747,000,000 | HUF | | | 3,186,769 | |
| Sereis 23A, 6%, 11/24/23 | | | 74,000,000 | HUF | | | 285,065 | |
| Series 13/D, 6.75%, 2/12/13 | | | 3,277,000,000 | HUF | | | 14,460,629 | |
| Series 14/D, 6.75%, 8/22/14 | | | 451,000,000 | HUF | | | 1,975,376 | |
| Series 15C, 7.75%, 8/24/15 | | | 592,000,000 | HUF | | | 2,646,969 | |
| Series 15/A, 8%, 2/12/15 | | | 238,000,000 | HUF | | | 1,071,495 | |
| Series 16/C, 5.50%, 2/12/16 | | | 315,000,000 | HUF | | | 1,315,972 | |
| Series 17/B, 6.75%, 2/24/17 | | | 678,000,000 | HUF | | | 2,904,683 | |
| Series 19/A, 6.50%, 6/24/19 | | | 369,000,000 | HUF | | | 1,538,532 | |
| Series 20/A, 7.50%, 11/12/20 | | | 455,000,000 | HUF | | | 1,991,300 | |
| Series 22A, 7%, 6/24/22 | | | 193,000,000 | HUF | | | 813,469 | |
| Hungary (Republic of) Sr. Unsec. | | | | | | | | |
| Bonds, 7.625%, 3/29/41 | | | 805,000 | | | | 790,913 | |
| Hungary (Republic of) Sr. Unsec. Nts., 5.75%, 6/11/18 | | | 880,000 | EUR | | | 1,037,135 | |
| Hungary (Republic of) Sr. Unsec. Unsub. Nts., 6.375%, 3/29/21 | | | 2,210,000 | | | | 2,163,590 | |
| Hungary (Republic of) Treasury | | | | | | | | |
Bills:
7.195%, 8/22/1212 | | | 183,000,000 | HUF | | | 803,168 | |
| 7.275%, 9/5/1212 | | | 330,000,000 | HUF | | | 1,443,294 | |
| 7.31%, 12/27/1212 | | | 2,152,000,000 | HUF | | | 9,247,181 | |
| | | | | | |
|
|
|
| | | | | | | | 48,621,240 | |
| Indonesia—0.5% | | | | | | | | |
Indonesia (Republic of) Nts.,
5.25%, 1/17/423 | | | 3,245,000 | | | | 3,411,306 | |
15 | OPPENHEIMER GLOBAL STRATEGIC INCOME FUND/VA
|
STATEMENT OF INVESTMENTS Unaudited / Continued
| | | | | | | | |
| | | Principal
Amount | | | Value | |
| | | | | | | | | |
| Indonesia Continued | | | | | | | | |
| Indonesia (Republic of) Sr. Unsec. | | | | | | | | |
| Bonds, 4.875%, 5/5/213 | | $ | 1,455,000 | | | $ | 1,591,406 | |
| Indonesia (Republic of) Sr. Unsec. | | | | | | | | |
| Nts., 7.75%, 1/17/383 | | | 1,605,000 | | | | 2,218,913 | |
| Indonesia (Republic of) Unsec. | | | | | | | | |
Nts.:
3.75%, 4/25/223 | | | 2,375,000 | | | | 2,380,938 | |
| 8.50%, 10/12/353 | | | 840,000 | | | | 1,236,900 | |
| | | | | | |
|
|
|
| | | | | | | | 10,839,463 | |
| Israel—0.2% | | | | | | | | |
Israel (State of) Sr. Unsec. Bonds,
4%, 6/30/22 | | | 3,520,000 | | | | 3,652,884 | |
| Italy—0.5% | | | | | | | | |
| Buoni Poliennali Del Tesoro Bonds, 4.50%, 3/1/19 | | | 2,765,000 | EUR | | | 3,339,824 | |
| Italy (Republic of) Bonds: | | | | | | | | |
| 3%, 4/1/14 | | | 625,000 | EUR | | | 784,097 | |
| 4%, 9/1/20 | | | 1,565,000 | EUR | | | 1,800,358 | |
| 5%, 3/1/22 | | | 500,000 | EUR | | | 605,264 | |
| 5%, 9/1/40 | | | 1,035,000 | EUR | | | 1,103,022 | |
| Series EU, 1.853%, 10/15/176 | | | 630,000 | EUR | | | 660,596 | |
| Italy (Republic of) Nts., 1.50%, 3/1/146 | | | 250,000 | EUR | | | 304,353 | |
| Italy (Republic of) Sr. Unsec. Nts., | | | | | | | | |
| 4.50%, 6/8/15 | | | 124,000,000 | JPY | | | 1,557,965 | |
| Italy (Republic of) Treasury Bonds: | | | | | | | | |
| 4.75%, 9/15/16 | | | 510,000 | EUR | | | 645,573 | |
| 5.75%, 2/1/33 | | | 440,000 | EUR | | | 526,044 | |
| | | | | | |
|
|
|
| | | | | | | | 11,327,096 | |
| Ivory Coast—0.0% | | | | | | | | |
| Ivory Coast Bonds, 3.75%, 12/31/32 | | | 850,000 | | | | 637,500 | |
| Japan—2.0% | | | | | | | | |
Japan Bonds:
2 yr., 0.10%, 5/15/14 | | | 986,000,000 | JPY | | | 12,334,529 | |
| 5 yr., 0.30%, 3/20/17 | | | 557,000,000 | JPY | | | 7,001,010 | |
| 10 yr., 1.10%, 3/20/21 | | | 234,000,000 | JPY | | | 3,031,956 | |
| 20 yr., Series 112, 2.10%, 6/20/29 | | | 713,000,000 | JPY | | | 9,701,599 | |
| 30 yr., 2%, 3/20/42 | | | 433,000,000 | JPY | | | 5,534,405 | |
Japan Sr. Unsec. Bonds,
Series 134, 1.80%, 3/20/32 | | | 344,000,000 | JPY | | | 4,405,588 | |
| Japan Sr. Unsec. Unsub. Bonds, | | | | | | | | |
| 10 yr., Series 307, 1.30%, 3/20/20 | | | 436,000,000 | JPY | | | 5,766,649 | |
| | | | | | |
|
|
|
| | | | | | | | 47,775,736 | |
| Latvia—0.1% | | | | | | | | |
Latvia (Republic of) Nts.,
5.25%, 2/22/173 | | | 2,690,000 | | | | 2,784,150 | |
| Lithuanua—0.1% | | | | | | | | |
| Lithuania (Republic of) Sr. Unsec. Bonds, 6.625%, 2/1/223 | | | 2,495,000 | | | | 2,866,131 | |
| | | | | | | | |
| | | Principal
Amount | | | Value | |
| | | | | | | | | |
| Malaysia—0.2% | | | | | | | | |
Malaysia (Government of) Sr. Unsec. Bonds, Series 1/06,
4.262%, 9/15/16 | | | 2,205,000 | MYR | | $ | 725,009 | |
| Wakala Global Sukuk Bhd Bonds, | | | | | | | | |
| 4.646%, 7/6/213 | | | 2,540,000 | | | | 2,797,767 | |
| | | | | | |
|
|
|
| | | | | | | | 3,522,776 | |
| Mexico—4.9% | | | | | | | | |
United Mexican States Bonds:
4.592%, 11/29/1212 | | | 109,230,000 | MXN | | | 8,035,709 | |
| 21.301%, 12/18/1414 | | | 18,000,000 | MXN | | | 7,030,645 | |
| Series M, 6.50%, 6/10/216 | | | 129,160,000 | MXN | | | 10,520,483 | |
| Series M20, 7.50%, 6/3/276 | | | 167,740,000 | MXN | | | 14,307,173 | |
| Series M10, 7.75%, 12/14/17 | | | 76,260,000 | MXN | | | 6,493,136 | |
| Series M, 8%, 6/11/20 | | | 81,000,000 | MXN | | | 7,201,183 | |
| Series M20, 8.50%, 5/31/296 | | | 55,400,000 | MXN | | | 5,080,585 | |
| Series MI10, 9%, 12/20/126 | | | 357,200,000 | MXN | | | 27,361,305 | |
| United Mexican States Treasury Bills: | | | | | | | | |
| 4.569%, 12/13/1212 | | | 162,930,000 | MXN | | | 11,965,242 | |
| 4.59%, 10/18/1212 | | | 257,700,000 | MXN | | | 19,057,865 | |
| | | | | | |
|
|
|
| | | | | | | | 117,053,326 | |
| Nigeria—0.1% | | | | | | | | |
Nigeria (Federal Republic of) Treasury Bills:
15.149%, 3/7/1312 | | | 38,000,000 | NGN | | | 208,690 | |
| 15.205%, 3/28/1312 | | | 145,000,000 | NGN | | | 787,793 | |
| Series 364, 15.455%, 2/21/1312 | | | 180,000,000 | NGN | | | 994,931 | |
| Series 364, 15.572%, 4/25/1312 | | | 109,000,000 | NGN | | | 585,653 | |
| | | | | | |
|
|
|
| | | | | | | | 2,577,067 | |
| Panama—0.2% | | | | | | | | |
Panama (Republic of) Bonds:
6.70%, 1/26/36 | | | 1,446,000 | | | | 1,959,330 | |
| 8.875%, 9/30/27 | | | 1,120,000 | | | | 1,744,400 | |
| 9.375%, 4/1/29 | | | 1,130,000 | | | | 1,853,200 | |
| | | | | | |
|
|
|
| | | | | | | | 5,556,930 | |
| Peru—1.0% | | | | | | | | |
Peru (Republic of) Bonds,
7.35%, 7/21/25 | | | 3,785,000 | | | | 5,336,850 | |
Peru (Republic of) Sr. Unsec. Bonds:
6.95%, 8/12/313 | | | 14,795,000 | PEN | | | 6,446,968 | |
| 8.20%, 8/12/263 | | | 9,280,000 | PEN | | | 4,457,220 | |
Peru (Republic of) Sr. Unsec. Nts.,
7.84%, 8/12/203 | | | 12,095,000 | PEN | | | 5,391,588 | |
| Peru (Republic of) Sr. Unsec. Unsub. Bonds, 5.625%, 11/18/50 | | | 2,550,000 | | | | 3,104,625 | |
| | | | | | |
|
|
|
| | | | | | | | 24,737,251 | |
| Philippines—0.1% | | | | | | | | |
| Philippines (Republic of the) Sr. Unsec. Bonds, 5%, 1/13/37 | | | 1,290,000 | | | | 1,409,325 | |
16 | OPPENHEIMER GLOBAL STRATEGIC INCOME FUND/VA
|
| | | | | | | | |
| | | Principal
Amount | | | Value | |
| | | | | | | | | |
| Philippines Continued | | | | | | | | |
Philippines (Republic of the) Sr. Unsec. Unsub. Bonds,
6.375%, 10/23/34 | | $ | 925,000 | | | $ | 1,186,313 | |
| | | | | | |
|
|
|
| | | | | | | | 2,595,638 | |
| Poland—1.0% | | | | | | | | |
Poland (Republic of) Bonds:
5.25%, 10/25/20 | | | 15,280,000 | PLZ | | | 4,648,103 | |
| Series WS0922, 5.75%, 9/23/22 | | | 12,870,000 | PLZ | | | 4,032,148 | |
| Series 0415, 5.50%, 4/25/15 | | | 2,165,000 | PLZ | | | 665,225 | |
| Series 0416, 5%, 4/25/16 | | | 16,905,000 | PLZ | | | 5,142,562 | |
| Series 1017, 5.25%, 10/25/17 | | | 15,440,000 | PLZ | | | 4,738,150 | |
Poland (Republic of) Sr. Unsec. Nts.:
5%, 3/23/22 | | | 870,000 | | | | 953,955 | |
| 5.125%, 4/21/21 | | | 3,285,000 | | | | 3,639,780 | |
| | | | | | |
|
|
|
| | | | | | | | 23,819,923 | |
| Qatar—0.2% | | | | | | | | |
Qatar (State of) Sr. Nts.,
5.25%, 1/20/203 | | | 1,945,000 | | | | 2,252,310 | |
Qatar (State of) Sr. Unsec. Nts.:
5.75%, 1/20/423 | | | 1,490,000 | | | | 1,784,275 | |
| 6.40%, 1/20/403 | | | 860,000 | | | | 1,098,650 | |
| | | | | | |
|
|
|
| | | | | | | | 5,135,235 | |
| Romania—0.2% | | | | | | | | |
Romania Sr. Unsec. Bonds,
6.75%, 2/7/223 | | | 5,535,000 | | | | 5,790,994 | |
| Russia—1.3% | | | | | | | | |
Russian Federation Bonds:
7.50%, 3/15/186 | | | 88,200,000 | RUR | | | 2,664,825 | |
| 7.50%, 2/27/196 | | | 96,700,000 | RUR | | | 2,897,753 | |
| 7.60%, 4/14/216 | | | 131,000,000 | RUR | | | 3,907,399 | |
| Series 6206, 7.40%, 6/14/17 | | | 380,000,000 | RUR | | | 11,551,425 | |
Russian Federation Unsec. Bonds:
4.50%, 4/4/223 | | | 1,720,000 | | | | 1,806,189 | |
| 5.625%, 4/4/423 | | | 3,430,000 | | | | 3,677,989 | |
| Series 9, 7.90%, 3/18/216 | | | 43,800,000 | RUR | | | 1,309,824 | |
Vnesheconombank Via VEB Finance plc Sr. Unsec.
Nts., 6.025%, 7/15/205,7 | | | 2,335,000 | | | | 2,353,972 | |
| | | | | | |
|
|
|
| | | | | | | | 30,169,376 | |
| Singapore—0.0% | | | | | | | | |
| Singapore (Republic of) Sr. Unsec. Bonds, 2.375%, 4/1/17 | | | 670,000 | SGD | | | 577,411 | |
| Slovakia—0.1% | | | | | | | | |
Slovakia (Republic of) Bonds,
4.375%, 5/21/223 | | | 2,575,000 | | | | 2,549,250 | |
| South Africa—2.5% | | | | | | | | |
| South Africa (Republic of) Bonds: Series R209, 6.25%, 3/31/36 | | | 68,040,000 | ZAR | | | 6,377,072 | |
| Series R208, 6.75%, 3/31/21 | | | 89,410,000 | ZAR | | | 10,572,187 | |
| | | | | | | | |
| | | Principal
Amount | | | Value | |
| | | | | | | | | |
| South Africa Continued | | | | | | | | |
| South Africa (Republic of) Bonds: Continued | | | | | | | | |
| Series R213, 7%, 2/28/31 | | | 87,295,000 | ZAR | | $ | 9,335,016 | |
| Series R207, 7.25%, 1/15/20 | | | 123,670,000 | ZAR | | | 15,223,847 | |
| Series R186, 10.50%, 12/21/26 | | | 105,040,000 | ZAR | | | 15,618,805 | |
| South Africa (Republic of) Sr. Unsec. Nts., 4.665%, 1/17/24 | | | 2,300,000 | | | | 2,501,250 | |
| | | | | | |
|
|
|
| | | | | | | | 59,628,177 | |
| Spain—0.1% | | | | | | | | |
| Spain (Kingdom of) Sr. Unsec. Bonds, 4.30%, 10/31/19 | | | 765,000 | EUR | | | 868,956 | |
| Spain (Kingdom of) Sr. Unsub. Bonds, 4.70%, 7/30/41 | | | 505,000 | EUR | | | 467,678 | |
| | | | | | |
|
|
|
| | | | | | | | 1,336,634 | |
| Sri Lanka—0.1% | | | | | | | | |
Sri Lanka (Democratic Socialist Republic of) Sr. Unsec. Nts.:
6.25%, 10/4/203 | | | 1,230,000 | | | | 1,266,900 | |
| 6.25% 7/27/213 | | | 1,525,000 | | | | 1,541,543 | |
| | | | | | |
|
|
|
| | | | | | | | 2,808,443 | |
| The Netherlands—0.2% | | | | | | | | |
| Netherlands (Kingdom of the) Nts., 4.50%, 7/15/17 | | | 3,480,000 | EUR | | | 5,099,622 | |
| Turkey—4.9% | | | | | | | | |
Turkey (Republic of) Bonds:
6.875%, 3/17/36 | | | 2,545,000 | | | | 2,997,374 | |
| 7%, 3/11/19 | | | 1,200,000 | | | | 1,399,500 | |
| 8.984%, 11/7/1212 | | | 96,800,000 | TRY | | | 51,858,787 | |
| 9%, 3/5/14 | | | 15,375,000 | TRY | | | 8,616,291 | |
| 9%, 3/8/17 | | | 35,160,000 | TRY | | | 19,840,077 | |
| 9.50%, 1/12/226 | | | 12,350,000 | TRY | | | 7,248,839 | |
| 9.907%, 7/17/1312 | | | 24,355,000 | TRY | | | 12,325,098 | |
| 10.50%, 1/15/206 | | | 1,120,000 | TRY | | | 682,156 | |
| 15.577%, 8/14/1314 | | | 2,310,000 | TRY | | | 1,877,440 | |
Turkey (Republic of)
Nts.,
7.50%, 7/14/17 | | | 1,520,000 | | | | 1,776,500 | |
| Turkey (Republic of) Unsec. Bonds, 6.25%, 9/26/22 | | | 4,175,000 | | | | 4,738,625 | |
| Turkey (Republic of) Unsec. Nts.: 5.125%, 3/25/22 | | | 1,150,000 | | | | 1,200,313 | |
| 6%, 1/14/41 | | | 2,260,000 | | | | 2,387,125 | |
| | | | | | |
|
|
|
| | | | | | | | 116,948,125 | |
| Ukraine—0.1% | | | | | | | | |
Ukraine (Republic of) Bonds,
7.75%, 9/23/203 | | | 820,000 | | | | 747,020 | |
Ukraine (Republic of) Sr. Unsec. Nts.:
6.75%, 11/14/173 | | | 1,800,000 | | | | 1,608,120 | |
| 7.95%, 2/23/213 | | | 1,195,000 | | | | 1,095,815 | |
| | | | | | |
|
|
|
| | | | | | | | 3,450,955 | |
17 | OPPENHEIMER GLOBAL STRATEGIC INCOME FUND/VA
|
STATEMENT OF INVESTMENTS Unaudited / Continued
| | | | | | | | |
| | | Principal
Amount | | | Value | |
| | | | | | | | | |
| United Kingdom—0.4% | | | | | | | | |
| United Kingdom Treasury Bonds: 3.75%, 9/7/21 | | | 1,235,000 | GBP | | $ | 2,277,637 | |
| 4%, 9/7/16 | | | 1,890,000 | GBP | | | 3,371,464 | |
| 4.75%, 12/7/38 | | | 2,340,000 | GBP | | | 4,884,451 | |
| | | | | | |
|
|
|
| | | | | | | | 10,533,552 | |
| Uruguay—0.3% | | | | | | | | |
| Uruguay (Oriental Republic of) Bonds, 7.625%, 3/21/36 | | | 2,665,000 | | | | 3,864,250 | |
| Uruguay (Oriental Republic of) Unsec. Bonds, 8%, 11/18/22 | | | 2,316,250 | | | | 3,271,703 | |
| | | | | | |
|
|
|
| | | | | | | | 7,135,953 | |
| Venezuela—0.7% | | | | | | | | |
Venezuela (Republic of) Bonds:
9%, 5/7/23 | | | 4,090,000 | | | | 3,169,750 | |
| 11.95%, 8/5/31 | | | 1,260,000 | | | | 1,127,700 | |
Venezuela (Republic of) Nts.,
8.25%, 10/13/24 | | | 2,125,000 | | | | 1,545,938 | |
Venezuela (Republic of) Sr. Unsec. Unsub. Nts.:
7.75%, 10/13/19 | | | 1,550,000 | | | | 1,197,375 | |
| 12.75%, 8/23/22 | | | 1,105,000 | | | | 1,066,325 | |
Venezuela (Republic of) Unsec. Bonds:
7%, 3/31/38 | | | 1,945,000 | | | | 1,283,700 | |
| 7.65%, 4/21/25 | | | 3,585,000 | | | | 2,491,575 | |
| Venezuela (Republic of) Unsec. Nts., 13.625%, 8/15/183 | | | 5,465,000 | | | | 5,328,375 | |
| | | | | | |
|
|
|
| | | | | | | | 17,210,738 | |
| | | | | | |
|
|
|
| Total Foreign Government Obligations (Cost $678,230,769) | | | | | | | 684,447,512 | |
| Loan Participations—0.9% | | | | | | | | |
| Atlantic Broadband Finance LLC, Sr. Sec. Credit Facilities 2nd Lien Term Loan, 9.75%, 9/20/196 | | | 685,000 | | | | 679,577 | |
Brock Holdings III, Inc., Sr. Sec. Credit Facilities 2nd Lien
Term Loan, 10%, 2/15/186 | | | 620,000 | | | | 613,800 | |
Cengage Learning Holdings II LP, Sr. Sec. Credit Facilities 1st Lien Exit Term Loan:
5.74%, 7/5/176 | | | 1,050,797 | | | | 908,446 | |
| 5.74%, 7/5/176,7 | | | 515,295 | | | | 445,489 | |
| Clear Channel Communications, Inc., Sr. Sec. Credit Facilities 1st Lien Term Loan, Tranche B, 3.889%, 1/29/166 | | | 3,612,257 | | | | 2,882,468 | |
| Crestwood Holdings LLC, Sr. Sec. Credit Facilities 1st Lien Term Loan, Tranche B, 9.75%, 3/8/186 | | | 1,005,000 | | | | 1,012,118 | |
| | | | | | | | |
| | | Principal
Amount | | | Value | |
| | | | | | | | | |
| Loan Participations Continued | | | | | | | | |
Entegra Holdings LLC, Sr. Sec. Credit Facilities 3rd Lien Term Loan:
Tranche B, 3.709%, 10/19/156,15 | | $ | 7,043,685 | | | $ | 3,821,200 | |
| Tranche B, 3.709%, 10/19/156,7,15 | | | 554,888 | | | | 301,027 | |
| iStar Financial, Inc., Sr. Sec. Credit Facilities 1st Lien Term Loan, Tranche A2, 7%, 3/19/176 | | | 2,010,000 | | | | 2,012,010 | |
| Lone Star Intermediate Super Holdings LLC, Sr. Sec. Credit Facilities Term Loan, 11%, 8/7/196 | | | 1,215,000 | | | | 1,249,628 | |
| Nuveen Investments, Inc., Sr. Sec. Credit Facilities 2nd Lien Term Loan, 8.25%, 3/1/196 | | | 2,275,000 | | | | 2,283,531 | |
| OneLink Communications/San Juan Cable LLC, Sr. Sec. Credit Facilities 2nd Lien Term Loan, Tranche B, 10%, 6/9/186 | | | 1,055,000 | | | | 1,057,638 | |
Revel Entertainment LLC, Sr. Sec. Credit Facilities 1st Lien Term Loan:
7.50%, 2/17/176,7 | | | 305,000 | | | | 262,300 | |
| 9%, 2/17/176,7 | | | 1,715,000 | | | | 1,474,900 | |
| Springleaf Financial Services, Sr. Sec. Credit Facilities 1st Lien Term Loan, 5.50%, 5/10/176 | | | 1,085,000 | | | | 1,024,550 | |
Texas Competitive Electric Holdings Co. LLC, Non-Extended Sr. Sec. Credit Facilities 1st Lien Term Loan:
3.739%, 10/10/146 | | | 635,000 | | | | 399,978 | |
| 3.741%, 10/10/146 | | | 1,595,000 | | | | 1,004,668 | |
| | | | | | |
|
|
|
Total Loan Participations
(Cost $22,428,141) | | | | | | | 21,433,328 | |
| Corporate Bonds and Notes—26.2% | |
| Consumer Discretionary—3.8% | | | | | | | | |
| Auto Components—0.4% | | | | | | | | |
| Goodyear Tire & Rubber Co. (The), 8.25% Sr. Unsec. Unsub. Nts., 8/15/20 | | | 2,190,000 | | | | 2,329,613 | |
Tower Automotive Holdings USA LLC/TA Holdings Finance, Inc.,
10.625% Sr. Sec. Nts., 9/1/173 | | | 4,652,000 | | | | 4,954,380 | |
UCI International, Inc.,
8.625% Sr. Unsec. Nts., 2/15/19 | | | 605,000 | | | | 611,806 | |
Visteon Corp.,
6.75% Sr. Unsec. Nts., 4/15/19 | | | 2,470,000 | | | | 2,414,425 | |
| | | | | | |
|
|
|
| | | | | | | | 10,310,224 | |
| Automobiles—0.0% | | | | | | | | |
Jaguar Land Rover plc:
7.75% Sr. Unsec. Bonds, 5/15/183 | | | 390,000 | | | | 403,650 | |
| 8.25% Sr. Nts., 3/15/203 | | | 245,000 | GBP | | | 391,955 | |
| | | | | | |
|
|
|
| | | | | | | | 795,605 | |
18 | OPPENHEIMER GLOBAL STRATEGIC INCOME FUND/VA
|
| | | | | | | | |
| | | Principal
Amount | | | Value | |
| | | | | | | | | |
| Diversified Consumer Services—0.1% | |
Monitronics International, Inc.,
9.125% Sr. Nts., 4/1/203 | | $ | 1,005,000 | | | $ | 969,825 | |
| ServiceMaster Co., 8% Sr. Unsec. | | | | | | | | |
| Unsub. Nts., 2/15/20 | | | 605,000 | | | | 661,719 | |
| | | | | | |
|
|
|
| | | | | | | | 1,631,544 | |
| Hotels, Restaurants & Leisure—1.1% | |
Boyd Gaming Corp., 9.125%
Sr. Unsec. Nts., 12/1/18 | | | 1,875,000 | | | | 1,940,625 | |
Burger King Corp., 9.875%
Sr. Unsec. Unsub. Nts., 10/15/18 | | | 860,000 | | | | 983,625 | |
| Chester Downs & Marina LLC, 9.25% Sr. Sec. Nts., 1/15/203 | | | 970,000 | | | | 1,013,650 | |
| CKE Restaurants, Inc., 11.375% Sec. Nts., 7/15/18 | | | 865,000 | | | | 992,588 | |
Equinox Holdings, Inc., 9.50%
Sr. Sec. Nts., 2/1/163 | | | 1,780,000 | | | | 1,895,700 | |
Harrah’s Operating Co., Inc., 10%
Sr. Sec. Nts., 12/15/18 | | | 9,522,000 | | | | 6,558,278 | |
HOA Restaurants Group LLC/HOA Finance Corp., 11.25%
Sr. Sec. Nts., 4/1/173 | | | 2,280,000 | | | | 2,123,250 | |
Isle of Capri Casinos, Inc., 7.75%
Sr. Unsec. Unsub. Nts., 3/15/19 | | | 2,030,000 | | | | 2,090,900 | |
Landry’s, Inc., 9.375% Sr. Unsec.
Nts., 5/1/203 | | | 2,005,000 | | | | 2,047,606 | |
MGM Mirage, Inc., 6.625%
Sr. Unsec. Nts., 7/15/15 | | | 3,890,000 | | | | 4,026,150 | |
| Penn National Gaming, Inc., 8.75% Sr. Unsec. Sub. Nts., 8/15/19 | | | 1,550,000 | | | | 1,724,375 | |
Premier Cruise Ltd., 11%
Sr. Nts., 3/15/084,5 | | | 250,000 | | | | — | |
| | | | | | |
|
|
|
| | | | | | | | 25,396,747 | |
| Household Durables—0.3% | | | | | | | | |
Beazer Homes USA, Inc.:
6.875% Sr. Unsec. Nts., 7/15/15 | | | 995,000 | | | | 960,175 | |
| 9.125% Sr. Unsec. Nts., 5/15/19 | | | 2,825,000 | | | | 2,478,938 | |
Jarden Corp., 6.125% Sr. Unsec.
Nts., 11/15/22 | | | 225,000 | | | | 238,500 | |
| Libbey Glass, Inc., 6.875% Sr. Sec. Nts., 5/15/203 | | | 770,000 | | | | 795,025 | |
Reynolds Group Issuer, Inc./Reynolds Group Issuer LLC/Reynolds Group Issuer Luxembourg SA:
9% Sr. Nts., 5/15/183 | | | 1,045,000 | | | | 1,029,325 | |
| 9% Sr. Nts., 4/15/193 | | | 1,000,000 | | | | 1,002,500 | |
| | | | | | |
|
|
|
| | | | | | | | 6,504,463 | |
| | | | | | | | |
| | | Principal
Amount | | | Value | |
| | | | | | | | | |
| Leisure Equipment & Products—0.1% | | | | | |
FGI Operating Co.
LLC/FGI Finance, Inc.,
7.875% Sr. Sec. Nts., 5/1/203 | | $ | 2,005,000 | | | $ | 2,095,225 | |
| Media—1.5% | | | | | | | | |
Affinion Group Holdings, Inc.,
11.625% Sr. Unsec. Nts., 11/15/15 | | | 1,140,000 | | | | 906,300 | |
Affinion Group, Inc., 7.875%
Sr. Unsec. Nts., 12/15/18 | | | 3,055,000 | | | | 2,619,663 | |
AMC Entertainment, Inc., 8.75%
Sr. Unsec. Nts., 6/1/19 | | | 940,000 | | | | 1,012,850 | |
| Belo (A.H.) Corp., 7.75% Sr. Unsec. Unsub. Debs., 6/1/27 | | | 2,983,000 | | | | 2,938,255 | |
Cequel Communications Holdings I LLC, 8.625% Sr. Unsec.
Nts., 11/15/173 | | | 1,800,000 | | | | 1,948,500 | |
Clear Channel Communications,
Inc., 5.75% Sr. Unsec. Unsub.
Nts., 1/15/13 | | | 3,010,000 | | | | 2,998,713 | |
Cumulus Media Holdings, Inc.,
7.75% Sr. Unsec. Unsub.
Nts., 5/1/19 | | | 1,230,000 | | | | 1,165,425 | |
DISH DBS Corp.:
5.875% Sr. Unsec. Nts., 7/15/223 | | | 770,000 | | | | 781,550 | |
| 7.875% Sr. Unsec. Nts., 9/1/19 | | | 2,215,000 | | | | 2,563,863 | |
Entravision Communications
Corp., 8.75% Sr. Sec. Nts., 8/1/17 | | | 1,806,000 | | | | 1,923,390 | |
Gray Television, Inc., 10.50%
Sr. Sec. Nts., 6/29/15 | | | 1,835,000 | | | | 1,917,575 | |
Lamar Media Corp., 5.875%
Sr. Sub. Nts., 2/1/223 | | | 785,000 | | | | 808,550 | |
Newport Television LLC/NTV
Finance Corp., 13.75%
Sr. Nts., 3/15/173 | | | 2,216,028 | | | | 2,304,669 | |
Nexstar Broadcasting, Inc./Mission
Broadcasting, Inc., 8.875% Sec. Nts., 4/15/17 | | | 1,780,000 | | | | 1,889,025 | |
Sinclair Television Group, Inc.,
8.375% Sr. Unsec. Nts., 10/15/18 | | | 2,505,000 | | | | 2,742,975 | |
Unitymedia Hessen GmbH & Co. KG/Unitymedia NRW GmbH,
7.50% Sr. Sec. Nts., 3/15/19 | | | 1,595,000 | | | | 1,698,675 | |
Univision Communications, Inc.,
7.875% Sr. Sec. Nts., 11/1/203 | | | 945,000 | | | | 1,015,875 | |
UPCB Finance V Ltd., 7.25%
Sr. Sec. Nts., 11/15/213 | | | 1,225,000 | | | | 1,286,250 | |
UPCB Finance VI Ltd., 6.875%
Sr. Sec. Nts., 1/15/223 | | | 1,965,000 | | | | 2,014,125 | |
Virgin Media Finance plc:
5.25% Sr. Unsec. Unsub.
Nts., 2/15/22 | | | 760,000 | | | | 780,900 | |
19 | OPPENHEIMER GLOBAL STRATEGIC INCOME FUND/VA
|
STATEMENT OF INVESTMENTS Unaudited / Continued
| | | | | | | | |
| | | Principal
Amount | | | Value | |
| | | | | | | | | |
| Media Continued | | | | | | | | |
| Virgin Media Finance plc: Continued | | | | | | | | |
8.375% Sr. Unsec. Unsub.
Nts., 10/15/19 | | $ | 860,000 | | | $ | 970,725 | |
| | | | | | |
|
|
|
| | | | | | | | 36,287,853 | |
| Specialty Retail—0.2% | | | | | | | | |
| Burlington Coat Factory Warehouse Corp., 10% Sr. Unsec. Nts., 2/15/19 | | | 500,000 | | | | 532,500 | |
J. Crew Group, Inc., 8.125%
Sr. Unsec. Nts., 3/1/19 | | | 980,000 | | | | 1,016,750 | |
Limited Brands, Inc., 5.625%
Sr. Nts., 2/15/22 | | | 1,975,000 | | | | 2,044,125 | |
Michaels Stores, Inc.,
7.75% Sr. Unsec. Nts., 11/1/18 | | | 155,000 | | | | 164,300 | |
Sally Holdings LLC/Sally Capital, Inc., 6.875% Sr. Unsec.
Nts., 11/15/19 | | | 1,830,000 | | | | 1,999,275 | |
| | | | | | |
|
|
|
| | | | | | | | 5,756,950 | |
| Textiles, Apparel & Luxury Goods—0.1% | |
Levi Strauss & Co., 7.625%
Sr. Unsec. Unsub. Nts., 5/15/20 | | | 940,000 | | | | 1,003,450 | |
| Quiksilver, Inc., 6.875% Sr. Unsec. | | | | | | | | |
| Nts., 4/15/15 | | | 725,000 | | | | 703,250 | |
| | | | | | |
|
|
|
| | | | | | | | 1,706,700 | |
| Consumer Staples—1.0% | | | | | | | | |
| Beverages—0.1% | | | | | | | | |
AmBev International Finance Co. Ltd., 9.50% Sr. Unsec. Unsub.
Nts., 7/24/176 | | | 2,080,000 | BRR | | | 1,134,887 | |
| Food & Staples Retailing—0.2% | |
| Cencosud SA, 5.50% Sr. Unsec. Nts., 1/20/213 | | | 2,840,000 | | | | 2,961,862 | |
Rite Aid Corp., 7.50% Sr. Sec.
Nts., 3/1/17 | | | 935,000 | | | | 958,375 | |
| | | | | | |
|
|
|
| | | | | | | | 3,920,237 | |
| Food Products—0.6% | | | | | | | | |
American Seafoods Group LLC,
10.75% Sr. Sub. Nts., 5/15/163 | | | 2,150,000 | | | | 2,031,750 | |
| ASG Consolidated LLC, 12.075% Sr. Nts., 5/15/173,15 | | | 5,391,928 | | | | 4,313,542 | |
| Bumble Bee Acquisition Corp., 9% Sr. Sec. Nts., 12/15/173 | | | 1,662,000 | | | | 1,666,155 | |
MHP SA, 10.25% Sr. Unsec.
Nts., 4/29/153 | | | 2,258,000 | | | | 2,187,460 | |
Post Holdings, Inc., 7.375%
Sr. Unsec. Nts., 2/15/223 | | | 1,890,000 | | | | 1,998,675 | |
| Southern States Cooperative, Inc., | | | | | | | | |
| 11.25% Sr. Nts., 5/15/153 | | | 2,465,000 | | | | 2,600,575 | |
| | | | | | |
|
|
|
| | | | | | | | 14,798,157 | |
| | | | | | | | |
| | | Principal
Amount | | | Value | |
| | | | | | | | | |
| Household Products—0.1% | | | | | |
Spectrum Brands Holdings, Inc.,
9.50% Sr. Sec. Nts., 6/15/18 | | $ | 870,000 | | | $ | 987,450 | |
| Personal Products—0.0% | | | | | | | | |
NBTY, Inc., 9% Sr. Unsec.
Nts., 10/1/18 | | | 460,000 | | | | 510,600 | |
| Tobacco—0.0% | | | | | | | | |
| Alliance One International, Inc., 10% Sr. Unsec. Nts., 7/15/16 | | | 980,000 | | | | 987,350 | |
| Energy—5.1% | | | | | | | | |
| Energy Equipment & Services—0.5% | |
Forbes Energy Services Ltd., 9%
Sr. Unsec. Nts., 6/15/19 | | | 1,185,000 | | | | 1,125,750 | |
| Global Geophysical Services, Inc., | | | | | | | | |
| 10.50% Sr. Unsec. Nts., 5/1/17 | | | 1,510,000 | | | | 1,445,825 | |
| Hercules Offshore, Inc., 7.125% | | | | | | | | |
| Sr. Sec. Nts., 4/1/173 | | | 1,005,000 | | | | 976,106 | |
| Hornbeck Offshore Services, Inc., | | | | | | | | |
| 5.875% Sr. Unsec. Nts., 4/1/203 | | | 2,010,000 | | | | 2,004,975 | |
| Offshore Group Investments Ltd.: | | | | | | | | |
| 11.50% Sr. Sec. Nts., 8/1/15 | | | 3,105,000 | | | | 3,384,450 | |
| 11.50% Sr. Sec. Nts., 8/1/153 | | | 815,000 | | | | 888,350 | |
| Precision Drilling Corp., 6.625% | | | | | | | | |
| Sr. Unsec. Nts., 11/15/20 | | | 1,850,000 | | | | 1,914,750 | |
| SESI LLC, 6.375% Sr. Unsec. Nts., 5/1/19 | | | 705,000 | | | | 742,013 | |
| | | | | | |
|
|
|
| | | | | | | | 12,482,219 | |
| Oil, Gas & Consumable Fuels—4.6% | |
| Alliance Oil Co. Ltd., 9.875% | | | | | | | | |
| Sr. Unsec. Nts., 3/11/153 | | | 1,680,000 | | | | 1,738,800 | |
| Antero Resources Finance Corp., | | | | | | | | |
| 9.375% Sr. Unsec. Nts., 12/1/17 | | | 2,070,000 | | | | 2,297,700 | |
| Atlas Pipeline Partners LP/Atlas Pipeline Finance Corp., 8.75% | | | | | | | | |
| Sr. Unsec. Sub. Nts., 6/15/18 | | | 1,535,000 | | | | 1,646,288 | |
| Bill Barrett Corp., 7.625% | | | | | | | | |
| Sr. Unsec. Unsub. Nts., 10/1/19 | | | 795,000 | | | | 798,975 | |
| BreitBurn Energy Partners LP/BreitBurn Finance Corp., 8.625% | | | | | | | | |
| Sr. Unsec. Nts., 10/15/20 | | | 2,805,000 | | | | 2,980,313 | |
| Chaparral Energy, Inc., 9.875% | | | | | | | | |
| Sr. Unsec. Nts., 10/1/20 | | | 1,760,000 | | | | 1,964,600 | |
Chesapeake Midstream Partners LP/CHKM Finance Corp., 6.125%
Sr. Unsec. Unsub. Nts., 7/15/22 | | | 1,880,000 | | | | 1,851,800 | |
Cimarex Energy Co., 5.875%
Sr. Unsec. Unsub. Nts., 5/1/22 | | | 3,040,000 | | | | 3,165,400 | |
| Cloud Peak Energy Resources LLC/Cloud Peak Energy Finance Corp., | | | | | | | | |
8.50% Sr. Unsec. Unsub.
Nts., 12/15/19 | | | 380,000 | | | | 396,150 | |
20 | OPPENHEIMER GLOBAL STRATEGIC INCOME FUND/VA
|
| | | | | | | | |
| | | Principal
Amount | | | Value | |
| | | | | | | | | |
| Oil, Gas & Consumable Fuels Continued | |
Continental Resources, Inc., 5%
Sr. Unsec. Nts., 9/15/223 | | $ | 1,215,000 | | | $ | 1,234,744 | |
| Gaz Capital SA: | | | | | | | | |
| 7.288% Sr. Sec. Nts., 8/16/373 | | | 7,090,000 | | | | 8,082,600 | |
| 8.146% Sr. Sec. Nts., 4/11/183 | | | 3,630,000 | | | | 4,340,471 | |
| 8.625% Sr. Sec. Nts., 4/28/343 | | | 2,290,000 | | | | 2,925,475 | |
9.25% Sr. Unsec. Unsub.
Nts., 4/23/193 | | | 4,965,000 | | | | 6,217,620 | |
James River Coal Co., 7.875%
Sr. Unsec. Unsub. Nts., 4/1/19 | | | 1,395,000 | | | | 711,450 | |
| KazMunayGaz National Co., 6.375% Sr. Unsec. Bonds, 4/9/213 | | | 1,890,000 | | | | 2,088,450 | |
KMG Finance Sub BV, 9.125%
Sr. Unsec. Unsub. Nts., 7/2/183 | | | 4,600,000 | | | | 5,709,750 | |
Linn Energy LLC/Linn Energy Finance Corp., 8.625%
Sr. Unsec. Nts., 4/15/20 | | | 3,620,000 | | | | 3,918,650 | |
| Lukoil International Finance BV: | | | | | | | | |
| 6.125% Sr. Unsec. Nts., 11/9/203 | | | 5,180,000 | | | | 5,458,166 | |
| 6.656% Sr. Unsec. Unsub. Bonds, 6/7/223 | | | 1,085,000 | | | | 1,194,466 | |
7.25% Sr. Unsec. Unsub.
Nts., 11/5/193 | | | 830,000 | | | | 937,900 | |
MEG Energy Corp., 6.50%
Sr. Unsec. Nts., 3/15/213 | | | 3,195,000 | | | | 3,278,869 | |
Murray Energy Corp., 10.25%
Sr. Sec. Nts., 10/15/153 | | | 1,315,000 | | | | 1,160,488 | |
| Navios Maritime Acquisition Corp., | | | | | | | | |
| 8.625% Sr. Sec. Nts., 11/1/17 | | | 695,000 | | | | 649,825 | |
| Odebrecht Drilling Norbe VIII/IX Ltd., 6.35% Sr. Sec. Nts., 6/30/213 | | | 1,705,200 | | | | 1,794,723 | |
| Pemex Project Funding Master Trust, 6.625% Unsec. Unsub. Bonds, 6/15/35 | | | 4,340,000 | | | | 5,186,300 | |
| Pertamina Persero PT: | | | | | | | | |
| 5.25% Nts., 5/23/213 | | | 1,575,000 | | | | 1,653,750 | |
| 6% Sr. Unsec. Nts., 5/3/423 | | | 1,720,000 | | | | 1,707,100 | |
| 6.50% Sr. Unsec. Nts., 5/27/413 | | | 1,075,000 | | | | 1,139,500 | |
| Petrobras International Finance Co., | | | | | | | | |
5.75% Sr. Unsec. Unsub.
Nts., 1/20/20 | | | 1,685,000 | | | | 1,852,745 | |
| Petroleos de Venezuela SA: | | | | | | | | |
4.90% Sr. Unsec. Nts.,
Series 2014, 10/28/14 | | | 3,060,000 | | | | 2,639,250 | |
| 8.50% Sr. Nts., 11/2/173 | | | 3,415,000 | | | | 2,783,225 | |
| 12.75% Sr. Unsec. Nts., 2/17/223 | | | 1,635,000 | | | | 1,540,988 | |
| Petroleos Mexicanos: | | | | | | | | |
| 1.95% Sr. Unsec. Nts., 12/20/227 | | | 185,000 | | | | 185,000 | |
| 2% Sr. Unsec. Nts., 12/20/227 | | | 915,000 | | | | 915,000 | |
| 5.50% Sr. Unsec. Unsub. Nts., 1/21/21 | | | 1,995,000 | | | | 2,264,325 | |
| 5.50% Sr. Unsec. Unsub. Nts., 6/27/443 | | | 1,930,000 | | | | 1,978,250 | |
| 6% Sr. Unsec. Unsub. Nts., 3/5/20 | | | 2,420,000 | | | | 2,810,830 | |
| | | | | | | | |
| | | Principal
Amount | | | Value | |
| | | | | | | | | |
| Oil, Gas & Consumable Fuels Continued | |
Petroleum Co. of Trinidad & Tobago Ltd., 9.75% Sr. Unsec.
Nts., 8/14/193 | | $ | 2,825,000 | | | $ | 3,493,113 | |
| Quicksilver Resources, Inc.: | | | | | | | | |
| 8.25% Sr. Unsec. Nts., 8/1/15 | | | 985,000 | | | | 925,900 | |
| 11.75% Sr. Nts., 1/1/16 | | | 1,395,000 | | | | 1,365,356 | |
Range Resources Corp., 8%
Sr. Unsec. Sub. Nts., 5/15/19 | | | 875,000 | | | | 960,313 | |
Samson Investment Co., 9.75%
Sr. Unsec. Nts., 2/15/203 | | | 1,510,000 | | | | 1,504,338 | |
| SandRidge Energy, Inc.: | | | | | | | | |
| 8.75% Sr. Unsec. Nts., 1/15/20 | | | 875,000 | | | | 916,563 | |
| 9.875% Sr. Unsec. Nts., 5/15/16 | | | 1,290,000 | | | | 1,419,000 | |
| Schahin II Finance Co. SPV Ltd., 5.875% Sr. Sec. Unsub. Nts., 9/25/223 | | | 2,260,000 | | | | 2,271,300 | |
SM Energy Co., 6.50%
Sr. Nts., 1/1/233 | | | 1,015,000 | | | | 1,023,881 | |
Tengizchevroil LLP, 6.124%
Nts., 11/15/145 | | | 661,080 | | | | 691,225 | |
Venoco, Inc., 8.875% Sr. Unsec.
Nts., 2/15/19 | | | 1,375,000 | | | | 1,258,125 | |
| | | | | | |
|
|
|
| | | | | | | | 109,029,050 | |
| Financials—5.1% | | | | | | | | |
| Capital Markets—0.7% | | | | | | | | |
| Credit Suisse AG (Guernsey), | | | | | | | | |
| 1.625% Sec. Bonds, 3/6/153 | | | 381,500 | | | | 383,595 | |
Edgen Murray Corp., 12.25% Sr. Sec.
Nts., 1/15/15 | | | 1,420,000 | | | | 1,420,000 | |
| Korea Development Bank (The), | | | | | | | | |
| 3.875% Sr. Unsec. Nts., 5/4/17 | | | 1,520,000 | | | | 1,620,443 | |
| Nationstar Mortgage/Nationstar Capital Corp. ,10.875% Sr. Unsec. Nts., 4/1/15 | | | 3,715,000 | | | | 4,030,775 | |
| Nuveen Investments, Inc.: | | | | | | | | |
| 5.50% Sr. Unsec. Nts., 9/15/15 | | | 845,000 | | | | 768,950 | |
10.50% Sr. Unsec. Unsub.
Nts., 11/15/15 | | | 845,000 | | | | 861,900 | |
Pinafore LLC/Pinafore, Inc., 9%
Sec. Nts., 10/1/18 | | | 2,826,000 | | | | 3,158,055 | |
Springleaf Finance Corp., 6.90%
Nts., Series J, 12/15/17 | | | 1,300,000 | | | | 1,044,056 | |
UBS AG (London), 2.25%
Sec. Nts., 3/30/173 | | | 495,000 | | | | 497,299 | |
| Verso Paper Holdings LLC, 11.375% Sr. Unsec. Sub. Nts., Series B, 8/1/16 | | | 1,460,000 | | | | 693,500 | |
| Verso Paper Holdings LLC/Verso Paper, Inc., 8.75% Sr. Sec. Nts., 2/1/19 | | | 2,495,000 | | | | 998,000 | |
| | | | | | |
|
|
|
| | | | | | | | 15,476,573 | |
21 | OPPENHEIMER GLOBAL STRATEGIC INCOME FUND/VA
|
STATEMENT OF INVESTMENTS Unaudited / Continued
| | | | | | | | |
| | | Principal
Amount | | | Value | |
| | | | | | | | | |
| Commercial Banks—3.1% | |
Akbank TAS, 5.125% Sr. Unsec.
Nts., 7/22/155 | | $ | 2,065,000 | | | $ | 2,114,147 | |
Alfa Bank/Alfa Bond Issuance plc,
7.875% Nts., 9/25/173 | | | 1,770,000 | | | | 1,790,355 | |
| Australia & New Zealand Banking Group Ltd., 2.40% Sec. Bonds, 11/23/163 | | | 640,000 | | | | 656,256 | |
Banco BMG SA:
9.15% Nts., 1/15/165 | | | 1,304,000 | | | | 1,193,160 | |
| 9.95% Unsec. Unsub. Nts., 11/5/193 | | | 1,260,000 | | | | 1,152,900 | |
Banco de Credito del Peru, 5.375%
Sr. Nts., 9/16/203 | | | 635,000 | | | | 661,988 | |
Banco de Credito del Peru/Panama,
6.875% Sub. Nts., 9/16/263,6 | | | 1,708,000 | | | | 1,865,990 | |
| Banco del Estado de Chile, 3.875% Sr. Unsec. Nts., 2/8/223 | | | 1,680,000 | | | | 1,718,442 | |
Banco do Brasil SA, 5.875%
Unsec. Sub. Nts., 1/26/223 | | | 1,160,000 | | | | 1,196,308 | |
| Banco do Brasil SA (Cayman), 9.25% Perpetual Jr. Sub. Bonds3,16 | | | 5,345,000 | | | | 5,953,261 | |
| Banco do Estado do Rio Grande do Sul SA, 7.375% Sub Nts., 2/2/223 | | | 2,110,000 | | | | 2,173,300 | |
Banco PanAmericano SA, 8.50%
Sr. Unsec. Sub. Nts., 4/23/203 | | | 1,295,000 | | | | 1,392,125 | |
Bank of Scotland plc:
4.875% Sr. Sec. Nts., 12/20/24 | | | 210,000 | GBP | | | 358,425 | |
| 4.875% Sr. Sec. Unsub. Nts., 11/8/16 | | | 125,000 | GBP | | | 216,728 | |
| Barclays Bank plc, 2.25% Sr. Sec. Bonds, 5/10/173 | | | 870,000 | | | | 871,341 | |
| BOM Capital plc, 6.699% Sr. Unsec. Nts., 3/11/153 | | | 3,970,000 | | | | 4,118,875 | |
BPCE SFH SA, 3.75% Sr. Sec.
Nts., 9/13/21 | | | 580,000 | EUR | | | 779,478 | |
| CIT Group, Inc., 7% Sec. Bonds, 5/2/175 | | | 1,485,735 | | | | 1,490,378 | |
Compagnie de Financement Foncier:
| | | | | |
| 4.875% Sec. Nts., 5/25/21 | | | 375,000 | EUR | | | 538,216 | |
| 5.75% Sec. Nts., 10/4/21 | | | 150,000 | EUR | | | 229,630 | |
Corp Financiera de Desarrollo SA,
4.75% Sr. Unsec. Nts., 2/8/223 | | | 1,730,000 | | | | 1,816,500 | |
| EUROFIMA Bonds, 6.25%, 12/28/18 | | | 870,000 | AUD | | | 963,198 | |
Grupo Aval Ltd., 5.25% Sr. Unsec.
Nts., 2/1/173 | | | 2,385,000 | | | | 2,510,213 | |
Halyk Savings Bank of Kazakhstan JSC:
7.25% Unsec. Unsub. Nts., 5/3/173 | | | 585,000 | | | | 585,000 | |
| 9.25% Sr. Nts., 10/16/135 | | | 8,350,000 | | | | 8,752,111 | |
| ICICI Bank Ltd., 6.375% Bonds, 4/30/223,6 | | | 3,460,000 | | | | 3,114,000 | |
| | | | | | | | |
| | | Principal
Amount | | | Value | |
| | | | | | | | | |
| Commercial Banks Continued | |
| Lloyds TSB Bank plc, 6% Sr. Sec. Nts., 2/8/29 | | | 375,000 | GBP | | $ | 701,732 | |
National Australia Bank Ltd., 2%
Sec. Bonds, 6/20/173 | | | 755,000 | | | | 754,774 | |
Sberbank of Russia Via SB Capital SA:
5.40% Sr. Unsec. Nts., 3/24/17 | | | 3,465,000 | | | | 3,607,827 | |
| 6.125% Sr. Nts., 2/7/223 | | | 2,835,000 | | | | 2,965,183 | |
Societe Generale SCF SA, 2.018%
Sec. Unsub. Nts., 6/19/176 | | | 100,000 | | | | 95,130 | |
| Sparebank 1 Boligkreditt AS, 2.30% Sec. Bonds, 6/30/173 | | | 620,000 | | | | 623,906 | |
| Stadshypotek AB, 6% Sec. Unsub. Bonds, 6/21/17 | | | 32,000,000 | SEK | | | 5,335,918 | |
Swedbank Hypotek AB:
2.375% Sec. Nts., 4/5/173 | | | 470,000 | | | | 475,687 | |
| 3.75% Bonds, 3/15/17 | | | 13,000,000 | SEK | | | 1,967,234 | |
Toronto-Dominion Bank (The),
1.50% Sec. Bonds, 3/13/173 | | | 510,000 | | | | 515,202 | |
| Turkiye Vakiflar Bankasi TAO, 5.75% Sr. Unsec. Nts., 4/24/173 | | | 1,275,000 | | | | 1,294,125 | |
| VEB Finance Ltd., 6.902% Sr. Unsec. Unsub. Nts., 7/9/203 | | | 2,135,000 | | | | 2,318,012 | |
VTB Capital SA:
6.315% Nts., 2/22/183 | | | 2,845,000 | | | | 2,891,231 | |
| 6.465% Sr. Sec. Unsub. Nts., 3/4/153 | | | 800,000 | | | | 841,000 | |
Yapi ve Kredi Bankasi AS, 6.75%
Sr. Unsec. Nts., 2/8/173 | | | 1,080,000 | | | | 1,105,650 | |
| | | | | | |
|
|
|
| | | | | | | | 73,704,936 | |
| Consumer Finance—0.1% | |
JSC Astana Finance, 9.16%
Nts., 3/14/124 | | | 7,200,000 | | | | 720,000 | |
| Speedy Cash, Inc., 10.75% Sr. Sec. Nts., 5/15/183 | | | 1,180,000 | | | | 1,224,250 | |
| TMX Finance LLC/TitleMax | | | | | | | | |
| Finance Corp., 13.25% Sr. Sec. Nts., 7/15/15 | | | 900,000 | | | | 999,000 | |
| | | | | | |
|
|
|
| | | | | | | | 2,943,250 | |
| Diversified Financial Services—0.6% | |
| Autopistas del Nordeste Cayman Ltd., 9.39% Nts., 1/15/263 | | | 2,472,556 | | | | 2,413,709 | |
BA Covered Bond Issuer,
4.25% Sec. Nts., 4/5/17 | | | 835,000 | EUR | | | 1,123,327 | |
Banco Invex SA, 30.555%
Mtg.-Backed Certificates,
Series 062U, 3/13/346,14 | | | 4,830,734 | MXN | | | 470,833 | |
Bank of America Corp.,
4.75% Sr. Unsec. Nts., 4/3/17 | | | 250,000 | EUR | | | 329,666 | |
22 | OPPENHEIMER GLOBAL STRATEGIC INCOME FUND/VA
|
| | | | | | | | |
| | | Principal
Amount | | | Value | |
| | | | | | | | | |
| Diversified Financial Services Continued | |
| Caisse Centrale Desjardins du Quebec, 1.60% Sec. Bonds, 3/6/173 | | $ | 510,000 | | | $ | 516,528 | |
Export Credit Bank of Turkey,
5.875% Sr. Unsec. Nts., 4/24/193 | | | 1,705,000 | | | | 1,758,281 | |
GMAC LLC, 8% Sr. Unsec.
Nts., 11/1/31 | | | 2,140,000 | | | | 2,519,850 | |
Instituto de Credito Oficial:
1.95% Sr. Unsec. Unsub.
Nts., 12/20/22 | | | 250,000 | GBP | | | 373,065 | |
5% Sr. Unsec. Unsub.
Nts., 11/14/16 | | | 510,000 | | | | 478,812 | |
| 5% Sr. Unsec. Unsub. Nts., 4/10/17 | | | 1,260,000 | | | | 1,143,458 | |
JPMorgan Hipotecaria su Casita:
8.066% Sec. Nts., 8/26/355,14 | | | 5,808,600 | MXN | | | 52,252 | |
28.897% Mtg.-Backed Certificates,
Series 06U, 9/25/3514 | | | 1,586,240 | MXN | | | 224,334 | |
Korea Development Bank (The),
4% Sr. Unsec. Unsub. Nts., 9/9/16 | | | 1,755,000 | | | | 1,876,876 | |
| PHH Corp., 9.25% Sr. Unsec. Unsub. Nts., 3/1/16 | | | 2,030,000 | | | | 2,167,025 | |
| | | | | | |
|
|
|
| | | | | | | | 15,448,016 | |
| Insurance—0.1% | | | | | | | | |
International Lease Finance Corp.,
8.75% Sr. Unsec. Unsub.
Nts., 3/15/17 | | | 1,475,000 | | | | 1,663,063 | |
| Real Estate Investment Trusts—0.2% | |
FelCor Escrow Holdings LLC,
6.75% Sr. Sec. Nts., 6/1/19 | | | 1,980,000 | | | | 2,036,925 | |
| OMEGA Healthcare Investors, Inc., | | | | | | | | |
| 6.75% Sr. Unsec. Nts., 10/15/22 | | | 2,470,000 | | | | 2,649,075 | |
| | | | | | |
|
|
|
| | | | | | | | 4,686,000 | |
| Real Estate Management & Development—0.3% | |
Ainsworth Lumber Co. Ltd.,
11% Sr. Unsec. Unsub.
Nts., 7/29/153,15 | | | 2,992,558 | | | | 2,618,488 | |
Realogy Corp.:
7.625% Sr. Sec. Nts., 1/15/203 | | | 1,975,000 | | | | 2,049,063 | |
| 9% Sr. Sec. Nts., 1/15/203 | | | 1,010,000 | | | | 1,045,350 | |
| Wallace Theater Holdings, Inc., | | | | | | | | |
| 12.50% Sr. Sec. Nts., 6/15/133,6 | | | 2,075,000 | | | | 1,963,469 | |
| | | | | | |
|
|
|
| | | | | | | | 7,676,370 | |
| Thrifts & Mortgage Finance—0.0% | |
Compagnie de Financement Foncier, 5.625% Sr. Sec.
Nts., 6/19/17 | | | 90,000 | | | | 99,495 | |
| Health Care—1.0% | | | | | | | | |
| Biotechnology—0.1% | | | | | | | | |
Grifols SA, 8.25% Sr. Sec.
Nts., 2/1/18 | | | 800,000 | | | | 862,000 | |
| | | | | | | | |
| | | Principal
Amount | | | Value | |
| | | | | | | | | |
| Health Care Equipment & Supplies—0.2% | |
| Accellent, Inc., 10% Sr. Unsec. Sub. Nts., 11/1/17 | | $ | 1,145,000 | | | $ | 967,525 | |
Alere, Inc.:
7.875% Sr. Unsec. Unsub.
Nts., 2/1/16 | | | 1,045,000 | | | | 1,076,350 | |
8.625% Sr. Unsec. Sub.
Nts., 10/1/18 | | | 1,030,000 | | | | 1,045,450 | |
| Biomet, Inc., 11.625% Sr. Unsec. Sub. Nts., 10/15/17 | | | 1,836,000 | | | | 1,989,765 | |
| | | | | | |
|
|
|
| | | | | | | | 5,079,090 | |
| Health Care Providers & Services—0.5% | |
| Catalent Pharma Solutions, Inc., 9.50% Sr. Unsec. Nts., 4/15/15 | | | 1,579,400 | | | | 1,624,808 | |
Fresenius Medical Care US Finance II, Inc.:
5.625% Sr. Unsec. Nts., 7/31/193 | | | 625,000 | | | | 653,125 | |
| 5.875% Sr. Unsec. Nts., 1/31/223 | | | 315,000 | | | | 328,781 | |
Gentiva Health Services, Inc., 11.50% Sr. Unsec. Unsub.
Nts., 9/1/18 | | | 1,170,000 | | | | 1,023,750 | |
Kindred Healthcare, Inc.,
8.25% Sr. Unsec. Nts., 6/1/19 | | | 2,145,000 | | | | 2,000,213 | |
Multiplan, Inc., 9.875%
Sr. Nts., 9/1/183 | | | 1,150,000 | | | | 1,265,000 | |
| Oncure Holdings, Inc., 11.75% Sr. Sec. Nts., 5/15/17 | | | 1,130,000 | | | | 813,600 | |
| PSS World Medical, Inc., 6.375% Sr. Unsec. Unsub. Nts., 3/1/223 | | | 455,000 | | | | 468,650 | |
| Radiation Therapy Services, Inc.: 8.875% Sec. Nts., 1/15/173 | | | 1,080,000 | | | | 1,042,200 | |
9.875% Sr. Unsec. Sub.
Nts., 4/15/17 | | | 900,000 | | | | 708,750 | |
US Oncology, Inc., Escrow Shares (related to 9.125% Sr. Sec.
Nts., 8/15/17)4 | | | 1,730,000 | | | | 34,600 | |
| Vanguard Health Holding Co. II LLC/Vanguard Holding Co. II, Inc., 8% Sr. Nts., 2/1/18 | | | 1,595,000 | | | | 1,638,863 | |
| | | | | | |
|
|
|
| | | | | | | | 11,602,340 | |
| Health Care Technology—0.0% | |
MedAssets, Inc., 8% Sr. Unsec.
Nts., 11/15/18 | | | 305,000 | | | | 323,300 | |
| Life Sciences Tools & Services—0.0% | |
Jaguar Holding Co./Jaguar Merger Sub, Inc., 9.50% Sr. Unsec.
Nts., 12/1/193 | | | 770,000 | | | | 846,038 | |
| Pharmaceuticals—0.2% | | | | | | | | |
DJO Finance LLC/DJO Finance Corp., 10.875% Sr. Unsec.
Nts., 11/15/14 | | | 535,000 | | | | 555,063 | |
| Mylan, Inc., 6% Sr. Nts., 11/15/183 | | | 810,000 | | | | 856,575 | |
23 | OPPENHEIMER GLOBAL STRATEGIC INCOME FUND/VA
|
STATEMENT OF INVESTMENTS Unaudited / Continued
| | | | | | | | |
| | | Principal
Amount | | | Value | |
| | | | | | | | | |
| Pharmaceuticals Continued | |
Valeant Pharmaceuticals International, Inc., 6.875%
Sr. Unsec. Nts., 12/1/183 | | $ | 765,000 | | | $ | 794,644 | |
Warner Chilcott Co. LLC/Warner Chilcott Finance LL C, 7.75%
Sr. Unsec. Nts., 9/15/18 | | | 2,320,000 | | | | 2,499,800 | |
| | | | | | |
|
|
|
| | | | | | | | 4,706,082 | |
| Industrials—2.6% | | | | | | | | |
| Aerospace & Defense—0.5% | |
BE Aerospace, Inc., 6.875% Sr.
Nts., 10/1/20 | | | 840,000 | | | | 932,400 | |
| DynCorp International, Inc., 10.375% Sr. Unsec. Nts., 7/1/17 | | | 4,005,000 | | | | 3,444,300 | |
| Embraer SA, 5.15% Sr. Unsec. Unsub. Nts., 6/15/22 | | | 1,330,000 | | | | 1,368,570 | |
Huntington Ingalls Industries, Inc., 7.125% Sr. Unsec. Unsub.
Nts., 3/15/21 | | | 1,410,000 | | | | 1,480,500 | |
Kratos Defense & Security Solutions, Inc., 10% Sr. Sec.
Nts., 6/1/17 | | | 1,040,000 | | | | 1,125,800 | |
Schaeffler Finance BV, 8.50%
Sr. Sec. Nts., 2/15/193 | | | 1,100,000 | | | | 1,179,750 | |
| TransDigm, Inc., 7.75% Sr. Unsec. Sub. Nts., 12/15/18 | | | 2,660,000 | | | | 2,932,650 | |
| | | | | | |
|
|
|
| | | | | | | | 12,463,970 | |
| Air Freight & Logistics—0.0% | |
AMGH Merger Sub, Inc., 9.25%
Sr. Sec. Nts., 11/1/183 | | | 770,000 | | | | 804,650 | |
| Airlines—0.2% | | | | | | | | |
| American Airlines 2011-2 Class A Pass-Through Trust, 8.625% Sec. Certificates, 4/15/23 | | | 407,601 | | | | 427,981 | |
| Delta Air Lines, Inc., 12.25% Sr. Sec. Nts., 3/15/153 | | | 3,630,000 | | | | 3,965,775 | |
| | | | | | |
|
|
|
| | | | | | | | 4,393,756 | |
| Building Products—0.1% | | | | | | | | |
| Associated Materials LLC, 9.125% Sr. Sec. Nts., 11/1/173 | | | 1,105,000 | | | | 991,738 | |
| Ply Gem Industries, Inc., 13.125% Sr. Unsec. Sub. Nts., 7/15/14 | | | 1,940,000 | | | | 1,973,950 | |
| | | | | | |
|
|
|
| | | | | | | | 2,965,688 | |
| Commercial Services & Supplies—0.2% | |
| R.R. Donnelley & Sons Co., 7.25% Sr. Nts., 5/15/18 | | | 2,000,000 | | | | 1,915,000 | |
STHI Holding Corp., 8% Sec.
Nts., 3/15/183 | | | 795,000 | | | | 844,688 | |
| | | | | | | | |
| | | Principal
Amount | | | Value | |
| | | | | | | | | |
| Commercial Services & Supplies Continued | |
West Corp., 8.625% Sr. Unsec.
Nts., 10/1/18 | | $ | 1,785,000 | | | $ | 1,901,025 | |
| | | | | | |
|
|
|
| | | | | | | | 4,660,713 | |
| Construction & Engineering—0.4% | |
IIRSA Norte Finance Ltd.,
8.75% Sr. Nts., 5/30/245 | | | 3,608,768 | | | | 4,348,566 | |
Odebrecht Finance Ltd.:
5.125% Sr. Nts., 6/26/225 | | | 1,785,000 | | | | 1,771,613 | |
| 7% Sr. Unsec. Nts., 4/21/203 | | | 970,000 | | | | 1,067,000 | |
| 7.125% Sr. Nts., 6/26/425 | | | 1,335,000 | | | | 1,335,000 | |
| | | | | | |
|
|
|
| | | | | | | | 8,522,179 | |
| Electrical Equipment—0.1% | |
Thermon Industries, Inc.,
9.50% Sr. Sec. Nts., 5/1/17 | | | 1,397,000 | | | | 1,543,685 | |
| Industrial Conglomerates—0.0% | |
| GE Capital Australia Funding Pty Ltd., 7% Bonds, 10/8/15 | | | 590,000 | AUD | | | 647,882 | |
| Machinery—0.5% | |
| Actuant Corp., 5.625% Sr. Unsec. Unsub. Nts., 6/15/223 | | | 1,220,000 | | | | 1,259,650 | |
Cleaver-Brooks, Inc.,
12.25% Sr. Sec. Nts., 5/1/163 | | | 1,880,000 | | | | 2,006,900 | |
CNH Capital LLC, 6.25% Sr. Unsec.
Nts., 11/1/163 | | | 520,000 | | | | 559,000 | |
Manitowoc Co., Inc. (The),
8.50% Sr. Unsec. Nts., 11/1/20 | | | 2,655,000 | | | | 2,880,675 | |
Terex Corp., 8% Sr. Unsec. Sub.
Nts., 11/15/17 | | | 1,910,000 | | | | 1,991,175 | |
Thermadyne Holdings Corp., 9%
Sr. Sec. Nts., 12/15/17 | | | 1,930,000 | | | | 1,983,075 | |
Xerium Technologies, Inc., 8.875%
Sr. Unsec. Nts., 6/15/18 | | | 1,245,000 | | | | 986,663 | |
| | | | | | |
|
|
|
| | | | | | | | 11,667,138 | |
| Marine—0.2% | |
| Marquette Transportation Co./Marquette Transportation Finance Corp., 10.875% Sec. Nts., 1/15/17 | | | 2,790,000 | | | | 2,950,425 | |
| Navios Maritime Holdings, Inc., 8.875% Sr. Sec. Nts., 11/1/17 | | | 565,000 | | | | 572,063 | |
| | | | | | |
|
|
|
| | | | | | | | 3,522,488 | |
| Professional Services—0.0% | |
Altegrity, Inc., 10.50%
Sr. Unsec. Sub. Nts., 11/1/155 | | | 995,000 | | | | 910,425 | |
| Road & Rail—0.3% | |
Avis Budget Car Rental LLC/Avis Budget Finance, Inc., 8.25%
Sr. Unsec. Unsub. Nts., 1/15/19 | | | 620,000 | | | | 668,050 | |
24 | OPPENHEIMER GLOBAL STRATEGIC INCOME FUND/VA
|
| | | | | | | | |
| | | Principal
Amount | | | Value | |
| | | | | | | | | |
| Road & Rail Continued | |
Hertz Corp. (The), 7.50% Sr. Unsec.
Nts., 10/15/18 | | $ | 2,840,000 | | | $ | 3,060,100 | |
| Kazakhstan Temir Zholy Finance BV, 6.375% Sr. Unsec. Nts., 10/6/203 | | | 980,000 | | | | 1,082,900 | |
Western Express, Inc., 12.50% Sr. Sec.
Nts., 4/15/153 | | | 3,730,000 | | | | 2,275,300 | |
| | | | | | |
|
|
|
| | | | | | | | 7,086,350 | |
| Trading Companies & Distributors—0.1% | |
UR Financing Escrow Corp.:
7.375% Sr. Unsec. Nts., 5/15/203 | | | 2,430,000 | | | | 2,545,425 | |
| 7.625% Sr. Unsec. Nts., 4/15/223 | | | 605,000 | | | | 635,250 | |
| | | | | | |
|
|
|
| | | | | | | | 3,180,675 | |
| Information Technology—1.2% | |
| Communications Equipment—0.1% | |
| Avaya, Inc., 7% Sr. Sec. Nts., 4/1/193 | | | 1,955,000 | | | | 1,823,038 | |
| ViaSat, Inc., 6.875% Sr. Unsec. Unsub. Nts., 6/15/205 | | | 913,000 | | | | 926,695 | |
Zayo Escrow Corp.:
8.125% Sr. Sec. Nts., 1/1/20 | | | 465,000 | | | | 488,250 | |
| 10.125% Sr. Unsec. Nts., 7/1/203 | | | 310,000 | | | | 330,925 | |
| | | | | | |
|
|
|
| | | | | | | | 3,568,908 | |
| Computers & Peripherals—0.1% | |
Seagate HDD (Cayman), 7%
Sr. Unsec. Nts., 11/1/21 | | | 1,665,000 | | | | 1,802,363 | |
| Electronic Equipment & Instruments—0.1% | |
Anixter, Inc., 5.625% Sr. Unsec.
Nts., 5/1/19 | | | 770,000 | | | | 798,875 | |
CDW LLC/CDW Finance Corp., 12.535% Sr. Unsec. Sub.
Nts., 10/12/17 | | | 1,920,000 | | | | 2,092,800 | |
| | | | | | |
|
|
|
| | | | | | | | 2,891,675 | |
| Internet Software & Services—0.1% | |
ITC DeltaCom, Inc., 10.50% Sr. Sec.
Nts., 4/1/16 | | | 3,650,000 | | | | 3,905,500 | |
| IT Services—0.3% | |
Ceridian Corp., 11.25% Sr. Unsec.
Nts., 11/15/15 | | | 2,145,000 | | | | 2,069,925 | |
First Data Corp.:
8.875% Sr. Sec. Nts., 8/15/203 | | | 1,530,000 | | | | 1,663,875 | |
| 9.875% Sr. Unsec. Nts., 9/24/15 | | | 955,000 | | | | 971,713 | |
| 12.625% Sr. Unsec. Nts., 1/15/21 | | | 1,670,000 | | | | 1,680,438 | |
| | | | | | |
|
|
|
| | | | | | | | 6,385,951 | |
| Semiconductors & Semiconductor Equipment—0.4% | |
| Advanced Micro Devices, Inc., 7.75% Sr. Unsec. Nts., 8/1/20 | | | 2,705,000 | | | | 2,989,025 | |
Amkor Technologies, Inc., 6.625%
Sr. Unsec. Nts., 6/1/21 | | | 935,000 | | | | 937,338 | |
| | | | | | | | |
| | | Principal
Amount | | | Value | |
| | | | | | | | | |
| Semiconductors & Semiconductor Equipment Continued | |
Freescale Semiconductor, Inc.:
9.25% Sr. Sec. Nts., 4/15/183 | | $ | 1,710,000 | | | $ | 1,838,250 | |
| 10.75% Sr. Unsec. Nts., 8/1/20 | | | 1,950,000 | | | | 2,106,000 | |
| NXP BV/NXP Funding LLC, 9.75% Sr. Sec. Nts., 8/1/183 | | | 855,000 | | | | 978,975 | |
| | | | | | |
|
|
|
| | | | | | | | 8,849,588 | |
| Software—0.1% | | | | | | | | |
Lawson Software, Inc., 9.375%
Sr. Nts., 4/1/193 | | | 380,000 | | | | 407,550 | |
SunGard Data Systems, Inc.:
7.375% Sr. Unsec. Nts., 11/15/18 | | | 560,000 | | | | 603,400 | |
| 7.625% Sr. Unsec. Nts., 11/15/20 | | | 765,000 | | | | 818,550 | |
| | | | | | |
|
|
|
| | | | | | | | 1,829,500 | |
| Materials—2.0% | | | | | | | | |
| Chemicals—0.6% | | | | | | | | |
| Braskem America Finance Co., 7.125% Sr. Unsec. Nts., 7/22/413 | | | 825,000 | | | | 827,063 | |
Braskem Finance Ltd.:
5.375% Sr. Unsec. Nts., 5/2/223 | | | 1,755,000 | | | | 1,768,163 | |
| 5.75% Sr. Unsec. Nts., 4/15/213 | | | 1,760,000 | | | | 1,817,200 | |
Ferro Corp., 7.875% Sr. Unsec.
Nts., 8/15/18 | | | 1,545,000 | | | | 1,514,100 | |
Hexion U.S. Finance Corp./Hexion Nova Scotia Finance ULC:
8.875% Sr. Sec. Nts., 2/1/18 | | | 980,000 | | | | 1,004,500 | |
| 9% Sec. Nts., 11/15/20 | | | 1,340,000 | | | | 1,162,450 | |
| Ineos Finance plc, 8.375% Sr. Sec. Bonds, 2/15/193 | | | 1,480,000 | | | | 1,535,500 | |
LyondellBasell Industries NV, 6%
Sr. Nts., 11/15/213 | | | 1,525,000 | | | | 1,681,313 | |
| Momentive Performance Materials, Inc., 9% Sec. Nts., 1/15/21 | | | 2,165,000 | | | | 1,650,813 | |
Scotts Miracle-Gro Co. (The), 6.625% Sr. Unsec. Unsub.
Nts., 12/15/20 | | | 250,000 | | | | 269,375 | |
| | | | | | |
|
|
|
| | | | | | | | 13,230,477 | |
| Construction Materials—0.1% | |
| Building Materials Corp. of America, 6.75% Sr. Nts., 5/1/213 | | | 1,540,000 | | | | 1,651,650 | |
Ply Gem Industries, Inc., 8.25%
Sr. Sec. Nts., 2/15/18 | | | 1,315,000 | | | | 1,295,275 | |
| | | | | | |
|
|
|
| | | | | | | | 2,946,925 | |
| Containers & Packaging—0.3% | |
Berry Plastics Corp., 9.75% Sec.
Nts., 1/15/21 | | | 1,580,000 | | | | 1,726,150 | |
Consolidated Container Co. LLC/Consolidated Container Capital, Inc., 10.125% Sr. Unsec.
Nts., 7/15/203,7 | | | 465,000 | | | | 481,275 | |
25 | OPPENHEIMER GLOBAL STRATEGIC INCOME FUND/VA
|
STATEMENT OF INVESTMENTS Unaudited / Continued
| | | | | | | | |
| | | Principal
Amount | | | Value | |
| | | | | | | | | |
| Containers & Packaging Continued | |
| Polymer Group, Inc., 7.75% Sr. Sec. Nts., 2/1/19 | | $ | 2,075,000 | | | $ | 2,202,094 | |
| Rock-Tenn Co., 4.45% Sr. Unsec. Nts., 3/1/193 | | | 455,000 | | | | 468,311 | |
Verso Paper Holdings LLC/Verso Paper, Inc., 11.75% Sr. Sec.
Nts., 1/15/193 | | | 1,949,000 | | | | 1,490,985 | |
| | | | | | |
|
|
|
| | | | | | | | 6,368,815 | |
| Metals & Mining—0.5% | | | | | | | | |
Aleris International, Inc., 7.625%
Sr. Unsec. Nts., 2/15/18 | | | 2,715,000 | | | | 2,769,300 | |
Alrosa Co. Ltd., 8.25%
Sr. Unsec. Nts., 6/23/156 | | | 19,220,000 | RUR | | | 594,649 | |
Alrosa Finance SA, 7.75%
Nts., 11/3/203 | | | 1,815,000 | | | | 1,909,870 | |
| Consolidated Minerals Ltd., 8.875% Sr. Sec. Nts., 5/1/163 | | | 1,245,000 | | | | 958,650 | |
CSN Islands XI Corp., 6.875%
Sr. Unsec. Nts., 9/21/193 | | | 1,095,000 | | | | 1,199,025 | |
Evraz Group SA, 7.40%
Nts., 4/24/173 | | | 1,700,000 | | | | 1,674,806 | |
Ferrexpo Finance plc, 7.875%
Sr. Unsec. Bonds, 4/7/163 | | | 1,435,000 | | | | 1,302,263 | |
| JSC Severstal, 6.70% Nts., 10/25/173 | | | 2,235,000 | | | | 2,266,424 | |
Novelis, Inc., 8.75% Sr. Unsec.
Nts., 12/15/20 | | | 465,000 | | | | 503,363 | |
| | | | | | |
|
|
|
| | | | | | | | 13,178,350 | |
| Paper & Forest Products—0.5% | | | | | |
Appleton Papers, Inc., 10.50%
Sr. Sec. Nts., 6/15/153 | | | 3,700,000 | | | | 3,977,500 | |
Catalyst Paper Corp., 11%
Sr. Sec. Nts., 12/15/163,4 | | | 3,981,000 | | | | 1,970,595 | |
Mercer International, Inc., 9.50%
Sr. Unsec. Nts., 12/1/17 | | | 2,005,000 | | | | 2,090,213 | |
NewPage Corp., 11.375%
Sr. Sec. Nts., 12/31/144 | | | 3,325,000 | | | | 2,177,875 | |
| Norske Skogindustrier ASA, 6.125% Unsec. Bonds, 10/15/153 | | | 1,500,000 | | | | 1,057,500 | |
| | | | | | |
|
|
|
| | | | | | | | 11,273,683 | |
| Telecommunication Services—2.0% | |
| Diversified Telecommunication Services—1.0% | |
Axtel SAB de CV, 9%
Sr. Unsec. Nts., 9/22/193 | | | 1,470,000 | | | | 984,900 | |
Brasil Telecom SA, 9.75%
Sr. Unsec. Nts., 9/15/163 | | | 2,990,000 | BRR | | | 1,566,828 | |
Cincinnati Bell, Inc.:
8.25% Sr. Nts., 10/15/17 | | | 1,365,000 | | | | 1,426,425 | |
| 8.75% Sr. Unsec. Sub. Nts., 3/15/18 | | | 1,215,000 | | | | 1,175,513 | |
| | | | | | | | |
| | | Principal
Amount | | | Value | |
| | | | | | | | | |
| Diversified Telecommunication Services Continued | |
| Frontier Communications Corp.: 8.25% Sr. Unsec. Nts., 4/15/17 | | $ | 950,000 | | | $ | 1,026,000 | |
| 8.50% Sr. Unsec. Nts., 4/15/20 | | | 635,000 | | | | 676,275 | |
Intelsat Bermuda Ltd.:
11.25% Sr. Unsec. Nts., 2/4/17 | | | 2,055,000 | | | | 2,124,356 | |
| 11.50% Sr. Unsec. Nts., 2/4/1715 | | | 1,424,414 | | | | 1,476,049 | |
| Intelsat Jackson Holdings SA, 7.25% Sr. Unsec. Nts., 10/15/20 | | | 755,000 | | | | 796,525 | |
Level 3 Financing, Inc., 9.375%
Sr. Unsec. Unsub. Nts., 4/1/19 | | | 1,820,000 | | | | 1,974,700 | |
Telemar Norte Leste SA, 5.50%
Sr. Unsec. Nts., 10/23/203 | | | 5,842,000 | | | | 5,988,050 | |
| Wind Acquisition Finance SA, 7.25% Sr. Sec. Nts., 2/15/183 | | | 1,975,000 | | | | 1,738,000 | |
| Windstream Corp., 7.50% Sr. Unsec. Unsub. Nts., 6/1/223 | | | 1,975,000 | | | | 2,044,125 | |
| | | | | | |
|
|
|
| | | | | | | | 22,997,746 | |
| Wireless Telecommunication Services—1.0% | |
America Movil SAB de CV, 8.46%
Sr. Unsec. Unsub. Bonds, 12/18/36 | | | 14,700,000 | MXN | | | 1,158,417 | |
| Cricket Communications, Inc., 7.75% Sr. Unsec. Nts., 10/15/20 | | | 2,440,000 | | | | 2,342,400 | |
MetroPCS Wireless, Inc., 6.625%
Sr. Unsec. Nts., 11/15/20 | | | 1,945,000 | | | | 1,920,688 | |
| MTS International Funding Ltd., 8.625% Sr. Unsec. Nts., 6/22/203 | | | 2,300,000 | | | | 2,644,287 | |
| Nextel Communications, Inc., 7.375% Sr. Nts., Series D, 8/1/15 | | | 2,065,000 | | | | 2,077,906 | |
| Sistema International Funding SA, 6.95% Unsec. Nts., 5/17/193 | | | 1,700,000 | | | | 1,680,875 | |
Sprint Capital Corp., 8.75%
Nts., 3/15/32 | | | 480,000 | | | | 439,200 | |
Sprint Nextel Corp., 9%
Sr. Unsec. Nts., 11/15/183 | | | 1,800,000 | | | | 2,016,000 | |
Vimpel Communications/VIP Finance Ireland Ltd. OJSC:
7.748% Sec. Nts., 2/2/213 | | | 1,370,000 | | | | 1,326,489 | |
| 9.125% Sr. Unsec. Nts., 4/30/183 | | | 4,910,000 | | | | 5,241,425 | |
Vimpel-Communications:
8.85% Sr. Unsec. Nts., 3/8/226 | | | 21,900,000 | RUR | | | 656,603 | |
| 8.85% Sr. Unsec. Nts., 3/8/226 | | | 21,900,000 | RUR | | | 656,603 | |
VimpelCom Holdings BV, 7.504%
Sr. Unsec. Unsub. Nts., 3/1/223 | | | 2,295,000 | | | | 2,161,752 | |
| | | | | | |
|
|
|
| | | | | | | | 24,322,645 | |
| Utilities—2.4% | | | | | | | | |
| Electric Utilities—1.5% | | | | | | | | |
| Centrais Eletricas Brasileiras SA, 5.75% Sr. Unsec. Unsub. Nts., 10/27/213 | | | 2,495,000 | | | | 2,739,510 | |
26 | OPPENHEIMER GLOBAL STRATEGIC INCOME FUND/VA
|
| | | | | | | | |
| | | Principal
Amount | | | Value | |
| | | | | | | | | |
| Electric Utilities Continued | |
Empresa Distribuidora y Comercializadora Norte SA, 9.75%
Nts., 10/25/223 | | $ | 910,000 | | | $ | 332,150 | |
Empresas Publicas de Medellin ESP, 7.625% Sr. Unsec.
Nts., 7/29/193 | | | 1,690,000 | | | | 2,070,250 | |
Energy Future Intermediate Holding Co. LLC, 10% Sr. Sec.
Nts., 12/1/20 | | | 1,807,000 | | | | 1,974,148 | |
Eskom Holdings Ltd.:
5.75% Sr. Unsec. Bonds, 1/26/213 | | | 1,845,000 | | | | 2,027,194 | |
7.85% Sr. Unsec. Unsub.
Nts., Series ES26, 4/2/26 | | | 31,000,000 | ZAR | | | 3,585,416 | |
| 10% Nts., Series ES23, 1/25/23 | | | 44,000,000 | ZAR | | | 6,178,639 | |
Israel Electric Corp. Ltd.:
6.70% Sr. Unsec. Nts., 2/10/173 | | | 1,415,000 | | | | 1,468,133 | |
| 7.25% Nts., 1/15/193 | | | 6,165,000 | | | | 6,314,446 | |
Majapahit Holding BV:
7.75% Nts., 10/17/163 | | | 1,835,000 | | | | 2,103,369 | |
| 8% Sr. Unsec. Nts., 8/7/193 | | | 1,410,000 | | | | 1,706,100 | |
National Power Corp.,
5.875% Unsec. Unsub. Bonds, 12/19/16 | | | 109,600,000 | PHP | | | 2,641,601 | |
| Perusahaan Listrik Negara PT, 5.50% Sr. Unsec. Nts., 11/22/213 | | | 2,410,000 | | | | 2,530,500 | |
| | | | | | |
|
|
|
| | | | | | | | 35,671,456 | |
| Energy Traders—0.6% | | | | | | | | |
AES Corp. (The):
7.375% Sr. Unsec. Nts., 7/1/213 | | | 525,000 | | | | 586,688 | |
8% Sr. Unsec. Unsub.
Nts., 10/15/17 | | | 855,000 | | | | 976,838 | |
Calpine Corp.:
7.50% Sr. Sec. Nts., 2/15/213 | | | 885,000 | | | | 960,225 | |
| 7.875% Sr. Sec. Nts., 1/15/233 | | | 555,000 | | | | 607,725 | |
Colbun SA, 6% Sr. Unsec.
Nts., 1/21/203 | | | 2,380,000 | | | | 2,572,383 | |
| Comision Federal de Electricidad, 4.875% Sr. Nts., 5/26/213 | | | 2,040,000 | | | | 2,223,600 | |
| Energy Future Holdings Corp., 10% Sr. Sec. Nts., 1/15/20 | | | 1,840,000 | | | | 1,973,400 | |
First Wind Capital LLC, 10.25%
Sr. Sec. Nts., 6/1/183 | | | 270,000 | | | | 271,350 | |
Foresight Energy LLC, 9.625%
Sr. Unsec. Nts., 8/15/173 | | | 575,000 | | | | 578,594 | |
| United Maritime Group LLC, 11.75% Sr. Sec. Nts., 6/15/15 | | | 2,595,000 | | | | 2,848,013 | |
| | | | | | |
|
|
|
| | | | | | | | 13,598,816 | |
| Gas Utilities—0.2% | | | | | | | | |
AmeriGas Finance LLC/AmeriGas Finance Corp., 6.75% Sr. Unsec.
Nts., 5/20/20 | | | 1,910,000 | | | | 1,952,815 | |
| | | | | | | | |
| | | Principal
Amount | | | Value | |
| | | | | | | | | |
| Gas Utilities Continued | |
Empresa de Energia de Bogota SA ESP, 6.125% Sr. Unsec. Unsub.
Nts., 11/10/213 | | $ | 1,140,000 | | | $ | 1,208,400 | |
Transportadora de Gas Internacional SA ESP, 5.70%
Sr. Unsec. Nts., 3/20/223 | | | 1,560,000 | | | | 1,626,300 | |
| | | | | | |
|
|
|
| | | | | | | | 4,787,515 | |
| Water Utilities—0.1% | | | | | | | | |
Cia de Saneamento Basico do Estado de Sao Paulo, 6.25%
Sr. Unsec. Nts., 12/16/203 | | | 1,640,000 | | | | 1,746,600 | |
| | | | | | |
|
|
|
| Total Corporate Bonds and Notes (Cost $622,703,552) | | | | | | | 621,177,926 | |
| | |
| | | Shares | | | | |
| Preferred Stocks—0.2% | | | | | | | | |
Ally Financial, Inc., 7% Cum.,
Series G, Non-Vtg. | | | 2,040 | | | | 1,817,576 | |
| Greektown Superholdings, Inc., Cv., Series A-12 | | | 29,815 | | | | 2,101,958 | |
| | | | | | |
|
|
|
| Total Preferred Stocks (Cost $4,848,095) | | | | | | | 3,919,534 | |
| Common Stocks—0.2% | | | | | | | | |
| American Media Operations, Inc.2 | | | 161,731 | | | | 2,102,503 | |
| Arco Capital Corp. Ltd.2,5 | | | 690,638 | | | | 1,035,957 | |
| Dana Holding Corp. | | | 62,573 | | | | 801,560 | |
| Global Aviation Holdings, Inc.2 | | | 100 | | | | — | |
| Greektown Superholdings, Inc., Series A-12 | | | 3,450 | | | | 179,400 | |
| Kaiser Aluminum Corp. | | | 229 | | | | 11,871 | |
| LyondellBasell Industries NV, Cl. A | | | 24,183 | | | | 973,849 | |
| Orbcomm, Inc.2 | | | 375 | | | | 1,223 | |
| Premier Holdings Ltd.2 | | | 18,514 | | | | — | |
| Resolute Forest Products2 | | | 64,417 | | | | 745,949 | |
| | | | | | |
|
|
|
| Total Common Stocks (Cost $20,298,776) | | | | | | | 5,852,312 | |
| | |
| | | Units | | | | |
| Rights, Warrants and Certificates—0.0% | |
| MediaNews Group, Inc. Wts., Strike Price $0.001, Exp. 3/19/172 (Cost $3,162,655) | | | 11,668 | | | | 420 | |
| | |
| | | Principal
Amount | | | | |
| Structured Securities—2.7% | |
Barclays Bank plc: Indonesia (Republic of) Total Return Linked Bonds, 7%, 5/19/27 | | | 12,180,000,000 | IDR | | | 1,351,892 | |
27 | OPPENHEIMER GLOBAL STRATEGIC INCOME FUND/VA
|
STATEMENT OF INVESTMENTS Unaudited / Continued
| | | | | | | | |
| | | Principal
Amount | | | Value | |
| | | | | | | | | |
| Structured Securities Continued | |
| Barclays Bank plc: Continued | | | | | |
| Indonesia (Republic of) Total Return Linked Bonds, 8.25%, 6/17/32 | | | 22,430,000,000 | IDR | | $ | 2,734,347 | |
Citigroup Global Markets Holdings, Inc.:
Colombia (Republic of) Credit Linked Bonds, 11.25%, 10/25/185 | | | 3,255,000,000 | COP | | | 2,268,663 | |
| Colombia (Republic of) Credit Linked Nts., Series 2, 10%, 7/25/245,14 | | | 3,660,000,000 | COP | | | 2,541,339 | |
| Colombia (Republic of) Credit Linked Nts., Series 2, 10%, 7/25/24 | | | 10,368,000,000 | COP | | | 7,199,072 | |
| Colombia (Republic of) Total Return Linked Bonds, Series 2, 11%, 7/27/20 | | | 2,665,000,000 | COP | | | 1,869,316 | |
Credit Suisse First Boston International, Moitk Total Return Linked Nts.,
21%, 3/30/114 | | | 53,910,000 | RUR | | | — | |
Credit Suisse First Boston, Inc. (Nassau Branch), Russian Specialized Construction & Installation Administration Total Return Linked Nts.,
13%, 5/24/104 | | | 97,250,000 | RUR | | | — | |
Deutsche Bank AG: Coriolanus Ltd. Sec. Credit Linked Bonds, Series 128, 3.006%, 5/6/255,12 | | | 1,763,500 | | | | 1,269,033 | |
| Coriolanus Ltd. Sec. Credit Linked Bonds, 3.061%, 5/6/255,12 | | | 2,246,971 | | | | 1,616,944 | |
| Coriolanus Ltd. Sec. Credit Linked Bonds, 3.10%, 5/6/255,12 | | | 1,939,900 | | | | 1,395,972 | |
| Coriolanus Ltd. Sec. Credit Linked Bonds, 3.134%, 5/6/255,12 | | | 1,734,026 | | | | 1,247,823 | |
| Coriolanus Ltd. Sec. Credit Linked Bonds, 3.187%, 5/6/255,12 | | | 2,159,003 | | | | 1,553,641 | |
| Coriolanus Ltd. Sec. Credit Linked Bonds, 3.239%, 5/6/255,12 | | | 2,464,173 | | | | 1,773,245 | |
| Coriolanus Ltd. Sec. Credit Linked Bonds, 3.266%, 5/6/255,12 | | | 1,968,587 | | | | 1,416,615 | |
| Coriolanus Ltd. Sec. Credit Linked Bonds, 3.343%, 5/6/255,12 | | | 1,850,388 | | | | 1,331,558 | |
| Coriolanus Ltd. Sec. Credit Linked Nts., 12.762%, 12/31/175,14 | | | 15,420,000 | BRR | | | 9,020,911 | |
| Opic Reforma I Credit Linked Nts., Cl. 2A, 8.265%, 5/22/155,6 | | | 697,693 | MXN | | | 50,210 | |
| Opic Reforma I Credit Linked Nts., Cl. 2B, 8.265%, 5/22/155,6 | | | 1,220,632 | MXN | | | 87,844 | |
| Opic Reforma I Credit Linked Nts., Cl. 2C, 8.265%, 5/22/155,6 | | | 18,404,162 | MXN | | | 1,324,467 | |
| Opic Reforma I Credit Linked Nts., Cl. 2D, 8.265%, 5/22/155,6 | | | 1,341,270 | MXN | | | 96,525 | |
| Opic Reforma I Credit Linked Nts., Cl. 2E, 8.265%, 5/22/155,6 | | | 974,458 | MXN | | | 70,127 | |
| | | | | | | | |
| | | Principal
Amount | | | Value | |
| | | | | | | | | |
| Structured Securities Continued | |
| Deutsche Bank AG: Continued | | | | | |
| Opic Reforma I Credit Linked Nts., Cl. 2F, 8.265%, 5/22/155,6 | | | 622,337 | MXN | | $ | 44,787 | |
| Opic Reforma I Credit Linked Nts., Cl. 2G, 8.265%, 5/22/155,6 | | | 114,609 | MXN | | | 8,248 | |
| Goldman Sachs Capital Markets LP, Colombia (Republic of) Credit Linked Nts., 10.476%, 2/8/375,12 | | | 63,720,800,000 | COP | | | 2,941,276 | |
Hallertau SPC Credit Linked Nts.:
Series 2007-01, 2.787%, 12/20/175,6 | | | 6,250,000 | | | | 5,385,000 | |
| Series 2008-01, 9.888%, 8/2/104,5,12 | | | 14,337,604 | BRR | | | 713,846 | |
| HSBC Bank USA NA, Indonesia (Republic of) Credit Linked Nts., 8.25%, 6/15/323 | | | 14,960,000,000 | IDR | | | 1,823,710 | |
JPMorgan Chase & Co.: Colombia (Republic of) Credit Linked Nts., 11%, 7/28/205 | | | 1,315,000,000 | COP | | | 922,357 | |
| Indonesia (Republic of) Credit Linked Nts., 7%, 5/19/273 | | | 28,640,000,000 | IDR | | | 3,178,834 | |
| LB Peru Trust II Certificates, Series 1998-A, 4.534%, 2/28/164,12 | | | 363,871 | | | | 36,387 | |
| Merrill Lynch, Colombia (Republic of) Credit Linked Nts., 10%, 11/17/165 | | | 1,784,000,000 | COP | | | 1,061,610 | |
| Morgan Stanley: Peru (Republic of) Credit Linked Nts., 6.25%, 3/23/173 | | | 4,885,000 | PEN | | | 1,591,497 | |
| Russian Federation Total Return Linked Bonds, Series 007, Cl. VR, 5%, 8/22/34 | | | 57,685,329 | RUR | | | 845,147 | |
Morgan Stanley Capital Services, Inc.:
Brazil (Federative Republic of) Credit Linked Nts., 12.551%, 1/5/223,12 | | | 28,914,000 | BRR | | | 2,159,373 | |
| United Mexican States Credit Linked Nts., 5.64%, 11/20/153 | | | 2,000,000 | | | | 1,662,000 | |
| UBS AG, Indonesia (Republic of) Total Return Linked Nts., 8.25%, 6/17/32 | | | 20,320,000,000 | IDR | | | 2,477,125 | |
| | | | | | |
|
|
|
Total Structured Securities
(Cost $85,171,527) | | | | | | | 65,070,741 | |
| | | | | | | | | | | | | | | | |
| | | | |
| | | Expiration
Date | | | Strike
Price | | | Contracts | | | | |
| Options Purchased—0.3% | |
| Australian Dollar (AUD) Call2 | | | 8/23/12 | | |
| 1AUD per
1.035USD |
| | | 7,295,000 | | | | 64,209 | |
| Australian Dollar (AUD) Call2 | | | 8/27/12 | | |
| 1AUD per
1.035USD |
| | | 43,700,000 | | | | 403,158 | |
28 | OPPENHEIMER GLOBAL STRATEGIC INCOME FUND/VA
|
| | | | | | | | | | | | | | | | |
| | | | |
| | | Expiration
Date | | | Strike
Price | | | Contracts | | | Value | |
| Options Purchased Continued | |
| Australian Dollar (AUD) Call2 | | | 8/27/12 | | |
| 1AUD per
1.013USD |
| | | 21,800,000 | | | $ | 436,286 | |
| Australian Dollar (AUD) Call2 | | | 8/28/12 | | |
| 1AUD per
1.035USD |
| | | 43,700,000 | | | | 407,605 | |
| Australian Dollar (AUD) Call2 | | | 8/28/12 | | |
| 1AUD per
1.0185USD |
| | | 21,900,000 | | | | 371,836 | |
| Australian Dollar (AUD) Call2 | | | 8/31/12 | | |
| 1AUD per
1.0195USD |
| | | 6,060,000 | | | | 101,542 | |
| Australian Dollar (AUD) Call2 | | | 8/31/12 | | |
| 1AUD per
1.0195USD |
| | | 6,060,000 | | | | 101,542 | |
| Australian Dollar (AUD) Call2 | | | 8/31/12 | | |
| 1AUD per
1.0195USD |
| | | 3,640,000 | | | | 60,992 | |
| Brazilian Real (BRR) Call2 | | | 10/18/12 | | |
| 1USD per
1.82BRR |
| | | 13,175,000 | | | | 11,272 | |
| Brazilian Real (BRR) Call2 | | | 10/18/12 | | |
| 1USD per
1.90BRR |
| | | 13,770,000 | | | | 40,763 | |
| Canadian Dollar (CAD) Put2 | | | 10/8/12 | | |
| 1AUD per
0.98CAD |
| | | 2,480,000 | | | | 7,578 | |
| Euro (EUR) FX Futures, 9/17/12 Call2 | | | 7/9/12 | | | | 1.290 | | | | 20 | | | | 2,750 | |
| Euro (EUR) FX Futures, 9/17/12 Call2 | | | 7/9/12 | | | | 1.310 | | | | 20 | | | | 500 | |
| Euro (EUR) FX Futures, 9/17/12 Put2 | | | 7/9/12 | | | | 1.160 | | | | 2 | | | | 13 | |
| Euro (EUR) FX Futures, 9/17/12 Put2 | | | 7/9/12 | | | | 1.170 | | | | 200 | | | | 1,250 | |
| Euro (EUR) FX Futures, 9/17/12 Put2 | | | 7/9/12 | | | | 1.190 | | | | 125 | | | | 781 | |
| Euro (EUR) FX Futures, 9/17/12 Put2 | | | 7/9/12 | | | | 1.230 | | | | 302 | | | | 15,100 | |
| Euro (EUR) FX Futures, 9/17/12 Put2 | | | 7/9/12 | | | | 1.190 | | | | 94 | | | | 588 | |
| Euro (EUR) FX Futures, 9/17/12 Put2 | | | 7/9/12 | | | | 1.200 | | | | 54 | | | | 338 | |
Euro (EUR) FX
Futures, 9/17/12 Put2 | | | 7/9/12 | | | | 1.200 | | | | 231 | | | | 1,444 | |
| | | | | | | | | | | | | | | | |
| | | | |
| | | Expiration
Date | | | Strike
Price | | | Contracts | | | Value | |
| Options Purchased Continued | |
Euro (EUR) FX
Futures, 9/17/12 Put2 | | | 7/9/12 | | | $ | 1.210 | | | | 58 | | | $ | 725 | |
| Euro (EUR) FX Futures, 9/17/12 Put2 | | | 7/9/12 | | | | 1.230 | | | | 288 | | | | 10,800 | |
Euro (EUR) FX
Futures, 9/17/12 Put2 | | | 7/9/12 | | | | 1.250 | | | | 15 | | | | 2,625 | |
Euro (EUR) FX
Futures, 9/17/12 Put2 | | | 7/9/12 | | | | 1.250 | | | | 66 | | | | 17,325 | |
Euro (EUR) FX
Futures, 9/17/12 Put2 | | | 7/9/12 | | | | 1.260 | | | | 1 | | | | 588 | |
| Euro (EUR) FX Futures, 9/17/12 Put2 | | | 9/10/12 | | | | 1.200 | | | | 57 | | | | 37,050 | |
| Euro$ 1 yr. MID-CRV Futures, 9/16/13 Put2 | | | 7/16/12 | | | | 99.250 | | | | 376 | | | | 4,700 | |
| Euro$ 1 yr. MID-CRV Futures, 9/16/13 Put2 | | | 9/17/12 | | | | 99.250 | | | | 188 | | | | 9,400 | |
| Japanese Yen (JPY) Futures, 9/17/12 Call2 | | | 7/9/12 | | | | 128.500 | | | | 18 | | | | 563 | |
| Japanese Yen (JPY) Futures, 9/17/12 Call2 | | | 7/9/12 | | | | 131.500 | | | | 61 | | | | 381 | |
| Japanese Yen (JPY) Futures, 9/17/12 Call2 | | | 7/9/12 | | | | 133.000 | | | | 21 | | | | 131 | |
| Japanese Yen (JPY) Futures, 9/17/12 Call2 | | | 7/9/12 | | | | 133.500 | | | | 61 | | | | 381 | |
| Japanese Yen (JPY) Futures, 9/17/12 Call2 | | | 9/10/12 | | | | 141.000 | | | | 20 | | | | 250 | |
| Japanese Yen (JPY) Futures, 9/17/12 Put2 | | | 7/9/12 | | | | 123.000 | | | | 34 | | | | 2,550 | |
| Japanese Yen (JPY) Futures, 9/17/12 Put2 | | | 7/9/12 | | | | 123.500 | | | | 102 | | | | 14,025 | |
| Japanese Yen (JPY) Futures, 9/17/12 Put2 | | | 7/9/12 | | | | 124.000 | | | | 82 | | | | 18,450 | |
| Japanese Yen (JPY) Futures, 9/17/12 Put2 | | | 9/10/12 | | | | 120.000 | | | | 131 | | | | 58,950 | |
| Japanese Yen (JPY) Futures, 9/17/12 Put2 | | | 9/10/12 | | | | 122.000 | | | | 18 | | | | 15,975 | |
29 | OPPENHEIMER GLOBAL STRATEGIC INCOME FUND/VA
|
STATEMENT OF INVESTMENTS Unaudited / Continued
| | | | | | | | | | | | | | | | |
| | | | |
| | | Expiration
Date | | | Strike
Price | | | Contracts | | | Value | |
| Options Purchased Continued | |
| Japanese Yen (JPY) Put2 | | | 3/29/13 | | |
| 1USD per
85JPY |
| | | 204,000,000 | | | $ | 31,810 | |
| Japanese Yen (JPY) Put2 | | | 5/31/13 | | |
| 1USD per
82JPY |
| | | 416,833,857 | | | | 141,569 | |
| Mexican Nuevo Peso (MXN) Call2 | | | 11/9/12 | | |
| 1USD per
12.84MXN |
| | | 186,100,000 | | | | 182,278 | |
| Mexican Nuevo Peso (MXN) Call2 | | | 11/13/12 | | |
| 1USD per
12.925MXN |
| | | 187,300,000 | | | | 214,075 | |
| Mexican Nuevo Peso (MXN) Call2 | | | 11/30/12 | | |
| 1USD per
13.333MXN |
| | | 171,010,000 | | | | 373,826 | |
| Mexican Nuevo Peso (MXN) Put2 | | | 9/26/12 | | |
| 1AUD per
13MXN |
| | | 1,240,000 | | | | 7,535 | |
| New Turkish Lira (TRY) Call2 | | | 8/29/12 | | |
| 1USD per
1.80TRY |
| | | 49,200,000 | | | | 309,775 | |
| New Turkish Lira (TRY) Call2 | | | 8/29/12 | | |
| 1USD per
1.80TRY |
| | | 39,400,000 | | | | 248,072 | |
| New Turkish Lira (TRY) Call2 | | | 8/30/12 | | |
| 1USD per
1.80TRY |
| | | 10,900,000 | | | | 69,267 | |
| New Turkish Lira (TRY) Call2 | | | 9/3/12 | | |
| 1USD per
1.80TRY |
| | | 8,730,000 | | | | 58,774 | |
| New Turkish Lira (TRY) Call2 | | | 9/3/12 | | |
| 1USD per
1.81TRY |
| | | 8,230,000 | | | | 66,214 | |
| Polish Zloty (PLZ) Call2 | | | 8/29/12 | | |
| 1USD per
3.250PLZ |
| | | 135,100,000 | | | | 579,856 | |
| Polish Zloty (PLZ) Call2 | | | 8/31/12 | | |
| 1USD per
3.32PLZ |
| | | 20,140,000 | | | | 145,753 | |
| Polish Zloty (PLZ) Call2 | | | 8/31/12 | | |
| 1USD per
3.311PLZ |
| | | 12,040,000 | | | | 81,256 | |
| Russian Ruble (RUR) Call2 | | | 11/29/12 | | |
| 1USD per
31.25RUR |
| | | 308,600,000 | | | | 93,913 | |
| South African Rand (ZAR) Call2 | | | 8/29/12 | | |
| 1USD per
7.90ZAR |
| | | 293,800,000 | | | | 306,328 | |
| South African Rand (ZAR) Call2 | | | 8/31/12 | | |
| 1USD per
8.002ZAR |
| | | 48,500,000 | | | | 75,073 | |
| South African Rand (ZAR) Call2 | | | 8/31/12 | | |
| 1USD per
8.018ZAR |
| | | 34,020,000 | | | | 55,715 | |
| South Korean Won (KRW) Call2 | | | 8/28/12 | | |
| 1USD per
1,137KRW |
| | | 24,860,000,000 | | | | 215,288 | |
| | | | | | | | | | | | | | | | |
| | | | |
| | | Expiration
Date | | | Strike
Price | | | Contracts | | | Value | |
| Options Purchased Continued | |
| South Korean Won (KRW) Call2 | | | 8/28/12 | | |
| 1USD per
1,137KRW |
| | | 24,860,000,000 | | | $ | 215,288 | |
| South Korean Won (KRW) Call2 | | | 8/31/12 | | |
| 1USD per
1,135.50KRW |
| | | 6,880,000,000 | | | | 58,205 | |
| South Korean Won (KRW) Call2 | | | 8/31/12 | | |
| 1USD per
1,136.50KRW |
| | | 4,480,000,000 | | | | 39,514 | |
| South Korean Won (KRW) Call2 | | | 8/31/12 | | |
| 1USD per
1,138KRW |
| | | 3,795,000,000 | | | | 35,559 | |
| U.S. Treasury Nts., 10 yr. Futures, 9/19/12 Put2 | | | 7/30/12 | | | | 132.500 | | | | 194 | | | | 72,750 | |
| U.S. Treasury Nts., 10 yr. Futures, 9/19/12 Put2 | | | 7/30/12 | | | | 131.500 | | | | 254 | | | | 43,656 | |
| U.S. Treasury Nts., 10 yr. Futures, 9/19/12 Put2 | | | 8/27/12 | | | | 128.000 | | | | 66 | | | | 4,125 | |
| U.S. Treasury Nts., 10 yr. Futures, 9/19/12 Put2 | | | 8/27/12 | | | | 130.000 | | | | 66 | | | | 11,344 | |
Worst performing of: Euro (EUR) Put/United States Dollar (USD) Call/ or the United States Dollar (USD) Call/ Japanese Yen (JPY) Put2 | | | 7/26/12 | | |
| 1EUR per
1.275USD/
1USD per
79.50JPY |
| | | 4,936,000 | | | | 24,483 | |
| Total Options Purchased (Cost $5,006,446) | | | | 5,985,717 | |
| | | | | | | | | | | | |
| | | |
| | | Swaption
Expiration
Date | | | Notional
Amount | | | | |
| Swaptions Purchased—0.2% | |
| Bank of America NA, Interest Rate Swaption (European); Swap Terms: Paid: 1.35%; Received: Three-Month USD BBA LIBOR; Termination Date: 11/5/172 | | | 11/2/12 | | | $ | 1,240,000 | | | | 2,633 | |
30 | OPPENHEIMER GLOBAL STRATEGIC INCOME FUND/VA
|
| | | | | | | | | | | | |
| | | |
| | | Swaption
Expiration
Date | | | Notional
Amount | | | Value | |
| Swaptions Purchased Continued | |
| Bank of America NA, Interest Rate Swaption (European); Swap Terms: Paid: 2.195%; Received: Three-Month USD BBA LIBOR; Termination Date: 10/2/192 | | | 10/1/12 | | | $ | 4,000,000 | | | $ | 1,624 | |
| Bank of America NA, Interest Rate Swaption (European); Swap Terms: Paid: 2.275%; Received: Three-Month USD BBA LIBOR; Termination Date: 7/9/222 | | | 7/5/12 | | | | 29,355,000 | | | | — | |
| Bank of America NA, Interest Rate Swaption (European); Swap Terms: Paid: 3.10%; Received: Three-Month USD BBA LIBOR; Termination Date: 5/22/432 | | | 5/21/13 | | | | 10,110,000 | | | | 327,906 | |
| Bank of America NA; Index Credit Default Swaption (European); Swap Terms: Paid: Sell Protection on iTraxx Europe Crossover Series 17 Version 1; Received: 5%; Termination Date: 6/20/172 | | | 9/20/12 | | | | 1,255,000 | | | | 27,531 | |
| Barclays Bank plc; Interest Rate Swaption (European); Swap Terms: Paid: 2.67%; Received: Six-Month EUR EURIBOR; Termination Date: 5/8/442 | | | 5/7/14 | | | | 5,030,000 | | | | 531,249 | |
| Barclays Bank plc; Interest Rate Swaption (European); Swap Terms: Paid: 2.695%; Received: Three-Month USD BBA LIBOR; Termination Date: 5/15/232 | | | 4/12/13 | | | | 25,100,000 | | | | 222,613 | |
| Barclays Bank plc; Interest Rate Swaption (European); Swap Terms: Paid: 3.48%; Received: Three-Month USD BBA LIBOR; Termination Date: 4/27/472 | | | 4/26/17 | | | | 5,040,000 | | | | 495,332 | |
| Goldman Sachs International, Interest Rate Swaption (European); Swap Terms: Paid: 1.88%; Received: Three-Month USD BBA LIBOR; Termination Date: 7/24/192 | | | 7/23/12 | | | | 19,685,000 | | | | 141 | |
| Goldman Sachs International, Interest Rate Swaption (European); Swap Terms: Paid: 1.945%; Received: Three-Month USD BBA LIBOR; Termination Date: 10/2/192 | | | 10/1/12 | | | | 10,005,000 | | | | 11,184 | |
| | | | | | | | | | | | |
| | | |
| | | Swaption
Expiration
Date | | | Notional
Amount | | | Value | |
| Swaptions Purchased Continued | |
| Goldman Sachs International, Interest Rate Swaption (European); Swap Terms: Paid: 2.185%; Received: Three-Month USD BBA LIBOR; Termination Date: 7/13/222 | | | 7/12/12 | | | $ | 14,735,000 | | | $ | 296 | |
| Goldman Sachs International, Interest Rate Swaption (European); Swap Terms: Paid: 2.495%; Received: Three-Month USD BBA LIBOR; Termination Date: 11/22/222 | | | 11/23/12 | | | | 37,700,000 | | | | 157,559 | |
| JPMorgan Chase Bank NA, Index Credit Default Swaption (European); Swap Terms: Paid: Sell Protection on iTraxx Europe Crossover Series 17 Version 1; Received: 5%; Termination Date: 6/20/172 | | | 9/20/12 | | | | 1,280,000 | | | | 22,158 | |
| JPMorgan Chase Bank NA, Interest Rate Swaption (European); Swap Term: Paid: 2.245%; Received: Three-Month USD BBA LIBOR; Termination Date: 7/10/222 | | | 7/9/12 | | | | 29,420,000 | | | | 4 | |
| JPMorgan Chase Bank NA, Interest Rate Swaption (European); Swap Terms: Paid: 1.65%; Received: Three-Month USD BBA LIBOR; Termianation Date: 2/25/182 | | | 2/22/13 | | | | 24,810,000 | | | | 80,409 | |
| UBS AG, Interest Rate Swaption (European); Swap Terms: Paid: 1.17%; Received: Six -Month JPY BBA LIBOR; Termination Date: 9/26/222 | | | 9/25/12 | | | | 990,000,000 | | | | 14,689 | |
| UBS AG, Interest Rate Swaption (European); Swap Terms: Paid: 2.11%; Received: Six-Month EUR EURIBOR; Termination Date: 1/3/232 | | | 1/2/13 | | | | 3,205,000 | | | | 94,503 | |
| UBS AG, Interest Rate Swaption (European); Swap Terms: Paid: 2.215%; Received: Three-Month USD BBA LIBOR; Termination Date: 12/4/222 | | | 12/3/12 | | | | 96,515,000 | | | | 898,879 | |
| UBS AG, Interest Rate Swaption (European); Swap Terms: Paid: 2.98%; Received: Six-Month EUR EURIBOR; Termination Date: 3/4/232 | | | 3/1/13 | | | | 24,830,000 | | | | 223,407 | |
31 | OPPENHEIMER GLOBAL STRATEGIC INCOME FUND/VA
|
STATEMENT OF INVESTMENTS Unaudited / Continued
| | | | | | | | | | | | |
| | | Swaption
Expiration
Date | | | Notional
Amount | | | Value | |
| Swaptions Purchased Continued | |
| UBS AG, Interest Rate Swaption (European); Swap Terms: Paid: 3.025%; Received: Six-Month EUR EURIBOR; Termination Date: 2/27/232 | | | 2/26/13 | | | $ | 24,845,000 | | | $ | 201,939 | |
| UBS AG, Interest Rate Swaption (European); Swap Terms: Paid: Three-Month AUD BBR BBSW; Received: 3.35%; Termination Date: 12/10/152 | | | 12/10/12 | | | | 3,770,000 | | | | 39,182 | |
| UBS AG, Interest Rate | | | | | | | | | | | | |
| Swaption (European); Swap Terms: Paid: Three-Month USD BBA LIBOR; Received: 1.54%; Termination Date: 6/13/232 | | | 6/12/13 | | | | 25,380,000 | | | | 273,428 | |
| | | | | | | | | | |
|
|
|
Total Swaptions Purchased
(Cost $13,032,842) | | | | | | | | | | | 3,626,666 | |
| | | | | | | | |
| | |
| | | Shares | | | Value | |
| Investment Companies—17.6% | | | | | | | | |
| Oppenheimer Institutional Money Market Fund, Cl. E, 0.20%1,17 | | | 44,544,249 | | | $ | 44,544,249 | |
| Oppenheimer Master Event-Linked Bond Fund, LLC1 | | | 4,827,322 | | | | 56,111,439 | |
| Oppenheimer Master Loan Fund, LLC1 | | | 24,613,303 | | | | 307,186,686 | |
| Oppenheimer Short Duration | | | | | | | | |
| Fund, Cl. Y1 | | | 1,005,307 | | | | 10,073,178 | |
| | | | | | |
|
|
|
Total Investment Companies
(Cost $419,900,287) | | | | | | | 417,915,552 | |
Total Investments, at Value
(Cost $2,734,021,232) | | | 113.0 | % | | | 2,681,160,263 | |
| Liabilities in Excess of Other Assets | | | (13.0 | ) | | | (307,956,933 | ) |
| | |
|
|
| |
|
|
|
| Net Assets | | | 100.0 | % | | $ | 2,373,203,330 | |
| | |
|
|
| |
|
|
|
32 | OPPENHEIMER GLOBAL STRATEGIC INCOME FUND/VA
|
Footnotes to Statement of Investments
* June 29, 2012 represents the last business day of the Fund’s 2012 semiannual period. See Note 1 of the accompanying Notes.
Principal amount is reported in U.S. Dollars, except for those denoted in the following currencies:
| | | | | | |
| AUD | | Australian Dollar | | MYR | | Malaysian Ringgit |
| BRR | | Brazilian Real | | NGN | | Nigeria Naira |
| CAD | | Canadian Dollar | | PEN | | Peruvian New Sol |
| COP | | Colombian Peso | | PHP | | Philippines Peso |
| DKK | | Danish Krone | | PLZ | | Polish Zloty |
| EUR | | Euro | | RUR | | Russian Ruble |
| GBP | | British Pound Sterling | | SEK | | Swedish Krona |
| HUF | | Hungarian Forint | | SGD | | Singapore Dollar |
| IDR | | Indonesia Rupiah | | TRY | | New Turkish Lira |
| JPY | | Japanese Yen | | ZAR | | South African Rand |
| MXN | | Mexican Nuevo Peso | | | | |
1. Is or was an affiliate, as defined in the Investment Company Act of 1940, at or during the period ended June 29, 2012, by virtue of the Fund owning at least 5% of the voting securities of the issuer or as a result of the Fund and the issuer having the same investment adviser. Transactions during the period in which the issuer was an affiliate are as follows:
| | | | | | | | | | | | | | | | |
| | | Shares
December 30, 2011a | | | Gross
Additions | | | Gross
Reductions | | | Shares
June 29, 2012 | |
| Oppenheimer Global Strategic Income Fund/VA (Cayman) Ltd.b | | | 15,000 | | | | — | | | | — | | | | 15,000 | |
| Oppenheimer Institutional Money Market Fund, Cl. E | | | 27,393,119 | | | | 489,551,317 | | | | 472,400,187 | | | | 44,544,249 | |
| Oppenheimer Master Event-Linked Bond Fund, LLC | | | 4,827,322 | | | | — | | | | — | | | | 4,827,322 | |
| Oppenheimer Master Loan Fund, LLC | | | 29,466,809 | | | | — | | | | 4,853,506 | | | | 24,613,303 | |
| Oppenheimer Short Duration Fund, Cl. Y | | | 1,001,329 | | | | 3,978 | | | | — | | | | 1,005,307 | |
| | | | | | | | | | | | | | |
| | | | | Value | | | Income | | | Realized
Loss | |
| Oppenheimer Global Strategic Income Fund/VA (Cayman) Ltd.b | | | | $ | 1,457,156 | | | $ | — | | | $ | — | |
| Oppenheimer Institutional Money Market Fund, Cl. E | | | | | 44,544,249 | | | | 39,276 | | | | — | |
| Oppenheimer Master Event-Linked Bond Fund, LLC | | | | | 56,111,439 | | | | 2,371,815 | c | | | 2,182,980 | c |
| Oppenheimer Master Loan Fund, LLC | | | | | 307,186,686 | | | | 11,792,831 | d | | | 2,163,697 | d |
| Oppenheimer Short Duration Fund, Cl. Y | | | | | 10,073,178 | | | | 34,665 | | | | — | |
| | | | |
|
|
| |
|
|
| |
|
|
|
| | | | | $ | 419,372,708 | | | $ | 14,238,587 | | | $ | 4,346,677 | |
| | | | |
|
|
| |
|
|
| |
|
|
|
a. December 30, 2011 represents the last business day of the Fund’s 2011 reporting period. See Note 1 of the accompanying Notes.
b. Investment in a wholly-owned subsidiary. See Note 1 of the accompanying Notes and individual financial statements of the entity included herein.
c. Represents the amount allocated to the Fund from Oppenheimer Master Event-Linked Bond Fund, LLC.
d. Represents the amount allocated to the Fund from Oppenheimer Master Loan Fund, LLC.
2. Non-income producing security.
3. Represents securities sold under Rule 144A, which are exempt from registration under the Securities Act of 1933, as amended. These securities have been determined to be liquid under guidelines established by the Board of Trustees. These securities amount to $393,108,205 or 16.56% of the Fund’s net assets as of June 29, 2012.
4. This security is not accruing income because the issuer has missed an interest payment on it and/or is not anticipated to make future interest and/or principal payments. The rate shown is the original contractual interest rate. See Note 1 of the accompanying Notes.
5. Restricted security. The aggregate value of restricted securities as of June 29, 2012 was $80,037,469, which represents 3.37% of the Fund’s net assets. See Note 7 of the accompanying Notes. Information concerning restricted securities is as follows:
| | | | | | | | | | | | | | | | |
| Security | | Acquisition
Dates | | | Cost | | | Value | | | Unrealized
Appreciation
(Depreciation) | |
| Akbank TAS, 5.125% Sr. Unsec. Nts., 7/22/15 | | | 7/15/10-12/16/11 | | | $ | 2,051,194 | | | $ | 2,114,147 | | | $ | 62,953 | |
| Altegrity, Inc., 10.50% Sr. Unsec. Sub. Nts., 11/1/15 | | | 2/17/10 | | | | 937,224 | | | | 910,425 | | | | (26,799 | ) |
| Arco Capital Corp. Ltd. | | | 2/27/07 | | | | 10,359,570 | | | | 1,035,957 | | | | (9,323,613 | ) |
| Banco BMG SA, 9.15% Nts., 1/15/16 | | | 12/15/05-4/3/12 | | | | 1,307,666 | | | | 1,193,160 | | | | (114,506 | ) |
BCAP LLC Trust, Mtg. Pass-Through Certificates, Series 2012-RR6, Cl.
1A5, 2.243%, 11/1/36 | | | 6/14/12 | | | | 552,300 | | | | 552,300 | | | | — | |
| Caisse D’Amortissement de la Dette Sociale Bonds,1.625%, 7/6/15 | | | 6/26/12 | | | | 638,931 | | | | 639,834 | | | | 903 | |
| CIT Group, Inc., 7% Sec. Bonds, 5/2/17 | | | 8/19/10-2/1/12 | | | | 1,466,478 | | | | 1,490,378 | | | | 23,900 | |
| Citigroup Global Markets Holdings, Inc., Colombia (Republic of) Credit Linked Bonds, 11.25%, 10/25/18 | | | 12/9/08 | | | | 1,379,053 | | | | 2,268,663 | | | | 889,610 | |
| Citigroup Global Markets Holdings, Inc., Colombia (Republic of) Credit Linked Nts., Series 2, 10%, 7/25/24 | | | 3/28/12 | | | | 2,581,733 | | | | 2,541,339 | | | | (40,394 | ) |
Deutsche Bank AG, Coriolanus Ltd. Sec. Credit Linked Bonds, Series 128,
3.006%, 5/6/25 | | | 10/8/10 | | | | 1,215,106 | | | | 1,269,033 | | | | 53,927 | |
| Deutsche Bank AG, Coriolanus Ltd. Sec. Credit Linked Bonds, 3.343%, 5/6/25 | | | 4/16/09 | | | | 1,239,301 | | | | 1,331,558 | | | | 92,257 | |
| Deutsche Bank AG, Coriolanus Ltd. Sec. Credit Linked Bonds, 3.266%, 5/6/25 | | | 8/18/09 | | | | 1,326,365 | | | | 1,416,615 | | | | 90,250 | |
| Deutsche Bank AG, Coriolanus Ltd. Sec. Credit Linked Bonds, 3.239%, 5/6/25 | | | 9/25/09 | | | | 1,663,739 | | | | 1,773,245 | | | | 109,506 | |
| Deutsche Bank AG, Coriolanus Ltd. Sec. Credit Linked Bonds, 3.187%, 5/6/25 | | | 12/17/09 | | | | 1,463,845 | | | | 1,553,641 | | | | 89,796 | |
| Deutsche Bank AG, Coriolanus Ltd. Sec. Credit Linked Bonds, 3.134%, 5/6/25 | | | 3/30/10 | | | | 1,180,936 | | | | 1,247,823 | | | | 66,887 | |
| Deutsche Bank AG, Coriolanus Ltd. Sec. Credit Linked Bonds, 3.10%, 5/6/25 | | | 5/18/10 | | | | 1,325,410 | | | | 1,395,972 | | | | 70,562 | |
| Deutsche Bank AG, Coriolanus Ltd. Sec. Credit Linked Bonds, 3.061%, 5/6/25 | | | 7/16/10 | | | | 1,540,321 | | | | 1,616,944 | | | | 76,623 | |
| Deutsche Bank AG, Coriolanus Ltd. Sec. Credit Linked Nts., 12.762%, 12/31/17 | | | 9/19/07 | | | | 6,966,017 | | | | 9,020,911 | | | | 2,054,894 | |
| Deutsche Bank AG, Opic Reforma I Credit Linked Nts., Cl. 2A, 8.265%, 5/22/15 | | | 5/21/08 | | | | 67,269 | | | | 50,210 | | | | (17,059 | ) |
| Deutsche Bank AG, Opic Reforma I Credit Linked Nts., Cl. 2B, 8.265%, 5/22/15 | | | 6/12/08 | | | | 117,680 | | | | 87,844 | | | | (29,836 | ) |
| Deutsche Bank AG, Opic Reforma I Credit Linked Nts., Cl. 2C, 8.265%, 5/22/15 | | | 6/18/08 | | | | 1,785,486 | | | | 1,324,467 | | | | (461,019 | ) |
33 | OPPENHEIMER GLOBAL STRATEGIC INCOME FUND/VA
|
STATEMENT OF INVESTMENTS Unaudited / Continued
Footnotes to Statement of Investments Continued
| | | | | | | | | | | | | | | | |
| Security | | Acquisition
Dates | | | Cost | | | Value | | | Unrealized
Appreciation
(Depreciation) | |
| Deutsche Bank AG, Opic Reforma I Credit Linked Nts., Cl. 2D, 8.265%, 5/22/15 | | | 7/8/08 | | | $ | 130,028 | | | $ | 96,525 | | | $ | (33,503 | ) |
| Deutsche Bank AG, Opic Reforma I Credit Linked Nts., Cl. 2E, 8.265%, 5/22/15 | | | 7/15/08 | | | | 94,626 | | | | 70,127 | | | | (24,499 | ) |
| Deutsche Bank AG, Opic Reforma I Credit Linked Nts., Cl. 2F, 8.265%, 5/22/15 | | | 8/8/08 | | | | 61,263 | | | | 44,787 | | | | (16,476 | ) |
| Deutsche Bank AG, Opic Reforma I Credit Linked Nts., Cl. 2G, 8.265%, 5/22/15 | | | 8/22/08 | | | | 11,304 | | | | 8,248 | | | | (3,056 | ) |
| Embarcadero Aircraft Securitization Trust, Airplane Receivable Nts., Series 2000-A, Cl. B, 0.656%, 8/15/25 | | | 8/17/00 | | | | 1,820,063 | | | | — | | | | (1,820,063 | ) |
| FDIC Trust, Commerical Mtg. Pass-Through Certificates, Series 2012-C1, Cl. A, 0.841%, 5/1/35 | | | 5/10/12 | | | | 1,556,650 | | | | 1,556,457 | | | | (193 | ) |
| Goldman Sachs Capital Markets LP, Colombia (Republic of) Credit Linked Nts., 10.476%, 2/8/37 | | | 1/18/07 | | | | 6,937,545 | | | | 2,941,276 | | | | (3,996,269 | ) |
| Hallertau SPC Credit Linked Nts., Series 2007-01, 2.787%, 12/20/17 | | | 12/13/07 | | | | 6,250,000 | | | | 5,385,000 | | | | (865,000 | ) |
| Hallertau SPC Credit Linked Nts., Series 2008-01, 9.888%, 8/2/10 | | | 4/18/08-10/1/08 | | | | 7,188,001 | | | | 713,846 | | | | (6,474,155 | ) |
| Halyk Savings Bank of Kazakhstan JSC, 9.25% Sr. Nts., 10/16/13 | | | 4/9/08-4/3/12 | | | | 8,404,811 | | | | 8,752,111 | | | | 347,300 | |
| Ice 1 Em CLO Ltd./Ice 1 Em CLO Corp., Sr. Sec. Sub. Term Nts., Series 2007-1A, Cl. B, 2.456%, 8/15/22 | | | 11/6/07 | | | | 7,026,708 | | | | 5,351,600 | | | | (1,675,108 | ) |
| Ice 1 Em CLO Ltd./Ice 1 Em CLO Corp., Sr. Sec. Sub. Term Nts., Series 2007-1A, Cl. C, 3.756%, 8/15/22 | | | 6/8/07 | | | | 5,270,000 | | | | 3,372,800 | | | | (1,897,200 | ) |
| Ice 1 Em CLO Ltd./Ice 1 Em CLO Corp., Sr. Sec. Sub. Term Nts., Series 2007-1A, Cl. D, 5.756%, 8/15/22 | | | 6/8/07 | | | | 5,270,000 | | | | 3,267,400 | | | | (2,002,600 | ) |
| IIRSA Norte Finance Ltd., 8.75% Sr. Nts., 5/30/24 | | | 8/3/06-7/24/07 | | | | 3,849,823 | | | | 4,348,566 | | | | 498,743 | |
| JPMorgan Chase & Co., Colombia (Republic of) Credit Linked Nts., 11%, 7/28/20 | | | 8/24/10 | | | | 894,433 | | | | 922,357 | | | | 27,924 | |
| JPMorgan Hipotecaria su Casita, 8.066% Sec. Nts., 8/26/35 | | | 3/21/07 | | | | 526,714 | | | | 52,252 | | | | (474,462 | ) |
| Merrill Lynch, Colombia (Republic of) Credit Linked Nts., 10%, 11/17/16 | | | 10/20/06 | | | | 762,393 | | | | 1,061,610 | | | | 299,217 | |
| NC Finance Trust, Collateralized Mtg. Obligation Pass-Through Certificates, Series 1999-I, Cl. ECFD, 3.405%, 1/25/29 | | | 8/10/10 | | | | 66,025 | | | | 5,840 | | | | (60,185 | ) |
| Odebrecht Finance Ltd., 5.125% Sr. Nts., 6/26/22 | | | 6/21/12 | | | | 1,774,665 | | | | 1,771,613 | | | | (3,052 | ) |
| Odebrecht Finance Ltd., 7.125% Sr. Nts., 6/26/42 | | | 6/21/12 | | | | 1,314,695 | | | | 1,335,000 | | | | 20,305 | |
| Premier Cruise Ltd., 11% Sr. Nts., 3/15/08 | | | 3/6/98 | | | | 242,675 | | | | — | | | | (242,675 | ) |
| Santander Drive Auto Receivables Trust 2011-S1A, Automobile Receivables Nts., Series 2011-S1A, Cl. D, 3.10%, 5/15/17 | | | 2/4/11-4/14/11 | | | | 173,457 | | | | 173,696 | | | | 239 | |
| Tengizchevroil LLP, 6.124% Nts., 11/15/14 | | | 4/29/05-3/16/10 | | | | 677,254 | | | | 691,225 | | | | 13,971 | |
| ViaSat, Inc., 6.875% Sr. Unsec. Unsub. Nts., 6/15/20 | | | 2/22/12 | | | | 918,332 | | | | 926,695 | | | | 8,363 | |
| Vnesheconombank Via VEB Finance plc Sr. Unsec. Nts., 6.025%, 7/15/20 | | | 6/26/12 | | | | 2,335,000 | | | | 2,353,972 | | | | 18,972 | |
| | | | | | |
|
|
| |
|
|
| |
|
|
|
| | | | | | | $ | 104,722,089 | | | $ | 80,037,469 | | | $ | (24,684,620 | ) |
| | | | | | |
|
|
| |
|
|
| |
|
|
|
6. Represents the current interest rate for a variable or increasing rate security.
7. All or a portion of the security position is when-issued or delayed delivery to be delivered and settled after June 29, 2012. See Note 1 of the accompanying Notes.
8. Interest-Only Strips represent the right to receive the monthly interest payments on an underlying pool of mortgage loans or other receivables. These securities typically decline in price as interest rates decline. Most other fixed income securities increase in price when interest rates decline. The principal amount of the underlying pool represents the notional amount on which current interest is calculated. The price of these securities is typically more sensitive to changes in prepayment rates than traditional mortgage or asset-backed securities (for example, GNMA pass-throughs). Interest rates disclosed represent current yields based upon the current cost basis and estimated timing and amount of future cash flows. These securities amount to $10,211,594 or 0.43% of the Fund’s net assets as of June 29, 2012.
9. The current amortization rate of the security’s cost basis exceeds the future interest payments currently estimated to be received. Both the amortization rate and interest payments are contingent on future mortgage pre-payment speeds and are therefore subject to change.
34 | OPPENHEIMER GLOBAL STRATEGIC INCOME FUND/VA
|
10. This security is accruing partial income at an anticipated effective rate based on expected interest and/or principal payments. The rate shown is the original contractual interest rate.
11. All or a portion of the security position is held in segregated accounts and pledged to cover margin requirements under certain derivative contracts. The aggregate market value of such securities is $3,215,701. See Note 6 of the accompanying Notes.
12. Zero coupon bond reflects effective yield on the date of purchase.
13. All or a portion of the security position is held in accounts at a futures clearing merchant and pledged to cover margin requirements on open futures contracts and written options on futures, if applicable. The aggregate market value of such securities is $7,310,940. See Note 6 of the accompanying Notes.
14. Denotes an inflation-indexed security: coupon or principal are indexed to a consumer price index.
15. Interest or dividend is paid-in-kind, when applicable.
16. This bond has no contractual maturity date, is not redeemable and contractually pays an indefinite stream of interest. Rate reported represents the current interest rate for this variable rate security.
17. Rate shown is the 7-day yield as of June 29, 2012.
Distribution of investments representing geographic holdings, as a percentage of total investments at value, is as follows:
| | | | | | | | |
| Geographic Holdings | | Value | | | Percent | |
| United States | | $ | 1,619,780,284 | | | | 60.4 | % |
| Mexico | | | 139,621,754 | | | | 5.2 | |
| Turkey | | | 123,972,430 | | | | 4.6 | |
| Brazil | | | 115,895,643 | | | | 4.3 | |
| Russia | | | 101,350,200 | | | | 3.8 | |
| South Africa | | | 71,856,542 | | | | 2.7 | |
| Hungary | | | 48,621,240 | | | | 1.8 | |
| Japan | | | 48,075,460 | | | | 1.8 | |
| Peru | | | 46,663,010 | | | | 1.7 | |
| Colombia | | | 37,458,343 | | | | 1.4 | |
| Indonesia | | | 33,245,690 | | | | 1.2 | |
| Poland | | | 24,626,788 | | | | 0.9 | |
| Venezuela | | | 24,174,201 | | | | 0.9 | |
| Kazakhstan | | | 19,629,436 | | | | 0.7 | |
| Canada | | | 15,501,023 | | | | 0.6 | |
| United Kingdom | | | 15,012,883 | | | | 0.6 | |
| Australia | | | 14,433,251 | | | | 0.5 | |
| Italy | | | 13,065,096 | | | | 0.5 | |
| Supranational | | | 12,979,481 | | | | 0.5 | |
| France | | | 12,495,497 | | | | 0.5 | |
| The Netherlands | | | 12,034,134 | | | | 0.5 | |
| Israel | | | 11,435,463 | | | | 0.4 | |
| Philippines | | | 10,622,239 | | | | 0.4 | |
| Sweden | | | 7,778,839 | | | | 0.3 | |
| Chile | | | 7,252,687 | | | | 0.3 | |
| Uruguay | | | 7,135,953 | | | | 0.3 | |
| Ukraine | | | 6,940,678 | | | | 0.3 | |
| Romania | | | 5,790,994 | | | | 0.2 | |
| Germany | | | 5,666,372 | | | | 0.2 | |
| Panama | | | 5,556,930 | | | | 0.2 | |
| Qatar | | | 5,135,235 | | | | 0.2 | |
| Spain | | | 4,193,969 | | | | 0.2 | |
| Korea, Republic of South | | | 4,061,173 | | | | 0.2 | |
| India | | | 3,617,363 | | | | 0.1 | |
| Luxembourg | | | 3,600,405 | | | | 0.1 | |
| Malaysia | | | 3,522,776 | | | | 0.1 | |
| Trinidad & Tobago | | | 3,493,113 | | | | 0.1 | |
| Belgium | | | 3,423,480 | | | | 0.1 | |
35 | OPPENHEIMER GLOBAL STRATEGIC INCOME FUND/VA
|
STATEMENT OF INVESTMENTS Unaudited / Continued
Footnotes to Statement of Investments Continued
| | | | | | | | |
| Geographic Holdings Continued | | Value | | | Percent | |
| Argentina | | $ | 3,067,285 | | | | 0.1 | % |
| Lithuanua | | | 2,866,131 | | | | 0.1 | |
| Sri Lanka | | | 2,808,443 | | | | 0.1 | |
| Latvia | | | 2,784,150 | | | | 0.1 | |
| Nigeria | | | 2,577,067 | | | | 0.1 | |
| Croatia | | | 2,566,762 | | | | 0.1 | |
| Slovakia | | | 2,549,250 | | | | 0.1 | |
| Dominican Republic | | | 2,413,709 | | | | 0.1 | |
| Norway | | | 1,681,406 | | | | 0.1 | |
| Austria | | | 1,454,911 | | | | 0.1 | |
| Ghana | | | 1,396,188 | | | | 0.1 | |
| European Union | | | 1,192,664 | | | | 0.1 | |
| Denmark | | | 1,144,480 | | | | — | |
| Switzerland | | | 880,894 | | | | — | |
| Finland | | | 841,957 | | | | — | |
| Ivory Coast | | | 637,500 | | | | — | |
| Singapore | | | 577,411 | | | | — | |
| | |
|
|
| |
|
|
|
| Total | | $ | 2,681,160,263 | | | | 100.0 | % |
| | |
|
|
| |
|
|
|
| | | | | | | | | | | | | | | | | | | | | | | | |
| Foreign Currency Exchange Contracts as of June 29, 2012 are as follows: | |
Counterparty/
Contract Description | | Buy/Sell | | | Contract
Amount
(000’s) | | | Expiration
Dates | | | Value | | | Unrealized
Appreciation | | | Unrealized
Depreciation | |
| Bank of America: | | | | | | | | | | | | | | | | | | | | | | | | |
| Chilean Peso (CLP) | | | Sell | | | | 440,900 | CLP | | | 7/17/12 | | | $ | 878,198 | | | $ | 20,036 | | | $ | 3,260 | |
| Colombian Peso (COP) | | | Buy | | | | 2,222,000 | COP | | | 8/24/12 | | | | 1,233,608 | | | | 8,353 | | | | — | |
| Colombian Peso (COP) | | | Sell | | | | 19,442,500 | COP | | | 7/16/12-8/24/12 | | | | 10,843,751 | | | | — | | | | 157,257 | |
| Euro (EUR) | | | Sell | | | | 19,589 | EUR | | | 7/17/12-7/23/12 | | | | 24,794,486 | | | | 9,158 | | | | 18,731 | |
| Indian Rupee (INR) | | | Sell | | | | 10,250 | INR | | | 7/17/12 | | | | 182,901 | | | | — | | | | 744 | |
| Indonesia Rupiah (IDR) | | | Sell | | | | 72,909,000 | IDR | | | 7/16/12 | | | | 7,745,998 | | | | 123,228 | | | | 44,686 | |
| Malaysian Ringgit (MYR) | | | Sell | | | | 380 | MYR | | | 7/17/12 | | | | 119,523 | | | | 1,323 | | | | — | |
| Mexican Nuevo Peso (MXN) | | | Sell | | | | 70 | MXN | | | 7/2/12 | | | | 5,280 | | | | — | | | | 120 | |
| Peruvian New Sol (PEN) | | | Buy | | | | 4,330 | PEN | | | 7/10/12 | | | | 1,623,093 | | | | — | | | | 8,889 | |
| Philippines Peso (PHP) | | | Sell | | | | 113,000 | PHP | | | 7/17/12 | | | | 2,678,204 | | | | — | | | | 46,625 | |
| Polish Zloty (PLZ) | | | Sell | | | | 25,070 | PLZ | | | 8/6/12-8/23/12 | | | | 7,488,115 | | | | — | | | | 500,681 | |
| South African Rand (ZAR) | | | Buy | | | | 24,412 | ZAR | | | 7/3/12-7/20/12 | | | | 2,978,457 | | | | 16,773 | | | | 84,859 | |
| South African Rand (ZAR) | | | Sell | | | | 124,500 | ZAR | | | 7/11/12 | | | | 15,203,526 | | | | 460,857 | | | | 17,092 | |
| Swiss Franc (CHF) | | | Buy | | | | 530 | CHF | | | 8/23/12 | | | | 559,171 | | | | — | | | | 5,122 | |
| | | | | | |
|
|
|
| | | | | | | | | | | | | | | | | | | | 639,728 | | | | 888,066 | |
| Barclay’s Capital: | | | | | | | | | | | | | | | | | | | | | | | | |
| Australian Dollar (AUD) | | | Sell | | | | 1,040 | AUD | | | 7/23/12 | | | | 1,062,049 | | | | — | | | | 7,051 | |
| British Pound Sterling (GBP) | | | Sell | | | | 2,745 | GBP | | | 7/16/12 | | | | 4,298,928 | | | | 68,544 | | | | — | |
| Euro (EUR) | | | Buy | | | | 2,165 | EUR | | | 7/23/12 | | | | 2,740,318 | | | | 2,474 | | | | 74,823 | |
| Euro (EUR) | | | Sell | | | | 13,750 | EUR | | | 7/25/12 | | | | 17,404,146 | | | | 645,411 | | | | — | |
| Hungarian Forint (HUF) | | | Buy | | | | 723,271 | HUF | | | 7/2/12-10/24/12 | | | | 3,188,217 | | | | 75,322 | | | | — | |
| Israeli Shekel (ILS) | | | Buy | | | | 2,030 | ILS | | | 4/2/13 | | | | 515,632 | | | | — | | | | 13,980 | |
| Israeli Shekel (ILS) | | | Sell | | | | 2,030 | ILS | | | 4/2/13 | | | | 515,632 | | | | 20,285 | | | | — | |
| Japanese Yen (JPY) | | | Sell | | | | 1,859,000 | JPY | | | 7/17/12 | | | | 23,262,227 | | | | 367,377 | | | | — | |
| Malaysian Ringgit (MYR) | | | Sell | | | | 200 | MYR | | | 9/20/12 | | | | 62,668 | | | | — | | | | 285 | |
| Mexican Nuevo Peso (MXN) | | | Sell | | | | 33,700 | MXN | | | 10/18/12 | | | | 2,499,825 | | | | 7,149 | | | | — | |
| Norwegian Krone (NOK) | | | Sell | | | | 80 | NOK | | | 9/20/12 | | | | 13,407 | | | | — | | | | 97 | |
36 | OPPENHEIMER GLOBAL STRATEGIC INCOME FUND/VA
|
| | | | | | | | | | | | | | | | | | | | | | | | |
| Foreign Currency Exchange Contracts: Continued | |
Counterparty/
Contract Description | | Buy/Sell | | | Contract
Amount
(000’s) | | | Expiration
Dates | | | Value | | | Unrealized
Appreciation | | | Unrealized
Depreciation | |
| Barclay’s Capital: Continued | | | | | | | | | | | | | | | | | | | | | | | | |
| Peruvian New Sol (PEN) | | | Sell | | | | 7,320 | PEN | | | 7/10/12 | | | $ | 2,743,889 | | | $ | — | | | $ | 4,368 | |
| Polish Zloty (PLZ) | | | Buy | | | | 246 | PLZ | | | 7/17/12 | | | | 73,678 | | | | 2,099 | | | | — | |
| Russian Ruble (RUR) | | | Buy | | | | 26,560 | RUR | | | 7/17/12-7/19/12 | | | | 817,315 | | | | 10,099 | | | | 8,588 | |
| Russian Ruble (RUR) | | | Sell | | | | 637,976 | RUR | | | 7/16/12-11/30/12 | | | | 19,524,342 | | | | 990,049 | | | | 192,460 | |
| South African Rand (ZAR) | | | Sell | | | | 299,640 | ZAR | | | 7/20/12-9/12/12 | | | | 36,382,175 | | | | 113,143 | | | | 655,514 | |
| Swedish Krona (SEK) | | | Sell | | | | 140 | SEK | | | 9/20/12 | | | | 20,178 | | | | — | | | | 405 | |
| | | | | | |
|
|
|
| | | | | | | | | | | | | | | | | | | | 2,301,952 | | | | 957,571 | |
| Chase Manhattan Bank: | | | | | | | | | | | | | | | | | | | | | | | | |
| Nigerian Naira (NGN) | | | Sell | | | | 138,473 | NGN | | | 7/3/12 | | | | 850,834 | | | | — | | | | 835 | |
| Russian Ruble (RUR) | | | Sell | | | | 42,623 | RUR | | | 7/6/12 | | | | 1,316,038 | | | | — | | | | 29,242 | |
| | | | | | |
|
|
|
| | | | | | | | | | | | | | | | | | | | — | | | | 30,077 | |
| Citigroup: | | | | | | | | | | | | | | | | | | | | | | | | |
| Australian Dollar (AUD) | | | Sell | | | | 9,770 | AUD | | | 8/23/12 | | | | 9,946,849 | | | | — | | | | 396,466 | |
| Canadian Dollar (CAD) | | | Sell | | | | 770 | CAD | | | 8/23/12 | | | | 755,366 | | | | — | | | | 3,075 | |
| Chilean Peso (CLP) | | | Buy | | | | 993,900 | CLP | | | 7/12/12-9/20/12 | | | | 1,980,707 | | | | 10,515 | | | | 33 | |
| Colombian Peso (COP) | | | Buy | | | | 2,020,000 | COP | | | 7/17/12-8/24/12 | | | | 1,125,090 | | | | 12,229 | | | | 5,227 | |
| Czech Koruna (CZK) | | | Buy | | | | 10,700 | CZK | | | 8/23/12 | | | | 530,508 | | | | 10,372 | | | | — | |
| Hungarian Forint (HUF) | | | Sell | | | | 330,000 | HUF | | | 9/5/12 | | | | 1,447,383 | | | | — | | | | 85,061 | |
| Indian Rupee (INR) | | | Buy | | | | 2,000 | INR | | | 9/20/12 | | | | 35,229 | | | | — | | | | 312 | |
| Mexican Nuevo Peso (MXN) | | | Buy | | | | 9,200 | MXN | | | 9/20/12-10/18/12 | | | | 682,519 | | | | 855 | | | | 21,085 | |
| Mexican Nuevo Peso (MXN) | | | Sell | | | | 452,260 | MXN | | | 9/20/12-12/13/12 | | | | 33,479,260 | | | | 518,792 | | | | 868,487 | |
| New Taiwan Dollar (TWD) | | | Buy | | | | 2,990 | TWD | | | 7/17/12 | | | | 100,062 | | | | — | | | | 535 | |
| New Zealand Dollar (NZD) | | | Sell | | | | 4 | NZD | | | 7/17/12 | | | | 3,198 | | | | — | | | | 33 | |
| Norwegian Krone (NOK) | | | Sell | | | | 1,240 | NOK | | | 9/20/12 | | | | 207,808 | | | | — | | | | 2,652 | |
| Peruvian New Sol (PEN) | | | Sell | | | | 8,940 | PEN | | | 7/10/12 | | | | 3,351,143 | | | | — | | | | 7,837 | |
| Singapore Dollar (SGD) | | | Sell | | | | 20 | SGD | | | 9/20/12 | | | | 15,790 | | | | — | | | | 37 | |
| South Korean Won (KRW) | | | Buy | | | | 36,000 | KRW | | | 9/20/12 | | | | 31,260 | | | | — | | | | 146 | |
| South Korean Won (KRW) | | | Sell | | | | 127,600 | KRW | | | 7/17/12-9/20/12 | | | | 110,881 | | | | 146 | | | | 1,487 | |
| Swedish Krona (SEK) | | | Buy | | | | 140 | SEK | | | 7/17/12 | | | | 20,226 | | | | 590 | | | | — | |
| Swiss Franc (CHF) | | | Sell | | | | 970 | CHF | | | 7/23/12 | | | | 1,022,520 | | | | — | | | | 947 | |
| | | | | | |
|
|
|
| | | | | | | | | | | | | | | | | | | | 553,499 | | | | 1,393,420 | |
| Credit Suisse: | | | | | | | | | | | | | | | | | | | | | | | | |
| British Pound Sterling (GBP) | | | Sell | | | | 1,380 | GBP | | | 8/23/12 | | | | 2,160,984 | | | | 14,162 | | | | 8,769 | |
| Hong Kong Dollar (HKD) | | | Buy | | | | 892 | HKD | | | 7/3/12 | | | | 114,954 | | | | — | | | | 13 | |
| Mexican Nuevo Peso (MXN) | | | Buy | | | | 3,480 | MXN | | | 7/17/12 | | | | 260,428 | | | | — | | | | 2,835 | |
| New Turkish Lira (TRY) | | | Sell | | | | 3,240 | TRY | | | 7/17/13 | | | | 1,669,988 | | | | — | | | | 100,165 | |
| Peruvian New Sol (PEN) | | | Sell | | | | 1,690 | PEN | | | 7/10/12 | | | | 633,494 | | | | 3,041 | | | | — | |
| Russian Ruble (RUR) | | | Buy | | | | 5,576 | RUR | | | 7/17/12 | | | | 171,634 | | | | — | | | | 16,252 | |
| Russian Ruble (RUR) | | | Sell | | | | 6,760 | RUR | | | 7/17/12 | | | | 208,079 | | | | 18,107 | | | | — | |
| South African Rand (ZAR) | | | Sell | | | | 1,580 | ZAR | | | 7/17/12 | | | | 192,765 | | | | — | | | | 8,218 | |
| Swedish Krona (SEK) | | | Sell | | | | 43,020 | SEK | | | 7/17/12-8/23/12 | | | | 6,206,205 | | | | 1,721 | | | | 161,835 | |
| | | | | | |
|
|
|
| | | | | | | | | | | | | | | | | | | | 37,031 | | | | 298,087 | |
| Deutsche Bank Securities, Inc.: | | | | | | | | | | | | | | | | | | | | | | | | |
| Australian Dollar (AUD) | | | Sell | | | | 745 | AUD | | | 7/16/12 | | | | 761,316 | | | | 7,355 | | | | 5,686 | |
| Canadian Dollar (CAD) | | | Sell | | | | 375 | CAD | | | 9/20/12 | | | | 367,648 | | | | — | | | | 3,707 | |
| Hungarian Forint (HUF) | | | Sell | | | | 2,561,000 | HUF | | | 7/16/12-8/6/12 | | | | 11,293,522 | | | | — | | | | 617,177 | |
| Indian Rupee (INR) | | | Buy | | | | 10,250 | INR | | | 7/17/12 | | | | 182,901 | | | | — | | | | 11,818 | |
| Malaysian Ringgit (MYR) | | | Buy | | | | 35,400 | MYR | | | 8/10/12 | | | | 11,116,639 | | | | — | | | | 469,405 | |
37 | OPPENHEIMER GLOBAL STRATEGIC INCOME FUND/VA
|
STATEMENT OF INVESTMENTS Unaudited / Continued
Footnotes to Statement of Investments Continued
| | | | | | | | | | | | | | | | | | | | | | | | |
| Foreign Currency Exchange Contracts: Continued | |
Counterparty/
Contract Description | | Buy/Sell | | | Contract
Amount
(000’s) | | | Expiration
Dates | | | Value | | | Unrealized
Appreciation | | | Unrealized
Depreciation | |
| Deutsche Bank Securities, Inc.: Continued | | | | | | | | | | | | | | | | | |
| New Turkish Lira (TRY) | | | Sell | | | | 7,555 | TRY | | | 7/25/12 | | | $ | 4,153,314 | | | $ | 5,202 | | | $ | — | |
| Russian Ruble (RUR) | | | Sell | | | | 72,370 | RUR | | | 7/19/12 | | | | 2,226,790 | | | | 197,465 | | | | — | |
| South Korean Won (KRW) | | | Buy | | | | 10,555,800 | KRW | | | 7/17/12-9/19/12 | | | | 9,166,953 | | | | 196,516 | | | | — | |
| Swedish Krona (SEK) | | | Sell | | | | 5,730 | SEK | | | 7/16/12 | | | | 827,836 | | | | 16,237 | | | | 4,859 | |
| | | | | | |
|
|
|
| | | | | | | | | | | | | | | | | | | | 422,775 | | | | 1,112,652 | |
| Goldman Sachs & Co.: | | | | | | | | | | | | | | | | | | | | | | | | |
| Australian Dollar (AUD) | | | Buy | | | | 745 | AUD | | | 8/23/12 | | | | 758,485 | | | | 29,648 | | | | — | |
| Canadian Dollar (CAD) | | | Sell | | | | 1,515 | CAD | | | 7/16/12 | | | | 1,487,529 | | | | 28,352 | | | | 2,239 | |
| Japanese Yen (JPY) | | | Buy | | | | 1,178,000 | JPY | | | 8/23/12 | | | | 14,748,434 | | | | — | | | | 102,089 | |
| Mexican Nuevo Peso (MXN) | | | Sell | | | | 881,000 | MXN | | | 7/16/12-12/20/12 | | | | 65,312,203 | | | | 1,235,375 | | | | 907,425 | |
| South African Rand (ZAR) | | | Buy | | | | 34 | ZAR | | | 7/17/12 | | | | 4,148 | | | | — | | | | 152 | |
| | | | | | |
|
|
|
| | | | | | | | | | | | | | | | | | | | 1,293,375 | | | | 1,011,905 | |
| HSBC: | | | | | | | | | | | | | | | | | | | | | | | | |
| New Turkish Lira (TRY) | | | Buy | | | | 3,240 | TRY | | | 7/17/13 | | | | 1,669,988 | | | | 6,316 | | | | — | |
| New Turkish Lira (TRY) | | | Sell | | | | 91,370 | TRY | | | 11/7/12 | | | | 49,205,919 | | | | — | | | | 187,679 | |
| | | | | | |
|
|
|
| | | | | | | | | | | | | | | | | | | | 6,316 | | | | 187,679 | |
| JP Morgan Chase: | | | | | | | | | | | | | | | | | | | | | | | | |
| Australian Dollar (AUD) | | | Buy | | | | 155 | AUD | | | 7/17/12 | | | | 158,379 | | | | 6,666 | | | | — | |
| Australian Dollar (AUD) | | | Sell | | | | 6 | AUD | | | 7/17/12 | | | | 6,131 | | | | 19 | | | | — | |
| British Pound Sterling (GBP) | | | Sell | | | | 118 | GBP | �� | | 7/17/12-9/20/12 | | | | 184,782 | | | | 3,215 | | | | 336 | |
| Canadian Dollar (CAD) | | | Buy | | | | 645 | CAD | | | 7/17/12 | | | | 633,290 | | | | — | | | | 14,482 | |
| Canadian Dollar (CAD) | | | Sell | | | | 30 | CAD | | | 7/17/12 | | | | 29,455 | | | | 456 | | | | — | |
| Euro (EUR) | | | Buy | | | | 625 | EUR | | | 7/17/12-8/17/12 | | | | 791,216 | | | | — | | | | 36,115 | |
| Euro (EUR) | | | Sell | | | | 38,256 | EUR | | | 7/16/12-9/28/12 | | | | 48,430,604 | | | | 1,512,374 | | | | 123,820 | |
| Hungarian Forint (HUF) | | | Sell | | | | 3,962,000 | HUF | | | 8/22/12-2/12/13 | | | | 17,093,832 | | | | 35,018 | | | | 814,705 | |
| Indian Rupee (INR) | | | Buy | | | | 2,000 | INR | | | 9/20/12 | | | | 35,229 | | | | 106 | | | | — | |
| Indian Rupee (INR) | | | Sell | | | | 2,000 | INR | | | 9/20/12 | | | | 35,229 | | | | — | | | | 885 | |
| Indonesia Rupiah (IDR) | | | Buy | | | | 61,339,000 | IDR | | | 7/9/12 | | | | 6,522,851 | | | | — | | | | 57,881 | |
| Malaysian Ringgit (MYR) | | | Buy | | | | 67,380 | MYR | | | 7/17/12-9/25/12 | | | | 21,108,090 | | | | 31,689 | | | | 1,940 | |
| Mexican Nuevo Peso (MXN) | | | Buy | | | | 10,800 | MXN | | | 11/9/12 | | | | 799,576 | | | | 13,549 | | | | — | |
| Mexican Nuevo Peso (MXN) | | | Sell | | | | 84,587 | MXN | | | 7/2/12-9/12/12 | | | | 6,317,235 | | | | 1,775 | | | | 235,726 | |
| New Taiwan Dollar (TWD) | | | Sell | | | | 5,990 | TWD | | | 7/17/12-9/20/12 | | | | 200,531 | | | | 1,480 | | | | 188 | |
| New Turkish Lira (TRY) | | | Sell | | | | 1,560 | TRY | | | 7/25/12 | | | | 857,600 | | | | 783 | | | | — | |
| New Zealand Dollar (NZD) | | | Buy | | | | 135 | NZD | | | 7/17/12 | | | | 107,936 | | | | 5,964 | | | | — | |
| Peruvian New Sol (PEN) | | | Sell | | | | 11,430 | PEN | | | 7/16/12 | | | | 4,282,349 | | | | 125 | | | | 11,921 | |
| Russian Ruble (RUR) | | | Buy | | | | 58,200 | RUR | | | 7/19/12 | | | | 1,790,786 | | | | — | | | | 124,318 | |
| Singapore Dollar (SGD) | | | Buy | | | | 18,640 | SGD | | | 7/17/12 | | | | 14,714,756 | | | | — | | | | 237,915 | |
| South Korean Won (KRW) | | | Buy | | | | 10,796,000 | KRW | | | 7/17/12 | | | | 9,414,544 | | | | 192,426 | | | | — | |
| South Korean Won (KRW) | | | Sell | | | | 7,956,200 | KRW | | | 7/16/12-7/17/12 | | | | 6,938,614 | | | | 18,737 | | | | 36,221 | |
| | | | | | |
|
|
|
| | | | | | | | | | | | | | | | | | | | 1,824,382 | | | | 1,696,453 | |
| Morgan Stanley & Co., Inc.: | | | | | | | | | | | | | | | | | | | | | | | | |
| Australian Dollar (AUD) | | | Sell | | | | 220 | AUD | | | 9/20/12 | | | | 223,440 | | | | — | | | | 3,931 | |
| Brazilian Real (BRR) | | | Sell | | | | 30,775 | BRR | | | 8/2/12 | | | | 15,212,894 | | | | — | | | | 473,203 | |
| Canadian Dollar (CAD) | | | Sell | | | | 4,465 | CAD | | | 7/23/12-9/20/12 | | | | 4,382,961 | | | | — | | | | 6,450 | |
| Euro (EUR) | | | Buy | | | | 12,479 | EUR | | | 7/2/12-8/23/12 | | | | 15,800,118 | | | | 27,919 | | | | 93,817 | |
| Euro (EUR) | | | Sell | | | | 383 | EUR | | | 7/5/12 | | | | 484,514 | | | | 12 | | | | 201 | |
| Japanese Yen (JPY) | | | Sell | | | | 500,000 | JPY | | | 7/23/12 | | | | 6,257,204 | | | | 74,218 | | | | — | |
38 | OPPENHEIMER GLOBAL STRATEGIC INCOME FUND/VA
|
| | | | | | | | | | | | | | | | | | | | | | | | |
| Foreign Currency Exchange Contracts: Continued | |
Counterparty/
Contract Description | | Buy/Sell | | | Contract
Amount
(000’s) | | | Expiration
Dates | | | Value | | | Unrealized
Appreciation | | | Unrealized
Depreciation | |
| Morgan Stanley & Co., Inc.: Continued | | | | | | | | | | | | | | | | | | | | | |
| New Zealand Dollar (NZD) | | | Buy | | | | 80 | NZD | | | 9/20/12 | | | $ | 63,678 | | | $ | — | | | $ | 188 | |
| New Zealand Dollar (NZD) | | | Sell | | | | 1,210 | NZD | | | 9/20/12 | | | | 963,127 | | | | — | | | | 2,641 | |
| Singapore Dollar (SGD) | | | Buy | | | | 3,520 | SGD | | | 7/17/12 | | | | 2,778,752 | | | | — | | | | 40,744 | |
| South African Rand (ZAR) | | | Buy | | | | 6,336 | ZAR | | | 7/5/12-7/17/12 | | | | 774,074 | | | | 6,415 | | | | 466 | |
| South African Rand (ZAR) | | | Sell | | | | 4,760 | ZAR | | | 7/20/12 | | | | 580,464 | | | | 493 | | | | — | |
| | | | | | |
|
|
|
| | | | | | | | | | | | | | | | | | | | 109,057 | | | | 621,641 | |
| Nomura Securities: | | | | | | | | | | | | | | | | | | | | | | | | |
| Australian Dollar (AUD) | | | Buy | | | | 1,005 | AUD | | | 9/20/12 | | | | 1,020,716 | | | | 4,249 | | | | 41 | |
| Australian Dollar (AUD) | | | Sell | | | | 95 | AUD | | | 9/20/12 | | | | 96,486 | | | | — | | | | 1,696 | |
| Brazilian Real (BRR) | | | Sell | | | | 66,835 | BRR | | | 8/2/12 | | | | 33,038,303 | | | | — | | | | 975,458 | |
| British Pound Sterling (GBP) | | | Sell | | | | 80 | GBP | | | 7/3/12-9/20/12 | | | | 125,467 | | | | 514 | | | | 2 | |
| Canadian Dollar (CAD) | | | Sell | | | | 394 | CAD | | | 7/17/12 | | | | 386,847 | | | | 12,942 | | | | — | |
| Euro (EUR) | | | Buy | | | | 136 | EUR | | | 7/3/12 | | | | 172,698 | | | | 21 | | | | — | |
| Euro (EUR) | | | Sell | | | | 500 | EUR | | | 9/20/12 | | | | 633,261 | | | | 41 | | | | 3,344 | |
| Indonesia Rupiah (IDR) | | | Buy | | | | 3,690,000 | IDR | | | 7/9/12 | | | | 392,398 | | | | — | | | | 7,949 | |
| Japanese Yen (JPY) | | | Buy | | | | 149,000 | JPY | | | 8/23/12 | | | | 1,865,464 | | | | — | | | | 21,731 | |
| Japanese Yen (JPY) | | | Sell | | | | 25,000 | JPY | | | 9/20/12 | | | | 313,116 | | | | 2,693 | | | | — | |
| Malaysian Ringgit (MYR) | | | Buy | | | | 280 | MYR | | | 7/17/12 | | | | 88,070 | | | | — | | | | 2,662 | |
| Malaysian Ringgit (MYR) | | | Sell | | | | 50,805 | MYR | | | 7/16/12 | | | | 15,981,090 | | | | 449,058 | | | | — | |
| Norwegian Krone (NOK) | | | Buy | | | | 2,700 | NOK | | | 7/17/12 | | | | 453,600 | | | | 572 | | | | — | |
| Norwegian Krone (NOK) | | | Sell | | | | 2,660 | NOK | | | 7/17/12-9/20/12 | | | | 445,946 | | | | 2,056 | | | | 703 | |
| Singapore Dollar (SGD) | | | Sell | | | | 30 | SGD | | | 9/20/12 | | | | 23,685 | | | | — | | | | 328 | |
| | | | | | |
|
|
|
| | | | | | | | | | | | | | | | | | | | 472,146 | | | | 1,013,914 | |
| RBS Greenwich Capital: | | | | | | | | | | | | | | | | | | | | | | | | |
| Australian Dollar (AUD) | | | Buy | | | | 132 | AUD | | | 7/17/12 | | | | 134,878 | | | | — | | | | 1,093 | |
| Australian Dollar (AUD) | | | Sell | | | | 32 | AUD | | | 7/17/12 | | | | 32,698 | | | | — | | | | 321 | |
| British Pound Sterling (GBP) | | | Buy | | | | 58 | GBP | | | 7/17/12 | | | | 90,833 | | | | 515 | | | | — | |
| British Pound Sterling (GBP) | | | Sell | | | | 2,595 | GBP | | | 7/23/12 | | | | 4,063,954 | | | | 9,620 | | | | — | |
| Canadian Dollar (CAD) | | | Buy | | | | 30 | CAD | | | 7/17/12 | | | | 29,455 | | | | 97 | | | | — | |
| Canadian Dollar (CAD) | | | Sell | | | | 251 | CAD | | | 7/17/12 | | | | 246,443 | | | | 4,560 | | | | — | |
| Czech Koruna (CZK) | | | Sell | | | | 10,700 | CZK | | | 8/23/12 | | | | 530,508 | | | | 13,758 | | | | — | |
| Hungarian Forint (HUF) | | | Sell | | | | 1,860,000 | HUF | | | 12/27/12 | | | | 8,044,291 | | | | — | | | | 457,651 | |
| Norwegian Krone (NOK) | | | Buy | | | | 400 | NOK | | | 7/17/12 | | | | 67,200 | | | | 414 | | | | 777 | |
| Norwegian Krone (NOK) | | | Sell | | | | 2,700 | NOK | | | 7/17/12 | | | | 453,600 | | | | 10,495 | | | | — | |
| Polish Zloty (PLZ) | | | Sell | | | | 23,476 | PLZ | | | 7/16/12-7/17/12 | | | | 7,032,056 | | | | 283,371 | | | | 34,922 | |
| Singapore Dollar (SGD) | | | Sell | | | | 210 | SGD | | | 7/17/12 | | | | 165,778 | | | | 258 | | | | 539 | |
| | | | | | |
|
|
|
| | | | | | | | | | | | | | | | | | | | 323,088 | | | | 495,303 | |
| Standard Chartered Bank: | | | | | | | | | | | | | | | | | | | | | | | | |
| Colombian Peso (COP) | | | Sell | | | | 608,500 | COP | | | 7/17/12 | | | | 339,991 | | | | — | | | | 1,747 | |
| Malaysian Ringgit (MYR) | | | Buy | | | | 35,400 | MYR | | | 7/9/12 | | | | 11,140,809 | | | | — | | | | 460,043 | |
| | | | | | |
|
|
|
| | | | | | | | | | | | | | | | | | | | — | | | | 461,790 | |
| State Street: | | | | | | | | | | | | | | | | | | | | | | | | |
| New Turkish Lira (TRY) | | | Sell | | | | 22,000 | TRY | | | 7/16/12 | | | | 12,119,712 | | | | — | | | | 145,738 | |
| Singapore Dollar (SGD) | | | Sell | | | | 7,190 | SGD | | | 7/16/12 | | | | 5,675,918 | | | | 51,477 | | | | 10,874 | |
| South African Rand (ZAR) | | | Buy | | | | 520 | ZAR | | | 9/20/12 | | | | 62,833 | | | | — | | | | 66 | |
| South African Rand (ZAR) | | | Sell | | | | 51,524 | ZAR | | | 7/16/12-7/17/12 | | | | 6,287,062 | | | | 130,750 | | | | 22,089 | |
| | | | | | |
|
|
|
| | | | | | | | | | | | | | | | | | | | 182,227 | | | | 178,767 | |
39 | OPPENHEIMER GLOBAL STRATEGIC INCOME FUND/VA
|
STATEMENT OF INVESTMENTS Unaudited / Continued
Footnotes to Statement of Investments Continued
| | | | | | | | | | | | | | | | | | | | | | | | |
| Foreign Currency Exchange Contracts: Continued | |
Counterparty/
Contract Description | | Buy/Sell | | | Contract
Amount
(000’s) | | | Expiration
Dates | | | Value | | | Unrealized
Appreciation | | | Unrealized
Depreciation | |
| UBS Investment Bank | | | | | | | | | | | | | | | | | | | | | | | | |
| Indonesia Rupiah (IDR) | | | Buy | | | | 22,828,000 | IDR | | | 7/9/12 | | | $ | 2,427,552 | | | | $ — | | | $ | 40,340 | |
| Westpac: | | | | | | | | | | | | | | | | | | | | | | | | |
| Australian Dollar (AUD) | | | Buy | | | | 38 | AUD | | | 7/17/12 | | | | 38,828 | | | | 820 | | | | — | |
| Australian Dollar (AUD) | | | Sell | | | | 287 | AUD | | | 7/17/12 | | | | 293,257 | | | | 2,267 | | | | — | |
| New Zealand Dollar (NZD) | | | Sell | | | | 131 | NZD | | | 7/17/12 | | | | 104,738 | | | | — | | | | 2,389 | |
| | | | | | |
|
|
|
| | | | | | | | | | | | | | | | | | | | 3,087 | | | | 2,389 | |
| | | | | | |
|
|
|
| Total unrealized appreciation and depreciation | | | | | | | | $8,168,663 | | | | $10,390,054 | |
| | | | | | | | | | | | | | | | | | |
|
|
|
| | | | | | | | | | | | | | | | | | | | |
| Futures Contracts as of June 29, 2012 are as follows: | | | | | | | | | | | | | |
| Contract Description | | Buy/Sell | | | Number of
Contracts | | | Expiration
Date | | | Value | | | Unrealized
Appreciation
(Depreciation) | |
| Australian (Commonwealth of) Bonds, 10 yr. | | | Sell | | | | 21 | | | | 9/17/12 | | | $ | 2,696,525 | | | $ | 9,072 | |
| Australian Treasury Bonds, 3 yr. | | | Sell | | | | 130 | | | | 9/17/12 | | | | 14,688,080 | | | | 14,892 | |
| Australian Treasury Bonds, 10 yr. | | | Buy | | | | 3 | | | | 9/17/12 | | | | 385,218 | | | | (91 | ) |
| CBOE Volatility Index | | | Sell | | | | 60 | | | | 8/21/12 | | | | 1,317,000 | | | | 119,315 | |
| Euro Buxl 30 yr. Bonds | | | Buy | | | | 18 | | | | 9/6/12 | | | | 2,982,688 | | | | (63,489 | ) |
| Euro OAT | | | Buy | | | | 97 | | | | 9/6/12 | | | | 15,718,616 | | | | (125,650 | ) |
| Euro-Bundesobligation | | | Buy | | | | 12 | | | | 9/6/12 | | | | 2,139,711 | | | | 3,129 | |
| FTSE 100 Index | | | Sell | | | | 24 | | | | 9/21/12 | | | | 2,075,958 | | | | (49,488 | ) |
| NIKKEI 225 Index | | | Sell | | | | 45 | | | | 9/13/12 | | | | 5,072,246 | | | | (383,443 | ) |
| SPI 200 Index | | | Sell | | | | 20 | | | | 9/20/12 | | | | 2,076,169 | | | | 28,720 | |
| Standard & Poor’s 500 E-Mini Index | | | Sell | | | | 662 | | | | 9/21/12 | | | | 44,896,840 | | | | (1,140,070 | ) |
| Standard & Poor’s/Toronto Stock Exchange 60 Index | | | Sell | | | | 11 | | | | 9/20/12 | | | | 1,429,211 | | | | (26,247 | ) |
| U.S. Treasury Long Bonds | | | Buy | | | | 591 | | | | 9/19/12 | | | | 87,449,531 | | | | 39,752 | |
| U.S. Treasury Long Bonds | | | Sell | | | | 26 | | | | 9/19/12 | | | | 3,847,188 | | | | 32,461 | |
| U.S. Treasury Nts., 2 yr. | | | Sell | | | | 793 | | | | 9/28/12 | | | | 174,608,688 | | | | 109,752 | |
| U.S. Treasury Nts., 5 yr. | | | Sell | | | | 118 | | | | 9/28/12 | | | | 14,628,313 | | | | (27,370 | ) |
| U.S. Treasury Nts., 5 yr. | | | Buy | | | | 153 | | | | 9/28/12 | | | | 18,967,219 | | | | (15,787 | ) |
| U.S. Treasury Nts., 10 yr. | | | Buy | | | | 394 | | | | 9/19/12 | | | | 52,549,750 | | | | (84,055 | ) |
| U.S. Treasury Nts., 10 yr. | | | Sell | | | | 781 | | | | 9/19/12 | | | | 104,165,875 | | | | 43,452 | |
| U.S. Treasury Ultra Bonds | | | Buy | | | | 197 | | | | 9/19/12 | | | | 32,868,219 | | | | 497,031 | |
| | | | | | | | | | | | | | | | | | |
|
|
|
| | | | | | | | | | | | | | | | | | | $ | (1,018,114 | ) |
| | | | | | | | | | | | | | | | | | |
|
|
|
| | | | | | | | | | | | | | | | | | | | | | | | | | | | |
| Written Options as of June 29, 2012 are as follows: | | | | |
| Description | | Type | | | Numberof
Contracts | | | Exercise
Price | | | Expiration
Date | | | Premiums
Received | | | Value | | | Unrealized
Appreciation/
(Depreciation) | |
| Australian Dollar (AUD) | | | Call | | | | 21,900,000 | | | | 1AUD per 1.050USD | | | | 8/28/12 | | | $ | 89,106 | | | $ | (105,701 | ) | | $ | (16,595 | ) |
| Australian Dollar (AUD) | | | Call | | | | 21,800,000 | | | | 1AUD per 1.050USD | | | | 8/27/12 | | | | 116,075 | | | | (103,444 | ) | | | 12,631 | |
| Australian Dollar (AUD) | | | Call | | | | 6,060,000 | | | | 1AUD per 1.050USD | | | | 8/31/12 | | | | 35,603 | | | | (30,689 | ) | | | 4,914 | |
| Australian Dollar (AUD) | | | Call | | | | 6,060,000 | | | | 1AUD per 1.050USD | | | | 8/31/12 | | | | 28,824 | | | | (28,824 | ) | | | — | |
| Euro (EUR) FX Futures, 9/17/12 | | | Call | | | | 111 | | | | 1.340 | | | | 7/9/12 | | | | 30,496 | | | | (694 | ) | | | 29,802 | |
| Euro (EUR) FX Futures, 9/17/12 | | | Call | | | | 57 | | | | 1.370 | | | | 9/10/12 | | | | 18,932 | | | | (4,988 | ) | | | 13,944 | |
| Euro (EUR) FX Futures, 9/17/12 | | | Call | | | | 41 | | | | 1.320 | | | | 7/9/12 | | | | 5,829 | | | | (513 | ) | | | 5,316 | |
| Euro (EUR) FX Futures, 9/17/12 | | | Call | | | | 41 | | | | 1.305 | | | | 7/9/12 | | | | 4,548 | | | | (1,538 | ) | | | 3,010 | |
40 | OPPENHEIMER GLOBAL STRATEGIC INCOME FUND/VA
|
| | | | | | | | | | | | | | | | | | | | | | | | | | | | |
| Written Options: Continued | | | | |
| Description | | Type | | | Number of
Contracts | | | Exercise
Price | | | Expiration
Date | | | Premiums
Received | | | Value | | | Unrealized
Appreciation/
(Depreciation) | |
| Euro (EUR) FX Futures, 9/17/12 | | | Put | | | | 496 | | | $ | 1.215 | | | | 7/9/12 | | | $ | 64,997 | | | $ | (9,300 | ) | | $ | 55,697 | |
| Euro (EUR) FX Futures, 9/17/12 | | | Put | | | | 414 | | | | 1.220 | | | | 7/9/12 | | | | 223,568 | | | | (10,350 | ) | | | 213,218 | |
| Euro (EUR) FX Futures, 9/17/12 | | | Put | | | | 283 | | | | 1.175 | | | | 7/9/12 | | | | 67,047 | | | | (1,769 | ) | | | 65,278 | |
| Euro (EUR) FX Futures, 9/17/12 | | | Put | | | | 281 | | | | 1.180 | | | | 7/9/12 | | | | 29,595 | | | | (1,756 | ) | | | 27,839 | |
| Euro (EUR) FX Futures, 9/17/12 | | | Put | | | | 134 | | | | 1.165 | | | | 7/9/12 | | | | 15,555 | | | | (838 | ) | | | 14,717 | |
| Euro (EUR) FX Futures, 9/17/12 | | | Put | | | | 113 | | | | 1.100 | | | | 9/10/12 | | | | 57,873 | | | | (6,356 | ) | | | 51,517 | |
| Euro (EUR) FX Futures, 9/17/12 | | | Put | | | | 105 | | | | 1.155 | | | | 7/9/12 | | | | 15,271 | | | | (656 | ) | | | 14,615 | |
| Euro (EUR) FX Futures, 9/17/12 | | | Put | | | | 89 | | | | 1.210 | | | | 7/9/12 | | | | 9,094 | | | | (1,669 | ) | | | 7,425 | |
| Euro (EUR) FX Futures, 9/17/12 | | | Put | | | | 23 | | | | 1.240 | | | | 7/9/12 | | | | 42,514 | | | | (2,588 | ) | | | 39,926 | |
| Euro (EUR) FX Futures, 9/17/12 | | | Put | | | | 21 | | | | 1.120 | | | | 7/9/12 | | | | 2,058 | | | | (131 | ) | | | 1,927 | |
| Euro (EUR) FX Futures, 9/17/12 | | | Put | | | | 9 | | | | 1.180 | | | | 9/10/12 | | | | 19,448 | | | | (3,600 | ) | | | 15,848 | |
| Japanese Yen (JPY) | | | Call | | | | 366,000,460 | | | | 1USD per 72JPY | | | | 5/31/13 | | | | 85,817 | | | | (54,713 | ) | | | 31,104 | |
| Japanese Yen (JPY) | | | Call | | | | 207,905,000 | | | | 1USD per 82JPY | | | | 9/20/12 | | | | 53,624 | | | | (87,056 | ) | | | (33,432 | ) |
| Japanese Yen (JPY) | | | Put | | | | 204,000,000 | | | | 1USD per 90JPY | | | | 3/29/13 | | | | 38,647 | | | | (12,783 | ) | | | 25,864 | |
| Japanese Yen (JPY) | | | Put | | | | 482,917,273 | | | | 1USD per 95JPY | | | | 5/31/13 | | | | 22,217 | | | | (18,732 | ) | | | 3,485 | |
| Japanese Yen (JPY) Futures, 9/17/12 | | | Call | | | | 123 | | | | 132.500 | | | | 7/9/12 | | | | 13,644 | | | | (769 | ) | | | 12,875 | |
| Japanese Yen (JPY) Futures, 9/17/12 | | | Call | | | | 43 | | | | 135.000 | | | | 9/10/12 | | | | 23,585 | | | | (4,838 | ) | | | 18,747 | |
| Japanese Yen (JPY) Futures, 9/17/12 | | | Call | | | | 41 | | | | 138.000 | | | | 9/10/12 | | | | 11,979 | | | | (1,538 | ) | | | 10,441 | |
| Japanese Yen (JPY) Futures, 9/17/12 | | | Call | | | | 18 | | | | 129.500 | | | | 7/9/12 | | | | 422 | | | | (225 | ) | | | 197 | |
| Japanese Yen (JPY) Futures, 9/17/12 | | | Put | | | | 114 | | | | 112.000 | | | | 9/10/12 | | | | 7,028 | | | | (4,988 | ) | | | 2,040 | |
| Japanese Yen (JPY) Futures, 9/17/12 | | | Put | | | | 113 | | | | 110.000 | | | | 9/10/12 | | | | 6,342 | | | | (2,825 | ) | | | 3,517 | |
| Japanese Yen (JPY) Futures, 9/17/12 | | | Put | | | | 112 | | | | 122.000 | | | | 7/9/12 | | | | 10,133 | | | | (2,800 | ) | | | 7,333 | |
| Japanese Yen (JPY) Futures, 9/17/12 | | | Put | | | | 106 | | | | 121.000 | | | | 7/9/12 | | | | 5,725 | | | | (1,325 | ) | | | 4,400 | |
| Japanese Yen (JPY) Futures, 9/17/12 | | | Put | | | | 89 | | | | 121.500 | | | | 7/9/12 | | | | 3,810 | | | | (1,669 | ) | | | 2,141 | |
| Japanese Yen (JPY) Futures, 9/17/12 | | | Put | | | | 61 | | | | 120.500 | | | | 7/9/12 | | | | 692 | | | | (381 | ) | | | 311 | |
| Japanese Yen (JPY) Futures, 9/17/12 | | | Put | | | | 41 | | | | 122.500 | | | | 7/9/12 | | | | 6,086 | | | | (1,794 | ) | | | 4,292 | |
| Mexican Nuevo Peso (MXN) | | | Put | | | | 216,500,000 | | | | 1USD per 14.94MXN | | | | 11/13/12 | | | | 275,335 | | | | (168,004 | ) | | | 107,331 | |
| Mexican Nuevo Peso (MXN) | | | Put | | | | 211,055,000 | | | | 1USD per 16.455MXN | | | | 11/30/12 | | | | 214,839 | | | | (58,179 | ) | | | 156,660 | |
| Mexican Nuevo Peso (MXN) | | | Put | | | | 214,500,000 | | | | 1USD per 14.800MXN | | | | 11/9/12 | | | | 272,618 | | | | (178,580 | ) | | | 94,038 | |
| Russian Ruble (RUR) | | | Put | | | | 375,200,000 | | | | 1USD per 38RUR | | | | 11/29/12 | | | | 165,878 | | | | (90,025 | ) | | | 75,853 | |
| U.S. Treasury Nts., 10 yr. Futures, 9/19/12 | | | Put | | | | 132 | | | | 129.000 | | | | 8/27/12 | | | | 22,505 | | | | (12,375 | ) | | | 10,130 | |
| | | | | | | | | | | | | | | | | | |
|
|
| |
|
|
| |
|
|
|
| | | | | | | | | | | | | | | | | | | $ | 2,117,359 | | | $ | (1,019,003 | ) | | $ | 1,098,356 | |
| | | | | | | | | | | | | | | | | | |
|
|
| |
|
|
| |
|
|
|
| | | | | | | | | | | | | | | | | | | | | | | | | | | | |
| Credit Default Swap Contracts as of June 29, 2012 are as follows: | | | | |
Reference Entity/
Swap Counterparty | | Buy/Sell
Credit
Protection | | | Notional
Amount
(000’s) | | | Pay/
Receive
Fixed
Rate | | | Termination
Date | | | Upfront
Payment
Received/
(Paid) | | | Value | | | Unrealized
Appreciation
(Depreciation) | |
| Barrick Gold Corp. | | | | | | | | | | | | | | | | | | | | | | | | | | | | |
| Barclays Bank plc | | | Buy | | | $ | 4,720 | | | | 1.0 | % | | | 6/20/17 | | | $ | (55,255 | ) | | $ | 144,702 | | | $ | 89,447 | |
| | | | | | |
|
|
| | | | | | | | | |
|
|
|
| | | | Total | | | | 4,720 | | | | | | | | | | | | (55,255 | ) | | | 144,702 | | | | 89,447 | |
| Brazil (Federative Republic of): | | | | | | | | | | | | | | | | | | | | | | | | | | | | |
| Deutsche Bank AG | | | Sell | | | | 3,720 | | | | 1.0 | | | | 6/20/17 | | | | 33,143 | | | | (102,394 | ) | | | (69,251 | ) |
| Deutsche Bank AG | | | Sell | | | | 670 | | | | 1.0 | | | | 6/20/17 | | | | 17,542 | | | | (18,442 | ) | | | (900 | ) |
| | | | | | |
|
|
| | | | | | | | | |
|
|
|
| | | | Total | | | | 4,390 | | | | | | | | | | | | 50,685 | | | | (120,836 | ) | | | (70,151 | ) |
| CDX Emerging Market Index, Series 17 | | | | | | | | | | | | | | | | | | | | | | | | | | | | |
| Deutsche Bank AG | | | Buy | | | | 5,260 | | | | 5.0 | | | | 6/20/17 | | | | 685,261 | | | | (518,344 | ) | | | 166,917 | |
| | | | | | |
|
|
| | | | | | | | | |
|
|
|
| | | | Total | | | | 5,260 | | | | | | | | | | | | 685,261 | | | | (518,344 | ) | | | 166,917 | |
41 | OPPENHEIMER GLOBAL STRATEGIC INCOME FUND/VA
|
STATEMENT OF INVESTMENTS Unaudited / Continued
Footnotes to Statement of Investments Continued
| | | | | | | | | | | | | | | | | | | | | | | | | | | | |
| Credit Default Swap Contracts: Continued | | | | |
Reference Entity/
Swap Counterparty | | Buy/Sell
Credit
Protection | | | Notional
Amount
(000’s) | | | Pay/
Receive
Fixed
Rate | | | Termination
Date | | | Upfront
Payment
Received/
(Paid) | | | Value | | | Unrealized
Appreciation
(Depreciation) | |
| Dell, Inc. | | | | | | | | | | | | | | | | | | | | | | | | | | | | |
| Citibank NA | | | Buy | | | $ | 4,660 | | | | 1.0% | | | | 6/20/17 | | | $ | (239,162 | ) | | $ | 219,322 | | | $ | (19,840 | ) |
| | | | | | |
|
|
| | | | | | | | | |
|
|
|
| | | | Total | | | | 4,660 | | | | | | | | | | | | (239,162 | ) | | | 219,322 | | | | (19,840 | ) |
| Expedia, Inc. | | | | | | | | | | | | | | | | | | | | | | | | | | | | |
| Deutsche Bank AG | | | Sell | | | | 4,780 | | | | 1.0 | | | | 6/20/17 | | | | 180,856 | | | | (171,804 | ) | | | 9,052 | |
| | | | | | |
|
|
| | | | | | | | | |
|
|
|
| | | | Total | | | | 4,780 | | | | | | | | | | | | 180,856 | | | | (171,804 | ) | | | 9,052 | |
| Freeport-McMoRan Copper & Gold, Inc. | | | | | | | | | | | | | | | | | | | | | | | | | | | | |
| JPMorgan Chase Bank NA | | | Buy | | | | 4,780 | | | | 1.0 | | | | 6/20/17 | | | | (123,734 | ) | | | 228,845 | | | | 105,111 | |
| | | | | | |
|
|
| | | | | | | | | |
|
|
|
| | | | Total | | | | 4,780 | | | | | | | | | | | | (123,734 | ) | | | 228,845 | | | | 105,111 | |
| Gap, Inc. (The) | | | | | | | | | | | | | | | | | | | | | | | | | | | | |
| Bank of America NA | | | Sell | | | | 4,720 | | | | 1.0 | | | | 6/20/17 | | | | 246,747 | | | | (257,990 | ) | | | (11,243 | ) |
| | | | | | |
|
|
| | | | | | | | | |
|
|
|
| | | | Total | | | | 4,720 | | | | | | | | | | | | 246,747 | | | | (257,990 | ) | | | (11,243 | ) |
| Halliburton Co. | | | | | | | | | | | | | | | | | | | | | | | | | | | | |
| Credit Suisse International | | | Buy | | | | 4,720 | | | | 1.0 | | | | 6/20/17 | | | | 78,820 | | | | (33,164 | ) | | | 45,656 | |
| | | | | | |
|
|
| | | | | | | | | |
|
|
|
| | | | Total | | | | 4,720 | | | | | | | | | | | | 78,820 | | | | (33,164 | ) | | | 45,656 | |
| Hungary (Republic of): | | | | | | | | | | | | | | | | | | | | | | | | | | | | |
| HSBC Bank USA NA | | | Sell | | | | 1,640 | | | | 1.0 | | | | 6/20/17 | | | | 293,847 | | | | (278,995 | ) | | | 14,852 | |
| UBS AG | | | Sell | | | | 1,640 | | | | 1.0 | | | | 6/20/17 | | | | 299,906 | | | | (278,995 | ) | | | 20,911 | |
| | | | | | |
|
|
| | | | | | | | | |
|
|
|
| | | | Total | | | | 3,280 | | | | | | | | | | | | 593,753 | | | | (557,990 | ) | | | 35,763 | |
| Istanbul Bond Co. SA for Finansbank AS | | | | | | | | | | | | | | | | | | | | | | | | | | | | |
| Morgan Stanley Capital Services, Inc. | | | Sell | | | | 3,100 | | | | 1.3 | | | | 3/24/13 | | | | — | | | | (54,629 | ) | | | (54,629 | ) |
| | | | | | |
|
|
| | | | | | | | | |
|
|
|
| | | | Total | | | | 3,100 | | | | | | | | | | | | — | | | | (54,629 | ) | | | (54,629 | ) |
| iTraxx Europe Crossover Index Series 17 Version 1 | | | | | | | | | | | | | | | | | | | | | | | | | | | | |
| JPMorgan Chase Bank NA | | | Buy | | | | 895 | EUR | | | 5.0 | | | | 6/20/17 | | | | (68,344 | ) | | | 68,344 | | | | — | |
| | | | | | |
|
|
| | | | | | | | | |
|
|
|
| | | | Total | | | | 895 | EUR | | | | | | | | | | | (68,344 | ) | | | 68,344 | | | | — | |
| M.D.C. Holdings, Inc. | | | | | | | | | | | | | | | | | | | | | | | | | | | | |
| Deutsche Bank AG | | | Sell | | | | 4,660 | | | | 1.0 | | | | 6/20/17 | | | | 214,562 | | | | (152,405 | ) | | | 62,157 | |
| | | | | | |
|
|
| | | | | | | | | |
|
|
|
| | | | Total | | | | 4,660 | | | | | | | | | | | | 214,562 | | | | (152,405 | ) | | | 62,157 | |
| Nabors Industries, Inc. | | | | | | | | | | | | | | | | | | | | | | | | | | | | |
| Credit Suisse International | | | Buy | | | | 4,660 | | | | 1.0 | | | | 6/20/17 | | | | (194,125 | ) | | | 234,764 | | | | 40,639 | |
| | | | | | |
|
|
| | | | | | | | | |
|
|
|
| | | | Total | | | | 4,660 | | | | | | | | | | | | (194,125 | ) | | | 234,764 | | | | 40,639 | |
| Peru (Republic of) | | | | | | | | | | | | | | | | | | | | | | | | | | | | |
| Deutsche Bank AG | | | Buy | | | | 2,000 | | | | 1.0 | | | | 6/20/17 | | | | (15,844 | ) | | | 58,578 | | | | 42,734 | |
| | | | | | |
|
|
| | | | | | | | | |
|
|
|
| | | | Total | | | | 2,000 | | | | | | | | | | | | (15,844 | ) | | | 58,578 | | | | 42,734 | |
| Sherwin-Williams Co. (The) | | | | | | | | | | | | | | | | | | | | | | | | | | | | |
| Deutsche Bank AG | | | Sell | | | | 4,660 | | | | 1.0 | | | | 6/20/17 | | | | (75,618 | ) | | | 72,502 | | | | (3,116 | ) |
| | | | | | |
|
|
| | | | | | | | | |
|
|
|
| | | | Total | | | | 4,660 | | | | | | | | | | | | (75,618 | ) | | | 72,502 | | | | (3,116 | ) |
| SLM Corp. | | | | | | | | | | | | | | | | | | | | | | | | | | | | |
| Bank of America NA | | | Sell | | | | 4,720 | | | | 5.0 | | | | 6/20/17 | | | | (162,650 | ) | | | 105,465 | | | | (57,185 | ) |
| | | | | | |
|
|
| | | | | | | | | |
|
|
|
| | | | Total | | | | 4,720 | | | | | | | | | | | | (162,650 | ) | | | 105,465 | | | | (57,185 | ) |
42 | OPPENHEIMER GLOBAL STRATEGIC INCOME FUND/VA
|
| | | | | | | | | | | | | | | | | | | | | | | | | | | | |
| Credit Default Swap Contracts: Continued | | | | |
Reference Entity/
Swap Counterparty | | Buy/Sell
Credit
Protection | | | Notional
Amount
(000’s) | | | Pay/
Receive
Fixed
Rate | | | Termination
Date | | | Upfront
Payment
Received/
(Paid) | | | Value | | | Unrealized
Appreciation
(Depreciation) | |
| Spain (Kingdom of) | | | | | | | | | | | | | | | | | | | | | | | | | | | | |
| JPMorgan Chase Bank NA | | | Sell | | | $ | 885 | | | | 1.0% | | | | 6/20/22 | | | $ | 242,001 | | | $ | (225,350 | ) | | $ | 16,651 | |
| | | | | | |
|
|
| | | | | | | | | |
|
|
|
| | | | Total | | | | 885 | | | | | | | | | | | | 242,001 | | | | (225,350 | ) | | | 16,651 | |
| | | | | | | | | | | | | | | | | | |
|
|
|
| | | | | | | | Grand Total Buys | | | | 67,617 | | | | 403,047 | | | | 470,664 | |
| | | | | | | | | | | | | | | | | | |
|
|
|
| | | | | | | | Grand Total Sells | | | | 1,290,336 | | | | (1,363,037 | ) | | | (72,701 | ) |
| | | | | | | | | | | | | | | | | | |
|
|
|
| | | | | | | | Total Credit Default Swaps | | | $ | 1,357,953 | | | $ | (959,990 | ) | | $ | 397,963 | |
| | | | | | | | | | | | | | | | | | |
|
|
|
Notional amount is reported in U.S. Dollars (USD), except for those denoted in the following currency:
The table that follows shows the undiscounted maximum potential payment by the Fund related to selling credit protection in credit default swaps:
| | | | | | | | | | | | |
Type of Reference
Asset on which the
Fund Sold Protection | | Total Maximum Potential
Payments for Selling Credit
Protection (Undiscounted) | | | Amount Recoverable* | | | Reference Asset
Rating Range** | |
| Investment Grade Single Name Corporate Debt | | $ | 17,260,000 | | | $ | — | | | | A to BBB- | |
| Non-Investment Grade Single Name Corporate Debt | | | 9,380,000 | | | | — | | | | BB+ | |
| Investment Grade Sovereign Debt | | | 5,275,000 | | | | — | | | | BBB+ to BBB | |
| Non-Investment Grade Sovereign Debt | | | 3,280,000 | | | | — | | | | BB+ | |
| | |
|
|
| | | | |
| Total | | $ | 35,195,000 | | | $ | — | | | | | |
| | |
|
|
| | | | |
* The Fund has no amounts recoverable from related purchased protection. In addition, the Fund has no recourse provisions under the credit derivatives and holds no collateral which can offset or reduce potential payments under a triggering event.
**The period end reference asset security ratings, as rated by any rating organization, are included in the equivalent Standard & Poor’s rating category. The reference asset rating represents the likelihood of a potential credit event on the reference asset which would result in a related payment by the Fund.
| | | | | | | | | | | | | | | | | | | | |
| Interest Rate Swap Contracts as of June 29, 2012 are as follows: | | | | |
Interest Rate/
Swap Counterparty | | Notional
Amount
(000’s) | | | Paid by
the Fund | | | Received by
the Fund | | | Termination
Date | | | Value | |
| BZDI: | | | | | | | | | | | | | | | | | | | | |
| Bank of America NA | | | 10,140 | BRR | | | BZDI | | | | 9.020 | % | | | 1/2/15 | | | $ | 65,394 | |
| Citibank NA | | | 8,380 | BRR | | | BZDI | | | | 9.490 | | | | 1/2/14 | | | | 90,349 | |
| Credit Suisse International | | | 7,240 | BRR | | | BZDI | | | | 9.010 | | | | 1/2/15 | | | | 10,113 | |
| Deutsche Bank AG | | | 10,130 | BRR | | | BZDI | | | | 9.050 | | | | 1/2/15 | | | | 69,763 | |
| Goldman Sachs International | | | 11,550 | BRR | | | BZDI | | | | 8.840 | | | | 1/2/15 | | | | 53,944 | |
| Goldman Sachs International | | | 20,940 | BRR | | | BZDI | | | | 8.330 | | | | 1/2/14 | | | | 60,935 | |
| | |
|
|
| | | | | | | | | | | | | |
|
|
|
| Total | | | 68,380 | BRR | | | | | | | | | | | | | | | 350,498 | |
| MXN TIIE BANXICO | | | | | | | | | | | | | | | | | | | | |
| Bank of America NA | | | 22,600 | MXN | | | MXN TIIE BANXICO | | | | 7.030 | | | | 6/4/32 | | | | 20,913 | |
| Six-Month AUD BBR BBSW: | | | | | | | | | | | | | | | | | | | | |
| Bank of America NA | | | 1,260 | AUD | |
| Six-Month AUD
BBR BBSW |
| | | 3.950 | | | | 6/13/22 | | | | (1,948 | ) |
| Bank of America NA | | | 1,305 | AUD | |
| Six-Month AUD
BBR BBSW |
| | | 3.888 | | | | 6/27/22 | | | | (10,074 | ) |
| | |
|
|
| | | | | | | | | | | | | |
|
|
|
| Total | | | 2,565 | AUD | | | | | | | | | | | | | | | (12,022 | ) |
43 | OPPENHEIMER GLOBAL STRATEGIC INCOME FUND/VA
|
STATEMENT OF INVESTMENTS Unaudited / Continued
Footnotes to Statement of Investments Continued
| | | | | | | | | | | | | | | | | | | | |
| Interest Rate Swap Contracts: Continued | | | | |
Interest Rate/
Swap Counterparty | | Notional
Amount
(000’s) | | | Paid by
the Fund | | | Received by
the Fund | | | Termination
Date | | | Value | |
| Six-Month JPY BBA LIBOR | | | | | | | | | | | | | | | | | | | | |
| Goldman Sachs International | | | 459,000 | JPY | | | 0.860 | % | |
| Six-Month JPY
BBA LIBOR |
| | | 6/4/22 | | | $ | (18,569 | ) |
| Three-Month CAD BA CDOR: | | | | | | | | | | | | | | | | | | | | |
| Bank of America NA | | | 1,860 | CAD | |
| Three-Month
CAD BA CDOR |
| | | 1.861 | % | | | 3/28/17 | | | | 30,892 | |
| Bank of America NA | | | 6,225 | CAD | |
| Three-Month
CAD BA CDOR |
| | | 1.825 | | | | 4/27/14 | | | | 31,424 | |
| Bank of America NA | | | 2,490 | CAD | |
| Three-Month
CAD BA CDOR |
| | | 1.950 | | | | 4/27/15 | | | | 26,699 | |
| | |
|
|
| | | | | | | | | | | | | |
|
|
|
| Total | | | 10,575 | CAD | | | | | | | | | | | | | | | 89,015 | |
| Three-Month NZD BBR FRA | | | | | | | | | | | | | | | | | | | | |
| Westpac Banking Corp. | | | 7,740 | NZD | |
| Three-Month
NZD BBR FRA |
| | | 3.655 | | | | 6/7/22 | | | | (75,918 | ) |
| Three-Month SEK STIBOR SIDE | | | | | | | | | | | | | | | | | | | | |
| Goldman Sachs International | | | 39,350 | SEK | | | 2.440 | | |
| Three-Month
SEK STIBOR SIDE |
| | | 11/3/21 | | | | (110,130 | ) |
| Three-Month USD BBA LIBOR | | | | | | | | | | | | | | | | | | | | |
| Barclays Bank plc | | | 5,870 | | |
| Three-Month
USD BBA LIBOR |
| | | 2.358 | | | | 11/2/21 | | | | 361,461 | |
| | | | | | | | | | | | | | | | | | |
|
|
|
| | | | | | | | Total Interest Rate Swaps | | | $ | 605,248 | |
| | | | | | | | | | | | | | | | | | |
|
|
|
| | | | | | | | |
| Notional amount is reported in U.S. Dollars (USD), except for those | | | | Abbreviations/Definitions are as follows: |
| denoted in the following currencies: | | | | | | BA CDOR | | Canada Bankers Acceptances Deposit |
| AUD | | Australian Dollar | | | | | | Offering Rate |
| BRR | | Brazilian Real | | | | BANXICO | | Banco de Mexico |
| CAD | | Canadian Dollar | | | | BBA LIBOR | | British Bankers’ Association London-Interbank |
| JPY | | Japanese Yen | | | | | | Offered Rate |
| MXN | | Mexican Nuevo Peso | | | | BBR | | Bank Bill Rate |
| NZD | | New Zealand Dollar | | | | BBR BBSW | | Bank Bill Swap Reference Rate |
| SEK | | Swedish Krona | | | | | | (Australian Financial Market) |
| | | | | | | BZDI | | Brazil Interbank Deposit Rate |
| | | | | | | FRA | | Forward Rate Agreement |
| | | | | | | STIBOR SIDE | | Stockholm Interbank Offered Rate |
| | | | | | | TIIE | | Interbank Equilibrium Interest Rate |
| | | | | | | | | | | | | | |
| Total Return Swap Contracts as of June 29, 2012 are as follows: | |
Reference Entity/
Swap Counterparty | | Notional
Amount
(000’s) | | | Paid by
the Fund | | Received by
the Fund | | Termination
Date | | Value | |
| Custom Basket of Securities: | | | | | | | | | | | |
| Citibank NA | | | 404,272 | JPY | | One-Month JPY BBA LIBOR plus 53 basis points and if negative, the absolute value of the Total Return of a Custom Basket of Securities | | If positive, the Total Return of a Custom Basket of Securities | | 4/16/13 | | $ | 452,541 | |
44 | OPPENHEIMER GLOBAL STRATEGIC INCOME FUND/VA
|
| | | | | | | | | | | | | | |
| Total Return Swap Contracts: Continued | |
Reference Entity/
Swap Counterparty | | Notional
Amount
(000’s) | | | Paid by
the Fund | | Received by
the Fund | | Termination
Date | | Value | |
| Custom Basket of Securities: Continued | | | | | | | | | | | |
| Citibank NA | | | 4,305 | AUD | | One-Month AUD BBA LIBOR plus 50 basis points and if negative, the absolute value of the Total Return of a Custom Basket of Securities | | If positive, the Total Return of a Custom Basket of Securities | | 3/8/13 | | $ | 9,211 | |
| Citibank NA | | | 4,302 | CAD | | One-Month CAD BA CDOR plus 30 basis points and if negative, the absolute value of the Total Return of a Custom Basket of Securities | | If positive, the Total Return of a Custom Basket of Securities | | 3/6/13 | | | 42,295 | |
| Goldman Sachs International | | | 32,021 | HKD | | One-Month HKD HIBOR HKAB plus 40 basis points and if negative, the absolute value of the Total Return of a Custom Basket of Securities | | If positive, the Total Return of a Custom Basket of Securities | | 6/11/13 | | | 305,081 | |
| Goldman Sachs International | | | 22,805 | | | One-Month USD BBA LIBOR plus 18 basis points and if negative, the absolute value of the Total Return of a Custom Basket of Securities | | If positive, the Total Return of a Custom Basket of Securities | | 6/6/13 | | | 1,209,402 | |
| Morgan Stanley & Co. International plc | | | 1,412 | GBP | | One-Month GBP BBA LIBOR plus 50 basis points and if negative, the absolute value of the Total Return of a Custom Basket of Securities | | If positive, the Total Return of a Custom Basket of Securities | | 1/10/13 | | | 106,772 | |
| UBS AG | | | 3,131 | | | One-Month USD BBA LIBOR plus 30 basis points and if negative, the absolute value of the Total Return of a Custom Basket of Securities | | If positive, the Total Return of a Custom Basket of Securities | | 4/5/13 | | | 198,190 | |
| | | | | | | | | | | | |
|
|
|
| | | | | | | | | | | Reference Entity Total | | | 2,323,492 | |
| HANG SENG Index (The) Futures Contract expiring 7/30/12 | | | | | | | | |
| Goldman Sachs International | | | 36,944 | HKD | | If positive, the Total Return of the HANG SENG Index (The) Futures Contract expiring 7/30/12 | | If negative, the absolute value of the Total Return of the HANG SENG Index (The) Futures Contract expiring 7/30/12 | | 8/6/12 | | | (126,498 | ) |
| IBOVESPA Futures Contract expiring 8/15/12 | | | | | | | | |
| UBS AG | | | 1,632 | | | If positive, the Total Return of the IBOVESPA Futures Contract expiring 8/15/12 | | If negative, the absolute value of the Total Return of the IBOVESPA Futures Contract expiring 8/15/12 plus 5 basis points | | 8/17/12 | | | (53,669 | ) |
| | | | | | | | | | | | |
|
|
|
| | | | | | | | | Total of Total Return Swaps | | $ | 2,143,325 | |
| | | | | | | | | | | | |
|
|
|
45 | OPPENHEIMER GLOBAL STRATEGIC INCOME FUND/VA
|
STATEMENT OF INVESTMENTS Unaudited / Continued
Footnotes to Statement of Investments Continued
| | |
Notional amount is reported in U.S. Dollars (USD), except for those denoted in the following currencies: |
AUD | | Australian Dollar |
CAD | | Canadian Dollar |
GBP | | British Pounds Sterling |
HKD | | Hong Kong Dollar |
JPY | | Japanese Yen |
|
Abbreviations are as follows: |
BA CDOR | | Canada Bankers Acceptances Deposit offering Rate |
BBA LIBOR | | British Bankers’ Association London-Interbank Offered Rate |
HANG SENG | | Hang Seng Bank |
HIBOR | | Hong Kong Interbank Offered Rate |
HKAB | | Hong Kong Association of Banks |
IBOVESPA | | Index of stocks that trade on the Sao Paulo, Mercantile & Futures Exchange |
| | | | | | | | | | | | | | | | | | |
| Volatility Swaps as of June 29, 2012 are as follows: | | | | | | | | | |
Reference Entity/
Swap Counterparty | | Notional
Amount
(000’s) | | | Paid by
the Fund | | Received by
the Fund | | | Termination
Date | | | Value | |
| AUD/CHF Spot Exchange Rate: | | | | | | | | | | | | | | | | | | |
| Bank of America NA | | | 56 AUD | | | The Historic Volatility of the mid AUD/CHF spot exchange rate during the period 6/25/12 to 7/25/12 | | | 8.150 | % | | | 7/27/12 | | | $ | (1,717 | ) |
| Goldman Sachs International | | | 59 | AUD | | The Historic Volatility of the mid AUD/CHF spot exchange rate during the period 5/31/12 to 7/3/12 | | | 10.150 | | | | 7/5/12 | | | | 137,076 | |
| Goldman Sachs International | | | 56 | AUD | | The Historic Volatility of the mid AUD/CHF spot exchange rate during the period 6/13/12 to 7/12/12 | | | 9.800 | | | | 7/16/12 | | | | 138,480 | |
| | | | | | | | | | | | | | | | |
|
|
|
| | | | | | | | | | Reference Entity Total | | | | 273,839 | |
| CHF/JPY Spot Exchange Rate: | | | | | | | | | | | | | | | | | | |
| Bank of America NA | | | 51 | CHF | | The Historic Volatility of the mid CHF/JPY spot exchange rate during the period 6/18/12 to 7/18/12 | | | 13.050 | | | | 7/20/12 | | | | (74,463 | ) |
| Credit Suisse (USA) LLC | | | 51 | CHF | | The Historic Volatility of the mid CHF/JPY spot exchange rate during the period 6/14/12 to 7/16/12 | | | 14.550 | | | | 7/18/12 | | | | 54,151 | |
| Royal Bank of Scotland plc (The) | | | 50 | CHF | | The Historic Volatility of the mid CHF/JPY spot exchange rate during the period 6/19/12 to 7/19/12 | | | 12.250 | | | | 7/23/12 | | | | (122,265 | ) |
| | | | | | | | | | | | | | | | |
|
|
|
| | | | | | | | | | Reference Entity Total | | | | (142,577 | ) |
46 | OPPENHEIMER GLOBAL STRATEGIC INCOME FUND/VA
|
| | | | | | | | | | | | | | | | | | |
| Volatility Swaps: Continued | | | | | | | | | | | | | | |
Reference Entity/
Swap Counterparty | | Notional
Amount
(000’s) | | | Paid by
the Fund | | Received by
the Fund | | | Termination
Date | | | Value | |
| CHF/NOK Spot Exchange Rate | | | | | | | | | | | | | | | | | | |
| Credit Suisse International | | | 50 | CHF | | The Historic Volatility of the mid CHF/NOK spot exchange rate during the period 6/20/12 to 7/19/12 | | | 5.800 | % | | | 7/23/12 | | | $ | 14,404 | |
| CHF/SEK Spot Exchange Rate | | | | | | | | | | | | | | | | | | |
| Royal Bank of Scotland plc (The) | | | 51 | CHF | | The Historic Volatility of the mid CHF/SEK spot exchange rate during the period 6/21/12 to 7/24/12 | | | 5.750 | | | | 7/26/12 | | | | 14,032 | |
| GBP/CAD Spot Exchange Rate: | | | | | | | | | | | | | | | | | | |
| Bank of America NA | | | 24 | GBP | | The Historic Volatility of the mid GBP/CAD spot exchange rate during the period 6/8/12 to 7/10/12 | | | 7.600 | | | | 7/12/12 | | | | 19,155 | |
| Bank of America NA | | | 23 | GBP | | The Historic Volatility of the mid GBP/CAD spot exchange rate during the period 6/7/12 to 7/9/12 | | | 8.000 | | | | 7/11/12 | | | | 32,459 | |
| Royal Bank of Scotland plc (The) | | | 23 | GBP | | The Historic Volatility of the mid GBP/CAD spot exchange rate during the period 6/6/12 to 7/5/12 | | | 8.550 | | | | 7/9/12 | | | | 61,240 | |
| | | | | | | | | | | | | | | | |
|
|
|
| | | | | | | | | | Reference Entity Total | | | | 112,854 | |
| GBP/NZD Spot Exchange Rate: | | | | | | | | | | | | | | | | | | |
| Bank of America NA | | | 23 | GBP | | The Historic Volatility of the mid GBP/NZD spot exchange rate during the period 6/26/12 to 7/26/12 | | | 8.250 | | | | 7/30/12 | | | | (23,139 | ) |
| Credit Suisse International | | | 23 | GBP | | The Historic Volatility of the mid GBP/NZD spot exchange rate during the period 6/22/12 to 7/24/12 | | | 8.550 | | | | 7/26/12 | | | | (5,421 | ) |
| Goldman Sachs International | | | 23 | GBP | | The Historic Volatility of the mid GBP/NZD spot exchange rate during the period 6/28/12 to 7/31/12 | | | 8.350 | | | | 8/2/12 | | | | (12,728 | ) |
| | | | | | | | | | | | | | | | |
|
|
|
| | | | | | | Reference Entity Total | | | | (41,288 | ) |
47 | OPPENHEIMER GLOBAL STRATEGIC INCOME FUND/VA
|
STATEMENT OF INVESTMENTS Unaudited / Continued
Footnotes to Statement of Investments Continued
| | | | | | | | | | | | | | | | | | |
| Volatility Swaps: Continued | | | | | | | | | | | | | | |
Reference Entity/
Swap Counterparty | | Notional
Amount
(000’s) | | | Paid by
the Fund | | Received by
the Fund | | | Termination
Date | | | Value | |
| NZD/CHF Spot Exchange Rate | | | | | | | | | | | | | | | | | | |
| Bank of America NA | | | 98 | NZD | | The Historic Volatility of the mid NZD/CHF spot exchange rate during the period 6/5/12 to 7/5/12 | | | 10.600 | % | | | 7/9/12 | | | $ | 144,393 | |
| USD/CHF Spot Exchange Rate | | | | | | | | | | | | | | | | | | |
| Royal Bank of Scotland plc (The) | | | 56 | | | The Historic Volatility of the mid USD/CHF spot exchange rate during the period 6/11/12 to 7/11/12 | | | 12.650 | | | | 7/13/12 | | | | 92,919 | |
| USD/NZD Spot Exchange Rate | | | | | | | | | | | | | | | | | | |
| Credit Suisse International | | | 56 | | | The Historic Volatility of the mid USD/NZD spot exchange rate during the period 6/27/12 to 7/27/12 | | | 10.900 | | | | 7/31/12 | | | | (114,646 | ) |
| USD/SEK Spot Exchange Rate: | | | | | | | | | | | | | | | | | | |
| Credit Suisse International | | | 56 | | | The Historic Volatility of the mid USD/SEK spot exchange rate during the period 6/12/12 to 7/12/12 | | | 13.700 | | | | 7/16/12 | | | | 61,904 | |
| Credit Suisse International | | | 56 | | | The Historic Volatility of the mid USD/SEK spot exchange rate during the period 6/4/12 to 7/5/12 | | | 13.600 | | | | 7/9/12 | | | | 98,975 | |
| Royal Bank of Scotland plc (The) | | | 56 | | | The Historic Volatility of the mid USD/SEK spot exchange rate during the period 6/1/12 to 7/3/12 | | | 14.100 | | | | 7/5/12 | | | | 100,452 | |
| Royal Bank of Scotland plc (The) | | | 56 | | | The Historic Volatility of the mid USD/SEK spot exchange rate during the period 6/15/12 to 7/17/12 | | | 13.400 | | | | 7/19/12 | | | | 41,493 | |
| | | | | | | | | �� | | | | | | | |
|
|
|
| | | | | | | | | | Reference Entity Total | | | | 302,824 | |
| | | | | | | | | | | | | | | | |
|
|
|
| | | | | | | | | | Total Volatility Swaps | | | $ | 656,754 | |
| | | | | | | | | | | | | | | | |
|
|
|
48 | OPPENHEIMER GLOBAL STRATEGIC INCOME FUND/VA
|
| | |
| Notional amount is reported in U.S. Dollars (USD), except for those denoted in the following currencies: |
| AUD | | Australian Dollar |
| CAD | | Canadian Dollar |
| CHF | | Swiss Franc |
| GBP | | British Pounds Sterling |
| JPY | | Japanese Yen |
| NOK | | Norwegian Krone |
| NZD | | New Zealand Dollar |
| SEK | | Swedish Krona |
The following table aggregates, as of period end, the amount receivable from/(payable to) each counterparty with whom the Fund has entered into a swap agreement. Swaps are individually disclosed in the preceding tables.
| | | | | | | | | | |
| Swap Summary as of June 29, 2012 is as follows: | |
| Swap Counterparty | | Swap Type from
Fund Perspective | | Notional
Amount
(000’s) | | | Value | |
| Bank of America NA: | | | | | | | | | | |
| | | Credit Default Sell Protection | | $ | 9,440 | | | $ | (152,525 | ) |
| | | Interest Rate | | | 2,565 | AUD | | | (12,022 | ) |
| | | Interest Rate | | | 10,140 | BRR | | | 65,394 | |
| | | Interest Rate | | | 10,575 | CAD | | | 89,015 | |
| | | Interest Rate | | | 22,600 | MXN | | | 20,913 | |
| | | Volatility | | | 56 | AUD | | | (1,717 | ) |
| | | Volatility | | | 51 | CHF | | | (74,463 | ) |
| | | Volatility | | | 70 | GBP | | | 28,475 | |
| | | Volatility | | | 98 | NZD | | | 144,393 | |
| | | | | | | | |
|
|
|
| | | | | | | | | | 107,463 | |
| Barclays Bank plc: | | | | | | | | | | |
| | | Credit Default Buy Protection | | | 4,720 | | | | 144,702 | |
| | | Interest Rate | | | 5,870 | | | | 361,461 | |
| | | | | | | | |
|
|
|
| | | | | | | | | | 506,163 | |
| Citibank NA: | | | | | | | | | | |
| | | Credit Default Buy Protection | | | 4,660 | | | | 219,322 | |
| | | Interest Rate | | | 8,380 | BRR | | | 90,349 | |
| | | Total Return | | | 4,305 | AUD | | | 9,211 | |
| | | Total Return | | | 4,302 | CAD | | | 42,295 | |
| | | Total Return | | | 404,272 | JPY | | | 452,541 | |
| | | | | | | | |
|
|
|
| | | | | | | | | | 813,718 | |
| Credit Suisse (USA) LLC | | Volatility | | | 51 | CHF | | | 54,151 | |
| Credit Suisse International: | | | | | | | | | | |
| | | Credit Default Buy Protection | | | 9,380 | | | | 201,600 | |
| | | Interest Rate | | | 7,240 | BRR | | | 10,113 | |
| | | Volatility | | | 50 | CHF | | | 14,404 | |
| | | Volatility | | | 23 | GBP | | | (5,421 | ) |
| | | Volatility | | | 168 | | | | 46,233 | |
| | | | | | | | |
|
|
|
| | | | | | | | | | 266,929 | |
| Deutsche Bank AG: | | | | | | | | | | |
| | | Credit Default Buy Protection | | | 7,260 | | | | (459,766 | ) |
| | | Credit Default Sell Protection | | | 18,490 | | | | (372,543 | ) |
| | | Interest Rate | | | 10,130 | BRR | | | 69,763 | |
| | | | | | | | |
|
|
|
| | | | | | | | | | (762,546 | ) |
49 | OPPENHEIMER GLOBAL STRATEGIC INCOME FUND/VA
|
STATEMENT OF INVESTMENTS Unaudited / Continued
Footnotes to Statement of Investments Continued
| | | | | | | | | | |
| Swap Summary: Continued | |
| Swap Counterparty | | Swap Type from
Fund Perspective | | Notional
Amount
(000’s) | | | Value | |
| Goldman Sachs International: | | | | | | | | | | |
| | | Interest Rate | | | 32,490 | BRR | | $ | 114,879 | |
| | | Interest Rate | | | 459,000 | JPY | | | (18,569 | ) |
| | | Interest Rate | | | 39,350 | SEK | | | (110,130 | ) |
| | | Total Return | | | 68,965 | HKD | | | 178,583 | |
| | | Total Return | | | 22,805 | | | | 1,209,402 | |
| | | Volatility | | | 115 | AUD | | | 275,556 | |
| | | Volatility | | | 23 | GBP | | | (12,728 | ) |
| | | | | | | | |
|
|
|
| | | | | | | | | | 1,636,993 | |
| HSBC Bank USA NA | | Credit Default Sell Protection | | | 1,640 | | | | (278,995 | ) |
| JPMorgan Chase Bank NA: | | | | | | | | | | |
| | | Credit Default Buy Protection | | | 895 | EUR | | | 68,344 | |
| | | Credit Default Buy Protection | | | 4,780 | | | | 228,845 | |
| | | Credit Default Sell Protection | | | 885 | | | | (225,350 | ) |
| | | | | | | | |
|
|
|
| | | | | | | | | | 71,839 | |
| Morgan Stanley & Co. International plc | | Total Return | | | 1,412 | GBP | | | 106,772 | |
| Morgan Stanley Capital Services, Inc. | | Credit Default Sell Protection | | | 3,100 | | | | (54,629 | ) |
| Royal Bank of Scotland plc (The): | | | | | | | | | | |
| | | Volatility | | | 101 | CHF | | | (108,233 | ) |
| | | Volatility | | | 23 | GBP | | | 61,240 | |
| | | Volatility | | | 168 | | | | 234,864 | |
| | | | | | | | |
|
|
|
| | | | | | | | | | 187,871 | |
| UBS AG: | | | | | | | | | | |
| | | Credit Default Sell Protection | | | 1,640 | | | | (278,995 | ) |
| | | Total Return | | | 4,763 | | | | 144,521 | |
| | | | | | | | |
|
|
|
| | | | | | | | | | (134,474 | ) |
| Westpac Banking Corp. | | Interest Rate | | | 7,740 | NZD | | | (75,918 | ) |
| | | | | | | | |
|
|
|
| | | | | | Total Swaps | | | $ | 2,445,337 | |
| | | | | | | | |
|
|
|
Notional amount is reported in U.S.Dollars (USD), except for those denoted in the following currencies:
| | | | | | |
| AUD | | Australian Dollar | | HKD | | Hong Kong Dollar |
| BRR | | Brazilian Real | | JPY | | Japanese Yen |
| CAD | | Canadian Dollar | | MXN | | Mexican Nuevo Peso |
| CHF | | Swiss Franc | | NZD | | New Zealand Dollar |
| EUR | | Euro | | SEK | | Swedish Krona |
| GBP | | British Pounds Sterling | | | | |
| | | | | | | | | | | | | | | | | | | | | | | | |
| As of June 29, 2012, the Fund had entered into the following written swaption contracts: | |
Reference Entity /
Swaption Counterparty | | Swaption Description | | Underlying
Swap Type from
Fund Perspective | | Notional
Amount
(000’s) | | | Swaption
Expiration
Date | | | Premium
Received | | | Value | | | Unrealized
Appreciation
(Depreciation) | |
| iTraxx Europe Crossover Series 17 Version 1: | | | | | | | | | | | | | | | | | |
| Bank of America NA | | Index Credit Default Swaption (European); Swap Terms: Paid: 5%; Received: Bought Protection on iTraxx Europe Crossover Series 17 Version 1; Termination Date: 6/20/17 | | Index Credit Default Pay Fixed | | | 1,255 | EUR | | | 9/20/12 | | | $ | 3,617 | | | $ | (5,263 | ) | | $ | (1,646 | ) |
50 | OPPENHEIMER GLOBAL STRATEGIC INCOME FUND/VA
|
| | | | | | | | | | | | | | | | | | | | | | | | |
| As of June 29, 2012, the Fund had entered into the following written swaption contracts: Continued | |
Reference Entity /
Swaption Counterparty | | Swaption Description | | Underlying
Swap Type from
Fund Perspective | | Notional
Amount
(000’s) | | | Swaption
Expiration
Date | | | Premium
Received | | | Value | | | Unrealized
Appreciation
(Depreciation) | |
iTraxx Europe Crossover
Series 17 Version 1: Continued | | | | | | | | | | | | | | | | | |
| JPMorgan Chase Bank NA | | Index Credit Default Swaption (European); Swap Terms: Paid: Sold Protection on iTraxx Europe Crossover Series 17 Version 1; Received: 5%; Termination Date: 6/20/17 | | Index Credit Default Pay Floating | | | 1,280 | EUR | | | 9/20/12 | | | $ | 20,589 | | | $ | (18,311 | ) | | $ | 2,278 | |
| | | | | | | | | | | | | | |
|
|
|
| | | | | | | | | | | | | | | | 24,206 | | | | (23,574 | ) | | | 632 | |
| Six-Month EUR EURIBOR: | | | | | | | | | | | | | | | | | |
| Goldman Sachs Bank USA | | Interest Rate Swaption (European); Swap Terms: Paid: 2.71%; Received: Six-Month EUR EURIBOR; Termination Date: 11/17/42 | | Interest Rate Pay Fixed | | | 14,850 | EUR | | | 11/16/12 | | | | 805,251 | | | | (911,608 | ) | | | (106,357 | ) |
| Goldman Sachs Bank USA | | Interest Rate Swaption (European); Swap Terms: Paid: 2.65%; Received: Six-Month EUR EURIBOR; Termination Date: 12/1/42 | | Interest Rate Pay Fixed | | | 14,900 | EUR | | | 11/30/12 | | | | 750,380 | | | | (851,045 | ) | | | (100,665 | ) |
| | | | | | | | | | | | | | |
|
|
|
| | | | | Total where Fund pays a fixed rate | | | | 1,555,631 | | | | (1,762,653 | ) | | | (207,022 | ) |
| | | | | | | | | | | | | | |
|
|
|
| Barclays Bank plc | | Interest Rate Swaption (European); Swap Terms: Paid: Six-Month EUR EURIBOR; Received: 2.70%; Termination Date: 5/8/24 | | Interest Rate Pay Floating | | | 11,970 | EUR | | | 5/7/14 | | | | 527,996 | | | | (506,184 | ) | | | 21,812 | |
| | | | | | | | | | | | | | |
|
|
|
| | | | | Total where Fund pays a floating rate | | | | 527,996 | | | | (506,184 | ) | | | 21,812 | |
| | | | | | | | | | | | | | |
|
|
|
| | | | | | | | | | | | Total | | | | 2,083,627 | | | | (2,268,837 | ) | | | (185,210 | ) |
| Six-Month GBP BBA LIBOR: | | | | | | | | | | | | | | | | | | | | | | |
| Barclays Bank plc | | Interest Rate Swaption (European); Swap Terms: Paid: 2.29%; Received: Six-Month GBP BBA LIBOR; Termination Date: 6/26/23 | | Interest Rate Pay Fixed | | | 10,275 | GBP | | | 6/27/13 | | | | 470,143 | | | | (433,846 | ) | | | 36,297 | |
51 | OPPENHEIMER GLOBAL STRATEGIC INCOME FUND/VA
|
STATEMENT OF INVESTMENTS Unaudited / Continued
Footnotes to Statement of Investments Continued
| | | | | | | | | | | | | | | | | | | | | | | | |
| As of June 29, 2012, the Fund had entered into the following written swaption contracts: Continued | |
Reference Entity /
Swaption Counterparty | | Swaption Description | | Underlying
Swap Type from
Fund Perspective | | Notional
Amount
(000’s) | | | Swaption
Expiration
Date | | | Premium
Received | | | Value | | | Unrealized
Appreciation
(Depreciation) | |
| Six-Month GBP BBA LIBOR: Continued | | | | | | | | | | | | | | | | | | | | |
| JPMorgan Chase Bank NA | | Interest Rate Swaption (European); Swap Terms: Paid: 3.231%; Received: Six-Month GBP BBA LIBOR; Termination Date: 2/14/43 | | Interest Rate Pay Fixed | | | 500 | GBP | | | 2/15/13 | | | $ | 49,596 | | | $ | (61,890 | ) | | $ | (12,294 | ) |
| | | | | | | | | | | | | | |
|
|
|
| | | | | Total where Fund pays a fixed rate | | | | 519,739 | | | | (495,736 | ) | | | 24,003 | |
| | | | | | | | | | | | | | |
|
|
|
| Barclays Bank plc | | Interest Rate Swaption (European); Swap Terms: Paid: Six-Month GBP BBA LIBOR; Received: 2.29%; Termination Date: 6/26/23 | | Interest Rate Pay Floating | | | 10,275 | GBP | | | 6/27/13 | | | | 470,143 | | | | (502,406 | ) | | | (32,263 | ) |
| | | | | | | | | | | | | | |
|
|
|
| | | | | Total where Fund pays a floating rate | | | | 470,143 | | | | (502,406 | ) | | | (32,263 | ) |
| | | | | | | | | | | | | | |
|
|
|
| | | | | | | | | | | | Total | | | | 989,882 | | | | (998,142 | ) | | | (8,260 | ) |
| Three-Month CAD BA CDOR: | | | | | | | | | | | | | | | | | | | | |
| Bank of America NA | | Interest Rate Swaption (European); Swap Terms: Paid: 1.59%; Received: Three-Month CAD BA CDOR; Termination Date: 8/7/14 | | Interest Rate Pay Fixed | | | 2,485 | CAD | | | 8/8/12 | | | | 7,239 | | | | (15,720 | ) | | | (8,481 | ) |
| Bank of America NA | | Interest Rate Swaption (European); Swap Terms: Paid: 2.30%; Received: Three-Month CAD BA CDOR; Termination Date: 9/5/22 | | Interest Rate Pay Fixed | | | 4,970 | CAD | | | 9/6/12 | | | | 53,495 | | | | (96,876 | ) | | | (43,381 | ) |
| Bank of America NA | | Interest Rate Swaption (European); Swap Terms: Paid: 2.2255%; Received: Three-Month CAD BA CDOR; Termination Date: 9/27/22 | | Interest Rate Pay Fixed | | | 10,260 | CAD | | | 9/28/12 | | | | 166,089 | | | | (160,696 | ) | | | 5,393 | |
| Bank of America NA | | Interest Rate Swaption (European); Swap Terms: Paid: 1.5375%; Received: Three-Month CAD BA CDOR; Termination Date: 8/13/13 | | Interest Rate Pay Fixed | | | 6,220 | CAD | | | 8/14/12 | | | | 8,390 | | | | (20,489 | ) | | | (12,099 | ) |
| Bank of America NA | | Interest Rate Swaption (European); Swap Terms: Paid: 1.525%; Received: Three-Month CAD BA CDOR; Termination Date: 8/3/13 | | Interest Rate Pay Fixed | | | 6,215 | CAD | | | 8/6/12 | | | | 7,856 | | | | (19,694 | ) | | | (11,838 | ) |
52 | OPPENHEIMER GLOBAL STRATEGIC INCOME FUND/VA
|
| | | | | | | | | | | | | | | | | | | | | | | | |
| As of June 29, 2012, the Fund had entered into the following written swaption contracts: Continued | |
Reference Entity /
Swaption Counterparty | | Swaption Description | | Underlying
Swap Type from
Fund Perspective | | Notional
Amount
(000’s) | | | Swaption
Expiration
Date | | | Premium
Received | | | Value | | | Unrealized
Appreciation
(Depreciation) | |
| Three-Month CAD BA CDOR: Continued | | | | | | | | | | | | | | | | | |
| Bank of America NA | | Interest Rate Swaption (European); Swap Terms: Paid: 2.53%; Received: Three-Month CAD BA CDOR; Termination Date: 9/24/22 | | Interest Rate Pay Fixed | | | 5,010 | CAD | | | 9/25/12 | | | $ | 56,687 | | | $ | (175,755 | ) | | $ | (119,068 | ) |
| Bank of America NA | | Interest Rate Swaption (European); Swap Terms: Paid: 2.61%; Received: Three-Month CAD BA CDOR; Termination Date: 9/21/22 | | Interest Rate Pay Fixed | | | 10,000 | CAD | | | 9/24/12 | | | | 113,883 | | | | (406,434 | ) | | | (292,551 | ) |
| Bank of America NA | | Interest Rate Swaption (European); Swap Terms: Paid: 2.27%; Received: Three-Month CAD BA CDOR; Termination Date: 8/27/22 | | Interest Rate Pay Fixed | | | 9,945 | CAD | | | 8/28/12 | | | | 112,485 | | | | (170,794 | ) | | | (58,309 | ) |
| | | | | | | | | | | | | | |
|
|
|
| | | | | | | | | | | | | | | | 526,124 | | | | (1,066,458 | ) | | | (540,334 | ) |
| Three-Month USD BBA LIBOR: | | | | | | | | | | | | | | | | | |
| Bank of America NA | | Interest Rate Swaption (European); Swap Terms: Paid: 2.2825%; Received: Three-Month USD BBA LIBOR; Termination Date: 10/11/22 | | Interest Rate Pay Fixed | | | 20,095 | | | | 10/10/12 | | | | 476,252 | | | | (892,636 | ) | | | (416,384 | ) |
| Bank of America NA | | Interest Rate Swaption (European); Swap Terms: Paid: 2.93%; Received: Three-Month USD BBA LIBOR; Termination Date: 8/18/22 | | Interest Rate Pay Fixed | | | 19,810 | | | | 8/17/12 | | | | 213,948 | | | | (292,590 | ) | | | (78,642 | ) |
| Goldman Sachs International | | Interest Rate Swaption (European); Swap Terms: Paid: 2.90%; Received: Three-Month USD BBA LIBOR; Termination Date: 11/13/22 | | Interest Rate Pay Fixed | | | 145,605 | | | | 11/9/12 | | | | 1,314,085 | | | | (2,642,777 | ) | | | (1,328,692 | ) |
| | | | | | | | | | | | | | |
|
|
|
| | | | | Total where Fund pays a fixed rate | | | | 2,004,285 | | | | (3,828,003 | ) | | | (1,823,718 | ) |
53 | OPPENHEIMER GLOBAL STRATEGIC INCOME FUND/VA
|
STATEMENT OF INVESTMENTS Unaudited / Continued
Footnotes to Statement of Investments Continued
| | | | | | | | | | | | | | | | | | | | | | | | |
| As of June 29, 2012, the Fund had entered into the following written swaption contracts: Continued | |
Reference Entity /
Swaption Counterparty | | Swaption Description | | Underlying
Swap Type from
Fund Perspective | | Notional
Amount
(000’s) | | | Swaption
Expiration
Date | | | Premium
Received | | | Value | | | Unrealized
Appreciation
(Depreciation) | |
| Three-Month USD BBA LIBOR: Continued | | | | | | | | | | | | | | | | | |
| Bank of America NA | | Interest Rate Swaption (European); Swap Terms: Paid: Three-Month USD BBA LIBOR; Received: 3%; Termination Date: 8/22/42 | | Interest Rate Pay Floating | | $ | 10,110 | | | | 8/21/12 | | | $ | 93,518 | | | $ | (25,010 | ) | | $ | 68,508 | |
| Barclays Bank plc | | Interest Rate Swaption (European); Swap Terms: Paid: Three-Month USD BBA LIBOR; Received: 3.50%; Termination Date: 4/27/22 | | Interest Rate Pay Floating | | | 20,515 | | | | 4/26/17 | | | | 681,481 | | | | (468,746 | ) | | | 212,735 | |
| Goldman Sachs International | | Interest Rate Swaption (European); Swap Terms: Paid: Three-Month USD BBA LIBOR; Received: 1.115%; Termination Date: 10/1/12 | | Interest Rate Pay Floating | | | 23,230 | | | | 10/1/12 | | | | 84,209 | | | | (2,508 | ) | | | 81,701 | |
| UBS AG | | Interest Rate Swaption (European); Swap Terms: Paid: Three-Month USD BBA LIBOR; Received: 2.80%; Termination Date: 6/13/23 | | Interest Rate Pay Floating | | | 25,380 | | | | 6/12/13 | | | | 304,560 | | | | (256,139 | ) | | | 48,421 | |
| | | | | | | | | | | | | | |
|
|
|
| | | | | Total where Fund pays a floating rate | | | | 1,163,768 | | | | (752,403 | ) | | | 411,365 | |
| | | | | | | | | | | | | | |
|
|
|
| | | | | | | | | | | | Total | | | | 3,168,053 | | | | (4,580,406 | ) | | | (1,412,353 | ) |
| Three-Month ZAR JIBAR SAFEX: | | | | | | | | | | | | | | | | | |
| Barclays Bank plc | | Interest Rate Swaption (European); Swap Terms: Paid: 7%, Received: Three-Month ZAR JIBAR SAFEX; Termination Date: 11/14/22 | | Interest Rate Pay Fixed | | | 17,000 | ZAR | | | 11/13/12 | | | | 22,009 | | | | (37,125 | ) | | | (15,116 | ) |
| JPMorgan Chase Bank NA | | Interest Rate Swaption (European); Swap Terms: Paid: 7%; Received: Three-Month ZAR JIBAR SAFEX; Termination Date: 11/19/22 | | Interest Rate Pay Fixed | | | 17,090 | ZAR | | | 11/20/12 | | | | 22,519 | | | | (38,239 | ) | | | (15,720 | ) |
54 | OPPENHEIMER GLOBAL STRATEGIC INCOME FUND/VA
|
| | | | | | | | | | | | | | | | | | | | | | | | |
| As of June 29, 2012, the Fund had entered into the following written swaption contracts: Continued | |
Reference Entity /
Swaption Counterparty | | Swaption Description | | Underlying
Swap Type from
Fund Perspective | | Notional
Amount
(000’s) | | | Swaption
Expiration
Date | | | Premium
Received | | | Value | | | Unrealized
Appreciation
(Depreciation) | |
| Three-Month ZAR JIBAR SAFEX: Continued | | | | | | | | | | | | | | | | | |
| JPMorgan Chase Bank NA | | Interest Rate Swaption (European); Swap Terms: Paid: 7%; Received: Three-Month ZAR JIBAR SAFEX; Termination Date: 12/18/22 | | Interest Rate Pay Fixed | | | 17,265 | ZAR | | | 12/19/12 | | | $ | 22,751 | | | $ | (42,315 | ) | | $ | (19,564 | ) |
| | | | | | | | | | | | | | |
|
|
|
| | | | | | | | | | | | | | | | 67,279 | | | | (117,679 | ) | | | (50,400 | ) |
| | | | | | | | | | | | | | |
|
|
|
| | | | | Total Written Swaptions | | | $ | 6,859,171 | | | $ | (9,055,096 | ) | | $ | (2,195,925 | ) |
| | | | | | | | | | | | | | |
|
|
|
Notional amount is reported in U.S. Dollars (USD), except for those denoted in the following currencies:
| | |
| CAD | | Canadian Dollar |
| EUR | | Euro |
| GBP | | British Pound Sterling |
| ZAR | | South African Rand |
|
| Abbreviations/Definitions are as follows: |
| BA CDOR | | Canada Bankers Acceptances Deposit Offering Rate |
| BBA LIBOR | | British Bankers’ Association London-Interbank Offered Rate |
| EURIBOR | | Euro Interbank Offered Rate |
| iTraxx Europe Crossover Series 17 Version 1 | | Credit Default Swap Trading Index for a Specific Basket of Securities |
| JIBAR | | South Africa Johannesburg Interbank Agreed Rate |
| SAFEX | | South African Futures Exchange |
See accompanying Notes to Financial Statements.
55 | OPPENHEIMER GLOBAL STRATEGIC INCOME FUND/VA
|
STATEMENT OF ASSETS AND LIABILITIES Unaudited
| | | | |
| June 29, 20121 | | | |
| Assets | | | |
| Investments, at value—see accompanying statement of investments: | | | | |
| Unaffiliated companies (cost $2,312,620,945) | | $ | 2,261,787,555 | |
| Affiliated companies (cost $419,900,287) | | | 417,915,552 | |
| Wholly-owned subsidiary (cost $1,500,000) | |
| 1,457,156
|
|
| | | | 2,681,160,263 | |
| Cash | | | 691,634 | |
| Unrealized appreciation on foreign currency exchange contracts | | | 8,168,663 | |
| Appreciated swaps, at value (upfront payments paid $388,958) | | | 4,823,401 | |
| Depreciated swaps, at value (upfront payments paid $477,430) | | | 397,289 | |
| Swaps, at value (upfront payments paid $68,344) | | | 68,344 | |
| Receivables and other assets: | | | | |
| Investments sold (including $129,326,964 sold on a when-issued or delayed delivery basis) | | | 395,943,597 | |
| Interest, dividends and principal paydowns | | | 26,669,532 | |
| Closed foreign currency contracts | | | 4,297,334 | |
| Shares of beneficial interest sold | | | 671,405 | |
| Futures margins | | | 618,166 | |
| Other | |
| 1,775,594
|
|
| Total assets | | | 3,125,285,222 | |
| Liabilities | | | |
| Bank overdraft-foreign currencies (cost $0) | | | 835,564 | |
| Appreciated options written, at value (premiums received $1,945,805) | | | 797,422 | |
| Depreciated options written, at value (premiums received $142,730) | | | 192,757 | |
| Options written, at value (premiums received $28,824) | | | 28,824 | |
| Appreciated swaptions written, at value (premiums received $2,348,585) | | | 1,871,440 | |
| Depreciated swaptions written, at value (premiums received $4,510,586) | | | 7,183,656 | |
| Unrealized depreciation on foreign currency exchange contracts | | | 10,390,054 | |
| Appreciated swaps, at value (upfront payments received $1,995,253) | | | 1,659,057 | |
| Depreciated swaps, at value (upfront payments received $297,432) | | | 1,184,640 | |
| Payables and other liabilities: | | | | |
| Investments purchased (including $463,057,309 purchased on a when-issued or delayed delivery basis) | | | 720,695,490 | |
| Futures margins | | | 3,214,082 | |
| Closed foreign currency contracts | | | 1,520,675 | |
| Shares of beneficial interest redeemed | | | 1,449,345 | |
| Foreign capital gains tax | | | 363,980 | |
| Distribution and service plan fees | | | 340,920 | |
| Transfer and shareholder servicing agent fees | | | 191,160 | |
| Shareholder communications | | | 99,809 | |
| Trustees’ compensation | | | 45,578 | |
| Other | |
| 17,439
|
|
| Total liabilities | | | 752,081,892 | |
| | |
| Net Assets | | $
| 2,373,203,330
|
|
1. June 29, 2012 represents the last business day of the Fund’s 2012 semiannual period. See Note 1 of the accompanying Notes.
56 | OPPENHEIMER GLOBAL STRATEGIC INCOME FUND/VA
|
| | | | |
| Composition of Net Assets | | | |
| Par value of shares of beneficial interest | | $ | 440,927 | |
| Additional paid-in capital | | | 2,378,577,585 | |
| Accumulated net investment income | | | 83,580,292 | |
| Accumulated net realized loss on investments and foreign currency transactions | | | (35,236,076 | ) |
| Net unrealized depreciation on investments and translation of assets and liabilities denominated in foreign currencies | |
| (54,159,398
| )
|
| Net Assets | | $
| 2,373,203,330
|
|
| Net Asset Value Per Share | | | |
| Non-Service Shares: | | | | |
Net asset value, redemption price per share and offering price per share (based on net assets of $682,151,256
and 128,746,838 shares of beneficial interest outstanding) | | | $5.30 | |
| Service Shares: | | | | |
Net asset value, redemption price per share and offering price per share (based on net assets of $1,691,052,074
and 312,180,407 shares of beneficial interest outstanding) | | | $5.42 | |
See accompanying Notes to Financial Statements.
57 | OPPENHEIMER GLOBAL STRATEGIC INCOME FUND/VA
|
STATEMENT OF OPERATIONS Unaudited
| | | | |
| For the Six Months Ended June 29, 20121 | | | |
| Allocation of Income and Expenses from Master Funds2 | | | |
| Net investment income allocated from Oppenheimer Master Event-Linked Bond Fund, LLC: | | | | |
| Interest | | $ | 2,368,884 | |
| Dividends | | | 2,931 | |
| Expenses3 | |
| (114,704
| )
|
| Net investment income allocated from Oppenheimer Master Event-Linked Bond Fund, LLC | | | 2,257,111 | |
| Net investment income allocated from Oppenheimer Master Loan Fund, LLC: | | | | |
| Interest | | | 11,778,054 | |
| Dividends | | | 14,777 | |
| Expenses4 | |
| (527,538
| )
|
| Net investment income allocated from Oppenheimer Master Loan Fund, LLC | |
| 11,265,293
|
|
| Total allocation of net investment income from master funds | | | 13,522,404 | |
| Investment Income | | | |
| Interest | | | 63,384,603 | |
| Dividends: | | | | |
| Unaffiliated companies (net of foreign withholding taxes of $2,358) | | | 101,355 | |
| Affiliated companies | | | 73,941 | |
| Fee income on when-issued securities | |
| 905,267
|
|
| Total investment income | | | 64,465,166 | |
| Expenses | | | |
| Management fees | | | 6,745,056 | |
| Distribution and service plan fees—Service shares | | | 2,072,064 | |
| Transfer and shareholder servicing agent fees: | | | | |
| Non-Service shares | | | 337,190 | |
| Service shares | | | 828,810 | |
| Shareholder communications: | | | | |
| Non-Service shares | | | 23,614 | |
| Service shares | | | 58,037 | |
| Custodian fees and expenses | | | 106,275 | |
| Trustees’ compensation | | | 26,531 | |
| Administration service fees | | | 750 | |
| Other | |
| 95,661
|
|
| Total expenses | | | 10,293,988 | |
| Less waivers and reimbursements of expenses | |
| (636,484
| )
|
| Net expenses | | | 9,657,504 | |
| | |
| Net Investment Income | | | 68,330,066 | |
1. June 29, 2012 represents the last business day of the Fund’s 2012 semiannual period. See Note 1 of the accompanying Notes.
2. The Fund invests in certain affiliated Mutual Funds that expect to be treated as partnerships for tax purposes. See Note 1 of the accompanying Notes
3. Net of expense waivers and/or reimbursements $1,327.
4. Net of expense waivers and/or reimbursements $6,636.
58 | OPPENHEIMER GLOBAL STRATEGIC INCOME FUND/VA
|
| | | | |
| Realized and Unrealized Gain (Loss) | | | |
| Net realized gain (loss) on: | | | | |
| Investments from unaffiliated companies (including premiums on options exercised) | | $ | (15,374,381 | ) |
| Distributions received from affiliated companies | | | 5,553 | |
| Closing and expiration of option contracts written | | | 6,753,263 | |
| Closing and expiration of swaption contracts written | | | 4,203,777 | |
| Closing and expiration of futures contracts | | | 5,329,556 | |
| Foreign currency transactions | | | (17,893,517 | ) |
| Swap contracts | | | 790,410 | |
| Increase from payment by affiliate | | | 7,699 | |
| Net realized loss allocated from: | | | | |
| Oppenheimer Master Event-Linked Bond Fund, LLC | | | (2,182,980 | ) |
| Oppenheimer Master Loan Fund, LLC | |
| (2,163,697
| )
|
| Net realized loss | | | (20,524,317 | ) |
| Net change in unrealized appreciation/depreciation on: | | | | |
| Investments (net of foreign capital gains tax of $313,555) | | | 69,240,957 | |
| Translation of assets and liabilities denominated in foreign currencies | | | 12,790,791 | |
| Futures contracts | | | (3,068,079 | ) |
| Option contracts written | | | (9,872 | ) |
| Swaption contracts written | | | (2,815,861 | ) |
| Swap contracts | | | 2,589,150 | |
| Net change in unrealized appreciation/deprecation allocated from: | | | | |
| Oppenheimer Master Event-Linked Bond Fund, LLC | | | 1,651,580 | |
| Oppenheimer Master Loan Fund, LLC | |
| 5,903,484
|
|
| Net change in unrealized appreciation/depreciation | | | 86,282,150 | |
| | |
| Net Increase in Net Assets Resulting from Operations | | $
| 134,087,899
|
|
See accompanying Notes to Financial Statements.
59 | OPPENHEIMER GLOBAL STRATEGIC INCOME FUND/VA
|
STATEMENTS OF CHANGES IN NET ASSETS
| | | | | | | | |
| | | Six Months
Ended
June 29, 20121
(Unaudited) | | | Year
Ended
December 30,
20111 | |
| Operations | | | | | | |
| Net investment income | | $ | 68,330,066 | | | $ | 149,720,270 | |
| Net realized gain (loss) | | | (20,524,317 | ) | | | 38,586,175 | |
| Net change in unrealized appreciation/depreciation | |
| 86,282,150
|
| |
| (168,669,648
| )
|
| Net increase in net assets resulting from operations | | | 134,087,899 | | | | 19,636,797 | |
| Dividends and/or Distributions to Shareholders | | | | | | |
| Dividends from net investment income: | | | | | | | | |
| Non-Service shares | | | (41,097,829 | ) | | | (23,004,040 | ) |
| Service shares | |
| (95,632,597
| )
| |
| (46,831,691
| )
|
| | | | (136,730,426 | ) | | | (69,835,731 | ) |
| Distributions from net realized gain: | | | | | | | | |
| Non-Service shares | | | (7,582,316 | ) | | | (8,843,118 | ) |
| Service shares | |
| (18,415,501
| )
| |
| (20,376,612
| )
|
| | | | (25,997,817 | ) | | | (29,219,730 | ) |
| Beneficial Interest Transactions | | | | | | |
| Net increase (decrease) in net assets resulting from beneficial interest transactions: | | | | | | | | |
| Non-Service shares | | | 43,399,683 | | | | (39,359,888 | ) |
| Service shares | |
| 105,453,893
|
| |
| (10,325,962
| )
|
| | | | 148,853,576 | | | | (49,685,850 | ) |
| Net Assets | | | | | | |
| Total increase (decrease) | | | 120,213,232 | | | | (129,104,514 | ) |
| Beginning of period | |
| 2,252,990,098
|
| |
| 2,382,094,612
|
|
End of period (including accumulated net investment income of $83,580,292 and
$151,980,652, respectively) | | $
| 2,373,203,330
|
| | $
| 2,252,990,098
|
|
1. June 29, 2012 and December 30, 2011 represent the last business days of the Fund’s respective reporting periods. See Note 1 of the accompanying Notes.
See accompanying Notes to Financial Statements.
60 | OPPENHEIMER GLOBAL STRATEGIC INCOME FUND/VA
|
FINANCIAL HIGHLIGHTS
| | | | | | | | | | | | | | | | | | | | | | | | |
| | | Six Months
Ended
June 29, 20121 | | | Year Ended
December 30, | | | Year Ended December 31, | |
| Non-Service Shares | | (Unaudited) | | | 20111 | | | 2010 | | | 2009 | | | 2008 | | | 2007 | |
| | | | | | | | | | | | | | | | | | | | | | | | | |
| Per Share Operating Data | | | | | | | | | | | | | | | | | | |
| Net asset value, beginning of period | | | $5.38 | | | | $5.58 | | | | $5.30 | | | | $4.49 | | | | $5.56 | | | | $5.26 | |
| Income (loss) from investment operations: | | | | | | | | | | | | | | | | | | | | | | | | |
| Net investment income2 | | | .17 | | | | .36 | | | | .34 | | | | .30 | | | | .30 | | | | .28 | |
| Net realized and unrealized gain (loss) | |
| .15
|
| |
| (.31
| )
| |
| .40
|
| |
| .53
|
| |
| (1.04
| )
| |
| .21
|
|
| Total from investment operations | | | .32 | | | | .05 | | | | .74 | | | | .83 | | | | (.74 | ) | | | .49 | |
| Dividends and/or distributions to shareholders: | | | | | | | | | | | | | | | | | | | | | | | | |
| Dividends from net investment income | | | (.34 | ) | | | (.18 | ) | | | (.46 | ) | | | (.02 | ) | | | (.27 | ) | | | (.19 | ) |
| Distributions from net realized gain | |
| (.06
| )
| |
| (.07
| )
| |
| —
|
| |
| —3
|
| |
| (.06
| )
| |
| —
|
|
| Total dividends and distributions to shareholders | | | (.40 | ) | | | (.25 | ) | | | (.46 | ) | | | (.02 | ) | | | (.33 | ) | | | (.19 | ) |
| Net asset value, end of period | |
| $5.30
|
| |
| $5.38
|
| |
| $5.58
|
| |
| $5.30
|
| |
| $4.49
|
| |
| $5.56
|
|
| Total Return, at Net Asset Value4 | | 6.13% | | | 0.85% | | | 14.97% | | | 18.83% | | | (14.21)% | | | 9.69% | |
| | | | | | | | | | | | | | | | | | | | | | | | | |
| Ratios/Supplemental Data | | | | | | | | | | | | | | | | | | |
| Net assets, end of period (in thousands) | | $ | 682,151 | | | $ | 648,084 | | | $ | 711,755 | | | $ | 757,772 | | | $ | 648,570 | | | $ | 734,611 | |
| Average net assets (in thousands) | | $ | 678,275 | | | $ | 694,868 | | | $ | 737,071 | | | $ | 681,926 | | | $ | 753,062 | | | $ | 664,668 | |
| Ratios to average net assets:5,6 | | | | | | | | | | | | | | | | | | | | | | | | |
| Net investment income | | | 6.04 | % | | | 6.50 | % | | | 6.47 | % | | | 6.20 | % | | | 5.78 | % | | | 5.34 | % |
| Total expenses | | | 0.76 | %7 | | | 0.77 | %7 | | | 0.75 | %8 | | | 0.67 | %8 | | | 0.59 | %8 | | | 0.59 | %8 |
Expenses after payments, waivers and/or
reimbursements and reduction to custodian expenses | | | 0.71 | %9 | | | 0.71 | %9 | | | 0.71 | % | | | 0.64 | % | | | 0.57 | % | | | 0.57 | % |
| Portfolio turnover rate10 | | | 45 | % | | | 49 | % | | | 99 | % | | | 110 | % | | | 86 | % | | | 76 | % |
1. June 29, 2012 and December 30, 2011 represent the last business days of the Fund’s respective reporting periods. See Note 1 of the accompanying Notes.
2. Per share amounts calculated based on the average shares outstanding during the period.
3. Less than $0.005 per share.
4. Assumes an initial investment on the business day before the first day of the fiscal period, with all dividends and distributions reinvested in additional shares on the reinvestment date, and redemption at the net asset value calculated on the last business day of the fiscal period. Total returns are not annualized for periods less than one full year. Total return information does not reflect expenses that apply at the separate account level or to related insurance products. Inclusion of these charges would reduce the total return figures for all periods shown. Returns do not reflect the deduction of taxes that a shareholder would pay on fund distributions or the redemption of fund shares.
5. Annualized for periods less than one full year.
6. Includes the Fund’s share of the allocated expenses and/or net investment income from the master funds.
7. Ratio including all expenses of the wholly-owned subsidiary and indirect expenses from affiliated fund were as follows:
| | | | |
| Six Months Ended June 29, 2012 | | | 0.77 | % |
| Year Ended December 30, 2011 | | | 0.78 | % |
8. Total expenses including all affiliated fund expenses were as follows:
| | | | |
| Year Ended December 31, 2010 | | | 0.75 | % |
| Year Ended December 31, 2009 | | | 0.68 | % |
| Year Ended December 31, 2008 | | | 0.60 | % |
| Year Ended December 31, 2007 | | | 0.61 | % |
9. Ratio including expenses of the wholly-owned subsidiary and indirect expenses from affiliated fund were as follows:
| | | | |
| Six Months Ended June 29, 2012 | | | 0.72 | % |
| Year Ended December 30, 2011 | | | 0.72 | % |
10. The portfolio turnover rate excludes purchase and sale transactions of To Be Announced (TBA) mortgage-related securities as follows:
| | | | | | | | |
| | | Purchase Transactions | | | Sale Transactions | |
| Six Months Ended June 29, 2012 | | $ | 1,207,855,796 | | | $ | 971,057,466 | |
| Year Ended December 30, 2011 | | $ | 1,050,654,783 | | | $ | 1,039,506,614 | |
| Year Ended December 31, 2010 | | $ | 1,034,550,699 | | | $ | 1,085,289,655 | |
| Year Ended December 31, 2009 | | $ | 1,909,574,925 | | | $ | 1,836,038,328 | |
| Year Ended December 31, 2008 | | $ | 634,319,548 | | | $ | 594,845,589 | |
| Year Ended December 31, 2007 | | $ | 1,061,009,472 | | | $ | 1,120,098,096 | |
See accompanying Notes to Financial Statements.
61 | OPPENHEIMER GLOBAL STRATEGIC INCOME FUND/VA
|
FINANCIAL HIGHLIGHTS Continued
| | | | | | | | | | | | | | | | | | | | | | | | |
| | | Six Months
Ended
June 29, 20121 | | | Year
Ended
December 30, | | | Year Ended December 31, | |
| Service Shares | | (Unaudited) | | | 20111 | | | 2010 | | | 2009 | | | 2008 | | | 2007 | |
| | | | | | | | | | | | | | | | | | | | | | | | | |
| Per Share Operating Data | | | | | | | | | | | | | | | | | | |
| Net asset value, beginning of period | | | $5.49 | | | | $5.68 | | | | $5.38 | | | | $4.56 | | | | $5.65 | | | | $5.34 | |
| Income (loss) from investment operations: | | | | | | | | | | | | | | | | | | | | | | | | |
| Net investment income2 | | | .16 | | | | .35 | | | | .33 | | | | .29 | | | | .29 | | | | .28 | |
| Net realized and unrealized gain (loss) | |
| .16
|
| |
| (.31
| )
| |
| .42
|
| |
| .54
|
| |
| (1.06
| )
| |
| .22
|
|
| Total from investment operations | | | .32 | | | | .04 | | | | .75 | | | | .83 | | | | (.77 | ) | | | .50 | |
| Dividends and/or distributions to shareholders: | | | | | | | | | | | | | | | | | | | | | | | | |
| Dividends from net investment income | | | (.33 | ) | | | (.16 | ) | | | (.45 | ) | | | (.01 | ) | | | (.26 | ) | | | (.19 | ) |
| Distributions from net realized gain | |
| (.06
| )
| |
| (.07
| )
| |
| —
|
| |
| —
| 3
| |
| (.06
| )
| |
| —
|
|
| Total dividends and distributions to shareholders | | | (.39 | ) | | | (.23 | ) | | | (.45 | ) | | | (.01 | ) | | | (.32 | ) | | | (.19 | ) |
| Net asset value, end of period | |
| $5.42
|
| |
| $5.49
|
| |
| $5.68
|
| |
| $5.38
|
| |
| $4.56
|
| |
| $5.65
|
|
| Total Return, at Net Asset Value4 | | 5.92% | | | 0.65% | | | 14.77% | | | 18.41% | | | (14.49)% | | | 9.55% | |
| | | | | | | | | | | | | | | | | | | | | | | | | |
| Ratios/Supplemental Data | | | | | | | | | | | | | | | | | | |
| Net assets, end of period (in thousands) | | $ | 1,691,052 | | | $ | 1,604,906 | | | $ | 1,670,340 | | | $ | 3,656,726 | | | $ | 2,810,315 | | | $ | 2,876,016 | |
| Average net assets (in thousands) | | $ | 1,667,244 | | | $ | 1,673,715 | | | $ | 2,485,427 | | | $ | 3,143,836 | | | $ | 3,152,967 | | | $ | 2,075,028 | |
| Ratios to average net assets:5,6 | | | | | | | | | | | | | | | | | | | | | | | | |
| Net investment income | | | 5.79 | % | | | 6.25 | % | | | 6.15 | % | | | 5.95 | % | | | 5.54 | % | | | 5.08 | % |
| Total expenses | | | 1.01 | %7 | | | 1.02 | %7 | | | 0.99 | %8 | | | 0.92 | %8 | | | 0.84 | %8 | | | 0.84 | %8 |
| Expenses after payments, waivers and/or reimbursements and reduction to custodian expenses | | | 0.96 | %9 | | | 0.96 | %9 | | | 0.95 | % | | | 0.89 | % | | | 0.82 | % | | | 0.82 | % |
| Portfolio turnover rate10 | | | 45 | % | | | 49 | % | | | 99 | % | | | 110 | % | | | 86 | % | | | 76 | % |
1. June 29, 2012 and December 30, 2011 represent the last business days of the Fund’s respective reporting periods. See Note 1 of the accompanying Notes.
2. Per share amounts calculated based on the average shares outstanding during the period.
3. Less than $0.005 per share.
4. Assumes an initial investment on the business day before the first day of the fiscal period, with all dividends and distributions reinvested in additional shares on the reinvestment date, and redemption at the net asset value calculated on the last business day of the fiscal period. Total returns are not annualized for periods less than one full year. Total return information does not reflect expenses that apply at the separate account level or to related insurance products. Inclusion of these charges would reduce the total return figures for all periods shown. Returns do not reflect the deduction of taxes that a shareholder would pay on fund distributions or the redemption of fund shares.
5. Annualized for periods less than one full year.
6. Includes the Fund’s share of the allocated expenses and/or net investment income from the master funds.
7. Ratio including all expenses of the wholly-owned subsidiary and indirect expenses from affiliated fund were as follows:
| | | | |
| Six Months Ended June 29, 2012 | | | 1.02 | % |
| Year Ended December 30, 2011 | | | 1.03 | % |
8. Total expenses including all affiliated fund expenses were as follows:
| | | | |
| Year Ended December 31, 2010 | | | 0.99 | % |
| Year Ended December 31, 2009 | | | 0.93 | % |
| Year Ended December 31, 2008 | | | 0.85 | % |
| Year Ended December 31, 2007 | | | 0.86 | % |
9. Ratio including expenses of the wholly-owned subsidiary and indirect expenses from affiliated fund were as follows:
| | | | |
| Six Months Ended June 29, 2012 | | | 0.97 | % |
| Year Ended December 30, 2011 | | | 0.97 | % |
10. The portfolio turnover rate excludes purchase and sale transactions of To Be Announced (TBA) mortgage-related securities as follows:
| | | | | | | | |
| | | Purchase Transactions | | | Sale Transactions | |
| Six Months Ended June 29, 2012 | | $ | 1,207,855,796 | | | $ | 971,057,466 | |
| Year Ended December 30, 2011 | | $ | 1,050,654,783 | | | $ | 1,039,506,614 | |
| Year Ended December 31, 2010 | | $ | 1,034,550,699 | | | $ | 1,085,289,655 | |
| Year Ended December 31, 2009 | | $ | 1,909,574,925 | | | $ | 1,836,038,328 | |
| Year Ended December 31, 2008 | | $ | 634,319,548 | | | $ | 594,845,589 | |
| Year Ended December 31, 2007 | | $ | 1,061,009,472 | | | $ | 1,120,098,096 | |
See accompanying Notes to Financial Statements.
62 | OPPENHEIMER GLOBAL STRATEGIC INCOME FUND/VA
|
NOTES TO FINANCIAL STATEMENTS Unaudited
1. Significant Accounting Policies
Oppenheimer Global Strategic Income Fund/VA (the “Fund”) is a separate series of Oppenheimer Variable Account Funds, a diversified open-end management investment company registered under the Investment Company Act of 1940, as amended. The Fund’s investment objective is to seek total return. The Fund’s investment adviser is OppenheimerFunds, Inc. (the “Manager”).
The Fund offers two classes of shares. Both classes are sold at their offering price, which is the net asset value per share, to separate investment accounts of participating insurance companies as an underlying investment for variable life insurance policies, variable annuity contracts or other investment products. The class of shares designated as Service shares is subject to a distribution and service plan. Both classes of shares have identical rights and voting privileges with respect to the Fund in general and exclusive voting rights on matters that affect that class alone. Earnings, net assets and net asset value per share may differ due to each class having its own expenses, such as transfer and shareholder servicing agent fees and shareholder communications, directly attributable to that class.
The following is a summary of significant accounting policies consistently followed by the Fund.
Semiannual and Annual Periods. The last day of the Fund’s semiannual period was the last day the New York Stock Exchange was open for trading. The Fund’s financial statements have been presented through that date to maintain consistency with the Fund’s net asset value calculations used for shareholder transactions.
The last day of the Fund’s fiscal year was the last day the New York Stock Exchange was open for trading. The Fund’s financial statements have been presented through that date to maintain consistency with the Fund’s net asset value calculations used for shareholder transactions.
Structured Securities. The Fund invests in structured securities whose market values, interest rates and/or redemption prices are linked to the performance of underlying foreign currencies, interest rate spreads, stock market indices, prices of individual securities, commodities or other financial instruments or the occurrence of other specific events. The structured securities are often leveraged, increasing the volatility of each note’s market value relative to the change in the underlying linked financial element or event. Fluctuations in value of these securities are recorded as unrealized gains and losses in the accompanying Statement of Operations. The Fund records a realized gain or loss when a structured security is sold or matures.
Securities on a When-Issued or Delayed Delivery Basis. The Fund may purchase securities on a “when-issued” basis, and may purchase or sell securities on a “delayed delivery” basis. “When-issued” or “delayed delivery” refers to securities whose terms and indenture are available and for which a market exists, but which are not available for immediate delivery. Delivery and payment for securities that have been purchased by the Fund on a when-issued basis normally takes place within six months and possibly as long as two years or more after the trade date. During this period, such securities do not earn interest, are subject to market fluctuation and may increase or decrease in value prior to their delivery. The purchase of securities on a when-issued basis may increase the volatility of the Fund’s net asset value to the extent the Fund executes such transactions while remaining substantially fully invested. When the Fund engages in when-issued or delayed delivery transactions, it relies on the buyer or seller, as the case may be, to complete the transaction. Their failure to do so may cause the Fund to lose the opportunity to obtain or dispose of the security at a price and yield it considers advantageous. The Fund may also sell securities that it purchased on a when-issued basis or forward commitment prior to settlement of the original purchase.
As of June 29, 2012, the Fund had purchased securities issued on a when-issued or delayed delivery basis and sold securities issued on a delayed delivery basis as follows:
| | | | |
| | | When-Issued or Delayed
Delivery Basis Transactions | |
| Purchased securities | | $ | 463,057,309 | |
| Sold securities | | | 129,326,964 | |
63 | OPPENHEIMER GLOBAL STRATEGIC INCOME FUND/VA
|
NOTES TO FINANCIAL STATEMENTS Unaudited / Continued
1. Significant Accounting Policies Continued
The Fund may enter into “forward roll” transactions with respect to mortgage-related securities. In this type of transaction, the Fund sells a mortgage-related security to a buyer and simultaneously agrees to repurchase a similar security (same type, coupon and maturity) at a later date at a set price. During the period between the sale and the repurchase, the Fund will not be entitled to receive interest and principal payments on the securities that have been sold. The Fund records the incremental difference between the forward purchase and sale of each forward roll as realized gain (loss) on investments or as fee income in the case of such transactions that have an associated fee in lieu of a difference in the forward purchase and sale price.
Forward roll transactions may be deemed to entail embedded leverage since the Fund purchases mortgage-related securities with extended settlement dates rather than paying for the securities under a normal settlement cycle. This embedded leverage increases the Fund’s market value of investments relative to its net assets which can incrementally increase the volatility of the Fund’s performance. Forward roll transactions can be replicated over multiple settlement periods.
Risks of entering into forward roll transactions include the potential inability of the counterparty to meet the terms of the agreement; the potential of the Fund to receive inferior securities at redelivery as compared to the securities sold to the counterparty; and counterparty credit risk.
Credit Risk. The Fund invests in high-yield, non-investment-grade bonds, which may be subject to a greater degree of credit risk. Credit risk relates to the ability of the issuer to meet interest or principal payments or both as they become due. The Fund may acquire securities that have missed an interest payment, and is not obligated to dispose of securities whose issuers or underlying obligors subsequently miss an interest payment. Information concerning securities not accruing interest as of June 29, 2012 is as follows:
| | | | |
| Cost | | $ | 33,477,648 | |
| Market Value | | $ | 9,909,456 | |
| Market Value as a % of Net Assets | | | 0.42 | % |
Investment in Oppenheimer Global Strategic Income Fund/VA (Cayman) Ltd. The Fund has established a Cayman Islands company that is wholly-owned and controlled by the Fund (the “Subsidiary”). The Fund may invest up to 25% of its total assets in the Subsidiary. The Subsidiary invests primarily in commodity-linked derivatives (including commodity related futures, options and swap contracts), exchange traded funds and certain fixed-income securities and other investments that may serve as margin or collateral for its derivatives positions. Investments in the Subsidiary are expected to provide the Fund with exposure to commodities markets within the limitations of the federal tax requirements that apply to the Fund. The Subsidiary is subject to the same investment restrictions and guidelines, and follows the same compliance policies and procedures, as the Fund. The Fund wholly owns and controls the Subsidiary, and the Fund and Subsidiary are both managed by the Manager.
The Fund does not consolidate the assets, liabilities, capital or operations of the Subsidiary into its financial statements. Rather, the Subsidiary is separately presented as an investment in the Fund’s Statement of Investments. Shares of the Subsidiary are valued at their net asset value per share. Gains or losses on withdrawals of capital from the Subsidiary by the Fund are recognized on an average cost basis. Unrealized appreciation or depreciation on the Fund’s investment in the Subsidiary is recorded in the Fund’s Statement of Assets and Liabilities and the Fund’s Statement of Operations. Distributions received from the Subsidiary are recorded as income on the ex-dividend date.
For tax purposes, the Subsidiary is an exempted Cayman investment company. The Subsidiary has received an undertaking from the Government of the Cayman Islands exempting it from all local income, profits and capital gains taxes through September of 2030. No such taxes are levied in the Cayman Islands at the present time. For U.S. income tax purposes, the Subsidiary is a Controlled Foreign Corporation and as such is not subject to U.S. income tax. However, as a wholly-owned Controlled Foreign Corporation, the Subsidiary’s net income and capital gain, to the extent of its earnings
64 | OPPENHEIMER GLOBAL STRATEGIC INCOME FUND/VA
|
and profits, will be included each year in the Fund’s investment company taxable income. For the six months ended June 29, 2012, the Subsidiary has a deficit of $25,363 in its taxable earnings and profits. In addition, any in-kind capital contributions made by the Fund to the Subsidiary will result in the Fund recognizing taxable gain to the extent of unrealized gain, if any, on securities transferred to the Subsidiary while any unrealized losses on securities so transferred will not be recognized at the time of transfer.
Investment in Oppenheimer Institutional Money Market Fund. The Fund is permitted to invest daily available cash balances in an affiliated money market fund. The Fund may invest the available cash in Class E shares of Oppenheimer Institutional Money Market Fund (“IMMF”) to seek current income while preserving liquidity. IMMF is a registered open-end management investment company, regulated as a money market fund under the Investment Company Act of 1940, as amended. The Manager is also the investment adviser of IMMF. When applicable, the Fund’s investment in IMMF is included in the Statement of Investments. Shares of IMMF are valued at their net asset value per share. As a shareholder, the Fund is subject to its proportional share of IMMF’s Class E expenses, including its management fee. The Manager will waive fees and/or reimburse Fund expenses in an amount equal to the indirect management fees incurred through the Fund’s investment in IMMF.
Investment in Oppenheimer Master Funds. The Fund is permitted to invest in entities sponsored and/or advised by the Manager or an affiliate. Certain of these entities in which the Fund invests are mutual funds registered under the Investment Company Act of 1940 that expect to be treated as partnerships for tax purposes, specifically Oppenheimer Master Loan Fund, LLC and Oppenheimer Master Event-Linked Bond Fund, LLC (the “Master Funds”). Each Master Fund has its own investment risks, and those risks can affect the value of the Fund’s investments and therefore the value of the Fund’s shares. To the extent that the Fund invests more of its assets in one Master Fund than in another, the Fund will have greater exposure to the risks of that Master Fund.
The investment objective of Oppenheimer Master Loan Fund, LLC is to seek as high a level of current income and preservation of capital as is consistent with investing primarily in loans and other debt securities. The investment objective of Oppenheimer Master Event-Linked Bond Fund, LLC is to seek a high level of current income principally derived from interest on debt securities. The Fund’s investments in the Master Funds are included in the Statement of Investments. The Fund recognizes income and gain/(loss) on its investments in each Master Fund according to its allocated pro-rata share, based on its relative proportion of total outstanding Master Fund shares held, of the total net income earned and the net gain/(loss) realized on investments sold by the Master Funds. As a shareholder, the Fund is subject to its proportional share of the Master Funds’ expenses, including their management fee. The Manager will waive fees and/or reimburse Fund expenses in an amount equal to the indirect management fees incurred through the Fund’s investment in the Master Funds.
Foreign Currency Translation. The Fund’s accounting records are maintained in U.S. dollars. The values of securities denominated in foreign currencies and amounts related to the purchase and sale of foreign securities and foreign investment income are translated into U.S. dollars as of the close of the Exchange, normally 4:00 P.M. Eastern time, on each day the Exchange is open for trading. Foreign exchange rates may be valued primarily using a reliable bank, dealer or service authorized by the Board of Trustees.
Reported net realized gains and losses from foreign currency transactions arise from sales of portfolio securities, sales and maturities of short-term securities, sales of foreign currencies, exchange rate fluctuations between the trade and settlement dates on securities transactions, and the difference between the amounts of dividends, interest, and foreign withholding taxes recorded on the Fund’s books and the U.S. dollar equivalent of the amounts actually received or paid. Net unrealized appreciation and depreciation on the translation of assets and liabilities denominated in foreign currencies arise from changes in the values of assets and liabilities, including investments in securities at fiscal period end, resulting from changes in exchange rates.
65 | OPPENHEIMER GLOBAL STRATEGIC INCOME FUND/VA
|
NOTES TO FINANCIAL STATEMENTS Unaudited / Continued
1. Significant Accounting Policies Continued
The effect of changes in foreign currency exchange rates on investments is separately identified from the fluctuations arising from changes in market values of securities held and reported with all other foreign currency gains and losses in the Fund’s Statement of Operations.
Allocation of Income, Expenses, Gains and Losses. Income, expenses (other than those attributable to a specific class), gains and losses are allocated on a daily basis to each class of shares based upon the relative proportion of net assets represented by such class. Operating expenses directly attributable to a specific class are charged against the operations of that class.
Federal Taxes. The Fund intends to comply with provisions of the Internal Revenue Code applicable to regulated investment companies and to distribute substantially all of its investment company taxable income, including any net realized gain on investments not offset by capital loss carryforwards, if any, to shareholders. Therefore, no federal income or excise tax provision is required. The Fund files income tax returns in U.S. federal and applicable state jurisdictions. The statute of limitations on the Fund’s tax return filings generally remain open for the three preceding fiscal reporting period ends.
During the fiscal year ended December 30, 2011, the Fund did not utilize any capital loss carryforward to offset capital gains realized in that fiscal year. The Fund had straddle losses of $792,837. Capital loss carryforwards with no expiration, if any, must be utilized prior to those with expiration dates. Capital losses with no expiration will be carried forward to future years if not offset by gains.
As of June 29, 2012, it is estimated that the capital loss carryforwards would be $20,524,317 which will not expire. The estimated capital loss carryforward represents the carryforward as of the end of the last fiscal year, increased or decreased by capital losses or gains realized in the first six months of the current fiscal year. During the six months ended June 29, 2012, it is estimated that the Fund will not utilize any capital loss carryforward to offset realized capital gains.
Net investment income (loss) and net realized gain (loss) may differ for financial statement and tax purposes. The character of dividends and distributions made during the fiscal year from net investment income or net realized gains may differ from their ultimate characterization for federal income tax purposes. Also, due to timing of dividends and distributions, the fiscal year in which amounts are distributed may differ from the fiscal year in which the income or net realized gain was recorded by the Fund.
The aggregate cost of securities and other investments and the composition of unrealized appreciation and depreciation of securities and other investments for federal income tax purposes as of June 29, 2012 are noted in the following table. The primary difference between book and tax appreciation or depreciation of securities and other investments, if applicable, is attributable to the tax deferral of losses or tax realization of financial statement unrealized gain or loss.
| | | | |
| Federal tax cost of securities | | $ | 2,743,468,818 | |
| Federal tax cost of other investments | | | (164,966,976) | |
| | |
|
|
|
| Total federal tax cost | | $ | 2,578,501,842 | |
| | |
|
|
|
| |
| Gross unrealized appreciation | | $ | 148,038,333 | |
| Gross unrealized depreciation | | | (209,069,950) | |
| | |
|
|
|
| Net unrealized depreciation | | $ | (61,031,617) | |
| | |
|
|
|
Certain foreign countries impose a tax on capital gains which is accrued by the Fund based on unrealized appreciation, if any, on affected securities. The tax is paid when the gain is realized.
Trustees’ Compensation. The Board of Trustees has adopted a compensation deferral plan for independent trustees that enables trustees to elect to defer receipt of all or a portion of the annual compensation they are entitled to receive from the Fund. For purposes of determining the amount owed to the Trustee under the plan, deferred amounts are
66 | OPPENHEIMER GLOBAL STRATEGIC INCOME FUND/VA
|
treated as though equal dollar amounts had been invested in shares of the Fund or in other Oppenheimer funds selected by the Trustee. The Fund purchases shares of the funds selected for deferral by the Trustee in amounts equal to his or her deemed investment, resulting in a Fund asset equal to the deferred compensation liability. Such assets are included as a component of “Other” within the asset section of the Statement of Assets and Liabilities. Deferral of trustees’ fees under the plan will not affect the net assets of the Fund, and will not materially affect the Fund’s assets, liabilities or net investment income per share. Amounts will be deferred until distributed in accordance with the compensation deferral plan.
Dividends and Distributions to Shareholders. Dividends and distributions to shareholders, which are determined in accordance with income tax regulations and may differ from U.S. generally accepted accounting principles, are recorded on the ex-dividend date. Income and capital gain distributions, if any, are declared and paid annually or at other times as deemed necessary by the Manager. The tax character of distributions is determined as of the Fund’s fiscal year end. Therefore, a portion of the Fund’s distributions made to shareholders prior to the Fund’s fiscal year end may ultimately be categorized as a tax return of capital.
Investment Income. Dividend income is recorded on the ex-dividend date or upon ex-dividend notification in the case of certain foreign dividends where the ex-dividend date may have passed. Non-cash dividends included in dividend income, if any, are recorded at the fair market value of the securities received. Interest income is recognized on an accrual basis. Discount and premium, which are included in interest income on the Statement of Operations, are amortized or accreted daily.
Custodian Fees. “Custodian fees and expenses” in the Statement of Operations may include interest expense incurred by the Fund on any cash overdrafts of its custodian account during the period. Such cash overdrafts may result from the effects of failed trades in portfolio securities and from cash outflows resulting from unanticipated shareholder redemption activity. The Fund pays interest to its custodian on such cash overdrafts, to the extent they are not offset by positive cash balances maintained by the Fund, at a rate equal to the Federal Funds Rate plus 0.50%. The “Reduction to custodian expenses” line item, if applicable, represents earnings on cash balances maintained by the Fund during the period. Such interest expense and other custodian fees may be paid with these earnings.
Security Transactions. Security transactions are recorded on the trade date. Realized gains and losses on securities sold (except for the investments in the Subsidiary) are determined on the basis of identified cost.
Indemnifications. The Fund’s organizational documents provide current and former trustees and officers with a limited indemnification against liabilities arising in connection with the performance of their duties to the Fund. In the normal course of business, the Fund may also enter into contracts that provide general indemnifications. The Fund’s maximum exposure under these arrangements is unknown as this would be dependent on future claims that may be made against the Fund. The risk of material loss from such claims is considered remote.
Other. The preparation of financial statements in conformity with accounting principles generally accepted in the United States of America requires management to make estimates and assumptions that affect the reported amounts of assets and liabilities and disclosure of contingent assets and liabilities at the date of the financial statements and the reported amounts of increases and decreases in net assets from operations during the reporting period. Actual results could differ from those estimates.
2. Securities Valuation
The Fund calculates the net asset value of its shares as of the close of the New York Stock Exchange (the “Exchange”), normally 4:00 P.M. Eastern time, on each day the Exchange is open for trading.
67 | OPPENHEIMER GLOBAL STRATEGIC INCOME FUND/VA
|
NOTES TO FINANCIAL STATEMENTS Unaudited / Continued
2. Securities Valuation Continued
The Fund’s Board has adopted procedures for the valuation of the Fund’s securities and has delegated the day-to-day responsibility for valuation determinations under those procedures to the Manager. The Manager has established a Valuation Committee which is responsible for determining a “fair valuation” for any security for which market quotations are not “readily available.” The Valuation Committee’s fair valuation determinations are subject to review, approval and ratification by the Fund’s Board at its next regularly scheduled meeting covering the calendar quarter in which the fair valuation was determined.
Valuation Methods and Inputs
Securities are valued using unadjusted quoted market prices, when available, as supplied primarily by third party pricing services or dealers.
The following methodologies are used to determine the market value or the fair value of the types of securities described below:
Securities traded on a registered U.S. securities exchange (including exchange-traded derivatives other than futures and futures options) are valued based on the last sale price of the security reported on the principal exchange on which it is traded, prior to the time when the Fund’s assets are valued. In the absence of a sale, the security is valued at the last sale price on the prior trading day, if it is within the spread of the current day’s closing “bid” and “asked” prices, and if not, at the current day’s closing bid price. A security of a foreign issuer traded on a foreign exchange but not listed on a registered U.S. securities exchange is valued based on the last sale price on the principal exchange on which the security is traded, as identified by the third party pricing service used by the Manager, prior to the time when the Fund’s assets are valued. If the last sale price is unavailable, the security is valued at the most recent official closing price on the principal exchange on which it is traded. If the last sales price or official closing price for a foreign security is not available, the security is valued at the mean between the bid and asked price per the exchange or, if not available from the exchange, obtained from two dealers. If bid and asked prices are not available from either the exchange or two dealers, the security is valued by using one of the following methodologies (listed in order of priority); (1) using a bid from the exchange, (2) the mean between the bid and asked price as provided by a single dealer, or (3) a bid from a single dealer.
Shares of a registered investment company that are not traded on an exchange are valued at that investment company’s net asset value per share.
Corporate and government debt securities (of U.S. or foreign issuers) and municipal debt securities, event-linked bonds, loans, mortgage-backed securities, collateralized mortgage obligations, and asset-backed securities are valued at the mean between the “bid” and “asked” prices utilizing evaluated prices obtained from third party pricing services or broker-dealers who may use matrix pricing methods to determine the evaluated prices.
Short-term money market type debt securities with a remaining maturity of sixty days or less are valued at cost adjusted by the amortization of discount or premium to maturity (amortized cost), which approximates market value. Short-term debt securities with a remaining maturity in excess of sixty days are valued at the mean between the “bid” and “asked” prices utilizing evaluated prices obtained from third party pricing services or broker-dealers.
Structured securities, swaps, swaptions, and other over-the-counter derivatives are valued utilizing evaluated prices obtained from third party pricing services or broker-dealers.
Forward foreign currency exchange contracts are valued utilizing current and forward currency rates obtained from third party pricing services. When the settlement date of a contract is an interim date for which a quotation is not available, interpolated values are derived using the nearest dated forward currency rate.
Futures contracts and futures options traded on a commodities or futures exchange will be valued at the final settlement price or official closing price on the principal exchange as reported by such principal exchange at its trading session ending at, or most recently prior to, the time when the Fund’s assets are valued.
68 | OPPENHEIMER GLOBAL STRATEGIC INCOME FUND/VA
|
A description of the standard inputs that may generally be considered by the third party pricing vendors in determining their evaluated prices is provided below.
| | |
| Security Type | | Standard inputs generally considered by third-party pricing
vendors |
| Corporate debt, government debt, municipal, mortgage-backed and asset-backed securities | | Reported trade data, broker-dealer price quotations, benchmark yields, issuer spreads on comparable securities, the credit quality, yield, maturity, and other appropriate factors. |
| Loans | | Information obtained from market participants regarding reported trade data and broker-dealer price quotations. |
| Event-linked bonds | | Information obtained from market participants regarding reported trade data and broker-dealer price quotations. |
| Structured securities | | Relevant market information such as the price of underlying financial instruments, stock market indices, foreign currencies, interest rate spreads, commodities, or the occurrence of other specific events. |
| Swaps | | Relevant market information, including underlying reference assets such as credit spreads, credit event probabilities, index values, individual security values, forward interest rates, variable interest rates, volatility measures, and forward currency rates. |
If a market value or price cannot be determined for a security using the methodologies described above, or if, in the “good faith” opinion of the Manager, the market value or price obtained does not constitute a “readily available market quotation,” or a significant event has occurred that would materially affect the value of the security the security is fair valued either (i) by a standardized fair valuation methodology applicable to the security type or the significant event as previously approved by the Valuation Committee and the Fund’s Board or (ii) as determined in good faith by the Manager’s Valuation Committee. The Valuation Committee considers all relevant facts that are reasonably available, through either public information or information available to the Manager, when determining the fair value of a security. Fair value determinations by the Manager are subject to review, approval and ratification by the Fund’s Board at its next regularly scheduled meeting covering the calendar quarter in which the fair valuation was determined. Those fair valuation standardized methodologies include, but are not limited to, valuing securities at the last sale price or initially at cost and subsequently adjusting the value based on: changes in company specific fundamentals, changes in an appropriate securities index, or changes in the value of similar securities which may be further adjusted for any discounts related to security-specific resale restrictions. When possible, such methodologies use observable market inputs such as unadjusted quoted prices of similar securities, observable interest rates, currency rates and yield curves. The methodologies used for valuing securities are not necessarily an indication of the risks associated with investing in those securities nor can it be assured that the Fund can obtain the fair value assigned to a security if it were to sell the security.
To assess the continuing appropriateness of security valuations, the Manager, or its third party service provider who is subject to oversight by the Manager, regularly compares prior day prices, prices on comparable securities, and sale prices to the current day prices and challenges those prices exceeding certain tolerance levels with the third party pricing service or broker source. For those securities valued by fair valuations, whether through a standardized fair valuation methodology or a fair valuation determination, the Valuation Committee reviews and affirms the reasonableness of the valuations based on such methodologies and fair valuation determinations on a regular basis after considering all relevant information that is reasonably available.
Classifications
Each investment asset or liability of the Fund is assigned a level at measurement date based on the significance and source of the inputs to its valuation. Various data inputs are used in determining the value of each of the Fund’s
69 | OPPENHEIMER GLOBAL STRATEGIC INCOME FUND/VA
|
NOTES TO FINANCIAL STATEMENTS Unaudited / Continued
2. Securities Valuation Continued
investments as of the reporting period end. These data inputs are categorized in the following hierarchy under applicable financial accounting standards:
| | 1) | Level 1—unadjusted quoted prices in active markets for identical assets or liabilities (including securities actively traded on a securities exchange) |
| | 2) | Level 2—inputs other than unadjusted quoted prices that are observable for the asset or liability (such as unadjusted quoted prices for similar assets and market corroborated inputs such as interest rates, prepayment speeds, credit risks, etc.) |
| | 3) | Level 3—significant unobservable inputs (including the Manager’s own judgments about assumptions that market participants would use in pricing the asset or liability). |
The inputs used for valuing securities are not necessarily an indication of the risks associated with investing in those securities.
The table below categorizes amounts that are included in the Fund’s Statement of Assets and Liabilities as of June 29, 2012 based on valuation input level:
| | | | | | | | | | | | | | | | |
| | | Level 1—
Unadjusted
Quoted Prices | | | Level 2—
Other Significant
Observable Inputs | | | Level 3—
Significant
Unobservable
Inputs | | | Value | |
| Assets Table | | | | | | | | | | | | | | | | |
| Investments, at Value: | | | | | | | | | | | | | | | | |
| Wholly-Owned Subsidiary | | $ | — | | | $ | 1,457,156 | | | $ | — | | | $ | 1,457,156 | |
| Asset-Backed Securities | | | — | | | | 35,638,045 | | | | 11,991,800 | | | | 47,629,845 | |
| Corporate Loans | | | — | | | | 1,701,789 | | | | 4,250,313 | | | | 5,952,102 | |
| Mortgage-Backed Obligations | | | — | | | | 701,461,034 | | | | — | | | | 701,461,034 | |
| U.S. Government Obligations | | | — | | | | 95,230,418 | | | | — | | | | 95,230,418 | |
| Foreign Government Obligations | | | — | | | | 684,447,512 | | | | — | | | | 684,447,512 | |
| Loan Participations | | | — | | | | 21,433,328 | | | | — | | | | 21,433,328 | |
| Corporate Bonds and Notes | | | 391,955 | | | | 620,785,971 | | | | — | | | | 621,177,926 | |
| Preferred Stocks | | | — | | | | 3,919,534 | | | | — | | | | 3,919,534 | |
| Common Stocks | | | 2,534,452 | | | | 3,317,860 | | | | — | | | | 5,852,312 | |
| Rights, Warrants and Certificates | | | — | | | | — | | | | 420 | | | | 420 | |
| Structured Securities | | | — | | | | 65,034,354 | | | | 36,387 | | | | 65,070,741 | |
| Options Purchased | | | 349,508 | | | | 5,636,209 | | | | — | | | | 5,985,717 | |
| Swaptions Purchased | | | — | | | | 3,626,666 | | | | — | | | | 3,626,666 | |
| Investment Companies | | | 54,617,427 | | | | 363,298,125 | | | | — | | | | 417,915,552 | |
| | |
|
|
| |
|
|
| |
|
|
| |
|
|
|
| Total Investments, at Value | | | 57,893,342 | | | | 2,606,988,001 | | | | 16,278,920 | | | | 2,681,160,263 | |
| Other Financial Instruments: | | | | | | | | | | | | | | | | |
| Appreciated swaps, at value | | | — | | | | 4,823,401 | | | | — | | | | 4,823,401 | |
| Depreciated swaps, at value | | | — | | | | 397,289 | | | | — | | | | 397,289 | |
| Swaps, at value | | | — | | | | 68,344 | | | | — | | | | 68,344 | |
| Futures margins | | | 618,166 | | | | — | | | | — | | | | 618,166 | |
| Foreign currency exchange contracts | | | — | | | | 8,168,663 | | | | — | | | | 8,168,663 | |
| | |
|
|
| |
|
|
| |
|
|
| |
|
|
|
| Total Assets | | $ | 58,511,508 | | | $ | 2,620,445,698 | | | $ | 16,278,920 | | | $ | 2,695,236,126 | |
| | |
|
|
| |
|
|
| |
|
|
| |
|
|
|
| Liabilities Table | | | | | | | | | | | | | | | | |
| Other Financial Instruments: | | | | | | | | | | | | | | | | |
| Appreciated swaps, at value | | $ | — | | | $ | (1,659,057 | ) | | $ | — | | | $ | (1,659,057 | ) |
| Depreciated swaps, at value | | | — | | | | (1,184,640 | ) | | | — | | | | (1,184,640 | ) |
| Appreciated options written, at value | | | (82,273 | ) | | | (715,149 | ) | | | — | | | �� | (797,422 | ) |
| Depreciated options written, at value | | | — | | | | (192,757 | ) | | | — | | | | (192,757 | ) |
| Options written, at value | | | — | | | | (28,824 | ) | | | — | | | | (28,824 | ) |
70 | OPPENHEIMER GLOBAL STRATEGIC INCOME FUND/VA
|
| | | | | | | | | | | | | | | | |
| | | Level 1—
Unadjusted
Quoted Prices | | | Level 2—
Other Significant
Observable Inputs | | | Level 3—
Significant
Unobservable
Inputs | | | Value | |
| Appreciated swaptions written, at value | | $ | — | | | $ | (1,871,440 | ) | | $ | — | | | $ | (1,871,440 | ) |
| Depreciated swaptions written, at value | | | — | | | | (7,183,656 | ) | | | — | | | | (7,183,656 | ) |
| Futures margins | | | (3,214,788 | ) | | | — | | | | — | | | | (3,214,788 | ) |
| Foreign currency exchange contracts | | | — | | | | (10,390,054 | ) | | | — | | | | (10,390,054 | ) |
| | |
|
|
| |
|
|
| |
|
|
| |
|
|
|
| Total Liabilities | | $ | (3,297,061 | ) | | $ | (23,225,577 | ) | | $ | — | | | $ | (26,522,638 | ) |
| | |
|
|
| |
|
|
| |
|
|
| |
|
|
|
Currency contracts and forwards, if any, are reported at their unrealized appreciation/depreciation at measurement date, which represents the change in the contract’s value from trade date. Futures, if any, are reported at their variation margin at measurement date, which represents the amount due to/from the Fund at that date. All additional assets and liabilities included in the above table are reported at their market value at measurement date.
The table below shows the significant transfers between Level 3 and Level 2. The Fund’s policy is to recognize transfers in and transfers out as of the beginning of the reporting period.
| | | | | | | | |
| | | Transfers into
Level 2* | | | Transfers out of
Level 3* | |
| Assets Table | | | | | | | | |
| Investments, at Value: | | | | | | | | |
| Common Stocks | | $ | 208,932 | | | $ | (208,932 | ) |
| Preferred Stocks | | | 2,968,560 | | | | (2,968,560 | ) |
| | |
|
|
| |
|
|
|
| Total Assets | | $ | 3,177,492 | | | $ | (3,177,492 | ) |
| | |
|
|
| |
|
|
|
*Transferred from Level 3 to Level 2 due to the availability of market data for this security.
There have been no significant changes to the fair valuation methodologies of the Fund during the period.
The net asset value per share of the Subsidiary is determined as of the close of the Exchange, on each day the Exchange is open for trading. The net asset value per share is determined by dividing the value of the Subsidiary’s net assets by the number of shares that are outstanding. The Subsidiary values its investments in the same manner as the Fund as described above.
3. Shares of Beneficial Interest
The Fund has authorized an unlimited number of $0.001 par value shares of beneficial interest of each class. Transactions in shares of beneficial interest were as follows:
| | | | | | | | | | | | | | | | |
| | | Six Months Ended June 29, 2012 | | | Year Ended December 30, 2011 | |
| | | Shares | | | Amount | | | Shares | | | Amount | |
| Non-Service Shares | | | | | | | | | | | | | | | | |
| Sold | | | 7,168,231 | | | $ | 39,885,007 | | | | 11,331,249 | | | $ | 62,405,055 | |
| Dividends and/or distributions reinvested | | | 9,254,780 | | | | 48,680,145 | | | | 5,843,515 | | | | 31,847,158 | |
| Redeemed | | | (8,088,128 | ) | | | (45,165,469 | ) | | | (24,340,756 | ) | | | (133,612,101 | ) |
| | |
|
|
| |
|
|
| |
|
|
| |
|
|
|
| Net increase (decrease) | | | 8,334,883 | | | $ | 43,399,683 | | | | (7,165,992 | ) | | $ | (39,359,888 | ) |
| | |
|
|
| |
|
|
| |
|
|
| |
|
|
|
| | | | | | | | | | | | | |
| Service Shares | | | | | | | | | | | | | | | | |
| Sold | | | 16,240,758 | | | $ | 92,301,966 | | | | 30,704,662 | | | $ | 172,623,711 | |
| Dividends and/or distributions reinvested | | | 21,198,531 | | | | 114,048,098 | | | | 12,087,824 | | | | 67,208,303 | |
| Redeemed | | | (17,751,813 | ) | | | (100,896,171 | ) | | | (44,589,582 | ) | | | (250,157,976 | ) |
| | |
|
|
| |
|
|
| |
|
|
| |
|
|
|
| Net increase (decrease) | | | 19,687,476 | | | $ | 105,453,893 | | | | (1,797,096 | ) | | $ | (10,325,962 | ) |
| | |
|
|
| |
|
|
| |
|
|
| |
|
|
|
71 | OPPENHEIMER GLOBAL STRATEGIC INCOME FUND/VA
|
NOTES TO FINANCIAL STATEMENTS Unaudited / Continued
4. Purchases and Sales of Securities
The aggregate cost of purchases and proceeds from sales of securities, other than short-term obligations and investments in the Subsidiary and IMMF, for the six months ended June 29, 2012, were as follows:
| | | | | | | | |
| | | Purchases | | | Sales | |
| Investment securities | | $ | 755,004,611 | | | $ | 739,492,339 | |
U.S. government and government
agency obligations | | | 77,990,595 | | | | 85,207,360 | |
To Be Announced (TBA)
mortgage-related securities | | | 1,207,855,796 | | | | 971,057,466 | |
5. Fees and Other Transactions with Affiliates
Management Fees. Under the investment advisory agreement, the Fund pays the Manager a management fee based on the daily net assets of the Fund at an annual rate as shown in the following table:
| | | | |
| Fee Schedule | | | |
| Up to $200 million | | | 0.75 | % |
| Next $200 million | | | 0.72 | |
| Next $200 million | | | 0.69 | |
| Next $200 million | | | 0.66 | |
| Next $200 million | | | 0.60 | |
| Over $1 billion | | | 0.50 | |
Administration Service Fees. The Fund pays the Manager a fee of $1,500 per year for preparing and filing the Fund’s tax returns.
Transfer Agent Fees. OppenheimerFunds Services (“OFS”), a division of the Manager, acts as the transfer and shareholder servicing agent for the Fund. For the six months ended June 29, 2012, the Fund paid $1,166,145 to OFS for services to the Fund.
Distribution and Service Plan for Service Shares. The Fund has adopted a Distribution and Service Plan (the “Plan”) in accordance with Rule 12b-1 under the Investment Company Act of 1940 for Service shares to pay OppenheimerFunds Distributor, Inc. (the “Distributor”), for distribution related services, personal service and account maintenance for the Fund’s Service shares. Under the Plan, payments are made periodically at an annual rate of 0.25% of the daily net assets of Service shares of the Fund. The Distributor currently uses all of those fees to compensate sponsors of the insurance product that offers Fund shares, for providing personal service and maintenance of accounts of their variable contract owners that hold Service shares. These fees are paid out of the Fund’s assets on an on-going basis and increase operating expenses of the Service shares, which results in lower performance compared to the Fund’s shares that are not subject to a service fee. Fees incurred by the Fund under the Plan are detailed in the Statement of Operations.
Waivers and Reimbursements of Expenses. The Manager has voluntarily agreed to limit the Fund’s total annual operating expenses so that those expenses, as percentages of daily net assets, will not exceed the annual rate of 0.75% for Non-Service shares and 1.00% for Service shares.
The Manager has contractually agreed to waive the management fee it receives from the Fund in an amount equal to the management fee it receives from the Subsidiary. This undertaking will continue in effect for so long as the Fund invests in the Subsidiary and may not be terminated unless approved by the Fund’s Board of Trustees. During the six months ended June 29, 2012, the Manager waived $5,474.
The Manager will waive fees and/or reimburse Fund expenses in an amount equal to the indirect management fees incurred through the Fund’s investments in IMMF, Oppenheimer Short Duration Fund and the Master Funds. During the six months ended June 29, 2012, the Manager waived fees and/or reimbursed the Fund $631,010 for management fees.
72 | OPPENHEIMER GLOBAL STRATEGIC INCOME FUND/VA
|
Some of these undertakings may be modified or terminated at any time; some may not be modified or terminated until after one year from the date of the current prospectus, as indicated therein.
During the six months ended June 29, 2012, the Manager voluntarily reimbursed the Fund $7,699 for certain transactions. The payment is reported separately in the Statement of Operations and increased the Fund’s total returns by less than .005%.
6. Risk Exposures and the Use of Derivative Instruments
The Fund’s investment objectives not only permit the Fund to purchase investment securities, they also allow the Fund to enter into various types of derivatives contracts, including, but not limited to, futures contracts, forward foreign currency exchange contracts, credit default swaps, interest rate swaps, total return swaps, and purchased and written options. In doing so, the Fund will employ strategies in differing combinations to permit it to increase, decrease, or change the level or types of exposure to market risk factors. Central to those strategies are features inherent to derivatives that make them more attractive for this purpose than equity and debt securities: they require little or no initial cash investment, they can focus exposure on only certain selected risk factors, and they may not require the ultimate receipt or delivery of the underlying security (or securities) to the contract. This may allow the Fund to pursue its objectives more quickly and efficiently than if it were to make direct purchases or sales of securities capable of effecting a similar response to market factors.
Market Risk Factors. In accordance with its investment objectives, the Fund may use derivatives to increase or decrease its exposure to one or more of the following market risk factors:
Commodity Risk. Commodity risk relates to the change in value of commodities or commodity indexes as they relate to increases or decreases in the commodities market. Commodities are physical assets that have tangible properties. Examples of these types of assets are crude oil, heating oil, metals, livestock, and agricultural products.
Credit Risk. Credit risk relates to the ability of the issuer to meet interest and principal payments, or both, as they come due. In general, lower-grade, higher-yield bonds are subject to credit risk to a greater extent than lower-yield, higher-quality bonds.
Equity Risk. Equity risk relates to the change in value of equity securities as they relate to increases or decreases in the general market.
Foreign Exchange Rate Risk. Foreign exchange rate risk relates to the change in the U.S. dollar value of a security held that is denominated in a foreign currency. The U.S. dollar value of a foreign currency denominated security will decrease as the dollar appreciates against the currency, while the U.S. dollar value will increase as the dollar depreciates against the currency.
Interest Rate Risk. Interest rate risk refers to the fluctuations in value of fixed-income securities resulting from the inverse relationship between price and yield. For example, an increase in general interest rates will tend to reduce the market value of already issued fixed-income investments, and a decline in general interest rates will tend to increase their value. In addition, debt securities with longer maturities, which tend to have higher yields, are subject to potentially greater fluctuations in value from changes in interest rates than obligations with shorter maturities.
Volatility Risk. Volatility risk refers to the magnitude of the movement, but not the direction of the movement, in a financial instrument’s price over a defined time period. Large increases or decreases in a financial instrument’s price over a relative time period typically indicate greater volatility risk, while small increases or decreases in its price typically indicate lower volatility risk.
73 | OPPENHEIMER GLOBAL STRATEGIC INCOME FUND/VA
|
NOTES TO FINANCIAL STATEMENTS Unaudited / Continued
6. Risk Exposures and the Use of Derivative Instruments Continued
The Fund’s actual exposures to these market risk factors during the period are discussed in further detail, by derivative type, below.
Risks of Investing in Derivatives. The Fund’s use of derivatives can result in losses due to unanticipated changes in the market risk factors and the overall market. In instances where the Fund is using derivatives to decrease, or hedge, exposures to market risk factors for securities held by the Fund, there are also risks that those derivatives may not perform as expected resulting in losses for the combined or hedged positions.
Derivatives may have little or no initial cash investment relative to their market value exposure and therefore can produce significant gains or losses in excess of their cost. This use of embedded leverage allows the Fund to increase its market value exposure relative to its net assets and can substantially increase the volatility of the Fund’s performance.
Additional associated risks from investing in derivatives also exist and potentially could have significant effects on the valuation of the derivative and the Fund. Typically, the associated risks are not the risks that the Fund is attempting to increase or decrease exposure to, per its investment objectives, but are the additional risks from investing in derivatives. Examples of these associated risks are liquidity risk, which is the risk that the Fund will not be able to sell the derivative in the open market in a timely manner, and counterparty credit risk, which is the risk that the counterparty will not fulfill its obligation to the Fund. Associated risks can be different for each type of derivative and are discussed by each derivative type in the notes that follow.
Counterparty Credit Risk. Certain derivative positions are subject to counterparty credit risk, which is the risk that the counterparty will not fulfill its obligation to the Fund. The Fund’s derivative counterparties are financial institutions who are subject to market conditions that may weaken their financial position. The Fund intends to enter into financial transactions with counterparties that the Manager believes to be creditworthy at the time of the transaction. As of June 29, 2012, the maximum amount of loss that the Fund would incur if the counterparties to its derivative transactions failed to perform would be $27,017,906, which represents gross payments to be received by the Fund on these derivative contracts were they to be unwound as of period end. To reduce this risk the Fund has entered into master netting arrangements, established within the Fund’s International Swap and Derivatives Association, Inc. master agreements, which allow the Fund to net unrealized appreciation and depreciation for certain positions in swaps, over-the-counter options, swaptions, and forward currency exchange contracts for each individual counterparty. The amount of loss that the Fund would incur taking into account these master netting arrangements would be $6,604,318 as of June 29, 2012. In addition, the Fund may require that certain counterparties post cash and/or securities in collateral accounts to cover their net payment obligations for those derivative contracts subject to International Swap and Derivatives Association, Inc. master agreements. If the counterparty fails to perform under these contracts and agreements, the cash and/or securities will be made available to the Fund.
As of June 29, 2012 the Fund has required certain counterparties to post collateral of $13,604,449.
Credit Related Contingent Features. The Fund’s agreements with derivative counterparties have several credit related contingent features that if triggered would allow its derivatives counterparties to close out and demand payment or additional collateral to cover their exposure from the Fund. Credit related contingent features are established between the Fund and its derivatives counterparties to reduce the risk that the Fund will not fulfill its payment obligations to its counterparties. These triggering features include, but are not limited to, a percentage decrease in the Fund’s net assets and or a percentage decrease in the Fund’s Net Asset Value or NAV. The contingent features are established within the Fund’s International Swap and Derivatives Association, Inc. master agreements which govern certain positions in swaps, over-the-counter options and swaptions, and forward currency exchange contracts for each individual counterparty.
As of June 29, 2012, the aggregate fair value of derivative instruments with credit related contingent features in a net liability position was $3,885,536 for which the Fund has posted collateral of $3,215,701. If a contingent feature would
74 | OPPENHEIMER GLOBAL STRATEGIC INCOME FUND/VA
|
have been triggered as of June 29, 2012, the Fund could have been required to pay this amount in cash to its counterparties. If the Fund fails to perform under these contracts and agreements, the cash and/or securities posted as collateral will be made available to the counterparty. Cash posted as collateral for these contracts, if any, is reported on the Statement of Assets and Liabilities; securities posted as collateral, if any, are reported on the Statement of Investments.
Valuations of derivative instruments as of June 29, 2012 are as follows:
| | | | | | | | | | | | |
| | | Asset Derivatives
| | | Liability Derivatives
| |
Derivatives Not
Accounted for as
Hedging Instruments | | Statement of Assets
and Liabilities Location | | Value | | | Statement of Assets
and Liabilities Location | | Value | |
| Credit contracts | | Appreciated swaps, at value | | $ | 666,889 | | | Appreciated swaps, at value | | $ | 1,659,057 | |
| Credit contracts | | Depreciated swaps, at value | | | 397,289 | | | Depreciated swaps, at value | | | 433,455 | |
| Credit contracts | | Swaps, at value | | | 68,344 | | | | | | | |
| Equity contracts | | Appreciated swaps, at value | | | 2,323,492 | | | Depreciated swaps, at value | | | 180,167 | |
| Interest rate contracts | | Appreciated swaps, at value | | | 821,887 | | | Depreciated swaps, at value | | | 216,639 | |
| Volatility contracts | | Appreciated swaps, at value | | | 1,011,133 | | | Depreciated swaps, at value | | | 354,379 | |
| Equity contracts | | Futures margins | | | 81,000 | * | | Futures margins | | | 1,271,943 | * |
| Interest rate contracts | | Futures margins | | | 537,166 | * | | Futures margins | | | 1,942,139 | * |
| Foreign exchange contracts | | Unrealized appreciation on foreign currency exchange contracts | | | 8,168,663 | | | Unrealized depreciation on foreign currency exchange contracts | | | 10,390,054 | |
| Foreign exchange contracts | | Closed foreign currency contracts | | | 4,297,334 | | | Closed foreign currency contracts | | | 1,520,675 | |
| Foreign exchange contracts | | | | | | | | Appreciated options written, at value | | | 785,047 | |
| Foreign exchange contracts | | | | | | | | Depreciated options written, at value | | | 192,757 | |
| Foreign exchange contracts | | | | | | | | Options written, at value | | | 28,824 | |
| Interest rate contracts | | | | | | | | Appreciated options written, at value | | | 12,375 | |
| Interest rate contracts | | | | | | | | Appreciated swaptions written, at value | | | 1,853,129 | |
| Credit contracts | | | | | | | | Appreciated swaptions written, at value | | | 18,311 | |
| Credit contracts | | | | | | | | Depreciated swaptions written, at value | | | 5,263 | |
| Interest rate contracts | | | | | | | | Depreciated swaptions written, at value | | | 7,178,393 | |
| Foreign exchange contracts | | Investments, at value | | | 5,839,742 | ** | | | | | | |
| Credit contracts | | Investments, at value | | | 49,689 | ** | | | | | | |
| Interest rate contracts | | Investments, at value | | | 3,722,952 | ** | | | | | | |
| | | | |
|
|
| | | |
|
|
|
| Total | | | | $ | 27,985,580 | | | | | $ | 28,042,607 | |
| | | | |
|
|
| | | |
|
|
|
*Includes only the current day’s variation margin. Prior variation margin movements have been reflected in cash on the Statement of Assets and Liabilities upon receipt or payment.
**Amounts relate to purchased option contracts and purchased swaption contracts, if any.
75 | OPPENHEIMER GLOBAL STRATEGIC INCOME FUND/VA
|
NOTES TO FINANCIAL STATEMENTS Unaudited / Continued
6. Risk Exposures and the Use of Derivative Instruments Continued
The effect of derivative instruments on the Statement of Operations is as follows:
| | | | | | | | | | | | | | | | | | | | | | | | | | | | |
| Amount of Realized Gain or (Loss) Recognized on Derivatives | |
Derivatives Not
Accounted for as
Hedging Instruments | | Investments from
unaffiliated
companies
(including
premiums on
options exercised)* | | | Closing and
expiration
of swaption
contracts
written | | | Closing and
expiration of
option
contracts
written | | | Closing and
expiration of
futures
contracts | | | Foreign
currency
transactions | | | Swap contracts | | | Total | |
| Credit contracts | | $ | — | | | $ | 12,172 | | | $ | — | | | $ | — | | | $ | — | | | $ | (374,581 | ) | | $ | (362,409 | ) |
| Equity contracts | | | — | | | | — | | | | — | | | | (2,994,279 | ) | | | — | | | | (1,366,177 | ) | | | (4,360,456 | ) |
| Foreign exchange contracts | | | (2,732,927 | ) | | | — | | | | 2,787,992 | | | | 466,168 | | | | (556,221 | ) | | | 16,034 | | | | (18,954 | ) |
| Interest rate contracts | | | (9,675,398 | ) | | | 4,191,605 | | | | 3,965,271 | | | | 7,857,667 | | | | — | | | | 404,722 | | | | 6,743,867 | |
| Volatility contracts | | | — | | | | — | | | | — | | | | — | | | | — | | | | 2,110,412 | | | | 2,110,412 | |
| | |
|
|
|
| Total | | $ | (12,408,325 | ) | | $ | 4,203,777 | | | $ | 6,753,263 | | | $ | 5,329,556 | | | $ | (556,221 | ) | | $ | 790,410 | | | $ | 4,112,460 | |
| | |
|
|
|
*Includes purchased option contracts, purchased swaption contracts and written option contracts exercised, if any.
| | | | | | | | | | | | | | | | | | | | | | | | | | | | |
| Amount of Change in Unrealized Gain or (Loss) Recognized on Derivatives | |
Derivatives Not
Accounted for as
Hedging Instruments | | Investments* | | | Option
contracts
written | | | Swaption
contracts
written | | | Futures
contracts | | | Translation of
assets and
liabilities
denominated
in foreign
currencies | | | Swap contracts | | | Total | |
| Credit contracts | | $ | 2,608 | | | $ | — | | | $ | 632 | | | $ | — | | | $ | — | | | $ | 348,002 | | | $ | 351,242 | |
| Equity contracts | | | — | | | | — | | | | — | | | | (1,117,547 | ) | | | — | | | | 1,773,961 | | | | 656,414 | |
| Foreign exchange contracts | | | 1,983,850 | | | | 277,256 | | | | — | | | | — | | | | 514,526 | | | | 573 | | | | 2,776,205 | |
| Interest rate contracts | | | (5,616,846 | ) | | | (287,128 | ) | | | (2,816,493 | ) | | | (1,950,532 | ) | | | — | | | | 72,361 | | | | (10,598,638 | ) |
| Volatility contracts | | | — | | | | — | | | | — | | | | — | | | | — | | | | 394,253 | | | | 394,253 | |
| | |
|
|
|
| Total | | $ | (3,630,388 | ) | | $ | (9,872 | ) | | $ | (2,815,861 | ) | | $ | (3,068,079 | ) | | $ | 514,526 | | | $ | 2,589,150 | | | $ | (6,420,524 | ) |
| | |
|
|
|
*Includes purchased option contracts and purchased swaption contracts, if any.
Foreign Currency Exchange Contracts
The Fund may enter into foreign currency exchange contracts (“forward contracts”) for the purchase or sale of a foreign currency at a negotiated rate at a future date.
Forward contracts are reported on a schedule following the Statement of Investments. The unrealized appreciation (depreciation) is reported in the Statement of Assets and Liabilities as a receivable or payable and in the Statement of Operations within the change in unrealized appreciation (depreciation). At contract close, the difference between the original cost of the contract and the value at the close date is recorded as a realized gain (loss) in the Statement of Operations.
The Fund has purchased and sold certain forward foreign currency exchange contracts of different currencies in order to acquire currencies to pay for or sell currencies to acquire related foreign securities purchase and sale transactions, respectively, or to convert foreign currencies to U.S. dollars from related foreign securities transactions. These foreign currency exchange contracts are negotiated at the current spot exchange rate with settlement typically within two business days thereafter.
The Fund has entered into forward foreign currency exchange contracts with the obligation to purchase specified foreign currencies in the future at a currently negotiated forward rate in order to take a positive investment perspective on the related currency. These forward foreign currency exchange contracts seek to increase exposure to foreign exchange rate risk.
76 | OPPENHEIMER GLOBAL STRATEGIC INCOME FUND/VA
|
The Fund has entered into forward foreign currency exchange contracts with the obligation to purchase specified foreign currencies in the future at a currently negotiated forward rate in order to decrease exposure to foreign exchange rate risk associated with foreign currency denominated securities held by the Fund.
The Fund has entered into forward foreign currency exchange contracts with the obligation to sell specified foreign currencies in the future at a currently negotiated forward rate in order to take a negative investment perspective on the related currency. These forward foreign currency exchange contracts seek to increase exposure to foreign exchange rate risk.
The Fund has entered into forward foreign currency exchange contracts with the obligation to sell specified foreign currencies in the future at a currently negotiated forward rate in order to decrease exposure to foreign exchange rate risk associated with foreign currency denominated securities held by the Fund.
During the six months ended June 29, 2012, the Fund had daily average contract amounts on forward foreign currency contracts to buy and sell of $329,477,040 and $651,691,615, respectively.
Additional associated risk to the Fund includes counterparty credit risk. Counterparty credit risk arises from the possibility that the counterparty will default.
Futures Contracts
A futures contract is a commitment to buy or sell a specific amount of a financial instrument, or currency, at a negotiated price on a stipulated future date. The Fund may buy and sell futures contracts and may also buy or write put or call options on these futures contracts.
Futures contracts traded on a commodities or futures exchange will be valued at the final settlement price or official closing price on the principal exchange as reported by such principal exchange at its trading session ending at, or most recently prior to, the time when the Fund’s assets are valued.
Upon entering into a futures contract, the Fund is required to deposit either cash or securities (initial margin) in an amount equal to a certain percentage of the contract value. Subsequent payments (variation margin) are made or received by the Fund each day. The variation margin payments are equal to the daily changes in the contract value and are recorded as unrealized gains and losses.
Futures contracts are reported on a schedule following the Statement of Investments. Securities held in collateralized accounts to cover initial margin requirements on open futures contracts are noted in the Statement of Investments. Cash held by the broker to cover initial margin requirements on open futures contracts and the receivable and/or payable for the daily mark to market for the variation margin are noted in the Statement of Assets and Liabilities. The net change in unrealized appreciation and depreciation is reported in the Statement of Operations. Realized gains (losses) are reported in the Statement of Operations at the closing or expiration of futures contracts.
The Fund has purchased futures contracts on various bonds and notes to increase exposure to interest rate risk.
The Fund has sold futures contracts on various bonds and notes to decrease exposure to interest rate risk.
The Fund has purchased futures contracts on various equity indexes to increase exposure to equity risk.
The Fund has sold futures contracts on various equity indexes to decrease exposure to equity risk.
The Fund has purchased futures contracts on various currencies to increase exposure to foreign exchange rate risk.
During the six months ended June 29, 2012, the Fund had an ending monthly average market value of $339,341,055 and $213,803,172 on futures contracts purchased and sold, respectively.
Additional associated risks of entering into futures contracts (and related options) include the possibility that there may be an illiquid market where the Fund is unable to liquidate the contract or enter into an offsetting position and, if used for hedging purposes, the risk that the price of the contract will correlate imperfectly with the prices of the Fund’s securities.
77 | OPPENHEIMER GLOBAL STRATEGIC INCOME FUND/VA
|
NOTES TO FINANCIAL STATEMENTS Unaudited / Continued
6. Risk Exposures and the Use of Derivative Instruments Continued
Option Activity
The Fund may buy and sell put and call options, or write put and call options. When an option is written, the Fund receives a premium and becomes obligated to sell or purchase the underlying security at a fixed price, upon exercise of the option.
Options are valued daily based upon the last sale price on the principal exchange on which the option is traded. The difference between the premium received or paid, and market value of the option, is recorded as unrealized appreciation or depreciation. The net change in unrealized appreciation or depreciation is reported in the Statement of Operations. When an option is exercised, the cost of the security purchased or the proceeds of the security sale are adjusted by the amount of premium received or paid. Upon the expiration or closing of the option transaction, a gain or loss is reported in the Statement of Operations.
The Fund has purchased call options on currencies to increase exposure to foreign exchange rate risk. A purchased call option becomes more valuable as the price of the underlying financial instrument appreciates relative to the strike price.
The Fund has purchased put options on currencies to decrease exposure to foreign exchange rate risk. A purchased put option becomes more valuable as the price of the underlying financial instrument depreciates relative to the strike price.
The Fund has purchased call options on treasury and/or euro futures to increase exposure to interest rate risk. A purchased call option becomes more valuable as the price of the underlying financial instrument appreciates relative to the strike price.
The Fund has purchased put options on treasury and/or euro futures to decrease exposure to interest rate risk. A purchased put option becomes more valuable as the price of the underlying financial instrument depreciates relative to the strike price.
During the six months ended June 29, 2012, the Fund had an ending monthly average market value of $2,755,085 and $1,162,396 on purchased call options and purchased put options, respectively.
Options written, if any, are reported in a schedule following the Statement of Investments and as a liability in the Statement of Assets and Liabilities. Securities held in collateralized accounts to cover potential obligations with respect to outstanding written options are noted in the Statement of Investments.
The risk in writing a call option is that the Fund gives up the opportunity for profit if the market price of the security increases and the option is exercised. The risk in writing a put option is that the Fund may incur a loss if the market price of the security decreases and the option is exercised. The risk in buying an option is that the Fund pays a premium whether or not the option is exercised. The Fund also has the additional risk that there may be an illiquid market where the Fund is unable to close the contract.
The Fund has written put options on currencies to increase exposure to foreign exchange rate risk. A written put option becomes more valuable as the price of the underlying financial instrument appreciates relative to the strike price.
The Fund has written call options on currencies to decrease exposure to foreign exchange rate risk. A written call option becomes more valuable as the price of the underlying financial instrument depreciates relative to the strike price.
The Fund has written call options on treasury and/or euro futures to decrease exposure to interest rate risk. A written call option becomes more valuable as the price of the underlying financial instrument depreciates relative to the strike price.
The Fund has written put options on treasury and/or euro futures to increase exposure to interest rate risk. A written put option becomes more valuable as the price of the underlying financial instrument appreciates relative to the strike price.
During the six months ended June 29, 2012, the Fund had an ending monthly average market value of $561,513 and $1,068,989 on written call options and written put options, respectively.
78 | OPPENHEIMER GLOBAL STRATEGIC INCOME FUND/VA
|
Additional associated risks to the Fund include counterparty credit risk for over-the-counter options and liquidity risk.
Written option activity for the six months ended June 29, 2012 was as follows:
| | | | | | | | | | | | | | | | |
| | | Call Options
| | | Put Options
| |
| | | Number of
Contracts | | | Amount of
Premiums | | | Number of
Contracts | | | Amount of
Premiums | |
| Options outstanding as of December 30, 2011 | | | 115,871,391,682 | | | $ | 2,007,763 | | | | 134,242,404,666 | | | $ | 1,464,690 | |
| Options written | | | 4,322,949,247 | | | | 2,760,996 | | | | 5,447,412,080 | | | | 9,721,643 | |
| Options closed or expired | | | (118,183,704,994 | ) | | | (3,919,353 | ) | | | (135,672,386,467 | ) | | | (9,208,660 | ) |
| Options exercised | | | (1,380,910,000 | ) | | | (330,922 | ) | | | (2,313,255,270 | ) | | | (378,798 | ) |
| | |
|
|
| |
|
|
| |
|
|
| |
|
|
|
| Options outstanding as of June 29, 2012 | | | 629,725,935 | | | $ | 518,484 | | | | 1,704,175,009 | | | $ | 1,598,875 | |
| | |
|
|
| |
|
|
| |
|
|
| |
|
|
|
Swap Contracts
The Fund may enter into swap contract agreements with a counterparty to exchange a series of cash flows based on either specified reference rates, or the occurrence of a credit event, over a specified period. Such contracts may include interest rate, equity, debt, index, total return, credit and currency swaps.
Swaps are marked to market daily using primarily quotations from pricing services, counterparties and brokers. Swap contracts are reported on a schedule following the Statement of Investments. The values of swap contracts are aggregated by positive and negative values and disclosed separately on the Statement of Assets and Liabilities by contracts in unrealized appreciation and depreciation positions. Upfront payments paid or received, if any, affect the value of the respective swap. Therefore, to determine the unrealized appreciation (depreciation) on swaps, upfront payments paid should be subtracted from, while upfront payments received should be added to, the value of contracts reported as an asset on the Statement of Assets and Liabilities. Conversely, upfront payments paid should be added to, while upfront payments received should be subtracted from the value of contracts reported as a liability. The unrealized appreciation (depreciation) related to the change in the valuation of the notional amount of the swap is combined with the accrued interest due to (owed by) the Fund at termination or settlement. The net change in this amount during the period is included on the Statement of Operations. The Fund also records any periodic payments received from (paid to) the counterparty, including at termination, under such contracts as realized gain (loss) on the Statement of Operations.
Swap contract agreements are exposed to the market risk factor of the specific underlying reference asset. Swap contracts are typically more attractively priced compared to similar investments in related cash securities because they isolate the risk to one market risk factor and eliminate the other market risk factors. Investments in cash securities (for instance bonds) have exposure to multiple risk factors (credit and interest rate risk). Because swaps require little or no initial cash investment, they can expose the Fund to substantial risk in the isolated market risk factor.
Credit Default Swap Contracts. A credit default swap is a bilateral contract that enables an investor to buy or sell protection on a debt security against a defined-issuer credit event, such as the issuer’s failure to make timely payments of interest or principal on the debt security, bankruptcy or restructuring. The Fund may enter into credit default swaps either by buying or selling protection on a single security, sovereign debt, or a basket of securities (the “reference asset”).
The buyer of protection pays a periodic fee to the seller of protection based on the notional amount of debt securities underlying the swap contract. The seller of protection agrees to compensate the buyer of protection for future potential losses as a result of a credit event on the reference asset. The contract effectively transfers the credit event risk of the reference asset from the buyer of protection to the seller of protection.
The ongoing value of the contract will fluctuate throughout the term of the contract based primarily on the credit risk of the reference asset. If the credit quality of the reference asset improves relative to the credit quality at contract initiation, the buyer of protection may have an unrealized loss greater than the anticipated periodic fee owed. This
79 | OPPENHEIMER GLOBAL STRATEGIC INCOME FUND/VA
|
NOTES TO FINANCIAL STATEMENTS Unaudited / Continued
6. Risk Exposures and the Use of Derivative Instruments Continued
unrealized loss would be the result of current credit protection being cheaper than the cost of credit protection at contract initiation. If the buyer elects to terminate the contract prior to its maturity, and there has been no credit event, this unrealized loss will become realized. If the contract is held to maturity, and there has been no credit event, the realized loss will be equal to the periodic fee paid over the life of the contract.
If there is a credit event, the buyer of protection can exercise its rights under the contract and receive a payment from the seller of protection equal to the notional amount of the reference asset less the market value of the reference asset. Upon exercise of the contract the difference between the value of the underlying reference asset and the notional amount is recorded as realized gain (loss) and is included on the Statement of Operations.
The Fund has sold credit protection through credit default swaps to increase exposure to the credit risk of individual securities and/or, indexes that are either unavailable or considered to be less attractive in the bond market.
The Fund has purchased credit protection through credit default swaps to decrease exposure to the credit risk of individual securities and/or, indexes.
For the six months ended June 29, 2012, the Fund had ending monthly average notional amounts of $51,170,375 and $43,637,143 on credit default swaps to buy protection and credit default swaps to sell protection, respectively.
Additional associated risks to the Fund include counterparty credit risk and liquidity risk.
Interest Rate Swap Contracts. An interest rate swap is an agreement between counterparties to exchange periodic payments based on interest rates. One cash flow stream will typically be a floating rate payment based upon a specified interest rate while the other is typically a fixed interest rate.
The Fund has entered into interest rate swaps in which it pays a floating interest rate and receives a fixed interest rate in order to increase exposure to interest rate risk. Typically, if relative interest rates rise, payments made by the Fund under a swap agreement will be greater than the payments received by the Fund.
The Fund has entered into interest rate swaps in which it pays a fixed interest rate and receives a floating interest rate in order to decrease exposure to interest rate risk. Typically, if relative interest rates rise, payments received by the Fund under the swap agreement will be greater than the payments made by the Fund.
For the six months ended June 29, 2012, the Fund had ending monthly average notional amounts of $34,135,494 and $76,280,326 on interest rate swaps which pay a fixed rate and interest rate swaps which receive a fixed rate, respectively.
Additional associated risks to the Fund include counterparty credit risk and liquidity risk.
Total Return Swap Contracts. A total return swap is an agreement between counterparties to exchange periodic payments based on asset or non-asset references. One cash flow is typically based on a non-asset reference (such as an interest rate or index) and the other on the total return of a reference asset (such as a security or a basket of securities). The total return of the reference asset typically includes appreciation or depreciation on the reference asset, plus any interest or dividend payments.
Total return swap contracts are exposed to the market risk factor of the specific underlying financial instrument or index. Total return swaps are less standard in structure than other types of swaps and can isolate and/or, include multiple types of market risk factors including equity risk, credit risk, and interest rate risk.
The Fund has entered into total return swaps on various equity securities or indexes to increase exposure to equity risk. These equity risk related total return swaps require the Fund to pay a floating reference interest rate, or an amount equal to the negative price movement of securities or an index multiplied by the notional amount of the contract. The Fund will receive payments equal to the positive price movement of the same securities or index multiplied by the notional amount of the contract.
80 | OPPENHEIMER GLOBAL STRATEGIC INCOME FUND/VA
|
The Fund has entered into total return swaps on various equity securities or indexes to decrease exposure to equity risk. These equity risk related total return swaps require the Fund to pay an amount equal to the positive price movement of securities or an index multiplied by the notional amount of the contract. The Fund will receive payments of a floating reference interest rate or an amount equal to the negative price movement of the same securities or index multiplied by the notional amount of the contract.
For the six months ended June 29, 2012, the Fund had ending monthly average notional amounts of $51,714,393 and $11,228,926 on total return swaps which are long the reference asset and total return swaps which are short the reference asset, respectively.
Additional associated risks to the Fund include counterparty credit risk and liquidity risk.
Currency Swaps. A currency swap is an agreement between counterparties to exchange different currencies equivalent to the notional value at contract inception and reverse the exchange of the same notional values of those currencies at contract termination. The contract may also include periodic exchanges of cash flows based on a specified index or interest rate.
The Fund has entered into currency swap contracts with the obligation to pay an interest rate on various foreign currency notional amounts and receive an interest rate on the dollar notional amount in order to take a negative investment perspective on the related currencies for which the Fund receives a payment. These currency swap contracts seek to decrease exposure to foreign exchange rate risk.
For the six months ended June 29, 2012, the Fund had ending monthly average notional amounts of $314,286 on currency swaps.
Additional associated risks to the Fund include counterparty credit risk and liquidity risk.
As of June 29, 2012, the Fund had no such currency swap agreements outstanding.
Volatility Swap Contracts. A volatility swap is an agreement between counterparties to exchange periodic payments based on the measured volatility of a reference security, index, currency or other reference investment over a specified time frame. One cash flow is typically based on the volatility of the reference investment as measured by changes in its price or level while the other cash flow is based on an interest rate or the measured volatility of a different reference investment. The appreciation or depreciation on a volatility swap will typically depend on the magnitude of the reference investment’s volatility, or size of the movement, rather than general directional increases or decreases in its price.
Volatility swaps are less standard in structure than other types of swaps and provide pure, or isolated, exposure to volatility risk of the specific underlying reference investment. Volatility swaps are typically used to speculate on future volatility levels, to trade the spread between realized and expected volatility, or to decrease the volatility exposure of investments held by the Fund.
The Fund has entered into volatility swaps to increase exposure to the volatility risk of various reference investments. These types of volatility swaps require the fund to pay the measured volatility and receive a fixed interest payment over the period of the contract. If the measured volatility of the related reference investment increases over the period, the swaps will depreciate in value. Conversely, if the measured volatility of the related reference investment decreases over the period, the swaps will appreciate in value.
The Fund has entered into volatility swaps to decrease exposure to the volatility risk of various reference investments. These types of volatility swaps require the fund to pay a fixed interest payment and receive the measured volatility over the period of the contract. If the measured volatility of the related reference investment increases over the period, the swaps will appreciate in value. Conversely, if the measured volatility of the related reference investment decreases over the period, the swaps will depreciate in value.
81 | OPPENHEIMER GLOBAL STRATEGIC INCOME FUND/VA
|
NOTES TO FINANCIAL STATEMENTS Unaudited / Continued
6. Risk Exposures and the Use of Derivative Instruments Continued
For the six months ended June 29, 2012, the Fund had ending monthly average notional amounts of $96,265 and $548,204 on volatility swaps which pay volatility and volatility swaps which receive volatility, respectively.
Additional associated risks to the Fund include counterparty credit risk and liquidity risk.
Swaption Transactions
The Fund may enter into a swaption contract which grants the purchaser the right, but not the obligation, to enter into a swap transaction at preset terms detailed in the underlying agreement within a specified period of time. The purchaser pays a premium to the swaption writer who bears the risk of unfavorable changes in the preset terms on the underlying swap.
Swaptions are marked to market daily using primarily portfolio pricing services or quotations from counterparties and brokers. Purchased swaptions are reported as a component of investments in the Statement of Investments, the Statement of Assets and Liabilities and the Statement of Operations. Written swaptions are reported on a schedule following the Statement of Investments and their value is reported as a separate asset or liability line item in the Statement of Assets and Liabilities. The net change in unrealized appreciation or depreciation on written swaptions is separately reported in the Statement of Operations. When a swaption is exercised, the cost of the swap is adjusted by the amount of premium paid or received. Upon the expiration or closing of an unexercised swaption contract, a gain or loss is reported in the Statement of Operations for the amount of the premium paid or received.
The Fund generally will incur a greater risk when it writes a swaption than when it purchases a swaption. When the Fund writes a swaption it will become obligated, upon exercise of the swaption, according to the terms of the underlying agreement. Swaption contracts written by the Fund do not give rise to counterparty credit risk as they obligate the Fund, not its counterparty, to perform. When the Fund purchases a swaption it only risks losing the amount of the premium it paid if the swaption expires unexercised. However, when the Fund exercises a purchased swaption there is a risk that the counterparty will fail to perform or otherwise default on its obligations under the swaption contract.
The Fund has purchased swaptions which gives it the option to sell credit protection through credit default swaps in order to increase exposure to the credit risk of individual securities and, or, indexes. A purchased swaption of this type becomes more valuable as the likelihood of a credit event on the reference asset decreases.
The Fund purchased swaptions which gives it the option to enter into an interest rate swap in which it pays a floating interest rate and receives a fixed interest rate in order to increase exposure to interest rate risk. A purchased swaption of this type becomes more valuable as the reference interest rate depreciates relative to the preset interest rate.
The Fund has purchased swaptions which gives it the option to enter into an interest rate swap in which it pays a fixed interest rate and receives a floating interest rate in order to decrease exposure to interest rate risk. A purchased swaption of this type becomes more valuable as the reference interest rate appreciates relative to the preset interest rate.
The Fund has written swaptions which gives it the obligation, if exercised by the purchaser, to enter into an interest rate swap in which it pays a floating interest rate and receives a fixed interest rate in order to increase exposure to interest rate risk. A written swaption of this type becomes more valuable as the reference interest rate depreciates relative to the preset interest rate.
The Fund has written swaptions which gives it the obligation, if exercised by the purchaser, to enter into an interest rate swap in which it pays a fixed interest rate and receives a floating interest rate in order to decrease exposure to interest rate risk. A written swaption of this type becomes more valuable as the reference interest rate appreciates relative to the preset interest rate.
The Fund has written swaptions which give it the obligation, if exercised by the purchaser, to sell credit protection through credit default swaps in order to increase exposure to the credit risk of individual securities and/or, indexes. A written swaption of this type becomes more valuable as the likelihood of a credit event on the reference asset decreases.
82 | OPPENHEIMER GLOBAL STRATEGIC INCOME FUND/VA
|
The Fund has written swaptions which give it the obligation, if exercised by the purchaser, to buy credit protection through credit default swaps in order to decrease exposure to the credit risk of individual securities and, or, indexes. A written swaption of this type becomes more valuable as the likelihood of a credit event on the reference asset increases.
During the six months ended June 29, 2012, the Fund had an ending monthly average market value of $5,541,169 and $6,860,303 on purchased and written swaptions, respectively.
Written swaption activity for the six months ended June 29, 2012 was as follows:
| | | | | | | | |
| | | Call Swaptions
| |
| | | Notional
Amount | | | Amount of
Premiums | |
| Swaptions outstanding as of December 30, 2011 | | $ | 385,315,000 | | | $ | 8,188,797 | |
| Swaptions written | | | 1,820,740,000 | | | | 10,976,007 | |
| Swaptions closed or expired | | | (1,759,540,000) | | | | (12,152,785) | |
| Swaptions exercised | | | (10,005,000) | | | | (152,848) | |
| | |
|
|
| |
|
|
|
| Swaptions outstanding as of June 29, 2012 | | $ | 436,510,000 | | | $ | 6,859,171 | |
| | |
|
|
| |
|
|
|
7. Restricted Securities
As of June 29, 2012, investments in securities included issues that are restricted. A restricted security may have a contractual restriction on its resale and is valued under methods approved by the Board of Directors as reflecting fair value. Securities that are restricted are marked with an applicable footnote on the Statement of Investments. Restricted securities are reported on a schedule following the Statement of Investments.
8. Pending Litigation
Since 2009, a number of class action, derivative and individual lawsuits have been pending in federal and state courts against OppenheimerFunds, Inc., the Fund’s investment advisor (the “Manager”), OppenheimerFunds Distributor, Inc., the Fund’s principal underwriter and distributor (the “Distributor”), and certain funds (but not including the Fund) advised by the Manager and distributed by the Distributor (the “Defendant Funds”). Several of these lawsuits also name as defendants certain officers and current and former trustees of the respective Defendant Funds. The lawsuits raise claims under federal securities laws and various states’ securities, consumer protection and common law and allege, among other things, that the disclosure documents of the respective Defendant Funds contained misrepresentations and omissions and that the respective Defendant Funds’ investment policies were not followed. The plaintiffs in these actions seek unspecified damages, equitable relief and awards of attorneys’ fees and litigation expenses.
Other class action and individual lawsuits have been filed since 2008 in various state and federal courts against the Manager and certain of its affiliates by investors seeking to recover investments they allegedly lost as a result of the “Ponzi” scheme run by Bernard L. Madoff and his firm, Bernard L. Madoff Investment Securities, LLC (“BLMIS”). Plaintiffs in these suits allege that they suffered losses as a result of their investments in several funds managed by an affiliate of the Manager and assert a variety of claims, including breach of fiduciary duty, fraud, negligent misrepresentation, unjust enrichment, and violation of federal and state securities laws and regulations, among others. They seek unspecified damages, equitable relief and awards of attorneys’ fees and litigation expenses. Neither the Distributor, nor any of the Oppenheimer mutual funds, their independent trustees or directors are named as defendants in these lawsuits. None of the Oppenheimer mutual funds invested in any funds or accounts managed by Madoff or BLMIS. On February 28, 2011, a stipulation of partial settlement of three groups of consolidated putative class action lawsuits relating to these matters was filed in the U.S. District Court for the Southern District of New York. On August 19, 2011, the court entered an order and final judgment approving the settlement as fair, reasonable and adequate. In September 2011, certain parties filed notices of appeal from the court’s order approving the settlement. On July 29, 2011, a stipulation of settlement
83 | OPPENHEIMER GLOBAL STRATEGIC INCOME FUND/VA
|
NOTES TO FINANCIAL STATEMENTS Unaudited / Continued
8. Pending Litigation Continued
between certain affiliates of the Manager and the Trustee appointed under the Securities Investor Protection Act to liquidate BLMIS was filed in the U.S. Bankruptcy Court for the Southern District of New York to resolve purported preference and fraudulent transfer claims by the Trustee. On September 22, 2011, the court entered an order approving the settlement as fair, reasonable and adequate. In October 2011, certain parties filed notices of appeal from the court’s order approving the settlement. The aforementioned settlements do not resolve other outstanding lawsuits against the Manager and its affiliates relating to BLMIS.
On April 16, 2010, a lawsuit was filed in New York state court against the Manager, an affiliate of the Manager and AAArdvark IV Funding Limited (“AAArdvark IV”), an entity advised by the Manager’s affiliate, in connection with investments made by the plaintiffs in AAArdvark IV. Plaintiffs allege breach of contract against the defendants and seek compensatory damages, costs and disbursements, including attorney fees. On July 15, 2011, a lawsuit was filed in New York state court against the Manager, an affiliate of the Manager and AAArdvark Funding Limited (“AAArdvark I”), an entity advised by the Manager’s affiliate, in connection with investments made by the plaintiffs in AAArdvark I. The complaint alleges breach of contract against the defendants and seeks compensatory damages, costs and disbursements, including attorney fees. On November 9, 2011, a lawsuit was filed in New York state court against the Manager, an affiliate of the Manager and AAArdvark XS Funding Limited (“AAArdvark XS”), an entity advised by the Manager’s affiliate, in connection with investments made by the plaintiffs in AAArdvark XS. The complaint alleges breach of contract against the defendants and seeks compensatory damages, costs and disbursements, including attorney fees.
The Manager believes the lawsuits and appeals described above are without legal merit and, with the exception of actions it has settled, is defending against them vigorously. The Defendant Funds’ Boards of Trustees have also engaged counsel to represent the Funds and the present and former Independent Trustees named in those suits. While it is premature to render any opinion as to the outcome in these lawsuits, or whether any costs that the Defendant Funds may bear in defending the suits might not be reimbursed by insurance, the Manager believes that these suits should not impair the ability of the Manager or the Distributor to perform their respective duties to the Fund, and that the outcome of all of the suits together should not have any material effect on the operations of any of the Oppenheimer mutual funds.
84 | OPPENHEIMER GLOBAL STRATEGIC INCOME FUND/VA
|
SPECIAL SHAREHOLDER MEETING (Unaudited)
On February 29, 2012, a shareholder meeting of the Oppenheimer Variable Account Funds, on behalf of Oppenheimer Global Strategic Income Fund/VA (the “Fund”) was held at which the twelve Trustees identified below were elected to the Trust (Proposal No. 1). At the meeting Proposal No. 2 (including all of its sub-proposals) and Proposal No. 3 were approved as described in the Fund’s proxy statement for that meeting. The following is a report of the votes cast:
| | | | | | | | |
| Nominee/Proposal | | For | | | Withheld | |
| Trustees | | | | | | | | |
| William L. Armstrong | | | 859,155,000 | | | | 36,277,763 | |
| Edward L. Cameron | | | 860,463,149 | | | | 34,969,615 | |
| Jon S. Fossel | | | 861,382,389 | | | | 34,050,375 | |
| Sam Freedman | | | 860,173,958 | | | | 35,258,806 | |
| Richard F. Grabish | | | 862,692,974 | | | | 32,739,789 | |
| Beverly L. Hamilton | | | 862,904,192 | | | | 32,528,571 | |
| Robert J. Malone | | | 862,354,488 | | | | 33,078,275 | |
| F. William Marshall, Jr. | | | 860,997,182 | | | | 34,435,581 | |
| Victoria J. Herget | | | 861,814,105 | | | | 33,618,659 | |
| Karen L. Stuckey | | | 861,434,246 | | | | 33,998,517 | |
| James D. Vaughn | | | 861,208,178 | | | | 34,224,585 | |
| William F. Glavin, Jr. | | | 861,148,846 | | | | 34,283,917 | |
2a: Proposal to revise the fundamental policy relating to borrowing
| | | | | | | | | | | | |
| For | | Against | | | Abstain | | | Broker Non Vote | |
| 358,547,893 | | | 19,482,394 | | | | 14,893,181 | | | | N/A | |
2b: Proposal to revise the fundamental policy relating to concentration of investments
| | | | | | | | | | | | |
| For | | Against | | | Abstain | | | Broker Non Vote | |
| 361,080,204 | | | 18,855,930 | | | | 12,987,334 | | | | N/A | |
2c: Proposal to remove the fundamental policy relating to diversification of investments
| | | | | | | | | | | | |
| For | | Against | | | Abstain | | | Broker Non Vote | |
| 358,491,763 | | | 18,973,715 | | | | 15,457,991 | | | | N/A | |
2d: Proposal to revise the fundamental policy relating to lending
| | | | | | | | | | | | |
| For | | Against | | | Abstain | | | Broker Non Vote | |
| 358,157,455 | | | 19,006,813 | | | | 15,759,201 | | | | N/A | |
2e-1: Proposal to revise the fundamental policy relating to real estate and commodities
| | | | | | | | | | | | |
| For | | Against | | | Abstain | | | Broker Non Vote | |
| 359,289,237 | | | 19,591,634 | | | | 14,042,597 | | | | N/A | |
2e-2: Proposal to remove the additional fundamental policy relating to real estate and commodities
| | | | | | | | | | | | |
| For | | Against | | | Abstain | | | Broker Non Vote | |
| 357,467,844 | | | 20,137,700 | | | | 15,317,925 | | | | N/A | |
85 | OPPENHEIMER GLOBAL STRATEGIC INCOME FUND/VA
|
SPECIAL SHAREHOLDER MEETING (Unaudited) / Continued
2f: Proposal to revise the fundamental policy relating to senior securities
| | | | | | | | | | | | |
| For | | Against | | | Abstain | | | Broker Non Vote | |
| 359,132,796 | | | 19,166,435 | | | | 14,624,238 | | | | N/A | |
2g: Proposal to revise the fundamental policy relating to underwriting
| | | | | | | | | | | | |
| For | | Against | | | Abstain | | | Broker Non Vote | |
| 358,787,656 | | | 19,495,268 | | | | 14,640,545 | | | | N/A | |
2i: Convert the Fund’s investment objective from fundamental to non-fundamental
| | | | | | | | | | | | |
| For | | Against | | | Abstain | | | Broker Non Vote | |
| 354,999,142 | | | 20,479,311 | | | | 17,445,016 | | | | N/A | |
2j: Approve a change in the fund’s investment objective
| | | | | | | | | | | | |
| For | | Against | | | Abstain | | | Broker Non Vote | |
| 358,711,219 | | | 19,198,770 | | | | 15,013,479 | | | | N/A | |
Proposal 3: To approve an Agreement and Plan of Reorganization that provides for the reorganization of a Fund from a Maryland corporation or Massachusetts business trust, as applicable, into a Delaware statutory trust.
| | | | | | | | | | | | |
| For | | Against | | | Abstain | | | Broker Non Vote | |
| 821,085,084 | | | 23,597,959 | | | | 50,749,721 | | | | N/A | |
86 | OPPENHEIMER GLOBAL STRATEGIC INCOME FUND/VA
|
PORTFOLIO PROXY VOTING POLICIES AND PROCEDURES;
UPDATES TO STATEMENTS OF INVESTMENTS Unaudited
The Fund has adopted Portfolio Proxy Voting Policies and Procedures under which the Fund votes proxies relating to securities (“portfolio proxies”) held by the Fund. A description of the Fund’s Portfolio Proxy Voting Policies and Procedures is available (i) without charge, upon request, by calling the Fund toll-free at 1.800.525.7048, (ii) on the Fund’s website at oppenheimerfunds.com, and (iii) on the SEC’s website at www.sec.gov. In addition, the Fund is required to file Form N-PX, with its complete proxy voting record for the 12 months ended June 30th, no later than August 31st of each year. The Fund’s voting record is available (i) without charge, upon request, by calling the Fund toll-free at 1.800.525.7048, and (ii) in the Form N-PX filing on the SEC’s website at www.sec.gov.
The Fund files its complete schedule of portfolio holdings with the SEC for the first quarter and the third quarter of each fiscal year on Form N-Q. The Fund’s Form N-Q filings are available on the SEC’s website at www.sec.gov. Those forms may be reviewed and copied at the SEC’s Public Reference Room in Washington, D.C. Information on the operation of the Public Reference Room may be obtained by calling 1-800-SEC-0330.
87 | OPPENHEIMER GLOBAL STRATEGIC INCOME FUND/VA
|
| | |
| |
| | | Financial Statements for Oppenheimer Global Strategic Income
Fund/VA (Cayman) Ltd. for the Six Months Ended June 29, 2012 |
88 | OPPENHEIMER GLOBAL STRATEGIC INCOME FUND/VA |
OPPENHEIMER GLOBAL STRATEGIC INCOME FUND/VA (CAYMAN) LTD.
STATEMENT OF ASSETS AND LIABILITIES Unaudited
| | | | |
| June 29, 20121 | | | |
| Assets | | | |
| Cash | | | 1,462,131 | |
| Receivables and other assets: | | | | |
| Other | |
| 6,824
|
|
| Total assets | | | 1,468,955 | |
| Liabilities | | | |
| Payables and other liabilities: | | | | |
| Auditing and other professional fees | | | 11,795 | |
| Other | |
| 4
|
|
| Total liabilities | | | 11,799 | |
| Net Assets | | $
| 1,457,156
|
|
| Composition of Net Assets | | | |
| Par value of shares of beneficial interest | | $ | 150 | |
| Additional paid-in capital | | | 1,499,850 | |
| Accumulated net investment loss | |
| (42,844
| )
|
| Net Assets—applicable to 15,000 shares of beneficial interest outstanding | | $
| 1,457,156
|
|
| Net Asset Value, Redemption Price Per Share and Offering Price Per Share | | $97.14 | |
| | | | | |
| 1. June 29, 2012 represents the last business day of the Fund’s 2012 semiannual period. See Note 1 of the accompanying Notes. | | | | |
See accompanying Notes to Financial Statements.
89 | OPPENHEIMER GLOBAL STRATEGIC INCOME FUND/VA
|
OPPENHEIMER GLOBAL STRATEGIC INCOME FUND/VA (CAYMAN) LTD.
STATEMENT OF OPERATIONS Unaudited
| | | | |
| For the Six Months Ended June 29, 20121 | | | |
| Expenses | | | |
| Management fees | | $ | 5,474 | |
| Auditing and other professional fees | | | 12,861 | |
| Directors’ compensation | | | 5,939 | |
| Custodian fees and expenses | | | 972 | |
| Other | |
| 117
|
|
| Total expenses | | | 25,363 | |
| Net Investment Loss | | | (25,363 | ) |
| Net Decrease in Net Assets Resulting from Operations | | $
| (25,363
| )
|
1. June 29, 2012 represents the last business day of the Fund’s 2012 semiannual period. See Note 1 of the accompanying Notes. | | | | |
See accompanying Notes to Financial Statements.
90 | OPPENHEIMER GLOBAL STRATEGIC INCOME FUND/VA
|
OPPENHEIMER GLOBAL STRATEGIC INCOME FUND/VA (CAYMAN) LTD.
STATEMENTS OF CHANGES IN NET ASSETS
| | | | | | | | |
| | | Six Months
Ended
June 29, 20121
(Unaudited) | | | Period
Ended
December 30,
20111,2 | |
| Operations | | | | | | |
| Net investment loss | | $
| (25,363
| )
| | $
| (17,481
| )
|
| Net decrease in net assets resulting from operations | | | (25,363 | ) | | | (17,481 | ) |
| Capital Transactions | | | | | | | | |
| Net increase in net assets resulting from capital transactions | | | — | | | | 1,500,000 | |
| Net Assets | | | | | | | | |
| Total increase (decrease) | | | (25,363 | ) | | | 1,482,519 | |
| Beginning of period | |
| 1,482,519
|
| |
| —
|
|
| End of period (including accumulated net investment loss of $42,844 and $17,481, respectively) | | $
| 1,457,156
|
| | $
| 1,482,519
|
|
1. June 29, 2012 and December 30, 2011 represent the last business days of the Fund’s respective reporting periods. See Note 1 of the accompanying Notes.
2. For the period from November 21, 2011 (commencement of operations) through December 30, 2011.
See accompanying Notes to Financial Statements.
91 | OPPENHEIMER GLOBAL STRATEGIC INCOME FUND/VA
|
NOTES TO FINANCIAL STATEMENTS Unaudited / Continued
1. Significant Accounting Policies
Oppenheimer Global Strategic Income Fund/VA (Cayman) Ltd. (the “Fund”) is organized as a Cayman Islands Company Limited by Shares. The Fund intends to carry on the business of an investment company and to acquire, invest in and hold by way of investment, sell and deal primarily in commodity-linked derivatives (including commodity futures, financial futures, options and swap contracts) and exchange traded funds (“ETF”). The Fund’s investment adviser is OppenheimerFunds, Inc. (the “Manager”). The Sub-Adviser is Oppenheimer Real Asset Management, Inc. (“ORAMI” or the “Sub-Adviser”), a wholly-owned subsidiary of the Manager. As of June 29, 2012, 100% of the Fund was owned by Oppenheimer Global Strategic Income Fund/VA (“OGSIFVA”). The Manager is also the investment adviser of OGSIFVA.
The beneficial interest of each investor in the Fund is represented by units of participating shares. The Fund’s directors may further designate classes of participating shares and series within each class. As of June 29, 2012, the directors have not designated classes or series of outstanding participating shares. During the six months ended June 29, 2012, all income, profits, losses and expenses, if any, of the Fund were allocated pro rata to all participating shares of the Fund. Issuance of additional participating shares is at the discretion of the Fund’s directors.
The following is a summary of significant accounting policies consistently followed by the Fund.
Semiannual and Annual Periods. The last day of the Fund’s semiannual period was the last day the New York Stock Exchange was open for trading. The Fund’s financial statements have been presented through that date to maintain consistency with the Fund’s net asset value calculations used for shareholder transactions.
The last day of the Fund’s fiscal year was the last day the New York Stock Exchange was open for trading. The Fund’s financial statements have been presented through that date to maintain consistency with the Fund’s net asset value calculations used for shareholder transactions.
Income Taxes. The Fund has received an undertaking from the Government of the Cayman Islands exempting it from all local income, profits and capital gains taxes through September of 2030. No such taxes are levied in the Cayman Islands at the present time. The Fund is a Controlled Foreign Corporation under U.S. tax laws and as such is not subject to U.S. income tax. Therefore, the Fund is not required to record a tax provision.
Dividends and Distributions to Shareholders. Dividends and distributions to shareholders, if any, are declared and paid annually from the Fund’s tax basis earnings and profits. Distributions are recorded on ex-dividend date. The tax character of distributions is determined as of the Fund’s fiscal year end. Therefore, a portion of the Fund’s distributions made to shareholders prior to the Fund’s fiscal year end may ultimately be categorized as a tax return of capital.
Investment Income. Dividend income is recorded on the ex-dividend date or upon ex-dividend notification in the case of certain foreign dividends where the ex-dividend date may have passed. Non-cash dividends included in dividend income, if any, are recorded at the fair market value of the securities received. Interest income is recognized on an accrual basis. Discount and premium, which are included in interest income on the Statement of Operations, are amortized or accreted daily.
Custodian Fees. “Custodian fees and expenses” in the Statement of Operations may include interest expense incurred by the Fund on any cash overdrafts of its custodian account during the period. Such cash overdrafts may result from the effects of failed trades in portfolio securities and from cash outflows resulting from unanticipated shareholder redemption activity. The Fund pays interest to its custodian on such cash overdrafts, to the extent they are not offset by positive cash balances maintained by the Fund, at a rate equal to the Federal Funds Rate plus 0.50%. The “Reduction to custodian expenses” line item, if applicable, represents earnings on cash balances maintained by the Fund during the period. Such interest expense and other custodian fees may be paid with these earnings.
Security Transactions. Security transactions are recorded on the trade date. Realized gains and losses on securities sold are determined on the basis of identified cost.
92 | OPPENHEIMER GLOBAL STRATEGIC INCOME FUND/VA
|
Indemnifications. The Fund’s organizational documents provide current and former trustees and officers with a limited indemnification against liabilities arising in connection with the performance of their duties to the Fund. In the normal course of business, the Fund may also enter into contracts that provide general indemnifications. The Fund’s maximum exposure under these arrangements is unknown as this would be dependent on future claims that may be made against the Fund. The risk of material loss from such claims is considered remote.
Other. The preparation of financial statements in conformity with accounting principles generally accepted in the United States of America requires management to make estimates and assumptions that affect the reported amounts of assets and liabilities and disclosure of contingent assets and liabilities at the date of the financial statements and the reported amounts of increases and decreases in net assets from operations during the reporting period. Actual results could differ from those estimates.
2. Securities Valuation
The Fund calculates the net asset value of its shares as of the close of the New York Stock Exchange (the “Exchange”), normally 4:00 P.M. Eastern time, on each day the Exchange is open for trading.
The Fund’s Board has adopted procedures for the valuation of the Fund’s securities and has delegated the day-to-day responsibility for valuation determinations under those procedures to the Manager. The Manager has established a Valuation Committee which is responsible for determining a “fair valuation” for any security for which market quotations are not “readily available.” The Valuation Committee’s fair valuation determinations are subject to review, approval and ratification by the Fund’s Board at its next regularly scheduled meeting covering the calendar quarter in which the fair valuation was determined.
Valuation Methods and Inputs
Securities are valued using unadjusted quoted market prices, when available, as supplied primarily by third party pricing services or dealers.
The following methodologies are used to determine the market value or the fair value of the types of securities described below:
Securities traded on a registered U.S. securities exchange (including exchange-traded derivatives other than futures and futures options) are valued based on the last sale price of the security reported on the principal exchange on which it is traded, prior to the time when the Fund’s assets are valued. In the absence of a sale, the security is valued at the last sale price on the prior trading day, if it is within the spread of the current day’s closing “bid” and “asked” prices, and if not, at the current day’s closing bid price. A security of a foreign issuer traded on a foreign exchange but not listed on a registered U.S. securities exchange is valued based on the last sale price on the principal exchange on which the security is traded, as identified by the third party pricing service used by the Manager, prior to the time when the Fund’s assets are valued. If the last sale price is unavailable, the security is valued at the most recent official closing price on the principal exchange on which it is traded. If the last sales price or official closing price for a foreign security is not available, the security is valued at the mean between the bid and asked price per the exchange or, if not available from the exchange, obtained from two dealers. If bid and asked prices are not available from either the exchange or two dealers, the security is valued by using one of the following methodologies (listed in order of priority); (1) using a bid from the exchange, (2) the mean between the bid and asked price as provided by a single dealer, or (3) a bid from a single dealer.
Shares of a registered investment company that are not traded on an exchange are valued at that investment company’s net asset value per share.
Corporate and government debt securities (of U.S. or foreign issuers) and municipal debt securities, event-linked bonds, loans, mortgage-backed securities, collateralized mortgage obligations, and asset-backed securities are valued at the mean between the “bid” and “asked” prices utilizing evaluated prices obtained from third party pricing services or broker-dealers who may use matrix pricing methods to determine the evaluated prices.
93 | OPPENHEIMER GLOBAL STRATEGIC INCOME FUND/VA
|
NOTES TO FINANCIAL STATEMENTS Unaudited / Continued
2. Securities Valuation Continued
Short-term money market type debt securities with a remaining maturity of sixty days or less are valued at cost adjusted by the amortization of discount or premium to maturity (amortized cost), which approximates market value. Short-term debt securities with a remaining maturity in excess of sixty days are valued at the mean between the “bid” and “asked” prices utilizing evaluated prices obtained from third party pricing services or broker-dealers.
A description of the standard inputs that may generally be considered by the third party pricing vendors in determining their evaluated prices is provided below.
| | |
| Security Type | | Standard inputs generally considered by third-party pricing
vendors |
| Corporate debt, government debt, municipal, mortgage-backed and asset-backed securities | | Reported trade data, broker-dealer price quotations, benchmark yields, issuer spreads on comparable securities, the credit quality, yield, maturity, and other appropriate factors. |
| Loans | | Information obtained from market participants regarding reported trade data and broker-dealer price quotations. |
| Event-linked bonds | | Information obtained from market participants regarding reported trade data and broker-dealer price quotations. |
If a market value or price cannot be determined for a security using the methodologies described above, or if, in the “good faith” opinion of the Manager, the market value or price obtained does not constitute a “readily available market quotation,” or a significant event has occurred that would materially affect the value of the security the security is fair valued either (i) by a standardized fair valuation methodology applicable to the security type or the significant event as previously approved by the Valuation Committee and the Fund’s Board or (ii) as determined in good faith by the Manager’s Valuation Committee. The Valuation Committee considers all relevant facts that are reasonably available, through either public information or information available to the Manager, when determining the fair value of a security. Fair value determinations by the Manager are subject to review, approval and ratification by the Fund’s Board at its next regularly scheduled meeting covering the calendar quarter in which the fair valuation was determined. Those fair valuation standardized methodologies include, but are not limited to, valuing securities at the last sale price or initially at cost and subsequently adjusting the value based on: changes in company specific fundamentals, changes in an appropriate securities index, or changes in the value of similar securities which may be further adjusted for any discounts related to security-specific resale restrictions. When possible, such methodologies use observable market inputs such as unadjusted quoted prices of similar securities, observable interest rates, currency rates and yield curves. The methodologies used for valuing securities are not necessarily an indication of the risks associated with investing in those securities nor can it be assured that the Fund can obtain the fair value assigned to a security if it were to sell the security.
To assess the continuing appropriateness of security valuations, the Manager, or its third party service provider who is subject to oversight by the Manager, regularly compares prior day prices, prices on comparable securities, and sale prices to the current day prices and challenges those prices exceeding certain tolerance levels with the third party pricing service or broker source. For those securities valued by fair valuations, whether through a standardized fair valuation methodology or a fair valuation determination, the Valuation Committee reviews and affirms the reasonableness of the valuations based on such methodologies and fair valuation determinations on a regular basis after considering all relevant information that is reasonably available.
There have been no significant changes to the fair valuation methodologies of the Fund during the period.
94 | OPPENHEIMER GLOBAL STRATEGIC INCOME FUND/VA
|
3. Capital Transactions
The Fund has authorized 5,000,000 participating shares of $0.01 par value per share. The Fund issued 15,000 participating shares for $1,500,000 on November 21, 2011 in conjunction with OGSI’s initial capitalization of the Fund. All subsequent capital contributions and withdrawals did not have participating shares associated with the transaction.
Capital transactions were as follows:
| | | | | | | | |
| | | Six Months Ended
June 29, 2012 | | | Period Ended
December 30, 20111 | |
| | | Amount | | | Amount | |
| Contributions | | | $— | | | | $ 1,500,000 | |
Withdrawals | | | — | | | | — | |
| | |
|
|
| |
|
|
|
| Net increase | | | $— | | | | $1,500,000 | |
| | |
|
|
| |
|
|
|
1. For the period from November 21, 2011 (commencement of operations) to December 30, 2011.
4. Expenses
Management Fees. Under the investment advisory agreement, the Fund pays the Manager a management fee based on the daily net assets of the Fund at an annual rate as shown in the following table:
| | | | |
| Fee Schedule | | | |
Up to $200 million | | | 0.75 | % |
Next $200 million | | | 0.72 | |
Next $200 million | | | 0.69 | |
Next $200 million | | | 0.66 | |
Next $200 million | | | 0.60 | |
Over $1 billion | | | 0.50 | |
Sub-Adviser Fees. The Manager retains the Sub-Adviser to provide the day-to-day portfolio management of the Fund. Under the Sub-Advisory Agreement, the Manager pays the Sub-Adviser a fee in monthly installments, based on the daily net assets of the Fund at an annual rate as shown in the following table:
| | | | |
| Fee Schedule | | | |
Up to $200 million | | | 0.375 | % |
Next $200 million | | | 0.360 | |
Next $200 million | | | 0.345 | |
Next $200 million | | | 0.330 | |
Next $200 million | | | 0.300 | |
Over $1 billion | | | 0.250 | |
The Fund shall bear all fees and expenses related to the business and affairs of the Fund, including among others, directors’ fees, audit fees, custodian fees and expenses in connection with the purchase and sale of securities and other Fund assets.
5. Financial Highlights
The following represents the total return of the Fund for the six months ended June 29, 2012. Total return was calculated based upon the daily returns of the Fund during this period. The calculation has not been annualized for reporting purposes:
| | | | |
Six Months Ended June 29, 2012 | | | (1.71 | )% |
Period Ended December 30, 20111 | | | (1.17 | )% |
95 | OPPENHEIMER GLOBAL STRATEGIC INCOME FUND/VA
|
NOTES TO FINANCIAL STATEMENTS Unaudited / Continued
5. Financial Highlights Continued
The following represents certain financial ratios of the Fund for the periods noted. The computation of the net investment income and total expense ratios was based upon the daily net assets of the Fund during these periods. The calculations have been annualized for reporting purposes:
| | | | | | | | |
| | | Six Months Ended
June 29, 2012 | | | Period Ended
December 30, 20111 | |
Ratios to average net assets: | | | | | | | | |
Net investment loss | | | (3.48 | )% | | | (10.44 | )% |
Total expenses | | | 3.48 | % | | | 10.44 | % |
1. For the period from November 21, 2011 (commencement of operations) through December 30, 2011.
6. Pending Litigation
Since 2009, a number of class action, derivative and individual lawsuits have been pending in federal and state courts against OppenheimerFunds, Inc., the Fund’s investment advisor (the “Manager”), OppenheimerFunds Distributor, Inc., the Fund’s principal underwriter and distributor (the “Distributor”), and certain funds (but not including the Fund) advised by the Manager and distributed by the Distributor (the “Defendant Funds”). Several of these lawsuits also name as defendants certain officers and current and former trustees of the respective Defendant Funds. The lawsuits raise claims under federal securities laws and various states’ securities, consumer protection and common law and allege, among other things, that the disclosure documents of the respective Defendant Funds contained misrepresentations and omissions and that the respective Defendant Funds’ investment policies were not followed. The plaintiffs in these actions seek unspecified damages, equitable relief and awards of attorneys’ fees and litigation expenses.
Other class action and individual lawsuits have been filed since 2008 in various state and federal courts against the Manager and certain of its affiliates by investors seeking to recover investments they allegedly lost as a result of the “Ponzi” scheme run by Bernard L. Madoff and his firm, Bernard L. Madoff Investment Securities, LLC (“BLMIS”). Plaintiffs in these suits allege that they suffered losses as a result of their investments in several funds managed by an affiliate of the Manager and assert a variety of claims, including breach of fiduciary duty, fraud, negligent misrepresentation, unjust enrichment, and violation of federal and state securities laws and regulations, among others. They seek unspecified damages, equitable relief and awards of attorneys’ fees and litigation expenses. Neither the Distributor, nor any of the Oppenheimer mutual funds, their independent trustees or directors are named as defendants in these lawsuits. None of the Oppenheimer mutual funds invested in any funds or accounts managed by Madoff or BLMIS. On February 28, 2011, a stipulation of partial settlement of three groups of consolidated putative class action lawsuits relating to these matters was filed in the U.S. District Court for the Southern District of New York. On August 19, 2011, the court entered an order and final judgment approving the settlement as fair, reasonable and adequate. In September 2011, certain parties filed notices of appeal from the court’s order approving the settlement. On July 29, 2011, a stipulation of settlement between certain affiliates of the Manager and the Trustee appointed under the Securities Investor Protection Act to liquidate BLMIS was filed in the U.S. Bankruptcy Court for the Southern District of New York to resolve purported preference and fraudulent transfer claims by the Trustee. On September 22, 2011, the court entered an order approving the settlement as fair, reasonable and adequate. In October 2011, certain parties filed notices of appeal from the court’s order approving the settlement. The aforementioned settlements do not resolve other outstanding lawsuits against the Manager and its affiliates relating to BLMIS.
On April 16, 2010, a lawsuit was filed in New York state court against the Manager, an affiliate of the Manager and AAArdvark IV Funding Limited (“AAArdvark IV”), an entity advised by the Manager’s affiliate, in connection with investments made by the plaintiffs in AAArdvark IV. Plaintiffs allege breach of contract against the defendants and seek compensatory damages, costs and disbursements, including attorney fees. On July 15, 2011, a lawsuit was filed in New York state court against the Manager, an affiliate of the Manager and AAArdvark Funding Limited (“AAArdvark I”), an
96 | OPPENHEIMER GLOBAL STRATEGIC INCOME FUND/VA
|
entity advised by the Manager’s affiliate, in connection with investments made by the plaintiffs in AAArdvark I. The complaint alleges breach of contract against the defendants and seeks compensatory damages, costs and disbursements, including attorney fees. On November 9, 2011, a lawsuit was filed in New York state court against the Manager, an affiliate of the Manager and AAArdvark XS Funding Limited (“AAArdvark XS”), an entity advised by the Manager’s affiliate, in connection with investments made by the plaintiffs in AAArdvark XS. The complaint alleges breach of contract against the defendants and seeks compensatory damages, costs and disbursements, including attorney fees.
The Manager believes the lawsuits and appeals described above are without legal merit and, with the exception of actions it has settled, is defending against them vigorously. The Defendant Funds’ Boards of Trustees have also engaged counsel to represent the Funds and the present and former Independent Trustees named in those suits. While it is premature to render any opinion as to the outcome in these lawsuits, or whether any costs that the Defendant Funds may bear in defending the suits might not be reimbursed by insurance, the Manager believes that these suits should not impair the ability of the Manager or the Distributor to perform their respective duties to the Fund, and that the outcome of all of the suits together should not have any material effect on the operations of any of the Oppenheimer mutual funds.
7. Subsequent Events Evaluation
The Fund has evaluated the need for disclosures and/or adjustments resulting from subsequent events through August 16, 2012, the date the financial statements were available to be issued. This evaluation determined that there are no subsequent events that necessitated disclosures and/or adjustments.
97 | OPPENHEIMER GLOBAL STRATEGIC INCOME FUND/VA
|
OPPENHEIMER GLOBAL STRATEGIC INCOME FUND/VA
| | |
| A Series of Oppenheimer Variable Account Funds |
| Trustees and Officers | | William L. Armstrong, Chairman of the Board of Trustees and Trustee Edward L. Cameron, Trustee Jon S. Fossel, Trustee Sam Freedman, Trustee Richard F. Grabish, Trustee Beverly L. Hamilton, Trustee Victoria J. Herget, Trustee Robert J. Malone, Trustee F. William Marshall, Jr., Trustee Karen L. Stuckey, Trustee James D. Vaughn, Trustee William F. Glavin, Jr., Trustee, President and Principal Executive Officer Arthur P. Steinmetz, Vice President Krishna Memani, Vice President Joseph Welsh, Vice President Sara J. Zervos, Ph.D. Vice President Arthur S. Gabinet, Secretary and Chief Legal Officer Christina M. Nasta, Vice President and Chief Business Officer Mark S. Vandehey, Vice President and Chief Compliance Officer Brian W. Wixted, Treasurer and Principal Financial & Accounting Officer |
| Manager | | OppenheimerFunds, Inc. |
| Distributor | | OppenheimerFunds Distributor, Inc. |
| Transfer Agent | | OppenheimerFunds Services |
| Independent Registered Public Accounting Firm | | KPMGLLP |
| Counsel | | K&L Gates LLP |
Before investing, investors should carefully consider a fund’s investment objectives, risks, charges and expenses. Fund prospectuses and summary prospectuses contain this and other information about the funds and may be obtained by asking your financial advisor, or calling us at 1.800.988.8287. Read prospectuses and summary prospectuses, carefully before investing.
The financial statements included herein have been taken from the records of the Fund without examination of those records by the independent auditors.
| | |
| ©2012 OppenheimerFunds, Inc. All rights reserved. | |  |
June 30, 2012
| | | | |
| | | |
| | | Oppenheimer Value Fund/VA A Series of Oppenheimer Variable Account Funds | | Semiannual Report |

SEMIANNUAL REPORT
Fund Performance Discussion
Listing of Top Holdings
Financial Statements

OPPENHEIMER VALUE FUND/VA
Portfolio Manager: Mitch Williams, CFA
| | | | | | |
Cumulative Total Returns
For the 6-Month Period Ended 6/29/121 |
| Non-Service Shares | | 5.68% | | | | |
| Service Shares | | 4.42 | | | | |
Average Annual Total Returns
For the Periods Ended 6/29/121 | | |
| | | |
| | | 1-Year | | 5-Year | | Since
Inception
(1/2/03) |
| Non-Service Shares | | –6.27% | | 0.65% | | 8.02% |
| | | |
| | | 1-Year | | 5-Year | | Since
Inception
(9/18/06) |
| Service Shares | | –5.70% | | –3.66% | | 0.01% |
Expense Ratios
For the Fiscal Year Ended 12/30/111 | | |
| | | |
| | | Gross
Expense
Ratios | | | | Net
Expense
Ratios |
| Non-Service Shares | | 1.83% | | | | 0.80% |
| Service Shares | | 1.90 | | | | 1.05 |
The performance data quoted represents past performance, which does not guarantee future results. The investment return and principal value of an investment in the Fund will fluctuate so that an investor’s shares, when redeemed, may be worth more or less than their original cost. Current performance and expense ratios may be lower or higher than the data quoted. For performance data current to the most recent month end, call us at 1.800.988.8287. The Fund’s total returns should not be expected to be the same as the returns of other funds, whether or not both funds have the same portfolio managers and/or similar names. The Fund’s total returns do not include the charges associated with the separate account products that offer this Fund. Such performance would have been lower if such charges were taken into account. Expense ratios are as stated in the Fund’s prospectus current as of the date of this report. The net expense ratios take into account voluntary fee waivers and/or expense reimbursements, without which performance would have been less. Some of these undertakings may be modified or terminated at any time, as indicated in the Fund’s prospectus.
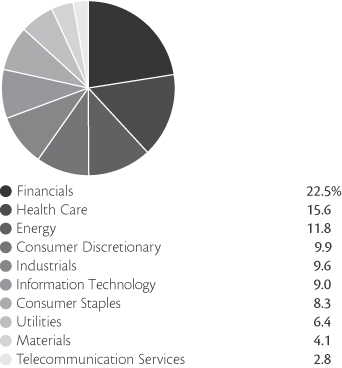
Portfolio holdings and allocations are subject to change. Percentages are as of June 29, 2012, and are based on the total market value of common stocks.
| | |
| Top Ten Common Stock Holdings | | |
| Chevron Corp. | | 5.3% |
| Humana, Inc. | | 3.8 |
| Coca-Cola Co. (The) | | 3.8 |
| Honeywell International, Inc. | | 3.5 |
| Merck & Co., Inc. | | 3.4 |
| Wells Fargo & Co. | | 3.2 |
| Target Corp. | | 3.2 |
| Exxon Mobil Corp. | | 3.1 |
| UnitedHealth Group, Inc. | | 3.0 |
| Goldman Sachs Group, Inc. (The) | | 3.0 |
Portfolio holdings and allocations are subject to change. Percentages are as of June 29, 2012, and are based on net assets.
2 | OPPENHEIMER VALUE FUND/VA
|
FUND PERFORMANCE DISCUSSION
During the six-month period ended June 29, 2012, the Fund’s Non-Service shares returned 5.68%. In comparison, the Fund underperformed the Russell 1000 Value Index (the “Index”), which returned 8.68%.1 The Fund underperformed the Index primarily in the industrials and information technology sectors, and underperformed to a lesser degree in the utilities, telecommunication services and materials sectors. The Fund outperformed the Index in the consumer staples sector.
Economic and Market Environment
The period began during a time of improved market sentiment in which the United States managed to avoid a return to recession and European policymakers appeared to take steps to address the region’s sovereign debt and banking sector crises. Renewed investor optimism helped produce gains across a number of international equity markets over the first three months of 2012. The rebound across equities gained momentum after the European Central Bank implemented the Long-Term Refinancing Operation (“LTRO”) to enhance liquidity for troubled banks and reduce rates on newly issued sovereign debt securities.
However, the second quarter was a volatile time for global markets. The fear of contagion from the worsening European sovereign debt crisis and a recession across much of Europe drove negative market sentiment, particularly over May and June. Very high unemployment, soaring debt and higher borrowing costs in Greece, Spain and Italy contributed to serious questions over how to implement austerity measures and restructure debt or instead take a different tact and provide some or all of those countries with additional funds. Perhaps most worrisome of all to investors was the possibility of Greece pulling out of the euro and its ramifications for the future of the Eurozone and its common currency. In the U.S., slower than expected first quarter growth also contributed to a sell-off in the U.S. stock market. Consumer confidence dropped as U.S. unemployment figures ticked slightly upwards after showing signs of improvement from the recession highs. However, the period ended on a positive note for the markets. The results of elections in Greece and continued efforts by European policymakers to stabilize the situation in the region appeared to soothe market jitters slightly in the final days of the period.
Fund Review
Four out of the top five performing stocks of the Fund were in the financials sector: Wells Fargo & Co., JPMorgan Chase & Co., U.S. Bancorp and MetLife, Inc. Following another round of bank stress tests by the Federal Reserve in March 2012, stocks of banks, including Wells Fargo, JPMorgan Chase and U.S. Bancorp, rallied. We exited our position in JPMorgan by period end. The stock of insurance company MetLife performed positively early in the period, and we exited our position over the first quarter, locking in gains. Also contributing to performance was consumer discretionary stock Comcast Corp. The cable provider’s high-speed Internet subscriptions increased during the period, which contributed to a positive earnings surprise. Additionally, Comcast aggressively repurchased shares and increased its dividend by over forty percent.
The most significant detractors from the Fund’s performance were Juniper Networks, Inc., Navistar International Corp. and GenOn Energy, Inc. Networking company Juniper experienced declines over the second quarter of 2012, announcing a decrease in revenue. Navistar, a manufacturer of commercial and military trucks, was negatively impacted by higher costs. It also has lost share in the Heavy Duty Class 8 truck market as the company struggles to develop an engine that meets new emissions rules. GenOn Energy is one of the largest generators of wholesale electricity in the United States. Shares of GenOn were hampered by declining natural gas prices, which hit 10-year lows during the period. We continue to believe that GenOn will benefit from its healthy balance sheet and the potential for higher power prices stemming from EPA regulations that may essentially force the closure of several competing power plants.
1. June 29, 2012, was the last business day of the Fund’s semiannual period. See Note 1 of the accompanying Notes to Financial Statements. Index returns are calculated through June 30, 2012. December 30, 2011 was the last business day of the Fund’s 2011 fiscal year.
3 | OPPENHEIMER VALUE FUND/VA
|
FUND PERFORMANCE DISCUSSION
Also hurting performance were Humana, Inc. and Cisco Systems, Inc. Humana, Inc. detracted from results as the managed health care company reported a decrease in profit in its first quarter, breaking a streak of four straight profit increases. Networking company Cisco declined after releasing earnings guidance below analysts’ expectations.
Outlook
We continue to have a tempered view of the global economy as the world continues to delever, with the risk of a European financial crisis or hard landing in China undermining companies’ willingness to invest. We believe that the U.S. currently has better investment prospects than the world’s other developed markets, though we do not believe the U.S. would be immune to worsening problems in Europe. Overall, we expect another year of continued higher volatility as the world continues to struggle with deleveraging, but we believe the U.S. market may be a relative winner in this process.
Our relative optimism on the U.S. stems from lower energy prices, an improving housing market and a general belief that, especially in an election year, the government will not engage in a radical withdrawal of stimulative economic measures. Moreover, the U.S. economy has proven time and time again to be more flexible and adaptive than its larger peers. Given this backdrop, we believe we remain well-positioned in inexpensive names that may perform well in a recovering economy. While we have seen some names in our portfolio move to discounts that we find surprising, we are excited about the prospects that lie ahead for the Fund.
Investors should consider the Fund’s investment objective, risks, and charges and expenses carefully before investing. The Fund’s prospectus and summary prospectus contain this and other information about the Fund, and may be obtained by asking your financial advisor or calling us at 1.800.988.8287. Read prospectuses and summary prospectuses carefully before investing.
Total returns include changes in share price and reinvestment of dividends and capital gains distributions in a hypothetical investment for the periods shown. Cumulative total returns are not annualized.
The Fund’s investment strategy and focus can change over time. The mention of specific fund holdings does not constitute a recommendation by OppenheimerFunds, Inc.
Shares of Oppenheimer funds are not deposits or obligations of any bank, are not guaranteed by any bank, are not insured by the FDIC or any other agency, and involve investment risks, including the possible loss of the principal amount invested.
4 | OPPENHEIMER VALUE FUND/VA
|
FUND EXPENSES
Fund Expenses. As a shareholder of the Fund, you incur two types of costs: (1) transaction costs and (2) ongoing costs, including management fees; distribution and service fees; and other Fund expenses. These examples are intended to help you understand your ongoing costs (in dollars) of investing in the Fund and to compare these costs with the ongoing costs of investing in other mutual funds.
The examples are based on an investment of $1,000.00 invested at the beginning of the period and held for the entire 6-month period ended June 29, 2012.
Actual Expenses. The first section of the table provides information about actual account values and actual expenses. You may use the information in this section for the class of shares you hold, together with the amount you invested, to estimate the expense that you paid over the period. Simply divide your account value by $1,000.00 (for example, an $8,600.00 account value divided by $1,000.00 = 8.60), then multiply the result by the number in the first section under the heading entitled “Expenses Paid During Period” to estimate the expenses you paid on your account during this period.
Hypothetical Example for Comparison Purposes. The second section of the table provides information about hypothetical account values and hypothetical expenses based on the Fund’s actual expense ratio for each class of shares, and an assumed rate of return of 5% per year for each class before expenses, which is not the actual return. The hypothetical account values and expenses may not be used to estimate the actual ending account balance or expenses you paid for the period. You may use this information to compare the ongoing costs of investing in the Fund and other funds. To do so, compare this 5% hypothetical example for the class of shares you hold with the 5% hypothetical examples that appear in the shareholder reports of the other funds.
Please note that the expenses shown in the table are meant to highlight your ongoing costs only and do not reflect any charges associated with the separate accounts that offer this Fund. Therefore, the “hypothetical” lines of the table are useful in comparing ongoing costs only, and will not help you determine the relative total costs of owning different funds. In addition, if these separate account charges were included your costs would have been higher.
| | | | | | | | | | | | |
| Actual | | Beginning
Account
Value
January 1, 2012 | | | Ending
Account
Value
June 29, 2012 | | | Expenses
Paid During
6 Months Ended
June 29, 2012 | |
| Non-Service Shares | | $ | 1,000.00 | | | $ | 1,056.80 | | | $ | 4.08 | |
| Service Shares | | | 1,000.00 | | | | 1,044.20 | | | | 5.32 | |
| | | |
Hypothetical
(5% return before expenses) | | | | | | | | | |
| Non-Service Shares | | | 1,000.00 | | | | 1,020.77 | | | | 4.01 | |
| Service Shares | | | 1,000.00 | | | | 1,019.53 | | | | 5.26 | |
Expenses are equal to the Fund’s annualized expense ratio for that class, multiplied by the average account value over the period, multiplied by 181/366 (to reflect the one-half year period). Those annualized expense ratios, excluding indirect expenses from affiliated fund, based on the 6-month period ended June 29, 2012 are as follows:
| | | | |
| Class | | Expense Ratios | |
| Non-Service Shares | | | 0.80 | % |
| Service Shares | | | 1.05 | |
The expense ratios reflect voluntary waivers and/or reimbursements of expenses by the Fund’s Manager. Some of these undertakings may be modified or terminated at any time, as indicated in the Fund’s prospectus. The “Financial Highlights” tables in the Fund’s financial statements, included in this report, also show the gross expense ratios, without such waivers or reimbursements and reduction to custodian expenses, if applicable.
5 | OPPENHEIMER VALUE FUND/VA
|
STATEMENT OF INVESTMENTS June 29, 2012* / Unaudited
| | | | | | | | |
| | | Shares | | | Value | |
| | | | | | | | | |
| Common Stocks—97.9% | | | | | | | | |
| Consumer Discretionary—9.7% | | | | | |
| Automobiles—1.4% | | | | | | | | |
| Ford Motor Co. | | | 10,120 | | | $ | 97,051 | |
| Household Durables—2.3% | | | | | | | | |
| Mohawk Industries, Inc.1 | | | 2,330 | | | | 162,704 | |
| Media—2.7% | | | | | | | | |
| Comcast Corp., Cl. A | | | 5,050 | | | | 161,449 | |
| Viacom, Inc., Cl. B | | | 720 | | | | 33,854 | |
| | | | | | |
|
|
|
| | | | | | | | 195,303 | |
| Multiline Retail—3.2% | | | | | | | | |
| Target Corp. | | | 3,940 | | | | 229,269 | |
| Specialty Retail—0.1% | | | | | | | | |
| Talbots, Inc. (The)1 | | | 1,940 | | | | 4,889 | |
| Consumer Staples—8.2% | | | | | | | | |
| Beverages—6.9% | | | | | | | | |
| Coca-Cola Co. (The) | | | 3,410 | | | | 266,628 | |
| Molson Coors Brewing Co., Cl. B, Non-Vtg. | | | 3,600 | | | | 149,796 | |
| PepsiCo, Inc. | | | 1,010 | | | | 71,367 | |
| | | | | | |
|
|
|
| | | | | | | | 487,791 | |
| Household Products—1.3% | | | | | | | | |
| Church & Dwight Co., Inc. | | | 1,630 | | | | 90,416 | |
| Energy—11.6% | | | | | | | | |
| Energy Equipment & Services—1.6% | | | | | | | | |
| Baker Hughes, Inc. | | | 2,650 | | | | 108,915 | |
| Oil, Gas & Consumable Fuels—10.0% | | | | | | | | |
| Apache Corp. | | | 710 | | | | 62,402 | |
| Chevron Corp. | | | 3,570 | | | | 376,635 | |
| Exxon Mobil Corp. | | | 2,574 | | | | 220,257 | |
| Valero Energy Corp. | | | 2,110 | | | | 50,957 | |
| | | | | | |
|
|
|
| | | | | | | | 710,251 | |
| Financials—22.0% | | | | | | | | |
| Capital Markets—5.2% | | | | | | | | |
| BlackRock, Inc. | | | 920 | | | | 156,234 | |
| Goldman Sachs Group, Inc. (The) | | | 2,180 | | | | 208,975 | |
| | | | | | |
|
|
|
| | | | | | | | 365,209 | |
| Commercial Banks—9.8% | | | | | | | | |
| M&T Bank Corp. | | | 1,900 | | | | 156,883 | |
| PNC Financial Services Group, Inc. | | | 1,690 | | | | 103,276 | |
| SunTrust Banks, Inc. | | | 5,350 | | | | 129,631 | |
| U.S. Bancorp | | | 2,260 | | | | 72,682 | |
| Wells Fargo & Co. | | | 6,880 | | | | 230,067 | |
| | | | | | |
|
|
|
| | | | | | | | 692,539 | |
| | | | | | | | |
| | | Shares | | | Value | |
| | | | | | | | | |
| Diversified Financial Services—2.5% | | | | | | | | |
| Citigroup, Inc. | | | 6,440 | | | $ | 176,520 | |
| Insurance—4.5% | | | | | | | | |
| ACE Ltd. | | | 2,360 | | | | 174,947 | |
| Marsh & McLennan Cos., Inc. | | | 1,980 | | | | 63,815 | |
| Travelers Cos., Inc. (The) | | | 1,300 | | | | 82,992 | |
| | | | | | |
|
|
|
| | | | | | | | 321,754 | |
| Health Care—15.2% | | | | | | | | |
| Health Care Equipment & Supplies—1.3% | | | | | | | | |
| Baxter International, Inc. | | | 1,810 | | | | 96,202 | |
| Health Care Providers & Services—6.8% | | | | | | | | |
| Humana, Inc. | | | 3,460 | | | | 267,942 | |
| UnitedHealth Group, Inc. | | | 3,610 | | | | 211,185 | |
| | | | | | |
|
|
|
| | | | | | | | 479,127 | |
| Pharmaceuticals—7.1% | | | | | | | | |
| Merck & Co., Inc. | | | 5,800 | | | | 242,150 | |
| Pfizer, Inc. | | | 6,700 | | | | 154,100 | |
| Teva Pharmaceutical Industries Ltd., Sponsored ADR | | | 2,690 | | | | 106,094 | |
| | | | | | |
|
|
|
| | | | | | | | 502,344 | |
| Industrials—9.4% | | | | | | | | |
| Aerospace & Defense—3.5% | | | | | | | | |
| Honeywell International, Inc. | | | 4,380 | | | | 244,579 | |
| Airlines—0.5% | | | | | | | | |
| United Continental Holdings, Inc.1 | | | 1,420 | | | | 34,549 | |
| Construction & Engineering—1.1% | | | | | |
| Quanta Services, Inc.1 | | | 3,100 | | | | 74,617 | |
| Industrial Conglomerates—2.0% | | | | | |
| Tyco International Ltd. | | | 2,700 | | | | 142,695 | |
| Machinery—0.7% | | | | | | | | |
| Navistar International Corp.1 | | | 1,870 | | | | 53,052 | |
| Trading Companies & Distributors—1.6% | | | | | | | | |
| AerCap Holdings NV1 | | | 10,290 | | | | 116,071 | |
| Information Technology—8.8% | | | | | |
| Communications Equipment—4.6% | | | | | |
| Cisco Systems, Inc. | | | 7,570 | | | | 129,977 | |
| Juniper Networks, Inc.1 | | | 11,910 | | | | 194,252 | |
| | | | | | |
|
|
|
| | | | | | | | 324,229 | |
| Electronic Equipment & Instruments—1.9% | |
| TE Connectivity Ltd. | | | 4,360 | | | | 139,128 | |
| Semiconductors & Semiconductor Equipment—2.3% | |
| Analog Devices, Inc. | | | 1,960 | | | | 73,833 | |
| Xilinx, Inc. | | | 2,650 | | | | 88,961 | |
| | | | | | |
|
|
|
| | | | | | | | 162,794 | |
6 | OPPENHEIMER VALUE FUND/VA
|
| | | | | | | | |
| | | Shares | | | Value | |
| Materials—4.0% | | | | | | | | |
| Chemicals—2.5% | | | | | | | | |
| Celanese Corp., Series A | | | 950 | | | $ | 32,889 | |
| Mosaic Co. (The) | | | 2,670 | | | | 146,209 | |
| | | | | | |
|
|
|
| | | | | | | | 179,098 | |
| Containers & Packaging—1.5% | | | | | | | | |
| Rock-Tenn Co., Cl. A | | | 1,880 | | | | 102,554 | |
| Telecommunication Services—2.8% | | | | | | | | |
| Diversified Telecommunication Services—2.8% | | | | | |
| AT&T, Inc. | | | 2,972 | | | | 105,982 | |
| Verizon Communications, Inc. | | | 2,020 | | | | 89,769 | |
| | | | | | |
|
|
|
| | | | | | | | 195,751 | |
| Utilities—6.2% | | | | | | | | |
| Electric Utilities—3.7% | | | | | | | | |
| American Electric Power Co., Inc. | | | 2,160 | | | | 86,184 | |
| Edison International, Inc. | | | 3,800 | | |
| 175,560
|
|
| | | | | | | | 261,744 | |
| Energy Traders—1.0% | | | | | | | | |
| GenOn Energy, Inc.1 | | | 44,550 | | | | 76,181 | |
| Multi-Utilities—1.5% | | | | | | | | |
| NiSource, Inc. | | | 1,630 | | | | 40,343 | |
| Public Service Enterprise Group, Inc. | | | 1,980 | | | | 64,346 | |
| | | | | | |
|
|
|
| | | | | | |
| 104,689
|
|
| Total Common Stocks (Cost $6,528,371) | | | | | | | 6,932,015 | |
| | | | | | | | | | | | | | | | |
| | | Expiration
Date | | | Strike
Price | | | Contracts | | | Value | |
| Options Purchased—0.0% | | | | | | | | | |
| Humana, Inc. Put1 | | | 7/23/12 | | | $ | 72.500 | | | | 5 | | | $ | 150 | |
| Humana, Inc. Put1 | | | 8/20/12 | | | | 67.500 | | | | 5 | | | | 250 | |
| UnitedHealth Group, Inc. Put1 | | | 7/23/12 | | | | 55.000 | | | | 8 | | | | 360 | |
| UnitedHealth Group, Inc. Put1 | | | 8/20/12 | | | | 52.500 | | | | 8 | | | | 480 | |
| | | | | | | | | | | | | | |
|
|
|
| Total Options Purchased (Cost $2,559) | | | | | | | | 1,240 | |
| | | | |
| | | | | | | | | Shares | | | | |
| Investment Company—4.1% | | | | | | | | | |
Oppenheimer Institutional Money
Market Fund, Cl. E, 0.20%2,3
(Cost $289,326) | | | | 289,326 | | | | 289,326 | |
Total Investments, at Value (Cost $6,820,256) | | | | 102.0 | % | | | 7,222,581 | |
| Liabilities in Excess of Other Assets | | |
| (2.0
| )
| |
| (141,771
| )
|
| Net Assets | | |
| 100.0
| %
| | $
| 7,080,810
|
|
Footnotes to Statement of Investments
* June 29, 2012 represents the last business day of the Fund’s 2012 semiannual period. See Note 1 of the accompanying Notes.
1. Non-income producing security.
2. Is or was an affiliate, as defined in the Investment Company Act of 1940, at or during the period ended June 29, 2012, by virtue of the Fund owning at least 5% of the voting securities of the issuer or as a result of the Fund and the issuer having the same investment adviser. Transactions during the period in which the issuer was an affiliate are as follows:
| | | | | | | | | | | | | | | | |
| | | Shares
December 30, 2011a | | | Gross
Additions | | | Gross
Reductions | | | Shares
June 29, 2012 | |
| Oppenheimer Institutional Money Market Fund, Cl. E | | | 374,186 | | | | 2,019,924 | | | | 2,104,784 | | | | 289,326 | |
| | | | |
| | | | | | | | | Value | | | Income | |
| Oppenheimer Institutional Money Market Fund, Cl. E | | | | | | | | | | | $289,326 | | | | $334 | |
a. December 30, 2011 represents the last business day of the Fund’s 2011 fiscal year. See Note 1 of the accompanying Notes.
3. Rate shown is the 7-day yield as of June 29, 2012.
See accompanying Notes to Financial Statements.
7 | OPPENHEIMER VALUE FUND/VA
|
STATEMENT OF ASSETS AND LIABILITIES Unaudited
| | | | |
| June 29, 20121 | | | |
| Assets | | | |
| Investments, at value—see accompanying statement of investments: | | | | |
| Unaffiliated companies (cost $6,530,930) | | $ | 6,933,255 | |
| Affiliated companies (cost $289,326) | |
| 289,326
|
|
| | | | 7,222,581 | |
| Cash | | | 2,309 | |
| Receivables and other assets: | | | | |
| Investments sold | | | 73,599 | |
| Dividends | | | 7,885 | |
| Shares of beneficial interest sold | | | 2,486 | |
| Other | |
| 6,576
|
|
| Total assets | | | 7,315,436 | |
| Liabilities | | | |
| Payables and other liabilities: | | | | |
| Investments purchased | | | 193,659 | |
| Shareholder communications | | | 20,803 | |
| Legal, auditing and other professional fees | | | 9,913 | |
| Trustees’ compensation | | | 5,620 | |
| Distribution and service plan fees | | | 1,351 | |
| Shares of beneficial interest redeemed | | | 662 | |
| Transfer and shareholder servicing agent fees | | | 569 | |
| Other | |
| 2,049
|
|
| Total liabilities | | | 234,626 | |
| Net Assets | | $
| 7,080,810
|
|
| Composition of Net Assets | | | |
| Par value of shares of beneficial interest | | $ | 711 | |
| Additional paid-in capital | | | 7,892,561 | |
| Accumulated net investment income | | | 36,726 | |
| Accumulated net realized loss on investments and foreign currency transactions | | | (1,251,513 | ) |
| Net unrealized appreciation on investments and translation of assets and liabilities denominated in foreign currencies | |
| 402,325
|
|
| Net Assets | | $
| 7,080,810
|
|
| Net Asset Value Per Share | | | |
| Non-Service Shares: | | | | |
Net asset value, redemption price per share and offering price per share (based on net assets of $124,791
and 14,985 shares of beneficial interest outstanding) | | | $8.33 | |
| Service Shares: | | | | |
Net asset value, redemption price per share and offering price per share (based on net assets of $6,956,019
and 695,731 shares of beneficial interest outstanding) | | | $10.00 | |
1. June 29, 2012 represents the last business day of the Fund’s 2012 semiannual period. See Note 1 of the accompanying Notes.
See accompanying Notes to Financial Statements.
8 | OPPENHEIMER VALUE FUND/VA
|
STATEMENT OF OPERATIONS Unaudited
| | | | |
| For the Six Months Ended June 29, 20121 | | | |
| Investment Income | | | |
| Dividends: | | | | |
| Unaffiliated companies (net of foreign withholding taxes of $354) | | $ | 82,070 | |
| Affiliated companies | | | 334 | |
| Interest | |
| 21
|
|
| Total investment income | | | 82,425 | |
| Expenses | | | |
| Management fees | | | 27,223 | |
| Distribution and service plan fees—Service shares | | | 8,922 | |
| Transfer and shareholder servicing agent fees: | | | | |
| Non-Service shares | | | 61 | |
| Service shares | | | 3,569 | |
| Shareholder communications: | | | | |
| Non-Service shares | | | 269 | |
| Service shares | | | 14,562 | |
| Legal, auditing and other professional fees | | | 12,116 | |
| Trustees’ compensation | | | 4,350 | |
| Administration service fees | | | 750 | |
| Custodian fees and expenses | | | 620 | |
| Other | |
| 2,144
|
|
| Total expenses | | | 74,586 | |
| Less waivers and reimbursements of expenses | |
| (36,624
| )
|
| Net expenses | | | 37,962 | |
| Net Investment Income | | | 44,463 | |
| Realized and Unrealized Gain (Loss) | | | |
| Net realized gain on: | | | | |
| Investments from unaffiliated companies | | | 100,887 | |
| Foreign currency transactions | |
| 2
|
|
| Net realized gain | | | 100,889 | |
| Net change in unrealized appreciation/depreciation on: | | | | |
| Investments | | | 158,301 | |
| Translation of assets and liabilities denominated in foreign currencies | |
| (5
| )
|
| Net change in unrealized appreciation/depreciation | | | 158,296 | |
| | |
| Net Increase in Net Assets Resulting from Operations | | $
| 303,648
|
|
1. June 29, 2012 represents the last business day of the Fund’s 2012 semiannual period. See Note 1 of the accompanying Notes.
See accompanying Notes to Financial Statements.
9 | OPPENHEIMER VALUE FUND/VA
|
STATEMENTS OF CHANGES IN NET ASSETS
| | | | | | | | |
| | | Six Months
Ended
June 29, 20121
(Unaudited) | | | Year
Ended
December 30,
20111 | |
| Operations | | | | | | |
| Net investment income | | $ | 44,463 | | | $ | 82,226 | |
| Net realized gain | | | 100,889 | | | | 600,874 | |
| Net change in unrealized appreciation/depreciation | |
| 158,296
|
| |
| (1,040,601
| )
|
| Net increase (decrease) in net assets resulting from operations | | | 303,648 | | | | (357,501 | ) |
| Dividends and/or Distributions to Shareholders | | | | | | |
| Dividends from net investment income: | | | | | | | | |
| Non-Service shares | | | (1,809 | ) | | | (904 | ) |
| Service shares | |
| (81,182
| )
| |
| (66,745
| )
|
| | | | (82,991 | ) | | | (67,649 | ) |
| Beneficial Interest Transactions | | | | | | |
| Net increase (decrease) in net assets resulting from beneficial interest transactions: | | | | | | | | |
| Non-Service shares | | | 17,019 | | | | 17,714 | |
| Service shares | |
| (146,299
| )
| |
| (6,322
| )
|
| | | | (129,280 | ) | | | 11,392 | |
| Net Assets | | | | | | |
| Total increase (decrease) | | | 91,377 | | | | (413,758 | ) |
| Beginning of period | |
| 6,989,433
|
| |
| 7,403,191
|
|
| End of period (including accumulated net investment income of $36,726 and $75,254, respectively) | | $
| 7,080,810
|
| | $
| 6,989,433
|
|
1. June 29, 2012 and December 30, 2011 represent the last business days of the Fund’s respective reporting periods. See Note 1 of the accompanying Notes.
See accompanying Notes to Financial Statements.
10 | OPPENHEIMER VALUE FUND/VA
|
FINANCIAL HIGHLIGHTS
| | | | | | | | | | | | | | | | | | | | | | | | |
| | | Six Months
Ended
June 29, 20121 | | | Year Ended
December 30, | | | Year Ended December 31, | |
| Non-Service Shares | | (Unaudited) | | | 20111 | | | 2010 | | | 2009 | | | 2008 | | | 2007 | |
| | | | | | | | | | | | | | | | | | | | | | | | | |
| Per Share Operating Data | | | | | | | | | | | | | | | | | | |
| Net asset value, beginning of period | | $ | 8.00 | | | $ | 8.49 | | | $ | 7.22 | | | $ | 4.99 | | | $ | 11.73 | | | $ | 11.58 | |
| Income (loss) from investment operations: | | | | | | | | | | | | | | | | | | | | | | | | |
| Net investment income2 | | | .08 | | | | .15 | | | | .11 | | | | .11 | | | | .12 | | | | .10 | |
| Net realized and unrealized gain (loss) | |
| .37
|
| |
| (.56
| )
| |
| 1.24
|
| |
| 2.14
|
| |
| (4.44
| )
| |
| .59
|
|
| Total from investment operations | | | .45 | | | | (.41 | ) | | | 1.35 | | | | 2.25 | | | | (4.32 | ) | | | .69 | |
| Dividends and/or distributions to shareholders: | | | | | | | | | | | | | | | | | | | | | | | | |
| Dividends from net investment income | | | (.12 | ) | | | (.08 | ) | | | (.08 | ) | | | (.02 | ) | | | (2.42 | ) | | | (.10 | ) |
| Distributions from net realized gain | |
| —
|
| |
| —
|
| |
| —
|
| |
| —
|
| |
| —
|
| |
| (.44
| )
|
| Total dividends and/or distributions to shareholders | | | (.12 | ) | | | (.08 | ) | | | (.08 | ) | | | (.02 | ) | | | (2.42 | ) | | | (.54 | ) |
| Net asset value, end of period | | $
| 8.33
|
| | $
| 8.00
|
| | $
| 8.49
|
| | $
| 7.22
|
| | $
| 4.99
|
| | $
| 11.73
|
|
| Total Return, at Net Asset Value3 | | 5.68% | | | (4.93)% | | | 18.85% | | | 45.08% | | | (36.43)% | | | 5.89% | |
| | | | | | | | | | | | | | | | | | | | | | | | | |
| Ratios/Supplemental Data | | | | | | | | | | | | | | | | | | |
| Net assets, end of period (in thousands) | | | $125 | | | | $104 | | | | $92 | | | | $38 | | | | $ 6 | | | | $1,728 | |
| Average net assets (in thousands) | | | $122 | | | | $101 | | | | $57 | | | | $20 | | | | $857 | | | | $2,753 | |
| Ratios to average net assets:4 | | | | | | | | | | | | | | | | | | | | | | | | |
| Net investment income | | | 1.92 | % | | | 1.78 | % | | | 1.46 | % | | | 1.75 | % | | | 1.07 | % | | | 0.80 | % |
| Total expenses5 | | | 1.95 | % | | | 1.83 | % | | | 2.05 | % | | | 2.30 | % | | | 1.48 | % | | | 1.49 | % |
| Expenses after payments, waivers and/or reimbursements and reduction to custodian expenses | | | 0.80 | % | | | 0.80 | % | | | 0.57 | % | | | 0.85 | % | | | 1.25 | % | | | 1.25 | % |
| Portfolio turnover rate | | | 54 | % | | | 86 | % | | | 109 | % | | | 122 | % | | | 175 | % | | | 142 | % |
1. June 29, 2012 and December 30, 2011 represent the last business days of the Fund’s respective reporting periods. See Note 1 of the accompanying Notes.
2. Per share amounts calculated based on the average shares outstanding during the period.
3. Assumes an initial investment on the business day before the first day of the fiscal period, with all dividends and distributions reinvested in additional shares on the reinvestment date, and redemption at the net asset value calculated on the last business day of the fiscal period. Total returns are not annualized for periods less than one full year. Total return information does not reflect expenses that apply at the separate account level or to related insurance products. Inclusion of these charges would reduce the total return figures for all periods shown. Returns do not reflect the deduction of taxes that a shareholder would pay on fund distributions or the redemption of fund shares.
4. Annualized for periods less than one full year.
5. Total expenses including indirect expenses from affiliated fund were as follows:
| | | | |
| Six Months Ended June 29, 2012 | | | 1.95 | % |
| Year Ended December 30, 2011 | | | 1.83 | % |
| Year Ended December 31, 2010 | | | 2.05 | % |
| Year Ended December 31, 2009 | | | 2.31 | % |
| Year Ended December 31, 2008 | | | 1.48 | % |
| Year Ended December 31, 2007 | | | 1.49 | % |
See accompanying Notes to Financial Statements.
11 | OPPENHEIMER VALUE FUND/VA
|
FINANCIAL HIGHLIGHTS Continued
| | | | | | | | | | | | | | | | | | | | | | | | |
| | | Six Months
Ended
June 29, 20121 | | | Year Ended
December 30, | | | Year Ended December 31, | |
| Service Shares | | (Unaudited) | | | 20111 | | | 2010 | | | 2009 | | | 2008 | | | 2007 | |
| | | | | | | | | | | | | | | | | | | | | | | | | |
| Per Share Operating Data | | | | | | | | | | | | | | | | | | |
| Net asset value, beginning of period | | | $ 9.69 | | | | $10.23 | | | | $ 8.99 | | | | $6.79 | | | | $11.75 | | | | $11.57 | |
| Income (loss) from investment operations: | | | | | | | | | | | | | | | | | | | | | | | | |
| Net investment income2 | | | .06 | | | | .11 | | | | .08 | | | | .09 | | | | .08 | | | | .06 | |
| Net realized and unrealized gain (loss) | |
| .37
|
| |
| (.56
| )
| |
| 1.24
|
| |
| 2.12
|
| |
| (4.97
| )
| |
| .60
|
|
| Total from investment operations | | | .43 | | | | (.45 | ) | | | 1.32 | | | | 2.21 | | | | (4.89 | ) | | | .66 | |
| Dividends and/or distributions to shareholders: | | | | | | | | | | | | | | | | | | | | | | | | |
| Dividends from net investment income | | | (.12 | ) | | | (.09 | ) | | | (.08 | ) | | | (.01 | ) | | | (.07 | ) | | | (.04 | ) |
| Distributions from net realized gain | |
| —
|
| |
| —
|
| |
| —
|
| |
| —
|
| |
| —
|
| |
| (.44
| )
|
| Total dividends and/or distributions to shareholders | | | (.12 | ) | | | (.09 | ) | | | (.08 | ) | | | (.01 | ) | | | (.07 | ) | | | (.48 | ) |
| Net asset value, end of period | |
| $10.00
|
| |
| $ 9.69
|
| |
| $10.23
|
| |
| $8.99
|
| |
| $ 6.79
|
| |
| $11.75
|
|
| Total Return, at Net Asset Value3 | | 4.42% | | | (4.48)% | | | 14.81% | | | 32.57% | | | (41.62)% | | | 5.70% | |
| | | | | | | | | | | | | | | | | | | | | | | | | |
| Ratios/Supplemental Data | | | | | | | | | | | | | | | | | | |
| Net assets, end of period (in thousands) | | | $6,956 | | | | $6,885 | | | | $7,311 | | | | $7,505 | | | | $4,690 | | | | $6,481 | |
| Average net assets (in thousands) | | | $7,177 | | | | $7,449 | | | | $7,008 | | | | $5,501 | | | | $5,561 | | | | $3,527 | |
| Ratios to average net assets:4 | | | | | | | | | | | | | | | | | | | | | | | | |
| Net investment income | | | 1.21 | % | | | 1.08 | % | | | 0.85 | % | | | 1.10 | % | | | 0.84 | % | | | 0.49 | % |
| Total expenses5 | | | 2.06 | % | | | 1.90 | % | | | 2.08 | % | | | 2.17 | % | | | 2.13 | % | | | 1.63 | % |
| Expenses after payments, waivers and/or reimbursements and reduction to custodian expenses | | | 1.05 | % | | | 1.05 | % | | | 0.93 | % | | | 1.15 | % | | | 1.50 | % | | | 1.50 | % |
| Portfolio turnover rate | | | 54 | % | | | 86 | % | | | 109 | % | | | 122 | % | | | 175 | % | | | 142 | % |
1. June 29, 2012 and December 30, 2011 represent the last business days of the Fund’s respective reporting periods. See Note 1 of the accompanying Notes.
2. Per share amounts calculated based on the average shares outstanding during the period.
3. Assumes an initial investment on the business day before the first day of the fiscal period, with all dividends and distributions reinvested in additional shares on the reinvestment date, and redemption at the net asset value calculated on the last business day of the fiscal period. Total returns are not annualized for periods less than one full year. Total return information does not reflect expenses that apply at the separate account level or to related insurance products. Inclusion of these charges would reduce the total return figures for all periods shown. Returns do not reflect the deduction of taxes that a shareholder would pay on fund distributions or the redemption of fund shares.
4. Annualized for periods less than one full year.
5. Total expenses including indirect expenses from affiliated fund were as follows:
| | | | |
| Six Months Ended June 29, 2012 | | | 2.06 | % |
| Year Ended December 30, 2011 | | | 1.90 | % |
| Year Ended December 31, 2010 | | | 2.08 | % |
| Year Ended December 31, 2009 | | | 2.18 | % |
| Year Ended December 31, 2008 | | | 2.13 | % |
| Year Ended December 31, 2007 | | | 1.63 | % |
See accompanying Notes to Financial Statements.
12 | OPPENHEIMER VALUE FUND/VA
|
NOTES TO FINANCIAL STATEMENTS Unaudited
1. Significant Accounting Policies
Oppenheimer Value Fund/VA (the “Fund”) is a separate series of Oppenheimer Variable Account Funds, an open-end management investment company registered under the Investment Company Act of 1940, as amended. The Fund’s investment objective is to seek long-term growth of capital by investing primarily in common stocks with low price earnings ratios and better-than-anticipated earnings. Realization of current income is a secondary consideration. The Fund’s investment adviser is OppenheimerFunds, Inc. (the “Manager”).
The Fund offers two classes of shares. Both classes are sold at their offering price, which is the net asset value per share, to separate investment accounts of participating insurance companies as an underlying investment for variable life insurance policies, variable annuity contracts or other investment products. The class of shares designated as Service shares is subject to a distribution and service plan. Both classes of shares have identical rights and voting privileges with respect to the Fund in general and exclusive voting rights on matters that affect that class alone. Earnings, net assets and net asset value per share may differ due to each class having its own expenses, such as transfer and shareholder servicing agent fees and shareholder communications, directly attributable to that class.
The following is a summary of significant accounting policies consistently followed by the Fund.
Semiannual and Annual Periods. The last day of the Fund’s semiannual period was the last day the New York Stock Exchange was open for trading. The Fund’s financial statements have been presented through that date to maintain consistency with the Fund’s net asset value calculations used for shareholder transactions.
The last day of the Fund’s fiscal year was the last day the New York Stock Exchange was open for trading. The Fund’s financial statements have been presented through that date to maintain consistency with the Fund’s net asset value calculations used for shareholder transactions.
Investment in Oppenheimer Institutional Money Market Fund. The Fund is permitted to invest daily available cash balances in an affiliated money market fund. The Fund may invest the available cash in Class E shares of Oppenheimer Institutional Money Market Fund (“IMMF”) to seek current income while preserving liquidity. IMMF is a registered open-end management investment company, regulated as a money market fund under the Investment Company Act of 1940, as amended. The Manager is also the investment adviser of IMMF. When applicable, the Fund’s investment in IMMF is included in the Statement of Investments. Shares of IMMF are valued at their net asset value per share. As a shareholder, the Fund is subject to its proportional share of IMMF’s Class E expenses, including its management fee. The Manager will waive fees and/or reimburse Fund expenses in an amount equal to the indirect management fees incurred through the Fund’s investment in IMMF.
Foreign Currency Translation. The Fund’s accounting records are maintained in U.S. dollars. The values of securities denominated in foreign currencies and amounts related to the purchase and sale of foreign securities and foreign investment income are translated into U.S. dollars as of the close of the Exchange, normally 4:00 P.M. Eastern time, on each day the Exchange is open for trading. Foreign exchange rates may be valued primarily using a reliable bank, dealer or service authorized by the Board of Trustees.
Reported net realized gains and losses from foreign currency transactions arise from sales of portfolio securities, sales and maturities of short-term securities, sales of foreign currencies, exchange rate fluctuations between the trade and settlement dates on securities transactions, and the difference between the amounts of dividends, interest, and foreign withholding taxes recorded on the Fund’s books and the U.S. dollar equivalent of the amounts actually received or paid. Net unrealized appreciation and depreciation on the translation of assets and liabilities denominated in foreign currencies arise from changes in the values of assets and liabilities, including investments in securities at fiscal period end, resulting from changes in exchange rates.
13 | OPPENHEIMER VALUE FUND/VA
|
NOTES TO FINANCIAL STATEMENTS Unaudited / Continued
1. Significant Accounting Policies Continued
The effect of changes in foreign currency exchange rates on investments is separately identified from the fluctuations arising from changes in market values of securities held and reported with all other foreign currency gains and losses in the Fund’s Statement of Operations.
Allocation of Income, Expenses, Gains and Losses. Income, expenses (other than those attributable to a specific class), gains and losses are allocated on a daily basis to each class of shares based upon the relative proportion of net assets represented by such class. Operating expenses directly attributable to a specific class are charged against the operations of that class.
Federal Taxes. The Fund intends to comply with provisions of the Internal Revenue Code applicable to regulated investment companies and to distribute substantially all of its investment company taxable income, including any net realized gain on investments not offset by capital loss carryforwards, if any, to shareholders. Therefore, no federal income or excise tax provision is required. The Fund files income tax returns in U.S. federal and applicable state jurisdictions. The statute of limitations on the Fund’s tax return filings generally remain open for the three preceding fiscal reporting period ends.
During the fiscal year ended December 30, 2011, the Fund utilized $652,156 of capital loss carryforward to offset capital gains realized in that fiscal year. The Fund had post-October losses of $85,825. Details of the fiscal year ended December 30, 2011 capital loss carryforwards are included in the table below. Capital loss carryforwards with no expiration, if any, must be utilized prior to those with expiration dates. Capital losses with no expiration will be carried forward to future years if not offset by gains.
| | | | |
| Expiring | | | |
| 2016 | | $ | 204,829 | |
| 2017 | | | 999,882 | |
| No expiration | | | 85,825 | |
| | |
|
|
|
| Total | | $ | 1,290,536 | |
| | |
|
|
|
As of June 29, 2012, it is estimated that the capital loss carryforwards would be $1,189,647 expiring by 2017. The estimated capital loss carryforward represents the carryforward as of the end of the last fiscal year, increased or decreased by capital losses or gains realized in the first six months of the current fiscal year. During the six months ended June 29, 2012, it is estimated that the Fund will utilize $100,889 of capital loss carryforward to offset realized capital gains.
Net investment income (loss) and net realized gain (loss) may differ for financial statement and tax purposes. The character of dividends and distributions made during the fiscal year from net investment income or net realized gains may differ from their ultimate characterization for federal income tax purposes. Also, due to timing of dividends and distributions, the fiscal year in which amounts are distributed may differ from the fiscal year in which the income or net realized gain was recorded by the Fund.
The aggregate cost of securities and other investments and the composition of unrealized appreciation and depreciation of securities and other investments for federal income tax purposes as of June 29, 2012 are noted in the following table. The primary difference between book and tax appreciation or depreciation of securities and other investments, if applicable, is attributable to the tax deferral of losses or tax realization of financial statement unrealized gain or loss.
| | | | |
| Federal tax cost of securities | | $ | 6,953,345 | |
| | |
|
|
|
| |
| Gross unrealized appreciation | | $ | 669,230 | |
| Gross unrealized depreciation | | | (399,994) | |
| | |
|
|
|
| Net unrealized appreciation | | $ | 269,236 | |
| | |
|
|
|
14 | OPPENHEIMER VALUE FUND/VA
|
Trustees’ Compensation. The Board of Trustees has adopted a compensation deferral plan for independent trustees that enables trustees to elect to defer receipt of all or a portion of the annual compensation they are entitled to receive from the Fund. For purposes of determining the amount owed to the Trustee under the plan, deferred amounts are treated as though equal dollar amounts had been invested in shares of the Fund or in other Oppenheimer funds selected by the Trustee. The Fund purchases shares of the funds selected for deferral by the Trustee in amounts equal to his or her deemed investment, resulting in a Fund asset equal to the deferred compensation liability. Such assets are included as a component of “Other” within the asset section of the Statement of Assets and Liabilities. Deferral of trustees’ fees under the plan will not affect the net assets of the Fund, and will not materially affect the Fund’s assets, liabilities or net investment income per share. Amounts will be deferred until distributed in accordance with the compensation deferral plan.
Dividends and Distributions to Shareholders. Dividends and distributions to shareholders, which are determined in accordance with income tax regulations and may differ from U.S. generally accepted accounting principles, are recorded on the ex-dividend date. Income and capital gain distributions, if any, are declared and paid annually or at other times as deemed necessary by the Manager. The tax character of distributions is determined as of the Fund’s fiscal year end. Therefore, a portion of the Fund’s distributions made to shareholders prior to the Fund’s fiscal year end may ultimately be categorized as a tax return of capital.
Investment Income. Dividend income is recorded on the ex-dividend date or upon ex-dividend notification in the case of certain foreign dividends where the ex-dividend date may have passed. Non-cash dividends included in dividend income, if any, are recorded at the fair market value of the securities received. Interest income is recognized on an accrual basis. Discount and premium, which are included in interest income on the Statement of Operations, are amortized or accreted daily.
Custodian Fees. “Custodian fees and expenses” in the Statement of Operations may include interest expense incurred by the Fund on any cash overdrafts of its custodian account during the period. Such cash overdrafts may result from the effects of failed trades in portfolio securities and from cash outflows resulting from unanticipated shareholder redemption activity. The Fund pays interest to its custodian on such cash overdrafts, to the extent they are not offset by positive cash balances maintained by the Fund, at a rate equal to the Federal Funds Rate plus 0.50%. The “Reduction to custodian expenses” line item, if applicable, represents earnings on cash balances maintained by the Fund during the period. Such interest expense and other custodian fees may be paid with these earnings.
Security Transactions. Security transactions are recorded on the trade date. Realized gains and losses on securities sold are determined on the basis of identified cost.
Indemnifications. The Fund’s organizational documents provide current and former trustees and officers with a limited indemnification against liabilities arising in connection with the performance of their duties to the Fund. In the normal course of business, the Fund may also enter into contracts that provide general indemnifications. The Fund’s maximum exposure under these arrangements is unknown as this would be dependent on future claims that may be made against the Fund. The risk of material loss from such claims is considered remote.
Other. The preparation of financial statements in conformity with accounting principles generally accepted in the United States of America requires management to make estimates and assumptions that affect the reported amounts of assets and liabilities and disclosure of contingent assets and liabilities at the date of the financial statements and the reported amounts of increases and decreases in net assets from operations during the reporting period. Actual results could differ from those estimates.
15 | OPPENHEIMER VALUE FUND/VA
|
NOTES TO FINANCIAL STATEMENTS Unaudited / Continued
2. Securities Valuation
The Fund calculates the net asset value of its shares as of the close of the New York Stock Exchange (the “Exchange”), normally 4:00 P.M. Eastern time, on each day the Exchange is open for trading.
The Fund’s Board has adopted procedures for the valuation of the Fund’s securities and has delegated the day-to-day responsibility for valuation determinations under those procedures to the Manager. The Manager has established a Valuation Committee which is responsible for determining a “fair valuation” for any security for which market quotations are not “readily available.” The Valuation Committee’s fair valuation determinations are subject to review, approval and ratification by the Fund’s Board at its next regularly scheduled meeting covering the calendar quarter in which the fair valuation was determined.
Valuation Methods and Inputs
Securities are valued using unadjusted quoted market prices, when available, as supplied primarily by third party pricing services or dealers.
The following methodologies are used to determine the market value or the fair value of the types of securities described below:
Securities traded on a registered U.S. securities exchange (including exchange-traded derivatives other than futures and futures options) are valued based on the last sale price of the security reported on the principal exchange on which it is traded, prior to the time when the Fund’s assets are valued. In the absence of a sale, the security is valued at the last sale price on the prior trading day, if it is within the spread of the current day’s closing “bid” and “asked” prices, and if not, at the current day’s closing bid price. A security of a foreign issuer traded on a foreign exchange but not listed on a registered U.S. securities exchange is valued based on the last sale price on the principal exchange on which the security is traded, as identified by the third party pricing service used by the Manager, prior to the time when the Fund’s assets are valued. If the last sale price is unavailable, the security is valued at the most recent official closing price on the principal exchange on which it is traded. If the last sales price or official closing price for a foreign security is not available, the security is valued at the mean between the bid and asked price per the exchange or, if not available from the exchange, obtained from two dealers. If bid and asked prices are not available from either the exchange or two dealers, the security is valued by using one of the following methodologies (listed in order of priority); (1) using a bid from the exchange, (2) the mean between the bid and asked price as provided by a single dealer, or (3) a bid from a single dealer.
Shares of a registered investment company that are not traded on an exchange are valued at that investment company’s net asset value per share.
Corporate and government debt securities (of U.S. or foreign issuers) and municipal debt securities, event-linked bonds, loans, mortgage-backed securities, collateralized mortgage obligations, and asset-backed securities are valued at the mean between the “bid” and “asked” prices utilizing evaluated prices obtained from third party pricing services or broker-dealers who may use matrix pricing methods to determine the evaluated prices.
Short-term money market type debt securities with a remaining maturity of sixty days or less are valued at cost adjusted by the amortization of discount or premium to maturity (amortized cost), which approximates market value. Short-term debt securities with a remaining maturity in excess of sixty days are valued at the mean between the “bid” and “asked” prices utilizing evaluated prices obtained from third party pricing services or broker-dealers.
A description of the standard inputs that may generally be considered by the third party pricing vendors in determining their evaluated prices is provided below.
16 | OPPENHEIMER VALUE FUND/VA
|
| | |
| Security Type | | Standard inputs generally considered by third-party pricing vendors |
| Corporate debt, government debt, municipal, mortgage-backed and asset-backed securities | | Reported trade data, broker-dealer price quotations, benchmark yields, issuer spreads on comparable securities, the credit quality, yield, maturity, and other appropriate factors. |
| Loans | | Information obtained from market participants regarding reported trade data and broker-dealer price quotations. |
| Event-linked bonds | | Information obtained from market participants regarding reported trade data and broker-dealer price quotations. |
If a market value or price cannot be determined for a security using the methodologies described above, or if, in the “good faith” opinion of the Manager, the market value or price obtained does not constitute a “readily available market quotation,” or a significant event has occurred that would materially affect the value of the security the security is fair valued either (i) by a standardized fair valuation methodology applicable to the security type or the significant event as previously approved by the Valuation Committee and the Fund’s Board or (ii) as determined in good faith by the Manager’s Valuation Committee. The Valuation Committee considers all relevant facts that are reasonably available, through either public information or information available to the Manager, when determining the fair value of a security. Fair value determinations by the Manager are subject to review, approval and ratification by the Fund’s Board at its next regularly scheduled meeting covering the calendar quarter in which the fair valuation was determined. Those fair valuation standardized methodologies include, but are not limited to, valuing securities at the last sale price or initially at cost and subsequently adjusting the value based on: changes in company specific fundamentals, changes in an appropriate securities index, or changes in the value of similar securities which may be further adjusted for any discounts related to security-specific resale restrictions. When possible, such methodologies use observable market inputs such as unadjusted quoted prices of similar securities, observable interest rates, currency rates and yield curves. The methodologies used for valuing securities are not necessarily an indication of the risks associated with investing in those securities nor can it be assured that the Fund can obtain the fair value assigned to a security if it were to sell the security.
To assess the continuing appropriateness of security valuations, the Manager, or its third party service provider who is subject to oversight by the Manager, regularly compares prior day prices, prices on comparable securities, and sale prices to the current day prices and challenges those prices exceeding certain tolerance levels with the third party pricing service or broker source. For those securities valued by fair valuations, whether through a standardized fair valuation methodology or a fair valuation determination, the Valuation Committee reviews and affirms the reasonableness of the valuations based on such methodologies and fair valuation determinations on a regular basis after considering all relevant information that is reasonably available.
Classifications
Each investment asset or liability of the Fund is assigned a level at measurement date based on the significance and source of the inputs to its valuation. Various data inputs are used in determining the value of each of the Fund’s investments as of the reporting period end. These data inputs are categorized in the following hierarchy under applicable financial accounting standards:
| | 1) | Level 1—unadjusted quoted prices in active markets for identical assets or liabilities (including securities actively traded on a securities exchange) |
| | 2) | Level 2—inputs other than unadjusted quoted prices that are observable for the asset or liability (such as unadjusted quoted prices for similar assets and market corroborated inputs such as interest rates, prepayment speeds, credit risks, etc.) |
| | 3) | Level 3—significant unobservable inputs (including the Manager’s own judgments about assumptions that market participants would use in pricing the asset or liability). |
The inputs used for valuing securities are not necessarily an indication of the risks associated with investing in those securities.
17 | OPPENHEIMER VALUE FUND/VA
|
NOTES TO FINANCIAL STATEMENTS Unaudited / Continued
2. Securities Valuation Continued
The table below categorizes amounts that are included in the Fund’s Statement of Assets and Liabilities as of June 29, 2012 based on valuation input level:
| | | | | | | | | | | | | | | | |
| | | Level 1—
Unadjusted
Quoted Prices | | | Level 2—
Other Significant
Observable Inputs | | | Level 3—
Significant
Unobservable
Inputs | | | Value | |
| Assets Table | | | | | | | | | | | | | | | | |
| Investments, at Value: | | | | | | | | | | | | | | | | |
| Common Stocks | | | | | | | | | | | | | | | | |
Consumer Discretionary | | $ | 689,216 | | | $ | — | | | $ | — | | | $ | 689,216 | |
Consumer Staples | | | 578,207 | | | | — | | | | — | | | | 578,207 | |
Energy | | | 819,166 | | | | — | | | | — | | | | 819,166 | |
Financials | | | 1,556,022 | | | | — | | | | — | | | | 1,556,022 | |
Health Care | | | 1,077,673 | | | | — | | | | — | | | | 1,077,673 | |
Industrials | | | 665,563 | | | | — | | | | — | | | | 665,563 | |
Information Technology | | | 626,151 | | | | — | | | | — | | | | 626,151 | |
Materials | | | 281,652 | | | | — | | | | — | | | | 281,652 | |
Telecommunication Services | | | 195,751 | | | | — | | | | — | | | | 195,751 | |
Utilities | | | 442,614 | | | | — | | | | — | | | | 442,614 | |
| Options Purchased | | | 1,240 | | | | — | | | | — | | | | 1,240 | |
| Investment Company | | | 289,326 | | | | — | | | | — | | | | 289,326 | |
| | |
|
|
| |
|
|
| |
|
|
| |
|
|
|
| Total Assets | | $ | 7,222,581 | | | $ | — | | | $ | — | | | $ | 7,222,581 | |
| | |
|
|
| |
|
|
| |
|
|
| |
|
|
|
Currency contracts and forwards, if any, are reported at their unrealized appreciation/depreciation at measurement date, which represents the change in the contract’s value from trade date. Futures, if any, are reported at their variation margin at measurement date, which represents the amount due to/from the Fund at that date. All additional assets and liabilities included in the above table are reported at their market value at measurement date.
There have been no significant changes to the fair valuation methodologies of the Fund during the period.
3. Shares of Beneficial Interest
The Fund has authorized an unlimited number of $0.001 par value shares of beneficial interest of each class. Transactions in shares of beneficial interest were as follows:
| | | | | | | | | | | | | | | | |
| | | Six Months Ended June 29, 2012 | | | Year Ended December 30, 2011 | |
| | | Shares | | | Amount | | | Shares | | | Amount | |
| Non-Service Shares | | | | | | | | | | | | | | | | |
| Sold | | | 3,210 | | | | $ 27,707 | | | | 4,906 | | | | $ 40,931 | |
| Dividends and/or distributions reinvested | | | 219 | | | | 1,809 | | | | 101 | | | | 904 | |
| Redeemed | | | (1,500 | ) | | | (12,497 | ) | | | (2,787 | ) | | | (24,121 | ) |
| | |
|
|
| |
|
|
| |
|
|
| |
|
|
|
| Net increase | | | 1,929 | | | | $ 17,019 | | | | 2,220 | | | | $ 17,714 | |
| | |
|
|
| |
|
|
| |
|
|
| |
|
|
|
| | | | | | | | | | | | | |
| Service Shares | | | | | | | | | | | | | | | | |
| Sold | | | 38,159 | | | | $ 395,579 | | | | 114,846 | | | | $ 1,183,318 | |
| Dividends and/or distributions reinvested | | | 8,159 | | | | 81,182 | | | | 6,285 | | | | 66,745 | |
| Redeemed | | | (61,321 | ) | | | (623,060 | ) | | | (125,191 | ) | | | (1,256,385 | ) |
| | |
|
|
| |
|
|
| |
|
|
| |
|
|
|
| Net decrease | | | (15,003 | ) | | | $(146,299 | ) | | | (4,060 | ) | | | $ (6,322 | ) |
| | |
|
|
| |
|
|
| |
|
|
| |
|
|
|
18 | OPPENHEIMER VALUE FUND/VA
|
4. Purchases and Sales of Securities
The aggregate cost of purchases and proceeds from sales of securities, other than short-term obligations and investments in IMMF, for the six months ended June 29, 2012, were as follows:
| | | | | | | | |
| | | Purchases | | | Sales | |
| Investment securities | | $ | 3,748,192 | | | $ | 3,736,391 | |
5. Fees and Other Transactions with Affiliates
Management Fees. Under the investment advisory agreement, the Fund pays the Manager a management fee based on the daily net assets of the Fund at an annual rate as shown in the following table:
| | | | |
| Fee Schedule | | | |
| Up to $200 million | | | 0.75 | % |
| Next $200 million | | | 0.72 | |
| Next $200 million | | | 0.69 | |
| Next $200 million | | | 0.66 | |
| Over $800 million | | | 0.60 | |
Administration Service Fees. The Fund pays the Manager a fee of $1,500 per year for preparing and filing the Fund’s tax returns.
Transfer Agent Fees. OppenheimerFunds Services (“OFS”), a division of the Manager, acts as the transfer and shareholder servicing agent for the Fund. For the six months ended June 29, 2012, the Fund paid $3,655 to OFS for services to the Fund.
Distribution and Service Plan for Service Shares. The Fund has adopted a Distribution and Service Plan (the “Plan”) in accordance with Rule 12b-1 under the Investment Company Act of 1940 for Service shares to pay OppenheimerFunds Distributor, Inc. (the “Distributor”), for distribution related services, personal service and account maintenance for the Fund’s Service shares. Under the Plan, payments are made periodically at an annual rate of 0.25% of the daily net assets of Service shares of the Fund. The Distributor currently uses all of those fees to compensate sponsors of the insurance product that offers Fund shares, for providing personal service and maintenance of accounts of their variable contract owners that hold Service shares. These fees are paid out of the Fund’s assets on an on-going basis and increase operating expenses of the Service shares, which results in lower performance compared to the Fund’s shares that are not subject to a service fee. Fees incurred by the Fund under the Plan are detailed in the Statement of Operations.
Waivers and Reimbursements of Expenses. The Manager has voluntarily agreed to limit the Fund’s total annual operating expenses so that those expenses, as percentages of daily net assets, will not exceed the annual rate of 0.80% for Non-Service shares and 1.05% for Service shares. During the six months ended June 29, 2012, the Manager waived fees and/or reimbursed the Fund $696 and $35,778 for Non-Service and Service shares, respectively.
The Manager will waive fees and/or reimburse Fund expenses in an amount equal to the indirect management fees incurred through the Fund’s investment in IMMF. During the six months ended June 29, 2012, the Manager waived fees and/or reimbursed the Fund $150 for IMMF management fees.
Some of these undertakings may be modified or terminated at any time; some may not be modified or terminated until after one year from the date of the current prospectus, as indicated therein.
6. Risk Exposures and the Use of Derivative Instruments
The Fund’s investment objectives not only permit the Fund to purchase investment securities, they also allow the Fund to enter into various types of derivatives contracts, including, but not limited to, futures contracts, forward foreign
19 | OPPENHEIMER VALUE FUND/VA
|
NOTES TO FINANCIAL STATEMENTS Unaudited / Continued
6. Risk Exposures and the Use of Derivative Instruments Continued
currency exchange contracts, credit default swaps, interest rate swaps, total return swaps, and purchased and written options. In doing so, the Fund will employ strategies in differing combinations to permit it to increase, decrease, or change the level or types of exposure to market risk factors. Central to those strategies are features inherent to derivatives that make them more attractive for this purpose than equity and debt securities: they require little or no initial cash investment, they can focus exposure on only certain selected risk factors, and they may not require the ultimate receipt or delivery of the underlying security (or securities) to the contract. This may allow the Fund to pursue its objectives more quickly and efficiently than if it were to make direct purchases or sales of securities capable of effecting a similar response to market factors.
Market Risk Factors. In accordance with its investment objectives, the Fund may use derivatives to increase or decrease its exposure to one or more of the following market risk factors:
Commodity Risk. Commodity risk relates to the change in value of commodities or commodity indexes as they relate to increases or decreases in the commodities market. Commodities are physical assets that have tangible properties. Examples of these types of assets are crude oil, heating oil, metals, livestock, and agricultural products.
Credit Risk. Credit risk relates to the ability of the issuer to meet interest and principal payments, or both, as they come due. In general, lower-grade, higher-yield bonds are subject to credit risk to a greater extent than lower-yield, higher-quality bonds.
Equity Risk. Equity risk relates to the change in value of equity securities as they relate to increases or decreases in the general market.
Foreign Exchange Rate Risk. Foreign exchange rate risk relates to the change in the U.S. dollar value of a security held that is denominated in a foreign currency. The U.S. dollar value of a foreign currency denominated security will decrease as the dollar appreciates against the currency, while the U.S. dollar value will increase as the dollar depreciates against the currency.
Interest Rate Risk. Interest rate risk refers to the fluctuations in value of fixed-income securities resulting from the inverse relationship between price and yield. For example, an increase in general interest rates will tend to reduce the market value of already issued fixed-income investments, and a decline in general interest rates will tend to increase their value. In addition, debt securities with longer maturities, which tend to have higher yields, are subject to potentially greater fluctuations in value from changes in interest rates than obligations with shorter maturities.
Volatility Risk. Volatility risk refers to the magnitude of the movement, but not the direction of the movement, in a financial instrument’s price over a defined time period. Large increases or decreases in a financial instrument’s price over a relative time period typically indicate greater volatility risk, while small increases or decreases in its price typically indicate lower volatility risk.
The Fund’s actual exposures to these market risk factors during the period are discussed in further detail, by derivative type, below.
Risks of Investing in Derivatives. The Fund’s use of derivatives can result in losses due to unanticipated changes in the market risk factors and the overall market. In instances where the Fund is using derivatives to decrease, or hedge, exposures to market risk factors for securities held by the Fund, there are also risks that those derivatives may not perform as expected resulting in losses for the combined or hedged positions.
Derivatives may have little or no initial cash investment relative to their market value exposure and therefore can produce significant gains or losses in excess of their cost. This use of embedded leverage allows the Fund to increase its market value exposure relative to its net assets and can substantially increase the volatility of the Fund’s performance.
20 | OPPENHEIMER VALUE FUND/VA
|
Additional associated risks from investing in derivatives also exist and potentially could have significant effects on the valuation of the derivative and the Fund. Typically, the associated risks are not the risks that the Fund is attempting to increase or decrease exposure to, per its investment objectives, but are the additional risks from investing in derivatives. Examples of these associated risks are liquidity risk, which is the risk that the Fund will not be able to sell the derivative in the open market in a timely manner, and counterparty credit risk, which is the risk that the counterparty will not fulfill its obligation to the Fund. Associated risks can be different for each type of derivative and are discussed by each derivative type in the notes that follow.
Counterparty Credit Risk. Certain derivative positions are subject to counterparty credit risk, which is the risk that the counterparty will not fulfill its obligation to the Fund. The Fund’s derivative counterparties are financial institutions who are subject to market conditions that may weaken their financial position. The Fund intends to enter into financial transactions with counterparties that the Manager believes to be creditworthy at the time of the transaction.
Credit Related Contingent Features. The Fund’s agreements with derivative counterparties have several credit related contingent features that if triggered would allow its derivatives counterparties to close out and demand payment or additional collateral to cover their exposure from the Fund. Credit related contingent features are established between the Fund and its derivatives counterparties to reduce the risk that the Fund will not fulfill its payment obligations to its counterparties. These triggering features include, but are not limited to, a percentage decrease in the Fund’s net assets and or a percentage decrease in the Fund’s Net Asset Value or NAV. The contingent features are established within the Fund’s International Swap and Derivatives Association, Inc. master agreements which govern certain positions in swaps, over-the-counter options and swaptions, and forward currency exchange contracts for each individual counterparty.
Valuations of derivative instruments as of June 29, 2012 are as follows:
| | | | | | |
| | | Asset Derivatives
| |
Derivatives Not
Accounted for as
Hedging Instruments | | Statement of Assets
and Liabilities Location | | Value | |
| Equity contracts | | Investments, at value | | | $1,240 | * |
* Amounts relate to purchased options.
The effect of derivative instruments on the Statement of Operations is as follows:
| | | | |
| Amount of Realized Gain or (Loss) Recognized on Derivatives | |
Derivatives Not Accounted
for as Hedging Instruments | | Investments from
unaffiliated companies* | |
| Volatility contracts | | | $(25,532 | ) |
* Includes purchased option contracts and purchased swaption contracts, if any.
| | | | |
| Amount of Change in Unrealized Gain or (Loss) Recognized on Derivatives | |
Derivatives Not Accounted
for as Hedging Instruments | | Investments* | |
| Equity contracts | | | $(1,319 | ) |
| Volatility contracts | | | 14,149 | |
| | |
|
|
|
| Total | | | $12,830 | |
| | |
|
|
|
* Includes purchased option contracts and purchased swaption contracts, if any.
21 | OPPENHEIMER VALUE FUND/VA
|
NOTES TO FINANCIAL STATEMENTS Unaudited / Continued
6. Risk Exposures and the Use of Derivative Instruments Continued
Option Activity
The Fund may buy and sell put and call options, or write put and call options. When an option is written, the Fund receives a premium and becomes obligated to sell or purchase the underlying security at a fixed price, upon exercise of the option.
Options are valued daily based upon the last sale price on the principal exchange on which the option is traded. The difference between the premium received or paid, and market value of the option, is recorded as unrealized appreciation or depreciation. The net change in unrealized appreciation or depreciation is reported in the Statement of Operations. When an option is exercised, the cost of the security purchased or the proceeds of the security sale are adjusted by the amount of premium received or paid. Upon the expiration or closing of the option transaction, a gain or loss is reported in the Statement of Operations.
The Fund has purchased put options on individual equity securities and/or equity indexes to decrease exposure to equity risk. A purchased put option becomes more valuable as the price of the underlying financial instrument depreciates relative to the strike price.
The Fund has purchased call options on volatility indexes to increase exposure to volatility risk. A purchased call option becomes more valuable as the level of the underlying volatility index increases relative to the strike price.
During the six months ended June 29, 2012, the Fund had an ending monthly average market value of $1,276 and $177 on purchased call options and purchased put options, respectively.
Options written, if any, are reported in a schedule following the Statement of Investments and as a liability in the Statement of Assets and Liabilities. Securities held in collateralized accounts to cover potential obligations with respect to outstanding written options are noted in the Statement of Investments.
The risk in writing a call option is that the Fund gives up the opportunity for profit if the market price of the security increases and the option is exercised. The risk in writing a put option is that the Fund may incur a loss if the market price of the security decreases and the option is exercised. The risk in buying an option is that the Fund pays a premium whether or not the option is exercised. The Fund also has the additional risk that there may be an illiquid market where the Fund is unable to close the contract.
Additional associated risks to the Fund include counterparty credit risk for over-the-counter options and liquidity risk.
As of June 29, 2012, the Fund had no outstanding written options.
7. Pending Litigation
Since 2009, a number of class action, derivative and individual lawsuits have been pending in federal and state courts against OppenheimerFunds, Inc., the Fund’s investment advisor (the “Manager”), OppenheimerFunds Distributor, Inc., the Fund’s principal underwriter and distributor (the “Distributor”), and certain funds (but not including the Fund) advised by the Manager and distributed by the Distributor (the “Defendant Funds”). Several of these lawsuits also name as defendants certain officers and current and former trustees of the respective Defendant Funds. The lawsuits raise claims under federal securities laws and various states’ securities, consumer protection and common law and allege, among other things, that the disclosure documents of the respective Defendant Funds contained misrepresentations and omissions and that the respective Defendant Funds’ investment policies were not followed. The plaintiffs in these actions seek unspecified damages, equitable relief and awards of attorneys’ fees and litigation expenses.
Other class action and individual lawsuits have been filed since 2008 in various state and federal courts against the Manager and certain of its affiliates by investors seeking to recover investments they allegedly lost as a result of the “Ponzi” scheme run by Bernard L. Madoff and his firm, Bernard L. Madoff Investment Securities, LLC (“BLMIS”). Plaintiffs in these suits allege that they suffered losses as a result of their investments in several funds managed by an affiliate of the Manager and assert a variety of claims, including breach of fiduciary duty, fraud, negligent misrepresentation, unjust
22 | OPPENHEIMER VALUE FUND/VA
|
enrichment, and violation of federal and state securities laws and regulations, among others. They seek unspecified damages, equitable relief and awards of attorneys’ fees and litigation expenses. Neither the Distributor, nor any of the Oppenheimer mutual funds, their independent trustees or directors are named as defendants in these lawsuits. None of the Oppenheimer mutual funds invested in any funds or accounts managed by Madoff or BLMIS. On February 28, 2011, a stipulation of partial settlement of three groups of consolidated putative class action lawsuits relating to these matters was filed in the U.S. District Court for the Southern District of New York. On August 19, 2011, the court entered an order and final judgment approving the settlement as fair, reasonable and adequate. In September 2011, certain parties filed notices of appeal from the court’s order approving the settlement. On July 29, 2011, a stipulation of settlement between certain affiliates of the Manager and the Trustee appointed under the Securities Investor Protection Act to liquidate BLMIS was filed in the U.S. Bankruptcy Court for the Southern District of New York to resolve purported preference and fraudulent transfer claims by the Trustee. On September 22, 2011, the court entered an order approving the settlement as fair, reasonable and adequate. In October 2011, certain parties filed notices of appeal from the court’s order approving the settlement. The aforementioned settlements do not resolve other outstanding lawsuits against the Manager and its affiliates relating to BLMIS.
On April 16, 2010, a lawsuit was filed in New York state court against the Manager, an affiliate of the Manager and AAArdvark IV Funding Limited (“AAArdvark IV”), an entity advised by the Manager’s affiliate, in connection with investments made by the plaintiffs in AAArdvark IV. Plaintiffs allege breach of contract against the defendants and seek compensatory damages, costs and disbursements, including attorney fees. On July 15, 2011, a lawsuit was filed in New York state court against the Manager, an affiliate of the Manager and AAArdvark Funding Limited (“AAArdvark I”), an entity advised by the Manager’s affiliate, in connection with investments made by the plaintiffs in AAArdvark I. The complaint alleges breach of contract against the defendants and seeks compensatory damages, costs and disbursements, including attorney fees. On November 9, 2011, a lawsuit was filed in New York state court against the Manager, an affiliate of the Manager and AAArdvark XS Funding Limited (“AAArdvark XS”), an entity advised by the Manager’s affiliate, in connection with investments made by the plaintiffs in AAArdvark XS. The complaint alleges breach of contract against the defendants and seeks compensatory damages, costs and disbursements, including attorney fees.
The Manager believes the lawsuits and appeals described above are without legal merit and, with the exception of actions it has settled, is defending against them vigorously. The Defendant Funds’ Boards of Trustees have also engaged counsel to represent the Funds and the present and former Independent Trustees named in those suits. While it is premature to render any opinion as to the outcome in these lawsuits, or whether any costs that the Defendant Funds may bear in defending the suits might not be reimbursed by insurance, the Manager believes that these suits should not impair the ability of the Manager or the Distributor to perform their respective duties to the Fund, and that the outcome of all of the suits together should not have any material effect on the operations of any of the Oppenheimer mutual funds.
23 | OPPENHEIMER VALUE FUND/VA
|
SPECIAL SHAREHOLDER MEETING Unaudited
On February 29, 2012, a shareholder meeting of the Oppenheimer Variable Account Funds, on behalf of Oppenheimer Value Fund/VA (the “Fund”) was held at which the twelve Trustees identified below were elected to the Trust (Proposal No. 1). At the meeting Proposal No. 2 (including all of its sub-proposals) and Proposal No. 3 were approved as described in the Fund’s proxy statement for that meeting. The following is a report of the votes cast:
| | | | | | | | |
| Nominee/Proposal | | For | | | Withheld | |
| Trustees | | | | | | | | |
| William L. Armstrong | | | 859,155,000 | | | | 36,277,763 | |
| Edward L. Cameron | | | 860,463,149 | | | | 34,969,615 | |
| Jon S. Fossel | | | 861,382,389 | | | | 34,050,375 | |
| Sam Freedman | | | 860,173,958 | | | | 35,258,806 | |
| Richard F. Grabish | | | 862,692,974 | | | | 32,739,789 | |
| Beverly L. Hamilton | | | 862,904,192 | | | | 32,528,571 | |
| Robert J. Malone | | | 862,354,488 | | | | 33,078,275 | |
| F. William Marshall, Jr. | | | 860,997,182 | | | | 34,435,581 | |
| Victoria J. Herget | | | 861,814,105 | | | | 33,618,659 | |
| Karen L. Stuckey | | | 861,434,246 | | | | 33,998,517 | |
| James D. Vaughn | | | 861,208,178 | | | | 34,224,585 | |
| William F. Glavin, Jr. | | | 861,148,846 | | | | 34,283,917 | |
2a: Proposal to revise the fundamental policy relating to borrowing
| | | | | | | | | | | | |
| For | | Against | | | Abstain | | | Broker Non Vote | |
| 533,826 | | | 14,414 | | | | 21,771 | | | | N/A | |
2b: Proposal to revise the fundamental policy relating to concentration of investments
| | | | | | | | | | | | |
| For | | Against | | | Abstain | | | Broker Non Vote | |
| 533,826 | | | 14,414 | | | | 21,771 | | | | N/A | |
2c: Proposal to remove the fundamental policy relating to diversification of investments
| | | | | | | | | | | | |
| For | | Against | | | Abstain | | | Broker Non Vote | |
| 531,949 | | | 14,414 | | | | 23,647 | | | | N/A | |
2d: Proposal to revise the fundamental policy relating to lending
| | | | | | | | | | | | |
| For | | Against | | | Abstain | | | Broker Non Vote | |
| 539,895 | | | 8,345 | | | | 21,771 | | | | N/A | |
2e-1: Proposal to revise the fundamental policy relating to real estate and commodities
| | | | | | | | | | | | |
| For | | Against | | | Abstain | | | Broker Non Vote | |
| 531,949 | | | 16,290 | | | | 21,771 | | | | N/A | |
2e-2: Proposal to remove the additional fundamental policy relating to real estate and commodities
| | | | | | | | | | | | |
| For | | Against | | | Abstain | | | Broker Non Vote | |
| 531,949 | | | 14,414 | | | | 23,647 | | | | N/A | |
24 | OPPENHEIMER VALUE FUND/VA
|
2f: Proposal to revise the fundamental policy relating to senior securities
| | | | | | | | | | | | |
| For | | Against | | | Abstain | | | Broker Non Vote | |
| 539,895 | | | 8,345 | | | | 21,771 | | | | N/A | |
2g: Proposal to revise the fundamental policy relating to underwriting
| | | | | | | | | | | | |
| For | | Against | | | Abstain | | | Broker Non Vote | |
| 539,895 | | | 8,345 | | | | 21,771 | | | | N/A | |
Proposal 3: To approve an Agreement and Plan of Reorganization that provides for the reorganization of a Fund from a Maryland corporation or Massachusetts business trust, as applicable, into a Delaware statutory trust.
| | | | | | | | | | | | |
| For | | Against | | | Abstain | | | Broker Non Vote | |
| 821,085,084 | | | 23,597,959 | | | | 50,749,721 | | | | N/A | |
25 | OPPENHEIMER VALUE FUND/VA
|
PORTFOLIO PROXY VOTING POLICIES AND PROCEDURES;
UPDATES TO STATEMENTS OF INVESTMENTS Unaudited
The Fund has adopted Portfolio Proxy Voting Policies and Procedures under which the Fund votes proxies relating to securities (“portfolio proxies”) held by the Fund. A description of the Fund’s Portfolio Proxy Voting Policies and Procedures is available (i) without charge, upon request, by calling the Fund toll-free at 1.800.525.7048, (ii) on the Fund’s website at oppenheimerfunds.com, and (iii) on the SEC’s website at www.sec.gov. In addition, the Fund is required to file Form N-PX, with its complete proxy voting record for the 12 months ended June 30th, no later than August 31st of each year. The Fund’s voting record is available (i) without charge, upon request, by calling the Fund toll-free at 1.800.525.7048, and (ii) in the Form N-PX filing on the SEC’s website at www.sec.gov.
The Fund files its complete schedule of portfolio holdings with the SEC for the first quarter and the third quarter of each fiscal year on Form N-Q. The Fund’s Form N-Q filings are available on the SEC’s website at www.sec.gov. Those forms may be reviewed and copied at the SEC’s Public Reference Room in Washington, D.C. Information on the operation of the Public Reference Room may be obtained by calling 1-800-SEC-0330.
26 | OPPENHEIMER VALUE FUND/VA
|
OPPENHEIMER VALUE FUND/VA
| | |
| A Series of Oppenheimer Variable Account Funds |
| Trustees and Officers | | William L. Armstrong, Chairman of the Board of Trustees and Trustee Edward L. Cameron, Trustee Jon S. Fossel, Trustee Sam Freedman, Trustee Richard F. Grabish, Trustee Beverly L. Hamilton, Trustee Victoria J. Herget, Trustee Robert J. Malone, Trustee F. William Marshall, Jr., Trustee Karen L. Stuckey, Trustee James D. Vaughn, Trustee William F. Glavin, Jr., Trustee, President and Principal Executive Officer Mitch Williams, Vice President Arthur S. Gabinet, Secretary and Chief Legal Officer Christina M. Nasta, Vice President and Chief Business Officer Mark S. Vandehey, Vice President and Chief Compliance Officer Brian W. Wixted, Treasurer and Principal Financial & Accounting Officer |
| Manager | | OppenheimerFunds, Inc. |
| Distributor | | OppenheimerFunds Distributor, Inc. |
| Transfer Agent | | OppenheimerFunds Services |
| Independent Registered Public Accounting Firm | | KPMGLLP |
| Counsel | | K&L Gates LLP |
Before investing, investors should carefully consider a fund’s investment objectives, risks, charges and expenses. Fund prospectuses and summary prospectuses contain this and other information about the funds and may be obtained by asking your financial advisor, or calling us at 1.800.988.8287. Read prospectuses and summary prospectuses carefully before investing.
The financial statements included herein have been taken from the records of the Fund without examination of those records by the independent registered public accounting firm.
| | |
| ©2012 OppenheimerFunds, Inc. All rights reserved. | |  |
Item 2. Code of Ethics.
Not applicable to semiannual reports.
Item 3. Audit Committee Financial Expert.
Not applicable to semiannual reports.
Item 4. Principal Accountant Fees and Services.
Not applicable to semiannual reports.
Item 5. Audit Committee of Listed Registrants
Not applicable.
Item 6. Schedule of Investments.
a) Not applicable. The complete schedule of investments is included in Item 1 of this Form N-CSR.
b) Not applicable.
Item 7. Disclosure of Proxy Voting Policies and Procedures for Closed-End Management Investment Companies.
Not applicable.
Item 8. Portfolio Managers of Closed-End Management Investment Companies.
Not applicable.
Item 9. Purchases of Equity Securities by Closed-End Management Investment Company and Affiliated Purchasers.
Not applicable.
Item 10. Submission of Matters to a Vote of Security Holders.
The Fund’s Governance Committee Provisions with Respect to Nominations of Directors/Trustees to the Respective Boards
| 1. | The Fund’s Governance Committee (the “Committee”) will evaluate potential Board candidates to assess their qualifications. The Committee shall have the authority, upon approval of the Board, to retain an executive search firm to assist in this effort. The Committee may consider recommendations by business and personal contacts of current Board members and by executive search firms which the Committee may engage from time to time and may also consider shareholder recommendations. The Committee may consider the advice and recommendation of the Funds’ investment manager and its affiliates in making the selection. |
| 2. | The Committee shall screen candidates for Board membership. The Committee has not established specific qualifications that it believes must be met by a trustee nominee. In evaluating trustee nominees, the Committee considers, among other things, an individual’s background, skills, and experience; whether the individual is an “interested person” as |
| | defined in the Investment Company Act of 1940; and whether the individual would be deemed an “audit committee financial expert” within the meaning of applicable SEC rules. The Committee also considers whether the individual’s background, skills, and experience will complement the background, skills, and experience of other nominees and will contribute to the Board. There are no differences in the manner in which the Committee evaluates nominees for trustees based on whether the nominee is recommended by a shareholder. |
| 3. | The Committee may consider nominations from shareholders for the Board at such times as the Committee meets to consider new nominees for the Board. The Committee shall have the sole discretion to determine the candidates to present to the Board and, in such cases where required, to shareholders. Recommendations for trustee nominees should, at a minimum, be accompanied by the following: |
| | • | | the name, address, and business, educational, and/or other pertinent background of the person being recommended; |
| | • | | a statement concerning whether the person is an “interested person” as defined in the Investment Company Act of 1940; |
| | • | | any other information that the Funds would be required to include in a proxy statement concerning the person if he or she was nominated; and |
| | • | | the name and address of the person submitting the recommendation and, if that person is a shareholder, the period for which that person held Fund shares. |
The recommendation also can include any additional information which the person submitting it believes would assist the Committee in evaluating the recommendation.
| 4. | Shareholders should note that a person who owns securities issued by Massachusetts Mutual Life Insurance Company (the parent company of the Funds’ investment adviser) would be deemed an “interested person” under the Investment Company Act of 1940. In addition, certain other relationships with Massachusetts Mutual Life Insurance Company or its subsidiaries, with registered broker-dealers, or with the Funds’ outside legal counsel may cause a person to be deemed an “interested person.” |
| 5. | Before the Committee decides to nominate an individual as a trustee, Committee members and other directors customarily interview the individual in person. In addition, the individual customarily is asked to complete a detailed questionnaire which is designed to elicit information which must be disclosed under SEC and stock exchange rules and to determine whether the individual is subject to any statutory disqualification from serving as a trustee of a registered investment company. |
Item 11. Controls and Procedures.
Based on their evaluation of the registrant’s disclosure controls and procedures (as defined in rule 30a-3(c) under the Investment Company Act of 1940 (17 CFR 270.30a-3(c)) as of 6/29/2012, the registrant’s principal executive officer and principal financial officer found the registrant’s disclosure controls and procedures to provide reasonable assurances that information required to be disclosed by the registrant in the reports that it files under the Securities Exchange Act of 1934 (a) is accumulated and communicated to registrant’s management, including its principal executive officer and principal financial officer, to allow timely decisions regarding required disclosure, and (b) is recorded, processed, summarized and reported, within the time periods specified in the rules and forms adopted by the U.S. Securities and Exchange Commission.
There have been no changes in the registrant’s internal controls over financial reporting that occurred during the registrant’s second fiscal quarter of the period covered by this report that have materially affected, or are reasonably likely to materially affect, the registrant’s internal control over financial reporting.
Item 12. Exhibits.
| (a) | (1) Not applicable to semiannual reports. |
(2) Exhibits attached hereto.
(3) Not applicable.
| (b) | Exhibit attached hereto. |
SIGNATURES
Pursuant to the requirements of the Securities Exchange Act of 1934 and the Investment Company Act of 1940, the registrant has duly caused this report to be signed on its behalf by the undersigned, thereunto duly authorized.
Oppenheimer Variable Account Funds
| | |
| |
| By: | | /s/ William F. Glavin, Jr. |
| | William F. Glavin, Jr. |
| | Principal Executive Officer |
| Date: | | 8/9/2012 |
Pursuant to the requirements of the Securities Exchange Act of 1934 and the Investment Company Act of 1940, this report has been signed below by the following persons on behalf of the registrant and in the capacities and on the dates indicated.
| | |
| |
| By: | | /s/ William F. Glavin, Jr. |
| | William F. Glavin, Jr. |
| | Principal Executive Officer |
| Date: | | 8/9/2012 |
| | |
| |
| By: | | /s/ Brian W. Wixted |
| | Brian W. Wixted |
| | Principal Financial Officer |
| Date: | | 8/9/2012 |