UNITED STATES
SECURITIES AND EXCHANGE COMMISSION
WASHINGTON, D.C. 20549
FORM 10-K/A
(Amendment No. 2)
| x | ANNUAL REPORT PURSUANT TO SECTION 13 OR 15(D) OF THE SECURITIES EXCHANGE ACT OF 1934 |
For the fiscal year ended March 31, 2006
OR
| ¨ | TRANSITION REPORT PURSUANT TO SECTION 13 OR 15(D) OF THE SECURITIES EXCHANGE ACT OF 1934 |
FOR THE TRANSITION PERIOD FROM TO
Commission File No. 0-14225
EXAR CORPORATION
(Exact Name of Registrant as specified in its charter)
| | |
| Delaware | | 94-1741481 |
(State or other jurisdiction of incorporation or organization) | | (I.R.S. Employer Identification Number) |
48720 Kato Road, Fremont, CA 94538
(Address of principal executive offices, Zip Code)
Registrant’s telephone number, including area code: (510) 668-7000
SECURITIES REGISTERED PURSUANT TO SECTION 12(b) OF THE ACT: NONE
SECURITIES REGISTERED PURSUANT TO SECTION 12(g) OF THE ACT:
COMMON STOCK
(Title of Class)
Indicate by check mark if the Registrant is a well-known seasoned issuer, as defined in Rule 405 the Securities Act. Yes ¨ No x
Indicate by check mark if the Registrant is not required to file reports pursuant to Section 13 or 15(d) of the Act. Yes ¨ No x
Indicate by check mark whether the Registrant (1) has filed all reports required to be filed by Section 13 or 15(d) of the Securities Exchange Act of 1934 during the preceding 12 months (or for such shorter period that the Registrant was required to file such reports), and (2) has been subject to such filing requirements for the past 90 days. Yes x No ¨
Indicate by check mark if disclosure of delinquent filers pursuant to Item 405 of Regulation S-K is not contained herein, and will not be contained, to the best of Registrant’s knowledge, in definitive proxy or information statements incorporated by reference in Part III of this Form 10-K or any amendment to this Form 10-K. x
Indicate by check mark whether the Registrant is a large accelerated filer, an accelerated filer, or a non-accelerated filer. See the definition of “accelerated filer and large accelerated filer” in Rule 12b-2 of the Exchange Act.
Large accelerated filer ¨ Accelerated filer x Non-accelerated filer ¨
Indicate by check mark whether the Registrant is a shell company (as defined in Rule 12b-2 of the Act). Yes ¨ No x
The aggregate market value of the voting stock held by non-affiliates of the Registrant as of September 30, 2005 was $494,074,109 based on the last sales price reported for such date as reported on The NASDAQ National Market.
The number of shares outstanding of the Registrant’s Common Stock was 35,942,845 as of May 31, 2006, net of treasury shares.
DOCUMENTS INCORPORATED BY REFERENCE
Portions of the Company’s 2006 Definitive Proxy Statement to be filed not later than 120 days after the close of the 2006 fiscal year are incorporated by reference into Part III, Items 10, 11, 12, 13 and 14 of this Report.
EXPLANATORY NOTE
This Amendment No. 2 on Form 10-K/A (this “Amendment”) amends the Registrant’s Annual Report on Form 10-K for the fiscal year ended March 31, 2006, originally filed on June 12, 2006 (the “Original Filing”) and Amendment No. 1 on Form 10-K/A filed on July 27, 2006 (“Amendment No. 1”) . The Registrant is filing this Amendment in order to refile Exhibit 32.1, Certification of Chief Executive Officer Pursuant to 18 U.S.C. Section 1350, as Adopted Pursuant to Section 906 of the Sarbanes-Oxley Act of 2002 and Exhibit 32.2, Certification of Chief Financial Officer Pursuant to 18 U.S.C. Section 1350, as Adopted Pursuant to Section 906 of the Sarbanes-Oxley Act of 2002, in each case in order to file new certifications showing dates of execution of November 8, 2006. This Amendment covers only the periods covered by the Original Filing and Amendment No. 1.
Except as described above, no other changes have been made to the Original Filing or Amendment No. 1, other than to combine the Original Filing and Amendment No. 1 in this Amendment.
2
EXAR CORPORATION AND SUBSIDIARIES
INDEX TO
ANNUAL REPORT ON FORM 10-K
FOR FISCAL YEAR ENDED MARCH 31, 2006
3
PART I
FORWARD LOOKING STATEMENTS
This Annual Report on Form 10-K (the “Annual Report”) contains forward-looking statements within the meaning of Section 27A of the Securities Act of 1933, as amended, and Section 21E of the Securities Exchange Act of 1934, as amended. Forward-looking statements are generally written in the future tense and/or may generally be identified by words such as “will,” “may,” “should,” “could,” “expect,” “suggest,” “believe,” “anticipate,” “intend,” “plan,” or other similar words. Forward-looking statements contained in this Annual Report include, among others, statements made in “Part II, Item 7. Management’s Discussion and Analysis of Financial Condition and Results of Operations-” Outlook for Fiscal Year 2007” and elsewhere regarding (1) the Company’s market share and competitive position, (2) the Company’s revenue growth, (3) the Company’s belief that its success will continue to depend on its distributors and sales representatives, (4) the Company’s product enhancements (5) the Company’s design wins, (6) the Company’s gross profits, (7) the Company’s research and development efforts and related expenses, (8) the Company’s selling, general and administrative expenses (9) the Company’s belief that its cash and cash equivalents, short-term marketable securities and cash flows from operations will be sufficient to satisfy working capital requirements and capital equipment needs for at least the next 12 months, (10) the effect of interest rates on the Company’s interest income, (11) the Company’s anticipation that it will continue to finance operations with cash flows from operations, existing cash and investment balances, and some combination of long-term and/or lease financing and additional sales of equity securities and (12) the possibility of future acquisitions and investments. Actual results may differ materially from those projected in the forward-looking statements as a result of various factors. Factors that could cause actual results to differ materially from those included herein include, but are not limited to: the information contained under the captions “Part I, Item 1. Business,” “Part I, Item 1A. Risk Factors” and “Part II, Item 7. Management’s Discussion and Analysis of Financial Condition and Results of Operations.” The Company disclaims any obligation to update information in any forward-looking statement.
ITEM 1. BUSINESS
Overview
Exar Corporation (“Exar” or the “Company”) designs, develops and markets high-performance, high-bandwidth physical interface and access control solutions that facilitate the aggregation and transport of signals in access, metro and wide area networks over the worldwide communications infrastructure. The Company’s industry-proven analog and digital design expertise, system-level knowledge and standard complementary metal oxide semiconductors (“CMOS”) process technologies provides original equipment manufacturers (“OEMs”) with innovative, highly integrated circuits (“ICs”) addressing standards such as T/E carrier, ATM, SONET/SDH and Multi-Protocol Over SONET (“MPOS”). In addition, the Company has developed a portfolio of clock products that address various system needs for clock generation, distribution, skew adjustment and fail-safe applications. The clock and timing product lines leverage Exar’s phase locked-loop (“PLL”) technology that is used extensively in its existing network and transmission products. The clock and timing products are targeted at wireless base stations, network switches and routers.
The Company also provides a comprehensive family of serial communications solutions comprised of low voltage, single/multi-channel universal asynchronous receiver transmitters (“UARTs”). UARTs are well suited to increase data transfer efficiency for various industrial, telecommunications and consumer applications.
The Company designs and markets IC products that address select applications for the video and imaging markets. Late in fiscal year 2006, Exar introduced its first SATA/SAS Port-Multiplier product addressing the storage marketplace.
Exar was incorporated in California in 1971 and reincorporated in Delaware in 1991. Exar’s common stock trades on The NASDAQ National Market (“NASDAQ”) under the symbol “EXAR”. See the information in “Part II, Item 8, Financial Statements and Supplementary Data” for information on the Company’s financial position as of March 31, 2006 and 2005 and its results of operations and cash flows for the periods ended March 31, 2006, 2005 and 2004.
4
Exar believes its broad product offerings provide its customers the following benefits:
| | • | | increased bandwidth through the integration of multiple channels on a single device; |
| | • | | reduced system noise/jitter to improve data integrity; |
| | • | | a single source for a full range of transceivers, mappers and framer solutions and transmission rates; |
| | • | | reduced overall system cost and size through the integration of multiple functions on a single device; |
| | • | | accelerated time-to-market by allowing customers to focus on core competencies and outsource standards-based solutions; and |
| | • | | unique value added features and functions. |
Key elements of the Company’s solution include:
Commitment to Connectivity. Exar remains steadfast in its commitment to connectivity—a strategic principle that drives Exar’s product strategies and serves as a foundation for customer and vendor engagements. Connectivity describes our distinctive approach in creating and providing value to our shareholders, employees, customers and suppliers.
Leading Analog and Mixed-Signal Design Expertise. Exar has approximately thirty-five years of proven technical competency in developing analog and mixed-signal ICs. As a result, the Company has developed deep expertise in these areas and a comprehensive library of design elements. For example, the Company believes that it has particularly strong expertise in the design of high-speed, low-jitter phase-locked loops, which are key elements in its mixed-signal transceiver, jitter attenuator, data aggregation mapper products and clock devices. As a result, Exar can provide its customers with solutions that typically exceed standard specifications and allow them flexibility in designing other system elements.
Comprehensive Solutions to Enhance System Integration. The combination of Exar’s design and system-level expertise allows it to provide a comprehensive solution that encompasses hardware, software and applications support. Exar believes that, by using its solutions, OEMs can efficiently integrate the Company’s devices into their systems, better leverage their development resources and reduce their time-to-market.
Compelling Performance Solutions. The Company uses its systems expertise and its analog, digital and mixed-signal design techniques to architect high-performance products based on standard CMOS process technologies. Exar believes that these CMOS processes are proven, stable, predictable and able to meet its customers’ speed, power and performance requirements at a competitive price point.
The Company’s OEM customers include, among others, Adtran Inc. (“Adtran”), Alcatel, Cisco Systems Inc. (“Cisco”), Digi International, Inc. (“Digi International”), Fujitsu Limited (“Fujitsu”), Hewlett-Packard Company (“Hewlett-Packard”), Huawei Technologies Company, LTD. (“Huawei”), ITT Industries, Inc. (“ITT”), Lucent Technologies, Inc. (“Lucent”), Ericsson/Marconi, Mitsubishi Electronic Corporation of Japan (“Mitsubishi Electronics”), NEC Corporation (“NEC”), Nokia Corporation (“Nokia”), Plantronics, Inc. (“Plantronics”), Siemens A.G. (“Siemens”), and Tellabs, Inc. (“Tellabs”). For the fiscal year ended March 31, 2006, Alcatel represented 10.5% of the Company’s net sales.
Industry Background
Communications
The communications industry, and its underlying technology, has gone through a significant transformation during the last several years. It has been driven by the continuing adoption of broadband, and the increasing consumer demand for more services delivered at ever-faster speeds. This phenomenon has changed the complexion of the market, and the companies that support it. The industry is typified by increasing competition with the convergence of telecommunication and cable/satellite operators expanding to offer telecommunications, Internet and video services. Recently, the telecommunication industry has experienced consolidation as surviving carriers acquire wireline and wireless networks to compete with expanded coverage and services.
The network infrastructure — a highway of interconnections — must transmit varied traffic (voice, data and video) at different speeds over the Internet. To accomplish this, OEMs are designing complex ICs in multi-service equipment leveraging industry standard protocols and high data transmission speeds enabling networks to communicate with each other. In North America, the high-speed data traffic standard is Synchronous Optical Network (“SONET”), and in most of the rest of the world, it is Synchronous Data Hierarchy (“SDH”). Over optical fiber, the SONET/SDH standard ensures network
5
reliability, data integrity and the interoperability of equipment deployed across the network from different manufacturers. Additionally, carriers are ramping up triple play services (voice, data and video) over converged wireless and wireline infrastructure using standards-based Multi-protocol over SONET/SDH solutions and on “greenfield” deployments using native Ethernet based technologies, while making sure that reliable and seamless services are offered across these multiple inter-networking domains. Beyond the wireline infrastructure, wireless services have also evolved during this period with more carriers offering consumers advanced capabilities such as video conferencing and wireless TV services.
The combined effect of all of these changes in the telecommunications market is driving IC manufacturers to increase the bandwidth supported by their devices by providing vertical integration (more functionality) and horizontal integration (more channels). This push to more cost effective devices in turn is increasing the adoption rate of these services in both the established and emerging markets. The Company believes that IC companies with analog and digital design expertise and a deep understanding of system-level applications will have a competitive advantage in this changing market environment.
Storage
The need for reliable and cost effective storage technologies has increased almost exponentially with the increased volume of data transmitted over the Internet. This data now includes critical business and personal information, which in many cases no longer has paper back-up.
This increase in the volume of data is already pushing IC manufacturers to constantly augment the throughput of their devices to data rates of three gigabytes per second and higher. The critical nature of the data is also pressuring IC manufacturers to pay constant attention to the performance of these devices especially at the physical layer.
Data reliability and security is improved by distributing the storage functionality across multiple hosts and drives. This method includes deploying port multipliers that provide access to multiple disk drives by a single host and deploying port selectors that allow multiple hosts to access a single drive. In some cases, both the port multiplier and port selector functionality is implemented in a single system that addresses both the reliability and redundancy requirements of a storage system.
Clock and Timing
During the past several years, clock and timing products have played a more ubiquitous and critical role within digital systems. The appetite of consumers for digital entertainment and instant global connectivity, and the drive for complex data processing require a broad range of timing solutions. This change in system dynamics is fueling the need to support higher speed synchronization and communication between complex microprocessors, memory, application specific integrated circuits (“ASICs”), and other elements on the system board. To effectively facilitate gigabyte rates in communications systems, clock and timing solutions now have to provide very high frequencies combined with stringent jitter performance.
Consumer applications such as set top boxes and digital televisions require timing solutions that provide a high level of flexibility in terms of frequencies and programmability. Computing systems also need clocks and buffers that can manage vast arrays of memory within sophisticated workstations and servers. The timing market has to keep pace with these diverse applications that are driving the volumes and sophistication of clock synthesizers and related products.
Serial Communications
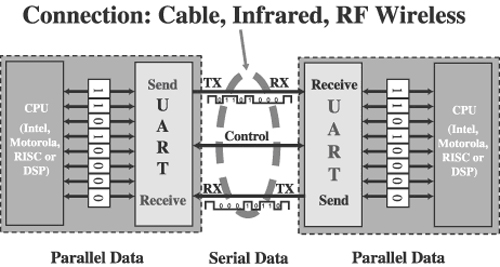
The move from parallel to serial interfaces for chip-to-chip or system-to-system interconnects is required to address the needs of the fastest-growing data communications markets. By converting parallel links into serial links, UARTs play a vital role in reducing the large number of wires and traces in legacy designs. In addition to this conversion, a UART offers additional benefits by off loading functions such as interrupt processing and data flow control from the CPU, which results in increased bandwidth.
UARTs are used in a wide range of communications equipment for control and diagnostics functions. UARTs are also used in system management to monitor Quality of Service (“QoS”) information, or to provide redundancy in fault tolerant systems. The Company’s highly integrated single/multi-channel UARTs have been specifically designed for communication systems with high throughput. These include servers, routers, network management equipment, computer telephony, remote access servers, wireless base stations and repeaters.
6
Multi-channel UARTs are commonly used in industrial applications such as process control and factory automation. Point-of-sale host systems often communicate to multiple remote terminals and self-service pumps at gas/petrol stations. These environments will typically have 8 to 32 (RS-232 or RS-485) ports by using multiple UARTs for communications.
Single and multi-channel UARTs are used in portable consumer applications such as multi-media products, Global Positioning System (“GPS”) and Personal Digital Assistant (“PDA”) devices. Products such as smart phones and PDAs utilize multiple serial interfaces to connect to Bluetooth, compact flash, IrDA, serial docking interface and GPS receivers for wireless or wired interface to global positioning systems. When a Bluetooth or GPS receiver is not integrated in the device, an external module can easily be connected via the UART interface in most applications. The Company’s UARTs are well suited for battery-operated applications that require mobility such as handheld data entry devices, security alarm and point-of-sale terminals.
Strategy
Exar strives to be a leading provider of physical layer high-performance, high-bandwidth IC solutions for use in the worldwide communications infrastructure. The Company also designs, develops and markets IC products that address the needs of the serial communications market. To achieve its business objectives, the Company employs the following strategies:
Focus on Growing Market Share within the Communications Markets. Exar targets communications markets, including T/E carrier, ATM, SONET/SDH and MPOS. The Company has built substantial expertise in the areas of analog and digital design, systems architecture and applications support. Exar believes that the integration of these capabilities enables the Company to develop solutions addressing the high-bandwidth physical layer requirements of communications systems OEMs. The Company’s broad product offerings support differentiated features that the Company believes will enable it to increase its market share. Additionally, the Company seeks to expand its markets by incorporating adjacent functionality into its products.
Leverage Analog and Mixed-Signal Design Expertise to Provide Integrated System-Level Solutions. Utilizing its strong analog and mixed-signal design expertise, the Company integrates mixed-signal physical interface devices with digital access control devices. The Company offers products that integrate transceivers, jitter attenuators and framers/ATM UNIs on a single IC. The Company’s data aggregation devices leverage its T/E carrier and SONET/SDH expertise, mapping multiple T3 data streams into a single SONET/SDH stream. These configurations enable OEMs to use less board space and reduce their overall system cost. In the last two years, the Company has utilized its PLL expertise to introduce new clock products for communications and server applications. Lastly, the Company expanded its mixed-signal expertise to solve signal integrity design challenges in the storage market with the introduction of SATA/SAS port multipliers.
Expand the Company’s Revenue Content Per System. Exar’s analog and mixed-signal design expertise has enabled the Company to build what it believes to be a technological advantage in T/E transceivers and framers and SONET mapping and aggregation. The Company intends to leverage this advantage and its established customer relationships to capture design wins for its physical layer products, thereby increasing the Company’s overall revenue content per system.
Strengthen and Expand Strategic OEM Relationships. Exar’s OEM customers include Alcatel, Cisco, Digi International, Hewlett-Packard, Huawei, Lucent, Marconi/Ericsson, NEC, Nokia and Tellabs. To promote the early adoption of its solutions, the Company actively seeks collaborative relationships with strategic OEMs during product development. The Company believes that OEMs recognize the value of Exar’s early involvement because designing their system products in parallel with the Company’s development can accelerate time-to-market for their end products. In addition, Exar believes that collaborative relationships help the Company to obtain early design wins and to increase the likelihood of market acceptance of its new products.
Leverage Broad Product Portfolio to Accelerate Communications Product Development. Exar believes it has developed a strong presence in the serial communications market, where the Company has leading industry customers and proven technological capabilities. The Company’s design expertise has enabled it to offer a diverse portfolio of both industry standard and proprietary serial communications products. The Company plans to expand this portfolio by developing integrated solutions that extend the reach of its offerings into new input/output applications. In addition, the Company has further expanded its communications portfolio by offering a family of clock devices, which leverage technology common with its existing network and transmission products.
Use Standard CMOS Process Technologies to Provide Compelling Price/Performance Solutions. Exar designs its products to be manufactured using standard CMOS processes. The Company believes that these processes are proven, stable and predictable and benefit from the extensive semiconductor-manufacturing infrastructure devoted to CMOS processes. Therefore, the Company believes that it can achieve a higher level of performance at a lower cost than competitors’ products based on alternative manufacturing technologies. However, in certain specialized cases the Company may use other process technologies to take advantage of their performance characteristics.
7
Leverage Fabless Semiconductor Model. Exar has long-standing relationships with third-party assembly, test and wafer foundries to manufacture the Company’s ICs. The Company’s fabless approach allows it to avoid substantial capital spending, obtain competitive pricing, minimize the negative effects of industry cycles, reduce time-to-market, reduce technology and product risks, and facilitate the migration of the Company’s products to new CMOS process technologies, which reduces costs and power consumption and optimizes performance. By leveraging the fabless model, Exar can focus on its core competencies of sales and marketing as well as product design, development and support.
Products
Communications
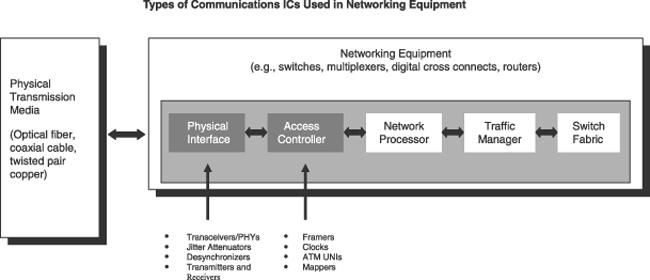
Exar’s products for T/E carrier, ATM, SONET/SDH and MPOS applications include high-speed analog, digital and mixed-signal physical interface and access control ICs. The physical interface IC consists of a transmitter and receiver that, when integrated, is called a transceiver. Transceivers interface with the physical transmission media. Most of these high-speed, mixed-signal ICs convert digital inputs in a parallel format into a single bit stream that is many times faster than the original signal. Access control circuits are digital circuits that format, or frame, the data, perform error checking, and in some applications, aggregate signals by mapping multiple lower-speed data streams into one single higher-speed stream. The figure below illustrates where the Company’s products are employed within networking equipment.
Exar’s communications products include analog front ends (“AFEs”), transmitters, receivers, transceivers (also known as line interface units or “LIUs” or “PHYs”), jitter attenuators, framers, clocks, ATM UNIs and data aggregation mappers. These products are used in networking equipment such as SONET/SDH Add/Drop Multiplexers (“ADMs”), PBX, central office switches, digital cross connects, multi-service provisioning platforms, routers and Digital Subscriber Loop Access Multiplexes (“DSLAMs”).
T/E
Exar offers a broad range of products in the T1/E1 segment encompassing AFEs, short-haul and long-haul LIUs and LIU/framer combinations that incorporate reconfigurable, relayless, redundancy with integrated termination resistors and jitter attenuators. Used individually or in chip sets, Exar’s T1/E1/J1 devices offer customers key advantages including design flexibility, enhanced system reliability and standards compliance which are critical components of high-density, low-power system boards and line-cards. In addition, Exar’s T1/E1/J1 LIU combination products simplify the design process. Exar’s T1/E1 portfolio includes products with up to 21 channels of AFEs, up to 14 channels LIU/JA and up to 8 channel LIU/framer combinations.
Exar has developed a diversified portfolio of single/multi-channel T3/E3 physical interface solutions with integrated transceivers and jitter attenuators, that achieve high performance levels while reducing board space and overall power in multi-port applications. Extending its jitter attenuation capabilities, Exar incorporates desynchronization in its transceivers
8
and data aggregation mappers to solve complex timing issues associated with mapping/demapping from SONET/SDH (synchronous) to T3/E3 (asynchronous) environments. In addition, the Company has integrated its LIU and framer functions into its multi-channel DS3/E3 LIU/Framer/JA combination device that offer customers additional design flexibility.
The Company also supplies a family of V.35 transceiver products used for data transmission, primarily in networking equipment such as routers and bridges.
SONET/SDH
Exar’s data aggregation mapper solutions leverage the Company’s expertise in T/E carrier with SONET/SDH, enabling the Company to provide unique solutions to the SONET/SDH market place. In addition to integrating SONET PHY capability into its data aggregation mappers, the Company also offers OC-3/12/48 PHYs and plans to complement these devices with additional OC-48 data aggregation solutions. Exar’s access control products include framers and ATM UNIs, in addition to its data aggregation mappers. Complementing Exar’s OC-3 to OC-48 SONET/SDH devices was the addition of a highly integrated and innovative OC-3/STM-1 to OC-192/STM-64 multi-rate framer. This product extends Exar’s SONET/SDH capabilities to cover all data rates starting from OC-3/STM-1 to OC-192/STM-64. In addition, the device enables significant flexibility in line card design coupled with substantial cost and power savings. Exar extended its mixed-signal technology leadership into next generation metro core and transport network markets with the introduction of the first in a family of multi-protocol over SONET/SDH framers. Deployment of these devices is ideal for the growing market shift towards the convergence of triple-play services over SONET/SDH.
Clock and Timing
Whether regulating data transmissions or executing system instructions, clocks perform the critical role of producing precisely timed and repeated pulses that synchronize the overall system or other embedded applications. In fiscal year 2004, Exar introduced a family of five new clock products targeted at high-performance system boards, offering flexibility to board designers by providing them with precision, low jitter, programmable skew, zero delay and fan out buffers. These were followed in fiscal year 2005 by a series of Intelligent Dynamic Clock Switch (“IDCS”) devices. These products offer features including dynamic switch, manual override, on-board redundancy and fail-safe operations plus other features that enable customers to easily develop applications that increase over-all system reliability. In fiscal year 2006, the Company further expanded its clock products by introducing several families of high performance, industry standard Zero Delay Buffers (“ZDB”) for the timing market segment. These ZDB devices are instrumental for effective distribution of clock signals across a printed circuit board’s (“PCBs”) timing topology. They have ubiquitous applications within all key market segments including networking, computation and consumer applications.
Storage
Market demand is driving the need for increased storage capacity for a host of consumer, home media, and industrial applications where cost effective, dense storage is a requirement. There are many approaches to data storage deployment: Storage Area Network (“SAN”), Direct Attached Storage (“DAS”), Network Attached Storage (“NAS”), Redundant Array of Inexpensive Disks (“RAID”) and Just a Bunch of Disks (“JBOD”). Each of these will support unique configurations (number of disk drives) and locations (internal to the system, or connected externally to an enclosure). Connecting to all of these storage environments entails supporting industry-adopted protocols including Serial Advanced Technology Attachment (“SATA”) and Serial Attached SCSI (“SAS”), among others. The SATA I/II specifications were recently standardized as a serial interconnect technology of choice between advanced host controllers and storage drives. Exar’s SATA/SAS port multipliers enable distribution of data across multiple disk drives from a single host. Exar’s port selectors enable multiple hosts to access a single drive. These approaches ensure greater data reliability and security.
Serial Communications
As a leader of UART solutions, Exar offers a broad line of industry-proven product families. Exar’s product portfolio consists of single, dual, quad and octal channel devices with enhanced feature sets, and a broad range of packaging options. These products provide an easy migration path from one product generation to the next. All are highly integrated UARTs that the Company believes are the defacto industry standard for UARTs with First-In First-Out (“FIFO”) used in multi-port applications. In fiscal year 2006, Exar introduced four innovative solutions: a multi-channel 66MHz PCI 3.0 compliant UART family, a small UART (5x5x0.9mm); 1.8 Volt single-channel UART in 24 and 32-pin QFN packages; and a dual-channel 66MHz PCI 3.0 compliant device. Collectively, these innovative products provide immediate competitive advantages to designers. Utilization of Exar’s devices accelerate time-to-market and performance capabilities by reducing development time and addressing the growing need for board space savings, lower power, and increased bandwidth requirements for communications, industrial and consumer applications.
9
During fiscal year 2006, the Company developed an integrated 8-bit UART and RS-232 Transceiver device, the first in a family of innovative Combo devices for introduction in fiscal year 2007. By integrating these two functions into a simple space saving package, the series targets the growing market demand of consumer and battery powered applications including laptops and portable devices; desktop PCs; and industrial peripheral interfaces such as handheld terminals and Point-of-Sale (“POS”) systems, amongst others.
Exar sells its UART products to the remote access, data collection, industrial automation, point-of-sale, handheld/mobile and consumer markets.
Video and Imaging
Exar supplies high-performance analog-to-digital converters, and integrated analog front ends, for products such as copiers and scanners, digital still cameras, and multifunctional peripherals. These ICs incorporate scanning, faxing, copying and printing functions in a single integrated system. The Company uses advanced design techniques and process technologies to integrate low-power converter architectures with surrounding analog functions, thereby reducing system costs.
Sales and Customers
The Company markets its products globally through both direct and indirect channels. In North and South America through 21 independent sales representatives and two independent, non-exclusive primary distributors, as well as the Company’s own direct sales organization. The Company currently has domestic support offices in or near Atlanta, Boston, Chicago, Dallas, Los Angeles and Fremont, California. Additionally, the Company is represented in Europe and the Asia/Pacific region by its wholly-owned foreign subsidiaries and international support offices in Vallauris, France; Kawasaki, Japan; and Shanghai, China. In addition to these Exar offices, 21 independent sales representatives and other independent, non-exclusive distributors represent the Company in Europe and the Asia/Pacific region. The Company’s international sales represented 51.3%, 50.9% and 53.5% of net sales for the fiscal years ended March 31, 2006, 2005 and 2004, respectively.
10
The Company’s OEM customers include, among others, the following:
| | |
Communications | | Serial and Other Communications |
| |
• Adtran • Alcatel • Cisco • Huawei • Lucent • Marconi/Ericsson • NEC • Nokia • Siemens • Tellabs | | • Cisco • Digi International • Fujitsu • Plantronics • Hewlett-Packard • Huawei • Mitsubishi Electronics |
Alcatel accounted for 10.5% of the Company’s net sales for the fiscal year ended March 31, 2006. For the fiscal years ended March 31, 2005 and 2004, no OEM customer accounted for 10% or more of the Company’s net sales. The Company sells its products to distributors and OEMs throughout the world. For the year ended March 31, 2006, worldwide sales through the Company’s two primary distributors for subsequent resale to OEMs or their subcontract manufacturers accounted for 40.0% of net sales. Future Electronics (“Future”) was and continues to be the Company’s largest primary distributor. Future, on a worldwide basis, represented 24.1%, 20.4% and 20.3% of net sales in fiscal years 2006, 2005 and 2004, respectively. The Company’s second largest primary distributor, Nu Horizons Electronics Corp. (“Nu Horizons”), accounted for 15.9%, 16.4% and 13.4% of net sales in fiscal years 2006, 2005 and 2004, respectively.
Manufacturing
Exar outsources all of its fabrication and assembly, as well as the majority of its testing operations. This fabless manufacturing model allows the Company to focus on its core competencies of sales and marketing as well as product design, development and support.
The majority of the Company’s current products are implemented in standard CMOS. The Company uses CMOS manufacturing processes to take advantage of that technology’s lower power consumption, cost-effectiveness, foundry availability and ever-increasing speed. Chartered Semiconductor Manufacturing Ltd. (“Chartered”) manufactures the majority of the Company’s CMOS semiconductor wafers from which the Company’s products are manufactured. The Company does not have long-term supply agreements with its suppliers. See“Part I, Item 1A Risk Factors.”
Most semiconductor wafers are shipped to the Company’s subcontractors in Asia for wafer test and assembly, where they are cut into individual die and packaged. Independent contractors in Hong Kong, Indonesia and the Philippines perform most of the Company’s assembly work. Following assembly, final test and quality assurance are performed either at the Company’s Fremont, California facility or at its subcontractors’ facilities in Asia.
Research and Development
Exar believes that ongoing innovation and the introduction of new products in its targeted and adjacent markets is essential to sustaining growth. Exar’s research and development is focused on developing high-performance analog, digital and mixed-signal solutions addressing the high-bandwidth requirements of both communications and storage systems OEMs. Exar continues to make significant investments in advanced design tools and high-performance standard cell libraries. By utilizing these tools, the Company pursues the development of design methodologies that are optimized for reducing design-cycle time and increasing the likelihood of first-time successes. In order to support high pin-count devices, the Company continues to develop high-performance packages for its new products in collaboration with packaging suppliers. Exar spent $24.7 million, $22.0 million and $21.8 million on research and development in fiscal years 2006, 2005 and 2004, respectively.
Competition
The semiconductor industry is intensely competitive and is characterized by rapid technological change and a history of price reductions as production efficiencies are achieved in successive generations of products. Although the market for analog and mixed-signal integrated circuits is generally characterized by longer product life cycles and less dramatic price reductions than the market for digital integrated circuits, the Company faces substantial competition in each market in which it participates. Competition in the Company’s markets is based principally on technical innovation, product features, timely introduction of new products, quality and reliability, performance, price, technical support and service. The Company believes that it competes favorably in all of these areas.
11
Because the IC markets are highly fragmented, the Company generally encounters different competitors in its various target markets. Competitors with respect to the Company’s communications products include Agere Systems, Applied Micro Circuits Corporation, Infineon Technologies North America Corp., Integrated Device Technology, Inc., Mindspeed Technologies, Inc., PMC Sierra, Inc., TranSwitch Corporation and Vitesse Semiconductor Corporation. Competitors in the clock products area include Cypress Semiconductor and Integrated Device Technology, Inc. Competitors in the Company’s serial communications and video and imaging markets include Royal Philips Electronics, Texas Instruments Incorporated and Wolfson Microelectronics LTD.
Backlog
Exar defines backlog to include OEM orders and distributor orders for which a delivery schedule has been specified for product shipment occurring during the succeeding six months. As of March 31, 2006, Exar’s backlog was $14.6 million, compared to $9.6 million as of March 31, 2005.
The Company’s business and, to a large extent, that of the semiconductor industry, has been characterized by short order-to-shipment schedules. Sales are made pursuant to either purchase orders for current delivery of standard items or agreements covering purchases over a period of time, which are frequently subject to revisions and cancellations. Lead times for the release of purchase orders depend on the scheduling practices of the individual customer, and the Company’s rate of bookings varies from month-to-month. In addition, Exar’s domestic distributor agreements generally permit the return of up to 10% of purchases of the preceding quarter for purposes of stock rotation and also provide for credits to distributors in the event that Exar reduces the price of any inventoried product. Since orders constituting the Company’s backlog are subject to changes in delivery schedules or to cancellations at the option of the customer without significant penalty, backlog is not necessarily an indication of future sales. The Company believes that its backlog as of any particular date may not be representative of actual sales for any succeeding six month period.
Intellectual Property Rights
The Company has 113 patents issued and 26 patent applications pending in the United States. The Company has 18 patents issued and 34 patent applications pending in various foreign countries. The Company’s existing patents will expire between 2006 and 2023, or sooner if it chooses not to pay renewal fees. The Company believes that its intellectual property is critical to its current and future success. However, the Company does not believe that it is materially dependent upon any one patent. To protect its intellectual property, the Company also relies on a combination of mask work registrations, trademarks, copyrights, trade secrets, employee and third party nondisclosure agreements and licensing arrangements. The Company may enter into license agreements or other agreements to gain access to externally developed products or technologies.
The Company may fail to adequately protect its intellectual property. Others may gain access to the Company’s trade secrets or disclose such trade secrets to third parties. Some or all of the Company’s pending and future patent applications may not result in issued patents that provide it with a competitive advantage. Even if issued, such patents, as well as the Company’s existing patents, may be challenged and later determined to be invalid or unenforceable. In addition, others may develop similar or superior products without access to or without infringing upon the Company’s intellectual property, including intellectual property that is protected by trade secret and patent rights.
The Company cannot be sure that its products or technologies do not infringe patents that may be granted in the future pursuant to pending patent applications or that the Company’s products do not infringe any patents or proprietary rights of third parties. Occasionally, the Company is informed by third parties of alleged patent infringement. In the event that any relevant claims of third-party patents are found to be valid and enforceable, the Company may be required to:
| | • | | stop selling, incorporating or using its products that use the infringed intellectual property; |
| | • | | obtain a license to make, sell or use the relevant technology from the owner of the infringed intellectual property, although, such license may not be available on commercially reasonable terms, if at all; or |
| | • | | redesign the Company’s products so as not to use the infringed intellectual property, which may not be technically or commercially feasible or meet customer requests. |
If the Company were required to take any of the actions described above or defend against any claims from third parties, its business, financial condition and results of operations could be harmed. See“Part I, Item 1A. Risk Factors.”
12
Employees
As of March 31, 2006, the Company employed 255 full-time employees, with 118 in research and development, 44 in operations, 49 in marketing and sales and 44 in administration. Of the 118 research and development employees, 51 hold advanced degrees. The Company’s ability to attract, motivate and retain qualified personnel is essential to its continued success. See“Part I, Item 1A..Risk Factors”None of the Company’s employees is represented by a collective bargaining agreement, nor has the Company ever experienced a work stoppage due to labor issues. The Company believes its employee relations are good.
Available Information
The Company files electronically with the SEC its Annual Reports on Form 10-K, Quarterly Reports on Form 10-Q, current Reports on Form 8-K, and amendments to those Reports pursuant to Section 13 or 15(d) of the Securities Exchange Act of 1934. Those reports and statements (1) may be read and copied at the SEC’s public reference room at 100 F Street, N.E., Washington, DC 20549, (2) are available at the SEC’s internet site (http://www.sec.gov), which contains reports, proxy and information statements and other information regarding issuers that file electronically with the SEC and (3) are available free of charge through our website (www.exar.com) as soon as reasonably practicable after electronic filing with, or furnishing to, the SEC. Information regarding the operation of the SEC’s public reference room may be obtained by calling the SEC at 1-800-SEC-0330. Copies of such documents may be requested by contacting the Company’s Investor Relations Department at (510) 668-7201 or by sending an e-mail through the Investor Relations page on the Company’s website. The Company has adopted a Code of Business Conduct and Ethics for its principal executive officer, principal financial officer, principal accounting officer or controller, or persons performing similar functions. The Company has posted its Code of Business Conduct and Ethics on its website. Any future amendments to this code will also be posted to its website.
13
EXECUTIVE OFFICERS OF THE REGISTRANT
The names of the Company’s executive officers, and their ages as of March 31, 2006, are as follows:
| | | | |
| Name | | Age | | Position |
| Roubik Gregorian | | 56 | | President, Chief Executive Officer and Director |
| Mir Bahram Ghaderi | | 54 | | Vice President and General Manager, Network and Transmission Products Division |
| Ronald W. Guire | | 57 | | Executive Vice President, Chief Financial Officer, Assistant Secretary and Director |
| Thomas R. Melendrez | | 52 | | General Counsel, Secretary and Vice President Business Development |
| Levent Ozcolak | | 44 | | Division Vice President and General Manager, Interface Products |
| Stephen W. Michael | | 59 | | Vice President, Operations and Reliability & Quality Assurance |
Roubik Gregorian joined the Company in 1995 as President, Startech Division, when the Company acquired Startech Semiconductor, Inc., where he had served as President. During Dr. Gregorian’s tenure at the Company, he was appointed Chief Technology Officer and Vice President of the Communications Division in 1996 and Chief Technology Officer, Senior Vice President/General Manager, Communications Division, in 1998. Dr. Gregorian was promoted to Executive Vice President/General Manager, Communications Division in 2002 and to Chief Operating Officer in 2003. Dr. Gregorian served as the Company’s acting President and Chief Executive Officer from September 2004 to February 2005, when he was appointed to his current position of President and Chief Executive Officer. Dr. Gregorian has been a director of the Company since March 2005. From 1983 to 1994, Dr. Gregorian served as Vice President of Research and Development and Chief Technology Officer for Sierra Semiconductor where he directed the company’s product strategy and product development activities including the data communications and graphic products which were instrumental in taking the company public in 1991. From 1977 to 1983, Dr. Gregorian was manager of analog and telecommunications products at American Microsystems where he received several awards including one for developing the industry’s first PCM CODEC. Dr. Gregorian has been issued 27 patents, authored two textbooks and 45 technical articles. He received his M.S.E.E. and Ph.D. in Electrical Engineering from the University of California at Los Angeles, as well as a M.Sc. from Tehran University in Electrical Engineering.
Mir Bahram Ghaderi joined the Company in March 1995 as Director of Engineering, Startech Division, when the Company acquired Startech Semiconductor, Inc., where he had served as Vice President of Engineering. He was promoted to Divisional Vice President of Engineering, Communications Division in September 2001, and to his current position as Vice President and General Manager, Network and Transmission Products Division, in April 2003. Prior to joining Startech in 1994, he was Director of Engineering, Modem/Clock Products, at Sierra Semiconductor, Inc. Dr. Ghaderi has 25 years of product development experience in the semiconductor industry and received a M.S.E.E. and Ph.D. in Electrical Engineering from the University of California at Los Angeles, as well as a M.S.E.E. from Tehran University.
Ronald W. Guire is the Executive Vice President, Chief Financial Officer, and Assistant Secretary for Exar. He joined the Company in 1984 as Vice President and Treasurer; in 1985 his title was changed to Vice President, Chief Financial Officer (CFO) and Secretary (until June 2001 when he became Assistant Secretary), and in 1995 Mr. Guire was named Executive Vice President. Mr. Guire has been a director of the Company since 1985. Mr. Guire was a partner in the certified public accounting firm of Graubart & Co. from 1979 until joining the Company. Mr. Guire is a member of the California Society of Certified Public Accountants and a member of Financial Executives International. Mr. Guire holds a B.S. in Accounting from California College of Commerce and has been a certified public accountant since 1977.
Thomas R. Melendrez joined the Company in April 1986 as Corporate Attorney. He was promoted to Director, Legal Affairs in July 1991, and again to Corporate Vice President, Legal Affairs in March 1993. In March 1996, Mr. Melendrez was promoted to Corporate Vice President, General Counsel. In June 2001, Mr. Melendrez was appointed Secretary of the Company. In April 2003, Mr. Melendrez assumed, in addition to his other duties, the responsibilities of Vice President, Business Development. Mr. Melendrez has over 25 years of legal experience in the semiconductor and related industries. He received a B.A. from the University of Notre Dame, a J.D. from the University of San Francisco, and an M.B.A. from Pepperdine University.
Levent Ozcolakjoined the Company in 1985 after completing school as a Design Engineer. He held several engineering management positions prior to his promotion to Director of Engineering, Video and Imaging Division in 1998. Mr. Ozcolak was appointed Director of Marketing, Video and Imaging Division in 1999, and Director of Marketing, Interface Products Division in 2003. He was promoted to General Manager, Interface Products Division in 2004, and to his current position of Division Vice President and General Manager, Interface Products in 2005. Mr. Ozcolak has over 20 years of product development experience in the semiconductor industry and holds a B.S. in Electrical Engineering from the Massachusetts Institute of Technology and an M.S. in Electrical Engineering from the University of California at Los Angeles, as well as an M.B.A. from the University of Phoenix.
14
Stephen W. Michael joined Exar as Vice President New Market Development in September 1992. In July 1995, he was appointed Vice President Operations, and in May 2001, he was appointed to his current position of Vice President, Operations and Reliability & Quality Assurance. Mr. Michael has thirty years of semiconductor industry experience. Prior to joining Exar, Mr. Michael was Vice President and General Manager, Analog and Custom Products with Catalyst Semiconductor. Prior to joining Catalyst Semiconductor, he served in various senior positions at GE Semiconductor, Intersil, Fairchild and National Semiconductor. He holds a B.S. in Electrical Engineering from the University of California at Davis.
ITEM 1A. RISK FACTORS
We are subject to a number of risks. Some of these risks are endemic to the high-technology industry and are the same or similar to those disclosed in our previous SEC filings, and some new risks may arise in the future. You should carefully consider all of these risks and the other information in this Annual Report before investing in us. The fact that certain risks are endemic to the high-technology industry does not lessen the significance of these risks.
As a result of these risks, our business, financial condition or results of operations could be materially and adversely affected. This could cause the trading price of our common stock to decline, and stockholders might lose some or all of their investment.
IF WE ARE UNABLE TO GENERATE REVENUE ABOVE CURRENT LEVELS FROM THE SALE OF OUR COMMUNICATIONS PRODUCTS, OR OUR REVENUE FROM THESE PRODUCTS DECLINES, OUR BUSINESS, FINANCIAL CONDITION AND RESULTS OF OPERATIONS WILL BE MATERIALLY AND ADVERSELY IMPACTED.
We continue to focus a significant portion of our research and sales resources on the communications market with the expectation that the communications sector will grow over the long term. Given our dependence on the communications market to support revenue growth, we must continue to generate additional sales from this market by successfully marketing the existing product portfolio, introducing new products and securing design wins which are released into production or by gaining market share. If we are unable to generate increased revenue from our communications products or our revenue from these products declines, our business, financial condition, and results of operations will be materially and adversely impacted.
THE UNCERTAINTY IN THE U.S. AND GLOBAL ECONOMIES, AS WELL AS THE COMMUNICATIONS EQUIPMENT MARKET, MAY CONTINUE TO MATERIALLY AND ADVERSELY AFFECT OUR BUSINESS, FINANCIAL CONDITION AND RESULTS OF OPERATIONS.
Periodic declines or fluctuations in corporate profits, lower capital equipment spending, the impact of conflicts throughout the world, terrorist acts, natural disasters, the outbreak of communicable diseases such as the Avian Flu and other geopolitical factors have had, and may continue to have, a negative impact on the U.S. and global economies. Our revenue and profitability have generally followed the modest recovery of the communications equipment industry. This modest recovery has affected carrier capital equipment spending which in turn has affected the demand for our customers’ products, thus affecting our revenues and profitability. Communications service providers and equipment manufacturers continue to experience consolidation in their industries. Although there currently appears to be positive signs for growth, further delay or reduction in anticipated communications equipment spending levels may adversely affect our business, financial condition and results of operations.
We are unable to predict the timing, strength or duration of the communications market recovery or effects of equipment manufacturer consolidation. If the sector does not continue to recover measurably, or declines, our business, financial condition and results of operations may be materially and adversely impacted.
IF WE FAIL TO DEVELOP AND INTRODUCE NEW PRODUCTS IN OUR CORE OR NEW MARKETS THAT MEET EVOLVING MARKET NEEDS, OUR BUSINESS, FINANCIAL CONDITION AND RESULTS OF OPERATIONS COULD BE MATERIALLY AND ADVERSELY IMPACTED.
The markets for our products are characterized by:
| • | | evolving and competing industry standards; |
| • | | changing customer requirements; |
15
| • | | increasing costs of product development. |
| • | | long design-to-production cycles; |
| • | | frequent product introductions and enhancements; |
| • | | increasing functional integration; |
| • | | increasing price pressure; |
| • | | moderate to slow growth; |
| • | | capital equipment spending levels and/or deployment; and/or |
| • | | changing competitive landscape (consolidation, financial conditions). |
Our success depends in part on the successful development of new products for our core markets. We must: (i) be able to anticipate customer and market requirements and changes in technology and industry standards; (ii) be able to accurately define and develop, on a timely basis, new products; (iii) be able to gain access to and use technologies in a cost-effective manner; (iv) continue to expand our technical and design expertise; (v) be able to timely introduce and cost-effectively have manufactured new products; (vi) be able to differentiate our products from our competitors’ offerings; and (vii) gain customer acceptance of our products. In addition, we must continue to have our products designed into our customers’ future products and maintain close working relationships with key customers to develop new products that meet their evolving needs. Moreover, we must be able to respond to shifts in market demands, the trend towards increasing functional integration and other changes in a rapid and cost-effective manner. Migration from older products to newer products may result in volatility of earnings during periods of transition of the products.
Products for communications applications are based on continually evolving industry standards and new technologies. Our ability to compete will depend in part on our ability to identify and ensure compliance with these industry standards. The emergence of new standards could render our products incompatible with systems developed by major communications equipment manufacturers. As a result, we could be required to invest significant time, effort and expenses to develop and qualify new products to ensure compliance with industry standards.
The process of developing and supporting new products is complex, expensive and uncertain, and if we fail to accurately predict and understand our customers’ changing needs and emerging technological trends, our business may be harmed. We cannot assure that we will be able to identify new product opportunities successfully, develop and bring to market new products, achieve design wins, ensure when and which design wins actually get released to production, or respond effectively to technological changes or product announcements by our competitors. In addition, we may not be successful in developing or using new technologies or may incorrectly anticipate market demand and develop products that achieve little or no market acceptance. Our pursuit of necessary technological advances may require substantial time and expense and may ultimately prove unsuccessful. Failure in any of these areas may harm our business, financial condition and results of operations.
IF WE ARE UNABLE TO CONVERT A SIGNIFICANT PORTION OF OUR DESIGN WINS INTO ACTUAL REVENUE, OUR BUSINESS, FINANCIAL CONDITION AND RESULTS OF OPERATIONS COULD BE MATERIALLY AND ADVERSELY IMPACTED.
We have secured a significant number of design wins for new and existing products. Such design wins are necessary for revenue growth. However, many of our design wins may never generate revenues if their end-customer projects are unsuccessful in the market place or the end-customer terminates the project, which may occur for a variety of reasons. Additionally, some of our design wins are with privately-held, early-stage companies that may fail to bring their product to market. If design wins do generate revenue, the time lag between the design win and meaningful revenue may be in excess of eighteen months. If we fail to convert a significant portion of our design wins into substantial revenue, our business, financial condition and results of operations could be materially and adversely impacted.
16
OUR FINANCIAL RESULTS MAY FLUCTUATE SIGNIFICANTLY BECAUSE OF A NUMBER OF FACTORS, MANY OF WHICH ARE BEYOND OUR CONTROL.
Our financial results may fluctuate significantly. Some of the factors that affect our financial results, many of which are difficult or impossible to control or predict, are:
| • | | our difficulty predicting revenues and ordering the correct mix of products from suppliers due to limited visibility provided by customers and channel partners coupled with a high number of orders placed for products to be shipped in the same quarter; |
| • | | the reduction, rescheduling, cancellation or timing of orders by our customers and channel partners due to, among others, the following factors; |
| | • | | management of customer, subcontractor and/or channel inventory; |
| | • | | dependency on a single product with a single customer; |
| | • | | volatility of demand for equipment sold by our large customers, which in turn, introduces demand volatility for our products; |
| | • | | temporary disruption in customer demand as customers change or modify their complex subcontract manufacturing supply chain; |
| | • | | the inability of our customers to obtain components from their other suppliers; and |
| | • | | disruption in the sales or distribution channels; |
| • | | changes in sales and implementation cycles for our products; |
| • | | the ability of our suppliers, customers and communications service providers to obtain financing or to fund capital expenditures; |
| • | | changes in the mix of products that our customers purchase; |
| • | | risks associated with entering new markets, such as increased competition, should we decide to do so; |
| • | | the announcement or introduction of products by our competitors; |
| • | | loss of market share by our customers; |
| • | | competitive pressures on selling prices or product availability; |
| • | | pressures on selling prices overseas due to foreign currency exchange fluctuations; |
| • | | erosion of average selling prices coupled with the inability to sell newer products with higher average selling prices, resulting in lower overall revenue and margins; |
| • | | market and/or customer acceptance of our products; |
| • | | consolidation among our competitors, our customers and/or our customers’ customers; |
| • | | changes in our customers’ end user concentration or requirements; |
| • | | loss of one or more major customers; |
| • | | significant changes in ordering pattern by major customers; |
| • | | our or our channel partners’ ability to maintain adequate inventory levels; |
| • | | the availability and cost of materials and services, including foundry, assembly and test capacity, needed by us from our foundries and suppliers; |
| • | | discontinuance of wafer fabrication or packaging technologies by our suppliers; |
17
| • | | if wafer fabrications or packaging and test suppliers discontinue or experience extended disruption of supply, we may incur increased costs to obtain alternative suppliers or investment in inventory to meet continuity of supply obligations to customers; |
| • | | temporary disruptions in our or our customers’ supply chain due to natural disaster, fire, outbreak of communicable diseases such as the Avian Flu, or labor disputes; |
| • | | fluctuations in the manufacturing output, yield capabilities, and capacity of our suppliers; |
| • | | fluctuation in suppliers’ capacity due to reorganization, relocation or shift in business focus; |
| • | | problems, costs, or delays that we may face in shifting our products to smaller geometry process technologies and in achieving higher levels of design and device integration; |
| • | | our ability to successfully introduce and transfer into production new products and/or integrate new technologies; |
| • | | increase in manufacturing costs; |
| • | | increase in mask tooling costs associated with advanced technologies; |
| • | | the amount and timing of our investment in research and development; |
| • | | costs and business disruptions associated with shareholder or regulatory issues; |
| • | | the timing and amount of employer payroll tax to be paid on our employees’ gains on stock options exercised; |
| • | | increasing costs and time associated with compliance with accounting rules or other regulatory requirements; |
| • | | changes in accounting or other regulatory rules, such as the future requirement to record expenses for employee stock option grants; |
| • | | fluctuations in interest rates and/or market values of our marketable securities; |
| • | | litigation costs associated with the defense of suits brought or complaints made against us; and/or |
| • | | legislators’ desire or ability to renew favorable tax legislation in a timely manner, which may subject our tax provision to volatility. |
As a consequence, operating results for a particular future period are difficult to predict and prior results are not necessarily indicative of results to be expected in the future. Any of the foregoing factors, or any other factors discussed elsewhere herein, may have a material adverse effect on our business, financial condition and results of operations.
WE HAVE MADE AND MAY IN THE FUTURE MAKE ACQUISITIONS AND SIGNIFICANT STRATEGIC EQUITY INVESTMENTS, WHICH MAY INVOLVE A NUMBER OF RISKS. IF WE ARE UNABLE TO ADDRESS THESE RISKS SUCCESSFULLY, SUCH ACQUISITIONS AND INVESTMENTS COULD HAVE A MATERIALLY ADVERSE IMPACT ON OUR BUSINESS, FINANCIAL CONDITION AND RESULTS OF OPERATIONS.
We have undertaken a number of strategic acquisitions and investments in the past and may do so from time to time in the future. The risks involved with these acquisitions and investments include, among others:
| • | | the possibility that we may not receive a favorable return on our investment or incur losses from our investment, or the original investment may become impaired; |
| • | | failure to satisfy the strategic objectives; |
| • | | our assumption of known or unknown liabilities or other unanticipated events or circumstances; and/or |
| • | | the diversion of management’s attention from normal daily operations of the business. |
18
Additional risks involved with acquisitions include, among others:
| • | | difficulties in integrating the operations, technologies, products and personnel of the acquired company or its assets; |
| • | | difficulty in supporting acquired products or technologies; |
| • | | difficulties or delays in the transfer of manufacturing flows and supply chains of products of acquired businesses; |
| • | | failure to retain key personnel; |
| • | | unexpected capital equipment outlays and related expenses; |
| • | | difficulties in entering markets in which we have limited or no direct prior experience and where competitors in such markets may have stronger market positions; |
| • | | insufficient revenues to offset increased expenses associated with acquisitions; |
| • | | under-performance problems with an acquired company; |
| • | | issuance of common stock that would dilute our current stockholders’ percentage ownership; |
| • | | recording of goodwill and non-amortizable intangible assets that will be subject to periodic impairment testing and potential impairment charges against our future earnings; |
| • | | incurring amortization expenses related to certain intangible assets; |
| • | | the opportunity cost associated with committing capital in such investments; |
| • | | incurring large and immediate write-offs; and/or |
| • | | becoming subject to litigation. |
Risks involved with strategic equity investments include, among others:
| • | | the possibility of litigation resulting from these types of investments; |
| • | | the possibility that we may not receive a favorable return on our investments or incur losses from these investments, or the original investment may become impaired; |
| • | | a change or poorly executed strategic plan; and/or |
| • | | the opportunity cost associated with committing capital in such investments. |
We cannot assure that we will be able to address these risks successfully without substantial expense, delay or other operational or financial problems. Any delays or other such operations or financial problems could adversely impact our business, financial condition and results of operations.
WE MAY NOT INTEGRATE ACQUIRED TECHNOLOGY SUCCESSFULLY.
We have made and may in the future acquire intellectual property to accelerate our time to market for new products. Acquisitions of intellectual property may involve risks such as successful technical integration into existing products, market acceptance of new products, and achievement of planned return on investment. The potential failure of product introduction utilizing acquired intellectual property could lead to an impairment of capitalized intellectual property acquisition costs.
19
COMPETITION IN THE MARKETS IN WHICH WE PARTICIPATE, OR MAY PARTICIPATE, MAY MAKE IT MORE DIFFICULT FOR US TO BE SUCCESSFUL.
We compete against an established group of semiconductor companies that focus on similar markets. These competitors include Applied Micro Circuits Corporation, Integrated Device Technology Inc., Mindspeed Technologies Inc., PMC Sierra Inc., Royal Philips Electronics, Texas Instruments Incorporated, TranSwitch Corporation, Vitesse Semiconductor Corporation and Wolfson Microelectronics LTD. Additionally, we are facing competition from other established companies and start-up businesses that seek to enter the markets in which we participate.
We have experienced increased competition at the design stage, where customers evaluate alternative solutions based on a number of factors, including price, performance, product features, technologies, and availability of long-term product supply and/or roadmap guarantee. Additionally, we experience, in some cases, severe pressure on pricing from some of our competitors or cost expectations from customers. Such circumstances may make some of our products unattractive due to price or performance measures. These circumstances may result in us losing design opportunities or may decrease our revenue and margins as a result of the price competition. Also, competitors from new companies in emerging countries with significant lower costs could affect selling price and gross margins.
WE DEPEND ON THIRD-PARTY FOUNDRIES TO MANUFACTURE OUR INTEGRATED CIRCUITS. ANY DISRUPTION IN OR LOSS OF THE FOUNDRIES’ CAPACITY TO MANUFACTURE OUR PRODUCTS SUBJECTS US TO A NUMBER OF RISKS, INCLUDING THE POTENTIAL FOR AN INADEQUATE SUPPLY OF PRODUCTS AND HIGHER MATERIALS COSTS. THESE RISKS MAY LEAD TO DELAYED PRODUCT DELIVERY OR INCREASED COSTS, WHICH COULD MATERIALLY AND ADVERSELY AFFECT OUR BUSINESS, FINANCIAL CONDITION AND RESULTS OF OPERATIONS.
We do not own or operate a semiconductor fabrication facility, or a foundry. Most of our products are based on complementary metal oxide semiconductor, or CMOS, processes. Chartered Semiconductor Manufacturing Ltd., or Chartered, located in Singapore, manufactures the majority of the CMOS wafers from which our products are manufactured. Chartered produces semiconductors for many other companies (many of which have greater requirements than us), and therefore we may not have access on a timely basis to sufficient capacity or certain process technologies. In addition, we are reliant on Chartered’s continued financial health and ability to continue to invest in smaller geometry manufacturing processes and foundries.
Many of our new products are designed to take advantage of smaller geometry manufacturing processes. Due to the complexity and increased cost of migrating to smaller geometries, we may experience problems, which could result in design and production delays of our products. If such delays occur, our products may have delayed market acceptance or customers may select our competitors’ products during the design process.
We do not have long-term wafer supply agreements with Chartered or our other foundries that would guarantee wafer or product quantities, prices, delivery or lead times. Rather, the foundries manufacture our products on a purchase order basis. We provide Chartered and our other foundries with rolling forecasts of our production requirements. However, the ability of our foundries to provide wafers is limited by the foundries’ available capacity. In addition, we cannot be certain that we will continue to do business with Chartered or our other foundries on terms as favorable as our current terms. Significant risks associated with our reliance on third party foundries include:
| • | | the lack of assured process technology and wafer supply; |
| • | | financial and operating stability of the foundries; |
| • | | limited control over delivery schedules; |
| • | | limited manufacturing capacity of the foundries; |
| • | | limited control over quality assurance, manufacturing yields and production costs; and/or |
| • | | potential misappropriation of our intellectual property. |
20
We could experience a substantial delay or interruption in the shipment of our products or an increase in our costs due to any of the following:
| • | | a manufacturing disruption experienced by foundries utilized by us or sudden reduction or elimination of any existing source or sources of semiconductor manufacturing materials or processes, which might include the potential closure, change of ownership, change of management or consolidation by one of our foundries; |
| • | | extended time required to identify, qualify and transfer to alternative manufacturing sources for existing or new products; |
| • | | failure of our suppliers to obtain the raw materials and equipment; |
| • | | financial and operating stability of the foundry or any of our suppliers; |
| • | | acts of terrorism or civil unrest or an unanticipated disruption due to communicable diseases, political instability, natural disasters; and/or |
| • | | a sudden, sharp increase in demand for semiconductor devices, which could strain the foundries’ manufacturing resources and cause delays in manufacturing and shipment of our products. |
IF OUR FOUNDRIES DISCONTINUE OR LIMIT THE AVAILABILITY OF THE MANUFACTURING PROCESSES NEEDED TO MEET OUR DEMANDS OR ARE UNABLE TO PROVIDE THE TECHNOLOGIES NEEDED TO MANUFACTURE OUR PRODUCTS, WE MAY FACE PRODUCTION DELAYS, WHICH COULD MATERIALLY AND ADVERSELY IMPACT OUR BUSINESS, FINANCIAL CONDITION AND RESULTS OF OPERATIONS.
Our wafer requirements represent a small portion of the total production of the foundries that manufacture our products. As a result, we are subject to the risk that a foundry may cease production of a wafer fabrication process required by us. Additionally, we cannot be certain that our foundries will continue to devote resources to the production of our products or continue to advance the process design technologies on which the manufacturing of our products are based. Each of these events could increase our costs and harm our ability to deliver our products on time, or force us to terminate affected products, thereby materially and adversely affecting our business, financial condition and results of operations.
TO SECURE FOUNDRY CAPACITY, WE MAY BE REQUIRED TO ENTER INTO FINANCIAL AND OTHER ARRANGEMENTS WITH FOUNDRIES, WHICH COULD RESULT IN THE DILUTION OF OUR EARNINGS OR OTHERWISE HARM OUR OPERATING RESULTS.
Allocation of a foundry’s manufacturing capacity may be influenced by a foundry customer’s size, the existence of a long-term agreement with the foundry or other commitments. To address foundry capacity constraints, we and other semiconductor companies that rely on third-party foundries have utilized various arrangements, including equity investments in or loans to foundries in exchange for guaranteed production capacity, joint ventures to own and operate foundries or “take or pay” contracts that commit a company to purchase specified quantities of wafers over extended periods. While we are not currently a party to any of these arrangements, we may decide to enter into these arrangements in the future. We cannot be sure, however, that these arrangements will be available to us on acceptable terms, if at all. Any of these arrangements could require us to commit substantial capital and, accordingly, could require us to reduce our cash holdings, incur additional debt or secure equity financing. This could result in the dilution of our earnings or the ownership of our stockholders or otherwise harm our operating results. Furthermore, there can be no assurance that we will be able to obtain sufficient foundry capacity in the future pursuant to such arrangements.
OUR DEPENDENCE ON THIRD-PARTY SUBCONTRACTORS TO ASSEMBLE AND TEST OUR PRODUCTS SUBJECTS US TO A NUMBER OF RISKS, INCLUDING THE POTENTIAL FOR AN INADEQUATE SUPPLY OF PRODUCTS AND HIGHER MATERIALS COSTS. THESE RISKS MAY LEAD TO DELAYED PRODUCT DELIVERY OR INCREASED COSTS, WHICH COULD MATERIALLY AND ADVERSELY AFFECT OUR BUSINESS, FINANCIAL CONDITION AND RESULTS OF OPERATIONS.
We depend on independent subcontractors in Asia for all of the assembly and the majority of the testing of our products. Our reliance on these subcontractors involves the following risks:
| • | | our reduced control over manufacturing yields, production schedules and product quality; |
| • | | the potential closure, change of ownership, change in business conditions or relationships, change of management or consolidation by one or more of our subcontractors; |
21
| • | | long term financial stability of our subcontractors and their ability to invest in new capabilities and equipment; |
| • | | disruption of services due to the outbreak of communicable diseases such as the Avian Flu, acts of terrorism, natural disasters, labor disputes, or civil unrest; |
| • | | disruption of manufacturing or test services due to relocation of subcontractor manufacturing facilities; |
| • | | failure of our subcontractors to obtain the raw materials and equipment; |
| • | | entry into “take-or-pay” agreements; |
| • | | difficulties in selecting, qualifying and integrating new subcontractors; |
| • | | reallocation or limited manufacturing capacity of the subcontractors; |
| • | | a sudden, sharp increase in demand for semiconductor devices, which could strain the subcontractor’s manufacturing resources and cause delays in manufacturing and shipment of our products; |
| • | | limited warranties from the subcontractors for products assembled and tested for us; |
| • | | the possible unavailability of qualified assembly or test services; |
| • | | the subcontractors may cease production on a specific package type used to assemble product required by us and the possible inability to obtain an alternate source to supply the package; |
| • | | potential increases in assembly and test costs; and/or |
| • | | the third party subcontractors abilities to transition to smaller package types and to new package compositions. |
These risks may lead to shipment delays and supply constraints of our products or increased cost for the finished products, either of which could adversely affect our business, financial condition or results of operations.
OUR RELIANCE ON FOREIGN SUPPLIERS EXPOSES US TO RISKS ASSOCIATED WITH INTERNATIONAL OPERATIONS, ANY OF WHICH COULD MATERIALLY AND ADVERSELY IMPACT OUR BUSINESS, FINANCIAL CONDITION AND RESULTS OF OPERATIONS.
We use semiconductor wafer foundries and assembly and test subcontractors throughout Asia to manufacture the significant portion of our products. Our dependence on these subcontractors involves the following risks:
| • | | disruption of services due to political, civil, labor, and economic instability; |
| • | | disruption of services due to natural disasters or outbreak of communicable diseases such as the Avian Flu; |
| • | | disruption of transportation to and from Asia; |
| • | | embargoes or other regulatory limitations affecting the availability of raw materials, equipment or services; |
| • | | changes in tax laws, tariffs and freight rates; and/or |
| • | | compliance with local or international regulatory requirements. |
These risks may lead to delays in product delivery or increased costs, either of which could harm our profitability and customer relationships, thereby materially and adversely impacting our business, financial condition and results of operations.
22
WE DEPEND IN PART ON THE CONTINUED SERVICE OF OUR KEY ENGINEERING AND MANAGEMENT PERSONNEL AND OUR ABILITY TO IDENTIFY, HIRE, INCENT AND RETAIN QUALIFIED PERSONNEL. IF WE LOST KEY EMPLOYEES OR FAILED TO IDENTIFY, HIRE, INCENT AND RETAIN THESE INDIVIDUALS, OUR BUSINESS, FINANCIAL CONDITION AND RESULTS OF OPERATIONS COULD BE MATERIALLY AND ADVERSELY IMPACTED.
Our future success depends, in part, on the continued service of our key design engineering, technical, sales, marketing and executive personnel and our ability to identify, hire, incent, and retain other qualified personnel.
In the future, we may not be able to continue to attract and retain qualified personnel, including executive officers and other key management and technical personnel necessary for the management of our business. Competition for skilled employees having specialized technical capabilities and industry-specific expertise continues to be a considerable risk inherent in the markets in which we compete. Volatility or lack of positive performance in our stock price and the ability to offer options to as many or in amounts consistent with past practices, as a result of regulations regarding the expensing of options, may also adversely affect our ability to retain key employees, all of whom have been granted stock options. The failure to retain and recruit, as necessary, key design engineers, technical, sales, marketing and executive personnel could harm our business, financial condition and results of operations.
RECENT RULEMAKING BY THE FINANCIAL ACCOUNTING STANDARDS BOARD WILL REQUIRE US TO EXPENSE EQUITY COMPENSATION GIVEN TO EMPLOYEES AND NON-EMPLOYEE DIRECTORS THAT WILL SIGNIFICANTLY HARM OPERATING RESULTS.
We historically have used stock options as a significant component of our employee compensation program in order to align employees’ interests with the interests of our stockholders, encourage employee retention, and provide competitive compensation packages. Stock options are also utilized to attract and retain non-employee directors. The Financial Accounting Standards Board has adopted changes that will require companies to record a charge to earnings for stock option grants and other equity incentives, which will have a significant impact on our results of operations. We are required to implement the standard as of April 1, 2006. By causing us to incur significantly increased compensation costs, this accounting change will reduce our reported earnings.
OUR RELIANCE ON FOREIGN CUSTOMERS COULD CAUSE FLUCTUATIONS IN OUR OPERATING RESULTS, WHICH COULD MATERIALLY AND ADVERSELY IMPACT OUR BUSINESS, FINANCIAL CONDITION AND RESULTS OF OPERATIONS.
International sales accounted for 51.3%, 50.9% and 53.5% of net sales for the fiscal year ended March 31, 2006, March 31, 2005 and March 31, 2004, respectively. International sales will likely continue to account for a significant portion of our revenues, which would subject us to the following risks:
| • | | changes in regulatory requirements; |
| • | | tariffs and other barriers; |
| • | | timing and availability of export or import licenses; |
| • | | disruption of services due to political, civil, labor, and economic instability; |
| • | | disruption of services due to natural disasters; |
| • | | disruptions to customer operations due to the outbreak of communicable diseases such as the Avian Flu; |
| • | | difficulties in accounts receivable collections; |
| • | | difficulties in staffing and managing foreign subsidiary and branch operations; |
| • | | difficulties in managing sales channel partners; |
| • | | difficulties in obtaining governmental approvals for communications and other products; |
| • | | limited intellectual property protection; |
23
| • | | foreign currency exchange fluctuations; |
| • | | the burden of complying with foreign laws and treaties; and/or |
| • | | potentially adverse tax consequences. |
In addition, because sales of our products have been denominated primarily in United States dollars, increases in the value of the United States dollar could increase the relative price of our products such that they become more expensive to customers in the local currency of a particular country. Increases in the value of the United States dollar could also evoke customers to apply pricing pressures on our products. Increased international activity in the future may result in increased foreign currency denominated sales. Furthermore, because some of our customers’ purchase orders and agreements are governed by foreign laws, we may be limited in our ability, or it may be too costly for us, to enforce our rights under these agreements and to collect damages, if awarded.
THE COMPLEXITY OF OUR PRODUCTS MAY LEAD TO ERRORS, DEFECTS AND BUGS, WHICH COULD SUBJECT US TO SIGNIFICANT COSTS OR DAMAGES AND ADVERSELY AFFECT MARKET ACCEPTANCE OF OUR PRODUCTS.
Although we, our customers and our suppliers rigorously test our products, nonetheless they may contain undetected errors, weaknesses, defects or bugs when first introduced or as new versions are released. If any of our products contain production defects, reliability, quality or compatibility problems that are significant to our customers, our reputation may be damaged and customers may be reluctant to continue to buy our products, which could adversely affect our ability to retain and attract new customers. In addition, these defects or bugs could interrupt or delay sales of affected products, which could adversely affect our results of operations.
If defects or bugs are discovered after commencement of commercial production of a new product, we may be required to make significant expenditures of capital and other resources to resolve the problems. This could result in significant additional development costs and the diversion of technical and other resources from our other development efforts. We could also incur significant costs to repair or replace defective products. These costs or damages could have a material adverse effect on our financial condition and results of operations.
IF OUR DISTRIBUTORS OR SALES REPRESENTATIVES STOP SELLING OR FAIL TO SUCCESSFULLY PROMOTE OUR PRODUCTS, OUR BUSINESS, FINANCIAL CONDITION, AND RESULTS OF OPERATIONS COULD BE ADVERSELY AFFECTED.
We sell many of our products through two non-exclusive distributors and numerous sales representatives. Our non-exclusive distributors and sales representatives may carry our competitors’ products, which could adversely impact or limit the sales of our products. Additionally, they could reduce or discontinue sales of our products or may not devote the resources necessary to sell our products in the volumes and within the time frames that we expect. Moreover, we depend on the continued viability and financial resources of these distributors and sales representatives, some of which are small organizations with limited working capital. In turn, these distributors and sales representatives are subject to general economic and semiconductor industry conditions. We believe that our success will continue to depend on these distributors and sales representatives. If some or all of our distributors and sales representatives experience financial difficulties, or otherwise become unable or unwilling to promote and sell our products, our business, financial condition and results of operations could be adversely affected.
BECAUSE OUR COMMUNICATIONS INTEGRATED CIRCUITS TYPICALLY HAVE LENGTHY SALES CYCLES, WE MAY EXPERIENCE SUBSTANTIAL DELAYS BETWEEN INCURRING EXPENSES RELATED TO RESEARCH AND DEVELOPMENT AND THE GENERATION OF REVENUE DERIVED FROM THESE PRODUCTS.
Due to the communications integrated circuit, or IC, equipment product development cycle, we have typically experienced at least an eighteen-month time lapse between our initial contact with a customer to realizing volume shipments. We first work with customers to achieve a design win, which may take nine months or longer. Our customers then complete the design, testing and evaluation process and begin to ramp up production, a period which typically lasts an additional nine months. The customers of communications equipment manufacturers may also require a period of time for testing and evaluation, which may cause further delays. As a result, a significant period of time may elapse between our research and development efforts and our realization of revenue, if any, from volume purchasing of our communications products by our customers. Due to length of the communications IC equipment product development cycle, the risk of project cancellation by the customer is present for an extended period of time.
24
OUR BACKLOG MAY NOT RESULT IN FUTURE REVENUE.
Due to the possibility of customer changes in delivery schedules and quantities actually purchased, cancellation of orders, distributor returns or price reductions, our backlog at any particular date is not necessarily indicative of actual sales for any succeeding period. A reduction of the order backlog during any particular period, or the failure of our backlog to result in future revenue, could negatively impact our business, financial condition and results of operations.
FIXED OPERATING EXPENSES AND OUR PRACTICE OF ORDERING MATERIALS IN ANTICIPATION OF FUTURE CUSTOMER DEMAND COULD MAKE IT DIFFICULT FOR US TO RESPOND EFFECTIVELY TO SUDDEN SWINGS IN DEMAND AND RESULT IN HIGHER THAN EXPECTED COSTS AND EXCESS INVENTORY. SUCH SUDDEN SWINGS IN DEMAND COULD THEREFORE HAVE A MATERIAL ADVERSE IMPACT ON OUR BUSINESS, FINANCIAL CONDITION AND RESULTS OF OPERATIONS.
Our operating expenses are relatively fixed in the short to medium term, and, therefore, we have limited ability to reduce expenses quickly and sufficiently in response to any revenue shortfall. In addition, we typically plan our production and inventory levels based on internal forecasts of customer demand, which are highly unpredictable and can fluctuate substantially. From time to time, in response to anticipated long lead times to obtain inventory and materials from our outside suppliers and foundries, we may order materials in advance of anticipated customer demand. This advance ordering may result in excess inventory levels or unanticipated inventory write-downs if expected orders fail to materialize. This incremental cost could have a materially adverse impact on our business, financial condition and results of operations.
WE MAY BE UNABLE TO PROTECT OUR INTELLECTUAL PROPERTY RIGHTS, WHICH COULD HARM OUR COMPETITIVE POSITION.
Our ability to compete is affected by our ability to protect our intellectual property rights. We rely on a combination of patents, trademarks, copyrights, mask work registrations, trade secrets, confidentiality procedures and non-disclosure and licensing arrangements to protect our intellectual property rights. Despite these efforts, we may be unable to protect our proprietary information. Such intellectual property rights may not be recognized or if recognized, it may not be commercially feasible to enforce. Moreover, we cannot be certain that our competitors will not independently develop technology that is substantially similar or superior to our technology.
More specifically, we cannot be sure that our pending patent applications or any future applications will be approved, or that any issued patents will provide us with competitive advantages or will not be challenged by third parties. Nor can we be sure that, if challenged, our patents will be found to be valid or enforceable, or that the patents of others will not have an adverse effect on our ability to do business. Furthermore, others may independently develop similar products or processes, duplicate our products or processes or design around any patents that may be issued to us.
WE COULD BE REQUIRED TO PAY SUBSTANTIAL DAMAGES OR COULD BE SUBJECT TO VARIOUS EQUITABLE REMEDIES IF IT WERE PROVEN THAT WE INFRINGED THE INTELLECTUAL PROPERTY RIGHTS OF OTHERS.
As a general matter, the semiconductor industry is characterized by substantial litigation regarding patents and other intellectual property rights. If a third party were to prove that our technology infringed a third party’s intellectual property rights, we could be required to pay substantial damages for past infringement and could be required to pay license fees or royalties on future sales of our products. If we were required to pay such license fees whenever we sold our products, such fees could exceed our revenue. In addition, if it were proven that we willfully infringed a third party’s proprietary rights, we could be held liable for three times the amount of the damages that we would otherwise have to pay. Such intellectual property litigation could also require us to:
| • | | stop selling, incorporating or using our products that use the infringed intellectual property; |
| • | | obtain a license to make, sell or use the relevant technology from the owner of the infringed intellectual property, which license may not be available on commercially reasonable terms, if at all; and/or |
| • | | redesign our products so as not to use the infringed intellectual property, which may not be technically or commercially feasible. |
25
Furthermore, the defense of infringement claims and lawsuits, regardless of their outcome, would likely be expensive to resolve and could require a significant portion of management’s time. In addition, rather than litigating an infringement matter, we may determine that it is in our best interests to settle the matter. Terms of a settlement may include the payment of damages and our agreement to license technology in exchange for a license fee and ongoing royalties. These fees could be substantial. If we were required to pay damages or otherwise became subject to such equitable remedies, our business, financial condition and results of operations would suffer. Similarly, if we were required to pay license fees to third parties based on a successful infringement claim brought against us, such fees could exceed our revenue.
OUR STOCK PRICE IS VOLATILE.
The market price of our common stock has fluctuated significantly to date. In the future, the market price of our common stock could be subject to significant fluctuations due to:
| • | | our anticipated or actual operating results; |
| • | | announcements or introductions of new products by us or our competitors; |
| • | | technological innovations by us or our competitors; |
| • | | product delays or setbacks by us, our customers or our competitors; |
| • | | potential supply disruptions; |
| • | | sales channel interruptions; |
| • | | concentration of sales among a small number of customers; |
| • | | conditions in the communications and semiconductor markets; |
| • | | the commencement and/or results of litigation; |
| • | | changes in estimates of our performance by securities analysts; |
| • | | decreases in the value of our investments, thereby requiring an asset impairment charge against earnings; |
| • | | our repurchasing shares of our common stock; |
| • | | announcements of merger or acquisition transactions; |
| • | | the impact of expensing stock options; and/or |
| • | | general global economic and market conditions. |
In the past, securities and class action litigation has been brought against companies following periods of volatility in the market prices of their securities. We may be the target of one or more of these class action suits, which could result in significant costs and divert management’s attention, thereby harming our business, results of operations and financial condition.
In addition, in recent years the stock market has experienced extreme price and volume fluctuations that have affected the market prices of many high technology companies, including semiconductor companies, and that have often been unrelated or disproportionate to the operating performance of those companies. These fluctuations may harm the market price of our common stock.
26
EARTHQUAKES AND OTHER NATURAL DISASTERS MAY DAMAGE OUR FACILITIES OR THOSE OF OUR SUPPLIERS.
Our corporate headquarters in Fremont, California is located near major earthquake faults that have experienced seismic activity. In addition, some of our customers and suppliers are located near fault lines. In the event of a major earthquake or other natural disaster near our headquarters, our operations could be disrupted. Similarly, a major earthquake or other natural disaster affecting one or more of our major customers or suppliers could adversely impact the operations of those affected, which could disrupt the supply of our products and harm our business.
ITEM 1B. UNRESOLVED STAFF COMMENTS
None.
ITEM 2. PROPERTIES
Exar’s executive offices, marketing and sales, research and development, manufacturing, test and engineering operations are located in Fremont, California in two adjacent buildings that the Company owns, which consist of approximately 151,000 square feet. Additionally, the Company owns approximately 4.5 acres of partially developed property adjacent to its headquarters, which is presently being held for future office expansion. The Company believes that its existing facilities are suitable and adequate for its current needs. The Company leases additional space for sales offices in the United States in or near Atlanta, Boston, Chicago, Dallas, as well as internationally in or near Kawasaki, Japan, Shanghai, China, and Vallauris, France.
ITEM 3. LEGAL PROCEEDINGS
On November 16, 2004, Ericsson Wireless Communications, Inc. initiated a lawsuit against Exar Corporation in San Diego Superior Court. In its third amended complaint, Ericsson asserts causes of action for negligence, strict product liability, and unfair competition against Exar. Through its complaint, Ericsson seeks unspecified monetary damages and unspecified injunctive relief. The case is based on Ericsson’s purchase of allegedly defective products from Vicor Corporation, a former customer of Exar to whom Exar sold untested semi-custom wafers. The Court granted Ericsson to file its third amended complaint on April 28, 2006. Exar’s response to the Third Amended Complaint is due on or before May 30, 2006. The Court recently continued the trial from September 29, 2006 to March 29, 2007 and discovery is continuing. Exar disputes the allegations in Ericsson’s third amended complaint, believes it has meritorious defenses, and intends to defend the lawsuit vigorously. At this stage of the litigation and without additional information, Exar is unable to determine the probability that the claim asserted by Ericsson will result in liability. As of the date of this Report, Exar does not believe that the litigation will have a material impact on its financial condition, results of operations, or liquidity.
On April 15, 2005, Vicor filed a cross-complaint against Exar in San Diego Superior Court. In the cross-complaint, Vicor alleged, among other things, that Exar sold it integrated circuits that were defective, that failed to meet agreed-upon specifications, and that Exar intentionally concealed material facts regarding the specifications of the integrated circuits that Vicor alleges it bought from Exar. In its cross-complaint, Vicor alleges that it is entitled to indemnification from Exar for any damages that Vicor must pay to Ericsson as a result of the causes of action asserted by Ericsson against Vicor. Vicor asserted causes of action against Exar for breach of contract, breach of express contract warranty, breach of implied warranties of merchantability and fitness, breach of the covenant of good faith and fair dealing, fraud, negligence, strict liability, implied contractual indemnity, and equitable indemnity. On May 9, 2005, Exar filed a demurrer to all but one of the indemnity causes of action in Vicor’s Cross-Complaint. On June 17, 2005, the San Diego Superior Court sustained Exar’s demurrer to all of Vicor’s causes of action except the claims for implied contractual indemnity and equitable indemnity without leave to amend. Exar answered the two remaining causes of action on July 5, 2005. Trial on the cross-complaint asserted by Vicor is scheduled for September 29, 2006. Exar disputes the allegations in Vicor’s cross-complaint, believes it has meritorious defenses, and intends to defend the lawsuit vigorously. At this stage of the litigation and without additional information, Exar is unable to determine the probability that the claim asserted by Vicor will result in liability. As of the date of this Report, Exar does not believe that the litigation will have a material impact on its financial condition, results of operations, or liquidity.
On March 4, 2005, Exar filed a complaint in Santa Clara Superior Court against Vicor. In the complaint, Exar sought a declaration regarding the respective rights and obligations, including warranty and indemnity rights and obligations, under
27
the written contracts between Exar and Vicor for the sale of untested, semi-custom wafers. In addition, Exar sought a declaration that it was not responsible for any damages that Vicor must pay to Ericsson or any other customer of Vicor arising from claims that Vicor sold allegedly defective products.
On March 17, 2005, Vicor filed a cross-complaint against Exar and Rohm Device USA, LLC and Rohm Co., Ltd, the owners and operators of the foundry which supplied the untested, semi-custom wafers that Exar sold to Vicor. In the cross-complaint, Vicor alleged, among other things, that Exar sold it integrated circuits that were defective, that failed to meet agreed-upon specifications, and that Exar intentionally concealed material facts regarding the specifications of the integrated circuits that Vicor alleges it bought from Exar. In its cross-complaint, Vicor also alleges that it is entitled to indemnification from Exar for any damages that Vicor must pay to Ericsson and other Vicor customers as a result of the causes of action asserted by Ericsson in the San Diego case discussed above and any other claims that may be made against Vicor. In the cross-complaint, Vicor asserted causes of action against Exar for breach of contract, breach of express contract warranty, breach of implied warranties of merchantability and fitness, breach of covenant of good faith and fair dealing, fraud, negligence, strict liability, implied contractual indemnity, and equitable indemnity. On May 23, 2005, Exar filed a demurrer to each cause of action in Vicor’s cross-complaint in Santa Clara County. On July 15, 2005, the Santa Clara Superior Court sustained Exar’s demurrer to each of the causes of action asserted by Vicor. The Court granted Vicor leave to amend the cross-complaint to assert a cause of action for declaratory relief only. On August 1, 2005, Vicor filed its amended cross-complaint seeking a declaration of the parties respective rights and obligations, including warranty and indemnity rights, under the alleged contracts between Exar and Vicor for the sale of untested, semi-custom wafers. In addition, Vicor sought a declaration that Exar was obligated to indemnify it for any damages resulting from claims brought against Vicor by its customers. No trial date has been set in the matter, although a motion is currently pending to coordinate the San Diego action with the action in Santa Clara. Exar disputes the allegations in Vicor’s cross-complaint, believes it has meritorious defenses, and intends to defend the lawsuit vigorously. At this stage of the litigation and without additional information, Exar is unable to determine the probability that the claim asserted by Vicor will result in liability. As of the date of this Report, Exar does not believe that the litigation will have a material impact on its financial condition, results of operations, or liquidity.
The Company is not currently a party to any other material legal proceedings.
ITEM 4. SUBMISSION OF MATTERS TO A VOTE OF SECURITY HOLDERS
During the fourth quarter of fiscal year 2006, no matter was submitted to a vote of security holders through the solicitation of proxies or otherwise.
28
PART II
ITEM 5. MARKET FOR REGISTRANT’S COMMON EQUITY, RELATED STOCKHOLDER MATTERS AND ISSUER PURCHASES OF EQUITY SECURITIES
The common stock of Exar is traded on NASDAQ under the symbol “EXAR.” The following table sets forth the range of high and low sales prices of the Company’s common stock for the periods indicated, as reported by NASDAQ. The listed quotations represent inter-dealer prices without retail markups, markdowns or commissions.
| | | | | | |
| | | Common Stock
Prices |
| | | High | | Low |
FISCAL 2006 | | | | | | |
Quarter Ended March 31, 2006 | | $ | 14.29 | | $ | 12.00 |
Quarter Ended December 31, 2005 | | $ | 14.52 | | $ | 11.80 |
Quarter Ended September 30, 2005 | | $ | 16.79 | | $ | 13.12 |
Quarter Ended June 30, 2005 | | $ | 15.65 | | $ | 11.94 |
| | |
FISCAL 2005 | | | | | | |
Quarter Ended March 31, 2005 | | $ | 15.19 | | $ | 13.12 |
Quarter Ended December 31, 2004 | | $ | 15.76 | | $ | 13.26 |
Quarter Ended September 30, 2004 | | $ | 15.13 | | $ | 12.29 |
Quarter Ended June 30, 2004 | | $ | 19.94 | | $ | 13.76 |
The Company has never paid cash dividends on its common stock and presently intends to continue this policy in order to retain earnings for use in its business. The Company had approximately 189 stockholders on record as of May 31, 2006. The closing sales price for Exar’s common stock, as reported by NASDAQ on May 31, 2006 was $13.20 per share.
29
ITEM 6. SELECTED CONSOLIDATED FINANCIAL DATA
The following selected consolidated financial data should be read in conjunction with the Consolidated Financial Statements and Notes thereto and“Management’s Discussion and Analysis of Financial Condition and Results of Operations” included in Part II, Item 7. of this Report.
| | | | | | | | | | | | | | | | | | | |
| | | YEARS ENDED MARCH 31, | |
| | | 2006(A) | | | 2005(B) | | | 2004(C) | | 2003(D,E) | | | 2002(F) | |
| | | (In thousands, except per share amounts) | |
Consolidated Statements of Operation Data: | | | | | | | | | | | | | | | | | | | |
Net sales | | $ | 67,024 | | | $ | 57,369 | | | $ | 67,196 | | $ | 67,008 | | | $ | 54,988 | |
Gross profit | | | 45,475 | | | | 39,156 | | | | 43,959 | | | 36,811 | | | | 30,964 | |
Income (loss) from operations | | | (507 | ) | | | (2,321 | ) | | | 2,747 | | | (4,221 | ) | | | (8,882 | ) |
Net income (loss) | | | 7,786 | | | | 5,319 | | | | 4,636 | | | (32,300 | ) | | | 4,028 | |
| | | | | |
Net income (loss) per share: | | | | | | | | | | | | | | | | | | | |
Basic | | $ | 0.20 | | | $ | 0.13 | | | $ | 0.11 | | ($ | 0.81 | ) | | $ | 0.10 | |
Diluted | | $ | 0.20 | | | $ | 0.13 | | | $ | 0.11 | | ($ | 0.81 | ) | | $ | 0.10 | |
| | | | | |
Shares used in computation of net income(loss) per share: | | | | | | | | | | | | | | | | | | | |
Basic | | | 38,152 | | | | 41,532 | | | | 40,656 | | | 39,674 | | | | 38,921 | |
Diluted | | | 38,510 | | | | 42,423 | | | | 42,510 | | | 39,674 | | | | 41,996 | |
| |
| | | AS OF MARCH 31, | |
| | | 2006 | | | 2005 | | | 2004 | | 2003 | | | 2002 | |
| | | (In thousands) | |
Consolidated Balance Sheets Data: | | | | | | | | | | | | | | | | | | | |
Cash, cash equivalents and short-term and long-term marketable securities | | $ | 329,528 | | | $ | 446,285 | | | $ | 436,996 | | $ | 422,110 | | | $ | 404,201 | |
Working capital | | | 335,896 | | | | 447,292 | | | | 437,881 | | | 368,489 | | | | 351,867 | |
Total assets | | | 401,397 | | | | 503,203 | | | | 495,885 | | | 479,225 | | | | 503,035 | |
Long-term obligations | | | 222 | | | | 265 | | | | 265 | | | 312 | | | | 385 | |
Retained earnings | | | 90,140 | | | | 82,354 | | | | 77,035 | | | 72,399 | | | | 104,699 | |
Stockholders’ equity | | $ | 387,405 | | | $ | 490,047 | | | $ | 480,271 | | $ | 466,766 | | | $ | 491,505 | |
| (A) | Fiscal 2006 included impairment charges of $1.2 million related to the Company’s investment in TechFarm Ventures (Q), L.P. (“TechFarm Fund”). |
| (B) | Fiscal 2005 included a gain on legal settlement of $1.2 million. |
| (C) | Fiscal 2004 included impairment charges of $6.0 million related to the Company’s investment in IMC Semiconductor, Inc. (“IMC”) ($5.0 million) and TechFarm Fund ($1.0 million). |
| (D) | Fiscal 2003 included a charge of $2.3 million to cost of sales related to the write-down of inventory the Company determined to be excess. |
| (E) | Fiscal 2003 included impairment charges of $35.9 million related to the Company’s investment in IMC ($35.4 million) and TechFarm Fund ($0.5 million). |
| (F) | Fiscal 2002 included an impairment charge of $0.7 million related to the Company’s investment in TechFarm Fund. |
30
ITEM 7. MANAGEMENT’S DISCUSSION AND ANALYSIS OF FINANCIAL CONDITION AND RESULTS OF OPERATIONS
The following Management’s Discussion and Analysis of Financial Condition and Results of Operations, as well as information contained in “Risk Factors” above and elsewhere in this Annual Report on Form 10-K contains “forward-looking statements” within the meaning of Section 27A of the Securities Act of 1933 and Section 21E of the Securities Exchange Act of 1934, as amended, that involve risks and uncertainties. Please see “Forward Looking Statements” in Part I above. Actual results may differ materially from those projected in the forward-looking statements as a result of various factors, including, among others, those identified above under Part I, Item 1A. “Risk Factors.”
Overview
Exar Corporation (“Exar” or the “Company”) designs, develops and markets high-performance, high-bandwidth physical interface and access control solutions that facilitate the aggregation and transport of signals in access, metro and wide area networks over the worldwide communications infrastructure. The Company’s industry-proven analog and digital design expertise, system-level knowledge and standard complementary metal oxide semiconductors (“CMOS”) process technologies provides original equipment manufacturers (“OEMs”) with innovative, highly integrated circuits (“ICs”) addressing standards such as T/E carrier, ATM, SONET/SDH and Multi-Protocol Over SONET (“MPOS”). In addition, the Company has developed a portfolio of clock products that address various system needs for clock generation, distribution, skew adjustment and fail-safe applications. The clock and timing product lines leverage Exar’s phase-locked loop (“PLL”) technology that is used extensively in its existing network and transmission products. The clock and timing products are targeted at wireless base stations, network switches and routers.
The Company also provides one of the industry’s most comprehensive families of serial communications solutions comprised of low voltage, single/multi-channel universal asynchronous receiver transmitters (“UARTs”). UARTs are well suited to increase data transfer efficiency for various industrial, telecommunications and consumer applications.
The Company designs and markets IC products that address select applications for the video and imaging markets. Late in fiscal year 2006, Exar introduced its first SATA/SAS Port-Multiplier product addressing the storage marketplace.
Exar believes its products offer its customers the following benefits:
| | • | | increased bandwidth through the integration of multiple channels on a single device; |
| | • | | reduced system noise/jitter to improve data integrity; |
| | • | | a single source for a full range of transceivers, mappers and framer solutions and transmission rates; |
| | • | | reduced overall system cost and size through the integration of multiple functions on a single device; |
| | • | | accelerated time-to-market by allowing customers to focus on core competencies and outsource standards-based solutions; and |
| | • | | unique value added features and functions. |
The Company’s OEM customers include, among others, Adtran Inc. (“Adtran”), Alcatel, Cisco Systems Inc. (“Cisco”), Digi International, Inc. (“Digi International”), Fujitsu Limited (“Fujitsu”), Hewlett-Packard Company (“Hewlett-Packard”), Huawei Technologies Company, LTD. (“Huawei”), ITT Industries, Inc. (“ITT”), Lucent Technologies, Inc. (“Lucent”), Ericsson/Marconi, Mitsubishi Electronic Corporation of Japan (“Mitsubishi Electronics”), NEC Corporation (“NEC”), Nokia Corporation (“Nokia”), Plantronics, Inc. (“Plantronics”), Siemens A.G. (“Siemens”), and Tellabs, Inc. (“Tellabs”). For the fiscal year ended March 31, 2006, Alcatel represented 10.5% of the Company’s net sales.
The Company markets its products in North and South America through independent sales representatives and independent, non-exclusive distributors, as well as the Company’s own direct sales organization. The Company is represented in Europe and the Asia/Pacific region by its wholly-owned foreign subsidiaries, independent sales representatives and independent, non-exclusive distributors. The Company’s international sales represented 51.3%, 50.9%, and 53.5% of net sales for the fiscal years ended March 31, 2006, 2005 and 2004, respectively. These international sales consist primarily of export sales from the United States that are denominated in United States dollars. Such international related operations expenses expose the Company to fluctuations in currency exchange rates because the Company’s foreign operating expenses are denominated in foreign currency while its sales are denominated in United States dollars. Although foreign sales within certain countries or foreign sales comprised of certain products may subject the Company to tariffs, the Company’s profit
31
margin on international sales, adjusted for differences in product mix, is not significantly different from that realized on the Company’s sales to domestic customers. The Company’s operating results are subject to quarterly and annual fluctuations as a result of several factors that could materially and adversely affect the Company’s future profitability, as described above in “Risk Factors.”
Fiscal Year 2006 Review
In order to augment and complement the Company’s SONET product offerings and strengthen its market position, the Company acquired for $11.1 million in cash a significant part of Infineon Technologies North America Corp.’s Optical Networking (“ON”) Business Unit on April 14, 2005. The acquisition includes assets relating to the multi-rate TDM framer products, Fiber Channel over SONET/SDH, Resilient Packet Ring (“RPR”), as well as certain intellectual property for Data over SONET products.
During fiscal year 2006, the Company experienced continued sales growth in the network and transmission market through sales of its existing and acquired products, the serial communications market and slightly lower sales in the video and imaging markets. The Company believes that increased sales of its communications products are due in part to the gradual recovery experienced by the telecommunications market as carriers increase capital investment in network upgrades.
For fiscal year 2006, sales of the Company’s communications products, which encompass network and transmission products and serial communication products, represented 95.5% of its net sales, as compared to 91.9% and 81.1% of its net sales for the fiscal years ended March 31, 2005 and 2004, respectively.
Gross margins as a percentage of net sales in fiscal 2006 were 67.8% as compared to 68.3% and 65.4% for fiscal years 2005 and 2004, respectively. In the second half of fiscal 2006, the Company achieved operating profitability of $0.7 million. For fiscal year 2006, net income was $7.8 million.
In the second quarter of fiscal 2006, the Company completed a Modified “Dutch Auction” Self Tender Offer (“tender offer”) whereby it repurchased 7,500,000 shares of its common stock for $120.0 million plus costs of approximately $0.8 million. The Company’s cash and cash equivalents and short-term marketable securities were $329.5 million at March 31, 2006. For additional information about the tender offer, please see the Schedule TO-I filed with the SEC on July 25, 2005.
During the year, the Company introduced a number of new communications ICs, that provide an expanded line of T/E carrier products, SONET/SDH products, clock devices, as well as its first storage product and a multi-channel 66MHz PCI 3.0 UART.
Outlook for Fiscal Year 2007
The Company believes that near-term market trends are consistent with improvement in end market demand and that inventories at OEM customers and distributors, while increasing, appear to be at appropriate levels to support end demand. Looking forward to the medium to long-term, the Company believes that broadband connectivity will grow and that carriers will increase their capital spending in the wireline and wireless areas. Therefore, the Company believes that it should be able to grow its revenue in line with end demand. The Company anticipates that revenue growth will be driven by increased sales from its network and transmission products, serial communications products and clock products, and also initial revenue from products targeting the storage application market.
The Company does, however, continue to experience limited visibility with respect to customer demand and ordering patterns for its communications products resulting from short order-to-delivery times. These net sales expectations are subject to change as customer demand and related customer component inventory levels change. The Company’s future results of operations and financial condition may be negatively impacted as a result of such factors.
Critical Accounting Policies and Estimates
The preparation of the Company’s financial statements and accompanying disclosures in conformity with GAAP, the accounting principles generally accepted in the United States, requires estimates and assumptions that affect the reported amounts of assets, liabilities, revenues and expenses, and related disclosures of contingent assets and liabilities in the consolidated financial statements and the accompanying notes. The U.S. Securities and Exchange Commission (“SEC”) has defined a company’s critical accounting policies as policies that are most important to the portrayal of a company’s financial condition and results of operations, and which require a company to make its most difficult and subjective judgments, often as a result of the need to make estimates of matters that are inherently uncertain. Based on this definition, the Company has identified its most critical accounting policies and estimates to be as follows: (1) net sales; (2) reserves for excess inventories; (3) income taxes; and (4) non-marketable equity securities, which are addressed below. The Company also has other key
32
accounting policies that involve the use of estimates, judgments and assumptions that are significant to understanding the Company’s results. For additional information, see“Part II, Item 8.”Financial Statements and Supplementary Data,” and “Notes to Consolidated Financial Statements Note 2—Accounting Policies.”Although the Company believes that its estimates, assumptions and judgments are reasonable, they are based upon information presently available. Actual results may differ significantly from these estimates if the assumptions, judgments and conditions upon which they are based turn out to be inaccurate.
Net Sales
Net sales are comprised of product deliveries principally to OEMs or their contract manufacturers and non-exclusive distributors. The Company recognizes product revenue when persuasive evidence of an arrangement exists, delivery has occurred, the fee is fixed and determinable and collection is reasonably assured. The Company’s delivery terms are primarily FOB shipping point, at which time title and all transit risk transfer to the customer. The Company has agreements with its non-exclusive domestic distributors that provide for estimated returns and allowances to these distributors. The Company records an estimated allowance, at the time of delivery to such distributors, based on authorized and historical patterns of returns and other concessions. The following is a description of the provisions of these agreements allowing the distributors certain volume-based discounts and rights of return:
| | (a) | Volume Discounts. The Company provides for discounts based on the volume of product ordered by a non-exclusive distributor for a specific product with a specified volume range for a given customer over a period not to exceed one year. Exar records a provision for future volume discounts when the related revenue is recognized. The provision is based on historical information and other known factors. If the Company’s provision does not accurately reflect future volume discounts, the Company’s net sales could be materially and adversely affected. |
| | (b) | Stock Rotation. The Company allows a non-exclusive distributor to exchange products, generally in an amount of up to 10% of the amount purchased in the preceding quarter, provided that a purchase order from the distributor for an equal dollar amount of other products is in place at the time the exchange is authorized. The Company uses historical information along with current market conditions and other known factors to support the estimated allowance recorded against sales for potential future stock rotations. This estimated allowance is recorded in the same period that the related revenue is recognized. If the recorded estimated allowance does not accurately reflect future stock rotations, the Company’s net sales could be materially and adversely affected. Salable rotated stock is returned to the Company’s inventory. Returned product that is deemed unsalable is scrapped and expensed. |
As of March 31, 2006, the Company had $1.0 million of estimated allowances for future volume discounts and stock rotation related to sales that were recorded during the fiscal year ended March 31, 2006. The Company has estimated volume discounts and stock rotation required by its distributors. However, the Company’s actual results could differ from its original estimated allowances, therefore requiring adjustments to revenues in the relevant period.
Inventories
The Company’s policy is to establish a provision for excess inventory that is greater than approximately six months of forecasted demand, unless there are other factors indicating that the inventory will be sold at a profit after six months. Among other factors, management considers known backlog of orders, projected sales and marketing forecasts, shipment activity, inventory-on-hand at the Company’s primary distributors, past and current market conditions, anticipated demand for the Company’s products, changing lead times in the manufacturing process and other business conditions when determining if a provision for excess inventory is required. The Company’s net inventories at March 31, 2006 were $5.5 million, compared with $3.7 million at March 31, 2005. Should the assumptions used by management in estimating the provision for excess inventory differ from actual future demand or should market conditions become less favorable than those projected by management, additional inventory write-downs may be required, which would have a negative impact on the Company’s gross margins. See “Part I, Item 1A. Risk Factors ‘The Company’s Financial Results May Fluctuate Significantly Because Of A Number Of Factors, Many Of Which Are Beyond The Company’s Control’.”
Income Taxes
Income taxes are accounted for under the asset and liability method. The Company makes certain estimates and judgments in determining income tax expense for financial statement purposes. These estimates and judgments occur in the calculation of certain deferred tax assets and liabilities, which arise from timing differences in the recognition of revenue and expense for tax and financial statement purposes. Such deferred income tax assets and liabilities are recognized for the future tax consequences attributable to differences between the financial statement carrying amounts of existing assets and liabilities and their respective tax base, operating losses and tax credit carryforwards. Changes in tax rates affect the deferred income tax assets and liabilities and are recognized in the period in which the tax rates or benefits are enacted.
33
The Company must determine the probability that it will be able to utilize its deferred tax assets. If the Company determines that recovery is unlikely, then a valuation allowance against its deferred tax assets must be recorded by increasing its income tax expense. As of March 31, 2006, the Company believed that its deferred tax assets recorded on its Consolidated Balance Sheets will be realized. However, should there be a change in its ability to utilize or recover its deferred tax assets, an additional income tax expense would be incurred in the period in which it was determined that the recovery is not probable.
Non-Marketable Equity Securities
Non-marketable equity securities are accounted at historical cost and are subject to a periodic impairment review. This impairment analysis requires significant judgment to identify events or circumstances that would likely have a significant adverse effect on the fair value of the investment. The indicators the Company uses to identify those events and circumstances include the investee’s revenue and earnings trends relative to predefined milestones and overall business prospects; the technological feasibility of the investee’s products and technologies; the general market conditions in the investee’s industry; and the investee’s liquidity, debt ratios and the rate at which the investee is using cash. Investments identified as having an indicator of impairment are subject to further analysis to determine if the investment is other-than-temporarily impaired, in which case the investment is written down to its impaired value. When an investee is not considered viable from a financial or technological point of view, the entire investment is written down, since the estimated fair market value is considered to be nominal. Impairment of non-marketable equity securities is recorded in other-than-temporary loss on long-term investments in the Consolidated Statements of Operations.
During the fiscal year ended March 31, 2006, the Company assessed the value of certain discontinued companies and the remaining portfolio companies within TechFarm Ventures (Q), L.P. (“TechFarm Fund”). The Company believed that these changes permanently impaired the carrying value of its investment in the TechFarm Fund. In the fiscal year ended March 31, 2006, the Company recorded an impairment charge against its earnings of $1.2 million, thereby reducing its carrying value in the TechFarm Fund to $0.6 million.
34
Results of Operations
The following table shows certain Consolidated Statements of Operations as a percentage of net sales for the periods indicated:
| | | | | | | | | |
| | | Fiscal Years Ended March 31, | |
| | | 2006 | | | 2005 | | | 2004 | |
Net sales | | 100.0 | % | | 100.0 | % | | 100.0 | % |
Cost of sales: | | | | | | | | | |
Product cost of sales | | 30.8 | | | 31.7 | | | 34.6 | |
Amortization of purchased intangible assets | | 1.4 | | | — | | | — | |
| | | | | | | | | |
Total cost of sales | | 32.2 | | | 31.7 | | | 34.6 | |
| | | | | | | | | |
Gross profit | | 67.8 | | | 68.3 | | | 65.4 | |
| | | |
Operating expenses: | | | | | | | | | |
Research and development | | 36.8 | | | 38.4 | | | 32.5 | |
Selling, general and administrative | | 31.8 | | | 36.0 | | | 28.8 | |
| | | | | | | | | |
Total operating expenses | | 68.6 | | | 74.4 | | | 61.3 | |
| | | |
Gain from legal settlement | | — | | | 2.1 | | | — | |
| | | | | | | | | |
Income (loss) from operations | | (0.8 | ) | | (4.0 | ) | | 4.1 | |
| | | |
Other income, net: | | | | | | | | | |
Interest and other income, net | | 18.3 | | | 14.9 | | | 10.6 | |
Other-than-temporary loss on long-term investment | | (1.8 | ) | | — | | | (8.9 | ) |
| | | | | | | | | |
Total other income, net | | 16.5 | | | 14.9 | | | 1.7 | |
| | | |
Income before income taxes | | 15.8 | | | 10.9 | | | 5.8 | |
Provision for income taxes | | 4.2 | | | 1.6 | | | (1.1 | ) |
| | | | | | | | | |
Net income | | 11.6 | % | | 9.3 | % | | 6.9 | % |
| | | | | | | | | |
Net Sales by Product Line
The following table shows net sales by product line in absolute dollars and as a percentage of net sales for the periods indicated (in thousands):
| | | | | | | | | | | | | | | | | | | | |
| | | Fiscal Years Ended March 31, | | | | | | | |
| | | 2006 | | | 2005 | | | 2004 | | | 2006 vs 2005
Change | | | 2005 vs 2004
Change | |
Net sales: | | | | | | | | | | | | | | | | | | | | |
Communications | | $ | 63,995 | | | $ | 52,720 | | | $ | 54,489 | | | $ | 11,275 | | | $ | (1,769 | ) |
Percentage of net sales | | | 95.5 | % | | | 91.9 | % | | | 81.1 | % | | | | | | | | |
Video, Imaging and Other | | $ | 3,029 | | | $ | 4,649 | | | $ | 12,707 | | | $ | (1,620 | ) | | $ | (8,058 | ) |
Percentage of net sales | | | 4.5 | % | | | 8.1 | % | | | 18.9 | % | | | | | | | | |
| | | | | | | | | | | | | | | | | | | | |
Total net sales | | $ | 67,024 | | | $ | 57,369 | | | $ | 67,196 | | | $ | 9,655 | | | $ | (9,827 | ) |
| | | | | | | | | | | | | | | | | | | | |
35
Fiscal Year 2006 versus Fiscal Year 2005
Net sales for fiscal year 2006 increased $9.7 million, or 16.8%, compared to fiscal year 2005 primarily due to increased sales volume in existing communications products and sales of the SONET product from the ON acquisition.
Communications net sales for fiscal year 2006 increased by $11.3 million, or 21.4% as compared to fiscal year 2005. Net sales in the network and transmission market for fiscal year 2006 increased $7.4 million, or 44.8%, as compared to net sales in fiscal year 2005.
Growth in the network and transmission market resulted from increased T1/E1 (+ 12%), T3/E3 (+17%) and SONET (+414%) product sales. Growth in SONET product sales was derived by increased sales volume of existing products of 15.6% and sales of the SONET product from the ON acquisition.
Net sales in the serial communications market for fiscal year 2006 increased $3.9 million, or 10.7%, primarily due to increased sales volume offset by normal price erosion on a limited number of products.
Video, imaging and other net sales for the fiscal year 2006 decreased by $1.6 million, or 34.8%, as compared to the fiscal year 2005. The decline in video, imaging and other product sales year-over-year reflect reduced shipments to Hewlett-Packard and the completion of a customer’s older program.
Fiscal Year 2005 versus Fiscal Year 2004
Net sales for fiscal year 2005 decreased $9.8 million, or 14.6%, compared to fiscal year 2004, which included a one-time technology license agreement revenue of $0.5 million. This reduction in net sales was primarily due to reduced sales volume in video, imaging and other products. Also during fiscal year 2005, the Company experienced a reduction in demand for its communications products following strong second half demand in fiscal year 2004.
Communications net sales for fiscal year 2005 decreased by $1.8 million, or 3.2%, compared to fiscal year 2004. During fiscal year 2005, the Company’s OEM and distributor customers reduced their inventory levels of the Company’s communications products, thereby reducing product demand on the Company. Despite this trend, net sales in the network and transmission market for fiscal year 2005 increased $0.8 million, or 5.0%, as compared to net sales for fiscal year 2004.
Growth in the network and transmission market resulted from increased T1/E1 (+ 13%) and SONET (+14%) product sales, while T3/E3 product sales remained flat.
Serial communications net sales for fiscal year 2005 decreased $2.1 million, or 5.4%, compared to fiscal year 2004, primarily due to the effects of distributor inventory reductions, normal price erosion on a limited number of products and reduced sales volume due to the end of life of customers’ older programs.
Video, imaging and other net sales for the fiscal year 2005 decreased by $8.1 million, or 63.4%, as compared to the fiscal year 2004. The decline in video, imaging and other product sales year-over-year reflect continued reductions in sales volume to Hewlett-Packard, in addition to the completion of last-time buy orders for non-strategic products.
Net Sales by Channel and Geography
The following table shows net sales by channel in absolute dollars and as a percentage of net sales for the periods indicated (in thousands):
| | | | | | | | | | | | | | | | | | | |
| | | Fiscal Years Ended March 31, | | | | | | |
| | | 2006 | | | 2005 | | | 2004 | | | 2006 vs 2005
Change | | 2005 vs 2004
Change | |
Primary distributors | | $ | 26,838 | | | $ | 21,130 | | | $ | 22,627 | | | $ | 5,708 | | $ | (1,497 | ) |
Percentage of net sales | | | 40.0 | % | | | 36.8 | % | | | 33.7 | % | | | | | | | |
OEM | | $ | 40,186 | | | $ | 36,239 | | | $ | 44,569 | | | $ | 3,947 | | $ | (8,330 | ) |
Percentage of net sales | | | 60.0 | % | | | 63.2 | % | | | 66.3 | % | | | | | | | |
36
Fiscal Year 2006 versus Fiscal Year 2005
Net sales for fiscal year 2006 to the Company’s primary distributors, Future Electronics (“Future”) and Nu Horizons Corp. (“Nu Horizons”), increased 27.0% compared to fiscal year 2005. The increase is primarily due to increased market demand for a number of serial communications products.
Net sales for the fiscal year 2006 to OEMs and their subcontract manufacturers increased 10.9% compared to fiscal year 2005 due to sales of the acquired SONET product to Alcatel partially offset by reduced shipments to Hewlett-Packard and the completion of an older customer’s program.
Fiscal Year 2005 versus Fiscal Year 2004
Net sales for fiscal year 2005 to the Company’s primary distributors, Future and Nu Horizons decreased 6.7% compared to fiscal year 2004. The decrease was due to reduction in inventory levels by the distributors.
Net sales for the fiscal year 2005 to OEMs and their subcontract manufacturers decreased 18.7%, compared to fiscal year 2004, due to reduced imaging product sales to Hewlett-Packard’s contract manufacturers located in Asia.
The following table shows net sales by geography in absolute dollars and as a percentage of net sales for the periods indicated (in thousands):
| | | | | | | | | | | | | | | | | | | |
| | | Fiscal Years Ended March 31, | | | | | | |
| | | 2006 | | | 2005 | | | 2004 | | | 2006 vs 2005
Change | | 2005 vs 2004
Change | |
United States | | $ | 32,615 | | | $ | 28,188 | | | $ | 31,219 | | | $ | 4,427 | | $ | (3,031 | ) |
Percentage of net sales | | | 48.7 | % | | | 49.1 | % | | | 46.5 | % | | | | | | | |
International | | $ | 34,409 | | | $ | 29,181 | | | $ | 35,977 | | | $ | 5,228 | | $ | (6,796 | ) |
Percentage of net sales | | | 51.3 | % | | | 50.9 | % | | | 53.5 | % | | | | | | | |
Fiscal Year 2006 versus Fiscal Year 2005
Domestic sales increased in fiscal year 2006 compared to fiscal year 2005 due to increased sales volume to a number of network and transmission and serial communications customers. International sales increased during the same period due to sales of acquired SONET product to Alcatel.
Fiscal Year 2005 versus Fiscal Year 2004
Domestic sales decreased in fiscal year 2005 compared to fiscal year 2004 due to customers reducing their inventory stock and the end of life of customers’ older programs. International sales decreased during the same period due to reduced imaging product sales to Hewlett-Packard’s contract manufacturers located in Asia.
37
Gross Profit
The following table shows gross profit in absolute dollars and as a percentage of net sales for the periods indicated (in thousands):
| | | | | | | | | | | | | | | | | | | |
| | | Fiscal Years Ended March 31, | | | | | | |
| | | 2006 | | | 2005 | | | 2004 | | | 2006 vs 2005
Change | | 2005 vs 2004
Change | |
Gross Profit | | $ | 45,475 | | | $ | 39,156 | | | $ | 43,959 | | | $ | 6,319 | | $ | (4,803 | ) |
Percentage of net sales | | | 67.8 | % | | | 68.3 | % | | | 65.4 | % | | | | | | | |
Gross profit represents net sales less cost of sales. Cost of sales includes:
| | • | | the cost of purchasing finished silicon wafers manufactured by independent foundries; |
| | • | | the costs associated with assembly, packaging, test, quality assurance and product yields; |
| | • | | the cost of personnel and equipment associated with manufacturing support and manufacturing engineering; |
| | • | | the amortization of purchased intangible assets in connection with the ON acquisition; and |
| | • | | provision for excess and obsolete inventory. |
Included in gross profit for the fiscal years ended March 31, 2006, 2005 and 2004, respectively, is the recovery of $0.3 million, $0.4 million and $0.4 million, respectively, from inventory written-down in fiscal year 2003.
The Company anticipates that gross profit will continue to fluctuate as a percentage of net sales and in absolute dollars due to, among other factors, future fluctuations in: net sales, manufacturing costs, competitive pricing and product mix.
Fiscal Year 2006 versus Fiscal Year 2005
The increase in gross profit in absolute dollars was due to increased sales volume of existing products and sales from the acquired SONET product. The decrease in gross profit as a percentage of net sales in fiscal year 2006 compared to fiscal year 2005 was primarily due to the amortization of purchased intangible assets and sales of the acquired SONET product, which is sold at a lower gross margin than other communications products. The decrease was partially offset by the continued product mix shift from lower margin video, imaging and other products to higher margin communications products and manufacturing efficiencies due to increased production volumes.
Fiscal Year 2005 versus Fiscal Year 2004
The decrease in gross profit in absolute dollars was due to reduced sales volume. The increase in gross profit as a percentage of net sales in fiscal year 2005 compared to fiscal year 2004 was due in part to a product mix shift resulting from increased sales of communications products, which typically have higher margins than video and imaging products offset by manufacturing inefficiencies due to decreased production volumes.
Research and Development (“R&D”)
The following table shows research and development expenses in absolute dollars and as a percentage of net sales for the periods indicated (in thousands):
| | | | | | | | | | | | | | | | | | |
| | | Fiscal Years Ended March 31, | | | | | |
| | | 2006 | | | 2005 | | | 2004 | | | 2006 vs 2005
Change | | 2005 vs 2004
Change |
Research and development | | $ | 24,691 | | | $ | 22,025 | | | $ | 21,819 | | | $ | 2,666 | | $ | 206 |
Percentage of net sales | | | 36.8 | % | | | 38.4 | % | | | 32.5 | % | | | | | | |
38
Research and development costs consist primarily of:
| | • | | the salaries and related expenses of employees engaged in product research, design and development activities; |
| | • | | costs related to design tools, license expenses related to intellectual property, mask tooling costs, supplies and services and use of in-house test equipment; and |
Fiscal Year 2006 versus Fiscal Year 2005
The increase in R&D expenses in fiscal year 2006 as compared to fiscal year 2005 resulted from an increase in labor-related expenses associated with the ON acquisition of approximately $1.4 million, depreciation and maintenance associated with the purchases of new engineering design software and upgrades to an advanced tester and other lab equipment, mask tooling costs, and legal fees associated with patent applications.
Fiscal Year 2005 versus Fiscal Year 2004
The increase in R&D expenses in fiscal year 2005 as compared to fiscal year 2004 resulted from an increase in labor-related expenses and depreciation associated with the addition of an advanced tester.
The Company believes that technological innovation is critical to its long-term success, and it intends to continue to invest in R&D to enhance its product offerings to meet the current and future technological requirements of its customers and markets. Some aspects of the Company’s R&D efforts require significant short-term expenditures, such as mask tooling for advanced technology products, the timing of which may cause significant fluctuations in the Company’s expenses.
Selling, General and Administrative (“SG&A”)
The following table shows selling, general and administrative expenses in absolute dollars and as a percentage of net sales for the periods indicated (in thousands):
| | | | | | | | | | | | | | | | | | |
| | | Fiscal Years Ended March 31, | | | | | |
| | | 2006 | | | 2005 | | | 2004 | | | 2006 vs 2005
Change | | 2005 vs 2004
Change |
Selling, general and administrative | | $ | 21,291 | | | $ | 20,660 | | | $ | 19,393 | | | $ | 631 | | $ | 1,267 |
Percentage of net sales | | | 31.8 | % | | | 36.0 | % | | | 28.8 | % | | | | | | |
Selling, general and administrative expenses consist primarily of:
| | • | | salaries and related expenses; |
| | • | | professional and legal fees; |
Fiscal Year 2006 versus Fiscal Year 2005
The increase in SG&A spending in absolute dollars for the fiscal year 2006 as compared to fiscal year 2005 was primarily due to the Company’s proxy expenses of $0.9 million and an accrual of $0.4 million for proxy expense reimbursement to GWA Investments, LLC and GWA Master Fund, L.P. partially offset by lower labor-related costs and insurance premiums. Additionally, SG&A expenses in fiscal year 2005 reflect the Company’s recovery of legal fees of $0.7 million in connection with a legal settlement.
39
Fiscal Year 2005 versus Fiscal Year 2004
The increase in SG&A spending in both absolute dollars and as a percentage of net sales for the fiscal year 2005 as compared to fiscal year 2004 was primarily due to increased labor-related expenses including a charge resulting from an international labor settlement and professional fees related to compliance with Sarbanes-Oxley regulations partially offset by a legal fee recovery of $0.7 million in connection with a legal settlement.
SG&A expenses may vary both in absolute dollars and as a percentage of net sales due to sales commissions, audit fees, litigation costs and costs of any corporate governance or other activity at the direction of the Board of Directors. In the short term, many of the SG&A expenses are fixed; however, the Company expects SG&A expense will continue to fluctuate.
Other Income, Net
The following table shows other income, net in absolute dollars and as a percentage of net sales for the periods indicated (in thousands):
| | | | | | | | | | | | | | | | | | | | |
| | | Fiscal Years Ended March 31, | | | | | | | |
| | | 2006 | | | 2005 | | | 2004 | | | 2006 vs 2005
Change | | | 2005 vs 2004
Change | |
Other income, net: | | | | | | | | | | | | | | | | | | | | |
Interest income and other, net | | $ | 12,304 | | | $ | 8,593 | | | $ | 6,833 | | | $ | 3,711 | | | $ | 1,760 | |
Other-than-temporary loss on long-term investments | | | (1,215 | ) | | | — | | | | (6,000 | ) | | | (1,215 | ) | | | 6,000 | |
Net realized gain (loss) on marketable securities | | | (7 | ) | | | (47 | ) | | | 306 | | | | 40 | | | | (353 | ) |
| | | | | | | | | | | | | | | | | | | | |
Total other income, net | | $ | 11,082 | | | $ | 8,546 | | | $ | 1,139 | | | $ | 2,536 | | | $ | 7,407 | |
Percentage of net sales | | | 16.5 | % | | | 14.9 | % | | | 1.7 | % | | | | | | | | |
Other income (loss), net primarily consists of:
| | • | | realized gains (losses) on marketable securities; |
| | • | | gains or losses resulting from investments in non-marketable equity securities and venture funds; |
| | • | | impairment charges; and |
| | • | | gains or losses on the sale of equipment. |
Fiscal Year 2006 versus Fiscal Year 2005
The increase in other income, net during fiscal year 2006 as compared to fiscal year 2005 resulted principally from higher interest income of $3.7 million partially offset by impairment charges of $1.2 million recorded on other long-term investments. Interest income increased to $12.3 million for fiscal year 2006 from $8.6 million for fiscal year 2005 as a result of higher market interest rates partially offset by lower invested cash and cash equivalents and short-term investments due to the $120.8 million required to complete the Company’s Modified “Dutch Auction” Self Tender Offer in the second quarter of fiscal year 2006. The Company expects that its interest income will continue to fluctuate due to changes in interest rates.
Fiscal Year 2005 versus Fiscal Year 2004
The increase in other income, net during fiscal year 2005 as compared to fiscal year 2004 resulted principally from impairment charges of $6.0 million recorded on other long-term investments in fiscal year 2004 and an increase in interest income due to increasing market interest rates. As a result of higher interest rates on the Company’s interest-bearing investments, interest income, net increased to $8.6 million for fiscal year 2005 from $6.8 million for fiscal year 2004. Net realized losses on investments were $0.05 million for fiscal year 2005, as compared to net realized gains on investments of $0.3 million for fiscal year 2004. The decrease resulted from an increase in interest rates and fewer sales of marketable securities in fiscal year 2005 relative to fiscal year 2004.
40
Gain on Legal Settlement
During fiscal year 2005, the Company recorded a gain on a legal settlement of $1.2 million arising from its entry into a settlement agreement in connection with a commercial dispute.
Long-Term Investments
TechFarm Ventures L.P. (Q), L.P.(“TechFarm Fund”)
Exar became a limited partner in the TechFarm Fund in May 2001. This partnership is a venture capital fund, managed by TechFarm Ventures Management L.L.C., the general partner of the TechFarm Fund, a Delaware limited partnership, and focuses its investment activities on seed and early stage technology companies. Effective May 31, 2002, in connection with the amendment of the partnership agreement, the Company and TechFarm agreed to reduce the Company’s capital commitment in the TechFarm Fund to approximately $4.0 million, or approximately 5% of the TechFarm Fund’s total committed capital. Additionally, the Company and TechFarm Ventures Management L.L.C. agreed to change the Company’s status from a limited partner to that of an assignee having fewer rights and less status than a limited partner. Because of these modifications, the Company changed its method of accounting for this investment from the equity method to the cost basis method as of May 31, 2002. The Company has fulfilled its capital contribution commitment and, therefore, will not be required to fund additional amounts.
In September 2003, the Company became aware of significant changes in the business of certain portfolio companies within the TechFarm Fund. The Company believed that these changes permanently impaired a portion of the carrying value of its investment in the TechFarm Fund. As a result, Exar recorded an impairment charge against its earnings of $1.0 million, thereby reducing its carrying value in the TechFarm Fund to $1.8 million.
In December 2005, the Company assessed the value of certain discontinued companies and the remaining portfolio companies within the TechFarm Fund. The Company believed that these changes permanently impaired the carrying value of its investment in the TechFarm Fund. As a result, Exar recorded an impairment charge against its earnings of $1.2 million, thereby reducing its carrying value in the TechFarm Fund to $0.6 million.
Skypoint Telecom Fund II (US), L.P. (“Skypoint Fund”)
In July 2001, Exar became a limited partner in the Skypoint Fund, a venture capital fund focused on investments in communications infrastructure companies. The investment provides the Company with the opportunity to align itself with potential strategic partners in emerging technologies within the telecommunications and/or networking industry. Exar is obligated to contribute $5.0 million, which represents approximately 5% of the Skypoint Fund’s total capital commitments. Of the $5.0 million obligation, Exar has funded $2.8 million as of March 31, 2006 and is contractually obligated to contribute the remaining capital of $2.2 million as requested by the Skypoint Fund’s General Partner prior to June 18, 2007 for new portfolio companies. All subsequent capital contributions, up to the $5.0 million capital commitment, must be for portfolio companies invested in by the Skypoint Fund prior to June 18, 2007.
During the fiscal year 2006, the Company funded $0.7 million to the Skypoint Fund. In September 2005, the Company recorded a $0.6 million distribution from the venture capital fund related to a sale of a company within the fund’s portfolio. In accordance with Financial Accounting Standards Board’s (“FASB”), Accounting Principles Bulletin 18 (“APB 18”), “The Equity Method of Accounting for Investments in Common Stock,” the Company recorded the distribution on the cost basis and reduced the carrying value of its investment in the Skypoint Fund. The $2.2 million carrying value of the Skypoint Fund investment as of March 31, 2006 reflects contributions to date of $2.8 million less the $0.6 million distribution.
Internet Machines Corporation (“IMC”)
In July 2001, Exar invested $40.3 million for a 16% equity interest in Internet Machines Corporation, which subsequently changed its name to IMC Semiconductor, Inc., a pre-revenue, privately-held company that was developing a family of highly-integrated communications ICs that provides protocol-independent network processing, switch fabric and traffic management solutions for high-speed optical, metro area network and Internet infrastructure equipment.
In September 2002, the Company became aware of a potential decline in the value of its 16% equity investment in IMC. Consequently, the Company recorded an impairment charge of $35.3 million against its earnings in that quarter, reducing its equity investment from $40.3 million to $5.0 million. During the three months ended September 30, 2003, the
41
Company determined that the carrying value of its investment in IMC was further impaired and thus recorded a $5.0 million impairment charge to write-off the remainder of its investment carrying value in IMC. In May 2004, IMC ceased operations and liquidated its remaining assets.
Provision (Benefit) for Income Taxes
Fiscal Year 2006
The Company’s effective tax rate for the fiscal year 2006 was 26.4%. The provision for income taxes for fiscal year 2006 differs from the amount computed by applying the statutory federal rate of 35%. This difference is principally due to benefits claimed for research and development tax credits generated during the fiscal year, partially offset by state income taxes.
Fiscal Year 2005
The Company’s effective tax rate for the fiscal year 2005 was 14.6%. The provision for income taxes for fiscal year 2005 differs from the amount computed by applying the statutory federal rate of 35%. This difference is principally due to tax-exempt interest, the usage of research and development tax credits and the usage of net operating loss carryovers from acquired subsidiaries, partially offset by state income taxes.
Fiscal Year 2004
The Company’s effective tax rate for the year ended March 31, 2004 was a benefit of 19%. The Company’s effective income tax rate for fiscal year 2004, excluding the impact of the asset impairment charge of $6 million and a one-time tax benefit of $2.7 million associated with the extension and preservation of tax attributes related to research and development carryforward credits and certain excess tax accruals, was approximately 17%. The provision for income taxes for the fiscal year 2004 differs from the amount computed by applying the statutory federal rate of 35%. This difference is principally due to the Company’s decision not to recognize a tax benefit for the $6 million IMC and TechFarm Fund impairment charges. This decision resulted from the Company’s uncertainty regarding whether it would earn sufficient future capital gains to offset this capital loss after the loss is recognized for tax purposes. The other differences relate primarily to tax-exempt interest, the usage of research and development tax credits and the usage of net operating loss carryovers from acquired subsidiaries, partially offset by state income taxes.
Liquidity and Capital Resources
The Company does not have any off-balance sheet arrangements, investments in special purpose entities or undisclosed borrowings or debt. Additionally, the Company is not a party to any derivative contracts, nor does it have any synthetic leases. At March 31, 2006, the Company had no foreign currency contracts outstanding.
The Company’s principal source of liquidity in fiscal years 2006, 2005 and 2004 was cash and cash equivalents and short-term securities, which decreased by $116.8 million to $329.5 million at March 31, 2006 from $446.3 million at March 31, 2005, which had increased by $9.3 million to $446.3 million at March 31, 2005 from $437.0 million at March 31, 2004.
Fiscal Year 2006
Cash and cash equivalents decreased by $70.8 million to $187.6 million at March 31, 2006 from $258.4 million at March 31, 2005. The decrease was due to net cash used in financing activities of $112.8 million offset by net cash provided by investing activities of $30.3 million and net cash provided by operating activities of $11.7 million.
The Company generated cash flows from operating activities of $11.7 million in the fiscal year 2006 as compared to $11.3 million in the fiscal year 2005. Net income, adjusted for non-cash related items, provided cash of $19.8 million during fiscal year 2006. The decrease for fiscal year 2006 in working capital sources of cash included increases in accounts receivable of $6.8 million and inventories of $1.9 million during fiscal year 2006. The increase in accounts receivable was primarily due to higher sales in the fourth quarter of fiscal year 2006 as compared to the fourth quarter of fiscal year 2005. Working capital sources of cash included increased accounts payable, accrued expenses and income taxes payable.
Net cash provided by investing activities totaled $30.3 million in the fiscal year 2006. During fiscal 2006, the Company’s investing activities included proceeds of $111.0 million from short-term marketable securities partially offset by purchases of $64.2 million in short-term marketable securities, $11.4 million for the ON acquisition, and purchases of property, plant and equipment of $5.0 million which consisted primarily of purchases for test equipment.
42
As of March 31, 2006, the Company had funded $2.8 million of its $5.0 million committed capital in the Skypoint Telecom Fund II (US), L.P. The Company is obligated to contribute its remaining committed capital of approximately $2.2 million as required by the Skypoint Fund’s General Partner and in accordance with the partnership agreement between Exar and the Skypoint Fund. To meet its capital commitment to the Skypoint Fund, the Company may need to use its existing cash, cash equivalents and marketable securities.
Net cash used in financing activities totaled $112.8 million in the fiscal year 2006. Net cash used in financing activities is primarily due to the repurchase of 7.5 million shares of the Company’s common stock for $120.0 million and associated costs of $0.8 million in connection with the Company’s tender offer. Additionally, the Company repurchased 270,000 shares of its common stock for $3.6 million under the stock repurchase program authorized in March 2001. This was partially offset by the proceeds of $11.6 million from the issuance of shares of common stock, representing proceeds from the exercise of stock options under the Company’s stock option plans and the purchase of shares of common stock under the Company’s employee stock participation plan.
Fiscal Year 2005
Cash and cash equivalents increased by $243.3 million to $258.4 million at March 31, 2005 from $15.1 million at March 31, 2004. The increase was due to net cash provided by operating activities of $11.3 million, net cash provided by investing activities of $227.8 million and net cash provided by financing activities of $4.3 million.
The Company generated cash flows from operating activities of $11.3 million in the fiscal year 2005 as compared to $12.5 million in the fiscal year 2004. Cash was provided by net income adjusted for non-cash related items of $16.2 million during fiscal year 2005. The increase for fiscal year 2005 in working capital sources of cash included decreases in accounts receivable of $0.8 million and inventories of $0.5 million. Accounts receivable decreased by $0.8 million over the March 31, 2004 level, primarily due to lower sales in the fourth quarter of fiscal year 2005 as compared to the fourth quarter of fiscal year 2004. Working capital uses of cash included increased prepaid expenses and decreased accounts payable, accrued expenses and income taxes payable.
Net cash provided by investing activities totaled $227.8 million in the fiscal year 2005. During fiscal 2005, the Company’s investing activities included a net transfer of $231.9 million from short-term marketable securities to cash and cash equivalents. Purchases of manufacturing test equipment, computer equipment, software and hardware used for product development amounted to $3.1 million for the fiscal year 2005.
Net cash provided by financing activities totaled $4.3 million in the fiscal year 2005. Net cash provided by financing activities is primarily from proceeds from the issuance of common stock upon the exercise of stock options under the Company’s stock option plans and the purchase of shares of common stock under the Company’s employee stock participation plan offset by the Company’s repurchase of common stock.
Fiscal Year 2004
Cash and cash equivalents decreased from $28.8 million at March 31, 2003 to $15.1 million at March 31, 2004. The decrease was due to net cash used in investing activities of $35.1 million offset by net cash provided by operating activities of $12.5 million, and net cash provided by financing activities of $8.8 million.
During the fiscal year 2004, the Company generated cash from operating activities of $12.5 million. Cash was provided by net income adjusted for non-cash related items of $15.4 million during fiscal year 2004. The increase for fiscal year 2004 in working capital uses of cash included increases in accounts receivable of $5.5 million and inventories of $1.3 million. Accounts receivable increased by $5.5 million, primarily due to higher sales in the fourth quarter of fiscal year 2004 as compared to the fourth quarter of fiscal year 2003. Inventory levels increased by $1.3 million at March 31, 2004 as compared to March 31, 2003 primarily due to additional wafers purchased to ensure continuity of supply during the transition to the Chartered eight-inch wafer fabrication facility. Working capital sources of cash included increased accounts payable, accrued expenses and income taxes payable.
Net cash used in investing activities totaled $35.1 million in the fiscal year 2004. During fiscal year 2004, the Company’s investing activities included net purchases of short-term marketable securities of $28.7 million. Purchases of manufacturing test equipment, computer equipment, software and hardware used for product development amounted to $5.8 million for the fiscal year 2004. Included in purchases of property and equipment was a refund of $0.9 million from the California Energy Commission related to the Company’s on-site power generation equipment installed in fiscal year 2003.
43
Net cash provided by financing activities totaled $8.8 million in the fiscal year 2004. Net cash provided by financing activities is primarily from proceeds from the issuance of common stock upon the exercise of stock options under the Company’s stock option plans and the purchase of shares of common stock under the Company’s employee stock participation plan.
In March 2001, the Board of Directors authorized a stock repurchase program to acquire outstanding common stock in the open market due to the decrease in market price and to partially offset some dilution from the Company’s stock option programs. Under this program, the Board of Directors authorized the acquisition of up to $40.0 million of Exar’s common stock. During the fiscal year ended March 31, 2006, the Company repurchased 270,000 shares for approximately $3.6 million. In the fiscal year ended March 31, 2005, the Company repurchased 250,000 shares for approximately $3.7 million. Through the fiscal year ended March 31, 2004, the Company acquired 247,110 shares of its common stock for $4.6 million. In the future, the Company may utilize this stock repurchase program, which would reduce cash, cash equivalents and/or marketable securities available to fund future operations and meet other liquidity requirements.
To date, inflation has not had a significant impact on the Company’s operating results.
The Company anticipates that it will continue to finance its operations with cash flows from operations, existing cash and investment balances, and some combination of long-term debt and/or lease financing and additional sales of equity securities. The combination and sources of capital will be determined by management based on the Company’s needs and prevailing market conditions. The Company believes that its cash and cash equivalents, short-term marketable securities and cash flows from operations will be sufficient to satisfy working capital requirements and capital equipment needs for at least the next 12 months. However, should the demand for the Company’s products decrease in the future, the availability of cash flows from operations may be limited, thus possibly having a material adverse effect on the Company’s financial condition or results of operations. From time to time, the Company evaluates potential acquisitions, strategic arrangements and equity investments complementary to its design expertise and market strategy, which may include investments in wafer fabrication foundries. To the extent that the Company pursues or positions itself to pursue these transactions, the Company could consume a significant portion of its capital resources or choose to seek additional equity or debt financing. There can be no assurance that additional financing could be obtained on terms acceptable to the Company. The sale of additional equity or convertible debt could result in dilution to the Company’s stockholders.
The following table summarizes the Company’s contractual payment obligations and commitments as of March 31, 2006 (in thousands):
| | | | | | | | | | | | | | | | | | | | | |
| | | Fiscal Years Ended March 31, | | | | |
Contractual Obligations | | 2007 | | 2008 | | 2009 | | 2010 | | 2011 | | Thereafter | | Total |
Purchase Obligations(1) | | $ | 4,080 | | $ | 575 | | $ | 435 | | $ | — | | $ | | | $ | — | | $ | 5,090 |
Venture Investment Commitments | | | | | | | | | | | | | | | | | | | | | |
(Skypoint Fund)(2) | | | 2,152 | | | — | | | — | | | — | | | — | | | — | | | 2,152 |
Remediation commitment(3) | | | 53 | | | 53 | | | 53 | | | 53 | | | 19 | | | — | | | 231 |
Lease Obligations | | | 81 | | | 19 | | | 19 | | | 5 | | | — | | | — | | | 124 |
| | | | | | | | | | | | | | | | | | | | | |
Total | | $ | 6,366 | | $ | 647 | | $ | 507 | | $ | 58 | | $ | 19 | | $ | — | | $ | 7,597 |
| | | | | | | | | | | | | | | | | | | | | |
| (1) | The Company places purchase orders with wafer foundries and other vendors as part of its normal course of business. The Company expects to receive and pay for wafers, capital equipment and various service contracts over the next 12 months from its existing cash balances. |
| (2) | The commitment related to the Skypoint Fund does not have a set payment schedule and thus will become payable upon the request from the Skypoint Fund's General Partner. |
| (3) | The commitment relates to the environmental clean-up at the former location of Micro Power Systems, Inc. |
44
Recently Issued Accounting Pronouncements
In December 2004, the Financial Accounting Standards Board (“FASB”) issued Statement No. 123 (revised 2004), “Share-Based Payment” (“SFAS 123R”). This statement replaces SFAS 123, “Accounting for Stock-Based Compensation” and supersedes Accounting Principles Board’s Opinion No. 25 (“APB 25”), “Accounting for Stock Issued to Employees.” SFAS 123R will require the Company to measure the cost of the Company’s employee stock-based compensation awards granted after the effective date based on the grant date fair value of those awards and to record that cost as compensation expense over the period, during which the employee is required to perform services in exchange for the award (generally over the vesting period of the award). SFAS 123R addresses all forms of share-based payments awards, including shares issued under employee stock purchase plans, stock options, restricted stock and stock appreciation rights. In addition, the Company will be required to record compensation expense (as previous awards continue to vest) for the unvested portion of previously granted awards that remain outstanding at the date of adoption. SFAS 123R is effective for annual fiscal periods beginning after June 15, 2005. The Company, therefore, is required to implement the standard as of April 1, 2006. In addition, the SEC issued Staff Accounting Bulletin No. 107, or SAB 107 in March 2005. SAB 107 includes interpretive guidance for the initial implementation of SFAS 123R.
As permitted by SFAS 123, the Company currently accounts for share-based payments to employees using the intrinsic value method prescribed by APB 25 and, as such, generally recognizes no compensation cost for employee stock options. Accordingly, the adoption of SFAS 123R will have a significant impact on the Company’s result of operations, although it will have no negative impact on cash flow. However, the actual result of the adoption of SFAS 123R cannot be determined at this time because it will depend on levels of share-based payments granted in the future.
In November 2004, the FASB issued Statement of Financial Accounting Standards No. 151, “Inventory Costs, an amendment to ARB No. 43, Chapter 4” (“SFAS 151”). SFAS 151 amends ARB No. 43, Chapter 4, to clarify that abnormal amounts of idle facility expense, freight, handling costs and wasted materials (spoilage) should be recognized as current period charges. In addition, SFAS 151 requires that the allocation of fixed production overheads to the cost of conversion be based on the normal capacity of the production facilities. SFAS 151 is effective for inventory costs incurred for fiscal years beginning after June 15, 2005. Therefore, the Company is required to adopt the standard effective April 1, 2006. The Company is currently assessing the impact but does not expect the adoption of SFAS 151 to have a significant impact on its financial condition or results of operations.
In May 2005, the FASB issued SFAS No. 154, “Accounting Changes and Error Corrections” (“SFAS 154”). SFAS No. 154 replaces APB Opinion No. 20, Accounting Changes and SFAS No. 3, Reporting Accounting Changes in Interim Financial Statements. SFAS 154 requires retrospective application to prior period financial statements of changes in accounting principle, unless it is impracticable to determine either the period-specific effects or the cumulative effect of the change. The Company does not expect the adoption of SFAS 154 to have a material impact on its consolidated financial position or results of operations.
45
ITEM 7A. QUANTITATIVE AND QUALITATIVE DISCLOSURES ABOUT MARKET RISK
Foreign Currency Fluctuations. The Company is exposed to foreign currency fluctuations primarily through its foreign operations. This exposure is the result of foreign operating expenses being denominated in foreign currency. Operational currency requirements are typically forecasted for a three-month period. If there is a need to hedge this risk, the Company will enter into transactions to purchase currency in the open market or enter into forward currency exchange contracts. While it is expected that this method of hedging foreign currency risk will be utilized in the future, the hedging methodology and/or usage may be changed to manage exposure to foreign currency fluctuations.
If the Company’s foreign operations forecasts are overstated or understated during periods of currency volatility, the Company could experience unanticipated currency gains or losses. For the fiscal year ended March 31, 2006, the Company did not have significant foreign currency denominated net assets or net liabilities positions, and had no foreign currency contracts outstanding.
Interest Rate Sensitivity. The Company maintains investment portfolio holdings of various issuers, types, and maturity dates with various banks and investment banking institutions. The market value of these investments on any given day during the investment term may vary as a result of market interest rate fluctuations. The Company’s investment portfolio consisted of fixed income securities of $328.3 million as of March 31, 2006, $443.9 million as of March 31, 2005 and $438.6 million as of March 31, 2004. These securities, like all fixed income instruments, are subject to interest rate risk and will vary in value as market interest rates fluctuate. If market interest rates were to increase or decline immediately and uniformly by less than 10% from levels as of March 31, 2006, the increase or decline in the fair value of the portfolio would not be material.
Both short-term and long-term investments are classified as “available-for-sale” securities and the cost of securities sold is based on the specific identification method. At March 31, 2006, short-term investments consisted of commercial paper, asset-backed securities, corporate bonds and government securities of $141.9 million. At March 31, 2006, the difference between the fair market value and the underlying cost of such investments was $1.0 million.
The Company’s net income is dependent on, among other things, interest income. If interest rates decrease, the Company’s net income may be negatively impacted.
46
ITEM 8. FINANCIAL STATEMENTS AND SUPPLEMENTARY DATA
Management’s Annual Report on Internal Control over Financial Reporting
Management is responsible for establishing and maintaining adequate internal control over financial reporting. Management conducted an assessment of the Company’s internal control over financial reporting as of March 31, 2006 based on the framework established by the Committee of Sponsoring Organizations of the Treadway Commission inInternal Control—Integrated Framework. Based on this assessment, management concluded that, as of March 31, 2006, the Company’s internal control over financial reporting was effective.
Management’s assessment of the effectiveness of the Company’s internal control over financial reporting as of March 31, 2006 has been audited by PricewaterhouseCoopers LLP, an independent registered public accounting firm, as stated in their report which appears below.
Internal control over financial reporting cannot provide absolute assurance of achieving financial reporting objectives because of its inherent limitations. Internal control over financial reporting is a process that involves human diligence and compliance, and is subject to lapses in judgment and breakdowns resulting from human failures. Internal control over financial reporting also can be circumvented by collusion or improper management override. Because of such limitations, there is a risk that material misstatements may not be prevented or detected on a timely basis by internal control over financial reporting. However, these inherent limitations are known features of the financial reporting process. Therefore it is possible to design into the process safeguards to reduce, though not eliminate, this risk.
47
Report of Independent Registered Public Accounting Firm
To the Board of Directors and Shareholders of Exar Corporation:
We have completed an integrated audit of Exar Corporation’s 2006 consolidated financial statements and of its internal control over financial reporting as of March 31, 2006 and audits of its 2005 and 2004 consolidated financial statements in accordance with the standards of the Public Company Accounting Oversight Board (United States). Our opinions, based on our audits, are presented below.
Consolidated financial statements and financial statement schedule
In our opinion, the consolidated financial statements listed in the index appearing under 15(a)(1) present fairly in all material respects, the financial position of Exar Corporation and its subsidiaries at March 31, 2006 and 2005, and the results of their operations and their cash flows for each of the three years in the period ended March 31, 2006 in conformity with accounting principles generally accepted in the United States of America. In addition, in our opinion, the financial statement schedule listed in the index appearing under 15(a)(2) presents fairly, in all material respects, the information set forth therein when read in conjunction with the related consolidated financial statements. These financial statements and financial statement schedule are the responsibility of the Company’s management. Our responsibility is to express an opinion on these financial statements and financial statement schedule based on our audits. We conducted our audits of these statements in accordance with the standards of the Public Company Accounting Oversight Board (United States). Those standards require that we plan and perform the audit to obtain reasonable assurance about whether the financial statements are free of material misstatement. An audit of financial statements includes examining, on a test basis, evidence supporting the amounts and disclosures in the financial statements, assessing the accounting principles used and significant estimates made by management, and evaluating the overall financial statement presentation. We believe that our audits provide a reasonable basis for our opinion.
Internal control over financial reporting
Also, in our opinion, management’s assessment, included in Management’s Annual Report on Internal Control over Financial Reporting appearing under Item 8, that the Company maintained effective internal control over financial reporting as of March 31, 2006 based on criteria established inInternal Control—Integrated Framework issued by the Committee of Sponsoring Organizations of the Treadway Commission (COSO), is fairly stated, in all material respects, based on those criteria. Furthermore, in our opinion, the Company maintained, in all material respects, effective internal control over financial reporting as of March 31, 2006, based on criteria established inInternal Control—Integrated Framework issued by the COSO. The Company’s management is responsible for maintaining effective internal control over financial reporting and for its assessment of the effectiveness of internal control over financial reporting. Our responsibility is to express opinions on management’s assessment and on the effectiveness of the Company’s internal control over financial reporting based on our audit. We conducted our audit of internal control over financial reporting in accordance with the standards of the Public Company Accounting Oversight Board (United States). Those standards require that we plan and perform the audit to obtain reasonable assurance about whether effective internal control over financial reporting was maintained in all material respects. An audit of internal control over financial reporting includes obtaining an understanding of internal control over financial reporting, evaluating management’s assessment, testing and evaluating the design and operating effectiveness of internal control, and performing such other procedures as we consider necessary in the circumstances. We believe that our audit provides a reasonable basis for our opinions.
A company’s internal control over financial reporting is a process designed to provide reasonable assurance regarding the reliability of financial reporting and the preparation of financial statements for external purposes in accordance with generally accepted accounting principles. A company’s internal control over financial reporting includes those policies and procedures that (i) pertain to the maintenance of records that, in reasonable detail, accurately and fairly reflect the transactions and dispositions of the assets of the company; (ii) provide reasonable assurance that transactions are recorded as necessary to permit preparation of financial statements in accordance with generally accepted accounting principles, and that receipts and expenditures of the company are being made only in accordance with authorizations of management and directors of the company; and (iii) provide reasonable assurance regarding prevention or timely detection of unauthorized acquisition, use, or disposition of the company’s assets that could have a material effect on the financial statements.
48
Because of its inherent limitations, internal control over financial reporting may not prevent or detect misstatements. Also, projections of any evaluation of effectiveness to future periods are subject to the risk that controls may become inadequate because of changes in conditions, or that the degree of compliance with the policies or procedures may deteriorate.
|
/s/ PricewaterhouseCoopers LLP |
| San Jose, California |
| June 12, 2006 |
49
EXAR CORPORATION AND SUBSIDIARIES
CONSOLIDATED BALANCE SHEETS
(In thousands, except share amounts)
| | | | | | | | |
| | | March 31, | |
| | | 2006 | | | 2005 | |
ASSETS | | | | | | | | |
| | |
Current assets: | | | | | | | | |
Cash and cash equivalents | | $ | 187,610 | | | $ | 258,378 | |
Short-term marketable securities | | | 141,918 | | | | 187,907 | |
Accounts receivable (net of allowances of $1,074 and $858) | | | 7,429 | | | | 3,899 | |
Inventories | | | 5,531 | | | | 3,659 | |
Interest receivable and prepaid expenses | | | 4,599 | | | | 3,645 | |
Deferred income taxes, net | | | 2,579 | | | | 2,695 | |
| | | | | | | | |
Total current assets | | | 349,666 | | | | 460,183 | |
| | |
Property, plant and equipment, net | | | 27,770 | | | | 27,317 | |
Long-term investments | | | 2,828 | | | | 3,978 | |
Deferred income taxes, net | | | 9,361 | | | | 10,053 | |
Goodwill and intangible assets, net | | | 10,020 | | | | — | |
Other non-current assets | | | 1,752 | | | | 1,672 | |
| | | | | | | | |
Total assets | | $ | 401,397 | | | $ | 503,203 | |
| | | | | | | | |
LIABILITIES AND STOCKHOLDERS’ EQUITY | | | | | | | | |
| | |
Current liabilities: | | | | | | | | |
Accounts payable | | $ | 2,631 | | | $ | 2,199 | |
Accrued compensation and related benefits | | | 3,899 | | | | 4,074 | |
Accrued sales commissions | | | 650 | | | | 646 | |
Other accrued expenses | | | 1,895 | | | | 1,360 | |
Income taxes payable | | | 4,695 | | | | 4,612 | |
| | | | | | | | |
Total current liabilities | | | 13,770 | | | | 12,891 | |
Long-term obligations | | | 222 | | | | 265 | |
| | | | | | | | |
Total liabilities | | | 13,992 | | | | 13,156 | |
| | | | | | | | |
Commitments and contingencies (Note 12 and 13) | | | | | | | | |
| | |
Stockholders’ equity: | | | | | | | | |
Preferred stock, $.0001 par value; 2,250,000 shares authorized; no shares outstanding | | | | | | | | |
Common stock, $.0001 par value; 100,000,000 shares authorized; 43,898,555 and 42,507,031 shares outstanding | | | 430,384 | | | | 417,077 | |
Accumulated other comprehensive loss | | | (417 | ) | | | (1,070 | ) |
Retained earnings | | | 90,140 | | | | 82,354 | |
Treasury stock, 8,267,110 and 497,110 shares of common stock at cost | | | (132,702 | ) | | | (8,314 | ) |
| | | | | | | | |
Total stockholders’ equity | | | 387,405 | | | | 490,047 | |
| | | | | | | | |
Total liabilities and stockholders’ equity | | $ | 401,397 | | | $ | 503,203 | |
| | | | | | | | |
See accompanying notes to consolidated financial statements.
50
EXAR CORPORATION AND SUBSIDIARIES
CONSOLIDATED STATEMENTS OF OPERATIONS
(In thousands, except per share amounts)
| | | | | | | | | | | | |
| | | Fiscal Years Ended March 31, | |
| | | 2006 | | | 2005 | | | 2004 | |
Net sales | | $ | 67,024 | | | $ | 57,369 | | | $ | 67,196 | |
Cost of sales: | | | | | | | | | | | | |
Product cost of sales | | | 20,629 | | | | 18,213 | | | | 23,237 | |
Amortization of purchased intangible assets | | | 920 | | | | — | | | | — | |
| | | | | | | | | | | | |
| | | 21,549 | | | | 18,213 | | | | 23,237 | |
| | | | | | | | | | | | |
Gross profit | | | 45,475 | | | | 39,156 | | | | 43,959 | |
| | | |
Operating expenses: | | | | | | | | | | | | |
Research and development | | | 24,691 | | | | 22,025 | | | | 21,819 | |
Selling, general and administrative | | | 21,291 | | | | 20,660 | | | | 19,393 | |
| | | | | | | | | | | | |
Total operating expenses | | | 45,982 | | | | 42,685 | | | | 41,212 | |
| | | | | | | | | | | | |
Gain on legal settlement | | | — | | | | 1,208 | | | | — | |
| | | | | | | | | | | | |
Income (loss) from operations | | | (507 | ) | | | (2,321 | ) | | | 2,747 | |
| | | | | | | | | | | | |
Other income, net: | | | | | | | | | | | | |
Interest income and other, net | | | 12,304 | | | | 8,593 | | | | 6,833 | |
Other-than-temporary loss on long-term investments | | | (1,215 | ) | | | — | | | | (6,000 | ) |
Net realized gain (loss) on marketable securities | | | (7 | ) | | | (47 | ) | | | 306 | |
| | | | | | | | | | | | |
Total other income, net | | | 11,082 | | | | 8,546 | | | | 1,139 | |
| | | | | | | | | | | | |
Income before income taxes | | | 10,575 | | | | 6,225 | | | | 3,886 | |
Provision (benefit) for income taxes | | | 2,789 | | | | 906 | | | | (750 | ) |
| | | | | | | | | | | | |
Net income | | $ | 7,786 | | | $ | 5,319 | | | $ | 4,636 | |
| | | | | | | | | | | | |
Earnings per share: | | | | | | | | | | | | |
Basic earnings per share | | $ | 0.20 | | | $ | 0.13 | | | $ | 0.11 | |
| | | | | | | | | | | | |
Diluted earnings per share | | $ | 0.20 | | | $ | 0.13 | | | $ | 0.11 | |
| | | | | | | | | | | | |
Shares used in the computation of earnings per share: | | | | | | | | | | | | |
Basic | | | 38,152 | | | | 41,532 | | | | 40,656 | |
| | | | | | | | | | | | |
Diluted | | | 38,510 | | | | 42,423 | | | | 42,510 | |
| | | | | | | | | | | | |
See accompanying notes to consolidated financial statements.
51
EXAR CORPORATION AND SUBSIDIARIES
CONSOLIDATED STATEMENTS OF STOCKHOLDERS’ EQUITY AND COMPREHENSIVE INCOME
(In thousands, except share amounts)
| | | | | | | | | | | | | | | | | | | | | | | | | | | |
| | | Common Stock | | Treasury Stock | | | Retained Earnings | | Accumulated Other Comprehensive Income (Loss) | | | Total Stockholders’ Equity | | | Comprehensive Income | |
| | | Shares | | Amount | | Shares | | | Amount | | | | | |
Balance, March 31, 2003 | | 40,329,609 | | | 398,606 | | (245,000 | ) | | | (4,611 | ) | | | 72,399 | | | 372 | | | | 466,766 | | | | | |
Comprehensive income: | | | | | | | | | | | | | | | | | | | | | | | | | | | |
Net income | | | | | | | | | | | | | | | 4,636 | | | | | | | 4,636 | | | $ | 4,636 | |
Other comprehensive income (loss): | | | | | | | | | | | | | | | | | | | | | | | | | | | |
Foreign currency translation adjustments, net of tax expense of $50 | | | | | | | | | | | | | | | | | | 66 | | | | 66 | | | | 66 | |
Unrealized gains (losses) on marketable securities net of tax benefit of $59 | | | | | | | | | | | | | | | | | | (88 | ) | | | (88 | ) | | | (88 | ) |
| | | | | | | | | | | | | | | | | | | | | | | | | | | |
Comprehensive income | | | | | | | | | | | | | | | | | | | | | | | | | $ | 4,614 | |
| | | | | | | | | | | | | | | | | | | | | | | | | | | |
Exercise of stock options | | 1,075,379 | | | 7,343 | | | | | | | | | | | | | | | | | 7,343 | | | | | |
Stock issued under employee stock participation plan | | 120,042 | | | 1,490 | | | | | | | | | | | | | | | | | 1,490 | | | | | |
Income tax benefit from stock option exercises | | | | | 97 | | | | | | | | | | | | | | | | | 97 | | | | | |
Acquisition of treasury stock | | | | | | | (2,110 | ) | | | (39 | ) | | | | | | | | | | (39 | ) | | | | |
| | | | | | | | | | | | | | | | | | | | | | | | | | | |
Balance, March 31, 2004 | | 41,525,030 | | | 407,536 | | (247,110 | ) | | | (4,650 | ) | | | 77,035 | | | 350 | | | | 480,271 | | | | | |
| | | | | | | | |
Comprehensive income: | | | | | | | | | | | | | | | | | | | | | | | | | | | |
Net income | | | | | | | | | | | | | | | 5,319 | | | | | | | 5,319 | | | $ | 5,319 | |
Other comprehensive income (loss): | | | | | | | | | | | | | | | | | | | | | | | | | | | |
Foreign currency translation adjustments, net of tax expense of $43 | | | | | | | | | | | | | | | | | | (64 | ) | | | (64 | ) | | | (64 | ) |
Unrealized gains (losses) on marketable securities net of tax benefit of $547 | | | | | | | | | | | | | | | | | | (1,356 | ) | | | (1,356 | ) | | | (1,356 | ) |
| | | | | | | | | | | | | | | | | | | | | | | | | | | |
Comprehensive income | | | | | | | | | | | | | | | | | | | | | | | | | $ | 3,899 | |
| | | | | | | | | | | | | | | | | | | | | | | | | | | |
Exercise of stock options | | 846,471 | | | 6,360 | | | | | | | | | | | | | | | | | 6,360 | | | | | |
Stock issued under employee stock participation plan | | 135,530 | | | 1,614 | | | | | | | | | | | | | | | | | 1,614 | | | | | |
Income tax benefit from stock option exercises | | | | | 1,567 | | | | | | | | | | | | | | | | | 1,567 | | | | | |
Acquisition of treasury stock | | | | | | | (250,000 | ) | | | (3,664 | ) | | | | | | | | | | (3,664 | ) | | | | |
| | | | | | | | | | | | | | | | | | | | | | | | | | | |
Balance, March 31, 2005 | | 42,507,031 | | $ | 417,077 | | (497,110 | ) | | $ | (8,314 | ) | | $ | 82,354 | | $ | (1,070 | ) | | $ | 490,047 | | | | | |
| | | | | | | | |
Comprehensive income: | | | | | | | | | | | | | | | | | | | | | | | | | | | |
Net income | | | | | | | | | | | | | | | 7,786 | | | | | | | 7,786 | | | $ | 7,786 | |
Other comprehensive income: | | | | | | | | | | | | | | | | | | | | | | | | | | | |
Foreign currency translation adjustments, net of tax expense of $37 | | | | | | | | | | | | | | | | | | 62 | | | | 62 | | | | 62 | |
Unrealized gains (losses) on marketable securities net of tax benefit of $254 | | | | | | | | | | | | | | | | | | 591 | | | | 591 | | | | 591 | |
| | | | | | | | | | | | | | | | | | | | | | | | | | | |
Comprehensive income | | | | | | | | | | | | | | | | | | | | | | | | | $ | 8,439 | |
| | | | | | | | | | | | | | | | | | | | | | | | | | | |
Exercise of stock options | | 1,220,904 | | | 10,021 | | | | | | | | | | | | | | | | | 10,021 | | | | | |
Stock issued under employee stock participation plan | | 140,620 | | | 1,559 | | | | | | | | | | | | | | | | | 1,559 | | | | | |
Income tax benefit from stock option exercises | | | | | 1,592 | | | | | | | | | | | | | | | | | 1,592 | | | | | |
Issuance of common stock for services | | 30,000 | | | — | | | | | | | | | | | | | | | | | — | | | | | |
Acquisition of treasury stock | | | | | | | (7,770,000 | ) | | | (124,388 | ) | | | | | | | | | | (124,388 | ) | | | | |
Amortization of deferred stock based compensation | | | | | 135 | | | | | | | | | | | | | | | | | 135 | | | | | |
| | | | | | | | | | | | | | | | | | | | | | | | | | | |
Balance, March 31, 2006 | | 43,898,555 | | $ | 430,384 | | (8,267,110 | ) | | $ | (132,702 | ) | | $ | 90,140 | | $ | (417 | ) | | $ | 387,405 | | | | | |
| | | | | | | | | | | | | | | | | | | | | | | | | | | |
See accompanying notes to consolidated financial statements.
52
EXAR CORPORATION AND SUBSIDIARIES
CONSOLIDATED STATEMENTS OF CASH FLOWS
(In thousands)
| | | | | | | | | | | | |
| | | Fiscal Years Ended March 31, | |
| | | 2006 | | | 2005 | | | 2004 | |
Cash flows from operating activities: | | | | | | | | | | | | |
Net income | | $ | 7,786 | | | $ | 5,319 | | | $ | 4,636 | |
Reconciliation of net income to net cash provided by operating activities: | | | | | | | | | | | | |
Depreciation and amortization | | | 5,745 | | | | 5,309 | | | | 4,904 | |
Amortizaton of stock based compensation | | | 135 | | | | — | | | | — | |
Income tax benefit from stock option exercises | | | 1,592 | | | | 1,568 | | | | 97 | |
Provision for sales returns and allowances | | | 3,231 | | | | 2,417 | | | | 2,540 | |
Other-than-temporary loss on long-term investments | | | 1,215 | | | | — | | | | 6,000 | |
Deferred income taxes | | | 112 | | | | 1,551 | | | | (2,768 | ) |
Changes in operating assets and liabilities: | | | | | | | | | | | | |
Accounts receivable | | | (6,761 | ) | | | 882 | | | | (5,463 | ) |
Inventories | | | (1,872 | ) | | | 524 | | | | (1,290 | ) |
Prepaid expenses and other assets | | | (968 | ) | | | (3,585 | ) | | | 687 | |
Accounts payable | | | 432 | | | | (405 | ) | | | 310 | |
Accrued compensation and related benefits | | | (175 | ) | | | 250 | | | | 556 | |
Accrued sales commissions and other accrued expenses | | | 496 | | | | (910 | ) | | | 793 | |
Income taxes payable | | | 702 | | | | (1,620 | ) | | | 1,505 | |
| | | | | | | | | | | | |
Net cash provided by operating activities | | | 11,670 | | | | 11,300 | | | | 12,507 | |
| | | | | | | | | | | | |
Cash flows from investing activities: | | | | | | | | | | | | |
Purchase of property, plant and equipment | | | (5,049 | ) | | | (3,097 | ) | | | (5,769 | ) |
Purchase of short-term marketable securities | | | (64,169 | ) | | | (974,396 | ) | | | (1,082,148 | ) |
Proceeds from sales and maturities of short-term marketable securities | | | 111,044 | | | | 1,205,881 | | | | 1,053,448 | |
Distribution of (contribution to) long-term investments, net | | | (129 | ) | | | (604 | ) | | | (615 | ) |
Acquisiton of ON business from Infineon | | | (11,420 | ) | | | — | | | | — | |
| | | | | | | | | | | | |
Net cash provided by (used in) investing activities | | | 30,277 | | | | 227,784 | | | | (35,084 | ) |
| | | | | | | | | | | | |
Cash flows from financing activities: | | | | | | | | | | | | |
Proceeds from issuance of common stock | | | 11,580 | | | | 7,974 | | | | 8,833 | |
Repurchase of common stock | | | (124,388 | ) | | | (3,664 | ) | | | (39 | ) |
| | | | | | | | | | | | |
Net cash provided by (used in) financing activities | | | (112,808 | ) | | | 4,310 | | | | 8,794 | |
Effect of exchange rate changes on cash | | | 93 | | | | (106 | ) | | | 116 | |
| | | | | | | | | | | | |
Net increase (decrease) in cash and cash equivalents | | | (70,768 | ) | | | 243,288 | | | | (13,667 | ) |
Cash and cash equivalents at the beginning of period | | | 258,378 | | | | 15,090 | | | | 28,757 | |
| | | | | | | | | | | | |
Cash and cash equivalents at the end of period | | $ | 187,610 | | | $ | 258,378 | | | $ | 15,090 | |
| | | | | | | | | | | | |
Supplemental disclosure of cash flow information: | | | | | | | | | | | | |
Cash paid for income taxes | | $ | 351 | | | $ | 292 | | | $ | 431 | |
| | | | | | | | | | | | |
See accompanying notes to consolidated financial statements.
53
EXAR CORPORATION AND SUBSIDIARIES
NOTES TO CONSOLIDATED FINANCIAL STATEMENTS
FISCAL YEARS ENDED MARCH 31, 2006, 2005 AND 2004
NOTE 1. DESCRIPTION OF BUSINESS
Exar Corporation (“Exar” or the “Company”) designs, develops and markets high-performance, analog and mixed-signal silicon solutions for a variety of markets including networking, serial communications, clock and timing, and storage.
NOTE 2. ACCOUNTING POLICIES
Basis of Presentation—The Company has a fiscal year that ends on March 31. The consolidated financial statements include the accounts of Exar and its wholly-owned subsidiaries. Intercompany accounts and transactions have been eliminated. Certain amounts previously reported have been reclassified to conform to the fiscal year 2006 presentation.
Use of Management Estimates—The preparation of financial statements in conformity with accounting principles generally accepted in the United States requires management to make estimates and assumptions that affect the reported amounts of assets and liabilities and disclosure of contingent assets and liabilities as of the date of the financial statements and the reported amounts of revenues and expenses during the reporting period. Actual results could differ from those estimates, and material effects on operating results and financial position may result.
Cash and Cash Equivalents—The Company considers all highly liquid debt securities and investments with an original maturity from the date of purchase of ninety days or less to be classified as cash and cash equivalents.
Inventories—Inventories are recorded at the lower of cost or market, determined on a first-in, first-out basis. Cost is computed using the standard cost, which approximates average actual cost. The Company generally provides inventory allowances on obsolete inventories and inventories in excess of six month demand for each specific part.
Inventories consisted of the following (in thousands):
| | | | | | |
| | | March 31,
2006 | | March 31,
2005 |
Work-in-process | | $ | 3,616 | | $ | 1,909 |
Finished goods | | | 1,915 | | | 1,750 |
| | | | | | |
Inventories | | $ | 5,531 | | $ | 3,659 |
| | | | | | |
During the fiscal year ended March 31, 2003, the Company recorded a $2.3 million provision to write-down inventory the Company determined to be in excess of a six-month demand forecast for the Company’s communications products. The provision was included in the cost of sales for the fiscal year ended March 31, 2003. For the fiscal years ended March 31, 2006, 2005 and 2004, is a benefit to gross profit from the sale of previously written down inventory for which the original costs were $0.3 million, $0.4 million and $0.4 million, respectively.
54
EXAR CORPORATION AND SUBSIDIARIES
NOTES TO CONSOLIDATED FINANCIAL STATEMENTS—(CONTINUED)
FISCAL YEARS ENDED MARCH 31, 2006, 2005 AND 2004
Property, Plant and Equipment—Property, plant and equipment is stated at cost less accumulated depreciation and amortization. Property, plant and equipment consist of the following (in thousands):
| | | | | | | | |
| | | March 31, | |
| | | 2006 | | | 2005 | |
Land | | $ | 6,660 | | | $ | 6,584 | |
Building | | | 14,209 | | | | 13,743 | |
Machinery and equipment | | | 53,419 | | | | 48,369 | |
Construction-in-progress | | | — | | | | 307 | |
| | | | | | | | |
| | | 74,288 | | | | 69,003 | |
Accumulated depreciation and amortization | | | (46,518 | ) | | | (41,686 | ) |
| | | | | | | | |
Total | | $ | 27,770 | | | $ | 27,317 | |
| | | | | | | | |
Depreciation is computed using the straight-line method over the estimated useful lives of the assets, in the following classifications:
| | |
Building | | 30 years |
Machinery and equipment | | 3-10 years |
Depreciation and amortization expense for the fiscal years ended March 31, 2006, 2005 and 2004 was $5.1 million, $4.7 million and $4.9 million, respectively.
Long-Lived Assets—Long-lived assets are evaluated for impairment whenever events or changes in circumstances indicate that the carrying amount of an asset may not be recoverable. The Company evaluates the recoverability of its property, plant, equipment and intangible assets in accordance with Statement of Financial Accounting Standards No. 144 (“SFAS 144”), “Accounting for the Impairment or Disposal of Long-Lived Assets.” The Company at least annually compares the carrying value of long-lived assets to its projection of future undiscounted cash flows attributable to such assets and, in the event that the carrying value exceeds the future undiscounted cash flows, it records an impairment charge against income equal to the excess of the carrying value over the asset’s fair value. Substantially all of the Company’s property, plant and equipment and other long-lived assets are located in the United States.
Non-Marketable Equity Securities—Non-marketable equity securities are accounted for at historical cost and are subject to a periodic impairment review. This impairment analysis requires significant judgment to identify events or circumstances that would likely have a significant adverse effect on the fair value of the investment. The indicators the Company uses to identify those events and circumstances include the investee’s revenue and earnings trends relative to predefined milestones and overall business prospects; the technological feasibility of the investee’s products and technologies; the general market conditions in the investee’s industry; and the investee’s liquidity, debt ratios and the rate at which the investee is using cash. Investments identified as having an indicator of impairment are subject to further analysis to determine if the investment is other than temporarily impaired, in which case the investment is written down to its impaired value. When an investee is not considered viable from a financial or technological point of view, the entire investment is written down, since the estimated fair value is considered to be nominal. Impairment of non-marketable equity securities is recorded in other-than-temporary loss on long-term investments in the Consolidated Statements of Operations.
55
EXAR CORPORATION AND SUBSIDIARIES
NOTES TO CONSOLIDATED FINANCIAL STATEMENTS—(CONTINUED)
FISCAL YEARS ENDED MARCH 31, 2006, 2005 AND 2004
Income Taxes—Income taxes are reported under Statement of Financial Accounting Standard No. 109, “Accounting for Income Taxes,” (“SFAS 109”) and, accordingly, deferred taxes are recognized using the asset and liability method, whereby deferred tax assets and liabilities are recognized for the future tax consequence attributable to differences between the financial statement carrying amounts of existing assets and liabilities and their respective tax base, and operating loss and tax credit carry-forwards. Valuation allowances are provided if it is more likely than not that some or all of the deferred tax assets will not be realized.
Revenue Recognition—The Company recognizes product revenue when persuasive evidence of an arrangement exists, delivery has occurred, the fee is fixed and determinable and collection is reasonably assured. The Company’s delivery terms are primarily FOB shipping point, at which time, title and all transit risk transfer to the customer. The Company’s distributor agreements permit the return of up to 10% of a distributor’s purchases of a preceding quarter for purposes of stock rotation. Exar also provides discounts to distributors based on volume of product ordered for a specific product with a specific volume range for a given customer over a period not to exceed one year. The Company records an estimated allowance, at the time of shipment to the distributor, based on the Company’s historical patterns of returns and other authorized pricing allowances. See Note 12, “Commitments and Contingencies” for a discussion related to the Company’s warranty on its products.
Research and Development Expenses—All research and development expenses that have no alternative future use are expensed as incurred. Research and development expenses consist primarily of the salaries and related expenses of those employees engaged in research, design and development activities; costs related to design tools, license expenses related to intellectual property; mask costs; supplies and services; and facilities expenses.
Comprehensive Income—Comprehensive income includes charges or credits to equity as a result of foreign currency translation adjustments, net of taxes, and unrealized gains or losses on marketable securities, net of taxes. Comprehensive income for the fiscal years ended March 31, 2006, 2005 and 2004 has been disclosed within the Consolidated Statements of Stockholders’ Equity and Comprehensive Income.
Foreign Currency—The functional currency of each of the Company’s foreign subsidiaries is the local currency of that country. Accordingly, gains and losses from the translation of the financial statements of the foreign subsidiaries are included in stockholders’ equity. Gains and losses resulting from foreign currency transactions are included in other income, net. Foreign currency transaction losses were approximately $34,000, $0, and $48,000 for the fiscal years ended March 31, 2006, 2005 and 2004, respectively.
Financial Instruments, Concentration of Credit Risk and Other Risks—Financial instruments potentially subjecting the Company to concentrations of credit risk consist primarily of accounts receivable, cash, cash equivalents, short-term investments and long-term investments. The majority of the Company’s sales are derived from manufacturers in the communications, industrial and computer industries. The Company performs ongoing credit evaluations of its customers and generally does not require collateral for sales on credit. The Company maintains allowances for potential credit losses, and such losses have been within management’s expectations. Charges to bad debt expense were insignificant for all three years. The Company’s policy is to place its cash, cash equivalents and short-term investments with high credit quality financial institutions and limit the amounts invested with any one financial institution or in any type of financial instrument. The Company does not hold or issue financial instruments for trading purposes.
The Company sells its products to distributors and OEMs throughout the world. For the year ended March 31, 2006, worldwide sales through primary distributors for subsequent resale to OEMs or their subcontract manufacturers accounted for 40.0% of net sales. Future Electronics (“Future”) continues to be the Company’s largest distributor. Future, on a worldwide basis, represented 24.1%, 20.4%, and 20.3% of net sales in fiscal years ended March 31, 2006, 2005 and 2004, respectively. The Company’s second largest distributor, Nu Horizons Electronics Corp. (“Nu Horizons”), accounted for 15.9%, 16.4%, and 13.4% of net sales in fiscal years ended March 31, 2006, 2005 and 2004, respectively. Alcatel accounted for 10.5% of the Company’s net sales for the fiscal year ended March 31, 2006. For fiscal years ended March 31, 2005 and 2004, no OEM customer accounted for 10% or more of the Company’s net sales.
At March 31, 2006, two distributors, Future and Nu Horizons, accounted for 25.3% and 14.2% of total trade accounts receivable, respectively, before the allowances for sale returns, volume discounts and bad debts. At March 31, 2005, Future represented 22.1% of total trade accounts receivable, before the allowances for sale returns, volume discounts and bad debts.
56
EXAR CORPORATION AND SUBSIDIARIES
NOTES TO CONSOLIDATED FINANCIAL STATEMENTS—(CONTINUED)
FISCAL YEARS ENDED MARCH 31, 2006, 2005 AND 2004
The majority of the Company’s products are currently fabricated at Chartered Semiconductor Manufacturing Ltd. (“Chartered”) and assembled and tested by other third party sub-contractors located in Asia. The Company does not have long-term agreements with any of these sub-contractors. A significant disruption in the operations of one or more of these sub-contractors would impact the production of the Company’s products for a substantial period of time which could have a material adverse effect on the Company’s business, financial condition and results of operations.
Fair Value of Financial Instruments—The Company has estimated the fair value of its financial instruments by using available market information and valuation methodology considered to be appropriate. However, considerable judgment is required in interpreting market data to develop the estimates of fair value. The use of different market assumptions and/or estimation methodologies could have a material effect on estimated fair value amounts. The estimated fair value of the Company’s financial instruments at March 31, 2006 and 2005 was not materially different from the carrying values presented in the Consolidated Balance Sheets.
Stock-Based Compensation—The Company adopted SFAS No. 148 “Accounting for Stock-Based Compensation—Transition and Disclosure—an Amendment of FAS 123,” (“SFAS 148”) in fiscal year ended March 31, 2003. The Company accounts for stock-based employee compensation using the intrinsic value method under Accounting Principles Board Opinion No. 25, “Accounting for Stock Issued to Employees,” (“APB 25”), and related interpretations and complies with the disclosure provisions of SFAS No. 123, “Accounting for Stock-Based Compensation,” (“SFAS 123”). SFAS 123 requires the disclosure of pro forma net income and earnings per share. Under SFAS 123, the fair value of stock-based awards to employees is calculated through the use of option pricing models, even though such models were developed to estimate the fair value of freely tradable, fully transferable options without vesting restrictions, which significantly differ from the Company’s stock option awards. These models also require subjective assumptions, including future stock price volatility and expected time to exercise, which can greatly affect the calculated values.
The Company’s pro forma information under SFAS 123 and SFAS 148 is as follows:
| | | | | | | | | | | | |
| | | Fiscal Years Ended March 31, | |
| | | 2006 | | | 2005 | | | 2004 | |
| | | (In thousands, except per share amounts) | |
Net income - as reported | | $ | 7,786 | | | $ | 5,319 | | | $ | 4,636 | |
Add: Stock-based employee compensation expense included in reported net income, net of related tax effects | | | 82 | | | | — | | | | — | |
Deduct: Total stock-based employee compensation determined under fair value based method for all awards, net of related tax effects | | | (11,668 | ) | | | (13,120 | ) | | | (20,984 | ) |
| | | | | | | | | | | | |
Net loss - Pro forma | | $ | (3,800 | ) | | $ | (7,801 | ) | | $ | (16,348 | ) |
| | | | | | | | | | | | |
As reported: | | | | | | | | | | | | |
Earnings per share - Basic | | $ | 0.20 | | | $ | 0.13 | | | $ | 0.11 | |
Earnings per share - Diluted | | | 0.20 | | | | 0.13 | | | | 0.11 | |
| | | |
Pro forma: | | | | | | | | | | | | |
Loss per share - Basic and diluted | | $ | (0.10 | ) | | $ | (0.19 | ) | | $ | (0.40 | ) |
The fiscal years ended March 31, 2006, 2005 and 2004 pro forma amounts are not necessarily indicative of future period amounts.
57
EXAR CORPORATION AND SUBSIDIARIES
NOTES TO CONSOLIDATED FINANCIAL STATEMENTS—(CONTINUED)
FISCAL YEARS ENDED MARCH 31, 2006, 2005 AND 2004
The Financial Accounting Standards Board (“FASB”) issued Statement of Financial Accounting Standards No. 123 (Revised 2004), “Share-Based Payment” (“SFAS 123R”). SFAS 123R, which the Company is required to implement in the first quarter of its fiscal year 2007 beginning on April 1, 2006, will require that compensation cost related to share-based payment transactions, including stock options, be recognized in the consolidated statement of operations of the financial statements. Currently, the Company accounts for share-based payment transactions under the provisions of Accounting Principles Board Opinion No. 25, “Accounting for Stock Issued to Employees” (“APB 25”), which does not necessarily require the recognition of compensation cost in the statement of operations of the financial statements.
On March 22, 2006, in response to SFAS 123R, the Board of Directors approved the full acceleration of vesting of all employee stock options, including options held by the Company’s executive officers, with exercise prices in excess of $15.05. Such vesting acceleration does not apply to any options held by the Company’s non-employee directors. On March 22, 2006, the Company’s stock price closed at $13.67 per share. As a result of the Board of Director’s decision to fully accelerate the vesting of stock options, as described above, options to purchase approximately 1.1 million shares of the Company’s common stock became fully vested and immediately exercisable effective as of March 22, 2006. The weighted average exercise price per share of all of the accelerated options was $15.77.
Because the accelerated options have exercise prices in excess of the current market value of the Company’s common stock, the Company believes that the incentive value to the Company’s employees of the unvested options is outweighed by the benefit to the Company’s from the reduction of the potential compensation expense associated with the options under SFAS 123R. The acceleration eliminates future compensation expense the Company would otherwise recognize in its statement of operations with respect to these accelerated options under SFAS 123R. As a result of the Board of Director’s action, approximately $4.9 million of compensation expenses, net of taxes, are included in the above pro forma information for fiscal year 2006.
NOTE 3. CASH EQUIVALENTS AND SHORT-TERM INVESTMENTS
Marketable securities include commercial paper, asset-backed securities, corporate bonds and government securities. The Company classifies investments as available-for-sale at the time of purchase and re-evaluates such designation as of each consolidated balance sheet date. The Company amortizes premiums and discounts against interest income over the life of the investment. The Company’s available-for-sale securities are classified as cash equivalents if the original maturity from the date of purchase is ninety days or less, and as short-term investments for those with original maturities, from the date of purchase, in excess of ninety days which the Company intends to sell as necessary to meet its liquidity requirements.
Such investments are stated at amortized cost with corresponding premiums or discounts, such premiums or discounts are amortized against interest income over the life of the investment. All marketable securities are reported at fair value based on the estimated or quoted market prices as of each consolidated balance sheet date, with unrealized gains or losses on short-term and long-term marketable securities recorded directly in stockholders’ equity except those unrealized losses that are deemed to be other than temporary are reflected in income. Realized gains or losses on the sale of marketable securities are determined on the specific identification method and are reflected in other income, net. Net realized losses on marketable securities for fiscal years ended March 31, 2006 and 2005 were $7,000 and $47,000, respectively. Net realized gains on marketable securities for fiscal year ended March 31, 2004 were $306,000.
58
EXAR CORPORATION AND SUBSIDIARIES
NOTES TO CONSOLIDATED FINANCIAL STATEMENTS—(CONTINUED)
FISCAL YEARS ENDED MARCH 31, 2006, 2005 AND 2004
The following table summarizes the Company’s investments in marketable securities as of March 31, 2006 and 2005:
| | | | | | | | | | | | | |
| | | Original
Cost | | Gross
Unrealized
Gains | | Gross
Unrealized
Losses | | | Market
Value |
| | | (In thousands) |
Money market funds | | $ | 4,299 | | $ | — | | $ | — | | | $ | 4,299 |
Municipal securities | | | 400 | | | — | | | (6 | ) | | | 394 |
Corporate bonds and commercial paper | | | 193,964 | | | — | | | (126 | ) | | | 193,838 |
U.S. government and agency obligations | | | 107,359 | | | — | | | (673 | ) | | | 106,686 |
Asset-backed and collateralized obligations | | | 23,349 | | | — | | | (232 | ) | | | 23,117 |
| | | | | | | | | | | | | |
Total at March 31, 2006 | | $ | 329,371 | | $ | — | | $ | (1,037 | ) | | $ | 328,334 |
| | | | | | | | | | | | | |
As reported: | | | | | | | | | | | | | |
Cash equivalents | | | | | | | | | | | | $ | 186,416 |
Short-term investment | | | | | | | | | | | | | 141,918 |
| | | | | | | | | | | | | |
Total at March 31, 2006 | | | | | | | | | | | | $ | 328,334 |
| | | | | | | | | | | | | |
| | | | |
| | | Original
Cost | | Gross
Unrealized
Gains | | Gross
Unrealized
Losses | | | Market
Value |
| | | (In thousands) |
Money market funds | | $ | 2,577 | | $ | — | | $ | — | | | $ | 2,577 |
Municipal securities | | | 1,850 | | | — | | | (3 | ) | | | 1,847 |
Corporate bonds and commercial paper | | | 268,749 | | | — | | | (124 | ) | | | 268,625 |
U.S. government and agency obligations | | | 7,200 | | | — | | | (26 | ) | | | 7,174 |
Asset-backed and collateralized obligations | | | 165,211 | | | 2 | | | (1,523 | ) | | | 163,690 |
| | | | | | | | | | | | | |
Total at March 31, 2005 | | $ | 445,587 | | $ | 2 | | $ | (1,676 | ) | | $ | 443,913 |
| | | | | | | | | | | | | |
As reported: | | | | | | | | | | | | | |
Cash equivalents | | | | | | | | | | | | $ | 256,006 |
Short-term investment | | | | | | | | | | | | | 187,907 |
| | | | | | | | | | | | | |
Total at March 31, 2005 | | | | | | | | | | | | $ | 443,913 |
| | | | | | | | | | | | | |
59
EXAR CORPORATION AND SUBSIDIARIES
NOTES TO CONSOLIDATED FINANCIAL STATEMENTS—(CONTINUED)
FISCAL YEARS ENDED MARCH 31, 2006, 2005 AND 2004
The amortized cost and estimated fair value of cash equivalents and marketable securities classified as available-for-sale at March 31, 2006 and 2005 by expected maturity are shown below:
| | | | | | | | | | | | |
| | | March 31, 2006 | | March 31, 2005 |
| | | Amortized
Cost | | Market
Value | | Amortized
Cost | | Market
Value |
| | | (In thousands) |
Less than 1 year | | $ | 308,310 | | $ | 307,479 | | $ | 340,841 | | $ | 340,408 |
Due in 1 to 5 years | | | 21,061 | | | 20,855 | | | 104,746 | | | 103,505 |
| | | | | | | | | | | | |
Totals | | $ | 329,371 | | $ | 328,334 | | $ | 445,587 | | $ | 443,913 |
| | | | | | | | | | | | |
In accordance with EITF 03-1, “The Meaning of Other-Than-Temporary Impairment and Its Application to Certain Investments,” the following table shows the gross unrealized losses and fair values of the Company’s investments in an unrealized loss position as of March 31, 2006, aggregated by investment category and length of time that individual securities have been in a continuous unrealized loss position (in thousands).
| | | | | | | | | | | | | | | | | | | | | |
| | | Less than 12 months | | | 12 months or greater | | | Total | |
| | | Fair Value | | Gross
Unrealized
Losses | | | Fair Value | | Gross
Unrealized
Losses | | | Fair Value | | Gross
Unrealized
Losses | |
Money market funds | | $ | 4,299 | | $ | — | | | $ | — | | $ | — | | | $ | 4,299 | | $ | — | |
Municipal securities | | | 394 | | | (6 | ) | | | — | | | — | | | | 394 | | | (6 | ) |
Corporate bonds and commercial paper | | | 191,348 | | | (86 | ) | | | 2,490 | | | (39 | ) | | | 193,838 | | | (126 | ) |
U.S. government and agency obligations | | | 23,538 | | | (133 | ) | | | 83,148 | | | (540 | ) | | | 106,686 | | | (673 | ) |
Asset-backed and collateralized obligations | | | 16,799 | | | (107 | ) | | | 6,318 | | | (126 | ) | | | 23,117 | | | (232 | ) |
| | | | | | | | | | | | | | | | | | | | | |
Total at March 31, 2006 | | $ | 236,378 | | $ | (332 | ) | | $ | 91,956 | | $ | (705 | ) | | $ | 328,334 | | $ | (1,037 | ) |
| | | | | | | | | | | | | | | | | | | | | |
As of March 31, 2005, the Company’s gross unrealized losses of $1.7 million were in a loss position for less than a twelve-month period.
The gross unrealized losses related to investments are primarily due to a decrease in the fair value of debt securities as a result of an increase in interest rates during fiscal years ended March 31, 2006 and 2005. The Company reviews its investment portfolio to identify and evaluate investments that have indications of possible impairment. Factors considered in determining whether a loss is temporary include the length of time and extent to which fair value has been less than the cost basis, the financial condition and near-term prospects of the investee, credit quality and the Company’s ability to hold the investment for a period of time sufficient to allow for any anticipated recovery in market value. The Company determined that such amounts were not “other-than-temporary” as defined by SFAS No. 115, Accounting for Certain Investments in Debt and Equity Securities.
60
EXAR CORPORATION AND SUBSIDIARIES
NOTES TO CONSOLIDATED FINANCIAL STATEMENTS—(CONTINUED)
FISCAL YEARS ENDED MARCH 31, 2006, 2005 AND 2004
NOTE 4. ACQUISITION OF INFINEON’S OPTICAL NETWORKING BUSINESS
On April 6, 2005, Exar entered into a Purchase Agreement with Infineon Technologies North America Corp., a subsidiary of Infineon Technologies AG (“Infineon”), under which Exar agreed to purchase a significant part of Infineon’s Optical Networking Business Unit (“ON”). On April 14, 2005, Exar completed the purchase of such assets for $11,050,000 in cash. The acquisition included assets relating to multi-rate TDM framer products, Fiber Channel over SONET/SDH, and Resilient Packet Ring (RPR), as well as certain intellectual property for data over SONET products. The acquisition expanded Exar’s SONET/SDH product portfolio.
The acquisition has been accounted for as a business combination. Assets acquired were recorded at their fair values as of April 14, 2005. The total purchase price of $11.42 million includes cash paid to Infineon of $11.05 million and acquisition related transaction costs of $0.37 million. ON related transaction costs included legal and accounting fees, and other external costs directly related to the acquisition.
Purchase price allocation
Under business combination accounting, the total purchase price was allocated to ON’s tangible and identifiable intangible assets based on their estimated fair values as of April 14, 2005 as set forth below. The excess of the purchase price over the tangible and identifiable intangible assets was recorded as goodwill. The purchase price allocation was as follows (in thousands):
| | | |
Property acquired at fair value | | $ | 480 |
Intangible assets - purchased technology | | | 5,750 |
Goodwill | | | 5,190 |
| | | |
Total purchase price | | $ | 11,420 |
| | | |
Intangible assets
The intangible assets recognized, apart from goodwill, represented contractual or other legal rights of the acquisition and those intangible assets of the acquisition that could be clearly identified. These intangible assets were identified and valued through interviews and analysis of data provided by ON concerning development projects, their stage of development, the time and resources needed to complete them and, if applicable, their expected income generating ability. There were no other contractual or other legal rights of ON clearly identifiable by management, other than those discussed below.
Purchased technology of approximately $5.8 million consists of intellectual property related to the acquired technology as well as incremental value associated with existing customer relationships. At the date of acquisition, the developed SONET technology had reached technological feasibility. Any costs to be incurred in the future relating to the ongoing maintenance of the developed SONET technology will be expensed as incurred. To estimate the fair value of the developed SONET technology, an income approach was used, which included an analysis of future cash flows and the risks associated with achieving such cash flows.
The purchased SONET technology is amortized to cost of revenues on a straight-line basis over its estimated lives of six years. Amortization expense for this intangible asset for the fiscal year 2006 was $920,000. There was no amortization expense for this intangible asset for fiscal year 2005 and 2004. The balances of purchased technology and related amortization were as follows (in thousands):
| | | | | | | |
| | | March 31, |
| | | 2006 | | | 2005 |
Purchased technology | | $ | 5,750 | | | $ | — |
Less accumulated amortization | | | (920 | ) | | | — |
| | | | | | | |
Purchased technology, net | | $ | 4,830 | | | $ | — |
| | | | | | | |
61
EXAR CORPORATION AND SUBSIDIARIES
NOTES TO CONSOLIDATED FINANCIAL STATEMENTS—(CONTINUED)
FISCAL YEARS ENDED MARCH 31, 2006, 2005 AND 2004
The aggregate estimated future annual intangible amortization expense through fiscal year ending March 31, 2012, is as follows (in thousands):
| | | |
Amortization Expense (by fiscal year) |
2007 | | | 958 |
2008 | | | 958 |
2009 | | | 958 |
2010 | | | 958 |
2011 | | | 958 |
Thereafter | | | 40 |
| | | |
| | $ | 4,830 |
| | | |
Goodwill
Of the total purchase price, approximately $5.2 million was allocated to goodwill. Goodwill represents the excess of the purchase price over the estimated fair value of the underlying net tangible and identifiable intangible assets acquired. The Company believed that the acquisition would augment and compliment its SONET product offerings and strengthen its market position. Those factors contributed to a purchase price in excess of the fair market value of net tangible and intangible assets acquired in the ON acquisition and, as a result, the Company has recorded goodwill in connection with the transaction. The Company accounts for goodwill in accordance with Statement of Financial Accounting Standards No. 142, “Goodwill and Intangible Assets” (“SFAS 142”). In accordance with SFAS 142, goodwill will not be amortized, but instead will be tested for impairment at least annually and more frequently if certain indicators are present. As of March 31, 2006, the Company determined that no impairment existed.
Pro Forma Financial Information
The unaudited financial information in the table below summarizes the combined results of operations of Exar and ON, on a pro forma basis, as though the operations had been combined as of the beginning of each of the periods presented. The pro forma financial information is presented for informational purposes only and is not indicative of the results of operations that would have been achieved if the acquisition had taken place at the beginning of each of the periods presented. The pro forma financial information for periods presented includes the business combination accounting effect of adjustments to depreciation on acquired property, amortization charges from acquired intangible assets, adjustments to interest income for cash paid to Infineon in connection with the ON acquisition, and related tax effects.
The unaudited pro forma financial information for the fiscal year 2006 combines the historical results of the Company for the twelve months ended March 31, 2006 and the historical results for ON for the period from April 1, 2005 to April 14, 2005. The unaudited pro forma financial information for fiscal year 2005 combines the historical results of the Company with the historical results for ON for the twelve months ended March 31, 2005.
| | | | | | | |
| (in thousands, except per share amounts) | | | | | | | |
| | | Fiscal Years Ended March 31, | |
| | | 2006 | | 2005 | |
Net sales | | $ | 67,080 | | $ | 60,504 | |
Net income (loss) | | $ | 7,513 | | $ | (6,298 | ) |
Net income (loss) per share: | | | | | | | |
Basic and diluted | | $ | 0.20 | | $ | (0.15 | ) |
62
EXAR CORPORATION AND SUBSIDIARIES
NOTES TO CONSOLIDATED FINANCIAL STATEMENTS—(CONTINUED)
FISCAL YEARS ENDED MARCH 31, 2006, 2005 AND 2004
NOTE 5. OTHER LONG-TERM INVESTMENTS
TechFarm Ventures L.P. (Q), L.P.(“TechFarm Fund”)
Exar became a limited partner in the TechFarm Fund in May 2001. This partnership is a venture capital fund, managed by TechFarm Ventures Management L.L.C., the general partner of the TechFarm Fund, a Delaware limited partnership, and focuses its investment activities on seed and early stage technology companies. Effective May 31, 2002, in connection with the amendment of the partnership agreement, the Company and TechFarm agreed to reduce the Company’s capital commitment in the TechFarm Fund to approximately $4.0 million, or approximately 5% of the TechFarm Fund’s total committed capital. Additionally, the Company and TechFarm Ventures Management L.L.C. agreed to change the Company’s status from a limited partner to that of an assignee having fewer rights and less status than a limited partner. Because of these modifications, the Company changed its method of accounting for this investment from the equity method to the cost basis method as of May 31, 2002. The Company has fulfilled its capital contribution commitment and, therefore, will not be required to fund additional amounts.
In September 2003, the Company became aware of significant changes in the business of certain portfolio companies within the TechFarm Fund. The Company believed that these changes permanently impaired a portion of the carrying value of its investment in the TechFarm Fund. As a result, Exar recorded an impairment charge against its earnings of $1.0 million, thereby reducing its carrying value in the TechFarm Fund to $1.8 million.
In December 2005, the Company assessed the value of certain discontinued companies and the remaining portfolio companies within the TechFarm Fund. The Company believed that these changes permanently impaired the carrying value of its investment in the TechFarm Fund. As a result, Exar recorded an impairment charge against its earnings of $1.2 million, thereby reducing its carrying value in the TechFarm Fund to $0.6 million.
Skypoint Telecom Fund II (US), L.P. (“Skypoint Fund”)
In July 2001, Exar became a limited partner in the Skypoint Fund, a venture capital fund focused on investments in communications infrastructure companies. The investment provides the Company with the opportunity to align itself with potential strategic partners in emerging technologies within the telecommunications and/or networking industry. Exar is obligated to contribute $5.0 million, which represents approximately 5% of the Skypoint Fund’s total capital commitments. Of the $5.0 million obligation, Exar funded $2.8 million as of March 31, 2006 and is contractually obligated to contribute the remaining capital of $2.2 million as requested by the Skypoint Fund’s General Partner prior to June 18, 2007 for new portfolio companies. All subsequent capital contributions, up to the $5.0 million capital commitment, must be for portfolio companies invested in by the Skypoint Fund prior to June 18, 2007.
During the fiscal year 2006, the Company funded $0.7 million to the Skypoint Fund. In September 2005, the Company recorded a $0.6 million distribution from the venture capital fund related to a sale of a company within the fund’s portfolio. In accordance with Financial Accounting Standards Board’s (“FASB”), Accounting Principles Bulletin 18 (“APB 18”), “The Equity Method of Accounting for Investments in Common Stock,” the Company recorded the distribution on the cost basis and reduced the carrying value of its investment in the Skypoint Fund. The $2.2 million carrying value of the Skypoint Fund investment as of March 31, 2006 reflects contributions to date of $2.8 million less the $0.6 million distribution.
Internet Machines Corporation (“IMC”)
In July 2001, Exar invested $40.3 million for a 16% equity interest in Internet Machines Corporation, which subsequently changed its name to IMC Semiconductor, Inc., a pre-revenue, privately-held company that was developing a family of highly-integrated communications ICs that provides protocol-independent network processing, switch fabric and traffic management solutions for high-speed optical, metro area network and Internet infrastructure equipment.
63
EXAR CORPORATION AND SUBSIDIARIES
NOTES TO CONSOLIDATED FINANCIAL STATEMENTS—(CONTINUED)
FISCAL YEARS ENDED MARCH 31, 2006, 2005 AND 2004
In September 2002, the Company became aware of a potential decline in the value of its 16% equity investment in IMC. Consequently, the Company recorded an impairment charge of $35.3 million against its earnings in that quarter, reducing its equity investment from $40.3 million to $5.0 million. During the three months ended September 30, 2003, the Company determined that the carrying value of its investment in IMC was further impaired and thus recorded a $5.0 million impairment charge to write off the remainder of its investment carrying value in IMC. In May 2004, IMC ceased operations and liquidated its remaining assets.
NOTE 6. INCOME TAXES
The components of the provision (benefit) for income taxes are as follows (in thousands):
| | | | | | | | | | | | |
| | | Fiscal Years Ended March 31, | |
| | | 2006 | | | 2005 | | | 2004 | |
Current: | | | | | | | | | | | | |
Federal | | $ | 1,993 | | | $ | 599 | | | $ | 1,817 | |
State | | | 148 | | | | 366 | | | | 129 | |
Foreign | | | 79 | | | | 64 | | | | 72 | |
| | | | | | | | | | | | |
Total current | | | 2,220 | | | | 1,029 | | | | 2,018 | |
| | | | | | | | | | | | |
Deferred: | | | | | | | | | | | | |
Federal | | | 727 | | | | (206 | ) | | | (199 | ) |
State | | | (158 | ) | | | 83 | | | | (2,569 | ) |
| | | | | | | | | | | | |
Total deferred | | | 569 | | | | (123 | ) | | | (2,768 | ) |
| | | | | | | | | | | | |
Total provision for income taxes | | $ | 2,789 | | | $ | 906 | | | $ | (750 | ) |
| | | | | | | | | | | | |
Consolidated pre-tax income includes foreign income of $229,000, $233,000 and $225,000 in fiscal years ended March 31, 2006, 2005 and 2004, respectively. Undistributed earnings of the Company’s foreign subsidiaries of $871,000 are considered to be indefinitely reinvested and, accordingly, no provisions for federal and state income taxes have been provided thereon. Upon distribution of those earnings in the form of a dividend or otherwise, the Company would be subject to both United States income taxes (subject to an adjustment for foreign tax credits) and withholding taxes payable to the various foreign countries.
Significant components of the Company’s net deferred tax assets are as follows (in thousands):
| | | | | | | | | | | | |
| | | March 31, | |
| | | 2006 | | | 2005 | | | 2004 | |
Deferred tax assets: | | | | | | | | | | | | |
Reserves and accruals not currently deductible | | $ | 2,579 | | | $ | 2,695 | | | $ | 3,170 | |
Net operating loss and tax credit carryforwards | | | 2,132 | | | | 3,314 | | | | 3,151 | |
Tax credits | | | 11,123 | | | | 9,653 | | | | 10,123 | |
Losses on investments | | | 17,024 | | | | 17,044 | | | | 16,751 | |
Capitalized R&D expenses | | | 3,454 | | | | 4,108 | | | | 4,488 | |
| | | | | | | | | | | | |
| | | 36,312 | | | | 36,814 | | | | 37,683 | |
Deferred tax liabilities: | | | | | | | | | | | | |
Depreciation | | | (1,189 | ) | | | (1,077 | ) | | | (1,213 | ) |
Valuation allowance | | | (23,183 | ) | | | (22,935 | ) | | | (22,987 | ) |
| | | | | | | | | | | | |
Net deferred tax assets | | $ | 11,940 | | | $ | 12,802 | | | $ | 13,483 | |
| | | | | | | | | | | | |
64
EXAR CORPORATION AND SUBSIDIARIES
NOTES TO CONSOLIDATED FINANCIAL STATEMENTS—(CONTINUED)
FISCAL YEARS ENDED MARCH 31, 2006, 2005 AND 2004
Reconciliations of the income tax provision at the statutory rate to the Company’s provision for income tax are as follows (in thousands):
| | | | | | | | | | | | |
| | | March 31, | |
| | | 2006 | | | 2005 | | | 2004 | |
Income tax provision at statutory rate | | $ | 3,701 | | | $ | 2,179 | | | $ | 1,360 | |
State income taxes, net of federal income tax benefit | | | 568 | | | | 508 | | | | 169 | |
Deferred tax assets, not benefited/(benefited) | | | 117 | | | | (456 | ) | | | 1,944 | |
Tax-exempt interest income | | | (4 | ) | | | (281 | ) | | | (138 | ) |
Tax credits, net | | | (1,178 | ) | | | (802 | ) | | | (1,129 | ) |
Tax accruals no longer required | | | — | | | | — | | | | (2,727 | ) |
Other | | | (415 | ) | | | (242 | ) | | | (229 | ) |
| | | | | | | | | | | | |
Total | | $ | 2,789 | | | $ | 906 | | | $ | (750 | ) |
| | | | | | | | | | | | |
As of March 31, 2006, the Company’s federal and state net operating loss carryforwards for income tax purposes were approximately $6.0 million and $0.7 million, respectively. If not utilized, a portion of the federal net operating loss carryforwards will expire next year, while the state net operating losses will begin to expire in 2012. Additionally, the Company has capital loss carryforwards of approximately $39.8 million, which will expire in 2010 if not utilized.
As of March 31, 2006, the Company’s federal and state tax credit carryforwards were $6.8 million and $6.6 million, respectively. The federal and state credits will begin to expire in 2012 and 2007, respectively. Utilization of these federal and state net operating loss and tax credit carryforwards may be subject to a substantial annual limitation due to the ownership change limitations provided by the Internal Revenue Code of 1986, as amended, and similar state provisions.
The Company has evaluated its deferred tax assets and concluded that a valuation allowance is required for that portion of the total deferred tax assets that are not considered more likely than not to be realized in future periods. To the extent that the deferred tax assets with a valuation allowance become realizable in future periods, the Company will have the ability, subject to carryforward limitations, to benefit from these amounts. Approximately $6.1 million of these deferred tax assets pertain to certain net operating loss and credit carryforwards resulting from the exercise of employee stock options. When recognized, the tax benefit of these carryforwards are accounted for as a credit to additional paid-in capital rather than a reduction of the income tax provision.
NOTE 7. EARNINGS PER SHARE
Basic earnings per share (“EPS”) excludes dilution and is computed by dividing net income by the weighted average number of common shares outstanding for the period. Diluted EPS reflects the potential dilution that would occur if outstanding securities or other contracts to issue common stock were exercised or converted into common stock.
65
EXAR CORPORATION AND SUBSIDIARIES
NOTES TO CONSOLIDATED FINANCIAL STATEMENTS—(CONTINUED)
FISCAL YEARS ENDED MARCH 31, 2006, 2005 AND 2004
A summary of the Company’s EPS for each of the fiscal years ended March 31, 2006, 2005 and 2004 is as follows:
| | | | | | | | | |
| | | 2006 | | 2005 | | 2004 |
| | | (In thousands, except per share amounts) |
Net income | | $ | 7,786 | | $ | 5,319 | | $ | 4,636 |
| | | | | | | | | |
Shares used in computation: | | | | | | | | | |
Weighted average common shares outstanding used in computation of basic net income per share | | | 38,152 | | | 41,532 | | | 40,656 |
Dilutive effect of stock options | | | 358 | | | 891 | | | 1,854 |
| | | | | | | | | |
Shares used in computation of diluted net income per share | | | 38,510 | | | 42,423 | | | 42,510 |
| | | | | | | | | |
Basic and diluted earnings per share | | $ | 0.20 | | $ | 0.13 | | $ | 0.11 |
| | | | | | | | | |
Options to purchase 5,224,414 shares of common stock at a price ranging from $13.12 to $59.31 were outstanding as of March 31, 2006. Options to purchase 5,464,463 shares of common stock at prices ranging from $13.77 to $59.31 were outstanding as of March 31, 2005. Options to purchase 3,247,256 shares of common stock at prices ranging from $19.29 to $59.31 were outstanding as of March 31, 2004. These options to purchase shares of common stock that were outstanding as of March 31, 2006, 2005 and 2004, respectively were not included in the computation of diluted net income per share because the options’ exercise prices were greater than the average market price of the common shares as of such dates and, therefore, would be anti-dilutive under the treasury stock method.
NOTE 8. EMPLOYEE BENEFIT PLANS
Exar Savings Plans—The Exar Savings Plan, as amended and restated, covers substantially all employees of the Company. The Exar Savings Plan provides for voluntary salary reduction contributions in accordance with Section 401(k) of the Internal Revenue Code as well as contributions from the Company based on the achievement of specified operating results. The Company recognized expenses of approximately $0.6 million, $0.3 million and $0.1 million for the fiscal years ended March 31, 2006, 2005, and 2004, respectively.
Executive and Key Employee Incentive Compensation Programs—The Company’s incentive compensation programs provide for incentive awards for substantially all employees of the Company based on the achievement of specified operating and performance results. For the fiscal years ended March 31, 2006 and 2005, the Company did not incur expense related to the Executive and Key Employee Incentive Compensation Programs. For fiscal year ended March 31, 2004, the Company’s Executive and Key Employee Incentive Compensation Programs consisted of the following two programs, the FY ‘04 Executive Special Stock Based Incentive Program (“Executive Program”) and the FY ‘04 Key Employee Special Stock Based Incentive Program (“Key Employee Program”). In lieu of cash awards for fiscal year 2004, participants in the Executive Program and Key Employee Program were granted stock options at fair market value commensurate with their respective level in the Company. For fiscal year ended March 31, 2004, a total of 200,876 options were granted with an exercise price equal to the fair market value of the Company’s common stock on the date of the grant under the terms of the Executive and Key Employee Programs, and accordingly, no compensation expense was recorded. The Company’s incentive compensation programs may be amended or discontinued at the discretion of the Board of Directors.
Deferred Compensation—The Company awarded 30,000 shares of restricted stock to its President and Chief Executive Officer on March 24, 2005 in connection with his employment agreement. The Company amortizes the deferred stock based compensation over the vesting period of three years. Amortization of the deferred stock based compensation in fiscal year 2006 was $135,000. There was no amortization in fiscal years 2005 and 2004.
66
EXAR CORPORATION AND SUBSIDIARIES
NOTES TO CONSOLIDATED FINANCIAL STATEMENTS—(CONTINUED)
FISCAL YEARS ENDED MARCH 31, 2006, 2005 AND 2004
NOTE 9. VOLUNTARY STOCK OPTION EXCHANGE PROGRAM
On August 27, 2003, the Company offered eligible employees the opportunity to exchange certain outstanding options for new options. Eligible employees included regular, full-time, U.S. resident employees of the Company or its subsidiaries. Members of the Company’s Board of Directors, executive officers and employees of the Company subject to Section 16(b) of the Securities Exchange Act of 1934, as amended, were not eligible to participate in the offer. The offer expired on September 25, 2003.
The offer was a voluntary exchange for eligible option holders under the Company’s 1997 Equity Incentive Plan and 2000 Equity Incentive Plan, to exchange all of their options, vested or unvested, with exercise prices equal to or greater than $26.00 per share and all options granted on or after February 27, 2003, regardless of the exercise price.
A total of 1,438,205 exchanged options were cancelled on September 26, 2003 and 544,130 new options were granted on March 29, 2004, which was at least six months and one day from the cancellation date, September 26, 2003. The number of new options granted to the participants was dependent on the original exercise price at which the exchanged options were granted. Exchanged options with an exercise price per share equal to or greater than $26.00 and less than or equal to $50.00 were replaced with new options at an exchange ratio of one new option for every two exchanged options. Exchanged options with an exercise price per share greater than $50.00 were replaced with new options at an exchange ratio of one new option for every four exchanged options. Options with an exercise price per share less than $26.00 were not eligible for exchange under the offer, except for options granted on or after February 27, 2003, which were required to be exchanged as a condition to participate in the offer. Such options were replaced with new options at an exchange ratio of one new option for every one exchanged option. The new options were granted at the fair market value of $18.00 on the grant date of March 29, 2004.
Each new option granted to participants in the offer were subject to a new vesting schedule that commenced on March 29, 2004, the new option grant date. If any portion of the exchanged options were vested as of the date such options were cancelled, then the corresponding portion of the new options granted to such participants in exchange for the vested exchanged options were fully vested nine months from the new option grant date of March 29, 2004. If any portion of the exchanged options were unvested as of the date such options were cancelled, then 50% of the corresponding portion of the new options granted to such participants in exchange for the unvested exchanged options vested on the one year anniversary of the new option grant date and the remaining 50% of the corresponding portion of the new options shall vest on the two year anniversary of the new option grant date. For additional information about the offer, please refer to the Schedule TO-C filed with the SEC on August 21, 2003 and the Schedule TO-I filed with the SEC on August 27, 2003.
NOTE 10. STOCKHOLDERS’ EQUITY
Preferred Share Purchase Rights Plan—In December 1995, the Company’s Board of Directors adopted a Preferred Share Purchase Rights Plan under which the Board of Directors declared a dividend of one purchase right for each outstanding share of common stock of Exar held as of January 10, 1996. Each right entitles the registered holder to purchase one one-hundredth of a share of Exar’s Series A Junior Participating Preferred Stock. The rights become exercisable ten days after the announcement that an entity or person has commenced a tender offer to acquire or has acquired 15% or more of the outstanding Exar common stock (the “Distribution Date”).
After the Distribution Date, the Board of Directors may exchange the rights at an exchange ratio of one common share or one one-hundredth of a preferred share per right. Otherwise, each holder of a right, other than rights beneficially owned by the acquiring entity or person (which will thereafter be void), will have the right to receive upon exercise that number of common shares having a market value of two times the exercise price of the right. The Preferred Share Purchase Rights Plan was cancelled by the Board of Directors on July 22, 2005.
67
EXAR CORPORATION AND SUBSIDIARIES
NOTES TO CONSOLIDATED FINANCIAL STATEMENTS—(CONTINUED)
FISCAL YEARS ENDED MARCH 31, 2006, 2005 AND 2004
Employee Stock Participation Plan—Exar is authorized to issue 4,500,000 shares of common stock under its Employee Stock Participation Plan (“ESPP”). The ESPP permits employees to purchase common stock through payroll deductions. The purchase price is the lower of 85% of the fair market value of the common stock at the beginning or end of each three-month offering period. Shares purchased by and distributed to participating employees were 140,620 in fiscal year ended March 31, 2006, 135,530 in fiscal year ended March 31, 2005 and 120,042 in fiscal year ended March 31, 2004 at weighted average prices of $11.09, $11.91 and $12.42, respectively.
At March 31, 2006, the Company has reserved 1,733,851 shares of common stock for future issuance under its Employee Stock Participation Plan.
Effective April 1, 2006, the Company amended its ESPP to permit Exar employees to purchase common stock through payroll deductions at a purchase price that is 95% of the fair market value of the common stock on the last day of each three-month offering period.
Stock Option Plans—Exar has a 2000 Equity Incentive Plan, as amended and restated (the “2000 Plan”), that only permits the granting of non-statutory stock options to executive officers and employees. A maximum of 40% of the total number of shares reserved under the 2000 Plan may be granted to executive officers of the Company. The Board of Directors adopted the 2000 Plan in September 2000, and was subsequently amended. The Company also has a 1997 Equity Incentive Plan (the “1997 Plan”), also subsequently amended and restated, which permits the granting of both incentive and non-statutory stock options to executive officers of the Company and its employees, and the granting of non-statutory stock options to the Company’s directors and consultants. Exar also has a 1996 Non-Employee Director’s Stock Option Plan (the “Non-Employee Director’s Plan”), also amended and restated, that permits the granting of non-statutory stock options to non-employee directors of the Company. Generally, options under the three plans are granted with an exercise price of 100% of the fair value of the underlying stock on the date of grant and have a term of seven years, although the plans provide that options may be granted with a term of up to ten years. Options generally vest over four years.
Under the plans, certain employees, including executive officers, directors, senior management and technical personnel of the Company, were allowed the opportunity to defer a portion of his or her base salary and apply such deferred salary to options to purchase shares of the Company’s common stock with exercise prices set at a discount to market with the aggregate of such discounts equal to the aggregate amount of the base salary so deferred. On June 13, 2005, the Board of Directors approved the amendment of the Plans to eliminate the compensation deferral provision in each Plan, effective June 13, 2005. At the same time, as permitted by Internal Revenue Code Section 409A, the Board of Directors approved the cancellation of deferral elections for the 2005 calendar year for four (4) participants and also the cancellation of the stock options granted with respect to those deferrals.
In fiscal year ended March 31, 2004, the Company cancelled options to purchase 618,000 shares of common stock held by certain executive officers in exchange for $0.05 per share. In connection with these cancellations, the Company recorded compensation expense of $0.03 million.
In the fiscal years ended March 31, 2006, 2005, and 2004, the Company granted 1,282,812, 1,803,526 and 1,390,789 shares of common stock, respectively, on a combined basis under the 2000 Plan, the 1997 Plan and the 1996 Non-employee Director’s Plan.
As of March 31, 2006, up to 5,318,841, 5,100,351, and 947,630 shares of common stock, were available for grant by the Company under the 2000 Plan, the 1997 Plan and the 1996 Non-employee Director’s Plan, respectively.
68
EXAR CORPORATION AND SUBSIDIARIES
NOTES TO CONSOLIDATED FINANCIAL STATEMENTS—(CONTINUED)
FISCAL YEARS ENDED MARCH 31, 2006, 2005 AND 2004
Option activity under the option plans was as follows:
| | | | | | | | | | | | | | | | | | |
| | | Fiscal Years Ended March 31, |
| | | 2006 | | 2005 | | 2004 |
| | | Number of
Shares | | | Weighted
Average
Exercise
Price per
Share | | Number of
Shares | | | Weighted
Average
Exercise
Price per
Share | | Number of
Shares | | | Weighted
Average
Exercise
Price per
Share |
Outstanding at beginning of period | | 9,221,732 | | | $ | 18.13 | | 8,678,790 | | | $ | 17.99 | | 10,483,967 | | | $ | 22.47 |
Granted | | 1,282,812 | | | | 12.73 | | 1,803,526 | | | | 14.69 | | 1,390,789 | | | | 16.33 |
Exercised | | (1,220,904 | ) | | | 8.48 | | (846,471 | ) | | | 7.51 | | (1,075,379 | ) | | | 6.82 |
Cancelled | | (1,774,742 | ) | | | 24.63 | | (414,113 | ) | | | 21.90 | | (2,120,587 | ) | | | 44.70 |
| | | | | | | | | | | | | | | | | | |
Outstanding at end of period | | 7,508,898 | | | | 17.34 | | 9,221,732 | | | | 18.13 | | 8,678,790 | | | | 17.99 |
Exercisable at end of period | | 6,320,416 | | | $ | 18.17 | | 6,477,210 | | | $ | 19.16 | | 6,061,439 | | | $ | 17.49 |
| | | | | | | | | | | | | | | | | | |
The following table summarizes information concerning options outstanding and exercisable for the combined option plans at March 31, 2006:
| | | | | | | | | | |
| | | OPTIONS OUTSTANDING | | OPTIONS EXERCISABLE |
Range of Exercise Prices | | Number Outstanding | | Weighted Average
Remaining Life (Yrs) | | Weighted Average
Exercise Price | | Number Exercisable | | Weighted Average
Exercise Price |
$ 0.00 - $ 12.45 | | 2,106,484 | | 3.40 | | $12.10 | | 1,427,503 | | $12.04 |
12.49 - 15.09 | | 1,502,333 | | 4.54 | | 13.52 | | 1,010,833 | | 13.50 |
15.12 - 16.38 | | 1,501,905 | | 5.23 | | 15.50 | | 1,501,905 | | 15.50 |
16.99 - 27.15 | | 1,911,576 | | 2.66 | | 22.11 | | 1,893,575 | | 22.12 |
30.56 - 59.31 | | 486,600 | | 1.16 | | 38.77 | | 486,600 | | 38.77 |
| | | | | | | | | | | |
$ 0.00 - $ 59.31 | | 7,508,898 | | 3.66 | | $17.34 | | 6,320,416 | | $18.17 |
| | | | | | | | | | |
Stock Repurchase Program—In March 2001, the Board of Directors authorized a stock repurchase program to acquire outstanding common stock in the open market due to the decrease in market price and to partially offset some dilution from the Company’s stock option programs. Under this program, the Board of Directors authorized the acquisition of up to $40.0 million of Exar’s common stock. During the fiscal year ended March 31, 2006, the Company repurchased 270,000 shares for approximately $3.6 million. During fiscal year ended March 31, 2005, the Company repurchased 250,000 shares for approximately $3.7 million. From March 2001 through the fiscal year ended March 31, 2004, the Company repurchased 247,110 shares for $4.6 million. In the future, the Company may utilize this stock repurchase program, which would reduce cash, cash equivalents and/or marketable securities available to fund future operations and meet other liquidity requirements. Under this program, $28.1 million remains available to repurchase Exar’s common stock as of March 31, 2006.
69
EXAR CORPORATION AND SUBSIDIARIES
NOTES TO CONSOLIDATED FINANCIAL STATEMENTS—(CONTINUED)
FISCAL YEARS ENDED MARCH 31, 2006, 2005 AND 2004
Modified “Dutch Auction” Self Tender Offer —In addition to the above, on July 25, 2005, Exar commenced a Modified “Dutch Auction” Self Tender Offer (“tender offer”) to acquire up to 7,058,823 shares of its common stock at a purchase price of not greater than $17.00 nor less than $15.00 per share. During the three months ended September 30, 2005, the Company completed the tender offer and repurchased 7,500,000 shares of its common stock at a purchase price of $16.00 per share, resulting in aggregate payments of $120.0 million plus costs of approximately $0.8 million.
Fair Value Disclosures
Information regarding net income and net income per share, as adjusted, is required by SFAS 123, which also requires that the information be determined as if the Company had accounted for its employee stock options granted under the fair value method. The fair value for these options was estimated using the Black-Scholes option pricing model. The per share weighted average estimated fair value for employee options granted was $5.18, $7.83 and $10.17 for the three fiscal years ended March 31, 2006, 2005 and 2004, respectively. The per share weighted average fair value of shares purchased under the employee stock participation plan was $2.57, $2.86 and $3.57 for the three fiscal years ended March 31, 2006, 2005 and 2004, respectively. The Black-Scholes model was developed for use in estimating the fair value of traded options that have no restrictions and are fully transferable and negotiable in a freely traded market. The Black-Scholes model does not consider the employment, transfer or vesting restrictions that are inherent in the Company’s employee options. The usage of an option valuation model, as required by SFAS 123, includes highly subjective assumptions based on long-term predictions, including the expected stock price volatility and average life of each option grant that greatly affect the fair value of the option. However, the Black-Scholes model has been widely adopted by many companies for valuation under SFAS 123.
The Company’s calculations in accordance with SFAS 123 were made using the Black-Scholes option pricing model with the following weighted average assumptions for options granted:
| | | | | | | | | |
| | | Fiscal Years Ended March 31, | |
| | | 2006 | | | 2005 | | | 2004 | |
Risk-free interest rate | | 4.9 | % | | 3.9 | % | | 2.9 | % |
Expected term of options (years) | | 4.3 | | | 4.0 | | | 5.6 | |
Expected volatility | | 38.4 | % | | 68.3 | % | | 71.8 | % |
Expected dividend yield | | 0.0 | % | | 0.0 | % | | 0.0 | % |
Under SFAS 123, pro forma compensation cost is calculated for the fair market value of the options granted under the Employee Stock Participation Plan (“ESPP”). The fair value of each stock purchase right granted under the ESPP is estimated using the Black-Scholes option pricing model with the following weighted average assumptions by fiscal year:
| | | | | | | | | |
| | | Fiscal Years Ended March 31, | |
| | | 2006 | | | 2005 | | | 2004 | |
Risk-free interest rate | | 4.7 | % | | 2.8 | % | | 1.0 | % |
Expected term of options (years) | | 0.25 | | | 0.25 | | | 0.25 | |
Expected volatility | | 21.7 | % | | 26.3 | % | | 48.0 | % |
Expected dividend yield | | 0.0 | % | | 0.0 | % | | 0.0 | % |
70
EXAR CORPORATION AND SUBSIDIARIES
NOTES TO CONSOLIDATED FINANCIAL STATEMENTS—(CONTINUED)
FISCAL YEARS ENDED MARCH 31, 2006, 2005 AND 2004
NOTE 11. RELATED PARTY TRANSACTION
In the fourth quarter of fiscal 2006, GWA Investments, LLC and GWA Master Fund, L.P. (“GWA”), requested that the Company reimburse its costs of $0.4 million in connection with its proxy solicitation in October 2005 in support of their director candidates, all of whom were elected to the Board of Directors at the 2005 annual shareholder meeting. GWA is a hedge fund managed by a director of the Company, Guy W. Adams. These costs have been accrued by the Company and are included in selling, general and administrative costs in the Company’s Consolidated Statements of Operations for the fiscal period ended March 31, 2006.
NOTE 12. COMMITMENTS AND CONTINGENCIES
In 1986, Micro Power Systems Inc. (“MPSI”), one of the Company’s subsidiaries that the Company had acquired in June 1994, identified low-level groundwater contamination at its principal manufacturing site. Although the area and extent of the contamination appear to have been defined, the source of the contamination has not been identified. MPSI previously reached an agreement with another entity to participate in the cost of ongoing site investigations and the operation of remedial systems to remove subsurface chemicals, which is expected to continue for an additional 4 to 5 years from the fiscal year ended March 31, 2006. The Company believes that its site closure costs pertaining to the capping of wells and removal of the filtering system will be immaterial. Management estimates that the accrual of $0.2 million as of March 31, 2006 is sufficient to cover the estimated remaining 4 to 5 years of continued remediation activities and post-remediation site closure activities. If further investigation reveals that additional remediation need to be employed or related closure costs exceed original estimations, the Company would be required to accrue an additional provision for such remediation costs.
The Company warrants all of its products against defects in materials and workmanship for a period of ninety days from the delivery date. The Company’s sole liability is limited to either replacing, repairing or issuing credit, at its option, for the product if it has been paid for. The warranty does not cover damage which results from accident, misuse, abuse, improper line voltage, fire, flood, lightning or other damage resulting from modifications, repairs or alterations performed other than by the Company, or resulting from failure to comply with the Company’s written operating and maintenance instructions. Warranty expense has historically been immaterial.
Additionally, the Company’s sales agreements indemnify its customers for any expenses or liability resulting from alleged or claimed infringements of any United States letter patents of third parties. However, the Company is not liable for any collateral, incidental or consequential damages arising out of patent infringement. The terms of these indemnification agreements are generally perpetual commencing after execution of the agreement or the date indicated on the Company’s order acknowledgement. The maximum amount of potential future indemnification is unlimited. However, to date, the Company has not paid any claims or been required to defend any lawsuits with respect to any such indemnity claim.
71
EXAR CORPORATION AND SUBSIDIARIES
NOTES TO CONSOLIDATED FINANCIAL STATEMENTS—(CONTINUED)
FISCAL YEARS ENDED MARCH 31, 2006, 2005 AND 2004
The following table summarizes the Company’s contractual payment obligations and commitments as of March 31, 2006 (in thousands):
| | | | | | | | | | | | | | | | | | | | | |
| | | Fiscal Years Ended March 31, | | | | |
Contractual Obligations | | 2007 | | 2008 | | 2009 | | 2010 | | 2011 | | Thereafter | | Total |
Purchase Obligations(1) | | $ | 4,080 | | $ | 575 | | $ | 435 | | $ | — | | $ | | | $ | — | | $ | 5,090 |
Venture Investment Commitments (Skypoint Fund)(2) | | | 2,152 | | | — | | | — | | | — | | | — | | | — | | | 2,152 |
Remediation commitment(3) | | | 53 | | | 53 | | | 53 | | | 53 | | | 19 | | | — | | | 231 |
Lease Obligations | | | 81 | | | 19 | | | 19 | | | 5 | | | — | | | — | | | 124 |
| | | | | | | | | | | | | | | | | | | | | |
Total | | $ | 6,366 | | $ | 647 | | $ | 507 | | $ | 58 | | $ | 19 | | $ | — | | $ | 7,597 |
| | | | | | | | | | | | | | | | | | | | | |
| (1) | The Company places purchase orders with wafer foundries and other vendors as part of its normal course of business. The Company expects to receive and pay for wafers, capital equipment and various service contracts over the next 12 months from its existing cash balances. |
| (2) | The commitment related to the Skypoint Fund does not have a set payment schedule and thus will become payable upon the request from the Skypoint Fund’s General Partner. |
| (3) | The commitment relates to the environmental clean-up at the former location of Micro Power Systems, Inc. |
NOTE 13. LITIGATION
On November 16, 2004, Ericsson Wireless Communications, Inc. initiated a lawsuit against Exar Corporation in San Diego Superior Court. In its third amended complaint, Ericsson asserts causes of action for negligence, strict product liability, and unfair competition against Exar. Through its complaint, Ericsson seeks unspecified monetary damages and unspecified injunctive relief. The case is based on Ericsson’s purchase of allegedly defective products from Vicor Corporation, a former customer of Exar to whom Exar sold untested semi-custom wafers. The Court granted Ericsson to file its third amended complaint on April 28, 2006. Exar’s response to the Third Amended Complaint is due on or before May 30, 2006. The Court recently continued the trial from September 29, 2006 to March 29, 2007 and discovery is continuing. Exar disputes the allegations in Ericsson’s third amended complaint, believes it has meritorious defenses, and intends to defend the lawsuit vigorously. At this stage of the litigation and without additional information, Exar is unable to determine the probability that the claim asserted by Ericsson will result in liability. As of the date of this Report, Exar does not believe that the litigation will have a material impact on its financial condition, results of operations, or liquidity.
On April 15, 2005, Vicor filed a cross-complaint against Exar in San Diego Superior Court. In the cross-complaint, Vicor alleged, among other things, that Exar sold it integrated circuits that were defective, that failed to meet agreed-upon specifications, and that Exar intentionally concealed material facts regarding the specifications of the integrated circuits that Vicor alleges it bought from Exar. In its cross-complaint, Vicor alleges that it is entitled to indemnification from Exar for any damages that Vicor must pay to Ericsson as a result of the causes of action asserted by Ericsson against Vicor. Vicor asserted causes of action against Exar for breach of contract, breach of express contract warranty, breach of implied warranties of merchantability and fitness, breach of the covenant of good faith and fair dealing, fraud, negligence, strict liability, implied contractual indemnity, and equitable indemnity. On May 9, 2005, Exar filed a demurrer to all but one of the indemnity causes of action in Vicor’s Cross-Complaint. On June 17, 2005, the San Diego Superior Court sustained Exar’s demurrer to all of Vicor’s causes of action except the claims for implied contractual indemnity and equitable indemnity without leave to amend. Exar answered the two remaining causes of action on July 5, 2005. Trial on the cross-complaint asserted by Vicor is scheduled for September 29, 2006. Exar disputes the allegations in Vicor’s cross-complaint, believes it has meritorious defenses, and intends to defend the lawsuit vigorously. At this stage of the litigation and without additional
72
EXAR CORPORATION AND SUBSIDIARIES
NOTES TO CONSOLIDATED FINANCIAL STATEMENTS—(CONTINUED)
FISCAL YEARS ENDED MARCH 31, 2006, 2005 AND 2004
information, Exar is unable to determine the probability that the claim asserted by Vicor will result in liability. As of the date of this Report, Exar does not believe that the litigation will have a material impact on its financial condition, results of operations, or liquidity.
On March 4, 2005, Exar filed a complaint in Santa Clara Superior Court against Vicor. In the complaint, Exar sought a declaration regarding the respective rights and obligations, including warranty and indemnity rights and obligations, under the written contracts between Exar and Vicor for the sale of untested, semi-custom wafers. In addition, Exar sought a declaration that it was not responsible for any damages that Vicor must pay to Ericsson or any other customer of Vicor arising from claims that Vicor sold allegedly defective products.
On March 17, 2005, Vicor filed a cross-complaint against Exar and Rohm Device USA, LLC and Rohm Co., Ltd, the owners and operators of the foundry which supplied the untested, semi-custom wafers that Exar sold to Vicor. In the cross-complaint, Vicor alleged, among other things, that Exar sold it integrated circuits that were defective, that failed to meet agreed-upon specifications, and that Exar intentionally concealed material facts regarding the specifications of the integrated circuits that Vicor alleges it bought from Exar. In its cross-complaint, Vicor also alleges that it is entitled to indemnification from Exar for any damages that Vicor must pay to Ericsson and other Vicor customers as a result of the causes of action asserted by Ericsson in the San Diego case discussed above and any other claims that may be made against Vicor. In the cross-complaint, Vicor asserted causes of action against Exar for breach of contract, breach of express contract warranty, breach of implied warranties of merchantability and fitness, breach of covenant of good faith and fair dealing, fraud, negligence, strict liability, implied contractual indemnity, and equitable indemnity. On May 23, 2005, Exar filed a demurrer to each cause of action in Vicor’s cross-complaint in Santa Clara County. On July 15, 2005, the Santa Clara Superior Court sustained Exar’s demurrer to each of the causes of action asserted by Vicor. The Court granted Vicor leave to amend the cross-complaint to assert a cause of action for declaratory relief only. On August 1, 2005, Vicor filed its amended cross-complaint seeking a declaration of the parties respective rights and obligations, including warranty and indemnity rights, under the alleged contracts between Exar and Vicor for the sale of untested, semi-custom wafers. In addition, Vicor sought a declaration that Exar was obligated to indemnify it for any damages resulting from claims brought against Vicor by its customers. No trial date has been set in the matter, although a motion is currently pending to coordinate the San Diego action with the action in Santa Clara. Exar disputes the allegations in Vicor’s cross-complaint, believes it has meritorious defenses, and intends to defend the lawsuit vigorously. At this stage of the litigation and without additional information, Exar is unable to determine the probability that the claim asserted by Vicor will result in liability. As of the date of this Report, Exar does not believe that the litigation will have a material impact on its financial condition, results of operations, or liquidity.
The Company is not currently a party to any other material legal proceedings.
From time to time, the Company is involved in various claims, legal actions and complaints arising in the normal course of business. Although the ultimate outcome of the matters discussed above and other matters is not presently determinable, management currently believes that the resolution of all such pending matters will not have a material adverse effect on the Company’s consolidated financial position, results of operations, or cash flows.
NOTE 14. INDUSTRY AND SEGMENT INFORMATION
The Company operates in one reportable segment and designs, develops and markets high-performance, analog and mixed-signal silicon solutions for a variety of markets including networking, serial communications, clock and timing, and storage. The nature of the Company’s products and production processes as well as type of customers and distribution methods is consistent among all of the Company’s products. Net sales by product line are as follows (in thousands):
| | | | | | | | | |
| | | Fiscal Years Ended March 31, |
| | | 2006 | | 2005 | | 2004 |
Net sales: | | | | | | | | | |
Communications | | $ | 63,995 | | $ | 52,720 | | $ | 54,489 |
Video, Imaging and Other | | | 3,029 | | | 4,649 | | | 12,707 |
| | | | | | | | | |
Total | | $ | 67,024 | | $ | 57,369 | | $ | 67,196 |
| | | | | | | | | |
73
EXAR CORPORATION AND SUBSIDIARIES
NOTES TO CONSOLIDATED FINANCIAL STATEMENTS—(CONTINUED)
FISCAL YEARS ENDED MARCH 31, 2006, 2005 AND 2004
The Company’s foreign operations are conducted primarily through its wholly-owned subsidiaries in Japan, United Kingdom, France and China. The Company’s principal markets include North America, Asia/Japan and Europe. Net sales by geographic area represent sales to unaffiliated customers.
All information on sales by geographic area is based upon the location to which the products were shipped. The following table sets forth revenue by geographic area for fiscal years ended March 31 (in thousands):
| | | | | | | | | |
| | | Fiscal Years Ended March 31, |
| | | 2006 | | 2005 | | 2004 |
Net sales: | | | | | | | | | |
United States | | $ | 32,615 | | $ | 28,188 | | $ | 31,219 |
Other | | | 355 | | | 612 | | | 2,092 |
| | | | | | | | | |
Total North America sales | | | 32,970 | | | 28,800 | | | 33,311 |
| | | | | | | | | |
China | | | 9,335 | | | 7,490 | | | 8,068 |
Asia (excludes China) | | | 10,314 | | | 10,813 | | | 14,053 |
Italy | | | 7,867 | | | 3,835 | | | 3,259 |
Europe (excludes Italy) | | | 6,538 | | | 6,431 | | | 8,505 |
| | | | | | | | | |
Total export sales | | | 34,054 | | | 28,569 | | | 33,885 |
| | | | | | | | | |
Total net sales | | $ | 67,024 | | $ | 57,369 | | $ | 67,196 |
| | | | | | | | | |
Substantially all of the Company’s long-lived assets at March 31, 2006 and 2005 were located in the United States.
NOTE 15. RECENTLY ISSUED ACCOUNTING STANDARDS
In December 2004, the Financial Accounting Standards Board (“FASB”) issued Statement No. 123 (revised 2004), “Share-Based Payment” (“SFAS 123R”). This statement replaces SFAS 123, “Accounting for Stock-Based Compensation” and supersedes Accounting Principles Board’s Opinion No. 25 (“APB 25”), “Accounting for Stock Issued to Employees”. SFAS 123R will require the Company to measure the cost of the Company’s employee stock-based compensation awards granted after the effective date based on the grant date fair value of those awards and to record that cost as compensation expense over the period, during which the employee is required to perform services in exchange for the award (generally over the vesting period of the award). SFAS 123R addresses all forms of share-based payments awards, including shares issued under employee stock purchase plans, stock options, restricted stock and stock appreciation rights. In addition, the Company will be required to record compensation expense (as previous awards continue to vest) for the unvested portion of previously granted awards that remain outstanding at the date of adoption. SFAS 123R is effective for annual fiscal periods beginning after June 15, 2005. The Company, therefore, is required to implement the standard as of April 1, 2006. In addition, the SEC issued Staff Accounting Bulletin No. 107, or SAB 107 in March 2005. SAB 107 includes interpretive guidance for the initial implementation of SFAS 123R.
74
EXAR CORPORATION AND SUBSIDIARIES
NOTES TO CONSOLIDATED FINANCIAL STATEMENTS—(CONTINUED)
FISCAL YEARS ENDED MARCH 31, 2006, 2005 AND 2004
As permitted by SFAS 123, the Company currently accounts for share-based payments to employees using the intrinsic value method prescribed by APB 25 and, as such, generally recognizes no compensation cost for employee stock options. Accordingly, the adoption of SFAS 123R will have a significant impact on the Company’s result of operations, although it will have no negative impact on cash flow. However, the actual result of the adoption of SFAS 123R cannot be determined at this time because it will depend on levels of share-based payments granted in the future.
In November 2004, the FASB issued Statement of Financial Accounting Standards No. 151, “Inventory Costs, an amendment to ARB No. 43, Chapter 4” (“SFAS 151”). SFAS 151 amends ARB No. 43, Chapter 4, to clarify that abnormal amounts of idle facility expense, freight, handling costs and wasted materials (spoilage) should be recognized as current period charges. In addition, SFAS 151 requires that the allocation of fixed production overheads to the cost of conversion be based on the normal capacity of the production facilities. SFAS 151 is effective for inventory costs incurred for fiscal years beginning after June 15, 2005. Therefore, the Company is required to adopt the standard effective April 1, 2006. The Company is currently assessing the impact but does not expect the adoption of SFAS 151 to have a significant impact on its financial condition or results of operations.
In May 2005, the FASB issued SFAS No. 154, “Accounting Changes and Error Corrections” (“SFAS 154”). SFAS No. 154 replaces APB Opinion No. 20, Accounting Changes and SFAS No. 3, Reporting Accounting Changes in Interim Financial Statements. SFAS 154 requires retrospective application to prior period financial statements of changes in accounting principle, unless it is impracticable to determine either the period-specific effects or the cumulative effect of the change. The Company does not expect the adoption of SFAS 154 to have a material impact on its consolidated financial position or results of operations.
SUPPLEMENTARY DATA
Quarterly Results (Unaudited)
The following table contains selected unaudited quarterly financial data for the eight quarters ended March 31, 2006, both in absolute dollars as well as in terms of percentage of net sales. In the opinion of management, this unaudited information has been prepared on the same basis as the audited information and includes all adjustments, consisting only of normal and recurring adjustments necessary to state fairly the information set forth therein. Results for a given quarter are not necessarily indicative of results for any subsequent quarter.
75
Exar Corporation
Quarterly Results
For Fiscal Years Ended March 31, 2006 and 2005
| | | | | | | | | | | | | | | | | | | | | | | | | | | | | | | | |
| | | Quarter Ended | |
| | | Mar. 31,
2006 | | | Dec. 31,
2005 | | | Sept. 30,
2005 | | | Jun. 30,
2005 | | | Mar. 31,
2005 | | | Dec. 31,
2004 | | | Sept. 30,
2004 | | | Jun. 30,
2004 | |
| | | (In thousands, except per share amounts) | |
Net sales | | $ | 17,574 | | | $ | 17,009 | | | $ | 16,528 | | | $ | 15,912 | | | $ | 13,656 | | | $ | 13,245 | | | $ | 14,181 | | | $ | 16,287 | |
Cost of sales | | | 5,234 | | | | 5,520 | | | | 5,543 | | | | 5,251 | | | | 3,994 | | | | 4,441 | | | | 4,522 | | | | 5,256 | |
| | | | | | | | | | | | | | | | | | | | | | | | | | | | | | | | |
Gross profit | | | 12,340 | | | | 11,489 | | | | 10,985 | | | | 10,661 | | | | 9,662 | | | | 8,804 | | | | 9,659 | | | | 11,031 | |
| | | | | | | | |
Operating expense: | | | | | | | | | | | | | | | | | | | | | | | | | | | | | | | | |
Research and development | | | 6,259 | | | | 6,178 | | | | 6,022 | | | | 6,232 | | | | 5,691 | | | | 5,304 | | | | 5,371 | | | | 5,659 | |
Selling, general and administrative | | | 5,475 | | | | 5,187 | | | | 5,443 | | | | 5,186 | | | | 5,136 | | | | 4,962 | | | | 5,231 | | | | 5,331 | |
| | | | | | | | | | | | | | | | | | | | | | | | | | | | | | | | |
Total operating expenses | | | 11,734 | | | | 11,365 | | | | 11,465 | | | | 11,418 | | | | 10,827 | | | | 10,266 | | | | 10,602 | | | | 10,990 | |
Gain on legal settlement | | | — | | | | — | | | | — | | | | — | | | | — | | | | — | | | | 1,208 | | | | — | |
Income (loss) from operations | | | 606 | | | | 124 | | | | (480 | ) | | | (757 | ) | | | (1,165 | ) | | | (1,462 | ) | | | 265 | | | | 41 | |
Other income, net | | | 3,161 | | | | 1,687 | | | | 3,234 | | | | 3,000 | | | | 2,711 | | | | 2,296 | | | | 1,951 | | | | 1,588 | |
| | | | | | | | | | | | | | | | | | | | | | | | | | | | | | | | |
Income before income taxes | | | 3,767 | | | | 1,811 | | | | 2,754 | | | | 2,243 | | | | 1,546 | | | | 834 | | | | 2,216 | | | | 1,629 | |
Provision for income taxes | | | 904 | | | | 702 | | | | 690 | | | | 493 | | | | 233 | | | | — | | | | 347 | | | | 326 | |
| | | | | | | | | | | | | | | | | | | | | | | | | | | | | | | | |
Net income | | $ | 2,863 | | | $ | 1,109 | | | $ | 2,064 | | | $ | 1,750 | | | $ | 1,313 | | | $ | 834 | | | $ | 1,869 | | | $ | 1,303 | |
| | | | | | | | | | | | | | | | | | | | | | | | | | | | | | | | |
Net income per share: | | | | | | | | | | | | | | | | | | | | | | | | | | | | | | | | |
Basic | | $ | 0.08 | | | $ | 0.03 | | | $ | 0.05 | | | $ | 0.04 | | | $ | 0.03 | | | $ | 0.02 | | | $ | 0.05 | | | $ | 0.03 | |
Diluted | | $ | 0.08 | | | $ | 0.03 | | | $ | 0.05 | | | $ | 0.04 | | | $ | 0.03 | | | $ | 0.02 | | | $ | 0.04 | | | $ | 0.03 | |
Shares used in the computation of net income per share: | | | | | | | | | | | | | | | | | | | | | | | | | | | | | | | | |
Basic | | | 35,472 | | | | 35,202 | | | | 39,711 | | | | 42,222 | | | | 41,829 | | | | 41,639 | | | | 41,400 | | | | 41,261 | |
Diluted | | | 35,639 | | | | 35,347 | | | | 40,365 | | | | 42,687 | | | | 42,537 | | | | 42,539 | | | | 42,198 | | | | 42,419 | |
| |
| | | Quarter Ended | |
| | | Mar. 31,
2006 | | | Dec. 31,
2005 | | | Sept. 30,
2005 | | | Jun. 30,
2005 | | | Mar. 31,
2005 | | | Dec. 31,
2004 | | | Sept. 30,
2004 | | | Jun. 30,
2004 | |
| | | (As a percentage of net sales) | |
Net sales | | | 100.0 | % | | | 100.0 | % | | | 100.0 | % | | | 100.0 | % | | | 100.0 | % | | | 100.0 | % | | | 100.0 | % | | | 100.0 | % |
Cost of sales | | | 29.8 | % | | | 32.5 | % | | | 33.5 | % | | | 33.0 | % | | | 29.2 | % | | | 33.5 | % | | | 31.9 | % | | | 32.3 | % |
| | | | | | | | | | | | | | | | | | | | | | | | | | | | | | | | |
Gross margin | | | 70.2 | % | | | 67.5 | % | | | 66.5 | % | | | 67.0 | % | | | 70.8 | % | | | 66.5 | % | | | 68.1 | % | | | 67.7 | % |
| | | | | | | | |
Operating expense: | | | | | | | | | | | | | | | | | | | | | | | | | | | | | | | | |
Research and development | | | 35.6 | % | | | 36.3 | % | | | 36.4 | % | | | 39.2 | % | | | 41.7 | % | | | 40.0 | % | | | 37.9 | % | | | 34.7 | % |
Selling, general and administrative | | | 31.2 | % | | | 30.5 | % | | | 32.9 | % | | | 32.6 | % | | | 37.6 | % | | | 37.5 | % | | | 36.9 | % | | | 32.7 | % |
| | | | | | | | | | | | | | | | | | | | | | | | | | | | | | | | |
Total operating expenses | | | 66.8 | % | | | 66.8 | % | | | 69.3 | % | | | 71.8 | % | | | 79.3 | % | | | 77.5 | % | | | 74.8 | % | | | 67.4 | % |
Gain on legal settlement | | | 0.0 | % | | | 0.0 | % | | | 0.0 | % | | | 0.0 | % | | | 0.0 | % | | | 0.0 | % | | | 8.5 | % | | | 0.0 | % |
Income (loss) from operations | | | 3.4 | % | | | 0.7 | % | | | -2.9 | % | | | -4.8 | % | | | -8.5 | % | | | -11.0 | % | | | 1.8 | % | | | 0.3 | % |
Other income, net | | | 18.0 | % | | | 9.9 | % | | | 19.6 | % | | | 18.9 | % | | | 19.9 | % | | | 17.3 | % | | | 13.8 | % | | | 9.8 | % |
| | | | | | | | | | | | | | | | | | | | | | | | | | | | | | | | |
Income before income taxes | | | 21.4 | % | | | 10.6 | % | | | 16.7 | % | | | 14.1 | % | | | 11.4 | % | | | 6.3 | % | | | 15.6 | % | | | 10.1 | % |
Provision for income taxes | | | 5.1 | % | | | 4.1 | % | | | 4.2 | % | | | 3.1 | % | | | 1.7 | % | | | 0.0 | % | | | 2.4 | % | | | 2.0 | % |
| | | | | | | | | | | | | | | | | | | | | | | | | | | | | | | | |
Net income | | | 16.3 | % | | | 6.5 | % | | | 12.5 | % | | | 11.0 | % | | | 9.7 | % | | | 6.3 | % | | | 13.2 | % | | | 8.1 | % |
| | | | | | | | | | | | | | | | | | | | | | | | | | | | | | | | |
76
ITEM 9. CHANGES IN AND DISAGREEMENTS WITH ACCOUNTANTS ON ACCOUNTING AND FINANCIAL DISCLOSURE
None.
ITEM 9A. CONTROLS AND PROCEDURES
Disclosure Controls and Procedures.
Evaluation of Disclosure Controls and Procedures (“Disclosure Controls”). The Company evaluated the effectiveness of the design and operation of its Disclosure Controls, as defined by the rules and regulations of the SEC (the “Evaluation”), as of the end of the period covered by this Report. This Evaluation was performed under the supervision and with the participation of management, including the Chief Executive Officer (the “CEO”) and Chief Financial Officer (the “CFO”).
CEO and CFO Certifications. Attached as Exhibits 31.1 and 31.2 of this Report are the certifications of the CEO and the CFO in compliance with Section 302 of the Sarbanes-Oxley Act of 2002 (the “Certifications”). This section of the Report provides information concerning the Evaluation referred to in the Certifications and should be read in conjunction with the Certifications.
Disclosure Controls. Disclosure Controls are controls and procedures designed to ensure that information required to be disclosed in the reports filed under the Securities Exchange Act of 1934, as amended, is recorded, processed, summarized and reported within the time periods as specified in the SEC’s rules and forms. In addition, Disclosure Controls are designed to allow for the accumulation and communications of information to the Company’s management, including the CEO and CFO, to allow timely decisions regarding required disclosures.
Conclusion. Based on the Evaluation, the CEO and CFO have concluded that the Company’s Disclosure Controls are effective as of the end of fiscal year 2006.
Changes in Internal Control Over Financial Reporting.
There was no change in the Company’s internal control over financial reporting that occurred during the fourth quarter of fiscal year 2006 that has materially affected, or is reasonably likely to materially affect, the Company’s internal control over financial reporting.
Inherent Limitations on the Effectiveness of Disclosure Controls.
The Company’s management, including the CEO and CFO, does not expect that the Disclosure Controls will prevent all errors and all fraud. Disclosure Controls, no matter how well conceived, managed, utilized and monitored, can provide only reasonable assurance that the objectives of such controls are met. Therefore, because of the inherent limitation of Disclosure Controls, no evaluation of such controls can provide absolute assurance that all control issues and instances of fraud, if any, within the Company have been detected.
Management’s Annual Report on Internal Control Over Financial Reporting
SeePart II, Item 8.” Financial Statements and Supplemental Data”for Management’s Annual Report on Internal Control over Financial Reporting and the audit report of PricewaterhouseCoopers LLP, the Company’s independent registered public accounting firm.
ITEM 9B. OTHER INFORMATION
None
77
PART III
ITEM 10. DIRECTORS AND EXECUTIVE OFFICERS OF THE REGISTRANT
Certain information regarding the Company’s directors is set forth below.
| | | | |
Name | | Age | | Position |
Guy W. Adams (1), (3) | | 55 | | Director |
Frank P. Carrubba (2) | | 68 | | Director, Chairman |
Roubik Gregorian | | 56 | | Chief Executive Officer, President and Director |
Richard L. Leza (1), (2) | | 59 | | Director |
John S. McFarlane (1), (3) | | 57 | | Director |
Juan “Oscar” Rodriguez (2), (3) | | 46 | | Director |
Pete Rodriguez (2), (3) | | 44 | | Director |
| (1) | Member of the Audit Committee. |
| (2) | Member of the Corporate Governance and Nominating Committee. |
| (3) | Member of the Compensation Committee. |
GUY W. ADAMS
Guy W. Adams, age 55, joined the Company as a Director in October 2005. Mr. Adams is the managing director of GWA Capital Partners LLC, which is the managing member of GWA Investments, LLC and the general partner of GWA Master Fund, L.P., where he has served since 2002. GWA Investments, LLC is an investment fund investing in publicly traded securities managed by GWA Capital Partners LLC, a registered investment advisor. Prior to 2002, Mr. Adams was the President of GWA Capital, which he founded in 1996 to invest his own capital in public and private equity transactions. Mr. Adams earned an MBA from Harvard Business School and a B.S. in Petroleum Engineering from Louisiana State University. Mr. Adams is currently a member of the board of trustees of Mercer International Inc., where he has served since August 2003 as a result of his successful involvement in a proxy contest. From July 2001 until May 2002, Mr. Adams served as a director of Lone Star Steakhouse & Saloon, Inc. after unseating the Chief Executive Officer and Chairman of the Board in 2001 in a contested election.
FRANK P. CARRUBBA
Frank P. Carrubba, age 68, joined the Company as a Director in August 1998. Dr. Carrubba served as Executive Vice President and Chief Technical Officer of Royal Philips Electronics, headquartered in Eindhoven, The Netherlands, from 1991 to 1997. From 1982 to 1991, Dr. Carrubba was with Hewlett-Packard Company, where he was a member of the Group Management Committee and was Director of Hewlett-Packard Laboratories. Prior to joining Hewlett-Packard, he spent 22 years as a member of the technical staff at IBM Corporation’s Thomas J. Watson Research Laboratory in Yorktown Heights, New York. Dr. Carrubba was one of the original designers of the RISC Architecture, for which he was named “Inventor of the Year” by the Intellectual Property Owners in Washington, D.C. in 1992. From 1989 to November 2004, Dr. Carrubba served as a Director of Coherent, Inc., a global leader in the design, manufacture and sale of lasers. In June 2002, Dr. Carrubba was appointed Chairman of the Board of Accerra Corporation, a provider of secure online services for business communications located in Santa Rosa, California. Dr. Carrubba is also a member of the Board of Governors of the University of New Haven. He holds a B.S. in Electrical Engineering, an M.S. in Operations Management and an Honorary Ph.D. in Computer Engineering from the University of New Haven.
ROUBIK GREGORIAN
Roubik Gregorian, age 56, joined the Company in 1995 as President, Startech Division, when the Company acquired Startech Semiconductor, Inc., where he served as President. During Dr. Gregorian’s tenure at the Company, he was appointed Chief Technology Officer and Vice President of the Communications Division in 1996 and Chief Technology Officer, Senior Vice President/General Manager, Communications Division, in 1998. Dr. Gregorian was promoted to Executive Vice President/General Manager, Communications Division in 2002 and to Chief Operating Officer in 2003. Dr. Gregorian served as the Company’s acting President and Chief Executive Officer from September 2004 to February 2005, when he was appointed to his current position of President and Chief Executive Officer. Dr. Gregorian has been a Director of the Company
78
since March 2005. From 1983 to 1994, Dr. Gregorian served as Vice President of Research and Development and Chief Technology Officer for Sierra Semiconductor where he directed the company’s product strategy and product development activities including the data communications and graphic products which were instrumental in taking the company public in 1991. From 1977 to 1983, Dr. Gregorian was manager of analog and telecommunications products at American Microsystems where he received several patent awards including one for developing the industry’s first PCM CODEC. Dr. Gregorian has been issued 27 patents, authored two textbooks and 45 technical articles. He received his M.S.E.E. and Ph.D. in Electrical Engineering from the University of California at Los Angeles, as well as a M.Sc. from Tehran University in Electrical Engineering.
RICHARD L. LEZA, SR.
Richard L. Leza, Sr., age 59, joined the Company as a Director in October 2005. Mr. Leza is the founder, Chairman and Chief Executive Officer of AI Research Corporation, an early stage venture capital firm specializing in the areas of business-to-business software, information technology, medical devices and medical analytical software applications. Mr. Leza has served in such position, which is his principal occupation and employment, since 1988. He is also the Co-Founder, past Chairman and past President of Hispanic-Net, a non-profit organization dedicated to creating a network of successful Hispanics that will improve and enhance Hispanic business and investment opportunities in technology. From 1998 to 2001, Mr. Leza was the Co-Founder, Chairman and Chief Executive Officer of CastaLink, Inc., a provider of a web-based supply chain collaboration solution which provided business process automation and real-time access to mission critical information among enterprises, their customers and suppliers. From 1997 to 1999, Mr. Leza served as co-founder, Chairman and Chief Executive Officer of NucleoTech Corporation, an application software company focused on developing, integrating and marketing a family of digital image-driven analytical DNA software solutions. From 1982 to 1988, he was co-founder, Chairman and Chief Executive Officer of RMC Group, Inc., which provided management and research services for public and private technology companies. Mr. Leza is a Board member of the Stanford Graduate School of Business Advisory Counsel and a three time member of Hispanic Business Magazines’ top 100 influential Hispanics in the United States. He is also a 2004 Telemundo Hispanic Business Salute Honoree and the recipient of the 2003 Rainbow/PUSH Coalition TrailBlazer Award. He is the author of various publications, writing on topics such as exporting, venture capital and developing business plans. Mr. Leza earned an MBA from Stanford University Graduate School of Business and a B.S. in Civil Engineering from New Mexico State University.
JOHN S. MCFARLANE
John S. McFarlane, age 57, joined the Company as a Director in January 2004. He is currently self-employed as a private investor and has served as a Director of Pitney Bowes, a provider of mailstream solutions, since October 2000. From February 2004 to February 2005, Mr. McFarlane was the Chairman and Chief Executive Officer of Ascendent Systems, a private communications software company. From March 2001 to April 2002, Mr. McFarlane was President and Chief Executive Officer of Nexsi Systems, a provider of high-performance Internet security and traffic management systems. Nexsi Systems filed for chapter 7 bankruptcy protection on May 17, 2002, and the technology was sold to Juniper Networks. From May 1997 to March 2001, Mr. McFarlane held senior executive positions, including President of the Service Provider business and President of the software division, at Sun Microsystems, Inc., a network computing product and service company. Prior to Sun, he spent over 17 years at Northern Telecom and Bell Northern Research. Mr. McFarlane holds a B.Sc. and an MBA from the University of Toronto.
JUAN “OSCAR” RODRIGUEZ
Oscar Rodriguez, age 46, joined the Company as a Director in September 2005. Mr. Rodriguez has held the position of Vice President for the Carrier Ethernet Solutions business at Lucent Technologies, which designs and delivers the systems, services and software that drive communications networks, since April 2006. From August 2003 until the acquisition of Riverstone Networks, Inc., a provider of carrier Ethernet Infrastructure solutions for business and residential communications services, in April 2006 by Lucent Technologies, Mr. Rodriguez served as Chief Executive Officer, President and a Director of Riverstone Networks. Mr. Rodriguez also held various positions at Nortel Networks Corporation, a telecommunications systems company, including as Divisional President, Enterprise solutions business, from October 2002 to August 2003; Divisional President, Intelligent Internet business from August 2001 to October 2002; and Vice President, Portfolio & Operations from October 2000 to July 2001. Prior to that, Mr. Rodriguez served as President and Chief Operating Officer of Arris Interactive, a provider of cable MSO (Multiple Service Operator) voice and data products. He has also served in several management positions in privately-held and venture-backed companies in the communications and networking industry. Mr. Rodriguez holds a B.S. in Computer Engineering from the University of Central Florida, an MBA from the Kenan-Flagler Business School at the University of North Carolina, Chapel Hill, and a certificate in Strategic Marketing from Harvard Business School.
79
PETE RODRIGUEZ
Pete Rodriguez, age 44, joined the Company as a Director in October 2005. Mr. Rodriguez has nearly 20 years of engineering, sales and senior management experience in the semiconductor and electronics industry. He is currently President and CEO and a Director of Xpedion Design Systems, Inc., a private, VC-backed company focused on electronic design automation solutions for use in designing wireless communication circuits and systems, where he has served in those positions since May 2000. Prior to joining Xpedion, Mr. Rodriguez held senior management positions in sales and marketing at Escalade Corporation, which provided software for chip design, until its acquisition by Mentor Graphics. He also held senior sales management positions at LSI Logic, a semiconductor company, as well as product management and process engineering positions at Aerojet Electronics, an aerospace systems company; Teledyne Microwave, a microwave systems and sub-systems company; and Siliconix, a semiconductor company. Mr. Rodriguez holds an MBA from Pepperdine University, an MSEE from California Polytechnic University and a B.S. in chemical engineering from California Institute of Technology.
Term of Office
Directors Carrubba, Gregorian and MacFarlane are Class III Directors whose term of office expires at the 2006 Annual Meeting of Stockholders. Director O. Rodriguez is a Class I Director whose term of office expires at the 2007 Annual Meeting of Stockholders. Directors Adams, Leza and P. Rodriguez are Class II Directors whose term of office expires at the 2008 Annual Meeting of Stockholders.
There is no family relationship between any of our directors or executive officers.
Audit Committee
The Audit Committee currently consists of three (3) Directors, Messrs. Adams, Leza and McFarlane, and Mr. Adams serves as Chairman of the Audit Committee. The Audit Committee, serving under a written charter adopted by the Board of Directors, reviews financial reports, information and other disclosures submitted by the Company to any regulatory agency or disclosed to the public, reviews the Company’s system of internal controls regarding finance and accounting and the Company’s auditing, accounting and financial reporting processes. The Audit Committee’s primary duties and responsibilities are to: (i) serve as an independent and objective party to review the reliability and integrity of the Company’s financial reporting process and internal control system; (ii) select the independent accountants and review and appraise the independent accountants’ qualifications, independence and performance; and (iii) provide the Board with such information and materials as it may deem necessary to make the Board aware of significant financial matters that require the attention of the Board. The Audit Committee held 10 meetings and did not act by written consent during the 2006 fiscal year. The Board of Directors has determined that Mr. Adams is an “audit committee financial expert” as defined by Item 401 of SEC Regulation S-K and that each member of the Audit Committee is an “independent director” as currently defined under the listing standards of The NASDAQ Global Market.
Section 16(a) Beneficial Ownership Reporting Compliance
Section 16(a) of the Exchange Act requires the Company’s Directors and Executive Officers, and persons who own more than ten percent (10%) of a registered class of the Company’s equity securities to file with the SEC initial reports of ownership and reports of changes in ownership of Common Stock and other equity securities of the Company. Executive Officers, Directors and greater than ten percent (10%) Stockholders are required by SEC regulation to furnish the Company with copies of all Section 16(a) forms they file.
80
To the Company’s knowledge, based solely on a review of the copies of such reports furnished to the Company and written representations that no other reports were required during the fiscal year ended March 31, 2006, all of the Company’s Executive Officers, Directors and greater than ten percent (10%) Stockholders complied with applicable Section 16(a) filing requirements.
Code of Ethics
The Company has adopted a Code of Ethics for Principal Executives, Executive Management and Senior Financial Officers and a Code of Business Conduct and Ethics that applies to all employees. The current Code of Ethics for Principal Executives, Executive Management and Senior Financial Officers and Code of Business Conduct and Ethics are posted on the Company’s web site at: www.exar.com. Any future amendments to the Company’s Code of Ethics for Principal Executives, Executive Management and Senior Financial Officers will also be posted to the Company’s web site. For a listing of Executive Officers of the Company and certain information about them,see Part I, “Executive Officers of the Registrant.”
ITEM 11. EXECUTIVE COMPENSATION
Summary Compensation Table
The following table shows for the fiscal years ended March 31, 2006, 2005 and 2004 compensation awarded or paid to, or earned by, the Company’s President and CEO, and its other four most highly compensated Executive Officers for the fiscal year ended March 31, 2006 (the “Named Executive Officers”):
| | | | | | | | | | | | | | |
Name and Principal Position | | Year | | Annual Compensation (1) | | Long-Term Compensation Awards | |
| | | Salary ($) | | Bonus ($) | | Restricted Stock Awards ($)(2) | | | Securities Underlying Options (#) | | All Other Compensation ($) (3) | |
Roubik Gregorian
Chief Executive Officer,
President and Director | | 2006
2005
2004 | | 452,385
410,577
363,615 | | —
—
— | | —
405,597
— |
(4)
| | —
300,000
110,000 | | 36,318
14,819
19,578 |
(5) |
| | | | | | |
Ronald W. Guire(6)
Executive Vice President,
Chief Financial Officer,
Assistant Secretary and Director | | 2006
2005
2004 | | 301,058
299,269
281,000 | | —
—
— | | —
—
— |
| | 28,020
56,000
40,000 | | 16,848
13,623
17,548 |
(7) |
| | | | | | |
Thomas R. Melendrez
General Counsel,
Secretary and Senior Vice President
Business Development | | 2006
2005
2004 | | 243,896
236,866
225,654 | | —
—
— | | —
—
— |
| | 46,000
40,000
40,000 | | 13,128
9,093
12,028 |
(8) |
| | | | | | |
Mir B. Ghaderi
Vice President/General Manager,
Network and Transmissions Division | | 2006
2005
2004 | | 240,058
238,692
226,948 | | —
—
— | | —
—
— |
| | 27,600
56,000
70,000 | | 14,169
9,903
10,828 |
(9) |
| | | | | | |
Michael Class(11)
Vice President, Worldwide Sales | | 2006
2005
2004 | | 221,058
219,231
195,385 | | —
—
— | | —
—
— |
| | 18,000
56,000
32,500 | | 15,840
12,615
17,540 |
(10) |
| (1) | As permitted by rules promulgated by the SEC, no amounts are shown for “perquisites” as such amounts for each Named Executive Officers do not exceed the lesser of 10% of the sum of such executive’s salary plus bonus or $50,000. |
81
| (2) | The following table reflects the aggregated restricted stock holdings for each of the Named Executive Officers as of the end of the 2006 fiscal year and the value of such restricted stock based on the market value of the stock on March 31, 2006 (the last day of trading for the 2006 fiscal year): |
| | | | | |
| | | Number of Shares of Unvested
Restricted Stock
at March 31, 2006 | | Value of Unvested
Restricted Stock
at March 31, 2006
($) |
Roubik Gregorian | | 20,000 | | $ | 285,600 |
Ronald W. Guire | | 0 | | | 0 |
Thomas R. Melendrez | | 0 | | | 0 |
Mir B. Ghaderi | | 0 | | | 0 |
Michael Class | | 0 | | | 0 |
| (3) | Includes matching contributions made by the Company on behalf of each Executive Officer to the Exar Corporation Savings Plan (“401(k) Plan”): for fiscal year 2006: Roubik Gregorian—$6,300, Ronald W. Guire—$6,300, Thomas R. Melendrez—$6,300, Mir B. Ghaderi—$6,300 and Michael Class—$6,300; for fiscal year 2005: Roubik Gregorian—$3,075, Ronald W. Guire—$3,075, Thomas R. Melendrez—$3,075, Mir B. Ghaderi—$3,075 and Michael Class—$3,075; for fiscal year 2004: Roubik Gregorian—$3,000, Ronald W. Guire—$3,000, Mr. Thomas R. Melendrez—$3,000, Mir B. Ghaderi—$3,000 and Michael Class—$3,000. |
Includes auto allowances as follows: for fiscal year 2006: Roubik Gregorian—$25,830, Ronald W. Guire—$9,000, Thomas R. Melendrez—$6,000, Mir B. Ghaderi—$6,000 and Michael Class—$9,000; for fiscal year 2005: Roubik Gregorian—$9,000, Ronald W. Guire—$9,000, Thomas R. Melendrez—$6,000, Mir B. Ghaderi—$6,000 and Michael Class—$9,000; for fiscal year 2004: Roubik Gregorian—$9,000, Ronald W. Guire—$9,000, Thomas R. Melendrez—$6,000, Mir B. Ghaderi—$6,000 and Michael Class—$9,000.
Includes amounts relating to Company-paid life insurance benefits on behalf of each executive officer: for fiscal year 2006: Roubik Gregorian—$1,548, Ronald W. Guire—$1,548, Thomas R. Melendrez—$828, Mir B. Ghaderi—$994 and Michael Class—$540; for fiscal year 2005: Roubik Gregorian—$994, Ronald W. Guire—$1,548, Thomas R. Melendrez—$828, Mir. B. Ghaderi—$828 and Michael Class—$540; for fiscal year 2004: Roubik Gregorian—$828, Ronald W. Guire—$1,548, Thomas R. Melendrez—$828, Mir B. Ghaderi—$828 and Michael Class—$540.
Includes patent awards made by the Company to each of the following Executive Officers: for fiscal year 2006: Roubik Gregorian—$1,750 and Mir B. Ghaderi—$875; for fiscal year 2005: Roubik Gregorian—$1,750; for fiscal year 2004: Roubik Gregorian—$750.
Includes professional tax services made by the Company on behalf of Roubik Gregorian in fiscal year 2006 of $890.
| (4) | Based on a grant of 30,000 shares of restricted stock on March 24, 2005 at a purchase price of $0.0001, which was valued at $13.52 per share based on the closing market price of the Company’s Common Stock on the date of grant. The restricted stock is scheduled to vest in annual installments during the three-year period following the date of grant and includes the right to receive dividend payments prior to vesting. |
| (5) | Includes amounts relating to the voluntary cancellation of options to purchase 120,000 shares of Common Stock ($0.05 per share). |
| (6) | Effective June 30, 2006, Ronald W. Guire retired as an officer and employee of the Company and resigned as a member of the Board of Directors. In connection with his departure, he and the Company entered into a Separation Agreement as described below. |
| (7) | Includes amounts relating to the voluntary cancellation of options to purchase 80,000 shares of Common Stock ($0.05 per share). |
| (8) | Includes amounts relating to the voluntarily cancellation of options to purchase 44,000 shares of Common Stock ($0.05 per share). |
82
| (9) | Includes amounts relating to the voluntary cancellation of options to purchase 20,000 shares of Common Stock ($0.05 per share). |
| (10) | Includes amounts relating to the voluntary cancellation of options to purchase 100,000 shares of Common Stock ($0.05 per share). |
| (11) | Mr. Class left the Company effective April 3, 2006. |
Option Grants in Last Fiscal Year
In fiscal 2006, the Company granted nonqualified stock options to its Named Executive Officers under the 2000 Equity Incentive Plan, as amended and restated (the “2000 Plan”) and the 1997 Equity Incentive Plan (the “1997 Plan”). The following tables show for the fiscal year ended March 31, 2006 certain information regarding options granted to, exercised by, and held at year-end by, the Named Executive Officers:
| | | | | | | | | | | | |
| | | Number Of Securities Underlying Options Granted(1) | | % of Total Options Granted To Employees In Fiscal Year(2) | | Exercise Price ($/Sh)(3) | | Expiration
Date | | Potential Realizable Value At Assumed Annual Rate of Stock Price Appreciation For Option Term (4) |
| | | | | | | 5% ($) | | 10% ($) |
Roubik Gregorian | | — | | — | | — | | — | | — | | — |
Ronald W. Guire | | 28,020 | | 2.96 | | 12.30 | | 10/27/12 | | 140,306 | | 326,972 |
Thomas R. Melendrez | | 24,000 | | 2.54 | | 12.30 | | 10/27/12 | | 120,176 | | 280,061 |
| | 22,000 | | 2.33 | | 15.96 | | 7/12/12 | | 142,896 | | 333,009 |
| | | | | | | | | | | | |
| | 46,000 | | 4.87 | | | | | | 263,072 | | 613,070 |
Mir B. Ghaderi | | 27,600 | | 2.92 | | 12.30 | | 10/27/12 | | 138,202 | | 322,070 |
Michael Class | | 18,000 | | 1.90 | | 12.30 | | 10/27/12 | | 90,132 | | 210,046 |
| (1) | Options granted prior to October 27, 2005 vest annually for a four year period from the date of grant. Options granted after October 27, 2005 vest monthly for a one year period from the date of the grant. |
| (2) | Based on options to purchase an aggregate of 945,312 shares of the Company’s Common Stock granted to employees of the Company in fiscal 2006, including the Named Executive Officers. |
| (3) | The exercise price of the options was equal to the fair market value of the Company’s Common Stock on the date of the grant. |
| (4) | The potential realizable value is based on the term of the options at the time of the grant (which is generally seven years). The potential realizable value is calculated by assuming that the stock price on the date of grant appreciates at the indicated rate for the entire term of the option and that the option is exercised and sold on the last day of its term at the appreciated price. These amounts represent certain assumed rates of appreciation, in accordance with rules of the SEC, and do not reflect the Company’s estimate or projection of future stock price performance. |
83
Aggregated Option Exercises in Last Fiscal Year and Fiscal Year-End Option Values
| | | | | | | | | | | | |
Name | | Number Of Shares Acquired On Exercise | | Value
Realized (1)
($) | | Number Of Securities
Underlying Unexercised
Options At FY-End | | Value Of Unexercised In-The Money Options At FY-End ($) (2) |
| | | | Exercisable | | Unexercisable | | Exercisable | | Unexercisable |
Roubik Gregorian | | — | | — | | 786,480 | | 195,000 | | 357,495 | | 423,098 |
Ronald W. Guire | | 67,498 | | 604,092 | | 563,675 | | 16,345 | | 250,247 | | 32,363 |
Thomas R. Melendrez | | 38,998 | | 299,144 | | 233,500 | | 21,500 | | 131,077 | | 34,470 |
Mir B. Ghaderi | | 11,182 | | 123,073 | | 249,116 | | 39,850 | | 126,607 | | 59,316 |
Michael Class | | 30,000 | | 235,065 | | 375,000 | | 10,500 | | 265,690 | | 20,790 |
| (1) | Represents the fair market value of the Company’s Common Stock on the date of the exercise (based on the closing sales price reported on The NASDAQ Global Market or the actual sales price if the shares were sold by the optionee simultaneously with the exercise) less the exercise price, without taking into account any taxes that may be payable in connection with the transaction. |
| (2) | These amounts represent the difference between the fair market value of the Company’s Common Stock on March 31, 2006 (the last trading day of the 2006 fiscal year), which was $14.28 per share, less the exercise price of “in-the-money” options. |
Director Compensation
During the fiscal year ended March 31, 2006, each non-employee Director was paid an annual fee of $40,000. In addition, the Chairperson of the Audit Committee and the Chairperson of the Compensation Committee each received an additional annual fee of $10,000, and the Chairman of the Board received an additional $20,000 annual fee. Pursuant to the automatic option grant provisions of the Company’s 1996 Director Stock Option Plan (as defined below) in effect at the time of the 2005 Annual Meeting of Stockholders under, each individual who became a non-employee Director at the 2005 Annual Meeting automatically received on the date of the 2005 Annual Meeting an option to purchase 54,000 shares of Common Stock, and each continuing non-employee Director automatically received an option to purchase 22,500 shares of Common Stock. Under the same automatic option grant provisions, Mr. O. Rodriguez automatically received an option to purchase 54,000 shares of Common Stock upon his appointment to the Board. Options granted under these provisions have an exercise price per share equal to the fair market value of the Common Stock on the date the option is granted and have a term of seven years. Options granted to newly elected or appointed non-employee Directors vest in annual installments or at the next Annual Meeting, whichever is first, over the three-year period following the grant date, while options granted to continuing non-employee Directors vest in monthly installments over the one-year period following the grant date. In addition, Mr. Carrubba received an option grant for 22,500 shares under the 1996 Directors Plan and the 1997 Plan on December 16, 2005. Such option vests in monthly installments over a one-year period.
On May 25, 2006, the Board of Directors approved a new compensation program for non-employee Directors (the “Director Compensation Program”). The equity portion of the Director Compensation Program is subject to Stockholder approval of the 2006 Equity Incentive Plan, which will be submitted for Stockholder approval at the next Annual Meeting. In establishing the Director Compensation Program, the Compensation Committee and the Board of Directors engaged the services of an independent compensation specialist, Mercer Inc., and took into consideration its recommendations. The Director Compensation Program was designed to reflect current market trends in non-employee Director compensation while seeking to reduce overall compensation. Based on the information compiled by Mercer Inc. and on assumptions the Board and the Compensation Committee deem reasonable, the Board and the Compensation Committee expect that the Director Compensation Program will result in an overall decrease in compensation for non-employee Directors of up to approximately 55%, depending on the performance of the Company’s stock price.
Cash Compensation. Under the Director Compensation Program, each non-employee Director will be paid an annual cash retainer of $30,000, paid in four quarterly installments. The Chairperson of a committee of the Board will receive an
84
additional retainer as follows: an additional $15,000 for the Audit Committee Chairperson, an additional $10,000 for the Compensation Committee Chairperson and an additional $5,000 for the Corporate Governance and Nominating Committee Chairperson. The Chairman of the Board will also receive an additional $20,000 for such service. These changes to the cash compensation portions of the current non-employee Director compensation program will be effective as of October 1, 2006. Consistent with past practice, the Company will reimburse all Directors for certain expenses incurred in connection with their service as Directors in accordance with Company policy.
Equity Compensation. Under the Director Compensation Program, each non-employee Director will be granted a stock option to purchase 24,000 shares of Common Stock upon such Director’s initial election or appointment to the Board of Directors. Such options will generally vest annually over a period of three (3) years. Each non-employee Director will also automatically receive a restricted stock unit (“RSU”) grant of 4,500 units on the date such Director is initially elected or appointed to the Board and each continuing non-employee Director shall receive an additional grant of 4,500 RSUs on the date of each subsequent Annual Meeting of Stockholders following such initial grant. Such RSUs will vest upon the earlier of (i) one year from the grant date and (ii) the next Annual Meeting of Stockholders, and will be paid in Common Stock of the Company. The number of RSUs granted to a non-employee Director joining the Board other than at an Annual Meeting of Stockholders shall be pro-rated based on the amount of time remaining until the next Annual Meeting of Stockholders. In addition to the annual 4,500 RSU grant for all non-employee Directors, the Chairman of the Board (if a non-employee Director) shall receive annually an additional 2,250 RSUs. These changes to the equity compensation portions of the current non-employee Director compensation program will be effective as of the 2006 Annual Meeting of Stockholders, subject to Stockholder approval of the 2006 Equity Incentive Plan.
The following table sets forth a comparison of the current non-employee Director compensation program and the Director Compensation Program:
| | | | | | | | |
| | | Current
Plan | | | Director
Compensation
Program | |
Annual Fee | | $ | 40,000 | | | $ | 30,000 | |
Audit Committee Chair Fee | | $ | 10,000 | | | $ | 15,000 | |
Compensation Committee Chair Fee | | $ | 10,000 | | | $ | 10,000 | |
Corporate Governance and Nominating | | | | | | | | |
Committee Chair Fee | | $ | 0 | | | $ | 5,000 | |
Chairman of the Board - Additional Fee | | $ | 20,000 | | | $ | 20,000 | |
Initial Option Grant | | | 54,000 | shares | | | 24,000 | shares |
Initial RSU Grant | | | None | | | | 4,500 | shares |
Annual Option Grant | | | 22,500 | shares | | | None | |
Annual RSU Grant | | | None | | | | 4,500 | shares |
Chairman of the Board - Additional | | | | | | | | |
Annual Option Grant | | | 22,500 | | | | None | |
Chairman of the Board - Additional | | | | | | | | |
Annual RSU Grant | | | None | | | | 2,250 | |
85
Change of Control and Employment Arrangements
Change of Control Severance Benefit Plan
On June 24, 1999, the Board of Directors adopted the Executive Officers’ Change of Control Severance Benefit Plan (the “Severance Plan”). The following individuals are eligible to receive benefits under the Severance Plan: Group I, currently consisting of no individuals; and Group II, consisting of Thomas R. Melendrez, Stephen W. Michael, and Mir B. Ghaderi. The Board of Directors or the Compensation Committee may, in their sole discretion, designate additional employees as eligible to receive benefits under the Severance Plan. The Severance Plan provides that an eligible employee will receive benefits if the employee’s employment is involuntarily terminated without “cause” or if the employee voluntarily terminates his or her employment for “good reason,” (as each such term is defined in the Severance Plan) in either case within thirteen (13) months following the effective date of a “change of control” (as defined in the Severance Plan) of the Company. Employees in Group I will receive a lump sum payment equal to two (2) times the employee’s annual base salary. Employees in Group II will receive a lump sum payment equal to the greater of (a) one year’s base salary, or (b) one month’s base salary for each complete year of service the employee has provided to the Company, up to a maximum of two (2) times the employee’s annual base salary. In order to receive benefits under the Severance Plan, an employee must execute a release of all claims that the employee may have against the Company and its successors and assigns. In addition, should an employee’s benefits be subject to the excise tax imposed under Section 280G of the U.S. Internal Revenue Code of 1986 (“Section 280G”), the Company will make an additional payment to the employee so that the net amount of such payment (after taxes) received by the employee is sufficient to pay the excise tax due.
Agreement with President and Chief Executive Officer
On August 2, 2005, the Company and Roubik Gregorian entered into an Executive Employment Agreement (the “Employment Agreement”) setting forth the compensation to be provided to Dr. Gregorian in return for his service to the Company as President and Chief Executive Officer.
The Employment Agreement provides for an annual base salary of $450,000, effective as of February 16, 2005, and provides that Dr. Gregorian is eligible to receive an annual target incentive compensation payment for each fiscal year, as determined by the Compensation Committee of the Company’s Board of Directors.
On March 24, 2005, the Compensation Committee approved the grant to Dr. Gregorian of an option to purchase two hundred thousand (200,000) shares of Common Stock under the Company’s 1997 Equity Incentive Plan with an exercise price equal to $13.52, which was the last quoted per share selling price for the Common Stock on The NASDAQ Global Market on March 24, 2005. The shares subject to such option vest and become exercisable in forty-eight (48) equal monthly installments, beginning on April 24, 2005. Such vesting is subject to Dr. Gregorian’s continuing to render services to the Company through each vesting date. The option expires on the date that is the earlier of seven (7) years from the date of grant or three (3) months following the termination of Dr. Gregorian’s service to the Company. On March 24, 2005, the Compensation Committee also approved the grant to Dr. Gregorian of 30,000 shares of restricted stock under the Company’s 1997 Equity Incentive Plan, which stock has a purchase price of $0.0001 per share. The restricted stock is scheduled to vest in annual installments over the three-year period following the date of grant. If Dr. Gregorian ceases to provide services to the Company, the Company has the right to repurchase any shares that are not then vested at the original purchase price. The Employment Agreement references both such option grant and restricted stock grant and provides that Dr. Gregorian is eligible to receive additional options to purchase Common Stock and other equity incentive awards.
The Employment Agreement also provides that Dr. Gregorian shall to be entitled to all rights and benefits for which he is eligible under the terms and conditions of the standard Company benefits and compensation practices that may be in effect from time to time and are provided by the Company to its executive employees generally, including health, disability, life and accidental death insurance coverage. In addition, Dr. Gregorian is entitled to receive the following benefits while employed under the terms of the Employment Agreement:
(a) Dr. Gregorian is eligible to accrue up to twenty-two (22) paid vacation days per year (plus paid holidays), which number of days will increase based on the established graduated scale to the maximum of twenty-five (25) days as his seniority in the Company increases;
(b) the Company will provide Dr. Gregorian with additional life insurance coverage pursuant to a term life insurance policy in an amount equal to one million dollars ($1,000,000);
86
(c) the Company will provide Dr. Gregorian with a monthly automobile allowance equal to two thousand dollars ($2,000);
(d) the Company, pursuant to the terms and conditions of the Company’s Executive Health Plan, will reimburse Dr. Gregorian up to five thousand dollars ($5,000) for each fiscal year for the documented cost of covered medical expenses, without the need for any contribution by Dr. Gregorian; and
(e) the Company will reimburse Dr. Gregorian up to five thousand dollars ($5,000) per year for costs incurred by Dr. Gregorian for obtaining professional services, including but not limited to, legal, tax planning, accounting and investment services.
In the event Dr. Gregorian’s employment is terminated by the Company without cause (as defined in the Employment Agreement) or Dr. Gregorian resigns for good reason (as defined in the Employment Agreement) more than two months before or more than twelve months after a change of control (as defined in the Employment Agreement), Dr. Gregorian will receive the following severance benefits, subject to the execution by Dr. Gregorian of a general release of claims in favor of the Company: (i) a lump sum payment equal to two times his annual base salary, and (ii) continued payment by the Company of group health continuation coverage premiums for Dr. Gregorian and his eligible dependents under COBRA through the lesser of (A) twenty four months or (B) the maximum period of time the Company is required to provide health continuation coverage under COBRA.
In the event Dr. Gregorian’s employment is terminated by the Company without cause or Dr. Gregorian resigns for good reason within two months prior, through twelve months following, a change of control, Dr. Gregorian will receive the following severance benefits, subject to the execution by Dr. Gregorian of a general release of claims in favor of the Company: (i) a lump sum payment equal to two times his annual base salary, (ii) full acceleration of the vesting of the stock option and restricted stock referenced in the Agreement, and (iii) continued payment by the Company of group health continuation coverage premiums for Dr. Gregorian and his eligible dependents under COBRA through the lesser of (A) twenty four months or (B) the maximum period of time the Company is required to provide health continuation coverage under COBRA.
The Employment Agreement provides that the foregoing severance benefits supersede any benefits Dr. Gregorian may have been entitled to under the Severance Plan. The Employment Agreement also provides that should Dr. Gregorian’s aggregate severance benefits trigger the excise tax imposed under Section 280G, the severance benefits will be either be paid in full or reduced to the extent that the excise tax would not apply, whichever results in the greater amount of severance benefits.
The Employment Agreement provides that, subject to the execution by Dr. Gregorian of a general release of claims in favor of the Company, in the event that Dr. Gregorian’s employment is terminated by the Company without cause or Dr. Gregorian resigns for good reason, Dr. Gregorian agrees to be available to the Company for a period of three months to help transition his duties and responsibilities to his successor. Dr. Gregorian will be paid $1,000 per month for such services and his equity awards will continue to vest during such period.
The Employment Agreement has a term of three years, however, Dr. Gregorian’s employment is at-will and both the Company and Dr. Gregorian have the right to terminate Dr. Gregorian’s employment with the Company at any time and for any reason. In the event of a change of control that occurs during the term of the Employment Agreement while Dr. Gregorian continues to remain employed under the Employment Agreement, the term of the Employment Agreement will extend through the later of (i) the one year anniversary of the change of control or (ii) the three year anniversary of the effective date of the Employment Agreement.
The Employment Agreement provides that while Dr. Gregorian is employed by the Company and for one year following the date of the termination of his employment, Dr. Gregorian agrees not to solicit or attempt to solicit any employee of the Company to terminate such employee’s employment.
2006 Executive Incentive Compensation Program
On July 12, 2005, the Compensation Committee approved the Fiscal Year 2006 Executive Incentive Compensation Program (the “Executive Compensation Program”). The purpose of the Executive Compensation Program is to provide incentives to eligible executives for surpassing established revenue and operating income goals derived from the Company’s fiscal year 2006 operating plan. The following executives are currently eligible participants under the Executive
87
Compensation Program: Roubik Gregorian, Mir B. Ghaderi, Stephen W. Michael and Thomas R. Melendrez. The bonus pool payable under the Executive Compensation Program is funded upon achievement of certain revenue and operating income goals and the size of the bonus pool is the sum of the 2006 fiscal year annual base salary of the participants times their respective target award percentages. The Compensation Committee has set such target award percentages between 40-50% of a participant’s base salary. A participant’s payout is determined using the formula set forth in the Executive Compensation Program which is based on such participant’s 2006 fiscal year annual base salary, individual target award percentage, actual corporate revenue and operating income results and personal performance factors. The Company has the right to modify or cancel at any time the Executive Compensation Program.
Separation Agreement with Ronald W. Guire
On June 29, 2006, in connection with the resignation of Ronald W. Guire, the Company’s Executive Vice President, Chief Financial Officer, Assistant Secretary and Director, the Company entered into a separation agreement with Mr. Guire (the “Separation Agreement”). Under the Separation Agreement, Mr. Guire is entitled to severance pay equal to two year’s base salary, two years of continued health benefits, full acceleration of all of his outstanding and unvested stock options and extension of his period in which to exercise his outstanding options until December 31, 2006. In addition, Mr. Guire will provide transition consulting services until the earlier of September 30, 2006 or the date the Company hires a new full-time Chief Financial Officer.
Compensation Committee Interlocks and Insider Participation
As noted above, during the fiscal year ended March 31, 2006, the Compensation Committee consisted of Messrs. Adams, McFarlane, O. Rodriguez and P. Rodriguez, none of whom is an officer or an employee of the Company or had any relationships requiring disclosure by the Company under the SEC’s rules requiring disclosure of certain relationships and related party transactions. No Executive Officer of the Company serves as a member of the board of directors or compensation committee of any entity that has one or more Executive Officers serving as a member of the Company’s Board of Directors or Compensation Committee.
ITEM 12. SECURITY OWNERSHIP OF CERTAIN BENEFICIAL OWNERS AND MANAGEMENT AND RELATED STOCKHOLDER MATTERS
The following table sets forth certain information regarding the beneficial ownership of the Company’s Common Stock as of July 1, 2006:
| | • | | each Stockholder who is known by the Company to own beneficially more than 5% of the Company’s Common Stock; |
| | • | | each of the Company’s President and Chief Executive Officer and the Company’s other four most highly compensated Executive Officers for the 2006 fiscal year; |
| | • | | each of the Company’s Directors; and |
| | • | | all of the Company’s Directors and Executive Officers as a group. |
Unless otherwise indicated, to the Company’s knowledge, all persons listed below have sole voting and investment power with respect to their shares of Common Stock, except to the extent authority is shared by spouses under applicable law. Beneficial ownership is determined in accordance with the rules of the SEC. Applicable percentage ownership is based on 35,974,865 shares of Common Stock outstanding as of July 1, 2006. In computing the number and percentage of shares beneficially owned by a particular person, shares of Common Stock subject to options currently exercisable, or exercisable within sixty (60) days of July 1, 2006, are counted as outstanding, while these shares are not counted as outstanding for computing the percentage ownership of any other person.
88
| | | | | |
| | | Beneficial Ownership(1) | |
Beneficial Owner | | Number Of
Shares | | Percent Of
Total | |
Dimensional Fund Advisors, Inc(2)
1299 Ocean Ave, 11th Floor
Santa Monica, CA 90401 | | 3,355,255 | | 9.33 | % |
Royce and Associates, LLC(3)
1414 Avenue of Americas
New York, NY 10019 | | 2,566,282 | | 7.13 | % |
Lazard Asset Management LLC(4)
30 Rockefeller Plaza
New York, NY 10112 | | 2,504,675 | | 6.96 | % |
Franklin Advisers, Inc(5)
1 Franklin Pkwy
San Mateo, CA 94403 | | 2,487,333 | | 6.91 | % |
Alliance Capital Management L.P.(6)
1290 Avenue of the Americas
New York, New York 10104 | | 2,302,289 | | 6.40 | % |
T. Rowe Price Associates, Inc.(7)
100 E. Pratt Street
Baltimore, MD 21202 | | 1,641,350 | | 4.56 | % |
Frank Carrubba(8) | | 184,474 | | * | |
Guy W. Adams(9) | | 10,000 | | * | |
Richard L. Leza, Sr. | | 1,000 | | * | |
John S. McFarlane(10) | | 55,324 | | * | |
Oscar Rodriguez | | 0 | | — | |
Pete Rodriguez | | 0 | | — | |
Michael Class(11) | | 217,100 | | * | |
Mir B. Ghaderi(12) | | 275,316 | | * | |
Ronald W. Guire(13) | | 605,565 | | 1.66 | % |
Roubik Gregorian(14) | | 985,622 | | 2.68 | % |
Thomas R. Melendrez(15) | | 254,565 | | * | |
All Executive Officers and Non-Employee Directors as a group (12 persons)(16) | | 2,821,582 | | 7.32 | % |
| * | Represents beneficial ownership of less than one percent of the Common Stock. |
89
| (1) | This table is based on information supplied by the Executive Officers, Directors, and principal Stockholders and Schedules 13G filed with the SEC. |
| (2) | Based on Schedule 13G filed with the SEC on February 1, 2006. Dimensional Fund Advisors, Inc. has sole voting power and sole dispositive power with respect to 3,355,255 shares. |
| (3) | Based on Schedule 13G filed with the SEC on January 20, 2006. Royce and Associates, LLC has sole voting power and sole dispositive power with respect to 2,566,282 shares. |
| (4) | Based on Schedule 13G filed with the SEC on January 31, 2006. Lazard Asset Management LLC has 2,462,850 sole voting power and 2,504,675 sole dispositive power with respect to 2,504,675 shares. |
| (5) | Based on Schedule 13G filed with the SEC on February 10, 2006. Franklin Advisers, Inc. has 2,481,900 sole voting power and 2,487,333 sole dispositive power with respect to 2,487,333 shares. Franklin Templeton Portfolio Advisors, Inc. has sole voting power and sole dispositive power with respect to 1,626,941 shares. Franklin Templeton Investments Corp. has sole voting power and sole dispositive power with respect to 276,400 shares. |
| (6) | Based on Schedule 13G filed with the SEC on February 14, 2006. Alliance Capital Management L.P. has 1,957,112 sole voting power and 2,302,289 sole dispositive power with respect to 2,302,289 shares. |
| (7) | Based on Schedule 13G filed with the SEC on February 14, 2006. T. Rowe Price Associates, Inc. has 301,600 sole voting power and 1,641,350 sole dispositive power with respect to 1,641,350 shares. |
| (8) | Includes options to purchase 166,974 shares, of which options to purchase 7,499 shares become exercisable within sixty (60) days from July 1, 2006. |
| (9) | Consists of 4,000 shares owned by GWA Investments, LLC and 6,000 shares owned by GWA Master Fund, LP, in each case which Guy W. Adams may be deemed to beneficially own. |
| (10) | Includes options to purchase 52,324 shares, of which options to purchase 3,750 shares become exercisable within sixty (60) days of July 1, 2006. |
| (11) | Includes options to purchase 216,500 shares. |
| (12) | Includes options to purchase 269,366 shares, of which options to purchase 4,600 shares become exercisable within sixty (60) days of July 1, 2006. |
| (13) | Includes options to purchase 580,020 shares. |
| (14) | Includes options to purchase 839,813 shares, of which options to purchase 7,973 shares become exercisable within sixty (60) days of July 1, 2006. |
| (15) | Includes options to purchase 247,250 shares, of which options to purchase 4,000 shares become exercisable within sixty (60) days of July 1, 2006. |
| (16) | Includes options to purchase 2,573,745 shares, of which options to purchase 30,322 shares become exercisable within sixty (60) days of July 1, 2006. |
90
Equity Compensation Plan Summary
The below table sets forth the status of the Company’s current equity compensation plans.
| | | | | | |
Plan | | Number Of Securities
To Be Issued Upon
Exercise Of
Outstanding Options
As Of March 31, 2006 | | Weighted-average
Exercise Price Of
Outstanding Options ($) | | Number Of Securities
Remaining Available
For Future Issuance
Under Equity
Compensation Plans
As Of March 31, 2006 |
Equity compensation plans approved by Stockholders (1) | | 3,079,501 | | 16.91 | | 2,968,480 |
Equity compensation plans not approved by Stockholders(2) | | 4,429,397 | | 17.64 | | 889,444 |
| | | | | | |
Totals | | 7,508,898 | | 17.34 | | 3,857,924 |
| | | | | | |
| (1) | Includes the 1996 Directors’ Stock Option Plan (options to purchase 947,630 shares with a weighted average exercise price per share of $19.65) and the 1997 Equity Incentive Plan (options to purchase 2,131,871 shares with a weighted average exercise price per share of $15.69). |
| (2) | Consists of the 2000 Equity Incentive Plan (the “2000 Plan”). In September 2000, the Board of Directors approved the 2000 Plan. The 2000 Plan is administered by the Board or a committee of the Board (“Committee”) and provides for the grant of non-statutory options, stock bonuses, rights to purchase restricted stock, or a combination of the foregoing (collectively “Stock Awards”) to employees and consultants in the Company’s service or in the service of the Company’s affiliates. There are 5,318,841 shares of the Company’s Common Stock reserved under the 2000 Plan, and 889,444 shares remain available for future issuance thereunder as of March 31, 2006. |
Options are granted with an exercise price not less than the fair market value of the Company’s Common Stock on the date of grant. The Board or Committee determines when options granted under the 2000 Plan may be exercised. The 2000 Plan provides that vested options may generally be exercised for (a) three (3) months after termination of service other than due to death or disability, (b) twelve (12) months after termination of service as a result of disability, or (c) eighteen (18) months after termination of service as a result of death. The 2000 Plan permits options to be exercised with cash, other shares of the Company’s Common Stock, or any other form of legal consideration acceptable to the Board or Committee. Prior to June 13, 2005, the Board or Committee had the ability to select employees to participate in a program that allowed them to make an irrevocable election to apply a portion of their base salary (minimum of $5,000 and a maximum of $50,000) to the acquisition of an option to purchase shares of the Company’s Common Stock. Recently enacted Internal Revenue Code (the “Code”) Section 409A imposes new requirements on arrangements allowing for the deferral of compensation. In order to avoid the imposition of additional taxes under the Code Section 409A, on June 13, 2005 the Board approved the amendment to the 2000 Plan to eliminate the compensation deferral provision, effective June 13, 2005.
The Board or Committee determines the purchase price of restricted stock as well as the permissible form of consideration to be paid for such stock. The Board or Committee may award eligible participants stock pursuant to a stock bonus agreement in consideration for past services actually rendered to the Company or for the Company’s benefit. Shares of the Company’s Common Stock sold or awarded under the 2000 Plan may be subject to a repurchase option in the Company’s favor, which will lapse at such times as the Board or Committee may determine. The Company may exercise such repurchase option for any or all the unvested shares held by the purchaser upon his or her termination of service with the Company.
In the event of (i) a dissolution or liquidation, (ii) a merger or consolidation in which the Company is not the surviving corporation, (iii) a reverse merger in which the Company is the surviving corporation, but the shares of the Company’s Common Stock outstanding immediately preceding the merger are converted into other property, or (iv) any other capital reorganization in which more than 50% of the Company’s shares entitled to vote are exchanged, excluding in each case a
91
capital reorganization in which the purpose is to change the state of the Company’s incorporation, the 2000 Plan provides that each outstanding Stock Award will fully vest and become exercisable for a period of at least ten (10) days. Outstanding Stock Awards that are not exercised prior to the occurrence of any of the listed events will terminate on the date of such event, unless the successor corporation assumes such awards.
ITEM 13. CERTAIN RELATIONSHIPS AND RELATED TRANSACTIONS
The Company has entered into various arrangements with some of its Executive Officers, all of which are discussed under the Section entitled “Item 11. Executive Compensation—Change of Control and Employment Arrangements.”
The Company has entered into indemnity agreements with certain of its Executive Officers and Directors which provide, among other things, that the Company will indemnify such Executive Officer or Director, under the circumstances and to the extent provided for therein, for expenses, damages, judgments, fines and settlements he/she may be required to pay in actions or proceedings to which he/she is or may be made a party by reason of his/her position as a Director, Executive Officer or other agent of the Company, and otherwise to the full extent permitted under Delaware law and the Company’s Bylaws.
ITEM 14. PRINCIPAL ACCOUNTING FEES AND SERVICES
Fees Paid to Principal Accountants
The following table shows the fees paid or accrued by the Company for the audit and other services provided by PricewaterhouseCoopers LLP for fiscal years 2005 and 2006:
| | | | | | |
Description Of Services | | 2006 | | 2005 |
Audit Fees | | $ | 803,845 | | $ | 608,062 |
Audit-Related Fees | | $ | 32,500 | | | — |
Tax Fees | | | — | | $ | 153,800 |
All Other Fees | | $ | 1,500 | | $ | 4,000 |
| | | | | | |
Total | | $ | 837,845 | | $ | 765,862 |
| | | | | | |
Audit Fees. Audit Fees relate to professional services rendered in connection with the audit of the Company’s annual financial statements and the audit of internal controls and the related management assessment of internal controls, quarterly review of financial statements included in the Company’s 10-Q, and audit services provided in connection with other statutory and regulatory filings. The increase in Audit fees is primarily attributable to the recently required audit of internal controls and the related management assessment of internal controls.
Audit-Related Fees. Audit-Related Fees include professional services reasonably related to the audit of the Company’s financial statements, including but not limited to consultation on accounting standards or transactions and audits of employee benefit plans.
Tax Fees. Tax Fees include professional services related to tax compliance, tax advice and tax planning, including but not limited to the preparation of federal and state tax returns.
All Other Fees. All Other Fees include professional services related to non-audit related consulting services.
Financial Information Systems Design and Implementation Fees. The Company did not engage PricewaterhouseCoopers LLP to provide advice to the Company regarding financial information systems design and implementation during fiscal year 2006.
Audit Committee Pre-Approval Policies and Procedures
The charter of the Company’s Audit Committee requires that the Audit Committee pre-approve all audit and non-audit services provided to the Company by the independent auditors or subsequently approve non-audit services in those circumstances where a subsequent approval is necessary and permissible. All of the 2006 audit fees, audit-related fees and tax fees, and all other fees, were pre-approved by the Audit Committee of the Company’s Board of Directors.
92
The Audit Committee considered whether the provision of audit-related services, tax services, financial information systems design and implementation services and other non-audit services is compatible with the principal accountants’ independence.
PART IV
ITEM 15. EXHIBITS AND FINANCIAL STATEMENT SCHEDULES
(a) The following documents are filed as part of this Form 10-K:
(1) Index to Consolidated Financial Statements. The following Consolidated Financial Statements of Exar Corporation and its subsidiaries are filed as part of this Form 10-K:
(2) Index to Financial Statement Schedules. The following Consolidated Financial Statement Schedule of Exar Corporation and its subsidiaries for each of the years ended March 31, 2006, 2005 and 2004 are filed as part of this Form 10-K:
Schedules not listed above have been omitted because they are not applicable or required, or the information required to be set forth therein is included in the Consolidated Financial Statements or Notes thereto.
(3) Exhibits.
See Exhibit Index on page 96 of this Form 10-K.
93
SIGNATURES
Pursuant to the requirements of Section 13 or 15(d) of the Securities Exchange Act of 1934, the Registrant has duly caused this Report to be signed on its behalf by the undersigned, thereunto duly authorized.
| | |
| EXAR CORPORATION |
| |
| By: | | /s/ ROUBIK GREGORIAN |
| | Roubik Gregorian |
| | Chief Executive Officer, |
| | President and Director |
Date: November 8, 2006
Pursuant to the requirements of the Securities Exchange Act of 1934, this Report has been signed below by the following persons on behalf of the Registrant and in the capacities and on the dates indicated.
| | | | |
Signature | | Title | | Date |
/s/ ROUBIK GREGORIAN | | Chief Executive Officer, President and Director (Principal Executive Officer, Principal Financial and Accounting Officer) | | November 8, 2006 |
| (Roubik Gregorian) | | |
| | |
* | | Chairman of the Board | | November 8, 2006 |
| (Richard L. Leza, Sr.) | | |
| | |
* | | Director | | November 8, 2006 |
| (Guy W. Adams) | | |
| | |
* | | Director | | November 8, 2006 |
| (John McFarlane) | | |
| | |
* | | Director | | |
| (Oscar Rodriguez) | | | November 8, 2006 |
| | |
* | | Director | | |
| (Pete Rodriguez) | | | November 8, 2006 |
| | |
*By: /s/ Roubik Gregorian | | Chief Executive Officer, President and Director (Principal Executive Officer, Principal Financial and Accounting Officer) | | |
Roubik Gregorian Attorney-in-Fact | | | November 8, 2006 |
94
SCHEDULE II
VALUATION AND QUALIFYING ACCOUNTS AND RESERVES
(In thousands)
| | | | | | | | | | | | | |
Classification | | Balance at
Beginning
of Year | | Addition | | | Write-offs and
Recoveries (1) | | Balance
at End
of Year |
Allowance for sales return: | | | | | | | | | | | | | |
| | | | |
Year ended March 31, 2006 | | $ | 787 | | $ | 3,193 | | | $ | 3,015 | | $ | 965 |
Year ended March 31, 2005 | | $ | 856 | | $ | 2,428 | | | $ | 2,497 | | $ | 787 |
Year ended March 31, 2004 | | $ | 942 | | $ | 2,509 | | | $ | 2,595 | | $ | 856 |
| | | | |
Allowance for doubtful accounts: | | | | | | | | | | | | | |
| | | | |
Year ended March 31, 2006 | | $ | 71 | | $ | 38 | | | $ | — | | $ | 109 |
Year ended March 31, 2005 | | $ | 231 | | $ | (11 | ) | | $ | 149 | | $ | 71 |
Year ended March 31, 2004 | | $ | 200 | | $ | 31 | | | $ | — | | $ | 231 |
| (1) | Write-offs and recoveries reflect credits issued to distributors for stock rotations and volume discounts, and write-offs of uncollectible accounts receivable. |
95
EXHIBIT INDEX
| | | | |
Exhibit Footnote | | Exhibit Number | | Description |
| (m) | | 2.1++ | | Purchase Agreement between Exar Corporation and Infineon Technologies North America Corp., dated April 6, 2005. |
| | |
| (a) | | 3.1 | | Amended and Restated Certificate of Incorporation of Exar Corporation. |
| | |
| (d) | | 3.2 | | Certificate of Amendment of Amended and Restated Certificate of Incorporation. |
| | |
| (h) | | 3.3 | | Amended and Restated Bylaws of the Company. |
| | |
| (g) | | 4.1 | | Rights Agreement dated December 15, 1995, between the Company and the First National Bank of Boston. |
| | |
| (e) | | 4.2 | | Amendment of Rights Agreement dated May 1, 2000, between the Company and Fleet National Bank (f/k/a BankBoston, N.A., f/k/a The First National Bank of Boston). |
| | |
| (c) | | 4.3 | | Second Amendment to Rights Agreement dated December 5, 2001 between the Company and Fleet National Bank f/k/a BankBoston, N.A. |
| | |
| (j) | | 4.4 | | Third Amendment of Rights Agreement dated September 9, 2004 between the Company and EquiServe Trust Company, N.A. |
| | |
| (o) | | 4.5 | | Amendment and Termination of Rights Agreement dated July 22, 2005 between Registrant and EquiServe Trust Company, N.A. |
| | |
| (q) | | 10.1* | | 1989 Employee Stock Participation Plan and related Offering documents. |
| | |
| (a) | | 10.2* | | 1991 Stock Option Plan and related forms of stock option grant and exercise. |
| | |
| (a) | | 10.3* | | 1991 Non-Employee Directors’ Stock Option Plan and related forms of stock option grant and exercise. |
| | |
| (f) | | 10.4* | | Fiscal 2001 Key Employee Incentive Compensation Program. |
| | |
| (f) | | 10.5* | | Fiscal 2001 Executive Incentive Compensation Program. |
| | |
| (q) | | 10.6* | | 1996 Non-Employee Directors’ Stock Option Plan and related forms of stock option grant and exercise. |
| | |
| (m) | | 10.7* | | 1997 Equity Incentive Plan and related forms of stock option grant and exercise. |
| | |
| (e) | | 10.8* | | Executive Officers’ Change of Control Severance Benefit Plan. |
| | |
| (m) | | 10.9* | | 2000 Equity Incentive Plan and related forms of stock option grant and exercise. |
| | |
| (k) | | 10.10* | | Executive Employment Agreement between Exar Corporation and Donald L. Ciffone, Jr., dated December 6, 2000, as amended and restated on June 21, 2001, March 28, 2003, June 12, 2003, December 3, 2003 and October 28, 2004. |
| | |
| (f) | | 10.11* | | Form of Letter Agreement Regarding Change of Control for each of the following: Frank P. Carrubba, Raimon L. Conlisk, James E. Dykes, Richard Previte, Donald L. Ciffone, Jr., Michael J. Class, Roubik Gregorian, Ronald W. Guire, Susan J. Hardman, Thomas R. Melendrez, Stephen W. Michael. |
| | |
| (c) | | 10.12* | | Fiscal 2003 Key Employee Incentive Compensation Program. |
| | |
| (c) | | 10.13* | | Fiscal 2003 Executive Incentive Compensation Program. |
| | |
| (i ) | | 10.14* | | Fiscal 2004 Key Employee Incentive Compensation Program. |
| | |
| (i ) | | 10.15* | | Fiscal 2004 Executive Incentive Compensation Program. |
| | |
| (p) | | 10.16*+ | | Fiscal 2005 Executive Incentive Compensation Program. |
| | |
| (p) | | 10.17*+ | | Fiscal 2005 Key Employee Incentive Compensation Program. |
| | |
| (b) | | 10.18 | | Indemnity Agreement between the Company and John S. McFarlane, member of the Company’s Board of Directors. |
| | |
| (k) | | 10.19 | | Agreement Regarding Ongoing Services as Chairman of the Board between Exar Corporation and Donald L. Ciffone, Jr., dated October 29, 2004. |
| | |
| (l ) | | 10.20* | | Grant of Restricted Stock Purchase Right between Exar Corporation and Roubik Gregorian dated March 24, 2005. |
96
| | | | |
Exhibit
Footnote | | Exhibit Number | | Description |
| (m) | | 10.21 | | Compensation Deferral and Option Cancellation Agreement between the Company and John S. McFarlane dated June 13, 2005. |
| | |
| (m) | | 10.22 | | Compensation Deferral and Option Cancellation Agreement between the Company and Raimon L. Conlisk dated June 13, 2005. |
| | |
| (n) | | 10.23*+ | | Fiscal 2006 Executive Incentive Compensation Program. |
| | |
| (n) | | 10.24* | | Executive Employment Agreement between Exar Corporation and Roubik Gregorian. |
| | |
| (q) | | 21.1 | | Subsidiaries of the Company. |
| | |
| (q) | | 23.1 | | Consent of Independent Registered Public Accounting Firm, PricewaterhouseCoopers LLP. |
| | |
| (q) | | 24.1 | | Power of Attorney. Reference is made to the signature page 94. |
| | |
| (q) | | 31.1 | | Chief Executive Officer Certification. |
| | |
| (q) | | 31.2 | | Chief Financial Officer Certification. |
| | |
| (q) | | 32.1 | | Certification of Chief Executive Officer Pursuant to 18 U.S.C. Section 1350, as Adopted Pursuant to Section 906 of the Sarbanes-Oxley Act of 2002. |
| | |
| (q) | | 32.2 | | Certification of Chief Financial Officer Pursuant to 18 U.S.C. Section 1350, as Adopted Pursuant to Section 906 of the Sarbanes-Oxley Act of 2002. |
| (a) | Filed as an exhibit to the Company’s Annual Report on Form 10-K for the fiscal year ended March 31, 1992 and incorporated herein by reference. |
| (b) | Filed as an exhibit to the Company’s Annual Report on Form 10-K for the fiscal year ended March 31, 2004 and incorporated herein by reference. |
| (c) | Filed as an exhibit to the Company’s Quarterly Report on Form 10-Q for the three months ended December 31, 2001, and incorporated herein by reference. |
| (d) | Filed as an exhibit to the Company’s Current Report on Form 8-K, filed on June 23, 2000, and incorporated herein by reference. |
| (e) | Filed as an exhibit to the Company’s Annual Report on Form 10-K for the fiscal year ended March 31, 2000 and incorporated herein by reference. |
| (f) | Filed as an exhibit to the Company’s Annual Report on Form 10-K for the fiscal year ended March 31, 2001 and incorporated herein by reference. |
| (g) | Filed as an exhibit to the Company’s Current Report on Form 8-K filed January 9, 1996, and incorporated herein by reference. |
| (h) | Filed as an exhibit to the Company’s Current Report on Form 8-K filed on November 2, 2005, and incorporated herein by reference. |
| (i) | Filed as an exhibit to the Company’s Quarterly Report on Form 10-Q for the three months ended December 31, 2002, and incorporated herein by reference. |
| (j) | Filed as an exhibit to the Company’s Current Report on Form 8-K, filed on September 15, 2004, and incorporated herein by reference. |
| (k) | Filed as an exhibit to the Company’s Current Report on Form 8-K, filed on November 1, 2004, and incorporated herein by reference. |
| (l) | Filed as an exhibit to the Company’s Current Report on Form 8-K, filed on March 30, 2005 and incorporated herein by reference. |
| (m) | Filed as an exhibit to the Company’s Annual Report on Form 10-K for the fiscal year ended March 31, 2005, and incorporated herein by reference. |
| (n) | Filed as an exhibit to the Company’s Quarterly Report on Form 10-Q for the three months ended June 30, 2005, and incorporated herein by reference. |
97
| (o) | Filed as an exhibit to the Company’s Current Report on Form 8-K, filed on July 25, 2005, and incorporated herein by reference. |
| (p) | Filed as an exhibit to the Company’s Amendment to a Previously Filed Form 10-K on Form 10-K/A, filed on May 2, 2006, and incorporated herein by reference. |
| * | Indicates management contracts or compensatory plans and arrangements filed pursuant for Item 601(B)(10) of Regulation S-K. |
| + | Portions of this agreement have been omitted pursuant to a request for confidential treatment and the omitted portions have been filed separately with the Securities and Exchange Commission. |
| ++ | Portions of this agreement have been omitted pursuant to a request for confidential treatment and the omitted portions have been filed separately with the Securities and Exchange Commission. Schedules, exhibits and similar attachments have also been excluded, copies of which will be furnished supplementally to the Securities and Exchange Commission upon request. |
98