UNITED STATES SECURITIES AND EXCHANGE COMMISSION
WASHINGTON, D.C. 20549
FORM 10-K
x ANNUAL REPORT PURSUANT TO SECTION 13 OR 15(D) OF THE SECURITIES EXCHANGE ACT OF 1934
For the fiscal year ended December 31, 2013
OR
¨ TRANSITION REPORT PURSUANT TO SECTION 13 OR 15(D) OF THE SECURITIES EXCHANGE ACT OF 1934
FOR THE TRANSITION PERIOD FROM TO _______ TO ______
Commission File Number: 000-13580
SUFFOLK BANCORP
(Exact name of registrant as specified in its charter)
New York | | 11-2708279 |
| (State or Other Jurisdiction of Incorporation or Organization) | | (I.R.S. Employer Identification No.) |
| | |
4 West Second Street, P.O. Box 9000, Riverhead, NY | | 11901 |
| (Address of Principal Executive Offices) | | (Zip Code) |
Registrant’s Telephone Number, Including Area Code: (631) 208-2400
Securities registered pursuant to Section 12(b) of the Act:
| Title of each class | Name of each exchange on which registered |
Common Stock, par value $2.50 per share | The NASDAQ Global Select Market |
Securities registered pursuant to Section 12(g) of the Act: None
Indicate by check mark if the Registrant is a well-known seasoned issuer, as defined in Rule 405 of the Securities Act. YES ¨ NO x
Indicate by check mark if the Registrant is not required to file reports pursuant to Section 13 or 15(d) of the Act. YES ¨ NO x
Indicate by check mark whether the Registrant (1) has filed all reports required to be filed by Section 13 or 15(d) of the Securities Exchange Act of 1934 during the preceding 12 months (or for such shorter period that the Registrant was required to file such reports), and (2) has been subject to such filing requirements for the past 90 days. YES x NO ¨
Indicate by check mark whether the registrant has submitted electronically and posted on its corporate Web site, if any, every Interactive Data File required to be submitted and posted pursuant to Rule 405 of Regulation S-T (§ 232.405 of this chapter) during the preceding 12 months (or for such shorter period that the registrant was required to submit and post such files) YES x NO ¨
Indicate by check mark if disclosure of delinquent filers pursuant to Item 405 of Regulation S-K (§ 229.405 of this chapter) is not contained herein and will not be contained, to the best of Registrant’s knowledge, in definitive proxy or information statements incorporated by reference in Part III of this Form 10-K or any amendment to this Form 10-K. x
Indicate by check mark whether the Registrant is a large accelerated filer, an accelerated filer, a non-accelerated filer or a smaller reporting company. See the definitions of “large accelerated filer,” “accelerated filer” and “smaller reporting company” in Rule 12b-2 of the Exchange Act.
Large accelerated filer ¨ | Accelerated filer x | Non-accelerated filer ¨ | Smaller reporting company ¨ |
Indicate by check mark whether the Registrant is a shell company. YES ¨ NO x
The aggregate market value of the common equity held by non-affiliates of the Registrant as of the last business day of the Registrant’s most recently completed second fiscal quarter was $184 million.
As of February 20, 2014, there were 11,573,014 shares of Registrant’s Common Stock outstanding.
Annual Report on Form 10-K
For the Year Ended December 31, 2013
Table of Contents
| | Page |
| | |
| | 3 |
| | |
| PART I | |
| | |
| Item 1. | | 3 |
| | |
| Item 1A. | | 7 |
| | |
| Item 1B. | | 10 |
| | |
| Item 2. | | 11 |
| | |
| Item 3. | | 11 |
| | |
| Item 4. | | 11 |
| | |
| PART II | |
| | |
| Item 5. | | 11 |
| | |
| Item 6. | | 13 |
| | |
| Item 7. | | 14 |
| | |
| Item 7A. | | 29 |
| | |
| Item 8. | | 32 |
| | |
| Item 9. | | 71 |
| | |
| Item 9A. | | 71 |
| | |
| PART III | |
| | |
| Item 10. | | 74 |
| | |
| Item 11. | | 74 |
| | |
| Item 12. | | 74 |
| | |
| Item 13. | | 74 |
| | |
| Item 14. | | 74 |
| | |
| PART IV | |
| | |
| Item 15. | | 75 |
| | |
| | 76 |
DOCUMENTS INCORPORATED BY REFERENCE
Portions of the definitive proxy statement to be used in connection with the Annual Meeting of Stockholders and which is expected to be filed with the Securities and Exchange Commission (“SEC”) within 120 days from December 31, 2013 are incorporated by reference into Part III.
PART I
Suffolk Bancorp (the “Company”) was incorporated in 1985 as a bank holding company. The Company currently owns all of the outstanding capital stock of the Suffolk County National Bank of Riverhead (the “Bank”). The Bank was organized under the national banking laws of the United States in 1890. The Bank is a member of the Federal Reserve System and its deposits are insured by the Federal Deposit Insurance Corporation (“FDIC”) to the extent provided by law. In 1994, the Company acquired all the outstanding capital stock of Hamptons Bancshares, Inc. and merged it into a subsidiary. The income of the Company is primarily derived through the operations of the Bank and its subsidiaries, consisting of the real estate investment trust (“REIT”) Suffolk Greenway, Inc., an insurance agency and two corporations used to acquire foreclosed real estate. The insurance agency and the two corporations used to acquire foreclosed real estate are immaterial to the Company’s operations. The Company had 350 full-time equivalent employees as of December 31, 2013.
The Bank is a full-service bank serving the needs of its local residents through 25 branches, exclusive of four branches scheduled to be closed in the first quarter of 2014, in Nassau and Suffolk Counties, New York and loan production offices in Garden City and Melville, New York. The Bank offers a full line of domestic commercial and retail banking services and wealth management services. The Bank’s primary lending area includes all of Suffolk County and the adjacent markets of Nassau County and New York City. The Bank makes commercial real estate floating and fixed rate loans, commercial and industrial loans to manufacturers, wholesalers, distributors, developers/contractors and retailers and agricultural loans. The Bank also makes loans secured by residential mortgages, and both fixed and floating rate second mortgage loans with a variety of plans for repayment. Real estate construction loans are also offered.
At December 31, 2013, the Company, on a consolidated basis, had total assets of approximately $1.7 billion, total deposits of approximately $1.5 billion and stockholders’ equity of approximately $167 million.
Unless the context otherwise requires, references herein to the Company include the Company and the Bank on a consolidated basis.
Business Segment Reporting
The Bank is a community bank, which offers a wide array of products and services to its customers. Pursuant to its banking strategy, emphasis is placed on building relationships with its customers, as opposed to building specific lines of business. As a result, the Company is not organized around discernible lines of business and prefers to work as an integrated unit to customize solutions for its customers, with business line emphasis and product offerings changing over time as needs and demands change.
Available Information
The Company files Annual Reports on Form 10-K, Quarterly Reports on Form 10-Q, Current Reports on Form 8-K, Proxy Statements on Schedule 14A, and any amendments to those reports, with the United States Securities and Exchange Commission (“SEC”). The public may read and copy any of these materials at the SEC’s Public Reference Room at 100 F Street, NE, Washington, D.C. 20549. Information on the operation of the Public Reference Room can be obtained by calling the SEC at 1-800-SEC-0330 (1-800-732-0330). The SEC also maintains an Internet site (http://www.sec.gov) that contains reports, proxy and information statements, and other information regarding issuers, including the Company, that file electronically with the SEC. The Company also makes these reports available free of charge through its Internet website (http://www.suffolkbancorp.com) as soon as practicably possible after the Company files these reports electronically with the SEC. Information on the Company’s website is not incorporated by reference into this Form 10-K.
Supervision and Regulation
References in this section to applicable statutes and regulations are brief summaries only and do not purport to be complete. It is suggested that the reader review such statutes and regulations in their entirety for a full understanding.
As a consequence of the extensive regulation of commercial banking activities in the United States, the business of the Company and the Bank is particularly susceptible to federal and state legislation that may affect the cost of doing business, modifying permissible activities or enhancing the competitive position of other financial institutions.
The Dodd-Frank Wall Street Reform and Consumer Protection Act (“Dodd-Frank Act”) signed into law in 2011 makes extensive changes to the laws regulating financial services firms. The Dodd-Frank Act also requires significant rulemaking and mandates multiple studies which could result in additional legislative or regulatory action. Under the Dodd-Frank Act federal banking regulatory agencies are required to draft and implement enhanced supervision, examination and capital standards for depository institutions and their holding companies. The enhanced requirements include, among other things, changes to capital, leverage and liquidity standards and numerous other requirements. The Dodd-Frank Act authorizes various new assessments and fees, expands supervision and oversight authority over non-bank subsidiaries, increases the standards for certain covered transactions with affiliates and requires the establishment of minimum leverage and risk-based capital requirements for insured depository institutions. The Dodd-Frank Act also established a new federal Consumer Financial Protection Bureau with broad authority and permits states to adopt stricter consumer protection laws and enforce consumer protection rules issued by the Consumer Financial Protection Bureau. Due to the passage of the Dodd-Frank Act, the standard deposit insurance amount is $250 thousand per depositor per insured bank for each account ownership category. In addition, the FDIC assessment is now based on the Bank’s total average assets less tier 1 capital, instead of deposits, and is computed at lower rates.
Bank Holding Company Regulation
The Company is a bank holding company registered under the Bank Holding Company Act (“BHC Act”) and is subject to supervision and regulation by the Federal Reserve Board. Federal laws subject bank holding companies to particular restrictions on the types of activities in which they may engage and to a range of supervisory requirements and activities, including regulatory enforcement actions, for violation of laws and policies.
Activities Closely Related to Banking
The BHC Act prohibits a bank holding company, with certain limited exceptions, from acquiring direct or indirect ownership or control of any voting shares of any company that is not a bank or from engaging in any activities other than those of banking, managing or controlling banks and certain other subsidiaries or furnishing services to or performing services for its subsidiaries. Bank holding companies also may engage in or acquire interests in companies that engage in a limited set of activities that are closely related to banking or managing or controlling banks. If a bank holding company has become a financial holding company (an “FHC”), it may engage in a broader set of activities, including insurance underwriting and broker-dealer services as well as activities that are jointly determined by the Federal Reserve Board and the Treasury Department to be financial in nature or incidental to such financial activity. FHCs may also engage in activities that are determined by the Federal Reserve to be complementary to financial activities. The Company has not elected to be an FHC at this time but may make such an election at any time so long as the statutory criteria are satisfied. In order to become an FHC, the bank holding company and all subsidiary depository institutions must be well managed and well capitalized. Additionally, all subsidiary depository institutions must have received at least a “satisfactory” rating on its most recent Community Reinvestment Act (“CRA”) examination. At December 31, 2013, the Bank’s CRA rating was “outstanding.”
Safe and Sound Banking Practices
Bank holding companies are not permitted to engage in unsafe and unsound banking practices. The Federal Reserve Board may order a bank holding company to terminate an activity or control of a nonbank subsidiary if such activity or control constitutes a significant risk to the financial safety, soundness or stability of a subsidiary bank and is inconsistent with sound banking principles. Regulation Y also requires a holding company to give the Federal Reserve Board prior notice of any redemption or repurchase of its own equity securities if the consideration to be paid, together with the consideration paid for any repurchases or redemptions in the preceding year, is equal to 10% or more of the company’s consolidated net worth.
The Federal Reserve Board has broad authority to prohibit activities of bank holding companies and their non-banking subsidiaries which represent unsafe and unsound banking practices or which constitute violations of laws or regulations. Notably, the Financial Institutions Reform, Recovery and Enforcement Act of 1989 (“FIRREA”) provides that the Federal Reserve Board can assess civil money penalties for such practices or violations which can be as high as $1 million per day. FIRREA contains expansive provisions regarding the scope of individuals and entities against which such penalties may be assessed.
Annual Reporting and Examinations
The Company is required to file an annual report with the Federal Reserve Board and such additional information as the Federal Reserve Board may require pursuant to the BHC Act. The Federal Reserve Board may examine a bank holding company or any of its subsidiaries and charge the company for the cost of such an examination. The Company is also subject to reporting and disclosure requirements under state and federal securities laws.
New Rules on Regulatory Capital
New regulatory capital rules, released in July 2013, implement higher minimum capital requirements for bank holding companies and banks. The new rules include a new common equity tier 1 capital requirement and establish criteria that instruments must meet in order to be considered common equity tier 1 capital, additional tier 1 capital or tier 2 capital. These enhancements are expected to both improve the quality and increase the quantity of capital required to be held by banking organizations, better equipping the U.S. banking system to deal with adverse economic conditions. The revised capital rules require banks and bank holding companies to maintain a minimum common equity tier 1 capital ratio of 4.5%, a tier 1 capital ratio of 6%, a total capital ratio of 8% and a leverage ratio of 4%. Bank holding companies are also required to hold a capital conservation buffer of common equity tier 1 capital of 2.5% to avoid limitations on capital distributions and executive compensation payments. The revised capital rules also require banks to maintain a common equity tier 1 capital ratio of 6.5%, a tier 1 capital ratio of 8%, a total capital ratio of 10% and a leverage ratio of 5% to be deemed “well capitalized” for purposes of certain rules and prompt corrective action requirements.
The new rules attempt to improve the quality of capital by implementing changes to the definition of capital. Among the most important changes are stricter eligibility criteria for regulatory capital instruments that would disallow the inclusion of instruments, such as trust preferred securities, in tier 1 capital going forward and new constraints on the inclusion of minority interests, mortgage-servicing assets, deferred tax assets and certain investments in the capital of unconsolidated financial institutions. In addition, the new rules require that most regulatory capital deductions be made from common equity tier 1 capital.
Under the new rules, in order to avoid limitations on capital distributions, including dividend payments and certain discretionary bonus payments to executive officers, a banking organization must hold a capital conservation buffer composed of common equity tier 1 capital above its minimum risk-based capital requirements. This buffer will help to ensure that banking organizations conserve capital when it is most needed, allowing them to better weather periods of economic stress. The buffer is measured relative to risk-weighted assets.
Community banks, such as the Bank, will begin transitioning to the new rules on January 1, 2015. The new minimum capital requirements are effective on January 1, 2015, whereas the capital conservation buffer and the deductions from common equity tier 1 capital phase in over time. Phase-in of the capital conservation buffer requirements will begin on January 1, 2016. Although these new capital ratios do not become effective until 2015 and 2016, the banking regulators will expect bank holding companies and banks to meet these requirements well ahead of that date.
The Federal Reserve Board may also set higher capital requirements for holding companies whose circumstances warrant it. For example, holding companies experiencing internal growth or making acquisitions are expected to maintain strong capital positions substantially above the minimum supervisory levels, without significant reliance on intangible assets. At this time, the bank regulatory agencies are more inclined to impose higher capital requirements in order to meet well-capitalized standards and future regulatory change could impose higher capital standards as a routine matter. The Company’s regulatory capital ratios and those of the Bank are in excess of the levels established for “well-capitalized” institutions.
Imposition of Liability for Undercapitalized Subsidiaries
The Federal Deposit Insurance Corporation Improvement Act of 1991 (“FDICIA”) required each federal banking agency to revise its risk-based capital standards to ensure that those standards take adequate account of interest rate risk, concentration of credit risk and the risks of nontraditional activities, as well as reflect the actual performance and expected risk of loss on multifamily mortgages. In accordance with the law, each federal banking agency has specified, by regulation, the levels at which an insured institution would be considered well capitalized, adequately capitalized, undercapitalized, significantly undercapitalized and critically undercapitalized. As of December 31, 2013, the Bank exceeded the capital levels required in order to be deemed well capitalized.
By statute and regulation a bank holding company must serve as a source of financial and managerial strength to each bank that it controls and, under appropriate circumstances, may be required to commit resources to support each such controlled bank. This support may be required at times when the bank holding company may not have the resources to provide the support.
Under the prompt corrective action provisions of FDICIA, if a controlled bank is undercapitalized, then the regulators could require the bank holding company to guarantee the bank’s capital restoration plan. In addition, if the Federal Reserve Board believes that a bank holding company’s activities, assets or affiliates represent a significant risk to the financial safety, soundness or stability of a controlled bank, then the Federal Reserve Board could require the bank holding company to terminate the activities, liquidate the assets or divest the affiliates. The regulators may require these and other actions in support of controlled banks even if such actions are not in the best interests of the bank holding company or its stockholders.
The appropriate federal banking agency may also require a holding company to provide financial assistance to a bank with impaired capital. Under this requirement, in the future the Company could be required to provide financial assistance to Bank should it experience financial distress. Based on our ownership of a national bank subsidiary, the Office of the Comptroller of the Currency (“OCC”) could assess us if the capital of the Bank were to become impaired. If we failed to pay the assessment within three months, the OCC could order the sale of our stock in the Bank to cover the deficiency.
Additionally, FDICIA requires bank regulators to take prompt corrective action to resolve problems associated with insured depository institutions. In the event an institution becomes undercapitalized, it must submit a capital restoration plan. If an institution becomes significantly undercapitalized or critically undercapitalized, additional and significant limitations are placed on the institution. The capital restoration plan of an undercapitalized institution will not be accepted by the regulators unless each company having control of the undercapitalized institution guarantees the subsidiary’s compliance with the capital restoration plan until it becomes adequately capitalized. The Company has control of the Bank for the purpose of this statute.
Acquisitions by Bank Holding Companies
The BHC Act requires every bank holding company to obtain the prior approval of the Federal Reserve Board before it may acquire all or substantially all of the assets of any bank or ownership or control of any voting shares of any bank if after such acquisition it would own or control, directly or indirectly, more than 5% of the voting shares of such bank. In approving bank acquisitions by bank holding companies, the Federal Reserve Board is required to consider the financial and managerial resources and future prospects of the bank holding company and banks concerned, the convenience and needs of the communities to be served and the effect on competition. The Attorney General of the United States may, within 30 days after approval of an acquisition by the Federal Reserve Board, bring an action challenging such acquisition under the federal antitrust laws, in which case the effectiveness of such approval is stayed pending a final ruling by the courts. Under certain circumstances, the 30-day period may be shortened to 15 days.
Interstate Acquisitions
Under the Riegle-Neal Interstate Banking and Branching Efficiency Act (“Riegle-Neal Act”), a bank holding company may acquire banks in states other than its home state, subject to any state requirement that the bank has been organized and operating for a minimum period of time, not to exceed five years, and the requirement that the bank holding company not control, prior to or following the proposed acquisition, more than 10% of the total amount of deposits of insured depository institutions nationwide or, unless the acquisition is the bank holding company’s initial entry into the state, more than 30% of such deposits in the state (or such lesser or greater amount set by the state). The Riegle-Neal Act also authorizes banks to merge across state lines, thereby creating interstate branches. The Dodd-Frank Act permits a national or state bank, with the approval of its regulator, to open a branch in any state if the law of the state in which the branch is located would permit the establishment of the branch if the bank were a bank chartered in that state. National banks may provide trust services in any state to the same extent as a trust company chartered by that state.
Bank Regulation
The Bank is a national bank, which is subject to regulation and supervision primarily by the OCC and secondarily by the Federal Reserve Board and the FDIC. The Bank is subject to requirements and restrictions under federal law, including requirements to maintain reserves against deposits, restrictions on the types and amounts of loans that may be granted and the interest that may be charged thereon and limitations on the types of investments that may be made and the types of services that may be offered. Various consumer laws and regulations also affect the operations of the Bank.
The OCC regularly examines the Bank and records of the Bank. The FDIC may also periodically examine and evaluate insured banks.
Standards for Safety and Soundness
As part of FDICIA’s efforts to promote the safety and soundness of depository institutions and their holding companies, appropriate federal banking regulators are required to have in place regulations specifying operational and management standards (addressing internal controls, loan documentation, credit underwriting and interest rate risk), asset quality and earnings. As discussed above, the Federal Reserve Board, the OCC, and the FDIC have extensive authority to police unsafe or unsound practices and violations of applicable laws and regulations by depository institutions and their holding companies. For example, the FDIC may terminate the deposit insurance of any institution that it determines has engaged in an unsafe or unsound practice. The agencies can also assess civil money penalties of up to $1 million per day, issue cease-and-desist or removal orders, seek injunctions and publicly disclose such actions.
Restrictions on Transactions with Affiliates
Section 23A of the Federal Reserve Act imposes quantitative and qualitative limits on transactions between a bank and any affiliate and requires certain levels of collateral for such loans. It also limits the amount of advances to third parties which are collateralized by the securities or obligations of the Company. Section 23B requires that certain transactions between the Bank and its affiliates must be on terms substantially the same, or at least as favorable, as those prevailing at the time for comparable transactions with or involving other nonaffiliated companies. In the absence of such comparable transactions, any transaction between the Bank and its affiliates must be on terms and under circumstances, including credit standards, which in good faith would be offered to or would apply to nonaffiliated companies.
Governmental Monetary Policies and Economic Conditions
The principal sources of funds essential to the business of banks and bank holding companies are deposits, stockholders’ equity and borrowed funds. The availability of these various sources of funds and other potential sources, such as preferred stock or commercial paper, and the extent to which they are utilized depends on many factors, the most important of which are the Federal Reserve Board’s monetary policies and the relative costs of different types of funds. An important function of the Federal Reserve Board is to regulate the national supply of bank credit in order to combat recession and curb inflationary pressure. Among the instruments of monetary policy used by the Federal Reserve Board to implement these objectives are open market operations in United States government securities, changes in the discount rate on bank borrowings and changes in reserve requirements against bank deposits. The monetary policies of the Federal Reserve Board have had a significant effect on the operating results of commercial banks in the past and are expected to continue to do so in the future. In view of the recent changes in regulations affecting commercial banks and other actions and proposed actions by the federal government and its monetary and fiscal authorities, no prediction can be made as to future changes in interest rates, availability of credit, deposit balances or the overall performance of banks generally or the Company and the Bank in particular.
The Company’s results may be adversely affected if it suffers higher than expected losses on its loans or is required to increase its allowance for loan losses.
The Company assumes credit risk from the possibility that it will suffer losses because borrowers, guarantors, and related parties fail to perform under the terms of their loans. Management tries to minimize and monitor this risk by adopting and implementing what management believes are effective underwriting and credit policies and procedures, including how the Company establishes and reviews the allowance for loan losses. The allowance for loan losses is determined by continuous analysis of the loan portfolio and the analytical process is regularly reviewed and adjustments may be made based on the assessments of internal and external influences on credit quality. Those policies and procedures may still not prevent unexpected losses that could adversely affect our results. Weak economic conditions could adversely impact the ability of borrowers to repay outstanding loans or the value of collateral securing those loans. In addition, deterioration in economic conditions affecting borrowers, new information regarding existing loans, identification of additional problem loans, changes in regulation and regulatory interpretation and other factors, both within and outside of our control, may require an increase in the allowance for loan losses. (See also Part II, Item 7, Loans and Allowance for Loan Losses and Part II, Item 8, Notes 1 and 4 to our Consolidated Financial Statements contained in this Form 10-K for further discussion related to our loan portfolio and our process for determining the appropriate level of the allowance for loan losses.)
The Company operates in a highly regulated environment and its operations and income may be affected adversely by changes in laws and regulations governing its operations.
The Company is subject to extensive regulation and supervision by the Federal Reserve Board, the OCC and the FDIC. Such regulators govern the activities in which the Company may engage. These regulatory authorities have extensive discretion in connection with their supervisory and enforcement activities, including the ability to impose restrictions on a bank’s operations, reclassify assets, determine the adequacy of a bank’s allowance for loan losses and determine the level of deposit insurance premiums assessed. Any change in such regulation and oversight, whether in the form of regulatory policy, new regulations or legislation or additional deposit insurance premiums could have a material adverse impact on the Company’s operations. Any new laws, rules and regulations could make compliance more difficult or expensive or otherwise adversely affect the Company’s business, financial condition or growth prospects. Such changes could subject the Company to additional costs, limit the types of financial services and products the Company may offer and/or increase the ability of non-banks to offer competing financial services and products, among other things.
Recent financial reforms and related regulations may affect our results of operations, financial condition or liquidity.
The Dodd-Frank Act could result in additional legislative or regulatory action. For a description of the Dodd-Frank Act see Part I, Item 1. Business, Supervision and Regulation contained in this Form 10-K. At this time, it is difficult to predict the extent to which the Dodd-Frank Act or the resulting regulations will impact the Company’s business. However, compliance with these new laws and regulations will likely result in additional costs and these additional costs may adversely impact our results of operations, financial condition or liquidity.
As a bank holding company that conducts substantially all of its operations through its banking subsidiary, our ability to pay dividends to stockholders depends upon the results of operations of the Bank and its ability to pay dividends to the Company. Dividends paid by the Bank are subject to limits imposed by law and regulation.
Substantially all of the Company’s activities are conducted through the Bank, and the Company receives substantially all of its funds through dividends from the Bank. The Company’s ability to pay dividends to stockholders depends on the Bank’s ability to pay dividends to the Company. Various laws and regulations limit the amount of dividends that the Bank may pay to the Company. If the Bank is unable to pay dividends to the Company, the Company will not be able to pay dividends to its stockholders.
Changes in interest rates could adversely affect the Company’s results of operations and financial condition.
The Company’s ability to generate net income depends primarily upon our net interest income. Net interest income is income that remains after deducting from total income generated by earning assets the interest expense attributable to the acquisition of the funds required to support earning assets. Income from earning assets includes income from loans, investment securities and short-term investments. The amount of interest income is dependent on many factors including the volume of earning assets, the general level of interest rates, the dynamics of the change in interest rates and the levels of non-performing loans. The cost of funds varies with the amount of funds necessary to support earning assets, the rates paid to attract and hold deposits, rates paid on borrowed funds and the levels of non-interest-bearing demand deposits and equity capital.
Different types of assets and liabilities may react differently, at different times, to changes in market interest rates. Management expects that the Company will periodically experience gaps in the interest-rate sensitivities of its assets and liabilities. That means either our interest-bearing liabilities will be more sensitive to changes in market interest rates than our interest earning assets or vice versa. When interest-bearing liabilities mature or reprice more quickly than interest-earning assets, an increase in market rates of interest could reduce our net interest income. Likewise, when interest-earning assets mature or reprice more quickly than interest-bearing liabilities, falling interest rates could reduce net interest income. Management is unable to predict changes in market interest rates which are affected by many factors beyond our control including inflation, recession, unemployment, money supply and other governmental monetary and fiscal policies, domestic and international events and changes in the United States and other financial markets. Net interest income is not only affected by the level and direction of interest rates, but also by the shape of the yield curve, relationships between interest sensitive instruments and key driver rates, as well as balance sheet growth, client loan and deposit preferences and the timing of changes in these variables.
Management attempts to manage risk from changes in market interest rates, in part, by controlling the mix of interest rate-sensitive assets and interest rate-sensitive liabilities. Management reviews the Company's interest rate risk position and modifies its strategies based on projections to minimize the impact of future interest rate changes. However, interest rate risk management techniques are not exact. A rapid increase or decrease in interest rates could adversely affect our results of operations and financial condition.
Potential impairment in the carrying value of our goodwill could negatively impact our earnings and capital.
At December 31, 2013, the Company had goodwill totaling $814 thousand. Goodwill is reviewed for impairment at least annually or more frequently if events or changes in circumstances indicate that the carrying value may not be recoverable. Given the current economic environment, we could be required to evaluate the recoverability of goodwill prior to our normal annual assessment if we experience disruption in our business and/or sustained market capitalization declines. These types of events and the resulting analyses could result in goodwill impairment charges in the future. These non-cash impairment charges could adversely affect our results of operations or financial condition in future periods.
The Company is subject to risks associated with taxation.
The amount of income taxes the Company is required to pay on its earnings is based on federal and state legislation and regulations. The Company provides for current and deferred taxes in its financial statements, based on its results of operations, business activity, legal structure, interpretation of tax statutes, assessment of risk of adjustment upon audit and application of financial accounting standards. The Company may take tax return filing positions for which the final determination of tax is uncertain. The Company’s net income and earnings per share may be reduced if a federal, state or local authority assesses additional taxes that have not been provided for in the consolidated financial statements. There can be no assurance that the Company will achieve its anticipated effective tax rate either due to a change in tax law, a change in regulatory or judicial guidance or an audit assessment that denies previously recognized tax benefits. Tax provisions of New York State Article 32 allow banking corporations to exclude from income 60% of the dividends it has received from subsidiaries such as a REIT. On various occasions over the course of a number of years, including most recently in 2014, the tax commissioner of New York State has proposed the elimination of this provision, raising the question for New York State banking corporations as to whether this exclusion would remain in effect. Going forward, the Company may not realize the benefits of the exclusion from income of 60% of the dividends received from the REIT, resulting in a higher effective state income tax rate.
The Company’s financial condition and results of operations are dependent on the economy, as well as competition from other banks. Changing economic conditions could adversely impact the Company’s earnings and increase the credit risk of the Company’s loan portfolio.
The Company’s primary market area includes all of Suffolk County, New York and the adjacent markets of Nassau County and New York City. Adverse economic conditions in that market area could reduce the Company’s rate of growth, affect customers’ ability to repay loans and result in higher levels of loan delinquencies, problem assets and foreclosures and a decline in the values of the collateral securing the Company’s loans, any of which could have a material adverse effect on the Company’s business, financial condition and results of operations. General economic conditions, including inflation, unemployment and money supply fluctuations, also may adversely affect the Company’s business, financial condition and results of operations. In addition, competition in the banking industry is intense and the Company’s profitability depends upon its continued ability to successfully compete in its market.
The Company is subject to significant operational risks.
Operational risk is the risk of loss from operations, including fraud by employees or outside persons, employees’ execution of incorrect or unauthorized transactions and breaches of internal control systems. Operational risk also encompasses technology, compliance and legal risk, which is the risk of loss from violations of, or noncompliance with, laws, rules, regulations, prescribed practices or ethical standards, as well as the risk of our noncompliance with contractual and other obligations. The Company is also exposed to operational risk through its outsourcing arrangements and the effect that changes in circumstances or capabilities of its outsourcing vendors can have on the Company’s ability to continue to perform operational functions necessary to its business. Although the Company seeks to mitigate operational risk through a system of internal controls which it reviews and updates, no system of controls, however well designed and maintained, is infallible. Control weaknesses or failures or other operational risks could result in charges, increased operational costs, harm to the Company’s reputation or foregone business opportunities.
A failure in or breach of the Company’s security systems or infrastructure, or those of our third-party service providers, could result in financial losses or in the disclosure or misuse of confidential or proprietary information, including client information.
As a financial institution, the Company may be the target of fraudulent activity that may result in financial losses to the Company and its clients, privacy breaches against its clients or damage to its reputation. Such fraudulent activity may take many forms, including check fraud, electronic fraud, wire fraud, phishing, unauthorized intrusion into or use of the Company’s systems and other dishonest acts. The Company provides its customers the ability to bank remotely, including online over the Internet. The secure transmission of confidential information is a critical element of remote banking. The Company’s network could be vulnerable to unauthorized access, computer viruses, phishing schemes, spam attacks, human error, natural disasters, power loss and other security breaches. The Company may be required to spend significant capital and other resources to protect against the threat of security breaches and computer viruses, or to alleviate problems caused by security breaches or viruses. Given the volume of Internet transactions, certain errors may be repeated or compounded before they can be discovered and rectified. To the extent that the Company’s activities or the activities of its customers involve the storage and transmission of confidential information, security breaches and viruses could expose the Company to claims, litigation and other possible liabilities. Any inability to prevent security breaches or computer viruses could also cause existing customers to lose confidence in the Company’s systems and could adversely affect its reputation, results of operations and ability to attract and maintain customers and businesses. In addition, a security breach could also subject the Company to additional regulatory scrutiny, expose it to civil litigation and possible financial liability and cause reputational damage. The Company’s risk and exposure to these matters remains heightened because of the evolving nature and complexity of the threats from organized cybercriminals and hackers, and the Company’s plans to continue to provide electronic banking services to its customers.
Liquidity risk could impair the Company’s ability to fund operations and jeopardize its financial condition.
Liquidity is essential to the Company’s business. An inability to raise funds through deposits, borrowings, the sale of loans or securities and other sources could have a substantial negative effect on the Company’s liquidity. The Company’s access to funding sources in amounts adequate to finance its activities or on terms that are acceptable to it could be impaired by factors that affect the Company specifically or the banking industry or economy in general. Factors that could detrimentally impact the Company’s access to liquidity sources include a decrease in the level of its business activity as a result of a downturn in the markets in which its loans are concentrated or adverse regulatory action against the Company. The Company’s ability to borrow could also be impaired by factors that are not specific to it, such as a disruption in the financial markets.
The Company may elect or be compelled to seek additional capital in the future, but that capital may not be available when it is needed.
The Company is required by federal regulatory authorities to maintain adequate levels of capital to support its operations. At some point, the Company may need to raise additional capital. If the Company raises additional capital, it may seek to do so through the issuance of, among other things, its common stock. The issuance of additional shares of common stock or convertible securities to new stockholders would be dilutive to the Company’s current stockholders.
The Company’s ability to raise additional capital, if needed, will depend on conditions in the capital markets, economic conditions and a number of other factors, many of which are outside the Company’s control, and on the Company’s financial performance. Accordingly, the Company cannot be assured of its ability to raise additional capital if needed or to raise capital on terms acceptable to the Company. If the Company cannot raise additional capital when needed, its ability to further expand its operations could be materially impaired and its financial condition and liquidity could be materially and adversely affected.
The Company is subject to risks associated with litigation.
The Company is subject to litigation risks as a result of a number of factors and from various sources. Substantial legal liability against the Company could have a material adverse effect or cause significant reputational harm to the Company. For a description of the litigation risks that the Company faces, see Part I, Item 3. Legal Proceedings contained in this Form 10-K.
The price of the Company’s common stock may fluctuate significantly, making it difficult to resell shares of the Company’s common stock at times and prices that stockholders may find attractive.
The Company cannot predict how its common stock will trade in the future. The market value of the Company’s common stock will likely continue to fluctuate in response to a number of factors including the following, many of which are beyond the Company’s control, as well as the other risk factors described herein:
| • | actual or anticipated quarterly fluctuations in the Company’s operating and financial results; |
| • | developments related to investigations, proceedings or litigation involving the Company; |
| • | changes in financial estimates and recommendations by financial analysts; |
| • | dispositions, acquisitions and financings; |
| • | actions of the Company’s current stockholders, including sales of common stock by existing stockholders and the Company’s directors and executive officers; |
| • | fluctuations in the stock price and operating results of the Company’s competitors; |
| • | regulatory developments; and |
| • | developments related to the financial services industry. |
The market value of the Company’s common stock may also be affected by conditions affecting the financial markets in general, including price and trading fluctuations. These conditions may result in volatility in the market prices of stocks generally and, in turn, the Company’s common stock and sales of substantial amounts of the Company’s common stock in the market, in each case that could be unrelated or disproportionate to changes in the Company’s operating performance. These broad market fluctuations may adversely affect the market value of the Company’s common stock.
There may be future sales of additional common stock or other dilution of the Company’s stockholders’ equity, which may adversely affect the market price of the Company’s common stock.
The Company is not restricted from issuing additional common stock, including securities that are convertible into or exchangeable for, or that represent the right to receive, common stock or any substantially similar securities. The market value of the Company’s common stock could decline as a result of sales by the Company of a large number of shares of common stock or similar securities in the market or the perception that such sales could occur.
Anti-takeover provisions could negatively impact the Company’s stockholders.
Provisions in the Company’s charter and bylaws, the corporate law of the State of New York and federal laws and regulations could delay, defer or prevent a third party from acquiring the Company, despite the possible benefit to its stockholders, or otherwise adversely affect the market price of the Company’s common stock. These provisions include the election of directors to staggered terms of three years, advance notice requirements for nominations for election to the Company’s Board of Directors and for proposing matters that stockholders may act on at stockholder meetings and the requirement that directors fill vacancies on the Company’s Board of Directors. In addition, the BHC Act, as amended, and the Change in Bank Control Act of 1978, as amended, together with federal regulations, require that, depending on the particular circumstances, either regulatory approval must be obtained or notice must be furnished to the appropriate regulatory agencies and not disapproved prior to any person or entity acquiring control of a national bank, such as the Bank. These provisions may prevent a merger or acquisition that may be attractive to stockholders and could limit the price investors would be willing to pay in the future for the Company’s common stock. These provisions could also discourage proxy contests and make it more difficult for holders of the Company’s common stock to elect directors other than the candidates nominated by the Company’s Board of Directors.
The Company’s loan portfolio has a high concentration of commercial real estate loans (exclusive of multifamily loans) and its business may be adversely affected by credit risk associated with commercial real estate and a decline in property values.
At December 31, 2013, $469 million, or 44% of the Company’s total gross loan portfolio, was comprised of commercial real estate (exclusive of multifamily loans). This type of lending is generally sensitive to regional and local economic conditions that significantly impact the ability of borrowers to meet their loan payment obligations, making loss levels difficult to predict. Although real estate prices have shown signs of improvement, a decline in real estate values may reduce the value of the real estate collateral securing these types of loans and increase the risk that the Company would incur losses if borrowers default on their loans.
| ITEM 1B. | UNRESOLVED STAFF COMMENTS None. |
The following table sets forth certain information relating to properties owned or used in the Company’s banking activities at December 31, 2013:
| Location | Primary Use | Owned or Leased |
| 4 West Second Street, Riverhead, NY | Corporate Headquarters | Owned |
| 400 Merrick Road, Amityville, NY | Branch Office | Leased |
| 3880 Veterans Memorial Highway, Bohemia, NY | Branch Office | Owned |
| 502 Main Street, Center Moriches, NY | Branch Office | Leased |
| 31525 Main Road, Cutchogue, NY | Branch Office | Leased |
| 21 East Industry Court, Deer Park, NY | Branch Office | Leased |
| 351 Pantigo Road, East Hampton, NY | Branch Office | Owned |
| 99 Newtown Lane, East Hampton, NY | Branch Office | Leased |
| 168 West Montauk Highway, Hampton Bays, NY | Branch Office | Owned |
| 110 Marcus Boulevard, Hauppauge, NY | Branch Office | Leased |
| 460 County Road 111, Manorville, NY (1) | Branch Office | Leased |
| 10900 Main Road, Mattituck, NY (1) | Branch Office | Owned |
| 2801 Route 112, Medford, NY | Branch Office | Leased |
| 159 Route 25A, Miller Place, NY | Branch Office | Leased |
| 541 West Lake Drive, Montauk, NY (1) | Branch Office | Leased |
| 746 Montauk Highway, Montauk, NY | Branch Office | Owned |
| 135 West Broadway, Port Jefferson, NY | Branch Office | Owned |
| 1500-10 Route 112, Port Jefferson Station, NY (1) | Branch Office | Leased |
| 228 East Main Street, Port Jefferson, NY | Branch Office | Leased |
| 1201 Ostrander Avenue, Riverhead, NY | Branch Office | Owned |
| 6 West Second Street, Riverhead, NY | Branch Office | Owned |
| 17 Main Street, Sag Harbor, NY | Branch Office | Owned |
| 161 North Main Street, Sayville, NY | Branch Office | Leased |
| 9926 Route 25A, Shoreham, NY | Branch Office | Leased |
| 222 Middle Country Road, Smithtown, NY | Branch Office | Leased |
| 295 North Sea Road, Southampton, NY | Branch Office | Owned |
| 2065 Wading River-Manor Road, Wading River, NY | Branch Office | Owned |
| 955 Little East Neck Road, West Babylon, NY | Branch Office | Leased |
| 144 Sunset Avenue, Westhampton Beach, NY | Branch Office | Owned |
| 1055 Franklin Avenue, Garden City, NY | Loan Production and Branch Office | Leased |
| 290 Broad Hollow Road, Melville, NY | Loan Production Office | Leased |
| 206 Griffing Avenue, Riverhead, NY | Administrative Office | Owned |
| (1) | Scheduled to be closed in the first quarter of 2014. |
See the information set forth in Note 17. Legal Proceedings in the Notes to Consolidated Financial Statements under Part II, Item 8, which information is incorporated by reference in response to this item.
| ITEM 4. | MINE SAFETY DISCLOSURES Not applicable. |
PART II
| ITEM 5. | MARKET FOR REGISTRANT’S COMMON EQUITY, RELATED STOCKHOLDER MATTERS AND ISSUER PURCHASES OF EQUITY SECURITIES |
At December 31, 2013, the approximate number of common equity stockholders was as follows:
Title of Class: Common Stock
Number of Record Holders: 1,266
The Company’s common stock is traded on the NASDAQ Global Select Market under the symbol SUBK. Following are quarterly high and low closing prices of the Company’s common stock for the years ended December 31, 2013 and 2012 and the quarterly dividends paid during those periods.
| 2013 | | High Close | | | Low Close | | | Dividends | | 2012 | | High Close | | | Low Close | | | Dividends | |
| 1st Quarter | | $ | 14.42 | | | $ | 13.15 | | | $ | - | | 1st Quarter | | $ | 13.82 | | | $ | 11.51 | | | $ | - | |
| 2nd Quarter | | | 17.04 | | | | 13.96 | | | | - | | 2nd Quarter | | | 13.72 | | | | 11.26 | | | | - | |
| 3rd Quarter | | | 19.05 | | | | 16.69 | | | | - | | 3rd Quarter | | | 16.80 | | | | 11.53 | | | | - | |
| 4th Quarter | | | 20.80 | | | | 17.18 | | | | - | | 4th Quarter | | | 15.86 | | | | 12.47 | | | | - | |
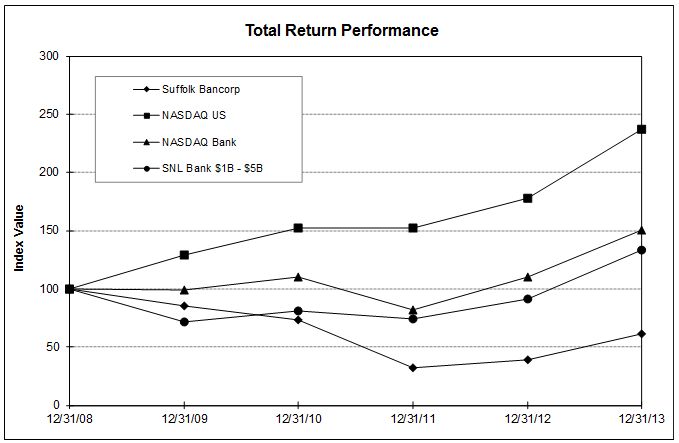
The following Performance Graph compares the yearly percentage change in the Company’s cumulative total stockholder return on its common stock with the cumulative total return of the NASDAQ US Index, the cumulative total return of the NASDAQ Bank index and the cumulative total return of the SNL Bank $1B - $5B index. We believe the newly selected SNL Bank $1B - $5B index, comprised of banks with assets from $1 billion to $5 billion, more accurately represents our asset size peer group than does the NASDAQ Bank index.
| | Period Ending | |
| Index | | 12/31/08 | | | 12/31/09 | | | 12/31/10 | | | 12/31/11 | | | 12/31/12 | | | 12/31/13 | |
| Suffolk Bancorp | | | 100.00 | | | | 85.52 | | | | 73.17 | | | | 31.99 | | | | 38.84 | | | | 61.66 | |
| NASDAQ US | | | 100.00 | | | | 129.26 | | | | 151.94 | | | | 152.42 | | | | 177.46 | | | | 236.88 | |
| NASDAQ Bank | | | 100.00 | | | | 98.65 | | | | 109.85 | | | | 81.92 | | | | 110.37 | | | | 150.79 | |
| SNL Bank $1B - $5B | | | 100.00 | | | | 71.68 | | | | 81.25 | | | | 74.10 | | | | 91.37 | | | | 132.87 | |
Sources: Performance Graph prepared by SNL Financial LC, Charlottesville, VA, NASDAQ Bank and NASDAQ US total return data provided by CRSP.
For information about the Company’s equity compensation plans, please see Part III, Item 12. Security Ownership of Certain Beneficial Owners and Management and Related Stockholder Matters contained in this Form 10-K.
| ITEM 6. | SELECTED FINANCIAL DATA |
The Company’s selected financial data for the last five years follows.
FIVE-YEAR SUMMARY (dollars in thousands, except per share data)
| As of or for the year ended December 31, | | 2013 | | | 2012 | | | 2011 | | | 2010 | | | 2009 | |
| OPERATING RESULTS: | | | | | | | | | | | | | | | |
| Interest income | | $ | 59,678 | | | $ | 60,447 | | | $ | 75,433 | | | $ | 86,276 | | | $ | 87,008 | |
| Interest expense | | | 2,930 | | | | 3,719 | | | | 5,925 | | | | 9,714 | | | | 12,672 | |
| Net interest income | | | 56,748 | | | | 56,728 | | | | 69,508 | | | | 76,562 | | | | 74,336 | |
| Provision for loan losses | | | 1,250 | | | | 8,500 | | | | 24,888 | | | | 32,086 | | | | 4,275 | |
| Net interest income after provision | | | 55,498 | | | | 48,228 | | | | 44,620 | | | | 44,476 | | | | 70,061 | |
| Non-interest income | | | 19,507 | | | | 10,881 | | | | 10,121 | | | | 11,253 | | | | 11,118 | |
| Operating expenses | | | 58,565 | | | | 61,571 | | | | 59,042 | | | | 50,778 | | | | 48,801 | |
| Income (loss) before income taxes | | | 16,440 | | | | (2,462 | ) | | | (4,301 | ) | | | 4,951 | | | | 32,378 | |
| Provision (benefit) for income taxes | | | 3,722 | | | | (714 | ) | | | (4,223 | ) | | | (1,305 | ) | | | 9,830 | |
| Net income (loss) | | $ | 12,718 | | | $ | (1,748 | ) | | $ | (78 | ) | | $ | 6,256 | | | $ | 22,548 | |
| FINANCIAL CONDITION: | | | | | | | | | | | | | | | | | | | | |
| Investment securities | | | 412,446 | | | | 410,388 | | | | 308,519 | | | | 406,606 | | | | 446,343 | |
| Loans | | | 1,068,848 | | | | 780,780 | | | | 969,654 | | | | 1,112,279 | | | | 1,160,379 | |
| Total assets | | | 1,699,816 | | | | 1,622,464 | | | | 1,484,227 | | | | 1,606,867 | | | | 1,694,496 | |
| Total deposits | | | 1,510,061 | | | | 1,431,114 | | | | 1,311,872 | | | | 1,402,753 | | | | 1,385,278 | |
| Borrowings | | | - | | | | - | | | | - | | | | 40,000 | | | | 150,800 | |
| Stockholders' equity | | | 167,198 | | | | 163,985 | | | | 136,560 | | | | 136,820 | | | | 137,171 | |
| SELECTED FINANCIAL RATIOS: | | | | | | | | | | | | | | | | | | | | |
| Performance: | | | | | | | | | | | | | | | | | | | | |
| Return on average stockholders' equity | | | 7.78 | % | | | (1.22 | )% | | | (0.06 | )% | | | 4.42 | % | | | 18.30 | % |
| Return on average assets | | | 0.76 | | | | (0.11 | ) | | | - | | | | 0.37 | | | | 1.36 | |
| Net interest margin (taxable-equivalent) | | | 3.91 | | | | 4.19 | | | | 4.97 | | | | 5.05 | | | | 4.99 | |
| Efficiency ratio | | | 73.64 | | | | 86.22 | | | | 71.83 | | | | 57.82 | | | | 57.11 | |
| Average stockholders' equity to average assets | | | 9.83 | | | | 9.30 | | | | 8.55 | | | | 8.32 | | | | 7.41 | |
| Dividend payout ratio | | | - | | | | - | | | | - | | | | 124.62 | | | | 37.44 | |
| Asset quality: | | | | | | | | | | | | | | | | | | | | |
| Non-performing loans to total loans (1) | | | 1.42 | | | | 2.10 | | | | 8.33 | | | | 2.61 | | | | 1.66 | |
| Non-performing assets to total assets | | | 0.89 | | | | 1.17 | | | | 5.56 | | | | 2.16 | | | | 1.73 | |
| Allowance for loan losses to non-performing loans (1) | | | 113.70 | | | | 108.19 | | | | 49.48 | | | | 98.03 | | | | 63.91 | |
| Allowance for loan losses to total loans (1) | | | 1.62 | | | | 2.28 | | | | 4.12 | | | | 2.56 | | | | 1.06 | |
| Net charge-offs to average loans | | | 0.20 | | | | 3.57 | | | | 1.31 | | | | 1.42 | | | | 0.09 | |
| CAPITAL RATIOS: | | | | | | | | | | | | | | | | | | | | |
| Tier 1 leverage ratio | | | 9.81 | % | | | 9.79 | % | | | 8.85 | % | | | 8.26 | % | | | 8.21 | % |
| Total risk-based capital ratio | | | 15.02 | | | | 18.15 | | | | 14.26 | | | | 12.62 | | | | 11.73 | |
| Tangible common equity ratio | | | 9.68 | | | | 9.96 | | | | 9.05 | | | | 8.38 | | | | 7.97 | |
| COMMON SHARE DATA: | | | | | | | | | | | | | | | | | | | | |
| Net income (loss) per share - fully diluted | | $ | 1.10 | | | $ | (0.17 | ) | | $ | (0.01 | ) | | $ | 0.65 | | | $ | 2.35 | |
| Cash dividends per share | | | - | | | | - | | | | - | | | | 0.81 | | | | 0.88 | |
| Book value per share | | | 14.45 | | | | 14.18 | | | | 14.04 | | | | 14.12 | | | | 14.27 | |
| Tangible book value per share | | | 14.19 | | | | 13.95 | | | | 13.79 | | | | 13.87 | | | | 14.03 | |
| Average common shares outstanding | | | 11,570,731 | | | | 10,248,751 | | | | 9,720,827 | | | | 9,658,534 | | | | 9,602,802 | |
| OTHER INFORMATION: | | | | | | | | | | | | | | | | | | | | |
| Number of full-time-equivalent employees | | | 350 | | | | 373 | | | | 368 | | | | 370 | | | | 368 | |
| Number of branch offices (2) | | | 25 | | | | 30 | | | | 30 | | | | 30 | | | | 29 | |
| Number of ATMs (2) | | | 25 | | | | 30 | | | | 30 | | | | 30 | | | | 29 | |
| (1) | Excluding loans held-for-sale. |
| (2) | 2013 amounts exclusive of four branches scheduled to be closed in the first quarter of 2014. |
| MANAGEMENT’S DISCUSSION AND ANALYSIS OF FINANCIAL CONDITION AND RESULTS OF OPERATIONS |
Safe Harbor Statement Pursuant to the Private Securities Litigation Reform Act of 1995
Certain statements contained in this discussion are “forward-looking statements” within the meaning of the Private Securities Litigation Reform Act of 1995. These can include remarks about the Company, the banking industry, the economy in general, expectations of the business environment in which the Company operates, projections of future performance, and potential future credit experience. These remarks are based upon current management expectations, and may, therefore, involve risks and uncertainties that cannot be predicted or quantified and are beyond the Company’s control and are subject to a variety of uncertainties that could cause future results to vary materially from the Company’s historical performance, or from current expectations. These remarks may be identified by such forward-looking statements as “should,” “expect,” “believe,” “view,” “opportunity,” “allow,” “continues,” “reflects,” “typically,” “usually,” “anticipate,” or similar statements or variations of such terms. Factors that could affect the Company include particularly, but are not limited to: increased capital requirements mandated by the Company’s regulators; the Company’s ability to raise capital; competitive factors, including price competition; changes in interest rates; increases or decreases in retail and commercial economic activity in the Company’s market area; variations in the ability and propensity of consumers and businesses to borrow, repay, or deposit money, or to use other banking and financial services; results of regulatory examinations or changes in law, regulations or regulatory practices; the Company’s ability to attract and retain key management and staff; any failure by the Company to maintain effective internal control over financial reporting; larger-than-expected losses from the sale of assets; the potential that net charge-offs are higher than expected or for further increases in our provision for loan losses; and a failure by the Company to meet the deadlines under SEC rules for filing its periodic reports (or any permitted extension thereof). Further, it could take the Company longer than anticipated to implement its strategic plans to increase revenue and manage non-interest expense, or it may not be possible to implement those plans at all. Finally, new and unanticipated legislation, regulation, or accounting standards may require the Company to change its practices in ways that materially change the results of operations. We have no obligation to update any forward-looking statements to reflect events or circumstances after the date of this document. For more information, see the risk factors described in this Annual Report on Form 10-K and other filings with the Securities and Exchange Commission.
Non-GAAP Disclosure
This discussion includes a non-GAAP financial measure of the Company’s tangible common equity (“TCE”) ratio. A non-GAAP financial measure is a numerical measure of historical or future financial performance, financial position or cash flows that excludes or includes amounts that are required to be disclosed in the most directly comparable measure calculated and presented in accordance with generally accepted accounting principles in the United States (“U.S. GAAP”). The Company believes that this non-GAAP financial measure provides both management and investors a more complete understanding of the underlying operational results and trends and the Company’s marketplace performance. The presentation of this additional information is not meant to be considered in isolation or as a substitute for the numbers prepared in accordance with U.S. GAAP and may not be comparable to similarly titled measures used by other financial institutions.
Executive Summary
The Company is a one-bank holding company incorporated in 1985. The Company operates as the parent for its wholly owned subsidiary, the Bank, a national bank founded in 1890. The income of the Company is primarily derived through the operations of the Bank and the REIT.
The Bank is a full-service bank serving the needs of its local residents through 25 branches, exclusive of four branches scheduled to be closed in the first quarter of 2014, in Nassau and Suffolk Counties, New York and loan production offices in Garden City and Melville, New York. The Bank offers a full line of domestic commercial and retail banking services and wealth management services. The Bank’s primary lending area includes all of Suffolk County and the adjacent markets of Nassau County and New York City. The Bank makes commercial real estate floating and fixed rate loans, commercial and industrial loans to manufacturers, wholesalers, distributors, developers/contractors and retailers and agricultural loans. The Bank also makes loans secured by residential mortgages, and both fixed and floating rate second mortgage loans with a variety of plans for repayment. Real estate construction loans are also offered.
In order to expand the Company geographically into western Suffolk and Nassau Counties and to diversify the lending business of the Company, loan production offices were opened in Garden City and Melville in 2013 and 2012, respectively. As part of our strategy to move westward, the loan production office in Garden City serves the major business markets in central and western Long Island. Seasoned banking professionals have joined the Company to augment both interest and fee income through the origination of commercial and industrial loans, the generation of high quality multifamily and jumbo mortgages to be retained in the portfolio and conforming mortgages for sale in secondary markets. The Bank finances most of its activities with deposits, including demand, saving, N.O.W. and money market deposits, as well as time deposits. It may also rely on other sources of funds, including inter-bank overnight loans. The Company’s chief competition includes local banks within its market area, as well as New York City money center banks and regional banks.
Overview of Results of Operations and Financial Condition for the Year Ended December 31, 2013
At December 31, 2013, the Company, on a consolidated basis, had total assets of $1.7 billion, total deposits of $1.5 billion and stockholders’ equity of $167 million. The Company recorded net income of $12.7 million, or $1.10 per diluted common share, in 2013, compared with a net loss of $1.7 million, or ($0.17) per diluted common share, in 2012. The increase in 2013 net income primarily reflects an $8.6 million improvement in non-interest income, a $7.2 million decrease in the provision for loan losses and a $3.0 million reduction in total operating expenses in 2013 versus 2012. Somewhat offsetting these positive factors was a $4.4 million increase in income tax expense in 2013.
The $8.6 million increase in non-interest income resulted from improvements in several categories, including a $755 thousand increase in income from bank owned life insurance, a $7.8 million gain on the sale of Visa, Inc.’s (“Visa”) Class B shares in 2013 and a $620 thousand increase in the net gain on the sale of securities available for sale. The gain on the sale of the Visa shares and the increase in the net gain on the sale of securities available for sale should not be considered indicative of future results.
Total operating expenses declined by $3.0 million or 4.9% to $58.6 million in 2013 from $61.6 million in 2012, primarily due to reductions in employee compensation and benefits ($2.8 million), other operating expenses ($3.4 million), accounting and audit fees ($553 thousand) and consulting and professional services ($463 thousand). Partially offsetting these improvements was an increase in occupancy expense ($687 thousand), which includes $507 thousand in accelerated depreciation related to two branches closed in 2013 and four branches scheduled to be closed in the first quarter of 2014. Additional one-time branch closing costs of $2.1 million and $231 thousand were recorded in branch consolidation costs and equipment expense, respectively, in 2013.
Net interest income was flat in 2013 versus 2012 as growth in average loans outstanding of $46 million and investment securities were offset by a 28 basis point narrowing of the Company’s net interest margin to 3.91% in 2013 from 4.19% a year ago. Generally, the Company’s net interest margin is impacted not only by the average balance and mix of the Company’s interest-earning assets and interest-bearing liabilities, but also by the level of market interest rates. These rates are significantly influenced by the actions of the Federal Open Market Committee of the Board of Governors of the Federal Reserve System (“FOMC”) policy makers. The Company’s average cost of funds declined by seven basis points to 0.20% in 2013 versus 0.27% a year ago.
The Company recorded income tax expense of $3.7 million in 2013 resulting in an effective tax rate of 22.6% versus an income tax benefit of $714 thousand in 2012.
The Company’s return on average assets and return on average common stockholders’ equity were 0.76% and 7.78%, respectively, for 2013 versus (0.11%) and (1.22%), respectively, for 2012.
The Company experienced an overall increase in the total loan portfolio of $288 million, from $781 million at December 31, 2012 to $1.1 billion at December 31, 2013, a 36.9% year-over-year growth rate. The geographic and product diversification strategies implemented in our lending businesses are working well. Each of our lending businesses, commercial, multifamily and residential, are contributing to this momentum. The Company is increasing market share by preserving our eastern Suffolk lending franchise while simultaneously expanding west.
As part of the Bank’s desire to diversify its portfolio on both a product and geographic basis, an initiative aimed at the development of a multifamily mortgage portfolio has given the Bank more exposure to a favorable geographic area that had previously been a minimal segment of the portfolio. This effort is primarily concentrated in the five boroughs of New York City and targets rent-controlled or rent-stabilized buildings. It has been well-established that the incidence of loss in multifamily loan transactions is lower than almost all other loan categories as their performance over time has shown limited defaults, even during the worst period of the recent recession. The property value for these buildings is directly attributable to the cash flow from rents and the rate of return investors need on their invested capital. Rental rates are a function of demand for apartments and the vacancy rates in New York City (where the majority of the Bank’s assets are located) are currently at historical lows. Average rental rates for an apartment in Manhattan are above $3,000/month for the first time ever. New apartments are coming to market but are being absorbed rapidly.
The Bank has dedicated credit analysts/underwriters and a portfolio manager for the multifamily product line that have extensive experience in this type of lending. The portfolio of multifamily loans continues to perform satisfactorily with no delinquencies reported and risk ratings solidly in the pass range. At December 31, 2013, the Company’s multifamily loans totaled $185 million, and represented 17.3% of the Company’s total loans, compared to only $9 million or 1.2% at December 31, 2012.
The Company’s core deposit franchise continues to be among the best in the region. Core deposits, consisting of demand, N.O.W., saving and money market deposits, totaled $1.3 billion at December 31, 2013, representing 85% of total deposits at that date. Demand deposits totaled $629 million at December 31, 2013 and represented 42% of total deposits at that date. The deposit product mix continues to be a primary strength of the Company and resulted in an average cost of funds of 20 basis points in 2013.
On the expense side, management continues to work diligently to balance the increased investments needed to grow the lending businesses with offsetting operating expense reductions in other areas, and believe we will see continued improvement as we move forward. Several of the major projects previously announced on the expense reduction side are performing better than expected. During 2013 we announced the phased-in closing of six branches in Suffolk County that, once fully implemented, will reduce annual operating expenses by an estimated $2.4 million. Further, the assumptions used in deciding to close these branches relating to deposit runoff and expense savings are proving to be conservative.
Overview of Asset Quality for the Year Ended December 31, 2013
Credit performance strengthened in 2013 as important credit metrics showed improvement. This improvement is largely attributable to the successful conclusion of several negotiated workout transactions, the upgrading of several large relationships to accrual status based on sustained improvement in financial performance and the successful completion of an $8 million sale of both non-accrual and classified loans during the fourth quarter of 2013.
Non-accrual loans, excluding loans categorized as held-for-sale, totaled $15 million or 1.42% of total loans outstanding at December 31, 2013 versus $16 million or 2.10% of loans outstanding at December 31, 2012. At December 31, 2013, approximately 71% of the Company’s non-accrual loans were current with respect to principal and interest payments. The allowance for loan losses as a percentage of total non-accrual loans amounted to 114% at December 31, 2013 versus 108% at December 31, 2012. Total accruing loans delinquent 30 days or more amounted to $3 million or 0.33% of loans outstanding at December 31, 2013 versus $14 million or 1.81% of loans outstanding at December 31, 2012.
Total criticized and classified loans were $43 million at December 31, 2013 versus $99 million at December 31, 2012. Criticized loans are those loans that require some degree of heightened monitoring but are not classified. Classified loans were $37 million at December 31, 2013 as compared to $54 million at December 31, 2012. The allowance for loan losses as a percentage of total classified loans was 47% and 33%, respectively, at the same dates.
At December 31, 2013, the Company had $16 million in troubled debt restructurings (“TDRs”), primarily consisting of commercial and industrial loans, commercial real estate loans and residential mortgages totaling $6 million, $6 million and $4 million, respectively. The Company had TDRs amounting to $17 million at December 31, 2012.
At December 31, 2013, the Company’s allowance for loan losses amounted to $17 million or 1.62% of period-end loans outstanding. The allowance as a percentage of loans outstanding was 2.28% at December 31, 2012.
Net loan charge-offs of $1.8 million, inclusive of a charge-off of $1.5 million incurred in connection with the fourth quarter 2013 loan sale mentioned above, were recorded in 2013 versus $30.7 million in 2012. As a percentage of average total loans outstanding, these net amounts represented 0.20% for 2013 and 3.57% for 2012.
The Company held no OREO at December 31, 2013. The Company held OREO amounting to $1.6 million at December 31, 2012.
The Company’s investment portfolio does not contain any mortgage obligations with underlying collateral that could be classified as sub-prime.
Critical Accounting Policies, Judgments and Estimates
The Company’s accounting and reporting policies conform to U.S. GAAP and general practices within the banking industry. The preparation of the financial statements in conformity with U.S. GAAP requires management to make estimates and assumptions that affect the amounts reported in the financial statements and the accompanying notes. Actual results could differ from those estimates.
Allowance for Loan Losses - In management’s opinion, one of the most critical accounting policies impacting the Company’s financial statements is the evaluation of the allowance for loan losses. The allowance for loan losses is a valuation allowance for probable incurred losses, increased by the provision for loan losses and recoveries, and decreased by loan charge-offs. For all classes of loans, when a loan, in full or in part, is deemed uncollectible, it is charged against the allowance for loan losses. This happens when the loan is past due and the borrower has not shown the ability or intent to make the loan current, or the borrower does not have sufficient assets to pay the debt, or the value of the collateral is less than the balance of the loan and is not considered likely to improve soon. The allowance for loan losses is determined by a continuous analysis of the loan portfolio. Such analysis includes changes in the size and composition of the portfolio, the Company’s own historical loan losses, industry-wide losses, current and anticipated economic trends, and details about individual loans. It also includes estimates of the actual value of collateral, other possible sources of repayment and estimates that are susceptible to significant changes due to changes in appraisal values of collateral, national and regional economic conditions and other relevant factors. All non-accrual loans over $250 thousand in the commercial and industrial, commercial real estate and real estate construction loan classes and all TDRs are evaluated individually for impairment. Management will use judgment to determine if there are other loans outside of these two categories that fit the definition of impaired. All other loans are generally evaluated as homogeneous pools with similar risk characteristics. In assessing the adequacy of the allowance for loan losses, management reviews the loan portfolio by separate classes that have similar risk and collateral characteristics; e.g., commercial and industrial, commercial real estate, multifamily, real estate construction, residential mortgages, home equity and consumer loans.
The allowance for loan losses consists of specific and general components. The specific component relates to loans that are individually classified as impaired. Specific reserves are established based on an analysis of the most probable sources of repayment and liquidation of collateral. Impaired loans that are collateral dependent are reviewed based on their collateral and the estimated time required to recover the Company’s investment in the loans, as well as the cost of doing so, and the estimate of the recovery. Non-collateral dependent impaired loans are reviewed based on the present value of estimated future cash flows, including balloon payments, if any, using the loan’s effective interest rate. While every impaired loan is evaluated individually, not every loan requires a specific reserve. Specific reserves fluctuate based on changes in the underlying loans, anticipated sources of repayment, and charge-offs. The general component covers non-impaired loans and is based on historical loss experience for each loan class from a rolling twelve quarter period and modifying those percentages, if necessary, after adjusting for current qualitative and environmental factors that reflect changes in the estimated collectability of the loan class not captured by historical loss data. These factors augment actual loss experience and help estimate the probability of loss within the loan portfolio based on emerging or inherent risk trends. These qualitative factors are applied as an adjustment to historical loss rates and require judgments that cannot be subjected to exact mathematical calculation. There are no formulas for translating them into a specific basis point adjustment of the Company’s historical loss rate for a pool of loans having similar risk characteristics. These adjustments reflect management’s overall estimate of the extent to which current losses on a pool of loans will differ from historical loss experience. These adjustments are subjective estimates and management reviews them on a quarterly basis. TDRs are also considered impaired with impairment generally measured at the present value of estimated future cash flows using the loan’s effective interest rate at inception or using the fair value of collateral, less estimated costs to sell, if repayment is expected solely from the collateral.
Deferred Tax Assets and Liabilities – Deferred tax assets and liabilities are the expected future tax consequences of temporary differences between the carrying amounts and the tax bases of assets and liabilities, computed using enacted tax rates. Deferred tax assets are recognized if it is more likely than not that a future benefit will be realized. A valuation allowance, if needed, reduces deferred tax assets to the amount expected to be realized. The realization of deferred tax assets (net of a recorded valuation allowance) is largely dependent upon future taxable income, future reversals of existing taxable temporary differences and the ability to carryback losses to available tax years. In assessing the need for a valuation allowance, the Company considers all relevant positive and negative evidence, including taxable income in carryback years, scheduled reversals of deferred tax liabilities, expected future taxable income and available tax planning strategies.
Other-Than-Temporary Impairment (“OTTI”) of Investment Securities – Management evaluates securities for OTTI on at least a quarterly basis, and more frequently when economic or market conditions warrant such an evaluation. For securities in an unrealized loss position, management considers the extent and duration of the unrealized loss, and the financial condition and near-term prospects of the issuer. Management also assesses whether it intends to sell, or it is more likely than not that it will be required to sell, a security in an unrealized loss position before recovery of its amortized cost basis. If either of the criteria regarding intent or requirement to sell is met, the entire difference between amortized cost and fair value is recognized as impairment through earnings. For debt securities that do not meet the aforementioned criteria, the amount of impairment is split into two components as follows: 1) OTTI related to credit loss, which must be recognized in the statement of operations and 2) OTTI related to other factors, which is recognized in other comprehensive income (loss). The credit loss is defined as the difference between the present value of the cash flows expected to be collected and the amortized cost basis. For equity securities, the entire amount of impairment is recognized through earnings.
Material Changes in Financial Condition
Total assets of the Company were $1.7 billion at December 31, 2013. When compared to December 31, 2012, total assets increased by $77 million. This change largely reflects increases in loans, bank owned life insurance and interest-bearing time deposits in other banks of $288 million, $39 million and $10 million, respectively, partially offset by a decline in cash and cash equivalents of $253 million as we continue our redeployment of lower-yielding overnight interest-bearing deposits into higher yielding assets. Total loans were $1.1 billion at December 31, 2013 as compared to $781 million at December 31, 2012. Total investment securities were $412 million at December 31, 2013 and $410 million at December 31, 2012.
The increase in the loan portfolio largely reflects growth of multifamily and commercial real estate loans of $175 million and $109 million, respectively, during 2013. The increase in the investment portfolio largely reflects purchases of U.S. Government agency securities and mortgage-backed securities of U.S. Government-sponsored enterprises of $62 million and $44 million, respectively, during 2013. These were partially offset by sales and principal paydowns of collateralized mortgage obligations (“CMOs”) of U.S. Government-sponsored enterprises totaling $61 million and calls of U.S. Government agency securities of $18 million during 2013. Higher interest rates in 2013 negatively impacted the market value of the Company’s available for sale investment portfolio by approximately $23 million at December 31, 2013 when compared to December 31, 2012.
At December 31, 2013, total deposits were $1.5 billion, an increase of $79 million when compared to December 31, 2012. This increase was primarily due to growth in saving, N.O.W. and money market deposits of $84 million coupled with higher demand deposit balances of $13 million. These were partially offset by decreases in higher-cost time certificates of $100,000 or more and other time deposits of $7 million and $11 million, respectively. Core deposit balances, which consist of demand, saving, N.O.W. and money market deposits, represented 85% and 83% of total deposits at December 31, 2013 and December 31, 2012, respectively. Demand deposit balances represented 42% of total deposits at December 31, 2013 versus 43% at December 31, 2012. The Company had no borrowed funds outstanding at either December 31, 2013 or December 31, 2012.
Material Changes in Results of Operations
2013 versus 2012
The Company recorded net income of $12.7 million for 2013 versus a net loss of $1.7 million in 2012. The increase in 2013 net income primarily reflects an $8.6 million improvement in non-interest income, a $7.2 million decrease in the provision for loan losses and a $3.0 million reduction in total operating expenses in 2013 versus 2012. Somewhat offsetting these positive factors was a $4.4 million increase in income tax expense in 2013.
Net interest income was flat in 2013 versus 2012 as growth in average investment securities and loans outstanding of $93 million and $46 million, respectively, were offset by a 28 basis point narrowing of the Company’s net interest margin to 3.91% in 2013 from 4.19% a year ago. The Company’s average cost of funds declined by seven basis points to 0.20% in 2013 versus 0.27% a year ago.
The Company’s average total interest-earning asset yield for the year ended December 31, 2013 was 4.10%, down 35 basis points from the comparable 2012 period principally due to an 89 basis point reduction in the average yield on the Company’s investment securities portfolio to 3.72% in 2013 from 4.61% in 2012. This is largely a result of principal paydowns on CMOs of U.S. Government-sponsored enterprises and calls of U.S. Government agency securities, as these securities had higher yields than those of the U.S. Government agency securities and mortgage-backed securities of U.S. Government-sponsored enterprises subsequently purchased. In addition, the average yield on the Company’s loans outstanding declined 43 basis points to 5.16% for the year ended December 31, 2013 from 5.59% for the same period in 2012. The lower yields reflect the lower rate environment that has been prevalent.
The Company’s total cost of funds declined by seven basis points to 0.20% for 2013 versus 0.27% in 2012. The Company’s lower funding cost resulted largely from average core deposits of $1.2 billion for the year ended December 31, 2013, with average demand deposits representing 41% of average total deposits. The average cost of time deposits declined 27 basis points to 0.72% in 2013 compared to 2012. The Company also experienced a $13 million decrease in the average balance of time deposits for the year ended December 31, 2013 versus the same period in 2012. (See also Distribution of Assets, Liabilities and Stockholders’ Equity: Net Interest Income and Rates and Analysis of Changes in Net Interest Income contained herein.)
The Company recorded a $1.3 million provision for loan losses for the year ended December 31, 2013 as compared to $8.5 million for the comparable 2012 period. The $1.3 million provision for loan losses recorded in 2013 was due principally to the impact of a charge-off of $1.5 million incurred in connection with the loan sale completed in the fourth quarter of 2013 and should not be considered indicative of future results.
The adequacy of the provision and the resulting allowance for loan losses, which was $17 million at December 31, 2013, is determined by management’s ongoing review of the loan portfolio, including identification and review of individual problem situations that may affect a borrower’s ability to repay, delinquency and non-performing loan data including the current status of criticized and classified loans, collateral values and changes in the size and mix of the loan portfolio. (See also Critical Accounting Policies, Judgments and Estimates and Loans and Allowance for Loan Losses contained herein.)
Non-interest income increased by $8.6 million in the year ended December 31, 2013 versus the comparable 2012 period. This increase was principally due to a $7.8 million pre-tax gain on the sale of 100,000 Visa Class B shares executed in 2013. The Company received these shares in 2008 as part of Visa’s initial public offering. A reserve of $932 thousand was established for potential future reductions in the Visa Class B conversion ratio and was recorded in operating expenses, thereby resulting in a $6.8 million net gain on the sale of Visa Class B shares in 2013. The Company continues to own 38,638 Visa Class B shares subsequent to the sales described here. These shares remain subject to restrictions on the manner of sale of Class B shares. Accordingly, the Company continues to record its Visa Class B shares at zero value pending the outcome of the litigation. To the extent that the Company continues to own Visa Class B shares in the future, the Company expects to record the fair value of those shares upon expiration of the foregoing restriction. Also contributing to the improvement in non-interest income in 2013 versus 2012 was a $755 thousand increase in income from the Company’s $38 million initial investment in bank owned life insurance in 2013. The Company had no such investment prior to 2013. In addition, the Company also recorded a $404 thousand gain on the sale of its Water Mill branch building in 2013. This gain was recorded in other operating income. The Water Mill branch was closed early in the fourth quarter of 2013.
Total operating expenses declined by $3.0 million or 4.9% in 2013 versus 2012 primarily as the result of reductions in employee compensation and benefits, consulting and professional services and accounting and audit fees. Employee compensation and benefits expense declined by $2.8 million or 7.8% in the year ended December 31, 2013 largely due to a $1.7 million non-recurring gain related to the termination of post-retirement life insurance benefits coupled with lower pension costs in 2013 that resulted from a freezing of the Company’s defined benefit plan at December 31, 2012. The Company made significant investments in people and systems in 2013 to implement its growth plans. As a result, the Company was able to realize reduced consulting and professional services expenses of $463 thousand in 2013 as compared to 2012. The decrease of $553 thousand in accounting and audit fees in 2013 versus 2012 was largely due to fees recorded in 2012 and not repeated in 2013 pertaining to the Company’s predecessor independent registered public accounting firm. In addition, other operating expenses in 2012 included $2.3 million in problem assets expense which was not repeated in 2013.
Partially offsetting these lower costs were one-time costs of $2.6 million, including accelerated depreciation, incurred in 2013 related to two branches closed in 2013 and four branches scheduled to be closed in the first quarter of 2014. Of these one-time expenses, the amounts recorded in branch consolidation costs (primarily lease termination costs and severance), occupancy expense and equipment expense were $2.1 million, $276 thousand and $231 thousand, respectively. In addition, reserve and carrying costs related to Visa Class B shares sold of $989 thousand were established in 2013 for potential future reductions in the Visa Class B conversion ratio. There were no such costs in 2012.
The Company recorded income tax expense of $3.7 million in 2013 resulting in an effective tax rate of 22.6% versus an income tax benefit of $714 thousand and an effective tax rate of (29.0%) in 2012. The change in the 2013 effective tax rate was primary due to the Company generating pretax income of $16 million compared to a 2012 pretax loss of $2 million. Furthermore, tax exempt income was augmented in 2013 due to the Company’s $38 million initial investment in bank owned life insurance in 2013.
2012 versus 2011
The Company recorded a net loss of $1.7 million, or ($0.17) per diluted common share, for the year ended December 31, 2012 versus a net loss of $78 thousand, or ($0.01) per diluted common share, in 2011. The increased loss in 2012 resulted from several factors, most notably the significant non-recurring charges associated with the bulk sale of loans in connection with resolving the Company’s legacy credit issues. Other factors included a $12.8 million reduction in net interest income, a $2.5 million increase in operating expenses and a $3.5 million decrease in the income tax benefit in 2012. Partially offsetting these negative factors was a $16.4 million reduction in the provision for loan losses and a $760 thousand improvement in non-interest income in 2012.
The decline in net interest income versus 2011 resulted from a 78 basis point narrowing of the Company’s net interest margin to 4.19% and a $31 million reduction in average interest-earning assets in 2012. The margin contraction was primarily due to a 92 basis point decline in the average yield on interest-earning assets in 2012 resulting from a 52 basis point contraction in the average loan portfolio yield. A shift in the Company’s average interest-earning asset mix from loans (down $153 million) and investment securities (down $28 million) into lower yielding overnight investments (up $152 million) also contributed to the margin contraction in 2012. The Company’s cost of average interest-bearing liabilities declined by 20 basis points in 2012 to 46 basis points from 66 basis points a year ago and the total cost of funds declined by 15 basis points to 27 basis points in 2012 from 42 basis points in 2011.
The $16.4 million reduction in the 2012 provision for loan losses resulted from the significant improvement in the level of criticized and classified assets during 2012. Growth in staff count and expenses associated with problem assets, primarily $1.9 million resulting from the bulk sale of non-performing loans, were the primary drivers of the $2.5 million increase in operating expenses in 2012 versus 2011. The improvement in non-interest income was due to a $1.5 million increase in net gains on the sale of loans in 2012 along with the impact of a non-recurring $1.1 million OTTI charge on two private label CMOs recorded in 2011. Somewhat offsetting these positive factors was a $1.9 million decline in net gains on the sale of securities available for sale in 2012.
Distribution of Assets, Liabilities and Stockholders’ Equity: Net Interest Income and Rates
The following table presents the average daily balances of the Company’s assets, liabilities and stockholders’ equity, together with an analysis of net interest earnings and average rates, for each major category of interest-earning assets and interest-bearing liabilities. Interest and average rates are computed on a fully taxable-equivalent basis (dollars in thousands):
| For the Years Ended December 31, | | | | | 2013 | | | | | | | | | 2012 | | | | | | | | | 2011 | | | | |
| | Average | | | | | | Average | | | Average | | | | | | Average | | | Average | | | | | | Average | |
| | Balance | | | Interest | | | Rate | | | Balance | | | Interest | | | Rate | | | Balance | | | Interest | | | Rate | |
| Interest-earning assets | | | | | | | | | | | | | | | | | | | | | | | | | | | |
| Securities: | | | | | | | | | | | | | | | | | | | | | | | | | | | |
| Taxable | | $ | 252,454 | | | $ | 6,342 | | | | 2.51 | % | | $ | 152,561 | | | $ | 5,559 | | | | 3.64 | % | | $ | 163,422 | | | $ | 6,302 | | | | 3.86 | % |
| Tax-exempt | | | 171,512 | | | | 9,446 | | | | 5.51 | | | | 178,674 | | | | 9,727 | | | | 5.44 | | | | 196,138 | | | | 10,433 | | | | 5.32 | |
| Total securities | | | 423,966 | | | | 15,788 | | | | 3.72 | | | | 331,235 | | | | 15,286 | | | | 4.61 | | | | 359,560 | | | | 16,735 | | | | 4.65 | |
| Federal Reserve Bank, Federal Home Loan Bank and other stock | | | 2,937 | | | | 146 | | | | 4.97 | | | | 2,439 | | | | 121 | | | | 4.96 | | | | 3,412 | | | | 191 | | | | 5.60 | |
| Federal funds sold and interest-bearing deposits with banks | | | 209,834 | | | | 591 | | | | 0.28 | | | | 247,548 | | | | 599 | | | | 0.24 | | | | 95,925 | | | | 232 | | | | 0.24 | |
| Loans (including non-accrual loans): | | | | | | | | | | | | | | | | | | | | | | | | | | | | | | | | | | | | |
| Taxable | | | 898,771 | | | | 46,404 | | | | 5.16 | | | | 859,790 | | | | 48,083 | | | | 5.59 | | | | 1,012,835 | | | | 61,844 | | | | 6.11 | |
| Tax-exempt | | | 6,842 | | | | 353 | | | | 5.16 | | | | - | | | | - | | | | - | | | | - | | | | - | | | | - | |
| Total loans | | | 905,613 | | | | 46,757 | | | | 5.16 | | | | 859,790 | | | | 48,083 | | | | 5.59 | | | | 1,012,835 | | | | 61,844 | | | | 6.11 | |
| Total interest-earning assets | | | 1,542,350 | | | $ | 63,282 | | | | 4.10 | % | | | 1,441,012 | | | $ | 64,089 | | | | 4.45 | % | | | 1,471,732 | | | $ | 79,002 | | | | 5.37 | % |
| Cash and due from banks | | | 60,426 | | | | | | | | | | | | 56,076 | | | | | | | | | | | | 38,562 | | | | | | | | | |
| Other non-interest-earning assets | | | 60,624 | | | | | | | | | | | | 40,282 | | | | | | | | | | | | 80,694 | | | | | | | | | |
| Total assets | | $ | 1,663,400 | | | | | | | | | | | $ | 1,537,370 | | | | | | | | | | | $ | 1,590,988 | | | | | | | | | |
| | | | | | | | | | | | | | | | | | | | | | | | | | | | | | | | | | | | |
| Interest-bearing liabilities | | | | | | | | | | | | | | | | | | | | | | | | | | | | | | | | | | | | |
| Saving, N.O.W. and money market deposits | | $ | 623,519 | | | $ | 1,190 | | | | 0.19 | % | | $ | 547,390 | | | $ | 1,192 | | | | 0.22 | % | | $ | 588,508 | | | $ | 1,960 | | | | 0.33 | % |
| Time deposits | | | 242,807 | | | | 1,740 | | | | 0.72 | | | | 255,341 | | | | 2,527 | | | | 0.99 | | | | 285,821 | | | | 3,310 | | | | 1.16 | |
| Total saving and time deposits | | | 866,326 | | | | 2,930 | | | | 0.34 | | | | 802,731 | | | | 3,719 | | | | 0.46 | | | | 874,329 | | | | 5,270 | | | | 0.60 | |
| Federal funds purchased and securities sold under agreements to repurchase | | | 17 | | | | - | | | | 0.37 | | | | 30 | | | | - | | | | 0.55 | | | | 128 | | | | 1 | | | | 0.78 | |
| Other borrowings | | | 5 | | | | - | | | | 0.39 | | | | 27 | | | | - | | | | 0.39 | | | | 20,142 | | | | 654 | | | | 3.24 | |
| Total interest-bearing liabilities | | | 866,348 | | | | 2,930 | | | | 0.34 | | | | 802,788 | | | | 3,719 | | | | 0.46 | | | | 894,599 | | | | 5,925 | | | | 0.66 | |
| Total cost of funds | | | | | | | | | | | 0.20 | | | | | | | | | | | | 0.27 | | | | | | | | | | | | 0.42 | |
| Rate spread | | | | | | | | | | | 3.76 | | | | | | | | | | | | 3.99 | | | | | | | | | | | | 4.71 | |
| Demand deposits | | | 608,580 | | | | | | | | | | | | 554,617 | | | | | | | | | | | | 518,499 | | | | | | | | | |
| Other non-interest-bearing liabilities | | | 24,982 | | | | | | | | | | | | 37,011 | | | | | | | | | | | | 41,796 | | | | | | | | | |
| Total liabilities | | | 1,499,910 | | | | | | | | | | | | 1,394,416 | | | | | | | | | | | | 1,454,894 | | | | | | | | | |
| Stockholders' equity | | | 163,490 | | | | | | | | | | | | 142,954 | | | | | | | | | | | | 136,094 | | | | | | | | | |
| Total liabilities and stockholders' equity | | $ | 1,663,400 | | | | | | | | | | | $ | 1,537,370 | | | | | | | | | | | $ | 1,590,988 | | | | | | | | | |
| Net interest income (taxable-equivalent basis) and interest rate margin | | | | | | | 60,352 | | | | 3.91 | % | | | | | | 60,370 | | | | 4.19 | % | | | | | | | 73,077 | | | | 4.97 | % |
| Less: taxable-equivalent basis adjustment | | | | | | | (3,604 | ) | | | | | | | | | | | (3,642 | ) | | | | | | | | | | | (3,569 | ) | | | | |
| Net interest income | | | | | | $ | 56,748 | | | | | | | | | | | $ | 56,728 | | | | | | | | | | | $ | 69,508 | | | | | |
Interest income on a taxable-equivalent basis includes the additional amount of interest income that would have been earned if the Company’s investment in tax-exempt securities and loans had been subject to New York State and federal income taxes yielding the same after-tax income. The rate used for this adjustment was approximately 34% for federal income taxes, 3.5% for New York State income taxes for 2013 and 2012 and 9% for New York State income taxes for 2011. Loan fees included in interest income amounted to $1.1 million, $1.3 million and $1.0 million in 2013, 2012 and 2011, respectively.
Analysis of Changes in Net Interest Income
The following table presents a comparative analysis of the changes in the Company’s interest income and interest expense due to the changes in the average volume and the average rates earned on interest-earning assets and due to the changes in the average volume and the average rates paid on interest-bearing liabilities. Interest and average rates are computed on a fully taxable-equivalent basis. Variances in rate/volume relationships have been allocated proportionately to the amount of change in average volume and average rate (in thousands):
| | In 2013 over 2012 | | | In 2012 over 2011 | |
| | Changes Due to | | | Changes Due to | |
| | | Volume | | | Rate | | | Net Change | | | Volume | | | Rate | | | Net Change | |
| Interest-earning assets | | | | | | | | | | | | | | | | | | |
| Securities: | | | | | | | | | | | | | | | | | | |
| Taxable | | $ | 2,873 | | | $ | (2,090 | ) | | $ | 783 | | | $ | (824 | ) | | $ | 81 | | | $ | (743 | ) |
| Tax-exempt | | | (393 | ) | | | 112 | | | | (281 | ) | | | (946 | ) | | | 240 | | | | (706 | ) |
| Total securities | | | 2,480 | | | | (1,978 | ) | | | 502 | | | | (1,770 | ) | | | 321 | | | | (1,449 | ) |
| Federal Reserve Bank, Federal Home Loan Bank and other stock | | | 25 | | | | - | | | | 25 | | | | (50 | ) | | | (20 | ) | | | (70 | ) |
| Federal funds sold and interest-bearing deposits with banks | | | (98 | ) | | | 90 | | | | (8 | ) | | | 367 | | | | - | | | | 367 | |
| Loans (including non-accrual loans): | | | | | | | | | | | | | | | | | | | | | | | | |
| Taxable | | | 2,118 | | | | (3,797 | ) | | | (1,679 | ) | | | (8,840 | ) | | | (4,921 | ) | | | (13,761 | ) |
| Tax-exempt | | | 353 | | | | - | | | | 353 | | | | - | | | | - | | | | - | |
| Total loans | | | 2,471 | | | | (3,797 | ) | | | (1,326 | ) | | | (8,840 | ) | | | (4,921 | ) | | | (13,761 | ) |
| Total interest-earning assets | | | 4,878 | | | | (5,685 | ) | | | (807 | ) | | | (10,293 | ) | | | (4,620 | ) | | | (14,913 | ) |
| | | | | | | | | | | | | | | | | | | | | | | | |
| Interest-bearing liabilities | | | | | | | | | | | | | | | | | | | | | | | | |
| Saving, N.O.W. and money market deposits | | | 155 | | | | (157 | ) | | | (2 | ) | | | (129 | ) | | | (639 | ) | | | (768 | ) |
| Time deposits | | | (119 | ) | | | (668 | ) | | | (787 | ) | | | (331 | ) | | | (452 | ) | | | (783 | ) |
| Total saving and time deposits | | | 36 | | | | (825 | ) | | | (789 | ) | | | (460 | ) | | | (1,091 | ) | | | (1,551 | ) |
| Federal funds purchased and securities sold under agreements to repurchase | | | - | | | | - | | | | - | | | | (1 | ) | | | - | | | | (1 | ) |
| Other borrowings | | | - | | | | - | | | | - | | | | (327 | ) | | | (327 | ) | | | (654 | ) |
| Total interest-bearing liabilities | | | 36 | | | | (825 | ) | | | (789 | ) | | | (788 | ) | | | (1,418 | ) | | | (2,206 | ) |
| Net change in net interest income (taxable-equivalent basis) | | $ | 4,842 | | | $ | (4,860 | ) | | $ | (18 | ) | | $ | (9,505 | ) | | $ | (3,202 | ) | | $ | (12,707 | ) |
Investment Securities
The Company’s investment policy is conservative in nature and investment securities are purchased only after a disciplined evaluation to ensure that they are the most appropriate asset available given the Company’s objectives. Several key factors are considered before executing any transaction including:
| · | Liquidity – the ease with which the security can be pledged or sold. |
| · | Credit quality – the likelihood the security will perform according to its original terms with timely payments of principal and interest. |
| · | Yield – the rate of return on the investment balanced against liquidity and credit quality. |
The Company also considers certain key risk factors in its selection of investment securities:
| · | Market risk – can be defined as the sensitivity of the portfolio’s market value to changes in the level of interest rates. The market value of fixed-rate securities increases when interest rates fall and decreases when interest rates rise. The longer the duration of the security, the greater sensitivity to changes in interest rates. |
| · | Income risk – is identified as the time period over which fixed payments associated with an investment security can be assured. The shorter the duration of the security, the greater this risk. |
| · | Asset/liability management – seeks to limit the change in net interest income as a result of changing interest rates. In a rising rate environment when the maturities or the intervals between the repricing of investments are longer than those of the liabilities that fund them, net interest income will decline. This is referred to as a liability-sensitive position. Conversely, when investments mature or are repriced sooner than their funding sources, net interest income will increase as interest rates rise. Asset/liability management attempts to manage the duration of the loan and investment portfolios, as well as that of all funding, to minimize the risk to net interest income while maximizing returns. Security selection is governed by the Company’s investment policy and serves to supplement the Company’s asset/liability position. |
The Company seeks to create an investment portfolio that is diversified across different classes of assets. At December 31, 2013, the majority of the Company’s portfolio consisted of investments in municipal securities, U.S. Government agency obligations, mortgage-backed securities (“MBS”) and CMOs. MBS are backed by a pool of mortgages in which investors share payments based on the percentage of the pool they own. The cash flows associated with CMOs are assigned to specific securities, or tranches, in the order in which they are received. Analysis of CMOs requires careful due diligence of the mortgages that serve as the underlying collateral. The Company does not own any mortgage obligations with underlying collateral that could be classified as sub-prime. Tranche structure, final maturity and credit support also provide improved assurance of repayment. The investment portfolio provides collateral for various liabilities to municipal depositors as well as enhances the Company’s liquidity position through cash flows and the ability to pledge these assets to secure various borrowing lines.
The Company’s average investment portfolio grew by $93 million to $424 million in 2013 compared to $331 million in 2012. The components of the average investment portfolio and the year-over-year net changes are presented below (in thousands).
| For the Years Ended December 31, | | 2013 | | | 2012 | | | | |
| | Average Balance | | | Net Change | |
| U.S. Treasury securities | | $ | 12 | | | $ | 3,526 | | | $ | (3,514 | ) |
| U.S. Government agency securities | | | 91,412 | | | | 13,683 | | | | 77,729 | |
| Corporate bonds | | | 16,073 | | | | 6,607 | | | | 9,466 | |
| Collateralized mortgage obligations | | | 53,143 | | | | 110,615 | | | | (57,472 | ) |
| Mortgage-backed securities | | | 91,814 | | | | 18,130 | | | | 73,684 | |
| Obligations of states and political subdivisions | | | 171,512 | | | | 178,674 | | | | (7,162 | ) |
| Total investment securities | | $ | 423,966 | | | $ | 331,235 | | | $ | 92,731 | |
The increase in the average investment portfolio largely reflects purchases of U.S. Government agency securities and mortgage-backed securities of U.S. Government-sponsored enterprises during 2013. These were partially offset by sales and principal paydowns of CMOs of U.S. Government-sponsored enterprises and calls of U.S. Government agency securities during the same 2013 period.
The following table summarizes the Company’s investment securities available for sale and held to maturity for each period (in thousands):
| At December 31, | | 2013 | | | 2012 | |
| Investment securities available for sale: | | | | | | |
| U.S. Treasury securities | | $ | - | | | $ | 500 | |
| U.S. Government agency securities | | | 100,095 | | | | 65,078 | |
| Corporate bonds | | | 15,651 | | | | 16,198 | |
| Collateralized mortgage obligations | | | 30,104 | | | | 89,692 | |
| Mortgage-backed securities | | | 97,767 | | | | 62,450 | |
| Obligations of states and political subdivisions | | | 157,163 | | | | 168,435 | |
| Total investment securities available for sale | | | 400,780 | | | | 402,353 | |
| Investment securities held to maturity: | | | | | | | | |
| Obligations of states and political subdivisions | | | 11,666 | | | | 8,035 | |
| Total investment securities held to maturity | | | 11,666 | | | | 8,035 | |
| Total investment securities | | $ | 412,446 | | | $ | 410,388 | |
The following table presents the distribution by contractual maturity and the approximate weighted-average yields of the Company’s investment portfolio at December 31, 2013 (dollars in thousands). Available for sale securities are shown at estimated fair value and held to maturity securities are shown at amortized cost.
| | Maturity (in years) | | | | | | | |
| | | Within 1 | | | Yield | | | After 1 but within 5 | | | Yield | | | After 5 but within 10 | | | Yield | | | After 10 | | | Yield | | | Total | | | Yield | |
| Investment securities available for sale: | | | | | | | | | | | | | | | | | | | | | | | | | | | | | | |
| U.S. Government agency securities | | $ | - | | | | - | % | | $ | - | | | | - | % | | $ | 79,737 | | | | 2.41 | % | | $ | 20,358 | | | | 2.94 | % | | $ | 100,095 | | | | 2.52 | % |
| Corporate bonds | | | - | | | | - | | | | 6,970 | | | | 2.25 | | | | 8,681 | | | | 2.36 | | | | - | | | | - | | | | 15,651 | | | | 2.31 | |
| Collateralized mortgage obligations (1) | | | 5,802 | | | | 4.70 | | | | 15,653 | | | | 4.31 | | | | 8,649 | | | | 1.89 | | | | - | | | | - | | | | 30,104 | | | | 3.69 | |
| Mortgage-backed securities (1) | | | 19 | | | | 7.37 | | | | 19,268 | | | | 1.48 | | | | 78,480 | | | | 2.19 | | | | - | | | | - | | | | 97,767 | | | | 2.05 | |
| Obligations of states and political subdivisions (2) | | | 6,507 | | | | 5.68 | | | | 95,120 | | | | 5.68 | | | | 55,536 | | | | 5.47 | | | | - | | | | - | | | | 157,163 | | | | 5.61 | |
| Total investment securities available for sale | | | 12,328 | | | | 5.22 | | | | 137,011 | | | | 4.76 | | | | 231,083 | | | | 3.05 | | | | 20,358 | | | | 2.94 | | | | 400,780 | | | | 3.69 | |
| Investment securities held to maturity: | | | | | | | | | | | | | | | | | | | | | | | | | | | | | | | | | | | | | | | | |
| Obligations of states and political subdivisions (2) | | | 824 | | | | 4.81 | | | | 6,618 | | | | 6.16 | | | | 205 | | | | 5.92 | | | | 4,019 | | | | 5.39 | | | | 11,666 | | | | 5.80 | |
| Total investment securities held to maturity | | | 824 | | | | 4.81 | | | | 6,618 | | | | 6.16 | | | | 205 | | | | 5.92 | | | | 4,019 | | | | 5.39 | | | | 11,666 | | | | 5.80 | |
| Total investment securities | | $ | 13,152 | | | | 5.20 | % | | $ | 143,629 | | | | 4.82 | % | | $ | 231,288 | | | | 3.05 | % | | $ | 24,377 | | | | 3.34 | % | | $ | 412,446 | | | | 3.75 | % |
| (1) | Assumes maturity dates pursuant to average lives. |
| (2) | The yields on obligations of states & political subdivisions are at a fully taxable-equivalent basis. |
As a member of the Federal Reserve Bank (“FRB”) and the Federal Home Loan Bank (“FHLB”), the Bank owns 27,735 shares and 14,652 shares of FRB and FHLB stock, respectively, with a book value of $1.4 million and $1.5 million, respectively, at December 31, 2013. There is no public market for these shares. The last dividends paid were 6.00% on FRB stock in December 2013 and 4.00% on FHLB stock in November 2013.
Management evaluates securities for OTTI on at least a quarterly basis, and more frequently when economic or market conditions warrant such an evaluation. For securities in an unrealized loss position, management considers the extent and duration of the unrealized loss, and the financial condition and near-term prospects of the issuer. Management also assesses whether it intends to sell, or it is more likely than not that it will be required to sell, a security in an unrealized loss position before recovery of its amortized cost basis. If either of the criteria regarding intent or requirement to sell is met, the entire difference between amortized cost and fair value is recognized as impairment through earnings. For debt securities that do not meet the aforementioned criteria, the amount of impairment is split into two components as follows: 1) OTTI related to credit loss, which must be recognized in the statement of operations and 2) OTTI related to other factors, which is recognized in other comprehensive income (loss). The credit loss is defined as the difference between the present value of the cash flows expected to be collected and the amortized cost basis. For equity securities, the entire amount of impairment is recognized through earnings. The Company did not recognize any OTTI-related charges during 2013.
The Bank was a member of the Visa USA payment network and was issued Class B shares upon Visa’s initial public offering in March 2008. The Visa Class B shares are transferable only under limited circumstances until they can be converted into shares of the publicly traded class of stock. This conversion cannot happen until the settlement of certain litigation, which is indemnified by Visa members. Since its initial public offering, Visa has funded a litigation reserve based upon a change in the ratio for conversion of Visa Class B shares into Visa Class A shares. At its discretion, Visa may continue to increase the conversion rate in connection with any settlements in excess of amounts then in escrow for that purpose and reduce the conversion rate to the extent that it adds any funds to the escrow in the future. Based on the existing transfer restriction and the uncertainty of the litigation, the Company has recorded its Visa Class B shares on its balance sheet at zero value.
In 2013, the Bank sold 100,000 Visa Class B shares to another Visa USA member financial institution at a gross pre-tax gain of approximately $7.8 million which was recorded in non-interest income in the Company’s statement of operations. In conjunction with the sale, the Company entered into derivative swap contracts with the purchaser of these Visa Class B shares which provide for settlements between the purchaser and the Company based upon a change in the ratio for conversion of Visa Class B shares into Visa Class A shares.
The Company has recorded $932 thousand in operating expenses and in other liabilities on the balance sheet, representing the estimate of the Company’s exposure to the settlement of the Visa litigation or the derivative liability. A relatively high degree of subjectivity is used in estimating the fair value of this derivative liability, but management believes that the estimate of its fair value is reasonable based on current information. The present value of estimated future fees to be paid to the derivative counterparty, or carrying costs, calculated by reference to the market price of the Visa Class A shares at a fixed rate of interest are expensed as incurred. For the year ended December 31, 2013, $57 thousand in such carrying costs was expensed.
Management believes that the estimate of the Company’s exposure to the Visa indemnification and fees associated with the derivatives are adequate based on current information. However, future developments in the litigation could require potentially significant changes to the estimate.
The Company has pledged U.S. Government agency securities held in its available for sale portfolio, with a market value of approximately $2.6 million at December 31, 2013, as collateral for the derivative swap contracts.
At December 31, 2013, the Company still owned 38,638 Visa Class B shares subsequent to the sales described here. Based on the existing transfer restriction and the uncertainty of the litigation, these Visa Class B shares continue to be carried on the Company’s balance sheet at zero value. Upon termination of the existing transfer restriction and settlement of the litigation, and to the extent that the Company continues to own such Visa Class B shares in the future, the Company expects to record its Visa Class B shares at fair value.
Loans and Allowance for Loan Losses
The following table categorizes the Company’s loan portfolio for each period (dollars in thousands):
| At December 31, | | 2013 | | | 2012 | | | 2011 | | | | | | 2010 | | | | | | 2009 | | | | |
| Commercial and industrial | | $ | 171,199 | | | | 16.0 | % | | $ | 168,709 | | | | 21.6 | % | | $ | 206,652 | | | | 21.3 | % | | $ | 248,750 | | | | 22.4 | % | | $ | 259,565 | | | | 22.4 | % |
| Commercial real estate | | | 469,357 | | | | 43.9 | | | | 360,010 | | | | 46.1 | | | | 420,472 | | | | 43.4 | | | | 422,711 | | | | 38.0 | | | | 367,398 | | | | 31.7 | |
| Multifamily | | | 184,624 | | | | 17.3 | | | | 9,261 | | | | 1.2 | | | | 8,174 | | | | 0.8 | | | | 8,468 | | | | 0.8 | | | | 8,254 | | | | 0.7 | |
| Real estate construction | | | 6,565 | | | | 0.6 | | | | 15,469 | | | | 2.0 | | | | 49,704 | | | | 5.1 | | | | 82,720 | | | | 7.4 | | | | 133,431 | | | | 11.5 | |
| Residential mortgages | | | 169,552 | | | | 15.9 | | | | 146,575 | | | | 18.8 | | | | 160,619 | | | | 16.6 | | | | 195,993 | | | | 17.6 | | | | 214,501 | | | | 18.5 | |
| Home equity | | | 57,112 | | | | 5.3 | | | | 66,468 | | | | 8.5 | | | | 79,684 | | | | 8.2 | | | | 84,696 | | | | 7.6 | | | | 82,808 | | | | 7.1 | |
| Consumer | | | 10,439 | | | | 1.0 | | | | 14,288 | | | | 1.8 | | | | 44,349 | | | | 4.6 | | | | 68,941 | | | | 6.2 | | | | 94,422 | | | | 8.1 | |
| Total loans | | $ | 1,068,848 | | | | 100.0 | % | | $ | 780,780 | | | | 100.0 | % | | $ | 969,654 | | | | 100.0 | % | | $ | 1,112,279 | | | | 100.0 | % | | $ | 1,160,379 | | | | 100.0 | % |
The following table presents the contractual maturities of selected loans and the sensitivities of those loans to changes in interest rates at December 31, 2013 (in thousands):
| | | One Year or Less | | | One Through Five Years | | | Over Five Years | | | Total | |
| Commercial and industrial | | $ | 119,268 | | | $ | 43,881 | | | $ | 8,050 | | | $ | 171,199 | |
| Real estate construction | | | 6,275 | | | | 290 | | | | - | | | | 6,565 | |
| Total | | $ | 125,543 | | | $ | 44,171 | | | $ | 8,050 | | | $ | 177,764 | |
| Loans maturing after one year with: | | | | | | | | | | | | | | | | |
| Fixed interest rate | | | | | | $ | 37,693 | | | $ | 7,772 | | | $ | 45,465 | |
| Variable interest rate | | | | | | $ | 6,478 | | | $ | 278 | | | $ | 6,756 | |
Non-performing loans are defined as non-accrual loans and loans 90 days or more past due and still accruing. Generally, recognition of interest income is discontinued when reasonable doubt exists as to whether principal or interest due can be collected. Loans of all classes will generally no longer accrue interest when over 90 days past due unless the loan is well-secured and in process of collection.
The following table shows non-performing loans for each period (in thousands):
| At December 31, | | 2013 | | | 2012 | | | 2011 | | | 2010 | | | 2009 | |
| Non-accrual loans | | $ | 15,183 | | | $ | 16,435 | | | $ | 80,760 | | | $ | 28,991 | | | $ | 19,124 | |
| Loans 90 days or more past due and still accruing | | | - | | | | - | | | | - | | | | - | | | | 173 | |
| Total | | $ | 15,183 | | | $ | 16,435 | | | $ | 80,760 | | | $ | 28,991 | | | $ | 19,297 | |
Non-accrual loans, excluding loans categorized as held-for-sale, totaled $15 million or 1.42% of total loans outstanding at December 31, 2013 versus $16 million or 2.10% of loans outstanding at December 31, 2012. At December 31, 2013, approximately 71% of the Company’s non-accrual loans were current with respect to principal and interest payments. The allowance for loan losses as a percentage of total non-accrual loans amounted to 114% at December 31, 2013 versus 108% at December 31, 2012. Total accruing loans delinquent 30 days or more amounted to $3 million or 0.33% of loans outstanding at December 31, 2013 versus $14 million or 1.81% of loans outstanding at December 31, 2012.
Total criticized and classified loans were $43 million at December 31, 2013 versus $99 million at December 31, 2012. Criticized loans are those loans that require some degree of heightened monitoring but are not classified. Classified loans were $37 million at December 31, 2013 as compared to $54 million at December 31, 2012. The allowance for loan losses as a percentage of total classified loans was 47% and 33%, respectively, at the same dates.
At December 31, 2013, the Company had $16 million in TDRs, primarily consisting of commercial and industrial loans, commercial real estate loans and residential mortgages totaling $6 million, $6 million and $4 million, respectively. At December 31, 2013, $10 million of the TDRs were current and accruing, $708 thousand was past due 30 days or more and still accruing and $5 million were on non-accrual status. The Company had TDRs amounting to $17 million at December 31, 2012.
At December 31, 2013, the Company’s allowance for loan losses amounted to $17 million or 1.62% of period-end loans outstanding. The allowance as a percentage of loans outstanding was 2.28% at December 31, 2012.
Net loan charge-offs of $1.8 million, inclusive of a charge-off of $1.5 million incurred in connection with the fourth quarter 2013 loan sale mentioned previously, were recorded in 2013 versus $30.7 million in 2012. As a percentage of average total loans outstanding, these net amounts represented 0.20% for 2013 and 3.57% for 2012.
The following table presents an analysis of the Company’s allowance for loan losses for each period (dollars in thousands):
| | | 2013 | | | 2012 | | | 2011 | | | 2010 | | | 2009 | |
| Balance, January 1 | | $ | 17,781 | | | $ | 39,958 | | | $ | 28,419 | | | $ | 12,333 | | | $ | 9,051 | |
| Loans charged-off: | | | | | | | | | | | | | | | | | | | | |
| Commercial and industrial | | | 2,867 | | | | 8,534 | | | | 9,490 | | | | 8,501 | | | | 806 | |
| Commercial real estate | | | 383 | | | | 15,794 | | | | 4,059 | | | | 2,788 | | | | - | |
| Real estate construction | | | - | | | | 3,671 | | | | 232 | | | | 3,548 | | | | - | |
| Residential mortgages | | | 126 | | | | 3,727 | | | | 411 | | | | 769 | | | | - | |
| Home equity | | | 558 | | | | 1,953 | | | | 191 | | | | 315 | | | | - | |
| Consumer | | | 166 | | | | 267 | | | | 214 | | | | 317 | | | | 404 | |
| Total charge-offs | | | 4,100 | | | | 33,946 | | | | 14,597 | | | | 16,238 | | | | 1,210 | |
| Loans recovered after being charged-off: | | | | | | | | | | | | | | | | | | | | |
| Commercial and industrial | | | 2,077 | | | | 2,456 | | | | 781 | | | | 69 | | | | 41 | |
| Commercial real estate | | | 97 | | | | - | | | | - | | | | - | | | | - | |
| Real estate construction | | | - | | | | 340 | | | | 415 | | | | - | | | | - | |
| Residential mortgages | | | 5 | | | | 115 | | | | 3 | | | | - | | | | - | |
| Home equity | | | 32 | | | | 246 | | | | 2 | | | | - | | | | - | |
| Consumer | | | 121 | | | | 112 | | | | 97 | | | | 118 | | | | 176 | |
| Total recoveries | | | 2,332 | | | | 3,269 | | | | 1,298 | | | | 187 | | | | 217 | |
| Net loans charged-off | | | 1,768 | | | | 30,677 | | | | 13,299 | | | | 16,051 | | | | 993 | |
| Reclass to allowance for contingent liabilities | | | - | | | | - | | | | (50 | ) | | | 51 | | | | - | |
| Provision for loan losses | | | 1,250 | | | | 8,500 | | | | 24,888 | | | | 32,086 | | | | 4,275 | |
| Balance, December 31 | | $ | 17,263 | | | $ | 17,781 | | | $ | 39,958 | | | $ | 28,419 | | | $ | 12,333 | |
| Year ended December 31, | | 2013 | | | 2012 | | | 2011 | | | 2010 | | | 2009 | |
| Loans: | | | | | | | | | | | | | | | |
| Average | | $ | 905,613 | | | $ | 859,790 | | | $ | 1,012,835 | | | $ | 1,129,917 | | | $ | 1,107,294 | |
| At end of period | | | 1,068,848 | | | | 780,780 | | | | 969,654 | | | | 1,112,279 | | | | 1,160,379 | |
| Non-performing loans/total loans (1) | | | 1.42 | % | | | 2.10 | % | | | 8.33 | % | | | 2.61 | % | | | 1.66 | % |
| Non-performing assets/total assets | | | 0.89 | | | | 1.17 | | | | 5.56 | | | | 2.16 | | | | 1.73 | |
| Net charge-offs/average loans | | | 0.20 | | | | 3.57 | | | | 1.31 | | | | 1.42 | | | | 0.09 | |
| Allowance for loan losses/total loans (1) | | | 1.62 | | | | 2.28 | | | | 4.12 | | | | 2.56 | | | | 1.06 | |
| (1) | Excluding loans held-for-sale. |
The following table presents the allocation of the Company’s allowance for loan losses by loan class for each period (dollars in thousands):
| | | | | | % of | | | | | | % of | | | | | | % of | | | | | | % of | | | | | | % of | |
| At December 31, | | 2013 | | | Total | | | 2012 | | | Total | | | 2011 | | | Total | | | 2010 | | | Total | | | 2009 | | | Total | |
| Commercial and industrial | | $ | 2,615 | | | | 15.1 | % | | $ | 6,181 | | | | 34.8 | % | | $ | 25,047 | | | | 62.7 | % | | $ | 13,826 | | | | 48.6 | % | | $ | 5,421 | | | | 44.0 | % |
| Commercial real estate | | | 6,626 | | | | 38.4 | | | | 5,999 | | | | 33.7 | | | | 10,470 | | | | 26.2 | | | | 9,149 | | | | 32.2 | | | | 3,585 | | | | 29.1 | |
| Multifamily | | | 2,159 | | | | 12.5 | | | | 150 | | | | 0.8 | | | | 559 | | | | 1.4 | | | | 77 | | | | 0.3 | | | | 59 | | | | 0.4 | |
| Real estate construction | | | 88 | | | | 0.5 | | | | 141 | | | | 0.8 | | | | 623 | | | | 1.5 | | | | 3,177 | | | | 11.2 | | | | 1,258 | | | | 10.2 | |
| Residential mortgages | | | 2,463 | | | | 14.3 | | | | 1,576 | | | | 8.9 | | | | 2,401 | | | | 6.0 | | | | 519 | | | | 1.8 | | | | 1,154 | | | | 9.4 | |
| Home equity | | | 745 | | | | 4.3 | | | | 907 | | | | 5.1 | | | | 512 | | | | 1.3 | | | | 1,392 | | | | 4.9 | | | | 280 | | | | 2.3 | |
| Consumer | | | 241 | | | | 1.4 | | | | 189 | | | | 1.1 | | | | 313 | | | | 0.8 | | | | 279 | | | | 1.0 | | | | 471 | | | | 3.8 | |
| Unallocated | | | 2,326 | | | | 13.5 | | | | 2,638 | | | | 14.8 | | | | 33 | | | | 0.1 | | | | - | | | | - | | | | 105 | | | | 0.8 | |
| Total | | $ | 17,263 | | | | 100.0 | % | | $ | 17,781 | | | | 100.0 | % | | $ | 39,958 | | | | 100.0 | % | | $ | 28,419 | | | | 100.0 | % | | $ | 12,333 | | | | 100.0 | % |
The Company recorded a $1.3 million consolidated provision for loan losses for the year ended December 31, 2013 as compared to a provision of $8.5 million for the year ended December 31, 2012. The decrease in the 2013 provision for loan losses resulted from a significant reduction in the level of criticized and classified loans. The adequacy of the provision and the resulting allowance for loan losses, which was $17 million at December 31, 2013, is determined by management’s ongoing review of the loan portfolio, including identification and review of individual problem situations that may affect a borrower’s ability to repay, delinquency and non-performing loan data including the current status of criticized and classified loans, collateral values and changes in the size and mix of the loan portfolio.
Management has determined that the current level of the allowance for loan losses is adequate in relation to the probable inherent losses present in the portfolio. The Company continues to have an allowance for loan losses that compares favorably to both our local and national peer groups as defined in the Uniform Bank Performance Report (“UBPR”). As per the most recent UBPR reports at September 30, 2013, the national peer group’s allowance for loan losses to total loans was 1.69% as compared to the Company’s ratios of 1.62% and 1.76% at December 31 and September 30, 2013, respectively. In comparison to the Company’s local peer group, the Company’s allowance for loan losses to total loans exceeded those peers, on average, by 50 basis points at September 30, 2013. Recent publications have stated, and earnings results announced by commercial banks indicate, that many financial institutions continue to release loan loss reserves. The Company believes its allowance for loan losses is adequate and will remain comparable to its peers.
Loan portfolio growth was strong during 2013, primarily in commercial real estate and multifamily loans. At December 31, 2013, the Company’s allowance for loan losses included an unallocated portion totaling $2.3 million. Loan growth, including multifamily loans, is expected to continue in 2014. An unallocated portion of the reserve is considered a prudent option until these loans to new borrowers establish satisfactory payment patterns.
Management considers many factors in this analysis, among them credit risk grades, delinquency trends, concentrations within segments of the loan portfolio, recent charge-off experience, local and national economic conditions, current real estate market conditions in geographic areas where the Company’s loans are located, changes in the trend of non-performing loans, changes in interest rates and loan portfolio growth. Changes in one or a combination of these factors may adversely affect the Company’s loan portfolio resulting in increased delinquencies, loan losses and future levels of loan loss provisions. Due to these uncertainties, management expects to record loan charge-offs in future periods. (See also Critical Accounting Policies, Judgments and Estimates contained herein.)
Deposits
The following table presents the average balance and the average rate paid on the Company’s deposits for each period (dollars in thousands):
| | 2013 | | | 2012 | | | 2011 | |
| | | | | Average | | | | | | Average | | | | | | Average | |
| | | Average | | | Rate Paid | | | Average | | | Rate Paid | | | Average | | | Rate Paid | |
| Demand deposits | | $ | 608,580 | | | | - | % | | $ | 554,617 | | | | - | % | | $ | 518,499 | | | | - | % |
| Saving deposits | | | 287,120 | | | | 0.15 | | | | 260,910 | | | | 0.16 | | | | 256,169 | | | | 0.18 | |
| N.O.W. and money market deposits | | | 336,399 | | | | 0.23 | | | | 286,480 | | | | 0.27 | | | | 332,339 | | | | 0.45 | |
| Time certificates of $100,000 or more | | | 171,241 | | | | 0.66 | | | | 173,478 | | | | 0.90 | | | | 194,672 | | | | 1.04 | |
| Other time deposits | | | 71,566 | | | | 0.86 | | | | 81,863 | | | | 1.17 | | | | 91,149 | | | | 1.41 | |
| Total | | $ | 1,474,906 | | | | 0.20 | % | | $ | 1,357,348 | | | | 0.27 | % | | $ | 1,392,828 | | | | 0.38 | % |
The following table sets forth, by time remaining to maturity, the Company’s certificates of deposit of $100,000 or more at December 31, 2013 (in thousands):
| 3 months or less | | $ | 113,582 | |
| Over 3 through 6 months | | | 15,775 | |
| Over 6 through 12 months | | | 7,710 | |
| Over 12 months | | | 21,270 | |
| Total | | $ | 158,337 | |
Borrowings
The Company may utilize both short-term and long-term borrowings which could include lines of credit for federal funds with correspondent banks, securities sold under agreements to repurchase and FHLB borrowings. Borrowings averaged $22 thousand during 2013, down from $57 thousand in 2012. The Company had no borrowings outstanding at December 31, 2013 or December 31, 2012.
The following provides information on the Company’s borrowings for each period (dollars in thousands):
| | Federal Home Loan Bank Borrowings | | | Federal Funds Purchased | |
| | | 2013 | | | 2012 | | | 2013 | | | 2012 | |
| December 31 balance | | $ | - | | | $ | - | | | $ | - | | | $ | - | |
| Weighted-average interest rate on balances outstanding | | | - | % | | | - | % | | | - | % | | | - | % |
| Maximum amount outstanding at any month-end | | $ | - | | | $ | - | | | $ | - | | | $ | - | |
| Daily average outstanding | | | 5 | | | | 27 | | | | 17 | | | | 30 | |
| Average interest rate paid | | | 0.39 | % | | | 0.39 | % | | | 0.37 | % | | | 0.55 | % |
Contractual and Off-Balance Sheet Obligations
Shown below are the amounts of payments due under specified contractual obligations, aggregated by category of contractual obligation, for specified time periods. All information is as of December 31, 2013 (in thousands):
| Contractual Obligations | | Total | | | Less than 1 year | | | 1 - 3 years | | | 3 - 5 years | | | More than 5 years | |
| Time deposits | | $ | 225,079 | | | $ | 182,923 | | | $ | 31,618 | | | $ | 10,528 | | | $ | 10 | |
| Operating lease obligations | | | 6,749 | | | | 1,420 | | | | 2,376 | | | | 1,359 | | | | 1,594 | |
| Capital lease obligations | | | 6,706 | | | | 311 | | | | 646 | | | | 689 | | | | 5,060 | |
| Performance and financial letters of credit | | | 18,137 | | | | 17,418 | | | | 719 | | | | - | | | | - | |
| Total | | $ | 256,671 | | | $ | 202,072 | | | $ | 35,359 | | | $ | 12,576 | | | $ | 6,664 | |
The Company has not used, and has no intention to use, any significant off-balance-sheet financing arrangements for liquidity purposes. Its primary financial instruments with off-balance-sheet risk are limited to loan servicing for others and obligations to fund loans to customers pursuant to existing commitments.
Liquidity and Capital Resources
Liquidity management is defined as both the Company’s and the Bank’s ability to meet their financial obligations on a continuous basis without material loss or disruption of normal operations. These obligations include the withdrawal of deposits on demand or at their contractual maturity, the repayment of borrowings as they mature, funding new and existing loan commitments and the ability to take advantage of business opportunities as they arise. Asset liquidity is provided by short-term investments and the marketability of securities available for sale. The Company may also leave excess reserve balances at the FRB if the rate being paid is higher than would be available from other short-term investments. Liquid assets, consisting of federal funds sold, securities available for sale and balances at the FRB, were $462 million at December 31, 2013 compared to $706 million at December 31, 2012. These liquid assets may include assets that have been pledged against municipal deposits or short-term borrowings. In addition, the Company has pledged U.S. Government agency securities held in its available for sale portfolio, with a market value of approximately $2.6 million at December 31, 2013, as collateral for the derivative swap contracts. Liquidity is also provided by the maintenance of a base of core deposits, maturing short-term assets including cash and due from banks, the ability to sell or pledge marketable assets and access to lines of credit.
Liquidity is continuously monitored, thereby allowing management to better understand and react to emerging balance sheet trends, including temporary mismatches with regard to sources and uses of funds. After assessing actual and projected cash flow needs, management seeks to obtain funding at the most economical cost. These funds can be obtained by converting liquid assets to cash or by attracting new deposits or other sources of funding. Many factors affect the Company’s ability to meet liquidity needs, including variations in the markets served, loan demand, its asset/liability mix, its reputation and credit standing in its markets and general economic conditions. Borrowings and the scheduled amortization of investment securities and loans are more predictable funding sources. Deposit flows and securities prepayments are somewhat less predictable as they are often subject to external factors. Among these are changes in the local and national economies, competition from other financial institutions and changes in market interest rates.
The Company’s primary sources of funds are cash provided by deposits and borrowings, proceeds from maturities and sales of securities available for sale and cash provided by operating activities. At December 31, 2013, total deposits were $1.5 billion, an increase of $79 million when compared to December 31, 2012. Of the total time deposits at December 31, 2013, $183 million are scheduled to mature within the next 12 months. Based on historical experience, the Company expects to be able to replace a substantial portion of those maturing deposits with comparable deposit products. At December 31, 2013 and 2012, there were no borrowings outstanding. For the years ended December 31, 2013 and 2012, proceeds from sales and maturities of securities available for sale totaled $38 million and $41 million, respectively.
The Company’s primary uses of funds are for the origination of loans and the purchase of investment securities. For the year ended December 31, 2013, the Company had net loan originations for portfolio of $301 million compared to net loan repayments of $101 million for the same period in 2012. The Company purchased investment securities totaling $122 million and $183 million during the years ended December 31, 2013 and 2012, respectively.
The Bank’s Asset/Liability and Funds Management Policy establishes specific policies and operating procedures governing liquidity levels to assist management in developing plans to address future and current liquidity needs. Management monitors the rates and cash flows from the loan and investment portfolios while also examining the maturity structure and volatility characteristics of liabilities to develop an optimum asset/liability mix. Available funding sources include retail, commercial and municipal deposits, purchased liabilities and stockholders’ equity. At December 31, 2013, access to approximately $337 million in FHLB lines of credit for overnight or term borrowings with maturities of up to thirty years was available. At December 31, 2013, approximately $45 million and $10 million in unsecured and secured lines of credit, respectively, extended by correspondent banks were also available to be utilized, if needed, for short-term funding purposes. At December 31, 2013, no borrowings were outstanding under lines of credit with the FHLB or correspondent banks.
The Bank also has the ability to access the brokered deposit market. Deposits gathered through the Certificate of Deposit Account Registry Service (“CDARS”) are considered for regulatory purposes to be brokered deposits. At December 31, 2013, the Bank had $5 million in CDARS deposits outstanding.
The Company strives to maintain an efficient level of capital, commensurate with its risk profile, on which a competitive rate of return to stockholders will be realized over both the short and long term. Capital is managed to enhance stockholder value while providing flexibility for management to act opportunistically in a changing marketplace. Management continually evaluates the Company’s capital position in light of current and future growth objectives and regulatory guidelines. Total stockholders’ equity amounted to $167 million at December 31, 2013 and $164 million at December 31, 2012. The increase in stockholders’ equity versus December 31, 2012 was primarily due to a $13 million increase in retained earnings resulting from the net income recorded during 2013, partially offset by a $10 million reduction in accumulated other comprehensive income, net of tax. The reduction in accumulated other comprehensive income resulted primarily from the negative impact of the increase in interest rates in 2013 on the value of the Company’s available for sale investment portfolio, somewhat offset by the net reduction in the Company’s pension benefit obligations.
The Company and the Bank are subject to regulatory capital requirements. The Company’s tier 1 leverage, tier 1 risk-based and total risk-based capital ratios were 9.81%, 13.77% and 15.02%, respectively, at December 31, 2013. The Company’s capital ratios exceeded all regulatory requirements at December 31, 2013. The Bank’s tier 1 leverage, tier 1 risk-based and total risk-based capital ratios were 9.74%, 13.67% and 14.92%, respectively, at December 31, 2013. Each of these ratios exceeds the regulatory guidelines for a well-capitalized institution, the highest regulatory capital category.
The Company did not repurchase any shares of its common stock during 2013. Repurchase of shares will occur only if management believes that the purchase will be at prices that are accretive to earnings per share and is the most efficient use of the Company’s capital.
The Company completed a $25 million private placement of its common stock with several institutional investors and certain of the Company’s directors and officers in September 2012. The institutional investors purchased 1,783,000 shares of common stock at a price of $13.50 per share. Certain of the Company’s directors and officers purchased 56,533 shares of common stock at $16.44 per share.
The Company’s tangible common equity ratio was 9.68% at December 31, 2013 compared to 9.96% at December 31, 2012. The ratio of tangible common equity to tangible assets, or TCE ratio, is calculated by dividing total common stockholders’ equity by total assets, after reducing both amounts by intangible assets. The TCE ratio is not required by GAAP or by applicable bank regulatory requirements, but is a metric used by management to evaluate the adequacy of our capital levels. Since there is no authoritative requirement to calculate the TCE ratio, our TCE ratio is not necessarily comparable to similar capital measures disclosed or used by other companies in the financial services industry. Tangible common equity and tangible assets are non-GAAP financial measures and should be considered in addition to, not as a substitute for or superior to, financial measures determined in accordance with GAAP or as required by bank regulatory agencies. Set forth below are the reconciliations of tangible common equity to GAAP total common stockholders’ equity and tangible assets to GAAP total assets at December 31, 2013 (in thousands):
| Total stockholders' equity | | $ | 167,198 | |
| Less: intangible assets | | | (2,978 | ) |
| Tangible common equity | | $ | 164,220 | |
| | | | |
| Total assets | | $ | 1,699,816 | |
| Less: intangible assets | | | (2,978 | ) |
| Tangible assets | | $ | 1,696,838 | |
All dividends must conform to applicable statutory requirements. The Company’s ability to pay dividends depends on the Bank’s ability to pay dividends. Under 12 USC 56-9, a national bank may not pay a dividend on its common stock if the dividend would exceed net undivided profits then on hand. Further, under 12 USC 60, a national bank must obtain prior approval from the OCC to pay dividends on either common or preferred stock that would exceed the bank’s net profits for the current year combined with retained net profits (net profits minus dividends paid during that period) of the prior two years. The ability of the Bank to pay dividends to the Company is subject to certain regulatory restrictions. Generally, dividends declared in a given year by a national bank are limited to its net profit, as defined by regulatory agencies, for that year, combined with its retained net income for the preceding two years, less any required transfer to surplus or to fund for the retirement of any preferred stock. In addition, a national bank may not pay dividends in an amount greater than its undivided profits or declare any dividends if such declaration would leave the bank inadequately capitalized. Also, the ability of the Bank to declare dividends will depend on the prior approval of the FRB. At December 31, 2013, $10.9 million was available for dividends from the Bank to the Company.
| QUANTITATIVE AND QUALITATIVE DISCLOSURES ABOUT MARKET RISK |
Asset/Liability Management
The process by which financial institutions manage interest-earning assets and funding sources under different interest rate environments is called asset/liability management. The principal objective of the Company’s asset/liability management program is to maximize net interest income within an acceptable range of overall risk. Management must ensure that liquidity, capital, interest rate and market risk are prudently managed. Monitoring and managing this risk is a crucial part of the Company’s asset/liability management program. The program is governed by policies established by the Company’s Board of Directors. These policies are reviewed and approved no less than annually. The Board of Directors delegates responsibility for asset/liability management to the Asset/Liability Management Committee (“ALCO”). The ALCO develops guidelines and strategies to implement the approved policies. The ALCO includes members of the Board of Directors as well as executive and senior officers of the Bank. It uses computer simulations to quantify interest rate risk and to project liquidity. The simulations also help the ALCO to develop contingent strategies to increase net interest income. The ALCO assesses the impact of any change in strategy on the Company’s ability to make loans and repay deposits. The Company has not used forward contracts or interest rate swaps to manage interest rate risk.
Interest Rate Sensitivity
Interest rate sensitivity is determined by the date when each asset and liability in the Company’s portfolio can be repriced. Sensitivity increases when interest-earning assets and interest-bearing liabilities reprice in different time horizons. While this analysis presents the volume of assets and liabilities repricing in each period of time, it does not consider how quickly various assets and liabilities might actually be repriced in response to changes in interest rates. Management reviews its interest rate sensitivity regularly and adjusts its asset/liability management strategy accordingly. Because the interest rates of assets and liabilities vary according to their maturity, management may selectively mismatch the repricing of assets and liabilities to take advantage of temporary or projected differences between short- and long-term interest rates.
The accompanying table sets forth the amounts of interest-earning assets and interest-bearing liabilities outstanding at December 31, 2013 (dollars in thousands) which, based upon certain assumptions, are expected to reprice or mature in each of the time frames shown. When monitoring this interest-sensitivity gap position, management recognizes that these static measurements do not reflect the results of any projected activity and are best utilized as early indicators of potential interest rate exposures. Rather, management relies on net interest income simulation analysis to manage the Company's asset/liability position on a dynamic repricing basis.
| | 0 to 3 | | | 4 to 6 | | | 7 to 12 | | | More Than | | | Not Rate | | | | |
| | | Months | | | Months | | | Months | | | 1 Year | | | Sensitive | | | Total | |
| Interest-earning assets | | | | | | | | | | | | | | | | | | |
| Loans (1) | | $ | 252,434 | | | $ | 56,201 | | | $ | 99,905 | | | $ | 645,584 | | | $ | 14,724 | | | $ | 1,068,848 | |
| Federal Reserve Bank, Federal Home Loan Bank and other stock (2) | | | - | | | | - | | | | - | | | | - | | | | 2,863 | | | | 2,863 | |
| Investment securities (3) | | | 17,017 | | | | 10,457 | | | | 21,649 | | | | 363,323 | | | | - | | | | 412,446 | |
| Interest-bearing time deposits in other banks | | | - | | | | 10,000 | | | | - | | | | - | | | | - | | | | 10,000 | |
| Interest-bearing deposits with banks and fed funds sold | | | 63,287 | | | | - | | | | - | | | | - | | | | - | | | | 63,287 | |
| Total interest-earning assets | | $ | 332,738 | | | $ | 76,658 | | | $ | 121,554 | | | $ | 1,008,907 | | | $ | 17,587 | | | $ | 1,557,444 | |
| | | | | | | | | | | | | | | | | | | | | | | | |
| Interest-bearing liabilities | | | | | | | | | | | | | | | | | | | | | | | | |
| Saving, N.O.W. and money market deposits (4) | | $ | 36,112 | | | $ | 33,339 | | | $ | 36,162 | | | $ | 550,753 | | | $ | - | | | $ | 656,366 | |
| Time deposits (5) | | | 136,913 | | | | 27,260 | | | | 18,750 | | | | 42,156 | | | | - | | | | 225,079 | |
| Total interest-bearing liabilities | | $ | 173,025 | | | $ | 60,599 | | | $ | 54,912 | | | $ | 592,909 | | | $ | - | | | $ | 881,445 | |
| Gap | | $ | 159,713 | | | $ | 16,059 | | | $ | 66,642 | | | $ | 415,998 | | | $ | 17,587 | | | $ | 675,999 | |
| Cumulative difference between interest-earning assets and interest-bearing liabilities | | $ | 159,713 | | | $ | 175,772 | | | $ | 242,414 | | | $ | 658,412 | | | $ | 675,999 | | | | | |
| Cumulative difference/total assets | | | 9.40 | % | | | 10.34 | % | | | 14.26 | % | | | 38.73 | % | | | 39.77 | % | | | | |
| | (1) | Based on contractual maturity and instrument repricing date if applicable; projected prepayments and prepayments of principal based on experience. |
| | (2) | Federal Reserve Bank, Federal Home Loan Bank and other stock is not considered rate sensitive. |
| | (3) | Based on contractual maturity, instrument repricing dates if applicable and projected prepayments. |
| | (4) | Saving, N.O.W. and money market deposits decay is calculated using an estimated weighted-average life of 6.6 years. |
| | (5) | Based on contractual maturity. |
At December 31, 2013, interest-earning assets with maturities or repricing dates of less than one year exceed interest-bearing liabilities of similar timing. This is indicative of the Bank being in an asset sensitive position. This cumulative gap position might result in increased net interest income if interest rates rise. If interest rates decline, net interest income may be reduced.
Interest Rate Risk
Interest rate risk is the potential adverse change to earnings or capital arising from movements in interest rates. Interest rate risk arises from repricing risk, basis risk, yield curve risk and option risk, and is measured using financial modeling techniques including interest rate ramp and shock simulations. Interest rate risk depicts the sensitivity of earnings to changes in interest rates. As interest rates change, interest income and expense also change, thereby changing net interest income (“NII”). NII is the primary component of the Company’s earnings. The ALCO uses a detailed, dynamic model to quantify the effect of sustained changes in interest rates on NII. The ALCO routinely monitors simulated NII sensitivity two years into the future in relation to its established policy guidelines. The ALCO will also examine changes in NII under longer time horizons of up to five years and utilize additional tools in monitoring long term interest rate risk. The model simulations are used to determine whether corrective action may be warranted or required in order to adjust the overall interest rate risk profile of the Company.
Simulation modeling applies alternative interest rate scenarios to the Company’s balance sheet to estimate the related impact on NII. The use of simulation modeling assists management in its continuing efforts to achieve earnings stability in a variety of interest rate environments. The model results are compared to the Company’s asset/liability and interest rate risk management policy stating that interest rate risk exposure must be limited to -12.5% and -18% of the year one base case net interest income for net earnings at risk at the 12-month and 24-month time horizons, respectively. NII was projected two years in the future, assuming no growth in assets or liabilities, under a 200 basis point change in interest rates upward and a 100 basis points change downward. In prior periods the earnings at risk was measured under a down 200 basis point scenario, however, at December 31, 2013, a down 100 basis point environment was analyzed due to the historically low interest rate environment as of the date of computation.
The Company may be considered asset sensitive when net interest income increases in a rising interest rate environment or decreases under a falling interest rate scenario. Similarly, the Company may be considered liability sensitive when net interest income increases in a falling interest rate environment or decreases in a rising interest rate environment.
At December 31, 2013, the Company’s balance sheet was considered asset sensitive as a hypothetical decrease in interest rates would have a negative impact on the percentage change in the Company’s net interest income; whereas, a hypothetical increase in interest rates would have a positive impact on the Company’s net interest income.
The following table presents the Company’s NII sensitivity at December 31, 2013.
| | Estimated NII Sensitivity | |
| | at December 31, 2013 | |
| Time Horizon | | -100 basis point rate ramp | | | +200 basis point rate ramp | |
| Year One | | | (0.3%) | | | | 0.1% | |
| Year Two | | | (7.4%) | | | | 2.2% | |
These estimates should not be interpreted as the Company’s forecast, and should not be considered as indicative of management’s expectations for operating results. They are hypothetical estimates that are based on many assumptions including: the nature and timing of changes in interest rates, the shape of the yield curve (variations in interest rates for financial instruments of varying maturity at a given moment in time), prepayments on loans and securities, deposit outflows, pricing on loans and deposits, and the reinvestment of cash flows from assets and liabilities, among other things. While these assumptions are based on management’s best estimate of current economic conditions, the Company cannot give any assurance that they will actually predict results, nor can they anticipate how the behavior of customers and competitors may change in the future.
When appropriate, ALCO may use off-balance-sheet instruments such as interest rate floors, caps, and swaps to hedge its position with regard to interest rate risk. The Board of Directors has approved a hedging policy statement that governs the use of such instruments. At December 31, 2013, there were no derivative financial instruments outstanding for hedging purposes.
Market Risk
Market risk is the possibility that a financial instrument will lose value as the result of adverse changes in market prices, interest rates, foreign currency exchange rates, commodity prices or the prices of equity securities. The Company’s primary exposure to market risk is from changing interest rates. The Company’s operations are subject to market risk resulting from fluctuations in interest rates to the extent that there is a difference between the amounts of interest-earning assets and interest-bearing liabilities that are prepaid, withdrawn, mature or repriced in any given period of time. The Company recognizes that changes in interest rates affect the underlying value of its assets, liabilities and off-balance sheet instruments because the present value of future cash flows (and the cash flows themselves) change when interest rates change.
Economic Value of Equity (“EVE”) is defined as the present value of the Bank’s assets, less the present value of its liabilities, +/- the net present value of any off-balance sheet items. The Company’s earnings or the net value of its portfolio will change under different interest rate scenarios. Management uses scenario analysis on a static basis to assess its equity value at risk by modeling the potential adverse changes in EVE arising from an immediate hypothetical shock in interest rates.
The following table presents the Company’s EVE sensitivity at December 31, 2013.
| Estimated EVE Sensitivity |
| Rate Change | at December 31, 2013 |
| +200 basis point shock | 2.8% |
| -100 basis point shock | (9.4%) |
When modeling EVE at risk, management recognizes the high degree of subjectivity when projecting long-term cash flows and reinvestment rates, and therefore uses EVE at risk as a relative indicator of interest rate risk. Accordingly, the Company does not set definitive policy limits over EVE at risk; however, the Company has set various policy level triggers at which successively heightened monitoring is required and, if necessary, steps will be taken to lower observed volatility of its EVE exposure.
| FINANCIAL STATEMENTS AND SUPPLEMENTARY DATA |
REPORT OF INDEPENDENT REGISTERED PUBLIC ACCOUNTING FIRM
Board of Directors and Stockholders
Suffolk Bancorp
Riverhead, New York
We have audited the accompanying consolidated statements of condition of Suffolk Bancorp as of December 31, 2013 and 2012 and the related consolidated statements of operations, comprehensive income (loss), changes in stockholders’ equity, and cash flows for each of the three years in the period ended December 31, 2013. These financial statements are the responsibility of the Company’s management. Our responsibility is to express an opinion on these financial statements based on our audits.
We conducted our audits in accordance with the standards of the Public Company Accounting Oversight Board (United States). Those standards require that we plan and perform the audit to obtain reasonable assurance about whether the financial statements are free of material misstatement. An audit includes examining, on a test basis, evidence supporting the amounts and disclosures in the financial statements, assessing the accounting principles used and significant estimates made by management, as well as evaluating the overall financial statement presentation. We believe that our audits provide a reasonable basis for our opinion.
In our opinion, the consolidated financial statements referred to above present fairly, in all material respects, the financial position of Suffolk Bancorp at December 31, 2013 and 2012, and the results of its operations and its cash flows for each of the three years in the period ended December 31, 2013, in conformity with accounting principles generally accepted in the United States of America.
We also have audited, in accordance with the standards of the Public Company Accounting Oversight Board (United States), Suffolk Bancorp’s internal control over financial reporting as of December 31, 2013, based on criteria established in Internal Control – Integrated Framework (1992) issued by the Committee of Sponsoring Organizations of the Treadway Commission (COSO) and our report dated March 4, 2014 expressed an unqualified opinion thereon.
/s/ BDO USA, LLP
New York, New York
March 4, 2014
SUFFOLK BANCORP AND SUBSIDIARIES
CONSOLIDATED STATEMENTS OF CONDITION
December 31, 2013 and December 31, 2012
(dollars in thousands, except per share data)
| | December 31, 2013 | | | December 31, 2012 | |
| ASSETS | | | | | | |
| Cash and cash equivalents | | | | | | |
| Cash and non-interest-bearing deposits due from banks | | $ | 69,065 | | | $ | 80,436 | |
| Interest-bearing deposits due from banks | | | 62,287 | | | | 304,220 | |
| Federal funds sold | | | 1,000 | | | | 1,150 | |
| Total cash and cash equivalents | | | 132,352 | | | | 385,806 | |
| Interest-bearing time deposits in other banks | | | 10,000 | | | | - | |
| Federal Reserve Bank, Federal Home Loan Bank and other stock | | | 2,863 | | | | 3,043 | |
| Investment securities: | | | | | | | | |
| Available for sale, at fair value | | | 400,780 | | | | 402,353 | |
| Held to maturity (fair value of $12,234 and $8,861, respectively) | | | 11,666 | | | | 8,035 | |
| Total investment securities | | | 412,446 | | | | 410,388 | |
| Loans | | | 1,068,848 | | | | 780,780 | |
| Allowance for loan losses | | | 17,263 | | | | 17,781 | |
| Net loans | | | 1,051,585 | | | | 762,999 | |
| Loans held-for-sale | | | 175 | | | | 907 | |
| Premises and equipment, net | | | 25,261 | | | | 27,656 | |
| Bank owned life insurance | | | 38,755 | | | | - | |
| Deferred taxes | | | 13,953 | | | | 11,385 | |
| Income tax receivable | | | - | | | | 5,406 | |
| Other real estate owned ("OREO") | | | - | | | | 1,572 | |
| Accrued interest and loan fees receivable | | | 5,441 | | | | 4,883 | |
| Goodwill and other intangibles | | | 2,978 | | | | 2,670 | |
| Other assets | | | 4,007 | | | | 5,749 | |
| TOTAL ASSETS | | $ | 1,699,816 | | | $ | 1,622,464 | |
| | | | | | | | |
| LIABILITIES & STOCKHOLDERS' EQUITY | | | | | | | | |
| Demand deposits | | $ | 628,616 | | | $ | 615,120 | |
| Saving, N.O.W. and money market deposits | | | 656,366 | | | | 572,263 | |
| Time certificates of $100,000 or more | | | 158,337 | | | | 165,731 | |
| Other time deposits | | | 66,742 | | | | 78,000 | |
| Total deposits | | | 1,510,061 | | | | 1,431,114 | |
| Unfunded pension liability | | | 258 | | | | 7,781 | |
| Capital leases | | | 4,612 | | | | 4,688 | |
| Other liabilities | | | 17,687 | | | | 14,896 | |
| TOTAL LIABILITIES | | | 1,532,618 | | | | 1,458,479 | |
| COMMITMENTS AND CONTINGENT LIABILITIES | | | | | | | | |
| STOCKHOLDERS' EQUITY | | | | | | | | |
Common stock (par value $2.50; 15,000,000 shares authorized; 13,738,752 shares issued at December 31, 2013, 13,732,085 shares issued at December 31, 2012; 11,573,014 shares outstanding at December 31, 2013, 11,566,347 shares outstanding at December 31, 2012) | | | 34,348 | | | | 34,330 | |
| Surplus | | | 43,280 | | | | 42,628 | |
| Retained earnings | | | 102,273 | | | | 89,555 | |
| Treasury stock at par (2,165,738 shares) | | | (5,414 | ) | | | (5,414 | ) |
| Accumulated other comprehensive (loss) income, net of tax | | | (7,289 | ) | | | 2,886 | |
| TOTAL STOCKHOLDERS' EQUITY | | | 167,198 | | | | 163,985 | |
| TOTAL LIABILITIES & STOCKHOLDERS' EQUITY | | $ | 1,699,816 | | | $ | 1,622,464 | |
See accompanying notes to consolidated financial statements.
SUFFOLK BANCORP AND SUBSIDIARIES
CONSOLIDATED STATEMENTS OF OPERATIONS
For the Years Ended December 31, 2013, 2012 and 2011
(dollars in thousands, except per share data)
| | | For the Years Ended December 31, | |
| | 2013 | | | 2012 | | | 2011 | |
| INTEREST INCOME | | | | | | | | | |
| Loans and loan fees | | $ | 46,625 | | | $ | 48,083 | | | $ | 61,844 | |
| U.S. Treasury securities | | | - | | | | - | | | | 96 | |
| U.S. Government agency obligations | | | 2,012 | | | | 241 | | | | 337 | |
| Obligations of states and political subdivisions | | | 5,975 | | | | 6,085 | | | | 6,864 | |
| Collateralized mortgage obligations | | | 2,062 | | | | 4,696 | | | | 5,839 | |
| Mortgage-backed securities | | | 1,871 | | | | 418 | | | | 30 | |
| Corporate bonds | | | 396 | | | | 204 | | | | - | |
| Federal funds sold and interest-bearing deposits due from banks | | | 591 | | | | 599 | | | | 232 | |
| Dividends | | | 146 | | | | 121 | | | | 191 | |
| Total interest income | | | 59,678 | | | | 60,447 | | | | 75,433 | |
| INTEREST EXPENSE | | | | | | | | | | | | |
| Saving, N.O.W. and money market deposits | | | 1,190 | | | | 1,192 | | | | 1,960 | |
| Time certificates of $100,000 or more | | | 1,128 | | | | 1,567 | | | | 2,029 | |
| Other time deposits | | | 612 | | | | 960 | | | | 1,281 | |
| Borrowings | | | - | | | | - | | | | 655 | |
| Total interest expense | | | 2,930 | | | | 3,719 | | | | 5,925 | |
| Net interest income | | | 56,748 | | | | 56,728 | | | | 69,508 | |
| Provision for loan losses | | | 1,250 | | | | 8,500 | | | | 24,888 | |
| Net interest income after provision for loan losses | | | 55,498 | | | | 48,228 | | | | 44,620 | |
| NON-INTEREST INCOME | | | | | | | | | | | | |
| Service charges on deposit accounts | | | 3,800 | | | | 3,932 | | | | 3,898 | |
| Other service charges, commissions and fees | | | 3,290 | | | | 3,515 | | | | 3,467 | |
| Fiduciary fees | | | 1,084 | | | | 945 | | | | 853 | |
| Net gain (loss) on sale of securities available for sale | | | 403 | | | | (217 | ) | | | 1,648 | |
| Other-than-temporary impairment ("OTTI") of securities | | | - | | | | - | | | | (1,052 | ) |
| Net gain on sale of portfolio loans | | | 445 | | | | 755 | | | | - | |
| Net gain on sale of mortgage loans originated for sale | | | 1,062 | | | | 1,182 | | | | 405 | |
| Gain on Visa shares sold | | | 7,766 | | | | - | | | | - | |
| Income from bank owned life insurance | | | 755 | | | | - | | | | - | |
| Other operating income | | | 902 | | | | 769 | | | | 902 | |
| Total non-interest income | | | 19,507 | | | | 10,881 | | | | 10,121 | |
| OPERATING EXPENSES | | | | | | | | | | | | |
| Employee compensation and benefits | | | 33,090 | | | | 35,879 | | | | 30,914 | |
| Occupancy expense | | | 6,496 | | | | 5,809 | | | | 5,794 | |
| Equipment expense | | | 2,410 | | | | 2,024 | | | | 1,940 | |
| Consulting and professional services | | | 2,663 | | | | 3,126 | | | | 4,320 | |
| FDIC assessment | | | 1,645 | | | | 1,573 | | | | 3,069 | |
| Data processing | | | 2,390 | | | | 2,404 | | | | 1,531 | |
| Accounting and audit fees | | | 504 | | | | 1,057 | | | | 2,312 | |
| Branch consolidation costs | | | 2,074 | | | | - | | | | - | |
| Reserve and carrying costs related to Visa shares sold | | | 989 | | | | - | | | | - | |
| Other operating expenses | | | 6,304 | | | | 9,699 | | | | 9,162 | |
| Total operating expenses | | | 58,565 | | | | 61,571 | | | | 59,042 | |
| Income (loss) before income tax expense (benefit) | | | 16,440 | | | | (2,462 | ) | | | (4,301 | ) |
| Income tax expense (benefit) | | | 3,722 | | | | (714 | ) | | | (4,223 | ) |
| NET INCOME (LOSS) | | $ | 12,718 | | | $ | (1,748 | ) | | $ | (78 | ) |
| EARNINGS (LOSS) PER COMMON SHARE - BASIC | | $ | 1.10 | | | $ | (0.17 | ) | | $ | (0.01 | ) |
| EARNINGS (LOSS) PER COMMON SHARE - DILUTED | | $ | 1.10 | | | $ | (0.17 | ) | | $ | (0.01 | ) |
| WEIGHTED AVERAGE NUMBER OF COMMON SHARES - BASIC | | | 11,570,731 | | | | 10,248,751 | | | | 9,720,827 | |
| WEIGHTED AVERAGE NUMBER OF COMMON SHARES - DILUTED | | | 11,591,121 | | | | 10,248,751 | | | | 9,720,827 | |
See accompanying notes to consolidated financial statements.
SUFFOLK BANCORP AND SUBSIDIARIES
CONSOLIDATED STATEMENTS OF COMPREHENSIVE INCOME (LOSS)
For the Years Ended December 31, 2013, 2012 and 2011
(in thousands)
| | For the Years Ended December 31, | |
| | 2013 | | | 2012 | | | 2011 | |
| | | | | | | | | |
| Net income (loss) | | $ | 12,718 | | | $ | (1,748 | ) | | $ | (78 | ) |
| Other comprehensive (loss) income, net of taxes and reclassification adjustments: | | | | | | | | | | | | |
| Net change in unrealized (loss) gain on securities available for sale arising during the period | | | (14,648 | ) | | | (1,320 | ) | | | 5,636 | |
| Non-credit loss portion of OTTI of securities | | | - | | | | - | | | | (1,039 | ) |
| Pension and post-retirement plan benefit obligation | | | 4,473 | | | | 7,276 | | | | (5,438 | ) |
| Total other comprehensive (loss) income, net of taxes | | | (10,175 | ) | | | 5,956 | | | | (841 | ) |
| Total comprehensive income (loss) | | $ | 2,543 | | | $ | 4,208 | | | $ | (919 | ) |
See accompanying notes to consolidated financial statements.
SUFFOLK BANCORP AND SUBSIDIARIES
CONSOLIDATED STATEMENTS OF CHANGES IN STOCKHOLDERS' EQUITY
For the Years Ended December 31, 2013, 2012 and 2011
(dollars in thousands, except per share data)
| | For the Years Ended December 31, | |
| | 2013 | | | 2012 | | | 2011 | |
| Common stock | | | | | | | | | |
| Balance, January 1 | | $ | 34,330 | | | $ | 34,330 | | | $ | 34,236 | |
| Stock dividend reinvestment | | | - | | | | - | | | | 82 | |
| Stock options exercised | | | 18 | | | | - | | | | 12 | |
| Ending balance | | | 34,348 | | | | 34,330 | | | | 34,330 | |
| Surplus | | | | | | | | | | | | |
| Balance, January 1 | | | 42,628 | | | | 24,010 | | | | 23,368 | |
| Private equity offering, net of $2,241 of stock issuance costs | | | - | | | | 18,160 | | | | - | |
| Stock options exercised | | | 73 | | | | - | | | | 65 | |
| Stock dividend reinvestment | | | - | | | | - | | | | 577 | |
| Stock-based compensation | | | 579 | | | | 458 | | | | - | |
| Ending balance | | | 43,280 | | | | 42,628 | | | | 24,010 | |
| Retained earnings | | | | | | | | | | | | |
| Balance, January 1 | | | 89,555 | | | | 91,303 | | | | 91,450 | |
| Net income (loss) | | | 12,718 | | | | (1,748 | ) | | | (78 | ) |
| Stock options exercised | | | - | | | | - | | | | (69 | ) |
| Ending balance | | | 102,273 | | | | 89,555 | | | | 91,303 | |
| Treasury stock | | | | | | | | | | | | |
| Balance, January 1 | | | (5,414 | ) | | | (10,013 | ) | | | (10,005 | ) |
| Reissuance of 1,839,533 common shares from treasury in connection with private equity offering | | | - | | | | 4,599 | | | | - | |
| Stock options exercised | | | - | | | | - | | | | (8 | ) |
| Ending balance | | | (5,414 | ) | | | (5,414 | ) | | | (10,013 | ) |
| Accumulated other comprehensive (loss) income, net of tax | | | | | | | | | | | | |
| Balance, January 1 | | | 2,886 | | | | (3,070 | ) | | | (2,229 | ) |
| Other comprehensive (loss) income | | | (10,175 | ) | | | 5,956 | | | | (841 | ) |
| Ending balance | | | (7,289 | ) | | | 2,886 | | | | (3,070 | ) |
| Total stockholders' equity | | $ | 167,198 | | | $ | 163,985 | | | $ | 136,560 | |
See accompanying notes to consolidated financial statements.
SUFFOLK BANCORP AND SUBSIDIARIES
CONSOLIDATED STATEMENTS OF CASH FLOWS
For the Years Ended December 31, 2013, 2012 and 2011
(in thousands)
| | For the Years Ended December 31, | |
| | 2013 | | | 2012 | | | 2011 | |
| NET INCOME (LOSS) | | $ | 12,718 | | | $ | (1,748 | ) | | $ | (78 | ) |
| ADJUSTMENTS TO RECONCILE NET INCOME (LOSS)TO NET CASH PROVIDED BY OPERATING ACTIVITIES | | | | | | | | | | | | |
| Provision for loan losses | | | 1,250 | | | | 8,500 | | | | 24,888 | |
| Depreciation and amortization | | | 3,258 | | | | 2,572 | | | | 2,510 | |
| Stock-based compensation | | | 579 | | | | 458 | | | | - | |
| OTTI of securities | | | - | | | | - | | | | 1,052 | |
| Net amortization of premiums | | | 1,312 | | | | 1,411 | | | | 2,307 | |
| Originations of mortgage loans for sale | | | (42,052 | ) | | | (47,832 | ) | | | (19,226 | ) |
| Proceeds from sale of mortgage loans originated for sale | | | 47,519 | | | | 49,014 | | | | 19,631 | |
| Gain on sale of mortgage loans originated for sale | | | (1,062 | ) | | | (1,182 | ) | | | (405 | ) |
| Gain on sale of portfolio loans | | | (445 | ) | | | (755 | ) | | | - | |
| Increase in other intangibles | | | (308 | ) | | | (233 | ) | | | (27 | ) |
| Deferred tax expense | | | 3,077 | | | | 3,133 | | | | - | |
| Decrease in income tax receivable | | | 5,406 | | | | 15 | | | | - | |
| (Increase) decrease in accrued interest and loan fees receivable | | | (558 | ) | | | 2,002 | | | | 140 | |
| Decrease (increase) in other assets | | | 1,742 | | | | 2,177 | | | | (1,524 | ) |
| Adjustment to unfunded pension liability | | | (63 | ) | | | 3,147 | | | | 8,473 | |
| Increase (decrease) in other liabilities | | | 2,514 | | | | 1,797 | | | | (7,981 | ) |
| Income from bank owned life insurance | | | (755 | ) | | | - | | | | - | |
| Gain on Visa shares sold | | | (7,766 | ) | | | - | | | | - | |
| Gain on sale of branch building | | | (404 | ) | | | - | | | | - | |
| Loss on sale and writedowns of OREO | | | 47 | | | | 600 | | | | - | |
| (Gain) loss on sale of securities available for sale | | | (403 | ) | | | 217 | | | | (1,648 | ) |
| Net cash provided by operating activities | | | 25,606 | | | | 23,293 | | | | 28,112 | |
| CASH FLOWS FROM INVESTING ACTIVITIES | | | | | | | | | | | | |
| Principal payments on investment securities | | | 55,904 | | | | 32,662 | | | | 32,650 | |
| Proceeds from sale of investment securities - available for sale | | | 13,427 | | | | 7,457 | | | | 44,142 | |
| Maturities of investment securities - available for sale | | | 24,752 | | | | 33,493 | | | | 30,000 | |
| Purchases of investment securities - available for sale | | | (116,403 | ) | | | (181,789 | ) | | | (3,287 | ) |
| Maturities of investment securities - held to maturity | | | 1,593 | | | | 2,247 | | | | 2,270 | |
| Purchases of investment securities - held to maturity | | | (5,243 | ) | | | (990 | ) | | | (1,655 | ) |
| Increase in interest-bearing time deposits in other banks | | | (10,000 | ) | | | - | | | | - | |
| Decrease (increase) in Federal Reserve Bank, Federal Home Loan Bank and other stock | | | 180 | | | | (507 | ) | | | 1,727 | |
| Proceeds from sale of portfolio loans | | | 7,732 | | | | 56,993 | | | | - | |
| Loan (originations) repayments - net | | | (300,796 | ) | | | 100,680 | | | | 128,177 | |
| Proceeds from sale of Visa shares | | | 7,766 | | | | - | | | | - | |
| Proceeds from sale of branch building | | | 851 | | | | - | | | | - | |
| Proceeds from sale of OREO | | | 1,525 | | | | - | | | | 3,919 | |
| Increase in bank owned life insurance | | | (38,000 | ) | | | - | | | | - | |
| Purchases of premises and equipment - net | | | (1,310 | ) | | | (2,244 | ) | | | (2,969 | ) |
| Net cash (used in) provided by investing activities | | | (358,022 | ) | | | 48,002 | | | | 234,974 | |
| CASH FLOWS FROM FINANCING ACTIVITIES | | | | | | | | | | | | |
| Net increase (decrease) in deposit accounts | | | 78,947 | | | | 119,242 | | | | (90,881 | ) |
| Net decrease in short-term borrowings | | | - | | | | - | | | | (40,000 | ) |
| Proceeds from private equity offering, net | | | - | | | | 22,759 | | | | - | |
| Dividends paid to stockholders | | | - | | | | - | | | | (1,454 | ) |
| Proceeds from stock dividend reinvestment | | | - | | | | - | | | | 659 | |
| Proceeds from stock options exercised | | | 91 | | | | - | | | | - | |
| Decrease in capital lease payable | | | (76 | ) | | | (49 | ) | | | - | |
| Net cash provided by (used in) financing activities | | | 78,962 | | | | 141,952 | | | | (131,676 | ) |
| NET (DECREASE) INCREASE IN CASH AND CASH EQUIVALENTS | | | (253,454 | ) | | | 213,247 | | | | 131,410 | |
| CASH AND CASH EQUIVALENTS, BEGINNING OF PERIOD | | | 385,806 | | | | 172,559 | | | | 41,149 | |
| CASH AND CASH EQUIVALENTS, END OF PERIOD | | $ | 132,352 | | | $ | 385,806 | | | $ | 172,559 | |
| SUPPLEMENTAL DATA: | | | | | | | | | | | | |
| Interest paid | | $ | 3,007 | | | $ | 3,830 | | | $ | 6,168 | |
| Income taxes paid | | $ | 480 | | | $ | - | | | $ | - | |
| Loans transferred to held-for-sale | | $ | 6,383 | | | $ | 56,843 | | | $ | - | |
| Loans transferred to OREO | | $ | - | | | $ | 372 | | | $ | - | |
See accompanying notes to consolidated financial statements.
NOTES TO CONSOLIDATED FINANCIAL STATEMENTS
1. SUMMARY OF SIGNIFICANT ACCOUNTING POLICIES
Organization and Nature of Operations — Suffolk Bancorp (the “Company”) was incorporated in 1985 as a bank holding company. The Company currently owns all of the outstanding capital stock of the Suffolk County National Bank of Riverhead (the “Bank”). The Bank was organized under the national banking laws of the United States in 1890. The consolidated financial statements include the accounts of the Company and its wholly owned subsidiary, the Bank. The Bank formed the REIT, Suffolk Greenway, Inc., and owns 100% of an insurance agency and two corporations used to acquire foreclosed real estate. The insurance agency and the two corporations used to acquire foreclosed real estate are immaterial to the Company’s operations. All material intercompany accounts and transactions have been eliminated in consolidation. Unless the context otherwise requires, references herein to the Company include the Company and the Bank on a consolidated basis.
The accounting and reporting policies of the Company conform to U.S. GAAP and general practices within the banking industry. The preparation of the financial statements in conformity with U.S. GAAP requires management to make estimates and assumptions that affect the amounts reported in the financial statements and the accompanying notes. Actual results could differ from those estimates. The following describe the most significant of these policies.
Cash and Cash Equivalents — For purposes of the consolidated statements of cash flows, cash and due from banks and federal funds sold are considered to be cash equivalents. Generally, federal funds are sold for one-day periods.
Investment Securities — The Company reports investment securities in one of the following categories: (i) held to maturity (management has the intent and ability to hold to maturity), which are reported at amortized cost; (ii) trading (held for current resale), which are reported at fair value, with unrealized gains and losses included in earnings; and (iii) available for sale, which are reported at fair value, with unrealized gains and losses excluded from earnings and reported as a separate component of stockholders’ equity. The Company has classified all of its holdings of investment securities as either held to maturity or available for sale. At the time a security is purchased, a determination is made as to the appropriate classification.
Premiums and discounts on investment securities are amortized as expense and accreted as income over the estimated life of the respective security using a method that generally approximates the level-yield method. Gains and losses on the sales of investment securities are recognized upon realization, using the specific identification method and shown separately in the consolidated statements of operations.
Management evaluates securities for OTTI on at least a quarterly basis, and more frequently when economic or market conditions warrant such an evaluation. For securities in an unrealized loss position, management considers the extent and duration of the unrealized loss and the financial condition and near-term prospects of the issuer. Management also assesses whether it intends to sell, or it is more likely than not that it will be required to sell, a security in an unrealized loss position before recovery of its amortized cost basis. If either of the criteria regarding intent or requirement to sell is met, the entire difference between amortized cost and fair value is recognized as impairment through earnings. For debt securities that do not meet the aforementioned criteria, the amount of impairment is split into two components as follows: 1) OTTI related to credit loss, which must be recognized in the statement of operations and 2) OTTI related to other factors, which is recognized in other comprehensive income (loss). The credit loss is defined as the difference between the present value of the cash flows expected to be collected and the amortized cost basis. For equity securities, the entire amount of impairment is recognized through earnings.
Loans and Loan Interest Income Recognition — Loans that management has the intent and ability to hold for the foreseeable future or until maturity or payoff are reported at the principal balance outstanding, net of unearned discounts, deferred loan fees and costs. Unearned discounts on installment loans are credited to income using methods that result in a level yield. Loan origination fees, net of certain direct origination costs, are deferred and recognized in interest income over the respective term of the loan without anticipating prepayments.
Interest income is accrued on the unpaid loan principal balance. Recognition of interest income is discontinued when reasonable doubt exists as to whether principal or interest due can be collected. Loans of all classes will generally no longer accrue interest when over 90 days past due unless the loan is well-secured and in process of collection. When a loan is placed on non-accrual status, all interest previously accrued, but not collected, is reversed against current-year interest income. Interest received on such loans is applied against principal or interest, according to management’s judgment as to the collectability of the principal, until qualifying for return to accrual status. Loans start accruing interest again when they become current as to principal and interest for at least six months, and when, after a well-documented analysis by management, it has been determined that the loans can be collected in full. For all classes of loans, an impaired loan is defined as a loan for which it is probable that the lender will not collect all amounts due under the contractual terms of the loan agreement. Loans for which the terms have been modified resulting in a concession, and for which the borrower is experiencing financial difficulties are considered TDRs and are classified as impaired. Generally, TDRs are initially classified as non-accrual until sufficient time has passed to assess whether the restructured loan will continue to perform. For impaired, accruing loans, interest income is recognized on an accrual basis with cash offsetting the recorded accruals upon receipt.
Allowance for Loan Losses - The allowance for loan losses is a valuation allowance for probable incurred losses, increased by the provision for loan losses and recoveries, and decreased by loan charge-offs. For all classes of loans, when a loan, in full or in part, is deemed uncollectible, it is charged against the allowance for loan losses. This happens when the loan is past due and the borrower has not shown the ability or intent to make the loan current, or the borrower does not have sufficient assets to pay the debt, or the value of the collateral is less than the balance of the loan and is not considered likely to improve soon. The allowance for loan losses is determined by a continuous analysis of the loan portfolio. Such analysis includes changes in the size and composition of the portfolio, the Company’s own historical loan losses, industry-wide losses, current and anticipated economic trends, and details about individual loans. It also includes estimates of the actual value of collateral, other possible sources of repayment and estimates that are susceptible to significant changes due to changes in appraisal values of collateral, national and regional economic conditions and other relevant factors. All non-accrual loans over $250 thousand in the commercial and industrial, commercial real estate and real estate construction loan classes and all TDRs are evaluated individually for impairment. Management will use judgment to determine if there are other loans outside of these two categories that fit the definition of impaired. All other loans are generally evaluated as homogeneous pools with similar risk characteristics. In assessing the adequacy of the allowance for loan losses, management reviews the loan portfolio by separate classes that have similar risk and collateral characteristics; e.g., commercial and industrial, commercial real estate, multifamily, real estate construction, residential mortgages, home equity and consumer loans.
The allowance for loan losses consists of specific and general components. The specific component relates to loans that are individually classified as impaired. Specific reserves are established based on an analysis of the most probable sources of repayment and liquidation of collateral. Impaired loans that are collateral dependent are reviewed based on their collateral and the estimated time required to recover the Company’s investment in the loans, as well as the cost of doing so, and the estimate of the recovery. Non-collateral dependent impaired loans are reviewed based on the present value of estimated future cash flows, including balloon payments, if any, using the loan’s effective interest rate. While every impaired loan is evaluated individually, not every loan requires a specific reserve. Specific reserves fluctuate based on changes in the underlying loans, anticipated sources of repayment, and charge-offs. The general component covers non-impaired loans and is based on historical loss experience for each loan class from a rolling twelve quarter period and modifying those percentages, if necessary, after adjusting for current qualitative and environmental factors that reflect changes in the estimated collectability of the loan class not captured by historical loss data. These factors augment actual loss experience and help estimate the probability of loss within the loan portfolio based on emerging or inherent risk trends. These qualitative factors are applied as an adjustment to historical loss rates and require judgments that cannot be subjected to exact mathematical calculation. These adjustments reflect management’s overall estimate of the extent to which current losses on a pool of loans will differ from historical loss experience. These adjustments are subjective estimates and management reviews them on a quarterly basis. TDRs are also considered impaired with impairment generally measured at the present value of estimated future cash flows using the loan’s effective interest rate at inception or using the fair value of collateral, less estimated costs to sell, if repayment is expected solely from the collateral.
Transfers of Financial Instruments - Transfers of financial assets for which the Bank has surrendered control of the financial assets are accounted for as sales to the extent that consideration other than beneficial interests in the transferred assets is received in exchange. Retained interests in a sale or securitization of financial assets are measured at the date of transfer by allocating the previous carrying amount between the assets transferred and based on their relative estimated fair values. The fair values of retained servicing rights and any other retained interests are determined based on the present value of expected future cash flows associated with those interests and by reference to market prices for similar assets. There were no transfers of financial assets to related or affiliated parties. At December 31, 2013 and 2012, the Bank’s servicing loan portfolio approximated $161 million and $138 million, respectively, which are not included in the accompanying consolidated statements of condition. The carrying value which approximates the estimated fair value of mortgage servicing rights was $2 million as of December 31, 2013 and 2012, and is recorded in goodwill and other intangibles in the Company’s consolidated statements of condition.
Loans Held-For-Sale – Loans held-for-sale are carried at the lower of aggregate cost or fair value, based on observable inputs in the secondary market. Changes in fair value of loans held-for-sale are recognized in earnings.
Other Real Estate Owned (“OREO”) — Property acquired through foreclosure, or OREO, is initially stated at fair value less estimated selling costs. Losses arising at the time of the acquisition of property are charged against the allowance for loan losses. Any additional write-downs to the carrying value of these assets that may be required, as well as the cost of maintaining and operating these foreclosed properties, are charged to expense. The Company held no OREO at December 31, 2013. The carrying value of OREO at December 31, 2012 was $1.6 million.
Premises and Equipment — Premises and equipment are stated at cost, less accumulated depreciation and amortization. Depreciation is calculated by the declining-balance or straight-line method over the estimated useful lives of the assets. Leasehold improvements are amortized using the straight-line method over the term of the lease or the estimated life of the asset, whichever is shorter. The Bank periodically evaluates impairment of long-lived assets to be held and used or to be disposed of by sale. There was no impairment of long-lived assets as of December 31, 2013 and 2012, respectively.
Bank Owned Life Insurance - Bank owned life insurance is recorded at the lower of the cash surrender value or the amount that can be realized under the insurance policy and is included as an asset in the consolidated statements of condition. Changes in the cash surrender value and insurance benefit payments are recorded in non-interest income in the consolidated statements of operations.
Goodwill — Goodwill resulting from business combinations represents the excess of the purchase price over the fair value of the net assets of the acquired business. Goodwill is not amortized but tested for impairment at least annually or when there is a circumstance that would indicate the need to evaluate between annual tests. Based on these tests, there was no impairment of goodwill as of December 31, 2013 and 2012.
Allowance for Off-Balance Sheet Credit Risk — The balance of the allowance for off-balance sheet credit risk is determined by management’s estimate of the amount of financial risk in outstanding loan commitments and contingent liabilities such as performance and financial letters of credit. The allowance for off-balance sheet credit risk was $255 thousand at December 31, 2013 and 2012, and is recorded in other liabilities in the Company’s consolidated statements of condition.
The Company has financial and performance letters of credit. Financial letters of credit require the Bank to make payment if the customer’s financial condition deteriorates, as defined in the agreements. Performance letters of credit require the Bank to make payments if the customer fails to perform certain non-financial contractual obligations.
Income Taxes — Deferred tax assets and liabilities are the expected future tax consequences of temporary differences between the carrying amounts and the tax bases of assets and liabilities, computed using enacted tax rates. Deferred tax assets are recognized if it is more likely than not that a future benefit will be realized. A valuation allowance, if needed, reduces deferred tax assets to the amount expected to be realized. The realization of deferred tax assets (net of a recorded valuation allowance) is largely dependent upon future taxable income, future reversals of existing taxable temporary differences and the ability to carryback losses to available tax years. In assessing the need for a valuation allowance, the Company considers all relevant positive and negative evidence, including taxable income in carryback years, scheduled reversals of deferred tax liabilities, expected future taxable income and available tax planning strategies.
Summary of Retirement Benefits Accounting — The Company’s retirement plan is noncontributory and covers substantially all eligible employees. The plan conforms to the provisions of the Employee Retirement Income Security Act of 1974, as amended, and the Pension Protection Act of 2006, which requires certain funding rules for defined benefit plans. The Company’s policy is to accrue for all pension costs and to fund the maximum amount allowable for tax purposes. Actuarial gains and losses that arise from changes in assumptions concerning future events are amortized over a period that reflects the long-term nature of pension expense used in estimating pension costs.
The Company accounts for its retirement plan in accordance with Accounting Standards Codification (“ASC”) 715, “Compensation – Retirement Benefits,” and ASC 960, “Plan Accounting – Defined Benefit Pension Plans,” which require an employer that is a business entity and sponsors one or more single-employer defined benefit plans to recognize the funded status of a benefit plan in its statement of financial position; recognize as a component of other comprehensive income, net of tax, the gains or losses and prior service costs or credits that arise during the period but are not recognized as components of net periodic benefit cost; measure defined benefit plan assets and obligation as of the date of fiscal year-end statement of financial position (with limited exceptions); and disclose in the notes to financial statements additional information about certain effects of net periodic benefit cost for the next fiscal year that arise from delayed recognition of the gains or losses, prior service costs or credits, and transition asset and obligation. Plan assets and benefit obligations shall be measured as of the date of its statement of financial position and in determining the amount of net periodic benefit cost. An employer is required to use the same date for the measurement of plan assets as for the statement of condition. The Company accrues for post-retirement benefits other than pensions by accruing the cost of providing those benefits to an employee during the years that the employee serves.
Stock-Based Compensation — The Company accounts for stock-based compensation on a modified prospective basis with the fair value of grants of employee stock options recognized in the financial statements.
Treasury Stock — The balance of treasury stock is computed at par value. Under the par value method, the acquisition cost of treasury shares is compared with the amount received at the time of their original issue. The treasury stock account is debited for the par value (or stated value) of the shares and a pro rata amount of any excess over par (or stated value) on original issuance is charged to the surplus account. Any excess of the acquisition cost over the original issue price is charged to retained earnings. If, however, the original issue price exceeds the acquisition price of the treasury stock, this difference is credited to surplus.
Earnings Per Share — Basic earnings per common share is computed by dividing net income by the weighted-average number of common shares outstanding. Diluted earnings per common share is computed by dividing net income by the weighted-average number of common shares outstanding, increased by the number of potential common shares that are assumed to have been purchased with the proceeds from the exercise of stock options. These purchases were assumed to have been made at the average market price of the common stock. The average market price is based on the average closing price for the common stock.
Comprehensive Income — Comprehensive income includes net income and all other changes in equity during a period except those resulting from investments by owners and distributions to owners. Other comprehensive income includes revenues, expenses, gains and losses that under U.S. GAAP are included in comprehensive income but excluded from net income. Comprehensive income and accumulated other comprehensive income are reported net of related income taxes. Accumulated other comprehensive income for the Bank consists of unrealized holding gains or losses on securities available for sale and gains or losses on the unfunded projected benefit obligation of the pension plan.
Derivatives - Derivatives are contracts between counterparties that specify conditions under which settlements are to be made. The only derivatives held by the Company are swap contracts with the purchaser of its Visa Class B shares. The Company records its derivatives on the balance sheet at fair value. The Company’s derivatives do not qualify for hedge accounting. As a result, changes in fair value are recognized in earnings in the period in which they occur. (See also Note 3. Investment Securities contained herein.)
Fair Value Measurements — Fair value measurement is determined based on the assumptions that market participants would use in pricing the asset or liability in an exchange. The definition of fair value includes the exchange price, which is the price in an orderly transaction between market participants to sell an asset or transfer a liability in the principal market for the asset or liability. Market participant assumptions include assumptions about risk, the risk inherent in a particular valuation technique used to measure fair value and/or the risk inherent in the inputs to the valuation technique, as well as the effect of credit risk on the fair value of liabilities.
Segment Reporting — ASC 28, “Segment Reporting,” requires that public companies report certain information about operating segments. It also requires that public companies report certain information about their products and services, the geographic areas in which they operate and their major customers. The Company is a community bank which offers a wide array of products and services to its customers. Pursuant to its banking strategy, emphasis is placed on building relationships with its customers as opposed to building specific lines of business. As a result, at December 31, 2013 and 2012, the Company, the only reportable segment, is not organized around discernible lines of business and prefers to work as an integrated unit to customize solutions for its customers, with business line emphasis and product offerings changing over time as needs and demands change.
Recent Accounting Guidance – In January 2014, the Financial Accounting Standards Board (“FASB”) issued Accounting Standards Update (“ASU”) 2014-04, Receivables—Troubled Debt Restructurings by Creditors (Topic 310), “Reclassification of Residential Real Estate Collateralized Consumer Mortgage Loans upon Foreclosure,” to clarify when an in substance repossession or foreclosure occurs, that is, when a creditor should be considered to have received physical possession of residential real estate property collateralizing a consumer mortgage loan such that the loan receivable should be derecognized and the real estate property recognized. The ASU requires interim and annual disclosure of both (1) the amount of foreclosed residential real estate property held by the creditor and (2) the recorded investment in consumer mortgage loans collateralized by residential real estate property that are in the process of foreclosure according to local requirements of the applicable jurisdiction. The ASU is effective for fiscal years, and interim periods within those years, beginning after December 15, 2014. Management intends to adopt ASU 2014-04 on January 1, 2015 and does not believe that the adoption will have a material effect on the Company’s consolidated financial statements.
In July 2013, the FASB issued ASU 2013-11, Income Taxes (Topic 740), “Presentation of an Unrecognized Tax Benefit When a Net Operating Loss Carryforward, a Similar Tax Loss, or a Tax Credit Carryforward Exists,” to clarify the balance sheet presentation of an unrecognized tax benefit when a net operating loss carryforward, a similar tax loss, or a tax credit carryforward exists. The ASU requires an unrecognized tax benefit, or a portion of an unrecognized tax benefit, to be presented in the financial statements as a reduction to a deferred tax asset for a net operating loss carryforward, a similar tax loss, or a tax credit carryforward, except as follows. To the extent a net operating loss carryforward, a similar tax loss, or a tax credit carryforward is not available at the reporting date under the tax law of the applicable jurisdiction to settle any additional income taxes that would result from the disallowance of a tax position or the tax law of the applicable jurisdiction does not require the entity to use, and the entity does not intend to use, the deferred tax asset for such purpose, the unrecognized tax benefit should be presented in the financial statements as a liability and should not be combined with deferred tax assets. The ASU is effective for fiscal years, and interim periods within those years, beginning after December 15, 2013. The Company’s adoption of ASU 2013-11 on January 1, 2014 did not have a material effect on the Company’s consolidated financial statements.
In February 2013, the FASB issued ASU 2013-02, Comprehensive Income (Topic 220), “Reporting of Amounts Reclassified Out of Accumulated Other Comprehensive Income.” ASU 2013-02 does not change the current requirements for reporting net income or other comprehensive income in financial statements. However, the amendments require an entity to provide information about the amounts reclassified out of accumulated other comprehensive income by component. In addition, an entity is required to present, either on the face of the statement where net income is presented or in the notes, significant amounts reclassified out of accumulated other comprehensive income by the respective line items of net income but only if the amount reclassified is required under U.S. GAAP to be reclassified to net income in its entirety in the same reporting period. For other amounts that are not required under U.S. GAAP to be reclassified in their entirety to net income, an entity is required to cross-reference to other disclosures required under U.S. GAAP that provide additional detail about those amounts. This standard is effective prospectively for public entities for annual and interim reporting periods beginning after December 15, 2012. Being disclosure-related only, the Company’s adoption of ASU 2013-02 on January 1, 2013 did not have a material effect on the Company’s results of operations or financial condition.
Reclassifications — Certain reclassifications have been made to prior period information in order to conform to the current period’s presentation. Such reclassifications had no impact on the Company’s consolidated results of operations or financial condition.
2. ACCUMULATED OTHER COMPREHENSIVE INCOME (“AOCI”)
The changes in the Company’s AOCI by component, net of tax, for the years ended December 31, 2013 and 2012 follow (in thousands). The decrease in net unrealized gains on available for sale securities for the year ended December 31, 2013 resulted solely from the negative impact of higher interest rates in 2013.
| | Year Ended December 31, 2013 | | | Year Ended December 31, 2012 | |
| | Unrealized Gains and Losses on Available for Sale Securities | | | Pension and Post- Retirement Plan Items | | | Total | | | Unrealized Gains and Losses on Available for Sale Securities | | | Pension and Post- Retirement Plan Items | | | Total | |
| Beginning balance | | $ | 10,553 | | | $ | (7,667 | ) | | $ | 2,886 | | | $ | 11,873 | | | $ | (14,943 | ) | | $ | (3,070 | ) |
| Other comprehensive (loss) income before reclassifications | | | (14,391 | ) | | | 4,473 | | | | (9,918 | ) | | | (1,458 | ) | | | 7,276 | | | | 5,818 | |
| Amounts reclassified from AOCI | | | (257 | ) | | | - | | | | (257 | ) | | | 138 | | | | - | | | | 138 | |
| Net other comprehensive (loss) income | | | (14,648 | ) | | | 4,473 | | | | (10,175 | ) | | | (1,320 | ) | | | 7,276 | | | | 5,956 | |
| Ending balance | | $ | (4,095 | ) | | $ | (3,194 | ) | | $ | (7,289 | ) | | $ | 10,553 | | | $ | (7,667 | ) | | $ | 2,886 | |
The table below presents reclassifications out of AOCI for the year ended December 31, 2013 (in thousands).
| | Amount Reclassified from AOCI | | |
| Details about AOCI Components | | Year Ended December 31, 2013 | | Affected Line Item in the Statement Where Net Income is Presented |
| Unrealized gains and losses on available for sale securities | | $ | 403 | | Net gain (loss) on sale of securities available for sale |
| | | | | |
| | | (146 | ) | Income tax expense (benefit) |
| | | | | |
| Total reclassifications, net of tax | | $ | 257 | | |
3. INVESTMENT SECURITIES
The amortized cost, estimated fair value and gross unrealized gains and losses of the Company’s investment securities available for sale and held to maturity at December 31, 2013 and 2012 were as follows (in thousands):
| | December 31, 2013 | | | December 31, 2012 | |
| | | | | Gross | | | Gross | | | Estimated | | | | | | Gross | | | Gross | | | Estimated | |
| | Amortized | | | Unrealized | | | Unrealized | | | Fair | | | Amortized | | | Unrealized | | | Unrealized | | | Fair | |
| | | Cost | | | Gains | | | Losses | | | Value | | | Cost | | | Gains | | | Losses | | | Value | |
| Available for sale: | | | | | | | | | | | | | | | | | | | | | | | | |
| U.S. Treasury securities | | $ | - | | | $ | - | | | $ | - | | | $ | - | | | $ | 500 | | | $ | - | | | $ | - | | | $ | 500 | |
| U.S. Government agency securities | | | 109,315 | | | | - | | | | (9,220 | ) | | | 100,095 | | | | 65,085 | | | | 70 | | | | (77 | ) | | | 65,078 | |
| Obligations of states and political subdivisions | | | 148,664 | | | | 8,499 | | | | - | | | | 157,163 | | | | 155,121 | | | | 13,314 | | | | - | | | | 168,435 | |
| Collateralized mortgage obligations | | | 30,335 | | | | 557 | | | | (788 | ) | | | 30,104 | | | | 87,624 | | | | 2,148 | | | | (80 | ) | | | 89,692 | |
| Mortgage-backed securities | | | 103,332 | | | | 19 | | | | (5,584 | ) | | | 97,767 | | | | 61,750 | | | | 766 | | | | (66 | ) | | | 62,450 | |
| Corporate bonds | | | 15,565 | | | | 264 | | | | (178 | ) | | | 15,651 | | | | 15,701 | | | | 497 | | | | - | | | | 16,198 | |
| Total available for sale securities | | | 407,211 | | | | 9,339 | | | | (15,770 | ) | | | 400,780 | | | | 385,781 | | | | 16,795 | | | | (223 | ) | | | 402,353 | |
| Held to maturity: | | | | | | | | | | | | | | | | | | | | | | | | | | | | | | | | |
| Obligations of states and political subdivisions | | | 11,666 | | | | 655 | | | | (87 | ) | | | 12,234 | | | | 8,035 | | | | 826 | | | | - | | | | 8,861 | |
| Total investment securities | | $ | 418,877 | | | $ | 9,994 | | | $ | (15,857 | ) | | $ | 413,014 | | | $ | 393,816 | | | $ | 17,621 | | | $ | (223 | ) | | $ | 411,214 | |
The amortized cost, contractual maturities and estimated fair value of the Company’s investment securities at December 31, 2013 (in thousands) are presented in the table below. CMOs and MBS assume maturity dates pursuant to average lives.
| | December 31, 2013 | |
| | Amortized | | | Estimated | |
| | | Cost | | | Fair Value | |
| Securities available for sale: | | | | | | |
| Due in one year or less | | $ | 12,171 | | | $ | 12,328 | |
| Due from one to five years | | | 131,422 | | | | 137,011 | |
| Due from five to ten years | | | 240,768 | | | | 231,083 | |
| Due after ten years | | | 22,850 | | | | 20,358 | |
| Total securities available for sale | | | 407,211 | | | | 400,780 | |
| Securities held to maturity: | | | | | | | | |
| Due in one year or less | | | 824 | | | | 833 | |
| Due from one to five years | | | 6,618 | | | | 7,251 | |
| Due from five to ten years | | | 205 | | | | 218 | |
| Due after ten years | | | 4,019 | | | | 3,932 | |
| Total securities held to maturity | | | 11,666 | | | | 12,234 | |
| Total investment securities | | $ | 418,877 | | | $ | 413,014 | |
As a member of the Federal Reserve System and the FHLB, the Bank owns FRB and FHLB stock with a book value of $1.4 million and $1.5 million, respectively, at December 31, 2013. At December 31, 2012, the Bank owned FRB and FHLB stock with a book value of $1.4 million and $1.6 million, respectively. There is no public market for these shares. The last dividends paid were 6.00% on FRB stock in December 2013 and 4.00% on FHLB stock in November 2013.
At December 31, 2013 and 2012, investment securities carried at $292 million and $286 million, respectively, were pledged for trust deposits, public funds on deposit and as collateral for the derivative swap contracts.
The proceeds from sales of securities available for sale and the associated net realized gains (losses) are shown below for the years indicated (in thousands):
| | 2013 | | | 2012 | | | 2011 | |
| | | | | | | | | |
| Proceeds | | $ | 13,427 | | | $ | 7,457 | | | $ | 44,142 | |
| | | | | | | | | | | | |
| Gross realized gains | | $ | 403 | | | $ | - | | | $ | 1,701 | |
| Gross realized losses | | | - | | | | 217 | | | | 53 | |
| Net realized gains (losses) | | $ | 403 | | | $ | (217 | ) | | $ | 1,648 | |
Information pertaining to securities with unrealized losses at December 31, 2013 and 2012, aggregated by investment category and length of time that individual securities have been in a continuous loss position, follows (in thousands):
| | Less than 12 months | | | 12 months or longer | | | Total | |
| | Estimated | | | Unrealized | | | Estimated | | | Unrealized | | | Estimated | | | Unrealized | |
| December 31, 2013 | | Fair value | | | Losses | | | Fair value | | | Losses | | | Fair value | | | Losses | |
| U.S. Government agency securities | | $ | 86,590 | | | $ | 7,726 | | | $ | 13,505 | | | $ | 1,494 | | | $ | 100,095 | | | $ | 9,220 | |
| Obligations of states and political subdivisions | | | 3,932 | | | | 87 | | | | - | | | | - | | | | 3,932 | | | | 87 | |
| Collateralized mortgage obligations | | | 2,935 | | | | 160 | | | | 5,713 | | | | 628 | | | | 8,648 | | | | 788 | |
| Mortgage-backed securities | | | 84,869 | | | | 4,850 | | | | 12,637 | | | | 734 | | | | 97,506 | | | | 5,584 | |
| Corporate bonds | | | 8,681 | | | | 178 | | | | - | | | | - | | | | 8,681 | | | | 178 | |
| Total | | $ | 187,007 | | | $ | 13,001 | | | $ | 31,855 | | | $ | 2,856 | | | $ | 218,862 | | | $ | 15,857 | |
| | Less than 12 months | | | 12 months or longer | | | Total | |
| | Estimated | | | Unrealized | | | Estimated | | | Unrealized | | | Estimated | | | Unrealized | |
| December 31, 2012 | | Fair value | | | Losses | | | Fair value | | | Losses | | | Fair value | | | Losses | |
| U.S. Government agency securities | | $ | 28,958 | | | $ | 77 | | | $ | - | | | $ | - | | | $ | 28,958 | | | $ | 77 | |
| Collateralized mortgage obligations | | | 7,878 | | | | 80 | | | | - | | | | - | | | | 7,878 | | | | 80 | |
| Mortgage-backed securities | | | 14,098 | | | | 66 | | | | - | | | | - | | | | 14,098 | | | | 66 | |
| Total | | $ | 50,934 | | | $ | 223 | | | $ | - | | | $ | - | | | $ | 50,934 | | | $ | 223 | |
The Company’s management evaluates securities for OTTI at least on a quarterly basis, and more frequently when economic or market conditions warrant such an evaluation. All of the Company’s investment securities classified as available-for-sale or held-to-maturity are evaluated for OTTI under FASB ASC 320, “Accounting for Certain Investments in Debt and Equity Securities.” In determining OTTI under ASC 320, management considers many factors, including: (1) the length of time and the extent to which the fair value has been less than amortized cost, (2) the financial condition and near-term prospects of the issuer, (3) whether the market decline was affected by macroeconomic conditions, and (4) whether the Company has the intent to sell the debt security or more likely than not will be required to sell the debt security before its anticipated recovery. The assessment of whether an OTTI decline exists involves a high degree of subjectivity and judgment and is based on information available to management at a point in time. An OTTI is deemed to have occurred if there has been an adverse change in the remaining expected future cash flows.
When an OTTI occurs, the amount of the OTTI recognized in earnings depends on whether an entity intends to sell the security or more likely than not will be required to sell the security before recovery of its amortized cost basis less any current-period credit loss. If an entity intends to sell or more likely than not will be required to sell the security before recovery of its amortized cost basis less any current-period credit loss, the OTTI is recognized in earnings equal to the entire difference between the investment’s amortized cost and its estimated fair value at the balance sheet date. If an entity does not intend to sell the security and it is not more likely than not that the entity will be required to sell the security before recovery of its amortized cost less any current-period loss, the OTTI is separated into the amount representing the credit loss and the amount related to all other factors. The amount of the total OTTI related to the credit loss is determined based on the present value of cash flows expected to be collected and is recognized in earnings. The amount of the total OTTI related to other factors is recognized in other comprehensive income, net of applicable tax benefit. The previous amortized cost basis less the OTTI recognized in earnings becomes the new amortized cost basis of the investment.
The securities at unrealized losses for twelve months or longer in the table above are all issued or guaranteed by U.S. Government agencies or sponsored enterprises. The unrealized losses resulted solely from the negative impact of higher interest rates in 2013.
Upon review of the considerations mentioned here, no OTTI was deemed to be warranted at December 31, 2013.
The Bank was a member of the Visa USA payment network and was issued Class B shares upon Visa’s initial public offering in March 2008. The Visa Class B shares are transferable only under limited circumstances until they can be converted into shares of the publicly traded class of stock. This conversion cannot happen until the settlement of certain litigation, which is indemnified by Visa members. Since its initial public offering, Visa has funded a litigation reserve based upon a change in the ratio for conversion of Visa Class B shares into Visa Class A shares. At its discretion, Visa may continue to increase the conversion rate in connection with any settlements in excess of amounts then in escrow for that purpose and reduce the conversion rate to the extent that it adds any funds to the escrow in the future. Based on the existing transfer restriction and the uncertainty of the litigation, the Company has recorded its Visa Class B shares on its balance sheet at zero value.
In 2013, the Bank sold 100,000 Visa Class B shares to another Visa USA member financial institution at a gross pre-tax gain of approximately $7.8 million which was recorded in non-interest income in the Company’s statement of operations. In conjunction with the sale, the Company entered into derivative swap contracts with the purchaser of these Visa Class B shares which provide for settlements between the purchaser and the Company based upon a change in the ratio for conversion of Visa Class B shares into Visa Class A shares.
The Company has recorded $932 thousand in operating expenses and in other liabilities on the balance sheet, representing the estimate of the Company’s exposure to the settlement of the Visa litigation or the derivative liability. A relatively high degree of subjectivity is used in estimating the fair value of this derivative liability, but management believes that the estimate of its fair value is reasonable based on current information. The present value of estimated future fees to be paid to the derivative counterparty, or carrying costs, calculated by reference to the market price of the Visa Class A shares at a fixed rate of interest are expensed as incurred. For the year ended December 31, 2013, $57 thousand in such carrying costs was expensed.
Management believes that the estimate of the Company’s exposure to the Visa indemnification and fees associated with the derivatives are adequate based on current information. However, future developments in the litigation could require potentially significant changes to the estimate.
The Company has pledged U.S. Government agency securities held in its available for sale portfolio, with a market value of approximately $2.6 million at December 31, 2013, as collateral for the derivative swap contracts.
At December 31, 2013, the Company still owned 38,638 Visa Class B shares subsequent to the sales described here. Based on the existing transfer restriction and the uncertainty of the litigation, these Visa Class B shares continue to be carried on the Company’s balance sheet at zero value. Upon termination of the existing transfer restriction and settlement of the litigation, and to the extent that the Company continues to own such Visa Class B shares in the future, the Company expects to record its Visa Class B shares at fair value.
4. LOANS
At December 31, 2013 and 2012, net loans disaggregated by class consisted of the following (in thousands):
| | December 31, 2013 | | | December 31, 2012 | |
| Commercial and industrial | | $ | 171,199 | | | $ | 168,709 | |
| Commercial real estate | | | 469,357 | | | | 360,010 | |
| Multifamily | | | 184,624 | | | | 9,261 | |
| Real estate construction | | | 6,565 | | | | 15,469 | |
| Residential mortgages | | | 169,552 | | | | 146,575 | |
| Home equity | | | 57,112 | | | | 66,468 | |
| Consumer | | | 10,439 | | | | 14,288 | |
| Gross loans | | | 1,068,848 | | | | 780,780 | |
| Allowance for loan losses | | | (17,263 | ) | | | (17,781 | ) |
| Net loans at end of period | | $ | 1,051,585 | | | $ | 762,999 | |
The Bank’s real estate loans and loan commitments are primarily for properties located throughout Long Island, New York. Repayment of these loans is dependent in part upon the overall economic health of the Company’s market area and current real estate values. The Bank considers the credit circumstances, the nature of the project and loan to value ratios for all real estate loans.
The Bank makes loans to its directors and executive officers, and other related parties, in the ordinary course of its business. Loans made to directors and executive officers, either directly or indirectly, totaled $20 million and $21 million at December 31, 2013 and 2012, respectively. New loans totaling $52 million and $44 million were extended and payments of $53 million and $44 million were received during 2013 and 2012, respectively, on these loans.
The allowance for loan losses is a valuation allowance for probable incurred credit losses. Loan losses are charged against the allowance when management believes the uncollectability of a loan balance is confirmed. Subsequent recoveries, if any, are credited to the allowance. Management estimates the allowance balance required using past loan loss experience, the nature and volume of the portfolio, information about specific borrower situations and estimated collateral values, economic conditions, and other factors. Allocations of the allowance may be made for specific loans, but the entire allowance is available for any loan that, in management’s judgment, should be charged off. The allowance consists of specific and general components. The specific component relates to loans that are individually classified as impaired.
A loan is impaired when, based on current information and events, it is probable that the Company will be unable to collect all amounts due according to the contractual terms of the loan agreement. Loans for which the terms have been modified resulting in a concession, and for which the borrower is experiencing financial difficulties, are considered TDRs and classified as impaired. Generally, TDRs are initially classified as non-accrual until sufficient time has passed to assess whether the restructured loan will continue to perform. Generally, the Company returns a TDR to accrual status upon six months of performance under the new terms.
Factors considered by management in determining impairment include payment status, collateral value, and the probability of collecting scheduled principal and interest payments when due. Loans that experience insignificant payment delays and payment shortfalls generally are not classified as impaired. Management determines the significance of payment delays and payment shortfalls on a case-by-case basis, taking into consideration all of the circumstances surrounding the loan and the borrower, including the length of the delay, the reasons for the delay, the borrower’s prior payment record, and the amount of the shortfall in relation to the principal and interest owed.
Management has determined that all TDRs and all non-accrual loans are impaired; however, non-accrual loans with an impaired balance of $250 thousand or less are evaluated under ASC 450 with other groups of smaller or homogeneous loans with similar risk characteristics. Management will use judgment to determine if there are other loans outside of these two categories that fit the definition of impaired. If a loan is impaired, a specific reserve may be recorded so that the loan is reported, net, at the present value of estimated future cash flows including balloon payments, if any, using the loan’s existing rate or at the fair value of collateral if repayment is expected solely from the collateral. Large groups of homogeneous loans with smaller individual balances, such as consumer and residential real estate loans, are generally evaluated collectively for impairment, and accordingly, are not separately identified for impairment disclosures. TDRs are separately identified for impairment disclosures and are measured at the present value of estimated future cash flows using the loan’s effective rate at inception. If a TDR is considered to be collateral-dependent, the loan is reported at the fair value of the collateral net of estimated costs to sell. For TDRs that subsequently default, the Company determines the allowance amount in accordance with its accounting policy for the allowance for loan losses.
The general component of the allowance covers non-impaired loans and is based on historical loss experience, adjusted for qualitative factors. The historical loss experience is determined by loan class, and is based on the actual loss history experienced by the Company over a rolling twelve quarter period. This actual loss experience is supplemented with other qualitative factors based on the risks present for each loan class. These qualitative factors include consideration of the following: levels of and trends in delinquencies and impaired loans; levels of and trends in charge-offs and recoveries; trends in volume and terms of loans; effects of any changes in risk selection and underwriting standards; other changes in lending policies, procedures and practices; experience, ability, and depth of lending management and other relevant staff; local, regional and national economic trends and conditions; industry conditions; and effects of changes in credit concentrations. The following loan classes have been identified: commercial and industrial, commercial real estate, multifamily, real estate construction, residential mortgages, home equity and consumer loans.
The qualitative factors utilized by the Company in computing its allowance for loan losses are determined based on the various risk characteristics of each loan class. Relevant risk characteristics are as follows:
Commercial and industrial loans – Loans in this class are made to businesses. Generally these loans are secured by assets of the business and repayment is expected from the cash flows of the business. A weakened economy and resultant decreased consumer and/or business spending will have an effect on the credit quality in this loan class.
Commercial real estate loans – Loans in this class include income‑producing investment properties and owner-occupied real estate used for business purposes. The underlying properties are generally located largely in the Company’s primary market area. The cash flows of the income producing investment properties are adversely impacted by a downturn in the economy as evidenced by increased vacancy rates, which in turn, will have an effect on credit quality. Generally, management seeks to obtain annual financial information for borrowers with loans in excess of $250 thousand in this category. In the case of owner-occupied real estate used for business purposes, a weakened economy and resultant decreased consumer and/or business spending will have an adverse effect on credit quality.
Multifamily loans – Loans in this class are primarily concentrated in the five boroughs of New York City and target buildings with stabilized rent flows. It has been well-established that the incidence of loss in multifamily loan transactions is lower than almost all other loan categories as their performance over time has shown limited defaults. The property value for these buildings is directly attributable to the cash flow from rents and the rate of return investors need on their invested capital. Rental rates are a function of demand for apartments and the vacancy rates in New York City have been at historical lows.
Real estate construction loans – Loans in this class primarily include land loans to local individuals, contractors and developers for developing the land for sale or for the purpose of making improvements thereon. Repayment is derived from sale of the lots/ units including any pre-sold units. Credit risk is affected by market conditions, time to sell at an adequate price and cost overruns. To a lesser extent this class includes commercial development projects the Company finances, which in most cases require interest only during construction, and then convert to permanent financing. Credit risk is affected by construction delays, cost overruns, market conditions and the availability of permanent financing, to the extent such permanent financing is not being provided by us.
Residential mortgages and home equity loans – Loans in these classes are made to and secured by owner-occupied residential real estate and repayment is dependent on the credit quality of the individual borrower. The overall health of the economy, including unemployment rates and housing prices, will have an effect on the credit quality in this loan class. The Bank generally does not originate loans with a loan-to-value ratio greater than 80% and does not grant sub-prime loans.
Consumer loans – Loans in this class may be either secured or unsecured and repayment is dependent on the credit quality of the individual borrower and, if applicable, sale of the collateral securing the loan (such as automobiles and manufactured homes). Therefore, the overall health of the economy, including unemployment rates and housing prices, will have a significant effect on the credit quality in this loan class.
For performing loans, an estimate of adequacy of the general component of the allowance is made by applying qualitative factors specific to the portfolio to the period-end balances. Consideration is also given to the type and collateral of the loans with particular attention paid to commercial real estate construction loans, due to the inherent risk of this type of loan. Specific and general reserves are available for any identified loss.
At December 31, 2013 and 2012, the ending balance in the allowance for loan losses disaggregated by class and impairment methodology is as follows (in thousands). Also in the tables below are total loans at December 31, 2013 and 2012 disaggregated by class and impairment methodology (in thousands).
December 31, 2013 | | Commercial and industrial | | | Commercial real estate | | | Multifamily | | | Real estate construction | | | Residential mortgages | | | Home equity | | | Consumer | | | Unallocated | | | Total | |
| Allowance for loan losses: | | | | | | | | | | | | | | | | | | | | | | | | | | | |
| Ending balance: individually evaluated for impairment | | $ | 41 | | | $ | - | | | $ | - | | | $ | - | | | $ | 709 | | | $ | 93 | | | $ | 102 | | | $ | - | | | $ | 945 | |
| Ending balance: collectively evaluated for impairment | | | 2,574 | | | | 6,626 | | | | 2,159 | | | | 88 | | | | 1,754 | | | | 652 | | | | 139 | | | | 2,326 | | | | 16,318 | |
| Ending balance | | $ | 2,615 | | | $ | 6,626 | | | $ | 2,159 | | | $ | 88 | | | $ | 2,463 | | | $ | 745 | | | $ | 241 | | | $ | 2,326 | | | $ | 17,263 | |
| Loan balances: | | | | | | | | | | | | | | | | | | | | | | | | | | | | | | | | | | | | |
| Ending balance: individually evaluated for impairment | | $ | 7,754 | | | $ | 11,821 | | | $ | - | | | $ | - | | | $ | 5,049 | | | $ | 1,082 | | | $ | 284 | | | $ | - | | | $ | 25,990 | |
| Ending balance: collectively evaluated for impairment | | | 163,445 | | | | 457,536 | | | | 184,624 | | | | 6,565 | | | | 164,503 | | | | 56,030 | | | | 10,155 | | | | - | | | | 1,042,858 | |
| Ending balance | | $ | 171,199 | | | $ | 469,357 | | | $ | 184,624 | | | $ | 6,565 | | | $ | 169,552 | | | $ | 57,112 | | | $ | 10,439 | | | $ | - | | | $ | 1,068,848 | |
December 31, 2012 | | Commercial and industrial | | | Commercial real estate | | | Multifamily | | | Real estate construction | | | Residential mortgages | | | Home equity | | | Consumer | | | Unallocated | | | Total | |
| Allowance for loan losses: | | | | | | | | | | | | | | | | | | | | | | | | | | | |
| Ending balance: individually evaluated for impairment | | $ | 340 | | | $ | 22 | | | $ | - | | | $ | 1 | | | $ | 575 | | | $ | 86 | | | $ | - | | | $ | - | | | $ | 1,024 | |
| Ending balance: collectively evaluated for impairment | | | 5,841 | | | | 5,977 | | | | 150 | | | | 140 | | | | 1,001 | | | | 821 | | | | 189 | | | | 2,638 | | | | 16,757 | |
| Ending balance | | $ | 6,181 | | | $ | 5,999 | | | $ | 150 | | | $ | 141 | | | $ | 1,576 | | | $ | 907 | | | $ | 189 | | | $ | 2,638 | | | $ | 17,781 | |
| Loan balances: | | | | | | | | | | | | | | | | | | | | | | | | | | | | | | | | | | | | |
| Ending balance: individually evaluated for impairment | | $ | 10,369 | | | $ | 9,443 | | | $ | - | | | $ | 1,961 | | | $ | 4,660 | | | $ | 502 | | | $ | 21 | | | $ | - | | | $ | 26,956 | |
| Ending balance: collectively evaluated for impairment | | | 158,340 | | | | 350,567 | | | | 9,261 | | | | 13,508 | | | | 141,915 | | | | 65,966 | | | | 14,267 | | | | - | | | | 753,824 | |
| Ending balance | | $ | 168,709 | | | $ | 360,010 | | | $ | 9,261 | | | $ | 15,469 | | | $ | 146,575 | | | $ | 66,468 | | | $ | 14,288 | | | $ | - | | | $ | 780,780 | |
At December 31, 2013 and 2012, past due loans disaggregated by class were as follows (in thousands).
| | Past Due | | | | | | | |
December 31, 2013 | | 30 - 59 days | | | 60 - 89 days | | | 90 days and over | | | Total | | | Current | | | Total | |
| Commercial and industrial | | $ | 13 | | | $ | - | | | $ | 5,014 | | | $ | 5,027 | | | $ | 166,172 | | | $ | 171,199 | |
| Commercial real estate | | | 631 | | | | - | | | | 7,492 | | | | 8,123 | | | | 461,234 | | | | 469,357 | |
| Multifamily | | | - | | | | - | | | | - | | | | - | | | | 184,624 | | | | 184,624 | |
| Real estate construction | | | - | | | | - | | | | - | | | | - | | | | 6,565 | | | | 6,565 | |
| Residential mortgages | | | 1,535 | | | | 339 | | | | 1,897 | | | | 3,771 | | | | 165,781 | | | | 169,552 | |
| Home equity | | | 795 | | | | 100 | | | | 647 | | | | 1,542 | | | | 55,570 | | | | 57,112 | |
| Consumer | | | 75 | | | | - | | | | 133 | | | | 208 | | | | 10,231 | | | | 10,439 | |
| Total | | $ | 3,049 | | | $ | 439 | | | $ | 15,183 | | | $ | 18,671 | | | $ | 1,050,177 | | | $ | 1,068,848 | |
| % of Total Loans | | | 0.3 | % | | | 0.0 | % | | | 1.4 | % | | | 1.7 | % | | | 98.3 | % | | | 100.0 | % |
| | Past Due | | | | | | | |
December 31, 2012 | | 30 - 59 days | | | 60 - 89 days | | | 90 days and over | | | Total | | | Current | | | Total | |
| Commercial and industrial | | $ | 6,591 | | | $ | 1,274 | | | $ | 6,529 | | | $ | 14,394 | | | $ | 154,315 | | | $ | 168,709 | |
| Commercial real estate | | | 1,145 | | | | 329 | | | | 5,192 | | | | 6,666 | | | | 353,344 | | | | 360,010 | |
| Multifamily | | | - | | | | - | | | | - | | | | - | | | | 9,261 | | | | 9,261 | |
| Real estate construction | | | 1,382 | | | | - | | | | 1,961 | | | | 3,343 | | | | 12,126 | | | | 15,469 | |
| Residential mortgages | | | 2,867 | | | | 6 | | | | 2,466 | | | | 5,339 | | | | 141,236 | | | | 146,575 | |
| Home equity | | | 261 | | | | 100 | | | | 266 | | | | 627 | | | | 65,841 | | | | 66,468 | |
| Consumer | | | 189 | | | | 18 | | | | 21 | | | | 228 | | | | 14,060 | | | | 14,288 | |
| Total | | $ | 12,435 | | | $ | 1,727 | | | $ | 16,435 | | | $ | 30,597 | | | $ | 750,183 | | | $ | 780,780 | |
| % of Total Loans | | | 1.6 | % | | | 0.2 | % | | | 2.1 | % | | | 3.9 | % | | | 96.1 | % | | | 100.0 | % |
The following table presents the Company’s impaired loans disaggregated by class for the years ended December 31, 2013 and 2012 (in thousands).
| | December 31, 2013 | | | December 31, 2012 | |
| | Unpaid Principal Balance | | | Recorded Balance | | | Allowance Allocated | | | Unpaid Principal Balance | | | Recorded Balance | | | Allowance Allocated | |
| With no allowance recorded: | | | | | | | | | | | | | | | | | | |
| Commercial and industrial | | $ | 6,711 | | | $ | 6,711 | | | $ | - | | | $ | 7,913 | | | $ | 7,492 | | | $ | - | |
| Commercial real estate | | | 12,239 | | | | 11,821 | | | | - | | | | 8,859 | | | | 7,282 | | | | - | |
| Real estate construction | | | - | | | | - | | | | - | | | | 1,334 | | | | 1,305 | | | | - | |
| Residential mortgages | | | 2,305 | | | | 2,176 | | | | - | | | | 1,918 | | | | 1,788 | | | | - | |
| Home equity | | | 891 | | | | 891 | | | | - | | | | 418 | | | | 416 | | | | - | |
| Consumer | | | 25 | | | | 9 | | | | - | | | | 21 | | | | 21 | | | | - | |
| Subtotal | | | 22,171 | | | | 21,608 | | | | - | | | | 20,463 | | | | 18,304 | | | | - | |
| | | | | | | | | | | | | | | | | | | | | | | | |
| With an allowance recorded: | | | | | | | | | | | | | | | | | | | | | | | | |
| Commercial and industrial | | | 1,043 | | | | 1,043 | | | | 41 | | | | 2,884 | | | | 2,877 | | | | 340 | |
| Commercial real estate | | | - | | | | - | | | | - | | | | 2,161 | | | | 2,161 | | | | 22 | |
| Real estate construction | | | - | | | | - | | | | - | | | | 656 | | | | 656 | | | | 1 | |
| Residential mortgages | | | 2,873 | | | | 2,873 | | | | 709 | | | | 3,015 | | | | 2,872 | | | | 575 | |
| Home equity | | | 328 | | | | 191 | | | | 93 | | | | 86 | | | | 86 | | | | 86 | |
| Consumer | | | 274 | | | | 275 | | | | 102 | | | | - | | | | - | | | | - | |
| Subtotal | | | 4,518 | | | | 4,382 | | | | 945 | | | | 8,802 | | | | 8,652 | | | | 1,024 | |
| Total | | $ | 26,689 | | | $ | 25,990 | | | $ | 945 | | | $ | 29,265 | | | $ | 26,956 | | | $ | 1,024 | |
The following table presents the Company’s average recorded investment in impaired loans and the related interest income recognized disaggregated by class for the years ended December 31, 2013, 2012 and 2011 (in thousands). No interest income was recognized on a cash basis on impaired loans for any of the periods presented.
| | Year Ended December 31, 2013 | | | Year Ended December 31, 2012 | | | Year Ended December 31, 2011 | |
| | Average recorded investment in impaired loans | | | Interest income recognized on impaired loans | | | Average recorded investment in impaired loans | | | Interest income recognized on impaired loans | | | Average recorded investment in impaired loans | | | Interest income recognized on impaired loans | |
| Commercial and industrial | | $ | 12,065 | | | $ | 800 | | | $ | 23,215 | | | $ | 447 | | | $ | 25,179 | | | $ | 1,422 | |
| Commercial real estate | | | 11,556 | | | | 1,041 | | | | 38,477 | | | | 501 | | | | 55,449 | | | | 2,970 | |
| Real estate construction | | | 488 | | | | 114 | | | | 13,681 | | | | 410 | | | | 30,641 | | | | - | |
| Residential mortgages | | | 4,970 | | | | 102 | | | | 9,538 | | | | 127 | | | | 6,956 | | | | - | |
| Home equity | | | 814 | | | | 15 | | | | 2,607 | | | | 13 | | | | 3,369 | | | | - | |
| Consumer | | | 235 | | | | 22 | | | | 429 | | | | - | | | | 337 | | | | - | |
| Total | | $ | 30,128 | | | $ | 2,094 | | | $ | 87,947 | | | $ | 1,498 | | | $ | 121,931 | | | $ | 4,392 | |
The following table presents a summary of non-performing assets for each period (in thousands):
| | | December 31, 2013 | | | December 31, 2012 | |
| Non-accrual loans | | $ | 15,183 | | | $ | 16,435 | |
| Non-accrual loans held-for-sale | | | - | | | | 907 | |
| Loans 90 days past due and still accruing | | | - | | | | - | |
| OREO | | | - | | | | 1,572 | |
| Total non-performing assets | | $ | 15,183 | | | $ | 18,914 | |
| TDRs accruing interest | | $ | 10,647 | | | $ | 9,954 | |
| TDRs non-accruing | | $ | 5,438 | | | $ | 6,650 | |
At December 31, 2013 and 2012, non-accrual loans disaggregated by class were as follows (dollars in thousands):
| | December 31, 2013 | | | December 31, 2012 | |
| | | Non- accrual loans | | | % of Total | | | Total Loans | | | % of Total Loans | | | Non- accrual loans | | | % of Total | | | Total Loans | | | % of Total Loans | |
| Commercial and industrial | | $ | 5,014 | | | | 33.0 | % | | $ | 171,199 | | | | 0.4 | % | | $ | 6,529 | | | | 39.8 | % | | $ | 168,709 | | | | 0.8 | % |
| Commercial real estate | | | 7,492 | | | | 49.3 | | | | 469,357 | | | | 0.7 | | | | 5,192 | | | | 31.6 | | | | 360,010 | | | | 0.7 | |
| Multifamily | | | - | | | | - | | | | 184,624 | | | | - | | | | - | | | | - | | | | 9,261 | | | | - | |
| Real estate construction | | | - | | | | - | | | | 6,565 | | | | - | | | | 1,961 | | | | 11.9 | | | | 15,469 | | | | 0.3 | |
| Residential mortgages | | | 1,897 | | | | 12.5 | | | | 169,552 | | | | 0.2 | | | | 2,466 | | | | 15.0 | | | | 146,575 | | | | 0.3 | |
| Home equity | | | 647 | | | | 4.3 | | | | 57,112 | | | | 0.1 | | | | 266 | | | | 1.6 | | | | 66,468 | | | | - | |
| Consumer | | | 133 | | | | 0.9 | | | | 10,439 | | | | - | | | | 21 | | | | 0.1 | | | | 14,288 | | | | - | |
| Total | | $ | 15,183 | | | | 100.0 | % | | $ | 1,068,848 | | | | 1.4 | % | | $ | 16,435 | | | | 100.0 | % | | $ | 780,780 | | | | 2.1 | % |
The following table presents the collateral value securing non-accrual loans for each period (in thousands):
| | December 31, 2013 | | | December 31, 2012 | |
| | | Principal Balance | | | Collateral Value | | | Principal Balance | | | Collateral Value | |
| Commercial and industrial (1) | | $ | 5,014 | | | $ | 3,750 | | | $ | 6,529 | | | $ | 4,400 | |
| Commercial real estate | | | 7,492 | | | | 13,050 | | | | 5,192 | | | | 12,675 | |
| Real estate construction | | | - | | | | - | | | | 1,961 | | | | 3,661 | |
| Residential mortgages | | | 1,897 | | | | 3,764 | | | | 2,466 | | | | 5,141 | |
| Home equity | | | 647 | | | | 3,072 | | | | 266 | | | | 849 | |
| Consumer | | | 133 | | | | - | | | | 21 | | | | - | |
| Total | | $ | 15,183 | | | $ | 23,636 | | | $ | 16,435 | | | $ | 26,726 | |
(1) Repayment of commercial and industrial loans is expected primarily from the cash flow of the business. The collateral typically securing these loans is a lien on all corporate assets via a blanket UCC filing and does not usually include real estate. For purposes of this disclosure, the Company has ascribed no value to the non-real estate collateral for this class of loans.
Additional interest income of approximately $521 thousand, $854 thousand and $4.3 million would have been recorded during the years ended December 31, 2013, 2012 and 2011, respectively, if non-accrual loans had performed in accordance with their original terms.
The following summarizes the activity in the allowance for loan losses disaggregated by class for the periods indicated (in thousands):
| | Commercial and industrial | | | Commercial real estate | | | Multifamily | | | Real estate construction | | | Residential mortgages | | | Home equity | | | Consumer | | | Unallocated | | | Total | |
Year ended December 31, 2013 | | | | | | | | | | | | | | | | | | | | | | | | | | | |
| Balance at beginning of period | | $ | 6,181 | | | $ | 5,999 | | | $ | 150 | | | $ | 141 | | | $ | 1,576 | | | $ | 907 | | | $ | 189 | | | $ | 2,638 | | | $ | 17,781 | |
| Charge-offs | | | (2,867 | ) | | | (383 | ) | | | - | | | | - | | | | (126 | ) | | | (558 | ) | | | (166 | ) | | | - | | | | (4,100 | ) |
| Recoveries | | | 2,077 | | | | 97 | | | | - | | | | - | | | | 5 | | | | 32 | | | | 121 | | | | - | | | | 2,332 | |
| (Credit) provision for loan losses | | | (2,776 | ) | | | 913 | | | | 2,009 | | | | (53 | ) | | | 1,008 | | | | 364 | | | | 97 | | | | (312 | ) | | | 1,250 | |
| Balance at end of period | | $ | 2,615 | | | $ | 6,626 | | | $ | 2,159 | | | $ | 88 | | | $ | 2,463 | | | $ | 745 | | | $ | 241 | | | $ | 2,326 | | | $ | 17,263 | |
| | Commercial and industrial | | | Commercial real estate | | | Multifamily | | | Real estate construction | | | Residential mortgages | | | Home equity | | | Consumer | | | Unallocated | | | Total | |
Year ended December 31, 2012 | | | | | | | | | | | | | | | | | | | | | | | | | | | |
| Balance at beginning of period | | $ | 25,047 | | | $ | 10,470 | | | $ | 559 | | | $ | 623 | | | $ | 2,401 | | | $ | 512 | | | $ | 313 | | | $ | 33 | | | $ | 39,958 | |
| Charge-offs | | | (8,534 | ) | | | (15,794 | ) | | | - | | | | (3,671 | ) | | | (3,727 | ) | | | (1,953 | ) | | | (267 | ) | | | - | | | | (33,946 | ) |
| Recoveries | | | 2,456 | | | | - | | | | - | | | | 340 | | | | 115 | | | | 246 | | | | 112 | | | | - | | | | 3,269 | |
| (Credit) provision for loan losses | | | (12,788 | ) | | | 11,323 | | | | (409 | ) | | | 2,849 | | | | 2,787 | | | | 2,102 | | | | 31 | | | | 2,605 | | | | 8,500 | |
| Balance at end of period | | $ | 6,181 | | | $ | 5,999 | | | $ | 150 | | | $ | 141 | | | $ | 1,576 | | | $ | 907 | | | $ | 189 | | | $ | 2,638 | | | $ | 17,781 | |
| | Commercial and industrial | | | Commercial real estate | | | Multifamily | | | Real estate construction | | | Residential mortgages | | | Home equity | | | Consumer | | | Unallocated | | | Total | |
Year ended December 31, 2011 | | | | | | | | | | | | | | | | | | | | | | | | | | | |
| Balance at beginning of period | | $ | 13,826 | | | $ | 9,149 | | | $ | 77 | | | $ | 3,177 | | | $ | 519 | | | $ | 1,392 | | | $ | 279 | | | $ | - | | | $ | 28,419 | |
| Charge-offs | | | (9,490 | ) | | | (4,059 | ) | | | - | | | | (232 | ) | | | (411 | ) | | | (191 | ) | | | (214 | ) | | | - | | | | (14,597 | ) |
| Recoveries | | | 781 | | | | - | | | | - | | | | 415 | | | | 3 | | | | 2 | | | | 97 | | | | - | | | | 1,298 | |
| Reclass to allowance for off-balance sheet credit risk | | | - | | | | (50 | ) | | | - | | | | - | | | | - | | | | - | | | | - | | | | - | | | | (50 | ) |
| Provision (credit) for loan losses | | | 19,930 | | | | 5,430 | | | | 482 | | | | (2,737 | ) | | | 2,290 | | | | (691 | ) | | | 151 | | | | 33 | | | | 24,888 | |
| Balance at end of period | | $ | 25,047 | | | $ | 10,470 | | | $ | 559 | | | $ | 623 | | | $ | 2,401 | | | $ | 512 | | | $ | 313 | | | $ | 33 | | | $ | 39,958 | |
The Company recorded a $1.3 million consolidated provision for loan losses for the year ended December 31, 2013 as compared to a provision of $8.5 million for the year ended December 31, 2012. The decrease in the 2013 provision for loan losses resulted from a significant reduction in the level of criticized and classified loans.
For the year ended December 31, 2013, the ending balance of the Company’s allowance for loan losses decreased by $518 thousand when compared to December 31, 2012. During 2013, the Company increased its allowance for loan losses allocated to multifamily loans and commercial real estate loans (“CRE”) by $2.0 million and $627 thousand, respectively, while reducing the amount allocated to commercial and industrial loans (“C&I”) by $3.6 million.
The increases in the allowance for loan losses allocated to multifamily and CRE loans were primarily due to increases in the balances of unimpaired pass rated multifamily and CRE loans of $175 million and $143 million, respectively, versus December 31, 2012, partially offset by reductions of 0.39% and 0.24%, respectively, in the ASC 450-20 historical loss factors rates for such unimpaired pass rated loans.
The decrease in the allowance for loan losses allocated to C&I loans during 2013 reflected a 2.18% reduction in the ASC 450-20 historical loss factors rate on unimpaired pass rated C&I loans and a decrease of $299 thousand in specific reserves for C&I loans as computed under ASC 310-10, partially offset by a $15 million increase in the balance of unimpaired pass rated C&I loans in 2013.
Effective with the March 31, 2013 calculation, the ASC 450-20 loss factors rates incorporate an expansion of the look back period used in calculating historical losses to a rolling twelve quarter period (from an eight quarter period) for each loan segment. This change resulted from the Company’s effort to improve the granularity of its individual loan segment charge-off history. Additionally, the expansion of the look back period reduces the volatility associated with improperly weighting short-term trends in this calculation. These changes more accurately represent the Company’s incurred and expected losses by individual loan segment.
The Bank utilizes an eight-grade risk-rating system for commercial and industrial loans, commercial real estate and construction loans. Loans in risk grades 1- 4 are considered pass loans. The Bank’s risk grades are as follows:
Risk Grade 1, Excellent - Loans secured by liquid collateral such as certificates of deposit, reputable bank letters of credit, or other cash equivalents; loans that are guaranteed or otherwise backed by the full faith and credit of the United States government or an agency thereof, such as the Small Business Administration; or loans to any publicly held company with a current long-term debt rating of A or better.
Risk Grade 2, Good - Loans to businesses that have strong financial statements containing an unqualified opinion from a CPA firm and at least three consecutive years of profits; loans supported by un-audited financial statements containing strong balance sheets, five consecutive years of profits, a five-year satisfactory relationship with the Bank, and key balance sheet and income statement trends that are either stable or positive; loans secured by publicly traded marketable securities where there is no impediment to liquidation; loans to individuals backed by liquid personal assets, established credit history, and unquestionable character; or loans to publicly held companies with current long-term debt ratings of Baa or better.
Risk Grade 3, Satisfactory - Loans supported by financial statements (audited or un-audited) that indicate average or slightly below average risk and having some deficiency or vulnerability to changing economic conditions; loans with some weakness but offsetting features of other support are readily available; loans that are meeting the terms of repayment, but which may be susceptible to deterioration if adverse factors are encountered. Loans may be graded Satisfactory when there is no recent information on which to base a current risk evaluation and the following conditions apply:
| · | At inception, the loan was properly underwritten, did not possess an unwarranted level of credit risk, and the loan met the above criteria for a risk grade of Excellent, Good, or Satisfactory. |
| · | At inception, the loan was secured with collateral possessing a loan value adequate to protect the Bank from loss. |
| · | The loan has exhibited two or more years of satisfactory repayment with a reasonable reduction of the principal balance. |
| · | During the period that the loan has been outstanding, there has been no evidence of any credit weakness. Some examples of weakness include slow payment, lack of cooperation by the borrower, breach of loan covenants or the borrower is in an industry known to be experiencing problems. If any of these credit weaknesses is observed, a lower risk grade may be warranted. |
Risk Grade 4, Satisfactory/Monitored - Loans in this category are considered to be of acceptable credit quality, but contain greater credit risk than satisfactory loans due to weak balance sheets, marginal earnings or cash flow, or other uncertainties. These loans warrant a higher than average level of monitoring to ensure that weaknesses do not advance. The level of risk in a Satisfactory/Monitored loan is within acceptable underwriting guidelines so long as the loan is given the proper level of management supervision.
Risk Grade 5, Special Mention - Loans which possess some credit deficiency or potential weakness which deserves close attention. Such loans pose an unwarranted financial risk that, if not corrected, could weaken the loan by adversely impacting the future repayment ability of the borrower. The key distinctions of a Special Mention classification are that (1) it is indicative of an unwarranted level of risk and (2) weaknesses are considered potential, not defined, impairments to the primary source of repayment.
Risk Grade 6, Substandard - One or more of the following characteristics may be exhibited in loans classified Substandard:
| · | Loans which possess a defined credit weakness. The likelihood that a loan will be paid from the primary source of repayment is uncertain. Financial deterioration is under way and very close attention is warranted to ensure that the loan is collected without loss. |
| · | Loans are inadequately protected by the current net worth and paying capacity of the obligor. |
| · | The primary source of repayment is gone, and the Bank is forced to rely on a secondary source of repayment, such as collateral liquidation or guarantees. |
| · | Loans have a distinct possibility that the Bank will sustain some loss if deficiencies are not corrected. |
| · | Unusual courses of action are needed to maintain a high probability of repayment. |
| · | The borrower is not generating enough cash flow to repay loan principal; however, it continues to make interest payments. |
| · | The lender is forced into a subordinated or unsecured position due to flaws in documentation. |
| · | Loans have been restructured so that payment schedules, terms, and collateral represent concessions to the borrower when compared to the normal loan terms. |
| · | The lender is seriously contemplating foreclosure or legal action due to the apparent deterioration in the loan. |
| · | There is a significant deterioration in market conditions to which the borrower is highly vulnerable. |
Risk Grade 7, Doubtful - One or more of the following characteristics may be present in loans classified Doubtful:
| | · | Loans have all of the weaknesses of those classified as Substandard. However, based on existing conditions, these weaknesses make full collection of principal highly improbable. |
| · | The primary source of repayment is gone, and there is considerable doubt as to the quality of the secondary source of repayment. |
| · | The possibility of loss is high but because of certain important pending factors which may strengthen the loan, loss classification is deferred until the exact status of repayment is known. |
Risk Grade 8, Loss - Loans are considered uncollectible and of such little value that continuing to carry them as assets is not feasible. Loans will be classified Loss when it is neither practical nor desirable to defer writing off or reserving all or a portion of a basically worthless asset, even though partial recovery may be possible at some time in the future.
The Bank annually reviews the ratings on all commercial and industrial, commercial real estate and real estate construction loans greater than $1 million. Semi-annually, the Bank engages an independent third-party to review a significant portion of loans within these loan classes. Management uses the results of these reviews as part of its ongoing review process.
The following presents the Company’s loan portfolio credit risk profile by internally assigned grade disaggregated by class of loan at December 31, 2013 and 2012 (in thousands).
December 31, 2013 | | Commercial and industrial | | | Commercial real estate | | | Multifamily | | | Real estate construction | | | Residential mortgages | | | Home equity | | | Consumer | | | Total | | | % of Total | |
| Grade: | | | | | | | | | | | | | | | | | | | | | | | | | | | |
| Pass | | $ | 158,536 | | | $ | 445,302 | | | $ | 184,624 | | | $ | 6,565 | | | $ | 164,559 | | | $ | 56,379 | | | $ | 10,156 | | | $ | 1,026,121 | | | | 96.0 | % |
| Special mention | | | 2,934 | | | | 2,817 | | | | - | | | | - | | | | - | | | | - | | | | - | | | | 5,751 | | | | 0.5 | |
| Substandard | | | 9,729 | | | | 21,238 | | | | - | | | | - | | | | 4,993 | | | | 733 | | | | 283 | | | | 36,976 | | | | 3.5 | |
| Total | | $ | 171,199 | | | $ | 469,357 | | | $ | 184,624 | | | $ | 6,565 | | | $ | 169,552 | | | $ | 57,112 | | | $ | 10,439 | | | $ | 1,068,848 | | | | 100.0 | % |
December 31, 2012 | | Commercial and industrial | | | Commercial real estate | | | Multifamily | | | Real estate construction | | | Residential mortgages | | | Home equity | | | Consumer | | | Total | | | % of Total | |
| Grade: | | | | | | | | | | | | | | | | | | | | | | | | | | | |
| Pass | | $ | 143,804 | | | $ | 301,862 | | | $ | 9,261 | | | $ | 4,790 | | | $ | 141,915 | | | $ | 65,966 | | | $ | 14,267 | | | $ | 681,865 | | | | 87.3 | % |
| Special mention | | | 5,995 | | | | 38,670 | | | | - | | | | - | | | | - | | | | - | | | | - | | | | 44,665 | | | | 5.7 | |
| Substandard | | | 18,910 | | | | 19,478 | | | | - | | | | 10,679 | | | | 4,660 | | | | 502 | | | | 21 | | | | 54,250 | | | | 7.0 | |
| Total | | $ | 168,709 | | | $ | 360,010 | | | $ | 9,261 | | | $ | 15,469 | | | $ | 146,575 | | | $ | 66,468 | | | $ | 14,288 | | | $ | 780,780 | | | | 100.0 | % |
TDRs are modifications or renewals where the Company has granted a concession to a borrower in financial distress. The Company reviews all modifications and renewals for determination of TDR status. The Company allocated $586 thousand and $800 thousand of specific reserves to customers whose loan terms have been modified as TDRs as of December 31, 2013 and 2012, respectively. These loans involved the restructuring of terms to allow customers to mitigate the risk of default by meeting a lower payment requirement based upon their current cash flow. These may also include loans that renewed at existing contractual rates, but below market rates for comparable credit.
A total of $250 thousand and $35 thousand were committed to be advanced in connection with TDRs as of December 31, 2013 and 2012, respectively, representing the amount the Company is legally required to advance under existing loan agreements. These loans are not in default under the terms of the loan agreements and are accruing interest. It is the Company’s policy to evaluate advances on such loans on a case by case basis. Absent a legal obligation to advance pursuant to the terms of the loan agreement, the Company generally will not advance funds for which it has outstanding commitments, but may do so in certain circumstances.
Outstanding TDRs, disaggregated by class, at December 31, 2013 and 2012 are as follows (dollars in thousands):
| | December 31, 2013 | | | December 31, 2012 | |
TDRs Outstanding | | Number of Loans | | | Outstanding Recorded Balance | | | Number of Loans | | | Outstanding Recorded Balance | |
| Commercial and industrial | | | 43 | | | $ | 6,022 | | | | 41 | | | $ | 6,468 | |
| Commercial real estate | | | 7 | | | | 6,022 | | | | 9 | | | | 6,238 | |
| Residential mortgages | | | 17 | | | | 3,891 | | | | 15 | | | | 3,587 | |
| Consumer | | | 3 | | | | 150 | | | | 5 | | | | 311 | |
| Total | | | 70 | | | $ | 16,085 | | | | 70 | | | $ | 16,604 | |
The following presents, disaggregated by class, information regarding TDRs executed during the years ended December 31, 2013, 2012 and 2011 (dollars in thousands):
| | For the year ended December 31, 2013 | | | For the year ended December 31, 2012 | |
| | | | | Pre-Modification | | | Post-Modification | | | | | | Pre-Modification | | | Post-Modification | |
| | Number | | | Outstanding | | | Outstanding | | | Number | | | Outstanding | | | Outstanding | |
| | of | | | Recorded | | | Recorded | | | of | | | Recorded | | | Recorded | |
New TDRs | | Loans | | | Balance | | | Balance | | | Loans | | | Balance | | | Balance | |
| Commercial and industrial | | | 8 | | | $ | 2,484 | | | $ | 2,484 | | | | 17 | | | $ | 6,674 | | | $ | 6,674 | |
| Commercial real estate | | | 3 | | | | 3,025 | | | | 3,025 | | | | - | | | | - | | | | - | |
| Residential mortgages | | | 4 | | | | 924 | | | | 924 | | | | 6 | | | | 1,617 | | | | 1,617 | |
| Consumer | | | 1 | | | | 17 | | | | 17 | | | | 1 | | | | 49 | | | | 49 | |
| Total | | | 16 | | | $ | 6,450 | | | $ | 6,450 | | | | 24 | | | $ | 8,340 | | | $ | 8,340 | |
| | For the year ended December 31, 2011 | |
| | | | | Pre-Modification | | | Post-Modification | |
| | Number | | | Outstanding | | | Outstanding | |
| | of | | | Recorded | | | Recorded | |
New TDRs | | Loans | | | Balance | | | Balance | |
| Commercial and industrial | | | 29 | | | $ | 4,099 | | | $ | 4,123 | |
| Commercial real estate | | | 8 | | | | 8,697 | | | | 8,697 | |
| Residential mortgages | | | 5 | | | | 1,437 | | | | 1,622 | |
| Home equity | | | 1 | | | | 291 | | | | 291 | |
| Consumer | | | 1 | | | | 34 | | | | 34 | |
| Total | | | 44 | | | $ | 14,558 | | | $ | 14,767 | |
Presented below and disaggregated by class is information regarding loans modified as TDRs that had payment defaults of 90 days or more within twelve months of restructuring during the years ended December 31, 2013, 2012 and 2011 (dollars in thousands):
| | Year ended December 31, 2013 | | | Year ended December 31, 2012 | | | Year ended December 31, 2011 | |
| | | | | Outstanding | | | | | | Outstanding | | | | | | Outstanding | |
| | Number | | | Recorded | | | Number | | | Recorded | | | Number | | | Recorded | |
Defaulted TDRs | | of Loans | | | Balance | | | of Loans | | | Balance | | | of Loans | | | Balance | |
| Commercial and industrial | | | - | | | $ | - | | | | 2 | | | $ | 1,125 | | | | 9 | | | $ | 41 | |
| Commercial real estate | | | 1 | | | | 390 | | | | - | | | | - | | | | 2 | | | | 4,879 | |
| Residential mortgages | | | 1 | | | | 310 | | | | 2 | | | | 807 | | | | - | | | | - | |
| Total | | | 2 | | | $ | 700 | | | | 4 | | | $ | 1,932 | | | | 11 | | | $ | 4,920 | |
Not all loan modifications are TDRs. In some cases, the Company might provide a concession, such as a reduction in interest rate, but the borrower is not experiencing financial distress. This could be the case if the Company is matching a competitor’s interest rate.
The following presents information regarding modifications and renewals executed during the years ended December 31, 2013, 2012 and 2011 that are not considered TDRs (dollars in thousands):
| | Year ended December 31, 2013 | | | Year ended December 31, 2012 | | | Year ended December 31, 2011 | |
| | | | | Outstanding | | | | | | Outstanding | | | | | | Outstanding | |
| | Number | | | Recorded | | | Number | | | Recorded | | | Number | | | Recorded | |
Non-TDR Modifications | | of Loans | | | Balance | | | of Loans | | | Balance | | | of Loans | | | Balance | |
| Commercial and industrial | | | 19 | | | $ | 6,741 | | | | 13 | | | $ | 8,111 | | | | - | | | $ | - | |
| Commercial real estate | | | 41 | | | | 40,004 | | | | 34 | | | | 40,004 | | | | 5 | | | | 1,599 | |
| Multifamily | | | 1 | | | | 410 | | | | - | | | | - | | | | - | | | | - | |
| Total | | | 61 | | | $ | 47,155 | | | | 47 | | | $ | 48,115 | | | | 5 | | | $ | 1,599 | |
5. PREMISES AND EQUIPMENT
At December 31, 2013 and 2012, premises and equipment consisted of the following (in thousands):
| | Estimated | | | | | | |
| | Useful Lives | | 2013 | | | 2012 | |
| Land | Indefinite | | $ | 3,201 | | | $ | 3,326 | |
| Premises | 30 - 40 years | | | 27,570 | | | | 28,167 | |
| Furniture, fixtures & equipment | 3 - 7 years | | | 28,669 | | | | 28,250 | |
| Leasehold improvements | 2 - 25 years | | | 3,825 | | | | 3,869 | |
| | | | 63,265 | | | | 63,612 | |
| Accumulated depreciation and amortization | | | | (38,004 | ) | | | (35,956 | ) |
| Balance at end of year | | | $ | 25,261 | | | $ | 27,656 | |
Premises and accumulated depreciation and amortization include amounts related to property under capital leases of approximately $5 million as of December 31, 2013 and 2012.
Depreciation and amortization charged to operations amounted to $3.3 million, $2.6 million and $2.5 million during 2013, 2012 and 2011, respectively. The 2013 total includes $507 thousand in accelerated depreciation related to two branches closed in 2013 and four branches scheduled to be closed in the first quarter of 2014. Depreciation and amortization charged to operations includes amounts related to property under capital leases of $704 thousand, $461 thousand and $167 thousand in 2013, 2012 and 2011, respectively.
6. DEPOSITS
Scheduled maturities of certificates of deposit are as follows (in thousands):
| Year During Which | | Time Deposits | | | Other Time | |
| Time Deposit Matures | | > $100,000 | | | Deposits | |
| 2014 | | $ | 137,067 | | | $ | 45,856 | |
| 2015 | | | 9,804 | | | | 10,671 | |
| 2016 | | | 7,613 | | | | 3,530 | |
| 2017 | | | 2,802 | | | | 4,350 | |
| 2018 | | | 1,051 | | | | 2,335 | |
| Total | | $ | 158,337 | | | $ | 66,742 | |
7. BORROWINGS
Borrowings, comprised primarily of FHLB advances, securities sold under agreements to repurchase and federal funds purchased, are presented below for each period (dollars in thousands):
| | Short-Term | | | Long-Term | | | | |
| December 31, 2013 | | Borrowings | | | Borrowings | | | Total | |
| Daily average outstanding | | $ | 22 | | | $ | - | | | $ | 22 | |
| Total interest cost | | | - | | | | - | | | | - | |
| Average interest rate paid | | | 0.37 | % | | | - | % | | | 0.37 | % |
| Maximum amount outstanding at any month-end | | $ | - | | | $ | - | | | $ | - | |
| December 31 balance | | | - | | | | - | | | | - | |
| Weighted-average interest rate on balances outstanding | | | - | % | | | - | % | | | - | % |
| | Short-Term | | | Long-Term | | | | |
| December 31, 2012 | | Borrowings | | | Borrowings | | | Total | |
| Daily average outstanding | | $ | 57 | | | $ | - | | | $ | 57 | |
| Total interest cost | | | - | | | | - | | | | - | |
| Average interest rate paid | | | 0.48 | % | | | - | % | | | 0.48 | % |
| Maximum amount outstanding at any month-end | | $ | - | | | $ | - | | | $ | - | |
| December 31 balance | | | - | | | | - | | | | - | |
| Weighted-average interest rate on balances outstanding | | | - | % | | | - | % | | | - | % |
Assets pledged as collateral to the FHLB at December 31, 2013 and 2012 totaled $337 million and $85 million, respectively, consisting of eligible loans and investment securities as determined under FHLB borrowing guidelines. The Company had no FHLB borrowings outstanding at December 31, 2013 or 2012.
8. STOCKHOLDERS’ EQUITY
The Company has a Dividend Reinvestment Plan to provide stockholders of record with a convenient method of investing cash dividends and optional cash payments in additional shares of the Company’s common stock without payment of any brokerage commission or service charges. At the Company’s discretion, such additional shares may be purchased directly from the Company using either originally issued shares or treasury shares at a 3% discount from market value, or the shares may be purchased in negotiated transactions or on any securities exchange where such shares may be traded at 100% of cost. No shares were issued in 2013 or 2012 under this plan. There were 32,614 shares issued in 2011.
Under the terms of the Company’s stock option plans adopted in 1999 and 2009, options have been granted to key employees and directors to purchase shares of the Company’s stock. Under the 2009 Stock Incentive Plan (“the Plan”), a total of 500,000 shares of the Company’s common stock were reserved for issuance, of which 261,833 shares remain for possible issuance at December 31, 2013. There are no remaining shares reserved for issuance under the 1999 Stock Option Plan. Options are awarded by the Compensation Committee of the Board of Directors. Both plans provide that the option price shall not be less than the fair value of the common stock on the date the option is granted. All options are exercisable for a period of ten years or less. Options granted in 2013 and 2012 are exercisable over a three-year period commencing one year from the date of grant at a rate of one third per year. Options granted in 2011 are exercisable over a three-year period commencing three years from the date of grant at a rate of one third per year.
Both plans provide for but do not require the grant of stock appreciation rights (“SARs”) that the holder may exercise instead of the underlying option. At December 31, 2013, there were 6,000 SARs outstanding related to options granted before 2011. The SARs had no intrinsic value at December 31, 2013. When the SAR is exercised, the underlying option is canceled. The optionee receives shares of common stock or cash with a fair market value equal to the excess of the fair value of the shares subject to the option at the time of exercise (or the portion thereof so exercised) over the aggregate option price of the shares set forth in the option agreement. The exercise of SARs is treated as the exercise of the underlying option.
The total intrinsic value of options exercised for the year ended December 31, 2013 was $15 thousand. The total cash received from such option exercises was $91 thousand, excluding the tax benefit realized. In exercising those options, 6,667 new shares of the Company’s common stock were issued. No options were exercised in 2012. The total intrinsic value of options exercised for the year ended December 31, 2011 was $47 thousand. No cash was received from the option exercises in 2011 as the optionee, in exercising those options, paid the option exercise price in full by surrendering 3,112 shares at a fair market value of $77 thousand.
In 2011 the Company granted an award of 30,000 non-qualified stock options at an exercise price of $10.79 per share to its President and Chief Executive Officer as a material inducement to employment with the Company. The non-qualified options were not issued as part of any of the Company’s registered stock-based compensation plans. The options are exercisable over a three-year period commencing three years from the date of grant at a rate of one third per year.
The Company accounts for stock-based compensation on a modified prospective basis with the fair value of grants of employee stock options recognized in the financial statements. Compensation expense related to stock-based compensation amounted to $579 thousand and $458 thousand for the years ended December 31, 2013 and 2012, respectively. There was no such expense for 2011. The remaining unrecognized compensation cost of approximately $942 thousand at December 31, 2013 will be expensed over the remaining weighted average vesting period of approximately 2.4 years.
A summary of stock option activity follows:
| | | Number of Shares | | | Weighted-Average Exercise Price Per Share | |
| Outstanding - January 1, 2011 | | | 89,500 | | | $ | 30.32 | |
| Granted | | | 50,000 | | | | 10.79 | |
| Exercised | | | (5,000 | ) | | | 15.50 | |
| Forfeited or expired | | | (23,000 | ) | | | 28.67 | |
| Outstanding - December 31, 2011 | | | 111,500 | | | | 22.57 | |
| Granted | | | 130,000 | | | | 13.15 | |
| Exercised | | | - | | | | - | |
| Forfeited or expired | | | (30,000 | ) | | | 32.23 | |
| Outstanding - December 31, 2012 | | | 211,500 | | | | 15.41 | |
| Granted | | | 111,500 | | | | 17.31 | |
| Exercised | | | (6,667 | ) | | | 13.44 | |
| Forfeited or expired | | | (25,333 | ) | | | 15.50 | |
| Outstanding - December 31, 2013 | | | 291,000 | | | $ | 16.18 | |
The following table presents the Black-Scholes parameters for stock options granted during the past three years:
| | | 2013 | | | 2012 | | | 2011 | |
| Risk-free interest rate | | | 1.22 | % | | | 0.78 | % | | | 2.10 | % |
| Expected dividend yield | | | - | | | | - | | | | - | |
| Expected life in years | | | 10 | | | | 10 | | | | 10 | |
| Expected volatility | | | 42.95 | % | | | 43.03 | % | | | 42.60 | % |
| Weighted average fair value | | $ | 9.24 | | | $ | 7.13 | | | $ | 5.95 | |
The following summarizes shares subject to purchase from stock options outstanding and exercisable as of December 31, 2013:
| | | Outstanding | | | Exercisable | |
| | | | | Weighted-Average | | | | | | | Weighted-Average | | | |
| Range of | | | | | Remaining | | Weighted-Average | | | | | Remaining | | Weighted-Average | |
| Exercise Prices | | | Shares | | Contractual Life | | Exercise Price | | | Shares | | Contractual Life | | Exercise Price | |
| $ | 10.00 - $14.00 | | | | 140,000 | | 8.2 years | | $ | 12.01 | | | | 30,002 | | 8.3 years | | $ | 12.68 | |
| $ | 14.01 - $20.00 | | | | 121,500 | | 9.5 years | | $ | 17.12 | | | | 3,334 | | 8.7 years | | $ | 14.97 | |
| $ | 20.01 - $30.00 | | | | 5,000 | | 5.1 years | | $ | 28.30 | | | | 5,000 | | 5.1 years | | $ | 28.30 | |
| $ | 30.01 - $40.00 | | | | 24,500 | | 2.3 years | | $ | 32.87 | | | | 24,500 | | 2.3 years | | $ | 32.87 | |
| | | | | | 291,000 | | 8.2 years | | $ | 16.18 | | | | 62,836 | | 5.7 years | | $ | 21.92 | |
9. INCOME TAXES
The following table presents the expense (benefit) for income taxes in the consolidated statements of operations which is comprised of the following (in thousands):
| | | 2013 | | | 2012 | | | 2011 | |
| Current: | Federal | | $ | 135 | | | $ | (4,126 | ) | | $ | 751 | |
| | State | | | 510 | | | | 280 | | | | 345 | |
| | | | 645 | | | | (3,846 | ) | | | 1,096 | |
| Deferred: | Federal | | | 3,046 | | | | 1,412 | | | | (4,339 | ) |
| | State | | | 31 | | | | 1,162 | | | | (980 | ) |
| | | | 3,077 | | | | 2,574 | | | | (5,319 | ) |
| Valuation allowance | | | | - | | | | 558 | | | | - | |
| Total | | | $ | 3,722 | | | $ | (714 | ) | | $ | (4,223 | ) |
The total tax expense (benefit) was different from the amounts computed by applying the federal income tax rate because of the following:
| | | 2013 | | | 2012 | | | 2011 | |
| Federal income tax expense (benefit)at statutory rates | | | 34 | % | | | (34 | )% | | | (35 | )% |
| Tax-exempt income | | | (14 | ) | | | (82 | ) | | | (56 | ) |
| State income taxes, net of federal benefit | | | 2 | | | | 26 | | | | (10 | ) |
| Deferred tax asset adjustment | | | - | | | | 62 | | | | - | |
| Other | | | 1 | | | | (1 | ) | | | 3 | |
| Total | | | 23 | % | | | (29 | )% | | | (98 | )% |
The effects of temporary differences between tax and financial accounting that create significant deferred tax assets and liabilities and the recognition of income and expense for purposes of tax and financial reporting are presented below (in thousands):
| | | 2013 | | | 2012 | | | 2011 | |
| Deferred tax assets: | | | | | | | | | |
| Allowance for loan losses | | $ | 6,269 | | | $ | 6,458 | | | $ | 15,835 | |
| Post-retirement benefits | | | - | | | | 571 | | | | 551 | |
| Deferred compensation | | | 1,588 | | | | 1,642 | | | | 1,941 | |
| Stock-based compensation | | | 668 | | | | 458 | | | | 326 | |
| Unrealized losses on securities available for sale | | | 2,336 | | | | - | | | | - | |
| Unfunded pension obligation | | | 94 | | | | 2,826 | | | | 7,396 | |
| Alternative Minimum Tax credit | | | 668 | | | | 537 | | | | - | |
| Net operating loss carryforward | | | 2,864 | | | | 5,277 | | | | - | |
| Other | | | 961 | | | | 1,300 | | | | 1,677 | |
| Total deferred tax assets | | | 15,448 | | | | 19,069 | | | | 27,726 | |
| Deferred tax liabilities: | | | | | | | | | | | | |
| Unrealized gains on securities available for sale | | | - | | | | (6,019 | ) | | | (7,692 | ) |
| Other | | | (961 | ) | | | (1,107 | ) | | | (1,569 | ) |
| Total deferred tax liabilities | | | (961 | ) | | | (7,126 | ) | | | (9,261 | ) |
| Valuation allowance | | | (534 | ) | | | (558 | ) | | | - | |
| Net deferred tax asset | | $ | 13,953 | | | $ | 11,385 | | | $ | 18,465 | |
The deferred tax assets and liabilities are netted and presented in a single amount which is included in deferred taxes in the accompanying consolidated statements of condition. The realization of deferred tax assets (net of a recorded valuation allowance) is largely dependent upon future taxable income, future reversals of existing taxable temporary differences and the ability to carryback losses to available tax years. In assessing the need for a valuation allowance, the Company considers positive and negative evidence, including taxable income in carryback years, scheduled reversals of deferred tax liabilities, expected future taxable income and tax planning strategies. The Company applied a carryback of the net operating losses for 2012, which resulted in $5 million included in income tax receivable in the 2012 consolidated statements of condition, and which was received in 2013. The Company has net operating loss carryforwards of approximately $6.9 million and $23.1 million for Federal and New York State (“NYS”) income tax purposes, respectively, which may be applied against future taxable income. The Company has a full valuation reserve of $534 thousand, tax effected, on the NYS net operating loss due to the Company’s significant tax-exempt investment income in NYS. The valuation allowance may be reversed to income in future periods to the extent that the related deferred tax assets are realized or when the Company returns to consistent, taxable earnings in NYS. Management believes it is more likely than not that forecasted income, including income that may be generated as a result of certain tax planning strategies, together with the tax effects of the deferred tax liabilities, will be sufficient to fully recover the remaining deferred tax assets. Both the Federal and NYS unused net operating loss carryforwards are expected to expire in varying amounts through the year 2032. It is anticipated that the Federal carryforward will be utilized prior to its expiration based on the Company’s future years’ projected earnings.
The Company had unrecognized tax benefits including interest of approximately $34 thousand, $34 thousand and $38 thousand at December 31, 2013, 2012 and 2011, respectively. Changes in unrecognized tax benefits consist of the following (in thousands):
| | | 2013 | | | 2012 | | | 2011 | |
| Balance January 1 | | $ | 34 | | | $ | 38 | | | $ | 41 | |
| Additions from current year tax positions | | | - | | | | 1 | | | | - | |
| Reductions for prior year tax positions | | | - | | | | (5 | ) | | | (3 | ) |
| Balance December 31 | | $ | 34 | | | $ | 34 | | | $ | 38 | |
The Company recognizes interest and penalties accrued relating to unrecognized tax benefits in income tax expense. There is no accrued interest relating to uncertain tax positions as of December 31, 2013. The Company files income tax returns in the U.S. federal jurisdiction and in New York State. Federal returns are subject to audits by tax authorities and the Company is currently under an audit for the tax years 2010 through 2012. The Company does not expect a significant change in income taxes as a result of this audit. In 2012, New York State audited the Company and Suffolk Greenway, Inc., a subsidiary of the Bank, for the years 2008, 2009 and 2010 and there was no change as a result of these audits. It is not anticipated that the unrecognized tax benefits will significantly change over the next 12 months.
10. EMPLOYEE BENEFITS
Retirement Plan
The Company’s retirement plan is noncontributory and covers substantially all eligible employees. The plan conforms to the provisions of the Employee Retirement Income Security Act of 1974, as amended, and the Pension Protection Act of 2006, which requires certain funding rules for defined benefit plans. The Company’s policy is to accrue for all pension costs and to fund the maximum amount allowable for tax purposes. Actuarial gains and losses that arise from changes in assumptions concerning future events are amortized over a period that reflects the long-term nature of pension expense used in estimating pension costs.
On December 31, 2012, certain provisions of the Company’s retirement plan were changed which affected all participants in this plan and froze the participation of new entrants into the pension plan for all remaining employees in 2012. These changes froze the plan such that no additional pension benefits would accumulate.
The tables below set forth the status of the Company’s pension plan at December 31 for the years presented, the time at which the annual valuation of the plan is made.
The following table sets forth the plan’s change in benefit obligation (in thousands):
| | | 2013 | | | 2012 | | | 2011 | |
| Benefit obligation at start of year | | $ | 45,376 | | | $ | 53,028 | | | $ | 42,570 | |
| Service cost | | | - | | | | 2,665 | | | | 2,179 | |
| Interest cost | | | 1,993 | | | | 2,218 | | | | 2,250 | |
| Actuarial (gain) loss | | | (3,970 | ) | | | (3,789 | ) | | | 7,671 | |
| Benefits paid and expected expenses | | | (1,686 | ) | | | (1,777 | ) | | | (1,642 | ) |
| Curtailment | | | - | | | | (6,969 | ) | | | - | |
| Benefit obligation at end of year | | $ | 41,713 | | | $ | 45,376 | | | $ | 53,028 | |
The following table sets forth the plan’s change in plan assets (in thousands):
| | | 2013 | | | 2012 | | | 2011 | |
| Fair value of plan assets at start of year | | $ | 37,595 | | | $ | 34,817 | | | $ | 32,830 | |
| Actual return on plan assets | | | 5,758 | | | | 3,615 | | | | 13 | |
| Employer contribution | | | - | | | | 1,000 | | | | 3,700 | |
| Benefits paid and actual expenses | | | (1,897 | ) | | | (1,837 | ) | | | (1,726 | ) |
| Fair value of plan assets at end of year | | $ | 41,456 | | | $ | 37,595 | | | $ | 34,817 | |
The following table presents the plan’s funded status and amounts recognized in the consolidated statements of condition (in thousands):
| | | 2013 | | | 2012 | |
| Prepaid pension cost | | $ | 4,696 | | | $ | 4,632 | |
| Unrecognized net loss | | | (4,953 | ) | | | (12,413 | ) |
| Underfunded status | | $ | (257 | ) | | $ | (7,781 | ) |
| Amount included in other liabilities | | $ | (257 | ) | | $ | (7,781 | ) |
| Accumulated benefit obligation | | $ | 41,713 | | | $ | 45,376 | |
In December 2012, the Company made an annual minimum contribution of $1 million for the plan year ended September 30, 2013. There was no additional minimum required contribution for the plan year ended September 30, 2013. The Company does not expect to contribute to its pension plan in 2014.
The following table presents estimated benefits to be paid during the years indicated (in thousands):
| 2014 | | $ | 1,969 | |
| 2015 | | | 2,105 | |
| 2016 | | | 2,178 | |
| 2017 | | | 2,268 | |
| 2018 | | | 2,319 | |
| 2019-2023 | | | 12,439 | |
The following table summarizes the net periodic pension (credit) cost (in thousands):
| | | 2013 | | | 2012 | | | 2011 | |
| Service cost | | $ | - | | | $ | 2,665 | | | $ | 2,179 | |
| Interest cost on projected benefit obligations | | | 1,993 | | | | 2,218 | | | | 2,250 | |
| Expected return on plan assets | | | (2,301 | ) | | | (2,362 | ) | | | (2,238 | ) |
| Net amortization and deferral | | | 244 | | | | 1,628 | | | | 974 | |
| Curtailment gain | | | - | | | | (1 | ) | | | - | |
| Net periodic pension (credit) cost | | | (64 | ) | | | 4,148 | | | | 3,165 | |
| Other changes in plan assets and benefit obligations recognized in other comprehensive income: | | | | | | | | | | | | |
| Net actuarial (gain) loss | | | (7,460 | ) | | | (13,578 | ) | | | 5,348 | |
| Total recognized in other comprehensive income | | | (7,460 | ) | | | (13,578 | ) | | | 5,348 | |
| Total recognized in net periodic pension (credit) cost and other comprehensive income | | $ | (7,524 | ) | | $ | (9,430 | ) | | $ | 8,513 | |
| Weighted-average discount rate | | | 4.50 | % | | | 4.27 | % | | | 5.38 | % |
| Rate of increase in future compensation | | | 0.00 | % | | | 3.50 | % | | | 3.50 | % |
| Expected long-term rate of return on assets | | | 7.00 | % | | | 7.00 | % | | | 7.00 | % |
The assumptions used in the measurement of the Company’s pension obligation at December 31, 2013 were:
| · | Weighted-average discount rate of 5.33%; |
| · | Rate of increase in future compensation of 0.00%; |
| · | Expected long-term rate of return on assets was not applicable. |
The following table summarizes the net periodic pension credit expected for the year ended December 31, 2014. This amount is subject to change if a significant plan-related event should occur before the end of fiscal 2014 (in thousands):
| | Projected | |
| | | 2014 | |
| Service cost | | $ | - | |
| Interest cost on projected benefit obligations | | | 2,158 | |
| Expected return on plan assets | | | (2,547 | ) |
| Net amortization and deferral | | | 25 | |
| Net periodic pension credit | | $ | (364 | ) |
| Weighted-average discount rate | | | 4.50 | % |
| Rate of increase in future compensation | | | 0.00 | % |
| Expected long-term rate of return on assets | | | 7.00 | % |
The Company’s pension plan weighted-average asset allocations at December 31, 2013 and 2012, by asset category are as follows:
| | At December 31, | |
| Asset category | | 2013 | | | 2012 | |
| Cash | | | 1 | % | | | 13 | % |
| Equity securities | | | 60 | | | | 45 | |
| Debt securities | | | 39 | | | | 42 | |
| Total | | | 100 | % | | | 100 | % |
The following table summarizes the fair value measurements of the Company’s pension plan assets on a recurring basis as of December 31, 2013 (in thousands):
| | Fair Value Measurements Using | |
| | Active Markets for | | | Significant | | | | |
| | Identical Assets | | | Other | | | | |
| | Quoted Prices | | | Observable Inputs | | | | |
| Description | | (Level 1) | | | (Level 2) | | | Total | |
| Short-term investment funds | | $ | 290 | | | $ | - | | | $ | 290 | |
| Common collective trusts: | | | | | | | | | | | | |
| U.S. equity securities | | | 9,395 | | | | - | | | | 9,395 | |
| Non - U.S. equity securities | | | 15,654 | | | | - | | | | 15,654 | |
| U.S. fixed income securities | | | - | | | | 13,692 | | | | 13,692 | |
| Non - U.S. fixed income securities | | | - | | | | 2,425 | | | | 2,425 | |
| Total | | $ | 25,339 | | | $ | 16,117 | | | $ | 41,456 | |
The following table summarizes the fair value measurements of the Company’s pension plan assets on a recurring basis as of December 31, 2012 (in thousands):
| | Fair Value Measurements Using | |
| | Active Markets for | | | Significant | | | | |
| | Identical Assets | | | Other | | | | |
| | Quoted Prices | | | Observable Inputs | | | | |
| Description | | (Level 1) | | | (Level 2) | | | Total | |
| Investment in securities | | | | | | | | | |
| Short-term investment funds | | $ | 39 | | | $ | 4,813 | | | $ | 4,852 | |
| Equity securities | | | 17,073 | | | | - | | | | 17,073 | |
| Fixed income securities | | | | | | | | | | | | |
| Auto loan receivable | | | - | | | | 204 | | | | 204 | |
| Collateralized mortgage obligations | | | - | | | | 4,074 | | | | 4,074 | |
| Corporate bonds | | | - | | | | 3,549 | | | | 3,549 | |
| Government-issued securities | | | - | | | | 7,834 | | | | 7,834 | |
| Other asset-backed | | | - | | | | 9 | | | | 9 | |
| Total | | $ | 17,112 | | | $ | 20,483 | | | $ | 37,595 | |
The following is a description of the valuation methodologies used for pension assets measured at fair value:
Level 1 – Quoted prices in active markets for identical assets or liabilities.
Level 2 – Inputs other than Level 1 that are observable, either directly or indirectly, such as quoted prices for similar assets or liabilities; quoted prices in markets that are not active; or other inputs that are observable or can be corroborated by observable market data for substantially the full term of the assets or liabilities.
Level 3 – Unobservable inputs that are supported by little or no market activity and that are significant to the fair value of the assets or liabilities.
For pension assets, Level 1 securities consist primarily of short-term investment funds and equity securities which include investments in common stock and depository receipts. Level 2 securities consist of fixed income securities including corporate bonds, government issues and mortgage-backed securities.
During 2013, all of the assets of the Company’s retirement plan were transferred to State Street Bank & Trust from the New York State Bankers Retirement System. An investment manager, Mercer Investment Management, is responsible for the implementation of the plan’s investment policies and for appointing and terminating sub-advisors to manage the plan’s assets. The plan’s overall investment strategy is to invest in a mix of growth assets (primarily equities) with the objective of achieving long-term growth and hedging assets (primarily fixed income) with the objective of matching the plan’s liabilities. At December 31, 2013, the plan’s assets were invested in 13 common collective trust funds, which use 26 sub-advisors.
The following table presents target investment allocations for 2014 by asset category:
| | Target Allocation | |
| Asset Category | | 2014 | |
| Cash equivalents | | | 0 - 5 | % |
| Equity securities | | | 54 - 64 | % |
| Fixed income securities | | | 36 - 46 | % |
Director’s Retirement Income Agreement of the Bank of the Hamptons
On April 11, 1994, the Company acquired Hamptons Bancshares, Inc., which had a director’s deferred compensation plan. The liability for this plan was approximately $138 thousand at December 31, 2013 and 2012. Expenses of approximately $10 thousand in 2013, $24 thousand in 2012 and $10 thousand in 2011 are included in the consolidated statements of operations. In 2013, the Company paid approximately $10 thousand to participants.
Deferred Compensation
In 1986, the Board approved a deferred compensation plan. Under this plan, certain employees and Directors of the Company elected to defer compensation aggregating approximately $177 thousand in 1986 in exchange for stated future payments to be made at specified dates. The rate of return on the initial deferral was guaranteed. For purposes of financial reporting, expenses of approximately $71 thousand and $58 thousand were recorded in 2013 and 2011, respectively. Income of approximately $13 thousand was recorded in 2012.
During 2013, the Company made payments of approximately $46 thousand to participants of this plan. The Company had purchased life insurance policies on the plan’s participants based upon reasonable actuarial benefit and other financial assumptions where the present value of the projected cash flows from the insurance proceeds approximated the present value of the projected cost of the employee benefit. The Company was the named beneficiary on the policies. In 2013, the Company surrendered these policies. Net insurance expense related to the policies aggregated approximately $155 thousand and $156 thousand in 2012 and 2011, respectively. There was no such expense in 2013.
In 1999, the Board approved a non-qualified deferred compensation plan. Under this plan, certain employees and Directors of the Company may elect to defer some or all of their compensation in exchange for a future payment of the compensation deferred, with accrued interest, at retirement. Participants deferred compensation totaling $95 thousand, $64 thousand and $100 thousand during 2013, 2012 and 2011, respectively. Payments of $356 thousand, $383 thousand and $335 thousand were made to participants during 2013, 2012 and 2011, respectively.
Post-Retirement Benefits Other Than Pension
The Company formerly provided life insurance benefits to employees meeting eligibility requirements. Employees hired after December 31, 1997 were not eligible for retiree life insurance. No other welfare benefits were provided. In the second quarter of 2013, the Company terminated all post-retirement life insurance benefits and recorded a non-recurring gain of $1.7 million as a credit to employee compensation and benefits expense in the Company’s consolidated statements of operations.
401(k) Retirement Plan
The Bank has a 401(k) Retirement Plan and Trust (“401(k) Plan”). Employees who have attained the age of 21 and have completed one-half month of service and 40 hours worked have the option to participate. Employees may currently elect to contribute up to $17,500. The Bank may match up to one-half of the employee’s contribution up to a maximum of 6% of the employee’s annual gross compensation. Employees are fully vested immediately in their own contributions and the Bank’s matching contributions. Bank contributions under the 401(k) Plan amounted to $486 thousand, $110 thousand and $394 thousand during 2013, 2012 and 2011, respectively. The Bank funds all amounts when due. Contributions to the 401(k) Plan may be invested in various bond, equity, money market or diversified funds as directed by each employee. The 401(k) Plan does not allow for investment in the Company’s common stock.
11. COMMITMENTS AND CONTINGENT LIABILITIES
The Bank is a party to financial instruments with off-balance sheet risk in the normal course of business to meet the financing needs of its customers. These financial instruments include commitments to extend credit and standby and documentary letters of credit. Those instruments involve, to varying degrees, elements of credit risk in excess of the amount recognized in the consolidated financial statements. The Bank uses the same credit policies in making commitments and conditional obligations as it does for on-balance sheet instruments.
The Company was contingently liable under standby letters of credit in the amount of $18 million and $19 million at December 31, 2013 and 2012, respectively. The outstanding letters of credit as of December 31, 2013 expire as follows (in thousands):
| 2014 | | $ | 17,418 | |
| 2015 | | | 377 | |
| 2016 | | | 342 | |
| Total | | $ | 18,137 | |
Amounts due under these letters of credit would be reduced by any proceeds that the Company would be able to obtain in liquidating the collateral for the loans, which varies depending on the customer. At December 31, 2013 and 2012, commitments to originate loans and commitments under unused lines of credit for which the Bank is obligated amounted to $113 million and $140 million, respectively.
The Bank is required to maintain balances with the FRB to satisfy reserve requirements. In addition, during 2013 the FRB continued to offer higher interest rates on overnight deposits compared to correspondent banks. The average balance maintained at the FRB during 2013 was $200 million compared to $244 million in 2012.
At December 31, 2013, the Company was obligated under a number of non-cancelable leases for land and buildings used for bank purposes. Minimum annual rentals, exclusive of taxes and other charges under non-cancelable operating leases, are as follows (in thousands):
| | Capital | | | Operating | |
| | | Leases | | | Leases | |
| 2014 | | $ | 311 | | | $ | 1,420 | |
| 2015 | | | 317 | | | | 1,365 | |
| 2016 | | | 329 | | | | 1,011 | |
| 2017 | | | 341 | | | | 856 | |
| 2018 | | | 348 | | | | 503 | |
| Thereafter | | | 5,060 | | | | 1,594 | |
| Total minimum lease payments | | | 6,706 | | | $ | 6,749 | |
| Less: amounts representing interest | | | 2,094 | | | | | |
| Present value of minimum lease payments | | $ | 4,612 | | | | | |
Total rental expense for the years ended December 31, 2013, 2012 and 2011 amounted to $1.6 million, $1.3 million and $1.6 million, respectively.
The Company and the Bank are subject to legal proceedings and claims that arise in the ordinary course of business. In the opinion of management, the amount of ultimate liability, if any, with respect to such matters will not materially affect future operations and will not have a material impact on the Company’s consolidated financial statements.
12. REGULATORY MATTERS
The Company and the Bank are subject to various regulatory capital requirements administered by the federal banking agencies. Failure to meet minimum capital requirements can initiate certain mandatory and possibly additional discretionary actions by regulators that, if undertaken, could have a direct material effect on the Company’s financial statements. Under capital adequacy guidelines and the regulatory framework for prompt corrective action, the Company and the Bank must meet specific capital requirements that involve quantitative measures of the Company’s and the Bank’s assets, liabilities and certain off-balance-sheet items calculated under regulatory accounting practices. The Company’s and the Bank’s capital amounts and the Bank’s classification are also subject to qualitative judgments by the regulators about components, risk weighting and other factors.
Quantitative measures established by regulation to ensure capital adequacy require the Company and the Bank to maintain minimum amounts and ratios of total and tier 1 capital, as defined in the federal banking regulations, to risk-weighted assets and of tier 1 capital to adjusted average assets (leverage). Management believes, as of December 31, 2013, that the Company and the Bank met all such capital adequacy requirements to which it is subject.
The Bank’s capital amounts (in thousands) and ratios are as follows:
| | | | | | | | Minimum | | | Minimum to be Well | |
| | | | | | | | for capital | | | Capitalized under prompt | |
| | Actual capital ratios | | | adequacy | | | corrective action provisions | |
| | Amount | | | Ratio | | | Amount | | | Ratio | | | Amount | | | Ratio | |
| December 31, 2013 | | | | | | | | | | | | | | | | | | |
| Total capital to risk-weighted assets | | $ | 181,952 | | | | 14.92 | % | | $ | 97,542 | | | | 8.00 | % | | $ | 121,927 | | | | 10.00 | % |
| Tier 1 capital to risk-weighted assets | | | 166,683 | | | | 13.67 | % | | | 48,771 | | | | 4.00 | % | | | 73,156 | | | | 6.00 | % |
| Tier 1 capital to adjusted average assets (leverage) | | | 166,683 | | | | 9.74 | % | | | 68,454 | | | | 4.00 | % | | | 85,567 | | | | 5.00 | % |
| | | | | | | | | | | | | | | | | | | | | | | | |
| December 31, 2012 | | | | | | | | | | | | | | | | | | | | | | | | |
| Total capital to risk-weighted assets | | $ | 162,458 | | | | 18.05 | % | | $ | 72,020 | | | | 8.00 | % | | $ | 90,025 | | | | 10.00 | % |
| Tier 1 capital to risk-weighted assets | | | 151,121 | | | | 16.79 | % | | | 36,010 | | | | 4.00 | % | | | 54,015 | | | | 6.00 | % |
| Tier 1 capital to adjusted average assets (leverage) | | | 151,121 | | | | 9.74 | % | | | 62,092 | | | | 4.00 | % | | | 77,615 | | | | 5.00 | % |
The reduction in the Bank’s capital ratios at December 31, 2013 versus December 31, 2012 resulted from an increase in total assets coupled with a change in the Bank’s mix of assets from 0% risk-weighted interest-bearing deposits due from banks to loans, principally at a 100% risk-weighting.
The Company’s tier 1 leverage, tier 1 risk-based and total risk-based capital ratios were 9.81%, 13.77% and 15.02%, respectively, at December 31, 2013, versus 9.79%, 16.89% and 18.15%, respectively, at December 31, 2012.
The ability of the Bank to pay dividends to the Company is subject to certain regulatory restrictions. Generally, dividends declared in a given year by a national bank are limited to its net profit, as defined by regulatory agencies, for that year, combined with its retained net income for the preceding two years, less any required transfer to surplus or to fund for the retirement of any preferred stock. In addition, a national bank may not pay dividends in an amount greater than its undivided profits or declare any dividends if such declaration would leave the bank inadequately capitalized. Also, the ability of the Bank to declare dividends will depend on the prior approval of the FRB. At December 31, 2013, $10.9 million was available for dividends from the Bank to the Company.
In July 2013, the OCC approved new rules on regulatory capital applicable to national banks, implementing Basel III. Most banking organizations are required to apply the new capital rules on January 1, 2015. The final rules set a new common equity tier 1 requirement and higher minimum tier 1 requirements for all banking organizations. They also place limits on capital distributions and certain discretionary bonus payments if a banking organization does not maintain a buffer of common equity tier 1 capital above minimum capital requirements. The rules revise the prompt corrective action framework to incorporate the new regulatory capital minimums. They also enhance risk sensitivity and address weaknesses identified over recent years with the measure of risk-weighted assets, including through new measures of creditworthiness to replace references to credit ratings, consistent with section 939A of the Dodd-Frank Act. Based on our capital levels and balance sheet composition at December 31, 2013, we believe implementation of the new rules will not have a material impact on our capital needs.
13. CONCENTRATIONS
Loans
The following table presents the Company’s loan portfolio disaggregated by class of loan at December 31, 2013 and each class’s percentage of total loans and total assets (dollars in thousands):
| At December 31, | | 2013 | | | % of total loans | | | % of total assets | |
| Commercial and industrial | | $ | 171,199 | | | | 16.0 | % | | | 10.1 | % |
| Commercial real estate | | | 469,357 | | | | 43.9 | | | | 27.6 | |
| Multifamily | | | 184,624 | | | | 17.3 | | | | 10.9 | |
| Real estate construction | | | 6,565 | | | | 0.6 | | | | 0.4 | |
| Residential mortgages | | | 169,552 | | | | 15.9 | | | | 10.0 | |
| Home equity | | | 57,112 | | | | 5.3 | | | | 3.4 | |
| Consumer | | | 10,439 | | | | 1.0 | | | | 0.6 | |
| Total loans | | $ | 1,068,848 | | | | 100.0 | % | | | 63.0 | % |
Commercial and industrial loans, unsecured or secured by collateral other than real estate, present significantly greater risk than other types of loans. The Company obtains, whenever possible, both the personal guarantees of the principal and cross-guarantees among the principal’s business enterprises. Commercial real estate loans (exclusive of multifamily loans) present greater risk than residential mortgages. The Company has attempted to minimize the risks of these loans by considering several factors, including the creditworthiness of the borrower, location, condition, value and the business prospects for the security property. A majority of the Company’s consumer loans are indirect dealer-generated loans secured by automobiles. Most of these loans are made to residents of the Company’s primary lending area. Each loan is small in amount.
Investment Securities
The following presents the Company’s investment portfolio disaggregated by category of security at December 31, 2013 and each category’s percentage of total investment securities and total assets (dollars in thousands):
| At December 31, | | 2013 | | | % of total investment securities | | | % of total assets | |
| U.S. Government agency securities | | $ | 100,095 | | | | 24.3 | % | | | 5.9 | % |
| Corporate bonds | | | 15,651 | | | | 3.8 | | | | 0.9 | |
| Collateralized mortgage obligations | | | 30,104 | | | | 7.3 | | | | 1.8 | |
| Mortgage-backed securities | | | 97,767 | | | | 23.7 | | | | 5.8 | |
| Obligations of states and political subdivisions | | | 168,829 | | | | 40.9 | | | | 9.9 | |
| Total investment securities | | $ | 412,446 | | | | 100.0 | % | | | 24.3 | % |
Obligations of states and political subdivisions present slightly greater risk than securities backed by the U.S. Government, but significantly less risk than loans as they are backed by the full faith and taxing power of the issuer, most of which are located in the state of New York. MBS and CMOs are both backed by pools of mortgages. However, CMOs provide more predictable cash flows since payments are assigned to specific tranches of securities in the order in which they are received. The Company invests in senior tranches, some of which provide for prioritized receipt of cash flows.
14. FAIR VALUE
Fair value measurement is determined based on the assumptions that market participants would use in pricing the asset or liability in an exchange. The definition of fair value includes the exchange price which is the price in an orderly transaction between market participants to sell an asset or transfer a liability in the principal market for the asset or liability. Market participant assumptions include assumptions about risk, the risk inherent in a particular valuation technique used to measure fair value and/or the risk inherent in the inputs to the valuation technique, as well as the effect of credit risk on the fair value of liabilities. The Company uses three levels of the fair value inputs to measure assets, as described below.
Basis of Fair Value Measurement:
Level 1 – Valuations based on quoted prices in active markets for identical investments.
Level 2 – Valuations based on quoted prices in markets that are not active or for which all significant inputs are observable, either directly or indirectly. Level 2 inputs include: (i) quoted prices for similar investments in active markets, (ii) quoted prices for identical investments traded in non-active markets (i.e., dealer or broker markets) and (iii) inputs other than quoted prices that are observable or inputs derived from or corroborated by market data for substantially the full term of the investment.
Level 3 – Valuations based on inputs that are unobservable, supported by little or no market activity, and significant to the overall fair value measurement.
The types of instruments valued based on quoted market prices in active markets include most U.S. Treasury securities. Such instruments are generally classified within Level 1 and Level 2 of the fair value hierarchy. The Company does not adjust the quoted price for such instruments.
The types of instruments valued based on quoted prices in markets that are not active, broker or dealer quotations, or alternative pricing sources with reasonable levels of price transparency include U.S. Government agency securities, state and municipal obligations, MBS, CMOs and corporate bonds. Such instruments are generally classified within Level 2 of the fair value hierarchy.
The types of instruments valued based on significant unobservable inputs that reflect the Company’s own assumptions about the assumptions that market participants would use in pricing an asset or liability are generally classified within Level 3 of the fair value hierarchy.
ASC 820, “Fair Value Measurements and Disclosures,” presents requirements for measuring fair value and for disclosing information about fair value measurements, including a consistent meaning of the term fair value. ASC 820 provides additional guidance in determining fair values when the volume and level of activity for the asset or liability have significantly decreased, particularly when there is no active market or where the price inputs being used represent distressed sales. It also provides guidelines for making fair value measurements more consistent with principles, reaffirming the need to use judgment to ascertain if a formerly active market has become inactive and in determining fair values when markets become inactive.
The following table presents the carrying amounts and estimated fair values of the Company’s financial instruments (in thousands).
| | Level in | | | December 31, 2013 | | | December 31, 2012 | |
| | Fair Value | | | Carrying | | | Estimated | | | Carrying | | | Estimated | |
| | | Heirarchy | | | Amount | | | Fair Value | | | Amount | | | Fair Value | |
| Cash and due from banks | | Level 1 | | | $ | 131,352 | | | $ | 131,352 | | | $ | 384,656 | | | $ | 384,656 | |
| Cash equivalents | | Level 2 | | | | 1,000 | | | | 1,000 | | | | 1,150 | | | | 1,150 | |
| Interest-bearing time deposits in other banks | | Level 2 | | | | 10,000 | | | | 10,000 | | | | - | | | | - | |
| Federal Reserve Bank, Federal Home Loan Bank and other stock | | N/A | | | | 2,863 | | | | N/A | | | | 3,043 | | | | N/A | |
| Investment securities held to maturity | | Level 2 | | | | 11,666 | | | | 12,234 | | | | 8,035 | | | | 8,861 | |
| Investment securities available for sale | | Level 2 | | | | 400,780 | | | | 400,780 | | | | 402,353 | | | | 402,353 | |
| Loans held-for-sale | | Level 2 | | | | 175 | | | | 175 | | | | 907 | | | | 907 | |
| Loans, net of allowance | | Level 2, 3 (1) | | | | 1,051,585 | | | | 1,056,279 | | | | 762,999 | | | | 787,597 | |
| Bank owned life insurance | | Level 3 | | | | 38,755 | | | | 38,755 | | | | - | | | | - | |
| Accrued interest and loan fees receivable | | Level 2 | | | | 5,441 | | | | 5,441 | | | | 4,883 | | | | 4,883 | |
| Non-maturity deposits | | Level 2 | | | | 1,284,982 | | | | 1,284,982 | | | | 1,187,383 | | | | 1,187,383 | |
| Time deposits | | Level 2 | | | | 225,079 | | | | 225,946 | | | | 243,731 | | | | 245,595 | |
| Accrued interest payable | | Level 2 | | | | 160 | | | | 160 | | | | 237 | | | | 237 | |
| (1) | Impaired loans are generally classified within Level 3 of the fair value hierarchy. |
Fair value estimates are made at a specific point in time and may be based on judgments regarding losses expected in the future, risk, and other factors that are subjective in nature. The methods and assumptions used to produce the fair value estimates follow.
The Company records investments available for sale and mortgage servicing rights at fair value. For cash and due from banks, cash equivalents, interest-bearing time deposits in other banks, bank owned life insurance, accrued interest and loan fees receivable, non-maturity deposits and accrued interest payable, the carrying amount is a reasonable estimate of fair value. Time deposits are valued using a replacement cost of funds approach.
Fair values are estimated for portfolios of loans with similar characteristics. The fair value of performing loans was calculated by discounting projected cash flows through their estimated maturity using market discount rates that reflect the general credit and interest rate characteristics of the loan category. The maturity horizon is based on the Bank’s history of repayments for each type of loan and an estimate of the effect of current economic conditions. Fair value for significant non-performing loans is based on recent external appraisals of collateral, if any. If appraisals are not available, estimated cash flows are discounted using a rate commensurate with the associated risk. Assumptions regarding credit risk, cash flows, and discount rates are made using available market information and specific borrower information.
OREO properties are initially recorded at fair value, less estimated costs to sell when acquired, establishing a new cost basis. Adjustments to OREO are measured at fair value, less estimated costs to sell. Fair values are generally based on third party appraisals or realtor evaluations of the property. These appraisals and evaluations may utilize a single valuation approach or a combination of approaches including comparable sales and the income approach. Adjustments are routinely made in the appraisal process by the appraisers to adjust for differences between the comparable sales and income data available. Such adjustments are usually significant and typically result in a Level 3 classification. In cases where the carrying amount exceeds the fair value, less estimated costs to sell, an impairment loss is recognized through a valuation allowance, and the property is reported as non-recurring Level 3.
Loans identified as impaired are measured using one of three methods: the loan’s observable market price, the fair value of collateral or the present value of expected future cash flows. Those measured using the loan’s observable market price or the fair value of collateral are recorded at fair value. For each period presented, no impaired loans were measured using the loan’s observable market price. If an impaired loan has had a charge-off or if the fair value of the collateral is less than the recorded investment in the loan, the Company establishes a specific reserve and reports the loan as non-recurring Level 3. The fair value of collateral of impaired loans is generally based on recent real estate appraisals. These appraisals may utilize a single valuation approach or a combination of approaches including comparable sales and the income approach. Adjustments are routinely made in the appraisal process by the appraisers to adjust for differences between the comparable sales and income data available. Such adjustments are usually significant and typically result in a Level 3 classification of the inputs for determining fair value.
The fair value of loans held-for-sale is based on observable inputs in the secondary market.
The fair value of commitments to extend credit was estimated by either discounting cash flows or using the fees currently charged to enter into similar agreements, taking into account the remaining terms of the agreements and the current creditworthiness of the counter-parties. The estimated fair value of written financial guarantees and letters of credit is based on fees currently charged for similar agreements. The fees charged for the commitments were not material in amount.
In 2013, the Company entered into derivative swap contracts with the purchaser of its Visa Class B shares. The fair value of these derivatives is measured using an internal model that includes the use of probability weighted scenarios for estimates of Visa’s aggregate exposure to the litigation matters, with consideration of amounts funded by Visa into its escrow account for this litigation. As a result, the Company estimates a fair value for these derivatives at 12% of the net sale proceeds from the Company’s sale of the related Visa Class B shares. Since this estimation process requires application of judgment in developing significant unobservable inputs used to determine the possible outcomes and the probability weighting assigned to each scenario, these derivatives have been classified as Level 3 within the valuation hierarchy. (See also Note 3. Investment Securities contained herein.)
Assets measured at fair value on a non-recurring basis are as follows (in thousands):
| Assets: | | December 31, 2013 | | | Fair Value Measurements Using Significant Unobservable Inputs (Level 3) | |
| Impaired loans | | $ | 16,942 | | | $ | 16,942 | |
| Total | | $ | 16,942 | | | $ | 16,942 | |
| Assets: | | December 31, 2012 | | | Fair Value Measurements Using Significant Unobservable Inputs (Level 3) | |
| Impaired loans | | $ | 9,390 | | | $ | 9,390 | |
| OREO | | | 1,572 | | | | 1,572 | |
| Total | | $ | 10,962 | | | $ | 10,962 | |
The following presents fair value measurements on a recurring basis as of December 31, 2013 and 2012 (in thousands):
| | | | | Fair Value Measurements Using | |
| | | | | Significant Other | | | Significant | |
| | | | | Observable Inputs | | | Unobservable Inputs | |
| Assets: | | December 31, 2013 | | | (Level 2) | | | (Level 3) | |
| U.S. Government agency securities | | $ | 100,095 | | | $ | 100,095 | | | $ | - | |
| Corporate bonds | | | 15,651 | | | | 15,651 | | | | - | |
| Collateralized mortgage obligations | | | 30,104 | | | | 30,104 | | | | - | |
| Mortgage-backed securities | | | 97,767 | | | | 97,767 | | | | - | |
| Obligations of states and political subdivisions | | | 157,163 | | | | 157,163 | | | | - | |
| Loans held-for-sale | | | 175 | | | | 175 | | | | - | |
| Mortgage servicing rights | | | 2,163 | | | | - | | | | 2,163 | |
| Total | | $ | 403,118 | | | $ | 400,955 | | | $ | 2,163 | |
| | | | | | | | | | | | |
| Liabilities: | | | | | | | | | | | | |
| Derivatives | | | 932 | | | $ | - | | | $ | 932 | |
| Total | | $ | 932 | | | $ | - | | | $ | 932 | |
| | | | | Fair Value Measurements Using | |
| | | | | Significant Other | | | Significant | |
| | | | | Observable Inputs | | | Unobservable Inputs | |
| Assets: | | December 31, 2012 | | | (Level 2) | | | (Level 3) | |
| U.S. Treasury securities | | $ | 500 | | | $ | 500 | | | $ | - | |
| U.S. Government agency securities | | | 65,078 | | | | 65,078 | | | | - | |
| Corporate bonds | | | 16,198 | | | | 16,198 | | | | - | |
| Collateralized mortgage obligations | | | 89,692 | | | | 89,692 | | | | - | |
| Mortgage-backed securities | | | 62,450 | | | | 62,450 | | | | - | |
| Obligations of states and political subdivisions | | | 168,435 | | | | 168,435 | | | | - | |
| Loans held-for-sale | | | 907 | | | | 907 | | | | - | |
| Mortgage servicing rights | | | 1,856 | | | | - | | | | 1,856 | |
| Total | | $ | 405,116 | | | $ | 403,260 | | | $ | 1,856 | |
Reconciliations for assets and liabilities measured at fair value on a recurring basis using significant unobservable inputs (Level 3) for the years ended December 31, 2013, 2012 and 2011 follow (in thousands).
| Fair Value Measurements Using Significant Unobservable Inputs (Level 3) | |
| | Assets | | | Liabilities | |
| | | Collateralized Mortgage Obligations | | | Mortgage Servicing Rights | | | Derivatives | |
| Balance at January 1, 2011 | | $ | - | | | $ | 1,596 | | | $ | - | |
| Transfers from level 2 | | | 7,994 | | | | - | | | | - | |
| Net increases | | | - | | | | 27 | | | | - | |
| Balance at December 31, 2011 | | | 7,994 | | | | 1,623 | | | | - | |
| Sales | | | (7,994 | ) | | | - | | | | - | |
| Net increases | | | - | | | | 233 | | | | - | |
| Balance at December 31, 2012 | | | - | | | | 1,856 | | | | - | |
| Net increases | | | - | | | | 307 | | | | 932 | |
| Balance at December 31, 2013 | | $ | - | | | $ | 2,163 | | | $ | 932 | |
15. SUFFOLK BANCORP (PARENT COMPANY ONLY) CONDENSED FINANCIAL STATEMENTS (in thousands)
| Condensed Statements of Condition at December 31, | | 2013 | | | 2012 | | | 2011 | |
| Assets: | | | | | | | | | |
| Due from banks | | $ | 605 | | | $ | 515 | | | $ | 405 | |
| Investment in the Bank | | | 165,924 | | | | 163,007 | | | | 135,941 | |
| Other assets | | | 669 | | | | 463 | | | | 333 | |
| Total Assets | | $ | 167,198 | | | $ | 163,985 | | | $ | 136,679 | |
| Liabilities and Stockholders' Equity: | | | | | | | | | | | | |
| Other liabilities | | $ | - | | | $ | - | | | $ | 119 | |
| Stockholders' Equity | | | 167,198 | | | | 163,985 | | | | 136,560 | |
| Total Liabilities and Stockholders' Equity | | $ | 167,198 | | | $ | 163,985 | | | $ | 136,679 | |
| Condensed Statements of Operations and Comprehensive Income (Loss) for the Years Ended December 31, | | 2013 | | | 2012 | | | 2011 | |
| Expense: | | | | | | | | | |
| Other expense | | $ | 372 | | | $ | 358 | | | $ | 362 | |
| Loss before equity in undistributed net income (loss) of the Bank | | | (372 | ) | | | (358 | ) | | | (362 | ) |
| Equity in undistributed earnings (loss) of the Bank | | | 13,090 | | | | (1,390 | ) | | | 284 | |
| Net income (loss) | | $ | 12,718 | | | $ | (1,748 | ) | | $ | (78 | ) |
| Total Comprehensive Income (Loss) | | $ | 2,543 | | | $ | 4,208 | | | $ | (919 | ) |
| Condensed Statements of Cash Flows for the Years Ended December 31, | | 2013 | | | 2012 | | | 2011 | |
| Cash Flows From Operating Activities: | | | | | | | | | |
| Net income (loss) | | $ | 12,718 | | | $ | (1,748 | ) | | $ | (78 | ) |
| Less: equity in undistributed (earnings) loss of the Bank | | | (13,090 | ) | | | 1,390 | | | | (284 | ) |
| Other - net | | | 371 | | | | 209 | | | | 1,504 | |
| Net cash (used in) provided by operating activities | | | (1 | ) | | | (149 | ) | | | 1,142 | |
| Cash Flows From Investing Activities: | | | | | | | | | | | | |
| Advances to the Bank | | | - | | | | (22,500 | ) | | | (2,000 | ) |
| Net cash used in investing activities | | | - | | | | (22,500 | ) | | | (2,000 | ) |
| Cash Flows From Financing Activities: | | | | | | | | | | | | |
| Dividend reinvestment and stock option exercises | | | 91 | | | | - | | | | 659 | |
| Proceeds from issuance of capital stock | | | - | | | | 22,759 | | | | - | |
| Dividends paid | | | - | | | | - | | | | (1,454 | ) |
| Net cash provided by (used in) financing activities | | | 91 | | | | 22,759 | | | | (795 | ) |
| Net Increase (Decrease) in Cash and Cash Equivalents | | | 90 | | | | 110 | | | | (1,653 | ) |
| Cash and Cash Equivalents, Beginning of Year | | | 515 | | | | 405 | | | | 2,058 | |
| Cash and Cash Equivalents, End of Year | | $ | 605 | | | $ | 515 | | | $ | 405 | |
16. SELECTED QUARTERLY FINANCIAL DATA (UNAUDITED) (dollars in thousands, except per share data)
| | 2013 | | | 2012 | |
| | 4th | | | 3rd | | | 2nd | | | 1st | | | 4th | | | 3rd | | | 2nd | | | 1st | |
| | Quarter | | | Quarter | | | Quarter | | | Quarter | | | Quarter | | | Quarter | | | Quarter | | | Quarter | |
| Interest income | | $ | 15,969 | | | $ | 14,705 | | | $ | 14,560 | | | $ | 14,444 | | | $ | 14,317 | | | $ | 15,041 | | | $ | 15,845 | | | $ | 15,244 | |
| Interest expense | | | 682 | | | | 733 | | | | 747 | | | | 768 | | | | 829 | | | | 887 | | | | 967 | | | | 1,036 | |
| Net interest income | | | 15,287 | | | | 13,972 | | | | 13,813 | | | | 13,676 | | | | 13,488 | | | | 14,154 | | | | 14,878 | | | | 14,208 | |
| Provision (credit) for loan losses (1) | | | 1,250 | | | | - | | | | - | | | | - | | | | (1,100 | ) | | | 12,000 | | | | (2,400 | ) | | | - | |
| Net interest income after provision (credit) for loan losses | | | 14,037 | | | | 13,972 | | | | 13,813 | | | | 13,676 | | | | 14,588 | | | | 2,154 | | | | 17,278 | | | | 14,208 | |
| Non-interest income (2) | | | 7,139 | | | | 6,587 | | | | 2,464 | | | | 3,317 | | | | 4,344 | | | | 1,881 | | | | 2,401 | | | | 2,255 | |
| Operating expenses (3) | | | 16,982 | | | | 15,090 | | | | 12,692 | | | | 13,801 | | | | 15,656 | | | | 17,171 | | | | 14,139 | | | | 14,605 | |
| Income tax expense (benefit) | | | 866 | | | | 1,557 | | | | 816 | | | | 483 | | | | 1,231 | | | | (3,975 | ) | | | 1,340 | | | | 690 | |
| Net income (loss) | | $ | 3,328 | | | $ | 3,912 | | | $ | 2,769 | | | $ | 2,709 | | | $ | 2,045 | | | $ | (9,161 | ) | | $ | 4,200 | | | $ | 1,168 | |
| Net income (loss) per common share - basic | | $ | 0.29 | | | $ | 0.34 | | | $ | 0.24 | | | $ | 0.23 | | | $ | 0.18 | | | $ | (0.94 | ) | | $ | 0.43 | | | $ | 0.12 | |
| Net income (loss) per common share - diluted | | $ | 0.29 | | | $ | 0.34 | | | $ | 0.24 | | | $ | 0.23 | | | $ | 0.18 | | | $ | (0.94 | ) | | $ | 0.43 | | | $ | 0.12 | |
| Cash dividends per common share | | $ | - | | | $ | - | | | $ | - | | | $ | - | | | $ | - | | | $ | - | | | $ | - | | | $ | - | |
| (1) | 4th quarter 2013 amount reflects the impact of a charge-off of $1.5 million related to the sale of $8 million in non-performing and classified loans. |
| (2) | 4th quarter 2013 and 3rd quarter 2013 amounts include gains on Visa shares sold of $3.9 million and $3.8 million, respectively. |
| (3) | 4th quarter 2013 and 3rd quarter 2013 amounts include branch consolidation costs of $1.6 million and $460 thousand, respectively. Also included are reserve and carrying costs related to Visa shares sold totaling $515 thousand and $474 thousand for the 4th and 3rd quarter 2013, respectively. |
17. LEGAL PROCEEDINGS
On November 19, 2013, the U.S. District Court for the Eastern District of New York dismissed with prejudice the class action, James E. Fisher v. Suffolk Bancorp, et al., No. 11 Civ. 5114 (SJ), filed in the District Court on October 20, 2011. The complaint alleged that the defendants violated Sections 10(b) and 20(a) of the Securities Exchange Act of 1934 by knowingly or recklessly making false statements about, or failing to disclose accurate information about, the Company’s financial results and condition, loan loss reserves, impaired assets, internal and disclosure controls, and banking practices. The complaint sought damages in an unspecified amount on behalf of purchasers of the Company’s Common Stock between March 12, 2010 and August 10, 2011 (“Class Members”). The Company denied and continues to deny each and all of the allegations alleged by the plaintiffs in the action. In accordance with the parties’ settlement agreement and the court’s approval order, the Company’s insurer paid the sum of $2.8 million into an escrow account for the benefit of Class Members and for the payment of attorneys’ fees and expenses to the lead counsel in the action.
On September 25, 2013, the Supreme Court of the State of New York for the County of Suffolk dismissed with prejudice the shareholder derivative action, Susan Forbush v. Edgar F. Goodale, et al., No. 33538/2011, filed in the Supreme Court on October 28, 2011, and approved the settlement among the parties to that action along with another shareholder of the Company who had made a litigation demand on the Company. On October 3, 2013, as requested by the parties in accordance with their settlement agreement, the U.S. District Court for the Eastern District of New York dismissed with prejudice the shareholder derivative action, Robert J. Levy v. J. Gordon Huszagh, et al., Civ. 3321 (JS), filed in the District Court on July 11, 2011. These derivative actions alleged that the defendants breached their fiduciary duties by making improper statements regarding the sufficiency of the Company’s allowance for loan losses and loan portfolio and credit quality, and by failing to establish sufficient allowances for loan losses and to establish effective credit risk management policies. The Company denied and continues to deny each and all of the allegations alleged by the plaintiffs in the actions. The terms of the settlement require the Company to implement various corporate governance enhancements, and, as part of the settlement, plaintiff’s counsel was awarded fees and expenses in the amount of $600 thousand which was paid by the Company’s insurer.
The Company assesses its liabilities and contingencies in connection with legal proceedings on an ongoing basis. For those matters where it is probable that the Company will incur losses and the amounts of the losses can be reasonably estimated, the Company records an expense and corresponding liability in its consolidated financial statements. We have concluded that an amount for such a loss contingency is not to be accrued at this time.
18. BRANCH CONSOLIDATION
In 2013, the Company announced the phased-in closing of six branches in Suffolk County that, once fully implemented, will reduce annual operating expenses by an estimated $2.4 million.
Two branches, Middle Island and Water Mill, closed in October 2013. One-time costs of $596 thousand, including accelerated depreciation of $136 thousand, were recorded in 2013 related to the closing of these two branches. Of these one-time expenses, the amounts recorded in branch consolidation costs (primarily lease termination costs and severance), occupancy expense and equipment expense were $460 thousand, $84 thousand and $52 thousand, respectively. Partially offsetting these one-time costs was a $404 thousand gain on the sale of the Water Mill branch building in the fourth quarter of 2013. This gain was recorded in other operating income.
Mattituck, Port Jefferson Station, Manorville and Montauk Harbor are scheduled to be closed in the first quarter of 2014. One-time costs of $2.0 million, including accelerated depreciation of $371 thousand, were recorded in 2013 related to the 2014 closing of these four branches. Of these one-time expenses, the amounts recorded in branch consolidation costs (primarily lease termination costs and severance), occupancy expense and equipment expense were $1.6 million, $192 thousand and $179 thousand, respectively.
| CHANGES IN AND DISAGREEMENTS WITH ACCOUNTANTS ON ACCOUNTING AND FINANCIAL DISCLOSURE None. |
(a) Evaluation of Disclosure Controls and Procedures
The Company carried out an evaluation, under the supervision and with the participation of its principal executive officer and principal financial officer, of the effectiveness of the design and operation of its disclosure controls and procedures as defined in Rule 13a-15(e) and Rule 15d-15(e) under the Securities Exchange Act of 1934, as amended (“Exchange Act”). Based on this evaluation, the Company’s principal executive officer and principal financial officer concluded that, as of the end of the period covered by this report, the Company’s disclosure controls and procedures were effective in ensuring information required to be disclosed by the Company in reports that it files or submits under the Exchange Act is i) recorded, processed, summarized and reported within the time periods specified in the Securities and Exchange Commission’s rules and forms and ii) accumulated and communicated to the Company’s management, including the Company’s principal executive officer and principal financial officer, as appropriate to allow timely decisions regarding required disclosure. There have been no changes in the Company’s internal controls or in other factors that have materially affected, or are reasonably likely to materially affect, internal controls subsequent to the date the Company carried out its evaluation.
(b) Changes in Internal Controls
There were no changes to the Company’s internal control over financial reporting as defined in Rule 13a-15(f) and Rule 15d-15(f) under the Exchange Act that occurred in the fourth quarter of 2013 that have materially affected, or are reasonably likely to materially affect, the Company’s internal control over financial reporting.
(c) Management’s Report on Internal Control over Financial Reporting
The management of Suffolk Bancorp (the “Company”) is responsible for establishing and maintaining effective internal control over financial reporting as defined in Rules 13a-15(f) and 15d-15(f) under the Securities Exchange Act of 1934. The Company’s internal control over financial reporting is designed to provide reasonable assurance regarding the reliability of financial reporting and the preparation of financial statements for external purposes in accordance with generally accepted accounting principles in the United States of America.
Because of its inherent limitations, internal control over financial reporting may not prevent or detect all misstatements. Also, projections of any evaluation of effectiveness to future periods are subject to the risk that controls may become inadequate because of changes in conditions, or that the degree of compliance with the policies or procedures may deteriorate.
Management assessed the effectiveness of the Company’s internal control over financial reporting for financial presentations as of December 31, 2013. In making this assessment, management used the criteria set forth by the Committee of Sponsoring Organizations of the Treadway Commission as described in the original (1992) version of Internal Control-Integrated Framework. Based on this assessment, management concluded that the Company maintained effective internal control over financial reporting presented in conformity with generally accepted accounting principles in the United States of America as of December 31, 2013.
The Company’s independent registered public accounting firm has audited and issued their report on the effectiveness of the Company’s internal control over financial reporting.
(d) Report of Independent Registered Public Accounting Firm.
REPORT OF INDEPENDENT REGISTERED PUBLIC ACCOUNTING FIRM
Board of Directors and Stockholders
Suffolk Bancorp
Riverhead, New York
We have audited Suffolk Bancorp’s internal control over financial reporting as of December 31, 2013, based on criteria established in Internal Control – Integrated Framework (1992) issued by the Committee of Sponsoring Organizations of the Treadway Commission (the COSO criteria). Suffolk Bancorp’s management is responsible for maintaining effective internal control over financial reporting and for its assessment of the effectiveness of internal control over financial reporting, included in the accompanying Item 9A(c), Management’s Report on Internal Control over Financial Reporting. Our responsibility is to express an opinion on Suffolk Bancorp’s internal control over financial reporting based on our audit.
We conducted our audit in accordance with the standards of the Public Company Accounting Oversight Board (United States). Those standards require that we plan and perform the audit to obtain reasonable assurance about whether effective internal control over financial reporting was maintained in all material respects. Our audit included obtaining an understanding of internal control over financial reporting, assessing the risk that a material weakness exists, and testing and evaluating the design and operating effectiveness of internal control based on the assessed risk. Our audit also included performing such other procedures as we considered necessary in the circumstances. We believe that our audit provides a reasonable basis for our opinion.
A company’s internal control over financial reporting is a process designed to provide reasonable assurance regarding the reliability of financial reporting and the preparation of financial statements for external purposes in accordance with generally accepted accounting principles. A company’s internal control over financial reporting includes those policies and procedures that (1) pertain to the maintenance of records that, in reasonable detail, accurately and fairly reflect the transactions and dispositions of the assets of the company; (2) provide reasonable assurance that transactions are recorded as necessary to permit preparation of financial statements in accordance with generally accepted accounting principles, and that receipts and expenditures of the company are being made only in accordance with authorizations of management and directors of the company; and (3) provide reasonable assurance regarding prevention or timely detection of unauthorized acquisition, use, or disposition of the company’s assets that could have a material effect on the financial statements.
Because of its inherent limitations, internal control over financial reporting may not prevent or detect misstatements. Also, projections of any evaluation of effectiveness to future periods are subject to the risk that controls may become inadequate because of changes in conditions, or that the degree of compliance with the policies or procedures may deteriorate.
In our opinion, Suffolk Bancorp maintained, in all material respects, effective internal control over financial reporting as of December 31, 2013, based on the COSO criteria.
We also have audited, in accordance with the standards of the Public Company Accounting Oversight Board (United States), the consolidated statements of condition of Suffolk Bancorp as of December 31, 2013 and 2012, and the related consolidated statements of operations, comprehensive income (loss), changes in stockholders’ equity, and cash flows for each of the three years in the period ended December 31, 2013 and our report dated March 4, 2014 expressed an unqualified opinion thereon.
/s/ BDO USA, LLP
New York, New York
March 4, 2014
PART III
| DIRECTORS, EXECUTIVE OFFICERS AND CORPORATE GOVERNANCE |
Incorporated herein by reference to the Company’s Proxy Statement for the 2014 Annual Meeting of Stockholders (“2014 Proxy Statement”). The identification of the directors of the Company may be found under “Election of Directors.” The identification of the executive officers of the Company may be found under “Named Executive Officers.” There exists no family relationship between any director and executive officer. Disclosure of the Audit Committee and the audit committee financial expert may be found under “Committees.” Compliance with section 16(a) of the Exchange Act may be found under “Filing of S.E.C. Reports – Section 16(a) Beneficial Ownership Reporting Compliance.” A copy of the Company’s code of business conduct and ethics, which applies to the Chief Executive Officer, Chief Financial Officer, and all other senior financial officers of the Company designated by the Chief Executive Officer from time to time, is available at our website, www.suffolkbancorp.com, and will be provided, without charge, upon written request to the Corporate Secretary at 4 West Second Street, PO Box 9000, Riverhead, NY 11901.
Incorporated herein by reference to the Company’s 2014 Proxy Statement. Executive compensation may be found under “Executive Compensation and Related Matters.” Compensation Committee interlocks and insider participation may be found under “Compensation Committee Interlocks and Insider Participation” and the Compensation Committee report may be found under “Compensation Committee Report.”
| SECURITY OWNERSHIP OF CERTAIN BENEFICIAL OWNERS AND MANAGEMENT AND RELATED STOCKHOLDER MATTERS |
Incorporated herein by reference to the Company’s 2014 Proxy Statement. Security ownership of certain beneficial owners and management may be found under “Security Ownership of Certain Beneficial Owners” and “Security Ownership of Management.”
Additionally, information about the Company’s equity compensation plans is as follows:
| | At December 31, 2013 | |
| | Number of securities to be issued upon exercise of outstanding options, warrants and rights | | | Weighted-average exercise price of outstanding options, warrants and rights ($) | | | Number of securities remaining available for future issuance under equity compensation plans (excluding securities reflected in column (a)) | |
| Plan category | | (a) | | | (b) | | | (c) | |
| Equity compensation plans approved by security holders | | | 261,000 | | | | 16.80 | | | | 261,833 | |
| Equity compensation plans not approved by security holders | | | 30,000 | | | | 10.79 | | | | - | |
| Total | | | 291,000 | | | | 16.18 | | | | 261,833 | |
| CERTAIN RELATIONSHIPS AND RELATED TRANSACTIONS AND DIRECTOR INDEPENDENCE |
Incorporated herein by reference to the Company’s 2014 Proxy Statement. Certain relationships and related transactions may be found under “Transactions with Related Persons, Promoters and Certain Control Persons.” Director independence may be found under “Nominating and Governance Committee.”
| PRINCIPAL ACCOUNTANT FEES AND SERVICES |
Incorporated herein by reference to the Company’s 2014 Proxy Statement. Audit fees, audit-related fees, tax fees and all other fees may be found under “Audit Fees.” Disclosure of the Audit Committee’s pre-approval of policies and procedures may be found under “Committees.”
PART IV
| EXHIBITS AND FINANCIAL STATEMENT SCHEDULES |
The Report of Independent Registered Public Accounting Firm, the Consolidated Financial Statements and the Notes to Consolidated Financial Statements may be found in Part II, Item 8 of this 10-K. As to any schedules omitted, they are not applicable or the required information is shown in the Consolidated Financial Statements or the Notes thereto.
Exhibits:
| 3.1 | Certificate of Incorporation of Suffolk Bancorp (incorporated by reference from Exhibit 3.(i) to the Company’s Form 10-K for the fiscal year ended December 31, 1999, filed March 10, 2000) |
| 3.2 | Bylaws of Suffolk Bancorp (incorporated by reference from Exhibit 3.(ii) to the Company’s Form 10-K for the fiscal year ended December 31, 1999, filed March 10, 2000) |
| 10.1 | Suffolk Bancorp 2009 Stock Incentive Plan (incorporated by reference from Exhibit C to the Company’s Form 10-K for the fiscal year ended December 31, 2008, filed March 13, 2009) |
| 10.2 | Suffolk Bancorp Form of Change-of-Control Employment Contract (incorporated by reference from Exhibit D to the Company’s Form 10-K for the fiscal year ended December 31, 2008, filed March 13, 2009) |
| 10.3 | Suffolk Bancorp Form of Change-of-Control Employment Contract (incorporated by reference from Exhibit 10.3 to the Company's Annual Report on Form 10-K for the year ended December 31, 2011, filed March 30, 2012) |
| 10.4 | Suffolk Bancorp Form of Option Agreement (incorporated by reference from Exhibit 10.4 to the Company's Annual Report on Form 10-K for the year ended December 31, 2011, filed March 30, 2012) |
| 10.5 | Suffolk Bancorp Severance Agreement (incorporated by reference from Exhibit 99.1 to the Company’s report on Form 10-Q for the quarterly period ended June 30, 2011, filed December 20, 2011) |
| 10.6 | Suffolk Bancorp Letter Agreement (incorporated by reference from Exhibit 10.1 to the Company’s report on Form 8-K, filed January 3, 2012) |
| Subsidiaries of the Registrant (filed herein) |
| Consent of Independent Registered Public Accounting Firm (filed herein) |
| Certification of principal executive officer pursuant to Rule 13a-14(a) or 15d-14(a) of the Securities Exchange Act of 1934, as adopted pursuant to Section 302 of the Sarbanes-Oxley Act of 2002 (filed herein) |
| Certification of principal financial officer pursuant to Rule 13a-14(a) or 15d-14(a) of the Securities Exchange Act of 1934, as adopted pursuant to Section 302 of the Sarbanes-Oxley Act of 2002 (filed herein) |
| Certification of principal executive officer pursuant to 18 U.S.C. Section 1350, as adopted pursuant to Section 906 of the Sarbanes-Oxley Act of 2002 (filed herein) |
| Certification of principal financial officer pursuant to 18 U.S.C. Section 1350, as adopted pursuant to Section 906 of the Sarbanes-Oxley Act of 2002 (filed herein) |
| 101.INS | XBRL Instance Document (filed herein) |
| 101.SCH | XBRL Taxonomy Extension Schema Document (filed herein) |
| 101.CAL | XBRL Taxonomy Extension Calculation Linkbase Document (filed herein) |
| 101.LAB | XBRL Taxonomy Extension Label Linkbase Document (filed herein) |
| 101.PRE | XBRL Taxonomy Extension Presentation Linkbase Document (filed herein) |
| 101.DEF | XBRL Taxonomy Extension Definition Linkbase Document (filed herein) |
Pursuant to the requirements of Section 13 or 15(d) of the Securities Exchange Act of 1934, the Registrant has duly caused this report to be signed on its behalf by the undersigned, thereunto duly authorized.
| Suffolk Bancorp | |
| Registrant | |
| | |
| /s/ Howard C. Bluver | |
| Howard C. Bluver | |
| President & Chief Executive Officer | |
| (principal executive officer) | |
| | |
| /s/ Brian K. Finneran | |
| Brian K. Finneran | |
| Executive Vice President & Chief Financial Officer | |
| (principal financial and accounting officer) | |
Dated: March 4, 2014
Pursuant to the requirements of the Securities Exchange Act of 1934, this report has been signed below by the following persons on behalf of the Registrant and in the capacities and on the date indicated.
| By: | /s/ JOSEPH A. GAVIOLA | |
| Joseph A. Gaviola | |
| Chairman of the Board & Director | |
| | |
| By: | /s/ HOWARD C. BLUVER | |
| Howard C. Bluver | |
| President, Chief Executive Officer & Director | |
| | |
| By: | /s/ STEVEN M. COHEN | |
| Steven M. Cohen | |
| Director | |
| | |
| By: | /s/ JAMES E. DANOWSKI | |
| James E. Danowski | |
| Director | |
| | |
| By: | /s/ EDGAR F. GOODALE | |
| Edgar F. Goodale | |
| Director | |
| | |
| By: | /s/ DAVID A. KANDELL | |
| David A. Kandell | |
| Director | |
| | |
| By: | /s/ TERENCE X. MEYER | |
| Terence X. Meyer | |
| Director | |
| | |
| By: | /s/ RAMESH N. SHAH | |
| Ramesh N. Shah | |
| Director | |
| | |
| By: | /s/ JOHN D. STARK, JR. | |
| John D. Stark, Jr. | |
| Director | |
Dated: March 4, 2014