UNITED STATES
SECURITIES AND EXCHANGE COMMISSION
Washington, D.C. 20549
FORM N-CSR
CERTIFIED SHAREHOLDER REPORT OF REGISTERED
MANAGEMENT INVESTMENT COMPANIES
Investment Company Act file number | 811-852 |
|
FPA PARAMOUNT FUND, INC. |
(Exact name of registrant as specified in charter) |
|
11400 WEST OLYMPIC BLVD., SUITE 1200, LOS ANGELES, CALIFORNIA | | 90064 |
(Address of principal executive offices) | | (Zip code) |
|
J. RICHARD ATWOOD, 11400 WEST OLYMPIC BLVD., SUITE 1200, LOS ANGELES, CALIFORNIA 90064 |
(Name and address of agent for service) |
|
Registrant’s telephone number, including area code: | 310-473-0225 | |
|
Date of fiscal year end: | SEPTEMBER 30 | |
|
Date of reporting period: | September 30, 2005 | |
| | | | | | | | | |
Item 1. Report to Stockholders.
Annual Report

Distributor:
FPA FUND DISTRIBUTORS, INC.
11400 West Olympic Boulevard, Suite 1200
Los Angeles, California 90064
45237
FPA Paramount Fund, Inc.
September 30, 2005
LETTER TO SHAREHOLDERS
The stock market performed well in the third quarter, with 3-5% gains in the major averages. As a result, the market is now also ahead for the year-to-date period (though a weak October has erased much of this gain). Smaller stocks have continued to outperform larger ones, as they have since the tech stock crash in early 2000.
Paramount's performance this year has been gratifying, up 5.6% in the third quarter and almost 8% for the nine-month period. Results for longer periods continue to be strong. According to Lipper, a company which collects data on mutual funds, Paramount's 5-year performance ranks #4 out of 167 funds in the Mid-Cap Core category.
| | | Periods Ended September 30, 2005 | |
| | | Third
Quarter | | YTD | | One
Year | | Three
Years* | | Five
Years* | |
| Paramount | | | 5.6 | % | | | 7.8 | % | | | 15.5 | % | | | 22.8 | % | | | 15.9 | % | |
| Russell 2500 | | | 4.9 | % | | | 6.2 | % | | | 21.3 | % | | | 24.9 | % | | | 7.9 | % | |
| S&P 500 | | | 3.6 | % | | | 2.8 | % | | | 12.3 | % | | | 16.7 | % | | | (1.5 | )% | |
| Nasdaq | | | 4.6 | % | | | (1.1 | )% | | | 13.4 | % | | | 22.5 | % | | | (10.1 | )% | |
*Annualized Returns
CDW first appeared in the Paramount portfolio in February of this year, and is now one of its larger positions.
CDW is the largest direct marketer of multi-branded technology products - computers, software, printers, storage, communications, etc. About two-thirds of its sales are to commercial customers - mostly small and medium-sized businesses (SMB's), and the rest to governments and not-for-profit institutions - schools, hospitals, etc.
CDW's value proposition to its customers includes an extensive selection of products, best prices available, an experienced and knowledgeable sales force, and next-day delivery from its large and efficient Chicago-area distribution center.
A number of powerful secular trends have contributed to CDW's growth in the past and we expect them to continue for many years into the future.
First, the utilization of technology by CDW's key SMB customer base has been steadily increasing. This group has historically lagged behind large enterprises in realizing tech's potential benefits, but it is now rapidly catching up.
Second, changes in distribution practices are serving to improve CDW's competitive position in the market. For example, the steadily declining cost of tech equipment makes direct sales by the manufacturer to the end user increasingly uneconomic, and favors indirect modes of distribution, such as CDW's. In addition, the improving user-friendliness of tech products, and the greater tech savvy of CDW's SMB customers gives them the confidence to buy equipment directly from firms like CDW, without the help of local tech consultants or value-added resellers (VAR's).
We were drawn to CDW as an investment by a strong set of business and financial attractions. CDW permits us to participate in the continued adoption of technology while avoiding significant company or product risks. It is the market leader, with a share about twice that of its next largest direct competitor. CDW has industry-leading operating margins.
CDW's pure size confers considerable competitive advantages in vendor support such as pricing, special programs, and technical training. It also gives CDW economies of scale in logistics and marketing, as well as the ability to offer customers the widest selection of products.
On the financial side, CDW has an outstanding record:
• Over the past five years EPS growth at a 20% annual rate, with revenue up 18% a year
• Pre-tax return on operating assets of over 40%, and a return-on-equity of 22%
• An unleveraged balance sheet, with no debt and over $7 per share in cash
The reader may be wondering how Paramount's CDW investment has been faring. Well, the business has been doing fine. For the first three quarters of 2005 revenues have increased by 11% and EPS by 17%,
1
results that are consistent with recent years and with general expectations.
The stock price, however, has done little. Did this make us unhappy with our CDW investment? On the contrary. We have always been patient investors, with a long time horizon. With our increased confidence in CDW and the stock's improved valuation (same price, higher earnings), we have gradually increased our modest initial investment to a full-sized position.
The difference between our long-term approach to investing and the shorter time horizon of many, though by no means all, investment managers can be illustrated by the market's reaction to CDW's recently released third quarter earnings report.
In addition to announcing strong sales and earnings growth, CDW told investors that several investments, which were being planned to accommodate the continued growth of the business, would reduce operating margins by a few tenths of a point for part of 2006. The investments, a new distribution center in Nevada and additional office space for the Chicago sales force, are inherently lumpy, increasing capacity and expenses a year or two in advance of the anticipated growth.
Wall Street's reaction to the news.....CDW's stock was down 2 points (4%). In contrast, we liked what we heard, feeling that a successful business planning and investing for the future is positive news. We took advantage of the price decline and bought more shares.
Respectfully submitted,

Eric S. Ende
President & Portfolio Manager
November 2, 2005
The discussion of Fund investments represents the views of the Fund's managers at the time of this report and are subject to change without notice. References to individual securities are for informational purposes only and should not be construed as recommendations to purchase or sell individual securities. While the Fund's managers believe that the Fund's holdings are value stocks, there can be no assurance that others will consider them as such. Further, investing in value stocks presents the risk that value stocks may fall out of favor with investors and underperform growth stocks during given periods.
FORWARD LOOKING STATEMENT DISCLOSURE
As mutual fund managers, one of our responsibilities is to communicate with shareholders in an open and direct manner. Insofar as some of our opinions and comments in our letters to shareholders are based on current management expectations, they are considered "forward-looking statements" which may or may not be accurate over the long term. While we believe we have a reasonable basis for our comments and we have confidence in our opinions, actual results may differ materially from those we anticipate. You can identify forward-looking statements by words such as "believe," "expect," "may," "anticipate," and other similar expressions when discussing prospects for particular portfolio holdings and/or the markets, generally. We cannot, however, assure future results and disclaim any obligation to update or alter any forward-looking statements, whether as a result of new information, future events, or otherwise. Further, information provided in t his report should not be construed as a recommendation to purchase or sell any particular security.
2
HISTORICAL PERFORMANCE
Change in Value of a $10,000 Investment in FPA Paramount Fund, Inc. vs. Russell 2500 Index and Lipper Mid-Cap Core Fund Average from October 1, 1995 to September 30, 2005
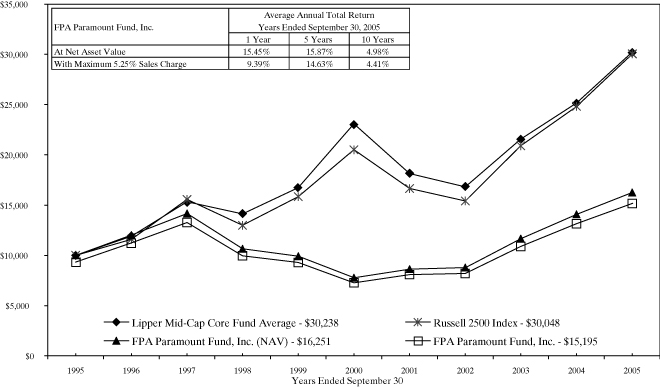
Past performance is not indicative of future performance. The Russell 2500 Index consists of the 2,500 smallest companies in the Russell 3000 total capitalization universe. This index is considered a measure of small to medium capitalization stock performance. This index does not reflect any commissions or fees which would be incurred by an investor purchasing the stocks it represents. The Lipper Mid-Cap Core Fund Average provides an additional comparison of how your Fund performed in relation to other mutual funds with similar objectives. The Lipper data does not include sales charges. The performance shown for FPA Paramount Fund, Inc., with an ending value of $15,195 reflects deduction of the current maximum sales charge of 5.25% of the offering price. In addition, since investors purchase shares of the Fund with varying sales charges depending primarily on volume purchased, the Fund's performance at net asset val ue (NAV) is also shown, as reflected by the ending value of $16,251. The performance of the Fund and of the Averages is computed on a total return basis which includes reinvestment of all distributions. The current portfolio managers, Eric S. Ende and Steven R. Geist, have been primarily responsible for the management of the portfolio since April 1, 2000.
3
PORTFOLIO SUMMARY
September 30, 2005
| Common Stocks | | | | | | | 81.9 | % | |
| Business Services & Supplies | | | 14.7 | % | | | | | |
| Technology | | | 12.2 | % | | | | | |
| Health Care | | | 10.9 | % | | | | | |
| Energy | | | 10.1 | % | | | | | |
| Producer Durable Goods | | | 9.5 | % | | | | | |
| Financial | | | 7.6 | % | | | | | |
| Retailing | | | 7.2 | % | | | | | |
| Consumer Durable Goods | | | 3.3 | % | | | | | |
| Transportation | | | 3.1 | % | | | | | |
| Materials | | | 2.0 | % | | | | | |
| Entertainment | | | 1.3 | % | | | | | |
| Short-Term Corporate Notes | | | | | | | 17.4 | % | |
| Other Assets and Liabilities, net | | | | | | | 0.7 | % | |
| Total Net Assets | | | | | | | 100.0 | % | |
MAJOR PORTFOLIO CHANGES
Six Months Ended September 30, 2005
(Unaudited)
| | | Shares | |
| NET PURCHASES | | | |
| Common Stocks | | | |
| AmSurg Corp. (1) | | | 110,000 | | |
| Brady Corporation (1) | | | 90,000 | | |
| Briggs & Stratton Corporation | | | 62,500 | | |
| Brown & Brown, Inc. | | | 75,000 | | |
| CDW Corporation | | | 82,500 | | |
| CarMax, Inc. | | | 83,000 | | |
| Charles River Laboratories International, Inc. | | | 77,500 | | |
| Cognex Corporation | | | 32,500 | | |
| Graco Inc. | | | 58,500 | | |
| Health Management Associates, Inc. | | | 92,500 | | |
| Heartland Express, Inc. | | | 158,400 | | |
| Invitrogen Corporation | | | 20,500 | | |
| Knight Transportation, Inc. | | | 84,250 | | |
| Lincare Holdings Inc. | | | 55,000 | | |
| Manpower Inc. | | | 30,000 | | |
| Microchip Technology Incorporated (1) | | | 125,000 | | |
| O'Reilly Automotive, Inc. | | | 15,000 | | |
| Plantronics, Inc. | | | 146,500 | | |
| Polaris Industries Inc. (1) | | | 70,000 | | |
| ScanSource, Inc. | | | 102,700 | | |
| Zebra Technologies Corporation (Class A) | | | 137,000 | | |
| Common Stocks | | | |
| Crane Co. (2) | | | 192,500 | | |
| Diebold, Incorporated (2) | | | 35,000 | | |
| SanDisk Corporation | | | 45,000 | | |
(1) Indicates new commitment to portfolio
(2) Indicates elimination from portfolio
4
PORTFOLIO OF INVESTMENTS
September 30, 2005
| COMMON STOCKS | | Shares | | Value | |
| BUSINESS SERVICES & SUPPLIES - 14.7% | | | |
| Brady Corporation | | | 90,000 | | | $ | 2,784,600 | | |
| CDW Corporation | | | 185,000 | | | | 10,900,200 | | |
| Charles River Laboratories International, Inc.* | | | 265,000 | | | | 11,559,300 | | |
| Invitrogen Corporation* | | | 103,000 | | | | 7,748,690 | | |
| Landauer, Inc. | | | 4,500 | | | | 220,500 | | |
| Manpower Inc. | | | 115,000 | | | | 5,104,850 | | |
| ScanSource, Inc.* | | | 255,000 | | | | 12,428,700 | | |
| | | $ | 50,746,840 | | |
| TECHNOLOGY - 12.2% | | | |
| Cognex Corporation | | | 355,000 | | | $ | 10,674,850 | | |
| Microchip Technology Incorporated | | | 125,000 | | | | 3,765,000 | | |
| Plantronics, Inc. | | | 391,500 | | | | 12,062,115 | | |
| SanDisk Corporation* | | | 325,000 | | | | 15,681,250 | | |
| | | $ | 42,183,215 | | |
| HEALTH CARE - 10.9% | | | |
| AmSurg Corp.* | | | 110,000 | | | $ | 3,009,600 | | |
| Bio-Rad Laboratories, Inc.* | | | 95,400 | | | | 5,246,046 | | |
| Health Management Associates, Inc. | | | 345,000 | | | | 8,097,150 | | |
| Lincare Holdings Inc.* | | | 270,000 | | | | 11,083,500 | | |
| Renal Care Group, Inc.* | | | 215,000 | | | | 10,173,800 | | |
| | | $ | 37,610,096 | | |
| ENERGY - 10.1% | | | |
| Cal Dive International, Inc.* | | | 232,500 | | | $ | 14,742,825 | | |
| Noble Corporation | | | 195,000 | | | | 13,349,700 | | |
| Tidewater Inc. | | | 142,500 | | | | 6,935,475 | | |
| | | $ | 35,028,000 | | |
| PRODUCER DURABLE GOODS - 9.5% | | | |
| Graco Inc. | | | 180,000 | | | $ | 6,170,400 | | |
| HNI Corporation | | | 96,900 | | | | 5,835,318 | | |
| IDEX Corporation | | | 110,750 | | | | 4,712,412 | | |
| Oshkosh Truck Corporation | | | 175,000 | | | | 7,553,000 | | |
| Zebra Technologies Corporation (Class A)* | | | 215,000 | | | | 8,404,350 | | |
| | | $ | 32,675,480 | | |
| FINANCIAL - 7.6% | | | |
| Brown & Brown, Inc. | | | 170,000 | | | $ | 8,447,300 | | |
| First American Corporation | | | 80,000 | | | | 3,653,600 | | |
| Gallagher & Co., Arthur J. | | | 225,000 | | | | 6,482,250 | | |
| North Fork Bancorporation, Inc. | | | 295,000 | | | | 7,522,500 | | |
| | | $ | 26,105,650 | | |
5
PORTFOLIO OF INVESTMENTS
September 30, 2005
| COMMON STOCKS - Continued | | Shares or
Principal
Amount | | Value | |
| RETAILING - 7.2% | |
| CEC Entertainment, Inc.* | | | 85,000 | | | $ | 2,699,600 | | |
| CarMax, Inc.* | | | 360,496 | | | | 11,272,710 | | |
| O'Reilly Automotive, Inc.* | | | 380,000 | | | | 10,708,400 | | |
| | | $ | 24,680,710 | | |
| CONSUMER DURABLE GOODS - 3.3% | | | |
| Briggs & Stratton Corporation | | | 225,000 | | | $ | 7,782,750 | | |
| Polaris Industries Inc. | | | 70,000 | | | | 3,468,500 | | |
| | | $ | 11,251,250 | | |
| TRANSPORATION - 3.1% | | | |
| Heartland Express, Inc. | | | 410,000 | | | $ | 8,339,400 | | |
| Knight Transporation, Inc. | | | 100,000 | | | | 2,436,000 | | |
| | | $ | 10,775,400 | | |
| MATERIALS - 2.0% | | | |
| Engelhard Corporation | | | 252,500 | | | $ | 7,047,275 | | |
| ENTERTAINMENT - 1.3% | |
| Carnival Corporation | | | 90,000 | | | $ | 4,498,200 | | |
| TOTAL COMMON STOCKS - 81.9% (Cost $209,264,439) | | | | | | $ | 282,602,116 | | |
| SHORT-TERM INVESTMENTS - 17.4% | |
| Short-term Corporate Notes: | |
| Rabobank USA Financial Corporation - 3.87% 10/03/05 | | $ | 5,919,000 | | | $ | 5,917,727 | | |
| Barclays U.S. Funding, Inc. - 3.645% 10/03/05 | | | 14,500,000 | | | | 14,497,064 | | |
| General Electric Capital Services Corporation - 3.66% 10/13/05 | | | 11,719,000 | | | | 11,704,703 | | |
| Toyota Motor Credit Corporation - 3.73% 10/21/05 | | | 15,000,000 | | | | 14,968,917 | | |
| DuPont (E.I.) De Nemours & Co. - 3.72% 10/25/05 | | | 13,000,000 | | | | 12,967,760 | | |
| TOTAL SHORT-TERM INVESTMENTS (Cost $60,056,171) | | | | | | $ | 60,056,171 | | |
| TOTAL INVESTMENTS - 99.3% (Cost $269,320,610) | | | | | | $ | 342,658,287 | | |
| Other assets and liabilities, net - 0.7% | | | | | | | 2,368,719 | | |
| TOTAL NET ASSETS - 100% | | | | | | $ | 345,027,006 | | |
*Non-income producing security
See notes to financial statements.
6
STATEMENT OF ASSETS AND LIABILITIES
September 30, 2005
| ASSETS | |
| Investments at value: | |
Investment securities - at market value
(identified cost $209,264,439) | | $ | 282,602,116 | | | | | | |
Short-term investments - at amortized cost
(maturities 60 days or less) | | | 60,056,171 | | | $ | 342,658,287 | | |
| Cash | | | | | | | 970 | | |
| Receivable for: | |
| Capital Stock sold | | $ | 1,602,155 | | | | | | |
| Investment securities sold | | | 959,158 | | | | | | |
| Dividends | | | 132,963 | | | | 2,694,276 | | |
| | | | | | | $ | 345,353,533 | | |
| LIABILITIES | |
| Payable for: | |
| Advisory fees and financial services | | $ | 214,204 | | | | | | |
| Investment securities purchased | | | 44,070 | | | | | | |
| Accrued expenses | | | 37,500 | | | | | | |
| Capital Stock repurchased | | | 30,753 | | | | 326,527 | | |
| NET ASSETS | | | | | | $ | 345,027,006 | | |
| SUMMARY OF SHAREHOLDERS' EQUITY | |
Capital Stock - par value $0.25 per share: authorized
100,000,000 shares; outstanding 22,973,932 shares | | | | | | $ | 5,743,483 | | |
| Additional paid-in capital | | | | | | | 424,236,784 | | |
| Accumulated net realized loss on investments | | | | | | | (159,130,781 | ) | |
| Undistributed net investment income | | | | | | | 839,843 | | |
| Unrealized appreciation of investments | | | | | | | 73,337,677 | | |
| NET ASSETS | | | | | | $ | 345,027,006 | | |
NET ASSET VALUE, REDEMPTION PRICE AND
MAXIMUM OFFERING PRICE PER SHARE | |
Net asset value and redemption price per share
(net assets divided by shares outstanding) | | | | | | $ | 15.02 | | |
Maximum offering price per share
(100/94.75 of per share net asset value) | | | | | | $ | 15.85 | | |
See notes to financial statements.
7
STATEMENT OF OPERATIONS
For the Year Ended September 30, 2005
| INVESTMENT INCOME | | | |
| Interest | | | | | | $ | 1,825,112 | | |
| Dividends | | | | | | | 1,547,806 | | |
| | | | | | | $ | 3,372,918 | | |
| EXPENSES - Note 3 | | | |
| Advisory fees | | $ | 1,861,950 | | | | | | |
| Financial services | | | 278,761 | | | | | | |
| Transfer agent fees and expenses | | | 181,596 | | | | | | |
| Reports to shareholders | | | 44,653 | | | | | | |
| Custodian fees and expenses | | | 39,544 | | | | | | |
| Directors' fees and expenses | | | 37,674 | | | | | | |
| Registration fees | | | 28,794 | | | | | | |
| Audit fees | | | 28,250 | | | | | | |
| Legal fees | | | 15,820 | | | | | | |
| Insurance | | | 15,021 | | | | | | |
| Other expenses | | | 1,012 | | | | 2,533,075 | | |
| Net investment income | | | | | | $ | 839,843 | | |
| NET REALIZED AND UNREALIZED GAIN ON INVESTMENTS | | | |
| Net realized gain on investments: | |
| Proceeds from sale of investment securities | | $ | 27,440,854 | | | | | | |
| Cost of investment securities sold | | | 24,018,344 | | | | | | |
| Net realized gain on investments | | | | | | $ | 3,422,510 | | |
| Unrealized appreciation of investments: | |
| Unrealized appreciation at beginning of year | | $ | 37,715,833 | | | | | | |
| Unrealized appreciation at end of year | | | 73,337,677 | | | | | | |
| Increase in unrealized appreciation of investments | | | | | | | 35,621,844 | | |
| Net realized and unrealized gain on investments | | | | | | $ | 39,044,354 | | |
| NET INCREASE IN NET ASSETS RESULTING FROM OPERATIONS | | | | | | $ | 39,884,197 | | |
See notes to financial statements.
8
STATEMENT OF CHANGES IN NET ASSETS
| | | For the Year Ended September 30, | |
| | | 2005 | | 2004 | |
| INCREASE IN NET ASSETS | | | |
| Operations: | |
| Net investment income (loss) | | $ | 839,843 | | | | | | | $ | (226,400 | ) | | | | | |
| Net realized gain on investments | | | 3,422,510 | | | | | | | | 6,987,390 | | | | | | |
| Net unrealized appreciation of investments | | | 35,621,844 | | | | | | | | 18,513,513 | | | | | | |
| Increase in net assets resulting from operations | | | | | | $ | 39,884,197 | | | | | | | $ | 25,274,503 | | |
| Capital Stock transactions: | |
| Proceeds from Capital Stock sold | | $ | 118,248,065 | | | | | | | $ | 90,278,196 | | | | | | |
| Cost of Capital Stock repurchased* | | | (21,012,060 | ) | | | 97,236,005 | | | | (17,284,393 | ) | | | 72,993,803 | | |
| Total increase in net assets.. | | | | | | $ | 137,120,202 | | | | | | | $ | 98,268,306 | | |
| Beginning of year | | | | | | | 207,906,804 | | | | | | | | 109,638,498 | | |
| End of year | | | | | | $ | 345,027,006 | | | | | | | $ | 207,906,804 | | |
CHANGE IN CAPITAL STOCK
OUTSTANDING | |
| Shares of Capital Stock sold | | | | | | | 8,495,132 | | | | | | | | 7,240,277 | | |
| Shares of Capital Stock repurchased | | | | | | | (1,497,418 | ) | | | | | | | (1,422,239 | ) | |
| Increase in Capital Stock outstanding | | | | | | | 6,997,714 | | | | | | | | 5,818,038 | | |
* Net of redemption fees of $3,956 and $97,375 for the years ended September 30, 2005 and 2004, respectively.
See notes to financial statements.
9
FINANCIAL HIGHLIGHTS
Selected Data for Each Share of Capital Stock Outstanding Throughout Each Year
| | | Year Ended September 30, | |
| | | 2005 | | 2004 | | 2003 | | 2002 | | 2001 | |
| Per share operating performance: | |
| Net asset value at beginning of year | | $ | 13.01 | | | $ | 10.79 | | | $ | 8.12 | | | $ | 8.00 | | | $ | 7.33 | | |
| Income from investment operations: | | | | | | | | | | | | | | | | | | | | | |
| Net investment income (loss) | | $ | 0.04 | | | $ | (0.01 | ) | | $ | (0.04 | ) | | $ | (0.03 | ) | | $ | 0.08 | | |
Net realized and unrealized gain on
investment securities | | | 1.97 | | | | 2.23 | | | | 2.71 | | | | 0.16 | | | | 0.72 | | |
| Total from investment operations | | $ | 2.01 | | | $ | 2.22 | | | $ | 2.67 | | | $ | 0.13 | | | $ | 0.80 | | |
| Less dividends from net investment income | | | - | | | | - | | | | - | | | $ | (0.01 | ) | | $ | (0.13 | ) | |
| Redemption fees | | | - | * | | | - | * | | | - | | | | - | | | | - | | |
| Net asset value at end of year | | $ | 15.02 | | | $ | 13.01 | | | $ | 10.79 | | | $ | 8.12 | | | $ | 8.00 | | |
| Total investment return** | | | 15.45 | % | | | 20.57 | % | | | 32.88 | % | | | 1.63 | % | | | 11.11 | % | |
| Ratios/supplemental data: | |
| Net assets at end of year (in 000's) | | $ | 345,027 | | | $ | 207,907 | | | $ | 109,638 | | | $ | 74,192 | | | $ | 67,078 | | |
| Ratio of expenses to average net assets: | |
| Before reimbursement from Investment Adviser | | | 0.89 | % | | | 0.99 | % | | | 1.15 | % | | | 1.18 | % | | | 1.28 | % | |
| After reimbursement from Investment Adviser | | | 0.89 | % | | | 0.99 | % | | | 1.15 | % | | | 1.17 | % | | | 1.20 | % | |
Ratio of net investment income (loss) to average
net assets: | |
| Before reimbursement from Investment Adviser | | | 0.30 | % | | | (0.16 | )% | | | (0.47 | )% | | | (0.34 | )% | | | 0.84 | % | |
| After reimbursement from Investment Adviser | | | 0.30 | % | | | (0.16 | )% | | | (0.47 | )% | | | (0.34 | )% | | | 0.92 | % | |
| Portfolio turnover rate | | | 13 | % | | | 16 | % | | | 17 | % | | | 14 | % | | | 16 | % | |
* Rounds to less than $0.01 per share
** Return is based on net asset value per share, adjusted for reinvestment of distributions, and does not reflect deduction of the sales charge.
See notes to financial statements.
10
NOTES TO FINANCIAL STATEMENTS
September 30, 2005
NOTE 1 - Significant Accounting Policies
The Fund is registered under the Investment Company Act of 1940, as a diversified, open-end management investment company. The Fund's objective is a high total investment return, including capital appreciation and income, from a diversified portfolio of securities. The following is a summary of significant accounting policies consistently followed by the Fund in the preparation of its financial statements.
A. Security Valuation
Securities listed or traded on a national securities exchange are valued at the last sale price on the last business day of the year, or if there was not a sale that day, at the last bid price. Securities traded in the NASDAQ National Market System are valued at the NASDAQ Official Closing Price on the last business day of the year, or if there was not a sale that day, at the last bid price. Unlisted securities are valued at the most recent bid price. Short-term investments with maturities of 60 days or less are valued at amortized cost, which approximates market value. Securities for which market quotations are not readily available are valued at fair value as determined in good faith by, or under the direction of, the Board of Directors.
B. Federal Income Tax
No provision for federal income tax is required because the Fund has elected to be taxed as a "regulated investment company" under the Internal Revenue Code and intends to maintain this qualification and to distribute each year to its shareholders, in accordance with the minimum distribution requirements of the Code, all of its taxable net investment income and taxable net realized gains on investments.
C. Securities Transactions and Related
Investment Income
Securities transactions are accounted for on the date the securities are purchased or sold. Dividend income and distributions to shareholders are recorded on the ex-dividend date. Interest income and expenses are recorded on an accrual basis.
D. Use of Estimates
The preparation of the financial statements in accordance with accounting principles generally accepted in the United States requires management to make estimates and assumptions that affect the amounts reported. Actual results could differ from those estimates.
NOTE 2 - Purchases of Investment Securities
Cost of purchases of investment securities (excluding short-term investments with maturities of 60 days or less) aggregated $115,700,371 for the year ended September 30, 2005. Realized gains or losses are based on the specific identification method. There were no differences between the amounts reported in the financial statements at September 30, 2005 for federal income tax and financial reporting purposes. Gross unrealized appreciation and depreciation for all securities at September 30, 2005 for federal income tax purposes was $74,493,366 and $1,155,689, respectively, resulting in net unrealized appreciation of $73,337,677. For federal income tax purposes, the Fund currently has accumulated net realized losses in the amount of $159,130,781 which can be carried forward to offset future gains. The ability to carry these losses forward expires as follows: $86,675,202 in 2007; $1,128,157 in 2008; and $ 71,327,422 in 2009. During the year ended September 30, 2005, the Fund reclassified $5,968 from accumulated net losses to additional paid in capital to align financial reporting with tax reporting.
NOTE 3 - Advisory Fees and Other Affiliated Transactions
Pursuant to an Investment Advisory Agreement, advisory fees were paid by the Fund to First Pacific Advisors, Inc. (the "Adviser"). Under the terms of this Agreement, the Fund pays the Adviser a monthly fee calculated at the annual rate of 0.75% of the first $50 million of the Fund's average daily net assets and 0.65% of the average daily net assets in excess of $50 million. In addition, the Fund reimburses the Adviser monthly for the costs incurred by the Adviser in providing financial services to the Fund, provided, however, that this reimbursement shall not exceed 0.1% of the average daily net assets for any fiscal year. The Agreement obligates the Adviser to reduce its fee to the extent necessary to reimburse the Fund for any
11
NOTES TO FINANCIAL STATEMENTS
Continued
annual expenses (exclusive of interest, taxes, the cost of any supplemental statistical and research information, and extraordinary expenses such as litigation) in excess of 11/2% of the first $30 million and 1% of the remaining average net assets of the Fund for the year.
For the year ended September 30, 2005, the Fund paid aggregate fees, excluding expenses, of $35,000 to all Directors who are not affiliated persons of the Adviser. Certain officers of the Fund are also officers of the Adviser and FPA Fund Distributors, Inc.
NOTE 4 - Redemption Fees
A redemption fee of 2% applies to redemptions within 90 days of purchase for certain purchases made by persons eligible to purchase shares without an initial sales charge. For the year ended September 30, 2005, the Fund collected $3,956 in redemption fees.
NOTE 5 - Distributor
For the year ended September 30, 2005, FPA Fund Distributors, Inc. ("Distributors"), a wholly owned subsidiary of the Adviser, received $19,877 in net Fund share sales commissions after reallowance to other dealers. The Distributor pays its own overhead and general administrative expenses, the cost of supplemental sales literature, promotion and advertising.
REPORT OF INDEPENDENT REGISTERED
PUBLIC ACCOUNTING FIRM
TO THE SHAREHOLDERS AND
BOARD OF DIRECTORS OF FPA PARAMOUNT FUND, INC.
We have audited the accompanying statement of assets and liabilities of FPA Paramount Fund, Inc. (the "Fund"), including the portfolio of investments, as of September 30, 2005, and the related statement of operations for the year then ended, the statements of changes in net assets for each of the two years in the period then ended, and the financial highlights for each of the three years in the period then ended. These financial statements and financial highlights are the responsibility of the Fund's management. Our responsibility is to express an opinion on these financial statements and financial highlights based on our audits. The financial highlights of the Fund for each of the two years in the period ended September 30, 2002 were audited by other auditors whose report, dated November 12, 2002, expressed an unqualified opinion on those financial highlights.
We conducted our audits in accordance with standards of the Public Company Accounting Oversight Board (United States). Those standards require that we plan and perform the audit to obtain reasonable assurance about whether the financial statements and financial highlights are free of material misstatement. The Fund is not required to have, nor were we engaged to perform, an audit of its internal control over financial reporting. Our audits included consideration of internal control over financial reporting as a basis for designing audit procedures that are appropriate in the circumstances, but not for the purpose of expressing an opinion on the effectiveness of the Fund's internal control over financial reporting. Accordingly, we express no such opinion. An audit also includes examining, on a test basis, evidence supporting the amounts and disclosures in the financial statements, assessing the accounting p rinciples used and significant estimates made by management, as well as evaluating the overall financial statement presentation. Our procedures included confirmation of securities owned as of September 30, 2005, by correspondence with the custodian and brokers; where replies were not received from brokers we performed other auditing procedures. We believe that our audits provide a reasonable basis for our opinion.
In our opinion, the 2004 and 2005 financial statements and financial highlights referred to above present fairly, in all material respects, the financial position of FPA Paramount Fund, Inc. as of September 30, 2005, the results of its operations for the year then ended, the changes in net assets for each of the two years in the period then ended, and financial highlights for each of the three years in the period then ended, in conformity with accounting principles generally accepted in the United States of America.

Los Angeles, California
November 15, 2005
12
SHAREHOLDER EXPENSE EXAMPLE
September 30, 2005 (unaudited)
Fund Expenses
As a shareholder of the Fund, you incur two types of costs: (1) transaction costs, and (2) ongoing costs, including advisory and administrative fees; shareholder service fees; and other Fund expenses. The Example is intended to help you understand your ongoing costs (in dollars) of investing in the Fund and to compare these costs with the ongoing costs of investing in other mutual funds. The Example is based on an investment of $1,000 invested at the beginning of the year and held for the entire year.
Actual Expenses
The information in the table under the heading "Actual Performance" provides information about actual account values and actual expenses. You may use the information in this column, together with the amount you invested, to estimate the expenses that you paid over the period. Simply divide your account value by $1,000 (for example, an $8,600 account value divided by $1,000= 8.6), then multiply the result by the number in the first column in the row entitled "Expenses Paid During Period" to estimate the expenses you paid on your account during this period.
Hypothetical Example for Comparison Purposes
The information in the table under the heading "Hypothetical Performance (5% return before expenses)" provides information about hypothetical account values and hypothetical expenses based on the Fund's actual expense ratio and an assumed rate of return of 5% per year before expenses, which is not the Fund's actual return. The hypothetical account values and expenses may not be used to estimate the actual ending account balance or expenses you paid for the period. You may use this information to compare the ongoing costs of investing in the Fund and other funds. To do so, compare this 5% hypothetical example with the 5% hypothetical examples that appear in the shareholder reports of other funds.
Please note that the expenses shown in the table are meant to highlight your ongoing costs only and do not reflect any transactional costs. Therefore, the information under the heading "Hypothetical Performance (5% return before expenses)" is useful in comparing ongoing costs only, and will not help you determine the relative total costs of owning different funds. In addition, if these transactional costs were included, your costs would have been higher.
| | | Actual
Performance | | Hypothetical
Performance
(5% return
before
expenses) | |
| Beginning Account Value March 31, 2005 | | $1,000.00 | | $1,000.00 | |
| Ending Account Value September 30, 2005 | | $1,066.76 | | $1,020.58 | |
| Expenses Paid During Period* | | $ 4.51 | | $ 4.42 | |
* Expenses are equal to the Fund's annualized expense ratio of 0.87%, multiplied by the average account value over the period and prorated for the six-months ended September 30, 2005 (183/365 days).
RENEWAL OF INVESTMENT ADVISORY AGREEMENT
The Investment Advisory Agreement provides that it may be renewed from year to year by (i) the Board of Directors of the Fund or by the vote of a majority (as defined in the Investment Company Act of 1940) of the outstanding voting securities of the Fund, and (ii) by the vote of a majority of Directors who are not interested persons (as defined in the 1940 Act) of the Fund or of the Adviser cast in person at a meeting called for the purpose of voting on such approval. At a meeting of the Board of Directors held on May 3, 2005, the continuance of the advisory agreement through May 31, 2006, was approved by the Board of Directors and by a majority of the Directors who are not interested persons of the Fund or of the Adviser.
In determining whether to renew the advisory agreement, those Fund Directors who were not affiliated with the Adviser met separately to evaluate information provided by the Adviser in accordance with the 1940 Act and to determine their recommendation to the full Board of Directors. The Directors considered a variety of factors, including the quality of advisory, management and accounting services provided to the Fund, the fees and expenses borne by the Fund, the profitability of the Adviser and the investment performance of the Fund both on an absolute basis and as compared with a peer group of mutual funds. The Fund's advisory fee and expense ratio were also considered in light of the advisory fees and expense ratios of a peer group of mutual funds. The Directors noted the Fund's superior investment results and the qua lity and depth of experience of the Adviser and its investment and administrative personnel. The Directors also took into consideration the benefits derived by the Adviser from arrangements under which it receives research services from brokers to whom the Fund's brokerage transactions are allocated. Based upon its consideration of these and other relevant factors, the Directors concluded that the advisory fees and other expenses paid by the Fund are fair and that shareholders have received reasonable value in return for such fees and expenses.
13
DIRECTOR AND OFFICER INFORMATION
| Name, Age & Address | | Positions(s)
With Fund/
Years Served | | Principal Occupation(s)
During the Past 5 Years | | Portfolios in
Fund Complex
Overseen | | Other Directorships | |
Williard H. Altman, Jr. – (70)†
11400 W. Olympic Blvd., #1200
Los Angeles, CA 90064 | | Director*
Years Served: 3 | | Retired, Formerly, until 1995, Partner of Ernst & Young LLP, a public accounting firm. | | | 6 | | | | |
|
Leonard Mautner – (88)†
11400 W. Olympic Blvd., #1200
Los Angeles, CA 90064 | | Director*
Years Served: 24 | | President, Leonard Mautner Associates; and General Partner, Goodman & Mautner Ltd. | | | 2 | | | | |
|
John H. Rubel – (85)†
11400 W. Olympic Blvd., #1200
Los Angeles, CA 90064 | | Director*
Years Served: 27 | | President, John H. Rubel and Associates, Inc. | | | 1 | | | | |
|
John P. Shelton (85)†
11400 W. Olympic Blvd., #1200
Los Angeles, CA 90064 | | Director*
Years Served: 28 | | Professor Emeritus at UCLA Graduate School of Management. | | | 1 | | | Genisco Systems, Inc. | |
|
Eric S. Ende – (61)
11400 W. Olympic Blvd., #1200
Los Angeles, CA 90064 | | Director*
President & Portfolio Manager
Years Served: 5 | | Senior Vice President of the Adviser. | | | 3 | | | | |
|
Steven R. Geist (51)
11400 W. Olympic Blvd., #1200
Los Angeles, CA 90064 | | Executive Vice President & Portfolio Manager
Year Served: 5 | | Vice President of the Adviser. | | | | | | | |
|
J. Richard Atwood – (45)
11400 W. Olympic Blvd., #1200
Los Angeles, CA 90064 | | Treasurer
Years Served: 8 | | Principal and Chief Operating Officer of the Adviser. President and Chief Executive Officer of FPA Fund Distributors, Inc. | | | | | | First Pacific Advisors Inc. and FPA Fund Distributors, Inc. | |
|
Sherry Sasaki – (50)
11400 W. Olympic Blvd., #1200
Los Angeles, CA 90064 | | Secretary
Years Served: 23 | | Assistant Vice President and Secretary of the Adviser and of FPA Fund Distributors, Inc. | | | | | | | |
|
Christopher H. Thomas – (48)
11400 W. Olympic Blvd., #1200
Los Angeles, CA 90064 | | Chief Compliance Officer and Assistant Treasurer
Years Served: 10 | | Vice President and Controller of the Adviser and Secretary of FPA Fund Distributors, Inc. | | | | | | FPA Fund
Distributors, Inc. | |
|
* Directors serve until their resignation, removal or retirement.
† Audit Committee Member
Additional information on the Directors is available in the Statement of Additional Information.
14
FPA PARAMOUNT FUND, INC.
INVESTMENT ADVISER
First Pacific Advisors, Inc.
11400 West Olympic Boulevard, Suite 1200
Los Angeles, CA 90064
DISTRIBUTOR
FPA Fund Distributors, Inc.
11400 West Olympic Boulevard, Suite 1200
Los Angeles, California 90064
COUNSEL
O'Melveny & Myers LLP
Los Angeles, California
TICKER SYMBOL: FPRAX
CUSIP: 302546106
INDEPENDENT REGISTERED PUBLIC ACCOUNTING FIRM
Deloitte & Touche LLP
Los Angeles, California
CUSTODIAN & TRANSFER AGENT
State Street Bank and Trust Company
Boston, Massachusetts
SHAREHOLDER SERVICE AGENT
Boston Financial Data Services, Inc.
P.O. Box 8115
Boston, Massachusetts 02266-8500
(800) 638-3060
(617) 483-5000
This report has been prepared for the information of shareholders of FPA Paramount, Inc., and is not authorized for distribution to prospective investors unless preceded or accompanied by an effective prospectus.
The Fund's complete proxy voting record for the 12 months ended June 30, 2005 is available without charge, upon request by calling (800) 982-4372 and on the SEC's website at www.sec.gov.
The Fund's schedule of portfolio holdings, filed the second and fourth quarter on Form N-Q with the SEC, is available on the SEC's website at www.sec.gov. Form N-Q is available at the SEC's Public Reference Room in Washington, D.C., and information on the operations of the Public Reference Room may be obtained by calling (202) 942-8090. To obtain Form N-Q from the Fund, shareholders can call (800) 982-4372.
Item 2. Code of Ethics.
(a) The registrant has adopted a code of ethics that applies to the registrant’s senior executive and financial officers. Upon request, any person may obtain a copy of this code of ethics, without charge, by calling (800) 982-4372. A copy of the code of ethics is filed as an exhibit to this Form N-CSR.
(b) During the period covered by this report, there were not any amendments to the provisions of the code of ethics adopted in 2(a) above.
(c) During the period covered by this report, there were not any implicit or explicit waivers to the provisions of the code of ethics adopted in 2(a).
Item 3. Audit Committee Financial Expert.
The registrant’s board of directors has determined that Willard H. Altman, Jr., a member of the registrant’s audit committee and board of directors, is an “audit committee financial expert” and is “independent,” as those terms are defined in this Item. This designation will not increase the designee’s duties, obligations or liability as compared to his duties, obligations and liability as a member of the audit committee and of the board of directors. This designation does not affect the duties, obligations or liability of any other member of the audit committee or the board of directors.
Item 4. Principal Accountant Fees and Services.
| | | | 2004 | | 2005 | |
(a) | | Audit Fees | | $ | 23,000 | | $ | 27,380 | |
(b) | | Audit Related Fees | | -0- | | -0- | |
(c) | | Tax Fees | | $ | 5,250 | | $ | 5,765 | |
(d) | | All Other Fees | | -0- | | -0- | |
(e)(1) Disclose the audit committee’s pre-approval policies and procedures described in paragraph (c)(7) of Rule 2-01 of Regulation S-X. The audit committee shall pre-approve all audit and permissible non-audit services that the committee considers compatible with maintaining the independent auditors’ independence. The pre-approval requirement will extend to all non-audit services provided to the registrant, the adviser, and any entity controlling, controlled by, or under common control with the adviser that provides ongoing services to the registrant, if the engagement relates directly to the operations and financial reporting of the registrant; provided, however, that an engagement of the registrant’s independent auditors to perform attest services for the registrant, the adviser or its affiliates required by generally accepted auditing standards to complete the examination of the registrant’s financial statements (such as an examination conducted
in accordance with Statement on Auditing Standards Number 70 issued by the American Institute of Certified Public Accountants), will be deem pre-approved if: (i) the registrant’s independent auditors inform the audit committee of the engagement, (ii) the registrant’s independent auditors advise the audit committee at least annually that the performance of this engagement will not impair the independent auditor’s independence with respect to the registrant, and (iii) the audit committee receives a copy of the independent auditor’s report prepared in connection with such services. The committee may delegate to one or more committee members the authority to review and pre-approve audit and permissible non-audit services. Actions taken under any such delegation will be reported to the full committee at its next meeting.
(e)(2) Disclose the percentage of services described in each of paragraphs (b) – (d) of this Item that were approved by the audit committee pursuant to paragraph (c)(7)(i)(C) of Rule 2-01 of Regulation S-X. 100% of the services provided to the registrant described in paragraphs (b) – (d) of this Item were pre-approved by the audit committee pursuant to paragraph (e)(1) of this Item. There were no services provided to the investment adviser or any entity controlling, controlled by or under common control with the adviser described in paragraphs (b) – (d) of this Item that were required to be pre-approved by the audit committee.
(f) If greater than 50%, disclose the percentage of hours expended on the principal accountant’s engagement to audit the registrant’s financial statements for the most recent fiscal year that were attributed to work performed by persons other than the principal accountant’s full-time, permanent employees. All services performed on the engagement to audit the registrant’s financial statements for the most recent fiscal year end were performed by the principal accountant’s full-time, permanent employees.
(g) Disclose the aggregate non-audit fees billed by the registrant’s accountant for services rendered to the registrant, and rendered to the registrant’s investment adviser (not including any sub-adviser whose role is primarily portfolio management and is subcontracted with or overseen by another investment adviser), and any entity controlling, controlled by, or under common control with the adviser that provides ongoing services to the registrant for each of the last two fiscal years of the registrant. None.
(h) Disclose whether the registrant’s audit committee of the board of directors has considered whether the provision of non-audit services that were rendered to the registrant’s investment adviser (not including any sub-adviser whose role is primarily portfolio management and is subcontracted with or overseen by another investment adviser), and any entity controlling, controlled by, or
under common control with the investment adviser that provides ongoing services to the registrant that were not pre-approved pursuant to paragraph (c)(7)(ii) of Rule 2-01 of Regulation S-X is compatible with maintaining the principal accountant’s independence. Not Applicable.
Item 5. Audit Committee of Listed Registrants.
The registrant has a separately-designated standing audit committee established in accordance with Section 3(a)(58)(A) of the Securities Exchange Act of 1934, consisting of all the independent directors of the registrant. The members of the audit committee are: Willard H. Altman, Jr., Leonard Mautner, John H. Rubel and John P. Shelton.
Item 6. Schedule of Investments. The schedule of investments is included as part of the report to stockholders filed under Item 1 of this Form.
Item 7. Disclosure of Proxy Voting Policies and Procedures for Closed-End Management Investment Companies. Not Applicable.
Item 8. Portfolio Managers of Closed-End Management Investment Companies. Not Applicable.
Item 9. Purchases of Equity Securities by Closed-End Management Investment Company and Affiliated Purchasers. Not Applicable.
Item 10. Submission of Matters to a Vote of Security Holders. There has been no material change to the procedures by which shareholders may recommend nominees to the registrant’s board of directors.
Item 11. Controls and Procedures.
(a) The principal executive officer and principal financial officer of the registrant have concluded that the registrant’s disclosure controls and procedures (as defined in Rule 30a-3(c) under the Investment Company Act of 1940) are effective based on their evaluation of the disclosure controls and procedures as of a date within 90 days of the filing date of this report.
(b) There have been no significant changes in the registrant’s internal controls over financial reporting (as defined in Rule 30a-3(d) under the Investment Company Act of 1940) that occurred during the registrant’s last fiscal half-year (the registrant’s second fiscal half-year in the case of an annual report) that has materially affected, or is reasonably likely to materially affect, the registrant’s internal controls over financial reporting.
Item 12. Exhibits.
(a)(1) Code of ethics as applies to the registrant’s officers and directors, as required to be disclosed under Item 2 of Form N-CSR. Attached hereto as Ex.99.CODE.ETH.
(a)(2) Separate certification for the registrant’s principal executive officer and principal financial officer, as required by Rule 30a-2(a) under the Investment Company Act of 1940. Attached hereto.
(a)(3) Not Applicable
(b) Separate certification for the registrant’s principal executive officer and principal financial officer, as required by Rule 30a-2(b) under the Investment Company Act of 1940. Attached hereto.
SIGNATURES
Pursuant to the Securities Exchange Act of 1934 and the Investment Company Act of 1940, the registrant has duly caused this report to be signed on its behalf by the undersigned, thereunto duly authorized.
FPA PARAMOUNT FUND, INC. | |
| |
| |
By: | /s/ ERIC S. ENDE | | |
| Eric S. Ende | | |
| |
Date: December 2, 2005 | |
Pursuant to the Securities Exchange Act of 1934 and the Investment Company Act of 1940, the registrant has duly caused this report to be signed on its behalf by the undersigned, thereunto duly authorized.
FPA PARAMOUNT FUND, INC. | |
| |
| |
By: | /s/ J. RICHARD ATWOOD | | |
| J. Richard Atwood, Treasurer | | |
| |
Date: December 2, 2005 | |