UNITED STATES
SECURITIES AND EXCHANGE COMMISSION
Washington, D.C. 20549
FORM N-CSR
CERTIFIED SHAREHOLDER REPORT OF REGISTERED
MANAGEMENT INVESTMENT COMPANIES
Investment Company Act file number | 811-852 |
|
FPA PARAMOUNT FUND, INC. |
(Exact name of registrant as specified in charter) |
|
11400 WEST OLYMPIC BLVD., SUITE 1200, LOS ANGELES, CALIFORNIA | | 90064 |
(Address of principal executive offices) | | (Zip code) |
|
J. RICHARD ATWOOD,
11400 WEST OLYMPIC BLVD., SUITE 1200, LOS ANGELES, CALIFORNIA 90064 |
(Name and address of agent for service) |
|
Registrant’s telephone number, including area code: | 310-473-0225 | |
|
Date of fiscal year end: | SEPTEMBER 30 | |
|
Date of reporting period: | SEPTEMBER 30, 2008 | |
| | | | | | | | | |
Item 1. Report to Stockholders.
FPA Paramount Fund, Inc.
Annual Report
September 30, 2008

Distributor:
FPA FUND DISTRIBUTORS, INC.
11400 West Olympic Boulevard, Suite 1200
Los Angeles, California 90064
50905
LETTER TO SHAREHOLDERS
In recent Congressional testimony, former Chairman of the Federal Reserve, Alan Greenspan, described the events of the last year as a global financial tsunami. An apt characterization given the destructiveness and widespread impact, though perhaps not nearly so unexpected and impossible to forecast as the word implies.
After several false starts, we appear to have dodged the threat of a total meltdown of the financial system by recapitalizing certain banks as well as implementing a number of related actions. This is not to suggest that the crisis is past and the good times will roll again. On the contrary, as we look out to sea, we can detect several more big waves approaching. Though perhaps not as potentially destructive as the first, they clearly will be dangerous enough to continue to threaten our economic well being.
While this can be only a partial list, some of the future challenges will include:
• A significant slowdown in formerly rapidly developing countries like China, India, and Brazil.
• Losses in emerging market debt and related currency crises.
• Commercial real estate, though not egregiously overbuilt as at times in the past, will suffer from reduced demand for new space, threatening the leveraged capital structures of existing buildings and slowing the construction of new ones.
• Continued shrinkage of hedge fund balance sheets driven by withdrawals, reduced access to bank credit, and the desire to lower traditionally high leverage levels.
• A bad end to the private-equity party as companies purchased and overleveraged in recent years now find they cannot service high levels of debt in a recessionary economy and start to go bankrupt.
As long-time readers know, our approach is to search company by company to find the highest quality businesses with low debt levels selling at attractive prices. We will describe in some detail later in the letter why we believe that the current adverse environment will provide these companies with the opportunity to outshine their competitors and to emerge from the wreckage in an even stronger position.
Market averages were down sharply in the third quarter, about 8-9% for the general indexes and 7% for smaller stocks. The best performers in the portfolio were HNI (+43%), Brown & Brown and Bio-Rad (each up 20-25%), and several retailers (which had done poorly in the second quarter).
Third-quarter weak performers include oil service (down 35%), Manpower and WABCO (down 25% each). However, two-thirds of the stocks in the portfolio were down less than the overall market.
For the year-to-date period, market averages declined 15-20%. The worst portfolio performers included Helix (down 41%), Maxim, and CarMax (down 30% each). The best were Franklin Electric (up 15%) and the truckload carriers Knight and Heartland (up 10-15%). About three-quarters of the stocks in the portfolio were down less than the market.
The table below shows the performance of Paramount's net asset value so far in 2008 compared to the benchmark Russell 2500, as well as the leading large-cap indexes. We are roughly the same as the Russell, but well ahead of the market as a whole. Performance for longer periods, especially five and eight years (the tenure of the current portfolio managers), is generally strong.
| | | Periods Ended September 30, 2008 | |
| | | Third
Quarter | | Nine
Months | | One
Year | | Three
Years* | | Five
Years* | | Eight
Years* | |
FPA
Paramount** | | | (4.2 | )% | | | (12.6 | )% | | | (12.0 | )% | | | 0.6 | % | | | 7.2 | % | | | 9.9 | % | |
Russell
2500 | | | (6.7 | )% | | | (14.3 | )% | | | (18.0 | )% | | | 0.9 | % | | | 8.1 | % | | | 5.2 | % | |
| S&P 500 | | | (8.4 | )% | | | (19.3 | )% | | | (22.0 | )% | | | 0.2 | % | | | 5.2 | % | | | (0.9 | )% | |
| Nasdaq | | | (9.2 | )% | | | (21.5 | )% | | | (22.9 | )% | | | (1.1 | )% | | | 3.1 | % | | | (6.9 | )% | |
* Annualized Returns
We are proud to note that the FPA Paramount Fund was included in the ten best-performing mid-cap core funds (based on past year returns) in the Wall Street Journal's third-quarter mutual funds report. The absolute performance was a 12% decline, compared to
** Does not reflect deduction of the sales charge which, if reflected, would reduce the performance shown
1
a 21% decline for the average fund in the category. It was ranked ninth out of 331 funds. Similarly, Morningstar ranked FPA Paramount in the top three percent in its category, out of 294 funds, based on year-to-date returns.
We have written in the past about the importance of looking at performance over a full market cycle (combining both bull and bear markets). This permits the strong relative performance we typically achieve in weak environments to more than offset our normally lagging performance in years of great ebullience.
The following table shows Paramount investment returns at net asset value over the last full market cycle, encompassing the bear market starting in early 2000 and the bull market which extended to September 2007. The reader should especially note the final column, "Bear Market II," showing performance in the most recent bear market, which began in October 2007 and has extended into early October 2008.
Over this one-year period (October 2007 – September 2008) the market indexes have declined 18-23% while Paramount is down 12%, about six points better than the benchmark Russell 2500 and ten points ahead of the S&P 500.
| | | Total Returns | |
| | | Bear
Market
(2Q'00-
3Q'02) | | Bull
Market
(4Q'02-
3Q'07) | | Total
Cycle | | Total
Cycle
Annualized
Returns | | Bear
Market II
(4Q'07-
3Q'08) | |
FPA
Paramount** | | | 5 | % | | | 114 | % | | | 124 | % | | | 11 | % | | | (12 | )% | |
| Russell 2500 | | | (26 | )% | | | 144 | % | | | 80 | % | | | 8 | % | | | (18 | )% | |
| S&P 500 | | | (44 | )% | | | 105 | % | | | 15 | % | | | 2 | % | | | (22 | )% | |
| Nasdaq | | | (74 | )% | | | 131 | % | | | (41 | )% | | | (7 | )% | | | (23 | )% | |
Subsequent to the end of the quarter, the net asset value of the Fund declined from $15.01 at September 30, 2008, to $10.84 at November 10, 2008.
We would like to devote the remainder of the shareholder letter to a discussion of why we expect many of our portfolio companies can take advantage of difficult economic environments to improve their market position and financial strength compared to their competitors.
There are a number of sources for the competitive advantage that these companies enjoy. These include:
• Market Leadership
• Superior Returns on Capital
• Unleveraged Balance Sheets
Market leadership, typically associated with superior products and growing share, has many advantages. Market leaders often have some degree of influence over industry pricing, which gives them the ability to raise prices and make them stick, or alternatively to keep prices down to seize share from stressed competitors. Market leaders often are able to set the pace of new product introductions.
In addition, there is a tendency for companies to reduce the number of suppliers they deal with in tough economic times as concerns about supplier solvency and ability to perform are given increased emphasis. This typically benefits the market share leaders.
Portfolio companies with especially strong market shares include Charles River Labs (laboratory animals), Copart (auction of salvage vehicles), and VCA Antech (veterinary hospitals).
Superior returns on capital give companies the ability to fund product development, marketing, and geographic expansion with less strain on the income statement, putting them in a stronger and stronger position both during the downturn and the eventual economic recovery.
On a more subtle note, superior returns on capital can be viewed as evidence of some combination of superior products, market position, and management execution. The factors that produced this superior performance in the past are more likely than not to lead to similar better decision-making and performance in the future.
Portfolio company Graco recently announced a modest 10% decline in its earnings, the major cause of which was stepped-up spending for new products and to expand its presence in rapidly developing countries. We support this long-range thinking and are confident it will pay off for shareholders as well as improve Graco's competitive position.
** Does not reflect deduction of the sales charge which, if reflected, would reduce the performance shown
2
Unleveraged balance sheets, often with substantial net cash balances, give companies great flexibility at any time but especially so when corporate profits are declining and capital markets are tight. This can permit funding large internal projects, making acquisitions big and small, increasing dividends, or repurchasing shares at especially attractive prices.
There is nothing like violating debt covenants, or being unable to rollover debt or raise new capital to focus management's attention on financial rather than operating issues and to mandate a less competitive posture. We try to make sure it is not our portfolio companies but rather their competitors who face challenges of this kind.
The reader may recall our past discussion of Oshkosh Truck, a former holding that we sold in late 2006 when it took on excessive debt as the result of a large acquisition. That single action now threatens the viability of the company, whose common stock has declined over 90% from its record high, little more than a year ago.
A number of our portfolio companies have business models that are acquisition driven – they leverage their limited internal reinvestment opportunities by spending excess cash flow on carefully selected and usually modestly-sized acquisitions. This strategy can really shine during an economic slump, as there are often more businesses on the market, and at better prices, than in normal times.
Portfolio companies with strategies fitting this description include IDEX (pumps), CLARCOR (engine filters), Brown & Brown (insurance brokers), and October purchase Actuant (industrial tools). These companies have all picked up the acquisition pace recently and are well supplied with both internal and external funds.
In addition, several of our portfolio companies have billion-dollar-plus deals in various stages of completion. Generally funded by a combination of balance sheet cash, bank borrowings, and newly issued common stock, none could have been contemplated without the buyer being in a strong financial condition. In addition to the O'Reilly Automotive acquisition of CSK, which closed in July, and which we discussed in the last quarterly letter, there are two other large acquisitions in progress.
Invitrogen is in the late stages of acquiring Applied Biosystems, a company with complementary products (mostly for gene sequencing and mass spectrometry) sold to a similar customer base as Invitrogen's. The acquisition is expected to close in November.
Microchip recently has offered to buy Atmel, a company whose line of 32-bit microcontrollers would be an excellent fit with Microchip's industry leading 8-bit and rapidly growing 16-bit product offering. So far Atmel is unenthusiastic. We await further developments with interest.
Based on the above discussion, it should be clear that we have a high degree of confidence in the ability of the superior companies in our portfolio to outperform their competitors and gain strength in the coming difficult economic environment. When this might be reflected in stock price outperformance is another matter and impossible to forecast.
We do believe, however, based on many years of experience, that superior businesses, bought at reasonable prices and held for a long time, will earn attractive returns in both the business and the stock market.
Respectfully submitted,

Eric S. Ende
President & Portfolio Manager
November 10, 2008
The discussion of Fund investments represents the views of the Fund's managers at the time of this report and are subject to change without notice. References to individual securities are for informational purposes only and should not be construed as recommendations to purchase or sell individual securities. While the Fund's managers believe that the Fund's holdings are value stocks, there can be no assurance that others will consider them as such. Further, investing in value stocks presents the risk that value stocks may fall out of favor with investors and underperform growth stocks during given periods.
3
FORWARD LOOKING STATEMENT DISCLOSURE
As mutual fund managers, one of our responsibilities is to communicate with shareholders in an open and direct manner. Insofar as some of our opinions and comments in our letters to shareholders are based on current management expectations, they are considered "forward-looking statements" which may or may not be accurate over the long term. While we believe we have a reasonable basis for our comments and we have confidence in our opinions, actual results may differ materially from those we anticipate. You can identify forward-looking statements by words such as "believe," "expect," "may," "anticipate," and other similar expressions when discussing prospects for particular portfolio holdings and/or the markets, generally. We cannot, however, assure future results and disclaim any obligation to update or alter any forward-looking statements, whether as a result of new information, future events, or otherwise. Further, information provided in t his report should not be construed as a recommendation to purchase or sell any particular security.
HISTORICAL PERFORMANCE
Change in Value of a $10,000 Investment in FPA Paramount Fund, Inc. vs. Russell 2500 Index and Lipper Mid-Cap Core Fund Average from October 1, 1998 to September 30, 2008
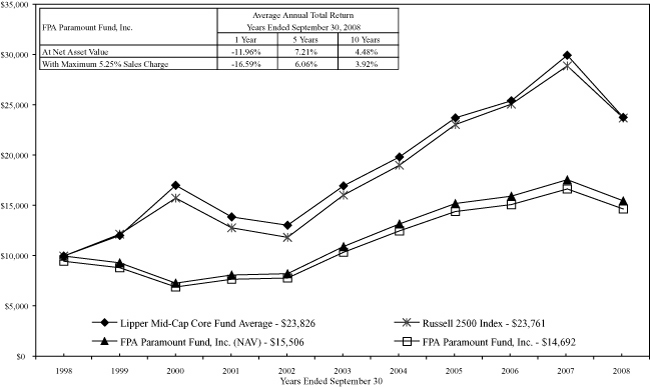
Past performance is not indicative of future performance. The Russell 2500 Index consists of the 2,500 smallest companies in the Russell 3000 total capitalization universe. This index is considered a measure of small to medium capitalization stock performance. This index does not reflect any commissions or fees which would be incurred by an investor purchasing the stocks it represents. The Lipper Mid-Cap Core Fund Average provides an additional comparison of how your Fund performed in relation to other mutual funds with similar objectives. The Lipper data does not include sales charges. The performance shown for FPA Paramount Fund, Inc., with an ending value of $14,692 reflects deduction of the current maximum sales charge of 5.25% of the offering price. In addition, since investors purchase shares of the Fund with varying sales charges depending primarily on volume purchased, the Fund's performance at net asset value (NAV) is also shown, as reflected by the ending value of $15,506. The performance of the Fund and of the Averages is computed on a total return basis which includes reinvestment of all distributions. The current portfolio managers, Eric S. Ende and Steven R. Geist, have been primarily responsible for the management of the portfolio since April 1, 2000.
4
PORTFOLIO SUMMARY
September 30, 2008
| Common Stocks | | | | | | | 95.1 | % | |
| Business Services & Supplies | | | 26.5 | % | | | | | |
| Producer Durables | | | 16.6 | % | | | | | |
| Technology | | | 11.7 | % | | | | | |
| Retailing | | | 11.3 | % | | | | | |
| Energy | | | 8.5 | % | | | | | |
| Health Care | | | 8.0 | % | | | | | |
| Transportation | | | 7.3 | % | | | | | |
| Financial | | | 3.1 | % | | | | | |
| Entertainment | | | 2.1 | % | | | | | |
| Short-Term Investments | | | | | | | 5.1 | % | |
| Other Assets and Liabilities, net | | | | | | | (0.2 | )% | |
| Total Net Assets | | | | | | | 100.0 | % | |
MAJOR PORTFOLIO CHANGES
Six Months Ended September 30, 2008
(Unaudited)
| | | Shares | |
| NET PURCHASES | |
| Common Stocks | |
| HNI Corporation | | | 65,900 | | |
| Signet Jewelers Ltd. | | | 165,000 | | |
| VCA Antech, Inc. (1) | | | 31,100 | | |
| WABCO Holdings Inc. (1) | | | 150,000 | | |
| NET SALES | |
| Common Stocks | |
| AmSurg Corporation | | | 31,200 | | |
| Bio-Rad Laboratories, Inc (Class A) | | | 10,400 | | |
| Brady Corporation (Class A) | | | 48,800 | | |
| Brown & Brown, Inc. | | | 56,000 | | |
| CarMax, Inc. | | | 85,500 | | |
| Carnival Corporation | | | 24,300 | | |
| Charles River Laboratories International, Inc. | | | 48,000 | | |
| CLARCOR, Inc. | | | 34,800 | | |
| Cognex Corporation | | | 69,000 | | |
| Copart, Inc. | | | 44,500 | | |
| Franklin Electric Co., Inc. | | | 27,300 | | |
| Graco Inc. | | | 27,500 | | |
| Heartland Express, Inc. | | | 92,200 | | |
| Helix Energy Solutions Group, Inc. | | | 53,300 | | |
| IDEX Corporation | | | 42,100 | | |
| Invitrogen Corporation | | | 38,700 | | |
| Knight Transportation, Inc. | | | 86,800 | | |
| Lincare Holdings, Inc. | | | 69,500 | | |
| Manpower Inc. | | | 17,900 | | |
| Maxim Integrated Products, Inc. | | | 28,800 | | |
| Microchip Technology, Inc. | | | 37,900 | | |
| Noble Corporation | | | 68,700 | | |
| O'Reilly Automotive, Inc. | | | 42,200 | | |
| Plantronics, Inc. | | | 84,600 | | |
| Polaris Industries, Inc. (2) | | | 15,100 | | |
| SanDisk Corporation (2) | | | 123,800 | | |
| ScanSource Inc. | | | 51,500 | | |
| Zebra Technologies Corporation (Class A) | | | 44,300 | | |
(1) Indicates new security added to portfolio
(2) Indicates security eliminated from portfolio
5
PORTFOLIO OF INVESTMENTS
September 30, 2008
| COMMON STOCKS | | Shares | | Value | |
| BUSINESS SERVICES & SUPPLIES — 26.5% | |
| Brady Corporation (Class A) | | | 341,800 | | | $ | 12,058,704 | | |
| Charles River Laboratories International, Inc.* | | | 260,600 | | | | 14,471,118 | | |
| CLARCOR, Inc. | | | 243,200 | | | | 9,229,440 | | |
| Copart, Inc.* | | | 200,100 | | | | 7,603,800 | | |
| Invitrogen Corporation* | | | 328,400 | | | | 12,413,520 | | |
| Landauer, Inc. | | | 3,800 | | | | 276,450 | | |
| Manpower Inc. | | | 141,600 | | | | 6,111,456 | | |
| ScanSource Inc.* | | | 566,100 | | | | 16,298,019 | | |
| | | $ | 78,462,507 | | |
| PRODUCER DURABLES — 16.6% | |
| Franklin Electric Co., Inc. | | | 191,300 | | | $ | 8,522,415 | | |
| Graco Inc. | | | 196,700 | | | | 7,004,487 | | |
| HNI Corporation | | | 405,700 | | | | 10,280,438 | | |
| IDEX Corporation | | | 302,250 | | | | 9,375,795 | | |
| WABCO Holdings Inc. | | | 150,000 | | | | 5,331,000 | | |
| Zebra Technologies Corporation (Class A)* | | | 316,500 | | | | 8,814,525 | | |
| | | $ | 49,328,660 | | |
| TECHNOLOGY — 11.7% | |
| Cognex Corporation | | | 483,700 | | | $ | 9,751,392 | | |
| Maxim Integrated Products, Inc. | | | 273,200 | | | | 4,944,920 | | |
| Microchip Technology, Inc. | | | 308,800 | | | | 9,087,984 | | |
| Plantronics, Inc. | | | 486,300 | | | | 10,951,476 | | |
| | | $ | 34,735,772 | | |
| RETAILING — 11.3% | |
| CarMax, Inc.* | | | 636,300 | | | $ | 8,908,200 | | |
| O'Reilly Automotive, Inc.* | | | 445,300 | | | | 11,920,681 | | |
| Signet Jewelers Ltd. | | | 540,000 | | | | 12,625,200 | | |
| | | $ | 33,454,081 | | |
| ENERGY — 8.5% | |
| Helix Energy Solutions Group, Inc.* | | | 442,100 | | | $ | 10,734,188 | | |
| Noble Corporation | | | 328,200 | | | | 14,407,980 | | |
| | | $ | 25,142,168 | | |
| HEALTH CARE — 8.0% | |
| Amsurg Corporation* | | | 222,200 | | | $ | 5,659,434 | | |
| Bio-Rad Laboratories, Inc. (Class A)* | | | 73,700 | | | | 7,305,144 | | |
| Lincare Holdings, Inc.* | | | 324,700 | | | | 9,770,223 | | |
| VCA Antech, Inc.* | | | 31,100 | | | | 916,517 | | |
| | | $ | 23,651,318 | | |
| TRANSPORATION — 7.3% | |
| Heartland Express, Inc. | | | 692,100 | | | $ | 10,741,392 | | |
| Knight Transporation, Inc. | | | 638,900 | | | | 10,842,133 | | |
| | | $ | 21,583,525 | | |
6
PORTFOLIO OF INVESTMENTS
September 30, 2008
| COMMON STOCKS — Continued | | Shares or
Principal
Amount | | Value | |
| FINANCIAL — 3.1% | |
| Brown & Brown, Inc. | | | 429,100 | | | $ | 9,277,142 | | |
| ENTERTAINMENT — 2.1% | |
| Carnival Corporation (Class A) | | | 180,200 | | | $ | 6,370,070 | | |
| TOTAL COMMON STOCKS — 95.1% (Cost $310,188,678) | | | | | | $ | 282,005,243 | | |
| SHORT-TERM INVESTMENTS — 5.1% (Cost $15,237,438) | |
| General Electric Capital Corporation — 1.75% 10/01/08 | | $ | 7,740,000 | | | $ | 7,740,000 | | |
| Chevron Funding Corporation — 2.05% 10/07/08 | | | 7,500,000 | | | | 7,497,438 | | |
| TOTAL SHORT-TERM INVESTMENTS | | | | | | $ | 15,237,438 | | |
| TOTAL INVESTMENTS — 100.2% (Cost $325,426,116) | | $ | 297,242,681 | | |
| Other assets and liabilities, net — (0.2)% | | | | | | | (596,749 | ) | |
| TOTAL NET ASSETS — 100% | | $ | 296,645,932 | | |
*Non-income producing security
See notes to financial statements.
7
STATEMENT OF ASSETS AND LIABILITIES
September 30, 2008
| ASSETS | |
| Investments at value: | |
Investment securities — at market value
(identified cost $310,188,678) | | $ | 282,005,243 | | | | | | |
Short-term investments — at amortized cost
(maturities 60 days or less) | | | 15,237,438 | | | $ | 297,242,681 | | |
| Cash | | | | | | | 231 | | |
| Receivable for: | |
| Dividends | | $ | 119,528 | | | | | | |
| Capital stock sold | | | 113,870 | | | | 233,398 | | |
| | | | | | | $ | 297,476,310 | | |
| LIABILITIES | |
| Payable for: | |
| Capital stock repurchased | | $ | 598,602 | | | | | | |
| Advisory fees and financial services | | | 200,655 | | | | | | |
| Accrued expenses | | | 31,121 | | | | 830,378 | | |
| NET ASSETS | | | | | | $ | 296,645,932 | | |
| SUMMARY OF SHAREHOLDERS' EQUITY | |
Capital Stock — par value $0.25 per share: authorized
100,000,000 shares; outstanding 19,767,684 shares | | | | | | $ | 4,941,921 | | |
| Additional paid-in capital | | | | | | | 361,872,609 | | |
| Accumulated net realized loss on investments | | | | | | | (42,924,470 | ) | |
| Undistributed net investment income | | | | | | | 939,307 | | |
| Unrealized depreciation of investments | | | | | | | (28,183,435 | ) | |
| NET ASSETS | | | | | | $ | 296,645,932 | | |
NET ASSET VALUE, REDEMPTION PRICE AND
MAXIMUM OFFERING PRICE PER SHARE | |
Net asset value and redemption price per share
(net assets divided by shares outstanding) | | | | | | $ | 15.01 | | |
Maximum offering price per share
(100/94.75 of per share net asset value) | | | | | | $ | 15.84 | | |
See notes to financial statements.
8
STATEMENT OF OPERATIONS
September 30, 2008
| INVESTMENT INCOME | |
| Interest | | | | | | $ | 386,250 | | |
| Dividends | | | | | | | 3,793,599 | | |
| | | | | | | $ | 4,179,849 | | |
| EXPENSES — Note 3 | |
| Advisory fees | | $ | 2,358,594 | | | | | | |
| Financial services | | | 355,169 | | | | | | |
| Transfer agent fees and expenses | | | 187,964 | | | | | | |
| Custodian fees and expenses | | | 53,509 | | | | | | |
| Registration fees | | | 43,908 | | | | | | |
| Audit and tax services | | | 37,350 | | | | | | |
| Reports to shareholders | | | 34,171 | | | | | | |
| Director's fees and expenses | | | 32,318 | | | | | | |
| Legal fees | | | 17,306 | | | | | | |
| Insurance | | | 14,746 | | | | | | |
| Other expenses | | | 12,707 | | | | 3,147,742 | | |
| Net investment income | | | | | | $ | 1,032,107 | | |
| NET REALIZED AND UNREALIZED GAIN (LOSS) ON INVESTMENTS | |
| Net realized gain on investments: | |
| Proceeds from sale of investment securities | | $ | 100,808,778 | | | | | | |
| Cost of investment securities sold | | | 79,420,941 | | | | | | |
| Net realized gain on investments | | | | | | $ | 21,387,837 | | |
| Change in unrealized appreciation of investments | |
| Unrealized appreciation at beginning of year | | $ | 38,002,491 | | | | | | |
| Unrealized depreciation at end of year | | | (28,183,435 | ) | | | | | |
| Change in unrealized appreciation of investments | | | | | | | (66,185,926 | ) | |
| Net realized and unrealized loss on investments | | | | | | $ | (44,798,089 | ) | |
| CHANGE IN NET ASSETS RESULTING FROM OPERATIONS | | | | | | $ | (43,765,982 | ) | |
See notes to financial statements.
9
STATEMENT OF CHANGES IN NET ASSETS
| | | For the Year Ended September 30, | |
| | | 2008 | | 2007 | |
| CHANGE IN NET ASSETS | |
| Operations: | |
| Net investment income | | $ | 1,032,107 | | | | | | | $ | 3,832,923 | | | | | | |
| Net realized gain on investments | | | 21,387,837 | | | | | | | | 78,234,281 | | | | | | |
Change in unrealized appreciation
of investments | | | (66,185,926 | ) | | | | | | | (27,943,471 | ) | | | | | |
Change in net assets resulting from
operations | | | | | | $ | (43,765,982 | ) | | | | | | $ | 54,123,733 | | |
| Dividends from net investment income | | | | | | | (227,343 | ) | | | | | | | (5,161,971 | ) | |
| Capital Stock transactions: | |
| Proceeds from capital stock sold | | $ | 22,185,401 | | | | | | | $ | 78,729,894 | | | | | | |
Proceeds from shares issued for dividends
reinvested | | | 170,618 | | | | | | | | 3,800,501 | | | | | | |
| Cost of capital stock repurchased* | | | (79,091,169 | ) | | | (56,735,150 | ) | | | (329,942,304 | ) | | | (247,411,909 | ) | |
| Total change in net assets | | | | | | $ | (100,728,475 | ) | | | | | | $ | (198,450,147 | ) | |
| NET ASSETS | |
| Beginning of year | | | | | | | 397,374,407 | | | | | | | | 595,824,554 | | |
| End of year | | | | | | $ | 296,645,932 | | | | | | | $ | 397,374,407 | | |
CHANGE IN CAPITAL STOCK
OUTSTANDING | |
| Shares of capital stock sold | | | | | | | 1,350,012 | | | | | | | | 4,794,371 | | |
Shares of capital stock issued for dividends
reinvested | | | | | | | 10,131 | | | | | | | | 223,476 | | |
| Shares of capital stock repurchased | | | | | | | (4,881,955 | ) | | | | | | | (19,862,630 | ) | |
| Decrease in capital stock outstanding | | | | | | | (3,521,812 | ) | | | | | | | (14,844,783 | ) | |
* Net of redemption fees of $25,653 and $15,361 for the years ended September 30, 2008 and 2007, respectively.
See notes to financial statements.
10
FINANCIAL HIGHLIGHTS
Selected Data for Each Share of Capital Stock Outstanding Throughout Each Year
| | | Year Ended September 30, | |
| | | 2008 | | 2007 | | 2006 | | 2005 | | 2004 | |
| Per share operating performance: | | | | | | | | | | | | | | | | | | | | | |
| Net asset value at beginning of year | | $ | 17.06 | | | $ | 15.62 | | | $ | 15.02 | | | $ | 13.01 | | | $ | 10.79 | | |
| Income from investment operations: | | | | | | | | | | | | | | | | | | | | | |
| Net investment income (loss) | | $ | 0.05 | | | $ | 0.14 | | | $ | 0.12 | | | $ | 0.04 | | | $ | (0.01 | ) | |
Net realized and unrealized gain (loss)
on investment securities | | | (2.09 | ) | | | 1.47 | | | | 0.60 | | | | 1.97 | | | | 2.23 | | |
| Total from investment operations | | $ | (2.04 | ) | | $ | 1.61 | | | $ | 0.72 | | | $ | 2.01 | | | $ | 2.22 | | |
| Less dividends from net investment income | | $ | (0.01 | ) | | $ | (0.17 | ) | | $ | (0.12 | ) | | | — | | | | — | | |
| Redemption fees | | | — | * | | | — | * | | | — | * | | | — | * | | | — | * | |
| Net asset value at end of year | | $ | 15.01 | | | $ | 17.06 | | | $ | 15.62 | | | $ | 15.02 | | | $ | 13.01 | | |
| Total investment return** | | | (11.96 | )% | | | 10.30 | % | | | 4.79 | % | | | 15.45 | % | | | 20.57 | % | |
| Ratios/supplemental data: | |
| Net assets at end of year (in $000's) | | $ | 296,646 | | | $ | 397,374 | | | $ | 595,825 | | | $ | 345,027 | | | $ | 207,907 | | |
| Ratio of expenses to average net assets | | | 0.89 | % | | | 0.90 | % | | | 0.85 | % | | | 0.89 | % | | | 0.99 | % | |
Ratio of net investment income to average
net assets | | | 0.29 | % | | | 0.74 | % | | | 0.89 | % | | | 0.30 | % | | | (0.16 | )% | |
| Portfolio turnover rate | | | 12 | % | | | 17 | % | | | 15 | % | | | 13 | % | | | 16 | % | |
* Rounds to less than $0.01 per share.
** Return is based on net asset value per share, adjusted for reinvestment of distributions, and does not reflect deduction of the sales charge.
See notes to financial statements.
11
NOTES TO FINANCIAL STATEMENTS
September 30, 2008
NOTE 1 — Significant Accounting Policies
FPA Paramount Fund, Inc. (the "Fund") is registered under the Investment Company Act of 1940, as a diversified, open-end investment company. The Fund's objective is a high total investment return, including capital appreciation and income, from a diversified portfolio of securities. The following is a summary of significant accounting policies consistently followed by the Fund in the preparation of its financial statements.
A. Security Valuation
Securities listed or traded on a national securities exchange are valued at the last sale price on the last business day of the year, or if there was not a sale that day, at the last bid price. Securities traded in the NASDAQ National Market System are valued at the NASDAQ Official Closing Price on the last business day of the year, or if there was not a sale that day, at the last bid. Unlisted securities are valued at the most recent bid price. Short-term investments with maturities of 60 days or less at the time of purchase are valued at amortized cost which approximates market value. Securities for which market quotations are not readily available are valued at fair value as determined in good faith by, or under the direction of, the Board of Directors.
B. Securities Transactions and Related Investment Income
Securities transactions are accounted for on the date the securities are purchased or sold. Dividend income and distributions to shareholders are recorded on the ex-dividend date. Interest income and expenses are recorded on an accrual basis.
C. Use of Estimates
The preparation of the financial statements in accordance with accounting principles generally accepted in the United States of America requires management to make estimates and assumptions that affect the amounts reported. Actual results could differ from those estimates.
NOTE 2 — Purchases of Investment Securities
Cost of purchases of investment securities (excluding short-term investments with maturities of 60 days or less at the time of purchase) aggregated $41,288,064 for the year ended September 30, 2008. Realized gains or losses are based on the specific identification method.
NOTE 3 — Federal Income Tax
No provision for federal income tax is required because the Fund has elected to be taxed as a "regulated investment company" under the Internal Revenue Code and intends to maintain this qualification and to distribute each year to its shareholders, in accordance with the distribution requirements of the Code, all of its taxable net investment income and taxable net realized gains on investments.
Distributions paid to shareholders are based on net investment income and net realized gains determined on a tax reporting basis, which may differ from financial reporting. At September 30, 2008, the components of distributable earnings were the same for financial statement and federal income tax purposes, and were as follows:
| Undistributed net investment income | | $ | 939,307 | | |
The tax status of distributions paid during the fiscal years ended September 30, 2008 and 2007 were as follows:
| | | 2008 | | 2007 | |
Dividends from
ordinary income | | $ | 227,343 | | | $ | 5,161,971 | | |
The cost of investment securities (excluding short-term investments with maturities of 60 days or less at the time of purchase) held at September 30, 2008, was $310,209,998 for federal income tax purposes. Gross unrealized appreciation and depreciation for all investment securities at September 30, 2008, for federal income tax purposes was $14,866,113 and $43,070,868, respectively resulting in net unrealized depreciation of $28,204,755. For federal income tax purposes, the Fund currently has accumulated net realized losses in the amount of $42,903,150 which can be carried forward to offset future gains. The ability to carry these losses forward expires in 2009. The Fund adopted the provisions of Financial Accounting Standards Board Interpretation No. 48 ("FIN 48"), Accounting for Uncertainty in Income Taxes, on October 1, 2007. The implementation of FIN 48 resulted in no liability for unrecognized tax benefits and no change to the beginning net asset value of the Fund. As of and during the year ended September 30, 2008, the Fund did not have any liability for unrecognized tax benefits. The Fund recognizes interest and penalties, if any, related to unrecognized tax benefits as income tax expense in the Statement of Operations. During the year, the Fund did not incur any interest or penalties. The Fund is not subject to examination by U.S. federal tax authorities for years ended before September 30, 2004 or by state tax authorities for years ended before September 30, 2003.
NOTE 4 — Advisory Fees and Other Affiliated Transactions
Pursuant to an Investment Advisory Agreement, advisory fees were paid by the Fund to First Pacific Advisors, LLC (the "Adviser"). Under the terms of this
12
NOTES TO FINANCIAL STATEMENTS
Continued
Agreement, the Fund pays the Adviser a monthly fee calculated at the annual rate of 0.75% of the first $50 million of the Fund's average daily net assets and 0.65% of the average daily net assets in excess of $50 million. In addition, the Fund pays the Adviser an amount equal to 0.1% of the average daily net assets for each fiscal year in reimbursement for the provision of financial services to the Fund. The Agreement provides that the Adviser will reimburse the Fund for any annual expenses (exclusive of interest, taxes, the cost of any supplemental statistical and research information, and extraordinary expenses such as litigation) in excess of 11/2% of the first $30 million and 1% of the remaining average net assets of the Fund for the year.
For the year ended September 30, 2008, the Fund paid aggregate fees of $32,084 to all Directors who are not interested persons of the Adviser. Certain officers of the Fund are also officers of the Adviser and FPA Fund Distributors, Inc.
NOTE 5 — Redemption Fees
A redemption fee of 2% applies to redemptions within 90 days of purchase for certain purchases made by persons eligible to purchase shares without an initial sales charge. For the year ended September 30, 2008, the Fund collected $25,653 in redemption fees, which amounted to less than $0.01 per share.
NOTE 6 — Distributor
For the year ended September 30, 2008, FPA Fund Distributors, Inc. ("Distributor"), a wholly owned subsidiary of the Adviser, received $4,118 in net Fund share sales commissions after reallowance to other dealers. The Distributor pays its own overhead and general administrative expenses, the cost of supplemental sales literature, promotion and advertising.
NOTE 7 — Disclosure of Fair Value
Measurements
The Fund adopted Statement of Financal Accounting Standards No. 157 ("FAS 157"), Fair Value Measurements, on October 1, 2007. FAS 157 requires the Fund to classify its assets based on valuation method, using three levels. Level 1 investment securities are valued based on quoted market prices in active markets for identical assets. Level 2 investment securities are valued based on significant observable market inputs, such as quoted prices for similar assets and quoted prices in inactive markets or other market observable inputs. Level 3 investment securities are valued using significant unobservable inputs that reflect the Fund's determination of assumptions that market participants might reasonably use in valuing the assets. The valuation levels are not necessarily an indication of the risk associated with investing in those securities. The following table presents the valuation levels of the Fund's investments as of September 30, 2008:
| Level 1 — Quoted Prices | | $ | 282,005,243 | | |
Level 2 — Other significant
observable inputs | | | 15,237,438 | * | |
Level 3 — Significant unobservable
inputs | | | — | | |
| Total investments | | $ | 297,242,681 | | |
* Comprised solely of short-term investments with maturities of 60 days or less that are valued at amortized cost.
13
REPORT OF INDEPENDENT REGISTERED
PUBLIC ACCOUNTING FIRM
TO THE SHAREHOLDERS AND
BOARD OF DIRECTORS OF FPA PARAMOUNT FUND, INC.
We have audited the accompanying statement of assets and liabilities of FPA Paramount Fund, Inc. (the "Fund"), including the portfolio of investments, as of September 30, 2008, the related statement of operations for the year then ended, the statements of changes in net assets for each of the two years in the period then ended, and the financial highlights for each of the five years in the period then ended. These financial statements and financial highlights are the responsibility of the Fund's management. Our responsibility is to express an opinion on these financial statements and financial highlights based on our audits.
We conducted our audits in accordance with standards of the Public Company Accounting Oversight Board (United States). Those standards require that we plan and perform the audit to obtain reasonable assurance about whether the financial statements and financial highlights are free of material misstatement. The Fund is not required to have, nor were we engaged to perform, an audit of its internal control over financial reporting. Our audits included consideration of internal control over financial reporting as a basis for designing audit procedures that are appropriate in the circumstances, but not for the purpose of expressing an opinion on the effectiveness of the Fund's internal control over financial reporting. Accordingly, we express no such opinion. An audit also includes examining, on a test basis, evidence supporting the amounts and disclosures in the financial statements, assessing the accounting principles used and significant estim ates made by management, as well as evaluating the overall financial statement presentation. Our procedures included confirmation of securities owned as of September 30, 2008, by correspondence with the custodian. We believe that our audits provide a reasonable basis for our opinion.
In our opinion, the financial statements and financial highlights referred to above present fairly, in all material respects, the financial position of FPA Paramount Fund, Inc. as of September 30, 2008, the results of its operations for the year then ended and the changes in its net assets for each of the two years in the period then ended, and the financial highlights for each of the five years in the period then ended in conformity with accounting principles generally accepted in the United States of America.

Los Angeles, California
November 10, 2008
RENEWAL OF INVESTMENT ADVISORY AGREEMENT
The following paragraphs summarize the material information and factors considered by the Board of Directors at a meeting held August 4, 2008 as well as their conclusions relative to such factors.
Nature, Extent and Quality of Services. The Board considered information regarding the Adviser and its staffing in connection with the Fund, including the Fund's portfolio managers, the addition of a senior analyst to their team, the scope of accounting, administrative, shareholder and other services supervised and provided by the Adviser, and the absence of any significant service problems reported to the Board. The Board noted the experience, length of service and the outstanding reputation of the Fund's Portfolio managers, Eric Ende and Steven Geist, who have managed the Fund since 2000. The Directors concluded that the nature, extent and quality of services provided by the Adviser have benefited and should continue to benefit the Fund and its shareholders.
Investment Performance. The Directors reviewed the overall investment performance of the Fund. They also received information from an independent consultant, Lipper Analytical Services, Inc. ("Lipper"), regarding the Fund's performance relative to a peer group of mid-cap core funds selected by Lipper (the "Peer Group"). The Directors noted the Fund's competitive longer-term investment performance since
14
RENEWAL OF INVESTMENT ADVISORY AGREEMENT
Continued
the current portfolio managers assumed management of the Fund when compared to the Peer Group. They further concluded that the Adviser's continued management of the Fund should benefit the Fund and its shareholders.
Advisory Fees and Fund Expenses; Adviser Profitability; Economies of Scale and Sharing of Economies of Scale. The Directors were provided information by the Adviser to enable consideration of the Fund's advisory fees and total expense levels, as well as the overall profitability of the Adviser, the benefits to the Adviser from its relationship to the Fund, the extent to which economies of scale with respect to the management of the Fund, if any, would be realized, and whether the Fund is sharing, or will share, in those economies.
The Directors reviewed comparative information relative to fees and expenses for the mutual fund industry generally and for the Peer Group. The Directors noted that the Fund's fees and expenses were at the lowest end of the range for the Peer Group. The Directors noted that the overall expense ratio of the Fund was also the lowest when compared to the Peer Group. The Directors noted that the fee rate charged to the Fund is currently lower than the fee rate charged by the Adviser on the other products managed in a similar style by the portfolio manager. The Directors concluded that the overall fee rate was reasonable and fair to the Fund and its shareholders in light of the nature and quality of the services provided by the Adviser.
The Directors considered whether there have been economies of scale with respect to the management of the Fund, whether the Fund has appropriately benefited from any economies of scale, and whether the fee rate is reasonable in relation to the Fund's assets and any economies of scale that may exist. The Directors expressed concern that the fee rate does not have any additional breakpoints. The mutual fund industry has trended toward funds having breakpoints in the advisory fee structure as a means by which to share in economies of scale as a fund's assets grow; however, not all funds have breakpoints in their fee structures. The Adviser indicated its belief that additional breakpoints currently were not appropriate for the Fund and that no meaningful income and expense forecasts for its business could be prepared given uncertainties regarding the direction of the economy, rising inflation, increasing costs for personnel and systems, and grow th (or not) in the Fund's assets, all of which could negatively impact the Adviser. The Directors noted that the Adviser had not increased the fee rate charged to the Fund despite the Adviser's claims of increases in the Adviser's internal costs of providing investment management services to the Fund, in part due to administrative burdens and expenses resulting from recent legislative and regulatory actions such as Sarbanes-Oxley. According to the Adviser, such increased costs have included a significant investment in a new analyst who assists with the management of the Fund, additions to administrative personnel and systems that enhance the quality of services provided to the Fund and the establishment of a full-time Chief Compliance Officer and his assistant. The Directors also noted that asset levels of the Fund are currently lower than they were three years ago, yet the Adviser has continued to make investments in personnel servicing the Fund.
Conclusions. The Directors determined that the Fund continues to benefit from the services of a highly experienced portfolio management team that has produced competitive long-term returns. In addition, the Directors agreed that the Fund continues to receive high quality accounting, administrative, shareholder and other ancillary services from the Adviser. The Directors acknowledged that there is no uniform industry methodology to measure or apply economies of scale. The Directors determined that the Fund's expense ratio, the overall profitability of the Adviser, and the sharing of economies of scale with the Fund are fair and reasonable under the current circumstances. In reaching their conclusions, the Directors acknowledged that the fees and expenses of the Fund are clearly disclosed in the Fund's prospectus, in all reports to Fund shareholders and in industry research databases such as those maintained by Lipper and Morningstar, and that the Fund's shareholders have ready access to other funds with different strategies, fees and expenses and can redeem at any time if they feel the Adviser does not add fair value for the fees and expenses charged. The Directors also stated their intention to continue monitoring the factors relevant to the Adviser's compensation, such as changes in the Fund's asset levels, changes in portfolio management personnel and the cost and quality of the services provided by the Adviser to the Fund. On the basis of the foregoing, and without assigning particular weight to any single factor, the Directors determined to approve the continuation of the current advisory agreement for another one-year period ending September 30, 2009.
15
SHAREHOLDER EXPENSE EXAMPLE
September 30, 2008 (unaudited)
Fund Expenses
As a shareholder of the Fund, you incur two types of costs: (1) transaction costs, and (2) ongoing costs, including advisory and administrative fees; shareholder service fees; and other Fund expenses. The Example is intended to help you understand your ongoing costs (in dollars) of investing in the Fund and to compare these costs with the ongoing costs of investing in other mutual funds. The Example is based on an investment of $1,000 invested at the beginning of the year and held for the entire year.
Actual Expenses
The information in the table under the heading "Actual Performance" provides information about actual account values and actual expenses. You may use the information in this column, together with the amount you invested, to estimate the expenses that you paid over the period. Simply divide your account value by $1,000 (for example, an $8,600 account value divided by $1,000= 8.6), then multiply the result by the number in the first column in the row entitled "Expenses Paid During Period" to estimate the expenses you paid on your account during this period.
Hypothetical Example for Comparison Purposes
The information in the table under the heading "Hypothetical Performance (5% return before expenses)" provides information about hypothetical account values and hypothetical expenses based on the Fund's actual expense ratio and an assumed rate of return of 5% per year before expenses, which is not the Fund's actual return. The hypothetical account values and expenses may not be used to estimate the actual ending account balance or expenses you paid for the period. You may use this information to compare the ongoing costs of investing in the Fund and other funds. To do so, compare this 5% hypothetical example with the 5% hypothetical examples that appear in the shareholder reports of other funds.
Please note that the expenses shown in the table are meant to highlight your ongoing costs only and do not reflect any transactional costs. Therefore, the information under the heading "Hypothetical Performance (5% return before expenses)" is useful in comparing ongoing costs only, and will not help you determine the relative total costs of owning different funds. In addition, if these transactional costs were included, your costs would have been higher.
| | | Actual
Performance | | Hypothetical
Performance
(5% return
before
expenses) | |
Beginning Account Value
March 31, 2008 | |
$1,000.00 | | $1,000.00 | |
Ending Account Value
September 30, 2008 | |
$ 958.49 | | $1,020.55 | |
Expenses Paid During
Period* | |
$ 4.31 | | $ 4.45 | |
* Expenses are equal to the Fund's annualized expense ratio of 0.88%, multiplied by the average account value over the period and prorated for the six-months ended September 30, 2008 (183/366 days).
16
DIRECTOR AND OFFICER INFORMATION
| Name, Age & Address | | Positions(s)
With Fund/
Years Served | | Principal Occupation(s)
During the Past 5 Years | | Portfolios in
Fund Complex
Overseen | | Other Directorships | |
| Willard H. Altman, Jr. – (73)† | | Director*
Years Served: 6 | | Retired, Formerly, until 1995, Partner of Ernst & Young LLP, a public accounting firm. | | | 6 | | | | |
|
| Thomas P. Merrick – (71)† | | Director*
Years Served: <1 | | Private consultant. President of Strategic Planning Consultants for more than the past five years. Former Executive Committee member and Vice President of Fluor Corporation, responsible for strategic planning, from 1984 to 1998. | | | 2 | | | | |
|
| Lawrence J. Sheehan – (76)† | | Director*
Years Served: 2 | | Retired. Formerly partner (1969 to 1994) and of counsel employee (1994-2002) of the law firm of O'Melveny & Myers LLP, legal counsel to the Fund. | | | 6 | | | | |
|
| Eric S. Ende – (64) | | Director*
President & Portfolio Manager
Years Served: 8 | | Partner of the Adviser since 2006. Formerly Senior Vice President of First Pacific Advisors, Inc. from 1984 to 2006. | | | 3 | | | | |
|
| Steven R. Geist – (54) | | Executive Vice President & Portfolio Manager
Year Served: 8 | | Partner of the Adviser since 2006. Fomerly Vice President of First Pacific Advisors, Inc. from 1992 to 2006. | | | | | | | |
|
| J. Richard Atwood – (48) | | Treasurer
Years Served: 11 | | Chief Operating Officer of the Adviser. President and Chief Executive Officer of FPA Fund Distributors, Inc. | | | | | | FPA Fund
Distributors, Inc. | |
|
| Sherry Sasaki – (53) | | Secretary
Years Served: 26 | | Assistant Vice President and Secretary of the Adviser and of FPA Fund Distributors, Inc. | | | | | | | |
|
| Christopher H. Thomas – (51) | | Chief Compliance Officer
Years Served: 13 | | Vice President and Chief Compliance Officer of the Adviser and Secretary of FPA Fund Distributors, Inc. | | | | | | FPA Fund
Distributors, Inc. | |
|
| E. Lake Setzler – (41) | | Assistant Treasurer
Years Served: 2 | | Vice President and Controller of the Adviser since 2005. Formerly Chief Operating Officer of Inflective Asset Management, LLC (2004 - 2005) and Vice President of Transamerica Investment Management, LLC (2000 - 2004). | | | | | | | |
|
* Directors serve until their resignation, removal or retirement.
† Audit Committee member
Additional information on the Directors is available in the Statement of Additional Information. Each of the above individuals can be contacted at 11400 W. Olympic Blvd,. Suite 1200, Los Angeles, CA 90064.
17
FPA PARAMOUNT FUND, INC.
INVESTMENT ADVISER
First Pacific Advisors, LLC
11400 West Olympic Boulevard, Suite 1200
Los Angeles, CA 90064
DISTRIBUTOR
FPA Fund Distributors, Inc.
11400 West Olympic Boulevard, Suite 1200
Los Angeles, California 90064
COUNSEL
O'Melveny & Myers LLP
Los Angeles, California
TICKER SYMBOL: FPRAX
CUSIP: 302546106
INDEPENDENT REGISTERED PUBLIC ACCOUNTING FIRM
Deloitte & Touche LLP
Los Angeles, California
CUSTODIAN & TRANSFER AGENT
State Street Bank and Trust Company
Boston, Massachusetts
SHAREHOLDER SERVICE AGENT
Boston Financial Data Services, Inc.
P.O. Box 8115
Boston, Massachusetts 02266-8500
30 Dan Road
Canton, MA 02021-2809
(800) 638-3060
(617) 483-5000
This report has been prepared for the information of shareholders of FPA Paramount Fund, Inc., and is not authorized for distribution to prospective investors unless preceded or accompanied by an effective prospectus.
The Fund's complete proxy voting record for the 12 months ended June 30, 2008 is available without charge, upon request by calling (800) 982-4372 and on the SEC's website at www.sec.gov.
The Fund's schedule of portfolio holdings, filed the first and third quarter of the Fund's fiscal year on Form N-Q with the SEC, is available on the SEC's website at www.sec.gov. Form N-Q is available at the SEC's Public Reference Room in Washington, D.C., and information on the operations of the Public Reference Room may be obtained by calling (202) 942-8090. To obtain Form N-Q from the Fund, shareholders can call (800) 982-4372.
Additional information about the Fund is available online at www.fpafunds.com. This information includes, among other things, holdings, top sectors, and performance, and is updated on or about the 15th business day after the end of each quarter.
Item 2. Code of Ethics.
(a) The registrant has adopted a code of ethics that applies to the registrant’s principal executive and financial officers.
(b) Not Applicable
(c) During the period covered by this report, there were not any amendments to the provisions of the code of ethics adopted in 2(a) above.
(d) During the period covered by this report, there were not any implicit or explicit waivers to the provisions of the code of ethics adopted in 2(a).
(e) Not Applicable
(f) A copy of the registrant’s code of ethics is filed as an exhibit to this Form N-CSR. Upon request, any person may obtain a copy of this code of ethics, without charge, by calling (800) 982-4372.
Item 3. Audit Committee Financial Expert.
The registrant’s board of directors has determined that Willard H. Altman, Jr., a member of the registrant’s audit committee and board of directors, is an “audit committee financial expert” and is “independent,” as those terms are defined in this Item. This designation will not increase the designee’s duties, obligations or liability as compared to his duties, obligations and liability as a member of the audit committee and of the board of directors. This designation does not affect the duties, obligations or liability of any other member of the audit committee or the board of directors.
Item 4. Principal Accountant Fees and Services.
| | | | 2007 | | 2008 | |
(a) | | Audit Fees | | $ | 30,900 | | $ | 32,450 | |
(b) | | Audit Related Fees | | -0- | | -0- | |
(c) | | Tax Fees | | $ | 6,450 | | $ | 6,750 | |
(d) | | All Other Fees | | -0- | | -0- | |
(e)(1) Disclose the audit committee’s pre-approval policies and procedures described in paragraph (c)(7) of Rule 2-01 of Regulation S-X. The audit committee shall pre-approve all audit and permissible non-audit services that the committee considers compatible with maintaining the independent auditors’ independence. The pre-approval requirement will extend to all non-audit services provided to the registrant, the adviser, and any entity controlling, controlled by, or under common control with the adviser that provides ongoing services to the registrant, if the engagement relates directly to the operations and financial
reporting of the registrant; provided, however, that an engagement of the registrant’s independent auditors to perform attest services for the registrant, the adviser or its affiliates required by generally accepted auditing standards to complete the examination of the registrant’s financial statements (such as an examination conducted in accordance with Statement on Auditing Standards Number 70 issued by the American Institute of Certified Public Accountants), will be deem pre-approved if: (i) the registrant’s independent auditors inform the audit committee of the engagement, (ii) the registrant’s independent auditors advise the audit committee at least annually that the performance of this engagement will not impair the independent auditor’s independence with respect to the registrant, and (iii) the audit committee receives a copy of the independent auditor’s report prepared in connection with such services. The committee may delegate to one or more committee members the authority to review and pre-approve audit and permissible non-audit services. Actions taken under any such delegation will be reported to the full committee at its next meeting.
(e)(2) Disclose the percentage of services described in each of paragraphs (b) – (d) of this Item that were approved by the audit committee pursuant to paragraph (c)(7)(i)(C) of Rule 2-01 of Regulation S-X. 100% of the services provided to the registrant described in paragraphs (b) – (d) of this Item were pre-approved by the audit committee pursuant to paragraph (e)(1) of this Item. There were no services provided to the investment adviser or any entity controlling, controlled by or under common control with the adviser described in paragraphs (b) – (d) of this Item that were required to be pre-approved by the audit committee.
(f) If greater than 50%, disclose the percentage of hours expended on the principal accountant’s engagement to audit the registrant’s financial statements for the most recent fiscal year that were attributed to work performed by persons other than the principal accountant’s full-time, permanent employees. All services performed on the engagement to audit the registrant’s financial statements for the most recent fiscal year end were performed by the principal accountant’s full-time, permanent employees.
(g) Disclose the aggregate non-audit fees billed by the registrant’s accountant for services rendered to the registrant, and rendered to the registrant’s investment adviser (not including any sub-adviser whose role is primarily portfolio management and is subcontracted with or overseen by another investment adviser), and any entity controlling, controlled by, or under common control with the adviser that provides ongoing services to the registrant for each of the last two fiscal years of the registrant. None.
| | (h) | | Disclose whether the registrant’s audit committee of the board of directors has considered whether the provision of non-audit services that were rendered to the registrant’s investment adviser (not including any sub-adviser whose role is primarily portfolio management and is subcontracted with or overseen by another investment adviser), and any entity controlling, controlled by, or under common control with the investment adviser that provides ongoing services to the registrant that were not pre-approved pursuant to paragraph (c)(7)(ii) of Rule 2-01 of Regulation S-X is compatible with maintaining the principal accountant’s independence. Not Applicable. |
| | | | |
Item 5. | | Audit Committee of Listed Registrants. Not Applicable. |
| | |
Item 6. | | Schedule of Investments. The schedule of investments is included as part of the report to stockholders filed under Item 1 of this Form. |
| | |
Item 7. | | Disclosure of Proxy Voting Policies and Procedures for Closed-End Management Investment Companies. Not Applicable. |
| | |
Item 8. | | Portfolio Managers of Closed-End Management Investment Companies. Not Applicable. |
| | |
Item 9. | | Purchases of Equity Securities by Closed-End Management Investment Company and Affiliated Purchasers. Not Applicable. |
| | |
Item 10. | | Submission of Matters to a Vote of Security Holders. There has been no material change to the procedures by which shareholders may recommend nominees to the registrant’s board of directors. |
| | |
Item 11. | | Controls and Procedures. |
| | |
| | (a) | | The principal executive officer and principal financial officer of the registrant have concluded that the registrant’s disclosure controls and procedures (as defined in Rule 30a-3(c) under the Investment Company Act of 1940) are effective based on their evaluation of the disclosure controls and procedures as of a date within 90 days of the filing date of this report. |
| | | | |
| | (b) | | There have been no significant changes in the registrant’s internal controls over financial reporting (as defined in Rule 30a-3(d) under the Investment Company Act of 1940) that occurred during the second fiscal quarter of the period covered by this report that have materially affected, or is reasonably likely to materially affect, the registrant’s internal controls over financial reporting. |
Item 12. | | Exhibits. |
| | | | |
| | (a)(1) | | Code of ethics as applies to the registrant’s officers and directors, as required to be disclosed under Item 2 of Form N-CSR. Attached hereto as Ex.99.CODE.ETH. |
| | | | |
| | (a)(2) | | Separate certification for the registrant’s principal executive officer and principal financial officer, as required by Rule 30a-2(a) under the Investment Company Act of 1940. Attached hereto. |
| | | | |
| | (a)(3) | | Not Applicable |
| | | | |
| | (b) | | Separate certification for the registrant’s principal executive officer and principal financial officer, as required by Rule 30a-2(b) under the Investment Company Act of 1940. Attached hereto. |
SIGNATURES
Pursuant to the requirements of the Securities Exchange Act of 1934 and the Investment Company Act of 1940, the registrant has duly caused this report to be signed on its behalf by the undersigned, thereunto duly authorized.
FPA PARAMOUNT FUND, INC.
By: | /s/ ERIC S. ENDE | |
Eric S. Ende, President | |
(Principal Executive Officer) | |
Date: November 21, 2008
Pursuant to the requirements of the Securities Exchange Act of 1934 and the Investment Company Act of 1940, this report has been signed below by the following persons on behalf of the registrant and in the capacities and on the dates indicated.
FPA PARAMOUNT FUND, INC.
By: | /s/ ERIC S. ENDE | |
Eric S. Ende, President | |
(Principal Executive Officer) | |
Date: November 21, 2008
By: | /s/ J. RICHARD ATWOOD | |
J. Richard Atwood, Treasurer | |
(Principal Financial Officer) | |
Date: November 21, 2008