UNITED STATES
SECURITIES AND EXCHANGE COMMISSION
Washington, D.C. 20549
FORM N-CSR
CERTIFIED SHAREHOLDER REPORT OF REGISTERED
MANAGEMENT INVESTMENT COMPANIES
Investment Company Act file number | 811-852 |
|
FPA PARAMOUNT FUND, INC. |
(Exact name of registrant as specified in charter) |
|
11400 WEST OLYMPIC BLVD., SUITE 1200, LOS ANGELES, CALIFORNIA | | 90064 |
(Address of principal executive offices) | | (Zip code) |
|
J. RICHARD ATWOOD,
11400 WEST OLYMPIC BLVD., SUITE 1200, LOS ANGELES, CALIFORNIA 90064 |
(Name and address of agent for service) |
|
Registrant’s telephone number, including area code: | 310-473-0225 | |
|
Date of fiscal year end: | SEPTEMBER 30 | |
|
Date of reporting period: | SEPTEMBER 30, 2006 | |
| | | | | | | | | |
Item 1. Report to Stockholders.
Annual Report

Distributor:
FPA FUND DISTRIBUTORS, INC.
11400 West Olympic Boulevard, Suite 1200
Los Angeles, California 90064
47430
FPA Paramount Fund, Inc.
September 30, 2006
LETTER TO SHAREHOLDERS
After a first six months of 2006 in which smaller and more speculative companies significantly outperformed, the tables were turned in the third quarter, and larger-cap stocks did especially well. For example, the S&P 500 outperformed the Russell 2000 by over 500 basis points during the third quarter. For the year-to-date period, there is now much less difference between small- and large-stock indexes, with gains in the 7-9% range.
Paramount performance this year has continued to be disappointing with flat returns for both the third-quarter and year-to-date periods, well behind the benchmark Russell 2500. Returns realized over longer time periods continue to be significantly better.
We believe that other managers who are attracted to the kinds of high-quality, high-return businesses that we like are also struggling this year. Regardless, we can assure the Paramount shareholder that we have not changed our investment philosophy and do not plan to do so.
| | | Periods Ended September 30, 2006 | |
| | | Third
Quarter | | Calendar
YTD | | Three
Years* | | Five
Years* | |
| Paramount | | | (0.3 | )% | | | 0.7 | % | | | 13.4 | % | | | 14.5 | % | |
| Russell 2500 | | | 0.5 | % | | | 6.9 | % | | | 16.1 | % | | | 14.4 | % | |
| S&P 500 | | | 5.7 | % | | | 8.5 | % | | | 12.3 | % | | | 7.0 | % | |
| Nasdaq | | | 4.0 | % | | | 2.4 | % | | | 8.1 | % | | | 8.6 | % | |
*Annualized Returns
Significant price declines in a number of portfolio stocks contributed to Paramount's underperformance over the first nine months of 2006.
Headset manufacturer Plantronics is down close to 40% as it has struggled with a transition to wireless equipment, with the consolidation of a large acquisition, and with starting up a new plant in China. Briggs & Stratton declined 30% as poor weather hurt both its lawnmower engine and portable generator business, resulting in excess inventories and production cutbacks. Zebra Technologies is down almost 20% because of weakness in sales to retailers and slow development of RFID (video frequency identification) technology. Lincare is also down 20%, driven by concerns about the extent of Medicare reimbursement cuts for home oxygen equipment and service.
We think it noteworthy that, in the case of half of the portfolio stocks which declined most over the first 9 months of 2006, we took advantage of the lower prices and significantly increased position sizes. These names include Knight Transportation, Maxim, Polaris, HNI, and Zebra. We expect these increased investments to significantly benefit Paramount shareholders over time.
Our reaction was different in the case of Briggs & Stratton, where we liquidated the position. We now believe that we misjudged the strength of Briggs' business model in the face of important changes in industry structure.
Long-term shareholders will undoubtedly have noted that we typically devote relatively little space to dissecting recent performance and a great deal to talking about companies in the portfolio. We believe that the primary purpose of the shareholder letter is to shed light on our investment process, which is focused on long-term business strategy and profitability, and not on forecasting short-term price fluctuations, which are often no more than market "noise." We believe that in-depth discussion of selected portfolio companies is the best way of illustrating our investment philosophy and decision making process and we intend to continue this practice.
The Brady Corporation investment first appeared in the Paramount portfolio in May 2005. The position has subsequently been increased, and is now about 3% of the portfolio.
Brady is a leader in high-performance identification products and specialty materials that help customers increase safety, security, productivity and performance. Its products include high-performance labels and signs, printing systems and software, label application systems, safety devices and precision die-cut materials. It has over 500,000 customers, with a product focus on the maintenance, repair, and operations (MRO) market. It goes to market both directly, mostly through catalogs, and via industrial distributors like W.W. Grainger.
Our investment thesis for Brady was that it was a solid business which new senior management was transforming into a significantly more dynamic company. We think of this kind of investment as a "shallow turnaround" — the company wasn't exactly broken, but its business was being made a lot better.
The historical Brady had a strong competitive position, with leading market shares and a powerful brand. Its balance sheet was solid and it earned respectable returns on capital, but with an uneven operating history. The most recent instance of this last issue was in 2001-2003, when a somewhat sluggish
1
response to a weaker economic environment led to a severe deterioration of Brady's returns. The operating margin declined from the low-teens in the late 1990's to 6% and returns on operating assets dropped from the mid-20's to 9%.
The promotion of Frank Jaehnert to CEO in early 2003 marked the start of a period of greatly improved performance. The restructuring program was accelerated and completed, and the pace of revenue growth, both internal and acquisition driven, was accelerated. Since 2003 sales have grown over 20% annually, with about 8 points of that internal, the rest from acquisitions. Returns on operating assets have doubled and operating margins almost tripled. EPS has gone from a depressed 46 cents to over $2/share — the prior peak had been $1.02 in 2000.
Our decision to purchase and continue to hold Brady shares is of course based on our conviction that these dramatic improvements in performance are sustainable. We believe that the most important issue is how Brady deploys capital to support its growth strategy, which combines organic growth with acquisitions.
Brady management continues to target 5% annual internal growth. Although its core MRO market is unlikely to grow any faster than GDP, we believe that Brady's strong product development effort, some market share gains, and geographic expansion should lead to results somewhat above GDP for this part of its business, perhaps 3-5%. Other portions of Brady's business are more dynamic. About 20% of its sales are precision die-cut components for cell phones and disk drives, businesses which we believe can grow at above 5% annually.
The acquisition-driven portion of future growth is more difficult to assess. When thinking about acquisitions, we concentrate on the most common ways of getting into trouble:
• Buying businesses not well understood.
• Paying too much.
• Taking on too many deals in a short time period.
So far, Brady's purchases have been tightly focused on filling in and expanding its current markets and we believe prices paid have been reasonable. Brady has been helped here by the highly fragmented nature of most of the markets in which it operates.
The issue of trying to do too much too quickly is still an open one, however. There is no question that Brady has greatly stepped up the acquisition pace in recent years, and it is proceeding more rapidly than we anticipated at the point of our initial investment a year and a half ago. After spending $112 million on deals over 1999-2003, it paid $308 million for purchases made in 2004-2005, and then about $350 million for eleven deals closed in fiscal year 2006. It would appear that the pre-2006 purchases have been successfully consolidated and are contributing to company profitability. For 2006, however, it is still too early to draw any conclusions. Brady's performance in dealing with these more recent acquisitions will certainly have considerable impact on how successful an investment it will prove to be for Paramount shareholders.
In closing, we are happy to report that First Pacific Advisors has successfully completed our transaction with Old Mutual (US) Holdings. We are now a Limited Liability Company owned entirely by eight internal members of FPA. This is the first time in the fifty-year history of this organization that the members who manage your Fund are the sole owners of the firm. We believe this solidifies the organization so that we may continue to manage it with a long-term perspective that is in the best interests of our clients, mutual-fund shareholders, employees and members. We thank Old Mutual for helping to make this an absolutely smooth transition and wish them well in their future endeavors.
Respectfully submitted,

Eric S. Ende
President & Portfolio Manager
October 27, 2006
The discussion of Fund investments represents the views of the Fund's managers at the time of this report and are subject to change without notice. References to individual securities are for informational purposes only and should not be construed as recommendations to purchase or sell individual securities. While the Fund's managers believe that the Fund's holdings are value stocks, there can be no assurance that others will consider them as such. Further, investing in value stocks presents the risk that value stocks may fall out of favor with investors and underperform growth stocks during given periods.
2
FORWARD LOOKING STATEMENT DISCLOSURE
As mutual fund managers, one of our responsibilities is to communicate with shareholders in an open and direct manner. Insofar as some of our opinions and comments in our letters to shareholders are based on current management expectations, they are considered "forward-looking statements" which may or may not be accurate over the long term. While we believe we have a reasonable basis for our comments and we have confidence in our opinions, actual results may differ materially from those we anticipate. You can identify forward-looking statements by words such as "believe," "expect," "may," "anticipate," and other similar expressions when discussing prospects for particular portfolio holdings and/or the markets, generally. We cannot, however, assure future results and disclaim any obligation to update or alter any forward-looking statements, whether as a result of new information, future events, or otherwise. Further, information provided in t his report should not be construed as a recommendation to purchase or sell any particular security.
3
HISTORICAL PERFORMANCE
Change in Value of a $10,000 Investment in FPA Paramount Fund, Inc. vs. Russell 2500 Index and Lipper Mid-Cap Core Fund Average from October 1, 1996 to September 30, 2006
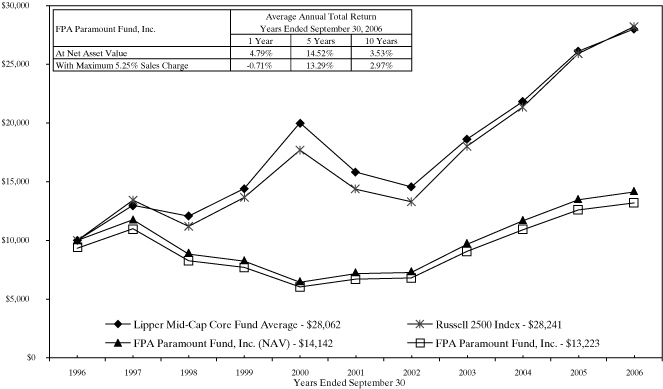
Past performance is not indicative of future performance. The Russell 2500 Index consists of the 2,500 smallest companies in the Russell 3000 total capitalization universe. This index is considered a measure of small to medium capitalization stock performance. This index does not reflect any commissions or fees which would be incurred by an investor purchasing the stocks it represents. The Lipper Mid-Cap Core Fund Average provides an additional comparison of how your Fund performed in relation to other mutual funds with similar objectives. The Lipper data does not include sales charges. The performance shown for FPA Paramount Fund, Inc., with an ending value of $13,223 reflects deduction of the current maximum sales charge of 5.25% of the offering price. In addition, since investors purchase shares of the Fund with varying sales charges depending primarily on volume purchased, the Fund's performance at net asset value (NAV) is also shown, as reflected by the ending value of $14,142. The performance of the Fund and of the Averages is computed on a total return basis which includes reinvestment of all distributions. The current portfolio managers, Eric S. Ende and Steven R. Geist, have been primarily responsible for the management of the portfolio since April 1, 2000.
4
PORTFOLIO SUMMARY
September 30, 2006
| Common Stocks | | | | | | | 78.5 | % | |
| Business Services & Supplies | | | 20.7 | % | | | | | |
| Producer Durable Goods | | | 12.2 | % | | | | | |
| Technology | | | 10.2 | % | | | | | |
| Retailing | | | 7.4 | % | | | | | |
| Energy | | | 7.2 | % | | | | | |
| Health Care | | | 6.9 | % | | | | | |
| Transportation | | | 4.9 | % | | | | | |
| Financial | | | 3.8 | % | | | | | |
| Consumer Durable Goods | | | 2.7 | % | | | | | |
| Entertainment | | | 2.5 | % | | | | | |
| Short-Term Investments | | | | | | | 21.9 | % | |
| Other Assets and Liabilities, net | | | | | | | (0.4 | )% | |
| Total Net Assets | | | | | | | 100.0 | % | |
MAJOR PORTFOLIO CHANGES
Six Months Ended September 30, 2006
(Unaudited)
| | | Shares | |
| NET PURCHASES | |
| Common Stocks | |
| Brady Corporation | | | 262,000 | | |
| CarMax, Inc. | | | 145,000 | | |
| Carnival Corporation | | | 150,000 | | |
| Charles River Laboratories International, Inc. | | | 210,000 | | |
| CLARCOR, Inc. (1) | | | 350,000 | | |
| Cognex Corporation | | | 310,500 | | |
| Copart, Inc. | | | 168,000 | | |
| HNI Corporation | | | 286,600 | | |
| Heartland Express, Inc. | | | 415,134 | | |
| IDEX Corporation | | | 157,200 | | |
| Knight Transportation, Inc. | | | 570,000 | | |
| Maxim Integrated Products, Inc. (1) | | | 210,000 | | |
| O'Reilly Automotive, Inc. | | | 257,400 | | |
| Plantronics, Inc. . | | | 381,300 | | |
| Polaris Industries, Inc. | | | 182,500 | | |
| Zebra Technologies Corporation | | | 290,000 | | |
| NET SALES | |
| Common Stocks | |
| Briggs & Stratton Corporation | | | 127,700 | | |
| CEC Entertainment, Inc. (2) | | | 85,000 | | |
| Gallagher, Arthur J. & Co. (2) | | | 225,000 | | |
| North Fork Bancorporation (2) | | | 295,000 | | |
(1) Indicates new commitment to portfolio
(2) Indicates elimination from portfolio
5
PORTFOLIO OF INVESTMENTS
September 30, 2006
| COMMON STOCKS | | Shares | | Value | |
| BUSINESS SERVICES & SUPPLIES — 20.7% | |
| Brady Corporation | | | 492,000 | | | $ | 17,298,720 | | |
| CDW Corporation | | | 390,100 | | | | 24,061,368 | | |
| Charles River Laboratories International, Inc.* | | | 500,000 | | | | 21,705,000 | | |
| CLARCOR, Inc. | | | 350,000 | | | | 10,671,500 | | |
| Copart, Inc.* | | | 180,000 | | | | 5,074,200 | | |
| Invitrogen Corporation* | | | 290,000 | | | | 18,388,900 | | |
| Landauer, Inc. | | | 4,500 | | | | 228,375 | | |
| Manpower Inc. | | | 125,300 | | | | 7,677,131 | | |
| ScanSource, Inc.* | | | 590,000 | | | | 17,894,700 | | |
| | | $ | 122,999,894 | | |
| PRODUCER DURABLES — 12.2% | |
| Franklin Electric Co., Inc. | | | 76,100 | | | $ | 4,043,954 | | |
| Graco Inc. | | | 260,000 | | | | 10,155,600 | | |
| HNI Corporation | | | 391,600 | | | | 16,282,728 | | |
| IDEX Corporation | | | 282,200 | | | | 12,148,710 | | |
| Oshkosh Truck Corporation | | | 232,500 | | | | 11,734,275 | | |
| Zebra Technologies Corporation (Class A)* | | | 505,000 | | | | 18,048,700 | | |
| | | $ | 72,413,967 | | |
| TECHNOLOGY — 10.2% | |
| Cognex Corporation | | | 790,000 | | | $ | 19,955,400 | | |
| Maxim Integrated Products, Inc. | | | 210,000 | | | | 5,894,700 | | |
| Microchip Technology Incorporated | | | 390,000 | | | | 12,643,800 | | |
| Plantronics, Inc. | | | 816,300 | | | | 14,309,739 | | |
| SanDisk Corporation* | | | 150,000 | | | | 8,031,000 | | |
| | | $ | 60,834,639 | | |
| RETAILING — 7.4% | |
| CarMax, Inc.* | | | 525,000 | | | $ | 21,897,750 | | |
| O'Reilly Automotive, Inc.* | | | 665,000 | | | | 22,084,650 | | |
| | | $ | 43,982,400 | | |
| ENERGY — 7.2% | |
| Helix Energy Solutions Group, Inc.* | | | 575,000 | | | $ | 19,205,000 | | |
| Noble Corporation | | | 280,000 | | | | 17,970,400 | | |
| Tidewater Inc. | | | 135,000 | | | | 5,965,650 | | |
| | | $ | 43,141,050 | | |
| HEALTH CARE — 6.9% | |
| Amsurg Corporation* | | | 330,000 | | | $ | 7,345,800 | | |
| Bio-Rad Laboratories, Inc.* | | | 113,500 | | | | 8,027,855 | | |
| Health Management Associates, Inc. | | | 352,700 | | | | 7,371,430 | | |
| Lincare Holdings Inc.* | | | 535,000 | | | | 18,532,400 | | |
| | | $ | 41,277,485 | | |
6
PORTFOLIO OF INVESTMENTS
September 30, 2006
| COMMON STOCKS — Continued | | Shares or
Principal
Amount | | Value | |
| TRANSPORATION — 4.9% | |
| Heartland Express, Inc. | | | 1,051,800 | | | $ | 16,492,224 | | |
| Knight Transporation, Inc. | | | 755,000 | | | | 12,797,250 | | |
| | | $ | 29,289,474 | | |
| FINANCIAL — 3.8% | |
| Brown & Brown, Inc. | | | 390,000 | | | $ | 11,918,400 | | |
| First American Corporation | | | 250,000 | | | | 10,585,000 | | |
| | | $ | 22,503,400 | | |
| CONSUMER DURABLES — 2.7% | |
| Briggs & Stratton Corporation | | | 97,300 | | | $ | 2,680,615 | | |
| Polaris Industries Inc. | | | 330,000 | | | | 13,579,500 | | |
| | | $ | 16,260,115 | | |
| ENTERTAINMENT — 2.5% | |
| Carnival Corporation | | | 315,000 | | | $ | 14,814,450 | | |
| TOTAL COMMON STOCKS — 78.5% (Cost $401,570,912) | | | | | | $ | 467,516,874 | | |
| SHORT-TERM INVESTMENTS — 21.9% | |
| Short-term Corporate Notes: | |
| Rabobank USA Financial Corporation — 5.35% 10/02/06 | | $ | 10,890,000 | | | $ | 10,888,382 | | |
| Toyota Motor Credit Corporation — 5.24% 10/06/06 | | | 25,000,000 | | | | 24,981,806 | | |
| Barclays U.S. Funding, Inc. — 5.225% 10/16/06 | | | 30,000,000 | | | | 29,934,687 | | |
| ChevronTexaco Funding Corporation — 5.21% 10/18/06 | | | 20,000,000 | | | | 19,950,794 | | |
| General Electric Capital Services, Inc. — 5.22% 10/25/06 | | | 23,000,000 | | | | 22,919,960 | | |
| AIG Funding, Inc. — 5.23% 10/27/06 | | | 22,000,000 | | | | 21,916,901 | | |
| TOTAL SHORT-TERM INVESTMENTS (Cost $130,592,530) | | | | | | $ | 130,592,530 | | |
| TOTAL INVESTMENTS — 100.4% (Cost $532,163,442) | | | | | | $ | 598,109,404 | | |
| Other assets and liabilities, net — (0.4)% | | | | | | | (2,284,850 | ) | |
| TOTAL NET ASSETS — 100% | | | | | | $ | 595,824,554 | | |
*Non-income producing security
See notes to financial statements.
7
STATEMENT OF ASSETS AND LIABILITIES
September 30, 2006
| ASSETS | |
| Investments at value: | |
Investment securities — at market value
(identified cost $401,570,912) | | $ | 467,516,874 | | | | | | |
Short-term investments — at amortized cost
(maturities 60 days or less) | | | 130,592,530 | | | $ | 598,109,404 | | |
| Cash | | | | | | | 908 | | |
| Receivable for: | |
| Capital Stock sold | | $ | 1,853,615 | | | | | | |
| Dividends and accrued interest | | | 116,761 | | | | | | |
| Investment securities sold | | | 30,746 | | | | 2,001,122 | | |
| | | | | | | $ | 600,111,434 | | |
| LIABILITIES | |
| Payable for: | |
| Capital Stock repurchased | | $ | 2,198,390 | | | | | | |
| Investment securities purchased | | | 1,677,768 | | | | | | |
| Advisory fees and financial services | | | 374,222 | | | | | | |
| Accrued expenses | | | 36,500 | | | | 4,286,880 | | |
| NET ASSETS | | | | | | $ | 595,824,554 | | |
| SUMMARY OF SHAREHOLDERS' EQUITY | |
Capital Stock — par value $0.25 per share: authorized
100,000,000 shares; outstanding 38,134,279 shares | | | | | | $ | 9,533,570 | | |
| Additional paid-in capital | | | | | | | 661,428,019 | | |
| Accumulated net realized loss on investments | | | | | | | (142,546,588 | ) | |
| Undistributed net investment income | | | | | | | 1,463,591 | | |
| Unrealized appreciation of investments | | | | | | | 65,945,962 | | |
| NET ASSETS | | | | | | $ | 595,824,554 | | |
NET ASSET VALUE, REDEMPTION PRICE AND
MAXIMUM OFFERING PRICE PER SHARE | |
Net asset value and redemption price per share
(net assets divided by shares outstanding) | | | | | | $ | 15.62 | | |
Maximum offering price per share
(100/94.75 of per share net asset value) | | | | | | $ | 16.49 | | |
See notes to financial statements.
8
STATEMENT OF OPERATIONS
September 30, 2006
| INVESTMENT INCOME | | | | | |
| Interest | | | | | | $ | 5,701,783 | | |
| Dividends | | | | | | | 2,835,034 | | |
| | | | | | | $ | 8,536,817 | | |
| EXPENSES — Note 3 | |
| Advisory fees | | $ | 3,167,539 | | | | | | |
| Financial services | | | 479,621 | | | | | | |
| Transfer agent fees and expenses | | | 283,656 | | | | | | |
| Custodian fees and expenses | | | 51,789 | | | | | | |
| Reports to shareholders | | | 46,339 | | | | | | |
| Director's fees and expenses | | | 41,822 | | | | | | |
| Registration fees | | | 41,645 | | | | | | |
| Audit fees | | | 33,145 | | | | | | |
| Insurance | | | 20,245 | | | | | | |
| Legal fees | | | 14,884 | | | | | | |
| Other expenses | | | 5,584 | | | | 4,186,269 | | |
| Net investment income | | | | | | $ | 4,350,548 | | |
| NET REALIZED AND UNREALIZED GAIN ON INVESTMENTS | |
| Net realized gain on investments: | |
| Proceeds from sale of investment securities | | $ | 54,904,510 | | | | | | |
| Cost of investment securities sold | | | 38,320,317 | | | | | | |
| Net realized gain on investments | | | | | | $ | 16,584,193 | | |
| Change in unrealized appreciation of investments: | |
| Unrealized appreciation at beginning of year | | $ | 73,337,677 | | | | | | |
| Unrealized appreciation at end of year | | | 65,945,962 | | | | | | |
| Change in unrealized appreciation of investments | | | | | | | (7,391,715 | ) | |
| Net realized and unrealized gain on investments | | | | | | $ | 9,192,478 | | |
NET INCREASE IN NET ASSETS RESULTING
FROM OPERATIONS | | | | | | $ | 13,543,026 | | |
See notes to financial statements.
9
STATEMENT OF CHANGES IN NET ASSETS
| | | For the Year Ended September 30, | |
| | | 2006 | | 2005 | |
| INCREASE IN NET ASSETS | |
| Operations: | |
| Net investment income | | $ | 4,350,548 | | | | | | | $ | 839,843 | | | | | | |
| Net realized gain on investments | | | 16,584,193 | | | | | | | | 3,422,510 | | | | | | |
Change in unrealized appreciation
of investments | | | (7,391,715 | ) | | | | | | | 35,621,844 | | | | | | |
| Increase in net assets resulting from operations | | | | | | $ | 13,543,026 | | | | | | | $ | 39,884,197 | | |
| Dividends from net investment income | | | | | | $ | (3,726,800 | ) | | | | | | | — | | |
| Capital Stock transactions: | |
| Proceeds from Capital Stock sold | | $ | 295,523,207 | | | | | | | $ | 118,248,065 | | | | | | |
Proceeds from shares issued for dividends
reinvested | | | 3,055,815 | | | | | | | | — | | | | | | |
| Cost of Capital Stock repurchased* | | | (57,597,700 | ) | | | 240,981,322 | | | | (21,012,060 | ) | | | 97,236,005 | | |
| Total increase in net assets | | | | | | $ | 250,797,548 | | | | | | | $ | 137,120,202 | | |
| NET ASSETS | |
Beginning of year, including undistributed
net investment income of $839,843
at September 30, 2005 | | | | | | | 345,027,006 | | | | | | | | 207,906,804 | | |
End of year, including undistributed net
| |
investment income of $1,463,591 and
| |
$839,843 at September 30, 2006
| |
| and 2005, respectively | | | | | | $ | 595,824,554 | | | | | | | $ | 345,027,006 | | |
CHANGE IN CAPITAL STOCK
OUTSTANDING | |
| Shares of Capital Stock sold | | | | | | | 18,659,106 | | | | | | | | 8,495,132 | | |
Shares of Capital Stock issued for dividends
reinvested | | | | | | | 194,390 | | | | | | | | — | | |
| Shares of Capital Stock repurchased | | | | | | | (3,693,149 | ) | | | | | | | (1,497,418 | ) | |
| Increase in Capital Stock outstanding | | | | | | | 15,160,347 | | | | | | | | 6,997,714 | | |
* Net of redemption fees of $7,519 and $3,956 for the years ended september 30, 2006 and 2005, respectively.
See notes to financial statements.
10
FINANCIAL HIGHLIGHTS
Selected Data for Each Share of Capital Stock Outstanding Throughout Each Year
| | | Year Ended September 30, | |
| | | 2006 | | 2005 | | 2004 | | 2003 | | 2002 | |
| Per share operating performance: | | | | | | | | | | | | | | | | | | | | | |
| Net asset value at beginning of year | | $ | 15.02 | | | $ | 13.01 | | | $ | 10.79 | | | $ | 8.12 | | | $ | 8.00 | | |
| Income from investment operations: | | | | | | | | | | | | | | | | | | | | | |
| Net investment income (loss) | | $ | 0.12 | | | $ | 0.04 | | | $ | (0.01 | ) | | $ | (0.04 | ) | | $ | (0.03 | ) | |
Net realized and unrealized gain on
investment securities | | | 0.60 | | | | 1.97 | | | | 2.23 | | | | 2.71 | | | | 0.16 | | |
| Total from investment operations | | $ | 0.72 | | | $ | 2.01 | | | $ | 2.22 | | | $ | 2.67 | | | $ | 0.13 | | |
| Less dividends from net investment income | | $ | (0.12 | ) | | | — | | | | — | | | | — | | | $ | (0.01 | ) | |
| Redemption fees | | | — | * | | | — | * | | | — | * | | | — | | | | — | | |
| Net asset value at end of year | | $ | 15.62 | | | $ | 15.02 | | | $ | 13.01 | | | $ | 10.79 | | | $ | 8.12 | | |
| Total investment return** | | | 4.79 | % | | | 15.45 | % | | | 20.57 | % | | | 32.88 | % | | | 1.63 | % | |
| Ratios/supplemental data: | |
| Net assets at end of year (in $000's) | | $ | 595,825 | | | $ | 345,027 | | | $ | 207,907 | | | $ | 109,638 | | | $ | 74,192 | | |
| Ratio of expenses to average net assets | | | 0.85 | % | | | 0.89 | % | | | 0.99 | % | | | 1.15 | % | | | 1.18 | %† | |
Ratio of net investment income to average
net assets | | | 0.89 | % | | | 0.30 | % | | | (0.16 | )% | | | (0.47 | )% | | | 0.34 | % | |
| Portfolio turnover rate | | | 15 | % | | | 13 | % | | | 16 | % | | | 17 | % | | | 14 | % | |
* Rounds to less than $0.01 per share.
** Return is based on net asset value per share, adjusted for reinvestment of distributions, and does not reflect deduction of the sales charge.
† The ratio of expenses to average net assets for the year ended September 30, 2002, was 1.17% after reimbursements from the Adviser.
See notes to financial statements.
11
NOTES TO FINANCIAL STATEMENTS
September 30, 2006
NOTE 1 — Significant Accounting Policies
FPA Paramount Fund, Inc. (the "Fund") is registered under the Investment Company Act of 1940, as a diversified, open-end investment company. The Fund's objective is a high total investment return, including capital appreciation and income, from a diversified portfolio of securities. The following is a summary of significant accounting policies consistently followed by the Fund in the preparation of its financial statements.
A. Security Valuation
Securities listed or traded on a national securities exchange are valued at the last sale price on the last business day of the year, or if there was not a sale that day, at the last bid price. Securities traded in the NASDAQ National Market System are valued at the NASDAQ Official Closing Price on the last business day of the year, or if there was not a sale that day, at the last bid. Unlisted securities are valued at the most recent bid price. Short-term investments with maturities of 60 days or less at the time of purchase are valued at amortized cost which approximates market value. Securities for which market quotations are not readily available are valued at fair value as determined in good faith by, or under the direction of, the Board of Directors.
B. Securities Transactions and Related Investment Income
Securities transactions are accounted for on the date the securities are purchased or sold. Dividend income and distributions to shareholders are recorded on the ex-dividend date. Interest income and expenses are recorded on an accrual basis.
C. Use of Estimates
The preparation of the financial statements in accordance with accounting principles generally accepted in the United States of America requires management to make estimates and assumptions that affect the amounts reported. Actual results could differ from those estimates.
NOTE 2 — Purchases of Investment Securities
Cost of purchases of investment securities (excluding short-term investments with maturities of 60 days or less at the time of purchase) aggregated $230,626,790 for the year ended September 30, 2006. Realized gains or losses are based on the specific identification method.
NOTE 3 — Federal Income Tax
No provision for federal income tax is required because the Fund has elected to be taxed as a "regulated investment company" under the Internal Revenue Code and intends to maintain this qualification and to distribute each year to its shareholders, in accordance with the distribution requirements of the Code, all of its taxable net investment income and taxable net realized gains on investments.
Distributions paid to shareholders are based on net investment income and net realized gains determined on a tax reporting basis, which may differ from financial reporting. For federal income tax purposes, the components of distributable earnings at September 30, 2006, were as follows:
| Undistributed Net Investment Income | | $ | 1,463,591 | | |
The tax status of distributions paid during the fiscal years ended September 30, 2006 and 2005 were as follows:
| | | 2006 | | 2005 | |
Dividends from
Ordinary Income | | $ | 3,726,800 | | | | — | | |
The cost of investment securities (excluding short-term investments with maturities of 60 days or less at the time of purchase) held at September 30, 2006, were the same for federal income tax and financial reporting purposes. Gross unrealized appreciation and depreciation for all investment securities at September 30, 2006, for federal income tax purposes was $77,373,290 and $11,427,328, respectively resulting in net unrealized appreciation of $65,945,962. For federal income tax purposes, the Fund currently has accumulated net realized losses in the amount of $142,546,588 which can be carried forward to offset future gains. The ability to carry these losses forward expires as follows: $70,091,009 in 2007; $1,128,157 in 2008; and $71,327,422 in 2009.
NOTE 4 — Advisory Fees and Other Affiliated Transactions
Pursuant to an Investment Advisory Agreement, advisory fees were paid by the Fund to First Pacific Advisors, Inc. (the "Adviser"). Under the terms of this Agreement, the Fund pays the Adviser a monthly fee calculated at the annual rate of 0.75% of the first $50 million of the Fund's average daily net assets and 0.65% of the average daily net assets in excess of $50 million. In addition, the Fund pays the Adviser an amount equal to 0.1% of the average daily net assets for each fiscal year in reimbursement for the provision of financial services to the Fund. The Agreement provides that the Adviser will reimburse the Fund for any annual expenses (exclusive of interest, taxes, the cost of any supplemental statistical and research information, and extraordinary expenses such as litigation) in excess of
12
NOTES TO FINANCIAL STATEMENTS
Continued
11/2% of the first $30 million and 1% of the remaining average net assets of the Fund for the year. On October 1, 2006, a new investment advisory firm, First Pacific Advisors, LLC, owned entirely by the former principals and key investment professionals of the Adviser, commenced providing advisory services under a new investment advisory agreement approved by shareholders on May 2, 2006. This new investment advisory agreement is identical to the prior investment advisory agreement.
For the year ended September 30, 2006, the Fund paid aggregate fees of $38,833 to all Directors who are not interested persons of the Adviser. Certain officers of the Fund are also officers of the Adviser and FPA Fund Distributors, Inc.
NOTE 5 — Redemption Fees
A redemption fee of 2% applies to redemptions within 90 days of purchase for certain purchases made by persons eligible to purchase shares without an initial sales charge. For the year ended September 30, 2006, the Fund collected $7,519 in redemption fees, which amounted to less than $0.01 per share.
NOTE 6 — Distributor
For the year ended September 30, 2006, FPA Fund Distributors, Inc. ("Distributor"), a wholly owned subsidiary of the Adviser, received $26,218 in net Fund share sales commissions after reallowance to other dealers. The Distributor pays its own overhead and general administrative expenses, the cost of supplemental sales literature, promotion and advertising.
REPORT OF INDEPENDENT REGISTERED
PUBLIC ACCOUNTING FIRM
TO THE SHAREHOLDERS AND
BOARD OF DIRECTORS OF FPA PARAMOUNT FUND, INC.
We have audited the accompanying statement of assets and liabilities of FPA Paramount Fund, Inc. (the "Fund"), including the portfolio of investments, as of September 30, 2006, the related statement of operations for the year then ended, the statements of changes in net assets for each of the two years in the period then ended, and the financial highlights for each of the four years in the period then ended. These financial statements and financial highlights are the responsibility of the Fund's management. Our responsibility is to express an opinion on these financial statements and financial highlights based on our audits. The financial highlights of FPA Paramount Fund, Inc. for the year ended September 30, 2002 were audited by other auditors whose report, dated November 12, 2002, expressed an unqualified opinion on those financial highlights.
We conducted our audits in accordance with standards of the Public Company Accounting Oversight Board (United States). Those standards require that we plan and perform the audit to obtain reasonable assurance about whether the financial statements and financial highlights are free of material misstatement. The Fund is not required to have, nor were we engaged to perform, an audit of its internal control over financial reporting. Our audits included consideration of internal control over financial reporting as a basis for designing audit procedures that are appropriate in the circumstances, but not for the purpose of expressing an opinion on the effectiveness of the Fund's internal control over financial reporting. Accordingly, we express no such opinion. An audit also includes examining, on a test basis, evidence supporting the amounts and disclosures in the financial statements, assessing the accounting principles used and significant estim ates made by management, as well as evaluating the overall financial statement presentation. Our procedures included confirmation of securities owned as of September 30, 2006, by correspondence with the custodian and brokers. We believe that our audits provide a reasonable basis for our opinion.
In our opinion, the financial statements and financial highlights referred to above present fairly, in all material respects, the financial position of FPA Paramount Fund, Inc. as of September 30, 2006, the results of its operations for the year then ended and the changes in its net assets for each of the two years in the period then ended, and the financial highlights for each of the four years in the period then ended in conformity with accounting principles generally accepted in the United States of America.

Los Angeles, California
November 14, 2006
13
SHAREHOLDER EXPENSE EXAMPLE
September 30, 2006 (unaudited)
Fund Expenses
As a shareholder of the Fund, you incur two types of costs: (1) transaction costs, and (2) ongoing costs, including advisory and administrative fees; shareholder service fees; and other Fund expenses. The Example is intended to help you understand your ongoing costs (in dollars) of investing in the Fund and to compare these costs with the ongoing costs of investing in other mutual funds. The Example is based on an investment of $1,000 invested at the beginning of the year and held for the entire year.
Actual Expenses
The information in the table under the heading "Actual Performance" provides information about actual account values and actual expenses. You may use the information in this column, together with the amount you invested, to estimate the expenses that you paid over the period. Simply divide your account value by $1,000 (for example, an $8,600 account value divided by $1,000= 8.6), then multiply the result by the number in the first column in the row entitled "Expenses Paid During Period" to estimate the expenses you paid on your account during this period.
Hypothetical Example for Comparison Purposes
The information in the table under the heading "Hypothetical Performance (5% return before expenses)" provides information about hypothetical account values and hypothetical expenses based on the Fund's actual expense ratio and an assumed rate of return of 5% per year before expenses, which is not the Fund's actual return. The hypothetical account values and expenses may not be used to estimate the actual ending account balance or expenses you paid for the period. You may use this information to compare the ongoing costs of investing in the Fund and other funds. To do so, compare this 5% hypothetical example with the 5% hypothetical examples that appear in the shareholder reports of other funds.
and expenses may not be used to estimate the actual ending account balance or expenses you paid for the period. You may use this information to compare the ongoing costs of investing in the Fund and other funds. To do so, compare this 5% hypothetical example with the 5% hypothetical examples that appear in the shareholder reports of other funds.
Please note that the expenses shown in the table are meant to highlight your ongoing costs only and do not reflect any transactional costs. Therefore, the information under the heading "Hypothetical Performance (5% return before expenses)" is useful in comparing ongoing costs only, and will not help you determine the relative total costs of owning different funds. In addition, if these transactional costs were included, your costs would have been higher.
| | | Actual
Performance | | Hypothetical
Performance
(5% return
before
expenses) | |
Beginning Account Value
March 31, 2006 | |
$1,000.00 | | $1,000.00 | |
Ending Account Value
September 30, 2006 | |
$ 946.87 | | $1,020.74 | |
Expenses Paid During
Period* | |
$ 4.10 | | $ 4.26 | |
* Expenses are equal to the Fund's annualized expense ratio of 0.84%, multiplied by the average account value over the period and prorated for the six-months ended September 30, 2006 (183/365 days).
RENEWAL OF INVESTMENT ADVISORY AGREEMENT
The investment advisory agreement provides that it may be renewed from year to year by (i) the Board of Directors of the Fund or by the vote of a majority (as defined in the Investment Company Act of 1940) of the outstanding voting securities of the Fund, and (ii) by the vote of a majority of Directors who are not interested persons (as defined in the 1940 Act) of the Fund or of the Adviser cast in person at a meeting called for the purpose of voting on such approval. At a meeting of the Board of Directors held on May 2, 2006, the continuance of the advisory agreement through May 31, 2007, was approved by the Board of Directors and by a majority of the Directors who are not interested persons of the Fund or of the Adviser. A new investment advisory agreement between the Fund and Resolute, LLC ("Resolute") was approved by the Board of Directors and by a majority of the Di rectors who are not interested persons of the Fund, the Adviser or Resolute, at a meeting held on February 7, 2006. Resolute was created by the principals and key investment professionals of the Fund's Adviser. Resolute exercised its option to purchase, among other things, the operating assets and name of the Adviser. The purchase was effected on September 30, 2006, and the new investment advisory agreement took effect on October 1, 2006. This new investment advisory agreement is identical to the Fund's prior investment advisory agreement. At a special meeting of shareholders held on May 2, 2006, the shareholders of the Fund approved the new investment advisory agreement. Finally, on
14
RENEWAL OF INVESTMENT ADVISORY AGREEMENT
Continued
October 1, 2006, Resolute changed its name to First Pacific Advisors, LLC.
In determining whether to renew the advisory agreements, those Fund Directors who were not interested persons of the Adviser met separately to evaluate information provided by the Adviser in accordance with the 1940 Act and to determine their recommendation to the full Board of Directors. The Directors considered a variety of factors, including the quality of advisory, management and accounting services provided to the Fund, the fees and expenses borne by the Fund, the profitability of the Adviser and the investment performance of the Fund both on an absolute basis and as compared with a peer group of mutual funds. The Fund's advisory fee and expense ratio were also considered in light of the advisory fees and expense ratios of a peer group of mutual funds. The Directors noted the depth of experience of the Adviser and its investment and administrative personnel. The Dir ectors also took into consideration the benefits derived by the Adviser from arrangements under which it receives research services from brokers to whom the Fund's brokerage transactions are allocated. Based upon its consideration of these and other relevant factors, the Directors concluded that the advisory fees and other expenses paid by the Fund are fair and that shareholders have received reasonable value in return for such fees and expenses.
RESULTS OF SPECIAL MEETING
Following is a list of matters voted upon and the results of those votes cast at the special meeting of shareholders held May 2, 2006:
1. With respect to the election of six directors by shareholders:
| | | Votes For | | Votes
Withheld | |
| Willard H. Altman, Jr. | | | 18,864,868 | | | | 209,174 | | |
| A. Robert Pisano | | | 18,879,904 | | | | 194,138 | | |
| John H. Rubel | | | 18,816,566 | | | | 257,476 | | |
| Lawrence J. Sheehan | | | 18,860,213 | | | | 213,830 | | |
| John P. Shelton | | | 18,809,520 | | | | 264,523 | | |
| Eric S. Ende | | | 18,874,283 | | | | 199,760 | | |
2. With respect to a new Investment Advisory Agreement with Resolute, LLC, to take effect on or about October 1, 2006, a total of 13,345,277 shares voted for, 98,157 shares voted against, and 221,581 shares abstained.
15
DIRECTOR AND OFFICER INFORMATION
| Name, Age & Address | | Positions(s)
With Fund/
Years Served | | Principal Occupation(s)
During the Past 5 Years | | Portfolios in
Fund Complex
Overseen | | Other Directorships | |
| Willard H. Altman, Jr. – (71)† | | Director*
Years Served: 4 | | Retired, Formerly, until 1995, Partner of Ernst & Young LLP, a public accounting firm. | | | 6 | | | | |
|
| A. Robert Pisano – (63)† | | Director*
Years Served: <1 | | President and Chief Operating Officer of the Motion Picture Association of America, Inc. since 2005. Formerly, until 2005, National Executive Director and Chief Executive Officer of Screen Actors Guild. | | | 5 | | | State Net, Resources Global Professionals, and The Motion Picture and Television Fund | |
|
| John H. Rubel – (86)† | | Director*
Years Served: 28 | | President, John H. Rubel and Associates, Inc. | | | 1 | | | | |
|
| Lawrence J. Sheehan – (74)† | | Director*
Years Served: <1 | | Retired. Formerly partner (1969 to 1994) and of counsel employee (1994-2002) of the law firm of O'Melveny & Myers LLP, legal counsel to the Fund. | | | 6 | | | | |
|
| John P. Shelton, CFA – (86)† | | Director*
Years Served: 29 | | Professor Emeritus at UCLA Graduate School of Management. | | | 1 | | | | |
|
| Eric S. Ende – (62) | | Director*
President & Portfolio Manager
Years Served: 6 | | Partner of the Adviser. | | | 3 | | | | |
|
| Steven R. Geist – (52) | | Executive Vice President & Portfolio Manager
Year Served: 6 | | Partner of the Adviser. | | | | | | | |
|
| J. Richard Atwood – (46) | | Treasurer
Years Served: 9 | | Chief Operating Officer of the Adviser. President and Chief Executive Officer of FPA Fund Distributors, Inc. | | | | | | FPA Fund
Distributors, Inc. | |
|
| Sherry Sasaki – (51) | | Secretary
Years Served: 24 | | Assistant Vice President and Secretary of the Adviser and of FPA Fund Distributors, Inc. | | | | | | | |
|
| Christopher H. Thomas – (49) | | Chief Compliance Officer
Years Served: 11 | | Vice President and Chief Compliance Officer of the Adviser and Secretary of FPA Fund Distributors, Inc. | | | | | | FPA Fund
Distributors, Inc. | |
|
| E. Lake Setzler – (39) | | Assistant Treasurer
Years Served: <1 | | Vice President and Controller of the Adviser since 2005. Formerly Chief Operating Officer of Inflective Asset Management, LLC (2004 - 2005) and Vice President of Transamerica Investment Management, LLC (2000 - 2004). | | | | | | | |
|
* Directors serve until their resignation, removal or retirement.
† Audit Committee member
Additional information on the Directors is available in the Statement of Additional Information. Each of the above individuals can be contacted at 11400 W. Olympic Blvd,. Suite 1200, Los Angeles, CA 90064.
16
FPA PARAMOUNT FUND, INC.
INVESTMENT ADVISER
First Pacific Advisors, LLC
11400 West Olympic Boulevard, Suite 1200
Los Angeles, CA 90064
DISTRIBUTOR
FPA Fund Distributors, Inc.
11400 West Olympic Boulevard, Suite 1200
Los Angeles, California 90064
COUNSEL
O'Melveny & Myers LLP
Los Angeles, California
TICKER SYMBOL: FPRAX
CUSIP: 302546106
INDEPENDENT REGISTERED PUBLIC ACCOUNTING FIRM
Deloitte & Touche LLP
Los Angeles, California
CUSTODIAN & TRANSFER AGENT
State Street Bank and Trust Company
Boston, Massachusetts
SHAREHOLDER SERVICE AGENT
Boston Financial Data Services, Inc.
P.O. Box 8115
Boston, Massachusetts 02266-8500
(800) 638-3060
(617) 483-5000
This report has been prepared for the information of shareholders of FPA Paramount Fund, Inc., and is not authorized for distribution to prospective investors unless preceded or accompanied by an effective prospectus.
The Fund's complete proxy voting record for the 12 months ended June 30, 2006 is available without charge, upon request by calling (800) 982-4372 and on the SEC's website at www.sec.gov.
The Fund's schedule of portfolio holdings, filed the first and third quarter of the Fund's fiscal year on Form N-Q with the SEC, is available on the SEC's website at www.sec.gov. Form N-Q is available at the SEC's Public Reference Room in Washington, D.C., and information on the operations of the Public Reference Room may be obtained by calling (202) 942-8090. To obtain Form N-Q from the Fund, shareholders can call (800) 982-4372.
Additional information about the Fund is available online at www.fpafunds.com. This information includes, among other things, holdings, top sectors, and performance, and is updated on or about the 15th business day after the end of each quarter.
Item 2. Code of Ethics.
(a) The registrant has adopted a code of ethics that applies to the registrant’s senior executive and financial officers.
(b) Not Applicable
(c) During the period covered by this report, the code of ethics was amended to reflect the name change of the investment adviser, which resulted from the consummation of a transaction with its former parent. No changes were made to the provisions of the code of ethics adopted in 2(a) above.
(d) During the period covered by this report, there were not any implicit or explicit waivers to the provisions of the code of ethics adopted in 2(a).
(e) Not Applicable
(f) A copy of the registrant’s code of ethics is filed as an exhibit to this Form N-CSR. Upon request, any person may obtain a copy of this code of ethics, without charge, by calling (800) 982-4372.
Item 3. Audit Committee Financial Expert.
The registrant’s board of directors has determined that Willard H. Altman, Jr., a member of the registrant’s audit committee and board of directors, is an “audit committee financial expert” and is “independent,” as those terms are defined in this Item. This designation will not increase the designee’s duties, obligations or liability as compared to his duties, obligations and liability as a member of the audit committee and of the board of directors. This designation does not affect the duties, obligations or liability of any other member of the audit committee or the board of directors.
Item 4. Principal Accountant Fees and Services.
| | | | 2005 | | 2006 | |
(a) | | Audit Fees | | $ | 27,380 | | $ | 29,600 | |
(b) | | Audit Related Fees | | -0- | | -0- | |
(c) | | Tax Fees | | $ | 5,765 | | $ | 6,200 | |
(d) | | All Other Fees | | -0- | | -0- | |
(e)(1) Disclose the audit committee’s pre-approval policies and procedures described in paragraph (c)(7) of Rule 2-01 of Regulation S-X. The audit committee shall pre-approve all audit and permissible non-audit services that the committee considers compatible with maintaining the independent auditors’ independence. The pre-approval requirement will extend to all non-audit services provided to the registrant, the adviser, and any entity controlling, controlled by, or under common control with the
adviser that provides ongoing services to the registrant, if the engagement relates directly to the operations and financial reporting of the registrant; provided, however, that an engagement of the registrant’s independent auditors to perform attest services for the registrant, the adviser or its affiliates required by generally accepted auditing standards to complete the examination of the registrant’s financial statements (such as an examination conducted in accordance with Statement on Auditing Standards Number 70 issued by the American Institute of Certified Public Accountants), will be deem pre-approved if: (i) the registrant’s independent auditors inform the audit committee of the engagement, (ii) the registrant’s independent auditors advise the audit committee at least annually that the performance of this engagement will not impair the independent auditor’s independence with respect to the registrant, and (iii) the audit committee receives a copy of the independent auditor’s report prepared in connection with such services. The committee may delegate to one or more committee members the authority to review and pre-approve audit and permissible non-audit services. Actions taken under any such delegation will be reported to the full committee at its next meeting.
(e)(2) Disclose the percentage of services described in each of paragraphs (b) – (d) of this Item that were approved by the audit committee pursuant to paragraph (c)(7)(i)(C) of Rule 2-01 of Regulation S-X. 100% of the services provided to the registrant described in paragraphs (b) – (d) of this Item were pre-approved by the audit committee pursuant to paragraph (e)(1) of this Item. There were no services provided to the investment adviser or any entity controlling, controlled by or under common control with the adviser described in paragraphs (b) – (d) of this Item that were required to be pre-approved by the audit committee.
(f) If greater than 50%, disclose the percentage of hours expended on the principal accountant’s engagement to audit the registrant’s financial statements for the most recent fiscal year that were attributed to work performed by persons other than the principal accountant’s full-time, permanent employees. All services performed on the engagement to audit the registrant’s financial statements for the most recent fiscal year end were performed by the principal accountant’s full-time, permanent employees.
(g) Disclose the aggregate non-audit fees billed by the registrant’s accountant for services rendered to the registrant, and rendered to the registrant’s investment adviser (not including any sub-adviser whose role is primarily portfolio management and is subcontracted with or overseen by another investment adviser), and any entity controlling, controlled by, or under common control with the adviser that provides ongoing services to the registrant for each of the last two fiscal years of the registrant. None.
(h) Disclose whether the registrant’s audit committee of the board of directors has considered whether the provision of non-audit services that were rendered to the registrant’s investment adviser (not including any sub-adviser whose role is primarily portfolio management and is subcontracted with or overseen by another investment adviser), and any entity controlling, controlled by, or under common control with the investment adviser that provides ongoing services to the registrant that were not pre-approved pursuant to paragraph (c)(7)(ii) of Rule 2-01 of Regulation S-X is compatible with maintaining the principal accountant’s independence. Not Applicable.
Item 5. Audit Committee of Listed Registrants. Not Applicable.
Item 6. Schedule of Investments. The schedule of investments is included as part of the report to stockholders filed under Item 1 of this Form.
Item 7. Disclosure of Proxy Voting Policies and Procedures for Closed-End Management Investment Companies. Not Applicable.
Item 8. Portfolio Managers of Closed-End Management Investment Companies. Not Applicable.
Item 9. Purchases of Equity Securities by Closed-End Management Investment Company and Affiliated Purchasers. Not Applicable.
Item 10. Submission of Matters to a Vote of Security Holders. There has been no material change to the procedures by which shareholders may recommend nominees to the registrant’s board of directors.
Item 11. Controls and Procedures.
(a) The principal executive officer and principal financial officer of the registrant have concluded that the registrant’s disclosure controls and procedures (as defined in Rule 30a-3(c) under the Investment Company Act of 1940) are effective based on their evaluation of the disclosure controls and procedures as of a date within 90 days of the filing date of this report.
(b) There have been no significant changes in the registrant’s internal controls over financial reporting (as defined in Rule 30a-3(d) under the Investment Company Act of 1940) that occurred during the second fiscal quarter covered by this report that have materially affected, or is reasonably likely to materially affect, the registrant’s internal controls over financial reporting.
Item 12. Exhibits.
(a)(1) Code of ethics as applies to the registrant’s officers and directors, as required to be disclosed under Item 2 of Form N-CSR. Attached hereto as Ex.99.CODE.ETH.
(a)(2) Separate certification for the registrant’s principal executive officer and principal financial officer, as required by Rule 30a-2(a) under the Investment Company Act of 1940. Attached hereto.
(a)(3) Not Applicable
(b) Separate certification for the registrant’s principal executive officer and principal financial officer, as required by Rule 30a-2(b) under the Investment Company Act of 1940. Attached hereto.
SIGNATURES
Pursuant to the Securities Exchange Act of 1934 and the Investment Company Act of 1940, the registrant has duly caused this report to be signed on its behalf by the undersigned, thereunto duly authorized.
FPA PARAMOUNT FUND, INC. | |
| |
| |
By: | /s/ ERIC S. ENDE | |
| Eric S. Ende, President | |
| | |
Date: | December 8, 2006 | |
| | | |
Pursuant to the Securities Exchange Act of 1934 and the Investment Company Act of 1940, the registrant has duly caused this report to be signed on its behalf by the undersigned, thereunto duly authorized.
FPA PARAMOUNT FUND, INC. | |
| |
| |
By: | /s/ J. RICHARD ATWOOD | |
| J. Richard Atwood, Treasurer | |
| | |
Date: | December 8, 2006 | |
| | | |