UNITED STATES
SECURITIES AND EXCHANGE COMMISSION
Washington, D.C. 20549
FORM N-CSR
CERTIFIED SHAREHOLDER REPORT OF REGISTERED
MANAGEMENT INVESTMENT COMPANIES
Investment Company Act file number | 811-852 |
|
FPA PARAMOUNT FUND, INC. |
(Exact name of registrant as specified in charter) |
|
11400 WEST OLYMPIC BLVD., SUITE 1200, LOS ANGELES, CALIFORNIA | | 90064 |
(Address of principal executive offices) | | (Zip code) |
|
J. RICHARD ATWOOD,
11400 WEST OLYMPIC BLVD., SUITE 1200, LOS ANGELES, CALIFORNIA 90064 |
(Name and address of agent for service) |
|
Registrant’s telephone number, including area code: | 310-473-0225 | |
|
Date of fiscal year end: | SEPTEMBER 30 | |
|
Date of reporting period: | SEPTEMBER 30, 2010 | |
| | | | | | | | | |
Item 1. Report to Stockholders.
FPA Paramount Fund, Inc.
Annual Report
September 30, 2010

Distributor:
FPA FUND DISTRIBUTORS, INC.
11400 West Olympic Boulevard, Suite 1200
Los Angeles, California 90064
53988
LETTER TO SHAREHOLDERS
Commentary
"The Song Remains the Same"
In the world of investment management, results are typically measured each quarter. While markets sometimes experience a dramatic shift in the course of ninety days, usually the most important influences on the economy evolve more slowly. That is the situation today, where from our perspective, little about the investment backdrop has changed in 2010. The rest of this commentary will summarize our view of the current situation, the policy options available and likely outcomes. Finally, we will discuss the expected impact on our portfolio, and how we expect to position it in the future.
The Debt Is Still Here
Just like in prior quarters, over the past two years, the main factor overhanging the markets continues to be the amount of debt owed by individuals, certain financial companies and governments. As stock, bond and commodity prices increased during the quarter, this issue received little attention in the media. Temporarily forgotten unfortunately does not mean permanently resolved. In the U.S., total debt to GDP reached its peak of about 350% at the beginning of 2009. According to the Federal Reserve's most recent Flow of Funds Accounts, the ratio today is little changed from that level. In order to lower it, we can see three options:
First, economic growth (similar to the experience of the late 1990s despite the over-investment in telecom and internet infrastructure) represents the best way to achieve a reduction. If the economy grows faster than the growth in debt, more resources are created to pay for the current borrowing.
Second, is the repayment of the amount of debt outstanding.
Finally, the least desirable option would result from a rise in inflation. In that case, inflation increases the size of the economy compared to fixed rate debt, allowing future repayment with less valuable dollars.
We believe economic growth over the next several years will likely be positive, but not robust enough to lower debt levels meaningfully. Repayment appears challenging for individuals and governments for the foreseeable future. Acting like its back is against the wall, the Federal Reserve ("Fed") has recently endorsed higher inflation.
Examining the historical record reveals the difficulty the country faces in generating strong economic growth over the next few years. A recent paper given at the Fed conclave in Jackson Hole by Carmen Reinhart looked back at economic recoveries around the world following severe dislocations over the last seventy-five years. This data series suggests that "economic growth is notably slower in the decade following a macroeconomic disruption." She finds advanced economies typically lost 1% of real GDP growth per year in the decade after a crisis compared to the decade preceding it. The U.S. average for the ten years ended in 2007 was 3% growth per year, which shows the significance of a potential 1% annual drag going forward. The data also shows a similar pattern of headwinds can be expected over the next decade in employment, housing and credit availability, which is not surprising given the links these have to the economy. No two time period s are ever the same, but due to our current high unemployment, a destabilized housing market, and elevated consumer debt, history suggests we face several more challenging years of modest economic growth.
American consumers in total have reduced their borrowing. The Fed's Flows data suggests households' total debt has declined by $473 billion or just over 3% since its high at the start of 2008. Based on the work of Reinhart and a study from the Bank for International Settlements, typically the amount of borrowing by consumers in an economy's run-up phase before a crisis is reversed over most of the following decade. From the end of 2000 until the peak in 2008, U.S. households' total debt doubled. While a retrenchment of that magnitude is unlikely over the next ten years, consumers have only just started to work down their elevated level of obligations. Over the next few years, as households reduce their debt levels, we expect a substantial portion of this to be offset by higher governmen tal borrowing.
1
U.S. government debt has increased substantially over the last two years as deficits have annually exceeded $1 trillion. As state and local governments reduced consumption, Washington's spending has picked up the slack, with a commensurate rise in debt outstanding to a gross total of $13.6 trillion at September 30. For perspective, in fiscal 2010, the entire federal budget outlays were $3.5 trillion. Increased debt issuance in the future appears likely based on projections by the Congressional Budget Office for deficits to total $7 trillion over the next ten years. Such a trajectory is definitely not sustainable. Eventually, if the amount of debt gets too large compared to the size of our economy, even the U.S. will not be immune to much higher borrowing costs. However, that day of reckoning appears to be at least several more years ahead as the country seems to have the necessary capacity today to bear the increased burden.
Threatening to accelerate our creditors' concerns is the looming insolvency of the major entitlement programs. Without belaboring this point already familiar to most of our readers, we will simply quote what we wrote at this time last year (2009):
The present value today of what the government owes for Social Security and Medicare is $46 trillion, according to the 2009 Trustee reports. The CBO estimated in June that federal spending on Medicare and Medicaid will grow from 5.3% of GDP in 2009 to 9.7% in 2035. To illustrate the issue another way, Social Security, Medicare and Medicaid received 43% of fiscal 2008 federal budget outlays. The CBO's projections imply that the government will easily spend more than half its budget on these programs in coming years, either crowding out other programs or increasing total spending.
The dire outlook confronting these programs requires substantial changes over the medium term.
Choices are Limited
We mentioned earlier that the best way to mitigate the debt overhang is economic growth. Facing the headwinds of high unemployment, weak housing and reduced credit, policy makers have two options at their disposal. One is fiscal (the ability of Congress to increase/decrease spending or taxes), and the other is monetary (the ability of the Fed to increase/decrease interest rates or the supply of money). Unfortunately, neither seems likely to provide compelling benefit.
Looking to fiscal options, U.S. mid-term elections largely focused on whether Congress should have spent to stimulate the economy, or cut to reduce deficits. Arguments can be made in support of both positions. Practically, however, it likely won't matter. Public opposition to more stimulus and Republican gains have made arguments for higher fiscal spending moot. We should expect no benefit for the economy from fiscal options, leaving only monetary ones.
The most direct impact of monetary policy occurs when the Fed changes the level of interest rates (its discount rate). In past downturns, rate cuts helped boost economic activity. With current rates already at practical lows (0.25%), there is no ability to cut further. In reality, even these rock-bottom interest rates are not having any economic impact because banks are unwilling to lend, individuals show limited desire to borrow and companies forego new investments. Facing this situation, the Fed is preparing to utilize its secondary monetary option which involves changing the amount of money in circulation. In theory, greater supply of money will be used for additional investment and spending which would boost the economy. From the time of his speech at the same Jackson Hole conference, Chairman Bernanke has communicated a desire to begin expanding the money supply through purchases of government bonds. This is known popularly as QE2 (the second program of quantitative easing).
Impacts
Will it work? We have a hard time seeing any tangible economic benefit from QE2. The U.S. government bond market is huge and very liquid. Even
2
at the size of indicated Fed buying, rates on 2 to 10 year Treasuries are expected to fall from their already very low levels by 0.10% - 0.25%. It is extremely difficult to imagine such a reduction would have much impact on lending rates, particularly with lenders and borrowers on the sidelines. Another problem confronting the Fed's attempted monetary stimulus is what economists call leakage. When its purchases of Treasuries cause yields to fall to even more meager levels, the Fed hopes to force capital into riskier assets. Since the U.S. is not a closed economy, instead of boosting investment and employment in the U.S., leakage means that this capital will get channeled into areas like commodities and emerging markets. The initial stimulus flows of the last eighteen months appear to have already inflated the values of these markets. The Fed's next round could potentially push commodities and emerging market valuations into bubble status.
Since Chairman Bernanke's advocacy began in September for a renewed Fed purchase plan, there was an obvious impact on the dollar. Against nearly all the major floating currencies, the dollar weakened. The longer the Fed engages in open-ended QE2 buying, and the larger the amounts it acquires, we believe the greater the downward pressure will fall on the dollar. In turn, the more the dollar weakens, the greater the risk of competitive devaluations (by other countries) and trade restrictions.
This recent move in currencies has occurred because investors feared the Chairman's program will allow the Fed to engineer higher rates of inflation. In fact the September 21 statement of the FOMC explicitly endorsed higher inflation. Theoretically, one could argue that a small increase in the rate of inflation could be beneficial. As we mentioned before, much of U.S. consumers' debt excesses are found in fixed rate mortgages. The Fed had hoped that when its initial stimulus measures drove down mortgage rates, this would allow consumers to refinance this debt at significantly lower rates. That phenomenon never occurred because of more stringent lending standards combined with falling home prices and the resulting negative equity positions of many borrowers. Since the refinancing play didn't work, the Fed now appears to be turning to inflation to create growth in wages, o r particularly in home prices. A recent study from the Quarterly Review of the Bank for International Settlements found that in 19 of the last 20 episodes of credit booms which resulted in banking crises, inflation was a major part of the subsequent deleveraging process. The Fed seems to be following a well trodden path.
Based on the initially published size of the QE2 program, we expect the Fed will struggle to increase the rate of inflation. Persistently high unemployment, uncertainty about government regulation and its scope, and a limited appetite for capital investment mean the Fed will have to shock markets to have inflation achieve its desired outcomes. The Fed will potentially have to buy more than expected for longer periods if it wants to make the most important impact — a shift in psychology. After more than thirty years in the U.S. with the experience of negligible inflation, dramatic actions are required to shift thinking of individuals and markets.
Conclusion
Congress' hands are tied on the fiscal front. Proposed Fed actions are potentially inflationary, depending on the size (how much they buy). The dollar should continue to feel the effects of investor concern on this issue. An initial toe stuck in the QE2 water will probably not cause a lasting change to investors' expectations about inflation. It will take an enormous amount of buying to change psychology. Over the longer term, if the Fed does resort to massive asset purchases, and succeeds in causing a real pickup in inflation, we are skeptical that the Fed will magically be able to put that genie back in the bottle.
What It Means for the Portfolio
The more assets the Fed purchases, the more the dollar will likely suffer, particularly against emerging market currencies. Our portfolio companies have, on average, thirty-seven percent of sales outside the U.S. We see this as a good hedge against dollar weakness.
3
For future investments, sales diversity is an important criterion. Beyond the currency hedge, conducting business in multiple geographies insulates against political risk and offers greater reinvestment opportunities. We are aware of the stampede of investors into international markets, emerging in particular. With many starting to appreciate the benefits of this exposure, we will be mindful to pay attention to the valuations of these types of companies.
For the longer term, we expect some inflationary consequences from the intended Fed actions. If inflation increases moderately, this will likely lead to nominal (not deducting for inflation) increases in the value of the portfolio. Whether the portfolio's potential increase in value exceeds the rate of inflation depends on the profile of the companies we are invested in. One of the criteria we seek for our companies is a strong market position. That leadership can be based on cost, technology or other attributes, and it typically translates into market share gains and pricing power. The ability to raise prices faster than costs increase is a powerful advantage in inflationary environments. We believe a number of our companies possess this attribute. As an example, oil and gas driller Noble Corporation stands to benefit in an increasing energy price environment because of its long-lived assets. With useful lives of over thirty years, Noble's drilling rigs have fixed depreciation expenses while the drilling contracts are re-priced on average annually. Another advantage for our companies in an inflationary environment is the lack of needed debt financing. While fixed rate debt in place prior to an inflationary pickup will look attractive for the first few years, over time large financing needs will be a drag if a high level of inflation persists.
Performance
For the third quarter, Paramount was up 10%, a performance slightly behind its benchmark Russell 2500, and the broader market (S&P +11%). This was in sharp contrast to the 10-12% declines in the second quarter.
The best performing stocks for the quarter were retailers (CarMax +40%, Signet Jewelers +16%) and other companies viewed by the market as economically sensitive (WABCO, Zebra, Idex, and Actuant, up 22-33%).
Down stocks were scarce. Only five companies failed to advance during the quarter. Standouts were health care names Lincare (-23%) and VCA-Antech (-15%).
For the year-to-date period, Paramount gained 7.4%, as positive performance in the first and third quarters more than offset the second quarter decline. Market averages ranged from a 10% advance in the Russell 2500 to a less inspiring 4% gain for the S&P.
Individual company performance year-to-date was much like the third quarter alone — retailers led (O'Reilly +40%, Signet +19%, CarMax +15%), while other more cyclical companies were also strong (WABCO, Actuant, Clarcor, and Zebra, up 19-63%).
The table below shows performance for both Paramount and the benchmark Russell 2500, as well as leading large-cap indexes. Concentrating on the longer intervals, Paramount has outperformed market indexes for virtually all periods.
| | | Periods Ending September 30, 2010 | |
| | | Third
Quarter | | Nine
Months | | Three
Years* | | Five
Years* | | Ten
Years* | |
| Paramount** | | | 10.1 | % | | | 7.4 | % | | | (0.8 | )% | | | 2.5 | % | | | 9.0 | % | |
| Russell 2500 | | | 12.2 | % | | | 10.3 | % | | | (3.6 | )% | | | 2.4 | % | | | 5.1 | % | |
| S & P 500 | | | 11.3 | % | | | 3.9 | % | | | (7.2 | )% | | | 0.6 | % | | | (0.4 | )% | |
| Nasdaq | | | 12.5 | % | | | 5.1 | % | | | (3.4 | )% | | | 2.8 | % | | | (3.6 | )% | |
* Annualized Returns
** The returns shown are at net asset value and do not reflect deduction of the maximum sales charge of 5.25% which, if reflected, would reduce the performance shown.
Company Discussion
One of our larger portfolio holdings is WABCO, a company we have discussed briefly in past shareholder letters, initially after its purchase in mid 2008, and then more recently after it was fined about $400 million by the European Union for uncompetitive practices of its former parent, American Standard.
4
A more detailed discussion of WABCO, which is headquartered and legally domiciled in Belgium, illustrates our global investment strategy.
In addition to the usual financial requirements of high returns on capital and a strong balance sheet, when considering a foreign-domiciled company for inclusion in our portfolio we pay special attention to the following criteria:
• Strong worldwide franchise
• Accessible Management
• Familiar accounting and presentations
• No linguistic or cultural barriers
• New York as primary trading market
We have always viewed management access as an important component of our company analysis and due diligence process. It gives us an opportunity to both learn more about the business and to assess management. Potential locales are our offices or theirs, broker-sponsored conferences, or periodic conference calls.
WABCO scores well on this item, though headquartered in Belgium. Management visits U.S. investors frequently. They have been to our office three times. They do periodic conference appearances and conduct detailed and helpful quarterly conference calls.
Analyzing companies and businesses is difficult enough without having to contend with the risks and uncertainties of unfamiliar accounting and other communications with shareholders. We will leave the intricacies of Sri Lankan GAAP or Myanmar disclosure regulations to others.
WABCO does well here too. Its financial reporting is governed by U.S. GAAP and there is nothing exotic about its shareholder reports. If anything, disclosure has been more extensive than the typical U.S. based company.
Linguistic and cultural barriers are another potential obstacle to company ownership. This might result from lack of a common language. It might also involve the nature of the business itself. If we don't understand it as well as other investors, then we should avoid it. An example might be a clothing retailer focused on Italian teenage girls.
WABCO has no problem meeting these criteria. Although neither WABCO's CEO, Jacques Esculier, nor Chief Financial Officer, Ulrich Michel, is a native English speaker, their level of fluency in English is high.
From the standpoint of cultural barriers to understanding WABCO's business, there are few. The business could be located anywhere and would not, as a result, be easier or more difficult to understand. Its business in China or India looks a lot like it does in Europe or North America. WABCO sells similar products (heavy truck components), to similar customers (heavy truck manufacturers), for similar applications (long distance transportation of industrial and consumer products).
We have a preference for companies that have New York as their primary trading market. Among the factors involved in this are time zone differences, broker familiarity, knowledge of local customs, data flow, and foreign exchange issues. That said, we would be willing to consider stocks in any market where liquidity and securities regulations are up to New York standards. This could include London, Zurich, or other West European countries, or, farther afield, Tokyo, Hong Kong, or Singapore.
None of these factors is an issue for WABCO, which despite its Belgian domicile trades only in New York.
Finally, WABCO undoubtedly has a strong worldwide franchise in a growing and profitable market. The company manufactures technically advanced components for heavy trucks and buses. These include air disc brakes, electronic braking and stability control systems, and automatic transmissions.
This is a market that has strong growth drivers, for both the short and long-term. These include increased unit production of trucks, as well as higher content of WABCO products in each truck sold.
In the developed countries of Western Europe and in the U.S. and Japan, truck production is driven by
5
GDP growth and is thus likely to increase slowly. However, in some of the high-growth developing countries, China, India, and Brazil, as well as parts of S.E. Asia and Eastern Europe, lots of trucks are needed to support the expanding economies. Unit growth in China, India, and Brazil in 2010 is expected to be 40%. These three countries accounted for 65% of global truck production in the third quarter, though this number was aided by very depressed build rates in the U.S. and Western Europe.
The second leg to the WABCO growth story is increased content in each truck produced. This will be driven by stricter government regulations, more emphasis on safety, and pressure to improve productivity (enhancing driver skill levels with sophisticated electronics).
WABCO content on a new truck varies widely, from perhaps $300 in China to $1,000 in the U.S., to $3,000 in Europe. These numbers can only go up as government regulation becomes stricter, and especially as China and India become sufficiently prosperous to pay for road safety. Revised regulations currently in process include shorter stopping distances in the U.S. and electronic stability control in Europe. Other safety equipment in development, but not yet mandated, includes lane departure warning systems and collision avoidance systems.
WABCO has a long history of innovation and technology leadership. It is credited with being the first to market with many of the industry's most important products. They include anti-lock braking, electronic stability control systems, automated manual transmissions, and autonomous emergency braking for collision avoidance.
WABCO is the industry's sales leader, with a worldwide market share estimated at 40-50%. The number two player is Knorr-Bremse, a private German company, with Haldex a more distant number three. Emerging market competitors are generally limited to low-end products. We see no indication that WABCO's competitive position will be any less powerful in the future.
WABCO is an excellent vehicle for participating in non-U.S. and emerging-market growth. Currently China, India, and Brazil account for about a quarter of WABCO sales, with tremendous future growth potential from increased truck demand and higher content of WABCO products. For example, Brazil will require anti-lock braking systems starting in 2013. WABCO's competitive position in these high-growth markets is strong, including manufacturing joint ventures and long-term supplier contracts with truck manufacturers in both China and India.
WABCO's profitability is remarkably good. Despite deeply depressed truck demand in both the U.S. and Europe, WABCO's operating margins have recently been about 10%, with return on equity approaching 20%. We expect WABCO's returns on capital to increase in future years as production revives in developed markets.
As you will see later in this report, the strength of WABCO's stock price performance allowed us to trim a small amount of the position. This is representative of our usual strategy of trimming positions as they become overweighted in the portfolio due to strong performance.
In the past, reader feedback to shareholder letters came in written form or over the telephone. While those methods are still welcome, we are now pleased to also receive comments at the email address, Paramount@firstpacad.com.
Respectfully submitted,

Eric S. Ende
President & Portfolio Manager
October 29, 2010
6
FORWARD LOOKING STATEMENT DISCLOSURE
As mutual fund managers, one of our responsibilities is to communicate with shareholders in an open and direct manner. Insofar as some of our opinions and comments in our letters to shareholders are based on current management expectations, they are considered "forward-looking statements" which may or may not be accurate over the long term. While we believe we have a reasonable basis for our comments and we have confidence in our opinions, actual results may differ materially from those we anticipate. You can identify forward-looking statements by words such as "believe," "expect," "may," "anticipate," and other similar expressions when discussing prospects for particular portfolio holdings and/or the markets, generally. We cannot, however, assure future results and disclaim any obligation to update or alter any forward-looking statements, whether as a result of new information, future events, or otherwise. Further, information provided in t his report should not be construed as a recommendation to purchase or sell any particular security.
HISTORICAL PERFORMANCE
Change in Value of a $10,000 Investment in FPA Paramount Fund, Inc. vs. Russell 2500 Index and Lipper Mid-Cap Core Fund Average from October 1, 2000 to September 30, 2010.
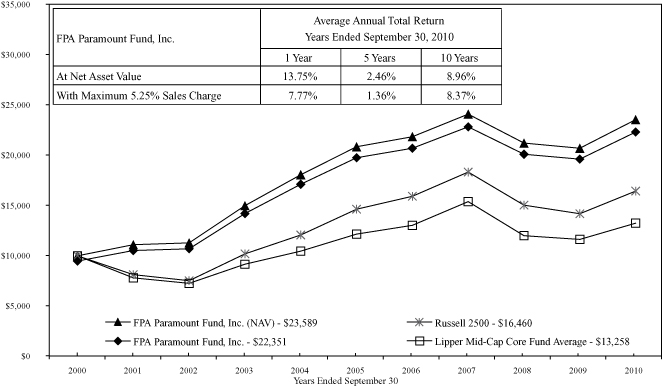
Past performance is not indicative of future performance. The Russell 2500 Index consists of the 2,500 smallest companies in the Russell 3000 total capitalization universe. This index is considered a measure of small to medium capitalization stock performance. This index does not reflect any commissions or fees which would be incurred by an investor purchasing the stocks it represents. The Lipper Mid-Cap Core Fund Average provides an additional comparison of how your Fund performed in relation to other mutual funds with similar objectives. The Lipper data does not include sales charges. The performance shown for FPA Paramount Fund, Inc., with an ending value of $22,351 reflects deduction of the current maximum sales charge of 5.25% of the offering price. In addition, since investors purchase shares of the Fund with varying sales charges depending primarily on volume purchased, the Fund's performance at net asset value (NAV) is also shown, as reflected by the ending value of $23,589. The performance of the Fund and of the Averages is computed on a total return basis which includes reinvestment of all distributions. The current portfolio managers, Eric S. Ende and Steven R. Geist, have been primarily responsible for the management of the portfolio since April 1, 2000.
7
PORTFOLIO SUMMARY
September 30, 2010
(Unaudited)
| Common Stocks | | | | | | | 93.7 | % | |
| Business Services & Supplies | | | 22.9 | % | | | | | |
| Producer Durable Goods | | | 22.7 | % | | | | | |
| Retailing | | | 16.1 | % | | | | | |
| Health Care | | | 10.4 | % | | | | | |
| Energy | | | 8.4 | % | | | | | |
| Transportation | | | 7.2 | % | | | | | |
| Technology | | | 5.0 | % | | | | | |
| Entertainment | | | 1.0 | % | | | | | |
| Short-Term Investments | | | | | | | 6.1 | % | |
| Other Assets and Liabilities, net | | | | | | | 0.2 | % | |
| Total Net Assets | | | | | | | 100.0 | % | |
MAJOR PORTFOLIO CHANGES
Six Months Ended September 30, 2010
(Unaudited)
| | | Shares | |
| NET PURCHASES | |
| Common Stocks | |
| Bio-Rad Laboratories, Inc. (Class A) | | | 11,300 | | |
| Copart, Inc. | | | 60,700 | | |
| VCA Antech, Inc. | | | 73,500 | | |
| NET SALES | |
| Common Stocks | |
| Charles River Laboratories International, Inc. (1) | | | 111,500 | | |
| Helix Energy Solutions Group, Inc. | | | 72,600 | | |
| WABCO Holdings, Inc. | | | 68,300 | | |
(1) Indicates elimination from portfolio
8
PORTFOLIO OF INVESTMENTS
September 30, 2010
| COMMON STOCKS | | Shares | | Value | |
| BUSINESS SERVICES & SUPPLIES — 22.9% | |
| Brady Corporation (Class A) | | | 242,600 | | | $ | 7,076,642 | | |
| CLARCOR, Inc. | | | 165,400 | | | | 6,389,402 | | |
| Copart, Inc.* | | | 237,500 | | | | 7,830,375 | | |
| Landauer, Inc. | | | 3,800 | | | | 237,994 | | |
| Life Technologies Corporation* | | | 286,300 | | | | 13,367,347 | | |
| Manpower Inc. | | | 144,800 | | | | 7,558,560 | | |
| ScanSource Inc.* | | | 441,400 | | | | 12,244,436 | | |
| | | $ | 54,704,756 | | |
| PRODUCER DURABLES — 22.7% | |
| Actuant Corporation (Class A) | | | 227,500 | | | $ | 5,223,400 | | |
| Franklin Electric Co., Inc. | | | 150,200 | | | | 4,980,632 | | |
| Graco Inc. | | | 198,800 | | | | 6,307,924 | | |
| HNI Corporation | | | 356,500 | | | | 10,252,940 | | |
| IDEX Corporation | | | 180,450 | | | | 6,407,779 | | |
| WABCO Holdings, Inc. | | | 295,000 | | | | 12,372,300 | | |
| Zebra Technologies Corporation (Class A)* | | | 258,500 | | | | 8,695,940 | | |
| | | $ | 54,240,915 | | |
| RETAILING — 16.1% | |
| CarMax, Inc.* | | | 512,600 | | | $ | 14,281,036 | | |
| O'Reilly Automotive, Inc.* | | | 238,000 | | | | 12,661,600 | | |
| Signet Jewelers Limited* | | | 358,700 | | | | 11,385,138 | | |
| | | $ | 38,327,774 | | |
| HEALTH CARE — 10.4% | |
| Bio-Rad Laboratories, Inc. (Class A)* | | | 87,400 | | | $ | 7,910,574 | | |
| Lincare Holdings, Inc.* | | | 395,100 | | | | 9,913,059 | | |
| Varian Medical Systems, Inc.* | | | 26,800 | | | | 1,621,400 | | |
| VCA Antech, Inc.* | | | 250,000 | | | | 5,272,500 | | |
| | | $ | 24,717,533 | | |
| ENERGY — 8.4% | |
| FMC Technologies, Inc.* | | | 118,700 | | | $ | 8,106,023 | | |
| Helix Energy Solutions Group, Inc.* | | | 200,000 | | | | 2,228,000 | | |
| Noble Corporation | | | 288,900 | | | | 9,761,931 | | |
| | | $ | 20,095,954 | | |
| TRANSPORTATION — 7.2% | |
| Heartland Express, Inc. | | | 541,300 | | | $ | 8,049,131 | | |
| Knight Transportation, Inc. | | | 472,600 | | | | 9,135,358 | | |
| | | $ | 17,184,489 | | |
| TECHNOLOGY — 5.0% | |
| Maxim Integrated Products, Inc. | | | 221,400 | | | $ | 4,098,114 | | |
| Microchip Technology Incorporated | | | 250,100 | | | | 7,865,645 | | |
| | | $ | 11,963,759 | | |
9
PORTFOLIO OF INVESTMENTS
September 30, 2010
| COMMON STOCKS — Continued | | Shares or
Principal
Amount | | Value | |
| ENTERTAINMENT — 1.0% | |
| Carnival Corporation (Class A) | | | 63,000 | | | $ | 2,407,230 | | |
| TOTAL COMMON STOCKS — 93.7% (Cost $230,356,210) | | | | | | $ | 223,642,410 | | |
| SHORT-TERM INVESTMENTS — 6.1% (Cost $14,447,813) | |
| General Electric Capital Corporation — 0.15% 10/01/10 | | $ | 6,448,000 | | | $ | 6,448,000 | | |
| Chevron Funding Corporation — 0.14% 10/07/10 | | | 8,000,000 | | | | 7,999,813 | | |
| TOTAL SHORT-TERM INVESTMENTS | | | | | | $ | 14,447,813 | | |
| TOTAL INVESTMENTS — 99.8% (Cost $244,804,023) | | $ | 238,090,223 | | |
| Other assets and liabilities, net — 0.2% | | | | | | | 565,377 | | |
| TOTAL NET ASSETS — 100.0% | | $ | 238,655,600 | | |
*Non-income producing security
See notes to financial statements.
10
STATEMENT OF ASSETS AND LIABILITIES
September 30, 2010
| ASSETS | |
| Investments at value: | |
Investment securities — at market value
(identified cost $230,356,210) | | $ | 223,642,410 | | | | | | |
Short-term investments — at amortized cost
(maturities 60 days or less) | | | 14,447,813 | | | $ | 238,090,223 | | |
| Cash | | | | | | | 432 | | |
| Receivable for: | |
| Dividends | | $ | 563,269 | | | | | | |
| Capital stock sold | | | 183,858 | | | | 747,127 | | |
| | | | | | | $ | 238,837,782 | | |
| LIABILITIES | |
| Payable for: | |
| Advisory fees and financial services | | $ | 147,757 | | | | | | |
| Capital stock repurchased | | | 19,925 | | | | | | |
| Accrued expenses | | | 14,500 | | | | 182,182 | | |
| NET ASSETS | | | | | | $ | 238,655,600 | | |
| SUMMARY OF SHAREHOLDERS' EQUITY | |
Capital Stock — par value $0.25 per share: authorized
100,000,000 shares; outstanding 14,420,815 shares | | | | | | $ | 3,605,204 | | |
| Additional Paid-in Capital | | | | | | | 255,488,955 | | |
| Accumulated net realized loss on investments | | | | | | | (14,174,196 | ) | |
| Undistributed net investment income | | | | | | | 449,437 | | |
| Unrealized depreciation of investments | | | | | | | (6,713,800 | ) | |
| NET ASSETS | | | | | | $ | 238,655,600 | | |
NET ASSET VALUE, REDEMPTION PRICE AND
MAXIMUM OFFERING PRICE PER SHARE | |
Net asset value and redemption price per share
(net assets divided by shares outstanding) | | | | | | $ | 16.55 | | |
Maximum offering price per share
(100/94.75 of per share net asset value) | | | | | | $ | 17.47 | | |
See notes to financial statements.
11
STATEMENT OF OPERATIONS
For the Year Ended September 30, 2010
| INVESTMENT INCOME | |
| Dividends | | | | | | $ | 2,612,453 | | |
| Interest | | | | | | | 17,734 | | |
| | | | | | | $ | 2,630,187 | | |
| EXPENSES — Note 5 | |
| Advisory fees | | $ | 1,563,359 | | | | | | |
| Financial services | | | 232,824 | | | | | | |
| Transfer agent fees and expenses | | | 134,449 | | | | | | |
| Registration fees | | | 41,618 | | | | | | |
| Reports to shareholders | | | 38,553 | | | | | | |
| Custodian fees and expenses | | | 35,327 | | | | | | |
| Audit and tax fees | | | 34,100 | | | | | | |
| Directors fees and expenses | | | 34,095 | | | | | | |
| Line of credit | | | 33,854 | | | | | | |
| Legal fees | | | 15,342 | | | | | | |
| Insurance | | | 8,198 | | | | | | |
| Other fees and expenses | | | 9,031 | | | | 2,180,750 | | |
| Net investment income | | | | | | $ | 449,437 | | |
| NET REALIZED AND UNREALIZED LOSS ON INVESTMENTS | |
| Net realized loss on investments: | |
| Proceeds from sales of investment securities | | $ | 33,352,903 | | | | | | |
| Cost of investment securities sold | | | 38,353,203 | | | | | | |
| Net realized loss on investments | | | | | | $ | (5,000,300 | ) | |
| Change in unrealized appreciation of investments: | |
| Unrealized depreciation at beginning of year | | $ | (41,560,183 | ) | | | | | |
| Unrealized depreciation at end of year | | | (6,713,800 | ) | | | | | |
| Change in unrealized appreciation of investments | | | | | | | 34,846,383 | | |
| Net realized and unrealized gain on investments | | | | | | $ | 29,846,083 | | |
| CHANGE IN NET ASSETS RESULTING FROM OPERATIONS | | | | | | $ | 30,295,520 | | |
See notes to financial statements.
12
STATEMENT OF CHANGES IN NET ASSETS
| | | For the Year Ended September 30, | |
| | | 2010 | | 2009 | |
| CHANGE IN NET ASSETS | |
| Operations: | |
| Net investment income | | $ | 449,437 | | | | | | | $ | 180,014 | | | | | | |
| Net realized loss on investments | | | (5,000,300 | ) | | | | | | | (9,173,896 | ) | | | | | |
Change in unrealized appreciation
of investments | | | 34,846,383 | | | | | | | | (13,376,748 | ) | | | | | |
Change in net assets resulting from
operations | | | | | | $ | 30,295,520 | | | | | | | $ | (22,370,630 | ) | |
| Dividends from net investment income | | | | | | | — | | | | | | | | (1,162,067 | ) | |
| Capital Stock transactions: | |
| Proceeds from Capital Stock sold | | $ | 13,463,645 | | | | | | | $ | 16,910,350 | | | | | | |
Proceeds from shares issued to shareholders
upon reinvestment of dividends and
distributions | | | — | | | | | | | | 964,591 | | | | | | |
| Cost of Capital Stock repurchased* | | | (36,572,612 | ) | | | (23,108,967 | ) | | | (59,519,129 | ) | | | (41,644,188 | ) | |
| Total change in net assets | | | | | | $ | 7,186,553 | | | | | | | $ | (65,176,885 | ) | |
| NET ASSETS | |
| Beginning of year | | | | | | | 231,469,047 | | | | | | | | 296,645,932 | | |
| End of year | | | | | | $ | 238,655,600 | | | | | | | $ | 231,469,047 | | |
CHANGE IN CAPITAL STOCK
OUTSTANDING | |
| Shares of Capital Stock sold | | | | | | | 858,970 | | | | | | | | 1,522,182 | | |
Shares issued to shareholders upon
reinvestment of dividends and distributions | | | | | | | — | | | | | | | | 97,829 | | |
| Shares of Capital Stock repurchased | | | | | | | (2,348,607 | ) | | | | | | | (5,477,243 | ) | |
| Change in Capital Stock outstanding | | | | | | | (1,489,637 | ) | | | | | | | (3,857,232 | ) | |
* Net of redemption fees of $5,177 and $13,266 for the years ended September 30, 2010 and 2009, respectively.
See notes to financial statements.
13
FINANCIAL HIGHLIGHTS
Selected Data for Each Share of Capital Stock Outstanding Throughout Each Year
| | | Year Ended September 30, | |
| | | 2010 | | 2009 | | 2008 | | 2007 | | 2006 | |
| Per share operating performance: | | | | | | | | | | | | | | | | | | | | | |
| Net asset value at beginning of year | | $ | 14.55 | | | $ | 15.01 | | | $ | 17.06 | | | $ | 15.62 | | | $ | 15.02 | | |
| Income from investment operations: | | | | | | | | | | | | | | | | | | | | | |
| Net investment income | | $ | 0.03 | | | $ | 0.01 | | | $ | 0.05 | | | $ | 0.14 | | | $ | 0.12 | | |
Net realized and unrealized gain (loss)
on investment securities | | | 1.97 | | | | (0.40 | ) | | | (2.09 | ) | | | 1.47 | | | | 0.60 | | |
| Total from investment operations | | $ | 2.00 | | | $ | (0.39 | ) | | $ | (2.04 | ) | | $ | 1.61 | | | $ | 0.72 | | |
| Less dividends from net investment income | | | — | | | $ | (0.07 | ) | | $ | (0.01 | ) | | $ | (0.17 | ) | | $ | (0.12 | ) | |
| Redemption fees | | | — | * | | | — | * | | | — | * | | | — | * | | | — | * | |
| Net asset value at end of year | | $ | 16.55 | | | $ | 14.55 | | | $ | 15.01 | | | $ | 17.06 | | | $ | 15.62 | | |
| Total investment return** | | | 13.75 | % | | | (2.43 | )% | | | (11.96 | )% | | | 10.30 | % | | | 4.79 | % | |
| Ratios/supplemental data: | |
| Net assets at end of year (in $000's) | | $ | 238,656 | | | $ | 231,469 | | | $ | 296,646 | | | $ | 397,374 | | | $ | 595,825 | | |
| Ratio of expenses to average net assets | | | 0.95 | % | | | 0.99 | % | | | 0.89 | % | | | 0.90 | % | | | 0.85 | % | |
Ratio of net investment income to average
net assets | | | 0.20 | % | | | 0.09 | % | | | 0.29 | % | | | 0.74 | % | | | 0.89 | % | |
| Portfolio turnover rate | | | 3 | % | | | 46 | % | | | 12 | % | | | 17 | % | | | 15 | % | |
* Rounds to less than $0.01 per share.
** Return is based on net asset value per share, adjusted for reinvestment of distributions, and does not reflect deduction of the sales charge.
See notes to financial statements.
14
NOTES TO FINANCIAL STATEMENTS
September 30, 2010
NOTE 1 — Significant Accounting Policies
FPA Paramount Fund, Inc. (the "Fund") is registered under the Investment Company Act of 1940, as a diversified, open-end management investment company. The Fund's primary investment objective is a high total investment return, including capital appreciation and income. The following is a summary of significant accounting policies consistently followed by the Fund in the preparation of its financial statements.
A. Security Valuation
The Fund values securities pursuant to policies and procedures approved by the Board of Directors. Securities listed or traded on a national securities exchange are valued at the last sale price. If there was not a sale that day, these securities are valued at the last bid price. Securities traded on the NASDAQ National Market System are valued at the NASDAQ Official Closing Price on the last business day of the year, or if there was not a sale that day, at the last bid price. Unlisted securities are valued at the most recent bid price. Short-term investments with maturities of 60 days or less are valued at amortized cost which approximates market value. Securities for which market quotations are not readily available from the sources above are valued at fair value as determined in good faith by, or under the direction of, the Board of Directors.
B. Securities Transactions and Related Investment Income
Securities transactions are accounted for on the date the securities are purchased or sold. Dividend income and distributions to shareholders are recorded on the ex-dividend date. Interest income and expenses are recorded on an accrual basis.
C. Use of Estimates
The preparation of the financial statements in accordance with accounting principles generally accepted in the United States of America requires management to make estimates and assumptions that affect the amounts reported. Actual results could differ from those estimates.
NOTE 2 — Risk Considerations
Investing in the Fund may involve certain risks including, but not limited to, those described below.
Market Risk: Because the values of the Fund's investments will fluctuate with market conditions, so will the value of your investment in the Fund. You
could lose money on your investment in the Fund or the Fund could underperform other investments.
Common Stocks and Other Securities: The prices of common stocks and other securities held by the Fund may decline in response to certain events taking place around the world, including those directly involving companies whose securities are owned by the Fund; conditions affecting the general economy; overall market changes; local, regional or global political, social or economic instability; and currency, interest rate and commodity price fluctuations. In addition, the Adviser's emphasis on a value-oriented investment approach generally results in the Fund's portfolio being invested primarily in medium or smaller sized companies. Smaller companies may be subject to a greater degree of change in earnings and business prospects than larger, more established companies. Also, securities of smaller companies are traded in lower volumes than those issued by larger companies and may be more volatile than those of larger companies. In light of these characteristics of smaller companies and their securities, the Fund may be subjected to greater risk than that assumed when investing in the equity securities of larger companies.
NOTE 3 — Purchases of Investment Securities
Cost of purchases of investment securities (excluding short-term investments with maturities of 60 days or less at the time of purchase) aggregated $5,640,069 for the year ended September 30, 2010. Realized gains or losses are based on the specific identification method.
NOTE 4 — Federal Income Tax
No provision for federal income tax is required because the Fund has elected to be taxed as a "regulated investment company" under the Internal Revenue Code and intends to maintain this qualification and to distribute each year to its shareholders, in accordance with the minimum distribution requirements of the Code, its taxable net investment income and taxable net realized gains on investments.
Distributions paid to shareholders are based on net investment income and net realized gains determined on a tax reporting basis, which may differ from financial reporting. For federal income tax purposes, the components of distributable earnings at September 30, 2010, were as follows:
| Undistributed ordinary income | | $ | 449,437 | | |
15
NOTES TO FINANCIAL STATEMENTS
Continued
The tax status of distributions paid during the fiscal years ended September 30, 2010 and 2009 were as follows:
| | | 2010 | | 2009 | |
Dividends from
ordinary income | | | — | | | $ | 1,162,067 | | |
The cost of investment securities held at September 30, 2010, was $230,411,022 for federal income tax purposes. Gross unrealized appreciation and depreciation for all investments at September 30, 2010, for federal income tax purposes was $20,115,324 and $26,883,936, respectively resulting in net unrealized depreciation of $6,768,612. As of and during the year ended September 30, 2010, the Fund did not have any liability for unrecognized tax benefits. The Fund recognizes interest and penalties, if any, related to unrecognized tax benefits as income tax expense in the Statement of Operations. During the year, the Fund did not incur any interest or penalties. The Fund is not subject to examination by U.S. federal tax authorities for years ended on or before September 30, 2006 or by state tax authorities for years ended on or before September 30, 2005.
During the year ended September 30, 2010, the Fund reclassified $42,746 of net investment losses from Accumulated Net Investment Loss to Additional Paid-in Capital to align financial reporting with tax reporting. The reclassification relates to the expiration of capital losses carried forward from prior years.
NOTE 5 — Advisory Fees and Other Affiliated Transactions
Pursuant to an Investment Advisory Agreement, advisory fees were paid by the Fund to First Pacific Advisors, LLC (the "Adviser"). Under the terms of this Agreement, the Fund pays the Adviser a monthly fee calculated at the annual rate of 0.75% of the first $50 million of the Fund's average daily net assets and 0.65% of the average daily net assets in excess of $50 million. In addition, the Fund pays the Adviser an amount equal to 0.10% of the average daily net assets for each fiscal year in reimbursement for the provision of financial services to the Fund. The Agreement obligates the Adviser to reduce its fee to the extent necessary to reimburse the Fund for any annual expenses (exclusive of interest, taxes, the cost of any supplemental statistical and research information, and extraordinary expenses such as litigation) in excess of 11/2% of the first $30 million and 1% of the remaining average net assets of the Fund for the year.
For the year ended September 30, 2010, the Fund paid aggregate fees of $33,750 to all Directors who are not affiliated persons of the Adviser. Certain officers of the Fund are also officers of the Adviser and FPA Fund Distributors, Inc.
NOTE 6 — Redemption Fees
A redemption fee of 2% applies to redemptions within 90 days of purchase for certain purchases made by persons eligible to purchase shares without an initial sales charge. For the year ended September 30, 2010, the Fund collected $5,177 in redemption fees. The impact of these fees is less than $0.01 per share.
NOTE 7 — Distributor
For the year ended September 30, 2010, FPA Fund Distributors, Inc. ("Distributor"), a wholly owned subsidiary of the Adviser, received $2,878 in net Fund share sales commissions after reallowance to other dealers. The Distributor pays its own overhead and general administrative expenses, the cost of supplemental sales literature, promotion and advertising.
NOTE 8 — Disclosure of Fair Value
Measurements
The Fund classifies its assets based on three valuation methodologies. Level 1 investment securities are valued based on quoted market prices in active markets for identical assets. Level 2 investment securities are valued based on significant observable market inputs, such as quoted prices for similar assets and quoted prices in inactive markets or other market observable inputs. Level 3 investment securities are valued using significant unobservable inputs that reflect the Fund's determination of assumptions that market participants might reasonably use in valuing the assets. The valuation levels are not necessarily an indication of the risk associated with investing in those securities. The following table presents the valuation levels of the Fund's investments as of September 30, 2010:
| Level 1 — Quoted Prices | | $ | 223,642,410 | * | |
Level 2 — Other significant
observable inputs | | | 14,447,813 | ** | |
Level 3 — Significant unobservable
inputs | | | — | | |
| Total investments | | $ | 238,090,223 | | |
* All common stocks are classified under Level 1. The Portfolio of Investments provides further information on major security types.
** Comprised solely of short-term investments with maturities of 60 days or less that are valued at amortized cost.
16
NOTES TO FINANCIAL STATEMENTS
Continued
NOTE 9 — Line of Credit
The Fund, along with FPA Perennial Fund, Inc., has collectively entered into an agreement that enables them to participate in a $50 million unsecured line of credit with State Street Bank and Trust. Borrowings will be made solely to temporarily finance the repurchase of Capital Stock. Interest is charged to each Fund based on its borrowings at a rate per annum equal to the higher of the Federal Funds Rate or the Overnight LIBOR Rate plus 1.25%. In addition, the Fund and FPA Perennial Fund, Inc. pay a commitment fee of 0.15% per annum on any unused portion of the line of credit. During the year ended September 30, 2010, the Fund had no borrowings under the agreement.
Note 10 — Subsequent Events
As of the date the financial statements were available to be issued, no subsequent events or transactions had occurred that would have materially impacted the financial statements as presented.
Note 11 — New Accounting Pronouncement
In January 2010, the FASB issued ASU No. 2010-06, Improving Disclosures about Fair Value Measurements, which, among other things, amends ASC 820 to require entities to separately present purchases, sales, issuances, and settlements in their reconciliation of Level 3 fair value measurements (i.e., to present such items on a gross basis rather than on a net basis) and which clarifies existing disclosure requirements provided by ASC 820 regarding the level of disaggregation and the inputs and valuation techniques used to measure fair value for measurements that fall within either Level 2 or Level 3 of the fair value hierarchy. ASU 2010-06 is effective for interim and annual periods beginning after December 15, 2009, except for the disclosures about purchases, sales, issuances, and settlements in the rollforward of activity in Level 3 fair value measurements (which are effec tive for fiscal years beginning after December 15, 2010, and for interim periods within those fiscal years). The Adviser is currently assessing the impact that the adoption of ASU 2010-06 will have on the Fund's financial statement disclosures.
17
REPORT OF INDEPENDENT REGISTERED
PUBLIC ACCOUNTING FIRM
TO THE SHAREHOLDERS AND
BOARD OF DIRECTORS OF FPA PARAMOUNT FUND, INC.
We have audited the accompanying statement of assets and liabilities of FPA Paramount Fund, Inc. (the "Fund"), including the portfolio of investments, as of September 30, 2010, the related statement of operations for the year then ended, the statements of changes in net assets for each of the two years in the period then ended, and the financial highlights for each of the five years in the period then ended. These financial statements and financial highlights are the responsibility of the Fund's management. Our responsibility is to express an opinion on these financial statements and financial highlights based on our audits.
We conducted our audits in accordance with standards of the Public Company Accounting Oversight Board (United States). Those standards require that we plan and perform the audit to obtain reasonable assurance about whether the financial statements and financial highlights are free of material misstatement. The Fund is not required to have, nor were we engaged to perform, an audit of its internal control over financial reporting. Our audits included consideration of internal control over financial reporting as a basis for designing audit procedures that are appropriate in the circumstances, but not for the purpose of expressing an opinion on the effectiveness of the Fund's internal control over financial reporting. Accordingly, we express no such opinion. An audit also includes examining, on a test basis, evidence supporting the amounts and disclosures in the financial statements, assessing the accounting principles used and significant estim ates made by management, as well as evaluating the overall financial statement presentation. Our procedures included confirmation of securities owned as of September 30, 2010, by correspondence with the custodian. We believe that our audits provide a reasonable basis for our opinion.
In our opinion, the financial statements and financial highlights referred to above present fairly, in all material respects, the financial position of FPA Paramount Fund, Inc. as of September 30, 2010, the results of its operations for the year then ended and the changes in its net assets for each of the two years in the period then ended, and the financial highlights for each of the five years in the period then ended in conformity with accounting principles generally accepted in the United States of America.

Los Angeles, California
November 12, 2010
RENEWAL OF INVESTMENT ADVISORY AGREEMENT
Approval of the Advisory Agreement. At a meeting of the Board of Directors held on August 2, 2010, the Directors approved the continuation of the advisory agreement between the Fund and the Adviser for an additional one-year period through September 30, 2011, on the recommendation of the Independent Directors who met in executive session on August 2, 2010 prior to the Board meeting to review and discuss the proposed continuation of the advisory agreement. The following paragraphs summarize the material information and factors considered by the Board and the Independent Directors as well as the Directors' conclusions relative to such factors.
Nature, Extent and Quality of Services. The Board and the Independent Directors considered information regarding the Adviser and its staffing in connection with the Fund, including the Fund's portfolio managers, the addition of a senior analyst to their team, the scope of accounting, administrative, shareholder and other services supervised and provided by the Adviser, and the absence of any significant service problems reported to the Board. The Board and the Independent Directors noted the experience, length of service and the outstanding reputation of the Fund's Portfolio managers, Eric Ende and Steven Geist, who have managed the Fund since 2000. The Board and the Independent Directors concluded that the nature, extent and quality of services provided by the Adviser have benefited and should continue to benefit the Fund and its shareholders.
18
RENEWAL OF INVESTMENT ADVISORY AGREEMENT
Continued
Investment Performance. The Board and the Independent Directors reviewed the overall investment performance of the Fund. They also received information from an independent consultant, Lipper Analytical Services, Inc. ("Lipper"), regarding the Fund's performance relative to a peer group of mid-cap core funds selected by Lipper (the "Peer Group"). They noted the Fund's competitive longer-term investment performance since the current portfolio managers assumed management of the Fund when compared to the Peer Group. They further concluded that the Adviser's continued management of the Fund should benefit the Fund and its shareholders.
Advisory Fees and Fund Expenses; Adviser Profitability; Economies of Scale and Sharing of Economies of Scale. The Board and the Independent Directors were provided information by the Adviser to enable consideration of the Fund's advisory fees and total expense levels, as well as the overall profitability of the Adviser, the benefits to the Adviser from its relationship to the Fund, the extent to which economies of scale with respect to the management of the Fund, if any, would be realized, and whether the Fund is sharing, or will share, in those economies.
The Board and the Independent Directors reviewed comparative information relative to fees and expenses for the mutual fund industry generally and for the Peer Group. The Board and the Independent Directors noted that the Fund's fees and expenses were at the lowest end of the range for the Peer Group. The Board and the Independent Directors noted that the overall expense ratio of the Fund was also the lowest when compared to the Peer Group. The Board and the Independent Directors noted that the fee rate charged to the Fund is currently lower than the fee rate charged by the Adviser on the other products managed in a similar style by the portfolio manager. The Board and the Independent Directors concluded that the overall fee rate was reasonable and fair to the Fund and its shareholders in light of the nature and quality of the services provided by the Adviser.
The Board and the Independent Directors considered whether there have been economies of scale with respect to the management of the Fund, whether the Fund has appropriately benefited from any economies of scale, and whether the fee rate is reasonable in relation to the Fund's assets and any economies of scale that may exist. The Independent Directors expressed concern that the fee rate does not have any additional breakpoints. The mutual fund industry has trended toward funds having breakpoints in the advisory fee structure as a means by which to share in economies of scale as a fund's assets grow; however, not all funds have breakpoints in their fee structures. The Adviser indicated its belief that additional breakpoints currently were not appropriate for the Fund and that no meaningful income and expense forecasts for its business could be prepared given uncertainties regarding the direction of the economy, rising inflation, increasing cos ts for personnel and systems, and growth (or not) in the Fund's assets, all of which could negatively impact the Adviser. The Board and the Independent Directors noted that the Adviser had not increased the fee rate charged to the Fund despite the Adviser's claims of increases in the Adviser's internal costs of providing investment management services to the Fund, in part due to administrative burdens and expenses resulting from recent legislative and regulatory actions. According to the Adviser, such increased costs have included investment in a new senior analyst who assists with the management of the Fund, additions to administrative personnel and systems that enhance the quality of services provided to the Fund and the continued employment of a full-time Chief Compliance Officer and his assistant. The Directors also noted that asset levels of the Fund are currently lower than they have been for the past several years, yet the Adviser has continued to make investments in personnel servicing the Fund.
Conclusions. The Board and the Independent Directors determined that the Fund continues to benefit from the services of a highly experienced portfolio management team that has produced competitive long-term returns. In addition, the Board and the Independent Directors agreed that the Fund continues to receive high quality accounting, administrative, shareholder and other ancillary services from the Adviser. The Board and the Independent Directors also determined that while there is no uniform industry methodology to measure or apply economies of scale, the Fund's expense ratio, the overall profitability of the Adviser, and the sharing of economies of scale with the Fund are fair and reasonable under the current circumstances. The Board and the Independent Directors also stated their intention to continue monitoring the factors relevant to the Adviser's compensatio n, such as changes in the Fund's asset levels, changes in portfolio management personnel and the cost and quality of the services provided by the
19
RENEWAL OF INVESTMENT ADVISORY AGREEMENT
Continued
Adviser to the Fund. On the basis of the foregoing, and without assigning particular weight to any single factor, the Board and the Independent Directors determined to approve the continuation of the current advisory agreement for another one-year period ending September 30, 2011.
SHAREHOLDER EXPENSE EXAMPLE
September 30, 2010 (unaudited)
Fund Expenses
As a shareholder of the Fund, you incur two types of costs: (1) transaction costs, and (2) ongoing costs, including advisory and administrative fees; shareholder service fees; and other Fund expenses. The Example is intended to help you understand your ongoing costs (in dollars) of investing in the Fund and to compare these costs with the ongoing costs of investing in other mutual funds. The Example is based on an investment of $1,000 invested at the beginning of the year and held for the entire year.
Actual Expenses
The information in the table under the heading "Actual Performance" provides information about actual account values and actual expenses. You may use the information in this column, together with the amount you invested, to estimate the expenses that you paid over the period. Simply divide your account value by $1,000 (for example, an $8,600 account value divided by $1,000= 8.6), then multiply the result by the number in the first column in the row entitled "Expenses Paid During Period" to estimate the expenses you paid on your account during this period.
Hypothetical Example for Comparison Purposes
The information in the table under the heading "Hypothetical Performance (5% return before expenses)" provides information about hypothetical account values and hypothetical expenses based on the Fund's actual expense ratio and an assumed rate of return of 5% per year before expenses, which is not the Fund's actual return. The hypothetical account values and expenses may not be used to estimate the actual ending account balance or expenses you paid for the period. You may use this information to compare the ongoing costs of investing in the Fund and other funds. To do so, compare this 5% hypothetical example with the 5% hypothetical examples that appear in the shareholder reports of other funds.
Please note that the expenses shown in the table are meant to highlight your ongoing costs only and do not reflect any transactional costs. Therefore, the information under the heading "Hypothetical Performance (5% return before expenses)" is useful in comparing ongoing costs only, and will not help you determine the relative total costs of owning different funds. In addition, if these transactional costs were included, your costs would have been higher.
| | | Actual
Performance | | Hypothetical
Performance
(5% return
before
expenses) | |
Beginning Account Value
March 31, 2010 | | $ | 1,000.00 | | | $ | 1,000.00 | | |
Ending Account Value
September 30, 2010 | | $ | 1,006.08 | | | $ | 1,020.33 | | |
Expenses Paid During
Period* | | $ | 4.63 | | | $ | 4.67 | | |
* Expenses are equal to the Fund's annualized expense ratio of 0.92%, multiplied by the average account value over the period and prorated for the six-months ended September 30, 2010 (183/365 days).
20
DIRECTOR AND OFFICER INFORMATION
| Name, Age & Address | | Positions(s)
With Fund/
Years Served | | Principal Occupation(s)
During the Past 5 Years | | Portfolios in
Fund Complex
Overseen | | Other Directorships | |
| Willard H. Altman, Jr. – (75)† | | Director*
Years Served: 8 | | Retired, Formerly, until 1995, Partner of Ernst & Young LLP, a public accounting firm. | | | 6 | | | | |
|
| Thomas P. Merrick – (73)† | | Director*
Years Served: 2 | | Private consultant. President of Strategic Planning Consultants for more than the past five years. Former Executive Committee member and Vice President of Fluor Corporation, responsible for strategic planning, from 1993 to 1998. | | | 6 | | | | |
|
| Lawrence J. Sheehan – (78)† | | Director*
Years Served: 4 | | Retired. Formerly partner (1969 to 1994) and of counsel employee (1994-2002) of the law firm of O'Melveny & Myers LLP, legal counsel to the Fund. | | | 2 | | | | |
|
| Eric S. Ende – (66) | | Director*
President & Portfolio Manager
Years Served: 10 | | Partner of the Adviser since 2006. Formerly Senior Vice President of First Pacific Advisors, Inc. from 1984 to 2006. | | | 3 | | | | |
|
| Steven R. Geist – (56) | | Executive Vice President & Portfolio Manager
Year Served: 10 | | Partner of the Adviser since 2006. Fomerly Vice President of First Pacific Advisors, Inc. from 1992 to 2006. | | | | | | | |
|
| J. Richard Atwood – (50) | | Treasurer
Years Served: 13 | | Chief Operating Officer of the Adviser. President and Chief Executive Officer of FPA Fund Distributors, Inc. | | | | | | FPA Fund
Distributors, Inc. | |
|
| Sherry Sasaki – (55) | | Secretary
Years Served: 28 | | Assistant Vice President and Secretary of the Adviser and of FPA Fund Distributors, Inc. | | | | | | | |
|
| Christopher H. Thomas – (53) | | Chief Compliance Officer
Years Served: 15 | | Vice President and Chief Compliance Officer of the Adviser and Secretary of FPA Fund Distributors, Inc. | | | | | | FPA Fund
Distributors, Inc. | |
|
| E. Lake Setzler – (43) | | Assistant Treasurer
Years Served: 4 | | Vice President and Controller of the Adviser since 2005. Formerly Chief Operating Officer of Inflective Asset Management, LLC (2004 - 2005) and Vice President of Transamerica Investment Management, LLC (2000 - 2004). | | | | | | | |
|
* Directors serve until their resignation, removal or retirement.
† Audit Committee member
Additional information on the Directors is available in the Statement of Additional Information. Each of the above individuals can be contacted at 11400 W. Olympic Blvd,. Suite 1200, Los Angeles, CA 90064.
21
FPA PARAMOUNT FUND, INC.
INVESTMENT ADVISER
First Pacific Advisors, LLC
11400 West Olympic Boulevard, Suite 1200
Los Angeles, CA 90064
DISTRIBUTOR
FPA Fund Distributors, Inc.
11400 West Olympic Boulevard, Suite 1200
Los Angeles, California 90064
COUNSEL
O'Melveny & Myers LLP
Los Angeles, California
TICKER SYMBOL: FPRAX
CUSIP: 302546106
INDEPENDENT REGISTERED PUBLIC ACCOUNTING FIRM
Deloitte & Touche LLP
Los Angeles, California
CUSTODIAN & TRANSFER AGENT
State Street Bank and Trust Company
Boston, Massachusetts
SHAREHOLDER SERVICE AGENT
Boston Financial Data Services, Inc.
P.O. Box 8115
Boston, Massachusetts 02266-8500
30 Dan Road
Canton, MA 02021-2809
(800) 638-3060
(617) 483-5000
This report has been prepared for the information of shareholders of FPA Paramount Fund, Inc., and is not authorized for distribution to prospective investors unless preceded or accompanied by an effective prospectus.
The Fund's complete proxy voting record for the 12 months ended June 30, 2010 is available without charge, upon request by calling (800) 982-4372 and on the SEC's website at www.sec.gov.
The Fund's schedule of portfolio holdings, filed the first and third quarter of the Fund's fiscal year on Form N-Q with the SEC, is available on the SEC's website at www.sec.gov. Form N-Q is available at the SEC's Public Reference Room in Washington, D.C., and information on the operations of the Public Reference Room may be obtained by calling (202) 942-8090. To obtain Form N-Q from the Fund, shareholders can call (800) 982-4372.
Additional information about the Fund is available online at www.fpafunds.com. This information includes, among other things, holdings, top sectors, and performance, and is updated on or about the 15th business day after the end of each quarter.
Item 2. Code of Ethics.
(a) The registrant has adopted a code of ethics that applies to the registrant’s principal executive and financial officers.
(b) Not Applicable
(c) During the period covered by this report, there were not any amendments to the provisions of the code of ethics adopted in 2(a) above.
(d) During the period covered by this report, there were not any implicit or explicit waivers to the provisions of the code of ethics adopted in 2(a).
(e) Not Applicable
(f) A copy of the registrant’s code of ethics is filed as an exhibit to this Form N-CSR. Upon request, any person may obtain a copy of this code of ethics, without charge, by calling (800) 982-4372.
Item 3. Audit Committee Financial Expert.
The registrant’s board of directors has determined that Willard H. Altman, Jr., a member of the registrant’s audit committee and board of directors, is an “audit committee financial expert” and is “independent,” as those terms are defined in this Item. This designation will not increase the designee’s duties, obligations or liability as compared to his duties, obligations and liability as a member of the audit committee and of the board of directors. This designation does not affect the duties, obligations or liability of any other member of the audit committee or the board of directors.
Item 4. Principal Accountant Fees and Services.
| | | | 2009 | | 2010 | |
(a) | | Audit Fees | | $ | 34,100 | | $ | 34,100 | |
(b) | | Audit Related Fees | | -0- | | -0- | |
(c) | | Tax Fees | | $ | 7,100 | | $ | 7,100 | |
(d) | | All Other Fees | | -0- | | -0- | |
(e)(1) Disclose the audit committee’s pre-approval policies and procedures described in paragraph (c)(7) of Rule 2-01 of Regulation S-X. The audit committee shall pre-approve all audit and permissible non-audit services that the committee considers compatible with maintaining the independent auditors’ independence. The pre-approval requirement will extend to all non-audit services provided to the registrant, the adviser, and any entity controlling, controlled by, or under common control with the adviser that provides ongoing services to the registrant, if the engagement relates directly to the operations and financial
reporting of the registrant; provided, however, that an engagement of the registrant’s independent auditors to perform attest services for the registrant, the adviser or its affiliates required by generally accepted auditing standards to complete the examination of the registrant’s financial statements (such as an examination conducted in accordance with Statement on Auditing Standards Number 70 issued by the American Institute of Certified Public Accountants), will be deem pre-approved if: (i) the registrant’s independent auditors inform the audit committee of the engagement, (ii) the registrant’s independent auditors advise the audit committee at least annually that the performance of this engagement will not impair the independent auditor’s independence with respect to the registrant, and (iii) the audit committee receives a copy of the independent auditor’s report prepared in connection with such services. The committee may delegate to one or more committee members the authority to review and pre-approve audit and permissible non-audit services. Actions taken under any such delegation will be reported to the full committee at its next meeting.
(e)(2) Disclose the percentage of services described in each of paragraphs (b) – (d) of this Item that were approved by the audit committee pursuant to paragraph (c)(7)(i)(C) of Rule 2-01 of Regulation S-X. 100% of the services provided to the registrant described in paragraphs (b) – (d) of this Item were pre-approved by the audit committee pursuant to paragraph (e)(1) of this Item. There were no services provided to the investment adviser or any entity controlling, controlled by or under common control with the adviser described in paragraphs (b) – (d) of this Item that were required to be pre-approved by the audit committee.
(f) If greater than 50%, disclose the percentage of hours expended on the principal accountant’s engagement to audit the registrant’s financial statements for the most recent fiscal year that were attributed to work performed by persons other than the principal accountant’s full-time, permanent employees. All services performed on the engagement to audit the registrant’s financial statements for the most recent fiscal year end were performed by the principal accountant’s full-time, permanent employees.
(g) Disclose the aggregate non-audit fees billed by the registrant’s accountant for services rendered to the registrant, and rendered to the registrant’s investment adviser (not including any sub-adviser whose role is primarily portfolio management and is subcontracted with or overseen by another investment adviser), and any entity controlling, controlled by, or under common control with the adviser that provides ongoing services to the registrant for each of the last two fiscal years of the registrant. None.
| | (h) | | Disclose whether the registrant’s audit committee of the board of directors has considered whether the provision of non-audit services that were rendered to the registrant’s investment adviser (not including any sub-adviser whose role is primarily portfolio management and is subcontracted with or overseen by another investment adviser), and any entity controlling, controlled by, or under common control with the investment adviser that provides ongoing services to the registrant that were not pre-approved pursuant to paragraph (c)(7)(ii) of Rule 2-01 of Regulation S-X is compatible with maintaining the principal accountant’s independence. Not Applicable. |
| | | | |
Item 5. | | Audit Committee of Listed Registrants. Not Applicable. |
| | |
Item 6. | | Schedule of Investments. The schedule of investments is included as part of the report to stockholders filed under Item 1 of this Form. |
| | |
Item 7. | | Disclosure of Proxy Voting Policies and Procedures for Closed-End Management Investment Companies. Not Applicable. |
| | |
Item 8. | | Portfolio Managers of Closed-End Management Investment Companies. Not Applicable. |
| | |
Item 9. | | Purchases of Equity Securities by Closed-End Management Investment Company and Affiliated Purchasers. Not Applicable. |
| | |
Item 10. | | Submission of Matters to a Vote of Security Holders. There has been no material change to the procedures by which shareholders may recommend nominees to the registrant’s board of directors. |
| | |
Item 11. | | Controls and Procedures. |
| | |
| | (a) | | The principal executive officer and principal financial officer of the registrant have concluded that the registrant’s disclosure controls and procedures (as defined in Rule 30a-3(c) under the Investment Company Act of 1940) are effective based on their evaluation of the disclosure controls and procedures as of a date within 90 days of the filing date of this report. |
| | | | |
| | (b) | | There have been no significant changes in the registrant’s internal controls over financial reporting (as defined in Rule 30a-3(d) under the Investment Company Act of 1940) that occurred during the second fiscal quarter of the period covered by this report that have materially affected, or is reasonably likely to materially affect, the registrant’s internal controls over financial reporting. |
Item 12. | | Exhibits. |
| | | | |
| | (a)(1) | | Code of ethics as applies to the registrant’s officers and directors, as required to be disclosed under Item 2 of Form N-CSR. Attached hereto as Ex.99.CODE.ETH. |
| | | | |
| | (a)(2) | | Separate certification for the registrant’s principal executive officer and principal financial officer, as required by Rule 30a-2(a) under the Investment Company Act of 1940. Attached hereto. |
| | | | |
| | (a)(3) | | Not Applicable |
| | | | |
| | (b) | | Separate certification for the registrant’s principal executive officer and principal financial officer, as required by Rule 30a-2(b) under the Investment Company Act of 1940. Attached hereto. |
SIGNATURES
Pursuant to the requirements of the Securities Exchange Act of 1934 and the Investment Company Act of 1940, the registrant has duly caused this report to be signed on its behalf by the undersigned, thereunto duly authorized.
FPA PARAMOUNT FUND, INC.
By: | /s/ ERIC S. ENDE | |
Eric S. Ende, President | |
(Principal Executive Officer) | |
Date: November 24, 2010
Pursuant to the requirements of the Securities Exchange Act of 1934 and the Investment Company Act of 1940, this report has been signed below by the following persons on behalf of the registrant and in the capacities and on the dates indicated.
FPA PARAMOUNT FUND, INC.
By: | /s/ ERIC S. ENDE | |
Eric S. Ende, President | |
(Principal Executive Officer) | |
Date: November 24, 2010
By: | /s/ J. RICHARD ATWOOD | |
J. Richard Atwood, Treasurer | |
(Principal Financial Officer) | |
Date: November 24, 2010