UNITED STATES
SECURITIES AND EXCHANGE COMMISSION
Washington, D.C. 20549
FORM N-CSR
CERTIFIED SHAREHOLDER REPORT OF REGISTERED
MANAGEMENT INVESTMENT COMPANIES
Investment Company Act file number | 811-852 |
|
FPA PARAMOUNT FUND, INC. |
(Exact name of registrant as specified in charter) |
|
11400 WEST OLYMPIC BLVD., SUITE 1200, LOS ANGELES, CALIFORNIA | | 90064 |
(Address of principal executive offices) | | (Zip code) |
|
J. RICHARD ATWOOD,
11400 WEST OLYMPIC BLVD., SUITE 1200, LOS ANGELES, CALIFORNIA 90064 |
(Name and address of agent for service) |
|
Registrant’s telephone number, including area code: | 310-473-0225 | |
|
Date of fiscal year end: | SEPTEMBER 30 | |
|
Date of reporting period: | SEPTEMBER 30, 2013 | |
| | | | | | | | | |
Item 1. Report to Stockholders.

Distributor:
UMB DISTRIBUTION SERVICES, LLC
803 West Michigan Street
Milwaukee, Wisconsin 53233
FPA PARAMOUNT FUND, INC.
LETTER TO SHAREHOLDERS
Dear Fellow Shareholders:
During the third quarter of 2013, the Fund rose 6.42% compared to the MSCI All Country World Index's (Net) (the "Index") gain of 7.90%. Year-to-date, the Fund is up 21.30% versus the Index, which is up 14.43%. In May 2011, we announced that the Fund would adopt a more global approach in order to take advantage of a broader opportunity set, and continue with FPA's tradition of benchmark agnostic investing. Since the end of the third quarter of 2011, the Fund has appreciated 28.07% annualized versus 19.33% for the Index.
Though the Fund's returns have been positive year-to-date, we highlight that a continued run-up in market prices may translate into fewer opportunities and reduced margins of safety1. Such dynamics could cause the Fund to underperform relative to its benchmark in the short-term. Our focus is on earning superior returns over the long run, and we urge investors to always consider the Fund's performance over a multi-year horizon.
Lead management and investment team
On September 1, 2013, FPA announced the formation of a new Global Value Strategy. As part of the launch, Gregory Herr and Pierre Py were promoted to Lead Managers of the Fund. Greg and Pierre have been Co-Managers of the Fund since the strategy commenced its global mandate. Jason Dempsey and Victor Liu, already members of the International Value Strategy Team, also joined as Research Analysts for the new Strategy and for the Fund.
The Global Value Strategy team employs an investment philosophy that is consistent across FPA — a focus on value, bottom-up analysis, and downside protection. The FPA Paramount Fund objective is a high total investment return, including capital appreciation and income. We seek to provide above-average capital appreciation over the long term while attempting to minimize the risk of permanent losses. As value investors, we also share the bias towards quality that has long driven stock selection in the Fund, investing only in well-run, financially robust, high-quality companies. We think value opportunities arise across geographies with companies of all sizes, and are agnostic to domicile and market capitalization. We consider as broad an investment universe as we can to populate the portfolio with only true value opportunities. We look to invest in companies that trade at a significant discount to intrinsic value2. Our strategy for the Fund is unchanged with a long-term, benchmark agnostic, and concentrated approach. While we are fundamentally valuation driven, our mandate is to maintain a minimum U.S. and International weight of 20%, a level that still provides greater flexibility than most global funds.
We are pleased to provide our first report as Lead Managers of the Fund. Our primary objective in this communication is to discuss some of the recent portfolio developments, along with selected opportunities that we see in the current environment. It is also our goal to give you a better sense of how we think as investors, and how we manage the portfolio. To that end, we have attached our Global Value Policy Statement to this letter.
Main developments
The first step we took was to impose a new burden of proof on every name in the portfolio, and to conduct "re-buy analyses" both from a fundamental and a valuation perspective, for all of our holdings. At the end of the third quarter, we had completed almost all company reviews and updated most assessments of intrinsic value.
1 Buying with a "margin of safety", is when a security is purchased for less than its estimated value. This helps protect against permanent loss in the case of an unexpected event or analytical mistake. A purchase made with a margin of safety does not guarantee the security will not decline in price.
2 Our estimate of the actual value of a company or an asset based on our underlying perception of its true value including all aspects of the business, in terms of both tangible and intangible factors.
1
FPA PARAMOUNT FUND, INC.
LETTER TO SHAREHOLDERS
Continued
Given the strong historical stock selection, many of our investments had performed well over the last couple of years. Based upon our analysis, we felt certain holdings were not trading at appropriate discounts to intrinsic value.
As we focused on thinking about each business prospectively and normalized economics, our research "re-runs" also identified three cases in the portfolio where we felt the fundamentals were undergoing structural changes. Consistent with our policy, we exit any holding for which we think the original investment thesis no longer holds, either because we made a mistake or because the business has experienced a paradigm shift. Also consistent with our policy, we weight portfolio holdings based on their relative discounts to intrinsic value. We sell every position that no longer offers an acceptable margin of safety.
The second step is to monetize these positions that either no longer meet our quality requirements or no longer offer enough of a margin of safety, and to adjust the weights of our holdings based on their confirmed relative discounts to intrinsic value. At the same time, we have progressively added to our International exposure based on where we see the most compelling opportunities. In total thus far, since September 1 we have sold 13 holdings, re-weighted several positions, and added seven new investments.
The third step will be to complete the work on several pending new investment ideas, both on the U.S. and on the International side, and, pending the appropriate valuation, add them to the portfolio.
Portfolio review
At the end of the quarter, the Fund comprised 27 holdings, which is at the lower end of the 25 to 50 names we would typically expect to own at any given point in time. Our cash exposure was a little over 35%. This is an elevated level of cash for the Fund, and more an indication of where we stand in our process than the residual output of our process at this stage.
While we are working from a "target portfolio," things are inherently fluid. Given the current market environment, future developments along with their timing are difficult to predict. As we go through this, we have to define priorities, factor-in liquidity issues, and try to opportunistically take advantage of high volatility in the markets. That said we would expect to complete the process by early next year, at which stage we will start disclosing the portfolio's weighted average discount to intrinsic value. We would also expect our International holdings to increase, with significant exposure to businesses domiciled in Europe. This is a function of where we find the most compelling opportunities. Country weightings could shift materially depending on the relative attractiveness of opportunities across regions. As we stand today though, from a bottom-up perspective, we are generally able to identify a greater number of high quality businesses trading at significant discounts to intrinsic value in Europe. Next, and in descending order, are U.S. large caps, emerging markets, and U.S. small caps. The Fund's weighted average market cap stands around $5 billion. Given our previous observation, this average could increase as we start adding more U.S. names.
One last thing to expect, as we mentioned in previous Fund announcements, is the inevitable tax impact of monetizing some of the upside the Fund has delivered over the past few years. Efforts to reduce or sell some of our investments in order to redeploy capital into investment opportunities that the team finds most compelling may likely result in the Fund paying significantly higher taxable distributions of capital gains than in prior years. Taxable shareholders interested in making additional contributions or initial purchases in the Fund should take this under consideration.
2
FPA PARAMOUNT FUND, INC.
LETTER TO SHAREHOLDERS
Continued
Key performers
Our best performing holding in the quarter was Idex (up 21.74% in US currency). Based in the US, Idex makes pumps, flow meters and other fluid handling components. Most of these highly-engineered products are sold into niche applications that are relatively low cost, but essential for their customers' business. This produces attractive profitability with operating margins in excess of 20%, and strong cash flow generation. Leverage is modest with Net Debt to EBITDA3 at 1.0x. In addition to operating the business well, we find that management allocates capital sensibly in a mix of bolt-on acquisitions and distributions back to shareholders. Strength in Idex's overall reported results during the quarter, along with improvements in the photonics division were likely the main drivers behind the increase in the company's share price. Idex is a high quality company and we remain interested in being shareholders, within the limits of our valuation discipline.
Our worst performing holding in the quarter was EVS (down 7.08% in US currency). The company which is highly innovative and well-managed, was able to carve-out an impressive position in the niche market of broadcasting equipment for remote production of live sporting events. They have consistently delivered strong operating and financial performance, and its current economics are remarkable both in terms of operating margins, and in terms of returns on capital. Free cash flow is running high and the balance sheet is debt free. Unfortunately, we think current developments in the field could make it difficult for EVS to maintain these strong fundamentals in the long-run. It is one of the three companies we mentioned were undergoing fundamental structural changes earlier in our portfolio development section.
Our next worst performing holding was Incitec Pivot (down 3.72% in US currency). Based in Australia, Incitec is a leading provider of explosive products and services, with a strong position in North America following their acquisition of Dyno Nobel in 2008. The business has material exposure to the coal and mining sectors which are going through a cyclical correction. In addition, Incitec encountered some difficulties upon starting production at their new massive Moranbah complex. Beyond these short-term issues, we feel the fundamentals are strong. Explosives are highly regulated, a critical driver of performance for miners, and the business is concentrated in the hands of a few players. However, these qualities are partially masked by Incitec's other division. The group is a key player in the production and distribution of fertilizers in Australia. Fertilizer prices have been under pressure, and the business recently faced some issues that for the most part we see as temporary. More importantly, fertilizers are not a long-term strategic focus and will account for less than 20% of earnings three to five years out. Management has proven to be operationally astute and return driven. Leverage is below 2x Net Debt to EBITDA. Yet, at the end of the quarter, Incitec was trading at less than 8x next fiscal year earnings. It was offering a free cash flow yield of 13% and a dividend yield of 6%.
Concluding thoughts
We recognize that this is a difficult environment to manage money. The global economy is faced with many challenges including high levels of debt, in particular at sovereign levels, structurally weak financial institutions, most notably in Europe, imbalances in developing countries, the likelihood of more tax pressure along with further austerity measures, slower economic growth, and the threat of rampant inflation in the long-run driven by fiscal and monetary policies. Nonetheless, we are excited about the investment opportunities that the Fund may identify given its acute focus on business fundamentals and its solid value bias.
Finally, we and the Board of Directors extend our appreciation to Eric Ende and Steven Geist for their many years of Fund stewardship.
3 Earnings before interest, taxes, depreciation and amortization.
3
FPA PARAMOUNT FUND, INC.
LETTER TO SHAREHOLDERS
Continued
We are grateful for your confidence as shareholders of the FPA Paramount Fund, and look forward to continue serving your interests.
Respectfully submitted,

| | 
| |
Gregory Herr
Co-President and
Co-Chief Investment Officer | | Pierre O. Py
Co-President and
Co-Chief Investment Officer | |
October 16, 2013 | | | | | |
FORWARD LOOKING STATEMENT DISCLOSURE
As mutual fund managers, one of our responsibilities is to communicate with shareholders in an open and direct manner. Insofar as some of our opinions and comments in our letters to shareholders are based on current management expectations, they are considered "forward-looking statements" which may or may not be accurate over the long term. While we believe we have a reasonable basis for our comments and we have confidence in our opinions, actual results may differ materially from those we anticipate. You can identify forward-looking statements by words such as "believe," "expect," "may," "anticipate," and other similar expressions when discussing prospects for particular portfolio holdings and/or the markets, generally. We cannot, however, assure future results and disclaim any obligation to update or alter any forward-looking statements, whether as a result of new information, future events, or otherwise. Further, information provided in this report should not be construed as a recommendation to purchase or sell any particular security.
4
FPA GLOBAL VALUE STRATEGY POLICY STATEMENT
(including FPA Paramount Fund)
On September 1, 2013, FPA announced the formation of a new FPA Global Value Strategy. The Strategy is overseen by Gregory Herr and Pierre O. Py. Greg and Pierre also manage the FPA Paramount Fund under the new Strategy. This policy statement summarizes who we are and how we think as investors, as well as how we construct and manage the portfolios.
******
We are long-term value investors focused on global equities, having helped build strong track records both externally with well-known advisory teams, and internally at FPA. Greg has been a member of the Small/Mid-Cap Strategy since 2007 and currently serves as Co-Portfolio Manager of the FPA Perennial Fund and Source Capital. Pierre has been Portfolio Manager of the FPA International Value Strategy and the FPA International Value Fund since its inception in 2011. Both have been Co-Managers of the FPA Paramount Fund since 2011.
We spent the last ten years scouring the world to find investment opportunities across a wide range of sectors, researching and analyzing hundreds of businesses, and building local intelligence networks in the process. We maintain a concentrated, disciplined approach to long-term value investing whereby we focus on our best ideas while attempting to weed out higher risk, lower quality, and more expensive businesses.
Our goal is to deliver above-average capital appreciation over the long-term while attempting to minimize the risk of a permanent impairment of capital.
We are absolute value investors. That is to say, we seek genuine bargains rather than relatively attractive ones. Unlike many long-only investment managers, our approach is not to build a fully-invested portfolio based on a chosen index. Instead, our benchmark-agnostic strategy focuses on opportunities that meet all of our investment criteria, and where we think we are exposed to an asymmetric outcome. We commit capital when we can buy a stake in a business at a discount to its intrinsic value, and when we believe the risk of potential losses is limited.
What we mean by losses or permanent impairment of capital is a reduction in intrinsic value that exceeds the discount received at purchase. It is something that cannot be measured based on capital market developments. We do not consider volatility in share prices to be a proper measure of risk, and rather think of that as a source of opportunities.
Over the years, we have identified hundreds of businesses throughout the world that we would like to own, but they often trade at prices that are too high for us to become shareholders. We consistently monitor these companies while patiently awaiting a cheaper share price. We may at times hold cash if we cannot find enough opportunities. However given our broad investment universe and our mandate to maintain minimum levels of exposure to both US and non-US based companies, we would expect to have a limited portion of the Fund's assets invested in cash.
With capital markets generally short-term minded and susceptible to herd-like behavior, we find that our investment goals are best achieved by taking a long-term and often contrarian approach. We consider ourselves owners of businesses. A successful business owner would not care about what happens in the coming quarter, and neither do we. While in principle we would be happy to be invested in perpetuity under the right conditions, in practice we find that five years is a reasonable timeframe.
We insist that our investments meet the following criteria:
1. High Quality — businesses that have sustainable, superior fundamentals. These include high barriers to entry, low threat of product or service substitution, unique competitive advantages, power over customers as well as suppliers, and ultimately, pricing power. We believe that such businesses can generate industry leading margins, realize high levels of free cash flows, and earn attractive returns on capital.
5
FPA GLOBAL VALUE STRATEGY POLICY STATEMENT
(including FPA Paramount Fund)
2. Financial Strength — companies that have conservative balance sheets and good free cash flow profiles. Our view is that financial robustness enhances a business' ability to weather temporary disruptions or adverse economic circumstances, and puts it in a position to consistently gain strength through difficult times. Value destruction, on the other hand, is often the result of excessive leverage, particularly when combined with unforeseen events.
3. Strong Management — shareholder-aligned management teams that we believe not only run operations well, but also allocate capital in a way that creates value over time. Frequently and preferably these managers are shareholders themselves who think and act as owners. We would expect them to appropriately allocate capital by comparing the relative returns of various investment opportunities and, in the absence of attractive options, consider returning capital to shareholders through dividends and/or share repurchases.
4. Low Absolute Valuations — an opportunity to invest at a discount to our estimate of intrinsic value. This is how we expect to achieve excess returns in the long run. We recognize that we cannot always be right in our assessment of value which is one of the reasons we only invest in a company when we can purchase its stock at prices below what we think the business is worth. Buying into quality businesses that build value over time, coupled with a margin of safety, helps mitigate the potential negative impact of unforeseen factors and allows the passage of time to work in our favor.
Given our stringent criteria, we need to look broadly across capitalizations, industries, and geographies to find good opportunities. While there are thousands of listed corporations in the world, only a few combine all of our investment requirements at a given time, which leads us to run a more concentrated portfolio. Concentration allows us, in turn, to spend a disproportionate amount of time getting to know the most attractive companies, helping to reduce the risk of mistake which might otherwise lead to capital loss. We focus only on our best ideas and typically expect to be invested in 25 to 50 stocks.
In analyzing companies, we take a bottom-up, research-driven approach. We eschew businesses that do not lend themselves to appraisal. We limit ourselves to countries with established rules of law and political systems that allow for transparent and unbiased enforcement of those laws. We are also cognizant of macro-economic factors but center our analyses around, and select stocks based on, the fundamentals of the underlying businesses. To understand these fundamentals, we engage in extensive research.
We dedicate a lot of time traveling to visit investment prospects and meet with management teams or key employees to discuss operations, strategy, and capital allocation. We interview competitors, suppliers, customers, and other relevant third parties. We study how industries and companies evolve over time and how adept management is at responding to and taking advantage of changes in the business. We think prospectively rather than looking only at the past to anticipate potential changes. We also review a long history of annual reports, investor presentations, conference call transcripts, third-party research and other relevant publicly available materials for each targeted company, as well as the other industry participants.
Through this process, we seek to obtain an understanding of the value chain, market forces, and strategic dynamics. We use our research findings and analytical work to assess the normal economics of the business, and to estimate the present value of its future stream of cash flows. What we try to determine is how much cash flow it can sustainably generate; how much that cash flow grows over time; and what management does with that cash flow. These are the key tenets of intrinsic value. What other market participants may be willing to pay for the business at a given time based on a particular set of financial circumstances is not relevant to us. We study the company's financial position and how its balance sheet could hold up in challenging conditions. We look at leverage, debt structure, and free cash flow generation profile. We spend a lot of time asking ourselves what could go wrong and, if something did, what it might mean.
6
FPA GLOBAL VALUE STRATEGY POLICY STATEMENT
(including FPA Paramount Fund)
The portfolio is the product of that research and valuation process. We only add the companies that meet our qualitative investment criteria and offer enough margin of safety to the list of portfolio investments. We then allocate individual portfolio weightings according to the relative discount to our estimate of intrinsic value. This approach allows our ideas with the greatest discounts (and upside potential) to have a more significant impact on performance.
We continuously monitor each portfolio company to ensure that the original thesis remains intact and that the intrinsic value advantage remains. We may sell a holding when its market price appreciates and approaches our estimate of value; when we find opportunities to reallocate capital to other investments with greater reward potential; or when the original investment thesis no longer holds. While a painful decision, it is preferable in our view to take our losses early rather than simply hoping for a better outcome and increasing exposure as value deteriorates, thus further expanding the possibility of even greater capital impairment.
******
In conclusion, our approach is to concentrate on a few well thought-out and researched positions. We want to be long-term owners of high quality, financially sound businesses that are run by proven managers who build value over time for shareholders. We invest in these businesses only when we can buy their stocks at what we believe to be low prices.
We adopted this approach because that is the only one that makes sense to us and because that is how we manage our own money. We invest a significant portion of our net worth in the Funds we manage. Should our portfolios lag, we will feel the pain along with our shareholders. At times we expect to experience short-term periods of poor relative performance, but are confident that as patient, long-term investors we should be rewarded.
We thank you in advance for your trust and look forward to future communication.
The Global Value Strategy Team
You should consider the Fund's investment objectives, risks, and charges and expenses carefully before you invest. The Prospectus details the Fund's objective and policies, charges, and other matters of interest to the prospective investor. Please read this Prospectus carefully before investing. The Prospectus may be obtained by visiting the website at www.fpafunds.com, by email at crm@fpafunds.com, toll-free by calling 1-800-982-4372 or by contacting the Fund in writing.
Fund Risks
Investments in mutual funds carry risks and investors may lose principal value. Stock markets are volatile and can decline significantly in response to adverse issuer, political, regulatory, market, or economic developments. The Fund may purchase foreign securities, which are subject to interest rate, currency exchange rate, economic and political risks. Small and mid-cap stocks involve greater risks and they can fluctuate in in price more than larger company stocks. Groups of stocks, such as value and growth, go in and out of favor which may cause certain funds to underperform other equity funds.
Please consult your tax advisor regarding higher capital gains distributions.
The FPA Funds are distributed by UMB Distribution Services, LLC. 803 W. Michigan Street, Milwaukee, WI 53233
7
FPA PARAMOUNT FUND, INC.
HISTORICAL PERFORMANCE
(Unaudited)
Change in Value of a $10,000 Investment in FPA Paramount Fund, Inc. vs. MSCI AWCI and Russell 2500 Index from October 1, 2003 to September 30, 2013
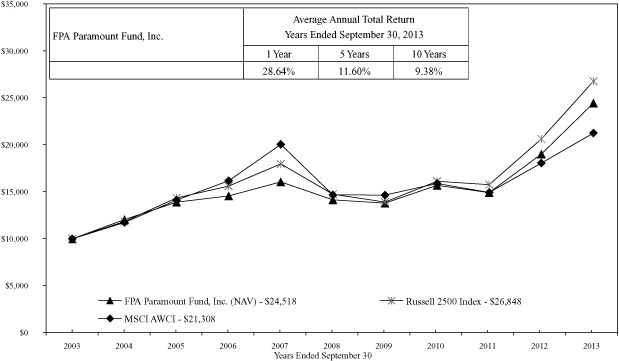
The MSCI All Country World NR Index is a float-adjusted market capitalization index that is designed to measure the combined equity market performance of developed and emerging market. The Russell 2500 Index consists of the 2,500 smallest companies in the Russell 3000 total capitalization universe. This index is considered a measure of small to medium capitalization stock performance. The Russell 2500 Index had been the Fund's primary benchmark; however, the MSCI AWCI Index more closely reflects the Fund's current global focus. These indexes do not reflect any commissions or fees which would be incurred by an investor purchasing the stocks it represents. The performance of the Fund and of the Indexes is computed on a total return basis which includes reinvestment of all distributions.
Past performance is no guarantee of future results and current performance may be higher or lower than the performance shown. This data represents past performance and investors should understand that investment returns and principal values fluctuate, so that when you redeem your investment may be worth more or less than its original cost. Current month-end performance data can be obtained by visiting the website at www.fpafunds.com or by calling toll-free, 1-800-982-4372. As of the most recent prospectus, the expense ratio is 0.94% (see notes to financial statements). Information regarding the Fund's redemption fees can be found on page 19.
The Prospectus details the Fund's objective and policies, sales charges, and other matters of interest to prospective investors. Please read the prospectus carefully before investing. The Prospectus may be obtained by visiting the website at www.fpafunds.com, by email at crm@fpafunds.com, toll-free by calling 1-800-982-4372 or by contacting the Fund in writing.
8
FPA PARAMOUNT FUND, INC.
PORTFOLIO SUMMARY
September 30, 2013
(Unaudited)
Common Stocks | | | | | | | 62.2 | % | |
Producer Durable Goods | | | 18.6 | % | | | | | |
Business Services & Supplies | | | 16.2 | % | | | | | |
Retailing | | | 8.4 | % | | | | | |
Technology | | | 8.3 | % | | | | | |
Health Care | | | 7.4 | % | | | | | |
Basic Materials | | | 1.9 | % | | | | | |
Consumer Non-Durables | | | 1.0 | % | | | | | |
Transportation | | | 0.3 | % | | | | | |
Trading & Distribution | | | 0.1 | % | | | | | |
Short-Term Corporate Notes | | | | | 37.8 | % | |
Other Assets and Liabilities, net | | | | | 0.0 | % | |
Total Net Assets | | | | | 100.0 | % | |
MAJOR PORTFOLIO CHANGES
Six Months Ended September 30, 2013
(Unaudited)
| | Shares | |
NET PURCHASES | |
Common Stocks | |
Aggreko plc. | | | 225,000 | | |
Atea ASA (1) | | | 15,000 | | |
Danone (1) | | | 45,000 | | |
Fugro NV (1) | | | 80,000 | | |
G4S plc (1) | | | 13,500 | | |
Incitec Pivot Limited (1) | | | 2,500,000 | | |
Nordson Corporation (1) | | | 22,300 | | |
SAP AG (1) | | | 115,000 | | |
Sodexo (1) | | | 35,000 | | |
NET SALES | |
Common Stocks | |
Actuant Corporation (2) | | | 196,600 | | |
bioMerieux S.A. | | | 48,087 | | |
CarMax , Inc. (2) | | | 443,200 | | |
Domino Printing Sciences plc | | | 322,900 | | |
EVS Broadcast Equipment S.A. | | | 25,489 | | |
FMC Technologies, Inc. (2) | | | 205,300 | | |
Halma plc (2) | | | 730,000 | | |
Heartland Express, Inc. (2) | | | 467,900 | | |
(1) Indicates new commitment to portfolio
(2) Indicates elimination from portfolio | |
9
FPA PARAMOUNT FUND, INC.
MAJOR PORTFOLIO CHANGES (Continued)
Six Months Ended September 30, 2013
(Unaudited)
| | Shares | |
HNI Corporation (2) | | | 275,500 | | |
Knight Transportation, Inc. (2) | | | 408,600 | | |
L'Occitane International SA (2) | | | 1,060,000 | | |
Manpower, Inc. (2) | | | 67,900 | | |
Noble Corporation (2) | | | 249,700 | | |
Nordson Corporation (2) | | | 22,300 | | |
Rotork plc (2) | | | 38,500 | | |
Signet Jewelers Ltd. | | | 223,400 | | |
Sonova Holdings AG (2) | | | 30,000 | | |
Spirax Sarco Engineering plc (2) | | | 154,748 | | |
VCA Antech, Inc.(2) | | | 240,200 | | |
(1) Indicates new commitment to portfolio
(2) Indicates elimination from portfolio | |
10
FPA PARAMOUNT FUND, INC.
PORTFOLIO OF INVESTMENTS
September 30, 2013
COMMON STOCKS | | Shares | | Fair
Value | |
PRODUCER DURABLES — 18.6% | |
| Franklin Electric Co., Inc. | | | 252,200 | | | $ | 9,936,680 | | |
| Graco Inc. | | | 166,900 | | | | 12,360,614 | | |
| IDEX Corporation | | | 151,350 | | | | 9,875,588 | | |
| WABCO Holdings, Inc. * | | | 222,200 | | | | 18,722,572 | | |
| Zebra Technologies Corporation (Class A) * | | | 216,800 | | | | 9,870,904 | | |
| | $ | 60,766,358 | | |
BUSINESS SERVICES & SUPPLIES — 16.2% | |
| Aggreko plc (Great Britain) | | | 363,000 | | | $ | 9,426,094 | | |
| Clarcor, Inc. | | | 138,600 | | | | 7,696,458 | | |
| Copart, Inc. * | | | 398,500 | | | | 12,668,315 | | |
| Domino Printing Sciences plc (Great Britain) | | | 49,000 | | | | 507,689 | | |
| Fugro NV (Netherlands) | | | 80,000 | | | | 4,879,824 | | |
| G4S plc (Great Britain) | | | 13,500 | | | | 55,578 | | |
| ScanSource Inc. * | | | 416,000 | | | | 14,393,600 | | |
| Sodexo (France) | | | 35,000 | | | | 3,276,863 | | |
| | $ | 52,904,421 | | |
RETAILING — 8.4% | |
| O'Reilly Automotive, Inc. * | | | 178,400 | | | $ | 22,762,056 | | |
| Signet Jewelers Ltd. (Bermuda) | | | 62,600 | | | | 4,485,290 | | |
| | $ | 27,247,346 | | |
TECHNOLOGY — 8.3% | |
| EVS Broadcast Equipment S.A. (Belgium) | | | 70,711 | | | $ | 4,561,920 | | |
| Maxim Integrated Products, Inc. | | | 185,800 | | | | 5,536,840 | | |
| Microchip Technology, Inc. | | | 209,700 | | | | 8,448,813 | | |
| SAP AG (Germany) | | | 115,000 | | | | 8,488,012 | | |
| | $ | 27,035,585 | | |
HEALTH CARE — 7.4% | |
Bio-Rad Laboratories, Inc. * | | | 73,300 | | | $ | 8,617,148 | | |
bioMerieux S.A. (France) | | | 14,113 | | | | 1,366,992 | | |
Life Technologies Corporation* | | | 142,400 | | | | 10,655,792 | | |
Varian Medical Systmes, Inc. * | | | 44,500 | | | | 3,325,485 | | |
| | $ | 23,965,417 | | |
BASIC MATERIALS — 1.9% | |
Incitec Pivot Limited (Australia) | | | 2,500,000 | | | $ | 6,274,500 | | |
CONSUMER NON-DURABLES — 1.0% | |
Danone (France) | | | 45,000 | | | $ | 3,391,865 | | |
11
FPA PARAMOUNT FUND, INC.
PORTFOLIO OF INVESTMENTS (Continued)
September 30, 2013
COMMON STOCKS — Continued | | Shares or
Principal
Amount | | Fair
Value | |
TRANSPORTATION — 0.3% | |
Kuehne & Nagel International AG Reg (Switzerland) | | | 6,700 | | | $ | 877,972 | | |
TRADING & DISTRIBUTION — 0.1% | |
Atea ASA (Norway) | | | 15,000 | | | $ | 157,773 | | |
| TOTAL COMMON STOCKS — 62.2% (Cost $133,309,156) | | | | $ | 202,621,237 | | |
| SHORT-TERM INVESTMENT — 37.8% (Cost $123,287,573) | |
Toyota Motor Credit Corporation — 0.05% 10/4/13 | | $ | 10,000,000 | | | $ | 9,999,958 | | |
General Capital Corporation — 0.04% 10/22/13 | | | 16,500,000 | | | | 16,499,615 | | |
State Street Bank Repurchase Agreement — 0.00% 10/01/13
(Dated 9/30/13, repurchase price of $96,788,000, collateralized by
$83,315,000 principal amount U.S. Treasury Bond — 4.625% 2040,
fair value $98,728,275) | | | 96,788,000 | | | | 96,788,000 | | |
TOTAL SHORT-TERM INVESTMENTS | | | | $ | 123,287,573 | | |
| TOTAL INVESTMENTS — 100.0% (Cost $256,596,729) | | $ | 325,908,810 | | |
Other assets and liabilities, net — 0.0% | | | | | 136,453 | | |
NET ASSETS — 100% | | $ | 326,045,263 | | |
*Non-income producing security
See notes to financial statements.
12
FPA PARAMOUNT FUND, INC.
STATEMENT OF ASSETS AND LIABILITIES
September 30, 2013
ASSETS | |
Investments at value: | |
Investment securities — at fair value
(identified cost $133,309,156) | | $ | 202,621,237 | | | | | | |
Short-term investment — at amortized cost
(maturities 60 days or less) | | | 123,287,573 | | | $ | 325,908,810 | | |
Cash | | | | | | | 615 | | |
Receivable for: | |
Investment securities sold | | $ | 6,618,347 | | | | | | |
| Capital stock sold | | | 513,354 | | | | | | |
Dividends | | | 42,153 | | | | 7,173,854 | | |
| | | | | | $ | 333,083,279 | | |
LIABILITIES | |
Payable for: | |
Investment securities purchased | | $ | 6,668,728 | | | | | | |
Advisory fees and financial services | | | 207,080 | | | | | | |
Capital stock repurchased | | | 137,708 | | | | | | |
Accrued expenses | | | 24,500 | | | $ | 7,038,016 | | |
NET ASSETS | | | | $ | 326,045,263 | | |
SUMMARY OF SHAREHOLDERS' EQUITY | |
Capital Stock — par value $0.25 per share: authorized
100,000,000 shares; outstanding 12,697,487 shares | | | | | | $ | 3,174,372 | | |
Additional Paid-in Capital | | | | | | | 226,421,533 | | |
Accumulated net realized gain on investments | | | | | | | 27,137,277 | | |
Unrealized appreciation of investments | | | | | | | 69,312,081 | | |
NET ASSETS | | | | $ | 326,045,263 | | |
NET ASSET VALUE | |
Offering and redemption price per share | | | | $ | 25.68 | | |
See notes to financial statements.
13
FPA PARAMOUNT FUND, INC.
STATEMENT OF OPERATIONS
September 30, 2013
INVESTMENT INCOME | |
Dividends | | | | $ | 3,038,834 | | |
Interest | | | | | 11,588 | | |
| | | | $ | 3,050,422 | | |
EXPENSES | |
Advisory fees | | $ | 1,929,547 | | | | | | |
Financial services | | | 289,161 | | | | | | |
Transfer agent fees and expenses | | | 118,424 | | | | | | |
Directors fees and expenses | | | 65,579 | | | | | | |
Reports to shareholders | | | 46,845 | | | | | | |
Registration fees | | | 44,696 | | | | | | |
Audit fees | | | 43,850 | | | | | | |
Legal fees | | | 41,989 | | | | | | |
Line of credit | | | 38,021 | | | | | | |
Custodian fees and expenses | | | 35,807 | | | | | | |
| Insurance | | | 5,832 | | | | | | |
Other fees and expenses | | | 6,826 | | | | 2,666,577 | | |
Net investment income | | | | $ | 383,845 | | |
NET REALIZED AND UNREALIZED GAIN ON INVESTMENTS | |
Net realized gain on investments: | |
Proceeds from sales of investment securities | | $ | 150,110,467 | | | | | | |
Cost of investment securities sold | | | 112,746,690 | | | | | | |
| Net realized gain on investments | | | | | | $ | 37,363,777 | | |
Change in unrealized appreciation of investments: | |
Unrealized appreciation at beginning of year | | $ | 36,193,342 | | | | | | |
Unrealized appreciation at end of year | | | 69,312,081 | | | | | | |
| Change in unrealized appreciation of investments | | | | | | | 33,118,739 | | |
Net realized and unrealized gain on investments | | | | | | $ | 70,482,516 | | |
NET CHANGE IN NET ASSETS RESULTING FROM OPERATIONS | | | | $ | 70,866,361 | | |
See notes to financial statements.
14
FPA PARAMOUNT FUND, INC.
STATEMENT OF CHANGES IN NET ASSETS
| | For the Year Ended September 30, | |
| | 2013 | | 2012 | |
CHANGES IN NET ASSETS | |
Operations: | |
Net investment income | | $ | 383,845 | | | | | | | $ | 33,214 | | | | | | |
Net realized gain on investments | | | 37,363,777 | | | | | | | | 3,076,798 | | | | | | |
Change in unrealized appreciation
of investments | | | 33,118,739 | | | | | | | | 56,234,842 | | | | | | |
Change in net assets resulting from operations | | | | | | $ | 70,866,361 | | | | | | | $ | 59,344,854 | | |
Distributions to shareholders from: | |
Net investment income | | $ | (383,845 | ) | | | | | | | — | | | | | | |
Net realized gains | | | (107,391 | ) | | $ | (491,236 | ) | | | — | | | | — | | |
Capital Stock transactions: | |
Proceeds from Capital Stock sold | | $ | 40,981,481 | | | | | | | $ | 10,130,378 | | | | | | |
Proceeds from shares issued to shareholders
upon reinvestment of dividends and
distributions | | | 456,967 | | | | | | | | — | | | | | | |
Cost of Capital Stock repurchased* | | | (44,926,327 | ) | | | (3,487,879 | ) | | | (34,227,068 | ) | | | (24,096,690 | ) | |
Total change in net assets | | | | | | $ | 66,887,246 | | | | | | | $ | 35,248,164 | | |
NET ASSETS | |
Beginning of year | | | | | | $ | 259,158,017 | | | | | | | $ | 223,909,853 | | |
End of year | | | | | | $ | 326,045,263 | | | | | | | $ | 259,158,017 | | |
CHANGE IN CAPITAL STOCK
OUTSTANDING | |
Shares of Capital Stock sold | | | | | | | 1,707,058 | | | | | | | | 527,355 | | |
Shares issued to shareholders upon
reinvestment of dividends and distributions | | | | | | | 21,147 | | | | | | | | — | | |
Shares of Capital Stock repurchased | | | | | | | (1,986,960 | ) | | | | | | | (1,847,349 | ) | |
Increase (decrease) in Capital Stock outstanding | | | | | | | (258,755 | ) | | | | | | | (1,319,994 | ) | |
* Net of redemption fees of $13,216 and $1,050 for the years ended September 30, 2013 and September 30, 2012, respectively.
See notes to financial statements.
15
FPA PARAMOUNT FUND, INC.
FINANCIAL HIGHLIGHTS
Selected Data for Each Share of Capital Stock Outstanding Throughout Each Year
| | | Year Ended September 30, | |
| | | 2013 | | 2012 | | 2011 | | 2010 | | 2009 | |
Per share operating performance: | | | | | | | | | | | |
Net asset value at beginning of year | | $ | 20.00 | | | $ | 15.68 | | | $ | 16.55 | | | $ | 14.55 | | | $ | 15.01 | | |
Income from investment operations: | | | | | | | | | | | |
Net investment income | | $ | 0.03 | | | | — | * | | $ | 0.02 | | | $ | 0.03 | | | $ | 0.01 | | |
Net realized and unrealized gain (loss)
on investments | | | 5.69 | | | $ | 4.32 | | | | (0.83 | ) | | | 1.97 | | | | (0.40 | ) | |
Total from investment operations | | $ | 5.72 | | | $ | 4.32 | | | $ | (0.81 | ) | | $ | 2.00 | | | $ | (0.39 | ) | |
Less distributions: | | | | | | | | | | | |
From net investment income | | $ | (0.03 | ) | | | — | | | $ | (0.06 | ) | | | — | | | $ | (0.07 | ) | |
From net realized gains | | | (0.01 | ) | | | — | | | | — | | | | — | | | | — | | |
| | $ | (0.04 | ) | | | — | | | $ | (0.06 | ) | | | — | | | $ | (0.07 | ) | |
| Redemption fees | | | — | * | | | — | * | | | — | * | | | — | * | | | — | * | |
Net asset value at end of year | | $ | 25.68 | | | $ | 20.00 | | | $ | 15.68 | | | $ | 16.55 | | | $ | 14.55 | | |
Total investment return** | | | 28.64 | % | | | 27.55 | % | | | (4.95 | )% | | | 13.75 | % | | | (2.43 | )% | |
Ratios/supplemental data: | |
Net assets at end of year (in $000's) | | $ | 326,045 | | | $ | 259,158 | | | $ | 223,910 | | | $ | 238,656 | | | $ | 231,469 | | |
| Ratio of expenses to average net assets | | | 0.92 | % | | | 0.94 | % | | | 0.93 | % | | | 0.95 | % | | | 0.99 | % | |
Ratio of net investment income to average
net assets | | | 0.13 | % | | | 0.01 | % | | | 0.08 | % | | | 0.20 | % | | | 0.09 | % | |
Portfolio turnover rate | | | 19 | % | | | 6 | % | | | 10 | % | | | 3 | % | | | 46 | % | |
* Rounds to less than $0.01 per share.
** Return is based on net asset value per share, adjusted for reinvestment of distributions.
See notes to financial statements.
16
FPA PARAMOUNT FUND, INC.
NOTES TO FINANCIAL STATEMENTS
September 30, 2013
NOTE 1 — Significant Accounting Policies
FPA Paramount Fund, Inc. (the "Fund") is registered under the Investment Company Act of 1940, as a diversified, open-end management investment company. The Fund's primary investment objective is high total investment return, including capital appreciation and income. The following is a summary of significant accounting policies consistently followed by the Fund in the preparation of its financial statements.
A. Security Valuation
The Fund's investments are reported at fair value as defined by accounting principles generally accepted in the United States of America. The Fund generally determines its net asset value as of approximately 4:00 p.m. New York time each day the New York Stock Exchange is open. Further discussion of valuation methods, inputs and classifications can be found under Note 7.
B. Securities Transactions and Related Investment Income
Securities transactions are accounted for on the date the securities are purchased or sold. Dividend income and distributions to shareholders are recorded on the ex-dividend date. Interest income and expenses are recorded on an accrual basis. The books and records of the Fund are maintained in U.S. dollars as follows: (1) the foreign currency market value of investment securities, and other assets and liabilities stated in foreign currencies, are translated using the daily spot rate; and (2) purchases, sales, income and expenses are translated at the rate of exchange prevailing on the respective dates of such transactions. The resultant exchange gains and losses are included in net realized or net unrealized gain (loss) on investments in the statement of operations.
C. Use of Estimates
The preparation of the financial statements in accordance with accounting principles generally accepted in the United States of America requires management to make estimates and assumptions that affect the amounts reported. Actual results could differ from those estimates.
NOTE 2 — Risk Considerations
Investing in the Fund may involve certain risks including, but not limited to, those described below.
Market Risk: Because the values of the Fund's investments will fluctuate with market conditions, so will the value of your investment in the Fund. You could lose money on your investment in the Fund or the Fund could underperform other investments.
Common Stocks and Foreign Securities: The prices of common stocks and other securities held by the Fund may decline in response to certain events taking place around the world, including those directly involving companies whose securities are owned by the Fund; conditions affecting the general economy; overall market changes; local, regional or global political, social or economic instability; and currency, interest rate and commodity price fluctuations. Since the Fund invests in foreign securities, it will be subject to risks not typically associated with domestic securities. Foreign investments, especially those of companies in emerging markets, can be riskier, less liquid, harder to value, and more volatile than investments in the United States. Adverse political and economic developments or changes in the value of foreign currency can make it more difficult for the Fund to value the securities. Differences in tax and accounting standards, difficulties in obtaining information about foreign companies, restrictions on receiving investment proceeds from a foreign country, confiscatory foreign tax laws, and potential difficulties in enforcing contractual obligations, can all add to the risk and volatility of foreign investments. The financial problems in global economies over the past several years, including the European sovereign debt crisis, may continue to cause high volatility in global financial markets.
17
FPA PARAMOUNT FUND, INC.
NOTES TO FINANCIAL STATEMENTS
Continued
Repurchase Agreements: Repurchase agreements permit the Fund to maintain liquidity and earn income over periods of time as short as overnight. Repurchase agreements held by the Fund are fully collateralized by U.S. Government securities, or securities issued by U.S. Government agencies, or securities that are within the three highest credit categories assigned by established rating agencies (Aaa, Aa, or A by Moody's or AAA, AA or A by Standard & Poor's) or, if not rated by Moody's or Standard & Poor's, are of equivalent investment quality as determined by the Adviser. Such collateral is in the possession of the Fund's custodian. The collateral is evaluated daily to ensure its market value equals or exceeds the current market value of the repurchase agreements including accrued interest. In the event of default on the obligation to repurchase, the Fund has the right to liquidate the collateral and apply the proceeds in satisfaction of the obligation.
NOTE 3 — Purchases of Investment Securities
Cost of purchases of investment securities (excluding short-term investments with maturities of 60 days or less at the time of purchase) aggregated $48,006,040 for the year ended September 30, 2013. Realized gains or losses are based on the specific identification method.
NOTE 4 — Federal Income Tax
No provision for federal income tax is required because the Fund has elected to be taxed as a "regulated investment company" under the Internal Revenue Code and intends to maintain this qualification and to distribute each year to its shareholders, in accordance with the minimum distribution requirements of the Code, its taxable net investment income and taxable net realized gains on investments.
Distributions paid to shareholders are based on net investment income and net realized gains determined on a tax reporting basis, which may differ from financial reporting. For federal income tax purposes, the components of distributable earnings at September 30, 2013 were as follows:
Undistributed Ordinary Income | | | — | | |
Undistributed Net Realized Gains | | $ | 27,297,282 | | |
For the fiscal year ended September 30, 2013, the Fund paid dividends of $383,845 from ordinary income and distributions of $107,391 from net realized gains. The Fund paid no distributions during the fiscal year ended September 30, 2012.
The cost of investment securities held at September 30, 2013, was $133,361,770 for federal income tax purposes. Gross unrealized appreciation and depreciation for all investments at September 30, 2013, for federal income tax purposes was $69,752,470 and $493,003, respectively resulting in net unrealized appreciation of $69,259,467. As of and during the year ended September 30, 2013, the Fund did not have any liability for unrecognized tax benefits. The Fund recognizes interest and penalties, if any, related to unrecognized tax benefits as income tax expense in the Statement of Operations. During the year, the Fund did not incur any interest or penalties. The Fund is not subject to examination by U.S. federal tax authorities for years ended on or before September 30, 2010 or by state tax authorities for years ended on or before September 30, 2009.
During the year ended September 30, 2013, the Fund reclassified $33,214 between Undistributed Net Investment Income and Additional Paid-in Capital for book/tax differences from prior years.
NOTE 5 — Advisory Fees and Other Affiliated Transactions
Pursuant to an Investment Advisory Agreement, advisory fees were paid by the Fund to First Pacific Advisors, LLC (the "Adviser"). Under the terms of this Agreement, the Fund paid the Adviser a monthly fee calculated at the annual rate of 0.75% of the first $50 million of the Fund's average daily net assets and 0.65% of the average daily net assets in excess of $50 million. In addition, the Fund paid the Adviser an amount equal to 0.10% of the
18
FPA PARAMOUNT FUND, INC.
NOTES TO FINANCIAL STATEMENTS
Continued
average daily net assets for each fiscal year in reimbursement for the provision of financial services to the Fund. The Agreement obligates the Adviser to reduce its fee to the extent necessary to reimburse the Fund for any annual expenses (exclusive of interest, taxes, the cost of brokerage and research services, and extraordinary expenses such as litigation) in excess of 11/2% of the first $30 million and 1% of the remaining average net assets of the Fund for the year.
For the year ended September 30, 2013, the Fund paid aggregate fees of $64,835 to all Directors who are not affiliated persons of the Adviser. Certain officers of the Fund are also officers of the Adviser and FPA Fund Distributors, Inc.
NOTE 6 — Redemption Fees
A redemption fee of 2% applies to redemptions within 90 days of purchase for certain purchases made by persons eligible to purchase shares without an initial sales charge. For the year ended September 30, 2013, the Fund collected $13,216 in redemption fees. The impact of these fees is less than $0.01 per share.
NOTE 7 — Disclosure of Fair Value Measurements
The Fund uses the following methods and inputs to establish the fair value of its assets and liabilities. Use of particular methods and inputs may vary over time based on availability and relevance as market and economic conditions evolve.
Equity securities are generally valued at the official closing price of, or the last reported sale price on, the exchange or market on which such securities are traded, as of the close of business on the day the securities are being valued or, lacking any sales, at the last available bid price. Prices for each security are taken from the principal exchange or market in which the security trades. Securities that are unlisted and fixed-income and convertible securities listed on a national securities exchange for which the over-the-counter market more accurately reflects the securities' value in the judgment of the Fund's officers, are valued at the most recent bid price. Short-term corporate notes with maturities of 60 days or less at the time of purchase are valued at amortized cost, which approximates fair value.
Securities for which representative market quotations are not readily available or are considered unreliable by the Adviser are valued as determined in good faith under procedures adopted by authority of the Fund's Board of Trustees. Various inputs may be reviewed in order to make a good faith determination of a security's value. These inputs include, but are not limited to, the type and cost of the security; contractual or legal restrictions on resale of the security; relevant financial or business developments of the issuer; actively traded similar or related securities; conversion or exchange rights on the security; related corporate actions; significant events occurring after the close of trading in the security; and changes in overall market conditions. Fair valuations and valuations of investments that are not actively trading involve judgment and may differ materially from valuations of investments that would have been used had greater market activity occurred.
The Fund classifies its assets based on three valuation methodologies. Level 1 values are based on quoted market prices in active markets for identical assets. Level 2 values are based on significant observable market inputs, such as quoted prices for similar assets and quoted prices in inactive markets or other market observable inputs. Level 3 values are based on significant unobservable inputs that reflect the Fund's determination of assumptions that market participants might reasonably use in valuing the assets. The valuation levels are not
19
FPA PARAMOUNT FUND, INC.
NOTES TO FINANCIAL STATEMENTS
Continued
necessarily an indication of the risk associated with investing in those securities. The following table presents the valuation levels of the Fund's investments as of September 30, 2013:
| | | Level 1(3) | | Level 2(3) | | Level 3(3) | | Total | |
Common Stocks(1) | | $ | 202,621,237 | | | | — | | | | — | | | $ | 202,621,237 | | |
Short-Term Investments(2) | | | — | | | $ | 123,287,573 | | | | — | | | | 123,287,573 | | |
| | | $ | 202,621,237 | | | $ | 123,287,573 | | | | — | | | $ | 325,908,810 | | |
(1) All common stocks are classified under Level 1. The Portfolio of Investments provides further information on major security types.
(2) Comprised solely of short-term investments with maturities of 60 days or less that are valued at amortized cost.
(3) Transfers of investments between different levels of the fair value hierarchy are recorded at market value as of the end of the reporting period. There were no transfers between Levels 1, 2, or 3 during the year ended September 30, 2013.
NOTE 8 — Line of Credit
The Fund, along with FPA Perennial Fund, Inc. (another mutual fund managed by the Adviser), has collectively entered into an agreement that enables them to participate in a $50 million unsecured line of credit with State Street Bank and Trust. Borrowings will be made solely to temporarily finance the repurchase of Capital Stock. Interest is charged to each Fund based on its borrowings at a rate per annum equal to the Overnight LIBOR Rate plus 0.625%. In addition, the Fund and FPA Perennial Fund, Inc. pay a commitment fee of 0.125% per annum on any unused portion of the line of credit. During the year ended September 30, 2013, the Fund had no borrowings under the agreement.
NOTE 9 — Subsequent Event
On November 15, 2013, shareholders of the Fund approved a number of proposals, including a new Investment Advisory Agreement that raises the fee paid to the Adviser to an annualized rate of 1%. The Adviser has voluntarily agreed to waive that fee increase through May 15, 2014, and has contractually agreed to waive fees or expenses (excluding brokerage fees and commissions, interest, taxes, shareholder service fees, fees and expenses of other funds in which the Fund invests, and extraordinary expenses) in order to ensure that the Fund's annualized expense ratio will not exceed 1.32% through January 31, 2015. Shareholders also approved a proposal to change the Fund from a diversified fund to a non-diversified fund. Shareholders adopted updates to certain fundamental investment policies of the Fund and proposals to eliminate certain other fundamental investment policies that are not required by law or are more restrictive than the law requires, as follows: revise the fundamental policy relating to real estate; revise the fundamental policy relating to commodities; revise the fundamental policy relating to industry concentration; revise the fundamental policy relating to lending; revise the fundamental policy relating to the issuance of senior securities and borrowing; revise the fundamental policy relating to underwriting; remove the fundamental policy relating to participation in joint trading accounts for securities; remove the fundamental policy relating to affiliate transactions; remove the fundamental policy relating to purchasing and writing put and call options and engaging in short sales; remove the fundamental policy relating to investments in other investment companies, and remove the fundamental policy relating to investments in companies for the purpose of exercising control or management. Lastly, shareholders approved a proposal to change the Fund's investment objective from a fundamental policy to a non-fundamental policy. The actual tabulation of the vote will appear in the Fund's March 31, 2014 Semi-Annual Report.
20
REPORT OF INDEPENDENT REGISTERED
PUBLIC ACCOUNTING FIRM
TO THE SHAREHOLDERS AND
BOARD OF DIRECTORS OF FPA PARAMOUNT FUND, INC.
We have audited the accompanying statement of assets and liabilities of FPA Paramount Fund, Inc. (the "Fund"), including the portfolio of investments, as of September 30, 2013, the related statement of operations for the year then ended, the statements of changes in net assets for each of the two years in the period then ended, and the financial highlights for each of the five years in the period then ended. These financial statements and financial highlights are the responsibility of the Fund's management. Our responsibility is to express an opinion on these financial statements and financial highlights based on our audits.
We conducted our audits in accordance with the standards of the Public Company Accounting Oversight Board (United States). Those standards require that we plan and perform the audit to obtain reasonable assurance about whether the financial statements and financial highlights are free of material misstatement. The Fund is not required to have, nor were we engaged to perform, an audit of its internal control over financial reporting. Our audits included consideration of internal control over financial reporting as a basis for designing audit procedures that are appropriate in the circumstances, but not for the purpose of expressing an opinion on the effectiveness of the Fund's internal control over financial reporting. Accordingly, we express no such opinion. An audit also includes examining, on a test basis, evidence supporting the amounts and disclosures in the financial statements, assessing the accounting principles used and significant estimates made by management, as well as evaluating the overall financial statement presentation. Our procedures included confirmation of securities owned as of September 30, 2013, by correspondence with the custodian and brokers; where replies were not received from brokers, we performed other auditing procedures. We believe that our audits provide a reasonable basis for our opinion.
In our opinion, such financial statements and financial highlights referred to above present fairly, in all material respects, the financial position of FPA Paramount Fund, Inc. as of September 30, 2013, the results of its operations for the year then ended, the changes in its net assets for each of the two years in the period then ended, and the financial highlights for each of the five years in the period then ended in conformity with accounting principles generally accepted in the United States of America.

Los Angeles, California
November 19, 2013
21
FPA PARAMOUNT FUND, INC.
RENEWAL OF INVESTMENT ADVISORY AGREEMENT
(Unaudited)
Approval of the Advisory Agreement. At a meeting of the Board of Directors held on August 5, 2013, the Directors approved the continuation of the advisory agreement between the Fund and the Adviser for an additional one-year period through September 30, 2014, on the recommendation of the Independent Directors who met in executive session on August 5, 2013 prior to the Board meeting to review and discuss the proposed continuation of the advisory agreement. The following paragraphs summarize the material information and factors considered by the Board and the Independent Directors as well as the Directors' conclusions relative to such factors.
General. The Adviser noted that it was creating a new investment strategy using the Adviser's expanded research and investment management capabilities relating to non-U.S. investments and would propose at an upcoming meeting that the Fund transition to this new strategy, at which time it would provide further information and seek the Board's approval of a new investment advisory agreement at a new fee rate. The Adviser also noted that a new investment advisory agreement, if approved by the Board, would also require shareholder approval, and that shareholder approval could not be assured. Accordingly, the Adviser proposed that the Board consider continuing, for another year, the Fund's existing investment advisory agreement initially and that, when the Board meets at a subsequent meeting and has additional information about the Adviser's proposal, it could consider a new investment advisory agreement for the Fund. Accordingly, the factors and considerations by the Board and the Independent Directors at the meeting summarized below relate solely to continuance of the existing investment advisory agreement.
Nature, Extent and Quality of Services. The Board and the Independent Directors considered information regarding the Adviser and its staffing in connection with the Fund, including the Fund's portfolio managers and the senior analysts on their team, the scope of accounting, administrative, shareholder and other services supervised and provided by the Adviser, and the absence of any significant service problems reported to the Board. The Board and the Independent Directors noted the experience, length of service and the outstanding reputation of the Fund's portfolio managers, Eric Ende and Steven Geist, who have managed the Fund since 2000, Gregory A. Herr, who joined the Adviser in 2007, and Pierre O. Py, who joined the Adviser in September, 2011. The Board and the Independent Directors concluded that the nature, extent and quality of services provided by the Adviser have benefited and should continue to benefit the Fund and its shareholders.
Investment Performance. The Board and the Independent Directors reviewed the overall investment performance of the Fund. The Directors also received information from an independent consultant, Morningstar Associates, LLC ("Morningstar"), regarding the Fund's performance relative to a peer group of mid-cap core funds selected by Morningstar (the "Peer Group"). The Board and the Independent Directors noted the Fund's competitive investment performance when compared to the Peer Group. The Board and the Independent Directors concluded that the Adviser's continued management of the Fund should benefit the Fund and its shareholders.
Advisory Fees and Fund Expenses; Adviser Profitability; Economies of Scale and Sharing of Economies of Scale. The Board and the Independent Directors were provided information by the Adviser to enable consideration of the Fund's advisory fees and total expense levels, as well as the overall profitability of the Adviser, the benefits to the Adviser from its relationship to the Fund, the extent to which economies of scale with respect to the management of the Fund, if any, would be realized, and whether the Fund is sharing, or will share, in those economies.
The Board and the Independent Directors reviewed comparative information relative to fees and expenses for the Fund and for the Peer Group. The Board and the Independent Directors noted that the Fund's advisory fees and overall expense ratio were each below the median of those for the Peer Group. The Board and the Independent Directors noted that the Fund reimburses the Adviser for providing administrative and other financial services to the Fund and considered the administrative and other financial services provided by the Adviser and the reimbursement level in connection with their consideration of the overall services provided by the Adviser and its compensation. The Board and the Independent Directors compared the Fund's advisory fee with the advisory
22
FPA PARAMOUNT FUND, INC.
RENEWAL OF INVESTMENT ADVISORY AGREEMENT
Continued
fees charged by the Adviser to other clients. The Board and the Independent Directors noted that where the fees paid by the Adviser's other clients were lower, the differences reflected the differences in services provided by the Adviser to those clients. The Board and the Independent Directors considered other actual and potential benefits to the Adviser from managing the Fund, including the acquisition and use of research services with commissions generated by the Fund, in concluding that the contractual advisory and other fees are fair and reasonable for the Fund. The Board and the Independent Directors concluded that the continued payment of advisory fees and expenses by the Fund to the Adviser was fair and reasonable and should continue to benefit the Fund and its shareholders.
The Board and the Independent Directors considered whether there have been economies of scale with respect to the management of the Fund, whether the Fund has appropriately benefited from any economies of scale, and whether the fee rate is reasonable in relation to the Fund's asset levels and any economies of scale that may exist. The Board and the Independent Directors noted that the fee rate has a breakpoint at $50 million in Fund assets and discussed the fact that the fee rate does not have any additional breakpoints. They considered that many mutual funds have breakpoints in the advisory fee structure as a means by which to share in the benefits of potential economies of scale as a fund's assets grow. They also considered that not all funds have breakpoints in their fee structures and that breakpoints are not the exclusive means of sharing potential economies of scale. The Board and the Independent Directors considered the Adviser's statement that it believes that additional breakpoints currently were not appropriate for the Fund given the ongoing investments the Adviser is making in its business for the benefit of the Fund, uncertainties regarding the direction of the economy, rising inflation, increasing costs for personnel and systems, and growth or contraction in the Fund's assets, all of which could negatively impact the Adviser.
The Board and the Independent Directors considered the Adviser's representation that its internal costs of providing investment management services to the Fund have increased significantly in recent years as a result of a number of factors, including the Adviser's substantial investment in additional professional resources and staffing. The Board and the Independent Directors considered information regarding the Adviser's representation that such increased costs have also included a significant investment in increasing the portfolio management team to four, and additions to administrative personnel and systems that enhance the quality of services provided to the Fund. The Board and the Independent Directors concluded that the Fund is benefitting from the ongoing investments made by the Adviser in its team of personnel serving the Fund and in its service infrastructure, and that in light of these investments, additional breakpoints in the Fund's advisory fee structure were not warranted at current asset levels.
Conclusions. The Board and the Independent Directors determined that the Fund continues to benefit from the services of a highly experienced portfolio management team that has produced competitive long-term returns. In addition, the Board and the Independent Directors agreed that the Fund continues to receive high-quality accounting, administrative, shareholder and other ancillary services from the Adviser. The Board and the Independent Directors concluded that the current advisory fee rate is reasonable and fair to the Fund and its shareholders in light of the nature and quality of the services provided by the Adviser and the Adviser's profitability and costs. The Board and the Independent Directors also stated their intention to continue monitoring the factors relevant to the Adviser's compensation, such as changes in the Fund's asset levels, changes in portfolio management personnel and the cost and quality of the services provided by the Adviser to the Fund. On the basis of the foregoing, and without assigning particular weight to any single factor, none of which was dispositive, the Board and the Independent Directors concluded that it would be in the best interests of the Fund to continue to be advised and managed by the Adviser and determined to approve the continuation of the current Advisory Agreement for another one-year period through September 30, 2014.
23
FPA PARAMOUNT FUND, INC.
SHAREHOLDER EXPENSE EXAMPLE
September 30, 2013 (unaudited)
Fund Expenses
As a shareholder of the Fund, you incur two types of costs: (1) transaction costs, and (2) ongoing costs, including advisory and administrative fees; shareholder service fees; and other Fund expenses. The Example is intended to help you understand your ongoing costs (in dollars) of investing in the Fund and to compare these costs with the ongoing costs of investing in other mutual funds. The Example is based on an investment of $1,000 invested at the beginning of the year and held for the entire year.
Actual Expenses
The information in the table under the heading "Actual Performance" provides information about actual account values and actual expenses. You may use the information in this column, together with the amount you invested, to estimate the expenses that you paid over the period. Simply divide your account value by $1,000 (for example, an $8,600 account value divided by $1,000= 8.6), then multiply the result by the number in the first column in the row entitled "Expenses Paid During Period" to estimate the expenses you paid on your account during this period.
Hypothetical Example for Comparison Purposes
The information in the table under the heading "Hypothetical Performance (5% return before expenses)" provides information about hypothetical account values and hypothetical expenses based on the Fund's actual expense ratio and an assumed rate of return of 5% per year before expenses, which is not the Fund's actual return. The hypothetical account values
and expenses may not be used to estimate the actual ending account balance or expenses you paid for the period. You may use this information to compare the ongoing costs of investing in the Fund and other funds. To do so, compare this 5% hypothetical example with the 5% hypothetical examples that appear in the shareholder reports of other funds.
Please note that the expenses shown in the table are meant to highlight your ongoing costs only and do not reflect any transactional costs. Therefore, the information under the heading "Hypothetical Performance (5% return before expenses)" is useful in comparing ongoing costs only, and will not help you determine the relative total costs of owning different funds. In addition, if these transactional costs were included, your costs would have been higher.
| | | Actual
Performance | | Hypothetical
Performance
(5% return
before
expenses) | |
Beginning Account Value
March 31, 2013 | | $ | 1,000.00 | | | $ | 1,000.00 | | |
Ending Account Value
September 30, 2013 | | $ | 1,085.38 | | | $ | 1.020.48 | | |
Expenses Paid During
Period* | | $ | 4.65 | | | $ | 4.52 | | |
* Expenses are equal to the Fund's annualized expense ratio of 0.89%, multiplied by the average account value over the period and prorated for the six-months ended September 30, 2013 (183/365 days).
24
FPA PARAMOUNT FUND, INC.
DIRECTOR AND OFFICER INFORMATION
| Name, Age & Address | | Positions(s)
With Fund/
Years Served | | Principal Occupation(s)
During the Past 5 Years | | Portfolios in
Fund Complex
Overseen | | Other
Directorships | |
Allan M. Rudnick – (72)† | | Director and Chairman*
Years Served: 1 | | Private Investor. Formerly Co-Founder, Chief Executive Officer, Chairman and Chief Investment Officer of Kayne Anderson Rudnick Investment Management from 1989 to 2007. | | | 7 | | | | |
Thomas P. Merrick – (76)† | | Director*
Years Served: 5 | | Private consultant. President of Strategic Planning Consultants for more than the past five years. Former Executive Committee member and Vice President of Fluor Corporation, responsible for strategic planning, from 1993 to 1998. | | | 7 | | | | |
Alfred E. Osborne, Jr. – (68)† | | Director*
Years Served: <1 | | Senior Associate Dean of the John E. Anderson School of Management at UCLA. | | | 7 | | | Wedbush, Inc., Heckman Corporation, and Kaiser Aluminum, Inc. | |
A. Robert Pisano – (70)† | | Director*
Years Served: 1 | | Retired. Formerly President and Chief Operating Officer of the Motion Picture Association of America, Inc. from 2005 to 2011. | | | 7 | | | Resources Connection, The Motion Picture and Television Fund | |
Patrick B. Purcell – (70)† | | Director*
Years Served: 1 | | Retired. Formerly Executive Vice President, Chief Financial and Administrative Officer of Paramount Pictures from 1983 to 1998. | | | 7 | | | The Motion Picture and Television Fund | |
Eric S. Ende – (69) | | Director*
Years Served: 13 | | Partner of the Adviser. | | | 3 | | | | |
Gregory A. Herr – (41) | | Co-President and Co-Chief Investment Officer
Years Served: 2 | | Managing Director (2013) and Vice President (2007-2012) of the Adviser since 2007. | | | | | |
Pierre O. Py – (37) | | Co-President and Co-Chief Investment Officer
Years Served: 2 | | Managing Director (2013), Vice President (2011-2012) and Portfolio Manager of the Adviser since 2011. Formerly an international investment analyst at Harris Associates L.P. from 2005 to 2010. | | | | | |
J. Richard Atwood – (53) | | Treasurer
Years Served: 16 | | Chief Operating Officer of the Adviser. | | | | | |
25
FPA PARAMOUNT FUND, INC.
DIRECTOR AND OFFICER INFORMATION
Continued
| Name, Age & Address | | Positions(s)
With Fund/
Years Served | | Principal Occupation(s)
During the Past 5 Years | | Portfolios in
Fund Complex
Overseen | | Other
Directorships | |
Christopher H. Thomas – (56) | | Chief Compliance Officer
Years Served: 18 | | Vice President and Chief Compliance Officer of the Adviser. | | | | | |
Sherry Sasaki – (58) | | Secretary
Years Served: 31 | | Assistant Vice President and Secretary of the Adviser. | | | | | |
E. Lake Setzler – (46) | | Assistant Treasurer
Years Served: 7 | | Senior Vice President and Controller of the Adviser. | | | | | |
Michael P. Gomez – (28) | | Assistant Vice President
Years Served: 1 | | Assistant Vice President of the Adviser since 2010. Formerly In-Charge Associate of PricewaterhouseCoopers from 2007 to 2010. | | | | | |
* Directors serve until their resignation, removal or retirement.
† Audit Committee member
Additional information on the Directors is available in the Statement of Additional Information. Each of the above individuals can be contacted at 11400 W. Olympic Blvd,. Suite 1200, Los Angeles, CA 90064.
26
INVESTMENT ADVISER
First Pacific Advisors, LLC
11400 West Olympic Boulevard, Suite 1200
Los Angeles, CA 90064
DISTRIBUTOR
UMB Distribution Services, LLC
803 West Michigan Street
Milwaukee, Wisconsin 53233
COUNSEL
K&L Gates LLP
San Francisco, California
TICKER SYMBOL: FPRAX
CUSIP: 302546106
INDEPENDENT REGISTERED PUBLIC ACCOUNTING FIRM
Deloitte & Touche LLP
Los Angeles, California
CUSTODIAN
State Street Bank and Trust Company
Boston, Massachusetts
TRANSFER & SHAREHOLDER SERVICE AGENT
UMB Fund Services, Inc.
P.O. Box 2175
Milwaukee, WI 53201-2175
or
803 W. Michigan St.
Milwaukee, WI 53233-2301
(800) 638-3060
This report has been prepared for the information of shareholders of FPA Paramount Fund, Inc., and is not authorized for distribution to prospective investors unless preceded or accompanied by an effective prospectus.
The Fund's complete proxy voting record for the 12 months ended June 30, 2013 is available without charge, upon request by calling (800) 982-4372 and on the SEC's website at www.sec.gov.
The Fund's schedule of portfolio holdings, filed the first and third quarter of the Fund's fiscal year on Form N-Q with the SEC, is available on the SEC's website at www.sec.gov. Form N-Q is available at the SEC's Public Reference Room in Washington, D.C., and information on the operations of the Public Reference Room may be obtained by calling (202) 942-8090. To obtain Form N-Q from the Fund, shareholders can call (800) 982-4372.
Additional information about the Fund is available online at www.fpafunds.com. This information includes, among other things, holdings, top sectors, and performance, and is updated on or about the 15th business day after the end of each quarter.
Item 2. Code of Ethics.
(a) The registrant has adopted a code of ethics that applies to the registrant’s principal executive and financial officers.
(b) Not Applicable
(c) During the period covered by this report, there were not any amendments to the provisions of the code of ethics adopted in 2(a) above.
(d) During the period covered by this report, there were not any implicit or explicit waivers to the provisions of the code of ethics adopted in 2(a).
(e) Not Applicable
(f) A copy of the registrant’s code of ethics is filed as an exhibit to this Form N-CSR. Upon request, any person may obtain a copy of this code of ethics, without charge, by calling (800) 982-4372.
Item 3. Audit Committee Financial Expert.
The registrant’s board of directors has determined that Patrick B. Purcell, a member of the registrant’s audit committee and board of directors, is an “audit committee financial expert” and is “independent,” as those terms are defined in this Item. This designation will not increase the designee’s duties, obligations or liability as compared to his duties, obligations and liability as a member of the audit committee and of the board of directors. This designation does not affect the duties, obligations or liability of any other member of the audit committee or the board of directors.
Item 4. Principal Accountant Fees and Services.
| | | | 2012 | | 2013 | |
(a) | | Audit Fees | | $ | 36,000 | | $ | 36,000 | |
(b) | | Audit Related Fees | | -0- | | -0- | |
(c) | | Tax Fees | | $ | 7,860 | | $ | 8,000 | |
(d) | | All Other Fees | | -0- | | -0- | |
(e)(1) Disclose the audit committee’s pre-approval policies and procedures described in paragraph (c)(7) of Rule 2-01 of Regulation S-X. The audit committee shall pre-approve all audit and permissible non-audit services that the committee considers compatible with maintaining the independent auditors’ independence. The pre-approval requirement will extend to all non-audit services provided to the registrant, the adviser, and any entity controlling, controlled by, or under common control with the adviser that provides ongoing services to the registrant, if the engagement relates directly to the operations and financial
reporting of the registrant; provided, however, that an engagement of the registrant’s independent auditors to perform attest services for the registrant, the adviser or its affiliates required by generally accepted auditing standards to complete the examination of the registrant’s financial statements (such as an examination conducted in accordance with Statement on Auditing Standards Number 70 issued by the American Institute of Certified Public Accountants), will be deem pre-approved if: (i) the registrant’s independent auditors inform the audit committee of the engagement, (ii) the registrant’s independent auditors advise the audit committee at least annually that the performance of this engagement will not impair the independent auditor’s independence with respect to the registrant, and (iii) the audit committee receives a copy of the independent auditor’s report prepared in connection with such services. The committee may delegate to one or more committee members the authority to review and pre-approve audit and permissible non-audit services. Actions taken under any such delegation will be reported to the full committee at its next meeting.
(e)(2) Disclose the percentage of services described in each of paragraphs (b) – (d) of this Item that were approved by the audit committee pursuant to paragraph (c)(7)(i)(C) of Rule 2-01 of Regulation S-X. 100% of the services provided to the registrant described in paragraphs (b) – (d) of this Item were pre-approved by the audit committee pursuant to paragraph (e)(1) of this Item. There were no services provided to the investment adviser or any entity controlling, controlled by or under common control with the adviser described in paragraphs (b) – (d) of this Item that were required to be pre-approved by the audit committee.
(f) If greater than 50%, disclose the percentage of hours expended on the principal accountant’s engagement to audit the registrant’s financial statements for the most recent fiscal year that were attributed to work performed by persons other than the principal accountant’s full-time, permanent employees. All services performed on the engagement to audit the registrant’s financial statements for the most recent fiscal year end were performed by the principal accountant’s full-time, permanent employees.
(g) Disclose the aggregate non-audit fees billed by the registrant’s accountant for services rendered to the registrant, and rendered to the registrant’s investment adviser (not including any sub-adviser whose role is primarily portfolio management and is subcontracted with or overseen by another investment adviser), and any entity controlling, controlled by, or under common control with the adviser that provides ongoing services to the registrant for each of the last two fiscal years of the registrant. None.
(h) Disclose whether the registrant’s audit committee of the board of directors has considered whether the provision of non-audit services that were rendered to the registrant’s investment adviser (not including any sub-adviser whose role is primarily portfolio management and is subcontracted with or overseen by another investment adviser), and any entity controlling, controlled by, or under common control with the investment adviser that provides ongoing services to the registrant that were not pre-approved pursuant to paragraph (c)(7)(ii) of Rule 2-01 of Regulation S-X is compatible with maintaining the principal accountant’s independence. Not Applicable.
Item 5. Audit Committee of Listed Registrants. Not Applicable.
Item 6. Schedule of Investments. The schedule of investments is included as part of the report to stockholders filed under Item 1 of this Form.
Item 7. Disclosure of Proxy Voting Policies and Procedures for Closed-End Management Investment Companies. Not Applicable.
Item 8. Portfolio Managers of Closed-End Management Investment Companies. Not Applicable.
Item 9. Purchases of Equity Securities by Closed-End Management Investment Company and Affiliated Purchasers. Not Applicable.
Item 10. Submission of Matters to a Vote of Security Holders. There has been no material change to the procedures by which shareholders may recommend nominees to the registrant’s board of directors.
Item 11. Controls and Procedures.
(a) The principal executive officer and principal financial officer of the registrant have concluded that the registrant’s disclosure controls and procedures (as defined in Rule 30a-3(c) under the Investment Company Act of 1940) are effective based on their evaluation of the disclosure controls and procedures as of a date within 90 days of the filing date of this report.
(b) There have been no significant changes in the registrant’s internal controls over financial reporting (as defined in Rule 30a-3(d) under the Investment Company Act of 1940) that occurred during the second fiscal quarter of the period covered by this report that have materially affected, or is reasonably likely to materially affect, the registrant’s internal controls over financial reporting.
Item 12. Exhibits.
(a)(1) Code of ethics as applies to the registrant’s officers and directors, as required to be disclosed under Item 2 of Form N-CSR. Attached hereto as Ex.99.CODE.ETH.
(a)(2) Separate certification for the registrant’s principal executive officer and principal financial officer, as required by Rule 30a-2(a) under the Investment Company Act of 1940. Attached hereto.
(a)(3) Not Applicable
(b) Separate certification for the registrant’s principal executive officer and principal financial officer, as required by Rule 30a-2(b) under the Investment Company Act of 1940. Attached hereto.
SIGNATURES
Pursuant to the requirements of the Securities Exchange Act of 1934 and the Investment Company Act of 1940, the registrant has duly caused this report to be signed on its behalf by the undersigned, thereunto duly authorized.
FPA PARAMOUNT FUND, INC.
By: | /s/ GREGORY A. HERR | |
Gregory A. Herr, Co-President | |
(Principal Executive Officer) | |
Date: November 21, 2013
Pursuant to the requirements of the Securities Exchange Act of 1934 and the Investment Company Act of 1940, this report has been signed below by the following persons on behalf of the registrant and in the capacities and on the dates indicated.
FPA PARAMOUNT FUND, INC.
By: | /s/ GREGORY A. HERR | |
Gregory A. Herr, Co-President | |
(Principal Executive Officer) | |
Date: November 21, 2013
By: | /s/ J. RICHARD ATWOOD | |
J. Richard Atwood, Treasurer | |
(Principal Financial Officer) | |
Date: November 21, 2013