UNITED STATES
SECURITIES AND EXCHANGE COMMISSION
Washington, D.C. 20549
FORM N-CSR
CERTIFIED SHAREHOLDER REPORT OF REGISTERED
MANAGEMENT INVESTMENT COMPANIES
Investment Company Act file number | 811-852 |
|
FPA PARAMOUNT FUND, INC. |
(Exact name of registrant as specified in charter) |
|
11400 WEST OLYMPIC BLVD., SUITE 1200, LOS ANGELES, CALIFORNIA | | 90064 |
(Address of principal executive offices) | | (Zip code) |
|
J. RICHARD ATWOOD,
11400 WEST OLYMPIC BLVD., SUITE 1200, LOS ANGELES, CALIFORNIA 90064 |
(Name and address of agent for service) |
|
Registrant’s telephone number, including area code: | 310-473-0225 | |
|
Date of fiscal year end: | SEPTEMBER 30 | |
|
Date of reporting period: | SEPTEMBER 30, 2011 | |
| | | | | | | | | |
Item 1. Report to Stockholders.
FPA Paramount Fund, Inc.
Annual Report

Distributor:
FPA FUND DISTRIBUTORS, INC.
11400 West Olympic Boulevard, Suite 1200
Los Angeles, California 90064
IMPORTANT REMINDER:
Effective as of the close of business on November 4, 2011, UMB Fund Services, Inc. (UMBFS) officially replaced Boston Financial Data Services as the transfer agent for the FPA Funds. While many of the services UMBFS provides take place behind the scenes, we believe that changing providers will result in lower overall costs to the Funds while providing greater reporting and online capabilities. We hope that this change further enhances your experience with the FPA Funds. Please refer to the back cover of this report for the new contact information.
September 30, 2011
LETTER TO SHAREHOLDERS
Performance
For the third quarter Paramount was down 22%, one of its worst quarterly performances. The benchmark Russell 2500 was only nominally better with a 21% decline. It was very much a large-cap quarter as investors took shelter behind bigger companies. The S&P was down 14% and the Nasdaq down 13% while the Dow declined just 11%. In contrast the Russell 2000 was down 22%. Fortunately, much of Paramount's weak third quarter was largely offset by the market's strong performance in October.
For the quarter we had only two up stocks. First, Sonova (+7%), a maker of hearing aids, saw a number of favorable fundamental events impact its business during the quarter (more on this later). And second, O'Reilly Auto (+2%), a parts retailer and jobber has acted as a refuge when investors are most worried because the essential nature of car repairs supports demand for its products. All the other portfolio stocks declined in the quarter, with the greatest losses concentrated in the economically sensitive names. The fall in their stock prices resulted from the market anticipating an economic slowdown that has yet to materialize in the underlying businesses. Through the third quarter earnings reports, we have observed no significant deterioration in the fundamental performances of these companies. This was reflected in the strong October rebound in share prices.
For the year-to-date period, Paramount was down 17%, notably weaker than the benchmark Russell 2500 (down 15%). As in the case of the third quarter, the large caps were the leaders. The Dow was down only 5% at the end of September.
Our best performing stocks were viewed by the market as having limited economic risk. O'Reilly Auto was up 10%. Aggreko, provider of supplementary electric power in developing countries, was up 6%. Copart, which runs auctions for salvage autos, was up 5%.
On the downside for the nine months we find some more cyclical names, including Manpower, HNI, and Wabco (all down 40-45%), as well as several healthcare companies, including Life Technologies and VCA-Antech (both down about 30%).
The table below shows performance for both Paramount and the benchmark Russell 2500, as well as leading large-cap indexes.
| | | Periods Ended September 30, 2011 | |
| | | Third
Quarter | | Nine
Months | | One
Year | | Three
Years* | | Five
Years* | | Ten
Years* | |
| Paramount** | | | (22.0 | )% | | | (17.4 | )% | | | (5.0 | )% | | | 1.8 | % | | | 0.5 | % | | | 7.3 | % | |
Russell
2500 | | | (21.2 | )% | | | (14.9 | )% | | | (2.2 | )% | | | 2.2 | % | | | 0.2 | % | | | 7.1 | % | |
| S & P 500 | | | (13.9 | )% | | | (8.7 | )% | | | 1.1 | % | | | 1.2 | % | | | (1.2 | )% | | | 2.8 | % | |
| Nasdaq | | | (12.7 | )% | | | (8.3 | )% | | | 3.0 | % | | | 5.9 | % | | | 2.2 | % | | | 5.6 | % | |
* Annualized Returns
** The returns shown are at net asset value and do not reflect deduction of the maximum sales charge of 5.25% which, if reflected, would reduce the performance shown.
Change of Fund Focus
As we noted in the Fund's last Semi-Annual Report, FPA Paramount's investment focus changed to a global orientation beginning August 1, 2011. Once this reorientation is fully implemented, we expect the Fund to typically maintain a foreign allocation of more than 50%, that is more than 50% of the Fund's assets invested in companies domiciled outside the U.S. The transition to this global focus will be gradual and, given our historically low turnover, could likely take more than one year. As securities are sold in the normal course of portfolio management, they will be replaced with new holdings, most of which we expect to be domiciled outside the U.S. We expect that upcoming portfolio changes will be similarly deliberate. Our March 31, 2011 Semi-Annual Report contains an expanded commentary that fully explained our rationale for the change.
We are pleased to report that along with our new global focus we continue to enhance our investment team. First, we added Greg Herr and Pierre Py as portfolio managers. We introduced Greg to you when he joined FPA as one of our analysts in 2007. Pierre joined FPA this year from Harris Associates. In addition, we added Eric Bokota as an analyst on the Fund. Eric also joined FPA this year from Harris Associates. Both Pierre and Eric have extensive experience researching and analyzing international companies. Their addition further bolsters our international investment capabilities.
1
Commentary
"Holding on, but Wanting to Let Go"
The risk of a major government (sovereign) debt default exists for the first time in a decade. The situations in Greece and potentially Portugal, Ireland, Spain and Italy conjure up fears of the market declines experienced when Russia and much of Latin America defaulted. These sovereign debt concerns lead markets also to consider more systemic risks to the financial system. Many European banks have far too little capital in light of their true economic losses on the government bonds they hold. Fears of a large bank failure are heightened by memories of the aftermath of Lehman's collapse. Compounding these concerns, structural flaws in the European Union (EU)1 are also creating political risk. An ill-defined resolution mechanism coupled with the volatility of politics does not inspire confidence in timely and well-considered responses to the crises. Finally, the combination of all these factors weighs on the economy. Caution among business leaders translates into lower investment spending which reduces economic activity.
Total Country Debt
The 2008 downturn led to an unsustainable accumulation of debt across many of the countries. In Ireland, a real estate loan boom and bust decimated banks and saddled consumers with an enormous burden. At the end of March, the country's total debt (household, corporate and government) was over 350% of gross domestic product (GDP).2 The story is the same in Portugal and Spain where total borrowings exceeded 325% of GDP for each at the end of March. Greece is in even worse shape. With only meager economic growth prospects for an extended period of time, markets began to worry about the ability of these countries to handle their elevated debt loads. At the end of September, nearly half of the €6.5 trillion EU government debt outstanding traded at yields more than 200 basis points higher than the equivalent German government bond.3 There could be no clearer sign of the market's concern about sovereign credit risk. Nor can the size of the issue be overlooked.
Banks
Who financed a decade's worth of European excesses? The banks did, and still hold sizable amounts of the government bonds (Greece, Italy) and housing loans (Ireland, Portugal, Spain). According to the Bank for International Settlements (BIS), at the end of June European banks had $1.8 trillion of exposure to Portugal, Ireland, Italy, Greece and Spain.4 Making matters worse, Europe's banks appear grossly undercapitalized, for the ten largest on average have tangible common equity representing only 2.8% of tangible assets.5 We believe that even these meager capital levels are based on unrealistic accounting. Much of their EU sovereign debt is carried at par in the long-term held-to-maturity category, despite many bonds trading at a significant discount to that level in the market. This valuation treatment will continue until the event of a default.
With the status quo capital levels appearing unsustainable, banks will likely receive government capital infusions. Since EU banks generally rely more heavily on commercial funding than their U.S. counterparts, this recapitalization process is crucial. Since the end of June almost no EU bank bonds have been issued. With approximately €800 billion in term debt to roll over in the next twelve months, these banks
1 Please note that the EU refers to the European political union of twenty-seven member states.
Seventeen of those countries are members of the Euro area (EA) (also known as the Eurozone), the currency union which adopted the Euro. Despite the important distinction between the two groups, for simplicity our discussion will use EU interchangeably to mean either group.
2 Calculated by FPA based on data from Haver Analytics.
3 International Monetary Fund, Global Financial Stability Report: Grappling with Crisis Legacies September 2011: 16
4 Bank for International Settlements, Detailed Tables on Preliminary Banking Statistics at end-June 2011 October 2011: 78-82
5 CLSA, Asia Maxima: Risk Eruption 4Q 2011: 7. For comparison, the same measure is 6% for the top ten U.S. banks.
2
must regain market confidence or radically shrink their balance sheets.6
Structurally Unstable
Two major flaws exist in the current economic structure of the EU. The negotiators involved in its creation knew they could not obtain central authority to set tax and spending levels and still win support for the union. Instead, they decided to establish collective decision making where they could while deferring the difficult issue of fiscal unification until later. As a result, the currency union has seventeen countries utilizing the Euro, but limited practical control over the spending and tax collections of each. Under circumstances where bailouts are required, this inability to guarantee sound fiscal policy by recipients limits the willingness of the providers. However, remedying the deficiency with a move to collective fiscal control faces enormous political challenges.
The lack of a resolution process for countries unable to meet their financial obligations is the second structural issue. Europe has no "lender of last resort" structure when countries get into trouble and need to stop financial market panics. ECB buying of distressed government bonds has been the stop gap response so far but looks like a limited option going forward. Limitations also exist on a country's ability to exit the union. While the EU treaty permits such a departure, it imposes a two-year waiting period, which is an eternity during market panics. There is also no provision for the forced removal of a country. If the EU's framers found it difficult to reach consensus on these structural issues at the outset, we suspect that today's environment makes it even harder.
Government Action
European governments, to the exasperation of observers around the world, have moved at a glacial pace thus far to resolve the crises. There are multiple interrelated reasons for the lack of preemptive action. First, most of the EU countries, including the largest economies, have experienced significant public debt growth since 2008. At the end of September, the ratio of German government debt to GDP was 83%.7 The same ratio for French government debt outstanding was 87% of GDP. France has explicit obligations under the bailout of Dexia bank, and both countries are expected to provide capital injections into their largest banks. This outlook leaves little room for additional government borrowing, and has caused saber rattling by the ratings agencies about a downgrade of the French AAA rating. Sovereign ratings downgrades, especially among the larger countries, would only worsen the situation. Second, and not to be overlooked as an impediment to government action, is popular discontent. Regular social protests against austerity in the south and bailouts in the north, and incumbents losing elections everywhere have discouraged aggressive action. Third, politicians face the risk of moral hazard. They know that if Greece is given needed debt relief, voters in Ireland, Portugal, Spain and even Italy will want the same deal. Fourth, political leaders have held off on any actions that would constitute a sovereign debt default because they recognize that bank capital levels are insufficient to absorb the immediate losses that would result. The fifth issue is regulatory. European bank regulators have been unwilling to perform stress test scenarios for sovereign bond holdings that include a modeled Greek default and other sovereign write downs, when political masters are still arguing these are unnecessary. This does not inspire confidence in the regulatory process. Next, the ECB must be considered. Over the last three years, it has purchased EU government bonds, and accepted collateral of unknown quality in return for loans to EU banks. Events that cause losses resulting from these actions will at a minimum damage the ECB's reputation. Finally, and probably the central reason for inaction, as the magnitude of potential losses became apparent, the politicians have tried to buy time to decide who will pay the bill among bank stock and bond investors, private sector savers (holders of government bonds) and taxpayers, and to make sure the system can handle the losses when they occur.
6 Barclay's Capital Thinking the Unthinkable? September 15, 2011:9
7 International Monetary Fund, Global Financial Stability Report: Grappling with Crisis Legacies September 2011: 5
3
What Will Happen?
We have always assumed that despite the apparent political inertia, when markets reached a panic state, governments would ultimately act. This belief rests on just how unpleasant departing the EU would be for any of the countries. In 2008 the market drop after the House of Representatives failed to pass the TARP legislation hastened its passage the next day. We suspect that European politicians need market panic to provide them similar political cover. Churchill, in a May 1935 speech to the House of Commons, described this behavior as "unwillingness to act when action would be simple and effective ... until self-preservation strikes its jarring gong."8
The largest impediment to successful action at the eleventh hour is the political complexity of the EU itself. Seventeen countries, each needing to vote, took almost three months to agree to the EU bail-out vehicle, the European Financial Stability Facility (EFSF). Additionally, as European leaders argue about how to deploy the EFSF, it is worth remembering that Congress gave Treasury Secretary Paulson and team total flexibility in how use the TARP funds. Allowing markets to reach a panic stage is a valid tactic only if rapid and decisive action can then be taken. We hope the EU's leaders have the capacity to produce an adequate response when ultimately needed.
Because politics are involved, it is very difficult to handicap the eventual outcome. We expect governments to intervene during periods of high market stress with half measures that treat symptoms, but not the underlying cause. Eventually, markets will force the issue, and the countries of northern Europe, Germany in particular, must then decide whether to subsidize the rest of Europe, or restructure the union.
Portfolio Opportunities
So what does all of this EU turmoil and market volatility mean for Paramount shareholders? We believe our existing portfolio companies are well positioned to weather storms in the financial system or the economy spawned by the European sovereign debt issues. We own no banks or insurers because of our inability to know what lies within their investment portfolios. If credit again becomes difficult to obtain, our companies' balance sheets should be a source of strength. At September 30, the portfolio's weighted debt as a percentage of total capital stood at 26%. If cash is netted against debt the same ratio falls to 15%. Most of the EU economies are likely to enter recession at the end of 2011. In past downturns, our companies were able to continue investing in their businesses while competitors often struggled to stay afloat. We expect a similar outcome this cycle.
As we have discussed in prior letters, with our new focus we continue to broaden our pool of potential investments by looking at companies outside the U.S. This greater flexibility will allow us to take advantage of market volatility across the U.S., Europe and Asia. The sovereign debt issues of the last six months caused many outstanding European companies to sell at attractive prices. As we discuss in the subsequent Company section of the letter, five of the six positions profiled are European based. Their weightings are currently small since government failure to stem the crisis could cause valuations to fall significantly. We have performed our rigorous business analysis, and can add to these positions aggressively when the opportunity presents.
In addition to share price changes, returns on these investments are impacted by currency fluctuations. During the third quarter, the dollar appreciated approximately 6% versus a group of other major currencies.9 We believe the perceived need for liquidity and relative safety spawned by turmoil in Europe drove much of the strengthening. Such appreciation causes the value of our international holdings to be lower in dollar terms. The upward dollar move also makes the international sales of our U.S. companies less valuable as they are translated from local currencies back into higher dollars.
A stronger dollar does have a silver lining. Currently less than 6% of the portfolio trades in another currency and about 40% of total portfolio company
8 Robert Rhodes James , ed., Winston S. Churchill: His Complete Speeches (Vol. 6) (London, Chelsea House, 1979) 5592
9 Based on the price changes of the DXY currency index.
4
sales come from outside the U.S. We expect both measures to increase in the years ahead. In periods when investor anxiety makes the dollar rise and we buy international companies, those holdings could potentially benefit from a resumption of the dollar's multi-year decline. We suspect this is the likely long-term trend for the greenback based on reduced future central bank buying (particularly if the Chinese trade deficit with the U.S. declines) and U.S. fiscal policy implying higher taxes and lower growth. Over time, if we are able to purchase foreign companies at depressed prices and the dollar subsequently weakens, the combination could boost the returns of our U.S. shareholders.
Company Discussion
We recently added a number of new names to the portfolio that we hadn't the opportunity to discuss with shareholders. These companies are in widely diverse businesses, but share the attributes of having strong world-wide franchises, high returns on capital, excellent balance sheets, and attractive valuations. We will profile several of these additions below.
The companies range over a number of economic sectors, including consumer, healthcare, and capital goods. Company domiciles include the U.S., France, Switzerland, the U.K. and Luxembourg, but all operate global businesses.
L'Occitane en Provence is a cosmetics company whose products feature natural and organic ingredients. Its focus is on skin care and it has strong regional roots in Provence, which is the source of most of its raw materials as well as its manufacturing base.
The company is vertically integrated, from product sourcing through retail stores, giving it a significant degree of control over its operations.
Although the cosmetics business is highly competitive and dominated by multinationals like L'Oreal, Estee Lauder, P&G, and Shiseido, we believe that a specialty brand, like L'Occitane's natural and organic skin care franchise, can develop a differentiated niche.
L'Occitane's business is remarkably diverse geographically. Its largest markets are Europe (40-45%), Japan (25%) and Greater China (15%). The U.S. is only about 10%. The company is enjoying especially strong growth in China, Brazil and Russia.
Operating margins have been maintained in the 15-18% range over the past five years, an excellent result. There is no balance sheet debt and considerable cash.
We have taken an initial position and hope to add to it at attractive future prices. Though headquarters are in France, L'Occitane trades only in Hong Kong.
Halma is a diverse industrial company with a dozen distinct business units. They are linked together by an emphasis on safety, health, and the environment. Examples include, in its infrastructure group, elevator and automatic door sensors, fire detection and security sensors, and in its industrial safety group, gas detection and safety interlocks.
Demand for many of these products is driven by government regulations. This creates long product life cycles and makes suppliers difficult to dislodge.
The business has a large acquisition component. Halma has shown good bidding discipline and typically pays a very attractive 6-9x EBIT (Earnings Before Interest and Taxes). They never feel that they have to do a particular deal.
Operating margins have averaged 17-20% over the past decade. The recession had little impact. Debt levels are nominal.
Sonova is a company that we would typically not have an opportunity to purchase at a reasonable price because it has many characteristics highly sought by equity investors. These include the leading global market share, strong organic growth driven by demographics and improving technology, and outstanding profitability.
After trading as high as 135 Swiss francs (SFR) in 2010, a number of worrisome challenges arose in Sonova's business, driving the stock price down by more than 50%, permitting us to establish our position in the 60-70 SFR range.
5
The issues impacting Sonova were real and significant, but in our opinion more likely to be transitory than permanent.
• First, there was a recall of Sonova's cochlear implant product for a re-tooling and resubmission to regulatory authorities.
• Second, there were rollout delays with Sonova's updated hearing aid technology platform.
• Finally, in March of 2011, an insider trading investigation led to the resignation of both Sonova's Chief Executive and Chief Financial Officer.
More recently, Sonova's outlook has improved:
• Its cochlear implant was approved by both European and U.S. regulators
• The "teething problems" with Sonova's new hearing aid chipset were resolved
• A new CEO and a new CFO were appointed after a lengthy search process.
• A Sonova-competitor, Cochlear Ltd., an Australian company which is number one worldwide in implants, was forced to withdraw its leading product after a number of adverse events.
The market has taken note of Sonova's more favorable news and in response the stock has been trading recently more than 60% above the lows set earlier in the year.
Spirax-Sarco is the world leader in steam systems management. It provides products and engineering expertise to more than 100,000 industrial and other facilities. A customer who optimizes his steam system gains valuable benefits in safety, energy and water consumption, and overall efficiency.
The key to Spirax's success is the 1300 technically trained sales and service engineer force that Spirax deploys worldwide. They serve to replace or supplement the shrinking technical resources of Spirax's customers.
Spirax increased its sales through the recent recession and has generated operating margins of 15-20%. It has no net debt.
Dolby Laboratories is a leading developer of technologies used to enhance audio and video quality. This is accomplished using encoding and decoding algorithms to manipulate the signals in an effort to reduce distortion. These technologies are licensed to hardware manufacturers for use in products such as mobile devices, personal computers, HDTV, cinema and broadcast equipment.
Although Dolby produces some hardware, approximately 80% of the company's revenues come from licensing arrangements. It is this licensing model that provides Dolby with 90% gross margins, 45% operating margins and net margins of 30%. This is truly a worldwide business with Dolby having arrangements with manufacturers and software vendors in more than 40 countries. The company has dominant market shares and in many cases is the de facto standard.
Annual sales are close to $1 billion and annual free cash flow generation has averaged $250 million for the last five years. The balance sheet is superb with over $10 per share in cash and no debt. Dolby has generated returns on capital of mid-teens or better since going public in 2005. Our shares have been purchased at an average valuation of less than 12x trailing twelve-month earnings (net of cash).
bioMerieux is a major world-wide company serving the in-vitro diagnostics market. The company's strength is in microbiology, the study of micro organisms, where it has over 40% of the global market. As an example, microbiology might involve culturing a biological sample so it can grow, be identified, and then tested for antibiotic resistance.
Also important to bioMerieux's business is the rapidly growing immunoassay market, detecting and measuring infectious agents through the antigen-antibody reaction. This is about one-quarter of bioMerieux's revenues.
Finally, bioMerieux has a toehold in the exploding molecular biology market, which involves
6
the study of biology at the molecular level, for example, analyzing genetic markers as opposed to looking at cells in a microscope.
bioMerieux also has a promising business in industrial applications of its diagnostic know-how, primarily in food safety and bio pharma.
bioMerieux has achieved pre-tax margins in the 15-18% range over the past five years. It has no net debt.
The chart below summarizes as of September 30, 2011 some of the outstanding financial characteristics of the companies discussed above, as well as a comparison with the benchmark Russell 2500.
| | | 5 Yr Average | | | | | | | |
| Company Name | | Return
on
Equity | | Debt %
Cap | | Sales
Growth | | Market
Cap
(billions) | | LTM
P/E | |
HQ | |
| bioMérieux | | | 19 | % | | | 7 | % | | | 6 | % | | $ | 3.4 | | | | 15.6 | x | | France | |
| Dolby Laboratories | | | 20 | % | | | 1 | % | | | 23 | % | | $ | 3.2 | | | | 11.0 | x | | United States | |
| Halma | | | 21 | % | | | 17 | % | | | 11 | % | | $ | 2.0 | | | | 17.6 | x | | United Kingdom | |
| L'Occitane | | | 36 | % | | | 24 | % | | | 23 | % | | $ | 3.1 | | | | 21.9 | x | | France | |
| Sonova Holding | | | 26 | % | | | 9 | % | | | 14 | % | | $ | 6.5 | | | | 25.8 | x | | Switzerland | |
| Spirax-Sarco Engineering | | | 22 | % | | | 11 | % | | | 11 | % | | $ | 2.3 | | | | 17.4 | x | | United Kingdom | |
| Average | | | 24 | % | | | 12 | % | | | 15 | % | | $ | 3.4 | | | | 18.2 | x | | | | | |
| Russell 2500 Index | | | 11 | % | | | 43 | % | | | 4 | % | | | n/a | | | | 17.4 | x | | n/a | |
Source: BNY Mellon, Capital IQ
In the past, reader feedback to shareholder letters came in written form or over the telephone. While those methods are still welcome, we can also receive comments at the email address, Paramount@fpafunds.com.
Thank you for your continued support and trust.
Respectfully submitted,

Eric S. Ende
President & Portfolio Manager
October 29, 2011
7
FORWARD LOOKING STATEMENT DISCLOSURE
As mutual fund managers, one of our responsibilities is to communicate with shareholders in an open and direct manner. Insofar as some of our opinions and comments in our letters to shareholders are based on current management expectations, they are considered "forward-looking statements" which may or may not be accurate over the long term. While we believe we have a reasonable basis for our comments and we have confidence in our opinions, actual results may differ materially from those we anticipate. You can identify forward-looking statements by words such as "believe," "expect," "may," "anticipate," and other similar expressions when discussing prospects for particular portfolio holdings and/or the markets, generally. We cannot, however, assure future results and disclaim any obligation to update or alter any forward-looking statements, whether as a result of new information, future events, or otherwise. Further, information provided in this report should not be construed as a recommendation to purchase or sell any particular security.
HISTORICAL PERFORMANCE
Change in Value of a $10,000 Investment in FPA Paramount Fund, Inc. vs. Russell 2500 Index and Lipper Mid-Cap Core Fund Average from October 1, 2001 to September 30, 2011
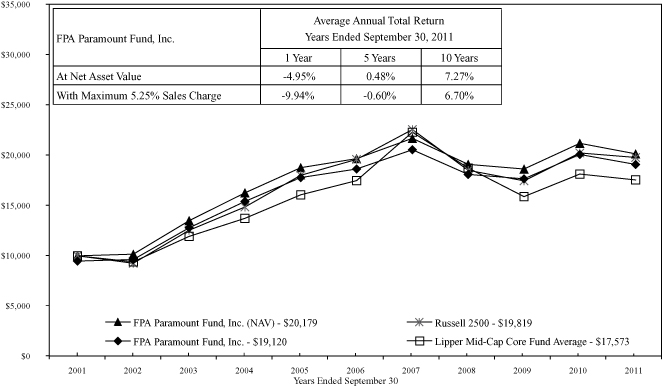
Past performance is not indicative of future performance. The Russell 2500 Index consists of the 2,500 smallest companies in the Russell 3000 total capitalization universe. This index is considered a measure of small to medium capitalization stock performance. This index does not reflect any commissions or fees which would be incurred by an investor purchasing the stocks it represents. The Lipper Mid-Cap Core Fund Average provides an additional comparison of how your Fund performed in relation to other mutual funds with similar objectives. The Lipper data does not include sales charges. The performance shown for FPA Paramount Fund, Inc., with an ending value of $19,120 reflects deduction of the current maximum sales charge of 5.25% of the offering price. In addition, since investors purchase shares of the Fund with varying sales charges depending primarily on volume purchased, the Fund's performance at net asset value (NAV) is also shown, as reflected by the ending value of $20,179. The performance of the Fund and of the Averages is computed on a total return basis which includes reinvestment of all distributions.
8
PORTFOLIO SUMMARY
September 30, 2011
(Unaudited)
| Common Stocks | | | | | | | 94.4 | % | |
| Business Services & Supplies | | | 20.4 | % | | | | | |
| Producer Durable Goods | | | 20.3 | % | | | | | |
| Retailing | | | 17.1 | % | | | | | |
| Health Care | | | 16.1 | % | | | | | |
| Energy | | | 7.4 | % | | | | | |
| Technology | | | 6.5 | % | | | | | |
| Transportation | | | 5.8 | % | | | | | |
| Entertainment | | | 0.8 | % | | | | | |
| Short-Term Investments | | | | | 5.6 | % | |
| Other Assets and Liabilities, net | | | | | 0.0 | % | |
| Total Net Assets | | | | | 100.0 | % | |
MAJOR PORTFOLIO CHANGES
Six Months Ended September 30, 2011
(Unaudited)
| | | Shares | |
| NET PURCHASES | |
| Common Stocks | |
| bioMérieux S.A. (1) | | | 12,000 | | |
| Dolby Laboratories, Inc. (Class A) (1) | | | 83,000 | | |
| Halma plc (1) | | | 400,000 | | |
| L'Occitane International S.A. (1) | | | 270,000 | | |
| Rotork plc (1) | | | 14,100 | | |
| Sonova Holding AG (1) | | | 30,000 | | |
| Spirax - Sarco Engineering plc | | | 63,700 | | |
| VCA Antech, Inc. | | | 24,200 | | |
| NET SALES | |
| Common Stocks | |
| Helix Energy Solutions Group, Inc. (2) | | | 192,800 | | |
| Signet Jewelers Limited | | | 23,800 | | |
(1) Indicates new commitment to portfolio
(2) Indicates elimination from portfolio
9
PORTFOLIO OF INVESTMENTS
September 30, 2011
| COMMON STOCKS | | Shares | | Value | |
| BUSINESS SERVICES & SUPPLIES — 20.4% | |
| Aggreko plc | | | 76,337 | | | $ | 1,938,418 | | |
| Brady Corporation (Class A) | | | 231,500 | | | | 6,118,545 | | |
| CLARCOR, Inc. | | | 157,800 | | | | 6,529,764 | | |
| Copart, Inc.* | | | 226,600 | | | | 8,864,592 | | |
| Halma plc | | | 400,000 | | | | 1,967,840 | | |
| Landauer, Inc. | | | 3,800 | | | | 188,252 | | |
| Manpower Inc. | | | 138,000 | | | | 4,639,560 | | |
| ScanSource Inc.* | | | 421,200 | | | | 12,450,672 | | |
| Spirax-Sarco Engineering plc | | | 109,000 | | | | 3,048,174 | | |
| | | $ | 45,745,817 | | |
| PRODUCER DURABLES — 20.3% | |
| Actuant Corporation (Class A) | | | 217,000 | | | $ | 4,285,750 | | |
| Franklin Electric Co., Inc. | | | 143,400 | | | | 5,202,552 | | |
| Graco Inc. | | | 189,700 | | | | 6,476,358 | | |
| HNI Corporation | | | 343,600 | | | | 6,573,068 | | |
| IDEX Corporation | | | 172,050 | | | | 5,361,078 | | |
| Rotork plc | | | 14,100 | | | | 341,336 | | |
| WABCO Holdings, Inc.* | | | 252,700 | | | | 9,567,222 | | |
| Zebra Technologies Corporation (Class A)* | | | 246,500 | | | | 7,626,710 | | |
| | | $ | 45,434,074 | | |
| RETAILING — 17.1% | |
| CarMax, Inc.* | | | 489,100 | | | $ | 11,665,035 | | |
| L'Occitane International S.A. | | | 270,000 | | | | 548,532 | | |
| O'Reilly Automotive, Inc.* | | | 226,900 | | | | 15,118,347 | | |
| Signet Jewelers Limited | | | 321,700 | | | | 10,873,460 | | |
| | | $ | 38,205,374 | | |
| HEALTH CARE — 16.1% | |
| Bio-Rad Laboratories, Inc. (Class A)* | | | 83,400 | | | $ | 7,570,218 | | |
| bioMérieux S.A. | | | 12,000 | | | | 1,052,376 | | |
| Life Technologies Corporation* | | | 273,000 | | | | 10,491,390 | | |
| Lincare Holdings, Inc. | | | 377,000 | | | | 8,482,500 | | |
| Sonova Holding AG | | | 30,000 | | | | 2,736,744 | | |
| Varian Medical Systems, Inc.* | | | 25,500 | | | | 1,330,080 | | |
| VCA Antech, Inc.* | | | 265,000 | | | | 4,234,700 | | |
| | | $ | 35,898,008 | | |
| ENERGY — 7.4% | |
| FMC Technologies, Inc.* | | | 226,500 | | | $ | 8,516,400 | | |
| Noble Corporation | | | 275,500 | | | | 8,085,925 | | |
| | | $ | 16,602,325 | | |
10
PORTFOLIO OF INVESTMENTS
September 30, 2011
| COMMON STOCKS — Continued | | Shares or
Principal
Amount | | Value | |
| TECHNOLOGY — 6.5% | |
| Dolby Laboratories, Inc. (Class A)* | | | 83,000 | | | $ | 2,277,520 | | |
| Maxim Integrated Products, Inc. | | | 211,200 | | | | 4,927,296 | | |
| Microchip Technology Incorporated | | | 238,500 | | | | 7,419,735 | | |
| | | $ | 14,624,551 | | |
| TRANSPORTATION — 5.8% | |
| Heartland Express, Inc. | | | 516,500 | | | $ | 7,003,740 | | |
| Knight Transportation, Inc. | | | 451,100 | | | | 6,004,141 | | |
| | | $ | 13,007,881 | | |
| ENTERTAINMENT — 0.8% | |
| Carnival Corporation (Class A) | | | 60,100 | | | $ | 1,821,030 | | |
| TOTAL COMMON STOCKS — 94.4% (Cost $231,380,560) | | | | $ | 211,339,060 | | |
| SHORT-TERM INVESTMENTS — 5.6% (Cost $12,591,985) | |
State Street Bank Repurchase Agreement — 0.01% 10/03/11
(Collateralized by $6,770,000 Principal Amount U.S. Treasury Note —
1.375 % 2018) | | $ | 6,592,000 | | | $ | 6,592,000 | | |
| Chevron Funding Corporation — 0.03% 10/04/11 | | | 6,000,000 | | | | 5,999,985 | | |
| TOTAL SHORT-TERM INVESTMENTS | | | | $ | 12,591,985 | | |
| TOTAL INVESTMENTS — 100.0% (Cost $243,972,545) | | $ | 223,931,045 | | |
| Other assets and liabilities, net — 0.0% | | | | | (21,192 | ) | |
| TOTAL NET ASSETS — 100.0% | | $ | 223,909,853 | | |
*Non-income producing security
See notes to financial statements.
11
STATEMENT OF ASSETS AND LIABILITIES
September 30, 2011
| ASSETS | |
| Investments at value: | |
Investment securities — at market value
(identified cost $231,380,560) | | $ | 211,339,060 | | | | | | |
Short-term investments — at amortized cost
(maturities 60 days or less) | | | 12,591,985 | | | $ | 223,931,045 | | |
| Cash | | | | | | | 46 | | |
| Receivable for: | |
| Capital stock sold | | $ | 153,968 | | | | | | |
| Dividends | | | 29,684 | | | | 183,652 | | |
| | | | | | | $ | 224,114,743 | | |
| LIABILITIES | |
| Payable for: | |
| Advisory fees and financial services | | $ | 149,978 | | | | | | |
| Accrued expenses | | | 32,143 | | | | | | |
| Capital stock repurchased | | | 22,769 | | | | 204,890 | | |
| NET ASSETS | | | | $ | 223,909,853 | | |
| SUMMARY OF SHAREHOLDERS' EQUITY | |
Capital Stock — par value $0.25 per share: authorized
100,000,000 shares; outstanding 14,276,236 shares | | | | | | $ | 3,569,059 | | |
| Additional Paid-in Capital | | | | | | | 253,711,742 | | |
| Accumulated net realized loss on investments | | | | | | | (13,174,796 | ) | |
| Accumulated net investment loss | | | | | | | (154,652 | ) | |
| Unrealized depreciation of investments | | | | | (20,041,500 | ) | |
| NET ASSETS | | | | $ | 223,909,853 | | |
NET ASSET VALUE, REDEMPTION PRICE AND
MAXIMUM OFFERING PRICE PER SHARE | |
Net asset value and redemption price per share
(net assets divided by shares outstanding) | | | | $ | 15.68 | | |
Maximum offering price per share
(100/94.75 of per share net asset value) | | | | $ | 16.55 | | |
See notes to financial statements.
12
STATEMENT OF OPERATIONS
For the Year Ended September 30, 2011
| INVESTMENT INCOME | |
| Dividends | | | | $ | 2,669,995 | | |
| Interest | | | | | 19,904 | | |
| | | | | $ | 2,689,899 | | |
| EXPENSES — Note 5 | |
| Advisory fees | | $ | 1,779,614 | | | | | | |
| Financial services | | | 266,094 | | | | | | |
| Transfer agent fees and expenses | | | 161,155 | | | | | | |
| Reports to shareholders | | | 46,223 | | | | | | |
| Audit and tax fees | | | 41,200 | | | | | | |
| Registration fees | | | 39,720 | | | | | | |
| Line of credit | | | 38,021 | | | | | | |
| Custodian fees and expenses | | | 36,991 | | | | | | |
| Directors fees and expenses | | | 36,481 | | | | | | |
| Legal fees | | | 14,947 | | | | | | |
| Insurance | | | 8,142 | | | | | | |
| Other fees and expenses | | | 8,068 | | | | 2,476,656 | | |
| Net investment income | | | | $ | 213,243 | | |
| NET REALIZED AND UNREALIZED LOSS ON INVESTMENTS | |
| Net realized gain on investments: | |
| Proceeds from sales of investment securities | | $ | 25,861,595 | | | | | | |
| Cost of investment securities sold | | | 24,862,195 | | | | | | |
| Net realized gain on investments | | | | | | $ | 999,400 | | |
| Change in unrealized depreciation of investments: | |
| Unrealized depreciation at beginning of year | | $ | (6,713,800 | ) | | | | | |
| Unrealized depreciation at end of year | | | (20,041,500 | ) | | | | | |
| Change in unrealized depreciation of investments | | | | | | | (13,327,700 | ) | |
| Net realized and unrealized loss on investments | | | | $ | (12,328,300 | ) | |
| CHANGE IN NET ASSETS RESULTING FROM OPERATIONS | | | | $ | (12,115,057 | ) | |
See notes to financial statements.
13
STATEMENT OF CHANGES IN NET ASSETS
| | | For the Year Ended September 30, | |
| | | 2011 | | 2010 | |
| CHANGE IN NET ASSETS | |
| Operations: | |
| Net investment income | | $ | 213,243 | | | | | | | $ | 449,437 | | | | | | |
| Net realized gain (loss) on investments | | | 999,400 | | | | | | | | (5,000,300 | ) | | | | | |
Change in unrealized appreciation
(depreciation) of investments | | | (13,327,700 | ) | | | | | | | 34,846,383 | | | | | | |
Change in net assets resulting from
operations | | | | | | $ | (12,115,057 | ) | | | | | | $ | 30,295,520 | | |
| Dividends from net investment income | | | | | | | (817,332 | ) | | | | | | | — | | |
| Capital Stock transactions: | |
| Proceeds from Capital Stock sold | | $ | 36,384,989 | | | | | | | $ | 13,463,645 | | | | | | |
Proceeds from shares issued to shareholders
upon reinvestment of dividends and
distributions | | | 761,242 | | | | | | | | — | | | | | | |
| Cost of Capital Stock repurchased* | | | (38,959,589 | ) | | | (1,813,358 | ) | | | (36,572,612 | ) | | | (23,108,967 | ) | |
| Total change in net assets | | | | | | $ | (14,745,747 | ) | | | | | | $ | 7,186,553 | | |
| NET ASSETS | |
| Beginning of year | | | | | | | 238,655,600 | | | | | | | | 231,469,047 | | |
| End of year | | | | | | $ | 223,909,853 | | | | | | | $ | 238,655,600 | | |
CHANGE IN CAPITAL STOCK
OUTSTANDING | |
| Shares of Capital Stock sold | | | | | | | 1,948,736 | | | | | | | | 858,970 | | |
Shares issued to shareholders upon
reinvestment of dividends and distributions | | | | | | | 40,320 | | | | | | | | — | | |
| Shares of Capital Stock repurchased | | | | | | | (2,133,635 | ) | | | | | | | (2,348,607 | ) | |
| Change in Capital Stock outstanding | | | | | | | (144,579 | ) | | | | | | | (1,489,637 | ) | |
* Net of redemption fees of $5,843 and $5,177 for the years ended September 30, 2011 and 2010, respectively.
See notes to financial statements.
14
FINANCIAL HIGHLIGHTS
Selected Data for Each Share of Capital Stock Outstanding Throughout Each Year
| | | Year Ended September 30, | |
| | | 2011 | | 2010 | | 2009 | | 2008 | | 2007 | |
| Per share operating performance: | | | | | | | | | | | |
| Net asset value at beginning of year | | $ | 16.55 | | | $ | 14.55 | | | $ | 15.01 | | | $ | 17.06 | | | $ | 15.62 | | |
| Income from investment operations: | | | | | | | | | | | |
| Net investment income | | $ | 0.02 | | | $ | 0.03 | | | $ | 0.01 | | | $ | 0.05 | | | $ | 0.14 | | |
Net realized and unrealized gain (loss)
on investment securities | | | (0.83 | ) | | | 1.97 | | | | (0.40 | ) | | | (2.09 | ) | | | 1.47 | | |
| Total from investment operations | | $ | (0.81 | ) | | $ | 2.00 | | | $ | (0.39 | ) | | $ | (2.04 | ) | | $ | 1.61 | | |
| Less dividends from net investment income | | $ | (0.06 | ) | | | — | | | $ | (0.07 | ) | | $ | (0.01 | ) | | $ | (0.17 | ) | |
| Redemption fees | | | — | * | | | — | * | | | — | * | | | — | * | | | — | * | |
| Net asset value at end of year | | $ | 15.68 | | | $ | 16.55 | | | $ | 14.55 | | | $ | 15.01 | | | $ | 17.06 | | |
| Total investment return** | | | (4.95 | )% | | | 13.75 | % | | | (2.43 | )% | | | (11.96 | )% | | | 10.30 | % | |
| Ratios/supplemental data: | |
| Net assets at end of year (in $000's) | | $ | 223,910 | | | $ | 238,656 | | | $ | 231,469 | | | $ | 296,646 | | | $ | 397,374 | | |
| Ratio of expenses to average net assets | | | 0.93 | % | | | 0.95 | % | | | 0.99 | % | | | 0.89 | % | | | 0.90 | % | |
Ratio of net investment income to average
net assets | | | 0.08 | % | | | 0.20 | % | | | 0.09 | % | | | 0.29 | % | | | 0.74 | % | |
| Portfolio turnover rate | | | 10 | % | | | 3 | % | | | 46 | % | | | 12 | % | | | 17 | % | |
* Rounds to less than $0.01 per share.
** Return is based on net asset value per share, adjusted for reinvestment of distributions, and does not reflect deduction of the sales charge.
See notes to financial statements.
15
NOTES TO FINANCIAL STATEMENTS
September 30, 2011
NOTE 1 — Significant Accounting Policies
FPA Paramount Fund, Inc. (the "Fund") is registered under the Investment Company Act of 1940, as a diversified, open-end management investment company. The Fund's primary investment objective is long-term growth of capital. Current income is a secondary consideration. The following is a summary of significant accounting policies consistently followed by the Fund in the preparation of its financial statements.
A. Security Valuation
The Fund's investments are reported at fair value as defined by accounting principles generally accepted in the United States of America. The Fund generally determines its net asset value as of approximately 4:00 p.m. New York time each day the New York Stock Exchange is open. Further discussion of valuation methods, inputs and classifications can be found under Note 8.
B. Securities Transactions and Related Investment Income
Securities transactions are accounted for on the date the securities are purchased or sold. Dividend income and distributions to shareholders are recorded on the ex-dividend date. Interest income and expenses are recorded on an accrual basis.
C. Use of Estimates
The preparation of the financial statements in accordance with accounting principles generally accepted in the United States of America requires management to make estimates and assumptions that affect the amounts reported. Actual results could differ from those estimates.
NOTE 2 — Risk Considerations
Investing in the Fund may involve certain risks including, but not limited to, those described below.
Market Risk: Because the values of the Fund's investments will fluctuate with market conditions, so will the value of your investment in the Fund. You could lose money on your investment in the Fund or the Fund could underperform other investments.
Common Stocks and Other Securities: The prices of common stocks and other securities held by the Fund may decline in response to certain events taking place around the world, including those directly involving companies whose securities are owned by the Fund; conditions affecting the general economy; overall market changes; local, regional or global political, social or economic instability; and currency, interest rate and commodity price fluctuations. In addition, the Adviser's emphasis on a value-oriented investment approach generally results in the Fund's portfolio being invested primarily in medium or smaller sized companies. Smaller companies may be subject to a greater degree of change in earnings and business prospects than larger, more established companies. Also, securities of smaller companies are traded in lower volumes than those issued by larger companies and may be more volatile than those of larger companies. In light of these characteristics of smaller companies and their securities, the Fund may be subjected to greater risk than that assumed when investing in the equity securities of larger companies.
NOTE 3 — Purchases of Investment Securities
Cost of purchases of investment securities (excluding short-term investments with maturities of 60 days or less at the time of purchase) aggregated $25,886,545 for the year ended September 30, 2011. Realized gains or losses are based on the specific identification method.
NOTE 4 — Federal Income Tax
No provision for federal income tax is required because the Fund has elected to be taxed as a "regulated investment company" under the Internal Revenue Code and intends to maintain this qualification and to distribute each year to its shareholders, in accordance with the minimum distribution requirements of the Code, its taxable net investment income and taxable net realized gains on investments.
Distributions paid to shareholders are based on net investment income and net realized gains determined on a tax reporting basis, which may differ from financial reporting. For federal income tax purposes, the Fund had no distributable earnings at September 30, 2011.
The tax status of distributions paid during the fiscal years ended September 30, 2011 and 2010 were as follows:
| | | 2011 | | 2010 | |
Dividends from
ordinary income | | $ | 817,332 | | | | — | | |
Accumulated net realized losses of $13,157,180 can be carried forward to offset future gains. The ability to carry these losses forward expires as follows: $5,770,554 in 2017, $3,366,139 in 2018 and $4,020,487 in 2019.
The cost of investment securities held at September 30, 2011, was $231,398,175 for federal income tax purposes. Gross unrealized appreciation
16
NOTES TO FINANCIAL STATEMENTS
Continued
and depreciation for all investments at September 30, 2011, for federal income tax purposes was $17,303,934 and $37,363,049, respectively resulting in net unrealized depreciation of $20,059,115. As of and during the year ended September 30, 2011, the Fund did not have any liability for unrecognized tax benefits. The Fund recognizes interest and penalties, if any, related to unrecognized tax benefits as income tax expense in the Statement of Operations. During the year, the Fund did not incur any interest or penalties. The Fund is not subject to examination by U.S. federal tax authorities for years ended on or before September 30, 2008 or by state tax authorities for years ended on or before September 30, 2007.
On December 22, 2010, The Regulated Investment Company Modernization Act of 2010 (the "Modernization Act") was enacted. The Modernization Act is the first major piece of legislation affecting Regulated Investment Companies ("RICs") since 1986 and it modernizes several of the federal income and excise tax provisions related to RICs. Some highlights of the enacted provisions are as follows: new capital losses may now be carried forward indefinitely, and retain the character of the original loss; several provisions are aimed at preventing disqualification of a RIC for "inadvertent" failures of the asset diversification and/or qualifying income tests; and, the Modernization Act exempts RICs from the preferential dividend rule, and repealed the 60-day designation requirement for certain types of pay-through income and gains. Except for the simplification provisions related to RIC qualification, the Modernization Act is effective for taxable years beginning after December 22, 2010.
NOTE 5 — Advisory Fees and Other Affiliated Transactions
Pursuant to an Investment Advisory Agreement, advisory fees were paid by the Fund to First Pacific Advisors, LLC (the "Adviser"). Under the terms of this Agreement, the Fund pays the Adviser a monthly fee calculated at the annual rate of 0.75% of the first $50 million of the Fund's average daily net assets and 0.65% of the average daily net assets in excess of $50 million. In addition, the Fund pays the Adviser an amount equal to 0.10% of the average daily net assets for each fiscal year in reimbursement for the provision of financial services to the Fund. The Agreement obligates the Adviser to reduce its fee to the extent necessary to reimburse the Fund for any annual expenses (exclusive of interest, taxes, the cost of brokerage and research services, and extraordinary expenses such as litigation) in excess of 11/2% of the first $30 million and 1% of the remaining average net assets of the Fund for the year.
For the year ended September 30, 2011, the Fund paid aggregate fees of $36,000 to all Directors who are not affiliated persons of the Adviser. Certain officers of the Fund are also officers of the Adviser and FPA Fund Distributors, Inc.
NOTE 6 — Redemption Fees
A redemption fee of 2% applies to redemptions within 90 days of purchase for certain purchases made by persons eligible to purchase shares without an initial sales charge. For the year ended September 30, 2011, the Fund collected $5,843 in redemption fees. The impact of these fees is less than $0.01 per share.
NOTE 7 — Distributor
For the year ended September 30, 2011, FPA Fund Distributors, Inc. ("Distributor"), a wholly owned subsidiary of the Adviser, received $8,917 in net Fund share sales commissions after reallowance to other dealers. The Distributor pays its own overhead and general administrative expenses, the cost of supplemental sales literature, promotion and advertising.
NOTE 8 — Disclosure of Fair Value
Measurements
The Fund uses the following methods and inputs to establish the fair value of its assets and liabilities. Use of particular methods and inputs may vary over time based on availability and relevance as market and economic conditions evolve.
Equity securities are generally valued at the official closing price of, or the last reported sale price on, the exchange or market on which such securities are traded, as of the close of business on the day the securities are being valued or, lacking any sales, at the last available bid price. Prices for each security are taken from the principal exchange or market in which the security trades. Securities that are unlisted and fixed-income and convertible securities listed on a national securities exchange for which the over-the-counter market more accurately reflects the securities' value in the judgment of the Fund's officers, are valued at the most recent bid price. Short-term corporate notes with maturities of 60 days or less are valued at amortized cost, which approximates market value.
Securities for which representative market quotations are not readily available or are considered unreliable by the Adviser are valued as determined in
17
NOTES TO FINANCIAL STATEMENTS
Continued
good faith by, or under the direction of, the Fund's Board of Directors. Various inputs may be reviewed in order to make a good faith determination of a security's value. These inputs include, but are not limited to, the type and cost of the security; contractual or legal restrictions on resale of the security; relevant financial or business developments of the issuer; actively traded similar or related securities; conversion or exchange rights on the security; related corporate actions; significant events occurring after the close of trading in the security; and changes in overall market conditions. Fair valuations and valuations of investments that are not actively trading involve judgment and may differ materially from valuations of investments that would have been used had greater market activity occurred.
The Fund classifies its assets based on three valuation methodologies. Level 1 values are based on quoted market prices in active markets for identical assets. Level 2 values are based on significant observable market inputs, such as quoted prices for similar assets and quoted prices in inactive markets or other market observable inputs. Level 3 values are based on significant unobservable inputs that reflect the Fund's determination of assumptions that market participants might reasonably use in valuing the assets. The valuation levels are not necessarily an indication of the risk associated with investing in those securities. The following table presents the valuation levels of the Fund's investments as of September 30, 2011:
| Level 1 — Quoted Prices | | $ | 211,339,060 | (1),(3) | |
Level 2 — Other significant
observable inputs | | | 12,591,985 | (2),(3) | |
Level 3 — Significant unobservable
inputs | | | — | (3) | |
| Total investments | | $ | 223,931,045 | | |
(1) All common stocks are classified under Level 1. The Portfolio of Investments provides further information on major security types.
(2) Comprised solely of short-term investments with maturities of 60 days or less that are valued at amortized cost.
(3) Transfers of investments between different levels of the fair value hierarchy are recorded at market value as of the end of the reporting period. There were no transfers between Levels 1, 2, or 3 during the year ended September 30, 2011.
NOTE 9 — Line of Credit
The Fund, along with FPA Perennial Fund, Inc., has collectively entered into an agreement that enables them to participate in a $50 million unsecured line of credit with State Street Bank and Trust. Borrowings will be made solely to temporarily finance the repurchase of Capital Stock. Interest is charged to each Fund based on its borrowings at a rate per annum equal to the higher of the Federal Funds Rate or the Overnight LIBOR Rate plus 1.25%. In addition, the Fund and FPA Perennial Fund, Inc. pay a commitment fee of 0.15% per annum on any unused portion of the line of credit. During the year ended September 30, 2011, the Fund had no borrowings under the agreement.
18
REPORT OF INDEPENDENT REGISTERED
PUBLIC ACCOUNTING FIRM
TO THE SHAREHOLDERS AND
BOARD OF DIRECTORS OF FPA PARAMOUNT FUND, INC.
We have audited the accompanying statement of assets and liabilities of FPA Paramount Fund, Inc. (the "Fund"), including the portfolio of investments, as of September 30, 2011, the related statement of operations for the year then ended, the statements of changes in net assets for each of the two years in the period then ended, and the financial highlights for each of the five years in the period then ended. These financial statements and financial highlights are the responsibility of the Fund's management. Our responsibility is to express an opinion on these financial statements and financial highlights based on our audits.
We conducted our audits in accordance with standards of the Public Company Accounting Oversight Board (United States). Those standards require that we plan and perform the audit to obtain reasonable assurance about whether the financial statements and financial highlights are free of material misstatement. The Fund is not required to have, nor were we engaged to perform, an audit of its internal control over financial reporting. Our audits included consideration of internal control over financial reporting as a basis for designing audit procedures that are appropriate in the circumstances, but not for the purpose of expressing an opinion on the effectiveness of the Fund's internal control over financial reporting. Accordingly, we express no such opinion. An audit also includes examining, on a test basis, evidence supporting the amounts and disclosures in the financial statements, assessing the accounting principles used and significant estimates made by management, as well as evaluating the overall financial statement presentation. Our procedures included confirmation of securities owned as of September 30, 2011, by correspondence with the custodian. We believe that our audits provide a reasonable basis for our opinion.
In our opinion, the financial statements and financial highlights referred to above present fairly, in all material respects, the financial position of FPA Paramount Fund, Inc. as of September 30, 2011, the results of its operations for the year then ended and the changes in its net assets for each of the two years in the period then ended, and the financial highlights for each of the five years in the period then ended in conformity with accounting principles generally accepted in the United States of America.

Los Angeles, California
November 18, 2011
RENEWAL OF INVESTMENT ADVISORY AGREEMENT (Unaudited)
Approval of the Advisory Agreement. At a meeting of the Board of Directors held on August 1, 2011, the Directors approved the continuation of the advisory agreement between the Fund and the Adviser for an additional one-year period through September 30, 2012, on the recommendation of the Independent Directors who met in executive session on August 1, 2011 prior to the Board meeting to review and discuss the proposed continuation of the advisory agreement. The following paragraphs summarize the material information and factors considered by the Board and the Independent Directors as well as the Directors' conclusions relative to such factors.
Nature, Extent and Quality of Services. The Board and the Independent Directors considered information regarding the Adviser and its staffing in connection with the Fund, including the Fund's portfolio managers and the senior analyst on their team, the scope of accounting, administrative, shareholder and other services supervised and provided by the Adviser, and the absence of any significant service problems reported to the Board. The Board and the Independent Directors especially noted the experience, length of service and the outstanding reputation of the Fund's portfolio managers, Eric Ende and Steven Geist, who have managed the Fund since 2000, and Gregory A. Herr, who joined the Adviser as an analyst in 2007. The Board and the Independent Directors concluded that the nature, extent and quality of services provided by the Adviser have benefited and should continue to benefit the Fund and its shareholders.
19
RENEWAL OF INVESTMENT ADVISORY AGREEMENT
Continued
Investment Performance. The Board and the Independent Directors reviewed the overall investment performance of the Fund. The Directors also received information from an independent consultant, Lipper, a Thomson Reuters Company ("Lipper"), regarding the Fund's performance relative to a peer group of mid-cap core funds selected by Lipper (the "Peer Group"). The Board and the Independent Directors noted the Fund's competitive longer-term investment performance of the Fund when compared to the Peer Group. They further concluded that the Adviser's continued management of the Fund should benefit the Fund and its shareholders.
Advisory Fees and Fund Expenses; Adviser Profitability; Economies of Scale and Sharing of Economies of Scale. The Board and the Independent Directors were provided information by the Adviser to enable consideration of the Fund's advisory fees and total expense levels, as well as the overall profitability of the Adviser, the benefits to the Adviser from its relationship to the Fund, the extent to which economies of scale with respect to the management of the Fund, if any, would be realized, and whether the Fund is sharing, or will share, in those economies.
The Board and the Independent Directors reviewed comparative information relative to fees and expenses for the mutual fund industry generally and for the Peer Group. The Board and the Independent Directors noted that the Fund's fees and expenses were at the lowest end of the range for the Peer Group. The Board and the Independent Directors noted that the overall expense ratio of the Fund was also the lowest when compared to the Peer Group. The Board and the Independent Directors noted that the fee rate charged to the Fund is currently lower than the fee rate charged by the Adviser on the other products managed in a similar style by the portfolio managers. The Board and the Independent Directors concluded that the overall fee rate was reasonable and fair to the Fund and its shareholders in light of the nature and quality of the services provided by the Adviser.
The Board and the Independent Directors considered whether there have been economies of scale with respect to the management of the Fund, whether the Fund has appropriately benefited from any economies of scale, and whether the fee rate is reasonable in relation to the Fund's assets and any economies of scale that may exist. The Independent Directors discussed the fact that the fee rate does not have any additional breakpoints. The mutual fund industry has trended toward funds having breakpoints in the advisory fee structure as a means by which to share in economies of scale as a fund's assets grow; however, not all funds have breakpoints in their fee structures. The Adviser indicated its belief that additional breakpoints currently were not appropriate for the Fund and that no meaningful income and expense forecasts for its business could be prepared given uncertainties regarding the direction of the economy, rising inflation, increasing costs for personnel and systems, and growth (or not) in the Fund's assets, all of which could negatively impact the Adviser. The Board and the Independent Directors noted that the Adviser had not increased the fee rate charged to the Fund despite the Adviser's claims of increases in the Adviser's internal costs of providing investment management services to the Fund, in part due to administrative burdens and expenses resulting from recent legislative and regulatory actions such as Sarbanes-Oxley. According to the Adviser, such increased costs have included additions to administrative personnel and systems that enhance the quality of services provided to the Fund and the establishment of a full-time Chief Compliance Officer and his assistant. The Board and the Independent Directors also noted that asset levels of the Fund are currently lower than they have been for the past several years, yet the Adviser has continued to make investments in personnel servicing the Fund.
Conclusions. The Board and the Independent Directors determined that the Fund continues to benefit from the services of a highly experienced portfolio management team that has produced competitive long-term returns. In addition, the Board and the Independent Directors agreed that the Fund continues to receive high quality accounting, administrative, shareholder and other ancillary services from the Adviser. The Board and the Independent Directors also determined that while there is no uniform industry methodology to measure or apply economies of scale, the Fund's expense ratio, the overall profitability of the Adviser, and the sharing of economies of scale with the Fund are fair and reasonable under the current circumstances. The Board and the Independent Directors also stated their intention to continue monitoring the factors relevant to the Adviser's compensation, such as changes in the Fund's asset levels, changes in portfolio management personnel and the cost and quality of the services provided by the Adviser to the Fund. On the basis of the foregoing, and without assigning particular weight to any single factor, the Board and the Independent Directors determined to approve the continuation of the current Advisory Agreement for another one-year period through September 30, 2012.
20
SHAREHOLDER EXPENSE EXAMPLE
September 30, 2011 (unaudited)
Fund Expenses
As a shareholder of the Fund, you incur two types of costs: (1) transaction costs, and (2) ongoing costs, including advisory and administrative fees; shareholder service fees; and other Fund expenses. The Example is intended to help you understand your ongoing costs (in dollars) of investing in the Fund and to compare these costs with the ongoing costs of investing in other mutual funds. The Example is based on an investment of $1,000 invested at the beginning of the year and held for the entire year.
Actual Expenses
The information in the table under the heading "Actual Performance" provides information about actual account values and actual expenses. You may use the information in this column, together with the amount you invested, to estimate the expenses that you paid over the period. Simply divide your account value by $1,000 (for example, an $8,600 account value divided by $1,000= 8.6), then multiply the result by the number in the first column in the row entitled "Expenses Paid During Period" to estimate the expenses you paid on your account during this period.
Hypothetical Example for Comparison Purposes
The information in the table under the heading "Hypothetical Performance (5% return before expenses)" provides information about hypothetical account values and hypothetical expenses based on the Fund's actual expense ratio and an assumed rate of return of 5% per year before expenses, which is not the Fund's actual return. The hypothetical account values and expenses may not be used to estimate the actual ending account balance or expenses you paid for the period. You may use this information to compare the ongoing costs of investing in the Fund and other funds. To do so, compare this 5% hypothetical example with the 5% hypothetical examples that appear in the shareholder reports of other funds.
Please note that the expenses shown in the table are meant to highlight your ongoing costs only and do not reflect any transactional costs. Therefore, the information under the heading "Hypothetical Performance (5% return before expenses)" is useful in comparing ongoing costs only, and will not help you determine the relative total costs of owning different funds. In addition, if these transactional costs were included, your costs would have been higher.
| | | Actual
Performance | | Hypothetical
Performance
(5% return
before
expenses) | |
Beginning Account Value
March 31, 2011 | | $ | 1,000.00 | | | $ | 1,000.00 | | |
Ending Account Value
September 30, 2011 | | $ | 775.09 | | | $ | 1,020.33 | | |
Expenses Paid During
Period* | | $ | 4.09 | | | $ | 4.67 | | |
* Expenses are equal to the Fund's annualized expense ratio of 0.92%, multiplied by the average account value over the period and prorated for the six-months ended September 30, 2011 (183/365 days).
21
DIRECTOR AND OFFICER INFORMATION
| Name, Age & Address | | Positions(s)
With Fund/
Years Served | | Principal Occupation(s)
During the Past 5 Years | | Portfolios in
Fund Complex
Overseen | | Other
Directorships | |
| Willard H. Altman, Jr. – (76)† | | Director & Chairman*
Years Served: 9 | | Retired, Formerly, until 1995, Partner of Ernst & Young LLP, a public accounting firm. | | | 6 | | | | |
|
| Thomas P. Merrick – (74)† | | Director*
Years Served: 3 | | Private consultant. President of Strategic Planning Consultants for more than the past five years. Former Executive Committee member and Vice President of Fluor Corporation, responsible for strategic planning, from 1993 to 1998. | | | 6 | | | | |
|
| Lawrence J. Sheehan – (79)† | | Director*
Years Served: 5 | | Retired. Formerly Partner (1969 to 1994) and of counsel employee (1994 to 2002) of the law firm of O'Melveny & Myers LLP. | | | 2 | | | | |
|
| Eric S. Ende – (67) | | Director*
President & Portfolio Manager
Years Served: 11 | | Partner of the Adviser since 2006. Formerly Senior Vice President of First Pacific Advisers, Inc. from 1984 to 2006. | | | 3 | | | | |
|
| Steven R. Geist (57) | | Executive Vice President & Portfolio Manager
Year Served: 11 | | Partner of the Adviser since 2006. Formerly Vice President of First Pacific Advisers, Inc. from 1992 to 2006. | | | | | |
|
| Gregory A. Herr – (39) | | Vice President & Portfolio Manager Years Served: <1 | | Vice President and Analyst of the Adviser since 2007. Formerly a research analyst at Vontobel Asset Management, Inc. from 2003 to 2007. | | | | | |
|
| Pierre O. Py – (35) | | Vice President & Portfolio Manager Years Served: <1 | | Vice President and Portfolio Manager of the Adviser since 2011. Formerly an international investment analyst at Harris Associates L.P. from 2005 to 2010. | | | | | |
|
| J. Richard Atwood – (51) | | Treasurer
Years Served: 14 | | Chief Operating Officer of the Adviser. President and Chief Executive Officer of FPA Fund Distributors, Inc. | | | | FPA Fund Distributors, Inc. | |
|
| Christopher H. Thomas – (54) | | Chief Compliance Officer
Years Served: 16 | | Vice President and Chief Compliance Officer of the Adviser and Vice President of FPA Fund Distributors, Inc. | | | | FPA Fund
Distributors, Inc. | |
|
| Sherry Sasaki – (56) | | Secretary
Years Served: 29 | | Assistant Vice President and Secretary of the Adviser and of FPA Fund Distributors, Inc. | | | | | |
|
| E. Lake Setzler – (44) | | Assistant Treasurer
Years Served: 5 | | Vice President and Controller of the Adviser. | | | | | |
|
* Directors serve until their resignation, removal or retirement.
† Audit Committee member
Additional information on the Directors is available in the Statement of Additional Information. Each of the above individuals can be contacted at 11400 W. Olympic Blvd,. Suite 1200, Los Angeles, CA 90064.
22
FPA PARAMOUNT FUND, INC.
INVESTMENT ADVISER
First Pacific Advisors, LLC
11400 West Olympic Boulevard, Suite 1200
Los Angeles, CA 90064
DISTRIBUTOR
FPA Fund Distributors, Inc.
11400 West Olympic Boulevard, Suite 1200
Los Angeles, California 90064
COUNSEL
O'Melveny & Myers LLP
Los Angeles, California
TICKER SYMBOL: FPRAX
CUSIP: 302546106
INDEPENDENT REGISTERED PUBLIC ACCOUNTING FIRM
Deloitte & Touche LLP
Los Angeles, California
CUSTODIAN
State Street Bank and Trust Company
Boston, Massachusetts
TRANSFER & SHAREHOLDER SERVICE AGENT
UMB Fund Services, Inc.
P.O. Box 2175
Milwaukee, WI 53201-2175
or
803 W. Michigan St., Ste. A
Milwaukee, WI 53233-2301
(800) 638-3060
This report has been prepared for the information of shareholders of FPA Paramount Fund, Inc., and is not authorized for distribution to prospective investors unless preceded or accompanied by an effective prospectus.
The Fund's complete proxy voting record for the 12 months ended June 30, 2011 is available without charge, upon request by calling (800) 982-4372 and on the SEC's website at www.sec.gov.
The Fund's schedule of portfolio holdings, filed the first and third quarter of the Fund's fiscal year on Form N-Q with the SEC, is available on the SEC's website at www.sec.gov. Form N-Q is available at the SEC's Public Reference Room in Washington, D.C., and information on the operations of the Public Reference Room may be obtained by calling (202) 942-8090. To obtain Form N-Q from the Fund, shareholders can call (800) 982-4372.
Additional information about the Fund is available online at www.fpafunds.com. This information includes, among other things, holdings, top sectors, and performance, and is updated on or about the 15th business day after the end of each quarter.
Item 2. Code of Ethics.
(a) The registrant has adopted a code of ethics that applies to the registrant’s principal executive and financial officers.
(b) Not Applicable
(c) During the period covered by this report, there were not any amendments to the provisions of the code of ethics adopted in 2(a) above.
(d) During the period covered by this report, there were not any implicit or explicit waivers to the provisions of the code of ethics adopted in 2(a).
(e) Not Applicable
(f) A copy of the registrant’s code of ethics is filed as an exhibit to this Form N-CSR. Upon request, any person may obtain a copy of this code of ethics, without charge, by calling (800) 982-4372.
Item 3. Audit Committee Financial Expert.
The registrant’s board of directors has determined that Willard H. Altman, Jr., a member of the registrant’s audit committee and board of directors, is an “audit committee financial expert” and is “independent,” as those terms are defined in this Item. This designation will not increase the designee’s duties, obligations or liability as compared to his duties, obligations and liability as a member of the audit committee and of the board of directors. This designation does not affect the duties, obligations or liability of any other member of the audit committee or the board of directors.
Item 4. Principal Accountant Fees and Services.
| | | | 2010 | | 2011 | |
(a) | | Audit Fees | | $ | 34,100 | | $ | 35,000 | |
(b) | | Audit Related Fees | | -0- | | -0- | |
(c) | | Tax Fees | | $ | 7,100 | | $ | 7,100 | |
(d) | | All Other Fees | | -0- | | -0- | |
(e)(1) Disclose the audit committee’s pre-approval policies and procedures described in paragraph (c)(7) of Rule 2-01 of Regulation S-X. The audit committee shall pre-approve all audit and permissible non-audit services that the committee considers compatible with maintaining the independent auditors’ independence. The pre-approval requirement will extend to all non-audit services provided to the registrant, the adviser, and any entity controlling, controlled by, or under common control with the adviser that provides ongoing services to the registrant, if the engagement relates directly to the operations and financial
reporting of the registrant; provided, however, that an engagement of the registrant’s independent auditors to perform attest services for the registrant, the adviser or its affiliates required by generally accepted auditing standards to complete the examination of the registrant’s financial statements (such as an examination conducted in accordance with Statement on Auditing Standards Number 70 issued by the American Institute of Certified Public Accountants), will be deem pre-approved if: (i) the registrant’s independent auditors inform the audit committee of the engagement, (ii) the registrant’s independent auditors advise the audit committee at least annually that the performance of this engagement will not impair the independent auditor’s independence with respect to the registrant, and (iii) the audit committee receives a copy of the independent auditor’s report prepared in connection with such services. The committee may delegate to one or more committee members the authority to review and pre-approve audit and permissible non-audit services. Actions taken under any such delegation will be reported to the full committee at its next meeting.
(e)(2) Disclose the percentage of services described in each of paragraphs (b) – (d) of this Item that were approved by the audit committee pursuant to paragraph (c)(7)(i)(C) of Rule 2-01 of Regulation S-X. 100% of the services provided to the registrant described in paragraphs (b) – (d) of this Item were pre-approved by the audit committee pursuant to paragraph (e)(1) of this Item. There were no services provided to the investment adviser or any entity controlling, controlled by or under common control with the adviser described in paragraphs (b) – (d) of this Item that were required to be pre-approved by the audit committee.
(f) If greater than 50%, disclose the percentage of hours expended on the principal accountant’s engagement to audit the registrant’s financial statements for the most recent fiscal year that were attributed to work performed by persons other than the principal accountant’s full-time, permanent employees. All services performed on the engagement to audit the registrant’s financial statements for the most recent fiscal year end were performed by the principal accountant’s full-time, permanent employees.
(g) Disclose the aggregate non-audit fees billed by the registrant’s accountant for services rendered to the registrant, and rendered to the registrant’s investment adviser (not including any sub-adviser whose role is primarily portfolio management and is subcontracted with or overseen by another investment adviser), and any entity controlling, controlled by, or under common control with the adviser that provides ongoing services to the registrant for each of the last two fiscal years of the registrant. None.
| | (h) | | Disclose whether the registrant’s audit committee of the board of directors has considered whether the provision of non-audit services that were rendered to the registrant’s investment adviser (not including any sub-adviser whose role is primarily portfolio management and is subcontracted with or overseen by another investment adviser), and any entity controlling, controlled by, or under common control with the investment adviser that provides ongoing services to the registrant that were not pre-approved pursuant to paragraph (c)(7)(ii) of Rule 2-01 of Regulation S-X is compatible with maintaining the principal accountant’s independence. Not Applicable. |
| | | | |
Item 5. | | Audit Committee of Listed Registrants. Not Applicable. |
| | |
Item 6. | | Schedule of Investments. The schedule of investments is included as part of the report to stockholders filed under Item 1 of this Form. |
| | |
Item 7. | | Disclosure of Proxy Voting Policies and Procedures for Closed-End Management Investment Companies. Not Applicable. |
| | |
Item 8. | | Portfolio Managers of Closed-End Management Investment Companies. Not Applicable. |
| | |
Item 9. | | Purchases of Equity Securities by Closed-End Management Investment Company and Affiliated Purchasers. Not Applicable. |
| | |
Item 10. | | Submission of Matters to a Vote of Security Holders. There has been no material change to the procedures by which shareholders may recommend nominees to the registrant’s board of directors. |
| | |
Item 11. | | Controls and Procedures. |
| | |
| | (a) | | The principal executive officer and principal financial officer of the registrant have concluded that the registrant’s disclosure controls and procedures (as defined in Rule 30a-3(c) under the Investment Company Act of 1940) are effective based on their evaluation of the disclosure controls and procedures as of a date within 90 days of the filing date of this report. |
| | | | |
| | (b) | | There have been no significant changes in the registrant’s internal controls over financial reporting (as defined in Rule 30a-3(d) under the Investment Company Act of 1940) that occurred during the second fiscal quarter of the period covered by this report that have materially affected, or is reasonably likely to materially affect, the registrant’s internal controls over financial reporting. |
Item 12. | | Exhibits. |
| | | | |
| | (a)(1) | | Code of ethics as applies to the registrant’s officers and directors, as required to be disclosed under Item 2 of Form N-CSR. Attached hereto as Ex.99.CODE.ETH. |
| | | | |
| | (a)(2) | | Separate certification for the registrant’s principal executive officer and principal financial officer, as required by Rule 30a-2(a) under the Investment Company Act of 1940. Attached hereto. |
| | | | |
| | (a)(3) | | Not Applicable |
| | | | |
| | (b) | | Separate certification for the registrant’s principal executive officer and principal financial officer, as required by Rule 30a-2(b) under the Investment Company Act of 1940. Attached hereto. |
SIGNATURES
Pursuant to the requirements of the Securities Exchange Act of 1934 and the Investment Company Act of 1940, the registrant has duly caused this report to be signed on its behalf by the undersigned, thereunto duly authorized.
FPA PARAMOUNT FUND, INC.
By: | /s/ ERIC S. ENDE | |
Eric S. Ende, President | |
(Principal Executive Officer) | |
Date: November 23, 2011
Pursuant to the requirements of the Securities Exchange Act of 1934 and the Investment Company Act of 1940, this report has been signed below by the following persons on behalf of the registrant and in the capacities and on the dates indicated.
FPA PARAMOUNT FUND, INC.
By: | /s/ ERIC S. ENDE | |
Eric S. Ende, President | |
(Principal Executive Officer) | |
Date: November 23, 2011
By: | /s/ J. RICHARD ATWOOD | |
J. Richard Atwood, Treasurer | |
(Principal Financial Officer) | |
Date: November 23, 2011